minerals - MDPI
34
minerals Article Multi-Proxy Provenance Analyses of the Kingriali and Datta Formations (Triassic–Jurassic Transition): Evidence for Westward Extension of the Neo-Tethys Passive Margin from the Salt Range (Pakistan) Shahid Iqbal 1,2, * , Michael Wagreich 2 , Mehwish Bibi 2 , Irfan U. Jan 3 and Susanne Gier 2 Citation: Iqbal, S.; Wagreich, M.; Bibi, M.; Jan, I.U.; Gier, S. Multi-Proxy Provenance Analyses of the Kingriali and Datta Formations (Triassic– Jurassic Transition): Evidence for Westward Extension of the Neo- Tethys Passive Margin from the Salt Range (Pakistan). Minerals 2021, 11, 573. https://doi.org/10.3390/ min11060573 Academic Editors: Hans-Jürgen Gawlick, Michal Krobicki and Laszlo Bujtor Received: 24 April 2021 Accepted: 22 May 2021 Published: 27 May 2021 Publisher’s Note: MDPI stays neutral with regard to jurisdictional claims in published maps and institutional affil- iations. Copyright: © 2021 by the authors. Licensee MDPI, Basel, Switzerland. This article is an open access article distributed under the terms and conditions of the Creative Commons Attribution (CC BY) license (https:// creativecommons.org/licenses/by/ 4.0/). 1 Department of Earth Sciences, Quaid-i-Azam University, Islamabad 45320, Pakistan 2 Department of Geology, University of Vienna, Althanstrasse 14, A-1090 Vienna, Austria; [email protected] (M.W.); [email protected] (M.B.); [email protected] (S.G.) 3 National Centre for Excellence in Geology, University of Peshawar, Peshawar 25130, Khyber Pakhtunkhwa, Pakistan; [email protected] * Correspondence: [email protected] Abstract: The Salt Range, in Pakistan, preserves an insightful sedimentary record of passive margin dynamics along the NW margin of the Indian Plate during the Mesozoic. This study develops provenance analyses of the Upper Triassic (Kingriali Formation) to Lower Jurassic (Datta Formation) siliciclastics from the Salt and Trans Indus ranges based on outcrop analysis, petrography, bulk sediment elemental geochemistry, and heavy-mineral data. The sandstones are texturally and com- positionally mature quartz arenites and the conglomerates are quartz rich oligomictic conglomerates. Geochemical proxies support sediment derivation from acidic sources and deposition under a passive margin setting. The transparent heavy mineral suite consists of zircon, tourmaline, and rutile (ZTR) with minor staurolite in the Triassic strata that diminishes in the Jurassic strata. Together, these data indicate that the sediments were supplied by erosion of the older siliciclastics of the eastern Salt Range and adjoining areas of the Indian Plate. The proportion of recycled component exceeds the previous literature estimates for direct sediment derivation from the Indian Shield. A possible increase in de- tritus supply from the Salt Range itself indicates notably different conditions of sediment generation, during the Triassic–Jurassic transition. The present results suggest that, during the Triassic–Jurassic transition in the Salt Range, direct sediment supply from the Indian Shield was probably reduced and the Triassic and older siliciclastics were exhumed on an elevated passive margin and reworked by a locally established fluvio-deltaic system. The sediment transport had a north-northwestward trend parallel to the northwestern Tethyan margin of the Indian Plate and normal to its opening axis. During the Late Triassic, hot and arid hot-house palaeoclimate prevailed in the area that gave way to a hot and humid greenhouse palaeoclimate across the Triassic–Jurassic Boundary. Sedimentological similarity between the Salt Range succession and the Neo-Tethyan succession exposed to the east on the northern Indian passive Neo-Tethyan margin suggests a possible westward extension of this margin. Keywords: Triassic–Jurassic boundary; framework mineralogy; sediment geochemistry; heavy minerals; passive margin; Neo-Tethys opening; Himalayas; Salt Range 1. Introduction Pangaea break-up resulted in the formation of rift systems and consecutive pas- sive margins [1–3] associated with globally distributed extensional structures, rift basins, breakup, and passive margins [4–7]. The Triassic–Jurassic Boundary (TJB) marks one of the five major phanerozoic mass extinction intervals [8] and a short-lived, but pronounced Minerals 2021, 11, 573. https://doi.org/10.3390/min11060573 https://www.mdpi.com/journal/minerals
-
Upload
khangminh22 -
Category
Documents
-
view
0 -
download
0
Transcript of minerals - MDPI

minerals
Article
Multi-Proxy Provenance Analyses of the Kingriali and DattaFormations (Triassic–Jurassic Transition): Evidence forWestward Extension of the Neo-Tethys Passive Margin from theSalt Range (Pakistan)
Shahid Iqbal 1,2,* , Michael Wagreich 2, Mehwish Bibi 2, Irfan U. Jan 3 and Susanne Gier 2
�����������������
Citation: Iqbal, S.; Wagreich, M.; Bibi,
M.; Jan, I.U.; Gier, S. Multi-Proxy
Provenance Analyses of the Kingriali
and Datta Formations (Triassic–
Jurassic Transition): Evidence for
Westward Extension of the Neo-
Tethys Passive Margin from the Salt
Range (Pakistan). Minerals 2021, 11,
573. https://doi.org/10.3390/
min11060573
Academic Editors:
Hans-Jürgen Gawlick,
Michał Krobicki and Laszlo Bujtor
Received: 24 April 2021
Accepted: 22 May 2021
Published: 27 May 2021
Publisher’s Note: MDPI stays neutral
with regard to jurisdictional claims in
published maps and institutional affil-
iations.
Copyright: © 2021 by the authors.
Licensee MDPI, Basel, Switzerland.
This article is an open access article
distributed under the terms and
conditions of the Creative Commons
Attribution (CC BY) license (https://
creativecommons.org/licenses/by/
4.0/).
1 Department of Earth Sciences, Quaid-i-Azam University, Islamabad 45320, Pakistan2 Department of Geology, University of Vienna, Althanstrasse 14, A-1090 Vienna, Austria;
[email protected] (M.W.); [email protected] (M.B.);[email protected] (S.G.)
3 National Centre for Excellence in Geology, University of Peshawar,Peshawar 25130, Khyber Pakhtunkhwa, Pakistan; [email protected]
* Correspondence: [email protected]
Abstract: The Salt Range, in Pakistan, preserves an insightful sedimentary record of passive margindynamics along the NW margin of the Indian Plate during the Mesozoic. This study developsprovenance analyses of the Upper Triassic (Kingriali Formation) to Lower Jurassic (Datta Formation)siliciclastics from the Salt and Trans Indus ranges based on outcrop analysis, petrography, bulksediment elemental geochemistry, and heavy-mineral data. The sandstones are texturally and com-positionally mature quartz arenites and the conglomerates are quartz rich oligomictic conglomerates.Geochemical proxies support sediment derivation from acidic sources and deposition under a passivemargin setting. The transparent heavy mineral suite consists of zircon, tourmaline, and rutile (ZTR)with minor staurolite in the Triassic strata that diminishes in the Jurassic strata. Together, these dataindicate that the sediments were supplied by erosion of the older siliciclastics of the eastern Salt Rangeand adjoining areas of the Indian Plate. The proportion of recycled component exceeds the previousliterature estimates for direct sediment derivation from the Indian Shield. A possible increase in de-tritus supply from the Salt Range itself indicates notably different conditions of sediment generation,during the Triassic–Jurassic transition. The present results suggest that, during the Triassic–Jurassictransition in the Salt Range, direct sediment supply from the Indian Shield was probably reducedand the Triassic and older siliciclastics were exhumed on an elevated passive margin and reworkedby a locally established fluvio-deltaic system. The sediment transport had a north-northwestwardtrend parallel to the northwestern Tethyan margin of the Indian Plate and normal to its opening axis.During the Late Triassic, hot and arid hot-house palaeoclimate prevailed in the area that gave way toa hot and humid greenhouse palaeoclimate across the Triassic–Jurassic Boundary. Sedimentologicalsimilarity between the Salt Range succession and the Neo-Tethyan succession exposed to the easton the northern Indian passive Neo-Tethyan margin suggests a possible westward extension ofthis margin.
Keywords: Triassic–Jurassic boundary; framework mineralogy; sediment geochemistry; heavyminerals; passive margin; Neo-Tethys opening; Himalayas; Salt Range
1. Introduction
Pangaea break-up resulted in the formation of rift systems and consecutive pas-sive margins [1–3] associated with globally distributed extensional structures, rift basins,breakup, and passive margins [4–7]. The Triassic–Jurassic Boundary (TJB) marks one ofthe five major phanerozoic mass extinction intervals [8] and a short-lived, but pronounced
Minerals 2021, 11, 573. https://doi.org/10.3390/min11060573 https://www.mdpi.com/journal/minerals

Minerals 2021, 11, 573 2 of 34
sea-level fall is globally observed during this time interval [9,10]. This sea-level fall ex-posed new areas for mechanical denudation and chemical weathering, e.g., in England [11],Germany, Danish Basin, Sweden, Poland, Austria, Hungary, and Slovakia [12–15], andprovided new siliciclastic supplies for rift basins and passive margins.
The geologic evolution of the northern margin of the Indian Plate is best recorded inthe stratigraphy of the Tethys Himalayan Succession (THS) e.g., [16]. The E/W-trendingTHS stretch along the Himalayan Orogen for over 1500 km, from NW India in the westto Nepal and southern Tibet in the east [17–19]. The THS preserves a continuous strati-graphic record from Late Precambrian to Eocene, thereby documenting the history ofnorthern Indian margin during most of the Phanerozoic [20–29]. The Neo-Tethys open-ing is well-documented by sedimentary records in Spiti, Lahaul, Zanskar, and adjoiningareas of Kashmir e.g., [30–33]. The Salt and Trans Indus ranges of the NW Pakistan(Figures 1 and 2) preserve Precambrian to Recent sedimentary successions [34–40]. TheSalt Range Succession (SRS) displays an apparent lithological correlation with the THSexposed in the Lahul-Zanskar and the nearby Kashmir area (Table 1). This may help intracing the Neo-Tethyan margin of the Greater India further to the west. The SRS has widelybeen investigated for the reconstruction of the geological history of sediment generationsites, palaeoclimatic conditions, transport pathways, and depositional sites e.g., [40–45].However, most of such provenance studies conclude with sediment derivation from theIndian Plate basement rocks and the hypothesis of possible link between the SRS and theTHS remains yet to be tested.
The present work analyses siliciclastics of the upper Triassic Kingriali Formation tothe Lower Jurassic Datta Formation, using outcrop analysis, petrographic data, bulk rockgeochemistry, and heavy mineral data. Based on these data, we propose a source-to-sinkhistory of the Salt and Trans Indus ranges following the demise of the Rhaetian carbonateplatform. The present results indicate that the conventional Indian Plate basement rocksmay not have served as direct sources for the siliciclastics of the Salt Range around the TJBinterval. Instead, the source area was located on the elevated NW-passive margin of theIndian Plate facing the southern Neo-Tethys. Exhumation of the passive margin possiblyexposed the eastern Salt Range and areas further to the east, thereby generating new silici-clastic source areas. This passive margin setting in the Salt Range during the TJB intervalcould represent a westward extension of the NW-passive margin of the Greater India.
Table 1. Similarities between the Tethyan Himalaya Succession (THS) and Salt Range Succession (SRS) and their potentiallink to the Neo-Tethys tectonic events [16,20–24,37].
Episode Tethyan Himalaya Succession (THS) Salt Range Succession (SRS)
Syn-Collisional Paleogene limestones followed by post Eocene fluvio-deltaic redbeds derived from erosion of the Himalayas
Paleogene shallow marine limestones and shales followed by Post Eocenebrown-red fluvio-deltaic siliciclastics derived from erosion of Himalayas
Drift
(g) Cretaceous drowning and deposition of glauconitic andphosphatic ironstones.
(g) Cretaceous iron rich glauconitic shales and sandstones (Chichali andLumshiwal formations)
(f) Middle Jurassic carbonate-platform sedimentation becamewidespread (“mature passive-margin stage”)
(f) Middle Jurassic widespread platform carbonates deposition(Samana Suk Formation)
(e) Early Jurassic development of dysoxic bottom waters (e) Toarcian black shale deposition (Shinawari Formation)(d) Late Triassic-Lower Jurassic quartzose sands deposition(locally until the middle Early Jurassic)
d) Late Triassic shale and sandstone (Kingriali Formation) and thick lowerJurassic quartzose sandstones Datta Formation)
(c) Norian sudden increase in siliciclastic detritus suddenly(Passive margin rejuvenation)
(c) Middle Triassic thick sandstones with large scale slumps (TredianFormation) pointing to passive margin rejuvenation
(b) Lower Triassic deep-water, ammonoid-bearingsediment deposition
(b) Lower Triassic deep marine ammonoid rich deposition(Mianwali Formation)
(a) Upper Permian transgressive bioclastic sands and shales withdeepening upward trend
(a) Upper Permian sandstones and shales (Warchha and Sardhai formations)followed by thick, richly fossiliferous carbonates (Zaluch Group)
Syn-Rift Lowermost Permian glacigenic diamictites overlain by Sakmariandeglaciation mudrocks.
Lowermost Permian glacial diamictites (Tobra Formation) overlain bydeglaciation shale (Dandot Formation)
Pre-RiftAngular unconformity between the underlying Upper Devonianto Tournaisian limestones and the overlying syn-rift sequenceCambrian-Devonian succession
Ordovician-Carboniferous unconfirmityGentle angular unconformity between Baghawala Formation (Cambrian)and Tobra Formation (Permo-Carboniferous)Salt Range Formation (Precambrian), Jhelum Group (Cambrian)
Minerals 2021, 11, 573 3 of 34
Figure 1. Current and palaeogeographic locations of the Salt Range, Pakistan. (a) Early Jurassic palaeogeographic locationof the study area. The star marks location of the study area. (b) Google Earth view of Pakistan in regional context. Therectangle marks the location of Salt Range–Kohat–Potwar Plateau. (c) Salt and Trans–Indus ranges with locations of thestudied sections. The inset map shows location of the Salt Range-Potwar Plateau (SR–PP) within the Himalayan orogenicbelt. ISZ = Indus Suture Zone, MKT = Main Karakoram Thrust, HKS = Hazara-Kashmir Syntaxis, MBT = Main BoundaryThrust, MFT = Main Frontal Thrust (modified after [34–36]).

Minerals 2021, 11, 573 4 of 34
Figure 2. Generalised cross section of the Salt and Trans–Indus ranges showing the distribution of lithostratigraphic unitsin different parts of the area. Note the angular unconformity between the Cambrian and Permian strata and the absenceof Mesozoic strata in the eastern Salt Range. The studied strata are highlighted in green colour. The studied sections arenumbered 1–6. 1 = Kasanwala; 2 = Kaowaali; 3 = Nammal Gorge; 4 = Zaluch Nala; 5 = Gulla Khel; and 6 = Paniala. LowerPermian (Tobra, Dandot, Warchha, and Sardhai formations), Upper Permian (Amb, Wargal, and Chiddru formations),Triassic (Mianwali, Tredian, and Kingriali formations), Jurassic (Datta, Shinawari, and Samana Suk formations), Cretaceous(Chichali, Lumshiwal, and Kawagarh formations), Paleocene (Hangu, Lockhart, and Patala formations), Eocene (Nammal,Sakesar, and Chorgali formations), Miocene (Murree and Kamlial formations), and Plio-Pleistocene (Chinji, Nagri, DhokPattan, and Soan formations) (modified from [37]).
2. Geological Setting and Palaeogeography
The Salt Range, with its Trans Indus extension, is a nearly east–west trending mountainrange located in Pakistan (Figure 1). The SRS preserves thick Precambrian to recentsedimentary record e.g., [36,37,40,46–48]. According to the literature, the SRS displaysconsiderable similarity to the THS e.g., [16,19,23]. The SRS can be broadly subdividedinto four supersequences similar to that of the THS (Table 1): (a) the Late Neoproterozoic–Cambrian sequence consists of evaporites of the Salt Range Formation and overlyingsiliciclastics of the Cambrian Jhelum Group that can be correlated with the pre-rift sequenceof the THS; (b) the Lower Permian siliciclastics of the Tobra and Dandot formations of theNilawahan Group, which are correlatable with the syn-rift sequence of the THS; (c) themiddle Permian–Cretaceous sequence, which can be correlated with the drift sequence ofthe THS; and (d) the Paleocene–Eocene sequence, a probable stratigraphic equivalent of thesyncollisional sequence of the THS. This succession of the SRS is capped by postcollisionalsiliciclastics of post Eocene age.
The SRS displays a major Ordovician–Carboniferous unconformity between the pr-riftand the syn-rift supersequences (Figure 2 and Table 1). This points towards the possibleoccurrence of the Cambro-Ordovician orogeny in the Salt Range that is documented overlarge parts of Gondwana [49,50]. The Ordovician to Carboniferous strata is, however, welldeveloped in the Peshawar Basin [38] located ca. 200 km to the north of the Salt Range.
The syn-rift sequence on the northwestern margin of the Indian Plate documents thetectonic processes that resulted in the continental break-up and Neo-Tethys opening. Thedrift sequence of the area preserves the sedimentation and subsidence history of the NWpassive continental margin of the Indian Plate [51–53]. The sudden increase in siliciclasticdetritus during the Late Triassic points to a possible passive-margin rejuvenation in theNW Greater India. Quartzose sandstones were deposited during this interval in THS

Minerals 2021, 11, 573 5 of 34
and this deposition locally continued until the middle Early Jurassic [16]. The quartzosesandstones of the SRS around the TJB interval were possibly deposited during this passivemargin rejuvenation phase. The Kingriali Formation consists of dolostones, limestones withgreen-black shales, and sandstones in the upper part. A Rhaetian age is confirmed by newpalynology data [15]. The Datta Formation, of Hettangian age, consists of conglomerates,sandstones, shales, and carbonates.
Around 200 Ma ago, the Salt Range (Figure 1) was located on the NW margin of theIndian Plate, close to the Arabian and Greater Somalian plates, in the tropical-near tropicalregion of the southern hemisphere in the Tethyan realm at ∼20◦–25◦ S latitude [34,54,55].The TJB interval witnessed a transition from hot and arid to hot and humid greenhousepalaeoclimate [56–58]. During this interval, a fluvio-deltaic system developed in theareas, nowadays the Salt Range–Kohat–Potwar Plateau, and deposited the siliciclastics ofKingriali and Datta formations on an area of ca. 15,000 km2 [15,36].
3. Material and Methods3.1. Fieldwork and Sampling
In the Salt and Trans Indus ranges of Pakistan the upper part of the Kingriali Formationand the overlying entire Datta Formation were studied (Figure 1b,c). A total of six (6)stratigraphic sections were measured along a ca. 300 km transect from the western SaltRange through the Surghar Range, and the Khisor Range (Figures 2 and 3; Table 2).
Sedimentological analyses were conducted in the field (Figures 2–5). In total, 400 sampleswere collected from the entire facies’ variation.
3.2. Palaeocurrent Analysis
Palaeocurrent data, mostly from trough cross bedding and where possible from theimbricated clasts and ripples, were collected. In total, 229 readings for palaeocurrents werecollected in the field, including 209 from cross bedding and 20 from imbricated clasts andripples. For each reading, measurements of the dip and azimuth of the structure and dipand strike of the beds were taken using a Brunton compass. The direction for each readingwas recorded as a plunge with respect to the orientation of the bedding, and this directionwas then rotated back to the depositional horizontal using stereonet techniques [59]. Thedata were restored to reconstruct the palaeoflow pathway and rose diagrams were preparedfor each stratigraphic section (Figure 5).
Table 2. Geographic positions of the studied sections in the Salt and Trans Indus ranges.
S. No Locality Name Area Latitude Longitude
1 Kasanwala Nala
Salt Range
32◦36/14.17//N 71◦49/45.63//E
2 Kaowaali 32◦37/1.28//N 71◦49/13.00//E
3 Nammal Gorge 32◦39/43.83//N 71◦47/48.23//E
4 Zaluch Nala 32◦46/1.45//N 71◦39/54.06//E
5 Gulla Khel Surghar Range 32◦58/28.80//N 71◦13/23.17//E
6 Paniala Khisor Range 32◦13/25.19//N 70◦53/49.33//E

Minerals 2021, 11, 573 6 of 34
Figure 3. Measured stratigraphic sections in the Salt and Trans–Indus ranges. Sedimentary structures, sample locations,and grain size trend are displayed on each log. Vertical facies variation is displayed and a general lithofacies correlationis also marked on the lithological logs. 1 = dolostone lithofacies; 2 = shallow marine dolostone and shale lithofacies;3 = lagoonal shale and evaporites lithofacies; 4 = channel margin sandstone lithofacies and overbank-floodplain shalelithofacies; 5 = laterite-bauxite lithofacies; 6 = channel belt conglomerate lithofacies; 7 = channel belt sandstone lithofacies;8 = lagoonal shale lithofacies and lagoonal carbonates lithofacies; and 9 = contact zone with the overlying strata. Thedistance between each section is displayed in kilometers. (P) = petrography; (G) = geochemistry; (C) = clay mineralogy;(H) = heavy minerals.

Minerals 2021, 11, 573 7 of 34
Figure 4. Representative field photographs showing: (a) an overview of the upper part of theKingriali Formation and the Datta Formation in Zaluch Nala; (b,d,e) cross bedding (dominantlytrough cross bedding) with the tangential and truncated side labeled in the Datta Formation atKasanwala, Kaowaali, and Nammal Gorge, respectively; (c) quartz-rich conglomerate in the DattaFormation at the Kasanwala section; (f) laminated siltstone with erosive upper bedding plane andfining upward quartz rich pebbly sandstone in the Datta Formation at Nammal Gorge; (g) plantremains in pebbly sandstones of the Datta Formation at Kasanwala; and (h) ripple-laminated finegrained sandstone in the Datta Formation at Gulla Khel.

Minerals 2021, 11, 573 8 of 34
3.3. Petrographic Studies
Except for loose shale, thin sections were made for all siltstones, sandstones, con-glomerates, carbonates, and evaporites samples. In total, 300 thin sections were madeat the Department of Geology, University of Vienna. All thin sections were studied sys-tematically using a Leica DM2700 P microscope with a Leica MC170 HD camera. Herein,the petrographic studies were focused on point counting of 500 grains per thin section(Supplementary Materials S1) and its application for provenance analysis. The petro-graphic detail of the carbonates present in the succession are avoided as these are notsignificant in provenance analysis. Similarly, the various types of cementation and diage-netic features add little to the provenance analysis and have been avoided.
For point counting, the total quartz (Qtotal) was subdivided into monocrystalline(Qm) and polycrystalline (Qp) varieties. The latter also included chert. Qm was furtherclassified into Qm with unit extinction (Qmue) and Qm with undulose extinction (Qmuu).Similarly, Qp was subdivided into Qp with 2–3 crystals (Qpq(2-3)) and Qp with >3 crystals(Qpq>3). Total feldspars (Ftotal) were subdivided into plagioclase (P) and K-feldspar (A).The total lithic fragments (Ltotal) were subdivided into sedimentary (Ls), metamorphic(Lm), and volcanic-metavolcanic (Lv) lithics [60,61]. The data were plotted on Quartz–Feldspars–Lithic fragments (QFL) plots for sandstone classifications and tectonic settingdiscrimination [62].
3.4. Clay Mineralogy/XRD Separation
Thirty samples from the clays/shale horizons were selected and investigated for claymineralogy. These include 10 samples from the Kingriali Formation and 20 samples fromthe Datta Formation. XRD separation analysis was conducted using a PANalytical X’PertPro diffractometer (CuKα-radiation (40 kV, 40 mA), step size 0.0167, 5 s per step) at theUniversity of Vienna. Each sample was treated with 15% hydrogenperoxide (H2O2) toremove the organic matter [63] and then dispersed with a 400 W ultrasonic probe. The<2 µm fraction of each sample was separated using Atterberg cylinders and dried in ovenat a temperature <40 ◦C to avoid the destruction of kaolinite. Then, 1 mL suspension(10 mg/mL) of each sample was pipetted out onto a glass slide to prepare oriented claysamples. Each sample was saturated with Mg and K ions and the mounts were analysed.These samples were saturated with glycerol (Mg-samples) and ethylene-glycol (K-samples)to separate smectite and vermiculite. Every sample was heated to 550 ◦C [64] and analysedas kaolinite loses it structure at this temperature. The XRD patterns were interpreted [65]and quantified using the correction factors [66].
3.5. Bulk Geochemistry
In total, 150 samples were selected, including 40 samples from the Kingirali Formationand 110 samples from the Datta Formation, for bulk rock geochemical analysis basedon field and petrographic studies. Each sample was powdered and homogenised andthe analysis was conducted at Bureau Veritas, Canada using inductively coupled plasmaoptical emission spectroscopy/mass spectrometry (ICP-OES/MS). The analysis includedmajor, minor oxides, trace, and rare earth elements (REEs) (Supplementary Materials S2).
For each sample, a split of 0.2 mg powdered and homogenised sample was fused inlithium metaborate/tetraborate followed by nitric acid digestion to extract Si, Nb, andRb and measured by ICP-OES (Spectro Ciros Vision). Besides, 0.5 g of each sample wasdigested in 95 ◦C Aqua Regia and analysed for Al, Fe, Mg, Ca, Na, K, Ti, P, Mn, Cr, Ba, Co,Sr, Th, U, V, W, and Zr using ICP-MS (Perkin Elmer ELAN 9000, Sciex). Both splits werecalibrated against reference materials SO18, DS 10, and OREAS 45 EA. Thirteen sampleswere analysed in duplicates. The average analytical error in the analysis is 0.18%.
The interpretation of geochemical data is based on widely used proxies to recon-struct weathering and palaeoclimatic trends including the Chemical Index of Alteration(CIA) [67,68], Al2O3-CaO*+Na2O-K2O (A-CN-K) plot, and Th/U versus Th plot [69]. Inboth the CIA and A-CN-K, all the quantities were used in molar proportions and the CaO*

Minerals 2021, 11, 573 9 of 34
is the amount of CaO incorporated in the silicate fraction of the rock and correction forK-metasomatism was also made [70]. Th/Sc versus Zr/Sc plot [71] was used to understandthe sediment recycling. Th/Co versus La/Sc plot [72] and V-Ni-Thx10 plot [73] were usedfor the identification of parent rocks composition. La/Th versus Hf plot [74]; Ti/Zr versusLa/Sc, La-Th-Sc, Th-Sc-Zr/10, and Th-Co-Zr/10 plots [75]; and Nb/La versus (La/Sm)Nplot have been used for discrimination of tectonic settings. These proxies are widely usedfor provenance analysis worldwide e.g., [76–87].
3.6. Heavy Minerals
Subsequent to detail petrography and geochemistry, 30 rock samples from the silt-stones and sandstones of the succession (Supplementary Materials S3) were selected forheavy mineral analysis. Each sample was gently crushed to separate the constituent par-ticles. A solution of 3:2 distilled water and 80% acetic acid was prepared to decalcifyeach sample. Each of the treated samples was sieved to separate the 0.4 mm to 63 µmfraction used for the heavy mineral separation e.g., [84]. Heavy minerals were separatedby gravity settling in low-toxicity inorganic solutions, based on tungsten compoundslithium heteropolytungstates (LST) with a specific gravity of 2.90 g/cm3 [88,89]. The grainconcentrates containing the whole heavy mineral fraction were embedded in a CanadaBalsam mount. Herein, heavy mineral data for the Kasanwala section are presented as thissection preserves the complete lithofacies variations of the succession.
Figure 5. (a) Restored palaeoflow data from cross-strata favouring a north-northwestward palaeo-flow. The number ofreadings (N) is indicated for each section on the horizontal axis (total 229). Both the rotation of the Indian Plate and tilt ofthe strata are considered for the palaeoflow restoration. (b) Palaeoflow data plotted on the palaeogeographic map of thearea (locations are tentative and not to the scale) [90].
4. Results4.1. Field Data
A summary of the outcrop observations and facies distribution based on the presentstudy is included in Table 3. Herein, information just relevant in the provenance analysis isincluded. The Kingriali Formation consists mainly of thick-bedded dolostone displayingvarious shades of a gray colour. The formation forms distinct ridges of variable thicknessfrom the western Salt Range (75 m–85 m) to the Surghar Range (92 m–108 m). Thin beds of

Minerals 2021, 11, 573 10 of 34
dark green, brownish-black shales and sandstones occur in the upper part of the formation,indicating the onset of siliciclastic supply to the basin (Figure 3).
Table 3. Lithofacies and lithofacies associations observed in the Kingriali and Datta formations during the present study.The lithofacies classification is based on their depositional setting. Only the first occurrence in a complete cycle is presentedand the lateral distribution in the Salt and Trans–Indus ranges is included in the table.
Formation/Age
Lithofacies/Environments
Lithology/Features LithofaciesAssociation
Distribution
SaltRange
SurgharRange
KhisorRange
Lagoonal carbonate Yellowish orange to brown dolomites,ripple marks, Present Present only in
eastern parts Absent
Lagoonal shale Gray, calcareous shales, with siltstone,fine sandstone interbeds having ripples
Lagoonal lithofaciesAssociation Present Present only in
eastern parts Absent
Channel beltsandstone
Quartz rich sandstones, cross bedding,fining upward, coal patches and
carbonaceous horizons, fining upwardPresent Present Present
Channel beltconglomerate
Quartz rich conglomerates, crossbedding, flat pebbles imbrications,
erosive bases, fining upward
Channel belt faciesassociation
Present Absent Absent
Laterite–bauxite Red-purple laterite–bauxite with kaolinite Present Present PresentOverbank-
floodplain shale Red, gray shales with fire clay deposits Present Present Present
Datta FormationJurassic
(Hettangian)
Channelmargin sandstone
Brown-red, fine–medium grained,quartzose sandstone interbedded with
red, brown shale, ripples, graded bedding
Channel margin andoverbank floodplain
lithofacies association Present Present Present
Lagoonal shaleand evaporites
Greenish gray shale with gypsum ontop, illite rich Present Present Present
Shallow marinedolomite and shale
Thin–medium bedded dolomite andinterbedded greenish gray shale (illite
rich), shale thickness increasesupward, lateritic oxidation on top of
upper dolomite beds
Lagoonal andshallow marine
lithofacies association Present Present PresentKingriali
FormationTriassic
(Rhaetian)
DolomiteThick bedded, massive dolomite,
laminations, occasional crossbedding, oolitic
Platform carbonateslithofacies association Present Present Present
The lower part of the Datta Formation consists of rounded, well-sorted, and quartzoseconglomerates, as well as pebbly and coarse quartz rich sandstones (Figure 4a–e). Thecoarsest pebbles (average diameter = 5–7 cm) occur in the Kasanwala section (Figure 4c);the Zaluch Nala section displays finer pebbles (average diameter = 2–3 cm). In the Surgharand Khisor ranges, conglomerates are not present. Upsection, red-brown colour fine tomedium grained sandstones, siltstones, and light to dark brown shale occur throughoutthe study area. Brown-black calcareous shale and carbonates are limited to the westernSalt Range and eastern parts of the Surghar Range.
The conglomerates, pebbly sandstones, sandstones, and siltstones possess abundanttrough cross-beds and cross bed sets (Figure 4b,d,e). Laminated siltstone with erosiveupper bedding plane and fining upward pebbly sandstones occur in the Datta Formationat Nammal Gorge (Figure 4f). In the Kasanwala section, plant remains occur in the pebblysandstones of the Datta Formation (Figure 4g). In the Gulla Khel section, ripple-laminatedfine-grained sandstones are common in the Datta Formation (Figure 4h). Additionally,aligned pebbles with their longer axes parallel to the bedding plane and pebble’s imbri-cation indicative of transport direction occur. All these palaeoflow indicators indicate ageneral southeast to northwest transport of the sediments (Figure 5).
4.2. Framework Composition/Petrographic Studies
The Triassic sandstones are fine to medium grained and consist of poorly sortedangular to subrounded clasts (Figure 6a,b). Silica and iron oxide are the major cementingmaterial, while carbonate cements are minor. The grains display a sharp margin with pointand long linear contacts. Corroded grain margins and sutured contacts are rare (Figure 6a).
Minerals 2021, 11, 573 11 of 34
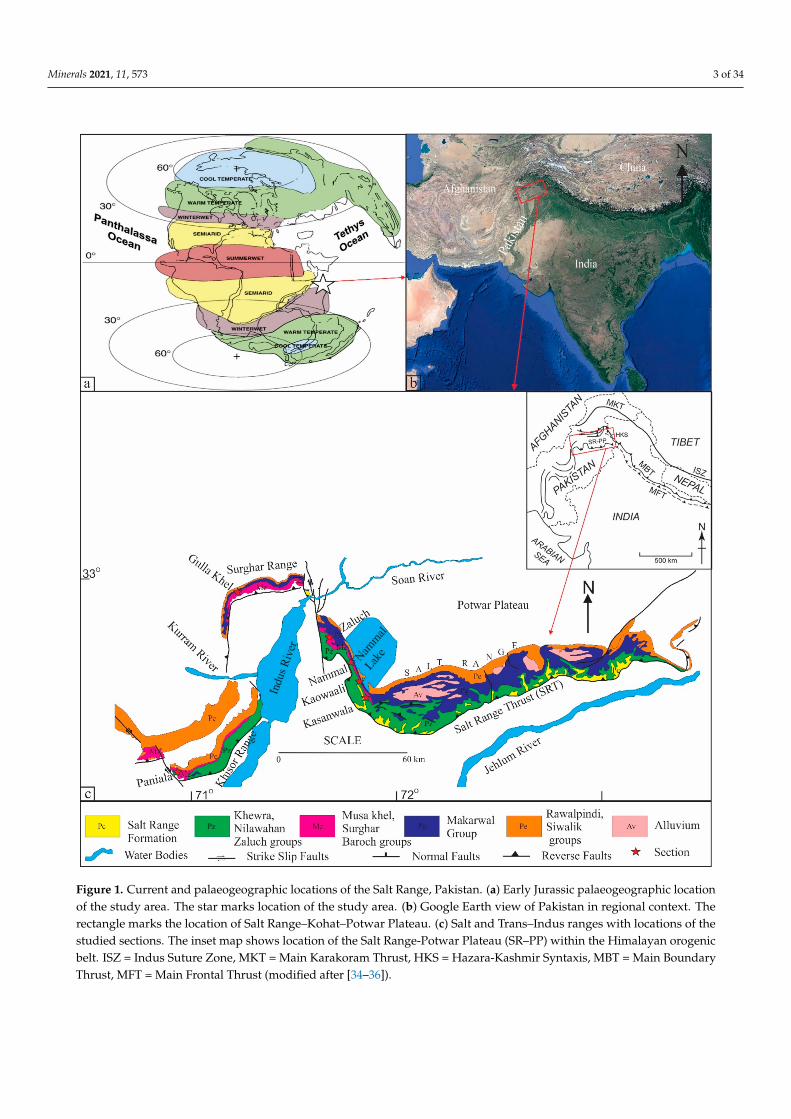
Figure 6. Representative thin section photomicrographs of the Kingriali and Datta formationssiliciclastics. (a) Poor to moderately sorted, angular to subangular medium grained quartz richsandstone with matrix and Fe-cement in the Kingriali Formation (Kasanwala); (b) subangular tosubrounded poorly sorted fine grained sandstone of the Kingriali Formation (Kasanwala); (c) quartz-rich lithoclasts in well-rounded and very well sorted, pebbly sandstone of the Datta Formation(Nammal Gorge); (d) quartz-rich sandstone with carbonate cement and dolomite rhomb in the DattaFormation (Kasanwala); (e) fining upward cycle in quartz-rich sandstone at Gulla Khel; and (f) verywell rounded and very well sorted quartz-rich sandstone in the Datta Formation (Nammal Gorge).Red arrow in each case indicates the top of bed. D = dolomite crystal; L = lithoclast; M = mica;Q = quartz.
The Jurassic sandstones are medium to very coarse grained and pebbly, are roundedto very well rounded, and are very well sorted (Figure 6c,d). A fining upward trend isobservable in the sandstones (Figure 6e). Point and long linear contacts are common, andconcavo-convex contacts are also observable, while suture contacts are rare (Figure 6f).Fine silt and clay size particles are present in the pore spaces of the coarse grained topebbly sandstones. Iron oxide, calcite, dolomite/ferroan dolomite, and silica are thecommon cementing materials. Matrix is generally lacking, but where the grains are not incontact, they are floating in iron oxide, finely crystalline calcite, and dolomite (Figure 6c,d).Fractures filled with brown colour iron oxide are crosscut by sparry calcite veins/fractures.
Point counting data indicate that quartz is the dominant framework component andQtotal averages 98% in the Triassic strata (Figure 7a). Lt is 1%, while the sum of Ft and otherframework components is 1%. Qtotal is a mixture of Qm (96%) and Qp (4%). Qm consists ofQmue (90%) and Qmuu (6%), while Qp consists of Qpq(2-3) (3%) and Qpq>3 (1%) (Figure 7b).
Minerals 2021, 11, 573 12 of 34
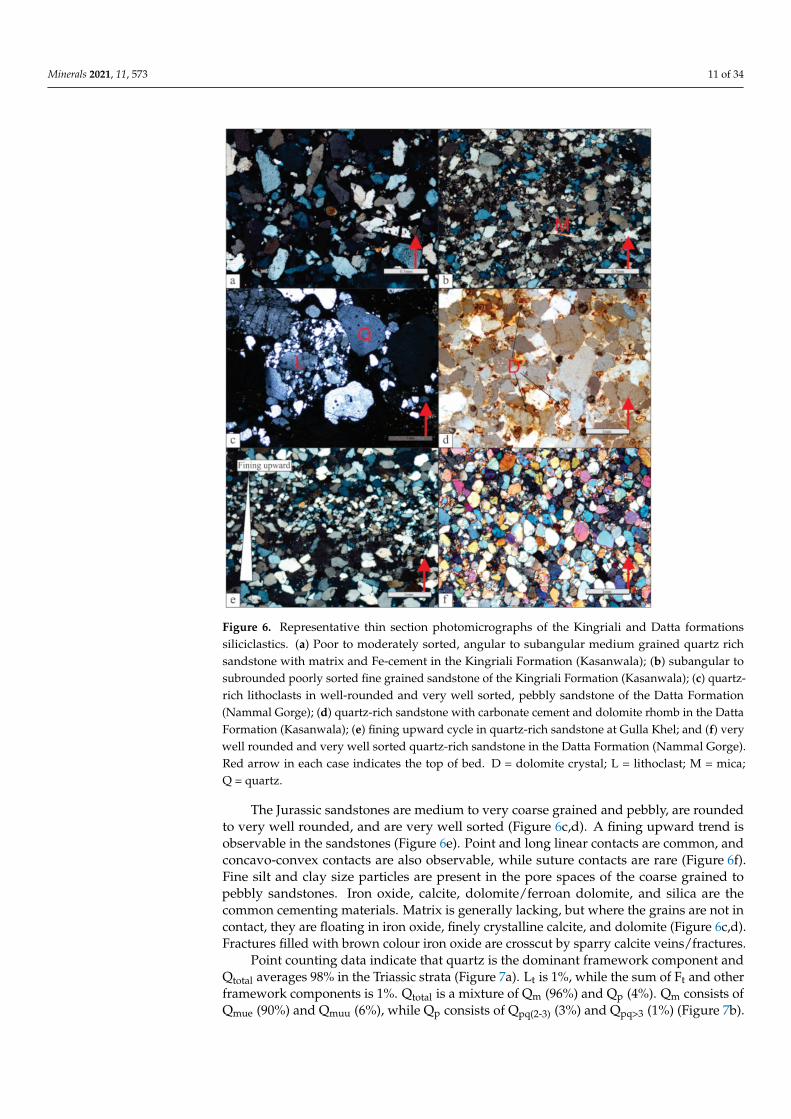
Figure 7. Framework mineralogical composition plots for the siliciclastics of the Kingriali and Datta formations. (a,b) Piecharts of the point count analysis showing quartz as the dominant framework composition in the Triassic strata; (c,d) piecharts of point count analysis showing quartz as the dominant constituent in the Jurassic strata and monocrystalline quartzhas more undulose constituent.
The Jurassic strata consist of 96% average Qtotal (Figure 7c). Lt averages 2% of the totalframework composition, while Ft is less than 1% (Figure 7c). The Qtotal consists of 94% Qm,of which 81% is Qmue and 11% Qmuu. Qp counts for 6% of Qtotal and is subdivided into 4%Qpq(2-3) and 2% Qpq>3 (Figure 7d).
The average of the total point counting data indicates that Qtotal averaged 96% ofthe total framework composition. Qmue predominates, averaging 81%, followed by Qmuu(10%), whereas Qpq(2-3) averages 3% and Qpq>3 averages 2%. Comparatively high Qmuuand Qp contents occur in the conglomerates and pebbly sandstones. The Ftotal accounts foronly 0.13%, of which A averages 0.12%, while P is 0.01%. The Lt averages 1.4% and is thecombination of Ls, Lm, and Lv. According to the QtFtLt plot, >96% of the samples plot inthe pure quartzose field (Figure 8a). Around 97% of the samples plot in the undissectedpart of the continental block provenance field (Figure 8b).
4.3. Clay Mineralogy
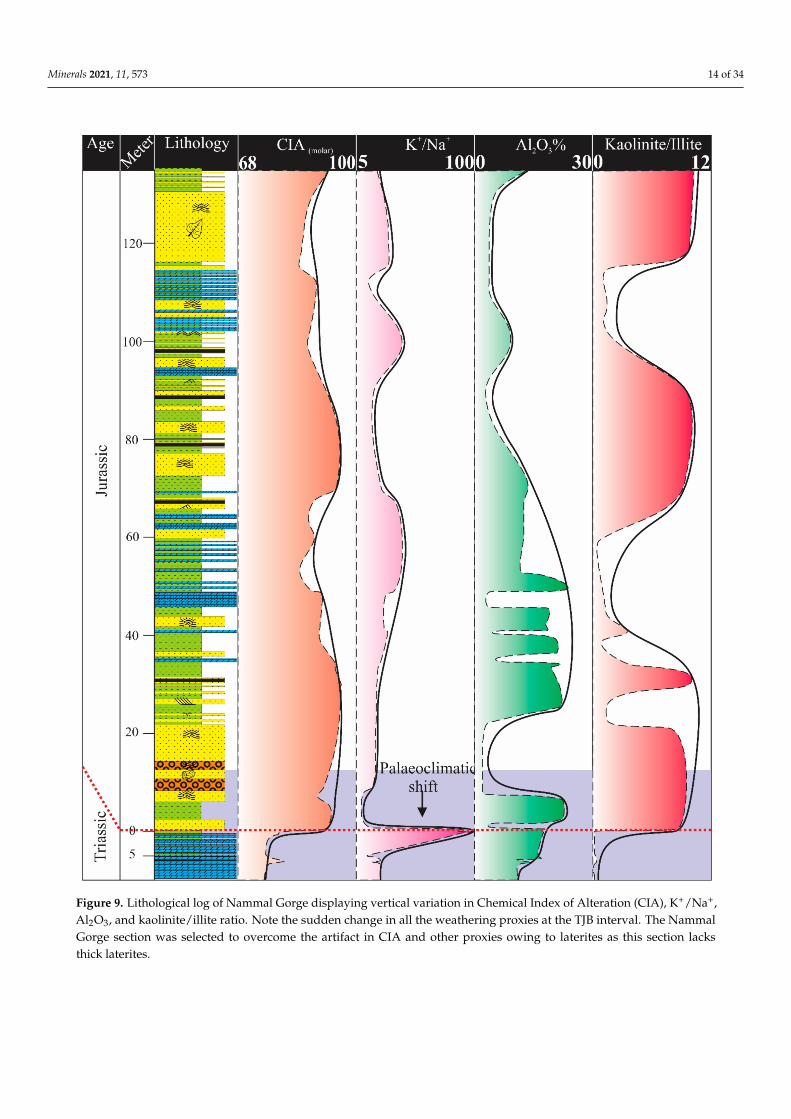
Analysis of the oriented clay samples displays a mixture of illite and kaolinite (Figure 9).Illite is the dominant clay mineral in the Kingriali Formation that averages 94% of thetotal clay content, while the remaining 6% is kaolinite. By contrast, the overlying DattaFormation is rich in kaolinite, which averages 69% of the total clays, while the remaining31% is all illite. Following the very high illite content during the Triassic (100% in theuppermost part of the Kingriali Formation), a jump to very high kaolinite content (92%) isobserved in the basal part of the Datta Formation (Figure 9).
4.4. Bulk Geochemical Proxies4.4.1. Tectonic Settings Discrimination PlotsLa/Th versus Hf(ppm), Ti/Zr versus La/Sc, and Nb/La versus (La/Sm)N Plots
The La/Th versus Hf(ppm) plot (Figure 10a) displays uniform low La/Th values of<8 and a wide range for Hf (1–30 ppm). More than 85% of the samples have La/Th values

Minerals 2021, 11, 573 13 of 34
of <5, while 80% of the samples have Hf values above ≥3 ppm. Moreover, 65% of thesamples plot in the passive margin source field, while the remaining fall into the acidic arcsource and mixed felsic/basic source fields.
The present samples have Ti/Zr ratios of <35 and a broad La/Sc range of 1 to >14.Around 75% of samples from the Kingriali Formation occupy the andesitic arc source andactive continental margin fields. While the Datta Formation show 50% samples populationin these fields and the remaining 50% are positioned in the passive margin source field(Figure 10b).
The Nb/La versus (La/Sm)N plot indicates that all the samples have an Nb/La ratioof <1.4 (Figure 10c). Similarly, the (La/Sm)N values are >3 for most of the samples (>95%).More than 90% of the samples plot in the passive margin settings.
La–Th–Sc, Th–Sc–Zr/10, and Th–Co–Zr/10 Plots
The results of the La/Th and La/Sc have already been included in the previous section.The Th/Sc ratio shows an average of 1.6 for the Kingriali Formation that increases to 2.8 forthe Datta Formation. On the La–Th–Sc plot (Figure 11a), around 60% of the samples fromthe Kingriali Formation plot in the continental island arc field and 25% in the active andpassive margins combined field. Moreover, 40% of the samples from the Datta Formationoccupy the continental island arc field and 40% plot in the combined active and passivemargin field (Figure 11a).
The Kingriali Formation has an average Zr/Th ratio of 12.5 that increases to 20.3 in theDatta Formation (Figure 11b). Around 85% of the samples from the Kingriali Formationplot in the active continental margin and continental island arc fields. On the contrary,68% of the samples from the Datta Formation fall into the passive margin field of theTh–Sc–Zr/10 plot (Figure 11b). This percentage increases to 82% in the Th–Co–Zr/10 plot(Figure 11c).
Figure 8. (a) Total Quartz–Feldspars–Lithics (QtFtLt) plot for the sandstone’s classification [62], showing that ma-jority of the sandstones are pure quartzose: Q = quartzose (qQ = pure quartzose); F = feldspathic; L = lithic;FQ = feldspatho-quartzose (fFQ = feldspar-rich; qFQ = quartz-rich); QF = quartzo-feldspathic; LF = litho-feldspathic;FL = feldspatho-lithic; QL = quartzolithic; LQ = litho-quartzose; lFQ = litho-feldspatho-quartzose; lQF = litho-quartzo-feldspathic; qLF = quartzo-lithofeldspathic; qFL = quartzo-feldspatho-lithic; fQL = feldspatho-quartzo-lithic;fLQ = feldspatho-litho-quartzose; (b) QmFtLt plot for tectonic setting discrimination [60], showing sediment derivationfrom undissected continental block.
Minerals 2021, 11, 573 14 of 34
Figure 9. Lithological log of Nammal Gorge displaying vertical variation in Chemical Index of Alteration (CIA), K+/Na+,Al2O3, and kaolinite/illite ratio. Note the sudden change in all the weathering proxies at the TJB interval. The NammalGorge section was selected to overcome the artifact in CIA and other proxies owing to laterites as this section lacksthick laterites.

Minerals 2021, 11, 573 15 of 34
Figure 10. (a) La/Th versus Hf(ppm) bivariate plot [74], (b) Ti/Zr versus La/Sc bivariate plot [75] negating sedimentderivation from oceanic island. Red dots are the Kingriali samples and black dots are the Datta samples in all figures,(c) Nb/La versus (La/Sm)N bivariate plot [91] indicating sedimentation on passive margin setting.

Minerals 2021, 11, 573 16 of 34
Figure 11. (a–c) La–Th–Sc, Th–Sc–Zr/10 and Th–Co–Zr/10 ternary plots [75] for tectonic setting discrimination indicatingsediment derivation from the passive margin; (d) V–Ni–Th × 10 ternary plot [73] showing that the sediments were derivedfrom a felsic source.
4.4.2. Source Rock Composition Identification PlotsV–Ni–Th × 10 and Th/Co versus La/Sc Plots
The V–Ni–Th × 10 ternary plot indicates that all samples plot in the felsic source fieldor close to it (Figure 11d). By comparison, samples from the Datta Formation cluster moreclosely to the felsic field, while those of the Kingriali Formation are slightly off.
The Kingriali Formation displays La/Sc values of 2–10 and Th/Co values of 0.1–2.The Datta Formation has La/Sc values of 0.3–25 and Th/Co values of 0.4–17. The Th/Coversus La/Sc plot indicates a cluster of samples in the silicic rocks field (Figure 12a).
4.4.3. Weathering and Recycling TrendChemical Index of Alteration (CIA) and A-CN-K Plot
The Kingriali Formation yielded low CIA values (Figure 9) ranging from 68.5 to80 (average 77.7). By contrast, the Datta Formation yielded very high CIA values rangingfrom 88.8 to 99.8 (average 92.7). On the ternary plot A–CN–K, the present samples clusternear the A vertex roughly parallel to the A–K side (Figure 12d). Samples of the Kingriali

Minerals 2021, 11, 573 17 of 34
Formation plot in the muscovite–illite position and those of the Datta Formation areclustered close to the A vertex corresponding to the kaolinite position.
Th/U versus Th(ppm) and Th/Sc versus Zr/Sc Plots
The Th/U versus Th(ppm) plot indicates Th/U values below the upper continentalcrust (<3.8) for around 60% of the samples from the Kingriali Formation. In the DattaFormation (>90% samples), these values are above the upper continental crust (Figure 12b).
The Th/Sc versus Zr/Sc plot illustrates that >95% of the samples yield Th/Sc valuesabove 1 (Figure 12c). Similarly, >95% of the samples show Zr/Sc values above 10. Ingeneral, the Datta Formation yielded higher Th/Sc and Zr/Sc values than the KingrialiFormation (Figure 12c).
Figure 12. (a) Th/Co versus La/Sc plot [72] indicating sediment derivation from a silicic source; (b) Th/U versus Th(ppm)plot [69] favouring chemical weathering of the sediments; (c) Th/Sc versus Zr/Sc plot [71] supporting the recycled originof the sediments; and (d) A–CN–K plot for the studied samples, where positions of reference minerals (muscovite, illite,smectite, and kaolinite) are indicated on the plot [92]. The Triassic and Jurassic samples are separated in the lower partof the plot and the CIA range (dotted and dashed lines) and average (black dots) are plotted to left for both the Triassicand Jurassic samples. PAAS = Post Archaean Australian Shale; NASC = North American Shale Composite; UCC = UpperContinental Crust; ACC = Average Continental Crust (ACC) [93–95].
4.5. Heavy Minerals Analysis
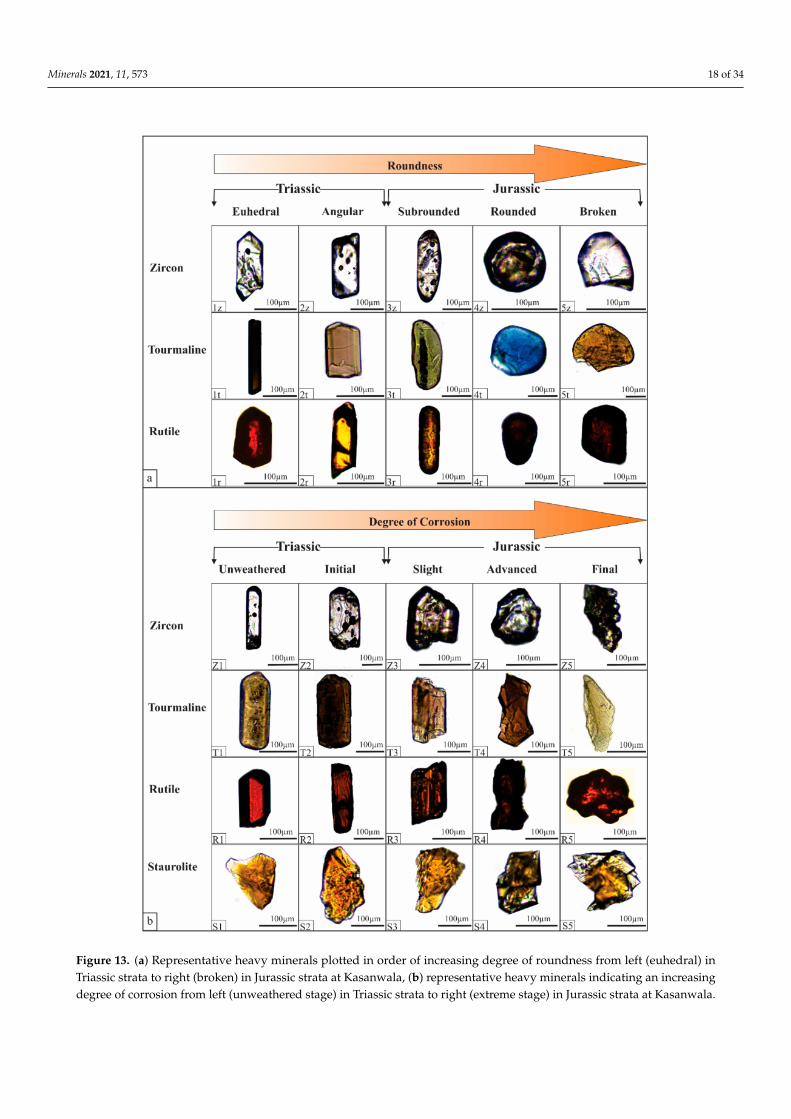
In the present case, the heavy mineral assemblage represents a simple mixture(Supplementary Materials S3) of ultra-stable zircon, tourmaline, and rutile with minorstaurolite and rare chloritoid. In general, the Triassic heavy minerals are smaller in size;have well preserved crystal faces, sharp edges, and corners; and display less dissolution andcorrosion effects. The Jurassic heavy minerals are comparatively bigger in size and displayadvanced stage corrosion and dissolution and are rounded and broken (Figures 13 and 14).
Minerals 2021, 11, 573 18 of 34
Figure 13. (a) Representative heavy minerals plotted in order of increasing degree of roundness from left (euhedral) inTriassic strata to right (broken) in Jurassic strata at Kasanwala, (b) representative heavy minerals indicating an increasingdegree of corrosion from left (unweathered stage) in Triassic strata to right (extreme stage) in Jurassic strata at Kasanwala.

Minerals 2021, 11, 573 19 of 34
Figure 14. Heavy mineral’s distribution in the Kasanwala section. ZTR-Index [96] is displayed to the left side, indicating anoverall very high sediment maturity. A vertical grain size plot is included to have an idea of the grain size variation fromTriassic to Jurassic. Pie charts of the point counting for heavy minerals for Triassic and Jurassic sediments are also includedto have an idea of the vertical variation from Triassic to Jurassic.
Tourmaline is the most abundant transparent heavy mineral that averages 44.3% ofthe heavy mineral assemblage. It averages 39.8% in the strata below the thick laterite(hereafter called the Triassic strata). In the strata above the thick laterite (hereafter calledJurassic strata), tourmaline averages 51.7% of the total assemblage. Zircon represents thesecond most abundant transparent heavy mineral and represents 32% of the Triassic heavymineral population and 29.4% in the Jurassic strata (Figure 14). Rutile constitutes the thirdmost abundant transparent heavy mineral and averages 21.5% of the assemblage (23.9%

Minerals 2021, 11, 573 20 of 34
in the Triassic and 17.7% in the Jurassic). Staurolite is the least abundant heavy mineral,averaging nearly 3%.
The only visible difference in heavy mineral assemblage is the higher concentrationof staurolite in the Triassic strata (averaging 4.1%) that diminished to less than 1% in theJurassic (Figure 14).
4.5.1. ZTR Index
The sum of total zircons, tourmalines, and rutiles (ZTR) is termed as the ZTR-Index [96]. The lowest ZTR-Index of 87 is measured for the basal unit of the Triassicstrata that displays an increasing upsection trend and reaches 100 in the Jurassic strata(Figure 14). The Triassic succession displays an average ZTR-Index of 95.7, while it reachesan average of 98.9 in the overlying Jurassic strata.
4.5.2. Tectonic Setting Using Heavy Minerals Plot
The present sediments lack any of the heavy minerals that can provide evidence fora basic igneous or metamorphic provenance; therefore, the ternary plot of the transportlimited (TL) heavy minerals (zircon, tourmaline, rutile)-low grade metamorphic (LGM)heavy minerals (epidote, chloritoid, chlorite, actinolite)-high grade metamorphic (HGM)heavy minerals (sillimanite, staurolite, garnet, andalusite) becomes the ideal candidatefor tectonic settings and palaeoclimatic discriminations [97]. Presently, all the samples areclustered near the TL apex of the plot (Figure 15).
Figure 15. Tectonic setting discrimination TL-LGM-HGM heavy minerals plot indicating reworking of sediments in cratonicsetting [97]. TL = transport limited; LGM = low grade metamorphic; HGM = high-grade metamorphic.
5. Interpretation and Discussion5.1. Sediments Transport Pathways
Restored palaeocurrents data, in combination with the sedimentological characteristicsof the investigated strata, advocate for a fluvial system that transported sediments fromthe palaeo-south-southeast toward the palaeo-north-northwest. The bimodal palaeoflow

Minerals 2021, 11, 573 21 of 34
suggests the interaction between the fluvial system and the beach/tides [98]. On the otherhand, channel avulsion and switching of the meander lobs may also yield bimodal flow [99].The western Salt Range occupied a comparatively proximal position to the source region,while the Surghar Range was most probably the depocenter of the fluvial-deltaic system.The Khirsor Range (at least the southwestern part) was on the distal side of the depocenter.
5.2. Tectonic Settings5.2.1. Quartz–Feldspars–Lithics (QFL) Plots
The pure quartzose nature of the sediments provides evidence for polycyclicity(Figures 7 and 8) and supports sediment derivation from a stable cratonic interior ina continental block provenance setting [99]. Presently, the concentration of samples inthe continental block provenance field (Figure 8b) may negate sediment derivation frommagmatic arc source or orogenic belt. Dissolution and differential removal of the liableminerals such as feldspar during weathering produced mature quartz arenite.
5.2.2. La/Th versus Hf(ppm) and Ti/Zr versus La/Sc and Nb/La versus (La/Sm)N Plots
Sediments with acidic arc provenance generally have low La/Th ratio and Hf contentof about 3–7 ppm [74]. Progressive erosion of the plutonic roots and continental basementof ancient (meta)sedimentary rocks concentrate zircon and hence Hf content in suchsediments. The present samples cluster roughly parallel to the Hf axis (Figure 10a). Morethan 95% of samples support derivation from the acidic arc and passive margin sourceareas with increasing recycling components. However, possible poor control on the oceanicisland arc composition using this plot may question its application. The Ti/Zr versus La/Scplot [75] addresses this issue.
The oceanic island arc-derived sediments have a higher Ti/Zr ratio (generally > 40)accompanied by a very low La/Sc ratio (<1). The continental island arc detritus displays aTi/Zr ratio of 10–35 and their La/Sc ratios are 1–3. The active continental margin sedimentshave Ti/Zr values like the continental island arc, but are discriminated from the latter bytheir higher La/Sc ratio (3–6). The passive margin siliciclastics have wide variation in theirLa/Sc ratio, and their low Ti/Zr ratio (generally < 10) discriminate them from sedimentsof other tectonic settings [75]. The present samples indicate sediment derivation underpassive margin setting with a significant component from active continental margin andcontinental island arc settings (Figure 10b).
The REEs provide significant information in tracing sediment source [100–103]. Oceanicisland arc sediments have a high Nb/La ratio and low (La/Sm)N values. The continentalarc and passive margin sediments have opposite trends and are positioned parallel tothe (La/Sm)N axis [91]. Among these, the passive margin sediments generally have high(La/Sm)N values. The present samples support passive margin settings (Figure 10c).
5.2.3. La–Th–Sc, Th–Sc–Zr/10, and Th–Co–Zr/10 Plots
The significance of La/Th and La/Sc values has already been discussed; therefore,repetition is avoided. The Th/Sc ratio is very low (average = 0.15 ± 0.08) for the oceanicisland arc sediments and these will plot close to the Sc apex. The Th/Sc ratio averages0.85 ± 0.13 for the continental island arc sediments and 2.59 ± 0.5 for the active continentalmargin sediments. Sediments derived from passive margin settings have an average Th/Scratio of 3.06 ± 0.8 [75].
The La–Th–Sc ternary plot negates oceanic arc-derived sedimentation (Figure 11a).However, with the increasing Th/Sc value, the average error increases. This limitation ofthe plot does not allow clear discrimination of active continental margin from passive mar-gins. The Zr/Th ratio is helpful in such discriminations. Further, Co behaves concordantlywith Sc. Therefore, the Th–Sc–Zr/10 and Th–Co–Zr/10 plots [75] are valuable tools forsuch discriminations.
The oceanic island arc sediments are depleted in Th, and thus have a high Zr/Th ratio(average = 48 ± 13.4) and yield high Th/Sc and Th/Co ratios. Therefore, such sediments

Minerals 2021, 11, 573 22 of 34
plot close to Sc and Co apices. The Zr/Th ratio for the active continental margin sedimentsis 9.5 ± 0.7 and is accompanied by low Th/Sc and Th/Co ratios. Hence, such sedimentsplot in closest vicinity to the Th pole on both plots. The passive margin siliciclastics have aZr/Th ratio of 19.1 ± 5.8 and their Zr enrichment forces such sediments to plot near the Zrpole. Sediments derived from continental island arc have a Zr/Th average of 21.5 ± 2.4and on both diagrams occupy an in-between position.
In the present case, the Th–Sc–Zr/10 and Th–Co–Zr/10 plots (Figure 11b,c) supportsedimentation of the Datta Formation mostly under passive margin condition. Samplesfrom the Kingriali Formation support sedimentation in an active continental margin andcontinental island arc source scenario. This apparent difference in sample position is aninterplay of the palaeoclimatic conditions. The hot and arid climate during the Rhaetiane.g., [15] probably did not allow the differential leaching of Co [104]; therefore, the KingrialiFormation samples plot away from the passive margin field. The concentration of Coin sediments under reducing conditions [105,106] strengthens this argument. High Zrvalues in the Datta Formation suggest zircon concentration due to weathering during theHettangian as interpreted for this time interval in the area and globally e.g., [15]. On thecontrary, the transition elements (Co, Ni, and V) are immobile during weathering, and arecompatible in magmatic processes. Therefore, Co is highly concentrated in ultramafic andmafic source rocks than felsic rocks [107], and thus mirror the chemistry of their sourcerocks [108]. Presently, no sediment contribution from oceanic island arc setting is indicated;however, to verify this, the concentration of V and Ni provides valuable information.
5.3. Source Compositions IdentificationV–Ni–Th × 10 and Th/Co versus La/Sc Plots
Mafic source rocks are rich in V and Ni. Therefore, sediments derived from suchsources will occupy position along the V-Ni side of the plot. Samples close to Ni-apex sup-port ultramafic source derivation, whereas mafics are close to the V-apex. As felsic sourcesare rich in Th, such sediments plot close to Th-apex. Presently, the V–Ni–Th × 10 plotfavours sediment derivation from a felsic source (Figure 11d).
The La/Sc versus Th/Co plot [72] provides good discrimination between the acidicand basic source rocks. Generally, Co and Sc are compatible with basic rocks, while Laand Th display the opposite trend [73]. Therefore, basic rocks have low La/Sc and Th/Covalues. As the felsic sources are rich in Th, sediments derived from these rocks have higherTh/Co ratios. Presently, the La/Sc versus Th/Co plot supports sediment derivation fromthe silicic composition (Figure 12a).
5.4. Weathering and Recycling Trend5.4.1. Clay Mineralogy
Illite is a common clay mineral in arid climates [109]. Dominance of Illite in theshales of the Kingriali Formation indicates semiarid to arid conditions of deposition duringTriassic [110]. The 100% illitic mineralogy of the uppermost green shales of the KingrialiFormation may suggest arid and potentially cooler conditions established during volcanicwinters at the start of the Triassic–Jurassic transition [6]. Kaolinite is generally a productof intense chemical weathering, and hence hot and humid climates e.g., [111]. Thus, thekaolinite rich shales of the Datta Formation (Figure 9) support strong chemical weatheringduring Jurassic. Diagenetic controls generally limit the paleoclimatic significance of clayminerals; however, the sharp change from illite rich clays (in Triassic strata) to kaoliniterich clays (in Jurassic strata) in a confirmable succession supports depositional controls onclay mineralogy [112,113].
5.4.2. CIA and A-CN-K Plots
CIA values may be the direct indication of the intensity of chemical weathering, whichis a function of temperature and humidity of the prevailing palaeoclimate [67,68]. CIAvalues of <80 for the Kingriali Formation (Figure 12d) indicate weak chemical weather-

Minerals 2021, 11, 573 23 of 34
ing, and thus semiarid to arid palaeoclimate, during the Late Triassic. High CIA val-ues (>90) in the Datta Formation favour increased chemical weathering, and thus hotand humid palaeoclimate, during Jurassic. The kaolinite rich clay mineralogy and thepresence of laterite/bauxite horizons in the Datta Formation support this palaeoclimaticinterpretation [114].
The A–CN–K plot (Figure 12d) is useful in interpreting the weathering trend of sedi-ments [115]. Presently, the sample population between A vertex and muscovite positionparallel to the A–K side hints for a recycled origin of the sediments. The muscovite–illiteposition of samples favours semiarid to arid palaeoclimate for the Kingriali Formation.The cluster of samples close to A apex (kaolinite position) for the Datta Formation indi-cates increasing chemical maturity, a support of recycling under a hot/warm and humidpalaeoclimate. Correlation between the CIA and A–CN–K plot [116] shows coherencebetween the two data sets (Figure 12d). A possible diagenetic input of carbonates andK-metasomatism may have overprinted the results of CIA and A-CN-K plot, but both ofthe related corrections have been applied [70].
5.4.3. Th/U versus Th(ppm) and Th/Zr versus Zr/Sc Plots
During weathering, the Th/U value rises above the upper crustal values of3.5–4.0 [69,111,117]. Sediment weathering and recycling under oxidising conditions resultsin oxidation of U4+ to U6+. The U6+ is more soluble and is lost resulting in elevated Th/Uratio e.g., [78,118,119]. Therefore, the Datta Formation (Figure 12b) supports increasingintensity of chemical weathering across the TJB interval into the Hettangian. Low Th/Uvalues in the Kingriali Formation indicate poor chemical weathering during the Rhaetian.
Zr is particularly enriched in zircons, while Sc generally preserves its provenancesignature; therefore, the Zr/Sc ratio is a useful index of zircon enrichment [120]. Theincompatibility of Th makes Th/Sc a good indicator of igneous chemical differentiationprocesses. Presently, the higher Zr/Sc and Th/Sc ratios indicate increasing weathering andsediment recycling from the Kingriali Formation to the Datta Formation (Figure 12c).
5.5. Heavy Minerals and Weathering and Tectonics
Heavy mineral analyses have a wide range of applications in studying the provenanceof siliciclastic rocks e.g., [121]. Specific heavy minerals assemblages are a characteristic ofspecific source rocks and are sensitive indicators of provenance [122]. The dominance ofultra-stable heavy minerals (zircon, tourmaline, and rutile, i.e., high ZTR > 87) supports thedifferential removal of chemically unstable minerals under multi-cyclic weathering, erosion,and transportation. The presence of well-preserved crystals (Figure 13a,b) in the Triassicstrata does not support rounding and thus long transportation. Their relatively smallgrain-sizes (Figure 14) further hint for the absence of high energy transporting agent. Thepresence of sharp edges and lack of corroded margins and dissolution cavities may negatestrong chemical weathering (Figure 13b). The presence of staurolite suggests derivationfrom a nearby metamorphic source.
The rounded to very well rounded heavy mineral assemblage of the Jurassic stratasupports an efficient transport mechanism. This supports hydraulic sorting during fluvialtransport under prolonged exposure of the low-relief source areas. The relatively coarse-grained nature of these minerals indicates high energy transporting agent. The corrodedand etched grains indicate strong chemical weathering (Figure 13a).
The concentration of ultra-stable heavy mineral suites (ZTR) suggests extensive re-cycling with no contemporaneous volcanic activity. The corroded margins in the Jurassicheavy minerals could hint for dissolution and differential removal of the liable heavy min-erals during diagenesis. However, the presence of well-preserved crystals in the Triassicstrata does not favour deep burial diagenesis.
The cluster of samples along the TL apex (Figure 15) indicates sediment derivationfrom a mature and recycled source such as passive margins, cratonic basins, and craton

Minerals 2021, 11, 573 24 of 34
lowlands. Additionally, such mature quartz-rich sediments may indicate uplift and erosionof mature sedimentary rocks [97].
5.6. Palaeogeography and Possible Detritus Suppliers
The neo-Proterozoic (800 Ma to 600 Ma) marks the peak time of crust productionduring the Pan-African Orogeny prior to the assembly of Gondwana [123]. Geochronologyof the Pan-African orogenic belts in the central-north Africa, Saudi Arabia, Kazakhstan,eastern Baltica, and Pakistan Block supports continental crust formation during this period.The final Gondwana assembly occurred at ca. 540 Ma and, by the late Cambrian (ca.500 Ma), the orogeny had produced sufficient positive relief structures in Arabia, EastAfrica, as well in Pakistan that could have provided the long-term source for sedimentarybasins [123].
The palaeogeographic position [90] of the study area (Figure 16a,b) puts the nearbyArabian Plate, Greater Somalian Plate (southeastern margin of northeastern Africa), andIndian Plate as the candidate sources of the siliciclastics. The Arabian–Nubian Shieldin these areas formed during the Pan-African Orogeny, closure of Mozambique Ocean,and subsequent collision of east and west Gondwana at ca. 540 Ma [124]. The basementrocks of Arabian Peninsula include amphibolite facies gneissic terrains, diorites, tonalites,and granitoids, as well as granites with rhyolites, tuffs, lava breccias, quartzites, marbles,and mafic dykes [125]. Similar gneisses, basalts, tuffs, rhyolites, granites, quartzites,and marbles also occur in Somalia [126]. However, both the pinching out of the strataand decreasing grain size towards the west-northwest and south-southwest [40] negatesiliciclastic supply from the Arabian and Greater Somalian plates. Further, the palaeoflowdirection (Figure 5) argues against sediment supply from these two sites and advocate foran easterly (present-day) source of the sediments. Thus, the Indian Plate most likely servedas the principal source for the siliciclastics (Figures 16c and 17).
5.7. Correlation with Northern Indian Passive Tethyan Margin
The Salt Range (Kohat-Potwar Basin) represents a rim basin along the NW marginof India (Figure 16c) associated with the Neo-Tethys rift system [127]. It possibly openedinto a rift that separated Arabia and India, which extended towards Madagascar [128] andconnected southwards up with the Karoo system [129]. The rifting activity most likelycommenced during the Late Carboniferous [16,19,42]. Evidence for various stages of theNeo-Tethys opening in SRS and their tentative correlation with the THS is provided in the
Geological setting and palaeogeography chapter (Table 1) and an extended correlationbetween the syn-rift and drift sequences of the THS and the SRS is presented here.
The syn-rift sequence in the THS includes the Pennsylvanian to lowermost Permianglacigenic diamictites overlain by Sakmarian deglaciation mudrocks [130]. The glacigenicdiamictites of the Tobra Formation e.g., [45] and the overlying deglaciation shale/mudrocksof the Dandot Formation with cold water Eurydesma fauna [40] of Gondwanan charactersmay be an indication of the westward extension of the synrift sequence in the SRS. Agentle angular unconformity (1–2◦) exists between the Tobra Formation and the underly-ing Cambrian strata (Figure 2) in the Salt Range [131]. This correlates with the angularunconformity between Upper Devonian to Tournaisian limestones and the overlying riftsequence in the THS [132]. Furthermore, normal faults in the strata underlying the TobraFormation are observed in the field and reported in the basement on seismic data e.g., [47]that provide additional evidence for rift-related tectonics in the Salt Range area like thoseobserved in THS e.g., [133].
The “break-up unconformity” on top of the rift sequence observed in THS (Lahul-Zanskar) [21] is not truly reported in the SRS. However, the Dandot Formation (uppermostpart of the syn-rift sequence) is missing in the western Salt Range and in the KhisorRange [40]. The basal part of the drift sequence in the Salt Range consists of Permian sandsand shales (Warchha and Sardhai formations) overlain by limestones (Zaulch Group) anddisplays an overall transgressive trend like that observed in the Lahul-Zanskar area (THS)

Minerals 2021, 11, 573 25 of 34
e.g., [21]. The presence of Lower Triassic ammonoid-rich sediments (Mianwali Formation)in the Salt Range e.g., [47] may indicate subsidence of the newly formed rift margin andcorrelates with the ammonoid-rich sediments of THS deposited in Lower Triassic [134,135].Thick sandstones of the Tredian Formation succeed the Mianwali Formation [47]. Thismay provide evidence for the sudden increase in siliciclastic supply in the Salt Rangeduring the Middle–Late Triassic like that observed in the THS [136]. Large-scale syn-depositional slumps occur especially in the lower part of the Tredian Formation [47]. Theseslumps provide evidence for possible occurrence of tectonic activity in the Salt Rangelike passive margin rejuvenation observed in the THS. The present quartz-rich sedimentsof the Kingriali and Datta formations in the Salt Range during the Late Triassic to EarlyJurassic [15] may correlate with the deposition of quartzose sands until the middle EarlyJurassic in the THS [22]. In the Salt Range the platform carbonates of the Samana SukFormation were deposited following the Datta Formation and reflect the mature passive-margin stage of the Neo-Tethys as observed by carbonate-platform sedimentation duringthe mature passive-margin stage in the THS [23].
Figure 16. (a,b) Palaeogeographic position of the Salt and Trans–Indus ranges during the TJB interval with location of crosssection A–B [90]; and (c) tentative basin cross-section A–B of the northwestern passive margin of the Indian Plate duringLate Triassic (modified from [42]) with pre-rift, syn-rift, and drift sequences marked e.g., [16]. Location of cross section C–D(explained in Figure 17) is also given.
The break-up of Gondwana and formation of NW passive margin of the India beganin Late Carboniferous, around 100 ma prior to the deposition of the sediments under studye.g., [137]. By the Late Triassic, passive margin setting had established in the area now theSalt Range. A possible faulting and tilting of strata during passive margin rejuvenationoccurred during this time [16,136,138,139]. These complicated processes probably resultedin the post-break-up exhumation of the passive margin in the eastern Salt Range andadjoining areas e.g., [140,141]. The prominent sea-level fall observed at the TJB interval inthe Salt Range and globally [9–11,15] may also have facilitated exposure in the eastern SaltRange. This passive margin exhumation and subsequent exposure of the Triassic and olderstrata in the Salt Range and further south-southeast in Greater India may have provided

Minerals 2021, 11, 573 26 of 34
the main source for sediments that were transported north-northwestward by the newlyestablished fluvial system during the Late Triassic–Early Jurassic (Figure 17).
Figure 17. (a) A cross-sectional C–D (see Figure 16 for location) view of the northwestern margin of the Indian Plate ca.200 Ma ago; (b) source to sink transport model for the Upper Triassic–Lower Jurassic siliciclastics in the Salt and Trans–Indusranges. Note: both models are not to scale.
5.8. Possible Sediment Suppliers
The north-south trending, nearly 700 km long, Aravalli–Malani Range (Figure 18)is a part of the foreland normal-sense high strain zones that were active in the Paleopro-terozoic [142]. The range is located 600 km to the southeast of the Salt Range and was apositive topographic feature by Early Permian [43]. The Precambrian Aravalli Supergroup

Minerals 2021, 11, 573 27 of 34
overlies the banded gneisses [143] and consists of granites, siliciclastics, carbonates, slates,and phyllites [144]. The Malani Suite consists of porphyritic rhyolites and granites [145].
Figure 18. A generalised geological map of foreland Pakistan and adjoining northwest India showing the Salt Range andthe possible source areas of the siliciclastics for the Upper Triassic–Lower Jurassic siliciclastics of the Kingriali and Dattaformations (modified from [43]).
The rhyolites have abundant pink orthoclase and some sanidine, oligoclase, quartz,and rare hornblende and magnetite. The pink coloured Malani Granite intruded the rhyo-lites and is composed of orthoclase, quartz, sodic plagioclase, biotite, hornblende, and lesscommon occurrences of muscovite. Accessory minerals include tourmaline and fluorite.
The Lower Permian, glacial–periglacial Tobra Formation in the Salt Range containslithoclasts of Aravalli–Malani origin [45]. Similarly, the same ranges shed detritus for thePermian Warchha Sandstone of the Salt Range. Further, the sedimentary clasts withinthe Warchha Sandstone are considered to have been the product of local recycling of theunderlying Permian, Cambrian, and Precambrian strata in the Salt Range region itself [43].
The Salt Range contains thick Cambrian, Permian, and Triassic siliciclastics that couldprove detritus suppliers if exposed to surficial weathering and denudation. These includethe thick sandstones and shales of the Cambrian Khewra Sandstone (sandstones), KussakFormation (sandstones and shale), and Baghanwala Formation (sandstones, shales). TheLower Permian Nilawahan Group in the area consists of thick conglomerates of TobraFormation, shales of Dandot Formation, sandstones and shales of Warchha Sandstone,and shales of Sardhai formations. The shales and sandstones of Mianwali Formation andthe thick sandstones of Tredian Formation constitute the Triassic siliciclastics in the Salt
Minerals 2021, 11, 573 28 of 34
Range [40,43]. Exposure of these Triassic and older sediments of the Salt Range itselfduring the eastward exhumation of the passive margin may have provided siliciclasticdetritus for the Triassic–Jurassic sediments of the western Salt Range and adjoining area.The tropical palaeogeographic position of the area favoured dissolution of the liable com-ponents, thereby producing highly mature quartz arenites [15]. The comparative lowrelief did not allow sediment derivation from diverse source rocks. The meandering flu-vial system reworked and transported mostly the older Triassic and Permian siliciclastics(Figure 17a) [146].
This is confirmed by the eastward disappearance of the Triassic and Permian stratain the present-day eastern Salt Range (Figure 2). A possible destruction of the unstableminerals during diagenesis may have further facilitated the formation of quartz aren-ites [147–150]. However, lack of evidence does not allow reliable understanding of thediagenetic history of the present sediments, while the recently published burial history ofthe area [131] does not indicate deep burial of the strata during Mesozoic.
The extreme wet greenhouse conditions interpreted for the Jurassic strata [15,57,58]could have easily removed unstable components, thereby forcing highly mature quartzarenites with very high ZTR-index and hiding evidence for sediment incorporation fromthe basement or other diverse sources. However, Cambrian and older strata are widelydistributed throughout the Salt and Trans–Indus ranges (Figure 17a) and reported in thesubsurface in the Kohat-Potwar Plateau and Punjab platform [40], thereby indicating thatthe fluvial system was unable to cut into the Cambrian and older strata and the basementrocks were not exposed to reworking.
6. Conclusions
The Neo-Tethys opening produced passive margin settings on the north-northwesternmargin of the Indian Plate. Tectonic activity during this passive margin formation pro-duced elevated passive margin in the eastern Salt Range and area further to the easton the Indian Plate. A prominent sea-level fall and a possible passive margin rejuvena-tion in the area during the late Triassic resulted in the demise of the Rhaetian platformcarbonates deposition and a fluvial system initiated during the TJB interval in the Saltand Trans–Indus ranges. During the following Hettangian, this system matured into afluvio-deltaic system under wet greenhouse palaeoclimatic conditions and had a generalsouth-southeast to north-northwest palaeoflow. The present analyses do not support directsediment derivation from the Indian Plate basement rocks. Instead, the fluvial systemreworked the older (Carboniferous–Permian–Triassic) strata in the present-day easternSalt Range and adjoining western-northwestern part of the Indian Plate. These polycyclicsediments were deposited (as the upper part of the Kingriali Formation and the DattaFormation) in the western Salt Range and Trans–Indus ranges in a fluvio-deltaic deposi-tional system in a Neo-Tethyan passive margin setting like that observed in the TethyanHimalaya. Thus, the Triassic–Jurassic sediments of the Salt and Trans Indus ranges, Pak-istan, provide evidence for westward extension of the Neo-Tethyan passive margin andpossible occurrence of Tethyan Himalayan Succession in the Salt Range. Varietal studiesand isotopic geochronology are suggested to be carried to further pinpoint the source rockfor these sediments.
Supplementary Materials: The following are available online at https://www.mdpi.com/article/10.3390/min11060573/s1. Supplementary Materials S1. Point counting data for framework miner-alogical composition of the selected samples. Qmue = monocrystalline quartz with unit extinction,Qmuu = monocrystalline quartz with undulose extinction, Qpq = polycrystalline quartz includingchert, Qtotal = total quartz, A = K-feldspar, P = plagioclase, Ftotal = total feldspar, Lv = volcanic andhypabyssal lithic, Lm = metamorphic lithic, Ls = sedimentary lithic excluding chert, Ltotal = total lithic,M = phyllosilicates, D = heavy minerals, O = others/not recognizable. Supplementary Materials S2.Bulk rock geochemistry data for the selected samples. The concentration of major oxides/elementsis provided in percentage (%), while trace element concentrations are listed in parts per million

Minerals 2021, 11, 573 29 of 34
(ppm). Note that only those chemical species are included here that are used in the present study.Supplementary Materials S3. Point count data for heavy minerals of the selected samples.
Author Contributions: Conceptualization, S.I. and M.W.; Data curation, M.B. and I.U.J.; Formalanalysis, S.I., M.B. and S.G.; Funding acquisition, S.I. and M.W.; Investigation, S.I. and I.U.J.; Method-ology, S.I. and S.G.; Project administration, M.W.; Resources, M.W. and I.U.J.; Software, S.I. and M.B.;Validation, S.I. and S.G.; Visualization, S.I. and M.W.; Writing—original draft, S.I.; Writing—review &editing, S.I. and M.W. All authors have read and agreed to the published version of the manuscript.
Funding: This research was funded by UNESCO-IUGS project IGCP-609 and Higher EducationCommission (HEC) Pakistan.
Institutional Review Board Statement: Not applicable.
Informed Consent Statement: Not applicable.
Data Availability Statement: Data are available in Supplementary Materials.
Acknowledgments: The authors are thankful to Hafiz Shahid Hussain, Mukhtiar Ghani, and SyedIrfan Hashmi for their help during the fieldwork. Claudia Beybel and Ilka Wünsche providedtechnical support in thin-section preparation and Maria Meszar and Sabine Hruby-Nichtenbergerhelped in heavy minerals sample preparation. Comments of three anonymous reviewers greatlyimproved quality of the manuscript.
Conflicts of Interest: The authors declare no conflict of interest.
References1. Schlische, R.W.; Withjack, M.O.; Olsen, P.E. Relative timing of CAMP, rifting, continental breakup, and basin inversion: Tectonic
significance. In The Central Atlantic Magmatic Province, Insights from Fragments of Pangea; Geophysical Monograph; Hames,W.E., McHone, J.G., Renne, P.R., Ruppel, C., Eds.; American Geophysical Union: Washington, DC, USA, 2003; Volume 136,pp. 33–59. [CrossRef]
2. De Lamotte, D.F.; Fourdan, B.; Leleu, S.; Leparmentier, F.; De Clarens, P. Style of rifting and the stages of Pangea breakup. Tectonics2015, 34, 1009–1029. [CrossRef]
3. Peace, A.L.; Phethean, J.; Franke, D.; Foulger, G.; Schiffer, C.; Welford, J.; McHone, G.; Rocchi, S.; Schnabel, M.; Doré, A. A review ofPangaea dispersal and Large Igneous Provinces—In search of a causative mechanism. Earth Sci. Rev. 2020, 206, 102902. [CrossRef]
4. Withjack, M.O.; Schlische, R.W.; Olsen, P.E. Diachronous rifting, drifting, and inversion on the passive margin of central easternNorth America: An analog for other passive margins. AAPG Bull. 1998, 82, 817–835.
5. Marzoli, A.; Renne, P.R.; Piccirillo, E.M.; Ernesto, M.; Bellieni, G.; De Min, A. Extensive 200-Million-Year-Old Continental FloodBasalts of the Central Atlantic Magmatic Province. Science 1999, 284, 616–618. [CrossRef] [PubMed]
6. Olsen, P.E. Giant lava flows, mass extinctions, and mantle plumes. Science 1999, 284, 604–605. [CrossRef]7. Petersen, K.D.; Schiffer, C. Wilson cycle passive margins: Control of orogenic inheritance on continental breakup. Gondwana Res.
2016, 39, 131–144. [CrossRef]8. Sepkowski, J.J. Biodiversity: Past, present, and future. J. Paleontol. 1997, 71, 533–539. [CrossRef] [PubMed]9. Hallam, A. A review of the broad pattern of Jurassic sea-level changes and their possible causes in the light of current knowledge.
Palaeogeogr. Palaeoclim. Palaeoecol. 2001, 167, 23–37. [CrossRef]10. Haq, B.U. Jurassic Sea-Level Variations: A Reappraisal. GSA Today 2017, 28, 4–10. [CrossRef]11. Hallam, A. Mass extinctions and sea-level changes. Earth Sci. Rev. 1999, 48, 217–250. [CrossRef]12. Ludwig, W.; Amiotte-Suchet, P.; Probst, J.-L. Enhanced chemical weathering of rocks during the last glacial maximum: A sink for
atmospheric CO2? Chem. Geol. 1999, 159, 147–161. [CrossRef]13. Hallam, T.; Wignall, P.; Hesselbo, S.P.; Robinson, S.A.; Surlyk, F. Discussion on sea-level change and facies development across
potential Triassic–Jurassic boundary horizons, SW Britain. J. Geol. Soc. 2004, 161, 1053–1056. [CrossRef]14. Zajzon, N.; Kristály, F.; Pálfy, J.; Németh, T. Detailed clay mineralogy of the Triassic-Jurassic boundary section at Kendlbachgraben
(Northern Calcareous Alps, Austria). Clay Miner. 2012, 47, 177–189. [CrossRef]15. Iqbal, S.; Wagreich, M.; Irfan U, J.; Kuerschner, W.M.; Gier, S.; Bibi, M. Hot-house climate during the Triassic/Jurassic tran-
sition: The evidence of climate change from the southern hemisphere (Salt Range, Pakistan). Glob. Planet. Chang. 2019, 172,15–32. [CrossRef]
16. Sciunnach, D.; Garzanti, E. Subsidence history of the Tethys Himalaya. Earth Science Rev. 2012, 111, 179–198. [CrossRef]17. Yin, A.; Harrison, T.M. Geologic Evolution of the Himalayan-Tibetan Orogen. Annu. Rev. Earth Planet. Sci. 2000, 28,
211–280. [CrossRef]18. Yin, A. Cenozoic tectonic evolution of the Himalayan orogen as constrained by along-strike variation of structural geometry,
exhumation history, and foreland sedimentation. Earth Sci. Rev. 2006, 76, 1–131. [CrossRef]

Minerals 2021, 11, 573 30 of 34
19. Zhang, B.; Wei, Y.; Garzanti, E.; Wang, C.; Chen, X.; Pan, W.; Liu, Q. Sedimentologic and stratigraphic constraints on the orientationof the Late Triassic northern Indian passive continental margin. Palaeogeogr. Palaeoclim. Palaeoecol. 2019, 533, 109234. [CrossRef]
20. Gaetani, M.; Garzanti, E. Multicyclic history of the Northern India continental margin (Northwestern Himalaya) (1). Am. Assoc.Pet. Geol. Bull. 1991, 75, 1427–1446.
21. Garzanti, E.; Angiolini, L.; Sciunnach, D. The Permian Kuling Group (Spiti, Lahaul and Zanskar; NW Himalaya): Sedimentaryevolution during rift/drift transition and initial opening of neo-tethys. Riv. Ital. Paieontologia Stratigr. 1996, 102, 175–200.
22. Jadoul, F.; Berra, F.; Garzanti, E. The Tethys Himalayan passive margin from Late Triassic to Early Cretaceous (South Tibet).J. Asian Earth Sci. 1998, 16, 173–194. [CrossRef]
23. Garzanti, E. Stratigraphy and sedimentary history of the Nepal Tethys Himalaya passive margin. J. Asian Earth Sci. 1999, 17,805–827. [CrossRef]
24. DeCelles, P.G. Tectonic Implications of U-Pb Zircon Ages of the Himalayan Orogenic Belt in Nepal. Science 2000, 288,497–499. [CrossRef]
25. McQuarrie, N.; Robinson, D.; Long, S.; Tobgay, T.; Grujic, D.; Gehrels, G.; Ducea, M. Preliminary stratigraphic and structuralarchitecture of Bhutan: Implications for the along strike architecture of the Himalayan system. Earth Planet. Sci. Lett. 2008, 272,105–117. [CrossRef]
26. McQuarrie, N.; Long, S.; Tobgay, T.; Nesbit, J.; Gehrels, G.E.; Ducea, M.N. Documenting basin scale, geometry and provenancethrough detrital geochemical data: Lessons from the Neoproterozoic to Ordovician Lesser, Greater, and Tethyan Himalayan strataof Bhutan. Gondwana Res. 2013, 23, 1491–1510. [CrossRef]
27. Myrow, P.M.; Hughes, N.C.; Goodge, J.; Fanning, C.M.; Williams, I.S.; Peng, S.; Bhargava, O.N.; Parcha, S.K.; Pogue, K.R.Extraordinary transport and mixing of sediment across Himalayan central Gondwana during the Cambrian-Ordovician. GSABull. 2010, 122, 1660–1670. [CrossRef]
28. Gehrels, G.; Kapp, P.; DeCelles, P.; Pullen, A.; Blakey, R.; Weislogel, A.; Ding, L.; Guynn, J.; Martin, A.; McQuarrie, N.; et al.Detrital zircon geochronology of pre-Tertiary strata in the Tibetan-Himalayan orogen. Tectonics 2011, 30, 1–27. [CrossRef]
29. Zhu, D.-C.; Zhao, Z.-D.; Niu, Y.; Dilek, Y.; Hou, Z.-Q.; Mo, X.-X. The origin and pre-Cenozoic evolution of the Tibetan Plateau.Gondwana Res. 2013, 23, 1429–1454. [CrossRef]
30. Gaetani, M.; Casnedi, R.; Fois, E.; Garzanti, E.; Jadoul, F.; Nicora, A.; Tintori, A. Stratigraphy of the Tethys Himalaya in Zanskar,Ladakh. Riv. Ital. Paleontol. Stratigr. 1986, 91, 443–478.
31. Jadoul, F.; Garzanti, E.; Fois, E. Upper Triassic-Lower Jurassic stratigraphy and palaeogeographic evolution of the Zanskar TethysHimalaya (Zangla Unit). Riv. Ital. Paieontologia Stratigr. 1990, 95, 351–396. [CrossRef]
32. Ali, J.R.; Aitchison, J.C. Greater India’s northern margin prior to its collision with Asia. Basin Res. 2014, 26, 73–84. [CrossRef]33. Bhargava, O.N. Evolution of the Tethyan and Karewa successions in Kashmir: A synthesis. J. Palaeontol. Soc. India 2015, 60, 51–71.34. Rees, P.M.; Ziegler, A.M.; Valdes, P.J. Jurassic phytogeography and climates: New data and model comparisons. In Warm Climates
in Earth History; Huber, B.T., Macleod, K.G., Wing, S.L., Eds.; Cambridge University Press: Cambridge, UK, 2000; pp. 297–318.35. Faisal, S.; Dixon, J.M. Physical analog (centrifuge) model investigation of contrasting structural styles in the Salt Range and
Potwar Plateau, northern Pakistan. J. Struct. Geol. 2015, 77, 277–292. [CrossRef]36. Iqbal, S.; Jan, I.U.; Akhter, M.G.; Bibi, M. Palaeoenvironmental and sequence stratigraphic analyses of the Jurassic Datta Formation,
Salt Range, Pakistan. J. Earth Syst. Sci. 2015, 124, 747–766. [CrossRef]37. Kadri, I.B. Petroleum Geology of Pakistan; Pakistan Petroleum Limited: Karachi, Pakistan, 1995; p. 275.38. Kazmi, A.H.; Jan, M.Q. Geology and Tectonic of Pakistan; Graphic Publication: Karachi, Pakistan, 1997; p. 554.39. Kazmi, A.H.; Abbasi, I.A. Stratigraphy & Historical Geology of Pakistan; Department and National Centre of Excellence in Geology:
Peshawar, Pakistan, 2008; p. 524.40. Shah, S.M.I. Stratigraphy of Pakistan; Gov Pak Ministry of Petroleum and Natural Resources Geological Survey of Pakistan:
Islamabad, Pakistan, 2009; p. 381.41. Hassan, S.; Ishiga, H.; Roser, B.; Dozen, K.; Naka, T. Geochemistry of Permian–Triassic shales in the Salt Range, Pakistan:
Implications for provenance and tectonism at the Gondwana margin. Chem. Geol. 1999, 158, 293–314. [CrossRef]42. Stampfli, G.M.; Mosar, J.; Favre, P.; Pillevuit, A.; Vannay, J.C. Permo-Mesozoic evolution of the western Tethys realm: The
Neo-Tethys East Mediterranean Basin connection. In Peri-Tethys Memoir 6: Peri-Tethyan Rift/Wrench Basins and Passive Margins;Ziegler, P.A., Cavalza, W., Robertson, A.H.F., Crasquin-Soleau, S., Eds.; Mémoires du Muséum National D’histoire Naturelle:Paris, France, 2001; Volume 186, pp. 51–108. ISBN 2-85653-528-3.
43. Ghazi, S.; Mountney, N.P. Petrography and provenance of the Early Permian Fluvial Warchha Sandstone, Salt Range, Pakistan.Sediment. Geol. 2011, 233, 88–110. [CrossRef]
44. Jehangiri, M.; Hanif, M.; Arif, M.; Jan, I.U.; Ahmad, S. The Early Cambrian Khewra Sandstone, Salt Range, Pakistan: Endorsingsouthern Indian provenance. Arab. J. Geosci. 2014, 8, 6169–6187. [CrossRef]
45. Jan, I.U.; Iqbal, S.; Davies, S.J.; Zalasiewicz, J.A.; Stephenson, M.H.; Wagreich, M.; Haneef, M.; Hanif, M.; Ahmad, S. A PeriglacialPalaeoenvionment in the Upper Carboniferous-Lower Permian Tobra Formation of the Salt Range, Pakistan. Acta Geol. Sin. 2017,91, 1063–1078. [CrossRef]
46. Burbank, D.W.; Raynolds, R.G.H. Stratigraphic keys to the timing of thrusting in the terrestrial foreland basins: Applications tothe northwest Himalaya. In Frontiers in Sedimentary Geology, New Perspective in Basin Analysis; Kleinspahn, K.L., Paol, C., Eds.;Springer: Berlin, Germany, 1988; pp. 331–351.

Minerals 2021, 11, 573 31 of 34
47. Iqbal, S.; Jan, I.U.; Hanif, M. The Mianwali and Tredian Formations: An Example of the Triassic Progradational Deltaic System inthe Low-Latitude Western Salt Range, Pakistan. Arab. J. Sci. Eng. 2013, 39, 5489–5507. [CrossRef]
48. Iqbal, S.; Akhter, G.; Bibi, S. Structural model of the Balkassar area, Potwar Plateau, Pakistan. Acta Diabetol. 2015, 104,2253–2272. [CrossRef]
49. Wiesmayr, G.; Grasemann, B. Eohimalayan fold and thrust belt: Implications for the geodynamic evolution of the NW-Himalaya(India). Tectonics 2002, 21. [CrossRef]
50. Bhargava, O.N.; Frank, W.; Bertle, R. Late Cambrian deformation in the Lesser Himalaya. J. Asian Earth Sci. 2011, 40,201–212. [CrossRef]
51. Klootwijk, C.T.; Gee, J.S.; Peirce, J.W.; Smith, G.M.; McFadden, P.L. An early India-Asia contact: Paleomagnetic constraints fromNinetyeast Ridge, ODP Leg 121. Geology 1992, 20, 395–398. [CrossRef]
52. Dupont-Nivet, G.; Lippert, P.C.; Van Hinsbergen, D.J.; Meijers, M.J.; Kapp, P. Palaeolatitude and age of the Indo-Asia collision:Palaeomagnetic constraints. Geophys. J. Int. 2010, 182, 1189–1198. [CrossRef]
53. Najman, Y.; Appel, E.; BouDagher-Fadel, M.; Bown, P.; Carter, A.; Garzanti, E.; Godin, L.; Han, J.; Liebke, U.; Oliver, G.; et al.Timing of India-Asia collision: Geological, biostratigraphic, and palaeomagnetic constraints. J. Geophys. Res. Space Phys. 2010,115, 12416. [CrossRef]
54. Damborenea, S.E. Jurassic evolution of Southern Hemisphere marine palaeobiogeographic units based on benthonic bivalves.Geobios 2002, 35, 51–71. [CrossRef]
55. Scotese, C.R. Atlas of Jurassic Paleogeographic Maps, PALEOMAP Atlas for ArcGIS; The Jurassic, Maps 32–42, Mollweide Projection;PALEOMAP Project: Evanston, IL, USA, 2014; Volume 4.
56. Ge, Y.; Al-Suwaidi, A.; Shi, M.; Li, Q.; Morad, S.; Steuber, T. Short-term variation of ooid mineralogy in the Triassic-Jurassicboundary interval and its environmental implications: Evidence from the equatorial Ghalilah Formation, United Arab Emirates.Glob. Planet. Chang. 2019, 182, 103006. [CrossRef]
57. Hesselbo, S.P.; Korte, C.; Ullmann, C.V.; Ebbesen, A.L. Carbon and oxygen isotope records from the southern Eurasian Seawayfollowing the Triassic-Jurassic boundary: Parallel long-term enhanced carbon burial and seawater warming. Earth Sci. Rev. 2020,203, 103131. [CrossRef]
58. Ruhl, M.; Hesselbo, S.; Al-Suwaidi, A.; Jenkyns, H.; Damborenea, S.; Manceñido, M.; Storm, M.; Mather, T.; Riccardi, A.On the onset of Central Atlantic Magmatic Province (CAMP) volcanism and environmental and carbon-cycle change at theTriassic–Jurassic transition (Neuquén Basin, Argentina). Earth Sci. Rev. 2020, 208, 103229. [CrossRef]
59. Collinson, J.; Mountney, N.; Thompson, D. Sedimentary Structures; Terra Publishing: London, UK, 2006.60. Dickinson, W.R.; Beard, L.S.; Brakenridge, G.R.; Erjavec, J.L.; Ferguson, R.C.; Inman, K.F.; Knepp, R.A.; Lindberg, F.A.; Ryberg,
P.T. Provenance of North American Phanerozoic Sandstones in Relation to Tectonic Setting. Geol. Soc. Am. Bull. 1983, 94,222–235. [CrossRef]
61. Ingersoll, R.V.; Bullard, T.F.; Ford, R.L.; Grimm, J.P.; Pickle, J.D.; Sares, S.W. The effect of grain size on detrital modes: A test of theGazzi-Dickinson point-counting method. J. Sediment. Res. 1984, 54, 103–116. [CrossRef]
62. Garzanti, E. Petrographic classification of sand and sandstone. Earth Sci. Rev. 2019, 192, 545–563. [CrossRef]63. Van Langeveld, A.D.; Van der Gaast, S.J.; Eisma, D. A comparison of the effectiveness of eight methods for the removal of organic
matter from clay. Clays Clay Miner. 1978, 26, 361–364. [CrossRef]64. Moore, D.M.; Reynolds, R.C., Jr. X-ray Diffraction and the Identification and Analysis of Clay Minerals; Oxford University Press (OUP):
Oxford, UK, 1989.65. Brindley, G.W.; Brown, G. Quantitative X-ray mineral analysis of clays. In Crystal Structures of Clay Minerals and Their X-ray
Identification; Mineralogical Society of Great Britain and Ireland: Twickenham, UK, 1980; Volume 5, pp. 411–438.66. Schultz, L.G. Quantitative Interpretation of Mineralogical Composition X-ray and Chemical Data for the Pierre Shale; Professional Paper;
U.S. Geological Survey: Washington, DC, USA, 1964; pp. 1–31.67. Nesbitt, H.W.; Young, G.M. Early Proterozoic climates and plate motions inferred from major element chemistry of lutites. Nature
1982, 299, 715–717. [CrossRef]68. Nesbitt, H.; Young, G. Prediction of some weathering trends of plutonic and volcanic rocks based on thermodynamic and kinetic
considerations. Geochim. Cosmochim. Acta 1984, 48, 1523–1534. [CrossRef]69. McLennan, S. Weathering and Global Denudation. J. Geol. 1993, 101, 295–303. [CrossRef]70. Fedo, C.M.; Nesbitt, H.W.; Young, G.M. Unraveling the effects of potassium metasomatism in sedimentary rocks and paleosols,
with implications for paleoweathering conditions and provenance. Geology 1995, 23, 921–924. [CrossRef]71. McLennan, S.M.; Hemming, S.; McDaniel, D.K.; Hanson, G.M. Geochemical approaches to sedimentation, provenance, and
tectonics. In Processes Controlling the Composition of Clastic Sediments; Special Papers; Johnsson, M.J., Basu, A., Eds.; GeologicalSociety of America: Boulder, CO, USA, 1993; Volume 284, pp. 21–40. [CrossRef]
72. Cullers, R.L. Implications of elemental concentrations for provenance, redox conditions, and metamorphic studies of shales andlimestones near Pueblo, CO, USA. Chem. Geol. 2002, 191, 305–327. [CrossRef]
73. Bracciali, L.; Marroni, M.; Pandolfi, L.; Rocchi, S.; Arribas, J.; Critelli, S.; Johnsson, M. Geochemistry and petrography of WesternTethys Cretaceous sedimentary covers (Corsica and Northern Apennines): From source areas to configuration of margins. Spec.Pap. Geol. Soc. Am. 2007, 420, 73–93. [CrossRef]

Minerals 2021, 11, 573 32 of 34
74. Floyd, P.A.; Leveridge, B.E. Tectonic environment of the Devonian Gramscatho basin, south Cornwall: Framework mode andgeochemical evidence from turbiditic sandstones. J. Geol. Soc. 1987, 144, 531–542. [CrossRef]
75. Bhatia, M.R.; Crook, K.A.W. Trace element characteristics of graywackes and tectonic setting discrimination of sedimentarybasins. Contrib. Miner. Pet. 1986, 92, 181–193. [CrossRef]
76. Bhatia, M.R. Plate Tectonics and Geochemical Composition of Sandstones. J. Geol. 1983, 91, 611–627. [CrossRef]77. Bhatia, M.R. Rare earth element geochemistry of Australian Paleozoic graywackes and mudrocks: Provenance and tectonic
control. Sediment. Geol. 1985, 45, 97–113. [CrossRef]78. Taylor, S.R.; McLennan, S.M. The Continental Crust: Its Composition and Evolution; Blackwell: Oxford, UK, 1985; 321p,
ISBN-13: 978-0632011483.79. Suttner, P.K.D.L.J. Alluvial Sandstone Composition and Paleoclimate, I. Framework Mineralogy. J. Sediment. Res. 1986, 56,
329–345. [CrossRef]80. Cingolani, C.A.; Manassero, M.; Abre, P. Composition, provenance, and tectonic setting of Ordovician siliciclastic rocks in the San
Rafael block: Southern extension of the Precordillera crustal fragment, Argentina. J. S. Am. Earth Sci. 2003, 16, 91–106. [CrossRef]81. McLennan, S. Sedimentary silica on Mars. Geology 2003, 31, 315–318. [CrossRef]82. Hegde, V.; Chavadi, V. Geochemistry of late Archaean metagreywackes from the Western Dharwar Craton, South India:
Implications for provenance and nature of the Late Archaean crust. Gondwana Res. 2009, 15, 178–187. [CrossRef]83. Abre, P.; Cingolani, C.; Zimmermann, U.; Cairncross, B.; Chemale, F. Provenance of Ordovician clastic sequences of the San Rafael
Block (Central Argentina), with emphasis on the Ponón Trehué Formation. Gondwana Res. 2011, 19, 275–290. [CrossRef]84. Stern, G.; Wagreich, M. Provenance of the Upper Cretaceous to Eocene Gosau Group around and beneath the Vienna Basin
(Austria and Slovakia). Swiss J. Geosci. 2013, 106, 505–527. [CrossRef]85. Hofmann, M.; Li, X.; Chen, J.; MacKenzie, L.; Hinman, N. Provenance and temporal constraints of the Early Cambrian
Maotianshan Shale, Yunnan Province, China. Gondwana Res. 2016, 37, 348–361. [CrossRef]86. Bibi, M.; Wagreich, M.; Iqbal, S.; Jan, I.U. Regional sediment sources versus the Indus River system: The Plio-Pleistocene of the
Peshawar Basin (NW-Pakistan). Sediment. Geol. 2019, 389, 26–41. [CrossRef]87. Bibi, M.; Wagreich, M.; Iqbal, S.; Gier, S.; Jan, I.U. Sedimentation and glaciations during the Pleistocene: Palaeoclimate reconstruc-
tion in the Peshawar Basin, Pakistan. Geol. J. 2020, 55, 671–693. [CrossRef]88. Mange, M.A.; Maurer, H.F.W. Heavy Minerals in Colour; Chapman and Hall: London, UK, 1992; pp. 11–25.89. Koroznikova, L.; Klutke, C.; McKnight, S.; Hall, S. The use of low-toxic heavy suspensions in mineral sands evaluation and zircon
fractionation. J. Afr. Inst. Min. Metall. 2008, 108, 25–33.90. Sorkhabi, R. How Much Oil in the Middle East? GeoExPro 2014, 11, 1–2014.91. John, T.; Schenk, V.; Haase, K.; Scherer, E.; Tembo, F. Evidence for a Neoproterozoic ocean in south-central Africa from
mid-oceanic-ridge–type geochemical signatures and pressure-temperature estimates of Zambian eclogites. Geology 2003, 31,243–246. [CrossRef]
92. Basu, A. Petrology of Holocene fluvial sand derived from plutonic source rocks; implications to paleoclimatic interpretation.J. Sediment. Res. 1976, 46, 694–709. [CrossRef]
93. Gromet, L.; Haskin, L.A.; Korotev, R.L.; Dymek, R.F. The “North American shale composite”: Its compilation, major and traceelement characteristics. Geochim. Cosmochim. Acta 1984, 48, 2469–2482. [CrossRef]
94. Nesbitt, H.W.; Young, G.M.; McLennan, S.; Keays, R. Effects of Chemical Weathering and Sorting on the Petrogenesis of SiliciclasticSediments, with Implications for Provenance Studies. J. Geol. 1996, 104, 525–542. [CrossRef]
95. Rudnick, R.L.; Gao, S.; Holland, H.D.; Turekian, K.K. Composition of the continental crust. Crust 2003, 3, 1–64.96. Hubert, J.F. A zircon–tourmaline–rutile maturity index and the interdependence of the composition of heavy mineral assemblages
with the gross composition and texture of sandstones. J. Sediment. Res. 1962, 32, 440–450.97. Garzanti, E.; Andò, S. Chapter 29 Plate Tectonics and Heavy Mineral Suites of Modern Sands. Dev. Sedimentol. 2007, 58,
741–763. [CrossRef]98. Tucker, M.E. (Ed.) Sedimentary Petrology: An Introduction to the Origin of Sedimentary Rocks; John Wiley & Sons: Oxford, UK,
2009; p. 278.99. Boggs, S., Jr.; Boggs, S. Petrology of Sedimentary Rocks; Cambridge University Press: Cambridge, UK, 2009; p. 600.100. Condie, K.C. Another look at rare earth elements in shales. Geochim. Cosmochim. Acta 1991, 55, 2527–2531. [CrossRef]101. Cox, R.; Lowe, D.R.; Cullers, R. The influence of sediment recycling and basement composition on evolution of mudrock chemistry
in the southwestern United States. Geochim. Cosmochim. Acta 1995, 59, 2919–2940. [CrossRef]102. Garver, J.I.; Scott, T.J. Trace elements in shale as indicators of crustal provenance and terrane accretion in the southern Canadian
Cordillera. GSA Bull. 1995, 107, 440–453. [CrossRef]103. Blake, J.M.; Peters, S.C.; Johannesson, K.H. Application of REE geochemical signatures for Mesozoic sediment provenance to the
Gettysburg Basin, Pennsylvania. Sediment. Geol. 2017, 349, 103–111. [CrossRef]104. Mukherjee, I.; Large, R.R.; Bull, S.; Gregory, D.G.; Stepanov, A.S.; Ávila, J.; Ireland, T.R.; Corkrey, R. Pyrite trace-element and
sulfur isotope geochemistry of paleo-mesoproterozoic McArthur Basin: Proxy for oxidative weathering. Am. Miner. 2019, 104,1256–1272. [CrossRef]
105. Little, S.H.; Vance, D.; Lyons, T.W.; McManus, J. Controls on trace metal authigenic enrichment in reducing sediments: Insightsfrom modern oxygen-deficient settings. Am. J. Sci. 2015, 315, 77–119. [CrossRef]

Minerals 2021, 11, 573 33 of 34
106. Sweere, T.; Boorn, S.V.D.; Dickson, A.J.; Reichart, G.-J. Definition of new trace-metal proxies for the controls on organic matterenrichment in marine sediments based on Mn, Co, Mo and Cd concentrations. Chem. Geol. 2016, 441, 235–245. [CrossRef]
107. Kanhaiya, S.; Singh, B.P.; Singh, S. Mineralogical and Geochemical Behavior of Sediments Solely Derived from Bundelk-hand Granitic Complex, Central India: Implications to Provenance and Source Rock Weathering. Geochem. Int. 2018, 56,1245–1262. [CrossRef]
108. McLennan, S.; Taylor, S.; McCulloch, M.; Maynard, J. Geochemical and Nd Sr isotopic composition of deep-sea turbidites: Crustalevolution and plate tectonic associations. Geochim. Cosmochim. Acta 1990, 54, 2015–2050. [CrossRef]
109. Singer, A. The paleoclimatic interpretation of clay minerals in sediments—A review. Earth Sci. Rev. 1984, 21, 251–293. [CrossRef]110. Dill, H.G. Kaolin: Soil, rock and ore: From the mineral to the magmatic, sedimentary and metamorphic environments. Earth Sci.
Rev. 2016, 161, 16–129. [CrossRef]111. Newman, S.; Macdougall, J.D.; Finkel, R.C. 230Th-238U disequilibrium in island arcs: Evidence from the Aleutians and the
Marianas. Nature 1984, 308, 268–270. [CrossRef]112. Worden, R.H.; Burley, S.D. Sandstone Diagenesis: The Evolution of Sand to Stone. Sandstone Diagenesis 2009, 4, 1–44.113. Marfil, R.; La Iglesia, A.; Herrero, M.J.; Scherer, M.; Delgado, A. Clay mineral occurrence and burial transformations: Reservoir
potential of the Permo-Triassic sediments of the Iberian Range. Basin Res. 2014, 27, 295–309. [CrossRef]114. Mindszenty, A. Bauxites: Feedbacks of System Earth at Greenhouse times. Geol. Croat. 2016, 69, 79–87. [CrossRef]115. Selvaraj, K.; Chen, C.A. Moderate Chemical Weathering of Subtropical Taiwan: Constraints from Solid-Phase Geochemistry of
Sediments and Sedimentary Rocks. J. Geol. 2006, 114, 101–116. [CrossRef]116. Bahlburg, H.; Dobrzinski, N.; Arnaud, E.; Halverson, G.P.; Shields-Zhou, G. Chapter 6 A review of the Chemical Index of
Alteration (CIA) and its application to the study of Neoproterozoic glacial deposits and climate transitions. Geol. Soc. Lond. Mem.2011, 36, 81–92. [CrossRef]
117. McLennan, S.M. Archean sedimentary rocks and the Archean mantle. In Workshop on the Archean Mantle; Technical Report; Aswal,L.D., Ed.; LPI: New York, NY, USA, 1989; Volume 89-05, pp. 57–59.
118. McLennan, S.; Taylor, S.R. Th and U in sedimentary rocks: Crustal evolution and sedimentary recycling. Nat. Cell Biol. 1980, 285,621–624. [CrossRef]
119. McLennan, S.; Taylor, S.R. Sedimentary Rocks and Crustal Evolution: Tectonic Setting and Secular Trends. J. Geol. 1991, 99,1–21. [CrossRef]
120. McLennan, S.M. Rare earth elements in sedimentary rocks: Influence of provenance and sedimentary processes. Miner. Soc. Am.Rev. Mineral. 1989, 21, 169–200.
121. Mange, M.A.; Wright, D.T. (Eds.) Heavy Minerals in Use: Developments in Sedimentology; Elsevier: Amsterdam, The Netherlands,2007; p. 1283.
122. Sevastjanova, I.; Hall, R.; Alderton, D. A detrital heavy mineral viewpoint on sediment provenance and tropical weathering in SEAsia. Sediment. Geol. 2012, 280, 179–194. [CrossRef]
123. Rino, S.; Kon, Y.; Sato, W.; Maruyama, S.; Santosh, M.; Zhao, D. The Grenvillian and Pan-African orogens: World’s largestorogenies through geologic time, and their implications on the origin of superplume. Gondwana Res. 2008, 14, 51–72. [CrossRef]
124. Stern, R.J.; Johnson, P. Continental lithosphere of the Arabian Plate: A geologic, petrologic, and geophysical synthesis. Earth Sci.Rev. 2010, 101, 29–67. [CrossRef]
125. Heikal, M.T.S.; Al-Khirbash, S.A.; Hassan, A.M.; Al-Kotbah, A.M.; Al-Selwi, K.M. Lithostratigraphy, deformation history, andtectonic evolution of the basement rocks, Republic of Yemen: An overview. Arab. J. Geosci. 2013, 7, 2007–2018. [CrossRef]
126. Whitehouse, M.J.; Windley, B.F.; Stoeser, D.B.; Al-Khirbash, S.; Ba-Bttat, M.A.; Haider, A. Precambrian basement character ofYemen and correlations with Saudi Arabia and Somalia. Precambrian Res. 2001, 105, 357–369. [CrossRef]
127. Stampfli, G.; Marcoux, J.; Baud, A. Tethyan margins in space and time. Palaeogeogr. Palaeoclim. Palaeoecol. 1991, 87,373–409. [CrossRef]
128. Pillevuit, A. Les Blocs exotiques du Sultanat d’Oman, évolution paléogéographique d’une marge passive flexurale. MémoiresGéologie Lausanne 1993, 17, 1–249.
129. Wopfner, H. Pangean depositional sequences between Karoo and Lut. In Geoscientific Research in Northeast Africa; Balkema, A.A.,Thorweihe, U., Schandelmeier, H., Eds.; Brookfield: Rotterdam, The Netherlands, 1993; pp. 189–195.
130. Jin, X. Permo-Carboniferous sequences of Gondwana affinity in Southwest China and their paleogeographic implications. J. AsianEarth Sci. 2002, 20, 633–646.
131. Ghani, H.; Sobel, E.R.; Zeilinger, G.; Glodny, J.; Zapata, S.; Irum, I. Palaeozoic and Pliocene tectonic evolution of the Salt Rangeconstrained by low-temperature thermochronology. Terra Nova 2021, 33, 293–305. [CrossRef]
132. Sciunnach, D.; Garzanti, E. Sedimentary record of Late Paleozoic rift and break-up in Northern Gondwana: A case history fromthe Thini Chu Group and Tamba-Kurkur Formation (Dolpo Tethys Himalaya, Nepal). Geodin. Acta 1996, 9, 41–56. [CrossRef]
133. Sciunnach, D.; Garzanti, E. Detrital chromian spinels record tectono-magmatic evolution from Carboniferous rifting to Permianspreading in Neotethys (India, Nepal and Tibet). In From Rifting to Drifting in Present-Day and Fossil Ocean Basins; Messiga, B.,Tribuzio, R., Eds.; Ofioliti: Pisa, Italy, 1997; pp. 101–110.
134. Jin, Y.; Shen, S.Z.; Zhu, Z.; Mei, S.; Wang, W. The Selong section, candidate of the global stratotype and section, and pointof the Permian–Triassic boundary. In The Palaeozoic–Mesozoic Boundary Candidates of Global Stratotype Section and Point of thePermian–Triassic Boundary; Yin, H.F., Ed.; China University of Geosciences: Beijing, China, 1996; pp. 127–137.

Minerals 2021, 11, 573 34 of 34
135. Wignall, P.B.; Newton, R. Contrasting Deep-water Records from the Upper Permian and Lower Triassic of South Tibet and BritishColumbia: Evidence for a Diachronous Mass Extinction. PALAIOS 2003, 18, 153–167. [CrossRef]
136. von Rad, U.; Exon, N.F.; Boyd, R.; Haq, B.U. Mesozoic paleoenvironment of the rifted margin off NW Australia (ODP Legs122/123). In American Geophysical Union Monograph; Duncan, R.A., Rea, D.K., Kidd, R.B., von Rad, U., Weissel, J.K., Eds.; AmericanGeophysical Union: Washington, DC, USA, 1992; Volume 70, pp. 157–184. [CrossRef]
137. Garzanti, E.; Le Fort, P.; Sciunnach, D. First report of Lower Permian basalts in South Tibet: Tholeiitic magmatism during break-upand incipient opening of Neotethys. J. Asian Earth Sci. 1999, 17, 533–546. [CrossRef]
138. Biswas, S. Regional tectonic framework, structure and evolution of the western marginal basins of India. Tectonophysics 1987, 135,307–327. [CrossRef]
139. Mukhopadhyay, G.; Mukhopadhyay, S.K.; Roychowdhury, M.; Parui, P.K. Stratigraphic correlation between different GondwanaBasins of India. J. Geol. Soc. India 2010, 76, 251–266. [CrossRef]
140. Brown, B.J.; Muller, R.D.; Gaina, C.; Struckmeyer, H.I.M.; Stagg, H.M.J.; Symonds, P.A. Formation and evolution of Australianpassive margins: Implications for locating the boundary between continental and oceanic crust. Spec. Pap. Geol. Soc. Am. 2003,372, 223–244.
141. Green, P.F.; Japsen, P.; Chalmers, J.A.; Bonow, J.M.; Duddy, I.R. Post-breakup burial and exhumation of passive continentalmargins: Seven propositions to inform geodynamic models. Gondwana Res. 2018, 53, 58–81. [CrossRef]
142. Martin, A.J. A review of Himalayan stratigraphy, magmatism, and structure. Gondwana Res. 2017, 49, 42–80. [CrossRef]143. Heron, A.M. The geology of central Rajputana. Mem. Geol. Soc. India 1953, 79, 389.144. Sisodia, M.S.; Chauhan, D.S. Indian Precambrian; Paliwal, B.S., Ed.; Scientific Publisher: Jodhpur, India, 1998; pp. 171–182.145. Bhushan, S.K. Classification of Malani Igneous Suite. Geol. Surv. India Spec. Public 1984, 12, 199–205.146. Di Giulio, A.; Amadori, C.; Mueller, P.; Langone, A. Role of the Down-Bending Plate as a Detrital Source in Convergent
Systems Revealed by U–Pb Dating of Zircon Grains: Insights from the Southern Andes and Western Italian Alps. Minerals 2020,10, 632. [CrossRef]
147. Burley, S.; Worden, R. (Eds.) Sandstone Diagenesis: Recent and Ancient; Wiley-Blackwell: Hoboken, NJ, USA, 2009;Volume 24, p. 650.
148. Walderhaug, O. Temperatures of Quartz Cementation in Jurassic Sandstones from the Norwegian Continental Shelf–Evidencefrom Fluid Inclusions. J. Sediment. Res. 1994, 64, 311–323. [CrossRef]
149. Primmer, T.J.; Cade, C.A.; Evans, J.; Gluyas, J.G.; Hopkins, M.S.; Oxtoby, N.H.; Smalley, S.; Warren, E.A.; Worden, R.H. Globalpatterns in sandstone diagenesis: Their application to reservoir quality prediction for petroleum exploration. In Reservoir QualityPrediction in Sandstones and Carbonates; Kupecz, J.A., Gluyas, J., Bloch, S., Eds.; American Association of Petroleum Geologists:Tulsa, OK, USA, 1997; pp. 61–77, Memoir 69.
150. Worden, R.; Morad, S. Quartz Cementation in Sandstones; Special Publication 29, International Association of Sedimentologists;Blackwell Science: Oxford, UK, 2000; p. 342.