Enhancing ASEAN Minerals Trade and Investment
134
Enhancing ASEAN Minerals Trade and Investment REPSF Project No. 04/009b Authors: ABARE Jane Mélanie, Marina Kim, Sam Hester, Peter Berry, Allison Ball and Karen Schneider Mekong Economics Paul Burke, Le Hoa Au Duong and Adam McCarty Final Report December 2005 The views expressed in this report are those of the authors, and not necessarily those of the ASEAN Secretariat and/or the Australian Government.
Transcript of Enhancing ASEAN Minerals Trade and Investment

Enhancing ASEAN Minerals Trade and Investment REPSF Project No. 04/009b Authors: ABARE Jane Mélanie, Marina Kim, Sam Hester, Peter Berry, Allison Ball and Karen Schneider
Mekong Economics Paul Burke, Le Hoa Au Duong and Adam McCarty
Final Report December 2005
The views expressed in this report are those of the authors, and not necessarily those of the ASEAN Secretariat and/or the Australian Government.


Enhancing ASEAN Minerals Trade and Investment
REPSF Project 04/009b: Final Report i
ABSTRACT
The development of mineral resources has contributed to economic growth and development in many of the world’s economies. The mining sector has the potential to boost economic growth through the provision of employment, export revenues and investment in infrastructure and human capital. Most ASEAN member countries are highly prospective in terms of minerals. However, to date, much of this potential has remained largely untapped.
In this study, the factors underlying the relatively weak performance of the minerals sector in ASEAN member countries are investigated. The assessment reveals that the sector remains constrained by economy wide impediments, such as weak governance and underdeveloped infrastructure, and minerals sector issues, such as poor geological information and regulatory uncertainty. These factors affect the ability of ASEAN member countries to secure the necessary investment to sustain the development of capital intensive and long term minerals projects.
The prospects for the minerals sector in ASEAN will be influenced not only by the emerging opportunities in global minerals markets, but critically on the readiness and capacity of individual ASEAN member countries to address the major obstacles to the development of the sector within their respective economic, social and political settings.


Enhancing ASEAN Minerals Trade and Investment
REPSF Project 04/009b: Final Report iii
CONTENTS
ABSTRACT.............................................................................................................................. I CONTENTS............................................................................................................................ III LIST OF TABLES ...................................................................................................................V LIST OF FIGURES.................................................................................................................VI LIST OF BOXES ...................................................................................................................VII ABBREVIATIONS................................................................................................................VIII ACKNOWLEDGMENTS ........................................................................................................IX EXECUTIVE SUMMARY ........................................................................................................X
A. Study objectives ........................................................................................................ x B. Minerals sectors of the ASEAN region.................................................................... x C. Global outlook for minerals .................................................................................... xii D. Investment in the minerals sector......................................................................... xiii E. Policy recommendations ........................................................................................ xv F. The role of regional cooperation......................................................................... xviii
I. INTRODUCTION ............................................................................................................... 1 II. OVERVIEW OF THE ASEAN MINERALS SECTOR........................................................ 3
A. Economic contribution of the minerals sector ....................................................... 3 B. Mineral reserves ........................................................................................................ 4 C. Minerals production .................................................................................................. 6 D. Minerals consumption............................................................................................... 9 E. Minerals trade .......................................................................................................... 10
III. GLOBAL OUTLOOK FOR MINERALS .......................................................................... 13 A. Outlook overview..................................................................................................... 15
1. Aluminium .......................................................................................................... 15 2. Bauxite................................................................................................................ 17 3. Copper ................................................................................................................ 17 4. Gold..................................................................................................................... 20 5. Lead .................................................................................................................... 22 6. Nickel .................................................................................................................. 23 7. Tin ....................................................................................................................... 25 8. Zinc ..................................................................................................................... 26 9. Gemstones ......................................................................................................... 28
B. The role of China ..................................................................................................... 30 C. Implications of global minerals outlook for ASEAN............................................. 30 D. Sensitivity of outlook to key variables .................................................................. 31 E. Market access issues.............................................................................................. 35
1. Global trade environment for minerals............................................................ 35 2. The proposed EU REACH legislation .............................................................. 39
IV. INVESTMENT IN THE MINERALS SECTOR IN ASEAN............................................... 41 A. Investment flows in the minerals sector ............................................................... 42
1. Total investment ................................................................................................ 42 2. Foreign direct investment................................................................................. 43 3. Future investment prospects ........................................................................... 46
B. Institutional and regulatory arrangements affecting investment in the minerals sector........................................................................................................................ 47

Enhancing ASEAN Minerals Trade and Investment
iv REPSF Project 04/009b: Final Report
1. National institutions and regulations .............................................................. 47 2. Regional investment frameworks .................................................................... 54
C. Key determinants of minerals sector investment................................................. 55 1. Minerals sector investment decision criteria.................................................. 55
Economy wide factors.......................................................................................... 56 Minerals sector factors......................................................................................... 58 Environmental and social factors......................................................................... 58
2. Minerals sector investment decision model ................................................... 59 D. Key impediments to minerals sector investment in ASEAN ............................... 60
1. Economy wide impediments ............................................................................ 61 2. Minerals sector impediments ........................................................................... 63 3. Environmental and social issues ..................................................................... 66
E. Risk, investment and economic activity................................................................ 67 F. Funding investment................................................................................................. 70
V. POLICY RECOMMENDATIONS..................................................................................... 75 A. Economy wide recommendations.......................................................................... 76
1. AMCAP Strategy 1: Facilitating trade and investment................................... 76 Competitive neutrality .......................................................................................... 76 Trading rights....................................................................................................... 76 Foreign direct investment .................................................................................... 76 Infrastructure development .................................................................................. 76 Access to finance................................................................................................. 77
2. AMCAP Strategy 3: Strengthening institutional and human capacities....... 77 Governance ......................................................................................................... 77
B. Minerals sector recommendations ........................................................................ 77 1. AMCAP Strategy 1: Facilitating trade and investment................................... 77
Reliability and availability of basic geological information ................................... 77 Land access......................................................................................................... 78 Regulatory certainty............................................................................................. 78 Security of tenure................................................................................................. 79 Competitive taxation regime ................................................................................ 79
2. AMCAP Strategy 2: Promoting environmentally and socially sustainable mineral development............................................................................................... 80 3. AMCAP Strategy 3: Strengthening institutional and human capacities....... 81
VI. ASEAN COOPERATION IN MINERALS: MAXIMISING OPPORTUNITIES.................. 83 A. Potential benefits of ASEAN cooperation in minerals ......................................... 83 B. ASEAN minerals cooperation to date .................................................................... 84 C. AMCAP 2005-2010 and the prospects for regional cooperation ......................... 90 D. Conclusion ............................................................................................................... 92
REFERENCES...................................................................................................................... 95 APPENDIXES .....................................................................................................................101
A. Appendix 1: A brief technical description of the GTEM model ......................... 101 B. Appendix 2: Interview program............................................................................ 104 C. Appendix 3: About the authors ............................................................................ 110

Enhancing ASEAN Minerals Trade and Investment
REPSF Project 04/009b: Final Report v
LIST OF TABLES
Table 1: FDI in Mining and Quarrying, ASEAN member countries, 1999-2003, US$ Million ...................................................................................................................... xiii
Table 2.1: Distribution of Metallic Mineral Reserves in ASEAN.................................. 4 Table 2.2: Estimated Reserves of ASEAN Key Metallic Minerals ............................... 5 Table 2.3: Distribution of Non-Metallic Mineral Reserves in ASEAN.......................... 5 Table 2.4: ASEAN Production of Key Minerals, 2003................................................... 7 Table 2.5: ASEAN Gemstones Production, 2003.......................................................... 9 Table 3.1: World Aluminium Outlook........................................................................... 16 Table 3.2: World Copper Outlook................................................................................. 18 Table 3.3: World Gold Outlook ..................................................................................... 20 Table 3.4: World Lead Outlook..................................................................................... 22 Table 3.5: World Nickel Outlook................................................................................... 24 Table 3.6: World Tin Outlook........................................................................................ 26 Table 3.7: World Zinc Outlook...................................................................................... 27 Table 3.8: Most-Favoured-Nation Applied Duties on Selected Mineral Ores and
Concentrates and Metal Products.......................................................................... 37 Table 3.9: Common Effective Preferential Tariffs under the AFTA Scheme, 2005..37 Table 4.1: Minerals Sector Investment in ASEAN member countries, 1997-2004, $US
Million ....................................................................................................................... 43 Table 4.2: FDI in Mining and Quarrying, ASEAN member countries, 1999-2003, US$
Million ....................................................................................................................... 45 Table 4.3: FDI in the ASEAN Mining and Quarrying Sector by Major Source
Country, 1999-2003, US$ Million ............................................................................ 45 Table 4.4: Major Recently Approved Investment Projects in the Metallic Minerals
Sector in ASEAN...................................................................................................... 46 Table 4.5: Summary of Minerals Regulations in ASEAN member countries ........... 51 Table 4.6: Timeframes for the Phasing Out of Temporary Exclusion List ............... 55 Table 4.7: Ranking of Investment Decision Factors at the Exploration and Mining
Stages....................................................................................................................... 56 Table 4.8: Credit Risk Assessments of ASEAN member countries and Associated
GTEM Risk Classifications ..................................................................................... 69 Table 4.9: Assumed Increase in Investment for Each Country Risk Group, Relative
to the Reference Case at 2010................................................................................ 69 Table 4.10: Types of Finance and Sources of Funds for Mining Projects ............... 71

Enhancing ASEAN Minerals Trade and Investment
vi REPSF Project 04/009b: Final Report
LIST OF FIGURES
Figure 1: Production of Key Metallic Minerals in ASEAN, 2003................................. xi Figure 2: Forecast Average Annual Growth in World Metals Consumption, 2004-
2010...........................................................................................................................xii Figure 3: Key Impediments to Minerals Sector Investment in ASEAN.................... xiv Figure 2.1: ASEAN Minerals Production as a Share of GDP (%), 2003 ...................... 4 Figure 2.2: Production of Key Minerals in ASEAN, 2003 ............................................. 6 Figure 2.3: ASEAN Share of World Minerals Production (%), 2003 ............................ 7 Figure 2.4: ASEAN Production of Key Minerals by Country, 1990-2004 .................... 8 Figure 2.5: ASEAN Production of Key Minerals, 1990-2004 ........................................ 8 Figure 2.6: ASEAN Consumption of Key Metals, 1990-2004 ..................................... 10 Figure 2.7: ASEAN Trade in Key Minerals, 2003......................................................... 11 Figure 3.1: Forecast Average Annual Growth in World Metals Consumption, 2004-
2010...........................................................................................................................15 Figure 3.2: Outlook for World Metals Consumption to 2010 ..................................... 15 Figure 3.3: Forecast Average Annual Growth in China’s Metals Consumption, 2004-
2010...........................................................................................................................30 Figure 3.4: Per cent Change in Global Consumption of Selected Mineral
Commodities under Higher Economic Growth in China, Relative to the Reference Case at 2010........................................................................................... 33
Figure 3.5: Per cent Change in ASEAN Production of Selected Mineral Commodities under High Productivity Growth Assumptions in ASEAN Mining, Relative to the Reference Case at 2010................................................................. 34
Figure 3.6: Per cent Change in ASEAN Exports of Selected Mineral Commodities under High Productivity Growth Assumptions in ASEAN Mining, Relative to the Reference Case at 2010........................................................................................... 35
Figure 4.1: Minerals Sector Investment Decision Model ........................................... 60 Figure 4.2 Key Impediments to Minerals Sector Investment in ASEAN................... 61 Figure 4.3: Change in GDP in ASEAN under Alternative Scenarios of Investment
Growth, Relative to the Reference Case at 2010 .................................................. 70 Figure 4.4: IFC’s Extractive Industries Approvals, 1990-2002 .................................. 72 Figure 6.1: ASEAN Minerals Cooperation ................................................................... 85 Figure 6.2: ASEAN Minerals Cooperation Areas ........................................................ 87 Figure 6.3: Regional Cooperation Spectrum .............................................................. 89

Enhancing ASEAN Minerals Trade and Investment
REPSF Project 04/009b: Final Report vii
LIST OF BOXES
Box 3.1: Key Characteristics of Selected Metallic Minerals ...................................... 14 Box 3.2: ABARE’s Global Trade and Environment Model (GTEM) ........................... 32 Box 4.1: Taxes Affecting the Minerals Sector............................................................. 48 Box 4.2: Types of Mineral Royalties ............................................................................ 49 Box 4.3: Minerals Sector Risks .................................................................................... 57

Enhancing ASEAN Minerals Trade and Investment
viii REPSF Project 04/009b: Final Report
ABBREVIATIONS
AADCP ASEAN – Australia Development Cooperation Program
ABARE Australian Bureau of Agricultural and Resource Economics
AFTA ASEAN Free Trade Area
AIA ASEAN Investment Area
AMCAP ASEAN Minerals Cooperation Action Plan
AMMin ASEAN Ministerial Meeting on Minerals
APEC Asia Pacific Economic Cooperation
ASEAN Association of Southeast Asian Nations
ASOMM ASEAN Senior Officials Meeting on Minerals
CEPT Common Effective Preferential Tariff
ECA Export Credit Agency
FDI Foreign Direct Investment
GDP Gross Domestic Product
GEMEED Expert Group on Minerals and Energy Exploration and Development
GTAP Global Trade Analysis Project
GTEM Global Trade and Environment Model
IBRD International Bank for Reconstruction and Development
ICSID International Centre for Settlement of Investment Disputes
IDA International Development Association
IFC International Financial Corporation
MIGA Multilateral Investment Guarantee Agency
MKE Mekong Economics Ltd
NGO Non-Government Organisation
OECD Organisation for Economic Cooperation and Development
REACH Registration, Evaluation and Authorisation of Chemicals
REPSF Regional Economic Policy Support Facility
WTO World Trade Organisation

Enhancing ASEAN Minerals Trade and Investment
REPSF Project 04/009b: Final Report ix
ACKNOWLEDGMENTS
This study was made possible by funding support from the Regional Economic Policy Support Facility under the ASEAN–Australia Development Cooperation Program.
The authors gratefully acknowledge the assistance provided by government and industry organisations that were consulted throughout the preparation of this report. While the extensive list of participants in the interview program (see Appendix 2) makes it impractical to thank each interviewee individually, we are highly appreciative of the valuable insights, information and comments provided by all. The authors also thank national study coordinators and Australian Embassy officers for facilitating consultations with industry and government organisations.
We would also like to acknowledge the constructive feedback of participants at the following meetings: the 2nd Special ASEAN Senior Officials Meeting of Minerals Experts (9 June 2005 – Langkawi), the 2nd Private Sector Forum on Minerals Cooperation (1 August 2005 – Kuching) and the 7th ASEAN Senior Officials Meeting on Minerals (2 August 2005 – Kuching).
We are also grateful for valuable contributions to the project made by ABARE colleagues. In particular, thanks are due to Andrew Maurer (formerly of ABARE), Frank Drum, Wil Mollard, Simon Richmond and Ryan Wilson for the commodity outlook notes, and to Lindsay Hogan, Jammie Penm and Don Gunasekera for helpful advice and comments.

Enhancing ASEAN Minerals Trade and Investment
x REPSF Project 04/009b: Final Report
EXECUTIVE SUMMARY
The Association of Southeast Asian Nations (ASEAN) region is well endowed with mineral resources. However, to date, the minerals sector has performed below its potential in the majority of member countries, reflecting a diverse set of regulatory and institutional constraints. In an environment of growing global demand for mineral based commodities, the sustainable development of these resources has the potential to deliver substantial economic benefits to ASEAN member countries. In some of these countries, the mining sector represents a large potential source of government revenue, that could contribute to the resources required to finance social and physical infrastructure to support economic growth and alleviate poverty. In other countries, the development of the sector also provides an opportunity to create a diversified and more resilient economic portfolio.
A. STUDY OBJECTIVES The key objectives in this study, undertaken jointly by the Australian Bureau of
Agricultural and Resource Economics (ABARE) and Mekong Economics Ltd (MKE) for the ASEAN Secretariat, through the ASEAN-Australia Development Cooperation Program (AADCP) Regional Economic Policy Support Facility (REPSF), are as follows:
o identify key mineral commodities in ASEAN in terms of resources, production and trade;
o assess the international market outlook for minerals, including mineral processing activities, and examine ASEAN’s actual and potential economic and trade performance in the light of the policy and market environment;
o evaluate current regulatory and institutional arrangements in ASEAN member countries that govern investment, including foreign direct investment, in the minerals sector, and identify the factors determining the attractiveness of investment in that sector; and
o provide recommendations for enhancing the attractiveness of investment in the minerals sector in ASEAN, taking into account the potential role of regional cooperation.
The focus in this study is primarily on high value globally traded non-energy minerals significant in the ASEAN region. These include metallic minerals such as gold, copper and tin, and gemstones. It should be noted, however, that locally and regionally traded mineral products, in particular non-metallic minerals, often dominate in volume terms in several ASEAN member countries.
B. MINERALS SECTORS OF THE ASEAN REGION From a regional perspective, ASEAN’s role in global minerals production, consumption
and trade is currently relatively limited, with the exception of tin, nickel and copper for which the region contributes a significant share of world production and trade. Minerals production accounted for 0.9% of ASEAN gross domestic product (GDP) in 2003. However, within the region, there is significant variation in the composition and volume of minerals produced, reflecting different resource endowments, economic structures and socio-political settings. The contribution of minerals production to GDP is highest in Indonesia (2.3%), followed by the Lao PDR (1.7%), and the Philippines (1.6%).
Minerals production in ASEAN is backed by diverse reserves of both metallic and non-metallic minerals. A lack of consistent reserves data across all ASEAN member countries makes it difficult to provide definitive estimates for the region as a whole. Indonesia accounts for a significant share of ASEAN and world mineral reserves, including 7.5% of the world’s

Enhancing ASEAN Minerals Trade and Investment
REPSF Project 04/009b: Final Report xi
known reserves of copper, more than 13% of known reserves of tin, more than 5% of known reserves of nickel, and more than 4% of the world’s known gold reserves (USGS 2005). Myanmar, the Philippines, Thailand and Viet Nam are also well endowed with substantial mineral wealth.
Different resource endowments, risk profiles, levels of economic development and regulatory and institutional factors account for the considerable diversity in the size and scope of minerals production across countries in the region (Figure 1). Indonesia is by far the largest producer of a number of metallic mineral commodities, mainly as a result of its rich mineral endowment and government promotion of investment in the mining sector. In value terms, the key minerals produced in ASEAN member countries are nickel, copper, tin and gold, with Indonesia being the main producer of these metals. For tin, nickel and copper, ASEAN production represents a significant share of world production, accounting for 29%, 11% and 8% of global production respectively. Other metallic minerals produced on a smaller scale in the region include bauxite, lead, zinc and iron ore. In 2003, ASEAN total minerals production was valued at around US$5.9 billion.
ASEAN member countries are also significant producers of a wide array of non-metallic minerals, including gemstones, gypsum, limestone, kaolin, phosphate rock, sand, gravel and a wide range of other industrial minerals. Non-metallic minerals production is important for the economies of the Lao PDR, Malaysia and Myanmar, and constitutes a significant share of total minerals production in Thailand and Viet Nam.
There are limited processing facilities in ASEAN and most of the production of metallic minerals is exported as ores and concentrates for processing/refining outside the region. However, some mineral processing occurs in the region, particularly of copper, bauxite, lead, zinc and tin. As the largest producer of mineral ores and concentrates, Indonesia is also the main producer of refined mineral products. Some of the refined metals produced locally in ASEAN member countries are consumed by domestic manufacturing and construction industries, although the region generally relies on imports of refined metals to meet consumption requirements.
Figure 1: Production of Key Metallic Minerals in ASEAN, 2003
Note: Production in thousand tonnes; gold production is in tonnes. Source: World Bureau of Metal Statistics 2005.

Enhancing ASEAN Minerals Trade and Investment
xii REPSF Project 04/009b: Final Report
ASEAN accounts for a substantial share of world trade in tin, copper and nickel, although its role in world markets for other mineral commodities is relatively minor. In 2003, ASEAN export volumes of refined tin accounted for 58% of world trade, while exports of unrefined and refined copper accounted for 16% and 6% of world trade respectively. In value terms, the key ASEAN minerals exports over the 10 years to 2003 were copper, aluminium, tin and nickel. The value of ASEAN exports of metallic minerals grew rapidly until 1995, largely led by strong growth in copper and aluminium. From this peak, the value of minerals exports declined, to be more than 8% below the 1995 level in 2002, reflecting lower world prices for copper, nickel, zinc and tin over the period. However, world demand for metals rose significantly in 2003 and 2004, resulting in strong price rises for mineral commodities. As a consequence, the value of ASEAN exports of copper, nickel, aluminium, lead, zinc, tin and other base metals rose by more than 62% to US$7.1 billion in 2003 (AFTA 2005). With increased ASEAN minerals production and stronger metals prices, the value of ASEAN minerals exports has risen significantly in 2004 and 2005.
In contrast with metallic minerals, a significant proportion of ASEAN non-metallic minerals production is consumed locally. Some higher value non-metallic minerals, such as gemstones, are largely exported, both to foreign countries and other ASEAN member countries.
C. GLOBAL OUTLOOK FOR MINERALS Economic growth, supported by growth in the construction, infrastructure and
manufacturing sectors, will remain the key driver of world minerals and metals consumption over the medium to longer term. Also important will be continued population growth and rising per person incomes.
Global consumption of most refined minerals considered in this study is projected to grow by more than 3% a year between 2004 and 2010 (Figure 2). The strongest growth in consumption is expected to occur in aluminium, followed by nickel, tin and zinc. World gold consumption is projected to grow at a slower rate, at around 1.5% a year out to 2010.
Figure 2: Forecast Average Annual Growth in World Metals Consumption, 2004-2010
Source: ABARE.
Continued growth in demand in China is expected to be one of the key drivers of world metals consumption in the coming years. In the medium term, China’s consumption of all mineral commodities is expected to grow well above the average world growth rates. More specifically, annual growth of more than 10% is expected in China’s consumption of nickel,

Enhancing ASEAN Minerals Trade and Investment
REPSF Project 04/009b: Final Report xiii
tin and zinc. Aluminium and copper consumption in China are forecast to grow by 9% a year over the period to 2010. The strong demand for minerals in China can be expected to provide significant opportunities for minerals producers worldwide. In 2003, China accounted for close to 7% of total exports of mineral products from ASEAN (AFTA 2005). The expected growth in China’s minerals demand represents an important opportunity for ASEAN member countries to become more prominent players on the international minerals scene by taking advantage of their mineral prospectivity, geographical proximity to key markets and relatively low labor costs.
D. INVESTMENT IN THE MINERALS SECTOR A key determinant of ASEAN member countries’ ability to capitalise on future growth
opportunities in world minerals markets is their capacity to secure the necessary investment to support long term capital intensive mining projects. Domestic sources of finance are often constrained and unable to satisfy total demand for investment, making minerals sector developments in ASEAN strongly dependent on inflows of foreign direct investment (FDI).
Investment in the ASEAN minerals sector over the past decade has remained relatively limited and concentrated in a handful of member countries. Mining sector investment typically contributes a small percentage of total investment in ASEAN, representing less than 5% of total investment in most ASEAN member countries in recent years. As can be expected, countries with a more established minerals sector, such as Indonesia, have received larger investment inflows than countries where the minerals sector is less mature, such as Cambodia.
Over time, foreign investment has increasingly become a dominant factor in total capital flows in a number of countries in the region. However, while several ASEAN member countries have established minerals sectors built on FDI, the relatively new ASEAN members have opened their doors to foreign investment only recently. Over the period 1999-2003 (the period for which data are available), FDI in the ASEAN mining and quarrying sector was highly variable, with a low of US$635 million in 2000 and a peak of US$1.6 billion in 2001. Similarly, the share of FDI in the ASEAN mining and quarrying sector as a proportion of total FDI in ASEAN fluctuated widely, ranging from 3% in 2000 to 10% in 2002 (Table 1).
Table 1: FDI in Mining and Quarrying, ASEAN member countries, 1999-2003, US$ Million
1999 2000 2001 2002 2003 1999-2003 Share of FDI in mining and quarrying,
1999-2003a (%) Indonesia (211.0) (275.3) (233.7) (242.3) 232.3 (729.9) - Lao PDR 12.2 9.2 2.0 4.8 9.5 37.7 1 Malaysia 722.4 677.4 911.1 1,089.0 253.0 3,652.8 61 Myanmar 220.2 107.2 111.2 162.9 112.7 714.1 12 The Philippines 379.0 79.9 (1.0) 22.3 (7.5) 472.7 8 Thailand (41.8) (274.7) 518.0 (97.0) (5.0) 99.4 2 Viet Nam 264.6 311.2 298.6 406.7 431.8 1,712.8 29 ASEAN 1,345.6 634.9 1,606.2 1,346.4 1,026.8 5,959.6 100 Share of total FDI in ASEAN (%)
5 3 8 10 5 3
a: Indonesia had a negative net FDI flow over the period 1999-2003. The share is not reported to avoid confusion related to the sign of the percentage. FDI = foreign direct investment. Note: negative numbers are enclosed in parentheses. Source: ASEAN Secretariat 2004a.

Enhancing ASEAN Minerals Trade and Investment
xiv REPSF Project 04/009b: Final Report
This broad regional profile is underpinned by significant diversity across individual countries. In particular, in the period between 1999 and 2003, FDI in mining and quarrying declined in the Philippines, while rising sharply in the Lao PDR, and more moderately in Myanmar since 2001. Indonesia and Thailand mostly saw FDI outflows from the sector over the 5-year period to 2003. More than 60% of total FDI in ASEAN mining and quarrying was directed to Malaysia and was largely associated with oil and natural gas.
There is a wide assortment of factors that determine a country’s ability to attract foreign investment in the minerals sector. Some factors are common to investment decisions across all sectors. Typically, these relate to the maturity and stability of the political, economic and legal systems in a potential host country, and the availability of infrastructure. Other factors are more specific to the minerals sector and include geological potential, security of tenure, taxation regimes, and access to technologies and skilled labor.
Importantly, environmental and social considerations are also having a strong bearing on investment decisions pertaining to the minerals sector. Poor environmental management during the early development of the industry has tarnished the image of the sector in several ASEAN member countries, giving rise to strong anti-mining sentiments. Further, it is increasingly recognised that much of the environmental damage caused by mining activities has a direct impact on local communities in terms of their livelihoods and health. Against this background, it is becoming increasingly clear that the institutions and systems that countries establish to regulate, manage and monitor the environmental impact of mining operations directly influence the extent of investors’ interest in starting up a particular mining operation.
In view of the general objective to increase FDI in the region, ASEAN member countries have achieved significant progress in liberalising their trade and investment regimes. However, to date, the minerals sector has not been successful in attracting a significant share of total FDI inflows in the majority of ASEAN member countries. This reflects a wide spectrum of economy wide and sector specific impediments that have constrained the development of the sector. An assessment of the key impediments, as identified through the extensive consultation program in individual ASEAN member countries, is summarised in Figure 3.
Figure 3: Key Impediments to Minerals Sector Investment in ASEAN
A key impediment at the economy wide level is weak governance at many levels including weak rule of law, lack of transparency and accountability, and lack of partnership between government and non-government organisations.
Enhancing ASEAN Minerals Trade and Investment
REPSF Project 04/009b: Final Report xv
In terms of sector specific issues, uncertainty, whether related to the scope and implementation of regulations, the process for obtaining exploration and mining licences, or the resolution of land access issues, represents a significant impediment to investment in many of the countries in the ASEAN region. These factors, combined with shortcomings at the broader economy wide level, contribute to raise the risks associated with mining activities in the region. The higher the risks involved, the higher the rate of return required to attract investment in the minerals sector.
E. POLICY RECOMMENDATIONS The development of the minerals sector within a country calls for a strong and effective
policy framework. Governments are ultimately responsible for the regulatory and institutional settings within which mining takes place in a given jurisdiction, and their actions are critical to achieving sustainable benefits from the minerals industry for the national economy. More specifically, the sustainable development of the minerals sector is contingent on the provision of strategic direction; the requisite legal, regulatory and institutional frameworks to pursue economic, social and environmental objectives; accountability, transparency, and stakeholder consultation; and systems to deliver tangible benefits to the country’s citizens.
These conditions are also necessary for attracting the substantial levels of private sector investment, particularly FDI, required to underpin the development of the minerals sector in ASEAN member countries. At a time when globalisation is creating new opportunities for investment and increasing competition for mining capital, maintaining a stable and facilitative policy climate is becoming more important, and more challenging than it has ever been.
Key policy recommendations to address the wide spectrum of shortcomings identified in the report are summarised below. These recommendations are structured within the framework of the ASEAN Minerals Action Plan (AMCAP) 2005-2010. Country specific recommendations to improve the trade and investment environment in individual ASEAN member countries are provided in the Country Reports (see Volume II).
Economy wide recommendations In order to enhance trade and investment in the minerals sector, governments in
ASEAN member countries should address issues at the economy wide level. In particular, governments should:
AMCAP Strategy 1: Facilitating trade and investment o have a clear sense of direction, vision and purposeful commitment to ensure that
there is a level playing field across all economic sectors in terms of fiscal and other economic conditions;
o convey their commitment to the community through targeted and sustained education programs designed to enhance the profile of the minerals sector in terms of its potential economic benefits and environmental performance;
o minimise the involvement of state-owned enterprises in the operation of resources sectors and remove any conflict of interest between the government as a regulator and developer of natural resources;
o remove all non-tariff barriers to trade affecting the minerals sector both directly and indirectly;
o remove restrictions on FDI in order to facilitate further development of the region’s minerals sector. In some countries, this would involve removing quotas for domestic

Enhancing ASEAN Minerals Trade and Investment
xvi REPSF Project 04/009b: Final Report
investment in minerals sector enterprises. In several other countries, the relaxation of joint venture requirements would also assist to stimulate foreign investors’ participation in the development of extractive industries;
o create and maintain an environment characterised by a liberal trade and investment regime and stable macroeconomic conditions;
o reduce the commercial and political risks faced by potential investors;
o strengthen domestic capital markets through the provision of stable and unambiguous regulatory environments;
o consider the consolidation of equity markets across ASEAN member countries. Such a consolidated market would benefit from higher volumes, reduced trading costs and harmonised regulations;
AMCAP Strategy 3: Strengthening institutional and human capacities o continue to invest in capacity building programs to strengthen the technical,
regulatory, legal, commercial and administrative skills of public sector agencies involved in regulation of the minerals and other sectors;
o pay particular attention to capacity building at the local government level in terms of personnel, financial resource management, and intra- and intergovernmental relationships;
o focus on delivering accountable, participative and results-oriented governance outcomes in countries where significant policy reform initiatives are already in place; and
o pursue an integrated and sustainable reform strategy, backed by strong political will and appropriate resourcing.
Minerals sector recommendations In addition to addressing economy wide issues, governments in ASEAN member
countries should address issues that affect the minerals sector specifically. In this context, governments should:
AMCAP Strategy 1: Facilitating trade and investment o strive to provide high level geoscientific information;
o in the presence of limited government resources, explore the opportunities for partnerships with industry, academia and community organisations to provide that information;
o generate support for collaborative research programs designed to add to the region’s mineral reserves by developing ways of finding new ores and extracting currently uneconomic resources in a sustainable manner;
o investigate the potential for donor funding to improve the capacity of ASEAN member countries to collect, compile and disseminate geological information;
o adopt a market based system for determining the optimal allocation of land resources, in cases where property rights can be assigned to particular land uses;
o devote additional resources to the development of regulatory frameworks for allocating and securing property rights over land resources where property rights are not clearly defined;

Enhancing ASEAN Minerals Trade and Investment
REPSF Project 04/009b: Final Report xvii
o where property rights cannot be defined, adopt transparent and consistent administrative processes and procedures to remove the uncertainty surrounding access to land resources;
o ensure that these processes and procedures are flexible enough to allow new information related to mining technologies, for example, as well as changes in economic factors such as minerals prices, to be taken into account;
o ensure that the licensing process is clear, efficient and transparent, while acknowledging that improving regulatory certainty in the minerals sector requires an enhancement of both regulations themselves and institutions that carry out their implementation;
o where laws are vague or incomplete, pay attention to improving their clarity and broadening their scope;
o strengthen institutions to ensure that government agencies are consistent in their application of regulations, acknowledging that improving regulatory certainty in the minerals sector is closely linked to the broader issues of improving governance generally and reducing sovereign risk;
o provide clear information about existing regulations and procedures, including licensing processes, to potential investors in a readily accessible form;
o consider the establishment of a ‘one-stop shop’ for minerals sector investment;
o consider the potential contribution of the private sector in identifying the weaknesses in existing regulations and procedures and in designing and delivering appropriate capacity building programs;
o ensure that the requirements for investors to proceed from an exploration licence to a mining licence are clear and transparent so as to reduce the actual and perceived risks involved in allocating substantial capital resources at the high risk exploration stage;
o specify the conditions under which a title can be revoked;
o ensure that minerals rights are exclusive, and transferable to other enterprises, provided that all technical, financial, environmental and other requirements are met;
o move toward mining taxation regimes that are:
- internationally competitive and allow a fair share of benefits between governments and investors;
- easy to understand;
- easy to administer;
- stable and predictable over time;
- non-discriminatory;
- transparent; and
- provide a level playing field for all participants.
o consider their minerals sector taxation regimes in comparison with those of countries with more established minerals sectors and countries that have had recent success in attracting substantial capital inflows to their minerals sector (Chile and Mongolia, for example), taking into consideration that the mix of minerals produced, the degree of decentralisation and the level of economic development will affect the composition of minerals taxation regimes across countries;

Enhancing ASEAN Minerals Trade and Investment
xviii REPSF Project 04/009b: Final Report
o develop taxation regimes for the minerals sector with a full understanding of the international context in which mining companies operate;
o move toward the adoption of royalty arrangements that are linked to profitability, given the cyclical nature of minerals markets;
AMCAP Strategy 2: Promoting environmentally and socially sustainable mineral development o demonstrate their commitment and ability to set appropriate and reliable
environmental rules, at acceptable international standards, and to monitor these standards in a credible manner;
o where the legal and institutional settings are not in place, initiate a process of gradually establishing:
- a legal basis for environmental regulation;
- basic institutional responsibilities;
- essential regulatory frameworks;
- monitoring and enforcement procedures, including public disclosure; and
- human and financial resources to address priority issues, taking into account that the methods employed for achieving environmental objectives will vary considerably on the basis of different local, natural, socio-economic and cultural conditions;
o where the legal and related institutional mechanisms are already in place, focus on the implementation of these frameworks and in finding pragmatic solutions that take into account resource and capacity constraints;
o work with the private sector to address the environmental liabilities that the mining sector has inherited from past operations;
o provide strong underlying regulatory regimes to encourage the development of, participation in, and continued evolution of effective voluntary initiatives;
o consider more explicitly the social impact of mining, particularly on local communities that rely on the natural environment for their livelihoods; and
AMCAP Strategy 3: Strengthening institutional and human capacities o seek to improve technical skills in geology, mine engineering, environmental sciences
and other disciplines related to the mining sector through regional cooperation initiatives and public-private sector partnerships.
F. THE ROLE OF REGIONAL COOPERATION The majority of constraints to the development of the minerals sectors in ASEAN member
countries are driven by domestic policies. Consequently, most of the reforms required to improve the investment environment in the minerals sector are also domestic in nature.
However, significant potential also exists for regional cooperation to complement domestic efforts to improve the trade and investment environment in the minerals sector. Governments have a role to play in the provision of public goods such as high level geological information, and the facilitation of an enabling regime for private sector investment. ASEAN cooperation in minerals can enhance the ability of ASEAN governments to carry out these functions at both the domestic and regional levels through activities

Enhancing ASEAN Minerals Trade and Investment
REPSF Project 04/009b: Final Report xix
ranging from the development of policy frameworks to the undertaking of joint scientific and economic research. Further, regional cooperation provides an opportunity to benefit from the potential economies of scale and scope in activities such as those involved in undertaking geological surveys.
To date, the role of ASEAN cooperation in the development of the minerals sector has been limited. However, recent advances under the ASEAN minerals cooperation umbrella have generated significant momentum in fostering stronger ties across ASEAN member countries. In particular, the ASEAN Minerals Cooperation Action Plan (AMCAP) 2005-2010, adopted at the first ASEAN Ministerial Meeting on Minerals (AMMin) in Malaysia in August 2005, is poised to become one of the most comprehensive regional minerals cooperation programs in the world. The AMCAP 2005-2010 identifies a comprehensive list of activities and projects to be carried out toward:
o facilitating and enhancing trade and investment in minerals; o promoting environmentally and socially sustainable mineral development; and o strengthening institutional and human capacities.
Importantly, the outcomes of the plan will be highly contingent on its effective implementation over the next 5 years. Implementation of the AMCAP will require resources, careful project planning, institutions that are capable of implementing the plan, and ongoing political will in ASEAN member countries.

Enhancing ASEAN Minerals Trade and Investment
xx REPSF Project 04/009b: Final Report
This page has intentionally been left blank

Enhancing ASEAN Minerals Trade and Investment
REPSF Project 04/009b: Final Report 1
I. INTRODUCTION
The development of mineral resources has contributed to economic growth and development in many of the world’s economies. The mining sector can boost economic growth and raise living standards through the provision of employment, both directly and indirectly, export revenues and investment in infrastructure and human capital. Minerals sector development can make a significant contribution not only in developing countries that may have few alternative drivers of economic growth, but also in countries that are seeking to diversify their economic structures in response to global market forces.
The Association of Southeast Asian Nations (ASEAN) region has abundant natural resources and is prospective in terms of both metallic and non-metallic minerals. Individual ASEAN member countries have a diverse mix of mineral endowments, different economic structures and political settings. In terms of the development of their mineral resources, they can be broadly categorised into three groups:
(i) those countries with more mature minerals sectors - Indonesia, Malaysia, the Philippines and Thailand;
(ii) those countries that have prospective yet immature minerals sectors - Cambodia, the Lao PDR, Myanmar and Viet Nam; and
(iii) those countries that do not have a strong mineral resource base - Brunei Darussalam and Singapore.
In comparison with its mineral wealth, ASEAN’s contribution to world non-energy minerals production, consumption and trade is generally relatively small, notwithstanding the region’s significant production of tin, nickel and copper. This reflects a range of factors, including limited access to capital, unsupportive regulatory regimes and weak institutions. Further, the bulk of ASEAN minerals production and trade currently occurs in ores and concentrates, rather than refined metals, with much of the value adding (and economic benefit) occurring outside the region.
In recent years, strong world economic growth has fuelled global demand for mineral commodities. This has resulted in significantly higher commodity prices that have created incentives and opportunities for ASEAN member countries to further develop their mineral resources. With strong global demand for mineral commodities expected to continue, ASEAN member countries will be well placed to boost economic growth and contribute to poverty alleviation through increased investment in the minerals sector. However, this will be depend on a number of factors. These revolve largely around the ability to provide and maintain a stable and constructive investment climate in the region, within a global context characterised by growing competition for limited capital resources.
This study, undertaken for the ASEAN Secretariat, through the ASEAN-Australia Development Cooperation Program (AADCP) Regional Economic Policy Support Facility (REPSF), has the following key objectives:
o identify key mineral commodities in ASEAN in terms of resources, production and trade;
o assess the international market outlook for minerals, including mineral processing activities, and examine ASEAN’s actual and potential economic and trade performance in the light of the policy and market environment;
o evaluate current regulatory and institutional arrangements in ASEAN member countries that govern investment, including foreign direct investment, in the minerals sector, and identify the factors determining the attractiveness of investment in that sector; and
o provide recommendations for enhancing the attractiveness of investment in the minerals sector in ASEAN, taking into account the potential role of regional cooperation.

Enhancing ASEAN Minerals Trade and Investment
2 REPSF Project 04/009b: Final Report
The focus in the study is primarily on high value, globally traded non-energy minerals significant in the ASEAN region. These include metallic minerals such as gold, copper and tin, and gemstones. It should be noted, however, that locally and regionally traded mineral products, in particular non-metallic minerals, often dominate in volume terms in several ASEAN member countries.
The report is structured as follows. An overview of the minerals sector in ASEAN member countries is presented in Chapter II. This is followed by an analysis of the global medium term outlook for key mineral commodities from the region’s perspective (bauxite, aluminium, copper, gold, lead, nickel, tin, zinc and gemstones). The implications of the outlook for ASEAN in terms of future trade prospects are also highlighted in Chapter III, taking into consideration market access issues relevant to minerals trade.
The focus of Chapter IV is on investment in the minerals sector in ASEAN. Recent patterns of investment, including foreign direct investment (FDI), in the minerals sector are examined. Existing regulatory and institutional arrangements affecting investment flows to the sector are also reviewed. Drawing on the extensive consultation program undertaken in ASEAN member countries (Appendix 2), this chapter also presents an assessment of the major impediments to attracting investment flows to the region’s mining sector.
In the light of the assessment presented in Chapter IV, key domestic policy recommendations to enhance trade and investment in the ASEAN minerals sector are provided in Chapter V. This is supplemented in Chapter VI by a discussion of the potential role of regional cooperation in pursuing the development of minerals sectors in ASEAN. Country specific recommendations are provided in Country Reports – Volume II (Mélanie, Kim, Hester, Berry, Ball, Schneider, Burke, Au Duong and McCarty 2005) that accompany this report (henceforth, referred to as Country Reports).

Enhancing ASEAN Minerals Trade and Investment
REPSF Project 04/009b: Final Report 3
II. OVERVIEW OF THE ASEAN MINERALS SECTOR o Most countries in the ASEAN region are prospective in terms of both metallic and
non-metallic mineral resources. However, despite this rich mineral potential, the contribution of the minerals sector to regional economic development is relatively limited. Minerals production accounted for around 0.9% of ASEAN gross domestic product (GDP) in 2003.
o There is considerable diversity in the size and scope of minerals production across countries in the region. This reflects varying resource endowments, risk profiles and levels of economic development, and the effectiveness of regulatory regimes and institutions. Indonesia is by far the largest producer of a number of metallic mineral commodities in ASEAN.
o For the region generally, metallic minerals production is more significant in value terms, while non-metallic minerals represent a larger share of production in volume terms. However, in Thailand and Viet Nam, non-metallic minerals are also more significant in value terms. Key metallic minerals produced in ASEAN include nickel, copper, tin and gold. Major non-metallic minerals produced in the region comprise gemstones, gypsum, limestone, kaolin and a wide range of other industrial minerals.
o Minerals consumption in ASEAN has been increasing, in parallel with the growth in manufacturing, infrastructure development and rising incomes in the region. Major processed metallic minerals consumed in ASEAN include aluminium, copper, zinc, lead, tin and nickel. However, much of the indigenous production of metallic minerals tends to be exported as ores and concentrates for processing outside the region, rather than being consumed in domestic mineral processing sectors.
o ASEAN has a substantial share of world trade in tin, copper and nickel, with major trading partners comprising Japan, the Republic of Korea and China, as well as other ASEAN member countries.
A. ECONOMIC CONTRIBUTION OF THE MINERALS SECTOR Reflecting the large variations in the maturity and intensity of development within the
minerals sector, the contribution of mining to overall economic development varies considerably across the ASEAN region. For the region as a whole, the minerals sector accounts for a relatively small share of GDP, with minerals production accounting for 0.9% of ASEAN GDP in 2003. The contribution of minerals production to GDP is highest in Indonesia (2.3%), followed by the Lao PDR (1.7%) and the Philippines (1.6%) (Figure 2.1). For comparison, production of metallic and non-metallic minerals accounts for 2.9% of GDP in Australia (ABARE 2004). Further, the mining sector makes an important contribution to GDP in Latin American economies, such as Chile, where it accounts for 8% of GDP. Notably, the contribution of the minerals sector to economic activity varies significantly on a provincial basis within some ASEAN member countries. In Indonesia, for example, the PT Freeport Indonesia copper mine contributed almost 50% of gross regional product in Papua province in 2000.
The minerals sector is also not a significant contributor to total employment in ASEAN, reflecting the small contribution of mining to economic activity and the capital intensive nature of the industry. However, the minerals sector has the potential to boost local employment in some of the least developed parts of the region, both directly and indirectly. It is estimated that at least 300,000 workers were directly employed in the ASEAN minerals sector in 2004. This figure is unlikely to include workers at unregulated and sometimes illegal small scale mining enterprises, which in some ASEAN member countries may be significant. For example, the Philippines has a large number of self-employed informal sector miners operating small scale gold mines. In addition, considerable numbers of workers in ASEAN

Enhancing ASEAN Minerals Trade and Investment
4 REPSF Project 04/009b: Final Report
member countries are employed indirectly by the sector, largely through the provision of goods and services to mining operations and their employees.
Figure 2.1: ASEAN Minerals Production as a Share of GDP (%), 2003
Sources: Country reports.
Incomes and revenues raised from the minerals sector can make an important contribution to economic development, both nationally and on a regional basis. The contribution of the minerals sector to government revenues varies significantly across ASEAN member countries. For example, in Indonesia, ASEAN’s largest minerals producer, an estimated US$1.1 billion, accounting for 2.7% of total government revenues, was raised from the mining industry in 2003 (Indonesia Country Report). In the Philippines, mining activities generated less than 1% of total government revenues in 2004.
B. MINERAL RESERVES Across ASEAN, known reserves are diverse and extensive for both metallic and non-
metallic minerals. However, the lack of consistent reserves data across all ASEAN member countries makes it difficult to provide definitive estimates for the region as a whole. Indonesia accounts for a significant share of ASEAN and world mineral reserves. Indonesia’s mineral reserves include 7.5% of the world’s known reserves of copper, more than 13% of known reserves of tin, more than 5% of known reserves of nickel, and more than 4% of the world’s known gold reserves (USGS 2005). Myanmar, the Philippines, Thailand and Viet Nam are also well endowed with substantial mineral wealth (Table 2.1). Where available, estimated reserves of key metallic minerals are summarised in Table 2.2.
Table 2.1: Distribution of Metallic Mineral Reserves in ASEAN Bauxite Copper Gold Iron
Ore Lead Nickel Silver Tin Zinc Other
Cambodia Indonesia Lao PDR Malaysia Myanmar The Philippines Thailand Viet Nam Sources: Country reports.

Enhancing ASEAN Minerals Trade and Investment
REPSF Project 04/009b: Final Report 5
Table 2.2: Estimated Reserves of ASEAN Key Metallic Minerals Bauxite Copper Gold Nickel Tin
Mt Mt kt Mt Mt Indonesiaa 2.8 4,772.2 3,379,486.0 598.9 0.5 Lao PDRb - 3.8 0.1 - 21.7 Malaysiac 18.0 0.8 0.1 75.0 0.9 The Philippines - 6,473.0 2,163,000.0 3,385.0 - Thailand - 96.5 2,746.0 - 0.3 Viet Namd 4,175.0 0.8 0.4 0.1 0.1 a: Includes proven plus probable reserves; b: Includes indicated, inferred and hypothetic resources; c: Indicative mineral reserves; d: Excludes possible resources. kt = thousand tonnes; Mt = million tonnes. Note: Reserves data refer to mineral ores. Reserves in terms of metal content is significantly lower. For example, gold reserves in Indonesia amount to 3000 tonnes in metal content. Sources: Country Reports.
Many ASEAN member countries are also endowed with significant reserves of non-metallic minerals, including gemstones, potash, silica, limestone, marble, gypsum and kaolin (Table 2.3). In a number of ASEAN member countries, including Indonesia, the Philippines and Thailand, non-metallic mineral reserves are larger than those of metallic minerals. However, in value terms, reserves of metallic minerals tend to be higher, reflecting the relatively higher prices for globally traded minerals.
Table 2.3: Distribution of Non-Metallic Mineral Reserves in ASEAN Gemstones Sands Clays Stones Gypsum Lime
stone Marble Granite Potash Other
Cambodia Indonesia Lao PDR Malaysia Myanmar The Philippines Thailand Viet Nam
Sources: Country reports.
There are large differences in the intensity of exploration that has been conducted and the known reserves of various minerals across ASEAN member countries. In Indonesia, for example, there is a significant amount of ongoing mineral exploration. However, in some other countries, there has been minimal exploration and limited data are available on mineral reserves. Brunei Darussalam and Singapore have little or no mineral potential.
In Indonesia, mining and exploration permits cover 2% of the country’s landmass, with actual mining projects covering less than 0.1% of the landmass. Permits cover 1.4% and 0.3% of the landmass in the Philippines and Malaysia, respectively. Other ASEAN member countries such as Cambodia, the Lao PDR, Myanmar and Viet Nam also have significant mineral prospectivity, but remain relatively unexplored. For example, based on available data, mineral resources of the Lao PDR are comparable to those of several countries in the region with larger mining industries such as Indonesia and the Philippines (World Bank 2003). Myanmar has the highest quality rubies and jade in the world and world-class deposits of lead-zinc-silver, tin-tungsten, fine rubies, sapphires and jade, while Viet Nam’s bauxite deposits are estimated to be among the largest in the world.

Enhancing ASEAN Minerals Trade and Investment
6 REPSF Project 04/009b: Final Report
C. MINERALS PRODUCTION Historically, mining activity has been unevenly distributed across ASEAN, reflecting a mix
of factors. These include varying resource endowments, risk profiles, levels of economic development, and regulatory and institutional settings. As a result, there is considerable diversity in the size and scope of minerals production across countries in the region (Figure 2.2). Indonesia is by far the largest producer of a number of metallic mineral commodities, mainly as a result of its rich mineral endowment and government promotion of investment in the mining sector. In Malaysia, which has a long and important history of tin mining, metallic minerals production has generally been declining over the past two decades, reflecting to a large extent the Government’s prioritisation of manufacturing as a pillar of economic development. Similarly, the Philippines mining sector has languished since the mid-1980s as a result of domestic factors such as political instability and restrictive minerals policies, and external factors, including sluggish commodity prices and natural disasters. The minerals sector in many less developed ASEAN member countries has typically lacked the investment and exploration needed to develop a sustainable minerals industry.
Figure 2.2: Production of Key Minerals in ASEAN, 2003
Note: Production in thousand tonnes; gold production in tonnes. Production data refer to metal content only. Source: World Bureau of Metal Statistics 2005.
In value terms, the key minerals produced in ASEAN member countries are nickel, copper, tin and gold, with Indonesia being ASEAN’s largest producer of these minerals. Other major metallic minerals produced in ASEAN include bauxite, lead, zinc and iron ore. Production of these minerals is widely dispersed across countries (Table 2.4). In 2003, ASEAN total minerals production was valued at around US$5.9 billion.
ASEAN production of tin, nickel and copper accounts for a significant share of world production of these commodities. ASEAN mine and refined tin production accounted for 29% and 33% of world production respectively in 2003. For nickel, ASEAN mine and refined production accounted for 11% and 1% of world production. For copper, ores and refined production in ASEAN member countries accounted for 8% and 3% of world production respectively (Figure 2.3).

Enhancing ASEAN Minerals Trade and Investment
REPSF Project 04/009b: Final Report 7
Table 2.4: ASEAN Production of Key Minerals, 2003 Bauxite Copper Gold Nickel Tin Zinc kt kt t kt kt kt
Indonesia 1,262.7 1,003.4 164.4 103.5 64.0 - Lao PDR - - 5.1 - 1.1 0.6 Malaysia 5.7 - 4.7 - 3.4 - Myanmar - 27.9 - - 1.3 1.0 The Philippines - 20.4 39.0 19.5 - - Thailand - - - - 0.9 25.9 Viet Nam 20.0 1.2 - - 2.1 26.1 ASEAN 1,288.4 1,052.9 213.2 123.0 72.8 53.6 kt = thousand tonnes; t = tonnes; - = nil. Note: Data for Cambodia are not available. To allow for comparison, data for the above table were sourced from the World Bureau of Metal Statistics (2005). Therefore, some inconsistency may occur with the data reported in individual country reports, based on in-country data sources. Mine production data refer to metal content only. Source: World Bureau of Metal Statistics 2005.
Figure 2.3: ASEAN Share of World Minerals Production (%), 2003
Note: To allow for comparison, the above graph is based on data from the World Bureau of Metal Statistics (2005). Therefore, some inconsistency may occur with the data reported in individual country reports, based on in-country data sources. Source: World Bureau of Metal Statistics 2005.
Notwithstanding the decline in mine output in some ASEAN member countries, total production of ASEAN four key minerals — copper, gold, nickel and tin — doubled between 1990 and 2004, driven primarily by Indonesia, and reached its peak in 2002 (Figure 2.4). In particular, copper production increased by 130%, gold by 369%, nickel by 35%, and tin by 17% over that period. ASEAN production of copper and gold — which are extracted jointly — has increased more rapidly than for other minerals, mainly as a result of the new production from the very large Grasberg and Batu Hijau copper/gold mines in Indonesia (Figure 2.5). Also contributing to the rise in copper production over the period was increased output from the Monywa mine in Myanmar. However, total ASEAN copper production has fallen over the past few years as a result of unstable mine conditions at Grasberg that have sharply reduced output. In addition, copper production in the Philippines has declined steadily over the past decade primarily as a result of mine closures. Mine closures also led to the cessation of copper mining in Malaysia in 1999.
ASEAN tin production has grown moderately since 2002 (after a period of flat production since 1990) as a result of rising production in Indonesia, the Lao PDR and Myanmar. However, growth in overall production was partially offset by declining production in Malaysia and Thailand as a result of lower grades of ore and mine depletion, together with decreased replacement capacity coming on stream in those countries. ASEAN nickel production has

Enhancing ASEAN Minerals Trade and Investment
8 REPSF Project 04/009b: Final Report
risen slowly since the late 1990s, largely as a result of increased production in Indonesia and the Philippines.
Figure 2.4: ASEAN Production of Key Minerals by Country, 1990-2004
a: For Viet Nam, base year is 1996. Note: Mine production has increased in recent years in the Lao PDR and Myanmar, albeit from a low base. Source: World Bureau of Metal Statistics 2005.
Figure 2.5: ASEAN Production of Key Minerals, 1990-2004
kt = thousand tonnes. Sources: Country Reports; World Bureau of Metal Statistics 2005, International Nickel Study Group 2005.
ASEAN member countries also produce significant volumes of a wide range of non-metallic minerals, including gemstones, gypsum, limestone, kaolin, phosphate rock, sand, gravel and other industrial minerals. Much of this non-metallic minerals production comes from a large number of small scale mining and quarrying operations that are typically operated by small private concerns. Apart from gemstones (Table 2.5), a small proportion of this production is traded within the Asian region, with the vast bulk of non-metallic minerals production consumed by domestic industries such as construction. Local production of cement, for example, consumes large quantities of sand and limestone.

Enhancing ASEAN Minerals Trade and Investment
REPSF Project 04/009b: Final Report 9
Table 2.5: ASEAN Gemstones Production, 2003 Thousand Carats
Cambodia 50 Indonesia 30 Lao PDR 2,303 Myanmar 45,442 Thailand 716 Sources: Country reports.
In some ASEAN member countries, the production of non-metallic minerals is higher than the production of metallic minerals in volume terms. Non-metallic minerals production is important for the economies of the Lao PDR, Malaysia and Myanmar, and constitutes a significant share of total minerals production in Thailand and Viet Nam. In particular, non-metallic minerals accounted for 80% and 55% of the total value of minerals production in 2004 in Thailand and Viet Nam respectively.
D. MINERALS CONSUMPTION Much of ASEAN production of metallic minerals tends to be exported as ores and
concentrates for processing/refining outside the region, rather than being consumed in domestic mineral processing sectors. However, some mineral processing occurs in the region. The main minerals processed in ASEAN include copper, bauxite, lead, zinc and tin, with Indonesia being the main producer of refined mineral products. Copper refineries are located in Indonesia, Myanmar and the Philippines, while the region’s only aluminium smelter is located in Indonesia. Lead refining, primarily from used batteries, occurs in Indonesia, Malaysia, Myanmar, the Philippines and Thailand, while Thailand has the region’s only zinc smelter. Indonesia is the second largest refined tin producer in the world, with smaller scale facilities also located in Malaysia, Myanmar, Thailand and Viet Nam.
Some of the processed minerals produced locally in ASEAN member countries are consumed by domestic manufacturing and construction industries, although the region generally relies on imports of metals to meet demand. Rapid industrialisation — particularly in Malaysia and Singapore — combined with rising incomes in several ASEAN member countries has resulted in strong increases in demand for metals as inputs to industrial production and final consumption. Aluminium and copper are the major processed minerals consumed in ASEAN, together with smaller volumes of zinc, lead, tin and nickel. ASEAN consumption of lead, tin, copper and zinc accounted for between 3% and 5% of total world consumption of these commodities in 2003 (World Bureau of Metal Statistics 2005).
Growth in ASEAN metals consumption is strongly correlated with growth in manufacturing, infrastructure development and rising incomes in the region. ASEAN manufacturing activity grew rapidly between 1990 and 2004, with average industrial production growth rates of between 3.4% and 6.3% a year for the ASEAN member countries of Indonesia, Malaysia, the Philippines, Singapore, and Thailand. This growth has been driven largely by rising demand for consumer durables such as cars, whitegoods and home electronics, together with the expansion of infrastructure for electricity generation and supply, transport and communications. Much of this increased manufacturing activity and infrastructure development is highly metals intensive and has resulted in strong and expanding markets for metals within the ASEAN region.
However, with the Asian financial downturn in 1997, there was a sharp contraction in economic activity in the ASEAN region. As a consequence, there were significant falls in the region’s production of metals intensive products such as consumer durables. However, by 1999 ASEAN industrial production had begun to improve, with metals consumption having largely recovered to previous levels by 2001 (Figure 2.6).
Enhancing ASEAN Minerals Trade and Investment
10 REPSF Project 04/009b: Final Report
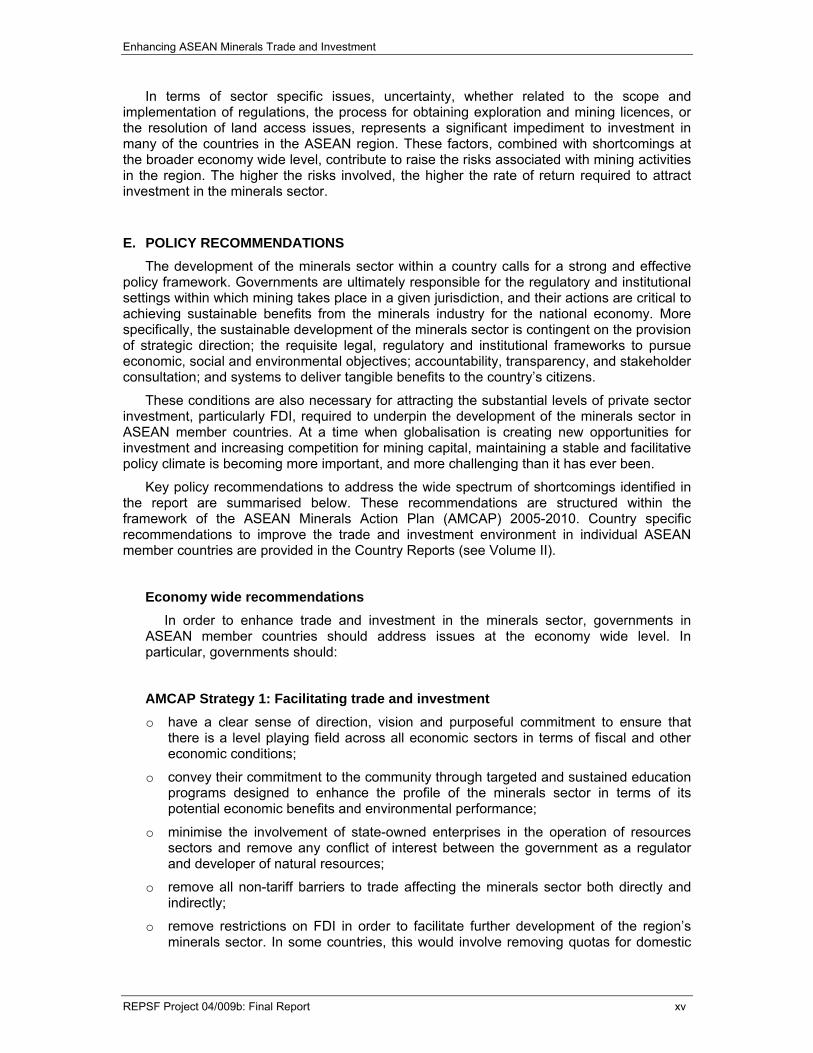
Non-metallic minerals are also in strong demand in ASEAN member countries. Non-metallic minerals consumed in ASEAN include limestone, aggregates and sand for construction of buildings and transport infrastructure, as well as clays and other minerals for a variety of industrial and consumer applications.
Figure 2.6: ASEAN Consumption of Key Metals, 1990-2004
kt = thousand tonnes. Sources: World Bureau of Metal Statistics 2005; International Lead-Zinc Study Group 2005.
E. MINERALS TRADE The bulk of ASEAN metallic minerals production is exported, with only a relatively small
proportion of local minerals production consumed by industries within the region. For example, over the 10 years to 2004, Indonesia exported 87% of its copper production, 84% of gold, 98% of nickel and 97% of bauxite production, respectively. Other ASEAN member countries that produce metallic minerals also export a significant share of their production, with the bulk of ASEAN minerals exports going to markets in the Asia Pacific region. Major trading partners include Japan, the Republic of Korea and China as well as other ASEAN member countries.
ASEAN has a substantial share of world trade in tin, copper and nickel, although its role in world markets for other mineral commodities is relatively limited. In 2003, ASEAN export volumes of refined tin accounted for 58% of world trade, while exports of unrefined and refined copper accounted for 16% and 6% of global trade respectively. The region is also becoming an increasingly significant exporter of nickel and aluminium as a result of increased productive capacity.
In value terms, the main ASEAN minerals exports over the 10 years to 2003 were copper, aluminium, tin and nickel (Figure 2.7). The value of ASEAN exports of metallic minerals grew rapidly until 1995, largely led by strong export growth in copper and aluminium. From this peak, the value of minerals exports declined, to more than 8% below the 1995 level in 2002, reflecting lower world prices for minerals over that period. However, world demand for metals rose significantly in 2003 and 2004, resulting in strong price rises for mineral commodities. As a consequence, the value of ASEAN exports of copper, nickel, aluminium, lead, zinc, tin and other base metals rose by more than 62% to US$7.1 billion in 2003 (AFTA 2005). With increased ASEAN minerals production and stronger metals prices, the value of ASEAN minerals exports rose significantly in 2004 and 2005.

Enhancing ASEAN Minerals Trade and Investment
REPSF Project 04/009b: Final Report 11
Figure 2.7: ASEAN Trade in Key Minerals, 2003
Source: AFTA 2005.
Compared with metallic minerals, much of ASEAN non-metallic minerals production is consumed in the country of origin. Some higher value non-metallic minerals such as gemstones are largely exported, both to foreign countries and other ASEAN member countries. Several ASEAN member countries export gemstones to Thailand for processing.
Imports by ASEAN member countries accounted for around 13% and 10% of world refined lead and zinc trade by volume in 2003 (United Nations Statistics Division 2005). There is also a considerable amount of intra-ASEAN trade in tin ores and concentrates, mainly imported from Indonesia for refining in Malaysia. However, in value terms, ASEAN minerals imports over the 10 years to 2003 were comprised mainly of aluminium and copper, reflecting consumption patterns in the region (Figure 2.7).
Imports of minerals in ASEAN grew rapidly in the 1990s, but fell by more than 18% between 1997 and 2002. The decline in the value of imports was mainly a result of the lower value of copper and lead imports, reflecting weaker world prices for these commodities, together with lower ASEAN consumption during the Asian financial downturn. Since then, minerals consumption in the ASEAN region has recovered, with the value of metallic minerals imports up by 3% to US$6.5 billion in 2003, largely as a result of industrial production growth in the region.

Enhancing ASEAN Minerals Trade and Investment
12 REPSF Project 04/009b: Final Report
This page has intentionally been left blank

Enhancing ASEAN Minerals Trade and Investment
REPSF Project 04/009b: Final Report 13
III. GLOBAL OUTLOOK FOR MINERALS
o World minerals consumption grew strongly during the early to mid-2000s, as economic growth accelerated in China and remained robust in most industrialised countries. Beyond 2005, world output growth, particularly in the construction, infrastructure and manufacturing sectors, is expected to remain the key driver of world minerals consumption. Other important drivers include continued population growth and rising per person incomes, together with the associated stronger demand for minerals intensive consumer durables such as electronics and automobiles.
o Global consumption of most refined metals considered in this study is projected to grow by more than 3% a year between 2004 and 2010, with the strongest growth expected to occur in aluminium, nickel, tin and zinc. World gold consumption is projected to grow at a relatively slower pace, at around 1.5% a year out to 2010.
o Growth in minerals demand in China is expected to have a major influence on world minerals consumption in the coming years. In the medium term, China’s consumption of all mineral commodities is expected to grow well above the world average.
o Strong global demand for minerals and mineral products in the medium term provides a significant opportunity for developing and expanding minerals production in ASEAN member countries with significant mineral resources. However, the ability of ASEAN member countries to capitalise on this opportunity depends on the development of an enabling investment environment in ASEAN member countries, and on the international competitiveness of minerals producers in the region.
o In general, the global trade environment for minerals is relatively open, with low tariff barriers. Nonetheless, there are some regulatory and institutional factors that have the potential to raise market access issues.
World consumption of most minerals increased significantly between 2000 and 2005, driven by strong economic growth in China and several industrialised countries. Beyond 2005, weaker global economic growth is expected to lead to lower growth in world minerals consumption over the period to 2010. However, continued (albeit lower) economic growth in China is expected to support relatively strong growth in minerals consumption. As a result, opportunities remain for the development of profitable mineral operations.
Some ASEAN member countries, Indonesia and the Philippines in particular, produce large volumes of minerals and are active in global markets. Nonetheless, the majority of ASEAN member countries have immature minerals sectors and are not yet significant participants in international markets. However, given the mineral prospectivity of the ASEAN member countries, there is potential to expand trade in minerals in the future.
This chapter outlines the global outlook to 2010 for major metallic mineral commodities, with an emphasis on the factors expected to support growth in consumption. The outlook generally focuses on processed minerals and metals, from which demand for ores and concentrates is derived. Key supply and demand side characteristics of the metallic minerals considered in this outlook are presented in Box 3.1. Following the global outlook, issues likely to affect the trade prospects for ASEAN member countries are discussed. In particular, the potential implications of higher economic growth in China, productivity improvements in the ASEAN mining sector and market access issued are examined.

Enhancing ASEAN Minerals Trade and Investment
14 REPSF Project 04/009b: Final Report
Box 3.1: Key Characteristics of Selected Metallic Minerals
Supply Characteristics Demand Characteristics Bauxite Bauxite is a naturally occurring, heterogeneous
material comprised primarily of aluminium hydroxide minerals. Given that it is usually uneconomic to transport bauxite over long distances, bauxite mines are usually developed in close proximity of alumina refineries.
Predominant use of bauxite is to convert it to alumina for the production of aluminium metal. Uses of aluminium include electrical equipment; transport vehicles; metallurgical and chemical processes; and other domestic and industrial applications.
Copper Copper is often found in deposits with other metals such as lead, zinc, gold and silver. Pure copper metal is generally produced through a multistage process, involving mining and concentrating of low-grade copper ores, followed by smelting and electrolytic refining to produce a pure copper cathode.
Copper is a major industrial metal, ranking third after iron and aluminium in terms of quantities consumed. As a good conductor of electricity, copper is mostly used in power transmission and generation, building wiring, telecommunication, and electrical and electronic products.
Gold Gold is relatively scarce. It does not readily combine with other substances. Therefore, it is found in nature almost always as pure gold.
Gold is used as a medium of exchange in monetary transactions. As a result of its superior electrical conductivity and resistance to corrosion, gold is also widely used in jewellery, electrical-electronic applications, dentistry, the aircraft-aerospace industry, and medical and chemical fields.
Iron ore Most deposits of iron ore are found in rocks known as banded iron formations. These are sedimentary rocks with alternating layers of iron-rich minerals and fine-grained silica rocks.
Iron ore is the source of primary iron for iron and steel industries. Almost all (98%) iron ore is used in steelmaking.
Lead Lead ore is usually found with zinc, silver and copper and is extracted jointly with these minerals.
The principal consumption of lead is for lead-acid batteries used in vehicles and emergency systems (e.g. hospitals), as well as industrial batteries in computers and fork lift trucks.
Nickel Nickel occurs in nature principally as oxides, sulphides and silicates. Primary nickel is produced and used in the form of ferronickel, nickel oxides and other chemicals, and as more or less pure nickel metal.
Nickel has strong heat, corrosion and resistance properties. Most nickel is consumed in the manufacture of nickel alloys. Dominating the use of nickel alloys is stainless steel, which accounts for around 65% of total world nickel consumption.
Silver Silver is mined and produced mainly as a co-product of copper, lead, zinc, and to a lesser extent, gold. Its main source is silver minerals in lead ore.
Silver has many industrial applications such as electrical and electronic products, and photography, the largest single end use of silver. Silver's catalytic properties make it ideal for use as a catalyst in oxidation reactions.
Tin Cassiterite is by far the most important tin ore, although small amounts of tin are recovered from sulphide minerals such as stannite. Tin occurs in both primary and secondary deposits. Primary deposits are typically associated with granite intrusive rocks. Secondary deposits (placers) derive from the weathering and erosion of primary tin deposits.
Tin is mostly used as a protective coating or as an alloy with other metals such as lead or zinc. Tin is also used in solders for joining pipes or electrical/electronic circuits, glass making, and a wide range of chemical applications.
Zinc The world is naturally abundant in zinc. The most common zinc mineral is sphalerite (zinc sulphide), which is found in almost all currently mined zinc deposits. Zinc is often mined in association with lead, copper, silver and other metals.
As a result of its effectiveness in protecting steel against corrosion by galvanising and the ability to die cast complicated components, zinc is used in a multitude of industry and household products. It is also used in the brass and construction industries, and in chemicals.
Sources: USGS 2005, Geoscience Australia 2005, International Lead-Zinc Study Group 2005, Minerals Council of Australia 2005.

Enhancing ASEAN Minerals Trade and Investment
REPSF Project 04/009b: Final Report 15
A. OUTLOOK OVERVIEW Economic growth, particularly in the construction, infrastructure and manufacturing
sectors, will remain the key driver of world minerals and metals consumption. Also important will be continued population growth and rising per person incomes. Global consumption of most refined metals is projected to grow by more than 3% a year between 2004 and 2010 (Figure 3.1). The strongest growth in world consumption is expected to occur in aluminium, followed by nickel, tin and zinc. World gold consumption is projected to grow more slowly, at around 1.5% a year over the outlook period. In absolute volumes, the largest increases are in aluminium, followed by copper, zinc and lead consumption (Figure 3.2).
Figure 3.1: Forecast Average Annual Growth in World Metals Consumption, 2004-2010
Source: ABARE.
Figure 3.2: Outlook for World Metals Consumption to 2010
kt = thousand tonnes; Mt = million tonnes. Source: ABARE.
1. Aluminium Consumption
Aluminium is used mainly in the vehicle manufacture, construction, packaging and aerospace industries, where it has been an important substitute for steel and other

Enhancing ASEAN Minerals Trade and Investment
16 REPSF Project 04/009b: Final Report
materials. China and the United States (US) are the two largest consumers of aluminium, accounting for 40% of global consumption.
Over the medium term, world aluminium consumption is projected to grow by 4% a year to reach 37 million tonnes in 2010, compared with 29 million tonnes in 2004 (Table 3.1).
China is expected to continue to account for the majority of growth in world aluminium consumption over the period to 2010. Despite expectations that growth in aluminium consumption in China will begin to ease in the short to medium term, consumption is still expected to increase relatively strongly in the near term: by 10% in 2005 (to 6.8 million tonnes), compared with 20% in 2004. This reflects measures introduced in 2004 designed to slow growth in certain industries, including the construction and motor vehicle manufacturing industries, which are intensive users of aluminium. The building construction and motor vehicle industries account for 31% and 14% of China’s total aluminium consumption respectively. Aluminium consumption in China is projected to increase by 9% a year between 2004 and 2010.
Aluminium consumption in the United States is forecast to grow by 2% in 2005. An easing in motor vehicle production growth and lower growth in the construction industry are expected to be the main factors contributing to the slowing of consumption growth in 2005. The motor vehicle and construction industries account for 38% and 13% respectively of total aluminium consumption in the United States. Over the medium term, aluminium consumption in the United States is projected to increase by around 1.5% a year, as growth in the construction industry moderates and growth in industrial production declines from 2004 levels.
Table 3.1: World Aluminium Outlook
2004 2005 2010 AAG (%)
2004-2010 Production Primary aluminium Kt 29,821 31,300 36,701 3.5 Bauxite Mt 171 182 230 4.7 Consumption Primary aluminium Kt 29,248 31,000 36,942 4.0 Bauxite Mt 171 182 208 3.4 Prices World aluminiuma – nominal US$/t 1,716 1,838 1,501 (2.2) – realb US$/t 1,766 1,838 1,353 (4.3) Alumina – nominal spot US$/t 393 414 195 (11.0) – real spotb US$/t 405 414 176 (13.0)
a: London Metal Exchange cash prices for primary aluminium; b: In 2005 US dollars. AAG = average annual growth; kt = thousand tonnes; Mt = million tonnes; t = tonnes. Note: negative numbers are enclosed in parentheses. Source: ABARE.
Production
From 2006, world growth in aluminium production is expected to slow, reflecting slower production growth in China and a limited amount of planned new capacity elsewhere. World aluminium production is projected to be around 36.7 million tonnes in 2010, 23% above 2004 production.
Over the medium term, expansions in aluminium production capacity will be dictated, to a large extent, by the ability of new and existing smelters to secure low cost power contracts. In developed countries in particular, where aluminium smelters

Enhancing ASEAN Minerals Trade and Investment
REPSF Project 04/009b: Final Report 17
compete for power with other industrial users and residential users, aluminium smelters are likely to find it increasingly difficult to replace current contracts with similar priced contracts. Therefore, over the medium term, expansions in aluminium capacity are more likely to gravitate toward countries with relatively cheaper power.
Reflecting this, a significant proportion of planned smelting capacity in 2005 and beyond is expected to be located in the Middle East (where fuel, such as natural gas, is relatively less expensive) and in Iceland, which has abundant resources of cheap hydroelectric power. Aluminium production is also forecast to increase in India and Iran in the medium term.
2. Bauxite Consumption
Bauxite is predominantly used in alumina production, that is, in turn, converted to aluminium. An average of more than two tonnes of bauxite is required to produce one tonne of alumina. As such, world consumption of bauxite is derived from alumina production. In 2004, Australia accounted for around 20% of the world’s consumption of bauxite. China and the United States accounted for 7% and 6% respectively of total world bauxite consumption in 2004.
In 2005, world bauxite consumption is forecast to increase by 6.4%. Increased alumina production in Australia, along with expansions in Brazil, Ireland and the Russian Federation, is expected to drive this increase in bauxite consumption.
Over the medium term, world bauxite consumption is forecast to increase at an annual average of around 3.4%, in line with growth in world alumina production. World bauxite consumption is projected to reach 208 million tonnes in 2010 (Table 3.1). Over the medium term, substantial new alumina refinery capacity is planned in Australia, Jamaica, Brazil and Guinea.
Production
Bauxite production in ASEAN member countries amounted to around 1.3 million tonnes in 2004. This represented around 0.8% of world bauxite production. The majority of ASEAN production occurs in Indonesia, with Malaysia and Viet Nam also minor bauxite producers. The world’s major deposits of bauxite are found in Guinea (32% of world reserves), Australia (19% of world reserves) and Jamaica (9% of world reserves). Given the relatively low value of bauxite (around US$19/tonne), it is usually uneconomic to transport bauxite over long distances. As a result, bauxite mines are usually developed in conjunction with, and in close proximity of, alumina refineries.
World bauxite production was 171 million tonnes in 2004, with Australia, Brazil and Guinea accounting for around 60% of the total. In 2005, world bauxite production is forecast to increase by 6% to 182 million tonnes. Over the medium term, world bauxite production is projected to increase at an average of 4.7% a year. Australia, China and Guinea will account for the majority of the increase in world production. In 2010, world bauxite production is forecast to reach 230 million tonnes.
3. Copper Consumption
Demand for copper has a strong relationship with industrial production. For example, copper is used in electrical products, industrial machinery and motor vehicles. Copper is also used extensively in housing construction for wiring, as well as

Enhancing ASEAN Minerals Trade and Investment
18 REPSF Project 04/009b: Final Report
power generation and transmission. In 2004, China accounted for around one fifth of world refined copper consumption. The United States accounted for 15% of world consumption, while Japan accounted for a further 8%. ASEAN member countries accounted for around 4% of world refined copper consumption in 2004.
In 2004, world consumption of refined copper increased by 6.7%. Consumption growth is expected to be slower in 2005, in line with lower expected growth in industrial production in the United States, China and Europe. World consumption of copper is forecast to increase by 2.8% in 2005 to 16.8 million tonnes.
Over the medium term, world copper consumption is projected to increase by 3.3% a year to reach 19.7 million tonnes in 2010 (Table 3.2). China and India are expected to account for the majority of world growth in copper consumption.
While growth in China’s copper demand is expected to slow in response to easing growth in industrial production in late 2005 and in 2006, it is still expected to remain at a relatively high level, reflecting the substantial investment in China’s power generation capacity (an estimated 40% of China’s copper demand) that is currently being undertaken. Further, it is likely that China’s State Reserves Bureau (the official government stockpiling agency) will rebuild its copper stockpile in 2005.
Over the medium term, China will remain the world’s largest consumer of copper, with consumption projected to grow by 8.9% a year in the period 2004-2010. China’s continued strong growth in demand for copper is a reflection of both its size and the tendency for developing countries to exhibit metals consumption growth well above that of more developed countries. As incomes rise, consumers spend more on products that contain copper, such as air conditioners and electrical appliances, leading to increased intensity of copper use. China’s metals consumption per person, while increasing, is still low in comparison with that in developed Asian countries, implying a considerable potential for further increases in copper consumption.
India, which currently accounts for 2% of world copper consumption, is emerging as another potentially large copper consumer over the medium term. Growth in India’s infrastructure and electricity generation is expected to result in strong growth in copper consumption in the country.
Table 3.2: World Copper Outlook 2004 2005 2010 AAG (%)
2004-2010 Productiona kt 15,777 16,810 19,240 3.4 Consumption kt 16,388 16,840 19,740 3.3 Price (London Metal Exchange) – nominal US$/t 2,866 3,435 2,065 (5.3) – realb US$/t 2,949 3,435 1,861 (7.4)
a: Refers to refined production; b: In 2005 US dollars. AAG = average annual growth; kt = thousand tonnes; t = tonnes. Note: negative numbers are enclosed in parentheses. Source: ABARE.
Mine production
Chile accounted for more than one third of world copper mine production in 2004. Other large producers are the United States (8% of world production) and Peru (7%). ASEAN member countries accounted for 6% of world mine production in 2004, most of which can be attributed to Indonesia.
During a period of low copper prices in 2001 and 2002, a number of producers withdrew mine capacity. Exploration and investment budgets were also substantially

Enhancing ASEAN Minerals Trade and Investment
REPSF Project 04/009b: Final Report 19
reduced. The recent strong copper prices are encouraging an increase in investment in new capacity, which is expected to be commissioned during the outlook period. Strong prices are also expected to encourage an increase in exploration for copper resources and lead to the development of previously marginal projects that are viable at current prices.
World copper mine output is forecast to increase by 6.4% in 2005, to 15.5 million tonnes, mainly because of higher expected production in Indonesia and south America. The Grasberg mine in Indonesia is targeting production of around 680,000 tonnes of copper in 2005, an increase of more than 50% on 2004 output. World copper mine production is projected to be around 17.8 million tonnes in 2010.
Refined production
The United States accounted for more than one third of world refined copper production in 2004, while Chile and China accounted for 18% and 13% respectively. ASEAN member countries accounted for 3% of world refined copper production, mostly from Indonesia and the Philippines.
Despite strong growth in world mine production, growth in refined copper production has been comparatively slow in 2004 and early 2005. This has been largely the result of planned maintenance programs at a number of smelters around the world. It is estimated that shutdowns at these facilities will result in up to half a million tonnes of copper concentrates being left unrefined in 2005.
Consistent with a large increase in copper concentrate production over the past year at a time when smelter availability has been disrupted, spot treatment and refining charges have increased substantially. This increase in treatment and refining charges will encourage increased production at smelters. The majority of planned smelter maintenance shutdowns are also expected to have been completed by mid-2005 and will enable an increase in the rate of concentrate processing in the remainder of the year.
Over the medium term, world refined capacity utilisation is expected to rise in line with increased mine output. World refined copper output is projected to reach 19.2 million tonnes in 2010, an increase of 3.4% a year.
Prices
After increasing by more than 60% in 2004, world copper prices continued to rise in early 2005, despite a noticeable fall in global copper demand. This outcome was caused by refined copper production being disrupted by maintenance programs at a number of smelters around the world, with the result that stocks of copper remained at very low levels over this period. Despite an expected increase in world refined copper production in the remainder of 2005, global copper consumption is forecast to exceed production for the year as a whole. Prices are likely to remain volatile until there is evidence of a sustained increase in stocks. Any further major production disruptions could also lead to additional substantial spikes in spot copper prices. For 2005 as a whole, world copper prices are forecast to rise by 20% to average US$3,435 a tonne.
For much of the outlook period to 2010, world copper production is expected to exceed consumption as consumption growth moderates in line with a steady world economic growth outlook, resulting in steady increases in copper stocks. This outcome, together with an assumed gradual strengthening of the US dollar over this period is projected to result in lower world copper prices. Real copper prices are projected to average US$1,861 a tonne (in 2005 dollars) in 2010.

Enhancing ASEAN Minerals Trade and Investment
20 REPSF Project 04/009b: Final Report
4. Gold Consumption
In 2005, world gold fabrication consumption is forecast to rise by 2.2% to 3,233 tonnes. An increase in gold jewellery demand in the Middle East, India and China is expected to offset a fall in the demand for gold in electronics.
Gold jewellery consumption fell by around 4% in 2004. In 2005, continued low economic growth in Europe is expected to lead to a further fall in demand for gold jewellery. Similarly, in the United States, an assumed fall in economic growth, higher energy costs and increasing interest rates are expected to result in lower gold jewellery demand again in 2005, for the sixth year in a row.
In contrast, gold jewellery consumption in the Middle East, India and China is expected to increase in 2005 and 2006. In the Middle East, high oil prices will raise regional incomes, resulting in increased gold jewellery demand. In China, continued strong growth in income is expected to lead to a further increase in gold jewellery demand. Strong economic growth is expected to result in an increase in demand for gold jewellery in India. Gold is an important investment instrument in the Middle East and Indian subcontinent, with a high proportion of individuals’ wealth being held in the form of pure gold jewellery.
One of the reasons for high gold demand in emerging markets is that, in the absence of alternatives, gold continues to play a key role as a hedge against inflation and currency weakness in developing countries. Evidence suggests that as economies develop, the population has a wider range of spending and investment options. Indeed, per person gold consumption in the comparatively wealthier countries of Europe (excluding Italy) and the United States is significantly lower than in the Middle Eastern countries and a number of Asian countries.
World gold fabrication consumption is projected to increase to 3,462 tonnes in 2010, an increase of 1.5% a year (Table 3.3). Demand for gold jewellery in China will be an important determinant of growth in world jewellery consumption over the medium term. Given strong growth in consumer incomes and increasing liberalisation of the gold market, demand for gold jewellery is likely to increase strongly over the period to 2010.
Table 3.3: World Gold Outlook 2004 2005 2010 AAG (%)
2004-2010 Fabrication consumption
t 3,164 3,233 3,462 1.5
Mine production t 2,464 2,504 2,697 1.5 Scrap sales t 828 800 700 (2.8) Price (London Bullion Market Association A.M.) – nominal US$/oz 409 431 350 (2.6) – reala US$/oz 421 431 315 (4.7)
a: In 2005 US dollars. AAG = average annual growth; oz = ounce; t = tonnes. Note: negative numbers are enclosed in parentheses. Source: ABARE

Enhancing ASEAN Minerals Trade and Investment
REPSF Project 04/009b: Final Report 21
Mine production
The largest gold producers include South Africa, Australia and the United States. ASEAN member countries accounted for 9% of world production in 2004, mainly from Indonesia and, to a lesser extent, the Philippines.
In 2005, world gold production is forecast to increase by 1.6% to 2,504 tonnes. Lower production in South Africa is expected to be more than offset by increased production in Australia, Indonesia, China and south America. Gold production in Indonesia is forecast to increase in 2005, largely because of an expected recovery in production at Freeport’s Grasberg mine. A mine wall slippage in late 2003 resulted in gold production falling by more than half in 2004.
Growth in world mine production is expected to slow significantly toward the end of the outlook period. Despite expected increases in world mine production in south America, Australia, the Russian Federation and China, a substantial fall in mine production in South Africa is expected to limit total world growth over the projection period. In 2010, world mine production is projected to be 2,697 tonnes.
Prices
Movements in the US dollar significantly influence the price of gold. As a depreciation of the US dollar against other major currencies leads to an increase in the purchasing power of those currencies, a weaker US dollar increases the gold price denominated in the US dollars.
In 2004, the depreciation of the US dollar against other major currencies, particularly the euro, was the major cause of the increase in the US dollar denominated price. With concerns about the current account and budget deficits in the United States leading to a fall in the US dollar in 2004, gold prices increased. A number of other factors also supported the gold price in 2004. These included a reduction in central bank sales, ongoing geopolitical uncertainty, high levels of producer de-hedging, lower world mine production and an increase in world gold consumption.
Since mid-2004, the US interest rates were raised on eleven occasions with the Federal funds rate reaching 3.75% in October 2005. Economic growth in the United States is also assumed to continue to outperform growth in the European Union (EU) in 2005 and 2006. These factors are expected to halt the recent decline in the US dollar and as a result, provide less support for the gold price in 2005 and 2006. However, concerns regarding the large US current account and budget deficits are expected to limit any substantial rise in the US dollar.
The record level of de-hedging provided some support for the gold price in 2004. However, in 2005 and 2006, the reduced size of the global hedge book and an increased incentive to forward sell production is expected to lead to a decline in the level of de-hedging. Other factors will also provide less support in 2005 and 2006: world fabrication demand is forecast to decline; the sale of gold by central banks is expected to increase; and world mine production is forecast to increase.
In 2006, the world gold price is forecast to average US$414 an ounce, 4% lower than the forecast 2005 average price of US$431 an ounce. Beyond 2006, the gold price is projected to decline further, primarily as a result of an assumed further appreciation of the US dollar. The negative impact of an assumed stronger dollar is expected to be partially offset by strong growth in gold jewellery consumption, low growth in world mine production and relatively stable central bank sales. In 2010, the world gold price is projected to average US$315 (in 2005 dollars) an ounce.

Enhancing ASEAN Minerals Trade and Investment
22 REPSF Project 04/009b: Final Report
5. Lead Consumption
As lead battery production accounts for more than 75% of total world lead consumption, the outlook for lead is directly linked to developments in world automobile and industrial markets.
China and the United States each accounted for around one fifth of world refined lead consumption in 2004. Germany (6%), Republic of Korea (5%) and the United Kingdom (5%) are also large lead consumers. ASEAN member countries accounted for 5% of world lead consumption in 2004, mainly in Thailand, Malaysia and, to a lesser extent, Indonesia.
In 2004, strong industrial production growth and the associated increase in power demand supported world primary lead consumption rising by 4.1% to 7.1 million tonnes (Table 3.4). Growth was dominated by the Asian region (excluding Japan), particularly China, whilst lead consumption fell in the United States and western Europe.
Over the medium term, these trends are expected to continue as those nations such as the United States and Japan relocate automobile production facilities to nations with lower input costs, such as China, the Republic of Korea and India.
As higher economic development leads to higher disposable incomes in China, the demand for durable goods, such as automobiles, will also rise strongly. Private motor vehicle ownership in China has increased at an average annual rate of 23% a year since 1990. Over the same period, access to cheap labor and raw materials has supported Chinese automobile production rising at an average rate of 18% a year to reach 444 million units. In 2003, China became the world’s fourth largest automobile producer (behind the United States, Japan and Germany).
As the production of automobiles uses a significant quantity of lead contained in batteries, Chinese lead consumption has also risen. In 2004, China’s lead consumption rose by 14% to reach 1.29 million tonnes, accounting for 19% of world lead consumption. Further increases in automobile production will underpin strong growth in lead consumption to 2010. Growth in lead consumption over the medium term will also be supported by significant investment in the technology and communications sectors, along with infrastructure such as railways and hospitals, which are reliant on stationary batteries for the provision of uninterrupted power.
Furthermore, those nations with a relatively short history of battery production, such as China and India, have smaller reservoirs of scrap to draw upon. They therefore tend to have scrap ratios far below their counterparts in Europe and North America. As the largest increase in battery production, both industrial and automotive, is forecast from these nations, the outlook for world consumption of primary lead remains positive.
Table 3.4: World Lead Outlook 2004 2005 2010 AAG (%)
2004-2010 Productiona kt 6,821 7,320 7,690 2.0 Consumption kt 7,082 7,340 7,645 1.3 Price (London Metal Exchange) – nominal US$/t 887 927 591 (6.5) – reala US$/t 912 927 533 (8.6)
a: Refers to refined production; b: In 2005 US dollars. AAG = average annual growth; kt = thousand tonnes; t = tonnes. Note: negative numbers are enclosed in parentheses. Source: ABARE.

Enhancing ASEAN Minerals Trade and Investment
REPSF Project 04/009b: Final Report 23
Mine production
China accounted for one third of world lead mine production in 2004, while Australia accounted for more than one fifth. The United States and Peru accounted for 13% and 10% respectively. ASEAN lead mine production was insignificant on a world scale.
Significant capacity closures in the past 2 years, combined with limited new capacity coming on stream have led to weaker growth in both mine production and smelter output. However, the recent higher prices and an improved price outlook have encouraged a number of companies to announce higher production from existing mines and investment in new capacity. The majority of the increase is expected to occur during 2005 and 2006.
Over the medium term, world mine production growth is projected to ease in line with slowing investment in new capacity. Between 2007 and 2010 growth in world mine production is projected to rise by 3% a year to reach 3.8 million tonnes.
Refined production
China accounts for one quarter of world refined lead production, while the United States accounts for one fifth. Germany, the United Kingdom and Mexico each accounted for 5% of world production in 2004. ASEAN member countries, dominated by Malaysia, accounted for 2% of world production in that year.
After remaining flat in 2004 because of a lack of availability of lead concentrates, world refined lead production is expected to rise by 7.3% in 2005 and 5.1% in 2006, with increases in both secondary (recycled) and primary output. Growth in refined lead production in the short term is expected mainly from the ramping up of operations at a number of re-opened Italian smelters in 2004 and the expansion of Indian smelting capacity in 2005.
In 2006, growth in world lead production is expected to also be boosted by significant increases in Chinese smelting capacity. These increases in world refined lead capacity will be sufficient to meet most of the projected growth in lead consumption over the medium term.
6. Nickel Consumption
The largest consumers of refined nickel include Japan, the United States, China, the Republic of Korea and Germany. ASEAN member countries accounted for 1% of the world’s refined nickel consumption in 2004, with the main consumers being Singapore and Thailand.
While end use applications for nickel are numerous, most is consumed in the manufacture of nickel alloys for their heat, corrosion and resistance properties. Dominating the use of these nickel alloys is stainless steel, which accounts for around 65% of total world nickel consumption. Given its high share of nickel consumption, the outlook for the nickel industry is directly linked to developments in world stainless steel markets.
Significant quantities of stainless steel are used in the handling of corrosive substances such as gases, oil and sea water. An increasing quantity of stainless steel is also being used in architectural applications for its anticorrosive characteristics and attractive appearance. Furthermore, stainless steel imparts no taste to substances

Enhancing ASEAN Minerals Trade and Investment
24 REPSF Project 04/009b: Final Report
that it comes into contact with and is thus widely used in the food and beverage production and storage industries.
In the short term, lower assumed growth in industrial production in the Organisation for Economic Cooperation and Development (OECD) is expected to reduce growth in the stainless steel market. Further, the relatively high current price for stainless steel will encourage consumers to substitute away from stainless steel toward other alloys, such as galvanised steel, where this is a suitable option. Stainless steel output in 2005 and 2006 is expected to be lower in the relatively higher cost producing countries (such as France, Germany, Sweden and the United Kingdom), as producers seek to reduce their operating costs in response to higher world nickel prices. However, these decreases are expected to be more than offset by higher output from lower cost producers such as China, Republic of Korea and Chinese Taipei that are also closer to the key growth markets, particularly in Asia. Over the period to 2010, growth in stainless steel production is forecast to remain strong, rising by an average annual rate of 4% to reach 31.8 million tonnes.
China is now the world’s largest consumer of stainless steel (after overtaking the United States and Japan in 2001) and is expected to account for more than 70% of the projected growth in world consumption over the outlook period. This increase will be supported by continued strong growth in industrial production and provision of infrastructure, and an expected trend to use more corrosion resistant steels, such as stainless steel.
While growth in stainless steel production is expected to slow, growth in consumption of primary nickel is expected to rise. In 2004, the consumption of nickel from stainless steel scrap rose by an estimated 11% to 715,000 tonnes. However, the strong growth in stainless steel scrap consumption over this period is expected to have significantly depleted the scrap reservoir. Consequently, growth in world scrap supply is expected to slow in 2005 and 2006. A forecast decline in primary nickel prices in 2006 will also reduce the incentive to collect scrap. As a result, the proportion of primary nickel per tonne of stainless steel output is expected to rise.
On a smaller scale, growth in primary nickel demand is also expected to be boosted by demand from the world aerospace industries as gas turbines and jet engines require high-nickel-containing alloys. Growing demand from the United States and Europe, combined with strong demand from China and India (where economic development is leading to increased travel for both business and leisure), is expected to support significantly higher aerospace output from Airbus and Boeing in 2005 and 2006.
Over the four years to 2010, growth in world refined nickel consumption is expected to accelerate to an average of 3.9% a year, with the ratio of primary nickel used in stainless steel returning toward historically average levels. World refined nickel consumption is projected to be 1.6 million tonnes in 2010, compared with 1.3 million tonnes in 2005 (Table 3.5).
Table 3.5: World Nickel Outlook 2004 2005 2010 AAG (%)
2004-2010 Production kt 1,246 1,290 1,574 4.0 Consumption kt 1,249 1,296 1,567 3.9 Price (London Metal Exchange) – nominal US$/t 13,838 15,050 7,085 (10.6) – reala US$/t 14,239 15,050 6,386 (12.5)
a: In 2005 US dollars. AAG = average annual growth; kt = thousand tonnes; t = tonnes. Note: negative numbers are enclosed in parentheses. Source: ABARE.

Enhancing ASEAN Minerals Trade and Investment
REPSF Project 04/009b: Final Report 25
Production
The Russian Federation is the largest producer of mine and refined nickel, accounting for 24% and 22% of world production respectively in 2004. Other large producers of mine and refined nickel include Canada and Australia.
The significant delays and cost overruns in the construction of some recent nickel projects have contributed to an environment of caution toward investment in new nickel projects. As a result of these adverse effects, only limited new additions to production capacity are expected before 2007. Capacity utilisation is currently very high as the high nickel prices have provided the incentive for nickel producers to operate at full capacity. Increases in refined nickel production in 2005 and 2006 will rely mainly on new operations and incremental increases at recently commissioned facilities. This includes increased production from China, the Philippines, and Canada.
Beyond 2007, the recent high nickel prices and the positive outlook for nickel demand are expected to underpin the development of a number of nickel refining projects that are currently at various stages of the planning and development process. Nickel projects are currently planned in New Caledonia, Canada, Brazil, the Russian Federation and Australia.
Prices
Supported by a combination of strong demand from rising stainless steel production and limited short term supply availability, world nickel prices increased by 44% in 2004 and a further 13% in the first eight months of 2005. While nickel demand growth is expected to moderate over the remainder of the year, supply growth is expected to remain sufficiently weak for prices to be maintained at relatively high levels. World nickel prices are forecast to average US$15,050 a tonne in 2005. In 2006 and beyond, prices are expected to ease as new production facilities increase output sufficiently to allow stocks to increase more rapidly. However, any delays to construction and ramp-up schedules may lead to prices significantly higher than currently forecast. Nickel prices are forecast to fall to US$6,386 a tonne (in 2005 dollars) in 2010.
7. Tin Consumption
Tin is used as a protective coating or as an alloy with other metals. For example, tin is used as a coating for steel cans, in solders for joining pipes or electrical conductors, and other alloys for widely diversified applications. The largest single application for tin is solders that accounts for an estimated 32% of total world tin consumption. The electronics industry accounts for a significant proportion of solder use. In recent years, demand for tin has been boosted by a reduction in the amount of lead used in solder. Further, the European Union will ban the use of lead in electrical and electronic applications from 1 July 2006. From this date any electrical or electronic goods sold within the European Union cannot contain lead.
In 2004, China accounted for 28% of world consumption of refined tin and over 60% of the growth in world tin consumption. The United States accounted for a further 16% of total world consumption in 2004, while ASEAN member countries accounted for 5%.
In 2005, growth in global consumption of tin is forecast to slow to 2% in line with the lower assumed economic growth, particularly in China and the United States, to be 345,000 tonnes. Over the medium term, growth in world tin consumption is forecast to

Enhancing ASEAN Minerals Trade and Investment
26 REPSF Project 04/009b: Final Report
increase at an average annual rate of 3.5%, to reach 415,000 tonnes in 2010 (Table 3.6).
Strong growth in China’s production of electrical items for domestic consumption and export markets has led to a substantial increase in tin consumption, and China is expected to dominate growth in world tin consumption over the medium term. Given China’s comparative advantage in labor intensive manufacturing and significant inflows of foreign investment, growth in China’s exports of electrical and electronic items is expected to be high over the medium term.
Table 3.6: World Tin Outlook 2004 2005 2010 AAG (%)
2004-2010 Production kt 345 375 442 4.2 Consumption kt 338 345 415 3.5 Price (London Metal Exchange) – nominal US$/t 8,513 7,627 5,300 (7.6) – reala US$/t 8,760 7,627 4,777 (9.6)
a: In 2005 US dollars. AAG = average annual growth; kt = thousand tonnes; t = tonnes. Note: negative numbers are enclosed in parentheses. Source: ABARE.
Refined production
China and Indonesia are the two largest producers of refined tin, accounting for 34% and 25% respectively of world refined tin production in 2004. Peru accounted for a further 17% of world production. ASEAN member countries account for a combined 41% of world refined tin production, with Malaysia and Thailand also significant producers.
World refined tin production is forecast to increase by around 9% in 2005 to 375,000 tonnes, as China and Indonesia increase production in response to the recent higher world tin prices. In 2004, production of refined tin in Indonesia increased by around 40%. However, with operating costs at many of the smaller scale (and sometimes illegal) operations in Indonesia and China estimated to be in the vicinity of US$8,500 a tonne, forecast lower world tin prices are likely to result in the closure of a number of these operations over the medium term.
Growth in world refined tin production, therefore, is forecast to slow over the medium term as real prices decline over the projection period. World refined tin production is forecast to reach 442,000 tonnes in 2010.
Prices
World tin prices are projected to decline from an average US$7,627 a tonne in 2005 to US$4,777 a tonne (in 2005 dollars) in 2010. This reflects slowing growth in world demand, as well as recent increases in tin production capacity.
8. Zinc Consumption
Zinc consumption is closely correlated with manufacturing and construction activity. Galvanised steel production accounts for around 50% of world zinc consumption. China is the world’s largest zinc consumer, accounting for nearly one quarter of world

Enhancing ASEAN Minerals Trade and Investment
REPSF Project 04/009b: Final Report 27
consumption in 2004, followed by the United States (11%). ASEAN member countries account for 3% of world consumption, dominated by Indonesia and Thailand.
World zinc consumption rose by 6.5% in 2004 to 10.5 million tonnes. Slower world economic and industrial production growth in 2005 and in 2006 is expected to slow growth in zinc consumption in the short term. Reflecting this, world zinc consumption is forecast to rise by 2.1% to reach 10.7 million tonnes in 2005 (Table 3.7).
Developments in China will continue to have a significant impact on global zinc markets over the medium term. China is expected to remain the world’s fastest growing consumer of zinc, and to consolidate its position as the world’s largest zinc consumer. It is also expected to increase its share of total world zinc consumption to 32% in 2010. This expansion will be driven by continued strong growth in China’s major zinc consuming sectors such as the construction, motor vehicles and white goods industries.
Currently, China has insufficient galvanised steel production capacity to meet domestic demand and, as a result, imports a large proportion of its requirements. However, with significant additional capacity planned to come on line over the medium term, China is expected to make up most of this shortfall.
Table 3.7: World Zinc Outlook 2004 2005 2010 AAG (%)
2004-2010 Productiona kt 10,167 10,570 12,850 4.0 Consumption kt 10,465 10,680 12,790 3.4 Price (London Metal Exchange) – nominal US$/t 1,047 1,295 930 (2.0) – realb US$/t 1,078 1,295 838 (4.1)
a: Refers to refined production; b: In 2005 US dollars. AAG = average annual growth; kt = thousand tonnes; t = tonnes. Note: negative numbers are enclosed in parentheses. Source: ABARE.
Mine production
China accounted for more than one fifth of world zinc mine production in 2004. Australia and Peru accounted for a further 15% and 13% respectively. ASEAN member countries, mainly Thailand and Viet Nam, accounted for 1% of world production in 2004.
The prospect of higher world zinc prices and continued strong demand growth has supported the development of a number of new mines and smelters that are at various stages of planning and development. In 2005, world zinc mine production is expected to increase by 2.3% to 9.9 million tonnes. Higher mine output is expected from the ramping up of recently commissioned operations and the development of a number of new mines. Over the medium term, world mine output is projected to grow at 4% a year to reach 12.3 million tonnes in 2010, with zinc mine supply also expected to be significantly boosted in Bolivia and Iran.
Refined production
Reflecting its large share of mine output, China accounted for one quarter of world zinc slab production in 2004. Other significant producers include Canada and Spain. Thailand, the only ASEAN member country processing zinc, accounted for 1% of

Enhancing ASEAN Minerals Trade and Investment
28 REPSF Project 04/009b: Final Report
world production in 2004. World refined zinc output is projected to grow at 4% a year over the medium term to be around 12.9 million tonnes in 2010.
Prices
Recent zinc price rises have been underpinned by steadily falling stocks arising from a combination of strong demand growth in key zinc consuming countries, particularly in China, and limited supply growth. Over the outlook period, growth in world zinc consumption is expected to be more than offset by significant new additions to world zinc mine and refining capacity as producers respond to current strong prices and as planned new capacity comes on line. The increase in supply is expected to be sufficient to rebuild stocks, and as a result, real zinc prices are forecast to decline over the projection period, to average US$838 a tonne (in 2005 dollars) in 2010.
9. Gemstones Consumption
The world gemstones market is dominated by diamonds. As the outlook for other gemstones is closely linked to developments in the world diamond market, the bulk of this discussion focuses on the outlook for diamond consumption.
The world diamond market consists of gemstone diamonds, those which are polished and used in jewellery, and industrial diamonds, used in applications such as cutting, drilling, grinding and polishing. Diamonds are either mined naturally or made synthetically. While only industrial grade diamonds are currently made synthetically, technological advancements such as chemical vapor deposition (which produces gemstone quality diamonds) are expected to have an increasingly significant impact on the world gemstones industry.
Diamond is the hardest known material and has the highest thermal conductivity of any material at room temperature, and as a result, it has a number of industrial applications in the construction, machinery manufacturing, mining services (drilling), and stone cutting/polishing industries.
Over the outlook period to 2010, growth in industrial diamond consumption is expected to be dominated by the United States and China. Demand for industrial diamond containing machinery such as saw blades and drilling equipment in the United States is expected to rise strongly. Further, as the demand for industrial diamonds is closely correlated with manufacturing and construction activity, growth in China’s industrial diamond consumption is expected to rise in line with both the relative size of its economy and its higher assumed industrial production growth rates compared with the United States, western Europe and Japan.
Retail sales of diamonds in 2003 were estimated to have risen by 6% to reach US$60 billion. In the United States, which makes up over 48% of the world retail market for diamond jewellery, sales were estimated at US$28.7 billion, up by around 7%. Strong growth was also recorded in the United Kingdom and China, where sales rose by 8%. World retail sales of diamonds rose by 8% in 2004 to reach US$64.8 billion, as strong economic growth and rising consumer incomes in the major consuming nations of the United States, Japan and the United Kingdom boosted jewellery demand.
Over the medium term, the outlook for the world diamond industry remains positive. Despite an assumed easing of world economic growth and rising personal debt levels in the United States (which consumes over 48% of world gemstone diamonds), limited

Enhancing ASEAN Minerals Trade and Investment
REPSF Project 04/009b: Final Report 29
new supply availability is expected to maintain prices of rough diamonds at relatively high levels.
Over the outlook period to 2010, demand for gemstone jewellery diamonds in the United States is expected to slow, in line with lower assumed rates of economic growth and higher assumed interest rates. Higher interest rates increase costs of credit and debt servicing requirements, which in turn, is forecast to reduce the demand for luxury items such as diamond jewellery and other gemstones. Lower growth in gemstones demand in the United States is expected to be partially offset by robust growth in India and China, as high assumed rates of economic growth over the outlook period lift disposable incomes, and as a result, increase jewellery demand.
Production
World natural production of diamonds in 2003 is estimated to be US$9.4 billion. About 20% of the volume is gemstone quality, which is polished and set into jewellery and 45% is near-gem quality, which is polished by the low cost Indian cutting industry. The remaining 35% of diamond production is industrial quality.
In 2003, global output of industrial quality diamonds rose by an estimated 3% to reach 612 million carats, at an estimated value of nearly US$1 billion (USGS 2004). Synthetically produced diamonds accounted for 89% (or 543 million carats) of total production.
After rising by 12% in 2003, growth in world diamond mine production is expected to slow over the medium term in line with declining reserves at existing operations and the small number of new large scale projects that are expected to come on line over the outlook period. Canada is forecast to capture an increasing market share of world diamond mine production over the outlook period from the development of a number of new mines and the ramping up of production at recently commissioned mines.
Polishing
Access to low cost, skilled labor has supported significant growth in India’s diamond processing industry. The Indian diamond industry typically polishes lower-quality stones. As a result, India has significantly increased the volume and value of diamonds processed to become the world’s dominant polishing centre.
As India has insufficient domestic mine production, it imports a significant proportion of its rough stones for polishing. In 2004, Indian imports of rough stones rose by 11% to reach US$7.3 billion. Over the same period, India’s exports of cut and polished diamonds rose by 28% to reach an estimated US$10.3 billion. Higher values of exports were supported by a 23% rise in carats to 44.27 million carats. Over the period to 2010, India’s exports of polished diamonds are forecast to continue to rise. For example, the Indian Gem and Jewellery Export Promotion Council has raised its target value of polished diamond exports to US$20 billion.
Since the establishment of large scale diamond polishing facilities in Thailand in the 1980s, the industry has grown strongly, producing small, high quality gemstones to a high standard of cut. There are an estimated 9,000 persons employed in the industry, currently producing US$500 million in polished diamonds annually (Diamond Facts 2004).

Enhancing ASEAN Minerals Trade and Investment
30 REPSF Project 04/009b: Final Report
B. THE ROLE OF CHINA As mentioned in each section above, continued growth in demand in China is expected to
be one of the key drivers of world metals consumption in the coming years. In the medium term, China’s consumption of all mineral commodities is expected to grow well above the average world growth rates.
Lead consumption has the highest forecast growth rate over this period, reflecting the very positive outlook for battery production, both auto and industrial. In addition to China’s forecast strong growth in industrial production, environmental concerns in developed nations are expected to support the movement of lead intensive industries to the developing world, including China.
Annual growth of more than 10% is also expected in China’s consumption of nickel, tin and zinc. Aluminium and copper consumption in China is also forecast to grow by 9% a year (Figure 3.3).
Figure 3.3: Forecast Average Annual Growth in China’s Metals Consumption, 2004-2010
Source: ABARE.
C. IMPLICATIONS OF GLOBAL MINERALS OUTLOOK FOR ASEAN The global outlook shows ongoing strong demand for minerals and mineral products in
the medium term. This implies a requirement for expansions and new mining and refining capacity to supply these markets. With their significant mineral prospectivity, there is scope for developing and expanding production of particular minerals in ASEAN member countries.
A key determinant of whether ASEAN can capitalise on these opportunities is the investment climate in individual ASEAN member countries. Issues surrounding investment, particularly foreign investment, in the mining sector are discussed in Chapter IV.
Also relevant is that, while ASEAN is one potential source of minerals for world markets, there are many other competing producers worldwide. The presence of mineral deposits in a particular country, such as those in ASEAN, requires more than available investment funds to launch minerals projects. Minerals markets are competitive, and the relative cost of production will be an important determinant of ASEAN’s role in these markets. In this context, the region’s proximity to key minerals markets and relatively low labor costs are potential cost advantages.

Enhancing ASEAN Minerals Trade and Investment
REPSF Project 04/009b: Final Report 31
D. SENSITIVITY OF OUTLOOK TO KEY VARIABLES The preceding outlook for minerals production, consumption and trade over the period to
2010 is based on a number of key assumptions. These assumptions include both industry specific developments considered highly likely to affect markets for minerals and metals over the medium term, such as information about new mines and smelters, and assumptions about more general demand and supply drivers of global minerals markets, such as economic growth in major minerals consuming countries and growth in productivity in producing countries. As such, this outlook can be characterised as providing reference case projections for mineral commodities over the period to 2010.
Of particular importance for the outlook for minerals is the assumed rate of economic growth in China, given China’s role as one of the world’s largest consumers of mineral products. In particular, the assumptions used in the reference case outlook, which result in China achieving average annual economic growth of 8% over the period to 2010, reflect the expectation that China’s economy will continue along its current development path, albeit at a slightly slower rate than that attained in recent years. Given that this growth will occur from a high base and is expected to remain characterised by high minerals intensity, China is projected to remain the major driver of global commodity demand over this period. Should China’s economic growth proceed along a different path, the global outlook for minerals would be affected.
While economic growth in China is an external factor that, through its impact on global markets, could affect the prospects for minerals production and trade in ASEAN member countries, trends in productivity in the mining sector in ASEAN are also likely to have a strong bearing on the international competitiveness of ASEAN mining industry over the medium to longer term.
This section assesses the implications of alternative economic growth paths in China and alternative productivity growth paths in ASEAN member countries for minerals industries in the ASEAN region, using ABARE’s general equilibrium model of the world economy, GTEM (Box 3.2).
1. Economic growth in China Given the wide range of factors that can influence an economy’s performance, it is
possible that economic growth in China could proceed along different paths from that underlying the reference case outlook. Should such a situation arise, commodity demand growth in China would also evolve differently. This, in turn, would affect the output growth of minerals and metals producers in China and, through trade linkages between China and other economies, would affect minerals and metals production in economies supplying the Chinese market. Countries with only minimal direct trade connections with China would also be affected through changes in global minerals and metals prices.
In order to highlight the potential impacts of China on global minerals markets, it is assumed in this modeling simulation that China’s economic growth averages 9% a year between 2004 and 2010. This compares with an average annual growth rate of 8% in the reference case outlook.
China’s higher economic growth over the period 2004 to 2010, as analysed in this scenario, is projected to lead to increases in Chinese demand for minerals, through increased growth in mineral consuming sectors of the economy, such as manufacturing and construction industries. Because of China’s significance in world commodity markets, this increased demand is also projected to lead to noticeable increases in global demand for minerals and processed mineral products (Figure 3.4).

Enhancing ASEAN Minerals Trade and Investment
32 REPSF Project 04/009b: Final Report
Box 3.2: ABARE’s Global Trade and Environment Model (GTEM) GTEM is a multiregion, multisector, dynamic general equilibrium model of the world
economy. It is derived from the MEGABARE model (ABARE 1996) and the Global Trade Analysis Project (GTAP) model (Hertel 1997).
GTEM offers a comprehensive framework for analysing the direct and indirect impacts of changes in policy or external shocks on the economic outlook of an economy or group of economies. These impacts can be calculated for a range of key macroeconomic, sectoral and trade variables, including real GDP, industry output and employment, and trade and investment flows between regions. One of the major benefits of a general equilibrium model is its ability to trace the consequences of changes in policies in one sector throughout the entire economy.
The model’s database is highly suited to assessing the implications of changes in international minerals markets for ASEAN member countries. At its most disaggregated level, the model’s database includes 67 sectors with specific representation of six key mineral commodities - copper, lead, zinc, nickel, iron ore and bauxite – as well as a number of mineral processing and metal consuming sectors. The database also includes 87 regions, with specific representation of a number of key minerals producing and consuming economies, such as Australia, Chile, China and the United States, and six ASEAN member countries – Indonesia, Malaysia, the Philippines, Singapore, Thailand and Viet Nam. For the purpose of this study, the model’s database has been aggregated to the 21 regions and 23 sectors that best represent production and trade in the six minerals identified above. These are outlined in the following table.
GTEM Regional and Sectoral Aggregation Sectors Regions Coal Australia Oil Brazil Gas Canada Petroleum and coal products Chile Electricity China Bauxite Chinese Taipei Alumina EU 25 Copper ores and concentrates India Iron ore Indonesia Lead ores and concentrates Japan Nickel ores and concentrates Republic of Korea Zinc ores and concentrates Malaysia Non-metallic minerals Peru Other minerals The Philippines Iron and steel Rest of ASEAN Nonferrous metals Russian Federation Primary aluminium Singapore Motor vehicles production Thailand Machinery and electronic equipment United States Other manufacturing Viet Nam Trade and transport Rest of world Services Agriculture
A brief technical description of the GTEM model is provided in Appendix 1. For a more detailed description of the model, see ABARE’s website www.abareconomics.com.
The largest increases in world demand are projected to occur in commodities where China has a relatively significant share of global consumption (see the individual commodity outlooks earlier in this chapter). These include zinc ores and concentrates, of

Enhancing ASEAN Minerals Trade and Investment
REPSF Project 04/009b: Final Report 33
which world consumption is projected to increase by around 1.9% relative to the reference outlook at 2010, and lead ores and concentrates, of which world consumption is projected to increase by about 2.1% relative to the reference case outlook at 2010. The increase in the global demand for minerals suggests that the opportunities for minerals trade are likely to be greater for minerals producers, including those in ASEAN member countries, if China were to grow more rapidly than assumed in the reference case.
Figure 3.4: Per cent Change in Global Consumption of Selected Mineral Commodities
under Higher Economic Growth in China, Relative to the Reference Case at 2010
Source: ABARE.
2. Productivity improvements in ASEAN mining industries The ability of competing minerals producers to capitalise on growth in global demand
for minerals is influenced by their international competitiveness, which is in turn largely driven by relative costs of production.
Productivity is a key driver of changes in the costs of production. It indicates the rate at which outputs are produced relative to the quantity of inputs, including labor (number of employees or hours of work) and capital (for example, buildings, and machinery and equipment). Productivity growth reflects increases in output that occur without a corresponding increase in inputs.
Productivity improvements can stem from a combination of factors, such as technological progress, industry restructuring and resource reallocation, economies of scale, and research and development. In developing economies, FDI, through the transfer of advanced technologies and large scale operation, can be an important avenue for productivity improvement in the mining industry.
In the ASEAN minerals sector, there is a host of issues that could impinge on future productivity growth. Of most significance are the regulatory and institutional issues that, as presented in Chapter IV, have hindered FDI in mining in the majority of ASEAN member countries over the past decade. Other features of the regulatory regimes affecting mining in some ASEAN member countries can also have more direct impacts on productivity. For example, restrictions on employment practices or input procurement can reduce mine productivity when these result in the sub-optimal utilisation of inputs.
To illustrate the potential implications of productivity growth in the ASEAN mining sectors, it is assumed that the level of productivity in ASEAN minerals industries (excluding energy minerals) increases gradually to be 10% higher than in the reference case at 2010. This also implies a productivity improvement relative to minerals producers

Enhancing ASEAN Minerals Trade and Investment
34 REPSF Project 04/009b: Final Report
in non-ASEAN member countries. This is consistent with the expectation that there is significant scope in ASEAN member countries to improve relative competitiveness of the mining sector through regulatory, structural and institutional changes. The assumed productivity improvements are projected to significantly reduce the cost of mining throughout ASEAN, thus improving the competitiveness of ASEAN mineral products in both domestic and export markets, relative to the reference case.
As a result, minerals production in ASEAN is projected to increase relative to the reference case outlook (Figure 3.5). The largest increases are projected to occur in zinc, copper and nickel industries with respective output projected to increase by 13.5%, 12.9% and 12.8% relative to the reference case at 2010. To a lesser extent, the lower prices of mineral ores in ASEAN are also projected to improve the competitiveness of mineral processing industries, resulting in increased output of these industries in ASEAN relative to the reference case.
Figure 3.5: Per cent Change in ASEAN Production of Selected Mineral Commodities under High Productivity Growth Assumptions in ASEAN Mining, Relative to the
Reference Case at 2010
Source: ABARE.
In line with this higher domestic production, exports from the ASEAN region are projected to increase relative to the reference case (Figure 3.6). Total metallic mineral ores exports from ASEAN in 2010 are projected to increase by around 13% relative to the reference outlook. In 2004 prices, such an increase could be worth around US$630 million to the ASEAN region. ASEAN exports of processed minerals are also projected to increase under the high productivity scenario relative to the reference outlook.
This analysis suggests that policies designed to enhance productivity in the ASEAN minerals sector, especially relative to the rest of world, will be critical to the development and growth of the sector in the medium to longer term.

Enhancing ASEAN Minerals Trade and Investment
REPSF Project 04/009b: Final Report 35
Figure 3.6: Per cent Change in ASEAN Exports of Selected Mineral Commodities under High Productivity Growth Assumptions in ASEAN Mining, Relative to the Reference
Case at 2010
Source: ABARE.
E. MARKET ACCESS ISSUES The positive global outlook for minerals in the medium term can be expected to provide
market opportunities for minerals producers worldwide, particularly those with internationally competitive cost structures. Affecting the trade prospects for ASEAN member countries in particular are not only their relative costs of production but also their access to international markets through trade. In this context, the global trade environment for minerals is reviewed below with a focus on the tariff barriers applicable to minerals. Further, the potential implications of the proposed EU legislation on Registration, Evaluation and Authorisation of Chemicals (REACH) for minerals are highlighted as an example of a non-tariff barrier that could potentially affect minerals trade.
1. Global trade environment for minerals Traditional barriers to trade, such as tariffs, have declined substantially over the past
50 years as a result of multilateral trade negotiations under the General Agreement on Tariffs and Trade and its successor, the World Trade Organisation (WTO). The global trade weighted average industrial, or non-agricultural, tariff is now in the order of 3.6%, with about 85% of world trade bound at tariffs under 5% (Minerals Council of Australia 2004).
Global trade in mineral products is relatively liberalised in comparison with trade in agricultural products and labor intensive manufactures. However, there is significant diversity in tariff rates applied across individual countries. Notable barriers and distortions to trade remain in some markets in the form of tariff escalation, whereby higher import duties are imposed on semi-processed and finished products than on raw materials. This commonly adopted strategy protects domestic processing industries in importing countries and discourages the development of value adding activities in the country of origin.
In particular, key importers of ASEAN minerals apply either zero or very low tariff rates to mineral ores and concentrates (Table 3.8). These include China, the Republic of Korea, Japan, European Union and the United States, that together accounted for 47% of ASEAN exports of mineral ores and metal products in 2003 (AFTA 2005). The low tariffs reflect the importance of unprocessed minerals in supporting major metals industries in

Enhancing ASEAN Minerals Trade and Investment
36 REPSF Project 04/009b: Final Report
these countries. However, the tariffs tend to increase in line with the degree of mineral processing. For example, import duties applied to copper matte, which is a semi-processed copper product, range from 0% to 2%. For finished copper products, such as copper pipes, tubes and wire, import duties vary from 1.4% to 8%. A similar pattern applies to semi-processed and finished products derived from other metallic minerals.
It is worth noting that as an alternative to most-favoured-nation duties applied in the WTO framework, most industrialised countries can grant preferential tariff treatment to developing countries. Under this system, known as the generalised system of preferences, selected products originating in developing countries are granted reduced or zero tariffs. The least developed countries receive special and preferential treatment for a wider coverage of products and deeper tariff cuts (UNCTAD 2005). There are currently two ASEAN member countries, members of the WTO that are considered to be least developed countries – Cambodia and Myanmar. The Lao PDR, also considered as a least developed country, is in the process of gaining accession to the WTO.
In addition to the WTO, ASEAN trading environment is also affected by a number of other trading arrangements that have either been established or are under negotiation within ASEAN and between ASEAN and its trading partners. In this context, the ASEAN Free Trade Area (AFTA), initiated at the Fourth ASEAN Summit in Singapore in January 1992, is an essential mechanism for the implementation of trade liberalisation within the region. The AFTA laid out a comprehensive program of regional tariff reduction to be carried out in phases through the year 2008. This deadline was subsequently moved forward. In addition to the program of tariff reductions, a host of "AFTA Plus" activities have been initiated since the adoption of the AFTA, including efforts to eliminate non-tariff barriers and quantitative restrictions, harmonise customs nomenclature, valuation and procedures, and develop common product certification standards.
The agreement on the Common Effective Preferential Tariff (CEPT) scheme that underpins the AFTA required that tariff rates levied on a wide range of products traded within the region, that meet a 40% ASEAN content requirement, be reduced to no more than 5% by the year 2002/2003. The first signatories to the CEPT scheme were Brunei Darussalam, Indonesia, Malaysia, the Philippines, Singapore and Thailand. The average tariff for these countries under the CEPT scheme is now down to 1.5% from 12.8% when the tariff cutting exercise started in 1993 (ASEAN Secretariat 2004b). In the light of their later accession to the CEPT agreement, Viet Nam is expected to realise the AFTA commitments in 2006, the Lao PDR and Myanmar in 2008, and Cambodia in 2010 (ASEAN Secretariat 2002). The free trade area covers virtually all manufactured and primary products, including minerals and metals. In the longer term, ASEAN member countries have agreed to eliminate all import duties by 2010 for the six original members of ASEAN and by 2015 for the four newer members.
Intra-ASEAN exports accounted for 39% of total ASEAN exports of mineral ores and metal products in 2003 (AFTA 2005). Table 3.9 summarises 2005 CEPT rates for minerals related items traded under the AFTA scheme. As expected, tariff rates are bound at 5% for the six original signatories to the CEPT scheme, with zero tariff rates applied to most of the items under the specified categories. Brunei Darussalam and Singapore apply zero tariffs on virtually all minerals imports. Cambodia appears to apply the highest tariff rates among ASEAN member countries, with a small number of items not yet included in the CEPT scheme, including kaolin and kaolinic clays, marble and travertine blocks and slabs, zinc plates, sheets, strip and foil and some other items. Myanmar’s tariff rates are as high as 20% on gemstones, while Viet Nam applies a tariff rate of up to 20% to cement imports. These relatively high tariff rates reflect the importance of domestic production of the above mentioned items in these countries.

Enhancing ASEAN Minerals Trade and Investment
REPSF Project 04/009b: Final Report 37
Table 3.8: Most-Favoured-Nation Applied Duties on Selected Mineral Ores and Concentrates and Metal Products
Product Description China European Union
Japan Republic of Korea
Chinese Taipei
United States
Copper ores and concentrates
0% 0% 0% 1% 0% 1.7 cents/kg on lead content
Copper mattes, cement copper
2% 0% 0% 0% 0% 0%
Copper pipes, tubes 4-7% 4.8% 3% 8% 4.1% 1.4-3%
Nickel ores and concentrates
0% 0% 0% 1% 0% 0%
Nickel matte, interim products of nickel metallurgy
3% 0% 0-3%; 44 yen/kg
1-2% 0% 0%
Nickel tubes, pipes and tube or pipe fittings
6% 0-2.5% 0-3% 8% 1% 2-3%
Lead ores and concentrates 0% 0% 0% 1% 0% 1.1 cents/kg on lead content
Unwrought lead 3% 0-2.5% 0-3%; 2.70-4.50
yen/kg
2-5% 0% 2.5% on the value of the lead content
Lead tubes, pipes and fittings
6% 5% 3% 8% 1.7% 2%
Zinc ores and concentrates 0% 0% 0% 1% 0% 0%
Unwrought zinc 3% 2.5% 0-4.30 yen/kg
5% 0-1% 1.5-3%
Zinc tubes, pipes and tube or pipe fittings
6% 5% 3% 8% 3.5% 3%
Tin ores and concentrates 0% 0% 0% 1% 0% 0%
Unwrought tin 3% 0% 0-2.1% 3% 0% 0%
Tin pipes or tubes and pipe fittings
8% 0% 3% 8% 1% 2.4%
Source: WTO 2005.
Table 3.9: Common Effective Preferential Tariffs under the AFTA Scheme, 2005 Non-Metallic
Minerals Ores and
Concentrates Metal
Products Gemstones
Brunei Darussalam 0% 0% 0% 0-5% Cambodia 7-15% 7% 5-20% 7-20% Indonesia 0-5% 0-5% 0-5% 0-5% Lao PDR 0-6% 3% 2-15% 0-4% Malaysia 0-5% 0% 0-5% 0% Myanmar 0-5% 1% 1-7.5% 1-20% The Philippines 0-3% 0-3% 0-5% 0-3% Singapore 0% 0% 0% 0% Thailand 0-5% 0% 0-5% 0% Viet Nam 0-20% 0% 0-5% 1-3%
AFTA = ASEAN Free Trade Area. Note: the above table is for illustrative purposes only. The complete CEPT tariff schedules for ASEAN member countries can be downloaded from the ASEAN Secretariat website at http://www.aseansec.org. Source: ASEAN Secretariat 2005a.

Enhancing ASEAN Minerals Trade and Investment
38 REPSF Project 04/009b: Final Report
As a complement to the AFTA, ASEAN member countries are also engaged in a number of regional and bilateral trading arrangements. For example, the Framework Agreement on Comprehensive Economic Cooperation between ASEAN and China, that provides for an ASEAN – China Free Trade Area by 2010 for Brunei Darussalam, China, Indonesia, Malaysia, the Philippines, Singapore and Thailand, and by 2015 for the newer ASEAN member countries, entered into force on 1 January 2005.
Examples of free trade agreements currently under discussion include the ASEAN – Japan Comprehensive Economic Partnership, the ASEAN – Australia and New Zealand Free Trade Area, and the ASEAN – Republic of Korea Free Trade Area. At the 8th ASEAN + 3 Summit in Vientiane in November 2004, it was decided to set up an expert group to conduct a feasibility study on an East Asia Free Trade Area, which would comprise ASEAN member countries, China, Japan and the Republic of Korea (ASEAN Secretariat 2005b). It is yet unclear whether these arrangements would include provisions on the reduction of tariffs on minerals and metals trade among participating countries.
In addition to these agreements, ASEAN member countries have aimed to liberalise their trade and investment regimes within the context of the Asia Pacific Economic Cooperation (APEC) framework. In the declaration made by APEC leaders in Bogor, Indonesia, APEC aims to achieve the goal of free and open trade and investment in the region no later than 2020. In recognition of the differing levels of economic development among APEC economies, the goal was set at different timetables, with the developed member economies achieving the objective no later than 2010 and the developing member economies no later than 2020. Individual action plans have been formulated by member economies on a voluntary basis as a vehicle to achieve the objectives of the Bogor Declaration. Mineral products, metals and precious stones are covered in individual action plans.
In addition to the actions taken under the individual action plans, APEC Ministers responsible for mining meet regularly to discuss and analyse issues relating to minerals and metals. Three main issues that were highlighted at the Second Meeting of APEC Ministers Responsible for Mining in the Republic of Korea in October 2005 include market transparency and trade facilitation, promoting and facilitating mineral exploration and development, and mining and sustainable development. In particular, the Ministers agreed to examine ways to improve the functioning of minerals and metals markets through efforts, such as information sharing (APEC 2005).
One of the main mechanisms for the implementation of APEC Ministers’ decisions is the Expert Group on Minerals and Energy Exploration and Development (GEMEED). The GEMEED’s key objective in trade facilitation area is to promote adequate access to markets for mining products of APEC member economies. ASEAN member countries, that are also members of APEC, are Brunei Darussalam, Indonesia, Malaysia, the Philippines, Singapore, Thailand and Viet Nam.
Several ASEAN member countries have also undertaken measures to remove impediments to trade and investment through bilateral arrangements and unilateral reforms.
Generally, the objective of bilateral arrangements is to complement multilateral and regional efforts in liberalising trade in goods and services and creating more favourable conditions for the stimulation of trade and investment flows. Such arrangements typically include provisions on substantial reduction and ultimate elimination of tariffs on minerals and metals trade between the participating countries according to mutually agreed rules and timeframes. For example, the Thailand – Australia Free Trade Agreement that entered into force on 1 January 2005 provides for zero tariff rates on imports of minerals, metals and gemstones from Thailand to Australia (DFAT 2005).
Other examples of bilateral arrangements concluded between individual ASEAN member countries and their trading partners, comprising minerals and metals, include

Enhancing ASEAN Minerals Trade and Investment
REPSF Project 04/009b: Final Report 39
Singapore – Australia Free Trade Agreement, Japan – Singapore Economic Agreement for a New Age Partnership, New Zealand – Thailand Closer Economic Partnership Agreement, and a number of other similar arrangements currently in the process of negotiation.
While many of the mining industry’s tariff issues have been resolved through multilateral, regional and bilateral arrangements, there are some non-tariff barriers to trade in the form of institutional, regulatory and legal impediments that appear to affect the ability to produce and sell minerals and metals in world markets. For example, the lack of streamlined customs and quarantine procedures as well as trade distortions resulting from monopolistic purchasing practices adopted by state-owned enterprises add to the costs of exporting minerals to China (Minerals Council of Australia 2004). Non-tariff trade related measures, that appear to be primarily related to environmental, labor or other non-trade objectives, also have the potential to inhibit access to markets.
2. The proposed EU REACH legislation While the global trade environment for minerals is relatively open, there is the potential
for the proposed EU REACH legislation to have a restrictive impact on minerals trade. The essence of the proposed regulatory regime is to enhance the protection of human health and the environment from exposure to hasardous substances through the registration, evaluation and authorisation of chemicals produced or imported into the European Union. The proposed framework would also provide a harmonised approach to chemicals regulation across all EU members.
As currently drafted, the REACH proposal extends the definition of chemicals, and, therefore, the scope of the legislation to minerals – raw materials (ores and concentrates), massives (pig iron and alumina), metal compounds (alloys) that are classified as hasardous, and secondary raw materials for recycling – produced or imported in quantities of more than one tonne. Given that many ores and concentrates contain natural trace elements of substances considered hasardous in the European Union, these would potentially be subject to the registration, evaluation and authorisation provisions of the legislation, with potentially an unintentional, yet significant, cost burden on European minerals and metals businesses, and on the minerals industry more widely.
For example, under the current version of the legislation, it is estimated that around 60% of all shipments of primary inorganic raw materials such as ores, minerals, metals and alloys imported into the European Union would need to be authorised, even if they were to be exempt from registration. While it is not certain how the authorisation process would be implemented in practice, the draft legislation provides for the consideration of a cost-benefit analysis of the risks and socio-economic benefits associated with the use of substances, taking into account the availability of substitutes.
The European Union is dependent on imports for around 60% of the metallic mineral ores and concentrates consumed by its large scale metal manufacturing sector. The bulk of the European Union’s imports of minerals are sourced from resource rich developing economies and other low cost producers such as Australia. Against this background, the REACH legislation has significant potential to affect the minerals and related downstream sectors in both EU and non-EU economies (Hester, Mélanie, Curtotti and Ahammad 2005).
These impacts would include the direct costs of compliance with the legislation and the indirect costs associated with the trade distortion that could result from the legislation. The direct costs - involving the costs of testing of substances, documenting results, recordkeeping and monitoring compliance - have the potential to be prohibitive for firms in some countries, particularly those at an early stage of development. The total direct costs for commodities such as nickel and zinc are estimated to be in the range of €3-5 million

Enhancing ASEAN Minerals Trade and Investment
40 REPSF Project 04/009b: Final Report
per commodity (Eurometaux 2005). Further, from a logistical viewpoint, there is some concern that small and medium sized enterprises particularly in developing countries may not have the capacity for data generation required under REACH.
However, the potential indirect impacts of REACH are expected to be more considerable. These indirect impacts would arise from distortions in regional production and trade patterns across the whole minerals supply chain. Effectively, the proposed legislation would create a division between EU and non-EU countries, with trade with the European Union being conducted under one set of rules and trade with non-EU countries under another. As a result of the higher costs faced by EU industries based on minerals, the proposed legislation can be expected to create incentives for the relocation of value adding mineral processing and metal recycling activities offshore, to countries such as India and China.
In addition, the legislation has the potential to lead to lower demand for certain mineral commodities on world markets. This would apply to products that are banned from particular end uses and required to be substituted by potentially higher cost or less effective alternatives. Given that the European Union is a large importer of mineral ores and concentrates, an EU-wide restriction on certain minerals can be expected to lead to a fall in the world price of affected commodities.
The European Parliament voted to approve the REACH proposal in its first reading at the end of November 2005 (European Parliament 2005). The legislation is yet to pass the final stages of parliamentary debate before it can enter into force.

Enhancing ASEAN Minerals Trade and Investment
REPSF Project 04/009b: Final Report 41
IV. INVESTMENT IN THE MINERALS SECTOR IN ASEAN
o Investment in the minerals sectors of most ASEAN member countries remains limited. The development of the largest mines in ASEAN has been funded by foreign investment and, in parallel with globalisation, competition for global investment funds has become more intense over the past decade. Domestically funded investment in the sector also remains important, primarily for non-metallic and small scale mining projects.
o While available data suggest that ASEAN has significant mineral potential, investment in the ASEAN minerals sector remains constrained by weaknesses in the investment environment affecting the sector. These weaknesses include both economy wide factors (such as poor governance and underdeveloped infrastructure) and minerals sector issues (such as poor reliability of, and access to geological information and regulatory uncertainty). Environmental and social issues have also become increasingly significant on the mining development agenda.
o The regulatory environment for mineral enterprises in many ASEAN member countries is inconsistent with best practice, particularly in relation to security of tenure, mineral licensing conditions and fiscal arrangements for minerals projects. Further, where they are in place, workable minerals regulations are often let down by institutional weaknesses. These weaknesses, together with other issues, have a negative impact on investment, by increasing risk and the associated rate of return required for inducing investment. In some cases, mismanagement of environmental and social issues in ASEAN also acts to impede investment flows to the minerals sector.
o While the general investment environment in ASEAN member countries has improved in recent years, ASEAN member countries have a long way to go to ensure an ‘enabling’, and indeed attractive, environment for minerals sector investment.
As discussed in the previous chapter, the global outlook for minerals and mineral products is expected to remain strong in the medium term, creating incentives for the expansion of mining and refining capacity worldwide. This represents an important opportunity for ASEAN member countries to become more prominent players in international markets by taking advantage of their mineral prospectivity, geographical proximity to key minerals markets and relatively low labor costs.
A key determinant of whether ASEAN member countries can capitalise on this opportunity is their ability to secure the necessary investment in minerals projects that are typically capital intensive and long term. Domestic sources of capital are often limited and unable to satisfy total demand for investment. This implies that minerals sector developments in ASEAN member countries are strongly dependent on inflows of FDI. An important advantage of FDI is that it provides not only capital but also access to technologies, management and technical skills, and marketing networks in international trade and commerce.
This chapter explores major patterns in minerals sector investment across ASEAN member countries, with a focus on FDI. It identifies the main institutional and regulatory arrangements affecting investment and discusses some of the key economy wide and sector specific impediments to minerals sector investment in ASEAN member countries. The chapter concludes with a review of potential sources of funding for minerals sector investment in ASEAN member countries.
It should be noted that the data on minerals sector investment in ASEAN member countries reported in this chapter have several limitations. Investment flows, particularly domestic investment flows, are generally more difficult to measure than production or trade

Enhancing ASEAN Minerals Trade and Investment
42 REPSF Project 04/009b: Final Report
flows. Additional difficulty with measuring and monitoring investment is that investment concepts, coverage, measurement methodology and time reference differ across countries. Therefore, data on minerals sector investment in ASEAN are relatively weak.
Consistent investment data relating to non-energy minerals only are not available. Data on FDI in the ‘mining and quarrying’ sector reported by the ASEAN Secretariat include investment in energy minerals, such as oil and gas. For this reason, Brunei Darussalam and Singapore are generally excluded from comparison with other ASEAN member countries, as minerals sector investment in these countries mainly relates to oil and natural gas. Most of Malaysia’s FDI also relates to oil and natural gas.
There are generally no statistics available on exploration investment in ASEAN member countries, despite the large investments required to carry out exploration activities and the importance of exploration in the minerals project lifecycle. One of the reasons is that, in certain ASEAN member countries, investors in the minerals sector cannot obtain an investment licence until the production phase. Therefore, reported figures are likely to underestimate actual investment in the minerals sector in ASEAN member countries. All of the above issues suggest that minerals sector investment data should be treated with caution. Nevertheless, available data provide a useful indication of the general trends in investment flows to the ASEAN minerals sector and the sources of these inflows.
A. INVESTMENT FLOWS IN THE MINERALS SECTOR Investment in the ASEAN minerals sector over the past decade has remained relatively
limited and concentrated in a handful of ASEAN member countries. In particular, countries with a more established minerals sector, such as Indonesia, have received significant inflows of investment from both foreign and domestic sources, although there has been a decline in investment inflows in recent years. At the other end of the spectrum, the minerals sector in other countries, such as Cambodia, is still in its infancy and has yet to attract significant investment.
1. Total investment Minerals sector investment in ASEAN member countries is small relative to their
mineral prospectivity. This disparity results, to a large extent, from heightened risk perceptions and significant start-up costs in building infrastructure.
Over the past decades, minerals sector investment in ASEAN has been funded from both domestic and foreign sources, with foreign investment remaining a far more significant driver of minerals sector development than domestic investment. The notable exception is Viet Nam, where domestic sources accounted for 96% of total minerals sector investment in 2004, and state-owned enterprises accounted for the largest share of investment in the minerals sector (Viet Nam Country Report).
Mining sector investment typically contributes a small percentage of total investment in ASEAN, representing less than 5% of total investment in most ASEAN member countries in recent years. Generally, countries with a more established minerals sector have received larger investment inflows than countries where the minerals sector is less mature. For example, minerals sector investment in Indonesia (excluding investment in non-metallic minerals) averaged more than US$1.6 billion a year in the second half of the 1990s (Indonesia Country Report). Over the same period, the Philippines’ mining and quarrying sector received US$90 million a year on average (Philippines Country Report).
In comparison, Viet Nam and other relatively new members of ASEAN, where the minerals sector remains largely underdeveloped, have yet to see investment of any significant scale. Low levels of investment reflect a wide range of issues, including poor

Enhancing ASEAN Minerals Trade and Investment
REPSF Project 04/009b: Final Report 43
geological information, inadequate legal and regulatory frameworks, and weak infrastructure.
Total investment in the ASEAN minerals sector is estimated to have equalled US$2.6 billion in 2004. For comparison, new capital expenditure in the Australian mining industry in 2004-05 fiscal year is estimated at US$7.6 billion, with the average annual expenditure for the past 24 years amounting to US$5.7 billion (Haine and commodity analysts 2005).
Table 4.1 shows total minerals sector investment in ASEAN member countries for the period 1997-2004. For some countries, the data refer to approved investments in mining and mineral processing industries, and, therefore, overestimate actual realised investment.
Table 4.1: Minerals Sector Investment in ASEAN member countries, 1997-2004, $US Million
1997 1998 1999 2000 2001 2002 2003 2004 Indonesiaa 1,762.0 2,168.0 1,408.0 915.0 278.0 363.0 386.0 213.2 Lao PDRb - - - - - - 0.8 6.4 Malaysiac - - - - - - - 711.4 Myanmarb,d 3.3 4.9 16.0 1.1 0.0 - - - The Philippinese 94.8 33.1 93.7 24.6 5.1 7.0 - - Thailandf - - - - 134.8 48.8 412.0 1,590.6 Viet Namg - - - 22.8 35.0 66.2 66.9 81.7 a: 1997-2003 data are for realised investment (include coal, but exclude industrial minerals and oil and gas). 2004 data are for approved investment in mining, and basic metal and non-metallic processing; b: Foreign-invested projects; c: Malaysia data are for approved investment in processing of non-metallic minerals and basic metals; d: By fiscal year; e: The Philippines data are for realised investment in the mining and quarrying sector; f: Thailand data are for approved investment and include energy minerals and ceramics; g: By enterprises currently involved in production. Sources: Country reports.
Since 1997, minerals sector investment has followed a downward trend in most ASEAN member countries with established minerals sectors. In Indonesia, for example, minerals sector investment has decreased by 88% as a result of uncertainty in the regulatory environment. Greenfield exploration expenditure in Indonesia was US$7 million a year in 2003, which was almost eight times lower than in the mid-1990s.
In the Philippines, investment in the minerals sector stalled over much of the past decade, partly as a result of uncertainty over the legal status of the Mining Act of 1995, the constitutionality of which was challenged in the Supreme Court between 1997 and the end of 2004. The Supreme Court ruling, made in December 2004, upholding the constitutionality of the Mining Act has undoubtedly removed a major factor inhibiting the attractiveness of the Philippines as an investment destination over the past few years.
With the exception of Viet Nam, investment in the minerals sector in the transition economies in ASEAN remains negligible. However, there has been a significant increase in capital inflows to the Lao PDR in 2003 as a result of the recent investment by Australian companies Oxiana Limited and Pan Australian Resources Limited in the country’s gold and copper mines. The success of Australian investors is expected to attract further foreign interest in the Lao PDR’s minerals sector.
2. Foreign direct investment FDI has always been a significant component of total investment in the ASEAN region,
including in the minerals sector. It has increasingly become a dominant factor in total capital flows in ASEAN member countries as a result of its ability to supplement national savings, expand national income by inducing economic production, and, in general,

Enhancing ASEAN Minerals Trade and Investment
44 REPSF Project 04/009b: Final Report
promote economic development. In addition to these benefits, FDI can raise standards of living in the host economy through more employment opportunities and transfer of advanced technologies, labor skills and best management practices (De Guia 2005).
In parallel with globalisation, international competition to attract FDI has intensified over the past decade. Investors can now choose among many potential investment options, while investment capital is limited. In general, ASEAN member countries have been successful in attracting significant amounts of FDI in manufacturing, financial services, trade, commerce and other services. However, in the minerals sector the picture is less positive, with a large share of global investment funds flowing to other countries, such as China and Chile.
In the past decade, trends in total FDI flows to ASEAN have been mixed. After an initial rise, FDI flows were hard hit by the 1997 Asian financial downturn. The financial downturn was one of the main reasons for large net outflows of foreign investment from Indonesia between 1998 and 2001. Other ASEAN member countries were also significantly affected by the downturn, with marked declines in total FDI flows to Malaysia, for example. Total FDI flows to ASEAN fell from US$34 billion in 1997 to a low of US$14 billion in 2002. They recovered slightly to US$20 billion in 2003, led by strong growth in FDI to Singapore. Singapore received almost half of total FDI flows to ASEAN during the period 1995-2003.
Over that period, Japan, the European Union and the United States accounted for the bulk of total FDI flows to the region. Intra-ASEAN investment during the observed period was relatively small - 13% of total ASEAN FDI flows. Singapore accounted for 64% of cumulative intra-ASEAN investment. Significant contributions also came from Malaysia and Indonesia, with 15% and 13% of intra-ASEAN investment respectively (ASEAN Secretariat 2004a).
FDI in the minerals sector is a relatively new development in a number of less advanced ASEAN member countries. While several ASEAN member countries have established minerals sectors built on FDI, the relatively new ASEAN members have opened their doors to foreign investment only recently. Over the period 1999-2003 (the period for which data are available), FDI in the ASEAN mining and quarrying sector was highly variable, with a low of US$635 million in 2000 and a peak of US$1.6 billion in 2001, with significant diversity across individual countries (Table 4.2). FDI in mining and quarrying declined in the Philippines, while rising sharply in the Lao PDR, and more moderately in Myanmar from 2001. Indonesia and Thailand mostly saw FDI outflows from the sector over the 5-year period to 2003. More than 60% of total FDI in the ASEAN mining and quarrying sector went to Malaysia and was largely related to oil and natural gas.
More recent information suggests that total FDI in the ASEAN mining and quarrying sector has risen in 2004 and 2005. This is partly in response to increased global demand for mineral commodities and higher metals prices.
In the period 1999-2003, the share of FDI in the ASEAN mining and quarrying sector as a proportion of total FDI in ASEAN has varied, ranging from 3% in 2000 to 10% in 2002 (Table 4.2). In 2003, mining and quarrying accounted for the majority of FDI inflows in the Lao PDR and Myanmar. As noted previously, the significant increase in the level of mining and quarrying FDI in the Lao PDR is related to the development of foreign-invested gold and copper projects. The introduction of the Law on the Promotion and Management of Foreign Direct Investment of 2004, which allows operation of fully foreign-owned enterprises in the Lao PDR has generated a significant improvement in the country’s investment climate.

Enhancing ASEAN Minerals Trade and Investment
REPSF Project 04/009b: Final Report 45
Table 4.2: FDI in Mining and Quarrying, ASEAN member countries, 1999-2003, US$ Million
1999 2000 2001 2002 2003 1999-2003 Share of FDI in mining and quarrying,
1999-2003a (%) Indonesia (211.0) (275.3) (233.7) (242.3) 232.3 (729.9) - Lao PDR 12.2 9.2 2.0 4.8 9.5 37.7 1 Malaysia 722.4 677.4 911.1 1,089.0 253.0 3,652.8 61 Myanmar 220.2 107.2 111.2 162.9 112.7 714.1 12 The Philippines 379.0 79.9 (1.0) 22.3 (7.5) 472.7 8 Thailand (41.8) (274.7) 518.0 (97.0) (5.0) 99.4 2 Viet Nam 264.6 311.2 298.6 406.7 431.8 1,712.8 29 ASEAN 1,345.6 634.9 1,606.2 1,346.4 1,026.8 5,959.6 100 Share of total FDI in ASEAN (%)
5 3 8 10 5 3
a: Indonesia had a negative net FDI flow over the period 1999-2003. The share is not reported to avoid confusion related to the sign of the percentage. FDI = foreign direct investment. Note: negative numbers are enclosed in parentheses. Source: ASEAN Secretariat 2004a.
The main source countries of FDI in mining and quarrying between 1999 and 2003, as reported by the ASEAN Secretariat (2004a), are presented in Table 4.3. Excluding Brunei Darussalam and Singapore, the largest source of FDI in the ASEAN mining and quarrying sector over the period 1999-2003 was the United States, followed by intra-ASEAN investment flows. The largest share of investment from the Unites States was channelled to the Philippines, while Thailand attracted a large part of intra-ASEAN investment flows.
The United States has also traditionally been a major investor in Indonesia’s minerals sector, with Freeport-McMoRan Copper & Gold Inc and Newmont Gold Mining Co operating the country’s largest copper/gold mines. However, a significant deterioration in Indonesia’s investment environment over recent years has caused the number of US investors in the country to decline. Particular issues that have discouraged investment in Indonesia’s mining sector include regulatory uncertainty associated with proposed changes to the Mining Law and with the move to regional autonomy, conflicts between mining and forestry following the implementation of the Forestry Law in 1999, political instability and the security situation.
Table 4.3: FDI in the ASEAN Mining and Quarrying Sector by Major Source Country, 1999-2003, US$ Million
Japan United States
European Union-15
Republic of Korea
Chinaa ASEAN
Indonesia (4.5) (48.4) (491.2) (86.8) - (10.0) Lao PDRb 0.0 - - 0.1 1.1 0.3 Malaysiac (681.9) (50.9) (126.6) - - - Myanmar - 224.9 139.0 2.5 11.2 37.8 The Philippines 19.0 1,123.5 - - - - Thailand 37.3 (273.5) (405.1) - 0.3 848.7 Viet Nam 257.86 132.7 561.3 50.4 - 177.6 ASEAN (372.2) 1,108.3 (322.6) (33.8) 12.6 1,054.4
a: Includes Chinese Taipei and Hong Kong; b: Data are for 2001-2003 only; c: Data are for 2002-2003 only. FDI = foreign direct investment. Note: negative numbers are enclosed in parentheses. Source: ASEAN Secretariat 2004a.

Enhancing ASEAN Minerals Trade and Investment
46 REPSF Project 04/009b: Final Report
In addition, a significant share of investment in the minerals sector in ASEAN is sourced from Australia and Canada. These two countries provide the base for highly developed mining sectors and many international mining enterprises. The largest foreign investor in Myanmar’s minerals sector, for example, is the Canadian company Ivanhoe Mines Ltd. Canadian mining companies, Inco Ltd and ALCAN Ltd, are also major investors in Indonesia’s nickel and Malaysia’s bauxite mining, respectively. In Viet Nam, Canadian company Tiberon Minerals Ltd has recently been granted a mining licence and is poised to become the largest foreign investor in the country’s minerals sector.
Australian foreign investment was the major contributor to the Lao PDR’s receipts of minerals sector inflows in 2003, with Oxiana Limited and Pan Australian Resources Limited the largest investors in the country’s minerals sector. Similarly, in Thailand, a number of Australian and Canadian companies are involved in mineral exploration and extraction activities.
3. Future investment prospects Considerable mineral prospectivity and relatively low investment flows to the minerals
sector in ASEAN suggest that there remain significant opportunities for investment in mineral development projects in the region. The capital intensive and long term nature of these projects implies a heavy reliance on FDI, as domestic financial resources are often constrained.
Currently, foreign investors are involved in almost all major mineral development projects in ASEAN. Many of the potentially important new projects have also attracted the interest of foreign investors. Some of the major recently approved metallic minerals projects in ASEAN member countries are listed in Table 4.4. These projects have the potential to foster greater development in the ASEAN minerals sector and bring significant benefits to ASEAN member countries. Actual investment in the minerals sector will, however, depend on the general investment environment in these countries, and also on the regulatory framework affecting the minerals sector specifically.
Table 4.4: Major Recently Approved Investment Projects in the Metallic Minerals Sector in ASEAN
Indonesia PT Dairi Prima Minerals – Zinc, lead, silver (exploration stage) PT Aneka Tambang Tbk – Bauxite to produce chemical grade alumina (exploration stage) PT Weda Bay Nickel – Nickel, cobalt (exploration stage) PT Gag Nickel – Nickel (exploration stage)
Lao PDR Oxiana Limited – Copper, gold (Sepon mine commenced operation in 2003) Pan Australian Resources Limited - Gold (Phu Bia mine commenced production in 2005)
Malaysia Grange Resources Ltd and the Road Builder Group - Iron ore pellet plant The Philippines Australasian Philippines Mining Inc – Copper, gold (Didipio mine) Thailand Kingsgate Consolidated Limited – Gold (Chatree mine commenced
operation in 2001) Thai Copper Industries plc. – Copper smelter (commenced production in 2004) Pan Australian Resources Limited - Copper (Puthep)
Sources: Wahju 2004, Country Reports, IndustrySearch 2005.

Enhancing ASEAN Minerals Trade and Investment
REPSF Project 04/009b: Final Report 47
B. INSTITUTIONAL AND REGULATORY ARRANGEMENTS AFFECTING INVESTMENT IN THE MINERALS SECTOR Investment in the minerals sector is governed by a variety of institutional and regulatory
arrangements that cover a broad spectrum of issues. The national mining law typically provides the core framework for the operation of the mining sector, with other important issues addressed in various other national and local laws relating to investment, taxation, environment, land use, employment and foreign exchange. Regulation of individual projects can also be implemented on an ad hoc basis through specially negotiated agreements. In addition, there is a growing number of bilateral and multilateral treaties, agreements, memoranda of understanding and other such arrangements that affect minerals sector operations in signatory countries.
This section focuses on the main elements of the institutional and regulatory framework affecting mining companies in ASEAN member countries. National regulatory approaches in the ASEAN region are discussed first. Regional arrangements relevant to investment in the minerals sector are then reviewed.
1. National institutions and regulations Since the late 1980s, regulation of minerals sector investment in ASEAN member
countries has undergone significant transformation. In the 1970s and early 1980s minerals policy and legal frameworks in a number of ASEAN member countries tended to focus on government involvement in the minerals sector. However, in many cases, state-owned mining enterprises performed poorly, a problem exacerbated by weak global demand for minerals during much of the 1980s. Recognition of the need to increase private sector participation in the minerals sector led to a review of minerals policies across the region. To different degrees, ASEAN member countries have engaged in the ongoing process of regulatory reform to establish an enabling environment for mining investment and encourage greater private and foreign participation in mining projects.
The main features of current institutional and regulatory frameworks in ASEAN member countries are presented in Table 4.5. While the regulatory system in each country is unique, national mining laws increasingly have many common elements. They typically establish ownership of mineral resources and focus on the issuance of mining titles, rights and obligations relating to such titles, and special forms of minerals taxation such as royalties and land taxes. Most mining acts specify separate authorisation processes for exploration and extraction but this is not always the case. For example, the Indonesian contract of work system grants a so-called conjunctive title to foreign investors in the minerals sector, that involves the right to perform consecutive activities starting from survey and exploration to development, processing and sale of the final mineral product. Mining laws also typically identify specific areas closed to mineral activity; use and occupation of land; power and authority of government agencies or officers to implement and enforce the law; and dispute settlement processes. A key feature of the more recent mining acts is that they include provisions for environmental protection and social considerations. Social and environmental matters can also be regulated by separate laws, typically in countries with more mature mining sectors.
In addition to the central mining law, ASEAN member countries usually adopt a supplemental mining law in the form of mining regulations or presidential, cabinet and ministerial decrees and directives. These supplemental laws typically address procedural, reporting and enforcement issues.
In almost all ASEAN member countries, implementation of the mining law is the responsibility of a single ministry/department at the central Government level. The exception is Malaysia, where the powers and responsibilities are divided between the federal and state levels of government. The power to issue mining licences is vested in
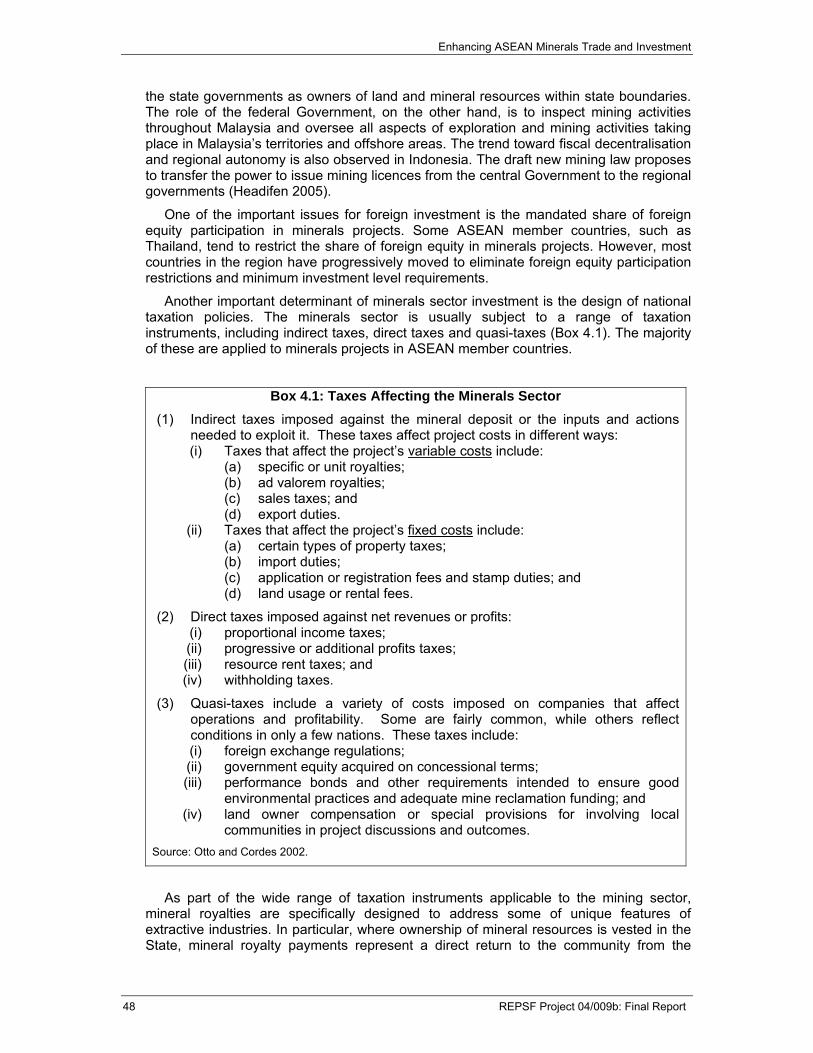
Enhancing ASEAN Minerals Trade and Investment
48 REPSF Project 04/009b: Final Report
the state governments as owners of land and mineral resources within state boundaries. The role of the federal Government, on the other hand, is to inspect mining activities throughout Malaysia and oversee all aspects of exploration and mining activities taking place in Malaysia’s territories and offshore areas. The trend toward fiscal decentralisation and regional autonomy is also observed in Indonesia. The draft new mining law proposes to transfer the power to issue mining licences from the central Government to the regional governments (Headifen 2005).
One of the important issues for foreign investment is the mandated share of foreign equity participation in minerals projects. Some ASEAN member countries, such as Thailand, tend to restrict the share of foreign equity in minerals projects. However, most countries in the region have progressively moved to eliminate foreign equity participation restrictions and minimum investment level requirements.
Another important determinant of minerals sector investment is the design of national taxation policies. The minerals sector is usually subject to a range of taxation instruments, including indirect taxes, direct taxes and quasi-taxes (Box 4.1). The majority of these are applied to minerals projects in ASEAN member countries.
Box 4.1: Taxes Affecting the Minerals Sector (1) Indirect taxes imposed against the mineral deposit or the inputs and actions
needed to exploit it. These taxes affect project costs in different ways: (i) Taxes that affect the project’s variable costs include:
(a) specific or unit royalties; (b) ad valorem royalties; (c) sales taxes; and (d) export duties.
(ii) Taxes that affect the project’s fixed costs include: (a) certain types of property taxes; (b) import duties; (c) application or registration fees and stamp duties; and (d) land usage or rental fees.
(2) Direct taxes imposed against net revenues or profits: (i) proportional income taxes; (ii) progressive or additional profits taxes; (iii) resource rent taxes; and (iv) withholding taxes.
(3) Quasi-taxes include a variety of costs imposed on companies that affect operations and profitability. Some are fairly common, while others reflect conditions in only a few nations. These taxes include: (i) foreign exchange regulations; (ii) government equity acquired on concessional terms; (iii) performance bonds and other requirements intended to ensure good
environmental practices and adequate mine reclamation funding; and (iv) land owner compensation or special provisions for involving local
communities in project discussions and outcomes. Source: Otto and Cordes 2002.
As part of the wide range of taxation instruments applicable to the mining sector, mineral royalties are specifically designed to address some of unique features of extractive industries. In particular, where ownership of mineral resources is vested in the State, mineral royalty payments represent a direct return to the community from the

Enhancing ASEAN Minerals Trade and Investment
REPSF Project 04/009b: Final Report 49
discovery and extraction of mineral resources by private enterprises. There are several possible mineral royalty arrangements that may be applied to production (Box 4.2). These alternative arrangements affect private sector exploration, development and production decisions in different ways (Hogan and Donaldson 2000). From an economic perspective, the resource rent royalty or tax is a relatively efficient form of resource taxation, because it takes into account changes in prices, costs and output. However, the administrative and compliance costs of a mineral royalty system increase with the amount of information required. Therefore, a resource rent tax is more costly to administer than an ad valorem royalty that is based only on prices and output. For this reason, ad valorem royalties are commonly applied in a wide range of countries, including in the majority of ASEAN member countries.
Box 4.2: Types of Mineral Royalties Royalty arrangements can be categorised as follows:
(1) brown tax, whereby the payment to government is a constant percentage of the project’s net cash flow in each year of the project’s life, with the government providing a cash rebate during the exploration and development stages when cash flow is negative;
(2) resource rent royalty or tax, whereby the payment to government is a constant percentage of the project’s net cash flow in each year of the project’s life except that exploration and development costs are accumulated at a threshold rate and offset against future revenues;
(3) ad valorem royalty, whereby the payment to government is a constant percentage of the value of production;
(4) excise, whereby the payment to government is a constant amount per physical unit of production; and
5) specific royalty, whereby the payment to government is a constant amount per physical unit of production.
Source: Hogan and Donaldson 2000.
Minerals taxation regimes in ASEAN member countries frequently provide special tax incentives to investors to accommodate minerals sector investment risks and attract investment in new minerals projects. Such incentives include tax holidays, tax credits and abatements, flexibility in the years during which losses can be applied to the tax base, and accelerated depreciation of exploration and development investment.
Some ASEAN member countries, for example the Philippines, also allow mining companies to integrate all domestic revenues, costs and allowances for tax purposes, as opposed to the ‘ring-fencing’ policy used in other countries. This has important implications for the overall risk allocation and effective levels of tax burden on mining companies. Additional investment guarantees can include repatriation of investments; remittance of earnings, interest and principal on foreign loans; freedom from expropriation of investment; and confidentiality of information.
Regulatory frameworks affecting the minerals sector in ASEAN member countries have generally improved in recent years. This has encouraged greater investment in the minerals sector in countries such as the Lao PDR, Thailand and Viet Nam. However, despite these improvements, ASEAN minerals regulatory regimes tend to lag behind international best practice in many ways. A survey of mining companies undertaken by the Fraser Institute (2005) identified states in the United States, Canada and Australia, as well as Ireland and Spain, among the leaders in terms of minerals policy environments. Among developing countries, Chile, Mexico and India were ranked as having the most favourable minerals policy environments. The Philippines and Indonesia, the only ASEAN

Enhancing ASEAN Minerals Trade and Investment
50 REPSF Project 04/009b: Final Report
member countries included in the survey, were ranked 58th and 62nd out of 64 jurisdictions.
When comparing regulatory regimes across countries, it is important to consider that the capacity of institutions in charge of implementing these regulatory regimes can be even more important than the regulations themselves. A workable minerals regulatory environment can be severely undermined by weak institutions (Morgan 2002). Indeed, in a number of ASEAN member countries, institutional structures affecting the minerals sector are generally weaker than the regulatory frameworks. These issues are discussed further in Section D.

Enhancing ASEAN Minerals Trade and Investment
REPSF Project 04/009b: Final Report 51
Table 4.5: Summary of Minerals Regulations in ASEAN member countries Cambodia Indonesia Lao PDR Malaysia Myanmar The Philippines Thailand Viet Nam Regulatory and institutional framework Minerals ownership
State State State States State State State State
Mining law Law on Management
and Exploitation of
Mineral Resources
(2001)
Law No. 11 on the
Provisions of Mining (1967)
Mining Law (1997)
Mineral Development Act (1994);
State Mineral Enactment
(1998)
Mines Law (1994)
Mining Act (1995)
Minerals Act (1967)
Mineral Law (1996)
Other major laws affecting minerals sector
Law on Investment
(1994); Law on
Environmental Protection
and Natural Resource
Management (1997)
Law No. 1 (1967) and Law No. 11 (1970) on Foreign
Investment; Law No. 22 on Regional Autonomy
(1999); Law No. 41 on Forestry (1999)
Law on the Promotion of
Foreign Investment
(2004); Environmental
Protection Law (1999)
Environmental Quality Act
(1974)
Foreign Investment Law (1988);
State-Owned Economic
Enterprises Law (1989); Myanmar
Gems Law (1995)
Indigenous Peoples Rights
Act (1997); Ecological Solid
Waste Management Act
(2000); Clean Water Act (2004)
Mineral Royalty Rates
Act No. 4 (1966);
Tin Control Act (1977); Investment
Promotion Act (Revision 3)
(2001); Foreign
Business Act (1999);
Enhancement and
Conservation of National
Environmental Quality Act
(1992)
Law on Foreign
Investment (1996); Law on
Environmental Protection
(1994)
Ministry responsible for the minerals sector
Ministry of Industry,
Mines and Energy
Ministry of Energy and
Mineral Resources
Ministry of Industry and Handicrafts
Ministry of Natural
Resources and
Environment
Ministry of Mines
Department of Environment and
Natural Resources
Ministry of Industry
Ministry of Natural
Resources and
Environment, Ministry of

Enhancing ASEAN Minerals Trade and Investment
52 REPSF Project 04/009b: Final Report
Cambodia Indonesia Lao PDR Malaysia Myanmar The Philippines Thailand Viet Nam Industry
Government agencies responsible for issuing mineral licences
Council for the
Development of Cambodia
(CDC), Ministry of Industry,
Mines and Energy
Directorate General of
Geology and Mineral
Resources, Ministry of
Energy and Mineral
Resources; regional
governments
Department for Promotion
and Management of Domestic and Foreign Investment
State governments
Department of Mines
Mines and Geosciences
Bureau, Department of
Environment and Natural
Resources
Department of Primary
Industries and Mines
Department of Geology and
Minerals
Licences Duration of exploration licences
2 years. Renewable for up to 4
years (2 years at a time)
3 years. Renewable for up to 2
years (1 year at a time)
3 years. Renewable for up to 4 years (2 years at a
time)
2 years. Renewable for up to 2 years (Prospecting
Permit) Up to 10 years.
Renewable for up to 5 years (Exploration
Licence)
3 years. Renewable for 2 years
and longer if required
2 years. Renewable for up to 6 years
5 yearsa 2 years. Renewable by
2 years
Maximum area for exploration licences
200km2 100km2b 100km2 4km2
(Prospecting Permit) 200km2
(Exploration Licence)
3,150km2 320km2 (onshore) 810km2
(offshore)
16km2 100km2 (precious minerals) 200km2 (metals)
Duration of mining licences
5 years. Renewable
for another 10 years (5 years
at a time)
30 years. Renewable by 10 years
30 years. Renewable for
another 20 years (10 years at a
time)
Maximum of 21 years
25 years. Renewable
by 5 years at a time
25 years. Renewable for
another 25 years
25 years 30 years. Renewable by
20 years

Enhancing ASEAN Minerals Trade and Investment
REPSF Project 04/009b: Final Report 53
Cambodia Indonesia Lao PDR Malaysia Myanmar The Philippines Thailand Viet Nam Foreign ownership restrictions (excluding gemstones)
None None on formation. Transfer of
some percentage
to Indonesian nationals after 15
years may be required.
Joint Venture with the
Government
None (subject to fulfilment of
several criteria)
Joint Venture with the
Government
None Thai ownership of shares not
less than 40% of total capital
None (except for precious
minerals)
Mining rights transfer
Possible Possible (subject to obtaining relevant
approvals)
Possible Possible Indefinite Possible Possible Possible
Fiscal Profit/production sharing with government
Yes No According to Joint Venture Arrangement
Yes Yes No No No
Royalties (excluding gemstones)
3-5% 3-5% 2-5% Vary across states
1-5% 2% 2-10% 1-5%
Royalties (gemstones)
15% 10% (diamonds)
5% - 5-7.5% - 10% 3-8%
Corporate tax 20% 10-30% 20% 28% 30% 32% 30% 25%
Export tax No No No No 8% No No No
Loss carried forward for accounting purposes (years)
3 5-10 3-5 Indefinite 3 3-5 5 5
a: for Special Atchayabat; b: for Mining Authorisations. For contracts of work, maximum exploration area is set individually. Note: the above summary table is for indicative purposes only. Summary tables such as these are simplifications. Regulatory regimes should be considered in their entirety. Sources: Hogarth 2003, Country Reports.

Enhancing ASEAN Minerals Trade and Investment
54 REPSF Project 04/009b: Final Report
2. Regional investment frameworks In addition to domestic institutions and regulations, there are also regional
arrangements that affect investment in ASEAN generally. The ASEAN Investment Area (AIA) is a relevant framework that affects manufacturing, agriculture, forestry and fisheries, mining and quarrying industries, and services incidental to these sectors. The AIA was established in 1998 at the 30th ASEAN Economic Ministers Meeting in Manila. It aims to provide a more competitive, liberal and transparent investment environment by 1 January 2010 in order to attract higher and sustainable levels of direct investment flows from both ASEAN and non-ASEAN sources. It is designed to contribute to ASEAN Vision 2020, including the goal of a “free flow of goods, services and investments” in ASEAN by 2020 (ASEAN Secretariat 1997). Key features of the AIA include extending national treatment and opening all relevant industries to ASEAN investors (ADB 2004a). Specifically, the AIA Framework Agreement includes the following measures:
(i) implementing coordinated ASEAN investment cooperation and facilitation; (ii) implementing a coordinated promotion program and investment
awareness activities; (iii) immediate opening up of all affected sectors for investment, with some
exceptions as specified in the Temporary Exclusion List and the Sensitive List;
(iv) granting national treatment, with some exceptions as specified in the Temporary Exclusion List and the Sensitive List, to ASEAN and non-ASEAN investors;
(v) actively involving the private sector in the AIA development process; (vi) promoting freer flows of capital, skilled labor, professional expertise and
technology among member countries; (vii) providing transparency in investment policies, rules, procedures and
administrative processes; (viii) providing a more streamlined and simplified investment process; and (ix) eliminating investment barriers and liberalising investment rules and
policies in the sectors covered by the Agreement (ASEAN Secretariat 2005c).
Under the AIA Framework Agreement, each country is allowed to nominate a Temporary Exclusion List and a Sensitive List of industries or measures affecting investments in which they are unable to open up or accord national treatment to ASEAN investors. The Temporary Exclusion List is subject to review every 2 years and is subject to the timeframes specified in Table 4.6. The Sensitive List will be reviewed periodically but will not be phased out. Both the Temporary Exclusion Lists and Sensitive Lists for a number of ASEAN member countries, including Myanmar and Viet Nam, involve activities related to the minerals sector.
The AIA Council, involving Ministers responsible for investment and the Secretary General of ASEAN, supervises, coordinates and reviews the implementation of the Framework Agreement on the AIA (ASEAN Secretariat 1998, 2001).
Under the AIA, ASEAN member countries agreed to three programs:
o investment cooperation and facilitation, through increased transparency of rules, regulations, policies, and procedures, simplification of procedures, and expansion of the number of double taxation treaties among member countries. This program also includes establishment of investment databases, promoting public-private linkages and identifying areas for technical cooperation;

Enhancing ASEAN Minerals Trade and Investment
REPSF Project 04/009b: Final Report 55
o investment promotion and awareness, by organising joint promotion activities and training programs for officials; and
o investment liberalisation, through reduction and elimination of restrictive investment measures, and promotion of a freer flow of capital, skilled labor, professionals and technology among member countries (Asian Development Bank 2004a).
Table 4.6: Timeframes for the Phasing Out of Temporary Exclusion List
For ASEAN Investors ASEAN Members Timeframe Manufacturing Brunei Darussalam, Indonesia, Malaysia,
Myanmar, the Philippines, Singapore and Thailand
Cambodia, Lao PDR and Viet Nam
1 January 2003
1 January 2010
Agriculture, Fisheries, Forestry, Mining and Quarrying, Services incidental to these sectors and Services incidental to Manufacturing
Brunei Darussalam, Cambodia, Indonesia, Malaysia, the Philippines, Singapore and
Thailand
Viet Nam
Lao PDR and Myanmar
1 January 2010
1 January 2013
1 January 2015
For Non-ASEAN Investors Manufacturing, Agriculture, Fisheries, Forestry, Mining and Quarrying, and Services incidental to these sectors
Brunei Darussalam, Indonesia, Malaysia, the Philippines, Singapore and Thailand
Cambodia, Lao PDR and Viet Nam
Myanmar
1 January 2010
1 January 2015
1 January 2020
C. KEY DETERMINANTS OF MINERALS SECTOR INVESTMENT There is a wide array of factors that determine a country’s ability to attract foreign
investment in the minerals sector. Some factors are common to investment decisions across all sectors. Typically, these relate to the maturity and stability of the political, economic and legal systems in a potential host country. Other factors are more specific to the minerals sector, including geological potential, security of tenure and the royalty regime.
This section highlights the results of a global survey of international mining companies on minerals sector investment decision criteria and a model for minerals sector investment decision making. It also discusses key factors affecting minerals sector investment in the ASEAN context.
1. Minerals sector investment decision criteria The minerals sector is a globalised sector and one of the most complex and
competitive industrial sectors in the world (World Bank 2003). Mining companies operate in the international marketplace where many commercial, financial and political factors influence their decisions about where to invest. A United Nations global survey of international mining companies undertaken in 1992 identified a number of mining companies’ investment preferences and criteria for assessing investment conditions. While these criteria may have changed to some extent since the start of the 1990s to reflect growing physical security concerns, better awareness of occupational health and safety issues, and the increasing importance of environmental and social issues, the results provide a representative assessment of some of the key factors influencing investment decisions in the mining sector (Table 4.7).

Enhancing ASEAN Minerals Trade and Investment
56 REPSF Project 04/009b: Final Report
The United Nations survey results and other sources (Feebrey 1998) indicate that, quite logically, geological potential is the most important determinant of the decision to invest in mineral exploration in any one country. However, even countries with rich mineral endowment cannot afford to rely on geology alone to ensure strong investment in the minerals sector. Other factors relating to the whole economy such as the strength of legal institutions, the regulatory framework within which the minerals sector operates, and, more recently, the regulatory framework governing environmental and social issues associated with mining are also major considerations. In addition, global market factors such as global demand for minerals and world market prices, the location of major markets, and climate and topography also play an important role in the investment decision making process.
Table 4.7: Ranking of Investment Decision Factors at the Exploration and Mining Stages
Decision Criteria Ranking (out of a total of 60 criteria)
Exploration
stage Mining stage
Geological potential for target mineral 1 - Security of tenure 2 1 Ability to repatriate profits 3 2 Measure of profitability - 3 Consistency and constancy of minerals policies 4 9 Company has management control 5 7 Minerals ownership 6 11 Realistic foreign exchange regulations 7 6 Stability of exploration/mining terms 8 4 Ability to predetermine tax liability 9 5 Ability to predetermine environmental obligations 10 8 Stability of fiscal regime 11 10 Ability to raise external financing 12 12 Long term national stability 13 16 Established mineral titles system 14 17 Ability to apply geological assessment techniques 15 - Method and level of tax levies 16 13 Import-export policies 17 15 Majority equity ownership held by company 18 18 Right to transfer ownership 19 21 Internal (armed) conflicts 20 20 Permitted external accounts 21 14 Modern minerals legislation 22 19 Sources: Morgan 2002, Otto 2002.
Economy wide factors
Foreign investors usually seek an environment where they can conduct their business profitably, taking into account risk (Box 4.3). Some of the most important economy wide factors considered by foreign investors are:
o a predictable and non-discriminatory regulatory environment and an absence of undue administrative impediments to business more generally;
o a stable macroeconomic environment, including access to international trade; and
o sufficient and accessible resources, including the presence of relevant infrastructure and human capital (OECD 2003).

Enhancing ASEAN Minerals Trade and Investment
REPSF Project 04/009b: Final Report 57
In response to the fierce international competition for FDI, governments of host countries frequently offer a range of investment incentives, such as tax incentives, financial subsidies and regulatory exemptions. ASEAN member countries have followed this trend, with the growing use of fiscal and financial incentives, and the relaxation of restrictive regulations and performance requirements.
Experience suggests that incentives do not rank high among the determinants of FDI, although their impact on the choice of investment location is sometimes apparent at the margin. The role of incentives is seen rather as a supplement to an already attractive enabling environment for investment or as compensation for the failure of markets or other government interventions, such as performance requirements (UNCTAD 1996). Overall, the use of investment incentives is not considered a substitute for pursuing appropriate general policy measures and focusing on the broader objective of encouraging investment generally through, for example, reducing sovereign risk.
Box 4.3: Minerals Sector Risks Minerals sector investment is capital intensive, long term, immobile
and illiquid in nature. Because of these and other factors, investors in the minerals sector face particularly significant and often unique risks. These include:
o Geological risk: mineral exploration is an extremely risky investment – the chance of making a commercial discovery is often very low. Many discoveries are commercial before taxation is considered, but are ruled unprofitable once taxation is considered. Because the quality and quantity of the main asset of mining investors (ore in the ground) is never fully known, geological risks last for the duration of minerals projects;
o Market risk: minerals prices are notoriously volatile, exposing the minerals sector to significant market risks. Because prices are typically in US dollars, those operating in the industry are also exposed to currency fluctuations;
o Financial risk: the capital intensive and long term nature of minerals sector investments, often with long lead times, causes considerable financial risk;
o Operational risk: mining activities can be dangerous and involve technical and other operational risks; and
o Sovereign risk: the immobile nature of minerals sector investments exposes mining companies to particular risk in relation to changing government regulations and/or implementation of regulations.
The above risks, which are either specific to the minerals sector or particularly significant for investors in the minerals sector, are compounded by risks that also affect other sectors, for example, those arising from unpredictable input prices and labor relations. Sources: Parsons 2001; United Nations 1992.

Enhancing ASEAN Minerals Trade and Investment
58 REPSF Project 04/009b: Final Report
Minerals sector factors
Minerals sector investment can also be affected by a number of sector specific factors, with security of tenure as one of the most important. Mining companies look for an assurance, that should a viable deposit be found during the exploration stage, they will obtain the necessary rights to extract the resource.
Essentially, there are two main aspects to the concept of security of tenure. The first aspect is the constancy, stability and continuity of the rights granted, which refers to the duration of rights at the exploration and mining phases, and the linkage between these phases. While the right to convert exploration rights into mining rights may be explicitly provided in the mining act, other acts may contain provisions that circumvent or conflict with the rights granted in the mining act. Problems and disagreement may arise around issues such as compensation, resettlement, land claims of indigenous peoples and protected areas. The extent to which the administrative regime can provide practical access to land and resolve ownership issues determines the associated level of risk for investors.
The second aspect is the length of time for which rights, such as exploration rights, are granted in relation to the actual time required in practice. It also involves the time that regulatory authorities take in granting these rights. Security of tenure can also be affected by the level of government interference in relation to such requirements as minimum work and expenditure commitments, obligatory relinquishments and filing of reports and plans (Morgan 2002).
Environmental and social factors
Increasingly, environmental and social considerations also have a bearing on investment decisions pertaining to the minerals sector. Unregulated mining activities during the early development of the mining industry have left a legacy of unrehabilitated mine sites, polluted rivers and degraded land. It is also recognised that the potential adverse environmental consequences of mining can linger long after mines are closed.
Much of the environmental damage caused by mining activities has a direct impact on local communities in terms of their livelihoods and health. For example, mining operations can affect land used by indigenous people for hunting and gathering, shift cultivation, or adversely affect forests that yield timber and non-timber products. Further, indigenous cultures are often closely linked to natural resources that have a high social and spiritual significance.
The environmental, social and economic effects of mining on local communities have attracted wide public attention and political controversy over the past decade. Mining operations, particularly of a large scale, have become the targets of increasingly pro-environment politicians, non-government organisations (NGOs), and the public at large. This increased interest has also led to a significant rise in the expectations of local communities, national and local governments about the effectiveness of the industry in addressing environmental concerns.
Against this background, it is becoming increasingly clear that the institutions and systems that countries establish to regulate, manage and monitor the environmental impact of mining operations directly influence the extent of investors’ interest in starting up a particular mining operation. From

Enhancing ASEAN Minerals Trade and Investment
REPSF Project 04/009b: Final Report 59
an investor’s perspective, it is now widely recognised that the financial success of mining firms is increasingly tied to environmental competence (Bond and Weber-Fahr 2002). As such, these firms are placing more emphasis on competent regulators and efficient institutions that understand the importance of reliable and widely accepted environmental frameworks. In parallel with growing environmental awareness, issues related to safety and health have also become more prominent.
In recognition of the growing importance of environmental and social considerations, voluntary initiatives in the form of industry codes of conduct are emerging as important tools for addressing these issues.
2. Minerals sector investment decision model The model in Figure 4.1 summarises the factors that contribute to minerals
sector investment decisions both across countries and over time. The model is applicable to both foreign and domestic minerals sector investments.
Of the factors affecting investment decisions in Figure 4.1, the investment environment category is the most amenable to policies. Other factors are either given, such as geological potential, or largely exogenous, such as world market prices, in the case of small players. As such, the analysis of impediments to minerals sector investment in this chapter and the policy recommendations presented in Chapter V are focused on those that have a direct impact on the investment environment.

Enhancing ASEAN Minerals Trade and Investment
60 REPSF Project 04/009b: Final Report
Figure 4.1: Minerals Sector Investment Decision Model
Sources: Fraser Institute 2005, Morgan 2002, Otto2002, 1997, Ritchie 1992.
D. KEY IMPEDIMENTS TO MINERALS SECTOR INVESTMENT IN ASEAN In view of the general objective to increase FDI in the region, ASEAN member
countries have achieved significant progress in improving their overall international investment competitiveness. However, to date, the minerals sector has not been successful in attracting a significant share of total FDI inflows in the majority of ASEAN member countries. This reflects a wide spectrum of economy wide and sector specific impediments that have constrained the development of the sector. An assessment of the key impediments, as identified through the consultation program in individual ASEAN member countries, is presented in Figure 4.2.

Enhancing ASEAN Minerals Trade and Investment
REPSF Project 04/009b: Final Report 61
Figure 4.2 Key Impediments to Minerals Sector Investment in ASEAN
1. Economy wide impediments Lack of competitive neutrality
In some ASEAN member countries, private investors are disadvantaged relative to other investors, in particular state-owned enterprises. The existence of uneven playing fields in the ASEAN minerals sector impedes the ability of private investors to successfully invest in the development of ASEAN mineral resources. In Viet Nam, for instance, state-owned enterprises continue to enjoy favoured conditions, particularly in gold and gemstone mining.
Another aspect of this issue relates to the playing field across competing economic sectors. In particular, in countries including Malaysia, the mining industry has languished as a low priority sector, overshadowed by the Government’s strong policy drive toward the development of the manufacturing sector, and the emphasis on oil and natural gas sectors. The federal Government provides both direct and indirect incentives to attract investment in industrial and related sectors. The minerals sector is affected only to the extent that it involves mineral processing. The low priority given to the minerals sector is also apparent at the state level. In many states, the tradeoffs across competing land uses such as housing, tourism, infrastructure development and mining are often resolved in favour of non-mining sectors, where the payoffs are more immediate, the benefits more tangible, and the environmental issues less evident. Further, states’ decisions on land management tend to reflect the interest of the state without taking into account the potential flow-on benefits of mining to the rest of the economy. The lack of a level playing field places the mining sector at a disadvantage relative to other sectors.
Trade restrictions
The metallic minerals sector is often export oriented. As such, general trade restrictions that affect the minerals sector will act as a disincentive to minerals sector investment. Restrictive export policies are in place in a number of ASEAN member countries. In Cambodia, for example, a 2005 Sub-

Enhancing ASEAN Minerals Trade and Investment
62 REPSF Project 04/009b: Final Report
Decree prohibits the export of raw materials and requires that only final processed products be exported from the country. This restriction on exports has significant implications for the minerals sector and, if enforced, may completely impede any significant development in Cambodia’s minerals sector. In Myanmar, export taxes are coupled with significant trade licensing problems and restrictions on imports of capital equipment and inputs. Myanmar’s trade policy environment acts as a significant barrier to investment in all sectors, including the minerals sector.
Investment restrictions
Despite ASEAN’s determination to encourage FDI inflows, specific restrictions continue to exist on these inflows. In Thailand, foreign investors may generally only contribute 60% of the total capital to businesses under ‘List 2’ of the 1999 Foreign Business Act that includes the mining sector. In Myanmar, the 1988 Foreign Investment Law restricts investment in mining operations to production sharing arrangements with state-owned enterprises (ASEAN Secretariat 2004c). Specific restrictions on investment obviously impede minerals sector investment inflows to these countries.
Inadequate infrastructure
Inadequate infrastructure undermines the attractiveness of investment across a wide range of sectors. The minerals sector is often based in remote regions, involving bulky and heavy commodities, which makes the sector dependent on a reliable supply of electricity. Therefore, it is particularly vulnerable to weak infrastructure. Several ASEAN member countries, particularly the newer ASEAN members, have underdeveloped transport, communications and energy infrastructure. The lack of infrastructure services can be expected to have a negative influence on investors’ assessment of risk adjusted profitability in the minerals sector.
Limited access to finance
Poorly developed financial systems constrain domestic and foreign investment in some ASEAN member countries. This is an important issue for the minerals sector, as it relies on large capital investments and access to risk capital. Several ASEAN member countries have well developed financial systems, and domestic and foreign investors are able to obtain access to finance for mineral development projects. However, other countries, including Cambodia, the Lao PDR, Myanmar and Viet Nam, have relatively underdeveloped financial systems. These countries also tend to have a higher risk profile, adding to the difficulties of obtaining finance from major financial institutions.
Weak governance
Governance is broadly defined as the sound exercise of political, economic and administrative authority to manage a country’s resources for development (ADB 1995). The importance of good governance in the public and private sectors, and civil society generally, to strengthen and sustain capacities to deliver programs, projects and basic services, is well recognised. Good governance requires sound economic management; the enforcement of the

Enhancing ASEAN Minerals Trade and Investment
REPSF Project 04/009b: Final Report 63
rule of law; and participation, transparency, accountability, and predictability in public administration (ADB 2004b).
The lack of good governance is considered an impediment to minerals sector investment in most ASEAN member countries. For example, while there are numerous efforts at various levels being pursued to achieve good governance in the Philippines, there remain areas of concern, such as public financial management and local governance (ADB 2005a). In Indonesia, while reforms have been implemented in some segments of the economy, public and foreign confidence in the investment climate continues to be eroded by a lack of clarity on policy and the legal environment, and uncertainties regarding the enforcement of the rule of law (ADB 2004b). Overall, key common problem areas in ASEAN member countries include weak rule of law, lack of transparency and accountability and lack of partnership between NGOs and the government.
The mining sector, by its nature, is particularly sensitive to governance issues at the local level. For example, one of the key challenges facing the Philippines mining industry in its revitalisation program is the ability to translate national policy at the local level. Inconsistencies in the approach to governance that have resulted from the devolution of significant powers to local governments over the past decade, unmatched by adequate capacity building, are potential barriers to the effective implementation of policies at the local level. Similar issues are relevant to Indonesia, where there has been a move to regional autonomy and the capacity to administer the mining industry is considered by industry participants to be less well developed at this level of government. These issues, if not addressed, have the potential to undermine the effectiveness of any policy reform initiative associated with the mining sector.
2. Minerals sector impediments A number of factors specific to the minerals sector act as significant
impediments to investment in the sector in ASEAN. These include factors related to sectoral regulations and administration by governments, and other specific factors such as access to land, technology and expertise.
Poor reliability and/or access to geological information
A credible geological database is essential to support private exploration in the mining sector. Private mineral exploration is a high risk process, and mineral exploration expenditure is an investment in knowledge about the location, size and quality of mineral deposits. This process is facilitated by access to geoscience maps that provide information about the geology of a country at a regional scale. Without this broadly based information, it is difficult for private explorers to pinpoint particular areas for detailed exploration, thereby increasing the costs and risks associated with mineral exploration. The role of government in the provision of basic geological information is well recognised (Hogan 2003). Importantly, public geological surveys contribute to reducing both the costs and risks of private mineral exploration, and, thereby, encourage investment in mineral exploration and development by the private sector.
Lack of reliable and current information on ASEAN geological resources acts as a disincentive to private exploration investment. In several ASEAN

Enhancing ASEAN Minerals Trade and Investment
64 REPSF Project 04/009b: Final Report
member countries, including Cambodia, the Lao PDR and Myanmar, significant areas are yet to be explored and geologically mapped using modern equipment. In these countries and others, including Viet Nam, existing geological information is also difficult to access and is not available in a user-friendly form. This lack of basic information on investment opportunities can make it difficult for countries to attract investor interest.
Land access issues
Access to land is a crucial issue facing the mining industry globally. In many cases, the development of mineral resources has significant implications for competing land uses such as for agricultural, residential, industrial and recreational purposes. Land access issues are particularly prominent in the more densely populated areas of ASEAN.
When property rights to a particular use of land can be assigned, a market based system for determining the optimal combination of uses is generally best. When property rights cannot be assigned, administrative processes and procedures are required. In several countries, for example Thailand, the lack of an efficient mechanism through which to resolve land access disputes can lead to significant delays and uncertainties for potential investors in the minerals sector, thus acting as a strong deterrent to investment.
Land access issues also arise in ASEAN member countries with weak land tenement systems. In several ASEAN member countries, and particularly the newer ASEAN members, land title is not always clear, and information on land titles is not available in a readily usable form. Uncertainty and lack of information about land ownership creates additional costs and significant uncertainty for minerals sector investors.
In addition, in countries with less developed minerals sectors, most of the areas for potential exploration can be categorised as greenfield. In these countries, exploration activities are particularly beneficial in supporting the discovery and extraction of mineral resources. However, modern exploration techniques, including aerial surveys, require an adequate land area to carry out exploration activities on a cost effective basis. In a number of ASEAN member countries, including Cambodia, the Lao PDR, Thailand and Viet Nam, tight spatial restrictions on exploration licences, particularly when combined with relinquishment requirements, increase the risks and costs faced by investors in mineral exploration. These restrictions also reduce the likelihood of large scale commercial discoveries being made.
Regulatory uncertainty
Regulatory uncertainty, which includes uncertainty over regulations and the implementation of these regulations, is a significant issue affecting the ASEAN minerals sector. In many cases, vague and general minerals regulations leave open room for interpretation. Given the lack of precedent in the implementation of minerals regulations in a number of countries, this uncertainty creates a major risk for investors. Frequent changes to regulations through sub-decrees and other means add a further degree of regulatory risk. These risks are often referred to as sovereign risk (United Nations 1992). In several ASEAN member countries, particularly in the transition economies with newly emerging regulatory systems, sovereign risk poses a significant disincentive for potential investors.

Enhancing ASEAN Minerals Trade and Investment
REPSF Project 04/009b: Final Report 65
Regulatory uncertainty also applies to the processes for obtaining exploration and mining licences. The ability of private enterprises to obtain timely government approval of applications and effective processing of documents are vital for investment decision making in the sector (United Nations 1997). Withdrawn licensing processes are a significant impediment to investment in many countries in the ASEAN region (Morgan 2002). In several cases, companies have shown interest in investing in the minerals sector, only to be thwarted in attempts to attain the necessary mineral licences (exploration, mining and investment licences). In some countries, licence applications have commonly been extended over indefinite periods of time – even beyond ten years – without due reason.
Licensing processes in several ASEAN member countries are unclear and non-transparent, thus contributing to delays. In several ASEAN member countries, lack of information about the licensing process can make it difficult for potential investors. Uncertainty over licensing processes, particularly given the track record of companies that have been left on hold by drawn-out licensing delays, and the significant investment required for investors to maintain a presence in-country, is a significant disincentive to investment in some ASEAN member countries. In Viet Nam, for example, delays and uncertainties in the licensing process have meant that private investment in the minerals sector, particularly private foreign investment, has been very small, despite significant interest from investors. ASEAN member countries with clear procedures for applications and efficient implementation of these procedures have been more successful in attracting minerals sector investment.
Government efforts to promote a clear and transparent institutional framework for the development of the minerals sector can also be undermined by the multiplicity of regulatory regimes existing within a country. This issue is particularly acute in Malaysia, where considerable effort has been made at the federal level to formulate a National Mineral Policy encompassing a template for mineral development at the state level through the State Mineral Enactment. However, the regulatory framework affecting the minerals sector in Malaysia remains highly fragmented. To date, only six states have adopted the State Mineral Enactment, formulated in 1998. Consequently, the regulatory framework varies significantly across the 13 states in terms of application procedures, title management systems and applicable royalties. Inconsistent regulatory regimes add a further layer of uncertainty for potential investors and, as such, hinder exploration and mineral development. Higher administrative complexity can also be expected to increase industry costs.
Low security of tenure
Investors in all sectors place a high value on the security of property rights. In the minerals sector, property rights are enshrined in mineral licences, and investment flows are particularly sensitive to the security of these licences. In many ASEAN member countries, mining laws do not provide the basic tenets of security and certainty required for the investment of large amounts of capital over long periods in what are often perceived as less-than-stable developing economies (Clark 2002).
An important aspect of security of tenure is the ability to convert exploration licences to mining licences in the event of a commercial discovery of resources during the exploration stage. In many ASEAN member countries, exploration and mining licences are formally separated, and clear protection of

Enhancing ASEAN Minerals Trade and Investment
66 REPSF Project 04/009b: Final Report
the rights of exploration companies who make commercial discoveries to move to the development stage is not provided. This lack of clear rights to the development of discovered mineral resources significantly reduces the incentive for mining companies to carry out exploration investment. Further, licence extensions are not always automatic on fulfilment of specified criteria but often remain unclear or discretionary. These regulatory weaknesses expose firms to further tenure related risk.
Generally, the security of property rights in some ASEAN member countries is not as high as in more developed economies with mature minerals industries. The risk of nationalisation of mining enterprises is a factor in some countries. More specifically, there are instances where private sector investors have had their rights to mineral resources taken over by the military or other entities. Such occurrences significantly discourage investment in the minerals sectors in these countries.
Uncompetitive taxation regimes
Taxation regimes for the minerals sector can distort investment decisions affecting mineral exploration and extraction. Several ASEAN member countries have taxation rates that are high compared with international standards. Corporate taxes, when combined with export taxes, personal income taxes, withholding taxes, land taxes, licence costs and other imposts can mean that a large share of the value of production flows to the government. Uncompetitive taxation regimes can make many potential mineral development projects unprofitable, and effectively curtail investment in all but the most lucrative projects.
Limited access to technology and/or skills
Limited access to technology is a particularly significant impediment to domestic investment in the minerals sector. While foreign investors can transfer the latest technologies; domestic investors, often capital-constrained, can be significantly limited in their investment prospects by the difficulties in accessing modern technologies. This situation is compounded by government policies in some countries. For example, Myanmar has a policy that prohibits the importation of second-hand, and often more affordable, capital equipment.
Similarly, limited technical skills in less developed ASEAN member countries, particularly Cambodia and the Lao PDR, impede investment in the minerals sectors in these countries. Weak skills in geology, mining engineering and related fields increase the costs of developing mineral resources and reduce the relative attractiveness of these countries as investment destinations.
3. Environmental and social issues The environmental and social issues associated with mining have become
increasingly important in ASEAN, and indeed globally, in the past decade. The minerals sector is seen as leaving behind environmental ‘footprints’ that can potentially limit the ability of affected communities to earn and sustain their livelihood. This is particularly the case in developing countries where communities are highly dependent on their natural environment for food, shelter, transport and other opportunities.

Enhancing ASEAN Minerals Trade and Investment
REPSF Project 04/009b: Final Report 67
In several ASEAN member countries, as is the case in other countries, including OECD countries, past environmental degradation by minerals sector operators has left a negative impression of the sector in the eyes of the public. In Thailand, for example, past scars from tin mining and the more recent lead contamination of a waterway in Kanchanaburi Province, have tainted the image of the minerals sector in the country. In the Philippines, the negative public perception and acceptance of mining was largely influenced by the environmental issues associated with the Marcopper spillage. The tailing dam system at the Marcopper mine on Marinduque Island failed in March 1996, releasing several million cubic metres of waste into the Boac River and severely affecting the livelihood of fisherfolk and others downstream.
Such environmental impacts have led to significant challenges for prospective investors in the minerals sector to gain government and public approval for further mineral development projects. This historical environmental baggage has also partly contributed to the current situation, whereby mining is lowly prioritised in the development strategies of a number of ASEAN governments, relative to other sectors.
Strong community resistance to the development of mining in certain areas has been a significant issue impeding investment in the minerals sector in a number of ASEAN member countries. In ASEAN member countries with well organised rural communities, NGOs have been particularly powerful in raising concerns about mineral development projects. Local resistance to minerals sector development, and the uncertainty that this introduces, can be a significant disincentive to minerals sector investment.
In the face of strong environmental awareness by local communities and the public generally, mining firms, particularly multinational firms investing in developing countries, have become increasingly concerned about the reputational and financial risks from causing, advertently or inadvertently, environmental damage. Consequently, these firms are placing more emphasis not only on clear environmental frameworks, but also on competent government institutions that can effectively monitor and enforce compliance with these frameworks.
In some ASEAN member countries, the frameworks are themselves weak and remote from best practice. In other ASEAN member countries, where environmental regulations are compatible with international standards, the challenge is in the enforcement of these regulations. For example, small scale mining in the Philippines, while contributing significantly to the economic wellbeing of rural inhabitants, is the source of many adverse environmental impacts such as soil erosion, mismanagement of mine waste and mill tailings, air pollution and the lack of mine site rehabilitation. However, given the remote, transient and subsistence nature of small scale mining, the environmental performance of this sub-sector is inherently difficult to regulate.
E. RISK, INVESTMENT AND ECONOMIC ACTIVITY As outlined in the preceding discussion, country specific risks associated with the
content and implementation of government regulations are a major barrier to foreign investment in some ASEAN member countries. From an investor’s perspective, higher country specific risks need to be compensated for by a higher rate of return on potential investment. As a result, the interest rate structure in a high risk country tends to be higher than in a low risk counterpart. This differential in interest rates between low and high risk countries reflects partly the presence of a risk premium.

Enhancing ASEAN Minerals Trade and Investment
68 REPSF Project 04/009b: Final Report
The presence of a risk premium in a country means that some projects that would be profitable at a lower rate of return will no longer be able to attract investment internationally. Assuming the interest rate structure remains unchanged, an increase in the risk premium in a country will lead to a decline in investment spending. Similarly, a reduction in the risk premium will result in an increase in investment expenditure without a significant increase in the rate of return.
In this section, the economic implications of increased economy wide investment resulting from a reduction of country specific risks in ASEAN are assessed using ABARE’s GTEM model. Two scenarios are examined ― a lower investment growth scenario and a higher investment growth scenario. In the lower investment growth scenario, ASEAN member countries are assumed to achieve modest risk reductions through some improvements in the investment regimes and environments, leading to moderate increases in investment spending relative to the reference case. In the higher investment growth scenario, ASEAN member countries are assumed to make substantial improvements in their regulatory and institutional frameworks and, as a result, benefit from larger increases in investment expenditure relative to the reference case.
To undertake these simulations, it is necessary to first examine the risk profiles of ASEAN member countries. International credit ratings published by agencies, such as Fitch, Moody’s and Standard and Poor’s and country risk assessments undertaken by the OECD are the most widely reported indicators of country credit risks. These ratings are based on a number of factors that are perceived to affect a country’s ability to service its debt, including political risk, the size of its existing debt burden, the flexibility of its policy settings and its economic growth prospects (World Bank 2005a). The OECD country risk classifications are reported on a scale of 0 for countries with virtually no credit risk to 7 for countries with relatively high credit risk (OECD 2004).
Comparison of the international credit ratings and country risk assessments indicates that ASEAN member countries can in general be classified into four risk categories ― no risk, low risk, medium risk and high risk (Table 4.8). Singapore, which has the highest credit rating from international credit agencies and lowest country risk by the OECD, is classified as having no country specific risk. Malaysia, with international credit ratings in the low A range and an OECD country risk classification of 2, and Thailand, which has international credit ratings in the high B range and an OECD classification of 3, are both considered to have low country specific risk. Indonesia, the Philippines and Viet Nam, with international credit ratings in the B range and an OECD country risk classification of 5, are considered to have medium levels of country specific risk. Cambodia, the Lao PDR and Myanmar, which are not rated by the international credit rating agencies but have an OECD country risk classification of 7, are considered to have relatively high levels of country specific risk.
Having classified ASEAN member countries into different risk categories, the second component in developing the simulations involves determining the magnitudes of investment shocks for each risk group. This is done primarily through a review of the historical relationship between investment flows and the risk profiles in the region (Cook and Devereux 2002; McKibbin and Martin 1998).

Enhancing ASEAN Minerals Trade and Investment
REPSF Project 04/009b: Final Report 69
Table 4.8: Credit Risk Assessments of ASEAN member countries and Associated GTEM Risk Classifications
Credit Rating GTEM Rating S&P Moody’s Fitch OECD
Brunei Darussalam Not rated Not rated Not rated 2 Low risk Cambodia Not rated Not rated Not rated Not rated High risk Indonesia B+ B2 BB- 5 Medium risk Lao PDR Not rated Not rated Not rated 7 High risk Malaysia A- A3 A 2 Low risk Myanmar Not rated Not rated Not rated 7 High risk The Philippines BB- B1 BB 5 Medium risk Singapore AAA Aaa AAA 0 No risk Thailand BBB+ Baa1 BBB+ 3 Low risk Viet Nam BB- Ba3 BB- 5 Medium risk GTEM = Global Trade and Environment Model; OECD = Organisation for Economic Cooperation and Development; S&P = Standard & Poor’s. Note: the S&P rating presented here range from AAA (the highest) to B+ (the lowest). The Moody’s ratings presented here range from Aaa (the highest) to B2 (the lowest). The Fitch ratings presented here range from AAA (the highest) to BB- (the lowest). Sources: http://asianbondsonline.adb.org/scripts/marketwatch/detailpage.php?Class_Code=Rating; OECD 2005.
Under the scenarios, it is assumed that a reduction in country specific risks in the ASEAN region would lead investment to increase over the medium to longer term at the economy wide level. In the higher investment growth scenario, it is assumed that, compared with the reference case, the level of investment by 2010 would be around 10% higher in low risk countries, 20% higher in medium risk countries and 30% higher in high risk countries (Table 4.9). Alternatively, the increase in the level of investment is assumed to be 5%, 10% and 15% at 2010 respectively in the lower investment growth scenario. Given the existence of significant untapped mineral resources and underemployment in many regional economies (ADB 2005b), a marked increase in overall investment in the region has the potential to have a significant impact on economic growth and mining sector output.
Table 4.9: Assumed Increase in Investment for Each Country Risk Group, Relative to the Reference Case at 2010
Country Risk Group % Increase in Investment, Relative to the Reference Case at 2010
Low investment growth
High investment growth
No risk 0 0 Low risk 5 10 Medium risk 10 20 High risk 15 30
Source: ABARE.
In these scenarios, increased investment in ASEAN member countries at 2010 is projected to lead to increased GDP in those countries. Under both scenarios, the largest increases in economic output are projected to occur in the relatively high risk investment destinations of Cambodia, the Lao PDR and Myanmar (as represented by the Rest of ASEAN region). In this region, the level of GDP at 2010 is projected to rise by 3.2% relative to the reference case under the low investment growth scenario and by 6% at 2010 relative to the reference case under the high investment growth scenario (Figure 4.3). This is because it is assumed that relatively large investment

Enhancing ASEAN Minerals Trade and Investment
70 REPSF Project 04/009b: Final Report
barriers in these destinations are having a relatively larger negative impact on current investment in those countries than elsewhere in ASEAN. Therefore, reductions in these barriers will lead to a greater increase in investment in these destinations than elsewhere in ASEAN. Smaller increases in economic output of between 1.2% and 3.1% relative to the reference case at 2010 are projected for the medium investment risk countries of Indonesia, the Philippines and Viet Nam. Similarly, smaller increases in investment in the low risk ASEAN member countries are projected to lead to increases in GDP of less than 1.1%, relative to the reference case at 2010. For ASEAN as a region, the potential impact of the investment growth scenario translates into an increase in GDP of around U$17 billion (high growth scenario) and U$8 billion (low growth scenario) in 2004 prices relative to the reference case in 2010.
Figure 4.3: Change in GDP in ASEAN under Alternative Scenarios of
Investment Growth, Relative to the Reference Case at 2010
Source: ABARE.
These results illustrate some of the potential economy wide benefits that could flow from an improvement in the risk profile of ASEAN member countries. To the extent that economy wide risk factors also affect the minerals sector, it can be expected that the removal of broad regulatory and institutional impediments will also have a positive impact on the performance of the minerals sector. The impact of minerals sector specific reforms are captured in the quantitative analysis presented in Chapter III.
F. FUNDING INVESTMENT Given the large scale nature of investments in the minerals sector and the limited
availability of domestic capital in the majority of ASEAN member countries, access to finance is an important issue facing prospective investors in the region. This section explores some of the key potential sources of funding for minerals sector investment in ASEAN.
The two main methods of financing mining investment are equity and debt. Most minerals projects are financed by a combination of these two methods (Table 4.10). The high risk and early stages of the minerals sector investment process, such as prospecting and exploration, tend to be almost exclusively financed by equity. Equity funding can be provided by private individuals, company’s own cash resources, joint
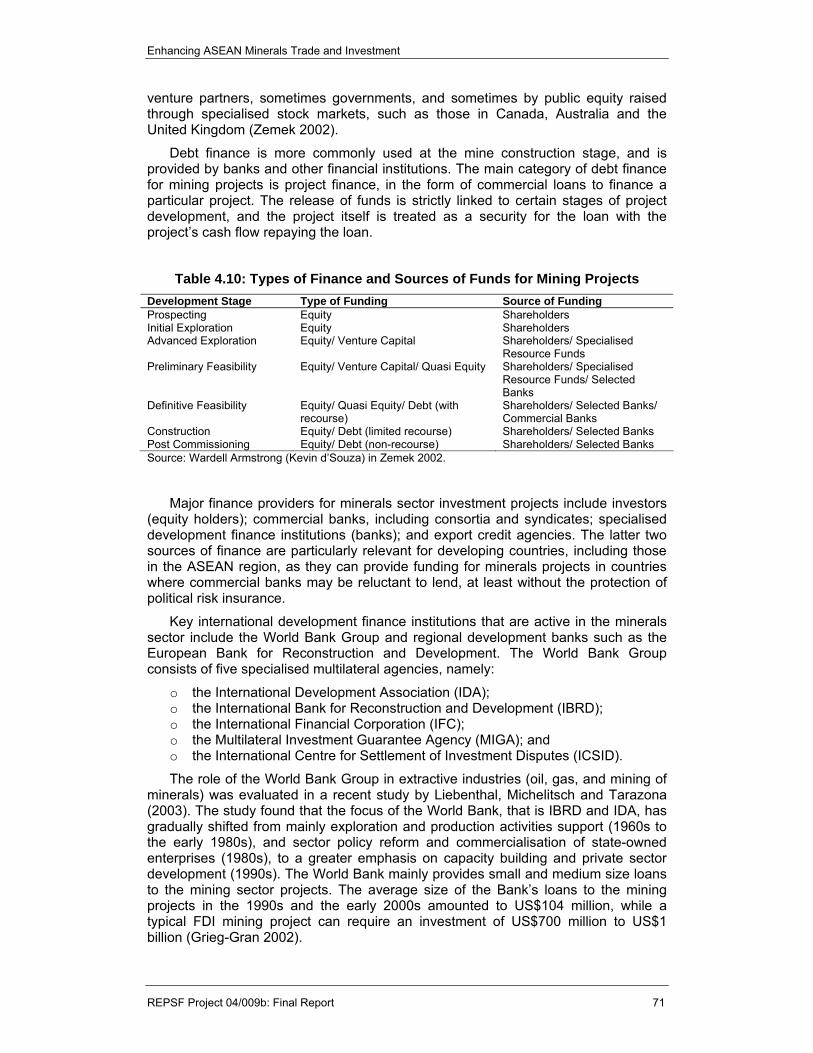
Enhancing ASEAN Minerals Trade and Investment
REPSF Project 04/009b: Final Report 71
venture partners, sometimes governments, and sometimes by public equity raised through specialised stock markets, such as those in Canada, Australia and the United Kingdom (Zemek 2002).
Debt finance is more commonly used at the mine construction stage, and is provided by banks and other financial institutions. The main category of debt finance for mining projects is project finance, in the form of commercial loans to finance a particular project. The release of funds is strictly linked to certain stages of project development, and the project itself is treated as a security for the loan with the project’s cash flow repaying the loan.
Table 4.10: Types of Finance and Sources of Funds for Mining Projects Development Stage Type of Funding Source of Funding Prospecting Equity Shareholders Initial Exploration Equity Shareholders Advanced Exploration Equity/ Venture Capital Shareholders/ Specialised
Resource Funds Preliminary Feasibility Equity/ Venture Capital/ Quasi Equity Shareholders/ Specialised
Resource Funds/ Selected Banks
Definitive Feasibility Equity/ Quasi Equity/ Debt (with recourse)
Shareholders/ Selected Banks/ Commercial Banks
Construction Equity/ Debt (limited recourse) Shareholders/ Selected Banks Post Commissioning Equity/ Debt (non-recourse) Shareholders/ Selected Banks Source: Wardell Armstrong (Kevin d’Souza) in Zemek 2002.
Major finance providers for minerals sector investment projects include investors (equity holders); commercial banks, including consortia and syndicates; specialised development finance institutions (banks); and export credit agencies. The latter two sources of finance are particularly relevant for developing countries, including those in the ASEAN region, as they can provide funding for minerals projects in countries where commercial banks may be reluctant to lend, at least without the protection of political risk insurance.
Key international development finance institutions that are active in the minerals sector include the World Bank Group and regional development banks such as the European Bank for Reconstruction and Development. The World Bank Group consists of five specialised multilateral agencies, namely:
o the International Development Association (IDA); o the International Bank for Reconstruction and Development (IBRD); o the International Financial Corporation (IFC); o the Multilateral Investment Guarantee Agency (MIGA); and o the International Centre for Settlement of Investment Disputes (ICSID).
The role of the World Bank Group in extractive industries (oil, gas, and mining of minerals) was evaluated in a recent study by Liebenthal, Michelitsch and Tarazona (2003). The study found that the focus of the World Bank, that is IBRD and IDA, has gradually shifted from mainly exploration and production activities support (1960s to the early 1980s), and sector policy reform and commercialisation of state-owned enterprises (1980s), to a greater emphasis on capacity building and private sector development (1990s). The World Bank mainly provides small and medium size loans to the mining sector projects. The average size of the Bank’s loans to the mining projects in the 1990s and the early 2000s amounted to US$104 million, while a typical FDI mining project can require an investment of US$700 million to US$1 billion (Grieg-Gran 2002).

Enhancing ASEAN Minerals Trade and Investment
72 REPSF Project 04/009b: Final Report
Between the 1980s and the 1990s, the Bank’s overall lending to the extractive industries sector decreased marginally in absolute terms and significantly relative to the Bank’s overall lending (from 4% to less than 2%). However, this overall decline masks a difference between the two sectors: lending for the oil and gas sector fell by 34%, while rising by 63% for the mining sector to reach approximately US$3.7 billion in the 1990s. The World Bank’s mining projects over the observed period were mainly targeted at structural and sectoral adjustment, for example in the coal sector, and capacity building and reform processes in the mining sector with an increasing environmental focus, rather than actual mine development.
There is an opportunity for ASEAN member countries to take advantage of the World Bank’s financial and technical support in establishing the conditions necessary to attract direct investment to the minerals sector. ASEAN member countries eligible for the World Bank’s long term interest free loans (credits) and grants are Cambodia, Indonesia, Lao PDR, Myanmar and Viet Nam. At present, the Bank is not involved in any mining related projects in ASEAN (World Bank 2005b).
The IFC is probably the most important World Bank Group agency in terms of providing actual investment funds for minerals projects in developing countries. It also acts as a catalyst for generating private sector funds in the projects that it finances. The IFC provides and facilitates three types of mining investment funding in developing member countries:
o equity investment in, and loans to, mining companies, including loans syndicated from commercial banks under the IFC's syndications loan umbrella;
o various risk management instruments (IBRD/IDA/MIGA); and o loans (the IFC's own A-loans, syndicated B-loans, or quasi-equity C-loans)
and grants to governments financing the development and implementation of government policies that support private sector development (IFC 2005).
Over the period 1990-2002, the IFC approved US$3.1 billion in extractive industries investment, with the share of extractive industries in total approved investments decreasing substantially, from a peak of US$400 million in 1991 to around US$250 million annually since then. Oil and gas accounted for more than half of the IFC’s extractive industries portfolio followed by gold and copper (Figure 4.4). In terms of geographical coverage, Latin America and Sub-Saharan Africa received 64% of the total approved extractive industries investments, with East Asia and the Pacific accounting for only 6% (Liebenthal et al. 2003).
Figure 4.4: IFC’s Extractive Industries Approvals, 1990-2002
Source: Liebenthal et al. 2003.

Enhancing ASEAN Minerals Trade and Investment
REPSF Project 04/009b: Final Report 73
The IFC is considered a standard bearer for the World Bank’s environmental and social policies, and its very presence in a mineral development project forces the ‘highest common denominator’ environmental standards onto other project finance providers (Zemek 2002). This is a particularly important aspect at a time when social and environmental issues stand close to the top of the agenda of banks and other financial institutions, and FDI in the mining sector is becoming increasingly environmentally conscious.
MIGA does not finance projects but provides political risk insurance for foreign investments in developing countries that typically have weak governance and high perceived political risks. Between 1990 and 2002, MIGA insured 24 mining and 7 oil and gas projects. Total liability issued in extractive industries over this period amounted to almost US$1.5 billion, with mining accounting for 74% of the total. Half of MIGA’s mining projects have been gold mines (12 projects), and another 8 have been copper mines. In terms of coverage, MIGA’s mining projects have been concentrated in Latin America and the Caribbean (45%) and Africa (27%), followed by the transition economies in the former Soviet Union (16%) (Liebenthal et al. 2003).
Although the World Bank provides only a small share of minerals sector financing, its reach - through its access to a wide range of stakeholders, the influence of its environmental and social policies, and the demonstration effects of its projects - is potentially much greater. The World Bank’s advice on developing an enabling environment for the extractive industries also has a broader impact on the sector than the financing volume would indicate (Liebenthal et al. 2003). This suggests a scope for securing a greater involvement of the World Bank agencies in minerals sector development in ASEAN member countries. This has the potential to lead not only to financial inflows from the World Bank, but also to increased attractiveness of minerals projects in the region for private sector funding.
Another option for mining finance is provided by export credit agencies (ECAs), the public agencies that provide government-backed loans, guarantees, credits and insurance to private corporations from their home country to do business abroad, particularly in financially and politically risky developing countries. Typically, ECAs provide part of the finance required for a mining project’s purchases of goods and services in the agency’s home country. Given that most of the heavy equipment used in mining operations is manufactured in developed countries, and many large construction companies are based there, the involvement of ECAs from those countries can be quite substantial.
ECAs are among the largest sources of mining sector finance. Their aggregated lending is probably much higher than all the commercial banks and multilateral institutions combined. No data are readily available for the mining sector, but in terms of general lending to mostly large projects, annual new commitments of officially supported export credits increased by more than four times between 1988 and 1996 to reach US$105 billion. By comparison, annual financing of all projects by the World Bank during the same period was US$21.5 billion a year (Zemek 2002).
In funding their investments, mining companies have access to a combination of different methods and sources of finance. However, competition for access to global investment funds is fierce, with the availability of funds highly sensitive to international commodity prices, competition from other industries and countries, and the track record of the company soliciting the funding.
While the interplay of commercial factors can hardly be influenced by small economies, ASEAN governments can help to turn the scale in their favour by providing a more conducive regulatory and investment environment for both foreign and domestic mining companies in their countries. International resource companies clearly have access to substantial funds. A critical determinant of whether these
Enhancing ASEAN Minerals Trade and Investment
74 REPSF Project 04/009b: Final Report
funds are channelled to ASEAN member countries is the companies’ assessed profitability of minerals projects in respective member countries.

Enhancing ASEAN Minerals Trade and Investment
REPSF Project 04/009b: Final Report 75
V. POLICY RECOMMENDATIONS
o In order to enhance trade and investment in the minerals sector in ASEAN, the key policy recommendations at the economy wide and minerals sector levels are proposed. These recommendations are broadly structured within the ASEAN Minerals Cooperation Action Plan (AMCAP) 2005-2010 framework.
o The recommendations are founded on the principle that governments are ultimately responsible for setting the rules by which mining takes place in a given jurisdiction and their actions are critical to achieving sustainable benefits from the minerals industry for the national economy. They must provide strategic direction; the requisite legal, regulatory and institutional frameworks to pursue economic, social and environmental objectives; accountability, transparency, and stakeholder consultation; and systems to deliver tangible benefits to the country’s citizens.
o The recommendations also highlight the role of the private sector in supporting the sustainable development of the minerals sector. In particular, mining companies are responsible for engaging in cooperative efforts with governments, local communities and other stakeholders to address the minerals sector’s negative environmental image and resolve the concerns associated with the social impacts of mining.
The minerals sector has the potential to make a significant contribution to ASEAN member countries and assist in the drive toward economic development and poverty alleviation. Importantly, the minerals sector can play a significant role in improving the livelihood of communities in remote rural areas where few alternative employment opportunities exist. In addition, the sustainable development of the mining sector would allow financially constrained ASEAN member countries to increase and stabilise government revenues, thereby reducing their exposure to external shocks. In the relatively more advanced ASEAN member countries, the development of the sector also provides an opportunity to create a diversified and more resilient economic portfolio.
In general, ASEAN member countries are prospective in terms of minerals. However, as a result of poor enabling environments, the contribution of the minerals sector to economic growth remains well below its potential in the majority of countries in the region. The mining sector tends to be isolated geographically and technologically from the rest of the economy. Further, the sector is characterised by high risk, high capital intensity and long gestation periods. As a result of these factors, the development of the minerals sector within a country calls for a strong and effective policy framework. This condition is also necessary for attracting the substantial levels of private sector investment, particularly FDI, required to underpin the development of the minerals sector in ASEAN member countries that have limited domestic capital resources. In a time when globalisation is creating new opportunities for investment and increasing competition for mining capital, maintaining a stable and welcoming policy climate is becoming more important, and more challenging, than it has ever been.
In this chapter, key policy recommendations to address the wide spectrum of issues identified in Chapter IV are presented. The focus here is on economy wide and sector specific policy recommendations that can be implemented unilaterally. In many ways, the recommendations provided in this section are aligned with the three broad strategies specified in AMCAP 2005-2010: facilitating trade and enhancing

Enhancing ASEAN Minerals Trade and Investment
76 REPSF Project 04/009b: Final Report
trade and investment in minerals; promoting environmentally and socially sustainable mineral development; and strengthening institutional and human capacities in the ASEAN minerals sector. The role of regional integration in supporting domestic reform efforts in ASEAN member countries is explored in Chapter VI.
A. ECONOMY WIDE RECOMMENDATIONS 1. AMCAP Strategy 1: Facilitating trade and investment
Competitive neutrality
In order to provide an economic environment that does not discriminate against the minerals sector, ASEAN governments should:
o have a clear sense of direction, vision and purposeful commitment to ensure that there is a level playing field across competing sectors in terms of fiscal and other economic conditions;
o convey their commitment to the community through targeted and sustained education programs designed to enhance the profile of the sector in terms of its potential economic benefits and environmental performance; and
o minimise the involvement of state-owned enterprises in the operation of the minerals sector and remove any conflict of interest between the government as a regulator and developer of mineral resources.
Trading rights
An important issue in a number of ASEAN member countries relates to government regulations concerning in-country processing. While it is understandable that governments may wish to support value adding activities within their own jurisdictions, mandatory domestic processing is unlikely to be in the best national interest if not based on comparative advantage. In addition to in-country processing requirements, other trade restrictions, such as restrictions on the import of second-hand capital equipment, exist in some ASEAN member countries. In this context ASEAN governments should:
o remove all non-tariff barriers to trade affecting the minerals sector both directly and indirectly.
Foreign direct investment
Despite ASEAN’s determination to encourage FDI inflows generally, specific restrictions continue to exist on these inflows. ASEAN governments should:
o remove restrictions on FDI in order to facilitate further development of the region’s minerals sector. In some countries, this would involve removing quotas for domestic investment in minerals sector enterprises. In several other countries, the relaxation of joint venture requirements would also assist in stimulating foreign investors’ participation in the development of extractive industries.
Infrastructure development
A prerequisite for the development of the minerals sector is the availability of essential infrastructure such as roads, ports, energy and communications. Infrastructure needs are particularly acute in the least developed ASEAN member countries of Cambodia, the Lao PDR, Myanmar and Viet Nam –

Enhancing ASEAN Minerals Trade and Investment
REPSF Project 04/009b: Final Report 77
countries where the options for financing investment are most limited. While governments have a role in the provision of infrastructure, financial constraints in many ASEAN member countries imply that there is heavy reliance on the private sector for the provision of infrastructure services. To ensure they attract sufficient funds, ASEAN governments should:
o create and maintain an environment characterised by a liberal trade and investment regime and stable macroeconomic conditions; and
o reduce the commercial and political risks faced by potential investors.
Access to finance
Given the limited availability of domestic capital in many ASEAN member countries, access to finance is an important issue facing prospective investors in the region. In many cases, capital markets are weak, making enterprises reliant on foreign borrowing and volatile foreign portfolio flows. In order to mobilise adequate investment funds to support economic development, governments in ASEAN member countries should:
o strengthen domestic capital markets through the provision of stable and unambiguous regulatory environments; and
o consider the consolidation of equity markets across ASEAN member countries. Such a consolidated market would benefit from higher volumes, reduced trading costs and harmonised regulations;
2. AMCAP Strategy 3: Strengthening institutional and human capacities Governance
While not confined to the minerals sector, there is a pressing need for improved governance across the majority of ASEAN member countries. While the importance of good governance in the public and private sectors, and civil society generally, to strengthen and sustain capacities to deliver programs, projects and basic services is well recognised, there remain several areas of concern. These negatively affect the general economic performance and equally the performance of individual sectors, such as mining. In order to achieve further progress in improving governance, governments in ASEAN should:
o continue to invest in capacity building programs to strengthen the technical, regulatory, legal, commercial and administrative skills of public sector agencies involved in regulation of the minerals and other sectors;
o pay particular attention to capacity building at the local government level in terms of personnel, financial resource management, and intra- and intergovernmental relationships;
o focus on delivering accountable, participative and results-oriented governance outcomes in countries where significant policy reform initiatives are already in place; and
o pursue an integrated and sustainable reform strategy, backed by strong political will and appropriate resourcing.
B. MINERALS SECTOR RECOMMENDATIONS
1. AMCAP Strategy 1: Facilitating trade and investment
Reliability and availability of basic geological information

Enhancing ASEAN Minerals Trade and Investment
78 REPSF Project 04/009b: Final Report
The availability of reliable and accessible basic geological data in ASEAN is limited, acting as a disincentive to private exploration expenditure. In order to secure the long term viability of the minerals industry in ASEAN member countries, governments should:
o provide high level geoscientific information; o in the presence of limited government resources, explore the opportunities
for partnerships with industry, academia and community organisations to provide that information;
o generate support for collaborative research programs designed to add to the region’s mineral reserves by developing ways of finding new ores and extracting currently uneconomic resources in a sustainable manner; and
o investigate the potential for donor funding to improve the capacity of ASEAN member countries to collect, compile and disseminate geological information.
Land access
In parallel with economic growth, land access issues are becoming more controversial in ASEAN member countries. In some countries, the tradeoffs across competing land uses such as housing, tourism, infrastructure development and mining are often being resolved in favour of non-mining sectors, where the payoffs are more immediate, the benefits more tangible, and the environmental issues less evident. In addressing these issues, governments should:
o adopt a market based system for determining the optimal allocation of land resources in cases where property rights can be assigned to particular land uses;
o devote additional resources to the development of regulatory frameworks for allocating and securing property rights over land resources where property rights are not clearly defined;
o where property rights cannot be defined, adopt transparent and consistent administrative processes and procedures to remove the uncertainty surrounding access to land resources; and
o ensure that these processes and procedures are flexible enough to allow new information related to mining technologies, for example, as well as changes in economic factors such as minerals prices, to be taken into account.
Regulatory certainty
In several ASEAN member countries, uncertainty about the licensing process is the single largest impediment to minerals sector investment. Further, in some countries, approval processes are open ended with different levels of government issuing exploration and mining licences without coordination. These factors add substantial uncertainty and cost to potential mining projects. ASEAN member countries, if serious about enhancing minerals trade and investment, must:
o ensure that the licensing process is clear, efficient and transparent, while acknowledging that improving regulatory certainty in the minerals sector requires an enhancement of both regulations themselves and institutions that carry out their implementation;
o where laws are vague or incomplete, pay attention to improving their clarity and broadening their scope;
o strengthen institutions to ensure that government agencies are consistent in their application of regulations, acknowledging that improving regulatory

Enhancing ASEAN Minerals Trade and Investment
REPSF Project 04/009b: Final Report 79
certainty in the minerals sector is closely linked to the broader issues of improving governance generally and reducing sovereign risk;
o provide clear information about existing regulations and procedures, including licensing processes, to potential investors in a readily accessible form;
o consider the establishment of a ‘one-stop shop’ for minerals sector investment; and
o consider the potential contribution of the private sector in identifying the weaknesses in existing regulations and procedures and in designing and delivering appropriate capacity building programs.
Security of tenure
There are also major issues associated with security of tenure in a number of ASEAN member countries. Typically, in these countries, the laws covering mineral exploration and extraction provide no guarantees that a company securing exploration rights will be given the first right of refusal to mine any economic deposits found. In addition, the lease period for mineral development is often short relative to the economic life of the reserve of mineral deposits, with possible renewal not always a feature of these licences. Where renewal is allowed, the process is often ad hoc, piecemeal and lengthy. These issues have a negative impact on investment in the mining sector, given the high capital intensity, long lead time and high risks involved. In order to enhance investor confidence in the security of mining tenements, it is important to:
o ensure that the requirements for investors to proceed from an exploration licence to a mining licence are clear and transparent so as to reduce the actual and perceived risks involved in allocating substantial capital resources at the high risk exploration stage;
o specify the conditions under which a title can be revoked; and o ensure that minerals rights are exclusive, and transferable to other
enterprises, provided that all technical, financial, environmental and other requirements are met.
Competitive taxation regime
Within the context of increasing competition for global capital resources, the establishment of internationally competitive taxation regimes is crucial for encouraging minerals sector investment in ASEAN. Importantly, the design of tax policy instruments has implications for the optimal allocation of mineral reserves, maximisation of mineral rents, maintenance of environmental standards and reinvestment of mineral rents (Sarma and Naresh 2001). Ideally, mining taxation regimes should be:
o internationally competitive and allow a fair share of benefits between governments and investors;
o easy to understand; o easy to administer; o stable and predictable over time; o non-discriminatory; o transparent; and o provide a level playing field for all participants (Parsons 2001, World Bank
2003). ASEAN member countries should:

Enhancing ASEAN Minerals Trade and Investment
80 REPSF Project 04/009b: Final Report
o consider their minerals sector taxation regimes in comparison with those of countries with more established minerals sectors and countries that have had recent success in attracting substantial capital inflows to their minerals sector (Chile and Mongolia, for example), taking into consideration that the mix of minerals produced, the degree of decentralisation and the level of economic development will affect the composition of minerals taxation regimes across countries;
o develop taxation regimes for the minerals sector with a full understanding of the international context in which mining companies operate; and
o given the cyclical nature of minerals markets, move toward the adoption of royalty arrangements that are linked to profitability.
2. AMCAP Strategy 2: Promoting environmentally and socially sustainable
mineral development In addition to economic issues, it is becoming increasingly evident that
addressing the environmental and social dimensions of mining will be paramount in allowing the sustainable development of mineral resources in both advanced and developing economies over the next decades. In this context, ASEAN member countries must:
o demonstrate their commitment and ability to set appropriate and reliable environmental rules, at acceptable international standards, and to monitor these standards in a credible manner;
o where the legal and institutional settings are not in place, initiate a process of gradually establishing:
- a legal basis for environmental regulation; - basic institutional responsibilities; - essential regulatory frameworks; - monitoring and enforcement procedures, including public disclosure; and - human and financial resources to address priority issues (Bond and
Weber-Fahr 2002), taking into account that the methods employed for achieving environmental objectives will vary considerably on the basis of different local, natural, socio-economic and cultural conditions;
o where the legal and related institutional mechanisms are already in place, focus on the implementation of these frameworks and in finding pragmatic solutions that take into account resource and capacity constraints;
o work with the private sector to address the environmental liabilities that the mining sector has inherited from past operations.
Reducing the minerals sector’s negative environmental image is, to a large extent, the responsibility of the private sector. Mining companies, by maintaining ‘clean’ track records, could contribute significantly to improving the profile of the minerals sector – an issue that international mining firms are fully aware of, and fully committed to.
In this context, the development and adoption of an industry code of conduct would be beneficial. There are numerous examples of voluntary national initiatives already underway or proposed for the mining sector across a range of countries (Greene 2002). These initiatives have a role in supplementing existing legal regimes, and can also be used to address unregulated areas and encourage ‘beyond compliance’ performance in regulated areas. Typically though, voluntary initiatives are often adopted in the first instance by larger companies, who are already advanced in environmental management. It is therefore recognised that there is a need to:

Enhancing ASEAN Minerals Trade and Investment
REPSF Project 04/009b: Final Report 81
o provide strong underlying regulatory regimes to encourage the development of, participation in, and continued evolution of effective voluntary initiatives.
There is also scope for community information campaigns to raise awareness about modern sustainable minerals sector practices. Community distrust of the mining sector will only dissipate, however, through the implementation of responsible and environmentally sound minerals sector practices (from exploration to mine site rehabilitation) by mining companies over a sustained period of time.
Associated with the anti-mining sentiment that is apparent in some ASEAN member countries is the need to:
o consider more explicitly the social impact of mining, particularly on local communities that rely on the natural environment for their livelihoods.
Again, it is important for mining companies to address the legitimate concerns raised by communities, with a focus on stakeholder engagement. Mining projects should be linked to development initiatives that are implemented and pursued in partnership with local government agencies and communities. These development initiatives should incorporate capacity building aimed at empowering local communities and, importantly, transparent and continuous consultation with the direct beneficiaries of mining projects to ensure that the actual distribution of earnings is as intended. It is essential for mining companies to build an atmosphere of trust and a reputation of responsible mining, and to work in cooperation with local communities to find ways of dividing the benefits from resource development.
3. AMCAP Strategy 3: Strengthening institutional and human capacities
Improving technical skills in geology, mine engineering, environmental sciences and other disciplines related to the mining sector in certain ASEAN member countries is an area where regional cooperation in ASEAN may be particularly valuable. The potential for regional cooperation in improving technical skills is discussed in Chapter VI.
Limited access to technology in the ASEAN minerals sector could be overcome by improving public-private sector partnerships in geological exploration, and by facilitating FDI. The AMCAP 2005-2010 also identifies regional cooperation initiatives to improve access to minerals sector technologies.

Enhancing ASEAN Minerals Trade and Investment
82 REPSF Project 04/009b: Final Report
This page has intentionally been left blank.
Enhancing ASEAN Minerals Trade and Investment
REPSF Project 04/009b: Final Report 83
VI. ASEAN COOPERATION IN MINERALS: MAXIMISING OPPORTUNITIES
o ASEAN regional cooperation has significant potential to complement domestic efforts in improving the trade and investment environment affecting the minerals sector in ASEAN member countries. ASEAN minerals cooperation can enhance the ability of ASEAN governments to provide public goods, facilitate private sector investment and trade, and regulate the minerals sector effectively.
o ASEAN minerals cooperation took a major step forward in August 2005, with the signing of the Ministerial Understanding on ASEAN Cooperation in Minerals and the adoption of the associated AMCAP 2005-2010. The AMCAP 2005-2010 contains a comprehensive set of strategies, projects and activities for ASEAN minerals cooperation in the following areas: facilitating and enhancing trade and investment in minerals; promoting environmentally and socially sustainable mineral development; and strengthening institutional and human capacities.
o The key challenge in delivering the objectives of the AMCAP 2005-2010 will be its effective implementation over the next 5 years.
ASEAN cooperation in minerals advanced in August 2005, with the signing of
the Ministerial Understanding on ASEAN Cooperation in Minerals. In recognition of the benefits of regional cooperation, the Ministerial Understanding and the associated AMCAP 2005-2010 identify areas of cooperation, strategies, and action plans for minerals cooperation in the region. There is the potential for ASEAN cooperation in minerals to deliver significant benefits to the region through initiatives to strengthen the trade and investment environment in the minerals sector. In this context, the implementation of the AMCAP 2005-2010 will be a key factor.
In this chapter, potential benefits from regional cooperation in minerals are discussed. The history and current situation regarding minerals cooperation in ASEAN is then reviewed. The scope for further enhancement of cooperation within ASEAN, and obstacles to sustained and effective cooperation, are also examined.
A. POTENTIAL BENEFITS OF ASEAN COOPERATION IN MINERALS The majority of the obstacles to the development of the minerals sector in ASEAN
member countries (as discussed in Chapter IV) are driven by domestic policies. These include regulatory uncertainty, lengthy and unclear licensing processes, low security of tenure in the minerals sector, and, more broadly, institutional weaknesses. As discussed in Chapter V, most of the reforms required to improve the investment environment in the minerals sector are also domestic in nature. In many cases, there are fairly clear steps that individual ASEAN governments could take to move toward a best practice regulatory and institutional regime for the minerals sector in order to encourage greater trade and investment flows.
However, significant potential also exists for regional cooperation to complement domestic efforts to improve the trade and investment environment in the minerals sector. While governments have a role to play in the provision of public goods such as the provision of high level geological information, and the facilitation of an enabling regime for private sector investment, ASEAN cooperation in minerals can raise the ability of ASEAN governments to carry out these functions by drawing on

Enhancing ASEAN Minerals Trade and Investment
84 REPSF Project 04/009b: Final Report
the complementarities within the region. Specifically, ASEAN minerals cooperation has the potential to provide the following benefits:
o strengthen the ability of ASEAN governments to provide public goods, facilitate private sector investment and trade, and regulate and tax the minerals sector (‘in-country’ benefits). This strengthening can occur through the sharing of experiences, ideas, research, expertise and technology for use by the public sector. ASEAN cooperation may be particularly beneficial because countries are at different stages of minerals sector development, and have a diverse mix of experiences and strengths;
o allow for regional efforts to provide public goods, facilitate private sector investment and trade, and regulate the minerals sector (‘regional’ or ‘collective’ benefits). These include the development of regional geological databases, regional investment promotion, the removal of intra-ASEAN barriers to trade and investment, and regional harmonisation of regulations and policies. Efforts in areas such as investment promotion and marketing may also be more cost effective at the regional level.
There is significant potential for this first formal stage of ASEAN cooperation in minerals to provide tangible net economic benefits to the region’s minerals sector, in terms of both strengthening the capacity of ASEAN governments to manage and facilitate the development of the minerals sector and regional initiatives that provide benefits to ASEAN member countries collectively. The minerals sector could be instrumental in helping to strengthen the ties of the ASEAN community. Current ASEAN cooperation efforts in minerals are discussed in Section B.
B. ASEAN MINERALS COOPERATION TO DATE ASEAN, established in 1967, binds ten Southeast Asian countries in political,
economic, and functional cooperation. The ASEAN Declaration, signed in Bangkok in 1967, states that “the Association represents the collective will of the nations of Southeast Asia to bind themselves together in friendship and cooperation and, through joint efforts and sacrifices, secure for their peoples and for posterity the blessings of peace, freedom and prosperity”.
The minerals sector, despite not being included on ASEAN list of ‘Priority Sectors for Integration’ (ASEAN Secretariat 2004d), has been the focus of increasing cooperation efforts in recent years (Figure 6.1). Cooperation in areas including the ASEAN Minerals Database and information exchange on minerals trade and investment and environmental management has been seen (ASEAN Secretariat 2005d).
On 4 August 2005, a Ministerial Understanding on ASEAN Cooperation in Minerals was signed at the first ASEAN Ministerial Meeting on Minerals (AMMin) in Kuching, Sarawak, Malaysia. The AMMin will meet at least once every three years to discuss issues and developments of common interest and set policy directions for minerals sector cooperation. The 2005 AMMin adopted the AMCAP 2005-2010, which contains 19 concrete and strategic actions to realise the policy agenda under the Vientiane Action Program and the Ministerial Understanding on ASEAN Cooperation on Minerals (ASEAN Secretariat 2005d). The ASEAN Senior Officials Meeting on Minerals (ASOMM) will be held annually and will have overall responsibility for the supervision, coordination and implementation of the AMCAP 2005-2010 (ASEAN Secretariat 2005d, 2005e).

Enhancing ASEAN Minerals Trade and Investment
REPSF Project 04/009b: Final Report 85
Figure 6.1: ASEAN Minerals Cooperation
Source: ASEAN Secretariat 2005e.
ASEAN cooperation in minerals has developed later than cooperation in several other sectors. While the Ministerial Understanding on Minerals was signed in 2005, similar Ministerial Understandings were signed earlier in relation to other sectors, including food, agriculture and forestry (1993), transport (1996), finance (1997),

Enhancing ASEAN Minerals Trade and Investment
86 REPSF Project 04/009b: Final Report
tourism (1998) and telecommunications and information technology (2001). The ASEAN Framework Agreement on Services was signed in 1995.
The objectives in the 2005 Ministerial Understanding on ASEAN Cooperation in Minerals are to:
(i) develop the minerals sector to be an engine for greater economic growth and social progress in the ASEAN region;
(ii) enhance trade and investment in the ASEAN minerals sector; and (iii) promote environmentally sound and socially responsible mineral
development practices in the sustainable management and optimum utilisation of mineral resources.
The 2005 Ministerial Understanding on ASEAN Cooperation in Minerals identified cooperation to be undertaken in the following areas:
(i) information exchange and development of the ASEAN Mineral Database; (ii) promotion and facilitation of intra- and inter-ASEAN trade and investment; (iii) promotion of environmentally and socially responsible mineral resources
management and development; (iv) intensifying private sector participation and public-private sector
collaboration in ASEAN mineral cooperation programs, projects and activities;
(v) fostering cooperation with ASEAN dialogue partner countries and relevant international and regional organisations in the promotion of scientific and technological research and development in mineral resources development and geosciences, as well as cooperative programs on technology transfer;
(vi) coordination of development policies and programs on mineral resources; (vii) exchange of technical information, experience and best practices; (viii) strengthening cooperation and joint approaches in addressing international
and regional issues and concerns of common interest; and (ix) all other areas of cooperation as may be deemed necessary.
The AMCAP 2005-2010 identifies activities and projects to be carried out toward the objective of creating a “vibrant ASEAN minerals sector by enhancing trade and investment and strengthening cooperation and capacity for sustainable mineral development” (ASEAN Secretariat 2005d). Areas of ASEAN minerals cooperation and key strategies covered by the AMCAP 2005-2010 are summarised in Figure 6.2.
The AMCAP 2005-2010 and joint press statement of the first AMMin identify four ASEAN working groups (minerals information and database, trade and investment in minerals, sustainable mineral development, capacity building in minerals) and cooperation and dialogue with ASEAN ten dialogue partners (China, Japan, Republic of Korea, the Russian Federation, the United States, Australia, Canada, the European Union, India and New Zealand) as important components of ASEAN minerals cooperation.
Recent developments under the ASEAN minerals cooperation framework are positive steps toward fostering stronger economic ties across the ASEAN member countries. While the role of ASEAN minerals cooperation in the development of the minerals sector has been limited to date, the AMCAP is poised to become one of the

Enhancing ASEAN Minerals Trade and Investment
REPSF Project 04/009b: Final Report 87
most comprehensive regional minerals cooperation programs in the world1. Importantly, the outcomes of the program will be highly contingent on its effective implementation over the next 5 years.
Figure 6.2: ASEAN Minerals Cooperation Areas
Source: ASEAN Secretariat 2005d.
1 Other regional cooperation programs in minerals include within APEC (GEMEED) and African cooperation held under the auspices of the United Nations Regional Cooperation and Integration Division (United Nations Economic Commission for Africa 1997)

Enhancing ASEAN Minerals Trade and Investment
88 REPSF Project 04/009b: Final Report
The recent ASEAN minerals cooperation agenda has also placed a strong emphasis on facilitating the private sector as the primary vehicle for investment and trade. This marks a change from previous cooperation initiatives, such as the public investment funded ‘ASEAN Potash Mining Project’ in Thailand (ASEAN Secretariat 1991). In 2005, the Forum on Private Sector Cooperation in ASEAN, under the auspices of the ASEAN Federation of Mining Associations, was established as a “cooperation vehicle to foster trade and investment in joint venture projects and creative partnerships in the ASEAN minerals sector”. The ASEAN Federation of Mining Associations will develop a prioritised strategic plan to support the Private Sector Forum’s Roadmap for Cooperation and the AMCAP 2005-2010, and establish a permanent secretariat to address the emerging priorities and challenges facing private sector involvement in the ASEAN minerals sector (ASEAN Secretariat 2005f).
Regional sectoral cooperation can be conceived of in terms of a ‘cooperation spectrum’. It takes time for effective regional sectoral cooperation to develop. The ultimate potential outcome of regional sectoral cooperation is full integration of sectors across countries, involving regional harmonisation of legislation. However, this outcome is rarely achieved in practice. A simplified spectrum of regional cooperation in minerals is presented in Figure 6.3. It should be noted that cooperation need not always follow this spectrum in a linear manner.
ASEAN minerals sector cooperation is in its infancy and still remains in early stages of the simplified spectrum above. The momentum of the Ministerial Understanding on ASEAN Cooperation in Minerals, and the projects and activities identified in the AMCAP 2005-2010, have the potential to move ASEAN further along the minerals cooperation spectrum. Such a move would be conducive to the development and implementation of key policies required to support the growth of a sustainable minerals sector in the region.

Enhancing ASEAN Minerals Trade and Investment
REPSF Project 04/009b: Final Report 89
Figure 6.3: Regional Cooperation Spectrum

Enhancing ASEAN Minerals Trade and Investment
90 REPSF Project 04/009b: Final Report
C. AMCAP 2005-2010 AND THE PROSPECTS FOR REGIONAL COOPERATION The AMCAP 2005-2010 presents a comprehensive set of strategies, projects and
activities for ASEAN minerals cooperation over the next 5 years. Implementation of the AMCAP will require resources, careful project planning, institutions that are capable of implementing such an ambitious plan, and ongoing political will in ASEAN member countries.
1. Project planning In general, there is still scope for further work to be done by ASOMM in terms
of project planning. It is important for ASOMM to identify specific projects and activities to be carried out during the 2005-2010 period and how these projects and activities will be carried out. Currently, the AMCAP 2005-2010 does not include any discussion of inputs. Identified outputs are also often vague. Detailed annual work plans will need to be developed by ASOMM in order to ensure a well focused project with a high likelihood of success in achieving project objectives. These work plans should specify which parties are responsible for individual projects and activities and detailed timelines for project implementation. The implementation of the AMCAP, as indeed that of other ASEAN projects, should be monitored and evaluated as a normal part of the ‘project cycle’ to ensure a degree of accountability.
2. Implementation
The ASOMM will have overall responsibility for the supervision, coordination and implementation of the AMCAP 2005-2010. There appears, however, to be very little continuity in the proposed implementation of the AMCAP. The ASOMM is held only once a year, and there is no ASEAN governmental institution established to progress the AMCAP agenda on a permanent basis. For successful cooperation in minerals in ASEAN, there is a need for such an institution with responsibility for coordinating the implementation of the AMCAP. ASOMM could then still have the role of setting cooperation objectives and reviewing success in achieving work plans and objectives. Specific suggestions to progress the objectives of regional cooperation in minerals include:
Sharing experiences
There is significant scope for ASEAN member countries to share experiences in regulation of the minerals sector in order to improve regulation of the sector. ASEAN member countries have different experiences in the minerals sector and these differences provide scope for beneficial cooperation. The regulation of gemstone mining provides a good example. Regulation of gemstone mining is particularly difficult because of the small size of gemstones and the difficulty of valuing gemstones. ASEAN member countries have had differing experiences with the gemstones sector and have in several instances faced regulatory problems related to gemstones. The sharing of experiences and strategies between ASEAN member countries in the field of gemstones regulations, in addition to other areas such as monitoring compliance with environmental and safety standards, contract negotiation and public-private sector cooperation, could be particularly beneficial.

Enhancing ASEAN Minerals Trade and Investment
REPSF Project 04/009b: Final Report 91
Study tours
Study tours could be particularly beneficial for public sector capacity building purposes. Study tours and joint ‘case studies’ for public sector geologists, mining engineers, inspectors and regulators could prove valuable. One option is to have annual pairings of ASEAN member countries for ‘study, capacity building and collaboration trips’. Short and long term personnel exchanges within ASEAN could be organised. Officials and others participating in the exchanges could build important networks during such exchanges and could report to ASOMM about their experiences and what they learnt during their time in the host country. ASEAN member countries with infant minerals sectors could send public sector professionals to ASEAN member countries with more developed minerals sectors (Indonesia, Malaysia, the Philippines, Thailand). Public sector professionals could also potentially participate in study trips to ASEAN dialogue partners, particularly those with advanced minerals sectors (Australia, Canada, the Russian Federation, China and other countries).
ASEAN market promotion
ASEAN could do a lot to improve information and marketing of investment potentials in the region’s minerals sector. The development of ASEAN minerals specific information kits (as in other countries) could increase investor interest. These, and other marketing tools, could complement the proposed web-based Directory on Trade and Investment in Minerals.
Education cooperation and collaborative research
One issue constraining the minerals sector in several ASEAN member countries is a lack of higher education courses and teaching capacity in geology, mine engineering, environmental sciences and related disciplines. There is potential for regional cooperation in minerals university education with the aim of increasing ASEAN capacity to manage and participate in the sustainable development of ASEAN mineral resources. Several potential models exist for this, including the development of short courses, student exchanges and an ASEAN centre for university studies in minerals.
There are also potential net economic benefits from the collaborative undertaking and funding of scientific and economic research targeted to address issues specific to the ASEAN region. Such activities avoid the duplication of research efforts and also take advantage of comparative research strengths across different countries.
Joint geological activities
Joint geological activities are a particularly good way for minerals sector agencies to work together in practical cooperation. Collaborative geological activities involving public sector geologists from a number of ASEAN member countries could be highly beneficial in terms of capacity building, sharing of experiences and network strengthening. Further along this line, the scope for establishing an ASEAN geological survey organisation could be assessed. Such a regional organisation would provide the opportunity to benefit from economies of scale in undertaking geological surveys, and also economies of scope, reflecting the other roles of geological surveys such as monitoring earthquakes.
Dialogue partners
All ten of ASEAN official dialogue partners, including countries with the largest and most modern minerals sectors in the world, have a potential

Enhancing ASEAN Minerals Trade and Investment
92 REPSF Project 04/009b: Final Report
contribution to make in strengthening ASEAN minerals sector institutions. ASEAN should work closely to engage these partners in minerals cooperation. Joint cooperation initiatives with ASEAN dialogue partners, including study tours, personnel exchanges, and technical, financial and technological cooperation initiatives, have significant potential to strengthen ASEAN management of the minerals sector.
Development of regional guiding principles
The development of regional guiding principles in minerals (step 4 in the cooperation spectrum) could assist regional marketing efforts for the ASEAN minerals sector and lead toward an improvement of minerals sector regulation across the region. ASEAN member countries could potentially discuss and agree to a set of guidelines on certain topics, including:
o royalty rates and other taxation arrangements; o licensing conditions; o reporting requirements for mining companies; o environmental regulations and environmental impact assessments; o monitoring and enforcement issues; o land access issues; o the public provision of geological information; o the division of mining revenues between central and regional
governments; and o dispute resolution processes and mechanisms.
Nations could apply ASEAN principles in each of these areas over specified timeframes. Principles should be based on international best practice, but allow some scope for differences in policies across ASEAN member countries. Such principles could be a first step toward developing an ASEAN wide minerals policy. ASEAN ‘principles’ would have a particularly positive effect if they led to improvements in currently ‘weak performers’ within ASEAN and if they reduced the sovereign risk faced by minerals sector investors.
Harmonisation
The AMCAP 2005-2010 states ASEAN could “possibly harmonise minerals policies of ASEAN member countries” (ASEAN Secretariat 2005d). Harmonisation and the move toward a single market is a challenge for ASEAN member countries. It is a process that should proceed gradually over time, and a process that becomes less difficult as integration among ASEAN member countries becomes deeper. The development of regional guiding principles as discussed above that could lead to some convergence in the currently very diverse minerals sector regulatory regimes in ASEAN would be significant progress toward harmonisation. The move to harmonise minerals sector statistics in ASEAN and develop a standardised database can be considered an important first step.
D. CONCLUSION ASEAN minerals cooperation, now in its infancy, has the potential to enhance the
investment environment for minerals in ASEAN. The Ministerial Understanding on ASEAN Cooperation in Minerals and the AMCAP 2005-2010 have set a comprehensive program for minerals sector cooperation in ASEAN across a number of fields and will potentially provide benefits at both the domestic and regional levels.

Enhancing ASEAN Minerals Trade and Investment
REPSF Project 04/009b: Final Report 93
While the potential benefits of regional cooperation are recognised, there are a number of obstacles to enhanced minerals cooperation in the ASEAN region. Cooperation in the early stages of the ‘cooperation spectrum’ may be relatively straightforward. Cooperation in the later stages of the spectrum (regional programs, development of regional guiding principles and moves toward harmonisation), however, is likely to be more challenging, and will require greater commitment in terms of both will and resources.
One of the main obstacles to ASEAN minerals cooperation is resource constraints. The minerals sectors of many ASEAN member countries face serious resource constraints, and it is more than likely that these will flow on to the regional level as well. ASEAN cooperation efforts are also dependent on the willingness of individual ASEAN member countries to participate. Given significant differences in resource endowment and economic, social and political settings across ASEAN member countries, moves toward integration are likely to meet some resistance. This is particularly so for the minerals sector, a sector that receives low prioritisation in a number of ASEAN member countries, and that is particularly sensitive to a wide range of domestic political issues.
More important than regional initiatives to enhance the minerals trade and investment environment in ASEAN are domestic initiatives toward the same goal.

Enhancing ASEAN Minerals Trade and Investment
94 REPSF Project 04/009b: Final Report
This page has intentionally been left blank

Enhancing ASEAN Minerals Trade and Investment
REPSF Project 04/009b: Final Report 95
REFERENCES
ABARE (Australian Bureau of Agricultural and Resource Economics). 2004. Australian Commodity Statistics 2004. Canberra: ABARE.
ABARE. 1996. The MEGABARE Model: Interim Documentation. Canberra: ABARE.
ADB (Asian Development Bank). 2005a. Country Governance Assessment: Philippines. Manila.
ADB. 2005b. Key Indicators 2005: Labour Markets in Developing Asia; Promoting Full, Productive and Decent Employment. Manila
ADB. 2004a. Asian Development Outlook 2004. Manila.
ADB. 2004b. Country Governance Assessment Report: Republic of Indonesia. Manila.
ADB. 1995. Governance: Sound Development Management. Manila.
AFTA (ASEAN Free Trade Area). 2005. ASEAN Trade Data. http://202.154.12.33/trade/publicview.asp
APEC (Asia Pacific Economic Cooperation). 2005. Joint Statement of the Second Meeting of APEC Ministers Responsible for Mining, Gyeongju, Korea, 20 October. http://www.apec.org/apec/ministerial_statements/sectoral_ministerial/mining/2005_mining.html
ASEAN Secretariat. 2005a. Consolidated 2005 CEPT Package by Country. http://www.aseansec.org/17693.htm
ASEAN Secretariat. 2005b. External Relations. http://www.aseansec.org/4918.htm
ASEAN Secretariat. 2005c. ASEAN Investment Area: An Update, http://www.aseansec.org/6480.htm
ASEAN Secretariat. 2005d. ASEAN Minerals Cooperation Action Plan 2005-2010. http://www.aseansec.org/17706.pdf
ASEAN Secretariat. 2005e. Ministerial Understanding on ASEAN Cooperation in Minerals. http://www.aseansec.org/17657.pdf
ASEAN Secretariat. 2005f. Joint Press Statement of the First ASEAN Ministerial Meeting on Minerals, Kuching, Sarawak, Malaysia, 4 August 2005. http://www.aseansec.org/17647.htm
ASEAN Secretariat. 2004a. Statistic of Foreign Direct Investment in ASEAN, Sixth Edition. Jakarta.
ASEAN Secretariat. 2004b. Trade. Jakarta. http://www.aseansec.org/12021.htm
ASEAN Secretariat. 2004c. Guide Book for Investing in ASEAN: Update 2004. Jakarta.
ASEAN Secretariat. 2004d. ASEAN Framework Agreement for the Integration of Priority Sectors. http://www.aseansec.org/16659.htm
ASEAN Secretariat. 2002. Southeast Asia, A Free Trade Area. Jakarta.
ASEAN Secretariat. 2001. Protocol to Amend the Framework Agreement on the ASEAN Investment Area. http://www.aseansec.org/6467.htm
ASEAN Secretariat. 1998. Framework Agreement on the ASEAN Investment Area. http://www.aseansec.org/6466.htm

Enhancing ASEAN Minerals Trade and Investment
96 REPSF Project 04/009b: Final Report
ASEAN Secretariat. 1997. ASEAN Vision 2020. http://www.aseansec.org/1814.htm
ASEAN Secretariat. 1991. Supplementary Agreement to the Basic Agreement on ASEAN Industrial Projects – ASEAN Potash Mining Project (Thailand). http://www.aseansec.org/987.htm
Bond, J., and M. Weber-Fahr. 2002. Attracting Foreign Direct Investment in Mining: The Role of Reliable Environmental Frameworks and Competent Institutions. Paris: OECD Global Forum on International Investment.
Clark, J.C. 2002. Elements of Mining Regulatory Regimes: Mineral Policy, Legislation and Contracts. Policies, Regulatory Regimes and Management Practices for Investment Promotion and Sustainable Development of Mineral Resources Sector in Economies in Transition and Developing Countries of East and Southeast Asia. New York: UNESCAP.
Cook, D. and Devereux, M. 2002. Accounting for the East Asian Crisis: A Quantitative Model of Capital Outflows in Small Open Economies. Economics and Finance Workshop Discussion Paper Series, School of Economics and Finance. The University of Hong Kong.
De Guia, J.F. 2005. Foreign Direct Investments: Why Do We Need Them? Statistically Speaking: by Dr. Romulo A. Virola. Makati City: National Statistical Coordination Board. http://www.nscb.gov.ph/headlines/StatsSpeak/061305_rav_jpd_fdi.asp
DFAT (Department of Foreign Affairs and Trade). 2005. Thailand – Australia Free Trade Agreement. Canberra. http://www.dfat.gov.au/trade/negotiations/aust-thai/
Diamond Facts. 2004. Diamond Industry Report. Canada: Northwest Territories Department of Industry, Tourism and Investment. http://www.iti.gov.nt.ca/diamond/industry.htm
Eurometaux. 2005. Business Impact Analysis: Level 1.
European Parliament. 2005. Texts adopted by Parliament – REACH. 17 November. http://www.europarl.eu.int/
Feebrey, C. 1998. Corporate Exploration and Mining Views on the ASEAN Region and Government Promotion of Foreign Investment. Yangon: Workshop for Investment Promotion & Environmental Protection in the Mining Sector in ASEAN.
Fraser Institute. 2005. Annual Survey of Mining Companies 2004/2005. Vancouver.
Geoscience Australia. 2005. Minerals Downunder. http://www.ga.gov.au/education/minerals/
Green, G. 2002. Industry Codes of Practice and other Voluntary Initiatives: Their Application to the Mining and Metals Sector, London: Mining, Minerals and Sustainable Development (MMSD) project of the International Institute for Environment and Development (IIED).
Grieg-Gran, M. 2002. Financial Institutions and the Greening of FDI in the Mining Sector. Paris: OECD Global Forum on International Investment.
Haine, I., and commodity analysts. 2005. Minerals and energy: major development projects – April 2005 listing. Australian Commodities, Vol. 12, No. 2, June quarter. Canberra: ABARE.

Enhancing ASEAN Minerals Trade and Investment
REPSF Project 04/009b: Final Report 97
Headifen, R. 2005. The Proposed New Mining Law: Too Little Too Late? Energy, Utilities & Mining News Flash, No. 23/2005. Jakarta: PricewaterhouseCoopers.
Hertel, T. (ed.) 1997. Global Trade Analysis: Modeling and Applications. Massachusetts: Cambridge University Press.
Hester, S., Mélanie, J., Curtotti, R., and Ahammad, H. 2005. Economic Impacts of the EU REACH Legislation. Preliminary Report Prepared for the Minerals Council of Australia and the Australian Government Department of Industry, Tourism and Resources. Canberra: ABARE. http://www.minerals.org.au/
Hogan, L. 2003. Public Geological Surveys in Australia. Report to the Department of Industry, Tourism and Resources. Canberra: ABARE.
Hogan, L. and Donaldson, K. 2000. Mineral royalties: net economic benefits of mining in Australia. Australian Commodities, Vol. 7, No. 3, September quarter. Canberra: ABARE.
Hogarth, R. 2003. Taxation, Mining Law and Financial Issues Facing Explorers and Mine Developers in Asia. http://www.smedg.org.au/Tiger/Hogarth.htm
IFC (International Finance Corporation). 2005. Website, various pages. Washington DC. http://www.ifc.org
Industry Search. 2005. Aust Gold Mining Project Gets Green Light in Philippines. 24 August. http://www.industrysearch.com.au
International Lead-Zinc Study Group. 2005. Lead and Zinc Statistics. London.
International Nickel Study Group. 2005. World Nickel Statistics, Vol. XIV, No. 2, February and previous editions. The Hague.
Liebenthal, A., R. Michelitsch, and E. Tarazona. 2003. Extractive Industries and Sustainable Development: An Evaluation of World Bank Group Experience. Washington DC: World Bank.
McKibbin, W. and Martin, W. 1998, The East Asian Crisis: Investigating Causes and Policy Responses, Working Papers 98-2, APSEM. Canberra: Australian National University.
Mélanie, J., Kim, M., Hester, S., Berry, P., Ball, A., Schneider, K., Burke, P., Au Duong Le, H., and McCarty, A. 2005. Enhancing ASEAN Minerals Trade and Investment, Volume II – Country Reports. Report to the ASEAN Secretariat, REPSF Project No. 04/009b. Canberra.
Minerals Council of Australia. 2005. Education. http://www.minerals.org.au/education/educational_resources/factsheets/
Minerals Council of Australia. 2004. Trade Reform Threats to Market Access. Presentation by Mr Mitchell H. Hooke, Chief Executive of Minerals Council of Australia. Minerals Industry Seminar.
Morgan, P.F. 2002. Mineral Title Management – the Key to Attracting Foreign Mining Investment in Developing Countries? London: The Institute of Materials, Minerals and Mining.
OECD (Organisation for Economic Cooperation and Development) 2005. Country Risk Classifications of the Participants to the Arrangement on Officially Supported Export Credits 2005, Export Credits Division, Paris http://www.oecd.org/dataoecd/47/29/3782900.pdf

Enhancing ASEAN Minerals Trade and Investment
98 REPSF Project 04/009b: Final Report
OECD 2004. Arrangement on Officially Supported Export Credits: Premium and Related Conditions: Explanation of the Premium Rules of the Arrangement on Officially Supported Export Credits (the Knaepen Package). Paris: Trade Directorate, Export Credits Division.
OECD 2003. Checklist for Foreign Direct Investment Incentive Policies. Paris.
Otto, J. 2002. A Global Survey of Mineral Company Investment Preferences and Criteria for Assessing Minerals investment Conditions. Minerals investment Conditions in Selected Countries of the Asia Pacific Region. New York: United Nations.
Otto, J. 1997. List of Criteria for Private Sector Appraisal of Minerals sector Investment Conditions. Toward Sustainable Minerals Supply in the Asian and Pacific Region: Review of Emerging Minerals policies and Development Activities. New York: UNESCAP.
Otto, J., and J. Cordes. 2002. The Regulation of Mineral Enterprises: A Global Perspective on Economics, Law and Policy. Colorado: Rocky Mountain Mineral Law Foundation.
Parsons, R.B. 2001. Minerals taxation Policies in Asia. Asia Pacific Mining & Quarrying 2000. Bangkok: Metal Mining Agency of Japan.
Ritchie, D. 1992. Investment Criteria for International Exploration/Mining Companies in the Asia Pacific Region. Negotiating Mineral Industry Agreements and Contracts. New York: UNESCAP and UNDP.
Sarma, J., and G. Naresh. 2001. Minerals taxation around the World: Trends and Issues. Asia Pacific Tax Bulletin, January. Amsterdam: International Bureau of Fiscal Documentation.
UNCTAD (United Nations Conference on Trade and Development). 2005. Website, various pages. Geneva. http://www.unctad.org
UNCTAD. 1996. World Investment Report 1996: Investment, Trade and International Policy Arrangements. New York and Geneva.
United Nations. 1997. Toward Sustainable Minerals Supply in the Asian and Pacific Region: Review of Emerging Minerals policies and Development Activities. New York: UNESCAP.
United Nations. 1992. The Contribution of Transnational Mining Corporations to the Asia Pacific Region. New York: UNESCAP and UNDP.
United Nations Economic Commission for Africa. 1997. Report of the Second Regional Conference of African Ministers Responsible for the Development and Utilization of Mineral and Energy Resources. http://www.uneca.org/eca_resources/Publications/RCID/old/97_Conf_ministers_mineral.htm
United Nations Statistics Division. 2005. UN Commodity Statistics Database (UN Comtrade). United Nations. http://unstats.un.org/unsd/comtrade/
USGS (U.S. Geological Survey). 2005. Mineral Commodity Summaries. http://minerals.usgs.gov/minerals/pubs/mcs/
USGS. 2004. Mineral Commodity Summaries. http://minerals.usgs.gov/minerals/pubs/mcs/
Wahju, B.N. 2004. Current Status of Mining in Indonesia. Manila: Mining Philippines 2004 Conference.

Enhancing ASEAN Minerals Trade and Investment
REPSF Project 04/009b: Final Report 99
Wee, K.H., and H. Mirza, in Freeman, N. and F. Bartels (eds.). 2002. The Future of Foreign Investment in Southeast Asia. Routledge-Curzon.
World Bank. 2005a. Global Development Finance 2005: Mobilizing Finance and Managing Vulnerability, Washington DC.
World Bank. 2005b. Website, various pages. Washington DC. http://www.worldbank.org
World Bank. 2003. Lao PDR: Review of the Mining Sector for the Study on Future Sources of Growth, Washington DC.
World Bureau of Metal Statistics. 2005. World Metal Statistics, April and previous editions. Herts.
WTO (World Trade Organisation). 2005. Integrated Data Base (IDB) and Consolidated Tariff Schedule Data Base (CTS). http://wits.worldbank.org/
Zemek, A. P. 2002. The Role of Financial Institutions in Sustainable Mineral Development. United Nations Environment Programme (UNEP).

Enhancing ASEAN Minerals Trade and Investment
100 REPSF Project 04/009b: Final Report
This page has intentionally been left blank

Enhancing ASEAN Minerals Trade and Investment
REPSF Project 04/009b: Final Report 101
APPENDIXES
A. APPENDIX 1: A BRIEF TECHNICAL DESCRIPTION OF THE GTEM MODEL The global trade and environment model (GTEM) is a best practice, multisector,
multiregion, dynamic, general equilibrium model of the world economy, designed at ABARE to analyse global issues where the interactions between sectors and economies are significant. These include issues such as the impacts of changes in energy prices, international trade and investment liberalisation, and energy supply disruptions. GTEM is derived from the MEGABARE model (ABARE 1996) and the Global Trade Analysis Project (GTAP) model (Hertel 1997).
Key features of GTEM include:
o a global general equilibrium framework that accounts for all economic transactions occurring in the world economy
- the model structure is built on microeconomic principles as represented by the equation systems, the data and parameters. The model tracks bilateral trade flows, allowing for bilateral trade analyses;
o the representation of a large number of economies, allowing for detailed analysis of the implications of external shocks and policy changes for individual economies;
o a high level of sectoral disaggregation; o detailed and explicit treatment of the minerals and minerals related sectors
(both in terms of data and in the equation structure), which makes GTEM an ideal tool for analysing trends and policies affecting the minerals and other sectors in an economy; and
o its dynamic nature, which gives it the ability to account for interindustry flows between sectors and trade flows between regions over time — as a dynamic model, it also accounts for the impacts of changes in investment on a region’s production capabilities.
Regional and sectoral coverage The GTEM database is derived from the highly disaggregated database
produced by GTAP. It classifies all goods and services into 67 broad groups and disaggregates the world into 87 economies or regions. The GTEM database has a high level of detail of industries in the minerals and minerals related sectors and all other key sectors in the economy.
Representation of agents’ behavior Households and aggregate industries are assumed to operate in perfectly
competitive markets, where goods and factor markets clear through movements in relative prices. Households earn income through their ownership of the factors of production (labor, capital, land and natural resources) as well as from tax revenues collected within the region and net foreign income. Households’ factor income is generated by renting the factors of production to firms, who combine them with intermediate inputs to produce goods and services. Households determine how this income is allocated between savings, government expenditure and consumption of various commodities and services. Commodities and services are produced by each economy and traded to satisfy consumer and intermediate demands.
In all industries, firms are assumed to choose input combinations to minimise costs subject to the input prices faced by the industry. The level of output is

Enhancing ASEAN Minerals Trade and Investment
102 REPSF Project 04/009b: Final Report
determined by output prices relative to input prices and the competitiveness of other regions in producing a similar good.
International trade Private final consumption, government final consumption and the demands of
firms for intermediate inputs can be met either from domestically produced goods or imports. This choice is governed by the Armington assumption, according to which a good produced in one region is considered to be an imperfect substitute for a similar good produced in another region. An elasticity of substitution determines the degree to which a good from one region is a substitute for one sourced from another. Therefore, in each region, the relative growth in the use of domestic and imported commodities will depend on movements in relative prices and the specified elasticity of substitution. GTEM contains an explicit representation of bilateral trade flows.
Technologies and input substitution possibilities Most industries are assumed to combine non-energy material inputs in fixed
proportions with combined units of energy and primary factors. More specifically, primary factors (for example, labor and capital) can be substituted for each other in response to changes in relative prices, as can the energy inputs (namely, coal, gas, oil and electricity), but not the non-energy intermediate inputs. Some activities require specific inputs: for example, agriculture uses farm land as an input and mining activities use a ‘natural resource input’ which represents mining reserves. This representation of production activity summarises a combination of many technologies used in an aggregate activity. This combination can be modified over time given enough information about which technologies might dominate.
Dynamic capability GTEM can be thought of as a series of single-year models linked by equations
of movement that determine the stock of labor and capital available at the beginning of a period. These equations of movement constitute the dynamic capability of the model and allow the paths of alternative variables to be tracked over time.
GTEM is dynamic in that:
o the capital stock in each sector is adjusted by investment and depreciation:
- at the beginning of a period, the stock of capital available to producers determines (in conjunction with other factors) the productive capacity of an economy. Since GTEM is dynamic, any factors affecting the stock of capital will therefore determine a region’s productive capability. This effect cannot be captured by a comparative static (or nondynamic) model;
- international capital flows in GTEM are determined by regional differences in returns to capital.
o the labor supply is specified as a function of the working age population, which is determined in the model’s demographic module:
- the population module determines the evolution of a region’s population as a function of fertility, migration and natural mortality. These variables are in turn affected by changes in income. This is especially relevant for economies with changing population structures. The population structure also affects a region’s savings patterns, and ultimately whether it is a net debtor or a net saver.

Enhancing ASEAN Minerals Trade and Investment
REPSF Project 04/009b: Final Report 103
Further information on GTEM is available on ABARE’s web site (www.abareconomics.com).

Enhancing ASEAN Minerals Trade and Investment
104 REPSF Project 04/009b: Final Report
B. APPENDIX 2: INTERVIEW PROGRAM
Name Position Organisation
Brunei Darussalam, 23 June 2005 Hjh Rosmawati Hj Manaf
International Division Brunei Economic Development Board
Amanda Teo International Division Brunei Economic Development Board Pg Metali bin Pg Hj Damit
Policy and Planning Ministry of Industry and Primary Resources
Pg Hj Harun Exploration Division Petroleum Unit, Prime Minister’s Department
Pg Hj Raihan
Strategic Finance
Petroleum Unit, Prime Minister’s Department
Pg Shahbirin Audit Department Petroleum Unit, Prime Minister’s Department
Cambodia, 27-30 June 2005 Tim Smyth
President Australian Business Association of Cambodia (and Managing Director, Indochina Research)
Lisa Filipetto Ambassador Australian Embassy Naomi Viccars Third Secretary Australian Embassy Nang Sothy
Director General Cambodia Chamber of Commerce (and President, Royal Phosphate Limited)
Heng Bun Hong
Information Officer Cambodia Investment Board (CIB), Council for the Development of Cambodia (CDC)
Sok Hach Director Economic Institute of Cambodia Sov Chiv Kun
Director General
General Department of Mineral Resources, Ministry of Industry, Mines and Energy
Sieng Sotham
Director, Department of Geology
General Department of Mineral Resources, Ministry of Industry, Mines and Energy
Chrea Vichett
Deputy Director, Department of Mineral Resource Development
General Department of Mineral Resources, Ministry of Industry, Mines and Energy
Yos Mony Rath
Deputy Director, Department of Mineral Resources
General Department of Mineral Resources, Ministry of Industry, Mines and Energy
Pean Sokhonnora
Deputy Director, General Department of ASEAN
Ministry of Foreign Affairs and International Cooperation
Ung Ponnara Under Secretary of State Ministry of Industry, Mines and Energy Nhem Thavy Memberof Parliament for
Kompong Thom Province National Assembly of the Kingdom of Cambodia (and Managing Director, Delcom Cambodia Pte. Ltd.)
- - National Institute of Statistics, Ministry of Planning
Wujin Park Chairman Oksan (Cambodia) Inc - - World Bank Public Information Center
Indonesia, 13-17 June 2005 Bernard Lynch Counsellor - Economic Australian Embassy Grant Dooley First Secretary – Economic Australian Embassy Ben Clanchy Third Secretary - Economic Australian Embassy Rob Crawford President Director BlueScope Steel Indonesia Mahendra Siregar Deputy for International Economic
Cooperation Coordinating Ministry for Economic Affairs
BN Wahju Chairman Indonesian Mining Association Noke Kiroyan President Indonesia Australia Business Council Yus’an
Deputy Chairman for Investment Climate Development
Investment Coordinating Board
Rubianto Indrayuda
Deputy Director for Mining and Geological Services
Ministry of Energy and Mineral Resources, Directorate General of

Enhancing ASEAN Minerals Trade and Investment
REPSF Project 04/009b: Final Report 105
Name Position Organisation
Geology and Mineral Resources, Directorate of Mineral and Coal Enterprises
Dr. Hadiyanto
Director Ministry of Energy and Mineral Resources, Directorate General of Geology and Mineral Resources, Directorate of Mineral Resources Inventory
Bambang Murdiono Director Ministry of Forestry, Bureau of International Cooperation and Investment
Koes Saparjadi
Director General
Ministry of Forestry, Directorate General of Forest Protection and Nature Conservation
Boen Purnama Head of Planning Bureau Ministry of Forestry, Directorate General of Forest Protection and Nature Conservation
Ir. Adi Sarwoko Soeronegoro
Advisor for Economy and International Cooperation
Ministry of Settlement and Regional Infrastructure
Andrew Wilson President Director PT BHP Billiton Indonesia Dan Bowman Senior Vice President PT Freeport Indonesia Hendra Sinadia Legal Advisor PT Freeport Indonesia Tony Ainscough Senior Legal Advisor PT Nusa Halmahera Minerals Roderick Jones President Director PT Sorikmas Mining Fathi Hanif Policy and Legal Officer WWF Indonesia Lao PDR, 21-24 June 2005 Lindsay Owler Managing Director Argonaut Resources (Laos) Co. Ltd. Alistair Maclean Ambassador Australian Embassy Richard Taylor First Secretary Australian Embassy Vinay Inthavong Chairman Bokeo Mining Co., Ltd. Dr. Simone Phichit
Director, Mining Concession Management Division
Department of Geology and Mines, Ministry of Industry and Handicrafts
Chansavath Boupha
Head, Geo-Mines Information Center
Department of Geology and Mines, Ministry of Industry and Handicrafts
Souvath Sisoutham
Senior Geologist, Mining Management Division
Department of Geology and Mines, Ministry of Industry and Handicrafts
Vilayvong Bouddakham
Deputy Director General
Department for Promotion and Management of Domestic and Foreign Investment (DDFI), Committee for Planning and Investment
Thamma Phetvixay
Director
Department for Promotion and Management of Domestic and Foreign Investment (DDFI), Committee for Planning and Investment
Bounphanh Souvannavong
Deputy Director, Project Screening Division
Department for Promotion and Management of Domestic and Foreign Investment (DDFI), Committee for Planning and Investment
Vongvichet Nithiboun General Director First Pacific Mining Lao Co., Ltd. Banthay Komphasouk President Khamkeut Mining Limited Khamsouk Sundara
Advisor
Lane Xang Minerals Group (Oxiana Limited)
Saman Aneka
Director, Govt. Community Relations & HR
Lane Xang Minerals Group (Oxiana Limited)
Vanthong Sitthikoune Vice Chairman Lao Mining Association (LMA) Phutthasone Phomvisay
Deputy Chief, Foreign Relation Division
Lao National Chamber of Commerce and Industry
Sirisamphanh Vorachith
Deputy Director General, Office of the Ministry
Ministry of Commerce
- - National Statistical Center, Committee for Planning and Investment
Morten Larson Consultant, Energy and Mining World Bank - -
World Bank Public Information Center
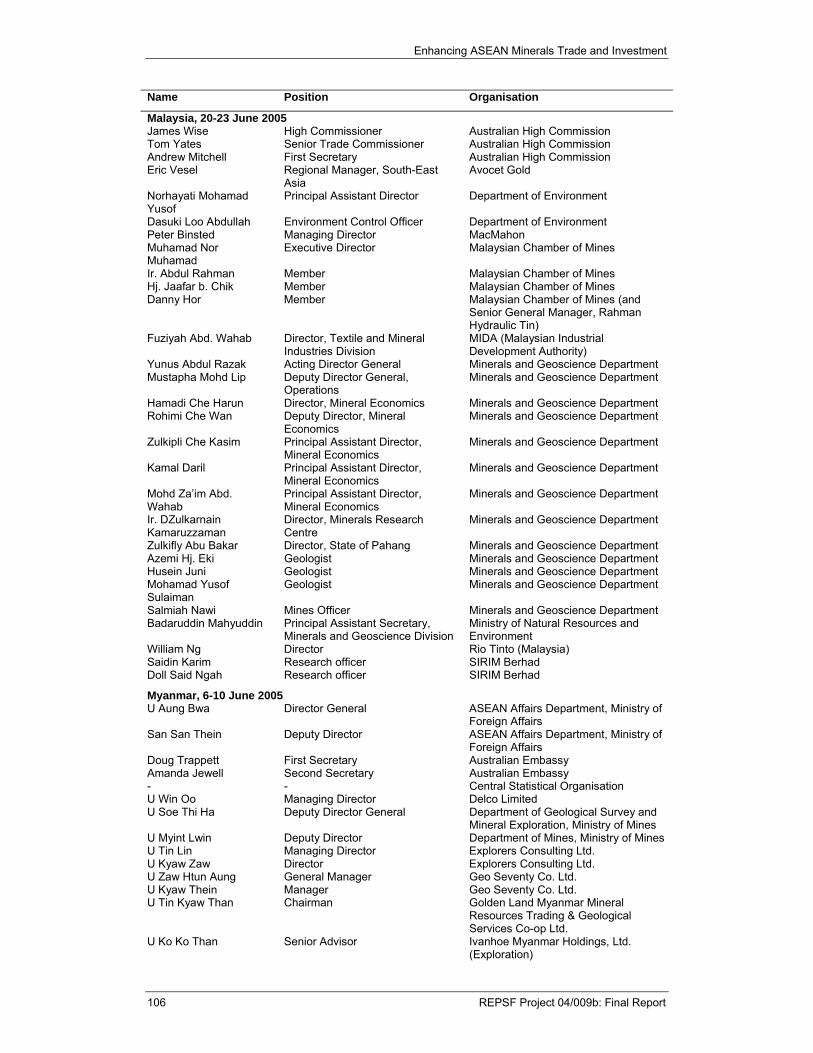
Enhancing ASEAN Minerals Trade and Investment
106 REPSF Project 04/009b: Final Report
Name Position Organisation
Malaysia, 20-23 June 2005 James Wise High Commissioner Australian High Commission Tom Yates Senior Trade Commissioner Australian High Commission Andrew Mitchell First Secretary Australian High Commission Eric Vesel Regional Manager, South-East
Asia Avocet Gold
Norhayati Mohamad Yusof
Principal Assistant Director Department of Environment
Dasuki Loo Abdullah Environment Control Officer Department of Environment Peter Binsted Managing Director MacMahon Muhamad Nor Muhamad
Executive Director Malaysian Chamber of Mines
Ir. Abdul Rahman Member Malaysian Chamber of Mines Hj. Jaafar b. Chik Member Malaysian Chamber of Mines Danny Hor Member
Malaysian Chamber of Mines (and Senior General Manager, Rahman Hydraulic Tin)
Fuziyah Abd. Wahab Director, Textile and Mineral Industries Division
MIDA (Malaysian Industrial Development Authority)
Yunus Abdul Razak Acting Director General Minerals and Geoscience Department Mustapha Mohd Lip Deputy Director General,
Operations Minerals and Geoscience Department
Hamadi Che Harun Director, Mineral Economics Minerals and Geoscience Department Rohimi Che Wan Deputy Director, Mineral
Economics Minerals and Geoscience Department
Zulkipli Che Kasim Principal Assistant Director, Mineral Economics
Minerals and Geoscience Department
Kamal Daril Principal Assistant Director, Mineral Economics
Minerals and Geoscience Department
Mohd Za’im Abd. Wahab
Principal Assistant Director, Mineral Economics
Minerals and Geoscience Department
Ir. DZulkarnain Kamaruzzaman
Director, Minerals Research Centre
Minerals and Geoscience Department
Zulkifly Abu Bakar Director, State of Pahang Minerals and Geoscience Department Azemi Hj. Eki Geologist Minerals and Geoscience Department Husein Juni Geologist Minerals and Geoscience Department Mohamad Yusof Sulaiman
Geologist Minerals and Geoscience Department
Salmiah Nawi Mines Officer Minerals and Geoscience Department Badaruddin Mahyuddin
Principal Assistant Secretary, Minerals and Geoscience Division
Ministry of Natural Resources and Environment
William Ng Director Rio Tinto (Malaysia) Saidin Karim Research officer SIRIM Berhad Doll Said Ngah Research officer SIRIM Berhad
Myanmar, 6-10 June 2005 U Aung Bwa
Director General ASEAN Affairs Department, Ministry of Foreign Affairs
San San Thein
Deputy Director ASEAN Affairs Department, Ministry of Foreign Affairs
Doug Trappett First Secretary Australian Embassy Amanda Jewell Second Secretary Australian Embassy - - Central Statistical Organisation U Win Oo Managing Director Delco Limited U Soe Thi Ha Deputy Director General Department of Geological Survey and
Mineral Exploration, Ministry of Mines U Myint Lwin Deputy Director Department of Mines, Ministry of Mines U Tin Lin Managing Director Explorers Consulting Ltd. U Kyaw Zaw Director Explorers Consulting Ltd. U Zaw Htun Aung General Manager Geo Seventy Co. Ltd. U Kyaw Thein Manager Geo Seventy Co. Ltd. U Tin Kyaw Than
Chairman Golden Land Myanmar Mineral Resources Trading & Geological Services Co-op Ltd.
U Ko Ko Than
Senior Advisor Ivanhoe Myanmar Holdings, Ltd. (Exploration)

Enhancing ASEAN Minerals Trade and Investment
REPSF Project 04/009b: Final Report 107
Name Position Organisation
Gerry Nugawela Commercial Manager Myanmar Ivanhoe Copper Company Ltd.
Professor U Myat Thein Chairman and Chief Economist Myat and Associates U Sai Than Aung Managing Director Thit Thant Sin Co. Ltd. Professor U Maw Than Rector (Retired) Yangon Institute of Economics
The Philippines, 13-17 June 2005 Johnny Co Country Head and General
Manager ANZ Banking Group
Jimmy Wu Country Portfolio Manager, Philippines Country Office
Asian Development Bank
Jose Leviste Chairman Australasian Philippines Mining – Climax Mining
Miles Armitage Counsellor and Deputy Head of Mission
Australian Embassy
Alan Morrell Senior Trade Commissioner Australian Embassy Angus Macdonald Counsellor, AusAID Australian Embassy Guillermo Laquindanum Director for Mining, Marine and
Natural Resources-based Products Department
Board of Investments
Nelia Halcon Executive Vice President Chamber of Mines of the Philippines Atty. Deinrado Simon Dimalibot
Undersecretary for Mining and Legal Affairs
Department of Environment and Natural Resources
Rod Watt Philippine Country Manager Lafayette Mining Jeremias Dolino Director Mines and Geosciences Bureau Leo Jasareno Regional Director and Chief,
Mining Tenements Management Division
Mines and Geosciences Bureau
Teresa Manalac Chief, Mineral Economics Section Mines and Geosciences Bureau Dr. Michael Clancy President and CEO Philippine Business Leaders Forum Malcolm Boyd Exploration Manager QNI Philippines Atty. Dennis Quintero - Quisumbing Torres Roy Antonio Manager for Corporate Affairs Sagittarius Mines
Singapore, 20-23 June 2005 Avryl Lattin Third Secretary Australian High Commission Kathy Klugman Acting High Commissioner Australian High Commission Jun Yen Teo Account Manager, Corporate
Group (International Trading) International Enterprise Singapore
Andrew Offen Marketing Director, Carbon Steel Materials
BHP Billiton
Phillip Crowley Managing Partner Singapore CEO ASEAN Offices
Deacons
Greg Conlon General Manager Worley Parsons Michael Dwyer Economics Editor Bloomberg Adam Grant Senior Commodity and Trade
Finance Manager ANZ Bank
Thailand, 12-17 June 2005 Surapol Udompornwirat Executive Vice President Akara Mining Limited Pieter Bakker Executive Vice President Amanta Resources Ltd. Kieng Mekvasedpun Managing Director Appropriate Technology Consultant Co.
Ltd Germain Bergeron
Business Development Manager Appropriate Technology Consultant Co. Ltd
Mark Williams Vice President, Operations Asia Pacific Potash Corporation Nadia Krivetz First Secretary Australian Embassy Nirachara Samanphand Senior Research Officer Australian Embassy Ian Davey
Counsellor (Commercial) and Trade Commissioner, Austrade
Australian Embassy
Martin Kyle Executive Director Australian-Thai Chamber of Commerce Chen Shick Pei
Director Coordinating Committee for Geoscience Programmes in East and Southeast Asia (CCOP)
Samai Chiamchindaratana
Deputy Director General Department of Mineral Resources, Ministry of Natural Resources and Environment

Enhancing ASEAN Minerals Trade and Investment
108 REPSF Project 04/009b: Final Report
Name Position Organisation
Tawsaporn Nuchanong
Director, Geological Resource Conservation and Management Division
Department of Mineral Resources, Ministry of Natural Resources and Environment
Jittima Utha-aroon
Chief, Economics Section, Geological Resource Conservation and Management Division
Department of Mineral Resources, Ministry of Natural Resources and Environment
Satien Sukontapongpow
Director, Mineral Resources Bureau
Department of Mineral Resources, Ministry of Natural Resources and Environment
Suraphol Phuvichit Head
Department of Mining and Petroleum Engineering, Faculty of Engineering, Chulalongkorn University
Pinyo Meechumna
Assistant Professor Department of Mining and Petroleum Engineering, Faculty of Engineering, Chulalongkorn University
Wichian Plodpradista
Secretary
Department of Primary Industries and Mines, Ministry of Industry
Nakorn Srimongkol
Mining Engineer
Department of Primary Industries and Mines, Ministry of Industry
Wisanu Tabtieng
Chief, Mining Enterprise Promotion
Department of Primary Industries and Mines, Ministry of Industry
Douglas Kirwin Executive Vice President Ivanhoe Mines Limited Yongyoth Petchsuwan Chairman Mining Industry Council Punya Adulyapachit Former Secretary-General Mining Industry Council Chitchai Thaveepanich Vice President, Human
Resources and Corporate Administrations
Padaeng Industry Co., Ltd.
Supavadee Khemacheva
Manager – Trade Administration Rio Tinto
Ganokpot Angkaew Geologist Santhad Group Co., Ltd. Marianne Debefve
Officer-in-Charge, Trade Efficiency and Facilitation Section, Trade and Investment Division
United Nations Economic and Social Commission for Asia and the Pacific
Anatoly Kadushkin
Scientific Affairs Officer, Water Resources Section, Environment and Sustainable Development Division (formerly Acting Chief, Mineral Resources Section, Environment and Natural Resources Management Division)
United Nations Economic and Social Commission for Asia and the Pacific
Viet Nam, 4-8 July 2005 David Woodhouse Chief Executive Officer Asian Minerals Resources Michael Growder First Secretary (Economics and
Trade) Australian Embassy
Hung Dinh
Senior Business Development Manager, Austrade
Australian Embassy
Rick Smith
Country Chief Representative and Project Director
BHP Billiton Aluminium Vietnam
James Merrillees
Exploration Director BHP Billiton Aluminium Vietnam
Trinh Minh Cuong Chief, Mineral Title Division Department of Geology and Minerals Nguyen Xuan Hop
Deputy Director, International Cooperation Division
Department of Geology and Minerals
Bui Thi Huyen
Officer In Charge, International Cooperation Division
Department of Geology and Minerals
- - General Statistics Office Christopher Roberts Visiting Associate Institute of Defence and Strategic
Studies, Singapore Nigel Tamlyn General Director Nui Phao Mining Joint Venture
Company - - Vietnam Development Information
Center Le Tri Hung General Manager, International Vietnam National Coal Corporation

Enhancing ASEAN Minerals Trade and Investment
REPSF Project 04/009b: Final Report 109
Name Position Organisation
Relations (VINACOAL) Steven Harnish Exploration Manager Vietnam Resources Corporation - - Zedex Minerals Limited Robert McLean Independent Consultant -

Enhancing ASEAN Minerals Trade and Investment
110 REPSF Project 04/009b: Final Report
C. APPENDIX 3: ABOUT THE AUTHORS This report has been produced jointly by the Australian Bureau of Agricultural
and Resource Economics (ABARE) and Mekong Economics Ltd (MKE).
ABARE is Australia’s largest applied economic research and policy analysis agency, with sixty years of operational experience. ABARE is located in Canberra and has approximately 150 professional staff, offering access to a multidisciplinary pool of talented and innovative economists, mathematicians, statisticians and modelers. ABARE undertakes economic research and policy analysis of issues relating to energy, minerals, agriculture, food, forestry, fisheries, trade, natural resource management and climate change, in both domestic and international markets. It provides world-class information and consulting services to a variety of Australian and international government agencies, industry groups, and other research organisations. ABARE has an international reputation for the quality of its research and policy analysis and for the contribution it makes to national and international economic debate. Of specific relevance to the current project is ABARE’s core strength in minerals and energy commodity forecasting and analysis. ABARE is the only Australian agency to publish short and medium term outlooks for a range of minerals commodities. These are widely consulted by the Australian government and domestic and international industry groups. Further details can be found on ABARE’s website www.abareconomics.com.
Located in Hanoi, Viet Nam and established in 2000, MKE is a leading economic consulting company in the Greater Mekong sub-region. MKE has a well earned reputation for the quality of its economic research and analysis on some of the most topical issues facing Viet Nam’s socio-economic development. MKE specialises in economic research, consulting and Official Development Assistance programs and projects. MKE’s strength lies in its knowledge of the institutional and cultural environments in the region, combined with international standard economic analysis. MKE has completed research projects for a range of clients from the Vietnamese Government to foreign universities and international companies. Further details can be found on MKE’s website www.mekongeconomics.com.
The individual authors contributing to this report are:
From ABARE:
o Karen Schneider – Deputy Executive Director of ABARE, Project Manager – has 25 years of expertise in analysing minerals and energy policy issues. Until December 2004, Karen was Chief Economist, Energy and Minerals Economics at ABARE. In this position she was responsible for designing, leading and delivering an extensive program of analysis on domestic and international minerals and energy issues and global climate change. Karen has extensive experience managing large scale projects for a range of clients in Australia and internationally and in public and private sectors. Key clients include the Australian Department of Industry, Tourism and Resources; the Australian Department of Foreign Affairs and Trade; the APEC Secretariat and the ASEAN Secretariat. Karen has a Bachelor of Applied Science (first class honours and the University medal) from the University of New South Wales.
o Jane Melanie – Manager, International Cooperation Section of ABARE, Project Leader – leads research with a focus on international minerals and energy markets. Since joining ABARE in 1993, Jane has had extensive experience in undertaking and managing applied research in resource economics covering trade liberalisation, energy market reform and environmental policy issues. More recently, Jane has concentrated on the

Enhancing ASEAN Minerals Trade and Investment
REPSF Project 04/009b: Final Report 111
development of international minerals and energy markets and emerging trade issues affecting these markets. She has co-authored a wide range of ABARE publications relating to international coal trade, the implications of energy market reform for energy demand and supply, and the potential for increased liquefied natural gas consumption in key markets in Asia. Jane holds an honours degree in economics from the University of Sydney and a master of economics degree from the Australian National University.
o Allison Ball – Principal Research Economist, International branch of ABARE – has several years experience in planning and undertaking economic research and analysis on international energy and minerals and related economic issues. Allison has a proven record of high quality research and publications, including chief authorship of a number of research reports and consultancies, which have received positive feedback from clients and industry. Much of the research and analysis undertaken by Allison at ABARE has focused on developments in international resource commodity markets and trade and investment in resource sectors, particularly in the Asian region, including ASEAN and its key trading partners. Allison has an honours degree in Economics and Asian Studies from the Australian National University.
o Sam Hester – Research Economist, International branch of ABARE – joined ABARE in 2000 and since then has worked on a range of issues relating to international minerals and energy markets, including the economic assessment of international climate change policy and the forecasting of Japanese energy demand. He has contributed to a number of ABARE publications and has played a key role in estimating the technology assumptions used in ABARE’s Global Trade and Environment Model (GTEM). Sam holds an honours degree in economics from the University of Adelaide.
o Marina Kim – Research Economist, International branch of ABARE – is currently involved in economic research and analysis of international energy and minerals and related economic issues. Marina’s research has covered a range of issues, including the development of the Russian energy sector and its impacts on international energy markets; Australia’s export performance in agriculture, mining, manufacturing and services; energy technologies; and international energy policy analysis. Marina holds an honours degree in foreign economic relations from the University of World Economy and Diplomacy (Uzbekistan).
o Peter Berry – Research Economist, International branch of ABARE – joined ABARE in 1998 and since then has undertaken forecasting and analysis on a wide range of mineral and agricultural commodities. He has conducted research into minerals economics, genetically modified crops, international agricultural trade, developing countries and economic development. Peter holds an honours degree in economics from the University of Western Sydney.
From MKE:
o Adam McCarty – Chief Economist, MKE – has extensive knowledge of economic development and poverty issues in the ASEAN region, having worked in Viet Nam as an economist and consultant since 1992. As an investment and trade analyst, Adam has been involved in collecting and analysing data and conducting, evaluating and overseeing the implementation of numerous projects throughout Asia, including Viet

Enhancing ASEAN Minerals Trade and Investment
112 REPSF Project 04/009b: Final Report
Nam. He has gained considerable experience in leading the design, management, and evaluation of primary data in Viet Nam and elsewhere. Dr. McCarty has been the Chief Economist of Mekong Economics Ltd. since 2001 and the Vice Chairman of the Australian Chamber of Commerce in Viet Nam since 2003. He holds a PhD in economics from the Australian National University.
o Paul Burke – Economist, MKE – has considerable experience as an economic researcher based in the ASEAN region, having worked as an economist at both the National Economics University, Hanoi and with MKE. He has been actively involved in a number of donor-funded research projects with MKE and has carried out several research pieces on the economies of the South East Asian countries. Paul’s research interests include international trade and investment, resource and agricultural economics, foreign aid and regional integration within ASEAN. Paul holds a Bachelor in Agricultural Economics (first class honours and the University medal) from the University of Sydney.
o Le Hoa Au Duong – Legal Analyst, MKE – is actively involved in trade and investment studies in South East Asia. Hoa has been involved in research and other project activities for a number of MKE projects. She has previously worked as a consultant in both England and central Viet Nam. She has experience in the fields of insurance, human resources and immigration law. Hoa’s research interests include Viet Nam’s integration with the global economy and international trade dispute settlements. Hoa has a Bachelor in Law from the University of Hue (Viet Nam) and Master in Commercial Law from the University of Westminster.