final report - ASEAN
168
FINAL REPORT “The Roles and Functions of the Banking Sector in the Financial System of the ASEAN+3 Region” Research Team: Marvin Raymond F. Castell Lawrence B. Dacuycuy Angelo B. Taningco Tereso S. Tullao, Jr. De La Salle University – Angelo King Institute (DLSU-AKI) Manila, Philippines March 2012 * We would like to thank Mr. Christopher James R. Cabuay for his valuable inputs and contributions as well as Mr. Jesus Carlos Exequiel D. Castillo for providing research assistance on this project. 1| Page
-
Upload
khangminh22 -
Category
Documents
-
view
1 -
download
0
Transcript of final report - ASEAN

FINAL REPORT
“The Roles and Functions of the Banking Sector in the Financial System of the
ASEAN+3 Region”
Research Team:
Marvin Raymond F. Castell
Lawrence B. Dacuycuy
Angelo B. Taningco
Tereso S. Tullao, Jr.
De La Salle University – Angelo King Institute (DLSU-AKI) Manila, Philippines
March 2012
* We would like to thank Mr. Christopher James R. Cabuay for his valuable inputs and contributions as well as Mr. Jesus Carlos Exequiel D. Castillo for providing research assistance on this project.
1 | P a g e

EXECUTIVE SUMMARY
The ASEAN+3 financial system can be characterized as a bank-dominated system with rapidly developing capital markets. Bank credit remains as the main source of financing in several ASEAN+3 economies, while bond and equity financing have both become an increasing funding source in recent years. Bank credit has grown steadily over the past years, exceeding the GDP levels for most countries in the region.
In our assessment of banking sector performance in the ASEAN+3 region using the CAMELS approach, we find that banks’ capital holdings remain adequate, that their asset quality is relatively high, that their profitability levels are positive, and that their liquidity conditions are stable. Specifically, capital adequacy ratios are above the minimum capital requirements set by their home country’s central banks/monetary authorities and the Bank for International Settlement. Non-performing loan (NPL) ratios were on a downward trend in recent quarters, while profitability indicators—the return on asset (ROA) and return on equity (ROE) ratios—were on an upward path. And the liquidity asset and loan-deposit ratios are at stable levels.
However, the banking system in the region faces increasing downside risks emanating from both external and internal fronts. The escalating sovereign debt crisis and expected recession in Europe, an anemic United States (US) economic recovery, and recent downgrades of European sovereigns and global banks based in Europe and the US, are all likely to contribute to increasing the credit and liquidity risks of ASEAN+3 banks. Furthermore, credit demand is expected to ease amid a slowdown in the growth of advanced economies and moderating growth in emerging markets. Bank profitability is expected to tighten on the back of narrowing interest margins, weak loan demand, and higher capital requirements. Asset quality conditions may deteriorate amid high loan concentration and exposure to vulnerable sectors.
In the ASEAN+3 banking system, we find that the regulatory measures and supervision are in place and well-functioning, with compliance of Basel requirements already being implemented or are in progress. However, there is significant heterogeneity across supervisory structures and practices, ranging from multiple supervisory structures in some economies to an integrated supervisory framework in others. Such differences may be influenced by the level of financial and economic development, institutional underpinnings, and legal frameworks.
Banking sector supervisors and regulators in the region have exerted efforts to improve the regulatory framework to be consistent with international best practices that are promoted by the Basel Committee on Banking Supervision (BCBS). The level of compliance still varies across countries while the existing prudential regulations are believed to be at their best at this juncture. Prudential regulations revolve around the capital adequacy and liquidity risk frameworks proposed by BCBS. There is variation in the determination of minimum capital for establishing domestic banks and foreign bank subsidiaries in the region. The high capital requirement has helped maintain bank stability but has also tend to deter new entrants in the banking sector.
Currently, there is an increased observance of the international regulatory standards among banks with the intention of integrating national regulatory framework with the guidelines for best practices in the global context. These levels of observance contribute to a sound financial system, as supervisors struggle to align national regulatory framework with international standards.
2 | P a g e

The CAMELS framework is a widely used tool by many bank supervisors and regulators
in most ASEAN+3 countries in assessing bank performance. However, other rating methodologies and systems in assessing bank performance must not be discounted.
Central banks/monetary authorities in the region have in place liquidity measures as well as a number of financial safety nets—such as deposit insurance mechanism. The interplay of these financial safety net arrangements and combination of these instruments vary across countries. However, many financial safety net arrangements have resulted in costly financial restructuring schemes for the government.
The development of the deposit insurance system in the region was evident after the 1997-98 Asian crisis. Over the past decade, those with existing protection systems have undertaken significant modifications in their mandates and regulations while those with temporary deposit guarantees have created a permanent protection scheme. Despite the disparities among economies in their deposit insurance system set-ups or models, the region represents a good mixture of deposit insurance systems. The region has a combination of few but mature systems and some new yet well-established systems. There are also variations in the powers and governance of the deposit insurance systems which hinge on their structures or mandates.
We employed empirical tests to assess the potential impact of economic, regulatory, and bank-specific characteristics on bank intermediation and credit creation in the ASEAN+3 region. We utilized bank-specific data on the top ten largest banks in ten ASEAN+3 economies— namely, the People’s Republic of China (PRC), Indonesia, Japan, Republic of Korea, Malaysia, the Philippines, Singapore, Thailand, and Viet Nam. (Brunei Darussalam, Cambodia, Lao PDR, and Myanmar were not included due to lack of bank-specific data.) The data covers the 2006-2010 period and is culled from Bankscope. Overall, our results reveal that: i) Focusing on liquidity reduces net loans but reduces net interest margin; ii) Bigger banks reduce net interest margin compared to small ones but they are in a position to make more loans; iii) Bank equity matters in net interest margin but not in the determination of net loans; iv) Market structure matters in financial intermediation but they do not affect net loans; and v) Regulations do not have uniform effects. Furthermore, financial intermediation cost is increased by the existence of reserve policies, deposit insurance and activity restrictions. Of this set of regulatory variables, only reserve policy matters in the net loans to asset ratio. A surprising finding which may require further empirical validation and verification is the ability of debt–to–GDP ratio to improve the number of significant predictors.
The stability of the banking sector rests on the capacity of banks to withstand risks that may threaten the financial sector in particular and the economy in general. Protection from exposures to these systemic and market risks and insurance against vulnerability will depend on how these banks are able to build up sufficient capital to cover them in any eventuality. There is a need to protect and insure banks from various risks in financial intermediation that has been complicated because of the increasing complexity of the roles of banks in financial intermediation, globalization of the market for goods and funds and the nature of the risks and causes of the financial crisis. However, there are opportunity costs to some of these regulations including among other the cost on credit creation as shown in the increase in the interest margin and the decline in the loans granted as shown in the empirical investigation.
Although the banks in the region have remained stable in the light of the current European financial difficulties and the US crisis a few years back, the outlook for banking
3 | P a g e

systems and economic performance in Europe and the US is not positive; this is highlighted by several downgrades of US and European banks in December 2011 and more recently, the ratings downgrade of several European economies, which includes France, Italy, Portugal, and Spain, in January 2012. These may have repercussions on the health of ASEAN+3 banks, as many of the large banks in the region have exposures to banks and sovereigns in Europe and the US. At the same time, several ASEAN+3 economies have been registering a slowdown in their growth as their exports deteriorated due to the sluggish demand from their major European and US export markets.
These downside risks are threatening the stability of the banking sector in ASEAN+3, thereby calling for policy responses that would help insulate the region from a possible financial contagion that is likely to emanate from the West. Indeed, such risks have begun to encroach upon ASEAN+3 banking systems, and these are evident via the tightening of bank lending conditions and intermittent surges in credit default swap of Asian banks. Moreover, as the region’s economic growth eases, with growth being pulled down by weak export performance, local banks’ profit margins may narrow down.
Against this backdrop, there is an impending need for ASEAN+3 policymakers to exert efforts that aim to mitigate the downside risks that can create financial vulnerabilities. The general goal of stronger regional financial cooperation is to maintain the resiliency of the banking system and boost banking sector stability, and safeguard credit creation which is the engine for financial development and inclusive growth.
Specifically, ASEAN+3 policymakers must continue monitoring closely financial sector and economic developments in the global economy and in their respective countries in the region in order to better prepare and insulate local banks from external shocks. Moreover, there is a need for policymakers to strengthen their financial cooperation efforts in dealing with and preparing for sudden capital reversals owing to a loss in market confidence, as well as in times of banking crisis situations. Timely sharing amongst policymakers of bank-specific data and information on their respective markets may be helpful in order to come up with “real-time” or immediate and appropriate policy responses. Constant bank stress tests and transparency in their findings may also be called upon by policymakers to ensure that banks are capable of withstanding the worst-possible scenario. Among the policy measures that they may tackle are: i) Liquidity measures – such as bank guarantees, deposit insurance, currency swap arrangements, or other appropriate financial safety nets -- that will help banks during times of a liquidity crunch; ii) Bank mergers and consolidations with the aim of helping banks meet the high capital requirement standards of Basel III; iii) Bank privatization, which can help state-owned banks be injected with additional capital and adopt superior management and technology and thereby improve on their business operations and reputation; and iv) Risk management techniques, which can help improve on their asset quality and risk-adjusted return.
However these policy options do have opportunity costs. Policies that are designed to promote internal restructuring through consolidations and mergers appear to contribute towards bank efficiency but at the same time, may increase industry concentration and banks’ market shares.
During the aftermath of the Asian financial crisis, a key initiative among ASEAN +3 countries was to deregulate the banking industry, thereby allowing the entry of foreign banks that led to consolidations. Bigger banks have the potential to reduce intermediation costs because of their ability to pool resources better, introduce more innovative practices and withstand shocks. As shown in the regressions, a bigger bank is associated with lower net
4 | P a g e

interest margins but at the same time, such banks may become large relative to the market that they may now be able to set higher interest rates on loans, thereby increasing the net interest margin and putting a drag on the efficient allocation of financial resources. Because the resultant industrial organization may be reconfigured by promoting competition, there is a need to revisit national bank entry regulations and bank competition policy.
Moreover, it is also evident from the empirical results that policies that promote the increase in capitalization requirements may not necessarily translate into lower net interest margins. Even in ASEAN+3, highly capitalized banks may increase net interest margins because of their ability to withstand bankruptcy risk.
In light of the crisis in Europe, there is a need to analyze how the debt-to-GDP ratio affects bank performance since banks are among the major financial institutions that buy sovereign bonds. In the study, higher debt-to-GDP ratio negatively affects net interest margin but caution should be exercised in interpreting the results since an increase in a country’s degree of indebtedness may lead to a lower net loans to total assets ratio. There are also studies that point to the plausible link between excessive debt-to-GDP ratios and economic growth. A key policy initiative is to develop early warning mechanisms that would inform banks on the true fiscal state of countries issuing sovereign bonds. This also necessitates a periodic assessment of banks’ asset holdings.
In terms of prudential supervision and banking regulations, calibrating existing measures poses a challenging task among central banks and supervisors. This requires a thorough understanding of the different types of risks to fully address the problem and use the appropriate policy measures among a wide range of policy instruments that the central bank can use as part of its monetary policies. Supervisory authorities in the region must be more vigilant in addressing the problems through the use of various surveillance mechanisms. Likewise, refinement of existing regulatory frameworks must be undertaken on a continuous basis to maintain stability in the financial system.
Notwithstanding the introduction of regulations related to liquidity risk management, supervisors must vigorously enhance their policies so that they are synchronized with the regional level. At the regional level, crisis management resolutions have to be introduced both at the national and regional levels. While regulations are put into place within the financial infrastructure of the country, the magnitude of its implementation vary in every jurisdiction. Reforms must incorporate uncertainties that surround these regulations or reforms to ensure safety and soundness in the financial system while introducing innovations and efficiency.
More liquidity risk enhancements must be introduced such as those that address contingencies and funding requirements, especially those that are related to foreign currency transactions. These transactions involve complexities and are vulnerable to risk compared to transactions made in local currencies, especially when there is reversal in capital flows. Since liquidity management varies across countries, efforts must be undertaken to address the management of the banks’ assets and liabilities to reflect liquidity needs and to maintain a balanced portfolio of assets.
In addition, the progress and the way banks has implemented the Basel II framework must be re-evaluated at the national and regional levels given the variability in the level of compliance. While it is ideal to implement international best practices, in reality, the changes might not be feasible for banks, given the current conditions.
5 | P a g e

A better understanding of the international guidelines must be made in the light of the limitations of the current financial landscape to fully integrate in the national regulatory framework a workable system for the country. It may be possible that banks are forced to make rapid adjustments to implement the new framework and prepare them for the implementation of the new Basel III framework that may turn counterproductive.
Problems on managing banks’ liquidity risk hinges from the absence of a strong framework for the management of liquidity. In this light, harmonized prudential regulations related to capital adequacy and liquidity may be desirable and are important to a strong collaborative arrangement among countries in the region. However, this exercise may be quite difficult as the financial developments among countries in the region are quite diverse, especially those countries which were not included in the evaluation or analysis. At the regional level, agreements among national authorities must be made related to any regulatory reform agenda especially among the countries with underdeveloped financial system.
Moreover, policy instruments that are designed to mitigate bank risks, reduce moral hazard and regulate bank activities must be guided with the fact that these measures appear to be negatively related to bank efficiency. As a monetary policy tool, higher reserves robustly reduce the net loans-to-asset ratio but at the same time appear to increase net interest margins. Other regulatory tools like deposit insurance and restrictions on bank activities will increase the net interest margin. While it is understandable that activity restrictions are imposed in order to limit moral hazard problems, studies show that loosening restrictions may in fact encourage bank development and reduce the cost of financial intermediation.
In addressing the differences in deposit insurance system, the International Association of Deposit Insurers have successfully released its guidelines for effective deposit insurance systems which are expected to be voluntarily and gradually incorporated in the country’s deposit insurance system mandate. Like the banking sector, the implementation of these Core Principles can provide a globally coordinated system for financial safety net arrangements. The issue lies on the current financial and institutional underpinnings of the country’s financial system. It may be possible that at the regional level, compliance with the international standards can slowly be integrated in each country’s financial safety net arrangement and certain issues (i.e., information sharing, types of financial safety net arrangements, form of surveillance mechanisms to be used, etc.) can be coordinated among national authorities which are necessary to prevent crisis and manage it when it occurs.
Given all these issues and implications, regulatory mechanisms should consider addressing the issue of flexibility in the implementation of safeguard measures given the thrust towards standardization of requirements. The move towards international statutory standards including the Basel Accord may pose some problems on several grounds including the variability of bank size, differences on the causes of financial crisis, uncertainties of the exposure and vulnerability to crisis, and the need to manage national concerns and financing needs as well as differences in the resolution measures for banks under siege.
In terms of bank size for example, the Basel III has proposed additional capital requirement for systemically important financial institutions (a.k.a., SIFIs) since these huge banks have extensive negative externalities if ever they fail. Although this proposed measure addresses the need to have differential safeguards according to bank size, it needs to be more flexible in terms of implementation. The opposition of a number of large Chinese and Japanese banks is instructive. Although they are quite large compared with other banks in the region they are, however, domestically oriented and therefore less exposed to risks and less vulnerable to
6 | P a g e

the havoc of financial crisis that are usually transmitted through global interconnections. Although bank size is indeed can be very risky to the financial sector and the economy, size in itself, however, will not lead banks to be exposed and vulnerable to the hazards external to their business environment. For example, the ability of the regional banks in ASEAN and East Asia to withstand the impact of the US financial crisis and the current European crisis can be attributed to a certain degree to their limited exposure to the US and European financial markets.
In addition, in assessing risks of bank assets there is a need to be more flexible from the standard evaluation of weighing. Because of the variations in exposure and vulnerability, banks may unnecessarily hold capital reserves with huge opportunity costs. Bias against short term loans over long term loans should be reconsidered in terms of the exposure of these loans to risks and the financing needs of the country which may not be uniform across the region.
Resolving the conflict between standardization and flexibility in regulatory measures will
have an impact on the spatial jurisdiction of regulatory bodies. We do not discount the value of international accords on prudential banking and protection against risks but we likewise value the role of national regulatory agencies on banks that may define national concerns. Aside from defining national jurisdiction over global statutory requirements there is a need to define the role of regional bodies. The optimal role is to bridge the gaps between universal standards and national flexibility. In particular, a regional approach also needed to oversee how national regulations and supervisory measures on banking are addressing systemic risks and other risks relative to global standards. The concern for regional cooperation on this matter lies on the need to a have a stable financial system for the entire region.
7 | P a g e
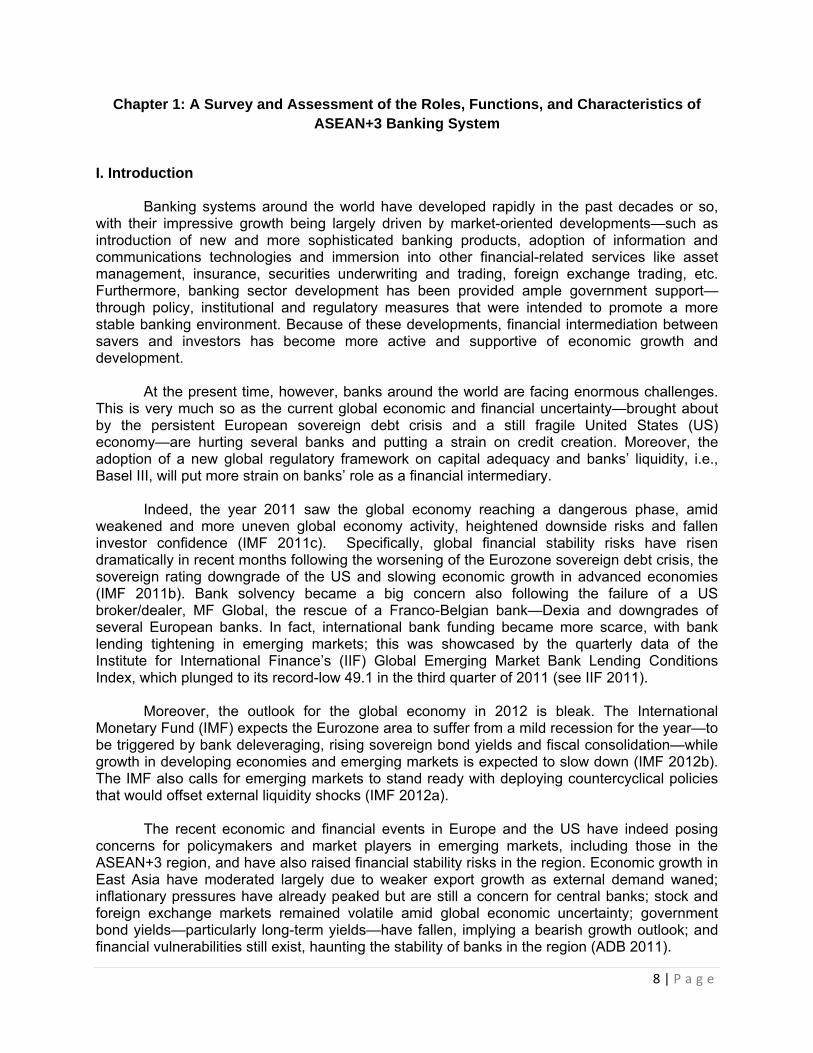
Chapter 1: A Survey and Assessment of the Roles, Functions, and Characteristics of ASEAN+3 Banking System
I. Introduction
Banking systems around the world have developed rapidly in the past decades or so, with their impressive growth being largely driven by market-oriented developments—such as introduction of new and more sophisticated banking products, adoption of information and communications technologies and immersion into other financial-related services like asset management, insurance, securities underwriting and trading, foreign exchange trading, etc. Furthermore, banking sector development has been provided ample government support—through policy, institutional and regulatory measures that were intended to promote a more stable banking environment. Because of these developments, financial intermediation between savers and investors has become more active and supportive of economic growth and development.
At the present time, however, banks around the world are facing enormous challenges. This is very much so as the current global economic and financial uncertainty—brought about by the persistent European sovereign debt crisis and a still fragile United States (US) economy—are hurting several banks and putting a strain on credit creation. Moreover, the adoption of a new global regulatory framework on capital adequacy and banks’ liquidity, i.e., Basel III, will put more strain on banks’ role as a financial intermediary.
Indeed, the year 2011 saw the global economy reaching a dangerous phase, amid weakened and more uneven global economy activity, heightened downside risks and fallen investor confidence (IMF 2011c). Specifically, global financial stability risks have risen dramatically in recent months following the worsening of the Eurozone sovereign debt crisis, the sovereign rating downgrade of the US and slowing economic growth in advanced economies (IMF 2011b). Bank solvency became a big concern also following the failure of a US broker/dealer, MF Global, the rescue of a Franco-Belgian bank—Dexia and downgrades of several European banks. In fact, international bank funding became more scarce, with bank lending tightening in emerging markets; this was showcased by the quarterly data of the Institute for International Finance’s (IIF) Global Emerging Market Bank Lending Conditions Index, which plunged to its record-low 49.1 in the third quarter of 2011 (see IIF 2011).
Moreover, the outlook for the global economy in 2012 is bleak. The International Monetary Fund (IMF) expects the Eurozone area to suffer from a mild recession for the year—to be triggered by bank deleveraging, rising sovereign bond yields and fiscal consolidation—while growth in developing economies and emerging markets is expected to slow down (IMF 2012b). The IMF also calls for emerging markets to stand ready with deploying countercyclical policies that would offset external liquidity shocks (IMF 2012a).
The recent economic and financial events in Europe and the US have indeed posing concerns for policymakers and market players in emerging markets, including those in the ASEAN+3 region, and have also raised financial stability risks in the region. Economic growth in East Asia have moderated largely due to weaker export growth as external demand waned; inflationary pressures have already peaked but are still a concern for central banks; stock and foreign exchange markets remained volatile amid global economic uncertainty; government bond yields—particularly long-term yields—have fallen, implying a bearish growth outlook; and financial vulnerabilities still exist, haunting the stability of banks in the region (ADB 2011).
8 | P a g e

The ADB (2011) emphasizes that the biggest challenge for governments in emerging East Asia is to safeguard economic growth against the likelihood of a global economic crisis. The IMF (2011b) calls for the need to have “coherent policy solutions” that will minimize sovereign risks inherent in advanced economies and prevent a contagion, and that “credible efforts” must be made in order to enhance the resilience of financial markets.
Against this backdrop, it is crucial to formulate and implement appropriate policy responses that will safeguard credit creation and banking sector development in the ASEAN+3 region. Part of finding these potential solutions is to have a better understanding of the past and the current situations of ASEAN+3 banks, focusing on its key roles and functions and also on its salient characteristics.
The next section of this paper provides the CAMEL framework, which is an important benchmark for analyzing bank performance. It is then followed by descriptive analysis on the structure of the ASEAN+3 banking sector. The following section describes the capital adequacy of ASEAN+3 banking sectors. Asset quality measures of banks in the region are then presented. This is followed by two sections that discuss profitability and liquidity trends of ASEAN+3 banking sectors, respectively. II. CAMEL Framework
The CAMEL framework makes use of five components in assessing bank performance, and they are: i) Capital adequacy; ii) Asset quality; iii) Management quality; iv) Earnings performance; and v) Liquidity.
Capital is a financial requirement for the entry of a bank and for sustaining the bank’s operations. Capital adequacy measures the financial strength of the bank when it comes to cushioning large losses. Banks as well as other financial institutions are required to have financial capital that is sufficient enough to support their risky assets. An indicator of capital adequacy is Capital Adequacy Ratio (CAR)—the proportion of equity capital to risk-weighted assets—which was introduced by the Basel Committee on Banking Supervision (BCBS) of the Bank for International Settlements (BIS). Specifically, the different capital adequacy ratios for bank analysis are:
Capital ratio (i.e., the ratio of total capital to total assets); Tier 1 capital ratio (the ratio of Tier 1 capital—which includes common equity, perpetual
preferred stock, mandatory convertible debt, etc.—to total assets); Tier 2 capital ratio (the ratio of Tier 2 capital—which includes long-term subordinated
debt, perpetual preferred stock and mandatory convertible debt not included in Tier 1, non-specific loan loss reserves, etc.—to total assets); and
Equity capital ratio (the ratio of common equity to total assets)
It may be worthwhile to note that the regulatory minimum capital requirements set forth by the BIS were embedded in the Basel Accords—Basel I, Basel II, Basel III. The first Basel Accord published in 1988 (a.k.a., Basel I) focused more on credit risk and has introduced certain classifications of bank assets based on their corresponding credit risk weights. Sixteen years later, in 2004, the second Basel Accord or Basel II was published, providing a more comprehensive view of the minimum capital requirements. In particular, it takes into account three types of risk that banks face in the computation of regulatory capital: i) Credit risk, ii)
9 | P a g e

Market risk, and iii) Operational risk. For credit risk measurement, it proposes three approaches, namely the standardized approach, the foundation internal rating-based approach and the advanced internal rating-based approach. As for market risk, Basel II recommends the use of the value at risk (VAR) methodology. In operational risk measurement, it proposes three approaches: the basic indicator approach, the standardized approach and the internal measurement approach. Later on, the BIS pushed for the implementation of Basel III through the BCBS’s announcement in September 2010 amid the global banking crises that engulfed the global economy in 2008-2009; one of the proposals in Basel III is the doubling of minimum standards for common equity or Tier 1 capital for banks.
Assessing the asset quality of banks is also important due to its implications to bank performance. The main types of assets that are being considered in this criterion are loans and investments. Among the asset quality indicators that are being used include:
Loan concentration or exposures; Non-performing loan (NPL) ratio—which is the proportion of NPLs to total loans
outstanding; Loan loss ratio (the amount of loan loss divided by total loans outstanding); Loan loss provisioning ratio (loan loss provisions as a ratio of total assets); and Reserve ratio (the amount of reserves maintained to cover loan losses as a proportion of
total loans outstanding).
Management quality reflects the ability of the board, bank executives, managers and other decision makers in using bank resources to meet their vision and objectives. Management must be able to operate the bank efficiently and be able to manage risks that the bank faces. However, this criterion is not that easily measurable, thus explaining the lack of proxy indicators.
Generating adequate profits is important for banks in order to improve the quality of their assets, raise financial capital, build up reserves, improve management capabilities and enhance their shareholder value and also their economic value. Banks use certain profitability measures and among the common ones are:
Return on Assets (ROA) – the ratio of net income to total assets; Return on Equity (ROE) – the ratio of net income to total equity; and Net interest margin (NIM) – the ratio of net interest income to average earning assets
Banks need to be liquid in order to meet the needs of their depositors and creditors.
Maintaining sufficient liquidity is crucial for them to promote market confidence. As learned from the past banking crises, banks ought to conduct smooth asset-liability management practices to avoid maturity mismatches in their balance sheets. Furthermore, banks need to ensure that they do not succumb to excessive leveraging that will precipitate a loss in confidence and later on a banking crisis. Among the common liquidity measures for banks are:
Loan-to-deposit ratio (total loans as a share of total deposits); and Liquid asset ratio (the proportion of liquid assets to total assets)
10 | P a g e

III. Banking Structure
The Asian financial system is still more of a bank-based system rather than a market-oriented system. Indeed, this is shown by the fact that bank lending is still the main source of domestic financing by sovereigns, state-owned enterprises and private corporates in the ASEAN+3 region (Figure 1.1). Using the Asian Development Bank’s (ADB) AsianBondsOnline data, the size of bank credit accounted for 46% of total domestic financing as of March 2011, while bonds and equities financing comprised 30% and 24% of the total, respectively. The People’s Republic of China (PRC)—the largest economy in the region starting in 2011—has 55% of its total financing in the form of bank credit, while equity and bond financing accounted for 26% and 19% of the total, respectively. Bank credit has been also relatively large in Japan (48% of total) and Thailand (50% of total).
Figure 1.1: Domestic Financing in ASEAN+3 Region, Mar. 2011 (percent of total)
0
10
20
30
40
50
60
70
80
90
PRC
Hong Kong, China
Indonesia
Japan
Korea, Rep
. of
Malaysia
Philippines
Singapore
Thailand
ASEAN+3
Bank credit
Bonds
Equity
PRC = People’s Republic of China.
Source of basic data: Asian Development Bank’s (ADB) AsianBondsOnline.
Bank credit has steadily climbed for most ASEAN+3 economies over the past five decades or so (Figures 1.2a and 1.2b). This is especially true for most Northeast Asian economies—particularly the PRC, Japan, Republic of Korea and Hong Kong, China—as they now have bank credit to GDP ratios greater than 100%. For instance, Japan’s bank credit to GDP ratio soared to 324.2% in 2010, compared with 60.3% in 1960. In the PRC, bank credit surged to 147.6% of GDP in 2010 from only 39.4% in 1977. The Republic of Korea also had an outstanding growth in credit creation, as its bank credit to GDP ratio jumped from a low of 8.6% in 1960 to 103.2% in 2010. In Hong Kong, China, bank credit as a proportion of GDP has stood above 100% since 1990, and had levelled off at 199.0% in 2010.
11 | P a g e

For ASEAN economies, the bank credit to GDP ratio for 2010 ranges from 22.5% in
Cambodia to 135.8% in Viet Nam. (This excludes Brunei Darussalam, Lao PDR, and Myanmar for lack of 2010 data.) In the past decades, there was positive annual growth in bank credit in many ASEAN economies—such as Malaysia and Thailand, which grew by an average rate of 7.8% and 4.6%, respectively, over the 1960-2010 period. Since 2000, among the ASEAN economies that recorded double-digit average annual growth rates include Brunei Darussalam, Cambodia, Lao PDR and Viet Nam. In Indonesia, the outstanding size of bank credit by commercial banks surged between end-2009 and end-2010 by 22.8% to IDR1,765.8 trillion, and accelerated further by 21.6% year-to-date to IDR2,146.9 trillion at end-November 2011, according to Bank Indonesia data. The sharp rise in bank credit in Indonesia is largely due to aggressive bank lending to micro enterprises and small-and medium-scale enterprises (SMEs) (EIU 2011c).
Figure 1.2a: Bank Credit in the People’s Republic of China; Hong Kong, China; Japan; and Republic of Korea, 1960-2010
(percent of GDP)
0
50
100
150
200
250
300
350
1960
1962
1964
1966
1968
1970
1972
1974
1976
1978
1980
1982
1984
1986
1988
1990
1992
1994
1996
1998
2000
2002
2004
2006
2008
2010
China, People's Rep.of
Hong Kong, China
Japan
Korea, Rep. of
Source of basic data: The World Bank’s Key Development Indicators.
12 | P a g e

13 | P a g e
Figure 1.2b: Bank Credit in the ASEAN Region, 1960-2010 (percent of GDP)
0
20
40
60
80
100
120
140
160
180
200
19
60
19
62
19
64
19
66
19
68
19
70
19
72
19
74
19
76
19
78
19
80
19
82
19
84
19
86
19
88
19
90
19
92
19
94
19
96
19
98
20
00
20
02
20
04
20
06
20
08
20
10
Brunei Darussalam
Cambodia
Indonesia
Lao PDR
Malaysia
Myanmar
Philippines
Singapore
Thailand
Viet Nam
Source of basic data: The World Bank’s Key Development Indicators.
However, more recent developments in the banking sectors of ASEAN+3 economies suggest that bank lending is expected to tighten at least in the early part of 2012. According to the latest bank lending survey of the Bank of Korea, the lending behaviour of Korean banks is expected to remain “prudent” in the first quarter of 2012, with bank credit for small and medium enterprises (SMEs) and households projected to tighten (The Bank of Korea, 2012). Similarly, bank lending conditions are expected to remain tight in the PRC despite the People’s Bank of China’s (PBC) 50 basis point cut in the reserve requirement ratio (RRR) in December, the first RRR cut since December 20081.
In the emerging East Asian region (ASEAN+3 excluding Japan), the PRC has the largest banking sector, with total assets occupying 73% of the region’s overall banking sector size (Table 1.1). The Republic of Korea has the second-largest banking sector, followed closely by Hong Kong, China. Within ASEAN-5 economies—Indonesia, Malaysia, the Philippines, Singapore and Thailand—the largest banking sector belongs to Singapore while the smallest is the Philippines. Taking ASEAN-5 region as a whole, the banking sector’s total assets is about 10.2% of the overall banking sector’s size in the emerging East Asian region.
1 Wu, K. “China Lending to Remain Tight Despite RRR Cut” IFR Asia. 10 December 2011. Link: http://www.ifrasia.com/china‐lending‐to‐remain‐tight‐despite‐rrr‐cut/1618998.article

Table 1.1: Asset Size of Banking Sector in ASEAN+3, 2010 LCY billion US$ billion
China, People's Rep. of 95,300 14,424
Hong Kong, China 12,291 1,581
Indonesia 3,054,595 340
Korea, Rep. of 1,841,707 1,636
Malaysia 1,550 506
Philippines 6,918 158
Singapore 782 609
Thailand 11,746 391
Country
LCY = local currency. Sources: People’s Bank of China, Hong Kong Monetary Authority, Bank Indonesia, The Bank of Korea, Bank Negara Malaysia, Bangko Sentral ng Pilipinas, Monetary Authority of Singapore, Bank of Thailand.
The PBC (2011) reports that the total assets of all banking institutions in the PRC are estimated at RMB95.3 trillion (US$14.4 trillion), which is more than 200% of the country’s GDP in 2010. This was significantly larger than the banking assets in 2005 of close to RMB40 trillion. Almost two-thirds of the assets were that of the country’s 17 major commercial banks. About 49% and 22% of the assets of these banks were in loans and investments, respectively. On the other hand, total liabilities of the banking industry in the PRC reached RMB89.5 trillion (US$13.5 trillion), of which 82% were in the form of deposits.
Hong Kong, China’s total bank assets in 2010 stood at HK$12.3 trillion (US$1.6 trillion), up 15.6% year-on-year (y-o-y), based on Hong Kong Monetary Authority (HKMA) data. About 34% of the total assets were loans and advances and 28% were amounts due from banks abroad. Total liabilities also amounted to HK$12.3 trillion, of which 56% were customer deposits.
Total assets of the Indonesian banking system were at IDR3,055 trillion (US$340 billion) in 2010, higher by 18.8% from a year earlier or 105.0% from 2005, as per Bank Indonesia (BI) data. By end-November 2011, total banking assets in the country reached IDR3,526 trillion. Commercial banks dominate the Indonesian banking industry with their total assets comprising 98% of the country’s total banking assets.
In the Republic of Korea, total assets of banks were at KRW1,842 trillion (US$1.6 trillion) in 2010. This was 2.3% higher than the previous year and 49.5% greater than in 2005. Meanwhile, the commercial banking industry had total liabilities of KRW1,060 trillion (US$941 billion) in 2010. About 73% of total liabilities were in deposits.
The Malaysian banking industry has total assets amounting to MYR1.6 trillion (US$506 billion) by end-2010. This was 8.7% higher than their 2009’s figure. The asset size of the commercial banking industry was 79% of the overall banking sector, while 17% were by Islamic banks.
In the Philippines, the total assets of the banking industry stood at PHP6.9 trillion (US$158 billion) in 2010, with 47% being in the form of loans. The share of the financial sector
14 | P a g e
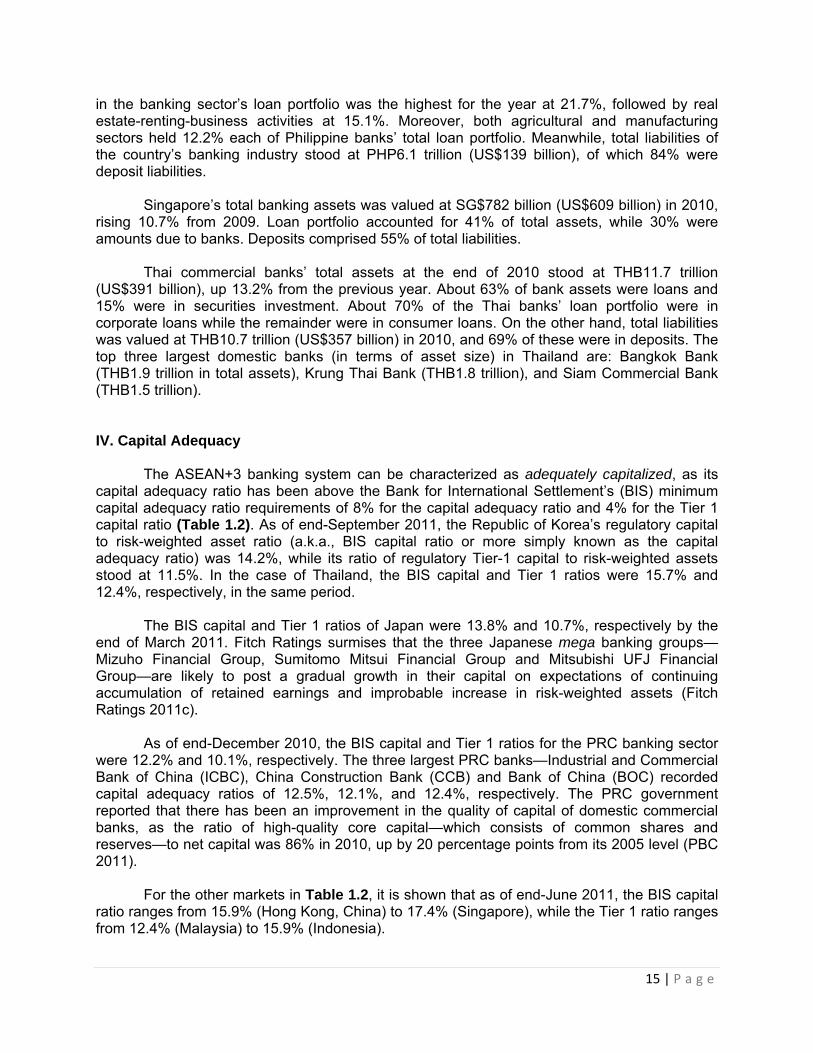
in the banking sector’s loan portfolio was the highest for the year at 21.7%, followed by real estate-renting-business activities at 15.1%. Moreover, both agricultural and manufacturing sectors held 12.2% each of Philippine banks’ total loan portfolio. Meanwhile, total liabilities of the country’s banking industry stood at PHP6.1 trillion (US$139 billion), of which 84% were deposit liabilities.
Singapore’s total banking assets was valued at SG$782 billion (US$609 billion) in 2010, rising 10.7% from 2009. Loan portfolio accounted for 41% of total assets, while 30% were amounts due to banks. Deposits comprised 55% of total liabilities.
Thai commercial banks’ total assets at the end of 2010 stood at THB11.7 trillion (US$391 billion), up 13.2% from the previous year. About 63% of bank assets were loans and 15% were in securities investment. About 70% of the Thai banks’ loan portfolio were in corporate loans while the remainder were in consumer loans. On the other hand, total liabilities was valued at THB10.7 trillion (US$357 billion) in 2010, and 69% of these were in deposits. The top three largest domestic banks (in terms of asset size) in Thailand are: Bangkok Bank (THB1.9 trillion in total assets), Krung Thai Bank (THB1.8 trillion), and Siam Commercial Bank (THB1.5 trillion). IV. Capital Adequacy
The ASEAN+3 banking system can be characterized as adequately capitalized, as its capital adequacy ratio has been above the Bank for International Settlement’s (BIS) minimum capital adequacy ratio requirements of 8% for the capital adequacy ratio and 4% for the Tier 1 capital ratio (Table 1.2). As of end-September 2011, the Republic of Korea’s regulatory capital to risk-weighted asset ratio (a.k.a., BIS capital ratio or more simply known as the capital adequacy ratio) was 14.2%, while its ratio of regulatory Tier-1 capital to risk-weighted assets stood at 11.5%. In the case of Thailand, the BIS capital and Tier 1 ratios were 15.7% and 12.4%, respectively, in the same period.
The BIS capital and Tier 1 ratios of Japan were 13.8% and 10.7%, respectively by the end of March 2011. Fitch Ratings surmises that the three Japanese mega banking groups—Mizuho Financial Group, Sumitomo Mitsui Financial Group and Mitsubishi UFJ Financial Group—are likely to post a gradual growth in their capital on expectations of continuing accumulation of retained earnings and improbable increase in risk-weighted assets (Fitch Ratings 2011c).
As of end-December 2010, the BIS capital and Tier 1 ratios for the PRC banking sector were 12.2% and 10.1%, respectively. The three largest PRC banks—Industrial and Commercial Bank of China (ICBC), China Construction Bank (CCB) and Bank of China (BOC) recorded capital adequacy ratios of 12.5%, 12.1%, and 12.4%, respectively. The PRC government reported that there has been an improvement in the quality of capital of domestic commercial banks, as the ratio of high-quality core capital—which consists of common shares and reserves—to net capital was 86% in 2010, up by 20 percentage points from its 2005 level (PBC 2011).
For the other markets in Table 1.2, it is shown that as of end-June 2011, the BIS capital ratio ranges from 15.9% (Hong Kong, China) to 17.4% (Singapore), while the Tier 1 ratio ranges from 12.4% (Malaysia) to 15.9% (Indonesia).
15 | P a g e

Table 1.2: Capital Adequacy Ratios of Banking Sector in ASEAN+3 Economies (percent)
Regulatory Capital to Risk-Weighted
Assets
Regulatory Tier-1 Capital to Risk-
Weighted Assets
PRC 12.2 10.1
Hong Kong, China 15.9 12.5
Indonesia 17.0 15.9
Japan 13.8 10.7
Korea, Rep. of 14.2 11.5
Malaysia 16.6 12.4
Philippines 16.7 13.1
Singapore 17.4 14.3
Thailand 15.7 12.4
Country
PRC = People’s Republic of China. Note: PRC data is as of end-December 2010. Japan’s data is as of end-March 2011. Republic of Korea and Thailand data are as of end-September 2011. The rest are as of end-June 2011. Source: International Monetary Fund’s (IMF) Financial Soundness Indicators Database, Bank of Thailand.
It is interesting to note that immediately following the global economic and financial
turmoil in 2008-2009, the capital adequacy of most ASEAN+3 banking sectors has improved; however, recent quarters appear to show a downward trend in the BIS capital and Tier-1 capital ratios of these banking systems in the region (Figures 1.3a and 1.3b).
This is especially true for Hong Kong, China—which had its BIS capital ratio dropping to 12.46% in end-June 2011 from 12.52% three months earlier; Malaysia (from 12.73% at end-March 2011 to 12.43% at end-June 2011); and Singapore (from 14.73% at end-March 2011 to 14.28% at end-June 2011). Nevertheless, it appears that the fall in the capital adequacy levels of banks in the region is not yet a concern. For instance, Fitch Ratings (2011d) assessed the core capitalization levels of the major Malaysian banks to be satisfactory and expects that their capital positions will remain intact. Fitch (2011f) also expects Singaporean banks to maintain their high capital buffer and prudent risk management, both of which will enable them to continue posting a strong core capitalization base.
For domestic banks in the Republic of Korea, the BIS capital ratio dropped on a quarterly basis between end-June 2011 and end-September 2011. According to the country’s Financial Supervisory Service (FSS), the BIS capital ratio fell to 14.17% at end-September 2011 from 14.40% at end-June 2011 as banks’ net income dropped while risk-weighted assets climbed (FSS 2011a); this is still, however, above the 14% mark, which started at end-September 2009. It further reported that the Korean banks’ BIS capital ratio is still “favourable”, as this is close to the average BIS capital ratio of the top 20 global banks of 14.69% as of end-July 2011.
In contrast, the BIS capital ratio rose in Thailand from 11.29% at end-June 2011 to 11.69% at end-September 2011; the EIU has reported that all financial institutions in Thailand have exceeded the BIS capital adequacy requirements (EIU 2011i). Meanwhile, the ratio for the Philippines remained unchanged from three months earlier at 13.1% at end-June 2011. Fitch (2011e) believes that the core capital of Philippine banks are still sound—and that it can support balance-sheet shortfalls—as they have limited high-risk assets likely to keep their core capital sound.
16 | P a g e

As for the BIS Tier-1 capital ratio, this fell on a quarterly basis for Hong Kong, China and
Singapore in 2Q11, and for Indonesia and Republic of Korea in 3Q11.
Figure 1.3a: BIS Capital Ratio of Banking Sector in ASEAN+3 Economies, 1Q09 – 3Q11 (percent)
12
13
14
15
16
17
18
19
1Q09
2Q09
3Q09
4Q09
1Q10
2Q10
3Q10
4Q10
1Q11
2Q11
3Q11
Hong Kong, China
Indonesia
Korea, Rep. of
Malaysia
Philippines
Singapore
Thailand
BIS = Bank for International Settlements. Source of basic data: Bank Indonesia, Bank of Thailand, Financial Supervisory Service, IMF’s Financial Soundness Indicators Database.
Figure 1.3b: BIS Tier-1 Capital Ratio of Banking Sector in ASEAN+3 Economies, 1Q09 – 3Q11
(percent)
9
10
11
12
13
14
15
16
1Q09
2Q09
3Q09
4Q09
1Q10
2Q10
3Q10
4Q10
1Q11
2Q11
3Q11
Hong Kong, China
Korea, Rep. of
Malaysia
Philippines
Singapore
Thailand
BIS = Bank for International Settlements. Source of basic data: Bank Indonesia, Bank of Thailand, Financial Supervisory Service, IMF’s Financial Soundness Indicators Database.
17 | P a g e
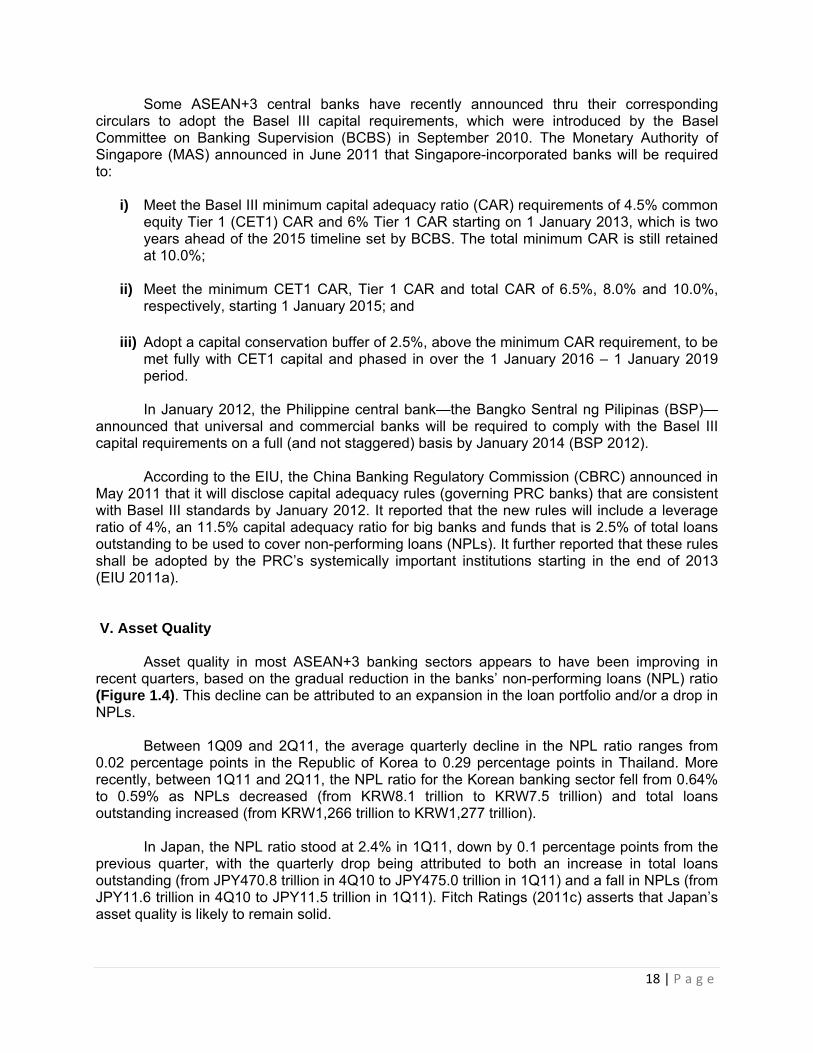
Some ASEAN+3 central banks have recently announced thru their corresponding circulars to adopt the Basel III capital requirements, which were introduced by the Basel Committee on Banking Supervision (BCBS) in September 2010. The Monetary Authority of Singapore (MAS) announced in June 2011 that Singapore-incorporated banks will be required to:
i) Meet the Basel III minimum capital adequacy ratio (CAR) requirements of 4.5% common equity Tier 1 (CET1) CAR and 6% Tier 1 CAR starting on 1 January 2013, which is two years ahead of the 2015 timeline set by BCBS. The total minimum CAR is still retained at 10.0%;
ii) Meet the minimum CET1 CAR, Tier 1 CAR and total CAR of 6.5%, 8.0% and 10.0%,
respectively, starting 1 January 2015; and
iii) Adopt a capital conservation buffer of 2.5%, above the minimum CAR requirement, to be met fully with CET1 capital and phased in over the 1 January 2016 – 1 January 2019 period.
In January 2012, the Philippine central bank—the Bangko Sentral ng Pilipinas (BSP)—
announced that universal and commercial banks will be required to comply with the Basel III capital requirements on a full (and not staggered) basis by January 2014 (BSP 2012).
According to the EIU, the China Banking Regulatory Commission (CBRC) announced in May 2011 that it will disclose capital adequacy rules (governing PRC banks) that are consistent with Basel III standards by January 2012. It reported that the new rules will include a leverage ratio of 4%, an 11.5% capital adequacy ratio for big banks and funds that is 2.5% of total loans outstanding to be used to cover non-performing loans (NPLs). It further reported that these rules shall be adopted by the PRC’s systemically important institutions starting in the end of 2013 (EIU 2011a). V. Asset Quality
Asset quality in most ASEAN+3 banking sectors appears to have been improving in recent quarters, based on the gradual reduction in the banks’ non-performing loans (NPL) ratio (Figure 1.4). This decline can be attributed to an expansion in the loan portfolio and/or a drop in NPLs.
Between 1Q09 and 2Q11, the average quarterly decline in the NPL ratio ranges from
0.02 percentage points in the Republic of Korea to 0.29 percentage points in Thailand. More recently, between 1Q11 and 2Q11, the NPL ratio for the Korean banking sector fell from 0.64% to 0.59% as NPLs decreased (from KRW8.1 trillion to KRW7.5 trillion) and total loans outstanding increased (from KRW1,266 trillion to KRW1,277 trillion).
In Japan, the NPL ratio stood at 2.4% in 1Q11, down by 0.1 percentage points from the previous quarter, with the quarterly drop being attributed to both an increase in total loans outstanding (from JPY470.8 trillion in 4Q10 to JPY475.0 trillion in 1Q11) and a fall in NPLs (from JPY11.6 trillion in 4Q10 to JPY11.5 trillion in 1Q11). Fitch Ratings (2011c) asserts that Japan’s asset quality is likely to remain solid.
18 | P a g e

For Indonesia, the NPL ratio of commercial banks was 2.56% at end-2010, climbed to 2.81% at end-March 2011 before tapering off to 2.74% at end-June 2011 and further down to 2.67% at end-September 2011. The latest NPL ratio for Indonesia was 2.55% at end-November 2011. The EIU reported that the reduction in Indonesian commercial banks’ NPL ratio in recent months has been made possible by loan restructuring efforts and “better bank management” (EIU 2011c). Meanwhile, the NPL ratio for the Malaysian banking system has continually fallen since 1Q09, reaching a low of 2.9% in 2Q11 after standing at 3.2% in 1Q11.
Figure 1.4: Non-performing Loans (NPL) Ratio in Selected ASEAN+3 Economies, 1Q09 –
3Q11 (percent)
0.0
1.0
2.0
3.0
4.0
5.0
6.0
7.0
1Q09
2Q09
3Q09
4Q09
1Q10
2Q10
3Q10
4Q10
1Q11
2Q11
3Q11
Japan
Hong Kong, China
Indonesia
Korea, Rep. of
Malaysia
Philippines
Singapore
Thailand
Note: Quarterly NPL data are not available for the PRC and Indonesia. Source: International Monetary Fund’s (IMF) Financial Soundness Indicators Database, Bank of Thailand.
For the PRC, its NPL ratio registered a total annual drop of 7.8 percentage points
between 2005 and 2010, reaching 1.1% by end-2010 (Figure 1.5). Three months later, by the end of March 2011, the NPL ratio of the PRC banking system remained unchanged at 1.1% (an improvement from 1.4% a year earlier) with 0.5% being “doubtful”, 0.4% being “substandard” and 0.2% being a “loss” (EIU 2011a). However, the country’s loan loss provisions to NPL ratio sharply rose to 217.7% in 2010 from a low of 24.8% in 2005. There have been observations that the decline in the NPL ratio for the PRC banking system is mainly a result of an increase in the stock of outstanding loans following massive lending conducted by the large state-owned banks to help finance the country’s fiscal stimulus program in late 2008 (Ibid).
19 | P a g e

Figure 1.5: Non-Performing Loans (NPL) Ratio of Major Commercial Banks in the PRC, 2005-2010 (percent)
0
1
2
3
4
5
6
7
8
9
10
2005 2006 2007 2008 2009 2010
PRC = People’s Republic of China. Source: IMF (2011).
In the Philippines, the recent drop in the NPL ratio can be attributed to the continuing
adoption of prudent lending standards by domestic banks that helped lower the incidence of problematic loans, as well as the expansion in the banks’ total loan portfolio (BSP 2011). Nevertheless, concerns still abound on the asset quality conditions of Philippine banks. Specifically, according to Fitch (2011e), the risk to a sharp increase in NPLs emanates from the banks’ high loan exposure to a few corporate accounts (i.e., domestic business conglomerate accounts) and from its limited corporate governance practices.
In Hong Kong, China, there have been recent efforts to strengthen asset quality conditions of its banking sector; for example, the EIU reported that Hong Kong Monetary Authority in 2010 had tightened the mortgage lending requirements—such as lowering the loan-to-value ratio ceiling for residential properties valuing no less than HKD12 million from 70% to 60% in August 2010 and lowered further to 50% in November 2010—in order to temper housing speculation and insulate the banking sector from a potential downswing in property prices (EIU 2011b).
In the Republic of Korea, the delinquency ratio for KRW-denominated loans that have overdue payments of at least 1 day climbed to 1.43% in November 2011 from 1.28% in the previous month (Figure 1.6). This was mainly on the back of a surge in new delinquent loans to KRW3.7 trillion for the month from KRW1.8 trillion in the previous month, with most of these being evident in the corporate sector (FSS 2011b). The Republic of Korea’s FSS reported that the chances of the ratio going up further still remain amid heightened uncertainty in global financial markets largely triggered by the Eurozone’s sovereign debt crisis.
20 | P a g e

Figure 1.6: Loan Delinquency Ratio in the Republic of Korea, Jan. 2009 – Nov. 2011 (percent)
0.6
0.8
1
1.2
1.4
1.6
1.8
Jan-
09
Mar
-09
May
-09
Jul-0
9
Sep-
09
Nov
-09
Jan-
10
Mar
-10
May
-10
Jul-1
0
Sep-
10
Nov
-10
Jan-
11
Mar
-11
May
-11
Jul-1
1
Sep-
11
Nov
-11
Source: FSS (2011b).
In Malaysia, Fitch warns that the household debt—which stood at 76% of GDP at end-
2010—is relatively high by emerging economy standards, and this high concentration on individual loans may leave the banking sector sensitive to jumps in unemployment and interest rates. The ratings agency also argued that business loans of domestic banks are much riskier than household loans as these are exposed to the vulnerable manufacturing sector (Fitch 2011d). Nevertheless, Bank Negara Malaysia has stated that the increase in the level of household debt was supported by sound economic and financial fundamentals, including steady economic growth, low unemployment rate, higher salary increase in the private sector and stronger income growth in the rural areas. It added that the rise in household debt has been commensurated by continued improvement in impaired loans, which stood at a historical low of 1.8% in 2011 (from 2.3% in 2010), and that the loan-in-arrears ratio has also improved to 2.6% for the year from 3.0% in the previous year.
For banks in Singapore, Fitch (2011f) conjectures that their asset quality conditions are vulnerable to potential downturns in the Singaporean economy, which relies heavily on its export sector, as about 30% of their total loans are in export-oriented businesses—mostly in manufacturing, general commerce and shipping.
Thai banks are expected to encounter an increase in their NPLs for 2012 following their financial assistance to flood-stricken borrowers and maintaining the credit status of their customers over the next 6 months to 1 year, as per the Bank of Thailand’s regulatory forbearance (Fitch 2011g).
VI. Profitability
Profitability of banking sectors varies across ASEAN+3 economies. In 2Q11, the return on assets (ROA) of banking systems in the region ranged from 1.0% in Hong Kong, China to 3.1% in Indonesia (Table 1.3a). In 3Q11, the ROAs for both Indonesia and Thailand were 3.1% and 0.9%, respectively. In 1Q11, Japan’s ROA was 0.3%. Against this backdrop, it appears that the Indonesian banking sector is the most profitable in the region. In fact, it has been reported
21 | P a g e

22 | P a g e
that the banking sector of Indonesia has been cited by the country’s central bank governor to be the most profitable in Southeast Asia.2
Based on return on equity (ROE) data, it is likewise revealed that the ratio likewise varies across banking markets in the region, ranging from 15.5% in the Philippines to 19.3% in Hong Kong, China (Table 1.3b). (Note that Indonesia and Thailand do not have publicly available ROE data for their banking sectors.) Between 1Q09 and 2Q11, the combined ROE of the banking sectors in Republic of Korea, Malaysia, the Philippines, Singapore and Hong Kong, China has recorded an average quarterly increase of 0.5 percentage point. More recently, the Republic of Korea’s financial regulator—Financial Supervisory Service (FSS)—reported that Korean banks’ earnings jumped 29.2% to KRW9.3 trillion at end-2011, and that net interest margin rose slightly to 2.31% from 2.30% in 2010 (FSS 2012a).
The outlook on banking sector profitability for most ASEAN+3 economies appears to be a moderating trend. On the Indonesian banking sector, Fitch Ratings (2011b) believes that it will continue to deliver solid core earnings in 2012 on the back of lower financing costs and a manageable credit costs. In contrast, Fitch Ratings (2011c) expects that the three “mega” Japanese banking groups are likely to succumb to lower net interest revenue—as weak loan demand from the corporate sector is likely to persist—and to a drop in non-interest earnings.
As for Singaporean banks, Fitch (2011f) thinks that bank earnings are likely to moderate in 2012 due to increasing credit costs, volatile trading conditions, and tight margins. Philippine banks are expected to post decelerating earnings growth amid expectations of higher credit costs and narrow net interest margins (Fitch 2011e).
For Thailand, the average quarterly rise for its ROA was 0.05 percentage points between 1Q09 and 3Q11; The EIU reported that the Thai banking system generated net profits totalling THB123 billion in 2010 alone, a 34.5% increase from 2009, on the back of higher net interest and non-interest earnings as well as lower provisioning costs (EIU 2011i). However, bank profitability in Thailand is expected to weaken in 2012 due to lower interest and bank fee earnings and higher operating expenses as domestic banks are providing financial assistance to many flood-affected borrowers.
Also, the average quarterly hike in banks’ return on equity (ROE) ranges from 0.01 percentage points in the Philippines to 1.9 percentage points in the Republic of Korea (Table 1.3b). However, Singaporean banks’ ROE registered an average quarterly decline of a marginal 0.1 percentage points.
In the PRC, the banking sector’s ROA climbed by 0.09 percentage points year-on-year (y-o-y) to 1.0% in 2010, while the sector’s ROE increased by 1.26 percentage points y-o-y to 17.5% for the year (PBC 2011).
2 Antara News. “RI Banking Industry Most Profitable in Southeast Asia: BI” November 30, 2011.

23 | P a g e
Table 1.3a: Return on Assets (ROA) of ASEAN+3 Banks, 1Q09 – 2Q11 (percent)
— = data not available. Note: Quarterly ROA data are not available for the PRC. Data for Indonesia are end-period. Source: International Monetary Fund’s (IMF) Financial Soundness Indicators Database, Bank Indonesia, Bank Negara Malaysia, Bank of Thailand.
Table 1.3b: Return on Equity (ROE) of ASEAN+3 Banks, 1Q09 – 2Q11 (percent)
1Q09 2Q09 3Q09 4Q09 1Q10 2Q10 3Q10 4Q10 1Q11 2Q11 3Q11
Hong Kong, China 15.4 17.2 16.1 16.7 15.7 16.5 16.1 16.7 18.1 19.3 —
Japan — — 5.7 — 5.5 — 9.2 — 6.9 — —
Korea, Rep. of 2.3 9.9 11.3 8.9 14.0 10.7 10.8 9.7 16.7 19.0 —
Malaysia 16.7 11.2 13.2 14.0 15.9 16.7 16.6 16.6 19.0 18.4 18.3
Philippines 14.3 15.0 15.0 15.4 15.2 15.4 16.1 16.7 14.2 15.5 —
Singapore 17.0 15.5 15.0 13.8 17.7 16.4 17.4 15.5 17.2 15.7 — — = data not available. Note: Quarterly ROE data are not available for the PRC, Indonesia, and Thailand. Source: International Monetary Fund’s (IMF) Financial Soundness Indicators Database, Bank Negara Malaysia.
VII. Liquidity
Bank liquidity appears to be relatively high in Singapore versus other ASEAN+3 economies, as the country’s liquid asset ratio was hovering around 70% since 1Q09, levelling off at 69.7% in 2Q11 (Figure 1.7). Between 1Q09 and 2Q11, the liquid asset ratio fell for most economies in the region, including Hong Kong, China; Malaysia; and Singapore, which had average quarterly decreases of 0.4, 0.1 and 0.1 percentage points, respectively. In contrast, the liquid asset ratio in Japan stood at 23.2% in 1Q11, up from its 3Q10 and 1Q10 levels of 21.8% and 21.6%, respectively. For the Philippines, the liquidity asset ratio also climbed, albeit marginally, between 1Q09 and 2Q11.
1Q09 2Q09 3Q09 4Q09 1Q10 2Q10 3Q10 4Q10 1Q11 2Q11 3Q11
Hong Kong, China 0.6 0.8 0.8 0.8 0.9 0.9 0.8 0.9 1.0 1.0 —
Japan — — 0.2 — 0.2 — 0.4 — 0.3 — —
Indonesia — — 2.6 3.1 3.0 2.9 2.9 3.1 3.1 3.1
Korea, Rep. of 0.1 0.6 0.8 0.6 1.0 0.8 0.8 0.7 1.3 1.5 —
Malaysia 1.4 1.0 1.2 1.2 1.5 1.6 1.6 1.5 1.8 1.7 1.7
Philippines 1.3 1.3 1.4 1.4 1.5 1.5 1.6 1.7 1.5 1.6 —
Singapore 1.3 1.3 1.3 1.3 1.6 1.5 1.6 1.4 1.5 1.4 —
Thailand 0.9 0.9 1.0 1.0 1.1 1.2 1.2 1.2 1.2 1.4 0.9
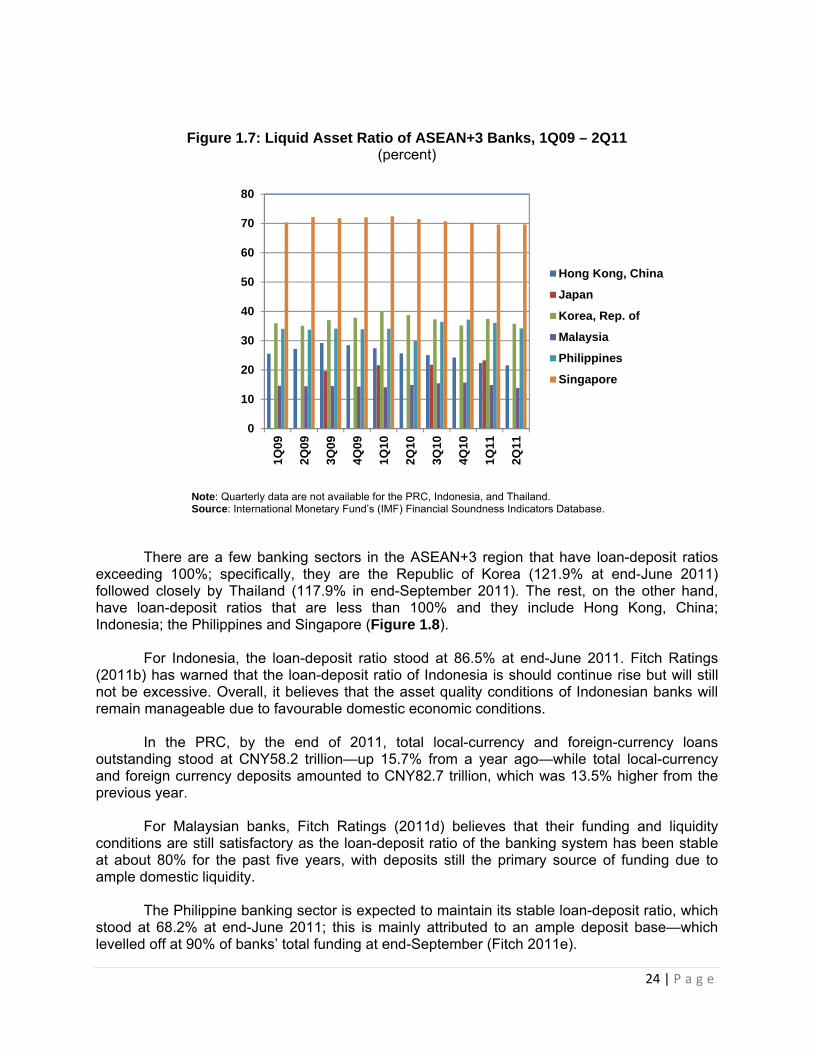
Figure 1.7: Liquid Asset Ratio of ASEAN+3 Banks, 1Q09 – 2Q11 (percent)
0
10
20
30
40
50
60
70
80
1Q
09
2Q
09
3Q
09
4Q
09
1Q
10
2Q
10
3Q
10
4Q
10
1Q
11
2Q
11
Hong Kong, China
Japan
Korea, Rep. of
Malaysia
Philippines
Singapore
Note: Quarterly data are not available for the PRC, Indonesia, and Thailand. Source: International Monetary Fund’s (IMF) Financial Soundness Indicators Database.
There are a few banking sectors in the ASEAN+3 region that have loan-deposit ratios exceeding 100%; specifically, they are the Republic of Korea (121.9% at end-June 2011) followed closely by Thailand (117.9% in end-September 2011). The rest, on the other hand, have loan-deposit ratios that are less than 100% and they include Hong Kong, China; Indonesia; the Philippines and Singapore (Figure 1.8).
For Indonesia, the loan-deposit ratio stood at 86.5% at end-June 2011. Fitch Ratings (2011b) has warned that the loan-deposit ratio of Indonesia is should continue rise but will still not be excessive. Overall, it believes that the asset quality conditions of Indonesian banks will remain manageable due to favourable domestic economic conditions.
In the PRC, by the end of 2011, total local-currency and foreign-currency loans outstanding stood at CNY58.2 trillion—up 15.7% from a year ago—while total local-currency and foreign currency deposits amounted to CNY82.7 trillion, which was 13.5% higher from the previous year.
For Malaysian banks, Fitch Ratings (2011d) believes that their funding and liquidity conditions are still satisfactory as the loan-deposit ratio of the banking system has been stable at about 80% for the past five years, with deposits still the primary source of funding due to ample domestic liquidity.
The Philippine banking sector is expected to maintain its stable loan-deposit ratio, which stood at 68.2% at end-June 2011; this is mainly attributed to an ample deposit base—which levelled off at 90% of banks’ total funding at end-September (Fitch 2011e).
24 | P a g e

In Singapore, Fitch (2011e) views banks’ loan-deposit ratio, which stood at 88.8% in
3Q11, to be not excessive despite being relatively high or close to 100%. This is because it thinks that Singaporean banks have stable funding profiles given their large retail deposit base, and that they are liquid in terms of the local currency.
Thailand’s relatively high loan-deposit ratio together with a surge in the issuance of bills of exchange by Thai banks in the previous year has increased the banks’ funding risk (Fitch 2011g).
Figure 1.8: Loan-to-Deposit Ratio of ASEAN+3 Banks, 1Q09 – 3Q11
(percent)
0
20
40
60
80
100
120
140
160
Hong Kong, China
Indonesia
Korea, Rep. of
Philippines
Singapore
Thailand
Source: International Monetary Fund’s (IMF) Financial Soundness Indicators Database, Bank of Thailand.
More recent events resulted in heightened risks in bank funding and solvency not just in Europe or US but also in Asia. This is evident in the recent jump in the 5-year credit default swap (CDS) spreads of Asian banks, soaring to more than 200 starting in August 2011 and reaching a high of 265 in October before settling at 247 in November (Figure 1.9).
This could be attributed to concerns over a possible credit crunch amongst Asian banks given their exposures to European and US banks. Based on Asian Development Bank (ADB) calculations, banks in Singapore and Hong Kong, China have the largest borrowings (as a proportion to domestic credit) from European banks at 72.1% and 78.6%, respectively, as of end-June 2011 (Table 1.4). Other ASEAN+3 banks that have borrowings to domestic credit of between 10% and 20% to European banks are Malaysia (16.7%), Republic of Korea (16.4%), the Philippines (15.1%) and Indonesia (13.3%). In addition, banks based in Singapore and Hong Kong, China are relatively more exposed to US banks as their borrowings to domestic credit ratios were at double-digits, i.e., at 25.7% and 10.9%, respectively.
Nevertheless, it appears that the liquidity risk arising from the foreign exposures of ASEAN+3 banks to their European and US counterparts is still manageable. For Indonesian
25 | P a g e

banks, Fitch Ratings (2011b) opined that the direct impact of the European sovereign debt turmoil on Indonesian banks is limited thanks to the large size of Indonesia’s domestic economy and minimal direct market exposure.
Figure 1.9: Average 5-year CDS Spreads of Asian Banks, May 2009 – Nov. 2011
0
50
100
150
200
250
300M
ay-
09
Ju
l-0
9
Sep
-09
No
v-0
9
Jan
-10
Ma
r-1
0
Ma
y-1
0
Ju
l-1
0
Sep
-10
No
v-1
0
Jan
-11
Ma
r-1
1
Ma
y-1
1
Ju
l-1
1
Sep
-11
No
v-1
1
CDS = credit default swap. Source of basic data: Bloomberg LP.
Table 1.4: ASEAN+3 Banking Sectors’ Exposure to European and US Banks, as of end-June 2011 (percent of domestic credit)
All France Germany UK GIIPS
China, People's Rep. of 2.7 0.3 0.2 1.6 0.2 0.8
Hong Kong, China 72.1 5.4 2.7 56.1 1.7 10.9
Japan 2.4 0.8 0.3 0.7 0.0 1.7
Indonesia 13.3 1.6 2.0 6.5 0.1 6.0
Korea, Rep. of 16.4 2.8 1.7 8.8 0.2 8.3
Malaysia 16.7 1.5 1.1 12.8 0.1 5.7
Philippines 15.1 2.6 1.7 7.1 0.1 7.5
Singapore 78.6 8.7 9.8 37.9 0.9 25.7
Thailand 4.7 0.5 0.7 2.9 0.0 2.2
Viet Nam 6.5 2.3 0.9 2.6 0.1 1.2
European banks
Lender
US banksBorrower
GIIPS = Greece, Ireland, Italy, Portugal, and Spain. UK = United Kingdom. US = United States. Note: Data above is based on ADB calculations using data from the Bank for International Settlements (BIS)—particularly Table 9D on consolidated foreign claims of reporting banks on an ultimate risk basis—and CEIC. Source: ADB (2011).
26 | P a g e

27 | P a g e
On the other hand, the liquidity risk in the PRC banking system appears to be
increasing, as according to Fitch Ratings (2011a), the PRC banks have been suffering from “rapid erosion” in their historical funding and liquidity strengths. The ratings agency added that this year, PRC banks would be facing certain risks such as: i) Rising forbearance burdens owing to greater repayment difficulties coming bank borrowers (ex. Local governments, SMEs, etc.); ii) Slowdown in deposit growth (that may come from a deceleration in economic growth, capital outflows, or a big rebound in the stock market); iii) Inflationary pressures that may hinder the central bank from conducting monetary easing; and iv) Freezing up of the inter-bank market potentially coming from increased counterparty risk.
Against the backdrop of heightened liquidity risks in the Republic of Korea amid escalating household debt, the country’s financial regulator—the FSS—announced in June 2011 that it plans to tighten rules governing the loan-deposit ratio of banks3. In contrast, there are expectations that the PRC may relax regulations on the loan-deposit ratio cap of 75%, which took effect on June 2011 as a means to curb excessive lending, in order to stimulate bank lending activity, amid a moderation in the country’s economic growth.4 VIII. Foreign Banks
The presence of foreign banks varies across ASEAN+3 economies, and appears to be relatively active in certain banking sectors in the region. The European sovereign debt crisis has been seen to have negatively affected the Asian operations of European banks, triggering concerns of a potential heightening of funding risk throughout Asia.
In the Republic of Korea, there are 2 foreign commercial banks—Citibank Korea and Standard Chartered Korea—both of which belong to the top ten largest banks in the country, and several foreign bank branches. Based on FSS data, the total assets of foreign bank branches rebounded to KRW228.7 trillion at end-September, following a quarterly decline from KRW200.6 trillion at end-March to KRW186.6 trillion at end-June. However, this was mainly led by a jump in their liabilities from KRW176.8 trillion at end-June to KRW218.4 trillion at end-September. Moreover, credit coming from foreign bank branches appears to be weakening as the outstanding size of their loans and discounts have been falling continually in 2011, from KRW38.3 trillion at end-March to KRW36.2 trillion at end-June and KRW34.4 trillion at end-September.
The FSS (2012b) documents that the 38 foreign bank branches in the Republic of Korea have raised KRW118.1 trillion in capital in 2011; this was however 4.8% lower than the 2010 amount due to lower borrowings. In particular, borrowings by the 15 branches of European banks fell 21.0% y-o-y to KRW38.1 trillion in 2011 amid the European sovereign debt crisis. The decline in borrowings by foreign bank branches had also reduced their investments in the domestic economy. Investments by the foreign bank branches into the Republic of Korea’s local currency-denominated government bonds fell 19.3% to KRW34.8 trillion in 2011. However, their investments into local currency-denominated corporate bonds jumped 144.4% to KRW2.2 trillion
3 “Korea to Tighten Loan‐Deposit Ratio Rules for Banks to Tame Household Debt” Bloomberg, 23 June 2011. Link: http://www.bloomberg.com/news/2011‐06‐22/korea‐regulator‐to‐tighten‐loan‐deposit‐ratio‐rules‐to‐tame‐household‐debt.html 4 “China May Relax Loan‐to‐Deposit Ratio for Growth, Goldman Says” Bloomberg, 16 December 2011. Link: http://www.bloomberg.com/news/2011‐12‐16/china‐may‐relax‐loan‐to‐deposit‐ratio‐for‐growth‐goldman‐says.html

in 2011, while their investments in foreign currency-denominated bonds have increased 9.2% to KRW14.3 trillion in the same period. Moody’s (2012) conjectures that the banking sector of the Republic of Korea is indeed highly dependent on external funding, leaving it heavily exposed to a potential tightening in external funding, possibly coming from lending cuts by European banks. However, the FSS (2012b) reports that amid the expected decline in bank borrowing and securities investment by branches of foreign banks, particularly European banks, in the Republic of Korea, Japanese banks are expected to expand its underwriting operations covering Korean corporate bonds while PRC banks are expected to increase their corporate lending activity in the Republic of Korea.
According to MAS in Singapore, as of 10 March 2012, Singapore’s banking industry
comprises of 123 commercial banks—of which 6 are domestic banks and the rest are foreign banks. Of the 117 foreign banks, 52 are wholesale banks, 39 are offshore banks, and 26 are foreign full banks. Moody’s (2012) notes that European banks have its strongest funding presence in Singapore, which makes it potentially vulnerable to liquidity tightening especially if the Eurozone’s sovereign debt crisis escalates forcing European banks to undergo credit retrenchment from their operations in Singapore.
The CBRC (2010) reports that as of the end of 2010, 360 foreign banking institutions—in
terms of branches, headquarters, and subsidiaries—have been operational in the PRC, and that the total assets of these foreign banks amounted to CNY1.7 trillion, which was 1.8% of the asset size of the country’s overall banking industry. Moody’s (2012) assesses the credit pressure coming from the PRC banking sector’s dependence on external funding and the influence of European banks to be “low”. Furthermore, the degree of credit pressure by European banks on the domestic banking system is not high in most other ASEAN+3 markets, according to Moody’s (2012), classifying it as “low” in Cambodia, and “medium” in Indonesia, Japan, Malaysia, the Philippines, Thailand, and Viet Nam. IX. Policy Implications
ASEAN+3 banks, overall, have remained resilient despite the European sovereign debt crisis, sluggish US economic growth and moderating growth in emerging markets, including emerging ASEAN+3 economies. This is evident in their adequate capital holdings, ample liquidity, sound asset quality and healthy profitability. However, the outlook for banking systems and economic performance in Europe and the US is not positive; this is highlighted by several downgrades of US and European banks in December 2011 and more recently, the ratings downgrade of nine European economies, which includes France, Italy, Portugal and Spain, in January 2012. These may have repercussions on the health of ASEAN+3 banks, as many of the large banks in the region have exposures to banks and sovereigns in Europe and the US. At the same time, several ASEAN+3 economies have been registering a slowdown in their growth as their exports deteriorated due to the sluggish demand from their major European and US export markets.
These downside risks are threatening the stability of the banking sector in ASEAN+3, thereby calling for policy responses that would help insulate the region from a possible financial contagion that is likely to emanate from the West. Indeed, such risks have begun to encroach upon ASEAN+3 banking systems, and these are evident via the tightening of bank lending conditions and intermittent surges in credit default swaps (CDS) of Asian banks. Moreover, as the region’s economic growth eases, with growth being pulled down by weak export performance, local banks’ profit margins may narrow down.
28 | P a g e

Against this backdrop, there is an impending need for ASEAN+3 policymakers to exert
efforts that aim to mitigate the downside risks that can create financial vulnerabilities. The general goal of stronger regional financial cooperation is to maintain the resiliency of the banking system, boost banking sector stability and safeguard credit creation which is the engine for financial development and inclusive growth.
Specifically, ASEAN+3 policymakers must continue monitoring closely financial sector and economic developments in the global economy and in their respective countries in the region in order to better prepare and insulate local banks from external shocks. Moreover, there is a need for policymakers to strengthen their financial cooperation efforts in dealing with and preparing for sudden capital reversals owing to a loss in market confidence, as well as in times of banking crisis situations. Timely sharing amongst policymakers of bank-specific data and information on their respective markets may be helpful in order to come up with “real-time” or immediate and appropriate policy responses. Constant bank stress tests and transparency in their findings may also be called upon by policymakers to ensure that banks are capable of withstanding the worst-possible scenario. Among the policy measures that they may tackle are: i) Liquidity measures – such as bank guarantees, deposit insurance, currency swap arrangements, or other appropriate financial safety nets -- that will help banks during times of a liquidity crunch; ii) Bank mergers and consolidations with the aim of helping banks meet the high capital requirement standards of Basel III; iii) Bank privatization, which can help state-owned banks be injected with additional capital and adopt superior management and technology and thereby improve on their business operations and reputation; and iv) Risk management techniques, which can help improve on their asset quality and risk-adjusted return.
29 | P a g e

Chapter 2: Policies and Regulations, Supervisory Practices, and Safety Net Mechanism in
the ASEAN+3 Banking System
I. Introduction
The role of the banking sector in the financial and economic development of a country cannot be discounted. It had been argued that a sound financial system could foster business development which eventually leads to economic development. In Asia, for example, the banking sector dominates the financial system compared to other financial institutions that operate in a given country. Banks role in mobilizing funds and in providing greater access to credit by private sector had always been the topic of many studies over the past years. The remarkable changes in the financial environment, especially the introduction and development of various financial markets in the global arena, have highlighted the need for banks to develop more sophisticated financial products aside from the traditional activities they had been offering over the past seven decades. In Asia many innovations and developments were introduced as countries struggle to capture the market in the western region; in some parts of the region, other countries struggle to maintain their status as financial centers.
It can be noted that the way banking activities are undertaken nowadays are reshaped
by various factors such as the degree of economic and financial developments, the legal and regulatory enhancements and other initiatives undertaken at the national, regional and global levels. These interplays of factors which shape the current financial architecture in a country are important key elements for enhancing stability in the financial system. Moreover, it can pose a direct or indirect impact on the country’s overall growth and competitiveness. However, the exposure of banks to a variety of risk had become an important concern among policy makers as banks continue to engage in risk-related transactions or complex transactions to diversify their portfolio and increase their profitability.
From a supervisory perspective, the development of the financial markets and the role of
banks of the financial system make up a feasible financial environment as they provide an avenue where investors and borrowers meet and satisfy their needs. However, this provides a threat to banks as the financial market provides a diversion of funds’ sources and uses which banks used to enjoy over the past three decades. As a result, banks started to engage in securities and insurance businesses through mergers and acquisitions to capture and maintain a good share of the market. Their linkages with these institutions had influenced the new wave of development in the country’s financial system.
Recent studies have presented pertinent findings that will deepen our understanding of
banks and supervisory agencies such as their role in the financial system, their key features and characteristics and their behavior. To date, what we had witnessed the fragility of the banking sector and other non-bank financial institutions which put forward pressures among national authorities. Regulators or supervisors have continuously instituted regulatory reforms aimed at providing stability in the financial system while managing efficiency and promoting public confidence. Likewise, we had witnessed many international agencies and group of country alliances (G-3, G-10 and recently G-20) designing solutions related to financial, economic and monetary affairs. However, the series of crises that occurred over the past 15 years have triggered financial development. More importantly, the events over the past four years are proofs of the challenges faced by supervisory agencies and central banks worldwide. This period had exposed advanced and emerging economies to greater risk and has highlighted
30 | P a g e

flaws and gaps in their current supervisory frameworks. It also provided an impetus among supervisors in shifting and calibrating existing regulatory and macro-prudential policies to a new paradigm for promoting financial stability in every country.
In early 2011, hopes of recovery in some regions and countries are seen as economic
growth has been relatively better compared to the previous years. However, the lingering problems in some countries and regions such as the Japan earthquake and tsunami, the social and political unrest in many oil producing countries and the European Economic Area’s sovereign debt crisis provided a major turnaround in many countries’ growth and development. This also greatly affected the emerging market economies which are struggling to combat any potential crisis that may occur as a result of the interplay of all these problems in the global market. The recovery over the succeeding years remains debatable issue especially when viewed in the context of the various external shocks and crises that occurred in the past. Our recent experience also shows that even the largest international banks or conglomerates can be affected by the crisis.
Among the most common solutions used by national authorities worldwide include the
use of financial safety nets arrangements to manage the crisis. In some countries in Asia, deposit insurance systems were used together with other temporary safety net arrangements (i.e.: lender of last resort and other liquidity support mechanisms) that are introduced to manage crisis. Among these arrangements, the deposit insurance system and prudential regulations are perceived to be more permanent solutions to manage crisis, both in normal and stressful conditions.
It is believed that the success of the country’s financial infrastructures depends on the
existing market and supervisory structures, the regulatory arrangements used by supervisors for managing financial institutions and the prevailing legal and political environment inherent in the system. The quality of regulation and the supervisory structure is crucial in every country. As observed, emphasis had been given over the past decade, to the improvement of the financial system and the introduction and development of financial markets in the region. However, given the different stages of development and the market structure of the financial system, countries’ practices are heterogeneous in some aspects and similar in others. Efforts are undertaken in the global context especially those related to the introduction and enhancement of prudential regulations geared at managing various types of risks. We have witnessed supervisory authorities all over the world exerting efforts in bringing national supervisory and regulatory frameworks at the international level by complying with the international best practices. At the regional level, efforts are also seen through collaborative regional cooperation among national authorities.
Against this backdrop, this chapter attempts to bring together valuable information in
understanding the background and key features of the supervision and regulation of banks including the financial safety net arrangements that were introduced in the East Asian Region, particularly among ASEAN5+3 economies. It compares these models and framework to provide a better perspective of the current financial landscape in the financial system especially the innovations that were introduced by supervisors and regulators. It is subdivided into five (5) main sections, with Section I involving the introduction that highlights the banking system and the recent financial developments. Sections II, III and IV consist of the discussions of the policies and regulations, supervisory practices, and safety net arrangements in the ASEAN+3 banking system. Section II presents the stylized facts on the institutional and regulatory framework for banking supervision and the prudential regulations in the ASEAN+3 region and other countries. The review and analysis of the prudential regulations focus on capital
31 | P a g e

adequacy, asset quality and liquidity risk management practices of the ASEAN5+3 countries and other developed countries, such as the United States of America, Canada, Australia and the United Kingdom. Comparisons are made among these countries to provide a better understanding of the behaviour of banks and supervisory agencies within the financial system. The analysis is followed by Section III involves the discussions of the significant features of the financial safety net arrangements, with special emphasis on the discussions of deposit insurance systems. Section IV discusses the other modes of financial safety net arrangements used by supervisory/regulatory authorities to manage crisis and risks. Lastly, Section V provides conclusions and some policy implications.
II. Comparison of Supervisory Framework among ASEAN5+3 Countries and
Developed Countries
According to United States Agency for International Development (2010), the country’s level of compliance can be measured using two indices (Standards Compliance Index and Business Compliance Index) developed by the Financial Stability Forum (now called Financial Stability Board). For this study, Standards Compliance Index is used as it embraces the Core Principles Developed by different international standards setting bodies that highlight the 12 key standards for Sound Financial Systems. They are grouped into three major categories, namely, macroeconomic transparency and data transparency, institutional and market infrastructure and financial regulation and supervision.
Table 2.1: Groups of Financial Systems Stability Indicators
Macroeconomic Policy and Data Transparency
Institutional and Market Infrastructure
Financial Regulation and Supervision
Data Dissemination Monetary Policy Transparency Fiscal Policy Transparency
Accounting Anti-Money Laundering Auditing Corporate Governance Insolvency and Creditor
Rights System Payment System
Banking Supervision Securities Regulation Insurance Regulation
Source: United States Agency for International Development (2008). eStandards Forum: Standards Compliance Index and Business Indicators. Retrieved September 23, 2011, from http://pdf.usaid.gov/pdf_docs/PNADM035.pdf
To date, 93 countries are covered by the assessment and are ranked according to their standards and codes compliances. (Table 2.1) depicts a detailed representation of the indicators listed above which highlights the different best practice indicators used worldwide. With the publication and adoption of the Core Principles for Effective Deposit Insurance Systems, accounting and auditing standards were grouped into one to pave way for the inclusion of said principle. They were formulated by different standards setting bodies as guidelines for countries’ supervisors in formulating appropriate regulations and policies. As indicated in (Table 2.2), these 12 indicators for financial systems stability are currently being used by different international organizations in their respective assessments:
32 | P a g e

Table 2.2: Indicators for Sound Financial Systems used Worldwide
Indicator Standard
International Organizations
undertaking Country Evaluation
Macroeconomic Policy and Data Transparency: Monetary and financial policy
Code of Good Practices on
transparency Transparency in Monetary and Financial policies
International Monetary Fund
Fiscal policy transparency Organisation for Economic Cooperation and Development (OECD)
International Monetary Fund
Data Dissemination International Accounting Standards Committee
International Monetary Fund
Institutional and Market Infrastructure: Core Principles for Systematically Committee on Payment
and Settlement Systems Important Payment Systems CPPS and International
Organization of Securities Commissions (IOSCO)
Recommendations for Securities
Payment Systems
Settlements Systems
Corporate Governance Principles of Corporate Governance Organisation for Economic Cooperation and Development (OECD)
International Accounting Standards (IAS) International Accounting Standards Board
Accounting and Auditing
International Standards on Auditing (ISA)
International Federation of Accountants (IFAC)
Deposit Protection System Core Principles for Effective Deposit Insurance Systems
International Association of Insurance Supervisors (IAIS)
The Forty Recommendations/ 8 Special Recommendations Against
Money Laundering
Terrorist Financing
Financial Action Task Force (FATF)
Insolvency Principles and Guidelines on Effective Insolvency and Creditor Rights System
World Bank
Financial Regulation and Supervision: Core Principles for Effective Banking Banking Supervision Supervision
Basel Committee on Banking Supervision (BCBS) of the G-10 central Banks
Objectives and Principles of Securities Securities Regulation Regulation
International Organization of Securities Commissions (IOSCO)
Insurance Supervision Insurance Core Principles International Association of Insurance (IAIS)
Source: Financial Stability Foundation (www.estandardsforum.org)
33 | P a g e

Some of these sets of standards to assess countries’ observance of the standards and
codes are intended for use by supervisors in evaluating operations of internationally active banks; hence, they are also used by many countries to align their supervisory and institutional frameworks with international best practices. Only selected indicators were included in the study to assess the level of compliance by selected countries in the ASEAN+3 region. Comparison among countries are undertaken to measure their supervisory and regulatory frameworks, prudential regulations and financial safety net arrangements. International comparison is also undertaken in this chapter using similar datasets for developed economies (United States of America, United Kingdom, Canada and Australia). The four countries were selected on the basis of the progress they have already made with their financial safety net arrangements, as the same were also affected by the global crisis. Likewise, the choice was made to determine developments that were undertaken at the international level, especially with the ongoing debt crisis in Europe, which was thought to have gradually diminished in early 2011. Since common data sets are difficult to gather for the European Union, the United Kingdom is used for the evaluation.
It can be noted that the financial crisis in mid 2007 had affected many economies
worldwide especially in Europe where many developed economies experienced recession and economic slumps over the past three years. This led many supervisors and national authorities to review their existing regulations and laws and make appropriate reforms both at the national and regional levels.
A. Assessment of Compliance with Best Practices for Sound Financial Systems
Table 2.3: Country’s Standards Compliance Index Scores and their Ranking for the Period 2008-2011
Country 2011* 2010** 2009*** 2008**** Indonesia 47 43.33 47 43.33 47 43.33 46 38.33 Malaysia 30 51.67 30 51.67 39 46.67 41 45.00 Philippines 39 48.33 39 48.33 23 55.00 26 52.50 Singapore 57 37.50 56 37.50 39 46.67 38 46.67 Thailand 35 50.83 34 50.83 32 50.83 44 39.17 China 71 25.83 71 25.83 72 23.83 62 23.33 Hong Kong 30 51.67 30 51.67 32 50.83 29 50.83 Japan 55 38.33 55 38.33 46 38.33 42 44.17 South Korea 65 32.50 65 32.50 64 32.50 53 32.50 Australia 4 69.17 4 69.17 2 69.17 4 69.17 Canada 14 59.17 14 59.17 26 54.17 21 54.17 United Kingdom**
5 68.33 5 68.33 3 58.33 1 72.50
United States 7 65.00 7 65.00 16 65.00 15 58.33 Source: www.eStandardsforum.org:
*Financial Standards Foundation (2011). eStandardsForum Weekly Report. Volume XI, Number 25. February 22-29, 2011. Retrieved October 14, 2011, from http://www.estandardsforum.org/system/files/193/original/weekly-report-2011-02-28.pdf?1298914056 **Financial Standards Foundation (2010b). eStandardsForum Weekly Report. Volume XI, Number 16. December 20-27, 2010. Retrieved October 12, 2011, from http://www.estandardsforum.org/system/files/184/original/weekly-report-2010-12-27.pdf?1293475688 ***Financial Standards Foundation (2009b). Weekly Report. Vol. X No. 16. December 21-28. 2009. Retrieved October 12, 2011, from http://www.estandardsforum.org/system/files/131/original/weekly-report-2009-12-28.pdf?1262094031 ****Financial Standards Foundation (2008a). eStandardsForum Weekly Report. Volume IX No. 15 December 22 - 29 , 2008. Retrieved October 12, 2011, from http://estandardsforum.org/system/files/71/original/weekly-report-2008-12-29.pdf
34 | P a g e

Note: As of 2008, only 81 countries were evaluated. Effective February 2009, 12 countries were included in the evaluation, with a total of 93 countries evaluated since then. The latest available data for 2011 was only for February 22, 2011, Since, then, no weekly report was published.
(Table 2.3) summarizes the Financial Standards Compliance Indices Scores and Rankings among East Asian countries and benchmark countries (United States of America, United Kingdom, Canada and Australia). In the ASEAN+3 region, Philippines and Hong Kong got the highest overall compliance scores of 52.50 and 50.83 in 2008, which put the two countries into the 26th and 29th global ranking, respectively. The rest of the countries in the region got medium to low scores with China getting the lowest overall compliance score of 23.33 for the 12 indicators for Sound Financial Systems.
A substantial downgrade in the Philippines’ compliance rating can be seen in 2010. While an upgrade from a score of 52.50 to 55.00 was evident in 2009, it suddenly plummeted to the 39th ranking as it scored only 48.33 points out of 100 in 2010. This is also evident for Indonesia, Singapore and Japan, whose global rankings plunged, arising from the downgrade in their respective overall compliance scores. On the other hand, Malaysia, Hong Kong and China made significant improvements thereto. Financial Standards Foundation weekly report (FSF) (2010h) weekly report indicated that the completion of the comprehensive assessment for Hong Kong revealed upgrades in auditing standards and insurance supervision compliances from ‘Intent Declared to Enacted’ and from ‘Insufficient Information to Intent Declared’, respectively. However, its anti-money laundering and securities supervision compliances received downgrades, respectively.
Notwithstanding a positive change in China’s standards compliance score in 2010, it still
ranks the lowest among the countries in the region, together with South Korea. It is during this period when China amended its Central Bank Law and issued its new Insolvency Law. Based on the weekly report published by the eStandards Forum (FSF, 2008b), the latest available assessment made for South Korea was in December 2008. Despite its compliance with the financial regulations indicator arising from the changes it made in its supervisory authority (Financial Supervisory Commission replaced Financial Supervisory Service), the lack of recently available information regarding its compliance to the new regulatory regime led to a significant downgrade in its overall ranking from 45.83 as of 2007 to 32.5 in 2008. Since then, no new assessment was made for Korea.
Outside the region, the United States’ Treasury Department released the 2008 Blueprint for a Modernized Financial Regulatory Structure which provided for short and long-term solutions to improve its regulatory structure for financial services. As can be gleaned in (Table 2.3) above, from its compliance score of 58.33 in 2008 which placed the country to 15th worldwide ranking, an upgrade in its score to 65.00 in 2009 was released. However, this only afforded the country to obtain a 16th place in its global ranking, as there was an increase in the number of membership to the forum (FSF) and there were also improvement in the ranking by other countries such as Netherlands and Australia.
From the data presented, mixed results on the overall compliance ratings and rankings of the economies were generated. The limited information generated renders inconclusive results to measure differences and similarities among economies being assessed, including their strengths and weaknesses across all 12 categories of financial systems stability indicators. However, succeeding discussion (refer to Table 2.7) can shed light in evaluating each country’s level of compliance for selected indicators for financial soundness. The results, however, can be used as a benchmark to compare best practices and evaluate the reforms that were and will be instituted in the country’s regulatory/supervisory framework.
35 | P a g e

It must be noted that while the rankings (either upward or downward) for some countries have changed, the scores generated for some years reflected no movement, as the assessment made by the eStandards Forum has not consummated yet or were not conducted during those years due to its reliance from the reports published by international standards setting bodies for their assessments. Arguments about these compliance standards reveal that they are Anglo-Saxon in nature and therefore are not applicable for emerging countries such as East Asia where large disparities in the economic and financial development among countries are apparent (Vojta, 2010). Likewise, most of the standards are geared towards the assessment of the banking system, with less emphasis on the other two major financial sectors (capital market and insurance).
It does not imply though that they are incorrect, but the approaches used for these standards are clear manifestations/characterization of best practices that can be employed for large and developed economies where internationally active institutions and multinational companies are operating. In a region where the financial system is either underdeveloped or developing with the banks being the only financial sector in the system, achievement of the best practices (that is, the policies and their enforcements must articulate the international standards to promote and maintain financial stability) may not be possible or may take long before institutional underpinnings and market infrastructures can be changed and aligned. Hence, these key indicators, once achieved through the country’s compliance will provide benefits for its own advantage and will encourage greater participation by investors and lenders who will find the country’s risk exposure to be low.
Like the Standards Compliance Indices prepared by the Financial Standards Foundation
(FSF), the compliance indices in (Table 2.4) show the weighted sum of compliance scores of countries for several indicators. There are two major groups, namely, Asian Economies and Global Economies (representing a total of 93 countries that were assessed). Likewise, they were further grouped according to their levels of compliances using a four-point system: compliant, largely compliant, non-compliant and materially non-compliant. Notwithstanding the summary of the compliance scores for these Core Principles presented in (Table 2.5), the table above provides detailed information on how the scores in (Table 2.5) were derived.
As can be observed, Lee and Park (2009) also included in their study those economies
that did not answer a question or group of questions in their survey to compare regulatory frameworks across regions using seven (7) sub-groups used by the Basel Committee for the 25 Core Principles for Effective Banking Supervision. They found that Asian countries’ compliance with prudential regulations was high compared to other principles. For many groups of principles, non-compliance among Asian countries was evident due to the difficulty encountered by international organizations in assessing their compliance with the supervisory framework.
Mixed results were generated for the answers to the survey. Principle 1 on objectives,
independence, powers, and transparency and cooperation guidance got the lowest compliance score for both economic groups among the seven (7) major subcategories of the Core Principles. It can be observed that a large percentage of the economies did not participate in answering this question. Hence, majority (approximately 50%) are compliant while others are either largely or materially compliant for this core principle. This only proves that many countries are already making significant change towards full compliance with this standard.
36 | P a g e

Table 2.4: Regional Comparison for Compliance with Basel Core Principles for Effective Banking Supervision
Core Principles Asia
% of Asian Economies Assessed
Global % of World Economies Assessed
No. Description
Co
mp
lian
t
Lar
gel
y C
om
plia
nt
Mat
eria
lly
Co
mp
lian
t
No
n-
com
plia
nt
No
An
swer
o
r N
ot
Ass
ess
ed
Co
mp
lian
t
Lar
gel
y C
om
plia
nt
Mat
eria
lly
Co
mp
lian
t
No
n-
com
plia
nt
No
An
swer
or
No
t A
sses
sed
1
Objectives, Independence, Powers, Transparency and Cooperation
10.5 5.3 5.3 - 78.9 11.6 4.3 2.2 - 81.9
2-5 Licensing and Structure
46.1 35.5 15.8 2.6 - 51.1 31.9 13.8 3.3 -
6-18
Prudential Regulations and Requirements
32.4 22.7 31.2 11.3 2.4 32.0 33.7 25.8 7.5 1.1
19-21
Methods of Ongoing Banking Supervision
33.3 26.3 24.6 8.8 7.0 36.5 29.7 23.9 5.6 4.3
22 Accounting and Disclosure
26.3 52.6 15.8 5.3 - 27.5 39.1 30.4 2.9 -
23
Corrective and Remedial Powers of Supervisors
36.8 5.3 21.1 10.5 26.3 30.4 19.6 13.8 8.0 28.3
24-25
Consolidated and Cross-Border Banking Supervision
36.8 34.2 13.2 7.9 7.9 40.2 29.0 14.5 4.3 12.0
Source: Lee, C and CY Park (2009). Beyond the Crisis: Financial Regulatory Reform in Emerging Asia. Asian Development Bank: ADB Working Paper Series on Regional Economic Integration WP34. Retrieved September 9, 2011, from http://www.adb.org/documents/papers/regional-economic-integration/WP34-Financial-Regulatory-Reform.pdf (derived from Table 7a)
For the seven (7) major categories listed above, the licensing power and structure of the
supervisory authority received the highest score for both groups of economies, with 51.1% of the worldwide economies and 46.1%of the Asian economies. Many economies are also largely compliant and others are materially compliant to these four principles found in Chapter 2 of the Basel Committee’s Core Principles. This is understandable as many economies worldwide had restructured their supervisory framework. In Asia, for instance, the crisis in 1997 led many economies in the region to immediately restructure their institutional set up for financial regulation and supervision. Since the activities of the different financial institutions overlap as a result of the diversified financial product offerings and increased cross-border transactions, licensing activities were enhanced to deal with these cross-border operations by international banks to protect the domestic financial institutions.
37 | P a g e

Among the global economies, full compliance to the consolidated and cross-border
banking supervision (Core Principles 24 and 25) got the highest response compared to the Asian economies. This is understandable as these core principles are designed for internationally active banks. Ideally, the country’s policies must incorporate regulations involving foreign bank operations, whether these are direct or indirect investments arising from cross-border transactions between domestic and international markets. Especially when their activities have crucial role in the country financial system and markets, formal coordination of supervision and regulation need to be undertaken.
Given the insufficient data available to further assess the countries, the analysis may render some biases. From the Standards Compliance indices derived for the economies in Asia as compared to the four major economies (refer to Table 2.3), the discussions on Core Principles for Effective Banking Supervision, Corporate Governance, Insolvency and Creditor Rights Framework and International Accounting Standards will partly shed light on their compliance scores for Sound Financial Systems by understanding how the way supervision and regulations are conducted in the East Asian region in comparison with selected economies. It can be said that there is no single standard that could be employed or are there standards fit for all financial systems across the globe.
Table 2.5: Compliance with Core Principles for Effective Banking Supervision (2008 Survey)
Country Full
Compliance Compliance in Progress
EnactedIntent
Declared Insufficient Information
Indonesia X Malaysia X Philippines X Singapore X Thailand X China X Hong Kong X Japan X South Korea X* Australia X Canada X** United Kingdom X* x United States X* X** Sources: Lee, JW and CY Park (September 2010) New Financial Reforms and Their Effects on Emerging Asia, Retrieved September 9, 2011,
from http://www.adb.org/documents/briefs/ADB-Briefs-2010-5-Financial-Regulation.pdf *Schneider, B (2005). Do Global Standards and Codes Prevent Financial Crises? Some Proposals on Modifying The Standards-
Based Approach. United Nations Conference on Trade and Development: UNCTAD/OSG/DP/2005/1 (note: derived from Annex 6 on Summary of Compliance with Key Financial Standards). . Retrieved September 19, 2011, from http://www.unctad.org/en/docs/osgdp20051_en.pdf
**Financial Standards Foundation (2010a). Annual Globalization Report 2009-2010. Accessed on October 31, 2011. http://www.estandardsforum.org/system/files/164/original/weekly-report-2010-08-02.pdf?12814492592
(Table 2.5) reveals the assessments made by the eStandardsForum on the compliance by each country with the Core Principles for Effective Banking Supervision. Gauging from the results shown above, most of the countries assessed have already made remarkable progress
38 | P a g e

in aligning their supervisory framework with the international best practices, as they received relatively high compliances scores from the Financial Stability Forum.
Hong Kong, the Philippines and South Korea are among the countries in the region which had undertaken major steps in their respective compliances, as they all received eStandardsForum scores of ‘Compliance in Progress’, followed by Indonesia and Singapore which both received an ’Enacted’ level of compliance. Only Malaysia, Thailand and China are slowly complying with the requirements for effective banking supervision with ‘Intent Declared’ ratings. While Malaysia has not undergone a formal assessment, the regulatory framework subscribes to the Basel Core Principles, as evidenced in our guidelines. An elaboration of regulatory and supervisory development can be obtained from the annual publication of the Financial Stability and Payment Systems Report (available on the Bank’s website). Malaysia will undergo the Financial Sector Assessment Program (FSAP) in 2012, where its compliance with Basel Core Principles will be independently assessed. Additionally, a new regulatory legislation will be enacted in 2012 to further enhance the regulatory and supervisory framework for financial institutions in Malaysia. The new legislation takes into consideration the latest developments in the Basel Core Principles, insights from the global financial crisis, leading international practices and the Bank’s own experiences in financial supervision
Arguably, a country’s legal framework and level of financial development must not be underestimated, as they can affect the quality and the level of compliance made by the supervisors in bringing about better supervisory framework for banks. However, the most recent assessment made by FSF (2009e) or eStandardsForum reveals that Thailand’s rating was upgraded to ‘Compliance in Progress’, following the IMF’s report in its Financial System Stability Assessment (FSSA) which states that the country has made significant progress in its supervisory framework for the financial sector industry.
Notwithstanding a country’s willingness to adopt the principles and align its practices with the international standards, these institutional underpinnings cannot be neglected and put into isolation. There were reports that showed the different laws or regulations related to banking were already enacted or reformed; however, the problem hinges on the enforcement issues which are believed to be contributory to the country’s financial stability and to its compliance standing vis-à-vis other economies around the world. Arner and Park (2010) point that as part of the reform process, a technical assistance program must be provided to some countries that will equip them in making their supervisory framework come to par with other countries in the region. This is relatively important when supervisors discuss issues at the regional level, with a support mechanism for regional implementation and monitoring.
Currently, Basel Committee on Banking Supervision (BCBS) is undertaking comprehensive evaluation of these principles including the review of the existing guidelines to address recent developments in the financial system. To date, the recognition and use of these principles have grown significantly over the past two decades as many countries adopted and incorporated these principles at different levels in their existing supervisory framework. As discussed in (Table 2.3), the changes in the overall compliance with these principles were rather small beginning year 2009, as few assessments were undertaken by the standards setting bodies (considering the limited number of staff who will evaluate over 100 economies). This is quite understandable due to the ensuing effects of the global crisis that led supervisors to ease some of their regulations for banks as they struggle to outdo any financial disruptions. Despite this problem, the FSF report (2010d) reveals that both Indonesia and Thailand received upgrades in their compliance rating from ‘Intent Declared to Enacted’ and from ‘Insufficient Information to Enacted’, respectively. These improvements were based on the third party’s assessment and Bank of Indonesia’s self assessment of the country’s regulatory framework for
39 | P a g e

bank supervision while favourable assessments for Thailand were made as a result of its establishment of new law related to its compliance with the Core Principles.
Japan and the United Kingdom should also consider bringing their supervision at this level if they want to be competitive. With the series of crises that these two economies had gone through, it is relatively important that supervision should be strengthened to respond to the demands of the financial environment and to manage financial stability Japan’s compliance to these Core Principles was downgraded from ‘Enacted to Insufficient Information’ as there are no available information regarding the country’s intention to comply with the standards since the IMF’s last Financial Stability Report in 2003 (Financial Standards Foundation, 2008b).
Outside the region, the United Nation Report indicates that Canada and the United States received full compliance with the standards for Effective Banking Supervision in 2004. The FSF report (2010i) shows changes in their 2009 compliance rating for Effective Banking Supervision where Canada’s rating was upgraded from ‘Compliance in Progress to Full Compliance’ in 2009 following IMF’s conclusion of the country’s commitment for an improved and effective bank supervision. The reverse happened in the United States as it got a two-level downgrade in 2009 from ‘Full Compliance’ to ‘Enacted’. FSF report reveals that its previous compliance score was based from the US Treasury’s 1999 self assessment of its supervisory framework. Since there were no other developments that were released thereafter, the country’s rating was downgraded to an evaluation of ‘Enacted’.
B. Comparison of Supervisory Structures and Functions in ASEAN+3 region and Other Developed Countries
Table 2.6: Financial Institution Supervisory Structure/Organization
Financial Institution
Supervisory Structure
CB Involvement in Banking
Supervision
Country
Sin
gle
S
up
ervi
sor
Sem
i-In
teg
rate
d
Su
per
viso
ry
Ag
ency
Mu
ltip
le
Su
per
viso
rs
As
Ban
kin
g
Su
per
viso
r
Han
dle
s sp
ecif
ic t
asks
in
the
sup
ervi
sio
n
Sh
arin
g
reso
urc
e w
ith
O
ther
S
up
ervi
sory
A
gen
cies
Indonesia X X Malaysia X X Philippines X* X Singapore X X Thailand X X China X** Hong Kong X X Japan X** South Korea X x Australia X Canada United Kingdom
X
40 | P a g e

United States
X
Sources: Lee, C and CY Park (2009). Beyond the Crisis: Financial Regulatory Reform in Emerging Asia. Asian Development Bank: ADB
Working Paper Series on Regional Economic Integration WP34. Retrieved September 9, 2011, from http://www.adb.org/documents/papers/regional-economic-integration/WP34-Financial-Regulatory-Reform.pdf
Hong Kong Monetary Authority (n.d.). Chapter 3: The Legal and Supervisory Framework. Retrieved October 29, 2011, from http://www.hkma.gov.hk/media/eng/doc/key-functions/banking-stability/guide-authorization/Chapter-3.pdf
**Additional data were compiled by the researcher from various sources (websites of supervisory agencies). www.worldbank.org
According to Barth, Gan and Nolle (n.d.), the choice of a supervisory structure for a
country’s financial system is crucial, as failure to determine an appropriate supervisory framework would adversely affect banks and may lead to crisis. They also mentioned that efforts in reviewing the role of the Central Bank in the supervision of banks are crucial so that any potential conflicts of interest between its monetary policy and supervisory responsibilities can be eliminated. It can be said that financial supervision and/or regulation had substantially changed over the past two (2) decades to deal with financial distortions in the aftermath of the different crises and to respond to the changes in the financial architecture brought about by globalization and massive financial liberalization. Thus, institutional and structural reforms were undertaken in the financial system, along with some forms of upgrading on the country’s supervisory and regulatory practices.
In many countries in the region, the central bank is the sole authority for supervising banking activities (refer to Table 2.6). The different crises, the increasing trend towards financial integration and the increasing cross border transactions led many countries in the region to adopt a single supervisory structure. This was undertaken either through the establishment of a new supervisory body that manages all activities of financial institutions or through the transfer of some functions and authority by different supervisory bodies to one (1) supervising authority. This supervisory model can be found in many European countries. In Indonesia and Thailand, the central bank is the main authority; on the other hand, Singapore, Japan and South Korea created a unified agency in 1971, 1998 and 1999, correspondingly, to supervise the operations of all institutions in the financial system. It is only in South Korea where its function is limited to the handling of some supervisory tasks which are shared with other authorities such as the Ministry of Finance and Economy and Bank of Korea.
Hong Kong, China and the Philippines have multiple supervisory agencies responsible for each financial institution (banking, capital market and insurance). Masciandaro and Quintyn (n.d.) describe this financial supervisory system as vertical or silos model. In China, it has the following supervisory authorities, namely, People’s Bank of China (banks), Insurance Regulatory Commission of China (insurance) and Securities Regulatory, Commission of China (securities). In some jurisdictions, supervisors share authorities in different aspects of supervision. In the Philippines, for example, banks are supervised by the Bangko Sentral ng Pilipinas, while the insurance and securities companies are regulated by Insurance Commission and Securities and Exchange Commission and Philippine Stock Exchange (under self-regulation), respectively. In cases where these two financial institutions’ operations affect some banking activities, BSP, being the supervisor for banks, acts as the regulator of the securities and insurance sectors.
The different results generated for the economies in the region do not suggest superiority of one supervisory model over the other. In fact, the other four economies, namely, Australia, Canada, United States of America and United Kingdom, also have different supervisory structures. In Canada and the United Kingdom, a single supervisory agency is
41 | P a g e

responsible for financial institutions while a multiple supervisory model is used by the United States of America and Australia. Aside from Reserve Bank of Australia, its twin-peak model of regulation includes Australian Prudential Regulation Authority (APRA) at one end and Australian Securities and Investment Corporation (ASIC) at the other end (Barth, Gan and Noelle, n.d.). APRA acts as the national regulator of prudential institutions namely deposit-taking institutions; superannuation licensees, life insurance companies, general insurer and friendly societies while the Australian Securities and Investments Commission (ASIC) acts as the corporate, market and financial services regulator.
As far as financial services regulation is concerned, Cooper (2006) mentioned that “ASIC licenses and monitors financial services businesses to ensure that they operate efficiently, honestly and fairly”. Compared to Australia and other economies in East Asia, the United States has a unique financial supervision as it employs a dual banking set-up aside from having multiple supervisory agencies in its financial system. The Basel Core Principle’s (BCP) report on the assessment of the country’s compliance with the core principles reveal that a bank may choose to be chartered by a federal government or the state, as each state has its own banking laws and regulations.
In developed countries such as the United Kingdom and Australia, financial supervision
was transferred from the central bank to a newly created supervisory authority. The Financial Services Authority of the United Kingdom has replaced the role of the Bank of England as the supervisor of all financial institutions; however, the critical role of the central bank as supervisor cannot be discounted. This only means that it still acts as the driver for financial institutions’ regulations. According to eStandardsForum, there is still a tripartite arrangement between BoE, FSA and the Treasury. With the enactment of the Financial Service Bill in April 2010 which created the Council for Financial Stability to coordinate, among other functions, the responsibilities of the three agencies in matters relating to financial stability are important (FSF, 2010a).
Against this backdrop, it can be noted that the reorganization in the supervisory architecture across the globe had heightened over the past ten years after the Asian Financial Crisis. National authorities responded to the sudden growth in the financial market activities while they endeavour to promote financial stability. Westrup (2005) points out that the changes in supervisory structures especially the trend towards the adoption of a single supervisory authority shows the commitment by the government to self regulation as the boundaries between the different financial institutions are eliminated. The removal of the burden of regulation from the central bank only proves commitment by the government to expand the central banks role which is important in influencing policy actions that are critical to financial regulation.
As seen in (Table 2.7), for all countries in the region the supervisor conducts on-site
examination as part of its surveillance mechanism to monitor the condition of banks and to ensure safety and soundness in the banking system. Off-site examination is also undertaken to comprehensively evaluate banks’ compliance with the existing laws and regulations.
One of the important aspects in supervision is the form of enforcement mechanism in every jurisdiction. Generally, whenever a bank is found in violation of any of these regulations, the supervisor can undertake formal enforcement mechanisms to address the problem. Except for Malaysia, Japan, Canada, Hong Kong and Australia, supervisors in other countries are required to make formal public enforcement action against banks. Except for US and UK, these mechanisms lead to the imposition of penalties and sanctions against errant banks. Despite the
42 | P a g e

absence of any formal public enforcement action in Japan, as shown in (Table 2.7), the supervisor still imposes corresponding penalties among banks. Among the enforcement tools used by supervisors in many jurisdictions are the cease-and-desist order, civil monetary penalties and other prompt corrective actions which are deemed to be crucial and applicable in the existing system.
Table 2.7: Institutional Framework for the Disposition of Supervisory Functions
Co
un
try
On
-sit
e E
xam
inat
ion
Leg
al L
iab
iliti
es o
f S
up
ervi
sors
fo
r th
eir
Act
ion
s
Mec
han
ism
of
Cea
se-
des
ist
Typ
e O
rder
Pu
blic
Fo
rmal
E
nfo
rcem
en
t A
ctio
n
agai
nst
Ban
ks
Su
per
viso
rs c
an o
rder
d
irec
tors
an
d/o
r m
anag
emen
t to
co
nst
itu
te p
rovi
sio
ns
to c
ove
r ac
tual
an
d
po
ten
tial
loss
es
DIS
CIP
LIN
E
(Po
wer
to
Su
per
sed
e b
ank
shar
eho
lder
s ri
gh
ts a
nd
dec
lare
ban
k in
solv
ent)
Indonesia Yes No Yes Yes Yes Yes Malaysia Yes No Yes No Yes Yes Philippines Yes Yes Yes Yes Yes Yes Singapore Yes No Yes Yes Yes Yes Thailand Yes Yes Yes Yes Yes No China Yes No Yes Yes Yes No Hong Kong Yes No No No Yes No Japan Yes No Yes No Yes Yes South Korea
Yes Yes Yes Yes No No
Australia Yes Yes No No Yes Yes Canada Yes No No No No No United Kingdom
Yes No No Yes Yes No
United States
Yes No No Yes Yes Yes
Source: www.worldbank.org. From the survey conducted by the World Bank on Regulation and Supervision of Banks around the World.
(Table 2.7) also shows disparities in the supervisors’ legal liabilities related to the
execution of their duties and responsibilities. It was highlighted by the Basel Committee on Banking Supervision (2006) and other researches that one of the important issues in bank supervision is the supervisor’s independence. Except for the Philippines, Thailand and South Korea, many countries have affirmed in the Caprio’s survey on bank regulation and supervision that the supervisor is not legally responsible for his actions. He is assumed to be acting in good faith in executing his duties and responsibilities. In situations where the supervisor will go after errant banks, the legal liability imposition and lack of independence impedes the supervisor’s ability to take further actions as they will be quite reluctant in pursuing this objective for fear of being sued for their actions. In the normal course of performing their duties and responsibilities or their functions, unless the same was made in bad faith, imposition of liabilities must be re-evaluated among countries with this type of policy.
43 | P a g e

Except for South Korea, most of the countries’ supervisors can order bank management or board of directors, to constitute provisions to cover losses incurred by the banks arising from excessive risk and unsound bank practices either through a formal or informal enforcement mechanism. This is also common in the US, UK and Australia. For most countries analyzed, one of the supervisor’s authorities, except for Canada and the United Kingdom, is to suspend the directors’ decision to declare dividends, make loans or investments or even require them to pay fees. Hence, the supervisors’ in these economies also has the power to supersede bank shareholders rights and declare a bank to be insolvent.
Many of the country’s insolvency laws are incorporated in their existing laws (constitution, company act, banking laws, etc). When the bank is found insolvent, as mentioned supervisors may exercise their authorities to supersede banks shareholders’ rights and declare the bank insolvent. This power is provided to supervisors in Malaysia, Indonesia, the Philippines, Singapore, Japan, Australia and the United States. Among these countries, the same power is exercised simultaneously by the court (Australia) or with the deposit insurer (in the case of the USA). It is only in Malaysia and the Philippines where this power can be exercised by any of the authorities: the supervisor, court or deposit insurer. In Hong Kong, Thailand, China, South Korea and United Kingdom, neither the supervisor nor the deposit insurance corporation has this power; thus, solvency cases are dealt with by the courts upon the recommendation by the supervisory agency.
From the information found on (Table 2.7), it can be noted that there are some disparities in the countries’ practices related to the supervisor’s accountability for executing his duties and responsibilities. These observed disparities are evident not only in East Asia but also in the other countries included in the study, between developed and developing countries and even for any form of supervisory structure. Given the massive scope of supervision undertaken by a single supervisor, some powers are left to other government authorities (deposit insurance corporations or courts) to enforce corrective actions against banks. This sharing or distribution of powers enables the supervisor to undertake due diligence in executing and exercising his powers.
C. Comparison between Prudential Regulation Initiatives Undertaken by Financial
Supervisors in the ASEAN+3 Region and Other Developed Countries
C.1. Risk-Based Framework Utilized by Countries
Aside from the supervisory structure, prudential regulations affecting banking activities and operations are crucial. Among the common measures used by supervisors to ensure compliance with the requirements and to determine the health of the bank are the financial soundness indicators proposed by Basel Committee. These are capital, liquidity, asset quality (non-performing loans and provisioning), profitability, and other performance measurements used by supervisors. These indicators are forward-looking and emphasize risk exposures that affect the health and performance of banks.
The Basel Committee on Banking Supervision has formulated financial soundness indicators for each type of financial sector, namely, banking, insurance and securities. For the banking sector, the committee recommends the use of CAMELS system in measuring performance and risk exposure. However, there are other risk-based prudential indicators that are recommended by the committee which are currently being used by other supervisors.
44 | P a g e

(Table 2.8) reveals that most of the countries in the region use CAMELS ratios (an acronym for Capital Adequacy, Asset Quality, Management Oversight, Earnings, Liquidity and Sensitivity to Risk) in their micro-prudential regulations for banks. In fact, in the supervisor’s on-site and off-site bank examinations, CAMELS system is used to measure bank performance, aside from the regular reportorial requirements imposed among banks. In Hong Kong, the Hong Kong Monetary Authority (n.d.) has issued several guidelines for the use of CAMEL system in the evaluation of the financial soundness of authorized institutions and claimed it as part of its risk-based approaches to proactively evaluate and monitor the quality of risk management systems and internal controls undertaken by authorized institutions. So far, this risk-based prudential regulation is one of the better means for maintaining financial soundness and preventing financial fragility. In the case of China, it utilizes CARSEL ratios, which stand for Capital Adequacy, Asset Quality, Regulations’ Compliance, Strategies and Stability, Earnings and Liquidity. Malaysia uses Risk-Based Supervisory Framework where it analyses financial institutions on all key risk areas and also monitors significant risks of the individual financial institutions. On the other hand, Thailand uses risk-based prudential measures for assessing banks where the Bank of Thailand uses 41 ratios. Table 2.8: Indicators used by Supervisors Related to Risk-Based Prudential Regulations
of Banks in East Asia and Across the Region
Country Indicator System Indicator/Ratios used Indonesia CAMELS 6 Malaysia Risk-Based Supervisory
Framework -
Philippines CAMELS 6 Singapore1 - - Thailand Risk-Based Supervision 41 China CARSEL 6 Hong Kong2 CAMEL - Japan - - South Korea - - Australia CAMEL 5 Canada - - United Kingdom CAMELB/COM 9 United States CAMELS 6
Main Sources: Batunanggar, S. Comparison of Problem Bank Identification, Intervention and Resolution in the SEACAN Countries (2008). The South East Asian Central Banks (SEACEN) Research and Training Centre. Retrieved September 16, 2011, from http://www.seacen.org/GUI/pdf/publications/research_proj/2008/rp73/rp73_complete.pdf from Figure 8:Indicator/Risk Categories and Ratios Used in Supervisory Risk Assessment and Early Warning Systems - Supervisory Bank Rating Systems Additional sources: 1 www.mas.gov.sg (Banking Act), 2Hong Kong Monetary Authority (n.d.). Chapter 3: The Legal and Supervisory Framework. Retrieved October 29, 2011, from http://www.hkma.gov.hk/media/eng/doc/key-functions/banking-stability/guide-authorization/Chapter-3.pdf; 3 Financial Services Authority (1998). Risk-Based Approach to Supervision of Banks. Retrieved November 5, 2011, from http://www.fsa.gov.uk/pubs/policy/p10.pdf Note: China’s CARSEL: C-Capital Adequacy, A- Asset Quality, R- Regulations' compliance, S- Strategies and Stability, E- Earnings, L- Liquidity.
The United Kingdom, however, utilizes the CAMELB/COM system, which is part of the
Advanced Risk-Responsive Operating Framework (ARROW) used by FSA. The latter replaced
45 | P a g e

the Risk Assessment, Tools and Evaluation (RATE) framework and Schedule 3 of the Compliance, Assessment, Liaison, Evaluation (SCALE) methodologies used by the Financial Supervisory Authority for its risk-based prudential regulation. These nine risk assessment evaluation factors (CAMELB/COM) which consist of capital, asset quality, market risk, earnings, liabilities, business, internal controls, organization and management are used to assess bank performance and risk exposures (Financial Services Authority, 1998).
Whatever prudential regulations a supervisor utilizes, differences rest on the banks’ degree of compliance and implementation albeit some commonalities in the sets of indicators used. As had been mentioned earlier, international guidelines were formulated or designed ideally for internationally active banks to serve as common groundwork or as a holistic approach to monitor bank operations and performance.
C.2. Prudential Regulations on Capital Adequacy
Table 2.9: Regulations on the Minimum Capital Requirements of Banks
Country Domestic Bank Subsidiary of a Foreign Bank
Branches of a Foreign Bank
Indonesia IDR 3.0 billion IDR 3.0 billion New entry - not allowed Malaysia MYR2billion MYR 300 million n.a Philippines PHP4.95 billion for EKBs
and PHP2.4 billion for KBs
PHP4.95 billion for EKBs and PHP2.4 billion for KBs
PHP1.5 billion for EKBs; PHP 210 million for KBs
Singapore SGD1.5 billion1
SGD100.0 million (internet banking) 2
SGD100.0 million (Locally incorporated wholesale bank) 3
SGD1.5 billion1; SGD100.0 million (internet banking) 2
SGD100.0 million (Locally incorporated wholesale bank) 3
S$200 million2
Thailand THB 5.0 billion THB 4.0 billion assets: no less than THD3.0 billion
China RMB 1 billion for a nation-wide bank; RMB 100
million for a city commercial bank; RMB 50
million for a rural commercial bank
RMB 300 million RMB 100 million
Hong Kong HKD 300.0 million –licensed banks; HKD
100.0 million -restricted licence banks;
HKD 25.0 million - deposit-taking companies
(HK$25 million)
- HKD300 million
Japan JPY 2 billion JPY 2 billion JPY 2 billion South Korea KRW 100B- local bank;
KRW 25.0b financial institutions which does not
operate nationwide
KRW 100 billion KRW3.0 billion
Australia AUD50.m in Tier 1 Capital AUD50 million in AUD50 million in Tier 1
46 | P a g e

Tier 1 Capital Capital Canada CAD 5.0 million CAD 5.0 million CAD 5.0 million United Kingdom
EUR 5.0 million EUR 5.0 million EUR 5.0 million
United States No absolute amount No absolute amount
No absolute amount
Primary Sources: Caprio (2003). Bank Regulation and Supervision survey (Microsoft excel data). Retrieved September 15, 2011, from siteresources.worldbank.org/.../Caprio_2003_Bank_regulation_surve... Wibowo, O.P. (2008) Understanding and Addressing the Pro-cyclicality impact of Basel II in the SEACAN Countries. (Table 1: Basel II Implementation in SEACAN Countries). Retrieved October 14, 2011, from http://www.seacen.org/GUI/pdf/publications/research_proj/2008/rp72/rp72_complete.pdf Other Sources: *Hong Kong Monetary Authority (n.d.). Licensing Requirements for Banks. Retrieved October 30, 2011, from http://www.hkma.gov.hk/media/eng/publication-and-research/background-briefs/bank_sup/licensing_requirements_for_banks.pdf 1Monetary Authority of Singapore. Banking Act. www.mas.gov.sg , 2Monetary Authority of Singapore. The Banking (Amendment) Bill: An Explanatory Brief. Retrieved December 8, 2011, from http://www.mas.gov.sg/news_room/press_releases/2001/The_Banking__Amendment__Bill__An_Explanatory_Brief__19_Apr_2001.html#back3 Monetary Authority of Singapore (2001). The Banking (Amendment) Bill: An Explanatory Brief, http://www.mas.gov.sg/news_room/press_releases/2001/The_Banking__Amendment__Bill__An_Explanatory_Brief__19_Apr_2001.html *FSC website: www.fscs.org 3Monetary Authority of Singapore. Banking Regulations 2001, from http://www.mas.gov.sg/resource/legislation_guidelines/banks/sub_legislation/Banking%20Regulations.pdf
(Table 2.9) summarizes the minimum capital requirements imposed by supervisors in
many countries in the region vis-à-vis other developed economies outside the region. The Philippines, China, South Korea and Hong Kong impose different capital requirements for different types of banks while other countries in the region including Australia, Canada and United Kingdom have uniform minimum requirements for domestic banks. In some economies (Singapore, Malaysia and Indonesia), high capital requirements are imposed while low minimum capital requirements are required in other jurisdictions (Japan and Hong Kong). As can be gleaned from (Table 2.9), Japan and Hong Kong banks’ capital requirements are higher compared to other jurisdictions in the region but are comparable to the capital imposed for the establishment and/or operations of a local bank by supervisors in Canada and United Kingdom. Singapore imposes a minimum capital of SGD 1.5 billion which is approximately equal to USD 1.171 billion, followed by Malaysia (MYR 2.0 billion approximately USD 636.947 million) and Indonesia (IDR 3,000 billion, approximately equal to USD 334.75 million). For the rest of the countries (Philippines, China, South Korea and Australia), the supervisor imposes a moderately reasonable amount for the capital to be put up to establish and operate a domestic bank.
In most countries, except Hong Kong, supervisors allow the entry of foreign bank’s subsidiaries to operate in their country. Many of them (Singapore, Philippines, Japan, South Korea and Australia) impose the same capital requirements that are imposed among domestic banks in the country. Other countries such as Thailand, Malaysia and China require the subsidiaries of foreign banks to put up a minimum capital which is lower than those imposed among local banks. On the other hand, different requirements are imposed among branches of foreign banks in the region. The Philippines, Hong Kong and China’s bank supervisors impose lower minimum capital requirement for this type of bank compared to those required among domestic banks. In South Korea, the supervisor also imposes a lower capital requirement for foreign branches (KRW 2.0 billion) compared to those required to operate domestic banks; however, it is higher compared to the minimum capital required among subsidiaries of foreign banks (KRW 300.0 million). In Japan, Australia, Canada and United Kingdom, the supervisor imposes only one capital for all types of banks (domestic and foreign banks). Thailand, on the other hand, has other special provisions in the imposition of minimum capital among foreign banks’ branches. Only Indonesia does not allow new entrants for foreign banks’ branches to operate in the country.
Against this backdrop, it can be deduced that there are wide disparities among supervisory practices in the way the minimum capital requirements are imposed to set up and
47 | P a g e

operate a bank in a country. This depends on various factors, such as the institutional and structural characteristics inherent in the country’s financial system, its legal underpinnings and other factors. Moreover, the high requirements imposed on domestic banks in some jurisdictions such as Malaysia and Indonesia only signifies a control mechanism (entry barrier) to protect the industry. This can be ascribed from the experiences by many countries in the region during the crisis which caused insolvencies/bankruptcies among some banks. With the increased cross-border activities, most of the countries have allowed entry of foreign banks (subsidiaries and branches) in their respective jurisdictions. As contrasted to the protectionist measure by some supervisors, the removal of entry barriers reflects the thrust of the government in opening the country’s financial services in the international market. This does not mean that satisfaction of the minimum paid-in capital required by supervisors is enough to set-up a branch in the country. There are still other factors or requirements that need to be satisfied in the form of restrictive provisions before foreign banks can operate in the country’s financial system.
Table 2.10: Supervisory Authority’s Prudential Regulations on Capital Adequacy
Ratio (CAR) Requirement
Country Minimum CAR (risk-weight %)
Capital Ratio as a Function of Market
Risk
Capital Ratio as a Function of
Operational Risk Indonesia 8% No Yes Malaysia 8% Yes Yes Philippines 10% Yes No Singapore 10%1 Yes No Thailand 8.5% No No China 8% No No Hong Kong 8% No No Japan 8% of IAB No No South Korea 8% No No Australia 8% - - Canada No No United Kingdom 8% Yes Yes United States 8% Yes Yes
Sources: Caprio (2003). Bank Regulation and Supervision survey (Microsoft excel data). Retrieved September 15, 2011, from siteresources.worldbank.org/.../Caprio_2003_Bank_regulation_surve... Wibowo, O.P. (2008) Understanding and Addressing the Pro-cyclicality impact of Basel II in the SEACAN Countries. (Table 1: Basel II Implementation in SEACAN Countries); 1Monetary Authority of Singapore (2007). Changes to the Capital Adequacy Requirements for Singapore-incorporated Banks, Retrieved December 8, 2011, from http://www.mas.gov.sg/news_room/press_releases/2007/Change_to_Capital_Adequacy_Requirements. Deloitte and Touche (n.d.). Understanding the Framework. Adopting the Basel II Accord in Asia Pacific.
Most countries use the 8% minimum capital adequacy ratio (CAR) requirement by
BCBS, with the exception of Thailand, Singapore and the Philippines whose prudential requirements of 8.5%, 10% and 10%, correspondingly, exceed the international requirement. Outside the region, the United States of America, United Kingdom, Australia and Canada also prescribe an 8% capital adequacy ratio similar to the international framework. This is understandable as these countries except Australia are members of the G-10 countries which are also members of the BCBS.
48 | P a g e

In some jurisdictions, the authority of the supervisor to increase the minimum CAR to a
level higher than the prudential requirement is stated in their regulatory framework (refer to Table 2.10). In Hong Kong, for instance, its supervisory policy manual for locally incorporated banks states the following:
“To enable the MA to take account of the risk profile of particular AIs, §101 of the Ordinance empowers the MA to raise this statutory minimum for AIs individually to not more than 16%. .... In addition, it has been the practice of the HKMA to request AIs to observe a non-statutory trigger ratio above the statutory minimum CAR to serve as an early warning signal for any potential contravention of §98(1)...” (Hong Kong Monetary Authority, 2008).
In Australia, on the other hand, APRA (n.d) requires that whenever a bank’s large
exposure to counterparties exceed the prescribed limit, it needs to seek its approval and shall be required to maintain a higher capital adequacy ratio to cover for the additional risk it had assumed. The BCBS’ minimum risk-based ratio requirement is deemed sufficient to strengthen financial soundness and ensure high degree of consistency in its application among banks operating worldwide. This also eliminates inequalities in their interpretation and application. As can be gleaned from (Table 2.10), most supervisors’ requirements are in compliance with the capital adequacy ratio requirement. Moreover, having a higher risk capital ratio is ideal especially if the country wants to be competitive in the international market.
MacDonough (1998, as cited in Walter 2010b) mentioned that major financial centers require higher capital and encourage banks to maintain capital above the minimum requirement to protect itself from any future financial disruptions and uncertainties that may affect banks’ performance. Prior to the implementation of the Basel 1 approach, the Bangko Sentral ng Pilipinas (BSP) already imposes a capital to asset ratio of 10 percent among depository institutions in the Philippines. Hence, it had maintained the same ratio for risk-weighted requirement under the Basel Capital Accord.
From the flaws that were observed in the calculation of the capital adequacy ratios of
banks or authorized institutions/deposit taking institutions under Basel I Accord, the new Basel II Accord incorporates a comprehensive measure in the computation of the CAR ratio. This risk-adjusted framework includes the evaluation of a bank’s credit, market and operational risk exposures. The BCBS Report (2001) indicates that Standardized and Internal Models approaches are the two methods for measuring market risk while Basic Indicator, Standardized and Internal Measurement Approaches are utilized to measure operational risk.
(Table 2.10) shows mixed results for the supervisor’s requirement for the calculation of the minimum capital as a function of market risk. In China, Indonesia, Hong Kong, Japan and South Korea, the supervisors use similar approaches in accounting for market risk while a different approach is used in Malaysia and Philippines. In the case of Singapore, banks are required to maintain capital for market risk, and risk-weighted assets for market risk incorporated for the CAR ratio computation is calculated in accordance to the Basel capital framework. When capital ratio is calculated to incorporate operational risk, countries in the region use a uniform measure. It can be assumed that since the standardized approach measures both market and operational risk, it is likely that some countries use the same computation to measure credit risk. Many studies have indicated that this approach is easier to apply and is usually recommended for less sophisticated banks in less developed economies compared to the other three approaches. Especially in instances where the country is in its
49 | P a g e

transition stage for implementing the new standard to replace the old one, the process may be quite cumbersome as it entails the use of a significant amount of resources to implement it. IMF report (2011) indicates that efforts are undertaken by the BSP to introduce the Basel II’s Internal Capital Adequacy Assessment Process (ICAAP) in 2011 and mentioned that the Philippines can position itself in applying this prudential regulation including its compliance with Basel III standard. This was made based on the finding that banks maintain high capital ratios and have strong supervisory framework and prudential regulations. Currently, the same is already being used and applied in the country’s banking system and by other countries such as Singapore, Australia and the United States.
Table 2.11: Basel 2 Target Implementation Dates for Capital Adequacy Framework’s Measurement of Credit Risk among ASEAN5+3 Countries vis-à-vis Other Countries
Country Standardized
Approach Scheduled Date
Advanced Approach Scheduled Date
Indonesia 2008 2010 Malaysia 2008 2010 Philippines 2007 2010 Singapore 2008* 2008* Thailand - - China - 2010** Hong Kong 2007* 2007* Japan 2007* 2008* South Korea 2008* 2008* Australia 2008* 2008* Canada 2007* 2007* United KINGDOM - - United States NA 2009*
Sources: Wibowo, O.P. (2008) Understanding and Addressing the Pro-cyclicality impact of Basel II in the SEACAN Countries. (Table 1: Basel II Implementation in SEACAN Countries) *Caprio (2003). Bank Regulation and Supervision survey (Microsoft excel data). Retrieved September 15, 2011, from siteresources.worldbank.org/.../Caprio_2003_Bank_regulation_surve... **Deloitte and Touche (n.d.) Understanding the Framework. Adopting the Basel II Accord in Asia Pacific (from Figure 1: Regulatory Timeframe for Basel II Implementation in Asia Pacific Countries
Every country has its own timetable for complying with the Basel II requirements as shown in (Table 2.11), many countries were scheduled to implement the accord as soon as possible. In fact, literature had shown that many countries had committed themselves to implement the newly enhanced rules. The report published by the Financial Stability Institute (2010) noted that Standardized Approach and Internal Ratings Based Approaches are the two measures of capital to assess credit risk under the Pillar 1 of Basel II Accord. However, BCBS mentioned that its implementation may reduce the capital levels in the banking system, and may lead to unfair competition within the system and to business cycle fluctuations. BSP in the Philippines started implementing the Standardized Approach in 2007, followed by Indonesia and Singapore in 2008. Among the different approaches committed by each country’s supervisor for the adoption of Basel II requirement, it is easier to implement as it uses different credit risk weights assigned to different assets classes compared to the advanced approach. Walter (2010) mentioned that the standardized and IRB approaches are easier to implement and are commonly adopted by less sophisticated banks in developing economies. Given the rigorous
50 | P a g e

requirements of the new approach and the amount of available data in the financial system, some countries still prefer to use the standardized approach although they had committed themselves to implement the advanced approach in 2010. Although each country has its own timetable in complying with this requirement, the issue hinges on the date they finally implemented the capital approaches they committed, given the various disruptions that occurred over the past years. Given the gaps on the levels of compliances by these countries in elevating their regulations to higher perspectives (best practices); it is more likely that the new model might be less appealing and inappropriate at the moment for these countries.
The recent study conducted by the Financial Stability Institute (2010) shows that among the member countries surveyed, the time frame commitment by many countries in implementing Basel II was evident. Their findings based on the 2008 and 2010 surveys reveal that in Asia, approximately 19 and 25 countries, respectively, were scheduled to implement Basel II. Of these numbers, only four have successfully implemented it compared to the timelines which were committed, where seven countries had affirmed their intention to implement it in 2008. The rest of the BCBS member countries ascribed the delay for its implementation from the global financial crisis. This potential delay was also affirmed by Deloitte and Touche (n.d.) based on the report that US regulators requested for extensions for its implementation and noted that this will impact other economies as the United States of America is part of the standards setting body in the Basel Accord and given the impact of the ongoing global crisis.
C.3. Prudential Regulations on Asset Quality and Diversification
Table 2.12: Tools Used by Central Banks in Classifying Loans Portfolios
Basis for Classifying Loans 1
Country No of days a loan
is in arrears
Forward-looking estimate of the probability of
Default
Other Factors
Indonesia X Malaysia X X Philippines X X Singapore X Thailand X China X Hong Kong X X X Japan X X X South Korea X X Australia X Canada X United Kingdom None None None United States x
Sources: Batunanggar, S (2008). Comparison of Problem Bank Identification, Intervention and Resolution in the SEACAN Countries (2008). The South East Asian Central Banks (SEACEN) Research and Training Centre. Retrieved September 16, 2011, from http://www.seacen.org/GUI/pdf/publications/research_proj/2008/rp73/rp73_complete.pdf Other Data was culled from: -Caprio (2003). Bank Regulation and Supervision survey (Microsoft excel data). Retrieved September 15, 2011, from siteresources.worldbank.org/.../Caprio_2003_Bank_regulation_surve...
51 | P a g e
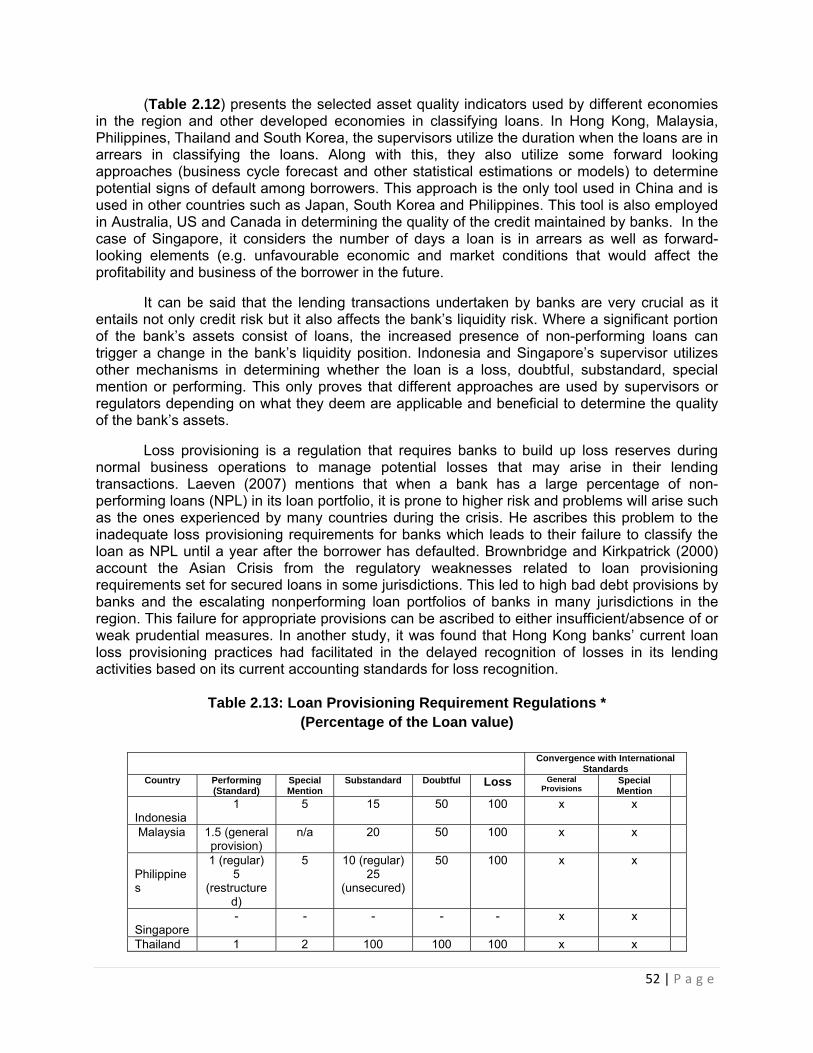
(Table 2.12) presents the selected asset quality indicators used by different economies in the region and other developed economies in classifying loans. In Hong Kong, Malaysia, Philippines, Thailand and South Korea, the supervisors utilize the duration when the loans are in arrears in classifying the loans. Along with this, they also utilize some forward looking approaches (business cycle forecast and other statistical estimations or models) to determine potential signs of default among borrowers. This approach is the only tool used in China and is used in other countries such as Japan, South Korea and Philippines. This tool is also employed in Australia, US and Canada in determining the quality of the credit maintained by banks. In the case of Singapore, it considers the number of days a loan is in arrears as well as forward-looking elements (e.g. unfavourable economic and market conditions that would affect the profitability and business of the borrower in the future.
It can be said that the lending transactions undertaken by banks are very crucial as it entails not only credit risk but it also affects the bank’s liquidity risk. Where a significant portion of the bank’s assets consist of loans, the increased presence of non-performing loans can trigger a change in the bank’s liquidity position. Indonesia and Singapore’s supervisor utilizes other mechanisms in determining whether the loan is a loss, doubtful, substandard, special mention or performing. This only proves that different approaches are used by supervisors or regulators depending on what they deem are applicable and beneficial to determine the quality of the bank’s assets.
Loss provisioning is a regulation that requires banks to build up loss reserves during normal business operations to manage potential losses that may arise in their lending transactions. Laeven (2007) mentions that when a bank has a large percentage of non-performing loans (NPL) in its loan portfolio, it is prone to higher risk and problems will arise such as the ones experienced by many countries during the crisis. He ascribes this problem to the inadequate loss provisioning requirements for banks which leads to their failure to classify the loan as NPL until a year after the borrower has defaulted. Brownbridge and Kirkpatrick (2000) account the Asian Crisis from the regulatory weaknesses related to loan provisioning requirements set for secured loans in some jurisdictions. This led to high bad debt provisions by banks and the escalating nonperforming loan portfolios of banks in many jurisdictions in the region. This failure for appropriate provisions can be ascribed to either insufficient/absence of or weak prudential measures. In another study, it was found that Hong Kong banks’ current loan loss provisioning practices had facilitated in the delayed recognition of losses in its lending activities based on its current accounting standards for loss recognition.
Table 2.13: Loan Provisioning Requirement Regulations *
(Percentage of the Loan value)
Convergence with International Standards
Country Performing (Standard)
Special Mention
Substandard Doubtful Loss General Provisions
Special Mention
Indonesia
1 5 15 50 100 x x
Malaysia 1.5 (general provision)
n/a 20 50 100 x x
Philippines
1 (regular) 5
(restructured)
5 10 (regular) 25
(unsecured)
50 100 x x
Singapore
- - - - - x x
Thailand 1 2 100 100 100 x x
52 | P a g e

China 0 2 10 50 100 x x Hong Kong
1 2 20a 50 a 100 a x x
Japan - - - - - South Korea
0.5 2.0 20 Corporation -50%,
households -55%, credit card - 60%
100 x x
Australia - - - - - Canada The
Canadian Institute of Chartered
Accountants require
that provisions
be linked to future
anticipated cash flow provisions thus cover anticipated shortfalls.
Not applica
ble
Not applica
ble
United Kingdomb
- - Not applicable
Not applica
ble
Not applica
ble
x x
United States
- - No minimum
No minimu
m
100%
* In line with the International Financial Reporting Standards (IFRS), banking institutions (BIs) are required to observe the impairment and provisioning requirements according to the IFRS (this replaced the previous framework which classified loans as substandard, doubtful or loss). In addition, BIs are also required to separately disclose loan amounts which are past due for 90 days or more. Thus, a number of countries do not prescribe any rules concerning special mention loans anymore.
Sources: Batunanggar, S. Comparison of Problem Bank Identification, Intervention and Resolution in the SEACAN Countries Other Data was culled from: Caprio (2003). Bank Regulation and Supervision survey (Microsoft excel data). Retrieved September 15, 2011, from siteresources.worldbank.org/.../Caprio_2003_Bank_regulation_surve... aHong Kong Monetary Authority (1999). Supervisor’s Memo. Retrieved on December 18, 2011, from www.hkma.gov.hk/media/eng/publication-and-research/quarterly-bulletin/qb9911/ra05.pdf - 2011-09-15 - Text Version bFinancial Services Authority (2004). Implications of a Changing Accounting Framework. Retrieved on December 18, 2011, from http://www.fsa.gov.uk/pubs/cp/cp04_17.pdf
(Table 2.13) shows the diversity in the supervisor’s enforcement of the provisioning
requirements among banks which are incorporated in its existing regulatory framework. For the performing and special mention loans, only a small percentage of the gross loan amount is allocated for loan impairment provisioning. For the substandard loans, which are past due loans which remain outstanding for 90 days (generally practiced by many countries) or for 180 days (Malaysia), the provisioning requirement ranges from 10% to 25%, except for Thailand which has the same provisioning requirements for substandard, doubtful and loss loans. In the Philippines, the BSP has different provisioning requirements for different types of loans. A 10% loan provision is allotted for regular loans while a larger provision (25%) is allotted for unsecured loans to protect the bank’s interest against default. Canada’s loan provisioning requirement is based on the future anticipated cash flows of the banks. Obviously, doubtful and loss portfolios
53 | P a g e
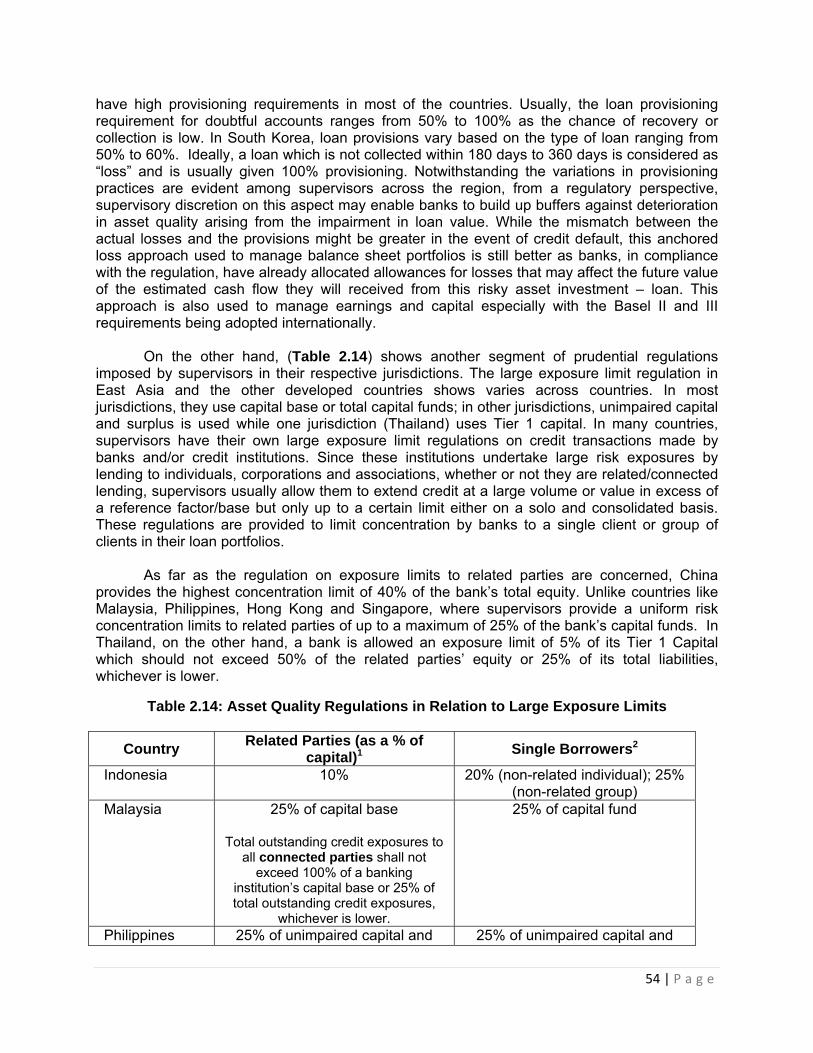
have high provisioning requirements in most of the countries. Usually, the loan provisioning requirement for doubtful accounts ranges from 50% to 100% as the chance of recovery or collection is low. In South Korea, loan provisions vary based on the type of loan ranging from 50% to 60%. Ideally, a loan which is not collected within 180 days to 360 days is considered as “loss” and is usually given 100% provisioning. Notwithstanding the variations in provisioning practices are evident among supervisors across the region, from a regulatory perspective, supervisory discretion on this aspect may enable banks to build up buffers against deterioration in asset quality arising from the impairment in loan value. While the mismatch between the actual losses and the provisions might be greater in the event of credit default, this anchored loss approach used to manage balance sheet portfolios is still better as banks, in compliance with the regulation, have already allocated allowances for losses that may affect the future value of the estimated cash flow they will received from this risky asset investment – loan. This approach is also used to manage earnings and capital especially with the Basel II and III requirements being adopted internationally.
On the other hand, (Table 2.14) shows another segment of prudential regulations
imposed by supervisors in their respective jurisdictions. The large exposure limit regulation in East Asia and the other developed countries shows varies across countries. In most jurisdictions, they use capital base or total capital funds; in other jurisdictions, unimpaired capital and surplus is used while one jurisdiction (Thailand) uses Tier 1 capital. In many countries, supervisors have their own large exposure limit regulations on credit transactions made by banks and/or credit institutions. Since these institutions undertake large risk exposures by lending to individuals, corporations and associations, whether or not they are related/connected lending, supervisors usually allow them to extend credit at a large volume or value in excess of a reference factor/base but only up to a certain limit either on a solo and consolidated basis. These regulations are provided to limit concentration by banks to a single client or group of clients in their loan portfolios.
As far as the regulation on exposure limits to related parties are concerned, China provides the highest concentration limit of 40% of the bank’s total equity. Unlike countries like Malaysia, Philippines, Hong Kong and Singapore, where supervisors provide a uniform risk concentration limits to related parties of up to a maximum of 25% of the bank’s capital funds. In Thailand, on the other hand, a bank is allowed an exposure limit of 5% of its Tier 1 Capital which should not exceed 50% of the related parties’ equity or 25% of its total liabilities, whichever is lower.
Table 2.14: Asset Quality Regulations in Relation to Large Exposure Limits
Country Related Parties (as a % of
capital)1 Single Borrowers2
Indonesia 10% 20% (non-related individual); 25% (non-related group)
Malaysia 25% of capital base
Total outstanding credit exposures to all connected parties shall not
exceed 100% of a banking institution’s capital base or 25% of total outstanding credit exposures,
whichever is lower.
25% of capital fund
Philippines 25% of unimpaired capital and 25% of unimpaired capital and
54 | P a g e

surplus3 surplus Singapore 25% of capital funds 25% of capital funds Thailand 5 % of tier 1 capital;
50% of equity of related parties; 25% of total liabilities of related;
parties (whichever is lower)
25% of tier 1 capital fund
China 40% (total equity) 3% of equity (individual) 15% (single legal entity)
Hong Kong 25% of capital base Japan 40% and 25% of capital base Na South Korea - - Australia - 25% - Unrelated external parties;
50% - unrelated ADI; foreign parents and subsidiaries
Canada - Maximum of 25% of total capital United Kingdom - 25% of Capital United States 15% -
Sources: 1Batunanggar, S. Comparison of Problem Bank Identification, Intervention and Resolution in the SEACAN Countries 2-Other data were culled from Caprio (2003). Bank Regulation and Supervision survey (Microsoft excel data). Retrieved September 15, 2011, from siteresources.worldbank.org/.../Caprio_2003_Bank_regulation_surve...
3 Bangko Sentral ng Pilipinas (2004a). Circular No. 425: Series of 2004. Retrieved October 8, 2011, from http://www.bsp.gov.ph/regulations/regulations.asp?type=1&id=163
On the other hand, prudential regulations related to credit accommodations to single borrower also vary across countries. Except for Indonesia, China and Australia, supervisors in the other countries allow banks to a single borrower’s limit (SBL) of up to 25 percent of their respective capital funds. However, Thailand and the Philippines utilize different reference factors (Thailand uses Tier 1 capital while the Philippines use unimpaired capital and surplus). In some jurisdictions, the supervisor allows banks to exceed the allowable limit for large exposures or connected lending. In the Philippines, for example, BSP Circular No. 425 allows banks to increase the SBL exposure up to a maximum of 10% of the capital fund provided that this is adequately secured with collaterals (BSP, 2004). As far as SBLs related to interbank transactions is concerned, its revised regulation stipulates that credit commitments made by banks shall be subject to the 25% SBL limit or PHP100.0 million of the lending bank’s capital funds, whichever is higher to allow small banks to cover their liquidity needs (BSP, 2011).
Among the three countries that have varying exposure limits, China has the lowest SBL
of 3% of its capital funds for individual clients while a 15% limit is provided to any single legal client. Bank Indonesia’s regulation allows banks to have credit concentration limit for unrelated individual client of up to 20% of its capital while for the unrelated group or external parties, the limit is up to 25%, which is similar to the exposure limit set by Australia’s supervisory body (APRA). It also extends credit to unrelated authorized depository institutions, foreign parents and subsidiaries with an SBL of 50% of its capital base.
It can be noted that credit concentration poses a high risk on the bank’s loan portfolio; thus, its willingness to take on large exposures will depend on its relationship with the client and the maturity of the loan. While the regulations are provided for compliance by banks, the final decision will depend on the bank whether or not it wishes to undertake credit risk. The awareness of this credit risk and its potential liquidity risk will allow banks to take necessary precautionary measures before extending a loan.
55 | P a g e

C.4. Prudential Regulations on Bank Liquidity and Liquidity Risk Management Used By Supervisors
Table 2.15: Liquidity Management Policies Adopted by Supervisory Authorities
Country
Minimum Holding of Liquidity Reserves
Monitoring via Data
Submission
Monitoring via On-site/Off-
site Examination
Encourage Contingency
Planning
Indonesia X X X X Malaysia X X X X Philippines X X X Singapore* X* X X X Thailand X X X X China* X Hong Kong SAR*
Not required* X X X
Japan* X* X X X South Korea X X X
Primary Sources: Siregar, R. and V. Lim (2010). The Role of Central Banks in Sustaining Economic Recovery and in Achieving Financial Stability. The South East Asian Central Banks (SEACEN)Staff Paper No. 74. Retrieved December 4, 2011, from http://www.seacen.org/GUI/pdf/publications/newsletter/2010/1stQtr.pdf derived from Table 4 on Bank Liquidity Management] * Caprio (2003). Bank Regulation and Supervision survey (Microsoft excel data). Retrieved September 15, 2011, from siteresources.worldbank.org/.../Caprio_2003_Bank_regulation_surve... survey conducted by Caprio on Bank Regulations. Other Sources: Hong Kong Monetary Authority (2011). Supervisory Policy Manual LM-1: Liquidity risk Management. Retrieved on December 7, 2011, from http://www.hkma.gov.hk/media/eng/doc/key-information/guidelines-and-circular/guideline/LM-1.pdf Hong Kong Monetary Authority (2011). Supervisory Policy Manual LM-1: Liquidity risk Management. Retrieved on December 7, 2011, from http://www.hkma.gov.hk/media/eng/doc/key-functions/banking-stability/supervisory-policy-manual/LM-2.pdf aBangko Sentral ng Pilipinas (2006). Circular No. 545, Series of 2006: Guidelines on Liquidity Risk Management. Retrieved December 14, 2011, from http://www.bsp.gov.ph/downloads/Regulations/attachments/2006/c545.pdf. bMonetary Authority of Singapore (2011a)Terms and Conditions Governing Intraday Liquidity Facility. Retrieved December 14, 2011, from http://www.mas.gov.sg/resource/eco_research/liquidity_management/2011-03-07%20ILF%20agreement.pdf cBank of Japan (2010). Liquidity Risk Management in Financial Institutions Following the Global Financial Crisis. Retrieved December 15, 2011, from http://www.boj.or.jp/en/announcements/release_2010/data/fss1007a.pdf
(Table 2.15) shows the liquidity management policies used by central banks in the
region. Almost all countries in the region have common liquidity management policies. Except for Hong Kong, all central banks in the region require banks to hold minimum reserves with the central banks either in the form of liquidity reserves, statutory reserves or a combination of these reserves. Likewise, most central banks monitor the banks and other financial institutions under their supervision by requiring them to submit different reports as part of their regular compliance procedures. They also conduct surveillance mechanisms such as on-site and off-site examinations. This serves to police the banks and monitor their performance. On a regular basis, usually once a year, regular bank examinations are conducted. Unlike capital adequacy standards, there are no stringent guidelines for the management of liquidity; thus, the interpretation and implementation by supervisors of the international prudential requirements vary across countries. In 2000, the Basel Committee cited the following key elements for effective or sound liquidity management to address liquidity risk exposures:
· Developing an agreed strategy for the day-to-day management of liquidity, including liquidity positions in major currencies, and establish adequate information systems for measuring, monitoring, controlling, and reporting liquidity risk.
· Creating a process for the ongoing measurement and monitoring of net funding requirements.
56 | P a g e
· Periodically reviewing efforts to establish and maintain relationships with liability holders, and assess market access.
· Establishing contingency funding plans to address the strategy for handling liquidity crises.
· Allowing independent evaluation by supervisors over strategies, procedures, and practices related to liquidity management. (BCBS, 2000).
These key elements were further reviewed and enhanced by the committee to account
for the rapid development in the financial markets over the past years as most banks (especially financial conglomerates) are also engaged in some financial market activities. It was also considered that the changes made for managing liquidity risk will allow banks to anticipate for financial and operational repercussions provided by the crisis (BCBS, 2008a). Earlier on, it issued initial guidelines for liquidity risk management entitled Sound Practices for Managing Liquidity in Banking Organization. It stresses on the importance of having sound liquidity management to sustain viability by requiring banks to regularly measure their liquidity positions and analyze their funding requirements under alternative scenarios (either for normal or crisis period) at different time horizons (BCBS, 2000). Among the key principles for assessing liquidity management among banks, the development of a structure for managing liquidity is crucial. Banks are required to have an agreed day-to-day liquidity management strategy and policy and the same must be approved by the bank’s board of directors and communicated throughout the organization. In some countries such as Indonesia, Malaysia and Thailand, the supervisors and/or central bank encourages banks to undertake contingency planning in line with BCBS guidelines. In fact, Principle 9 of the said guidelines states that “A bank should have contingency plans in place that address the strategy for handling liquidity crises and include procedures for making up cash flow shortfalls in emergency situations” (BCBS, 2000). Currently, this provision is incorporated under Principle 10 of the revised guidelines, which encourages banks to anticipate risk by managing liquidity using stress testing. The committee believes that this method can identify any potential effects of liquidity strains on the banks’ cash flows, liquidity, solvency and profitability.
Ideally, these regulations by the bank supervisors allow the bank to withstand any potential disruption, whether short-term or long-term in nature, which may impede its ability to fund its position at reasonable cost. However, while supervisors have uniform policies in some aspects, variations exist in their enforcements depending on the circumstances inherent in the country’s financial system and its stage of financial development. At times, their implementation may be quite loose or lax while others have stringent requirements based on the international standards. This only proves the crucial role of the supervisory or central bank, whichever is applicable, in assessing the banks’ compliance with the liquidity management principles through a timely use of information provided by the banks.
57 | P a g e

Table 2.16: Central Bank Tools to Manage Liquidity in the Financial System (Standing Facility/Liquidity Measures)
C
ou
ntr
y
Sh
ort
-ter
m
Fu
nd
ing
Intr
aday
L
iqu
idit
y/
Ove
rdra
ft
Dep
osi
t
Len
din
g
Fac
ility
(O
vern
igh
t)
Ag
gre
gat
e C
red
it C
eilin
g
Lo
an
En
d-o
f-d
ay
Fac
ility
Red
isco
un
t F
acili
ty
Fu
nct
ion
s
Indonesia
* * * Availability of daily liquidity need and guide
market rate Malaysia * * Typical standing facility;
satisfy temporary liquidity needs/place
overnight excess funds; Uncollateralised direct
borrowings; Repo transactions; Auction of
BNM Notes; Outright sales and purchases of Government securities and Foreign currency
(FX) swap Philippines
* * Meet banks’ unexpected liquidity needs, signal
monetary policy stance Singapore
*a * * * Cover banks net positions and ensure
adequate liquidity Thailand * * Provide insufficient
liquidity, ensure money market stability and set
an upper ceiling on overnight market rate
China - - - - - - - Hong Kong
*b * b - - - - X
Japan - * *1 * -- - - - South Korea
* * * Support banks in meeting shortages of
funds Sources: Ryoo, S. Operational Framework for Monetary Policy in the SEACAN Countries (2006) from Table 6 on Functions of Reserve Requirement. Retrieved December 17, 2011, from http://www.seacen.org/GUI/pdf/publications/research_proj/2006/rp61.pdf
aSingapore: Monetary Authority of Singapore (2011a)Terms and Conditions Governing Intraday Liquidity Facility. Retrieved December 14, 2011, from http://www.mas.gov.sg/resource/eco_research/liquidity_management/2011-03-07%20ILF%20agreement.pdf bHong Kong Monetary Authority (2011c)Annex 2: Sound Practices for Liquidity Risk Management, Retrieved December 18, 2011, from http://www.hkma.gov.hk/media/eng/doc/key-information/guidelines-and-circular/2011/20110804e1a2.pdf
(Table 2.16) presents the different tools used by central banks and/or bank supervisors to manage risk and maintain liquidity in the financial system. The practices of the central banks included in the table have changed significantly since 1997, especially with the different crises
58 | P a g e

that occurred over the past decade. This led monetary authorities to provide proactive liquidity management strategies and tools that are responsive to the needs of the industry within the financial system. As can be recalled, the series of crises that occurred in the past, made banks vulnerable to various financial risks, especially credit and liquidity risks. Many banks worldwide had tightened their credit transactions which resulted to high liquidity in the financial system. Likewise, this led many central banks in the region to redirect their open market operations to absorb liquidity surpluses held by banks.
Ryoo (2006) cited that many South East Asian Central Banks SEACAN countries suffered structural liquidity surplus. This observation was also refuted by the BCBS (2008b) where it reported that the advent of the 2007 global crisis had provided liquidity problems, as banks failed to consider many principles for sound liquidity risk management and this led to the reversal of what used to be an ‘overflowing’ liquidity among banks in some countries.
As can be observed from (Table 2.16), central banks’ policy responses to manage liquidity vary across countries in the region, although some similarities are also evident. Among the standing facilities used by central banks in East Asia, the most commonly used instruments are the intraday liquidity/overdrafts facility and deposit facility. Many financial institutions in the region make payments and settlement of day-to-day transactions involving foreign exchange transactions, purchase and sale of securities and other transactions necessary to conduct trade and finance for their clients and transactions with other financial institutions. Particularly in Asia where cross-border transactions are evolving and rising at a rapid pace, intraday activities are undertaken to manage liquidity. Likewise, with the electronic payment system already in place in many countries worldwide, the intraday liquidity/overdraft facility had been used by many central banks worldwide. This facility by the central banks was used in Indonesia, Singapore, Thailand and South Korea. In Singapore, the Monetary Authority of Singapore introduced in April 2011 its guidelines for banks for using this facility. Banks can avail of the intraday repurchase transaction using the New MAS Electronic Payment and Book-entry System (MEPS+) for obtaining funds on an intraday basis (Monetary Authority of Singapore, 2011a).
On the other hand, central banks in Malaysia, Indonesia, the Philippines and Japan utilize the deposit facility used by many banks and financial institutions with excess liquidity. Deposit standing facilities (for any remaining surplus liquidity) and lending standing facilities (for liquidity deficiency) are also made available in the evening for market participants. In comparing Japan with the major central Banks such as United States FED, ECB and BOE, Shiratsuka (n.d.) noted that the difference in policies were attributed from the different financial and economic environments, the institutional underpinnings and structures of the financial system and markets and the arrangements used by the central banks. During the late 2008, South Korea banks’ interest rates for short term borrowings increased while an increase in term instruments rates were evident in Japan. Overnight rates were also on the rise in Japan while they remained stable in Korea. This reflects how liquidity is being managed in Japan and South Korea. Hong Kong and Singapore can be seen as having sound financial environment prior to the crisis due to the banks’ strong and large net foreign assets surpluses. However, this strong financial sentiment did not last as higher funding costs and foreign bank deleveraging became apparent due to their large investments in some derivative instruments such as those linked with the Lehman Brothers. This can also be attributed to the Hong Kong’s experience of a bank run during this period; however, the same was immediately contained by Hong Kong Monetary Authority (HKMA). This only reflects that both markets and financial institutions are vulnerable to risks.
While it is not a common tool among central banks in the region, the aggregate credit ceiling is created by Bank of Korea (BoK) as financing sources among banks in providing
59 | P a g e

indirect Small and Medium Enterprise (SME) loans. It was reported that BoK even increased the funds for this facility by more than 50% to provide incentives among banks to extend credit to this group and paid off interest on their required reserve deposits (Chung, 2010). In fact, as cited by Binici and Yörükoğlu (2011), it is one of the macro-prudential facilities undertaken by some central banks in developed countries during and after crisis to increase credit growth and loan-to-value caps along with other tools such as debt-to-income limits, foreign currency credit limits, interbank exposure, open currency limits, countercyclical or dynamic provisioning and loan-to-deposit limits (refer to Tables 2.17 and 2.18).
Liquidity in the financial system has become an increasing problem recently as
transactions contracted while credit market was on the rise in some regions worldwide. In Europe, the sovereign debt crisis among EEA member countries still continues which might cause larger liquidity and credit risks as loan demand continues to be on the rise. (Table 2.17) provides information on the liquidity risk management practices of banks in the ASEAN+3 region. Most of the countries (Indonesia, Malaysia, Thailand, South Korea and Hong Kong) have comprehensive regulatory framework for sound liquidity risk management. This is in line with the guidelines for best practices prescribed by BCBS for sound liquidity risk management and supervision.
As shown in (Table 2.17), all countries’ supervisors require banks to conduct stress testing as one of the liquidity risk management techniques used for monitoring their own risks in both normal and stressful conditions. In Singapore, the Monetary Authority of Singapore requires banks to conduct institution-wide stress testing and scenario analysis to determine both market and non-market related risks associated with bank’s activities such as market liquidity and price risk, among others, which might potentially affect their earnings and capital (MAS, 2006b). In Malaysia, on the other hand, Malaysia’s Bank Negara Malaysia (BNM) issued in 2007 its guideline on stress testing (BNM/RH/GL 007-3) which prescribes the minimum requirements for conducting stress testing, the approaches to be used for using this model/tool and the reports to be submitted by all licensed banks to the bank (Bank Negara Malaysia, 2007). This is not only being required among banks to measure and monitor their own liquidity risk but this had also proven to be a vital supervisory tool for its prudential and macro-prudential supervision in evaluating and monitoring banks performance and in analyzing financial disruptions and global/economic weaknesses.
Table 2.17: Regulatory Prescriptions for Sound Liquidity Risk Management of Banks in the ASEAN+3 Region
Country
Min
imu
m H
old
ing
of
Liq
uid
Ass
ets
Min
imu
m H
old
ing
of
Res
erv
es
Liq
uid
ity
Rat
ios
Liq
uid
ity
Gap
Lim
its
Lim
its
on
C
on
cen
trat
ion
of
Fu
nd
ing
Cas
h F
low
Pro
ject
ion
s
Max
imu
m C
as
h
Ou
tflo
w
Str
ess
Tes
tin
g
Fo
reig
n C
urr
ency
L
iqu
idit
y M
anag
emen
t
Fu
nd
ing
D
iver
sifi
cati
on
M
anag
emen
t
Indonesia X X x x x x x
Malaysia X X x x x x x x unknown
60 | P a g e

Philippines X X x xa x xa xa
Singapore xb xb xc x Unknown
Thailand X X x x x x x x
China x xd xd xd
Hong Konge X none
x x x x xf x X X
Japan xg xg nonee xh not specified
not specified
not specified
xg xi not specified
South Korea X X x x x x x x xj -
Sources: Siregar, R. and V. Lim (2010). The Role of Central Banks in Sustaining Economic Recovery and in Achieving Financial Stability. The South East Asian Central Banks (SEACEN)Staff Paper No. 74. Retrieved December 4, 2011, from http://www.seacen.org/GUI/pdf/publications/newsletter/2010/1stQtr.pdf derived from Table 3 on Bank Liquidity Management aBangko Sentral ng Pilipinas (2006). Circular No. 545, Series of 2006: Guidelines on Liquidity Risk Management. Retrieved December 14, 2011, from http://www.bsp.gov.ph/downloads/Regulations/attachments/2006/c545.pdf. bMonetary Authority of Singapore (2006) Liquidity Risk Supervision: A Revised Minimum Liquid Asset Framework cMAS Notice 613 – Minimum Liquid Assets. Banking Act Cap 19 dFor China: China Banking Regulatory Commission (2009). Guidelines on Liquidity Risk Management of Commercial Banks. Retrieved December 14, 2011, from http://www.cbrc.gov.cn/EngdocView.do?docID=200911161A02DF6ACF9A64F1FF37E38D9EFBDA00 eHong Kong Monetary Authority (2011). Supervisory Policy Manual LM-1: Liquidity risk Management. Retrieved on December 7, 2011, from http://www.hkma.gov.hk/media/eng/doc/key-information/guidelines-and-circular/guideline/LM-1.pdf fHong Kong Monetary Authority (2011). Supervisory Policy Manual LM-2: Liquidity risk Management. Retrieved on December 7, 2011, from http://www.hkma.gov.hk/media/eng/doc/key-functions/banking-stability/supervisory-policy-manual/LM-2.pdf Note: for Hong Kong data* uses cumulative cash flow requirement instead of maximum cash outflows gBank of Japan (2009). The Bank of Japan’s Approach to Liquidity Risk Management in Financial Institutions. Retrieved December 17, 2011, from http://www.boj.or.jp/en/announcements/release_2009/data/fss0906a.pdf hFinancial Services Agency. Checklist for Liquidity risk Management. Retrieved December 17, 2011, from www.fsa.go.jp/en/refer/manual/yokin_e/y10.pdf iFinancial Services Agency (2011). Basic Policy for Financial Inspections in Program Year 2011. Retrieved December 18, 2011, from http://www.fsa.go.jp/en/news/2011/20111129-5/02.pdf jKim, M (2010). Liquidity Measurement and Management in Korea. Retrieved December 18, 2011, from http://www.seacen.org/GUI/pdf/publications/research_proj/2010/rp81/li3.pdf
Aside from stress testing, the use of various liquidity ratios, gap limits (maturity and liquidity) and cash flow projections are also required among banks in many jurisdictions (Indonesia, Malaysia, Hong Kong, Thailand and Korea) in the region to measure and manage their liquidity positions, risk exposures and other financial activities. Even the BSP in the Philippines does not explicitly prescribe banks to comply with liquidity gap limits; its guidelines for sound liquidity risk management require banks to use simulations such as maturity/liquidity gap or maximum cash outflow/liquidity gap models (Bangko Sentral ng Pilipinas, 2006). However, the effectiveness of these liquidity tools varies across countries, which is dependent on the depth, coverage, enforcement and scope of any possible expansion to be implemented to comply with the local regulatory framework and the requirements specified under the international guidelines. In the case of Malaysia, there are no prescriptive limits on concentration of funding and funding diversification management, although banking institutions are required to report ratios which indicate funding concentration levels for supervisory monitoring purposes. Also, while there are no prescriptions on foreign currency liquidity management in Malaysia, supervisors monitors banking institutions’ exposures to major currencies like the US and Singapore dollar, while also reviewing their internal foreign currency liquidity practices.
61 | P a g e

Aside from this, banks are also required to hold a minimum level of liquid assets and reserves and use liquidity ratios to measure liquidity risk in either funding or trading-related activities or both. All countries’ supervisors specifically prescribe in their guidelines that banks should maintain a minimum level of highly liquid assets and reserves which can be used to meet liquidity demands and fund unanticipated deposit or investment withdrawals. China Banking Regulatory Commission (2009), for example, requires commercial banks to hold sufficient liquid assets to prevent any liquidity risk arising from the potential erosion of liquid assets. In South Korea, the Financial Services Commission strictly requires banks to comply with the requirement for foreign currency liquidity management using the maturity ladder approach. Kim (2010) noted that this regulatory requirement enables the supervisor to monitor banks’ performance and manage liquidity. As it will be discussed in (Table 2.18), Hong Kong Monetary Authority does not require banks to hold and maintain reserves against deposits and other liabilities but are required to maintain minimum cash balance and liquid asset ratios.
Other liquidity risk management tools used include funding diversification management and the prescription of limits on concentration of funding sources. This is basically similar to the concept of funding diversification management strategies where banks have to consider a number of retail and wholesale funding sources, and their maturities. In fact, BCBS (2008) cited that in undertaking this liquidity risk management strategy, funding sources must be evaluated based on the type, currency and tenor of the instrument used and other factors, taking into consideration the existing market conditions at the time of the funding.
The key features of the reserve requirements of banks (rate and reasons) are summarized in (Table 2.18). Each country has its own reason for imposing reserve requirements among banks reserves against deposits and other liabilities that must be maintained with the central bank. As can be gleaned on the table above, they are part of the monetary policies of the central bank (Indonesia, Thailand and China) or used for managing liquidity (Philippines, Indonesia, Hong Kong, Malaysia, Thailand and South Korea). As part of the monetary policies, there are instances when central banks will either increase or decrease the reserve requirement. In emerging market economies, most central banks usually increase the reserves compared to the number of times they decrease them. This increase is undertaken to put into effect an increase in the monetary base arising from the portion of the deposits that are set aside for reserves to control the currencies in circulation. In the case of Malaysia, the Statutory Reserve Requirement is the instrument used to manage liquidity and not necessarily a signal of its monetary policy stance. The Overnight Policy Rate is used as the sole indicator to signal the stance of monetary policy which is announced through the Monetary Policy Statement released after each Monetary Policy Committee meetings.
Table 2.18: Reserve Requirement Policies and Reason for the use Maintenance of Reserves
Reserve Ratio1
Functions of Reserve Requirement11
Country Interest Rate
Buffer
Liquidity Management
Monetary Control
Seignorage Income
Settlement
62 | P a g e

Indonesia
8% of o/s deposit denominated in LCY1
* *
Malaysia 4% of Eligible Liabilities2
* *
Philippines
21% of Total Deposit Liabilities; (10% statutory reserves)3
*
Singapore
Minimum Cash Balance – 3% of liabilities4
* *
Thailand 6.0% of conventional deposits5
* *
China 21(50bps increase)6Large Banks 15.5%-21.5%; Small Banks -13.5%-19.5% 7
* *
Hong Kong
None; Statutory Liquidity Ratio of 25%8
*
Japan Various against reservable liabilities; (0.05%-1.3%)9
South Korea
Various against reservable
* *
63 | P a g e

liabilities from 1%-10%9
Australia None10
Canada None10
United Kingdom
None; Average cash reserve ratio – 3.1%
United States
Various, from 0%, 3% and 10%9
Sources: 1Bank Indonesia (n.d.). Key Explanations. Rupiah Statutory Reserve Requirement. Retrieved December 19, 2011, from http://www.bi.go.id/NR/rdonlyres/D275DE41-9213-44E7-8C8A-73FE9900F837/20980/KeyExplanationsRupiahStatutoryReserveRequirement.pdf 2Bank Negara Malaysia (2011). Increase in the Statutory Reserve Requirement Ratio. Press Release by Bank Negara Malaysia. Retrieved December 18, 2011, from http://www.bnm.gov.my/index.php?ch=8&pg=14&ac=2289 3Bangko Sentral ng Pilipinas (2011). Monetary Board Keeps Rates Steady, Increases Reserve Requirement. A Media Release by the Bangko Sentral ng Pilipinas. Retrieved December 17, 2011, from http://www.bsp.gov.ph/publications/media.asp?id=2605 4Monetary Authority of Singapore (2007). Monetary Policy Operations in Singapore. Retrieved on December 17, 2011, from http://www.sgs.gov.sg/resource/pub_guide/guides/SGPMonetaryPolicyOperations.pdf 5Bank of Thailand (2008). Monetary Policy Instruments. Retrieved December 19, 2011, from http://www.bot.or.th/English/FinancialMarkets/operations/Relating%20articles/Monetary%20Policy%20Instruments.pdf 6 Ma, G., Y. Xiandong and L. Xi (2011). China’s Evolving Reserve Requirement. Bank for International Settlements. BIS Working Papers No. 360. Retreived December 19, 2011, from http://www.bis.org/publ/work360.pdf 7 ____ (2011). People's Bank of China Raises Reserve Requirements 50bps. Retrieved December 18, 2011, from http://www.centralbanknews.info/2011/04/peoples-bank-of-china-raises-reserve.html 8_____ (n.d.) New Regime for the Supervision of Liquidity. Retrieved December 19, 2011,, from http://www.hkma.gov.hk/media/eng/publication-and-research/quarterly-bulletin/qb9411/fa04.pdf Yam, J (n.d.) Reserve Requirement. Retrieved December 18, 2011, from http://www.hkma.gov.hk/eng/publications-and-research/reference-materials/viewpoint/ 9 Obrien, Y (2007): Reserve Requirement Systems in OECD Countries, OECD Finance and Economics Discussion Series, 2007-54. Retrieved December 17, 2011, from
www.federalreserve.gov/pubs/feds/2007/200754/200754pap.pdf 10Gray, Simon (2011). Central Bank Balances and Reserve Requirements. International Monetary Fund. Retrieved December 18, 2011, from
www.imf.org/external/pubs/ft/wp/2011/wp1136.pdf 11 Ryoo, S. Operational Framework for Monetary Policy in the SEACAN Countries (2006) from Table 4 on Functions of Reserve Requirement. Retrieved December 17, 2011, from http://www.seacen.org/GUI/pdf/publications/research_proj/2006/rp61.pdf
As contrasted to the other central banks in the East Asian region, only Hong Kong Monetary Authority (HKMA) does not require banks to maintain reserves against deposits and other qualifying liabilities. Yam (n.d.) noted that unlike Mainland China’s practices, banks in Hong Kong are not required to set aside reserves. Hence, the country’s Banking Ordinance (section 102 (1)) specifies the maintenance by banks of a statutory liquidity ratio. The HKMA prescribes this among authorized institutions to ensure maintenance of highly liquid assets during a crisis with liquidity conversion factors ranging from 80% to 100%. The ratio is computed using liquefiable assets to qualifying liabilities both with tenors of one (1) month, with assets to be realized within one month (New Regime for the Supervision of Liquidity, n.d.). From a regional perspective, it can be said that it is only in the Philippines and China where reserve requirements are extremely high compared to other countries, with reserve rates of 21% as of 2011. These are also extremely high compared to the reserve requirements practiced in other countries outside the region. China’s reserve requirement used to be 21.5%, but over the past months, it decided to decrease the rate by 50 basis points. The BSP increased its reserve
64 | P a g e

65 | P a g e
requirement from 20% to 21% effective June 24, 20115, followed by BNM’s increase in its statutory reserve requirement from 3% to 4% effective July 16, 20116.
Several studies and researches (Ma G., Y. Xiandong and L. Xi 2011, Obrien, 2007, Ryoo, 2006, Hemedes and Lapid, 2005) and Bank Negara Malaysia, 2011) have cited that various amendments in the reserve requirement policies among central banks in the region and other regions had occurred over the past five years, especially in 2011 where many central banks have altered this monetary policy tool to manage either interest rates, credit issues or inflation. A good example is the experiences of China and Malaysia, which undertook several reserve rate adjustments within a year. In the case of Malaysia, the successive increases on reserves against deposit liabilities or qualifying liabilities were made by BNM within the year by 100 basis points, effective April 1, 20117 and May 16, 20118, respectively, from only 1% level since April 2009. In 2011, Malaysia’s purpose of increases in its Statutory Reserve Requirement was meant to absorb excess liquidity in the system. It can be noted that reserve ratios imposed among banks in Malaysia were historically high with the highest rate of 13.5% which was charged against liabilities in 1996. In the reserve requirement guidelines prepared by BNM, it was indicated that during periods of crisis, series of adjustments are made during a year (i.e., in 1998, there were four (4) downward adjustments that were made which resulted to a lower reserve rate); since 1989 until March 2009, eighteen 18 episodes of rate adjustments were evident.9 In China, the People’s Bank of China reported that it increased its reserves six (6) times in 2010, together with the adjustments made for the benchmark deposit and loan rates (PBC, 2006). These adjustments were also confirmed by Ma, Xiandong and Xi (2010) who documented several amendments in the country’s reserve requirement as part of its monetary policy for inflation targeting and to withdraw excess liquidity within the system. Like Thailand and Singapore, reserve requirement is also used to increase the income that can be collected from seigniorage (sometimes called inflation tax). This concept is a way to keep the inflation rate low while revenues can be collected from the reserves. This approach increases the monetary base on which the tax can be imposed by the government.
In many countries, a portion of the reserves is remunerated. This concept allows banks to earn interest income on certain reservable deposits. Especially if the reserve rate is high, like in the Philippines, China and Thailand, this serves as an incentive for banks. In Thailand, the Bank of Thailand imposes 6% reserves on conventional deposits; as contrasted to the other two countries, the reserve is not high and is at par with reserve requirements in Indonesia, United States and South Korea. The only difference is that both Thailand and Indonesia imposes a fixed rate while in the United States and South Korea, the rates are differentiated depending on the type of reservable liabilities and maturities/tenor. This practice is also used in Japan, however, the reserve requirements are quite low. The reserve requirement varies based on the type and size of reservable liabilities, the currency involved and the type of depository
5 ____ (2011). Monetary Board Keeps Rates Steady, Increases Reserve Requirement. A Media Release by the Bangko Sentral ng Pilipinas. Retrieved December 17, 2011, from http://www.bsp.gov.ph/publications/media.asp?id=2605 6___ (2011b). Increase in the Statutory Reserve Requirement Ratio. Press Release by Bank Negara Malaysia. Retrieved December 18, 2011, from http://www.bnm.gov.my/index.php?ch=8&pg=14&ac=2289 7 ____ (2011). Policy Interest Rates Rise in the Republic of Korea, Thailand, and Viet Nam; Malaysia Keeps Steady Its Overnight Policy Rate, Increases Statutory Reserve Requirement. Retrieved December 19, 2011, from http://asianbondsonline.adb.org/newsletters/abowdh20110314.pdf Bank Negara Malaysia 8 _____ (2011a). Increase in the Statutory Reserve Requirement (SRR) Ratio. Press Release by Bank Negara Malaysia. Retrieved December 18,
2011, from http://www.bnm.gov.my/index.php?ch=8&pg=14&ac=2252 9Bank Negara Malaysia (2009). BNM/RH/GL 007 – 1: Statutory Reserve Requirement. A Guideline Issuance by Bank Negara Malaysia. Retrieved December 18, 2011, from http://www.bnm.gov.my/guidelines/01_banking/04_prudential_stds/01_statutory_20090224.pdfhttp://www.bnm.gov.my/guidelines/01_banking/04_prudential_stds/01_statutory_20090224.pdf

institutions. This was highlighted by O’Brien (2007) when it compared the reserve requirement practice of Japan with other OECD countries. He finds that in countries such as Japan, South Korea and the United States have higher reserve requirements imposed on highly liquid deposits. He describes the three countries as having highly heterogeneous reserve requirement which can be ascribed to the various financial institutions operating in their respective jurisdictions.
In some countries (Hong Kong, United Kingdom, Canada and Australia), they do not
impose reserves against deposit liabilities and other qualifying liabilities. However, as far as these four countries are concerned, differences also exist among them. In Hong Kong and the United Kingdom, despite the absence of reserves, cash reserve ratios of 3.0% and 3.1%, respectively, are imposed. Aside from this, O’Brien (2011) mentioned that maintaining reserves in the United Kingdom is voluntary among banks except for CHAPS and CREST settlement transactions. Thus, they set their own reserve targets and may change their own reserves freely at a given time.
III. Financial Safety Net Arrangements: Comparison among Countries in the
ASEAN+3 Region and Other Regions on Deposit Insurance Systems
There are several financial safety net arrangements used by many countries in promoting a sound financial system. Among the most common are the deposit insurance system (DIS), lender of last resort, exit policies, failure resolutions, and prudential regulations and supervision. The level of their use depends on the depth of the problem faced by the country and its institutional, legal and structural underpinnings. In most instances, many supervisors use the lender of last resort scheme in their jurisdiction to provide an effective financial safety net. To be effective, the appropriate type of arrangement needs careful identification, assessment and containment of the main problem.
This section provides an assessment of the regulatory framework for DIS based on the core principles for deposit protection. As far as the DIS is concerned, it assesses the features and characteristics of the DIS in East Asia and compares the same with other DIS’ in developed economies outside the region, including the existing framework for failure resolution and bank liquidation. A. Trends in the Deposit Insurance Systems in East Asia and Other Developed
Countries
The benefits provided by the deposit insurance system cannot be discounted. It helps in promoting stability in the banking system as it supports in their supervision and regulation. For one, it provides market discipline among banks. Designing a deposit insurance system poses a challenging task among national authorities as it entails trade-offs (in most instances, costs outweighs benefits) and potential moral hazard that may distort the country’s current financial landscape. There are several arguments supporting or refuting its design and use including those that involve the potential incentive for banks to undertake excessive risk. It was observed that during a crisis, many countries are temporarily increasing the coverage limit to manage the crisis. Schich (2008) stressed that it defines the boundaries or the outer limit of the safety net arrangement such as the coverage limit and scope of coverage compared to the implicit guarantee which makes safety net provision quite ambiguous.
66 | P a g e

Table 2.19: Deposit Insurance Systems in the Region
Country Date Established Deposit Insurance Agency (DIA) ASEAN5
Indonesia September 2004 Indonesia Deposit Insurance Corporation
Malaysia September 2005 Malaysia Deposit Insurance Corporation (Perbadanan Insurans Deposit Malaysia)
Philippines June 1963 Philippine Deposit Insurance Corporation Singapore April 2006 Singapore Deposit Insurance Corporation Thailand 2008 Thailand Deposit Insurance Agency (Deposit
Protection Agency) +3 and Other Developed Markets China 2004- ; to be launched
soon; People’s Bank of China Financial Security Bureau - Deposit Insurance Division
Hong Kong 2006 Hong Kong Deposit Protection Board Japan March 1971 Deposit Insurance Corporation of Japan South Korea June 1996 (prior to this,
implicit government guarantee on deposits
Korea Deposit Insurance Corporation; FOR CRED.UNIONS – National Credit Union Federation of Korea
Australia NONE Australian Government Guarantee Scheme for Large Deposits and Wholesale Funding
Canada 1967 Canada Deposit Insurance Corporation
United States January 1934 Federal Deposit Insurance Corporation
United Kingdom
1979/Dec 2001 Deposit Protection Scheme (replaced by Financial Services Compensation Scheme
Sources: Sources Compiled from the International Deposit Insurance Surveys conducted by CDIC in 2003 and 2008 for the International
Association of Deposit Insurers .Except for UK’s DIS, data came from the answers to the survey culled from the International Association of Deposit Insurers: http://www.iadi.org/research.aspx?id=121 .
Walker, D (2007). Deposit Insurance in Selected Asian Countries: Before and After the Financial Crisis. PDIC Occasional Paper No. 2. Retrieved October 24, 2011, from http://www.pdic.gov.ph/files/Occasional_Paper_No2.pdf
For Hong Kong http://www.info.gov.hk/hkma/eng/consumer/deposit_protection_index.htm
Prior to the Asian crisis, relatively few countries in the region have explicit deposit
insurance scheme, following the United States of America and Canada’s creation of a deposit insurance mechanism in 1934 and 1967, respectively. The Philippines and Japan introduced this safety net arrangement in 1963 and 1971, respectively, through the creation of the Philippine Deposit Insurance Corporation (PDIC) and Deposit Insurance Corporation of Japan. They were quite successful in implementing this protection scheme within the country’s financial system. The Philippine DIS utilizes the US model with expanded powers compared to the other deposit insurance systems which only have limited regulatory powers. After more than two (2) decades, South Korea established its own DIS in 1996 through the creation of the Korea Deposit Insurance Corporation (KDIC). It has a separate DIS for credit unions which had existed even before the creation of KDIC and is currently managed by the National Credit Union Federation of Korea (refer to Table 2.19).
67 | P a g e

During the crisis, many of these countries have created an implicit deposit guarantee to mitigate the damaging effect of the crisis and some of them have considered the establishment of a DIS. Among the other countries in the region, Indonesia was the first country to establish a DIS (2004) after the crisis, followed by Malaysia (2005), Singapore (2006) and Hong Kong (2006). It was during the outbreak of the global crisis when Thailand established the Thailand Deposit Insurance Agency (2008).
Against this background, it can be said that while the presence of a DIS helps in promoting financial stability and in protecting depositors, there is no hard and fast rule for its success. Even the most developed economies and large financial centers were not spared of the financial disruption caused by the crisis such as the experience of KDIC. Despite its creation in 1996, it was one of the most affected countries in the region during the Asian Crisis while Singapore and Hong Kong managed to withstand the crisis even without a DIS. It can be argued that banks and other financial intermediaries had undertaken excessive long-term investments which were funded by short-term borrowings coupled by the fact that some were denominated in foreign currencies. This led many countries in the region into an inconceivable financial fiasco.
Having a deposit insurance system does not guarantee success nor is it considered as a bad supervisory decision. In fact, over the years, various countries in the region only provided implicit protection system (deposit guarantees) and other financial safety net arrangements such as the lender of last resort facility and other liquidity supports in the financial system. While these are used to manage short-term crisis or problems, their experience and the need to provide financial stability led to the surge in the growth of this explicit protection system in many countries in the region either before or during the global crisis.
These observed changes in the financial safety net arrangements are not only common in the East Asian Region but also in other regions worldwide. The series of crises that occurred over the past decade led to the design of a permanent yet limited protection mechanism among affected economies. This also led existing deposit insurers to enhance their operations and re-evaluate their functions and roles to minimize adverse consequences brought about by the crisis. For other countries such as Malaysia, Hong Kong and Singapore, its establishment was a response to the global trend on financial safety net arrangements, as many countries started establishing their own explicit protection schemes.
Hong Kong’s reaction to the bank run experience showed how developed economies had altered their decisions in revising the existing deposit protection coverage, given the stability of its financial system and its reputation as a large financial center in Asia. The lessons gained from this experience show the sincere commitment by the government in providing a sound and safe banking system. Malaysia, Singapore and Australia are also notable examples for this type of safety net arrangement in the hope of managing a crisis or preventing it. For some countries like Thailand, Malaysia and China, the creation of a depositor protection system was seen as a critical element for the government’s industry blueprint for its medium or long-term plan. This poses a challenge among policymakers as it calls for the creation of this institution, whether official or a combination. Indonesia and South Korea, however, saw the need for a more permanent system of replacing their respective implicit deposit guarantees. In most instances, most of these deposit insurance systems were created in response to the crisis.
68 | P a g e

B. The Deposit Insurance Fund and Size of the Fund:
Table 2.20: Deposit Insurance Fund and Target Reserve Ratios among Deposit Insurance Systems
Country Fund Name
(a) Target Fund’s
Name (b) Fund Ratio
(c) Indonesia Target Insurance
Reserve Target
Insurance Fund/Reserve
2.5% of total banking system’s deposits
Malaysia Conventional Deposit Insurance Fund and
Islamic Deposit Insurance Fund
NONE NA
Philippines Deposit Insurance Fund None None Singapore Deposit Insurance
Corporation Target Fund 0.3% of the aggregate of the
insured deposit Thailand Deposit Protection Fund
(Financial Institution Development Fund)
Target Fund Proposed rate of 1.5% - 2.0%
Hong Kong DPS Fund Target Fund 0.3% of the banking sector’s total amount of
protected deposits Japan Deposit Insurance Fund None None South Korea Deposit Insurance Fund Target
Reserves For Banks: Minimum limit -
0.825% Maximum limit - 1.10%
Canada Deposit Insurance Fund Target Fund 0.4%-0.5% of total insured deposits
United Kingdom
Long-term Insurance Fund
Target Fund For deposits: 0.3% of protected deposits.
United States
Deposit Insurance Fund Designated Reserve Ratio
1.35%
Sources: Major sources: they were compiled from the International Survey of Deposit Insurers conducted by CDIC for the International Association of Deposit Insurers (www.iadi.org) . For Column c on Target Fund Ratio for Canada, Malaysia, Japan, and Thailand: was taken from (Figure 14: Comparison of Deposit Protection Scheme using : Credit Suisse (2011). Thailand Bank Sector (Asia Pacific/Thailand Equity Research), Retrieved November 30, 2011, from https://research-and-analytics.csfb.com/docView?language=ENG&source=ulg&format=PDF&document_id=905415241&serialid=rE%2Bn11SKZ%2BN%2B3Dz2J9DdhyBt8Dz5j1H7mweBbgUA7cA%3D NOTE: Other data were culled and updated through the use of the following websites: For Hong Kong: http://www.hkma.gov.hk/media/eng/publication-and-research/quarterly-bulletin/qb200306/fa5.pdf; For Thailand: Wesaratchakit, W. The Future of Deposit Insurance System in Thailand; Retrieved November 29, 2011, from citeseerx.ist.psu.edu/viewdoc/download?doi=10.1.1.203... For South Korea: Korea Deposit Insurance Corporation (n.d.) Management of Deposit Insurance Fund. Retrieved November 23, 2011, from http://www.kdic.or.kr/english/major/sub1_2.jsp For the United States: Federal Deposit Insurance System (2011b). Deposit Insurance Fund Management. Retrieved December 3, 2011, from http://www.fdic.gov/deposit/insurance/fund.html; Federal Deposit Insurance Corporation (2011c). Update of Projected Deposit Insurance Fund Losses, Income, and Reserve Ratios for the Restoration Plan. Retrieved September 27, 2011, from http://www.fdic.gov/news/board/2011Octno4.pdf;
Crucial to the functions of the deposit insurers is to ensure that funds are readily
available when they are needed to provide sufficient liquidity especially during a crisis. Principle
69 | P a g e

11 on ‘DIS Funding under the Core Principles for Effective Deposit Insurance Systems’ states that:
A deposit insurance system should have available all funding mechanisms necessary to ensure the prompt reimbursement of depositors’ claims including a means of obtaining supplementary back-up funding for liquidity purposes when required. Primary responsibility for paying the cost of deposit insurance should be borne by banks since they and their clients directly benefit from having an effective deposit insurance system. (Bank for International Settlements, 2010c)
As shown on (Table 2.20), each deposit insurer maintains its own insurance fund
(sometimes called as deposit insurance fund, deposit protection fund, DPS Fund, Long-term Insurance Funds) which is usually considered as its permanent fund source. For DI systems which utilize ex-ante financing scheme, most of them set a target funds level. In most instances, the acceptable size of the target reserve fund must be determined to cover for potential losses arising from failure or insolvency cases, to fund other expenses/costs that may be incurred arising from the discharge of their duties and responsibilities and also to plan for any investments of temporary excess funds in interest-bearing, high-grade securities.
(Table 2.20) further depicts that of these deposit insurance funds, some deposit insurers (Philippines, Japan and Malaysia) do not have a target funds ratio. In the guidance paper published by the International Association of Deposit Insurers (2009), the maintenance of a target reserve ratio was emphasized for the efficient management of the deposit insurance fund. It was also noted that the deposit insurer adopting this funding concept must consider various factors such as the institutional characteristics of the banking system, the liabilities of banks in relation to the system’s risk exposure and the failure and losses experienced by a country. Moreover, deposit insurers have different practices in the provision of target fund ratios, with the lowest ratios that can be found in Hong Kong, Singapore, Canada and the United Kingdom; the highest ratios, however, are set by deposit insurers in Indonesia and the United States.
Among the deposit insurers which employ flat premium pricing schemes, some of them (Indonesia, Thailand, South Korea and the United Kingdom) also set an acceptable target funds ratio. They usually set a range in which the fund shall be maintained, and any excess during the fiscal or calendar year (whichever is applicable) can either be reimbursed to the insured members in the form of dividends or given as a discount (in the case of KDIC). However, whenever the target level falls below the acceptable minimum, it requires the members to pay additional contributions over and above what was originally set or paid for. This is almost similar to the concept as the ex-post financing used by some deposit insurers worldwide (i.e.: Financial Services Compensation Scheme). Among DIAs with target fund ratios, Indonesia, has the highest ratio which is equivalent to 2.5% of the total deposits of banks, followed by Thailand, which proposes a target ratio range of 1.5%-2.0% of the total deposits. In Korea, it has different target fund limits for each account under its insurance programs. For banks, the target fund level ranges from 0.825% to 1.10%, being the lower and upper limits, respectively. When the target level is reached, the premiums being paid by the said institution is discounted (KDIC, n.d.a). In another jurisdiction, Hong Kong Deposit Protection Agency HKDPA’s deposit protection fund is set at 0.3% of the insured deposits of the banking system. However, HKMA provides that where the fund falls outside the range of (+15% and -30% of the target fund size), a rebate will be given or surcharge will be levied among licensed banks to maintain the target level (HKMA, 2003). This practice ensures stability of the fund and allows any anticipated problems that may arise from insolvency or failure by high risk banks.
70 | P a g e

However, for some insurers which do not have target fund levels, provision for future losses are set aside for failure resolution undertakings and deposit insurance payments. In the case of Canada, the amount of CAD 500 million, which is computed annually, is set aside as a general provision for future losses (Canadian Deposit Insurance Corporation (CDIC), 2008b). Initially, it did not have target reserve funds. It only provides general provision for losses which can be drawn whenever an overdraft (IADI, 2009) or deficit is incurred and during a failure resolution. Currently, its target reserve fund ranges from 0.4%-0.5% of the total insured deposits. Whenever the premiums that were collected are not sufficient to cover the costs incurred by the system, it can require members to pay more funds within a given time period (part of ad-hoc adjustment to financing).
Federal Deposit Insurance Corporation (FDIC) on the other hand, has a target deposit
reserve ratio of 1.35% (minimum level) based on the estimated insured deposits. Where the deposit insurance fund balance exceeds the limit of 1.50%, it will pay insured members’ dividends, as contrasted to KDIC’s practice of providing discounts on the premium to be paid by the insured members. CDIC (2008d) reported several experiences by FDIC of the use of target reserve ratio (from being fixed to variable or vice versa). From 2007’s target level of 1.25%, the designated reserve ratio was set to 1.35%. There were also instances where the level reached a low of 1.15%. In a study that was conducted for the DR ratio of the system, the proposal to increase the ratio to 2.0% effective January 1, 2011 did not materialize (FDIC, 2011a). However, in a recent report by FDIC (2011b), the designated desired ratio is finally set at a minimum rate of 1.35%, following the memorandum letter submitted by its Division of Insurance and Research to the Board (FDIC, 2011c).
C. Investment Policies and Uses of Funds: Table 2.21: Investments Policies and Investment Securities/Deposits used by Countries
Country
Pre
sen
ce o
f an
In
vest
men
t P
olic
y
Co
mm
erci
al
Pap
ers
issu
ed b
y th
e G
ove
rnm
ent
Sec
uri
ties
is
sued
by
the
go
vern
men
t
Oth
er
Inve
stm
ent
Gra
de
Sec
uri
ties
Dep
osi
ts
wit
h C
B a
nd
o
ther
FIs
FX
an
d
Der
ivat
ive
s
Oth
er
Ap
pro
ved
In
vest
men
ts
Indonesia x x x Malaysia x x x x x X x Philippines x x x x x Singapore x x x* x Thailand x x x x Hong Kong x x x X Japan x x x x South Korea x x X x Canada x x X Unknown United States x x X Unknown x United Kingdom
x unknown unknown Unknown unknown unknown unknown
*Singapore dollar deposits placed with the Central Bank are approved investments. Sources:
http://www.iadi.org/research.aspx?id=121 . Compiled from the International Deposit Insurance Surveys conducted by CDIC for the International Association of Deposit Insurers (Malaysia, Japan, South Korea Philippines, Singapore, Canada and the United States).
71 | P a g e

For the United Kingdom: Annex 1: Frolov, M. (2003). Funding Deposit Insurance: Designing Options and Practical Choices. Keio University: Market Quality Research Project. KUMQRP Discussion Paper Series 2003-21.
For Indonesia: http://www.lps.go.id/v2/data/peraturan/THE%20LAW%20of%20REPUBLIC%20OF%20INDONESIA%20No.%2024%20YEAR%202004-Unofficial.pdf
For Thailand: Deposit Protection Agency Act B.E. 2551 (Unofficial English Translation) http://www.bot.or.th/English/FinancialInstitutionsDevelopmentFund/Law_Notification/DocLib_Acts/Act_DPA2551.pdf
Additional Information for Japan: _______ Deposit Insurance Law ((Law No. 34 of April 1, 1971). Provisional Version Accessed on December 2, 2011. http://www.dic.go.jp/english/e_laws/2002.9.10.pdf
(Table 2.21) reveals that all deposit insurers have their own investment policies, which are either stipulated in their mandate or policy manuals. Having a venue to temporarily park excess funds or surplus reserves is relatively important in the effective management of the deposit insurance fund. Especially nowadays where financial disruptions are bound to occur from one region to another and from one country to another, the deposit insurance systems are currently entrusted to help in maintaining financial stability. However, the ability of the deposit insurer to temporarily invest excess liquidity is measured not only in terms of the safety of the funds, but also the liquidity and flexibility of the said funds; while allowing reasonable rates of return to be generated. Of course, there will always be a trade-off in any investment endeavour.
As observed in (Table 2.21), there are many alternative investments that are currently being used by the DIS. These usually comprise a combination of several securities and/or deposits with banks. Three financial assets appeared to dominate among the different alternatives, namely, securities issued by the national government, other types of securities approved by the government for investments and deposits maintained with designated government and private financial institutions. Of these three, there is large dominance or preference by many deposit insurers in the investment in government securities such as bonds and commercial papers. First, they are considered safe albeit less liquid compared to the other securities offered in the financial market. Second, they are usually mandated by law or stipulated in the deposit insurance law. Lastly, the system was not created to undertake risky investments. Since these government bonds are classified as long-term investments and are held-to-maturity, they do not provide liquidity compared to temporary short term investment alternatives.
Deposits are usually prescribed in the mandate of most DISs as it provides them with easy access to fund (being demandable and readily available). The funds maintained with authorized depository institutions are used for the day-to-day operations of the DIS. In most instances, deposits either provide very low interest or no interest at all; however, payments and other financial transactions can be undertaken by the deposit insurer, which are deemed to be non-existent in other investments. While this alternative was not indicated in the answers to the survey conducted by CDIC or in the mandate of the said system, it is assumed that this deposit alternative is also being used by other deposit insurers but was not explicitly indicated in the DIS mandate.
Alternatively, other investment securities are used by some deposit insurers. Indonesia and Malaysia DIAs also invest in commercial papers issued by the government while in Hong Kong, aside from government securities investments, HKDPA also invests excess funds in derivative products such as foreign exchange and interest rate instruments. These investment alternatives are quite risky compared to government securities; however, they are only used for hedging purposes and could be presumed to be a small portion of the system’s total portfolios. In some jurisdictions (i.e.: Korea), there are predetermined shares of the total fund where KDIC can invest deposit insurance funds. In most instances, these investible funds are invested in the local markets (locally denominated investments).
72 | P a g e

Against this backdrop, it can be inferred that the investment practices among deposit insurers are quite diverse; hence, there is a tendency for more funds to be invested in government securities. While most of them are in the form of bonds, the trend towards investing excess liquidity in medium- and long-term securities is evident. However, since most of these investments are national government issuances and are done locally, the government stands ready to pay the investments when they fall due. Some deposit insurers’ mandates also stipulate the manner in which they are invested and the type of securities that can be used. However, for deposit insurers in Thailand and Canada, their investment policies are generally stated. Some policy manuals might provide guidance on the DIA’s investment policies.
D. Scope of Insurance Coverage and its Limits
It was pointed out earlier that the government utilizes either an implicit or explicit deposit guarantee. For the explicit guarantee, sometimes called the deposit insurance/protection scheme, the insurance deposit is a statutory protection by the deposit insurer. This represents a permanent amount of coverage for deposits and other financial products made by the deposit insurer.
Table 2.22: Insurance Coverage in East Asia vis-à-vis Other Countries
Country
Scope of Coverage
Deposits Foreign
Currencies Interbank Deposits
Others
Indonesia1 Yes Yes - Islamic deposits (with DIC) Malaysia Yes Yes - Islamic deposits (separate) Philippines Yes Yes Yes Singapore Yes No No Bank deposits placed under the
CPF Investment Scheme, CPF Minimum Sum Scheme and Supplementary Retirement Scheme and Murabaha, as prescribed by the Authority2
Thailand3 Yes No No Unknown Hong Kong Yes Yes No Special coverage for joint and
trust accounts; Secured Deposits4
Japan Yes No No 1Payment and Settlement Deposits; payment in progress; Instalment savings, Money trusts under the guarantee of principal, Bank debentures (custody products)5
South Korea Yes Yes No Monetary trusts with principal guarantees , Deposits in defined contribution retirement pension products or individual retirement accounts and other financial products held by
73 | P a g e

74 | P a g e
investment traders and brokers, insurance companies, merchant banks, and mutual savings banks10
Australia Canada Yes Yes only for
retail deposits
Yes Others
United Kingdom
Yes yes No Investments & home finance (GBP50k); Insurance – full; general insurance advice and arranging (unlimited for bus. After Jan. 2005
United States Yes yes yes Major Sources:
http://www.iadi.org/research.aspx?id=121 . Compiled from the International Deposit Insurance Surveys conducted by CDIC for the International Association of Deposit Insurers (Malaysia, Japan, South Korea Philippines, Singapore, Canada and the United States).
Walker, D (2007). Deposit Insurance in Selected Asian Countries: Before and After the Financial Crisis. PDIC Occasional Paper No. 2. Retrieved October 24, 2011, from http://www.pdic.gov.ph/files/Occasional_Paper_No2.pdf
Other Sorunces: 1 ______ (2004). The Law of Republic of Indonesia Number 24 Year 2004 concerning Deposit Insurance Corporation. Retrieved December 1, 2011.http://www.lps.go.id/v2/data/peraturan/THE%20LAW%20of%20REPUBLIC%20OF%20INDONESIA%20No.%2024%20YEAR%202004-Unofficial.pdf 2______ (n.d.) Scope of DI Coverage (by Singapore Deposit Insurance Corporation. Retrieved December 1, 2011, from https://www.sdic.org.sg/di_scope_of_coverage.php 3_____ (2008). Deposit Protection Agency Act B.E. 2551 (Unofficial English Translation) http://www.bot.or.th/English/FinancialInstitutionsDevelopmentFund/Law_Notification/DocLib_Acts/Act_DPA2551.pdf 4_____ Report of the Bills Committee on Deposit Protection Scheme (Amendment) Bill 2010 Purpose. LC Paper No. CB(1)2344/09-10 (Legislative Council of Hong Kong SAR). Retrieved December 8, 2011, from http://www.legco.gov.hk/yr09-10/english/bc/bc05/reports/bc050630cb1-2344-e.pdf 5Deposit Insurance Corporation of Japan (2005). As of 2005: A Guide to the Deposit Insurance system: Outline of the System and Q&A. Retrieved December 7, 2011, from http://www.dic.go.jp/english/e_seido/e_seido2005.pdf; Additional Information for Japan: _______ Deposit Insurance Law ((Law No. 34 of April 1, 1971). Provisional Version Accessed on December 2, 2011. http://www.dic.go.jp/english/e_laws/2002.9.10.pdf
6______ (n.d.). Are Your Deposits Insured? By Korea Deposit Insurance Corporation. Retrieved December 4, 2011, from http://www.kdic.or.kr/english/deposit/sub2_2.jsp
The funds and types of deposits that are covered by the insurance protection scheme in
the DIS vary across countries. These variations depend on the different definitions used by the deposit insurers which limit non-bank deposits from the protection scheme and also on the type of insured financial institutions. All countries have indicated that deposits are covered by the scheme. There are diversities in the types of deposits offered by banks in different countries and those that are covered by the insurance with DIS; however, as used in this section, it will generally refer to local currency deposits. It should be noted that some deposit types may be insured in one country while others may not be covered. Among those that are usually not covered are secured deposits, connected or related deposit, volatile deposits, long-term deposits, etc.
Except for Japan, South Korea, Singapore and Thailand DISs, foreign currency deposits are covered by the insurance with DIS but like deposits in local currency, they are subject to coverage limits. Only the Philippines cover interbank deposits in its insurance protection scheme; although in countries such as United States and Canada, this insurance coverage is
10 http://www.kdic.or.kr/english/deposit/sub2_2.jsp

75 | P a g e
also extended. Even large financial centers in Asia, such as Hong Kong and Singapore, do not include in their insurance coverage interbank deposits.
On the other hand, given the diversity of financial products offered in each country, the deposit insurance coverage also varies, with other countries extending their deposit coverage to other financial products. In the case of Hong Kong, secured deposits are covered, while provident funds in bank deposits are covered in Singapore. Islamic deposits in Malaysia and Indonesia, and payment/settlement deposits and payment in progress in Japan are covered by the deposit insurance. In Korea, however, KDIC covers various financial products being offered by insured and member financial institutions except for those held by credit unions which are insured with the National Credit Union Federation of Korea (refer to Table 2.22).
Against this backdrop, it can be deduced that the types of deposits and/or funds covered in the protection schemes offered by deposit insurers vary across countries and across organizational structures. In many newly created DISs, they do not include insurance coverage for financial products extended to other financial institutions such as interbank deposits but they offer insurance protection for other types of financial products. The diversity in their practices is also apparent in terms of the amount covered, with some deposit insurance systems offering very high insurance coverage per depositor per bank while others are offering low insurance coverage. E. Deposit Insurance Coverage Limits
Table 2.23: Maximum Coverage Limits
Country
Coverage Limit
Existing Limit
Proposed
Indonesia IDR 100.0 million IDR2.0 billion Malaysia MYR 60,000 excluding FXCY Deposits - Philippines PHP 500,000 PHP 1.0 million Singapore SGD50K as of May 2011 - Thailand Proposed THB1.0M - China Implicit Guarantee - Hong Kong HKD 500,00011 - Japan JPY10.0 million for ordinary and TD;
Full Guarantee-payment and settlement deposits
-
South Korea KRW 50.0 million - Australia
Not applicable -
Canada CAD 100,000 - UK Various: GBP 85,000
-
USA USD 250,000 USD 500,000 Sources:
11 http://www.hkma.gov.hk/eng/other-information/consumer-information/deposit-protection.shtml

76 | P a g e
http://www.iadi.org/research.aspx?id=121 . Compiled from the International Deposit Insurance Surveys conducted by CDIC for the International Association of Deposit Insurers (Malaysia, Japan, South Korea Philippines, Singapore, Canada and the United States).
Walker, D (2007). Deposit Insurance in Selected Asian Countries: Before and After the Financial Crisis. PDIC Occasional Paper No. 2. Retrieved October 24, 2011, from http://www.pdic.gov.ph/files/Occasional_Paper_No2.pdf
For Indonesia: ______ (2004). The Law of Republic of Indonesia Number 24 Year 2004 concerning Deposit Insurance Corporation. Retrieved December 1, 2011.http://www.lps.go.id/v2/data/peraturan/THE%20LAW%20of%20REPUBLIC%20OF%20INDONESIA%20No.%2024%20YEAR%202004-Unofficial.pdf
Report of the Bills Committee on Deposit Protection Scheme (Amendment) Bill 2010 Purpose. LC Paper No. CB(1)2344/09-10 (Legislative Council of Hong Kong SAR). Retrieved December 8, 2011, from http://www.legco.gov.hk/yr09-10/english/bc/bc05/reports/bc050630cb1-2344-e.pdf
Deposit Insurance Corporation of Japan (2005). As of 2005: A Guide to the Deposit Insurance system: Outline of the System and Q&A. Retrieved December 7, 2011, from http://www.dic.go.jp/english/e_seido/e_seido2005.pdf
For Thailand: Deposit Protection Agency Act B.E. 2551 (Unofficial English Translation) http://www.bot.or.th/English/FinancialInstitutionsDevelopmentFund/Law_Notification/DocLib_Acts/Act_DPA2551.pdf
Additional Information for Japan: _______ Deposit Insurance Law ((Law No. 34 of April 1, 1971). Provisional Version Accessed on December 2, 2011. http://www.dic.go.jp/english/e_laws/2002.9.10.pdf
___ (n.d.). Commission sets out proposal to increase minimum protection for bank deposits to €100,000 (by European Union). Retrieved December 7, 2011, from http://europa.eu/rapid/pressReleasesAction.do?reference=IP/08/1508&format=HTML&aged=0&language=EN&guiLanguage=fr
Shown in (Table 2.23) are the deposit coverage limits for insurable deposits under the
protection program of the deposit insurance system per country, expressed in local currencies. Among the countries in the region, Japan offers the highest coverage limit per depositor amounting to JPY 10.0 million (roughly USD128,000) followed by Hong Kong at HKD 500,000 (approximately USD 64,000). These limits are almost comparable to those offered in developed countries such as Canada (CAD 100,000) and United Kingdom (GBP 85,000.00). To date, FDIC offers the highest insurance coverage limit of USD 250,000. Indonesia and the Philippines offer the lowest insurance coverage limit per depositor per bank compared to the other economies in the region at IDR100.0 million and PHP500,000 correspondingly. Had the Philippines not increased the insurance coverage limit from PHP 250,000 to PHP 500,000 in 2009 as provided under Republic Act 957612, it will have the lowest deposit insurance coverage in the region. To date, a temporary increase in the deposit coverage limit to PHP 1.0 million per depositor is being proposed at the House of the Senate to ensure customer protection and to mitigate moral hazard arising from the ongoing global crisis. In the case of Singapore, a revised Deposit Insurance Scheme came into effect in May 2011 which now covers SGD50,000.
Many countries have recently increased their deposit insurance coverage in response to the crisis. To provide public confidence and avoid further financial disruptions, the increase in the insurance coverage, whether they are intended to be used on a permanent or temporary basis, are deemed to be reasonable in times of crisis. Especially in 2008, many countries have undertaken various financial safety net arrangements, through the creation of a deposit insurance system or an increase in the insurance coverage limit, the provision of full guarantee on all funds or a portion of it, the use of lender of last resort, restructuring mechanism and other prudential regulations. As far as deposit insurance is concerned, many countries in the region and the United States of America had increased their coverage limits on deposits and other related funds (whichever is applicable under their system). In the United States, the Federal Deposit Insurance Corporation increased its insurance coverage to $250.000 while in the United Kingdom; the ceiling on savings deposits was lifted and became GBP 85,000.00. Recently,
12 An Act increasing the maximum deposit insurance coverage and in connection therewith, to strengthen the regulatory and administrative authority, and financial capability of the Philippine Deposit Insurance Corporation (PDIC), amending for this purpose Republic Act Numbered Three Thousand Five Hundred Ninety-One, as amended, otherwise known as the PDIC Charter, and for other purposes. Note: The Act was approved in June 1, 2009.

Hong Kong increased its coverage limit from HKD 100,000 to HKD 500,000 effective January 1, 2011 and USA changed the USD 250,000 temporary deposit insurance coverage to a permanent coverage limit following the Dodd-Frank Bill’s approval in 2010. There are proposals, which are on the pipeline, to increase the deposit insurance coverage in some countries in response to the crisis. Indonesia’s IDIC plans to increase its coverage limit from IDR 100,000 to IDR 2.0 billion while an increase from USD 250,000 to USD 500,000 is considered by the FDIC.
Other countries had undertaken implicit deposit guarantees as a temporary cushion to curb the crisis (Malaysia and Australia) and contain bank-related problems in their respective jurisdictions (Hong Kong). In Hong Kong, full deposit guarantees were provided until December 2010, together with Malaysia, Singapore and Indonesia which also provided full guarantee on deposits and other funds. Australia also offered full deposit insurance guarantee to ensure confidence in the financial system until end of 2010. In the case of Singapore, an explicit Deposit Insurance Scheme has been in effect since 2006. In 2008, the Singapore Government announce the full deposit guarantee.
It is expected that the slowdown in financial and business activities following the shocks (Japan’s earthquake and tsunami, Europe’s proliferating debt crisis, political unrest in Middle East) will continue and will provide incentives for financial safety net participants to reconsider their strategies and plans to curb the ongoing debt crisis and ensure financial stability. As many countries’ full deposit guarantees/deposit insurance had completed by end of 2010, the same form or other forms of financial arrangements are expected to transpire in the near future to combat the effect of financial devastation or possible financial instability. IV. The Crises and its Implications for the Other Financial Safety Net Arrangements A. Crisis Resolution Mechanisms
Table 2.24: Central Bank Policy Responses for Crisis Resolutions in East Asia
Country
Dep
osi
t G
uar
ante
e
Go
vern
men
t S
take
in
Ban
ks
Reg
ula
tory
F
orb
eara
nce
an
d
Su
rvei
llan
ce
Po
licy
Rat
e
Res
erve
Rat
io
Liq
uid
ity
In
terv
enti
on
Exc
han
ge
Rat
e M
anag
emen
t
Inte
rnat
ion
al
Sw
ap
Arr
ang
emen
t
Indonesia * * * * * *
Malaysia * * * * * * *
Philippines
* * * * * * *
Singapore * * *
Thailand * * * * *
China
Hong Kong
* *1 *1
77 | P a g e

Japan
South Korea
* * * * * * *
Sources: Emerging Market Central Banks and the Present Global Financial Crisis Prepared for the 8th SEACEN Executive Committee
(EXCO) Meeting(2010) Appendix 2 1 ____ (n.d.) HKMA Policy Eased Post-Lehman Stress. Retrieved October 10, 2011, from http://www.centralbanking.com/central-banking/research/1561326/hkma-policy-eased-post-lehman-stress
(Table 2.24) shows the policy responses of the central banks during a crisis in ASEAN+3 region. It is believed that a country’s regulatory framework is crucial for the effective functioning of the system and the financial market. In instances where the stability of the financial system is compromised, the central bank, which is responsible for the country’s monetary policy, is faced with a broader responsibility of protecting the financial system from any financial disruption. The recent global crisis had proven its adverse effects in many countries, including those whom were believed to be developed or stable, and were led to modify its monetary policy prescriptions. Thus, central banks are always posed with the dilemma of implementing policies using extraordinary actions that are workable to the current situation.
Malaysia, Indonesia, the Philippines and South Korea’s central banks use several measures or a combination of these measures to safeguard the financial system against systemic risk and other types of risks. Among the most common tools are the use of deposit guarantees, regulatory forbearance, international swap arrangement and liquidity intervention. These are deemed to be appropriate and meaningful policy responses during a crisis. While these supervisory activities can temporarily ease pressures, they also entail substantial costs for the government. There may be instances when policy rates, reserve ratio and privatization or nationalization of banks are used by other countries. South Korea, for instance, utilizes various tools to manage the crisis; although, the data found in (Table 2.25) does not suggest that these tools were employed at the same time.
It can be noted that the Asian Crisis had prepared the economies in the region to manage the different crises that occurred over the past decade, especially the most recent global crisis which continued to heighten as economies worldwide struggled to contain the problem. As can be recalled, during and after the Asian Crisis, most of the countries in the region initiated various institutional and structural reforms at different stages. Among the most common responses was the introduction of blanket deposit guarantees, along with the establishment of a deposit insurance system, the injection of additional liquidity through the purchase of short-term government securities, repurchase agreements, domestic and international swap facilities, etc.
In a report prepared by SEACAN Research and Training Center (2010), it was mentioned that some central banks in the region (Indonesia and the Philippines) eased their reserve requirement regulations through the reduction of reserves ratios while other countries used policy rate adjustments. In Malaysia and the Philippines, central banks reduced their overnight policy rates successively during the first quarter of 2009 and between December 2008-July 2009, respectively, to influence market rates and stimulate economic activity. Outside the region, Chailloux, et. al. (2008) cited that Canada, USA and United Kingdom also reduced their policy rates in 2008 while Australia increased its policy rates in early 2009. While the policy response might result to a downside risk on the country’s economic growth, the same were deemed to be reasonable during the crisis.
78 | P a g e

79 | P a g e
During a crisis, central banks are confronted with a challenging task of overseeing and monitoring financial stability. This sometimes prompts countries (Indonesia, Malaysia, Philippines, Thailand and South Korea) to use macroeconomic surveillance and regulatory forbearance to manage a crisis. Lee and Park (2010) noted that regulatory forbearance eases the pressure existing within the financial system especially those that involve prudential regulations, as supervisors provide ad hoc exemptions from prudential or regulatory requirements such as extension of timelines to implement a policy (i.e.: Basel II Capital Accord), temporary removal of stringent policies to allow financial institutions to manage crisis, etc. A good example of this is the experience of Malaysia during the Asian Crisis. Lindgren, et. al. (1999) cited that Malaysia had used this tool in its regulations regarding loan loss recognition to assist banks and companies in their recovery process. This regulatory forbearance was described to have caused inefficient and unsound practices among nonviable or ailing companies. In fact, Brownbridge and Kirkpatrick (2000) regard this as detrimental to the financial system due to the presence of accommodative regulations that result to weak enforcement of prudential regulations arising from various factors such as some political pressures imposed among supervisors or regulators. At some instances, some regulatory commitments (i.e., timelines set for compliance with international standards, enforcement of regulations/laws) are temporarily suspended or eased until financial conditions normalize. During crisis, this policy response is seen as a workable solution to ease the pressure within the financial system and to allow banks to cope with the crisis. For the countries in the region, the Asian crisis had served as a lesson and facilitated in the financial deepening efforts among policy makers at the regional level.
On the other hand, there are several motivations why macroeconomic surveillance systems are undertaken. In some countries, it is used to assess potential stability problems in a country while in others, it is critical in determining the symptoms of crisis and how to proactively manage them. Efforts are vigorously undertaken at the regional level through the identification and establishment of Early Warning Signs (EWS), the use of balance sheet approach and sets of indicators to spot potential imbalances and vulnerabilities to different forms of risks, and other financial safety net arrangements that are appropriate for the member countries and the region.
It can be deduced that diversities in the policy responses by the central banks can be ascribed from the differences in the economic conditions and financial circumstances in these countries during a given period. The causes and consequences of the different crises will continue to be debated over the coming years. It is therefore believed that the policy prescriptions or the decisions made by central banks were deemed to be critical in safeguarding financial stability while maintaining monetary policy objectives. At the macro level, IMF recognizes the reforms that were undertaken by the supervisors to manage different crises. In its goal of assisting many economies, it is continuously instituting several enhancements especially those that involve the resolution of disputes at the national and global context to sustain economic growth. It must be noted that this does not call for the creation of an entirely new system but it is crucial that supervisors should take proactive roles in the provision and review of appropriate regulations that are neither too optimistic nor pessimistic and in the creation of a financial environment that is beneficial to the financial system. Among the five goals which IMF suggested for the prevention of crisis are as follows:13
FFinancial Standards Foundation (2010e). Weekly Report. Vol. XI No. 4. September 27-October 4, 2010. Accessed on November 1, 2011. http://www.estandardsforum.org/system/files/173/original/weekly-report-2010-10-04.pdf?1286221919

ensure a level playing field in regulation, coordinating rules on a global scale to prevent regulatory arbitrage;
improve the effectiveness of supervision by making it more intense and intrusive; develop coherent resolution mechanisms at the national level and for global financial
institutions that eliminate moral hazard but preserve financial stability and resolve the “too big to fail” problem;
establish a macro prudential framework, which identifies systemic risks generated by both individual firms and collective behaviour; and
cast a wide net, in which new regulations are applied to the entire financial institution and not just banks. (Financial Standards Foundation, 2010)
B. Provision of Deposit Guarantees in East Asia
Table 2.25: Deposit Guarantees Provided by Countries
Country Pre-Crisis 1997 – 2006 2007-2008
+3 and Other Developed Markets Indonesia January 26, 1998 –
Implicit Deposit Guarantee
Philippines None Singapore None None October 16, 2008 –
December 2010 (full deposit Guarantee of all S$ and foreign currency deposits of individual and non-bank customers)
Thailand June 29, 1997 – Provided Guarantee of Funds in Remaining Finance Companies
China Japan 1996- blanket
guarantee up to April 2002
2005 – transition from blanket guarantee to limited guarantee for all deposits except interbank of FXCY
Hong Kong None- Oct. 14-Dec 2010 full/blanket (all deposits including foreign currencies)
South Korea August 25, 1997 - Government guarantees banks’ external liabilities November 1997 – full deposit
Nov. 1997 - Blanket guarantee on all banks’ external liabilities. in Dec 1997 until 2001
2008, extended guarantees on new senior unsecured debt securities*
80 | P a g e

guarantees Provided implicit guarantee for all deposits until KDIC creation
Australia None None October 2008 full guarantee on deposits for 3 years (Nov 2008-Mar 2010)
Canada United
Kingdom Credit Guarantee
Scheme; *Ireland extended coverage to IB deposits and new and existing senior debt sec
United States New limited guarantee of USD250k; Temporary Liquidity Guarantee Program guarantees for newly issued senior unsecured debt and provides full coverage of noninterest bearing deposits
Sources: *Feyen and Vittas (2009). Blanket Guarantees: Necessary during the Crisis, but What Next? The World Bank group. Crisis Response Public Policy for the Private Sector. Note Number 4. Retrieved September 16, 2011, from http://rru.worldbank.org/documents/CrisisResponse/Note4.pdf Data for Thailand, Malaysia, Philippines, Indonesia and South Korea. Lindgren, et. al (1999). Financial Sector Crisis and Restructuring Lessons from Asia.
(Table 2.25) shows the deposit guarantee experiences of the different countries in East
Asia vis-à-vis those provided in other countries. This type of protection is employed by the deposit insurer during crisis by temporarily increasing the deposit insurance coverage at a capped amount. Moreover, it is resorted by the government when the failure resolution policies or the financial safety net arrangement does not seem to be effective in achieving the two public policy objectives under the guidelines formulated by the BCBS for an effective DIS, which are to promote public confidence and ensure financial stability. Since depositors panic when they observe that there is a threat in the current protection mechanism, assurance from the government is sought for.
(Table 2.25) also shows that in any crisis, some forms of deposit guarantees are usually
provided by countries in ensuring stability in the financial system and in providing public confidence. At some instances, different combinations of financial safety net arrangements are
81 | P a g e

provided in some jurisdictions. In ASEAN+3 region, very few countries (Japan, the Philippines and South Korea) had limited deposit protection system prior to the Asian Crisis and at the time the crisis occurred, they were faced with the decision to provide other safety net arrangements to manage the crisis. Except for the Philippines, which had stable financial system at the time of the crisis, South Korea also provided blanket guarantee to all depositors despite the presence of a deposit insurance system which was created a year prior to the crisis. This could be ascribed to the severity of the problem experienced by the country in its financial system compared to the Philippine experience. Among the crisis-affected economies, Thailand, Indonesia, South Korea and Malaysia had also provided temporary deposit guarantees; although, Malaysia did not experience a full-blown crisis compared to the three countries.
On the other hand, the global crisis also led developing and developed countries in providing deposit guarantees in their jurisdiction. In East Asia, Singapore, Hong Kong and Malaysia provided full guarantee of deposits/funds in October 2008. In the same year, other countries such as South Korea, Australia and the United States provided deposit guarantees in various forms. South Korea extended guarantees on new senior unsecured debt securities while the US also provided this type of guarantee, together with full guarantee on non-interest bearing deposits and a temporary increase in deposit insurance coverage of USD 250,000. Like Singapore, Malaysia and Hong Kong, Australia introduced the blanket guarantee on all deposits in October 2008. The only difference between them is that Australia has not yet established its DIS while the three had already an existing deposit insurance system prior to the crisis. Thus, the limited deposit insurance protection scheme was temporarily replaced by a blanket guarantee on all deposits.
It can be observed that despite the existence of a deposit insurance system, temporary implicit guarantees were still provided in many countries in the region to support and strengthen the existing financial safety net arrangement (deposit protection system). This provided confidence in the financial system in times of crisis, especially when some banks suffered illiquidity or insolvency. Even the most liquid and efficient banks were affected by the crisis. It is believed, that these guarantees could also increase moral hazard due to the high risk-taking activities undertaken by banks when these were introduced on the notion that the government guarantees full payment of deposits insured with the DIS.
In some instances, this transition becomes slow as the some of the regulatory, institutional and structural frameworks are not yet in place. In China, plans to set up a deposit protection system had been proposed for the past years. However, the deposit insurance system cannot be introduced yet until the other regulatory and legal infrastructures are undertaken. In general, certain preconditions inherent in the country, especially those that relate to prudential regulations, legal framework, governance structure and other factors must be considered for a smooth transition process.
In Hong Kong, Malaysia and Singapore, the speed of transition from full-guarantee to a deposit insurance system had proven to be successful. The three countries offered the blanket guarantee from October 2008 until the end of December 2010. In Hong Kong, for instance, the blanket guarantee on deposits paved way to the smooth transition of the financial safety net arrangement and helped HKMA in gaining public confidence after the bank run experience of one of the largest banks. In Thailand, a phase-in provision is provided where the protection of deposits extends beyond the date of the formal establishment of the deposit protection system to allow banks to adjust to the new prudential regulation.
82 | P a g e

Based from the data presented in (Table 2.25), it shows that implicit guarantee has been considered as one of the alternative financial safety net arrangements during the crisis. They also form part of the country’s financial system or some financial sector’s restructuring during the Asian Crisis. The role of the International Monetary Authority in providing financial support and in restoring public confidence during the Asian Crisis to countries such as Indonesia, South Korea and Thailand was indispensible. During this crisis Malaysia, Indonesia, South Korea and Thailand provided full guarantee on deposits and funds to depositors and creditors and undertook substantial restructuring programs aimed at managing the problem. These countries, except Malaysia, received financial support from the International Monetary Fund. Among the ASEAN5 countries, only Singapore and the Philippines did not provide deposit guarantees as they did not experience a full-blown crisis. Besides, Lindgren (1999) mentioned that the limited guarantee provided by PDIC is already sufficient to provide confidence among the banking public. In the case of Indonesia, the introduction of a blanket guarantee was made as the limited guarantee that was initially introduced at the onset of the crisis did not materialize to ensure public confidence in the system.
In other countries, the implementation of deposit guarantee, whether full or partial, is usually undertaken during crisis as part of their restructuring programs to mitigate risks. The duration of the guarantee must be carefully selected as this will affect the speed of transition from a blanket guarantee to a limited deposit insurance already being offered or towards the creation of a new one, in the absence of an existing DIS. The form of institutional arrangement that will be chosen, the premiums that will be levied, and the insurance coverage are some considerations that need to be dealt with when creating a deposit insurance system, as they will have long-run policy implications. In some countries, particularly those that had not yet established their own deposit insurance system; this transition period enables the supervisor to implement prudential regulations and will allow banks to adjust to the new system. Any decision for the creation of a new deposit protection system or for the use of any form of financial safety net arrangements must be carefully assessed to successfully implement prudential measures and regulations necessary to regain confidence and promote stability within the system.
C. The Use of Lender of Last Resort Facility
Table 2.26: Principles of Lender of Last Resort Facility
Types of Liquidity Shortages/Crunches
Nature of Liquidity Support
Shortage of Central Bank
Liquidity
Chronic Shortage of
Funding Liquidity at
Specific Institutions
Systemic Shortage of
Funding and Market
Liquidity
Distinction between illiquidity and solvency
Yes Yes No
Directed lending or open market Either Directed Both Lending or outright Lending Lending Both Ambiguity of access No Yes No
Penalty relative to market rate
No, if aggregate shortage
Yes, if institution-No No
83 | P a g e

specific
Quality of collateral/degree of central bank risk exposure
High/negligible Low/high
Low-high/ low-high
Term of support
Very Short (overnight) Long Short to medium
Public announcement of support No Depends Yes Separation from monetary policy Yes Yes No Coordination with fiscal authority No Yes Yes Source: S, Cecchetti and Disyatat, P. (2010). Central Bank Tools and Liquidity Shortages URL: http://www.ny.frb.org/research/epr/10v16n1/1008cecc.pdf
(Table 2.26) shows the characteristics and forms of liquidity support provided by the central banks as the lender of last resort, which is one of the financial safety net arrangements used in many jurisdictions. These are compared against different levels of liquidity shortages which may occur at one period within a country’s financial system, namely, central bank liquidity shortage, institution specific chronic funding shortage and systemic shortage of funding and market liquidity. Except during periods of systemic funding, there is no clear distinction between illiquidity and solvency. One of the monetary policy tools used by central banks to manage liquidity is the lending or borrowing facilities being offered in the open market such as repurchase and reversed repurchase agreements (RRP). From the point of view of the central bank, it provides reversed repurchase agreements to regulate aggregate reserves in the financial system in line with its policy interest rate targets. This collateralized transaction is usually backed up by high quality assets during normal times.
There are also instances when directed lending to a specific institution such as standing facility or traditional emergency lending assistance is provided to temporarily provide solution to an institution’s liquidity needs. Usually, the central bank will adopt both directed and open market operations during systemic risk. There are instances when it accepts low quality assets from problem banks that are availing this facility. It occurs during a systemic or even institution specific liquidity crunch. This exposes the central bank to high risk, whose tenor may extend beyond the traditional very short term liquidity support until such period when the liquidity problem of the illiquid bank normalizes. However, it can undertake both borrowing and lending activities during a systemic liquidity crunch.
Another monetary policy tool used by central banks involves the outright purchase and/or sale of financial assets (i.e.: such as government securities) from and to the financial institutions. This open market operation tool is undertaken to influence money supply and control the movement of interest rates. Cecchetti and Disyatat (2010) observed that there are wide disparities among the practices of countries worldwide in the way central bank use these monetary tools especially in the face of large liquidity crunch in the financial system caused by the crisis. These differences are influenced by many factors which are generally country specific and can alleviate the financial problem encountered by the country. They recommended that central bank must carefully assess the current liquidity shortage in the financial system to be able to address the issue by using an appropriate policy response such as the lender of last resort facility. This is critical as one type of liquidity shortage may need a different policy response over the other, under normal conditions compared to the one under stressful conditions.
84 | P a g e
V. Conclusions and Policy Implications:
Based on the findings presented above, conclusions are derived and some policy implications are provided:
A. On Supervisory Structure and Regulatory Frameworks and Practices: 1. The crises that occurred over the past two (2) decades have provided valuable lessons
among countries in the ASEAN+3 region and motivated them to design appropriate solutions for ensuring financial stability. For one, various reforms and developments in the supervisory structures and frameworks were evident since the Asian Crisis; however, significant heterogeneity among supervisory structures and practices exist in the region. Many countries have multiple supervisory structures within the financial system, while others have integrated supervisory framework. These differences are influenced by many factors such as the levels of financial and economic developments, the institutional underpinnings and the existing legal framework. While regulatory reforms and practices may vary across countries, it is hoped that new wave of challenges in the country’s financial system in the light of the ongoing global crisis will make them withstand any future disruptions.
2. Recent developments have been put forward by many supervisors to improve regulatory
framework in line with the international best practices introduced by the BCBS. However, compliance varies among countries. Notwithstanding the observed differences among countries in terms of their regulatory practices, the existing approaches used by countries for prudential regulations are believed to be the best at the current juncture.
To date, there is an increased observance of the international regulatory standards
among banks in the region aimed at integrating regulatory framework with the guidelines for best practices in the global context. These levels of observance contribute to a sound financial system, as supervisors struggle to align national regulatory framework with international standards. With this, they are also able to identify and compare the country/financial system’s standing vis-à-vis other countries worldwide. This will also enable them to implement relevant reforms that are appropriate for the current financial architecture. However, there seems to be some scepticism with regard to the effectiveness of the approaches used by supervisors to implement their respective mandates.
3. Many supervisors and central banks in the region have introduced various prudential
regulations. In the region, prudential regulations revolve around the capital adequacy and the liquidity risk management framework proposed by the BCBS. While the CAMELS system is used by many supervisors and banks in most of the countries assessed in the study, other rating systems to evaluate and monitor bank performances cannot be discounted. What is astounding about these micro-prudential measures or regulations in the region is the fact that almost all the countries in the region have already incorporated in their existing regulations and practices the guidelines issued by the BCBS at different levels. However, the way these are practiced and implemented in the financial system may vary across countries.
4. As observed, many countries have already adopted the Basel II capital framework.
Mixed results were generated on the levels of compliance to the framework among countries in the region. The progress and the way banks had implemented the Basel II framework must be re-evaluated at the national and regional levels. While it is ideal to implement international
85 | P a g e
best practices, in reality, the changes might not be feasible for banks, given the current conditions.
A better understanding of the international guidelines must be made in the light of the
limitations of the current financial landscape to fully integrate in the national regulatory framework a workable system for the country. It may be possible that banks are forced to make rapid adjustments to implement the new framework and prepare them for the implementation of the new Basel III framework. At this juncture, the experience of the region during the Asian Crisis may be encountered again; prior to the crisis, regulators and/or supervisors instituted various reforms to cope with the developments brought about by globalization and financial liberalization. Hence, the reforms were found to be flawed and less responsive to what the sectors in the financial system can only undertake.
5. Different central bank’s standing facilities were used to enable banks to access these
facilities when they are experiencing liquidity problems. They were also during crisis not only as policy signals for the central banks in some countries, but also as supporting tools to manage interest rates and liquidity problems. Various liquidity risk management tools and policies were also introduced to manage risks that are inherent in both normal and distressed conditions. However, country practices in the supervisory framework for managing bank’s liquidity are mixed. In some countries, regulations are more extensive and aligned with the international standards compared to other countries which have simple regulatory frameworks.
Compared to the capital standard practices and compliances among countries, the
absence of a regional consensus among supervisors for managing banks’ liquidity risk hinges from the absence of a strong framework for the management of liquidity. In some countries, the regulations are provided but the level of supervisory involvement for regulatory compliance by banks is low. This means that policies only serve as guidance for use by banks but not as explicit regulatory requirement for banks. Adoption of the same is made on a voluntary basis which is contrasted to the banks’ compliance with the capital standards. This is also true with the variables used to evaluate the asset quality management practices in different countries. The variations in loan provisioning lies on the different loan classifications used by countries and the types of loans provided and used by banks.
6. Against this backdrop, it can be said that at the regional level, harmonized prudential
regulations related to capital adequacy and liquidity are desirable and are key to a strong collaborative arrangements among countries in the region. However, this exercise may be quite difficult as the financial developments among countries in the region are diverse, especially those countries which were not included in the evaluation or analysis. As observed, many banks regulations among ASEAN5+3 countries were already in place and are currently synchronized with the international standards; hence, refinements must be continuously undertaken. At the regional level, agreements among national authorities must be made related to any regulatory reform agenda especially among the countries with underdeveloped financial system.
7. To date, the ongoing crisis in various regions, especially in the European Economic Area
can further aggravate the current imbalances and problems existing within the financial system and increase the vulnerabilities of the banks to different forms of risks especially when financial shocks will hit their portfolios. With the recent developments among the euro zone countries, prolonged crisis may be expected in the coming years.
86 | P a g e

How to calibrate the existing regulations and prudential measures poses a challenging task among central banks and supervisors. This requires a thorough understanding of the different types of risks to fully address the problem and use the appropriate policy measures among a wide range of policy instruments that the central bank can use as part of its monetary policies. Supervisory authorities in the region must be more vigilant in addressing the problems through the use of various surveillance mechanisms. Likewise, refinement of existing regulatory frameworks must be undertaken on a continuous basis to maintain stability in the financial system. More importantly, the role of banks in the financial system becomes a crucial aspect to be considered together with the financial market that makes up the current financial architecture in a country.
8. Notwithstanding the introduction of regulations related to liquidity risk management,
supervisors must vigorously enhance their policies such that synchronization at the regional level can be achieved to manage liquidity problems which are usually one of the pressing issues nowadays. At the regional level, crisis management resolutions have to be introduced both at the national and regional levels. While regulations are put into place within the financial infrastructure of the country, the magnitude of its implementation vary in every jurisdiction. Reforms must incorporate uncertainties that surround these regulations or reforms to ensure safety and soundness in the financial system while introducing innovations and efficiency.
More liquidity risk enhancements must be introduced such as those that address
contingencies and funding requirements, especially those that are related to foreign currency transactions. These transactions involve complexities and are vulnerable to risk compared to transactions made in local currencies, especially when there is reversal in capital flows. Since liquidity management varies across countries, efforts must be undertaken to address the management of the banks’ assets and liabilities to reflect liquidity needs and to maintain a balanced portfolio of assets.
B. On the Financial Safety Net Arrangements and the Deposit Insurance Systems
9. In the past, several bank runs had ensued as banks struggled to manage their liquidity,
which caused problems in the financial system such as financial crisis. As a result, various financial safety net arrangements were introduced and one of them is the explicit deposit protection scheme. As observed, those countries which initially did not have any protection scheme provided temporary deposit guarantees, usually blanket guarantee arrangements to manage bank failures and crisis. At the same time, liquidity support mechanisms were also provided such as standing facilities and lender of last resort facilities.
The interplay of these financial safety net arrangements and combination of these instruments vary across countries. What can be applied in one country may not be used or applicable in one country. The depth of the financial safety net arrangements used at a given period varies and would depend on several factors and the situation the country has during that period. Based from the experiences of the countries in the region, many financial safety net arrangements resulted to costly financial restructuring schemes for the government.
10. The provision of an explicit deposit guarantee in the form of a deposit insurance system
is considered as a permanent form of financial safety net arrangement, together with the prudential regulations implemented in a given country. The protection system is employed to protect depositors against unsound banking practices and maintain financial stability. It is notably a common response to any bank run problem or contagion within the system, as it is
87 | P a g e

more stable compared to other safety net arrangements. Viewed from another perspective, an immediate response inherent among national authorities is to create full deposit guarantees to temporarily ease any panic that may ensue and renew public confidence.
11. To date, astounding progress in the field of deposit insurance can be seen, especially in
the way countries have progressed over the years from having just an implicit deposit guarantee system to the provision of a deposit insurance system. Thus, the development of the deposit insurance systems in the region was evident after the Asian crisis. Over the past decade, those with existing protection systems (Philippines, Japan and South Korea) have undertaken significant modifications in their mandates and regulations while those with temporary deposit guarantees have created a permanent protection scheme.
Most deposit insurance systems were created by law and are operated and managed by
the government. This is understandable considering the intricacies involved in the creation of an explicit protection system and the costs entailed in its establishment. For privately managed systems (SDIC and FSCS), they are still accountable to the government as their creations are mandated by law. Notwithstanding the observed differences among deposit insurance systems in their public policy objectives, there are existing commonalities in their main goal or existence, namely, to assist in strengthening stability in the financial system and in promoting public confidence.
12. Along with the mandate of a deposit insurance system comes the type of structure or
model it uses for the country’s financial safety net arrangements. Other countries have chosen to have a protection system with broader scopes and powers (paybox plus and risk minimizer structures), not only to reimburse eligible deposits under the insurance program (paybox structure) but also to ensure that they actively undertake failure resolution mechanisms.
It can be noted that despite the disparities among economies in their DIS set-ups or
models, the region represents a good blend or mixture of deposit insurance systems. The region has a combination of few but mature systems and some new yet well-established systems. Except for Japan, the deposit insurance systems that were established earlier are risk minimizers (Canada, the Philippines and the United States) while most newly established protection systems utilized more conservative mandates, usually a pure paybox arrangement. Among the newly established systems, Malaysia and Indonesia are more aggressive in establishing their DIS by undertaking paybox plus systems. Australia and China, on the other hand, will soon establish their own deposit protection schemes. China’s move to create a new system might take a while compared to Australia as various reforms are currently undertaken to create a stable financial system.
13. There are also variations in the powers and governance of the deposit insurance
systems which hinge on their structures or mandates. Paybox systems have very limited powers and functions while paybox plus and risk minimization systems have expanded powers, which are sometimes related to the failure resolution mechanisms, enforcement powers and other supervisory powers. There are instances where the functions and powers of the systems with paybox plus and risk minimization mandates cannot be distinguished among the deposit insurance systems.
To date, efforts are undertaken at the international level to resolve these differences and
create uniform standards. The International Association of Deposit Insurers have successfully released its guidelines for effective deposit insurance systems which are expected to be voluntarily and gradually incorporated in the country’s DIS mandate. Like the banking sector,
88 | P a g e

the implementation of these Core Principles can provide a globally coordinated system for financial safety net arrangements. The issue lies on the current financial and institutional underpinnings of the country’s financial system. It may be possible that at the regional level, compliance with the international standards can slowly be integrated in each country’s financial safety net arrangement and certain issues (i.e.: information sharing, types of financial safety net arrangements, form of surveillance mechanisms to be used, etc) can be coordinated among national authorities which are necessary to prevent crisis and manage it when it occurs.
14. At the national level, the deposit insurer and other supervisory and regulatory agencies
have either formal or informal sharing arrangements or a combination of the two which are important in maintaining a sound financial system. The level of coordination among participants in the country’s safety net arrangements vary across countries. Findings reveal that different forms of insurance mandates or structures have different information requirements. Especially those with purely paybox structure, the least that the deposit insurers can have, in proactively performing the deposit reimbursement functions is to have timely access to deposit and depository institutions’ information.
While bank secrecy regulations are strictly enforced in many jurisdictions, in the interest
of the public and for the prompt payment of insured funds, it is highly crucial to have an information disclosure regime that considers this aspect in bank failure resolution. Sometimes, the speed in which the payout system can be made reflects the effectiveness of the protection system in a country and mitigates any moral hazard that may transpire for delayed payment. This is where the sharing system can be established between the deposit insurer and the supervisors, especially when the information disclosure is not stated in the mandate.
15. Different countries have different forms and levels of protection systems. Some DIAs
provides high deposit insurance coverage and has broader scope of coverage compared to other deposit insurance systems. In some countries, insurance coverage is limited to deposits only; while in other countries (DICJ and KDIC), other types of financial products are covered by the protection scheme. Likewise, in Malaysia and Indonesia, Islamic deposits are covered by the insurance scheme while in other countries, foreign currency deposits and interbank transactions are covered. These differences can be ascribed from the financial arrangements existing in the country.
16. Membership in the deposit protection scheme is made mandatory among banks and
other financial institutions, whichever is applicable. This ensures discipline among banks as they are required to abide or adhere to the guidelines set by the deposit insurers, as license may revoked for non-compliance and for any violations committed.
As far as governance is concerned, the ‘Board of Directors’ sometimes referred to by
other jurisdictions as board of commissioners, Policy Board, among others, is the governing body of the deposit insurance system and is usually represented by a combination of ex-officio members and private members. This mix of officials represents a holistic representation of the deposit insurance system’s official who make fundamental decisions for the DIS. While most of them are publicly managed systems, the DIS enjoys independence and is free from undue political influences, even with the presence of any representation of officials from central bank and other supervisory agencies that make up the financial safety net arrangements in a given country.
89 | P a g e

17. There is also diversity among deposit insurance systems in their current premium practices. These premiums are mostly fixed in various jurisdictions; although there are few deposit insurance systems (South Korea, Malaysia, Singapore and Hong Kong) that utilize risk-based system similar to the systems in Canada and the United States. However, observed preference for the use of risk-adjusted premium is evident, as many countries with flat premium systems have also considered shifting to the new pricing model for the premium contributions. This trend can be considered in the light of the series of crisis that occurred in the past and the ongoing global crisis. Likewise, this pricing model reflects the risk posed by each banks or financial institutions into the deposit insurance fund. It also creates market discipline among banks as they are likely to undertake cautious decisions in their investment and funding activities by avoid financial activities that may weaken their current financial condition and liquidity.
One example would be through prudent selection of transactions which could offer them
moderate risk compared to the current practice. One of the downsides of this pricing model is its impracticality in accumulating reserves brought about by potential miscalculation or estimates based on certain risk metrics. Scenario analyses or simulations may be undertaken by incorporating all possible scenarios (best, moderate and worst case scenarios) in both normal and distressed conditions. Arriving at the best estimate for the new pricing scheme will enable insurers to come up with equitable and appropriate level of premium rates to be imposed among member institutions.
18. There is a regional trend in the use of pre-funding arrangements among economies. This
is consistent with Frolov’s findings where many countries use this financing source. Among the advantages include the accumulation of reserves to finance large bank failures; to allow banks to make regular contribution while deposit insurers achieve stable funding sources over time. Aside from this, many deposit insurance systems rely mainly from the premium contributions of its members (private funding). However, they also rely from other sources which provide an additional source of financing for deposit insurers.
There are differences and similarities in the way additional financing is procured. In
many countries, the DIA has the authority to borrow from different sources. For others with expanded powers and mandates, they can generate funds from fees collected while in some jurisdictions; their mandate allows them to borrow either through the issuance of securities in the financial market. Despite the diversity in the sources of deposit insurance funds among deposit insurers, the key element hinges in the way these funds can be accessed especially during crisis or massive bank failures. Ready access to available funds must be ensured at the least possible costs. At times, the timing and availability of these funds results to the significant costs incurred by the national government as the crisis leads to the country’s use of various financial safety net arrangements such as blanket guarantees, lender of last resort facility and standing facility.
19. There are several competing thoughts regarding the type of funding arrangements
available to deposit insurers. Others may argue that building up reserves through the use of ex-ante financing is practical and more economical compared to ex-ante financing. Others claim that a combination of pre- and post-funding arrangements is appropriate, with a right mixture or balance among funding sources selected. The general tendency of the deposit insurers to use pre-financing over post-financing can be ascribed to the practicality of building up reserve funds to at least run or operate the deposit protection scheme effectively and provide ready funding for any unanticipated failure that will occur. Against this backdrop, it can be noted that the choice of the source of financing is dependent on various factors which were
90 | P a g e

incorporated in computation of the desired premium rate to be levied. The linkage between the funding sources, especially the contribution rates and the funding requirements of the deposit insurer must be established, especially in determining the appropriate ad-hoc financing that may be needed to fill the financing gap.
Whatever type of funding the system uses, clear cut policies must be formulated
especially in the use of back-up financing to provide enough liquidity for the system when the need arises? This only proves that in financing the system’s liquidity, the provision in their mandate of a ready liquidity support from the government is inevitable.
91 | P a g e

Chapter 3: An Empirical Investigation on the Role of Bank Regulations, Supervisory Practices, and Deposit Insurance on Banking Sector Development in the ASEAN+3
Region
I. Introduction
It is well known that banks act as intermediaries, channelling loanable funds from savers to those in need of funds in order to finance industrial expansion and fuel consumption growth. This process is critical in achieving allocative efficiency in financial markets. But today’s banks do more than just to create and safeguard deposits and lend money. Due to increasing complexity in economic transactions, banks also product innovate and engage in certain transactions or businesses that may be characteristically risky. There is a strong incentive to diversify loan portfolios, engage in commerce and trade in securities because banks, as economic agents need to prop up market valuation, increase market share and enhance profitability.
Because of their central role in fostering financial sector development and growth and the preponderance of asymmetric information in financial markets, banks are highly regulated and recurring concerns on stability, growth and bank valuation continue to preoccupy policy – makers and researchers. In a recent study, Barth et al (2004) find that there is an increasing propensity to impose regulations across countries, with some countries openly adopting more stringent regulations and increasing supervisory powers while other countries endeavour to strengthen private monitoring systems and restrain intrusive supervision.
The idea of imposing regulations on and strengthening supervision of banks has been the subject of intense debates within policy circles. There is empirical evidence that excessive bank regulation may backfire and may counteract its positive effect on governance and bank sector development.
In the literature, a highly regulated environment, though in theory would mitigate informational asymmetries and problems, does not automatically lead to robust bank valuation, stability and growth. This is primarily due to a myriad of plausible channels (e.g., ownership structure and corporate governance) through which regulations and policies affect key banking sector outcomes. Advocates of increased supervision argue that prevention is better than cure given that the main objective of regulations is usually to stem unnecessary risk taking on the part of banks, which in turn, prevents investors from being expropriated and promotes over – all financial stability.
Risk – taking behaviour may be manifested in several forms and may be actually caused by regulation or the lack of it. Both the financial crisis in 1997 and the subprime mess in 2008 have clearly shown that unfettered bank operation may have negative repercussions on a country’s overall financial health. Over time, the nature of financial instruments becomes so complex which may render inapplicable certain regulatory designs.
Prior to 1997, the world economy benefited from easy money as a result of expansionary monetary policy in the US. Awashed with excessive liquidity through robust portfolio flows, banks in Asia invested cheap money in real estate, a non – tradable sector. When investors detected fundamental flaws in some economies, speculative pressures have already built up, the flow of cheap funds have changed course and banks were left saddled with huge short – term debts. The decision of some economies to devalue currency spelled trouble for deeply
92 | P a g e

indebted banks and forced affected economies to fall into recession. Such policy prescriptions are needed to prevent speculative attacks from draining foreign exchange reserves.
The nature of policy or regulatory response is conditioned by the proximate causes of a crisis. The 1988 Basel Accord is partly a response to the US crisis. The Basel accord has two pillars, namely capital adequacy and increased bank supervision. To respond to the shortcomings of the 1988 Basel Accord, regulators added another key regulatory pillar which is intended to strengthen the capacity of banks to self – supervise a critical step in enhancing the development of truthful revelation mechanisms that may be strategy proofed. Many banks have adopted the Basel prescription of meeting capital adequacy ratios and submitted themselves to supervision by duly appointed regulators.
In today’s world, due to increasing economic integration, a seemingly insignificant banking crisis can shake confidence and may start trouble that cascade throughout the region. Some have questioned the rationale of continuing to neglect the third pillar of Basel II which promotes market discipline while others have opined that more needs to be done to address the key requirements of the new Basel accord. Barth, Caprio and Levine (2008a, 2008b) note that there is a potential for improving banks by not focusing on stringent capital requirements and intrusive external supervision but rather on institutions that help mitigate asymmetric information.
Partly to address the increasingly complex nature of crises’ solutions, policy makers continue to revise landmark regulatory frameworks. Despite the two Basel agreements, Basel III has been formulated to address shortcomings of Basel II in managing the 2007 – 2008 crisis (Ennis and Price, 2011). In contrast to its predecessors, the third one narrows down definitions of capital, adds a countercyclical component to capital requirements and increases equity capital requirements (Ennis and Price, 2011). As shown in Ennis and Price, the timeline clearly indicates an escalation of capital regulation. For instance, the Tier 1 ratio will now be augmented by the capital conservation buffer and countercyclical component driving the Tier 1 ratio to 8.5%.
While the usual objective of regulations is to stem unnecessary risk, a crisis may be precipitated not by bank’s risky activities but by the lack of confidence in national institutions due to negative perceptions. For instance, the current EUROZONE crisis was principally caused by fiscal irresponsibility and poor growth performance. The crisis is troubling because banks are one of the reliable institutional buyers of sovereign bonds. It turns out that the best defense is having capital depth. Within the EU, there is now fear that banks may find it difficult to raise capital due to considerable systemic and default risks. This scenario may later on evolve into a credit crunch that may introduce recessionary pressures.. The idea that debt issued within the EUROZONE will default is unthinkable given that governments have been well aware of the problems of moral hazard in monetary unions.
It is widely understood that crises erode banks’ capital which may complicate efforts to stabilize the financial sector. For instance, to comply with capital adequacy requirements, banks may need to issue equity. But because of significant country risks and depressed economic environments, banks may deleverage instead, thereby affecting credit creation. Within this context, a regulation on capital adequacy may contribute to more instability. In response to far – reaching structural problems spawned by the Asian financial crisis, prudential regulations were imposed and now more than ever, coordination through the use of early warning systems has been enhanced to counteract the lingering threat of contagion.
93 | P a g e

94 | P a g e
This paper explores the regulation and bank performance nexus using bank data for the ASEAN region. It attempts to confirm the model predictive power and validate the results in Barth, Caprio and Levine (2004) [henceforth referred to as BCL]. The ASEAN + 3 region is one of the world’s more dynamic regional trading blocs and it is of interest to at least know how national banking systems facilitate intermediation and handle regulatory impositions such as capital and reserve requirements and deposit insurance. In this paper, we also investigate the extent to which the debt to GDP ratio would affect key outcomes. This variable is included because it reflects the relevance of fiscal stability to investors which may have a direct impact on financial intermediation, credit and costs. To establish key stylized facts, we focus on surveys conducted to ascertain bank regulation reforms among ASEAN +3 countries only.
The paper is organized as follows: Section II briefly presents relevant statistics and discusses some regulations affecting banks. The objective is to simply ascertain relative rigidities in terms of country adjustments. Section III shows the empirical strategies to link key outcomes to country and bank specific characteristics. A general discussion of results is found in section IV. The last section concludes.
II. Regulations and ASEAN + 3 Banks
A. Some stylized facts
Given the backdrop of bank regulations implemented as a result of the Asian financial crisis, we look into some stylized facts concerning the comparative performance of banks within the ASEAN + 3 region. To accomplish this, we focus on two periods, namely 2000 – 2005 and 2006 – 2010 and use aggregate statistical ratios.14
Initial inspection of the data reveals significant country heterogeneity even when samples are selected based on assets. (Tables 3.1 and 3.2) show the average and standard deviation of selected ratios across countries. The observed variability of average values simply reflects to a certain extent, the diversity of policy and institutional reforms implemented by countries that were severely affected by the Asian financial crisis.
In terms of tier 1 capital ratio, we find interesting differences. The Asian financial crisis has ushered in an era of enhanced capital regulation. Countries that have been struck hard by the Asian financial crisis like Indonesia, Thailand, Korea and Malaysia have achieved relatively higher tier 1 capital ratio. A close examination of the variation of the said statistic reveals that for the same countries, their respective standard deviations were relatively low during the periods 2000 – 2005 and 2006 – 2010, indicating that capital regulations were strictly observed and enforced. Based on (Tables 3.1 and 3.2), Singapore has registered the highest Tier 1 ratio within the ASEAN + 3 region.
The observed variability of equity to total assets ratio also reveals another helpful pattern. Countries like the Philippines, Malaysia and Thailand have relatively limited variability while Singapore, South Korea and Vietnam appear to adjust better. Philippine, Singaporean and Indonesian banks do appear to be relatively well capitalized.
(Tables 3.1 and 3.2) also show that Singapore, Korea and China have relatively higher variability in terms of equity to short term funding ratio. In terms of return to average assets (ROAA), the Philippines and China have registered the least variability.
14 Mr. Jesus Carlos Exequiel D. Castillo computed the ratios using BANKSCOPE data.

Table 3.1 Average of selected ratios, 2000-2010
Country
Tier 1 Capital Total capital ratio Equity to total assets Equity to net loans ratio
2000 - 2005
2006 - 2010
2000 - 2010
2000 - 2005
2006 - 2010
2000 - 2010
2000 - 2005
2006 - 2010
2000 - 2010
2000 - 2005
2006 - 2010
2000 - 2010
CN 5.384 9.467 7.240 7.915 11.902 9.727 3.810 5.270 4.474 5.924 10.120 7.832ID 10.373 13.892 11.973 20.995 16.992 19.175 5.217 10.281 7.519 23.008 19.005 21.188JP 6.106 14.056 9.720 10.644 18.083 14.026 4.235 5.224 4.685 8.845 28.679 17.860KR 9.141 10.546 9.780 12.580 13.323 12.918 9.617 9.616 9.616 14.985 14.588 14.805MY 11.846 10.175 11.086 14.951 14.129 14.577 8.665 7.422 8.100 14.052 12.249 13.232PH 6.610 12.565 9.316 6.786 16.170 11.052 3.575 10.775 6.847 12.674 30.806 20.916SG 3.983 34.585 17.893 5.558 36.095 19.439 4.817 18.480 11.027 12.807 49.837 29.639TH 11.515 11.937 11.707 14.508 14.571 14.537 6.591 8.872 7.628 12.142 14.568 13.245VN 1.260 11.199 5.778 2.999 12.322 7.237 4.776 7.714 6.111 10.257 15.860 12.803 Country
Equity / Dep & ST Funding Equity to liabilities ratio Capital funds to total assets Capital funds to net loans
2000 - 2005
2006 - 2010
2000 - 2010
2000 - 2005
2006 - 2010
2000 - 2010
2000 - 2005
2006 - 2010
2000 - 2010
2000 - 2005
2006 - 2010
2000 - 2010
CN 15.375 11.075 13.420 4.143 5.765 4.881 5.198 7.374 6.187 7.959 13.484 10.470ID 8.477 13.042 10.552 7.459 11.713 9.392 5.998 12.086 8.765 25.985 21.366 23.886JP 5.710 6.422 6.033 4.553 5.664 5.058 6.610 7.626 7.072 13.463 17.527 15.310KR 35.999 25.709 31.321 11.994 11.248 11.654 9.178 10.737 9.886 14.954 17.426 16.078MY 10.427 8.795 9.685 9.651 8.256 9.017 9.572 9.863 9.704 15.488 16.445 15.923PH 4.907 14.421 9.232 4.104 12.433 7.890 4.215 13.104 8.256 15.127 37.456 25.277SG 5.651 63.029 31.732 5.788 34.833 18.990 4.555 13.198 8.484 10.260 28.073 18.357TH 7.710 10.994 9.203 7.302 9.908 8.486 9.466 11.004 10.165 16.458 16.453 16.456VN 5.390 9.411 7.218 5.095 8.652 6.712 3.999 5.324 4.601 9.023 10.700 9.785
95 | P a g e

Table 3.2 Average of selected ratios, 2000-2010 (cont.)
Country
Cap Funds / Dep & ST Funding
Cap Funds / Liabilities Subord Debt / Cap Funds ROAA
2000 - 2005
2006 - 2010
2000 - 2010
2000 - 2005
2006 - 2010
2000 - 2010
2000 - 2005
2006 - 2010
2000 - 2010
2000 - 2005
2006 - 2010
2000 - 2010
CN 22.191 13.307 18.153 5.528 8.001 6.652 5.980 14.253 9.740 0.529 0.933 0.712ID 9.487 15.515 12.227 8.322 13.860 10.839 11.050 14.072 12.424 -0.449 1.643 0.502JP 8.930 9.427 9.156 7.102 8.289 7.642 5.520 3.993 4.826 -0.141 0.306 0.062KR 27.727 21.248 24.782 10.313 12.121 11.135 35.783 24.556 30.680 0.488 0.734 0.600MY 11.577 11.631 11.602 10.644 10.974 10.794 10.468 19.470 14.560 1.165 1.213 1.187PH 5.318 17.541 10.874 4.862 15.148 9.537 3.152 15.888 8.941 0.323 1.064 0.660SG 6.833 19.288 12.494 5.277 15.218 9.796 8.528 23.180 15.188 0.490 0.943 0.696TH 11.031 13.387 12.102 10.545 12.407 11.392 23.125 16.405 20.070 0.901 0.787 0.850VN 4.550 6.164 5.284 4.221 5.771 4.925 0.000 15.435 7.016 0.774 1.458 1.085 Country
Net interest margin Net Int Rev / Avg Assets Cost to Income Ratio Liquid Assets / Dep & ST Funding
2000 - 2005
2006 - 2010
2000 - 2010
2000 - 2005
2006 - 2010
2000 - 2010
2000 - 2005
2006 - 2010
2000 - 2010
2000 - 2005
2006 - 2010
2000 - 2010
CN 2.317 2.629 2.459 2.167 2.520 2.327 50.977 35.810 44.083 16.981 43.263 28.928ID 3.842 6.691 5.137 3.375 5.798 4.476 81.946 54.103 69.290 28.081 26.260 27.253JP 0.901 0.893 0.897 0.848 0.822 0.836 50.945 60.626 55.345 13.128 12.725 12.945KR 2.140 2.060 2.104 1.952 1.887 1.922 49.923 44.438 47.430 24.873 13.661 19.777MY 3.607 3.279 3.458 2.973 2.688 2.843 41.535 41.510 41.524 25.964 26.017 25.988PH 1.169 3.690 2.315 0.988 3.173 1.981 23.165 65.684 42.492 8.704 32.758 19.638SG 0.756 2.276 1.447 0.613 1.706 1.110 26.312 51.810 37.902 19.338 64.788 39.997TH 2.342 3.324 2.788 2.160 3.056 2.567 65.140 54.211 60.172 17.045 18.056 17.505VN 2.694 3.299 2.969 2.443 2.891 2.647 40.962 39.408 40.256 46.363 33.360 40.453 Notes: Results are based on BANKSCOPE data.
96 | P a g e

The net interest margin for banks in Japan and Singapore are among the lowest in the sample. On the other hand, Indonesia, Philippines and China appear to have relatively higher financial intermediation cost. In reference to the cost to income ratio, the Philippines topped the list, indicating that its banks may be relatively inefficient. It is also surprising that Indonesian, Thai and Korean banks have registered significant declines in the said ratio.
B. A review of important regulatory measures
In an important survey published in 2007, Barth, Caprio and Levine documented the supervisory roles of central banks in managing bank behaviour. In the ASEAN +3, some countries like Cambodia, Philippines, Singapore, Malaysia, the Central bank acts as the only supervisory authority. In China and Thailand, the Central bank acts together with other supervisory authorities. In contrast, Japan and Korea’s banks are not supervised by their respective central banks. Bank governance mechanisms appear to interact with national regulations to shape risk – taking orientation. Leaven and Levine (2004) looked into the interactions between corporate governance and bank regulations and risk taking behaviours. They conclude that the regulations may affect banks differently due to power struggles among shareholders.
In terms of disclosure requirements, most countries, with the notable exception of Indonesia reported that they disclose their risk management procedures to the public. An equally notable item concerns the regulatory requirement of credit ratings for commercial banks. In this case, most countries with the notable exception of the Philippines reported that they do not require credit ratings. In most countries, the supervisory agency can order the bank's directors or management to constitute provisions to cover actual or potential losses.
There is also a role for the judiciary in reshaping the regulatory framework. For instance, based on the BCL dataset, some countries in South East Asia designate the court as the one in power to remove and replace directors. But in other countries, only the bank supervisor is empowered to do such.
We now focus on allowed bank activities. Prohibitions usually stem from lessons learned in previous crisis. Japan’s lost decade is principally blamed on real estate price bubbles and over – speculative activities by banks in real estate. In a survey in 2006, a single individual can own at most 40% of capital in the Philippines. In the Philippines, Malaysia, and Singapore, no restrictions are imposed on security – trading activities. In the Philippines, banks are permitted to engage in insurance, real estate and voting shares in nonfinancial firms but several restrictions are imposed on such activities in Malaysia, Singapore and Thailand. Japan and South Korean banks are restricted from having activities in the real estate market. In Thailand, banks are not permitted to participate in the stock market. It appears that most in the ASEAN +3 countries have deposit insurance. There are studies that show that the presence of deposit insurance enhances market discipline (Imai, 2006). However, the existence of bank deposit insurance may produce an unintended result in the sense that banks take excessive risk.
97 | P a g e

III. Empirical methodology
A. Data
Data on banks are taken from BANKSCOPE for the period 2006 to 2010. All ASEAN countries plus the East Asian countries of Japan, China and South Korea, with the exception of Brunei, Cambodia, Laos and Burma are included. Following Barth et al, we restrict our samples to banks that are among the top 10 in each country. Part of the reason why we focus on the said period is that for prior years, there are many missing observations. All variables pertaining to country level characteristics are averaged. To prevent simultaneity from occurring, we use average country characteristics but bank specific variables pertain to data in 2006.
B. Models and variables
To ascertain the impact of regulatory variables, we need to measure outcomes that relate to the performance of banks. The cost of financial intermediation can be measured or expressed in terms of the net interest margin or overhead costs. The net interest margin computes the gap between what the bank pays to saves for their deposits and what the bank receives from borrowers (BCL, p. 4). We also investigate other key outcomes such as net loans to assets ratio and cost to income ratio.
Because economic activity and key bank outcomes are closely intertwined, we also look at how macroeconomic variables such as average GDP growth per capita, and inflation rate would affect financial intermediation costs, credit, and ability to extend loans. Inflation is added because it leads to higher margins (BCL, p. 6).
This study employs almost the same model as in BCL. In capturing the effects of regulation, BCL used generalized least squares (GLS) with random effects. We first investigate how the costs of financial intermediation of banks are affected by regulatory, bank characteristics, and country characteristics. Next using the same variables, we look at how banks’ costs and ability to make loans are determined.
The methodology in Demigurk – Kunt, Laeven and Levine (2004) [henceforth referred to as DLL] will be used for the reason that the methodology combines country – specific characteristics that affect banks’ operations with bank specific characteristics usually composed of financial performance. The reason for the inclusion stems from the fact that DLL observed that robustness issues may emerge with respect to the effects of regulations on bank operation. We use BCL data collected in 2006.
Following DLL, the models are:
(1)
(2)
(3)
where , refer to average net interest margin, average net loans to
asset ratio and average cost to income ratio, respectively. i is used to index banks and j indexes countries. is a vector of bank characteristics while is a vector of country characteristics that
pertain to macroeconomic and refer regulatory variables.
98 | P a g e

In the first model, net interest margin ( , a proxy for bank intermediation cost, is
assumed to be jointly determined by bank and country characteristics and country specific regulations. Following DLL, bank size is included because it may act to temper the disparity between the rate at which deposits earn interest and the rate imposed on loans. Holding other factors constant, it may mean that a smaller bank may have limited revenue opportunities, thus, may have higher net interest margin for the same amount of loans and deposits. The ratio of bank equity to assets is included to control for the ability of banks to stave off bankruptcy since it may highlight the ease of raising needed capital. The amount of non-interest operating income represents the degree to which banks can diversify products or services that earn revenues. Diversification of revenue sources may be one way through which the upward pressure on net interest margin is reduced. As always, liquidity is proxied by the ratio of liquid assets to total assets. The effects of liquidity on banks are well known. If bank policy favor a higher proportion of liquid assets, then the opportunity costs may be high. But as DLL noted, the effect may hinge on the degree of competitiveness in the market for deposits. Bank risk is just the standard deviation of rate of return on average assets for the period 2006 to 2010.
We now focus on regulatory variables. We included activity restrictions which were extracted from the BCL database in 2006. We make a simplifying assumption that by the end of 2010, the same regulations are still in place. Activity restrictions are a part of the broader set of regulatory prohibitions. In South Korea for instance, banks are not allowed to engage in stock trading, real estate and insurance while Philippine banks enjoy no such restrictions. This is important because DLL actually found that activity restrictions dampen financial sector growth and may actually increase the cost of financial intermediation which may translate into inefficiencies. We follow DLL by computing for the factor component using component analysis. Because we are using a more restricted sample, an indicator variable on reserve requirement may not be feasible since all countries have reserve requirements. Rather we define a variable that equals 1 if banks earn from reserves required by central banks. If this is used, variability is now present.
Now we discuss important macroeconomic determinants. As justified in DLL, inflation is included because it is usually associated with potential misallocation of financial resources. Additionally, a sustained increase in the inflation rate may distort investment decisions. The average inflation rate may also indicate the effectiveness of the monetary authority in maintaining price stability, a key policy objective in many central banks. Real per capita GDP growth is a proxy for the existence of opportunities since banks may respond to the business cycle by contracting loans during periods of recession and facilitating loans during periods of expansion. Bank industry concentration is also included to determine the impact of the market structure of the banking industry. This is measured by the collective market share of a given country’s top 3 banks. Essentially, we address the question on whether or not a highly concentrated structure will lower financial intermediation costs. We also include deposit insurance which is important in the sense that it may affect net interest margin. Moral hazard is still an issue and the presence of deposit insurance may actually worsen it.
In light of the potential effects emanating from country’s poor management of its fiscal affairs, we also include the debt – to GDP ratio to proxy for over – all economic health. Does government issuance of debt relative to GDP have an independent effect on financial intermediation? Evidence for Latin American countries show that there is, given that banks demand government issued debt instruments (Kumhof and Tanner, 2005). More importantly, it seems that the ability of a country to honor its sovereign obligations may be an important factor since failure to do so may pose significant systemic risks that may pressure the banking system.
99 | P a g e
100 | P a g e
This will then affect the ability of banks to raise capital due to investor’s fears that deteriorating fundamentals may lead them to slowdown in credit growth.
In the second model, we look at how the net loans – to – asset ratio responds to a host of characteristics. Essentially, we would like to know what the effects of regulation are on the ability to make loans. We conjecture that certain regulations like reserve requirements, liquidity requirements may still play a role in determining the ability of banks to lend. The model includes all familiar determinants of bank efficiency. Bank characteristics are included as well as country specific characteristics.
In the third model, we simply ventured to determine whether the same bank characteristics, macroeconomic variables and regulatory variables have a significantly collective effect on cost to income ratio. The cost to income ratio is seen as a critical measure for bank efficiency. It is computed by dividing operating costs by operating income. Lower cost to income ratios are more desirable and it may signal bank profitability. We conjecture that the bigger and well capitalized the bank is, the lower is the ratio. This is because bigger banks have already put in place mechanisms that will contribute towards better efficiency when it comes to using resources needed for day to day activities.
Bank risk and industry concentration may contribute positively. It is understandable that increases in concentration may lead to strategic competition among dominant firms. When banks engage in risky activities, costs usually go up. When the economy is growing, banks may increase operating income which contributes to a lower ratio. Finally, deposit insurance and reserves appear to contribute differently. The former has a positive effect because it lowers operating income. With respect to selected macroeconomic variables, we hypothesize that growth rate in GDP will reduce the cost to income ratio due to its effects on income growth. We also conjecture that another macroeconomic variable debt to GDP ratio may not affect the said ratio because of the very nature of the cost variable which pertains to day to day operations.
C. Discussion of results
C.1 Average net interest margin regressions
Bank specific characteristics and concentration
As shown in the second column of (Table 3.3), there is evidence that bank size reduces the net interest margin. Concentration appears to reduce the net interest margin, although this is just an evidence that the larger the bank, the lower are intermediation costs due to economies of scale. This may lend support to the strategy of encouraging mergers and more consolidation in the banking industry, which actually occurred in response to the Asian financial crisis. For instance, the Philippine Central Bank encouraged greater consolidation as a way of further strengthening the banking system. This evidence is also consistent with DLL.
But this appears to be offset by the bank’s relative market share. If the market share is high, net interest margin may be relatively higher. As proxied by the standard deviation of the average ROAA, bank risk reduces net interest margin. Bank equity has a positive effect. As explained in DLL, well capitalized banks may charge higher interest rates and lower interest rates on deposits for the simple reason that they can because of capital adequacy.
However, while the model offers limited insights, it may appear that the coefficients are biased due to the omission of market opportunities proxied by economic growth rate.

Table 3.3 Standard deviation of selected ratios, 2000 - 2010
Country
Tier 1 Capital Total capital ratio Equity to total assets Equity to net loans ratio
2000 - 2005
2006 - 2010
2000 - 2010
2000 - 2005
2006 - 2010
2000 - 2010
2000 - 2005
2006 - 2010
2000 - 2010
2000 - 2005
2006 - 2010
2000 - 2010
CN 2.926 0.835 3.018 3.982 0.764 3.535 1.630 0.559 1.426 2.509 1.033 2.894ID 8.071 0.979 6.028 3.942 2.247 3.763 6.357 0.686 5.233 8.447 2.419 6.511JP 0.717 4.493 5.056 0.996 3.995 4.688 0.909 0.717 0.941 2.636 8.058 11.693KR 0.905 1.641 1.423 0.894 0.936 0.949 1.657 1.420 1.476 2.314 2.281 2.191MY 1.245 0.888 1.361 0.831 0.730 0.862 0.359 0.150 0.703 0.495 0.436 1.042PH 10.248 1.037 7.913 10.514 1.257 8.940 5.546 0.648 5.449 19.680 3.025 16.941SG 6.172 11.677 18.138 8.611 11.108 18.459 6.035 3.285 8.570 18.391 7.674 23.804TH 1.624 0.541 1.218 1.383 0.883 1.127 1.271 0.503 1.526 0.908 1.300 1.641VN 3.086 3.558 6.063 4.681 1.599 5.973 1.357 0.968 1.910 1.487 2.596 3.516 Country
Equity / Dep & ST Funding Equity to liabilities ratio Capital funds to total assets
Capital funds to net loans
2000 - 2005
2006 - 2010
2000 - 2010
2000 - 2005
2006 - 2010
2000 - 2010
2000 - 2005
2006 - 2010
2000 - 2010
2000 - 2005
2006 - 2010
2000 - 2010
CN 9.574 5.133 7.836 1.644 0.452 1.467 0.895 0.685 1.371 1.904 1.530 3.328ID 5.451 0.916 4.569 4.961 0.879 4.189 6.239 1.047 5.478 5.792 2.918 5.099JP 1.231 0.990 1.135 1.022 0.829 1.065 0.913 0.702 0.946 2.913 1.963 3.207KR 18.016 7.147 14.546 2.344 2.144 2.177 1.190 0.854 1.289 2.326 1.752 2.366MY 0.549 0.160 0.942 0.384 0.178 0.786 1.131 0.362 0.845 1.659 0.309 1.290PH 7.608 0.932 7.346 6.368 0.824 6.282 6.539 0.737 6.568 23.479 3.216 20.390SG 7.173 31.398 36.304 7.475 13.010 18.048 7.056 0.551 6.737 15.903 2.674 14.692TH 1.491 1.015 2.113 1.426 0.614 1.738 0.414 0.906 1.029 1.774 1.578 1.603VN 1.608 1.382 2.543 1.537 1.324 2.309 1.806 3.397 2.594 4.286 8.522 6.245
101 | P a g e
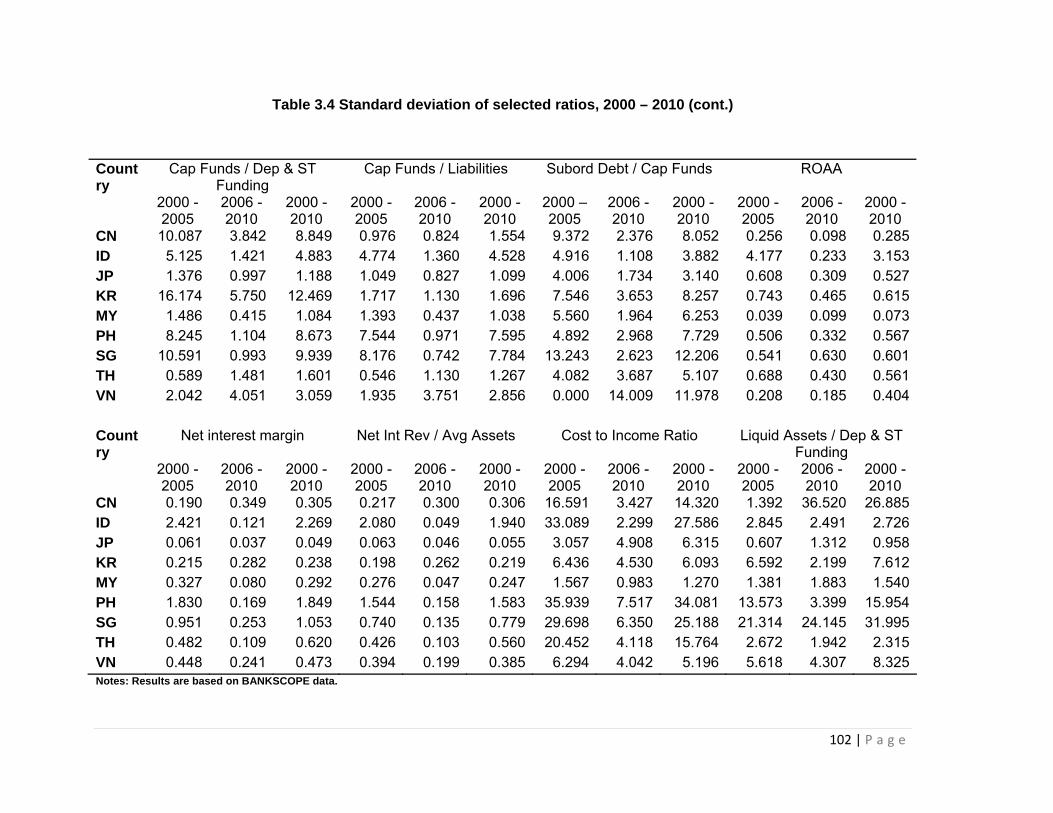
Table 3.4 Standard deviation of selected ratios, 2000 – 2010 (cont.)
Country
Cap Funds / Dep & ST Funding
Cap Funds / Liabilities Subord Debt / Cap Funds ROAA
2000 - 2005
2006 - 2010
2000 - 2010
2000 - 2005
2006 - 2010
2000 - 2010
2000 – 2005
2006 - 2010
2000 - 2010
2000 - 2005
2006 - 2010
2000 - 2010
CN 10.087 3.842 8.849 0.976 0.824 1.554 9.372 2.376 8.052 0.256 0.098 0.285ID 5.125 1.421 4.883 4.774 1.360 4.528 4.916 1.108 3.882 4.177 0.233 3.153JP 1.376 0.997 1.188 1.049 0.827 1.099 4.006 1.734 3.140 0.608 0.309 0.527KR 16.174 5.750 12.469 1.717 1.130 1.696 7.546 3.653 8.257 0.743 0.465 0.615MY 1.486 0.415 1.084 1.393 0.437 1.038 5.560 1.964 6.253 0.039 0.099 0.073PH 8.245 1.104 8.673 7.544 0.971 7.595 4.892 2.968 7.729 0.506 0.332 0.567SG 10.591 0.993 9.939 8.176 0.742 7.784 13.243 2.623 12.206 0.541 0.630 0.601TH 0.589 1.481 1.601 0.546 1.130 1.267 4.082 3.687 5.107 0.688 0.430 0.561VN 2.042 4.051 3.059 1.935 3.751 2.856 0.000 14.009 11.978 0.208 0.185 0.404 Country
Net interest margin Net Int Rev / Avg Assets Cost to Income Ratio Liquid Assets / Dep & ST Funding
2000 - 2005
2006 - 2010
2000 - 2010
2000 - 2005
2006 - 2010
2000 - 2010
2000 - 2005
2006 - 2010
2000 - 2010
2000 - 2005
2006 - 2010
2000 - 2010
CN 0.190 0.349 0.305 0.217 0.300 0.306 16.591 3.427 14.320 1.392 36.520 26.885ID 2.421 0.121 2.269 2.080 0.049 1.940 33.089 2.299 27.586 2.845 2.491 2.726JP 0.061 0.037 0.049 0.063 0.046 0.055 3.057 4.908 6.315 0.607 1.312 0.958KR 0.215 0.282 0.238 0.198 0.262 0.219 6.436 4.530 6.093 6.592 2.199 7.612MY 0.327 0.080 0.292 0.276 0.047 0.247 1.567 0.983 1.270 1.381 1.883 1.540PH 1.830 0.169 1.849 1.544 0.158 1.583 35.939 7.517 34.081 13.573 3.399 15.954SG 0.951 0.253 1.053 0.740 0.135 0.779 29.698 6.350 25.188 21.314 24.145 31.995TH 0.482 0.109 0.620 0.426 0.103 0.560 20.452 4.118 15.764 2.672 1.942 2.315VN 0.448 0.241 0.473 0.394 0.199 0.385 6.294 4.042 5.196 5.618 4.307 8.325Notes: Results are based on BANKSCOPE data.
102 | P a g e
Bank characteristics and macroeconomic variables
As shown in the third column of (Table 3.3), the inclusion of macroeconomic variables like inflation, GDP per capita growth appears to improve the model. Compared to the previous results, we now have an increase in the number of significant variables. Bank size, concentration and market share appear to be robust to the inclusion of macroeconomic variables. This indicates that they have an independent effect on net interest margin. By being associated with market opportunities, fees, bank risk, liquidity have significant impact on net interest margin. Higher bank risks appear to reduce interest rate margins. A usual characterization of risky banks is that they offer relatively higher interest rates on deposits, which will squeeze the margin further. Higher fees result in higher net interest margins.
Bank characteristics and reserve requirements
As shown in the fourth column of (Table 3.3), the inclusion of reserves results in a loss of significance of fees. It is also notable that a regulatory rule results in mitigating risks as the significance of bank risk is reduced. As more regulatory variables are included, bank risk becomes robustly insignificant. Liquidity is still negatively significant. Bank size still retains its significant effect of reducing net interest rate margins. Higher per capita GDP growth increases net interest margin since better economic prospects fuel credit growth.
Bank characteristics and reserve requirements and deposit insurance
As shown in the fifth column of (Table 3.3), reserves and deposit insurance do not have significant effects. Because reserve requirements penalize banks, the net interest margin may actually increase. Other variables that were significant in the previous model appear to be robust to the inclusion of deposit insurance.
Bank characteristics and reserve requirements and deposit insurance and activity restrictions
As shown in the last column of (Table 3.3), it is interesting to note that the inclusion of activity restrictions results in enhancing the positive effects of some regulatory impositions like deposit insurance and reserves. In some countries, activity restrictions are in place in order to stem unnecessary risks associated with real estate, participation in the stock market and in insurance. More activity restrictions are associated with higher net interest margins. This evidence shows that imposing activity restrictions might actually increase financial intermediation costs that may result in potential misallocation of financial resources. It is also consistent with the DLL’s findings.
The roles of fees, liquidity and bank risk are no longer significant because activity restrictions may already limit the role of non – interest operating income in determining the net interest margin. If activity restrictions result in higher liquidity as banks are prevented from engaging in activities that require more liquidity, then liquidity may not have a significant and independent effect on net interest margin.
C.2. Net loans to asset ratio regressions
In (Table 3.11), the net loans to assets ratio can only be explained significantly by liquidity in model 1. When model 1 is augmented by regulatory variables like reserves and deposit insurance, inflation and per capita GDP growth become significant positive predictors of net loans. Based on the results, the ratio is lower if the bank holds higher levels of liquid assets. Reserves and deposit insurance have divergent effects with the latter affecting the ratio
103 | P a g e

negatively. This is understandable in the sense that central bank regulations mandate that a certain proportion of deposits should not be lent but should function as a buffer in mitigating bank liquidity problems. Deposit insurance has a positive effect. While it does not provide a conclusive evidence for the existence of moral hazard, the positive coefficient simply means that banks in countries with deposit insurance tend to lend more than those who do not enjoy deposit protection schemes. The results appear robust even without incorporating market shares.
Table 3.5 Net interest margin regressions
(1) (2) (3) (4) (5) Bank size -0.859 *** -1.255 *** -
1.377*** -
1.411 *** -2.171 ***
0.321 0.285 0.304 0.304 0.306 Bank equity 0.056 * 0.069 *** 0.059 ** 0.063 ** 0.102 *** 0.029 0.025 0.028 0.029 0.022 Fees -0.175 0.161 ** 0.132 0.100 0.106 0.138 0.075 0.089 0.090 0.078 Liquidity -0.008 -0.018 ** -
0.019** -
0.018 * -0.010
0.009 0.008 0.010 0.010 0.007 Bank risk -0.518 * -0.375 ** -
0.372 -
0.342 -0.256
0.281 0.179 0.240 0.283 0.207 Bank industry concentration
-0.038 *** -0.026 *** -0.026
*** -0.041
*** -0.052 ***
0.008 0.009 0.010 0.013 0.010 Inflation 0.147 0.077 0.054 -0.243 ** 0.121 0.108 0.106 0.096 Per capita GDP growth
0.129 *** 0.098 ** 0.215 ** 0.135
0.036 0.048 0.089 0.082 Reserves 0.456 0.004 0.851 * 0.337 0.442 0.441 Deposit insurance 0.707 1.259 *** 0.485 0.431 Activity restrictions 0.562 *** 0.135 Market share 0.060 *** 0.034 ** 0.045 *** 0.050 *** 0.087 *** 0.016 0.014 0.015 0.015 0.015 Number of observations
76 76 76 76 76
Note: The dependent variable is net interest margin which is averaged for the 2006-2010 period. For bank characteristics, we use the 2006 data. For country level characteristics, we use the respective average values for 2006 - 2010.
104 | P a g e

105 | P a g e
C.3. Cost to income ratio regressions
Before we look at regression results, we need to see how the respective top banks in ASEAN + 3 countries were able to perform in terms of efficiency. Based on (Table 3.1), Indonesian and Thai banks were relatively inefficient during the 2000 – 2005 period because of their exposure in the Asian financial crisis. Relatively unscathed, Philippine banks were more efficient. However, tables were turned during the next 5 years as Philippine banks’ efficiency plummeted and Thailand and Indonesia overtook the said country by registering lower ratios.
Regression results are shown in (Table 3.7). In order to explain the variability of costs to income ratio regressions, we utilize bank characteristics, macroeconomic variables and some regulatory variables. We first start by looking at regulatory variables. From the said table, reserves increase the cost to income ratio while deposit insurance reduces it. Bank size and bank equity are associated with a decline in the cost to income ratio. Holding more liquid assets reduces the cost ratio. It appears that while it may not be definitive that some regulatory activities or characteristics causally effect costs. Bank industry concentration increases costs. Bank risk increases costs. Not surprisingly, the debt to GDP ratio is no longer significant.
D. Robustness D.1. Net Interest Margin and Debt to GDP ratio
In this section, we highlight the role of debt in determining the robustness properties of included covariates. As mentioned, there is a link between bank intermediation and government indebtedness. Governments usually issue debt securities and when banks buy them, it means that funds that should have been allocated to private borrowers may fall, and given capital adequacy requirements, this may result in limited credit expansion. However, we also need to ascertain how excessively high debt ratios would affect net interest margin.
As shown in (Table 3.5), the inclusion of the debt – GDP ratio renders inflation significant. Debt – GDP ratio is also robustly significant and has a negative effect, indicating that a high ratio is associated with low margin. In contrast to earlier regression runs, models with debt – GDP ratio are associated with robust regulatory effects. Reserve requirements, deposit insurance and activity restrictions act to increase financial intermediation costs. Thus, there is no more need to specify models that admit only one regulatory variable at a time.15 The inclusion also restores the significance of bank risk. This may imply that when debt levels are excessively high, our models would indicate that a reduction in margins would act as a warning.
Similar to DLL, we also look at another representation of cost of intermediation. Results are shown in (Table 3.7). We replace average net interest margin by the total cost to net income ratio. We use the same determinants and determine whether their respective effects are robust to the inclusion or exclusion of the debt – to – GDP ratio. The findings are not surprising. Banks that are well – capitalized have a low cost – to – income ratio. Deposit insurance has a negative effect while reserves appear to increase the cost to income ratio. Apparently debt to GDP ratio and activity restrictions do not have significant effects.
15 Results for this empirical exercise are given in Table 3.4.

106 | P a g e
Table 3.6 Net interest margin regressions and regulations (robustness)
(1) (2) (3)
Bank size -1.377 *** -1.354 *** -1.320 *** 0.304 0.295 0.297 Bank equity 0.059 ** 0.068 ** 0.076 *** 0.028 0.028 0.024 Fees 0.132 0.102 0.157 ** 0.089 0.086 0.080 Liquidity -0.019 ** -0.018 * -0.014 * 0.010 0.009 0.008 Bank risk -0.372 -0.356 -0.388 ** 0.240 0.277 0.188 Bank industry concentration
-0.026 *** -0.038 *** -0.027 ***
0.010 0.011 0.008 Inflation 0.077 0.069 0.162 0.108 0.109 0.119 Per capita GDP growth
0.098 ** 0.205 *** 0.090 **
0.048 0.050 0.042 Reserves 0.456 0.337 Deposit insurance 0.637 * 0.371 Activity restrictions 0.160 * 0.085 Market share 0.045 *** 0.046 *** 0.038 *** 0.015 0.015 0.014 Number of Observations
76 76 76
Note: The dependent variable is net interest margin which is averaged for the 2006-2010 period. For bank characteristics, we use the 2006 data. For country level characteristics, we use the respective average values for 2006 - 2010.

Table 3.7 Net interest margin regressions (Robustness results using debt - GDP ratio)
(1) (2) (3) (4)
Bank size -1.208 *** -1.696 *** -0.659 *** -1.134 *** 0.207 0.304 0.232 0.324 Bank equity 0.078 *** 0.086 *** 0.064 *** 0.069 *** 0.023 0.022 0.021 0.020 Fees 0.132 * 0.124 * 0.147 ** 0.130 ** 0.071 0.073 0.067 0.062 Liquidity -0.015 ** -0.006 -0.009 -0.003 0.006 0.007 0.006 0.006 Bank risk -0.299 -0.237 -0.368 ** -0.324 * 0.199 0.184 0.173 0.166 Bank industry concentration
-0.035 *** -0.043 *** -0.009 -0.018
0.008 0.008 0.014 0.014 Inflation -0.219 ** -0.162 ** 0.087 0.081 Per capita GDP growth -0.355 *** -0.301 ** 0.124 0.123 Reserves 0.608 *** 0.886 *** 1.652 *** 1.721 *** 0.220 0.254 0.460 0.455 Deposit insurance 1.281 *** 1.389 *** 0.752 * 0.919 ** 0.378 0.382 0.406 0.404 Activity restrictions 0.427 *** 0.590 *** 0.611 *** 0.722 *** 0.099 0.124 0.127 0.140 Market share 0.039 *** 0.065 *** 0.012 0.035 ** 0.011 0.015 0.012 0.017 Debt - GDP ratio -0.008 *** -0.009 *** -0.018 *** -0.016 *** 0.002 0.002 0.004 0.004 Number of Observations
76 76 76 76
Note: The dependent variable is net interest margin which is averaged for the 2006-2010 period. For bank characteristics, we use the 2006 data. For country level characteristics, we use the respective average values for 2006 - 2010.
107 | P a g e

D.2. Net Loans and Debt to GDP ratio
As shown in (Table 3.8), the Debt to GDP ratio is significantly negative, indicating that the more indebted the countries become, the smaller will be the amount of loans lent out. The trade – off can be explained by examining the investing behaviour of banks. There is a premium in government issued debt because of the guarantee that such obligations will be met.
Moreover the inclusion results in better models. Bank size will now have a positive influence indicating that higher net loan to asset ratio may be observed in large banks. Per capita GDP growth and market share have negative effect. Again, market share may induce a negative correlation but it is not conclusive at this point that it is a causal effect. When Debt to GDP ratio is included, only reserves play a significant role in determining the debt to GDP ratio. Inflation has a positive effect on the ratio.
Table 3.8 Cost - to - income ratio regressions
(1) (2)
Bank size -0.374 *** -0.314 *** 0.092 0.096 Bank equity -0.034 *** -0.036 *** 0.005 0.005 Fees 0.129 *** 0.126 *** 0.029 0.029 Liquidity -0.003 ** -0.002 * 0.001 0.001 Bank risk 0.195 *** 0.191 *** 0.035 0.035 Bank industry concentration
0.009 *** 0.011 ***
0.003 0.003 Inflation -0.021 -0.015 0.020 0.020 Per capita GDP growth -0.110 *** -0.136 *** 0.022 0.028 Reserves 0.473 *** 0.491 *** 0.068 0.069 Deposit insurance -0.230 *** -0.266 *** 0.068 0.073 Activity restrictions 0.003 0.002 0.015 0.014 Market share 0.000 -0.002 0.004 0.004 Debt - GDP ratio -0.001 0.001 Number of Observations
76 76
Note: The dependent variable is the logarithm of the cost to income ratio which is averaged for the 2006-2010 period. For bank characteristics, we use the 2006 data. For country level characteristics, we use the respective average values for 2006 - 2010.
108 | P a g e

Table 3.9 Net loans to asset ratio regressions
(1) (2) (3)
Bank size 0.106 0.113 0.157 0.122 0.102 0.114 Bank equity -0.005 0.007 0.006 0.008 0.006 0.005 Fees -0.069 -0.046 -0.043 0.044 0.037 0.038 Liquidity -0.010 *** -0.013 *** -0.013 *** 0.002 0.002 0.002 Bank risk -0.031 -0.014 -0.015 0.071 0.052 0.054 Bank industry concentration
0.002 -0.006 -0.006
0.004 0.005 0.005 Inflation 0.010 0.036 * 0.049 ** 0.016 0.020 0.023 Per capita GDP growth -0.007 0.044 ** 0.041 * 0.014 0.022 0.023 Reserves -0.434 *** -0.451 *** 0.090 0.091 Deposit insurance 0.173 * 0.174 * 0.098 0.099 Activity restrictions 0.017 0.011 0.019 0.019 Market share -0.124 -0.004 0.247 0.005
Note: The dependent variable is the logarithm of the net loans to asset ratio which is averaged for the 2006-2010 period. For bank characteristics, we use the 2006 data. For country level characteristics, we use the respective average values for 2006 - 2010.
109 | P a g e

Table 3.10 Net loan to asset ratio regressions with debt to GDP ratio
(1) (2) (3) (4)
Bank size 0.399 *** 0.197 * 0.361 *** 0.294 *** 0.121 0.107 0.103 0.105 Bank equity -0.008 -0.005 -0.004 -0.003 0.007 0.007 0.006 0.006 Fees -0.087 -0.089 ** -0.057 * -0.051 * 0.037 0.036 0.030 0.031 Liquidity -0.009 *** -0.010 *** -0.011 *** -0.010 *** 0.002 0.002 0.002 0.002 Bank risk -0.033 -0.032 -0.059 -0.052 0.059 0.051 0.036 0.037 Bank industry concentration
0.004 0.002 0.001 0.001
0.003 0.003 0.004 0.004 Inflation 0.022 -0.001 0.061 *** 0.036 * 0.017 0.015 0.016 0.021 Per capita GDP growth -0.076 *** -0.043 *** -0.039 -0.040 0.018 0.015 0.026 0.026 Reserves -0.309 *** -0.285 *** 0.084 0.086 Deposit insurance -0.003 0.018 0.093 0.092 Activity restrictions 0.029 0.019 Market share -0.015 *** -0.015 *** -0.012 ** 0.005 0.005 0.005 Debt to GDP ratio -0.005 *** -0.003 *** -0.004 *** -0.004 *** 0.001 0.001 0.001 0.001
Note: The dependent variable is the logarithm of the net loans to asset ratio which is averaged for the 2006-2010 period. For bank characteristics, we use the 2006 data. For country level characteristics, we use the respective average values for 2006 - 2010.
110 | P a g e

Table 3.11 Pair wise correlations of selected regressors
Net interes
t margin
Bank size
Bank equit
y
Fees Liquidity
Bank risk
Bank industry
concentration
Inflation
Per capita GDP
growth
Reserves
Deposit insuranc
e
Activity restriction
s
Market
share
Debt to
GDP ratio
Net interest margin 1.000 Bank size -0.465 1.000 Bank equity 0.171 -
0.3893*1.000
Fees -0.370 0.8997* -0.312
1.000
Liquidity 0.161 -0.4481*
0.086 -0.337 1.000
Bank risk -0.063 -0.142 0.087 -0.112 -0.085 1.000 Bank industry concentration
-0.199 -0.085 0.325 -0.142 0.180 -0.045
1.000
Inflation 0.651* -0.6477*
0.093 -0.5487*
0.503* 0.016 -0.085 1.000
Per capita GDP growth 0.165 0.095 -0.182
-0.051 0.089 -0.133
-0.017 0.333 1.000
Reserves 0.514* -0.137 -0.027
-0.088 0.142 -0.047
-0.292 0.4476* 0.4833* 1.000
Deposit insurance 0.078 -0.085 0.265 0.057 0.049 -0.031
0.324 -0.151 -0.6065*
0.039 1.000
Activity restrictions 0.328 0.035 -0.257
-0.092 0.011 -0.078
-0.073 0.4385* 0.5278* 0.106 -0.5162* 1.000
Market share -0.100 0.5662* -0.211
0.6140* -0.055 -0.163
0.090 -0.118 0.024 -0.060 0.013 -0.043 1.000
Debt to GDP ratio -0.507 0.3875* -0.102
0.372 -0.199 0.021 0.125 -0.5883*
-0.6282*
-0.4138* 0.343 -0.196 -0.003 1.000
111 | P a g e

IV. Some policy implications
First, policies that are designed to promote internal restructuring through consolidations and mergers appear to contribute towards bank efficiency but at the same time, may increase industry concentration and banks’ market shares. Promoting large banks may also enhance the likelihood that banks will be able to operate in other countries when the ASEAN Economic Community will be opened to financial services in 2020.
During the aftermath of the Asian financial crisis, a key initiative among ASEAN +3 countries like Korea, Indonesia and Thailand was to deregulate the banking industry, thereby allowing the entry of foreign banks that led to consolidations. Bigger banks have the potential to reduce intermediation costs because of their ability to pool resources better, introduce more innovative practices and withstand shocks. As shown in the regressions, a bigger bank is associated with lower net interest margins but at the same time, such banks may become large relative to the market that they may now be able to set higher interest rates on loans, thereby increasing the net interest margin and putting a drag on the efficient allocation of financial resources. Because the resultant industrial organization may be reconfigured by promoting competition, there is a need to revisit national bank entry regulations and bank competition policy.
Second, it is also evident from the paper’s results that policies that promote the increase in capitalization requirements may not necessarily translate into lower net interest margins. Even in ASEAN + 3, highly capitalized banks may increase net interest margins because of their ability to withstand bankruptcy risk.
Third, policy instruments that are designed to mitigate bank risk reduce moral hazard and regulate bank activities appear to be negatively related to bank efficiency. As a monetary policy tool, higher reserves robustly reduce the net loans to asset ratio but at the same time appear to increase net interest margins. Other regulatory tools like deposit insurance and restrictions on bank activities will increase the net interest margin. While it is understandable that activity restrictions are imposed in order to limit moral hazard problems, studies show that loosening restrictions may in fact encourage bank development and reduce the cost of financial intermediation.
Fourth, in light of the crisis in Europe, there is a need to analyze how debt to GDP ratio affects bank performance since banks are among the major financial institutions that buy sovereign bonds. In the study, higher debt to GDP ratio negatively affects net interest margin but caution should be exercised in interpreting the results since an increase in a country’s degree of indebtedness may lead to a lower net loans to total assets ratio. There are also studies that point to the plausible link between excessive debt to GDP ratios and economic growth. A key policy initiative is to develop early warning mechanisms that would inform banks on the true fiscal state of countries issuing sovereign bonds. This also necessitates a periodic assessment of banks’ asset holdings.
112 | P a g e

113 | P a g e
V. Concluding remarks
This study implements empirical frameworks that have been tested using a much broader sample of banks and countries. Results from such studies (BCL and DLL) should caution regulators about the pitfalls associated with too much on capital regulations and intrusive supervisions. With the onset of more contagious and stubborn crises, many advocate the continued use of such regulatory tools. In Europe, banks that are affected by the debt crisis have started to deleverage just to comply with EU wide capital requirements. With the movement of funds away from Europe, there is now a difficulty to raise capital which may result in credit crunch.
This study estimates models to explain how bank and country characteristics would affect financial intermediation and ability to make loans. Using the same frameworks, our findings are not even controversial since they reflect evidence that have been established already. Focusing on liquidity reduces net loans but reduces net interest margin. Bigger banks reduce net interest margin compared to small ones but they are in a position to make more loans. Bank equity matters in net interest margin but not in the determination of net loans. Market structure matters in financial intermediation but they do not affect net loans. Regulations do not have uniform effects. We have replicated results in DLL. Financial intermediation cost is increased by the existence of reserve policies, deposit insurance and activity restrictions. Of this set of regulatory variables, only reserve policy matters in net loans to asset ratio.
A surprising development which may require further empirical validation and verification is the ability of debt – to – GDP ratio to improve the number of significant predictors. This has not been included in previous studies. By imparting robustness properties to models of financial intermediation and net loans, the variable holds promise in light of the financial turmoil that Europe is currently facing.

Chapter 4: Policy Implications of Regulating Banks in ASEAN and East Asia An Integrative Report
I. Introduction
Over the years the role of banks in financial intermediation has undergone significant changes brought about by financial innovations facilitated by major developments in information and communication technology. These innovations were, in turn, responses to the dramatic changes in the financing needs of the various sectors of the real economy, growth of wealth and the rapid integration of global markets. Various financial products enabled banks to diversify their activities to include asset management, insurance, trading in securities issued by public and private organizations and trading in foreign exchange among others.
Accompanying these changes in financial intermediation is the widening of information asymmetry in the financial market. To address this asymmetry various regulatory measures were enacted both at the domestic and international levels. The regulatory framework brought about by the Basel Accord, for example, has put a lot of pressure on banks to diversify their loan portfolios, engage in commerce and trade in securities which subsequently changed the asset and liability management of banks.
Because of information asymmetry and the need to have stability in the financial sector,
there has been an increasing propensity across countries to impose regulations with some countries openly adopting more stringent regulations and increasing supervisory powers while other countries pursue to strengthen private monitoring systems and restrain intrusive supervision (Barth, Caprio & Levine, 2004). Although it should be pointed out that the idea of increasing regulations is highly debated as there are empirical evidence that excessive bank regulation may backfire and counteract its positive effect on governance and bank sector development (Dacuycuy, 2011). The Basel Accord has a history of policy or regulatory responses based on the causes of a crisis. The initial 1988 Basel Accord was founded on two pillars namely: capital adequacy and bank supervision partly in response to a US crisis. Another pillar was added to account for the shortcomings of the 1988 Basel Accord and intended to enhance the bank’s capacity for factual disclosure (BCBS, 2009). This third pillar came in the form of market discipline, which entails improvements in asset-liability management; improving assessment of those who are trying to avail of loans (which include credit assessments and background checks) as well as ensuring the safety of savers’ funds. This third pillar was incorporated in Basel II in 2004 (BCBS, 2009) which generally prioritizes less risky exposure and liquidity over higher returns, and hence the implementation of Basel II. However, there is a potential for improving banks by not focusing on stringent capital requirements and intrusive empirical supervision but rather on institutions that help mitigate information asymmetry. Due to the shortcomings of Basel II especially during the 2007-2008 crisis, Basel III was formulated that narrowed down the definitions of capital, adding countercyclical components to capital requirements, as well as increase equity capital requirements (Ennis & Price, 2011). Crises generally erode banks’ capital which may threaten the stability of the financial sector and may eventually impact on the real economy (Dacuycuy, 2011). During crises, banks may experience liquidity problems and may have difficulties complying not only with reserve requirements, but also with capital adequacy requirements. During these periods, banks may
114 | P a g e

choose to expand capital by equity financing but because of various significant risks and bleak economic conditions banks may deleverage instead which in turn may affect credit creation. Rescuing banks facing liquidity problems, however, may be subject to a moral hazard problem as can be seen in the 2008 subprime crisis. Stringent regulations on capital adequacy, on the other hand, may have adverse effects on financial stability. Given this backdrop this integrative paper will draw insights based on the major conclusions of the three previous papers. The first chapter by Taningco (2011) focuses on the roles, functions and characteristics of the ASEAN+3 banking system. The second chapter by Castell (2011) focuses on the policies, regulations, supervisory practices and safety net mechanisms of the ASEAN+3 banking system. The third chapter by Dacuycuy (2011) presents an empirical investigation of the role of bank regulations, supervisory practices and deposit insurance on the development of the ASEAN+3 banking sector. The banking systems will be assessed in terms of Capital Adequacy, Asset Quality, Management Oversight, Earnings, and Liquidity, which are the five elements in the CAMEL framework (which is an acronym of the aforementioned criteria. Using the CAMEL framework, the key features of the top banks in the region will be summarized, the regulatory environment governing the banking system will be described and the impact of capital adequacy on bank performance will be shown. The paper will likewise assess the degree of compliance of the ASEAN and East Asian banks to the Basel III Accord. Given the extent of capital adequacy of banks and the degree of their compliance to regulatory standards, what is the cost of financial stability in terms of financial intermediation specifically credit creation? Lastly, given the variations on the causes of three recent crises (the 1997 Asian Financial Crisis, the 2008 US Financial Meltdown, and the more recent 2010 Euro-crisis) this paper will craft policy recommendations in addressing regional cooperation in responding to various causes of financial crisis and the optimal mix of the regional-national responses. II. Key Features of the Top Banks in ASEAN and East Asia
In describing the key features of the banking system in the region we have used the following criteria: asset and liability sizes, foundations of the banking structure (sources of domestic financing: bank credits, bonds or equity), capital adequacy (according to the Bank for International Settlements’ minimum capital adequacy requirement), asset quality (through the ratio of non-performing loans), profitability (through the return on asset and return on equity ratios, and the net interest margin), and liquidity (through the liquid asset ratio, the average 5-year spread of Asian Banks, and the exposure of ASEAN+3 banking sectors to European and US banks) which conform with the CAMEL framework used in this study.
A. Asset and Liabilities As of 2011 the top 10 banks in each of the 6 ASEAN and 3 East Asian countries have a combined total assets amounting to USD 19 trillion. There is a wide disparity in the size of the top banking institutions in the region. The top Japanese and Chinese banks, for example, account for almost 90 percent of this amount. In the ASEAN, the top Singaporean banks have combined assets of USD 571 billion while the top Vietnamese banks only have USD 66 billion in total assets.
In terms of the growth of the assets of the top banks in nine countries in the region exhibit similar trends as shown in (Figure 4.1) drawn from the values in (Table 4.1). Generally, the banks in the region have similar growth trajectory with some exceptions like Indonesia and China that have generally lower levels of assets growth. These refer to the top 10 commercial
115 | P a g e

banks in each country, and not the entire banking sector. Though they may be the same trajectory in terms of asset growth, there variations in the absolute value of assets and there are differences as regards the source (whether domestic or foreign sourced), and the term-structure of their assets and liabilities (whether short or long term).
Figure 4.1: Assets of the Top 10 Banks per Country in the ASEAN and East Asia (1999-2011)
Source: BANKSCOPE
116 | P a g e

Table 4.1: Assets of top ten banks per country, in thousand USD, from 2000 to 2011
. 1999 2000 2001 2002 2003 2004 2005 2006 2007 2008 2009 2010
CN 0 37161493
4.5
46247802
6.7
99210669
2.9
22443308
88
25861479
28
31842287
10
40182864
83
51307331
82
66435064
48
82864394
93
84091615
54
ID 0 70357395
.27
69536573
.01
81906248
.32
90086388
.87
89533412
.07
94791193
.5
11763259
7.9
13715439
6.4
13539836
0.5
17877708
1.9
22414310
8.1
JP 0 37034172
18
30819550
30
44324396
06
51115578
88
49725357
96
46645791
50
45717745
86
75736606
58
77564706
16
83522780
16
87165897
14
KR 28461517
6.9
34777541
3.5
43630634
2.6
45666736
8.7
53818491
5.5
59565935
4.5
83666942
9.5
95158004
8.3
86796675
8.1
87128770
1.5
89468415
6.3
30981799
4.9
MY 6281947.593
10965724
0.8
11813124
1.1
13491403
1.1
15095005
8
17661210
1.4
20577996
1.2
26321834
5.1
30181575
8.8
32392367
9.2
37825627
0
43104228
6.6
PH 0 0 0 0 9964787.584
46354561
.14
54422963
.14
74662423
.35
89414373
.46
91418433
.15
10314206
9.6
88842275
.72
SG 0 0 0 7079646
5650013.056
17312242
6.5
29781694
8
35840601
3.7
43405793
8
46156689
9.5
48196235
7.3
57141008
0.5
TH 42450791
.85
12398867
4
13318241
2.1
14769328
1.7
16657427
7.2
17852223
7
18856690
1.2
23085936
8.8
25886137
4.9
29096164
2.2
33724134
6.2
25608816
2.1
VN 3691722.914
4465159.358
10507986
.63
12422312
.5
15047938
.48
30871224
.73
49204173
.28
71263157
.29
84765864
.31
10425753
0.7
82326113
.56
6638526.722
Grand Total
33703963
9.3
47312760
35
43120976
12
62652291
88
83323471
55
88493590
41
95760594
31
10657683
023
14878430
304
16678791
311
19095106
904
19013733
702
Source: BANKSCOPE
117 | P a g e

The growth in banks’ liabilities may be seen in Figure 4.2 drawn from the values in (Table 4.2) in the Appendix. The liabilities here are measured using deposits and short-term funding which apparently, all countries have roughly around less than a trillion worth of deposits except for China and Japan. The top 10 banks in each 6 ASEAN and 3 East Asian countries have a combined liabilities worth USD 16.5 trillion where Chinese and Japanese top banks account for 91 percent of the total. The top Singaporean banks have the highest deposits and short-term liabilities in the ASEAN region worth USD 411 billion.
Figure 4.2: Deposits and Short-term Funding of the Top 10 Banks per country in the ASEAN and East Asia (1999-2011)
Source: BANKSCOPE
118 | P a g e

Table 4.2: Deposits and Short-Term Funding of the top ten banks per country, in
thousand USD, from 2000-2011
1999 2000 2001 2002 2003 2004 2005 2006 2007 2008 2009 2010
CN
0
25287531
3.5
32402907
3.3
81336118
4.6
19808271
25
22590284
72
27079879
41
32011096
08
43806217
03
55837624
53
70885848
64
76054495
97
ID
0
52537821
.35
59667042
.57
65714897
.78
72907680
.31
71508669
.47
77154521
.2
95792320
.02
11120292
6.7
11152493
5.1
14849755
0.5
18300874
0.7
JP
0
28229717
10
24761306
91
36434316
72
42006135
18
40712800
60
38318432
17
37282718
54
64655277
45
66132576
17
70952913
81
74901636
29
KR 17583052
1.6
22987407
9.7
29098751
4
30566485
2.1
33437842
1.2
36342516
9.8
49578857
9.4
57035465
2.2
49252665
1.9
55967506
9.3
57146523
6.3
18849821
3.4
MY 5269158.083
92037924
.34
96956898
.2
11018834
6
12275942
5.4
14736736
4.2
17445892
5.8
22174240
3.2
25458187
7.6
27084498
8.2
31819940
9.8
36068279
8.8
PH
0 0 0 0
7446719.476
35394777
.62
42129542
.16
57945889
.57
70121178
.72
73480592
.71
82846799
.44
73711996
.31
SG
0 0 0 6555
355
5022519.364
12154512
4.5
19887969
0
24206803
5.9
29805280
7.3
31410305
2
33651258
7
41118569
6.8
TH 35950058
.18
10728194
6.6
11663104
6.4
12909197
6.1
14317444
7.7
15220581
9.7
16106211
8.5
19589412
5.6
21689727
7.5
24085121
4.2
27574631
4.9
20388809
1.1
VN 3267973.
78
3904985.664
8792072.056
10772593
.71
13197328
.81
27489203
.84
42207278
.98
62474405
.62
74212777
.3
89858574
.33
68742459
.52
5796501.388
Grand Total
22031771
1.6
35614837
81
33731943
37
50847808
77
68803271
84
72492446
62
77315118
14
83756532
94
12363744
945
13857358
496
15985886
602
16522385
265
Source: BANKSCOPE
119 | P a g e

Considering the entire banking sector for each of these countries, the picture is quite
different, particularly for that of the sizes of assets. The largest combined asset size is that of the PRC with nearly USD 14.4 trillion (Taningco, 2011) followed by Japan with USD10.445 trillion (Bank of Japan, 2012). The banks at the Republic of Korea have USD 1.636 trillion while Hong Kong banks have combined assets of USD 1.6 trillion. In the ASEAN Singapore banks have USD 609 billion and Malaysia with 506 billion USD. Banks in Indonesia, Thailand and the Philippines have assets less than 500 billion USD.
However, this analysis is only limited to the sizes of the assets and the liabilities. There
may still be similarities (or larger differences) with respect to the term structure of the assets these banks invest in (whether short-term or long-term) and the source of the deposits and investments (whether they come from domestic or foreign sources).
B. Banking Structure
Figure 4.3a (left) and 3b (right): Bank Credits as percentage of GDP (1960-2011)
0
50
100
150
200
250
300
350
1960
1962
1964
1966
1968
1970
1972
1974
1976
1978
1980
1982
1984
1986
1988
1990
1992
1994
1996
1998
2000
2002
2004
2006
2008
2010
China, People's Rep.of
Hong Kong, China
Japan
Korea, Rep. of
0
20
40
60
80
100
120
140
160
180
200
196
0
196
2
196
4
196
6
196
8
197
0
197
2
197
4
197
6
197
8
198
0
198
2
198
4
198
6
198
8
199
0
199
2
199
4
199
6
199
8
200
0
200
2
200
4
200
6
200
8
201
0
Brunei Darussalam
Cambodia
Indonesia
Lao PDR
Malaysia
Myanmar
Philippines
Singapore
Thailand
Viet Nam
Source: Chapter 1, Taningco (2011), World Bank Key Development Indicators
As of March 2011, the dominant source of domestic financing in the ASEAN+3 region is
bank credit (46% of total domestic financing), followed by bonds (30%) and equity financing (24%). In particular, the People’s Republic of China (PRC) had nearly 55% of bank credit as its form of domestic financing. Bank credit accounts for 48% and 50% of domestic financing for Japan and Thailand respectively. It may be seen in Figure 3a and 3b that bank credit surged for the ASEAN+ PRC, Hong Kong, Japan and Korea for nearly 5 decades now. This is especially true for most Northeast Asian economies (countries indicated in Figure 4.3a) as they have bank credit to GDP ratios greater than 100%. Their bank credit to GDP ratios have nearly tripled over the past 5 decades, whereas for ASEAN economies, the bank credit to GDP ratios in 2010 have ranged from 22.5% (Cambodia) to 135.8% (Vietnam). The rate of growth for ASEAN countries has been slower over the past 5 decades in comparison to the four Northeast Asian economies.
C. Capital Adequacy
The ASEAN+3 banking system is adequately capitalized as its capital adequacy ratio has been seen above the BIS’ minimum capital adequacy ratio of 8% and the 4% required for Tier 1 capital ratio in line with the Basel Accord. As can be seen in (Table 4.3), none of the
120 | P a g e

banking sectors’ regulatory capital to risk-weighted asset ratios falls below 8%. The lowest is that of the PRC with 12.2% and the highest is that of Singapore with 17.4%. in addition, none of the banking sectors’ regulatory Tier-1 capital to risk-weighted asset ratios falls below 4% given that the lowest is the PRC with 10.1% and the highest is that of Indonesia with 15.9%.
Table 4.3: Capital Adequacy Ratios of the Banking Sector in ASEAN+3 Economies
Regulatory Capital to Risk-Weighted
Assets
Regulatory Tier-1 Capital to Risk-
Weighted Assets
PRC 12.2 10.1
Hong Kong, China 15.9 12.5
Indonesia 17.0 15.9
Japan 13.8 10.7
Korea, Rep. of 14.2 11.5
Malaysia 16.6 12.4
Philippines 16.7 13.1
Singapore 17.4 14.3
Thailand 15.7 12.4 Source: Paper 1, Taningco (2011), International Monetary Fund’s (IMF) Financial Soundness Indicators Database, Bank of
Thailand
Figure 4.4a (left) and 4.4b (right): BIS and Tier-1 Capital Ratios of ASEAN+3 Banking
Sectors (1Q09 to 3Q11) in percent.
12
13
14
15
16
17
18
19
1Q09
2Q09
3Q09
4Q09
1Q10
2Q10
3Q10
4Q10
1Q11
2Q11
3Q11
Hong Kong, China
Indonesia
Korea, Rep. of
Malaysia
Philippines
Singapore
Thailand
9
10
11
12
13
14
15
16
1Q09
2Q09
3Q09
4Q09
1Q10
2Q10
3Q10
4Q10
1Q11
2Q11
3Q11
Hong Kong, China
Korea, Rep. of
Malaysia
Philippines
Singapore
Thailand
Source: Chapter 1, Taningco (2011), Bank of Indonesia, Bank of Thailand, Financial Supervisory Service, IMF’s Financial Soundness Indicators Database
It is interesting to note that despite the 2008 financial meltdown, capital adequacy of most ASEAN+3 banking sectors have improved although recent quarters in 2011 have reported decreasing trends in both BIS capital and Tier-1 capital ratios. This finding may be verified in Figures 4.4a and 4.4b. BIS capital has steadily increased from 1Q of 2009 to 1Q of 2010 except for Thailand, and decreased steadily up to 3Q of 2011 for most countries except for Malaysia and Thailand. The trend is the same for Tier-1 capital, particularly the trend of Thailand, whose early decline lead to a late increase in the 3Q of 2011 relative to other countries.
121 | P a g e

D. Asset Quality
Asset quality has improved in East Asian banking sectors with respect to Non-Performing Loan Ratios (NPL). The NPL has declined due to the expansion of loan portfolios and a drop in NPLs. This can be seen in Figure 4.5, the NPL ratio for 1Q of 2009 up to 2Q of 2011 has declined steadily. Although it was found out that despite the improvement in asset quality, loan quality has deteriorated. This loan quality deterioration was detected through the Loan Delinquency Ratio, particularly of Korea whose loan delinquency has been fluctuating and was known to climb to 1.28% of total loans in October 2011.
Figure 4.5: NPL Ratios in Selected ASEAN+3 Economies (1Q09-2Q11) in percent.
0.0
1.0
2.0
3.0
4.0
5.0
6.0
7.0
1Q
09
2Q
09
3Q
09
4Q
09
1Q
10
2Q
10
3Q
10
4Q
10
1Q
11
2Q
11
Japan
Hong Kong, China
Indonesia
Korea, Rep. of
Malaysia
Philippines
Singapore
Thailand
Source: Chapter 1, International Monetary Fund’s (IMF) Financial Soundness Indicators Database, Bank of Thailand.
E. Profitability
Table 4.4.: ROA of ASEAN+3 Banks (1Q09-2Q11) in percent
1Q09 2Q09 3Q09 4Q09 1Q10 2Q10 3Q10 4Q10 1Q11 2Q11 3Q11
Hong Kong, China 0.6 0.8 0.8 0.8 0.9 0.9 0.8 0.9 1.0 1.0 —
Japan — — 0.2 — 0.2 — 0.4 — 0.3 — —
Indonesia — — 2.6 3.1 3.0 2.9 2.9 3.1 3.1 3.1
Korea, Rep. of 0.1 0.6 0.8 0.6 1.0 0.8 0.8 0.7 1.3 1.5 —
Malaysia 1.4 1.0 1.2 1.2 1.5 1.6 1.6 1.5 1.8 1.7 1.7
Philippines 1.3 1.3 1.4 1.4 1.5 1.5 1.6 1.7 1.5 1.6 —
Singapore 1.3 1.3 1.3 1.3 1.6 1.5 1.6 1.4 1.5 1.4 —
Thailand 0.9 0.9 1.0 1.0 1.1 1.2 1.2 1.2 1.2 1.4 0.9 Source: International Monetary Fund’s (IMF) Financial Soundness Indicators Database, Bank Indonesia, Bank Negara Malaysia, Bank of Thailand.
Overall, ROA for all countries have improved over the past 2 years, from ROAs below
1% in 2009, to greater than 1% starting 2010. Among the ASEAN+3 countries, the Indonesian
122 | P a g e

banking industry has been the most profitable according to ROA in (Table 4.4), standing at 3.1% at the end of 2Q of 2011. At the same time, lowest has been recorded for Hong Kong with 1.0%, and Singapore and Thailand, both at 1.4%. Looking at ROE of selected ASEAN countries (Table 4.5), ROE has improved in 2011 as compared to that in 2009, however, at the end of the 2Q in 2011, Malaysia and Singapore has experienced slight declines in ROE. Despite the start-end improvement in ROE, looking at the values in between 1Q in 2009 and 2Q in 2011, it is revealed that ROE has fluctuated for all countries but faces an upward trend. With regard to the Net Interest Margin (NIM) of the ASEAN+3 Banks, there is no single trend, except for the Republic of Korea that recorded an average quarterly rise of 0.2 percentage points between the 1Q of 2009 and the 2Q of 2011 (Table 4.6). Thailand, however, posted a drop of 0.5 percentage point within the same period.
banking industry has been the most profitable according to ROA in (Table 4.4), standing at 3.1% at the end of 2Q of 2011. At the same time, lowest has been recorded for Hong Kong with 1.0%, and Singapore and Thailand, both at 1.4%. Looking at ROE of selected ASEAN countries (Table 4.5), ROE has improved in 2011 as compared to that in 2009, however, at the end of the 2Q in 2011, Malaysia and Singapore has experienced slight declines in ROE. Despite the start-end improvement in ROE, looking at the values in between 1Q in 2009 and 2Q in 2011, it is revealed that ROE has fluctuated for all countries but faces an upward trend. With regard to the Net Interest Margin (NIM) of the ASEAN+3 Banks, there is no single trend, except for the Republic of Korea that recorded an average quarterly rise of 0.2 percentage points between the 1Q of 2009 and the 2Q of 2011 (Table 4.6). Thailand, however, posted a drop of 0.5 percentage point within the same period.
Table 4.5: ROE of ASEAN+3 Banks (1Q09-3Q11) in percent Table 4.5: ROE of ASEAN+3 Banks (1Q09-3Q11) in percent
1Q09 2Q09 3Q09 4Q09 1Q10 2Q10 3Q10 4Q10 1Q11 2Q11 3Q11
Hong Kong, China 15.4 17.2 16.1 16.7 15.7 16.5 16.1 16.7 18.1 19.3 —
Japan — — 5.7 — 5.5 — 9.2 — 6.9 — —
Korea, Rep. of 2.3 9.9 11.3 8.9 14.0 10.7 10.8 9.7 16.7 19.0 —
Malaysia 16.7 11.2 13.2 14.0 15.9 16.7 16.6 16.6 19.0 18.4 18.3
Philippines 14.3 15.0 15.0 15.4 15.2 15.4 16.1 16.7 14.2 15.5 —
Singapore 17.0 15.5 15.0 13.8 17.7 16.4 17.4 15.5 17.2 15.7 — Source: Chapter 1, International Monetary Fund’s (IMF) Financial Soundness Indicators Database.
Table 4.6: Net Interest Margin of ASEAN+3 Banks (1Q09-3Q11) in percent
1Q09 2Q09 3Q09 4Q09 1Q10 2Q10 3Q10 4Q10 1Q11 2Q11 3Q11
Hong Kong, China 0.6 0.8 0.8 0.8 0.9 0.9 0.8 0.9 1.0 1.0 —
Japan — — 0.2 — 0.2 — 0.4 — 0.3 — —
Korea, Rep. of 0.1 0.6 0.8 0.6 1.0 0.8 0.8 0.7 1.3 1.5 —
Malaysia 0.4 0.5 0.9 1.2 0.4 0.8 1.2 1.5 1.8 1.7 —
Philippines 1.3 1.3 1.4 1.4 1.5 1.5 1.6 1.7 1.5 1.6 —
Singapore 2.3 2.2 2.2 2.2 2.1 2.0 2.0 2.0 1.9 1.9 1.9
Thailand 0.9 0.9 1.0 1.0 1.1 1.2 1.2 1.2 1.2 1.4 0.9
Source: Chapter 1, International Monetary Fund’s (IMF) Financial Soundness Indicators Database.
F. Liquidity
Among the ASEAN+3 countries, the most notable on this criterion is Singapore as it
hovers above all countries around 70% of the liquid-asset ratio since the 1Q of 2009, and levelling off at 69.7% in the 2Q of 2011. All other ASEAN+3 countries had liquid-asset ratio less than 40%, and countries including Hong Kong, China and Singapore experienced quarterly decreases. In the case of Malaysia, the liquid-asset ratio had hovered in the range of 14.1 – 16.3 % in the period between Q1 2010 and Q3 2011 with no clear upward or downward trend. However, recent events (the Euro-crisis) resulted in heightened risks in bank funding and
123 | P a g e
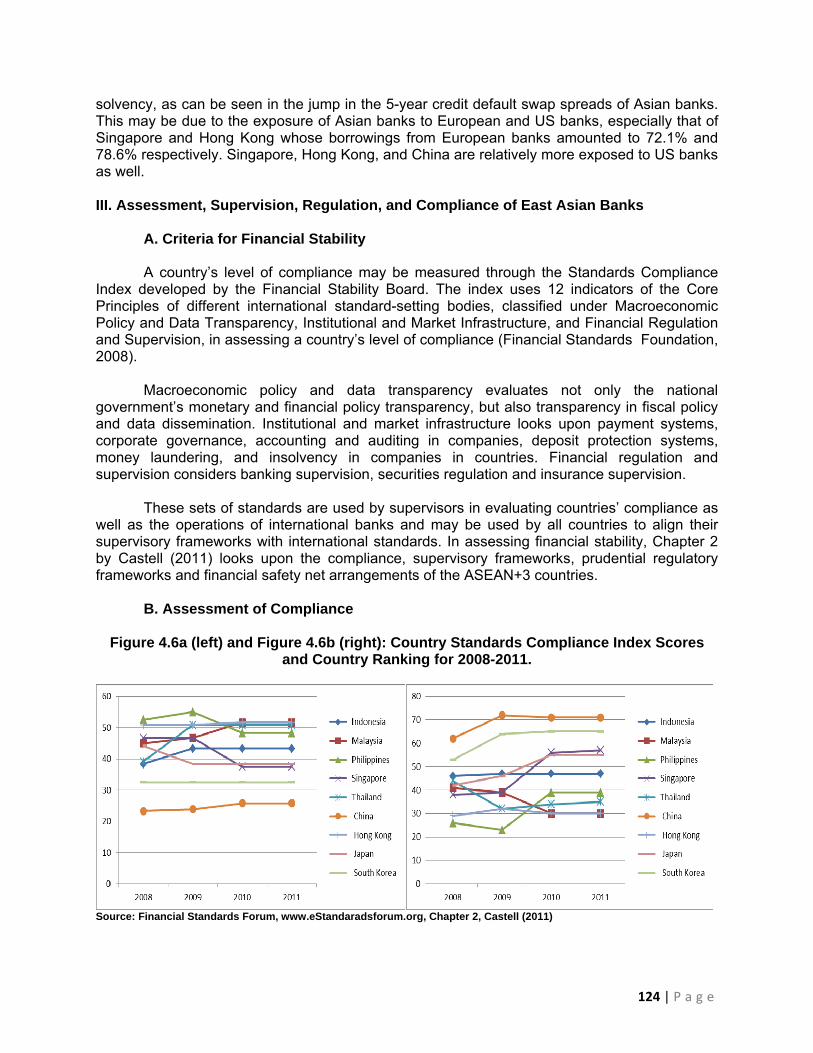
solvency, as can be seen in the jump in the 5-year credit default swap spreads of Asian banks. This may be due to the exposure of Asian banks to European and US banks, especially that of Singapore and Hong Kong whose borrowings from European banks amounted to 72.1% and 78.6% respectively. Singapore, Hong Kong, and China are relatively more exposed to US banks as well. III. Assessment, Supervision, Regulation, and Compliance of East Asian Banks
A. Criteria for Financial Stability
A country’s level of compliance may be measured through the Standards Compliance Index developed by the Financial Stability Board. The index uses 12 indicators of the Core Principles of different international standard-setting bodies, classified under Macroeconomic Policy and Data Transparency, Institutional and Market Infrastructure, and Financial Regulation and Supervision, in assessing a country’s level of compliance (Financial Standards Foundation, 2008).
Macroeconomic policy and data transparency evaluates not only the national government’s monetary and financial policy transparency, but also transparency in fiscal policy and data dissemination. Institutional and market infrastructure looks upon payment systems, corporate governance, accounting and auditing in companies, deposit protection systems, money laundering, and insolvency in companies in countries. Financial regulation and supervision considers banking supervision, securities regulation and insurance supervision.
These sets of standards are used by supervisors in evaluating countries’ compliance as well as the operations of international banks and may be used by all countries to align their supervisory frameworks with international standards. In assessing financial stability, Chapter 2 by Castell (2011) looks upon the compliance, supervisory frameworks, prudential regulatory frameworks and financial safety net arrangements of the ASEAN+3 countries.
B. Assessment of Compliance
Figure 4.6a (left) and Figure 4.6b (right): Country Standards Compliance Index Scores and Country Ranking for 2008-2011.
Source: Financial Standards Forum, www.eStandaradsforum.org, Chapter 2, Castell (2011)
124 | P a g e

Figure 4.6a and 4.6b were derived from (Table 2.3) in Chapter 2 and show the development of the compliance scores of the ASEAN+3 countries depending on the 12 indicators enumerated in the previous section, and their global ranking respectively. In 2008, the country with the highest score was the Philippines (52.50) ranking 26th worldwide, followed closely by Hong Kong (50.83, ranked 32nd). The country with the lowest score was China (23.33), which ranked 62nd globally. The Philippines’ score improved to 55.00 (ranked 23rd) in 2009 but faced a decline in 2010 to 48.33 and maintained this score in 2011, which then led to a decrease in its rank (39th). Hong Kong maintained its score of 50.83 in 2009 although its rank decreased to 32nd, but was able to improve its score to 51.67 for both 2010 and 2011, causing its rank to improve to the 30th in 2010 and 2011. China’s score improved over the period but its ranking decreased further (71st as of 2011) and remained at the lowest rank among the ASEAN+3 countries.
Most countries had moderate to low scores over the period, although among the ASEAN+3 countries, Thailand had the greatest marginal improvement in its compliance score: from 39.17 in 2008 (ranking 44th globally), its score rose to 50.83 in 2011 (ranking 35th). Singapore and Japan faced similar trends wherein they had high scores in 2008 (46.67 and 44.17 respectively, and ranked 38th and 42nd respectively) but Japan’s score declined to 38.33 in 2009 and Singapore’s score declined to 37.50 in 2010. In 2011, the countries with the highest scores were Malaysia and Hong Kong (both scored 51.67 and ranked 30th globally) followed by Thailand (50.83, 35th), the Philippines (48.33, 39th), Indonesia (43.33, 47th), Japan (38.33, 55th), Singapore (37.50, 57th), South Korea (32.50, 65th) and China (25.83, 71st).
In terms of the Basel Core Principles for Effective Banking Supervision, 46.1 percent of
Asian economies were most compliant with the 2nd chapter of the Core Principles on Licensing and Structure, as can be seen in (Table 2.4) (Lee and Park, 2009). This chapter on Licensing and Structure focuses on Core Principles 2-5: (2) the definitions of permissible activities, (3) the Right to set licensing criteria and reject applications for establishments that do meet the standards set, (4) Authority to review and reject proposals of significant ownership changes, and (5) the Authority to establish criteria for reviewing major acquisitions or investments. 36.8 percent of Asian economies were compliant with the 6th and 7th chapters of the Core Principles which focus on the Corrective and Remedial Powers of Supervisors, and the Consolidated and Cross-Border Banking Supervision. The 6th chapter focuses on Core Principle 23 which states that supervisors must practice global consolidated supervision over internationally active banks, adequately monitor and apply prudential norms to all aspects of the business conducted by these banks. The 7th chapter focuses on Core Principles 24-25 which state that (24) consolidated supervision should include establishing contact and information exchange with the various supervisors involved, primarily host country supervisory authorities, and that (25) supervisors must require the local operations of foreign banks to be conducted at the same standards as required of domestic institutions, and must have powers to share information needed by the home country supervisors of those banks Among the 7 chapters of the Basel Core Principles, Chapter 1, on Objectives, Independence, Powers, Transparency and Cooperation (The Preconditions for Effective banking Supervision) posted the lowest compliance especially since 78.9 percent of the sample did not answer to the assessment regarding the first principle (Lee and Park, 2009).
Among the ASEAN+3 countries, none are fully compliant to the Basel Core Principles for
Effective Banking Supervision (Table 2.5). Philippines’ Hong Kong’s, and South Korea’s compliance are still in progress as they are still taking steps to comply. Indonesia and Singapore have already enacted laws on the core principles, whereas Malaysia, Thailand and China have only declared their intention to comply (although Malaysia is expected to undergo Financial
125 | P a g e

Sector Assessment Program (FSAP) in 2012 where its compliance with Basel Core Principles will be independently assessed). Japan shows no compliance. However, these survey results do not lead to the conclusion that countries are not taking steps to comply. Different banking regulations have already been enacted or reformed but the problem lies in the enforcement of such regulations. Japan, in particular, should consider bringing their supervision to comply if they wish to be competitive as it is imperative to strengthen supervision in order to have a more stable financial environment.
C. Assessment of Supervision The supervisory frameworks of the banking system in general as well as that of the Central Bank need to be reviewed, especially since both play an essential role in addressing crises Barth, Gan and Nolle (n.d.). Monetary policy objectives, as well as banking supervision and regulation should have the same goals to deal with the various financial distortions brought about by a crisis. As seen in (Table 2.6) in Castell (2011), most ASEAN+3 banking systems are governed by just one supervising authority, which is usually the central bank. This is true for banking systems in Indonesia and Thailand, whereas Singapore, Japan and South Korea have created a unified agency to supervise the operations of all financial institutions (Lee and Park, 2009). Hong Kong, China, and the Philippines have different supervisory agencies responsible for banking, capital market and insurance institutions. Supervisory frameworks have been reorganized around the around since the Asian financial crisis as authorities responded to the sudden growth in financial market activity. The commitment of governments to self-regulation may be seen in their adoption of single supervisory structures, expanding the Central Bank’s role in influencing policy actions critical to financial regulation. With regard to the roles that supervisory bodies take on, as seen in (Table 2.7) in Castell (2011), all ASEAN+3 countries conduct on-site examinations of banks as a surveillance mechanism to monitor their activity and ensure the safety of the banking system. With regard to enforcement mechanisms, a bank found violating any regulations generally receive formal public enforcement by their supervisors such as penalties and sanctions such as cease-and-desist orders and civil monetary penalties. In the ASEAN+3 region, all countries except for Malaysia, Hong Kong and Japan implement enforcement mechanisms as mentioned above although Japan still imposes corresponding penalties. In the case of Malaysia, The Banking and Financial Institutions Act 1989 provides for a broad range of measures that includes monetary penalties, business restrictions, removal of directors, removal of officers and the application for order staying the commencement/continuance of civil proceedings against a financial institution. These enforcement mechanisms will be further strengthened under the new regulatory law to be enacted in 2012 where the Bank will have a more expanded penalty framework that will clearly provide for explicit powers to undertake administrative as well as civil actions. Under this law, supervisory intervention practices would also be strengthened through the expansion of the range of preemptive supervisory tools, consistent with the Bank’s aims to enhance its ability to intervene at an early stage and to employ supervisory measures that are proportionate. With respect to the degree of independence supervisors have, only the Philippines’, Thailand’s and South Korea’s supervisory bodies are legally liable for their own actions. The independence of the supervisor is crucial to its enforcement of regulation and policies. With regard to insolvency laws, only supervisors in Malaysia, Indonesia, Philippines and Japan are allowed to supersede banks shareholders’ rights and declare insolvency. In Malaysia and Philippines, this power is extended to courts and deposit insurers as well. Hong Kong, China, and South Korea
126 | P a g e

extend no such capability to their supervisors or deposit insurers, thus, solvency cases are dealt with by the courts upon recommendation of the supervisor that the bank is insolvent. There are disparities in the supervisory frameworks across the ASEAN+3 countries, and given the single supervisor structure of most countries, the diversification of powers with deposit insurance companies and courts enables a more diligent practice of the supervisor’s powers.
D. Assessment of Prudential Regulations
Comparing the Risk-Based frameworks among the ASEAN+3, it may be seen in (Table 2.8) in Chapter 2 (Castell, 2011) taken from Batunanggar’s study (2008), that most countries make use of the CAMELS framework. CAMELS is an acronym for Capital Adequacy, Asset Quality, Management Oversight, Earning, Liquidity, and Sensitivity to Risk which takes into consideration the corresponding ratios and indicators to measure bank performance and financial safety. This framework is being used by Indonesia, Philippines, and Hong Kong. China makes use of the CARSEL framework, which stands for Capital Adequacy, Asset Quality, Regulation Compliance, Strategies and Stability, Earnings, and Liquidity. Malaysia makes use of Risk Based Supervisory Framework while Thailand makes use of Risk-Based Supervision. These different frameworks make use of different ratios and indicators of banking performance and financial safety although they can give similar implications regarding the prudential regulations that supervisors utilize. Chapter 2 (Castell, 2011) compares the prudential regulations of the ASEAN+3 according to capital adequacy, asset quality and diversification, and bank liquidity and liquidity risk management taken by supervisors.
Table 4.7: Summary of Minimum Capital Requirements and Capital Adequacy Ratio Requirements in the ASEAN+3 Banks
Country Domestic Bank Subsidiary of a
Foreign Bank Branches of a Foreign Bank
Minimum Capital
Adequacy Ratio
Indonesia IDR 3.0 billion IDR 3.0 billion New entry - not allowed
8%
Malaysia MYR2billion MYR 300 million
n.a 8%
Philippines PHP4.95 billion for EKBs and PHP2.4 billion for KBs
PHP4.95 billion for EKBs and PHP2.4 billion for KBs
PHP1.5 billion for EKBs; PHP 210 million for KBs
10%
Singapore SGD1.5 billion1 SGD1.5 billion1;SGD100.0 million (internet banking) 2
S$200 million2 10%1
Thailand THB 5.0 billion THB 4.0 billion assets: no less than THD3.0 billion
8.5%
China RMB 1 billion for a nation-wide bank; RMB 100 million for a
RMB 300 million
RMB 100 million 8%
127 | P a g e

city commercial bank; RMB 50 million for a rural commercial bank
Hong Kong
HKD 300.0 million –licensed banks; HKD 100.0 million -restricted licence banks; HKD 25.0 million - deposit-taking companies (HK$25 million)
- HKD300 million
8%
Japan JPY 2 billion JPY 2 billion JPY 2 billion 8% of IAB
South Korea
KRW 100B- local bank; KRW 25.0b financial institutions which does not operate nationwide
KRW 100 billion KRW3.0 billion 8%
Source: World Bank’s Bank Regulation Database, Monetary Authority of Singapore, Wibowo, 2009., (Table 2.9 and 2.10), Chapter 2 (Castell, 2011).
It is noticeable from (Table 4.7) that the ASEAN+3 countries have different capital requirements for domestic banks, as well as branches and subsidiaries of foreign banks. This is true for the Philippines, China, South Korea and Hong Kong. The degree of the requirements is high for Singapore, Malaysia and Indonesia, but they are low in Japan and Hong Kong. The Philippines, China, and South Korea impose moderately reasonable amounts of capital requirements (Castell, 2011). Almost all countries (except Hong Kong) allow the entry of foreign subsidiaries and impose same capital requirements as that of domestic banks. This is true for Singapore, Philippines, Japan and South Korea (except for Japan who imposes the same capital requirement as that of other types of banks), whereas Thailand, Malaysia and China require the foreign subsidiaries to meet lower capital requirements. With regard to branches of foreign banks, the Philippines, Hong Kong, China and South Korea impose lower minimum capital requirements as compared to domestic banks. Only Indonesia does not allow the entry of branches of foreign banks. With regard to the minimum capital adequacy ratio, Indonesia, Malaysia, China, Hong Kong, Japan and South Korea follow the International Standard of minimum capital adequacy ratio of 8%, whereas the Philippines and Singapore require 10%, and Thailand requires 8.5%. There are wide disparities among supervisory frameworks that influence how capital requirements are imposed. Castell (2011) reports that the imposition and degree of the capital requirement depend on inherent institutional and structural characteristics in the financial system of a country. A high capital requirement may imply that a country is protecting the industry, so the high requirement is there to discourage new entrants. Low capital requirements may reflect the efforts of a country trying to promote cross-border activities among banks. In the context of money and banking, high capital requirements are necessary to cushion the effects of crises, and will reduce the moral hazard problem among banks, and a higher risk capital ratio is ideal if the country wants to be globally competitive.
128 | P a g e

The lending transaction of the bank is very crucial as it entails not only credit risk but also the bank’s liquidity risk. It is very important to monitor the loan provisioning of banks and therefore it is important to know the tools used by supervisory agents to monitor and classify loan portfolios. It may be seen in (Table 2.12) in Chapter 2 (Castell, 2011) that the ASEAN+3 Central Banks make use of different tools in classifying loan portfolios. Malaysia, Philippines, Thailand, Hong Kong, Japan and South Korea classify their loans (whether they are standard, special mention, sub-standard, doubtful or loss) depending on the duration the loans are in arrears (Batunanggar, 2008). The Philippines, China, Hong Kong, Japan and South Korea make use of business cycle forecasts and other statistical models to provide a forward-looking estimate of the probability of default. On a related note, the inadequate loss provisioning requirements will result to a high percentage of non-performing loans, and if this is not contained, it may come to be one of the causes of a crisis. Castell (2011) summarizes the provisioning requirements for the different types of loans for the ASEAN+3 countries in (Table 2.13) of Chapter 2. It is notable that each country has its own provisioning for each type of loan, and this may be attributed to the supervisory framework that the country implements. The general fashion is that little (1% of loan value) to no provision is required when the loan is standard, but increases as the probability of default increases. 50% provisioning is required if the loan is classified doubtful, and 100% if the loan is considered lost (Batunanggar, 2008). However, in line with the International Financial Reporting Standards (IFRS), banking institutions (BIs) are now required to observe the impairment and provisioning requirements according to the IFRS (this replaced the previous framework which classified loans as substandard, doubtful or loss). In addition, BIs are also required to separately disclose loan amounts which are past due for 90 days or more. Thus, a number of countries do not prescribe any rules concerning special mention loans anymore.
Table 4.8: Exposure Limits in ASEAN+3 Banks
Country Related Parties (as a % of
capital)1 Single Borrowers2
Indonesia 10% 20% (non-related individual); 25% (non-related group)
Malaysia 25% of capital base
Total outstanding credit exposures to all connected parties shall not exceed
100% of a banking institution’s capital base or 25% of total outstanding credit
exposures, whichever is lower.
25% of capital funds
Philippines 25% of unimpaired capital and surplus3
25% of unimpaired capital and surplus
Singapore 25% of capital funds 25% of capital funds
Thailand 5 % of tier 1 capital;
50% of equity of related parties;
25% of tier 1 capital fund
129 | P a g e

25% of total liabilities of related;
parties (whichever is lower)
China 40% (total equity) 3% of equity (individual)
15% (single legal entity)
Hong Kong 25% of capital base
Japan 40% and 25% of capital base Na
South Korea - -
Source: Batunanggar, 2008, (Table 2.14), Chapter 2 (Castell, 2011)
(Table 4.8) was directly lifted from Table 2.14 of Chapter 2 (Castell, 2011). It summarizes the exposure limits imposed by supervisors. These percentages represent proportions of capital that may be used for provisioning. Different jurisdictions use different bases for the limit. Some use capital base, some use unimpaired capital surplus, while others use Tier-1 capital. The higher the limit implies that there is greater credit concentration. This poses high risk on the bank’s loan portfolio, so a bank’s willingness to accommodate large exposures depends on its relationship with the client and the maturity of the loan. This implies then, that a bank willing to take on larger exposure should be prepared with precautionary measures prior to giving out a loan. With respect to the liquidity management frameworks of countries, it may be noted in (Table 2.15) in Chapter 2 (Castell, 2011) that almost all ASEAN+3 countries in the region have common liquidity management policies. Central banks in all countries require minimum holding of liquidity reserves, except for Hong Kong. The central banks of Indonesia, Malaysia, Philippines, Thailand, Hong Kong and South Korea further monitor banks and other financial institutions through requiring them to submit data or reports about their activity as part of their compliance (Siregar and Lim, 2010). The central banks in these same countries conduct on- and off-site examinations as well. These are well in-line with the regulations set by the Basel Committee: developing strategies for liquidity management, establishing information systems for the adequate measurement, monitoring, controlling and reporting of liquidity risk, creating processes to measure and monitor net funding requirements, periodical reviewing of efforts to establish and maintain relations with liability holders, assessing market access, establishing contingency funding plans to handle liquidity crises, and allowing independent evaluation by supervisors regarding banks’ liquidity management (Castell, 2011). (Table 2.16) in Chapter 2 (Castell, 2011) summarizes the different central bank tools for liquidity management. It may be noted that the most used tool among the ASEAN+3 countries is that of Deposits (used in particular by Indonesia, Malaysia, Philippines and Japan), as well as the Intraday Liquidity/Overdraft (particularly used by Indonesia, Singapore, Thailand and South Korea). Among the most used liquidity management tools by ASEAN+3 banks is setting minimum holding of liquid assets, minimum holding of reserves, liquidity ratios, liquidity gap limits, limits on concentration of funding, cash flow projections, maximum cash outflow and stress testing (Ryoo, 2006). Reserve ratios of the ASEAN+3 countries may be seen in (Table 2.18) in Chapter 2 (Castell, 2011), and it is notable that all countries have different basis of the reserve ratio. This primarily depends on the supervisory structure that each country has.
130 | P a g e

E. The Deposit Insurance System Among the various kinds of financial safety nets, the most commonly used across countries is that of deposit insurance. Deposit insurance promotes stability in the banking system as it supports countries’ supervision and regulation. It provides market discipline among banks although this will be a very challenging task on account of the potential moral hazard that may distort the financial landscape. Having a deposit insurance system does not guarantee success nor is it considered as a bad supervisory decision. In fact, over the years, various countries in the region only provided implicit protection system (deposit guarantees) and other financial safety net arrangements such as lender of last resort facility and other liquidity supports in the financial system (Castel, 2011). (Table 2.21) in Chapter 2 (Castell, 2011) summarizes how the funds for deposit insurance are used in different countries. It can be inferred that investment practices among deposit insurers are quite diverse. Funds tend to be invested more in Deposit Insurance companies’ own investment policies, as well as government securities. Many others deposit with the Central bank and other financial institutions. The Deposit Insurance System primarily covers deposits for all ASEAN+3 countries, foreign currencies for all except Singapore, Thailand and Japan, and interbank deposits only in the Philippines. These variations depend on the different definitions used by the deposit insurers which limit non-bank deposits from the protection scheme and also on the type of insured financial institutions (Table 2.22, Chapter 2, Castell, 2011). IV. Empirical Relationship of Bank Regulation, Supervision and Deposit Insurance on Banking Sector Development
The Chapter 3 by Dacuycuy (2011) presents an empirical estimation of the effects of specific bank characteristics, macroeconomic country characteristics, and regulatory variables on the banking performance of the top 10 banks in each country of the ASEAN+3. He presents 3 dependent variables, wherein the effects of the aforementioned independent variables are tested.
In the first model, average net interest margin (NIM) on the banks of the ASEAN + 3 countries is used as the dependent variable and proxies for bank intermediation cost. For the second model, average net loans to asset ratio (Loans) is used as the dependent variable in order to determine how regulation affects the banks’ ability to lend. The third model makes use of average cost to income ratio (Costs). These models were derived directly from the methodology in Demigurc-Kunt, Laeven and Levine (2004) as they combine country-specific characteristics, bank-specific characteristics and regulations on bank operations to make sure of the robustness of the effects. Using BANKSCOPE data, Chapter 3 (Dacuycuy, 2011) makes use of generalized least squares with random effects to determine how the three dependent variables are being influenced by bank and country-specific characteristics, and regulatory variables. (Table 4.9) summarizes the regression results of the three models:
131 | P a g e

Table 4.9: Regression Results for Net Interest Margins, Loans and Costs as functions of Bank, Country, and Regulatory Variables
Variables NIM (1) Loans (2) Cost (3)
Bank Size -2.171 *** 0.157 -0.374 *** Bank Equity 0.102 *** 0.006 -0.034 *** Fees 0.106 -0.0043 0.129 *** Liquidity -0.010 -0.013 *** -0.003 ** Bank Risk -0.256 -0.015 0.195 *** Bank Industry Concentration
-0.052 *** -0.0006 0.009 ***
Ban
k C
hara
cter
istic
s
Market Share 0.087 *** -0.004 0.000 Inflation -0.243 *** 0.049 ** -0.021
Cou
ntry
C
hara
c.
Per capita GDP Growth
0.135 0.041 * -0.110
Reserves 0.851 * -0.451 *** 0.473 ***
Deposit Insurance
1.259 *** 0.174 * -0.230 ***
Reg
ulat
ory
Var
iabl
es
Activity restrictions
0.562 *** 0.011 0.003
Source: Table 3.3, 3.7, 3.8 in Chapter 3, Dacuycuy, 2011. Note: *, **, *** indicates 10%, 5% and 1% level of significance respectively
For the first model, it is evident from the regression results that bank size reduces NIM, due to smaller banks having less revenue opportunities, thus forcing them to have higher net interest margins. Consistent with the results of Demigurck-Kunt, Laeven and Levine (2004), bank equity has a positive effect on NIM because well-capitalized banks may charge higher interest rates on loans and lower interest rates on deposits in order to maintain their capital adequacy. Fees have a positive effect on NIM indicating the bank’s objective of earning income through non-interest income-generating activity. However, the effect of fees is statistically insignificant. Liquidity reduces NIM due to the trade-off between liquidity and higher return. Bank risk, which is the standard deviation of the rate of return on average assets reduces NIM, which indicates the higher the risk that the bank engages in its average assets, the lower the interest margin that they have because they will need to compensate depositors for the risk they engage in. Bank industry concentration reduces NIM which gives evidence that larger banks have lower intermediation costs due to economies of scale. This supports the idea that banks engaged in mergers and consolidation in response to the Asian financial crisis. Market share appears to increase NIM indicating that banks with greater control of the market has more revenue-generating opportunities.
With respect to the effects of macroeconomic variables, it may be seen that inflation
reduces NIM probably due to the need to compensate depositors for inflation. This may also represent the effectiveness of monetary policy in maintain price stability. Higher per capita GDP growth increases NIM, but is statistically insignificant. Real per capita GDP growth is a proxy for market opportunities, or how banks respond to business cycle fluctuations (contracting loans during recessions and expanding loans during expansions).
As regards to regulatory variables, it may be seen that Reserves and Deposit Insurance,
together with Activity restrictions increase NIM. Interestingly, Dacuycuy (2011) finds that
132 | P a g e

including Reserves or Deposit Insurance alone causes robustness issues in the empirical model, but including Activity Restrictions makes all regulatory variables positively and statistically significant determinants of NIM. A regulatory rule results in mitigating risks, which Dacuycuy (2011) finds that including regulatory variables removes the statistical significance of the effect of bank risk on NIM. Imposing higher reserve requirements will force banks to lend less, thus resulting to higher NIM. Higher deposit insurance increases NIM due to banks greater engagement with riskier assets. The interest that banks charge on loans increases because borrowers that are willing to pay for higher interest are usually those who are engaged in risky investments, thus increasing NIM. Banks engage in this behaviour because of higher deposit insurance. Activity restrictions increase NIM as well. Activity restrictions are most often in place in order to stem unnecessary risks associated with real estate, participation in stock market activity as well as that of insurance activity. Imposing these restrictions increase the cost of financial intermediation, which may result to a misallocation of financial resources. Checking for robustness, Dacuycuy (2011) finds that when activity restrictions are included, fees, liquidity and bank risk lose their statistical significance due to these restrictions limiting non-interest operating income activities.
For the second model, only liquidity has a statistically significant effect on the loans to
asset ratio. Liquidity (or greater liquidity requirements) reduces the capability of banks to give loans. Particularly, the regulatory variable, reserves (or the increase of the reserve requirement), reduces the capability of banks to make loans, since this directly implies that a larger proportion of deposits may not be used for making loans. Deposit insurance increases the credit creation ability of banks because of the same reason indicated earlier wherein banks engage in more risky lending. However, Dacuycuy (2011) posits that this does not give sufficient evidence of a moral hazard problem. Among the three regulatory variables, only reserves and deposit insurance has statistically significant effects on the loan to asset ratio. For the third model, cost to income ratio is a simple measure for assessing bank efficiency, which is more desirable if the value were smaller (since this implies the bank is managing its costs well, while generating a modest amount of income). Dacuycuy (2011) posits that larger and well capitalized banks will be more efficient, and will have greater access to practices and technology that reduce costs, thus, will have a lower cost to income ratio. This is confirmed in the third regression model wherein both bank size and bank equity reduce the cost to income ratio. It may be seen as well, that increases in liquidity result to a lower cost to income ratio as well, although the marginal contribution is not as large as bank size and equity. The conduct of non-bank activities will incur fees which then increase the ratio. When the bank is faced with greater risk, it employs more measures to mitigate the risk thus contributing to a higher ratio. When the industry is more concentrated, dominant banks often engage in strategic competition, thus increasing the costs that these banks face. Of all the bank-specific characteristics, only the market share controlled by the bank is a statistically significant determinant of the cost to income ratio. With regard to country-specifics, inflation is a statistically insignificant determinant of the ratio, whereas per capita GDP growth improves the ratio, because when the economy is growing, the amount of financial transactions will increase, enabling banks to increase their operating income. With respect to the regulatory variables, it is seen that activity restrictions have no effect on the ratio. Deposit insurance on the other hand is highly significant, and Dacuycuy (2011) posits that it may either have a negative or positive effect on banks’ operating income depending on whether deposit insurance may act as an incentive inducement device that discourages the increase in income due to risky business activity, or may have a positive effect on operating income despite an eminent moral hazard. The positive effect on income
133 | P a g e

seems to be more apparent as can be seen from the regression results since deposit insurance reduces the cost to income ratio. Reserves have a positive effect on the ratio since operating income may be reduced when banks have less funding to lend out. V. Compliance with the Basel Requirements, Issues and Implications
A. Role of Banks in Recent Financial Crises
As major components of the financial intermediation system of economies banks are exposed and vulnerable to the hazards of any financial crisis. Thus, they played a significant role in the engendering some of the causes of the financial crisis in recent years as well as part of its transmission, magnification and debilitating impact.
One of the major causes of the Asian Financial Crisis (AFC) in the late 1990’s was the massive built up of short term external debt incurred by many countries in the ASEAN and the East Asian region. With the monetary authorities pursuing a pegged exchange rate policy banks in the region were encouraged to borrow abroad and lend it domestically since the Central Banks implicitly absorbed the exchange risks with its virtual fixed exchange rate.
Given this backdrop banks in the region were indiscriminate in extending loans particularly to the real estate sector (in the case of Thailand) and some preferred companies (in the case of South Korea) with negligible due diligence. When the property prices plummeted accompanied by an economic slowdown some major companies went bankrupt and banks became vulnerable because of the inability of their debtors to pay their obligations. With this development the flows of funds reversed as many foreign creditors withheld their funds from threatened banks, bankrupt companies and perceived unstable countries in the region.
This reversal together with the slowdown in exports resulted in the rapid depreciation of several currencies in the region. As banks tried to service their foreign loans they have sourced more foreign exchange to pay the higher cost of their external obligations given their depreciated currencies. This in turn led to huge losses as well as bank bankruptcies. What started in Thailand was transmitted to other capitals in the region as foreign creditors became lukewarm in the flow of funds since they perceived that banks in the region were similar in that they are inadequately protected from various risks. (Tullao, 2009)
The US Financial Crisis (USFC) in 2008, on the other hand, was caused by many factors including the huge inflows of funds from surplus countries in the Asian region and other emerging economies, liberal or almost arbitrary credit extension of banks to the property sector, securitization of loans, and the unregulated and underinsured trading in securities. Banks again played a pivotal role in the initiation, diffusion and impact of the crisis.
Huge capital inflows into the US coming from the BOP surpluses of China and other emerging economies were used to buy bonds and other financial instruments. As a consequence of excess liquidity banks look for high yielding but risky alternatives. Excess liquidity led to liberal loan policy including the giving of subprime loans in the housing sector. Too much liquidity prompted banks to give unsecured loans. The boom in housing sector likewise encouraged people to take mortgages.
There was also an increase in investments in derivatives including credit default swaps because these financial instruments allowed buyers to minimize risks in mortgage backed
134 | P a g e

securities. Insurance companies covered many these credit default swaps of mortgage backed securities because they reaped huge profits given the perceived low probability of default in many of huge financial institutions issuing these credit default swaps. However, with the economic slowdown housing prices collapsed and the bust in asset prices were transmitted in the financial assets. Prices of various financial assets including bonds and stocks went down. Many banks and financial institutions were holding depressed financial assets with no value or illiquid.
Worse, many banks and financial institutions became insolvent because they were having difficulties collecting from the housing loans and the tight liquidity in the market made it even harder and more expensive for them to borrow. Because many financial institutions were having difficulties, other banks refuse to give loans as the interbank interest rate went up. This further tightened the liquidity as banks refuse to extend loans to firms as a protection against the threat of insolvencies.
As a consequence, the stock market in Wall Street crushed with the dive of Dow Jones. Large financial institutions like Lehman Brothers, Merill Lynch and Bern Sterns incurred huge losses and have to declare bankruptcy. The American Insurance Group (AIG), the largest insurance company in the world had incurred huge losses and had difficulty raising more funds to finance the insurance cover it made for credit default swaps on bonds and other derivates based on housing mortgage.
In response, the US Treasury extended USD 85 billion to AIG to avert its eventual bankruptcy. Fannie Mae and Freddie Mac, the largest housing mortgage institutions were saved by the government with USD 200 billion loan in order to revive the sluggish housing market. Berns and Sterns received USD 20 billion assistance from the government to save it from eventual bankruptcy, The government of US with the approval of the US Congress allotted USD 700 billion in order to avert the worsening of a financial meltdown. (Tullao, 2009b)
If banks were indiscriminate in the credit extension particularly in the property sector experienced in the AFC and USFC the European Financial Crisis (EFC), on the other hand, stem from the undisciplined fiscal sector in the European Union. Although there is monetary integration in the region with a large number of member countries adopting the euro as the single currency, on the one hand, more relaxed rules on fiscal harmonization and less stringent penalties on profligate member countries, on the other hand, were pursued. This incurred huge fiscal deficits and financed their imbalances through the issuance of government securities.
In such a backdrop, banks are likewise threatened by this new source of risks since these euro denominated bonds were held by European banks. With distraught and cashless governments facing default the euro depreciated. Moreover, any possibility of default from these countries and a downgrade in credit ratings took a beating on banks as they can tighten liquidity and worse losses on their balance sheets. With the possibility of default and downgrade of sovereign bonds, the cost of borrowing further went up and further tightened liquidity. This has deflationary impact on the real sector that spread across the union.
The International Monetary Fund and the European Central Bank responded by extending loans to threatened government to prevent the possibility of default on condition that affected governments must undertake the bitter pills of structural adjustments including higher taxes and reduction of government subsidies to various sectors. Aside from the required structural adjustments banks took a beating when they were asked to accept payments for maturing sovereign securities at a huge discount in exchange for renewed loanable funds from
135 | P a g e

international creditors. With these unpopular policy recommendations, a number of governments in the union were replaced to implement these structural changes in the economy. But the sentiment of the market persisted and funds managers withdraw funds from the region that further tightened liquidity.
VI. Some Issues on the Basel Requirements
We have seen in the previous section that banks, as major components of the financial intermediation system, have been the one of sources of the crisis, the route of its transmission, and the victims of its impact. Given the variability of the causes of financial crises in recent past the Basel Accord has responded by improving its previous capital requirements and regulatory and supervisory measures. Because of the effects of these measures on cost, management, profitability and credit creation these requirements are opposed by the banking sectors across the globe. The majors concerns in these criticism is the variability of the causes of crisis, the extent of exposure to risks, the degree of vulnerability of the banks given the variations of banks features in terms of assets and in terms of exposure to risks.
In (Table 4.10) a listing of significant changes in Basel III is summarized. Basel III has raised the capital requirements for Tier 1 capital ratio, Core Tier 1 Capital ratio and added capital conservation buffer to shield the banks from future periods of stress and counter cyclical buffer. The purpose of the conservation buffer is to ensure that banks maintain a buffer of capital that can be used to absorb losses during periods of financial and economic stress. While banks are allowed to draw on the buffer during such periods of stress, the closer their regulatory capital ratios approach the minimum requirement, the greater the constraints on earnings distributions.
Table 4.10. Summary of Requirements in the Basel III Accord.
Criteria Basel III
Capital Requirements
Tier 1 Capital Ratio = 6%
Core Tier 1 Capital Ratio (Common Equity after deductions) = 4.5%
Capital Conservation Buffer*
Banks will be required to hold a capital conservation buffer of 2.5% to withstand future periods of stress bringing the total common equity requirements to 7%.
Countercyclical Capital Buffer
A countercyclical buffer within a range of 0% – 2.5% of common equity or other fully loss absorbing capital will be implemented according to national circumstances. Banks that have a capital ratio that is less than 2.5%, will face restrictions on payouts of dividends, share buybacks and bonuses.
Capital for Systemically Important
Systemically important banks should have loss absorbing capacity beyond the standards announced today and work continues on this issue in the Financial Stability Board (FSB) and relevant Basel
136 | P a g e

Financial Institutions (SIFIs)**
Committee work streams. The Basel Committee and the FSB are developing a well-integrated approach to systemically important financial institutions which could include combinations of capital surcharges, contingent capital and bail-in debt.
Leverage Leverage Ratio = Tier-1 / Assets = 3%, including off balance sheet
Liquidity Liquidity Coverage % (LCR) =
(Stock of high quality liquid assets – Cash, CB deposit, sovereign bond, bond, equity, corporate bond) / (Net cash outflows over a 30-day time period – deposit run off, corporate funding) ≥ 100%
Net Stable Funding % (NSFR)
(Available amount of stable funding – Tier 1 & 2, Preferred Stock, Liquidity & Term deposit over 1 year) / (Required amount of stable funding – sovereign bond, securities, government bond, equity, loan) > 100%
Aside from increasing substantially the capital requirements, Basel III has introduced
new definitions to be included as part of core capital. What used to be components of core capital previously are no longer considered. In addition, there is divergence among banks in terms of assessing risk-weight assets. The issue here is a standard assessment as against certain level of flexibility to allow the determination of core capital. This heightened requirement on capital adequacy can create heavy reliance on core capital (common equity and retained earnings). Capital instrument selection and issuance will become more challenging in terms of acceptability of minority interest. Tier-2 and other types of capital may be subjected to further scrutiny. Existing securities will benefit from the prolonged transition and special treatment, and will weaken the incentive for banks to redeem such instruments (Asian Bankers Association, 2010). In terms of capital strategy, governments’ injection of capital may cause banks to aggressively write-off non-performing loans and convert capital instruments into common equity during a crisis, which may dilute shareholder composition. This will cause banks to reluctantly cooperate with government capital injection which may lead to bank failure, systemic risk in the financial industry, accelerated de-leveraging and portfolio scale-down which would exacerbate pro-cyclicality. (Asian Bankers Association, 2010).
On the other hand, a high amount of capital is important for banks, especially because it limits the risk-taking capacity of banks, inducing them to lend to relatively safer investments/projects. A greater capital ratio, particularly that of common equity entails that managers will take care of their funds better. Furthermore, this will enable banks to comply with the reserve requirement set by their corresponding central banks.
137 | P a g e

Table 4.11. Country-Average Tier 1 Capital Ratio (2005-2011)
Country 2005 2006 2007 2008 2009 2010 2011
CN 7.315 7.89 9.71
10.61285714
9.116666667
8.304444444 9.43
ID 15.57444444 14.428 15.373 14.359 12.96
13.51888889
13.25111111
JP 6.732222222
6.686666667
7.394444444 15.738 16.509 18.733 12.6675
KR 10.682
9.618333333
9.351666667 9.31
11.41333333 12.454 14.495
MY 10.46571429
10.16714286 9.28
9.164444444
10.22444444
11.40666667 10.6275
PH 19.53
16.50166667
13.14909091
12.26818182
12.11545455
12.25636364
12.88428571
SG 11.8
27.13333333 24.374
40.64222222
37.15111111
41.22285714 15.815
TH 10.66777778
11.08333333 11.861
12.18909091
11.59545455
11.71090909
11.49571429
VN 7.56
6.496666667 9.6125 9.63 18.5025
14.26666667 17.44
Source: BANKSCOPE
It may be seen in (Table 4.11) that in 2010, Tier 1 ratios in ASEAN and East Asian
countries have easily increased way above the Tier 1 capital requirement set by Basel III. No country has Tier 1 capital below 8%, and the highest of that year would be Singapore with nearly 41% of Tier 1, followed by Japan with 18.8%, and the rest of the East Asian countries, averaging around 13-15%. The lowest among the countries would be China, with 8.3% of Tier 1 capital.
Table 4.12. Country-Average Total Capital Ratio (2005-2011)
Country 2005 2006 2007 2008 2009 2010 2011
CN 9.95
10.03857143
12.02142857
12.91857143 12.01
11.07222222
12.03625
ID 20.179 19.776 20.17 18.502 15.376 15.948 14.963
JP 11.33111111
11.42555556
12.28111111 19.19 20.235 22.535 16.905
KR 14.072
13.02833333 12.61
12.35166667 14.36
14.42833333 13.78
138 | P a g e

MY 14.11285714
14.25285714
13.50714286
13.46888889
14.02555556
15.12777778
14.72625
PH 20.844 19.581 16.87
15.32636364
15.81090909
16.18909091
16.64428571
SG 16.65
30.63333333 26.23
41.89111111
38.26777778
42.21428571 18.73
TH 13.39222222
13.64222222 14.167
14.01363636
14.19090909
14.98636364
15.65428571
VN 9.896
8.161666667
11.51625
12.37571429
15.48333333 14.104 17.79
Source: BANKSCOPE
Almost the same picture can be seen in terms of the country-averages of the total capital ratio of banks in ASEAN and East Asia as can be seen in (Table 4.12). Singapore leads with 42.21%, followed by Japan (22.535%) whereas banks of other countries average aroung14-15% total capital ratio. Another feature of Basel III is the capital reserve for Systematically Important Financial Institutions (SIFI). SIFIs are banks that are given much importance above other banks due to the size of their assets and deposits as well as their level of capital. These banks are what is considered “too big to fail”, since if any one of these SIFIs become vulnerable to shocks or to crises, this will cause mass instability in the region. Although this requirement addresses that there is wide variability in the size of banks and their impact on the financial sector is quite massive if they become vulnerable to risks. However, huge Chinese and Japanese banks in the region complain that this requirement should be qualified further because although they are huge they are not that exposed to risks and therefore less vulnerable to the crisis since they exposure is mainly the domestic market and have very limited exposure to international banking.
Other issues arising from the proposals under Basel III pertain to derivative clearing, liquidity and resolution. Because the concentration of risks in the over-the counter trading in derivative is not too transparent as experienced in the USFC, the US now requires higher capital and margin requirements for un-cleared derivatives. Although this is acceptable to banks the issue arises from the non-standardization in margin and capital requirements. In the absence of a common global requirement, some regional markets of derivatives can impose lower margin and capital requirements at the expense of US banks engaged in derivatives trading.
On liquidity issue, because of the risks associated with short term loans, Basel III is reviewing standards to increase long term funding and retail deposits for banks to hold more liquid assets. However, such international requirement may have an adverse effect on lending. Although this requirement may enhance the stability of the banks, it downplays national and local needs for credit creation. Thus, global regulatory measures for banking stability should also consider the opportunity cost of holding too much liquid assets in terms of the financing needs the local market.
139 | P a g e

Another important issue that has highlights the differences between national and global regulations pertains to resolution of affected or vulnerable banks. There are two options in addressing distressed banks. One is to provide cost efficient rescue plans and the other is to allow them fail to with minimal social cost. In the absence of global rules on resolution, national responses may protect domestic savers and taxpayers over foreign creditors. Cross-border regime will be hard to achieve, leaving a patchwork of national regimes and increasing pressure on banks to create subsidiaries. (The Economist, July 2, 2011 p.64.)
VII. Concluding Remarks and Policy Implications
A. Some Initial Findings and Conclusions
The crises that occurred over the past two (2) decades have provided valuable lessons among countries in the ASEAN+3 region and have motivated them to design appropriate solutions for ensuring financial stability. Currently, ASEAN+3 banks, overall, have remained resilient despite the European sovereign debt crisis, sluggish US economic growth, and moderating growth in emerging markets, including emerging ASEAN+3 markets. This is evident in their adequate capital holdings, ample liquidity, sound asset quality, and healthy profitability.
In terms of banking features, the size of banks in the region varies significantly. The top
Chinese banks have an average asset of USD 828 billion in 2010 while the top Japanese banks registered USD 835 billion in the same year. However, the banks in the ASEAN pale in comparison. The top banks in Singapore have an average asset worth only USD 57.1 billion while the top banks in the Philippines are a little than a tenth of the average bank assets in China or Japan.
Although there is wide variability in terms of bank size, the growth of these top banks followed similar trajectory making bank credit the dominant source of domestic credit in the region. In addition, the top banks in each country are quite stable based on capital adequacy, asset quality, profitability and liquidity. The top banks are adequately capitalized with capital adequacy ratios over and above the statutory requirements of 8% for BIS and 4 % for Tier I capital under the Basel Accord. In addition, asset quality has improved with the temporal decline in the Non-Performing Loans. Returns on Assets and Returns on Equity have likewise improved over the years. In terms of liquidity, the ratios are quite high and acceptable but have declined recently because of the pressures arising from the European Financial Crisis.
The regulatory measures and framework on bank supervision are likewise in place and well functioning while compliance with the Basel requirements are being implemented or are in progress. Various reforms in the supervisory structures and frameworks have been introduced since the Asian Financial Crisis. However, significant heterogeneity among supervisory structures and practices exist in the region. Many countries have multiple supervisory structures within the financial system, while others have integrated supervisory framework. These differences are influenced by many factors including among others the levels of financial and economic developments, the institutional underpinnings and the existing legal framework. Many of these agencies have surveillance mechanisms in place with sanctions on erring banks and independence of bank supervisors.
Recent developments have been put forward by many supervisors to improve regulatory framework in line with the international best practices introduced by the Basel Committee on Banking Supervision. However, compliance varies among countries with only 46 percent of
140 | P a g e

Asian economies are compliant on the Core Principles on Licensing and Structure but none is fully compliant on the Basel Core Principles for Effective Banking Supervision. Notwithstanding the observed differences among countries in terms of their regulatory practices, the existing approaches used by countries for prudential regulations are believed to be the best at the current juncture.
Currently, there is an increased observance of the international regulatory standards
among banks with the intention of integrating national regulatory framework with the guidelines for best practices in the global context. These levels of observance contribute to a sound financial system, as supervisors struggle to align national regulatory framework with international standards.
Prudential regulations in the region revolve around the capital adequacy and the liquidity risk management framework proposed by the Basel Committee on Banking Supervision. However, there are variations in the determination of minimum capital required for the establishment of domestic banks and foreign subsidiaries across the region. Aside from maintaining stability the high capital requirement has served as deterrent for new entrants. There are also variations in the capital adequacy ratios across the region but these have exceeded international statutory requirements.
While the CAMELS system is used by many supervisors and banks in most of the countries assessed in the study, other rating systems to evaluate and monitor bank performances cannot be discounted. What is interesting to note on these micro-prudential measures is the fact that almost all the countries in the region have already incorporated in their existing regulations and practices the guidelines issued by the Basel Committee for Banking Supervision at different levels.
Aside from mechanisms and tools used by the Central banks in managing liquidity a number of financial safety nets including deposit insurance system are also in place to protect depositors from bank runs as banks struggled to manage their liquidity arising from a crisis. The interplay of these financial safety net arrangements and combination of these instruments vary across countries. However, many financial safety net arrangements have resulted to costly financial restructuring schemes for the government. The development of the deposit insurance systems in the region was evident after the Asian crisis. Over the past decade, those with existing protection systems have undertaken significant modifications in their mandates and regulations while those with temporary deposit guarantees have created a permanent protection scheme. Despite the disparities among economies in their DIS set-ups or models, the region represents a good mixture of deposit insurance systems. The region has a combination of few but mature systems and some new yet well-established systems. There are also variations in the powers and governance of the deposit insurance systems which hinge on their structures or mandates.
The pursuit of financial stability as indicated by capital adequacy and liquidity
management and the strengthening of prudential banking mechanisms is not without cost. It has been empirically shown that capital requirements may have impact on the performance of banks, interest margin and ultimately the ability of banks to perform their primary function in financial intermediation. Imposing higher reserve requirements will force banks to lend less, thus resulting to higher net interest margin (NIM). Higher deposit insurance increases NIM due to banks greater engagement with riskier assets. The interest that banks charge on loans increases because borrowers that are willing to pay for higher interest are usually those who are engaged in risky investments, thus increasing NIM. Activity restrictions increase NIM as well.
141 | P a g e

Activity restrictions are most often in place in order to stem unnecessary risks associated with real estate, participation in stock market activity as well as that of insurance activity. Imposing these restrictions increase the cost of financial intermediation.
In terms of the effects of regulatory variables, the increase of reserve requirement reduces the capability of banks to make loans. Deposit insurance, on the other hand, increases the credit creation ability of banks because of the same reason indicated earlier wherein banks engage in more risky lending. Among the three regulatory variables, only reserves and deposit insurance have statistically significant effects on the loan to asset ratio. These regulatory variables have also significant effect on cost to income ratio. Deposit insurance reduces cost implying higher profitability while reserves increase costs and lower bank profitability.
Given these positive banking features and the presence of regulatory and supervisory mechanisms banks in the region are relatively stable and protected with the usual financial armaments to protect them and withstand the systemic risks that have threatened the financial sector in the past. The debilitating impact of the Asian financial crisis on banks in the region was a wake up call for banks in the region to strengthen their shields against risks, minimize their exposure and mitigate their vulnerability to financial risks. The improvements in the features of the banks in terms of capital adequacy, asset quality, management, equity and liquidity and the attending supervisory and safety nets prepared these banks to withstand the havoc brought about by the US Financial crisis and to keep the European fiscal and monetary crisis at bay. However, measures toward maintaining financial stability have cost as shown by the impact of regulatory measures on net interest margin, ability to extend loans and the profitability of banks. In this light there is a need to pursue an optimal policy mix that will balance the need for banks to be financially stable, on the one hand, and perform the major role of banks in financial intermediation.
B. Policy Implications
The stability of the banking sector rests on the capacity of banks to withstand risks that may threaten the financial sector in particular and the economy in general. Protection from exposures to these systemic and market risks and insurance against vulnerability will depend on the how these banks are able to built up sufficient capital to cover them in any eventuality. There is a need to protect and insure banks from various risks in financial intermediation that has been complicated because of the increasing complexity of the roles of banks in financial intermediation, globalization of the market for goods and funds and the nature of the risks and causes of the financial crisis. However, there are opportunity costs to some of these regulations including among other the cost on credit creation as shown in the increase in the interest margin and the decline in the loans granted as shown in the empirical investigation.
Although the banks in the region have remained stable in the light of the current European financial difficulties and the US crisis a few years back the outlook for banking systems and economic performance in Europe and the US is not positive; this is highlighted by several downgrades of US and European banks in December 2011 and more recently, the ratings downgrade of nine European economies, which includes France, Italy, Portugal, and Spain, in January 2012. These may have repercussions on the health of ASEAN+3 banks, as many of the large banks in the region have exposures to banks and sovereigns in Europe and the US. At the same time, several ASEAN+3 economies have been registering a slowdown in their growth as their exports deteriorated due to the sluggish demand from their major European and US export markets.
142 | P a g e

These downside risks are threatening the stability of the banking sector in ASEAN+3, thereby calling for policy responses that would help insulate the region from a possible financial contagion that is likely to emanate from the West. Indeed, such risks have begun to encroach upon ASEAN+3 banking systems, and these are evident via the tightening of bank lending conditions and intermittent surges in credit default swaps (CDS) of Asian banks. Moreover, as the region’s economic growth eases, with growth being pulled down by weak export performance, local banks’ profit margins may narrow down. Against this backdrop, there is an impending need for ASEAN+3 policymakers to exert efforts that aim to mitigate the downside risks that can create financial vulnerabilities. The general goal of stronger regional financial cooperation is to maintain the resiliency of the banking system and boost banking sector stability, and safeguard credit creation which is the engine for financial development and inclusive growth. Specifically, ASEAN+3 policymakers must continue monitoring closely financial sector and economic developments in the global economy and in their respective countries in the region in order to better prepare and insulate local banks from external shocks. Moreover, there is a need for policymakers to strengthen their financial cooperation efforts in dealing with and preparing for sudden capital reversals owing to a loss in market confidence, as well as in times of banking crisis situations. Timely sharing amongst policymakers of bank-specific data and information on their respective markets may be helpful in order to come up with “real-time” or immediate and appropriate policy responses. Constant bank stress tests and transparency in their findings may also be called upon by policymakers to ensure that banks are capable of withstanding the worst-possible scenario. Among the policy measures that they may tackle are: i) Liquidity measures – such as bank guarantees, deposit insurance, currency swap arrangements, or other appropriate financial safety nets -- that will help banks during times of a liquidity crunch; ii) Bank mergers and consolidations with the aim of helping banks meet the high capital requirement standards of Basel III; iii) Bank privatization, which can help state-owned banks be injected with additional capital and adopt superior management and technology and thereby improve on their business operations and reputation; and iv) Risk management techniques, which can help improve on their asset quality and risk-adjusted return.
However these policy options do have opportunity costs. Policies that are designed to promote internal restructuring through consolidations and mergers appear to contribute towards bank efficiency but at the same time, may increase industry concentration and banks’ market shares. During the aftermath of the Asian financial crisis, a key initiative among ASEAN +3 countries was to deregulate the banking industry, thereby allowing the entry of foreign banks that led to consolidations. Bigger banks have the potential to reduce intermediation costs because of their ability to pool resources better, introduce more innovative practices and withstand shocks. As shown in the regressions, a bigger bank is associated with lower net interest margins but at the same time, such banks may become large relative to the market that they may now be able to set higher interest rates on loans, thereby increasing the net interest margin and putting a drag on the efficient allocation of financial resources. Because the resultant industrial organization may be reconfigured by promoting competition, there is a need to revisit national bank entry regulations and bank competition policy. Moreover, it is also evident from the empirical results that policies that promote the increase in capitalization requirements may not necessarily translate into lower net interest margins. Even in ASEAN + 3, highly capitalized banks may increase net interest margins because of their ability to withstand bankruptcy risk.
143 | P a g e

In light of the crisis in Europe, there is a need to analyze how debt to GDP ratio affects bank performance since banks are among the major financial institutions that buy sovereign bonds. In the study, higher debt to GDP ratio negatively affects net interest margin but caution should be exercised in interpreting the results since an increase in a country’s degree of indebtedness may lead to a lower net loans to total assets ratio. There are also studies that point to the plausible link between excessive debt to GDP ratios and economic growth. A key policy initiative is to develop early warning mechanisms that would inform banks on the true fiscal state of countries issuing sovereign bonds. This also necessitates a periodic assessment of banks’ asset holdings.
In terms of prudential supervision and banking regulations calibrating existing measures poses a challenging task among central banks and supervisors. This requires a thorough understanding of the different types of risks to fully address the problem and use the appropriate policy measures among a wide range of policy instruments that the central bank can use as part of its monetary policies. Supervisory authorities in the region must be more vigilant in addressing the problems through the use of various surveillance mechanisms. Likewise, refinement of existing regulatory frameworks must be undertaken on a continuous basis to maintain stability in the financial system. Notwithstanding the introduction of regulations related to liquidity risk management, supervisors must vigorously enhance their policies so that they are synchronized with the regional level. At the regional level, crisis management resolutions have to be introduced both at the national and regional levels. While regulations are put into place within the financial infrastructure of the country, the magnitude of its implementation vary in every jurisdiction. Reforms must incorporate uncertainties that surround these regulations or reforms to ensure safety and soundness in the financial system while introducing innovations and efficiency.
More liquidity risk enhancements must be introduced such as those that address contingencies and funding requirements, especially those that are related to foreign currency transactions. These transactions involve complexities and are vulnerable to risk compared to transactions made in local currencies, especially when there is reversal in capital flows. Since liquidity management varies across countries, efforts must be undertaken to address the management of the banks’ assets and liabilities to reflect liquidity needs and to maintain a balanced portfolio of assets. In addition, the progress and the way banks has implemented the Basel II framework must be re-evaluated at the national and regional levels given the variability in the level of compliance. While it is ideal to implement international best practices, in reality, the changes might not be feasible for banks, given the current conditions. A better understanding of the international guidelines must be made in the light of the limitations of the current financial landscape to fully integrate in the national regulatory framework a workable system for the country. It may be possible that banks are forced to make rapid adjustments to implement the new framework and prepare them for the implementation of the new Basel III framework that may turn counterproductive. Problems on managing banks’ liquidity risk hinges from the absence of a strong framework for the management of liquidity. In this light, harmonized prudential regulations related to capital adequacy and liquidity may be desirable and are important to a strong collaborative arrangement among countries in the region. However, this exercise may be quite difficult as the financial developments among countries in the region are quite diverse,
144 | P a g e

especially those countries which were not included in the evaluation or analysis. At the regional level, agreements among national authorities must be made related to any regulatory reform agenda especially among the countries with underdeveloped financial system.
Moreover, policy instruments that are designed to mitigate bank risks, reduce moral hazard and regulate bank activities must be guided with the fact that these measures appear to be negatively related to bank efficiency. As a monetary policy tool, higher reserves robustly reduce the net loans to asset ratio but at the same time appear to increase net interest margins. Other regulatory tools like deposit insurance and restrictions on bank activities will increase the net interest margin. While it is understandable that activity restrictions are imposed in order to limit moral hazard problems, studies show that loosening restrictions may in fact encourage bank development and reduce the cost of financial intermediation.
In addressing the differences in deposit insurance system, the International Association of Deposit Insurers have successfully released its guidelines for effective deposit insurance systems which are expected to be voluntarily and gradually incorporated in the country’s DIS mandate. Like the banking sector, the implementation of these Core Principles can provide a globally coordinated system for financial safety net arrangements. The issue lies on the current financial and institutional underpinnings of the country’s financial system. It may be possible that at the regional level, compliance with the international standards can slowly be integrated in each country’s financial safety net arrangement and certain issues (i.e.: information sharing, types of financial safety net arrangements, form of surveillance mechanisms to be used, etc) can be coordinated among national authorities which are necessary to prevent crisis and manage it when it occurs.
Given all these issues and implications, regulatory mechanisms should consider addressing the issue of flexibility in the implementation of safeguard measures given the thrust towards standardization of requirements. The move towards international statutory standards including the Basel Accord may pose some problems on several grounds including the variability of bank size, differences on the causes of financial crisis, uncertainties of the exposure and vulnerability to crisis, and the need to manage national concerns and financing needs as well as differences in the resolution measures for banks under siege.
In terms of bank size for example, the Basel III has proposed additional capital requirement for SIFI since these huge banks have extensive negative externalities if ever they fail. Although this proposed measure addresses to the need to have differential safeguards according to bank size, it needs to be more flexible in terms of implementation. The opposition of a number of large Chinese and Japanese banks is instructive. Although they are quite large compared with other banks in the region they are, however, domestically oriented and therefore less exposed to risks and less vulnerable to the havoc of financial crisis that are usually transmitted through global interconnections. Although bank size is indeed can be very risky to the financial sector and the economy, size in itself, however, will not lead banks to be exposed and vulnerable to the hazards external to their business environment. For example, the ability of the regional banks in ASEAN and East Asia to withstand the impact of the US financial crisis and the current European crisis can be attributed to a certain degree to their limited exposure to the US and European financial markets.
In addition, in assessing risks of bank assets there is a need to be more flexible from the standard evaluation of weighing. Because of the variations in exposure and vulnerability, banks may unnecessarily hold capital reserves with huge opportunity costs. Bias against short term
145 | P a g e

loans over long term loans should be reconsidered in terms of the exposure of these loans to risks and the financing needs of the country which may not be uniform across the region.
Resolving the conflict between standardization and flexibility in regulatory measures will
have an impact on the spatial jurisdiction of regulatory bodies. We do not discount the value of international accords on prudential banking and protection against risks but we likewise value the role of national regulatory agencies on banks that may define national concerns. Aside from defining national jurisdiction over global statutory requirements there is a need to define the role of regional bodies. The optimal role is to bridge the gaps between universal standards and national flexibility. In particular, a regional approach also needed to oversee how national regulations and supervisory measures on banking are addressing systemic risks and other risks relative to global standards. The concern for regional cooperation on this matter lies on the need to a have a stable financial system for the entire region.
146 | P a g e

BIBLIOGRAPHY
Chapter 1: Asian Development Bank (ADB). 2011. Asia Economic Monitor. December. Link:
http://asianbondsonline.adb.org/publications/adb/2011/aem_dec_2011.pdf?src=spotlight Bank Indonesia (BI). 2011. Indonesian Banking Statistics (November 2011), Vol. 9, No. 12. Link:
http://www.bi.go.id/web/en/Statistik/Statistik+Perbankan/Statistik+Perbankan+Indonesia/spi_1111.htm
Bank of Thailand (BOT). 2011. Performance of the Thai banking system in the third quarter of
2011. November 15, 2011. Link: http://www.bot.or.th/Thai/PressAndSpeeches/Press/News2554/n5054e.pdf
Bangko Sentral ng Pilipinas (BSP). 2011. Report on Economic and Financial Developments:
Second Quarter 2011. Link: http://www.bsp.gov.ph/downloads/Publications/2011/LTP_2qtr2011.pdf
BSP. 2012. BSP to Fully Implement Basel 3 Capital Adequacy Rules for U/KBs in 2014.
January 6, 2012. Link: http://www.bsp.gov.ph/publications/media.asp?id=2779 China Banking Regulatory Commission (2010). 2010 Annual Report. Beijing. Link:
http://zhuanti.cbrc.gov.cn/subject/subject/nianbao2010/english/zwqb.pdf Economist Intelligence Unit. (EIU). 2011a. Country Finance: China. New York. August. _____. 2011b. Country Finance: Hong Kong. New York. January. _____. 2011c. Country Finance: Indonesia. New York. July. _____. 2011g. Country Finance: Singapore. New York. August. _____. 2011i. Country Finance: Thailand. New York. April. Financial Supervisory Service (FSS). 2012a. Domestic Banks’ Earnings in 2011. Link:
http://english.fss.or.kr/fss/en/media/release/view.jsp?bbsid=1289277491315&idx=1327987337446
_____. 2012b. Funding and Investment of Foreign Bank Branches in 2011. March 16, 2012.
Link: http://www.fss.or.kr/download.bbs?bbsid=1289277491315&fidx=1331789103592 _____. 2011a. Domestic Banks’ BIS Capital Ratios as of end-September 2011. November 28,
2011. Link: http://www.fss.or.kr/download.bbs?bbsid=1289277491315&fidx=1322458225198 _____. 2011b. Domestic Banks’ Loan Delinquency Ratio for end-November 2011. January 4,
2012. Link:http://english.fss.or.kr/fss/en/media/release/view.jsp?bbsid=1289277491315&idx=1325
652029715
147 | P a g e

Fitch Ratings. 2011a. “Chinese Banks: Cash Cushions Thinning as Liquidity Erodes and
Forbearance Burdens Rise.” 02 December. _____. 2011b. “2012 Outlook: Indonesian Banks.” 20 December. _____. 2011c. “2012 Outlook: Japanese Mega Banks.” 16 December. _____. 2011d. “2012 Outlook: Malaysian Banks.” 12 December. _____. 2011e. “2012 Outlook: Philippine Banks.” 6 December. _____. 2011f. “2012 Outlook: Singapore Banks.” 1 December. _____. 2011g. “2012 Outlook: Major Thai Banks.” 20 December. Institute of International Finance (IIF). 2011. Emerging Markets Bank Lending Conditions
Survey 2011Q3. The Institute of International Finance. October 21, 2011. International Monetary Fund (IMF). Financial Soundness Indicators Database. Link: http://elibrary.imf.org/ IMF. 2011a. People’s Republic of China: Financial System Stability Assessment. IMF Country
Report No. 11/321. Link: http://www.imf.org/external/pubs/ft/scr/2011/cr11321.pdf ___. 2011b. Global Financial Stability Report: Grappling With Crisis Legacies. September. Link: http://www.imf.org/external/pubs/ft/gfsr/2011/02/index.htm ___. 2011c. World Economic Outlook: Slowing Growth, Rising Risks. September.
Link: http://www.imf.org/external/pubs/ft/weo/2011/02/index.htm ___. 2012a. Global Financial Stability Report Update. January. Link: http://www.imf.org/external/pubs/ft/fmu/eng/2012/01/pdf/0112.pdf ___. 2012b. World Economic Outlook Update. January. Link: http://www.imf.org/external/pubs/ft/weo/2012/update/01/pdf/0112.pdf Monetary Authority of Singapore (MAS). 2011. Financial Stability Review. November. Link: http://www.mas.gov.sg/resource/publications/fsr/FSR%202011-FINAL.pdf Moody’s Investor Service (Moody’s). 2012. Asia Pacific Banks: Five Risk Scenarios for 2012.
February 6, 2012. People’s Bank of China (PBC). 2011. China Financial Stability Report 2011. China Financial
Publishing House. Link:http://www.pbc.gov.cn/image_public/UserFiles/english/upload/File/China%20Financial%20Stability%20Report%202011.pdf
The Bank of Korea. Survey on Bank Lending Practices (Changes in Q4 2011 and Prospects for Q1 2012). January 4, 2012. Link:
148 | P a g e
http://eng.bok.or.kr/down.search?file_path=/attach/eng/634/2012/01/1325650402406.pdf&file_name=press_release%282011_Q4%29_f.pdf
Chapter 2:
______ (n.d.). Are Your Deposits Insured? By Korea Deposit Insurance Corporation. Retrieved December 4, 2011, from http://www.kdic.or.kr/english/deposit/sub2_2.jsp
______ (n.d.). CDIC Board of Directors—Composition and Terms. Retrieved December 7, 2011, from http://www.cdic.ca/e/whoisCDIC/howCDICisgoverned/board_composition-terms.html
_______ (n.d.) Calculation of Compensation: Amount insured under the DI Scheme. Retrieved December 2, 2011, from https://www.sdic.org.sg/di_calc_of_comp.php
______ (n.d.). Claims Process (from Financial Services Compensation Scheme Retrieved December 3, 2011, from http://www.fscs.org.uk/industry/sub-schemes/accepting-deposits/claims-process/
_____ (n.d.). Commission sets out proposal to increase minimum protection for bank deposits
to €100,000 (by European Union). Retrieved December 7, 2011, from http://europa.eu/rapid/pressReleasesAction.do?reference=IP/08/1508&format=HTML&aged=0&language=EN&guiLanguage=fr
_____ (n.d.) Deposit Protection. Retrieved November 16, 2011, from
http://www.hkma.gov.hk/eng/other-information/consumer-information/deposit-protection.shtml
_____ (n.d.) HKMA Policy Eased Post-Lehman Stress. Retrieved October 10, 2011, from
http://www.centralbanking.com/central-banking/research/1561326/hkma-policy-eased-post-lehman-stress
_____ (n.d.) New Regime for the Supervision of Liquidity. Retrieved December 19, 2011,, from
http://www.hkma.gov.hk/media/eng/publication-and-research/quarterly-bulletin/qb9411/fa04.pdf
_____ (n.d.) Report of the Bills Committee on Deposit Protection Scheme (Amendment) Bill
2010 Purpose. LC Paper No. CB(1)2344/09-10 (Legislative Council of Hong Kong SAR). Retrieved December 8, 2011, from http://www.legco.gov.hk/yr09-10/english/bc/bc05/reports/bc050630cb1-2344-e.pdf
______ (n.d.) Q & A about Deposits. http://www.fscs.org.uk/what-we-cover/questions-and-
answers/qas-about-deposits/#Will_you_compensate_me_for_any_interest_I_have_earned_on_my_account_
_______ (2011). Consultation Paper: Premium Assessment Approach and Target Fund Level
Consultation Paper. Retrieved December 23, 2011, from http://www.cdic.ca/multimedia/Website/Documents/consultation/e/paa_tfl/paa_tfl_Consultation.pdf
149 | P a g e

___ (2011). Increase in the Statutory Reserve Requirement Ratio. Press Release by Bank Negara Malaysia. Retrieved December 18, 2011, from http://www.bnm.gov.my/index.php?ch=8&pg=14&ac=2289
____ (2011). Monetary Board Keeps Rates Steady, Increases Reserve Requirement. A Media
Release by the Bangko Sentral ng Pilipinas. Retrieved December 17, 2011, from http://www.bsp.gov.ph/publications/media.asp?id=2605
____ (2011). People's Bank of China Raises Reserve Requirements 50bps. Retrieved
December 18, 2011, from http://www.centralbanknews.info/2011/04/peoples-bank-of-china-raises-reserve.html
____ (2011). Policy Interest Rates Rise in the Republic of Korea, Thailand, and Viet
Nam;Malaysia Keeps Steady Its Overnight Policy Rate, Increases Statutory Reserve Requirement. Retrieved December 19, 2011, from http://asianbondsonline.adb.org/newsletters/abowdh20110314.pdf
______ (2010) Report of the Bills Committee on Deposit Protection Scheme (Amendment) Bill
2010 Purpose. LC Paper No. CB(1)2344/09-10 (Legislative Council of Hong Kong SAR). Retrieved December 8, 2011, from http://www.legco.gov.hk/yr09-10/english/bc/bc05/reports/bc050630cb1-2344-e.pdf
______ (2008). Deposit Protection Agency Act B.E. 2551 (Unofficial English Translation)
http://www.bot.or.th/English/FinancialInstitutionsDevelopmentFund/Law_Notification/DocLib_Acts/Act_DPA2551.pdf
______ (2009). Republic Act 9576. Retrieved November 6, 2011, from
http://www.pdic.gov.ph/index.php?nid1=10&nid2=5 ______ (2008). Recent Developments in Asian Deposit Guarantee Programs. Asia Focus:
October 2008. Federal Reserve Bank of San Francisco: Country Analysis Unit. Retrieved November 7, 2011, from http://www.frbsf.org/publications/banking/asiafocus/2008/Asia_Focus_Deposit_Insurance_Oct_08.pdf
______ (2008). The IDIC Law: A foundation for Promoting Indonesia Financial System Stability.
Presentation made by Firdaus Djaelani (Acting Cheif Executive Office of IDIC) during the 6thAsia Regional Committee Annual Meeting and International Conference held in Bali, Indonesia on March 2008). Retrieved November 24, 2011, from (www.lps.go.id)
______ (2005). Deposit Protection Act. Retrieved November 23, 2011, from
http://www.kdic.or.kr/english/public/view.jsp?1=1&search_txt=&search_sel=&tbl=laws&ser_no=49723
________ (2005). Hong Kong Deposit Protection Board. Annual Report 2004-2005. Retrieved
November 23, 2011, from http://www.hkma.gov.hk/media/eng/publication-and-research/reference-materials/viewpoint/doc/dis/ar0405e.pdf
______ (2005). Laws of Malaysia Act 642: Malaysia Deposit Insurance Corporation Act 2005.
Retrieved November 24, 2011, from http://www.pidm.gov.my/downloads/act2005.pdf
150 | P a g e

______ (2004). The Law of Republic of Indonesia Number 24 Year 2004 concerning Deposit Insurance Corporation. Retrieved December 1, 2011.
_______ (2002). Deposit Insurance Law (Law No. 34 of April 1, 1971). Provisional Version
Retrieved December 2, 2011, from http://www.dic.go.jp/english/e_laws/2002.9.10.pdf Arner, D. and CY Park (2010). Global Financial Regulatory Reforms: Implications for
Developing Asia. Asian Development Bank: ADB Working Paper Series on Regional Economic Integration WP57. Retrieved September 24, 2011, from http://www.adb.org/documents/papers/regional-economic-integration/WP57-Global-Financial-Regulatory-Reforms.pdf
Australian Prudential Regulation Authority’s (n.d.). Prudential Standard APS 221: Large
Exposures. Retrieved November 6, 2011, from http://www.apra.gov.au/adi/Documents/cfdocs/APS-221-12-12-07-3.pdf
Baker and McKenzie (2010). Financial Rehabilitation and Insolvency Act of 2010 Lapses into
Law in the Philippines. Retrieved November 12, 2011, from http://www.bakermckenzie.com/ALPhilippinesFinancialRehabInsolvencyAug10/
Bangko Sentral ng Pilipinas (2011). Monetary Board Approves Higher SBL for Interbank
Exposures of Small Banks. Retrieved October 8, 2011, from http://www.bsp.gov.ph/publications/media.asp?id=2642
Bangko Sentral ng Pilipinas (201b1). Monetary Board Keeps Rates Steady, Increases Reserve
Requirement. A Media Release by the Bangko Sentral ng Pilipinas. Retrieved December 17, 2011, from http://www.bsp.gov.ph/publications/media.asp?id=2605
Bangko Sentral ng Pilipinas (2006). Circular No. 545, Series of 2006: Guidelines on Liquidity
Risk Management. Retrieved December 14, 2011, from http://www.bsp.gov.ph/downloads/Regulations/attachments/2006/c545.pdf
Bangko Sentral ng Pilipinas (2004). Circular No. 425: Series of 2004. Retrieved October 8,
2011, from http://www.bsp.gov.ph/regulations/regulations.asp?type=1&id=163 Bank for International Settlements (2010a). Financial Stability in Emerging Market Economies:
A Strategy for the Formulation, Adoption and Implementation of Sound Principles and Practices to Strengthen Financial Systems. Report of the Working Party on Financial Stability in Emerging Market Economies. Retrieved October 30, 2011, from http://www.bis.org/publ/gten02.pdf
Bank for International Settlements (2010b). Principles for Enhancing Corporate Governance
issued by Basel Committee . Retrieved October 31, 2011, from http://www.bis.org/press/p100316.htm
Bank for International Settlements. (2010c). Core Principles for Effective Deposit Insurance
System. Prepared by the Basel Committee on Banking Supervision and International Association of Deposit Insurers. Retrieved November 25, 2011, from http://www.bis.org/publ/bcbs156.pdf
151 | P a g e
Bank for International Settlements. (2009). Core Principles for Effective Deposit Insurance System. Prepared by the Basel Committee on Banking Supervision and International Association of Deposit Insurers. Retrieved November 25, 2011, from http://www.bis.org/publ/bcbs156.pdf
Bank Indonesia (n.d.). Key Explanations. Rupiah Statutory Reserve Requirement. Retrieved
December 19, 2011, from http://www.bi.go.id/NR/rdonlyres/D275DE41-9213-44E7-8C8A-73FE9900F837/20980/KeyExplanationsRupiahStatutoryReserveRequirement.pdf
Bank of Japan (2010). Liquidity Risk Management in Financial Institutions Following the Global
Financial Crisis. Retrieved December 15, 2011, from http://www.boj.or.jp/en/announcements/release_2010/data/fss1007a.pdf
Bank of Japan (2009). The Bank of Japan’s Approach to Liquidity Risk Management in
Financial Institutions. Retrieved December 17, 2011, from http://www.boj.or.jp/en/announcements/release_2009/data/fss0906a.pdf
Bank of Thailand (2008). Monetary Policy Instruments. Retrieved December 19, 2011, from
http://www.bot.or.th/English/FinancialMarkets/operations/Relating%20articles/Monetary%20Policy%20Instruments.pdf
Bank Negara Malaysia (2007). BNM/RH/GL 007 – 3: Guideline on Stress Testing. Retrieved
December 21, 2011, from http://www.bnm.gov.my/guidelines/01_banking/04_prudential_stds/22_stress_test.pdf
Barth, J. R., J. Gan and D.e. Nolle ( ). Global Banking Regulation & Supervision: What Are the
Issues and What Are the Practices? Retrieved November 5, 2011, from http://www.bm.ust.hk/~jgan/papers/BARTHnolle%20gan_bood.pdf
Basel Committee on Banking Supervision (2010). Principles for enhancing Corporate
Governance. Bank for International Settlement. Retrieved November 18, 2011, from http://www.bis.org/publ/bcbs176.pdf
Basel Committee on Banking Supervision (2008a). Principles for Sound Liquidity Risk
Management and Supervision. Bank of International Settlements. Retrieved November 9, 2011.
Basel Committee on Banking Supervision (2008b). Sound Practices For Managing Liquidity in
Principles for Sound Liquidity Risk Management and Supervision. Bank for International Settlement. Retrieved November 21, 2011, from http://www.bis.org/publ/bcbs144.pdf
Basel Committee on Banking Supervision (2006). Core Principles for Effective Banking
Supervision. Bank for International Settlement. Retrieved November 21, 2011, from http://www.bis.org/publ/bcbs129.pdf
Basel Committee on Banking Supervision (2001). The New Basel Capital Accord: An
Explanatory Note. Bank for International Settlements. Retrieved October 18, 2011, from http://www.bis.org/publ/bcbsca01.pdf
152 | P a g e

Basel Committee on Banking Supervision (2000). Sound Practices For Managing Liquidity in Banking Organisations. Prepared by the Risk Management Group of the Basel Committee on Banking Supervision. Retrieved on October 8, 2011, from http://www.bis.org/publ/bcbs69.pdf
Basel Committee on Banking Supervision (1998). Deposit Protection Schemes in the Member
Countries of the Basle Committee. Bank for International Settlements. Retrieved November 7, 2011, from http://www.bis.org/publ/bcbs37a.pdf
Basel Committee on Banking Supervision and International Association of Deposit Insurers
(2009). Core Principles for Effective Deposit Insurance System. Bank for International Settlements. Retrieved November 8, 2011, from http://www.bis.org/publ/bcbs156.pdf
Batunanggar, S (2008). Comparison of Problem Bank Identification, Intervention and Resolution
in the SEACAN Countries (2008). The South East Asian Central Banks (SEACEN) Research and Training Centre. Retrieved September 16, 2011, from http://www.seacen.org/GUI/pdf/publications/research_proj/2008/rp73/rp73_complete.pdf
Binici M. and M. Yörükoğlu (2011). The Influence of External Factors on Monetary Policy
Frameworks and Operations - Capital Flows in the Post-Global Financial Crisis Era: Implications for Financial Stability and Monetary Policy. Bank for International Settlements: BIS Paper NO. 57. Retrieved November 8, 2011, from http://www.bis.org/publ/bppdf/bispap57.pdf
Brownbridge, M. And C. Kirkpatrick (2000). Financial Regulation in Developing Countries.
University of Manchester: Finance and Development Research Programme: WP No. 12. Retrieved October 9, 2011, from http://www.sed.manchester.ac.uk/idpm/research/publications/archive/fd/fdwp12.pdf
Canada Deposit Insurance Corporation (2011). Canada Deposit Insurance Corporation
Differential Premiums By-law. SOR/99-120. Retrieved December 8, 2011, from http://laws-lois.justice.gc.ca/PDF/SOR-99-120.pdf
Canada Deposit Insurance Corporation (2008a). International Deposit Insurance Survey: Bank
of Thailand. A Partially Completed Survey conducted by Canada Deposit Insurance Corporation for the International Association of Deposit Insurers. Retrieved September 16, 2011, from http://www.iadi.org/research.aspx?id=121
Canada Deposit Insurance Corporation (2008b). International Deposit Insurance Survey:
Canada Deposit Insurance Corporation. Survey conducted by Canada Deposit Insurance Corporation for the International Association of Deposit Insurers. Retrieved September 16, 2011, from http://www.iadi.org/research.aspx?id=121
Canada Deposit Insurance Corporation (2008c). International Deposit Insurance Survey:
Deposit Insurance Corporation of Japan. A Survey conducted by Canada Deposit Insurance Corporation for the International Association of Deposit Insurers. Retrieved September 16, 2011, from http://www.iadi.org/research.aspx?id=121
Canada Deposit Insurance Corporation (2008d). International Deposit Insurance Survey:
Federal Deposit Insurance Corporation. A Completed Survey conducted by Canada
153 | P a g e

Deposit Insurance Corporation for the International Association of Deposit Insurers. Retrieved September 16, 2011, from http://www.iadi.org/research.aspx?id=121
Canada Deposit Insurance Corporation (2008e). International Deposit Insurance Survey:
Financial Services Compensation Scheme. A Partially Completed Survey conducted by Canada Deposit Insurance Corporation for the International Association of Deposit Insurers. Retrieved September 16, 2011, from http://www.iadi.org/research.aspx?id=121
Canada Deposit Insurance Corporation (2008f). International Deposit Insurance Survey: Hong
Kong Monetary Authority. A Completed Survey conducted by Canada Deposit Insurance Corporation for the International Association of Deposit Insurers. Retrieved September 16, 2011, from http://www.iadi.org/research.aspx?id=121
Canada Deposit Insurance Corporation (2008g). International Deposit Insurance Survey:
Korea Deposit Insurance Corporation. A Completed Survey conducted by Canada Deposit Insurance Corporation for the International Association of Deposit Insurers. Retrieved September 16, 2011, from http://www.iadi.org/research.aspx?id=121
Canada Deposit Insurance Corporation (2008h). International Deposit Insurance Survey:
Malaysia Deposit Insurance Corporation. A Completed Survey conducted by Canada Deposit Insurance Corporation for the International Association of Deposit Insurers. Retrieved September 16, 2011, from http://www.iadi.org/research.aspx?id=121
Canada Deposit Insurance Corporation (2008i). International Deposit Insurance Survey:
Singapore Deposit Insurance Corporation. A Completed Survey conducted by Canada Deposit Insurance Corporation for the International Association of Deposit Insurers. Retrieved September 16, 2011, from http://www.iadi.org/research.aspx?id=121
Canada Deposit Insurance Corporation (2003a). International Deposit Insurance Survey:
Financial Services Compensation Scheme. A Completed Survey conducted by Canada Deposit Insurance Corporation for the International Association of Deposit Insurers. Retrieved September 16, 2011, from http://www.iadi.org/research.aspx?id=121
Canada Deposit Insurance Corporation (2003b). International Deposit Insurance Survey:
Philippine Deposit Insurance Corporation. A Completed Survey conducted by Canada Deposit Insurance Corporation for the International Association of Deposit Insurers. Retrieved September 16, 2011, from http://www.iadi.org/research.aspx?id=121
Canada Deposit Insurance Corporation (2003c). International Deposit Insurance Survey: Hong
Kong Monetary Authority. A Partially Completed Survey conducted by Canada Deposit Insurance Corporation for the International Association of Deposit Insurers. Retrieved September 16, 2011, from http://www.iadi.org/research.aspx?id=121
Caprio (2003). Bank Regulation and Supervision survey (Microsoft excel data). Retrieved
September 15, 2011, from siteresources.worldbank.org/.../Caprio_2003_Bank_regulation_surve...
Cecchetti, S. and P. Disyatat. (2010). Central Bank Tools and Liquidity Shortages Retrieved
October 29, 2011, from http://www.ny.frb.org/research/epr/10v16n1/1008cecc.pdf
154 | P a g e

Chailloux, et. al (2008). Central Bank Response to the 2007–08 Financial Market Turbulence: Experiences and Lessons Drawn. International Monetary Fund. WP/08/210. Retrieved October 27, 2011, from http://www.imf.org/external/pubs/ft/wp/2008/wp08210.pdf
China Banking Regulatory Commission (2009). Guidelines on Liquidity Risk Management of
Commercial Banks . Retrieved December 14, 2011, from http://www.cbrc.gov.cn/EngdocView.do?docID=200911161A02DF6ACF9A64F1FF37E38D9EFBDA00
Choi, JB (1998). Structuring a Deposit Insurance System from the Asian Perspective Rising to the Challenge in Asia: A Study of Financial Markets: Volume 02 - Special Issues. Retrieved November 23, 2011, from http://www.adb.org/Documents/Books/Rising_to_the_Challenge/Special_Issues/3-di.pdf
Chung, H .C. The Bank of Korea’s Policy Response to the Global Financial Crisis. Bank for
International Settlements. BIS Paper N0. 54. Retrieved November 9, 2011, from http://www.bis.org/publ/bppdf/bispap54.pdf
Clifford Chance (n.d.). Child Finance Survey: Deposit guarantee Schemes, Retrieved
December 7, 2011, from http://childfinanceinternational.org/images/Deposit_guarantee_survey.pdf
Cooper, J. (2006) The integration of financial regulatory authorities – the Australian experience.
Presented during the 30th Anniversary Conference ‘Assessing the Present, Conceiving the Future’. Retrieved October 29, 2011, from http://www.asic.gov.au/asic/pdflib.nsf/lookupbyfilename/integration-financial-regulatory-authorities.pdf/$file/integration-financial-regulatory-authorities.pdf
Credit Suisse (2011). Thailand Bank Sector (Asia Pacific/Thailand Equity Research), Retrieved
November 30, 2011, from https://research-and-analytics.csfb.com/docView?language=ENG&source=ulg&format=PDF&document_id=905415241&serialid=rE%2Bn11SKZ%2BN%2B3Dz2J9DdhyBt8Dz5j1H7mweBbgUA7cA%3D
Davis, K. (2004). Study of Financial System Guarantees. Retrieved December 1, 2011, from
http://fsgstudy.treasury.gov.au/content/davis_report.asp Deloitte and Touche (2010). Changes to the Financial Reporting Framework in Singapore.
Retrieved October 30, 2011, from http://www.deloitte.com/assets/Dcom-Singapore/Local%20Assets/Documents/Audit/2011/Changes%20to%20the%20financial%20reporting%20framework%20in%20Singapore_2010.pdf
Deloitte and Touche (2003). Changes to Accounting Standards: 2002 edition. Retrieved
October 26, 2011, from http://www.iasplus.com/resource/sg2002.pdf Deloitte Touche (n.d.) Understanding the Framework. Adopting the Basel II Accord in Asia
Pacific Deposit Insurance Corporation of Japan (2010). Annual Report 2009/2010 (April 2009-March
2010). Retrieved November 4, 2011, from http://www.dic.go.jp/english/e_annual/e_annual_2009-2010.pdf
155 | P a g e

Deposit Insurance Corporation of Japan (2005). As of 2005: A Guide to the Deposit Insurance
system: Outline of the System and Q&A. Retrieved December 7, 2011, from http://www.dic.go.jp/english/e_seido/e_seido2005.pdf
Deposit Insurance Corporation of Japan (n.d.). Outline of Funding. Retrieved November 30,
2011, from http://www.dic.go.jp/english/e_newzaimu/e_shikin1.html eStandards Forum (2008). Best Practice Report: China. Published by the Financial Standards
Foundation in November 2008 Experian (n.d.). Exploiting the Single Customer View to Maximise the Value of Customer
Relationships. Retrieved December 2, 2011, from http://www.experian.co.uk/assets/about-us/white-papers/single-customer-view-whitepaper.pdf
Federal Deposit Insurance Corporation (2011a). 12 CFR Part 327, .RIN 3064- Designated
Reserve Ratio. Retrieved December 3, 2011. Federal Deposit Insurance Corporation (2011b). Deposit Insurance Fund Management.
Retrieved December 3, 2011, from http://www.fdic.gov/deposit/insurance/fund.html Federal Deposit Insurance Corporation (2011c). Update of Projected Deposit Insurance Fund
Losses, Income, and Reserve Ratios for the Restoration Plan (A Memorandum Letter submitted by the Division of Insurance and Research to the Board of Directors dated September 27, 2011). Retrieved November 11, 2011, from http://www.fdic.gov/news/board/2011Octno4.pdf;
Federal Deposit Insurance Corporation (2011d). Financial Institution Letter FIL-8-2011:
Assessment Final rule. Retrieved December 8, 2011, from http://www.fdic.gov/news/news/financial/2011/fil11008.pdf
Federal Financial Institutions Examination Council (2011). Supplemental Instructions: March
2011 call Report Form. Retrieved December 8, 2011, from http://www.fdic.gov/news/news/financial/2011/fil11019a.pdf
Feyen E. and D. Vittas (2009). Blanket Guarantees: Necessary during the Crisis, but What
Next? The World Bank group. Crisis Response Public Policy for the Private Sector. Note Number 4. Retrieved September 16, 2011, from http://rru.worldbank.org/documents/CrisisResponse/Note4.pdf
Financial Services Agency (2011). Basic Policy for Financial Inspections in Program Year 2011.
Retrieved December 18, 2011, from http://www.fsa.go.jp/en/news/2011/20111129-5/02.pdf
Financial Services Agency (n.d.). Checklist for Liquidity risk Management. Retrieved
December 17, 2011, from www.fsa.go.jp/en/refer/manual/yokin_e/y10.pdf Financial Services Authority (2009 ). Financial Services Compensation Scheme Reform: Fast
payout for depositors and raising consumer awareness. Consultation Paper 08/15. Retrieved December 6, 2011, from http://www.fsa.gov.uk/pubs/cp/cp09_03.pdf
156 | P a g e

Financial Services Authority (2008). Financial Services Compensation Scheme: Review of
limits. Consultation Paper 08/15. Retrieved December 4, 2011, from http://www.fsa.gov.uk/pubs/cp/cp08_15.pdf
Financial Services Authority (2006). FSCS Funding Review. Discussion Paper 06/1. Retrieved
December 4, 2011, Financial Services Authority (2004). Implications of a Changing Accounting Framework.
Retrieved on December 18, 2011, from http://www.fsa.gov.uk/pubs/cp/cp04_17.pdf Financial Services Authority (1998). Risk-Based Approach to Supervision of Banks. Retrieved
November 5, 2011, from http://www.fsa.gov.uk/pubs/policy/p10.pdf Financial Services Compensation Scheme (n.d.). Single Customer View for Faster Payout.
Retrieved on December 4, 2011. http://www.fscs.org.uk/industry/single-customer-view-for-faster-payout/
Financial Services Compensation Scheme (2010). Financial Services Compensation Scheme:
Annual Report and Accounts 2009/10. Retrieved December 4, 2011, from http://www.fscs.org.uk/uploaded_files/Publications/Annual_Reports/annual_report_2009-10.pdf
Financial Standards Foundation (2011). eStandardsForum Weekly Report. Volume XI, Number
25. February 22-29, 2011. Retrieved October 14, 2011, from http://www.estandardsforum.org/system/files/193/original/weekly-report-2011-02-28.pdf?1298914056
Financial Standards Foundation (2010a). Annual Globalization Report 2009-2010. Accessed on October 31, 2011. Retrieved October 30, 2011, from http://www.estandardsforum.org/system/files/157/original/policy-brief-2010-06-11.pdf?1276706520
Financial Standards Foundation (2010b). eStandardsForum Weekly Report. Volume XI,
Number 16. December 20-27, 2010. Retrieved October 12, 2011, from http://www.estandardsforum.org/system/files/184/original/weekly-report-2010-12-27.pdf?1293475688
Financial Standards Foundation (2010c). eStandardsForum Weekly Report. Volume XI, Number 12. November 22-29, 2010. Retrieved October 30, 2011, from http://www.estandardsforum.org/system/files/181/original/weekly-report-2010-11-29.pdf?1291410774
Financial Standards Foundation (2010d). eStandardsForum Weekly Report. Volume XI No.II. November 15 – 22, 2010. Retrieved November 2, 2011, from http://www.estandardsforum.org/system/files/180/original/weekly-report-2010-11-22.pdf?1290454427
157 | P a g e

Financial Standards Foundation (2010e). eStandardsForum Weekly Report. Volume XI, Number 9. November 1-8, 2010. . Retrieved October 31, 2011, from http://www.estandardsforum.org/system/files/178/original/weekly-report-2010-11-08.pdf?1291410400
Financial Standards Foundation (2010f). Weekly Report. Vol. XI No. 4. September 27-
October 4, 2010. Accessed on November 1, 2011. http://www.estandardsforum.org/system/files/173/original/weekly-report-2010-10-04.pdf?1286221919
Financial Standards Foundation (2010g). eStandardsForum Weekly Report. Volume XI, Number 1. September 7-13, 2010. . Retrieved November 4, 2011, from http://www.estandardsforum.org/system/files/170/original/weekly-report-2010-09-13.pdf?1284404468
Financial Standards Foundation (2010h). eStandardsForum Weekly Report. Volume X, Number 47. July 19-August 2, 2010. . Retrieved October 5, 2011, from http://www.estandardsforum.org/system/files/164/original/weekly-report-2010-08-02.pdf?1281449259
Financial Standards Foundation (2010i). eStandardsForum Weekly Report. Volume X, Number 30. March 29-April 5, 2010. Retrieved October 11, 2011, from http://www.estandardsforum.org/system/files/145/original/weekly-report-2010-04-05.pdf?1270564348
Financial Standards Foundation (2010j). eStandardsForum Weekly Report. Volume XI, Number 20. January 17-24, 2011. . Retrieved October 30, 2011, from http://www.estandardsforum.org/system/files/187/original/weekly-report-2011-01-24.pdf?1295900579
Financial Standards Foundation (2010k). eStandardsForum Weekly Report. Volume X, Number 17. December 28-January 4, 2010. Retrieved October 13, 2011, from http://www.estandardsforum.org/system/files/132/original/weekly-report-2010-01-04.pdf?1262630927
Financial Standards Foundation (2009a). Annual Globalization Report 2008-2009. Retrieved October 30, 2011, from http://www.uas.mx/cegc/consilium/doc/Annual-Globalization-Report-0609.pdf
Financial Standards Foundation (2009b). Weekly Report. Vol. X No. 16. December 21-28. 2009. Retrieved October 12, 2011, from http://www.estandardsforum.org/system/files/131/original/weekly-report-2009-12-28.pdf?1262094031
Financial Standards Foundation (2009c). eStandardsForum Weekly Report. Volume X, Number 10. November 9-16, 2009. Retrieved October 31, 2011, from
158 | P a g e

http://www.estandardsforum.org/system/files/124/original/weekly-report-2009-11-16.pdf?1258407530
Financial Standards Foundation (2009d). eStandardsForum Weekly Report. Volume IX No. 38 August 10-17, 2009. Retrieved November 6, 2011, from http://estandardsforum.org/system/files/111/original/weekly-report-2009-08-17.pdf
Financial Standards Foundation (2009e). eStandardsForum Weekly Report. Volume IX No.48. August 3-10, 2009. Retrieved November 2, 2011, from http://www.estandardsforum.org/system/files/110/original/weekly-report-2009-08-10.pdf?1254977124
Financial Standards Foundation (2009f). eStandardsForum Weekly Report. Volume IX No. 38 May 25 – June 1 , 2009. Retrieved November 1, 2011, from http://www.estandardsforum.org/system/files/99/original/weekly-report-2009-06-01.pdf?1254977117
Financial Standards Foundation (2009g). eStandardsForum Weekly Report. Volume IX, Number 22. February 2-9, 2009. Retrieved October 15, 2011, from http://estandardsforum.org/system/files/77/original/weekly-report-2009-02-09.pdf
Financial Standards Foundation (2008a). eStandardsForum Weekly Report. Volume IX No. 15 December 22 - 29 , 2008. Retrieved October 12, 2011, from http://estandardsforum.org/system/files/71/original/weekly-report-2008-12-29.pdf
Financial Standards Foundation (2008b). eStandardsForum Weekly Report. Volume IX No. 13 December 1 - 8 , 29008. Retrieved November 1, 2011, from http://www.estandardsforum.org/system/files/68/original/weekly-report-2008-12-08.pdf?1254977101
Financial Standards Foundation (2008c). eStandardsForum Weekly Report. Volume XIII No. 31 April 7-14 , 2008. Retrieved November 1, 2011, from http://www.estandardsforum.org/system/files/16/original/weekly-report-2008-04-14.pdf?1254977078
Financial Standards Foundation (2008d). Annual Globalization Report 2007-2008. Retrieved October 31, 2011, from http://estandardsforum.org/system/files/28/original/annual-report-2008-04-30.pdf
Financial Stability Institute (2010). 2010 FSI Survey on the Implementation of the New Capital Adequacy Framework. Summary of responses to the Basel II implementation survey. FSI Occasional Paper No 9. Retrieved October 15, 2011, from http://www.bis.org/fsi/fsipapers09.pdf
Frolov, M. (2003). Funding Deposit Insurance: Designing Options and Practical Choices. Keio
University: Market Quality Research Project. KUMQRP Discussion Paper Series 2003-21. Retrieved December 2, 2011, from http://www.gcoe-econbus.keio.ac.jp/pdf/dp/DP03-21_rev.pdf
159 | P a g e

Gonzalez and Mendoza (2007). Governance in Southeast Asia: Issues and Options. Philippine Institute for Development Studies. Retrieved October 30, 2011, from http://www.jbic.go.jp/en/research/report/research-paper/pdf/rp16_e07.pdf
Gray, Simon (2011). Central Bank Balances and Reserve Requirements. International Monetary Fund. Retrieved December 18, 2011, from www.imf.org/external/pubs/ft/wp/2011/wp1136.pdf
Ma G., Y. Xiandong and L. Xi (2011). China’s Evolving Reserve Requirements. Bank for International Settlements. BIS Working Paper Series No. 360. Retrieved December 22, 2011, from http://www.bis.org/publ/work360.pdf
Hemedes C and D. Lapid. A Review of Issues Concerning reserve Requirements. Retrieved
December 22, 2011, from http://www.bsp.gov.ph/downloads/publications/2005/BSR2005b_02.pdf
Hong Kong Deposit Protection Board (2011). Hong Kong Deposit Protection Board: Annual
Report 2011. Retrieved December 6, 2011, from http://www.dps.org.hk/en/download/pdf/annual_report_2011/en/EWF121.pdf
Hong Kong Monetary Authority (2011a). Supervisory Policy Manual LM-1: Liquidity risk
Management. Retrieved on December 7, 2011, from http://www.hkma.gov.hk/media/eng/doc/key-information/guidelines-and-circular/guideline/LM-1.pdf
Hong Kong Monetary Authority (2011b). Supervisory Policy Manual LM-2: Liquidity risk
Management. Retrieved on December 7, 2011, from http://www.hkma.gov.hk/media/eng/doc/key-functions/banking-stability/supervisory-policy-manual/LM-2.pdf
Hong Kong Monetary Authority (2011c)Annex 2: Sound Practices for Liquidity Risk
Management, Retrieved December 18, 2011, from http://www.hkma.gov.hk/media/eng/doc/key-information/guidelines-and-circular/2011/20110804e1a2.pdf
Hong Kong Monetary Authority (2003). Deposit Protection Scheme Bill. Hong Kong Monetary
Authority Quarterly Bulletin, June 2003. Retrieved on November 30, 2011. Hong Kong Monetary Authority (1999). Supervisor’s Memo. Retrieved on December 18, 2011, from www.hkma.gov.hk/media/eng/publication-and-research/quarterly-bulletin/qb9911/ra05.pdf - 2011-09-15 - Text Version
Hong Kong Monetary Authority (2011). Chapter 3: The Legal and Supervisory Framework.
Retrieved October 29, 2011, from http://www.hkma.gov.hk/media/eng/doc/key-functions/banking-stability/guide-authorization/Chapter-3.pdf
Hong Kong Monetary Authority (2008). Supervisory Policy Manual: CA-G-1. Overview of
Capital Adequacy Regime for Locally Incorporated Authorized Institutions
160 | P a g e

Hong Kong Monetary Authority (n.d.). Chapter 3: The Legal and Supervisory Framework. Retrieved October 29, 2011, from http://www.hkma.gov.hk/media/eng/doc/key-functions/banking-stability/guide-authorization/Chapter-3.pdf
Hong Kong Monetary Authority (n.d.). Licensing Requirements for Banks. Retrieved October
30, 2011, from http://www.hkma.gov.hk/media/eng/publication-and-research/background-briefs/bank_sup/licensing_requirements_for_banks.pdf
International Association of Deposit Insurers (2009). Funding of Deposit Insurance Systems:
Guidance Paper. IIADI: Research and Guidance Committee. Retrieved December 3, 2011.
International Monetary Fund (2011). Philippines: 2010 Article IV Consultation—Staff Report;
Staff Statement; Public Information Notice on the Executive Board Discussion; and Statement by the Executive Director for Philippines. IMF Country Report No. 11/59. Retrieved October 7, 2011, from http://www.imf.org/external/pubs/ft/scr/2011/cr1159.pdf
International Monetary Fund (2008). Thailand: Financial System Stability Assessment.
Prepared by the Monetary and Capital Markets and Asia and Pacific Departments Financial System Stability Assessment. Retrieved September 7, 2011, from http://www.imf.org/external/pubs/ft/scr/2009/cr09147.pdf
_____ ( n.d). Management of Deposit Insurance Funds. Korea Deposit Insurance Corporation
Retrieved November 23, 2011, from http://www.kdic.or.kr/english/major/sub1_2.jsp Kim, M (2010). Liquidity Measurement and Management in Korea. Retrieved December 18,
2011, from http://www.seacen.org/GUI/pdf/publications/research_proj/2010/rp81/li3.pdf Korea Deposit Insurance Corporation (n.d.a) Management of Deposit Insurance Fund.
Retrieved November 23, 2011, from http://www.kdic.or.kr/english/major/sub1_2.jsp Korea Deposit Insurance Corporation (n.d.) Resolution of Insolvent Financial Institutions.
Retrieved December 6, 2011, from http://www.kdic.or.kr/english/major/sub3_2.jsp Laeven, L. Risk and Efficiency in East Asian Banks. world Bank Retrieved October 5, 2011,
from http://elibrary.worldbank.org/docserver/download/2255.pdf?expires=1319898375&id=id&accname=guest&checksum=0132A6595E69EE96897255002B9C26C4
Lee, JW and CY Park (September 2010) New Financial Reforms and Their Effects on merging
Asia, Retrieved September 9, 2011, from http://www.adb.org/documents/briefs/ADB-Briefs-2010-5-Financial-Regulation.pdf
Lee, C and CY Park (2009). Beyond the Crisis: Financial Regulatory Reform in Emerging Asia.
Asian Development Bank: ADB Working Paper Series on Regional Economic Integration WP34. Retrieved September 9, 2011, from http://www.adb.org/documents/papers/regional-economic-integration/WP34-Financial-Regulatory-Reform.pdf
Lee, J.S. (n.d.) Korean Experience with Integrated Financial Supervision. Retrieved December
6, 2011, from
161 | P a g e

http://www.adb.org/Projects/APEC/Market_Intermediaries/Integrated_Financial_Supervision_KOR.pdf.
Liangyuan (2008). New Issues in Chinese Enterprise Bankruptcy Law. Retrieved October 30,
2011, from https://insol.org/Turton%20Award/New%20Issues%20in%20Chinese%20Enterprise%20Bankruptcy%20Law%20Final%20Article%206%20Jan.pdf
Lindgren, C-J, et.al. (1999). Financial Sector Crisis and Restructuring Lessons from Asia.
International Monetary Fund: Occasional Paper No. 188 Ma, G., Y. Xiandong and L. Xi (2011). China’s Evolving Reserve Requirement. Bank for
International Settlements. BIS Working Papers No. 360. Retreived December 19, 2011, from http://www.bis.org/publ/work360.pdf
MacDonald, R (1996). Deposit Insurance: Handbook in Central Banking No. 9. Bank of
Engalnd: Center for Central Banking Studies Masciandaro D. And M. (n.d.) Regulating the Regulators: The Changing Face of Financial
Supervisory Architectures before and after the Crisis. Retrieved September 19, 2011: http://www.cepr.org/meets/wkcn/1/1724/papers/masciandarofinal.pdf
Ministry of Economy, Trade and Industry of Japan (2010). The Current Conditions and
Improvement Measure of Economic Legal Infrastructure in APEC Economies, A Pilot Study
Monetary Authority of Singapore (2011a). Terms and Conditions Governing the MAS Intraday
Liquidity Facility. http://www.mas.gov.sg/resource/eco_research/liquidity_management/2011-03-07%20ILF%20agreement.pdf
Monetary Authority of Singapore (2007). Changes to the Capital Adequacy Requirements for
Singapore-incorporated Banks, Retrieved December 8, 2011, from http://www.mas.gov.sg/news_room/press_releases/2007/Change_to_Capital_Adequacy_Requirements.
Monetary Authority of Singapore (2007b). Monetary Policy Operations in Singapore. Retrieved
on December 17, 2011, from http://www.sgs.gov.sg/resource/pub_guide/guides/SGPMonetaryPolicyOperations.pdf
Monetary Authority of Singapore (2006a) Liquidity Risk Supervision: A Revised Minimum Liquid
Asset Framework. Monetary Authority of Singapore (2006b). Market Risk (Guidelines on Risk Management
Practices). Retrieved December 21, 2011, from http://www.mas.gov.sg/resource/legislation_guidelines/risk_mgt/5-Market%20Risk.pdf
Monetary Authority of Singapore (n.d.) MAS Notice 613 – Minimum Liquid Assets. Banking Act
Cap 19 Monetary Authority of Singapore (n.d.). The Banking (Amendment) Bill: An Explanatory Brief.
Retrieved December 8, 2011, from
162 | P a g e

http://www.mas.gov.sg/news_room/press_releases/2001/The_Banking__Amendment__Bill__An_Explanatory_Brief__19_Apr_2001.html#back3
Monetary Authority of Singapore (2001). The Banking (Amendment) Bill: An Explanatory Brief,
http://www.mas.gov.sg/news_room/press_releases/2001/The_Banking__Amendment__Bill__An_Explanatory_Brief__19_Apr_2001.html
Monetary Authority of Singapore (n.d.). Banking Act. www.mas.gov.sg
Obrien, Y (2007): Reserve Requirement Systems in OECD Countries, OECD Finance and Economics Discussion Series, 2007-54. Retrieved decmber 17, 2011, from www.federalreserve.gov/pubs/feds/2007/200754/200754pap.pdf
Oxera Consulting Ltd. (2006). Funding of the financial Services compensation Scheme: Report
Prepared for the Financial Services Authority. Perbadanan Insurans Deposit Malaysia (2010). Annual Report 2010. Retrieved November 8,
2011, from http://www.pidm.gov.my/downloads/ar2010eng/AR2010_Sec1.pdf Philippine Deposit Insurance Corporation (2009). PDIC Charter (Republic Act No. 3591, As
Amended). Retrieved December 2, 2011, from http://www.pdic.gov.ph/files/PDIC_Charter_Insides_Dec07_email.pdf
Pothier, N (1992). Canada Deposit Insurance Corporation: Deposit Protection in Canada.
Retrieved November 14, 2011, from http://dsp-psd.pwgsc.gc.ca/Collection-R/LoPBdP/BP/bp312-e.htm;
Rhaman, Z. (2000). Accounting Standards in the East Asia Region. A Paper Presented to the
Second Asian Roundtable on Corporate Governance “The Role of Disclosure in Strengthening Corporate Governance and Accountability” (Conference organized by OECD and World Bank). Retrieved October 11, 2011, from http://www.oecd.org/dataoecd/6/58/1931072.pdf
Ryoo, S. Operational Framework for Monetary Policy in the SEACAN Countries (2006).
Retrieved December 17, 2011, from http://www.seacen.org/GUI/pdf/publications/research_proj/2006/rp61.pdf
Santoso, W. And A. Suyudi (2004). Insolvency Systems and risk Management in Asia: Trends
and Developments in Insolvency Systems and Risk Management: The Experience of Indonesia. Published by the World Bank’s Forum on Insolvency Risk Management. Retrieved October 31, 2011, from http://www.oecd.org/dataoecd/48/25/33938420.pdf
Schich, S. (2008). Financial Turbulence: Some Lessons Regarding Deposit Insurance.
Financial Market Trends. OECD 2008. Retrieved on September 13, 2011, from http://www.oecd.org/dataoecd/32/54/41420525.pdf
Schich, S. (2009). Expanded Government Guarantees for Bank Liabilities: Selected Issues.
Financial Market Trends: Vol. 2009/1. Retrieved October 12, 2011, from http://www.oecd.org/dataoecd/29/35/42779438.pdf
163 | P a g e

Schneider, B (2005). Do Global Standards and Codes Prevent Financial Crises? Some Proposals on Modifying The Standards-Based Approach. United Nations Conference on Trade and Development: UNCTAD/OSG/DP/2005/1. Retrieved September 19, 2011, from http://www.unctad.org/en/docs/osgdp20051_en.pdf
Shiratsuka, S. (n.d.). Size and Composition of the Central Bank Balance Sheet: Revisiting
Japan’s Experience of the Quantitative Easing Policy. Retrieved on October 9, 2011, from http://www.imes.boj.or.jp/research/papers/english/me28-6.pdf
Singapore Deposit Insurance Corporation. (n.d.) Scope of DI Coverage. Retrieved December
1, 2011, from https://www.sdic.org.sg/di_scope_of_coverage.php Siregar, R. and V. Lim (2010). The Role of Central Banks in Sustaining Economic Recovery
and in Achieving Financial Stability. The South East Asian Central Banks (SEACEN)Staff Paper No. 74. Retrieved December 4, 2011, from http://www.seacen.org/GUI/pdf/publications/newsletter/2010/1stQtr.pdf
Subhanij, T. ( ). Liquidity Measurement and Management in the SEACAN Countries.
SEACAN Training and Research Centre. Taplin, R., G. Tower and P. Hancock (2002). Disclosure (discernibility) and Compliance of
Accounting Policies: Asia-Pacific evidence. Accounting Forum Volume 26 No 2 June 2002. Blackwell Publishing Ltd. 2002 Retrieved October 11, 2011, from http://oldweb.econ.tu.ac.th/archan/RANGSUN/MB%20663/MB%20663%20Readings/%E0%B9%93.%20%E0%B8%9A%E0%B8%A3%E0%B8%A3%E0%B8%A9%E0%B8%B1%E0%B8%97%E0%B8%A0%E0%B8%B4%E0%B8%9A%E0%B8%B2%E0%B8%A5/Corporate%20Accounting/Disclosure%20%28discernibility%29%20and%20compliance%20of%20accounting%20po.pdf
United States Agency for International Development (2008). eStandsrds Forum: Standards
Compliance Index and Business Indicator Index. USAID Knowledge Service Center. Retrieved September 23, 2011.
Vojta, G (2010). Globalization for All: An Analysis. Published by the Financial Standards Forum.
Retrieved October 30, 2011, from http://www.estandardsforum.org/system/files/61/original/occasional-paper-2008-10-01.pdf?1259682283
Walker, D (2007). Deposit Insurance in Selected Asian Countries: Before and After the
Financial Crisis. PDIC Occasional Paper No. 2. Retrieved October 24, 2011, from http://www.pdic.gov.ph/files/Occasional_Paper_No2.pdf
Walter A. (2010). Assessing the current financial architecture (how well does it work?).
http://personal.lse.ac.uk/wyattwal/images/AdoptingInternational.pdf
Walter, A. (2010b). Global regulatory norms after the crisis: The case of China and Basel standards .
Wesaratchakit, W. The Future of Deposit Insurance System in Thailand; Retrieved November
29, 2011, from citeseerx.ist.psu.edu/viewdoc/download?doi=10.1.1.20
164 | P a g e
Westrup (2005). The Politics of Financial Regulatory Reform and the Privatization of Risk CLPE
Research Paper Series No. 8/2006. http://papers.ssrn.com/sol3/papers.cfm?abstract_id=902653&http://www.google.co.uk/url?sa=t&source=web&cd=3&ved=0CC0QFjAC&url=http%3A%2F%2Fpapers.ssrn.com%2Fsol3%2FDelivery.cfm%3Fabstractid%3D902653&rct=j&q=the%20politics%20of%20financial%20regulatory%20reform%20in%20britain%20and%20germany&ei=QCObTvfgEdOHhQe2q6idBA&usg=AFQjCNGstJVX_GOXAPwarg_sXVTNLEsNYA
Wibowo, O.P. (2008) Understanding and Addressing the Pro-cyclicality impact of Basel II in the
SEACAN Countries. (Table 1: Basel II Implementation in SEACAN Countries). The SEACAN Centre. Retrieved October 14, 2011, from http://www.seacen.org/GUI/pdf/publications/research_proj/2008/rp72/rp72_complete.pdf
Wong, D. (2009). An Assessment of Corporate governance Reforms in the Philippines: 2002-
2009. Philippine Management Review. Vol. 16. Pp. 24-57. Retrieved October 29, 2011, from http://journals.upd.edu.ph/index.php/pmr/article/viewFile/1796/1713
World Bank (2006). Report on the Observance of Standards and Codes (ROSC): Republic of
the Philippines Accounting and Auditing Update. Retrieved October 26, 2011: http://www.worldbank.org/ifa/rosc_aa_phl_2006.pdf
Yam, J (n.d.) Reserve Requirement. Retrieved December 18, 2011, from
http://www.hkma.gov.hk/eng/publications-and-research/reference-materials/viewpoint/
Chapter 3:
Barrios, V., & Blanco, J. (2003). The effectivenss of bank capital adequacy regulation: a theoretical and empirical approach. Journal of Banking & Fiance , 27, 1935-1958.
Barth, J., Caprio, G. J., & Levine, R. (2004). Bank regulation and supervision: what works best? Journal of Financial Intermediation , 205-248.
Barth, J., Caprio, G., & Levine, R. (2008). Bank Regulations are Changing: For Better or Worse? Comparative Economic Studies , 50 (4), 537-563.
Barth, J., Caprio, G., & Levine, R. (2008). Reassessing the Rationale and Practice of Bank Regulation and Supervision After Basel II. In Current Developments in Monetary and Financial Law (pp. 225-250). Washington DC: International Monetary Fund.
Berger, A. N., Hasan, I., & Zhou, M. (2009). Bank ownership and efficiency in China: What will happen in the world's largest nation? Journal of Banking & Finance , 33, 113-130.
Chiuri, M., Ferri, G., & Majnoni, G. (2002). The macroeconomic impact of bank capital requirements in emerging economies: past evidence to assess the future. Journal of Banking & Finance , 26, 881-904.
Demigurc-Kunt, A., Laeven, L., & Levine, R. (2004). Regulations, market structure, institutions, and the cost of financial intermediation. Journal of Money, Credit and Banking , 36, 593-622.
165 | P a g e

Ennis, H. M., & Price, D. (2011, June). Basel III and the continuing evolution of bank capital regulation. Richmond Fed Economic Brief, Federal Reserve Bank of Richmond .
Hyun, J., & Rhee, B. (2011). Bank capital regulation and credit supply. Journal of Banking & Finance , 35, 323-330.
Imai, M. (2006). Market discipline and deposit insurance reform in Japan. Journal of Banking & Finance , 30, 3433-3452.
Kumhof, M., & Tanner, E. (2005, March). Government Debt: A Key Role in Financial Intermediation. IMF Working Paper No. 05/57 .
Laeven, L., & Levine, R. (2009). Bank governance, regulation and risk-taking. Journal of Financial Economics , 259-275.
Romero-Avila, D. (2007). Finance and growth in the EU: New evidence from the harmonization of the banking industry. Journal of Banking & Finance , 31, 1937-1954.
Williams, J., & Nguyen, N. (2005). Financial liberalization, crisis, restructuring: a comparative study of bank performance and bank governance in South East Asia. Journal of Banking & Finance , 29, 2119-2154.
Yu, I., Fung, K., & Tam, C. (2010). Assessing financial market integration in Asia - Equity markets. Journal of Banking & Finance , 34, 2874-2885.
Chapter 4:
ASEAN+3 Papers
Chapter 1: Taningco, A., (2011). A survey and assessment of the roles, functions, and characteristics of ASEAN+3 banking system. Working Paper, Angelo King Institute, De La Salle University, Manila.
Chapter 2: Castell, M., (2011). Policies and regulations, supervisory practices, and safety net mechanisms in the ASEAN+3 banking system. Working Paper, Angelo King Institute, De La Salle University, Manila.
Chapter 3: Dacuycuy, L., (2011). An empirical investigation on the role of bank regulations, supervisory practices, and deposit insurance on banking sector development in the ASEAN+3 region. Working Paper, Angelo King Institute, De La Salle University, Manila.
Other References
Asian Bankers Association (ABA), (2010). ABA position paper on: Basel III and its implications on Asian banks. 25th ABA General Meeting and Conference, Taipei, Taiwan.
Barth, J., Caprio, G. J., & Levine, R. (2004). Bank regulation and supervision: what works best? Journal of Financial Intermediation , 205-248.
166 | P a g e

Barth, J. R., J. Gan and D.e. Nolle ( ). Global Banking Regulation & Supervision: What Are the Issues and What Are the Practices? Retrieved November 5, 2011, from http://www.bm.ust.hk/~jgan/papers/BARTHnolle%20gan_bood.pdf
Basel Committee on Banking Supervision (BCBS), (2009). History of the Basel Committee and it membership. Bank for International Settlements.
Batunanggar, S. Comparison of Problem Bank Identification, Intervention and Resolution in the SEACAN Countries (2008). The South East Asian Central Banks (SEACEN) Research and Training Centre. Retrieved September 16, 2011, from http://www.seacen.org/GUI/pdf/publications/research_proj/2008/rp73/rp73_complete.pdf from Figure 8:Indicator/Risk Categories and Ratios Used in Supervisory Risk Assessment and Early Warning Systems - Supervisory Bank Rating Systems
Demigurc-Kunt, A., Laeven, L., & Levine, R. (2004). Regulations, market structure, institutions, and the cost of financial intermediation. Journal of Money, Credit and Banking , 36, 593-622.
Ennis, H. M., & Price, D. (2011, June). Basel III and the continuing evolution of bank capital regulation. Richmond Fed Economic Brief, Federal Reserve Bank of Richmond.
Financial Standards Foundation (2008). eStandardsForum Weekly Report. Volume IX No. 13 December 1 - 8 , 29008. Retrieved November 1, 2011, from http://www.estandardsforum.org/system/files/68/original/weekly-report-2008-12-08.pdf?1254977101
Financial Standards Foundation (2008). ). eStandardsForum Weekly Report. Volume XIII No. 31 April 7-14 , 2008. Retrieved November 1, 2011, from http://www.estandardsforum.org/system/files/68/original/weekly-report-2008-12-08.pdf?1254977101
Financial Standards Foundation (2008). Annual Globalization Report 2007-2008. Retrieved October 31, 2011, from http://estandardsforum.org/system/files/28/original/annual-report-2008-04-30.pdf
Lee, C and CY Park (2009). Beyond the Crisis: Financial Regulatory Reform in Emerging Asia. Asian Development Bank: ADB Working Paper Series on Regional Economic Integration WP34. Retrieved September 9, 2011, from http://www.adb.org/documents/papers/regional-economic-integration/WP34-Financial-Regulatory-Reform.pdf
: Ryoo, S., (2006). Operational Framework for Monetary Policy in the SEACAN Countries (2006) from Table 4 on Functions of Reserve Requirement
Siregar, R. and V. Lim (2010). The Role of Central Banks in Sustaining Economic Recovery and in Achieving Financial Stability. The South East Asian Central Banks (SEACEN)Staff Paper No. 74. Retrieved December 4, 2011, from
167 | P a g e

168 | P a g e
http://www.seacen.org/GUI/pdf/publications/newsletter/2010/1stQtr.pdf Iderived from Table 4 on Bank Liquidity Management]
The Economist. (2011). August. p 64.
Tullao, T.S. (2009a). Global Imbalances and Macroeconomic Adjustments: The Case of East Asia. Working Paper. Angelo King Institute, De La Salle University.
Tullao, T.S. (2009b). Global Economic Imbalances Triggering the Financial Crisis. Proceedings of the Sixth Secretary Alfonso Yuchengco Policy Conference Implications of the Global Financial Crisis on the Philippine Economy. Yuchengco Center.
Wibowo, O.P. (2008) Understanding and Addressing the Pro-cyclicality impact of Basel II in the SEACAN Countries. (Table 1: Basel II Implementation in SEACAN Countries). Retrieved October 14, 2011, from http://www.seacen.org/GUI/pdf/publications/research_proj/2008/rp72/rp72_complete.pdf *FSC website: www.fscs.org
Data Sources
BANKSCOPE
Bangko Sentral ng Pilipinas
Bank Indonesia
Bank of Japan
Bank of Korea
Bank Negara Malaysia
Bank of Thailand
Financial Soundness Indicators Database, International Monetary Fund.
Hong Kong Monetary Authority
Key Development Indicators, World Bank.
Monetary Authority of Singapore
People’s Bank of China
World Bank, Bank Regulation Database