Postdoctoral Final Report
37
Figure 1 D=26.7 km D=18.9 km D= 30 km
Transcript of Postdoctoral Final Report
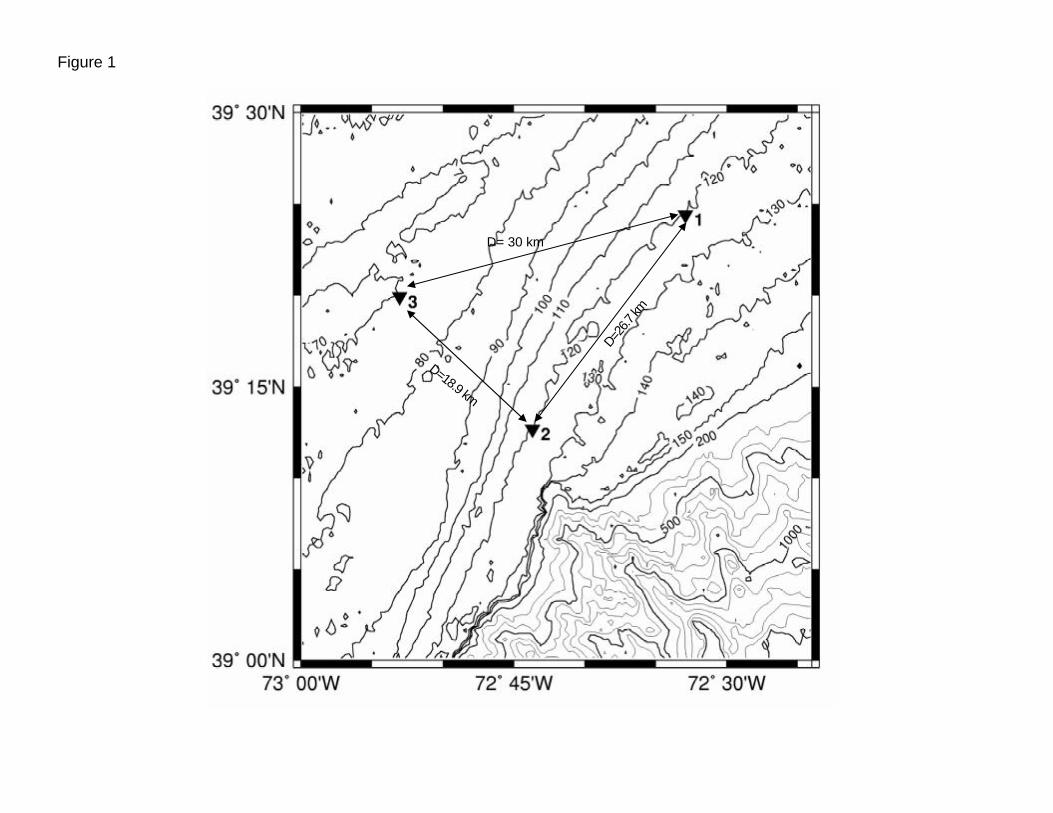
Figure 1
D=26.7
km
D=18.9 km
D= 30 km
Puerto Rico
SW coast and shelf
Location of the shelf and offshelf ADCP.
Figure 1b
Offshelf
shelfbreakshelf
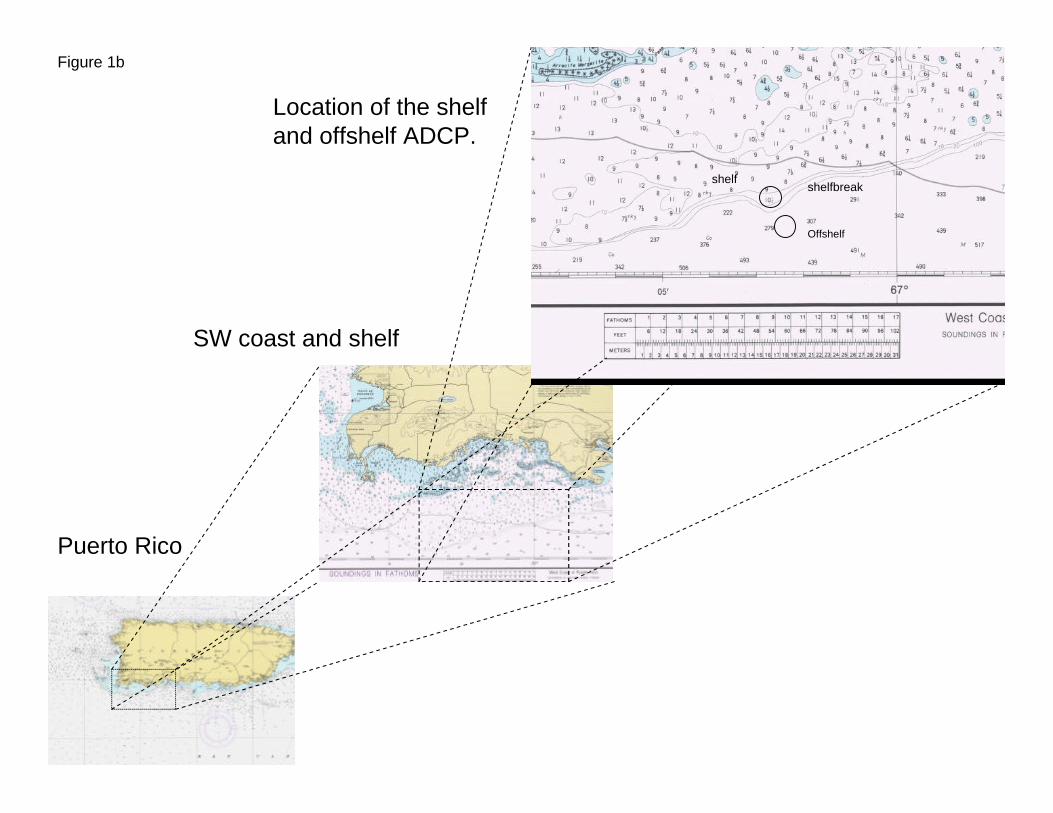
IMF sifting of u (tk , z) z=30 m, k = 1,2,3…K ; CE(100,5)Figure 2
270 275 280 285 290 295 300 305 310 315-10
0
10
F1
270 275 280 285 290 295 300 305 310 315-10
0
10
F2
270 275 280 285 290 295 300 305 310 315-10
0
10
F3
270 275 280 285 290 295 300 305 310 315-10
0
10
F4
270 275 280 285 290 295 300 305 310 315-10
0
10
F5
270 275 280 285 290 295 300 305 310 315-40
-20
0
20
Year day (2000)
cm/s
Original signal: u ( t , z ), Z = 30 m
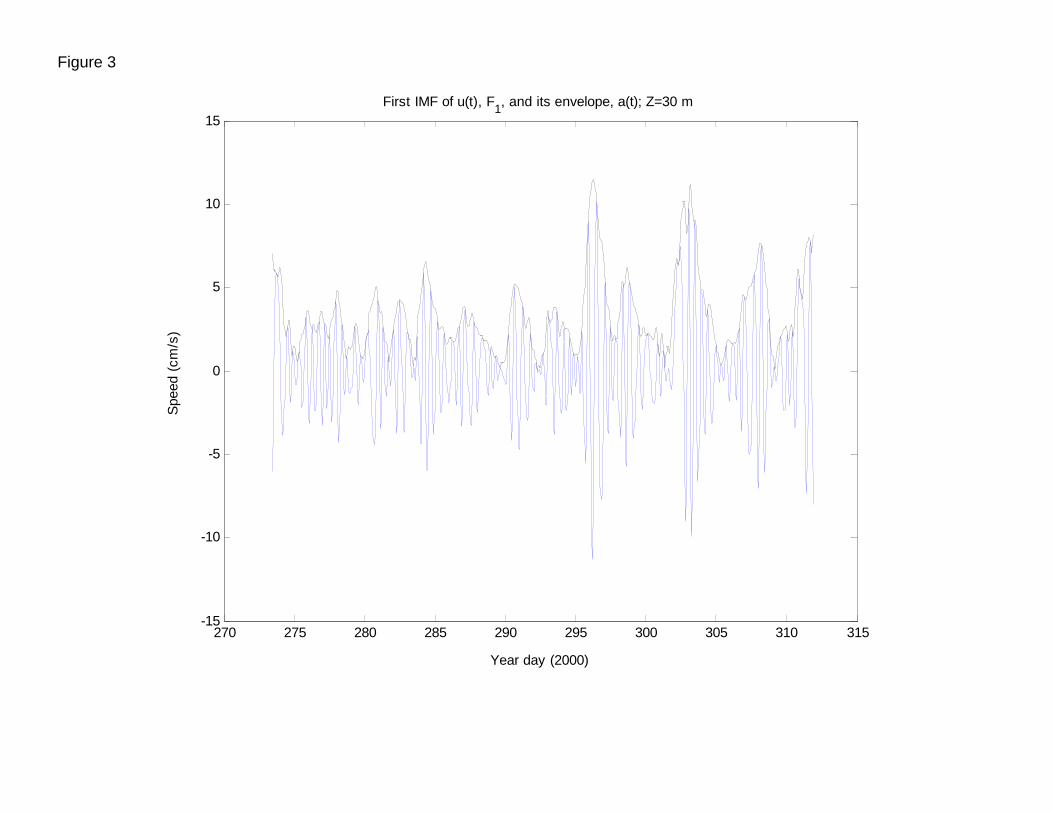
Figure 3
270 275 280 285 290 295 300 305 310 315-15
-10
-5
0
5
10
15
Year day (2000)
Spe
ed (
cm/s
)
First IMF of u(t), F1, and its envelope, a(t); Z=30 m
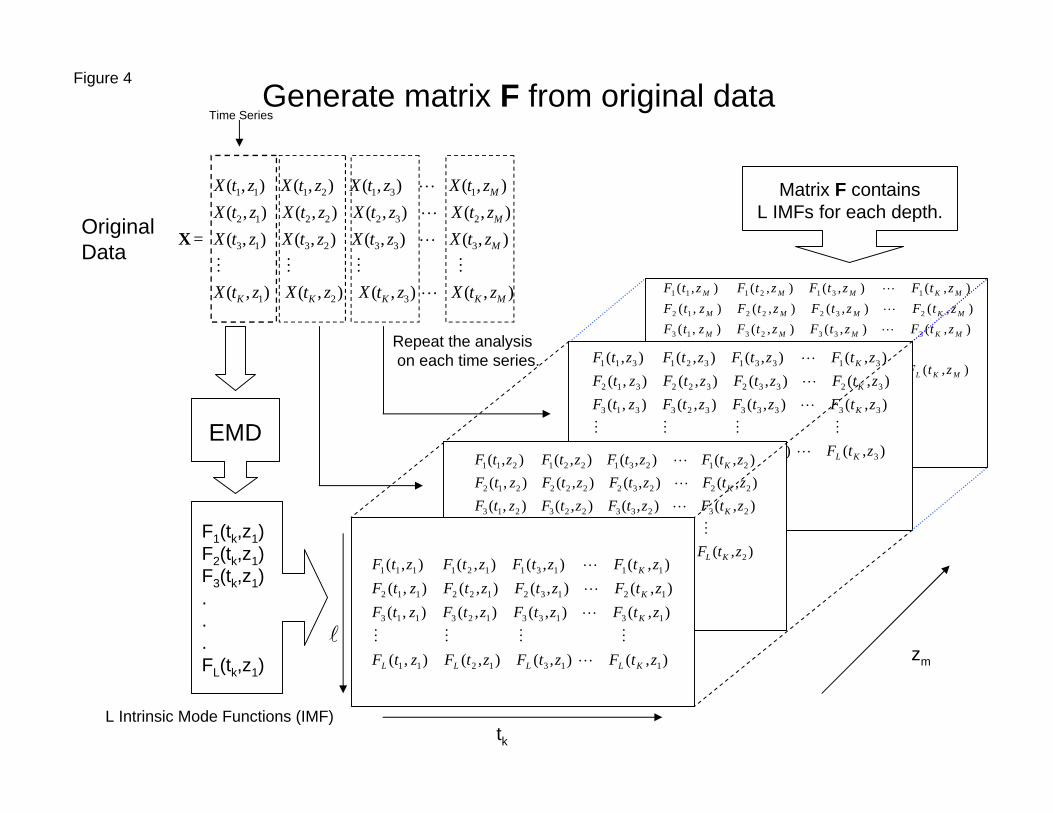
Generate matrix F from original dataFigure 4
=
),(),(),(),(
),(),(),(),(
),(),(),(),(
),(),(),(),(
321
3332313
2322212
1312111
MKKKK
M
M
M
ztXztXztXztX
ztXztXztXztX
ztXztXztXztX
ztXztXztXztX
LMMMM
L
L
L
XOriginal Data
Time Series
L Intrinsic Mode Functions (IMF)
F1(tk,z1)F2(tk,z1)F3(tk,z1)...FL(tk,z1)
EMD
Matrix F containsL IMFs for each depth.
),(),(),(),(
),(),(),(),(),(),(),(),(
),(),(),(),(
321
3332313
2322212
1312111
MKLMLMLML
MKMMM
MKMMM
MKMMM
ztFztFztFztF
ztFztFztFztFztFztFztFztF
ztFztFztFztF
LMMMM
L
L
L
),(),(),(),(
),(),(),(),(
),(),(),(),(
),(),(),(),(
3333231
33333323313
32332322312
31331321311
ztFztFztFztF
ztFztFztFztF
ztFztFztFztF
ztFztFztFztF
KLLLL
K
K
K
LMMMM
L
L
L
),(),(),(),(
),(),(),(),(
),(),(),(),(
),(),(),(),(
2232221
23233223213
22232222212
21231221211
ztFztFztFztF
ztFztFztFztF
ztFztFztFztF
ztFztFztFztF
KLLLL
K
K
K
LMMMM
L
L
L
Repeat the analysison each time series.
zm
),(),(),(),(
),(),(),(),(
),(),(),(),(
),(),(),(),(
1131211
13133123113
12132122112
11131121111
ztFztFztFztF
ztFztFztFztF
ztFztFztFztF
ztFztFztFztF
KLLLL
K
K
K
LMMMM
L
L
L
l
tk
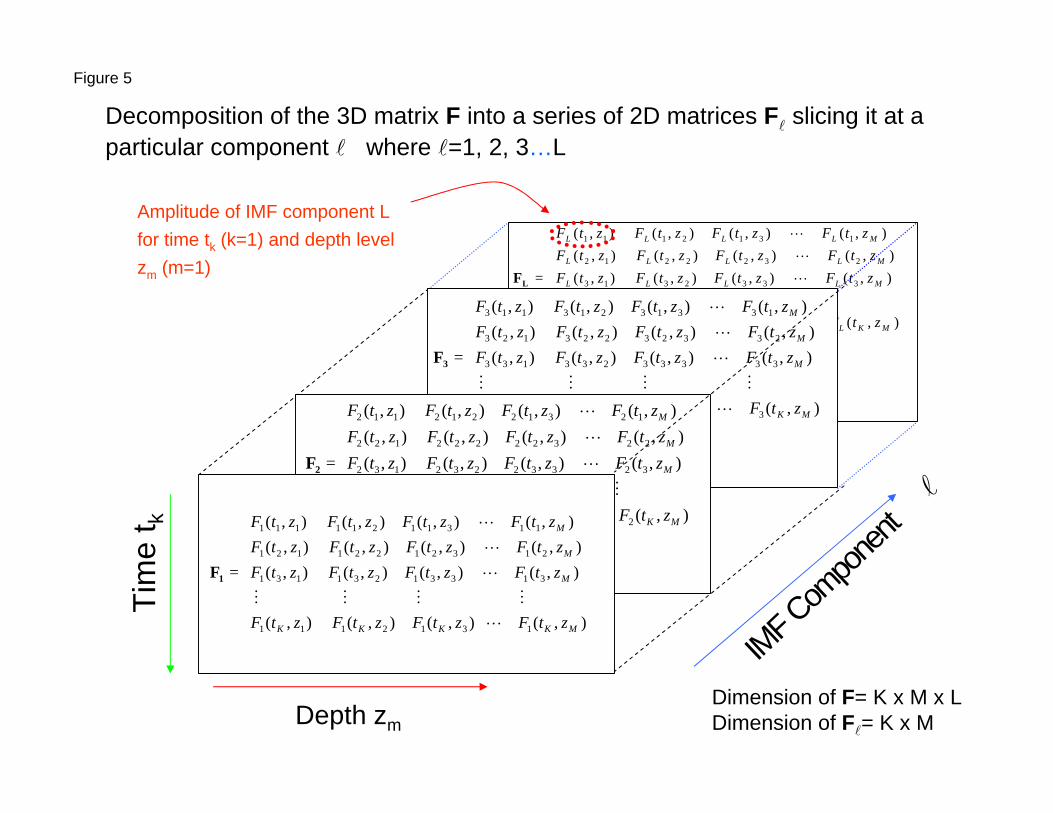
Decomposition of the 3D matrix F into a series of 2D matrices Fl slicing it at a particular component l where l=1, 2, 3…L
=
),(),(),(),(
),(),(),(),(
),(),(),(),(),(),(),(),(
321
3332313
2322212
1312111
MKLKLKLKL
MLLLL
MLLLL
MLLLL
ztFztFztFztF
ztFztFztFztF
ztFztFztFztFztFztFztFztF
LMMMM
L
L
L
LF
=
),(),(),(),(
),(),(),(),(
),(),(),(),(
),(),(),(),(
3332313
33333233133
23323223123
13313213113
MKKKK
M
M
M
ztFztFztFztF
ztFztFztFztF
ztFztFztFztF
ztFztFztFztF
LMMMM
L
L
L
3F
=
),(),(),(),(
),(),(),(),(
),(),(),(),(
),(),(),(),(
2322212
32332232132
22322222122
12312212112
MKKKK
M
M
M
ztFztFztFztF
ztFztFztFztF
ztFztFztFztF
ztFztFztFztF
LMMMM
L
L
L
2F
=
),(),(),(),(
),(),(),(),(
),(),(),(),(),(),(),(),(
1312111
31331231131
21321221121
11311211111
MKKKK
M
M
M
ztFztFztFztF
ztFztFztFztF
ztFztFztFztFztFztFztFztF
LMMMM
L
L
L
1F
IMF C
ompo
nent
l
Depth zm
Tim
e t k
Amplitude of IMF component L for time tk (k=1) and depth level zm (m=1)
Dimension of F= K x M x LDimension of Fl= K x M
Figure 5
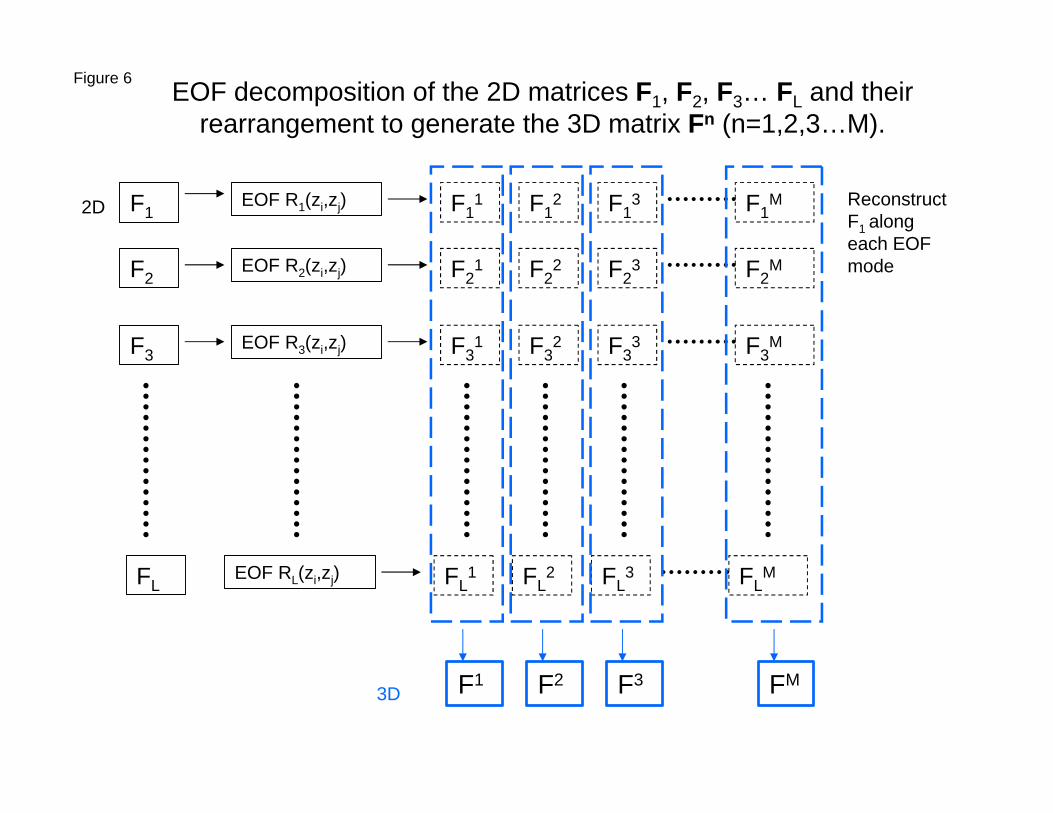
EOF decomposition of the 2D matrices F1, F2, F3… FL and their rearrangement to generate the 3D matrix Fn (n=1,2,3…M).
Figure 6
2D F1
F2
F3
FL
EOF R2(zi,zj)
EOF R1(zi,zj)
EOF R3(zi,zj)
EOF RL(zi,zj)
F31 F3
2 F33 F3
M
F11 F1
2 F13 F1
M
F21 F2
2 F23 F2
M
FL1 FL
2 FL3 FL
M
Reconstruct F1 along each EOF mode
F1 F2 F3 FM3D
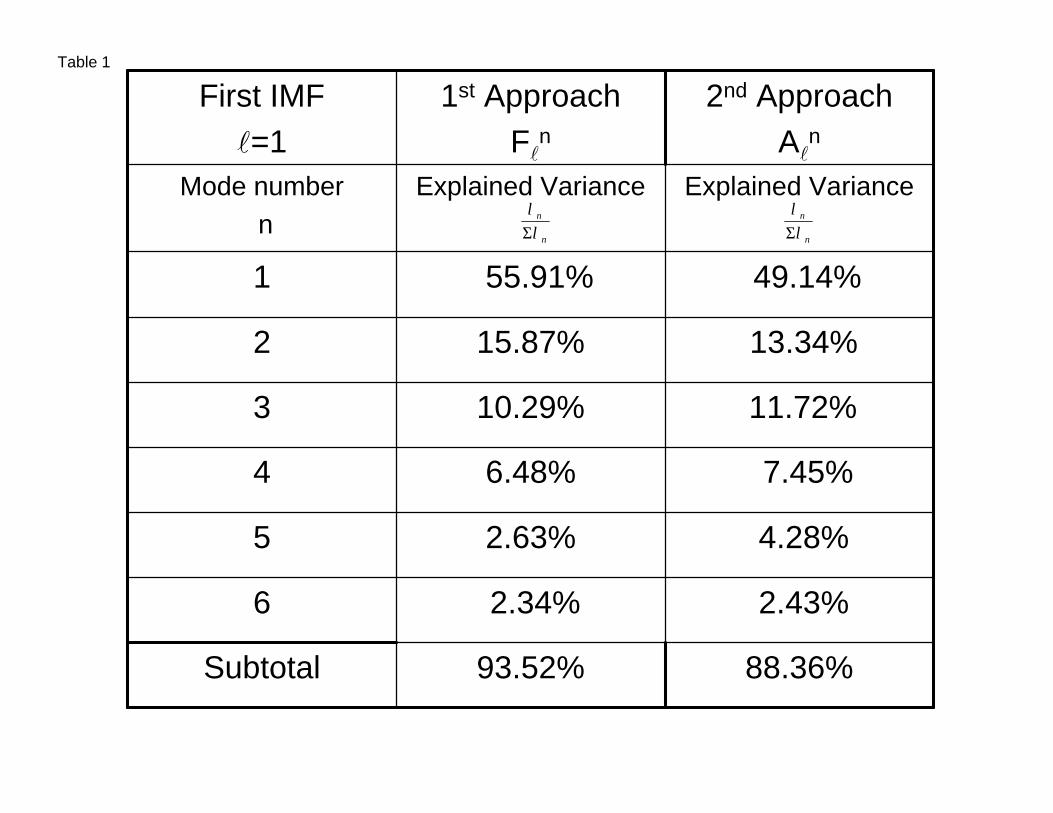
88.36%
2.43%
4.28%
7.45%
11.72%
13.34%
49.14%
Explained Variance
2nd ApproachAl
n
93.52%
2.34%
2.63%
6.48%
10.29%
15.87%
55.91%
Explained Variance
1st ApproachFl
n
First IMFl=1
6
Subtotal
5
4
3
2
1
Mode numbern
Table 1
n
n
λλ
Σ n
n
λλ
Σ
Year Day (2000)
Freq
uenc
y (C
PD
)
Hilbert Spectrum
275 280 285 290 295 300 305 310
0.5
1
1.5
2
2.5
3
0
0.1
0.2
0.3
0.4
0.5
0.6
0.7
0.8
0.9
1
Year Day (2000)
Freq
uenc
y (C
PD
)
Hilbert Spectrum
275 280 285 290 295 300 305 310
0.5
1
1.5
2
2.5
3
0
0.1
0.2
0.3
0.4
0.5
0.6
0.7
0.8
0.9
1
Year Day (2000)
Freq
uenc
y (C
PD
)
Hilbert Spectrum
275 280 285 290 295 300 305 310
0.5
1
1.5
2
2.5
3
0
0.1
0.2
0.3
0.4
0.5
0.6
0.7
0.8
0.9
1
Year Day (2000)
Freq
uenc
y (C
PD
)
Hilbert Spectrum
275 280 285 290 295 300 305 310
0.5
1
1.5
2
2.5
3
0
0.1
0.2
0.3
0.4
0.5
0.6
0.7
0.8
0.9
1
A
B
C
D
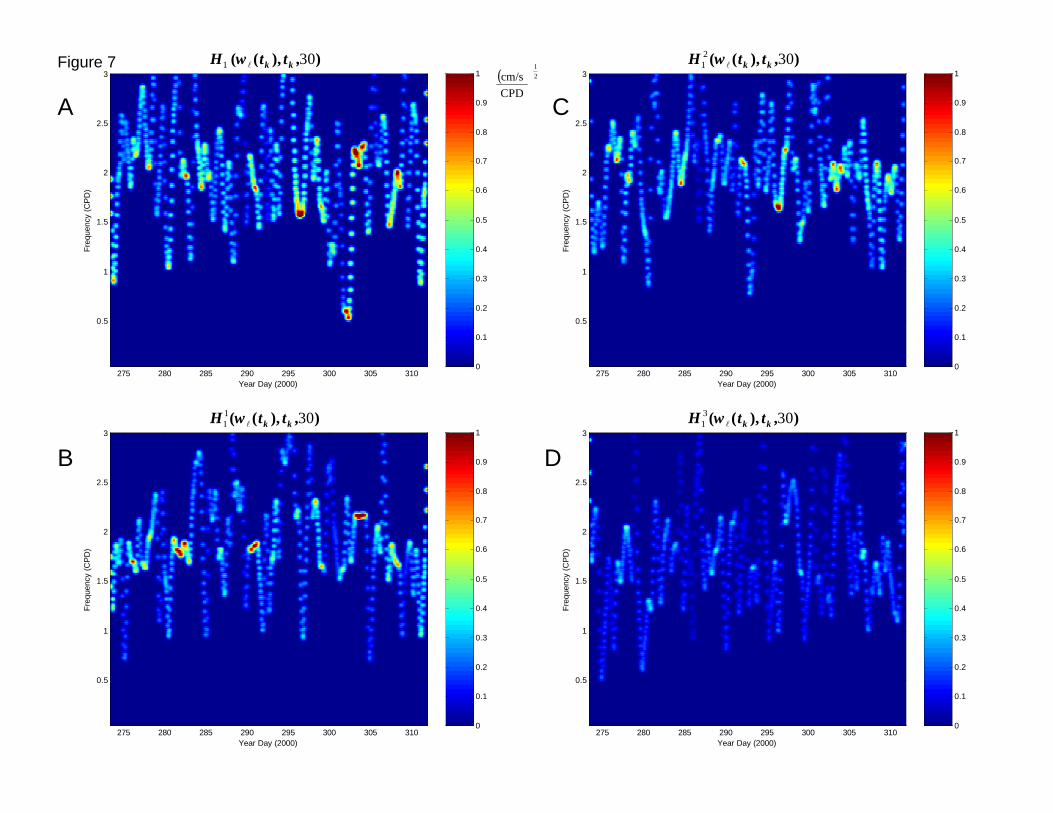
),),(( 3011 kk ttH lω
),),(( 3021 kk ttH lω
),),(( 3031 kk ttH lω
),),(( 301 kk ttH lω( ) 2
1
CPDcm/s
Figure 7
270 275 280 285 290 295 300 305 31010
12
14
16
18
20
22
24
26
28
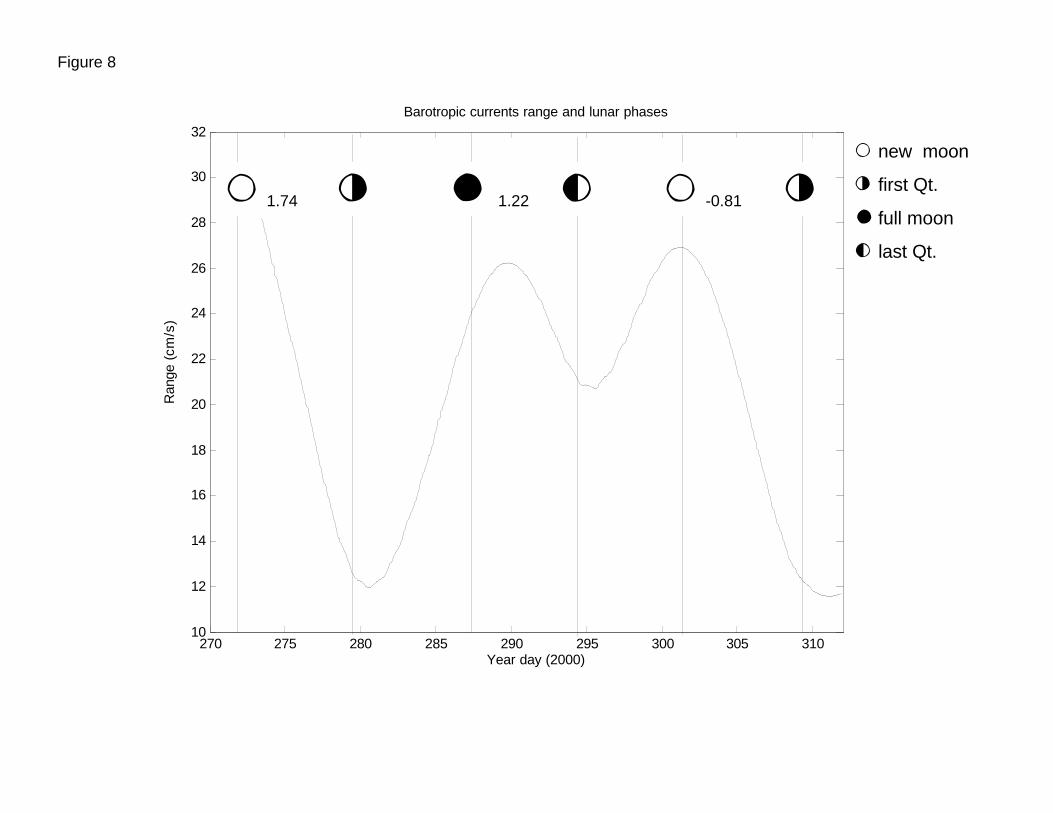
30
32Barotropic currents range and lunar phases
Year day (2000)
Ran
ge (
cm/s
)
1.6 2.4 0.0 1.74 1.22 -0.81- 4 , 6 - 4- new moon
4 first Qt.
, full moon
6 last Qt.
Figure 8
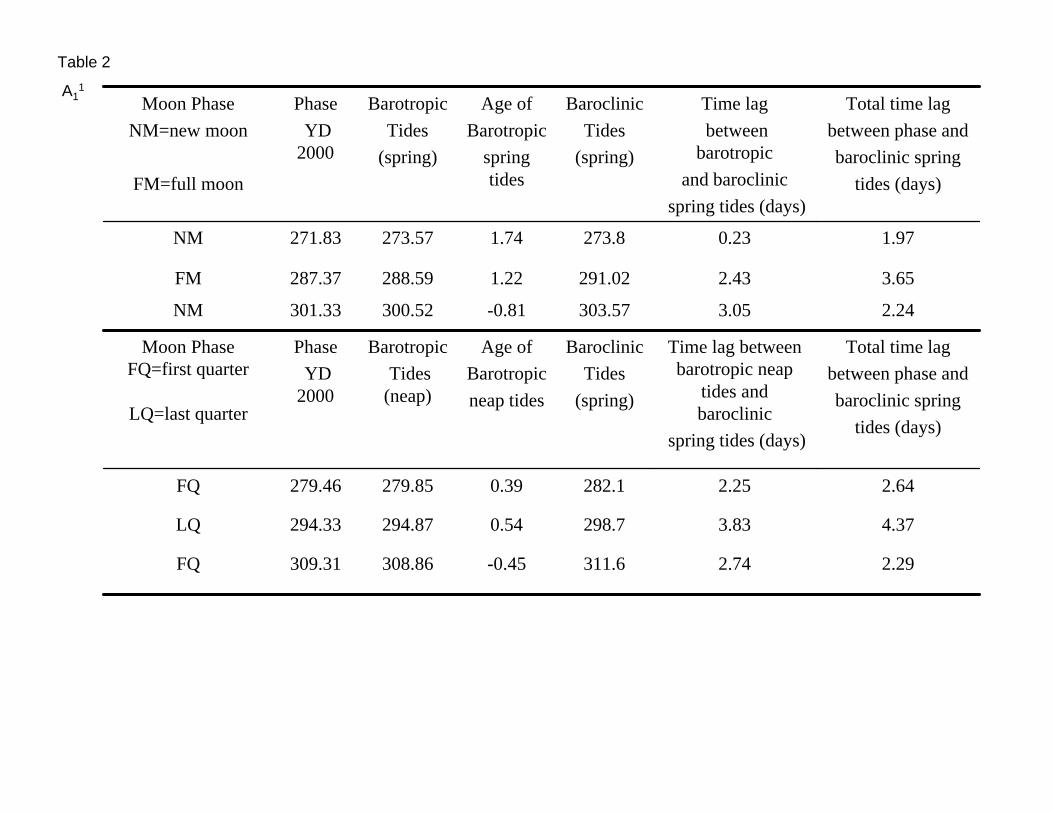
Table 2
A11
2.74
3.83
2.25
Time lag between barotropic neap
tides and baroclinic
spring tides (days)
3.05
2.43
0.23
Time lagbetween
barotropicand baroclinic
spring tides (days)
FQ
LQ
FQ
Moon PhaseFQ=first quarter
LQ=last quarter
NM
FM
NM
Moon PhaseNM=new moon
FM=full moon
2.29311.6-0.45308.86309.31
4.37298.70.54294.87294.33
2.64282.10.39279.85279.46
Total time lagbetween phase andbaroclinic spring
tides (days)
BaroclinicTides
(spring)
Age ofBarotropicneap tides
BarotropicTides
(neap)
PhaseYD
2000
2.24303.57-0.81300.52301.33
3.65291.021.22288.59287.37
1.97273.81.74273.57271.83
Total time lagbetween phase andbaroclinic spring
tides (days)
BaroclinicTides
(spring)
Age ofBarotropic
spring tides
BarotropicTides
(spring)
PhaseYD
2000
Year Day (2000)
Dep
th (
m)
EOF 3
275 280 285 290 295 300 305 310
-60
-50
-40
-30
-20
-10
-4
-3
-2
-1
0
1
2
3
4
Year Day (2000)
Dep
th (
m)
EOF 2
275 280 285 290 295 300 305 310
-60
-50
-40
-30
-20
-10
-10
-8
-6
-4
-2
0
2
4
6
8
10
Year Day (2000)
Dep
th (
m)
F11
275 280 285 290 295 300 305 310
-60
-50
-40
-30
-20
-10
-10
-5
0
5
10
Year Day (2000)
Dep
th (
m)
275 280 285 290 295 300 305 310
-60
-50
-40
-30
-20
-10
-10
-5
0
5
10
F12
F13
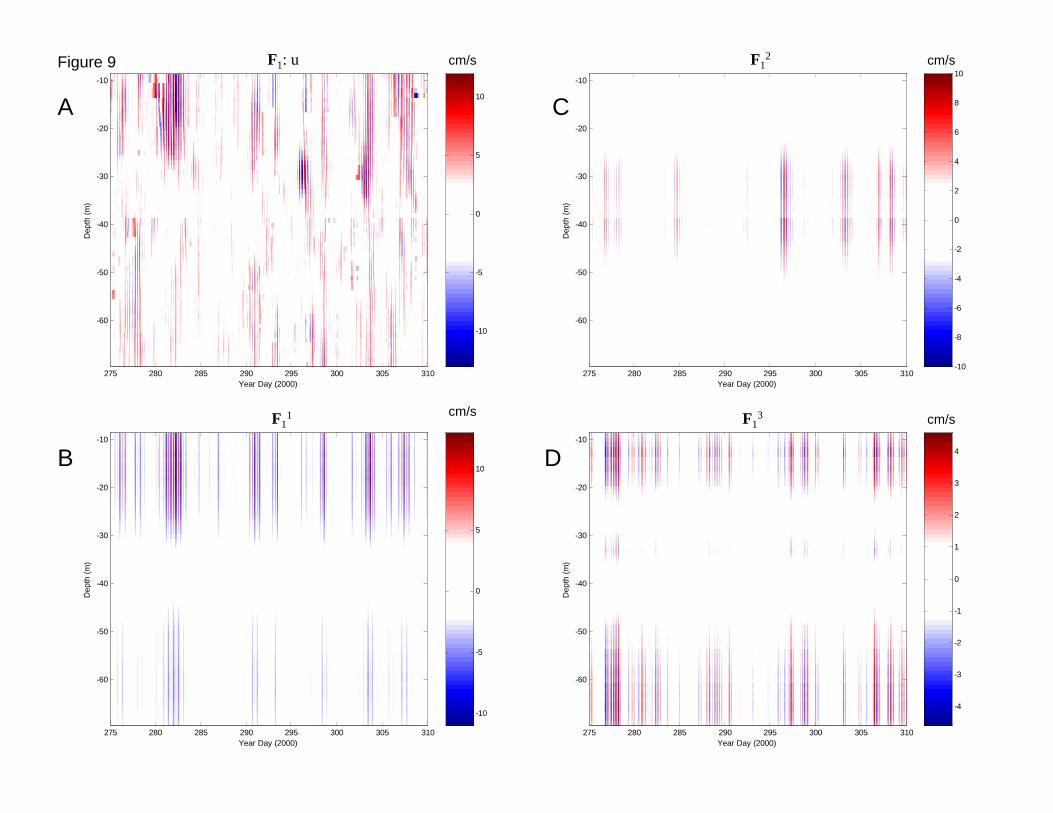
F1: u
A
B
C
D
Figure 9
F11
cm/s
cm/s
cm/s
cm/s
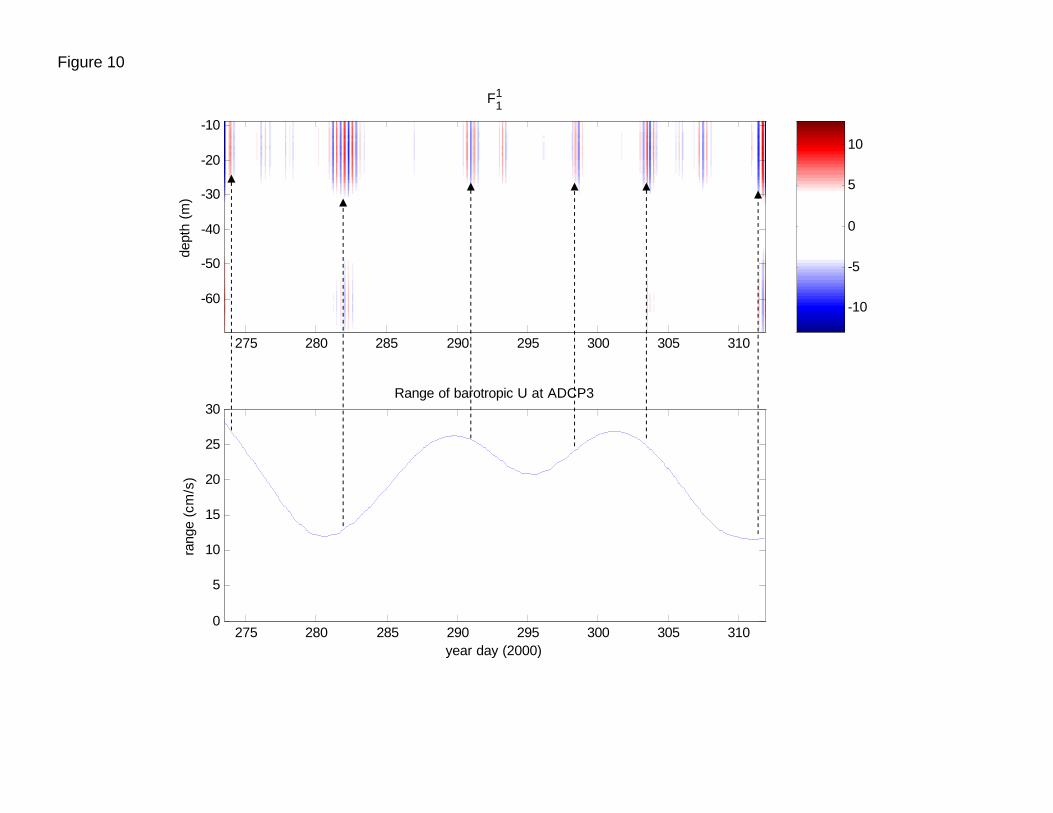
Figure 10
cm/s
dept
h (m
)
F11
275 280 285 290 295 300 305 310
-60
-50
-40
-30
-20
-10
275 280 285 290 295 300 305 3100
5
10
15
20
25
30
year day (2000)
rang
e (c
m/s
)
Range of barotropic U at ADCP3
-10
-5
0
5
10
cm/s
cm/s
cm/s
cm/s
Year Day (2002)
Dep
th (
m)
EOF 3
275 280 285 290 295 300 305 310
-60
-50
-40
-30
-20
-10
-6
-4
-2
0
2
4
6
Year Day (2002)
Dep
th (
m)
EOF 2
275 280 285 290 295 300 305 310
-60
-50
-40
-30
-20
-10
-4
-3
-2
-1
0
1
2
3
4
Year Day (2002)
Dep
th (
m)
EOF 1
275 280 285 290 295 300 305 310
-60
-50
-40
-30
-20
-10
-10
-8
-6
-4
-2
0
2
4
6
8
10
Year Day (2000)
Dep
th (
m)
275 280 285 290 295 300 305 310
-60
-50
-40
-30
-20
-10
0
2
4
6
8
10
12
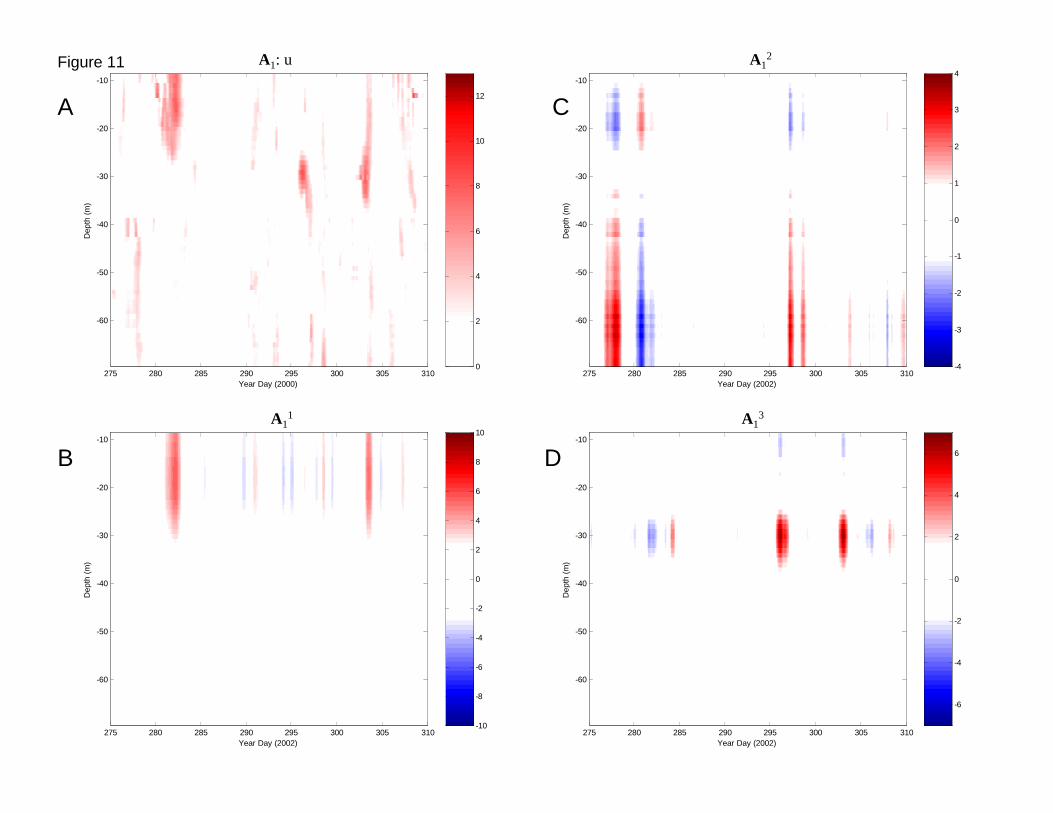
A11
A12
A13
A1: u
A
B
C
D
Figure 11
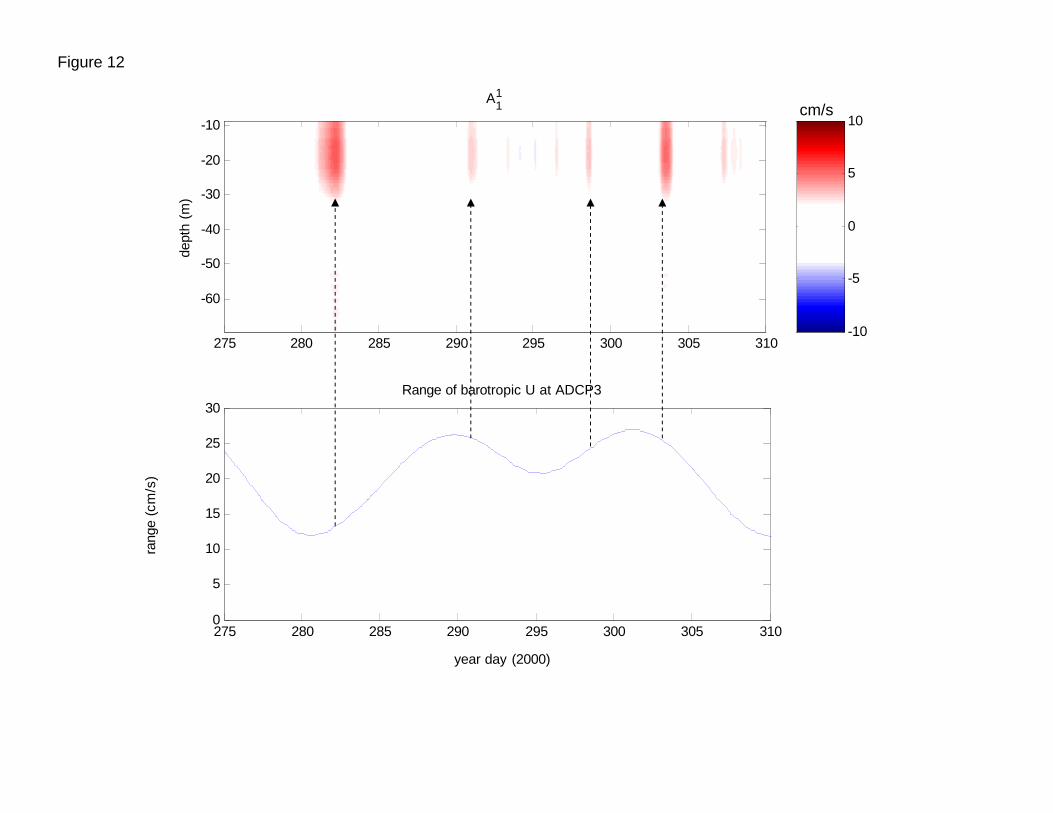
Figure 12
dept
h (m
)
A11
275 280 285 290 295 300 305 310
-60
-50
-40
-30
-20
-10
275 280 285 290 295 300 305 3100
5
10
15
20
25
30
year day (2000)
rang
e (c
m/s
)
Range of barotropic U at ADCP3
-10
-5
0
5
10cm/s
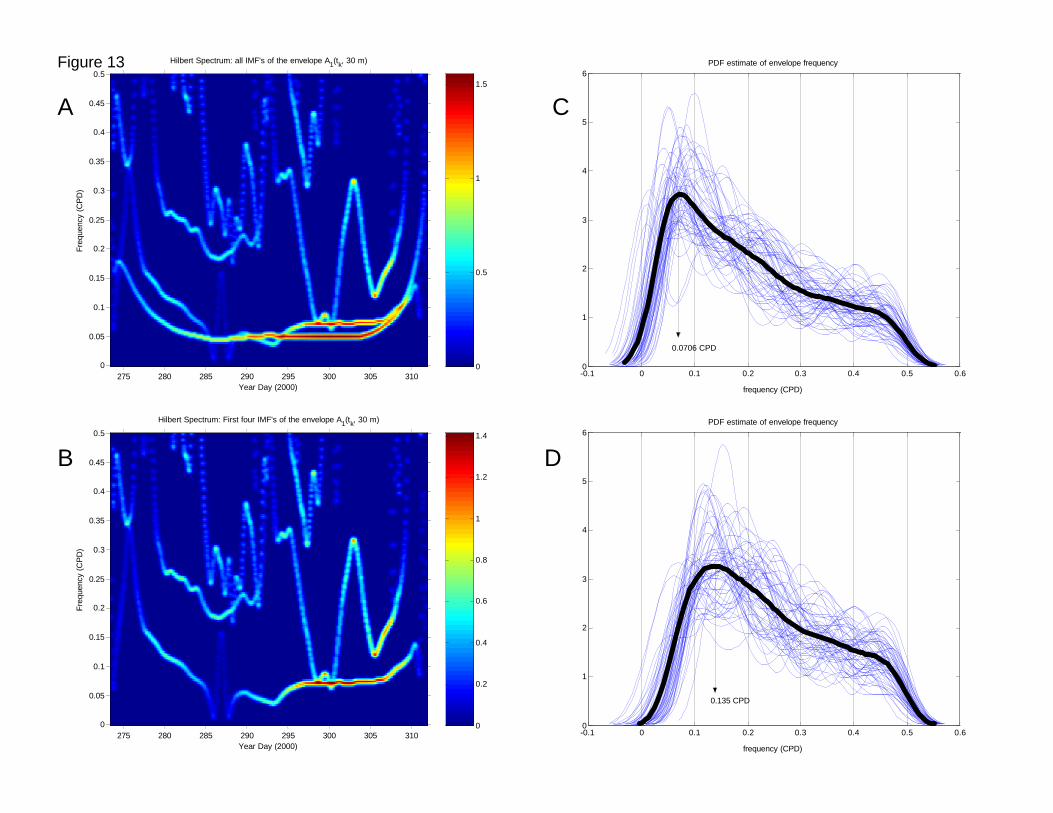
-0.1 0 0.1 0.2 0.3 0.4 0.5 0.60
1
2
3
4
5
6PDF estimate of envelope frequency
frequency (CPD)
0.135 CPD
-0.1 0 0.1 0.2 0.3 0.4 0.5 0.60
1
2
3
4
5
6PDF estimate of envelope frequency
frequency (CPD)
0.0706 CPD
Year Day (2000)
Freq
uenc
y (C
PD
)
Hilbert Spectrum: First four IMF's of the envelope A1(tk, 30 m)
275 280 285 290 295 300 305 3100
0.05
0.1
0.15
0.2
0.25
0.3
0.35
0.4
0.45
0.5
0
0.2
0.4
0.6
0.8
1
1.2
1.4
Year Day (2000)
Freq
uenc
y (C
PD
)
Hilbert Spectrum: all IMF's of the envelope A1(tk, 30 m)
275 280 285 290 295 300 305 3100
0.05
0.1
0.15
0.2
0.25
0.3
0.35
0.4
0.45
0.5
0
0.5
1
1.5
A
B
C
D
Figure 13
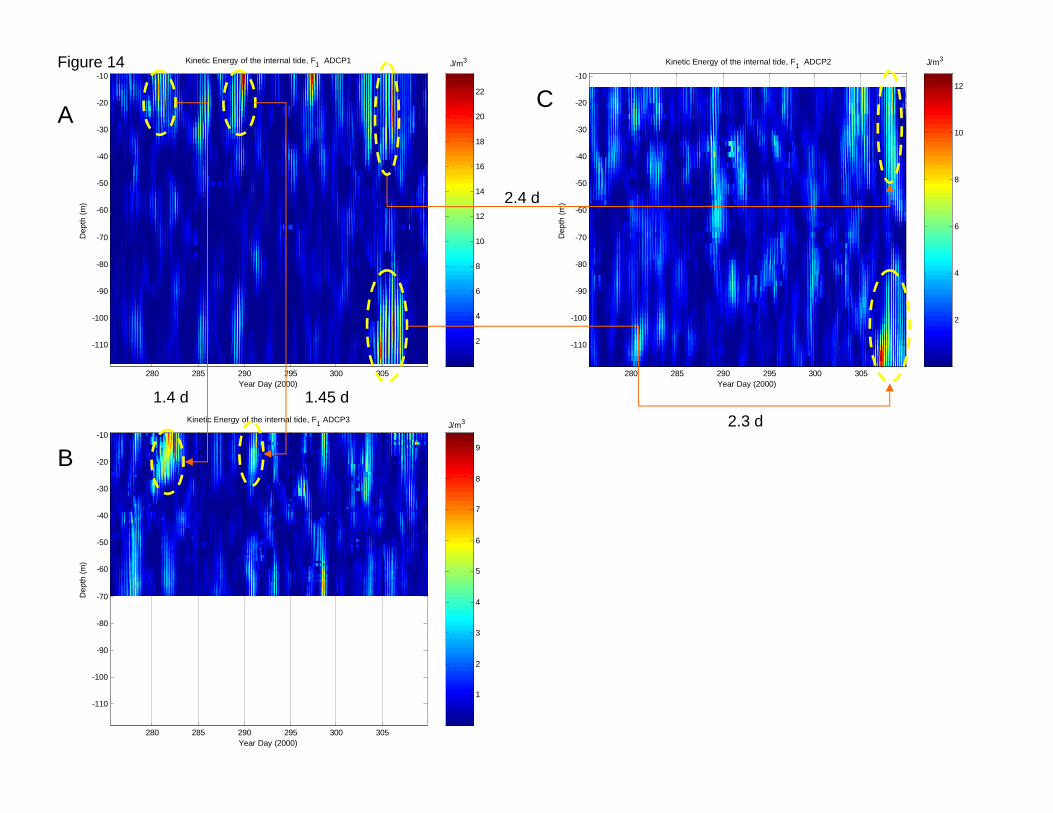
Year Day (2000)
Dep
th (
m)
Kinetic Energy of the internal tide, F1 ADCP2
280 285 290 295 300 305
-110
-100
-90
-80
-70
-60
-50
-40
-30
-20
-10
2
4
6
8
10
12
J/m3
Year Day (2000)
Dep
th (
m)
Kinetic Energy of the internal tide, F1 ADCP1
280 285 290 295 300 305
-110
-100
-90
-80
-70
-60
-50
-40
-30
-20
-10
2
4
6
8
10
12
14
16
18
20
22
J/m3
Year Day (2000)
Dep
th (
m)
Kinetic Energy of the internal tide, F1 ADCP3
280 285 290 295 300 305
-110
-100
-90
-80
-70
-60
-50
-40
-30
-20
-10
1
2
3
4
5
6
7
8
9
J/m3
Figure 14
2.3 d
2.4 d
1.45 d1.4 d
A
B
C
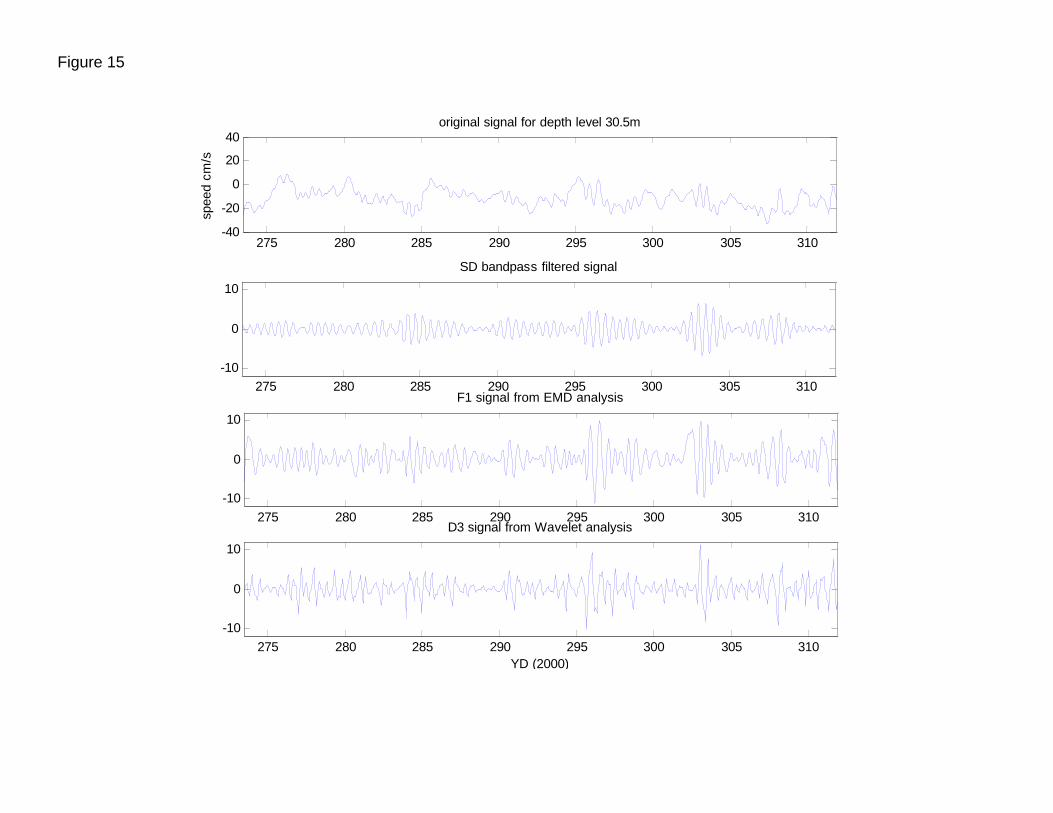
275 280 285 290 295 300 305 310-40
-20
0
20
40original signal for depth level 30.5m
spee
d cm
/s
275 280 285 290 295 300 305 310-10
0
10
SD bandpass filtered signal
275 280 285 290 295 300 305 310-10
0
10
F1 signal from EMD analysis
275 280 285 290 295 300 305 310-10
0
10
D3 signal from Wavelet analysis
YD (2000)
Figure 15
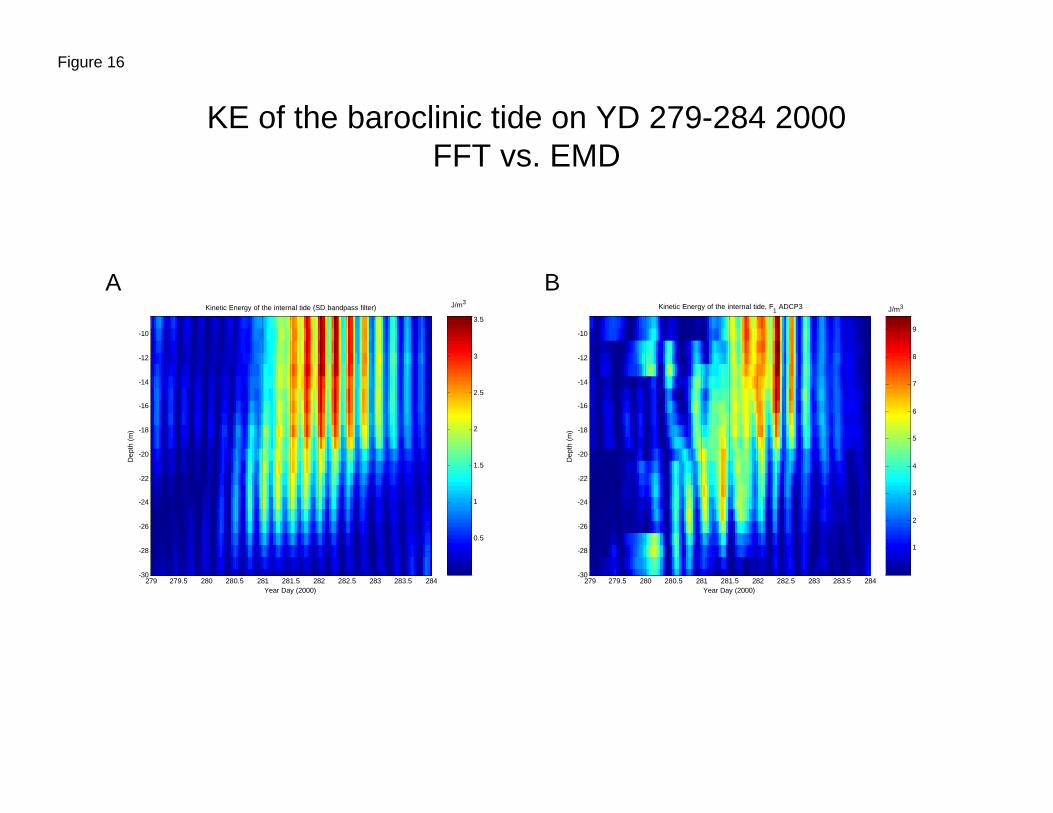
KE of the baroclinic tide on YD 279-284 2000FFT vs. EMD
Year Day (2000)
Dep
th (
m)
Kinetic Energy of the internal tide (SD bandpass filter)
279 279.5 280 280.5 281 281.5 282 282.5 283 283.5 284-30
-28
-26
-24
-22
-20
-18
-16
-14
-12
-10
0.5
1
1.5
2
2.5
3
3.5
J/m3
Year Day (2000)
Dep
th (
m)
Kinetic Energy of the internal tide, F1 ADCP3
279 279.5 280 280.5 281 281.5 282 282.5 283 283.5 284-30
-28
-26
-24
-22
-20
-18
-16
-14
-12
-10
1
2
3
4
5
6
7
8
9
J/m3
A B
Figure 16

KE of the internal tide on YD 279-284 2000Wavelet vs. EMD
Year Day (2000)
Dep
th (
m)
Kinetic Energy of the internal tide, F1 ADCP3
279 279.5 280 280.5 281 281.5 282 282.5 283 283.5 284-30
-28
-26
-24
-22
-20
-18
-16
-14
-12
-10
1
2
3
4
5
6
7
8
9
J/m3
A B
Year Day (2000)
Dep
th (
m)
Kinetic Energy of the internal tide (Wavelets: db2; detail 3)
279 279.5 280 280.5 281 281.5 282 282.5 283 283.5 284-30
-28
-26
-24
-22
-20
-18
-16
-14
-12
-10
2
4
6
8
10
12
14
16
18
J/m3
Figure 17

Results Parguera
ADCP offshelf
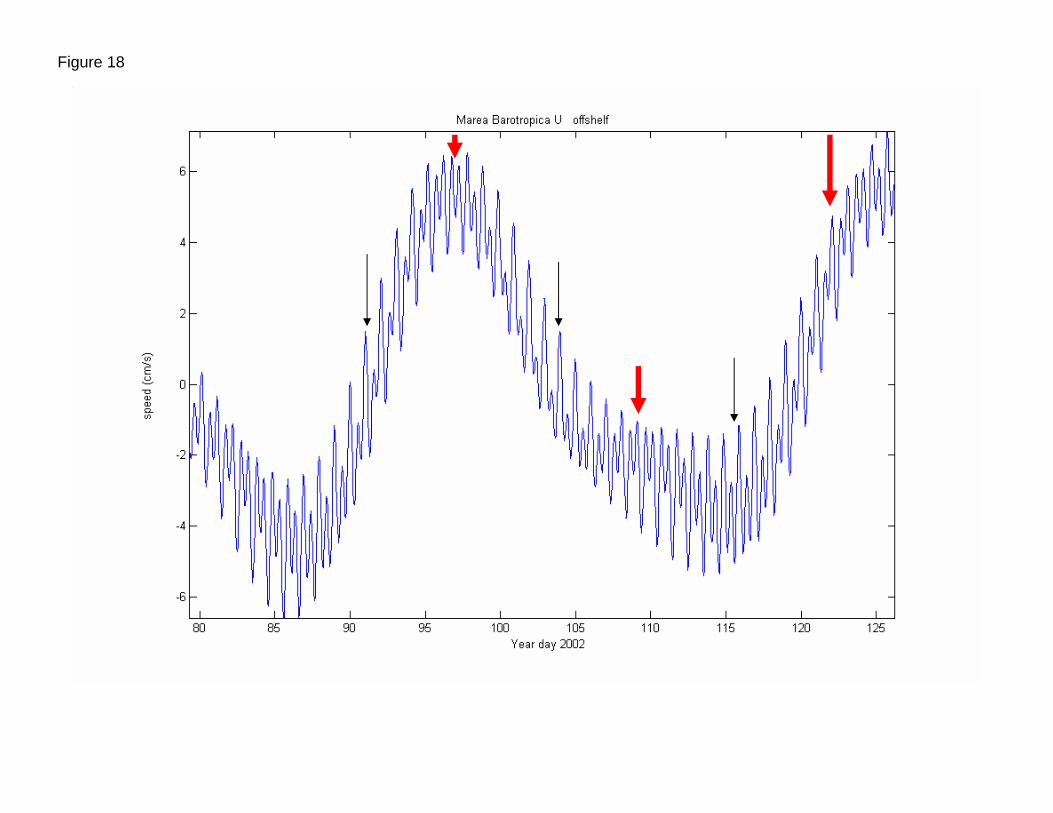
Figure 18
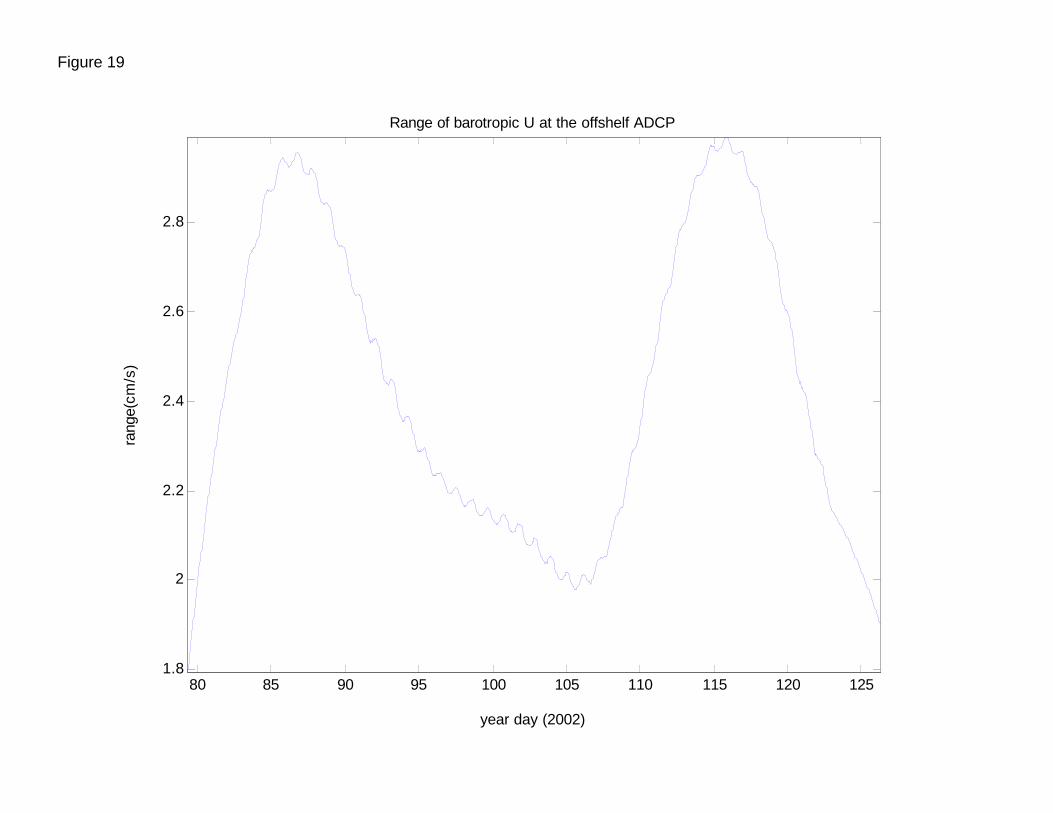
80 85 90 95 100 105 110 115 120 1251.8
2
2.2
2.4
2.6
2.8
year day (2002)
rang
e(cm
/s)
Range of barotropic U at the offshelf ADCP
Figure 19
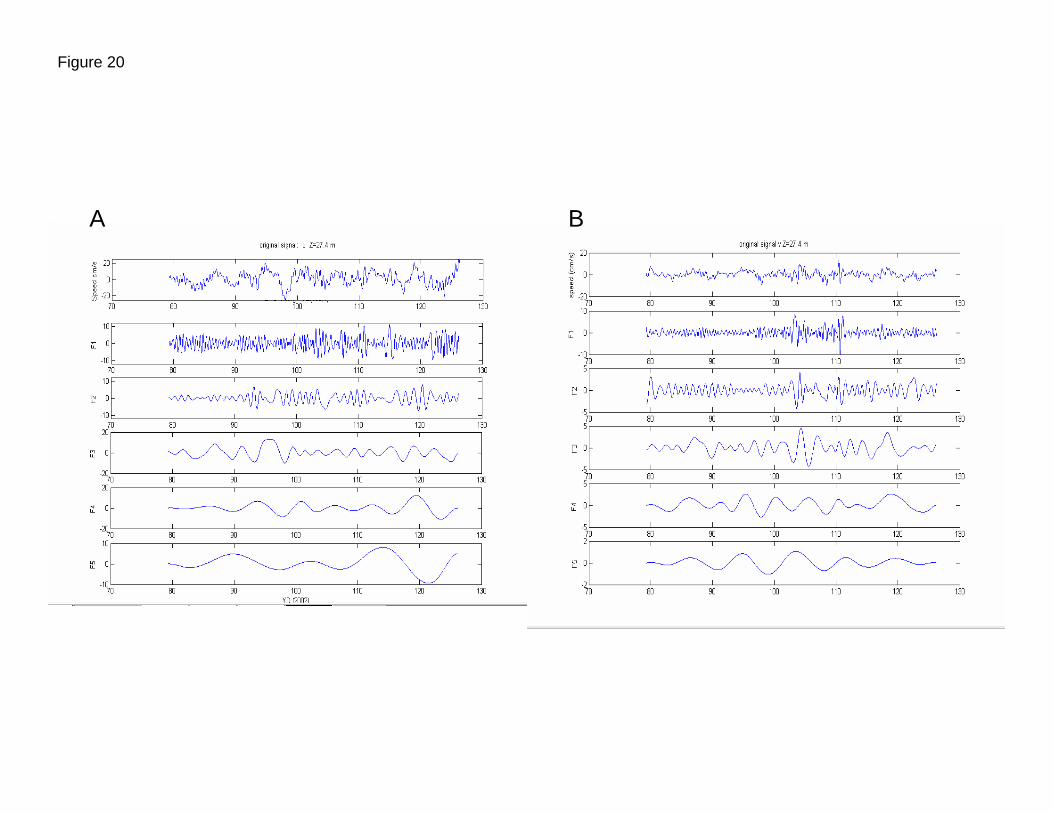
A B
Figure 20
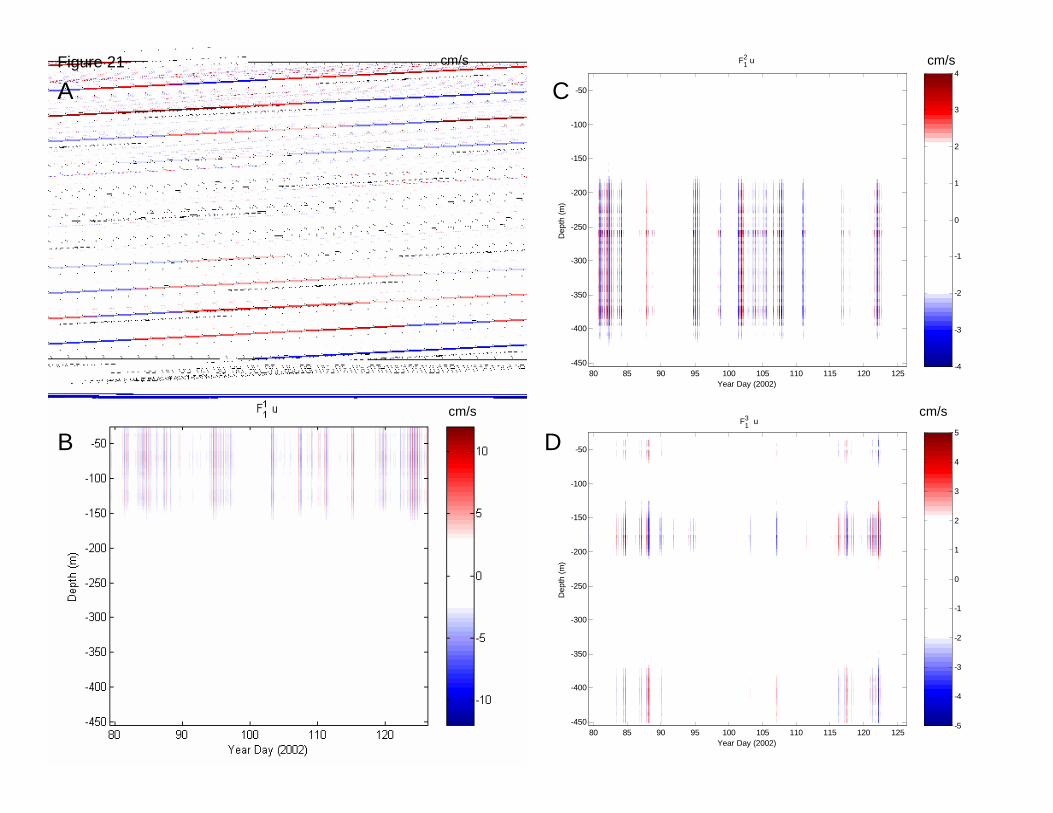
Year Day (2002)
Dep
th (
m)
F13 u
80 85 90 95 100 105 110 115 120 125-450
-400
-350
-300
-250
-200
-150
-100
-50
-5
-4
-3
-2
-1
0
1
2
3
4
5
Year Day (2002)
Dep
th (
m)
F12 u
80 85 90 95 100 105 110 115 120 125-450
-400
-350
-300
-250
-200
-150
-100
-50
-4
-3
-2
-1
0
1
2
3
4cm/s cm/s
cm/s cm/s
A
B
C
D
Figure 21
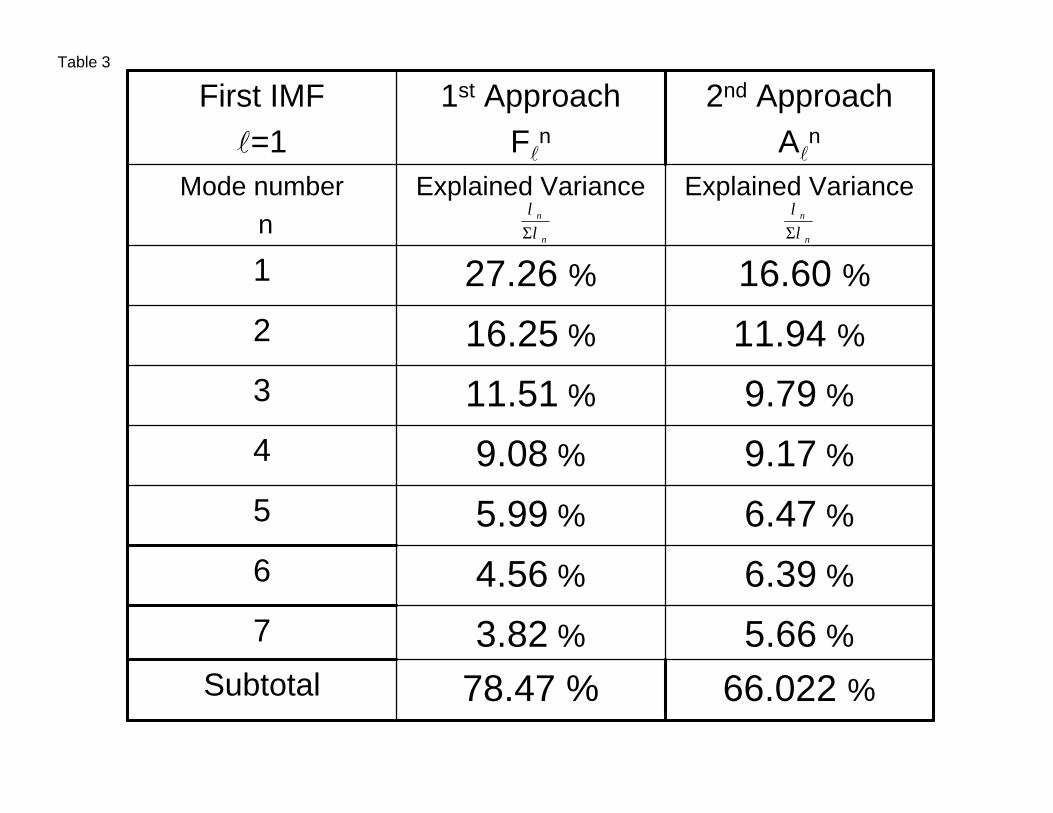
6.39 %4.56 %6
66.022 %5.66 %
6.47 %
9.17 %
9.79 %
11.94 %
16.60 %
Explained Variance
2nd ApproachAl
n
78.47 %3.82 %
5.99 %
9.08 %
11.51 %
16.25 %
27.26 %
Explained Variance
1st ApproachFl
n
First IMFl=1
7
Subtotal
5
4
3
2
1
Mode numbern
Table 3
n
n
λλ
Σ n
n
λλ
Σ
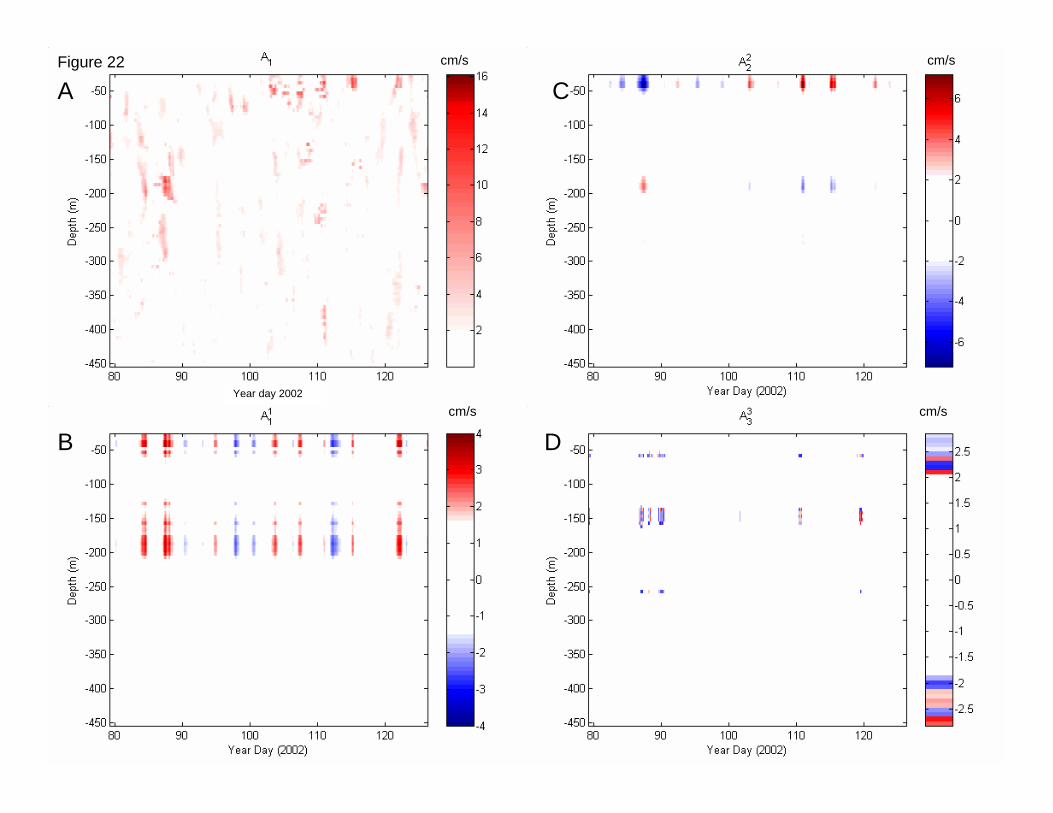
Year day 2002
cm/s cm/s
cm/s cm/s
A
B
C
D
Figure 22
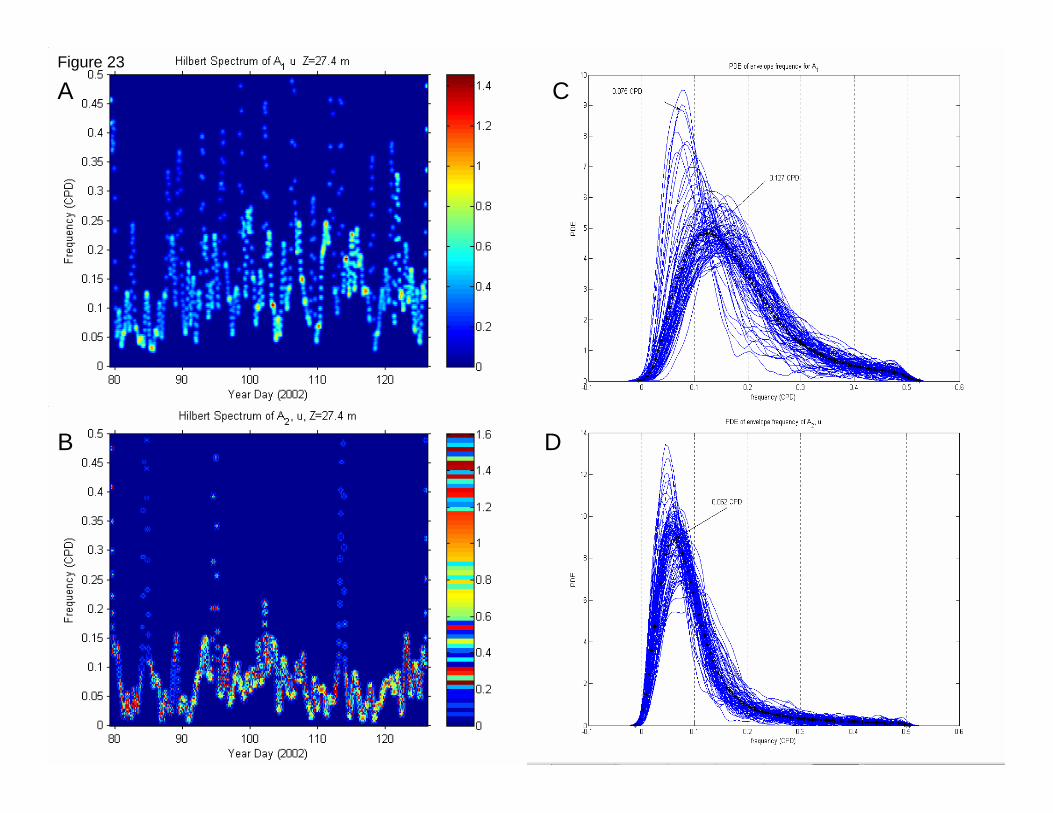
A
B
C
D
Figure 23
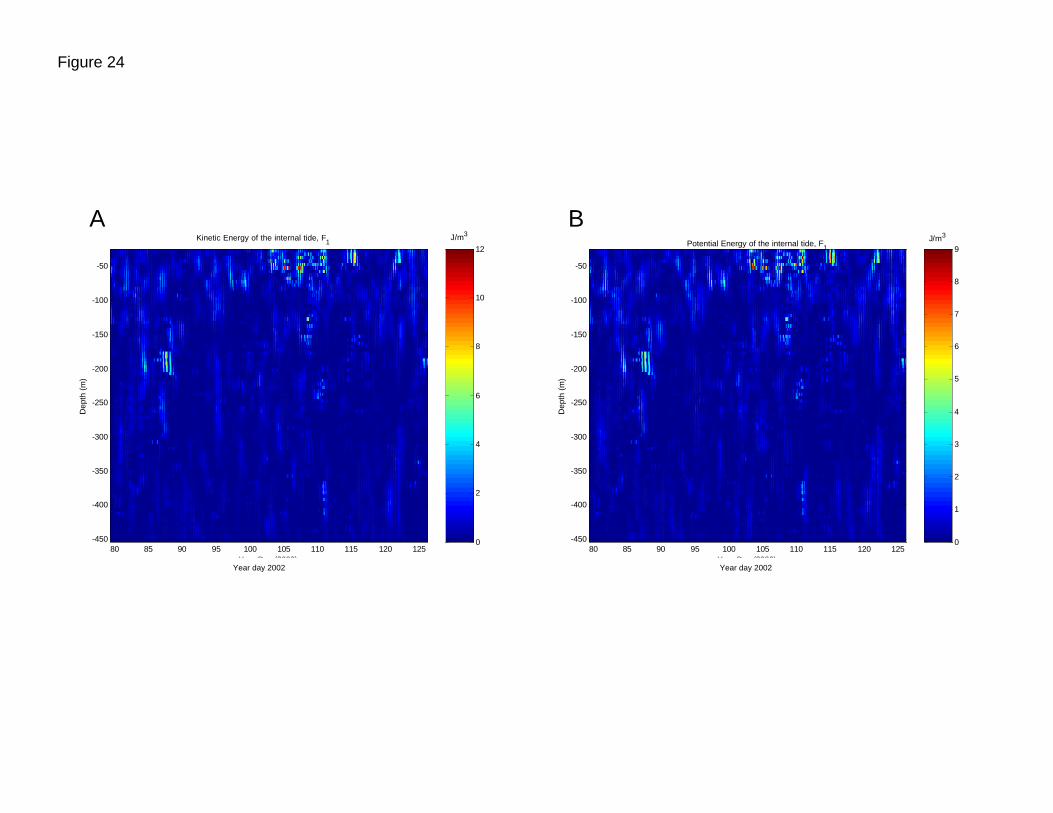
Year Day (2000)
Dep
th (
m)
Kinetic Energy of the internal tide, F1
80 85 90 95 100 105 110 115 120 125-450
-400
-350
-300
-250
-200
-150
-100
-50
0
2
4
6
8
10
12J/m3
Year Day (2000)D
epth
(m
)80 85 90 95 100 105 110 115 120 125
-450
-400
-350
-300
-250
-200
-150
-100
-50
0
1
2
3
4
5
6
7
8
9Potential Energy of the internal tide, F1
J/m3
A B
Figure 24
Year day 2002 Year day 2002
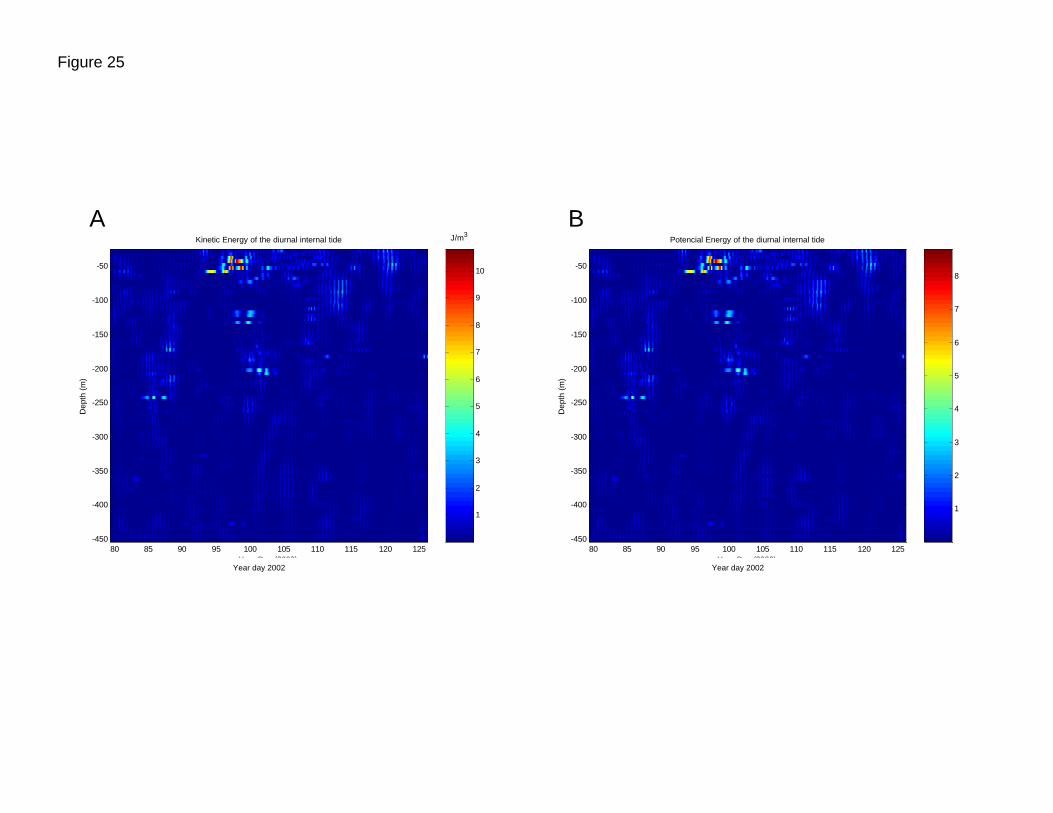
Year Day (2000)
Dep
th (
m)
Kinetic Energy of the diurnal internal tide
80 85 90 95 100 105 110 115 120 125-450
-400
-350
-300
-250
-200
-150
-100
-50
1
2
3
4
5
6
7
8
9
10
J/m3
Year Day (2000)D
epth
(m
)
Potencial Energy of the diurnal internal tide
80 85 90 95 100 105 110 115 120 125-450
-400
-350
-300
-250
-200
-150
-100
-50
1
2
3
4
5
6
7
8
A B
Figure 25
Year day 2002 Year day 2002
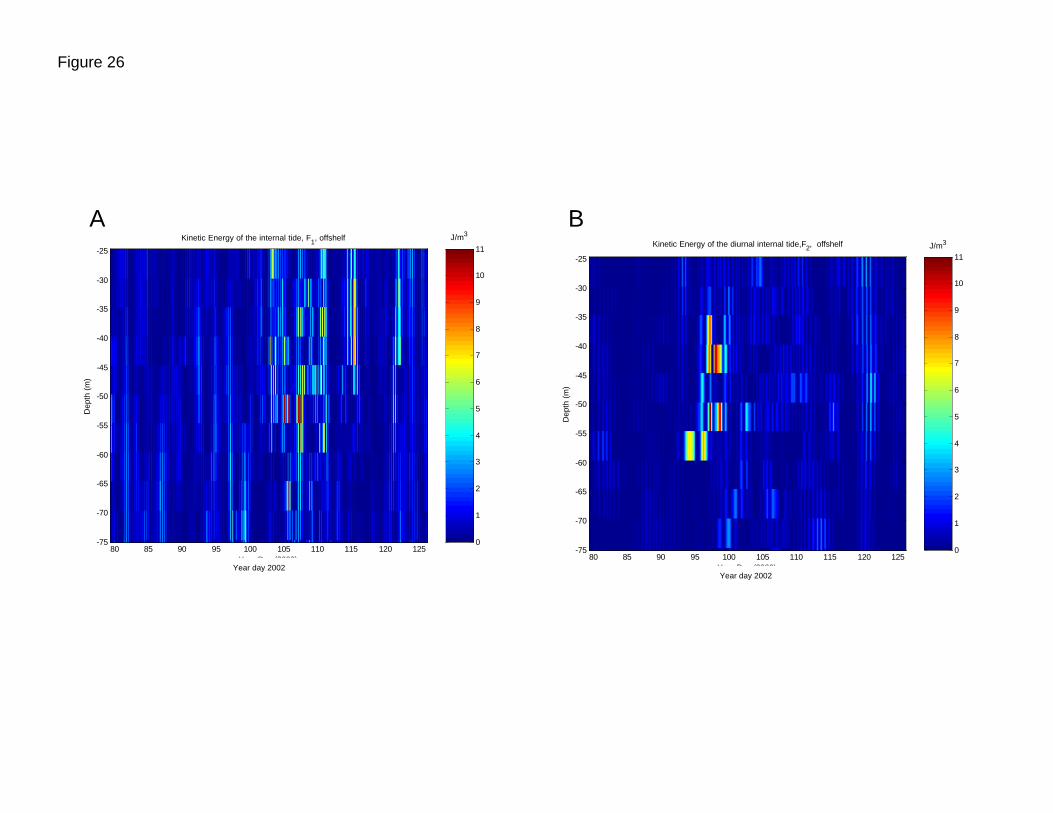
Year Day (2000)D
epth
(m
)
Kinetic Energy of the diurnal internal tide,F2, offshelf
80 85 90 95 100 105 110 115 120 125-75
-70
-65
-60
-55
-50
-45
-40
-35
-30
-25
0
1
2
3
4
5
6
7
8
9
10
11J/m3
Year Day (2000)
Dep
th (
m)
Kinetic Energy of the internal tide, F1, offshelf
80 85 90 95 100 105 110 115 120 125-75
-70
-65
-60
-55
-50
-45
-40
-35
-30
-25
0
1
2
3
4
5
6
7
8
9
10
11J/m3
A B
Figure 26
Year day 2002Year day 2002
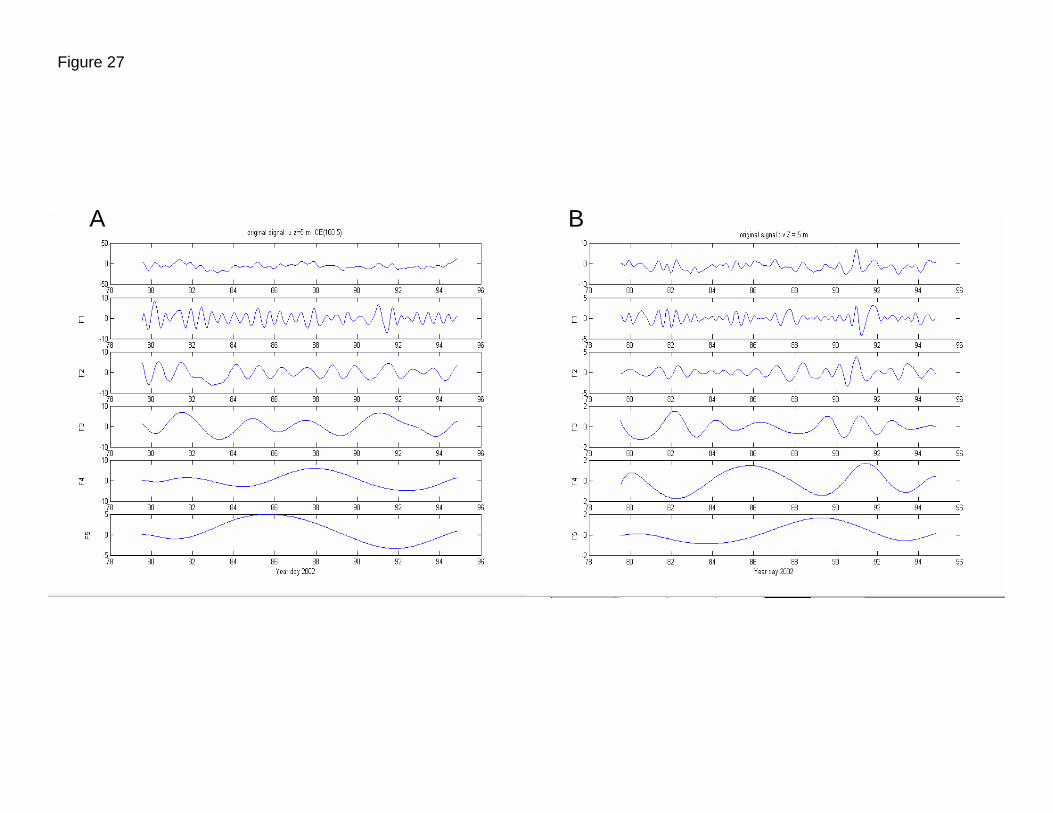
A B
Figure 27
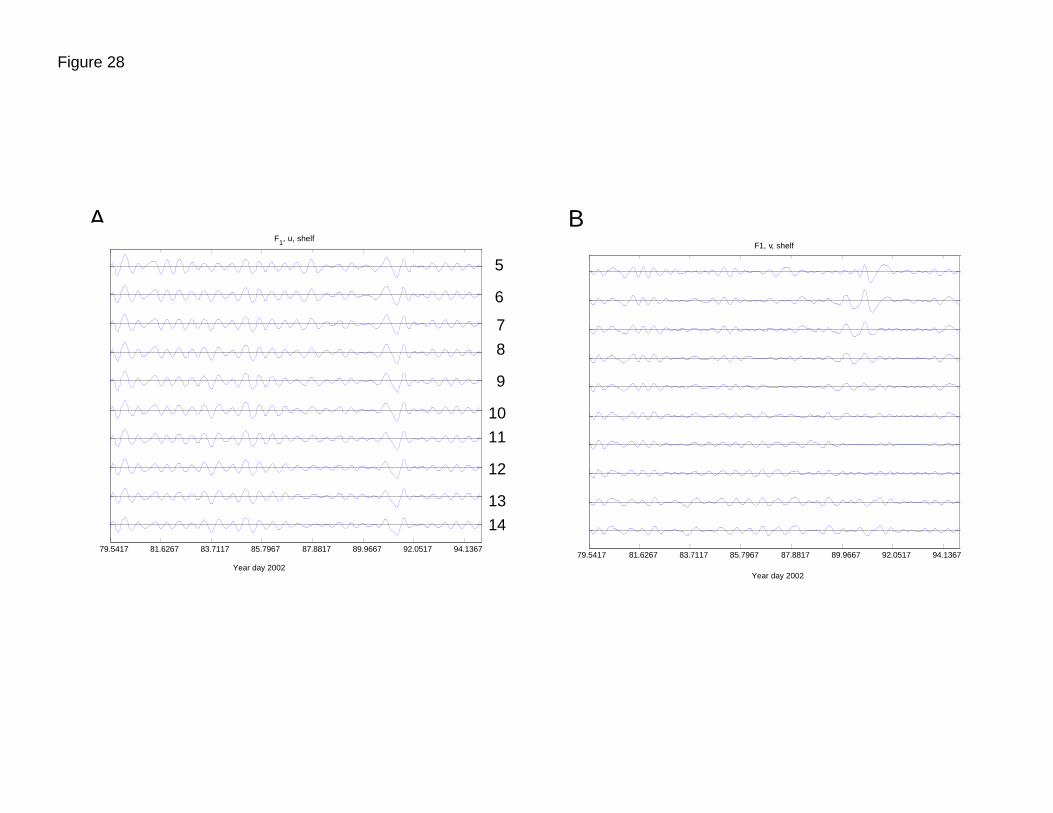
A B
Figure 28
79.5417 81.6267 83.7117 85.7967 87.8817 89.9667 92.0517 94.1367
F1, u, shelf
5
6
7
8
9
1011
12
1314
Year day 2002
79.5417 81.6267 83.7117 85.7967 87.8817 89.9667 92.0517 94.1367
F1, v, shelf
Year day 2002
A B
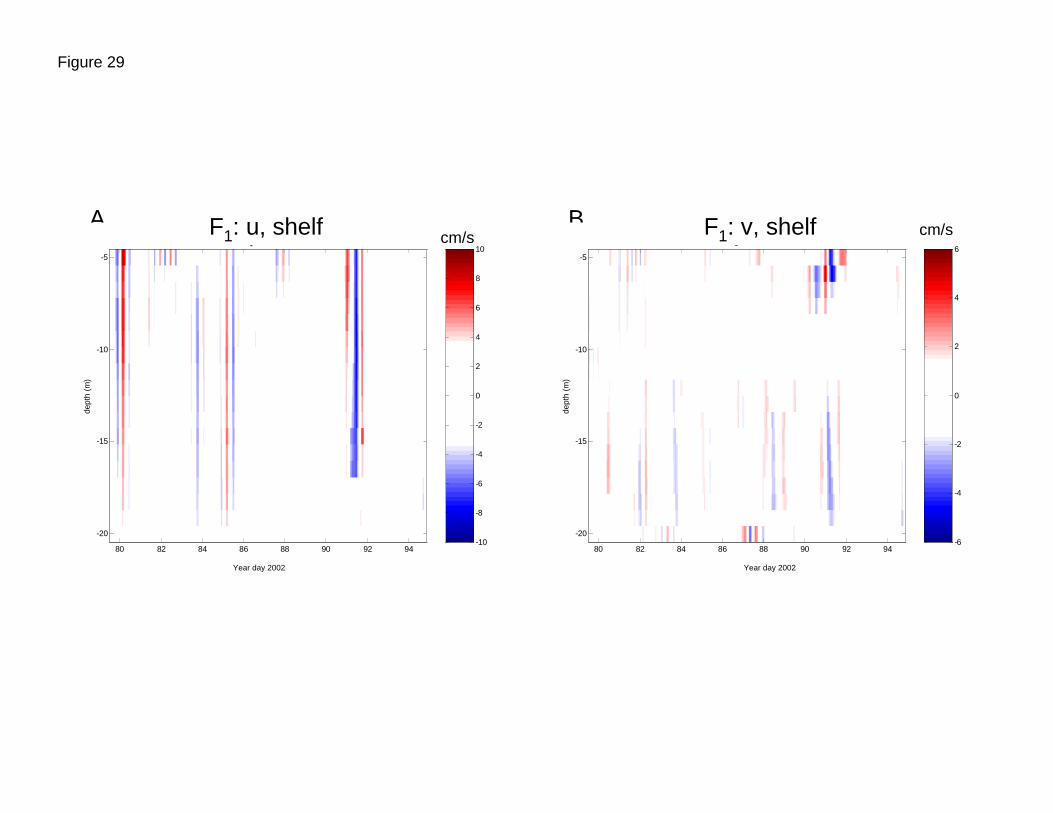
Figure 29de
pth
(m)
80 82 84 86 88 90 92 94
-20
-15
-10
-5
-10
-8
-6
-4
-2
0
2
4
6
8
10F1: u shelf cm/sF1: u, shelf
Year day 2002de
pth
(m)
80 82 84 86 88 90 92 94
-20
-15
-10
-5
-6
-4
-2
0
2
4
6F1 shelf
cm/sF1: v, shelf
Year day 2002
A B
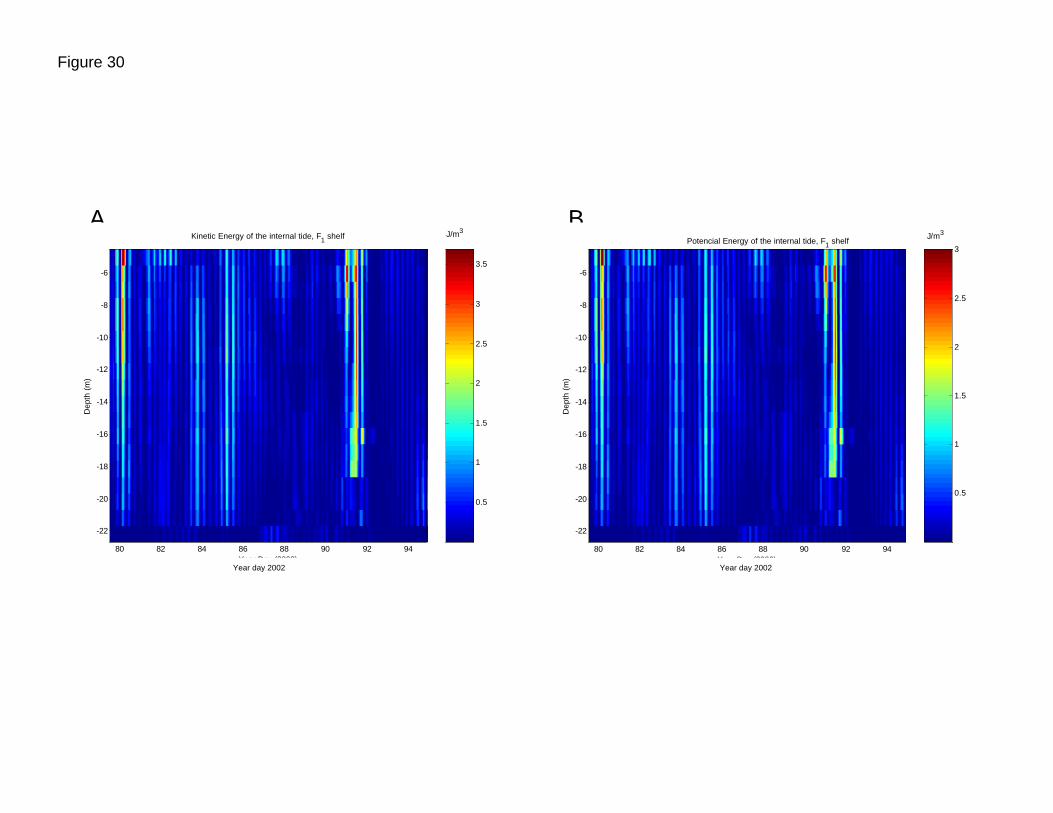
Figure 30
Year Day (2000)
Dep
th (
m)
Kinetic Energy of the internal tide, F1 shelf
80 82 84 86 88 90 92 94
-22
-20
-18
-16
-14
-12
-10
-8
-6
0.5
1
1.5
2
2.5
3
3.5
J/m3
Year day 2002Year Day (2000)
Dep
th (
m)
80 82 84 86 88 90 92 94
-22
-20
-18
-16
-14
-12
-10
-8
-6
0.5
1
1.5
2
2.5
3Potencial Energy of the internal tide, F1 shelf
J/m3
Year day 2002
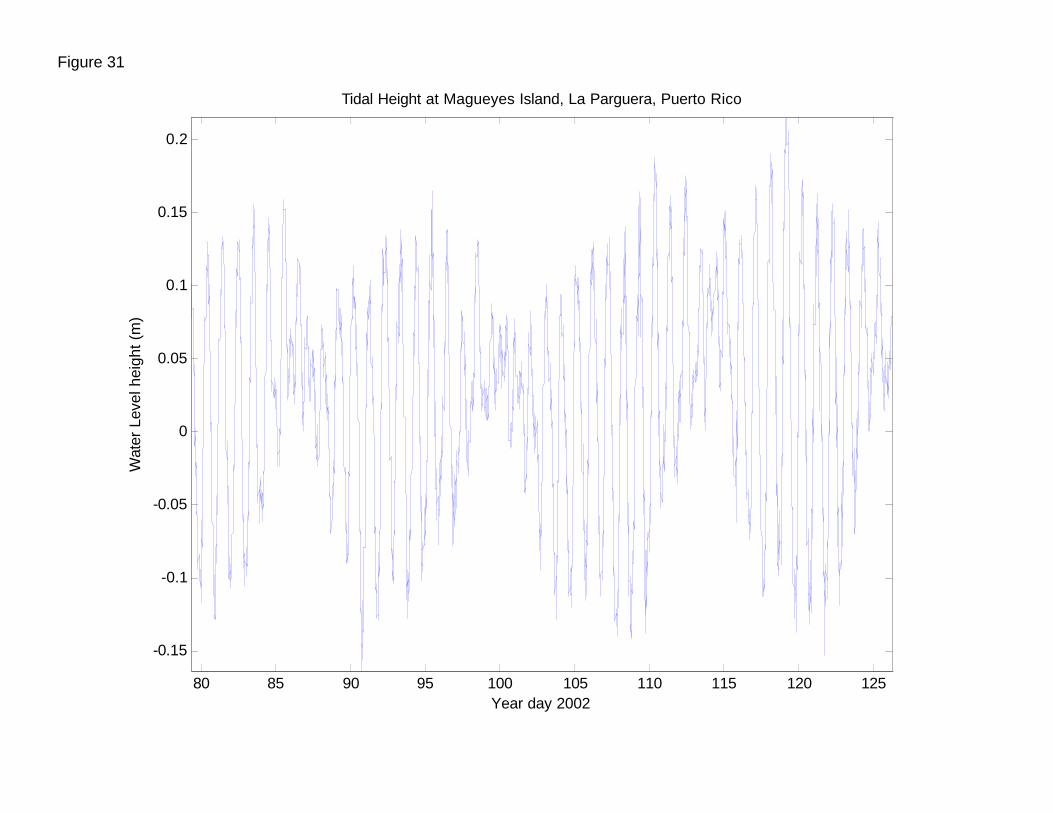
80 85 90 95 100 105 110 115 120 125
-0.15
-0.1
-0.05
0
0.05
0.1
0.15
0.2
Tidal Height at Magueyes Island, La Parguera, Puerto Rico
Year day 2002
Wat
er L
evel
hei
ght (
m)
Figure 31
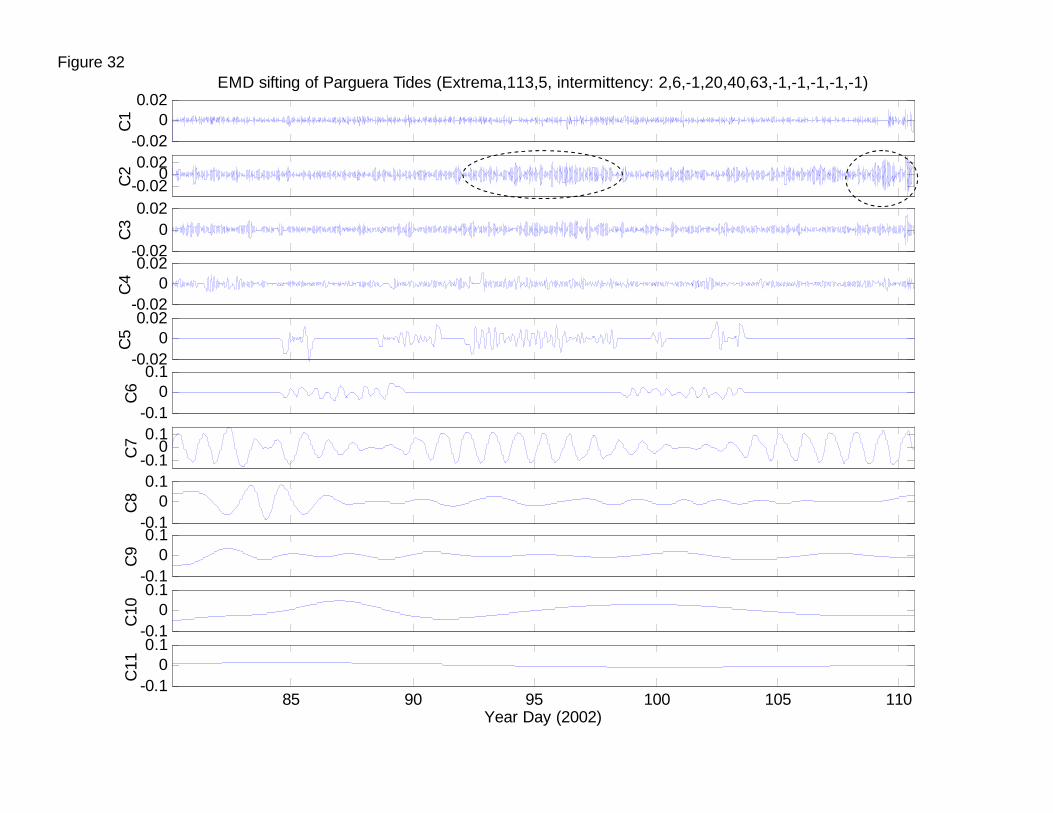
-0.020
0.02C
1
EMD sifting of Parguera Tides (Extrema,113,5, intermittency: 2,6,-1,20,40,63,-1,-1,-1,-1,-1)
-0.020
0.02
C2
-0.020
0.02
C3
-0.020
0.02
C4
-0.020
0.02
C5
-0.10
0.1
C6
-0.10
0.1
C7
-0.10
0.1
C8
-0.10
0.1
C9
-0.10
0.1
C10
85 90 95 100 105 110-0.1
00.1
C11
Year Day (2002)
Figure 32