Somaliland Final Report
272
Somaliland Multiple Indicator Cluster Survey 2011 Final Report March 2014 Jamhuuriyadda Somaliland WasaaraddaQorshayntaQar anka, Iyo Horumarinta (WQQH) – Hargeisa Republic of Somaliland Ministry of National Planning, and Development (MNPD) – Hargeisa
-
Upload
khangminh22 -
Category
Documents
-
view
1 -
download
0
Transcript of Somaliland Final Report

Somaliland Multiple Indicator Cluster Survey 2011
Final Report
March 2014
Jamhuuriyadda Somaliland WasaaraddaQorshayntaQaranka, Iyo Horumarinta
(WQQH) – Hargeisa
Republic of Somaliland Ministry of National Planning, and Development (MNPD) – Hargeisa
2
The Somaliland Multiple Indicator Cluster Survey (MICS) was carried out in 2011 by Somaliland Ministry of Planning and National Development. Financial and technical support was provided by the United Nations Children’s Fund (UNICEF). MICS is an international household survey programme developed by UNICEF. The Somaliland MICS was conducted as part of the fourth global round of MICS surveys (MICS4). It provides up-to-date information on the situation of children and women and measures key indicators that allow countries to monitor progress towards the Millennium Development Goals (MDGs) and other internationally agreed upon commitments. Additional information on the global MICS project may be obtained from www.childinfo.org. Suggested citation: UNICEF Somalia and Somaliland Ministry of Planning and National Development, 2014. Somaliland Multiple Indicator Cluster Survey 2011, Final Report. Nairobi, Kenya: UNICEF, Somalia and Somaliland Ministry of Planning and National Development, Somaliland.

Somaliland Multiple Indicator Cluster Survey
2011
UNICEF, Somalia
UNICEF United Nations Children’s Fund
Somaliland, Ministry of National Planning and Development
March 2014

4
Summary Table of Findings
Multiple Indicator Cluster Surveys (MICS) and Millennium Development Goals (MDG) Indicators, Somaliland, 2011
Topic
MICS4 Indicator Number
MDG Indicator Number Indicator Value
CHILD MORTALITY Child mortality 1.1 4.1 Under-five mortality rate 91 per 1,000
1.2 4.2 Infant mortality rate 72 per 1,000
1.3 Neonatal mortality rate 42 per 1,000
1.4 Post-neonatal mortality rate 30 per 1,000
1.5 Child mortality rate 20 per 1,000
Breastfeeding and infant feeding
2.4 Children ever breastfed 91.3 percent
2.5 Early initiation of breastfeeding 60.9 percent
2.6 Exclusive breastfeeding under 6 months 12.8 percent
2.7 Continued breastfeeding at 1 year 46.3 percent
2.8 Continued breastfeeding at 2 years 19.2 percent
2.9 Predominant breastfeeding under 6 months 32.7 percent
2.10 Duration of breastfeeding 14.7 months
2.11 Bottle feeding 50.8 percent
2.12 Introduction of solid, semi-solid or soft foods 32.5 percent
2.13 Minimum meal frequency 53.5 percent
2.14 Age-appropriate breastfeeding 20.6 percent
2.15 Milk feeding frequency for non-breastfed children 89.3 percent
Vitamin A 2.17 Vitamin A supplementation (children under age 5) 39.9 percent
CHILD HEALTH Vaccinations 3.1 BCG immunization coverage 26.8 percent
3.2 Polio immunization coverage 16.5 percent 3.3 Immunization coverage for diphtheria, pertussis and
tetanus (DPT) 10.8 percent
3.4 4.3 Measles immunization coverage 25.8 percent
Tetanus toxoid 3.7 Neonatal tetanus protection 33.9 percent
Care of illness 3.8 Oral rehydration therapy with continued feeding 20.1 percent
3.9 Care seeking for suspected pneumonia 31.0 percent
3.10 Antibiotic treatment of suspected pneumonia 52.8 percent
Solid fuel use 3.11 Solid fuels 98.3 percent
Malaria 3.12 Household availability of insecticide-treated nets (ITNs) 35.1 percent
3.13 Households protected by a vector control method 36.6 percent
3.14 Children under age 5 sleeping under any mosquito net 24.0 percent
3.15 6.7 Children under age 5 sleeping under insecticide-treated nets (ITNs)
21.9 percent
3.16 Malaria diagnostics usage 16.0 Percent
3.17 Antimalarial treatment of children under 5 the same or next day
3.4 percent
3.18 6.8 Antimalarial treatment of children under age 5 9.8 percent
3.19 Pregnant women sleeping under insecticide-treated nets (ITNs)
20.1 percent
3.20 Intermittent preventive treatment for malaria 1.4 percent

5
Topic
MICS4 Indicator Number
MDG Indicator Number Indicator Value Topic
WATER AND SANITATION Water and sanitation
4.1 7.8 Use of improved drinking water sources 41.9 percent
4.2 Water treatment 12.6 percent
4.3 7.9 Use of improved sanitation 51.1 percent
4.4 Safe disposal of child's faeces 50.5 percent
4.5 Place for handwashing 76.8 percent
4.6 Availability of soap 69.7 percent
REPRODUCTIVE HEALTH Contraception and unmet need
5.1 5.4 Adolescent birth rate 64 per 1,000
5.2 Early childbearing 13.6 percent
5.3 5.3 Contraceptive prevalence rate 9.8 Percent
5.4 5.6 Unmet need 20.2 Percent
Maternal and newborn health
5.5
Antenatal care coverage
5.5a At least once by skilled personnel 31.7 percent 5.5b At least four times by any provider 14.8 percent 5.6 Content of antenatal care 23.2 percent
5.7 5.2 Skilled attendant at delivery 44.1 percent
5.8 Institutional deliveries 30.6 percent
5.9 Caesarean section 4.0 percent
CHILD DEVELOPMENT Child development 6.1 Support for learning 65.2 percent
6.2 Father's support for learning 30.9 percent
6.3 Learning materials: children’s books 1.3 percent
6.4 Learning materials: playthings 6.8 percent
6.5 Inadequate care 27.3 percent
6.6 Early child development index 58.5 percent
6.7 Attendance to early childhood education 2.8 percent
EDUCATION Literacy and education
Literacy rate among young people
7.1 2.3 women age 15-24 years 44.1 percent
7.2 School readiness 6.5 percent
7.3 Net intake rate in primary education 20.6 percent
7.4 2.1 Primary school net attendance ratio (adjusted) 51.4 percent
7.5 Secondary school net attendance ratio (adjusted) 20.5 percent
7.6 2.2 Children reaching last grade of primary 88.7 percent
7.7 Primary completion rate 68.5 percent
7.8 Transition rate to secondary school 76.3 percent
7.9 Gender parity index (primary school) 0.85 ratio
7.10 Gender parity index (secondary school) 0.67 ratio
CHILD PROTECTION Child labour 8.2 Child labour 26.0 percent
8.3 School attendance among child labourers 41.9 percent
8.4 Child labour among students 24.8 percent
Child discipline 8.5 Violent discipline 78.2 percent Early marriage and polygyny 8.6
Marriage before age 15
women age 15-49 years 8.7 percent
8.7 Marriage before age 18
women age 20-49 years 30.8 percent 8.8 Young women age 15-19 years currently married 8.9 percent
8.9 Polygyny
16.8
women age 15-49 years percent Spousal age difference
8.10a women age 15-19 years 32.7 percent
8.10b women age 20-24 years 29.3 percent

6
Topic
MICS4 Indicator Number
MDG Indicator Number Indicator Value Topic
Female genital mutilation/
8.11 Approval for female genital mutilation/cutting (FGM/C) 28.9 percent
cutting 8.12 Prevalence of female genital mutilation/cutting (FGM/C) among women
99.1
percent
8.13 Prevalence of female genital mutilation/cutting (FGM/C) among girls
27.7 percent
Domestic violence 8.14
Attitudes towards domestic violence 54.6
women age 15-49 years percent
Orphaned children 9.17 Children’s living arrangements 11.9 percent
9.18 Prevalence of children with one or both parents dead 10.9 percent
9.19 6.4 School attendance of orphans 71.5 percent
9.20 6.4 School attendance of non-orphans 61.9 percent
HIV/AIDS HIV/AIDS knowledge and attitudes 9.1
Comprehensive knowledge about HIV prevention
6.4
women age 15-49 years percent
9.2 6.3
Comprehensive knowledge about HIV prevention among young people
7.0
percent
women age 15-24 years percent
9.3
Knowledge of mother-to-child transmission of HIV
53.2
women age 15-49 years percent
9.4
Accepting attitudes towards people living with HIV
8.3
women age 15-49 years percent
9.5 Women who know where to be tested for HIV 28.4 percent
9.6 Women who have been tested for HIV and know the
results 2.7 percent
9.8 HIV counselling during antenatal care 4.7 percent
9.9 HIV testing during antenatal care 2.6 percent
ACCESS TO MASS MEDIA AND USE OF INFORMATION/COMMUNICATION TECHNOLOGY Access to mass media
MT.1 Exposure to mass media 6.5
women age 15-49 years percent
Use of information/ communication technology
MT.2
Use of computers 13.1
women age 15-24 years percent
MT.3
Use of internet 14.3
women age 15-24 years percent

7
Table of Contents
Summary Table of Findings .................................................................................................... 4
Table of Contents .................................................................................................................. 7
List of Tables ….. .................................................................................................................... 9
List of Figures ….. ................................................................................................................. 13
List of Abbreviations ............................................................................................................ 14
Acknowledgements ............................................................................................................. 15
Disclaimer …..….. ........................................................................................................................... 16
Executive Summary ............................................................................................................. 17
I. Introduction ................................................................................................................... 21 Background .................................................................................................................................. 21 Survey Objectives ........................................................................................................................ 22
II. Sample and Survey Methodology ................................................................................. 23 Sample Design ............................................................................................................................. 23 Questionnaires ............................................................................................................................ 23 Training and Fieldwork ................................................................................................................ 25 Data Processing ........................................................................................................................... 25
III. Sample Coverage and the Characteristics of Households and Respondents .............. 26 Sample Coverage ......................................................................................................................... 26 Characteristics of Households ..................................................................................................... 27 Characteristics of Female Respondents 15-49 Years of Age and Children Under-5 ................... 30
IV. Child Mortality ............................................................................................................... 34
V. Nutrition ......................................................................................................................... 38 Breastfeeding and Infant and Young Child Feeding .................................................................... 38 Children’s Vitamin A Supplementation ....................................................................................... 48 Weighing children at birth ........................................................................................................... 50
VI. Child Health.................................................................................................................... 51 Vaccinations................................................................................................................................. 51 Neonatal Tetanus Protection ...................................................................................................... 55 Oral Rehydration Treatment ....................................................................................................... 57 Care Seeking and Antibiotic Treatment of Pneumonia ............................................................... 63 Solid Fuel Use .............................................................................................................................. 66 Malaria ......................................................................................................................................... 68
VII. Water and Sanitation .................................................................................................... 75 Use of Improved Water Sources.................................................................................................. 75 Use of Improved Sanitation Facilities .......................................................................................... 83 Handwashing ............................................................................................................................... 88

8
VIII. Reproductive Health ...................................................................................................... 91 Fertility ......................................................................................................................................... 91 Contraception .............................................................................................................................. 93 Unmet Need ................................................................................................................................ 95 Antenatal Care ............................................................................................................................. 97 Assistance at Delivery ................................................................................................................ 102 Place of Delivery ........................................................................................................................ 104
IX. Child Development ...................................................................................................... 106 Early Childhood Education and Learning ................................................................................... 106 Early Childhood Development ................................................................................................... 111
X. Literacy and Education ................................................................................................ 113 Literacy among Young Women ................................................................................................. 113 School Readiness ....................................................................................................................... 114 Primary and Secondary School Participation ............................................................................ 115 Non Formal Education ............................................................................................................... 122
XI. Child Protection ........................................................................................................... 126 Child Labour ............................................................................................................................... 126 Child Discipline .......................................................................................................................... 129 Early Marriage and Polygyny ..................................................................................................... 131 Female Genital Mutilation/Cutting ........................................................................................... 135 Attitudes toward Domestic Violence......................................................................................... 139 Orphans ..................................................................................................................................... 141
XII. HIV/AIDS ...................................................................................................................... 144 Knowledge about HIV Transmission and Misconceptions about HIV/AIDS .............................. 144 Accepting Attitudes toward People Living with HIV/AIDS......................................................... 149 Knowledge of a Place for HIV Testing, Counselling and Testing during Antenatal Care ........... 150
XIII. Access to Mass Media and Use of Information/Communication Technology .......... 153 Access to Mass Media ............................................................................................................... 153 Use of Information/Communication Technology ...................................................................... 154
Appendix A. Sample Design ........................................................................................................ 156
Appendix B. List of Personnel Involved in the Survey ................................................................ 159
Appendix C. Estimates of Sampling Errors .................................................................................. 164
Appendix D. Data Quality Tables ................................................................................................ 183
Appendix E. Somaliland MICS4 Indicators: Numerators and Denominators ............................. 196
Appendix F: Questionnaires ........................................................................................................ 207

9
List of Tables
Table HH.1: Results of household, women's and under-5 interviews .......................................... 26
Table HH.2: Household age distribution by sex ............................................................................ 27
Table HH.3: Household composition ............................................................................................ 29
Table HH.4: Women's background characteristics ....................................................................... 31
Table HH.5: Under-5's background characteristics ...................................................................... 32
Table CM.1: Early childhood mortality rates ................................................................................ 35
Table CM.2: Early childhood mortality rate by socioeconomic characteristics ........................... 35
Table CM.3: Early childhood mortality rates by demographic characteristics ............................. 36
Table NU.1: Initial breastfeeding .................................................................................................. 39
Table NU.2: Breastfeeding ............................................................................................................ 41
Table NU.3: Duration of breastfeeding ......................................................................................... 43
Table NU.4: Age-appropriate breastfeeding ................................................................................ 44
Table NU.5: Introduction of solid, semi-solid or soft foods .......................................................... 45
Table NU.6: Minimum meal frequency......................................................................................... 46
Table NU.7: Bottle feeding ............................................................................................................ 47
Table NU.8: Children's vitamin A supplementation ..................................................................... 49
Table NU.9: Infants weighed at birth ............................................................................................ 50
Table CH.1: Vaccinations in first year of life ................................................................................. 52
Table CH.2: Vaccinations by background characteristics ............................................................. 54
Table CH.3: Neonatal tetanus protection ..................................................................................... 56
Table CH.4: Oral rehydration solutions ........................................................................................ 58
Table CH.5: Feeding practices during diarrhoea ........................................................................... 60
Table CH.6: Oral rehydration therapy with continued feeding and other treatments ................ 62
Table CH.7: Care seeking for suspected pneumonia and antibiotic use during suspected pneumonia ................................................................................................................ 64
Table CH.8: Knowledge of the two danger signs of pneumonia .................................................. 66
Table CH.9: Solid fuel use.............................................................................................................. 67
Table CH.10: Solid fuel use by place of cooking ........................................................................... 68
Table CH.11: Household availability of insecticide treated nets and protection by a vector control method ......................................................................................................... 69
10
Table CH.12: Children sleeping under mosquito nets .................................................................. 70
Table CH.13: Pregnant women sleeping under mosquito nets .................................................... 71
Table CH.14: Anti-malarial treatment of children with anti-malarial drugs ................................. 72
Table CH.15: Malaria diagnostics usage ....................................................................................... 73
Table CH.16: Intermittent preventive treatment for malaria ...................................................... 74
Table WS.1: Use of improved water sources ................................................................................ 77
Table WS.2: Household water treatment ..................................................................................... 79
Table WS.3: Time to source of drinking water ............................................................................. 81
Table WS.4: Person collecting water ............................................................................................ 82
Table WS.5: Types of sanitation facilities ..................................................................................... 84
Table WS.6: Use and sharing of sanitation facilities ..................................................................... 85
Table WS.7: Disposal of child's faeces .......................................................................................... 86
Table WS.8: Drinking water and sanitation ladders ..................................................................... 87
Table WS.9: Water and soap at place for handwashing ............................................................... 89
Table WS.10: Availability of soap .................................................................................................. 90
Table RH.1: Adolescent birth rate and total fertility rate ............................................................. 91
Table RH.2: Early childbearing ...................................................................................................... 92
Table RH.4: Use of contraception ................................................................................................. 94
Table RH.5: Unmet need for contraception ................................................................................. 96
Table RH.6: Antenatal care coverage............................................................................................ 98
Table RH.6B: Place for receiving antenatal care ........................................................................... 99
Table RH.7: Number of antenatal care visits .............................................................................. 100
Table RH.8: Content of antenatal care ....................................................................................... 101
Table RH.9: Assistance during delivery ....................................................................................... 103
Table RH.10: Place of delivery .................................................................................................... 105
Table CD.1: Early childhood education ....................................................................................... 106
Table CD.2: Support for learning ................................................................................................ 107
Table CD.3: Learning materials ................................................................................................... 109
Table CD.4: Inadequate care ....................................................................................................... 110
Table CD.5: Early child development index ................................................................................ 112
Table ED.1: Literacy among young women ................................................................................ 113

11
Table ED.2: School readiness ...................................................................................................... 114
Table ED.3: Primary school entry ................................................................................................ 116
Table ED.4: Primary school attendance ...................................................................................... 117
Table ED.5: Secondary school attendance .................................................................................. 119
Table ED.6: Children reaching last grade of primary school ....................................................... 120
Table ED.7: Primary school completion and transition to secondary school ............................. 121
Table ED.8: Education gender parity .......................................................................................... 122
Table ED.9A. Ever Attendance of Non-Formal Education .......................................................... 123
Table ED.9B. Current Attendance for Non-Formal Education .................................................... 124
Table ED.9C: Completion of Non-formal education ................................................................... 125
Table CP.1: Child labour .............................................................................................................. 127
Table CP.2: Child labour and school attendance ........................................................................ 128
Table CP.3: Child discipline ......................................................................................................... 130
Table CP.4: Early marriage and polygyny.................................................................................... 132
Table CP.5: Trends in early marriage .......................................................................................... 133
Table CP.6: Spousal age difference ............................................................................................. 134
Table CP.7: Female genital mutilation/cutting (FGM/C) among women ................................... 136
Table CP.8: Female genital mutilation/cutting (FGM/C) among daughters ............................... 137
Table CP.9: Approval of female genital mutilation/cutting (FGM/C) ......................................... 139
Table CP.10: Attitudes toward domestic violence ...................................................................... 140
Table CP.11: Children's living arrangements and orphanhood .................................................. 142
Table CP.12: School attendance of orphans and non-orphans .................................................. 143
Table HA.1: Knowledge about HIV transmission, misconceptions about HIV/AIDS, and comprehensive knowledge about HIV transmission .............................................. 145
Table HA.2: Knowledge about HIV transmission, misconceptions about HIV/AIDS, and comprehensive knowledge about HIV transmission among young women .......... 146
Table HA.3: Knowledge of mother-to-child HIV transmission .................................................... 149
Table HA.4: Accepting attitudes toward people living with HIV/AIDS ....................................... 150
Table HA.5: Knowledge of a place for HIV testing ...................................................................... 151
Table HA.6: HIV counseling and testing during antenatal care .................................................. 152
Table MT.1: Exposure to mass media ......................................................................................... 153
Table MT.2: Use of computers and internet............................................................................... 155
12
Table SD.1: Allocation of Sample Clusters (Primary Sampling Units) to Sampling Strata .......... 157
Table SE.1: Indicators selected for sampling error calculations ................................................. 165
Table SE.2: Sampling errors: Total sample.................................................................................. 167
Table SE.3: Sampling errors: Urban areas ................................................................................... 169
Table SE.4: Sampling errors: Rural areas .................................................................................... 171
Table SE.5: Sampling errors: Maroodijeex/Saaxil ....................................................................... 173
Table SE.6: Sampling errors: Awdal ............................................................................................ 175
Table SE.7: Sampling errors: Togdheer ....................................................................................... 177
Table SE.8: Sampling errors: Sool ............................................................................................... 179
Table SE.9: Sampling errors: Sanaag ........................................................................................... 181
Table DQ.2: Age distribution of eligible and interviewed women ............................................. 184
Table DQ.3: Age distribution of under-5s in household and under-5 questionnaires ............... 185
Table DQ.4: Women's completion rates by socio-economic characteristics of households ..... 185
Table DQ.5: Completion rates for under-5 questionnaires by socio-economic characteristics of households.............................................................................................................. 186
Table DQ.6: Completeness of reporting ..................................................................................... 187
Table DQ.7: Observation of bednets and places for hand washing ........................................... 188
Table DQ.8: Observation of women's health cards .................................................................... 188
Table DQ.9: Observation of vaccination cards ........................................................................... 189
Table DQ.10: Presence of mother in the household and the person interviewed for the under-5 questionnaire .......................................................................................................... 189
Table DQ.11: Selection of children age 2-14 years for the child discipline module ................... 190
Table DQ.12: School attendance by single age ........................................................................... 191
Table DQ.13: Sex ratio at birth among children ever born and living ........................................ 192
Table DQ.14: Births by calendar years ........................................................................................ 193
Table DQ.15: Reporting of age at death in days ......................................................................... 194
Table DQ.16: Reporting of age at death in months .................................................................... 195

13
List of Figures
Figure HH.1: Age and sex distribution of household population, Somaliland, 2011 .................... 28
Figure CM.1: Under-5 mortality rates by background characteristics, Somaliland, 2011 ........... 37
Figure NU.2: Infant feeding patterns by age, Somaliland, 2011................................................... 42
Figure CH.1: Percentage of children aged 12-23 months who received the recommended vaccinations by 12 months, Somaliland, 2011 ......................................................... 53
Figure CH.2: Percentage of women with a live birth in the last 12 months who are protected against neonatal tetanus, Somaliland, 2011 ............................................................ 57
Figure CH.3: Percentage of children under age 5 with diarrhoea who received oral rehydration solution, Somaliland, 2011 ....................................................................................... 59
Figure WS.1: Percent distribution of household members by source of drinking water Somaliland, 2011 ...................................................................................................... 78
Figure HA.1: Percentage of women who have comprehensive knowledge of HIV/AIDS transmission by eduaction levels, Somaliland, 2011 .............................................. 148
Figure DQ.1: Number of household population by single ages, Somaliland, 2011 .................... 184

14
List of Abbreviations
ABE Alternative Basic Education AIDS Acquired Immune Deficiency Syndrome ANC Antenatal Care ANPPCAN African Network for the Prevention and Protection against Child Abuse and Neglect ASFR Age Specific Fertility Rate BCG Bacillis-Cereus-Geuerin (Tuberculosis) CSPro Census and Survey Processing System DPT Diphteria Pertussis Tetanus EPI Expanded Programme on Immunization FAO Food Agricultural Organization FGM/C Female genital mutilation/cutting GPI Gender Parity Index GPS Geographic Information Systems HIV Human Immunodeficiency Virus IDD Iodine Deficiency Disorders ITN Insecticide Treated Net IUD Intrauterine Device JMP Joint Monitoring Programme LAM Lactational Amenorrhea Method LPG Liquefied Petroleum Gas MDG Millennium Development Goals MICS Multiple Indicator Cluster Survey MICS4 Fourth global round of Multiple Indicator Clusters Surveys programme MoH Ministry of Health MoNPD Ministry of National Planning and Development NAR Net Attendance Rate NDP National Development Plan NN Neonatal ORT Oral rehydration treatment PPM Parts Per Million PPN Post Neonatal SPSS Statistical Package for Social Sciences TFT Total Fertility Rate UNAIDS United Nations Programme on HIV/AIDS UNDP United Nations Development Programme UNFPA United Nations Population Fund UNGASS United Nations General Assembly Special Session on HIV/AIDS UNICEF United Nations Children’s Fund USSC UNICEF Somalia Support Centre WFFC World Fit for Children WHO World Health Organization
15
Acknowledgements
The Somaliland 2011 Multiple Indicator Cluster Survey was implemented by UNICEF Somalia and Somaliland, Ministry of National Planning and Development as part of the global UNICEF MICS programme. The field work implementation was supported by the African Network for the Prevention and Protection Against Child Abuse and Neglect (ANPPCAN). The survey was coordinated by Sicily Matu, Peter Kingori, and Asha Hussein Adam from UNICEF and Hassan Jama (MoNPD). The data processing manager was Austin Mueke. Managerial and administrative support to the survey was provided by the following UNICEF staff: Debra Bowers, Volker Huls, Emily Mwadime, Catherine Kiraka, Ettie Higgins and Ahmed Hassan Yusuf (ANPPCAN). Penina Masibo (UNICEF) contributed to the final report writing. The contribution of the MICS4 Technical Committees at Nairobi and Hargeisa levels especially in diligently reviewing the questionnaires and positively contributing to the planning phase work is gratefully acknowledged. Training of Trainers and the overall survey team was undertaken by a team of highly resourceful and committed persons from UNICEF, MoNPD, MoHL and FSNAU/FAO as outlined in the list of personnel, including subject matter specialists from various UNICEF sections. Their contribution is acknowledged. Invaluable technical advice and support was provided in the various stages of the survey by the following UNICEF staff and consultants. The staff include: Attila Hancioglu, Bo Pedersen, Debra Bowers, Volker Huls, Edward Addai, Turgay Unalan, Yadigar Coskun, Ivana Bjelic and Mamadou Seyba Thiam. The UNICEF consultants include Pierre Martel, Aleksandar Zoric, David Megill and Oztas Ayhan. Special recognition is due to all the survey team members including team leaders, supervisors, enumerators, editors, sketch mappers, data entry clerks and filed guides for working tirelessly to a successful conclusion of the survey. Finally, the contribution of the survey households and respondents who cooperated and gave their time to respond to the numerous survey questions is sincerely appreciated. Funding for MICS4 in Somaliland was provided by UNICEF.

16
Disclaimer
For the purposes of this survey, the analysis and reporting refers to North West Zone (also known as Somaliland) according to the pre-war zonal boundaries and does not imply any recognition of administrative boundaries by the United Nations. This will allow some comparison of the results with the previous MICS surveys.

17
Executive Summary
The Somaliland Multiple Indicator Survey is a representative sample survey of 4,924 households, out which 4,820 were successfully interviewed, 5,865 women age 15 – 49 and 4,672 children age less than five years. The primary purpose of MICS is to provide policy makers and planners with reliable and detailed information needed to monitor the situation of women and children. It also provides information on child mortality, nutrition, child health, water and sanitation, reproductive health, child development, literacy and education, child protection, HIV/AIDS and orphan hood and access to mass media and use of information/communication technology. Child mortality
At the current mortality levels, one in every fourteen children die before age one and one in every eleven does not survive to the fifth birthday in Somaliland.
Mortality levels among children from the poorest households are nearly twice that of children from the richest households.
Mortality is highest among children with a previous birth interval of less than two years.
Nutrition
Three in every five children are breastfed within one hour of being born.
Exclusive breastfeeding levels are very low, contrary to UNICEF/WHO recommendations, only 13 percent of children age 0 – 6 months are exclusively breastfed.
Among children age 12 – 15 months nearly half are still breastfeeding which falls to 19 percent among children age 20 – 23 months.
Complimentary feeding in Somaliland is sub optimal. Only a third of the children 6 – 8 months receive appropriate complimentary feeding.
Immunization
Immunisation coverage is low and only 7 percent of children age 12 – 23 months are fully vaccinated at the time of the survey.
Two percent of children received their vaccination by their first birthday.
Thirty six percent of children age 12 – 23 months has received BCG vaccination while 38 percent have been vaccinated against measles.
About 11 percent of children aged 12 – 23 months had received their third dose of DPT by their first birthday.
Forty three percent of children aged 12 – 23 months have not received any of the basic vaccines
One in three women aged 15 – 49 years with a live birth in the last two years are protected against neonatal tetanus.
Diarrhoea
Thirteen percent of the children under five years of age had diarrhoea at some point in the two weeks before the survey.
Around one in two children who had diarrhoea were treated with Oral Rehydration Solution (ORS).
One in five children with diarrhoea received ORS with continued feeding.

18
Pneumonia
Six percent of children under five years had suspect pneumonia in the two weeks before the survey.
About one in three children under five with suspected pneumonia received treatment from an appropriate provider.
More than half of children with suspected pneumonia received antibiotics.
Malaria
Thirty nine percent of households own at least one mosquito net and one third own Insecticide Treated Net (ITN).
A quarter of the children under age of five years slept under a bed net during the night prior to the interview; with 22 percent of children sleeping under ITN.
Twenty percent of pregnant women slept under an ITN during the night prior to the interview.
Eight percent of children under age five had a fever at one point in the last two weeks before the survey; one in ten received any antimalarial drug and only 3 percent received an antimalarial drug on the same or next day.
Water and sanitation
Forty two percent of the population in Somaliland has access to an improved source of drinking water.
One in eight people living in households using unimproved drinking water sources use an appropriate water treatment method.
In three in every five households, an adult woman bears the responsibility of collecting water.
About one third of the population is living without any type of toilet facilities.
Half of the population are using facilities with a sanitary means of excreta disposal; and for half of the children age 0 – 2 years had their last stool disposed of safely.
Twenty nine percent of the population is using an improved source of drinking water and a sanitary means of excreta disposal and it is ten times high in urban compared to rural areas.
Water and soap for hand washing is available in three out of four households with a place for hand washing; and 70 percent of the households had soap anywhere in the dwelling.
Reproductive health
The total fertility rate is 5.4 births per woman.
Only one in ten married women are using any method of contraception; the most common non modern method is Lactational Amenorrhea Method (LAM) and the pill is the most common modern method though its use is very low.
The unmet need for contraception is 20 percent.
Thirty two percent of mothers with a live birth in the two years preceding the survey received ante natal care from a skilled provider (Doctor, Nurse or trained midwife).
Among women who received Ante-Natal Care (ANC), 39 percent had blood pressure taken, 28 percent had urine sample taken while another 28 percent had a blood test done.
One in seven women had four or more ANC visits but about one in every two did not receive ANC.
Forty four percent of births in the two years prior to the survey were delivered with the assistance of a skilled attendance.
Thirty one percent of the births were delivered in a health facility.
19
Child development
Only three percent of children ages 3 – 4 years are attending early childhood classes.
Nearly two thirds of children 3 – 4 years were engaged by adult household members in four or
more playing activities.
Irrespective of the sex of the child, 27 percent of children under five years of age had been left
with inadequate care a week before the survey.
Literacy and Education
At least 44 percent of the women 15 – 24 years are literate; among this group, literacy is almost
twice in urban compared to rural areas and four times higher among the women in the richest
quintile compared to those in the poorest quintile.
Only 7 percent of children attending first grade attended pre-school the previous year.
Only about one in five children of primary school entry age enter grade one and this is twice among children in the richest quintile compared to those in poorest quintile.
One in every two of the primary school age children are in primary school and this declines even further one in five of secondary school age children attending secondary school.
For every 10 boys attending primary school there are 9 girls. This declines further in secondary school education with 7 girls attending for every 10 boys.
Non formal education especially Koranic school is common with over half of school age children currently attending Koranic school and about one in every three attending integrated koranic school.
Child protection
About one in every four children is involved in child labour; and this if more common for girls
than boys.
A quarter of children who are in school are involved in child labour.
Violent methods of disciplining children are common with three in every four children
experiencing a violent method of discipline especially psychological aggression.
Almost all women aged 15 – 49 years have undergone one form of FGM/C; the most common
type is where they are sewn closed.
One in every five daughters aged 0 – 14 years have undergone FGM/C.
Nearly a third of women aged 15 – 49 years support continuation of FGM/C.
More than half of women believe that a husband is justified in beating his wife/partner, with
neglecting the children stated as the most common reason for support.
HIV/AIDS
Only 6 percent of women age 15 – 49 years has comprehensive knowledge on HIV transmission
and about one in every four reject the two common misconceptions about HIV.
Among women, 15 – 24 years, only 7 percent have comprehensive knowledge of HIV
transmission.
About half of women can correctly identify the three means of HIV transmission from mother-
to-child.

20
Only 28 percent of women know of a place they can be tested of HIV/AIDS and only 3 percent
have been tested and know their result.
Only 8 percent of women express accepting attitude towards people living with HIV/AIDS.
Access to mass media and information /communication technology
About 7 percent of women aged 15 – 49 years have access to all three media (Newspaper, radio
and television) at least once a week.
Only 13 percent of women aged 15 – 24 years have used a computer in the last 12 months; and
14 percent have used internet during the same period.
21
I. Introduction
Background
This report is based on the Somaliland Multiple Indicator Cluster Survey, conducted in 2011 by the Ministry of Planning and National Development and UNICEF. The survey provides valuable information on the situation of children and women in Somaliland and was based, in large part, on the needs to monitor progress towards goals and targets emanating from recent international agreements: the Millennium Declaration, adopted by all 191 United Nations Member States in September 2000, and the Plan of Action of A World Fit For Children, adopted by 189 Member States at the United Nations Special Session on Children in May 2002. Both of these commitments build upon promises made by the international community at the 1990 World Summit for Children. In signing these international agreements, governments committed themselves to improving conditions for their children and to monitoring progress towards that end. UNICEF was assigned a supporting role in this task (see table below).
A Commitment to Action: National and International Reporting Responsibilities The governments that signed the Millennium Declaration and the World Fit for Children Declaration and Plan of Action also committed themselves to monitoring progress towards the goals and objectives they contained: “We will monitor regularly at the national level and, where appropriate, at the regional level and assess progress towards the goals and targets of the present Plan of Action at the national, regional and global levels. Accordingly, we will strengthen our national statistical capacity to collect, analyse and disaggregate data, including by sex, age and other relevant factors that may lead to disparities, and support a wide range of child-focused research. We will enhance international cooperation to support statistical capacity-building efforts and build community capacity for monitoring, assessment and planning.” (A World Fit for Children, paragraph 60) “…We will conduct periodic reviews at the national and sub-national levels of progress in order to address obstacles more effectively and accelerate actions.…” (A World Fit for Children, paragraph 61) The Plan of Action (paragraph 61) also calls for the specific involvement of UNICEF in the preparation of periodic progress reports: “… As the world’s lead agency for children, the United Nations Children’s Fund is requested to continue to prepare and disseminate, in close collaboration with Governments, relevant funds, programmes and the specialized agencies of the United Nations system, and all other relevant actors, as appropriate, information on the progress made in the implementation of the Declaration and the Plan of Action.” Similarly, the Millennium Declaration (paragraph 31) calls for periodic reporting on progress: “…We request the General Assembly to review on a regular basis the progress made in implementing the provisions of this Declaration, and ask the Secretary-General to issue periodic reports for consideration by the General Assembly and as a basis for further action.”

22
The Ministry of National Planning and Development has launched the National Development Plan (NDP)1
which provides a medium term framework for achieving the long term development aspirations as
embodied in Vision 20302, and the Millennium Development Goals. The plan is built on five main pillars
comprising the economic pillar, the infra-structure pillar, the governance pillar, the social and the
environmental pillar. In the social pillar, the government aims to strengthen four key areas including
social protection, health, education and youth development. The MICS4 results presented in this final
report provide critical information and a baseline for assessing progress in the NDP indicators.
This final report presents the results of the indicators and topics covered in the survey.
Survey Objectives
The 2011 Somaliland Multiple Indicator Cluster Survey has as its primary objectives: To provide up-to-date information for assessing the situation of children and women in Somaliland. To furnish data needed for monitoring progress toward goals established in the Millennium
Declaration and other internationally agreed upon goals, as a basis for future action; To contribute to the improvement of data and monitoring systems in Somaliland and to strengthen
technical expertise in the design, implementation, and analysis of such systems.
To generate data on the situation of children and women, including the identification of vulnerable groups and of disparities, to inform policies and interventions.
1 Ministry of National Planning and Development, 2011. The National Development Plan (2012 – 2016), Hargeisa:
Somaliland Ministry of Planning and National Development, Somaliland. 2 Ministry of Planning and National Development, 2011. Somaliland National Vision 2030. Hargeisa: Somaliland
Ministry of Planning and National Development, Somaliland.
23
II. Sample and Survey Methodology
Sample Design
The sample for the Somaliland Multiple Indicator Cluster Survey (MICS) was designed to provide estimates for a large number of indicators on the situation of children and women at the regional level, for urban and rural areas, and for five regions: Maroodijeex/Saaxil, Awdal, Togdheer, Sool and Sanaag. The urban and rural areas within each region were identified as the main sampling strata and the sample was selected in two stages. Within each stratum, a specified number of enumeration areas were selected systematically with probability proportional to size. After a household listing was carried out within the selected enumeration areas, a systematic sample of 18 households was drawn in each sample enumeration area. Nineteen (19) of the selected enumeration areas were not visited because they were inaccessible due to population movement or civil conflict during the fieldwork period. For reporting national level results, sample weights are used. A more detailed description of the sample design can be found in Appendix A.
Questionnaires
Three sets of questionnaires were used in the survey: 1) a household questionnaire which was used to collect information on all de jure household members (usual residents), the household, and the dwelling; 2) a women’s questionnaire administered in each household to all women aged 15-49 years; and 3) an under-5 questionnaire, administered to mothers or caretakers for all children under 5 living in the household.
The Household Questionnaire included the following modules: o Household Listing Form o Education o Non Formal Education (non-MICS country specific module) o Water and Sanitation o Household Characteristics o Insecticide Treated Nets o Indoor Residual Spraying o Child Labour o Child Discipline o Handwashing
The Questionnaire for Individual Women was administered to all women aged 15-49 years living in the households, and included the following modules:
o Women’s Background o Access to Mass Media and Use of Information/Communication Technology o Child Mortality with Birth History o Desire for Last Birth
24
o Maternal and Newborn Health o Illness Symptoms o Contraception o Unmet Need o Female Genital Mutilation/Cutting o Attitudes Towards Domestic Violence o Marriage/Union o HIV/AIDS
The Questionnaire for children under five was administered to mothers or caretakers of children under 5 years of age3 living in the households. Normally, the questionnaire was administered to mothers of under-5 children; in cases when the mother was not listed in the household roster, a primary caretaker for the child was identified and interviewed. The questionnaire included the following modules:
o Age o Early Childhood Development o Breastfeeding o Care of Illness o Malaria o Immunization
The questionnaires are based on the MICS4 model questionnaire4. From the MICS4 model English version, the questionnaires were translated into Somali and were pre-tested in Gabilely, Hargeisa during February 2011. Based on the results of the pre-test, modifications were made to the wording and translation of the questionnaires. A copy of the Somaliland MICS questionnaires is provided in Appendix F. In addition to the administration of questionnaires, fieldwork teams observed the place for handwashing. The following modules were removed from the three sets of questionnaires each for the given reason. In the household questionnaire;
Salt iodisation module was removed because here is more recent data from the Micronutrient Survey of 2009.
In the questionnaire for women 15- 49 years;
Sexual behaviour module was not included as it was considered culturally sensitive in Somalia. Furthermore, it was not included in the 2006 MICS
In the questionnaire for children under five years;
Birth registration was omitted based on observations in MICS3 that there are very few births registered in Somaliland as most women gave birth at home.
The anthropometry module was excluded as there was more recent data in the micronutrient survey.
3 The terms “children under 5”, “children age 0-4 years”, and “children aged 0-59 months” are used
interchangeably in this report. 4 The model MICS4 questionnaires can be found at www.childinfo.org

25
The following additions were made to the modules for specific questionnaires; In the questionnaire for children under five years
In the immunisation module, treatment of diarrhoea using ORS distributed in the most recent Child Health Days i.e. December 2010, was added
In the same module, the type of card in which child immunisation was recorded included additional type of cards from the 2009 and 2010 child health days.
In the household questionnaire
The Non Formal Education module was added. It was considered necessary in order to provide information given the continued intervention by the government, with support from partners, in Non Formal Education.
Training and Fieldwork
Training for the fieldwork was conducted for 14 days in June 2011. Training included lectures on interviewing techniques and the contents of the questionnaires, and mock interviews between trainees to gain practice in asking questions. Towards the end of the training period, trainees spent two days in practice interviewing in Hargeisa town in an area not selected for actual data collection. The data were collected by 10 teams; each comprised 6 interviewers, one sketch mapper, two field editors, a supervisor and a team leader. Fieldwork began on 16th June 2011 and concluded in 27th July 2011
Data Processing
Data were entered using the CSPro software. The data were entered on 12 computers and carried out by 12 data entry operators under one data entry supervisor and one data manager. In order to ensure quality control, all questionnaires were double entered and internal consistency checks were performed. Procedures and standard programs developed under the global MICS4 programme and adapted to the Somaliland questionnaire were used throughout. Data processing began simultaneously with data collection in June 2011 and was completed in September 2011. Data for fifteen clusters had been collected in late May 2011 by the teams from Puntland. The consequence is that these clusters had to be entered (which was delayed until October) by the Puntland team before they were merged with the Somaliland data. Data were then analysed using the Statistical Package for Social Sciences (SPSS) software program, Version 18, and the model syntax and tabulation plans developed by UNICEF were used for this purpose.
26
III. Sample Coverage and the Characteristics of Households and Respondents
Sample Coverage
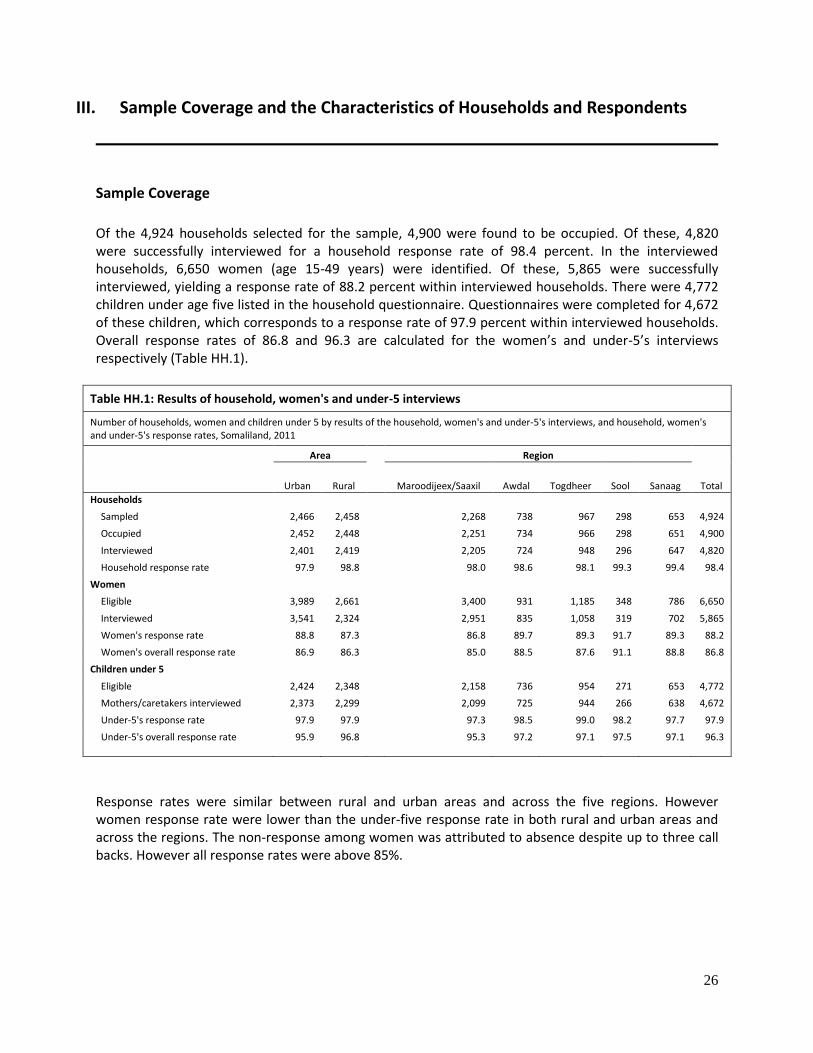
Of the 4,924 households selected for the sample, 4,900 were found to be occupied. Of these, 4,820 were successfully interviewed for a household response rate of 98.4 percent. In the interviewed households, 6,650 women (age 15-49 years) were identified. Of these, 5,865 were successfully interviewed, yielding a response rate of 88.2 percent within interviewed households. There were 4,772 children under age five listed in the household questionnaire. Questionnaires were completed for 4,672 of these children, which corresponds to a response rate of 97.9 percent within interviewed households. Overall response rates of 86.8 and 96.3 are calculated for the women’s and under-5’s interviews respectively (Table HH.1).
Table HH.1: Results of household, women's and under-5 interviews
Number of households, women and children under 5 by results of the household, women's and under-5's interviews, and household, women's and under-5's response rates, Somaliland, 2011
Area
Region
Urban Rural
Maroodijeex/Saaxil Awdal Togdheer Sool Sanaag Total
Households
Sampled 2,466 2,458 2,268 738 967 298 653 4,924
Occupied 2,452 2,448 2,251 734 966 298 651 4,900
Interviewed 2,401 2,419 2,205 724 948 296 647 4,820
Household response rate 97.9 98.8 98.0 98.6 98.1 99.3 99.4 98.4
Women
Eligible 3,989 2,661 3,400 931 1,185 348 786 6,650
Interviewed 3,541 2,324 2,951 835 1,058 319 702 5,865
Women's response rate 88.8 87.3 86.8 89.7 89.3 91.7 89.3 88.2
Women's overall response rate 86.9 86.3 85.0 88.5 87.6 91.1 88.8 86.8
Children under 5
Eligible 2,424 2,348 2,158 736 954 271 653 4,772
Mothers/caretakers interviewed 2,373 2,299 2,099 725 944 266 638 4,672
Under-5's response rate 97.9 97.9 97.3 98.5 99.0 98.2 97.7 97.9
Under-5's overall response rate 95.9 96.8 95.3 97.2 97.1 97.5 97.1 96.3
Response rates were similar between rural and urban areas and across the five regions. However women response rate were lower than the under-five response rate in both rural and urban areas and across the regions. The non-response among women was attributed to absence despite up to three call backs. However all response rates were above 85%.
27
Characteristics of Households
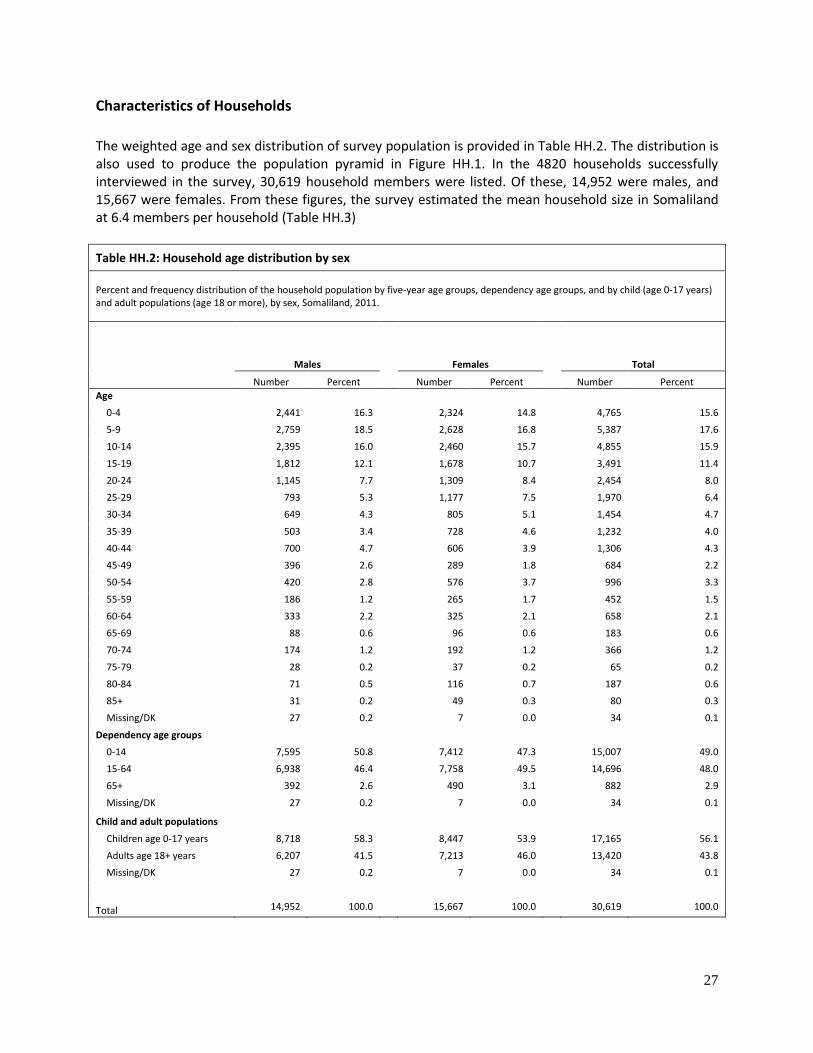
The weighted age and sex distribution of survey population is provided in Table HH.2. The distribution is also used to produce the population pyramid in Figure HH.1. In the 4820 households successfully interviewed in the survey, 30,619 household members were listed. Of these, 14,952 were males, and 15,667 were females. From these figures, the survey estimated the mean household size in Somaliland at 6.4 members per household (Table HH.3)
Table HH.2: Household age distribution by sex
Percent and frequency distribution of the household population by five-year age groups, dependency age groups, and by child (age 0-17 years) and adult populations (age 18 or more), by sex, Somaliland, 2011.
Males Females Total
Number Percent Number Percent Number Percent
Age
0-4 2,441 16.3 2,324 14.8 4,765 15.6
5-9 2,759 18.5 2,628 16.8 5,387 17.6
10-14 2,395 16.0 2,460 15.7 4,855 15.9
15-19 1,812 12.1 1,678 10.7 3,491 11.4
20-24 1,145 7.7 1,309 8.4 2,454 8.0
25-29 793 5.3 1,177 7.5 1,970 6.4
30-34 649 4.3 805 5.1 1,454 4.7
35-39 503 3.4 728 4.6 1,232 4.0
40-44 700 4.7 606 3.9 1,306 4.3
45-49 396 2.6 289 1.8 684 2.2
50-54 420 2.8 576 3.7 996 3.3
55-59 186 1.2 265 1.7 452 1.5
60-64 333 2.2 325 2.1 658 2.1
65-69 88 0.6 96 0.6 183 0.6
70-74 174 1.2 192 1.2 366 1.2
75-79 28 0.2 37 0.2 65 0.2
80-84 71 0.5 116 0.7 187 0.6
85+ 31 0.2 49 0.3 80 0.3
Missing/DK 27 0.2 7 0.0 34 0.1
Dependency age groups
0-14 7,595 50.8 7,412 47.3 15,007 49.0
15-64 6,938 46.4 7,758 49.5 14,696 48.0
65+ 392 2.6 490 3.1 882 2.9
Missing/DK 27 0.2 7 0.0 34 0.1
Child and adult populations
Children age 0-17 years 8,718 58.3 8,447 53.9 17,165 56.1
Adults age 18+ years 6,207 41.5 7,213 46.0 13,420 43.8
Missing/DK 27 0.2 7 0.0 34 0.1
Total 14,952 100.0 15,667 100.0 30,619 100.0

28
The population structure is characteristic of a society with a very young population with a high number of children aged below 15 years (49 percent). More than half the population (56 percent) is between the age of 0 and 17 years. Forty eight percent of the population is aged between 15 and 64 years with only about 3 percent aged over 65 years. From the population pyramid (Figure HH.1) and data quality tables (Appendix D) it appears like females aged 45-49 are underrepresented while there is a large bulge of women aged 50-54. Similarly, children aged 5-9 of both genders appear to be overrepresented as well as women 10-14 years. This suggests that enumerators may have introduced data quality errors by overstating the age of children aged under five years and women aged 10-14 and 40-49 possibly in order to minimize the number of interviews that they had to conduct. Furthermore, it is difficult to collect accurate information on age in Somalia as very few people have birth certificates or any form of identification and many more do not know their exact year of birth. In order to improve the accuracy of age data, a calendar of events was developed listing key events and annual seasons for the last 50 years such as the independence of Somalia and the 1988 war among others. These were used to help the women estimate their year and month of birth as well as those of their children (in case of children under five years). Table DQ.1 in Appendix D presents ages in single year categories; the table shows high level of digit preference for ages ending in zero and five. In only less than one percent was age unreported.
10 5 0 5 10
0-4
5-9
10-14
15-19
20-24
25-29
30-34
35-39
40-44
45-49
50-54
55-59
60-64
65-69
70-74
75-79
80-84
85+
Percent
Males Females
Figure HH.1: Age and sex distribution of household population, Somaliland, 2011
29
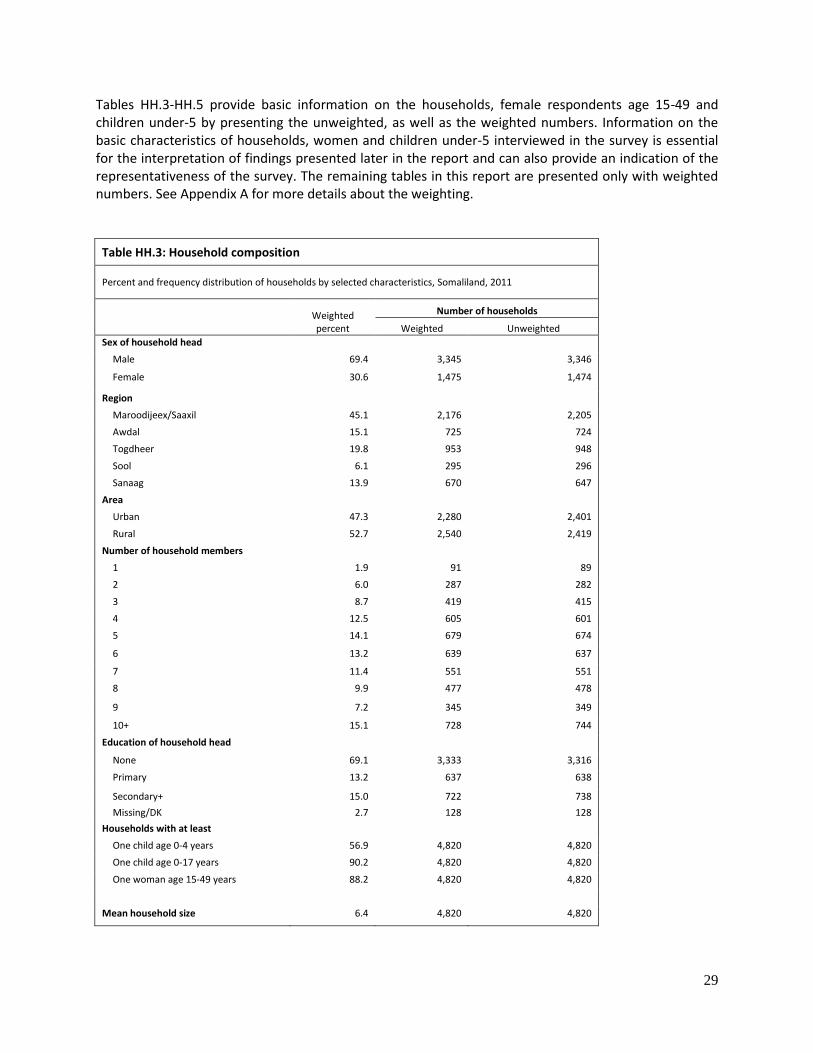
Tables HH.3-HH.5 provide basic information on the households, female respondents age 15-49 and children under-5 by presenting the unweighted, as well as the weighted numbers. Information on the basic characteristics of households, women and children under-5 interviewed in the survey is essential for the interpretation of findings presented later in the report and can also provide an indication of the representativeness of the survey. The remaining tables in this report are presented only with weighted numbers. See Appendix A for more details about the weighting.
Table HH.3: Household composition
Percent and frequency distribution of households by selected characteristics, Somaliland, 2011
Weighted percent
Number of households
Weighted Unweighted
Sex of household head
Male 69.4 3,345 3,346
Female 30.6 1,475 1,474
Region
Maroodijeex/Saaxil 45.1 2,176 2,205
Awdal 15.1 725 724
Togdheer 19.8 953 948
Sool 6.1 295 296
Sanaag 13.9 670 647
Area
Urban 47.3 2,280 2,401
Rural 52.7 2,540 2,419
Number of household members
1 1.9 91 89
2 6.0 287 282
3 8.7 419 415
4 12.5 605 601
5 14.1 679 674
6 13.2 639 637
7 11.4 551 551
8 9.9 477 478
9 7.2 345 349
10+ 15.1 728 744
Education of household head
None 69.1 3,333 3,316
Primary 13.2 637 638
Secondary+ 15.0 722 738
Missing/DK 2.7 128 128
Households with at least
One child age 0-4 years 56.9 4,820 4,820
One child age 0-17 years 90.2 4,820 4,820
One woman age 15-49 years 88.2 4,820 4,820
Mean household size 6.4 4,820 4,820
30
Table HH.3 provides basic background information on the households. Within households, the sex of the household head, region, residence, number of household members, and education of household head are shown in the table. These background characteristics are used in subsequent tables in this report; the figures in the table are also intended to show the numbers of observations by major categories of analysis in the report. In all tables in this report, the total weighted and total unweighted numbers of households are equal, since sample weights were normalized (See Appendix A). The table also shows the proportions of households with at least one child under 18, at least one child under 5, and at least one eligible woman age 15-49. The table also shows the weighted average household size estimated by the survey. In Somaliland, households are predominantly male headed with only about one in three households headed by a female. Households are quite large; the average household size observed in the survey is 6.4 persons with 15 percent households having ten or more household members. About 57 percent of the households have at least one child aged under 5 years and 90 percent have at least one child aged below 18 years. Most of the households (88 percent) had at least one woman of reproductive age.
Characteristics of Female Respondents 15-49 Years of Age and Children Under-5
Tables HH.4 and HH.5 provide information on the background characteristics of female respondents 15-49 years of age and of children under age 5. In addition they show the numbers of observations in each background category. These categories are used in the subsequent tabulations of this report. Table HH.4 provides background characteristics of female respondents 15-49 years of age. The table includes information on the distribution of women according to region, residence, age, marital status, motherhood status, births in last two years, education5, and wealth index quintiles6.
5 Unless otherwise stated, “education” refers to educational level attended by the respondent throughout this
report when it is used as a background variable. 6 Principal components analysis was performed by using information on the ownership of consumer goods,
dwelling characteristics, water and sanitation, and other characteristics that are related to the household’s wealth to assign weights (factor scores) to each of the household assets. Each household was then assigned a wealth score based on these weights and the assets owned by that household. The survey household population was then ranked according to the wealth score of the household they are living in, and was finally divided into 5 equal parts (quintiles) from lowest (poorest) to highest (richest). The assets used in these calculations were as follows: main source of drinking water, toilet facility, number of rooms used for sleeping, main materials for dwelling floor, main material of the roof, main material of the exterior walls, type of cooking fuel, radio, television, non-mobile telephone, refrigerator, charcoal stove/Jiko, wheel burrow, mat, vacuum flask, kerosene lamp, fan, bed, sofa, Somali stool, sitting cushion/pillow, watch, mobile phone, bicycle, motorcycle or scooter, animal drawn cart, car or truck, boat with motor, house ownership, land ownership, land size in hectares, ownership of livestock: herds, other farm animals or poultry, cattle - milk cows or bulls, horses, donkeys or mules, goats, sheep, chickens, camels, and having a bank account. The wealth index is assumed to capture the underlying long-term wealth through information on the household assets, and is intended to produce a ranking of households by wealth, from poorest to richest. The wealth index does not provide information on absolute poverty, current income or expenditure levels. The wealth scores calculated are applicable for only the particular data set they are based on. Further information on the construction of the wealth index can be found in Filmer, D. and Pritchett, L., 2001. “Estimating wealth effects without expenditure data – or tears: An application to educational enrolments in states of India”. Demography 38(1): 115-132.Gwatkin, D.R., Rutstein, S., Johnson, K. ,Pande, R. and Wagstaff. A., 2000. Socio-Economic Differences in Health, Nutrition, and Population. HNP/Poverty Thematic Group,

31
Washington, DC: World Bank. Rutstein, S.O. and Johnson, K., 2004. The DHS Wealth Index. DHS Comparative Reports No. 6. Calverton, Maryland: ORC Macro.
Table HH.4: Women's background characteristics Percent and frequency distribution of women age 15-49 years by selected background characteristics, Somaliland, 2011.
Weighted percent
Number of women
Weighted Unweighted
Region
Maroodijeex/Saaxil 49.9 2,925 2,951
Awdal 14.3 841 835
Togdheer 18.4 1,078 1,058
Sool 5.4 314 319
Sanaag 12.0 707 702
Area
Urban 57.6 3,378 3,541
Rural 42.4 2,487 2,324
Age
15-19 24.7 1,451 1,464
20-24 19.6 1,148 1,152
25-29 18.1 1,060 1,059
30-34 12.5 731 722
35-39 11.5 673 669
40-44 9.2 540 535
45-49 4.5 262 264
Marital/Union status
Currently married 53.6 3,146 3,118 Widowed 2.8 166 165
Divorced 4.7 273 272
Separated 0.4 24 24
Never married 38.3 2,248 2,278
Missing 0.1 8 8
Motherhood statusb
Ever gave birth 56.5 3,316 3,287
Never gave birth 43.3 2,539 2,568
Missing 0.2 10 10
Births in last two yearsc
Had a birth in last two years 26.7 1,566 1,553
Had no birth in last two years 73.1 4,289 4,302
Missing 0.2 10 10
Education
None 67.5 3,956 3,926
Primary 20.9 1,227 1,236
Secondary+ 11.6 682 703
Wealth index quintile
Poorest 15.7 920 867
Second 18.2 1,068 1,024
Middle 19.8 1,162 1,166
Fourth 21.4 1,254 1,295
Richest 24.9 1,461 1,513
Total 100.0 5,865 5,865
32
Half of the women sampled were from Maroodijeex/Sahil region. This region has the highest population in the Somaliland especially in the Hargeisa city. Consequently more than half (58 percent) of the women sampled were from urban areas compared to 42 percent from the rural areas. The proportion of women for each 5 year age category decreased with age and about one in four were aged 15 to 19 years compared to just under one in twenty in the 45 – 49 years category. Illiteracy among women is high and more than two thirds (68 percent) of the women sampled had no education at all and about twenty-one percent had primary level education (Table HH.4). Only one in 10 women had secondary or higher level of education.
Table HH.5: Under-5's background characteristics Percent and frequency distribution of children under five years of age by selected characteristics, Somaliland, 2011.
Weighted percent
Number of under-5 children
Weighted Unweighted
Sex
Male 51.3 2,395 2,395
Female 48.7 2,277 2,277
Region
Maroodijeex/Saaxil 44.4 2,074 2,099
Awdal 15.6 727 725
Togdheer 20.3 948 944
Sool 5.6 262 266
Sanaag 14.2 661 638
Area
Urban 48.3 2,256 2,373
Rural 51.7 2,416 2,299
Age
0-5 months 11.9 557 555
6-11 months 8.1 376 378
12-23 months 16.5 771 774
24-35 months 21.1 987 988
36-47 months 22.8 1,067 1,063
48-59 months 19.6 914 914
Mother’s education*
None 80.1 3,745 3,732
Primary 15.2 709 716
Secondary+ 4.6 217 222
Missing/DK 0.0 2 2
Wealth index quintile
Poorest 21.3 995 954
Second 22.6 1,055 1,026
Middle 20.1 940 952
Fourth 19.6 916 947
Richest 16.4 766 793
Total 100.0 4,672 4,672
*Mother's education refers to educational attainment of mothers and caretakers of children under the age of 5 years.
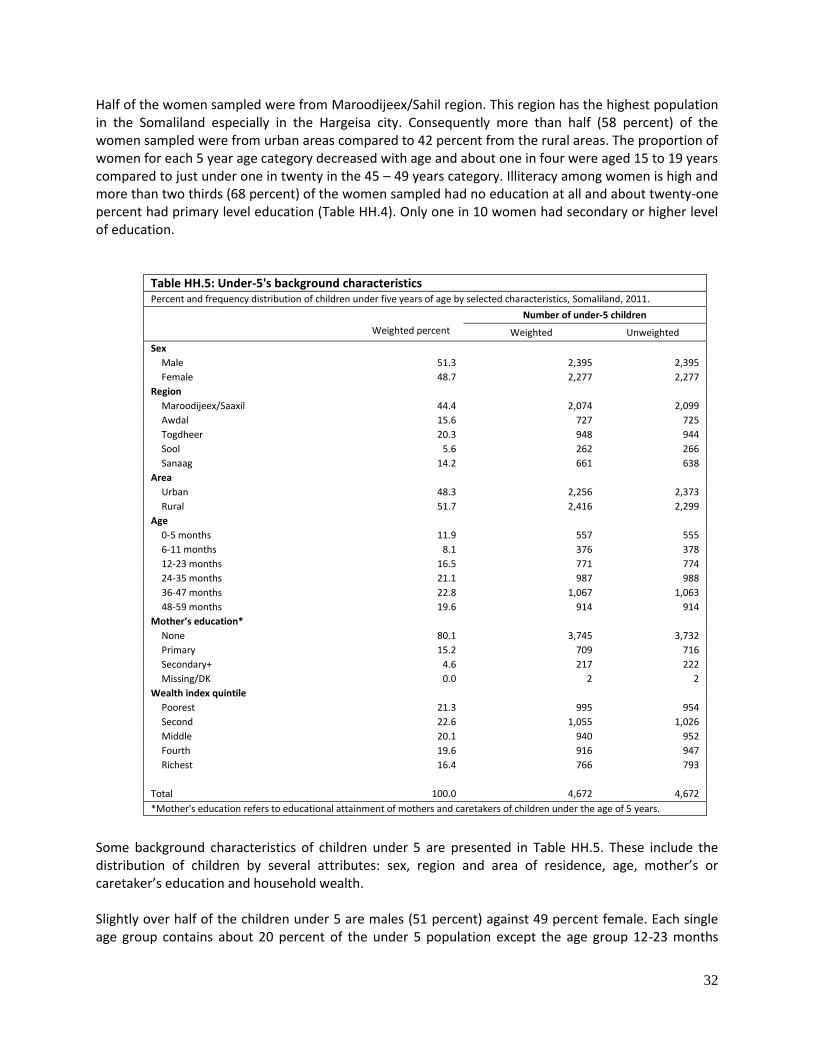
Some background characteristics of children under 5 are presented in Table HH.5. These include the distribution of children by several attributes: sex, region and area of residence, age, mother’s or caretaker’s education and household wealth. Slightly over half of the children under 5 are males (51 percent) against 49 percent female. Each single age group contains about 20 percent of the under 5 population except the age group 12-23 months
33
where the proportion is 17 percent. The educational level of mothers and caretakers is very low. The majority of mothers and caretakers had not attended any form of formal education (80 percent) and only one in twenty had reached secondary school or higher.
34
IV. Child Mortality7
One of the overarching goals of the Millennium Development Goals (MDGs) and the World Fit for Children (WFFC) is to reduce infant and under-five mortality. Specifically, the MDGs call for the reduction of under-five mortality by two-thirds between 1990 and 2015. Monitoring progress towards this goal is an important but difficult objective. Mortality rates presented in this chapter are calculated from information collected in the birth history of the Women’s Questionnaire. Women in the age-group 15-49 were asked whether they had ever given birth, and if yes, they were asked to report the number of sons and daughters who live with them, the number who live elsewhere, and the number who have died. In addition, they were asked to provide a detailed birth history of live births of children in chronological order starting with the firstborn. Women were asked whether births were single or multiple, the sex of the children, the date of birth (month and year), and survival status. Further, for children still alive, they were asked the current age of the child and, if not alive, the age at death. Since the primary causes of childhood mortality change as children age, from mostly biological factors to environmental factors, childhood mortality rates are expressed by age categories and are defined as follows; • Neonatal mortality (NN): the probability of dying within the first month of life • Post-neonatal mortality (PNN): the difference between infant and neonatal mortality • Infant mortality (1q0): the probability of dying between birth and the first birthday • Child mortality (4q1): the probability of dying between exact ages one and five • Under-five mortality (5q0): the probability of dying between birth and the fifth birthday The rates of childhood mortality are expressed as deaths per 1,000 live births, except in the case of child mortality, which is expressed as deaths per 1,000 children surviving to age one. Table CM.1 presents neonatal, post-neonatal, infant, child, and under-five mortality rates for the three most recent five year periods before the survey. Neonatal mortality in the most recent 5-year period is estimated at 42 per 1,000 live births, while the post-neonatal mortality rate is estimated as 30 per 1,000 live births. The infant mortality rate in the five years preceding the survey is 72 per 1,000 live births and under-five mortality is 91 deaths per 1,000 live births for the same period, indicating that the majority of under-five deaths are infant deaths.
7Note: The presented mortality estimates are generated based on the Birth History module of the MICS
questionnaires which is recognized as more complex to administer even in more stable countries. A review of the mortality data indicates potential underestimation and therefore the child mortality results need to be interpreted with caution.

35
Table CM.1 shows, that at the regional level, little, if any improvement has taken place during the last 15 years, with under-five mortality at 108 per 1,000 during the 10-14 year period preceding the survey, and 91 per 1,000 live births during the most recent 5-year period, roughly referring to the years 2006-2011.
Tables CM.2 and CM.3 provides estimates of child mortality by socioeconomic and demographic characteristics. Infant and under-5 mortality rates are lowest in Awdal region and highest in Togdheer. Mortality rates are higher in rural than in urban areas. Furthermore, they tend to be higher among males than females. Consistently across the different mortality indicators, the poorest wealth quintile shows very high levels of mortality compared to the richest quintile, except for neonatal mortality. There are also notable differences in mortality in terms of educational levels where the rates are lower among children whose mothers have secondary or higher education. The previous birth interval has a
Table CM.1: Early childhood mortality rates Neonatal, post-neonatal, Infant, child and under-five mortality rates for five year periods preceding the survey, Somaliland, 2011.
Neonatal mortality rate1
Post-neonatal mortality rate2
Infant mortality rate3
Child mortality rate4
Under-five mortality rate5
Years preceding the survey
0-4 42 30 72 20 91
5-9 32 37 69 28 95
10-14 30 40 70 41 108 1 MICS indicator 1.3 2 MICS indicator 1.4 3 MICS indicator 1.2; MDG indicator 4.2 4 MICS indicator 1.5 5 MICS indicator 1.1; MDG indicator 4.1 Note: Post-neonatal mortality rates are computed as the difference between the infant and neonatal mortality rates
Table CM.2: Early childhood mortality rate by socioeconomic characteristics Neonatal, post-neonatal, Infant, child and under-five mortality rates for the five year period preceding the survey, by socioeconomic characteristics, Somaliland, 2011.
Neonatal mortality
rate1 Post-neonatal mortality rate2
Infant mortality rate3
Child mortality rate4
Under-five mortality
rate5
Region
Maroodijeex/Saaxil 46 30 76 15 90
Awdal 29 21 50 12 62
Togdheer 49 45 94 29 121
Sool 52 22 74 25 97
Sanaag 32 19 51 27 76
Area
Urban 41 28 69 17 85
Rural 44 31 75 22 96
Mother's education
None 44 30 73 20 91
Primary 39 35 74 20 93
Secondary+ 32 20 53 20 71
Wealth index quintile
Poorest 44 40 84 28 110
Second 50 32 81 24 103
Middle 44 35 79 21 98
Fourth 29 21 51 15 65
Richest 44 17 61 5 66
Total 42 30 72 20 91
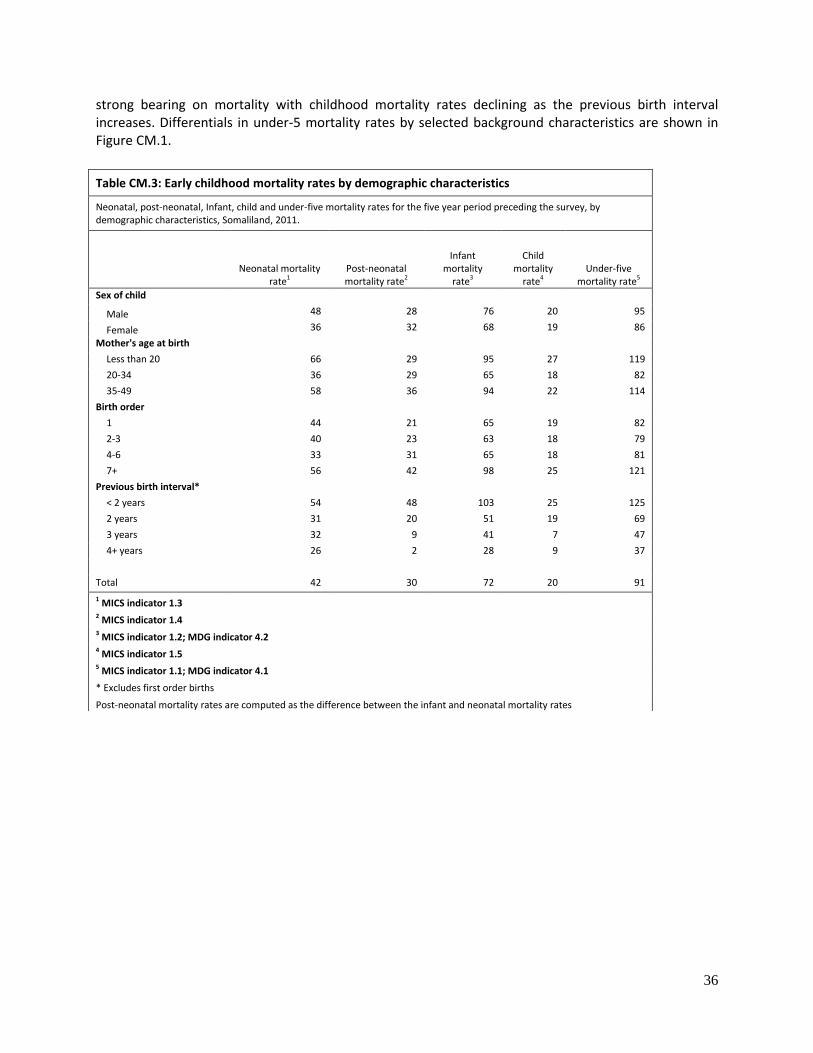
36
strong bearing on mortality with childhood mortality rates declining as the previous birth interval increases. Differentials in under-5 mortality rates by selected background characteristics are shown in Figure CM.1.
Table CM.3: Early childhood mortality rates by demographic characteristics
Neonatal, post-neonatal, Infant, child and under-five mortality rates for the five year period preceding the survey, by demographic characteristics, Somaliland, 2011.
Neonatal mortality rate1
Post-neonatal mortality rate2
Infant mortality
rate3
Child mortality
rate4 Under-five
mortality rate5
Sex of child
Male 48 28 76 20 95
Female 36 32 68 19 86
Mother's age at birth
Less than 20 66 29 95 27 119
20-34 36 29 65 18 82
35-49 58 36 94 22 114
Birth order
1 44 21 65 19 82
2-3 40 23 63 18 79
4-6 33 31 65 18 81
7+ 56 42 98 25 121
Previous birth interval*
< 2 years 54 48 103 25 125
2 years 31 20 51 19 69
3 years 32 9 41 7 47
4+ years 26 2 28 9 37
Total 42 30 72 20 91
1 MICS indicator 1.3 2 MICS indicator 1.4 3 MICS indicator 1.2; MDG indicator 4.2 4 MICS indicator 1.5 5 MICS indicator 1.1; MDG indicator 4.1
* Excludes first order births
Post-neonatal mortality rates are computed as the difference between the infant and neonatal mortality rates
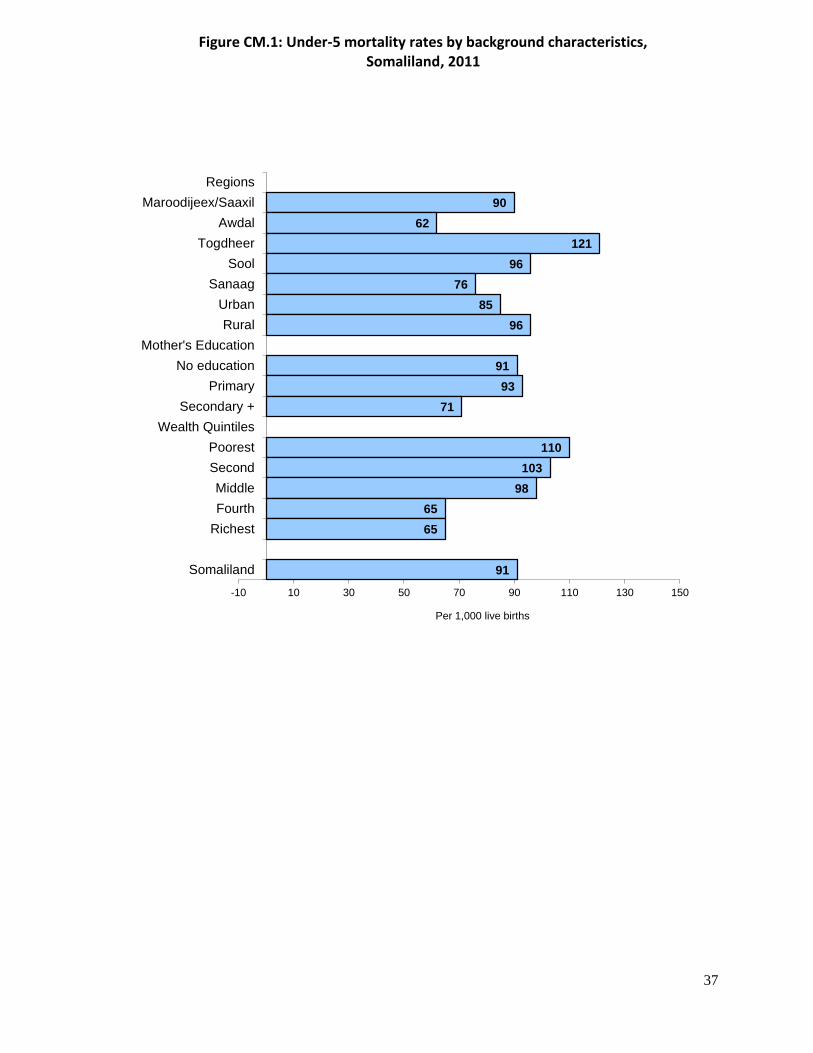
37
90
62
121
96
76
85
96
91
93
71
110
103
98
65
65
91
-10 10 30 50 70 90 110 130 150
Regions
Maroodijeex/Saaxil
Awdal
Togdheer
Sool
Sanaag
Urban
Rural
Mother's Education
No education
Primary
Secondary +
Wealth Quintiles
Poorest
Second
Middle
Fourth
Richest
Somaliland
Per 1,000 live births
Figure CM.1: Under-5 mortality rates by background characteristics, Somaliland, 2011
38
V. Nutrition
Breastfeeding and Infant and Young Child Feeding
Breastfeeding for the first few years of life protects children from infection, provides an ideal source of nutrients, and is economical and safe. However, many mothers stop breastfeeding too soon and there are often pressures to switch to infant formula, which can contribute to growth faltering and micronutrient malnutrition and is unsafe if clean water is not readily available. WHO/UNICEF have the following feeding recommendations:
• Exclusive breastfeeding for first six months
• Continued breastfeeding for two years or more
• Safe and age-appropriate complementary foods beginning at 6 months
• Frequency of complementary feeding: 2 times per day for 6-8 month olds; 3 times per day for 9-11 month olds
It is also recommended that breastfeeding be initiated within one hour of birth. The indicators related to recommended child feeding practices are as follows:
• Early initiation of breastfeeding (within 1 hour of birth)
• Exclusive breastfeeding rate (< 6 months)
• Predominant breastfeeding (< 6 months)
• Continued breastfeeding rate (at 1 year and at 2 years)
• Duration of breastfeeding
• Age-appropriate breastfeeding (0-23 months)
• Introduction of solid, semi-solid and soft foods (6-8 months)
• Minimum meal frequency (6-23 months)
• Milk feeding frequency for non-breastfeeding children (6-23 months)
• Bottle feeding (0-23 months) Table NU.1 shows the proportion of children born in the two years preceding the survey who were ever breastfed, those who were first breastfed within one hour and one day of birth, and those who received a prelacteal feed. Although a very important step in management of lactation and establishment of a physical and emotional relationship between the baby and the mother, 61 percent of babies are breastfed for the first time within one hour of birth, while 85 percent of new-borns in Somaliland start breastfeeding within one day of birth. Initiation of breastfeeding within one day of birth was similar across the background characteristics. However, initiation of breastfeeding within one hour depended on mother’s education and wealth status. More children (71 percent) born of mothers with secondary or more education, had breastfeeding within one hour of birth compared to those whose mothers had no education (60 percent). A similar pattern was observed across wealth quintiles with fewer children born in poor households receiving breast milk within one hour of birth (58 percent) compared to those in the richest quintile (69 percent). As presented in figure NU.1, Togdheer region has the lowest rate (53 percent) of
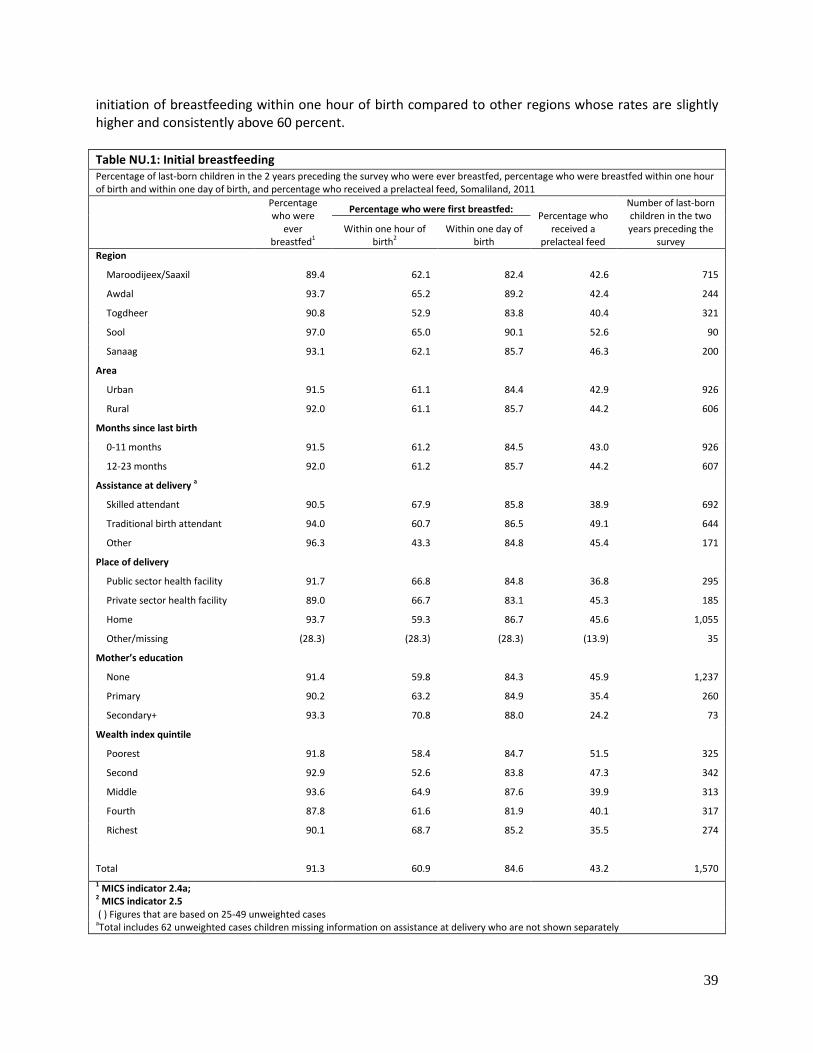
39
initiation of breastfeeding within one hour of birth compared to other regions whose rates are slightly higher and consistently above 60 percent.
Table NU.1: Initial breastfeeding Percentage of last-born children in the 2 years preceding the survey who were ever breastfed, percentage who were breastfed within one hour of birth and within one day of birth, and percentage who received a prelacteal feed, Somaliland, 2011
Percentage who were
ever breastfed1
Percentage who were first breastfed: Percentage who
received a prelacteal feed
Number of last-born children in the two years preceding the
survey
Within one hour of
birth2 Within one day of
birth
Region
Maroodijeex/Saaxil 89.4 62.1 82.4 42.6 715
Awdal 93.7 65.2 89.2 42.4 244
Togdheer 90.8 52.9 83.8 40.4 321
Sool 97.0 65.0 90.1 52.6 90
Sanaag 93.1 62.1 85.7 46.3 200
Area
Urban 91.5 61.1 84.4 42.9 926
Rural 92.0 61.1 85.7 44.2 606
Months since last birth
0-11 months 91.5 61.2 84.5 43.0 926
12-23 months 92.0 61.2 85.7 44.2 607
Assistance at delivery a
Skilled attendant 90.5 67.9 85.8 38.9 692
Traditional birth attendant 94.0 60.7 86.5 49.1 644
Other 96.3 43.3 84.8 45.4 171
Place of delivery
Public sector health facility 91.7 66.8 84.8 36.8 295
Private sector health facility 89.0 66.7 83.1 45.3 185
Home 93.7 59.3 86.7 45.6 1,055
Other/missing (28.3) (28.3) (28.3) (13.9) 35
Mother’s education
None 91.4 59.8 84.3 45.9 1,237
Primary 90.2 63.2 84.9 35.4 260
Secondary+ 93.3 70.8 88.0 24.2 73
Wealth index quintile
Poorest 91.8 58.4 84.7 51.5 325
Second 92.9 52.6 83.8 47.3 342
Middle 93.6 64.9 87.6 39.9 313
Fourth 87.8 61.6 81.9 40.1 317
Richest 90.1 68.7 85.2 35.5 274
Total 91.3 60.9 84.6 43.2 1,570
1 MICS indicator 2.4a;
2 MICS indicator 2.5 ( ) Figures that are based on 25-49 unweighted cases aTotal includes 62 unweighted cases children missing information on assistance at delivery who are not shown separately
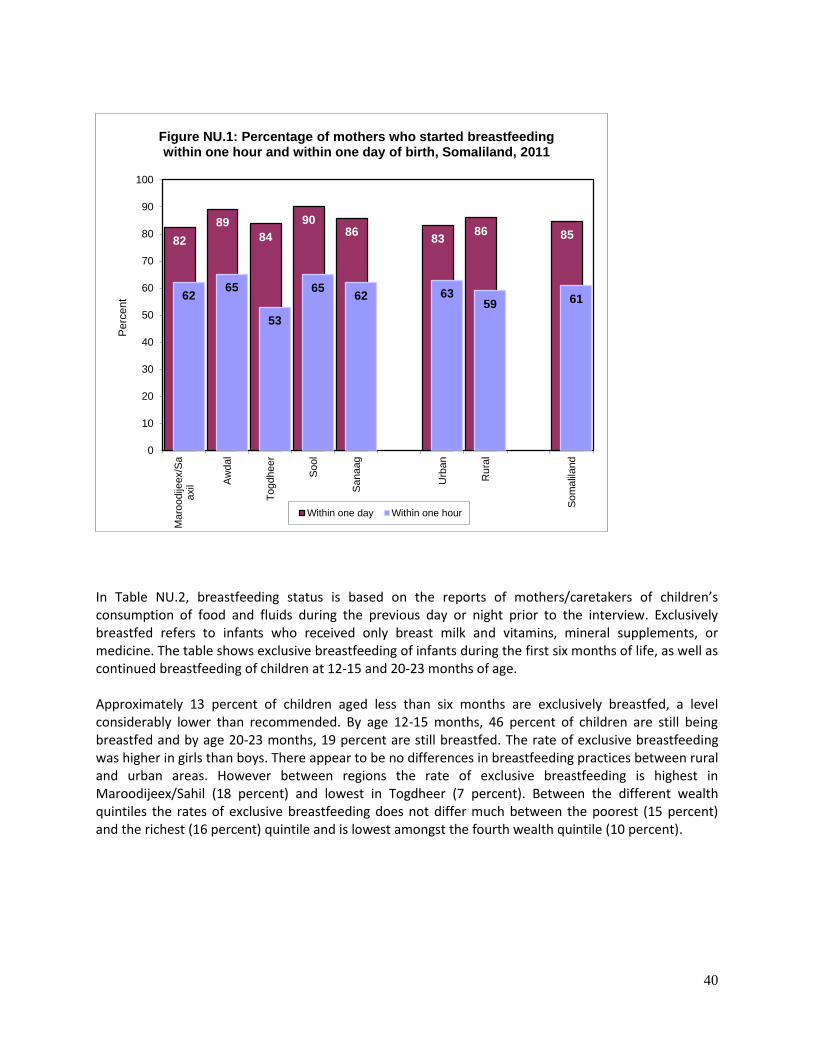
40
In Table NU.2, breastfeeding status is based on the reports of mothers/caretakers of children’s consumption of food and fluids during the previous day or night prior to the interview. Exclusively breastfed refers to infants who received only breast milk and vitamins, mineral supplements, or medicine. The table shows exclusive breastfeeding of infants during the first six months of life, as well as continued breastfeeding of children at 12-15 and 20-23 months of age. Approximately 13 percent of children aged less than six months are exclusively breastfed, a level considerably lower than recommended. By age 12-15 months, 46 percent of children are still being breastfed and by age 20-23 months, 19 percent are still breastfed. The rate of exclusive breastfeeding was higher in girls than boys. There appear to be no differences in breastfeeding practices between rural and urban areas. However between regions the rate of exclusive breastfeeding is highest in Maroodijeex/Sahil (18 percent) and lowest in Togdheer (7 percent). Between the different wealth quintiles the rates of exclusive breastfeeding does not differ much between the poorest (15 percent) and the richest (16 percent) quintile and is lowest amongst the fourth wealth quintile (10 percent).
82
89
84
90 86
83 86 85
62 65
53
65 62 63
59 61
0
10
20
30
40
50
60
70
80
90
100M
aro
odije
ex/S
aaxil A
wdal
Togdheer
Sool
Sanaag
Urb
an
Rura
l
Som
alil
and
Perc
ent
Figure NU.1: Percentage of mothers who started breastfeeding within one hour and within one day of birth, Somaliland, 2011
Within one day Within one hour

41
Table NU.2: Breastfeeding
Percentage of living children according to breastfeeding status at selected age groups, Somaliland, 2011
Children age 0-5 months
Children age 12-15 months
Children age 20-23 months
Percent exclusively breastfed1
Percent predominantly
breastfed2
Number of
children
Percent breastfed
(Continued breastfeeding at
1 year)3
Number of
children
Percent breastfed
(Continued breastfeeding at
2 years)4
Number of
children
Sex
Male 10.7 31.8 298 47.3 164 15.7 84
Female 15.3 33.9 258 45.5 178 24.2 61
Region
Maroodijeex/Saaxil 17.9 37.3 239 52.1 152 25.2 71
Awdal 10.0 43.2 90 55.5 54 (*) 21
Togdheer 7.1 15.0 116 38.1 68 (0.0) 31
Sool (11.1) (32.5) 35 (*) 21 (*) 5
Sanaag 10.0 33.2 77 40.7 47 (*) 18
Area
Urban 12.7 34.6 250 45.8 170 17.2 78
Rural 13.0 31.2 307 46.8 172 21.6 68
Mother’s education
None 12.3 33.6 445 49.3 281 20.1 105
Primary 14.8 25.2 86 36.7 47 (16.0) 31
Secondary+ (15.3) (42.5) 25 (*) 15 (*) 10
Wealth index quintile
Poorest 14.8 36.1 132 48.4 69 (15.5) 27
Second 11.8 28.5 120 54.7 75 (29.9) 32
Middle 11.9 37.3 113 46.1 72 (*) 21
Fourth 10.4 26.8 112 39.0 68 (20.1) 34
Richest 15.9 35.5 79 42.0 58 (15.3) 32
Total 12.8 32.7 557 46.3 342 19.2 146
1 MICS indicator 2.6 2 MICS indicator 2.9 3 MICS indicator 2.7 4 MICS indicator 2.8 (*) Figures that are based on less than 25 unweighted cases ( ) Figures that are based on 25 – 49 unweighted cases
Figure NU.2 shows the detailed pattern of breastfeeding by the child’s age in months. Even at the earliest ages, the majority of children are receiving liquids or foods other than breast milk. By the end of the sixth month, the percentage of children exclusively breastfed is below 5 percent. Only about 20 percent of children are receiving breast milk after 2 years.
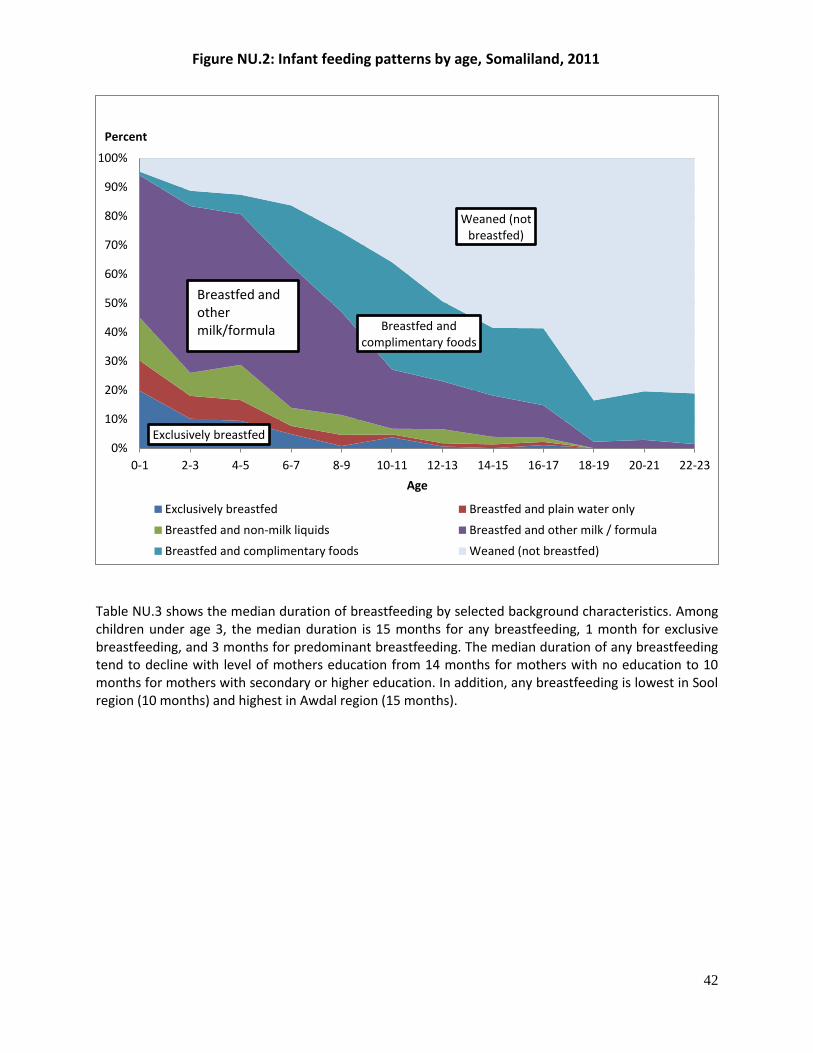
42
Table NU.3 shows the median duration of breastfeeding by selected background characteristics. Among children under age 3, the median duration is 15 months for any breastfeeding, 1 month for exclusive breastfeeding, and 3 months for predominant breastfeeding. The median duration of any breastfeeding tend to decline with level of mothers education from 14 months for mothers with no education to 10 months for mothers with secondary or higher education. In addition, any breastfeeding is lowest in Sool region (10 months) and highest in Awdal region (15 months).
Exclusively breastfed
Breastfed and complimentary foods
Weaned (not breastfed)
0%
10%
20%
30%
40%
50%
60%
70%
80%
90%
100%
0-1 2-3 4-5 6-7 8-9 10-11 12-13 14-15 16-17 18-19 20-21 22-23
Percent
Age
Exclusively breastfed Breastfed and plain water only
Breastfed and non-milk liquids Breastfed and other milk / formula
Breastfed and complimentary foods Weaned (not breastfed)
Breastfed and other milk/formula
Figure NU.2: Infant feeding patterns by age, Somaliland, 2011
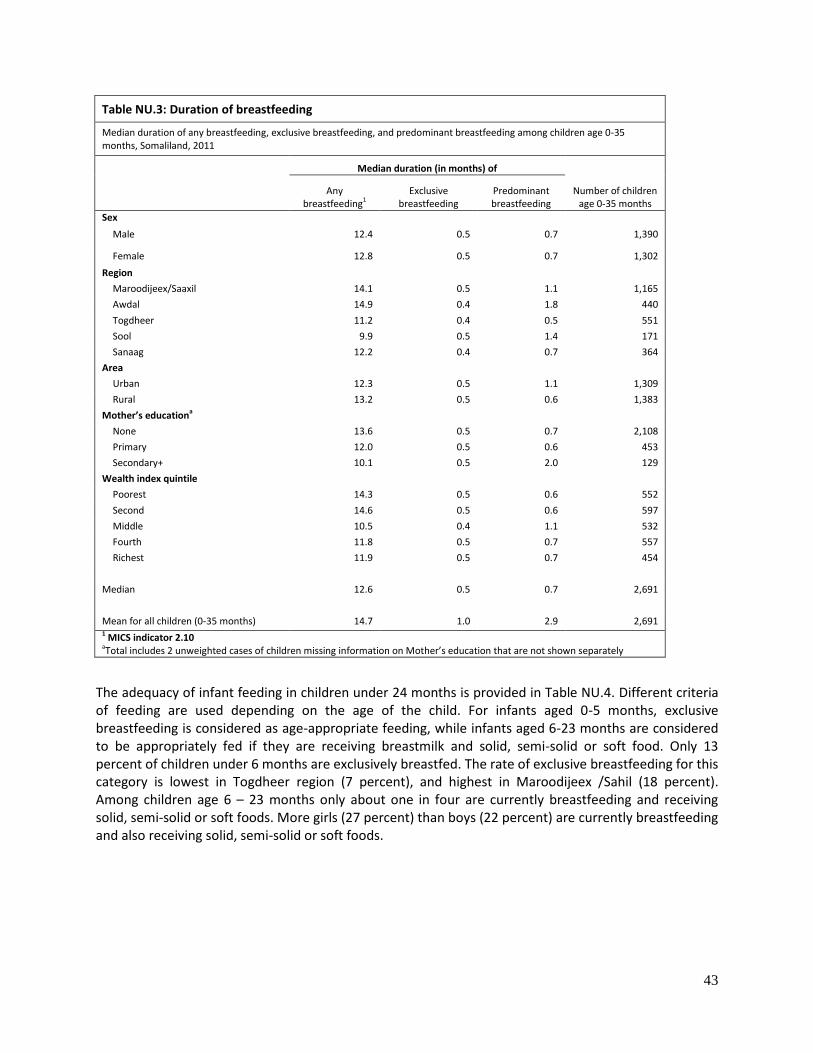
43
Table NU.3: Duration of breastfeeding
Median duration of any breastfeeding, exclusive breastfeeding, and predominant breastfeeding among children age 0-35 months, Somaliland, 2011
Median duration (in months) of
Number of children age 0-35 months
Any breastfeeding1
Exclusive breastfeeding
Predominant breastfeeding
Sex
Male 12.4 0.5 0.7 1,390
Female 12.8 0.5 0.7 1,302
Region
Maroodijeex/Saaxil 14.1 0.5 1.1 1,165
Awdal 14.9 0.4 1.8 440
Togdheer 11.2 0.4 0.5 551
Sool 9.9 0.5 1.4 171
Sanaag 12.2 0.4 0.7 364
Area
Urban 12.3 0.5 1.1 1,309
Rural 13.2 0.5 0.6 1,383
Mother’s educationa
None 13.6 0.5 0.7 2,108
Primary 12.0 0.5 0.6 453
Secondary+ 10.1 0.5 2.0 129
Wealth index quintile
Poorest 14.3 0.5 0.6 552
Second 14.6 0.5 0.6 597
Middle 10.5 0.4 1.1 532
Fourth 11.8 0.5 0.7 557
Richest 11.9 0.5 0.7 454
Median 12.6 0.5 0.7 2,691
Mean for all children (0-35 months) 14.7 1.0 2.9 2,691 1 MICS indicator 2.10 aTotal includes 2 unweighted cases of children missing information on Mother’s education that are not shown separately
The adequacy of infant feeding in children under 24 months is provided in Table NU.4. Different criteria of feeding are used depending on the age of the child. For infants aged 0-5 months, exclusive breastfeeding is considered as age-appropriate feeding, while infants aged 6-23 months are considered to be appropriately fed if they are receiving breastmilk and solid, semi-solid or soft food. Only 13 percent of children under 6 months are exclusively breastfed. The rate of exclusive breastfeeding for this category is lowest in Togdheer region (7 percent), and highest in Maroodijeex /Sahil (18 percent). Among children age 6 – 23 months only about one in four are currently breastfeeding and receiving solid, semi-solid or soft foods. More girls (27 percent) than boys (22 percent) are currently breastfeeding and also receiving solid, semi-solid or soft foods.
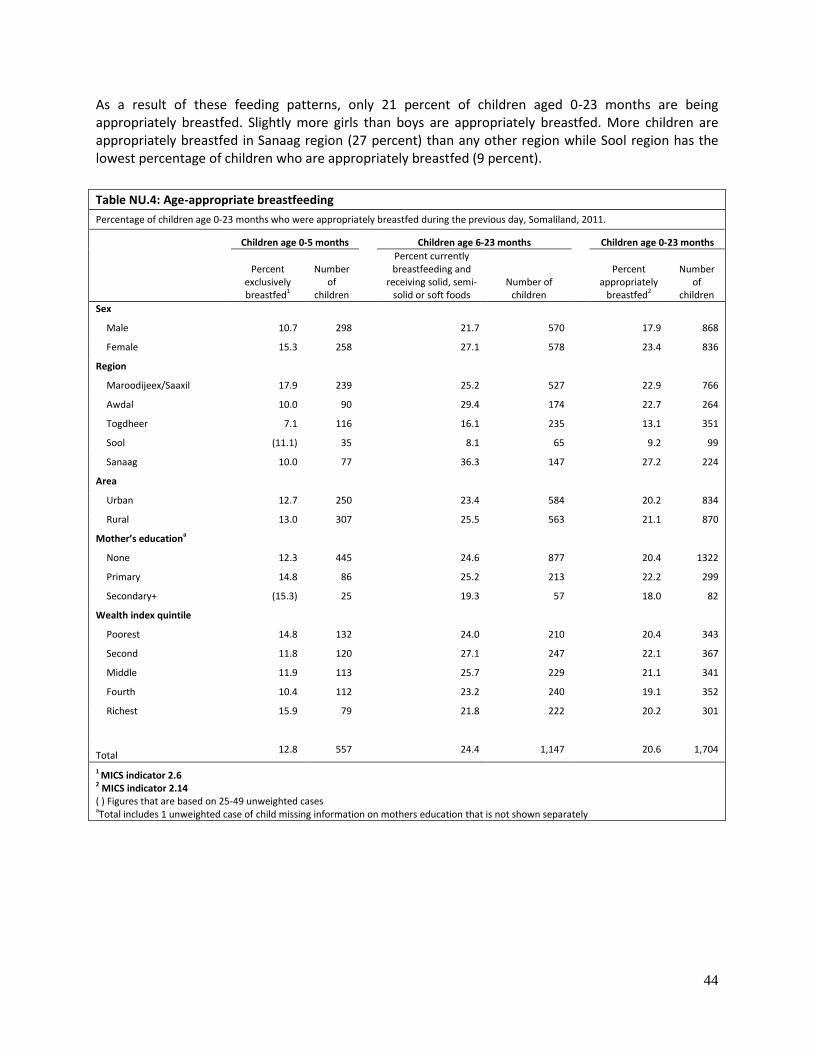
44
As a result of these feeding patterns, only 21 percent of children aged 0-23 months are being appropriately breastfed. Slightly more girls than boys are appropriately breastfed. More children are appropriately breastfed in Sanaag region (27 percent) than any other region while Sool region has the lowest percentage of children who are appropriately breastfed (9 percent).
Table NU.4: Age-appropriate breastfeeding
Percentage of children age 0-23 months who were appropriately breastfed during the previous day, Somaliland, 2011.
Children age 0-5 months
Children age 6-23 months
Children age 0-23 months
Percent exclusively breastfed1
Number of
children
Percent currently breastfeeding and
receiving solid, semi-solid or soft foods
Number of children
Percent appropriately
breastfed2
Number of
children
Sex
Male 10.7 298 21.7 570 17.9 868
Female 15.3 258 27.1 578 23.4 836
Region
Maroodijeex/Saaxil 17.9 239 25.2 527 22.9 766
Awdal 10.0 90 29.4 174 22.7 264
Togdheer 7.1 116 16.1 235 13.1 351
Sool (11.1) 35 8.1 65 9.2 99
Sanaag 10.0 77 36.3 147 27.2 224
Area
Urban 12.7 250 23.4 584 20.2 834
Rural 13.0 307 25.5 563 21.1 870
Mother’s educationa
None 12.3 445 24.6 877 20.4 1322
Primary 14.8 86 25.2 213 22.2 299
Secondary+ (15.3) 25 19.3 57 18.0 82
Wealth index quintile
Poorest 14.8 132 24.0 210 20.4 343
Second 11.8 120 27.1 247 22.1 367
Middle 11.9 113 25.7 229 21.1 341
Fourth 10.4 112 23.2 240 19.1 352
Richest 15.9 79 21.8 222 20.2 301
Total 12.8 557 24.4 1,147 20.6 1,704
1 MICS indicator 2.6 2 MICS indicator 2.14 ( ) Figures that are based on 25-49 unweighted cases aTotal includes 1 unweighted case of child missing information on mothers education that is not shown separately

45
Appropriate complementary feeding of children from 6 months to two years of age is particularly important for growth and development and the prevention of undernutrition. Continued breastfeeding beyond six months should be accompanied by consumption of nutritionally adequate, safe and appropriate complementary foods that help meet nutritional requirements when breastmilk is no longer sufficient. This requires that for breastfed children, two or more meals of solid, semi-solid or soft foods are needed if they are six to eight months old, and three or more meals if they are 9-23 months of age. For children 6-23 months and older who are not breastfed, four or more meals of solid, semi-solid or soft foods or milk feeds are needed. Overall, 33 percent of infants age 6-8 months received solid, semi-solid, or soft foods (Table NU.5). Among currently breastfeeding infants this percentage is 30 while it is 43 percent (to be interpreted with caution as it is based on 34 unweighted cases) among infants currently not breastfeeding. More girls than boys get timely introduction of complimentary feeding.
Table NU.6 presents the proportion of children age 6-23 months who received semi-solid or soft foods the minimum number of times or more during the day or night preceding the interview by breastfeeding status (see the note in Table NU.6 for a definition of minimum number of times for different age groups). Overall, more than a half of the children age 6-23 months (54 percent) were receiving the minimum meal frequency of solid, semi-solid and soft foods. A higher proportion of females (57 percent) were receiving the minimum meal frequency compared to males (50 percent). Among currently breastfeeding children age 6-23 months, just over a quarter (27 percent) were receiving the minimum meal frequency of solid, semi-solid and soft foods and this proportion was higher among females (32 percent) compared to males (22 percent). Among non-breastfeeding children, more than three in four of the children were receiving solid, semi-solid and soft foods or milk feeds 4 times or more.
Table NU.5: Introduction of solid, semi-solid or soft foods
Percentage of infants age 6-8 months who received solid, semi-solid or soft foods during the previous day, Somaliland, 2011.
Currently breastfeeding
Currently not breastfeeding
All
Percent receiving solid, semi-solid or soft foods
Number of children age 6-8 months
Percent receiving solid, semi-solid or soft foods
Number of children age 6-8 months
Percent receiving solid, semi-solid or soft foods1
Number of children age 6-8 months
Sex
Male 23.1 86 (*) 18 25.4 105
Female 38.1 82 (*) 16 40.1 98
Area
Urban 34.4 75 (*) 22 36.1 97
Rural 27.2 94 (*) 12 29.2 106
Total 30.4 168 (42.8) 34 32.5 203 1 MICS indicator 2.12 ( ) Figures that are based on 25-49 unweighted cases (*) Figures that are based on less than 25 unweighted cases

46
Table NU.6: Minimum meal frequency
Percentage of children age 6-23 months who received solid, semi-solid, or soft foods (and milk feeds for non-breastfeeding children) the minimum number of times or more during the previous day, according to breastfeeding status, Somaliland, 2011.
Currently breastfeeding
Currently not breastfeeding
All
Percent receiving solid, semi-solid and soft foods the
minimum number of
times
Number of children age 6-23 months
Percent receiving at least 2 milk
feeds1
Percent receiving solid, semi-solid and soft foods or milk feeds 4
times or more
Number of children age 6-23 months
Percent with minimum
meal frequency2
Number of children age 6-23 months
Sex
Male 21.5 280 89.2 77.9 290 50.2 570
Female 32.2 285 89.4 80.8 293 56.8 578
Age
6-8 months 24.4 168 94.3 (77.2) 34 33.3 203
9-11 months 17.4 115 86.3 76.6 59 37.5 174
12-17 months 30.6 239 89.2 78.3 298 57.1 537
18-23 months 40.8 43 89.5 82.1 191 74.6 234
Region
Maroodijeex/Saaxil 25.9 263 88.9 78.0 264 52.0 527
Awdal 27.9 104 88.4 84.1 70 50.6 174
Togdheer 22.8 91 90.8 80.4 144 58.1 235
Sool (11.0) 28 88.8 (69.5) 37 44.5 65
Sanaag 38.8 80 88.8 82.7 67 58.8 147
Area
Urban 28.8 270 90.5 81.8 314 57.3 584
Rural 25.1 295 87.8 76.5 268 49.6 563
Mother’s educationh
None 25.6 442 87.8 77.4 435 51.3 877
Primary 30.5 104 94.4 88.0 109 60.0 213
Secondary+ (35.9) 20 94.4 (79.1) 37 64.2 57
Missing/DK (*) 0 (*) (*) 1 (*) 1
Wealth index quintile
Poorest 20.7 112 88.2 72.4 98 44.8 210
Second 20.1 140 84.5 77.9 107 45.1 247
Middle 32.8 105 85.0 77.6 124 57.1 229
Fourth 36.9 107 94.1 84.6 133 63.4 240
Richest 26.4 102 93.6 82.3 120 56.7 222
Total 26.9 565 89.3 79.3 582 53.5 1,147
1 MICS indicator 2.15 2 MICS indicator 2.13 ( ) Figures that are based on 25-49 unweighted cases (* ) Figures that are based less than 25 unweighted cases
Among currently breastfeeding children age 6-8 months, minimum meal frequency is defined as children who also received solid, semi-solid or soft foods 2 times or more. Among currently breastfeeding children age 9-23 months, receipt of solid, semi-solid or soft foods at least 3 times constitutes minimum meal frequency. For non-breastfeeding children age 6-23 months, minimum meal frequency is defined as children receiving solid, semi-solid or soft foods, and milk feeds, at least 4 times during the previous day.
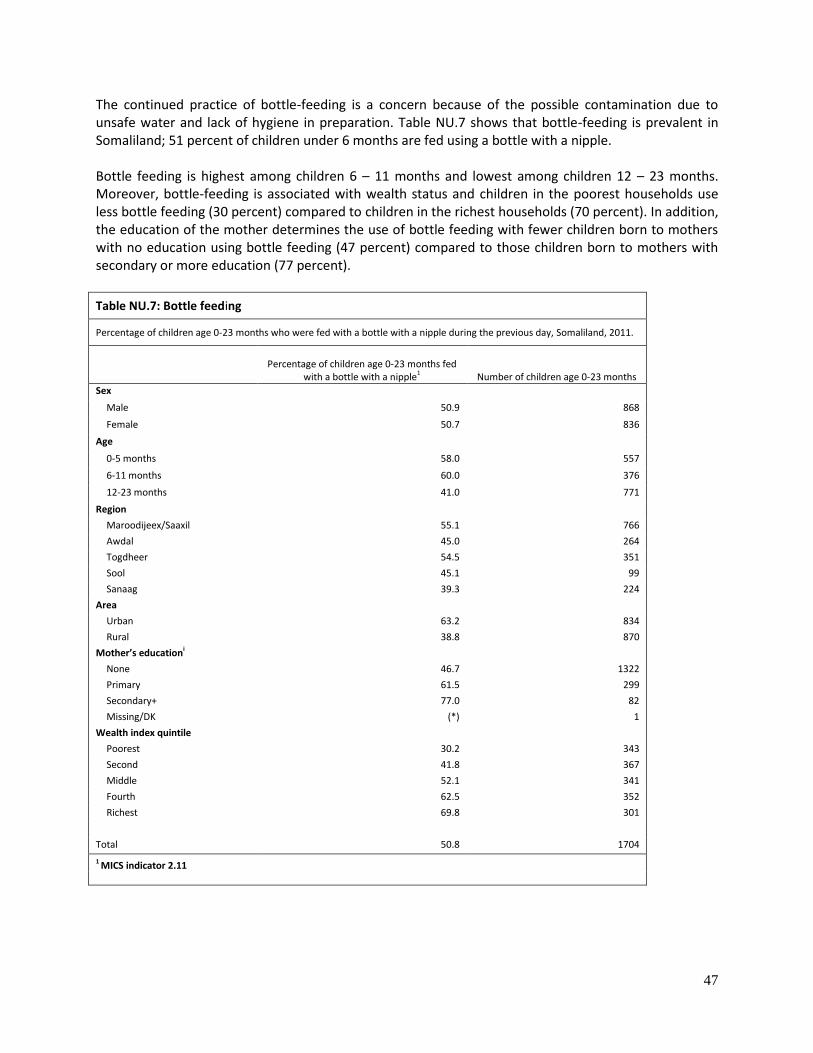
47
The continued practice of bottle-feeding is a concern because of the possible contamination due to unsafe water and lack of hygiene in preparation. Table NU.7 shows that bottle-feeding is prevalent in Somaliland; 51 percent of children under 6 months are fed using a bottle with a nipple. Bottle feeding is highest among children 6 – 11 months and lowest among children 12 – 23 months. Moreover, bottle-feeding is associated with wealth status and children in the poorest households use less bottle feeding (30 percent) compared to children in the richest households (70 percent). In addition, the education of the mother determines the use of bottle feeding with fewer children born to mothers with no education using bottle feeding (47 percent) compared to those children born to mothers with secondary or more education (77 percent).
Table NU.7: Bottle feeding
Percentage of children age 0-23 months who were fed with a bottle with a nipple during the previous day, Somaliland, 2011.
Percentage of children age 0-23 months fed
with a bottle with a nipple1 Number of children age 0-23 months
Sex
Male 50.9 868
Female 50.7 836
Age
0-5 months 58.0 557
6-11 months 60.0 376
12-23 months 41.0 771
Region
Maroodijeex/Saaxil 55.1 766
Awdal 45.0 264
Togdheer 54.5 351
Sool 45.1 99
Sanaag 39.3 224
Area
Urban 63.2 834
Rural 38.8 870
Mother’s educationi
None 46.7 1322
Primary 61.5 299
Secondary+ 77.0 82
Missing/DK (*) 1
Wealth index quintile
Poorest 30.2 343
Second 41.8 367
Middle 52.1 341
Fourth 62.5 352
Richest 69.8 301
Total 50.8 1704
1 MICS indicator 2.11

48
Children’s Vitamin A Supplementation
Vitamin A is essential for eye health and proper functioning of the immune system. It is found in foods such as milk, liver, eggs, red and orange fruits, red palm oil and green leafy vegetables, although the amount of vitamin A readily available to the body from these sources varies widely. In developing areas of the world, where vitamin A is largely consumed in the form of fruits and vegetables, daily per capita intake is often insufficient to meet dietary requirements. Inadequate intakes are further compromised by increased requirements for the vitamin as children grow or during periods of illness, as well as increased losses during common childhood infections. As a result, vitamin A deficiency is quite prevalent in the developing world and particularly in countries with the highest burden of under-five deaths. The 1990 World Summit for Children set the goal of virtual elimination of vitamin A deficiency and its consequences, including blindness, by the year 2000. This goal was also endorsed at the Policy Conference on Ending Hidden Hunger in 1991, the 1992 International Conference on Nutrition, and the UN General Assembly's Special Session on Children in 2002. The critical role of vitamin A for child health and immune function also makes control of deficiency a primary component of child survival efforts, and therefore critical to the achievement of the fourth Millennium Development Goal: a two-thirds reduction in under-five mortality by the year 2015. For countries with vitamin A deficiency problems, current international recommendations call for high-dose vitamin A supplementation every four to six months, targeted to all children between the ages of 6 to 59 months living in affected areas. Providing young children with two high-dose vitamin A capsules a year is a safe, cost-effective, efficient strategy for eliminating vitamin A deficiency and improving child survival. Giving vitamin A to new mothers who are breastfeeding helps protect their children during the first months of life and helps to replenish the mother's stores of vitamin A, which are depleted during pregnancy and lactation. For countries with vitamin A supplementation programs, the definition of the indicator is the percent of children 6-59 months of age receiving at least one high dose vitamin A supplement in the last six months. Based on UNICEF/WHO guidelines, the Somaliland Ministry of Health recommends that children aged 6-11 months be given one high dose Vitamin A capsules and children aged 12-59 months given a vitamin A capsule every 6 months. In some parts of the country, Vitamin A capsules are linked to immunization services and are given when the child has contact with these services after six months of age. It is also recommended that mothers take a Vitamin A supplement within eight weeks of giving birth due to increased Vitamin A requirements during pregnancy and lactation. Within the six months prior to the MICS, 40 percent of children aged 6-59 months received a high dose Vitamin A supplement (Table NU.8). Vitamin A supplementation coverage is lower in Sool region than in other regions. It is also higher in urban (45 percent) compared to rural areas (35 percent).
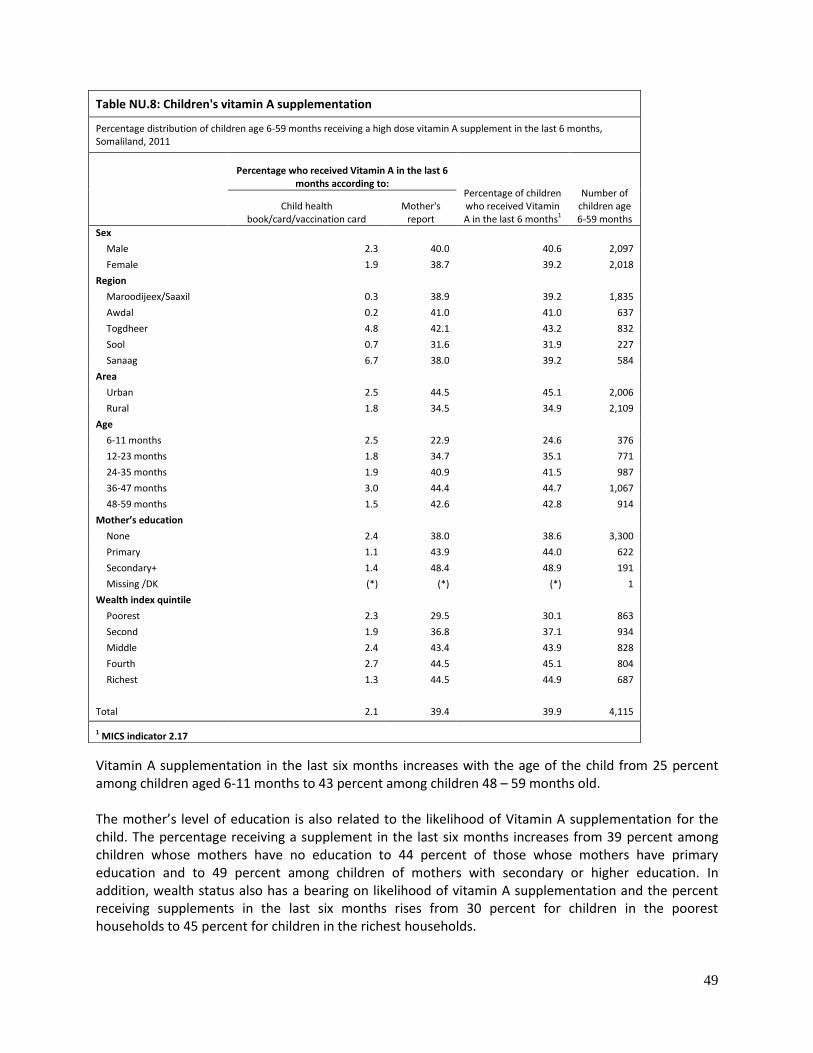
49
Vitamin A supplementation in the last six months increases with the age of the child from 25 percent among children aged 6-11 months to 43 percent among children 48 – 59 months old. The mother’s level of education is also related to the likelihood of Vitamin A supplementation for the child. The percentage receiving a supplement in the last six months increases from 39 percent among children whose mothers have no education to 44 percent of those whose mothers have primary education and to 49 percent among children of mothers with secondary or higher education. In addition, wealth status also has a bearing on likelihood of vitamin A supplementation and the percent receiving supplements in the last six months rises from 30 percent for children in the poorest households to 45 percent for children in the richest households.
Table NU.8: Children's vitamin A supplementation
Percentage distribution of children age 6-59 months receiving a high dose vitamin A supplement in the last 6 months, Somaliland, 2011
Percentage who received Vitamin A in the last 6 months according to:
Percentage of children who received Vitamin A in the last 6 months1
Number of children age 6-59 months
Child health book/card/vaccination card
Mother's report
Sex
Male 2.3 40.0 40.6 2,097
Female 1.9 38.7 39.2 2,018
Region
Maroodijeex/Saaxil 0.3 38.9 39.2 1,835
Awdal 0.2 41.0 41.0 637
Togdheer 4.8 42.1 43.2 832
Sool 0.7 31.6 31.9 227
Sanaag 6.7 38.0 39.2 584
Area
Urban 2.5 44.5 45.1 2,006
Rural 1.8 34.5 34.9 2,109
Age
6-11 months 2.5 22.9 24.6 376
12-23 months 1.8 34.7 35.1 771
24-35 months 1.9 40.9 41.5 987
36-47 months 3.0 44.4 44.7 1,067
48-59 months 1.5 42.6 42.8 914
Mother’s education
None 2.4 38.0 38.6 3,300
Primary 1.1 43.9 44.0 622
Secondary+ 1.4 48.4 48.9 191
Missing /DK (*) (*) (*) 1
Wealth index quintile
Poorest 2.3 29.5 30.1 863
Second 1.9 36.8 37.1 934
Middle 2.4 43.4 43.9 828
Fourth 2.7 44.5 45.1 804
Richest 1.3 44.5 44.9 687
Total 2.1 39.4 39.9 4,115
1 MICS indicator 2.17
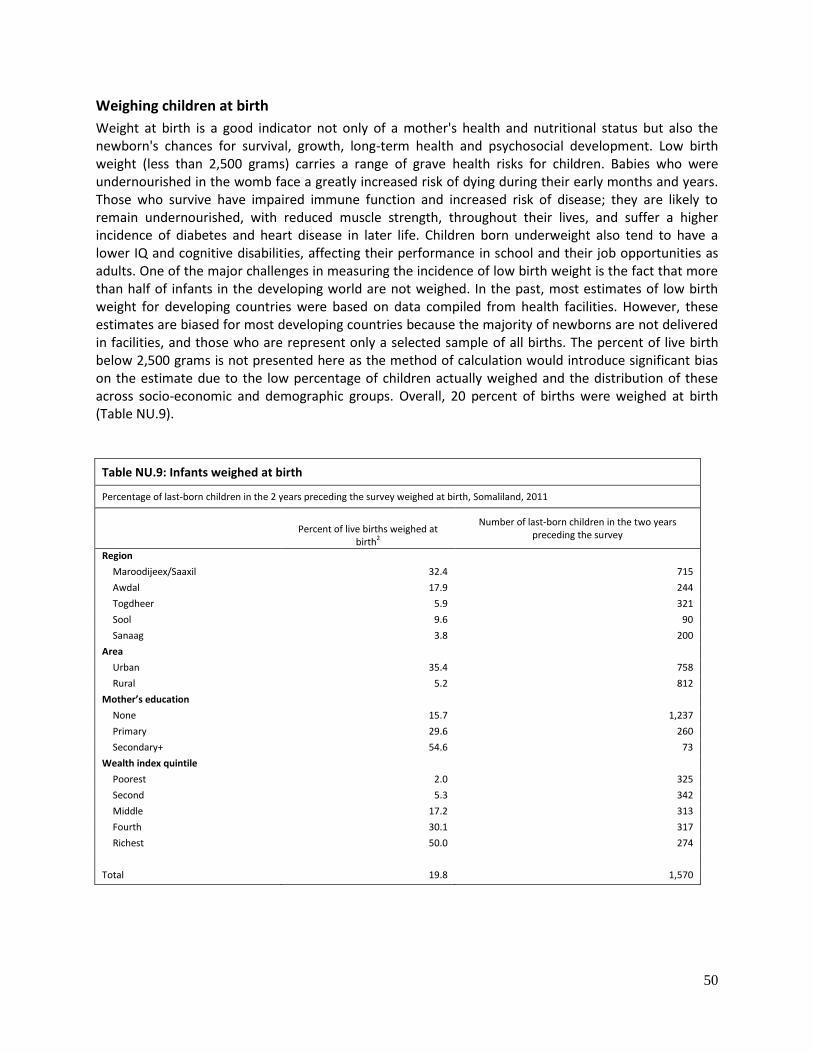
50
Weighing children at birth
Weight at birth is a good indicator not only of a mother's health and nutritional status but also the newborn's chances for survival, growth, long-term health and psychosocial development. Low birth weight (less than 2,500 grams) carries a range of grave health risks for children. Babies who were undernourished in the womb face a greatly increased risk of dying during their early months and years. Those who survive have impaired immune function and increased risk of disease; they are likely to remain undernourished, with reduced muscle strength, throughout their lives, and suffer a higher incidence of diabetes and heart disease in later life. Children born underweight also tend to have a lower IQ and cognitive disabilities, affecting their performance in school and their job opportunities as adults. One of the major challenges in measuring the incidence of low birth weight is the fact that more than half of infants in the developing world are not weighed. In the past, most estimates of low birth weight for developing countries were based on data compiled from health facilities. However, these estimates are biased for most developing countries because the majority of newborns are not delivered in facilities, and those who are represent only a selected sample of all births. The percent of live birth below 2,500 grams is not presented here as the method of calculation would introduce significant bias on the estimate due to the low percentage of children actually weighed and the distribution of these across socio-economic and demographic groups. Overall, 20 percent of births were weighed at birth (Table NU.9).
Table NU.9: Infants weighed at birth
Percentage of last-born children in the 2 years preceding the survey weighed at birth, Somaliland, 2011
Percent of live births weighed at
birth2
Number of last-born children in the two years preceding the survey
Region
Maroodijeex/Saaxil 32.4 715
Awdal 17.9 244
Togdheer 5.9 321
Sool 9.6 90
Sanaag 3.8 200
Area
Urban 35.4 758
Rural 5.2 812
Mother’s education
None 15.7 1,237
Primary 29.6 260
Secondary+ 54.6 73
Wealth index quintile
Poorest 2.0 325
Second 5.3 342
Middle 17.2 313
Fourth 30.1 317
Richest 50.0 274
Total 19.8 1,570

51
VI. Child Health
Vaccinations
The Millennium Development Goal (MDG) 4 is to reduce child mortality by two thirds between 1990 and 2015. Immunization plays a key part in this goal. Immunizations have saved the lives of millions of children in the three decades since the launch of the Expanded Programme on Immunization (EPI) in 1974. Worldwide there are still 27 million children overlooked by routine immunization and as a result, vaccine-preventable diseases cause more than 2 million deaths every year. A World Fit for Children goal is to ensure full immunization of children under one year of age at 90 percent nationally, with at least 80 percent coverage in every district or equivalent administrative unit. According to UNICEF and WHO guidelines, a child should receive a BCG vaccination to protect against tuberculosis, three doses of DPT to protect against diphtheria, pertussis, and tetanus, three doses of polio vaccine, and a measles vaccination by the age of 12 months. The vaccination schedule followed by the Somaliland Immunization Programme provides all the above mentioned vaccinations. All vaccinations should be received during the first year of life. Taking into consideration this vaccination schedule, the estimates for full immunization coverage from the Somaliland MICS are based on children age 12-23 months. Information on vaccination coverage was collected for all children under five years of age. All mothers or caretakers were asked to provide vaccination cards. If the vaccination card for a child was available, interviewers copied vaccination information from the cards onto the MICS questionnaire. If no vaccination card was available for the child, the interviewer proceeded to ask the mother to recall whether or not the child had received each of the vaccinations, and for Polio and DPT how many doses were received. The final vaccination coverage estimates are based on both information obtained from the vaccination card and the mother’s report of vaccinations received by the child.
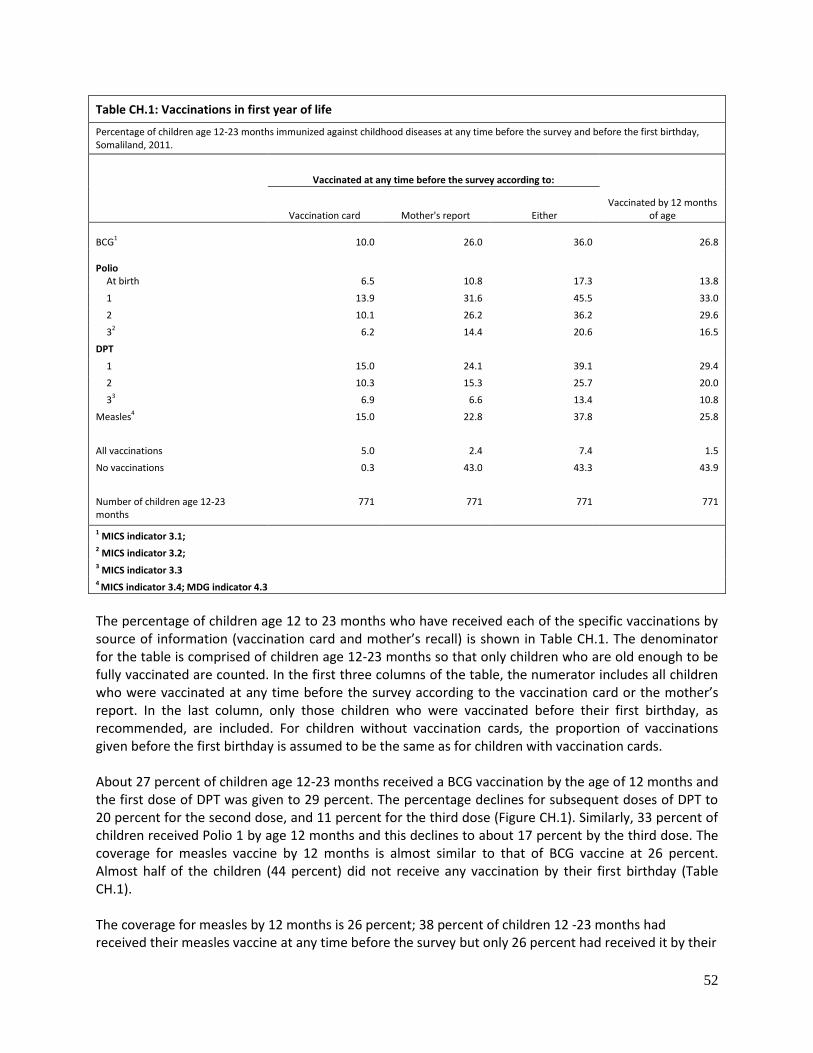
52
Table CH.1: Vaccinations in first year of life
Percentage of children age 12-23 months immunized against childhood diseases at any time before the survey and before the first birthday, Somaliland, 2011.
Vaccinated at any time before the survey according to:
Vaccinated by 12 months of age Vaccination card Mother's report Either
BCG1
10.0
26.0
36.0
26.8
Polio
At birth 6.5 10.8 17.3 13.8
1 13.9 31.6 45.5 33.0
2 10.1 26.2 36.2 29.6
32 6.2 14.4 20.6 16.5
DPT
1 15.0 24.1 39.1 29.4
2 10.3 15.3 25.7 20.0
33 6.9 6.6 13.4 10.8
Measles4 15.0 22.8 37.8 25.8
All vaccinations 5.0 2.4 7.4 1.5
No vaccinations 0.3 43.0 43.3 43.9
Number of children age 12-23 months
771 771 771 771
1 MICS indicator 3.1; 2 MICS indicator 3.2; 3 MICS indicator 3.3 4 MICS indicator 3.4; MDG indicator 4.3
The percentage of children age 12 to 23 months who have received each of the specific vaccinations by source of information (vaccination card and mother’s recall) is shown in Table CH.1. The denominator for the table is comprised of children age 12-23 months so that only children who are old enough to be fully vaccinated are counted. In the first three columns of the table, the numerator includes all children who were vaccinated at any time before the survey according to the vaccination card or the mother’s report. In the last column, only those children who were vaccinated before their first birthday, as recommended, are included. For children without vaccination cards, the proportion of vaccinations given before the first birthday is assumed to be the same as for children with vaccination cards. About 27 percent of children age 12-23 months received a BCG vaccination by the age of 12 months and the first dose of DPT was given to 29 percent. The percentage declines for subsequent doses of DPT to 20 percent for the second dose, and 11 percent for the third dose (Figure CH.1). Similarly, 33 percent of children received Polio 1 by age 12 months and this declines to about 17 percent by the third dose. The coverage for measles vaccine by 12 months is almost similar to that of BCG vaccine at 26 percent. Almost half of the children (44 percent) did not receive any vaccination by their first birthday (Table CH.1). The coverage for measles by 12 months is 26 percent; 38 percent of children 12 -23 months had received their measles vaccine at any time before the survey but only 26 percent had received it by their

53
first birthday. As a result the percentage for children who had all eight recommended vaccinations (excluding polio at birth) by their first birthday is very low at only 2 percent.
Table CH.2 presents vaccination coverage estimates among children 12-23 months by background characteristics. The figures indicate children receiving the vaccinations at any time up to the date of the survey, and are based on information from both the vaccination cards and mothers’/caretakers’ reports. Vaccination cards have been seen by the interviewer for only 20 percent of children. The vaccinations coverage did not vary much between boys and girls. For all vaccines, vaccination coverage was higher in urban areas compared to rural areas. Among the children in the urban areas, 40 percent received BCG and 42 percent received measles vaccination compared to 32 percent in the rural areas who received BCG and 33 percent who received measles vaccines. Vaccination coverage increases with the mothers’ education; 43 percent of children born to mothers with primary education have received BCG vaccine compared to 33 percent of mothers with no education.
27
29
20
11
33
30
17
26
2 0
5
10
15
20
25
30
35
BCG DPT1 DPT2 DPT3 Polio1 Polio2 Polio3 Measles All
Perc
ent
Figure CH.1: Percentage of children aged 12-23 months who received the recommended vaccinations by 12 months, Somaliland, 2011

54
Table CH.2: Vaccinations by background characteristics
Percentage of children age 12-23 months currently vaccinated against childhood diseases, Somaliland, 2011.
Percentage of children who received:
Percentage with vaccination card
seen
Number of children age
12-23 months BCG
Polio
DPT
Measles None All At
birth 1 2 3
1 2 3
Sex
Male 37.5 18.3 46.4 36.1 21.1 39.3 25.2 14.0 39.6 41.0 8.5 21.4 386
Female 34.5 16.3 44.6 36.3 20.2 38.9 26.1 12.9 36.0 45.6 6.3 19.3 385
Region
Maroodijeex/Saaxil 35.7 19.5 42.1 35.4 19.6 37.1 25.2 12.6 37.0 46.5 7.1 16.6 360
Awdal 37.0 16.1 47.4 42.6 24.8 43.2 30.3 13.1 36.1 39.5 6.8 23.0 119
Togdheer 41.7 14.2 54.7 36.7 24.8 43.3 25.0 15.0 40.9 35.8 8.6 23.1 161
Sool (26.0) (12.7) (25.2) (21.0) (14.8) (33.7) (23.1) (16.1) (28.8) (64.2) (11.9) (14.0) 39
Sanaag 30.4 17.7 48.7 36.8 14.4 36.4 23.8 13.4 41.5 40.2 5.4 29.3 92
Area
Urban 40.2 22.3 46.9 38.8 22.8 39.7 29.1 15.8 42.0 42.8 9.1 19.7 396
Rural 31.7 12.1 44.0 33.5 18.4 38.4 22.1 11.0 33.4 43.9 5.6 21.0 375
Mother’s educationa
None 33.1 15.7 43.5 33.7 19.0 38.1 24.4 12.2 36.4 44.8 6.2 20.5 605
Primary 43.0 18.1 52.2 43.1 22.7 40.1 25.2 12.5 37.2 38.8 7.5 17.1 129
Secondary+ (62.0) (40.5) (56.8) (53.9) (40.6) (52.9) (49.9) (38.5) (64.8) (32.5) (26.6) (29.3) 36
Wealth index quintile
Poorest 27.2 8.4 34.3 24.4 11.8 31.4 15.3 6.3 25.1 53.9 2.7 16.1 148
Second 36.6 13.2 47.5 35.1 21.4 42.4 28.4 13.9 38.2 39.8 7.5 22.7 163
Middle 39.8 18.5 51.2 40.6 21.4 43.6 28.6 15.4 43.0 34.9 7.4 23.9 160
Fourth 35.2 22.8 46.4 40.2 24.4 38.0 28.1 13.5 41.5 42.2 6.7 18.9 161
Richest 41.4 24.1 47.5 40.8 24.2 39.7 27.4 18.3 40.9 46.9 13.1 19.7 139
Total 36.0 17.3 45.5 36.2 20.6 39.1 25.7 13.4 37.8 43.3 7.4 20.3 771
( ) Figures that are based on 25 - 49 unweighted cases aTotal includes 1 unweighted case of child missing information on mother’s education that is not shown separately

55
Neonatal Tetanus Protection
One of the MDGs is to reduce by three quarters the maternal mortality ratio, with one strategy to eliminate maternal tetanus. In addition, another goal is to reduce the incidence of neonatal tetanus to less than 1 case of neonatal tetanus per 1000 live births in every district. A World Fit for Children goal is to eliminate maternal and neonatal tetanus by 2005. The strategy for preventing maternal and neonatal tetanus is to ensure all pregnant women receive at least two doses of tetanus toxoid vaccine. If a woman has not received at least two doses of tetanus toxoid during a particular pregnancy, she (and her newborn) is also considered to be protected against tetanus if she:
Received at least two doses of tetanus toxoid vaccine, the last within the previous 3 years;
Received at least 3 doses, the last within the previous 5 years;
Received at least 4 doses, the last within the previous 10 years;
Received 5 or more doses anytime during her life. To assess the status of tetanus vaccination coverage, women who gave birth during the two years before the survey were asked if they had received tetanus toxoid injections during the pregnancy for their most recent birth, and if so, how many. Women who did not receive two or more tetanus toxoid vaccinations during this pregnancy were then asked about tetanus toxoid vaccinations they may have received prior to this pregnancy. Interviewers also asked women to present their vaccination card, on which dates of tetanus toxoid are recorded and referred to information from the cards when available. Table CH.3 shows the protection status from tetanus of women who have had a live birth within the last 2 years. Figure CH.2 shows the protection of women against neonatal tetanus by major background characteristics. In Somaliland, 21 percent of women received two doses of tetanus toxoid vaccine during the last pregnancy. A further 11 percent received two doses of the vaccine within the three years prior to the birth. Overall, 34 percent are protected against tetanus in the Zone. As shown in figure CH. 2, a higher percentage of women in the urban areas received protection against tetanus compared to women living in rural areas (42 percent versus 26 percent). Protection against tetanus increased with education with slightly more than half of the women with secondary or higher education having received protection compared to one third of those who had no education.

56
Table CH.3: Neonatal tetanus protection
Percentage of women age 15-49 years with a live birth in the last 2 years protected against neonatal tetanus, Somaliland, 2011
Percentage of women who
received at least 2 doses during last pregnancy
Percentage of women who did not receive two or more doses during last pregnancy but received:
Protected against
tetanus1
Number of women
with a live birth in the last 2 years
2 doses, the last within
prior 3 years
3 doses, the last within
prior 5 years
4 doses, the last within
prior 10 years
5 or more doses during
lifetime
Region
Maroodijeex/Saaxil 20.1 12.4 1.1 0.7 0.1 34.4 715
Awdal 31.6 9.1 1.2 0.4 0.0 42.4 244
Togdheer 20.1 11.5 1.3 0.3 0.0 33.1 321
Sool 22.6 9.4 0.0 0.0 0.0 32.0 90
Sanaag 14.0 9.1 0.9 0.0 0.0 24.0 200
Area
Urban 26.6 14.0 1.0 0.8 0.1 42.4 758
Rural 16.3 8.4 1.2 0.1 0.0 26.0 812
Education
None 19.0 9.8 1.1 0.5 0.1 30.5 1237
Primary 29.9 14.4 0.4 0.4 0.0 45.0 260
Secondary+ 28.0 21.3 3.9 0.0 0.0 53.2 73
Wealth index quintile
Poorest 10.7 5.9 1.0 0.0 0.0 17.6 325
Second 15.3 9.4 1.3 0.3 0.0 26.3 342
Middle 26.8 10.9 1.0 0.3 0.0 39.0 313
Fourth 25.0 15.6 1.2 0.6 0.3 42.8 317
Richest 30.5 14.3 1.0 1.1 0.0 46.8 274
Total 21.2 11.1 1.1 0.4 0.1 33.9 1,570
1 MICS indicator 3.7

57
Oral Rehydration Treatment
Diarrhoea is the second leading cause of death among children under five worldwide. Most diarrhoea-related deaths in children are due to dehydration from loss of large quantities of water and electrolytes from the body in liquid stools. Management of diarrhoea – either through oral rehydration salts (ORS) or a recommended home fluid (RHF) - can prevent many of these deaths. Preventing dehydration and malnutrition by increasing fluid intake and continuing to feed the child are also important strategies for managing diarrhoea. The goals are to: 1) reduce by one half death due to diarrhoea among children under five by 2010 compared to 2000 (A World Fit for Children); and 2) reduce by two thirds the mortality rate among children under five by 2015 compared to 1990 (Millennium Development Goals). In addition, the World Fit for Children calls for a reduction in the incidence of diarrhoea by 25 percent. In the MICS, prevalence of diarrhoea was estimated by asking mothers or caretakers whether their child under age five years had an episode of diarrhoea in the two weeks prior to the survey. In cases where mothers reported that the child had diarrhoea, a series of questions were asked about the treatment of the illness, including what the child had to drink and eat during the episode and whether this was more or less than the child usually drinks and eats. The validity of this indicator is affected by the mother’s perception of diarrhoea as an illness and her capacity to recall the events. Moreover, the prevalence of diarrhoea varies seasonally. Thus, this variable should be interpreted with caution. Overall, 13 percent of under five children had diarrhoea in the two weeks preceding the survey (Table CH.4). Diarrhoea prevalence did not vary based on the sex of the child or household wealth index quintiles. It is also similar across regions. The peak of diarrhoea prevalence occurs in the weaning period, among children age 12-23 months.
34
42
33
32
24
42
26
31
45
53
34
0.0 10.0 20.0 30.0 40.0 50.0 60.0
RegionsMaroodijeex/Saaxil
AwdalTogdheer
SoolSanaag
AreaUrbanRural
Mother's EducationNone
PrimarySecondary +
Somaliland
Percent
Figure CH.2: Percentage of women with a live birth in the last 12 months who are protected against neonatal tetanus, Somaliland, 2011

58
Table CH.4: Oral rehydration solutions
Percentage of children age 0-59 months with diarrhoea in the last two weeks, and treatment with oral rehydration solutions, Somaliland, 2011.
Had diarrhoea in
last two weeks
Number of children age 0-59 months
Children with diarrhoea who received ORS
(Fluid from ORS packet or pre-packaged ORS fluid)
Number of children age 0-59 months with diarrhoea in last
two weeks
Sex
Male 12.6 2,395 52.0 301
Female 14.1 2,277 54.9 322
Region
Maroodijeex/Saaxil 13.8 2,074 53.1 285
Awdal 13.8 727 49.4 100
Togdheer 13.5 948 57.1 128
Sool 12.7 262 (61.1) 33
Sanaag 11.4 661 51.1 76
Area
Urban 14.4 2,256 60.9 325
Rural 12.3 2,416 45.4 298
Age
0-11 months 17.1 933 60.4 160
12-23 months 21.6 771 54.0 166
24-35 months 13.5 987 56.9 133
36-47 months 9.2 1,067 48.7 98
48-59 months 7.1 914 35.8 65
Mother’s educationa
None 12.8 3,745 49.5 478
Primary 16.7 709 62.6 118
Secondary+ 12.1 217 (85.0) 26
Wealth index quintile
Poorest 13.1 995 38.2 130
Second 12.4 1,055 51.9 131
Middle 13.5 940 53.4 127
Fourth 15.5 916 61.3 142
Richest 12.1 766 65.5 93
Total 13.3 4,672 53.5 623
( ) Figures that are based on 25-49 unweighted cases aTotal includes 2 unweighted cases of children missing information on mother’s education that is not shown separately
Table CH.4 also shows the percentage of children receiving oral rehydration solutions. About half (54 percent) received fluids from ORS packets or pre-packaged ORS fluids. Treatment with oral rehydration solution increased with mother’s education and household wealth. The percentage of children with diarrhoea who received oral rehydration solutions varies slightly across regions (Figure CH.3).

59
Only 8 percent of under five children with diarrhoea drank more than usual while another 14 percent drank about the same (Table CH.5). Twenty two percent of children who were given somewhat less to eat, 4 percent were given more to eat (continued feeding) and 40 percent were given much less food during episodes of diarrhoea while 10 percent of the children were not given food. A higher percentage of children aged 48-59 months were given much less to eat compared with those of other younger age categories. Feeding during diarrhoea was stopped for a higher percentage of children in the rural areas (12 percent) compared to the urban areas (8 percent). The drinking practices varied with the household wealth index quintiles with more than half of those in the poorest and the second poorest wealth index quintiles given much less to drink.
53 49
57 (61)
51 50
63
85
54
0
10
20
30
40
50
60
70
80
90
Perc
ent
( ) Data based on 25 - 49 unweighted cases
Figure CH.3: Percentage of children under age 5 with diarrhoea who received oral rehydration solution, Somaliland, 2011
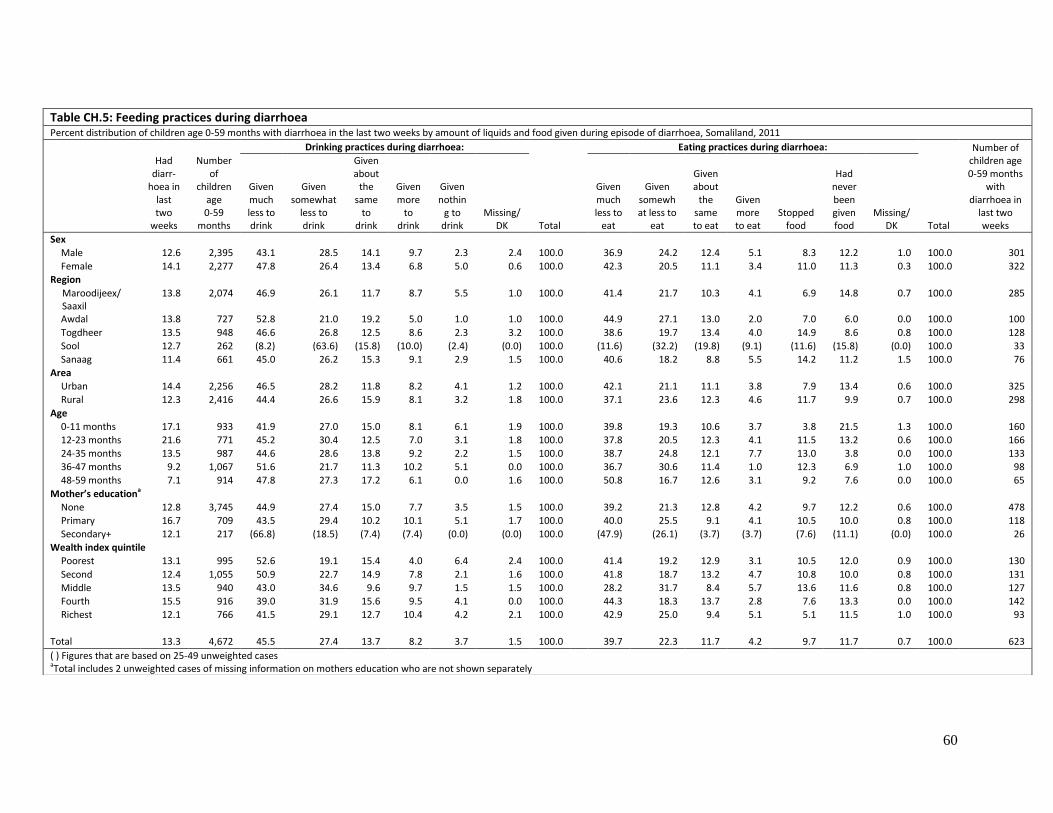
60
Table CH.5: Feeding practices during diarrhoea Percent distribution of children age 0-59 months with diarrhoea in the last two weeks by amount of liquids and food given during episode of diarrhoea, Somaliland, 2011
Had diarr-
hoea in last two
weeks
Number of
children age 0-59
months
Drinking practices during diarrhoea:
Eating practices during diarrhoea:
Number of
children age 0-59 months
with diarrhoea in
last two weeks
Given much less to drink
Given somewhat
less to drink
Given about
the same
to drink
Given more
to drink
Given nothin
g to drink
Missing/DK
Given much less to
eat
Given somewhat less to
eat
Given about
the same to eat
Given more to eat
Stopped food
Had never been given food
Missing/DK
Total Total
Sex
Male 12.6 2,395 43.1 28.5 14.1 9.7 2.3 2.4 100.0 36.9 24.2 12.4 5.1 8.3 12.2 1.0 100.0 301
Female 14.1 2,277 47.8 26.4 13.4 6.8 5.0 0.6 100.0 42.3 20.5 11.1 3.4 11.0 11.3 0.3 100.0 322
Region
Maroodijeex/ Saaxil
13.8 2,074 46.9 26.1 11.7 8.7 5.5 1.0 100.0 41.4 21.7 10.3 4.1 6.9 14.8 0.7 100.0 285
Awdal 13.8 727 52.8 21.0 19.2 5.0 1.0 1.0 100.0 44.9 27.1 13.0 2.0 7.0 6.0 0.0 100.0 100
Togdheer 13.5 948 46.6 26.8 12.5 8.6 2.3 3.2 100.0 38.6 19.7 13.4 4.0 14.9 8.6 0.8 100.0 128
Sool 12.7 262 (8.2) (63.6) (15.8) (10.0) (2.4) (0.0) 100.0 (11.6) (32.2) (19.8) (9.1) (11.6) (15.8) (0.0) 100.0 33
Sanaag 11.4 661 45.0 26.2 15.3 9.1 2.9 1.5 100.0 40.6 18.2 8.8 5.5 14.2 11.2 1.5 100.0 76
Area
Urban 14.4 2,256 46.5 28.2 11.8 8.2 4.1 1.2 100.0 42.1 21.1 11.1 3.8 7.9 13.4 0.6 100.0 325
Rural 12.3 2,416 44.4 26.6 15.9 8.1 3.2 1.8 100.0 37.1 23.6 12.3 4.6 11.7 9.9 0.7 100.0 298
Age
0-11 months 17.1 933 41.9 27.0 15.0 8.1 6.1 1.9 100.0 39.8 19.3 10.6 3.7 3.8 21.5 1.3 100.0 160
12-23 months 21.6 771 45.2 30.4 12.5 7.0 3.1 1.8 100.0 37.8 20.5 12.3 4.1 11.5 13.2 0.6 100.0 166
24-35 months 13.5 987 44.6 28.6 13.8 9.2 2.2 1.5 100.0 38.7 24.8 12.1 7.7 13.0 3.8 0.0 100.0 133
36-47 months 9.2 1,067 51.6 21.7 11.3 10.2 5.1 0.0 100.0 36.7 30.6 11.4 1.0 12.3 6.9 1.0 100.0 98
48-59 months 7.1 914 47.8 27.3 17.2 6.1 0.0 1.6 100.0 50.8 16.7 12.6 3.1 9.2 7.6 0.0 100.0 65
Mother’s educationa
None 12.8 3,745 44.9 27.4 15.0 7.7 3.5 1.5 100.0 39.2 21.3 12.8 4.2 9.7 12.2 0.6 100.0 478
Primary 16.7 709 43.5 29.4 10.2 10.1 5.1 1.7 100.0 40.0 25.5 9.1 4.1 10.5 10.0 0.8 100.0 118
Secondary+ 12.1 217 (66.8) (18.5) (7.4) (7.4) (0.0) (0.0) 100.0 (47.9) (26.1) (3.7) (3.7) (7.6) (11.1) (0.0) 100.0 26
Wealth index quintile
Poorest 13.1 995 52.6 19.1 15.4 4.0 6.4 2.4 100.0 41.4 19.2 12.9 3.1 10.5 12.0 0.9 100.0 130
Second 12.4 1,055 50.9 22.7 14.9 7.8 2.1 1.6 100.0 41.8 18.7 13.2 4.7 10.8 10.0 0.8 100.0 131
Middle 13.5 940 43.0 34.6 9.6 9.7 1.5 1.5 100.0 28.2 31.7 8.4 5.7 13.6 11.6 0.8 100.0 127
Fourth 15.5 916 39.0 31.9 15.6 9.5 4.1 0.0 100.0 44.3 18.3 13.7 2.8 7.6 13.3 0.0 100.0 142
Richest 12.1 766 41.5 29.1 12.7 10.4 4.2 2.1 100.0 42.9 25.0 9.4 5.1 5.1 11.5 1.0 100.0 93
Total 13.3 4,672 45.5 27.4 13.7 8.2 3.7 1.5 100.0 39.7 22.3 11.7 4.2 9.7 11.7 0.7 100.0 623
( ) Figures that are based on 25-49 unweighted cases aTotal includes 2 unweighted cases of missing information on mothers education who are not shown separately

61
Table CH.6 provides the proportion of children age 0-59 months with diarrhoea in the last two weeks who received oral rehydration therapy with continued feeding, and percentage of children with diarrhoea who received other treatments. Overall, 57 percent of children with diarrhoea received ORS or increased fluids. Combining the information in Table CH.5 with those in Table CH.4 on oral rehydration therapy, it is observed that 20 percent of children either received ORT and, at the same time, feeding was continued, as is the recommendation. Regional disparities exist in the home management of diarrhoea. In Awdal, Maroodijeex/Saaxil and Sanaag regions, only 18 percent of the children received ORT and continued feeding, while the percentages are 23 and 37 in Togdheer and Sool (the figures are based on less than 50 unweighted cases and need to be interpreted with caution) respectively (Figure CH.4).The percentage of ORT and continued feeding was lowest for older children (48-59 months old; 9 percent) compared to those of other age categories. Although it is not the recommended treatment for childhood diarrhoea, one out of five children with diarrhoea received antibiotics and a further 17 percent were given anti-motility treatments. On the other hand, zinc treatment which is recommended for decreasing the intensity and frequency of diarrhoea was given in less than 1 percent of the cases.
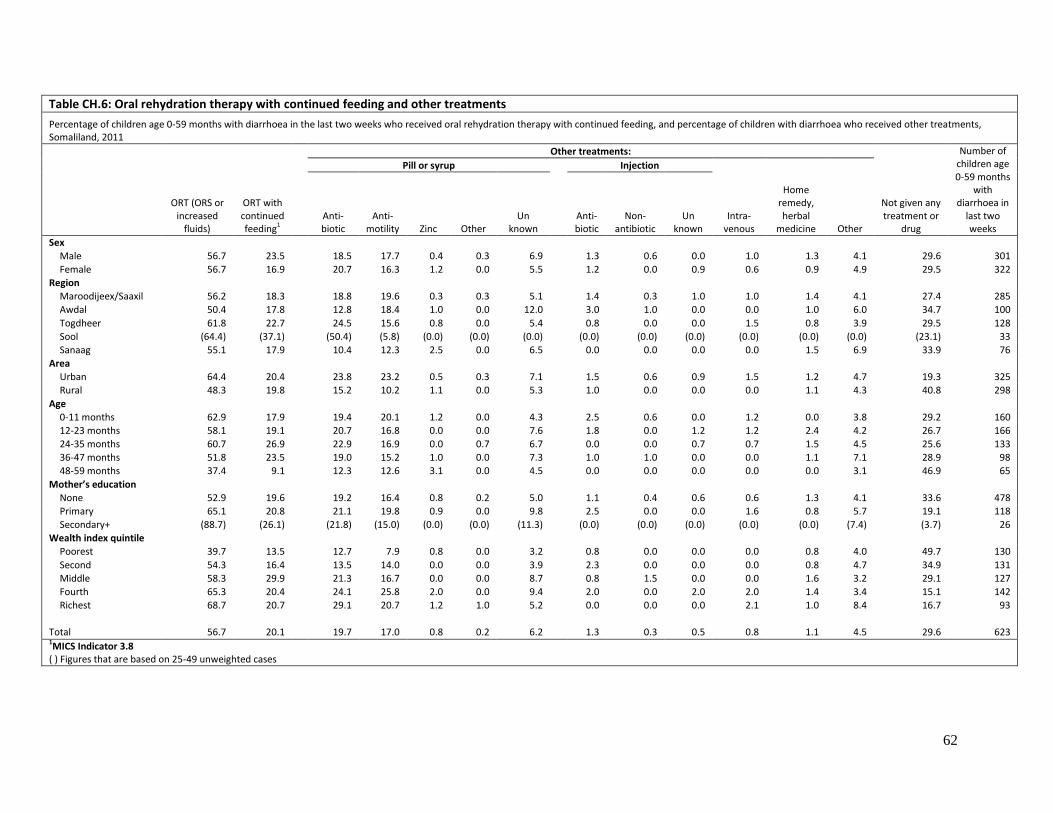
62
Table CH.6: Oral rehydration therapy with continued feeding and other treatments
Percentage of children age 0-59 months with diarrhoea in the last two weeks who received oral rehydration therapy with continued feeding, and percentage of children with diarrhoea who received other treatments, Somaliland, 2011
Other treatments:
Not given any treatment or
drug
Number of children age 0-59 months
with diarrhoea in
last two weeks
ORT (ORS or increased
fluids)
ORT with continued feeding1
Pill or syrup
Injection
Intra-venous
Home remedy, herbal
medicine Other Anti- biotic
Anti- motility Zinc Other
Un known
Anti- biotic
Non-antibiotic
Un known
Sex
Male 56.7 23.5 18.5 17.7 0.4 0.3 6.9 1.3 0.6 0.0 1.0 1.3 4.1 29.6 301
Female 56.7 16.9 20.7 16.3 1.2 0.0 5.5 1.2 0.0 0.9 0.6 0.9 4.9 29.5 322
Region
Maroodijeex/Saaxil 56.2 18.3 18.8 19.6 0.3 0.3 5.1 1.4 0.3 1.0 1.0 1.4 4.1 27.4 285
Awdal 50.4 17.8 12.8 18.4 1.0 0.0 12.0 3.0 1.0 0.0 0.0 1.0 6.0 34.7 100
Togdheer 61.8 22.7 24.5 15.6 0.8 0.0 5.4 0.8 0.0 0.0 1.5 0.8 3.9 29.5 128
Sool (64.4) (37.1) (50.4) (5.8) (0.0) (0.0) (0.0) (0.0) (0.0) (0.0) (0.0) (0.0) (0.0) (23.1) 33
Sanaag 55.1 17.9 10.4 12.3 2.5 0.0 6.5 0.0 0.0 0.0 0.0 1.5 6.9 33.9 76
Area
Urban 64.4 20.4 23.8 23.2 0.5 0.3 7.1 1.5 0.6 0.9 1.5 1.2 4.7 19.3 325
Rural 48.3 19.8 15.2 10.2 1.1 0.0 5.3 1.0 0.0 0.0 0.0 1.1 4.3 40.8 298
Age
0-11 months 62.9 17.9 19.4 20.1 1.2 0.0 4.3 2.5 0.6 0.0 1.2 0.0 3.8 29.2 160
12-23 months 58.1 19.1 20.7 16.8 0.0 0.0 7.6 1.8 0.0 1.2 1.2 2.4 4.2 26.7 166
24-35 months 60.7 26.9 22.9 16.9 0.0 0.7 6.7 0.0 0.0 0.7 0.7 1.5 4.5 25.6 133
36-47 months 51.8 23.5 19.0 15.2 1.0 0.0 7.3 1.0 1.0 0.0 0.0 1.1 7.1 28.9 98
48-59 months 37.4 9.1 12.3 12.6 3.1 0.0 4.5 0.0 0.0 0.0 0.0 0.0 3.1 46.9 65
Mother’s education
None 52.9 19.6 19.2 16.4 0.8 0.2 5.0 1.1 0.4 0.6 0.6 1.3 4.1 33.6 478
Primary 65.1 20.8 21.1 19.8 0.9 0.0 9.8 2.5 0.0 0.0 1.6 0.8 5.7 19.1 118
Secondary+ (88.7) (26.1) (21.8) (15.0) (0.0) (0.0) (11.3) (0.0) (0.0) (0.0) (0.0) (0.0) (7.4) (3.7) 26
Wealth index quintile
Poorest 39.7 13.5 12.7 7.9 0.8 0.0 3.2 0.8 0.0 0.0 0.0 0.8 4.0 49.7 130
Second 54.3 16.4 13.5 14.0 0.0 0.0 3.9 2.3 0.0 0.0 0.0 0.8 4.7 34.9 131
Middle 58.3 29.9 21.3 16.7 0.0 0.0 8.7 0.8 1.5 0.0 0.0 1.6 3.2 29.1 127
Fourth 65.3 20.4 24.1 25.8 2.0 0.0 9.4 2.0 0.0 2.0 2.0 1.4 3.4 15.1 142
Richest 68.7 20.7 29.1 20.7 1.2 1.0 5.2 0.0 0.0 0.0 2.1 1.0 8.4 16.7 93
Total 56.7 20.1 19.7 17.0 0.8 0.2 6.2 1.3 0.3 0.5 0.8 1.1 4.5 29.6 623 1MICS Indicator 3.8 ( ) Figures that are based on 25-49 unweighted cases

63
Care Seeking and Antibiotic Treatment of Pneumonia
Pneumonia is the leading cause of death in children and the use of antibiotics in under-5s with suspected pneumonia is a key intervention. A World Fit for Children goal is to reduce by one-third the deaths due to acute respiratory infections. In the Somaliland MICS, the prevalence of suspected pneumonia was estimated by asking mothers or caretakers whether their child under age five had an illness with a cough accompanied by rapid or difficult breathing, and whose symptoms were due to a problem in the chest or both a problem in the chest and a blocked nose. These data are based on the mother’s perception of illness and not validated by a medical examination. Moreover, the prevalence of pneumonia varies seasonally. Thus, this variable should be interpreted with caution as it may be subject to considerable bias
18
18
23
(37)
18
20
20
20
21
(26)
20
0.0 5.0 10.0 15.0 20.0 25.0 30.0 35.0 40.0
Regions
Maroodijeex/Saaxil
Awdal
Togdheer
Sool
Sanaag
Area
Urban
Rural
Mother's Education
No education
Primary
Secondary +
Somaliland
Percent
Figure CH.4: Percentage of children under age 5 with diarrhoea who received ORT and continued feeding Somaliland, 2011
( ) Data based on 25 - 49 unweighted cases

64
Table CH.7: Care seeking for suspected pneumonia and antibiotic use during suspected pneumonia
Percentage of children age 0-59 months with suspected pneumonia in the last two weeks who were taken to a health provider and percentage of children who were given antibiotics, Somaliland, 2011
Had susp-ected
pneumonia in the last
two weeks
Number of
children age 0-
59 months
Children with suspected pneumonia who were taken to:
Percentage of children
with suspected
pneumonia who
received antibiotics in the last two
weeks2
Number of children age 0-59 months
with suspected
pneumonia in the last two weeks
Public sources
Private sources
Other source Any
appro-priate
provider1 Govt. hosp.
Govt. health centre
Govt. health post
Village health worker
Other public
Private hosp./ clinic
Private physician
Private phar-macy
Mobile clinic
Other private Shop
Trad. Practi- tioner
Sex
Male 6.3 2,395 7.2 2.6 4.7 0.7 0.6 9.1 8.3 19.0 0.6 0.7 0.7 2.8 33.1 56.2 152
Female 5.1 2,277 5.9 5.9 1.7 2.7 0.0 5.1 7.6 20.8 0.0 0.0 1.8 0.0 28.1 48.2 115 Region
Maroodijeex/Saaxil 6.1 2,074 10.0 6.2 0.8 1.6 0.8 9.3 13.8 17.1 0.0 0.8 0.8 2.4 42.6 59.0 126 Awdal 2.7 727 (*) (*) (*) (*) (*) (*) (*) (*) (*) (*) (*) (*) (*) (*) 20 Togdheer 6.9 948 4.5 1.6 3.0 1.6 0.0 6.1 1.5 28.8 0.0 0.0 3.1 0.0 16.7 54.8 65 Sool 4.2 262 (*) (*) (*) (*) (*) (*) (*) (*) (*) (*) (*) (*) (*) (*) 11 Sanaag 6.7 661 (2.5) (0.0) (5.0) (2.5) (0.0) (2.5) (0.0) (14.2) (0.0) (0.0) (0.0) (2.5) (10.0) (28.6) 44
Area Urban 5.9 2,256 10.2 5.7 4.4 0.0 0.7 10.9 15.3 25.5 0.7 0.0 0.0 0.0 47.2 70.4 133 Rural 5.5 2,416 3.1 2.3 2.4 3.1 0.0 3.9 0.8 14.1 0.0 0.8 2.3 3.1 14.9 35.2 134
Age 0-11 months 4.6 933 (13.9) (2.3) (9.5) (2.6) (0.0) (11.6) (11.3) (14.1) (0.0) (0.0) (4.8) (0.0) (46.4) (60.4) 43 12-23 months 5.0 771 (2.5) (9.9) (0.0) (0.0) (0.0) (17.7) (9.9) (20.4) (0.0) (0.0) (0.0) (2.6) (37.4) (55.6) 39 24-35 months 6.3 987 7.8 1.5 4.6 1.6 0.0 4.7 7.7 23.3 1.5 0.0 0.0 0.0 29.7 52.8 63 36-47 months 6.6 1,067 7.0 5.6 1.4 1.5 1.4 2.7 9.7 18.7 0.0 0.0 0.0 1.5 29.2 55.4 71 48-59 months 5.7 914 1.9 1.9 2.1 2.0 0.0 5.7 1.9 21.4 0.0 2.0 2.0 4.1 17.4 40.7 52
Mother’s educationa None 5.8 3,745 5.9 3.6 2.7 1.4 0.4 6.4 6.3 18.5 0.4 0.0 1.4 1.9 26.3 46.8 216 Primary 5.3 709 (7.9) (5.3) (2.6) (3.0) (0.0) (7.8) (12.9) (28.3) (0.0) (0.0) (0.0) (0.0) (39.5) (76.3) 37 Secondary 5.5 217 (*) (*) (*) (*) (*) (*) (*) (*) (*) (*) (*) (*) (*) (*) 12
Wealth index quintile Poorest 5.5 995 1.9 0.0 2.0 0.0 0.0 2.0 1.9 13.1 0.0 0.0 5.7 5.8 7.9 36.3 54 Second 6.3 1,055 3.0 1.6 1.6 4.7 1.5 6.1 2.9 12.2 1.5 1.6 0.0 1.6 22.9 38.3 66 Middle 7.4 940 7.0 5.5 4.2 1.6 0.0 5.7 7.0 22.1 0.0 0.0 0.0 0.0 31.0 47.7 69 Fourth 4.9 916 15.4 8.6 6.7 0.0 0.0 10.7 10.7 38.5 0.0 0.0 0.0 0.0 47.5 80.8 45 Richest 4.2 766 (9.1) (6.1) (3.0) (0.0) (0.0) (18.2) (27.3) (15.2) (0.0) (0.0) (0.0) (0.0) (63.7) (81.9) 32
Total 5.7 4,672 6.7 4.0 3.4 1.6 0.4 7.4 8.0 19.8 0.4 0.4 1.2 1.6 31.0 52.8 267 1 MICS indicator 3.9 2 MICS indicator 3.10 (*) Figures that are based on less than 25 unweighted cases ( ) Figures that are based on 25-49 unweighted cases aTotal includes 2 unweighted cases of children missing information on mothers education who are not shown separately
There were no cases of mobile/outreach clinic or relative/friend thus they are not shown in the table
65
Table CH.7 presents the prevalence of suspected pneumonia and if care was sought outside the home, the site of care. Six percent of children age 0-59 months was reported to have had symptoms of pneumonia during the two weeks preceding the survey. Of these children, 31 percent were taken to an appropriate provider. An equal percentage of children (7 percent) with suspected pneumonia were taken to either government hospitals and private hospitals or clinics. One in ten of the children with suspected pneumonia living in the urban areas were taken to the government hospital for treatment compared to one in thirty three of those living in rural areas. Table CH.7 also presents the use of antibiotics for the treatment of suspected pneumonia in under-5s by sex, age, region, area, and socioeconomic factors. In Somaliland, 53 percent of under-five children with suspected pneumonia had received an antibiotic during the two weeks prior to the survey. The percentage was double in urban compared to rural areas: 70 percent versus 35 percent. The table also shows that antibiotic treatment of suspected pneumonia is lowest among the poorest households. The use of antibiotics decreases as children get older. Issues related to knowledge of danger signs of pneumonia are presented in Table CH.8. Obviously, mothers’ knowledge of the danger signs is an important determinant of care-seeking behaviour. Overall, 8 percent of women know of the two danger signs of pneumonia – fast and difficult breathing. The most commonly identified symptom for taking a child to a health facility is if the child becomes sicker. Twenty three percent of mothers identified fast breathing and 20 percent of mothers identified difficult breathing as symptoms for taking children immediately to a health care provider. Twice as many mothers in the urban areas recognised the two danger signs of pneumonia compared to those in the rural areas. Recognising of the two danger signs of pneumonia increased with wealth index quintile from 5 percent among the poorest to 11 percent among the richest.
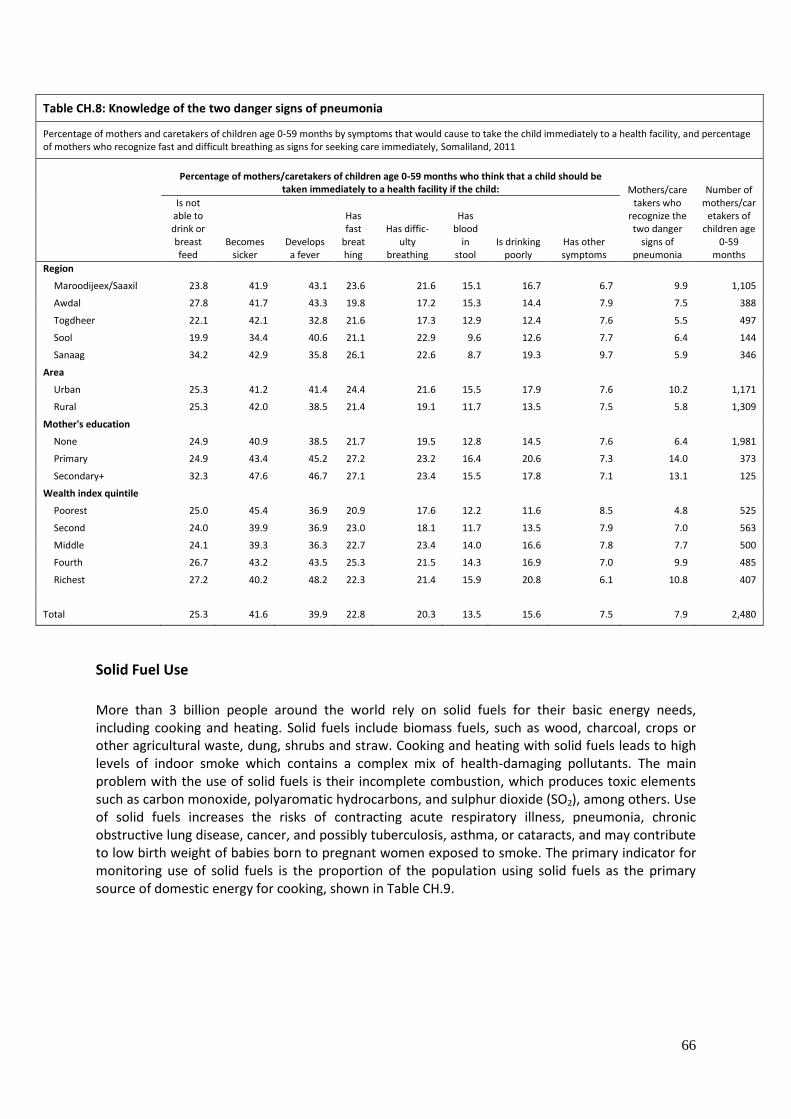
66
Table CH.8: Knowledge of the two danger signs of pneumonia
Percentage of mothers and caretakers of children age 0-59 months by symptoms that would cause to take the child immediately to a health facility, and percentage of mothers who recognize fast and difficult breathing as signs for seeking care immediately, Somaliland, 2011
Percentage of mothers/caretakers of children age 0-59 months who think that a child should be taken immediately to a health facility if the child: Mothers/care
takers who recognize the two danger
signs of pneumonia
Number of mothers/car
etakers of children age
0-59 months
Is not able to drink or breast feed
Becomes sicker
Develops a fever
Has fast
breathing
Has diffic-ulty
breathing
Has blood
in stool
Is drinking poorly
Has other symptoms
Region
Maroodijeex/Saaxil 23.8 41.9 43.1 23.6 21.6 15.1 16.7 6.7 9.9 1,105
Awdal 27.8 41.7 43.3 19.8 17.2 15.3 14.4 7.9 7.5 388
Togdheer 22.1 42.1 32.8 21.6 17.3 12.9 12.4 7.6 5.5 497
Sool 19.9 34.4 40.6 21.1 22.9 9.6 12.6 7.7 6.4 144
Sanaag 34.2 42.9 35.8 26.1 22.6 8.7 19.3 9.7 5.9 346
Area
Urban 25.3 41.2 41.4 24.4 21.6 15.5 17.9 7.6 10.2 1,171
Rural 25.3 42.0 38.5 21.4 19.1 11.7 13.5 7.5 5.8 1,309
Mother's education
None 24.9 40.9 38.5 21.7 19.5 12.8 14.5 7.6 6.4 1,981
Primary 24.9 43.4 45.2 27.2 23.2 16.4 20.6 7.3 14.0 373
Secondary+ 32.3 47.6 46.7 27.1 23.4 15.5 17.8 7.1 13.1 125
Wealth index quintile
Poorest 25.0 45.4 36.9 20.9 17.6 12.2 11.6 8.5 4.8 525
Second 24.0 39.9 36.9 23.0 18.1 11.7 13.5 7.9 7.0 563
Middle 24.1 39.3 36.3 22.7 23.4 14.0 16.6 7.8 7.7 500
Fourth 26.7 43.2 43.5 25.3 21.5 14.3 16.9 7.0 9.9 485
Richest 27.2 40.2 48.2 22.3 21.4 15.9 20.8 6.1 10.8 407
Total 25.3 41.6 39.9 22.8 20.3 13.5 15.6 7.5 7.9 2,480
Solid Fuel Use
More than 3 billion people around the world rely on solid fuels for their basic energy needs, including cooking and heating. Solid fuels include biomass fuels, such as wood, charcoal, crops or other agricultural waste, dung, shrubs and straw. Cooking and heating with solid fuels leads to high levels of indoor smoke which contains a complex mix of health-damaging pollutants. The main problem with the use of solid fuels is their incomplete combustion, which produces toxic elements such as carbon monoxide, polyaromatic hydrocarbons, and sulphur dioxide (SO2), among others. Use of solid fuels increases the risks of contracting acute respiratory illness, pneumonia, chronic obstructive lung disease, cancer, and possibly tuberculosis, asthma, or cataracts, and may contribute to low birth weight of babies born to pregnant women exposed to smoke. The primary indicator for monitoring use of solid fuels is the proportion of the population using solid fuels as the primary source of domestic energy for cooking, shown in Table CH.9.
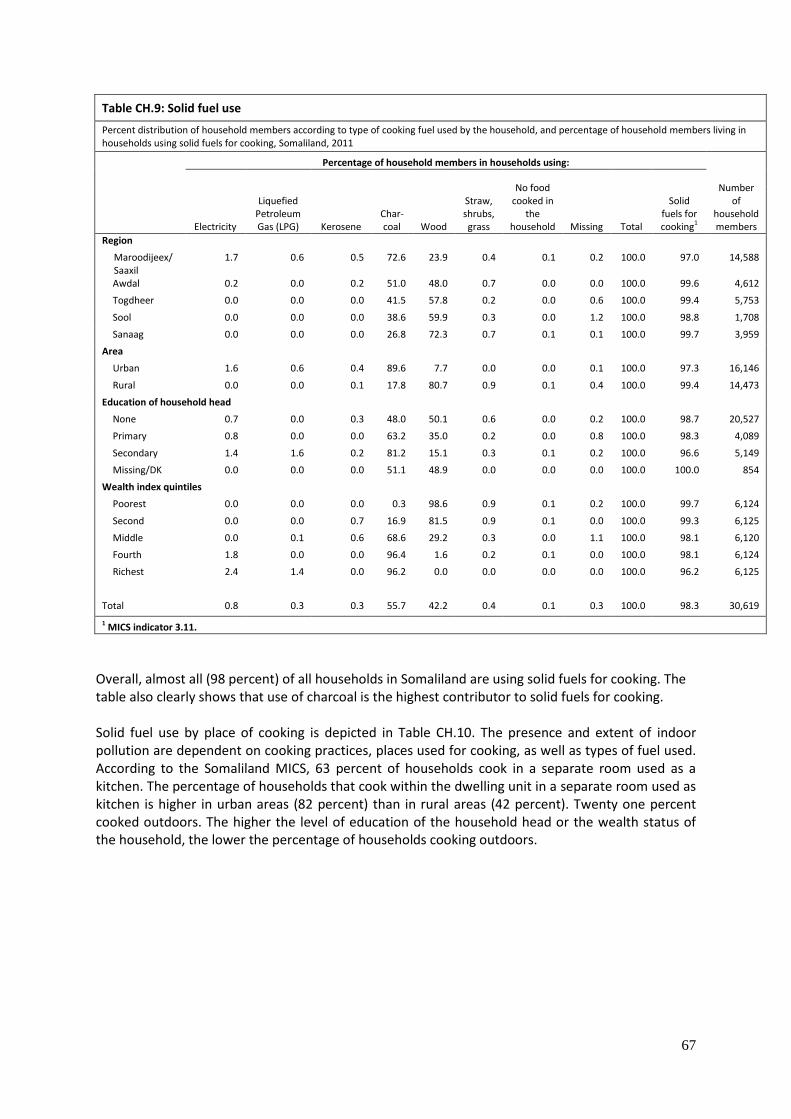
67
Table CH.9: Solid fuel use
Percent distribution of household members according to type of cooking fuel used by the household, and percentage of household members living in households using solid fuels for cooking, Somaliland, 2011
Percentage of household members in households using:
Number of
household members
Electricity
Liquefied Petroleum Gas (LPG) Kerosene
Char-coal Wood
Straw, shrubs, grass
No food cooked in
the household Missing Total
Solid fuels for cooking1
Region
Maroodijeex/ Saaxil
1.7 0.6 0.5 72.6 23.9 0.4 0.1 0.2 100.0 97.0 14,588
Awdal 0.2 0.0 0.2 51.0 48.0 0.7 0.0 0.0 100.0 99.6 4,612
Togdheer 0.0 0.0 0.0 41.5 57.8 0.2 0.0 0.6 100.0 99.4 5,753
Sool 0.0 0.0 0.0 38.6 59.9 0.3 0.0 1.2 100.0 98.8 1,708
Sanaag 0.0 0.0 0.0 26.8 72.3 0.7 0.1 0.1 100.0 99.7 3,959
Area
Urban 1.6 0.6 0.4 89.6 7.7 0.0 0.0 0.1 100.0 97.3 16,146
Rural 0.0 0.0 0.1 17.8 80.7 0.9 0.1 0.4 100.0 99.4 14,473
Education of household head
None 0.7 0.0 0.3 48.0 50.1 0.6 0.0 0.2 100.0 98.7 20,527
Primary 0.8 0.0 0.0 63.2 35.0 0.2 0.0 0.8 100.0 98.3 4,089
Secondary 1.4 1.6 0.2 81.2 15.1 0.3 0.1 0.2 100.0 96.6 5,149
Missing/DK 0.0 0.0 0.0 51.1 48.9 0.0 0.0 0.0 100.0 100.0 854
Wealth index quintiles
Poorest 0.0 0.0 0.0 0.3 98.6 0.9 0.1 0.2 100.0 99.7 6,124
Second 0.0 0.0 0.7 16.9 81.5 0.9 0.1 0.0 100.0 99.3 6,125
Middle 0.0 0.1 0.6 68.6 29.2 0.3 0.0 1.1 100.0 98.1 6,120
Fourth 1.8 0.0 0.0 96.4 1.6 0.2 0.1 0.0 100.0 98.1 6,124
Richest 2.4 1.4 0.0 96.2 0.0 0.0 0.0 0.0 100.0 96.2 6,125
Total 0.8 0.3 0.3 55.7 42.2 0.4 0.1 0.3 100.0 98.3 30,619
1 MICS indicator 3.11.
Overall, almost all (98 percent) of all households in Somaliland are using solid fuels for cooking. The table also clearly shows that use of charcoal is the highest contributor to solid fuels for cooking. Solid fuel use by place of cooking is depicted in Table CH.10. The presence and extent of indoor pollution are dependent on cooking practices, places used for cooking, as well as types of fuel used. According to the Somaliland MICS, 63 percent of households cook in a separate room used as a kitchen. The percentage of households that cook within the dwelling unit in a separate room used as kitchen is higher in urban areas (82 percent) than in rural areas (42 percent). Twenty one percent cooked outdoors. The higher the level of education of the household head or the wealth status of the household, the lower the percentage of households cooking outdoors.
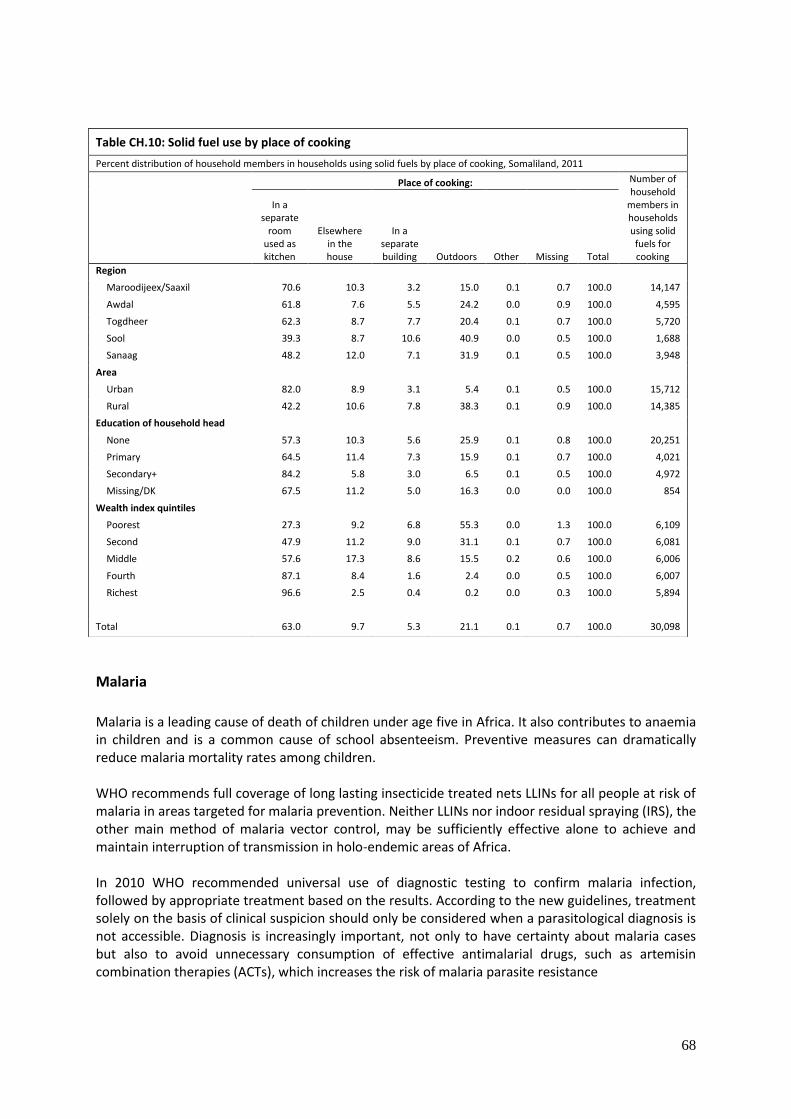
68
Malaria
Malaria is a leading cause of death of children under age five in Africa. It also contributes to anaemia in children and is a common cause of school absenteeism. Preventive measures can dramatically reduce malaria mortality rates among children. WHO recommends full coverage of long lasting insecticide treated nets LLINs for all people at risk of malaria in areas targeted for malaria prevention. Neither LLINs nor indoor residual spraying (IRS), the other main method of malaria vector control, may be sufficiently effective alone to achieve and maintain interruption of transmission in holo-endemic areas of Africa. In 2010 WHO recommended universal use of diagnostic testing to confirm malaria infection, followed by appropriate treatment based on the results. According to the new guidelines, treatment solely on the basis of clinical suspicion should only be considered when a parasitological diagnosis is not accessible. Diagnosis is increasingly important, not only to have certainty about malaria cases but also to avoid unnecessary consumption of effective antimalarial drugs, such as artemisin combination therapies (ACTs), which increases the risk of malaria parasite resistance
Table CH.10: Solid fuel use by place of cooking
Percent distribution of household members in households using solid fuels by place of cooking, Somaliland, 2011
Place of cooking: Number of household
members in households using solid fuels for cooking
In a separate
room used as kitchen
Elsewhere in the house
In a separate building Outdoors Other Missing Total
Region
Maroodijeex/Saaxil 70.6 10.3 3.2 15.0 0.1 0.7 100.0 14,147
Awdal 61.8 7.6 5.5 24.2 0.0 0.9 100.0 4,595
Togdheer 62.3 8.7 7.7 20.4 0.1 0.7 100.0 5,720
Sool 39.3 8.7 10.6 40.9 0.0 0.5 100.0 1,688
Sanaag 48.2 12.0 7.1 31.9 0.1 0.5 100.0 3,948
Area
Urban 82.0 8.9 3.1 5.4 0.1 0.5 100.0 15,712
Rural 42.2 10.6 7.8 38.3 0.1 0.9 100.0 14,385
Education of household head
None 57.3 10.3 5.6 25.9 0.1 0.8 100.0 20,251
Primary 64.5 11.4 7.3 15.9 0.1 0.7 100.0 4,021
Secondary+ 84.2 5.8 3.0 6.5 0.1 0.5 100.0 4,972
Missing/DK 67.5 11.2 5.0 16.3 0.0 0.0 100.0 854
Wealth index quintiles
Poorest 27.3 9.2 6.8 55.3 0.0 1.3 100.0 6,109
Second 47.9 11.2 9.0 31.1 0.1 0.7 100.0 6,081
Middle 57.6 17.3 8.6 15.5 0.2 0.6 100.0 6,006
Fourth 87.1 8.4 1.6 2.4 0.0 0.5 100.0 6,007
Richest 96.6 2.5 0.4 0.2 0.0 0.3 100.0 5,894
Total 63.0 9.7 5.3 21.1 0.1 0.7 100.0 30,098

69
Insecticide-treated mosquito nets, or ITNs, if used properly, are very effective in offering protection against mosquitos and other insects. The use of ITNs is one of the main health interventions applied to reduce malaria transmission in Somaliland. The questionnaire incorporates questions on the availability and use of bed nets, both at household level and among children under five years of age and pregnant women. In addition, all households in the Somaliland MICS were asked whether the interior dwelling walls were sprayed with an insecticide to kill mosquitoes that spread malaria during the 12 months preceding the survey. In Somaliland the survey results indicate that 35 percent of households have at least one mosquito net (Table CH.11). Thirty five percent of the households had at least one ITN. Further another 37 percent had at least one ITN or received Indoor Residual Spraying (IRS) in the last 12 months. Ownership of ITN was lowest in Sool and Maroodijeex/Saaxil regions as well as households whose head had no education and the poorest households.
Table CH.11: Household availability of insecticide treated nets and protection by a vector control method
Percentage of households with at least one mosquito net, percentage of households with at least one long-lasting treated net, percentage of households with at least one insecticide treated net (ITN) and percentage of households which either have at least one ITN or have received indoor residual spraying (IRS) in the last 12 months, Somaliland , 2011
Percentage of households with
at least one mosquito net
Percentage of households with at least one long-lasting treated net
Percentage of households with at least
one ITN1
Percentage of households with at least one ITN or received IRS
during the last 12 months2
Number of households
Region
Maroodijeex/Saaxil 31.0 27.5 28.3 30.8 2,176
Awdal 45.1 39.5 40.7 41.8 726
Togdheer 54.7 47.8 48.9 49.5 953
Sool 31.9 27.8 28.7 29.3 289
Sanaag 36.6 33.7 34.3 34.7 677
Area
Urban 37.3 33.0 33.9 36.8 2,281
Rural 39.9 35.4 36.2 36.4 2,539
Education of household head
None 34.5 30.7 31.6 32.8 3,334
Primary 46.3 41.3 42.0 44.0 637
Secondary+ 48.1 42.3 43.1 45.8 721
Missing/DK 53.7 46.7 48.2 48.2 128
Wealth index quintiles
Poorest 27.4 23.2 24.0 24.1 1,074
Second 44.8 40.2 41.4 41.8 1,079
Middle 40.1 35.5 36.4 37.2 993
Fourth 40.0 36.0 36.8 39.0 859
Richest 41.9 37.5 38.2 43.0 815
Total 38.6 34.2 35.1 36.6 4,820 1 MICS indicator 3.12 2 MICS indicator 3.13
Results indicate that 24 percent of children under the age of five slept under any mosquito net the night prior to the survey and 22 percent slept under an insecticide treated net (Table CH.12). There were no gender disparities in ITN use among children under five. The highest percentage of children who slept under an ITN was in Togdheer region (37 percent) while the lowest was in Maroodijeex/Saaxil region (14 percent).

70
Table CH.12: Children sleeping under mosquito nets
Percentage of children age 0-59 months who slept under a mosquito net during the previous night, by type of net, Somaliland , 2011
Percentage of children age 0-59
who stayed in the
household the previous
night
Number of
children age 0-59 months
Percentage of children who:
Number of children age 0-59 months who slept in
the household
the previous night
Percentage of children who
slept under an ITN living in households with at least
one ITN
Number of children age 0-59 living
in households with at least
one ITN
Slept under
any mosquito
net1
Slept under an
insecticide treated net2
Sex
Male 98.8 2,395 23.9 21.8 2,366 55.0 939
Female 99.0 2,277 24.0 22.0 2,253 56.0 884
Region
Maroodijeex/Saaxil 99.1 2,074 15.0 14.1 2,056 45.3 638
Awdal 99.6 727 28.5 25.7 724 55.3 336
Togdheer 98.9 948 40.9 36.6 938 68.2 503
Sool 100.0 262 22.6 19.9 262 59.3 88
Sanaag 96.8 661 23.2 22.0 640 54.4 258
Area
Urban 99.1 2,256 20.3 18.2 2,236 50.1 812
Rural 98.6 2,416 27.4 25.4 2,383 59.7 1,011
Age
0-11 months 99.5 933 30.0 27.5 929 65.1 393
12-23 months 98.9 771 23.6 21.5 763 54.2 303
24-35 months 99.0 987 24.0 21.5 978 55.8 376
36-47 months 98.6 1,067 23.4 21.6 1,053 53.0 428
48-59 months 98.2 914 18.6 17.2 897 47.8 322
Mother's educationa
None 99.0 3,745 23.1 21.2 3,705 54.9 1,427
Primary 98.5 709 27.5 24.6 698 56.0 307
Secondary+ 99.6 217 27.5 25.6 216 61.9 89
Wealth index quintiles
Poorest 98.8 995 20.3 18.0 983 57.8 307
Second 99.1 1,055 29.8 27.3 1,045 60.1 475
Middle 98.3 940 25.8 24.5 925 59.4 381
Fourth 99.0 916 22.0 19.9 907 48.5 372
Richest 99.1 766 20.8 18.5 759 48.9 287
Total 98.9 4,672 24.0 21.9 4,619 55.4 1,823 1 MICS indicator 3.14, 2 MICS indicator 3.15; MDG indicator 6.7 aTotal includes 2 unweighted cases of children missing information on mothers education who are not shown separately

71
Table CH.13: Pregnant women sleeping under mosquito nets
Percentage of pregnant women who slept under a mosquito net during the previous night, by type of net, Somaliland , 2011
Percentage of pregnant
women who stayed in the
household the previous night
Number of
pregnant women
Percentage of pregnant women who:
Number of pregnant women
who slept in the
household the
previous night
Percentage of pregnant
women who slept under an ITN, living in households with at least
one ITN
Number of pregnant women living in
households with at least
one ITN
Slept under any mosquito
net
Slept under an
insecticide treated
net1
Region
Maroodijeex/Saaxil 98.4 254 11.2 10.4 250 34.0 76
Awdal 100.0 72 29.8 26.9 72 (50.1) 39
Togdheer 100.0 99 40.4 38.2 99 66.0 57
Sool (100.0) 41 (22.0) (19.3) 41 (*) 12
Sanaag 95.3 64 22.7 22.7 61 (50.0) 28
Area
Urban 98.6 263 17.3 17.0 259 42.5 103
Rural 98.8 267 25.5 23.1 264 55.9 109
Age
15-19 (100.0) 32 (21.7) (21.7) 32 (*) 15
20-24 99.1 116 24.9 23.1 115 53.3 50
25-29 98.3 160 23.6 22.9 157 54.7 66
30-34 96.9 100 17.1 15.0 97 (49.3) 29
35-39 100.0 86 18.0 16.7 86 (40.3) 36
40-44 (100.0) 26 (21.0) (21.0) 26 (*) 14
45-49 (*) 10 (*) (*) 10 (*) 2
Education
None 98.8 415 18.9 17.9 410 44.7 164
Primary 97.5 77 29.6 28.3 75 (72.4) 29
Secondary+ (100.0) 38 (33.0) (27.3) 38 (*) 19
Wealth index quintiles
Poorest 100.0 88 14.6 13.4 88 (44.0) 27
Second 99.1 120 24.9 23.1 119 52.1 53
Middle 96.5 116 25.1 22.3 112 (59.8) 42
Fourth 100.0 110 24.5 24.5 110 51.4 53
Richest 98.1 96 15.7 14.6 94 (35.3) 39
Total 98.7 530 21.5 20.1 523 49.4 213 1 MICS indicator 3.19 (*) Figures that are based on less than 25 unweighted cases ( ) Figures that are based on 25-49 unweighted cases
Table CH.13 presents the proportion of pregnant women who slept under a mosquito net during the previous night. Twenty two percent of pregnant women slept under any mosquito net the night prior to the survey and one in four slept under an insecticide treated net. A higher proportion of women in the rural areas slept under ITN compared to those from the urban areas (23 versus 17 percent). The lowest percent of women who slept under ITN was found in Maroodijeex/Saaxil region (10 percent), those aged 30 to 34 years (15) and the poorest (13 percent). The use of ITNs appears to increase with education although the sample for secondary education is small and need to be interpreted with caution. Questions on the prevalence and treatment of fever were asked for all children under age five. Eight percent of under five children were ill with fever in the two weeks prior to the survey (Table CH.14).

72
Fever prevalence seems to be the same across age groups and for all levels of mother’s education.
The findings show the lowest fever prevalence was in Awdal regional (4 percent).
Table CH.14: Anti-malarial treatment of children with anti-malarial drugs
Percentage of children age 0-59 months who had a fever in the last two weeks who received anti-malarial drugs, Somaliland, 2011
Had a fever in last two weeks
Number of
children age 0-59 months
Children with a fever in the last two weeks who were treated with:
Number of
children with
fever in last two weeks
Anti-malarials:
Percentage who took an anti-malarial drug same
or next day2 SP/
Fansidar Chloroquine
Amodia-quine
Quinine
Combi nation with
artemi sinin
Any anti-
malarial drug1
Sex
Male 7.8 2,396 6.2 1.6 0.5 0.0 2.6 9.3 2.8 187
Female 7.3 2,276 5.3 1.1 2.7 1.9 1.3 10.3 4.1 166
Region
Maroodijeex /Saaxil
8.0 2,075 5.3 1.2 1.8 0.6 1.2 7.0 4.1 165
Awdal 4.3 727 (6.4) (0.0) (3.3) (0.0) (0.0) (9.7) (0.0) 31
Togdheer 8.5 948 6.2 2.5 0.0 1.2 4.8 14.8 3.6 81
Sool 9.1 254 (*) (*) (*) (*) (*) (*) (*) 23
Sanaag 7.8 667 2.2 0.0 0.0 0.0 0.0 2.2 2.2 52
Area
Urban 8.0 2,254 7.7 1.5 2.5 1.1 3.2 13.3 5.4 180
Rural 7.1 2,418 3.7 1.2 0.6 0.7 0.7 6.1 1.3 173
Age
0-11 months 7.3 932 8.0 0.0 1.4 0.0 0.0 8.0 2.9 68
12-23 months 8.6 771 9.1 1.1 1.5 0.0 2.9 14.6 7.5 67
24-35 months 7.5 986 2.8 2.8 2.0 1.3 0.0 8.9 1.3 74
36-47 months 7.6 1,069 4.6 1.2 1.2 0.0 2.4 8.2 1.2 81
48-59 months 6.8 914 4.9 1.5 1.5 3.4 4.9 9.8 4.9 63
Mother’s educationa
None 7.4 3,746 6.7 1.7 1.6 0.4 1.4 10.4 3.3 276
Primary 8.7 708 1.6 0.0 0.0 1.8 1.8 3.4 1.6 62
Secondary+ 6.5 216 (*) (*) (*) (*) (*) (*) (*) 14
Wealth index quintiles
Poorest 6.9 993 6.3 0.0 0.0 0.0 0.0 6.3 3.3 69
Second 7.5 1,056 2.5 1.3 1.3 0.0 2.4 7.5 1.2 79
Middle 8.0 942 8.3 2.4 2.0 1.5 1.5 14.2 2.6 75
Fourth 8.0 919 0.0 1.3 0.0 2.6 4.0 7.9 2.6 73
Richest 7.4 762 13.8 1.7 5.2 0.0 1.7 13.8 8.6 56
Total 7.5 4,672 5.8 1.3 1.5 0.9 2.0 9.8 3.4 352 1 MICS indicator 3.18; MDG indicator 6.8 2 MICS indicator 3.17 (*) Figures that are based on less than 25 unweighted cases ( ) Figures that are based on 25 - 49 unweighted cases aTotal includes 2 unweighted cases of children missing information on mothers’ education who are not shown separately
Mothers were asked to report all of the medicines given to a child to treat the fever, including both medicines given at home and medicines given or prescribed at a health facility. Overall, 10 percent of children with fever in the last two weeks were treated with an “appropriate” anti-malarial drug and only 3 percent received anti-malarial drugs either on the same day or day after the onset of symptoms.
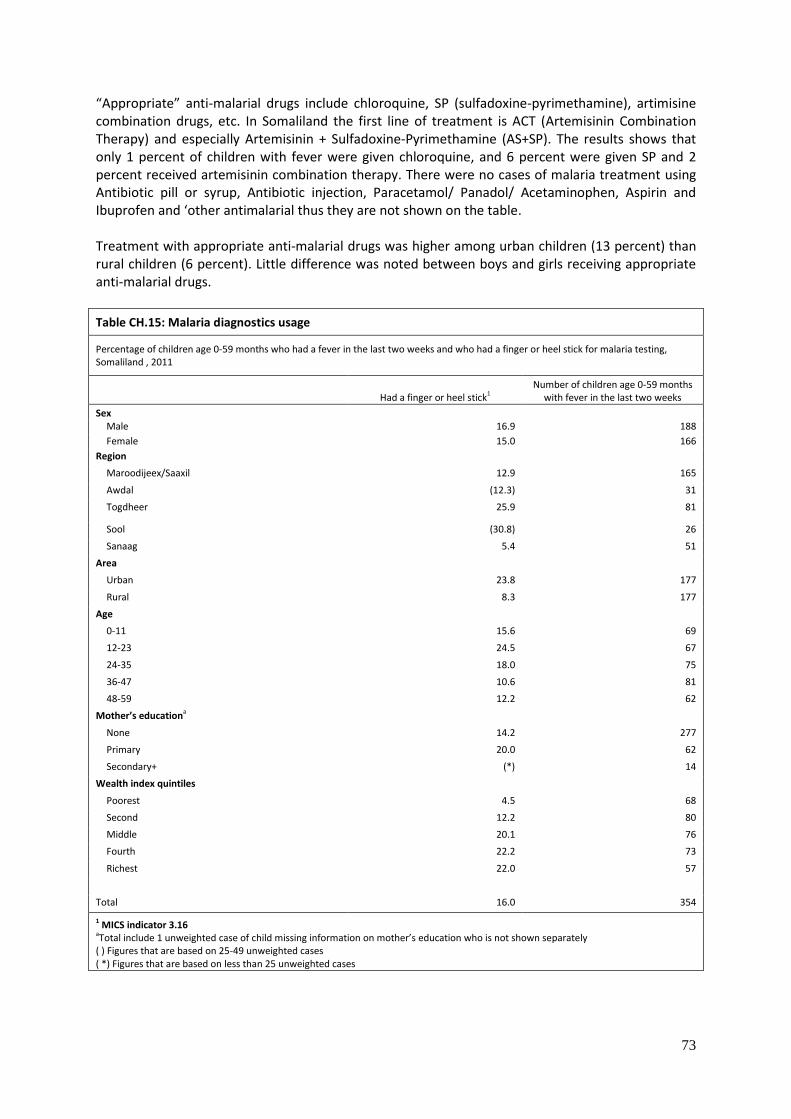
73
“Appropriate” anti-malarial drugs include chloroquine, SP (sulfadoxine-pyrimethamine), artimisine combination drugs, etc. In Somaliland the first line of treatment is ACT (Artemisinin Combination Therapy) and especially Artemisinin + Sulfadoxine-Pyrimethamine (AS+SP). The results shows that only 1 percent of children with fever were given chloroquine, and 6 percent were given SP and 2 percent received artemisinin combination therapy. There were no cases of malaria treatment using Antibiotic pill or syrup, Antibiotic injection, Paracetamol/ Panadol/ Acetaminophen, Aspirin and Ibuprofen and ‘other antimalarial thus they are not shown on the table. Treatment with appropriate anti-malarial drugs was higher among urban children (13 percent) than rural children (6 percent). Little difference was noted between boys and girls receiving appropriate anti-malarial drugs.
Table CH.15: Malaria diagnostics usage
Percentage of children age 0-59 months who had a fever in the last two weeks and who had a finger or heel stick for malaria testing, Somaliland , 2011
Had a finger or heel stick1 Number of children age 0-59 months
with fever in the last two weeks
Sex
Male 16.9 188
Female 15.0 166
Region
Maroodijeex/Saaxil 12.9 165
Awdal (12.3) 31
Togdheer 25.9 81
Sool (30.8) 26
Sanaag 5.4 51
Area
Urban 23.8 177
Rural 8.3 177
Age
0-11 15.6 69
12-23 24.5 67
24-35 18.0 75
36-47 10.6 81
48-59 12.2 62
Mother’s educationa
None 14.2 277
Primary 20.0 62
Secondary+ (*) 14
Wealth index quintiles
Poorest 4.5 68
Second 12.2 80
Middle 20.1 76
Fourth 22.2 73
Richest 22.0 57
Total 16.0 354
1 MICS indicator 3.16 aTotal include 1 unweighted case of child missing information on mother’s education who is not shown separately ( ) Figures that are based on 25-49 unweighted cases ( *) Figures that are based on less than 25 unweighted cases

74
Table CH.15 provides the proportion of children age 0-59 months who had a fever in the last two weeks and who had a finger or heel stick for malaria testing. Overall, 16 percent of children with a fever in the last two weeks had a finger or heel stick. The use of malaria diagnostics was highest among urban residents (24 percent), Togdheer region (26 percent), 12 to 23 months (24 percent) and among those within the fourth and fifth wealth index quintiles (22 percent).
Pregnant women living in places where malaria is highly prevalent are four times more likely than other adults to get malaria and twice as likely to die of the disease. Once infected, pregnant women risk anaemia, premature delivery and stillbirth. Their babies are likely to be of low birth weight, which makes them unlikely to survive their first year of life. For this reason, steps are taken to protect pregnant women by distributing insecticide-treated mosquito nets and treatment during antenatal check-ups with drugs that prevent malaria infection (Intermittent preventive treatment or IPT). In Somaliland MICS, women were asked of the medicines they had received in their last pregnancy during the 2 years preceding the survey. Women are considered to have received intermittent preventive therapy if they have received at least 2 doses of SP/Fansidar during the pregnancy.
Intermittent preventive treatment for malaria in pregnant women who gave birth in the two years preceding the survey is presented in Table CH.16. Six percent of the women who gave birth in the two years preceding the survey received any medicine to prevent malaria during pregnancy. However, only 1 percent received intermittent preventing therapy.
8A review of the quality of data relating to children below 2 years indicates potential data quality limitations hence the need to
interpret the results with caution.
Table CH.16: Intermittent preventive treatment for malaria Percentage of women age 15-49 years who had a live birth during the two years preceding the survey and who received intermittent preventive treatment (IPT) for malaria during pregnancy at any antenatal care visit, Somaliland , 2011
Percentage of women
who received antenatal care (ANC)
Number of women
who had a live birth in
the last two years
Percentage of pregnant women who took: Number of women who had a live birth in the last two years
and who received antenatal care
Any medicine to prevent malaria at
any ANC visit during pregnancy
SP/Fansidar at least once
8SP/Fansidar two or more
times1
Region Maroodijeex/Saaxil 39.5 715 6.0 2.8 2.1 282 Awdal 32.9 244 2.6 0.0 0.0 80 Togdheer 23.1 321 13.5 10.8 1.3 74 Sool 26.8 90 (*) (*) (*) 24 Sanaag 18.8 200 (5.0) (2.1) (0.0) 38
Area Urban 47.6 758 5.1 2.9 1.3 361 Rural 16.9 812 10.1 4.6 1.5 138
Education None 27.2 1237 5.4 3.3 1.5 336 Primary 44.4 260 7.8 4.1 1.7 115 Secondary+ 64.2 73 (10.6) (2.1) (0.0) 47
Wealth index quintiles Poorest 9.0 325 (7.2) (0.0) (0.0) 29 Second 17.0 342 17.7 12.2 3.7 58 Middle 30.5 313 5.2 2.1 0.0 96 Fourth 48.1 317 5.2 3.2 1.9 152 Richest 59.6 274 4.2 1.8 1.2 163
Total 31.7 1570 6.4 3.4 1.4 498 1 MICS indicator 3.20 (*) Figures that are based on less than 25 unweighted cases ( ) Figures that are based on 25-49 unweighted cases

75
VII. Water and Sanitation
Safe drinking water is a basic necessity for good health. Unsafe drinking water can be a significant carrier of diseases such as trachoma, cholera, typhoid, and schistosomiasis. Drinking water can also be tainted with chemical, physical and radiological contaminants with harmful effects on human health. In addition to its association with disease, access to drinking water may be particularly important for women and children, especially in rural areas, who bear the primary responsibility for carrying water, often for long distances. The MDG goal (7, C) is to reduce by half, between 1990 and 2015, the proportion of people without sustainable access to safe drinking water and basic sanitation. The World Fit for Children goal calls for a reduction in the proportion of households without access to hygienic sanitation facilities and affordable and safe drinking water by at least one-third. The list of indicators used in MICS is as follows: Water
• Use of improved drinking water sources
• Use of adequate water treatment method
• Time to source of drinking water
• Person collecting drinking water Sanitation
• Use of improved sanitation facilities
• Sanitary disposal of child’s faeces For more details on water and sanitation and to access some reference documents, please visit the UNICEF childinfo website9. MICS also collects additional information on the availability of facilities and conditions for handwashing. The following indicators are collected:
• Place for handwashing observed
• Availability of soap
Use of Improved Water Sources
The distribution of the population by main source of drinking water is shown in Table WS.1 and Figure WS.1. The population using improved sources of drinking water are those using any of the following types of supply: piped water (into dwelling, compound, yard or plot, to neighbour, public tap/standpipe), tubewell/borehole, protected well, protected spring, and rainwater collection. Bottled water is considered as an improved water source only if the household is using an improved water source for handwashing and cooking. Overall, 42 percent of the population is using an improved source of drinking water – 64 percent in urban areas and 17 percent in rural areas. The situation in Sool region is considerably worse than in other regions; only 15 percent of the population in this region gets its drinking water from an improved source. Access to improved sources of drinking water increases with wealth index quintile
9http://www.childinfo.org/wes.html

76
from 15 percent among the poorest to 78 percent among the richest wealth index quintile (Table WS.1). The source of drinking water for the population varies strongly by region (Table WS.1). In Maroodijeex/Saaxil and Awdal regions, 28 and 29 percent of the population use drinking water that is piped into their dwelling or into their yard or plot. In contrast, only 8 percent of those residing in Togdheer and 4 percent of those in Sanaag have piped water into dwelling. In Sool region, the most important source of drinking water is rainwater collection into a Berkad10. In Awdal and Sanaag regions, the second most important source of drinking water is unprotected wells (an unimproved source).
10 A berkad is a traditional water basin dug in the open ground which collects surface water acting as a source of water for people and animals.

77
Table WS.1: Use of improved water sources Percent distribution of household population according to main source of drinking water and percentage of household population using improved drinking water sources, Somaliland, 2011
Main source of drinking water
Total
Percentage using
improved sources of drinking water
1
Number of household members
Improved sources
Unimproved sources
Missing
Piped water Tube-well/ bore-hole
Pro-tected
well
Pro-tected spring
Unpro-tected
well
Unpro-tected spring
Rainwater Collection:
Tanker truck
Cart with tank/ drum
Surface water
Large tank near com-
pound/ village/ section Other
Into dwelling
Into yard/plot
To neigh-bour
Public tap/
stand-pipe
Roof top Berkad Bally
Region
Maroodijeex/Saaxil
28.0 3.8 7.9 8.6 0.9 2.3 0.2 5.6 1.7 0.2 10.8 2.7 17.4 7.3 1.8 0.1 0.5 0.0 100.0 51.8 14,590
Awdal 28.8 6.7 7.2 5.3 3.3 4.8 1.0 16.7 2.4 0.2 8.1 6.3 1.2 1.5 4.9 0.0 1.4 0.0 100.0 57.1 4,612
Togdheer 7.5 2.2 2.8 2.4 2.7 7.6 0.0 9.3 0.4 0.3 38.4 3.3 19.0 3.9 0.0 0.0 0.0 0.1 100.0 25.1 5,754
Sool 0.0 0.9 0.0 1.3 4.0 9.1 0.0 17.4 0.5 0.0 37.2 0.9 27.1 0.2 0.4 0.0 0.9 0.0 100.0 15.3 1,661
Sanaag 3.6 0.1 0.6 3.5 5.1 8.3 2.3 16.4 5.3 0.2 36.8 0.4 10.2 1.9 3.4 0.2 1.6 0.1 100.0 23.5 3,985
Area
Urban 36.2 6.1 9.8 8.9 1.4 1.5 0.0 1.9 0.1 0.0 2.7 0.1 23.6 7.1 0.0 0.0 0.4 0.0 100.0 64.0 16,137
Rural 1.1 0.2 0.5 2.5 3.4 8.5 1.2 19.1 4.1 0.4 40.2 6.2 5.1 2.0 4.3 0.1 1.1 0.1 100.0 17.3 14,465
Education of household head
None 14.5 2.5 5.6 6.0 2.8 5.4 0.5 11.9 2.6 0.2 22.9 3.5 13.6 4.4 2.5 0.1 0.8 0.1 100.0 37.4 20,523
Primary 19.5 4.6 6.2 6.9 2.2 6.2 0.4 7.4 0.7 0.0 20.1 3.0 15.5 4.7 1.9 0.1 0.7 0.1 100.0 45.9 40,85
Secondary+ 40.9 5.5 4.5 4.3 0.5 1.8 0.5 4.8 0.0 0.3 10.3 1.2 19.1 5.3 0.7 0.0 0.4 0.0 100.0 58.0 5,140
Missing/DK 13.0 2.9 3.2 6.7 2.5 3.2 2.8 9.3 4.4 0.0 24.8 1.9 14.5 9.5 0.2 0.0 1.1 0.0 100.0 34.2 854
Wealth index quintile
Poorest 0.0 0.1 0.5 0.8 4.8 7.4 1.5 28.3 6.7 0.6 32.0 7.3 2.1 0.6 6.1 0.1 1.0 0.0 100.0 15.1 6,123
Second 0.4 0.4 3.3 6.7 3.4 10.2 0.5 15.4 2.6 0.3 39.4 5.0 5.1 2.0 3.5 0.2 1.4 0.1 100.0 25.0 6,118
Middle 3.6 2.3 11.4 12.3 2.9 4.4 0.6 4.9 0.4 0.1 23.6 2.3 21.3 8.5 0.6 0.0 0.6 0.1 100.0 37.5 6,121
Fourth 29.8 5.3 9.0 7.6 0.5 1.7 0.2 1.5 0.1 0.0 6.0 0.4 28.1 9.2 0.0 0.0 0.4 0.0 100.0 54.3 6,121
Richest 64.0 8.5 3.1 1.9 0.0 0.3 0.0 0.1 0.0 0.0 1.1 0.1 17.6 3.2 0.1 0.0 0.1 0.0 100.0 77.7 6,118
Total 19.6 3.3 5.4 5.9 2.3 4.8 0.6
10.0 2.0 0.2 20.4 3.0 14.8 4.7 2.1 0.1 0.7 0.1 100.0 41.9 30,601
1 MICS indicator 4.1; MDG indicator 7.8 There were no households using bottled water whether improved or unimproved thus not shown on the table
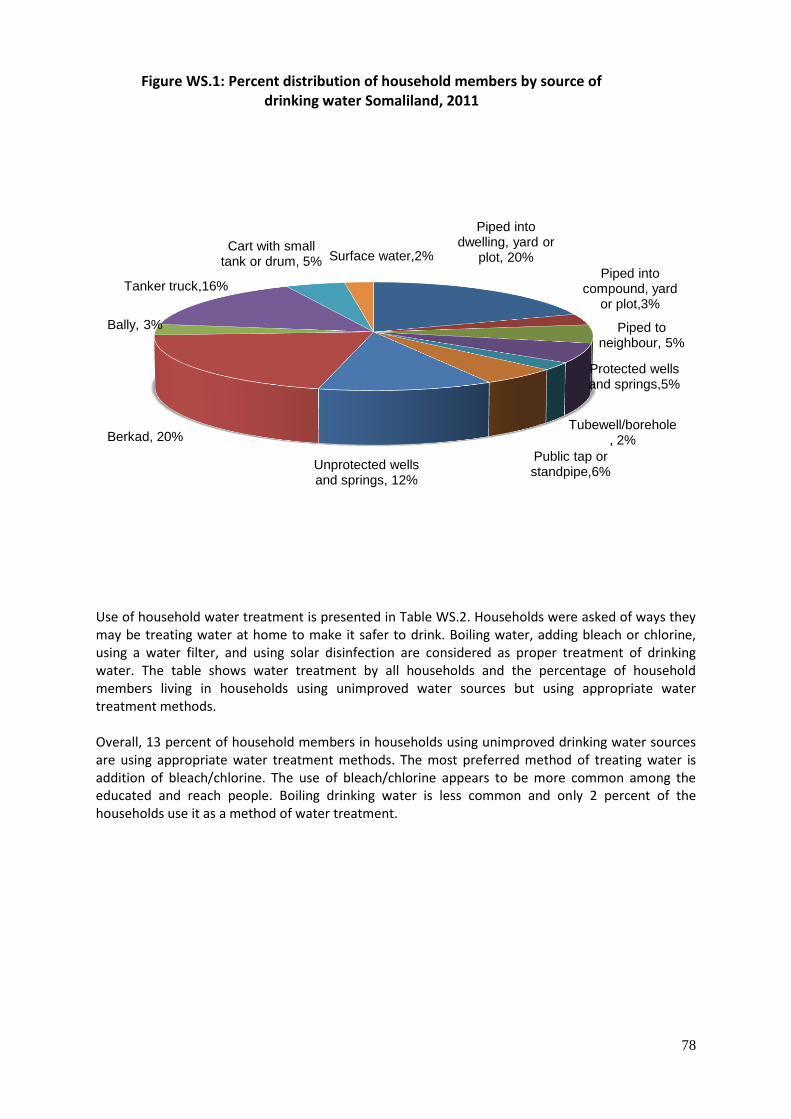
78
Use of household water treatment is presented in Table WS.2. Households were asked of ways they may be treating water at home to make it safer to drink. Boiling water, adding bleach or chlorine, using a water filter, and using solar disinfection are considered as proper treatment of drinking water. The table shows water treatment by all households and the percentage of household members living in households using unimproved water sources but using appropriate water treatment methods. Overall, 13 percent of household members in households using unimproved drinking water sources are using appropriate water treatment methods. The most preferred method of treating water is addition of bleach/chlorine. The use of bleach/chlorine appears to be more common among the educated and reach people. Boiling drinking water is less common and only 2 percent of the households use it as a method of water treatment.
Piped into dwelling, yard or
plot, 20%
Piped into compound, yard
or plot,3%
Piped to neighbour, 5%
Public tap or standpipe,6%
Tubewell/borehole, 2%
Protected wells and springs,5%
Unprotected wells and springs, 12%
Berkad, 20%
Bally, 3%
Tanker truck,16%
Cart with small tank or drum, 5% Surface water,2%
Figure WS.1: Percent distribution of household members by source of drinking water Somaliland, 2011
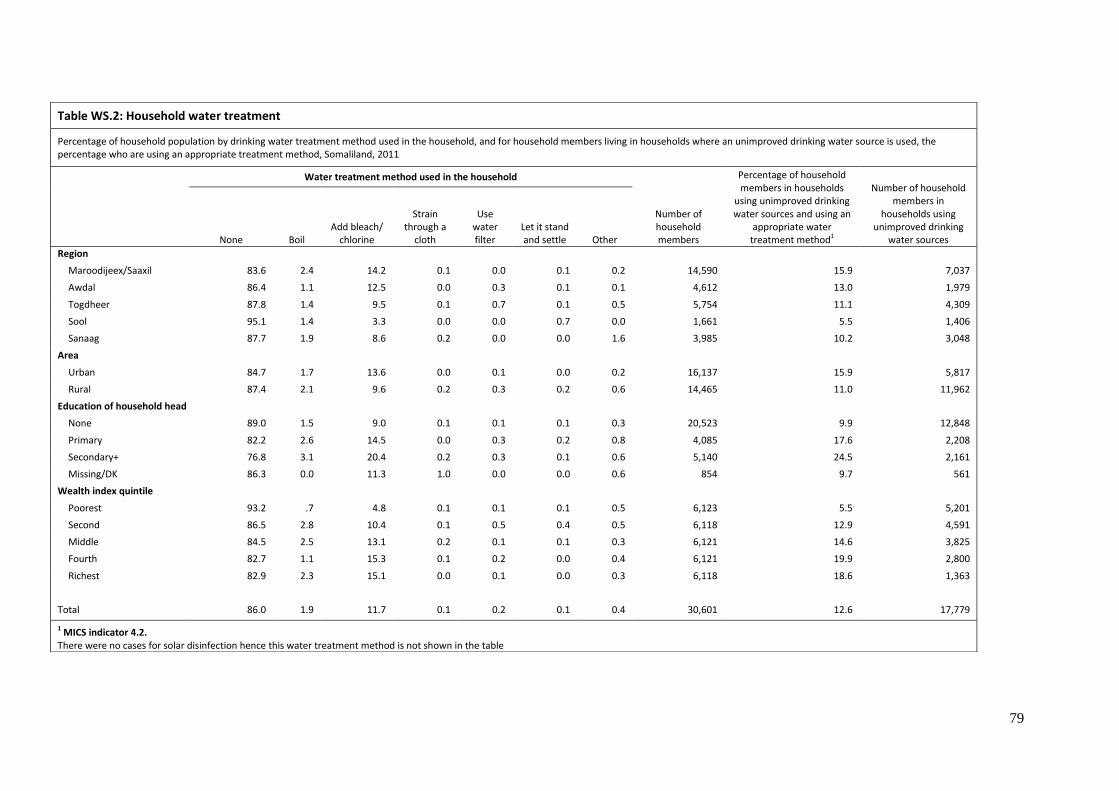
79
Table WS.2: Household water treatment
Percentage of household population by drinking water treatment method used in the household, and for household members living in households where an unimproved drinking water source is used, the percentage who are using an appropriate treatment method, Somaliland, 2011
Water treatment method used in the household
Number of household members
Percentage of household members in households
using unimproved drinking water sources and using an
appropriate water treatment method1
Number of household members in
households using unimproved drinking
water sources None Boil Add bleach/
chlorine
Strain through a
cloth
Use water filter
Let it stand and settle Other
Region
Maroodijeex/Saaxil 83.6 2.4 14.2 0.1 0.0 0.1 0.2 14,590 15.9 7,037
Awdal 86.4 1.1 12.5 0.0 0.3 0.1 0.1 4,612 13.0 1,979
Togdheer 87.8 1.4 9.5 0.1 0.7 0.1 0.5 5,754 11.1 4,309
Sool 95.1 1.4 3.3 0.0 0.0 0.7 0.0 1,661 5.5 1,406
Sanaag 87.7 1.9 8.6 0.2 0.0 0.0 1.6 3,985 10.2 3,048
Area
Urban 84.7 1.7 13.6 0.0 0.1 0.0 0.2 16,137 15.9 5,817
Rural 87.4 2.1 9.6 0.2 0.3 0.2 0.6 14,465 11.0 11,962
Education of household head
None 89.0 1.5 9.0 0.1 0.1 0.1 0.3 20,523 9.9 12,848
Primary 82.2 2.6 14.5 0.0 0.3 0.2 0.8 4,085 17.6 2,208
Secondary+ 76.8 3.1 20.4 0.2 0.3 0.1 0.6 5,140 24.5 2,161
Missing/DK 86.3 0.0 11.3 1.0 0.0 0.0 0.6 854 9.7 561
Wealth index quintile
Poorest 93.2 .7 4.8 0.1 0.1 0.1 0.5 6,123 5.5 5,201
Second 86.5 2.8 10.4 0.1 0.5 0.4 0.5 6,118 12.9 4,591
Middle 84.5 2.5 13.1 0.2 0.1 0.1 0.3 6,121 14.6 3,825
Fourth 82.7 1.1 15.3 0.1 0.2 0.0 0.4 6,121 19.9 2,800
Richest 82.9 2.3 15.1 0.0 0.1 0.0 0.3 6,118 18.6 1,363
Total 86.0 1.9 11.7 0.1 0.2 0.1 0.4 30,601 12.6 17,779
1 MICS indicator 4.2. There were no cases for solar disinfection hence this water treatment method is not shown in the table

80
The amount of time it takes to obtain water is presented in Table WS.3 and the person who usually collected the water in Table WS.4. Note that these results refer to one round trip from home to drinking water source. Information on the number of trips made in one day was not collected. Table WS.3 shows that 33 percent of household members in Somaliland have an improved water source on premises. Among users of improved drinking water sources, 3 percent of household members spend less than 30 minutes to get to the water source and bring water while 6 percent of the household members spend 30 minutes or more. More than half (56 percent) of urban household members use improved water sources on premises compared to 7 percent in rural areas. Twenty four percent of the household members use unimproved water sources located on their premises. Rural household members using unimproved water sources spend more time in collecting water compared to those in urban areas. Table WS.4 shows that for the majority of households, an adult female is usually the person collecting the water, when the source of drinking water is not on the premises. Adult men collect water in only 29 percent of cases, while for the rest of the households, female or male children under age 15 collect water (6 and 3 percent respectively).

81
Table WS.3: Time to source of drinking water
Percent distribution of household population according to time to go to source of drinking water, get water and return, for users of improved and unimproved drinking water sources, Somaliland, 2011
Time to source of drinking water
Users of improved drinking water sources
Users of unimproved drinking water sources
Number of household members
Water on premises
Less than 30 minutes
30 minutes or more
Missing/ DK
Water on premises
Less than 30 minutes
30 minutes or more Missing/ DK Total
Region
Maroodijeex/Saaxil 43.7 2.7 4.7 0.7 23.1 6.2 13.9 5.0 100.0 14,588
Awdal 45.6 3.9 7.2 0.4 13.9 5.1 20.9 3.0 100.0 4,612
Togdheer 17.5 2.7 4.8 0.2 28.2 13.0 30.5 3.2 100.0 5,753
Sool 5.2 3.4 5.6 1.3 42.9 5.0 33.8 2.9 100.0 1,708
Sanaag 9.4 4.4 9.8 0.4 24.6 11.2 37.5 2.7 100.0 3,959
Area
Urban 55.7 3.3 4.5 0.4 23.1 1.7 7.2 4.0 100.0 16,146
Rural 6.6 2.9 7.2 0.7 24.9 14.9 39.1 3.8 100.0 14,473
Education of household head None 27.3 3.1 6.4 0.6 24.2 9.0 25.0 4.3 100.0 20,527
Primary 35.3 4.8 5.4 0.5 23.7 6.6 20.3 3.5 100.0 4,089
Secondary+ 52.6 1.7 3.4 0.2 21.7 4.9 12.7 2.8 100.0 5,149
Missing/DK 23.6 4.2 6.5 0.0 32.7 6.3 23.1 3.5 100.0 854
Wealth index quintile
Poorest 4.3 2.8 7.2 0.8 22.2 15.9 42.3 4.5 100.0 6,124
Second 11.9 3.7 9.0 0.8 19.8 14.4 36.5 3.9 100.0 6,125
Middle 24.2 4.7 7.9 0.5 32.0 6.4 20.3 4.0 100.0 6,120
Fourth 46.3 3.9 3.7 0.3 31.2 1.9 8.7 4.0 100.0 6,124
Richest 75.9 0.5 1.1 0.2 14.7 1.0 3.5 3.1 100.0 6,125
Total 32.5 3.1 5.8 0.5 24.0 7.9 22.2 3.9 100.0 30,619
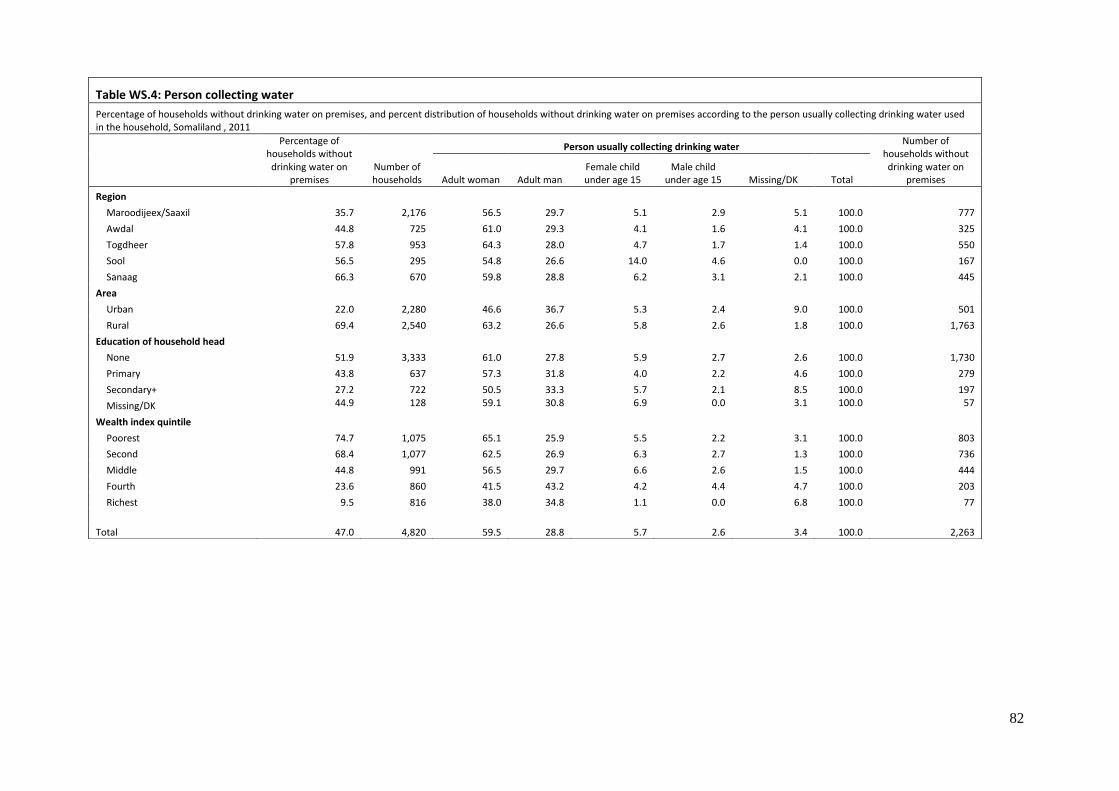
82
Table WS.4: Person collecting water
Percentage of households without drinking water on premises, and percent distribution of households without drinking water on premises according to the person usually collecting drinking water used in the household, Somaliland , 2011
Percentage of households without drinking water on
premises Number of households
Person usually collecting drinking water Number of
households without drinking water on
premises Adult woman Adult man Female child under age 15
Male child under age 15 Missing/DK Total
Region
Maroodijeex/Saaxil 35.7 2,176 56.5 29.7 5.1 2.9 5.1 100.0 777
Awdal 44.8 725 61.0 29.3 4.1 1.6 4.1 100.0 325
Togdheer 57.8 953 64.3 28.0 4.7 1.7 1.4 100.0 550
Sool 56.5 295 54.8 26.6 14.0 4.6 0.0 100.0 167
Sanaag 66.3 670 59.8 28.8 6.2 3.1 2.1 100.0 445
Area
Urban 22.0 2,280 46.6 36.7 5.3 2.4 9.0 100.0 501
Rural 69.4 2,540 63.2 26.6 5.8 2.6 1.8 100.0 1,763
Education of household head
None 51.9 3,333 61.0 27.8 5.9 2.7 2.6 100.0 1,730
Primary 43.8 637 57.3 31.8 4.0 2.2 4.6 100.0 279
Secondary+ 27.2 722 50.5 33.3 5.7 2.1 8.5 100.0 197
Missing/DK 44.9 128 59.1 30.8 6.9 0.0 3.1 100.0 57
Wealth index quintile
Poorest 74.7 1,075 65.1 25.9 5.5 2.2 3.1 100.0 803
Second 68.4 1,077 62.5 26.9 6.3 2.7 1.3 100.0 736
Middle 44.8 991 56.5 29.7 6.6 2.6 1.5 100.0 444
Fourth 23.6 860 41.5 43.2 4.2 4.4 4.7 100.0 203
Richest 9.5 816 38.0 34.8 1.1 0.0 6.8 100.0 77
Total 47.0 4,820 59.5 28.8 5.7 2.6 3.4 100.0 2,263

83
Use of Improved Sanitation Facilities Inadequate disposal of human excreta and personal hygiene is associated with a range of diseases including diarrhoeal diseases and polio. An improved sanitation facility is defined as one that hygienically separates human excreta from human contact. Improved sanitation can reduce diarrheal disease by more than a third, and can significantly lessen the adverse health impacts of other disorders responsible for death and disease among millions of children in developing countries. Improved sanitation facilities for excreta disposal include flush or pour flush to a piped sewer system, septic tank, or pit latrine; ventilated improved pit latrine, pit latrine with slab, and use of a composting toilet. Thirty two percent of the population of Somaliland is living in households using pit latrines with slabs while 15 percent of households have toilet facility which flush or pour flush into a pit latrine (Table WS.5). More than half (60 percent) of households in Sanaag region do not have any toilet facility. The percent of those without toilet facility is considerably higher in rural areas compared to urban areas. In rural areas, the population is mostly using pit latrines with slabs, or simply have no facilities. In contrast, the most common facilities in urban areas are pit latrines with slabs. Almost all of the poorest households (96 percent) have no toilet facility. Ownership of ventilated pit latrines increased with education of the household head.

84
Table WS.5: Types of sanitation facilities
Percent distribution of household population according to type of toilet facility used by the household, Somaliland, Somaliland , 2011
Type of toilet facility used by household
Total
Number of household members
Improved sanitation facility
Unimproved sanitation facility
Open defecation (no facility, bush, field)
Flush/Pour flush to:
Ventilated improved pit latrine
Pit latrine with slab
Flush/ pour flush to
somewhere else
Pit latrine
without slab/
open pit Bucket Other
Piped sewer system
Septic tank
Pit latrine
Unknown place/not sure/DK where
Region
Maroodijeex/Saaxil 1.8 4.9 19.7 0.3 8.5 34.0 0.9 6.2 0.1 0.4 23.1 100.0 14,588
Awdal 0.0 2.6 12.0 0.2 4.8 29.9 0.2 5.2 0.2 0.5 44.0 100.0 4,612
Togdheer 0.0 1.1 11.3 0.1 3.0 35.8 1.6 7.3 0.0 1.0 38.7 100.0 5,753
Sool 0.0 8.2 20.0 0.0 2.1 30.5 0.5 2.1 0.0 1.1 35.4 100.0 1,708
Sanaag 0.0 2.3 6.6 0.1 3.9 23.2 1.2 1.9 0.0 1.0 59.9 100.0 3,959
Area
Urban 1.6 5.6 21.7 0.3 10.0 47.4 1.1 6.8 0.1 0.6 4.7 100.0 16,146
Rural 0.0 1.5 8.1 0.1 1.5 15.1 0.7 4.0 0.0 0.6 68.0 100.0 14,473
Education of household head
None 0.5 3.6 13.5 0.2 4.4 27.4 0.9 5.7 0.0 0.7 42.8 100.0 20,527
Primary 0.9 2.9 18.6 0.2 5.1 41.2 0.2 7.1 0.2 0.2 23.3 100.0 4,089
Secondary+ 2.2 5.0 21.1 0.3 12.2 43.4 1.2 3.3 0.1 0.2 10.7 100.0 5,149 Missing/DK 0.9 0.6 5.4 0.0 10.9 35.9 2.4 5.1 0.0 1.9 36.9 100.0 854
Wealth index quintile
Poorest 0.0 0.0 0.4 0.0 0.2 0.8 0.4 1.9 0.1 0.4 95.9 100.0 6,124
Second 0.0 0.9 9.5 0.2 0.8 13.9 0.7 7.5 0.1 1.6 64.7 100.0 6,125
Middle 0.3 5.5 19.4 0.1 3.6 46.5 1.6 9.7 0.1 0.8 12.3 100.0 6,120
Fourth 1.0 6.0 25.1 0.0 7.8 52.7 0.5 6.3 0.0 0.2 0.1 100.0 6,124
Richest 3.0 6.1 21.9 0.6 17.6 46.8 1.4 2.2 0.1 0.1 0.0 100.0 6,125
Total 0.9 3.7 15.3 0.2 6.0 32.2 0.9 5.5 0.1 0.6 34.6 100.0 30,619
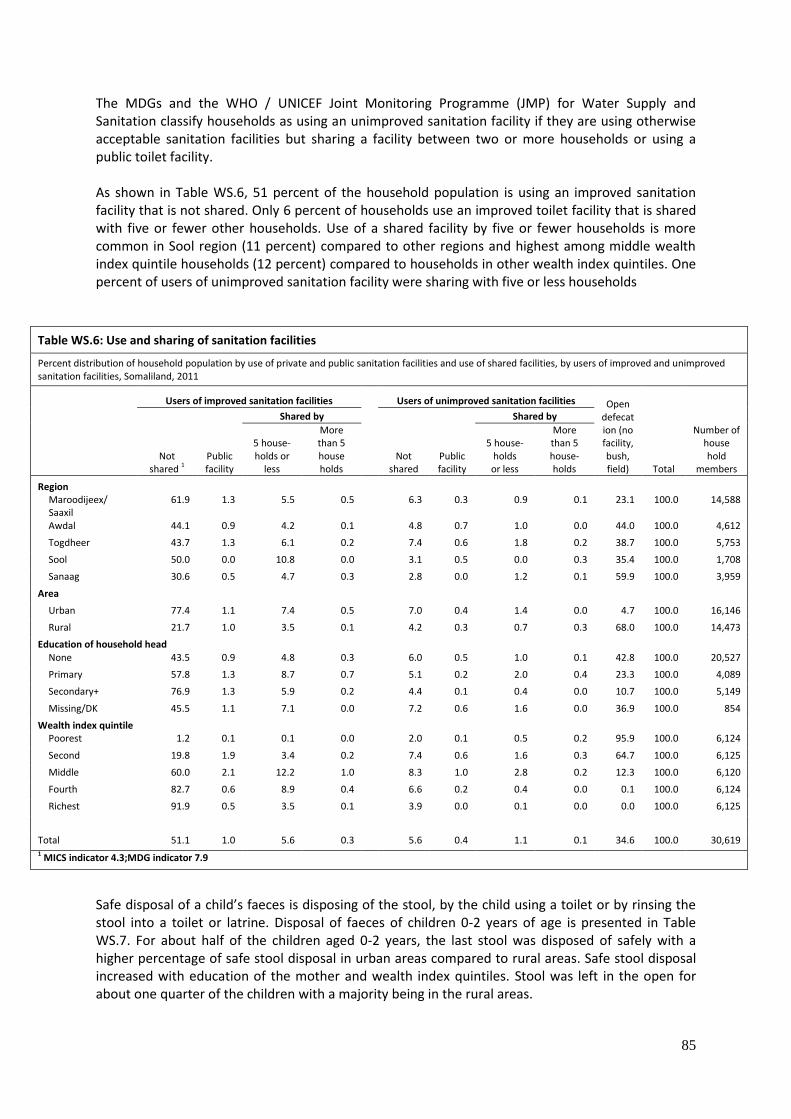
85
The MDGs and the WHO / UNICEF Joint Monitoring Programme (JMP) for Water Supply and Sanitation classify households as using an unimproved sanitation facility if they are using otherwise acceptable sanitation facilities but sharing a facility between two or more households or using a public toilet facility. As shown in Table WS.6, 51 percent of the household population is using an improved sanitation facility that is not shared. Only 6 percent of households use an improved toilet facility that is shared with five or fewer other households. Use of a shared facility by five or fewer households is more common in Sool region (11 percent) compared to other regions and highest among middle wealth index quintile households (12 percent) compared to households in other wealth index quintiles. One percent of users of unimproved sanitation facility were sharing with five or less households
Table WS.6: Use and sharing of sanitation facilities
Percent distribution of household population by use of private and public sanitation facilities and use of shared facilities, by users of improved and unimproved sanitation facilities, Somaliland, 2011
Users of improved sanitation facilities
Users of unimproved sanitation facilities Open
defecation (no facility, bush, field) Total
Number of house hold
members Not
shared 1 Public facility
Shared by
Not shared
Public facility
Shared by
5 house-holds or
less
More than 5 house holds
5 house-holds or less
More than 5 house-holds
Region
Maroodijeex/ Saaxil
61.9 1.3 5.5 0.5 6.3 0.3 0.9 0.1 23.1 100.0 14,588
Awdal 44.1 0.9 4.2 0.1 4.8 0.7 1.0 0.0 44.0 100.0 4,612
Togdheer 43.7 1.3 6.1 0.2 7.4 0.6 1.8 0.2 38.7 100.0 5,753
Sool 50.0 0.0 10.8 0.0 3.1 0.5 0.0 0.3 35.4 100.0 1,708
Sanaag 30.6 0.5 4.7 0.3 2.8 0.0 1.2 0.1 59.9 100.0 3,959
Area
Urban 77.4 1.1 7.4 0.5 7.0 0.4 1.4 0.0 4.7 100.0 16,146
Rural 21.7 1.0 3.5 0.1 4.2 0.3 0.7 0.3 68.0 100.0 14,473
Education of household head None 43.5 0.9 4.8 0.3 6.0 0.5 1.0 0.1 42.8 100.0 20,527
Primary 57.8 1.3 8.7 0.7 5.1 0.2 2.0 0.4 23.3 100.0 4,089
Secondary+ 76.9 1.3 5.9 0.2 4.4 0.1 0.4 0.0 10.7 100.0 5,149
Missing/DK 45.5 1.1 7.1 0.0 7.2 0.6 1.6 0.0 36.9 100.0 854
Wealth index quintile Poorest 1.2 0.1 0.1 0.0 2.0 0.1 0.5 0.2 95.9 100.0 6,124
Second 19.8 1.9 3.4 0.2 7.4 0.6 1.6 0.3 64.7 100.0 6,125
Middle 60.0 2.1 12.2 1.0 8.3 1.0 2.8 0.2 12.3 100.0 6,120
Fourth 82.7 0.6 8.9 0.4 6.6 0.2 0.4 0.0 0.1 100.0 6,124
Richest 91.9 0.5 3.5 0.1 3.9 0.0 0.1 0.0 0.0 100.0 6,125
Total 51.1 1.0 5.6 0.3 5.6 0.4 1.1 0.1 34.6 100.0 30,619 1 MICS indicator 4.3;MDG indicator 7.9
Safe disposal of a child’s faeces is disposing of the stool, by the child using a toilet or by rinsing the stool into a toilet or latrine. Disposal of faeces of children 0-2 years of age is presented in Table WS.7. For about half of the children aged 0-2 years, the last stool was disposed of safely with a higher percentage of safe stool disposal in urban areas compared to rural areas. Safe stool disposal increased with education of the mother and wealth index quintiles. Stool was left in the open for about one quarter of the children with a majority being in the rural areas.

86
Table WS.7: Disposal of child's faeces
Percent distribution of children age 0-2 years according to place of disposal of child's faeces, and the percentage of children age 0-2 years whose stools were disposed of safely the last time the child passed stools, Somaliland, 2011
Place of disposal of child's faeces
Percentage of children whose last stools were disposed of
safely1
Number of
children age 0-2 years
Child used toilet/latrine
Put/rinsed into toilet or latrine
Put/rinsed into drain or ditch
Thrown into
garbage Buried
Left in the
open Other Missing/DK Total
Type of sanitation facility in dwelling
Improved 3.1 76.2 7.0 3.3 0.7 2.9 2.5 4.3 100.0 79.4 1,517
Unimproved 1.7 55.4 11.0 5.6 9.4 12.9 0.6 3.3 100.0 57.2 177
Open defecation 0.2 4.7 1.3 16.4 10.0 63.0 1.2 3.3 100.0 4.9 986
Region
Maroodijeex/Saaxil 2.7 55.7 5.6 7.6 2.5 17.8 3.2 5.0 100.0 58.4 1,160
Awdal 2.7 38.2 4.7 7.5 4.7 37.7 0.4 4.1 100.0 40.9 437
Togdheer 1.1 46.2 7.5 7.0 6.3 28.2 1.6 2.0 100.0 47.3 550
Sool 0.0 60.4 1.1 13.4 2.6 18.2 0.5 3.7 100.0 60.4 170
Sanaag 1.1 36.1 2.6 10.7 10.3 36.0 0.3 2.9 100.0 37.2 364
Area
Urban 3.6 72.5 8.0 4.5 1.3 3.3 2.5 4.3 100.0 76.1 1,305
Rural 0.4 25.8 2.4 11.9 7.9 46.9 1.3 3.4 100.0 26.2 1,375
Mother’s educationa
None 1.7 43.7 4.6 8.9 5.3 29.9 1.8 4.2 100.0 45.4 2,098
Primary 2.5 65.4 7.1 6.5 3.3 10.9 2.4 1.9 100.0 67.9 452
Secondary+ 4.4 68.8 8.3 4.6 0.0 6.3 1.5 6.1 100.0 73.3 129
Wealth index quintile
Poorest 0.0 4.9 0.8 13.3 11.3 65.9 0.9 2.8 100.0 4.9 549
Second 0.7 23.3 2.7 15.2 8.0 45.0 1.6 3.6 100.0 24.0 594
Middle 3.1 65.3 6.8 5.5 2.6 10.2 2.2 4.2 100.0 68.4 529
Fourth 2.4 80.6 8.3 1.9 0.2 0.5 1.5 4.6 100.0 83.0 554
Richest 4.2 75.6 7.9 4.0 0.2 0.4 3.4 4.2 100.0 79.8 455
Total 2.0 48.5 5.1 8.3 4.7 25.7 1.9 3.9 100.0 50.5 2,681 1 MICS indicator 4.4. aTotal includes 2 unweighted cases of chidren missing information on mothers education who are not shown separately
In its 2008 report11, the JMP developed a new way of presenting the access figures, by disaggregating and refining the data on drinking-water and sanitation and reflecting them in "ladder" format. This ladder allows a disaggregated analysis of trends in a three rung ladder for drinking-water and a four-rung ladder for sanitation. For sanitation, this gives an understanding of the proportion of population with no sanitation facilities at all, of those reliant on technologies defined by JMP as "unimproved," of those sharing sanitation facilities of otherwise acceptable technology, and those using "improved" sanitation facilities. Table WS.8 presents the percentages of household population by drinking water and sanitation ladders. The table also shows the percentage of household members using improved sources of drinking water and sanitary means of excreta disposal. Overall, 29 percent of the household members have improved drinking water sources and improved sanitation facilities. The largest population using improved drinking water and improved sanitation facilities are in urban areas (51 percent) and among the richest wealth index quintile (72 percent; Table WS.8).
11
WHO/UNICEF JMP (2008), MDG assessment report - http://www.wssinfo.org/download?id_document=1279

87
Table WS.8: Drinking water and sanitation ladders
Percentage of household population by drinking water and sanitation ladders, Somaliland, 2011
Percentage of household population using:
Number of household members
Improved drinking water1
Un-improved drinking
water Total
Improved sanitation2
Unimproved sanitation
Total
Improved drinking water sources and
improved sanitation
Piped into dwelling, plot
or yard Other
improved
Shared improved facilities
Unimproved facilities
Open defecation
Region
Maroodijeex/Saaxil 31.8 20.0 48.2 100.0 61.9 7.3 7.7 23.1 100.0 39.7 14,588
Awdal 35.6 21.5 42.9 100.0 44.1 5.4 6.5 44.0 100.0 37.3 4,612
Togdheer 9.7 15.4 74.9 100.0 43.7 7.5 10.1 38.7 100.0 14.5 5,753
Sool 1.1 14.3 84.6 100.0 50.0 10.8 3.9 35.4 100.0 7.2 1,708
Sanaag 3.7 20.2 76.0 100.0 30.6 5.4 4.1 59.9 100.0 11.6 3,959
Area
Urban 42.3 21.8 36.0 100.0 77.4 9.1 8.8 4.7 100.0 50.5 16,146
Rural 1.3 16.0 82.7 100.0 21.7 4.7 5.5 68.0 100.0 5.3 14,473
Education of household head
None 17.0 20.4 62.6 100.0 43.5 6.1 7.6 42.8 100.0 23.9 20,527
Primary 24.1 21.8 54.1 100.0 57.8 11.1 7.7 23.3 100.0 31.8 4,089
Secondary+ 46.4 11.6 42.0 100.0 76.9 7.4 5.0 10.7 100.0 49.8 5,149
Missing /DK 15.9 18.5 65.6 100.0 45.5 8.2 9.5 36.9 100.0 18.5 854
Wealth index quintile
Poorest 0.1 14.9 85.0 100.0 1.2 0.2 2.7 95.9 100.0 0.1 6,124
Second 0.8 24.6 74.6 100.0 19.8 5.5 10.0 64.7 100.0 6.4 6,125
Middle 5.9 31.4 62.6 100.0 60.0 15.4 12.3 12.3 100.0 22.0 6,120
Fourth 35.1 19.1 45.8 100.0 82.7 10.0 7.2 0.1 100.0 44.9 6,124
Richest 72.5 5.3 22.3 100.0 91.9 4.1 4.0 0.0 100.0 72.3 6,125
Total 22.9 19.1 58.1 100.0 51.1 7.0 7.3 34.6 100.0 29.1 30,619
1 MICS indicator 4.1; MDG indicator 7.8 2 MICS indicator 4.3; MDG indicator 7.9

88
Handwashing
Handwashing with water and soap is the most cost effective health intervention to reduce both the incidence of diarrhoea and pneumonia in children under five. It is most effective when done using water and soap after visiting a toilet or cleaning a child, before eating or handling food and, before feeding a child. Monitoring correct hand washing behaviour at these critical times is challenging. A reliable alternative to observations or self-reported behaviour is assessing the likelihood that correct hand washing behaviour takes place by observing if a household has a specific place where people most often wash their hands and observing if water and soap (or other local cleansing materials) are present at a specific place for hand washing.
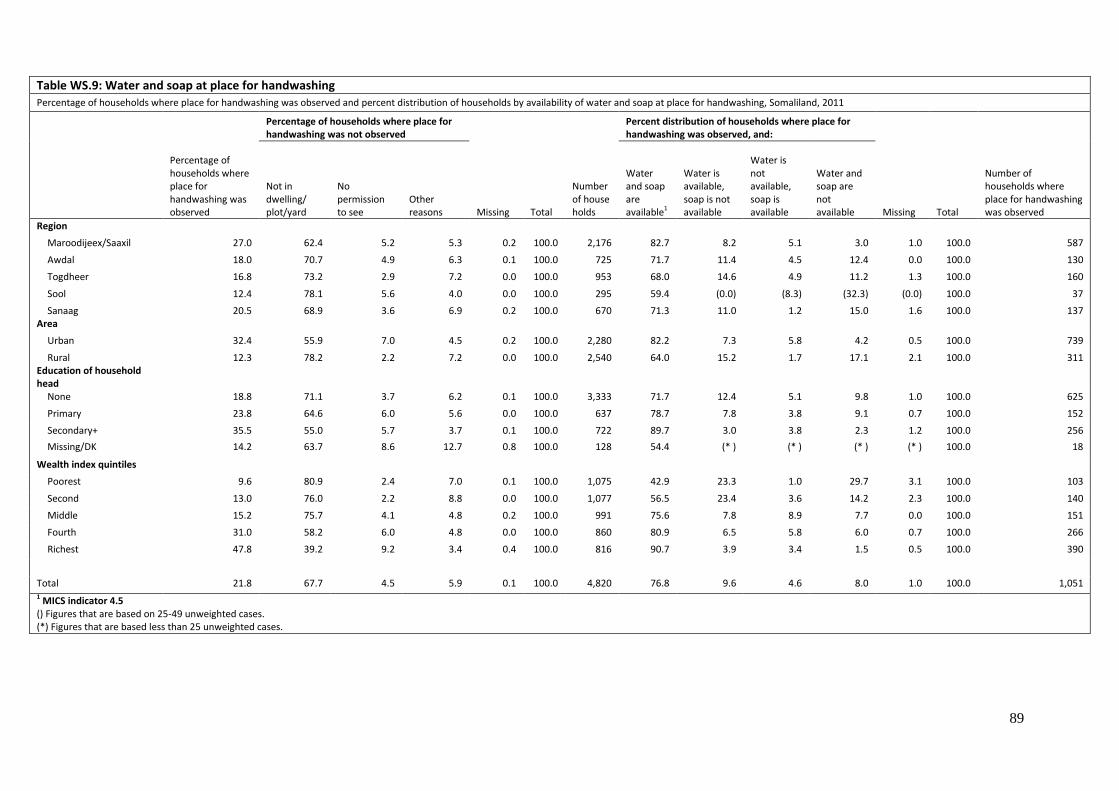
89
Table WS.9: Water and soap at place for handwashing Percentage of households where place for handwashing was observed and percent distribution of households by availability of water and soap at place for handwashing, Somaliland, 2011
Percentage of households where place for handwashing was observed
Percentage of households where place for handwashing was not observed
Total
Number of house holds
Percent distribution of households where place for handwashing was observed, and:
Total
Number of households where place for handwashing was observed
Not in dwelling/ plot/yard
No permission to see
Other reasons Missing
Water and soap are available1
Water is available, soap is not available
Water is not available, soap is available
Water and soap are not available Missing
Region
Maroodijeex/Saaxil 27.0 62.4 5.2 5.3 0.2 100.0 2,176 82.7 8.2 5.1 3.0 1.0 100.0 587
Awdal 18.0 70.7 4.9 6.3 0.1 100.0 725 71.7 11.4 4.5 12.4 0.0 100.0 130
Togdheer 16.8 73.2 2.9 7.2 0.0 100.0 953 68.0 14.6 4.9 11.2 1.3 100.0 160
Sool 12.4 78.1 5.6 4.0 0.0 100.0 295 59.4 (0.0) (8.3) (32.3) (0.0) 100.0 37
Sanaag 20.5 68.9 3.6 6.9 0.2 100.0 670 71.3 11.0 1.2 15.0 1.6 100.0 137 Area
Urban 32.4 55.9 7.0 4.5 0.2 100.0 2,280 82.2 7.3 5.8 4.2 0.5 100.0 739
Rural 12.3 78.2 2.2 7.2 0.0 100.0 2,540 64.0 15.2 1.7 17.1 2.1 100.0 311 Education of household head
None 18.8 71.1 3.7 6.2 0.1 100.0 3,333 71.7 12.4 5.1 9.8 1.0 100.0 625
Primary 23.8 64.6 6.0 5.6 0.0 100.0 637 78.7 7.8 3.8 9.1 0.7 100.0 152
Secondary+ 35.5 55.0 5.7 3.7 0.1 100.0 722 89.7 3.0 3.8 2.3 1.2 100.0 256
Missing/DK 14.2 63.7 8.6 12.7 0.8 100.0 128 54.4 (* ) (* ) (* ) (* ) 100.0 18
Wealth index quintiles
Poorest 9.6 80.9 2.4 7.0 0.1 100.0 1,075 42.9 23.3 1.0 29.7 3.1 100.0 103
Second 13.0 76.0 2.2 8.8 0.0 100.0 1,077 56.5 23.4 3.6 14.2 2.3 100.0 140
Middle 15.2 75.7 4.1 4.8 0.2 100.0 991 75.6 7.8 8.9 7.7 0.0 100.0 151
Fourth 31.0 58.2 6.0 4.8 0.0 100.0 860 80.9 6.5 5.8 6.0 0.7 100.0 266
Richest 47.8 39.2 9.2 3.4 0.4 100.0 816 90.7 3.9 3.4 1.5 0.5 100.0 390
Total 21.8 67.7 4.5 5.9 0.1 100.0 4,820 76.8 9.6 4.6 8.0 1.0 100.0 1,051 1 MICS indicator 4.5 () Figures that are based on 25-49 unweighted cases. (*) Figures that are based less than 25 unweighted cases.
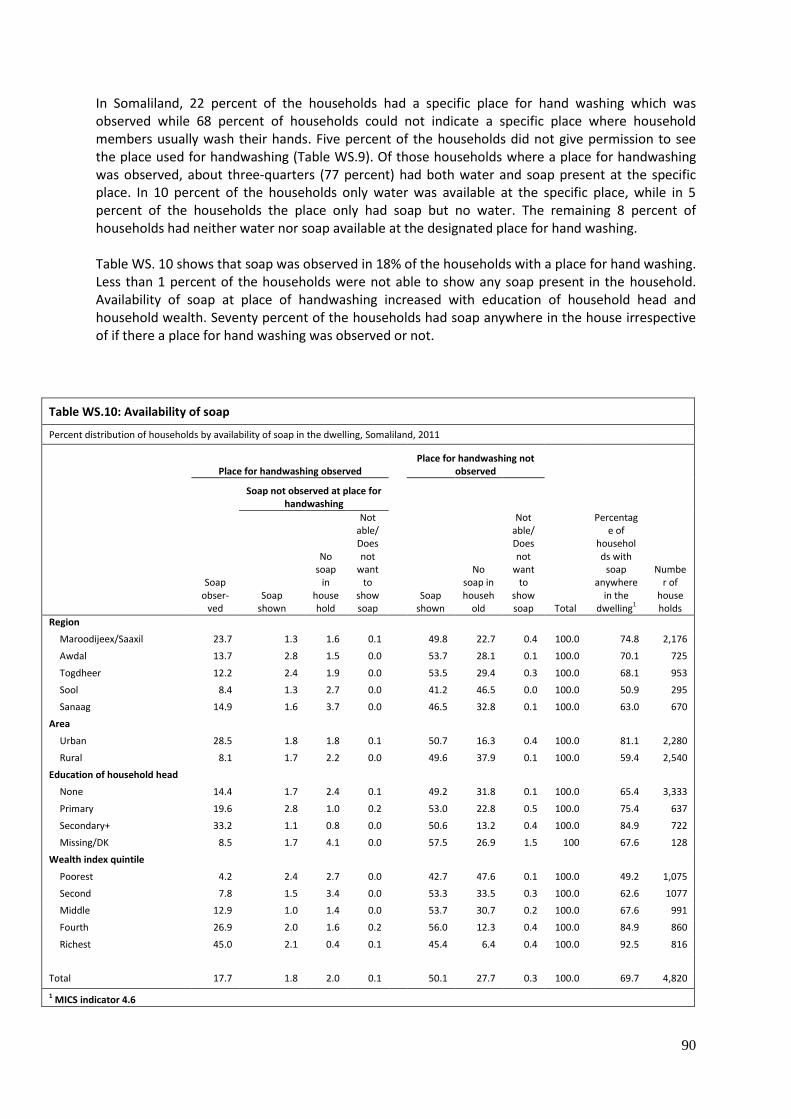
90
In Somaliland, 22 percent of the households had a specific place for hand washing which was observed while 68 percent of households could not indicate a specific place where household members usually wash their hands. Five percent of the households did not give permission to see the place used for handwashing (Table WS.9). Of those households where a place for handwashing was observed, about three-quarters (77 percent) had both water and soap present at the specific place. In 10 percent of the households only water was available at the specific place, while in 5 percent of the households the place only had soap but no water. The remaining 8 percent of households had neither water nor soap available at the designated place for hand washing. Table WS. 10 shows that soap was observed in 18% of the households with a place for hand washing. Less than 1 percent of the households were not able to show any soap present in the household. Availability of soap at place of handwashing increased with education of household head and household wealth. Seventy percent of the households had soap anywhere in the house irrespective of if there a place for hand washing was observed or not.
Table WS.10: Availability of soap
Percent distribution of households by availability of soap in the dwelling, Somaliland, 2011
Place for handwashing observed
Place for handwashing not observed
Total
Percentage of
households with
soap anywhere
in the dwelling1
Number of
house holds
Soap obser-
ved
Soap not observed at place for handwashing
Soap shown
No soap in househ
old
Not able/Does not
want to
show soap
Soap shown
No soap
in house hold
Not able/Does not
want to
show soap
Region
Maroodijeex/Saaxil 23.7 1.3 1.6 0.1 49.8 22.7 0.4 100.0 74.8 2,176
Awdal 13.7 2.8 1.5 0.0 53.7 28.1 0.1 100.0 70.1 725
Togdheer 12.2 2.4 1.9 0.0 53.5 29.4 0.3 100.0 68.1 953
Sool 8.4 1.3 2.7 0.0 41.2 46.5 0.0 100.0 50.9 295
Sanaag 14.9 1.6 3.7 0.0 46.5 32.8 0.1 100.0 63.0 670
Area
Urban 28.5 1.8 1.8 0.1 50.7 16.3 0.4 100.0 81.1 2,280
Rural 8.1 1.7 2.2 0.0 49.6 37.9 0.1 100.0 59.4 2,540
Education of household head
None 14.4 1.7 2.4 0.1 49.2 31.8 0.1 100.0 65.4 3,333
Primary 19.6 2.8 1.0 0.2 53.0 22.8 0.5 100.0 75.4 637
Secondary+ 33.2 1.1 0.8 0.0 50.6 13.2 0.4 100.0 84.9 722
Missing/DK 8.5 1.7 4.1 0.0 57.5 26.9 1.5 100 67.6 128
Wealth index quintile
Poorest 4.2 2.4 2.7 0.0 42.7 47.6 0.1 100.0 49.2 1,075
Second 7.8 1.5 3.4 0.0 53.3 33.5 0.3 100.0 62.6 1077
Middle 12.9 1.0 1.4 0.0 53.7 30.7 0.2 100.0 67.6 991
Fourth 26.9 2.0 1.6 0.2 56.0 12.3 0.4 100.0 84.9 860
Richest 45.0 2.1 0.4 0.1 45.4 6.4 0.4 100.0 92.5 816
Total 17.7 1.8 2.0 0.1 50.1 27.7 0.3 100.0 69.7 4,820
1 MICS indicator 4.6

91
VIII. Reproductive Health
Fertility
Measures of current fertility are presented in Table RH.1 for the three-year period preceding the survey. A three-year period was chosen for calculating these rates to provide the most current information while also allowing the rates to be calculated for a sufficient number of cases so as not to compromise the statistical precision of the estimates. Age-specific fertility rates (ASFRs), expressed as the number of births per 1,000 women in a specified age group, show the age pattern of fertility. Numerators for ASFRs are calculated by identifying live births that occurred in the three-year period preceding the survey classified according to the age of the mother (in five-year age groups) at the time of the child’s birth. The denominators of the rates represent the number of woman-years lived by the survey respondents in each of the five-year age groups during the specified period. The total fertility rate (TFR) is the number of live births a woman would have if she is subject to the current age-specific fertility rates throughout her reproductive years (15-49 years).
Table RH.1: Adolescent birth rate and total fertility rate12
Adolescent birth rates and total fertility rates, Somaliland, 2011
Adolescent birth rate1 (Age-specific fertility rate for women age 15-19) Total fertility rate
Region
Maroodijeex/Saaxil 45 4.9
Awdal 64 6.0
Togdheer 94 6.1
Sool 106 5.8
Sanaag 76 5.8
Area
Urban 35 5.0
Rural 112 6.1
Women’s education
None 92 5.7
Primary 47 5.6
Secondary+ 15 3.5
Wealth index quintile
Poorest 112 6.7
Second 115 6.2
Middle 84 5.3
Fourth 44 5.2
Richest 19 4.3
Total 64 5.4
1 MICS indicator 5.1; MDG indicator 5.4
12
Notes: The presented estimates are generated based on the Birth History module of the MICS questionnaires which is
recognized as more complex to administer even in more stable countries. The BH module was a challenge to implement in this MICS, hence the need to interpret the adolescent birth rate results with caution.
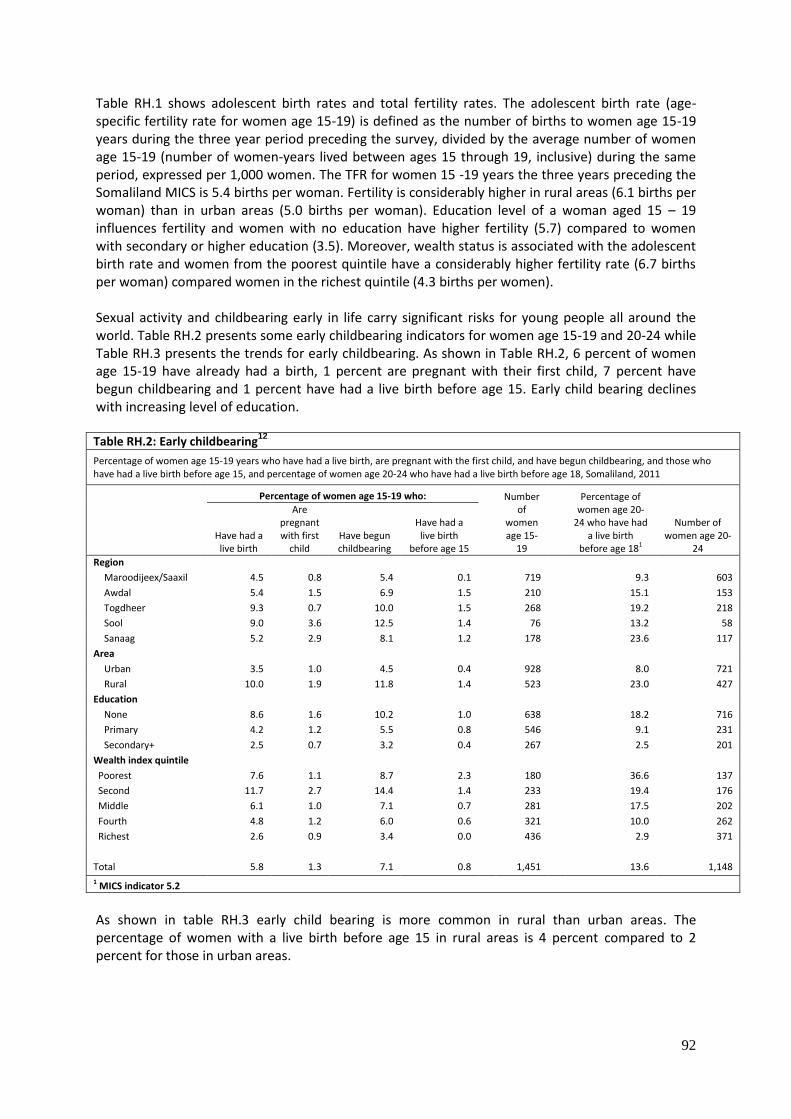
92
Table RH.1 shows adolescent birth rates and total fertility rates. The adolescent birth rate (age-specific fertility rate for women age 15-19) is defined as the number of births to women age 15-19 years during the three year period preceding the survey, divided by the average number of women age 15-19 (number of women-years lived between ages 15 through 19, inclusive) during the same period, expressed per 1,000 women. The TFR for women 15 -19 years the three years preceding the Somaliland MICS is 5.4 births per woman. Fertility is considerably higher in rural areas (6.1 births per woman) than in urban areas (5.0 births per woman). Education level of a woman aged 15 – 19 influences fertility and women with no education have higher fertility (5.7) compared to women with secondary or higher education (3.5). Moreover, wealth status is associated with the adolescent birth rate and women from the poorest quintile have a considerably higher fertility rate (6.7 births per woman) compared women in the richest quintile (4.3 births per women). Sexual activity and childbearing early in life carry significant risks for young people all around the world. Table RH.2 presents some early childbearing indicators for women age 15-19 and 20-24 while Table RH.3 presents the trends for early childbearing. As shown in Table RH.2, 6 percent of women age 15-19 have already had a birth, 1 percent are pregnant with their first child, 7 percent have begun childbearing and 1 percent have had a live birth before age 15. Early child bearing declines with increasing level of education.
As shown in table RH.3 early child bearing is more common in rural than urban areas. The percentage of women with a live birth before age 15 in rural areas is 4 percent compared to 2 percent for those in urban areas.
Table RH.2: Early childbearing12
Percentage of women age 15-19 years who have had a live birth, are pregnant with the first child, and have begun childbearing, and those who have had a live birth before age 15, and percentage of women age 20-24 who have had a live birth before age 18, Somaliland, 2011
Percentage of women age 15-19 who:
Number
of women age 15-
19
Percentage of
women age 20-24 who have had
a live birth before age 181
Number of women age 20-
24
Have had a live birth
Are pregnant with first
child Have begun childbearing
Have had a live birth
before age 15 Region
Maroodijeex/Saaxil 4.5 0.8 5.4 0.1 719 9.3 603
Awdal 5.4 1.5 6.9 1.5 210 15.1 153
Togdheer 9.3 0.7 10.0 1.5 268 19.2 218
Sool 9.0 3.6 12.5 1.4 76 13.2 58
Sanaag 5.2 2.9 8.1 1.2 178 23.6 117
Area
Urban 3.5 1.0 4.5 0.4 928 8.0 721
Rural 10.0 1.9 11.8 1.4 523 23.0 427
Education
None 8.6 1.6 10.2 1.0 638 18.2 716
Primary 4.2 1.2 5.5 0.8 546 9.1 231
Secondary+ 2.5 0.7 3.2 0.4 267 2.5 201
Wealth index quintile
Poorest 7.6 1.1 8.7 2.3 180 36.6 137
Second 11.7 2.7 14.4 1.4 233 19.4 176
Middle 6.1 1.0 7.1 0.7 281 17.5 202
Fourth 4.8 1.2 6.0 0.6 321 10.0 262
Richest 2.6 0.9 3.4 0.0 436 2.9 371
Total 5.8 1.3 7.1 0.8 1,451 13.6 1,148
1 MICS indicator 5.2
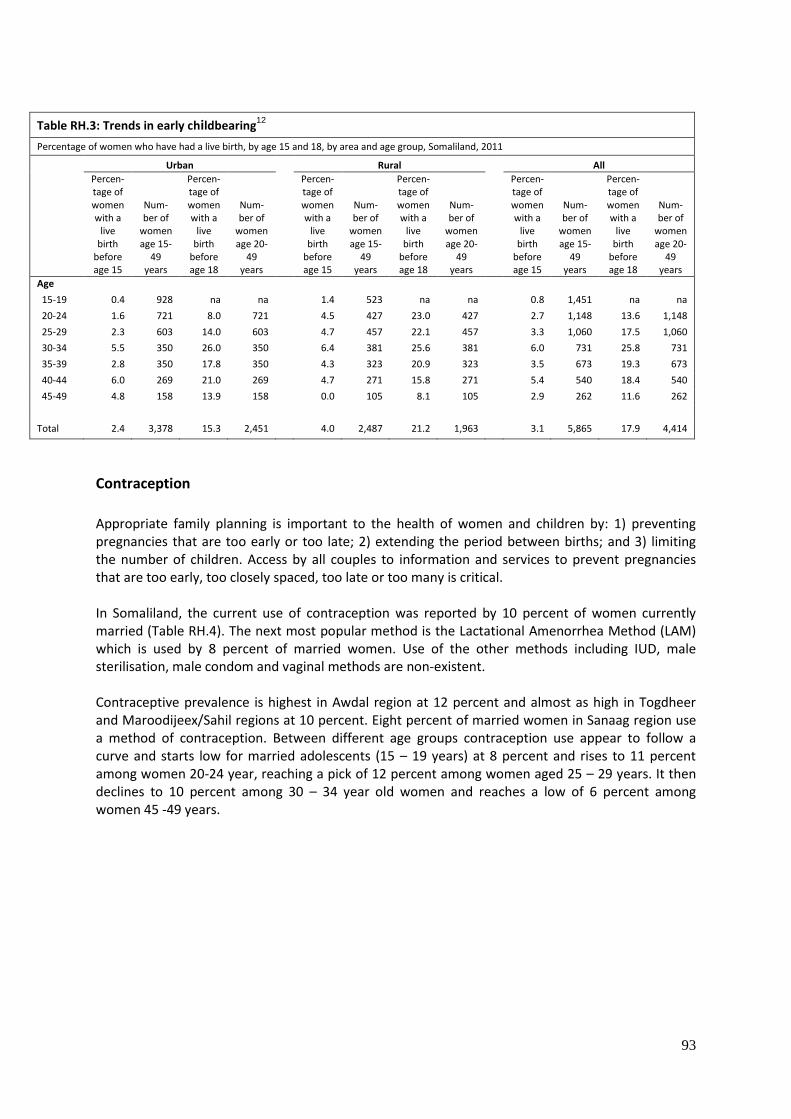
93
Table RH.3: Trends in early childbearing12
Percentage of women who have had a live birth, by age 15 and 18, by area and age group, Somaliland, 2011
Urban
Rural
All
Percen-tage of women with a
live birth
before age 15
Num-ber of
women age 15-
49 years
Percen-tage of women with a
live birth
before age 18
Num-ber of
women age 20-
49 years
Percen-tage of women with a
live birth
before age 15
Num-ber of
women age 15-
49 years
Percen-tage of women with a
live birth
before age 18
Num-ber of
women age 20-
49 years
Percen-tage of women with a
live birth
before age 15
Num-ber of
women age 15-
49 years
Percen-tage of women with a
live birth
before age 18
Num-ber of
women age 20-
49 years
Age
15-19 0.4 928 na na 1.4 523 na na 0.8 1,451 na na
20-24 1.6 721 8.0 721 4.5 427 23.0 427 2.7 1,148 13.6 1,148
25-29 2.3 603 14.0 603 4.7 457 22.1 457 3.3 1,060 17.5 1,060
30-34 5.5 350 26.0 350 6.4 381 25.6 381 6.0 731 25.8 731
35-39 2.8 350 17.8 350 4.3 323 20.9 323 3.5 673 19.3 673
40-44 6.0 269 21.0 269 4.7 271 15.8 271 5.4 540 18.4 540
45-49 4.8 158 13.9 158 0.0 105 8.1 105 2.9 262 11.6 262
Total 2.4 3,378 15.3 2,451 4.0 2,487 21.2 1,963 3.1 5,865 17.9 4,414
Contraception
Appropriate family planning is important to the health of women and children by: 1) preventing pregnancies that are too early or too late; 2) extending the period between births; and 3) limiting the number of children. Access by all couples to information and services to prevent pregnancies that are too early, too closely spaced, too late or too many is critical. In Somaliland, the current use of contraception was reported by 10 percent of women currently married (Table RH.4). The next most popular method is the Lactational Amenorrhea Method (LAM) which is used by 8 percent of married women. Use of the other methods including IUD, male sterilisation, male condom and vaginal methods are non-existent. Contraceptive prevalence is highest in Awdal region at 12 percent and almost as high in Togdheer and Maroodijeex/Sahil regions at 10 percent. Eight percent of married women in Sanaag region use a method of contraception. Between different age groups contraception use appear to follow a curve and starts low for married adolescents (15 – 19 years) at 8 percent and rises to 11 percent among women 20-24 year, reaching a pick of 12 percent among women aged 25 – 29 years. It then declines to 10 percent among 30 – 34 year old women and reaches a low of 6 percent among women 45 -49 years.

94
Table RH.4: Use of contraception Percentage of women age 15-49 years currently married who are using (or whose partner is using) a contraceptive method, Somaliland, 2011
Not using any
method
Percent of women (currently married or in union) who are using: Number of women
currently married
Inject-ables Pill
Female condom LAM
With-drawal
Any modern method
Any tradi-tional
method Any
method1
Region
Maroodijeex/Saaxil 90.2 0.6 1.5 0.1 7.3 0.1 2.4 7.5 9.8 1,439
Awdal 88.1 0.8 1.6 0.0 9.2 0.2 2.6 9.4 11.9 492
Togdheer 90.1 0.0 0.0 0.0 9.9 0.0 0.0 9.9 9.9 602
Sool 92.4 0.0 0.9 0.0 6.7 0.0 0.9 6.7 7.6 181
Sanaag 91.8 0.0 0.0 0.0 8.2 0.0 0.0 8.2 8.2 432
Area
Urban 89.3 0.8 2.1 0.1 7.5 0.1 3.2 7.6 10.7 1,521
Rural 91.1 0.0 0.0 0.0 8.8 0.1 0.0 8.9 8.9 1,626
Age
15-19 91.6 0.0 0.7 0.0 7.7 0.0 0.7 7.7 8.4 129
20-24 88.9 1.1 1.9 0.0 8.0 0.2 2.9 8.2 11.1 455
25-29 88.2 0.5 1.0 0.0 10.3 0.0 1.5 10.3 11.8 751
30-34 90.0 0.5 1.3 0.0 8.1 0.0 1.9 8.1 10.0 603
35-39 91.1 0.2 0.7 0.0 7.7 0.0 0.9 8.1 8.9 553
40-44 92.2 0.0 0.6 0.0 6.9 0.2 0.6 7.2 7.8 452
45-49 93.7 0.0 0.0 1.0 4.9 0.0 1.4 4.9 6.3 202
Number of living children
0 100.0 0.0 0.0 0.0 0.0 0.0 0.0 0.0 0.0 272
1 90.5 0.6 1.6 0.0 7.2 0.0 2.3 7.2 9.5 299
2 88.1 1.1 1.9 0.0 9.0 0.0 2.9 9.0 11.9 364
3 88.6 0.7 1.1 0.0 9.4 0.0 2.0 9.4 11.4 438
4+ 89.5 0.2 0.9 0.1 9.1 0.1 1.2 9.3 10.5 1,774
Education
None 90.7 0.2 0.6 0.0 8.2 0.0 1.0 8.3 9.3 2,510
Primary 88.9 1.3 1.9 0.2 7.7 0.0 3.4 7.7 11.1 459
Secondary+ 86.3 0.5 3.8 0.0 8.3 0.5 4.9 8.8 13.7 177
Wealth index quintile
Poorest 92.1 0.0 0.3 0.0 7.5 0.0 0.3 7.6 7.9 635
Second 88.2 0.0 0.0 0.0 11.7 0.2 0.0 11.8 11.8 683
Middle 91.0 0.4 0.7 0.1 7.7 0.0 1.3 7.7 9.0 660
Fourth 90.7 0.5 1.6 0.0 7.1 0.0 2.0 7.3 9.3 616
Richest 88.9 1.2 2.8 0.2 6.4 0.2 4.6 6.5 11.1 552
Total 90.2 0.4 1.0 0.1 8.2 0.1 1.5 8.3 9.8 3,146 1 MICS indicator 5.3; MDG indicator 5.3. There are no cases of female sterilization, male sterilization, IUD, Implants, male condom, periodic abstinence and diaphragm/foam/jelly thus not shown on the table.
Contraceptive prevalence appears to follow an increasing trend as women’s education increase. The percentage of women using any method of contraception varies slightly from 9 percent among those with no education to 11 percent among women with primary education, and to 14 percent among women with secondary or higher education. Use of LAM tends to remain fairly consistent across the education categories.

95
Unmet Need
Unmet need for contraception refers to fecund women who are not using any method of contraception, but who wish to postpone the next birth (spacing) or who wish to stop childbearing altogether (limiting). Unmet need is identified in MICS by using a set of questions eliciting current behaviours and preferences pertaining to contraceptive use, fecundity, and fertility preferences. Table RH.5 shows the levels of met need for contraception, unmet need, and the demand for contraception satisfied. Unmet need for spacing is defined as the percentage of women who are not using a method of contraception AND
are not pregnant and not postpartum amenorrheic13 and are fecund14 and say they want to wait two or more years for their next birth OR
are not pregnant and not postpartum amenorrheic and are fecund and unsure whether they want another child OR
are pregnant and say that pregnancy was mistimed: would have wanted to wait OR
are postpartum amenorrheic and say that the birth was mistimed: would have wanted to wait
Unmet need for limiting is defined as percentage of women who are not using a method of contraception AND
are not pregnant and not postpartum amenorrheic and are fecund and say they do not want any more children OR
are pregnant and say they do not want to have a child OR
are postpartum amenorrheic and say that they do not want the birth Total unmet need for contraception is the sum of unmet need for spacing and unmet need for limiting. In the Somaliland the unmet need appear fairly low (20 percent). Unmet need for birth spacing (16 percent) contributes to most of the total unmet need. The total unmet need is highest in Maroodi/Sahil and Sool regions (22 percent) and lowest in Sanaag region (16 percent). The data suggests that women in Somaliland tend to have many children and hence the low unmet need for contraception. Met need for limiting includes women who are using (or whose partner is using) a contraceptive method and who want no more children, are using male or female sterilization or declare themselves as infecund. Met need for spacing includes women who are using (or whose partner is using) a contraceptive method and who want to have another child or are undecided whether to have another child. The total of met need for spacing and limiting adds up to the total met need for contraception. The total met need for contraception is 15 percent and this mostly comes from the
13
A women is postpartum amenorrheic if she had a birth in last two years and is not currently pregnant, and her menstrual period has not returned since the birth of the last child 14
A women is considered infecund if she is neither pregnant nor postpartum amenorrheic, and (1a) has not had menstruation for at least six months, or (1b) never menstruated, or (1c) her last menstruation occurred before her last birth, or (1d) in menopause/has had hysterectomy OR (2) She declares that she has had hysterectomy, or that she has never menstruated or that she is menopausal, or that she has been trying to get pregnant for 2 or more years without result in response to questions on why she thinks she is not physically able to get pregnant at the time of survey OR (3) She declares she cannot get pregnant when asked about desire for future birth OR (4) She has not had a birth in the preceding 5 years, is currently not using contraception and is currently married and was continuously married during the last 5 years preceding the survey
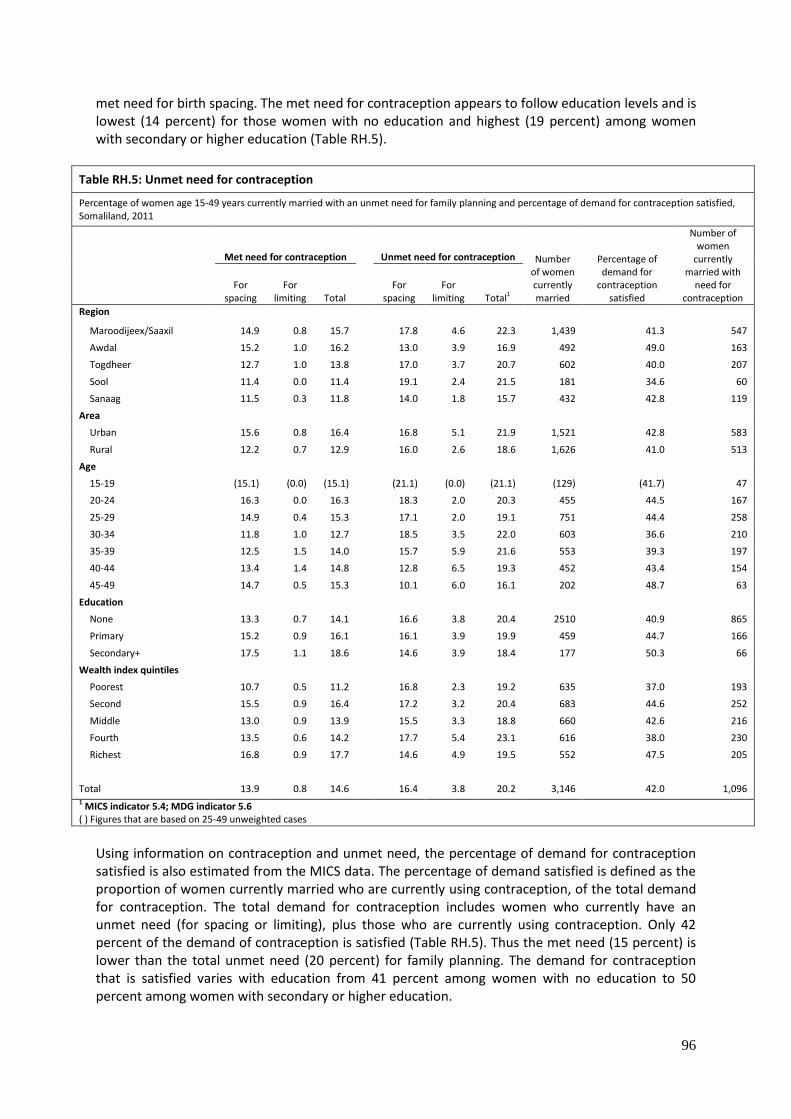
96
met need for birth spacing. The met need for contraception appears to follow education levels and is lowest (14 percent) for those women with no education and highest (19 percent) among women with secondary or higher education (Table RH.5).
Table RH.5: Unmet need for contraception
Percentage of women age 15-49 years currently married with an unmet need for family planning and percentage of demand for contraception satisfied, Somaliland, 2011
Met need for contraception
Unmet need for contraception Number of women currently married
Percentage of demand for
contraception satisfied
Number of women
currently married with
need for contraception
For spacing
For limiting Total
For spacing
For limiting Total1
Region
Maroodijeex/Saaxil 14.9 0.8 15.7 17.8 4.6 22.3 1,439 41.3 547
Awdal 15.2 1.0 16.2 13.0 3.9 16.9 492 49.0 163
Togdheer 12.7 1.0 13.8 17.0 3.7 20.7 602 40.0 207
Sool 11.4 0.0 11.4 19.1 2.4 21.5 181 34.6 60
Sanaag 11.5 0.3 11.8 14.0 1.8 15.7 432 42.8 119
Area
Urban 15.6 0.8 16.4 16.8 5.1 21.9 1,521 42.8 583
Rural 12.2 0.7 12.9 16.0 2.6 18.6 1,626 41.0 513
Age
15-19 (15.1) (0.0) (15.1) (21.1) (0.0) (21.1) (129) (41.7) 47
20-24 16.3 0.0 16.3 18.3 2.0 20.3 455 44.5 167
25-29 14.9 0.4 15.3 17.1 2.0 19.1 751 44.4 258
30-34 11.8 1.0 12.7 18.5 3.5 22.0 603 36.6 210
35-39 12.5 1.5 14.0 15.7 5.9 21.6 553 39.3 197
40-44 13.4 1.4 14.8 12.8 6.5 19.3 452 43.4 154
45-49 14.7 0.5 15.3 10.1 6.0 16.1 202 48.7 63
Education
None 13.3 0.7 14.1 16.6 3.8 20.4 2510 40.9 865
Primary 15.2 0.9 16.1 16.1 3.9 19.9 459 44.7 166
Secondary+ 17.5 1.1 18.6 14.6 3.9 18.4 177 50.3 66
Wealth index quintiles
Poorest 10.7 0.5 11.2 16.8 2.3 19.2 635 37.0 193
Second 15.5 0.9 16.4 17.2 3.2 20.4 683 44.6 252
Middle 13.0 0.9 13.9 15.5 3.3 18.8 660 42.6 216
Fourth 13.5 0.6 14.2 17.7 5.4 23.1 616 38.0 230
Richest 16.8 0.9 17.7 14.6 4.9 19.5 552 47.5 205
Total 13.9 0.8 14.6 16.4 3.8 20.2 3,146 42.0 1,096 1 MICS indicator 5.4; MDG indicator 5.6 ( ) Figures that are based on 25-49 unweighted cases
Using information on contraception and unmet need, the percentage of demand for contraception satisfied is also estimated from the MICS data. The percentage of demand satisfied is defined as the proportion of women currently married who are currently using contraception, of the total demand for contraception. The total demand for contraception includes women who currently have an unmet need (for spacing or limiting), plus those who are currently using contraception. Only 42 percent of the demand of contraception is satisfied (Table RH.5). Thus the met need (15 percent) is lower than the total unmet need (20 percent) for family planning. The demand for contraception that is satisfied varies with education from 41 percent among women with no education to 50 percent among women with secondary or higher education.
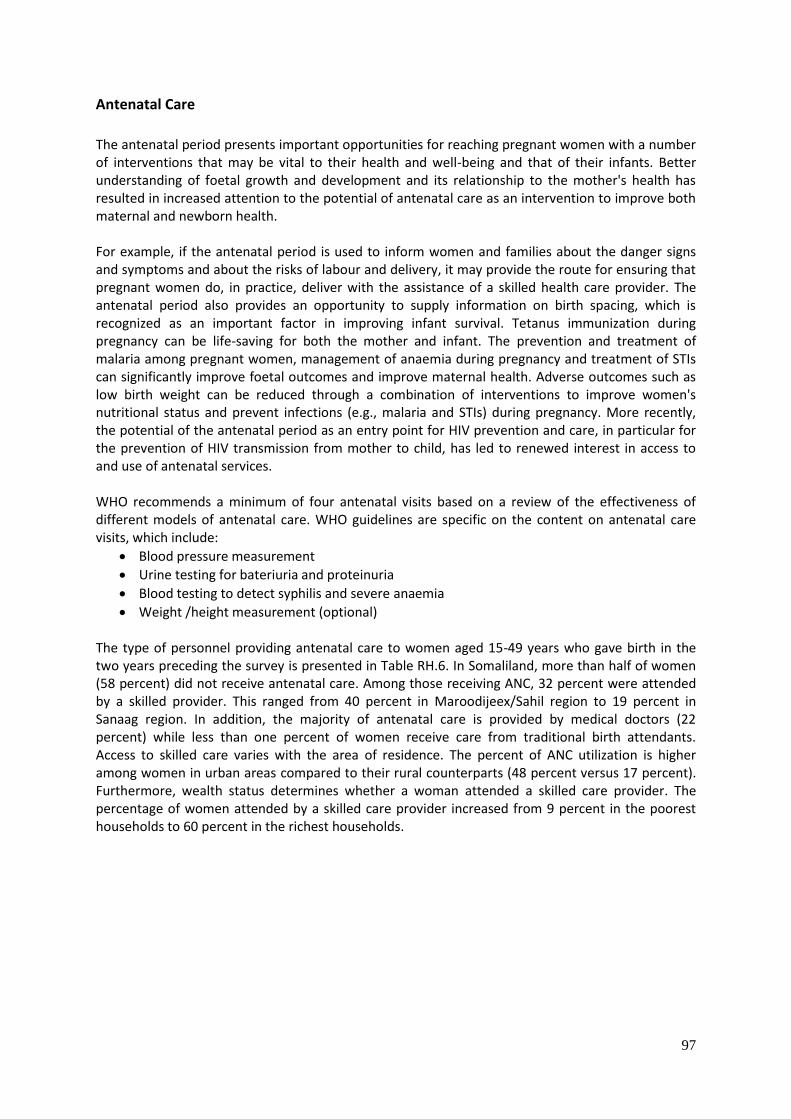
97
Antenatal Care
The antenatal period presents important opportunities for reaching pregnant women with a number of interventions that may be vital to their health and well-being and that of their infants. Better understanding of foetal growth and development and its relationship to the mother's health has resulted in increased attention to the potential of antenatal care as an intervention to improve both maternal and newborn health. For example, if the antenatal period is used to inform women and families about the danger signs and symptoms and about the risks of labour and delivery, it may provide the route for ensuring that pregnant women do, in practice, deliver with the assistance of a skilled health care provider. The antenatal period also provides an opportunity to supply information on birth spacing, which is recognized as an important factor in improving infant survival. Tetanus immunization during pregnancy can be life-saving for both the mother and infant. The prevention and treatment of malaria among pregnant women, management of anaemia during pregnancy and treatment of STIs can significantly improve foetal outcomes and improve maternal health. Adverse outcomes such as low birth weight can be reduced through a combination of interventions to improve women's nutritional status and prevent infections (e.g., malaria and STIs) during pregnancy. More recently, the potential of the antenatal period as an entry point for HIV prevention and care, in particular for the prevention of HIV transmission from mother to child, has led to renewed interest in access to and use of antenatal services. WHO recommends a minimum of four antenatal visits based on a review of the effectiveness of different models of antenatal care. WHO guidelines are specific on the content on antenatal care visits, which include:
Blood pressure measurement
Urine testing for bateriuria and proteinuria
Blood testing to detect syphilis and severe anaemia
Weight /height measurement (optional)
The type of personnel providing antenatal care to women aged 15-49 years who gave birth in the two years preceding the survey is presented in Table RH.6. In Somaliland, more than half of women (58 percent) did not receive antenatal care. Among those receiving ANC, 32 percent were attended by a skilled provider. This ranged from 40 percent in Maroodijeex/Sahil region to 19 percent in Sanaag region. In addition, the majority of antenatal care is provided by medical doctors (22 percent) while less than one percent of women receive care from traditional birth attendants. Access to skilled care varies with the area of residence. The percent of ANC utilization is higher among women in urban areas compared to their rural counterparts (48 percent versus 17 percent). Furthermore, wealth status determines whether a woman attended a skilled care provider. The percentage of women attended by a skilled care provider increased from 9 percent in the poorest households to 60 percent in the richest households.
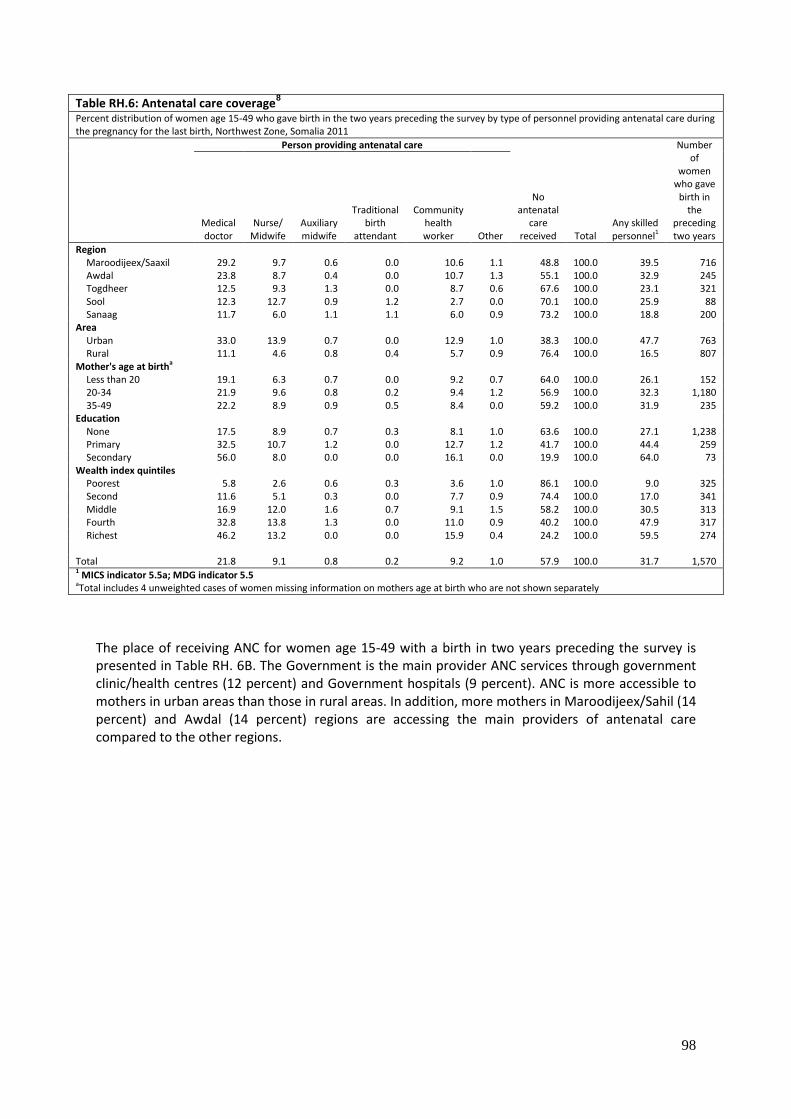
98
Table RH.6: Antenatal care coverage8
Percent distribution of women age 15-49 who gave birth in the two years preceding the survey by type of personnel providing antenatal care during the pregnancy for the last birth, Northwest Zone, Somalia 2011
Person providing antenatal care
No antenatal
care received Total
Any skilled personnel1
Number of
women who gave
birth in the
preceding two years
Medical doctor
Nurse/ Midwife
Auxiliary midwife
Traditional birth
attendant
Community health worker Other
Region Maroodijeex/Saaxil 29.2 9.7 0.6 0.0 10.6 1.1 48.8 100.0 39.5 716 Awdal 23.8 8.7 0.4 0.0 10.7 1.3 55.1 100.0 32.9 245 Togdheer 12.5 9.3 1.3 0.0 8.7 0.6 67.6 100.0 23.1 321 Sool 12.3 12.7 0.9 1.2 2.7 0.0 70.1 100.0 25.9 88 Sanaag 11.7 6.0 1.1 1.1 6.0 0.9 73.2 100.0 18.8 200
Area Urban 33.0 13.9 0.7 0.0 12.9 1.0 38.3 100.0 47.7 763 Rural 11.1 4.6 0.8 0.4 5.7 0.9 76.4 100.0 16.5 807
Mother's age at birtha Less than 20 19.1 6.3 0.7 0.0 9.2 0.7 64.0 100.0 26.1 152 20-34 21.9 9.6 0.8 0.2 9.4 1.2 56.9 100.0 32.3 1,180 35-49 22.2 8.9 0.9 0.5 8.4 0.0 59.2 100.0 31.9 235
Education None 17.5 8.9 0.7 0.3 8.1 1.0 63.6 100.0 27.1 1,238 Primary 32.5 10.7 1.2 0.0 12.7 1.2 41.7 100.0 44.4 259 Secondary 56.0 8.0 0.0 0.0 16.1 0.0 19.9 100.0 64.0 73
Wealth index quintiles Poorest 5.8 2.6 0.6 0.3 3.6 1.0 86.1 100.0 9.0 325 Second 11.6 5.1 0.3 0.0 7.7 0.9 74.4 100.0 17.0 341 Middle 16.9 12.0 1.6 0.7 9.1 1.5 58.2 100.0 30.5 313 Fourth 32.8 13.8 1.3 0.0 11.0 0.9 40.2 100.0 47.9 317 Richest 46.2 13.2 0.0 0.0 15.9 0.4 24.2 100.0 59.5 274
Total 21.8 9.1 0.8 0.2 9.2 1.0 57.9 100.0 31.7 1,570 1 MICS indicator 5.5a; MDG indicator 5.5 aTotal includes 4 unweighted cases of women missing information on mothers age at birth who are not shown separately
The place of receiving ANC for women age 15-49 with a birth in two years preceding the survey is presented in Table RH. 6B. The Government is the main provider ANC services through government clinic/health centres (12 percent) and Government hospitals (9 percent). ANC is more accessible to mothers in urban areas than those in rural areas. In addition, more mothers in Maroodijeex/Sahil (14 percent) and Awdal (14 percent) regions are accessing the main providers of antenatal care compared to the other regions.
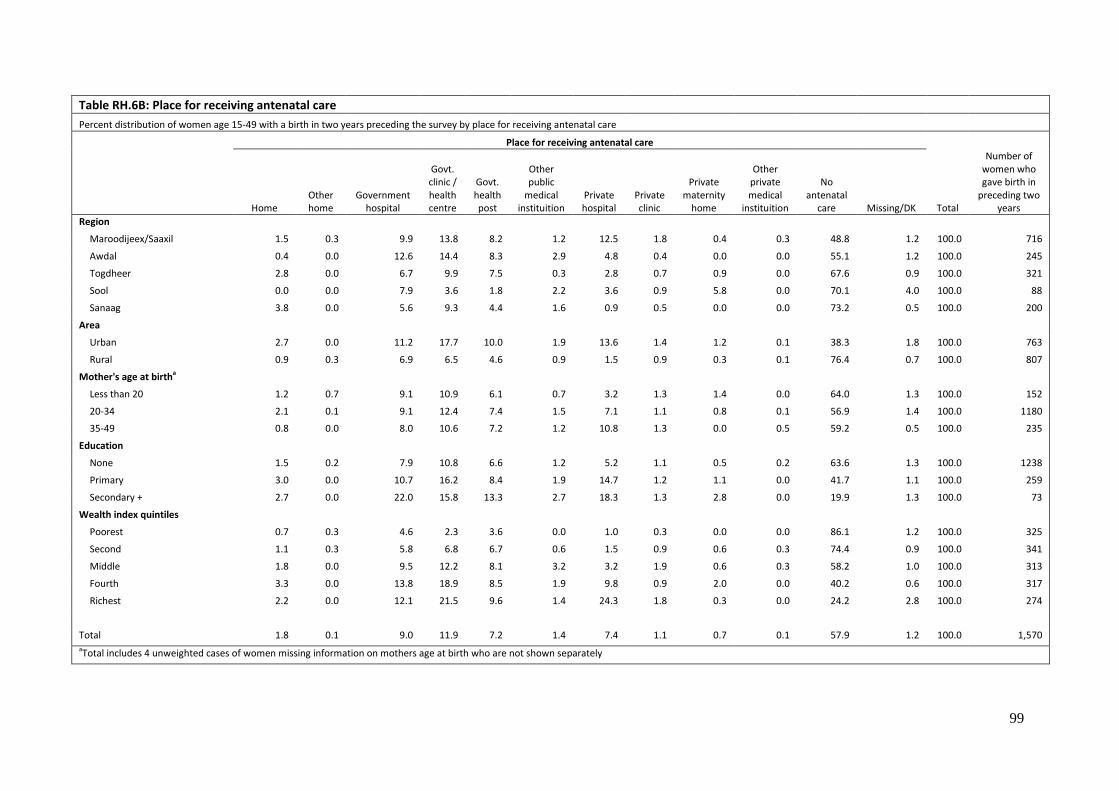
99
Table RH.6B: Place for receiving antenatal care
Percent distribution of women age 15-49 with a birth in two years preceding the survey by place for receiving antenatal care
Place for receiving antenatal care
Home Other home
Government hospital
Govt. clinic / health centre
Govt. health post
Other public
medical instituition
Private hospital
Private clinic
Private maternity
home
Other private medical
instituition
No antenatal
care Missing/DK Total
Number of women who gave birth in
preceding two years
Region Maroodijeex/Saaxil 1.5 0.3 9.9 13.8 8.2 1.2 12.5 1.8 0.4 0.3 48.8 1.2 100.0 716
Awdal 0.4 0.0 12.6 14.4 8.3 2.9 4.8 0.4 0.0 0.0 55.1 1.2 100.0 245
Togdheer 2.8 0.0 6.7 9.9 7.5 0.3 2.8 0.7 0.9 0.0 67.6 0.9 100.0 321
Sool 0.0 0.0 7.9 3.6 1.8 2.2 3.6 0.9 5.8 0.0 70.1 4.0 100.0 88
Sanaag 3.8 0.0 5.6 9.3 4.4 1.6 0.9 0.5 0.0 0.0 73.2 0.5 100.0 200
Area
Urban 2.7 0.0 11.2 17.7 10.0 1.9 13.6 1.4 1.2 0.1 38.3 1.8 100.0 763
Rural 0.9 0.3 6.9 6.5 4.6 0.9 1.5 0.9 0.3 0.1 76.4 0.7 100.0 807
Mother's age at birtha
Less than 20 1.2 0.7 9.1 10.9 6.1 0.7 3.2 1.3 1.4 0.0 64.0 1.3 100.0 152
20-34 2.1 0.1 9.1 12.4 7.4 1.5 7.1 1.1 0.8 0.1 56.9 1.4 100.0 1180
35-49 0.8 0.0 8.0 10.6 7.2 1.2 10.8 1.3 0.0 0.5 59.2 0.5 100.0 235
Education
None 1.5 0.2 7.9 10.8 6.6 1.2 5.2 1.1 0.5 0.2 63.6 1.3 100.0 1238
Primary 3.0 0.0 10.7 16.2 8.4 1.9 14.7 1.2 1.1 0.0 41.7 1.1 100.0 259
Secondary + 2.7 0.0 22.0 15.8 13.3 2.7 18.3 1.3 2.8 0.0 19.9 1.3 100.0 73
Wealth index quintiles
Poorest 0.7 0.3 4.6 2.3 3.6 0.0 1.0 0.3 0.0 0.0 86.1 1.2 100.0 325
Second 1.1 0.3 5.8 6.8 6.7 0.6 1.5 0.9 0.6 0.3 74.4 0.9 100.0 341
Middle 1.8 0.0 9.5 12.2 8.1 3.2 3.2 1.9 0.6 0.3 58.2 1.0 100.0 313
Fourth 3.3 0.0 13.8 18.9 8.5 1.9 9.8 0.9 2.0 0.0 40.2 0.6 100.0 317
Richest 2.2 0.0 12.1 21.5 9.6 1.4 24.3 1.8 0.3 0.0 24.2 2.8 100.0 274
Total 1.8 0.1 9.0 11.9 7.2 1.4 7.4 1.1 0.7 0.1 57.9 1.2 100.0 1,570 aTotal includes 4 unweighted cases of women missing information on mothers age at birth who are not shown separately
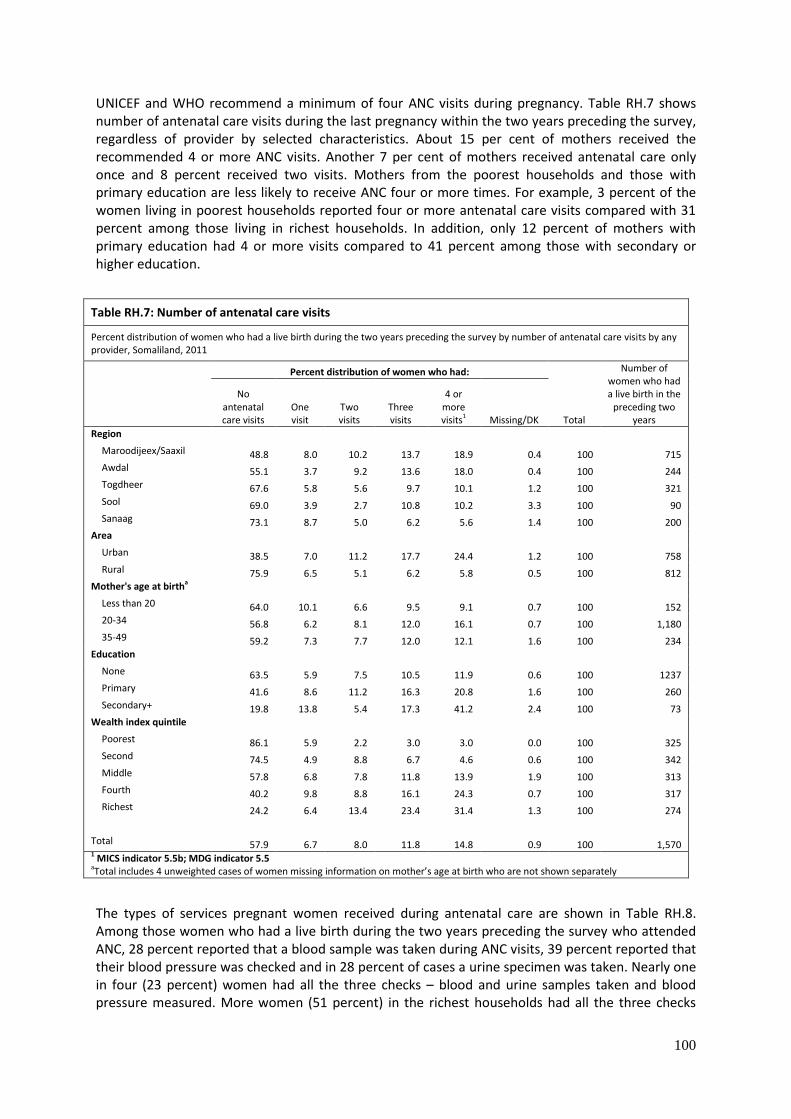
100
UNICEF and WHO recommend a minimum of four ANC visits during pregnancy. Table RH.7 shows number of antenatal care visits during the last pregnancy within the two years preceding the survey, regardless of provider by selected characteristics. About 15 per cent of mothers received the recommended 4 or more ANC visits. Another 7 per cent of mothers received antenatal care only once and 8 percent received two visits. Mothers from the poorest households and those with primary education are less likely to receive ANC four or more times. For example, 3 percent of the women living in poorest households reported four or more antenatal care visits compared with 31 percent among those living in richest households. In addition, only 12 percent of mothers with primary education had 4 or more visits compared to 41 percent among those with secondary or higher education.
Table RH.7: Number of antenatal care visits
Percent distribution of women who had a live birth during the two years preceding the survey by number of antenatal care visits by any provider, Somaliland, 2011
Percent distribution of women who had:
Number of women who had a live birth in the
preceding two years
No antenatal care visits
One visit
Two visits
Three visits
4 or more visits1 Missing/DK Total
Region
Maroodijeex/Saaxil 48.8 8.0 10.2 13.7 18.9 0.4 100 715 Awdal 55.1 3.7 9.2 13.6 18.0 0.4 100 244 Togdheer 67.6 5.8 5.6 9.7 10.1 1.2 100 321 Sool 69.0 3.9 2.7 10.8 10.2 3.3 100 90 Sanaag 73.1 8.7 5.0 6.2 5.6 1.4 100 200
Area
Urban 38.5 7.0 11.2 17.7 24.4 1.2 100 758 Rural 75.9 6.5 5.1 6.2 5.8 0.5 100 812
Mother's age at birtha
Less than 20 64.0 10.1 6.6 9.5 9.1 0.7 100 152 20-34 56.8 6.2 8.1 12.0 16.1 0.7 100 1,180 35-49 59.2 7.3 7.7 12.0 12.1 1.6 100 234
Education
None 63.5 5.9 7.5 10.5 11.9 0.6 100 1237 Primary 41.6 8.6 11.2 16.3 20.8 1.6 100 260 Secondary+ 19.8 13.8 5.4 17.3 41.2 2.4 100 73
Wealth index quintile
Poorest 86.1 5.9 2.2 3.0 3.0 0.0 100 325 Second 74.5 4.9 8.8 6.7 4.6 0.6 100 342 Middle 57.8 6.8 7.8 11.8 13.9 1.9 100 313 Fourth 40.2 9.8 8.8 16.1 24.3 0.7 100 317 Richest 24.2 6.4 13.4 23.4 31.4 1.3 100 274
Total 57.9 6.7 8.0 11.8 14.8 0.9 100 1,570 1 MICS indicator 5.5b; MDG indicator 5.5 aTotal includes 4 unweighted cases of women missing information on mother’s age at birth who are not shown separately
The types of services pregnant women received during antenatal care are shown in Table RH.8. Among those women who had a live birth during the two years preceding the survey who attended ANC, 28 percent reported that a blood sample was taken during ANC visits, 39 percent reported that their blood pressure was checked and in 28 percent of cases a urine specimen was taken. Nearly one in four (23 percent) women had all the three checks – blood and urine samples taken and blood pressure measured. More women (51 percent) in the richest households had all the three checks

101
done compared to 6 percent from the poorest households. Moreover, only 18 percent of women with no education had all the three checks done compared to 57 percent of women with secondary or higher education level.
Table RH.8: Content of antenatal care8
Percentage of women age 15-49 years who had their blood pressure measured, urine sample taken, and blood sample taken as part of antenatal care, Somaliland, 2011
Percentage of pregnant women who had:
Number of women who had a live birth
in the preceding two years
Blood pressure measured
Urine sample taken
Blood sample taken
Blood pressure measured, urine
and blood sample taken1
Region
Maroodijeex/Saaxil 46.8 35.1 34.6 29.4 715
Awdal 40.7 30.4 30.8 25.8 244
Togdheer 31.5 19.6 19.9 16.8 321
Sool 28.6 20.8 24.7 19.5 90
Sanaag 23.6 12.1 14.7 10.2 200
Area
Urban 57.4 42.4 42.5 36.4 758
Rural 21.3 13.5 14.3 10.9 812
Mother's age at birtha
Less than 20 31.5 24.3 26.1 23.6 152
20-34 40.0 28.3 29.0 23.8 1,180
35-49 37.1 25.1 23.4 20.1 234
Education
None 32.8 22.2 22.9 18.2 1,237
Primary 56.5 41.6 42.4 37.8 260
Secondary+ 74.7 65.4 61.5 57.3 73
Wealth index quintile
Poorest 12.6 7.1 8.8 6.1 325
Second 21.9 14.0 14.9 10.6 342
Middle 38.8 25.8 25.9 22.6 313
Fourth 54.5 39.5 38.3 31.2 317
Richest 72.3 56.4 57.1 50.7 274
Total 38.7 27.5 27.9 23.2 1,570 1 MICS indicator 5.6 aTotal includes 4 unweighted cases of women missing information on mothers age at birth who are not shown separately
102
Assistance at Delivery
Three quarters of all maternal deaths occur during delivery and the immediate post-partum period. The single most critical intervention for safe motherhood is to ensure a competent health worker with midwifery skills is present at every birth, and transport is available to a referral facility for obstetric care in case of emergency. A World Fit for Children goal is to ensure that women have ready and affordable access to skilled attendance at delivery. The indicators are the proportion of births with a skilled attendant and proportion of institutional deliveries. The skilled attendant at delivery indicator is also used to track progress toward the Millennium Development target of reducing the maternal mortality ratio by three quarters between 1990 and 2015. The MICS included a number of questions to assess the proportion of births attended by a skilled attendant. A skilled attendant includes a doctor, nurse, midwife or auxiliary midwife (who are also skilled birth attendants). About 44 percent of the last births to women occurring in the two years preceding the survey were delivered by skilled personnel (Table RH.9). This percentage is highest in Maroodijeex/Sahil at 57 percent and lowest in Sanaag region at 25 percent. The more educated a woman is, the more likely she is to have delivered with the assistance of a skilled attendant; 89 percent of women with secondary or higher education delivered with the assistance of a skilled attendant compared to 38 percent among women with no education.
The main providers of skilled delivery service in the Somaliland MICS 4 survey were a medical doctor (19 percent) and a nurse/midwife (21 percent). About 4 percent of births in the two years preceding the MICS survey are delivered with assistance of an auxiliary midwife. Overall, about 44 percent of births are delivered by skilled attendants. Maroodijeex/Sahil region has the highest proportion of deliveries attended by a skilled attendant: 57 percent of the births of which 30 percent were attended by medical doctors, 23 percent by nurse/midwife and 4 percent by auxiliary midwife. In Sanaag region 51 percent of births are delivered by a traditional birth attendant and only six percent of births by a medical doctor. In the other regions, between three and six percent of births are delivered with the assistance of an auxiliary midwife while 8 - 16 percent are delivered by a doctor. Four percent of women delivered through C-section. This mode of delivery was influenced by education and wealth status of the women. Women with secondary or higher education and in richest households (11 percent for each case) delivered by C-section compared with 3 percent of those with no education and less than one percent among the poorest.
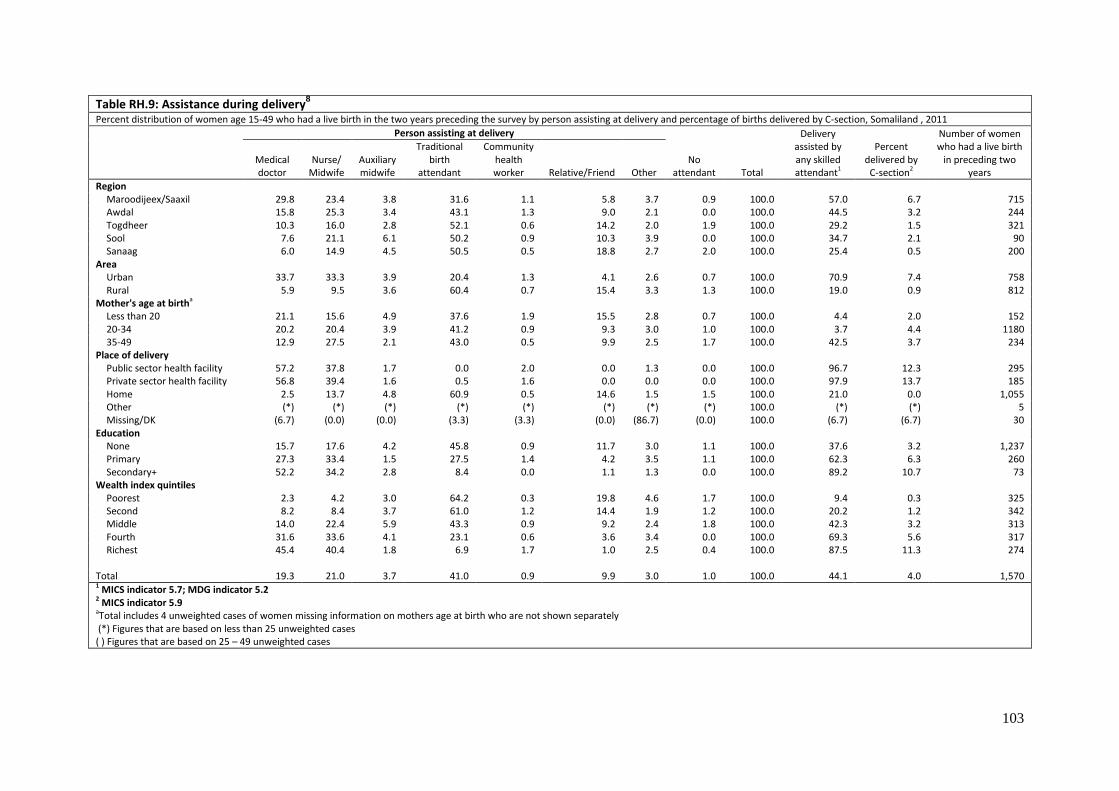
103
Table RH.9: Assistance during delivery8
Percent distribution of women age 15-49 who had a live birth in the two years preceding the survey by person assisting at delivery and percentage of births delivered by C-section, Somaliland , 2011
Person assisting at delivery
No attendant Total
Delivery assisted by any skilled attendant1
Percent delivered by
C-section2
Number of women who had a live birth
in preceding two years
Medical doctor
Nurse/ Midwife
Auxiliary midwife
Traditional birth
attendant
Community health worker Relative/Friend Other
Region Maroodijeex/Saaxil 29.8 23.4 3.8 31.6 1.1 5.8 3.7 0.9 100.0 57.0 6.7 715 Awdal 15.8 25.3 3.4 43.1 1.3 9.0 2.1 0.0 100.0 44.5 3.2 244 Togdheer 10.3 16.0 2.8 52.1 0.6 14.2 2.0 1.9 100.0 29.2 1.5 321 Sool 7.6 21.1 6.1 50.2 0.9 10.3 3.9 0.0 100.0 34.7 2.1 90 Sanaag 6.0 14.9 4.5 50.5 0.5 18.8 2.7 2.0 100.0 25.4 0.5 200
Area Urban 33.7 33.3 3.9 20.4 1.3 4.1 2.6 0.7 100.0 70.9 7.4 758 Rural 5.9 9.5 3.6 60.4 0.7 15.4 3.3 1.3 100.0 19.0 0.9 812
Mother's age at birtha Less than 20 21.1 15.6 4.9 37.6 1.9 15.5 2.8 0.7 100.0 4.4 2.0 152 20-34 20.2 20.4 3.9 41.2 0.9 9.3 3.0 1.0 100.0 3.7 4.4 1180 35-49 12.9 27.5 2.1 43.0 0.5 9.9 2.5 1.7 100.0 42.5 3.7 234
Place of delivery Public sector health facility 57.2 37.8 1.7 0.0 2.0 0.0 1.3 0.0 100.0 96.7 12.3 295 Private sector health facility 56.8 39.4 1.6 0.5 1.6 0.0 0.0 0.0 100.0 97.9 13.7 185 Home 2.5 13.7 4.8 60.9 0.5 14.6 1.5 1.5 100.0 21.0 0.0 1,055 Other (*) (*) (*) (*) (*) (*) (*) (*) 100.0 (*) (*) 5 Missing/DK (6.7) (0.0) (0.0) (3.3) (3.3) (0.0) (86.7) (0.0) 100.0 (6.7) (6.7) 30
Education None 15.7 17.6 4.2 45.8 0.9 11.7 3.0 1.1 100.0 37.6 3.2 1,237 Primary 27.3 33.4 1.5 27.5 1.4 4.2 3.5 1.1 100.0 62.3 6.3 260 Secondary+ 52.2 34.2 2.8 8.4 0.0 1.1 1.3 0.0 100.0 89.2 10.7 73
Wealth index quintiles Poorest 2.3 4.2 3.0 64.2 0.3 19.8 4.6 1.7 100.0 9.4 0.3 325 Second 8.2 8.4 3.7 61.0 1.2 14.4 1.9 1.2 100.0 20.2 1.2 342 Middle 14.0 22.4 5.9 43.3 0.9 9.2 2.4 1.8 100.0 42.3 3.2 313 Fourth 31.6 33.6 4.1 23.1 0.6 3.6 3.4 0.0 100.0 69.3 5.6 317 Richest 45.4 40.4 1.8 6.9 1.7 1.0 2.5 0.4 100.0 87.5 11.3 274
Total 19.3 21.0 3.7 41.0 0.9 9.9 3.0 1.0 100.0 44.1 4.0 1,570 1 MICS indicator 5.7; MDG indicator 5.2 2 MICS indicator 5.9 aTotal includes 4 unweighted cases of women missing information on mothers age at birth who are not shown separately (*) Figures that are based on less than 25 unweighted cases ( ) Figures that are based on 25 – 49 unweighted cases
104
Place of Delivery
Increasing the proportion of births that are delivered in health facilities is an important factor in reducing the health risks to both the mother and the baby. Proper medical attention and hygienic conditions during delivery can reduce the risks of complications and infection that can cause morbidity and mortality to either the mother or the baby. Table RH.10 presents the percent distribution of women age 15-49 who had a live birth in the two years preceding the survey by place of delivery and the percentage of births delivered in a health facility, according to background characteristics. About 31 percent of births in Somaliland are delivered in a health facility; 19 percent of deliveries occur in public sector facilities and 12 percent occur in private sector facilities. The percentage of women in urban areas delivering in health facilities is higher than their rural counterparts; (54 percent against 9 percent). Maroodijeex/Sahil region has the highest proportion of institutional deliveries (47 percent), followed by Awdal region (27 percent), while Sanaag region has the lowest proportion (9 percent). Women with higher levels of educational attainment are more likely to deliver in a health facility than women with less education or no education. The proportion of births occurring in a health facility increases steadily with increasing wealth quintile, from 4 percent of births in the lowest wealth quintile to 73 percent among those in the highest quintile. More than half (67 percent) of the deliveries in Somaliland occur at home. The proportion of those who delivered at home is highest in Sanaag region (90 percent) and lowest in Maroodijeex/Sahil region (50 percent). .

105
Table RH.10: Place of delivery8
Percent distribution of women age 15-49 who had a live birth in two years preceding the survey by place of delivery, Somaliland, 2011
Place of delivery
Total
Delivered in health facility1
Number of women who
had a live birth in
preceding two years
Public sector health facility
Private sector health facility Home Other Missing/DK
Region
Maroodijeex/Saaxil 27.2 20.0 49.5 0.3 3.1 100.0 47.1 715
Awdal 22.0 4.9 72.3 0.0 0.9 100.0 26.8 244
Togdheer 8.0 5.3 85.4 0.7 0.6 100.0 13.3 321
Sool 12.4 6.6 79.2 0.9 0.9 100.0 19.0 90
Sanaag 5.2 3.5 89.7 0.0 1.6 100.0 8.7 200
Area
Urban 31.9 22.3 43.2 0.4 2.3 100.0 54.2 758
Rural 6.6 2.0 89.6 0.3 1.6 100.0 8.5 812
Mother's age at birth
Less than 20 24.4 5.7 67.8 0.0 2.1 100.0 30.1 152
20-34 18.9 12.3 66.4 0.4 2.0 100.0 31.2 1,180
35-49 14.1 13.3 71.8 0.0 0.8 100.0 27.4 234
Number of antenatal care visits
None 9.1 3.5 84.6 0.3 2.4 100.0 12.7 908
1-3 visits 28.5 22.8 48.0 0.0 0.7 100.0 51.3 416
4+ visits 39.3 23.7 34.6 0.8 1.7 100.0 62.9 232
Missing/DK (*) (*) (*) (*) (*) 100.0 (*) 14
Education
None 16.4 8.8 72.4 0.4 1.9 100.0 25.2 1,237
Primary 24.6 19.4 54.1 0.0 1.9 100.0 43.9 260
Secondary+ 38.7 34.5 25.6 0.0 1.3 100.0 73.1 73
Wealth index quintiles
Poorest 3.6 0.3 93.8 0.3 2.0 100.0 3.9 325
Second 5.8 3.6 89.4 0.3 0.9 100.0 9.4 342
Middle 20.1 5.5 72.2 0.3 1.9 100.0 25.6 313
Fourth 32.2 17.0 48.6 0.0 2.1 100.0 49.3 317
Richest 36.0 36.5 24.0 0.6 2.9 100.0 72.5 274
Total 18.8 11.8 67.2 0.3 1.9 100.0 30.6 1,570
1 MICS indicator 5.8

106
IX. Child Development
Early Childhood Education and Learning
Readiness of children for primary school can be improved through attendance to early childhood education programmes or through pre-school attendance. Early childhood education programmes include programmes for children that have organised learning components as opposed to baby-sitting and day-care which do not typically have organised education and learning opportunities. Attendance to an organised early childhood education programme in Somaliland is almost non-existent. Only 3 percent of children aged 36-59 months had opportunity to attend an organised early childhood education programme in Somaliland (Table CD.1). Attendance is more prevalent in Maroodijeex/Saaxil region (5 percent), and non-existent in the Sanaag region. No gender differential exists, but differentials by socioeconomic status are seen. Nine percent of children living in rich households attend such programmes, while the figure drops to less than 1 percent in poor households.
Table CD.1: Early childhood education Percentage of children age 36-59 months who are attending an organized early childhood education programme, Somaliland , 2011
Percentage of children age 36-59 months currently attending
early childhood education1 Number of children age 36-59
months
Sex
Male 3.0 1,006
Female 2.5 975
Region
Maroodijeex/Saaxil 4.5 910
Awdal 3.1 287
Togdheer 1.0 397
Sool 0.9 90
Sanaag 0.0 297
Area
Urban 4.7 947
Rural 1.0 1,033
Age of child
36-47 months 1.7 1,067
48-59 months 4.0 914
Mother's education
None 1.9 1,637
Primary 6.5 256
Secondary+ 8.8 88
Wealth index quintile
Poorest 0.5 443
Second 0.9 458
Middle 1.9 409
Fourth 3.7 359
Richest 8.7 311
Total 2.8 1,981 1 MICS indicator 6.7

107
It is well recognized that a period of rapid brain development occurs in the first 3-4 years of life, and the quality of home care is the major determinant of the child’s development during this period. In this context, engagement of adults in activities with children, presence of books in the home for the child, and the conditions of care are important indicators of quality of home care. Children should be physically healthy, mentally alert, emotionally secure, socially competent and ready to learn. Information on a number of activities that support early learning was collected in the survey. These included the involvement of adults with children in the following activities: reading books or looking at picture books, telling stories, singing songs, taking children outside the home, compound or yard, playing with children, and spending time with children naming, counting, or drawing things. For two-thirds (65 percent) of children aged 3 to 5 years, an adult household member engaged in four or more activities that promote learning and school readiness during the 3 days preceding the survey (Table CD.2). The average number of activities that adults engaged with children was 4. The table also indicates that the father’s involvement in such activities was somewhat limited. Father’s involvement with one or more activities was 31 percent. One quarter of the children were living in a household without their fathers. Table CD.2: Support for learning Percentage of children age 36-59 months with whom an adult household member engaged in activities that promote learning and school readiness during the last three days, Somaliland, 2011
Percentage of children age 36-59
months
Mean number of activities
Percentage of children not living with their
natural father
Number of
children age 36-59 months
With whom adult
household members engaged
in four or more activities1
With whom the father engaged in
one or more activities2
Any adult household member engaged with the
child
The father engaged with the
child
Sex Male 67.5 33.9 3.8 0.6 23.2 1,006 Female 63.0 27.9 3.7 0.5 26.4 975
Region Maroodijeex/Saaxil 60.6 28.8 3.5 0.5 23.7 910 Awdal 59.3 27.3 3.6 0.5 16.9 287 Togdheer 75.6 35.5 4.1 0.6 26.9 397 Sool 75.8 38.5 4.1 0.9 30.0 90 Sanaag 68.1 32.5 3.8 0.7 30.9 297 Area
Urban 66.1 32.2 3.8 0.6 24.8 947 Rural 64.5 29.7 3.7 0.5 24.7 1,033
Age 36-47 months 65.6 30.6 3.7 0.6 24.1 1,067 48-59 months 64.8 31.2 3.7 0.6 25.6 914
Mother's education None 64.2 29.7 3.7 0.5 25.4 1,637 Primary 69.6 33.8 4.0 0.6 22.0 256 Secondary+ 71.1 45.5 4.2 0.9 21.0 88
Father's education None 61.4 34.1 3.5 0.6 na 834 Primary 63.9 40.5 3.7 0.7 na 254 Secondary+ 72.7 48.9 4.1 0.9 na 333 Father not in household 66.4 8.3 3.8 na na 490 Missing/DK 71.9 31.0 3.9 0.5 na 69
Wealth index quintiles Poorest 60.9 25.8 3.5 0.5 22.1 443 Second 62.3 29.4 3.7 0.5 24.9 458 Middle 66.7 35.3 3.8 0.6 24.4 409 Fourth 67.0 28.7 3.7 0.6 27.4 359 Richest 71.7 37.1 4.1 0.8 25.8 311
Total 65.2 30.9 3.7 0.6 24.8 1,981 1 MICS indicator 6.1 2 MICS Indicator 6.2

108
There are no gender differentials in terms of engagement of adults in activities with children; Urban-rural differentials were minimal with a slightly higher engagement by urban fathers than their rural counterparts. Slight gender differentials exist in terms of engagement of adults in activities with children. There was a higher proportion of male children (34 percent) with whom fathers engaged one or more activity compared to female children (28 percent). Differentials by region and socio-economic status are also observed: Adult engagement in activities with children was greatest in the Togdheer and Sool regions (76 percent each) and lowest in the Awdal region (59 percent), while the proportion was 72 percent for children living in the richest households, as opposed to those living in the poorest households (61 percent). The proportion of children with whom adults engaged in four or more activities is highest among those whose mothers have secondary or higher levels of education compared to those with primary or no education. Father’s involvement showed a similar pattern in terms of adults’ engagement in such activities. Exposure to books in early years not only provides the child with greater understanding of the nature of print, but may also give the child opportunities to see others reading, such as older siblings doing school work. Presence of books is important for later school performance. The mother/caretaker of all children under5 were asked about number of children’s books or picture books they have for the child, household objects or outside objects, and homemade toys or toys that came from a shop that are available at home. In Somaliland, only 1 percent of children age 0-59 months lives in households where at least 3 children’s books are present for the child (Table CD.3). The proportion of children with 10 or more books is 0.5 percent. There are no gender differentials and the figures are very low across all regions as well as in rural and urban areas, to make any meaningful comparison. In general, support for learning is very low in Somaliland according to this survey.

109
Table CD.3: Learning materials
Percentage of children under age 5 by numbers of children's books present in the household, and by playthings that child plays with, Somaliland, 2011
Household has for the child:
Child plays with:
Two or more types
of playthings2
Number of
children under age 5
3 or more
children's books1
10 or more
children's books
Homemade toys
Toys from a shop/manufactured
toys
Household objects/objects found outside
Sex
Male 1.1 0.5 5.8 8.4 30.3 6.6 2,395
Female 1.5 0.4 6.6 8.5 31.3 7.1 2,277
Region
Maroodijeex/Saaxil 1.8 0.5 7.2 11.3 29.1 8.0 2,074
Awdal 1.9 0.7 7.3 8.8 30.0 7.1 727
Togdheer 0.6 0.4 3.7 5.2 31.5 4.5 948
Sool 0.0 0.0 4.1 3.7 21.2 4.4 262
Sanaag 0.4 0.2 6.2 5.8 40.1 6.9 661
Area
Urban 2.2 0.9 8.7 14.5 30.7 10.3 2,256
Rural 0.4 0.0 3.9 2.8 30.9 3.5 2,416
Age
0-23 months 0.3 0.1 3.5 4.6 14.0 3.0 1,704
24-59 months 1.8 0.7 7.7 10.7 40.5 9.0 2,968
Mother’s educationa
None 0.8 0.3 5.3 6.3 31.5 5.6 3,745
Primary 2.5 0.8 9.8 16.8 29.1 11.6 709
Secondary+ 5.4 1.3 10.4 19.3 24.7 11.7 217
Wealth index quintiles
Poorest 0.0 0.0 2.7 0.5 29.3 2.1 995
Second 0.2 0.1 3.1 1.6 32.2 2.4 1,055
Middle 0.6 0.0 5.7 5.3 32.5 5.3 940
Fourth 2.0 0.8 7.9 13.5 30.7 10.6 916
Richest 4.4 1.6 13.7 26.0 29.1 16.3 766
Total 1.3 0.5 6.2 8.5 30.8 6.8 4,672
1 MICS indicator 6.3 2 MICS indicator 6.4 aTotal includes 3 unweighted cases of children missing information on mothers’ education who not shown separately (*) Figures that are based on less than 25 unweighted cases
Table CD.3 also shows that 7 percent of children aged 0-59 months had 2 or more types of playthings to play with in their homes. The types of playthings in MICS included homemade toys (such as dolls and cars, or other toys made at home), toys that came from a store, and household objects (such as pots and bowls) or objects and materials found outside the home (such as sticks, rocks, animal shells, or leaves). It is interesting to note that 9 percent of children play with toys that come from a store; while, the percentages for homemade toys is 6 percent. The proportion of children who have 2 or more types of playthings is similar for males and females (7 percent). One in every ten children in urban areas has two or more types of play things compared to 4 percent in the rural areas. The proportion of children with two or more types of playthings among children whose mothers have no education (6 percent) is about half that of mothers with primary or secondary education (12 percent). Differentials exist by socioeconomic status of the households, and by regions.

110
Leaving children alone or in the care of other young children is known to increase the risk of accidents. In MICS, two questions were asked to find out whether children aged 0-59 months were left alone during the week preceding the interview, and whether children were left in the care of other children under 10 years of age. Table CD.4 shows that 24 percent of children aged 0-59 months were left in the care of other children, while 13 percent were left alone during the week preceding the interview. Combining the two care indicators, it is calculated that 27 percent of children were left with inadequate care during the week preceding the survey, either by being left alone or in the care of another child. No differences were observed by the sex of the child or between urban and rural areas. Children aged 24-59 months were left with inadequate care more (33 percent) than those who were aged 0-23 months (17 percent). The least percentage of children left with inadequate care was in the richest compared with households in other wealth index quintiles.
Table CD.4: Inadequate care
Percentage of children under age 5 left alone or left in the care of another child younger than 10 years of age for more than one hour at least once during the past week, Somaliland, 2011
Percentage of children under age 5
Left alone in the past week
Left in the care of another child younger than 10 years of age in
the past week
Left with inadequate care in the past
week1 Number of children
under age 5
Sex
Male 11.8 24.5 27.4 2,395
Female 13.2 23.3 27.2 2,277
Region
Maroodijeex/Saaxil 12.6 22.0 25.5 2,074
Awdal 12.3 23.4 27.9 727
Togdheer 12.1 24.2 26.9 948
Sool 9.9 25.4 27.8 262
Sanaag 14.1 29.4 32.8 661
Area
Urban 11.4 21.9 25.7 2,256
Rural 13.5 25.8 28.8 2,416
Age
0-23 months 7.1 14.4 16.9 1,704
24-59 months 15.6 29.4 33.3 2,968
Mother’s educationa
None 12.6 24.6 27.5 3,745
Primary 13.8 20.8 27.0 709
Secondary+ 6.9 22.8 25.1 217
Wealth index quintiles
Poorest 12.8 23.8 27.3 995
Second 15.6 28.4 31.4 1,055
Middle 14.8 26.7 30.7 940
Fourth 11.1 22.6 26.1 916
Richest 6.7 16.1 19.0 766
Total 12.5 23.9 27.3 4,672
1 MICS indicator 6.5 aTotal includes 2 unweighted cases of children missing information on mother’s education who are not shown separately

111
Early Childhood Development
Early child development is defined as an orderly, predictable process along a continuous path, in which a child learns to handle more complicated levels of moving, thinking, speaking, feeling and relating to others. Physical growth, literacy and numeracy skills, socio-emotional development and readiness to learn are vital domains of a child’s overall development, which is a basis for overall human development. A 10-item module that has been developed for the MICS programme was used to calculate the Early Child Development Index (ECDI). The indicator is based on some benchmarks that children would be expected to have if they are developing as the majority of children in that age group. The primary purpose of the ECDI is to inform public policy regarding the developmental status of children in Somaliland. Each of the 10 items is used in one of the four domains, to determine if children are developmentally on track in that domain. The domains in question are:
Literacy-numeracy: Children are identified as being developmentally on track based on whether they can identify/name at least ten letters of the alphabet, whether they can read at least four simple, popular words, and whether they know the name and recognize the symbols of all numbers from 1 to 10. If at least two of these are true, then the child is considered developmentally on track.
Physical: If the child can pick up a small object with two fingers, like a stick or a rock from the ground and/or the mother/caretaker does not indicate that the child is sometimes too sick to play, then the child is regarded as being developmentally on track in the physical domain.
Social-emotional: Children are considered to be developmentally on track if two of the following are true: If the child gets along well with other children, if the child does not kick, bite, or hit other children and if the child does not get distracted easily
Learning: If the child follows simple directions on how to do something correctly and/or when given something to do, is able to do it independently, then the child is considered to be developmentally on track in this domain.
ECDI is then calculated as the percentage of children who are developmentally on track in at least three of these four domains. The results are presented in Table CD.5. In Somaliland, 59 percent of children aged 36-59 months are developmentally on track. ECDI is higher among girls (62 percent) than boys 55 percent). As expected, ECDI is higher in the older age group (65 percent among 48-59 months old compared to 53 percent among 36-47 months old), since children develop more skills with increasing age. Higher ECDI is seen in children attending an early childhood education programme (91 percent compared to 58 percent for those who are not attending). Children living in poorest households have lower ECDI (55 percent) compared to children living in richest households (64 percent). The analysis of four domains of child development shows that 87 percent of children are on track in the learning, 86 percent in the physical and 63 percent in the social-emotional domains, with much less in literacy-numeracy (25 percent) domain. In each individual domain the higher score is observed among older children (age 48 – 59), as expected.
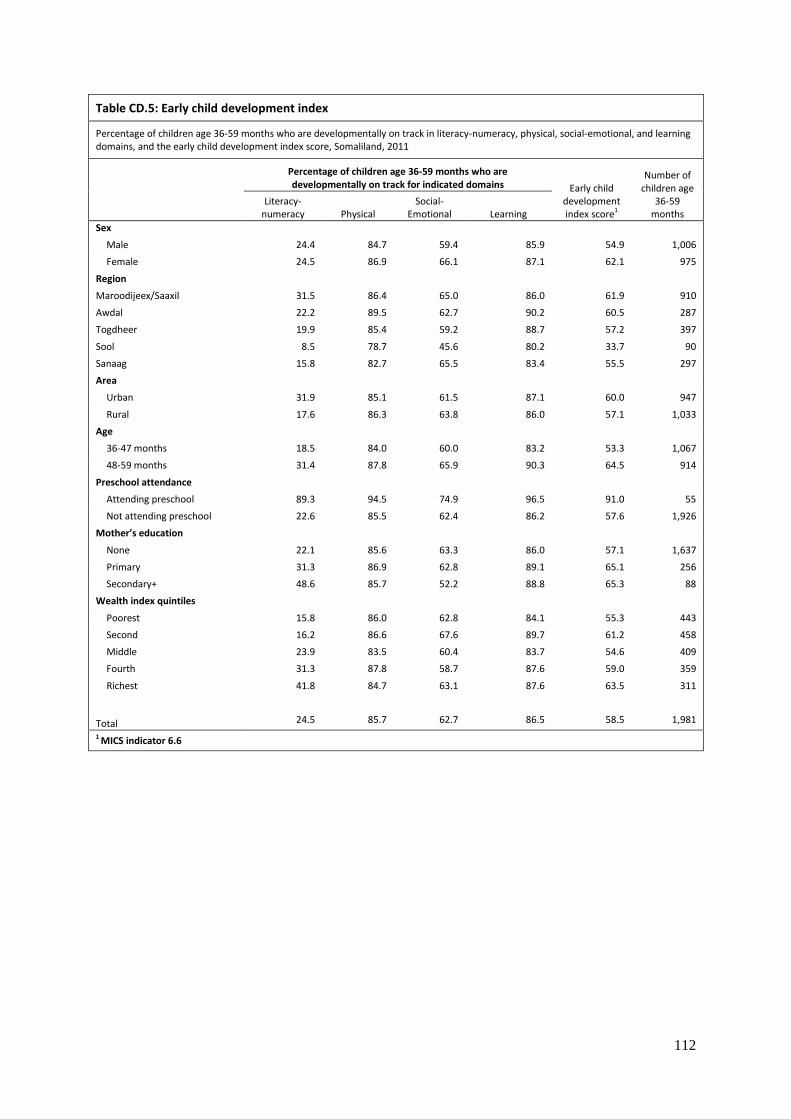
112
Table CD.5: Early child development index
Percentage of children age 36-59 months who are developmentally on track in literacy-numeracy, physical, social-emotional, and learning domains, and the early child development index score, Somaliland, 2011
Percentage of children age 36-59 months who are developmentally on track for indicated domains Early child
development index score1
Number of children age
36-59 months
Literacy-numeracy Physical
Social-Emotional Learning
Sex Male 24.4 84.7 59.4 85.9 54.9 1,006
Female 24.5 86.9 66.1 87.1 62.1 975
Region
Maroodijeex/Saaxil 31.5 86.4 65.0 86.0 61.9 910
Awdal 22.2 89.5 62.7 90.2 60.5 287
Togdheer 19.9 85.4 59.2 88.7 57.2 397
Sool 8.5 78.7 45.6 80.2 33.7 90
Sanaag 15.8 82.7 65.5 83.4 55.5 297
Area
Urban 31.9 85.1 61.5 87.1 60.0 947
Rural 17.6 86.3 63.8 86.0 57.1 1,033
Age
36-47 months 18.5 84.0 60.0 83.2 53.3 1,067
48-59 months 31.4 87.8 65.9 90.3 64.5 914
Preschool attendance
Attending preschool 89.3 94.5 74.9 96.5 91.0 55
Not attending preschool 22.6 85.5 62.4 86.2 57.6 1,926
Mother’s education
None 22.1 85.6 63.3 86.0 57.1 1,637
Primary 31.3 86.9 62.8 89.1 65.1 256
Secondary+ 48.6 85.7 52.2 88.8 65.3 88
Wealth index quintiles
Poorest 15.8 86.0 62.8 84.1 55.3 443
Second 16.2 86.6 67.6 89.7 61.2 458
Middle 23.9 83.5 60.4 83.7 54.6 409
Fourth 31.3 87.8 58.7 87.6 59.0 359
Richest 41.8 84.7 63.1 87.6 63.5 311
Total 24.5 85.7 62.7 86.5 58.5 1,981
1 MICS indicator 6.6
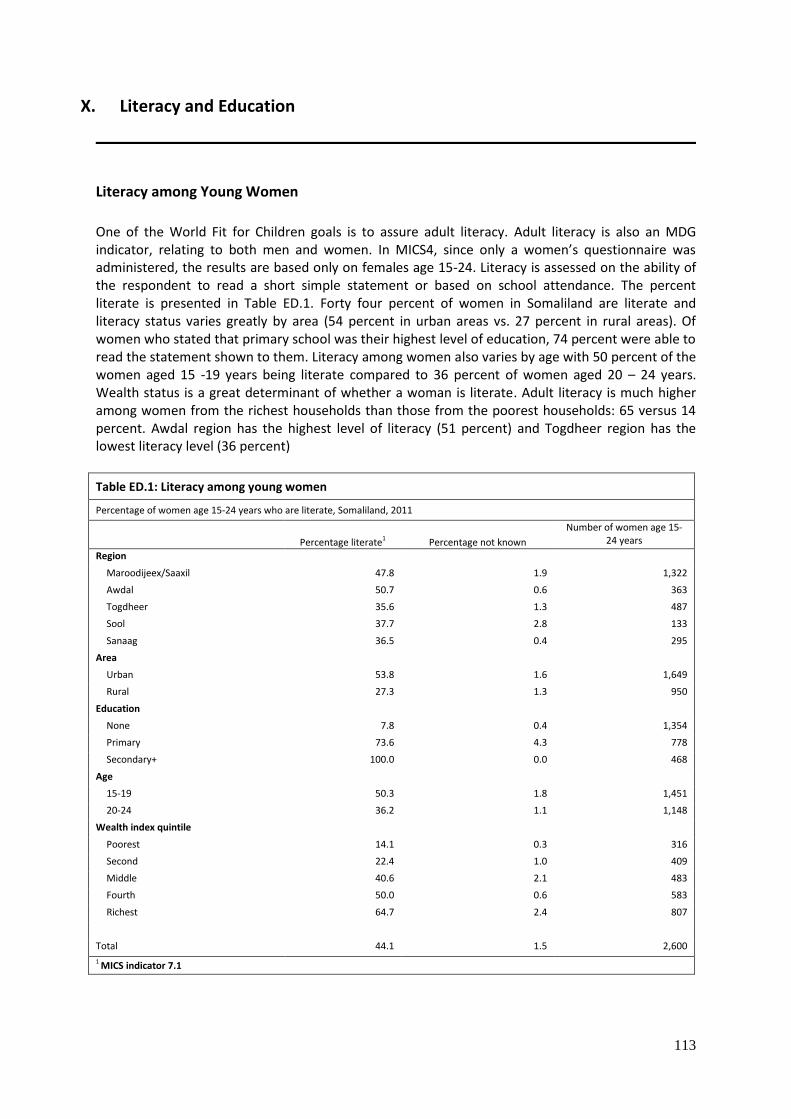
113
X. Literacy and Education
Literacy among Young Women
One of the World Fit for Children goals is to assure adult literacy. Adult literacy is also an MDG indicator, relating to both men and women. In MICS4, since only a women’s questionnaire was administered, the results are based only on females age 15-24. Literacy is assessed on the ability of the respondent to read a short simple statement or based on school attendance. The percent literate is presented in Table ED.1. Forty four percent of women in Somaliland are literate and literacy status varies greatly by area (54 percent in urban areas vs. 27 percent in rural areas). Of women who stated that primary school was their highest level of education, 74 percent were able to read the statement shown to them. Literacy among women also varies by age with 50 percent of the women aged 15 -19 years being literate compared to 36 percent of women aged 20 – 24 years. Wealth status is a great determinant of whether a woman is literate. Adult literacy is much higher among women from the richest households than those from the poorest households: 65 versus 14 percent. Awdal region has the highest level of literacy (51 percent) and Togdheer region has the lowest literacy level (36 percent)
Table ED.1: Literacy among young women
Percentage of women age 15-24 years who are literate, Somaliland, 2011
Percentage literate1 Percentage not known
Number of women age 15-24 years
Region
Maroodijeex/Saaxil 47.8 1.9 1,322
Awdal 50.7 0.6 363
Togdheer 35.6 1.3 487
Sool 37.7 2.8 133
Sanaag 36.5 0.4 295
Area
Urban 53.8 1.6 1,649
Rural 27.3 1.3 950
Education
None 7.8 0.4 1,354
Primary 73.6 4.3 778
Secondary+ 100.0 0.0 468
Age
15-19 50.3 1.8 1,451
20-24 36.2 1.1 1,148
Wealth index quintile
Poorest 14.1 0.3 316
Second 22.4 1.0 409
Middle 40.6 2.1 483
Fourth 50.0 0.6 583
Richest 64.7 2.4 807
Total 44.1 1.5 2,600
1 MICS indicator 7.1
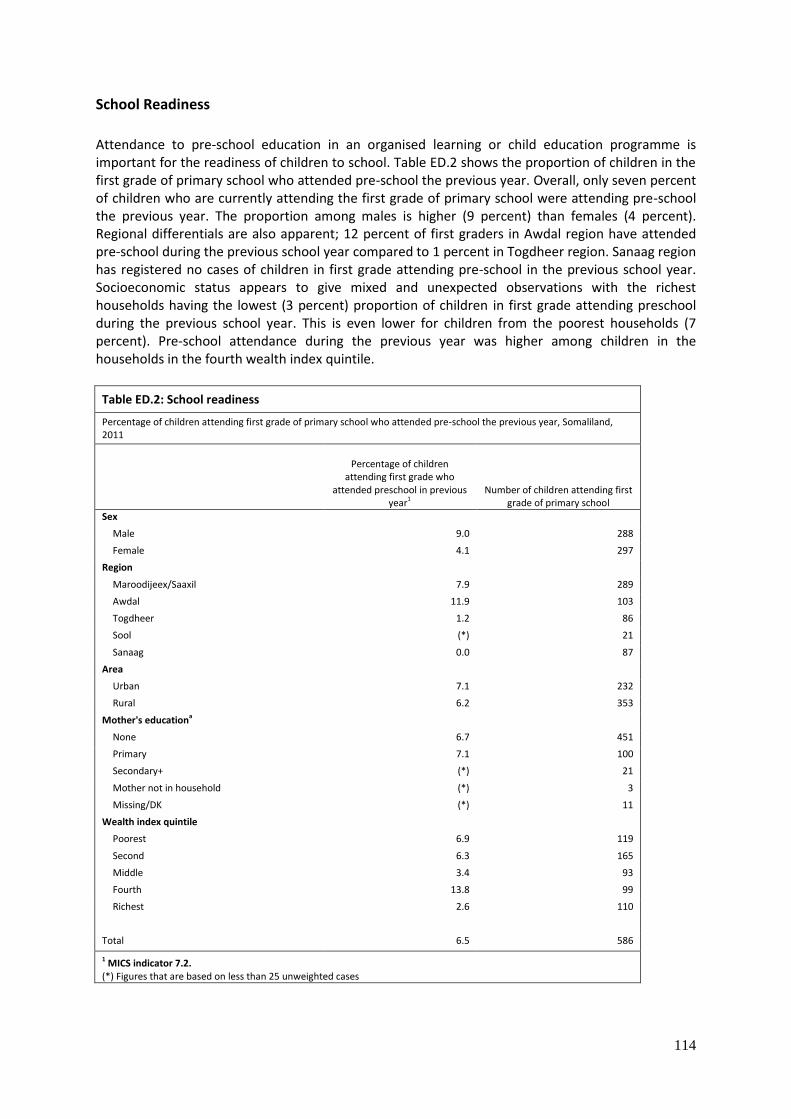
114
School Readiness
Attendance to pre-school education in an organised learning or child education programme is important for the readiness of children to school. Table ED.2 shows the proportion of children in the first grade of primary school who attended pre-school the previous year. Overall, only seven percent of children who are currently attending the first grade of primary school were attending pre-school the previous year. The proportion among males is higher (9 percent) than females (4 percent). Regional differentials are also apparent; 12 percent of first graders in Awdal region have attended pre-school during the previous school year compared to 1 percent in Togdheer region. Sanaag region has registered no cases of children in first grade attending pre-school in the previous school year. Socioeconomic status appears to give mixed and unexpected observations with the richest households having the lowest (3 percent) proportion of children in first grade attending preschool during the previous school year. This is even lower for children from the poorest households (7 percent). Pre-school attendance during the previous year was higher among children in the households in the fourth wealth index quintile.
Table ED.2: School readiness
Percentage of children attending first grade of primary school who attended pre-school the previous year, Somaliland, 2011
Percentage of children
attending first grade who attended preschool in previous
year1 Number of children attending first
grade of primary school
Sex
Male 9.0 288
Female 4.1 297
Region
Maroodijeex/Saaxil 7.9 289
Awdal 11.9 103
Togdheer 1.2 86
Sool (*) 21
Sanaag 0.0 87
Area
Urban 7.1 232
Rural 6.2 353
Mother's educationa
None 6.7 451
Primary 7.1 100
Secondary+ (*) 21
Mother not in household (*) 3
Missing/DK (*) 11
Wealth index quintile
Poorest 6.9 119
Second 6.3 165
Middle 3.4 93
Fourth 13.8 99
Richest 2.6 110
Total 6.5 586
1 MICS indicator 7.2. (*) Figures that are based on less than 25 unweighted cases
115
Primary and Secondary School Participation
Universal access to basic education and the achievement of primary education by the world’s children is one of the most important goals of the Millennium Development Goals and A World Fit for Children. Education is a vital prerequisite for combating poverty, empowering women, protecting children from hazardous and exploitative labour and sexual exploitation, promoting human rights and democracy, protecting the environment, and influencing population growth. The indicators for primary and secondary school attendance include:
Net intake rate in primary education
Primary school net attendance ratio (adjusted)
Secondary school net attendance ratio (adjusted)
Female to male education ratio (or gender parity index - GPI) in primary and secondary school
The indicators of school progression include:
Children reaching last grade of primary
Primary completion rate
Transition rate to secondary school In Somaliland, children enter primary school at age 6 and enter secondary school at age 14. There are 8 grades in primary school and 4 grades in secondary school. In primary school, grades are referred to as standard 1 to standard 8. For secondary school, grades are referred to as Form 1 to Form 4. The school year typically runs from September of one year to August of the following year. Of children who are of primary school entry age (age 6) in Somaliland, 21 percent are attending the first grade of primary school (Table ED.3). Gender and urban-rural differentials are minimal; however, differentials are present by region. In Awdal region, for instance, the value of the indicator reaches 27 percent, while it is 11 percent in Sool region. A positive correlation with mother’s education and socioeconomic status is observed; for children age 6 whose mothers have at least secondary school education, 29 percent were attending the first grade compared to 18 percent for mothers with no education. In the richest households, the proportion is around 31 percent, compared to 14 percent among children living in the poorest households.
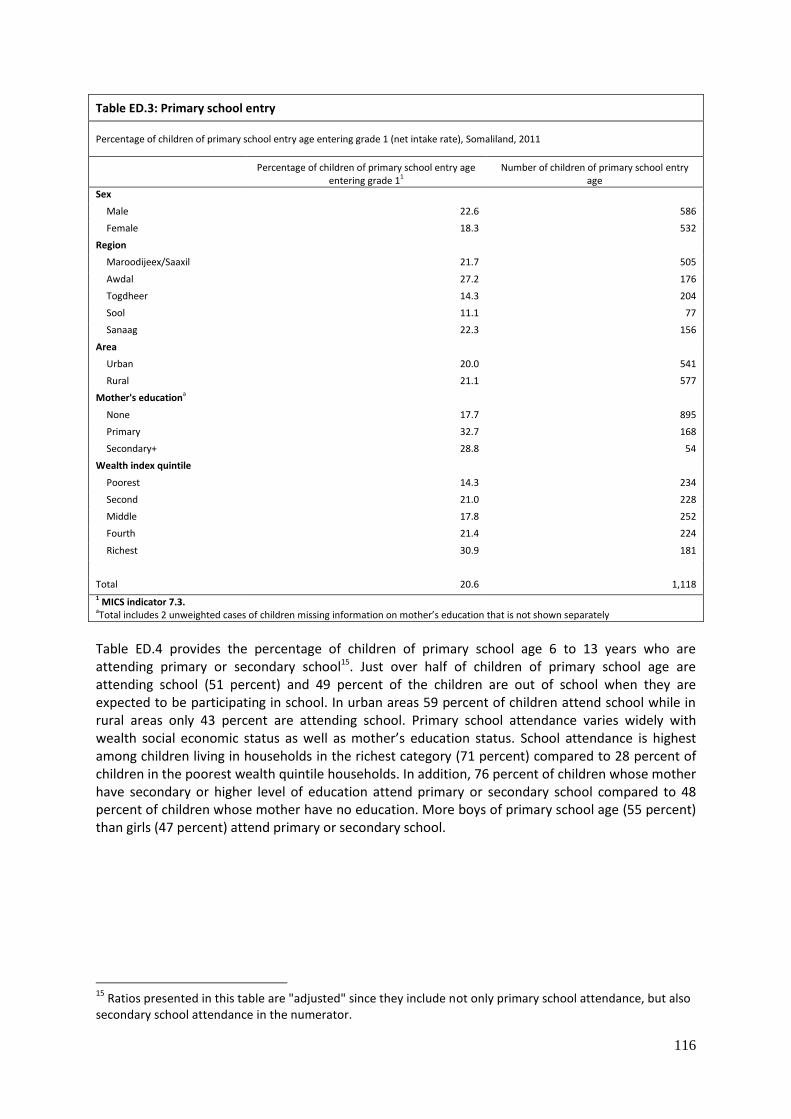
116
Table ED.3: Primary school entry
Percentage of children of primary school entry age entering grade 1 (net intake rate), Somaliland, 2011
Percentage of children of primary school entry age entering grade 11
Number of children of primary school entry age
Sex
Male 22.6 586
Female 18.3 532
Region
Maroodijeex/Saaxil 21.7 505
Awdal 27.2 176
Togdheer 14.3 204
Sool 11.1 77
Sanaag 22.3 156
Area
Urban 20.0 541
Rural 21.1 577
Mother's educationa
None 17.7 895
Primary 32.7 168
Secondary+ 28.8 54
Wealth index quintile
Poorest 14.3 234
Second 21.0 228
Middle 17.8 252
Fourth 21.4 224
Richest 30.9 181
Total 20.6 1,118 1 MICS indicator 7.3. aTotal includes 2 unweighted cases of children missing information on mother’s education that is not shown separately
Table ED.4 provides the percentage of children of primary school age 6 to 13 years who are attending primary or secondary school15. Just over half of children of primary school age are attending school (51 percent) and 49 percent of the children are out of school when they are expected to be participating in school. In urban areas 59 percent of children attend school while in rural areas only 43 percent are attending school. Primary school attendance varies widely with wealth social economic status as well as mother’s education status. School attendance is highest among children living in households in the richest category (71 percent) compared to 28 percent of children in the poorest wealth quintile households. In addition, 76 percent of children whose mother have secondary or higher level of education attend primary or secondary school compared to 48 percent of children whose mother have no education. More boys of primary school age (55 percent) than girls (47 percent) attend primary or secondary school.
15
Ratios presented in this table are "adjusted" since they include not only primary school attendance, but also secondary school attendance in the numerator.
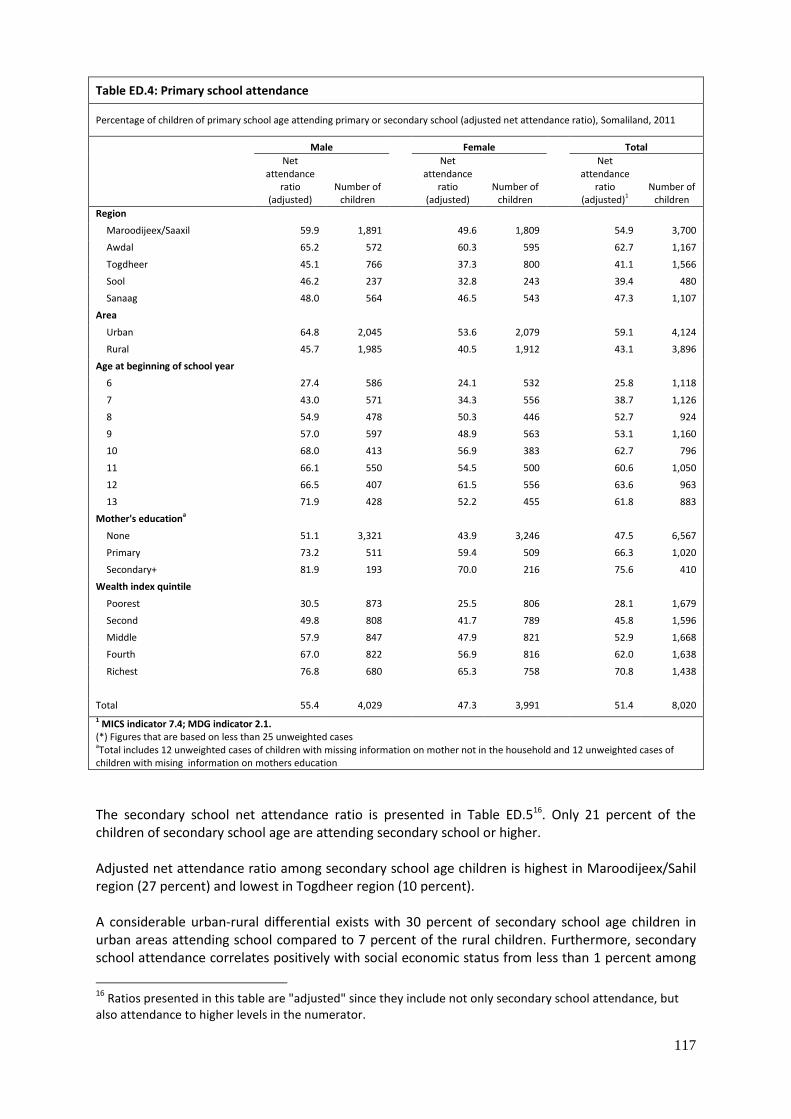
117
The secondary school net attendance ratio is presented in Table ED.516. Only 21 percent of the children of secondary school age are attending secondary school or higher. Adjusted net attendance ratio among secondary school age children is highest in Maroodijeex/Sahil region (27 percent) and lowest in Togdheer region (10 percent). A considerable urban-rural differential exists with 30 percent of secondary school age children in urban areas attending school compared to 7 percent of the rural children. Furthermore, secondary school attendance correlates positively with social economic status from less than 1 percent among
16
Ratios presented in this table are "adjusted" since they include not only secondary school attendance, but also attendance to higher levels in the numerator.
Table ED.4: Primary school attendance
Percentage of children of primary school age attending primary or secondary school (adjusted net attendance ratio), Somaliland, 2011
Male Female Total
Net attendance
ratio (adjusted)
Number of children
Net attendance
ratio (adjusted)
Number of children
Net attendance
ratio (adjusted)1
Number of children
Region
Maroodijeex/Saaxil 59.9 1,891 49.6 1,809 54.9 3,700
Awdal 65.2 572 60.3 595 62.7 1,167
Togdheer 45.1 766 37.3 800 41.1 1,566
Sool 46.2 237 32.8 243 39.4 480
Sanaag 48.0 564 46.5 543 47.3 1,107
Area
Urban 64.8 2,045 53.6 2,079 59.1 4,124
Rural 45.7 1,985 40.5 1,912 43.1 3,896
Age at beginning of school year
6 27.4 586 24.1 532 25.8 1,118
7 43.0 571 34.3 556 38.7 1,126
8 54.9 478 50.3 446 52.7 924
9 57.0 597 48.9 563 53.1 1,160
10 68.0 413 56.9 383 62.7 796
11 66.1 550 54.5 500 60.6 1,050
12 66.5 407 61.5 556 63.6 963
13 71.9 428 52.2 455 61.8 883
Mother's educationa
None 51.1 3,321 43.9 3,246 47.5 6,567
Primary 73.2 511 59.4 509 66.3 1,020
Secondary+ 81.9 193 70.0 216 75.6 410
Wealth index quintile
Poorest 30.5 873 25.5 806 28.1 1,679
Second 49.8 808 41.7 789 45.8 1,596
Middle 57.9 847 47.9 821 52.9 1,668
Fourth 67.0 822 56.9 816 62.0 1,638
Richest 76.8 680 65.3 758 70.8 1,438
Total 55.4 4,029 47.3 3,991 51.4 8,020
1 MICS indicator 7.4; MDG indicator 2.1. (*) Figures that are based on less than 25 unweighted cases aTotal includes 12 unweighted cases of children with missing information on mother not in the household and 12 unweighted cases of children with mising information on mothers education
118
the children from the poorest category to 42 percent of children in the richest category. Moreover, 43 percent of children whose mothers have secondary or more education are attending secondary school compared to 16 percent of children whose mothers have no education. The percentage of children entering first grade who eventually reach the last grade of primary school is presented in Table ED.6. Of all children starting grade one, fewer of them (28 percent) will eventually reach the last grade. Notice that this number includes children that repeat grades and that eventually move up to reach last grade.

119
Table ED.5: Secondary school attendance Percentage of children of secondary school age attending secondary school or higher (adjusted net attendance ratio) and percentage of children attending secondary school, Somaliland, 2011
Male Female Total
Net attendance ratio (adjusted)1
Percent attending primary school Number of children
Net attendance ratio (adjusted)1
Percent attending primary school
Number of children
Net attendance ratio (adjusted)1
Percent attending primary school
Number of children
Region
Maroodijeex/Saaxil 32.0 36.3 787 20.3 28.2 712 26.5 32.4 1,499
Awdal 24.6 44.2 205 23.0 29.2 210 23.8 36.6 415
Togdheer 13.3 40.0 326 6.4 28.8 274 10.1 34.9 601
Sool 22.4 29.7 80 8.3 33.2 76 15.5 31.4 156
Sanaag 11.7 31.3 186 10.8 28.0 186 11.3 29.7 372
Area
Urban 36.3 38.4 887 24.3 27.9 892 30.3 33.1 1,779
Rural 9.1 35.6 697 3.6 29.8 567 6.6 33.0 1,264
Age at beginning of school year
14 13.8 57.0 421 8.7 45.5 350 11.5 51.8 771
15 21.2 40.6 401 17.1 33.3 336 19.4 37.3 738
16 33.9 31.4 301 18.5 23.3 349 25.6 27.0 650
17 30.3 19.9 461 20.0 15.6 423 25.4 17.8 884
Mother's educationa
None 19.7 43.7 727 12.4 35.8 597 16.4 40.1 1,323
Primary 28.7 54.7 106 24.5 44.4 98 26.7 49.8 204
Secondary+ 46.9 33.6 59 38.2 48.5 58 42.6 41.0 117
Mother not in the household 19.6 43.7 227 11.1 24.6 275 15.0 33.2 502
Cannot be determined 30.1 20.0 464 19.8 15.4 429 25.2 17.8 892
Wealth index quintile
Poorest 0.7 28.4 316 0.0 19.7 211 0.4 24.9 528
Second 7.3 45.2 282 2.0 29.5 254 4.8 37.8 536
Middle 20.8 41.6 313 10.7 34.6 286 16.0 38.3 599
Fourth 37.6 40.7 324 21.1 30.5 309 29.5 35.7 633
Richest 50.5 31.3 348 34.3 27.3 398 41.8 29.2 746
Total 24.3 37.2 1,584 16.3 28.7 1,459 20.5 33.1 3,043 1 MICS indicator 7.5. aTotal includes 5 unweighted cases of children missing information on mother’s education who are not shown separately

120
Table ED.6: Children reaching last grade of primary school
Percentage of children entering first grade of primary school who eventually reach the last grade of primary school (Survival rate to last grade of primary school), Somaliland, 2011
Percent
attending grade 1
last school
year who are in
grade 2 this
school year
Percent attending grade 2
last school
year who are
attending grade 3
this school year
Percent attending grade 3
last school
year who are
attending grade 4
this school year
Percent attending grade 4
last school
year who are
attending grade 5
this school year
Percent attending grade 5
last school
year who are
attending grade 6
this school year
Percent attending grade 6
last school
year who are
attending grade 7
this school year
Percent attending grade 7
last school
year who are
attending grade 8
this school year
Percent who reach grade 8 of those who enter grade 11
Sex
Male 98.6 98.6 99.0 98.9 99.1 98.6 98.4 91.6
Female 98.2 98.0 98.3 96.7 97.3 96.7 98.8 85.1
Region
Maroodijeex/Saaxil 99.2 99.0 98.2 99.1 97.8 97.8 97.5 89.1
Awdal 100.0 98.0 100.0 99.0 98.2 97.6 100.0 92.9
Togdheer 98.3 97.4 98.6 93.0 98.9 98.8 100.0 85.9
Sool 100.0 100.0 100.0 100.0 100.0 100.0 100.0 100.0
Sanaag 94.5 96.9 97.9 98.9 100.0 96.1 98.5 83.9
Area
Urban 100.0 98.7 99.6 99.3 99.0 98.4 98.3 93.4
Rural 97.0 97.8 97.6 96.2 97.0 96.3 99.4 82.7
Mother's educationa
None 98.5 98.7 99.3 98.6 98.9 99.7 99.1 93.1
Primary 98.5 100.0 97.8 99.0 100.0 98.5 100.0 94.0
Secondary+ 100.0 100.0 100.0 100.0 100.0 100.0 100.0 100.0
Wealth index quintile
Poorest 96.3 95.9 97.0 93.3 95.6 96.1 100.0 76.7
Second 96.8 98.8 97.7 95.6 98.7 98.6 98.5 85.6
Middle 98.9 99.5 97.8 98.8 97.6 95.6 100.0 88.8
Fourth 100.0 98.0 100.0 98.7 99.3 97.6 98.4 92.3
Richest 100.0 98.8 100.0 100.0 98.8 99.4 97.6 94.7
Total 98.4 98.3 98.7 98.0 98.4 97.8 98.6 88.7 1 MICS indicator 7.6; MDG indicator 2.2 a In total there are 12 unweighted cases of children attending primary school with no mother in the household. The results are therefore
not shown.
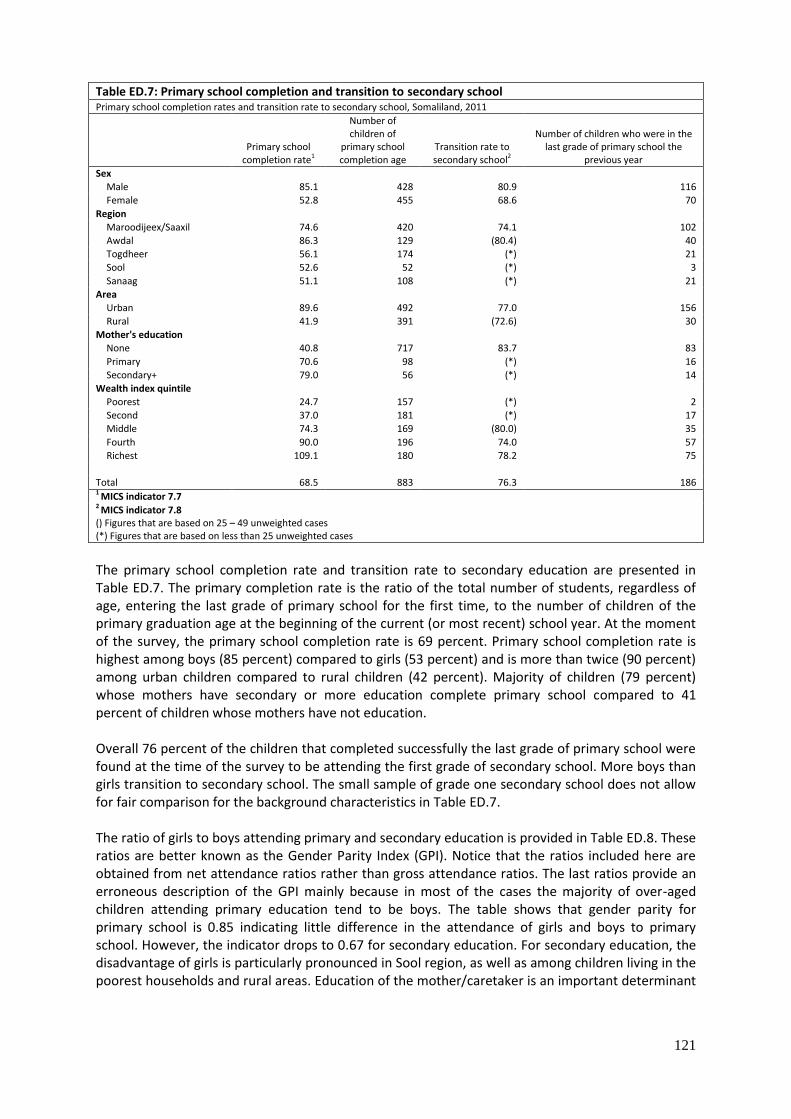
121
The primary school completion rate and transition rate to secondary education are presented in Table ED.7. The primary completion rate is the ratio of the total number of students, regardless of age, entering the last grade of primary school for the first time, to the number of children of the primary graduation age at the beginning of the current (or most recent) school year. At the moment of the survey, the primary school completion rate is 69 percent. Primary school completion rate is highest among boys (85 percent) compared to girls (53 percent) and is more than twice (90 percent) among urban children compared to rural children (42 percent). Majority of children (79 percent) whose mothers have secondary or more education complete primary school compared to 41 percent of children whose mothers have not education. Overall 76 percent of the children that completed successfully the last grade of primary school were found at the time of the survey to be attending the first grade of secondary school. More boys than girls transition to secondary school. The small sample of grade one secondary school does not allow for fair comparison for the background characteristics in Table ED.7. The ratio of girls to boys attending primary and secondary education is provided in Table ED.8. These ratios are better known as the Gender Parity Index (GPI). Notice that the ratios included here are obtained from net attendance ratios rather than gross attendance ratios. The last ratios provide an erroneous description of the GPI mainly because in most of the cases the majority of over-aged children attending primary education tend to be boys. The table shows that gender parity for primary school is 0.85 indicating little difference in the attendance of girls and boys to primary school. However, the indicator drops to 0.67 for secondary education. For secondary education, the disadvantage of girls is particularly pronounced in Sool region, as well as among children living in the poorest households and rural areas. Education of the mother/caretaker is an important determinant
Table ED.7: Primary school completion and transition to secondary school Primary school completion rates and transition rate to secondary school, Somaliland, 2011
Primary school
completion rate1
Number of children of
primary school completion age
Transition rate to secondary school2
Number of children who were in the last grade of primary school the
previous year
Sex
Male 85.1 428 80.9 116
Female 52.8 455 68.6 70
Region
Maroodijeex/Saaxil 74.6 420 74.1 102
Awdal 86.3 129 (80.4) 40
Togdheer 56.1 174 (*) 21
Sool 52.6 52 (*) 3
Sanaag 51.1 108 (*) 21
Area
Urban 89.6 492 77.0 156
Rural 41.9 391 (72.6) 30
Mother's education
None 40.8 717 83.7 83
Primary 70.6 98 (*) 16
Secondary+ 79.0 56 (*) 14
Wealth index quintile
Poorest 24.7 157 (*) 2
Second 37.0 181 (*) 17
Middle 74.3 169 (80.0) 35
Fourth 90.0 196 74.0 57
Richest 109.1 180 78.2 75
Total 68.5 883 76.3 186 1 MICS indicator 7.7 2 MICS indicator 7.8 () Figures that are based on 25 – 49 unweighted cases (*) Figures that are based on less than 25 unweighted cases
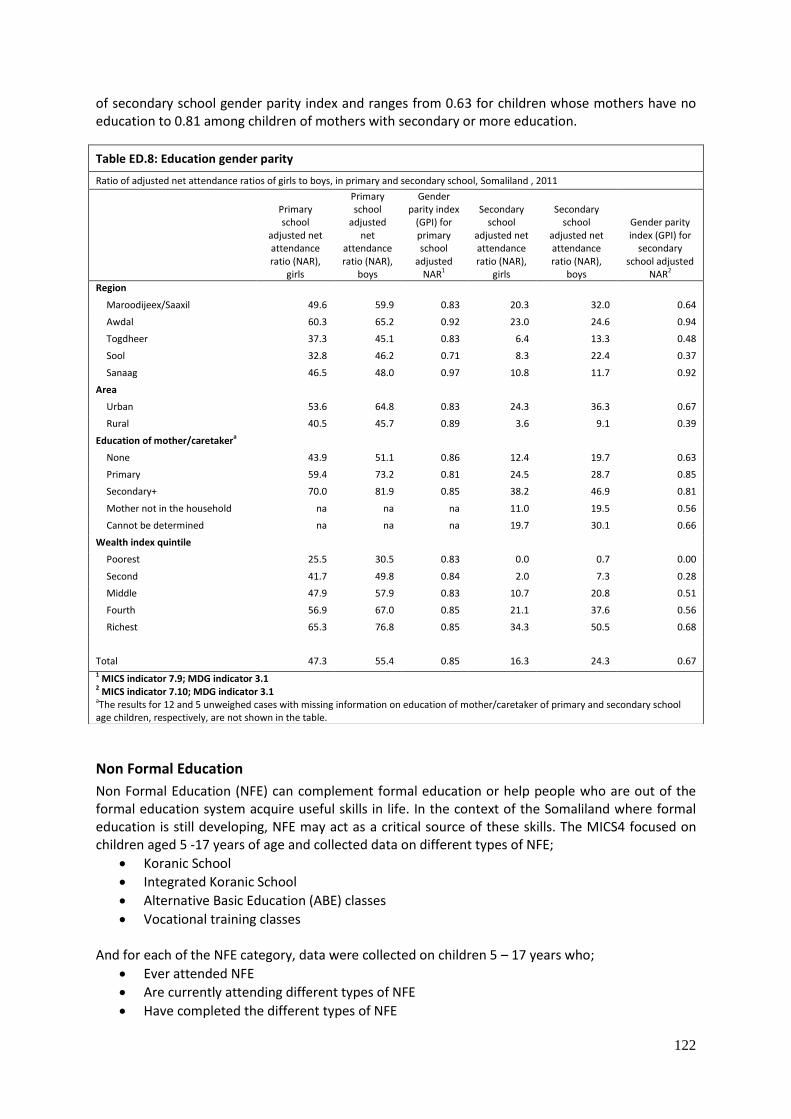
122
of secondary school gender parity index and ranges from 0.63 for children whose mothers have no education to 0.81 among children of mothers with secondary or more education.
Non Formal Education
Non Formal Education (NFE) can complement formal education or help people who are out of the formal education system acquire useful skills in life. In the context of the Somaliland where formal education is still developing, NFE may act as a critical source of these skills. The MICS4 focused on children aged 5 -17 years of age and collected data on different types of NFE;
Koranic School
Integrated Koranic School
Alternative Basic Education (ABE) classes
Vocational training classes And for each of the NFE category, data were collected on children 5 – 17 years who;
Ever attended NFE
Are currently attending different types of NFE
Have completed the different types of NFE
Table ED.8: Education gender parity
Ratio of adjusted net attendance ratios of girls to boys, in primary and secondary school, Somaliland , 2011
Primary school
adjusted net attendance ratio (NAR),
girls
Primary school
adjusted net
attendance ratio (NAR),
boys
Gender parity index
(GPI) for primary school
adjusted NAR1
Secondary school
adjusted net attendance ratio (NAR),
girls
Secondary school
adjusted net attendance ratio (NAR),
boys
Gender parity index (GPI) for
secondary school adjusted
NAR2
Region
Maroodijeex/Saaxil 49.6 59.9 0.83 20.3 32.0 0.64
Awdal 60.3 65.2 0.92 23.0 24.6 0.94
Togdheer 37.3 45.1 0.83 6.4 13.3 0.48
Sool 32.8 46.2 0.71 8.3 22.4 0.37
Sanaag 46.5 48.0 0.97 10.8 11.7 0.92
Area
Urban 53.6 64.8 0.83 24.3 36.3 0.67
Rural 40.5 45.7 0.89 3.6 9.1 0.39
Education of mother/caretakera
None 43.9 51.1 0.86 12.4 19.7 0.63
Primary 59.4 73.2 0.81 24.5 28.7 0.85
Secondary+ 70.0 81.9 0.85 38.2 46.9 0.81
Mother not in the household na na na 11.0 19.5 0.56
Cannot be determined na na na 19.7 30.1 0.66
Wealth index quintile
Poorest 25.5 30.5 0.83 0.0 0.7 0.00
Second 41.7 49.8 0.84 2.0 7.3 0.28
Middle 47.9 57.9 0.83 10.7 20.8 0.51
Fourth 56.9 67.0 0.85 21.1 37.6 0.56
Richest 65.3 76.8 0.85 34.3 50.5 0.68
Total 47.3 55.4 0.85 16.3 24.3 0.67 1 MICS indicator 7.9; MDG indicator 3.1 2 MICS indicator 7.10; MDG indicator 3.1 aThe results for 12 and 5 unweighed cases with missing information on education of mother/caretaker of primary and secondary school age children, respectively, are not shown in the table.
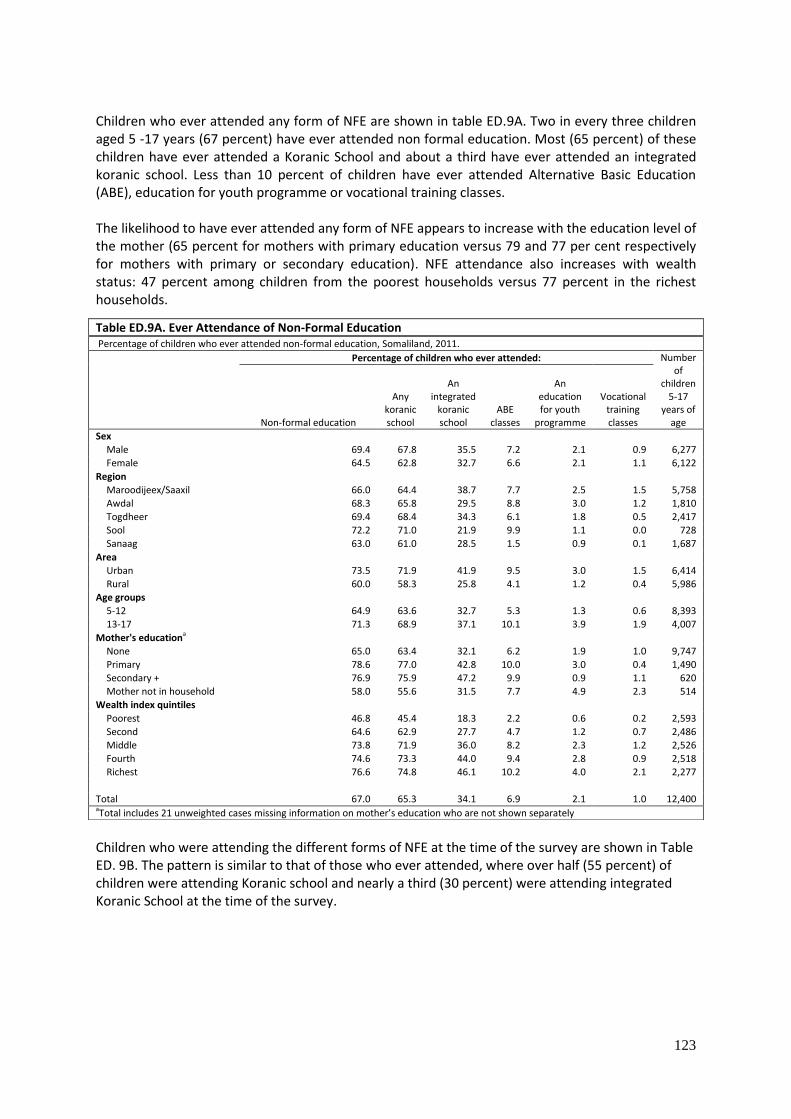
123
Children who ever attended any form of NFE are shown in table ED.9A. Two in every three children aged 5 -17 years (67 percent) have ever attended non formal education. Most (65 percent) of these children have ever attended a Koranic School and about a third have ever attended an integrated koranic school. Less than 10 percent of children have ever attended Alternative Basic Education (ABE), education for youth programme or vocational training classes. The likelihood to have ever attended any form of NFE appears to increase with the education level of the mother (65 percent for mothers with primary education versus 79 and 77 per cent respectively for mothers with primary or secondary education). NFE attendance also increases with wealth status: 47 percent among children from the poorest households versus 77 percent in the richest households.
Children who were attending the different forms of NFE at the time of the survey are shown in Table ED. 9B. The pattern is similar to that of those who ever attended, where over half (55 percent) of children were attending Koranic school and nearly a third (30 percent) were attending integrated Koranic School at the time of the survey.
Table ED.9A. Ever Attendance of Non-Formal Education Percentage of children who ever attended non-formal education, Somaliland, 2011.
Percentage of children who ever attended: Number of
children 5-17
years of age
Non-formal education
Any koranic school
An integrated
koranic school
ABE classes
An education for youth
programme
Vocational training classes
Sex
Male 69.4 67.8 35.5 7.2 2.1 0.9 6,277
Female 64.5 62.8 32.7 6.6 2.1 1.1 6,122
Region
Maroodijeex/Saaxil 66.0 64.4 38.7 7.7 2.5 1.5 5,758
Awdal 68.3 65.8 29.5 8.8 3.0 1.2 1,810
Togdheer 69.4 68.4 34.3 6.1 1.8 0.5 2,417
Sool 72.2 71.0 21.9 9.9 1.1 0.0 728
Sanaag 63.0 61.0 28.5 1.5 0.9 0.1 1,687
Area
Urban 73.5 71.9 41.9 9.5 3.0 1.5 6,414
Rural 60.0 58.3 25.8 4.1 1.2 0.4 5,986
Age groups
5-12 64.9 63.6 32.7 5.3 1.3 0.6 8,393
13-17 71.3 68.9 37.1 10.1 3.9 1.9 4,007
Mother's educationa
None 65.0 63.4 32.1 6.2 1.9 1.0 9,747
Primary 78.6 77.0 42.8 10.0 3.0 0.4 1,490
Secondary + 76.9 75.9 47.2 9.9 0.9 1.1 620
Mother not in household 58.0 55.6 31.5 7.7 4.9 2.3 514
Wealth index quintiles
Poorest 46.8 45.4 18.3 2.2 0.6 0.2 2,593
Second 64.6 62.9 27.7 4.7 1.2 0.7 2,486
Middle 73.8 71.9 36.0 8.2 2.3 1.2 2,526
Fourth 74.6 73.3 44.0 9.4 2.8 0.9 2,518
Richest 76.6 74.8 46.1 10.2 4.0 2.1 2,277
Total 67.0 65.3 34.1 6.9 2.1 1.0 12,400 aTotal includes 21 unweighted cases missing information on mother’s education who are not shown separately

124
Table ED.9B. Current Attendance for Non-Formal Education
Percentage of children currently attending non-formal education, Somaliland, 2011
Percentage of children currently
attending any koranic school
Percentage of children currently
attending an integrated koranic
school
Percentage of children currently attending
ABE classes
Percentage of children currently
attending an education for
youth programme
Percentage of children currently attending vocational
training classes
Number of
children 5-17
years of age
Sex
Male 57.8 31.5 1.6 0.7 0.4 6,277
Female 52.9 28.8 1.1 0.8 0.5 6,122
Region
Maroodijeex/Saaxil 53.7 34.1 2.0 1.1 0.8 5,758
Awdal 56.1 26.6 2.2 0.7 0.3 1,810
Togdheer 57.7 30.1 0.2 0.3 0.2 2,417
Sool 65.7 19.9 0.9 0.6 0.0 728
Sanaag 52.6 25.2 0.1 0.2 0.0 1,687
Area
Urban 61.6 37.2 2.2 1.1 0.7 6,414
Rural 48.7 22.6 0.6 0.4 0.2 5,986
Age groups
5-12 57.3 30.5 0.9 0.5 0.2 8,393
13-17 51.2 29.5 2.4 1.3 0.9 4,007
Mother's educationa
None 53.5 28.2 1.4 0.7 0.5 9,747
Primary 68.7 39.9 1.6 0.9 0.3 1,490
Secondary + 68.7 44.1 0.9 0.3 1.1 620
Mother not in household 36.0 22.0 1.7 1.3 0.2 514
Wealth index quintiles
Poorest 35.0 15.3 0.5 0.2 0.1 2,593
Second 52.3 23.8 0.5 0.3 0.2 2,486
Middle 63.8 32.8 2.0 1.2 0.5 2,526
Fourth 63.3 39.6 1.2 0.5 0.5 2,518
Richest 63.8 40.8 2.8 1.6 1.0 2,277
Total 55.4 30.2 1.4 0.7 0.4 12,400
aTotal includes 21 unweighted cases of children missing information on mother’s education that are not shown separately
The percentage of children who complete a NFE programme is shown in Table ED.9C. Only 5 percent of children completed ABE classes, 2 percent completed youth programme and a further 0.5 percent completed the vocational training programme. However this data should be interpreted with caution as the total includes very young children who may not be expected to have completed any of the non-formal education programme e.g. a five year old may not have compeleted vocational training.
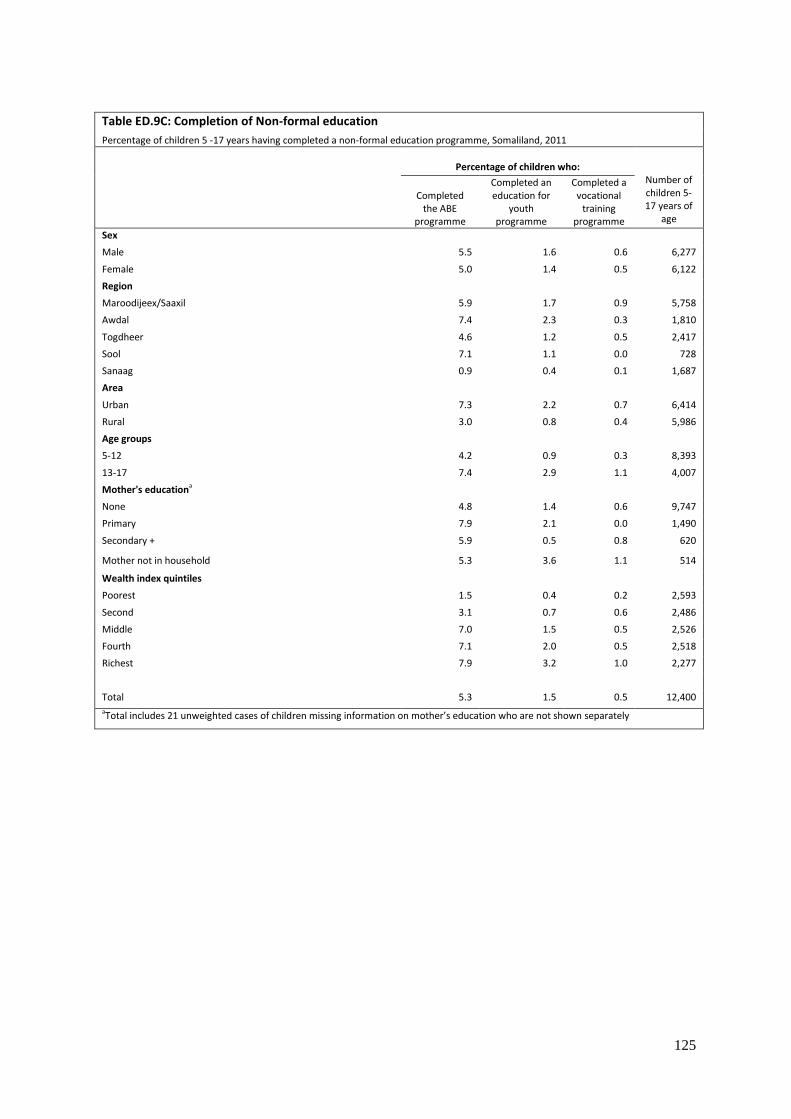
125
Table ED.9C: Completion of Non-formal education
Percentage of children 5 -17 years having completed a non-formal education programme, Somaliland, 2011
Percentage of children who:
Number of children 5-17 years of
age
Completed the ABE
programme
Completed an education for
youth programme
Completed a vocational
training programme
Sex
Male 5.5 1.6 0.6 6,277
Female 5.0 1.4 0.5 6,122
Region
Maroodijeex/Saaxil 5.9 1.7 0.9 5,758
Awdal 7.4 2.3 0.3 1,810
Togdheer 4.6 1.2 0.5 2,417
Sool 7.1 1.1 0.0 728
Sanaag 0.9 0.4 0.1 1,687
Area
Urban 7.3 2.2 0.7 6,414
Rural 3.0 0.8 0.4 5,986
Age groups
5-12 4.2 0.9 0.3 8,393
13-17 7.4 2.9 1.1 4,007
Mother's educationa
None 4.8 1.4 0.6 9,747
Primary 7.9 2.1 0.0 1,490
Secondary + 5.9 0.5 0.8 620
Mother not in household 5.3 3.6 1.1 514
Wealth index quintiles
Poorest 1.5 0.4 0.2 2,593
Second 3.1 0.7 0.6 2,486
Middle 7.0 1.5 0.5 2,526
Fourth 7.1 2.0 0.5 2,518
Richest 7.9 3.2 1.0 2,277
Total 5.3 1.5 0.5 12,400 aTotal includes 21 unweighted cases of children missing information on mother’s education who are not shown separately
126
XI. Child Protection
Child Labour
Article 32 of the Convention on the Rights of the Child states: "States Parties recognize the right of the child to be protected from economic exploitation and from performing any work that is likely to be hazardous or to interfere with the child's education, or to be harmful to the child's health or physical, mental, spiritual, moral or social development..."The World Fit for Children mentions nine strategies to combat child labour and the MDGs call for the protection of children against exploitation. In the MICS questionnaire, a number of questions addressed the issue of child labour, that is, children 5-14 years of age involved in labour activities. A child is considered to be involved in child labour activities at the moment of the survey if during the week preceding the survey he/she performed the following activities:
Ages 5-11: at least one hour of economic work or 28 hours of domestic work per week. Ages 12-14: at least 14 hours of economic work or 28 hours of domestic work per week.
This definition allows differentiation between child labour and child work to identify the type of work that should be eliminated. Table CP.1 presents the results of child labour by the type of work. Percentages do not add up to the total child labour as children may be involved in more than one type of work. Twenty six percent of all children age 5 – 14 years are involved in child labour. About 22 percent of the children age 5-11 years and 35 percent of those age 12 – 14 years were involved in working for family business in the past week before the survey. A higher percentage of children were working in family businesses in rural areas compared to urban areas in both age groups; 34 versus 9 percent in the 5 – 11 years age group and 55 versus 18 percent in the 12 – 14 years age group. There was little variation in the percentage of children who experienced child labour between males (23percent) and females (29 percent). Child labour involvement decreased with increasing maternal education and varied across regions. The percentage of children involved in household chores for 28 hours or more in the previous week is higher among children aged 12 – 14 years (11 percent) compared to younger children (4 percent).
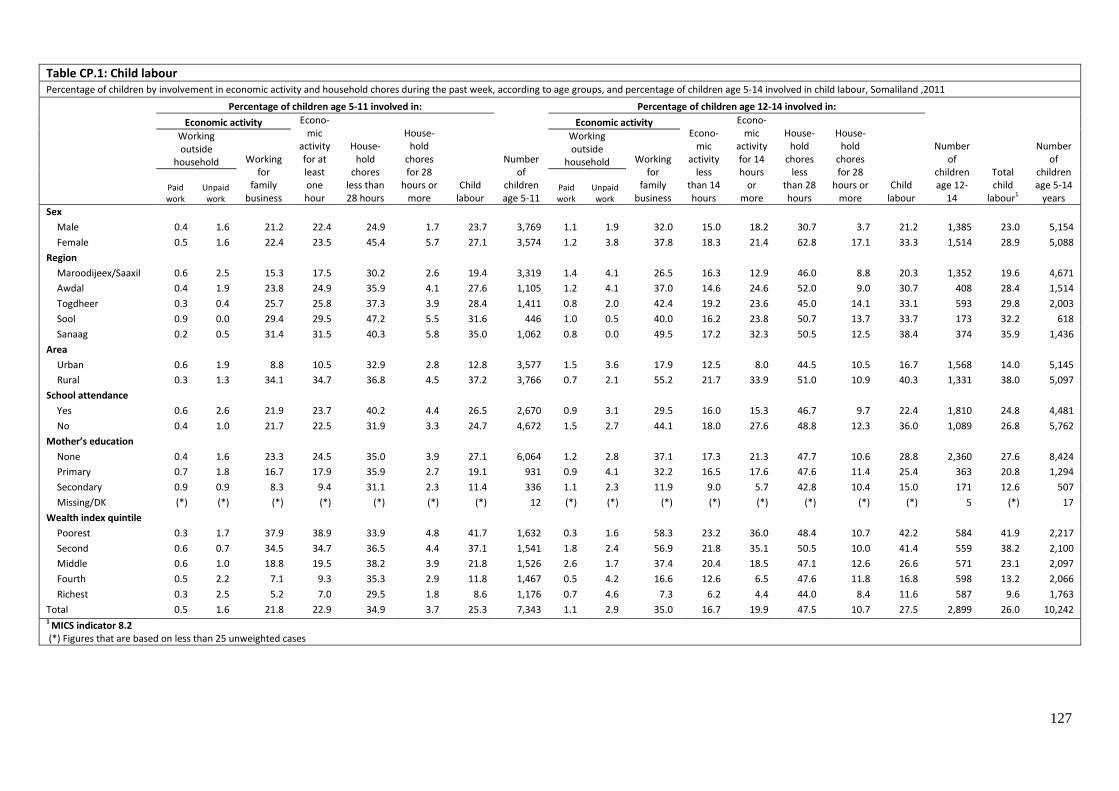
127
Table CP.1: Child labour Percentage of children by involvement in economic activity and household chores during the past week, according to age groups, and percentage of children age 5-14 involved in child labour, Somaliland ,2011
Percentage of children age 5-11 involved in:
Number of
children age 5-11
Percentage of children age 12-14 involved in:
Number of
children age 12-
14
Total child
labour1
Number of
children age 5-14
years
Economic activity Econo-mic
activity for at least one hour
House-hold
chores less than 28 hours
House-hold
chores for 28
hours or more
Child labour
Economic activity Econo-
mic activity
less than 14 hours
Econo-mic
activity for 14 hours
or more
House-hold
chores less
than 28 hours
House-hold
chores for 28
hours or more
Child labour
Working outside
household Working for
family business
Working outside
household Working for
family business
Paid work
Unpaid work
Paid work
Unpaid work
Sex
Male 0.4 1.6 21.2 22.4 24.9 1.7 23.7 3,769 1.1 1.9 32.0 15.0 18.2 30.7 3.7 21.2 1,385 23.0 5,154
Female 0.5 1.6 22.4 23.5 45.4 5.7 27.1 3,574 1.2 3.8 37.8 18.3 21.4 62.8 17.1 33.3 1,514 28.9 5,088
Region
Maroodijeex/Saaxil 0.6 2.5 15.3 17.5 30.2 2.6 19.4 3,319 1.4 4.1 26.5 16.3 12.9 46.0 8.8 20.3 1,352 19.6 4,671
Awdal 0.4 1.9 23.8 24.9 35.9 4.1 27.6 1,105 1.2 4.1 37.0 14.6 24.6 52.0 9.0 30.7 408 28.4 1,514
Togdheer 0.3 0.4 25.7 25.8 37.3 3.9 28.4 1,411 0.8 2.0 42.4 19.2 23.6 45.0 14.1 33.1 593 29.8 2,003
Sool 0.9 0.0 29.4 29.5 47.2 5.5 31.6 446 1.0 0.5 40.0 16.2 23.8 50.7 13.7 33.7 173 32.2 618
Sanaag 0.2 0.5 31.4 31.5 40.3 5.8 35.0 1,062 0.8 0.0 49.5 17.2 32.3 50.5 12.5 38.4 374 35.9 1,436
Area
Urban 0.6 1.9 8.8 10.5 32.9 2.8 12.8 3,577 1.5 3.6 17.9 12.5 8.0 44.5 10.5 16.7 1,568 14.0 5,145
Rural 0.3 1.3 34.1 34.7 36.8 4.5 37.2 3,766 0.7 2.1 55.2 21.7 33.9 51.0 10.9 40.3 1,331 38.0 5,097
School attendance
Yes 0.6 2.6 21.9 23.7 40.2 4.4 26.5 2,670 0.9 3.1 29.5 16.0 15.3 46.7 9.7 22.4 1,810 24.8 4,481
No 0.4 1.0 21.7 22.5 31.9 3.3 24.7 4,672 1.5 2.7 44.1 18.0 27.6 48.8 12.3 36.0 1,089 26.8 5,762
Mother’s education
None 0.4 1.6 23.3 24.5 35.0 3.9 27.1 6,064 1.2 2.8 37.1 17.3 21.3 47.7 10.6 28.8 2,360 27.6 8,424
Primary 0.7 1.8 16.7 17.9 35.9 2.7 19.1 931 0.9 4.1 32.2 16.5 17.6 47.6 11.4 25.4 363 20.8 1,294
Secondary 0.9 0.9 8.3 9.4 31.1 2.3 11.4 336 1.1 2.3 11.9 9.0 5.7 42.8 10.4 15.0 171 12.6 507
Missing/DK (*) (*) (*) (*) (*) (*) (*) 12 (*) (*) (*) (*) (*) (*) (*) (*) 5 (*) 17 Wealth index quintile
Poorest 0.3 1.7 37.9 38.9 33.9 4.8 41.7 1,632 0.3 1.6 58.3 23.2 36.0 48.4 10.7 42.2 584 41.9 2,217
Second 0.6 0.7 34.5 34.7 36.5 4.4 37.1 1,541 1.8 2.4 56.9 21.8 35.1 50.5 10.0 41.4 559 38.2 2,100
Middle 0.6 1.0 18.8 19.5 38.2 3.9 21.8 1,526 2.6 1.7 37.4 20.4 18.5 47.1 12.6 26.6 571 23.1 2,097
Fourth 0.5 2.2 7.1 9.3 35.3 2.9 11.8 1,467 0.5 4.2 16.6 12.6 6.5 47.6 11.8 16.8 598 13.2 2,066
Richest 0.3 2.5 5.2 7.0 29.5 1.8 8.6 1,176 0.7 4.6 7.3 6.2 4.4 44.0 8.4 11.6 587 9.6 1,763
Total 0.5 1.6 21.8 22.9 34.9 3.7 25.3 7,343 1.1 2.9 35.0 16.7 19.9 47.5 10.7 27.5 2,899 26.0 10,242 1 MICS indicator 8.2 (*) Figures that are based on less than 25 unweighted cases
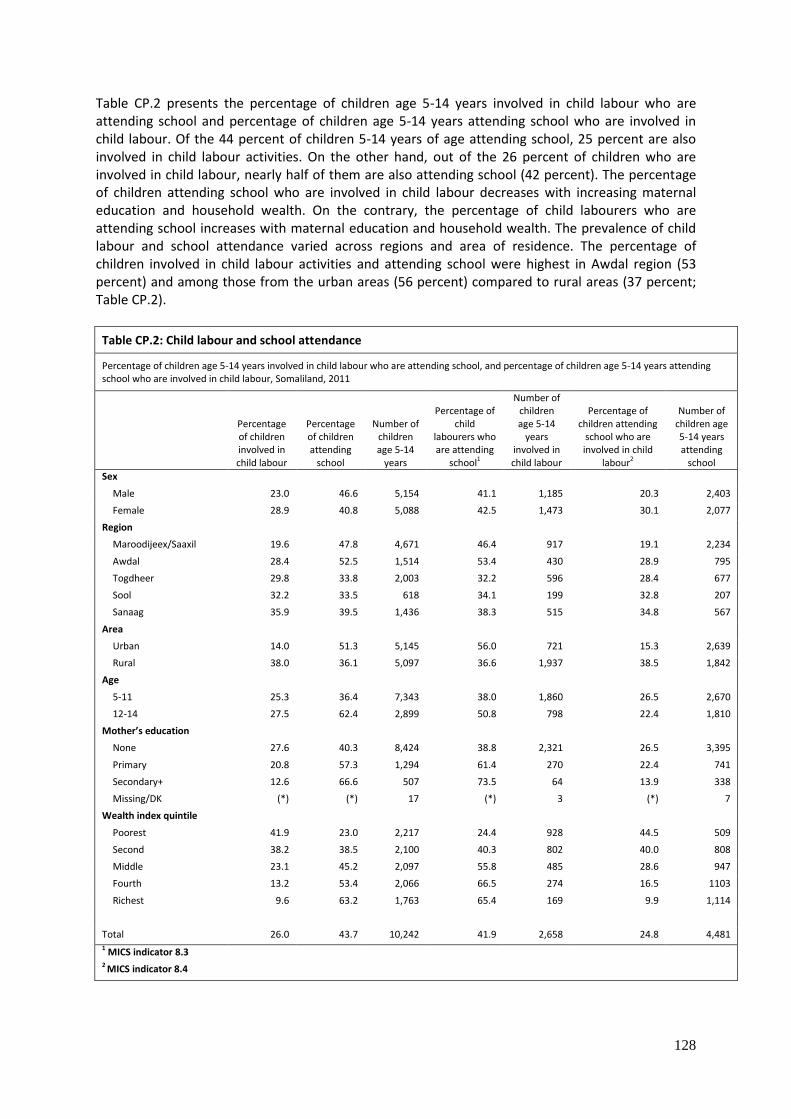
128
Table CP.2 presents the percentage of children age 5-14 years involved in child labour who are attending school and percentage of children age 5-14 years attending school who are involved in child labour. Of the 44 percent of children 5-14 years of age attending school, 25 percent are also involved in child labour activities. On the other hand, out of the 26 percent of children who are involved in child labour, nearly half of them are also attending school (42 percent). The percentage of children attending school who are involved in child labour decreases with increasing maternal education and household wealth. On the contrary, the percentage of child labourers who are attending school increases with maternal education and household wealth. The prevalence of child labour and school attendance varied across regions and area of residence. The percentage of children involved in child labour activities and attending school were highest in Awdal region (53 percent) and among those from the urban areas (56 percent) compared to rural areas (37 percent; Table CP.2).
Table CP.2: Child labour and school attendance
Percentage of children age 5-14 years involved in child labour who are attending school, and percentage of children age 5-14 years attending school who are involved in child labour, Somaliland, 2011
Percentage of children involved in child labour
Percentage of children attending
school
Number of children age 5-14
years
Percentage of child
labourers who are attending
school1
Number of children age 5-14
years involved in child labour
Percentage of children attending
school who are involved in child
labour2
Number of children age 5-14 years attending
school
Sex Male 23.0 46.6 5,154 41.1 1,185 20.3 2,403
Female 28.9 40.8 5,088 42.5 1,473 30.1 2,077
Region
Maroodijeex/Saaxil 19.6 47.8 4,671 46.4 917 19.1 2,234
Awdal 28.4 52.5 1,514 53.4 430 28.9 795
Togdheer 29.8 33.8 2,003 32.2 596 28.4 677
Sool 32.2 33.5 618 34.1 199 32.8 207
Sanaag 35.9 39.5 1,436 38.3 515 34.8 567
Area
Urban 14.0 51.3 5,145 56.0 721 15.3 2,639
Rural 38.0 36.1 5,097 36.6 1,937 38.5 1,842
Age
5-11 25.3 36.4 7,343 38.0 1,860 26.5 2,670
12-14 27.5 62.4 2,899 50.8 798 22.4 1,810
Mother’s education
None 27.6 40.3 8,424 38.8 2,321 26.5 3,395
Primary 20.8 57.3 1,294 61.4 270 22.4 741
Secondary+ 12.6 66.6 507 73.5 64 13.9 338
Missing/DK (*) (*) 17 (*) 3 (*) 7
Wealth index quintile
Poorest 41.9 23.0 2,217 24.4 928 44.5 509
Second 38.2 38.5 2,100 40.3 802 40.0 808
Middle 23.1 45.2 2,097 55.8 485 28.6 947
Fourth 13.2 53.4 2,066 66.5 274 16.5 1103
Richest 9.6 63.2 1,763 65.4 169 9.9 1,114
Total 26.0 43.7 10,242 41.9 2,658 24.8 4,481 1 MICS indicator 8.3 2 MICS indicator 8.4

129
Child Discipline
As stated in A World Fit for Children, “children must be protected against any acts of violence….’’and the Millennium Declaration calls for the protection of children against abuse, exploitation and violence. In the Somaliland MICS survey, respondents to the household questionnaire were asked a series of questions on the ways in which adults in the household tend to discipline children during the past month preceding the survey. Note that for the child discipline module, one child aged 2-14 per household was selected randomly during fieldwork. Out of these questions, the two indicators used to describe aspects of child discipline are: 1) the number of children 2-14 years that experience psychological aggression as punishment or physical punishment; and 2) the number of respondents who believe that in order to raise children properly, they need be physically punished. In Somaliland, 78 percent of children age 2-14 years were subjected to at least one form of psychological or physical punishment by their parents or other adult household members during the past month preceding the survey (Table CP.3). More importantly, 31 percent of children were subjected to severe physical punishment while 16 percent were subjected to non-violent form of discipline. There were no major variations in the severity of physical punishment experienced by male and female children. It is very interesting that differentials with respect to many of the background variables were relatively small. Older children were more likely to have experienced psychological aggression.
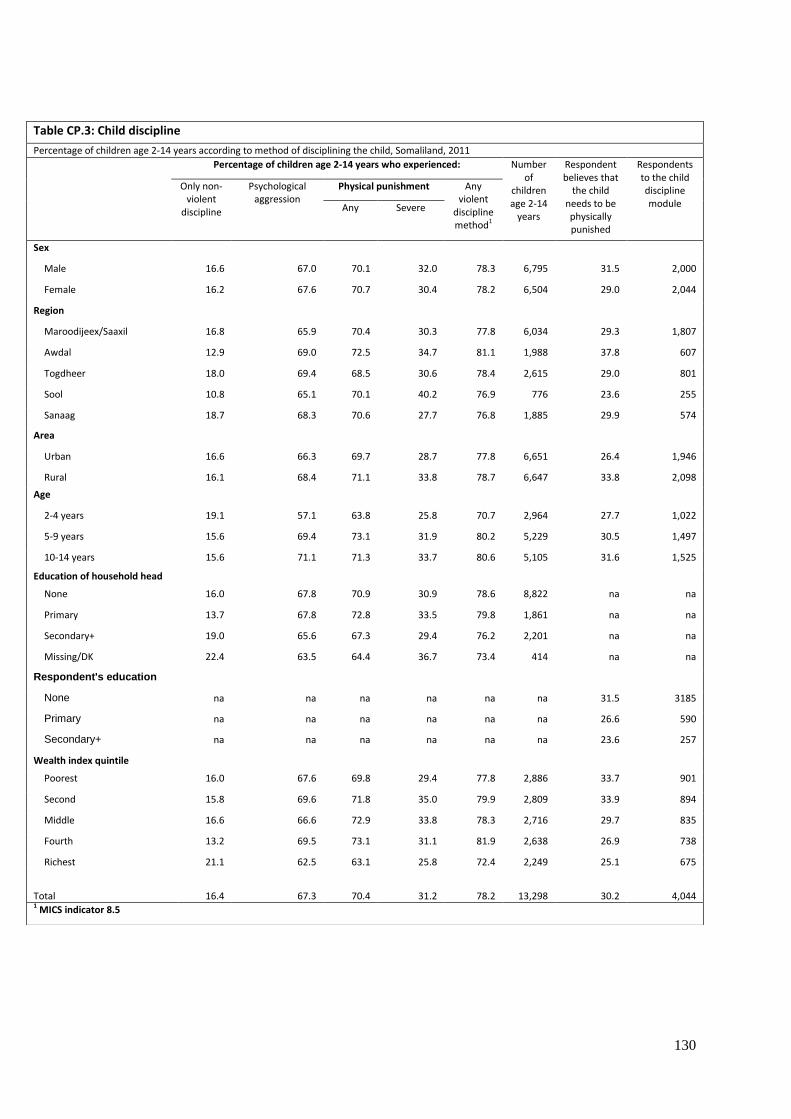
130
Table CP.3: Child discipline
Percentage of children age 2-14 years according to method of disciplining the child, Somaliland, 2011
Percentage of children age 2-14 years who experienced: Number of
children age 2-14
years
Respondent believes that
the child needs to be physically punished
Respondents to the child discipline module
Only non-violent
discipline
Psychological aggression
Physical punishment Any violent
discipline method1
Any Severe
Sex
Male 16.6 67.0 70.1 32.0 78.3 6,795 31.5 2,000
Female 16.2 67.6 70.7 30.4 78.2 6,504 29.0 2,044
Region
Maroodijeex/Saaxil 16.8 65.9 70.4 30.3 77.8 6,034 29.3 1,807
Awdal 12.9 69.0 72.5 34.7 81.1 1,988 37.8 607
Togdheer 18.0 69.4 68.5 30.6 78.4 2,615 29.0 801
Sool 10.8 65.1 70.1 40.2 76.9 776 23.6 255
Sanaag 18.7 68.3 70.6 27.7 76.8 1,885 29.9 574
Area
Urban 16.6 66.3 69.7 28.7 77.8 6,651 26.4 1,946
Rural 16.1 68.4 71.1 33.8 78.7 6,647 33.8 2,098
Age
2-4 years 19.1 57.1 63.8 25.8 70.7 2,964 27.7 1,022
5-9 years 15.6 69.4 73.1 31.9 80.2 5,229 30.5 1,497
10-14 years 15.6 71.1 71.3 33.7 80.6 5,105 31.6 1,525
Education of household head
None 16.0 67.8 70.9 30.9 78.6 8,822 na na
Primary 13.7 67.8 72.8 33.5 79.8 1,861 na na
Secondary+ 19.0 65.6 67.3 29.4 76.2 2,201 na na
Missing/DK 22.4 63.5 64.4 36.7 73.4 414 na na
Respondent's education
None na na na na na na 31.5 3185
Primary na na na na na na 26.6 590
Secondary+ na na na na na na 23.6 257
Wealth index quintile
Poorest 16.0 67.6 69.8 29.4 77.8 2,886 33.7 901
Second 15.8 69.6 71.8 35.0 79.9 2,809 33.9 894
Middle 16.6 66.6 72.9 33.8 78.3 2,716 29.7 835
Fourth 13.2 69.5 73.1 31.1 81.9 2,638 26.9 738
Richest 21.1 62.5 63.1 25.8 72.4 2,249 25.1 675
Total 16.4 67.3 70.4 31.2 78.2 13,298 30.2 4,044 1 MICS indicator 8.5
131
Early Marriage and Polygyny
Marriage before the age of 18 is a reality for many young girls. According to UNICEF's worldwide estimates, over 60 million women age 20-24 were married before the age of 18. Factors that influence child marriage rates include: the state of the country's civil registration system, which provides proof of age for children; the existence of an adequate legislative framework with an accompanying enforcement mechanism to address cases of child marriage; and the existence of customary or religious laws and practices that condone the practice. In many parts of the world parents encourage the marriage of their daughters while they are still children in hopes that the marriage will benefit them both financially and socially, while also relieving financial burdens on the family. In actual fact, child marriage is a violation of human rights, compromising the development of girls and often resulting in early pregnancy and social isolation, with little education and poor vocational training reinforcing the gendered nature of poverty. The right to 'free and full' consent to a marriage is recognized in the Universal Declaration of Human Rights - with the recognition that consent cannot be 'free and full' when one of the parties involved is not sufficiently mature to make an informed decision about a life partner. Closely related to the issue of child marriage is the age at which girls become sexually active. Women who are married before the age of 18 tend to have more children than those who marry later in life. Pregnancy related deaths are known to be a leading cause of mortality for both married and unmarried girls between the ages of 15 and 19, particularly among the youngest of this cohort. There is evidence to suggest that girls who marry at young ages are more likely to marry older men which puts them at increased risk of HIV infection. The demand for this young wife to reproduce and the power imbalance resulting from the age differential lead to very low condom use among such couples. Two of the indicators are the percentage of women married before 15 years of age and percentage married before 18 years of age. The percentage of women married at various ages is provided in Table CP.4. About one in ten young women age 15-19 years is currently married (9 percent). This proportion varies between urban (6 percent) and rural (14 percent) residence, and is strongly related to the level of education. Almost one third (31 percent) of women aged 20 to 49 years got married before age 18. The percentage of women in a polygynous union is also provided in Table CP.4. Seventeen percent of currently married women are in polygynous unions. This proportion increases sharply with age from 7 percent among younger women to 28 percent among older ones.

132
Table CP.4: Early marriage and polygyny
Percentage of women age 15-49 years who first married or entered a marital union before their 15th birthday, percentages of women age 20-49 years who first married or entered a marital union before their 15th and 18th birthdays, percentage of women age 15-19 years currently married , and the percentage of women currently married who are in a polygynous marriage, Somaliland, 2011
Percentage married
before age 151
Number of
women age 15-
49 years
Percentage married
before age 15
Percentage married
before age 182
Number of
women age 20-
49 years
Percentage of women
15-19 years
currently married3
Number of
women age 15-
19 years
Percentage of women age 15-49 years in
polygynous marriage4
Number of
women age 15-49 years currently married
Region
Maroodijeex/Saaxil 7.7 2,925 9.8 27.4 2,206 6.1 719 15.8 1,439
Awdal 9.3 841 11.2 30.2 631 9.2 210 10.8 492
Togdheer 9.3 1,078 11.4 34.8 809 12.2 268 19.4 602
Sool 9.1 314 10.7 36.6 239 18.6 76 17.5 181
Sanaag 11.1 707 13.8 36.6 529 11.0 178 22.7 432
Area
Urban 6.7 3,378 8.7 26.1 2,451 5.9 928 16.4 1,521
Rural 11.4 2,487 13.5 36.5 1,963 14.3 523 17.1 1,626
Age
15-19 2.3 1,451 na na na 8.9 1,451 6.5 129
20-24 6.8 1,148 6.8 24.1 1,148 na na 7.7 455
25-29 9.9 1,060 9.9 29.7 1,060 na na 11.2 751
30-34 16.8 731 16.8 38.6 731 na na 16.5 603
35-39 12.8 673 12.8 35.3 673 na na 24.2 553
40-44 11.5 540 11.5 32.5 540 na na 24.3 452
45-49 9.0 262 9.0 27.3 262 na na 27.8 202
Education
None 10.6 3,956 12.1 33.2 3,318 12.4 638 17.3 2,510
Primary 5.5 1,227 8.3 26.8 680 7.4 546 14.5 459
Secondary+ 3.3 682 5.0 17.7 416 3.5 267 14.5 177
Wealth index quintile
Poorest 13.7 920 16.2 40.7 740 12.7 180 16.9 635
Second 10.6 1,068 12.4 35.0 835 17.0 233 15.6 683
Middle 9.8 1,162 12.0 35.6 881 7.9 281 19.3 660
Fourth 8.3 1,254 10.4 28.3 933 7.8 321 15.0 616
Richest 3.7 1,461 5.1 18.3 1,026 4.6 436 17.0 552
Total 8.7 5,865 10.8 30.8 4,414 8.9 1,451 16.8 3,146
1 MICS indicator 8.6 2 MICS indicator 8.7 3 MICS indicator 8.8 4 MICS indicator 8.9
Table CP.5 presents respectively the proportion of women who were first married or entered into a marital union before age 15 and 18 by area of residence and age groups. Examining the percentages married before age 15 and 18 by different age groups allow us to see the trends in early marriage over time. The survey found that the trend for marriage before the age of 15 years appeared to form a curve between the seven age categories starting from 2 per cent for those 15 – 19 years, reaching a high of 17 per cent among those 30 – 34 years and then declining to 13 per cent (35 – 39 age group), 12 per cent (40 – 44 age group) and declines to 9 percent for the 45 – 49 age group. For those married before the age of 18 years, the same curve like trend is evident starting from 24

133
percent for the 20 – 24 age group to a high of 39 per cent for the 30 – 34 age group and then declines to 27 per cent for the 45 – 49 age group.
Table CP.5: Trends in early marriage
Percentage of women who were first married or entered into a marital union before age 15 and 18, by area and age groups, Somaliland, 2011
Urban Rural All
Percentage of
women married before age 15
Number of
women age 15-49
Percentage of
women married before age 18
Number of
women age 20-49
Percentage of
women married before age 15
Number of
women age 15-49
Percentage of
women married before age 18
Number of
women age 20-49
Percentage of
women married before age 15
Number of
women age 15-49
Percentage of
women married before age 18
Number of
women age 20-49
Age
15-19 1.6 928 na na 3.5 523 na na 2.3 1,451 na na
20-24 3.6 721 15.0 721 12.3 427 39.4 427 6.8 1,148 24.1 1,148
25-29 7.2 603 23.2 603 13.4 457 38.2 457 9.9 1,060 29.7 1,060
30-34 15.3 350 36.6 350 18.3 381 40.5 381 16.8 731 38.6 731
35-39 10.9 350 33.0 350 14.9 323 37.8 323 12.8 673 35.3 673
40-44 13.5 269 38.6 269 9.5 271 26.5 271 11.5 540 32.5 540
45-49 9.6 158 28.5 158 8.1 105 25.5 105 9.0 262 27.3 262
Total 6.7 3,378 26.1 2,451 11.4 2,487 36.5 1,963 8.7 5,865 30.8 4,414
Another component is spousal age difference measured as the percentage of married women whose husband or partner is 10 or more years older. Table CP.6 presents the results of the age difference between husbands and wives. The results show that there are some important spousal age differences in Somaliland. The percentage of women age 20-24 currently married to a man who is older by ten years or more is 29 percent. One third of women age 15-19 are currently married to men who are older by ten years or more (33 percent). The spousal age differentials by 10 years or more are slightly higher in rural than urban women.

134
Table CP.6: Spousal age difference Percent distribution of women currently married age 15-19 and 20-24 years according to the age difference with their husband or partner, Somaliland, 2011
Percentage of currently married women age 15-19 years
whose husband or partner is: Number
of women age 15-19 years currently married
Percentage of currently married women age 20-24 years whose husband or partner is:
Number of women age 20-24 years currently married
0-4 years older
5-9 years older
10+ years older1
Husband/Partner's age unknown Total
Younger
0-4 years older
5-9 years older
10+ years older2
Husband/Partner's age unknown Total
Region
Maroodijeex/Saaxil (22.9) (39.6) (33.1) (4.5) 100.0 44 1.6 30.6 31.8 30.2 5.8 100.0 189
Awdal (*) (*) (*) (*) 100.0 19 3.4 22.1 38.0 34.7 1.8 100.0 60
Togdheer (37.6) (37.6) (18.8) (5.9) 100.0 33 3.7 38.1 31.8 24.4 2.0 100.0 108
Sool (*) (*) (*) (*) 100.0 14 (3.9) (40.3) (34.6) (17.3) (3.9) 100.0 28
Sanaag (*) (*) (*) (*) 100.0 20 1.6 23.5 38.6 34.8 1.6 100.0 70
Area
Urban 28.7 36.1 24.5 10.7 100.0 55 2.9 30.8 34.4 28.0 3.9 100.0 201
Rural 24.3 34.3 38.6 2.9 100.0 75 2.1 30.8 33.4 30.4 3.4 100.0 254
Age
15-19 26.2 35.0 32.7 6.2 100.0 129 na na na na na na na
20-24 na na na na na na 2.5 30.8 33.8 29.3 3.6 100.0 455
Education
None 21.5 32.2 40.0 6.2 100.0 79 2.1 28.9 34.5 30.9 3.6 100.0 339
Primary (24.7) (43.9) (23.9) (7.5) 100.0 41 3.5 35.1 32.4 26.6 2.4 100.0 86
Secondary+ (*) (*) (*) (*) 100.0 9 (3.3) (39.9) (30.8) (19.6) (6.5) 100.0 30
Wealth index quintile
Poorest (*) (*) (*) (*) 100.0 23 2.5 27.5 34.8 30.1 5.0 100.0 85
Second (26.0) (37.4) (29.0) (7.6) 100.0 40 2.1 32.1 32.7 31.0 2.0 100.0 104
Middle (*) (*) (*) (*) 100.0 22 2.0 29.8 34.6 30.6 3.0 100.0 104
Fourth (19.3) (39.3) (33.6) (7.8) 100.0 25 3.4 32.4 32.0 28.8 3.4 100.0 85
Richest (*) (*) (*) (*) 100.0 20 2.5 32.2 35.1 25.2 5.0 100.0 77
Total 26.2 35.0 32.7 6.2 100.0 129 2.5 30.8 33.8 29.3 3.6 100.0 455 1 MICS indicator 8.10a 2 MICS indicator 8.10b ( ) Figures that are based on 25-49 unweighted cases (*) Figures that are based on less than 25 unweighted cases na: not applicable
135
Female Genital Mutilation/Cutting
Female genital mutilation/cutting (FGM/C) is the partial or total removal of the female external genitalia or other injury to the female genital organs. FGM/C is always traumatic with immediate complications including excruciating pain, shock, urine retention, ulceration of the genitals and injury to adjacent tissue. Other complications include septicaemia, infertility, obstructed labour, and even death. In Somaliland, the procedure is generally carried out on girls between the ages of 4 and 14. It is often performed by traditional practitioners, including untrained village midwives without anaesthesia, using scissors, razor blades or broken glass. The instruments are often not sterile and the ritual is very often performed in unsanitary conditions. FGM/C is a fundamental violation of human rights. It subjects girls and women to health risks and has life-threatening consequences. Among those rights violated are the rights to the highest attainable standard of health and to bodily integrity. Furthermore, it could be argued that girls (under 18) cannot be said to give informed consent to such a potentially damaging practice as FGM/C. Table CP.7 presents the prevalence of FGM/C among women and the type and extent of the procedure. The table shows that almost all women (99 percent) aged 15-49 had some form of female genital mutilation. The most common form of FGM is sewing closed (85 percent). The practice differs slightly across regions with Togdheer region having the highest percentage (92 percent) of women who were sewn closed compared to women from other regions.

136
Table CP.7: Female genital mutilation/cutting (FGM/C) among women
Percent distribution of women age 15-49 years by FGM/C status, Somaliland, 2011
Percent distribution of women age 15-49 years:
Percentage who had any
form of FGM/C1
Number of women age 15-49 years No FGM/C
Who had FGM/C
Had flesh removed
Were nicked
Were sewn
closed Form of FGM/C not determined Total
Region
Maroodijeex/Saaxil 1.3 9.0 3.0 82.9 3.9 100.0 98.7 2,925
Awdal 0.6 13.8 3.3 79.8 2.4 100.0 99.4 841
Togdheer 0.6 4.3 2.4 91.6 1.1 100.0 99.4 1,078
Sool 0.7 6.5 0.3 88.3 4.2 100.0 99.3 314
Sanaag 0.3 8.1 2.1 87.5 2.0 100.0 99.7 707
Area
Urban 1.3 10.3 3.3 81.6 3.5 100.0 98.7 3,378
Rural 0.4 6.2 1.8 89.4 2.2 100.0 99.6 2,487
Age
15-19 1.5 16.8 6.2 69.5 5.9 100.0 98.5 1,451
20-24 1.2 11.6 3.7 78.3 5.2 100.0 98.8 1,148
25-29 0.5 5.9 1.2 90.7 1.8 100.0 99.5 1,060
30-34 1.0 3.3 0.7 94.4 0.7 100.0 99.0 731
35-39 0.3 3.0 0.3 95.8 0.6 100.0 99.7 673
40-44 0.8 3.0 0.4 95.9 0.0 100.0 99.2 540
45-49 0.0 1.1 0.4 98.5 0.0 100.0 100.0 262
Education
None 0.8 6.2 1.3 90.1 1.6 100.0 99.2 3,956
Primary 1.0 11.4 4.6 78.0 5.0 100.0 99.0 1,227
Secondary+ 1.6 17.4 6.7 67.1 7.2 100.0 98.4 682
Wealth index quintile
Poorest 0.2 6.5 1.4 89.8 2.2 100.0 99.8 920
Second 0.5 6.3 2.0 89.8 1.4 100.0 99.5 1,068
Middle 0.5 6.6 1.9 88.0 3.0 100.0 99.5 1,162
Fourth 0.8 8.2 3.2 84.7 3.0 100.0 99.2 1,254
Richest 2.0 13.5 4.1 75.9 4.6 100.0 98.0 1,461
Total 0.9 8.6 2.7 84.9 3.0 100.0 99.1 5,865
1 MICS indicator 8.12
Somaliland like the rest of Somalia has one of the highest prevalence rates of FGM/C in the world with nearly all girls cut by the age of 12. Majority of these girls and women are subjected to ‘pharonic’ FGM/C, the most severe form of the practice, usually involving infibulations. Despite internationally recognized laws against FGM/C, lack of validation for the practice in Islam relgion and global advocacy to eradicate the practice, it remains deeply embedded in Somaliland culture. In the rural areas, FGM/C is practiced during the rainy season while in the urban centres there is no specific defined time frame.

137
Table CP.8 presents the prevalence and extent of FGM/C performed on the respondents’ daughters age 0-14. It is important to note that only women who have heard of FGM/C were eligible to respond. However, since 99.8 percent of women have heard of FGM/C, the information gathered is practically representative of all daughters. Overall, 28 per cent of daughters have undergone FGM/C17. Twelve percent were sewn closed while 10 percent had flesh removed. The percentage of daughters who had flesh removed was slightly more in urban areas (12 percent) compared to rural areas (8 percent). Thirteen percent of daughters in rural areas were sewn closed compared to 10 percent in urban areas
17
Note that this is the current (rather than final) status of the girls aged 0 -14 years. Therefore, this data cannot be compared with the prevalence of FGM/C among women 15 - 49 years.
Table CP.8: Female genital mutilation/cutting (FGM/C) among daughters
Percent distribution of daughters age 0-14 by FGM/C status, Northwest Zone, Somalia 2011
Percent distribution of daughters age 0-14 years:
Percentage who had
any form of FGM/C1
Number of daughters age 0-14
years No FGM/C
Who had FGM/C
Had flesh removed
Were nicked
Were sewn closed
Form of FGM/C not determined Total
Region
Maroodijeex/Saaxil 71.5 10.4 4.4 9.2 4.5 100.0 28.5 2,527
Awdal 71.4 11.8 3.2 10.7 3.0 100.0 28.6 854
Togdheer 75.4 8.4 2.0 12.8 1.5 100.0 24.6 1,202
Sool 73.6 5.9 2.1 16.9 1.5 100.0 26.4 336
Sanaag 70.5 8.5 2.5 16.0 2.5 100.0 29.5 810
Area
Urban 69.5 11.7 4.6 10.2 4.0 100.0 30.5 2,753
Rural 74.9 7.7 2.2 12.9 2.3 100.0 25.1 2,977
Age
0-4 99.6 0.1 0.0 0.1 0.2 100.0 0.4 2,078
5-9 83.2 6.5 2.1 6.2 2.1 100.0 16.8 2,086
10-14 21.5 26.4 9.4 34.1 8.6 100.0 78.5 1,566
Mothers Education
None 72.5 9.7 2.7 11.9 3.1 100.0 27.5 4,692
Primary 73.8 8.2 4.9 10.4 2.6 100.0 26.2 756
Secondary 64.8 11.8 9.1 9.4 4.9 100.0 35.2 282
Mother's FGM/C experience
No FGM/C (*) (*) (*) (*) (*) 100.0 (*) 11
Had FGM/C 72.3 9.6 3.3 11.6 3.2 100.0 27.7 5,718
Wealth index quintile
Poorest 78.0 6.3 2.5 10.5 2.7 100.0 22.0 1,230
Second 73.8 8.7 2.1 13.6 1.8 100.0 26.2 1,267
Middle 69.7 10.2 2.3 15.5 2.3 100.0 30.3 1,191
Fourth 70.8 11.4 5.2 8.3 4.3 100.0 29.2 1,145
Richest 67.5 12.4 5.3 9.4 5.4 100.0 32.5 895
Total 72.3 9.6 3.3 11.6 3.2 100.0 27.7 5,729 1 MICS indicator 8.13 (* ) Figures that are based on less than 25 unweighted cases
138
Table CP.9 presents women’s attitudes towards FGM/C. Regarding opinion as to whether the practice should be continued or discontinued, 29 percent of women thought it should be continued while 69 percent believed it should be discontinued. The percent of women believe FGM/C should stop was higher in urban areas, among those with secondary or higher education and those from the richest households. A higher proportion of younger women aged 15 – 19, thought FGM/C should continue compared to older women.
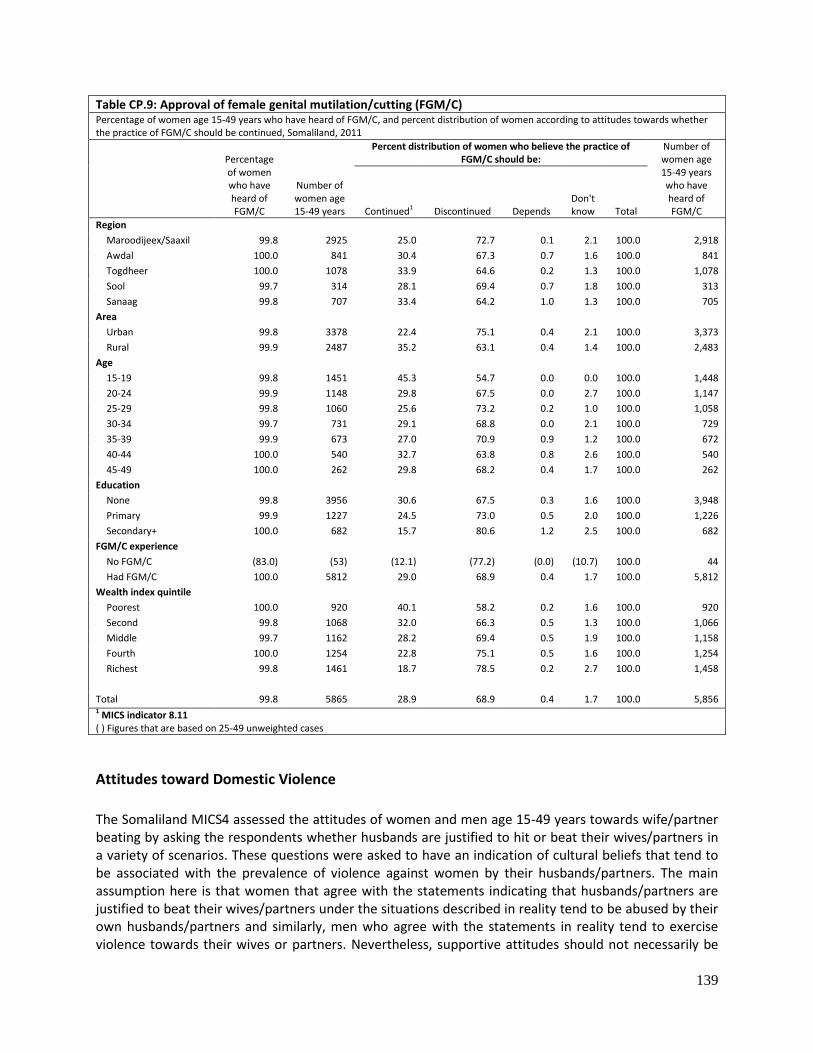
139
Table CP.9: Approval of female genital mutilation/cutting (FGM/C) Percentage of women age 15-49 years who have heard of FGM/C, and percent distribution of women according to attitudes towards whether the practice of FGM/C should be continued, Somaliland, 2011
Percentage of women who have heard of FGM/C
Number of women age 15-49 years
Percent distribution of women who believe the practice of FGM/C should be:
Number of women age 15-49 years who have heard of FGM/C Continued1 Discontinued Depends
Don't know Total
Region
Maroodijeex/Saaxil 99.8 2925 25.0 72.7 0.1 2.1 100.0 2,918
Awdal 100.0 841 30.4 67.3 0.7 1.6 100.0 841
Togdheer 100.0 1078 33.9 64.6 0.2 1.3 100.0 1,078
Sool 99.7 314 28.1 69.4 0.7 1.8 100.0 313
Sanaag 99.8 707 33.4 64.2 1.0 1.3 100.0 705
Area
Urban 99.8 3378 22.4 75.1 0.4 2.1 100.0 3,373
Rural 99.9 2487 35.2 63.1 0.4 1.4 100.0 2,483
Age
15-19 99.8 1451 45.3 54.7 0.0 0.0 100.0 1,448
20-24 99.9 1148 29.8 67.5 0.0 2.7 100.0 1,147
25-29 99.8 1060 25.6 73.2 0.2 1.0 100.0 1,058
30-34 99.7 731 29.1 68.8 0.0 2.1 100.0 729
35-39 99.9 673 27.0 70.9 0.9 1.2 100.0 672
40-44 100.0 540 32.7 63.8 0.8 2.6 100.0 540
45-49 100.0 262 29.8 68.2 0.4 1.7 100.0 262
Education
None 99.8 3956 30.6 67.5 0.3 1.6 100.0 3,948
Primary 99.9 1227 24.5 73.0 0.5 2.0 100.0 1,226
Secondary+ 100.0 682 15.7 80.6 1.2 2.5 100.0 682
FGM/C experience
No FGM/C (83.0) (53) (12.1) (77.2) (0.0) (10.7) 100.0 44
Had FGM/C 100.0 5812 29.0 68.9 0.4 1.7 100.0 5,812
Wealth index quintile
Poorest 100.0 920 40.1 58.2 0.2 1.6 100.0 920
Second 99.8 1068 32.0 66.3 0.5 1.3 100.0 1,066
Middle 99.7 1162 28.2 69.4 0.5 1.9 100.0 1,158
Fourth 100.0 1254 22.8 75.1 0.5 1.6 100.0 1,254
Richest 99.8 1461 18.7 78.5 0.2 2.7 100.0 1,458
Total 99.8 5865 28.9 68.9 0.4 1.7 100.0 5,856 1 MICS indicator 8.11 ( ) Figures that are based on 25-49 unweighted cases
Attitudes toward Domestic Violence
The Somaliland MICS4 assessed the attitudes of women and men age 15-49 years towards wife/partner beating by asking the respondents whether husbands are justified to hit or beat their wives/partners in a variety of scenarios. These questions were asked to have an indication of cultural beliefs that tend to be associated with the prevalence of violence against women by their husbands/partners. The main assumption here is that women that agree with the statements indicating that husbands/partners are justified to beat their wives/partners under the situations described in reality tend to be abused by their own husbands/partners and similarly, men who agree with the statements in reality tend to exercise violence towards their wives or partners. Nevertheless, supportive attitudes should not necessarily be
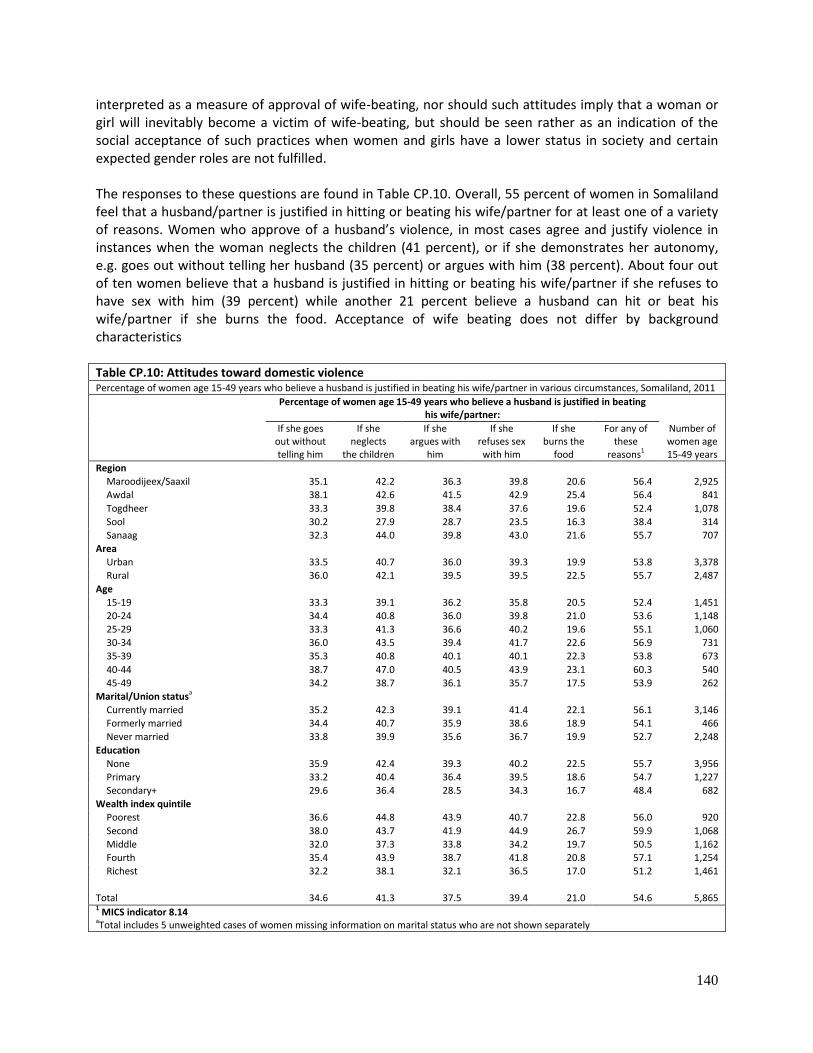
140
interpreted as a measure of approval of wife-beating, nor should such attitudes imply that a woman or girl will inevitably become a victim of wife-beating, but should be seen rather as an indication of the social acceptance of such practices when women and girls have a lower status in society and certain expected gender roles are not fulfilled. The responses to these questions are found in Table CP.10. Overall, 55 percent of women in Somaliland feel that a husband/partner is justified in hitting or beating his wife/partner for at least one of a variety of reasons. Women who approve of a husband’s violence, in most cases agree and justify violence in instances when the woman neglects the children (41 percent), or if she demonstrates her autonomy, e.g. goes out without telling her husband (35 percent) or argues with him (38 percent). About four out of ten women believe that a husband is justified in hitting or beating his wife/partner if she refuses to have sex with him (39 percent) while another 21 percent believe a husband can hit or beat his wife/partner if she burns the food. Acceptance of wife beating does not differ by background characteristics Table CP.10: Attitudes toward domestic violence Percentage of women age 15-49 years who believe a husband is justified in beating his wife/partner in various circumstances, Somaliland, 2011
Percentage of women age 15-49 years who believe a husband is justified in beating his wife/partner:
Number of women age 15-49 years
If she goes out without telling him
If she neglects
the children
If she argues with
him
If she refuses sex with him
If she burns the
food
For any of these
reasons1
Region
Maroodijeex/Saaxil 35.1 42.2 36.3 39.8 20.6 56.4 2,925
Awdal 38.1 42.6 41.5 42.9 25.4 56.4 841
Togdheer 33.3 39.8 38.4 37.6 19.6 52.4 1,078
Sool 30.2 27.9 28.7 23.5 16.3 38.4 314
Sanaag 32.3 44.0 39.8 43.0 21.6 55.7 707
Area
Urban 33.5 40.7 36.0 39.3 19.9 53.8 3,378
Rural 36.0 42.1 39.5 39.5 22.5 55.7 2,487
Age
15-19 33.3 39.1 36.2 35.8 20.5 52.4 1,451
20-24 34.4 40.8 36.0 39.8 21.0 53.6 1,148
25-29 33.3 41.3 36.6 40.2 19.6 55.1 1,060
30-34 36.0 43.5 39.4 41.7 22.6 56.9 731
35-39 35.3 40.8 40.1 40.1 22.3 53.8 673
40-44 38.7 47.0 40.5 43.9 23.1 60.3 540
45-49 34.2 38.7 36.1 35.7 17.5 53.9 262
Marital/Union statusa
Currently married 35.2 42.3 39.1 41.4 22.1 56.1 3,146
Formerly married 34.4 40.7 35.9 38.6 18.9 54.1 466
Never married 33.8 39.9 35.6 36.7 19.9 52.7 2,248
Education
None 35.9 42.4 39.3 40.2 22.5 55.7 3,956
Primary 33.2 40.4 36.4 39.5 18.6 54.7 1,227
Secondary+ 29.6 36.4 28.5 34.3 16.7 48.4 682
Wealth index quintile
Poorest 36.6 44.8 43.9 40.7 22.8 56.0 920
Second 38.0 43.7 41.9 44.9 26.7 59.9 1,068
Middle 32.0 37.3 33.8 34.2 19.7 50.5 1,162
Fourth 35.4 43.9 38.7 41.8 20.8 57.1 1,254
Richest 32.2 38.1 32.1 36.5 17.0 51.2 1,461
Total 34.6 41.3 37.5 39.4 21.0 54.6 5,865 1 MICS indicator 8.14 aTotal includes 5 unweighted cases of women missing information on marital status who are not shown separately

141
Orphans
Monitoring the variations in different outcomes for orphans and comparing them to their peers gives us a measure of how well communities and governments are responding to their needs. The frequencies of children living with neither parent, mother only, and father only are presented in Table CP.11 Sixty seven per cent of children aged 0-17 years in Somaliland live with both their parents. Twelve per cent of the children are living with neither parent while one or both parents are dead for 11 per cent of the children.
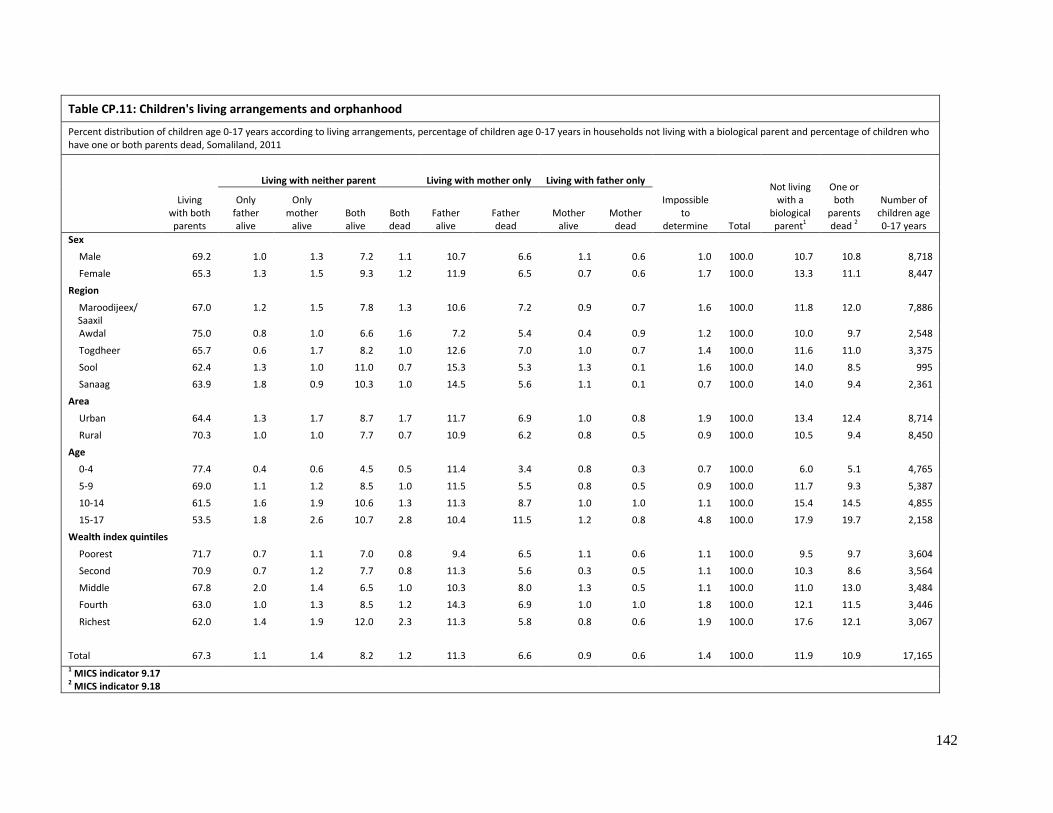
142
Table CP.11: Children's living arrangements and orphanhood
Percent distribution of children age 0-17 years according to living arrangements, percentage of children age 0-17 years in households not living with a biological parent and percentage of children who have one or both parents dead, Somaliland, 2011
Living with both parents
Living with neither parent Living with mother only Living with father only
Impossible to
determine Total
Not living with a
biological parent1
One or both
parents dead 2
Number of children age 0-17 years
Only father alive
Only mother
alive Both alive
Both dead
Father alive
Father dead
Mother alive
Mother dead
Sex
Male 69.2 1.0 1.3 7.2 1.1 10.7 6.6 1.1 0.6 1.0 100.0 10.7 10.8 8,718
Female 65.3 1.3 1.5 9.3 1.2 11.9 6.5 0.7 0.6 1.7 100.0 13.3 11.1 8,447
Region
Maroodijeex/ Saaxil
67.0 1.2 1.5 7.8 1.3 10.6 7.2 0.9 0.7 1.6 100.0 11.8 12.0 7,886
Awdal 75.0 0.8 1.0 6.6 1.6 7.2 5.4 0.4 0.9 1.2 100.0 10.0 9.7 2,548
Togdheer 65.7 0.6 1.7 8.2 1.0 12.6 7.0 1.0 0.7 1.4 100.0 11.6 11.0 3,375
Sool 62.4 1.3 1.0 11.0 0.7 15.3 5.3 1.3 0.1 1.6 100.0 14.0 8.5 995
Sanaag 63.9 1.8 0.9 10.3 1.0 14.5 5.6 1.1 0.1 0.7 100.0 14.0 9.4 2,361
Area
Urban 64.4 1.3 1.7 8.7 1.7 11.7 6.9 1.0 0.8 1.9 100.0 13.4 12.4 8,714
Rural 70.3 1.0 1.0 7.7 0.7 10.9 6.2 0.8 0.5 0.9 100.0 10.5 9.4 8,450
Age
0-4 77.4 0.4 0.6 4.5 0.5 11.4 3.4 0.8 0.3 0.7 100.0 6.0 5.1 4,765
5-9 69.0 1.1 1.2 8.5 1.0 11.5 5.5 0.8 0.5 0.9 100.0 11.7 9.3 5,387
10-14 61.5 1.6 1.9 10.6 1.3 11.3 8.7 1.0 1.0 1.1 100.0 15.4 14.5 4,855
15-17 53.5 1.8 2.6 10.7 2.8 10.4 11.5 1.2 0.8 4.8 100.0 17.9 19.7 2,158
Wealth index quintiles
Poorest 71.7 0.7 1.1 7.0 0.8 9.4 6.5 1.1 0.6 1.1 100.0 9.5 9.7 3,604
Second 70.9 0.7 1.2 7.7 0.8 11.3 5.6 0.3 0.5 1.1 100.0 10.3 8.6 3,564
Middle 67.8 2.0 1.4 6.5 1.0 10.3 8.0 1.3 0.5 1.1 100.0 11.0 13.0 3,484
Fourth 63.0 1.0 1.3 8.5 1.2 14.3 6.9 1.0 1.0 1.8 100.0 12.1 11.5 3,446
Richest 62.0 1.4 1.9 12.0 2.3 11.3 5.8 0.8 0.6 1.9 100.0 17.6 12.1 3,067
Total 67.3 1.1 1.4 8.2 1.2 11.3 6.6 0.9 0.6 1.4 100.0 11.9 10.9 17,165 1 MICS indicator 9.17 2 MICS indicator 9.18
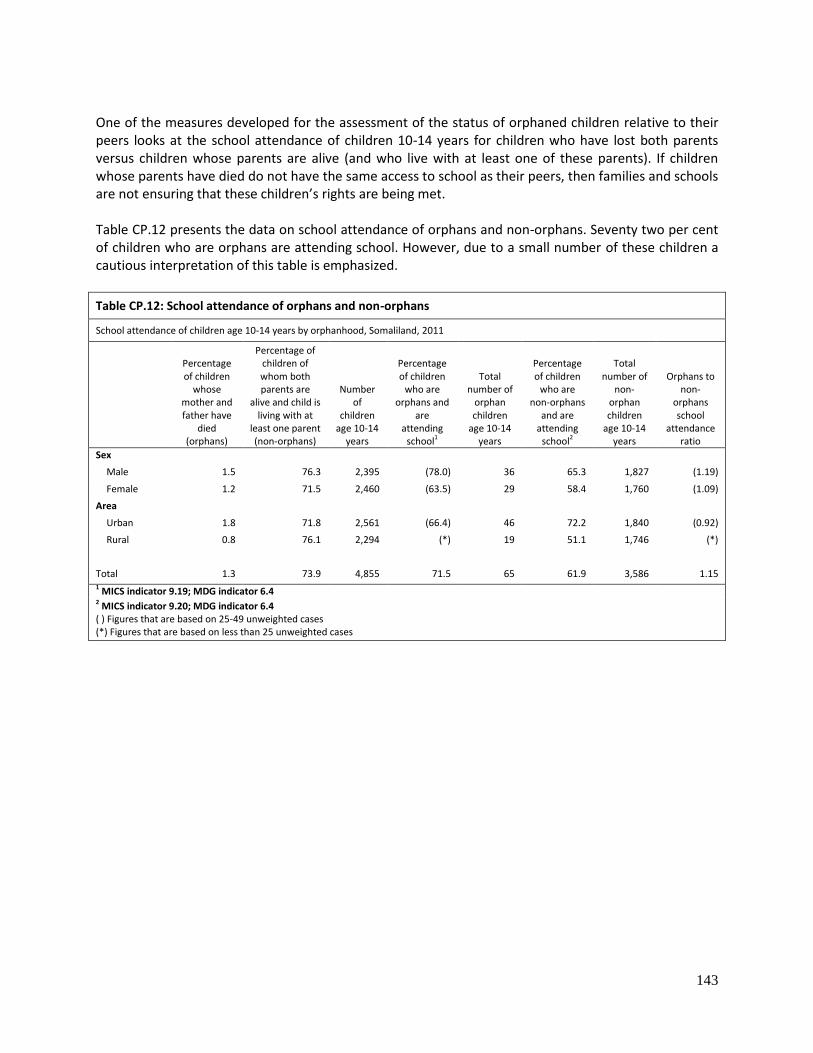
143
One of the measures developed for the assessment of the status of orphaned children relative to their peers looks at the school attendance of children 10-14 years for children who have lost both parents versus children whose parents are alive (and who live with at least one of these parents). If children whose parents have died do not have the same access to school as their peers, then families and schools are not ensuring that these children’s rights are being met. Table CP.12 presents the data on school attendance of orphans and non-orphans. Seventy two per cent of children who are orphans are attending school. However, due to a small number of these children a cautious interpretation of this table is emphasized.
Table CP.12: School attendance of orphans and non-orphans
School attendance of children age 10-14 years by orphanhood, Somaliland, 2011
Percentage of children
whose mother and father have
died (orphans)
Percentage of children of whom both parents are
alive and child is living with at
least one parent (non-orphans)
Number of
children age 10-14
years
Percentage of children
who are orphans and
are attending
school1
Total number of
orphan children
age 10-14 years
Percentage of children
who are non-orphans
and are attending
school2
Total number of
non-orphan children
age 10-14 years
Orphans to non-
orphans school
attendance ratio
Sex
Male 1.5 76.3 2,395 (78.0) 36 65.3 1,827 (1.19)
Female 1.2 71.5 2,460 (63.5) 29 58.4 1,760 (1.09)
Area
Urban 1.8 71.8 2,561 (66.4) 46 72.2 1,840 (0.92)
Rural 0.8 76.1 2,294 (*) 19 51.1 1,746 (*)
Total 1.3 73.9 4,855 71.5 65 61.9 3,586 1.15 1 MICS indicator 9.19; MDG indicator 6.4 2 MICS indicator 9.20; MDG indicator 6.4 ( ) Figures that are based on 25-49 unweighted cases (*) Figures that are based on less than 25 unweighted cases

144
XII. HIV/AIDS
Knowledge about HIV Transmission and Misconceptions about HIV/AIDS
One of the most important prerequisites for reducing the rate of HIV infection is accurate knowledge of how HIV is transmitted and strategies for preventing transmission. Correct information is the first step towards raising awareness and giving young people the tools to protect themselves from infection. Misconceptions about HIV are common and can confuse young people and hinder prevention efforts. Different regions are likely to have variations in misconceptions although some appear to be universal (for example that sharing food can transmit HIV or mosquito bites can transmit HIV). The UN General Assembly Special Session on HIV/AIDS (UNGASS) called on governments to improve the knowledge and skills of young people to protect themselves from HIV. The indicators to measure this goal as well as the MDG of reducing HIV infections by half include improving the level of knowledge of HIV and its prevention, and changing behaviours to prevent further spread of the disease. HIV modules were administered to women15-49 years of age. One indicator which is both an MDG and UNGASS indicator is the per cent of young women who have comprehensive and correct knowledge of HIV prevention and transmission. In Somaliland MICS all women who have heard of AIDS were asked whether they knew of the three main ways of preventing HIV transmission – having only one faithful uninfected partner, using a condom every time, and abstaining from sex. The results are presented in Table HA.1. In Somaliland, a majority (89 percent) of interviewed women have heard of AIDS. However, the percentage of women who know of both main ways of preventing HIV transmission is only 25. Seventy one percent of women know of having one faithful uninfected sex partner and 28 percent know of using a condom every time as main ways of preventing HIV transmission. Fifty nine percent of women know that a healthy looking person can have the AIDS virus and 24 percent reject the two main misconceptions and know that a healthy looking person can have the AIDS virus.

145
The results for women age 15-24 are separately presented in Table HA.2. Seventy per cent of young women know that having one faithful uninfected sex partner is a method of preventing HIV transmission. Although this proportion is highest in Maroodijeex/Saaxil region (76 per cent), there is little regional variation in other regions. Knowledge on the methods of HIV transmission prevention was generally higher among urban young women than their rural counterparts and among those with secondary levels of education and above (Figure HA.1).
Table HA.1: Knowledge about HIV transmission, misconceptions about HIV/AIDS, and comprehensive knowledge about HIV transmission Percentage of women age 15-49 years who know the main ways of preventing HIV transmission, percentage who know that a healthy looking person can have the AIDS virus, percentage who reject common misconceptions, and percentage who have comprehensive knowledge about HIV transmission, Somaliland, 2011
Percentage who have heard
of AIDS
Percentage who know transmission
can be prevented by:
Percentage of
women who know both ways
Percentage who know that a
healthy looking person
can have the AIDS
virus
Percentage who know that HIV cannot be transmitted by: Percentage who
reject the two most common misconceptions and know that a healthy looking person can have
the AIDS virus
Percentage with
compre-hensive
knowledge1
Number of
women
Having only one faithful
un infected
sex partner
Using a condom
every time
Mosquito bites
Supernatural
means
Sharing food with someone with AIDS
Region Maroodijeex/Saaxil 91.2 76.6 30.4 27.7 62.9 46.4 45.7 64.7 27.4 8.2 2,925 Awdal 86.8 67.0 26.8 24.0 54.9 40.6 40.0 58.9 23.2 6.0 841 Togdheer 86.9 63.6 22.8 20.4 55.3 40.4 39.7 59.2 19.8 4.9 1,078 Sool 85.3 62.7 28.3 22.3 47.7 40.1 46.8 53.3 19.5 4.9 314 Sanaag 86.5 65.6 24.0 20.3 56.0 34.6 35.5 49.1 17.6 2.9 707
Area Urban 93.4 76.1 31.9 28.9 65.1 48.4 48.2 69.2 29.0 8.6 3,378 Rural 82.8 63.5 21.7 18.8 50.1 34.9 35.0 48.4 16.7 3.6 2,487
Age 15-24 88.7 70.1 29.0 26.1 57.8 44.3 43.2 60.3 24.5 7.0 2,600 25-29 90.4 73.4 27.3 24.8 60.2 43.1 43.5 63.1 25.1 7.1 1,060 30-39 87.8 70.9 26.3 22.7 58.2 40.2 39.8 57.9 21.9 5.3 1,404 40-49 89.6 69.3 25.5 23.2 60.7 41.3 44.4 61.4 23.5 5.9 802
Marital statusa Ever married 88.6 70.9 25.9 23.0 58.3 40.0 41.4 59.3 21.9 5.5 3,612 Never married 89.3 70.6 30.2 27.3 59.4 47.0 44.4 62.0 27.0 8.0 2,248
Women’s education None 86.3 67.8 25.8 23.0 54.7 38.2 38.9 55.8 19.6 5.1 3,956 Primary 92.0 73.9 27.8 25.1 62.3 44.8 46.7 64.3 26.5 6.9 1,227 Secondary+ 98.2 82.5 37.2 33.6 75.7 65.2 56.8 79.8 43.3 13.4 682
Wealth index quintiles Poorest 77.0 57.8 19.5 17.9 42.4 29.8 26.6 38.6 11.6 3.1 920 Second 85.4 66.3 23.8 20.1 52.5 34.0 35.5 49.7 15.6 3.2 1,068 Middle 89.7 70.0 26.2 23.3 57.7 44.8 46.2 62.6 24.6 5.7 1,162 Fourth 93.7 75.4 31.2 27.4 65.1 45.6 46.8 68.9 26.8 8.2 1,254 Richest 94.2 78.8 33.4 30.9 69.0 53.0 51.4 72.7 34.3 10.0 1,461
Total 88.9 70.8 27.6 24.6 58.7 42.7 42.6 60.4 23.8 6.4 5,865 1MICS indicator 9.1. aTotal includes 5 unweighted cases of women missing information on marital status who are not shown separately

146
Table HA.2: Knowledge about HIV transmission, misconceptions about HIV/AIDS, and comprehensive knowledge about HIV transmission among young women Percentage of young women age 15-24 years who know the main ways of preventing HIV transmission, percentage who know that a healthy looking person can have the AIDS virus, percentage who reject common misconceptions, and percentage who have comprehensive knowledge about HIV transmission Somaliland, 2011
Percentage who have heard of
AIDS
Percentage who know transmission
can be prevented by:
Percentage of women who know both ways
Percentage who know
that a healthy looking
person can have the
AIDS virus
Percentage who know that HIV cannot be transmitted by:
Percentage who reject the two most common misconceptions and know that a healthy looking
person can have the AIDS
virus
Percentage with
comprehensive knowledge1
Number of women age
15-24
Having only one faithful
uninfected sex
partner
Using a condom
every time
Mosquito bites
Supernatural means
Sharing food with
someone with AIDS
Region Maroodijeex/Saaxil 90.9 76.2 31.7 28.8 62.1 47.8 46.7 64.1 27.4 8.6 1,322 Awdal 84.4 64.3 27.1 24.7 53.8 42.6 39.5 60.6 25.7 6.9 363 Togdheer 88.7 64.7 24.1 21.4 54.7 42.4 39.6 59.4 20.3 5.0 487 Sool 83.3 56.8 29.1 24.4 48.5 42.2 45.3 54.6 22.4 7.7 133 Sanaag 86.1 65.1 27.4 24.4 53.1 35.0 36.7 47.0 17.3 2.7 295
Area Urban 92.6 75.4 33.1 30.1 63.7 48.8 47.9 67.6 28.7 8.8 1,649 Rural 81.8 61.0 22.0 19.3 47.7 36.5 34.9 47.5 17.1 3.8 950
Age 15-19 86.8 66.6 27.7 25.0 56.3 42.4 41.3 56.2 22.6 6.3 1,451 20-24 91.0 74.5 30.6 27.5 59.8 46.7 45.5 65.4 26.8 7.8 1,148
Marital statusa Ever married 87.9 70.1 27.1 24.2 55.2 39.7 39.6 55.7 19.4 5.3 662 Never married 88.9 70.1 29.7 26.8 58.7 45.8 44.3 61.8 26.2 7.6 1,933
Women’s education None 84.1 65.4 26.7 23.9 51.0 37.9 36.9 53.2 18.0 4.6 1,354 Primary 91.1 71.8 28.0 25.6 59.1 43.6 44.8 60.7 24.2 6.7 778 Secondary+ 97.7 80.9 37.4 33.5 75.6 63.9 58.4 80.0 43.4 14.3 468
Wealth index quintiles Poorest 75.6 51.6 18.3 16.3 34.8 32.9 27.3 38.7 11.5 1.7 316 Second 83.2 63.6 24.9 21.4 52.4 35.9 35.1 47.7 17.2 3.3 409 Middle 88.7 69.9 27.0 24.1 55.0 43.4 44.0 61.4 23.1 6.3 483 Fourth 93.5 76.1 31.8 28.7 61.8 47.6 46.2 67.1 25.4 8.2 583 Richest 93.1 76.5 34.5 31.7 68.5 51.2 50.8 69.5 33.4 10.5 807
Total 88.7 70.1 29.0 26.1 57.8 44.3 43.2 60.3 24.5 7.0 2,600 1MICS indicator 9.2; MDG indicator 6.3. aTotal include 4 unweighted cases of women missing information on marital status who are not shown separately
147
Table HA.1 and HA.2 also present the per cent of women who can correctly identify misconceptions concerning HIV. The indicator is based on the two most common and relevant misconceptions in Somaliland, that HIV can be transmitted by supernatural means and mosquito bites. Table HA.2 also provides information on whether women know that HIV cannot be transmitted by sharing food with someone with AIDS. Of the interviewed women, 24 per cent reject the two most common misconceptions and know that a healthy-looking person can be infected (Table HA.1). Sixty per cent of women know that sharing food with someone with AIDS cannot transmit the virus, and 59 per cent of women know that a healthy looking person can have the AIDS virus. Further, 43 per cent know that the virus is not transmitted through supernatural means nor through a mosquito bite. Women who have comprehensive knowledge about HIV prevention include women who know of the two main ways of HIV prevention (having only one faithful uninfected partner and using a condom every time), who know that a healthy looking person can have the AIDS virus, and who reject the two most common misconceptions. Tables HA.1 and HA.2 also present the percentage of women with comprehensive knowledge. Comprehensive knowledge of HIV prevention methods and transmission is fairly low although there are differences by area. From table HA.1, 6 per cent of women age 15-49 were found to have comprehensive knowledge, which was slightly higher in urban areas (9 per cent). As expected, the per cent of women with comprehensive knowledge increases with the woman’s education level (Figure HA.1). Knowledge on HIV prevention and transmission is higher among the urban young women that their rural counterparts while comprehensive knowledge is higher among those who have achieved secondary level or education or above (14 per cent) and increases with household wealth index quintiles (Table HA.2).
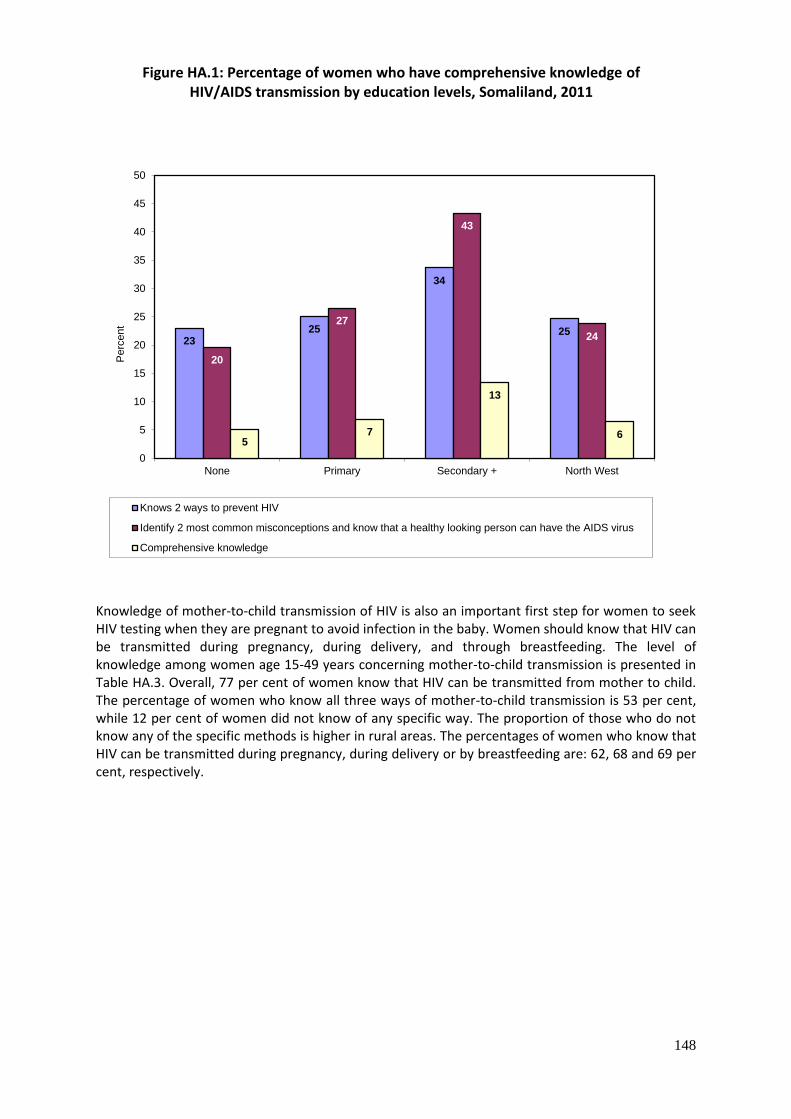
148
Knowledge of mother-to-child transmission of HIV is also an important first step for women to seek HIV testing when they are pregnant to avoid infection in the baby. Women should know that HIV can be transmitted during pregnancy, during delivery, and through breastfeeding. The level of knowledge among women age 15-49 years concerning mother-to-child transmission is presented in Table HA.3. Overall, 77 per cent of women know that HIV can be transmitted from mother to child. The percentage of women who know all three ways of mother-to-child transmission is 53 per cent, while 12 per cent of women did not know of any specific way. The proportion of those who do not know any of the specific methods is higher in rural areas. The percentages of women who know that HIV can be transmitted during pregnancy, during delivery or by breastfeeding are: 62, 68 and 69 per cent, respectively.
23 25
34
25
20
27
43
24
5 7
13
6
0
5
10
15
20
25
30
35
40
45
50
None Primary Secondary + North West
Perc
ent
Knows 2 ways to prevent HIV
Identify 2 most common misconceptions and know that a healthy looking person can have the AIDS virus
Comprehensive knowledge
Figure HA.1: Percentage of women who have comprehensive knowledge of HIV/AIDS transmission by education levels, Somaliland, 2011

149
Table HA.3: Knowledge of mother-to-child HIV transmission
Percentage of women age 15-49 years who correctly identify means of HIV transmission from mother to child, Somaliland, 2011
Percentage who know HIV can be transmitted from mother to child
Percent who know HIV can be transmitted: Does not know any
of the specific means
Number of women
During pregnancy
During delivery
By breastfeeding
All three means1
Region
Maroodijeex/Saaxil 81.1 64.5 72.0 70.8 54.5 10.0 2,925
Awdal 72.6 56.9 64.3 66.4 50.8 14.2 841
Togdheer 73.5 60.8 64.8 66.0 52.9 13.4 1,078
Sool 72.1 59.6 67.4 65.7 53.4 13.2 314
Sanaag 74.8 60.4 64.6 67.9 50.9 11.6 707
Area
Urban 83.6 66.5 73.9 73.3 56.7 9.8 3,378
Rural 68.7 55.8 60.9 62.4 48.5 14.1 2,487
Age group
15-24 76.2 60.2 66.4 67.6 51.0 12.4 2,600
15-19 73.6 58.8 63.4 65.7 49.4 13.2 1,451
20-24 79.5 62.1 70.3 70.1 53.0 11.5 1,148
25-29 79.8 64.4 70.2 71.1 55.0 10.6 1,060
30-39 76.9 62.4 69.6 68.5 54.5 10.9 1,404
40-49 78.0 63.7 70.6 69.3 55.7 11.6 802
Marital statusa
Ever married 77.2 62.7 69.0 69.8 54.9 11.5 3,612
Never married 77.5 60.9 67.6 67.0 50.4 11.8 2,248
Education
None 73.2 59.3 64.8 65.7 51.3 13.1 3,956
Primary 82.1 65.3 71.7 71.6 54.3 9.9 1,227
Secondary+ 92.1 71.8 83.7 80.8 61.9 6.0 682
Wealth index quintiles
Poorest 56.0 46.6 49.5 50.7 40.9 21.0 920
Second 73.5 59.2 65.9 66.8 52.1 11.9 1,068
Middle 78.7 63.1 69.2 71.6 54.9 10.9 1,162
Fourth 83.6 66.9 74.7 72.7 56.1 10.0 1,254
Richest 86.8 68.5 76.2 75.6 57.9 7.4 1,461
Total 77.3 62.0 68.4 68.7 53.2 11.6 5,865 1 MICS indicator 9.3. aTotal includes 5 unweighted cases of women missing information on marital status who are not shown separately
Accepting Attitudes toward People Living with HIV/AIDS
The indicators on attitudes toward people living with HIV measure stigma and discrimination in the community. Stigma and discrimination are low if respondents report an accepting attitude on the following four questions: 1) Would care for family member sick with AIDS; 2) would buy fresh vegetables from a vendor who is HIV positive; 3) thinks that a female teacher who is HIV positive should be allowed to teach in school; and 4) would not want to keep HIV status of a family member a secret. Table HA.4 presents the attitudes of women towards people living with HIV/AIDS. In Somaliland, 94 per cent of women who have heard of AIDS agree with at least one accepting attitude .The most common accepting attitude is willing to care for a family member with the AIDS virus in own home (69 per cent). There are minimal variations in the percentages of accepting altitudes between women living in rural or urban areas, as well as based on marital status. More

150
educated women and those from richest households have more accepting attitudes than the ones with lower education and a poorer wealth status. Only 8 per cent of women expressed accepting attitudes on all four indicators with a higher percentage in urban areas (11 per cent), women with secondary ore higher education (16 per cent) and the never married women (10 per cent).
Table HA.4: Accepting attitudes toward people living with HIV/AIDS Percentage of women age 15-49 years who have heard of AIDS who express an accepting attitude towards people living with HIV/AIDS, Somaliland, 2011
Percentage of women who:
Number of
women who have
heard of AIDS
Are willing to care for a
family member with the
AIDS virus in own home
Would buy fresh
vegetables from a
shopkeeper or vendor
who has the AIDS virus
Believe that a female teacher with the AIDS
virus and is not sick should be
allowed to continue teaching
Would not want to keep secret that a family member got infected with the AIDS virus
Agree with at
least one accepting attitude
Express accepting
attitudes on all four
indicators1
Region
Maroodijeex/Saaxil 72.7 32.9 35.2 65.4 94.5 9.7 2,669
Awdal 68.5 25.4 29.0 68.5 92.2 6.9 731
Togdheer 67.5 23.3 30.9 70.1 95.4 7.2 937
Sool 55.0 21.0 23.1 68.2 92.8 5.8 260
Sanaag 61.6 25.5 27.5 70.0 94.0 6.5 614
Area
Urban 72.3 33.2 37.2 67.2 95.0 10.6 3,155
Rural 64.0 21.7 24.2 67.7 93.0 4.8 2,056
Age
15-24 68.8 30.6 33.0 66.0 94.0 9.1 2,303
15-19 67.8 30.8 31.9 64.3 93.7 8.6 1,258
20-24 70.0 30.4 34.4 68.0 94.5 9.7 1,045
25-29 70.4 28.2 33.9 69.2 95.2 8.0 957
30-39 68.8 25.7 29.6 67.8 94.1 6.7 1,233
40-49 68.2 27.9 30.7 68.7 93.7 8.8 718
Marital statusa
Ever married 68.1 26.2 30.1 68.6 94.2 7.0 3,203
Never married 70.5 32.5 35.1 65.5 94.2 10.3 2,004
Education
None 67.7 25.7 28.7 67.0 93.8 6.5 3,417
Primary 68.1 30.2 34.9 67.9 94.3 9.2 1,128
Secondary+ 77.1 41.1 44.8 68.3 96.0 15.9 667
Wealth index quintiles
Poorest 60.6 19.7 24.0 64.1 91.2 3.2 710
Second 67.1 22.4 25.3 66.9 94.0 5.6 912
Middle 64.4 27.7 29.3 71.1 94.4 7.4 1,040
Fourth 73.8 30.5 37.2 69.3 94.9 10.7 1,174
Richest 74.0 36.6 38.4 64.9 95.1 11.4 1,376
Total 69.0 28.6 32.1 67.4 94.2 8.3 5,212 1 MICS indicator 9.4. aTotal include 5 unweighted cases of women missing information on marital status who are not shown separately
Knowledge of a Place for HIV Testing, Counselling and Testing during Antenatal Care
Another important indicator is the knowledge of where to be tested for HIV and use of such services. In order to protect themselves and to prevent infecting others, it is important for individuals to know their HIV status. Knowledge of own status is also a critical factor in the decision to seek treatment. Questions related to knowledge among women of a facility for HIV testing and whether they have ever been tested are presented in Table HA.5. Twenty eight per cent of women knew where to be tested, while 6 per cent have actually been tested. Of these, half of the proportion has been tested

151
and told the result within the last 12 months (3 per cent). Twice as many married women have ever been tested compared to those never married while testing increased with educational attainment. Table HA.5: Knowledge of a place for HIV testing Percentage of women age 15-49 years who know where to get an HIV test, percentage of women who have ever been tested, percentage of women who have been tested in the last 12 months, and percentage of women who have been tested and have been told the result, Somaliland, 2011
Percentage of women who:
Know a place to get
tested1 Have ever
been tested
Have been tested in the last 12
months
Have been tested in the last twelve months and have
been told result2 Number of
women
Region
Maroodijeex/Saaxil 33.2 8.0 4.0 3.6 2,925
Awdal 26.9 6.7 3.8 3.3 841
Togdheer 25.4 3.6 1.7 1.7 1,078
Sool 19.5 1.8 0.3 0.3 314
Sanaag 18.6 3.5 1.1 1.0 707
Area
Urban 36.8 8.4 4.1 3.7 3,378
Rural 16.9 3.1 1.5 1.3 2,487
Age
15-24 27.9 5.1 2.7 2.5 2,600
15-19 24.8 3.3 1.6 1.6 1,451
20-24 31.8 7.4 4.1 3.8 1,148
25-29 30.6 7.8 3.3 3.0 1,060
30-39 28.1 7.4 3.8 3.4 1,404
40-49 27.4 5.1 2.1 1.8 802
Marital statusa
Ever married 27.9 7.5 3.6 3.3 3,612
Never married 29.1 4.0 2.0 1.8 2,248
Education
None 23.9 5.0 2.5 2.2 3,956
Primary 31.6 7.9 3.4 3.2 1,227
Secondary+ 48.5 9.7 5.3 5.0 682
Wealth index quintiles
Poorest 12.1 2.1 0.6 0.6 920
Second 18.0 4.2 2.6 2.3 1,068
Middle 28.4 5.8 3.3 3.0 1,162
Fourth 36.5 8.2 4.2 3.7 1,254
Richest 39.1 8.7 3.6 3.3 1,461
Total 28.4 6.2 3.0 2.7 5,865 1 MICS indicator 9.5 2 MICS indicator 9.6 aTotal include 5 unweighted cases of women missing information on marital status who are not shown separately
Among women who had given birth within the two years preceding the survey, the per cent who received counselling and HIV testing during antenatal care is presented in Table HA.6. Thirty two per cent of women who gave birth in the last 2 years received ANC from a health professional during the last pregnancy. About 5 per cent received HIV counselling during ANC while 3 per cent were offered HIV test and were tested for HIV, and received their results.
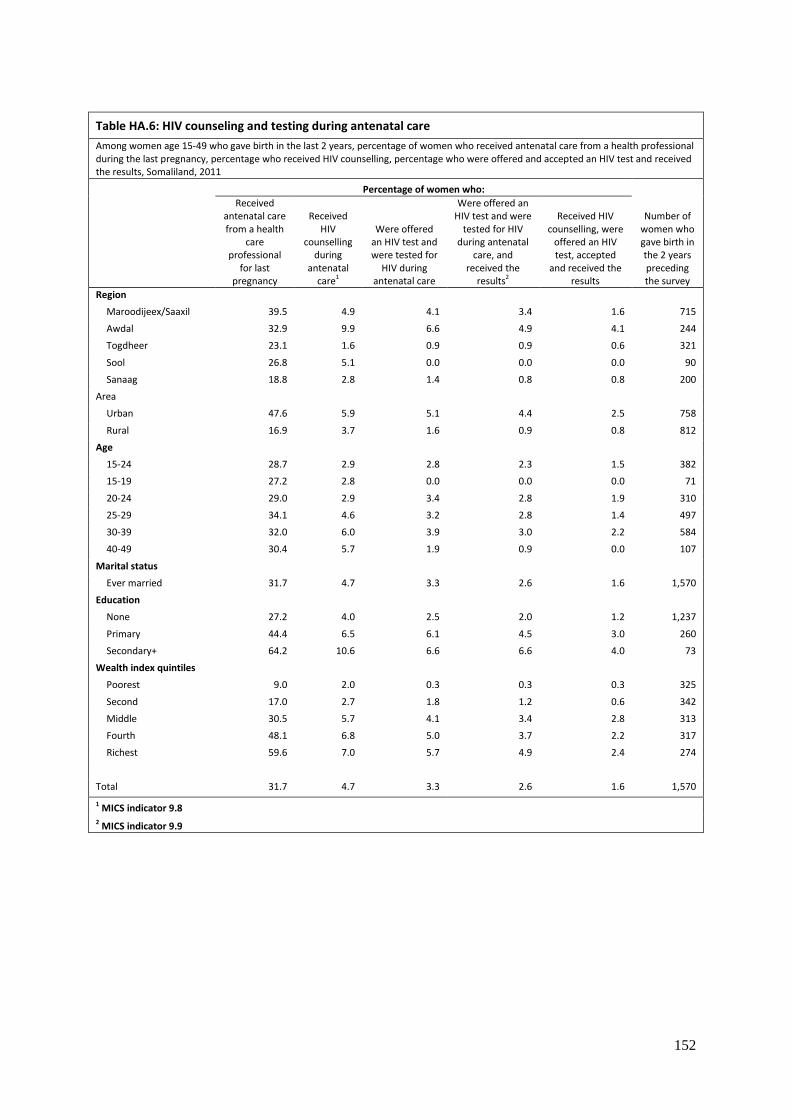
152
Table HA.6: HIV counseling and testing during antenatal care
Among women age 15-49 who gave birth in the last 2 years, percentage of women who received antenatal care from a health professional during the last pregnancy, percentage who received HIV counselling, percentage who were offered and accepted an HIV test and received the results, Somaliland, 2011
Percentage of women who:
Number of women who gave birth in the 2 years preceding the survey
Received antenatal care from a health
care professional
for last pregnancy
Received HIV
counselling during
antenatal care1
Were offered an HIV test and were tested for
HIV during antenatal care
Were offered an HIV test and were
tested for HIV during antenatal
care, and received the
results2
Received HIV counselling, were
offered an HIV test, accepted
and received the results
Region
Maroodijeex/Saaxil 39.5 4.9 4.1 3.4 1.6 715
Awdal 32.9 9.9 6.6 4.9 4.1 244
Togdheer 23.1 1.6 0.9 0.9 0.6 321
Sool 26.8 5.1 0.0 0.0 0.0 90
Sanaag 18.8 2.8 1.4 0.8 0.8 200
Area
Urban 47.6 5.9 5.1 4.4 2.5 758
Rural 16.9 3.7 1.6 0.9 0.8 812
Age
15-24 28.7 2.9 2.8 2.3 1.5 382
15-19 27.2 2.8 0.0 0.0 0.0 71
20-24 29.0 2.9 3.4 2.8 1.9 310
25-29 34.1 4.6 3.2 2.8 1.4 497
30-39 32.0 6.0 3.9 3.0 2.2 584
40-49 30.4 5.7 1.9 0.9 0.0 107
Marital status
Ever married 31.7 4.7 3.3 2.6 1.6 1,570
Education
None 27.2 4.0 2.5 2.0 1.2 1,237
Primary 44.4 6.5 6.1 4.5 3.0 260
Secondary+ 64.2 10.6 6.6 6.6 4.0 73
Wealth index quintiles
Poorest 9.0 2.0 0.3 0.3 0.3 325
Second 17.0 2.7 1.8 1.2 0.6 342
Middle 30.5 5.7 4.1 3.4 2.8 313
Fourth 48.1 6.8 5.0 3.7 2.2 317
Richest 59.6 7.0 5.7 4.9 2.4 274
Total 31.7 4.7 3.3 2.6 1.6 1,570
1 MICS indicator 9.8 2 MICS indicator 9.9

153
XIII. Access to Mass Media and Use of Information/Communication Technology
The 2011 Somaliland MICS collected information on exposure to mass media and the use of computers and the internet. Information is collected on:
exposure to newspapers/magazines, radio and television among women age 15-49,
use of computers among 15-24 year-olds, and
use of the internet among 15-24 year-olds.
Access to Mass Media
The proportion of women who read a newspaper, listen to the radio and watch television at least once a week is shown in table MT.1. At least once a week, 15 per cent of women in Somaliland read a newspaper, 26 per cent listen to the radio and 33 per cent watch television. Overall, 10 per cent do not have regular exposure to any of the three media, while 7 per cent are exposed to all the three types of media at least on a weekly basis. Table MT.1: Exposure to mass media Percentage of women age 15-49 years who are exposed to specific mass media on a weekly basis, Somaliland, 2011
Percentage of women age 15-49 who:
All three media at least once a week1
No media at least once a week
Number of women age 15-49 years
Read a newspaper at least once a week
Listen to the radio at least once a week
Watch television at least once a
week
Age
15-19 25.0 25.8 41.4 9.6 16.8 1,451 20-24 20.1 28.2 40.9 9.1 9.7 1,148 25-29 12.4 24.6 32.9 5.4 7.7 1,060 30-34 7.0 24.3 21.8 3.3 6.5 731 35-39 8.5 26.0 25.6 4.0 5.5 673 40-44 7.0 25.7 20.2 4.1 7.0 540 45-49 5.0 28.2 23.9 2.2 6.0 262
Region Maroodijeex/Saaxil 20.2 34.4 46.1 9.5 5.3 2,925 Awdal 16.0 26.5 33.6 7.5 9.8 841 Togdheer 8.3 15.7 15.0 1.7 16.3 1,078 Sool 6.9 13.8 12.5 1.7 18.3 314 Sanaag 6.6 11.7 13.0 2.2 14.6 707
Area Urban 23.1 32.8 52.7 10.5 7.1 3,378 Rural 4.1 16.7 5.8 1.0 13.5 2,487
Education None 2.6 20.2 21.6 1.0 3.4 3,956 Primary 30.1 32.8 44.8 10.5 31.4 1,227 Secondary+ 60.2 47.5 75.8 31.2 8.2 682
Wealth index quintile
Poorest 0.5 5.8 0.6 0.0 10.1 920 Second 3.1 19.2 2.0 0.0 13.5 1,068 Middle 9.6 21.7 11.3 1.7 16.1 1,162 Fourth 17.6 29.5 47.1 6.0 9.0 1,254 Richest 35.1 44.0 80.3 19.6 2.6 1,461
Total 15.0 26.0 32.8 6.5 9.8 5,865 1 MICS indicator MT.1
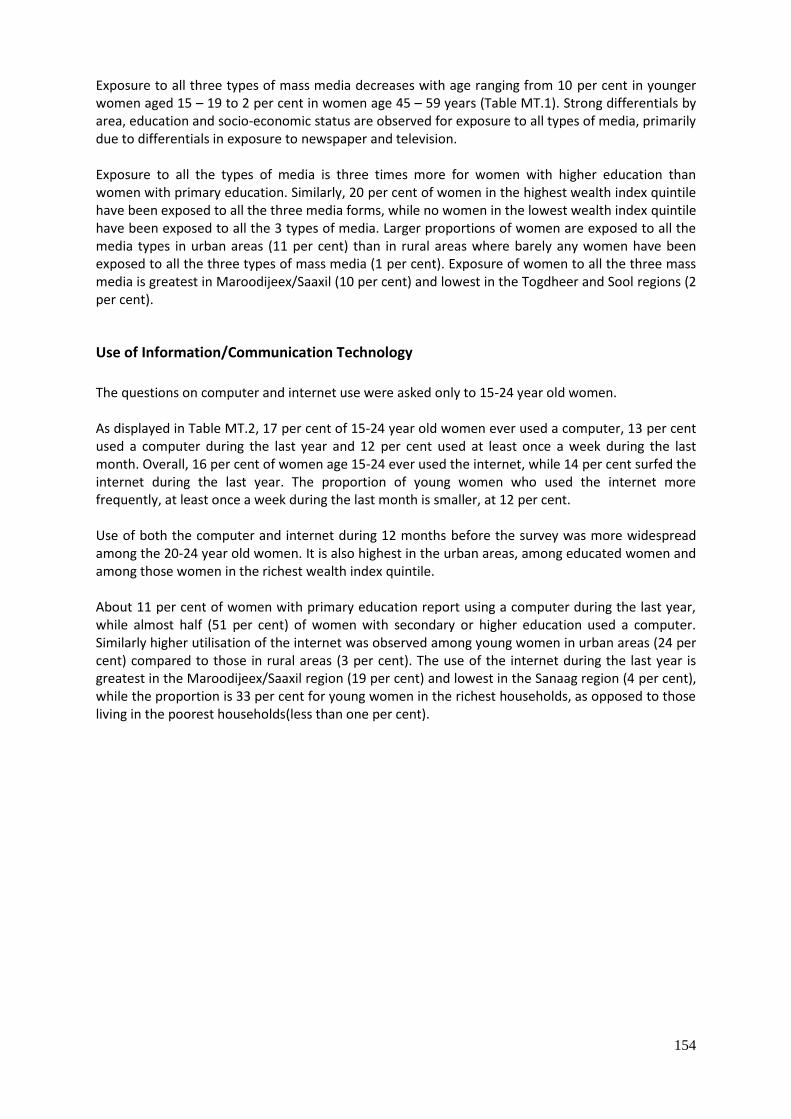
154
Exposure to all three types of mass media decreases with age ranging from 10 per cent in younger women aged 15 – 19 to 2 per cent in women age 45 – 59 years (Table MT.1). Strong differentials by area, education and socio-economic status are observed for exposure to all types of media, primarily due to differentials in exposure to newspaper and television. Exposure to all the types of media is three times more for women with higher education than women with primary education. Similarly, 20 per cent of women in the highest wealth index quintile have been exposed to all the three media forms, while no women in the lowest wealth index quintile have been exposed to all the 3 types of media. Larger proportions of women are exposed to all the media types in urban areas (11 per cent) than in rural areas where barely any women have been exposed to all the three types of mass media (1 per cent). Exposure of women to all the three mass media is greatest in Maroodijeex/Saaxil (10 per cent) and lowest in the Togdheer and Sool regions (2 per cent).
Use of Information/Communication Technology
The questions on computer and internet use were asked only to 15-24 year old women. As displayed in Table MT.2, 17 per cent of 15-24 year old women ever used a computer, 13 per cent used a computer during the last year and 12 per cent used at least once a week during the last month. Overall, 16 per cent of women age 15-24 ever used the internet, while 14 per cent surfed the internet during the last year. The proportion of young women who used the internet more frequently, at least once a week during the last month is smaller, at 12 per cent. Use of both the computer and internet during 12 months before the survey was more widespread among the 20-24 year old women. It is also highest in the urban areas, among educated women and among those women in the richest wealth index quintile. About 11 per cent of women with primary education report using a computer during the last year, while almost half (51 per cent) of women with secondary or higher education used a computer. Similarly higher utilisation of the internet was observed among young women in urban areas (24 per cent) compared to those in rural areas (3 per cent). The use of the internet during the last year is greatest in the Maroodijeex/Saaxil region (19 per cent) and lowest in the Sanaag region (4 per cent), while the proportion is 33 per cent for young women in the richest households, as opposed to those living in the poorest households(less than one per cent).
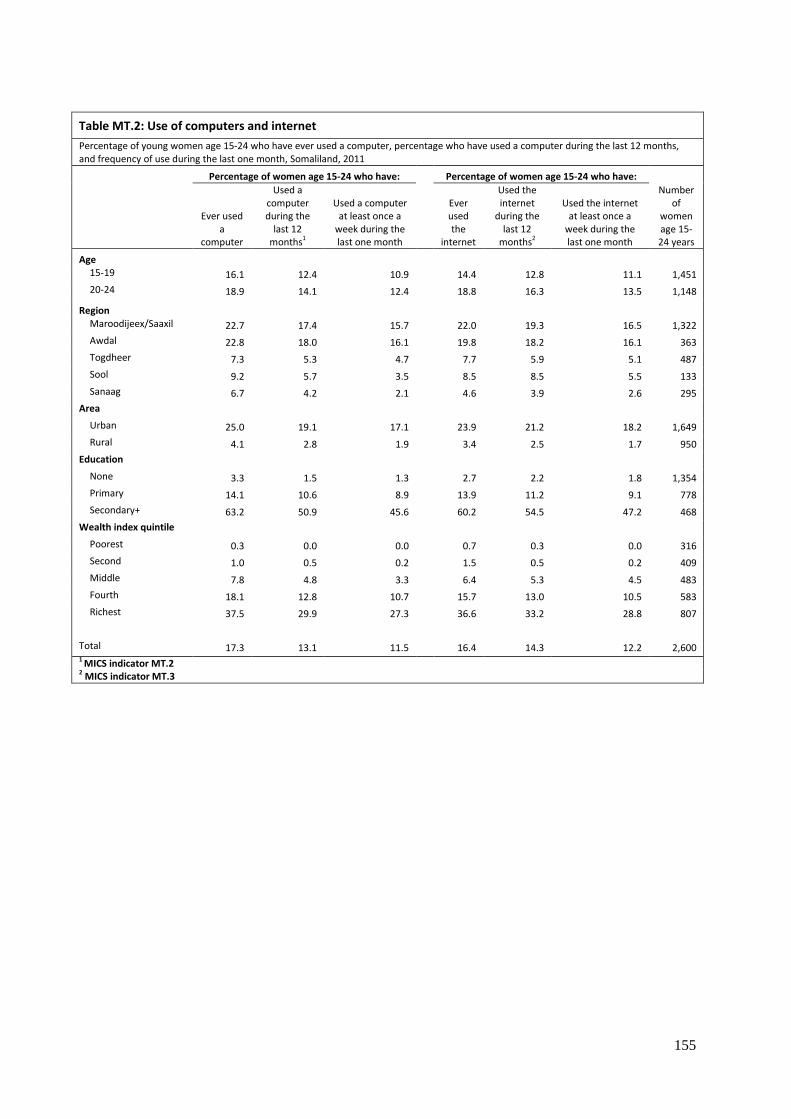
155
Table MT.2: Use of computers and internet
Percentage of young women age 15-24 who have ever used a computer, percentage who have used a computer during the last 12 months, and frequency of use during the last one month, Somaliland, 2011
Percentage of women age 15-24 who have:
Percentage of women age 15-24 who have:
Number of
women age 15-24 years
Ever used a
computer
Used a computer during the
last 12 months1
Used a computer at least once a
week during the last one month
Ever used the
internet
Used the internet
during the last 12
months2
Used the internet at least once a
week during the last one month
Age
15-19 16.1 12.4 10.9
14.4 12.8 11.1 1,451
20-24 18.9 14.1 12.4
18.8 16.3 13.5 1,148
Region
Maroodijeex/Saaxil 22.7 17.4 15.7
22.0 19.3 16.5 1,322
Awdal 22.8 18.0 16.1
19.8 18.2 16.1 363
Togdheer 7.3 5.3 4.7
7.7 5.9 5.1 487
Sool 9.2 5.7 3.5
8.5 8.5 5.5 133
Sanaag 6.7 4.2 2.1
4.6 3.9 2.6 295
Area
Urban 25.0 19.1 17.1
23.9 21.2 18.2 1,649
Rural 4.1 2.8 1.9
3.4 2.5 1.7 950
Education
None 3.3 1.5 1.3
2.7 2.2 1.8 1,354
Primary 14.1 10.6 8.9
13.9 11.2 9.1 778
Secondary+ 63.2 50.9 45.6
60.2 54.5 47.2 468
Wealth index quintile
Poorest 0.3 0.0 0.0
0.7 0.3 0.0 316
Second 1.0 0.5 0.2
1.5 0.5 0.2 409
Middle 7.8 4.8 3.3
6.4 5.3 4.5 483
Fourth 18.1 12.8 10.7
15.7 13.0 10.5 583
Richest 37.5 29.9 27.3
36.6 33.2 28.8 807
Total 17.3 13.1 11.5 16.4 14.3 12.2 2,600 1 MICS indicator MT.2 2 MICS indicator MT.3

156
Appendix A. Sample Design
The major features of the sample design are described in this appendix. Sample design features include target sample size, sample allocation, sampling frame and listing, choice of domains, sampling stages, stratification, and the calculation of sample weights. The primary objective of the sample design for the Somaliland Multiple Indicator Cluster Survey was to produce statistically reliable estimates of most indicators for the whole Somaliland, for urban and rural areas, and for the five regions (Maroodijeex/Sahil, Awdal, Togdheer, Sool and Sanaag) of the country. There were two main sampling strata: rural and urban areas. A multi-stage, stratified cluster sampling approach was used for the selection of the survey sample. Sample Size and Sample Allocation The target sample size for the Somaliland MICS was calculated as 5179 households. For the calculation of the sample size, the key indicator used was the polio immunization coverage for children aged 12 – 23 months. The following formula was used to estimate the required sample size for this indicator:
n = [ 4 (r) (1-r) (f) (1.1) ]
[ (0.12r)2 (p) (nh) ]
Where:
nis the required sample size, expressed as number of households
4 is a factor to achieve the 95 per cent level of confidence
r is the predicted or anticipated prevalence (coverage rate) of the indicator. The polio immunization coverage for children aged 12 – 23 months is 34.8% (MICS 2006)
1.1 is the factor necessary to raise the sample size by 10 per cent for non-response
fis the shortened symbol for deff(design effect). 1.75 was taken as a default, similar to that used in MICS 2006.
0.12r is the margin of error to be tolerated at the 95 per cent level of confidence, defined as 12 per cent of r (relative sampling error of r)
p is the proportion of the total population upon which the indicator, r, is based. Percentage of children aged 12 -23 months in total population was taken as 3.2% (MICS 2006)
nh is the average household size. The average household size was taken as 5.7 (MICS 2006)
The resulting number of households from the calculations was 5,179 households in total.
157
Separately in urban and rural areas, the total number of households was distributed to regions proportionally to the population size of that region. The table below shows the allocation of clusters to the sampling strata. Table SD.1: Allocation of Sample Clusters (Primary Sampling Units) to Sampling Strata
Region Population (2005 UNDP Estimates)
Number of Clusters
Total Urban Rural Urban Rural Total
Maroodijeex /Sahil Awdal Togdheer
728,079 255,846 406,866
498,100 113,100 144,806
229,979 142,746 262,060
82 18 24
39 25 44
121 43 68
Sool Sanaag
95,146 256,874
31,200 43,260
63,946 213,614
4 8
11 33
15 41
Total 1,742,811 792,566 950,245 136 152 288
Sampling frame and sample selection The sampling frame was the list of settlements obtained from the 2005/2006 UNDP settlement census and which was updated in preparation for the Somalia population estimation survey. For each settlement, this list contained an estimated number of households and the classification by urban and rural. Stratification consisted of separating urban and rural settlements within each region. Settlements
were then used as primary sampling units and were selected with probability proportional to size,
the size being the estimated number of households. Very large settlements were selected with
certainty as self-representing units (that is with probability equal to 1).
In rural areas and small towns, settlements with more than 200 households were divided into
segments of which one was randomly selected. All households in the selected segment were listed
to create a frame for the selection of 18 households at the second stage using systematic sampling.
For very large settlements, the list of villages and sections that comprised each settlement served as
frame for the second stage selection (secondary sampling units). Each selected village and section
was segmented if it contained more 200 households. One of the newly created segments was then
randomly selected and all of the households it contained were listed. In the final stage, 18
households were selected from the household listing. In villages and sections containing 200
households or less, a complete household listing was carried out and 18 households were directly
selected from the list of households.
Calculation of Sample Weights The sample for Somaliland was implemented according to its design. However, information on segmentation was not systematically captured at the field level for most of the clusters. As a result, information was incomplete for most clusters. Based on this finding, it was decided not to calculate the weights at cluster level. The sampling weights were calculated at stratum level.
158
The major component of the weight is the reciprocal of the sampling fraction employed in selecting the number of sample households in a particular sampling stratum (h):
hi
hif
W1
The term fhi, the sampling fraction for theh-th stratum, is defined ash
hh
Nf
n
where nh is the number of households selected from stratum h Nh is the total number of households in stratum h
A second component in the calculation of sample weights takes into account the level of non-response for the household and individual interviews. The adjustment for household non-response is equal to the inverse value of:
RRh = Number of interviewed households in stratum h/ Number of occupied households listed in stratum h
After the completion of fieldwork, response rates were calculated for each sampling stratum. These were used to adjust the sample weights calculated for each stratum. Response rates in the Somaliland Multiple Indicator Cluster Survey are shown in Table HH.1 in this report. Similarly, the adjustment for non-response at the individual level (women and under-5 children) for each stratum is equal to the inverse value of: RRh = Completed women’s (or under-5’s) questionnaires in stratum h / Eligible women (or under-5s) in stratum h
The non-response adjustment factors for women's and under-5's questionnaires were applied to the adjusted household weights. Numbers of eligible women and under-5 children were obtained from the roster of household members in the Household Questionnaire for households where interviews were completed. The sample weights for the households were calculated by multiplying the above factors for each stratum. These weights were then standardized (or normalized), one purpose of which is to make the weighted sum of the interviewed sample units equal the total sample size at the national level. Normalization is performed by by multiplying the sample weights by a constant factor equal to the unweighted number of households at the national level divided by the weighted total number of households (using the full sample weights adjusted for nonresponse). A similar standardization procedure was followed in obtaining standardized weights for the women’s and under-5’s questionnaires. Adjusted (normalized) weights varied between 0.81 and 1.12. Sample weights were appended to all data sets and analyses were performed by weighting each household, woman or under-5 with these sample weights.

159
Appendix B. List of Personnel Involved in the Survey
MICS4 Technical Committees MICS4 Technical Committee members - Nairobi
Name Organization
Bo Pedersen UNICEF ESARO Debra Bowers UNICEF PME Volker Huls UNICEF PME Sicily Matu UNICEF PME Nancy Balfour UNICEF WASH Zaid Jurji UNICEF WASH Lars Jensen UNICEF S/L Peter Hailey UNICEF Nutrition Osamu Kunii UNICEF ACSD Sheema Sen Gupta UNICEF CP Isabella Castrogiovanni UNICEF CP Chiara Pierotti UNICEF GF Mette Nordstrand UNICEF Education Woki Munyui UNICEF Education Teija Vallandingham UNICEF Education Grainne Moloney FSNAU/FAO Sriram Pande UNDP Richard Ngetich UNDP Uffe Poulsen UNICEF JPLGDSD Abraham Mulugeta WHO Raul Kamadjeu WHO Simon Renk WFP Niaz Mohammed UNFPA Stephen Macharia UNFPA
MICS4 Technical Committee members - Hargeisa
Hassan Abdillahi Jama MoNPD Ahmed Diriye MoNPD Mohamed Jama Farah MoE Khadar Mohamed MoHL Abdillahi Abdi Yusuf MoHL Saeed Dualeh Mohamed MoW&MR Abdirhaman Farah Omer MoW&MR Awale M Awale MoFA&SD Mohamed Ismail MoInterior Ahmed Hassan Yusuf MoInformation Asha Hussein Adam UNICEF Amran Ibrahim FSNAU/FAO Nura Gureh FSNAU/FAO Salada Roble UNFPA Ahmed Mihile UNDP Musa Warsame WFP Nasir Abdi Hirsi WHO

160
Survey Teams and ToTs Trainers
Name Organization
Pierre Martel UNICEF Bo Pedersen UNICEF Sicily Matu UNICEF Peter Kingori UNICEF Oztas Ayhan UNICEF Austin Mueke UNICEF Aleksandar Zoric UNICEF Asha Hussein Adam UNICEF Mohammed Dhaqane UNICEF Hassan Jama MoNPD Ahmed Hassan Yusuf ANPPCAN Idris Nur Mohamed ANPPCAN Abdulkadir Ali Ghelle SDRA Mohamed Ali Ismail SAREDO Yahye Ali Obsiye MoNPD Louise Masese FSNAU/FAO
Key resource persons for specific modules during the training
Agnes Makanyi UNICEF – WASH Woki Munyui UNICEF – Education Imran Ravji UNICEF – Health Awil Gureh UNICEF – Health Maryan Yussuf Fahiye UNICEF - Health Safia Jibril UNICEF – CP Abdirashid Hashi Abdi UNICEF – GF Ahmed Jama UNICEF - GF Ahmed M. Jama UNICEF Health Khadra Mohamud MoHL Louise Masese FSNAU/FAO

161
MICS4 Survey Teams
Team 1
Team leader (MoNPD) Ahmed Yousuf Jamac
Supervisor Abdikadir Esse Hussein
Editors Yasin Mahamed Farah
Kayse Kosar Elmi
Enumerators Sahra Cartanaw Jama
Hodan Ahmed Jama
ZamZam Mahamed Jama
Nimco Ali Dahir
Nura Mukhtar
ShukriOdawaa
Sketch mapper Jamac Hassan Deman
GPS operator Mahamed Saleban Ali
Team 2
Team leader (MoH) Awale Mahamed Muse
Supervisor Abdirahaman Dahir Abtidoon
Editors Mustefe Mahamed Ali
Ahmed Mahumoud Adan
Enumerators Nadira Jamal Jama
Maria Abdulahi Gahayr
Hamda Mohamed Khaire
Amina Abdulahi farah
Hodan Mohamed Hassan
Hodan Ahmed Jama
Sketch mapper A Kadir Samriye
GPS operator Jama Abdi Ali
Team 3
Team leader (FAO) Abdirahi Warsame
Supervisor Mahmad Abdi ARab
Editors Mustafe Mahamed Hassan
Ahmed Ali Mahamed
Enumerators HodanYussuf Asker
Naciima Mohamed Abdi
Nimco Ismail Sheikh Ibrahim
Farduus Abdi Jibriil
Kaltun Ali Mohamed
Enumerator Fadumo Osman Abdi
GPS operator Mahamed Abdi Adan
Sketchmapper Abdirisak Farah
162
Team 4
Team leader (MoH) Faysal Omer Madar
Supervisor Ahmed Muse Mahamed
Editors Jamac Abdirahman Ogle
Muse AbidlahiAdan
Enumerators Samira Muse Ahmed
Najah Bashir Diriye
Muna Mahamed Jibril
Naseem Farah Hassan
Hana Ibrahim Mahmed
Ido Muse Ismail
GPS operator Abdirashiid Saleban Mahamed
Sketch mapper Majid Abdisalan
Team 5
Team leader Abdirahman Mahamed Abdilahi
Supervisor Abdilahi Hasan Ali
Editors Fu’ad Abdilahi Muse
Rahman A.lahi Maygag
Enumerators Asma Osman Abdi
Fadumo Hussein Ali
Roda Mohamed Mahamud
HodanWarsame Jama
Muna said dirir
Ifrah Omer Hassan
Team 6
Team leader (UNICEF) Luul Dirir Mirreh
Supervisor Yasin Abdi Hashi
Editors Hamse Jibriil Ibrahim
Abdirahman Aden Farah
Enumerators NimcoYussuf Sheikh Omerh
Maryan Mahamed Hirad
Faadumo Ahmed Ismail
Asha Ali Fatah
Muna Mahamed Cilmi
Shukri Saed Axmed
GPS operator Ismail Cabdi Xirsi
Sketch mapper Ahmed Mohamed Said
Team 7
Team leader (UNICEF) Hassan Muse
Supervisor Mursal Daroor Adam
Editors Rajab Mahamud Ahmed
Mahad HussainAbdi
Enumerators Faduma Jama Hussuin
Na’ima Mohamed Abdi
Muna Ali Ahmed
Khadra Mohamed Ali
Hibo Abdulahi Ismail
Muna Hassan Mahamed
GPS operator Mustafe Mahamed Mahamud
Sketch mapper Said Mahamed Abdi
163
Team 8
Team leader (UNICEF) Mahamed Hussein Hassan
Supervisor Bashiir Muhumed Adan
Editors Abdirahman Mahamed Omer
Mahamed Ahmed Hussein
Enumerators Suhur Fathxi Mukhtar
Sucad Abdi Mahamed
Salwa Ali Farah
Yasmin Mahamed Abdilahi
Sahra Ahmed Mohamed
Sabah Mahamed Hussein
Sketch mapper Ishaq MahamedTani
GPS Operator Abidrahman Muse
Team 9
Team leader /annapcan Sabah Diriye Yousuf
Supervisor Ali Abiib Hassan
Editors Mustafe Mahdi Dahir
Abdirahman Mahamed
Enumerators Yasmin Omer Haji Mohamed
Sadia Mahamed Daud
Ruqiya Omer Mumin
Hodan Ahmed Farah
Naciima Abdijama
Samiira Hussein Caynaashe
GPS Hamse Mahamed Ahmed
Sketch mapper Mahamed Awil
Team 10
Team leader (UNICEF) Safia Jibril Yonis
Supervisor Abdale Yasin
Editors EidAdan Ali
Abdihakin Mumin Egeh
Enumerators Hoodo Abdurahman Osman
Ifrah Ahmed Hassan
Nasrin Osman Haji Mahamud
Amina Abdilahi Hassan
Hodan Hassan Muse
GPS Operator Mahad Mahamed Nuh
Sketch mapper Yussuf Ahmed Ali

164
Appendix C. Estimates of Sampling Errors
The sample of respondents selected in the Somaliland Multiple Indicator Cluster Survey is only one of the samples that could have been selected from the same population, using the same design and size. Each of these samples would yield results that differ somewhat from the results of the actual sample selected. Sampling errors are a measure of the variability between the estimates from all possible samples. The extent of variability is not known exactly, but can be estimated statistically from the survey data. The following sampling error measures are presented in this appendix for each of the selected indicators: Standard error (se): Sampling errors are usually measured in terms of standard errors for particular
indicators (means, proportions etc). Standard error is the square root of the variance of the estimate. The Taylor linearization method is used for the estimation of standard errors.
Coefficient of variation (se/r) is the ratio of the standard error to the value of the indicator, and is a measure of the relative sampling error.
Design effect (deff) is the ratio of the actual variance of an indicator, under the sampling method used in the survey, to the variance calculated under the assumption of simple random sampling. The square root of the design effect (deft) is used to show the efficiency of the sample design in relation to the precision. A deft value of 1.0 indicates that the sample design is as efficient as a simple random sample, while a deft value above 1.0 indicates an increase in the standard error due to the use of a more complex sample design.
Confidence limits are calculated to show the interval within which the true value for the population can be reasonably assumed to fall, with a specified level of confidence. For any given statistic calculated from the survey, the value of that statistic will fall within a range of plus or minus two times the standard error (r + 2.se or r – 2.se) of the statistic in 95 per cent of all possible samples of identical size and design.
For the calculation of sampling errors from MICS data, SPSS Version 18 Complex Samples module has been used. The results are shown in the tables that follow. In addition to the sampling error measures described above, the tables also include weighted and unweighted counts of denominators for each indicator. Sampling errors are calculated for indicators of primary interest, for the national level, for urban and rural areas, and for the regions. One of the indicators is based on households, 8 selected indicators are based on household members, 20 are based on women, and 15 are based on children under 5. All indicators presented here are in the form of proportions. Table SE.1 shows the list of indicators for which sampling errors are calculated, including the base population (denominator) for each indicator. Tables SE.2 to SE.8 show the calculated sampling errors for selected domains.

165
Table SE.1: Indicators selected for sampling error calculations List of indicators selected for sampling error calculations, and base populations (denominators) for each indicator, Somaliland, 2011
MICS4 Indicator Base Population
HOUSEHOLDS
3.12 Household availability of insecticide-treated nets (ITNs) All households
HOUSEHOLD MEMBERS
4.1 Use of improved drinking water sources All household members
4.3 Use of improved sanitation All household members
7.5 Secondary school net attendance ratio (adjusted) Children of secondary school age
8.2 Child labour Children age 5-14 years
9.18 Prevalence of children with one or both parents dead Children age0-17 years
9.19 School attendance of orphans Children age 10-14 years who have lost both parents
9.20 School attendance of non-orphans Children age 10-14 years, whose parents are alive, and who are living with at least one parent
8.5 Violent discipline Children age 2-14 years
WOMEN
Pregnant women Women age 15-49 years
3.19 Pregnant women sleeping under insecticide-treated nets (ITNs) Pregnant women
3.20 Intermittent preventive treatment for malaria Women age 15-49 years with a live birth in the 2 years preceding the survey
5.2 Early childbearing Women age 20-24 years
5.3 Contraceptive prevalence Women age 15-49 years who are currently married
5.4 Unmet need Women age 15-49 years who are currently married
5.5a Antenatal care coverage - at least once by skilled personnel Women age 15-49 years with a live birth in the 2 years preceding the survey
5.5b Antenatal care coverage – at least four times by any provider Women age 15-49 years with a live birth in the 2 years preceding the survey
5.7 Skilled attendant at delivery Women age 15-49 years with a live birth in the 2 years preceding the survey
5.8 Institutional deliveries Women age 15-49 years with a live birth in the 2 years preceding the survey
5.9 Caesarean section Women age 15-49 years with a live birth in the 2 years preceding the survey
7.1 Literacy rate among young women Women age 15-24 years
8.7 Marriage before age 18 Women age 20-49 years
8.9 Polygyny Women age 15-49 years who are currently married
8.12 Prevalence of female genital mutilation/cutting (FGM/C) among women
Women age 15-49 years
9.2 Comprehensive knowledge about HIV prevention among young people
Women age 15-24 years
9.3 Knowledge of mother- to-child transmission of HIV Women age 15-49 years
9.4 Accepting attitudes towards people living with HIV Women age 15-49 years who have heard of HIV
9.6 Women who have been tested for HIV and know the results Women age 15-49 years
8.13 Prevalence of female genital mutilation/cutting (FGM/C) among girls
Girls age 0-14 years
UNDER-5s
2.6 Exclusive breastfeeding under 6 months Total number of infants under 6 months of age
2.14 Age-appropriate breastfeeding Children age 0-23 months
- Tuberculosis immunization coverage Children age 12-23 months
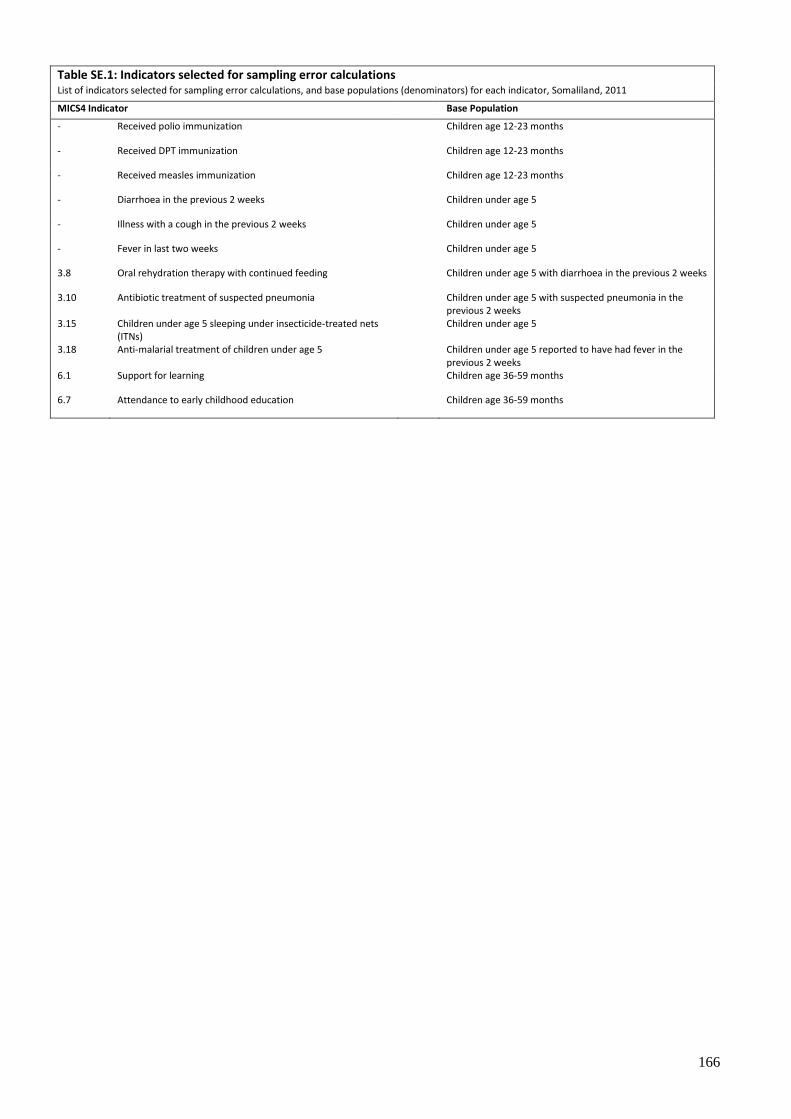
166
Table SE.1: Indicators selected for sampling error calculations List of indicators selected for sampling error calculations, and base populations (denominators) for each indicator, Somaliland, 2011
MICS4 Indicator Base Population
- Received polio immunization Children age 12-23 months
- Received DPT immunization Children age 12-23 months
- Received measles immunization Children age 12-23 months
- Diarrhoea in the previous 2 weeks Children under age 5
- Illness with a cough in the previous 2 weeks Children under age 5
- Fever in last two weeks Children under age 5
3.8 Oral rehydration therapy with continued feeding Children under age 5 with diarrhoea in the previous 2 weeks
3.10 Antibiotic treatment of suspected pneumonia Children under age 5 with suspected pneumonia in the previous 2 weeks
3.15 Children under age 5 sleeping under insecticide-treated nets (ITNs)
Children under age 5
3.18 Anti-malarial treatment of children under age 5 Children under age 5 reported to have had fever in the previous 2 weeks
6.1 Support for learning Children age 36-59 months
6.7 Attendance to early childhood education Children age 36-59 months
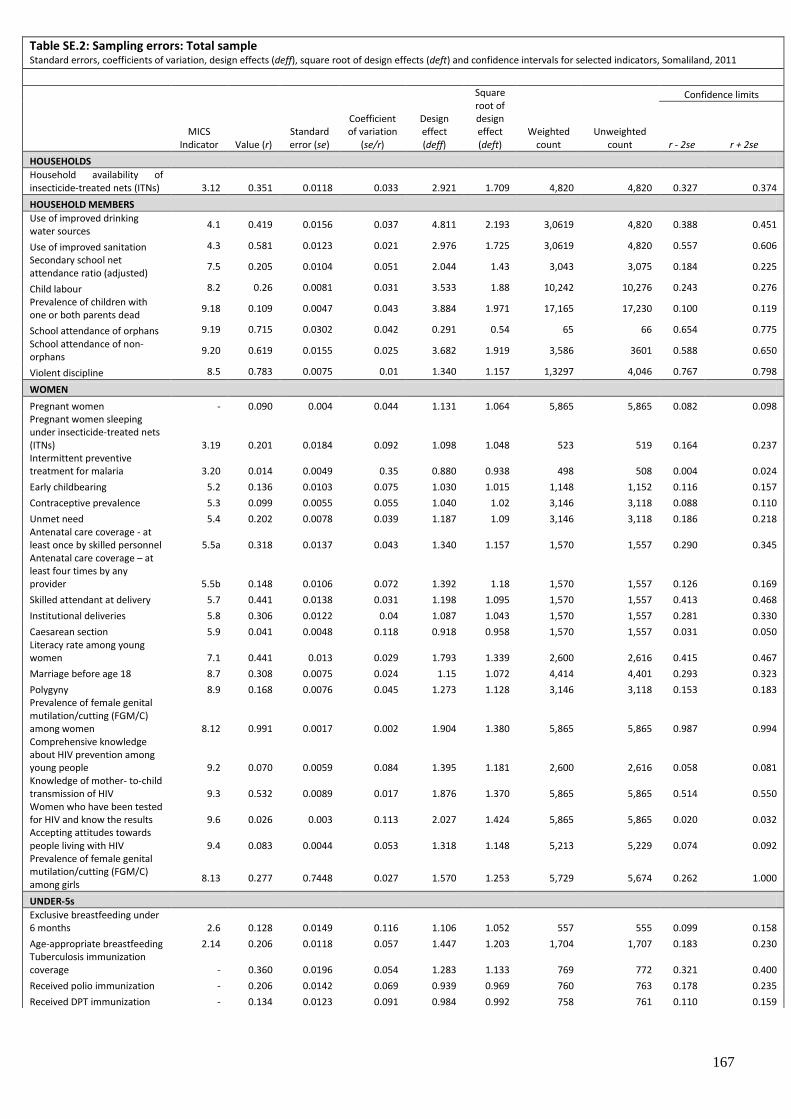
167
Table SE.2: Sampling errors: Total sample Standard errors, coefficients of variation, design effects (deff), square root of design effects (deft) and confidence intervals for selected indicators, Somaliland, 2011
MICS
Indicator Value (r) Standard error (se)
Coefficient of variation
(se/r)
Design effect (deff)
Square root of design effect (deft)
Weighted count
Unweighted count
Confidence limits
r - 2se r + 2se
HOUSEHOLDS
Household availability of insecticide-treated nets (ITNs) 3.12 0.351 0.0118 0.033 2.921 1.709 4,820 4,820 0.327 0.374
HOUSEHOLD MEMBERS
Use of improved drinking water sources
4.1 0.419 0.0156 0.037 4.811 2.193 3,0619 4,820 0.388 0.451
Use of improved sanitation 4.3 0.581 0.0123 0.021 2.976 1.725 3,0619 4,820 0.557 0.606
Secondary school net attendance ratio (adjusted)
7.5 0.205 0.0104 0.051 2.044 1.43 3,043 3,075 0.184 0.225
Child labour 8.2 0.26 0.0081 0.031 3.533 1.88 10,242 10,276 0.243 0.276
Prevalence of children with one or both parents dead
9.18 0.109 0.0047 0.043 3.884 1.971 17,165 17,230 0.100 0.119
School attendance of orphans 9.19 0.715 0.0302 0.042 0.291 0.54 65 66 0.654 0.775
School attendance of non-orphans
9.20 0.619 0.0155 0.025 3.682 1.919 3,586 3601 0.588 0.650
Violent discipline 8.5 0.783 0.0075 0.01 1.340 1.157 1,3297 4,046 0.767 0.798
WOMEN
Pregnant women - 0.090 0.004 0.044 1.131 1.064 5,865 5,865 0.082 0.098 Pregnant women sleeping under insecticide-treated nets (ITNs) 3.19 0.201 0.0184 0.092 1.098 1.048 523 519 0.164 0.237 Intermittent preventive treatment for malaria 3.20 0.014 0.0049 0.35 0.880 0.938 498 508 0.004 0.024
Early childbearing 5.2 0.136 0.0103 0.075 1.030 1.015 1,148 1,152 0.116 0.157
Contraceptive prevalence 5.3 0.099 0.0055 0.055 1.040 1.02 3,146 3,118 0.088 0.110
Unmet need 5.4 0.202 0.0078 0.039 1.187 1.09 3,146 3,118 0.186 0.218 Antenatal care coverage - at least once by skilled personnel 5.5a 0.318 0.0137 0.043 1.340 1.157 1,570 1,557 0.290 0.345 Antenatal care coverage – at least four times by any provider 5.5b 0.148 0.0106 0.072 1.392 1.18 1,570 1,557 0.126 0.169
Skilled attendant at delivery 5.7 0.441 0.0138 0.031 1.198 1.095 1,570 1,557 0.413 0.468
Institutional deliveries 5.8 0.306 0.0122 0.04 1.087 1.043 1,570 1,557 0.281 0.330
Caesarean section 5.9 0.041 0.0048 0.118 0.918 0.958 1,570 1,557 0.031 0.050 Literacy rate among young women 7.1 0.441 0.013 0.029 1.793 1.339 2,600 2,616 0.415 0.467
Marriage before age 18 8.7 0.308 0.0075 0.024 1.15 1.072 4,414 4,401 0.293 0.323
Polygyny 8.9 0.168 0.0076 0.045 1.273 1.128 3,146 3,118 0.153 0.183 Prevalence of female genital mutilation/cutting (FGM/C) among women 8.12 0.991 0.0017 0.002 1.904 1.380 5,865 5,865 0.987 0.994 Comprehensive knowledge about HIV prevention among young people 9.2 0.070 0.0059 0.084 1.395 1.181 2,600 2,616 0.058 0.081 Knowledge of mother- to-child transmission of HIV 9.3 0.532 0.0089 0.017 1.876 1.370 5,865 5,865 0.514 0.550 Women who have been tested for HIV and know the results 9.6 0.026 0.003 0.113 2.027 1.424 5,865 5,865 0.020 0.032 Accepting attitudes towards people living with HIV 9.4 0.083 0.0044 0.053 1.318 1.148 5,213 5,229 0.074 0.092 Prevalence of female genital mutilation/cutting (FGM/C) among girls
8.13
0.277
0.7448
0.027
1.570
1.253
5,729
5,674
0.262
1.000
UNDER-5s
Exclusive breastfeeding under 6 months 2.6 0.128 0.0149 0.116 1.106 1.052 557 555 0.099 0.158
Age-appropriate breastfeeding 2.14 0.206 0.0118 0.057 1.447 1.203 1,704 1,707 0.183 0.230 Tuberculosis immunization coverage - 0.360 0.0196 0.054 1.283 1.133 769 772 0.321 0.400
Received polio immunization - 0.206 0.0142 0.069 0.939 0.969 760 763 0.178 0.235
Received DPT immunization - 0.134 0.0123 0.091 0.984 0.992 758 761 0.110 0.159

168
MICS
Indicator Value (r) Standard error (se)
Coefficient of variation
(se/r)
Design effect (deff)
Square root of design effect (deft)
Weighted count
Unweighted count
Confidence limits
r - 2se r + 2se
Received measles immunization - 0.378 0.0170 0.045 0.937 0.968 760 763 0.344 0.412 Diarrhoea in the previous 2 weeks - 0.133 0.0066 0.05 1.782 1.335 4,672 4,672 0.120 0.147 Illness with a cough in the previous 2 weeks - 0.057 0.0044 0.077 1.685 1.298 4,672 4,672 0.048 0.066
Fever in last two weeks - 0.076 0.0053 0.070 1.871 1.368 4,672 4,672 0.065 0.086 Oral rehydration therapy with continued feeding 3.8 0.201 0.0143 0.071 0.792 0.890 623 626 0.172 0.229 Antibiotic treatment of suspected pneumonia 3.10 0.528 0.0231 0.044 0.568 0.753 267 267 0.481 0.574 Children under age 5 sleeping under insecticide-treated nets (ITNs) 3.15 0.219 0.0122 0.056 4.002 2.000 4,619 4,621 0.194 0.243 Anti-malarial treatment of children under age 5 3.18 0.034 0.0062 0.185 0.419 0.648 354 355 0.021 0.046
Support for learning 6.1 0.652 0.0136 0.021 1.611 1.269 1,981 1,977 0.625 0.680 Attendance to early childhood education 6.7 0.028 0.0039 0.141 1.109 1.053 1,981 1,977 0.020 0.035

169
Table SE.3: Sampling errors: Urban areas
Standard errors, coefficients of variation, design effects (deff), square root of design effects (deft) and confidence intervals for selected indicators, Somaliland, 2011
MICS
Indicator Value
(r)
Standard error
(se)
Coefficient of
variation (se/r)
Design
effect
(deff)
Square root of design effect (deft)
Weighted count
Un weighted count
Confidence limits
r - 2se r + 2se
HOUSEHOLDS
Household availability of insecticide-treated nets (ITNs) 3.12 0.339 0.012 0.032 1.23 1.109 2,280 2,401 0.317 0.360
HOUSEHOLD MEMBERS
Use of improved drinking water sources 4.1 0.640 0.021 0.033 4.583 2.141 16,146 2,401 0.598 0.682
Use of improved sanitation 4.3 0.865 0.012 0.014 2.841 1.685 16,146 2,401 0.842 0.889 Secondary school net attendance ratio (adjusted) 7.5 0.303 0.014 0.047 1.803 1.343 1,779 1,871 0.275 0.332
Child labour 8.2 0.140 0.008 0.053 2.504 1.582 5,145 5,423 0.125 0.155 Prevalence of children with one or both parents dead 9.18 0.124 0.007 0.057 4.18 2.044 8,714 9,181 0.110 0.138
School attendance of orphans 9.19 * * * * * 46 48 * *
School attendance of non-orphans 9.20 0.722 0.014 0.019 1.898 1.378 1,840 1,938 0.694 0.750
Violent discipline 8.5 0.778 0.012 0.015 1.583 1.258 6,608 2,034 0.755 0.801
WOMEN
Pregnant women - 0.078 0.005 0.066 1.305 1.142 3,378 3,541 0.067 0.088 Pregnant women sleeping under insecticide-treated nets (ITNs) 3.19 0.170 0.017 0.11 0.665 0.816 259 272 0.133 0.207
Intermittent preventive treatment for malaria 3.20 0.013 0.006 0.452 1.051 1.025 361 379 0.001 0.026
Early childbearing 5.2 0.080 0.009 0.116 0.888 0.942 721 753 0.062 0.099
Contraceptive prevalence 5.3 0.110 0.008 0.071 1.001 1.000 1,521 1,598 0.094 0.126
Unmet need 5.4 0.219 0.013 0.057 1.482 1.217 1,521 1,598 0.194 0.244 Antenatal care coverage - at least once by skilled personnel 5.5a 0.476 0.021 0.043 1.347 1.161 758 797 0.435 0.517 Antenatal care coverage – at least four times by any provider 5.5b 0.244 0.016 0.065 1.094 1.046 758 797 0.212 0.276
Skilled attendant at delivery 5.7 0.709 0.019 0.027 1.445 1.202 758 797 0.671 0.748
Institutional deliveries 5.8 0.542 0.020 0.038 1.33 1.153 758 797 0.501 0.582
Caesarean section 5.9 0.074 0.009 0.121 0.935 0.967 758 797 0.056 0.092
Literacy rate among young women 7.1 0.538 0.014 0.027 1.433 1.197 1,649 1,728 0.509 0.567
Marriage before age 18 8.7 0.261 0.009 0.034 1.055 1.027 2,451 2,566 0.244 0.279
Polygyny 8.9 0.164 0.012 0.072 1.598 1.264 1,521 1,598 0.140 0.187 Prevalence of female genital mutilation/cutting (FGM/C) among women 8.12 0.987 0.003 0.003 2.175 1.475 3,378 3,541 0.982 0.993 Comprehensive knowledge about HIV prevention among young people 9.2 0.088 0.008 0.092 1.404 1.185 1,649 1,728 0.072 0.104 Knowledge of mother- to-child transmission of HIV 9.3 0.567 0.012 0.021 2.031 1.425 3,378 3,541 0.543 0.590 Women who have been tested for HIV and know the results 9.6 0.035 0.005 0.137 2.443 1.563 3,378 3,541 0.026 0.045 Accepting attitudes towards people living with HIV 9.4 0.105 0.006 0.06 1.423 1.193 3,154 3,305 0.093 0.118 Prevalence of female genital mutilation/cutting (FGM/C) among girls
8.13
0.305
1.0261
0.034
1.438
1.199
2,753
2,897
0.285
1.000
UNDER-5s
Exclusive breastfeeding under 6 months 2.6 0.127 0.022 0.171 1.104 1.051 250 263 0.083 0.170
Age-appropriate breastfeeding 2.14 0.202 0.017 0.083 1.544 1.243 834 878 0.168 0.235
Tuberculosis immunization coverage - 0.402 0.028 0.07 1.343 1.159 394 414 0.346 0.458
Received polio immunization - 0.228 0.018 0.078 0.726 0.852 386 406 0.192 0.263
Received DPT immunization - 0.158 0.019 0.12 1.091 1.045 386 406 0.120 0.196
Received measles immunization - 0.420 0.020 0.048 0.682 0.826 387 407 0.380 0.461
Diarrhoea in the previous 2 weeks - 0.144 0.010 0.067 1.798 1.341 2,256 2,373 0.125 0.163
Illness with a cough in the previous 2 weeks - 0.059 0.007 0.117 2.045 1.43 2,256 2,373 0.045 0.073
Fever in last two weeks - 0.079 0.008 0.1 2.009 1.417 2,256 2,373 0.063 0.094 Oral rehydration therapy with continued feeding 3.8 0.204 0.020 0.097 0.825 0.908 325 342 0.164 0.243
Antibiotic treatment of suspected pneumonia 3.10 0.704 0.035 0.05 0.813 0.901 133 140 0.634 0.774
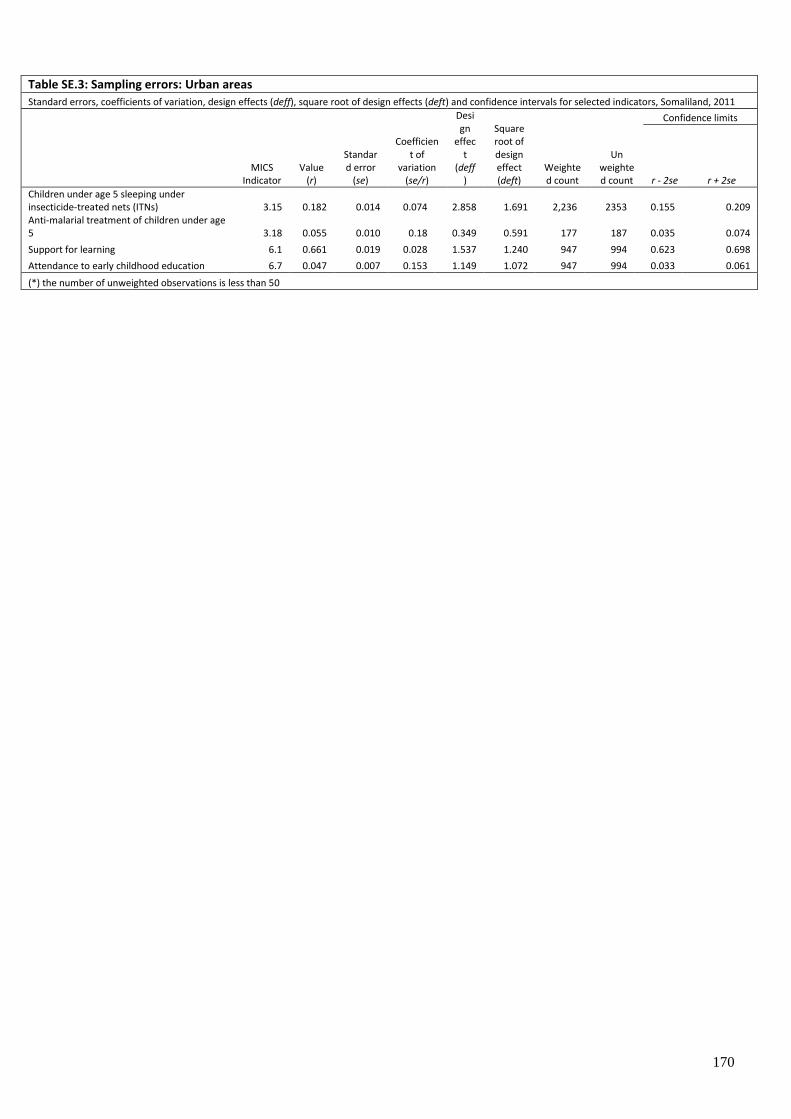
170
Table SE.3: Sampling errors: Urban areas
Standard errors, coefficients of variation, design effects (deff), square root of design effects (deft) and confidence intervals for selected indicators, Somaliland, 2011
MICS
Indicator Value
(r)
Standard error
(se)
Coefficient of
variation (se/r)
Design
effect
(deff)
Square root of design effect (deft)
Weighted count
Un weighted count
Confidence limits
r - 2se r + 2se
Children under age 5 sleeping under insecticide-treated nets (ITNs) 3.15 0.182 0.014 0.074 2.858 1.691 2,236 2353 0.155 0.209 Anti-malarial treatment of children under age 5 3.18 0.055 0.010 0.18 0.349 0.591 177 187 0.035 0.074
Support for learning 6.1 0.661 0.019 0.028 1.537 1.240 947 994 0.623 0.698
Attendance to early childhood education 6.7 0.047 0.007 0.153 1.149 1.072 947 994 0.033 0.061
(*) the number of unweighted observations is less than 50

171
Table SE.4: Sampling errors: Rural areas Standard errors, coefficients of variation, design effects (deff), square root of design effects (deft) and confidence intervals for selected indicators, Somaliland, 2011
MICS
Indicator Value (r) Standard error (se)
Coefficient of
variation (se/r)
Design effect (deff)
Square root of design effect (deft)
Weighted count
Un weighted count
Confidence limits
r - 2se r + 2se
HOUSEHOLDS Household availability of insecticide-treated nets (ITNs) 3.12 0.362 0.0201 0.056 4.237 2.058 2,540 2,419 0.322 0.402
HOUSEHOLD MEMBERS
Use of improved drinking water sources 4.1 0.173 0.0224 0.129 8.435 2.904 14,473 2,419 0.128 0.218 Use of improved sanitation 4.3 0.264 0.0233 0.088 6.738 2.596 14,473 2,419 0.218 0.311 Secondary school net attendance ratio (adjusted) 7.5 0.066 0.0136 0.207 3.626 1.904 1,264 1,204 0.039 0.093 Child labour 8.2 0.380 0.0148 0.039 4.508 2.123 5,097 4,853 0.350 0.410 Prevalence of children with one or both parents dead 9.18 0.094 0.0062 0.066 3.659 1.913 8,450 8,049 0.082 0.107 School attendance of orphans 9.19 0.837 0.0631 0.075 0.497 0.705 19 18 0.711 0.963 School attendance of non-orphans 9.20 0.511 0.0283 0.055 5.317 2.306 1,746 1,663 0.455 0.568 Violent discipline 8.5 0.787 0.0096 0.012 1.095 1.047 6,690 2,012 0.768 0.806
WOMEN
Pregnant women - 0.108 0.0063 0.058 0.954 0.977 2,487 2,324 0.095 0.120 Pregnant women sleeping under insecticide-treated nets (ITNs) 3.19 0.231 0.0316 0.137 1.387 1.178 264 247 0.168 0.294 Intermittent preventive treatment for malaria 3.20 0.015 0.0078 0.505 0.511 0.715 138 129 0.000 0.031 Early childbearing 5.2 0.231 0.0205 0.089 0.946 0.972 427 399 0.189 0.272 Contraceptive prevalence 5.3 0.089 0.0076 0.085 1.088 1.043 1,626 1,520 0.074 0.105 Unmet need 5.4 0.186 0.0095 0.051 0.914 0.956 1,626 1,520 0.167 0.205 Antenatal care coverage - at least once by skilled personnel 5.5a 0.170 0.0179 0.105 1.721 1.312 812 760 0.134 0.205 Antenatal care coverage – at least four times by any provider 5.5b 0.058 0.0128 0.222 2.294 1.514 812 760 0.032 0.083 Skilled attendant at delivery 5.7 0.190 0.0181 0.095 1.608 1.268 812 760 0.154 0.226 Institutional deliveries 5.8 0.086 0.0111 0.130 1.205 1.097 812 760 0.063 0.108 Caesarean section 5.9 0.009 0.0034 0.372 0.978 0.989 812 760 0.002 0.016 Literacy rate among young women 7.1 0.273 0.0231 0.085 2.394 1.547 950 888 0.227 0.319 Marriage before age 18 8.7 0.365 0.0124 0.034 1.213 1.101 1,963 1,835 0.341 0.390 Polygyny 8.9 0.171 0.0097 0.056 0.995 0.998 1,626 1,520 0.152 0.191 Prevalence of female genital mutilation/cutting (FGM/C) among women 8.12 0.996 0.0014 0.001 1.027 1.013 2,487 2,324 0.993 0.998 Comprehensive knowledge about HIV prevention among young people 9.2 0.038 0.008 0.209 1.547 1.244 950 888 0.022 0.054 Knowledge of mother- to-child transmission of HIV 9.3 0.485 0.0136 0.028 1.730 1.315 2,487 2,324 0.457 0.512 Women who have been tested for HIV and know the results 9.6 0.014 0.0023 0.159 0.841 0.917 2,487 2,324 0.010 0.019 Accepting attitudes towards people living with HIV 9.4 0.049 0.0052 0.106 1.118 1.057 2,059 1,924 0.039 0.060 Prevalence of female genital mutilation/cutting (FGM/C) among girls 8.13
0.251
1.0805
0.043
1.723
1.313
2,977
2,777
0.230
1.000
UNDER-5s
Exclusive breastfeeding under 6 months 2.6 0.13 0.0207 0.159 1.1 1.049 307 292 0.088 0.171 Age-appropriate breastfeeding 2.14 0.211 0.0165 0.078 1.353 1.163 870 829 0.178 0.244 Tuberculosis immunization coverage - 0.317 0.0271 0.086 1.215 1.102 375 358 0.262 0.371 Received polio immunization - 0.184 0.0222 0.121 1.172 1.083 374 357 0.140 0.229 Received DPT immunization - 0.11 0.0152 0.139 0.842 0.918 372 355 0.079 0.140 Received measles immunization - 0.334 0.0272 0.081 1.176 1.085 373 356 0.280 0.388 Diarrhoea in the previous 2 weeks - 0.123 0.0091 0.074 1.754 1.324 2,416 2,299 0.105 0.141 Illness with a cough in the previous 2 weeks - 0.055 0.0056 0.1 1.359 1.166 2,416 2,299 0.044 0.066 Fever in last two weeks - 0.073 0.0072 0.098 1.744 1.321 2,416 2,299 0.059 0.088

172
Table SE.4: Sampling errors: Rural areas Standard errors, coefficients of variation, design effects (deff), square root of design effects (deft) and confidence intervals for selected indicators, Somaliland, 2011
MICS
Indicator Value (r) Standard error (se)
Coefficient of
variation (se/r)
Design effect (deff)
Square root of design effect (deft)
Weighted count
Un weighted count
Confidence limits
r - 2se r + 2se
Oral rehydration therapy with continued feeding 3.8 0.198 0.0206 0.104 0.755 0.869 298 284 0.157 0.239 Antibiotic treatment of suspected pneumonia 3.10 0.352 0.029 0.082 0.464 0.681 134 127 0.294 0.410 Children under age 5 sleeping under insecticide-treated nets (ITNs) 3.15 0.254 0.0195 0.077 4.549 2.133 2,383 2,268 0.215 0.292 Anti-malarial treatment of children under age 5 3.18 0.013 0.0065 0.522 0.577 0.76 177 168 0.000 0.026 Support for learning 6.1 0.645 0.0197 0.031 1.667 1.291 1,033 983 0.605 0.684 Attendance to early childhood education 6.7 0.010 0.0031 0.314 0.974 0.987 1,033 983 0.004 0.016
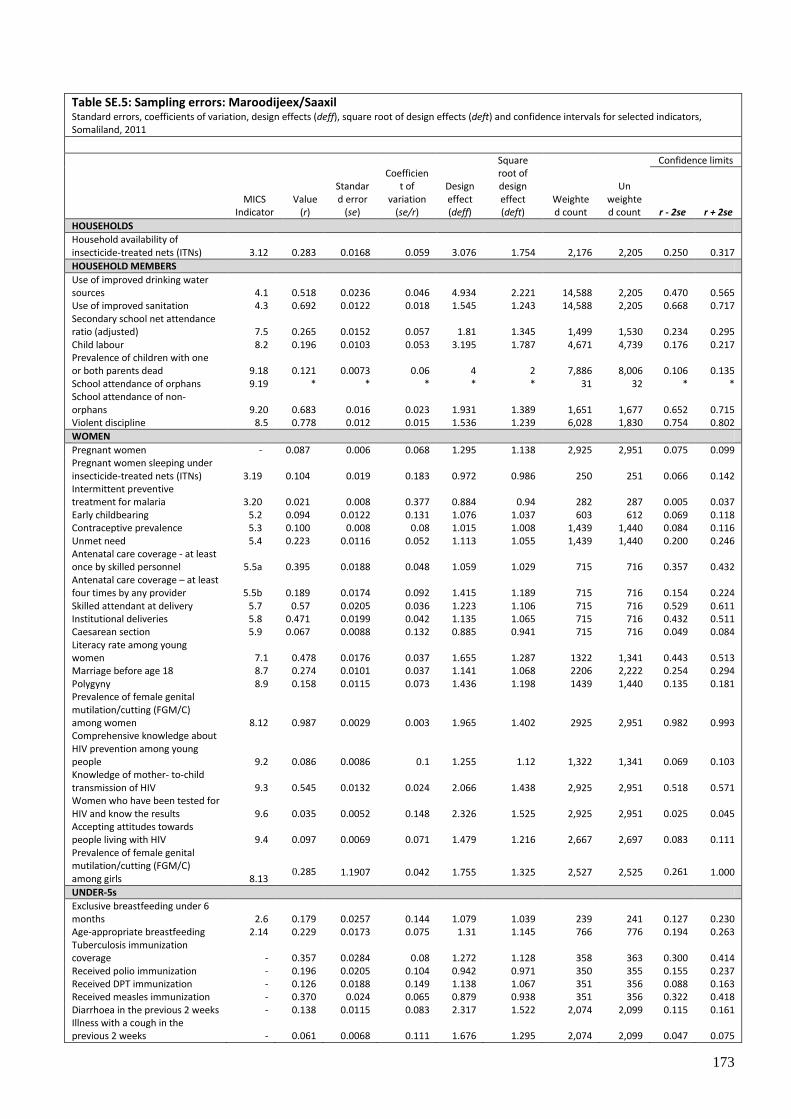
173
Table SE.5: Sampling errors: Maroodijeex/Saaxil Standard errors, coefficients of variation, design effects (deff), square root of design effects (deft) and confidence intervals for selected indicators, Somaliland, 2011
MICS Indicator
Value (r)
Standard error
(se)
Coefficient of
variation (se/r)
Design effect (deff)
Square root of design effect (deft)
Weighted count
Un weighted count
Confidence limits
r - 2se r + 2se
HOUSEHOLDS
Household availability of insecticide-treated nets (ITNs) 3.12 0.283 0.0168 0.059 3.076 1.754 2,176 2,205 0.250 0.317
HOUSEHOLD MEMBERS
Use of improved drinking water sources 4.1 0.518 0.0236 0.046 4.934 2.221 14,588 2,205 0.470 0.565 Use of improved sanitation 4.3 0.692 0.0122 0.018 1.545 1.243 14,588 2,205 0.668 0.717 Secondary school net attendance ratio (adjusted) 7.5 0.265 0.0152 0.057 1.81 1.345 1,499 1,530 0.234 0.295 Child labour 8.2 0.196 0.0103 0.053 3.195 1.787 4,671 4,739 0.176 0.217 Prevalence of children with one or both parents dead 9.18 0.121 0.0073 0.06 4 2 7,886 8,006 0.106 0.135 School attendance of orphans 9.19 * * * * * 31 32 * * School attendance of non-orphans 9.20 0.683 0.016 0.023 1.931 1.389 1,651 1,677 0.652 0.715 Violent discipline 8.5 0.778 0.012 0.015 1.536 1.239 6,028 1,830 0.754 0.802
WOMEN
Pregnant women - 0.087 0.006 0.068 1.295 1.138 2,925 2,951 0.075 0.099 Pregnant women sleeping under insecticide-treated nets (ITNs) 3.19 0.104 0.019 0.183 0.972 0.986 250 251 0.066 0.142 Intermittent preventive treatment for malaria 3.20 0.021 0.008 0.377 0.884 0.94 282 287 0.005 0.037 Early childbearing 5.2 0.094 0.0122 0.131 1.076 1.037 603 612 0.069 0.118 Contraceptive prevalence 5.3 0.100 0.008 0.08 1.015 1.008 1,439 1,440 0.084 0.116 Unmet need 5.4 0.223 0.0116 0.052 1.113 1.055 1,439 1,440 0.200 0.246 Antenatal care coverage - at least once by skilled personnel 5.5a 0.395 0.0188 0.048 1.059 1.029 715 716 0.357 0.432 Antenatal care coverage – at least four times by any provider 5.5b 0.189 0.0174 0.092 1.415 1.189 715 716 0.154 0.224 Skilled attendant at delivery 5.7 0.57 0.0205 0.036 1.223 1.106 715 716 0.529 0.611 Institutional deliveries 5.8 0.471 0.0199 0.042 1.135 1.065 715 716 0.432 0.511 Caesarean section 5.9 0.067 0.0088 0.132 0.885 0.941 715 716 0.049 0.084 Literacy rate among young women 7.1 0.478 0.0176 0.037 1.655 1.287 1322 1,341 0.443 0.513 Marriage before age 18 8.7 0.274 0.0101 0.037 1.141 1.068 2206 2,222 0.254 0.294 Polygyny 8.9 0.158 0.0115 0.073 1.436 1.198 1439 1,440 0.135 0.181 Prevalence of female genital mutilation/cutting (FGM/C) among women 8.12 0.987 0.0029 0.003 1.965 1.402 2925 2,951 0.982 0.993 Comprehensive knowledge about HIV prevention among young people 9.2 0.086 0.0086 0.1 1.255 1.12 1,322 1,341 0.069 0.103 Knowledge of mother- to-child transmission of HIV 9.3 0.545 0.0132 0.024 2.066 1.438 2,925 2,951 0.518 0.571 Women who have been tested for HIV and know the results 9.6 0.035 0.0052 0.148 2.326 1.525 2,925 2,951 0.025 0.045 Accepting attitudes towards people living with HIV 9.4 0.097 0.0069 0.071 1.479 1.216 2,667 2,697 0.083 0.111 Prevalence of female genital mutilation/cutting (FGM/C) among girls 8.13
0.285
1.1907
0.042
1.755
1.325
2,527
2,525
0.261
1.000
UNDER-5s
Exclusive breastfeeding under 6 months 2.6 0.179 0.0257 0.144 1.079 1.039 239 241 0.127 0.230 Age-appropriate breastfeeding 2.14 0.229 0.0173 0.075 1.31 1.145 766 776 0.194 0.263 Tuberculosis immunization coverage - 0.357 0.0284 0.08 1.272 1.128 358 363 0.300 0.414 Received polio immunization - 0.196 0.0205 0.104 0.942 0.971 350 355 0.155 0.237 Received DPT immunization - 0.126 0.0188 0.149 1.138 1.067 351 356 0.088 0.163 Received measles immunization - 0.370 0.024 0.065 0.879 0.938 351 356 0.322 0.418 Diarrhoea in the previous 2 weeks - 0.138 0.0115 0.083 2.317 1.522 2,074 2,099 0.115 0.161 Illness with a cough in the previous 2 weeks - 0.061 0.0068 0.111 1.676 1.295 2,074 2,099 0.047 0.075

174
Table SE.5: Sampling errors: Maroodijeex/Saaxil Standard errors, coefficients of variation, design effects (deff), square root of design effects (deft) and confidence intervals for selected indicators, Somaliland, 2011
MICS Indicator
Value (r)
Standard error
(se)
Coefficient of
variation (se/r)
Design effect (deff)
Square root of design effect (deft)
Weighted count
Un weighted count
Confidence limits
r - 2se r + 2se
Fever in last two weeks - 0.080 0.0086 0.108 2.128 1.459 2,074 2,099 0.062 0.097 Oral rehydration therapy with continued feeding 3.8 0.183 0.0182 0.099 0.64 0.800 285 290 0.147 0.220 Antibiotic treatment of suspected pneumonia 3.10 0.59 0.039 0.066 0.799 0.894 126 128 0.512 0.668 Children under age 5 sleeping under insecticide-treated nets (ITNs) 3.15 0.141 0.0159 0.113 4.349 2.085 2,056 2,080 0.109 0.173 Anti-malarial treatment of children under age 5 3.18 0.041 0.0097 0.237 0.403 0.635 165 168 0.022 0.060 Support for learning 6.1 0.606 0.0217 0.036 1.814 1.347 910 919 0.563 0.650 Attendance to early childhood education 6.7 0.045 0.007 0.156 1.056 1.028 910 919 0.031 0.059
(*) the number of unweighted observations is less than 50
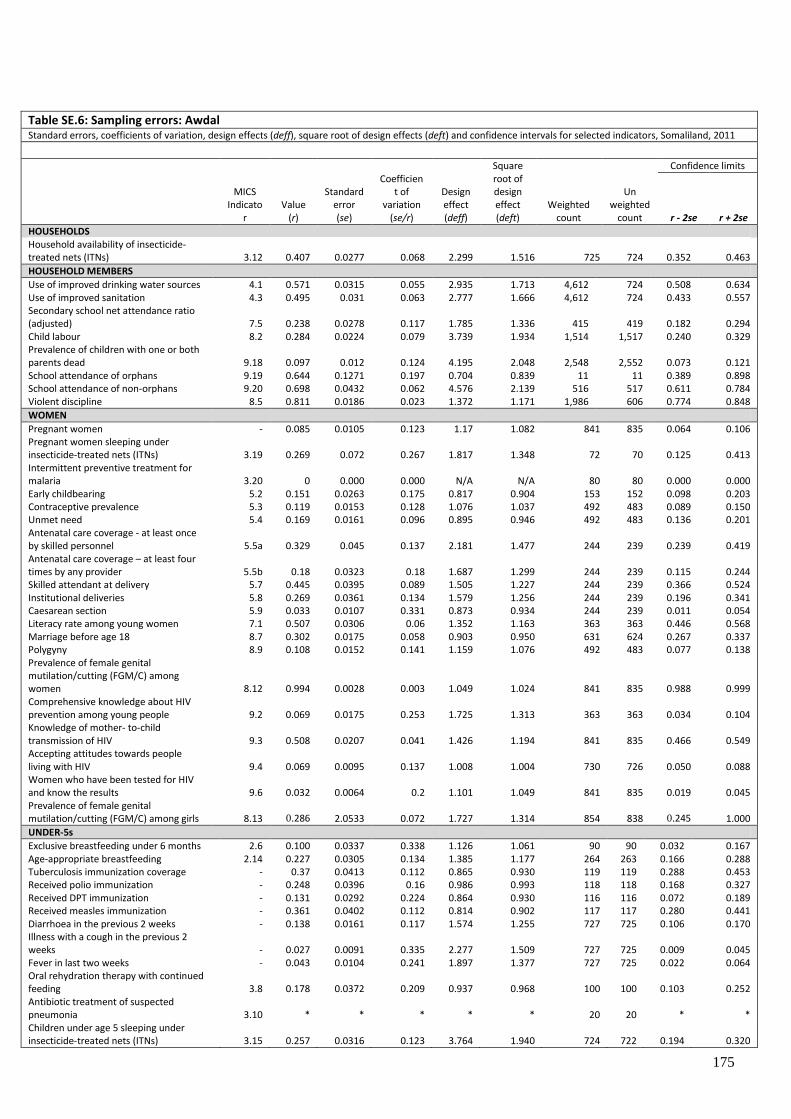
175
Table SE.6: Sampling errors: Awdal Standard errors, coefficients of variation, design effects (deff), square root of design effects (deft) and confidence intervals for selected indicators, Somaliland, 2011
MICS Indicato
r Value
(r)
Standard error (se)
Coefficient of
variation (se/r)
Design effect (deff)
Square root of design effect (deft)
Weighted count
Un weighted
count
Confidence limits
r - 2se r + 2se
HOUSEHOLDS Household availability of insecticide-treated nets (ITNs) 3.12 0.407 0.0277 0.068 2.299 1.516 725 724 0.352 0.463
HOUSEHOLD MEMBERS
Use of improved drinking water sources 4.1 0.571 0.0315 0.055 2.935 1.713 4,612 724 0.508 0.634 Use of improved sanitation 4.3 0.495 0.031 0.063 2.777 1.666 4,612 724 0.433 0.557 Secondary school net attendance ratio (adjusted) 7.5 0.238 0.0278 0.117 1.785 1.336 415 419 0.182 0.294 Child labour 8.2 0.284 0.0224 0.079 3.739 1.934 1,514 1,517 0.240 0.329 Prevalence of children with one or both parents dead 9.18 0.097 0.012 0.124 4.195 2.048 2,548 2,552 0.073 0.121 School attendance of orphans 9.19 0.644 0.1271 0.197 0.704 0.839 11 11 0.389 0.898 School attendance of non-orphans 9.20 0.698 0.0432 0.062 4.576 2.139 516 517 0.611 0.784 Violent discipline 8.5 0.811 0.0186 0.023 1.372 1.171 1,986 606 0.774 0.848
WOMEN
Pregnant women - 0.085 0.0105 0.123 1.17 1.082 841 835 0.064 0.106 Pregnant women sleeping under insecticide-treated nets (ITNs) 3.19 0.269 0.072 0.267 1.817 1.348 72 70 0.125 0.413 Intermittent preventive treatment for malaria 3.20 0 0.000 0.000 N/A N/A 80 80 0.000 0.000 Early childbearing 5.2 0.151 0.0263 0.175 0.817 0.904 153 152 0.098 0.203 Contraceptive prevalence 5.3 0.119 0.0153 0.128 1.076 1.037 492 483 0.089 0.150 Unmet need 5.4 0.169 0.0161 0.096 0.895 0.946 492 483 0.136 0.201 Antenatal care coverage - at least once by skilled personnel 5.5a 0.329 0.045 0.137 2.181 1.477 244 239 0.239 0.419 Antenatal care coverage – at least four times by any provider 5.5b 0.18 0.0323 0.18 1.687 1.299 244 239 0.115 0.244 Skilled attendant at delivery 5.7 0.445 0.0395 0.089 1.505 1.227 244 239 0.366 0.524 Institutional deliveries 5.8 0.269 0.0361 0.134 1.579 1.256 244 239 0.196 0.341 Caesarean section 5.9 0.033 0.0107 0.331 0.873 0.934 244 239 0.011 0.054 Literacy rate among young women 7.1 0.507 0.0306 0.06 1.352 1.163 363 363 0.446 0.568 Marriage before age 18 8.7 0.302 0.0175 0.058 0.903 0.950 631 624 0.267 0.337 Polygyny 8.9 0.108 0.0152 0.141 1.159 1.076 492 483 0.077 0.138 Prevalence of female genital mutilation/cutting (FGM/C) among women 8.12 0.994 0.0028 0.003 1.049 1.024 841 835 0.988 0.999 Comprehensive knowledge about HIV prevention among young people 9.2 0.069 0.0175 0.253 1.725 1.313 363 363 0.034 0.104 Knowledge of mother- to-child transmission of HIV 9.3 0.508 0.0207 0.041 1.426 1.194 841 835 0.466 0.549 Accepting attitudes towards people living with HIV 9.4 0.069 0.0095 0.137 1.008 1.004 730 726 0.050 0.088 Women who have been tested for HIV and know the results 9.6 0.032 0.0064 0.2 1.101 1.049 841 835 0.019 0.045 Prevalence of female genital mutilation/cutting (FGM/C) among girls 8.13
0.286
2.0533
0.072
1.727
1.314
854
838
0.245
1.000
UNDER-5s
Exclusive breastfeeding under 6 months 2.6 0.100 0.0337 0.338 1.126 1.061 90 90 0.032 0.167 Age-appropriate breastfeeding 2.14 0.227 0.0305 0.134 1.385 1.177 264 263 0.166 0.288 Tuberculosis immunization coverage - 0.37 0.0413 0.112 0.865 0.930 119 119 0.288 0.453 Received polio immunization - 0.248 0.0396 0.16 0.986 0.993 118 118 0.168 0.327 Received DPT immunization - 0.131 0.0292 0.224 0.864 0.930 116 116 0.072 0.189 Received measles immunization - 0.361 0.0402 0.112 0.814 0.902 117 117 0.280 0.441 Diarrhoea in the previous 2 weeks - 0.138 0.0161 0.117 1.574 1.255 727 725 0.106 0.170 Illness with a cough in the previous 2 weeks - 0.027 0.0091 0.335 2.277 1.509 727 725 0.009 0.045 Fever in last two weeks - 0.043 0.0104 0.241 1.897 1.377 727 725 0.022 0.064 Oral rehydration therapy with continued feeding 3.8 0.178 0.0372 0.209 0.937 0.968 100 100 0.103 0.252 Antibiotic treatment of suspected pneumonia 3.10 * * * * * 20 20 * * Children under age 5 sleeping under insecticide-treated nets (ITNs) 3.15 0.257 0.0316 0.123 3.764 1.940 724 722 0.194 0.320
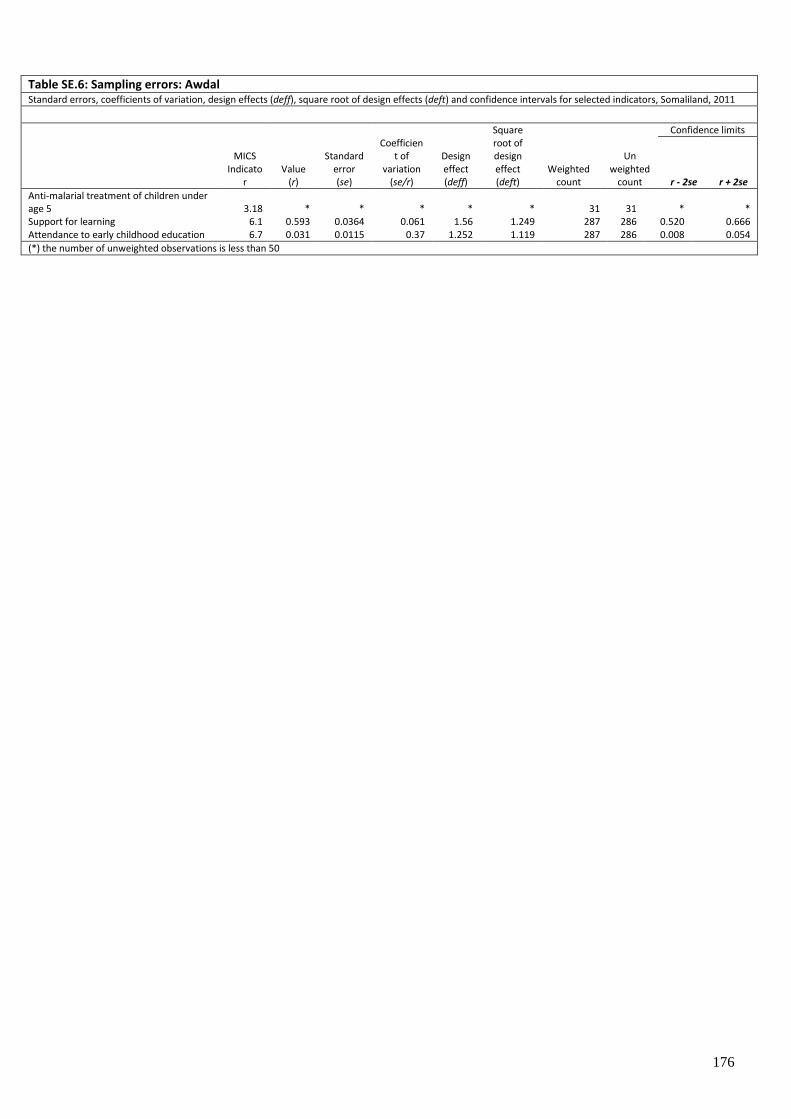
176
Table SE.6: Sampling errors: Awdal Standard errors, coefficients of variation, design effects (deff), square root of design effects (deft) and confidence intervals for selected indicators, Somaliland, 2011
MICS Indicato
r Value
(r)
Standard error (se)
Coefficient of
variation (se/r)
Design effect (deff)
Square root of design effect (deft)
Weighted count
Un weighted
count
Confidence limits
r - 2se r + 2se
Anti-malarial treatment of children under age 5 3.18 * * * * * 31 31 * * Support for learning 6.1 0.593 0.0364 0.061 1.56 1.249 287 286 0.520 0.666 Attendance to early childhood education 6.7 0.031 0.0115 0.37 1.252 1.119 287 286 0.008 0.054
(*) the number of unweighted observations is less than 50
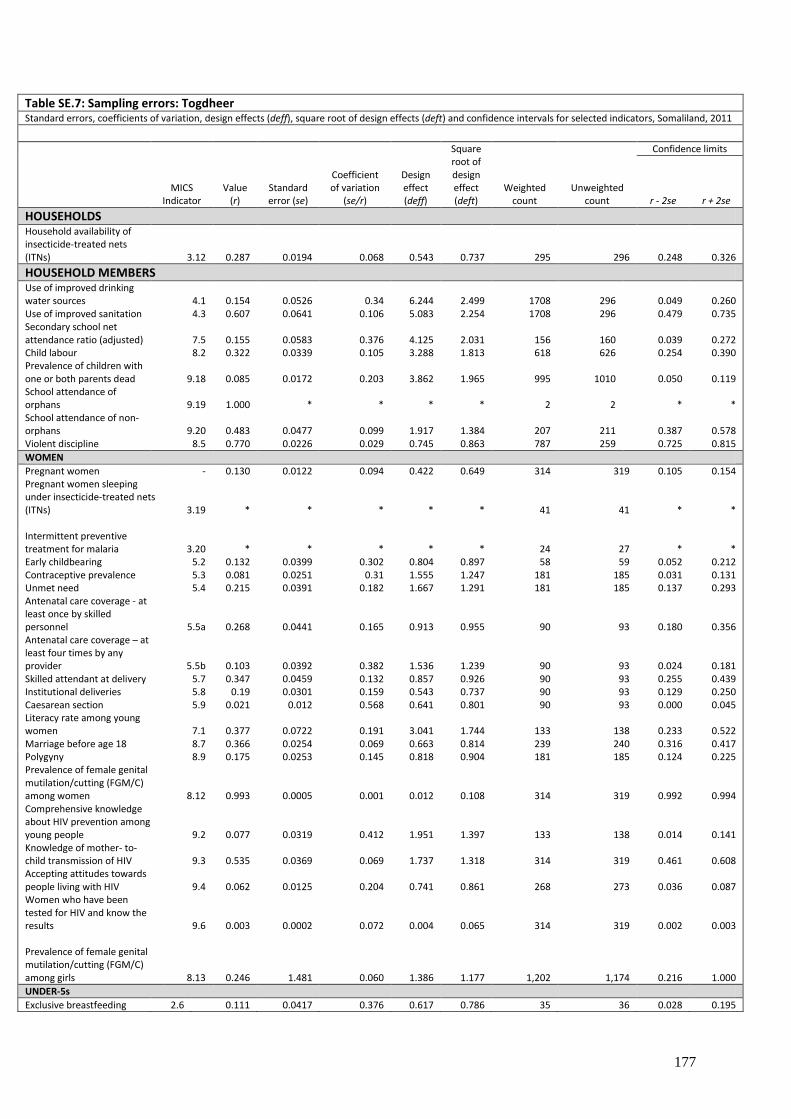
177
Table SE.7: Sampling errors: Togdheer Standard errors, coefficients of variation, design effects (deff), square root of design effects (deft) and confidence intervals for selected indicators, Somaliland, 2011
MICS Indicator
Value (r)
Standard error (se)
Coefficient of variation
(se/r)
Design effect (deff)
Square root of design effect (deft)
Weighted count
Unweighted count
Confidence limits
r - 2se r + 2se
HOUSEHOLDS Household availability of insecticide-treated nets (ITNs) 3.12 0.287 0.0194 0.068 0.543 0.737 295 296 0.248 0.326
HOUSEHOLD MEMBERS Use of improved drinking water sources 4.1 0.154 0.0526 0.34 6.244 2.499 1708 296 0.049 0.260 Use of improved sanitation 4.3 0.607 0.0641 0.106 5.083 2.254 1708 296 0.479 0.735 Secondary school net attendance ratio (adjusted) 7.5 0.155 0.0583 0.376 4.125 2.031 156 160 0.039 0.272 Child labour 8.2 0.322 0.0339 0.105 3.288 1.813 618 626 0.254 0.390 Prevalence of children with one or both parents dead 9.18 0.085 0.0172 0.203 3.862 1.965 995 1010 0.050 0.119 School attendance of orphans 9.19 1.000 * * * * 2 2 * * School attendance of non-orphans 9.20 0.483 0.0477 0.099 1.917 1.384 207 211 0.387 0.578 Violent discipline 8.5 0.770 0.0226 0.029 0.745 0.863 787 259 0.725 0.815
WOMEN
Pregnant women - 0.130 0.0122 0.094 0.422 0.649 314 319 0.105 0.154 Pregnant women sleeping under insecticide-treated nets (ITNs) 3.19 * * * * * 41 41 * * Intermittent preventive treatment for malaria 3.20 * * * * * 24 27 * * Early childbearing 5.2 0.132 0.0399 0.302 0.804 0.897 58 59 0.052 0.212 Contraceptive prevalence 5.3 0.081 0.0251 0.31 1.555 1.247 181 185 0.031 0.131 Unmet need 5.4 0.215 0.0391 0.182 1.667 1.291 181 185 0.137 0.293 Antenatal care coverage - at least once by skilled personnel 5.5a 0.268 0.0441 0.165 0.913 0.955 90 93 0.180 0.356 Antenatal care coverage – at least four times by any provider 5.5b 0.103 0.0392 0.382 1.536 1.239 90 93 0.024 0.181 Skilled attendant at delivery 5.7 0.347 0.0459 0.132 0.857 0.926 90 93 0.255 0.439 Institutional deliveries 5.8 0.19 0.0301 0.159 0.543 0.737 90 93 0.129 0.250 Caesarean section 5.9 0.021 0.012 0.568 0.641 0.801 90 93 0.000 0.045 Literacy rate among young women 7.1 0.377 0.0722 0.191 3.041 1.744 133 138 0.233 0.522 Marriage before age 18 8.7 0.366 0.0254 0.069 0.663 0.814 239 240 0.316 0.417 Polygyny 8.9 0.175 0.0253 0.145 0.818 0.904 181 185 0.124 0.225 Prevalence of female genital mutilation/cutting (FGM/C) among women 8.12 0.993 0.0005 0.001 0.012 0.108 314 319 0.992 0.994 Comprehensive knowledge about HIV prevention among young people 9.2 0.077 0.0319 0.412 1.951 1.397 133 138 0.014 0.141 Knowledge of mother- to-child transmission of HIV 9.3 0.535 0.0369 0.069 1.737 1.318 314 319 0.461 0.608 Accepting attitudes towards people living with HIV 9.4 0.062 0.0125 0.204 0.741 0.861 268 273 0.036 0.087 Women who have been tested for HIV and know the results 9.6 0.003 0.0002 0.072 0.004 0.065 314 319 0.002 0.003 Prevalence of female genital mutilation/cutting (FGM/C) among girls
8.13
0.246
1.481
0.060
1.386
1.177
1,202
1,174
0.216
1.000
UNDER-5s
Exclusive breastfeeding 2.6 0.111 0.0417 0.376 0.617 0.786 35 36 0.028 0.195

178
Table SE.7: Sampling errors: Togdheer Standard errors, coefficients of variation, design effects (deff), square root of design effects (deft) and confidence intervals for selected indicators, Somaliland, 2011
MICS Indicator
Value (r)
Standard error (se)
Coefficient of variation
(se/r)
Design effect (deff)
Square root of design effect (deft)
Weighted count
Unweighted count
Confidence limits
r - 2se r + 2se
under 6 months
Age-appropriate breastfeeding 2.14 0.092 0.0241 0.263 0.705 0.840 99 102 0.043 0.140 Tuberculosis immunization coverage - 0.260 0.054 0.208 0.591 0.769 39 40 0.152 0.367 Received polio immunization - 0.148 0.0505 0.342 0.791 0.889 39 40 0.047 0.249 Received DPT immunization - 0.161 0.0603 0.374 1.049 1.024 39 40 0.040 0.282 Received measles immunization - 0.288 0.0646 0.224 0.794 0.891 39 40 0.159 0.417 Diarrhoea in the previous 2 weeks - 0.127 0.0198 0.156 0.938 0.969 262 266 0.087 0.167 Illness with a cough in the previous 2 weeks - 0.042 0.0189 0.448 2.336 1.528 262 266 0.004 0.080 Fever in last two weeks - 0.098 0.0276 0.28 2.271 1.507 262 266 0.043 0.153
Oral rehydration therapy with continued feeding 3.8 * * * * * 33 34 * * Antibiotic treatment of suspected pneumonia 3.10 * * * * * 11 11 * * Children under age 5 sleeping under insecticide-treated nets (ITNs) 3.15 0.199 0.0127 0.064 0.267 0.516 262 266 0.173 0.224 Anti-malarial treatment of children under age 5 3.18 0.043 0.0041 0.095 0.011 0.105 26 28 0.035 0.051 Support for learning 6.1 0.758 0.0422 0.056 0.876 0.936 90 91 0.674 0.843 Attendance to early childhood education 6.7 0.009 0.0086 0.948 0.737 0.858 90 91 0.000 0.026
(*) the number of unweighted oberservations is less than 50

179
Table SE.8: Sampling errors: Sool Standard errors, coefficients of variation, design effects (deff), square root of design effects (deft) and confidence intervals for selected indicators, Somaliland, 2011
MICS Indicat
or Value
(r) Standard error (se)
Coefficient of
variation (se/r)
Design effect (deff)
Square root of design effect (deft)
Weighted count
Unweighted count
Confidence limits
r - 2se r + 2se
HOUSEHOLDS
Household availability of insecticide-treated nets (ITNs) 3.12 0.287 0.0194 0.068 0.543 0.737 295 296 0.248 0.326
HOUSEHOLD MEMBERS
Use of improved drinking water sources 4.1 0.154 0.0526 0.34 6.244 2.499 1,708 296 0.049 0.260 Use of improved sanitation 4.3 0.607 0.0641 0.106 5.083 2.254 1,708 296 0.479 0.735 Secondary school net attendance ratio (adjusted) 7.5 0.155 0.0583 0.376 4.125 2.031 156 160 0.039 0.272 Child labour 8.2 0.322 0.0339 0.105 3.288 1.813 618 626 0.254 0.390 Prevalence of children with one or both parents dead 9.18 0.085 0.0172 0.203 3.862 1.965 995 1,010 0.050 0.119 School attendance of orphans 9.19 1.000 * * * * 2 2 * * School attendance of non-orphans 9.20 0.483 0.0477 0.099 1.917 1.384 207 211 0.387 0.578 Violent discipline 8.5 0.770 0.0226 0.029 0.745 0.863 787 259 0.725 0.815
WOMEN
Pregnant women - 0.130 0.0122 0.094 0.422 0.649 314 319 0.105 0.154 Pregnant women sleeping under insecticide-treated nets (ITNs) 3.19 * * * * * 41 41 * * Intermittent preventive treatment for malaria 3.20 0.000 * * * * 24 27 * * Early childbearing 5.2 0.132 0.0399 0.302 0.804 0.897 58 59 0.052 0.212 Contraceptive prevalence 5.3 0.081 0.0251 0.31 1.555 1.247 181 185 0.031 0.131 Unmet need 5.4 0.215 0.0391 0.182 1.667 1.291 181 185 0.137 0.293 Antenatal care coverage - at least once by skilled personnel 5.5a 0.268 0.0441 0.165 0.913 0.955 90 93 0.180 0.356 Antenatal care coverage – at least four times by any provider 5.5b 0.103 0.0392 0.382 1.536 1.239 90 93 0.024 0.181 Skilled attendant at delivery 5.7 0.347 0.0459 0.132 0.857 0.926 90 93 0.255 0.439 Institutional deliveries 5.8 0.190 0.0301 0.159 0.543 0.737 90 93 0.129 0.250 Caesarean section 5.9 0.021 0.012 0.568 0.641 0.801 90 93 0.000 0.045 Literacy rate among young women 7.1 0.377 0.0722 0.191 3.041 1.744 133 138 0.233 0.522 Marriage before age 18 8.7 0.366 0.0254 0.069 0.663 0.814 239 240 0.316 0.417 Polygyny 8.9 0.175 0.0253 0.145 0.818 0.904 181 185 0.124 0.225 Prevalence of female genital mutilation/cutting (FGM/C) among women 8.12 0.993 0.0005 0.001 0.012 0.108 314 319 0.992 0.994 Comprehensive knowledge about HIV prevention among young people 9.2 0.077 0.0319 0.412 1.951 1.397 133 138 0.014 0.141 Knowledge of mother- to-child transmission of HIV 9.3 0.535 0.0369 0.069 1.737 1.318 314 319 0.461 0.608 Women who have been tested for HIV and know the results 9.6 0.003 0.0002 0.072 0.004 0.065 314 319 0.002 0.003 Accepting attitudes towards people living with HIV 9.4 0.062 0.0125 0.204 0.741 0.861 268 273 0.036 0.087 Prevalence of female genital mutilation/cutting (FGM/C) among girls 8.13
0.264
2.2210
0.084
0.873
0.934
336
345
0.213
1.000
UNDER-5s
Exclusive breastfeeding under 6 months 2.6 * * * * * 35 36 * * Age-appropriate breastfeeding 2.14 0.092 0.0241 0.263 0.705 0.840 99 102 0.043 0.140 Tuberculosis immunization coverage - * * * * * 39 40 * * Received polio immunization - * * * * * 39 40 * * Received DPT immunization - * * * * * 39 40 * * Received measles immunization - * * * * * 39 40 * * Diarrhoea in the previous 2 weeks - 0.127 0.0198 0.156 0.938 0.969 262 266 0.087 0.167 Illness with a cough in the previous 2 weeks - 0.042 0.0189 0.448 2.336 1.528 262 266 0.004 0.080 Fever in last two weeks - 0.098 0.0276 0.28 2.271 1.507 262 266 0.043 0.153 Oral rehydration therapy with continued feeding 3.8 * * * * * 33 34 * *
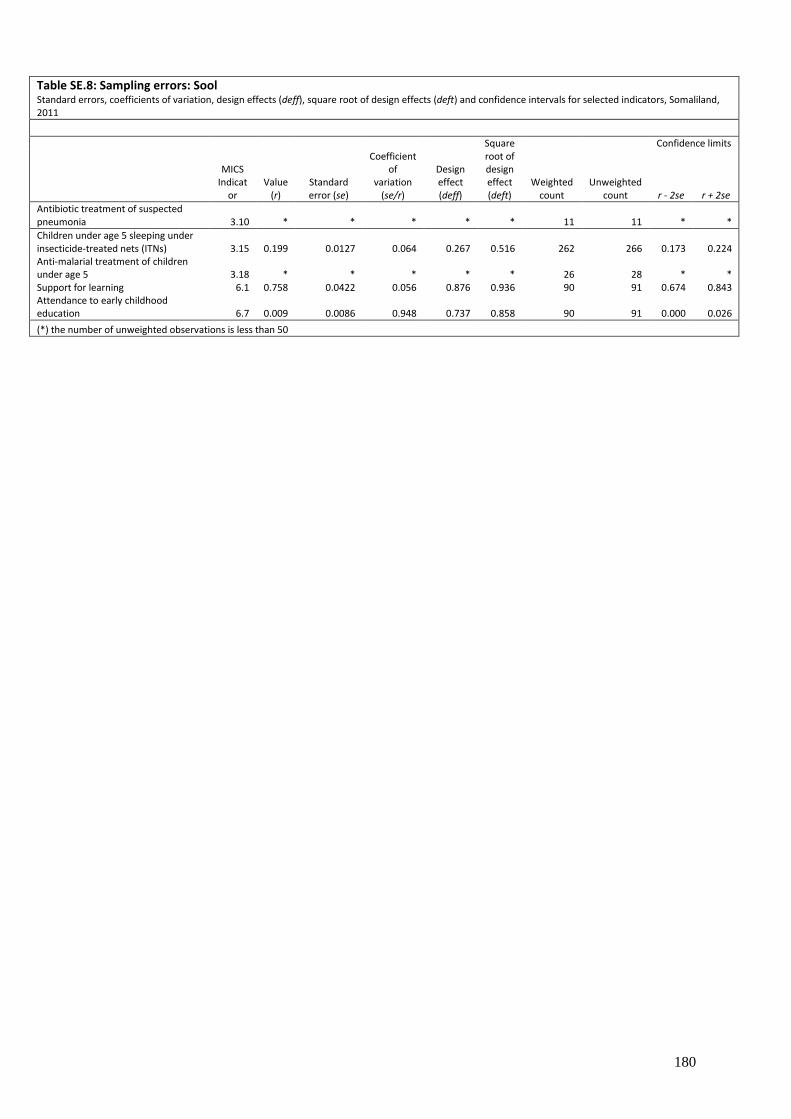
180
Table SE.8: Sampling errors: Sool Standard errors, coefficients of variation, design effects (deff), square root of design effects (deft) and confidence intervals for selected indicators, Somaliland, 2011
MICS Indicat
or Value
(r) Standard error (se)
Coefficient of
variation (se/r)
Design effect (deff)
Square root of design effect (deft)
Weighted count
Unweighted count
Confidence limits
r - 2se r + 2se
Antibiotic treatment of suspected pneumonia 3.10 * * * * * 11 11 * *
Children under age 5 sleeping under insecticide-treated nets (ITNs) 3.15 0.199 0.0127 0.064 0.267 0.516 262 266 0.173 0.224 Anti-malarial treatment of children under age 5 3.18 * * * * * 26 28 * * Support for learning 6.1 0.758 0.0422 0.056 0.876 0.936 90 91 0.674 0.843 Attendance to early childhood education 6.7 0.009 0.0086 0.948 0.737 0.858 90 91 0.000 0.026
(*) the number of unweighted observations is less than 50

181
Table SE.9: Sampling errors: Sanaag Standard errors, coefficients of variation, design effects (deff), square root of design effects (deft) and confidence intervals for selected indicators, Somaliland, 2011
MICS Indicator
Value (r)
Standard error (se)
Coefficient of
variation (se/r)
Design effect (deff)
Square root of design effect (deft)
Unweighted count
Confidence limits
Weighted count r - 2se
r + 2se
HOUSEHOLDS
Household availability of insecticide-treated nets (ITNs) 3.12 0.341 0.0367 0.108 3.872 1.968 670 647 0.268 0.414
HOUSEHOLD MEMBERS
Use of improved drinking water sources 4.1 0.240 0.0441 0.184 6.909 2.629 3,959 647 0.151 0.328
Use of improved sanitation 4.3 0.360 0.0498 0.138 6.953 2.637 3,959 647 0.261 0.460 Secondary school net attendance ratio (adjusted) 7.5 0.113 0.0263 0.234 2.534 1.592 372 366 0.060 0.165
Child labour 8.2 0.359 0.0248 0.069 3.723 1.930 1,436 1,398 0.309 0.408 Prevalence of children with one or both parents dead 9.18 0.094 0.0093 0.1 2.354 1.534 2,361 2299 0.075 0.112 School attendance of orphans 9.19 1.000 * * * * 8 8 * * School attendance of non-orphans 9.20 0.546 0.0531 0.097 5.42 2.328 491 477 0.440 0.653
Violent discipline 8.5 0.768 0.0197 0.026 1.202 1.096 1,883 555 0.728 0.807
WOMEN
Pregnant women - 0.091 0.0078 0.086 0.52 0.721 707 702 0.075 0.106 Pregnant women sleeping under insecticide-treated nets (ITNs) 3.19 0.227 0.0402 0.177 0.542 0.736 61 60 0.147 0.307 Intermittent preventive treatment for malaria 3.20 0.000 * * * * 38 40 * *
Early childbearing 5.2 0.236 0.0512 0.217 1.647 1.283 117 114 0.133 0.338
Contraceptive prevalence 5.3 0.083 0.011 0.133 0.671 0.819 432 422 0.061 0.104
Unmet need 5.4 0.157 0.0154 0.098 0.75 0.866 432 422 0.127 0.188 Antenatal care coverage - at least once by skilled personnel 5.5a 0.188 0.0406 0.215 2.097 1.448 200 196 0.107 0.270 Antenatal care coverage – at least four times by any provider 5.5b 0.056 0.0193 0.347 1.383 1.176 200 196 0.017 0.094 Skilled attendant at delivery 5.7 0.254 0.0346 0.136 1.229 1.109 200 196 0.185 0.323
Institutional deliveries 5.8 0.087 0.0232 0.267 1.321 1.149 200 196 0.041 0.133
Caesarean section 5.9 0.006 0.0054 0.991 1.05 1.025 200 196 0.000 0.016 Literacy rate among young women 7.1 0.365 0.0468 0.128 2.772 1.665 295 295 0.272 0.459
Marriage before age 18 8.7 0.366 0.0192 0.053 0.828 0.910 529 521 0.328 0.404
Polygyny 8.9 0.227 0.0183 0.08 0.801 0.895 432 422 0.191 0.264 Prevalence of female genital mutilation/cutting (FGM/C) among women 8.12 0.997 0.0031 0.003 2.209 1.486 707 702 0.991 1.000 Comprehensive knowledge about HIV prevention among young people 9.2 0.027 0.0106 0.397 1.274 1.129 295 295 0.005 0.048 Knowledge of mother- to-child transmission of HIV 9.3 0.509 0.0257 0.05 1.852 1.361 707 702 0.458 0.561 Women who have been tested for HIV and know the results 9.6 0.011 0.0045 0.402 1.276 1.130 707 702 0.002 0.020 Accepting attitudes towards people living with HIV 9.4 0.066 0.0093 0.141 0.856 0.925 611 611 0.047 0.084

182
Table SE.9: Sampling errors: Sanaag Standard errors, coefficients of variation, design effects (deff), square root of design effects (deft) and confidence intervals for selected indicators, Somaliland, 2011
MICS Indicator
Value (r)
Standard error (se)
Coefficient of
variation (se/r)
Design effect (deff)
Square root of design effect (deft)
Unweighted count
Confidence limits
Weighted count r - 2se
r + 2se
Prevalence of female genital mutilation/cutting (FGM/C) among girls 8.13 24.150 1.6053 0.066 1.366 1.169 987 972 20.934 1.000
UNDER-5s
Exclusive breastfeeding under 6 months 2.6 0.100 0.0475 0.473 1.797 1.341 77 73 0.005 0.195
Age-appropriate breastfeeding 2.14 0.273 0.0379 0.139 1.561 1.249 224 217 0.197 0.348 Tuberculosis immunization coverage - 0.304 0.0413 0.136 0.717 0.847 92 90 0.222 0.387
Received polio immunization - 0.144 0.0345 0.24 0.861 0.928 92 90 0.075 0.213 Received DPT immunization - 0.134 0.0265 0.197 0.537 0.733 92 90 0.081 0.187
Received measles immunization - 0.415 0.0338 0.081 0.418 0.647 92 90 0.347 0.483 Diarrhoea in the previous 2 weeks - 0.115 0.0168 0.147 1.775 1.332 661 638 0.081 0.148 Illness with a cough in the previous 2 weeks - 0.067 0.0121 0.181 1.497 1.223 661 638 0.043 0.091
Fever in last two weeks - 0.077 0.0143 0.185 1.822 1.350 661 638 0.049 0.106 Oral rehydration therapy with continued feeding 3.8 0.179 0.0273 0.153 0.375 0.612 76 75 0.124 0.233 Antibiotic treatment of suspected pneumonia 3.10 * * * * * 44 43 * * Children under age 5 sleeping under insecticide-treated nets (ITNs) 3.15 0.220 0.0279 0.127 2.81 1.676 640 619 0.164 0.275 Anti-malarial treatment of children under age 5 3.18 * * * * * 51 48 * *
Support for learning 6.1 0.681 0.0349 0.051 1.587 1.260 297 285 0.611 0.751 Attendance to early childhood education 6.7 0.000 0.000 0.000 N/A N/A 297 285 0.000 0.000
(*) the number of unweighted observations is less than 50
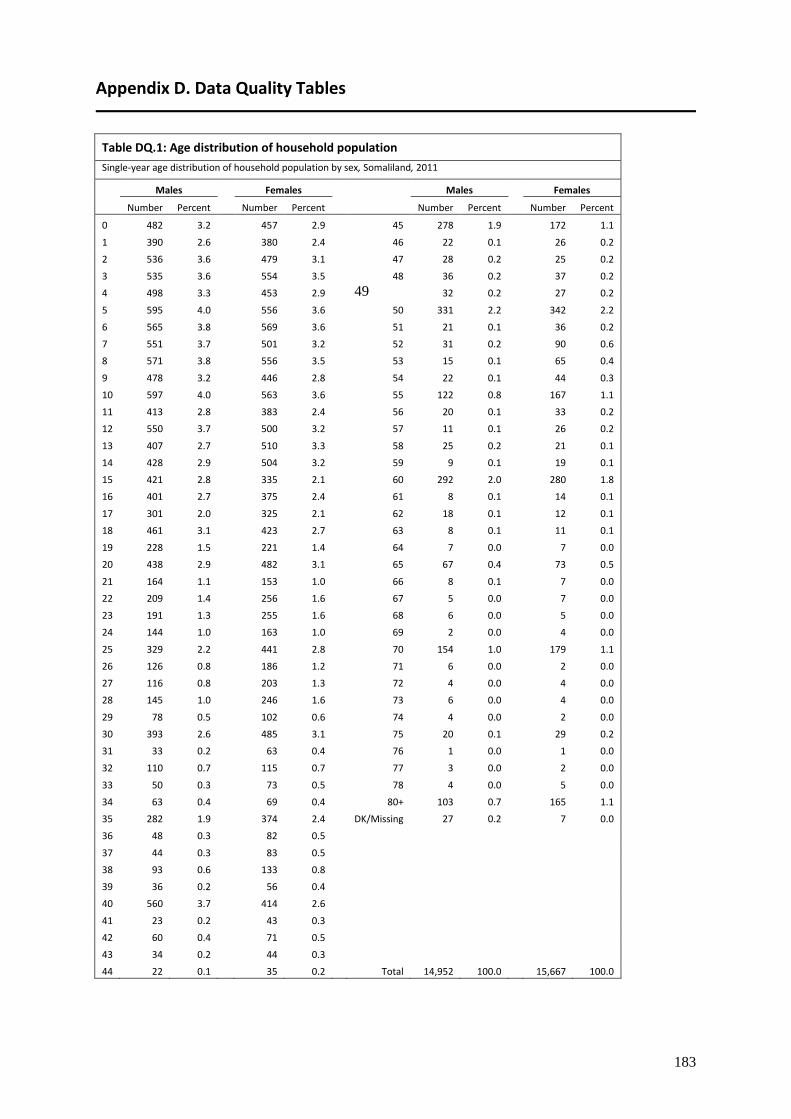
183
Appendix D. Data Quality Tables
Table DQ.1: Age distribution of household population
Single-year age distribution of household population by sex, Somaliland, 2011
Males
Females
Males
Females
Number Percent
Number Percent
Number Percent
Number Percent
0 482 3.2
457 2.9
45 278 1.9
172 1.1
1 390 2.6
380 2.4
46 22 0.1
26 0.2
2 536 3.6
479 3.1
47 28 0.2
25 0.2
3 535 3.6
554 3.5
48 36 0.2
37 0.2
4 498 3.3
453 2.9
49 32 0.2
27 0.2
5 595 4.0
556 3.6
50 331 2.2
342 2.2
6 565 3.8
569 3.6
51 21 0.1
36 0.2
7 551 3.7
501 3.2
52 31 0.2
90 0.6
8 571 3.8
556 3.5
53 15 0.1
65 0.4
9 478 3.2
446 2.8
54 22 0.1
44 0.3
10 597 4.0
563 3.6
55 122 0.8
167 1.1
11 413 2.8
383 2.4
56 20 0.1
33 0.2
12 550 3.7
500 3.2
57 11 0.1
26 0.2
13 407 2.7
510 3.3
58 25 0.2
21 0.1
14 428 2.9
504 3.2
59 9 0.1
19 0.1
15 421 2.8
335 2.1
60 292 2.0
280 1.8
16 401 2.7
375 2.4
61 8 0.1
14 0.1
17 301 2.0
325 2.1
62 18 0.1
12 0.1
18 461 3.1
423 2.7
63 8 0.1
11 0.1
19 228 1.5
221 1.4
64 7 0.0
7 0.0
20 438 2.9
482 3.1
65 67 0.4
73 0.5
21 164 1.1
153 1.0
66 8 0.1
7 0.0
22 209 1.4
256 1.6
67 5 0.0
7 0.0
23 191 1.3
255 1.6
68 6 0.0
5 0.0
24 144 1.0
163 1.0
69 2 0.0
4 0.0
25 329 2.2
441 2.8
70 154 1.0
179 1.1
26 126 0.8
186 1.2
71 6 0.0
2 0.0
27 116 0.8
203 1.3
72 4 0.0
4 0.0
28 145 1.0
246 1.6
73 6 0.0
4 0.0
29 78 0.5
102 0.6
74 4 0.0
2 0.0
30 393 2.6
485 3.1
75 20 0.1
29 0.2
31 33 0.2
63 0.4
76 1 0.0
1 0.0
32 110 0.7
115 0.7
77 3 0.0
2 0.0
33 50 0.3
73 0.5
78 4 0.0
5 0.0
34 63 0.4
69 0.4
80+ 103 0.7
165 1.1
35 282 1.9
374 2.4
DK/Missing 27 0.2
7 0.0
36 48 0.3
82 0.5 37 44 0.3
83 0.5
38 93 0.6
133 0.8 39 36 0.2
56 0.4
40 560 3.7
414 2.6 41 23 0.2
43 0.3
42 60 0.4
71 0.5 43 34 0.2
44 0.3
44 22 0.1
35 0.2
Total 14,952 100.0
15,667 100.0

184
0
100
200
300
400
500
600
700
0 5 10 15 20 25 30 35 40 45 50 55 60 65 70 75
Number
Age
Males Females
Table DQ.2: Age distribution of eligible and interviewed women
Household population of women age 10-54, interviewed women age 15-49, and percentage of eligible women who were interviewed, by five-year age groups, Somaliland, 2011
Household population of women age 10-54
years
Interviewed women age 15-49 years
Percentage of eligible women interviewed (Completion rate) Number
Number Percent
Age
10-14 2,460 na na na 15-19 1,678 1,430 24.6 85.2
20-24 1,309 1,139 19.6 87.0
25-29 1,177 1,053 18.1 89.4
30-34 805 732 12.6 90.9
35-39 728 661 11.4 90.8
40-44 606 544 9.4 89.7
45-49 289 252 4.3 87.4
50-54 576 na na Na
Total (15-49) 6,592 5,811 100.0 88.2
Ratio of 50-54 to 45-49
2.00
na= not applicable
Figure DQ.1: Number of household population by single ages, Somaliland, 2011
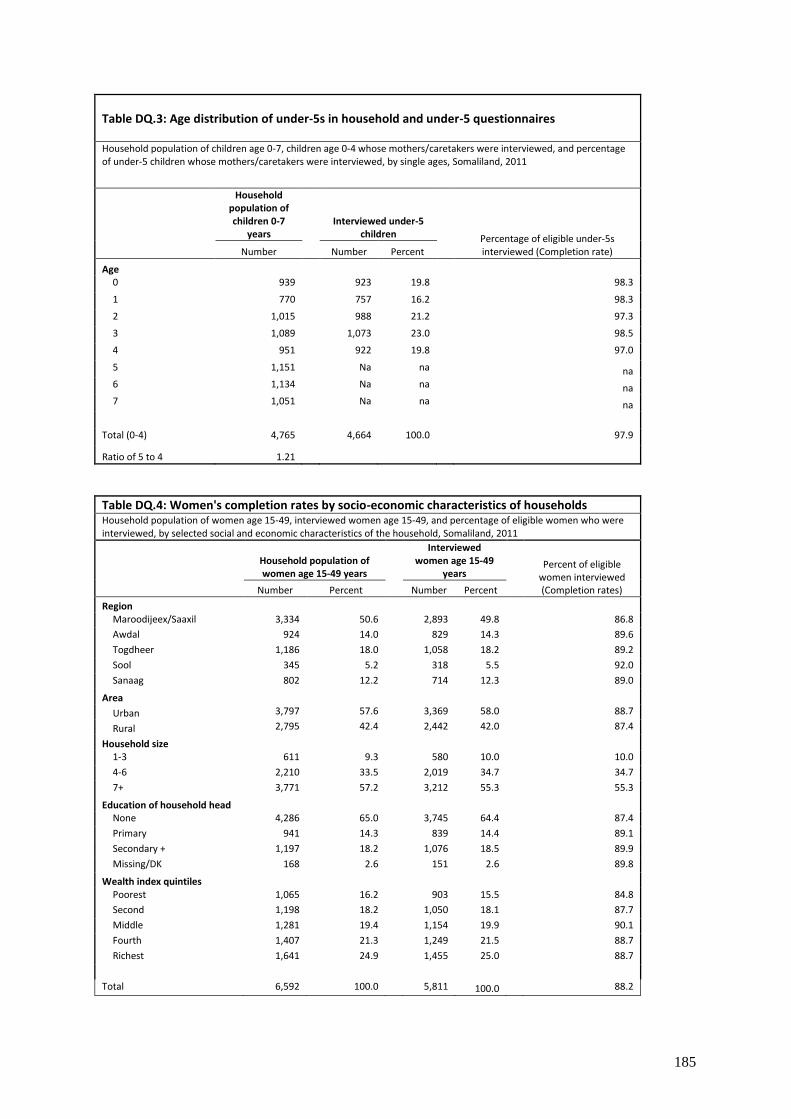
185
Table DQ.3: Age distribution of under-5s in household and under-5 questionnaires
Household population of children age 0-7, children age 0-4 whose mothers/caretakers were interviewed, and percentage of under-5 children whose mothers/caretakers were interviewed, by single ages, Somaliland, 2011
Household population of children 0-7
years
Interviewed under-5 children
Percentage of eligible under-5s interviewed (Completion rate) Number
Number Percent
Age
0 939 923 19.8 98.3
1 770 757 16.2 98.3
2 1,015 988 21.2 97.3
3 1,089 1,073 23.0 98.5
4 951 922 19.8 97.0
5 1,151 Na na na 6 1,134 Na na na 7 1,051 Na na na
Total (0-4) 4,765 4,664 100.0 97.9
Ratio of 5 to 4 1.21
Table DQ.4: Women's completion rates by socio-economic characteristics of households Household population of women age 15-49, interviewed women age 15-49, and percentage of eligible women who were interviewed, by selected social and economic characteristics of the household, Somaliland, 2011
Household population of women age 15-49 years
Interviewed women age 15-49
years
Percent of eligible women interviewed (Completion rates)
Number Percent
Number Percent
Region
Maroodijeex/Saaxil 3,334 50.6
2,893 49.8
86.8
Awdal 924 14.0
829 14.3
89.6
Togdheer 1,186 18.0
1,058 18.2
89.2
Sool 345 5.2
318 5.5
92.0
Sanaag 802 12.2
714 12.3
89.0
Area
Urban 3,797 57.6
3,369 58.0
88.7
Rural 2,795 42.4
2,442 42.0
87.4
Household size
1-3 611 9.3
580 10.0
10.0
4-6 2,210 33.5
2,019 34.7
34.7
7+ 3,771 57.2
3,212 55.3
55.3
Education of household head
None 4,286 65.0
3,745 64.4
87.4
Primary 941 14.3
839 14.4
89.1
Secondary + 1,197 18.2
1,076 18.5
89.9
Missing/DK 168 2.6
151 2.6
89.8
Wealth index quintiles
Poorest 1,065 16.2
903 15.5
84.8
Second 1,198 18.2
1,050 18.1
87.7
Middle 1,281 19.4
1,154 19.9
90.1
Fourth 1,407 21.3
1,249 21.5
88.7
Richest 1,641 24.9
1,455 25.0
88.7
Total 6,592 100.0 5,811 100.0 88.2
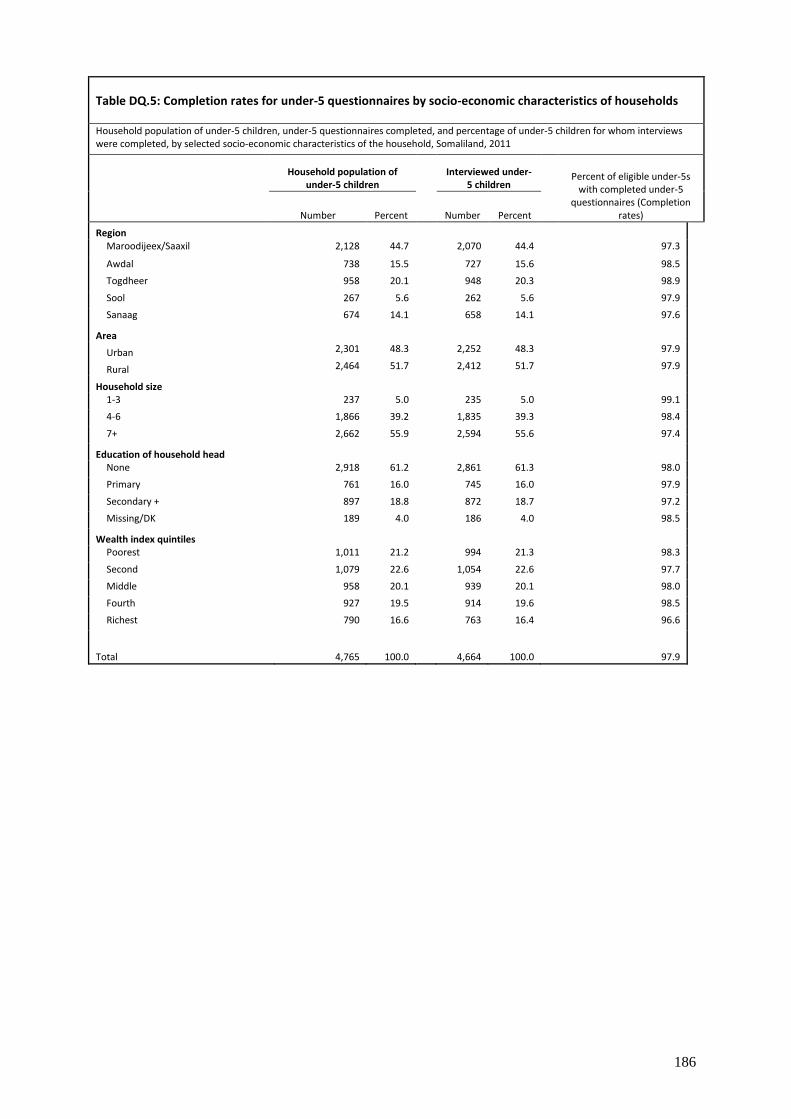
186
Table DQ.5: Completion rates for under-5 questionnaires by socio-economic characteristics of households
Household population of under-5 children, under-5 questionnaires completed, and percentage of under-5 children for whom interviews were completed, by selected socio-economic characteristics of the household, Somaliland, 2011
Household population of
under-5 children
Interviewed under-5 children
Percent of eligible under-5s with completed under-5
questionnaires (Completion rates) Number Percent
Number Percent
Region
Maroodijeex/Saaxil 2,128 44.7
2,070 44.4 97.3
Awdal 738 15.5
727 15.6 98.5
Togdheer 958 20.1
948 20.3 98.9
Sool 267 5.6
262 5.6 97.9
Sanaag 674 14.1
658 14.1 97.6
Area
Urban 2,301 48.3
2,252 48.3 97.9
Rural 2,464 51.7
2,412 51.7 97.9
Household size
1-3 237 5.0
235 5.0 99.1
4-6 1,866 39.2
1,835 39.3 98.4
7+ 2,662 55.9
2,594 55.6 97.4
Education of household head
None 2,918 61.2
2,861 61.3 98.0
Primary 761 16.0
745 16.0 97.9
Secondary + 897 18.8
872 18.7 97.2
Missing/DK 189 4.0 186 4.0 98.5
Wealth index quintiles
Poorest 1,011 21.2
994 21.3 98.3
Second 1,079 22.6
1,054 22.6 97.7
Middle 958 20.1
939 20.1 98.0
Fourth 927 19.5
914 19.6 98.5
Richest 790 16.6
763 16.4 96.6
Total 4,765 100.0 4,664 100.0 97.9

187
Table DQ.6: Completeness of reporting
Percentage of observations that are missing information for selected questions and indicators, Somaliland, 2011
Questionnaire and type of missing information Reference group
Percent with missing/incomplete
informationa Number of cases
Household
Age All household members 0.1 30,777
Starting time of interview All households interviewed 0.5 4,820
Ending time of interview All households interviewed 0.2 4,820
Women
Woman's date of birth All women age 15-49
Only month
52.2 5,865
Both month and year
4.3 5,865
Age at first marriage/union All ever married women age 15-49 with year of first marriage not known
3.4 3,617
Age at first intercourse All women age 15-24 who have ever had sex
Time since last intercourse All women age 15-24 who have ever had sex
Starting time of interview All women interviewed 4.7 5,865
Ending time of interview All women interviewed 0.4 5,865
Under-5
Date of birth All under-5 children
Only month
3.9 4,672
Both month and year
0.0 4,672
Starting time of interview All under-5 children 3.5 4,672
a Includes "Don't know" responses
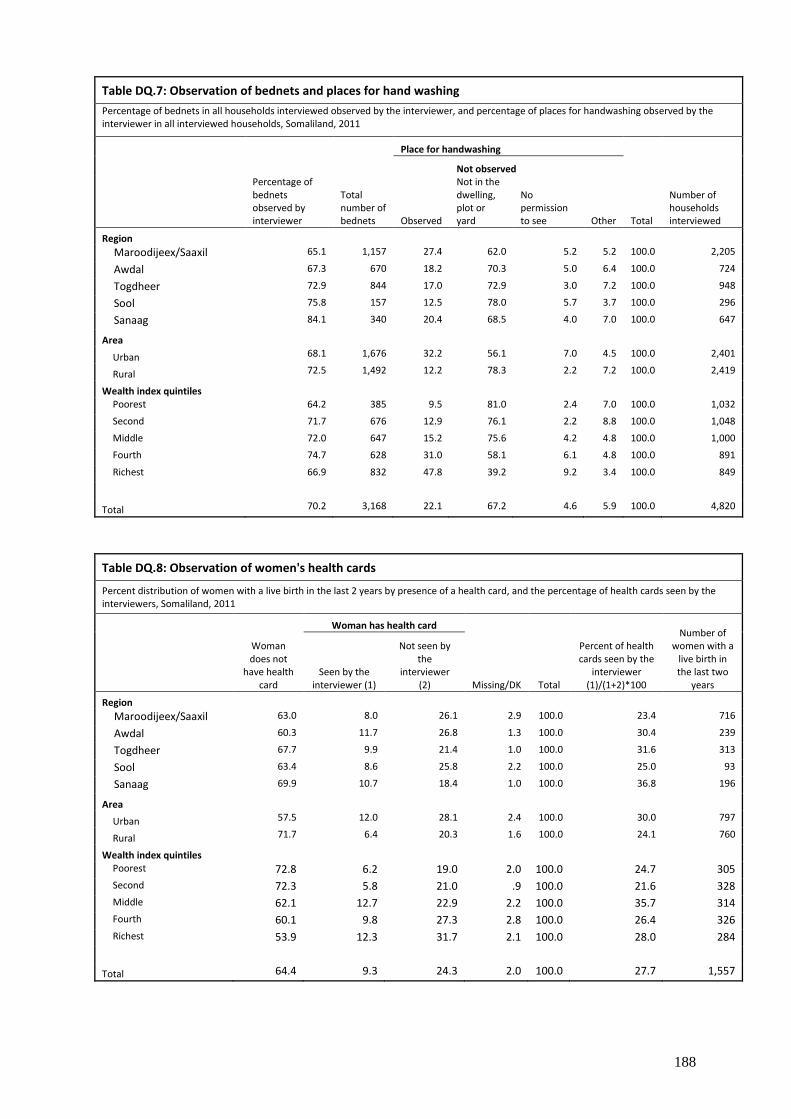
188
Table DQ.7: Observation of bednets and places for hand washing
Percentage of bednets in all households interviewed observed by the interviewer, and percentage of places for handwashing observed by the interviewer in all interviewed households, Somaliland, 2011
Percentage of bednets observed by interviewer
Total number of bednets
Place for handwashing
Total
Number of households interviewed
Observed
Not observed
Not in the dwelling, plot or yard
No permission to see Other
Region
Maroodijeex/Saaxil 65.1 1,157 27.4 62.0 5.2 5.2 100.0 2,205
Awdal 67.3 670 18.2 70.3 5.0 6.4 100.0 724
Togdheer 72.9 844 17.0 72.9 3.0 7.2 100.0 948
Sool 75.8 157 12.5 78.0 5.7 3.7 100.0 296
Sanaag 84.1 340 20.4 68.5 4.0 7.0 100.0 647
Area
Urban 68.1 1,676 32.2 56.1 7.0 4.5 100.0 2,401
Rural 72.5 1,492 12.2 78.3 2.2 7.2 100.0 2,419
Wealth index quintiles
Poorest 64.2 385 9.5 81.0 2.4 7.0 100.0 1,032
Second 71.7 676 12.9 76.1 2.2 8.8 100.0 1,048
Middle 72.0 647 15.2 75.6 4.2 4.8 100.0 1,000
Fourth 74.7 628 31.0 58.1 6.1 4.8 100.0 891
Richest 66.9 832 47.8 39.2 9.2 3.4 100.0 849
Total 70.2 3,168 22.1 67.2 4.6 5.9 100.0 4,820
Table DQ.8: Observation of women's health cards
Percent distribution of women with a live birth in the last 2 years by presence of a health card, and the percentage of health cards seen by the interviewers, Somaliland, 2011
Woman does not
have health card
Woman has health card
Missing/DK Total
Percent of health cards seen by the
interviewer (1)/(1+2)*100
Number of women with a
live birth in the last two
years Seen by the
interviewer (1)
Not seen by the
interviewer (2)
Region
Maroodijeex/Saaxil 63.0 8.0 26.1 2.9 100.0 23.4 716
Awdal 60.3 11.7 26.8 1.3 100.0 30.4 239
Togdheer 67.7 9.9 21.4 1.0 100.0 31.6 313
Sool 63.4 8.6 25.8 2.2 100.0 25.0 93
Sanaag 69.9 10.7 18.4 1.0 100.0 36.8 196
Area
Urban 57.5 12.0 28.1 2.4 100.0 30.0 797
Rural 71.7 6.4 20.3 1.6 100.0 24.1 760
Wealth index quintiles
Poorest 72.8 6.2 19.0 2.0 100.0 24.7 305
Second 72.3 5.8 21.0 .9 100.0 21.6 328
Middle 62.1 12.7 22.9 2.2 100.0 35.7 314
Fourth 60.1 9.8 27.3 2.8 100.0 26.4 326
Richest 53.9 12.3 31.7 2.1 100.0 28.0 284
Total 64.4 9.3 24.3 2.0 100.0 27.7 1,557

189
Table DQ.9: Observation of vaccination cards
Percent distribution of children under 5 by presence of a vaccination card, and the percentage of vaccination cards seen by the interviewers, Somaliland, 2011
Child does not have vaccination card
Child has vaccination card
Total
Percent of vaccination cards seen
by the interviewer (1)/(1+2)*1
00
Number of
children under
age 5
Had vaccinatio
n card previously
Never had vaccinatio
n card
Seen by the
interviewer (1)
Not seen by the
interviewer (2)
Don't know/Missin
g
Region
Maroodijeex/Saaxil
4.5 41.7 15.3 37.8 0.6 100.0 28.9 2,099
Awdal 4.1 38.8 18.1 39.0 0.0 100.0 31.6 725
Togdheer 2.2 45.6 18.8 33.3 0.2 100.0 36.0 944
Sool 3.4 53.0 12.4 30.8 0.4 100.0 28.7 266
Sanaag 1.7 43.3 26.8 28.2 0.0 100.0 48.7 638
Area Urban 3.8 36.9
18.5 40.3 0.5 100.0 31.4 2,373
Rural 3.3 49.1
17.2 30.2 0.2 100.0 36.2 2,299
Child's age 0 1.1 60.1 21.7 16.6 0.5 100.0 56.6 933
1 2.7 41.7 20.8 34.3 0.5 100.0 37.7 770
2 3.8 39.4 18.3 38.1 0.3 100.0 32.5 981
3 4.3 36.4 15.8 43.1 0.4 100.0 26.9 1,073
4 5.7 37.6 13.3 43.4 0.0 100.0 23.5 915
Total 3.6 42.9
17.9 35.4 0.3 100.0 33.5 4,672
Table DQ.10: Presence of mother in the household and the person interviewed for the under-5 questionnaire
Distribution of children under five by whether the mother lives in the same household, and the person interviewed for the under-5 questionnaire, Somaliland, 2011
Mother in the household
Mother not in the household
Total
Number of
children under 5
Mother interviewed
Father interviewed
Other adult female
interviewed
Other adult male
interviewed
Father interviewed
Other adult female
interviewed
Other adult male
interviewed
Age
0 97.5 0.0 0.1 0.1
0.0 2.3 0.0 100.0 939
1 94.8 0.1 0.1 0.0
0.0 4.8 0.0 100.0 770
2 91.1 0.0 0.1 0.0
0.5 7.8 0.4 100.0 1,015
3 90.4 0.0 0.1 0.1
0.0 9.2 0.1 100.0 1,089
4 88.4 0.0 0.1 0.0
0.3 11.0 0.1 100.0 951
Total 92.3 0.0 0.1 0.0 0.2 7.2 0.1 100.0 4,765

190
Table DQ.11: Selection of children age 2-14 years for the child discipline module
Percent of households with at least two children age 2-14 years where correct selection of one child for the child discipline module was performed, Somaliland, 2011
Percent of households where correct selection was
performed Number of households with 2 or more
children age 2-14 years
Region
Maroodijeex/Saaxil 78.6 1,447
Awdal 83.6 500
Togdheer 81.7 630
Sool 78.9 204
Sanaag 83.2 465
Area Urban 78.4 1,637
Rural 82.9 1,609
Number of children age 2-14 years 2 84.2 812
3 84.5 789
4 80.5 611
5+ 75.0 1,034
Total 80.7 3,246
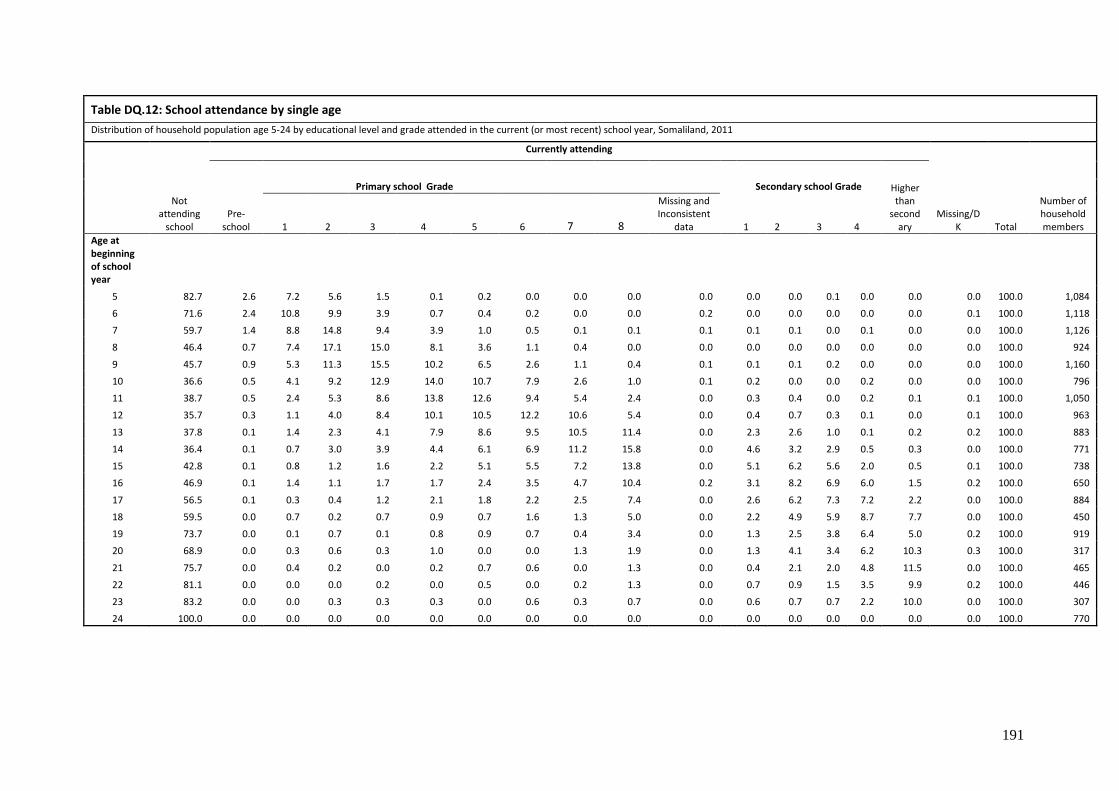
191
Table DQ.12: School attendance by single age
Distribution of household population age 5-24 by educational level and grade attended in the current (or most recent) school year, Somaliland, 2011
Currently attending
Number of household members
Not attending
school Pre-
school
Primary school Grade Secondary school Grade Higher than
secondary
Missing/DK
1 2 3 4 5 6 7 8
Missing and Inconsistent
data 1 2 3 4 Total
Age at beginning of school year
5 82.7 2.6 7.2 5.6 1.5 0.1 0.2 0.0 0.0 0.0 0.0
0.0 0.0 0.1 0.0 0.0 0.0 100.0 1,084
6 71.6 2.4 10.8 9.9 3.9 0.7 0.4 0.2 0.0 0.0 0.2
0.0 0.0 0.0 0.0 0.0 0.1 100.0 1,118
7 59.7 1.4 8.8 14.8 9.4 3.9 1.0 0.5 0.1 0.1 0.1
0.1 0.1 0.0 0.1 0.0 0.0 100.0 1,126
8 46.4 0.7 7.4 17.1 15.0 8.1 3.6 1.1 0.4 0.0 0.0
0.0 0.0 0.0 0.0 0.0 0.0 100.0 924
9 45.7 0.9 5.3 11.3 15.5 10.2 6.5 2.6 1.1 0.4 0.1
0.1 0.1 0.2 0.0 0.0 0.0 100.0 1,160
10 36.6 0.5 4.1 9.2 12.9 14.0 10.7 7.9 2.6 1.0 0.1
0.2 0.0 0.0 0.2 0.0 0.0 100.0 796
11 38.7 0.5 2.4 5.3 8.6 13.8 12.6 9.4 5.4 2.4 0.0
0.3 0.4 0.0 0.2 0.1 0.1 100.0 1,050
12 35.7 0.3 1.1 4.0 8.4 10.1 10.5 12.2 10.6 5.4 0.0
0.4 0.7 0.3 0.1 0.0 0.1 100.0 963
13 37.8 0.1 1.4 2.3 4.1 7.9 8.6 9.5 10.5 11.4 0.0
2.3 2.6 1.0 0.1 0.2 0.2 100.0 883
14 36.4 0.1 0.7 3.0 3.9 4.4 6.1 6.9 11.2 15.8 0.0
4.6 3.2 2.9 0.5 0.3 0.0 100.0 771
15 42.8 0.1 0.8 1.2 1.6 2.2 5.1 5.5 7.2 13.8 0.0
5.1 6.2 5.6 2.0 0.5 0.1 100.0 738
16 46.9 0.1 1.4 1.1 1.7 1.7 2.4 3.5 4.7 10.4 0.2
3.1 8.2 6.9 6.0 1.5 0.2 100.0 650
17 56.5 0.1 0.3 0.4 1.2 2.1 1.8 2.2 2.5 7.4 0.0
2.6 6.2 7.3 7.2 2.2 0.0 100.0 884
18 59.5 0.0 0.7 0.2 0.7 0.9 0.7 1.6 1.3 5.0 0.0
2.2 4.9 5.9 8.7 7.7 0.0 100.0 450
19 73.7 0.0 0.1 0.7 0.1 0.8 0.9 0.7 0.4 3.4 0.0
1.3 2.5 3.8 6.4 5.0 0.2 100.0 919
20 68.9 0.0 0.3 0.6 0.3 1.0 0.0 0.0 1.3 1.9 0.0
1.3 4.1 3.4 6.2 10.3 0.3 100.0 317
21 75.7 0.0 0.4 0.2 0.0 0.2 0.7 0.6 0.0 1.3 0.0
0.4 2.1 2.0 4.8 11.5 0.0 100.0 465
22 81.1 0.0 0.0 0.0 0.2 0.0 0.5 0.0 0.2 1.3 0.0
0.7 0.9 1.5 3.5 9.9 0.2 100.0 446
23 83.2 0.0 0.0 0.3 0.3 0.3 0.0 0.6 0.3 0.7 0.0
0.6 0.7 0.7 2.2 10.0 0.0 100.0 307
24 100.0 0.0 0.0 0.0 0.0 0.0 0.0 0.0 0.0 0.0 0.0
0.0 0.0 0.0 0.0 0.0 0.0 100.0 770

192
Table DQ.13: Sex ratio at birth among children ever born and living
Sex ratio (number of males per 100 females) among children ever born (at birth), children living, and deceased children, by age of women, Somaliland, 2011
Children Ever Born
Children Living
Children Deceased
Number of women
Number of sons ever born
Number of daughters ever born
Sex ratio at birth
Number of sons living
Number of daughters living
Sex ratio
Number of deceased sons
Number of deceased daughters
Sex ratio
Age
15-19 64 60 1.1
56 52 1.1
8 8 1.0
1,464
20-24 488 480 1.0
444 438 1.0
44 42 1.0
1,152
25-29 1,438 1,325 1.1
1,283 1,243 1.0
155 82 1.9
1,059
30-34 1,732 1,627 1.1
1,541 1,490 1.0
191 137 1.4
722
35-39 2,082 1,857 1.1
1,879 1,685 1.1
203 172 1.2
669
40-44 1,916 1,761 1.1
1,702 1,527 1.1
214 234 0.9
535
45-49 1,019 851 1.2
865 732 1.2
154 119 1.3
264
Total 8,739
7,961
1.1
7,770
7,167
1.1
969
794
1.2
5,865
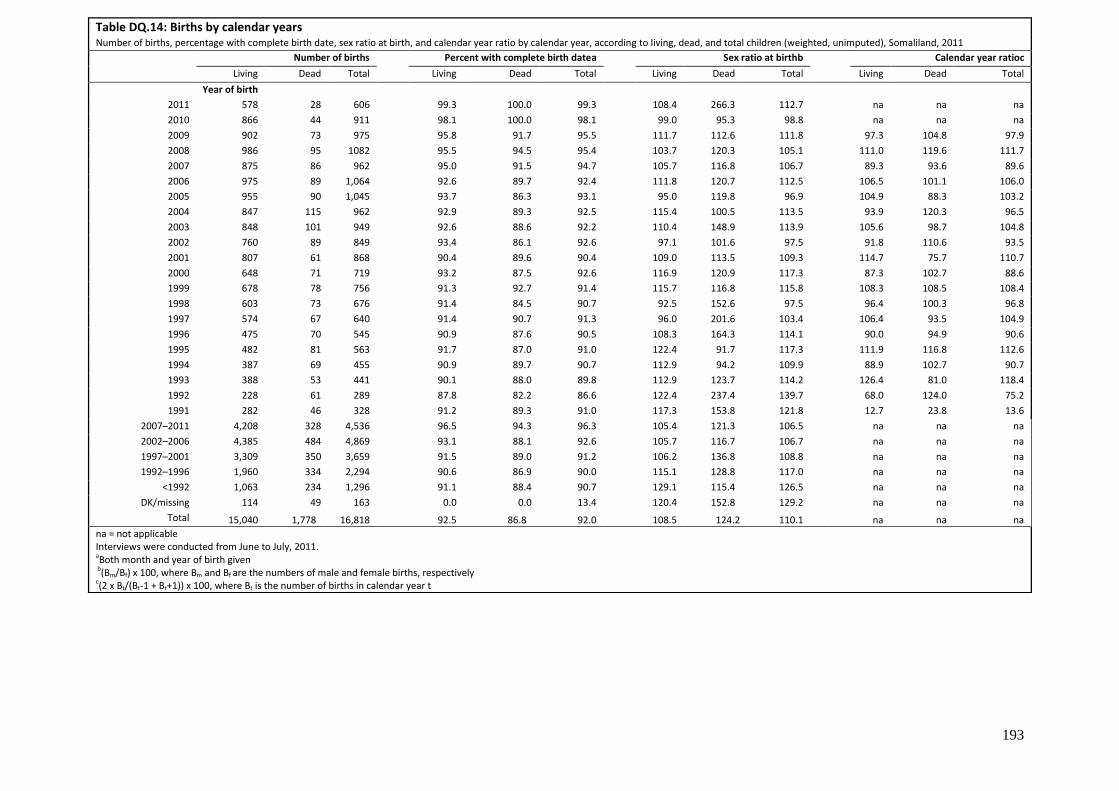
193
Table DQ.14: Births by calendar years Number of births, percentage with complete birth date, sex ratio at birth, and calendar year ratio by calendar year, according to living, dead, and total children (weighted, unimputed), Somaliland, 2011
Number of births Percent with complete birth datea Sex ratio at birthb Calendar year ratioc
Living Dead Total Living Dead Total Living Dead Total Living Dead Total
Year of birth
2011 578 28 606 99.3 100.0 99.3 108.4 266.3 112.7 na na na
2010 866 44 911 98.1 100.0 98.1 99.0 95.3 98.8 na na na
2009 902 73 975 95.8 91.7 95.5 111.7 112.6 111.8 97.3 104.8 97.9
2008 986 95 1082 95.5 94.5 95.4 103.7 120.3 105.1 111.0 119.6 111.7
2007 875 86 962 95.0 91.5 94.7 105.7 116.8 106.7 89.3 93.6 89.6
2006 975 89 1,064 92.6 89.7 92.4 111.8 120.7 112.5 106.5 101.1 106.0
2005 955 90 1,045 93.7 86.3 93.1 95.0 119.8 96.9 104.9 88.3 103.2
2004 847 115 962 92.9 89.3 92.5 115.4 100.5 113.5 93.9 120.3 96.5
2003 848 101 949 92.6 88.6 92.2 110.4 148.9 113.9 105.6 98.7 104.8
2002 760 89 849 93.4 86.1 92.6 97.1 101.6 97.5 91.8 110.6 93.5
2001 807 61 868 90.4 89.6 90.4 109.0 113.5 109.3 114.7 75.7 110.7
2000 648 71 719 93.2 87.5 92.6 116.9 120.9 117.3 87.3 102.7 88.6
1999 678 78 756 91.3 92.7 91.4 115.7 116.8 115.8 108.3 108.5 108.4
1998 603 73 676 91.4 84.5 90.7 92.5 152.6 97.5 96.4 100.3 96.8
1997 574 67 640 91.4 90.7 91.3 96.0 201.6 103.4 106.4 93.5 104.9
1996 475 70 545 90.9 87.6 90.5 108.3 164.3 114.1 90.0 94.9 90.6
1995 482 81 563 91.7 87.0 91.0 122.4 91.7 117.3 111.9 116.8 112.6
1994 387 69 455 90.9 89.7 90.7 112.9 94.2 109.9 88.9 102.7 90.7
1993 388 53 441 90.1 88.0 89.8 112.9 123.7 114.2 126.4 81.0 118.4
1992 228 61 289 87.8 82.2 86.6 122.4 237.4 139.7 68.0 124.0 75.2
1991 282 46 328 91.2 89.3 91.0 117.3 153.8 121.8 12.7 23.8 13.6
2007–2011 4,208 328 4,536 96.5 94.3 96.3 105.4 121.3 106.5 na na na
2002–2006 4,385 484 4,869 93.1 88.1 92.6 105.7 116.7 106.7 na na na
1997–2001 3,309 350 3,659 91.5 89.0 91.2 106.2 136.8 108.8 na na na
1992–1996 1,960 334 2,294 90.6 86.9 90.0 115.1 128.8 117.0 na na na
<1992 1,063 234 1,296 91.1 88.4 90.7 129.1 115.4 126.5 na na na
DK/missing 114 49 163 0.0 0.0 13.4 120.4 152.8 129.2 na na na
Total 15,040 1,778 16,818 92.5 86.8 92.0 108.5 124.2 110.1 na na na
na = not applicable Interviews were conducted from June to July, 2011. aBoth month and year of birth given b(Bm/Bf) x 100, where Bm and Bf are the numbers of male and female births, respectively c(2 x Bt/(Bt-1 + Bt+1)) x 100, where Bt is the number of births in calendar year t
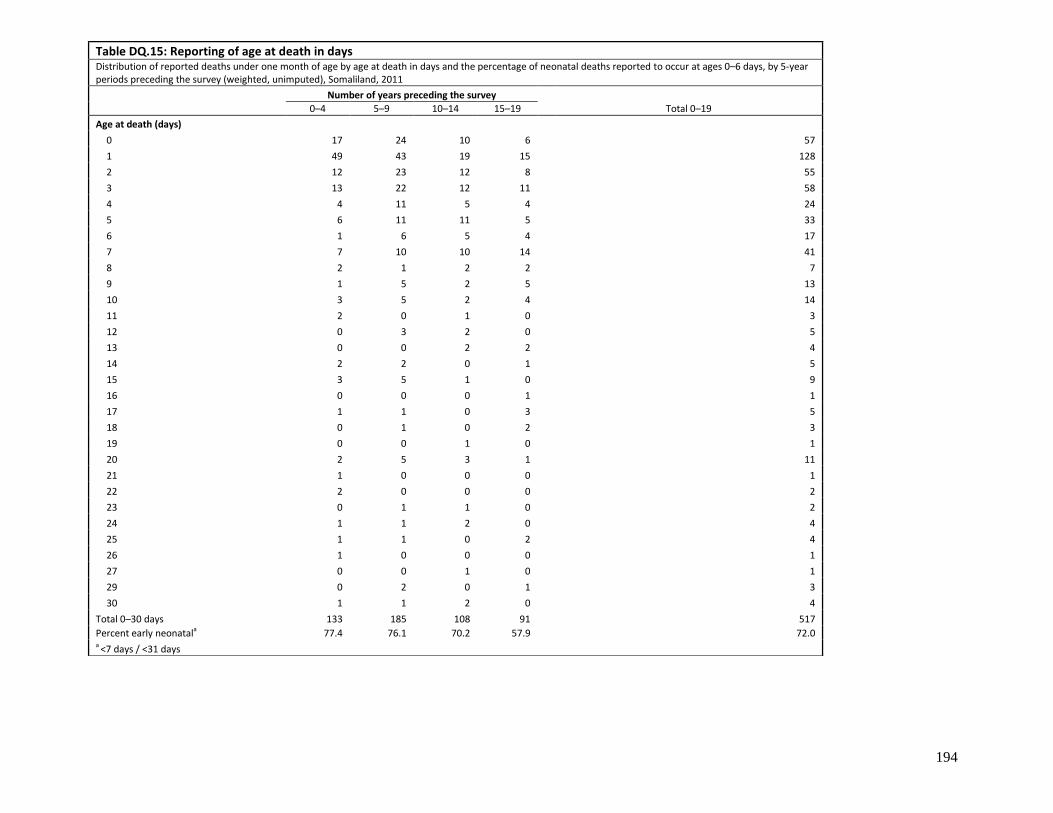
194
Table DQ.15: Reporting of age at death in days Distribution of reported deaths under one month of age by age at death in days and the percentage of neonatal deaths reported to occur at ages 0–6 days, by 5-year periods preceding the survey (weighted, unimputed), Somaliland, 2011
Number of years preceding the survey Total 0–19 0–4 5–9 10–14 15–19 Age at death (days)
0 17 24 10 6
57
1 49 43 19 15
128
2 12 23 12 8
55
3 13 22 12 11
58
4 4 11 5 4
24
5 6 11 11 5
33
6 1 6 5 4
17
7 7 10 10 14
41
8 2 1 2 2
7
9 1 5 2 5
13
10 3 5 2 4
14
11 2 0 1 0
3
12 0 3 2 0
5
13 0 0 2 2
4
14 2 2 0 1
5
15 3 5 1 0
9
16 0 0 0 1
1
17 1 1 0 3
5
18 0 1 0 2
3
19 0 0 1 0
1
20 2 5 3 1
11
21 1 0 0 0
1
22 2 0 0 0
2
23 0 1 1 0
2
24 1 1 2 0
4
25 1 1 0 2
4
26 1 0 0 0
1
27 0 0 1 0
1
29 0 2 0 1
3
30 1 1 2 0
4
Total 0–30 days 133 185 108 91
517
Percent early neonatala 77.4 76.1 70.2 57.9
72.0 a <7 days / <31 days

195
Table DQ.16: Reporting of age at death in months
Distribution of reported deaths under two years of age by age at death in months and the percentage of infant deaths reported to occur at age under one month, by 5-year periods preceding the survey (weighted, unimputed), Somaliland, 2011
Number of years preceding the survey
Total 0–19 0–4 5–9 10–14 15–19
Age at death (months)
0 133 185 108 92 518
1 10 20 16 10 56
2 12 17 18 13 60
3 12 24 21 15 72
4 7 23 14 12 56
5 7 16 9 13 46
6 9 30 16 17 72
7 5 9 10 5 29
8 7 25 18 11 62
9 5 13 9 8 35
10 2 5 5 4 16
11 2 4 5 4 15
12 11 28 20 26 84
13 2 1 4 1 8
14 1 1 1 4 7
15 1 2 3 4 10
16 1 0 1 0 2
17 1 1 1 4 7
18 0 4 1 3 8
20 1 0 1 0 2
21 0 1 0 0 1
22 0 0 1 0 1
23 0 2 3 2 7
Total 0–11 months 212 372 248 204 1037
Percent neonatala 62.6 49.8 43.5 45.1
50.0 a <1 month / <1 year

196
Appendix E. Somaliland MICS4 Indicators: Numerators and Denominators
MICS4 INDICATOR Module18
Numerator Denominator MDG19
1. MORTALITY
1.1 Under-five mortality rate20 BH Probability of dying by exact age 5 years MDG 4.1
1.2 Infant mortality rate21 BH Probability of dying by exact age 1 year MDG 4.2
1.3 Neonatal mortality rate BH Probability of dying within the first month of life, during the 5-year period preceding the survey
1.4 Post-neonatal mortality rate BH Difference between infant and neonatal mortality rates, during the 5-year period preceding the survey
1.5 Child mortality rate BH Probability of dying between exact ages one and five, during the 5-year period preceding the survey
2. NUTRITION
2.4 Children ever breastfed MN Number of women with a live birth in the 2 years preceding the survey who breastfed the child at any time
Total number of women with a live birth in the 2 years preceding the survey
2.5 Early initiation of breastfeeding MN Number of women with a live birth in the 2 years preceding the survey who put the newborn infant to the breast within 1 hour of birth
Total number of women with a live birth in the 2 years preceding the survey
2.6 Exclusive breastfeeding under 6 months
BF Number of infants under 6 months of age who are exclusively breastfed22
Total number of infants under 6 months of age
2.7 Continued breastfeeding at 1 year BF Number of children age 12-15 months who are currently breastfeeding
Total number of children age 12-15 months
[M]
Indicates that the indicator is also calculated for men, for the same age group, in surveys where the Questionnaire for Individual Men has been included. Calculations are carried
out by using modules in the Men‟s Questionnaire 18
Some indicators are constructed by using questions in several modules. In such cases, only the module(s) which contains most of the necessary information is indicated. 19
MDG indicators as of February 2010 20
Indicator is defined as “Probability of dying between birth and fifth birthday, during the 5-year period preceding the survey” when estimated from the birth history 21
Indicator is defined as “Probability of dying between birth and the first birthday, during the 5-year period preceding the survey” when estimated from the birth history 22
Infants receiving breast milk, and not receiving any other fluids or foods, with the exception of oral rehydration solution, vitamins, mineral supplements and medicines

197
MICS4 INDICATOR Module18
Numerator Denominator MDG19
2.8 Continued breastfeeding at 2 years
BF Number of children age 20-23 months who are currently breastfeeding
Total number of children age 20-23 months
2.9 Predominant breastfeeding under 6 months
BF Number of infants under 6 months of age who received breast milk as the predominant source of nourishment23 during the previous day
Total number of infants under 6 months of age
2.10 Duration of breastfeeding BF The age in months when 50 percent of children age 0-35 months did not receive breast milk during the previous day
2.11 Bottle feeding BF Number of children age 0-23 months who were fed with a bottle during the previous day
Total number of children age 0-23 months
2.12 Introduction of solid, semi-solid or soft foods
BF Number of infants age 6-8 months who received solid, semi-solid or soft foods during the previous day
Total number of infants age 6-8 months
2.13 Minimum meal frequency BF
Number of children age 6-23 months receiving solid, semi-solid and soft foods (plus milk feeds for non-breastfed children) the minimum times24 or more, according to breastfeeding status, during the previous day
Total number of children age 6-23 months
2.14 Age-appropriate breastfeeding BF Number of children age 0-23 months appropriately fed25 during the previous day
Total number of children age 0-23 months
2.15 Milk feeding frequency for non-breastfed children
BF Number of non-breastfed children age 6-23 months who received at least 2 milk feedings during the previous day
Total number of non-breastfed children age 6-23 months
2.17 Vitamin A supplementation (children under age 5)
IM Number of children age 6-59 months who received at least one high-dose vitamin A supplement in the 6 months preceding the survey
Total number of children age 6-59 months
2.18 Low-birthweight infants MN Number of last live births in the 2 years preceding the survey weighing below 2,500 grams at birth
Total number of last live births in the 2 years preceding the survey
3. CHILD HEALTH
3.1 Tuberculosis immunization IM Number of children age 12-23 months26 who received Total number of children age 12-23 months
23
Infants who receive breast milk and certain fluids (water and water-based drinks, fruit juice, ritual fluids, oral rehydration solution, drops, vitamins, minerals, and medicines), but do
not receive anything else (in particular, non-human milk and food-based fluids) 24
Breastfeeding children: Solid, semi-solid, or soft foods, two times for infants age 6-8 months, 3 times for children 9-23 months; Non-breastfeeding children: Solid, semi-solid, or soft
foods, or milk feeds, four times for children age 6-23 months 25
Infants age 0-5 who are exclusively breastfed, and children age 6-23 months who are breastfed and ate solid, semi-solid or soft foods
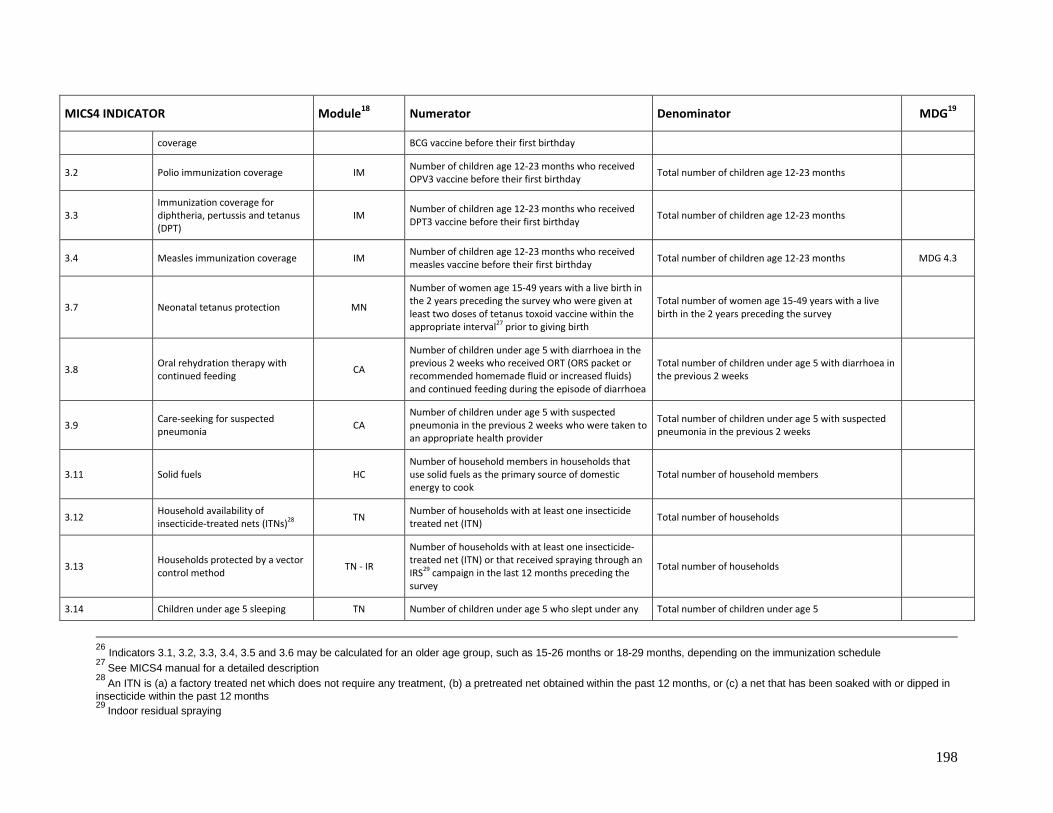
198
MICS4 INDICATOR Module18
Numerator Denominator MDG19
coverage BCG vaccine before their first birthday
3.2 Polio immunization coverage IM Number of children age 12-23 months who received OPV3 vaccine before their first birthday
Total number of children age 12-23 months
3.3 Immunization coverage for diphtheria, pertussis and tetanus (DPT)
IM Number of children age 12-23 months who received DPT3 vaccine before their first birthday
Total number of children age 12-23 months
3.4 Measles immunization coverage IM Number of children age 12-23 months who received measles vaccine before their first birthday
Total number of children age 12-23 months MDG 4.3
3.7 Neonatal tetanus protection MN
Number of women age 15-49 years with a live birth in the 2 years preceding the survey who were given at least two doses of tetanus toxoid vaccine within the appropriate interval27 prior to giving birth
Total number of women age 15-49 years with a live birth in the 2 years preceding the survey
3.8 Oral rehydration therapy with continued feeding
CA
Number of children under age 5 with diarrhoea in the previous 2 weeks who received ORT (ORS packet or recommended homemade fluid or increased fluids) and continued feeding during the episode of diarrhoea
Total number of children under age 5 with diarrhoea in the previous 2 weeks
3.9 Care-seeking for suspected pneumonia
CA Number of children under age 5 with suspected pneumonia in the previous 2 weeks who were taken to an appropriate health provider
Total number of children under age 5 with suspected pneumonia in the previous 2 weeks
3.11 Solid fuels HC Number of household members in households that use solid fuels as the primary source of domestic energy to cook
Total number of household members
3.12 Household availability of insecticide-treated nets (ITNs)28
TN Number of households with at least one insecticide treated net (ITN)
Total number of households
3.13 Households protected by a vector control method
TN - IR
Number of households with at least one insecticide-treated net (ITN) or that received spraying through an IRS29 campaign in the last 12 months preceding the survey
Total number of households
3.14 Children under age 5 sleeping TN Number of children under age 5 who slept under any Total number of children under age 5
26
Indicators 3.1, 3.2, 3.3, 3.4, 3.5 and 3.6 may be calculated for an older age group, such as 15-26 months or 18-29 months, depending on the immunization schedule 27
See MICS4 manual for a detailed description 28
An ITN is (a) a factory treated net which does not require any treatment, (b) a pretreated net obtained within the past 12 months, or (c) a net that has been soaked with or dipped in
insecticide within the past 12 months 29
Indoor residual spraying
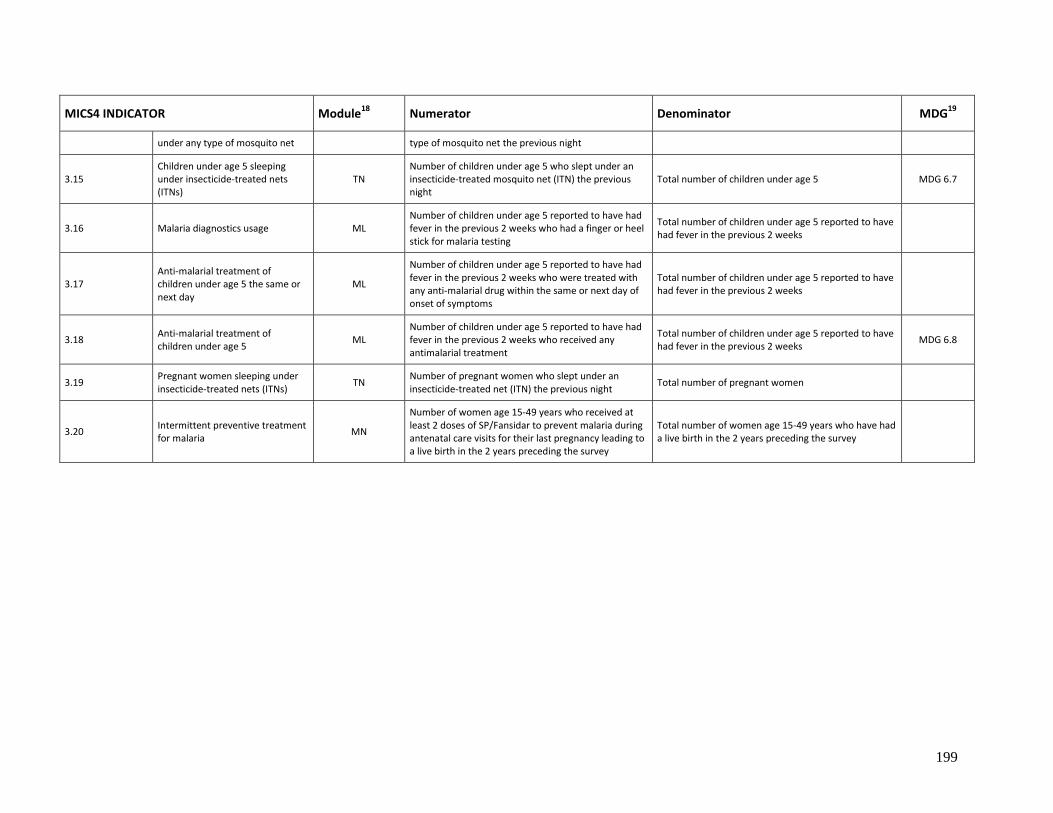
199
MICS4 INDICATOR Module18
Numerator Denominator MDG19
under any type of mosquito net type of mosquito net the previous night
3.15 Children under age 5 sleeping under insecticide-treated nets (ITNs)
TN Number of children under age 5 who slept under an insecticide-treated mosquito net (ITN) the previous night
Total number of children under age 5 MDG 6.7
3.16 Malaria diagnostics usage ML Number of children under age 5 reported to have had fever in the previous 2 weeks who had a finger or heel stick for malaria testing
Total number of children under age 5 reported to have had fever in the previous 2 weeks
3.17 Anti-malarial treatment of children under age 5 the same or next day
ML
Number of children under age 5 reported to have had fever in the previous 2 weeks who were treated with any anti-malarial drug within the same or next day of onset of symptoms
Total number of children under age 5 reported to have had fever in the previous 2 weeks
3.18 Anti-malarial treatment of children under age 5
ML Number of children under age 5 reported to have had fever in the previous 2 weeks who received any antimalarial treatment
Total number of children under age 5 reported to have had fever in the previous 2 weeks
MDG 6.8
3.19 Pregnant women sleeping under insecticide-treated nets (ITNs)
TN Number of pregnant women who slept under an insecticide-treated net (ITN) the previous night
Total number of pregnant women
3.20 Intermittent preventive treatment for malaria
MN
Number of women age 15-49 years who received at least 2 doses of SP/Fansidar to prevent malaria during antenatal care visits for their last pregnancy leading to a live birth in the 2 years preceding the survey
Total number of women age 15-49 years who have had a live birth in the 2 years preceding the survey

200
MICS4 INDICATOR Module18
Numerator Denominator MDG19
4. WATER AND SANITATION
4.1 Use of improved drinking water sources
WS Number of household members using improved sources of drinking water
Total number of household members MDG 7.8
4.2 Water treatment WS Number of household members using unimproved drinking water who use an appropriate treatment method
Total number of household members in households using unimproved drinking water sources
4.3 Use of improved sanitation WS Number of household members using improved sanitation facilities which are not shared
Total number of household members MDG 7.9
4.4 Safe disposal of child’s faeces CA Number of children age 0-2 years whose last stools were disposed of safely
Total number of children age 0-2 years
4.5 Place for handwashing HW Number of households with a specific place for hand washing where water and soap are present
Total number of households
4.6 Availability of soap HW Number of households with soap anywhere in the dwelling
Total number of households
5. REPRODUCTIVE HEALTH
5.1 Adolescent birth rate30 CM - BH Age-specific fertility rate for women age 15-19 years for the one year period preceding the survey MDG 5.4
5.2 Early childbearing CM - BH Number of women age 20-24 years who had at least one live birth before age 18
Total number of women age 20-24 years
5.3 Contraceptive prevalence rate CP Number of women age 15-49 years currently married or in union who are using (or whose partner is using) a (modern or traditional) contraceptive method
Total number of women age 15-49 years who are currently married or in union
MDG 5.3
5.4 Unmet need31 UN
Number of women age 15-49 years who are currently married or in union who are fecund and want to space their births or limit the number of children they have and who are not currently using contraception
Total number of women age 15-49 years who are currently married or in union
MDG 5.6
30
Indicator is defined as “Age-specific fertility rate for women age 15-19 years, for the 3-year period preceding the survey” when estimated from the birth history 31
See MICS4 manual for a detailed description
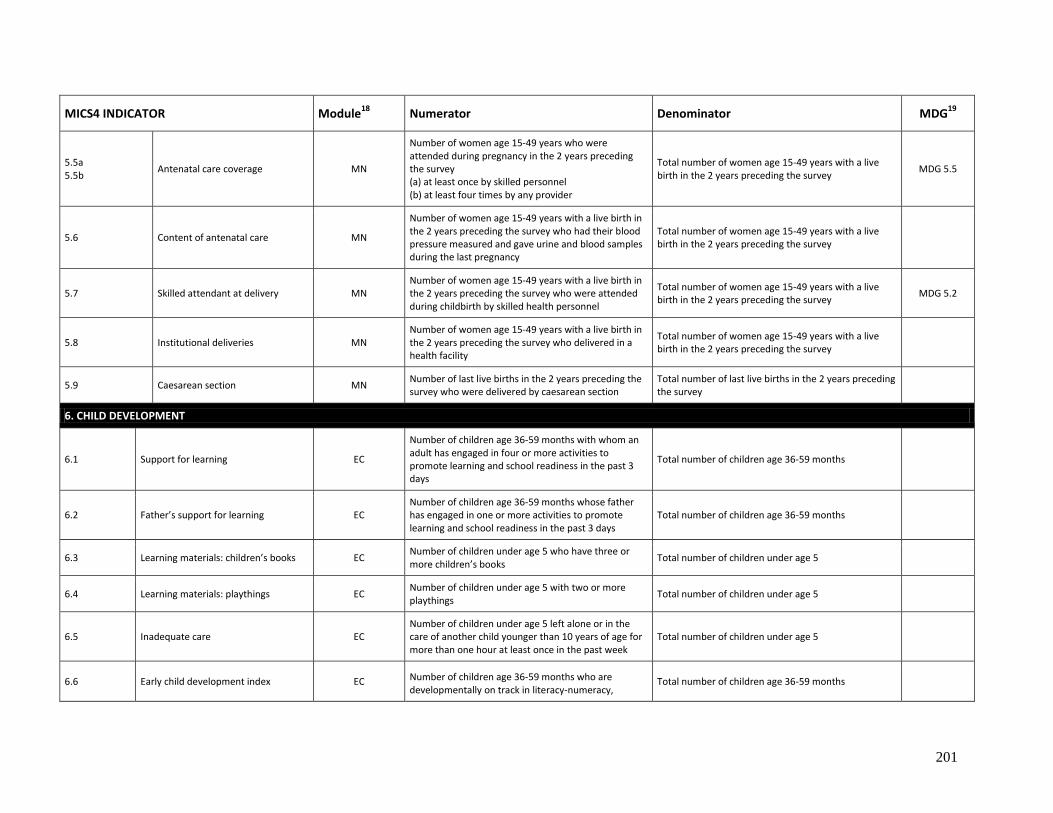
201
MICS4 INDICATOR Module18
Numerator Denominator MDG19
5.5a 5.5b
Antenatal care coverage MN
Number of women age 15-49 years who were attended during pregnancy in the 2 years preceding the survey (a) at least once by skilled personnel (b) at least four times by any provider
Total number of women age 15-49 years with a live birth in the 2 years preceding the survey
MDG 5.5
5.6 Content of antenatal care MN
Number of women age 15-49 years with a live birth in the 2 years preceding the survey who had their blood pressure measured and gave urine and blood samples during the last pregnancy
Total number of women age 15-49 years with a live birth in the 2 years preceding the survey
5.7 Skilled attendant at delivery MN Number of women age 15-49 years with a live birth in the 2 years preceding the survey who were attended during childbirth by skilled health personnel
Total number of women age 15-49 years with a live birth in the 2 years preceding the survey
MDG 5.2
5.8 Institutional deliveries MN Number of women age 15-49 years with a live birth in the 2 years preceding the survey who delivered in a health facility
Total number of women age 15-49 years with a live birth in the 2 years preceding the survey
5.9 Caesarean section MN Number of last live births in the 2 years preceding the survey who were delivered by caesarean section
Total number of last live births in the 2 years preceding the survey
6. CHILD DEVELOPMENT
6.1 Support for learning EC
Number of children age 36-59 months with whom an adult has engaged in four or more activities to promote learning and school readiness in the past 3 days
Total number of children age 36-59 months
6.2 Father’s support for learning EC Number of children age 36-59 months whose father has engaged in one or more activities to promote learning and school readiness in the past 3 days
Total number of children age 36-59 months
6.3 Learning materials: children’s books EC Number of children under age 5 who have three or more children’s books
Total number of children under age 5
6.4 Learning materials: playthings EC Number of children under age 5 with two or more playthings
Total number of children under age 5
6.5 Inadequate care EC Number of children under age 5 left alone or in the care of another child younger than 10 years of age for more than one hour at least once in the past week
Total number of children under age 5
6.6 Early child development index EC Number of children age 36-59 months who are developmentally on track in literacy-numeracy,
Total number of children age 36-59 months
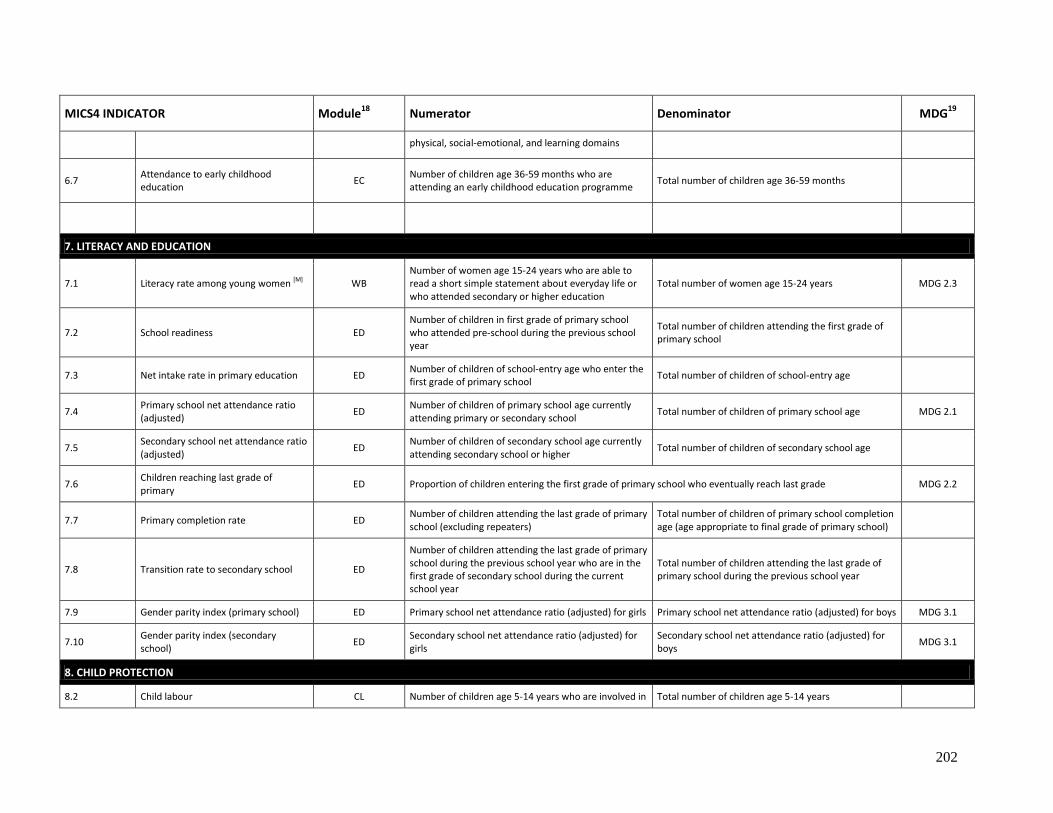
202
MICS4 INDICATOR Module18
Numerator Denominator MDG19
physical, social-emotional, and learning domains
6.7 Attendance to early childhood education
EC Number of children age 36-59 months who are attending an early childhood education programme
Total number of children age 36-59 months
7. LITERACY AND EDUCATION
7.1 Literacy rate among young women [M] WB Number of women age 15-24 years who are able to read a short simple statement about everyday life or who attended secondary or higher education
Total number of women age 15-24 years MDG 2.3
7.2 School readiness ED Number of children in first grade of primary school who attended pre-school during the previous school year
Total number of children attending the first grade of primary school
7.3 Net intake rate in primary education ED Number of children of school-entry age who enter the first grade of primary school
Total number of children of school-entry age
7.4 Primary school net attendance ratio (adjusted)
ED Number of children of primary school age currently attending primary or secondary school
Total number of children of primary school age MDG 2.1
7.5 Secondary school net attendance ratio (adjusted)
ED Number of children of secondary school age currently attending secondary school or higher
Total number of children of secondary school age
7.6 Children reaching last grade of primary
ED Proportion of children entering the first grade of primary school who eventually reach last grade MDG 2.2
7.7 Primary completion rate ED Number of children attending the last grade of primary school (excluding repeaters)
Total number of children of primary school completion age (age appropriate to final grade of primary school)
7.8 Transition rate to secondary school ED
Number of children attending the last grade of primary school during the previous school year who are in the first grade of secondary school during the current school year
Total number of children attending the last grade of primary school during the previous school year
7.9 Gender parity index (primary school) ED Primary school net attendance ratio (adjusted) for girls Primary school net attendance ratio (adjusted) for boys MDG 3.1
7.10 Gender parity index (secondary school)
ED Secondary school net attendance ratio (adjusted) for girls
Secondary school net attendance ratio (adjusted) for boys
MDG 3.1
8. CHILD PROTECTION
8.2 Child labour CL Number of children age 5-14 years who are involved in Total number of children age 5-14 years
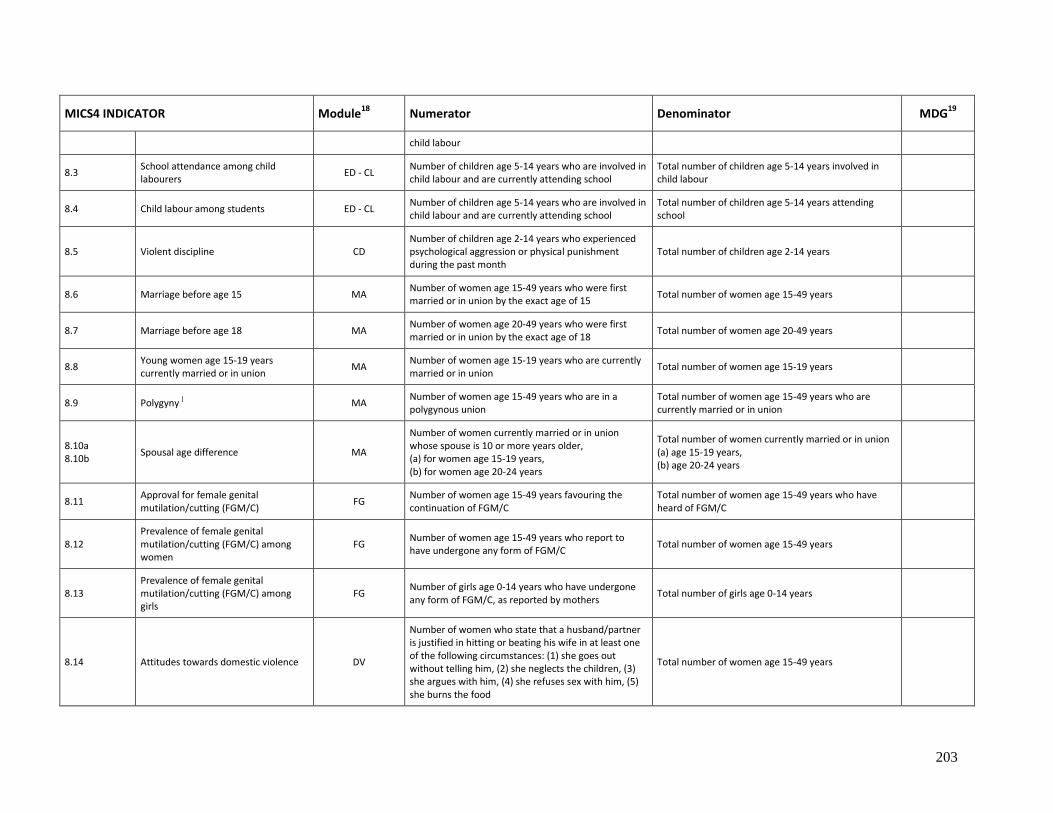
203
MICS4 INDICATOR Module18
Numerator Denominator MDG19
child labour
8.3 School attendance among child labourers
ED - CL Number of children age 5-14 years who are involved in child labour and are currently attending school
Total number of children age 5-14 years involved in child labour
8.4 Child labour among students ED - CL Number of children age 5-14 years who are involved in child labour and are currently attending school
Total number of children age 5-14 years attending school
8.5 Violent discipline CD Number of children age 2-14 years who experienced psychological aggression or physical punishment during the past month
Total number of children age 2-14 years
8.6 Marriage before age 15 MA Number of women age 15-49 years who were first married or in union by the exact age of 15
Total number of women age 15-49 years
8.7 Marriage before age 18 MA Number of women age 20-49 years who were first married or in union by the exact age of 18
Total number of women age 20-49 years
8.8 Young women age 15-19 years currently married or in union
MA Number of women age 15-19 years who are currently married or in union
Total number of women age 15-19 years
8.9 Polygyny [ MA Number of women age 15-49 years who are in a polygynous union
Total number of women age 15-49 years who are currently married or in union
8.10a 8.10b
Spousal age difference MA
Number of women currently married or in union whose spouse is 10 or more years older, (a) for women age 15-19 years, (b) for women age 20-24 years
Total number of women currently married or in union (a) age 15-19 years, (b) age 20-24 years
8.11 Approval for female genital mutilation/cutting (FGM/C)
FG Number of women age 15-49 years favouring the continuation of FGM/C
Total number of women age 15-49 years who have heard of FGM/C
8.12 Prevalence of female genital mutilation/cutting (FGM/C) among women
FG Number of women age 15-49 years who report to have undergone any form of FGM/C
Total number of women age 15-49 years
8.13 Prevalence of female genital mutilation/cutting (FGM/C) among girls
FG Number of girls age 0-14 years who have undergone any form of FGM/C, as reported by mothers
Total number of girls age 0-14 years
8.14 Attitudes towards domestic violence DV
Number of women who state that a husband/partner is justified in hitting or beating his wife in at least one of the following circumstances: (1) she goes out without telling him, (2) she neglects the children, (3) she argues with him, (4) she refuses sex with him, (5) she burns the food
Total number of women age 15-49 years

204
MICS4 INDICATOR Module18
Numerator Denominator MDG19
9. HIV/AIDS, SEXUAL BEHAVIOUR AND ORPHANS
9.1 Comprehensive knowledge about HIV prevention
HA
Number of women age 15-49 years who correctly identify two ways of preventing HIV infection32, know that a healthy looking person can have HIV, and reject the two most common misconceptions about HIV transmission
Total number of women age 15-49 years
9.2 Comprehensive knowledge about HIV prevention among young people
HA
Number of women age 15-24 years who correctly identify two ways of preventing HIV infection32, know that a healthy looking person can have HIV, and reject the two most common misconceptions about HIV transmission
Total number of women age 15-24 years MDG 6.3
9.3 Knowledge of mother-to-child transmission of HIV
HA Number of women age 15-49 years who correctly identify all three means33 of mother-to-child transmission of HIV
Total number of women age 15-49 years
9.4 Accepting attitudes towards people living with HIV
HA Number of women age 15-49 years expressing accepting attitudes on all four questions34 toward people living with HIV
Total number of women age 15-49 years who have heard of HIV
9.5 Women who know where to be tested for HIV
HA Number of women age 15-49 years who state knowledge of a place to be tested for HIV
Total number of women age 15-49 years
9.6 Women who have been tested for HIV and know the results [
HA Number of women age 15-49 years who have been tested for HIV in the 12 months preceding the survey and who know their results
Total number of women age 15-49 years
9.8 HIV counselling during antenatal care HA
Number of women age 15-49 years who gave birth in the 2 years preceding the survey and received antenatal care, reporting that they received counselling on HIV during antenatal care
Total number of women age 15-49 years who gave birth in the 2 years preceding the survey
9.9 HIV testing during antenatal care HA
Number of women age 15-49 years who gave birth in the 2 years preceding the survey and received antenatal care, reporting that they were offered and accepted an HIV test during antenatal care and received their results
Total number of women age 15-49 years who gave birth in the 2 years preceding the survey
32
Using condoms and limiting sex to one faithful, uninfected partner 33
Transmission during pregnancy, during delivery, and by breastfeeding 34
Women (1) who think that a female teacher with the AIDS virus should be allowed to teach in school, (2) who would buy fresh vegetables from a shopkeeper or vendor who has the
AIDS virus, (3) who would not want to keep it as a secret if a family member became infected with the AIDS virus, and (4) who would be willing to care for a family member who became sick with the AIDS virus

205
MICS4 INDICATOR Module18
Numerator Denominator MDG19
9.17 Children’s living arrangements HL Number of children age 0-17 years not living with a biological parent
Total number of children age 0-17 years
9.18 Prevalence of children with one or both parents dead
HL Number of children age 0-17 years with one or both parents dead
Total number of children age 0-17 years
9.19 School attendance of orphans HL - ED Number of children age 10-14 years who have lost both parents and are attending school
Total number of children age 10-14 years who have lost both parents
MDG 6.4
9.20 School attendance of non-orphans HL - ED Number of children age 10-14 years, whose parents are alive, who are living with one or both parents, and who are attending school
Total number of children age 10-14 years, whose parents are alive, and who are living with one or both parents
MDG 6.4

206
MICS4 INDICATOR Module18
Numerator Denominator MDG19
10. ACCESS TO MASS MEDIA AND USE OF INFORMATION/COMMUNICATION TECHNOLOGY
MT.1 Exposure to mass media MT Number of women age 15-49 years who, at least once a week, read a newspaper or magazine, listen to the radio, and watch television
Total number of women age 15-49 years
MT.2 Use of computers MT Number of young women age 15-24 years who used a computer during the last 12 months
Total number of women age 15-24 years
MT.3 Use of internet MT Number of young women age 15-24 who used the internet during the last 12 months
Total number of women age 15-24 years
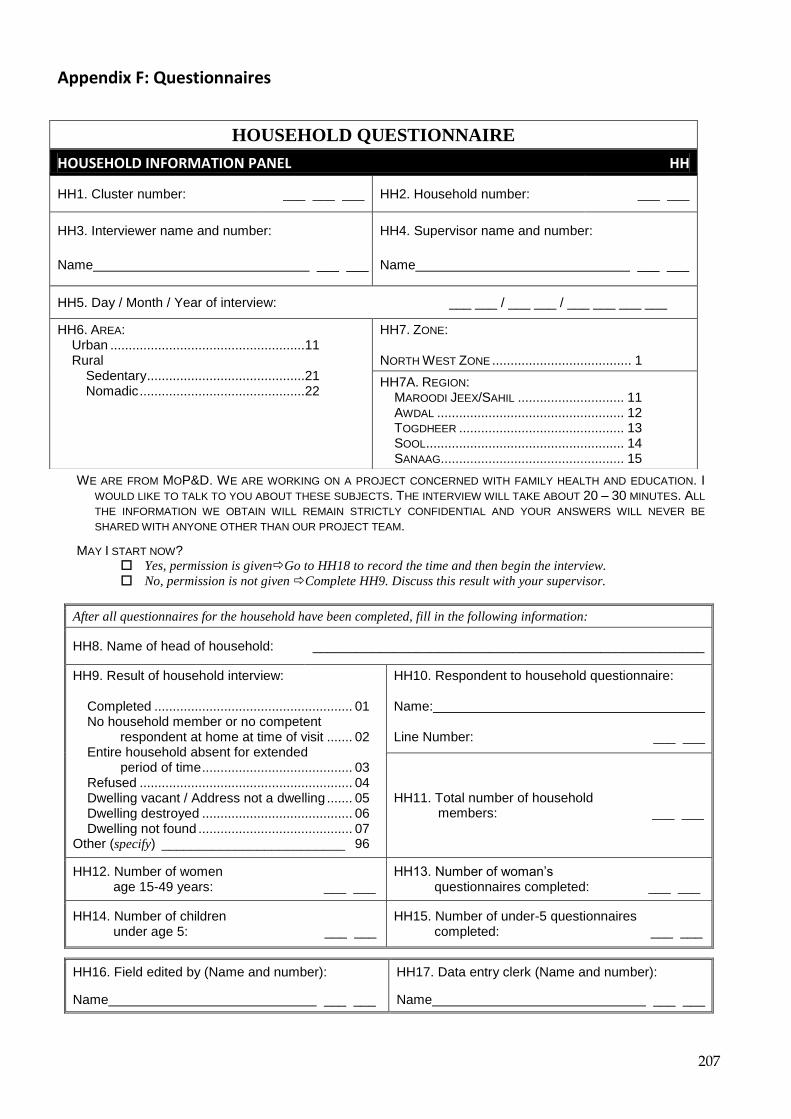
207
Appendix F: Questionnaires
WE ARE FROM MOP&D. WE ARE WORKING ON A PROJECT CONCERNED WITH FAMILY HEALTH AND EDUCATION. I WOULD LIKE TO TALK TO YOU ABOUT THESE SUBJECTS. THE INTERVIEW WILL TAKE ABOUT 20 – 30 MINUTES. ALL
THE INFORMATION WE OBTAIN WILL REMAIN STRICTLY CONFIDENTIAL AND YOUR ANSWERS WILL NEVER BE
SHARED WITH ANYONE OTHER THAN OUR PROJECT TEAM.
MAY I START NOW? Yes, permission is givenGo to HH18 to record the time and then begin the interview.
No, permission is not given Complete HH9. Discuss this result with your supervisor.
After all questionnaires for the household have been completed, fill in the following information:
HH8. Name of head of household: _____________________________________________________
HH9. Result of household interview:
Completed ...................................................... 01 No household member or no competent respondent at home at time of visit ....... 02 Entire household absent for extended period of time ......................................... 03 Refused .......................................................... 04 Dwelling vacant / Address not a dwelling ....... 05 Dwelling destroyed ......................................... 06 Dwelling not found .......................................... 07 Other (specify) _________________________ 96
HH10. Respondent to household questionnaire: Name: Line Number: ___ ___
HH11. Total number of household members: ___ ___
HH12. Number of women age 15-49 years: ___ ___
HH13. Number of woman‟s questionnaires completed: ___ ___
HH14. Number of children under age 5: ___ ___
HH15. Number of under-5 questionnaires completed: ___ ___
HH16. Field edited by (Name and number):
Name ___ ___
HH17. Data entry clerk (Name and number):
Name ___ ___
HOUSEHOLD QUESTIONNAIRE
HOUSEHOLD INFORMATION PANEL HH
HH1. Cluster number: ___ ___ ___ HH2. Household number: ___ ___
HH3. Interviewer name and number: HH4. Supervisor name and number:
Name ___ ___ Name ___ ___
HH5. Day / Month / Year of interview: ___ ___ / ___ ___ / ___ ___ ___ ___
HH6. AREA: Urban ..................................................... 11 Rural
Sedentary ........................................... 21 Nomadic ............................................. 22
HH7. ZONE: NORTH WEST ZONE ...................................... 1
HH7A. REGION: MAROODI JEEX/SAHIL ............................. 11
AWDAL ................................................... 12 TOGDHEER ............................................. 13 SOOL ...................................................... 14 SANAAG .................................................. 15

208
HH18. Record the time: Hour ........... __ __
Minutes ...... __ __
HOUSEHOLD LISTING FORM HL FIRST, PLEASE TELL ME THE NAME OF EACH PERSON WHO USUALLY LIVES HERE, STARTING WITH THE HEAD OF THE HOUSEHOLD.
List the head of the household in line 01. List all household members (HL2), their relationship to the household head (HL3), and their sex (HL4) Then ask: ARE THERE ANY OTHERS WHO LIVE HERE, EVEN IF THEY ARE NOT AT HOME NOW? If yes, complete listing for questions HL2-HL4. Then, ask questions starting with HL6 for each person at a time. Use an additional questionnaire if all rows in the household listing form have been used.
For all household
members age 0-6 AND
women age 14-16 or 50-
51
For
women
age 15-49
For
children
age 5-14
For
children
under age 5
For all household members
For children age 0-17 years
HL1. Line
number
HL2. Name
HL3. WHAT IS
THE
RELATION
-SHIP OF
(name) TO
THE HEAD
OF
HOUSE-HOLD?
HL4. IS (name)
MALE OR
FEMALE? 1 Male 2 Female
HL6. HOW OLD
IS (name)?
Record in
completed
years
If age is
95 or
above,
record
„95‟
HL5. WHAT IS (name)‟S
DATE OF BIRTH?
If unknown, probe for
documents or use the
calendar of events
Reconcile with HL6
HL7.
Circle
line
number
if woman
is age
15-49
HL8. WHO IS THE
MOTHER OR PRIMARY
CARETAKER
OF THIS
CHILD? Record
line number
of mother/
caretaker
HL9. WHO IS THE
MOTHER OR
PRIMARY
CARETAKER
OF THIS
CHILD? Record
line number
of mother/
caretaker
HL10. DID (name)
STAY HERE
LAST
NIGHT? 1 Yes 2 No
HL11. IS
(name)‟S
NATURAL
MOTHER
ALIVE?
1 Yes 2 No HL13 8 DK HL13
HL12. DOES
(name)‟S
NATURAL
MOTHER LIVE
IN THIS HOUSEHOLD?
Record
line number
of mother or
00 for “No”
HL13. IS (name)‟S
NATURAL FATHER ALIVE?
1 Yes 2 No Next Line 8 DK Next Line
HL14. DOES
(name)‟S
NATURAL
FATHER LIVE
IN THIS HOUSEHOLD?
Record
line number
of father or
00 for “No”
98 DK
9998 DK
Line Name Relation* M F Age Month Year 15-49 Mother Mother Y N Y N DK Mother Y N DK Father
01
0 1 1 2 __ __ __ __ __ __ __ __ 01 __ __ __ __ 1 2 1 2 8 __ __ 1 2 8 __ __
02
__ __ 1 2 __ __ __ __ __ __ __ __ 02 __ __ __ __ 1 2 1 2 8 __ __ 1 2 8 __ __
03
__ __ 1 2 __ __ __ __ __ __ __ __ 03 __ __ __ __ 1 2 1 2 8 __ __ 1 2 8 __ __
04
__ __ 1 2 __ __ __ __ __ __ __ __ 04 __ __ __ __ 1 2 1 2 8 __ __ 1 2 8 __ __
05
__ __ 1 2 __ __ __ __ __ __ __ __ 05 __ __ __ __ 1 2 1 2 8 __ __ 1 2 8 __ __
06
__ __ 1 2 __ __ __ __ __ __ __ __ 06 __ __ __ __ 1 2 1 2 8 __ __ 1 2 8 __ __
07
__ __ 1 2 __ __ __ __ __ __ __ __ 07 __ __ __ __ 1 2 1 2 8 __ __ 1 2 8 __ __
08
__ __ 1 2 __ __ __ __ __ __ __ __ 08 __ __ __ __ 1 2 1 2 8 __ __ 1 2 8 __ __
09
__ __ 1 2 __ __ __ __ __ __ __ __ 09 __ __ __ __ 1 2 1 2 8 __ __ 1 2 8 __ __

209
HL1. Line
number
HL2. Name
HL3. WHAT IS
THE
RELATION
-SHIP OF
(name) TO
THE HEAD
OF
HOUSE-HOLD?
HL4. IS (name)
MALE OR
FEMALE? 1 Male 2 Female
HL6. HOW OLD
IS (name)?
Record in
completed
years
If age is
95 or
above,
record
„95‟
HL5. WHAT IS (name)‟S
DATE OF BIRTH?
If unknown, probe for
documents or use the
calendar of events
Reconcile with HL6
HL7.
Circle
line
number
if woman
is age
15-49
HL8. WHO IS THE
MOTHER OR PRIMARY
CARETAKER
OF THIS
CHILD? Record
line number
of mother/
caretaker
HL9. WHO IS THE
MOTHER OR
PRIMARY
CARETAKER
OF THIS
CHILD? Record
line number
of mother/
caretaker
HL10. DID (name)
STAY HERE
LAST
NIGHT? 1 Yes 2 No
HL11. IS
(name)‟S
NATURAL
MOTHER
ALIVE?
1 Yes 2 No HL13 8 DK HL13
HL12. DOES
(name)‟S
NATURAL
MOTHER LIVE
IN THIS HOUSEHOLD?
Record
line number
of mother or
00 for “No”
HL13. IS (name)‟S
NATURAL FATHER ALIVE?
1 Yes 2 No Next Line 8 DK Next Line
HL14. DOES
(name)‟S
NATURAL
FATHER LIVE
IN THIS HOUSEHOLD?
Record
line number
of father or
00 for “No”
98 DK
9998 DK
Line Name Relation* M F Age Month Year 15-49 Mother Mother Y N Y N DK Mother Y N DK Father
10
__ __ 1 2 __ __ __ __ __ __ __ __ 10 __ __ __ __ 1 2 1 2 8 __ __ 1 2 8 __ __
11
__ __ 1 2 __ __ __ __ __ __ __ __ 11 __ __ __ __ 1 2 1 2 8 __ __ 1 2 8 __ __
12
__ __ 1 2 __ __ __ __ __ __ __ __ 12 __ __ __ __ 1 2 1 2 8 __ __ 1 2 8 __ __
13
__ __ 1 2 __ __ __ __ __ __ __ __ 13 __ __ __ __ 1 2 1 2 8 __ __ 1 2 8 __ __
14
__ __ 1 2 __ __ __ __ __ __ __ __ 14 __ __ __ __ 1 2 1 2 8 __ __ 1 2 8 __ __
15
__ __ 1 2 __ __ __ __ __ __ __ __ 15 __ __ __ __ 1 2 1 2 8 __ __ 1 2 8 __ __
Tick here if additional questionnaire used
Now for each woman age 15-49 years, write her name and line number and other identifying information in the information panel of a separate Individual Women’s Questionnaire. For each child under age 5, write his/her name and line number AND the line number of his/her mother or caretaker in the information panel of a separate Under-5 Questionnaire. You should now have a separate questionnaire for each eligible woman and each child under five in the household.
* Codes for HL3: Relationship to head of household:
01 Head 02 Wife / Husband 03 Son / Daughter 04 Son-In-Law / Daughter-In-Law 05 Grandchild
06 Parent 07 Parent-In-Law 08 Brother / Sister 09 Brother-In-Law / Sister-In-Law 10 Uncle / Aunt
11 Niece / Nephew 12 Other relative 13 Adopted / Foster / Stepchild 14 Not related 98 Don't know
Probe for additional household members. Probe especially for any infants or small children not listed, and others who may not be members of the family (such as servants, friends) but who usually live in the household. Insert names of additional members in the household list and complete form accordingly.
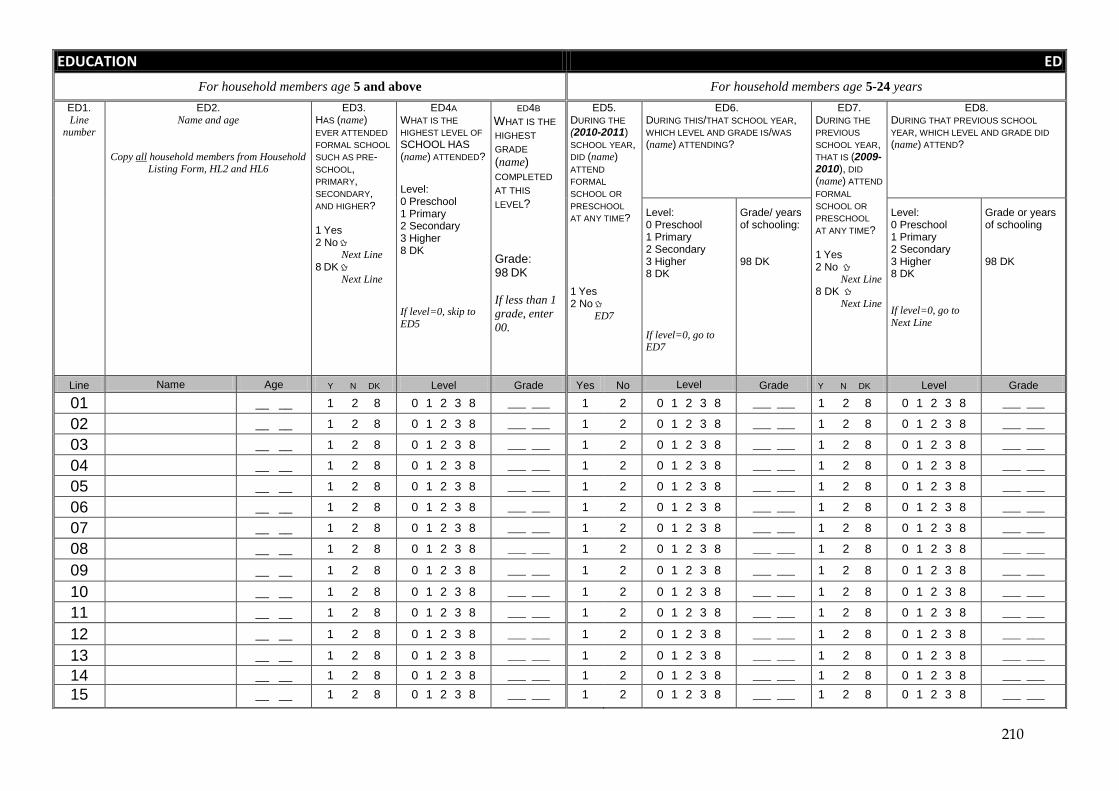
210
EDUCATION ED
For household members age 5 and above For household members age 5-24 years
ED1. Line
number
ED2. Name and age
Copy all household members from Household Listing Form, HL2 and HL6
ED3. HAS (name) EVER ATTENDED
FORMAL SCHOOL
SUCH AS PRE-SCHOOL, PRIMARY, SECONDARY, AND HIGHER? 1 Yes 2 No
Next Line
8 DK Next Line
ED4A WHAT IS THE
HIGHEST LEVEL OF
SCHOOL HAS
(name) ATTENDED?
Level: 0 Preschool 1 Primary 2 Secondary 3 Higher 8 DK If level=0, skip to
ED5
ED4B
WHAT IS THE
HIGHEST
GRADE
(name)
COMPLETED
AT THIS
LEVEL?
Grade: 98 DK If less than 1
grade, enter
00.
ED5. DURING THE
(2010-2011) SCHOOL YEAR, DID (name) ATTEND
FORMAL
SCHOOL OR
PRESCHOOL
AT ANY TIME? 1 Yes 2 No ED7
ED6. DURING THIS/THAT SCHOOL YEAR, WHICH LEVEL AND GRADE IS/WAS
(name) ATTENDING?
ED7. DURING THE
PREVIOUS
SCHOOL YEAR, THAT IS (2009-2010), DID
(name) ATTEND
FORMAL
SCHOOL OR
PRESCHOOL
AT ANY TIME? 1 Yes 2 No Next Line
8 DK Next Line
ED8. DURING THAT PREVIOUS SCHOOL
YEAR, WHICH LEVEL AND GRADE DID
(name) ATTEND?
Level: 0 Preschool 1 Primary 2 Secondary 3 Higher 8 DK
If level=0, go to ED7
Grade/ years of schooling: 98 DK
Level: 0 Preschool 1 Primary 2 Secondary 3 Higher 8 DK If level=0, go to
Next Line
Grade or years of schooling 98 DK
Line Name Age Y N DK Level Grade Yes No Level Grade Y N DK Level Grade
01 __ __ 1 2 8 0 1 2 3 8 ___ ___ 1 2 0 1 2 3 8 ___ ___ 1 2 8 0 1 2 3 8 ___ ___
02 __ __ 1 2 8 0 1 2 3 8 ___ ___ 1 2 0 1 2 3 8 ___ ___ 1 2 8 0 1 2 3 8 ___ ___
03 __ __ 1 2 8 0 1 2 3 8 ___ ___ 1 2 0 1 2 3 8 ___ ___ 1 2 8 0 1 2 3 8 ___ ___
04 __ __ 1 2 8 0 1 2 3 8 ___ ___ 1 2 0 1 2 3 8 ___ ___ 1 2 8 0 1 2 3 8 ___ ___
05 __ __ 1 2 8 0 1 2 3 8 ___ ___ 1 2 0 1 2 3 8 ___ ___ 1 2 8 0 1 2 3 8 ___ ___
06 __ __ 1 2 8 0 1 2 3 8 ___ ___ 1 2 0 1 2 3 8 ___ ___ 1 2 8 0 1 2 3 8 ___ ___
07 __ __ 1 2 8 0 1 2 3 8 ___ ___ 1 2 0 1 2 3 8 ___ ___ 1 2 8 0 1 2 3 8 ___ ___
08 __ __ 1 2 8 0 1 2 3 8 ___ ___ 1 2 0 1 2 3 8 ___ ___ 1 2 8 0 1 2 3 8 ___ ___
09 __ __ 1 2 8 0 1 2 3 8 ___ ___ 1 2 0 1 2 3 8 ___ ___ 1 2 8 0 1 2 3 8 ___ ___
10 __ __ 1 2 8 0 1 2 3 8 ___ ___ 1 2 0 1 2 3 8 ___ ___ 1 2 8 0 1 2 3 8 ___ ___
11 __ __ 1 2 8 0 1 2 3 8 ___ ___ 1 2 0 1 2 3 8 ___ ___ 1 2 8 0 1 2 3 8 ___ ___
12 __ __ 1 2 8 0 1 2 3 8 ___ ___ 1 2 0 1 2 3 8 ___ ___ 1 2 8 0 1 2 3 8 ___ ___
13 __ __ 1 2 8 0 1 2 3 8 ___ ___ 1 2 0 1 2 3 8 ___ ___ 1 2 8 0 1 2 3 8 ___ ___
14 __ __ 1 2 8 0 1 2 3 8 ___ ___ 1 2 0 1 2 3 8 ___ ___ 1 2 8 0 1 2 3 8 ___ ___
15 __ __ 1 2 8 0 1 2 3 8 ___ ___ 1 2 0 1 2 3 8 ___ ___ 1 2 8 0 1 2 3 8 ___ ___

211
NON-FORMAL EDUCATION NF
NF1. Does any child aged 5-17 reside in the household? Check household listing, column HL6, for any child 5-17 years.
Yes. Copy all names, line numbers and ages of household members age 5-17 into NF2. Then, ask questions NF3
to NF17 for each member at a time. Start by filling NF2 for all the household members across the columns.
NO. Go to next module.
HH member #1 HH member #2 HH member #3 HH member #4 HH member #5
NF2. Household member‟s:
Line number (HL1) ___ ___ ___ ___ ___ ___ ___ ___ ___ ___
Name (HL2) ___________ ___________ ___________ ___________ ___________
Age (HL6) ___ ___ ___ ___ ___ ___ ___ ___ ___ ___
NF3. HAS (name) EVER
ATTENDED NON-FORMAL
EDUCATION SUCH AS
KORANIC SCHOOL, ALTERNATIVE BASIC
EDUCATION, VOCATIONAL
TRAINING AND NON-FORMAL EDUCATION FOR
YOUTH?
Yes ..................... 1 No ....................... 2 DK ...................... 8 If “No” or “DK”,
go to NF3 for
next member. If
no more
members, go to
next module
Yes ..................... 1 No ...................... 2 DK ...................... 8 If “No” or “DK”,
go to NF3 for
next member. If
no more
members, go to
next module
Yes ..................... 1 No ...................... 2 DK ...................... 8 If “No” or “DK”,
go to NF3 for
next member. If
no more
members, go to
next module
Yes ..................... 1 No ...................... 2 DK ...................... 8 If “No” or “DK”,
go to NF3 for
next member. If
no more
members, go to
next module
Yes ..................... 1 No ...................... 2 DK ...................... 8 If “No” or “DK”,
go to NF3 in
first column of
additional
questionnaire
for next member.
If no more
members, go to
next module
NF4. HAS (name) EVER
ATTENDED KORANIC
SCHOOL?
Yes ..................... 1 No ....................... 2 DK ...................... 8 If “No” or “DK”,
go to NF7
Yes ..................... 1 No ...................... 2 DK ...................... 8 If “No” or “DK”,
go to NF7
Yes ..................... 1 No ...................... 2 DK ...................... 8 If “No” or “DK”,
go to NF7
Yes ..................... 1 No ...................... 2 DK ...................... 8 If “No” or “DK”,
go to NF7
Yes ..................... 1 No ...................... 2 DK ...................... 8 If “No” or “DK”,
go to NF7
NF5. IN THIS KORANIC
SCHOOL, IS/WAS (name) TAUGHT OTHER SUBJECTS
THAN THE KORAN? Probe: A KORANIC SCHOOL
TEACHING OTHER
SUBJECTS LIKE READING
AND WRITING ARABIC, SOMALI, ENGLISH OR
MATHEMATICS, IS
SOMETIMES CALLED AN
INTEGRATED KORANIC
SCHOOL.
Yes ..................... 1 No ....................... 2 DK ...................... 8
Yes ..................... 1 No ...................... 2 DK ...................... 8
Yes ..................... 1 No ...................... 2 DK ...................... 8
Yes ..................... 1 No ...................... 2 DK ...................... 8
Yes ..................... 1 No ...................... 2 DK ...................... 8
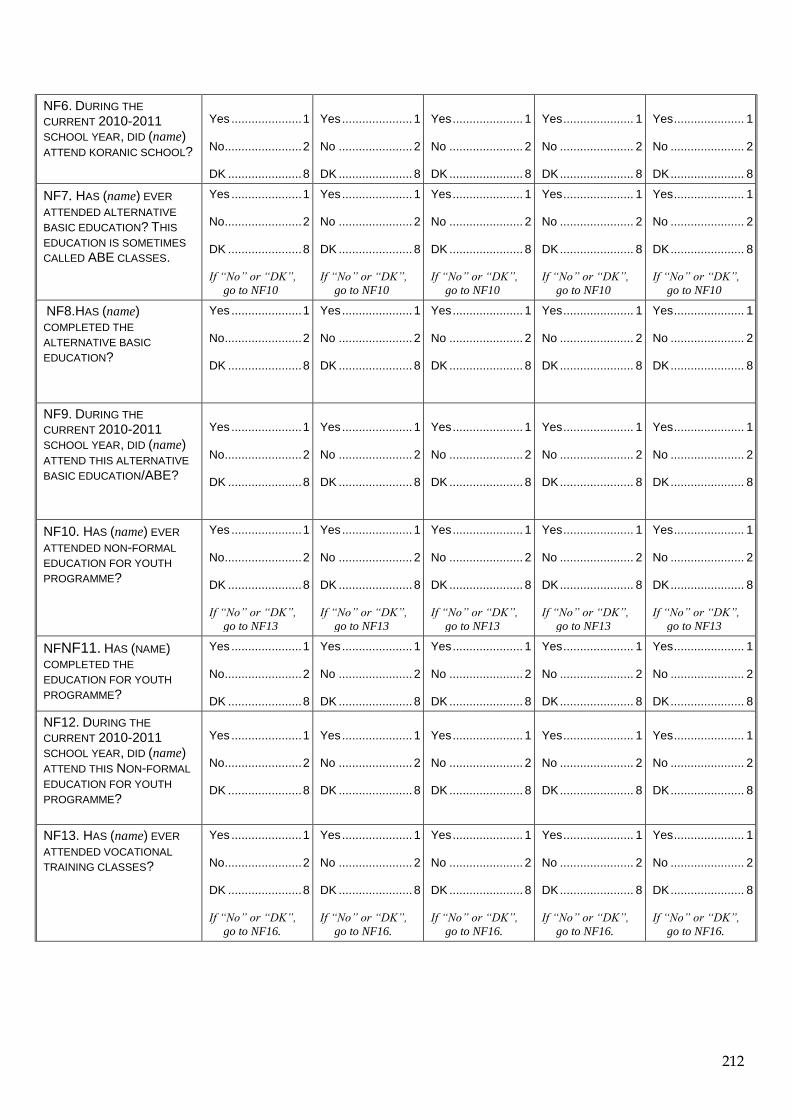
212
NF6. DURING THE
CURRENT 2010-2011
SCHOOL YEAR, DID (name) ATTEND KORANIC SCHOOL?
Yes ..................... 1 No ....................... 2 DK ...................... 8
Yes ..................... 1 No ...................... 2 DK ...................... 8
Yes ..................... 1 No ...................... 2 DK ...................... 8
Yes ..................... 1 No ...................... 2 DK ...................... 8
Yes ..................... 1 No ...................... 2 DK ...................... 8
NF7. HAS (name) EVER
ATTENDED ALTERNATIVE
BASIC EDUCATION? THIS
EDUCATION IS SOMETIMES
CALLED ABE CLASSES.
Yes ..................... 1 No ....................... 2 DK ...................... 8 If “No” or “DK”,
go to NF10
Yes ..................... 1 No ...................... 2 DK ...................... 8 If “No” or “DK”,
go to NF10
Yes ..................... 1 No ...................... 2 DK ...................... 8 If “No” or “DK”,
go to NF10
Yes ..................... 1 No ...................... 2 DK ...................... 8 If “No” or “DK”,
go to NF10
Yes ..................... 1 No ...................... 2 DK ...................... 8 If “No” or “DK”,
go to NF10
NF8.HAS (name)
COMPLETED THE
ALTERNATIVE BASIC
EDUCATION?
Yes ..................... 1 No ....................... 2 DK ...................... 8
Yes ..................... 1 No ...................... 2 DK ...................... 8
Yes ..................... 1 No ...................... 2 DK ...................... 8
Yes ..................... 1 No ...................... 2 DK ...................... 8
Yes ..................... 1 No ...................... 2 DK ...................... 8
NF9. DURING THE
CURRENT 2010-2011
SCHOOL YEAR, DID (name) ATTEND THIS ALTERNATIVE
BASIC EDUCATION/ABE?
Yes ..................... 1 No ....................... 2 DK ...................... 8
Yes ..................... 1 No ...................... 2 DK ...................... 8
Yes ..................... 1 No ...................... 2 DK ...................... 8
Yes ..................... 1 No ...................... 2 DK ...................... 8
Yes ..................... 1 No ...................... 2 DK ...................... 8
NF10. HAS (name) EVER
ATTENDED NON-FORMAL
EDUCATION FOR YOUTH
PROGRAMME?
Yes ..................... 1 No ....................... 2 DK ...................... 8 If “No” or “DK”,
go to NF13
Yes ..................... 1 No ...................... 2 DK ...................... 8 If “No” or “DK”,
go to NF13
Yes ..................... 1 No ...................... 2 DK ...................... 8 If “No” or “DK”,
go to NF13
Yes ..................... 1 No ...................... 2 DK ...................... 8 If “No” or “DK”,
go to NF13
Yes ..................... 1 No ...................... 2 DK ...................... 8 If “No” or “DK”,
go to NF13
NFNF11. HAS (NAME) COMPLETED THE
EDUCATION FOR YOUTH
PROGRAMME?
Yes ..................... 1 No ....................... 2 DK ...................... 8
Yes ..................... 1 No ...................... 2 DK ...................... 8
Yes ..................... 1 No ...................... 2 DK ...................... 8
Yes ..................... 1 No ...................... 2 DK ...................... 8
Yes ..................... 1 No ...................... 2 DK ...................... 8
NF12. DURING THE
CURRENT 2010-2011
SCHOOL YEAR, DID (name) ATTEND THIS NON-FORMAL
EDUCATION FOR YOUTH
PROGRAMME?
Yes ..................... 1 No ....................... 2 DK ...................... 8
Yes ..................... 1 No ...................... 2 DK ...................... 8
Yes ..................... 1 No ...................... 2 DK ...................... 8
Yes ..................... 1 No ...................... 2 DK ...................... 8
Yes ..................... 1 No ...................... 2 DK ...................... 8
NF13. HAS (name) EVER
ATTENDED VOCATIONAL
TRAINING CLASSES?
Yes ..................... 1 No ....................... 2 DK ...................... 8 If “No” or “DK”,
go to NF16.
Yes ..................... 1 No ...................... 2 DK ...................... 8 If “No” or “DK”,
go to NF16.
Yes ..................... 1 No ...................... 2 DK ...................... 8 If “No” or “DK”,
go to NF16.
Yes ..................... 1 No ...................... 2 DK ...................... 8 If “No” or “DK”,
go to NF16.
Yes ..................... 1 No ...................... 2 DK ...................... 8 If “No” or “DK”,
go to NF16.
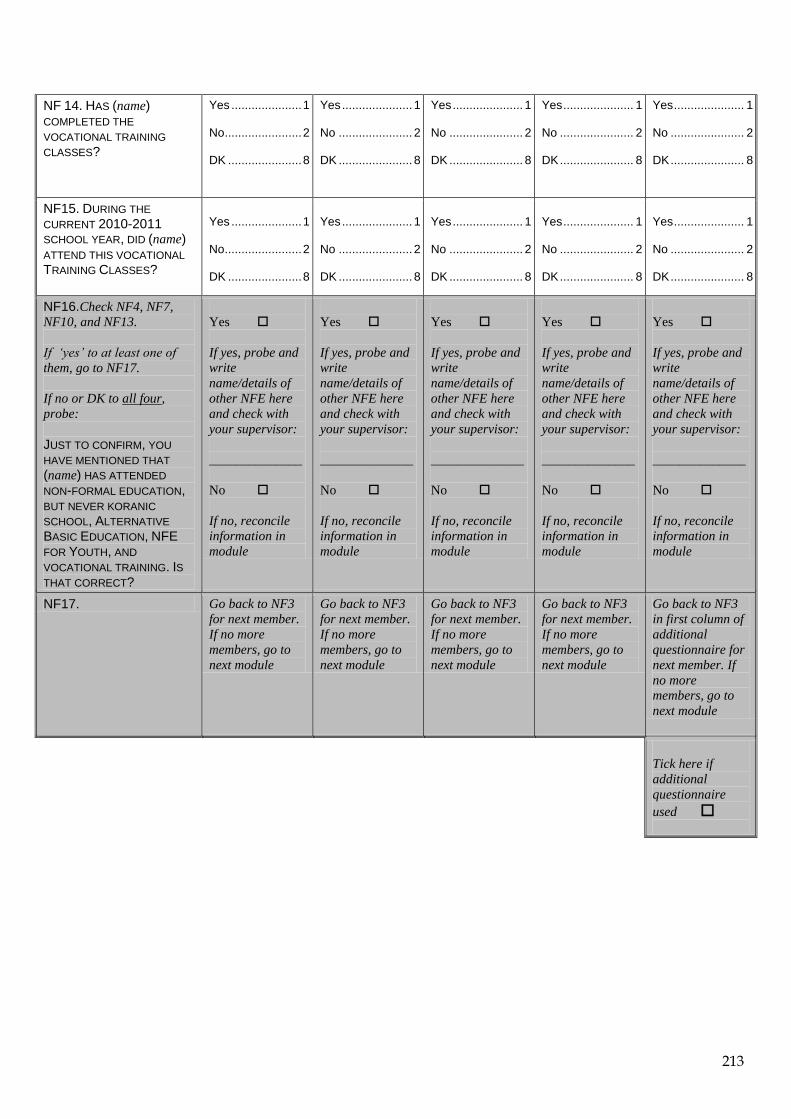
213
NF 14. HAS (name) COMPLETED THE
VOCATIONAL TRAINING
CLASSES?
Yes ..................... 1 No ....................... 2 DK ...................... 8
Yes ..................... 1 No ...................... 2 DK ...................... 8
Yes ..................... 1 No ...................... 2 DK ...................... 8
Yes ..................... 1 No ...................... 2 DK ...................... 8
Yes ..................... 1 No ...................... 2 DK ...................... 8
NF15. DURING THE
CURRENT 2010-2011
SCHOOL YEAR, DID (name)
ATTEND THIS VOCATIONAL
TRAINING CLASSES?
Yes ..................... 1 No ....................... 2 DK ...................... 8
Yes ..................... 1 No ...................... 2 DK ...................... 8
Yes ..................... 1 No ...................... 2 DK ...................... 8
Yes ..................... 1 No ...................... 2 DK ...................... 8
Yes ..................... 1 No ...................... 2 DK ...................... 8
NF16.Check NF4, NF7,
NF10, and NF13.
If „yes‟ to at least one of
them, go to NF17.
If no or DK to all four,
probe:
JUST TO CONFIRM, YOU
HAVE MENTIONED THAT (name) HAS ATTENDED
NON-FORMAL EDUCATION, BUT NEVER KORANIC
SCHOOL, ALTERNATIVE
BASIC EDUCATION, NFE
FOR YOUTH, AND
VOCATIONAL TRAINING. IS
THAT CORRECT?
Yes
If yes, probe and
write
name/details of
other NFE here
and check with
your supervisor:
______________
No
If no, reconcile
information in
module
Yes
If yes, probe and
write
name/details of
other NFE here
and check with
your supervisor:
______________
No
If no, reconcile
information in
module
Yes
If yes, probe and
write
name/details of
other NFE here
and check with
your supervisor:
______________
No
If no, reconcile
information in
module
Yes
If yes, probe and
write
name/details of
other NFE here
and check with
your supervisor:
______________
No
If no, reconcile
information in
module
Yes
If yes, probe and
write
name/details of
other NFE here
and check with
your supervisor:
______________
No
If no, reconcile
information in
module
NF17. Go back to NF3
for next member.
If no more
members, go to
next module
Go back to NF3
for next member.
If no more
members, go to
next module
Go back to NF3
for next member.
If no more
members, go to
next module
Go back to NF3
for next member.
If no more
members, go to
next module
Go back to NF3
in first column of
additional
questionnaire for
next member. If
no more
members, go to
next module
Tick here if
additional
questionnaire
used

214
WATER AND SANITATION WS
WS1. WHAT IS THE MAIN SOURCE OF DRINKING
WATER FOR MEMBERS OF YOUR
HOUSEHOLD?
Piped water Piped into dwelling ................................. 11 Piped into compound, yard or plot ......... 12 Piped to neighbour ................................ 13 Public tap / standpipe / kiosk ................. 14 Tube Well, Borehole .................................. 21 Dug well Protected well ........................................ 31 Unprotected well .................................... 32 Water from spring Protected spring .................................... 41 Unprotected spring ................................ 42 Rainwater collection Roof Top ................................................ 52 Berkad ................................................... 53 Rain water catchment (Bally) ................. 54 Tanker-truck .............................................. 61 Cart with small tank / drum ........................ 71 Surface water (river, stream, dam, lake, pond, canal, irrigation channel, hole in
river bed) ................................................ 81 Bottled water .............................................. 91
Other (specify) _____________________ 96
11WS6 12WS6 13WS6 14WS3 21WS3 31WS3 32WS3 41WS3 42WS3 52WS3 53WS3 54WS3 61WS3 71WS3 81WS3 96WS3
WS2. WHAT IS THE MAIN SOURCE OF WATER
USED BY YOUR HOUSEHOLD FOR OTHER
PURPOSES SUCH AS COOKING AND HAND
WASHING?
Piped water Piped into dwelling ................................. 11 Piped into compound, yard or plot ......... 12 Piped to neighbour ................................ 13 Public tap / standpipe / kiosk ................. 14 Tube Well, Borehole .................................. 21 Dug well Protected well ........................................ 31 Unprotected well .................................... 32 Water from spring Protected spring .................................... 41 Unprotected spring ................................ 42 Rainwater collection Roof Top ................................................ 52 Berkad ................................................... 53 Rain water catchment (Bally) ................. 54 Tanker-truck .............................................. 61 Cart with small tank / drum ........................ 71 Surface water (river, stream, dam, lake, pond, canal, irrigation channel, hole in
river bed) ................................................ 81 Other (specify) _____________________ 96
11WS6 12WS6 13WS6
WS3. WHERE IS THAT WATER SOURCE
LOCATED? In own dwelling ............................................ 1 In own yard / plot ......................................... 2 Elsewhere .................................................... 3
1WS6 2WS6
WS4. HOW LONG DOES IT TAKE TO GO THERE, GET WATER, AND COME BACK?
Number of minutes .......................... __ __ __ DK ............................................................ 998

215
WS5. WHO USUALLY GOES TO THIS SOURCE TO
COLLECT THE WATER FOR YOUR
HOUSEHOLD?
Probe:
IS THIS PERSON UNDER AGE 15? WHAT SEX?
Adult woman (age 15+ years) ..................... 1 Adult man (age 15+ years) .......................... 2 Female child (under 15) .............................. 3 Male child (under 15) ................................... 4 DK ................................................................ 8
WS6. DO YOU DO ANYTHING TO THE WATER TO
MAKE IT SAFER TO DRINK? Yes .............................................................. 1 No ................................................................ 2 DK ................................................................ 8
2WS8 8WS8
WS7. WHAT DO YOU USUALLY DO TO MAKE THE
WATER SAFER TO DRINK?
Probe:
ANYTHING ELSE?
Record all items mentioned.
Boil .............................................................. A Add bleach / chlorine .................................. B Strain it through a cloth .............................. C Use water filter (ceramic, sand,
composite, etc.) ...................................... D Solar disinfection ........................................ E Let it stand and settle .................................. F Wash hands before collecting water ………G Store drinking water in a clean container with cover ................................... H Use a separate clean cup with a long handle
for taking water out of the container .................. I Keep animals away from the container ....... J Other (specify) _____________________ X DK ................................................................ Z
WS8. WHAT KIND OF TOILET FACILITY DO
MEMBERS OF YOUR HOUSEHOLD USUALLY
USE?
If “flush” or “pour flush”, probe:
WHERE DOES IT FLUSH TO?
If necessary, ask permission to observe the
facility.
Flush / Pour flush Flush to piped sewer system ................. 11 Flush to septic tank ............................... 12 Flush to pit (latrine) ................................ 13 Flush to somewhere else ...................... 14 Flush to unknown place / Not sure / DK where ........................................... 15 Pit latrine Ventilated Improved Pit latrine (VIP) .... 21 Pit latrine with slab ................................ 22 Pit latrine without slab / Open pit ........... 23 Bucket........................................................ 41 No facility, Bush, Field, Beach .................. 95 Other (specify) _____________________ 96
95Next MODULE
WS9. DO YOU SHARE THIS FACILITY WITH
OTHERS WHO ARE NOT MEMBERS OF YOUR
HOUSEHOLD?
Yes .............................................................. 1 No ................................................................ 2
2Next Module
WS10. DO YOU SHARE THIS FACILITY ONLY WITH
MEMBERS OF OTHER HOUSEHOLDS THAT YOU
KNOW, OR IS THE FACILITY OPEN TO THE USE
OF THE GENERAL PUBLIC?
Other households only (not public) ............. 1 Public facility ................................................ 2
2Next Module
WS11. HOW MANY HOUSEHOLDS IN TOTAL USE
THIS TOILET FACILITY, INCLUDING YOUR OWN
HOUSEHOLD?
Number of households (if less than 10) 0 __ Ten or more households ........................... 10 DK .............................................................. 98

216
HOUSEHOLD CHARACTERISTICS HC
HC2. HOW MANY ROOMS IN THIS HOUSEHOLD ARE
USED FOR SLEEPING? Number of rooms ................................. __ __
HC3. Main material of the dwelling floor.
Record observation.
Natural floor Earth / Sand .......................................... 11 Dung ...................................................... 12 Rudimentary floor Wood planks ......................................... 21 Palm / Bamboo ...................................... 22 Finished floor Parquet or polished wood ..................... 31 Vinyl or asphalt strips ............................ 32 Ceramic tiles ......................................... 33 Cement .................................................. 34 Carpet (Wall to Wall) ............................. 35 Other (specify) _____________________ 96
HC4. Main material of the roof.
Record observation.
Natural roofing No Roof ................................................. 11 Thatch / Palm leaf ................................. 12 Sod (Mud & Grass) ............................... 13 Rudimentary Roofing Rustic mat ............................................. 21 Palm / Bamboo ...................................... 22 Wood planks ......................................... 23 Cardboard ............................................. 24 Sacks/Plastic Sheets/Cloth ................... 25 Canvas/Tent .......................................... 26 Finished roofing Metal/Corrugated Iron Sheets ............... 31 Wood ..................................................... 32 Corrugated cement /Asbestos/ Cement
fibre ....................................................... 33 Ceramic tiles ......................................... 34 Cement .................................................. 35 Other (specify) ______________________ 96
HC5. Main material of the exterior walls.
Record observation.
Natural walls No walls ................................................. 11 Sticks / Palm / Trunks ........................... 12 Mud ....................................................... 13 Rudimentary walls Bamboo/Sticks with mud ....................... 21 Stone with mud ..................................... 22 Uncovered adobe .................................. 23 Plywood ................................................. 24
Cardboard/Carton/Tin/Plastic/Sacks/ Cloth ................................................ 25
Reused wood ........................................ 26 Canvas/Tent .......................................... 27 Finished walls Cement .................................................. 31 Stone with lime / cement ....................... 32 Bricks ..................................................... 33 Cement blocks ...................................... 34 Covered adobe ...................................... 35 Wood planks / shingles ......................... 36 Other (specify) ______________________ 96
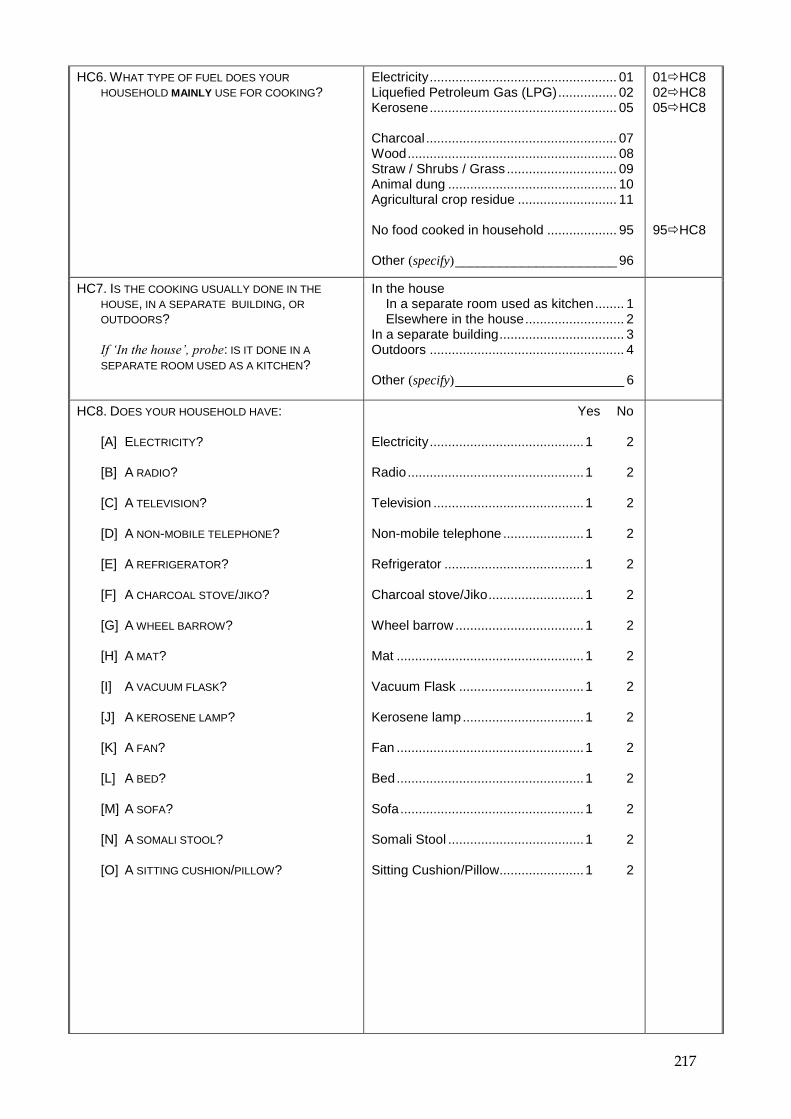
217
HC6. WHAT TYPE OF FUEL DOES YOUR
HOUSEHOLD MAINLY USE FOR COOKING? Electricity ................................................... 01 Liquefied Petroleum Gas (LPG) ................ 02 Kerosene ................................................... 05 Charcoal .................................................... 07 Wood ......................................................... 08 Straw / Shrubs / Grass .............................. 09 Animal dung .............................................. 10 Agricultural crop residue ........................... 11 No food cooked in household ................... 95 Other (specify) ______________________ 96
01HC8 02HC8 05HC8 95HC8
HC7. IS THE COOKING USUALLY DONE IN THE
HOUSE, IN A SEPARATE BUILDING, OR
OUTDOORS? If „In the house‟, probe: IS IT DONE IN A
SEPARATE ROOM USED AS A KITCHEN?
In the house In a separate room used as kitchen ........ 1 Elsewhere in the house ........................... 2 In a separate building .................................. 3 Outdoors ..................................................... 4 Other (specify) _______________________ 6
HC8. DOES YOUR HOUSEHOLD HAVE: [A] ELECTRICITY? [B] A RADIO? [C] A TELEVISION? [D] A NON-MOBILE TELEPHONE? [E] A REFRIGERATOR? [F] A CHARCOAL STOVE/JIKO? [G] A WHEEL BARROW? [H] A MAT? [I] A VACUUM FLASK? [J] A KEROSENE LAMP? [K] A FAN? [L] A BED? [M] A SOFA? [N] A SOMALI STOOL? [O] A SITTING CUSHION/PILLOW?
Yes No Electricity .......................................... 1 2 Radio ................................................ 1 2 Television ......................................... 1 2 Non-mobile telephone ...................... 1 2 Refrigerator ...................................... 1 2 Charcoal stove/Jiko .......................... 1 2 Wheel barrow ................................... 1 2 Mat ................................................... 1 2 Vacuum Flask .................................. 1 2 Kerosene lamp ................................. 1 2 Fan ................................................... 1 2 Bed ................................................... 1 2 Sofa .................................................. 1 2 Somali Stool ..................................... 1 2 Sitting Cushion/Pillow....................... 1 2
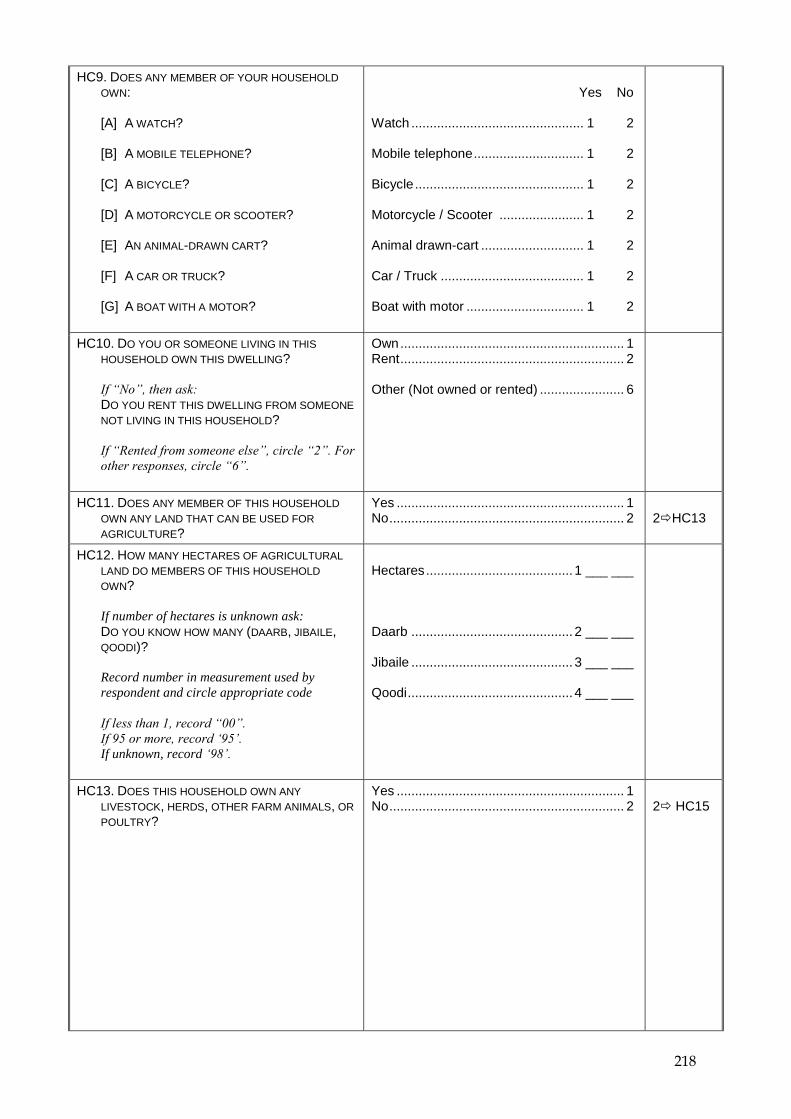
218
HC9. DOES ANY MEMBER OF YOUR HOUSEHOLD
OWN: [A] A WATCH? [B] A MOBILE TELEPHONE? [C] A BICYCLE? [D] A MOTORCYCLE OR SCOOTER? [E] AN ANIMAL-DRAWN CART? [F] A CAR OR TRUCK? [G] A BOAT WITH A MOTOR?
Yes No Watch ............................................... 1 2 Mobile telephone .............................. 1 2 Bicycle .............................................. 1 2 Motorcycle / Scooter ....................... 1 2 Animal drawn-cart ............................ 1 2 Car / Truck ....................................... 1 2 Boat with motor ................................ 1 2
HC10. DO YOU OR SOMEONE LIVING IN THIS
HOUSEHOLD OWN THIS DWELLING? If “No”, then ask:
DO YOU RENT THIS DWELLING FROM SOMEONE
NOT LIVING IN THIS HOUSEHOLD? If “Rented from someone else”, circle “2”. For
other responses, circle “6”.
Own ............................................................. 1 Rent ............................................................. 2 Other (Not owned or rented) ....................... 6
HC11. DOES ANY MEMBER OF THIS HOUSEHOLD
OWN ANY LAND THAT CAN BE USED FOR
AGRICULTURE?
Yes .............................................................. 1 No ................................................................ 2
2HC13
HC12. HOW MANY HECTARES OF AGRICULTURAL
LAND DO MEMBERS OF THIS HOUSEHOLD
OWN? If number of hectares is unknown ask:
DO YOU KNOW HOW MANY (DAARB, JIBAILE, QOODI)?
Record number in measurement used by
respondent and circle appropriate code
If less than 1, record “00”. If 95 or more, record „95‟.
If unknown, record „98‟.
Hectares ........................................ 1 ___ ___ Daarb ............................................ 2 ___ ___ Jibaile ............................................ 3 ___ ___ Qoodi ............................................. 4 ___ ___
HC13. DOES THIS HOUSEHOLD OWN ANY
LIVESTOCK, HERDS, OTHER FARM ANIMALS, OR
POULTRY?
Yes .............................................................. 1 No ................................................................ 2
2 HC15

219
HC14. HOW MANY OF THE FOLLOWING ANIMALS
DOES THIS HOUSEHOLD HAVE? [A] CATTLE, MILK COWS, OR BULLS? [B] HORSES, DONKEYS, OR MULES? [C] GOATS? [D] SHEEP? [E] CHICKENS? [G] CAMELS?
If none, record „00‟.
If 95 or more, record „95‟.
If unknown, record „98‟.
Cattle, milk cows, or bulls ................ ___ ___ Horses, donkeys, or mules .............. ___ ___ Goats ................................................ ___ ___ Sheep ............................................... ___ ___ Chickens .......................................... ___ ___ Camels ............................................. ___ ___
HC15. DOES ANY MEMBER OF THIS HOUSEHOLD
HAVE A BANK ACCOUNT?
Yes .............................................................. 1 No ................................................................ 2

220
INSECTICIDE TREATED NETS TN
TN1. DOES YOUR HOUSEHOLD HAVE ANY
MOSQUITO NETS THAT CAN BE USED WHILE
SLEEPING?
Yes .............................................................. 1 No ................................................................ 2
2Next Module
TN2. HOW MANY MOSQUITO NETS DOES YOUR
HOUSEHOLD HAVE?
Number of nets ................................. ___ ___
TN3. Ask the respondent to show you the nets in the household. If more than 3 nets, use additional questionnaire(s).
1st Net 2
nd Net 3
rd Net
TN4. Mosquito net observed? Observed ........................ 1 Not observed ................... 2
Observed ......................... 1 Not observed ................... 2
Observed ........................ 1 Not observed .................. 2
TN5. Observe or ask the
brand/type of mosquito
net
If brand is unknown and
you cannot observe the
net, show pictures of
typical net types/brands
to respondent
Long-lasting treated nets Permnet .................... 11 Netprotect ................. 12 Olyset ....................... 13 Badbaado ................. 14 Daawa…………… …15 Other (specify) _____ 16
DK brand .................. 18 Pre-treated nets Other(specify) _____ 26
DK brand .................. 28 Other net Other (specify) ______ 31
DK brand / type ............. 98
Long-lasting treated nets Permnet .................... 11 Netprotect ................. 12 Olyset ........................ 13 Badbaado.................. 14 Daawa………… 15 Other (specify) _____ 16
DK brand ................... 18 Pre-treated nets Other(specify) ______ 26
DK brand ................... 28 Other net Other (specify) ______ 31
DK brand / type ............. 98
Long-lasting treated nets Permnet .................... 11 Netprotect ................. 12 Olyset ....................... 13 Badbaado ................. 14 Daawa……………. …15 Other (specify) _____ 16
DK brand .................. 18 Pre-treated nets Other(specify) ______ 26
DK brand .................. 28 Other net Other (specify) ______ 31
DK brand / type ............. 98
TN6. HOW MANY MONTHS
AGO DID YOUR
HOUSEHOLD GET THE
MOSQUITO NET?
If less than one month,
record “00”
Months ago .......... ___ ___ More than 36 mo. ago ... 95 DK / Not sure ................ 98
Months ago .......... ___ ___ More than 36 mo. ago ... 95 DK / Not sure ................. 98
Months ago ...........___ ___ More than 36 mo. ago... 95 DK / Not sure ................ 98
TN7. Check TN5 for type of
net
Long-lasting (11-18) TN11 Pre-treated (26-28) TN9 Else Continue
Long-lasting (11-18) TN11 Pre-treated (26-28) TN9 Else Continue
Long-lasting (11-18) TN11 Pre-treated (26-28) TN9 Else Continue
TN8. WHEN YOU GOT THE
NET, WAS IT ALREADY
TREATED WITH AN
INSECTICIDE TO KILL OR
REPEL MOSQUITOES?
Yes .................................. 1 No ................................... 2 DK / Not sure .................. 8
Yes .................................. 1 No.................................... 2 DK / Not sure ................... 8
Yes ................................. 1 No ................................... 2 DK / Not sure .................. 8
TN9. SINCE YOU GOT THE
NET, WAS IT EVER
SOAKED OR DIPPED IN A
LIQUID TO KILL OR REPEL
MOSQUITOES?
Yes .................................. 1 No ................................... 2 TN11 DK / Not sure .................. 8 TN11
Yes .................................. 1 No.................................... 2 TN11 DK / Not sure ................... 8 TN11
Yes ................................. 1 No ................................... 2 TN11 DK / Not sure .................. 8 TN11
TN10. HOW MANY MONTHS
AGO WAS THE NET LAST
SOAKED OR DIPPED? If less than one month,
record “00”
Months ago .......... ___ ___ More than 24 mo. ago ... 95 DK / Not sure ................ 98
Months ago .......... ___ ___ More than 24 mo. ago ... 95 DK / Not sure ................. 98
Months ago ...........___ ___ More than 24 mo. ago... 95 DK / Not sure ................ 98
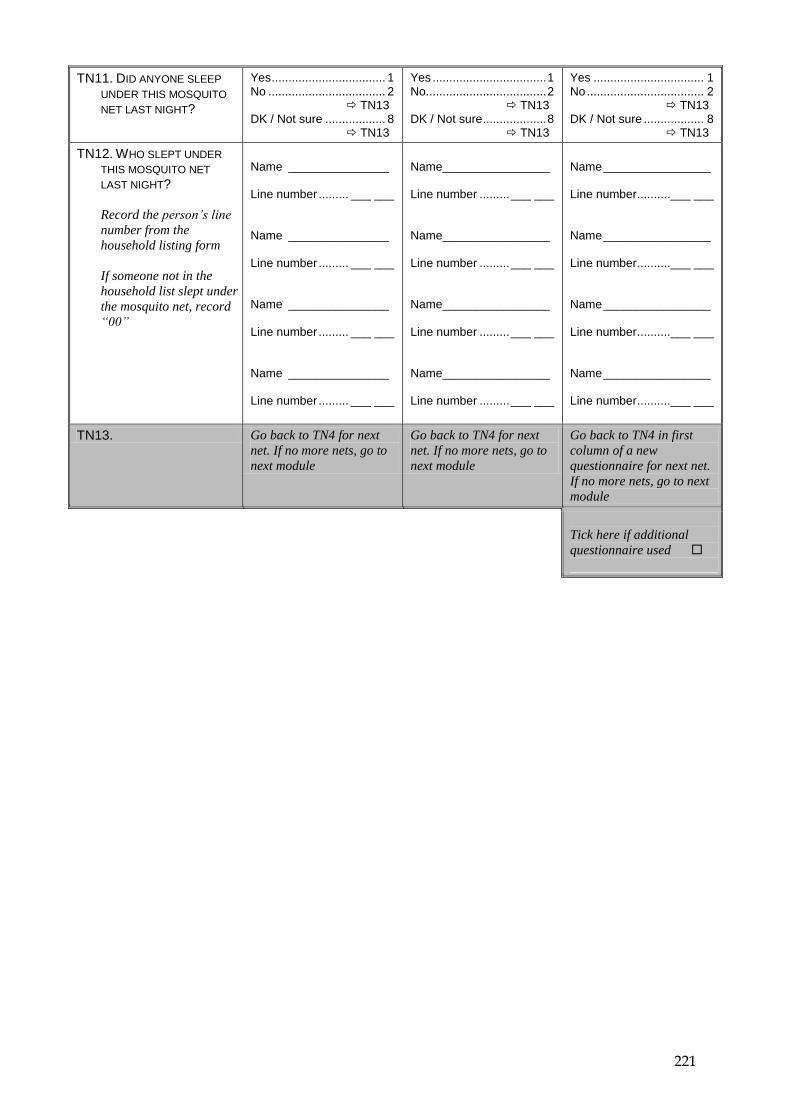
221
TN11. DID ANYONE SLEEP
UNDER THIS MOSQUITO
NET LAST NIGHT?
Yes .................................. 1 No ................................... 2 TN13 DK / Not sure .................. 8 TN13
Yes .................................. 1 No.................................... 2 TN13 DK / Not sure ................... 8 TN13
Yes ................................. 1 No ................................... 2 TN13 DK / Not sure .................. 8 TN13
TN12. WHO SLEPT UNDER
THIS MOSQUITO NET
LAST NIGHT? Record the person‟s line
number from the
household listing form
If someone not in the
household list slept under
the mosquito net, record
“00”
Name _______________ Line number ......... ___ ___ Name _______________ Line number ......... ___ ___ Name _______________ Line number ......... ___ ___ Name _______________ Line number ......... ___ ___
Name ________________ Line number ......... ___ ___ Name ________________ Line number ......... ___ ___ Name ________________ Line number ......... ___ ___ Name ________________ Line number ......... ___ ___
Name ________________ Line number ..........___ ___ Name ________________ Line number ..........___ ___ Name ________________ Line number ..........___ ___ Name ________________ Line number ..........___ ___
TN13. Go back to TN4 for next
net. If no more nets, go to
next module
Go back to TN4 for next
net. If no more nets, go to
next module
Go back to TN4 in first
column of a new
questionnaire for next net.
If no more nets, go to next
module
Tick here if additional
questionnaire used
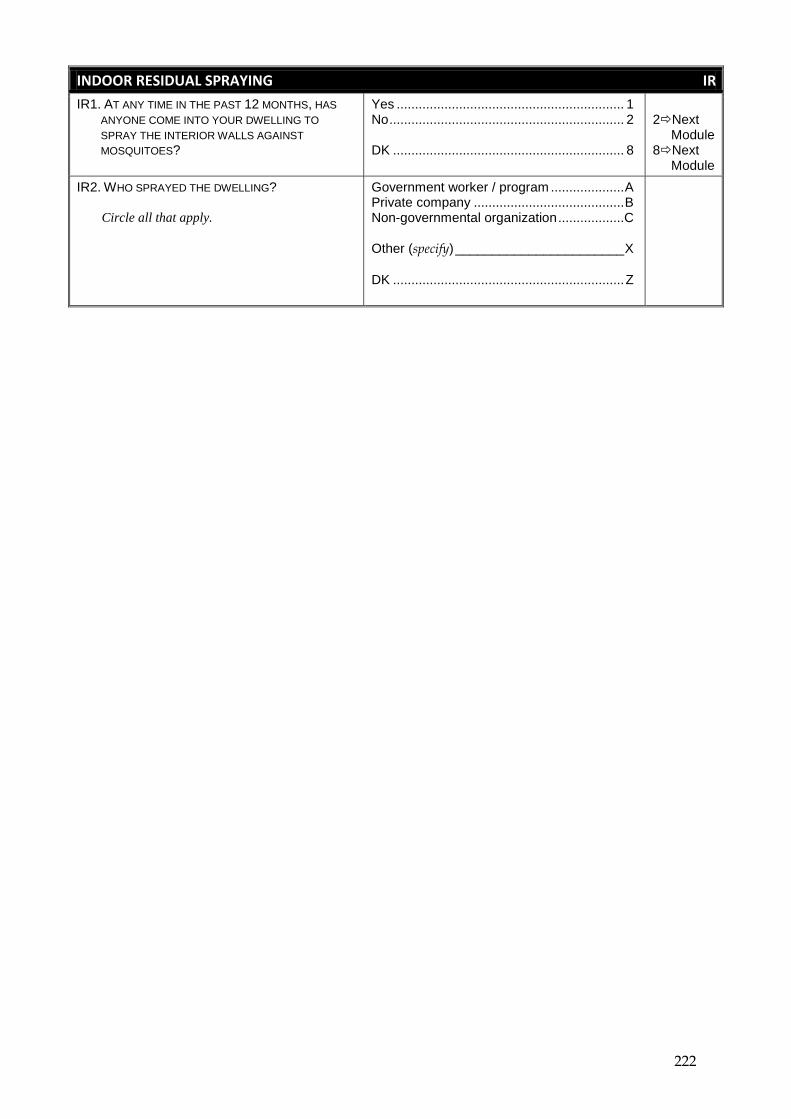
222
INDOOR RESIDUAL SPRAYING IR
IR1. AT ANY TIME IN THE PAST 12 MONTHS, HAS
ANYONE COME INTO YOUR DWELLING TO
SPRAY THE INTERIOR WALLS AGAINST
MOSQUITOES?
Yes .............................................................. 1 No ................................................................ 2 DK ............................................................... 8
2Next Module 8Next Module
IR2. WHO SPRAYED THE DWELLING?
Circle all that apply.
Government worker / program .................... A Private company ......................................... B Non-governmental organization ..................C Other (specify) _______________________ X
DK ............................................................... Z

223
CHILD LABOUR CL To be administered for children in the household age 5-17 years. For household members below age 5 or above age 17, fill-up CL2 and leave the rest of the row blank. NOW I WOULD LIKE TO ASK ABOUT ANY WORK CHILDREN IN THIS HOUSEHOLD MAY DO.
CL1. Line
number
CL2. Name and Age
Copy all household
members from Household Listing Form,
HL2 and HL6
CL3. DURING THE PAST
WEEK, DID (name)
DO ANY KIND OF
WORK FOR
SOMEONE WHO IS
NOT A MEMBER OF
THIS HOUSEHOLD? If yes: FOR PAY IN
CASH OR
KIND? 1 Yes, for pay (cash or kind) 2 Yes, unpaid 3 No CL5
CL4. SINCE LAST (day of the week),
ABOUT HOW MANY
HOURS DID
HE/SHE DO THIS
WORK FOR
SOMEONE WHO IS
NOT A MEMBER
OF THIS
HOUSEHOLD? If more than one
job, include all
hours at all jobs.
CL5. DURING THE PAST
WEEK, DID (name)
FETCH WATER OR
COLLECT
FIREWOOD FOR
HOUSEHOLD USE? 1 Yes 2 No CL7
CL6. SINCE LAST (day of the
week),
ABOUT HOW
MANY HOURS
DID HE/SHE
FETCH WATER
OR COLLECT
FIREWOOD FOR
HOUSEHOLD
USE?
CL7. DURING THE PAST WEEK, DID (name) DO ANY PAID OR
UNPAID WORK ON A FAMILY
FARM OR HERDING
LIVESTOCK OR FISHING OR
IN A FAMILY BUSINESS OR
SELLING GOODS IN THE
STREET? Include work for a business
run by the child, alone or
with one or more partners.
1 Yes 2 No CL9
CL8. SINCE LAST (day of the
week),
ABOUT HOW
MANY HOURS
DID HE/SHE DO
THIS WORK
FOR HIS/HER
FAMILY OR
HIMSELF/ HERSELF?
CL9. DURING THE PAST
WEEK, DID (name)
HELP WITH
HOUSEHOLD CHORES
SUCH AS SHOPPING, CLEANING, WASHING
CLOTHES, COOKING; OR CARING FOR
CHILDREN, OLD OR
SICK PEOPLE? 1 Yes 2 No Next Line
CL10. SINCE LAST (day of the
week),
ABOUT HOW
MANY HOURS
DID HE/SHE
SPEND DOING
THESE
CHORES?
Yes No Number Number Number Number Line Name Age Paid Unpaid of hours Yes No of hours Yes No of hours Yes No of hours
01 __ __ 1 2 3 ____ ____ 1 2 ____ ____ 1 2 ____ ____ 1 2 ____ ____
02 __ __ 1 2 3 ____ ____ 1 2 ____ ____ 1 2 ____ ____ 1 2 ____ ____
03 __ __ 1 2 3 ____ ____ 1 2 ____ ____ 1 2 ____ ____ 1 2 ____ ____
04 __ __ 1 2 3 ____ ____ 1 2 ____ ____ 1 2 ____ ____ 1 2 ____ ____
05 __ __ 1 2 3 ____ ____ 1 2 ____ ____ 1 2 ____ ____ 1 2 ____ ____
06 __ __ 1 2 3 ____ ____ 1 2 ____ ____ 1 2 ____ ____ 1 2 ____ ____
07 __ __ 1 2 3 ____ ____ 1 2 ____ ____ 1 2 ____ ____ 1 2 ____ ____
08 __ __ 1 2 3 ____ ____ 1 2 ____ ____ 1 2 ____ ____ 1 2 ____ ____
09 __ __ 1 2 3 ____ ____ 1 2 ____ ____ 1 2 ____ ____ 1 2 ____ ____
10 __ __ 1 2 3 ____ ____ 1 2 ____ ____ 1 2 ____ ____ 1 2 ____ ____
11 __ __ 1 2 3 ____ ____ 1 2 ____ ____ 1 2 ____ ____ 1 2 ____ ____
12 __ __ 1 2 3 ____ ____ 1 2 ____ ____ 1 2 ____ ____ 1 2 ____ ____
13 __ __ 1 2 3 ____ ____ 1 2 ____ ____ 1 2 ____ ____ 1 2 ____ ____
14 __ __ 1 2 3 ____ ____ 1 2 ____ ____ 1 2 ____ ____ 1 2 ____ ____
15 __ __ 1 2 3 ____ ____ 1 2 ____ ____ 1 2 ____ ____ 1 2 ____ ____
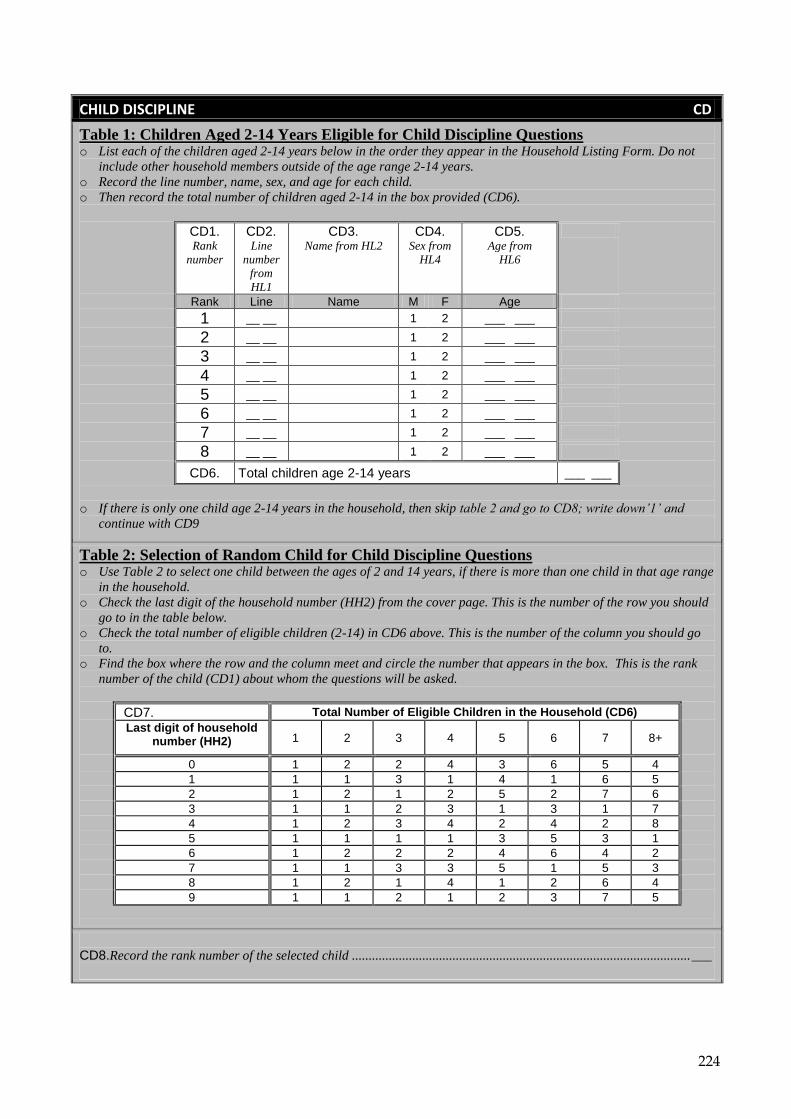
224
CHILD DISCIPLINE CD
Table 1: Children Aged 2-14 Years Eligible for Child Discipline Questions o List each of the children aged 2-14 years below in the order they appear in the Household Listing Form. Do not
include other household members outside of the age range 2-14 years.
o Record the line number, name, sex, and age for each child.
o Then record the total number of children aged 2-14 in the box provided (CD6).
CD1. Rank
number
CD2. Line
number
from
HL1
CD3. Name from HL2
CD4. Sex from
HL4
CD5. Age from
HL6
Rank Line Name M F Age
1 __ __ 1 2 ___ ___
2 __ __ 1 2 ___ ___
3 __ __ 1 2 ___ ___
4 __ __ 1 2 ___ ___
5 __ __ 1 2 ___ ___
6 __ __ 1 2 ___ ___
7 __ __ 1 2 ___ ___
8 __ __ 1 2 ___ ___
CD6. Total children age 2-14 years ___ ___
o If there is only one child age 2-14 years in the household, then skip table 2 and go to CD8; write down‟1‟ and
continue with CD9
Table 2: Selection of Random Child for Child Discipline Questions o Use Table 2 to select one child between the ages of 2 and 14 years, if there is more than one child in that age range
in the household.
o Check the last digit of the household number (HH2) from the cover page. This is the number of the row you should
go to in the table below.
o Check the total number of eligible children (2-14) in CD6 above. This is the number of the column you should go
to.
o Find the box where the row and the column meet and circle the number that appears in the box. This is the rank
number of the child (CD1) about whom the questions will be asked.
CD7. Total Number of Eligible Children in the Household (CD6)
Last digit of household number (HH2) 1 2 3 4 5 6 7 8+
0 1 2 2 4 3 6 5 4
1 1 1 3 1 4 1 6 5
2 1 2 1 2 5 2 7 6
3 1 1 2 3 1 3 1 7
4 1 2 3 4 2 4 2 8
5 1 1 1 1 3 5 3 1
6 1 2 2 2 4 6 4 2
7 1 1 3 3 5 1 5 3
8 1 2 1 4 1 2 6 4
9 1 1 2 1 2 3 7 5
CD8.Record the rank number of the selected child ..................................................................................................... ___

225
CD9.Write the name and line number of the
child selected for the module from CD3 and
CD2, based on the rank number in CD8.
Name ______________________________ Line number ........................................ __ __
CD10. ADULTS USE CERTAIN WAYS TO TEACH
CHILDREN THE RIGHT BEHAVIOUR OR TO
ADDRESS A BEHAVIOUR PROBLEM. I WILL
READ VARIOUS METHODS THAT ARE USED
AND I WANT YOU TO TELL ME IF YOU OR
ANYONE ELSE IN YOUR HOUSEHOLD HAS
USED THIS METHOD WITH (name)IN THE
PAST MONTH. CD11. TOOK AWAY PRIVILEGES, FORBADE
SOMETHING (name) LIKED OR DID NOT
ALLOW HIM/HER TO LEAVE HOUSE.
Yes .............................................................. 1 No ................................................................ 2
CD12. EXPLAINED WHY (name)‟S BEHAVIOR
WAS WRONG. Yes .............................................................. 1 No ................................................................ 2
CD13. SHOOK HIM/HER. Yes .............................................................. 1 No ................................................................ 2
CD14. SHOUTED, YELLED AT OR SCREAMED AT
HIM/HER. Yes .............................................................. 1 No ................................................................ 2
CD15. GAVE HIM/HER SOMETHING ELSE TO
DO. Yes .............................................................. 1 No ................................................................ 2
CD16. SPANKED, HIT OR SLAPPED HIM/HER ON
THE BOTTOM WITH BARE HAND. Yes .............................................................. 1 No ................................................................ 2
CD17. HIT HIM/HER ON THE BOTTOM OR
ELSEWHERE ON THE BODY WITH
SOMETHING LIKE A BELT, HAIRBRUSH, STICK OR OTHER HARD OBJECT.
Yes .............................................................. 1 No ................................................................ 2
CD18. CALLED HIM/HER DUMB, LAZY, OR
ANOTHER NAME LIKE THAT. Yes .............................................................. 1 No ................................................................ 2
CD19. HIT OR SLAPPED HIM/HER ON THE FACE, HEAD OR EARS.
Yes .............................................................. 1 No ................................................................ 2
CD20. HIT OR SLAPPED HIM/HER ON THE
HAND, ARM, OR LEG. Yes .............................................................. 1 No ................................................................ 2
CD21. BEAT HIM/HER UP, THAT IS HIT HIM/HER
OVER AND OVER AS HARD AS ONE COULD. Yes .............................................................. 1 No ................................................................ 2
CD22. DO YOU BELIEVE THAT IN ORDER TO
BRING UP, RAISE, OR EDUCATE A CHILD
PROPERLY, THE CHILD NEEDS TO BE
PHYSICALLY PUNISHED?
Yes .............................................................. 1 No ................................................................ 2 Don‟t know / No opinion .............................. 8

226
HANDWASHING HW
HW1. PLEASE SHOW ME WHERE MEMBERS OF
YOUR HOUSEHOLD MOST OFTEN WASH THEIR
HANDS.
Observed ..................................................... 1 Not observed Not in dwelling / plot / yard ...................... 2 No permission to see ............................... 3 Other reason............................................ 6
2 HW4 3 HW4 6 HW4
HW2. Observe presence of water at the specific
place for hand washing
Verify by checking the tap/pump, or basin,
bucket, water container or similar objects for
presence of water
Water is available ........................................ 1 Water is not available .................................. 2
HW3. Record if soap or detergent is present at the
specific place for hand washing.
Circle all that apply.
Skip to HH19 if any soap or detergent code (A,
B, C or D) is circled. If “None” (Y) is circled,
continue with HW4.
Bar soap ..................................................... A Detergent (Powder / Liquid / Paste) ........... B Liquid soap ................................................. C Ash / Mud / Sand ........................................ D None ........................................................... Y
AHH19 BHH19 CHH19 DHH19
HW4. DO YOU HAVE ANY SOAP, DETERGENT OR
ASH IN YOUR HOUSEHOLD FOR WASHING
HANDS?
Yes .............................................................. 1 No ................................................................ 2
2HH19
HW5. COULD YOU PLEASE SHOW IT TO ME?
Record observation. Circle all that apply
Bar soap ..................................................... A Detergent (Powder / Liquid / Paste) ........... B Liquid soap ................................................. C Ash / Mud / Sand ........................................ D Not able / Does not want to show .............. Y

227
HH19. Record the time.
Hour and minutes ..................... __ __ : __ __
HH20. Thank the respondent for his/her cooperation and check the Household Listing Form:
A separate Questionnaire for Individual Women has been issued for each woman age 15-49 years in
the household list (HL7)
A separate Questionnaire for Children Under Five has been issued for each child under age 5 years
in the household list (HL8)
Return to the cover page and make sure that all information is entered, including the number of
eligible women (HH12 and under-5s (HH14)
Make arrangements for the administration of the remaining questionnaire(s) in this household.
___ __

228
Interviewer’s Observations
Field Editor’s Observations
Supervisor’s Observations
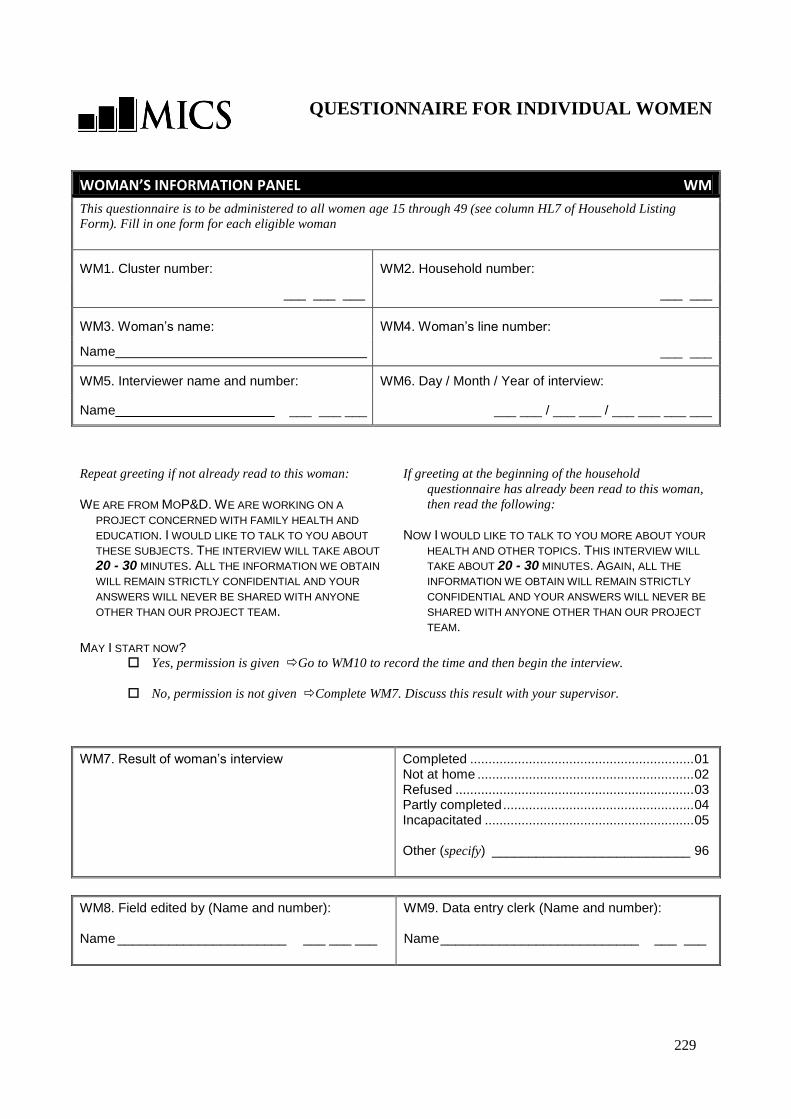
229
QUESTIONNAIRE FOR INDIVIDUAL WOMEN
WOMAN’S INFORMATION PANEL WM
This questionnaire is to be administered to all women age 15 through 49 (see column HL7 of Household Listing
Form). Fill in one form for each eligible woman
WM1. Cluster number: WM2. Household number:
___ ___ ___ ___ ___
WM3. Woman‟s name: WM4. Woman‟s line number:
Name ___ ___
WM5. Interviewer name and number: WM6. Day / Month / Year of interview:
Name ___ ___ ___ ___ ___ / ___ ___ / ___ ___ ___ ___
Repeat greeting if not already read to this woman:
WE ARE FROM MOP&D. WE ARE WORKING ON A
PROJECT CONCERNED WITH FAMILY HEALTH AND
EDUCATION. I WOULD LIKE TO TALK TO YOU ABOUT
THESE SUBJECTS. THE INTERVIEW WILL TAKE ABOUT
20 - 30 MINUTES. ALL THE INFORMATION WE OBTAIN
WILL REMAIN STRICTLY CONFIDENTIAL AND YOUR
ANSWERS WILL NEVER BE SHARED WITH ANYONE
OTHER THAN OUR PROJECT TEAM.
If greeting at the beginning of the household
questionnaire has already been read to this woman,
then read the following:
NOW I WOULD LIKE TO TALK TO YOU MORE ABOUT YOUR
HEALTH AND OTHER TOPICS. THIS INTERVIEW WILL
TAKE ABOUT 20 - 30 MINUTES. AGAIN, ALL THE
INFORMATION WE OBTAIN WILL REMAIN STRICTLY
CONFIDENTIAL AND YOUR ANSWERS WILL NEVER BE
SHARED WITH ANYONE OTHER THAN OUR PROJECT
TEAM.
MAY I START NOW? Yes, permission is given Go to WM10 to record the time and then begin the interview.
No, permission is not given Complete WM7. Discuss this result with your supervisor.
WM7. Result of woman‟s interview Completed ............................................................. 01 Not at home ........................................................... 02 Refused ................................................................. 03 Partly completed .................................................... 04 Incapacitated ......................................................... 05 Other (specify) ___________________________ 96
WM8. Field edited by (Name and number): Name _______________________ ___ ___ ___
WM9. Data entry clerk (Name and number): Name ___________________________ ___ ___
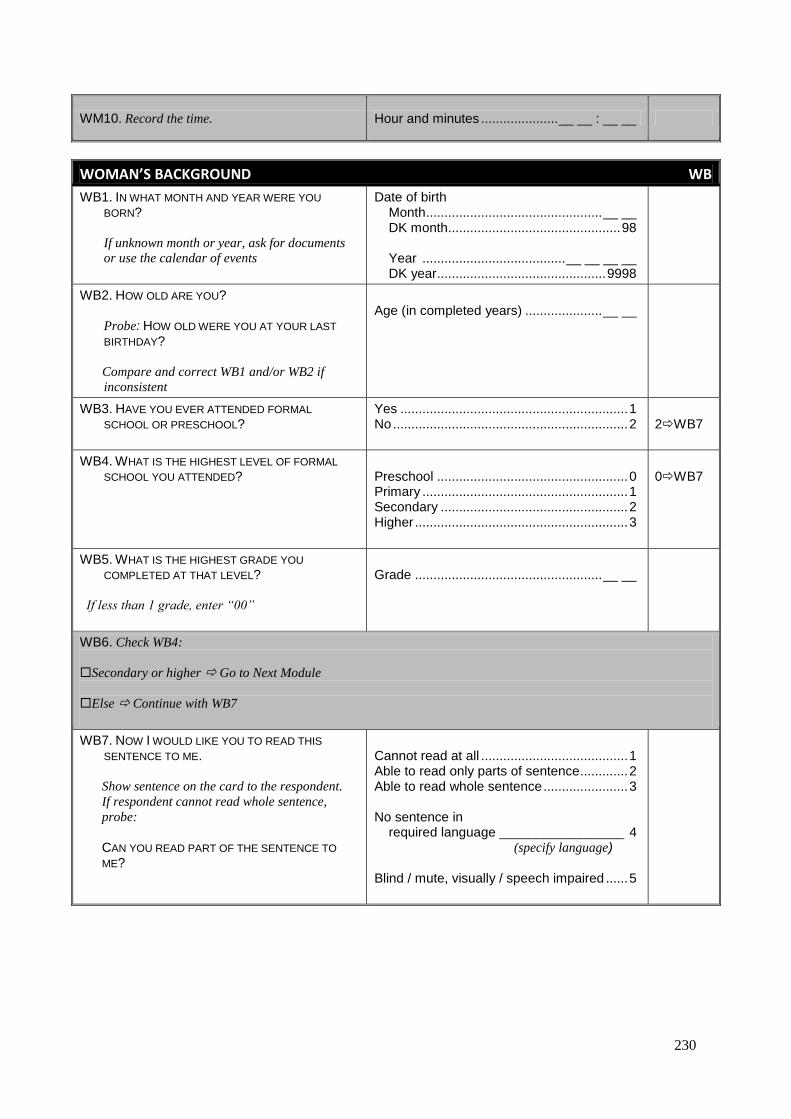
230
WM10. Record the time. Hour and minutes ..................... __ __ : __ __
WOMAN’S BACKGROUND WB
WB1. IN WHAT MONTH AND YEAR WERE YOU
BORN?
If unknown month or year, ask for documents
or use the calendar of events
Date of birth Month ................................................ __ __
DK month............................................... 98 Year ....................................... __ __ __ __ DK year .............................................. 9998
WB2. HOW OLD ARE YOU? Probe: HOW OLD WERE YOU AT YOUR LAST
BIRTHDAY?
Compare and correct WB1 and/or WB2 if
inconsistent
Age (in completed years) ..................... __ __
WB3. HAVE YOU EVER ATTENDED FORMAL
SCHOOL OR PRESCHOOL?
Yes .............................................................. 1 No ................................................................ 2
2WB7
WB4. WHAT IS THE HIGHEST LEVEL OF FORMAL
SCHOOL YOU ATTENDED?
Preschool .................................................... 0 Primary ........................................................ 1 Secondary ................................................... 2 Higher .......................................................... 3
0WB7
WB5. WHAT IS THE HIGHEST GRADE YOU
COMPLETED AT THAT LEVEL? If less than 1 grade, enter “00”
Grade ................................................... __ __
WB6. Check WB4:
Secondary or higher Go to Next Module
Else Continue with WB7
WB7. NOW I WOULD LIKE YOU TO READ THIS
SENTENCE TO ME.
Show sentence on the card to the respondent.
If respondent cannot read whole sentence,
probe:
CAN YOU READ PART OF THE SENTENCE TO
ME?
Cannot read at all ........................................ 1 Able to read only parts of sentence ............. 2 Able to read whole sentence ....................... 3 No sentence in required language _________________ 4 (specify language)
Blind / mute, visually / speech impaired ...... 5

231
ACCESS TO MASS MEDIA AND USE OF INFORMATION/COMMUNICATION TECHNOLOGY MT
MT1. Check WB7:
Question left blank (Respondent has secondary or higher education) Continue with MT2
Able to read or no sentence in required language (codes 2, 3 or 4) Continue with MT2
Cannot read at all or blind (codes 1 or 5) Go to MT3
MT2. HOW OFTEN DO YOU READ A NEWSPAPER
OR MAGAZINE: ALMOST EVERY DAY, AT LEAST
ONCE A WEEK, LESS THAN ONCE A WEEK OR
NOT AT ALL?
Almost every day ........................................ 1 At least once a week ................................... 2 Less than once a week ............................... 3 Not at all ...................................................... 4
MT3. DO YOU LISTEN TO THE RADIO ALMOST
EVERY DAY, AT LEAST ONCE A WEEK, LESS
THAN ONCE A WEEK OR NOT AT ALL?
Almost every day ........................................ 1 At least once a week ................................... 2 Less than once a week ............................... 3 Not at all ...................................................... 4
MT4. HOW OFTEN DO YOU WATCH TELEVISION: WOULD YOU SAY THAT YOU WATCH ALMOST
EVERY DAY, AT LEAST ONCE A WEEK, LESS
THAN ONCE A WEEK OR NOT AT ALL?
Almost every day ........................................ 1 At least once a week ................................... 2 Less than once a week ............................... 3 Not at all ...................................................... 4
MT5. Check WB2: Age of respondent 15-24 years?
Yes, age 15-24 Continue with MT6 No, age 25-49 Go to Next Module
MT6. HAVE YOU EVER USED A COMPUTER? Yes .............................................................. 1 No ............................................................... 2
2MT9
MT7. HAVE YOU USED A COMPUTER FROM ANY
LOCATION IN THE LAST 12 MONTHS?
Yes .............................................................. 1 No ............................................................... 2
2MT9
MT8. DURING THE LAST ONE MONTH, HOW
OFTEN DID YOU USE A COMPUTER: ALMOST
EVERY DAY, AT LEAST ONCE A WEEK, LESS
THAN ONCE A WEEK OR NOT AT ALL?
Almost every day ........................................ 1 At least once a week ................................... 2 Less than once a week ............................... 3 Not at all ...................................................... 4
MT9. HAVE YOU EVER USED THE INTERNET? Yes .............................................................. 1 No ............................................................... 2
2Next Module
MT10. IN THE LAST 12 MONTHS, HAVE YOU USED
THE INTERNET?
If necessary, probe for use from any location,
with any device.
Yes .............................................................. 1 No ............................................................... 2
2Next Module
MT11. DURING THE LAST ONE MONTH, HOW
OFTEN DID YOU USE THE INTERNET: ALMOST
EVERY DAY, AT LEAST ONCE A WEEK, LESS
THAN ONCE A WEEK OR NOT AT ALL?
Almost every day ........................................ 1 At least once a week ................................... 2 Less than once a week ............................... 3 Not at all ...................................................... 4
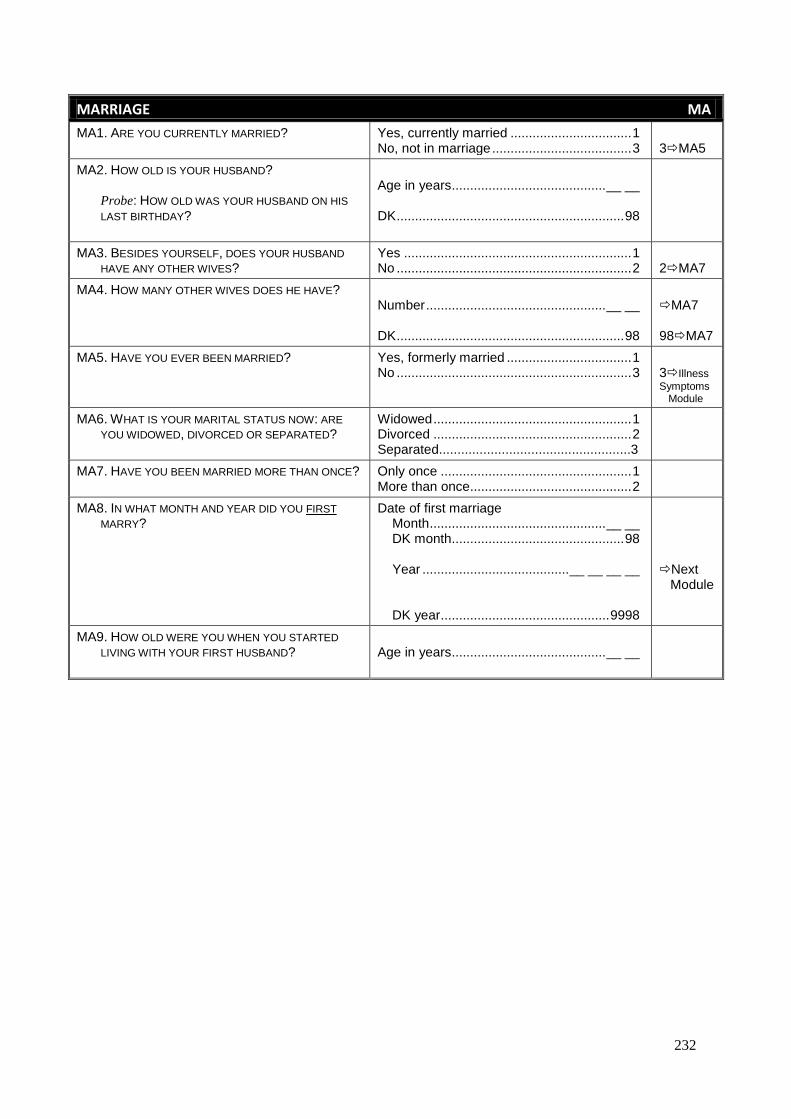
232
MARRIAGE MA
MA1. ARE YOU CURRENTLY MARRIED? Yes, currently married ................................. 1 No, not in marriage ...................................... 3
3MA5
MA2. HOW OLD IS YOUR HUSBAND? Probe: HOW OLD WAS YOUR HUSBAND ON HIS
LAST BIRTHDAY?
Age in years .......................................... __ __ DK .............................................................. 98
MA3. BESIDES YOURSELF, DOES YOUR HUSBAND
HAVE ANY OTHER WIVES? Yes .............................................................. 1 No ................................................................ 2
2MA7
MA4. HOW MANY OTHER WIVES DOES HE HAVE? Number ................................................. __ __ DK .............................................................. 98
MA7 98MA7
MA5. HAVE YOU EVER BEEN MARRIED? Yes, formerly married .................................. 1 No ................................................................ 3
3Illness
Symptoms Module
MA6. WHAT IS YOUR MARITAL STATUS NOW: ARE
YOU WIDOWED, DIVORCED OR SEPARATED? Widowed ...................................................... 1 Divorced ...................................................... 2 Separated....................................................3
MA7. HAVE YOU BEEN MARRIED MORE THAN ONCE?
Only once .................................................... 1 More than once............................................ 2
MA8. IN WHAT MONTH AND YEAR DID YOU FIRST
MARRY? Date of first marriage Month ................................................ __ __ DK month ............................................... 98 Year ........................................ __ __ __ __ DK year .............................................. 9998
Next Module
MA9. HOW OLD WERE YOU WHEN YOU STARTED
LIVING WITH YOUR FIRST HUSBAND? Age in years .......................................... __ __
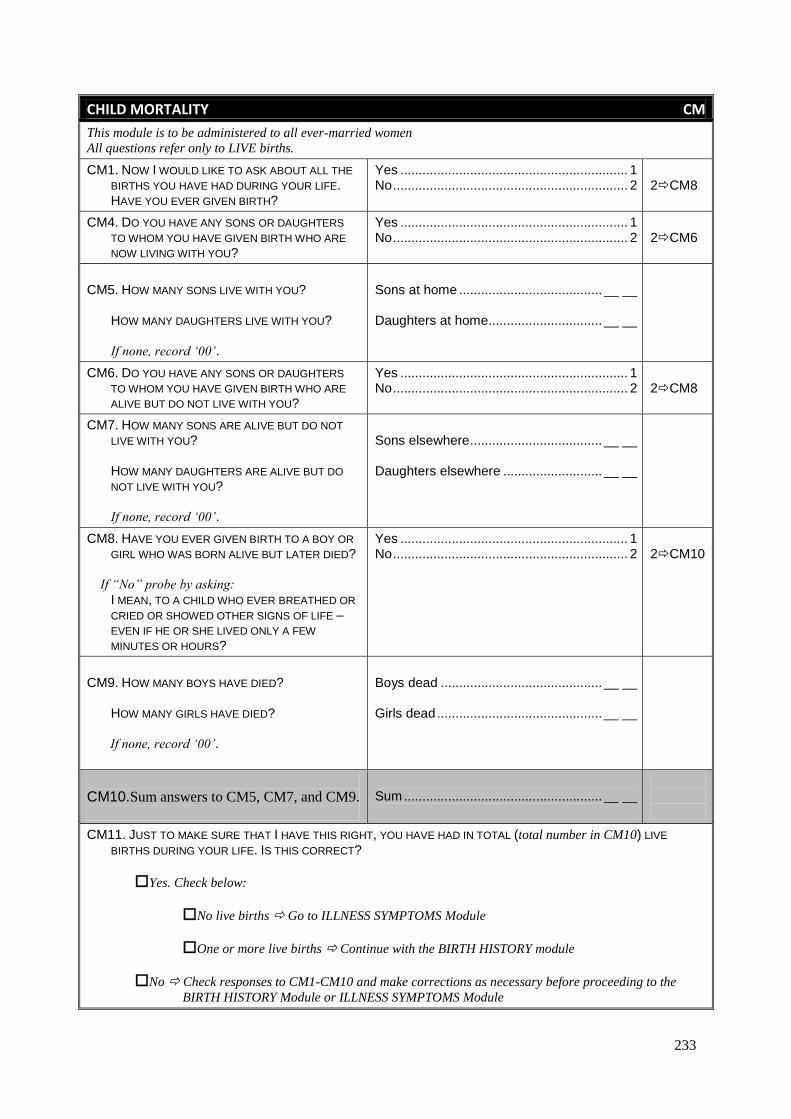
233
CHILD MORTALITY CM
This module is to be administered to all ever-married women
All questions refer only to LIVE births.
CM1. NOW I WOULD LIKE TO ASK ABOUT ALL THE
BIRTHS YOU HAVE HAD DURING YOUR LIFE. HAVE YOU EVER GIVEN BIRTH?
Yes .............................................................. 1 No ................................................................ 2
2CM8
CM4. DO YOU HAVE ANY SONS OR DAUGHTERS
TO WHOM YOU HAVE GIVEN BIRTH WHO ARE
NOW LIVING WITH YOU?
Yes .............................................................. 1 No ................................................................ 2
2CM6
CM5. HOW MANY SONS LIVE WITH YOU?
HOW MANY DAUGHTERS LIVE WITH YOU? If none, record „00‟.
Sons at home ....................................... __ __ Daughters at home ............................... __ __
CM6. DO YOU HAVE ANY SONS OR DAUGHTERS
TO WHOM YOU HAVE GIVEN BIRTH WHO ARE
ALIVE BUT DO NOT LIVE WITH YOU?
Yes .............................................................. 1 No ................................................................ 2
2CM8
CM7. HOW MANY SONS ARE ALIVE BUT DO NOT
LIVE WITH YOU?
HOW MANY DAUGHTERS ARE ALIVE BUT DO
NOT LIVE WITH YOU? If none, record „00‟.
Sons elsewhere .................................... __ __ Daughters elsewhere ........................... __ __
CM8. HAVE YOU EVER GIVEN BIRTH TO A BOY OR
GIRL WHO WAS BORN ALIVE BUT LATER DIED? If “No” probe by asking:
I MEAN, TO A CHILD WHO EVER BREATHED OR
CRIED OR SHOWED OTHER SIGNS OF LIFE –
EVEN IF HE OR SHE LIVED ONLY A FEW
MINUTES OR HOURS?
Yes .............................................................. 1 No ................................................................ 2
2CM10
CM9. HOW MANY BOYS HAVE DIED?
HOW MANY GIRLS HAVE DIED? If none, record „00‟.
Boys dead ............................................ __ __ Girls dead ............................................. __ __
CM10.Sum answers to CM5, CM7, and CM9.
Sum ...................................................... __ __
CM11. JUST TO MAKE SURE THAT I HAVE THIS RIGHT, YOU HAVE HAD IN TOTAL (total number in CM10) LIVE
BIRTHS DURING YOUR LIFE. IS THIS CORRECT?
Yes. Check below:
No live births Go to ILLNESS SYMPTOMS Module
One or more live births Continue with the BIRTH HISTORY module
No Check responses to CM1-CM10 and make corrections as necessary before proceeding to the
BIRTH HISTORY Module or ILLNESS SYMPTOMS Module
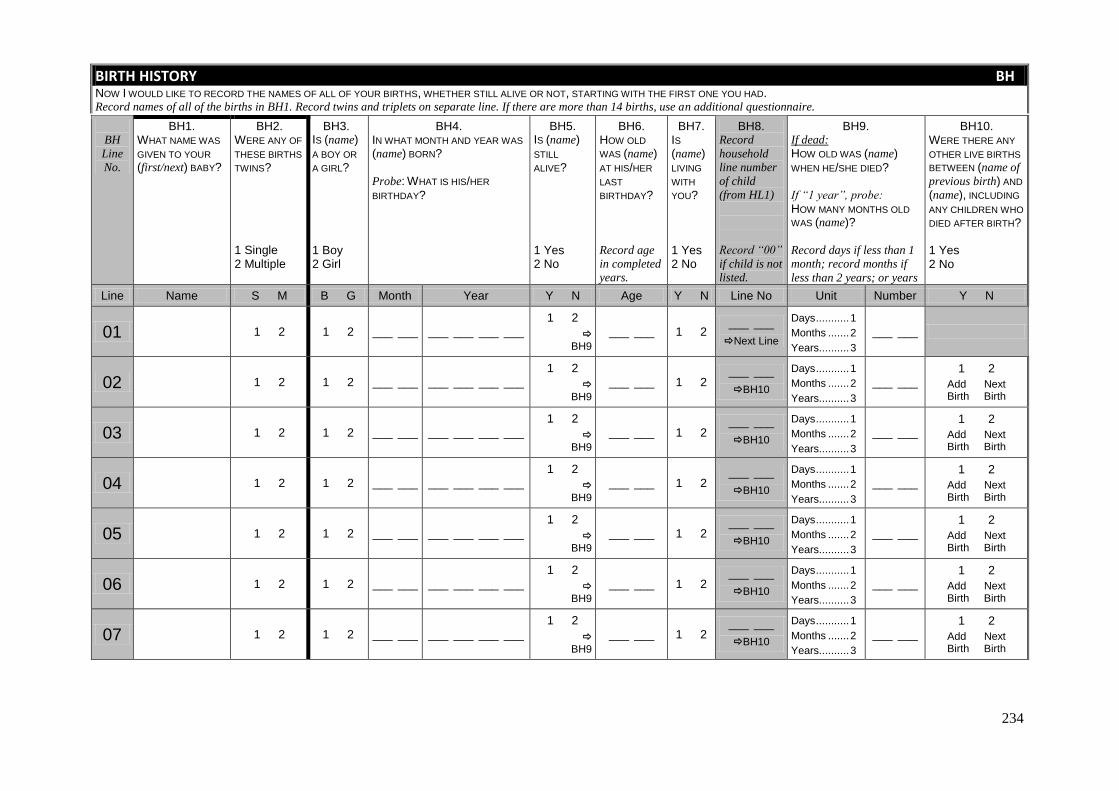
234
BIRTH HISTORY BH NOW I WOULD LIKE TO RECORD THE NAMES OF ALL OF YOUR BIRTHS, WHETHER STILL ALIVE OR NOT, STARTING WITH THE FIRST ONE YOU HAD. Record names of all of the births in BH1. Record twins and triplets on separate line. If there are more than 14 births, use an additional questionnaire.
BH
Line
No.
BH1. WHAT NAME WAS
GIVEN TO YOUR
(first/next) BABY?
BH2. WERE ANY OF
THESE BIRTHS
TWINS? 1 Single 2 Multiple
BH3. IS (name)
A BOY OR
A GIRL? 1 Boy 2 Girl
BH4. IN WHAT MONTH AND YEAR WAS
(name) BORN?
Probe: WHAT IS HIS/HER
BIRTHDAY?
BH5. IS (name)
STILL
ALIVE? 1 Yes 2 No
BH6. HOW OLD
WAS (name)
AT HIS/HER
LAST
BIRTHDAY?
Record age
in completed
years.
BH7. IS
(name)
LIVING
WITH
YOU? 1 Yes 2 No
BH8. Record
household
line number
of child
(from HL1)
Record “00”
if child is not
listed.
BH9. If dead:
HOW OLD WAS (name)
WHEN HE/SHE DIED? If “1 year”, probe:
HOW MANY MONTHS OLD
WAS (name)?
Record days if less than 1
month; record months if
less than 2 years; or years
BH10. WERE THERE ANY
OTHER LIVE BIRTHS
BETWEEN (name of
previous birth) AND
(name), INCLUDING
ANY CHILDREN WHO
DIED AFTER BIRTH? 1 Yes 2 No
Line Name S M B G Month Year Y N Age Y N Line No Unit Number Y N
01 1 2 1 2 ___ ___ ___ ___ ___ ___
1 2
BH9
___ ___ 1 2 ___ ___
Next Line
Days ........... 1
Months ....... 2
Years.......... 3
___ ___
02 1 2 1 2 ___ ___ ___ ___ ___ ___
1 2
BH9
___ ___ 1 2 ___ ___
BH10
Days ........... 1
Months ....... 2
Years.......... 3
___ ___ 1 2
Add Next Birth Birth
03 1 2 1 2 ___ ___ ___ ___ ___ ___
1 2
BH9
___ ___ 1 2 ___ ___
BH10
Days ........... 1
Months ....... 2
Years.......... 3
___ ___ 1 2
Add Next Birth Birth
04 1 2 1 2 ___ ___ ___ ___ ___ ___
1 2
BH9
___ ___ 1 2 ___ ___
BH10
Days ........... 1
Months ....... 2
Years.......... 3
___ ___ 1 2
Add Next Birth Birth
05 1 2 1 2 ___ ___ ___ ___ ___ ___
1 2
BH9
___ ___ 1 2 ___ ___
BH10
Days ........... 1
Months ....... 2
Years.......... 3
___ ___ 1 2
Add Next Birth Birth
06 1 2 1 2 ___ ___ ___ ___ ___ ___
1 2
BH9
___ ___ 1 2 ___ ___
BH10
Days ........... 1
Months ....... 2
Years.......... 3
___ ___ 1 2
Add Next Birth Birth
07 1 2 1 2 ___ ___ ___ ___ ___ ___
1 2
BH9
___ ___ 1 2 ___ ___
BH10
Days ........... 1
Months ....... 2
Years.......... 3
___ ___ 1 2
Add Next Birth Birth
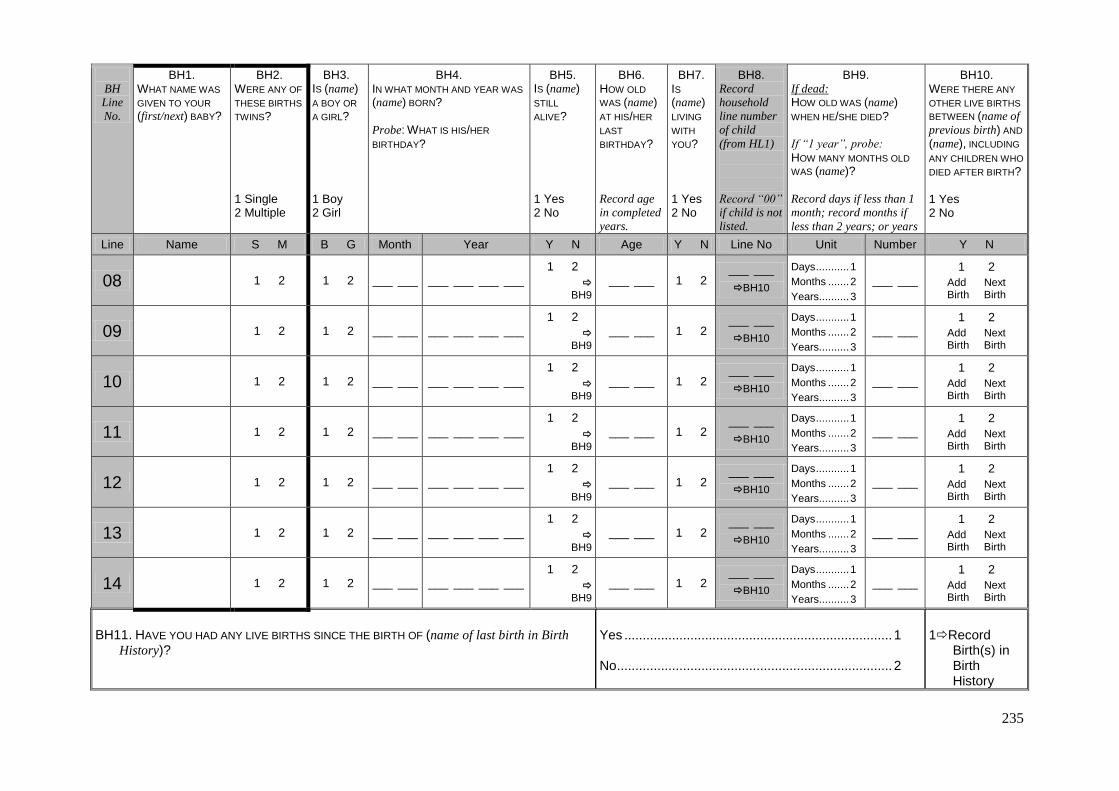
235
BH
Line
No.
BH1. WHAT NAME WAS
GIVEN TO YOUR
(first/next) BABY?
BH2. WERE ANY OF
THESE BIRTHS
TWINS? 1 Single 2 Multiple
BH3. IS (name)
A BOY OR
A GIRL? 1 Boy 2 Girl
BH4. IN WHAT MONTH AND YEAR WAS
(name) BORN?
Probe: WHAT IS HIS/HER
BIRTHDAY?
BH5. IS (name)
STILL
ALIVE? 1 Yes 2 No
BH6. HOW OLD
WAS (name)
AT HIS/HER
LAST
BIRTHDAY?
Record age
in completed
years.
BH7. IS
(name)
LIVING
WITH
YOU? 1 Yes 2 No
BH8. Record
household
line number
of child
(from HL1)
Record “00”
if child is not
listed.
BH9. If dead:
HOW OLD WAS (name)
WHEN HE/SHE DIED? If “1 year”, probe:
HOW MANY MONTHS OLD
WAS (name)?
Record days if less than 1
month; record months if
less than 2 years; or years
BH10. WERE THERE ANY
OTHER LIVE BIRTHS
BETWEEN (name of
previous birth) AND
(name), INCLUDING
ANY CHILDREN WHO
DIED AFTER BIRTH? 1 Yes 2 No
Line Name S M B G Month Year Y N Age Y N Line No Unit Number Y N
08 1 2 1 2 ___ ___ ___ ___ ___ ___
1 2
BH9
___ ___ 1 2 ___ ___
BH10
Days ........... 1
Months ....... 2
Years.......... 3
___ ___ 1 2
Add Next Birth Birth
09 1 2 1 2 ___ ___ ___ ___ ___ ___
1 2
BH9
___ ___ 1 2 ___ ___
BH10
Days ........... 1
Months ....... 2
Years.......... 3
___ ___ 1 2
Add Next Birth Birth
10 1 2 1 2 ___ ___ ___ ___ ___ ___
1 2
BH9
___ ___ 1 2 ___ ___
BH10
Days ........... 1
Months ....... 2
Years.......... 3
___ ___ 1 2
Add Next Birth Birth
11 1 2 1 2 ___ ___ ___ ___ ___ ___
1 2
BH9
___ ___ 1 2 ___ ___
BH10
Days ........... 1
Months ....... 2
Years.......... 3
___ ___ 1 2
Add Next Birth Birth
12 1 2 1 2 ___ ___ ___ ___ ___ ___
1 2
BH9
___ ___ 1 2 ___ ___
BH10
Days ........... 1
Months ....... 2
Years.......... 3
___ ___ 1 2
Add Next Birth Birth
13 1 2 1 2 ___ ___ ___ ___ ___ ___
1 2
BH9
___ ___ 1 2 ___ ___
BH10
Days ........... 1
Months ....... 2
Years.......... 3
___ ___ 1 2
Add Next Birth Birth
14 1 2 1 2 ___ ___ ___ ___ ___ ___ 1 2
BH9
___ ___ 1 2 ___ ___
BH10
Days ........... 1
Months ....... 2
Years.......... 3
___ ___ 1 2
Add Next Birth Birth
BH11. HAVE YOU HAD ANY LIVE BIRTHS SINCE THE BIRTH OF (name of last birth in Birth
History)?
Yes ......................................................................... 1 No ........................................................................... 2
1Record
Birth(s) in Birth History
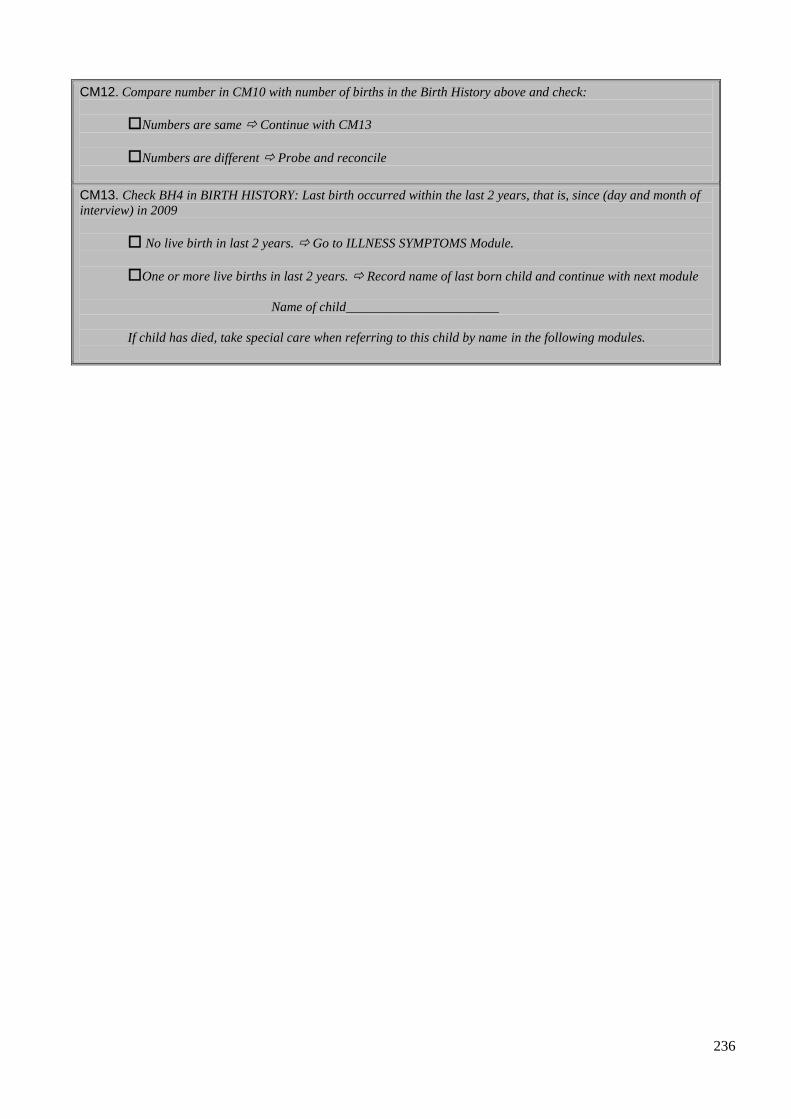
236
CM12. Compare number in CM10 with number of births in the Birth History above and check:
Numbers are same Continue with CM13
Numbers are different Probe and reconcile
CM13. Check BH4 in BIRTH HISTORY: Last birth occurred within the last 2 years, that is, since (day and month of
interview) in 2009
No live birth in last 2 years. Go to ILLNESS SYMPTOMS Module.
One or more live births in last 2 years. Record name of last born child and continue with next module
Name of child_______________________
If child has died, take special care when referring to this child by name in the following modules.
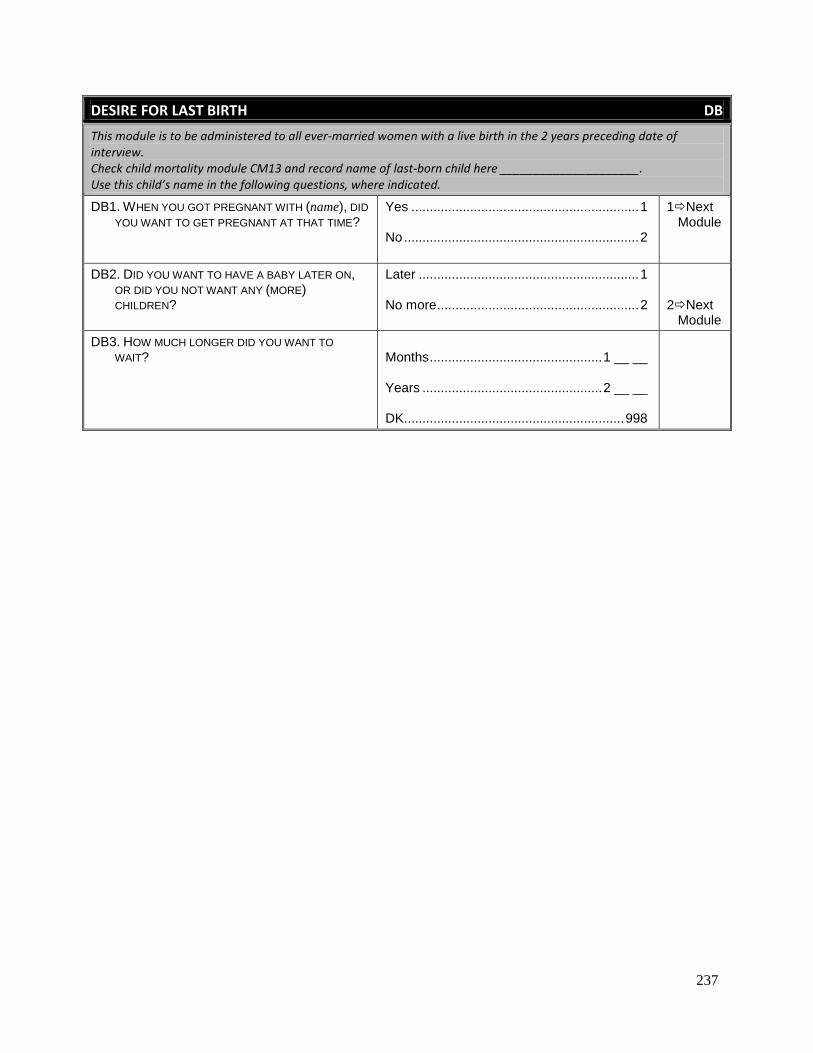
237
DESIRE FOR LAST BIRTH DB
This module is to be administered to all ever-married women with a live birth in the 2 years preceding date of interview. Check child mortality module CM13 and record name of last-born child here _____________________. Use this child’s name in the following questions, where indicated.
DB1. WHEN YOU GOT PREGNANT WITH (name), DID
YOU WANT TO GET PREGNANT AT THAT TIME? Yes .............................................................. 1 No ................................................................ 2
1Next Module
DB2. DID YOU WANT TO HAVE A BABY LATER ON, OR DID YOU NOT WANT ANY (MORE) CHILDREN?
Later ............................................................ 1 No more ....................................................... 2
2Next Module
DB3. HOW MUCH LONGER DID YOU WANT TO
WAIT? Months ............................................... 1 __ __ Years ................................................. 2 __ __ DK............................................................ 998
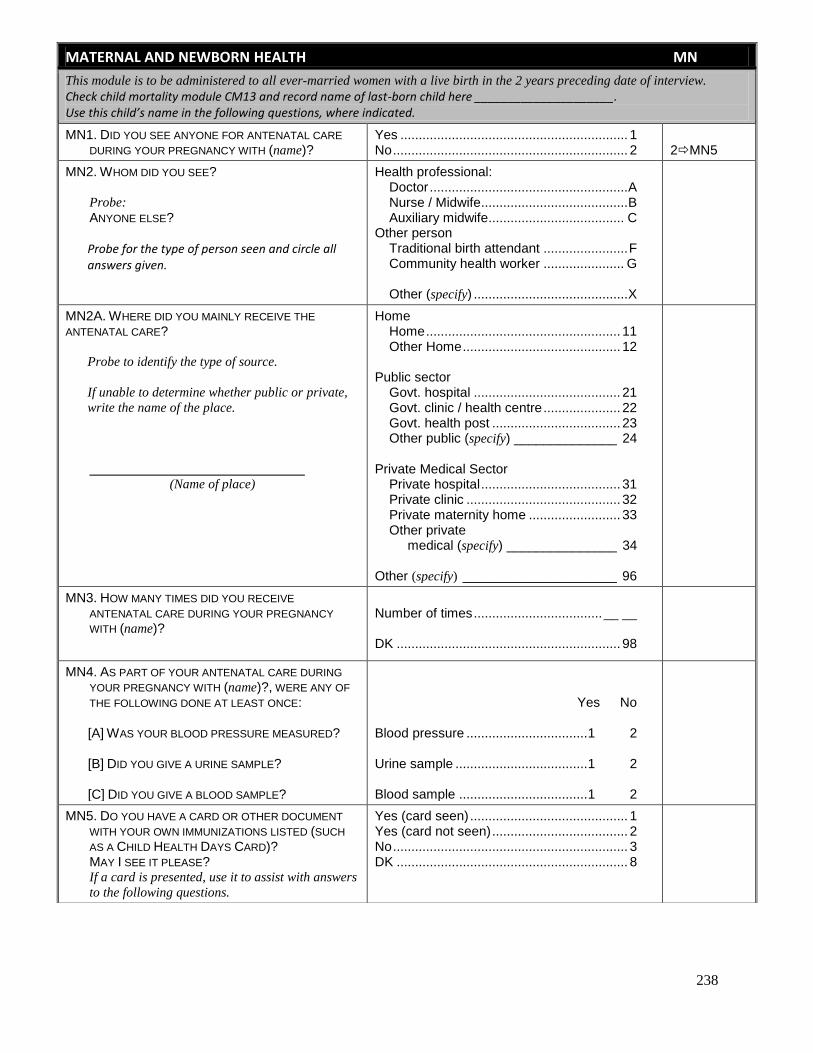
238
MATERNAL AND NEWBORN HEALTH MN
This module is to be administered to all ever-married women with a live birth in the 2 years preceding date of interview. Check child mortality module CM13 and record name of last-born child here _____________________. Use this child’s name in the following questions, where indicated.
MN1. DID YOU SEE ANYONE FOR ANTENATAL CARE
DURING YOUR PREGNANCY WITH (name)? Yes .............................................................. 1 No ................................................................ 2
2MN5
MN2. WHOM DID YOU SEE? Probe:
ANYONE ELSE?
Probe for the type of person seen and circle all answers given.
Health professional: Doctor ...................................................... A Nurse / Midwife ........................................ B Auxiliary midwife..................................... C
Other person Traditional birth attendant ....................... F Community health worker ...................... G Other (specify) .......................................... X
MN2A. WHERE DID YOU MAINLY RECEIVE THE
ANTENATAL CARE?
Probe to identify the type of source.
If unable to determine whether public or private,
write the name of the place.
(Name of place)
Home Home ..................................................... 11 Other Home ........................................... 12 Public sector Govt. hospital ........................................ 21 Govt. clinic / health centre ..................... 22 Govt. health post ................................... 23 Other public (specify) ______________ 24 Private Medical Sector Private hospital ...................................... 31 Private clinic .......................................... 32 Private maternity home ......................... 33 Other private medical (specify) _______________ 34 Other (specify) _____________________ 96
MN3. HOW MANY TIMES DID YOU RECEIVE
ANTENATAL CARE DURING YOUR PREGNANCY
WITH (name)?
Number of times ................................... __ __ DK ............................................................. 98
MN4. AS PART OF YOUR ANTENATAL CARE DURING
YOUR PREGNANCY WITH (name)?, WERE ANY OF
THE FOLLOWING DONE AT LEAST ONCE: [A] WAS YOUR BLOOD PRESSURE MEASURED? [B] DID YOU GIVE A URINE SAMPLE? [C] DID YOU GIVE A BLOOD SAMPLE?
Yes No Blood pressure ................................. 1 2 Urine sample .................................... 1 2 Blood sample ................................... 1 2
MN5. DO YOU HAVE A CARD OR OTHER DOCUMENT
WITH YOUR OWN IMMUNIZATIONS LISTED (SUCH
AS A CHILD HEALTH DAYS CARD)? MAY I SEE IT PLEASE?
If a card is presented, use it to assist with answers
to the following questions.
Yes (card seen) ........................................... 1 Yes (card not seen) ..................................... 2 No ................................................................ 3 DK ............................................................... 8
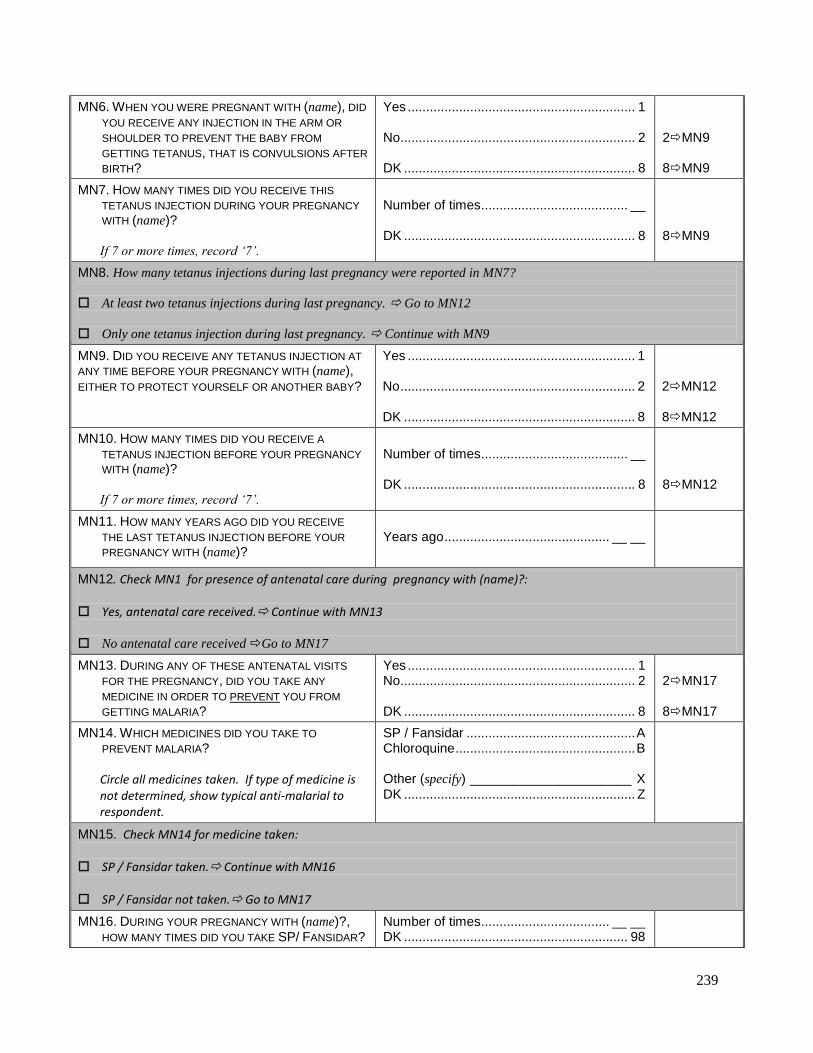
239
MN6. WHEN YOU WERE PREGNANT WITH (name), DID
YOU RECEIVE ANY INJECTION IN THE ARM OR
SHOULDER TO PREVENT THE BABY FROM
GETTING TETANUS, THAT IS CONVULSIONS AFTER
BIRTH?
Yes .............................................................. 1 No................................................................ 2 DK ............................................................... 8
2MN9 8MN9
MN7. HOW MANY TIMES DID YOU RECEIVE THIS
TETANUS INJECTION DURING YOUR PREGNANCY
WITH (name)?
If 7 or more times, record „7‟.
Number of times ........................................ __ DK ............................................................... 8
8MN9
MN8. How many tetanus injections during last pregnancy were reported in MN7?
At least two tetanus injections during last pregnancy. Go to MN12
Only one tetanus injection during last pregnancy. Continue with MN9
MN9. DID YOU RECEIVE ANY TETANUS INJECTION AT
ANY TIME BEFORE YOUR PREGNANCY WITH (name),
EITHER TO PROTECT YOURSELF OR ANOTHER BABY?
Yes .............................................................. 1 No ................................................................ 2 DK ............................................................... 8
2MN12 8MN12
MN10. HOW MANY TIMES DID YOU RECEIVE A
TETANUS INJECTION BEFORE YOUR PREGNANCY
WITH (name)?
If 7 or more times, record „7‟.
Number of times ........................................ __ DK ............................................................... 8
8MN12
MN11. HOW MANY YEARS AGO DID YOU RECEIVE
THE LAST TETANUS INJECTION BEFORE YOUR
PREGNANCY WITH (name)?
Years ago ............................................. __ __
MN12. Check MN1 for presence of antenatal care during pregnancy with (name)?: Yes, antenatal care received. Continue with MN13 No antenatal care received Go to MN17
MN13. DURING ANY OF THESE ANTENATAL VISITS
FOR THE PREGNANCY, DID YOU TAKE ANY
MEDICINE IN ORDER TO PREVENT YOU FROM
GETTING MALARIA?
Yes .............................................................. 1 No................................................................ 2 DK ............................................................... 8
2MN17 8MN17
MN14. WHICH MEDICINES DID YOU TAKE TO
PREVENT MALARIA?
Circle all medicines taken. If type of medicine is not determined, show typical anti-malarial to respondent.
SP / Fansidar .............................................. A Chloroquine ................................................. B Other (specify) ______________________ X DK ............................................................... Z
MN15. Check MN14 for medicine taken: SP / Fansidar taken. Continue with MN16 SP / Fansidar not taken. Go to MN17
MN16. DURING YOUR PREGNANCY WITH (name)?, HOW MANY TIMES DID YOU TAKE SP/ FANSIDAR?
Number of times ................................... __ __ DK ............................................................. 98

240
MN17. WHO ASSISTED WITH THE DELIVERY OF
(name)? Probe:
ANYONE ELSE?
Probe for the type of person assisting and circle all answers given.
If respondent says no one assisted, probe to determine whether any adults were present at the delivery.
Health professional: Doctor ...................................................... A Nurse / Midwife ....................................... B Auxiliary midwife ..................................... C
Other person Traditional birth attendant ....................... F Community health worker ...................... G Relative / Friend ...................................... H Other (specify) ______________________ X No one ........................................................ Y
MN18. WHERE DID YOU GIVE BIRTH TO (name)?
Probe to identify the type of source.
If unable to determine whether public or private,
write the name of the place.
(Name of place)
Home Your home............................................. 11 Other home ........................................... 12 Public sector Govt. hospital ........................................ 21 Govt. clinic / health centre ..................... 22 Govt. health post ................................... 23 Other public (specify) ______________ 26
Private Medical Sector Private hospital ..................................... 31 Private clinic .......................................... 32 Private maternity home ......................... 33 Other private medical (specify) _______________ 36
Other (specify) _____________________ 96
11MN19A 12MN19A 96MN19A
MN19. WAS (name) DELIVERED BY CAESAREAN
SECTION? THAT IS, DID THEY CUT YOUR BELLY
OPEN TO TAKE THE BABY OUT?
Yes .............................................................. 1 No................................................................ 2
MN19A. WHO ADVISED YOU ON WHERE TO GIVE
BIRTH TO (name)? Govt. doctor ................................................ A Govt. health worker ..................................... B Private Doctor ............................................. C Husband ...................................................... D Other relatives ............................................. E Friend(s) ...................................................... F NGO Health worker .................................... G Other (specify) ______________________ X No one / DK ................................................ Y
MN20. WHEN (name) WAS BORN, WAS HE/SHE VERY
LARGE, LARGER THAN AVERAGE, AVERAGE, SMALLER THAN AVERAGE, OR VERY SMALL?
Very large .................................................... 1 Larger than average.................................... 2 Average ....................................................... 3 Smaller than average .................................. 4 Very small ................................................... 5 DK ............................................................... 8
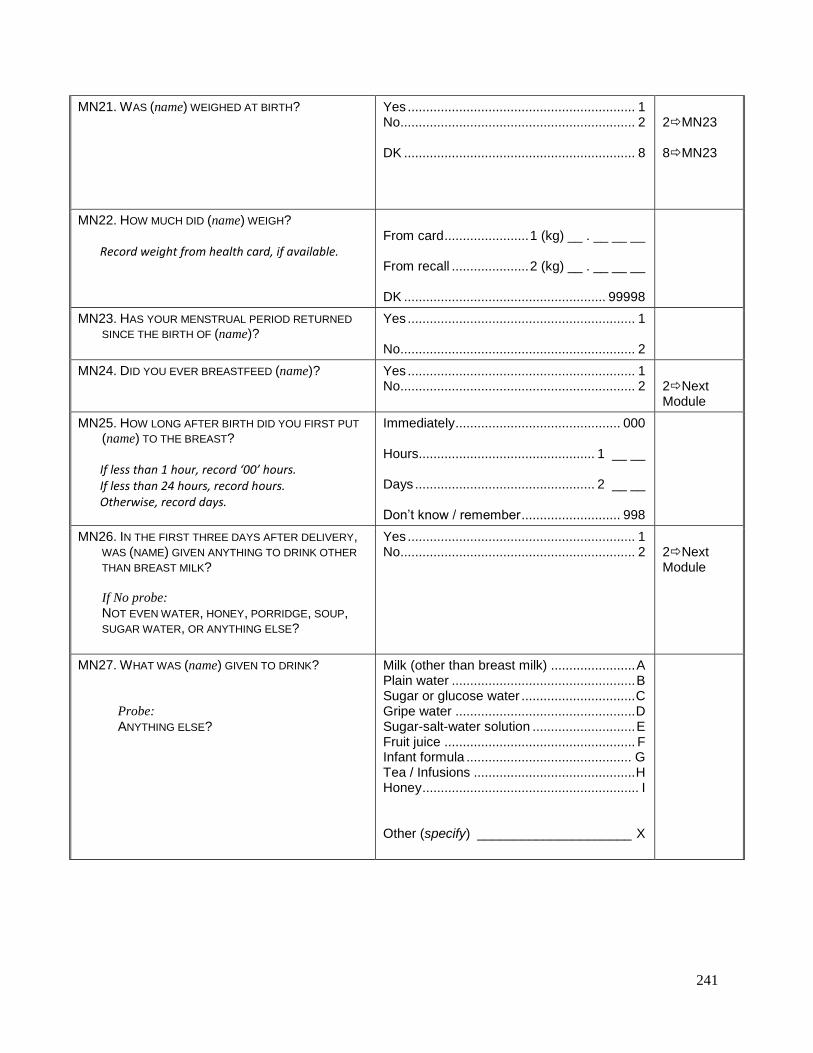
241
MN21. WAS (name) WEIGHED AT BIRTH? Yes .............................................................. 1 No................................................................ 2 DK ............................................................... 8
2MN23 8MN23
MN22. HOW MUCH DID (name) WEIGH?
Record weight from health card, if available.
From card ....................... 1 (kg) __ . __ __ __ From recall ..................... 2 (kg) __ . __ __ __ DK ....................................................... 99998
MN23. HAS YOUR MENSTRUAL PERIOD RETURNED
SINCE THE BIRTH OF (name)?
Yes .............................................................. 1 No................................................................ 2
MN24. DID YOU EVER BREASTFEED (name)? Yes .............................................................. 1 No................................................................ 2
2Next Module
MN25. HOW LONG AFTER BIRTH DID YOU FIRST PUT
(name) TO THE BREAST?
If less than 1 hour, record ‘00’ hours. If less than 24 hours, record hours. Otherwise, record days.
Immediately ............................................. 000 Hours................................................ 1 __ __ Days ................................................. 2 __ __ Don‟t know / remember ........................... 998
MN26. IN THE FIRST THREE DAYS AFTER DELIVERY, WAS (NAME) GIVEN ANYTHING TO DRINK OTHER
THAN BREAST MILK? If No probe:
NOT EVEN WATER, HONEY, PORRIDGE, SOUP, SUGAR WATER, OR ANYTHING ELSE?
Yes .............................................................. 1 No................................................................ 2
2Next Module
MN27. WHAT WAS (name) GIVEN TO DRINK?
Probe:
ANYTHING ELSE?
Milk (other than breast milk) ....................... A Plain water .................................................. B Sugar or glucose water ............................... C Gripe water ................................................. D Sugar-salt-water solution ............................ E Fruit juice .................................................... F Infant formula ............................................. G Tea / Infusions ............................................ H Honey ........................................................... I Other (specify) _____________________ X
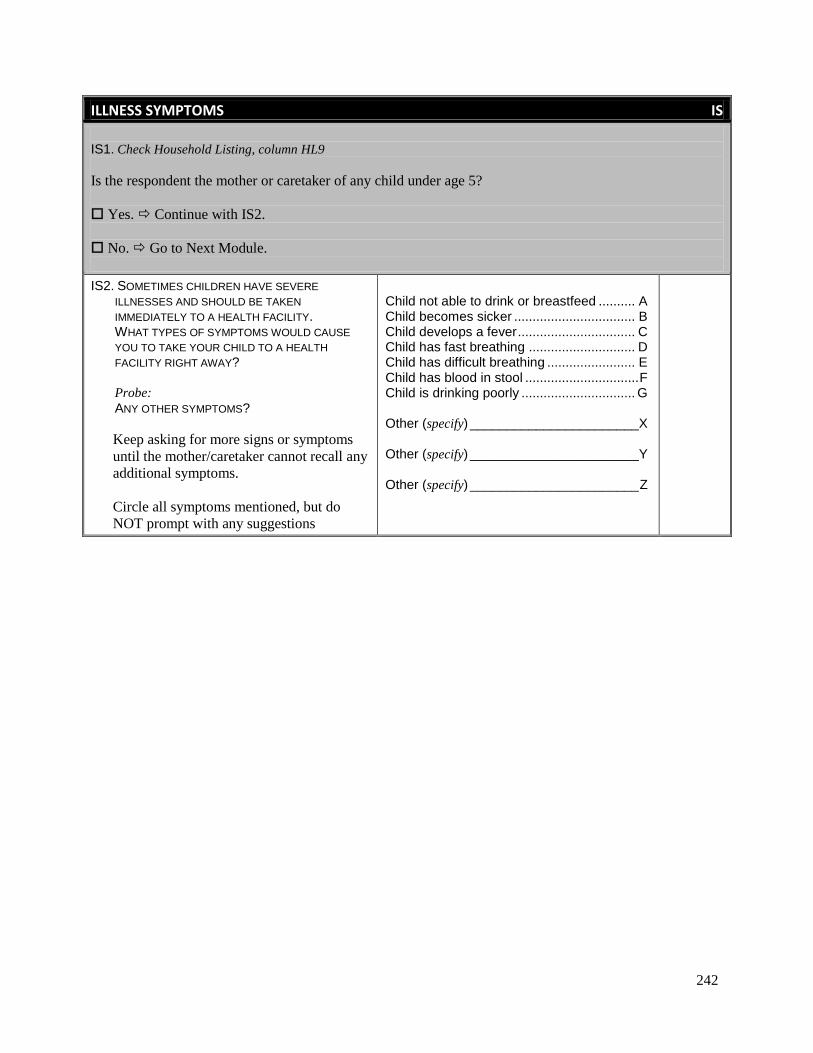
242
ILLNESS SYMPTOMS IS
IS1. Check Household Listing, column HL9
Is the respondent the mother or caretaker of any child under age 5?
Yes. Continue with IS2.
No. Go to Next Module.
IS2. SOMETIMES CHILDREN HAVE SEVERE
ILLNESSES AND SHOULD BE TAKEN
IMMEDIATELY TO A HEALTH FACILITY. WHAT TYPES OF SYMPTOMS WOULD CAUSE
YOU TO TAKE YOUR CHILD TO A HEALTH
FACILITY RIGHT AWAY? Probe:
ANY OTHER SYMPTOMS?
Keep asking for more signs or symptoms
until the mother/caretaker cannot recall any
additional symptoms.
Circle all symptoms mentioned, but do
NOT prompt with any suggestions
Child not able to drink or breastfeed .......... A Child becomes sicker ................................. B Child develops a fever ................................ C Child has fast breathing ............................. D Child has difficult breathing ........................ E Child has blood in stool ............................... F Child is drinking poorly ............................... G Other (specify) _______________________X Other (specify) _______________________Y Other (specify) _______________________ Z

243
CONTRACEPTION CP
CP0. Check MA1: Is respondent currently married?
Yes (MA1 = 1). Continue with CP1.
No (MA1 = 3). Go to FGM/C Module.
CP1. I WOULD LIKE TO TALK WITH YOU
ABOUT ANOTHER SUBJECT – FAMILY
PLANNING. ARE YOU PREGNANT NOW?
Yes, currently pregnant ............................... 1 No ................................................................ 2 Unsure or DK ............................................... 8
1Next Module
CP2. COUPLES USE VARIOUS WAYS OR
METHODS TO DELAY OR AVOID A
PREGNANCY.
ARE YOU CURRENTLY DOING
SOMETHING OR USING ANY METHOD
TO DELAY OR AVOID GETTING
PREGNANT?
Yes .............................................................. 1 No ................................................................ 2
2CP4
CP3. WHAT ARE YOU DOING TO DELAY
OR AVOID A PREGNANCY?
Do not prompt.
If more than one method is
mentioned, circle each one.
Female sterilization .................................... A Male sterilization ......................................... B IUD ............................................................. C Injectables .................................................. D Implants ...................................................... E Pill ................................................................ F Male condom .............................................. G Female condom .......................................... H Diaphragm .................................................... I Foam / Jelly ................................................. J Lactational amenorrhoea
method (LAM) ......................................... K Periodic abstinence/Rhythm ........................ L Withdrawal .................................................. M Other (specify) ______________________ X
Next Module
CP4. WHAT IS THE MAIN REASON FOR
NOT USING ANY METHOD TO DELAY
OR AVOID A PREGNANCY?
Religious ...................................................... 1 Husband against ......................................... 2 Other family members against .................... 3 Contraceptives not available ....................... 4 Desire for child ............................................ 5 Other (specify) ______________________ 6
DK ................................................................ 8

244
UNMET NEED UN
UN1. Check CP1. Currently pregnant?
Yes, currently pregnant Continue with UN2
No, unsure or DK Go to UN5
UN2. NOW I WOULD LIKE TO TALK TO YOU ABOUT
YOUR CURRENT PREGNANCY. WHEN YOU GOT
PREGNANT, DID YOU WANT TO GET PREGNANT
AT THAT TIME?
Yes .............................................................. 1 No ............................................................... 2
1UN4
UN3. DID YOU WANT TO HAVE A BABY LATER ON
OR DID YOU NOT WANT ANY (MORE) CHILDREN?
Later ............................................................ 1 No more ...................................................... 2
UN4. NOW I WOULD LIKE TO ASK SOME QUESTIONS
ABOUT THE FUTURE. AFTER THE CHILD YOU
ARE NOW EXPECTING, WOULD YOU LIKE TO
HAVE ANOTHER CHILD, OR WOULD YOU
PREFER NOT TO HAVE ANY MORE CHILDREN?
Have another child ...................................... 1 No more / None........................................... 2 Undecided / Don‟t know .............................. 8
1UN7 2UN13 8UN13
UN5. Check CP3. Currently using “Female sterilization”?
Yes. Go to UN13
No. Continue with UN6
UN6. NOW I WOULD LIKE TO ASK YOU SOME
QUESTIONS ABOUT THE FUTURE. WOULD YOU
LIKE TO HAVE (A/ANOTHER) CHILD, OR WOULD
YOU PREFER NOT TO HAVE ANY (MORE) CHILDREN?
Have (a/another) child ................................ 1 No more / None........................................... 2 Says she cannot get pregnant .................... 3 Undecided / Don‟t know .............................. 8
2UN9 3UN11 8UN9
UN7. HOW LONG WOULD YOU LIKE TO WAIT
BEFORE THE BIRTH OF (A/ANOTHER) CHILD?
Months ............................................. 1 __ __ Years ................................................ 2 __ __ Soon / Now ............................................. 993 Says she cannot get pregnant ................ 994 Other ....................................................... 996 Don‟t know .............................................. 998
994UN11
UN8. Check CP1. Currently pregnant?
Yes, currently pregnant Go to UN13
No, unsure or DK Continue with UN9

245
UN9. Check CP2. Currently using a method?
Yes. Go to UN13
No Continue with UN10
UN10. DO YOU THINK YOU ARE PHYSICALLY ABLE
TO GET PREGNANT AT THIS TIME?
Yes .............................................................. 1 No ............................................................... 2 DK ............................................................... 8
1 UN13 8 UN13
UN11. WHY DO YOU THINK YOU ARE NOT
PHYSICALLY ABLE TO GET PREGNANT?
Infrequent sex / No sex ............................... A Menopausal ................................................ B Never menstruated ..................................... C Hysterectomy (surgical removal of uterus) ................................................. D Has been trying to get pregnant for 2 years or more without result ........... E Postpartum amenorrhea ............................. F Breastfeeding .............................................. G Too old ........................................................ H Fatalistic ....................................................... I Other (specify) _______________________ X Don‟t know .................................................. Z
UN12. Check UN11. “Never menstruated” mentioned?
Yes. Go to Next Module
No Continue with UN13
UN13. WHEN DID YOUR LAST MENSTRUAL PERIOD
START?
Days ago .......................................... 1 __ __ Weeks ago ....................................... 2 __ __ Months ago ...................................... 3 __ __ Years ago ......................................... 4 __ __ In menopause / Has had hysterectomy ........................ 994 Before last birth ....................................... 995 Never menstruated ................................. 996

246
FEMALE GENITAL MUTILATION/CUTTING FG
FG1. HAVE YOU EVER HEARD OF FEMALE
CIRCUMCISION? Yes .............................................................. 1 No ................................................................ 2
1FG3
FG2. IN SOME COUNTRIES, THERE IS A PRACTICE IN
WHICH A GIRL MAY HAVE PART OF HER GENITALS
CUT OR NICKED SLIGHTLY (SUNI). HAVE YOU
EVER HEARD ABOUT THIS PRACTICE?
Yes .............................................................. 1 No ................................................................ 2
2Next Module
FG3. HAVE YOU YOURSELF EVER BEEN CIRCUMCISED
OR UNDERGONE SUNI? Yes .............................................................. 1 No ................................................................ 2
2FG8
FG4. NOW I WOULD LIKE TO ASK YOU WHAT WAS
DONE TO YOU AT THAT TIME. WAS ANY FLESH REMOVED FROM THE GENITAL
AREA?
Yes .............................................................. 1 No ................................................................ 2 DK ............................................................... 8
1FG6
FG5. WAS THE GENITAL AREA JUST NICKED WITHOUT
REMOVING ANY FLESH? Yes .............................................................. 1 No ................................................................ 2 DK ............................................................... 8
FG6. WAS THE GENITAL AREA SEWN CLOSED?
If necessary, probe: WAS IT SEALED?
Yes .............................................................. 1 No ................................................................ 2 DK ............................................................... 8
FG7. HOW OLD WERE YOU WHEN YOU WERE
CIRCUMCISED? If the respondent does not know the exact age,
probe to get an estimate using your calendar of
events and other information available to you
Age at circumcision .............................. __ __ DK / Don‟t remember / Not sure ................ 98
FG8. WHO PERFORMED THE CIRCUMCISION? Health professional Doctor .................................................... 11 Nurse/Midwife ...................................... 12 Other health professional (specify) ____________ 16 Traditional persons Traditional „circumciser‟ ......................... 21 Traditional birth attendant ..................... 22 Other traditional (specify) ______________ 26 DK ............................................................. 98
FG8A.Check if woman was ever married: MA5=3 (Never married) Skip toFG22
MA5=1 or MA5=No answer (formerly or currently married)
Continue with FG9
FG9.Check CM5 for Number of daughters at home
and CM7 for Number of daughters
elsewhere, and sum the answers here
Total number of living daughters ...... ___ ___
FG10. JUST TO MAKE SURE THAT I HAVE THIS RIGHT, YOU HAVE (total number in FG9) LIVING DAUGHTERS.
IS THIS CORRECT?
Yes One or more living daughters Continue with FG11
Does not have any living daughters Go to FG22
No Check responses to CM1 – CM12 and BH1 – BH10 and make corrections as necessary, until FG10 = Yes

247
FG11. Ask the respondent to tell you the name(s) of her daughter(s), beginning with the youngest daughter (if more
than one daughter). Write down the name of each daughter in FG12. Then, ask questions FG13 to FG20 for each
daughter at a time.
The total number of daughters in FG12 should be equal to the number in FG9
If more than 4 daughters, use additional questionnaires
Daughter #1 Daughter #2 Daughter #3 Daughter #4
FG12. Name of daughter
___________
___________
___________
___________
FG13. HOW OLD IS (name)?
Age ........... ___ ___
Age ........... ___ ___
Age ........... ___ ___
Age ........... ___ ___
FG14. Is (name) younger than
15 years of age?
Yes ..................... 1 No ...................... 2 If “No”, go to FG13
for next daughter.
If no more
daughters, go to
FG22
Yes ..................... 1 No ...................... 2 If “No”, go to FG13
for next daughter.
If no more
daughters, go to
FG22
Yes ..................... 1 No ...................... 2 If “No”, go to FG13
for next daughter.
If no more
daughters, go to
FG22
Yes ..................... 1 No ...................... 2 If “No”, go to FG13
for next daughter.
If no more
daughters, go to
FG22
FG15. IS (name)
CIRCUMCISED OR HAS
UNDERGONE SUNI?
Yes ..................... 1 No ...................... 2 If “No”, go to FG13
for next daughter.
If no more
daughters, go to
FG22
Yes ..................... 1 No ...................... 2 If “No”, go to FG13
for next daughter.
If no more
daughters, go to
FG22
Yes ..................... 1 No ...................... 2 If “No”, go to FG13
for next daughter.
If no more
daughters, go to
FG22
Yes ..................... 1 No ...................... 2 If “No”, go to FG13
for next daughter.
If no more
daughters, go to
FG22
FG16. HOW OLD WAS (name)
WHEN THIS OCCURRED?
If the respondent does not
know the exact age, probe to
get an estimate using your
calendar of events and other
information available to you
Age .......... ___ ___ DK .................... 98
Age .......... ___ ___ DK .................... 98
Age .......... ___ ___ DK .................... 98
Age .......... ___ ___ DK .................... 98
FG17. NOW I WOULD LIKE TO
ASK YOU WHAT WAS
DONE TO (name) AT THAT
TIME. WAS ANY FLESH
REMOVED FROM THE
GENITAL AREA?
Yes ..................... 1 FG19 No ...................... 2 DK ...................... 8
Yes ..................... 1 FG19 No ...................... 2 DK ...................... 8
Yes ..................... 1 FG19 No ...................... 2 DK ...................... 8
Yes ..................... 1 FG19 No ...................... 2 DK ...................... 8

248
FG18. WAS HER GENITAL
AREA JUST NICKED
WITHOUT REMOVING ANY
FLESH?
Yes ..................... 1 No ...................... 2 DK ...................... 8
Yes ..................... 1 No ...................... 2 DK ...................... 8
Yes ..................... 1 No ...................... 2 DK ...................... 8
Yes ..................... 1 No ...................... 2 DK ...................... 8
FG19. WAS HER GENITAL
AREA SEWN CLOSED?
If necessary, probe: WAS IT SEALED?
Yes ..................... 1 No ...................... 2 DK ...................... 8
Yes ..................... 1 No ...................... 2 DK ...................... 8
Yes ..................... 1 No ...................... 2 DK ...................... 8
Yes ..................... 1 No ...................... 2 DK ...................... 8
FG20. WHO PERFORMED THE
CIRCUMCISION?
Health professional Doctor............. 11 Nurse/midwife 12 Other health professional (specify) ____ 16
Traditional persons Traditional „circumciser‟ .. 21 Traditional birth attendant ....... 22 Other traditional (specify) _____ 26
DK .................... 98
Health professional Doctor............. 11 Nurse/midwife 12 Other health professional (specify) ____ 16
Traditional persons Traditional „circumciser‟ .. 21 Traditional birth attendant ....... 22 Other traditional (specify) ____ 26
DK .................... 98
Health professional Doctor ............ 11 Nurse/midwife 12 Other health professional (specify) ____ 16
Traditional persons Traditional „circumciser‟ .. 21 Traditional birth attendant ....... 22 Other traditional (specify) _____ 26
DK .................... 98
Health professional Doctor ............ 11 Nurse/midwife 12 Other health professional (specify) ____ 16
Traditional persons Traditional „circumciser‟ .. 21 Traditional birth attendant ....... 22 Other traditional (specify) ____ 26
DK .................... 98
FG21. Go back to FG13 for
next daughter. If
no more
daughters, go to
FG22
Go back to FG13 for
next daughter. If
no more
daughters, go to
FG22
Go back to FG13 for
next daughter. If
no more
daughters, go to
FG22
Go back to FG13 in
first column of
additional
questionnaire for
next daughter. If
no more
daughters, go to
FG22
Tick here if
additional
questionnaire
used
FG22. DO YOU THINK THE PRACTICE OF
CIRCUMCISION SHOULD BE CONTINUED OR
SHOULD IT BE DISCONTINUED?
Continued.................................................... 1 Discontinued ............................................... 2 Depends...................................................... 3 DK ............................................................... 8
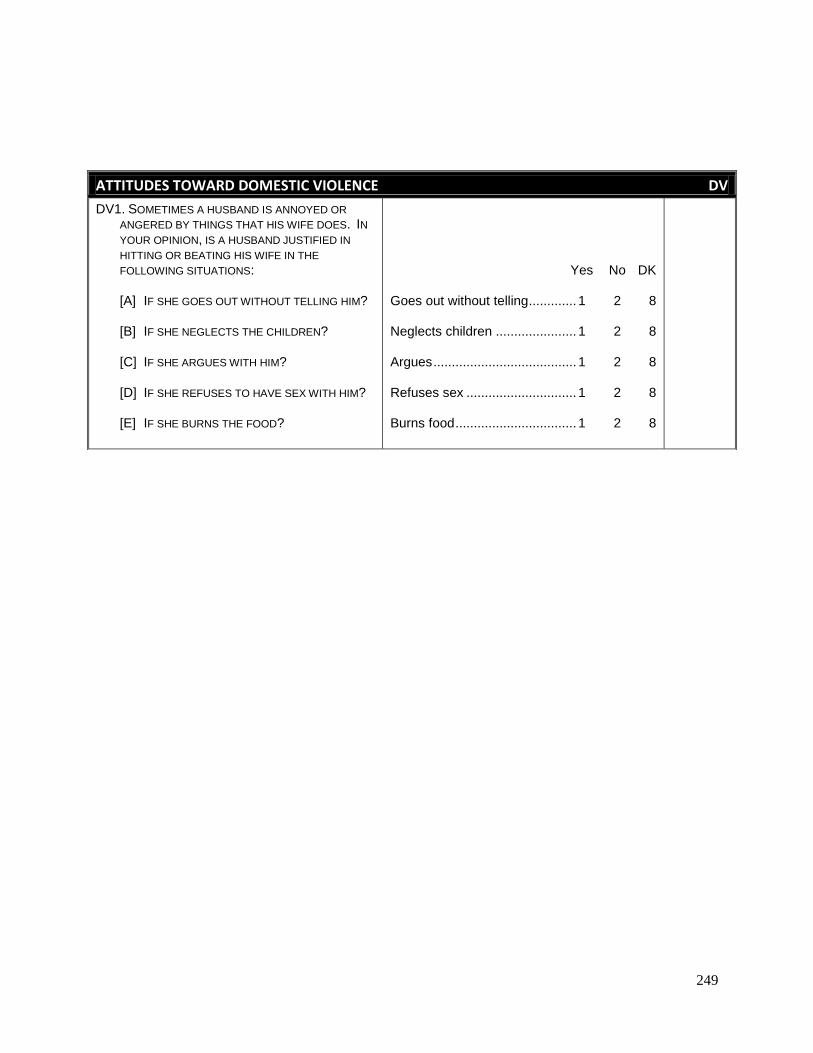
249
ATTITUDES TOWARD DOMESTIC VIOLENCE DV
DV1. SOMETIMES A HUSBAND IS ANNOYED OR
ANGERED BY THINGS THAT HIS WIFE DOES. IN
YOUR OPINION, IS A HUSBAND JUSTIFIED IN
HITTING OR BEATING HIS WIFE IN THE
FOLLOWING SITUATIONS: [A] IF SHE GOES OUT WITHOUT TELLING HIM? [B] IF SHE NEGLECTS THE CHILDREN? [C] IF SHE ARGUES WITH HIM? [D] IF SHE REFUSES TO HAVE SEX WITH HIM? [E] IF SHE BURNS THE FOOD?
Yes No DK Goes out without telling ............. 1 2 8 Neglects children ...................... 1 2 8 Argues ....................................... 1 2 8 Refuses sex .............................. 1 2 8 Burns food ................................. 1 2 8
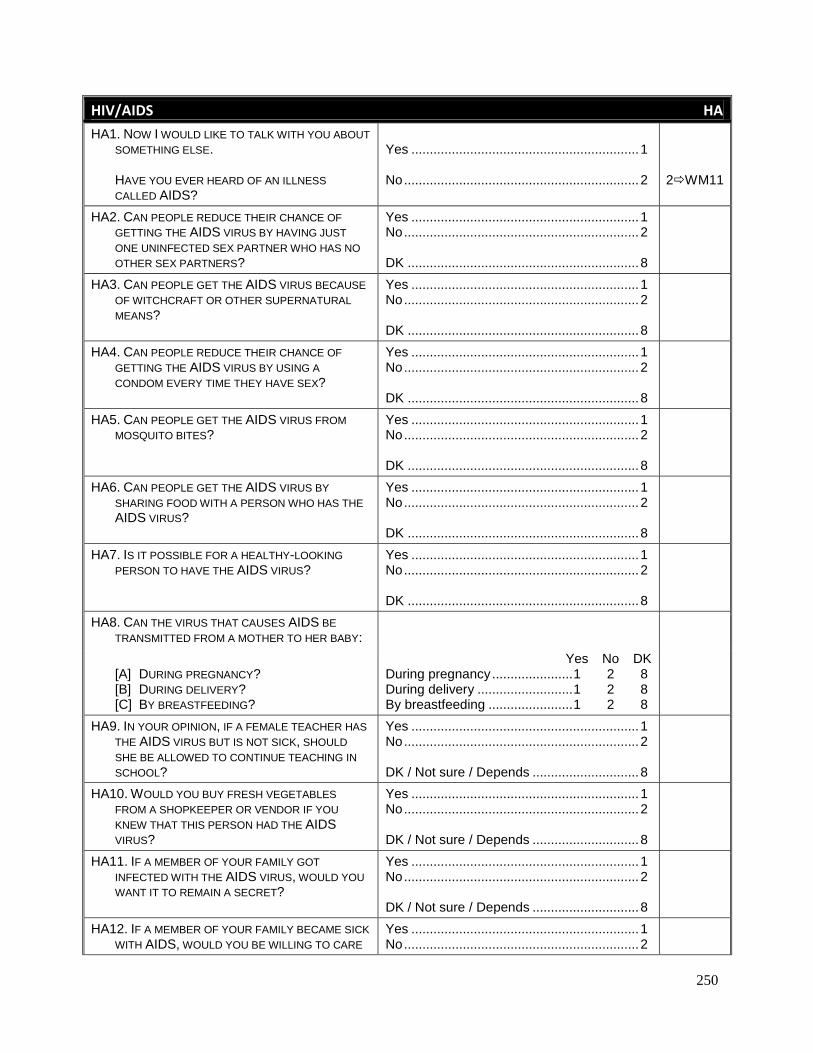
250
HIV/AIDS HA
HA1. NOW I WOULD LIKE TO TALK WITH YOU ABOUT
SOMETHING ELSE.
HAVE YOU EVER HEARD OF AN ILLNESS
CALLED AIDS?
Yes .............................................................. 1 No ................................................................ 2
2WM11
HA2. CAN PEOPLE REDUCE THEIR CHANCE OF
GETTING THE AIDS VIRUS BY HAVING JUST
ONE UNINFECTED SEX PARTNER WHO HAS NO
OTHER SEX PARTNERS?
Yes .............................................................. 1 No ................................................................ 2 DK ............................................................... 8
HA3. CAN PEOPLE GET THE AIDS VIRUS BECAUSE
OF WITCHCRAFT OR OTHER SUPERNATURAL
MEANS?
Yes .............................................................. 1 No ................................................................ 2 DK ............................................................... 8
HA4. CAN PEOPLE REDUCE THEIR CHANCE OF
GETTING THE AIDS VIRUS BY USING A
CONDOM EVERY TIME THEY HAVE SEX?
Yes .............................................................. 1 No ................................................................ 2 DK ............................................................... 8
HA5. CAN PEOPLE GET THE AIDS VIRUS FROM
MOSQUITO BITES? Yes .............................................................. 1 No ................................................................ 2 DK ............................................................... 8
HA6. CAN PEOPLE GET THE AIDS VIRUS BY
SHARING FOOD WITH A PERSON WHO HAS THE
AIDS VIRUS?
Yes .............................................................. 1 No ................................................................ 2 DK ............................................................... 8
HA7. IS IT POSSIBLE FOR A HEALTHY-LOOKING
PERSON TO HAVE THE AIDS VIRUS? Yes .............................................................. 1 No ................................................................ 2 DK ............................................................... 8
HA8. CAN THE VIRUS THAT CAUSES AIDS BE
TRANSMITTED FROM A MOTHER TO HER BABY:
[A] DURING PREGNANCY? [B] DURING DELIVERY? [C] BY BREASTFEEDING?
Yes No DK During pregnancy ...................... 1 2 8 During delivery .......................... 1 2 8 By breastfeeding ....................... 1 2 8
HA9. IN YOUR OPINION, IF A FEMALE TEACHER HAS
THE AIDS VIRUS BUT IS NOT SICK, SHOULD
SHE BE ALLOWED TO CONTINUE TEACHING IN
SCHOOL?
Yes .............................................................. 1 No ................................................................ 2 DK / Not sure / Depends ............................. 8
HA10. WOULD YOU BUY FRESH VEGETABLES
FROM A SHOPKEEPER OR VENDOR IF YOU
KNEW THAT THIS PERSON HAD THE AIDS
VIRUS?
Yes .............................................................. 1 No ................................................................ 2 DK / Not sure / Depends ............................. 8
HA11. IF A MEMBER OF YOUR FAMILY GOT
INFECTED WITH THE AIDS VIRUS, WOULD YOU
WANT IT TO REMAIN A SECRET?
Yes .............................................................. 1 No ................................................................ 2 DK / Not sure / Depends ............................. 8
HA12. IF A MEMBER OF YOUR FAMILY BECAME SICK
WITH AIDS, WOULD YOU BE WILLING TO CARE
Yes .............................................................. 1 No ................................................................ 2

251
FOR HER OR HIM IN YOUR OWN HOUSEHOLD? DK / Not sure / Depends ............................. 8
HA13. Check CM13: Any live birth in last 2 years?
No live birth in last 2 years. Go to HA24.
Yes, live birth in last 2 years. Continue with HA14.
HA14. Check MN1: Received antenatal care? Yes, antenatal care received. Continue with HA15 No antenatal care received Go to HA24
HA15. DURING ANY OF THE ANTENATAL VISITS FOR
YOUR PREGNANCY WITH (name), WERE YOU GIVEN ANY INFORMATION ABOUT:
[A] BABIES GETTING THE AIDS VIRUS FROM
THEIR MOTHER?
[B] THINGS THAT YOU CAN DO TO PREVENT
GETTING THE AIDS VIRUS?
[C] GETTING TESTED FOR THE AIDS VIRUS? WERE YOU:
[D] OFFERED A TEST FOR THE AIDS VIRUS?
Y N DK AIDS from mother ....................... 1 2 8 Things to do ................................ 1 2 8 Tested for AIDS .......................... 1 2 8 Offered a test .............................. 1 2 8
HA16. I DON‟T WANT TO KNOW THE RESULTS, BUT
WERE YOU TESTED FOR THE AIDS VIRUS AS
PART OF YOUR ANTENATAL CARE?
Yes .............................................................. 1 No ................................................................ 2 DK ................................................................ 8
2HA19 8HA19
HA17. I DON‟T WANT TO KNOW THE RESULTS, BUT
DID YOU GET THE RESULTS OF THE TEST? Yes .............................................................. 1 No ................................................................ 2 DK ................................................................ 8
2HA22 8HA22
HA18. REGARDLESS OF THE RESULT, ALL WOMEN
WHO ARE TESTED ARE SUPPOSED TO RECEIVE
COUNSELLING AFTER GETTING THE RESULT. AFTER YOU WERE TESTED, DID YOU RECEIVE
COUNSELLING?
Yes .............................................................. 1 No ................................................................ 2 DK ................................................................ 8
1HA22
2HA22
8HA22
HA19. Check MN17: Birth delivered by health professional (A, B or C)? Yes, birth delivered by health professional Continue with HA20 No, birth not delivered by health professional Go to HA24
HA20. I DON‟T WANT TO KNOW THE RESULTS, BUT
WERE YOU TESTED FOR THE AIDS VIRUS
BETWEEN THE TIME YOU WENT FOR DELIVERY
BUT BEFORE THE BABY WAS BORN?
Yes .............................................................. 1 No ................................................................ 2
2HA24
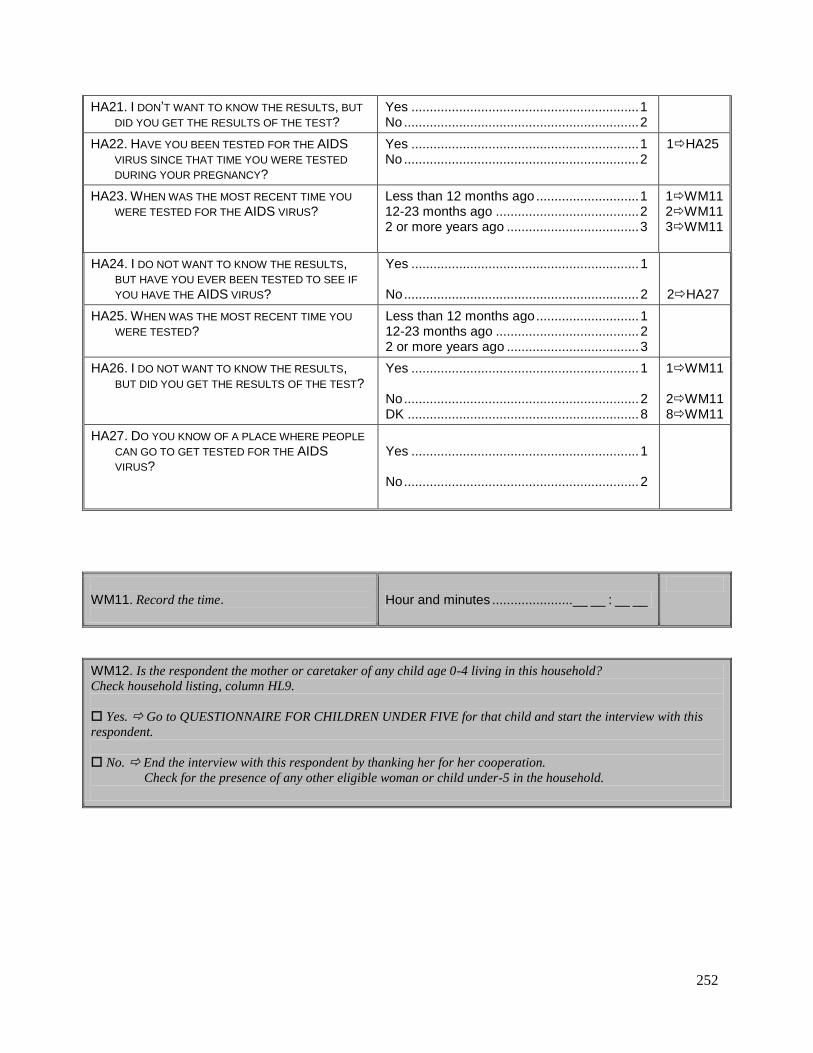
252
HA21. I DON‟T WANT TO KNOW THE RESULTS, BUT
DID YOU GET THE RESULTS OF THE TEST? Yes .............................................................. 1 No ................................................................ 2
HA22. HAVE YOU BEEN TESTED FOR THE AIDS
VIRUS SINCE THAT TIME YOU WERE TESTED
DURING YOUR PREGNANCY?
Yes .............................................................. 1 No ................................................................ 2
1HA25
HA23. WHEN WAS THE MOST RECENT TIME YOU
WERE TESTED FOR THE AIDS VIRUS?
Less than 12 months ago ............................ 1 12-23 months ago ....................................... 2 2 or more years ago .................................... 3
1WM11
2WM11
3WM11
HA24. I DO NOT WANT TO KNOW THE RESULTS, BUT HAVE YOU EVER BEEN TESTED TO SEE IF
YOU HAVE THE AIDS VIRUS?
Yes .............................................................. 1 No ................................................................ 2
2HA27
HA25. WHEN WAS THE MOST RECENT TIME YOU
WERE TESTED? Less than 12 months ago ............................ 1 12-23 months ago ....................................... 2 2 or more years ago .................................... 3
HA26. I DO NOT WANT TO KNOW THE RESULTS, BUT DID YOU GET THE RESULTS OF THE TEST?
Yes .............................................................. 1 No ................................................................ 2 DK ............................................................... 8
1WM11
2WM11
8WM11
HA27. DO YOU KNOW OF A PLACE WHERE PEOPLE
CAN GO TO GET TESTED FOR THE AIDS
VIRUS?
Yes .............................................................. 1 No ................................................................ 2
WM11. Record the time.
Hour and minutes ...................... __ __ : __ __
WM12. Is the respondent the mother or caretaker of any child age 0-4 living in this household?
Check household listing, column HL9.
Yes. Go to QUESTIONNAIRE FOR CHILDREN UNDER FIVE for that child and start the interview with this
respondent.
No. End the interview with this respondent by thanking her for her cooperation.
Check for the presence of any other eligible woman or child under-5 in the household.

253
Interviewer’s Observations
Field Editor’s Observations
Supervisor’s Observations

254
QUESTIONNAIRE FOR CHILDREN UNDER FIVE
UNDER-FIVE CHILD INFORMATION PANEL UF
This questionnaire is to be administered to all mothers or caretakers (see Household Listing Form, column
HL9) who care for a child that lives with them and is under the age of 5 years (see Household Listing Form,
column HL6).
A separate questionnaire should be used for each eligible child.
UF1. Cluster number: UF2. Household number:
___ ___ ___ ___ ___
UF3. Child‟s name: UF4. Child‟s line number:
Name ___ ___
UF5. Mother‟s / Caretaker‟s name: UF6. Mother‟s / Caretaker‟s line number:
Name ___ ___
UF7. Interviewer name and number: UF8. Day / Month / Year of interview:
Name ___ ___ ___ ___ / ___ ___ / ___ ___ ___ ___
REPEAT GREETING IF NOT ALREADY READ TO THIS
RESPONDENT: WE ARE FROM MOP&D. WE ARE WORKING ON A PROJECT
CONCERNED WITH FAMILY HEALTH AND EDUCATION. I WOULD LIKE TO TALK TO YOU ABOUT (name)‟S HEALTH
AND WELL-BEING. THE INTERVIEW WILL TAKE ABOUT
20 - 30 MINUTES. ALL THE INFORMATION WE OBTAIN
WILL REMAIN STRICTLY CONFIDENTIAL AND YOUR
ANSWERS WILL NEVER BE SHARED WITH ANYONE
OTHER THAN OUR PROJECT TEAM.
If greeting at the beginning of the household
questionnaire or for another child‟s questionnaire
has already been read to this woman, then read the
following:
NOW I WOULD LIKE TO TALK TO YOU MORE ABOUT
(name)‟S HEALTH AND OTHER TOPICS. THIS
INTERVIEW WILL TAKE ABOUT 20 - 30 MINUTES. AGAIN, ALL THE INFORMATION WE OBTAIN WILL
REMAIN STRICTLY CONFIDENTIAL AND YOUR
ANSWERS WILL NEVER BE SHARED WITH ANYONE
OTHER THAN OUR PROJECT TEAM.
MAY I START NOW? Yes, permission is given Go to UF12 to record the time and then begin the interview.
No, permission is not given Complete UF9. Discuss this result with your supervisor
UF9. Result of interview for children under 5
Codes refer to mother/caretaker.
Completed ............................................................. 01 Not at home ........................................................... 02 Refused ................................................................. 03 Partly completed .................................................... 04 Incapacitated ......................................................... 05 Other (specify) ___________________________ 96
UF10. Field edited by (Name and number):
Name ____________________________ ___ ___
UF11. Data entry clerk (Name and number):
Name ____________________________ ___ ___

255
AGE AG
AG1. NOW I WOULD LIKE TO ASK YOU SOME
QUESTIONS ABOUT THE HEALTH OF (name).
IN WHAT MONTH AND YEAR WAS (name) BORN?
Probe:
WHAT IS HIS / HER BIRTHDAY? DO YOU HAVE ANY DOCUMENTS THAT MAY HAVE
(name)‟S DATE OF BIRTH (SUCH AS A CHILD
HEALTH DAY CARD, BIRTH NOTIFICATION, OR
BIRTH CERTIFICATE)?
If the mother/caretaker knows the exact
birth date and/or it is printed in a
document/card , also enter the day;
otherwise, circle 98 for day
Month and year must be recorded
If unknown month or year, ask for
documents or use the calendar of events
Date of birth Day .................................................. __ __ DK day ................................................... 98 Month ............................................... __ __ Year ........................................ __ __ __ __
AG2. HOW OLD IS (name)?
Probe: HOW OLD WAS (name) AT HIS / HER LAST
BIRTHDAY?
Record age in completed years.
Record „0‟ if less than 1 year.
Note: For most children, the age indicated
on the Routine Immunization Card is not
current
Age (in completed years) .......................... __
AG3. Compare AG1 and AG2:
Date of birth and age are consistent Continue with next AG4
Date of birth and age are not consistent Probe further for both date of birth and age until consistent
UF12. Record the time.
Hour and minutes ..................... __ __ : __ __
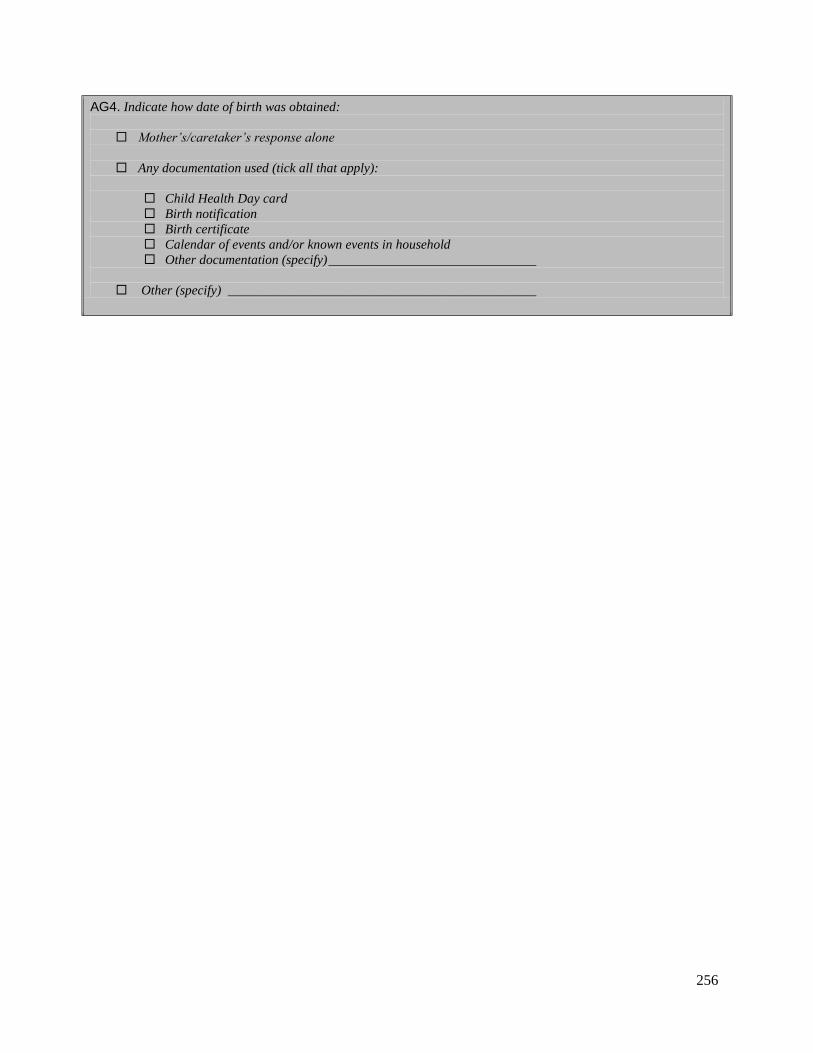
256
AG4. Indicate how date of birth was obtained:
Mother‟s/caretaker‟s response alone
Any documentation used (tick all that apply):
Child Health Day card
Birth notification
Birth certificate
Calendar of events and/or known events in household
Other documentation (specify) _______________________________
Other (specify) ______________________________________________
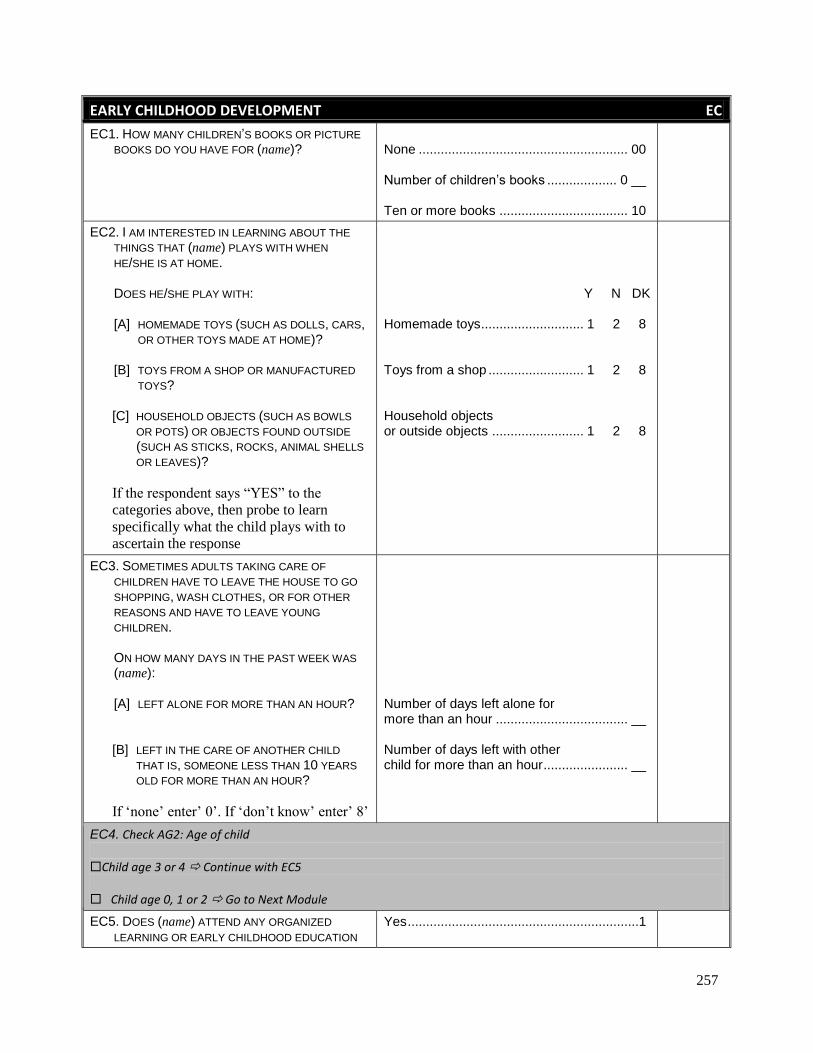
257
EARLY CHILDHOOD DEVELOPMENT EC
EC1. HOW MANY CHILDREN‟S BOOKS OR PICTURE
BOOKS DO YOU HAVE FOR (name)?
None ......................................................... 00 Number of children‟s books ................... 0 __ Ten or more books ................................... 10
EC2. I AM INTERESTED IN LEARNING ABOUT THE
THINGS THAT (name) PLAYS WITH WHEN
HE/SHE IS AT HOME. DOES HE/SHE PLAY WITH:
[A] HOMEMADE TOYS (SUCH AS DOLLS, CARS, OR OTHER TOYS MADE AT HOME)?
[B] TOYS FROM A SHOP OR MANUFACTURED
TOYS?
[C] HOUSEHOLD OBJECTS (SUCH AS BOWLS
OR POTS) OR OBJECTS FOUND OUTSIDE
(SUCH AS STICKS, ROCKS, ANIMAL SHELLS
OR LEAVES)?
If the respondent says “YES” to the
categories above, then probe to learn
specifically what the child plays with to
ascertain the response
Y N DK Homemade toys ............................ 1 2 8 Toys from a shop .......................... 1 2 8 Household objects or outside objects ......................... 1 2 8
EC3. SOMETIMES ADULTS TAKING CARE OF
CHILDREN HAVE TO LEAVE THE HOUSE TO GO
SHOPPING, WASH CLOTHES, OR FOR OTHER
REASONS AND HAVE TO LEAVE YOUNG
CHILDREN. ON HOW MANY DAYS IN THE PAST WEEK WAS
(name): [A] LEFT ALONE FOR MORE THAN AN HOUR?
[B] LEFT IN THE CARE OF ANOTHER CHILD
THAT IS, SOMEONE LESS THAN 10 YEARS
OLD FOR MORE THAN AN HOUR?
If „none‟ enter‟ 0‟. If „don‟t know‟ enter‟ 8‟
Number of days left alone for more than an hour .................................... __ Number of days left with other child for more than an hour ....................... __
EC4. Check AG2: Age of child Child age 3 or 4 Continue with EC5 Child age 0, 1 or 2 Go to Next Module
EC5. DOES (name) ATTEND ANY ORGANIZED
LEARNING OR EARLY CHILDHOOD EDUCATION
Yes ...............................................................1

258
PROGRAMME, SUCH AS A PRIVATE OR
GOVERNMENT FACILITY, INCLUDING
KINDERGARTEN OR COMMUNITY CHILD CARE?
No ................................................................2 DK ................................................................8
2EC6A 8EC6A
EC6. WITHIN THE LAST SEVEN DAYS, ABOUT HOW
MANY HOURS DID (name) ATTEND? Number of hours .................................. __ __
EC7
EC6A. DOES (name) ATTEND KORANIC SCHOOL? Yes ...............................................................1 No ................................................................2 DK ................................................................8
2EC7 8EC7
EC6B. WITHIN THE LAST SEVEN DAYS, ABOUT HOW
MANY HOURS DID (name) ATTEND KORANIC
SCHOOL?
Number of hours .................................. __ __
EC7. IN THE PAST 3 DAYS, DID YOU OR ANY
HOUSEHOLD MEMBER OVER 15 YEARS OF
AGEENGAGE IN ANY OF THE FOLLOWING
ACTIVITIES WITH (name): If yes, ask:
WHO ENGAGED IN THIS ACTIVITY WITH (name)?
Circle all that apply.
Mother Father Other No one
[A] READ BOOKS TO OR LOOKED AT PICTURE BOOKS WITH (name)?
Read books A B X Y
[B] TOLD STORIES TO (name)? Told stories A B X Y
[C] SANG SONGS TO (name) OR WITH (name),
INCLUDING LULLABYS? Sang songs A B X Y
[D] TOOK (name) OUTSIDE THE HOME,
COMPOUND, YARD OR ENCLOSURE? Took outside A B X Y
[E] PLAYED WITH (name)? Played with A B X Y
[F] NAMED, COUNTED, OR DREW THINGS TO OR WITH (name)?
Named/counted A B X Y
EC8. I WOULD LIKE TO ASK YOU SOME QUESTIONS
ABOUT THE HEALTH AND DEVELOPMENT OF
YOUR CHILD. CHILDREN DO NOT ALL DEVELOP
AND LEARN AT THE SAME RATE. FOR EXAMPLE, SOME WALK EARLIER THAN OTHERS. THESE
QUESTIONS ARE RELATED TO SEVERAL
ASPECTS OF YOUR CHILD‟S DEVELOPMENT. CAN (name) IDENTIFY OR NAME AT LEAST TEN
LETTERS OF THE ALPHABET?
Yes ...............................................................1 No ................................................................2 DK ................................................................8
EC9. CAN (name) READ AT LEAST FOUR SIMPLE, POPULAR WORDS?
Yes ...............................................................1 No ................................................................2

259
If no, probe: THIS CAN BE IN ANY LANGUAGE (SOMALI,
ARABIC, ETC.)
DK ................................................................8
EC10. DOES (name) KNOW THE NAME AND
RECOGNIZE THE SYMBOL OF ALL NUMBERS
FROM 1 TO 10?
Yes ...............................................................1 No ................................................................2 DK ................................................................8
EC11. CAN (name) PICK UP A SMALL OBJECT WITH
TWO FINGERS, LIKE A STICK OR A ROCK FROM
THE GROUND?
Yes ...............................................................1 No ................................................................2 DK ................................................................8
EC12. IS (name) SOMETIMES TOO SICK TO PLAY?
Yes ...............................................................1 No ................................................................2 DK ................................................................8
EC13. DOES (name) FOLLOW SIMPLE DIRECTIONS
ON HOW TO DO SOMETHING CORRECTLY?
Yes ...............................................................1 No ................................................................2 DK ................................................................8
EC14. WHEN GIVEN SOMETHING TO DO, IS (name) ABLE TO DO IT INDEPENDENTLY?
Yes ...............................................................1 No ................................................................2 DK ................................................................8
EC15. DOES (name) GET ALONG WELL WITH
OTHER CHILDREN?
Yes ...............................................................1 No ................................................................2 DK ................................................................8
EC16. DOES (name) KICK, BITE, OR HIT OTHER
CHILDREN OR ADULTS?
Yes ...............................................................1 No ................................................................2 DK ................................................................8
EC17. DOES (name) GET DISTRACTED EASILY?
Yes ...............................................................1 No ................................................................2 DK ................................................................8
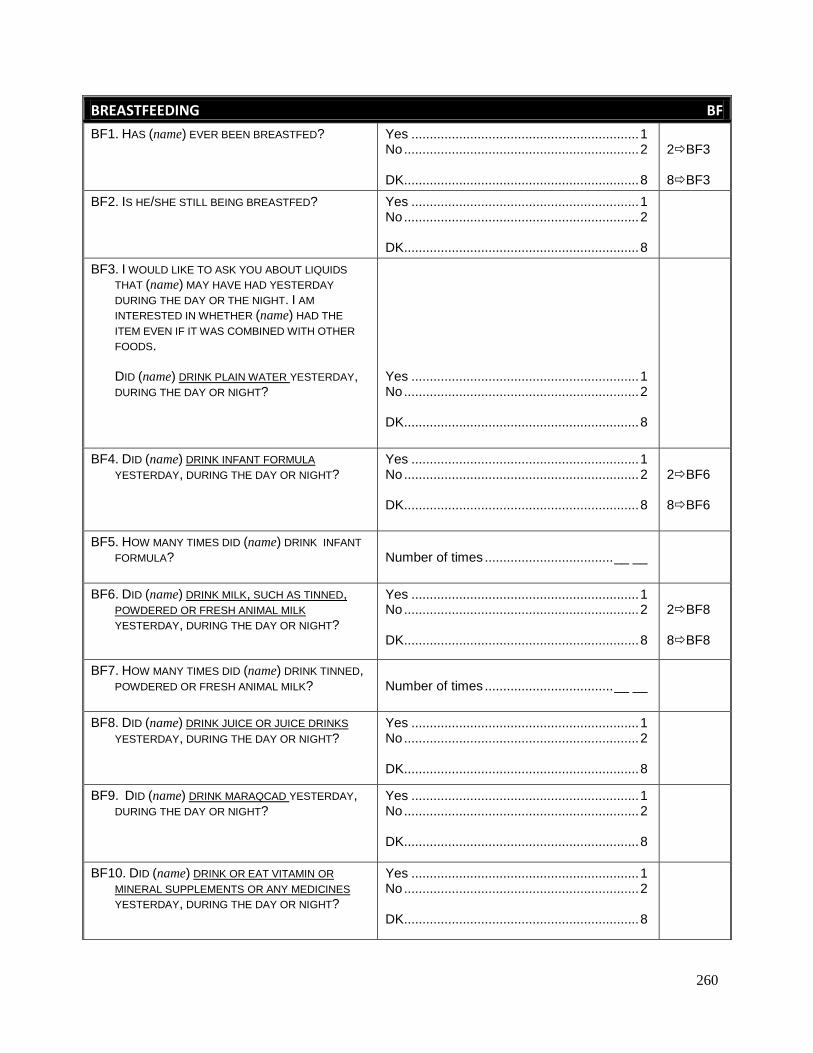
260
BREASTFEEDING BF
BF1. HAS (name) EVER BEEN BREASTFED?
Yes .............................................................. 1 No ................................................................ 2 DK................................................................ 8
2BF3 8BF3
BF2. IS HE/SHE STILL BEING BREASTFED? Yes .............................................................. 1 No ................................................................ 2 DK................................................................ 8
BF3. I WOULD LIKE TO ASK YOU ABOUT LIQUIDS
THAT (name) MAY HAVE HAD YESTERDAY
DURING THE DAY OR THE NIGHT. I AM
INTERESTED IN WHETHER (name) HAD THE
ITEM EVEN IF IT WAS COMBINED WITH OTHER
FOODS. DID (name) DRINK PLAIN WATER YESTERDAY,
DURING THE DAY OR NIGHT?
Yes .............................................................. 1 No ................................................................ 2 DK................................................................ 8
BF4. DID (name) DRINK INFANT FORMULA
YESTERDAY, DURING THE DAY OR NIGHT?
Yes .............................................................. 1 No ................................................................ 2 DK................................................................ 8
2BF6 8BF6
BF5. HOW MANY TIMES DID (name) DRINK INFANT
FORMULA? Number of times ................................... __ __
BF6. DID (name) DRINK MILK, SUCH AS TINNED, POWDERED OR FRESH ANIMAL MILK
YESTERDAY, DURING THE DAY OR NIGHT?
Yes .............................................................. 1 No ................................................................ 2 DK................................................................ 8
2BF8 8BF8
BF7. HOW MANY TIMES DID (name) DRINK TINNED, POWDERED OR FRESH ANIMAL MILK?
Number of times ................................... __ __
BF8. DID (name) DRINK JUICE OR JUICE DRINKS
YESTERDAY, DURING THE DAY OR NIGHT?
Yes .............................................................. 1 No ................................................................ 2 DK................................................................ 8
BF9. DID (name) DRINK MARAQCAD YESTERDAY, DURING THE DAY OR NIGHT?
Yes .............................................................. 1 No ................................................................ 2 DK................................................................ 8
BF10. DID (name) DRINK OR EAT VITAMIN OR
MINERAL SUPPLEMENTS OR ANY MEDICINES
YESTERDAY, DURING THE DAY OR NIGHT?
Yes .............................................................. 1 No ................................................................ 2 DK................................................................ 8
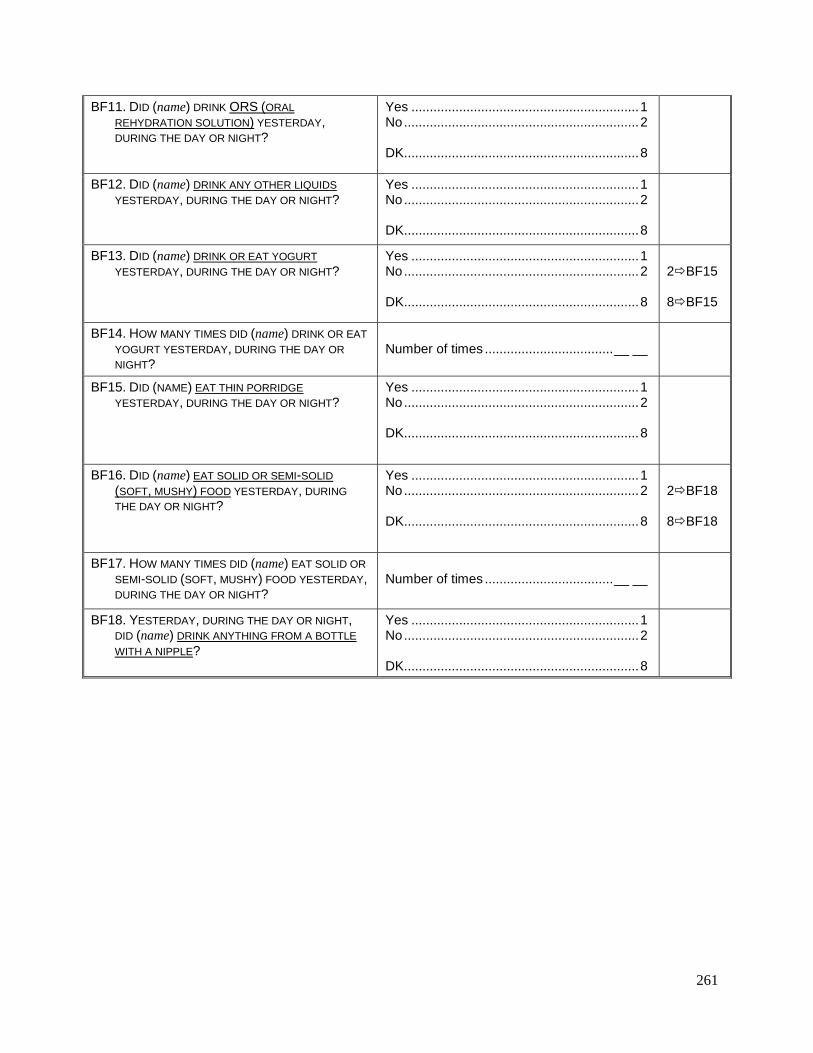
261
BF11. DID (name) DRINK ORS (ORAL
REHYDRATION SOLUTION) YESTERDAY, DURING THE DAY OR NIGHT?
Yes .............................................................. 1 No ................................................................ 2 DK................................................................ 8
BF12. DID (name) DRINK ANY OTHER LIQUIDS
YESTERDAY, DURING THE DAY OR NIGHT? Yes .............................................................. 1 No ................................................................ 2 DK................................................................ 8
BF13. DID (name) DRINK OR EAT YOGURT
YESTERDAY, DURING THE DAY OR NIGHT? Yes .............................................................. 1 No ................................................................ 2 DK................................................................ 8
2BF15 8BF15
BF14. HOW MANY TIMES DID (name) DRINK OR EAT
YOGURT YESTERDAY, DURING THE DAY OR
NIGHT?
Number of times ................................... __ __
BF15. DID (NAME) EAT THIN PORRIDGE
YESTERDAY, DURING THE DAY OR NIGHT? Yes .............................................................. 1 No ................................................................ 2 DK................................................................ 8
BF16. DID (name) EAT SOLID OR SEMI-SOLID
(SOFT, MUSHY) FOOD YESTERDAY, DURING
THE DAY OR NIGHT?
Yes .............................................................. 1 No ................................................................ 2 DK................................................................ 8
2BF18 8BF18
BF17. HOW MANY TIMES DID (name) EAT SOLID OR
SEMI-SOLID (SOFT, MUSHY) FOOD YESTERDAY, DURING THE DAY OR NIGHT?
Number of times ................................... __ __
BF18. YESTERDAY, DURING THE DAY OR NIGHT, DID (name) DRINK ANYTHING FROM A BOTTLE
WITH A NIPPLE?
Yes .............................................................. 1 No ................................................................ 2 DK................................................................ 8

262
CARE OF ILLNESS CA
CA1. IN THE LAST TWO WEEKS, HAS (name) HAD
DIARRHOEA?
Yes .............................................................. 1 No ................................................................ 2 DK................................................................ 8
2CA7 8CA7
CA2. I WOULD LIKE TO KNOW HOW MUCH (name) WAS GIVEN TO DRINK DURING THE DIARRHOEA
(INCLUDING BREASTMILK).
DURING THE TIME (name) HAD DIARRHOEA, WAS HE/SHE GIVEN LESS THAN USUAL TO
DRINK, ABOUT THE SAME AMOUNT, OR MORE
THAN USUAL?
If less, probe: WAS HE/SHE GIVEN MUCH LESS THAN USUAL
TO DRINK, OR SOMEWHAT LESS?
Much less .................................................... 1 Somewhat less ............................................ 2 About the same ........................................... 3 More ............................................................ 4 Nothing to drink ........................................... 5 DK................................................................ 8
CA3. DURING THE TIME (name) HAD DIARRHOEA,
WAS HE/SHE GIVEN LESS THAN USUAL TO EAT, ABOUT THE SAME AMOUNT, MORE THAN
USUAL, OR NOTHING TO EAT?
If “less”, probe: WAS HE/SHE GIVEN MUCH LESS THAN USUAL
TO EAT OR SOMEWHAT LESS?
Much less .................................................... 1 Somewhat less ............................................ 2 About the same ........................................... 3 More ............................................................ 4 Stopped food ............................................... 5 Never gave food .......................................... 6 DK................................................................ 8
CA4. DURING THE EPISODE OF DIARRHOEA, WAS
(name) GIVEN TO DRINK A FLUID MADE FROM A
SPECIAL PACKET CALLED ORS SUCH AS THIS? Show sample ORS packet
Yes .............................................................. 1 No ................................................................ 2 DK................................................................ 8
CA5. WAS ANYTHING (ELSE) GIVEN TO TREAT THE
DIARRHOEA?
Yes .............................................................. 1 No ................................................................ 2 DK................................................................ 8
2CA7 8CA7

263
CA6. WHAT (ELSE) WAS GIVEN TO TREAT THE
DIARRHOEA? Probe: ANYTHING ELSE?
Record all treatments given. Write brand
name(s) of all medicines mentioned.
(Name)
Pill or Syrup Antibiotic ................................................. A Antimotility .............................................. B Zinc ......................................................... C Other (Not antibiotic, antimotility or zinc) ............................................. G Unknown pill or syrup ............................. H Injection Antibiotic .................................................. L Non-antibiotic ......................................... M Unknown injection .................................. N Intravenous ................................................. O Home remedy / Herbal medicine ................ Q Other (specify) _______________________X
CA7. AT ANY TIME IN THE LAST TWO WEEKS, HAS
(name) HAD AN ILLNESS WITH A COUGH? Yes .............................................................. 1 No ................................................................ 2 DK................................................................ 8
2CA14 8CA14
CA8. WHEN (name) HAD AN ILLNESS WITH A
COUGH, DID HE/SHE BREATHE FASTER THAN
USUAL WITH SHORT, RAPID BREATHS OR HAVE
DIFFICULTY BREATHING?
Yes .............................................................. 1 No ................................................................ 2 DK................................................................ 8
2CA14 8CA14
CA9. WAS THE FAST OR DIFFICULT BREATHING
DUE TO A PROBLEM IN THE CHEST OR A
BLOCKED OR RUNNY NOSE?
Problem in chest only .................................. 1 Blocked or runny nose only ......................... 2 Both ............................................................. 3 Other (specify) _______________________ 6
DK................................................................ 8
2CA14 6CA14
CA10. DID YOU SEEK ANY ADVICE OR TREATMENT
FOR THE ILLNESS FROM ANY SOURCE? Yes .............................................................. 1 No ................................................................ 2 DK................................................................ 8
2CA12 8CA12

264
CA11. FROM WHERE DID YOU SEEK ADVICE OR
TREATMENT?
Probe: ANYWHERE ELSE?
Circle all providers mentioned,
but do NOT prompt with any suggestions.
Probe to identify each type of source.
If unable to determine if public or private
sector, write the name of the place.
(Name of place)
Public sector Govt. hospital ................................................ A Govt. health centre ........................................ B Govt. health post ........................................... C Village health worker ..................................... D Mobile / Outreach clinic ................................. E Other public (specify) ___________________ H
Private medical sector Private hospital / clinic ..................................... I Private physician ............................................ J Private pharmacy .......................................... K Mobile clinic ................................................... L Other private medical (specify) ___________ O
Other source Relative / Friend ............................................ P Shop ............................................................. Q Traditional practitioner .................................. R Sheikh .......................................................... S Traditional Birth Attendant ..............................T
Other (specify) _______________________X
CA12. WAS (name) GIVEN ANY MEDICINE TO TREAT
THIS ILLNESS? Yes .............................................................. 1 No ................................................................ 2 DK................................................................ 8
2CA14 8CA14
CA13. WHAT MEDICINE WAS (name) GIVEN? Probe: ANY OTHER MEDICINE?
Circle all medicines given. Write brand
name(s) of all medicines mentioned.
(Names of medicines)
Antibiotic Pill / Syrup .............................................. A Injection .................................................. B Anti-malarials .............................................. M Paracetamol / Panadol / Acetaminophen ... P Aspirin ........................................................ Q Ibuprofen .................................................... R Other (specify) _______________________X DK................................................................ Z
CA14. Check AG2: Child aged under 3?
Yes. Continue with CA15
No. Go to Next Module
CA15. THE LAST TIME (name) PASSED STOOLS, WHAT WAS DONE TO DISPOSE OF THE
STOOLS?
Child used toilet / latrine ............................ 01 Put / Rinsed into toilet or latrine ................ 02 Put / Rinsed into drain or ditch .................. 03 Thrown into garbage (solid waste) ............ 04 Buried ........................................................ 05 Left in the open .......................................... 06 Other (specify) ______________________ 96 DK.............................................................. 98

265
MALARIA ML
ML1. IN THE LAST TWO WEEKS, HAS (name) BEEN
ILL WITH A FEVER AT ANY TIME? Yes .............................................................. 1 No ................................................................ 2 DK................................................................ 8
2Next Module 8Next Module
ML2. AT ANY TIME DURING THE ILLNESS, DID
(name) HAVE BLOOD TAKEN FROM HIS/HER
FINGER OR HEEL FOR TESTING?
Yes .............................................................. 1 No ................................................................ 2 DK................................................................ 8
ML3. DID YOU SEEK ANY ADVICE OR TREATMENT
FOR THE ILLNESS FROM ANY SOURCE? Yes .............................................................. 1 No ................................................................ 2 DK................................................................ 8
2ML8 8ML8
ML4. WAS (NAME) TAKEN TO A HEALTH FACILITY
DURING THIS ILLNESS? Yes .............................................................. 1 No ................................................................ 2 DK................................................................ 8
2ML8 8ML8
ML5. WAS (name) GIVEN ANY MEDICINE FOR
FEVER OR MALARIA AT THE HEALTH FACILITY? Yes .............................................................. 1 No ................................................................ 2 DK................................................................ 8
2ML7 8ML7
ML6. WHAT MEDICINE WAS (name) GIVEN? Probe:
ANY OTHER MEDICINE?
Circle all medicines mentioned. Write brand name(s) of all medicines, if given.
(Name)
Anti-malarials: SP / Fansidar .......................................... A Chloroquine ............................................ B Amodiaquine........................................... C Quinine ................................................... D Combination with Artemisinin ................. E Other anti-malarial (specify) _______________________ H Antibiotic drugs Pill / Syrup ................................................ I Injection ................................................... J Other medications: Paracetamol/ Panadol /Acetaminophen . P Aspirin ..................................................... Q Ibuprofen ................................................ R Other (specify) _______________________X DK................................................................ Z
ML7. WAS (name) GIVEN ANY MEDICINE FOR THE
FEVER OR MALARIA BEFORE BEING TAKEN TO
THE HEALTH FACILITY?
Yes .............................................................. 1 No ................................................................ 2 DK................................................................ 8
1ML9 2ML10 8ML10
ML8. WAS (name) GIVEN ANY MEDICINE FOR
FEVER OR MALARIA DURING THIS ILLNESS?
Yes .............................................................. 1 No ................................................................ 2 DK................................................................ 8
2ML10 8ML10
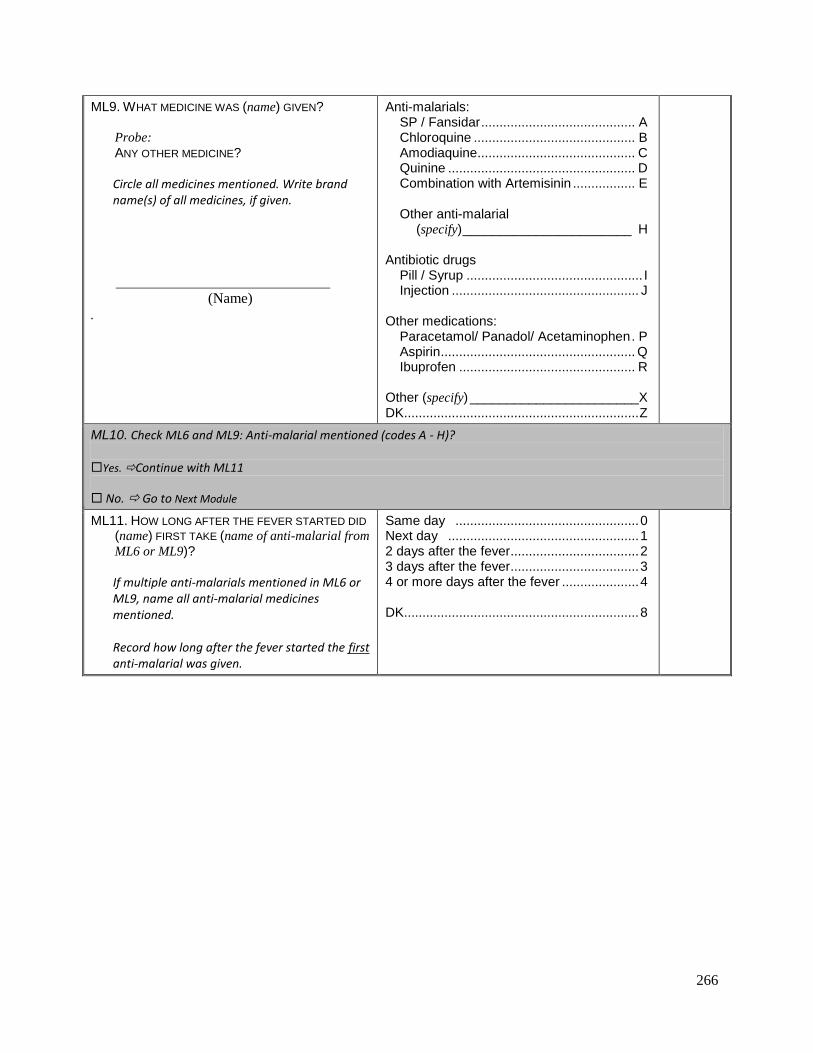
266
ML9. WHAT MEDICINE WAS (name) GIVEN? Probe:
ANY OTHER MEDICINE?
Circle all medicines mentioned. Write brand name(s) of all medicines, if given.
(Name) .
Anti-malarials: SP / Fansidar .......................................... A Chloroquine ............................................ B Amodiaquine........................................... C Quinine ................................................... D Combination with Artemisinin ................. E Other anti-malarial (specify) _______________________ H Antibiotic drugs Pill / Syrup ................................................ I Injection ................................................... J Other medications: Paracetamol/ Panadol/ Acetaminophen . P Aspirin ..................................................... Q Ibuprofen ................................................ R Other (specify) _______________________X DK................................................................ Z
ML10. Check ML6 and ML9: Anti-malarial mentioned (codes A - H)? Yes. Continue with ML11
No. Go to Next Module
ML11. HOW LONG AFTER THE FEVER STARTED DID
(name) FIRST TAKE (name of anti-malarial from
ML6 or ML9)?
If multiple anti-malarials mentioned in ML6 or ML9, name all anti-malarial medicines mentioned.
Record how long after the fever started the first anti-malarial was given.
Same day .................................................. 0 Next day .................................................... 1 2 days after the fever................................... 2 3 days after the fever................................... 3 4 or more days after the fever ..................... 4 DK................................................................ 8

267
IMMUNIZATION IM
If immunization card(s) is/are available, copy the dates in IM3 for each type of immunization recorded on the card(s). IM6-IM16A are for registering vaccinations that are not recorded on the card(s). IM6-IM16A will only be asked when card(s) is/are not available.
IM1. DO YOU HAVE ONE OR MORE CARDS WHERE
(name)‟S VACCINATIONS ARE WRITTEN DOWN? (If yes) MAY I SEE IT/THEM PLEASE?
Yes, at least one card seen .............. 1 Yes, no cards seen ........................... 2 No cards ........................................... 3
2IM2A 3IM2
IM1A. Observe and record the type of card(s) Routine EPI Card ............................. A Child Health Days Card 2009 .......... B Child Health Days Card 2010 .......... C Other (specify) _________________ X
AIM3 BIM3 BIM3 XIM3
IM2. DID YOU EVER HAVE A VACCINATION OR CHILD
HEALTH DAYS CARD FOR (name)? Yes .................................................... 1 No ..................................................... 2
2IM6
IM2A. DO OR DID YOU HAVE ONE OR MORE OF THE
CARDS SHOWN HERE WHERE (name)‟S
VACCINATIONS ARE OR WERE WRITTEN DOWN? Show the sample cards
and record the response
Routine EPI Card ............................. A Child Health Days Card 2009 .......... B Child Health Days Card 2010 .......... C Other(specify) _________________ X DK .................................................... Y
AIM6 BIM6 CIM6 XIM6 YIM6
IM3. (a) COPY DATES FOR EACH VACCINATION FROM THE
CARD.
(b) WRITE „44‟ IN DAY COLUMN IF CARD SHOWS THAT
VACCINATION WAS GIVEN BUT NO DATE
RECORDED.
Date of Immunization Card
Day Month Year A.Routine EPI Card. B.CHD 2009 C.CHD 2010
X.Other
BCG BCG
A B C X
POLIO AT BIRTH OPV0
A B C X
POLIO 1 OPV1
A B C X
POLIO 2 OPV2
A B C X
POLIO 3 OPV3
A B C X
DPT1 DPT1
A B C X
DPT2 DPT2
A B C X
DPT3 DPT3
A B C X
MEASLES MEASLES
A B C X
VITAMIN A (MOST RECENT) VITA A B C X
IM4. Check IM3. Are all vaccines (BCG to Measles) recorded?
YesContinue with IM18 No Continue with IM5
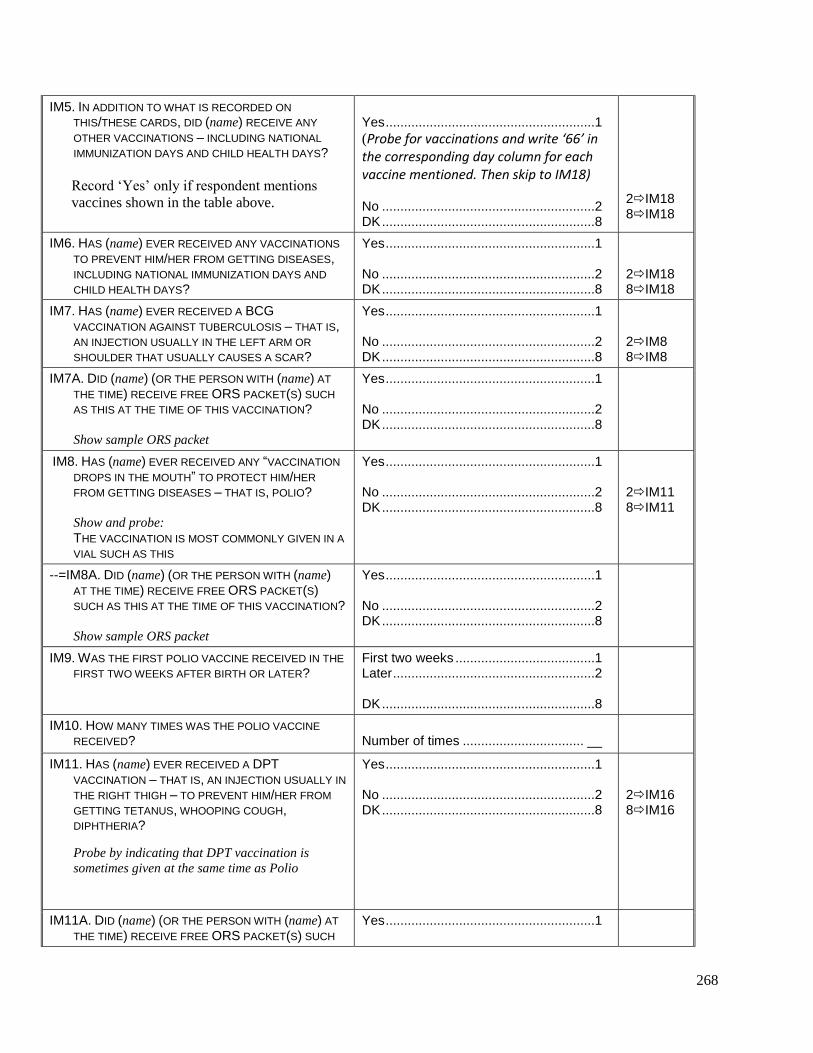
268
IM5. IN ADDITION TO WHAT IS RECORDED ON
THIS/THESE CARDS, DID (name) RECEIVE ANY
OTHER VACCINATIONS – INCLUDING NATIONAL
IMMUNIZATION DAYS AND CHILD HEALTH DAYS?
Record „Yes‟ only if respondent mentions
vaccines shown in the table above.
Yes .........................................................1
(Probe for vaccinations and write ‘66’ in the corresponding day column for each vaccine mentioned. Then skip to IM18) No ..........................................................2 DK ..........................................................8
2IM18 8IM18
IM6. HAS (name) EVER RECEIVED ANY VACCINATIONS
TO PREVENT HIM/HER FROM GETTING DISEASES, INCLUDING NATIONAL IMMUNIZATION DAYS AND
CHILD HEALTH DAYS?
Yes .........................................................1 No ..........................................................2 DK ..........................................................8
2IM18 8IM18
IM7. HAS (name) EVER RECEIVED A BCG
VACCINATION AGAINST TUBERCULOSIS – THAT IS, AN INJECTION USUALLY IN THE LEFT ARM OR
SHOULDER THAT USUALLY CAUSES A SCAR?
Yes .........................................................1 No ..........................................................2 DK ..........................................................8
2IM8 8IM8
IM7A. DID (name) (OR THE PERSON WITH (name) AT
THE TIME) RECEIVE FREE ORS PACKET(S) SUCH
AS THIS AT THE TIME OF THIS VACCINATION? Show sample ORS packet
Yes .........................................................1 No ..........................................................2 DK ..........................................................8
IM8. HAS (name) EVER RECEIVED ANY “VACCINATION
DROPS IN THE MOUTH” TO PROTECT HIM/HER
FROM GETTING DISEASES – THAT IS, POLIO? Show and probe:
THE VACCINATION IS MOST COMMONLY GIVEN IN A
VIAL SUCH AS THIS
Yes .........................................................1 No ..........................................................2 DK ..........................................................8
2IM11 8IM11
--=IM8A. DID (name) (OR THE PERSON WITH (name) AT THE TIME) RECEIVE FREE ORS PACKET(S) SUCH AS THIS AT THE TIME OF THIS VACCINATION?
Show sample ORS packet
Yes .........................................................1 No ..........................................................2 DK ..........................................................8
IM9. WAS THE FIRST POLIO VACCINE RECEIVED IN THE
FIRST TWO WEEKS AFTER BIRTH OR LATER? First two weeks ......................................1 Later .......................................................2 DK ..........................................................8
IM10. HOW MANY TIMES WAS THE POLIO VACCINE
RECEIVED? Number of times ................................. __
IM11. HAS (name) EVER RECEIVED A DPT
VACCINATION – THAT IS, AN INJECTION USUALLY IN
THE RIGHT THIGH – TO PREVENT HIM/HER FROM
GETTING TETANUS, WHOOPING COUGH, DIPHTHERIA?
Probe by indicating that DPT vaccination is
sometimes given at the same time as Polio
Yes .........................................................1 No ..........................................................2 DK ..........................................................8
2IM16 8IM16
IM11A. DID (name) (OR THE PERSON WITH (name) AT
THE TIME) RECEIVE FREE ORS PACKET(S) SUCH
Yes .........................................................1
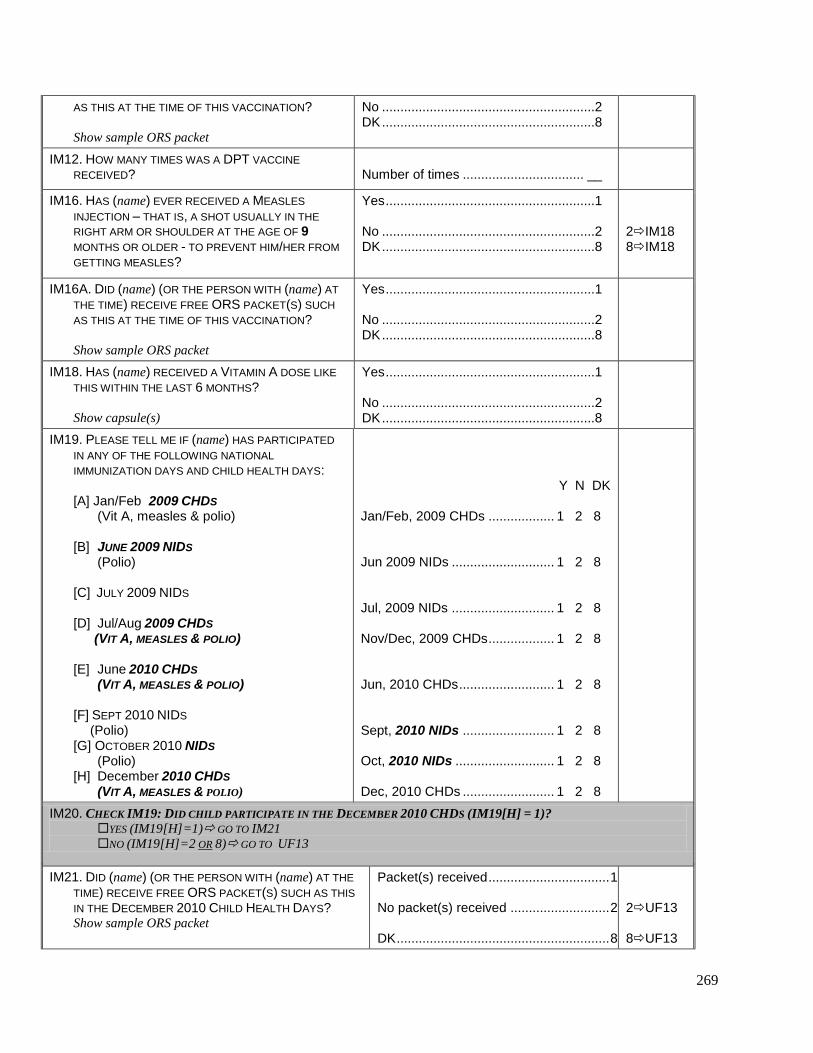
269
AS THIS AT THE TIME OF THIS VACCINATION? Show sample ORS packet
No ..........................................................2 DK ..........................................................8
IM12. HOW MANY TIMES WAS A DPT VACCINE
RECEIVED? Number of times ................................. __
IM16. HAS (name) EVER RECEIVED A MEASLES
INJECTION – THAT IS, A SHOT USUALLY IN THE
RIGHT ARM OR SHOULDER AT THE AGE OF 9
MONTHS OR OLDER - TO PREVENT HIM/HER FROM
GETTING MEASLES?
Yes .........................................................1 No ..........................................................2 DK ..........................................................8
2IM18 8IM18
IM16A. DID (name) (OR THE PERSON WITH (name) AT
THE TIME) RECEIVE FREE ORS PACKET(S) SUCH
AS THIS AT THE TIME OF THIS VACCINATION? Show sample ORS packet
Yes .........................................................1 No ..........................................................2 DK ..........................................................8
IM18. HAS (name) RECEIVED A VITAMIN A DOSE LIKE
THIS WITHIN THE LAST 6 MONTHS? Show capsule(s)
Yes .........................................................1 No ..........................................................2 DK ..........................................................8
IM19. PLEASE TELL ME IF (name) HAS PARTICIPATED
IN ANY OF THE FOLLOWING NATIONAL
IMMUNIZATION DAYS AND CHILD HEALTH DAYS: [A] Jan/Feb 2009 CHDS
(Vit A, measles & polio)
[B] JUNE 2009 NIDS (Polio)
[C] JULY 2009 NIDS [D] Jul/Aug 2009 CHDS (VIT A, MEASLES & POLIO) [E] June 2010 CHDS
(VIT A, MEASLES & POLIO) [F] SEPT 2010 NIDS
(Polio) [G] OCTOBER 2010 NIDS
(Polio) [H] December 2010 CHDS
(VIT A, MEASLES & POLIO)
Y N DK
Jan/Feb, 2009 CHDs .................. 1 2 8 Jun 2009 NIDs ............................ 1 2 8 Jul, 2009 NIDs ............................ 1 2 8 Nov/Dec, 2009 CHDs .................. 1 2 8 Jun, 2010 CHDs .......................... 1 2 8 Sept, 2010 NIDs ......................... 1 2 8 Oct, 2010 NIDs ........................... 1 2 8 Dec, 2010 CHDs ......................... 1 2 8
IM20. CHECK IM19: DID CHILD PARTICIPATE IN THE DECEMBER 2010 CHDS (IM19[H] = 1)? YES (IM19[H]=1) GO TO IM21
NO (IM19[H]=2 OR 8) GO TO UF13
IM21. DID (name) (OR THE PERSON WITH (name) AT THE
TIME) RECEIVE FREE ORS PACKET(S) SUCH AS THIS
IN THE DECEMBER 2010 CHILD HEALTH DAYS? Show sample ORS packet
Packet(s) received ................................. 1 No packet(s) received ........................... 2 DK .......................................................... 8
2UF13 8UF13

270
IM22. CHECK CA1: DID CHILD HAVE AN EPISODE OF DIARRHOEA IN THE PAST 2 WEEKS (CA1 = 1)? YES (CA1=1) GO TO IM24
NO (CA1=2OR 8) GO TO IM23
IM23. SINCE THE RECEIPT OF THE FREE ORS PACKET(S) IN DECEMBER, HAS (name) HAD ANY EPISODE OF
DIARRHOEA?
Yes, at least once .................................. 1 No episodes ........................................... 2 DK .......................................................... 8
2UF13 8UF13
IM24. WAS/WERE THE FREE ORS PACKET(S) RECEIVED
IN DECEMBER USED TO TREAT (name) FOR
DIARRHOEA?
Used to treat diarrhoea .......................... 1 Not used to treat .................................... 2 DK .......................................................... 8
UF13. Record the time.
Hour and minutes ..................... __ __ : __ __
UF14. Is the respondent the mother or caretaker of another child age 0-4 living in this household?
Yes. Go to the next QUESTIONNAIRE FOR CHILDREN UNDER FIVE to be administered to the
same respondent
No. End the interview with this respondent by thanking him/her for his/her cooperation.
Check to see if there are other woman‟s or under-5 questionnaires to be administered in this
household.
Move to another woman‟s or under-5 questionnaire.
271
Interviewer’s Observations
Field Editor’s Observations
Supervisor’s Observations

272