DEPARTMENT OF MINERALS AND ENERGY - Parliamentary ...
242
DEPARTMENT OF MINERALS AND ENERGY Annual Report 2009/2010
-
Upload
khangminh22 -
Category
Documents
-
view
7 -
download
0
Transcript of DEPARTMENT OF MINERALS AND ENERGY - Parliamentary ...

DEPARTMENT OF MINERALS AND ENERGY
DEPAR
TMEN
T OF M
INER
ALS AND
ENER
GY - AN
NU
AL REPO
RT 2009/10 Annual Report
2009/2010

1
DEPARTMENT OF MINERALS AND ENERGY
The Honourable D Peters, MP The Honourable S Shabangu, MPMinister of Energy Minister of Mineral Resources
Ministers, I present to you the Department of Minerals and Energy’s last annual report.
--------------------------------------------Adv Sandile NogxinaDirector General

2
1. GENERAL INFORMATION 4 Vision and Mission 5 Legislative Mandate 5 Public Entities Reporting to the Minister of Minerals and Energy 6 Director General’s Overview 8 Departmental Publications and Key Documents 10 Message from the Ministers 12 Information on the Ministries 16
2. PROGRAMME PERFORMANCE 17 Programme Overview 18 Strategic Overview and Key Policy Developments for 2009/10 Financial Year 18 Overview of Service Delivery and Organisation Development 22 Programme 1: Administration 30 Programme 2: Promotion of Mine Health and Safety 66 Programme 3: Mineral Regulation 76 Programme 4: Mineral Policy and Promotion 83 Programme 5: Hydrocarbons and Energy Planning 93 Programme 6: Electricity and Nuclear 111 Programme 7: Associated Services 125
TABLE OF CONTENTS

3
3. REPORT OF THE AUDIT COMMITTEE 136
4. ANNUAL FINANCIAL STATEMENTS 138 Report of the Accounting Officer 141 Report of the Auditor-General 149 Appropriation Statement 153 Notes to the Appropriation Statement 162 Statement of Financial Performance 165 Statement of Financial Position 166 Statement of Changes in Net Assets 167 Cash Flow Statement 168 Notes to the Annual Financial Statements 169 Disclosure Notes to the Annual Financial Statements 187 Annexures 196
5. HUMAN RESOURCE MANAGEMENT 214

4
GENERAL INFORMATION

5
VISION
World-class minerals and energy sectors through sustainable development.
MISSION
To regulate and promote the minerals and energy sectors for the benefit of all.
LEGISLATIVE MANDATE
The provision of services for the effective transformation and governance of minerals and energy industries for economic growth and development, thereby improving the quality of life.
6
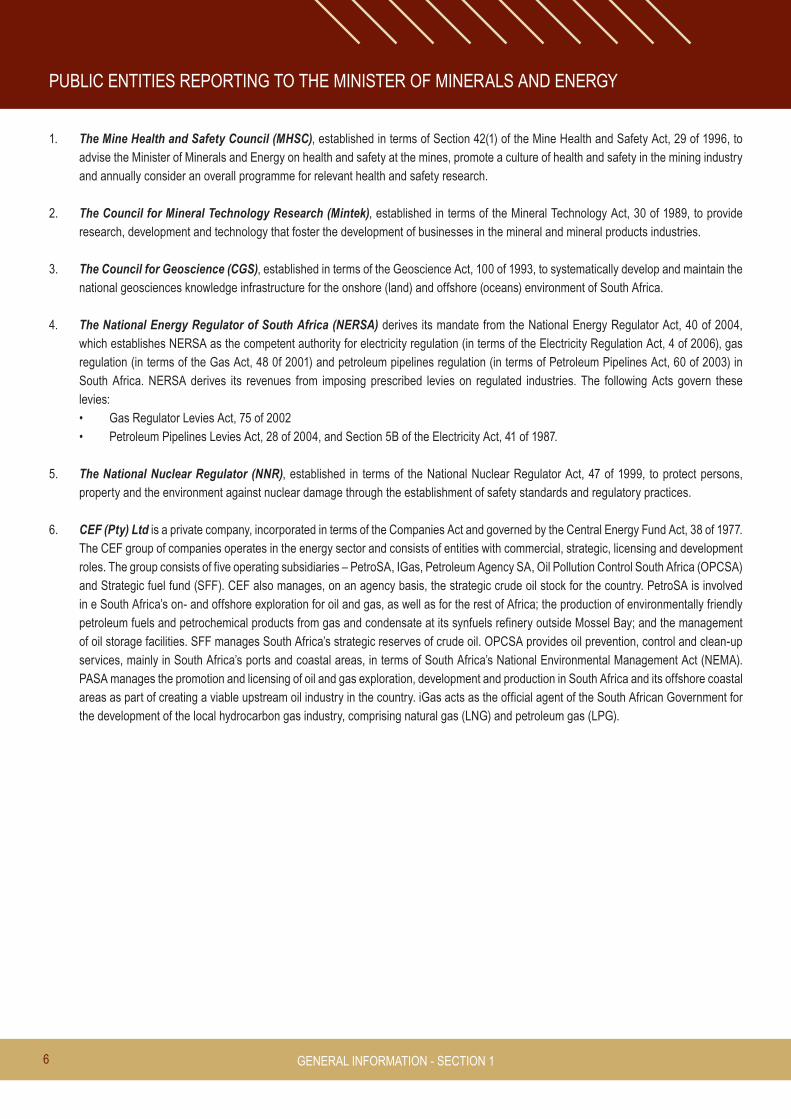
PUBLIC ENTITIES REPORTING TO THE MINISTER OF MINERALS AND ENERGY
1. The Mine Health and Safety Council (MHSC), established in terms of Section 42(1) of the Mine Health and Safety Act, 29 of 1996, to advise the Minister of Minerals and Energy on health and safety at the mines, promote a culture of health and safety in the mining industry and annually consider an overall programme for relevant health and safety research.
2. The Council for Mineral Technology Research (Mintek), established in terms of the Mineral Technology Act, 30 of 1989, to provide research, development and technology that foster the development of businesses in the mineral and mineral products industries.
3. The Council for Geoscience (CGS), established in terms of the Geoscience Act, 100 of 1993, to systematically develop and maintain the national geosciences knowledge infrastructure for the onshore (land) and offshore (oceans) environment of South Africa.
4. The National Energy Regulator of South Africa (NERSA) derives its mandate from the National Energy Regulator Act, 40 of 2004, which establishes NERSA as the competent authority for electricity regulation (in terms of the Electricity Regulation Act, 4 of 2006), gas regulation (in terms of the Gas Act, 48 0f 2001) and petroleum pipelines regulation (in terms of Petroleum Pipelines Act, 60 of 2003) in South Africa. NERSA derives its revenues from imposing prescribed levies on regulated industries. The following Acts govern these levies:
• Gas Regulator Levies Act, 75 of 2002 • Petroleum Pipelines Levies Act, 28 of 2004, and Section 5B of the Electricity Act, 41 of 1987.
5. The National Nuclear Regulator (NNR), established in terms of the National Nuclear Regulator Act, 47 of 1999, to protect persons, property and the environment against nuclear damage through the establishment of safety standards and regulatory practices.
6. CEF (Pty) Ltd is a private company, incorporated in terms of the Companies Act and governed by the Central Energy Fund Act, 38 of 1977. The CEF group of companies operates in the energy sector and consists of entities with commercial, strategic, licensing and development roles. The group consists of five operating subsidiaries – PetroSA, IGas, Petroleum Agency SA, Oil Pollution Control South Africa (OPCSA) and Strategic fuel fund (SFF). CEF also manages, on an agency basis, the strategic crude oil stock for the country. PetroSA is involved in e South Africa’s on- and offshore exploration for oil and gas, as well as for the rest of Africa; the production of environmentally friendly petroleum fuels and petrochemical products from gas and condensate at its synfuels refinery outside Mossel Bay; and the management of oil storage facilities. SFF manages South Africa’s strategic reserves of crude oil. OPCSA provides oil prevention, control and clean-up services, mainly in South Africa’s ports and coastal areas, in terms of South Africa’s National Environmental Management Act (NEMA). PASA manages the promotion and licensing of oil and gas exploration, development and production in South Africa and its offshore coastal areas as part of creating a viable upstream oil industry in the country. iGas acts as the official agent of the South African Government for the development of the local hydrocarbon gas industry, comprising natural gas (LNG) and petroleum gas (LPG).
GENERAL INFORMATION - SECTION 1

7
7. The South African Nuclear Energy Corporation (NECSA), mandated by the Nuclear Energy Act, 46 of 1999, to undertake and promote research and development in nuclear energy and radiation science. NECSA is also, on behalf of the state, responsible for the decommissioning and decontamination former strategic nuclear facilities; management of nuclear waste disposal on a national basis; application of radiation technology for scientific and medical purposes; operation of the SAFARI-1 nuclear reactor and the Pelindaba site and accompanying services; and execution of the safeguards function.
8. The South African Diamond and Precious Metals Regulator (SADPMR), established in terms of the Diamonds Act, 56 of 1986 and 29 of 2005 as amended, and the Precious Metals Act, 37 of 2005. The South African Diamond Board ceased to exist on 30 June 2007 and the South African Diamond and Precious Metals Regulator came into effect on 1 July 2007. The Regulator took over the mandate, current functions, staff and all assets and liabilities of the Diamond Board. The Diamond Bourse of South Africa was incorporated into the Regulator with all its staff, assets and liabilities. The Regulator regulates the diamond, platinum and gold sectors and is funded through a state grant, as opposed to the former Diamond Board, which generated its own funding from levies and licence fees from sight holders.
9. The Electricity Distribution Industry Holdings (Pty) Ltd (EDIH), created to restructure the electricity distribution industry into six financially viable regional electricity distribution companies ( REDs) as outlined in the White Paper on Energy Policy of 1998.
10. The State Diamond Trader, established in terms of the Diamond Act, 56 of 1986 and 29 of 2005 as amended, to promote equitable access to and beneficiation of diamond resources, address distortions in the diamond industry and correct historical market failures to develop and grow South Africa’s diamond cutting and polishing industry. The State Diamond Trader commenced its operations in September 2007 and was officially launched by the Director General, Advocate Sandile Nogxina, on behalf of the Minister of Minerals and Energy on 29 February 2008.
• �All�entities�submit�individual�Annual�Reports�to�the�Ministers,�which�are�tabled�with�the�DME’s�Annual�Report.�A�summary�of�performance�for�the�entities�is�reflected�in�this�report�under�Programme�7:�Associated�Services.��

8
OVERVIEW BY THE DIRECTOR GENERAL
Ministers, the end of the 2009/10 financial year also sees the closure of the Department of Minerals and Energy as we know it. We have worked diligently to divide the department into two separate entities as proclaimed by the State President. The new dispensation is aligned with our resolution to transformation and govern the minerals and energy sectors and stimulate economic growth to improve the quality of life for all our citizens.
I present the Department of Minerals and Energy’s performance report for the 2009/10 financial year.
MINING
In our continued effort to strengthen our regulatory framework, the Department completed the Geoscience Amendment Bill, 12 of 2010. This Bill was endorsed by Cabinet and gazetted in December 2009, and will be introduced to Parliament during the 2010/11 financial year. The main focus of the Bill is to effectively manage infrastructure development in dolomitic terrains and acknowledge the Council for Geoscience (CGS) as the advisory authority on geohazards and custodian of all geotechnical data and technical information on exploration and mining.
The Mining Charter, introduced in 2004, makes provision for assessing industry progress against set targets. An assessment, completed in October 2009, also reviewed the use of the Charter as an instrument of transformation. The report will form the basis of a review of the Charter in the period going forward.
Dealing with the environmental legacy of more than a hundred years of mining in South Africa requires a concerted effort to mitigate further degradation and pollution, as well as a potential impact on communities in surrounding areas. In response, the Department has:• developed a rehabilitation management strategy for derelict
and ownerless mines, which is ready for tabling before and consideration by Cabinet, and
• established a rehabilitation oversight committee as a transitional structure to implement the strategy and manage the progress of concurrent rehabilitation.
The Department also attended the 18th session of the United Nations Commission on Sustainable Development (UNCSD 18) and participated in the drafting of South Africa’s Country Report on mining to ensure that sustainable mining, aligned with the triple bottom line, is implemented in the country. The Country Report outlines the mining industry’s progress against the agreed developmental targets of the
Johannesburg Plan of Implementation (JPOI), which was adopted by all member countries at the World Summit on Sustainable Development held in Johannesburg in 2002. We will also participate in the session next year, where policy negotiations will take place.
The Department hosted the 7th African Mining Partnership (AMP) Plenary in Cape Town in February 2010 with Ghana as Chair and South Africa as the Secretariat. This was the last NEPAD AMP, and African ministers responsible for mining lobbied successfully for the transfer of the AMP to the African Union (AU). This merger will greatly improve the AMP’s standing, attract more participation, facilitate access to the AU’s financial resources and help achieve its vision of increasing the benefit of Africa’s mineral wealth for its own people.
In 2009, Cabinet approved the Department’s participation in the African Diamond Producers Association (ADPA). South Africa was nominated to take over the Chairmanship of ADPA from Angola during the second ordinary meeting of the Council of Ministers in 2010. Membership of this Association presents a window of opportunity for the country to position itself strategically amongst diamond producing countries in Africa and could provide significant impetus to its diamond beneficiation initiatives and aim of becoming a beneficiation hub and gateway to Africa.
The Department’s health and safety function is aligned with the related approved plan. The key recommendations from the Tripartite Leadership Summit are being implemented and the process of codifying best practice noise, fall-of-ground (FOG) and airborne pollutant control is progressing well.
GENERAL INFORMATION - SECTION 1
DIRECTOR GENERAL’S OVERVIEW

9
Cooperation between the Mining Qualifications Authority and the Department to improve occupational safety and health included raining all inspectors in new approaches to inspections and audits, while a programme to train 40 000 health and safety representatives is well underway. These strategic projects will, among others, enhance a health and safety dialogue to improve health and safety governance at mine sites.
ENERGY
During the year under review, we held a successful Renewable Energy Summit to review the Renewable Energy Policy. We received a positive stakeholder feedback on the progress made in attaining renewable energy targets, as well as the challenges encountered in the sector which led to a decision by the Department to revise the 2003 Renewable Energy White Paper. The revised White Paper, which will be finalised before the end of 2010 financial year, was revised with the assistance of a service provider at a cost of R1, 489 million.
We also engaged the public in the development of the Solar Water Heating Framework to guide the mass rollout of solar water heaters across the country. Our Renewable Energy Market Transformation Programme, in collaboration with the World Wide Fund for Nature (WWF) and the University of Stellenbosch, hosted a workshop to examine the industrial potential for concentrated solar power (CSP).
During the past year, the Department also supported the launches of key renewable energy projects, particularly the small-scale hydro project in Bethlehem in the Free State and the Ethekwini landfills gas-to-electricity project in Durban, KwaZulu-Natal, which were particularly funded through the Renewable Energy Finance and Subsidy Office (REFSO).
The Department encountered challenges with finalising financing for biolfuels and will complete this process during the 2010/11 financial year. The draft strategic framework for solar water heating will also be completed in the forthcoming financial year, as further engagement with stakeholders is required to agree on the most feasible implementation model. Pilot projects were identified to test framework, such as the Winterveldt initiative, and the Free State Province assisted, through the donor-funded REMT, to develop a business plan for the roll-out of solar water heaters. The Renewable Energy Directorate also participated in awareness campaigns with the Designated National Authority and Special Directorates.
A nuclear energy research and development (R&D) cooperation agreement was signed with the United States of America to strengthen our R&D capacity and capability. All nuclear materials and equipment to, in and from the country are recorded. During the reporting period,
authorisation was given for 10 possessions, three acquisitions, five disposals, 22 imports, 13 exports and two transfers.
GEF/UNDP funding of approximately 700 000 USD for the year under review enabled the South African Wind Energy Programme to appoint service providers and sub-contractors to update the South African wind atlas. The results are expected towards the end of 2010. The remaining funds were used to develop a business for the South African Wind Energy Association (SAWEA) and establish a SAWEA Board, as well as energy workshops which focused on, amongst others, standards and wind resource development.
As at 31 March 2010, approximately 15 198 petroleum license applications had been received, with 12 453 processed and approximately 2 745 waiting to be processed. Interim measures were adopted to mitigate the deficiencies of the current Petroleum Products Amendment Licensing System (PPALS). The project plan for a refined system is in place, but IT infrastructure constraints prevented its implementation and the project was put on hold due to non-delivery by the consultants.
CONCLUSION
Finally, I would like to commend and thank all our staff for their fortitude and commitment to ensuring that we progress in our efforts to improve the lives of our citizenry.
Unfortunately the DME’s reputation for clean audit reports has been blemished in the last year of its existence. We note however that the challenges presented by the tight deadlines of establishing the two separate departments exerted pressure on our strained resources. Notwithstanding the preceding, both departments have undertaken to employ measures that will resolve the matters identified in the audit report
It is with a degree of sadness that the Mineral Resources and Energy family members will part ways to pursue different directions. I am confident, however, that their diligence will allow the new Departments to build on the successes achieved thus far in their respective portfolios.
Thanking the Ministers,
Adv Sandile NogxinaDirector General: Department of Minerals and Energy

10
DEPARTMENTAL PUBLICATIONS AND KEY DOCUMENTS – 2009/10
Reviews
• 26th Edition of South Africa’s Mineral Industry (SAMI) 2008’09• Invest in an Intense and Diverse Mineral Industry 2010
Information Circulars
MB Bulletin Trimester Vol 22 Issue 1 of 3 2009 (April 2009)Vol 22 Issue 2 of 3 2009 (July 2009)Vol 22 Issue 3 of 3 2009 (October 2009)
Directories
• D1/2010: Operating Mines and Quarries and Mineral Processing Plants in the Republic of South Africa • D2/2010: Operating and Developing Coal Mines in South Africa• D3/2010: Operating and Developing Gold Mines in South Africa• D4/2010: Salt Producers in the Republic of SA• D5/2010: South African Mineral Beneficiators• D6/2009 Platinum-group Metal Mines in SA • D7/2009: SA Diamond Handbook and Operating Diamond Mines Directory• D8/2009: Ferrous Mineral Commodities produced in SA• D9/2008: Producers of Dimension Stone in South Africa• D10/2010: Producers of Nonferrous Metal Commodities produced in SA • D11/2008: Producers of Industrial Mineral Commodities in South Africa• D12/2009: Operating and Developing Black Economic Empowerment Mining Companies • D13/2009: African Mining – Mining Companies, Government Departments and related organisations• D14/2009: Producers of Sand and Aggregate in SA
Statistics
• Minerals - South Africa: Statistical Tables 1987 – 2008• Mineral Production and Sales Statistics (Monthly and Annually)
GENERAL INFORMATION - SECTION 1
11
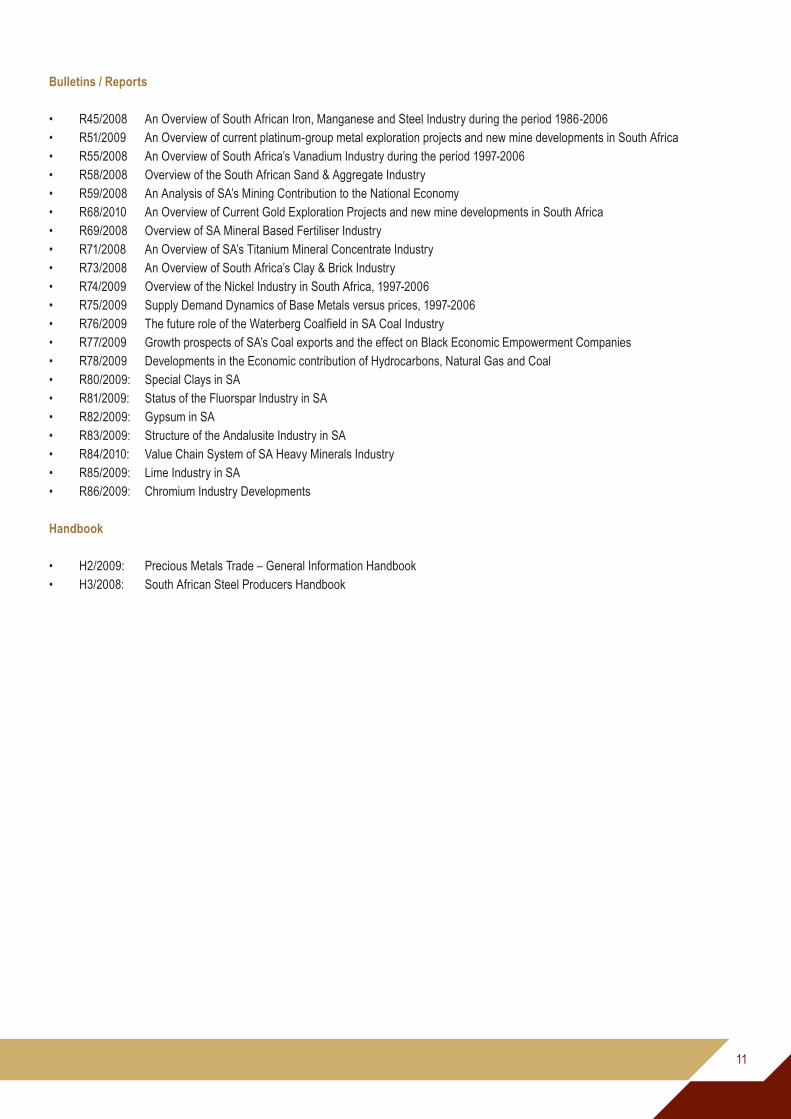
Bulletins / Reports
• R45/2008 An Overview of South African Iron, Manganese and Steel Industry during the period 1986-2006• R51/2009 An Overview of current platinum-group metal exploration projects and new mine developments in South Africa• R55/2008 An Overview of South Africa’s Vanadium Industry during the period 1997-2006• R58/2008 Overview of the South African Sand & Aggregate Industry• R59/2008 An Analysis of SA’s Mining Contribution to the National Economy• R68/2010 An Overview of Current Gold Exploration Projects and new mine developments in South Africa• R69/2008 Overview of SA Mineral Based Fertiliser Industry• R71/2008 An Overview of SA’s Titanium Mineral Concentrate Industry• R73/2008 An Overview of South Africa’s Clay & Brick Industry• R74/2009 Overview of the Nickel Industry in South Africa, 1997-2006• R75/2009 Supply Demand Dynamics of Base Metals versus prices, 1997-2006• R76/2009 The future role of the Waterberg Coalfield in SA Coal Industry• R77/2009 Growth prospects of SA’s Coal exports and the effect on Black Economic Empowerment Companies• R78/2009 Developments in the Economic contribution of Hydrocarbons, Natural Gas and Coal• R80/2009: Special Clays in SA• R81/2009: Status of the Fluorspar Industry in SA• R82/2009: Gypsum in SA• R83/2009: Structure of the Andalusite Industry in SA• R84/2010: Value Chain System of SA Heavy Minerals Industry• R85/2009: Lime Industry in SA• R86/2009: Chromium Industry Developments
Handbook
• H2/2009: Precious Metals Trade – General Information Handbook• H3/2008: South African Steel Producers Handbook

12
MESSAGE FROM THE MINISTER OF MINERAL RESOURCES
INFORMATION ON THE MINISTRY OF MINERAL RESOURCES
I have the pleasure of presenting to you our Annual Report for the 200/10 financial year.
In many respects, the past financial year has been both challenging and rewarding. Our fourth democratic election took place in the midst of a global recession, ushering in a new administration faced with the daunting task of cushioning the country from the impact of a worldwide economic downturn. I am pleased to report that while South Africa’s mining industry did not escape the impact of the recession, we rose to the challenges and will certainly reap the benefits going forward.
Shortly after taking office in 2009, President Jacob Zuma announced a reorganisation of national departments to align them with the priorities of the new Government. Among others, the Department of Minerals and Energy was divided into two Departments, that of Mineral Resources (DMR) and Energy (DoE). During the transition period, we entered into a shared support services agreement with the newly formed DoE to provide them with support services until the end of March 2010. I am pleased to report that, as of 1 April 2010, the Department of Mineral Resources became a stand-alone entity.
As indicated, the South African mining industry was not immune to the wrath of the global economic crisis during the past year. In collaboration with organised business and labour, and under the auspices of the Mining Industry Growth, Development and Employment Task Team (MIGDETT), the Department led a counter-cyclical intervention which saved 65 000 of the then-anticipated 100 000 job losses as a result of the recession. We also hosted a Mining Summit at the end of March 2010 to develop a strategy for sustainable growth and meaningful transformation in the mining industry to ensure that it is cushioned against future economic pressure. I am confident that the agreements reached at the Mining Summit will, during the first quarter of the 2010’11 financial year, produce a plan for the sector to attract new investment, create decent jobs and contribute significantly to the country’s overall socio-economic development.
While mining’s contribution to growth and development is significant, its impact on the environment can be detrimental. In mitigation, my Department continued to promote environmental management policies through more stringent legislation and a strong focus on research. Priority areas include the development of mine closure and water management strategies to deal with the legacy of derelict and ownerless mines. Significant strides have been made in this regard and we will continue to prioritise the adoption of best practice and standards to ensure that this area is adequately regulated.
Min S ShabanguMinister of Mineral Resources
GENERAL INFORMATION - SECTION 1

13
Representations from various stakeholders resulted in the submission of the beneficiation strategy to another round of consultations. Final amendments are being made and the strategy will be tabled before Cabinet for adoption as policy before the end of the 2010’11 financial year.
Major developments in the 2009’10 financial year saw a moratorium by Cabinet on the disposal of State mining assets and our audit of the State’s involvement in mining. We will table the findings of this audit for Cabinet consideration in the forthcoming financial year.
The past five years, which saw the transition from the mineral right ownership system to a State custodianship of mineral and petroleum resources, was characterised by a strong focus on processing applications in terms of the Mineral and Petroleum Resources Development Act (MPRDA), 28 of 2002, as amended. During the review period, the Department committed to shortening application turn-around times from six to three months for prospecting rights and twelve to six months for mining rights, to facilitate a seamless transition process.
Our focus going forward will be on giving effect to the objectives of the MPRDA and the Broad-Based Socio-Economic Empowerment Charter through monitoring and evaluating the implementation of social and labour plans, mining and prospecting programmes and environmental management.
The health and safety programme continued to play a critical regulatory role in improving occupational health and safety. While these efforts, for the second year, resulted in fewer mining deaths and injuries, the 165 reported injuries and deaths during the past year is still too high. A health and safety research programme, funded and operated under the auspices of the Mine Health and Safety Council, will therefore focus on finding solutions to health and safety challenges, such as rockfalls, seismicity, silicosis and noise.
Skills development is, and will continue to be, critical for the growth of the South African economy. The Mining Qualifications Authority (MQA) fulfilled their service level agreement with Government through the implementation of leanerships, internships, ABET programmes and a bursary scheme. The MQA also supports mine inspector training and, during the past year, started with the training of 40 000 health and safety representatives. Alignment with SETA-accredited mining-related training at Further Education and Training (FET) colleges will be prioritised in the year ahead.
In addition to regulatory progress, my Department also intensified the process of improving relations between mining houses, their host communities and provincial and local Government structures.
These achievements would not have been possible without the collaboration and partnership of a broad spectrum of role-players. A special word of appreciation goes to the management and employees of my Department. I thank them for their outstanding commitment under the sterling leadership of the Director General, Adv Sandile Nogxina. I would also like to acknowledge the work of the Boards and management of the State-owned entities reporting to me. Lastly, I would like to commend the captains of industry and the leadership of the labour movement, and their constituencies, for their meaningful contribution to the successes of our industry.
As we table the DME’s final annual report, we are mindful of the enormous task ahead for the DMR. The mining industry has a critical role to play in the South African economy, especially in its support of Government’s focus on job creation and skills and rural development. It is within this context that we close the chapter on the DME and look forward to the contribution of mining towards the overall socio-economic development of South Africa.
This annual report is tabled for your consideration.
SUSAN SHABANGU, MPMINISTER OF MINERAL RESOURCES

14
MESSAGE FROM THE MINISTER OF ENERGY
Min D PetersMinister of Energy
GENERAL INFORMATION - SECTION 1
The financial year which ended on 31 March 2010 marked the establishment, at a rudimentary level, of the Department of Energy (DoE). We had to construct the architecture of a new Department with a new mandate, mission, vision and organisational values. This epoch-making work was undertaken at a time when globally, countries were taking steps to guarantee the security of their own energy supplies. As a leader and regulator of the energy sector over the past year, my Department can rightfully look back with pride at our role in stabilising this sector at a time when countries world-wide, including South Africa, were emerging from the worst economic crisis of this century. This annual report comprehensively covers the activities of the Department of Energy during the year under review. It is intended to provide stakeholders and other interested parties with information about our key performance areas and financial performance. It also reviews our contribution to Government’s broader objective of ensuring a better life for all our people: black and white. Our activities for the better part of the 2009/10 financial year focused on the country’s electricity plan, well-known as the IRP2. This groundbreaking plan, which will be finalised in the forthcoming financial year, will provide clarity about the country’s electricity requirements in the period before and beyond 2010. In an ideal world, the drafting of the IRP should have been preceded by that of an integrated energy plan for South Africa. This plan, including oil and gas, will now be developed in the year ahead.
The involvement of youth and women in the energy sector will continue to define our work with vulnerable groups and will be escalated in the year ahead. The education and training of youth will enable us to address the sector’s capacity challenges and support the country’s growth and development.
During the past year, a learner focus week as part of our Malaysian school programme, aimed to encourage learners to study science and technology and create awareness about the array of career opportunities in the energy sector and the need for education and training to pursue them. The Department’s Memorandum of Understanding with the University of Fort Hare can be highlighted as a harbinger of our drive to partner with institutions of higher learning to develop the scarce skills required for our sector.
INFORMATION ON THE MINISTRY OF ENERGY

15
Given the finite nature of our country’s resources, our programmes are also aligned with the National Industrial Policy Framework to include high-potential projects such as the nuclear programme. It is our intention to increase prospects for sustainable jobs through these projects to help eradicate poverty and ultimately contribute to economic growth and development.
The narrow electricity reserve margin that led to South Africa’s energy crisis and the resultant establishment of the multi–stakeholder National Emergency Response Team (NERT), necessitates an ongoing focus on energy conservation and has directed our activities in entrenching sustainable behavioural change in energy management and usage.
One of these is the imperative of reducing greenhouse gas emissions, which directed our focus to cleaner energy sources through the use of renewable energy and environmentally–friendly policies. During the year under review, we convened the Renewable Energy Summit and standardised regulations under the Electricity Regulation Act, 4 of 2006, and Energy Act, 34 of 2008, respectively. This has been buttressed through among others, the energy feed in tariffs, launch of the Energy Addicts campaign, introduction of the smart meter programme for the high-consumption domestic sector, as well as the introduction of the solar water heating programme, which will start in the next financial year.
In conclusion, I would like to acknowledge the sterling work done by the management and entire staff of the Department, ably led by the Director General, Ms Nelisiwe Magubane. I am also grateful to the Boards and management of all the State-owned entities that have worked with us in effecting our mandate.
DIPUO PETERS MPMINISTER OF ENERGY

16
MINISTERIAL VISITS ABROAD
Visits abroad undertaken by Ministers Ms Susan Shabangu and Dipuo Peters (and the Directors General Adv Sandile Nogxina and Nelisiwe Magubane on behalf of the Ministers)
INTERNATIONAL VISITS UNDERTAKEN BY THE MINISTER AND DIRECTOR GENERAL (ON BEHALF OF THE MINISTER) APRIL 2009 TO MARCH 2010
DATE VENUE EVENT PARTICIPATION19-21 August 2009 Angola State visit Ministers of Mineral Resources &
Energy3-8 September 2009 Australia Africa Down-Under Conference and Trade
andInvestment ConferenceMinister of Mineral Resources
14-18 September 2009 Austria IAEA Conference Minister of Energy28 September-1 October 2009
Ethiopia AMP 5th Executive Committee Mid-Term Review meeting
Minister of Mineral Resources
7- 9 October 2009 Angola Technical visit DG of Mineral Resources12-13 October 2009 United Kingdom,
London3rd Ministerial meeting of the Carbon Sequestration Leadership Forum
Minister of Energy
3-4 November 2009 Equatorial Guinea State visit Minister of Energy7-13 November 2009 Venezuela Working visit DG of Mineral Resources9-14 November 2009 Nigeria Bi-National Commission Minister of Energy1- 3 December 2009 Cuba SA/Cuba Joint Bilateral Commission DG of Mineral Resources7- 9 December 2009 Zambia State visit Minister of Mineral Resources8-9 December 2009 Zambia State visit Minister of Energy9-11 December 2009 Ethiopia Africa Union Conference of Ministers Responsible
for HydrocarbonsMinister of Energy
15-18 December 2009 Denmark, Copenhagen Participate in the Climate Change negotiations DG of Energy16-17 January 2010 United Arab Emirates 3rd International Renewable Energy Agency
Preparatory meetingMinister of Energy
2- 5 March 2010 United Kingdom State visit Ministers of Mineral Resources and Energy
2-5 March 2010 United Kingdom State visit DG of Mineral Resources7-10 March 2010 Canada Prospectus and Developers Association of Canada Minister of Mineral Resources11-12 March 2010 USA 10th Anniversary of the UN Resolution 1325 Minister of Energy10-14 March 2010 USA, New York Reuters Global Mining and Steel Summit Minister of Mineral Resources22-23 March 2010 Switzerland, Geneva United Nations Conference on Trade and
Development Global Commodities ForumDG of Mineral Resources
23 March 2010 DRC African Petroleum Producers Association (APPA) Ministerial meeting
Minister of Energy
25-26 March 2010 Egypt Minister’s working visit Minister of Energy

17
PROGRAMMEPERFORMANCE

18
PROGRAMME OVERVIEW
Voted Funds (2009’10)
Appropriation Main AppropriationR’000
Adjusted Appropriation R’000
Actual Amount Spent R’000
Over/Under ExpenditureR’000
4,647,196 4,682,004 4,544,716 137,288Responsible Minister Minister of Minerals and EnergyAdministering Department Department of Minerals and EnergyAccounting Officer Director General of Minerals and Energy
Aim of the Vote
The aim of the Department of Minerals and Energy is to formulate and implement an overall minerals and energy policy to ensure the optimum utilisation of mineral and energy resources.
KEY MEASURABLE OBJECTIVES
Strategic objectives
At the 2009‘10 annual strategic planning session, used to align our mission, vision and strategies with Government’s imperatives of eradicating poverty, transforming our economy and society, and reconstructing and developing social justice, we developed the following strategic objectives to support our revised vision and mission:
1 Promote and regulate the minerals and energy sectors – through ensuring optimal service to all stakeholders by improving turnaround times, providing clear regulatory and policy frameworks and credible and accessible information, building alliances and partnerships, and improving the awareness and reputation of the DME.
2 Ensure effective service delivery through efficient organisational processes – through implementing legislation, consistent monitoring and enforcement guidelines, standardised policies and procedures, service standards and managed service level agreements, as well as understanding and managing customer expectations and providing regular consultation and feedback.
3 Promoting and maintaining a learning organisation – by attracting, developing and retaining skills, improving leadership and management capabilities, instilling core institutional values and managing institutional knowledge.
4 Ensure efficient, effective and economic use of financial resources – by aligning strategy with budget, managing budgets and costs, effectively providing State-owned entity oversight and ensuring good corporate governance.
STRATEGIC OVERVIEW AND KEY POLICY DEVELOPMENTS FOR THE 2009’10 FINANCIAL YEAR
Mining
In May 2009, the Inspectorate introduced critical amendments to the Mine Health and Safety Amendment Act (MHSAA), 74 of 2008, which enhanced the ability of the State to address the challenges of the high rate of injuries, ill-health and deaths in the industry. The Act also introduced stricter sanctions for non-compliance with health and safety standards.
While positive and encouraging milestones have been achieved in this regard, the fatalities and injuries remain unacceptably high, with recurring fatal accidents at some mines. It is evident that significant effort is still needed to effectively address this situation.
PROGRAMME PERFORMANCE - SECTION 2

19
The Mining Charter, introduced in 2004, makes provision for assessing industry progress against set targets. An assessment, completed in Oc-tober 2009, also assessed the use of the Charter as an instrument of transformation. The report will form the basis of a review of the Charter in the period going forward.
The Department has published a strategy to deal with derelict and ownerless mines in South Africa, recognising the long heritage of mining and its inherent environmental liability. The strategy includes the creation and verification of a database of abandoned mines, prioritising these mines for rehabilitation and site management.
The Geoscience Amendment Bill (GAB), 12 of 2010, was endorsed by Cabinet and gazzetted in December 2009, will be introduced to Parliament during the 2010’11 financial year. Its main focus is to effectively manage infrastructure development in dolomitic terrians and acknowledge the Council for Geoscience as the advisory authority on geohazards and the custodian of all geotechnical information related to exploration and mining.
Energy
Implementation of the National Energy Act, 34 of 2008
The National Energy Act, 34 of 2008, defines energy data as energy-related statistics, facts, figures, information and records of the energy industry and all other economic sectors. This places the collection of energy data in the ambit of the Department, as regulated by the Minister. The DoE faces a number of challenges in collecting this data, such as late submissions or none at all by data providers. This makes it difficult for the Department to meet its targets and commitments to supply statistics to the United Nations (UN) and other international bodies, as well as timeously publish energy statistics. In line with Section 19(1) (a), (b) and (c) of the Act, draft regulations on the Provision of Energy Data have been developed and approved for release for public comment. The regulations will be gazetted in the 2010’11 financial year and increase the Department’s ability to effectively collect, collate and publish quality energy data and information.
Renewable Energy Policy review
The success of the Renewable Energy Summit in March 2009 and positive stakeholder feedback on the progress made in attaining renewable energy targets, as well as the challenges encountered in the sector, led to a decision by the Department to revise the 2003 Renewable Energy White Paper. The revision will take the current receptivity towards renewable energy technologies in local and global environments into account to provide a new policy direction and set more ambitious medium- and long-term targets for the period to 2050.
The Department’s Renewable Energy Market Transformation Unit appointed service providers to assist with the revision of the White Paper at a cost of approximately R1,489 million. The revised White Paper will be finalised by the end of the 2010/11 years, and a Policy Advisory Committee consisting of a wide variety of stakeholders, was established to oversee this process. The revised White Paper is expected at the end of 2010 financial year. In addition, we also engaged the public in the development of the Solar Water Heating Framework to guide the mass rollout of solar water heaters across the country. The Department presented its proposed framework (details) at a conference attended by more than 500 delegates.
Our Renewable Energy Market Transformation Programme, in collaboration with the WWF (World-wide Fund for Nature) and University of Stellenbosch, hosted a workshop to examine the industrial potential for concentrated solar power (CSP). The focus on industrialisation is premised on the fact that renewable energy is more than merely a new or alternative source of energy. Instead, similar to most other forms of economic activity, it creates an extensive value chain with opportunities to expand and diversify South Africa’s industrial base.
This includes the creation of new businesses locally to supply manufacturing, operational, maintenance and refurbishment services, and everything in between. In addition, CSP is generally regarded as South Africa’s best long-term base load option for generating large-scale renewable energy. Similar industrialisation options were contemplated for wind energy and solar water heating. These meetings also created opportunities to consult with key stakeholders and disseminate information.
20
During the past year, the Department also supported the launches of key renewable energy projects, particularly the small-scale hydro project in Bethlehem in the Free State and the Ethekwini landfill gas-to-electricity project in Durban, KwaZulu-Natal, which were partially funded through the Renewable Energy Finance and Subsidy Office (REFSO).
Nuclear Energy Policy
The multifaceted nature and complexities involved in deploying nuclear energy requires a coordinated approach to implement the Nuclear Energy Policy. This ranges from decisions to deploy new nuclear power stations to determining the funding and procurement framework and the industrialisation and localisation strategy. The Department will develop the nuclear energy implementation strategy within the framework of the Inter-Ministerial Committee on Energy which was established in December 2009.
The National Radioactive Waste Disposal Institute Act, 53 of 2008, was promulgated during the past financial year. The development of the business case to list the entity is underway, as well as the appointment of A Board. The Disposal Institute is a critical entity in the overall management of radioactive waste material in accordance with international standards.
Energy Efficiency
The department together with the key stakeholders including members of the industry and the licensed distributors are continuing to cooperate in the efforts to promote and implement energy efficiency and demand side management programmes in order to address the electricity shortfall to meet the demand. In further collaboration with the department of Trade and Industry (dti), South African Bureau of Standards (SABS) and industries, a number of energy efficiency standards including the standard for energy efficient building are being finalised. In order to create capacity within the industrial sector the department together with the dti and BUSA , with the help of United Nation Industrial Development Organization( UNIDO) are implementing a capacity building programme on energy efficiency improvement within the industrial sector. This programme will see a number of technical professionals undergoing training programme to enhance their energy management skills.
The department is also, assisting the licensed distributors( municipalities and Eskom) to implement the electricity demand side management programmes through fiscal allocations. These allocations are currently used on retrofitting existing in-efficient lights including street and traffic lights with energy efficient technologies.
The department is continuing to engage with National Business Initiative on the formation of the new energy efficiency accord and how best to implement it. A number of meetings are taking place in this regard and a new accord will be agreed accordingly.
The National Energy Efficiency Strategy
The National Energy Efficiency Strategy was reviewed through a number of workshops with key stakeholders and was then gazetted in May 2009 for further public comments. Given the nature of comments and technical concerns raised during public consultation, it was therefore decided that a lot of work and consultation with key stakeholders is needed to allow the finalization of a proper strategy talking to the current and future energy use. The strategy review process is underway and is expected to be finalized by end of March 2011.
Overview of conditional grants
The�purpose�of� this�grant� is� to�assist�selected� licensed�distributors�with�high� load�centres�and�electricity�savings�potential,� to� implement� the�electricity�and�demand�side�management�programmes�in�order�to�reduce�the�electricity�consumption�and�mitigate�the�risk�of�load�shedding�and�supply�interruptions.��
PROGRAMME PERFORMANCE - SECTION 2

21
The table below provides a summary of the type of grant(s), total allocations, and the transfer trends for 2009/10:
Schedule 6: Energy Efficiency and Demand Side Management- this programme focuses only on retrofitting the existing lighting technologies with efficient technologies
Province Total allocation Total transferred to date
R’000 R’000Western Cape 39000 39000Eastern Cape 35 000 35 000Mpumalanga 12 100 12 100Limpopo 3 000 3 000North West 3000 3000KwaZulu Natal 24 000 24 000Free State 4 000 4 000Gauteng 54 900 54 900
Total 175 000 175 000
Schedule 7: Energy Efficiency and Demand Side Management Programme- this will focus on the roll-out of SWHs within selected areas.
Province Total allocation Total transferred to date
R’000 R’000Gauteng 74 475 74 475
Total 74 475 74 475
Clean Development Mechanism (CDM):
Clean Development Mechanism (CDM) is an important component of the global response to climate change mitigation. The development of the Clean Development Mechanism (CDM) market in South Africa has lagged behind some other industrialised developing countries. The pace of CDM project development to date has been slow. During this reporting period the Designated National Authority reviewed 37 Clean Development Mechanism projects (4 Project Design Documents and 33 project Identification notes). These projects have potential to help South Africa reduce green-house gas emissions such as carbon dioxide, which is emitted largely by the energy sector. In addition these projects contribute to sustainable development objectives of the government in the form of poverty alleviation, access to clean energy and contribution to Renewable Energy and Energy Efficiency targets, technology transfer and economic development. The projects submitted to the Designated National Authority for initial review and approval include energy efficiency, waste management, cogeneration, fuel switching and electricity generation from renewable energy sources.

22
Service delivery achievements: 2009/10
Sub-programme Objective Output performance/service delivery indicators
Actual performance against target
Target ActualDesignated National Authority
Regulation of CDM activity in South Africa
Issue letters of No Objection/ Approval for project submitted to DNA for review
70% of received projects within set time frames
37 projects have been reviewed( 33 Projects Idea Notes and 4 Project Design Documents
CDM Promotion and capacity Building
Publish CDM sector booklets and Annual CDM report
CDM promotion workshops
CDM sector booklets
1 CDM annual report.
9 Provincial workshop and 3 Sectoral workshop
CDM annual Report completed and is available on the website http://www.energy.gov.za/files/esources/kyoto/CDM.pdf
7 Provincial workshops and 2 sectoral workshops
The following CDM booklets were produced: Guidance for applicants of CDM in South Africa,CDM in the Agricultural sector, and CDM in the forestry sector.
OVERVIEW OF THE SERVICE DELIVERY AND ORGANISATIONAL ENVIRONMENT FOR 2009’10
During May 2009, President Jacob Zuma announced the restructuring of Cabinet and national departments to align the structure and electoral mandate of government with developmental challenges. As a result, the Department of Minerals and Energy (DME) was divided into two Departments, that of Mineral Resources and Energy. A Government-wide task team was established under the auspices of the Department of Public Service and Administration (DPSA) to oversee the transition. Due to funding and capacity constraints, the two new departments agreed to share support services through a Service Level Agreement wherein the Department of Mineral Resources, and the Director General of Minerals and Energy as the host Accounting Officer, agreed to provide support services to the Department of Energy until the end of the 2009’10 financial year.
Despite a significant additional workload, the affected employees in the DMR succeeded in establishing the separate Persal systems and information technology platforms to take effect for the two separate Departments on 1 April 2010.
Energy
Nuclear energy
The establishment of strategic relationships for the peaceful use of nuclear energy continues. A nuclear energy research and development (R&D) cooperation agreement was signed with the United States of America during the year under review to strengthen our R&D capacity and capability. Agreements with South Korea, Algeria and Canada are due for conclusion in 2010.
All nuclear materials and equipment to, in and from the country are recorded. During the reporting period, authorisation was given for 10 possessions, 3 acquisitions, 5 disposals, 22 imports, 13 exports and 2 transfers.
PROGRAMME PERFORMANCE - SECTION 2

23
Renewable energy
Considering that renewable energy, as an emerging industry, interfaces with the electricity and liquid fuels sectors, the Department considered the creation of supportive environments in both these sectors. The capital subsidy programme under the Renewable Energy Finance and Subsidy Office (REFSO) slowed down after the announcement and anticipated implementation of the REFIT tariffs support mechanism, with one project only subsidised during the 2009’10 financial year. As a result, only R6 million of the R10, 678 million allocated for renewable energy projects was spent. A revision of the REFSO mandate was proposed to ensure that going forward, a significant number of projects benefit from the REFIT tariffs through providing critical assistance during the early developmental phases of projects. The pursuit of green power trading was also terminated as a result of the REFIT programme.
The Department contracted service providers to develop a business plan and domain protocol to implement a tradable renewable energy certificate system (TRECs). The recommendation from conclusion of this process was that its would not be cost-effective to implement TRECs given the low uptake of renewable energy and that the market should continue trading on a voluntary basis, with Government involvement considered at a later stage, depending on the need. The cost of these processes amounted to R693,970 and R794,300 respectively, with domain protocol funding provided through GEF/UNDP donor funds under the South African Wind Energy Programme.
The Department encountered challenges with finalising financing for biofuels and will complete this process during the 2010’11 financial year.
The draft strategic framework for solar water heating will also be completed in the forthcoming financial year, as further engagement with stakeholders is required to agree on the most feasible implementation model. Pilot projects were identified to test the framework, such as the Winterveldt initiative, and the Free State Province assisted, through the donor-funded REMT, to develop a business plan for the roll out of solar water heaters. The Directorate also participated in awareness campaigns with the Designated National Authority and Special Programmes Directorates.
GEF/UNDP funding of approximately 700,000 USD for the year under review enabled the South African Wind Energy Programme to appoint service providers and sub-contractors to update the South African wind atlas. The first results are expected towards the end of 2010. The remaining funds were used to develop a business plan for the South African Wind Energy Association (SAWEA) and establish a SAWEA Board, as well as wind energy workshops which focused on, among others, standards and wind resource development.
Petroleum Products Amendment Act (PPAA)
The implementation of the Petroleum Products Amendment Act (PPAA), 58 of 2003, provides for the licensing of manufacturers (refines), wholesalers and retailers of petroleum products, and the transformation of the local petroleum and liquid fuels industry to give effect to the Liquid Fuels Charter. As at 31 March 2010, approximately 15,198 license applications had been received, with 12,453 processed and approximately 2,745 waiting to be processed.
Interim measures were adopted to mitigate the deficiencies of the current Petroleum Products Amendment Licensing System (PPALS). The project plan for a refined system is in place but IT infrastructure constraints prevented its implementation and the project was put on hold due to non- delivery by the consultants.
Inspectors from the compliance and monitoring Unit undertook 166 site inspections every month, coordinated by the Director at the Unit’s head office. A number of challenges, such as budgetary constraints and the slow progress of prosecuting transgressors through the justice system impeded its ability to fully deliver against its mandate, especially in the area of fuel specifications which has remained unfunded for the last three financial years.
Import and export of fuel products
Refined products are imported only when local producers cannot meet the demand and the importation is subject to State control to promote the use of local refineries. Export permits are required and generally granted when overproduction occurs, provided that the needs of both South Africa and other Southern African Customs Union members have been met. Currently about 15% of petrol and diesel products are imported to

24
meet local demand. Petrol and diesel make up 55% of total liquid-fuel exports, while South Africa is also the main supplier of all other liquid fuels to Botswana, Namibia, Lesotho and Swaziland.
Mining
Strategy on the rehabilitation of ownerless and derelict mines
The Department published a dynamic strategy to deal with derelict and ownerless mines in South Africa, recognising the long heritage of mining and its inherent environmental liability.�The strategy is comprised of three main components, namely the creation and verification of a database of abandoned mines, prioritising these mines for rehabilitation and the proposed management of the sites.
Mine safety
The health and safety track record in the mining industry continues to be a matter of great concern despite a slight year-on-year slight reduction in mine accident fatalities - 165 deaths in 2009 compared to 171 in 2008. Fall-of-ground still accounts for most accidents and fatalities, followed by transportation and machinery. Work is ongoing to improve seismic network coverage and the integration of seismic systems to assess how mines deal with high-risk areas prone to seismic activity.
Occupational health impacts are not immediately recognisable and difficult to quantify. The excessive exposure to dust, or silicosis, remains a major cause of premature retirement and death amongst South African miners. Tuberculosis (TB) is also a serious challenge for the mining industry and is exacerbated by HIV and AIDS, while noise-induced hearing loss is also a significant health hazard. The Mine Health and Safety Council budgeted R29,5 million for a comprehensive ‘zero harm’ research programme in alignment with the TB, HIV and AIDS policies and national health programmes of the Department of Health.
During the 2009’10 financial year, 19 engineering and occupational hygiene learner inspectors completed their experiential training at the Gold Fields Business and Leadership Academy in mechanical engineering (12) and electrical engineering (7). The learner inspectors were placed in regions such as Free State, Gauteng, Mpumalanga, Northern Cape and North West) to address capacity challenges at the Mine Health and Safety Inspectorate (MHSI). Existing MHSI inspectors attended courses at WITS as well as IRCA to equip them with the knowledge and skills to ensure that healthy and safe working conditions are in place for South Africa’s miners.
Monitoring of our State-owned Entities (SOEs)
During the year the Department approved the revised compliance framework for entities reporting to the Ministers of Mineral Resources and Energy, respectively. Chairmen and CEO’s of the State-owned enterprises (SOEs) participated in strategic planning sessions where the Ministers outlined their expectations of the alignment of SOE mandates with that of the Department. While there has been an improvement in the oversight of SOEs, some challenges remain and will be addressed in the period going forward.
Service Delivery Improvement Plan (SDIP)
The Department developed a Service Delivery Improvement Plan (SDIP) in accordance with the Public Service Regulations of 2001 and to intensify the implementation of the Batho�Pele programme. The implementation of this plan forms part of our continuous consultations with all institutions tasked with compliance monitoring, monitoring and evaluation, such as the Public Service Commission and Treasury. The approved SDIP and service standards are, among others, used as a basis for assessing the performance of the Department of Minerals and Energy.
Roll-over and virement between the main appropriation allocations for 2009’10 – details listed in the Annual Financial Statements for the year.
PROGRAMME PERFORMANCE - SECTION 2
25
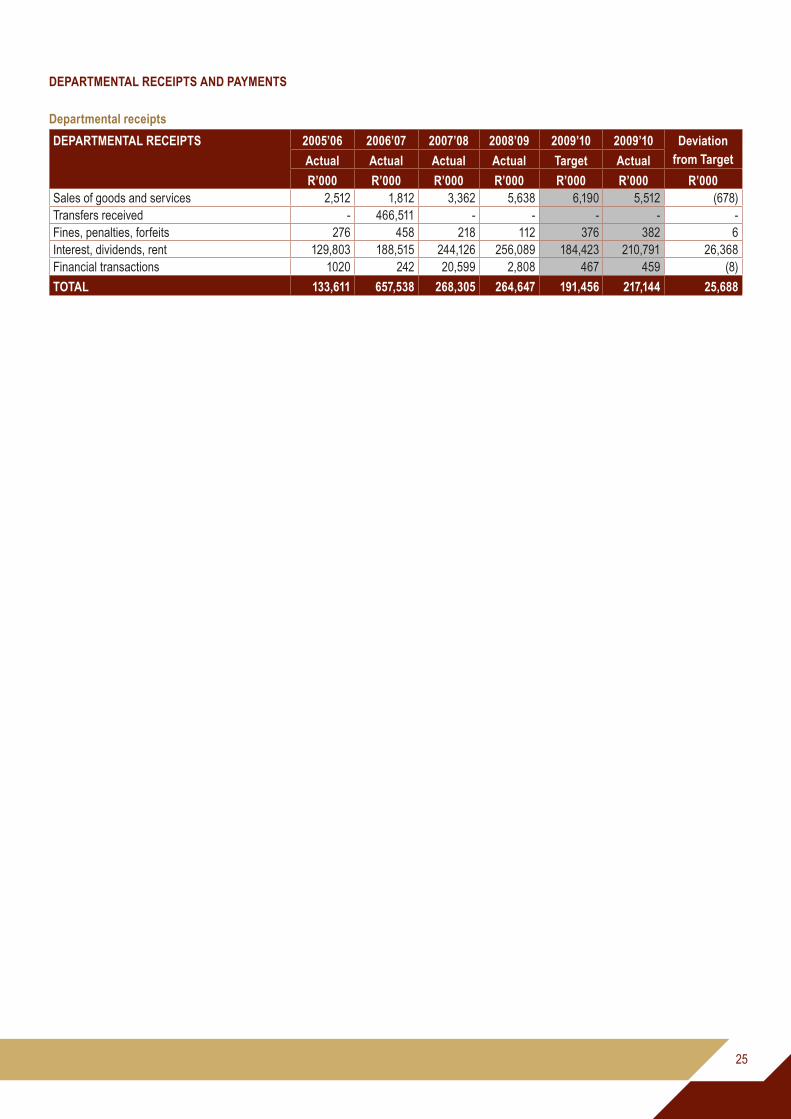
DEPARTMENTAL RECEIPTS AND PAYMENTS
Departmental receipts
DEPARTMENTAL RECEIPTS 2005’06 2006’07 2007’08 2008’09 2009’10 2009’10 Deviation from TargetActual Actual Actual Actual Target Actual
R’000 R’000 R’000 R’000 R’000 R’000 R’000Sales of goods and services 2,512 1,812 3,362 5,638 6,190 5,512 (678)Transfers received - 466,511 - - - - -Fines, penalties, forfeits 276 458 218 112 376 382 6Interest, dividends, rent 129,803 188,515 244,126 256,089 184,423 210,791 26,368Financial transactions 1020 242 20,599 2,808 467 459 (8)
TOTAL 133,611 657,538 268,305 264,647 191,456 217,144 25,688
26
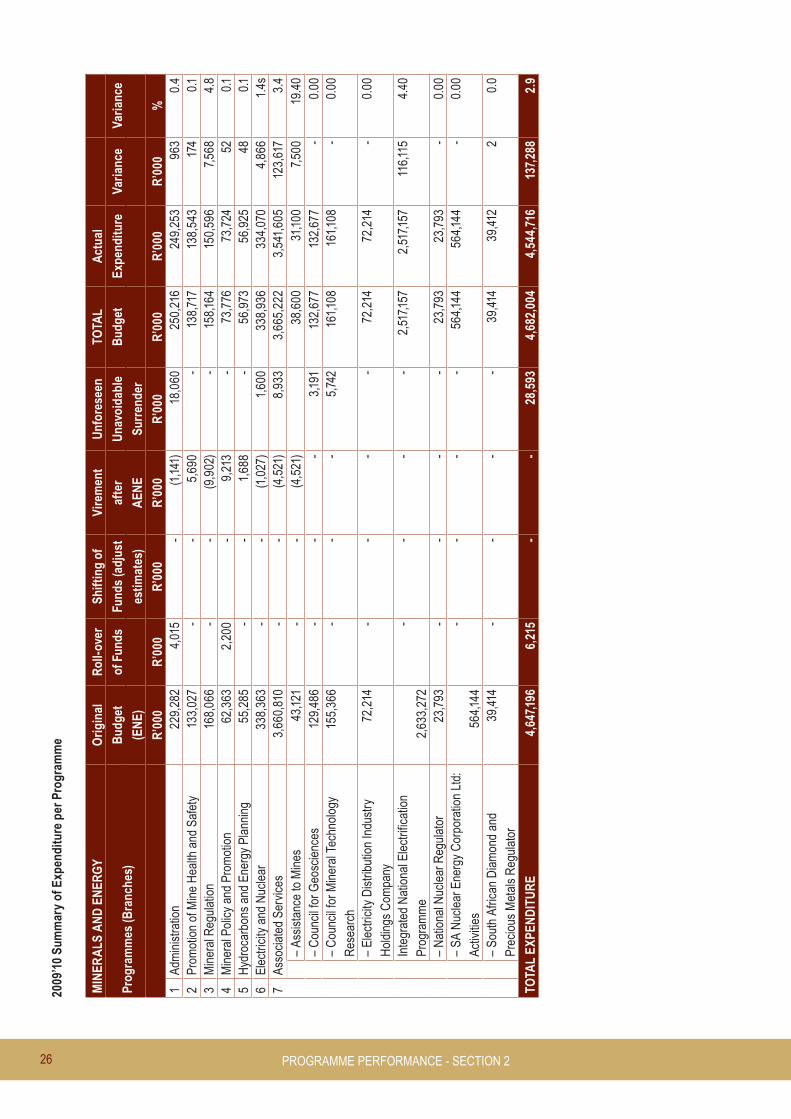
2009
’10
Sum
mar
y of
Exp
endi
ture
per
Pro
gram
me
MIN
ERA
LS A
ND
EN
ERG
YO
rigin
alR
oll-o
ver
Shift
ing
ofVi
rem
ent
Unf
ores
een
TOTA
LA
ctua
l
Prog
ram
mes
(Bra
nche
s)B
udge
tof
Fun
dsFu
nds
(adj
ust
afte
rU
navo
idab
leB
udge
tEx
pend
iture
Varia
nce
Varia
nce
(EN
E)
estim
ates
)A
ENE
Surr
ende
r
R
’000
R’0
00R
’000
R’0
00R
’000
R’0
00R
’000
R’0
00%
1Ad
min
istra
tion
229,
282
4,01
5-
(1,1
41)
18,0
6025
0,21
624
9,25
396
30.
42
Prom
otio
n of
Min
e H
ealth
and
Saf
ety
133,
027
--
5,69
0-
138,
717
138,
543
174
0.1
3M
iner
al R
egul
atio
n16
8,06
6-
-(9
,902
)-
158,
164
150,
596
7,56
84.
84
Min
eral
Pol
icy
and
Prom
otio
n62
,363
2,20
0-
9,21
3-
73,7
7673
,724
520.
15
Hyd
roca
rbon
s an
d En
ergy
Pla
nnin
g55
,285
--
1,68
8-
56,9
7356
,925
480.
16
Elec
trici
ty a
nd N
ucle
ar33
8,36
3-
-(1
,027
)1,
600
338,
936
334,
070
4,86
61.
4s7
Asso
ciat
ed S
ervi
ces
3,66
0,81
0-
-(4
,521
)8,
933
3,66
5,22
23,
541,
605
123,
617
3.4
–
Assi
stan
ce to
Min
es43
,121
--
(4,5
21)
38,6
0031
,100
7,50
019
.40
–
Cou
ncil
for G
eosc
ienc
es12
9,48
6-
--
3,19
113
2,67
713
2,67
7-
0.00
–
Cou
ncil
for M
iner
al T
echn
olog
y R
esea
rch
155,
366
--
-5,
742
161,
108
161,
108
-0.
00
–
Elec
trici
ty D
istri
butio
n In
dust
ry
Hol
ding
s C
ompa
ny72
,214
--
--
72,2
1472
,214
-0.
00
In
tegr
ated
Nat
iona
l Ele
ctrif
icat
ion
Prog
ram
me
2,63
3,27
2-
--
-2,
517,1
572,
517,1
5711
6,11
54.
40
–
Nat
iona
l Nuc
lear
Reg
ulat
or23
,793
--
--
23,7
9323
,793
-0.
00
– SA
Nuc
lear
Ene
rgy
Cor
pora
tion
Ltd:
Ac
tiviti
es56
4,14
4-
--
-56
4,14
456
4,14
4-
0.00
– So
uth
Afric
an D
iam
ond
and
Prec
ious
Met
als
Reg
ulat
or39
,414
--
--
39,4
1439
,412
20.
0
TOTA
L EX
PEN
DIT
UR
E4,
647,1
966,
215
-
-
28,5
93
4,68
2,00
44,
544,
716
137,
288
2.9
PROGRAMME PERFORMANCE - SECTION 2

27
MTEF TRANSFERS TO THE STATE-OWNED ENTITIES REPORTING TO THE MINISTER OF MINERALS AND ENERGY
Name of the Institution Amount transferred
R’000South African Nuclear Energy Corporation Ltd (NECSA) 564,144Council for Mineral Technology (Mintek) 161,108Council For Geoscience (CGS) 132,677National Nuclear Regulator (NNR) 23,793Electricity Distribution Industry Holdings Pty Ltd (EDIH) 72,214Mine Health and Safety Council (MHSC) 5,118South African Diamond and Precious Metals Regulator (SADPMR) 39,412
Total 998,466
OTHER TRANSFERS TO SOE’S REPORTING TO THE MINISTER OF MINERALS AND ENERGY
Name of the Institution Reason for transfer Amount TransferredR’000
Industrial Development Corporation of South Africa Small-scale Mining Projects 25,058Council for Geoscience (CGS) Implementation of the water ingress programme 17,600State Diamond Trader Bail-out during recession 1,000
TOTAL 43,658
TRANSFERS TO OTHER ORGANISATIONS
Name of the Institution Project Amount transferredR’000
Eskom Integrated National Electrification Programme 1,616,315Various municipalities Integrated National Electrification Programme 899,553Various municipalities Demand-side Management 175,000Eskom Energy Environment and Efficiency 74,475Solar Vision (Pty) Ltd Non-Grid Electrification 1,290Grootvlei Proprietary Mines State Assistance to Mines for Pumping Water from Underground Holdings 13,500Ethekwini Municipality Renewable Energy Subsidy Scheme 5,247Bethlehem Hydro Renewable Energy Subsidy Scheme 310
TOTAL 2,785,690
The Integrated National Electrification Programme is aimed at providing financial support in the form of transfer payments and conditional grants to achieve universal access to electricity. This programme consists of transfer payments to ESKOM, municipalities and non-grid service providers for grid and non-grid electricity connections at schools, clinics and households.
The assistance to mine sub-programme in turn assists marginal mines to pump extraneous water from underground holdings and provides research and strategic solutions to address the ingress of water into underground holdings in the Witwatersrand area.

28
CONDITIONAL GRANTS
Overview of conditional grants
The table below provides a summary of the type of grant(s), total allocations and transfer trends for 2009’10.
SCHEDULE 6A: NATIONAL ELECTRIFICATION PROGRAMME
Province Total allocation Total transfers
R’000 R’000Western Cape 78,324 78,324Northern Cape 28,675 28,675Eastern Cape 234,300 234,300Mpumalanga 98,436 98,436Limpopo 139,761 134,681North West 59,122 52,967KwaZulu-Natal 123,303 123,303Free State 88,456 87,988Gauteng 82,580 75,740
Total 932,957 914,413
SCHEDULE 7: NATIONAL ELECTRIFICATION PROGRAMME
Province Total allocation Total transfers
R’000 R’000Western Cape 125,689 125,689Northern Cape 31,540 31,540Eastern Cape 397,753 397,753Mpumalanga 99,843 99,843Limpopo 183,416 183,416North West 99,209 99,209KwaZulu-Natal 385,057 385,057Free State 50,708 50,708Gauteng 94,150 94,150
Total 1,467,365
PROGRAMME PERFORMANCE - SECTION 2

29
DME CONSOLIDATED PERFORMANCE REPORTS
The activities of the Department of Minerals and Energy are organised in the following seven programmes:
Programme 1: AdministrationProgramme 2: Promotion of Mine Health and SafetyProgramme 3: Mineral RegulationProgramme 4: Mineral Policy and PromotionProgramme 5: Hydrocarbons and Energy Planning Programme 6: Electricity, Nuclear and Clean EnergyProgramme 7: Associated Services

30
PROGRAMME 1: ADMINISTRATION
Purpose: To enable the Department to deliver on its mandate by providing strategic management and administrative support to the Department of Minerals & Energy and its Ministry.
CORPORATE SERVICES BRANCH
Headed by the Deputy Director-General: Corporate Services, the Branch consists of five Chief Directorates: • Management Services (Human Resources Management, Human Resource Development, Legal Services and Security Risk
Management)• Communication and International Co-ordination • Special Projects and Programmes• Strategy, Risk and Monitoring • The Ministry (administrative support). SERVICE DELIVERY – ACHIEVEMENTS – OBJECTIVES AND INDICATORS
The President’s announcement of the split of the Department of Minerals and Energy into two independent Departments came soon after the finalisation of the Department’s 2009’10 strategic plan. Among the decisions taken, were the restructuring of Corporate Services and the repositioning of Human Resources as priority focus areas to address capacity challenges accumulated over a number of years as the size of the Department increased. The government-wide restructuring process focused on the use of internal resources and used minimal internal capacity to restructure and reposition these critical functions.
Some of the planned projects were put on hold until the finalisation of the split (as indicated in the Tables below) had been completed. By the end of the 2009’10 financial year, the split of the Department of Minerals and Energy into two independent Departments of Energy and Mineral Resources, had been completed. The two new Departments became operational on 1 April 2010, each with its own budget, budget vote, personnel and accommodation.
Chief Directorate: Management Services
The Chief Directorate provides management support services to the Department regarding human resource and efficiency management, human resource development and capacity building, legal support services and security risk management. During the year under review, the Chief Directorate provided support services to line function components with a focus on restructuring and capacity building to align service delivery with new mandates and revised strategic priorities.
Human�Resource�and�Efficiency�Management�Directorate
The focus areas for this Directorate includes the provision of an integrated human resource management support service, which entails recruitment and selection, facilitating competency based assessments and performance evaluation of employees through the Performance Management and Development System (PMDS), managing service conditions and employment relations and implementing PILAR and Employee Assistance Programmes. A considerable effort was expended to recruit and retain employees to, among others, implement the new legislative frameworks for mining and petroleum.
Human�Resource�Development�and�Capacity�Building�Directorate
The main purpose of this Directorate is to build human resource capacity through training and development interventions. Training programmes included both department officials and third parties that were supported by various sponsored bursaries from both private and public sectors.
PROGRAMME PERFORMANCE - SECTION 2

31
The Malaysian Scholarship programme started in 1999 with an agreement between South Africa (represented by the Department of Minerals and Energy) and the Malaysian Government (represented by the Petronas University). Scholarships are awarded to students from disadvantaged communities and ten (10) students enrolled for 2009. Ten (10) students graduated in civil, chemical and mechanical engineering at the 3rd South African Chapter of the Petronas University Convocation in December 2009.
Legal�Services�Directorate
The Legal Services Directorate provides the Department with comprehensive legal support services, including legal opinions and advice, assistance with legal drafting, litigations, and ensuring the implementation of the Promotion of Access to Information Act (PAIA), 2 of 2000 and the Promotion of Administrative Justice Act, 3 of 2000 The Directorate also assists in the determination of culpability of officials in cases of lost or damaged property, assists the Minister in handling appeals against the Department’s administrative decisions, and facilitates the signing of international agreements between the Department and third parties.
Chief Directorate: Communication and International Co-ordination
The Chief Directorate comprises the Directorates of Communication and International Co-ordination. The objective of the Chief Directorate: Communication is to develop communication policies and implement communication strategies for both internal and external stakeholders, including the media.
Services include spokesperson services for the Department, media relations, publications, branding, advertising, events management, marketing, stakeholder and intergovernmental relations, library services, management of the Presidential Hotline queries, exhibitions and other initiatives to enhance the image and the brand of the Department.The Directorate also ensures that all communication in the Department is coherent and aligned with the Government’s Programme of Action as outlined in the President’s State of the Nation Address.
Internal�Communication
Internal Communication is an integral part of the overall responsibilities of Communication Directorate. Information is disseminated to employees at head office and regional offices through the Intranet/Internet, notice boards, internal newsletters, internal memos, information sessions and library services.The key strategic pillars of the Unit are:
• Brand advocacy – getting staff to understand and live the values of the DME brand• Employer branding – Project DME as an employer of choice (HR communication)• Internal communication – keeping staff informed ie Intranet Updates/Communiqués• Internal Communication Support – Assist Units in carrying out their communication needs• Employee engagement – interacting and engaging with staff• Brand experience – events and projects• Fun and excitement – work is fun.
Media�Liaison�
This section is responsible for liaising with the media, handling media queries, conducting media briefings and undertaking media monitoring and analyses of newsworthy issues in the minerals and energy sector. The section also develops and implements innovative media plans for strategic intervention purposes.
Publications�
The unit produces content for DME publications such as magazines, annual reports, internal newsletters, strategic planning documents, brochures and posters.
PROGRAMME 1

32
Welcome�Centre/Reception
The Welcome Centre is the face of the organisation with the responsibility of creating a warm and welcoming atmosphere for DME visitors. The reception is the only access to the building and is therefore manned by professionals skilled in communication and interpersonal interaction.
International�Co-ordination
The International Co-ordination Directorate participated in a number of forums and meetings to advance the DME agenda in the energy sector. Energy security is becoming increasingly important and remains a challenge that could hamper development locally, and in the region. In this regard, the Department is promoting renewable energy resources to support sustainable development, including access to nuclear energy, which is consistent with South Africa’s domestic energy policies and programmes.
International�Agreements
The Department started the process of reviewing all international agreements signed to-date to determine the status, validity and alignment of these agreements with the country’s strategic objectives and to guide future agreements. Forging relations with different countries is a dynamic process and has evolved since the attainment of democracy in 1994. National interests will always determine the social, political and economic developmental strategic milieu for our interaction with foreign nations.During the forthcoming financial year, we will finalise this process and ensure that our plans of foreign engagement are aligned with national needs, including the conclusion of a number of bilateral agreements and establishing new strategic relationships within the nuclear industry. The evaluation of these agreements ensured the promotion of the Department’s agenda in multilateral fora and through bilateral relations and structured bilateral meetings.
International�Renewable�Energy�Agency�(IRENA)
Engaging within the multilaterals has seen the Department of Energy successfully joining IRENA, an organisation seen as being critical for the inter-governmental structure for renewable energy. The draft articles of association proposed a funding arrangement related to the country’s contribution scales to the United Nations (UN). South Africa, through the Department of Energy, has now signed the multilateral agreement and obtained the necessary cabinet approval to commit the funds to IRENA.
Chief Directorate: Special Projects and Programmes
This Chief Directorate continues to play a significant role in ensuring that the Department addresses the issue of transformation by facilitating the mainstreaming of gender and youth programmes within the mining and energy industries.
The Chief Directorate: Special Projects is tasked to implement legislated transformation imperatives of vulnerable groups and disadvantaged communities. The Department’s strategy in this regard is to mainstream gender and youth empowerment and facilitate the participation of these groups and communities through sector groups and outreach programmes.
During the year under review the Chief Directorate implemented its outreach programmes in four provinces: Northern Cape, North West, Mpumalanga and KwaZulu-Natal. In partnership with our stakeholders, we provided targeted institutions with equipment, essential electronics and working material as a contribution towards their work with abandoned teenagers, disabled persons, abused women and people living with HIV and AIDS.
The Chief Directorate also facilitated bursaries and internships for the youth in partnership with PertroSA, Xstrata and DeBeers. Road shows were undertaken in three provinces in partnership with WoeSA, a broad-based energy sector women`s group, to address persisting challenges and disseminate information on the DOE programmes with opportunities for the youth and women interested in this sector. The Minister of Energy also launched the Bethlehem Hydropower Project in the Free State, a flagship women empowerment programme in which WoeSA owns 38%.The Chief Directorate will continue to facilitate the inclusion of youth and women in all our programmes as part of our transformation programme.
PROGRAMME PERFORMANCE - SECTION 2
33
Initiatives to increase in the number of learners that follow careers in the mining and energy sectors continued in partnership with provincial departments of education. These included partnering with other stakeholders in the mining and energy industries to disseminate information on careers in these sectors to learners. Chief Directorate: Strategy, Risk & Monitoring (the Compliance Office)
The Chief Directorate is the Department’s focal point on corporate governance and responsible for co-ordinating strategic planning, risk management, fraud prevention, quarterly and annual reporting, and compliance monitoring (by the Department and its public entities). It exercises oversight, in conjunction with line function branches, of the activities of state-owned entities reporting to the Ministers of Mineral Resources and Energy, respectively.
The Minister tables the 2008’09 Annual Reports of the Department and its state-owned entities, as well as its 2009’10 – 2011’12 Strategic Plan, in Parliament on time. This office and the state-owned entities have ensured compliance with the administrative, financial and legal requirements of the PFMA and Treasury Regulations, founding Acts of the respective entities and the Companies’ Act (where applicable). A Service Delivery Improvement Plan was developed as required by the Public Service Regulations and in line with the Cabinet decision to revitalise Batho�Pele. The plan was submitted to DPSA and implemented with effect from 1 April 2009.
Corporate�Governance
State-owned entities reporting to the Ministers of Mineral Resources and Energy are governed by, inter�alia:i. the Public Finance Management Act, government’s broader strategy to improve financial management and governance in the public
sectorii. the Protocol on Corporate Governance in the Public Sector, government’s guideline on how state-owned entities need to implement
corporate governance, andiii. the King III Report on Corporate Governance for South Africa.
Corporate governance is integral to creating an environment of good conduct, improved internal controls, risk management and better corporate culture. The Boards of the individual entities have the responsibility to set strategic direction, aligned with that of the Department, oversee and guide the entity and instil good governance. Transparency of conduct ensures that the Minister as shareholder can hold the Boards to account.
The public entities’ annual strategic plans, business plans, shareholder compacts (for scheduled 2s and 3a entities) and their budget proposals were reviewed and approved by the respective Ministers. Delays in the approval of some of the documentation were due to ongoing discussions between the Department and the entities concerned to ensure strategic alignment with government priorities.
PROGRAMME 1

34
PRO
GR
AM
ME
1: C
OR
POR
ATE
SER
VIC
ES
Purp
ose:
To
enab
le th
e D
epar
tmen
t to
deliv
er o
n its
man
date
by
prov
idin
g st
rate
gic
man
agem
ent a
nd a
dmin
istra
tive
supp
ort t
o th
e D
epar
tmen
t of M
iner
als
& En
ergy
and
its
Min
istry
.
Stak
ehol
der/C
usto
mer
Mea
sure
s
Obj
ectiv
esM
easu
res
Initi
ativ
esTa
rget
s 09
’10
Prog
ress
as
at31
Mar
ch 2
010
Con
stra
ints
/reas
ons
for u
nder
-per
form
ance
Impr
ove
turn
arou
nd
times
Res
pons
e da
ysIm
plem
ent c
orre
spon
denc
e m
anag
emen
t sys
tem
Max
five
day
s (q
uerie
s)D
ecis
ion
take
n to
impl
emen
t doc
umen
t man
agem
ent/t
rack
ing
syst
em fo
r ent
ire D
epar
tmen
t ins
tead
of s
epar
ate
syst
ems
with
in
Bran
ches
; new
sys
tem
ope
ratio
nal i
n ne
xt fi
nanc
ial y
ear o
nce
DM
E da
taba
se s
plit
into
DoE
and
DM
R d
atab
ases
Budg
etar
y co
nstra
ints
and
D
epar
tmen
tal s
plit
Impl
emen
t the
mag
ic s
yste
mM
ax tw
o da
ys
(sub
mis
sion
s) p
er
desk
Dec
isio
n ta
ken
to im
plem
ent a
doc
umen
t man
agem
ent/t
rack
ing
syst
em fo
r ent
ire D
epar
tmen
t ins
tead
of s
epar
ate
syst
ems
with
in
bran
ches
; new
sys
tem
will
be o
pera
tiona
l in
the
next
fina
ncia
l yea
r af
ter D
ME
data
base
spl
it in
to D
oE a
nd D
MR
Budg
etar
y co
nstra
ints
and
D
epar
tmen
tal s
plit
Impr
ove
deliv
ery
of
inte
grat
ed
serv
ices
% a
dher
ence
to
pre
scrib
ed
timef
ram
es
Iden
tific
atio
n an
d do
cum
enta
tion
of a
ll pr
oces
ses
with
in
pres
crib
ed tu
rnar
ound
tim
es
Esta
blis
h ba
selin
e (2
009’
10)
All p
roce
sses
doc
umen
ted
Budg
et a
nd h
uman
cap
ital
% c
usto
mer
sa
tisfa
ctio
n D
evel
opm
ent o
f a C
S cu
stom
er
satis
fact
ion
stra
tegy
60%
sat
isfa
ctio
n re
sult
2009
Proc
ess
post
pone
d to
the
next
fina
ncia
l yea
rBu
dget
con
stra
ints
Impl
emen
tatio
n of
sur
vey
Esta
blis
h su
rvey
resu
ltsIm
plem
ent r
emed
ial a
ctio
nC
omm
unic
ate
effe
ctiv
ely
% ta
rget
aud
ienc
e re
ache
d E
xecu
tion
of m
arke
ting
cam
paig
ns60
% 2
009
Med
ia a
nd s
take
hold
er e
ngag
emen
t pla
n dr
afte
dBu
dget
ary
cons
train
ts
Exec
utio
n of
med
ia a
nd
stak
ehol
der e
ngag
emen
t pla
nTh
e fo
llow
ing
activ
ities
wer
e ex
ecut
ed:
Ints
ika
bene
ficia
tion
proj
ect -
13
Nov
embe
r
Barb
erto
n, U
mjin
di M
unic
ipal
ity p
ublic
par
ticip
atio
n - 2
7 N
ov
Mhl
othl
o , L
impo
po p
ublic
par
ticip
atio
n
Adve
rtise
men
t in
Joha
nnes
burg
Sto
ck E
xcha
nge
mag
azin
e (J
SE)
Adve
rtoria
l in
our e
xter
nal s
take
hold
er m
agaz
ine,
Mol
ato
info
rmin
g ou
r sta
keho
lder
s an
d th
e pu
blic
abo
ut s
plit
anno
unce
d by
the
Pres
iden
t
Even
ts s
take
hold
er p
lann
ing
com
mitt
ee m
eetin
g
Exec
utio
n no
t mea
sure
d du
e to
spl
it of
Dep
artm
ent
PROGRAMME PERFORMANCE - SECTION 2

35
Obj
ectiv
esM
easu
res
Initi
ativ
esTa
rget
s 09
’10
Prog
ress
as
at31
Mar
ch 2
010
Con
stra
ints
/reas
ons
for u
nder
-per
form
ance
Mon
itor a
nd e
valu
ate
the
stra
tegy
Not
yet
don
eBu
dget
ary
cons
train
ts -
this
will
done
onc
e st
rate
gy
is fu
lly im
plem
ente
dQ
uarte
rly p
rodu
ctio
n of
inte
rnal
ne
ws
lette
r (N
tom
e-Ts
ebe)
4 ne
wsl
ette
rsan
nual
lyFo
ur is
sues
of M
olat
o ex
tern
al n
ewsl
ette
r pro
duce
d an
d on
e N
tom
e Ts
ebe
inte
rnal
new
slet
ter p
rodu
ced.
Bu
dget
ary
cons
train
ts a
nd
Dep
artm
enta
l spl
it Bi
-mon
thly
info
rmat
ion
sess
ions
At le
ast 6
in
form
atio
n se
ssio
ns a
nnua
lly
Info
rmat
ion
sess
ions
hel
d w
ith a
ll th
e br
anch
es w
ith a
focu
s on
ch
ange
man
agem
ent d
ue to
the
DM
E sp
litSp
lit o
f the
DM
E re
prio
ritis
ed re
sour
ces
Build
stra
tegi
c al
lianc
es/
partn
ersh
ips
Impl
emen
tatio
n of
sig
ned
bila
tera
l ag
reem
ents
Impl
emen
tatio
n of
the
Inte
rnat
iona
l Eng
agem
ent
stra
tegy
4
The
rene
wab
le e
nerg
y el
emen
t of t
he s
trate
gy w
as
impl
emen
ted
thro
ugh
the
IREN
A in
volv
emen
t
SAD
C c
ompo
nent
impl
emen
ted
eg S
ADC
pow
er p
ool
Split
of t
he D
ME
repr
iorit
ised
reso
urce
s
Mon
itor a
nd e
valu
ate
the
stra
tegy
Cou
ntry
agr
eem
ents
and
MO
Us
wer
e ev
alua
ted
as p
art o
f the
re
prio
rtisa
tion
of a
ll co
untri
es o
f im
porta
nce
to th
e D
ME
Bu
ild s
trate
gic
allia
nces
/ pa
rtner
ship
s
Impl
emen
tatio
n of
sig
ned
bila
tera
l ag
reem
ents
Assi
st H
ydro
carb
ons
and
Min
eral
Pol
icy
in c
o-or
dina
ting
impl
emen
tatio
n
Achi
eved
Incr
ease
in n
umbe
r of
suc
cess
ful j
oint
in
itiat
ives
/ pro
ject
s w
ith s
take
hold
ers
Dev
elop
stra
tegi
es fo
r vu
lner
able
gro
ups
(HIV
/AID
S,
disa
bilit
y, g
ende
r and
you
th)
Esta
blis
h ba
selin
e an
d in
crea
se b
y 10
% (2
009)
Dra
ft yo
uth
and
gend
er s
trate
gies
hav
e be
en d
evel
oped
and
the
esta
blis
hmen
t of p
roje
ct b
asel
ines
def
erre
d to
the
nex
t fin
anci
al
year
Lack
of c
apac
ity to
col
late
al
l pro
ject
s
Incr
ease
num
ber
of s
ucce
ssfu
l joi
nt
initi
ativ
es/ p
roje
cts
with
sta
keho
lder
s
Impl
emen
t stra
tegi
es fo
r vu
lner
able
gro
ups
Esta
blis
h ba
selin
e an
d in
crea
se b
y 10
% (2
009)
This
will
be d
one
in th
e ne
w fi
nanc
ial y
ear o
nce
the
stra
tegi
es a
re
final
ised
and
app
rove
dSp
lit o
f the
DM
E re
prio
ritis
ed re
sour
ces
Mon
itor a
nd e
valu
ate
the
stra
tegi
esIn
crea
se in
pos
itive
m
edia
cov
erag
eIm
plem
ent m
edia
and
st
akeh
olde
r eng
agem
ent p
lan
and
mon
itor a
nd e
valu
ate
the
plan
Esta
blis
h ba
selin
e an
d in
crea
se b
y 25
% (2
009)
Med
ia a
nd s
take
hold
er e
ngag
emen
t pla
n im
plem
ente
d; th
e D
ME
held
a n
umbe
r of p
ress
con
fere
nces
incl
udin
g on
e on
IRP
and
the
Nor
ther
n C
ape
Sola
r Par
k
Exec
utio
n no
t mea
sure
d du
e to
bud
geta
ry
cons
train
ts a
nd
Dep
artm
enta
l spl
it
PROGRAMME 1

36
Obj
ectiv
esM
easu
res
Initi
ativ
esTa
rget
s 09
’10
Prog
ress
as
at31
Mar
ch 2
010
Con
stra
ints
/reas
ons
for u
nder
-per
form
ance
Impr
ove
awar
enes
s an
d re
puta
tion
of
the
DM
E
Incr
ease
in D
MR
br
and
ratin
gIm
plem
enta
tion
of th
e m
arke
ting
plan
Es
tabl
ish
base
line
Com
mun
icat
ion
CD
faci
litat
ed a
cqui
sitio
n of
new
logo
s, b
rand
ed
stat
ione
ry in
cl le
tterh
eads
(int
erna
l and
ext
erna
l), in
tern
al m
emos
an
d fa
x co
vers
and
pro
mot
iona
l mat
eria
l inc
l pul
l-up
and
tear
drop
ba
nner
s on
tim
e th
roug
h G
CIS
as
part
of re
-bra
ndin
g th
e ne
w fo
r th
e D
epar
tmen
ts o
f Min
eral
Res
ourc
es a
nd E
nerg
y
Budg
etar
y co
nstra
ints
and
D
epar
tmen
tal s
plit
% im
plem
enta
tion
of th
e co
mm
unic
atio
n st
rate
gy
Mon
itor a
nd e
valu
ate
effe
ctiv
enes
s of
com
mun
icat
ion
stra
tegy
80%
200
9Po
st im
plem
enta
tion
eval
uatio
n an
d re
view
will
be d
one
in th
e ne
xt
finan
cial
yea
r Bu
dget
ary
cons
train
ts a
nd
Dep
artm
enta
l spl
it
Inte
rnal
Pro
cess
es
Obj
ectiv
esM
easu
res
Initi
ativ
esTa
rget
s 09
’10
Prog
ress
as
at31
Mar
ch 2
010
Con
stra
ints
/reas
ons
for u
nder
-pe
rfor
man
ce
Effic
ient
Bus
ines
s Pr
oces
ses
Dev
elop
con
sist
ent
mon
itorin
g &
enfo
rcem
ent
guid
elin
es
% o
f gui
delin
es is
sued
in
line
with
legi
slat
ion
Dev
elop
a re
view
fram
ewor
k fo
r po
licie
s an
d gu
idel
ines
Esta
blis
h ba
selin
eD
raft
guid
elin
e do
cum
ent d
evel
oped
and
will
be
circ
ulat
ed in
the
new
fina
ncia
l yea
r for
fina
l inp
uts
by
the
new
Dep
artm
ents
Hum
an R
esou
rce
cons
train
ts a
nd
Dep
artm
enta
l spl
itIm
plem
ent t
he fr
amew
ork
Mon
itor a
nd e
valu
ate
Red
uctio
n in
com
plai
nts
rela
ting
to p
roce
dura
l in
cons
iste
ncy
Dev
elop
com
plia
nce
regi
ster
Esta
blis
h ba
selin
e 20
09SR
M d
evel
oped
pol
icie
s an
d pr
oced
ures
regi
ster
whi
ch
is a
men
ded
whe
n br
anch
es a
nd C
hief
Dire
ctor
ates
am
end
and/
or d
evel
op n
ew p
olic
ies
and
proc
edur
esIm
plem
enta
tion
of
rele
vant
legi
slat
ion/
po
licie
s/ p
roce
sses
Red
uctio
n in
% n
on-
com
plia
nce
issu
es
(inte
rnal
)
Impl
emen
t aud
it re
com
men
datio
ns10
% o
f pre
viou
s ye
ar’s
audi
t qu
erie
s
All p
rior y
ear a
udit
findi
ngs
impl
emen
ted
% im
prov
emen
t in
st
akeh
olde
r com
plia
nce
(ext
erna
l)
Dev
elop
com
plia
nce
mat
rixEs
tabl
ish
base
line
2009
Com
plia
nce
Fram
ewor
k de
velo
ped,
app
rove
d an
d im
plem
ente
d
Rev
iew
and
dev
elop
po
licie
s, p
roce
dure
s an
d gu
idel
ines
Num
ber o
f pol
icie
s,
proc
edur
es a
nd
guid
elin
es d
evel
oped
Polic
y an
d st
anda
rds
audi
t to
dete
rmin
e th
e ba
selin
eEs
tabl
ish
base
line
(revi
ew)
All p
roce
dure
s w
ere
revi
ewed
and
fina
lised
for
Cor
pora
te S
ervi
ces
Fina
lised
at t
he e
nd o
f O
ctob
er 2
009
Iden
tify
gaps
Addr
ess
the
gaps
PROGRAMME PERFORMANCE - SECTION 2

37
Obj
ectiv
esM
easu
res
Initi
ativ
esTa
rget
s 09
’10
Prog
ress
as
at31
Mar
ch 2
010
Con
stra
ints
/reas
ons
for u
nder
-pe
rfor
man
ceAl
ign,
sta
ndar
dise
po
licie
s an
d in
itiat
e au
tom
atio
n of
pr
oces
ses
% p
olic
ies
and
proc
edur
es s
tand
ardi
sed
Wor
ksho
ps a
nd is
sue
of g
uide
lines
Impl
emen
tatio
n of
gu
idel
ines
200
9D
evel
oped
dra
ft gu
idel
ine
on th
e de
velo
pmen
t and
am
endm
ent o
f pol
icie
s an
d pr
oced
ures
Bu
dget
ary
cons
train
ts
and
Dep
artm
enta
l spl
itPo
licy
and
stan
dard
s au
dit t
o de
term
ine
the
base
line
30%
200
9
Iden
tify
gaps
Addr
ess
the
gaps
Alig
n, s
tand
ardi
se
polic
ies
and
initi
ate
auto
mat
ion
of
proc
esse
s
% p
roce
dure
s al
igne
d w
ith p
olic
ies
Audi
t to
iden
tify
num
ber o
f pr
oced
ures
to b
e es
tabl
ishe
dEs
tabl
ish
base
line
(revi
ew)
This
will
be d
one
once
the
guid
elin
e fo
r pol
icy
deve
lopm
ent a
nd re
view
has
bee
n ap
prov
edD
evel
opm
ent a
nd im
plem
enta
tion
of
proc
edur
es
Effe
ctiv
e Se
rvic
e D
eliv
ery
Allo
catio
n of
ap
prop
riate
re
sour
ces
% a
lignm
ent o
f res
ourc
es
to o
pera
tiona
l nee
dsAl
ign
busi
ness
pla
ns w
ith E
NE
Min
imun
65%
al
ignm
ent
All p
roce
dure
s fo
r Cor
pora
te S
ervi
ces
wer
e re
view
ed
and
docu
men
ted
as p
art o
f the
DM
E sp
litH
uman
reso
urce
and
bu
dget
ary
cons
train
ts
Build
acc
ount
abilit
y%
Impl
emen
tatio
n of
th
e Ba
lanc
ed S
core
card
(B
SC)
Dev
elop
and
impl
emen
t BSC
im
plem
enta
tion
Plan
100%
Achi
eved
. BSC
-bas
ed b
usin
ess
plan
s fo
rm th
e ba
sis
for p
erfo
rman
ce re
porti
ng in
the
Dep
artm
ent
Cus
tom
ise
or b
uild
new
IT s
yste
m
to s
uppo
rt BS
C re
porti
ngD
efer
red
to th
e ne
xt fi
nanc
ial y
ear
Del
ayed
by
split
of
the
Dep
artm
ent a
nd
ensu
ring
that
all
man
ager
s un
ders
tand
th
e re
quire
men
ts o
f the
BS
C m
etho
dolo
gyC
asca
ding
of B
SC to
all
leve
lsD
efer
red
to th
e ne
xt fi
nanc
ial y
ear
Del
ayed
by
split
of t
he
Dep
artm
ent
% o
f del
egat
ion
of
auth
ority
app
rove
dG
ap a
naly
sis
of re
quire
d de
lega
tion
Esta
blis
h ba
selin
e 20
09Al
l HR
M d
eleg
atio
n in
term
s of
Pub
lic S
ervi
ce A
ct a
nd
Publ
ic S
ervi
ce R
egul
atio
ns in
pla
ceFi
nalis
ed i
n 20
06
Com
pile
and
app
rove
rele
vant
de
lega
tion
Com
mun
icat
e D
eleg
atio
ns to
re
quis
ite c
ompo
nent
sD
eleg
atio
ns in
term
s of
Pub
lic S
ervi
ce A
ct a
nd
Reg
ulat
ions
wer
e de
velo
ped,
impl
emen
ted
and
com
mun
icat
ed
PROGRAMME 1
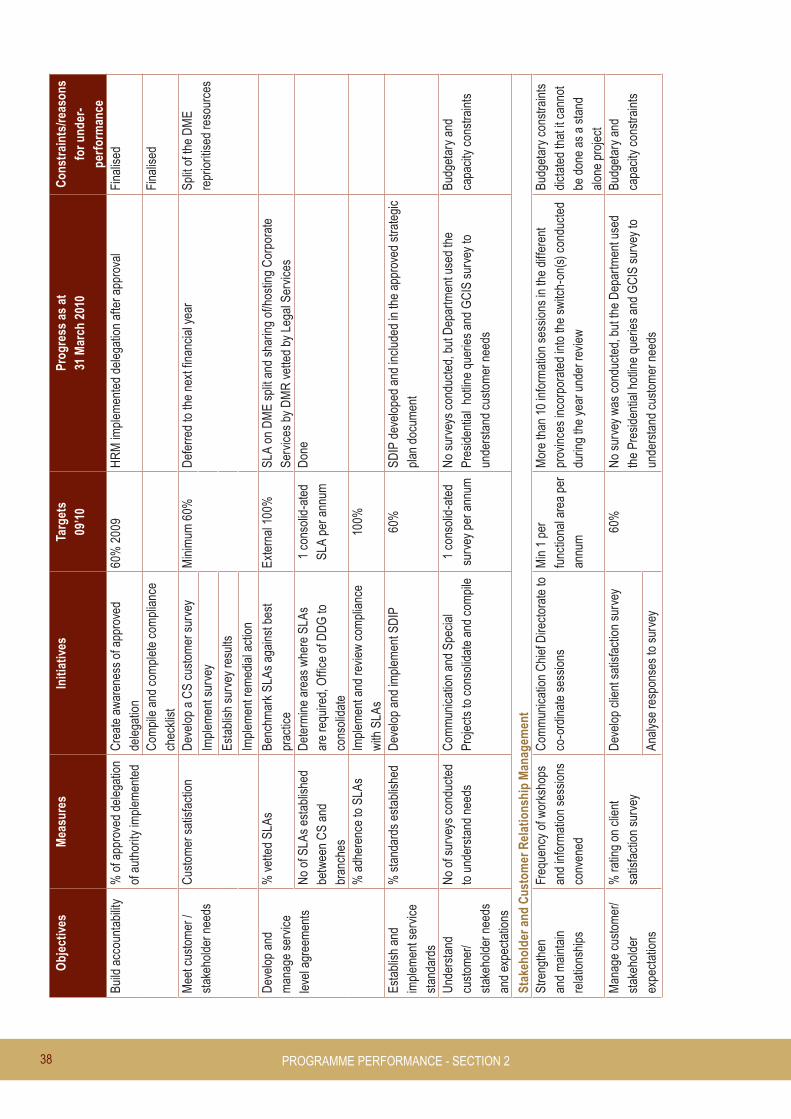
38
Obj
ectiv
esM
easu
res
Initi
ativ
esTa
rget
s 09
’10
Prog
ress
as
at31
Mar
ch 2
010
Con
stra
ints
/reas
ons
for u
nder
-pe
rfor
man
ceBu
ild a
ccou
ntab
ility
% o
f app
rove
d de
lega
tion
of a
utho
rity
impl
emen
ted
Cre
ate
awar
enes
s of
app
rove
d de
lega
tion
60%
200
9H
RM
impl
emen
ted
dele
gatio
n af
ter a
ppro
val
Fina
lised
Com
pile
and
com
plet
e co
mpl
ianc
e ch
eckl
ist
Fina
lised
Mee
t cus
tom
er /
stak
ehol
der n
eeds
Cus
tom
er s
atis
fact
ion
Dev
elop
a C
S cu
stom
er s
urve
yM
inim
um 6
0%D
efer
red
to th
e ne
xt fi
nanc
ial y
ear
Split
of t
he D
ME
repr
iorit
ised
reso
urce
sIm
plem
ent s
urve
y
Esta
blis
h su
rvey
resu
lts
Impl
emen
t rem
edia
l act
ion
Dev
elop
and
m
anag
e se
rvic
e le
vel a
gree
men
ts
% v
ette
d SL
AsBe
nchm
ark
SLAs
aga
inst
bes
t pr
actic
eEx
tern
al 1
00%
SLA
on D
ME
split
and
sha
ring
of/h
ostin
g C
orpo
rate
Se
rvic
es b
y D
MR
vet
ted
by L
egal
Ser
vice
sN
o of
SLA
s es
tabl
ishe
d be
twee
n C
S an
d br
anch
es
Det
erm
ine
area
s w
here
SLA
s ar
e re
quire
d, O
ffice
of D
DG
to
cons
olid
ate
1 co
nsol
id-a
ted
SLA
per a
nnum
Don
e
% a
dher
ence
to S
LAs
Impl
emen
t and
revi
ew c
ompl
ianc
e w
ith S
LAs
100%
Esta
blis
h an
d im
plem
ent s
ervi
ce
stan
dard
s
% s
tand
ards
est
ablis
hed
Dev
elop
and
impl
emen
t SD
IP60
%SD
IP d
evel
oped
and
incl
uded
in th
e ap
prov
ed s
trate
gic
plan
doc
umen
t
Und
erst
and
cust
omer
/ st
akeh
olde
r nee
ds
and
expe
ctat
ions
No
of s
urve
ys c
ondu
cted
to
und
erst
and
need
sC
omm
unic
atio
n an
d Sp
ecia
l Pr
ojec
ts to
con
solid
ate
and
com
pile
1 co
nsol
id-a
ted
surv
ey p
er a
nnum
No
surv
eys
cond
ucte
d, b
ut D
epar
tmen
t use
d th
e Pr
esid
entia
l ho
tline
que
ries
and
GC
IS s
urve
y to
un
ders
tand
cus
tom
er n
eeds
Budg
etar
y an
d ca
paci
ty c
onst
rain
ts
Stak
ehol
der a
nd C
usto
mer
Rel
atio
nshi
p M
anag
emen
t St
reng
then
an
d m
aint
ain
rela
tions
hips
Freq
uenc
y of
wor
ksho
ps
and
info
rmat
ion
sess
ions
co
nven
ed
Com
mun
icat
ion
Chi
ef D
irect
orat
e to
co
-ord
inat
e se
ssio
nsM
in 1
per
fu
nctio
nal a
rea
per
annu
m
Mor
e th
an 1
0 in
form
atio
n se
ssio
ns in
the
diffe
rent
pr
ovin
ces
inco
rpor
ated
into
the
switc
h-on
(s) c
ondu
cted
du
ring
the
year
und
er re
view
Budg
etar
y co
nstra
ints
di
ctat
ed th
at it
can
not
be d
one
as a
sta
nd
alon
e pr
ojec
tM
anag
e cu
stom
er/
stak
ehol
der
expe
ctat
ions
% ra
ting
on c
lient
sa
tisfa
ctio
n su
rvey
Dev
elop
clie
nt s
atis
fact
ion
surv
ey60
%N
o su
rvey
was
con
duct
ed, b
ut th
e D
epar
tmen
t use
d th
e Pr
esid
entia
l hot
line
quer
ies
and
GC
IS s
urve
y to
un
ders
tand
cus
tom
er n
eeds
Budg
etar
y an
d ca
paci
ty c
onst
rain
tsAn
alys
e re
spon
ses
to s
urve
y
PROGRAMME PERFORMANCE - SECTION 2

39
Obj
ectiv
esM
easu
res
Initi
ativ
esTa
rget
s 09
’10
Prog
ress
as
at31
Mar
ch 2
010
Con
stra
ints
/reas
ons
for u
nder
-pe
rfor
man
ceIm
prov
e co
nsul
tatio
n an
d fe
edba
ckFr
eque
ncy
of w
orks
hops
an
d in
form
atio
n se
ssio
ns
conv
ened
Com
mun
icat
ion
Chi
ef D
irect
orat
e to
co
-ord
inat
e se
ssio
nsM
in 1
per
fu
nctio
nal a
rea
per
annu
m
Und
erto
ok 2
info
rmat
ion
sess
ions
in K
ZN a
nd
Nor
thw
est P
rovi
nces
Budg
etar
y co
nstra
ints
Driv
e in
nova
tion
% o
f inn
ovat
ion
proj
ects
impl
emen
ted
(impr
ovem
ent i
n th
e w
ay
we
do b
usin
ess)
Inde
ntify
pot
entia
l inn
ovat
ion
proj
ects
20%
per
ann
um
Con
cept
ualis
e, s
tream
line
and
impl
emen
t mos
t via
ble
proj
ects
Lear
ning
and
Gro
wth
Obj
ectiv
esM
easu
res
Initi
ativ
esTa
rget
s 09
’10
Prog
ress
as
at31
Mar
ch 2
010
Con
stra
ints
/reas
ons
for u
nder
-per
form
ance
Driv
e tra
nsfo
rmat
ion
% p
rocu
rem
ent s
pent
on
targ
eted
gro
ups
Info
rm s
uppl
iers
to re
gist
er
on d
atab
ase
50%
This
is d
one
by th
e SC
M u
nit i
n th
e C
FO b
ranc
h
% im
prov
emen
t in
empl
oym
ent
equi
tyIm
plem
enta
tion
of E
E pl
anAc
hiev
e %
as
per
DM
E EE
pla
n Se
e H
R ta
bles
bel
ow
Impr
ove
lead
ersh
ip
and
man
agem
ent
capa
bilit
ies
% o
f man
ager
s co
mpl
eted
Le
ader
ship
& M
anag
emen
t co
urse
s
Exte
nsio
n of
WIT
S pr
ogra
mm
e70
% p
er a
nnum
67%
of m
iddl
e m
anag
emen
t pro
gram
mes
su
cces
sful
ly im
plem
ente
dBu
dget
con
stra
ints
% re
turn
on
inve
stm
ent o
n tra
inin
g an
d de
velo
pmen
t36
0˚ s
urve
y/ a
sses
smen
t to
olM
in 6
5%Ex
tens
ion
not a
ppro
ved
for E
LDP
45%
AM
DP
and
EMD
P im
plem
ente
dBu
dget
con
stra
ints
Attra
ct, d
evel
op a
nd
reta
in s
taff
% re
duct
ion
in s
taff
turn
over
ra
teIm
plem
enta
tion
of th
e H
R
Plan
2% p
er a
nnum
See
HR
tabl
es b
elow
% re
duct
ion
in v
acan
cies
5% p
er a
nnum
See
HR
tabl
es b
elow
Attra
ct, d
evel
op a
nd
reta
in s
taff
% im
plem
enta
tion
of P
DPs
that
ar
e al
igne
d w
ith D
epar
tmen
tal
need
s
Impl
emen
t HR
D p
lan
Esta
blis
h ba
selin
e an
d im
plem
ent a
t le
ast 5
0% in
200
9
90%
of t
he W
SP
impl
emen
ted
•N
on- a
ttend
ance
•
10%
of 2
009’
10
WSP
pro
gram
mes
ha
ve n
ot b
een
impl
emen
ted
due
to
budg
et c
onst
rain
ts
Dev
elop
Inte
grat
ed
know
ledg
e m
anag
emen
t sys
tem
% c
ompl
etio
n of
kno
wle
dge
man
agem
ent s
yste
ms
fram
ewor
k
Esta
blis
h ta
sk te
am h
eade
d by
Com
mun
icat
ion
Chi
ef
Dire
ctor
ate
100%
Def
erre
d to
the
next
fina
ncia
l yea
rBu
dget
con
stra
ints
and
sp
lit o
f Dep
artm
ent
Fina
lise
fram
ewor
k an
d de
velo
p IT
pla
tform
PROGRAMME 1

40
Obj
ectiv
esM
easu
res
Initi
ativ
esTa
rget
s 09
’10
Prog
ress
as
at31
Mar
ch 2
010
Con
stra
ints
/reas
ons
for u
nder
-per
form
ance
% im
plem
enta
tion
of k
now
ledg
e m
anag
emen
t sys
tem
Pla
nU
pdat
e kn
owle
dge
man
agem
ent s
yste
m50
%W
ill be
don
e on
ce fr
amew
ork
is in
pla
ce a
nd
appr
oved
Live
cor
e va
lues
% in
crea
se in
nom
inat
ions
for
the Ba
tho�Pe
le a
nd U
bunt
u aw
ards
Prom
otio
n of
aw
ards
sys
tem
an
d lin
k w
ith v
alue
s50
% 2
009
Nom
inat
ions
rece
ived
and
Loc
al M
oder
atin
g
Com
mitt
ee s
ched
uled
for 1
1/02
/201
0N
one
Num
ber o
f cor
e va
lue
awar
enes
s se
ssio
ns
DM
E va
lues
aw
aren
ess
w
orks
hops
M
inim
um 2
per
an
num
Not
yet
impl
emen
ted
Budg
et c
onst
rain
ts a
nd
split
of D
epar
tmen
tLi
ve c
ore
valu
es%
dec
reas
e in
num
ber o
f tra
nsgr
essi
ons
DM
E C
ode
of C
ondu
ct
wor
ksho
ps5%
Ref
er to
HR
tabl
es
Cus
tom
ise
indu
ctio
n to
in
clud
e C
ode
of C
ondu
ct
Fina
nce
Alig
n bu
dget
with
st
rate
gy%
of b
udge
t alig
ned
with
bra
nch
stra
tegi
c pr
iorit
ies
D
evel
op s
pend
ing
plan
s in
co
njun
ctio
n w
ith fi
nanc
e10
0%Sp
endi
ng p
lans
tabl
ed a
t Dep
artm
ent B
udge
t C
omm
ittee
N
one
Opt
imis
e as
set
utilis
atio
n (a
sset
s -
PFM
A)
Red
uce
redu
ndan
t ass
ets
(phy
sica
l) Im
plem
ent a
sset
m
aint
enan
ce a
nd d
ispo
sal
stra
tegy
Iden
tify
redu
ndan
t as
sets
and
redu
ce
by 3
0%
Don
e by
ass
et m
anag
emen
t in
Supp
ly C
hain
D
irect
orat
e
Man
age
cost
s ef
fect
ivel
yR
educ
tion
in c
onfir
med
frui
tless
, w
aste
ful a
nd u
naut
horis
ed
expe
nditu
re (B
ranc
h)
Atte
nd w
orks
hops
arr
ange
d an
d co
nduc
ted
by C
FO’s
Offi
ce
100%
Don
e
Res
pond
to id
entif
ied
inci
dent
s w
ithin
CFO
offi
cetim
efra
mes
Don
e
Effe
ctiv
ely
man
age
budg
et%
bud
get v
aria
nce
(Bra
nch)
Mon
itor a
ctua
l exp
endi
ture
ag
ains
t bud
get (
spen
ding
pl
ans)
5% 2
009
The
budg
et v
aria
nce
is h
ighe
r tha
n 5%
Dep
artm
ent s
plit
forc
ed
new
prio
ritie
s w
hich
re
quire
mor
e re
sour
ces
Prom
ote
Cor
pora
te
Gov
erna
nce
% c
ompl
ianc
e w
ith P
FMA
Impl
emen
t com
plia
nce
fram
ewor
k10
0%C
ompl
ianc
e fra
mew
ork
deve
lope
d an
d ap
prov
ed b
y bo
th M
inis
ters
Ap
prov
ed s
ubm
issi
ons
PROGRAMME PERFORMANCE - SECTION 2

41
SER
VIC
E D
ELIV
ERY
IMPR
OVE
MEN
T PL
AN
S
Bra
nch:
Cor
pora
te S
ervi
ces
Key
Ser
vice
Serv
ice
Ben
efic
iary
Cur
rent
Sta
ndar
d (2
008’
09)
Des
ired
Stan
dard
(200
9’10
)Pr
ogre
ss a
s at
31
Mar
ch 2
010
Secu
rity
Ris
k M
anag
emen
tD
evel
op a
nd
impl
emen
t Phy
sica
l an
d In
telle
ctua
l Ris
k Pl
an
DM
E pe
rson
nel a
nd
visi
tors
Qua
ntity
Ensu
re im
plem
enta
tion
of
min
imum
info
rmat
ion
Secu
rity
Stan
dard
s (M
ISS)
Phys
ical
Sec
urity
In
form
atio
n Se
curit
y Pe
rson
nel S
ecur
ityC
omm
unic
atio
n Se
curit
y
Qua
ntity
St
anda
rdis
ed s
ecur
ity
as p
er S
APS
and
NIA
se
curit
y re
com
men
datio
ns
DM
E se
curit
y w
as 8
0% s
tand
ardi
sed
as p
er
SAPS
and
NIA
sec
urity
reco
mm
enda
tions
Qua
lity
Hig
h le
vel o
f unc
erta
inty
Q
ualit
yR
educ
tion
of ri
skR
isks
to th
e D
epar
tmen
t wer
e si
gnifi
cant
ly
redu
ced
Con
sulta
tion
Nat
iona
l Int
ellig
ence
Age
ncy
and
Sout
h Af
rican
Pol
ice
Serv
ices
Con
sulta
tion
Nat
iona
l Int
ellig
ence
Ag
ency
and
Sou
th A
frica
n Po
lice
Serv
ices
Con
sulta
tions
with
NIA
and
SAP
S w
ere
impr
oved
whi
ch h
ad a
pos
itive
impa
ct o
n tu
rnar
ound
tim
es s
uch
as p
erso
nnel
sui
tabi
lity
chec
ks)
Acce
ssPr
esen
tatio
ns o
f sec
urity
aw
aren
ess
Acce
ssO
ffici
als
taki
ng
resp
onsi
bilit
y fo
r th
e se
curit
y of
thei
r po
sses
sion
s an
d th
eir
own
secu
rity
Sign
ifica
nt p
rogr
ess
with
offi
cial
s ta
king
re
spon
sibi
lity
for t
heir
secu
rity,
suc
h as
few
er
unlo
cked
offi
ces
afte
r hou
rs a
nd d
urin
g th
e da
y w
hen
offic
ials
are
not
in th
eir o
ffice
s
PROGRAMME 1

42
Key
Ser
vice
Serv
ice
Ben
efic
iary
Cur
rent
Sta
ndar
d (2
008’
09)
Des
ired
Stan
dard
(200
9’10
)Pr
ogre
ss a
s at
31
Mar
ch 2
010
Cou
rtesy
Orie
ntat
ion
of n
ew e
mpl
oyee
s an
d se
curit
y re
port
at E
XCO
Cou
rtesy
Seni
or m
anag
ers
atte
ndin
g o
rient
atio
n pr
ogra
mm
esO
pen
and
trans
pare
nt
Mos
t offi
cial
s un
ders
tand
sec
urity
on
ly a
t acc
ess
cont
rol p
oint
s O
pen
and
trans
pare
ntTo
tal u
nder
stan
ding
of
Min
imum
Info
rmat
ion
Secu
rity
Stan
dard
s (M
ISS)
MIS
S do
cum
ent s
umm
aris
ed fo
r all
empl
oyee
s to
read
and
fam
iliaris
e th
emse
lves
with
the
cont
ent a
nd w
ill be
pos
ted
on th
e In
trane
t
Info
rmat
ion
Secu
rity
polic
y on
the
Intra
net
Info
rmat
ion
Secu
rity
guid
elin
es a
nd
proc
edur
es o
n th
e In
trane
t W
ill be
pos
ted
on th
e In
trane
t
Red
ress
Chi
ef D
irect
orat
e re
ports
to
EXC
O d
urin
g D
irect
orat
e m
eetin
gs
Red
ress
Prom
ote
secu
rity
at C
hief
D
irect
orat
e m
eetin
gsIn
form
atio
n se
ssio
ns to
pro
mot
e se
curit
y he
ld
with
the
Min
eral
Pol
icy
and
Prom
otio
n Br
anch
as
wel
l as
all r
egio
nal o
ffice
sVa
lue
for
mon
eyLe
ss s
ecur
ity b
reac
hes
Valu
e fo
r m
oney
Prot
ectio
n of
info
rmat
ion
Secu
rity
brea
ches
wer
e m
inim
ised
Tim
eEn
d M
arch
201
0Ti
me
12 m
onth
sD
evel
op a
nd
impl
emen
t Phy
sica
l an
d In
telle
ctua
l Ris
k Pl
an
DM
E pe
rson
nel a
nd
visi
tors
Cos
tC
ompe
nsat
ion
of e
mpl
oyee
as
per b
udge
tC
ost
Com
pens
atio
n of
em
ploy
ee a
s pe
r bud
get
Perm
anen
t em
ploy
ees
wer
e co
mpe
nsat
ed
acco
rdin
g to
bud
get b
ut a
dditi
onal
con
tract
s w
ere
empl
oyed
to d
eal w
ith th
e ex
pand
ing
Dep
artm
ent
Hum
an
Res
ourc
esEx
istin
g pe
rson
nel
Hum
an
Res
ourc
esEx
istin
g pe
rson
nel
Spec
ial p
roje
cts/
prog
ram
mes
Red
ress
the
past
im
bala
nces
and
cr
eate
acc
ess
for t
he
vuln
erab
le g
roup
s to
ben
efit
from
the
min
eral
s an
d en
ergy
se
ctor
s
All d
esig
nate
d vu
lner
able
gro
ups
resi
dent
in a
reas
in
and
aro
und
min
ing
and
ener
gy
indu
stry
ope
ratio
ns,
ie W
omen
, you
th,
disa
bled
chi
ldre
n an
d th
e ag
ed
Qua
ntity
Ensu
re th
e pa
rtici
patio
n of
w
omen
and
you
th in
bot
h m
inin
g an
d en
ergy
sec
tors
to c
ompl
y w
ith th
e 10
% re
quire
men
t as
per
the
Min
ing
Cha
rter a
nd M
iner
al
and
Petro
leum
Res
ourc
es
Dev
elop
men
t Act
(MPR
DA)
Qua
ntity
As p
er C
harte
rC
urre
ntly
fina
lisin
g th
e dr
aft S
trate
gy o
n Yo
uth
Dev
elop
men
t. Al
so s
ensi
tisin
g th
e yo
uth
to p
artic
ipat
e in
the
Min
ing
Cha
rter
revi
ew p
roce
ss in
the
next
fina
ncia
l yea
r. Aw
aren
ess
wor
ksho
ps a
bout
bus
ines
s op
portu
nitie
s in
ene
rgy
cond
ucte
d in
th
ree
prov
ince
s w
ith 1
00 p
artic
ipan
ts
per w
orks
hop.
Dep
artm
ent o
f Ene
rgy
line
func
tion
pres
ente
d al
l opp
ortu
nitie
s sp
earh
eade
d by
Dep
artm
ent f
or
parti
cipa
tion
and
supp
ort b
y w
omen
and
yo
uth
PROGRAMME PERFORMANCE - SECTION 2

43
Key
Ser
vice
Serv
ice
Ben
efic
iary
Cur
rent
Sta
ndar
d (2
008’
09)
Des
ired
Stan
dard
(200
9’10
)Pr
ogre
ss a
s at
31
Mar
ch 2
010
Qua
lity
Giv
e hi
gh s
tand
ards
of s
ervi
ce
deliv
ery
as p
er d
emog
raph
ics
(equ
ity)
Qua
lity
Sam
e
Con
sulta
tion
All s
take
hold
er o
rgan
isat
ions
and
vu
lner
able
gro
ups
Con
sulta
tion
Rea
ch a
ll pr
ovin
ces
Abou
t fiv
e pr
ovin
ces
reac
hed
thro
ugh
Lear
ners
’ W
eek
Car
eer G
uida
nce
Prog
ram
me.
Rel
evan
t st
akeh
olde
rs a
nd ta
rget
gro
ups
cons
ulte
d in
all
the
thre
e pr
ovin
ces
and
all g
iven
a p
latfo
rm to
pr
esen
t the
ir bu
sine
ss id
eas
with
in th
e en
ergy
se
ctor
Acce
ssC
reat
e ac
cess
to th
e op
portu
nitie
s in
the
min
eral
s an
d en
ergy
sec
tors
Acce
ssEn
sure
info
rmat
ion
diss
emin
atio
n to
all
vuln
erab
le g
roup
s th
roug
h w
orks
hops
, in
form
atio
n se
ssio
ns a
nd
cons
ulta
tions
Two
info
rmat
ion
sess
ions
pre
sent
ed in
KZN
and
N
orth
wes
t Pro
vinc
es
Red
ress
the
past
im
bala
nces
and
cr
eate
acc
ess
for t
he
vuln
erab
le g
roup
s to
ben
efit
from
the
min
eral
s an
d en
ergy
se
ctor
s
All d
esig
nate
d vu
lner
able
gro
ups
resi
dent
in a
reas
in
and
aro
und
min
ing
and
ener
gy
indu
stry
ope
ratio
ns,
ie W
omen
, you
th,
disa
bled
chi
ldre
n an
d th
e ag
ed
Cou
rtesy
Res
pect
and
val
ue a
ll ou
r clie
nts
Cou
rtesy
Ensu
re n
o di
scrim
inat
ion
on th
e ba
sis
of a
ge, r
ace,
ge
nder
and
dis
abilit
y
Dur
ing
Dec
embe
r 200
9 Sp
ecia
l Pro
ject
s su
ppor
ted
No
Viol
ence
Aga
inst
Wom
en a
nd
Chi
ldre
n Ab
use
cam
paig
n w
hich
inco
rpor
ated
th
e di
sabl
e, H
IV/ A
IDS,
age
d an
d al
l vul
nera
ble
grou
psO
pen
and
trans
pare
ntEn
sure
ope
nnes
s in
dea
ling
with
le
gisl
atio
n an
d al
l opp
ortu
nitie
sO
pen
and
trans
pare
ntD
eal w
ith a
ll en
quiri
es
rece
ive
by D
epar
tmen
t fa
irly
and
trans
pare
ntly
All e
nqui
ries
atte
nded
to fa
irly
Info
rmat
ion
Rea
ch o
ut to
all
the
vuln
erab
le
grou
ps th
roug
h ad
voca
cy w
ork
Info
rmat
ion
Con
tinue
with
info
rmat
ion
sess
ions
as
plan
ned
Info
rmat
ion
sess
ions
ong
oing
Red
ress
Ensu
re e
quity
in li
ne w
ith ta
rget
sR
edre
ssM
onito
r equ
ity th
roug
h su
rvey
s an
d da
ta
colle
ctio
n
No
targ
ets
for t
he y
outh
with
Min
ing
Cha
rter s
till
unde
r rev
iew
PROGRAMME 1

44
Key
Ser
vice
Serv
ice
Ben
efic
iary
Cur
rent
Sta
ndar
d (2
008’
09)
Des
ired
Stan
dard
(200
9’10
)Pr
ogre
ss a
s at
31
Mar
ch 2
010
Valu
e fo
r m
oney
Use
all
reso
urce
s pr
ovid
ed to
be
nefit
vul
nera
ble
grou
ps e
qual
lyVa
lue
for
mon
eyC
ost-e
ffect
ive
use
of
reso
urce
sW
orks
hops
pro
vide
d Va
lue
for m
oney
as
stak
ehol
ders
who
nee
ded
to c
ontri
bute
to th
e ec
onom
ic e
mpo
wer
men
t of v
ulne
rabl
e gr
oups
pa
rtici
pate
d. T
he p
artic
ipat
ion
of th
e Pr
ovin
cial
Ec
onom
ic D
evel
opm
ent D
epar
tmen
ts a
nd
othe
r ena
blin
g ag
enci
es w
as a
ppre
ciat
ed b
y al
l pa
rtici
pant
s an
d st
akeh
olde
rs; m
ore
wor
ksho
ps
of th
is n
atur
e ne
ed to
be
cond
ucte
d fo
r us
to
reac
h ou
r obj
ectiv
es a
nd m
anda
teTi
me
2012
Tim
e20
12C
ost
MTE
F bu
dget
(ina
dequ
ate)
Cos
t50
% in
crea
se fo
r 20
09’1
0 M
TEF
budg
et
(inad
equa
te)
50%
incr
ease
end
orse
d
Chi
ef D
irect
orat
e: C
omm
unic
atio
nPr
ovid
e an
effi
cien
t ex
tern
al a
nd in
tern
al
com
mun
icat
ion
serv
ice
to b
oth
the
DM
E an
d M
inis
try
Sout
h Af
rican
pub
lic,
DM
E st
akeh
olde
rs
and
inte
rnal
sta
ff
Qua
ntity
Ensu
re in
corp
orat
ion
and
im
plem
enta
tion
of th
e m
edia
/m
arke
ting
plan
s in
the
Com
mun
icat
ion
Stra
tegy
Qua
ntity
: th
ree
exte
rnal
ev
ents
.
•St
ream
line
all D
ME
exte
rnal
eve
nts
•R
evam
p al
l ser
vice
re
late
d pu
blic
atio
ns•
Stre
ngth
en In
tern
al
Com
mun
icat
ion
•Em
bark
on
at le
ast
thre
e m
arke
ting
cam
paig
ns•
Hos
t mor
e co
nten
t dr
iven
Izim
bizo
/ pu
blic
liai
son
even
ts
Succ
essf
ully
org
anis
ed/ p
artic
ipat
ed in
:
Kwa
Nzi
mak
we
publ
ic p
artic
ipat
ion
cere
mon
y, n
ear P
ort E
dwar
d on
the
KwaZ
ulu-
Nat
al s
outh
coa
st
The
Prin
cess
Nom
buso
Ear
ly C
hild
hood
D
evel
opm
ent C
entre
is a
Pub
lic-P
rivat
e Pa
rtner
ship
(PPP
) bet
wee
n th
e D
epar
tmen
t of
Min
eral
Res
ourc
es, N
atal
Por
tland
C
emen
t (N
PC) a
nd th
e H
ibis
cus
Coa
st
Mun
icip
ality
Ints
ika
bene
ficia
tion
proj
ect,
13 N
ovem
ber
Barb
erto
n, U
mjin
di M
unic
ipal
ity p
ublic
pa
rtici
patio
n, 2
7 N
ovem
ber
Mhl
othl
o , L
impo
po p
ublic
par
ticip
atio
n
PROGRAMME PERFORMANCE - SECTION 2

45
Key
Ser
vice
Serv
ice
Ben
efic
iary
Cur
rent
Sta
ndar
d (2
008’
09)
Des
ired
Stan
dard
(200
9’10
)Pr
ogre
ss a
s at
31
Mar
ch 2
010
Prov
ide
an e
ffici
ent
exte
rnal
and
inte
rnal
co
mm
unic
atio
n se
rvic
e to
bot
h th
e D
ME
and
Min
istry
Sout
h Af
rican
pub
lic,
DM
E st
akeh
olde
rs
and
inte
rnal
sta
ff
Qua
lity
Publ
ic li
aiso
n an
d m
edia
en
gage
men
t is
bein
g do
ne b
ut
not e
xtre
mel
y co
nten
t driv
en.
Publ
icat
ions
ava
ilabl
e bu
t ou
tdat
ed
Qua
lity
2,00
0 co
pies
•U
pdat
e an
d de
velo
p ne
w p
ublic
atio
ns
•H
ost m
ore
stak
ehol
der a
nd
publ
ic li
aiso
n ev
ents
•
Hol
d In
tern
al
Com
mun
icat
ion
even
ts m
ore
frequ
ently
•R
olle
d ou
t mar
ketin
g ca
mpa
igns
Com
mun
icat
ion
CD
faci
litat
ed p
laci
ng
adve
rtoria
ls to
pro
file
the
Min
iste
r and
pr
ogra
mm
es o
f the
Dep
artm
ent:
An a
dver
t was
pla
ced
in a
Joh
anne
sbur
g St
ock
Exch
ange
mag
azin
e (J
SE)
An a
dver
toria
l was
pla
ced
in o
ur e
xter
nal
stak
ehol
der m
agaz
ine,
Molato,
info
rmin
g st
akeh
olde
rs a
nd th
e pu
blic
abo
ut s
plit
of D
epar
tmen
ts a
s an
noun
ced
by th
e Pr
esid
ent
Even
ts s
take
hold
er p
lann
ing
com
mitt
ee
mee
ting
The
Dire
ctor
ate
is fa
cilit
atin
g m
onth
ly
stak
ehol
der m
eetin
gs to
sha
re in
form
atio
n an
d re
sour
ces
whe
re n
eces
sary
Com
mun
icat
ion
CD
dra
fted
and
even
ts
polic
y pr
esen
ted
and
appr
oved
by
EXC
O
CD
atte
nds
wee
kly
GC
IS fo
rum
s ch
aire
d by
the
CEO
, to
shar
e in
form
atio
n an
d ga
in s
uppo
rt an
d po
sitio
n D
epar
tmen
tal
prog
ram
me
for p
ositi
ve m
edia
cov
erag
e (m
inut
es a
re a
vaila
ble
for p
roof
of t
he
abov
e)C
onsu
ltatio
nEn
gage
med
ia p
laye
rs; l
ine
func
tion
bran
ches
for s
trate
gic
com
mun
icat
ion
on in
tern
al
mat
ters
; eng
age
HR
and
CFO
of
fices
esp
ecia
lly th
ose
that
pr
ovid
e a
serv
ice
to in
tern
al D
ME
staf
f
Con
sulta
tion
Offi
ce th
e D
irect
or-
Gen
eral
and
Min
istry
•Is
sued
med
ia re
leas
es a
nd h
eld
med
ia
conf
eren
ces
•Pa
rtici
pate
d in
cha
nge
man
agem
ent
rega
rdin
g th
e D
epar
tmen
tal s
plit
Acce
ssPr
esen
tatio
n on
com
mun
icat
ion
need
s fo
r a g
over
nmen
t fun
ctio
n an
d w
hat a
lread
y ex
ists
Acce
ssR
outin
e su
bmis
sion
of
upda
ted
info
rmat
ion
on
all D
ME
serv
ice-
rela
ted
prog
ram
mes
and
mon
thly
m
eetin
gs w
ith D
DG
’s
•Pa
rtici
pate
con
tinuo
usly
in D
epar
tmen
tal
indu
ctio
n pr
ogra
mm
e•
Dis
tribu
te in
tern
al m
emor
andu
m a
nd
impo
rtant
info
rmat
ion
thro
ugh
DM
E gr
oup
(via
the
Inte
rnet
)
PROGRAMME 1
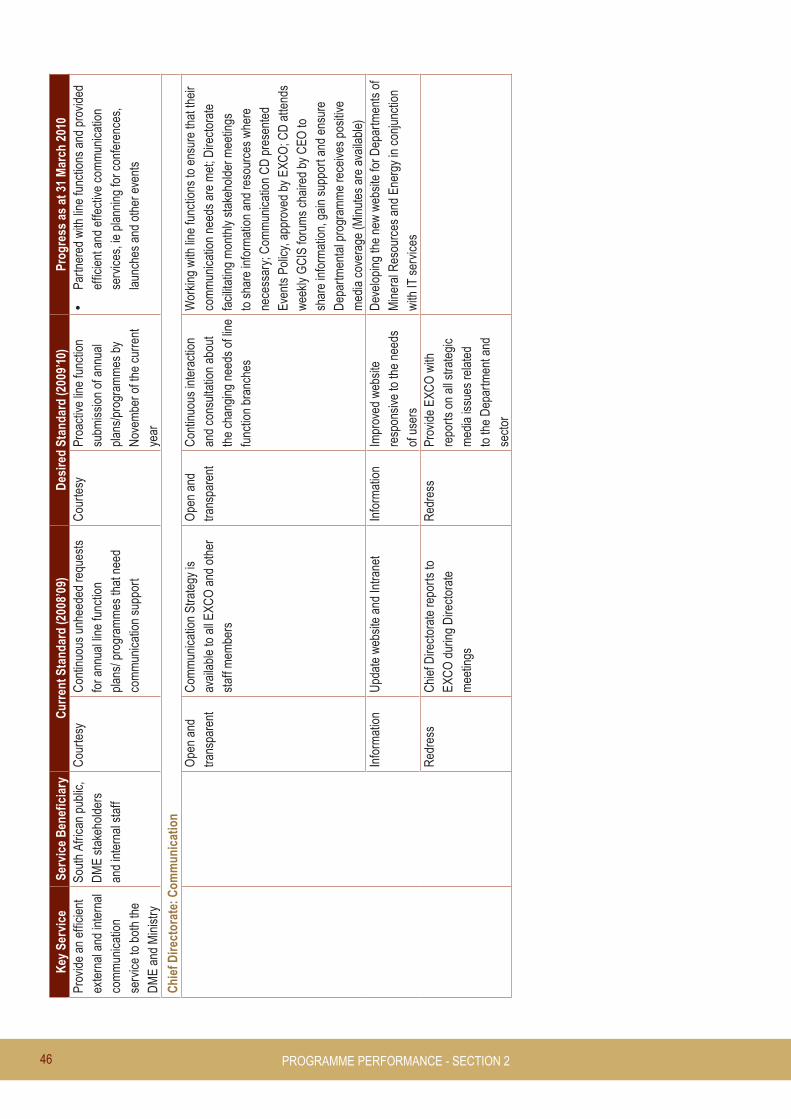
46
Key
Ser
vice
Serv
ice
Ben
efic
iary
Cur
rent
Sta
ndar
d (2
008’
09)
Des
ired
Stan
dard
(200
9’10
)Pr
ogre
ss a
s at
31
Mar
ch 2
010
Prov
ide
an e
ffici
ent
exte
rnal
and
inte
rnal
co
mm
unic
atio
n se
rvic
e to
bot
h th
e D
ME
and
Min
istry
Sout
h Af
rican
pub
lic,
DM
E st
akeh
olde
rs
and
inte
rnal
sta
ff
Cou
rtesy
Con
tinuo
us u
nhee
ded
requ
ests
fo
r ann
ual l
ine
func
tion
plan
s/ p
rogr
amm
es th
at n
eed
com
mun
icat
ion
supp
ort
Cou
rtesy
Proa
ctiv
e lin
e fu
nctio
n su
bmis
sion
of a
nnua
l pl
ans/
prog
ram
mes
by
Nov
embe
r of t
he c
urre
nt
year
•Pa
rtner
ed w
ith li
ne fu
nctio
ns a
nd p
rovi
ded
effic
ient
and
effe
ctiv
e co
mm
unic
atio
n se
rvic
es, i
e pl
anni
ng fo
r con
fere
nces
, la
unch
es a
nd o
ther
eve
nts
Chi
ef D
irect
orat
e: C
omm
unic
atio
nO
pen
and
trans
pare
ntC
omm
unic
atio
n St
rate
gy is
av
aila
ble
to a
ll E
XCO
and
oth
er
staf
f mem
bers
Ope
n an
d tra
nspa
rent
Con
tinuo
us in
tera
ctio
n an
d co
nsul
tatio
n ab
out
the
chan
ging
nee
ds o
f lin
e fu
nctio
n br
anch
es
Wor
king
with
line
func
tions
to e
nsur
e th
at th
eir
com
mun
icat
ion
need
s ar
e m
et; D
irect
orat
e fa
cilit
atin
g m
onth
ly s
take
hold
er m
eetin
gs
to s
hare
info
rmat
ion
and
reso
urce
s w
here
ne
cess
ary;
Com
mun
icat
ion
CD
pre
sent
ed
Even
ts P
olic
y, a
ppro
ved
by E
XCO
; CD
atte
nds
wee
kly
GC
IS fo
rum
s ch
aire
d by
CEO
to
shar
e in
form
atio
n, g
ain
supp
ort a
nd e
nsur
e D
epar
tmen
tal p
rogr
amm
e re
ceiv
es p
ositi
ve
med
ia c
over
age
(Min
utes
are
ava
ilabl
e)In
form
atio
nU
pdat
e w
ebsi
te a
nd In
trane
t In
form
atio
nIm
prov
ed w
ebsi
te
resp
onsi
ve to
the
need
s of
use
rs
Dev
elop
ing
the
new
web
site
for D
epar
tmen
ts o
f M
iner
al R
esou
rces
and
Ene
rgy
in c
onju
nctio
n w
ith IT
ser
vice
sR
edre
ssC
hief
Dire
ctor
ate
repo
rts to
E
XCO
dur
ing
Dire
ctor
ate
mee
tings
Red
ress
Prov
ide
EXC
O w
ith
repo
rts o
n al
l stra
tegi
c m
edia
issu
es re
late
d to
the
Dep
artm
ent a
nd
sect
or
PROGRAMME PERFORMANCE - SECTION 2

47
Key
Ser
vice
Serv
ice
Ben
efic
iary
Cur
rent
Sta
ndar
d (2
008’
09)
Des
ired
Stan
dard
(200
9’10
)Pr
ogre
ss a
s at
31
Mar
ch 2
010
Valu
e fo
r m
oney
All c
omm
unic
atio
n se
rvic
es
offe
red
with
in ‘V
alue
for m
oney
’ co
ncep
t, bu
t not
pos
sibl
e w
hen
requ
ests
rece
ived
late
, whi
ch
redu
ces
time
and
abilit
y to
sec
ure
valu
e fo
r the
mon
ey u
sed
Valu
e fo
r m
oney
Prop
erly
pro
cure
d se
rvic
es to
ens
ure
Valu
e fo
r mon
ey
Succ
essf
ully
pro
cure
d:
• Se
rvic
es fo
r thr
ee p
ublic
par
ticip
atio
ns
or im
bizo
s w
hich
are
repo
rted
in th
e pe
rform
ance
repo
rt ab
ove
• Ba
nner
s fo
r mar
ketin
g an
d br
andi
ng
purp
oses
• D
STV
serv
ices
for M
inis
ter a
nd D
G•
Plas
ma
scre
en fo
r Min
iste
r and
DG
for
med
ia m
onito
ring
purp
oses
• N
ewsp
aper
s fo
r med
ia m
onito
ring
purp
oses
• Ph
otos
of o
ffice
bea
rers
Faci
litat
ed p
rocu
rem
ent o
f Min
iste
rs’ 2
009
year
end
card
sVa
lue
for
mon
eyAl
l com
mun
icat
ion
serv
ices
of
fere
d w
ithin
‘Val
ue fo
r mon
ey’
conc
ept,
but n
ot p
ossi
ble
whe
n re
ques
ts re
ceiv
ed la
te, w
hich
re
duce
s tim
e an
d ab
ility
to s
ecur
e va
lue
for t
he m
oney
use
d
Valu
e fo
r m
oney
Prop
erly
pro
cure
d se
rvic
es to
ens
ure
Valu
e fo
r mon
ey
Tim
eEn
d M
arch
201
0Ti
me
12 m
onth
sC
ost
As p
er b
udge
t allo
catio
nC
ost
Mor
e pr
oact
ive
invo
lvem
ent i
n bu
dget
ing
proc
ess
to e
nsur
e al
loca
tion
is a
ligne
d w
ith
prio
ritie
sH
uman
R
esou
rces
Exis
ting
pers
onne
lH
uman
R
esou
rces
Exis
ting
pers
onne
l
PROGRAMME 1

48
PRO
GR
AM
ME
1.1:
CH
IEF
FIN
AN
CIA
L O
FFIC
E
Purp
ose:
To
prov
ide
adm
inis
trativ
e su
ppor
t to
the
Min
istry
and
the
Dep
artm
ent w
ith re
gard
to fi
nanc
ial,
syst
ems
deve
lopm
ent a
nd m
aint
enan
ce, i
nfor
mat
ion
and
supp
ly c
hain
man
agem
ent
Chi
ef F
inan
cial
Off
ice
stra
tegi
c ob
ject
ives
:
• To
cre
ate
cond
ition
s fo
r sus
tain
able
gro
wth
and
dev
elop
men
t for
the
bene
fit o
f all
Sout
h Af
rican
s•
To c
reat
e an
ena
blin
g en
viro
nmen
t aim
ed a
t sup
porti
ng th
e de
velo
pmen
t and
impl
emen
tatio
n of
pol
icie
s an
d le
gisl
atio
n (N
EW)
Stak
ehol
der/C
usto
mer
Mea
sure
s
Obj
ectiv
esM
easu
res
Initi
ativ
esTa
rget
s09
’10
Prog
ress
as
at31
Mar
ch 2
010
Con
stra
ints
/Rea
son
for u
nder
-per
form
ance
Impr
ove
turn
arou
nd
times
Ackn
owle
dge-
men
t of
quer
ies
Dev
elop
a q
uery
man
agem
ent s
yste
mFi
ve w
orki
ng
days
•Sy
stem
for a
ckno
wle
dgin
g ex
tern
al q
uerie
s in
pla
ce
in th
e C
FO’s
offic
e•
Aver
age
turn
arou
nd ti
me
for a
ckno
wle
dgin
g qu
erie
s an
d co
mpl
aint
s is
five
day
s%
adh
eren
ce to
legi
slat
ed
time-
fram
esD
evel
op a
nd p
ublis
h a
cale
ndar
of
legi
slat
ive
timef
ram
es10
0%R
epor
ting
cale
ndar
dev
elop
ed a
nd p
ublis
hed
% a
dher
ence
to d
efin
ed
turn
arou
nd ti
mes
Def
ine
turn
arou
nd ti
me
for a
ll pr
oces
ses
100%
Stan
dard
turn
arou
nd ti
me
defin
ed a
nd s
ervi
ce c
atal
ogue
de
velo
ped;
Impl
emen
tatio
n do
ne b
y EM
and
FPM
ASu
bmit
mon
thly
repo
rts o
n ac
hiev
emen
t of t
urna
roun
d tim
eSy
stem
effe
ctiv
e Fe
brua
ry 2
010
with
mon
thly
repo
rts
subm
itted
end
Feb
ruar
y 20
10
Prov
ide
clea
r int
erna
l ad
min
istr
ativ
e po
licie
s an
d pr
oced
ures
Impr
ovem
ent i
n t E
xter
nal
Audi
t Rep
ort
Red
uce
the
num
ber o
f rep
orta
ble
audi
t que
ries
No
emph
asis
of
mat
ter
A cl
ean
audi
t rep
ort r
ecei
ved
for 2
008’
09 fi
nanc
ial y
ear
Adm
inis
trativ
e pr
oces
ses
and
polic
ies
publ
ishe
dD
evel
op p
ocke
t han
d bo
oks
for
appr
oved
pol
icie
s80
%Ac
hiev
ed. P
ocke
t han
dboo
ks c
ould
not
be
deve
lope
d bu
t app
rove
d po
licie
s pu
blis
hed
on In
trane
tD
ue to
cos
t con
tain
men
t m
easu
res
and
split
of t
he
Dep
artm
ent,
focu
s ch
ange
d to
pub
lishi
ng o
n In
trane
tPu
blis
h al
l int
erna
l pro
cess
es o
n th
e In
trane
tPr
oced
ures
and
pro
cess
es fo
r app
rove
d po
licie
s pu
blis
hed
on th
e In
trane
t
PROGRAMME PERFORMANCE - SECTION 2

49
Obj
ectiv
esM
easu
res
Initi
ativ
esTa
rget
s09
’10
Prog
ress
as
at31
Mar
ch 2
010
Con
stra
ints
/Rea
son
for u
nder
-per
form
ance
Prov
ide
cred
ible
and
ac
cess
ible
in
form
atio
n
% ta
rget
aud
ienc
e re
ache
dId
entif
y ta
rget
ed a
udie
nce
70%
Targ
et a
udie
nce
iden
tifie
d by
all
Dire
ctor
sSu
bmit
mon
thly
repo
rts o
n nu
mbe
r of
targ
et a
udie
nces
reac
hed
•C
heck
list d
evel
oped
of i
nfor
mat
ion
subm
itted
to
targ
et a
udie
nces
•C
heck
list s
igne
d of
f by
Dire
ctor
s an
d su
bmitt
ed to
C
FO%
impr
ovem
ent i
n sy
stem
s av
aila
bilit
ySe
t-up
mon
itorin
g to
ols
80%
The
follo
win
g m
onito
ring
tool
s ar
e in
pla
ce:
•W
AN: S
ITA
repo
rts
• Se
rver
s: E
ye o
f the
Sto
rm to
mon
itor a
vaila
bilit
y of
se
rver
s•
Switc
hes:
Eye
of t
he S
torm
•Ap
plic
atio
n an
d da
taba
se: L
og fi
les
• 98
% s
yste
ms
avai
labi
lity
at 3
1 M
arch
201
0
Subm
it m
onth
ly re
ports
on
syst
ems
avai
labi
lity
Com
plet
ed
Bui
ld s
trat
egic
al
lianc
es/
part
ners
hips
Num
ber o
f agr
eem
ents
si
gned
and
impl
emen
ted
Iden
tify
stra
tegi
c pa
rtner
s12
Com
plet
ed
Dev
elop
and
sig
n co
-ope
rativ
e ag
reem
ents
Def
erre
d to
the
next
fina
ncia
l yea
rSp
lit o
f the
Dep
artm
ent:
•R
esou
rces
real
loca
ted
to fo
cus
on th
e sp
lit•
Co-
oper
ativ
e ag
reem
ents
wou
ld n
ot
have
bee
n ef
fect
ive
due
to s
epar
atio
n of
ac
tiviti
es.
Effic
ient
bus
ines
s pr
oces
ses
Dev
elop
co
nsis
tent
m
onito
ring
and
enfo
rcem
ent
guid
elin
es/
proc
edur
es
Proc
edur
es is
sued
in li
ne
with
app
rove
d po
licy
Alig
n pr
oced
ures
with
pol
icie
s10
0%C
ompl
eted
Red
uctio
n in
com
plai
nts
rela
ting
to p
roce
dura
l in
cons
iste
ncy
Dev
elop
a c
entra
l reg
iste
r of
com
plai
nts
90%
Reg
iste
r of c
ompl
aint
s fo
r dire
ctor
ates
by
1 M
arch
201
0
Com
mun
icat
e th
e co
mpl
aint
s pr
oces
s an
d m
onito
r pro
gres
sC
ompl
eted
PROGRAMME 1

50
Obj
ectiv
esM
easu
res
Initi
ativ
esTa
rget
s09
’10
Prog
ress
as
at31
Mar
ch 2
010
Con
stra
ints
/Rea
son
for u
nder
-per
form
ance
Impl
emen
tatio
n of
rele
vant
le
gisl
atio
n an
d po
licie
s
Red
uctio
n in
% n
on-
com
plia
nt is
sues
repo
rted
Impl
emen
tatio
n of
pro
cure
men
t pla
n40
%Pr
ocur
emen
t pla
n in
pla
ce fo
r the
CFO
’s of
fice
Mai
ntai
n an
d m
onito
r pro
gres
s re
port
on ir
regu
lar,
fruitl
ess
and
was
tefu
l ex
pend
iture
Reg
iste
r for
irre
gula
r, fru
itles
s an
d w
aste
ful e
xpen
ditu
re
up to
dat
e
Benc
hmar
k ag
ains
t bes
t pr
actic
e
% s
tand
ards
that
mee
t bes
t pr
actic
eId
entif
y re
leva
nt s
tand
ards
50%
IT p
olic
ies
deve
lope
d in
line
with
Cob
it, IT
IL, P
MBO
K an
d IS
O 1
7799
sta
ndar
dsAl
ign
proc
esse
s w
ith b
est p
ract
ice
Com
plet
ed
Rev
iew
and
st
ream
line
polic
ies
and
proc
esse
s
% p
olic
ies
& pr
oced
ures
st
anda
rdis
edR
evie
w id
entif
ied
polic
ies
50%
No
polic
ies
due
for r
evie
w
% p
roce
dure
s al
igne
d w
ith
polic
ies
Rev
iew
iden
tifie
d pr
oced
ures
and
al
igne
d w
ith p
olic
ies
70%
Not
don
eSp
lit o
f the
Dep
artm
ent
Effe
ctiv
e se
rvic
e de
liver
yAl
loca
te
appr
opria
te
reso
urce
s
Res
ourc
es a
lloca
ted
in li
ne
with
ope
ratio
nal n
eeds
Adop
t prio
rity-
driv
en b
udge
t allo
catio
n80
%C
ompl
eted
Build
ac
coun
tabi
lity
% im
plem
enta
tion
of th
e BS
CAl
ign
Busi
ness
Pla
n w
ith s
trate
gic
plan
100%
Com
plet
ed
Bui
ld a
nd
man
age
serv
ice
leve
l ag
reem
ents
% v
ette
d SL
AsN
/AN
/A
% o
f ide
ntifi
ed S
LAs
sign
edId
entif
y cr
itica
l ser
vice
s th
at re
quire
SL
As; s
ign
and
regi
ster
all
iden
tifie
d SL
As
70%
Com
plet
ed
SLAs
sig
ned
with
four
trav
el a
genc
ies
in M
arch
201
0
% a
dher
ence
to s
igne
d SL
AsEs
tabl
ish
and
mon
itor a
repo
rting
m
echa
nism
for a
dher
ence
to S
LAs
100%
No
form
al m
onito
ring
and
repo
rting
mec
hani
sm
esta
blis
hed;
mon
itorin
g an
d re
porti
ng d
one
by e
xcep
tion
Res
ourc
es re
allo
cate
d to
focu
s on
spl
it of
D
epar
tmen
tEs
tabl
ish
serv
ice
stan
dard
Stan
dard
s es
tabl
ishe
dD
evel
op a
nd im
plem
ent S
DIP
100%
Com
plet
ed
Und
erst
and
cust
omer
nee
dsSu
rvey
con
duct
ed to
un
ders
tand
nee
dsEs
tabl
ish
clie
ntel
e an
d co
nduc
t sur
vey
to u
nder
stan
d ne
eds
1 pe
r ann
umSu
rvey
com
plet
ed fo
r Inf
orm
atio
n Te
chno
logy
(IT)
, Su
pply
Cha
in M
anag
emen
t (SC
M) a
nd S
yste
ms
Dev
elop
men
t and
Man
agem
ent (
SDM
)G
AP A
naly
sis
Rep
ort
Rec
onci
le c
urre
nt s
tand
ards
with
su
rvey
resu
lts1
per a
nnum
Com
plet
ed
Stak
ehol
der a
nd C
usto
mer
Rel
atio
nshi
p M
anag
emen
t
PROGRAMME PERFORMANCE - SECTION 2

51
Obj
ectiv
esM
easu
res
Initi
ativ
esTa
rget
s09
’10
Prog
ress
as
at31
Mar
ch 2
010
Con
stra
ints
/Rea
son
for u
nder
-per
form
ance
Educ
ate
and
empo
wer
cl
ient
s
Wor
ksho
ps o
f app
rove
d po
licie
sD
evel
op a
nd im
plem
ent
com
mun
icat
ion
stra
tegy
for p
olic
ies
4D
evel
oped
; im
plem
enta
tion
dela
yed
due
to th
e sp
lit o
f D
epar
tmen
t and
del
ays
in s
ign-
off o
n po
licie
s
Si
gned
Ope
ratin
g Le
vel
Agre
emen
ts (O
LAs)
Dev
elop
and
sig
n O
LAs
1 br
anch
per
an
num
Not
com
plet
edR
esou
rces
real
loca
ted
to fo
cus
on s
plit
of
Dep
artm
ent
Man
age
cust
omer
/ st
akeh
olde
r ex
pect
atio
ns
% ra
ting
on c
lient
sa
tisfa
ctio
n su
rvey
Con
duct
cus
tom
er s
atis
fact
ion
surv
ey
base
d on
sig
ned
OLA
s60
%N
ot c
ompl
eted
R
esou
rces
real
loca
ted
to fo
cus
on s
plit
of
Dep
artm
ent
Impr
ove
cons
ulta
tion,
fe
edba
ck a
nd
acce
ssib
ility
Freq
uenc
y of
con
sulta
tion
and
feed
back
ses
sion
sFa
cilit
ate
feed
back
ses
sion
s2
Com
plet
ed; p
rese
ntat
ion
at o
rient
atio
n an
d to
pr
ocur
emen
t cha
mpi
ons;
pres
enta
tion
of b
udge
t; pr
oces
ses
to th
e Br
anch
es
Driv
e in
nova
tion
% o
f inn
ovat
ion
proj
ects
im
plem
ente
d Id
entif
y an
d im
plem
ent i
nnov
ativ
e pr
ojec
ts20
%In
nova
tive
inpu
ts re
ceiv
edD
one,
com
petit
ion
clos
ed
15 A
ugus
t 200
9; to
be
repe
ated
sin
ce in
puts
wer
e in
adeq
uate
Cre
ate
enab
ling
envi
ronm
ent f
or
inno
vatio
nLe
arni
ng a
nd G
row
th
Obj
ectiv
esM
easu
res
Initi
ativ
esTa
rget
s09
’10
Prog
ress
as
at31
Mar
ch 2
010
Con
stra
ints
/Rea
son
for u
nder
-pe
rfor
man
ceD
evel
op a
nd
reta
in s
taff
% re
duct
ion
in s
taff
turn
over
ra
te
Rew
ardi
ng o
f per
form
ance
2%As
sess
men
t don
e an
d fo
rwar
ded
to H
R o
n tim
e an
d bo
nuse
s pa
id to
all
entit
led
Aver
age
staf
f tur
nove
r rat
e du
ring
repo
rting
per
iod
was
15
.38
%
Dev
elop
men
t of s
uper
viso
ry a
nd
man
agem
ent c
apab
ilitie
sD
one;
12
supe
rvis
ory
leve
l (7-
8) a
ttend
ed th
e M
anag
emen
t D
evel
opm
ent P
rogr
amm
e Tr
ain
staf
fD
one;
em
ploy
ees
expo
sed
to th
e fo
llow
ing
train
ing
inte
rven
tions
: BAS
/Per
sal,
Logi
s Tr
aini
ng, C
usto
mer
Se
rvic
e, A
ctiv
e D
irect
ory,
SC
OA
, HE
AT, P
roje
ct
Man
agem
ent,
SCM
, Cor
pora
te M
odel
, Sec
reta
rial C
ours
e an
d In
tend
a Tr
aini
ng
PROGRAMME 1

52
Obj
ectiv
esM
easu
res
Initi
ativ
esTa
rget
s09
’10
Prog
ress
as
at31
Mar
ch 2
010
Con
stra
ints
/Rea
son
for u
nder
-pe
rfor
man
ce%
redu
ctio
n in
vac
anci
es
Fill
all p
ositi
on w
ithin
3 m
onth
s5%
The
Bran
ch h
ad 4
3 va
cant
pos
ts a
t end
of y
ear u
nder
re
view
% im
plem
enta
tion
of
Pers
onne
l Dev
elop
men
t Pl
ans
(PD
P) a
ligne
d to
D
epar
tmen
tal n
eeds
Dev
elop
PD
P fo
r eve
ry e
mpl
oyee
50%
Don
e; P
DP
deve
lope
d fo
r all
empl
oyee
s an
d ot
her t
rain
ing
need
s no
t par
t of P
DP
subm
itted
to H
RD
; 83
staf
f mem
bers
fro
m B
ranc
h at
tend
ed c
ours
es to
enh
ance
per
form
ance
Build
relia
ble
and
resp
onsi
ve
IT p
latfo
rm
Impl
emen
t app
rove
d D
isas
ter R
ecov
ery
Plan
(D
RP)
/BC
P
Dev
elop
, app
rove
and
impl
emen
t D
RP
100%
co
mpl
ianc
e w
ith p
lan
Dev
elop
ed D
PR; u
nder
goin
g ap
prov
al p
roce
ss; b
acku
p pr
oces
s an
d of
fsite
sto
rage
hav
e be
en im
plem
ente
d
% im
plem
ent o
f rev
iew
ed
Mas
ter S
yste
ms
Plan
(MSP
)R
evie
w M
SP10
0%
com
plia
nce
to
plan
Not
don
eC
hang
e of
prio
ritie
s du
e to
the
split
of t
he
Dep
artm
ent
Con
duct
due
dilig
ence
ass
essm
ent
Don
eIm
plem
ent s
tabi
lisat
ion
plan
Don
e
Rev
iew,
dev
elop
and
impl
emen
t a
syst
em d
evel
opm
ent a
nd
mai
nten
ance
pla
n
Don
e
Rev
iew,
dev
elop
and
impl
emen
t in
frast
ruct
ure
mai
nten
ance
pla
nD
one
Com
plet
ed a
nd a
ppro
ved
MSP
bei
ng
impl
emen
ted
60%
Not
don
eC
hang
e of
prio
ritie
s du
e to
the
split
of t
he
Dep
artm
ent
Impr
ove
lead
ersh
ip a
nd
man
agem
ent
capa
bilit
ies
% o
f man
ager
s co
mpl
eted
lead
ersh
ip a
nd
man
agem
ent
cour
ses
Iden
tify
and
impl
emen
t rel
evan
t m
anag
emen
t cou
rses
70%
50%
of t
he S
MS
atte
nded
Dev
elop
par
tner
ship
with
lear
ning
in
stitu
tes
Not
don
eC
hang
e of
prio
ritie
s du
e to
the
split
of t
he
Dep
artm
ent
Esta
blis
h fe
edba
ck m
echa
nism
on
impa
ct o
f tra
inin
gPe
rform
ance
impr
oved
from
76.
35%
ave
rage
in fi
rst c
ycle
to
79.1
0% a
vera
ge in
sec
ond
cycl
e; to
tal a
vera
ge p
erfo
rman
ce
was
88%
% R
etur
n on
Inve
stm
ent o
n tra
inin
g an
d de
velo
pmen
tEs
tabl
ish
base
line
65%
Perfo
rman
ce im
prov
ed fr
om 7
6.35
% a
vera
ge in
firs
t cyc
le to
79
.10%
ave
rage
in s
econ
d cy
cle;
tota
l ave
rage
per
form
ance
w
as 8
8%D
evel
op K
PIs
in li
ne w
ith a
cqui
red
know
ledg
e
PROGRAMME PERFORMANCE - SECTION 2

53
Obj
ectiv
esM
easu
res
Initi
ativ
esTa
rget
s09
’10
Prog
ress
as
at31
Mar
ch 2
010
Con
stra
ints
/Rea
son
for u
nder
-pe
rfor
man
ceD
rive
trans
form
atio
nIm
plem
enta
tion
of re
leva
nt
BBBE
E Po
licy
Rev
iew
and
alig
n D
ME
Pref
eren
tial
Proc
urem
ent P
olic
y w
ith N
atio
nal
BBBE
E po
licy
100%
Not
yet
don
eAw
aitin
g al
ignm
ent
of B
BBEE
Pol
icy
with
PP
PFA
by N
atio
nal
Trea
sury
and
DTI
% im
prov
emen
t in
Empl
oym
ent E
quity
(EE)
Inst
ill a
cultu
re o
f rec
ruiti
ng in
line
with
Dep
artm
enta
l EE
plan
Alig
ned
with
D
ME
EE P
lan
Ref
er to
Hum
an R
esou
rces
tabl
es
% p
rocu
rem
ent s
pent
on
targ
eted
gro
ups
Rev
iew
/upd
ate
supp
lier d
atab
ase
50%
45.4
% s
pent
on
BEE
targ
eted
gro
ups
Co-
ordi
nate
sup
plie
r inf
orm
atio
n se
ssio
nsD
one
Live
the
core
va
lues
% in
crea
se in
nom
inat
ions
fo
r Batho�Pele
and
Ubu
ntu
Awar
ds
Alig
n in
divi
dual
wor
k pl
an w
ith
Dire
ctor
ate
busi
ness
pla
n50
%D
one;
nin
e pe
ople
qua
lifie
d fo
r nom
inat
ion
% d
ecre
ase
in
trans
gres
sion
s of
Cod
e of
C
ondu
ct
Esta
blis
h an
d si
gn o
ff co
de o
f co
nduc
t10
0%D
one;
SC
M C
ode
of C
ondu
ct s
igne
d by
SC
M s
taff
and
CFO
Br
anch
Ple
dge
sign
ed b
y al
l sta
ff; n
o in
cide
nts
of n
on-
com
plia
nce
Syst
em to
reco
rd a
nd m
onito
r br
each
es o
f con
duct
5%D
one;
all
brea
ches
that
attr
acte
d di
scip
linar
y pr
oced
ures
ca
ptur
ed in
HR
regi
ster
of c
ases
N
umbe
r of c
ore
valu
es
awar
enes
s se
ssio
ns
Con
vene
gen
eral
mee
tings
to
educ
ate
staf
f abo
ut v
alue
s2
Don
e; tw
o C
FOst
aff m
eetin
gs h
eld;
Dire
ctor
ate
mee
tings
hel
d re
gula
rlyFi
nanc
e
Obj
ectiv
esM
easu
res
Initi
ativ
esTa
rget
s09
’10
Prog
ress
as
at31
Mar
ch 2
010
Con
stra
ints
/Rea
son
for u
nder
-pe
rfor
man
ceAl
ignm
ent o
f bu
dge
with
st
rate
gy
% a
lignm
ent b
etw
een
budg
et a
nd s
trate
gyFa
cilit
ate
deve
lopm
ent o
f sp
endi
ng p
lans
90%
Achi
eved
; 96%
of b
udge
t alig
ned
with
stra
tegy
% p
rocu
rem
ent a
ligne
d w
ith s
pend
ing
plan
and
st
rate
gy
Dev
elop
pro
cure
men
t pla
n90
%Pr
ocur
emen
t pla
n fo
r CFO
’s of
fice
PROGRAMME 1

54
Obj
ectiv
esM
easu
res
Initi
ativ
esTa
rget
s09
’10
Prog
ress
as
at31
Mar
ch 2
010
Con
stra
ints
/Rea
son
for u
nder
-pe
rfor
man
ceM
axim
ise
utilis
atio
n of
as
sets
Asse
ts d
ispo
sal s
trate
gy
impl
emen
ted
Dev
elop
ass
et m
aint
enan
ce a
nd d
ispo
sal
stra
tegy
100%
co
mpl
ianc
e w
ith ti
mel
ines
Asse
ts d
ispo
sal s
trate
gy 1
5% im
plem
ente
d
Faci
litie
s m
anag
emen
t pl
an im
plem
ente
dD
evel
op a
ccom
mod
atio
n m
anag
emen
t pl
an10
0%
com
plia
nce
with
tim
elin
es
Achi
eved
Dev
elop
faci
litie
s m
anag
emen
t pla
n in
line
w
ith n
orm
s an
d st
anda
rds
Don
e
Man
age
cost
s ef
fect
ivel
yR
educ
tion
in c
onfir
med
fru
itles
s, w
aste
ful a
nd
unau
thor
ised
exp
endi
ture
Con
duct
wor
ksho
ps o
n fin
anci
al
proc
edur
es a
nd p
olic
ies
20%
Don
e; S
CO
A an
d bu
dget
pro
cess
wor
ksho
ps
cond
ucte
d
Set t
imef
ram
es fo
r res
pons
e to
iden
tifie
d in
cide
nts
Don
e; re
gist
er u
pdat
ed m
onth
ly
% s
avin
g on
allo
cate
d bu
dget
Impl
emen
t the
cos
t red
uctio
n in
itiat
ives
5%Ac
hiev
ed; d
ue to
unp
lann
ed re
loca
tions
, unf
ores
een
expe
nditu
re in
curre
d;
cost
con
tain
men
t mea
sure
s su
cces
sful
ly im
plem
ente
d on
item
s su
ch a
s: in
tern
atio
nal t
rave
l, ca
r hire
, ven
ues
and
faci
litie
s, c
ater
ing,
adv
ertis
emen
ts/ r
ecru
itmen
t and
co
nsul
tant
fees
; tot
al a
vera
ge s
avin
g of
24%
Stra
tegi
c so
urci
ng
impl
emen
ted
Rev
iew
and
impl
emen
t sou
rcin
g st
rate
gy
80%
Not
fina
lised
; stra
tegi
c co
mm
oditi
es id
entif
ied
and
cont
ract
s in
pla
ce; r
egis
tratio
n pr
oces
s co
mm
oditi
es
that
requ
ire p
re-q
ualif
icat
ion
iden
tifie
d an
d ta
ken
into
ac
coun
t in
new
regi
stra
tion
form
.
Res
ourc
e ch
alle
nges
Prom
ote
Cor
pora
te
Gov
erna
nce
% c
ompl
ianc
e w
ith P
FMA
Rev
iew
com
plia
nce
certi
ficat
e10
0%R
evie
w d
one
twic
e to
incl
ude
all m
onth
ly re
conc
iliatio
ns
Subm
it M
onth
ly C
ompl
ianc
e C
ertif
icat
eD
one
Cle
an A
udit
Rep
ort
mai
ntai
ned
Impl
emen
t man
agem
ent r
epre
sent
atio
n m
easu
res
for a
ll pr
oces
ses
Annu
ally
Don
e; re
com
men
datio
ns fr
om 2
008’
09 fi
nanc
ial y
ear
audi
t fin
ding
s im
plem
ente
d; 2
009’
10 a
udit
repo
rt av
aila
ble
in J
uly
2010
Man
age
the
budg
et
effe
ctiv
ely
% b
udge
t var
ianc
eM
onito
ring
actu
al e
xpen
ditu
re a
gain
st
budg
et5%
3% (n
ot a
udite
d) u
nder
- spe
ndin
g re
cord
ed a
t 31
Mar
ch
2010
Con
duct
qua
rterly
bud
get r
evie
w a
gain
st
Dep
artm
enta
l per
form
ance
Don
e m
onth
ly
PROGRAMME PERFORMANCE - SECTION 2

55
SER
VIC
E D
ELIV
ERY
IMPR
OVE
MEN
T PL
AN
S
BR
AN
CH
: CH
IEF
FIN
AN
CIA
L O
FFIC
E
Key
ser
vice
Serv
ice
bene
ficia
ryC
urre
nt s
tand
ard
(200
8’09
)D
esire
d st
anda
rd (2
009’
10)
Prog
ress
as
at 3
1 M
arch
201
0
Expe
nditu
re m
anag
emen
tPa
y cr
edito
rs’
invo
ices
with
in 3
0 da
ys o
f rec
eipt
of
invo
ice
Exte
rnal
an
d in
tern
al
stak
ehol
ders
Qua
ntity
30 d
ays
Qua
ntity
21 d
ays
Qua
lity
<7%
reje
ctio
n du
e to
in
corre
ctly
load
ed b
ank
deta
ils
Qua
lity
<3%
reje
ctio
n du
e to
inco
rrect
ly
load
ed b
ank
deta
ilsN
o re
ject
ions
due
to w
rong
ly c
aptu
red
info
rmat
ion
this
qua
rter
Con
sulta
tion
Rea
ctiv
e: te
leph
one
and
e-m
ail
Con
sulta
tion
Info
rmat
ive:
circ
ular
s, m
emos
, le
tters
, tel
epho
nes
and
e-m
ails
Mem
os o
n S&
T, s
alar
ies
and
IRP5
ce
rtific
ates
circ
ulat
ed d
urin
g th
e qu
arte
r; le
tters
and
con
firm
atio
n of
bal
ance
s se
nt
to v
ario
us D
epar
tmen
ts b
etw
een
July
and
Se
ptem
ber 2
009
Acce
ssM
anua
l and
ele
ctro
nic
Invo
ice
and
boo
k-ou
t reg
iste
rs
Acce
ssIn
tegr
ated
regi
ster
s on
S:D
rive
Inte
grat
ed p
aym
ent r
egis
ters
for s
undr
y an
d or
der p
aym
ents
on
S: D
rive
and
upda
ted
mon
thly
Cou
rtesy
Inco
nsis
tenc
y in
reas
ons
for
dela
yed
paym
ent
Cou
rtesy
Rea
sons
for d
elay
ed p
aym
ent
prov
ided
con
sist
ently
Bran
ch/re
ques
tors
/clie
nts
are
info
rmed
of
the
reas
ons
for d
elay
s.
Ope
n an
d tra
nspa
rent
Rea
ctiv
e: d
elay
s ex
plai
ned
on
enqu
iryO
pen
and
trans
pare
ntPr
oact
ive:
del
ays
expl
aine
d im
med
iate
ly o
n id
entif
icat
ion
Cla
ims/
form
s se
nt b
ack
for c
orre
ctio
n w
ithin
five
day
s of
rece
ipt
Info
rmat
ion
Rem
ittan
ce a
dvic
e/pa
ymen
t st
ubs
Info
rmat
ion
Polic
y an
d pr
oced
ures
, tem
plat
es,
rem
ittan
ce a
dvic
e/pa
ymen
t stu
bsAp
prov
ed p
olic
ies
and
proc
edur
es p
im
plem
ente
d an
d re
gula
rly m
onito
red;
tw
o po
licie
s se
nt to
Acc
ount
ing
Offi
cer t
o ap
prov
e im
plem
enta
tion;
stu
bs fa
xed
to
the
bene
ficia
ry/p
ayee
with
in th
ree
days
of
disb
urse
men
tR
edre
ssC
ompl
aint
s m
ade
in a
n ad
hoc
m
anne
rR
edre
ssEs
tabl
ishe
d co
mpl
aint
s ce
ntre
Indi
vidu
al q
uery
logs
dev
elop
ed a
nd
impl
emen
ted
sinc
e M
ay 2
009
also
se
rvin
g as
com
plai
nts
regi
ster
pen
ding
de
velo
pmen
t of i
nteg
rate
d re
gist
er to
be
man
aged
at t
he C
FO’s
offic
ePa
y cr
edito
rs’
invo
ices
with
in 3
0 da
ys o
f rec
eipt
of
invo
ice
Exte
rnal
an
d in
tern
al
stak
ehol
ders
Valu
e fo
r m
oney
Tim
ely
paym
ents
with
no
fin
ance
cha
rges
Valu
e fo
r m
oney
Tim
ely
paym
ents
with
no
finan
ce
char
ges
All p
aym
ents
effe
cted
on
time
and
no
inte
rest
cha
rged
due
to d
elay
sTi
me
By M
arch
200
9Ti
me
By M
arch
201
0O
n tra
ckC
ost
Non
eC
ost
Rem
uner
atio
n fo
r add
ition
al s
taff
Two
Payr
oll c
ontra
ct p
ositi
ons
adve
rtise
d an
d fil
led
durin
g Ju
ly ‘0
9
PROGRAMME 1

56
Key
ser
vice
Serv
ice
bene
ficia
ryC
urre
nt s
tand
ard
(200
8’09
)D
esire
d st
anda
rd (2
009’
10)
Prog
ress
as
at 3
1 M
arch
201
0
Expe
nditu
re m
anag
emen
tR
econ
cile
pay
men
tsEx
tern
al
and
inte
rnal
st
akeh
olde
rs
Qua
ntity
90%
of p
aym
ents
reco
ncile
dQ
uant
ity10
0% o
f pay
men
ts re
conc
iled
Inte
grat
ed re
gist
er fo
r Jul
y, A
ugus
t and
Se
ptem
ber w
ere
prop
erly
reco
ncile
d an
d re
view
ed.
Qua
lity
Orig
in o
f all
paym
ents
ver
ified
Qua
lity
Paym
ent p
reve
nted
of t
rans
actio
ns
not o
rigin
ated
from
DM
E Ph
ysic
al b
atch
es v
erifi
ed d
aily
aga
inst
tra
nsac
tions
dis
burs
ed d
urin
g th
e qu
arte
rC
onsu
ltatio
nR
eact
ive:
ano
mal
ies
iden
tifie
d up
on e
nqui
ry
Con
sulta
tion
Proa
ctiv
e: d
aily
reco
ncilia
tion
iden
tify
anom
alie
s be
fore
EFT
ef
fect
ed
Tran
sact
ions
dis
burs
ed w
ithou
t di
sbur
sem
ent n
umbe
r dur
ing
Sept
embe
r; lo
gist
ic s
ectio
n pr
ovid
ed w
ith in
form
atio
n to
man
ually
upd
ate
LOG
IS; q
uerie
s lo
gged
an
d fo
llow
-up
done
Acce
ssTi
cked
dis
burs
emen
t lis
tAc
cess
Rec
onci
liatio
n st
atem
ent o
n S:
Driv
eIn
tegr
ated
Reg
iste
rs w
ith re
conc
iliatio
n ar
e on
S: D
rive
and
filed
in h
ard
copy
as
wel
lC
ourte
syR
easo
ns fo
r un-
reco
ncile
d ite
ms
prov
ided
regu
larly
C
ourte
syR
easo
ns fo
r un-
reco
ncile
d ite
ms
prov
ided
dai
ly u
pon
reco
ncilia
tion
Unr
econ
cile
d ite
ms
repo
rted
daily
upo
n id
entif
icat
ion
and
follo
wed
up
with
in th
e m
onth
of i
dent
ifica
tion
O
pen
and
trans
pare
ntR
epor
t on
exce
ptio
ns o
nly
Ope
n an
d tra
nspa
rent
Incl
usiv
e an
d co
mpu
lsor
y re
porti
ngIn
tegr
ated
regi
ster
s in
clus
ive
of a
ll in
voic
es
rece
ived
for p
roce
ssin
g to
geth
er w
ith
turn
arou
nd ti
me
Info
rmat
ion
Dis
burs
emen
t rep
ort
Info
rmat
ion
Dis
burs
emen
t rep
ort a
nd
reco
ncilia
tion
stat
emen
tR
econ
cilia
tion
for d
isbu
rsem
ent d
one
on
inte
grat
ed re
gist
ers
and
repo
rted
mon
thly
Red
ress
Inva
lid tr
ansa
ctio
n id
entif
ied
afte
r dis
burs
emen
t R
edre
ssIn
valid
tran
sact
ions
iden
tifie
d an
d in
terc
epte
d be
fore
fund
s di
sbur
sed
No
inva
lid tr
ansa
ctio
ns p
asse
d du
ring
the
quar
ter
Valu
e fo
r m
oney
Porti
on o
f mon
ey is
re
cove
rabl
eVa
lue
for
mon
eyFu
nds
trans
ferre
d to
val
id
bene
ficia
ries
only
Fund
s tra
nsfe
rred
to v
alid
ben
efic
iarie
s du
ring
the
quar
ter
Tim
e:W
ithin
the
sam
e m
onth
of
paym
ent a
nd o
ngoi
ngTi
me
With
in a
day
of p
aym
ent r
un a
nd
ongo
ing
No
inte
rcep
tion
of fu
nds
to in
valid
be
nefic
iary
nec
essa
ry d
urin
g th
e qu
arte
rC
ost:
Cos
t of i
nves
tigat
ing
fraud
ulen
t ca
ses
Cos
tR
emun
erat
ion
of d
edic
ated
offi
cial
to
impl
emen
t con
trol m
easu
res
Two
cont
ract
pos
ition
s ad
verti
sed
at
Acco
unts
Pay
able
fille
d du
ring
July
200
9
PROGRAMME PERFORMANCE - SECTION 2

57
Key
ser
vice
Serv
ice
bene
ficia
ryC
urre
nt s
tand
ard
(200
8’09
)D
esire
d st
anda
rd (2
009’
10)
Prog
ress
as
at 3
1 M
arch
201
0
FIN
AN
CIA
L PL
AN
NIN
G A
ND
MA
NA
GEM
ENT
AC
CO
UN
TIN
GR
e-fu
ndin
g of
re
habi
litat
ion
(EM
P)
cash
pro
visi
ons
Perm
it/lic
ense
ho
lder
sQ
uant
ityAv
erag
e of
sev
en re
fund
ap
plic
atio
ns p
er m
onth
Qua
ntity
All a
pplic
atio
ns lo
dged
Don
e
Qua
lity
Con
form
s to
gui
delin
es a
nd
refu
nd p
roce
dure
Qua
lity
Red
uctio
n in
que
ries
Don
e
Con
sulta
tion
Liai
se w
ith b
enef
icia
ry
tele
phon
ical
ly w
here
ne
cess
ary
Con
sulta
tion
Liai
se w
ith b
enef
icia
ry te
leph
onic
ally
w
here
nec
essa
ryD
one
Acce
ssO
ffice
s op
en w
eek
days
be
twee
n 7:
30 -
17:0
0Ac
cess
Offi
ces
open
wee
k da
ys b
etw
een
7:30
- 17
:00
Don
e; O
ffice
s op
en u
ntil
16:3
0 an
d cl
ient
fe
edba
ck is
sat
isfa
ctor
yC
ourte
syAd
vice
on
stat
us o
f ref
und
appl
icat
ion
Cou
rtesy
Advi
se o
n st
atus
of r
efun
d ap
plic
atio
n;
issu
e pr
oof o
f pay
men
t
Don
e
Ope
n an
d tra
nspa
rent
Annu
al F
inan
cial
Sta
tem
ents
Ope
n an
d tra
nspa
rent
Annu
al F
inan
cial
Sta
tem
ents
Don
e
Info
rmat
ion
Non
eIn
form
atio
nD
ocum
ent r
efun
d pr
oces
s ca
sh fl
owD
one
Red
ress
Non
eR
edre
ssPr
ovid
e cl
ient
feed
back
for
unfa
vour
able
app
licat
ions
Don
e
Valu
e fo
r m
oney
Non
eVa
lue
for
mon
eyN
one
N/A
Tim
e:Pr
oces
s re
fund
s w
ithin
five
w
orki
ng d
ays
of re
ceip
t Ti
me
Proc
ess
refu
nds
with
in fi
ve w
orki
ng
days
of r
ecei
pt
Aver
age
curre
ntly
sev
en d
ays
mai
nly
due
to s
huttl
ing
docu
men
ts b
etw
een
two
cam
puse
s; s
ituat
ion
expe
cted
to c
hang
e af
ter m
ovem
ent o
f offi
ces
Cos
tM
onth
ly s
alar
y of
sta
ffC
ost
Mon
thly
sal
ary
of s
taff
As p
lann
ed
FIN
AN
CIA
L PL
AN
NIN
G A
ND
MA
NA
GEM
ENT
AC
CO
UN
TIN
GPr
oces
s ca
sh/c
hequ
e fo
r DM
E se
rvic
esAp
plic
ants
(in
form
atio
n,
petro
leum
lic
ence
s, m
inin
g lic
ence
s)
Deb
tors
Qua
ntity
Aver
age
of 7
6 re
ceip
ts p
er
mon
thQ
uant
ityPr
oces
s al
l mon
ies
rece
ived
Don
e
Qua
lity
Syst
em-g
ener
ated
rece
ipts
Qua
lity
Syst
em-g
ener
ated
rece
ipts
Don
eC
onsu
ltatio
nIs
sue
rece
ipt
Con
sulta
tion
Issu
e re
ceip
tD
one
Acce
ssO
ffice
s op
en w
eek
days
be
twee
n 7:
30 -
16:3
0Ac
cess
Offi
ces
open
wee
k da
ys b
etw
een
7:30
- 16
:30
Don
e; c
lose
d du
ring
bank
ing
time
Cou
rtesy
Cou
rtesy
Send
sta
tem
ent o
f bal
ance
s N
ot d
one;
ass
essm
ent d
one
indi
cate
d po
ssib
le c
ostly
exe
rcis
e on
har
dcop
y ba
sis;
co
nsid
erin
g el
ectro
nic
solu
tion
PROGRAMME 1

58
Key
ser
vice
Serv
ice
bene
ficia
ryC
urre
nt s
tand
ard
(200
8’09
)D
esire
d st
anda
rd (2
009’
10)
Prog
ress
as
at 3
1 M
arch
201
0
Proc
ess
cash
/che
que
for D
ME
serv
ices
Appl
ican
ts
(info
rmat
ion,
pe
trole
um
licen
ces,
min
ing
licen
ces)
D
ebto
rs
Ope
n an
d tra
nspa
rent
Annu
al F
inan
cial
Sta
tem
ents
Ope
n an
d tra
nspa
rent
Annu
al F
inan
cial
Sta
tem
ents
Don
e
Info
rmat
ion
Info
rmat
ion
Don
eR
edre
ssN
one
Red
ress
Prov
ide
clie
nt fe
edba
ck fo
r un
favo
urab
le a
pplic
atio
nsD
one
Valu
e fo
r m
oney
Non
eVa
lue
for
mon
eyN
one
Don
e
Tim
eIs
sue
rece
ipt w
ithin
five
m
inut
es o
f cas
h/ch
eque
re
ceip
t
Tim
eIs
sue
rece
ipt w
ithin
five
min
utes
of
cash
/che
que
rece
ipt
Don
e
Cos
tM
onth
ly s
alar
y of
sta
ffC
ost
Mon
thly
sal
ary
of s
taff
As p
er s
tand
ard
SUPP
LY C
HA
IN M
AN
AG
EMEN
TSu
pplie
r man
agem
ent
Serv
ice
prov
ider
sD
ME
user
s
Qua
ntity
Qua
ntity
Qua
lity
Un-
preq
ualif
ied
serv
ice
prov
ider
s re
gist
ered
Qua
lity
Cre
dibl
e/pr
equa
lifie
d se
rvic
e pr
ovid
ers
read
ily a
vaila
ble
per
stra
tegi
c co
mm
odity
Appl
ied
on n
eeds
bas
is fo
r spe
cific
co
mm
oditi
es ie
offi
ce fu
rnitu
re a
nd
com
pute
r equ
ipm
ent;
user
s en
cour
aged
to
enga
ge S
CM
and
BAC
with
nee
d fo
r pre
-qu
alifi
ed s
uppl
iers
C
onsu
ltatio
nAd
hoc
inpu
ts re
ques
t C
onsu
ltatio
nC
omm
oditi
es id
entif
ied
from
pr
ocur
emen
t pla
nsD
one
afte
r vet
ting
supp
lier d
etai
ls fo
llow
ed
by o
peni
ng fo
r sup
plie
r reg
istra
tion;
co
mm
odity
stru
ctur
e to
be
info
rmed
, inter�
alia, b
y cu
rrent
and
his
toric
al p
rocu
rem
ent
plan
sAc
cess
Form
s on
Inte
rnet
, Int
rane
t and
at
Rec
eptio
nAc
cess
Form
s on
Inte
rnet
, Int
rane
t and
at
Rec
eptio
nD
one;
all
data
base
form
s, e
spec
ially
for
supp
lier r
egis
tratio
n, re
adily
ava
ilabl
e in
di
ffere
nt m
ediu
ms
upon
regi
stra
tion;
DM
E 44
0 pu
t on
the
P:D
rive
Cou
rtesy
Use
rs a
nd s
ervi
ce p
rovi
ders
tre
ated
with
resp
ect
Cou
rtesy
Use
rs a
nd s
ervi
ce p
rovi
ders
with
re
spec
tC
usto
mer
car
e an
d m
anag
emen
t sk
ills c
ours
es a
rran
ged
for e
mer
ging
su
perv
isor
s; re
com
men
d to
HR
D
that
gen
eral
sta
ff al
so a
ttend
cou
rse;
em
ergi
ng m
anag
emen
t dev
elop
men
t co
urse
atte
nded
by
Seni
or
Adm
inis
tratio
n O
ffice
rs
PROGRAMME PERFORMANCE - SECTION 2

59
Key
ser
vice
Serv
ice
bene
ficia
ryC
urre
nt s
tand
ard
(200
8’09
)D
esire
d st
anda
rd (2
009’
10)
Prog
ress
as
at 3
1 M
arch
201
0
Ope
n an
d tra
nspa
rent
Adve
rtise
men
t pla
ced
in
new
spap
ers
and
tend
er
bulle
tins
and
on In
tern
et
Ope
n an
d tra
nspa
rent
Adve
rtise
men
t pla
ced
in
new
spap
ers
and
tend
er b
ulle
tins
and
on In
tern
et
His
toric
ally
adv
erts
pla
ced
in a
ll m
entio
ned
and
nece
ssar
y m
ediu
ms
for t
rans
pare
ncy;
go
ing
forw
ard,
we
will
impr
ove
whe
re
chan
ge is
nee
ded
Supp
lier m
anag
emen
tSe
rvic
e pr
ovid
ers
DM
E us
ers
Info
rmat
ion
Inco
nsis
tent
feed
back
giv
en
Info
rmat
ion
Stru
ctur
ed te
mpl
ate
for f
eedb
ack
to
user
s an
d se
rvic
e pr
ovid
ers
Com
preh
ensi
ve p
roce
ss p
endi
ng o
f vet
ting
supp
lier’s
det
ails
on
our d
atab
ase
to v
erify
in
form
atio
n fro
m s
uppl
iers
of, inter�a
lia,
corre
ct b
usin
ess
addr
esse
s an
d te
leph
one
num
bers
R
edre
ssU
nava
ilabi
lity
of s
ervi
ce
prov
ider
s an
d de
laye
d pa
ymen
ts d
ue to
ver
ifica
tion
proc
ess
Red
ress
Vette
d su
pplie
r ava
ilabl
eSu
bmis
sion
dra
fted
for t
ablin
g at
BAC
to
ope
n bi
d fo
r ser
vice
pro
vide
rs to
vet
su
pplie
rs
Valu
e fo
r m
oney
Lim
ited
supp
liers
to s
ubm
it qu
otes
Valu
e fo
r m
oney
Enou
gh s
uppl
iers
to p
rom
ote
cost
-effe
ctiv
enes
s th
roug
h qu
ote
com
paris
ons
Forth
com
ing
supp
lier r
egis
tratio
n pr
oces
s w
ill en
sure
adv
ertis
emen
ts in
all
med
ium
s,
eg n
ewsp
aper
s an
d In
tern
et, t
o at
tract
en
ough
sup
plie
rs fo
r eac
h re
quire
d co
mm
odity
Tim
eN
o cl
ear t
imef
ram
es s
etTi
me
End
of J
une
2009
Awai
ting
the
appr
oval
of a
ll pr
oces
ses
Cos
tC
ost
SUPP
LY C
HA
IN M
AN
AG
EMEN
TBi
d an
d c
ontra
ct
adm
inis
tratio
nSe
rvic
e pr
ovid
ers
DM
E us
ers
DM
E m
anag
emen
tN
atio
nal
Trea
sury
Qua
ntity
Qua
ntity
Qua
lity
Ambi
guou
s To
R/s
pecs
are
so
met
imes
adv
ertis
edQ
ualit
yC
orre
ct b
id in
form
atio
n ad
verti
sed
All T
oR a
ppro
ved
by D
eman
d M
anag
emen
t gu
idel
ines
Con
sulta
tion
Rea
ctiv
e w
ith b
id
adve
rtise
men
tsC
onsu
ltatio
nBe
tter c
onsu
ltatio
n th
roug
h BS
CU
sers
adv
ised
acc
ordi
ngly
thro
ugh
BSC
gu
idel
ines
to a
void
poo
r pla
nnin
g Ac
cess
Bid
adve
rtise
men
ts a
nd
docu
men
ts a
vaila
ble
on
Inte
rnet
and
in T
ende
r Bul
letin
Acce
ssBi
d ad
verti
sem
ents
and
doc
umen
ts
avai
labl
e on
Inte
rnet
and
in T
ende
r Bu
lletin
; new
spap
er a
dver
tisem
ent
enco
urag
ed fo
r mor
e te
chni
cal b
ids
Achi
eved
and
ong
oing
Cou
rtesy
Use
rs a
nd s
ervi
ce p
rovi
ders
tre
ated
with
resp
ect
Cou
rtesy
Use
rs a
nd s
ervi
ce p
rovi
ders
trea
ted
with
resp
ect
Batho�Pe
le p
rinci
ples
dis
cuss
ed in
gen
eral
st
aff m
eetin
gs to
edu
cate
em
ploy
ees
to
treat
eve
rybo
dy, e
spec
ially
clie
nts,
with
re
spec
t
PROGRAMME 1

60
Key
ser
vice
Serv
ice
bene
ficia
ryC
urre
nt s
tand
ard
(200
8’09
)D
esire
d st
anda
rd (2
009’
10)
Prog
ress
as
at 3
1 M
arch
201
0
Ope
n an
d tra
nspa
rent
Bid
awar
d ad
verti
sed
in th
e sa
me
med
ia; p
ublic
ope
ning
of
bids
upo
n re
ques
t
Ope
n an
d tra
nspa
rent
Bid
awar
d ad
verti
sed
in th
e sa
me
med
ia; p
ublic
ope
ning
of b
ids
upon
re
ques
t; BE
C/ B
AC C
harte
r mad
e av
aila
ble
to a
ll C
omm
ittee
mem
bers
Achi
eved
, with
exc
eptio
n of
em
erge
ncie
s w
hich
are
a c
halle
nge
due
to th
e sp
lit a
nd
relo
catio
n of
Dep
artm
ent
Info
rmat
ion
Rep
ortin
g as
and
whe
n re
quire
d; B
AC m
embe
rs
train
ed u
pon
appo
intm
ent
Info
rmat
ion
Stru
ctur
ed re
porti
ng in
terv
als;
an
nual
trai
ning
of B
AC m
embe
rs
Rec
ently
app
oint
ed B
AC m
embe
rs
train
ed; t
rain
ing
to b
e re
peat
ed u
pon
re-
appo
intm
ent a
fter t
erm
s ex
pire
Bid
and
con
tract
ad
min
istra
tion
Serv
ice
prov
ider
sD
ME
user
sD
ME
man
agem
ent
Nat
iona
l Tr
easu
ry
Red
ress
Lim
ited
serv
ice
prov
ider
s bi
ddin
g fo
r tec
hnic
al b
ids;
45%
bid
s aw
arde
d to
SM
MEs
;po
or p
roje
ct m
anag
emen
t of
cont
ract
s
Red
ress
Incr
ease
d pa
rtici
patio
n in
tech
nica
l bi
ds a
nd S
MM
E sp
end
to 6
0%;
impl
emen
t con
tract
man
agem
ent
stra
tegy
Impl
emen
tatio
n on
goin
g in
term
s of
SM
ME
spen
d; la
ck o
f res
ourc
es to
impl
emen
t st
rate
gy c
ompr
ehen
sive
ly re
mai
ns;
reso
lutio
n de
pend
ed o
n ap
prov
al o
f st
ruct
ure
Valu
e fo
r m
oney
Lim
ited
supp
liers
to b
id
Valu
e fo
r m
oney
Enou
gh s
uppl
iers
to p
rom
ote
cost
-effe
ctiv
enes
s th
roug
h bi
d co
mpa
rison
s
Ope
n bi
ddin
g is
pro
mot
ed
Tim
eTw
o m
onth
s fro
m b
id c
losu
reTi
me
Six
wee
ks fr
om b
id c
losu
reAs
at 3
1 Ap
ril 2
009
bids
aw
arde
d in
tim
e,
with
no
laps
ed b
ids
Cos
tC
ost
SUPP
LY C
HA
IN M
AN
AG
EMEN
TLo
gist
ics
man
agem
ent:
Prom
pts
deliv
ery
of
good
s an
d se
rvic
e
Serv
ice
prov
ider
sD
ME
user
s
Qua
ntity
Qua
ntity
Qua
lity
Re-
activ
e or
der m
anag
emen
t pr
oces
s an
d no
n- a
dher
ence
to
del
iver
y tim
elin
es fo
r in
vent
ory
item
s
Qua
lity
Ord
ers
expe
dite
d to
ens
ure
prom
pt d
eliv
ery;
stri
ct a
dher
ence
to
turn
arou
nd ti
mes
for d
eliv
ery
of
inve
ntor
y ite
ms
Del
iver
y co
nfirm
ed u
pon
plac
ing
orde
r; re
ceip
t dai
ry m
aint
aine
d at
Tra
nsit
and
supp
liers
cal
led
timeo
usly
for d
eliv
ery;
no
n-de
liver
y ch
alle
nges
with
Gov
ernm
ent
Prin
ter r
emai
ns; m
eetin
g w
ith G
over
nmen
t Pr
inte
r to
addr
ess
the
issu
e on
or b
efor
e 31
Ju
ly 2
009
Con
sulta
tion
Min
imal
con
sulta
tion
with
se
rvic
e pr
ovid
er fo
r del
iver
yC
onsu
ltatio
nC
onst
ant f
ollo
w-u
p on
out
stan
ding
or
ders
Reg
ular
follo
w-u
p tim
eous
ly o
n ou
tsta
ndin
g or
ders
Acce
ssN
o cl
early
def
ined
con
tact
ce
ntre
sAc
cess
Cle
arly
def
ined
con
tact
cen
tres
for
user
s an
d se
rvic
e pr
ovid
esTh
is p
roce
ss is
aw
aitin
g th
e ap
prov
ed
stru
ctur
e.C
ourte
syAt
tend
to q
uerie
s up
on re
ques
tC
ourte
syAd
here
to p
resc
ripts
to a
void
que
ries
Que
ries
avoi
ded
by a
dher
ing
to
Dep
artm
enta
l and
Nat
iona
l Tre
asur
y pr
escr
ipts
; que
ries
atte
nded
to u
pon
requ
est a
nd re
leva
nt a
ssis
tant
pro
vide
d
PROGRAMME PERFORMANCE - SECTION 2

61
Key
ser
vice
Serv
ice
bene
ficia
ryC
urre
nt s
tand
ard
(200
8’09
)D
esire
d st
anda
rd (2
009’
10)
Prog
ress
as
at 3
1 M
arch
201
0
Ope
n an
d tra
nspa
rent
Use
rs u
naw
are
of th
e tu
rnar
ound
tim
esO
pen
and
trans
pare
ntTu
rnar
ound
tim
es p
ublis
hed;
in
vent
ory
item
s pu
blis
hed
Awai
ting
final
isat
ion
of p
roce
ss fl
ow b
y Pr
iceW
ater
Hou
seC
oope
rs; i
n th
e in
terim
us
ers
advi
sed
of tu
rnar
ound
tim
es.
Info
rmat
ion
Insu
ffici
ent d
escr
iptio
n on
or
ders
Info
rmat
ion
Des
crip
tion
on o
rder
s lin
ked
to
quot
atio
nIte
m d
escr
iptio
ns in
LO
GIS
sys
tem
re
view
ed a
nd s
tand
ardi
sed
for A
sset
s- a
nd
IT-r
elat
ed it
ems
Logi
stic
s m
anag
emen
t:Pr
ompt
s de
liver
y of
go
ods
and
serv
ice
Serv
ice
prov
ider
sD
ME
user
s
Red
ress
Late
del
iver
yR
edre
ssD
eliv
ery
acco
rdin
g to
agr
eed
lead
-tim
eD
edic
ated
exp
editi
ng te
am in
pla
ce to
en
sure
del
iver
y on
agr
eed
lead
tim
es;
in c
ases
of s
uppl
ier i
nabi
lity
to d
eliv
er,
supp
lier a
sked
for w
ritte
n co
nfirm
atio
n to
Dep
artm
ent;
subs
eque
ntly
ord
ers
are
clos
ed a
nd s
uppl
ier i
nfor
med
in w
ritin
g an
d em
ail i
s se
nt to
use
rVa
lue
for
mon
eyU
nava
ilabi
lity
of g
oods
an
d se
rvic
es is
dec
reas
ing
prod
uctiv
ity
Valu
e fo
r m
oney
Incr
ease
d pr
oduc
tivity
Hig
hly
utilis
ed in
-sto
re it
ems
iden
tifie
d;
subs
eque
nt a
ctio
n pl
an e
ntai
ling
rem
edie
s an
d co
ntro
ls to
min
imis
e st
ock
unav
aila
bilit
y dr
afte
d an
d aw
aitin
g ap
prov
al
Tim
eTh
roug
hout
200
8’09
fina
ncia
l ye
arTi
me
Thro
ugho
ut 2
009’
10 fi
nanc
ial y
ear
Dur
ing
2009
’10
finan
cial
yea
r
Cos
tC
ost:
INFO
RM
ATIO
N T
ECH
NO
LOG
YN
etw
ork
optim
isat
ion
Exte
rnal
an
d in
tern
al
stak
ehol
ders
Qua
ntity
50%
upt
ime
Qua
ntity
95%
upt
ime
Qua
lity
Slow
resp
onse
tim
eQ
ualit
yBa
ndw
idth
man
agem
ent
Impl
emen
ted
qual
ity o
f ser
vice
(QoS
) on
dat
a lin
e to
Hea
d of
fice
and
initi
ated
up
grad
e of
regi
onal
offi
ces’
dat
a lin
es to
im
prov
e pe
rform
ance
Con
sulta
tion
Uns
truct
ured
Con
sulta
tion
Liai
se w
ith C
hang
e C
ontro
l and
W
ebsi
te C
omm
ittee
sC
hang
e C
ontro
l for
um a
ttend
ance
in p
lace
Acce
ssAd
hoc
Acce
ss24
/7 a
cces
sibi
lity
Neg
otia
tions
of m
anag
ed s
ervi
ces
SLA
in
prog
ress
; im
plem
enta
tion
in n
ext f
inan
cial
ye
ar d
ue to
bud
get c
onst
rain
ts; i
nter
im p
lan
to a
ddre
ss 2
4/7
initi
ated
with
reso
urce
s on
st
andb
y da
ily fo
r ren
derin
g se
rvic
es
PROGRAMME 1

62
Key
ser
vice
Serv
ice
bene
ficia
ryC
urre
nt s
tand
ard
(200
8’09
)D
esire
d st
anda
rd (2
009’
10)
Prog
ress
as
at 3
1 M
arch
201
0
Cou
rtesy
Ad h
ocC
ourte
syAd
vise
on
stat
us w
ith d
edic
ated
re
sour
ceSe
rvic
e D
esk
proc
edur
e or
pro
cess
fo
rmal
ised
and
to b
e im
plem
ente
dO
pen
and
trans
pare
ntC
omm
unic
ate
high
light
ed
issu
esO
pen
and
trans
pare
ntPr
ovid
e pe
rform
ance
sta
tistic
sIn
frast
ruct
ure
perfo
rman
ce s
tatis
tics
avai
labl
e th
roug
h Ey
e of
the
Stor
mIn
form
atio
nC
omm
unic
ate
polic
ies
and
proc
edur
esIn
form
atio
nIn
form
ativ
e co
mm
uniq
uéR
evie
wed
pol
icie
s ta
bled
for a
ppro
val a
nd
all a
ppro
ved
polic
ies
publ
ishe
d on
Intra
net
Red
ress
Non
eR
edre
ssEs
tabl
ish
serv
ice
eval
uatio
n an
alys
isC
usto
mer
sur
vey
desi
gned
for s
ubm
issi
on
to id
entif
ied
key
user
sVa
lue
for
mon
eyN
one
Valu
e fo
r m
oney
With
in b
udge
tBu
dget
exc
eede
d du
e to
unf
ores
een
Dep
artm
enta
l spl
it ex
pend
iture
and
ac
quis
ition
of u
npla
nned
har
dwar
eN
etw
ork
optim
isat
ion
Exte
rnal
an
d in
tern
al
stak
ehol
ders
Tim
e20
08’0
9 fin
anci
al y
ear
Tim
e20
009’
10 fi
nanc
ial y
ear
Cos
tW
ithin
bud
get
Cos
tN
egot
iate
cos
t red
uctio
nC
ablin
g do
ne in
-hou
se; s
avin
g of
abo
ut
R30
0k p
er re
gion
al o
ffice
SYST
EMS
DEV
ELO
PMEN
T A
ND
MA
INTE
NA
NC
EN
atio
nal M
inin
g Pr
omot
ions
Sys
tem
(N
MPS
)
Exte
rnal
an
d in
tern
al
stak
ehol
ders
Qua
ntity
1Q
uant
ity1
Qua
lity
• Al
l lic
ence
type
s cu
rrent
ly
issu
ed b
y th
e sy
stem
•
Som
e m
odul
es to
be
adde
d
Qua
lity
•Al
l lic
ence
type
s cu
rrent
ly is
sued
by
the
syst
em•
Few
er m
odul
es to
be
adde
d
•D
one
•ED
SS, S
IAT
test
ed, a
ppea
ls b
eing
te
sted
now
C
onsu
ltatio
nC
hang
e co
ntro
l hel
d on
m
onth
ly b
asis
for a
ll re
ques
ted
enha
ncem
ents
Con
sulta
tion
Cha
nge
cont
rol h
eld
on
mon
thly
bas
is fo
r all
requ
este
d en
hanc
emen
ts
Don
e
Acce
ssEl
ectro
nic
acce
ss p
rovi
ded
user
cod
e an
d pa
ssw
ord
give
nAc
cess
Elec
troni
c ac
cess
pro
vide
d us
er
code
and
pas
swor
d gi
ven
Don
e
Cou
rtesy
Cha
nge
cont
rol h
eld
on
mon
thly
bas
is fo
r all
requ
este
d en
hanc
emen
ts
Cou
rtesy
Cha
nge
cont
rol h
eld
on
mon
thly
bas
is fo
r all
requ
este
d en
hanc
emen
ts
Don
e
Ope
n an
d tra
nspa
rent
Syst
em a
udite
d fro
m ti
me
to
time
and
AG re
port
issu
edO
pen
and
trans
pare
ntSy
stem
aud
ited
from
tim
e to
tim
e an
d AG
repo
rt is
sued
Don
e
Info
rmat
ion
Que
ries
and
repo
rts a
vaila
ble
from
the
syst
emIn
form
atio
nQ
uerie
s an
d re
ports
ava
ilabl
e fro
m
the
syst
emD
one
Red
ress
Con
tinuo
us c
hang
e co
ntro
l of
requ
este
d en
hanc
emen
ts d
one
with
GIS
CO
E as
sist
ance
Red
ress
Esta
blis
hed
com
plai
nts
cent
reIn
pro
gres
s
PROGRAMME PERFORMANCE - SECTION 2
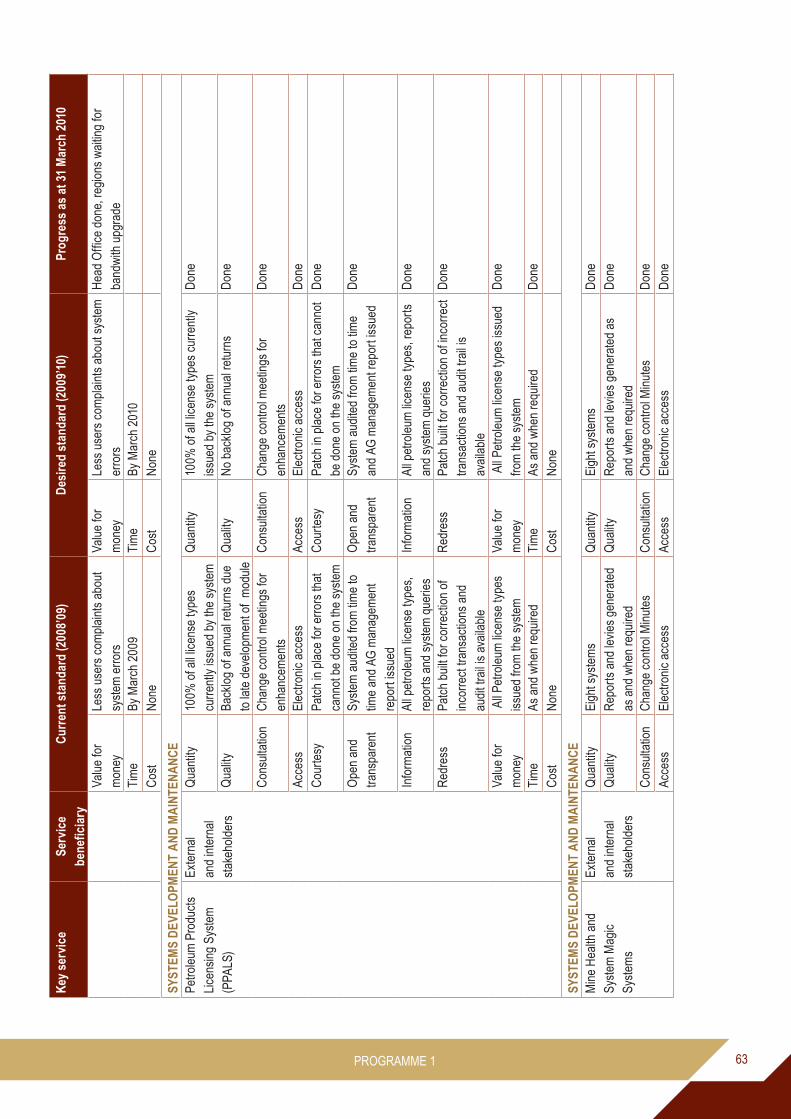
63
Key
ser
vice
Serv
ice
bene
ficia
ryC
urre
nt s
tand
ard
(200
8’09
)D
esire
d st
anda
rd (2
009’
10)
Prog
ress
as
at 3
1 M
arch
201
0
Valu
e fo
r m
oney
Less
use
rs c
ompl
aint
s ab
out
syst
em e
rrors
Valu
e fo
r m
oney
Less
use
rs c
ompl
aint
s ab
out s
yste
m
erro
rsH
ead
Offi
ce d
one,
regi
ons
wai
ting
for
band
with
upg
rade
Tim
eBy
Mar
ch 2
009
Tim
eBy
Mar
ch 2
010
Cos
tN
one
Cos
tN
one
SYST
EMS
DEV
ELO
PMEN
T A
ND
MA
INTE
NA
NC
EPe
trole
um P
rodu
cts
Lice
nsin
g Sy
stem
(P
PALS
)
Exte
rnal
an
d in
tern
al
stak
ehol
ders
Qua
ntity
100%
of a
ll lic
ense
type
s cu
rrent
ly is
sued
by
the
syst
emQ
uant
ity10
0% o
f all
licen
se ty
pes
curre
ntly
is
sued
by
the
syst
emD
one
Qua
lity
Back
log
of a
nnua
l ret
urns
due
to
late
dev
elop
men
t of
mod
ule
Qua
lity
No
back
log
of a
nnua
l ret
urns
D
one
Con
sulta
tion
Cha
nge
cont
rol m
eetin
gs fo
r en
hanc
emen
ts
Con
sulta
tion
Cha
nge
cont
rol m
eetin
gs fo
r en
hanc
emen
ts
Don
e
Acce
ssEl
ectro
nic
acce
ssAc
cess
Elec
troni
c ac
cess
Don
eC
ourte
syPa
tch
in p
lace
for e
rrors
that
ca
nnot
be
done
on
the
syst
em
Cou
rtesy
Patc
h in
pla
ce fo
r erro
rs th
at c
anno
t be
don
e on
the
syst
emD
one
Ope
n an
d tra
nspa
rent
Syst
em a
udite
d fro
m ti
me
to
time
and
AG m
anag
emen
t re
port
issu
ed
Ope
n an
d tra
nspa
rent
Syst
em a
udite
d fro
m ti
me
to ti
me
and
AG m
anag
emen
t rep
ort i
ssue
d D
one
Info
rmat
ion
All p
etro
leum
lice
nse
type
s,
repo
rts a
nd s
yste
m q
uerie
sIn
form
atio
nAl
l pet
role
um li
cens
e ty
pes,
repo
rts
and
syst
em q
uerie
sD
one
Red
ress
Patc
h bu
ilt fo
r cor
rect
ion
of
inco
rrect
tran
sact
ions
and
au
dit t
rail
is a
vaila
ble
Red
ress
Patc
h bu
ilt fo
r cor
rect
ion
of in
corre
ct
trans
actio
ns a
nd a
udit
trail
is
avai
labl
e
Don
e
Valu
e fo
r m
oney
All
Petro
leum
lice
nse
type
s is
sued
from
the
syst
em
Valu
e fo
r m
oney
All
Petro
leum
lice
nse
type
s is
sued
fro
m th
e sy
stem
D
one
Tim
eAs
and
whe
n re
quire
dTi
me
As a
nd w
hen
requ
ired
Don
eC
ost
Non
e C
ost
Non
e
SYST
EMS
DEV
ELO
PMEN
T A
ND
MA
INTE
NA
NC
EM
ine
Hea
lth a
nd
Syst
em M
agic
Sy
stem
s
Exte
rnal
an
d in
tern
al
stak
ehol
ders
Qua
ntity
Eigh
t sys
tem
s Q
uant
ityEi
ght s
yste
ms
Don
e Q
ualit
yR
epor
ts a
nd le
vies
gen
erat
ed
as a
nd w
hen
requ
ired
Qua
lity
Rep
orts
and
levi
es g
ener
ated
as
and
whe
n re
quire
d D
one
Con
sulta
tion
Cha
nge
cont
rol M
inut
esC
onsu
ltatio
nC
hang
e co
ntro
l Min
utes
Don
e Ac
cess
Elec
troni
c ac
cess
Acce
ssEl
ectro
nic
acce
ssD
one
PROGRAMME 1

64
Key
ser
vice
Serv
ice
bene
ficia
ryC
urre
nt s
tand
ard
(200
8’09
)D
esire
d st
anda
rd (2
009’
10)
Prog
ress
as
at 3
1 M
arch
201
0
Cou
rtesy
Enha
ncem
ents
pro
cess
ed
thro
ugh
chan
ge c
ontro
lC
ourte
syEn
hanc
emen
ts p
roce
ssed
thro
ugh
chan
ge c
ontro
l D
one
Ope
n an
d tra
nspa
rent
Rep
orts
and
que
ries
from
the
syst
emO
pen
and
trans
pare
ntR
epor
ts a
nd q
uerie
s fro
m th
e sy
stem
Don
e
Info
rmat
ion
Dat
a an
d re
ports
Info
rmat
ion
Dat
a an
d re
ports
Don
e M
ine
Hea
lth a
nd
Syst
em M
agic
Sy
stem
s
Exte
rnal
an
d in
tern
al
stak
ehol
ders
Red
ress
Poor
resp
onse
tim
es a
s a
resu
lt of
IT in
frast
ruct
ure
Red
ress
Poor
resp
onse
tim
es a
s a
resu
lt of
IT
infra
stru
ctur
eD
one
at H
ead
Offi
ce, w
aitin
g fo
r ban
dwith
up
grad
e in
the
regi
ons
Valu
e fo
r m
oney
Que
ries,
repo
rts a
nd le
vies
ge
nera
ted
from
the
syst
emVa
lue
for
mon
eyQ
uerie
s, re
ports
and
levi
es
gene
rate
d fro
m th
e sy
stem
Don
e
Tim
eAs
and
whe
n re
quire
dTi
me
As a
nd w
hen
requ
ired
Don
e C
ost
Non
eC
ost
Non
e
TRA
NSP
OR
T, F
AC
ILIT
IES
AN
D R
ECO
RD
S M
AN
AG
EMEN
TAp
plic
atio
ns fo
r ac
cess
to in
form
atio
nEx
tern
al
and
inte
rnal
st
akeh
olde
rs
Qua
ntity
70Q
uant
ity70
Don
eQ
ualit
yFi
les
open
ed a
nd d
eliv
ered
to
Dep
uty
Info
rmat
ion
Offi
cers
(D
IOs)
Qua
lity
File
s o
pene
d a
nd d
eliv
ered
to
Dep
uty
Info
rmat
ion
Offi
cers
(DIO
s)O
ngoi
ng;1
75 fi
les
open
ed a
nd fo
rwar
ded
to D
IOs
22 fi
les
wer
e re
turn
ed fo
r filli
ngC
onsu
ltatio
nLi
aise
with
line
func
tions
and
th
e pu
blic
Con
sulta
tion
Liai
se w
ith li
ne fu
nctio
ns a
nd th
e pu
blic
Ong
oing
Acce
ssIn
trane
t and
tele
phon
eAc
cess
Elec
troni
c ac
cess
Ong
oing
; for
ms
avai
labl
e on
Intra
net;
tele
phon
e re
ques
ts re
ceiv
ed re
gula
rly
Cou
rtesy
Rea
son
for d
elay
is p
rovi
ded
inco
nsis
tent
lyC
ourte
syR
easo
n fo
r del
ay to
be
prov
ided
co
nsis
tent
ly a
nd re
gula
rlyO
ngoi
ng. A
ll de
laye
d ap
plic
atio
ns a
re
forw
arde
d to
lega
l ser
vice
s to
ens
ure
timeo
us re
spon
se
Ope
n an
d tra
nspa
rent
Mon
thly
repo
rts p
rovi
ded
Ope
n an
d tra
nspa
rent
Mon
thly
repo
rts a
nd s
tatis
tics
to b
e pr
ovid
edD
one
Info
rmat
ion
Rep
orts
and
sta
tistic
sIn
form
atio
nR
epor
ts a
nd s
tatis
tics
Don
eR
edre
ssD
elay
in re
spon
se to
the
publ
icR
edre
ssPr
ompt
feed
back
Ong
oing
; all
dela
yed
appl
icat
ions
fo
rwar
ded
to le
gal s
ervi
ces
to e
nsur
e tim
eous
resp
onse
Valu
e fo
r m
oney
Less
com
plai
nts
from
line
fu
nctio
ns a
nd th
e pu
blic
Valu
e fo
r m
oney
Min
imis
e co
mpl
aint
s fro
m th
e pu
blic
Ong
oing
; eng
agem
ent w
ith le
gal s
ervi
ces
to id
entif
y be
tter a
nd ti
meo
us re
spon
ses
to
fast
trac
k re
spon
se ti
mes
Tim
eW
ithin
30
days
Tim
eW
ithin
30
days
Don
eC
ost
Cos
t
PROGRAMME PERFORMANCE - SECTION 2
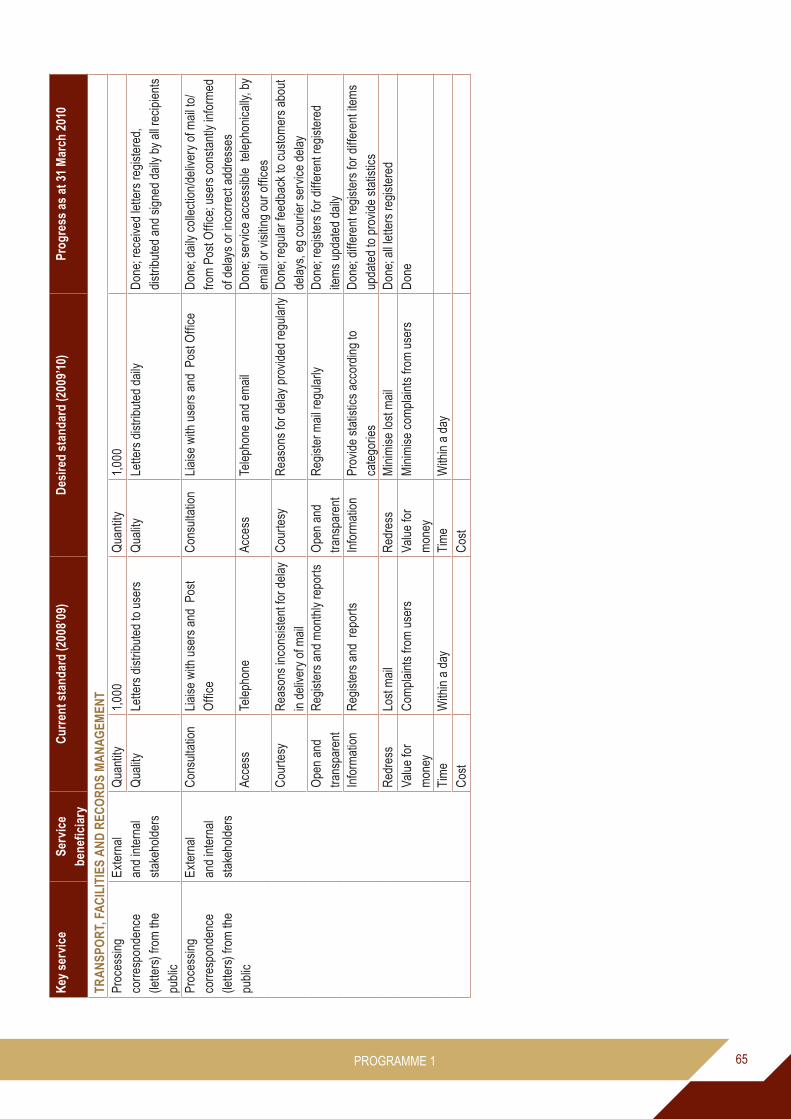
65
Key
ser
vice
Serv
ice
bene
ficia
ryC
urre
nt s
tand
ard
(200
8’09
)D
esire
d st
anda
rd (2
009’
10)
Prog
ress
as
at 3
1 M
arch
201
0
TRA
NSP
OR
T, F
AC
ILIT
IES
AN
D R
ECO
RD
S M
AN
AG
EMEN
TPr
oces
sing
co
rresp
onde
nce
(lette
rs) f
rom
the
publ
ic
Exte
rnal
an
d in
tern
al
stak
ehol
ders
Qua
ntity
1,00
0Q
uant
ity1,
000
Qua
lity
Lette
rs d
istri
bute
d to
use
rsQ
ualit
yLe
tters
dis
tribu
ted
daily
Don
e; re
ceiv
ed le
tters
regi
ster
ed,
dist
ribut
ed a
nd s
igne
d da
ily b
y al
l rec
ipie
nts
Proc
essi
ng
corre
spon
denc
e (le
tters
) fro
m th
e pu
blic
Exte
rnal
an
d in
tern
al
stak
ehol
ders
Con
sulta
tion
Liai
se w
ith u
sers
and
Pos
t O
ffice
Con
sulta
tion
Liai
se w
ith u
sers
and
Pos
t Offi
ceD
one;
dai
ly c
olle
ctio
n/de
liver
y of
mai
l to/
from
Pos
t Offi
ce; u
sers
con
stan
tly in
form
ed
of d
elay
s or
inco
rrect
add
ress
esAc
cess
Tele
phon
eAc
cess
Tele
phon
e an
d em
ail
Don
e; s
ervi
ce a
cces
sibl
e te
leph
onic
ally,
by
emai
l or v
isiti
ng o
ur o
ffice
sC
ourte
syR
easo
ns in
cons
iste
nt fo
r del
ay
in d
eliv
ery
of m
ail
Cou
rtesy
Rea
sons
for d
elay
pro
vide
d re
gula
rlyD
one;
regu
lar f
eedb
ack
to c
usto
mer
s ab
out
dela
ys, e
g co
urie
r ser
vice
del
ayO
pen
and
trans
pare
ntR
egis
ters
and
mon
thly
repo
rtsO
pen
and
trans
pare
ntR
egis
ter m
ail r
egul
arly
Don
e; re
gist
ers
for d
iffer
ent r
egis
tere
d ite
ms
upda
ted
daily
Info
rmat
ion
Reg
iste
rs a
nd r
epor
tsIn
form
atio
nPr
ovid
e st
atis
tics
acco
rdin
g to
ca
tego
ries
Don
e; d
iffer
ent r
egis
ters
for d
iffer
ent i
tem
s up
date
d to
pro
vide
sta
tistic
sR
edre
ssLo
st m
ail
Red
ress
Min
imis
e lo
st m
ail
Don
e; a
ll le
tters
regi
ster
ed
Valu
e fo
r m
oney
Com
plai
nts
from
use
rsVa
lue
for
mon
eyM
inim
ise
com
plai
nts
from
use
rsD
one
Tim
eW
ithin
a d
ayTi
me
With
in a
day
Cos
tC
ost
PROGRAMME 1

66
PROGRAMME 2: PROMOTION OF MINE HEALTH AND SAFETY
Purpose: To execute the Department’s statutory mandate to safeguard the health and safety of the mine employees and people affected by mining activities.
Measurable objective: Reduce mining-related deaths, injuries and ill-health through the formulation of national policy and legislation, the provision of advice and application of systems that monitor, audit and enforce compliance in the mining sector.
SERVICE DELIVERY
Staffing
The establishment of the Mine Health and Safety Inspectorate (MHSI) provides for 316 posts of which 278 are currently filled and 38 are vacant.
The demographics of the Inspectorate as at 31 March 2010 consisted of:
Gender African White Asian Coloured Total
Male 113 66 1 1 181
Female 76 18 0 3 97
Human�Resource�Development
During the reporting period, the Inspectorate continued to develop the skills and knowledge base of its staff members as follows:
• 99 officials attended IRCA training• 97 officials attended WITS training, and• 26 staff members attended other administrative and technical courses.
The Inspectorate appointed 19 Engineering Learner Inspectors on 1 August 2007 on a two-year training contract which ended post-yearend on 31 July 2010. They comprise four females and 15 male learner inspectors and were placed for mine experiential training at Goldfields Business and Leadership Academy (GFBLA). Seven Learner inspectors were placed in the electrical engineering discipline and 12 Learner Inspectors in Mechanical Engineering.
All 19 Engineering Learner Inspectors completed their respective mine experiential training post-yearend and are now placed for Inspector training within the regional offices of the Inspectorate. They were offered a four-year conditional contract and are required to acquire the Government Certificate of Competency (GCC) within the contract period. Upon successful completion and internal management assessment of candidates, they will be offered permanent employment.
The Inspectorate offered 18 bursaries to students during the reporting period. The group consists of seven female and 11 male students of which one student completed his studies and the remaining 17 are at various stages towards completing their respective qualifications. The students are pursuing the following mining-related qualifications:
• Electrical Engineering (Heavy Current)• Electrical Engineering• Mine Engineering.
PROGRAMME PERFORMANCE - SECTION 2

67
Disaster-type�accidents
Fall of ground accidents still remain the largest accident category and the predominant cause of fatalities, followed by the transportation and machinery categories. During the reporting period, a massive fall of ground accident at a platinum mine in North West claimed the lives of nine mine employees. In the Gauteng Region, four seismic events resulted in the death of eight mine workers, two workers in each individual event.
Small-scale�mining
Since the promulgation of the Minerals and Petroleum Resources Development Act, 28 of 2004, the issuing of mining permits to SMMEs increased dramatically and has stretched the regulatory capacity of the Inspectorate.
As a result, the MHSI conducted more inspections at these types of operations and continued to offer training and assistance to small-scale miners. Most of these operations are concentrated in the diamond sector, and therefore located in the Northern Cape and North West Regions.
HIV/Aids�and�Occupational�Health
The partnership between the Department of Minerals and Energy, Labour and Employers is committed to combating the HIV and AIDS epidemic in the mining industry.
A substantial number of employees opted for voluntary HIV testing during the year under review and the ARV programmes for affected employees are gaining momentum.
TB, the effects of HIV and AIDS and noise induced hearing loss (NIHL) are the main occupational health challenges faced by the mining industry. The large mines have mainly been implementing awareness and wellness programmes to improve the current status. Most of the mines are administering ARV medication to boost the health status of infected workers. The efforts by these mines and levels of success are commendable and all mines are encouraged to develop and implement similar programmes.
Although many challenges to achieve the mine health milestones remain, various initiatives and strategies have been successfully implemented in a number of mines in most of the regions. The initiatives are aimed at ensuring compliance with limits of both noise and silica hazards encountered at mines.
Regional working groups have been formed and maintained by the Inspectorate to support and monitor progress made by the mines to achieve their health milestones.
Service�delivery�achievements
The MHSI strategic plan and achievements during the reporting period are outlined in the Table below. This is an account of progress achieved by the end of the reporting period against the annual targets set for achieving the DME’s strategic objectives.
PROGRAMME 2

68
Stak
ehol
der/C
usto
mer
Mea
sure
s
Obj
ectiv
eM
easu
res
Initi
ativ
esTa
rget
09’1
0Pr
ogre
ss a
sat
31
Mar
ch 2
010
Con
stra
ints
/Rea
son
for u
nder
-per
form
ance
Prom
ote
and
regu
late
m
iner
als
and
ener
gy
sect
ors
% in
crea
se in
leve
l of c
ompl
ianc
e to
hea
lth a
nd s
afet
y re
gula
tions
Annu
al a
naly
sis
and
revi
ew o
f O
ccup
atio
n, H
ealth
and
Saf
ety
(OH
S) a
udits
10%
Not
ach
ieve
dSy
stem
stil
l in
deve
lopm
ent
Impr
ove
turn
arou
nd
times
Res
pons
e da
ysIm
plem
ent d
ocum
ent m
anag
emen
t sy
stem
Five
w
orki
ng
days
Rep
orte
d m
onth
ly
% a
dher
ence
to to
pre
scrib
ed
timef
ram
esSk
illing
of e
mpl
oyee
s an
d pr
ovid
ing
adeq
uate
sys
tem
s10
0%C
ontin
uous
pro
cess
Prov
ide
trans
pare
nt
and
cons
iste
nt
enfo
rcem
ent
Num
ber o
f app
eals
com
plet
edD
evel
op a
nd im
plem
ent p
olic
ies
and
proc
edur
es80
%80
%
% c
ompl
etio
n of
nat
iona
l Min
ing
Hea
lth a
nd S
afet
y (M
HS)
sys
tem
Reg
ular
revi
ew o
f OH
S sy
stem
im
plem
enta
tion
plan
30%
Alig
ned
with
im
plem
enta
tion
plan
Com
mun
icat
e va
lid
and
relia
ble
min
e he
alth
and
saf
ety
info
rmat
ion
% ta
rget
aud
ienc
e re
ache
dIn
con
junc
tion
with
com
mun
icat
ion
stra
tegy
60%
67%
% d
ata
verif
ied
Verif
icat
ion
of re
cord
s su
bmitt
ed b
y m
ines
100%
Don
e m
onth
ly o
n SA
MR
ASS
Num
ber o
f MH
S re
ports
Publ
icat
ion
of M
HS
Annu
al R
epor
t1
Subm
itted
to
Min
iste
rIm
prov
e st
akeh
olde
r en
gage
men
tsN
umbe
r of m
eetin
gs w
ith la
bour
Mee
tings
with
Uni
ons
4D
one
mon
thly
Num
ber o
f mee
tings
with
em
ploy
ers
Mee
tings
with
em
ploy
er
form
atio
ns??
4D
one
mon
thly
Num
ber o
f mee
tings
with
go
vern
men
t dep
artm
ents
Mee
tings
with
DoH
, DoL
, DPP
4D
one
mon
thly
as
plan
ned
Addr
ess
heal
th a
nd
safe
ty ri
sks
in m
inin
g%
aud
its c
ondu
cted
Con
duct
OH
S au
dits
100%
83%
Cap
acity
cha
lleng
es m
itiga
ted
with
recr
uitm
ent a
nd
initi
ativ
es in
clud
ing
burs
arie
s, le
arne
rshi
p pr
ogra
mm
es
and
train
ing
initi
ativ
es o
f exi
stin
g in
spec
tors
; st
anda
rdis
ed p
olic
ies
and
proc
edur
es b
eing
impl
emen
ted
to e
nhan
ce th
e qu
ality
and
exe
cutio
n of
task
s
PROGRAMME PERFORMANCE - SECTION 2

69
Obj
ectiv
eM
easu
res
Initi
ativ
esTa
rget
09’1
0Pr
ogre
ss a
sat
31
Mar
ch 2
010
Con
stra
ints
/Rea
son
for u
nder
-per
form
ance
% in
spec
tions
con
duct
edC
ondu
ct re
gula
r ins
pect
ions
100%
91%
Cap
acity
cha
lleng
es m
itiga
ted
with
recr
uitm
ent a
nd
initi
ativ
es in
clud
ing
burs
arie
s, le
arne
rshi
p pr
ogra
mm
es
and
train
ing
initi
ativ
es o
f exi
stin
g in
spec
tors
; st
anda
rdis
ed p
olic
ies
and
proc
edur
es b
eing
impl
emen
ted
to e
nhan
ce th
e qu
ality
and
exe
cutio
n of
task
s%
inve
stig
atio
ns c
ompl
eted
Con
duct
regu
lar i
nves
tigat
ion
80%
90%
Achi
eved
% o
f inq
uirie
s co
mpl
eted
Con
duct
regu
lar i
nqui
ries
80%
105%
Achi
eved
and
com
plet
ed fr
om p
revi
ous
year
% in
crea
se in
the
com
plia
nce
leve
lsAn
nual
ana
lysi
s an
d re
view
of O
HS
audi
ts10
%In
line
with
act
ion
plan
Follo
w-u
p au
dits
bei
ng p
erfo
rmed
follo
win
g re
leas
e of
Pr
esid
entia
l Aud
it fin
ding
sIn
tern
al p
roce
sses
Obj
ectiv
eM
easu
res
Initi
ativ
esTa
rget
09’1
0Pr
ogre
ss a
sat
31
Mar
ch 2
010
Con
stra
ints
/Rea
son
for u
nder
-pe
rfor
man
ce
Effic
ient
bus
ines
s pr
oces
ses
Dev
elop
men
t of e
nfor
cem
ent
guid
elin
esN
o of
iden
tifie
d gu
idel
ines
dev
elop
edR
evie
w e
xist
ing
guid
elin
es70
%Ac
hiev
edN
o of
gui
delin
es im
plem
ente
dIm
plem
ent e
nfor
cem
ent g
uide
lines
70%
Achi
eved
Impl
emen
t Hea
lth a
nd S
afet
y (H
&S) l
egis
latio
n%
gui
delin
es re
vise
d in
line
with
cur
rent
le
gisl
atio
nId
entif
y gu
idel
ines
that
nee
d to
be
revi
sed
70%
Achi
eved
Impl
emen
t H&S
legi
slat
ion
% re
duct
ion
in n
on-c
ompl
ianc
e (in
tern
al)
Impl
emen
t com
plia
nce
fram
ewor
k20
%N
o m
ajor
non
- com
plia
nce
issu
es re
porte
dBe
nchm
ark
H&S
aga
inst
glo
bal
best
pra
ctic
e%
incr
ease
d H
&S s
tand
ards
Iden
tify
H&S
inte
rnat
iona
l bes
t pra
ctic
e an
d al
ign
with
our
sta
ndar
ds70
%70
% a
chie
ved
Rev
iew
and
dev
elop
pol
icie
s,
proc
edur
es a
nd p
roce
sses
% id
entif
ied
polic
ies
and
proc
edur
es
deve
lope
dC
ondu
ct p
olic
y st
udie
s50
%Ac
hiev
ed
Prov
isio
n of
ade
quat
e re
sour
ces
% a
lignm
ent o
f res
ourc
e op
erat
iona
l ne
eds
Dev
elop
spe
ndin
g pl
ans
in li
ne w
ith s
trate
gy80
%Ac
hiev
ed
Build
acc
ount
abilit
y%
impl
emen
tatio
n of
BSC
Mon
itor i
mpl
emen
tatio
n of
BSC
100%
100%
BSC
prin
cipl
es
impl
emen
ted
Man
age
serv
ice
leve
l ag
reem
ents
(SLA
s) w
ith
prof
essi
onal
bod
ies
% S
LAs
sign
ed w
ith a
gree
d tim
efra
mes
Dev
elop
ToR
for i
nves
tigat
ions
and
rese
arch
co
ntra
cts
100%
Non
e fo
r the
per
iod
% a
dher
ence
to S
LAs
Rev
iew
of i
mpl
emen
ted
SLAs
100%
Achi
eved
Esta
blis
h co
mpl
ianc
e st
anda
rds
% s
tand
ards
est
ablis
hed
Inco
rpor
ate
rese
arch
out
com
es in
to O
HS
regu
latio
ns10
0%
Und
erst
and
stak
ehol
der n
eeds
N
umbe
r of s
take
hold
er s
urve
ys
cond
ucte
d (o
nce
ever
y th
ree
year
s)C
ondu
ct re
gula
r sur
veys
1N
ot y
et p
lann
ed
PROGRAMME 2

70
Obj
ectiv
eM
easu
res
Initi
ativ
esTa
rget
09’1
0Pr
ogre
ss a
sat
31
Mar
ch 2
010
Con
stra
ints
/Rea
son
for u
nder
-pe
rfor
man
ce
Stak
ehol
der a
nd c
usto
mer
rela
tions
hip
man
agem
ent
Educ
ate
and
empo
wer
our
st
akeh
olde
rsN
umbe
r of w
orks
hops
/ inf
orm
atio
n se
ssio
ns h
eld
as id
entif
ied
Con
duct
regu
lar w
orks
hops
42
Reg
ular
con
sulta
tion
and
feed
back
on
OH
SFe
edba
ck/c
onsu
ltatio
n se
ssio
ns h
eld
as
iden
tifie
dAt
tend
Boa
rd m
eetin
gs8
Achi
eved
Driv
e H
&S in
nova
tions
% in
nova
tion
proj
ects
impl
emen
ted
to
impr
ove
busi
ness
pra
ctic
eH
old
regu
lar m
eetin
gs50
%D
one
as re
sear
ch re
sults
ob
tain
edId
entif
y im
plem
enta
tion
chal
leng
esD
eter
min
e a
rese
arch
age
nda
Lear
ning
and
gro
wth
Attra
ct, d
evel
op a
nd re
tain
sk
ills%
redu
ctio
n in
sta
ff tu
rnov
erIm
plem
ent i
nteg
rate
d H
uman
Res
ourc
es p
lan
70%
Mon
itore
d m
onth
ly%
redu
ctio
n in
vac
anci
esIm
plem
ent I
nteg
rate
d H
R P
lan
70%
Achi
eved
% im
plem
enta
tion
of P
DPs
alig
ned
with
D
epar
tmen
tal n
eeds
Im
plem
ent H
RD
pla
n50
%M
onito
red
mon
thly
MH
SI tr
aini
ng a
cade
my
in p
lace
MoU
with
MQ
A20
%M
oU b
eing
revi
ewed
Dev
elop
OH
S M
ISIn
tegr
ated
OH
S M
anag
emen
t Inf
orm
atio
n Sy
stem
(MIS
) in
plac
eR
egul
ar re
view
on
OH
S M
IS im
plem
enta
tion
plan
50%
As p
er im
plem
enta
tion
plan
Impr
ove
lead
ersh
ip a
nd
man
agem
ent c
apab
ilitie
s%
man
ager
s th
at c
ompl
eted
lead
ersh
ip
and
man
agem
ent d
evel
opm
ent c
ours
esEx
tens
ion
of W
ITS
prog
ram
me
70%
Achi
eved
% R
etur
n on
Inve
stm
ent o
n tra
inin
g an
d de
velo
pmen
tIm
plem
ent 3
60˚ s
urve
y to
ol65
%To
ol n
ot y
et d
evel
oped
Driv
e tra
nsfo
rmat
ion
% a
chie
ved
agai
nst D
ME
Empl
oym
ent
Equi
ty (E
E) ta
rget
sIm
plem
ent E
mpl
oym
ent E
quity
Pla
n10
0%M
onito
red
mon
thly
% p
rocu
rem
ent s
pent
on
targ
eted
gro
ups
Info
rm re
quis
ite s
uppl
iers
to re
gist
er o
n da
taba
se50
%M
onito
red
mon
thly
Live
the
core
val
ues
% in
crea
sed
num
ber o
f Batho�Pele
and
Ubu
ntu
Awar
ds n
omin
ees
As p
er C
orpo
rate
Ser
vice
s pl
ans
70%
Four
sta
ff m
embe
rs
rece
ived
Em
ploy
ee o
f the
Ye
ar A
war
dsN
umbe
r of c
ore
valu
e aw
aren
ess
sess
ions
As p
er C
orpo
rate
Ser
vice
s pl
ans
4Ac
hiev
ed o
n m
onth
ly b
asis
% d
ecre
ase
in tr
ansg
ress
ions
of t
he
Cod
e of
Con
duct
As p
er C
orpo
rate
Ser
vice
s pl
ans
5%Ac
hiev
ed
PROGRAMME PERFORMANCE - SECTION 2

71
Obj
ectiv
eM
easu
res
Initi
ativ
esTa
rget
09’1
0Pr
ogre
ss a
sat
31
Mar
ch 2
010
Con
stra
ints
/Rea
son
for u
nder
-pe
rfor
man
ce
Fina
nce
Alig
nmen
t of s
trate
gy w
ith
budg
et%
bud
get a
ligne
d w
ith s
trate
gyD
evel
op s
pend
ing
plan
s in
con
junc
tion
with
fin
ance
100%
Achi
eved
Effe
ctiv
ely
man
age
budg
et%
bud
get v
aria
nce
Mon
itor a
ctua
l exp
endi
ture
aga
inst
bud
get
(spe
ndin
g pl
ans)
5%Ac
hiev
ed
Man
age
cost
s ef
fect
ivel
yR
educ
tion
in c
onfir
med
frui
tless
, was
tefu
l an
d un
auth
oris
ed e
xpen
ditu
re
Atte
nd w
orks
hops
arr
ange
d an
d co
nduc
ted
by
CFO
’s of
fice
100%
Achi
eved
Res
pond
to id
entif
ied
inci
dent
s w
ithin
tim
efra
mes
det
erm
ined
by
CFO
’s of
fice
Impr
ove
reve
nue
colle
ctio
n%
fund
s du
e to
MH
SI c
olle
cted
100%
ver
ifica
tion
of o
pera
ting
min
es fo
r lev
y pu
rpos
es
100%
In p
rogr
ess
Prom
ote
Cor
pora
te
Gov
erna
nce
Com
plia
nce
with
PFM
A an
d Tr
easu
ry
Reg
ulat
ions
Impl
emen
t com
plia
nce
fram
ewor
k10
0%M
onito
red
mon
thly
PROGRAMME 2

72
TABLE 1 Actual fatalities and rates (per million hours worked) per region
2008 2009* Rates
Fatalities Fatality rates Fatalities Fatality rates % change
All mines 171 0.15 167 0.16 6.67
Western Cape 2 0.12 3 0.19 58.33
Northern Cape 6 0.09 4 0.07 -22.22
Free State 18 0.18 21 0.23 27.78
Eastern Cape 0 0 0 0 0.00
KwaZulu Natal 2 0.08 9 0.36 350.00
Mpumalanga 27 0.16 25 0.16 0.00
Limpopo 8 0.09 5 0.05 -44.44
Gauteng 58 0.25 44 0.2 -20.00
North West 50 0.12 56 0.14 16.67
•� Provisional�figures�(*)�because�statistics�may�change�due�to�the�late�reporting�of�accidents�and�subsequent�deaths.•� A�negative�(-)�figure�denotes�a�decrease�in�frequency�rate.
TABLE 2 Actual reportable injuries and rates (per million hours worked) per region
2008 2009* Rates
Injuries Injury rates Injuries Injury rates % change
All mines 3,750 3.34 3672 3.45 3.29
Western Cape 22 1.34 15 0.93 -30.60
Northern Cape 56 0.85 56 0.94 10.59
Free State 472 4.80 400 4.44 -7.50
Eastern Cape 12 2.65 8 2.01 -24.15
Kwazulu Natal 31 1.30 54 2.18 67.69
Mpumalanga 472 2.76 419 2.66 -3.62
Limpopo 188 2.20 202 1.98 -10.00
Gauteng 862 3.78 761 3.52 -6.88
North West 1,635 3.78 1,757 4.47 18.25
•� Provisional�figures�(*)�because�statistics�may�change�due�to�the�late�reporting�of�accidents�and�subsequent�deaths.•� A�negative�(-)�figure�denotes�a�decrease�in�frequency�rate.
PROGRAMME PERFORMANCE - SECTION 2

73
TABLE 3 Actual fatalities and rates (per million hours worked) per commodity
2008 2009* Rates
Fatalities Fatality rate Fatalities Fatality rate % change 2008’09
All mines 171 0.15 167 0.16 6.67
Gold 85 0.25 80 0.24 -4.00
Platinum 36 0.09 41 0.11 22.22
Coal 20 0.15 18 0.12 -20.00
Diamonds 6 0.15 3 0.11 -26.67
Copper 1 0.12 1 0.14 16.67
Chrome 4 0.15 3 0.13 -13.33
Iron ore 2 0.07 3 0.10 42.86
Manganese 0 0.00 1 0.94 94.00
Other 17 0.14 17 0.15 7.14
• Provisional�figures�(*)�because�statistics�may�change�due�to�the�late�reporting�of�accidents�and�subsequent�deaths.• A�negative�(-)�figure�denotes�a�decrease�in�frequency�rate
TABLE 4 Actual reportable injuries and rates (per million hours worked) per commodity
2008 2009* Rates
Injuries Injury rates Injuries Injury rates % change
All mines 3750 3.34 3672 3.45 3.29
Gold 1938 5.65 1756 5.36 5.13
Platinum 1221 2.95 1320 3.55 20.34
Coal 332 2.42 295 1.97 -18.60
Diamonds 35 0.84 46 1.66 97.62
Copper 22 2.51 19 2.59 3.19
Chrome 58 2.12 61 2.58 21.70
Iron ore 12 0.44 15 0.49 11.36
Manganese 16 1.91 11 1.03 -46.07
Other 116 1.23 149 1.30 5.69
• Provisional�figures�(*)�because�statistics�may�change�due�to�the�late�reporting�of�accidents�and�subsequent�deaths.• A�negative�(-)�figure�denotes�a�decrease�in�frequency�rate
PROGRAMME 2

74
TABLE 5 Fatality and injury rates per casualty classification (rates per million hours worked)
Classification 2008 2009 2008 rates 2009 rates % change
1 Fatalities All mines 171 167 0.15 0.16 6.67
Fall of ground 56 64 0.05 0.06 20.00
Machinery 4 8 0.00 0.01 100.00
Transportation and mining 41 47 0.04 0.04 0.00
General 45 32 0.04 0.03 -25.00
Conveyance accidents 13 2 0.01 0.00 100.00
Electricity 5 5 0.00 0.00 0.00
Fires 2 0 0.00 0.00 0.00
Explosives 2 4 0.00 0.00 0.00
Subsidence/caving 0 0 0.00 0.00 0.00
Heat sickness 1 4 0.00 0.00 0.00
Diving sickness 0 0 0.00 0.00 0.00
Miscellaneous 2 1 0.00 0.00 0.00
2 Injuries All mines 3,750 3,672 3.34 3.45 3.29
Fall of ground 779 833 0.69 0.78 13.04
Machinery 192 301 0.17 0.28 64.71
Transportation and mining 729 694 0.65 0.65 0.00
General 1,868 1,617 1.66 1.52 -8.43
Conveyance accidents 24 19 0.02 0.02 0.00
Electricity 31 20 0.03 0.02 -33.33
Fires 3 5 0.00 0.00 0.00
Explosives 39 37 0.03 0.03 0.00
Subsidence/caving 2 0 0.00 0.00 0.00
Occupational diseases 1 1 0.00 0.00 0.00
Heat sickness 27 74 0.02 0.07 250.00
Diving sickness 0 1 0.00 0.00 0.00
Miscellaneous 55 70 0.05 0.07 40.00
•� Provisional�figures�(*)�because�statistics�may�change�due�to�the�late�reporting�of�accidents�and�subsequent�deaths.•� A�negative�(-)�figure�denotes�a�decrease�in�frequency�rate.
PROGRAMME PERFORMANCE - SECTION 2
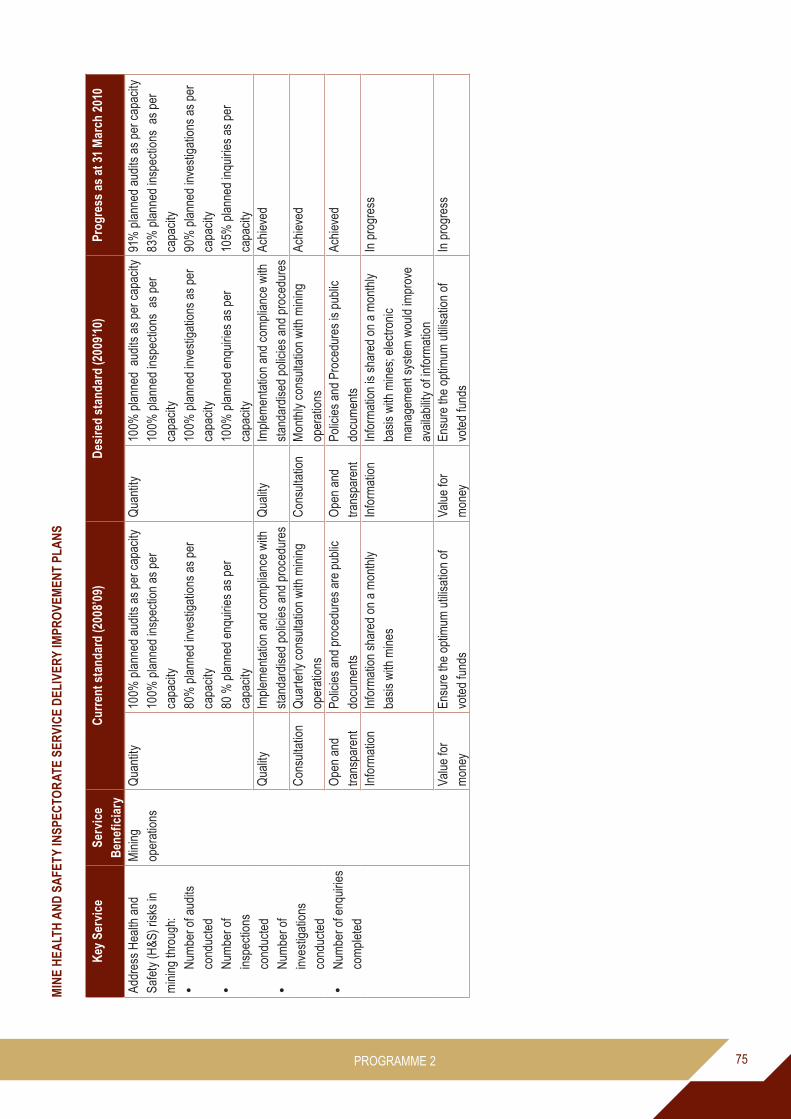
75
MIN
E H
EALT
H A
ND
SA
FETY
INSP
ECTO
RAT
E SE
RVI
CE
DEL
IVER
Y IM
PRO
VEM
ENT
PLA
NS
Key
Ser
vice
Serv
ice
Ben
efic
iary
Cur
rent
sta
ndar
d (2
008’
09)
Des
ired
stan
dard
(200
9’10
)Pr
ogre
ss a
s at
31
Mar
ch 2
010
Addr
ess
Hea
lth a
nd
Safe
ty (H
&S) r
isks
in
min
ing
thro
ugh:
•N
umbe
r of a
udits
co
nduc
ted
•N
umbe
r of
insp
ectio
ns
cond
ucte
d•
Num
ber o
f in
vest
igat
ions
co
nduc
ted
•N
umbe
r of e
nqui
ries
com
plet
ed
Min
ing
oper
atio
nsQ
uant
ity10
0% p
lann
ed a
udits
as
per c
apac
ity10
0% p
lann
ed in
spec
tion
as p
er
capa
city
80%
pla
nned
inve
stig
atio
ns a
s pe
r ca
paci
ty80
% p
lann
ed e
nqui
ries
as p
er
capa
city
Qua
ntity
100%
pla
nned
aud
its a
s pe
r cap
acity
100%
pla
nned
insp
ectio
ns a
s pe
r ca
paci
ty10
0% p
lann
ed in
vest
igat
ions
as
per
capa
city
100%
pla
nned
enq
uirie
s as
per
ca
paci
ty
91%
pla
nned
aud
its a
s pe
r cap
acity
83%
pla
nned
insp
ectio
ns a
s pe
r ca
paci
ty90
% p
lann
ed in
vest
igat
ions
as
per
capa
city
105%
pla
nned
inqu
iries
as
per
capa
city
Qua
lity
Impl
emen
tatio
n an
d co
mpl
ianc
e w
ith
stan
dard
ised
pol
icie
s an
d pr
oced
ures
Q
ualit
yIm
plem
enta
tion
and
com
plia
nce
with
st
anda
rdis
ed p
olic
ies
and
proc
edur
esAc
hiev
ed
Con
sulta
tion
Qua
rterly
con
sulta
tion
with
min
ing
oper
atio
nsC
onsu
ltatio
nM
onth
ly c
onsu
ltatio
n w
ith m
inin
g op
erat
ions
Achi
eved
Ope
n an
d tra
nspa
rent
Polic
ies
and
proc
edur
es a
re p
ublic
do
cum
ents
Ope
n an
d tra
nspa
rent
Polic
ies
and
Proc
edur
es is
pub
lic
docu
men
tsAc
hiev
ed
Info
rmat
ion
Info
rmat
ion
shar
ed o
n a
mon
thly
ba
sis
with
min
esIn
form
atio
nIn
form
atio
n is
sha
red
on a
mon
thly
ba
sis
with
min
es; e
lect
roni
c m
anag
emen
t sys
tem
wou
ld im
prov
e av
aila
bilit
y of
info
rmat
ion
In p
rogr
ess
Valu
e fo
r m
oney
Ensu
re th
e op
timum
util
isat
ion
of
vote
d fu
nds
Valu
e fo
r m
oney
Ensu
re th
e op
timum
util
isat
ion
of
vote
d fu
nds
In p
rogr
ess
PROGRAMME 2

76
PROGRAMME 3: MINERAL REGULATION
Purpose: To regulate the minerals and mining sectors to achieve transformation and sustainable development.
Programme objective: To transform the minerals and mining sectors into one that competitively contributes to the sustainable development in the country.
SERVICE DELIVERY OVERVIEW
The Mineral Regulation Branch completed its fourth year since inception during the 2009’10 financial year. Its main function is the processing, finalisation of applications, monitoring and evaluation of rights under the Mineral and Petroleum Resources Development Act, 28 of 2002 (MPRDA). As at 31 March 2010, the Department received 20,163 applications of which 16,190 were accepted, 3,653 rejected and 5,805 issued.
The Department, through the Mineral Regulation Branch, initiated the revision of internal processes for applications in terms of the MPRDA to shorten turnaround times and enhance service delivery.
During the 2009’10 financial year the objective of the Branch was to grant mineral rights 27 to historically disadvantaged South Africans (HDSAs) against an achievement of 465. In the case of women-led entities, 73 rights were granted compared with the target of 18. Eighteen workshops were held for HDSAs and women-led entities, against a planned 10, to engage and promote interaction with these stakeholders which assisted in promoting the objectives of the MPRDA.
The Branch achieved 317 Mining Charter compliance inspections against a target of 140, due to a strategic shift in focus on monitoring and compliance by holders of rights. In the area of environmental management, the Branch conducted 3,449 inspections against a target of 1,380. The Branch will also assist the Rehabilitation Oversight Committee (ROC), established in December 2009, with joint inspections and the identification of derelict and ownerless mines. We embarked on intensive compliance inspections mainly about the environment, such as water management, acid mine drainage and insufficient rehabilitation, BEE partnerships or participation, SLP and work programmes to determine the magnitude of compliance in view of the “use it or lose it “principle.
Challenges were experienced during the past financial year to effectively implement SLPs by holders of mining rights. This was established through increase of complaints received from various communities and through compliance inspections. The deadline for the conversion of old order mining rights into new mining rights, expired on 30 April 2009 and those who did not meet the said deadline have forfeited their rights and any continuation of their mining activities is illegal.
During the year the Branch identified the need to revise its organisational structure to improve service delivery as well as delivering on its mandate. The revised organisational structure was approved in principle pending funding of certain newly created posts. The implementation of the new structure started post-yearend and is currently in progress.
National�Mining�Promotion�System�(NMPS)
The Branch also identified that the National Mining Promotion System (NMPS) requires further development from its current purely application database capability, into an integrated management system that can facilitate more efficient processing, monitoring and resource management.
PROGRAMME PERFORMANCE - SECTION 2

77
MEA
SUR
AB
LE O
BJE
CTI
VES,
KEY
AC
TIVI
TIES
AN
D M
EDIU
M -T
ERM
OU
TPU
T TA
RG
ETS
Stak
ehol
der/C
usto
mer
Per
spec
tive
Obj
ectiv
esM
easu
res
Initi
ativ
esTa
rget
s 20
09’1
0Pr
ogre
ss
as a
t 31
Mar
ch 2
010
Con
stra
ints
/reas
on fo
r und
er-
perf
orm
ance
Reg
ulat
e m
iner
al a
nd m
inin
g se
ctor
to a
chie
ve tr
ansf
orm
atio
n an
d su
stai
nabi
lity
Proc
essi
ng a
ll ap
plic
atio
ns in
te
rms
of a
ppro
ved
polic
ies
and
legi
slat
ion
with
in p
resc
ribed
tim
efra
mes
Impr
ove
and
adhe
re to
exi
stin
g w
ork
proc
esse
s 10
0%80
%Ba
cklo
g w
ith re
gard
to re
new
als,
ex
ecut
ions
, non
-reg
istra
ble
right
sD
epar
tmen
tal n
etw
ork
dow
ntim
e,
capa
city
con
stra
ints
Non
-com
plia
nce
by a
pplic
ants
(BEE
an
d So
cial
and
Lab
our P
lans
)
Non
-com
plia
nce
by h
olde
rs o
f th
e rig
hts
Adju
dica
te a
pplic
atio
ns in
term
s of
app
rove
d w
ork
proc
esse
sAd
judi
cate
app
licat
ions
with
equ
al
cons
ider
atio
n to
soc
ial,
econ
omic
, en
viro
nmen
tal a
nd tr
ansf
orm
atio
n as
pect
s
Reg
iste
r rig
hts
and
reco
rd p
erm
its w
ithin
pr
escr
ibed
tim
e fra
mes
Num
ber o
f rig
hts
gran
ted
to
HD
SA’s
Proc
essi
ng o
f app
licat
ions
2730
0N
one
Reg
ulat
e m
iner
al a
nd m
inin
g se
ctor
to a
chie
ve tr
ansf
orm
atio
n an
d su
stai
nabi
lity
Num
ber o
f wom
en- l
ed
com
pani
es li
cens
ed
Eval
uate
em
pow
erm
ent t
rans
actio
ns a
nd
prov
ide
guid
ance
to m
eet c
ompl
ianc
e cr
iteria
1836
Non
e
Reg
ulat
e m
iner
al a
nd m
inin
g se
ctor
to a
chie
ve tr
ansf
orm
atio
n an
d su
stai
nabi
lity
Num
ber o
f wor
ksho
ps c
ondu
cted
w
ith m
iner
al a
nd m
inin
g in
dust
ry
stak
ehol
ders
Con
duct
indu
stry
wor
ksho
ps10
indu
stry
w
orks
hop
(1 p
er
regi
on)
10
Impr
ove
turn
arou
nd ti
mes
Res
pons
e to
que
ries
Impl
emen
t doc
umen
t man
agem
ent s
yste
m5
wor
king
day
s10
0%%
adh
eren
ce to
pre
scrib
ed
timef
ram
esPr
oces
s ap
plic
atio
ns a
ccor
ding
to le
gisl
atio
n an
d ap
prov
ed b
usin
ess
proc
esse
s10
0%85
%M
assi
ve In
flux
of n
ew a
pplic
atio
ns
and
syst
em fa
ilure
(NM
PS);
Dep
artm
enta
l net
wor
k do
wnt
ime;
ca
paci
ty c
onst
rain
tsC
onsi
sten
t im
plem
enta
tion
of
polic
ies
and
legi
slat
ive
fram
ewor
k%
redu
ctio
n in
iden
tifie
d po
licie
s an
d re
gula
tory
gap
sR
evie
w e
xist
ing
polic
ies,
legi
slat
ion
and
guid
elin
es80
%
75
%
Issu
e di
rect
ives
75%
Dev
elop
and
impl
emen
t gui
delin
es
75
%M
onth
ly B
ranc
h m
eetin
gs; s
peci
alis
t w
orks
hops
and
ann
ual p
erfo
rman
ce
wor
ksho
p
75%
PROGRAMME 3

78
Obj
ectiv
esM
easu
res
Initi
ativ
esTa
rget
s 20
09’1
0Pr
ogre
ss
as a
t 31
Mar
ch 2
010
Con
stra
ints
/reas
on fo
r und
er-
perf
orm
ance
Impr
ove
awar
enes
s an
d re
puta
tion
Num
ber o
f wor
ksho
ps c
ondu
cted
w
ith m
iner
al a
nd m
inin
g in
dust
ry
stak
ehol
ders
Con
duct
indu
stry
wor
ksho
ps10
indu
stry
w
orks
hop
(1 p
er
regi
on)
18
Stre
ngth
en c
oope
rativ
e go
vern
ance
Inte
r-dep
artm
enta
l/ st
akeh
olde
r in
itiat
ives
Atte
nd m
eetin
gs/ w
orks
hops
2411
7
Inte
rnal
Pro
cess
es
Obj
ectiv
esM
easu
res
Initi
ativ
esTa
rget
s20
09’1
0Pr
ogre
ss a
s at
31
Mar
ch
2010
Con
stra
ints
/reas
on fo
r un
der-
perf
orm
ance
Effic
ient
bus
ines
s pr
oces
ses
Mon
itor a
nd e
nfor
ce
com
plia
nce
Num
ber o
f Min
ing
Cha
rter i
nspe
ctio
nsC
ondu
ct in
spec
tions
and
enf
orce
com
plia
nce
140
171
Num
ber o
f EM
P in
spec
tions
Con
duct
insp
ectio
ns a
nd e
nfor
ce c
ompl
ianc
e13
8019
07N
umbe
r of P
WP
and
MW
P in
spec
tions
Con
duct
insp
ectio
ns a
nd e
nfor
ce c
ompl
ianc
e30
240
0R
educ
tion
in c
ompl
aint
s re
latin
g to
pr
oced
ural
inco
nsis
tenc
yIn
stitu
te c
ompl
aint
s re
gist
er a
nd re
porti
ng
syst
em90
%85
%
Hea
d O
ffice
revi
ew o
f reg
iona
l ass
essm
ent
repo
rtsAn
alys
e ro
ot c
ause
as
per a
ppea
ls re
gist
erEf
fect
ivel
y im
plem
ent
rele
vant
legi
slat
ion
Num
ber o
f ass
essm
ent w
orks
hops
with
th
e ap
plic
ants
hol
der o
f rig
hts
Con
duct
indu
stry
eng
agem
ent w
orks
hops
27
4
7
Stan
dard
ised
pro
cedu
res
and
proc
esse
s N
umbe
r of s
tand
ardi
sed
proc
edur
es
and
proc
esse
s R
evie
w e
xist
ing
proc
edur
es a
nd p
roce
sses
1
0M
ine
econ
omic
s gu
idel
ines
stil
l to
be a
ligne
d w
ith th
e re
quire
men
t of
Act
Num
ber o
f pro
cedu
res
and
proc
esse
s al
igne
d w
ith p
olic
ies
Alig
nmen
t of p
roce
sses
and
pro
cedu
res
1
1
Effe
ctiv
e se
rvic
e de
liver
yAl
loca
tion
of a
ppro
pria
te
reso
urce
s%
alig
nmen
t of f
inan
cial
reso
urce
s w
ith
oper
atio
nal n
eeds
Hol
d bu
dget
wor
ksho
p;co
stin
g al
l act
iviti
es;
anal
yse
budg
et; s
ubm
it bu
dget
pro
posa
l
100%
80%
Lim
ited
fund
s
% im
plem
enta
tion
of th
e BS
CIm
plem
ent B
SC fo
r eac
h co
rpor
ate
serv
ices
pla
n10
0%80
%M
isal
ignm
ent o
f per
form
ance
ag
reem
ents
with
BSC
PROGRAMME PERFORMANCE - SECTION 2

79
Obj
ectiv
esM
easu
res
Initi
ativ
esTa
rget
s20
09’1
0Pr
ogre
ss a
s at
31
Mar
ch
2010
Con
stra
ints
/reas
on fo
r un
der-
perf
orm
ance
Rev
iew
and
impr
ove
serv
ice
stan
dard
s%
ser
vice
sta
ndar
ds re
view
ed a
nd
impr
oved
Dev
elop
and
revi
ew s
ervi
ce s
tand
ards
in li
ne
with
Batho�Pele;�p
ublic
ser
vice
sta
ndar
ds10
0%75
%Bu
sine
ss p
roce
sses
and
in
form
atio
n de
sk
Stak
ehol
der a
nd C
usto
mer
Rel
atio
nshi
p M
anag
emen
tEd
ucat
e an
d em
pow
er
stak
ehol
ders
Num
ber o
f inf
orm
atio
n w
orks
hops
with
co
mm
uniti
esC
ondu
ct w
orks
hops
1622
Impr
ove
cons
ulta
tion
and
feed
back
Freq
uenc
y of
con
sulta
tion
and
feed
back
ses
sion
sC
ondu
ct in
dust
ry w
orks
hops
10 in
dust
ry
wor
ksho
ps (1
pe
r reg
ion)
52
Driv
e in
nova
tion
% in
nova
tion
proj
ects
impl
emen
ted
Iden
tify,
pla
n, im
plem
ent a
nd m
onito
r pro
ject
s20
%20
%C
ontri
bute
to s
usta
inab
le
deve
lopm
ent
Num
ber o
f ide
ntifi
ed, d
erel
ict a
nd
owne
rless
reha
bilit
atio
n pr
ojec
tsO
vers
ee im
plem
enta
tion
of c
ontra
ct w
ith s
ervi
ce
prov
ider
130
Lack
of r
ehab
ilitat
ion
stra
tegy
and
R
OC
inte
rven
tion
Id
entif
ied
and
prio
ritis
ed u
n-re
habi
litat
ed a
nd u
nsaf
e m
ines
Secu
re fu
ndin
g, c
oncl
ude
cont
ract
with
iden
tifie
d se
rvic
e pr
ovid
er1
0La
ck o
f reh
abilit
atio
n st
rate
gy a
nd
RO
C in
terv
entio
n
Lear
ning
and
Gro
wth
Attra
ct, d
evel
op a
nd re
tain
ap
prop
riate
sta
ff%
redu
ctio
n in
sta
ff tu
rnov
er ra
te
Impl
emen
t HR
pla
n2%
100%
% re
duct
ion
in v
acan
cies
Im
plem
ent H
R p
lan
5%95
%St
aff t
urno
ver
% im
plem
enta
tion
of P
DPs
alig
ned
with
D
epar
tmen
tal n
eeds
Impl
emen
t HR
D p
lan
50%
100%
Dev
elop
kno
wle
dge
man
agem
ent s
yste
ms
% c
ompl
etio
n of
Kno
wle
dge
Man
agem
ent S
yste
m p
lan
Esta
blis
h ta
sk te
am h
eade
d by
Com
mun
icat
ion
Chi
ef D
irect
orat
e10
0%
Fina
lise
fram
ewor
k an
d de
velo
p IT
pla
tform
% im
plem
enta
tion
of K
now
ledg
e M
anag
emen
t Sys
tem
pla
nU
pdat
e Kn
owle
dge
Man
agem
ent S
yste
m
Impr
ove
lead
ersh
ip a
nd
man
agem
ent c
apab
ilitie
sN
umbe
r of m
anag
ers
com
plet
ed
lead
ersh
ip a
nd m
anag
emen
t cou
rses
Exte
nsio
n of
WIT
S pr
ogra
mm
e10
0% n
ew
man
ager
s0
Fina
ncia
l con
stra
ints
% R
etur
n on
Inve
stm
ent o
n tra
inin
g &
deve
lopm
ent
Impl
emen
t 360
˚sur
vey
tool
65%
Driv
e tra
nsfo
rmat
ion
% im
prov
emen
t in
Empl
oym
ent E
quity
Impl
emen
t DM
E EE
pla
nPe
r DM
E EE
pl
anH
RD
% p
rocu
rem
ent s
pent
on
targ
eted
gr
oups
As
per
Cor
pora
te S
ervi
ces
plan
s50
%
PROGRAMME 3

80
Obj
ectiv
esM
easu
res
Initi
ativ
esTa
rget
s20
09’1
0Pr
ogre
ss a
s at
31
Mar
ch
2010
Con
stra
ints
/reas
on fo
r un
der-
perf
orm
ance
Live
the
core
val
ues
% in
crea
se in
nom
inat
ions
for B
atho�
Pele
and
Ubu
ntu
Awar
ds
As p
er C
orpo
rate
Ser
vice
s pl
ans
50%
% d
ecre
ase
in tr
ansg
ress
ions
of C
ode
of C
ondu
ctAs
per
Cor
pora
te S
ervi
ces
plan
s5%
0
Num
ber o
f cor
e va
lues
aw
aren
ess
prog
ram
mes
Con
duct
inte
rnal
wor
ksho
ps10
HR
bud
get c
onst
rain
ts
Fina
nce
Alig
n bu
dget
to s
trate
gy%
of b
udge
t alig
ned
to s
trate
gic
prio
ritie
sD
evel
op s
pend
ing
plan
s in
con
junc
tion
with
fin
ance
100%
100%
Effe
ctiv
ely
man
age
budg
et%
bud
get v
aria
nce
(Bra
nch)
Mon
itor a
ctua
l exp
endi
ture
aga
inst
bud
get
(spe
ndin
g pl
ans)
5%10
0%
Max
imis
e ut
ilisat
ion
of
asse
tsR
educ
e re
dund
ant a
sset
s (p
hysi
cal)
impl
emen
t ass
et m
aint
enan
ce a
nd d
ispo
sal
stra
tegy
Iden
tify
redu
ndan
t as
sets
and
re
duce
by
30%
Effe
ctiv
ely
man
age
expe
nditu
re a
nd re
venu
e co
llect
ion
Red
uctio
n in
con
firm
ed fr
uitle
ss,
was
tefu
l and
una
utho
rised
exp
endi
ture
(B
ranc
h)
Atte
nd w
orks
hops
arr
ange
d an
d co
nduc
ted
by
CFO
’s of
fice
100%
100%
Res
pond
to id
entif
ied
inci
dent
s w
ithin
tim
efra
mes
de
term
ined
by
CFO
’s of
fice
% d
ebts
col
lect
edM
onito
r deb
tors
on
a m
onth
ly b
asis
and
con
duct
au
dits
of m
ine
inco
me
100%
80%
Roy
altie
s fo
r exa
mpl
e, o
nly
beca
me
paya
ble
with
effe
ct 0
1 M
arch
201
0Pr
omot
e C
orpo
rate
G
over
nanc
e%
com
plia
nce
with
PFM
A Im
plem
ent c
ompl
ianc
e fra
mew
ork
100%
100%
PROGRAMME PERFORMANCE - SECTION 2

81
MIN
ERA
L R
EGU
LATI
ON
SER
VIC
E D
ELIV
ERY
IMPR
OVE
MEN
T PL
AN
S
Key
Ser
vice
Serv
ice
Ben
efic
iary
Cur
rent
Sta
ndar
d (2
008’
9)D
esire
d St
anda
rd (2
009’
10)
Prog
ress
as
at 3
1 M
arch
201
0In
crea
sed
num
ber
of H
DSA
’s an
d w
omen
pa
rtici
patio
n in
the
min
ing
indu
stry
HD
SA’s
(bla
cks,
co
lour
eds
and
Indi
ans)
Qua
ntity
45 ri
ghts
gra
nted
to H
DSA
Qua
ntity
63 ri
ghts
gra
nted
to H
DSA
’s
81
Qua
lity
Audi
ted
Qua
lity
Audi
tC
onsu
ltatio
nM
eetin
gs a
nd w
orks
hops
with
co
mm
uniti
es a
nd m
inin
g in
dust
ryC
onsu
ltatio
nM
eetin
gs a
nd w
orks
hops
with
co
mm
uniti
es a
nd m
inin
g in
dust
ry
6
Acce
ssC
omm
unic
atio
n th
roug
h D
ME
web
site
, te
leph
onic
and
writ
ten
Acce
ssC
omm
unic
atio
n th
roug
h D
ME
web
site
, tel
epho
nic
and
writ
ten
Batho�Pe
le p
rinci
ples
are
adh
ered
to
; ge
nera
l % o
f adh
eren
ce a
s at
31
Mar
ch 2
010
estim
ated
at 8
0%C
ourte
syH
elp
desk
, wor
ksho
ps, m
eetin
gsC
ourte
syH
elp
desk
, wor
ksho
ps, m
eetin
gsBa
tho�Pe
le p
rinci
ples
are
adh
ered
to
; ge
nera
l % o
f adh
eren
ce a
s at
31
Mar
ch 2
010
estim
ated
at 8
0%O
pen
and
trans
pare
ntC
lear
ly d
efin
ed a
nd d
ispl
ayed
bus
ines
s pr
oces
ses
Ope
n an
d tra
nspa
rent
Cle
arly
def
ined
and
dis
play
ed
busi
ness
pro
cess
es, b
ette
r acc
ess
to D
ME
web
site
Batho�Pe
le p
rinci
ples
are
adh
ered
to
; ge
nera
l % o
f adh
eren
ce a
s at
31
Mar
ch 2
010
estim
ated
at 8
0%In
form
atio
nG
uide
lines
, Inf
orm
atio
n w
orks
hops
, ap
plic
atio
n pr
oced
ures
in th
e D
ME
web
site
Info
rmat
ion
Gui
delin
es, i
nfor
mat
ion
wor
ksho
ps,
appl
icat
ion
proc
edur
es o
n D
ME
web
site
Batho�Pe
le p
rinci
ples
are
adh
ered
to
; ge
nera
l % o
f adh
eren
ce a
s at
31
Mar
ch 2
010
estim
ated
at 8
0%R
edre
ssFe
edba
ck m
eetin
gs, c
orre
ctiv
e ac
tions
Red
ress
Feed
back
mee
tings
, cor
rect
ive
actio
nsBa
tho�Pe
le p
rinci
ples
are
adh
ered
to
; ge
nera
l % o
f adh
eren
ce a
s at
31
Mar
ch 2
010
estim
ated
at 8
0%Va
lue
for
mon
eyAc
quis
ition
of s
hare
s an
d ow
ners
hip
in
the
min
ing
indu
stry
Va
lue
for
mon
ey R
epre
sent
ativ
e an
d tra
nsfo
rmed
in
dust
ryAw
aitin
g C
harte
r Rev
iew
pro
cess
fo
r sta
tistic
sTi
me
Six
mon
ths
for p
rosp
ectin
g rig
hts
and
min
ing
perm
its, t
wel
ve m
onth
s fo
r m
inin
g rig
hts
Tim
eSi
x m
onth
s fo
r pro
spec
ting
right
s an
d m
inin
g pe
rmits
, tw
elve
mon
ths
for m
inin
g rig
hts
80%
Cos
tPr
ospe
ctin
g fe
es a
nd fi
nanc
ial
prov
isio
n fo
r reh
abilit
atio
nC
ost
Pros
pect
ing
fees
and
R
ehab
ilitat
ion
fees
/fina
ncia
l pr
ovis
ion
Addr
essi
ng 8
0% o
f iss
ues
iden
tifie
d in
aud
it re
port
Con
sist
ent
turn
arou
nd ti
mes
in
pro
cess
ing
pros
pect
ing
and
min
ing
right
s
appl
icat
ions
Min
ing
indu
stry
, pl
ayer
s in
the
indu
stry
Qua
ntity
All s
ubm
itted
app
licat
ions
Qua
ntity
All s
ubm
itted
app
licat
ions
80%
Qua
lity
Audi
ted
and
final
ised
app
licat
ions
Qua
lity
Audi
ted
and
final
ised
app
licat
ions
80%
PROGRAMME 3

82
Key
Ser
vice
Serv
ice
Ben
efic
iary
Cur
rent
Sta
ndar
d (2
008’
9)D
esire
d St
anda
rd (2
009’
10)
Prog
ress
as
at 3
1 M
arch
201
0C
onsu
ltatio
nD
WAF
, DE
AT, D
LA, c
omm
uniti
es, l
ocal
au
thor
ities
, Nat
iona
l Par
ks B
oard
sC
onsu
ltatio
nD
WAF
, DE
AT, D
LA, c
omm
uniti
es,
loca
l aut
horit
ies,
Nat
iona
l Par
ks
Boar
ds
90%
Acce
ssC
omm
unic
atio
n vi
a em
ail,
tele
phon
ic
and
writ
ten
Acce
ssC
omm
unic
atio
n th
roug
h D
ME
web
site
, via
em
ail,
tele
phon
ic a
nd
writ
ten
Batho�Pe
le p
rinci
ples
are
adh
ered
to
; ge
nera
l % o
f adh
eren
ce a
s at
31
Mar
ch 2
010
estim
ated
at 8
0%C
ourte
syH
elp
desk
, ind
ustry
ass
essm
ent
wor
ksho
psC
ourte
syH
elp
desk
, iIn
dust
ry a
sses
smen
t w
orks
hops
, acc
ess
to N
MPS
Batho�Pe
le p
rinci
ples
are
adh
ered
to
; ge
nera
l % o
f adh
eren
ce a
s at
31
Mar
ch 2
010
estim
ated
at 8
0%O
pen
and
trans
pare
ntC
lear
ly d
efin
ed a
nd d
ispl
ayed
bu
sine
ss p
roce
sses
Ope
n an
d tra
nspa
rent
Cle
arly
def
ined
and
dis
play
ed
busi
ness
pro
cess
es, b
ette
r acc
ess
to th
e D
ME
web
site
/NM
PS
Batho�Pe
le p
rinci
ples
are
adh
ered
to
; ge
nera
l % o
f adh
eren
ce a
s at
31
Mar
ch 2
010
estim
ated
at 8
0%In
form
atio
nIn
dust
ry w
orks
hops
on
busi
ness
pr
oces
ses,
app
licat
ion
proc
edur
es o
n D
ME
web
site
, gui
delin
es
Info
rmat
ion
Indu
stry
wor
ksho
ps o
n bu
sine
ss
proc
esse
s, a
pplic
atio
n pr
oced
ures
in
the
DM
E w
ebsi
te, G
uide
lines
/N
MPS
Batho�Pe
le p
rinci
ples
are
adh
ered
to
; ge
nera
l % o
f adh
eren
ce a
s at
31
Mar
ch 2
010
estim
ated
at 8
0%
Red
ress
Feed
back
mee
tings
, cor
rect
ive
actio
nsR
edre
ssFe
edba
ck m
eetin
gs, c
orre
ctiv
e ac
tions
Batho�Pe
le p
rinci
ples
are
adh
ered
to
; ge
nera
l % o
f adh
eren
ce a
s at
31
Mar
ch 2
010
estim
ated
at 8
0%Va
lue
for
mon
eyAc
hiev
emen
t of o
bjec
tives
of t
he
MPR
DA
Valu
e fo
r m
oney
Tran
sfor
med
indu
stry
Batho�Pe
le p
rinci
ples
are
adh
ered
to
; ge
nera
l % o
f adh
eren
ce a
s at
31
Mar
ch 2
010
estim
ated
at 8
0%Ti
me
Six
mon
ths
for p
rosp
ectin
g rig
hts
and
min
ing
perm
its, t
wel
ve m
onth
s fo
r m
inin
g rig
hts
Tim
eSi
x m
onth
s fo
r pro
spec
ting
right
s an
d m
inin
g pe
rmits
, tw
elve
mon
ths
for m
inin
g rig
hts
Batho�Pe
le p
rinci
ples
are
adh
ered
to
; ge
nera
l % o
f adh
eren
ce a
s at
31
Mar
ch 2
010
estim
ated
at 8
0%C
ost
Pros
pect
ing
and
reha
bilit
atio
n fe
es/
finan
cial
pro
visi
onC
ost
Pros
pect
ing
and
reha
bilit
atio
n fe
es/fi
nanc
ial p
rovi
sion
PROGRAMME PERFORMANCE - SECTION 2

83
PROGRAMME 4: THE MINERAL POLICY AND PROMOTION BRANCH
Purpose: To formulate mineral-related policies and promote the mining and minerals industry of South Africa, making it attractive to investors.
Measurable objective: Through research, provide relevant information to enhance global competitiveness, review policies and formulate legislation to achieve transformation and attract new investment into South Africa’s minerals industry.
The 2009’10 financial year saw the full wrath of the global economic crisis to which the South African mining industry was not immune. The Branch continued to lead a counter-cyclical intervention, the Mining Industry Growth Development and Employment Task Team (MIGDETT), which sought to mitigate job losses and position the mining industry along a growth path with concurrent transformation. This intervention saved in excess of 60 000 jobs, representing more than half of the original projected losses. In line with its visionary second mandate, MIGDETT also developed a draft strategy on sustainable growth and meaningful transformation in South Africa’s mining industry with an emphasis on growth and transformation. The strategy culminated in the Mining Summit for all stakeholders on 31 March 2010. The Summit welcomed the MIGDETT strategy, agreed to the bulk of the recommendations and resolved that work should continue to finalise the outstanding issues during the 2010’11 financial year.
The Branch undertook a reconnaissance exercise to evaluate the extent to which the South African government is exposed to the mining industry. Consequent to the findings of this exercise, Cabinet imposed a moratorium on the disposal of any state mining assets subject to a more detailed audit being completed by the Department. Cabinet further directed the Department to propose a way of maximising government’s participation in the mining industry in line with its developmental objectives. The completed report on the creation of the state mining company will be tabled for consideration by Cabinet during the 2010’11 financial year.
The beneficiation strategy saw another round of consultations after the fourth consecutive election in May 2009 ushered in a new administration. The strategy is now ready for tabling before Cabinet formal adoption as a policy of South Africa.
The South African mining industry’s environmental legacy of more than a century requires a dedicated approach to mitigate further environmental degradation and pollution and the potentially negative impact on communities. Consequently, the Branch developed a rehabilitation strategy for derelict and ownerless mines, which was approved by the Minister in December 2009. An interim rehabilitation oversight committee was also established to develop an implementation plan for the rehabilitation strategy until the Branch is adequately capacitated to take over this responsibility.
South Africa’s sustainable development (SD) framework, incorporating all three SD spheres, namely economic, environmental and social, was finalised and the SD thematic report submitted to the United Nations Commission on Sustainable Development (UNCSD) in preparation for the 18th session of the Commission. This report outlines the mining industry’s progress against the developmental targets agreed at the 2002 Johannesburg UNCSD Summit.
PROGRAMME 4

84 PROGRAMME PERFORMANCE - SECTION 2
MEA
SUR
AB
LE O
BJE
CTI
VES,
KEY
AC
TIVI
TIES
AN
D M
EDIU
M-T
ERM
OU
TPU
T TA
RG
ETS
Stak
hold
er P
ersp
ectiv
e
Obj
ectiv
esM
easu
res
Initi
ativ
esTa
rget
s20
09’1
0Pr
ogre
ss a
s at
31
Mar
ch
2010
Con
stra
ints
/reas
on fo
r und
er-
perf
orm
ance
Dra
ft an
d de
velo
p po
licie
s an
d le
gisl
atio
n / p
rom
ote
the
min
ing
and
min
eral
s in
dust
ry
Con
tribu
tion
to s
ecto
r G
DP
grow
thPu
blis
h an
d di
ssem
inat
e in
dust
ry
prom
otio
nal m
ater
ial a
t loc
al a
nd
inte
rnat
iona
l inv
estm
ent e
vent
s (in
cl
conf
eren
ces,
wor
ksho
ps, e
xhib
ition
)
Parti
cipa
tion
in re
gion
al a
nd
inte
rnat
iona
l coo
pera
tion
to
stre
ngth
en tr
ade
rela
tions
(inc
l AM
P, K
PCS,
bi-
and
mul
tilat
eral
ag
reem
ents
)
[GD
P +
1%]
Perc
enta
ge c
hang
e in
min
ing
cont
ribut
ion
to G
DP
Q1-
Q4
2009
(lat
est f
igur
es a
vaila
ble,
R
eser
ve B
ank
QB
Mar
ch 2
010)
=
min
us 7
.2%
; tar
get w
as p
lus
1%, t
hus
diffe
renc
e be
twee
n ta
rget
and
act
ual i
s -8
.2%
-8.2
%
Mai
n co
nstra
int i
s pr
omot
ion
of in
vest
men
t co
inci
ding
with
nat
iona
l eco
nom
ic
cont
ract
ion
and
budg
etar
y co
nstra
ints
w
ithin
the
Bran
ch. T
he d
eclin
ing
quar
ter-
on-q
uarte
r inv
estm
ent i
n m
inin
g is
a
func
tion
of th
e gl
obal
fina
ncia
l and
ec
onom
ic c
risis
, whi
ch s
ever
ely
impa
cted
in
vest
men
t in
the
min
ing
sect
or.
Dra
ft an
d de
velo
p po
licie
s an
d le
gisl
atio
n / p
rom
ote
the
min
ing
and
min
eral
s in
dust
ry
Dev
elop
men
t and
im
plem
enta
tion
of
bene
ficia
tion
stra
tegy
Wor
ksho
p to
obt
ain
cons
ensu
s on
im
plem
enta
tion
plan
for b
enef
icia
tion
stra
tegy
Stra
tegy
ad
opte
dN
ot a
chie
ved
Stra
tegy
doc
umen
t dev
elop
ed fo
r tab
ling
to
Cab
inet
sub
ject
to a
dditi
onal
con
sulta
tion
with
var
ious
sta
keho
lder
s w
hich
is ta
king
lo
nger
than
pla
nned
Dra
ft an
d de
velo
p po
licie
s an
d le
gisl
atio
n / p
rom
ote
the
min
ing
and
min
eral
s in
dust
ry
Con
tribu
tion
to
empl
oym
ent c
reat
ion
Qua
ntify
num
ber o
f job
s cr
eate
d in
the
indu
stry
(abs
olut
e te
rms)
5%Jo
b lo
sses
con
tain
ed to
less
th
an 1
0% o
f tot
al m
inin
g em
ploy
men
t as
the
econ
omy
cont
ract
s; r
eces
sion
ary
econ
omy
thre
aten
ed to
she
d m
ore
than
20%
of m
inin
g em
ploy
men
tPr
ovid
e cl
ear M
inin
gan
d M
iner
als
Reg
ulat
ory
and
Polic
y Fr
amew
ork
% re
duct
ion
in
iden
tifie
d po
licy
and
regu
lato
ry g
aps
Rev
iew
Min
ing
Cha
rter
80%
95%
Con
stan
t rev
iew
of p
olic
ies
and
regu
latio
ns a
nd in
tern
atio
nal
benc
hmar
ks
Cab
inet
app
rove
d G
eosc
ienc
es
Bill
for t
ablin
g in
Par
liam
ent
Parli
amen
t sch
edul
ed a
Feb
ruar
y da
te fo
r M
inis
ter t
o ta
ble
the
Bill,
whi
ch c
oinc
ided
w
ith S
tate
vis
it; n
ew d
ate
secu
red
for l
ater
ta
blin
g of
the
Bill

85
Obj
ectiv
esM
easu
res
Initi
ativ
esTa
rget
s20
09’1
0Pr
ogre
ss a
s at
31
Mar
ch
2010
Con
stra
ints
/reas
on fo
r und
er-
perf
orm
ance
Prov
ide
clea
r Min
ing
And
Min
eral
s R
egul
ator
y An
d Po
licy
Fram
ewor
k
% re
duct
ion
in
iden
tifie
d po
licy
and
regu
lato
ry g
aps
Con
stan
t rev
iew
of p
olic
ies
and
regu
latio
ns a
nd in
tern
atio
nal
benc
hmar
ks
80%
MPR
DA
regu
latio
ns d
raft
docu
men
t dev
elop
edSt
akeh
olde
r con
sulta
tion
on d
raft
regu
latio
ns p
ut o
n ho
ld s
ubje
ct to
out
com
e of
Min
ing
Cha
rter r
evie
wD
evel
op n
ew p
olic
ies
whe
re n
eces
sary
Com
plet
ed d
raft
Sugi
lte P
olic
y do
cum
ent;
polic
y pu
t on
hold
for d
evel
opm
ent o
f co
mm
on p
olic
y fo
r all
by-p
rodu
cts
Impr
ove
turn
arou
nd ti
mes
Ackn
owle
dgem
ent o
f qu
erie
s Bu
ild a
que
ry d
atab
ase
With
in th
ree
days
Achi
eved
ave
rage
of f
ive
days
fo
r unc
ompl
icat
ed q
uerie
sTh
e qu
ery
track
ing
mec
hani
sm b
eing
de
velo
ped
but p
rogr
ess
depe
ndan
t on
SDM
su
ppor
t for
und
erly
ing
data
base
sys
tem
s.R
espo
nse
time
to
quer
ies
Dev
elop
a q
uery
man
agem
ent s
yste
mW
ithin
10
days
Achi
eved
less
than
10
days
re
spon
se
See
abov
e
Impr
ove
turn
arou
nd ti
mes
% a
dher
ence
to
pres
crib
ed ti
me
fram
es
Com
plia
nce
with
pre
scrib
ed ti
mef
ram
es
in le
gisl
atio
n, re
gula
tions
and
SLA
s10
0%80
%Is
sues
are
bey
ond
cont
rol o
f Bra
nch
as
mos
t are
dep
ende
nt o
n C
orpo
rate
Ser
vice
s an
d Fi
nanc
ial S
ervi
ces,
eg
IT e
quip
men
t w
orki
ng 1
00%
of t
he ti
me
Build
stra
tegi
c pa
rtner
ship
sN
umbe
r of s
trate
gic
partn
ersh
ips
esta
blis
hed
(eg
with
Bur
eau
of
Econ
omic
Res
earc
h,
Uni
vers
ities
)
Esta
blis
h pa
rtner
ship
s w
ith s
cien
tific
bo
dies
and
oth
er re
leva
nt b
odie
s to
en
hanc
e da
ta q
ualit
y
25
PROGRAMME 4

86 PROGRAMME PERFORMANCE - SECTION 2
Obj
ectiv
esM
easu
res
Initi
ativ
esTa
rget
s20
09’1
0Pr
ogre
ss a
s at
31
Mar
ch
2010
Con
stra
ints
/reas
on fo
r und
er-
perf
orm
ance
Impl
emen
tatio
n of
bila
tera
l and
m
ultil
ater
al
agre
emen
ts
Iden
tify
impl
emen
ting
agen
ts a
nd
conc
lude
impl
emen
tatio
n pl
ans
22
Prov
ide
cred
ible
, acc
essi
ble
info
rmat
ion
Mon
thly
pro
visi
on o
f m
inin
g da
taPr
oduc
e st
atis
tical
bul
letin
s12
12
Num
ber o
f min
eral
s an
d m
inin
g pu
blic
atio
ns a
nd
dire
ctor
ies
Num
ber o
f min
eral
s an
d m
inin
g pu
blic
atio
ns a
nd d
irect
orie
s (m
aint
ain
curre
ncy
in d
ata
man
agem
ent s
yste
ms
(SAM
IND
EX,
SIA
T, E
DSS
)
3336
Hig
h tu
rn-o
ver r
ate
of p
rofe
ssio
nals
(M
iner
al E
cono
mis
ts) a
nd tr
aini
ng o
f new
st
aff r
esul
ted
in th
e ta
rget
not
bei
ng m
et
Prov
ide
cred
ible
, acc
essi
ble
info
rmat
ion
Exhi
bitio
ns/
conf
eren
ces
and
wor
ksho
ps
Parti
cipa
tion
in lo
cal a
nd in
tern
atio
nal
prom
otio
nal e
vent
s (in
cl in
vest
men
t an
d te
chni
cal c
onfe
renc
es, w
orks
hops
, ex
hibi
tions
)
2430
Less
er fo
cus
on in
tern
atio
nal e
ngag
emen
t du
e to
bud
get c
onta
inm
ent m
easu
res,
mor
e em
phas
is o
n lo
cal p
rom
otio
nal a
ctiv
ities
INTE
RN
AL
BU
SIN
ESS
PRO
CES
SES
PER
SPEC
TIVE
Obj
ectiv
esM
easu
res
Initi
ativ
eTa
rget
s20
09’1
0Pr
ogre
ss a
s at
31
Mar
ch
2010
Con
stra
ints
/reas
on fo
r und
er-
perf
orm
ance
Effic
ient
bus
ines
s pr
oces
ses
Enha
nce
prod
uctiv
ityPr
ogre
ss a
gain
st b
usin
ess
plan
com
mitm
ents
Reg
ular
mon
itorin
g an
d ev
alua
tion
of p
rogr
ess
90%
90%
Con
tribu
tion
to U
NC
SSD
re
porti
ngPr
ovid
e in
put t
o N
atio
nal S
trate
gy
for S
usta
inab
le D
evel
opm
ent
Esta
blis
h re
porti
ng
stan
dard
s
Don
e
Dev
elop
men
t of s
usta
inab
le
deve
lopm
ent s
trate
gies
(m
ine
clos
ure
Der
elic
t and
O
wne
rless
Min
es S
trate
gy)
Cat
alys
e th
e im
plem
enta
tion
of th
e R
egio
nal M
ine
Clo
sure
St
rate
gies
(Witw
ater
sran
d an
d KO
SH)
Stra
tegi
es
com
plet
edD
raft
stra
tegy
dev
elop
ed (n
ot
yet a
dopt
ed)
Del
ayed
inpu
t rec
eive
d fro
m s
take
hold
ers
subs
eque
ntly
inco
rpor
ated
in d
raft
regi
onal
m
ine
clos
ure
stra
tegi
es d
evel
oped
for
Wes
tern
Bas
in, F
ar W
este
rn B
asin
, Eas
tern
Ba
sin,
Cen
tral B
asin
and
KO
SHM
aint
enan
ce a
nd u
pdat
e of
th
e da
taba
se o
f der
elic
t and
ow
nerle
ss m
ines
Stra
tegy
Stra
tegy
ado
pted

87
Obj
ectiv
esM
easu
res
Initi
ativ
eTa
rget
s20
09’1
0Pr
ogre
ss a
s at
31
Mar
ch
2010
Con
stra
ints
/reas
on fo
r und
er-
perf
orm
ance
Driv
e tra
nsfo
rmat
ion
Dev
elop
and
revi
ew m
inin
g po
licie
s an
d le
gisl
atio
n R
evie
w M
inin
g C
harte
r2
Con
stan
t rev
iew
of p
olic
ies
and
regu
latio
ns a
nd in
tern
atio
nal
benc
hmar
ks
Cab
inet
app
rove
d G
eosc
ienc
es
Bill
for t
ablin
g in
Par
liam
ent
MPR
DA
regu
latio
ns d
raft
docu
men
t dev
elop
ed
Parli
amen
t sch
edul
ed a
Feb
ruar
y da
te fo
r M
inis
ter t
o ta
ble
the
Bill,
whi
ch c
oinc
ided
w
ith S
tate
vis
it; n
ew s
ecur
ed fo
r lat
er
tabl
ing
of th
e Bi
ll
Stak
ehol
der c
onsu
ltatio
n on
dra
ft re
gula
tions
put
on
hold
sub
ject
to o
utco
me
of M
inin
g C
harte
r rev
iew
Dev
elop
new
pol
icie
s w
here
ne
cess
ary
Com
plet
ed d
raft
sugi
lte p
olic
y do
cum
ent;
polic
y pu
t on
hold
de
velo
p co
mm
on p
olic
y fo
r all
by-p
rodu
cts
Dev
elop
and
fina
lise
min
ing
stra
tegy
for S
MM
E de
velo
pmen
t St
rate
gy a
dopt
edD
raft
SSM
stra
tegy
doc
umen
t de
velo
ped,
not
yet
app
rove
dD
ocum
enta
tion,
st
anda
rdis
atio
n an
d re
view
of i
nter
nal
proc
edur
es
Num
ber o
f int
erna
l pr
oced
ures
doc
umen
ted
and
stan
dard
ised
Con
stan
tly d
evel
op a
nd re
view
gu
idel
ines
Doc
umen
tatio
n fin
alis
edAl
l uni
ts in
Bra
nch
deve
lope
d in
tern
al p
roce
dure
s do
cum
enta
tion
Dev
elop
con
sist
ent
mon
itorin
g an
d en
forc
emen
t gu
idel
ines
Red
uctio
n in
com
plai
nts
rela
ting
to p
roce
dura
l in
cons
iste
ncy
Doc
umen
t com
plai
nts
90%
70%
Mor
e th
an a
ntic
ipat
ed c
ompl
aint
s re
ceiv
ed
abou
t SSM
and
ben
efic
iatio
n pr
ojec
t su
ppor
t due
to c
hang
es in
ass
ista
nce
mod
el; m
ore
emph
asis
pla
ced
on fi
nalis
ing
and
impl
emen
ting
new
mod
el;
few
er
com
plai
nts
in th
ird q
uarte
r; bi
gges
t ch
alle
nge
is S
SMB
over
- com
mitm
ent a
nd
inad
equa
te fu
nds
to a
ssis
t all
proj
ects
ap
prov
ed fo
r fin
anci
al a
ssis
tanc
eN
umbe
r of g
uide
lines
de
velo
ped
in li
ne w
ith
legi
slat
ion
Dev
elop
gui
delin
es fo
r min
ing
polic
ies
and
legi
slat
ion
10
The
imm
inen
t Cha
rter r
evie
w th
e fo
cus
area
; no
guid
elin
es d
evel
oped
PROGRAMME 4

88 PROGRAMME PERFORMANCE - SECTION 2
Obj
ectiv
esM
easu
res
Initi
ativ
eTa
rget
s20
09’1
0Pr
ogre
ss a
s at
31
Mar
ch
2010
Con
stra
ints
/reas
on fo
r und
er-
perf
orm
ance
Effe
ctiv
e se
rvic
e de
liver
yAl
loca
tion
of
appr
opria
te re
sour
ces
% a
lignm
ent o
f res
ourc
es to
op
erat
iona
l nee
dsEv
alua
te jo
b pr
ofile
s to
ens
ure
rele
vanc
e to
job
requ
irem
ents
(q
ualif
icat
ions
and
mat
eria
l re
sour
ces)
and
upd
ate
cont
inuo
usly
60%
50%
Job
eval
uatio
n fo
r the
Chi
ef D
irect
orat
e:
Econ
omic
Adv
isor
y U
nit c
oncl
uded
Alig
nmen
t of r
esou
rces
to
cust
omer
nee
ds/ e
xpec
tatio
nsH
uman
cap
acity
stil
l lim
ited
to a
vaila
ble
reso
urce
sBu
ild a
ccou
ntab
ility
% im
plem
enta
tion
of B
SCEn
sure
that
all
offic
ials
ado
pt
BSC
app
roac
h in
per
form
ance
ag
reem
ents
100%
60%
Tran
slat
ion
of B
SC to
wor
kpla
n co
mpl
ex;
wor
k in
pro
gres
s
Perfo
rman
ce a
gree
men
ts
and
appr
aisa
ls fi
nalis
ed
with
in ta
rget
Com
plet
e an
d m
onito
r pe
rform
ance
agr
eem
ents
100%
10
0%
Build
and
man
age
Serv
ices
Lev
el
Agre
emen
ts
Esta
blis
h se
rvic
e st
anda
rds
(inte
rnal
ly a
nd e
xter
nally
)En
sure
com
plia
nce
with
exi
stin
g ag
reem
ents
and
dev
elop
new
on
es w
here
nec
essa
ry
100%
90%
W
ork
plan
s w
ith o
ffici
als
in th
e Br
anch
co
mpl
eted
; agr
eem
ents
ent
ered
into
with
M
inte
k fo
r reh
abilit
atio
n of
der
elic
t and
ow
nerle
ss m
ines
; CG
S to
win
d-up
SSM
pr
ojec
ts a
nd ID
C to
fina
nce
SSM
pro
ject
s%
adh
eren
ce to
Ser
vice
Le
vel A
gree
men
tsEn
sure
com
plia
nce
with
exi
stin
g ag
reem
ents
and
dev
elop
new
on
es w
here
nec
essa
ry
100%
95 %
Agre
emen
ts w
ith C
GS
to fi
nalis
e pr
ojec
ts
for w
hich
it w
as a
ppoi
nted
to m
anag
e an
d ID
C is
95%
com
plie
d w
ith.
Esta
blis
h se
rvic
e st
anda
rds
% s
tand
ards
Est
ablis
hed
Com
plet
e &
mon
itor S
ervi
ce
Del
iver
y Im
prov
emen
t Pla
n10
0%90
%Ad
min
iste
red
by S
uppl
y C
hain
Man
agem
ent
Und
erst
and
cust
omer
/ st
akeh
olde
rs n
eeds
Cus
tom
er n
eeds
sur
vey
cond
ucte
dD
evel
op s
trate
gy to
und
erst
and
cust
omer
s (e
g de
velo
p su
rvey
qu
estio
nnai
re a
nd s
ugge
stio
n bo
x)
1Su
rvey
not
yet
don
efro
m
Cus
tom
er s
atis
fact
ion
surv
ey
cond
ucte
dD
evel
op s
trate
gy to
und
erst
and
cust
omer
s (e
g de
velo
p su
rvey
qu
estio
nnai
re a
nd s
ugge
stio
n bo
x)
1Su
rvey
not
yet
don
eAw
aitin
g di
rect
ive
of th
e D
epar
tmen
t’s
supp
ort s
ervi
ce

89
Obj
ectiv
esM
easu
res
Initi
ativ
eTa
rget
s20
09’1
0Pr
ogre
ss a
s at
31
Mar
ch
2010
Con
stra
ints
/reas
on fo
r und
er-
perf
orm
ance
Driv
e in
nova
tion
Num
ber o
f inn
ovat
ion
proj
ects
impl
emen
ted
Impr
ove
serv
ice
thro
ugh
inno
vativ
e so
lutio
ns (c
reat
e en
ablin
g en
viro
nmen
t to
embr
ace
inno
vativ
e cu
lture
)
21
Cul
ture
of i
nnov
atio
n in
trodu
ced
durin
g re
porti
ng y
ear;
bein
g nu
rture
d fo
r mor
e in
nova
tive
prop
ositi
ons
in y
ears
ahe
ad
Stak
ehol
der a
nd C
usto
mer
Rel
atio
nshi
p M
anag
emen
t Ed
ucat
e an
d em
pow
er
stak
ehol
ders
Num
ber o
f min
ing/
min
eral
w
orks
hops
and
info
rmat
ion
sess
ions
Parti
cipa
tion
in lo
cal a
nd
inte
rnat
iona
l pro
mot
ion
even
ts (e
g M
inin
g Ta
sk T
eam
, con
fere
nces
, w
orks
hops
, exh
ibiti
ons)
2430
Less
er fo
cus
on in
tern
atio
nal e
ngag
emen
t du
e to
bud
get c
onta
inm
ent m
easu
res;
mor
e em
phas
is o
n lo
cal p
rom
otio
nal a
ctiv
ities
Reg
ular
con
sulta
tion
and
feed
back
Freq
uenc
y of
con
sulta
tion
and
feed
back
ses
sion
sC
onsu
ltatio
n an
d fe
edba
ck
sess
ions
in re
spec
t of p
olic
y de
velo
pmen
t/rev
iew,
stra
tegi
es
deve
lope
d (e
g be
nefic
iatio
n)
513
Build
stra
tegi
c al
lianc
es a
nd
partn
ersh
ips
Parti
cipa
tion
in b
ilate
ral a
nd
mul
tilat
eral
agr
eem
ents
and
im
plem
enta
tion
of re
leva
nt
agre
emen
ts
Prof
ile c
ount
ries
of s
trate
gic
sign
ifica
nce
514
cou
ntrie
s pr
ofile
dSl
ow p
rogr
ess
due
to in
crea
se in
num
ber o
f pr
iorit
ised
cou
ntrie
s
Rev
iew
all
min
eral
s an
d m
inin
g ag
reem
ents
and
impl
emen
tAl
l ava
ilabl
e ag
reem
ents
so
urce
d an
d re
view
ed;
cons
titut
e ba
sis
of p
rofil
ing
coun
tries
of s
trate
gic
sign
ifica
nce
Man
age
cust
omer
/ st
akeh
olde
r ex
pect
atio
ns
% ra
ting
in c
lient
sat
isfa
ctio
n su
rvey
Con
duct
sur
vey
on
stak
ehol
der
expe
ctat
ions
70%
0%C
usto
mer
sat
isfa
ctio
n su
rvey
not
yet
de
velo
ped;
aw
aitin
g gu
idan
ce fr
om
Cor
pora
te S
ervi
ces
colle
ague
s
Lear
ning
and
Gro
wth
Attra
ct, d
evel
op a
nd
reta
in s
kills
% re
duct
ion
in s
taff
turn
over
ra
te
Impl
emen
tatio
n of
HR
Pla
n2%
1%
% re
duct
ion
in v
acan
cies
Im
plem
enta
tion
of H
R P
lan
5%10
.5%
Two
resi
gnat
ions
of c
ritic
al s
kills
and
long
-st
andi
ng v
acan
cies
% im
plem
enta
tion
of P
DPs
al
igne
d w
ith D
epar
tmen
tal
need
s
Impl
emen
tatio
n of
HR
D P
lan
50%
35%
PROGRAMME 4

90 PROGRAMME PERFORMANCE - SECTION 2
Obj
ectiv
esM
easu
res
Initi
ativ
eTa
rget
s20
09’1
0Pr
ogre
ss a
s at
31
Mar
ch
2010
Con
stra
ints
/reas
on fo
r und
er-
perf
orm
ance
Dev
elop
Kno
wle
dge
Man
agem
ent S
yste
mIn
vest
men
t in
info
rmat
ion
capi
tal (
SIAT
and
bus
ines
s pl
an e
valu
atio
n to
ols)
Inve
st 1
0% o
f Bra
nch
reso
urce
s10
% o
f res
ourc
esLe
ss th
an 5
% re
sour
ces
allo
cate
dSD
M h
as s
igne
d-of
f on
SIAT
and
ED
SS
syst
ems
deve
lopm
ent;
coul
d no
t be
impl
emen
ted
due
to p
oor I
T in
frast
ruct
ure
Con
tribu
tion
to D
ME
know
ledg
e m
anag
emen
t (K
M) s
yste
ms
plan
Doc
umen
t int
erna
l pro
cess
es
and
upda
te th
em to
ens
ure
pres
erva
tion
of in
stitu
tiona
l m
emor
y
Bran
ch K
M
requ
irem
ents
fin
alis
ed
No
prog
ress
Awai
ting
Dep
artm
enta
l KM
cha
mpi
on fo
r gu
idel
ines
Impr
ove
lead
ersh
ip
and
man
agem
ent
capa
bilit
ies
% m
anag
ers
com
plet
ed
lead
ersh
ip a
nd m
anag
emen
t co
urse
s
Exte
nsio
n of
WIT
S pr
ogra
mm
e70
0% (H
RD
)Aw
aitin
g H
RD
for g
uida
nce
Awai
ting
depa
rtmen
tal H
R g
uida
nce
on
3600 re
view
mec
hani
sms
% R
etur
n on
Inve
stm
ent o
n tra
inin
g an
d de
velo
pmen
t36
0˚ s
urve
y to
ol65
%0%
Driv
e tra
nsfo
rmat
ion
% Im
prov
emen
t in
Empl
oym
ent E
quity
Im
plem
ent D
ME
EE P
lan
Per D
ME
EE P
lan
90%
ach
ieve
dIn
dian
, col
oure
d, w
omen
repr
esen
tatio
n at
sm
s-le
vel a
nd p
eopl
e w
ith d
isab
ility
rem
ain
unde
r-rep
rese
nted
% p
rocu
rem
ent s
pent
on
targ
eted
gro
ups
Info
rm re
quis
ite s
uppl
iers
to
regi
ster
on
data
base
50%
SCM
Dat
a Ba
se
Live
the
core
val
ues
Num
ber o
f cor
e va
lues
aw
aren
ess
sess
ions
As
per
Cor
pora
te S
ervi
ces
plan
sFo
ur s
essi
ons
per
year
2
% in
crea
se in
nom
inat
ions
for
the Ba
tho�Pe
le a
nd U
bunt
u Aw
ards
As p
er C
orpo
rate
Ser
vice
s pl
ans
50%
Achi
eved
% d
ecre
ase
in tr
ansg
ress
ions
of
Cod
e of
Con
duct
As p
er C
orpo
rate
Ser
vice
s pl
ans
5%1%
Alig
nmen
t of b
udge
t w
ith s
trate
gy%
bud
get a
ligne
d w
ith
stra
tegi
c pr
iorit
ies
Dev
elop
spe
ndin
g pl
ans
in
conj
unct
ion
with
fina
nce
90%
92%
Bran
ch m
anag
emen
t con
stitu
ted
by n
ew
man
ager
s; s
pend
ing
plan
s be
ing
final
ised
Ef
fect
ivel
y m
anag
e bu
dget
Util
isat
ion
of h
uman
cap
ital
Alig
nmen
t of h
uman
reso
urce
s w
ith b
udge
t70
%60
%
% b
udge
t var
ianc
eEn
sure
that
exp
endi
ture
m
anag
emen
t is
a pe
rman
ent i
tem
of
mon
thly
man
agem
ent m
eetin
gs
Mon
thly
Achi
eved
Mon
itor a
ctua
l exp
endi
ture
ag
ains
t bud
get (
spen
ding
pla
ns)

91
Obj
ectiv
esM
easu
res
Initi
ativ
eTa
rget
s20
09’1
0Pr
ogre
ss a
s at
31
Mar
ch
2010
Con
stra
ints
/reas
on fo
r und
er-
perf
orm
ance
Effe
ctiv
ely
man
age
cost
s%
con
firm
ed fr
uitle
ss,
was
tefu
l and
una
utho
rised
ex
pend
iture
Atte
nd w
orks
hops
arr
ange
d an
d co
nduc
ted
by C
FO’s
offic
e0%
0%Br
anch
not
ser
ved
with
any
con
cern
of
fruitl
ess
and
was
tefu
l exp
endi
ture
Res
pond
to id
entif
ied
inci
dent
s w
ithin
tim
efra
mes
det
erm
ined
by
CFO
’s of
fice
Bran
ch n
ot s
erve
d w
ith a
ny c
once
rn o
f fru
itles
s an
d w
aste
ful e
xpen
ditu
re
Prom
ote
gove
rnan
ce%
com
plia
nce
with
PFM
AIm
plem
ent c
ompl
ianc
e fra
mew
ork
100%
100%
No
conc
ern
of d
evia
tion
rais
ed
MIN
ERA
L PO
LIC
Y A
ND
PR
OM
OTI
ON
BR
AN
CH
SER
VIC
E D
ELIV
ERY
IMPR
OVE
MEN
T PL
AN
S
Key
Ser
vice
Serv
ice
bene
ficia
ries
Cur
rent
sta
ndar
d (2
008’
9)D
esire
d st
anda
rd (2
009’
10)
Prog
ress
as
at 3
1 M
arch
201
0
Prom
ote
min
ing
and
min
eral
in
dust
ry o
f Sou
th
Afric
a
The
publ
ic,
gove
rnm
ent
depa
rtmen
ts, D
ME,
D
ME-
asso
ciat
ed
inst
itutio
ns,
min
ing
indu
stry
, pr
ospe
ctiv
e in
vest
ors
Qua
ntity
28 P
ublic
atio
ns20
Pro
mot
iona
l eve
nts;
est
ablis
h an
d su
ppor
t 33
sust
aina
ble
SMM
Es;
deve
lop/
revi
ew p
olic
y an
d le
gisl
atio
n
Qua
ntity
33 P
ublic
atio
ns
24 P
rom
otio
nal e
vent
s49
new
and
exi
stin
g SM
MEs
su
ppor
ted
Dev
elop
ed/re
view
ed tw
o po
licie
s/le
gisl
atio
n
26 P
ublic
atio
ns49
new
and
exi
stin
g SM
ME
supp
orte
d30
pro
mot
iona
l eve
nts
held
Qua
lity
Rel
evan
t con
tent
in p
ublic
atio
nsQ
ualit
yPr
ovid
e cr
edib
le, a
cces
sibl
e in
form
atio
n th
roug
h pu
blic
atio
ns
and
cons
ulta
tions
/pro
mot
iona
l ev
ents
Build
ing
stra
tegi
c re
latio
ns a
ssis
ted
in e
nhan
cing
dat
a bu
t cur
rent
ce
ntra
lisat
ion
of s
ubsc
riptio
n is
M
AJO
R p
robl
em fo
r Dire
ctor
ate
Con
sulta
tion
Mee
tings
/wor
ksho
ps, r
oad
show
s,
med
ia in
terv
iew
sC
onsu
ltatio
nM
eetin
gs/w
orks
hops
, roa
d sh
ows,
med
ia in
terv
iew
sTr
avel
repo
rts to
sub
stan
tiate
Acce
ssW
ritte
n, te
leph
onic
, vis
its, w
ebsi
te,
e-co
mm
unic
atio
nAc
cess
Writ
ten,
tele
phon
ic, v
isits
, w
ebsi
te, e
-com
mun
icat
ion
Elec
troni
c co
pies
to s
ubst
antia
te
Cou
rtesy
Batho�Pe
le p
rinci
ples
Cou
rtesy
Batho�Pe
le p
rinci
ples
Satis
fact
ory
com
men
ts fr
om c
lient
s pr
ovid
e fe
edba
ck b
asis
Ope
n an
d tra
nspa
rent
Annu
al R
epor
tO
pen
and
trans
pare
ntAn
nual
Rep
ort
Annu
al re
port
is a
pub
lic d
ocum
ent
Info
rmat
ion
DM
E W
ebsi
te, p
ublic
atio
ns a
nd
prom
otio
nal e
vent
sIn
form
atio
nD
ME
Web
site
, pub
licat
ions
and
fo
cus
on lo
cal e
vent
sR
egul
ar u
pdat
e of
info
on
web
site
PROGRAMME 4

92 PROGRAMME PERFORMANCE - SECTION 2
Key
Ser
vice
Serv
ice
bene
ficia
ries
Cur
rent
sta
ndar
d (2
008’
9)D
esire
d st
anda
rd (2
009’
10)
Prog
ress
as
at 3
1 M
arch
201
0
Red
ress
Polic
ies
on tr
ansf
orm
ing
indu
stry
; is
sues
as
rais
edR
edre
ssPo
licie
s on
tran
sfor
min
g in
dust
ry; d
ocum
ent a
ll co
mpl
aint
s an
d fe
edba
ck
prov
ided
Valu
e fo
r mon
eyW
ithin
bud
get
Valu
e fo
r m
oney
Effe
ctiv
e se
rvic
e de
liver
y (h
ighe
r im
pact
) with
redu
ced
budg
etO
pera
ting
with
in b
udge
t.
Tim
eAn
nual
lyTi
me
Annu
ally
Annu
ally
Cos
tC
ost
With
in b
udge
t
93
PROGRAMME 5: HYDROCARBONS, ENERGY PLANNING AND CLEAN ENERGY
Purpose: To undertake integrated energy planning to promote the sustainable use of energy resources by developing appropriate policies and regulations that promote the efficient use of petroleum products, coal, gas and renewable energy sources.
Measurable objectives:
• Ensure sustainable supply and demand of energy, while taking into account macroeconomic factors, environmental considerations and energy infrastructural development, by developing an integrated energy plan by March 2011.
• Improve the security of energy supply by fostering investments in storage for liquid fuels through the development of a strategic stocks policy by March 2009.
• Promote gas as an alternative source of energy in South Africa by developing a pricing policy and licensing regulations for the supply and distribution of liquid petroleum gas by October 2009, which will enable fuel switching as a demand management mechanism for electricity.
• Encourage research and development for energy-related technologies with a key focus on energy efficiency and mitigation of greenhouse gases by establishing the South African National Energy Development Institute by September 2009.
• Ensure access to affordable energy sources and services by increasing the number of operational integrated energy centres from six to nine before March 2010.
• Strengthen the regulatory framework in the petroleum products industry by ring-fencing regulated products and implementing the regulatory accounting system before March 2010.
• Create an enabling environment for the diversification of fuel sources by developing and implementing a predictable and stable regulatory regime by introducing maximum pricing for petrol, diesel, paraffin, liquid petroleum gas and biofuels in revised magisterial district zones by December 2009.
• Improve the security of energy supply through integrated planning by developing and implementing a national integrated energy modelling system by March 2011.
SERVICE DELIVERY
Service�delivery�objectives�and�indicators�
The approached undertaken by the Department for the implementation of the 2007 energy security master plan for liquid fuels had to be reviewed in response to the Competitions Act, 89 of 1998. Certain elements of the ESMP are currently being implemented, including the construction of the New Multi-Product Pipeline (NMPP). Aligned with the National Energy Act, 34 of 2008, the Department started focusing on implementing elements of the legislation, including drafting the business case for the establishment of the South African National Energy Development Institute (SANEDI). The process of drafting regulations for the mandatory submission of energy data is also underway. Over the medium- term, the Department will develop a number of enabling policies including a security of supply strategy and regulatory accounting framework for the industry. An effective petroleum licensing system is a prerequisite for the Department to effectively regulate prices along with health, safety and environmental compliance within the petroleum sector.
The implementation of the Petroleum Products Amendment Act (PPAA), 58 of 2003, provides for the licensing of manufacturers (refiners), wholesalers and retailers of petroleum products. It also promotes the transformation of the South African petroleum and liquid fuels industry, giving effect to the Liquid Fuels Charter. As at 31 March 2010, approximately 15,198 licences had been received since the implementation of the Act, with a total of 12,453 licences (all types) processed and approximately 2,745 waiting to be processed.
Service�delivery�achievements�
Petroleum licensing and compliance
The office of the Petroleum Controller is mandated to conduct a PPAA awareness campaign to create awareness about the rules and regulations of licensing petroleum operations and products, compliance monitoring and enforcement. The envisaged road shows, press releases and
PROGRAMME 5

94
quarterly regional workshops to assist in this regard could not be conducted due budgetary constraints. Regional retailer dealer workshops are, however, currently being conducted by Regional Directors of Energy to spread awareness.
The office of the Controller developed an action plan to address the conversion licence backlog of outstanding accepted applications which was approved by senior management. As a result of this action plan the conversion backlog was completely eradicated by September 2009 with a focus now on new applications. As regards capacity building, our office continued with the small business development course for analysts, which has had a positive impact on the standard of analysis.
In February each year, as required by PPAA regulations, the office of the Petroleum Controller receives annual information submissions from all licensed activities. This information is used to monitor the impact of the PPAA in the liquid fuels sector.
National�Integrated�Energy�Modelling�System�(NIEMS)
User requirement specifications for the development of NIEMS were finalised. Due to funding constraints alternative approaches to developing a South African energy modelling system were evaluated and certain recommendations made.
Integrated�Energy�Planning�Strategy�(IEPS)
A Terms of Reference for the Integrated Energy Planning (IEP) Strategy was developed, which outlines the purpose of the strategy, expected outcomes and benefits of a structured approach in developing an IEP. The draft is currently in progress.
Data
DoE hosted a Joint Oil Data Initiative (JODI) and African Petroleum Producers Association (APPA) training workshop in December 2009 to train local oil companies and DoE officials on the JODI questionnaire and APPA databank. Noticeable improvements have been made to the SA JODI data provision to the United Nations Statistical Division (UNSD) and International Energy Forum (IEF).
The Digest of South African Energy Statistics was finalised in 2009 and published in 2010. It provides a summary of the SA Energy Balance for 2006, with an overview of the energy demand by sectors and energy supply by energy carrier. It is useful for forecasting future energy demand and showing dominant energy carriers and their use.
The Energy Price Report was compiled and summarises monthly and annual historical prices of common energy carriers in South Africa. It is useful for forecasting future energy prices and for energy planning purposes.
The Energy Balance for 2006 was finalised and published on the Department’s website. This is a useful way to present an overview of the energy flows for a specific period in time.
These efforts indicate the DoE’s intention to reduce the lag in publishing the energy balances annually and the 2007, 2008 and 2009 Energy Balances will be released in the 2010’11 financial year.
The DoE has signed a Memorandum of Understanding on partnerships in the National Statistics System (NSS) in September 2009. The MOU is aimed at formalising collaboration between DoE and Stats SA or other relevant NSS partners on issues of data quality for the production of reliable energy statistics designated as official energy statistics. The DoE and Stats SA have held meetings with the aim of implementing the MoU and establishing a Joint Working Party to manage the implementation.
The draft Regulations on the Provision of Energy Data, to support the data collection process, were developed and approved for release for public comment by the Minister of Energy. The objectives of these regulations are to:
PROGRAMME PERFORMANCE - SECTION 2

95
• enable the Department to effectively collect, collate and publish quality energy data and information • provide for the type, manner and form of energy data and information that must be provided by any person; and• provide for the form and manner of the link between the energy database and information system to any other system within the public
administration.
The final Regulations will be gazetted in the 2010’11 financial year.
The SANEDI business plan was approved by the Minister of Energy in 2009 and submitted to the Minister of Finance and the Minister of Public Service and Administration for further consideration and approval.
FIFA�World�Cup�2010�Task�Team
A task team was set up by the DoE to ensure adequate supply of fuel during WC2010. The task team comprised officials from other government departments, state-owned entities and oil companies. The team’s responsibilities included the development of a consolidated supply plan for jet fuel and other petroleum products, identifying and addressing operational constraints across the supply chain and developing consolidated operational plans in conjunction with the oil industry and Transnet.
Illuminating�Paraffin�Project
Safe Illuminating Paraffin (IP) Appliances Pilot Programme
The programme seeks to test the efficacy and promote the use of safer IP appliances while addressing problems associated with harmful incidents caused by the use of IP in low income households in the country. To this end, one thousand (1,000) safe IP stoves were distributed by the Department to a thousand (1,000) households in four identified areas with a history of IP fire accidents. These areas are: Alexandra in Gauteng (350 beneficiaries), Emizamoyethu in the Western Cape (350 beneficiaries), Ezinqoleni Municipality in KwaZulu Natal (150 beneficiaries) and Mbizana in the Eastern Cape (150 beneficiaries). The programme was officially launched by the Minister at Ezinqoleni Municipality (KZN South Coast) in October 2009. Youths in the identified areas were temporarily employed to assist with the programme and build capacity for future initiatives. The programme roll-out in all the four areas was completed and its assessment, based on surveys conducted using questionnaires, will be done by the end of 2010’11 financial year. The programme included the supply of free ten (10) litres IP per month to the beneficiaries.
Strategic stocks
The Department developed a Draft Strategic Stocks Policy document for petroleum products to ensure that the economy does not suffer from shortages during severe liquid fuel supply disruptions/ catastrophes. The drafting of the concomitant regulations for the management of strategic stocks has commenced for finalisation during the 2010’11 financial year.
The Draft Strategic Stocks Policy document was approved for consultation with other economic sector departments. It is expected to be tabled to Cabinet during the forthcoming financial year.
LPG
In response to the public outcry about exorbitant LPG prices, the Department undertook to regulate the retail price of LPG supplied to residential customers. In line with Government’s efforts to expand the energy mix and promote LPG as an efficient energy carrier for household cooking and other thermal purposes, the Department developed Draft Regulations regarding the maximum retail price of LPG supplied to household customers. The Draft Regulations and the associated Draft Working Rules were published in the Government Gazette for public comment in November 2009. A stakeholder workshop on comments received was held in February 2010. Comments were considered and the draft documents revised and sent to the State Law Adviser (SLA) for legal advice. The SLA’s advice was incorporated and the regulation of the retail price of LPG supplied to residential customers is expected to come into effect within the first quarter of 2010’11 financial year.
PROGRAMME 5

96
Regulatory accounts
The goal is to have a uniform and transparent set of regulatory accounts where costs are allocated according to predetermined methods to provide certainty to investors with regards to the returns on assets throughout the petroleum industry value chain. This would be achieved by ring-fencing regulated from unregulated activities to eliminate actual and potential cross-subsidies.
The benchmark service station (BSS) model was completed and discussed with relevant stakeholders. The models for the other three segments, namely coastal storage, secondary storage and distribution, as well as wholesale and head office, will be finalised in October 2010.
New multi-product pipeline
In recognition of the fact that more than 60% of our liquid fuels demand lies within the Durban-to-Johannesburg corridor and the fact the Durban-to-Johannesburg Pipeline (DJP) had become inadequate to transport the required volumes of petroleum products from the coast to the inland regions, the Department in its Energy Security Master Plan (ESMP) included the construction of a bigger new multi-product pipeline (NMPP) by Transnet.
As part of the implementation of the ESMP, the Department, in conjunction with the Department of Public Enterprises and National Treasury, worked on the funding mechanism for the NMPP. This culminated in the Minister of Finance raising a security of supply levy of 7.5 cents per litre to enable motorists to contribute funds towards the construction of the NMPP during his Budget Speech on 13 February 2010.
Project Mthombo
The Energy Security Master Plan for Liquid Fuels (ESMP) advocated for the development of a crude oil refinery in Coega by South Africa’s National Oil Company, PetroSA to mitigate the country’s growing reliance on imported finished product as a result of inadequate local refining capacity. Pursuant to this, PetroSA commenced with the development of a project for a 400,000 barrels per day crude oil refinery in the port of Nqhura under the leadership of the Department.
Besides addressing South Africa’s liquid fuels challenges, this project is crucial in repositioning the National Oil Company to compete with the best and the most efficient oil companies and to facilitate the introduction of more stringent clean fuels specifications and standards in the South African market. The feasibility study was completed and a request to proceed with Front-end Engineering and Design (FEED) activities lodged with the Department.
Cleaner fuels
Clean fuels, because of lower toxic emissions, are essential for people’s health and improved engine performance and longevity in motor vehicles.
The first regulation of fuel specifications and standards by Government occurred in 2006 when the Department promulgated Regulations regarding Petroleum Products Specifications and Standards.
An Inter-Departmental Task Team, comprising the Departments of Energy, Environmental Affairs, Trade and Industry, Transport, National Treasury and the South African Bureau of Standards, was established to develop a Government position and roadmap on the second phase of future fuel specifications and standards.
A draft Position Paper and Roadmap have been finalised, having engaged the two key stakeholders, namely the South African Petroleum Industry Association (SAPIA) and National Association of Automobile Manufacturers (NAAMSA). Intense consultations with all stakeholders will commence after the 2010 FIFA World Cup Soccer Tournament.
PROGRAMME PERFORMANCE - SECTION 2

97
Integrated Energy Centres (IeCs)
Integrated Energy Centres are one of many interventions led by the Department as part of Government’s comprehensive response to the challenges of addressing energy poverty and underdevelopment, particularly in outlying and rural areas. IeCs are “one-stop” shops in identified poverty nodal areas to contribute towards access to information on various energy sources/services and access to energy services (mainly petrol and diesel and, in some cases, illuminating paraffin and LPG), as well as facilitating integrated development and job creation in poverty stricken areas. IeCs are run by community cooperatives with the assistance of the Department.
To date there are five (5) operational IeCs with an average of eight (8) employees and forty (40) permanent jobs created. The eight (8) other IeCs are at different stages of development and not yet operational. Those that will be operationalised in the near future are in Eshane in Greytown, eNkandla and Ulundi in Kwazulu Natal and Mbizana and Qunu in the Eastern Cape. The Department continues to assist cooperatives to run IeCs in the Eastern Cape, Limpopo, North West and Northern Cape provinces.
Some of the achievements in respect of IeCs under development during the 2009’10 financial year include:
• Three IeCs, namely Ulundi (KwaZulu Natal), Qunu and Mbizana (both in the Eastern Cape) are at advanced stages of their Environmental Impact Assessments
• A sod-turning ceremony for the Qunu IeC was held in February 2010• The establishment and registration of the Mbizana and Qunu cooperatives with the Department of Trade and Industry in the Eastern Cape
in line with the cooperative framework for IeCs was completed • Two energy needs assessment surveys were done in Western Cape and Limpopo • Information sessions on energy safety and energy education were organised in seven Provinces, namely Western Cape, Eastern Cape,
Kwazulu-Natal, North West, Mpumalanga, Gauteng and Limpopo).
However, the allocation of land for IeCs and the operation of cooperatives to ensure the self-sustainability of IeCs remain a challenge.
Clean coal technologies
South Africa is richly endowed with coal and a coal-based economy, with more than 75% electricity generated from coal-fired power stations and about 22.5% of liquid fuels derived from coal-to-liquid plants. Cognisant of the concomitant negative impact of coal mining and energy generation from coal, the Department embarked on various initiatives to develop clean coal technologies and less environmentally threatening methods of using coal as an energy resource.
Among technology developments being considered and closely monitored is carbon capture and storage (CCS) or carbon sequestration, which entails the capturing and burying of carbon dioxide underground instead of letting it vent into the atmosphere to pollute the atmosphere and contribute to climate change. During 2009’10, the Department served as the Vice-Chair of the Policy Group of the Carbon Sequestration Leadership Forum (CSLF), which resulted in South Africa being elected as the Vice-Chair of the CSLF Technical Group. A Centre for CCS under the auspices of the South African Energy Research Institute (SANERI) was launched and South Africa hosted its first-ever CCS Conference in September 2009. This put South Africa on course for the development and deployment of CCS as part of its Long-Term Mitigation Strategy (LMTS) for climate change.
South African coal roadmap
In conjunction with the industry and related stakeholders, the Department developed the founding documents and requisite governance structure for the development of a South African Coal Roadmap. The objectives of the Coal Roadmap encapsulate the current contribution of the individual and collective components of the coal industry in South Africa; the local and international drivers that will shape the industry in the future; and the identification of the options that can be deployed to maximise future benefits for South Africa.
With stakeholders now on board, the actual development of the roadmap will commence during the 2010’11 financial year.
PROGRAMME 5

98
MEA
SUR
AB
LE O
BJE
CTI
VES,
KEY
AC
TIVI
TIES
AN
D M
EDIU
M -T
ERM
OU
TPU
T TA
RG
ETS
Stak
ehol
der /
Cus
tom
er M
easu
res
Obj
ectiv
esM
easu
res
Initi
ativ
esTa
rget
s09
’10
Prog
ress
as
at 3
1 M
arch
201
0C
onst
rain
ts/re
ason
for u
nder
-pe
rfor
man
ceIm
prov
ed
turn
arou
nd ti
mes
% a
dher
ence
to
pres
crib
ed ti
mef
ram
es
Attr
actio
n an
d re
tent
ion
of
com
pete
nt a
naly
sts,
wor
king
ov
ertim
e, s
taff
train
ing,
edu
catin
g ap
plic
ants
100%
Ei
ght n
ew a
naly
sts
appo
inte
d to
join
the
Lice
nsin
g D
irect
orat
e in
May
201
0; e
duca
tion
of a
pplic
ants
on
goin
g pr
oces
s im
plem
ente
d by
Reg
iona
l Dire
ctor
s
Fund
ing
still
an is
sue
for t
rain
ing
of s
taff
Num
ber o
f reg
ulat
ions
pro
mul
gate
dR
egul
atio
ns fo
r use
of p
aym
ent c
ards
to p
urch
ase
petro
l and
die
sel p
rom
ulga
ted;
dr
aft r
egul
atio
ns o
n th
e pr
ovis
ion
of e
nerg
y da
ta
com
plet
ed fo
r pub
licat
ion
in A
pril
2010
Impr
oved
tu
rnar
ound
tim
es%
redu
ctio
n in
fina
lisin
g pr
oces
sing
of
lice
nsin
g ap
plic
atio
ns10
0%
Cur
rent
ly a
t 60%
in re
duci
ng tu
rnar
ound
tim
es o
f fin
alis
ing
appl
icat
ions
Inte
rnal
inef
ficie
ncie
s eg
mis
filin
g ap
plic
atio
ns a
nd a
dditi
onal
in
form
atio
n, p
oor t
elep
hone
sy
stem
, lac
k of
func
tiona
lity
on c
urre
nt P
PALS
, lac
k of
un
ders
tand
ing
clie
nts
proc
esse
s,
lack
of I
T su
ppor
t eg
slow
tu
rnar
ound
tim
e fo
r rev
ersa
ls
Impr
oved
tu
rnar
ound
tim
esAc
know
-ledg
emen
t of
quer
ies
Impl
emen
cor
resp
onde
nce
man
agem
ent s
yste
m5
days
48-h
our q
uery
ack
now
ledg
emen
t tur
n- a
roun
d tim
e an
d fin
ality
with
in s
even
day
sC
onst
ant s
yste
m d
ownt
imes
Prov
ide
regu
lato
ry
certa
inty
Impl
emen
t-atio
n of
an
alyt
ical
cap
abilit
y to
gui
de d
ecis
ion-
m
akin
g
Dev
elop
and
impl
emen
t a N
atio
nal
Inte
grat
ed E
nerg
y M
odel
ling
Syst
em
(NIE
MS)
Con
sulta
nts
appo
inte
d to
de
velo
p sy
stem
(P
hase
1 o
f Pr
ojec
t)
A ph
ased
app
roac
h of
dev
elop
ing
NIE
MS
will
be
unde
rtake
n; p
ropr
ieta
ry m
odel
ling
tool
s w
ill be
use
d in
Pha
se 1
dev
elop
men
t of I
EP; f
ully
ope
ratio
nal
syst
em w
ill be
cus
tom
ised
and
fully
inte
grat
ed; f
ully
op
erat
iona
l mod
el w
ill be
use
d fo
r ong
oing
revi
ew o
f IE
P
Fund
ing
for N
IEM
S on
ly
appr
oved
from
201
0’11
fina
ncia
l ye
ar; d
evel
opm
ent t
here
fore
to
com
men
ce in
201
0’11
fina
ncia
l ye
ar
Prov
ide
regu
lato
ry
certa
inty
Inte
grat
ed E
nerg
y Pl
an
(IEP)
1.
Dev
elop
an
Inte
grat
ed E
nerg
y Pl
anni
ng s
trate
gy w
hich
out
lines
th
e op
erat
ing
fram
ewor
k an
d pr
oces
s fo
r dev
elop
ing
an
Inte
grat
ed E
nerg
y Pl
an.
Dev
elop
an
Inte
grat
ed
Ener
gy
Plan
ning
St
rate
gy
& En
ergy
St
rate
gy
Sout
h Af
rican
Nat
iona
l Ene
rgy
Res
earc
h In
stitu
te
(SAN
ERI)
prop
osal
rece
ived
in re
spon
se to
requ
est
for a
ssis
tanc
e w
ith d
raft
IEP
stra
tegy
; DoE
requ
este
d re
visi
on to
bet
ter
alig
ned
it w
ith T
erm
s of
Ref
eren
ce
scop
e
Cap
acity
con
stra
ints
hav
e hi
nder
ed p
rogr
ess
on th
e IE
PS
PROGRAMME PERFORMANCE - SECTION 2

99
Obj
ectiv
esM
easu
res
Initi
ativ
esTa
rget
s09
’10
Prog
ress
as
at 3
1 M
arch
201
0C
onst
rain
ts/re
ason
for u
nder
-pe
rfor
man
ce2.
Pu
t in
plac
e st
ruct
ures
to
supp
ort t
he o
pera
ting
fram
ewor
k pr
opos
ed in
the
IEP
stra
tegy
DoE
app
roac
hed
Ener
gy R
esea
rch
Cen
tre (E
RC
) to
assi
st w
ith d
evel
opm
ent o
f IEP
; con
tract
fina
lisat
ion
by e
nd M
ay 2
010
and
impl
emen
tatio
n to
sta
rt 1
June
20
10
Dev
elop
men
t of I
EP w
ill ta
ke p
lace
w
ithin
the
2010
/11
finan
cial
yea
r
3.
Dev
elop
the
IEP
guid
ed b
y th
e pr
oces
ses
and
supp
orte
d by
th
e st
ruct
ures
def
ined
in th
e IE
P st
rate
gyPr
ovid
e re
gula
tory
ce
rtain
ty
% C
ompl
etio
n of
re
gula
tory
acc
ount
ing
syst
em
Con
sulti
ng fi
rm d
evel
opin
g m
odel
100%
The
Benc
hmar
k Se
rvic
e St
atio
n (B
SS) f
inal
repo
rt (in
clud
ing
the
mod
el) r
ecei
ved
in D
ecem
ber 2
009.
Slow
sub
mis
sion
of d
ata
by th
e oi
l in
dust
ry a
nd th
e ga
ps w
ithin
the
data
tem
plat
es.
% re
duct
ion
in
iden
tifie
d po
licy
and
regu
lato
ry g
aps
Rev
iew
and
am
endm
ent o
f pol
icie
s an
d re
gula
tions
, dev
elop
regu
latio
n un
der N
atio
nal E
nerg
y Ac
t
80%
Dra
ft R
egul
atio
ns o
n th
e pr
ovis
ion
of E
nerg
y D
ata
have
bee
n de
velo
ped
and
revi
ewed
inte
rnal
ly.
Prom
ote
acce
ss
to e
nerg
y se
rvic
es
Num
ber o
f new
pe
trole
um p
rodu
cts
licen
ses
issu
ed
Info
rmat
ion
awar
enes
s di
ssem
inat
ion
prog
ram
me
1200
per
an
num
5581
lice
nsed
issu
ed a
s at
31st
Mar
ch 2
010
Prom
ote
acce
ss
to e
nerg
y se
rvic
es
Num
ber o
f IeC
s es
tabl
ishe
dM
obilis
e pa
rtner
s w
ithin
the
IeC
fra
mew
ork
(Com
mun
ities
, Loc
al
Gov
ernm
ent a
nd O
il C
ompa
nies
)
1Q
amat
a in
Chr
is H
ani D
M a
nd M
biza
na in
OR
Tam
bo
DM
- Ie
Cs
fund
ed b
y Pe
troSA
, Qun
u in
OR
Tam
bo
DM
, Ulu
ndi i
n Zu
lula
nd D
M a
nd N
kand
la in
Zul
ulan
d D
M -
IeC
s fu
nded
by
Saso
l
Sust
aina
bilit
y of
com
mun
ity
Co-
oper
ativ
es ;
co-o
pera
tion
at m
unic
ipal
leve
l; an
d de
lays
in
acq
uisi
tion
of la
nd re
mai
n a
chal
leng
e N
umbe
r of I
eCs
com
mis
sion
ed a
nd
oper
atio
nalis
ed
Esta
blis
h co
-ope
rativ
es in
line
with
Ie
C fr
amew
ork
1M
biza
na, Q
unu,
Ulu
ndi,
Qam
ata
IeC
Coo
pera
tives
ar
e re
gist
ered
with
the
DTI
. The
se Ie
Cs
are
at
diffe
rent
sta
ges
of d
evel
opm
ent
PROGRAMME 5

100
Obj
ectiv
esM
easu
res
Initi
ativ
esTa
rget
s09
’10
Prog
ress
as
at 3
1 M
arch
201
0C
onst
rain
ts/re
ason
for u
nder
-pe
rfor
man
cePr
ovid
e cr
edib
le
acce
ssib
le
info
rmat
ion
Num
ber o
f rep
orts
on
regi
onal
sta
keho
lder
en
gage
men
ts
Mee
tings
, wor
ksho
ps a
nd /
or
sem
inar
s w
ith (C
omm
uniti
es,
indu
stry
and
oth
er o
rgan
s of
sta
te)
Ever
y 2
mon
ths
The
Min
iste
r con
duct
ed th
e Q
unu
IeC
sod
turn
ing
cere
mon
y on
26
Feb
2010
. Th
e di
strib
utio
n of
par
affin
sto
ves
for p
hase
3 a
nd
final
sur
vey
in M
biza
na, E
zinq
olen
i, Al
exan
dra
and
Emiz
amoy
ethu
hav
e be
en c
ompl
eted
Num
ber o
f con
clud
ed
of b
ilate
ral a
gree
men
tsId
entif
y co
untri
es o
f stra
tegi
c im
porta
nce
and
initi
ate
bila
tera
l ne
gotia
tions
32
agre
emen
ts h
ave
been
sig
ned
with
Zam
bia
and
Vene
zuel
a.Ag
reem
ent s
igne
d: N
iger
ia w
as
pend
ing
but c
ance
lled
for p
oliti
cal
reas
ons.
Num
ber o
f mul
tilat
eral
ag
reem
ents
con
clud
ed
Iden
tify
coun
tries
of s
trate
gic
impo
rtanc
e an
d in
itiat
e m
ultil
ater
al
nego
tiatio
ns
3EU
ene
rgy
and
the
Clin
ton
foun
datio
n ag
reem
ents
to
be s
igne
d in
201
0/11
.Pa
rtici
patio
n in
the
Afric
a-So
uth
Amer
ica
(ASA
) C
orpo
ratio
n –
Sum
mit
in S
ep-0
9.
Met
hane
to m
arke
ts a
gree
men
t is
not y
et c
ompl
eted
.
Prov
ide
cred
ible
ac
cess
ible
in
form
atio
n
% im
plem
enta
tion
of
bila
tera
l / m
ultil
ater
al
agre
emen
ts
Esta
blis
h nu
mbe
r of e
xist
ing
agre
emen
ts a
nd M
OU
’s pe
ndin
g im
plem
enta
tion
30%
Agre
emen
t with
Nig
eria
pen
ding
impl
emen
tatio
n.
Iden
tify
impl
emen
ting
agen
ts a
nd
conc
lude
impl
emen
tatio
n pl
ans
Agen
ts h
ave
been
iden
tifie
d e.
g. E
skom
and
Pet
rosa
% im
prov
emen
t in
prov
isio
n of
acc
urat
e,
relia
ble
and
timel
y da
ta (J
OD
I Dat
a,
Ener
gy P
rice
Rep
ort,
APPA
Dat
a an
d ot
her
data
)
Impr
ove
data
col
lect
ion
met
hodo
logy
, whi
ch in
clud
es
(invo
lvem
ent o
f dat
a su
pplie
rs b
y m
eetin
g re
gula
rly)
50%
Ener
gy D
iges
t and
Ene
rgy
Pric
e R
epor
t hav
e al
so
been
com
plet
ed a
wai
ting
publ
icat
ion
All i
nitia
tives
are
cur
rent
ly o
n tra
ck.
How
ever
ava
ilabi
lity
of d
ata
from
N
ERSA
has
bee
n th
e bi
gges
t ch
alle
nge
as it
app
ears
that
they
ar
e un
able
to p
rovi
de th
e da
ta d
ue
to c
apac
ity/re
sour
ce c
onst
rain
ts.
Cha
lleng
e be
ing
expe
rienc
ed w
ith
obta
inin
g Pl
att’s
dat
a fo
r Ene
rgy
pric
e re
port
Setu
p in
stitu
tiona
l arr
ange
men
ts to
en
cour
age
the
shar
ing
of d
ata
in a
tim
ely
man
ner
PROGRAMME PERFORMANCE - SECTION 2

101
Obj
ectiv
esM
easu
res
Initi
ativ
esTa
rget
s09
’10
Prog
ress
as
at 3
1 M
arch
201
0C
onst
rain
ts/re
ason
for u
nder
-pe
rfor
man
cePr
ovid
e cr
edib
le
acce
ssib
le
info
rmat
ion
Prov
ide
cred
ible
ac
cess
ible
dat
a an
d tim
ely
Ener
gy B
alan
ce
data
Sign
ing
and
impl
emen
tatio
n of
MO
U
betw
een
DM
E an
d St
ats
SA.
Red
uce
lag
in
data
sup
ply
30
mon
ths
Join
t Ene
rgy
Stat
istic
s Ta
sk T
eam
(JES
TT) h
as b
een
esta
blis
hed.
Ter
ms
of R
efer
ence
are
cur
rent
ly b
eing
dr
afte
d fo
r the
app
rova
l of t
he D
irect
or G
ener
al a
s w
ell a
s St
atis
ticia
n G
ener
al a
nd C
EO o
f NER
SA.
MO
U h
as b
een
sign
ed a
nd in
the
proc
ess
of
impl
emen
ting
the
MO
U.
Proj
ect o
n tra
ck
Dev
elop
an
Ener
gy S
tatis
tics
Met
hodo
logy
Man
ual
Inpu
ts h
ave
been
pro
vide
d to
the
Uni
ted
Nat
ions
on
the
Inte
rnat
iona
l Rec
omm
enda
tions
on
Ener
gy
Stat
istic
s M
anua
l. T
he m
anua
l will
serv
e as
a g
uide
to
the
deve
lopm
ent o
f the
SA
Man
ual.
Prov
ide
cred
ible
ac
cess
ible
dat
a an
d tim
ely
Ener
gy B
alan
ce
data
Ensu
re d
ata
supp
liers
are
au
fait
with
our
nee
ds to
rele
ase
and
publ
ish
data
regu
larly
and
ear
ly
Red
uce
lag
in
data
sup
ply
30
mon
ths
Join
t Oil
Dat
a In
itiat
ive
(JO
DI)
and
Afric
an P
etro
leum
Pr
oduc
ers
Asso
ciat
ion
(APP
A) D
ata
has
been
su
bmitt
ed
Alth
ough
JO
DI a
nd A
PPA
data
has
no
w b
een
subm
itted
. Obt
aini
ng
data
from
pro
vide
rs in
a ti
mel
y m
anne
r is
an o
ngoi
ng c
halle
nge
Prov
ide
cred
ible
ac
cess
ible
in
form
atio
n
Num
ber o
f pub
licat
ions
of
ene
rgy
data
En
gage
dat
a su
pplie
rs to
pre
vent
pu
blic
atio
ns b
eing
del
ayed
2En
ergy
Dig
est a
nd E
nerg
y Pr
ice
Rep
ort h
ave
been
co
mpl
eted
and
aw
aitin
g pu
blic
atio
nSt
atus
repo
rt on
pe
trole
um li
cenc
e ap
plic
atio
ns li
sted
on
DM
E w
ebsi
te
licen
sing
dire
ctor
ate
to c
ompi
le
repo
rt an
d po
st o
n w
ebsi
te1
per m
onth
Last
pub
licat
ion
was
don
e in
11
Mar
ch 2
010.
Th
is h
as b
een
done
on
mon
thly
ba
ses
sinc
e Ja
nuar
y 20
10.
Impr
oved
aw
aren
ess
and
repu
tatio
n of
D
ME
Num
ber o
f aw
aren
ess
cam
paig
ns c
ondu
cted
(N
umbe
r of P
PAA
awar
enes
s ca
mpa
igns
co
nduc
ted
- roa
d sh
ows,
wor
ksho
ps,
audi
o &
visu
al
adve
rtise
men
t, ex
hibi
tions
PPA
A aw
aren
ess
cam
paig
n to
co
nsci
entis
e pe
ople
abo
ut th
e ru
les
and
regu
latio
ns p
erta
inin
g to
the
licen
sing
of p
etro
leum
ope
ratio
ns,
prod
ucts
and
com
plia
nce
mon
itorin
g an
d en
forc
emen
t the
reto
At le
ast 2
ro
ad s
how
s pe
r qua
rter
/ reg
ion.
1
Qua
rterly
w
orks
hop
per
regi
on. 1
Bi-
annu
al p
ress
re
leas
e
No
road
sho
ws
or b
i ann
ual p
ress
rele
ase
acco
mpl
ishe
d du
e to
fina
ncia
l con
stra
ints
.
How
ever
Reg
iona
l ret
aile
r dea
ler w
orks
hops
wer
e at
tend
ed b
y R
egio
nal D
irect
ors
No
fund
ing
avai
labl
e
PROGRAMME 5

102
Inte
rnal
Pro
cess
es
Obj
ectiv
esM
easu
res
Initi
ativ
esTa
rget
s20
09/1
0Pr
ogre
ss a
s at
31 M
arch
201
0C
onst
rain
ts/re
ason
for u
nder
-per
form
ance
Effic
ient
Bus
ines
s Pr
oces
ses
Impr
ove
mon
itorin
g an
d en
forc
emen
t of
pol
icie
s/
legi
slat
ion
% o
f gui
delin
es d
evel
oped
in li
ne
with
legi
slat
ion
Esta
blis
h nu
mbe
r of g
uide
lines
re
quire
d70
%G
uide
lines
dev
elop
ed fo
r pub
lishi
ng
docu
men
ts in
Gov
ernm
ent G
azet
te;
guid
elin
es d
evel
oped
to d
eter
min
e th
e pr
ice
of L
PGD
evel
op g
uide
lines
% im
plem
enta
tion
of s
igne
d M
oU
betw
een
DM
E an
d SA
RS
wrt
fuel
sp
ecifi
catio
ns a
nd s
tand
ards
DM
E an
d SA
RS
initi
ativ
e to
m
onito
r com
plia
nce
and
enfo
rce
fuel
spe
cific
atio
ns a
nd s
tand
ards
re
gula
tions
Qua
rterly
pr
ogre
ss re
port
No
form
al M
oU s
igne
d w
ith S
ARS
sinc
e D
epar
tmen
t dis
cove
red
that
SAR
S do
es n
ot
cond
uct f
uel s
peci
ficat
ions
and
sta
ndar
ds
% re
duct
ion
in c
ompl
aint
s re
latin
g to
pro
cedu
ral i
ncon
sist
ency
Inst
itute
com
plai
nts
regi
ster
and
re
porti
ng s
yste
m90
%C
ompl
aint
s re
gist
er a
nd re
porti
ng s
yste
m
inst
itute
d to
reco
rd c
ompl
aint
s w
hen
rece
ived
Inst
itute
pro
cess
for d
ocum
entin
g co
mpl
aint
sD
irect
orat
e al
so in
stitu
ted
mon
itorin
g an
d fo
llow
-up
of a
ctio
ns ta
ken
by In
spec
tors
Num
ber o
f lic
ense
e co
mpl
ianc
e in
spec
tions
Iden
tify
prov
ince
s w
ith h
igh
prev
alen
ce o
f con
trave
ning
re
gula
tions
120
per m
onth
Mpu
mal
anga
, Lim
popo
, KZN
and
Eas
tern
C
ape
iden
tifie
d as
pro
vinc
es w
ith h
igh
prev
alen
ce o
f con
trave
ning
regu
latio
ns;
687
insp
ectio
ns c
ondu
cted
dur
ing
last
qua
rter
and
2,30
9 fo
r the
yea
r und
er re
view
; mon
thly
in
spec
tion
sche
dule
s an
d re
ports
from
re
gion
s; s
ched
ules
don
e at
the
begi
nnin
g of
th
e m
onth
and
repo
rts a
t ten
d of
the
mon
th
and
two
are
reco
ncile
d at
the
end
of th
e m
onth
Con
duct
com
plia
nce
insp
ectio
ns%
impr
ovem
ent i
n st
akeh
olde
r co
mpl
ianc
e (e
xter
nal)
Impl
emen
t pen
altie
s re
sulti
ng fr
om
non-
com
plia
nce
50%
Pena
lties
impl
emen
ted
alig
ned
with
Act
and
re
gula
tions
Ac
t and
regu
latio
ns
requ
ires
corre
ctiv
e ap
proa
ch b
efor
e no
n-co
mpl
ying
per
sons
can
be
char
ged
Anal
yse
com
plia
nce
insp
ectio
n re
ports
Com
plia
nce
insp
ectio
n re
ports
ana
lyse
d on
m
onth
ly b
asis
PROGRAMME PERFORMANCE - SECTION 2

103
Obj
ectiv
esM
easu
res
Initi
ativ
esTa
rget
s20
09/1
0Pr
ogre
ss a
s at
31 M
arch
201
0C
onst
rain
ts/re
ason
for u
nder
-per
form
ance
% im
prov
emen
t in
stak
ehol
der
com
plia
nce
(ext
erna
l)In
crea
se n
umbe
r of i
nspe
ctio
ns p
er
prov
ince
90%
Num
ber o
f ins
pect
ions
per
pro
vinc
e im
prov
ed
by 6
0.35
% fo
r the
200
9’10
fina
ncia
l yea
r; 2,
309
insp
ectio
ns c
ompl
eted
dur
ing
2009
’10
repo
rting
per
iod
Fram
ewor
k do
es n
ot a
llow
ef
fect
ive
com
plia
nce
mon
itorin
g, t
here
fore
PP
AA
revi
ewre
com
men
ded
Impr
ove
mon
itorin
g an
d en
forc
emen
t of
pol
icie
s/
legi
slat
ion
Esta
blis
h SA
Nat
iona
l Ene
rgy
Dev
elop
men
t Ins
titut
eD
evel
op b
usin
ess
plan
and
bud
get
with
Dep
artm
ent o
f Sci
ence
and
Te
chno
logy
(DST
), N
atio
nal E
nerg
y Ef
ficie
ncy
Agen
cy (N
AEE
A) a
nd
Sout
h Af
rican
Nat
iona
l Ene
rgy
Res
earc
h In
stitu
te (S
ANER
I) fo
r th
e es
tabl
ishm
ent o
f Sou
th A
frica
n N
atio
nal E
nerg
y D
evel
opm
ent
Inst
itute
(SAN
EDI)
Busi
ness
pla
n fo
r SAN
EDI
Busi
ness
cas
e cu
rrent
ly u
nder
revi
ew b
y D
PSA
and
Nat
iona
l Tre
asur
y; v
ario
us
enga
gem
ents
hel
d w
ith N
atio
nal T
reas
ury
NER
SA, D
oE a
nd
Nat
iona
l Tre
asur
y to
cl
arify
ope
ratin
g m
odel
an
d fu
ndin
g m
echa
nism
fo
r ene
rgy
effic
ienc
y;
busi
ness
cas
e to
cle
arly
ar
ticul
ate
SAN
EDI
stra
tegi
c po
sitio
ning
in
ener
gy re
sear
ch w
rt D
ST
and
TIA
Impl
emen
t Ene
rgy
Secu
rity
Mas
ter P
lan
(ESM
P) fo
r liq
uid
fuel
s
Set u
p a
task
team
to fo
cus
on
ensu
ring
the
adeq
uate
sup
ply
of fu
el
durin
g 20
10 W
orld
Cup
Addr
ess
ESM
P sh
ort-t
erm
st
rate
gic
as
wel
l as
polic
y an
d re
gula
tion
depe
nden
cies
Exem
ptio
n on
rele
vant
sec
tions
of C
ompe
titio
n Ac
t gra
nted
by
Com
petit
ion
Com
mis
sion
erSo
me
com
pani
es s
ubm
it in
com
plet
e/un
clea
r co
ntin
genc
y pl
ans
Mon
itor a
nd re
port
indu
stry
pro
gres
s an
d SO
E re
gard
ing
impl
emen
tatio
n of
ES
MP
initi
ativ
es/ p
roje
cts
Con
solid
ated
Ris
k M
atrix
com
plet
ed;
indi
vidu
al c
ontin
genc
y pl
ans
subm
itted
by
oil
com
pani
es
Del
ay in
sub
mis
sion
of
requ
ired
info
rmat
ion
by
som
e co
mpa
nies
resu
lted
in d
elay
s of
con
solid
atin
g in
form
atio
nBe
nchm
ark
agai
nst
inte
rnat
iona
l bes
t pr
actic
e
% s
tand
ards
that
mee
t bes
t pr
actic
eId
entif
y po
licie
s, p
roce
dure
s an
d pr
oces
ses
that
requ
ire b
ench
mar
king
100%
Iden
tifie
d de
velo
pmen
t of f
utur
e fu
el
spec
ifica
tions
and
sta
ndar
ds fo
r ben
chm
arki
ng
Una
vaila
bilit
y of
Tas
k Te
am m
embe
rs a
nd la
ck
of a
ctiv
e pa
rtici
patio
n (p
ar-
ticul
arly
Nat
iona
l Tre
asur
y)
PROGRAMME 5

104
Obj
ectiv
esM
easu
res
Initi
ativ
esTa
rget
s20
09/1
0Pr
ogre
ss a
s at
31 M
arch
201
0C
onst
rain
ts/re
ason
for u
nder
-per
form
ance
Alig
n po
licie
s, p
roce
dure
s an
d pr
oces
ses
with
bes
t pra
ctic
eIn
terd
epar
tmen
tal T
ask
Team
hel
d th
ree
mee
tings
, inc
l Dep
artm
ent o
f Env
ironm
enta
l Af
fairs
(DE
A) p
rese
ntat
ion;
sep
arat
e m
eetin
gs
held
with
Sou
th A
frica
n Pe
trole
um In
dust
ry
Asso
ciat
ion
(SAP
IA)
and
Nat
iona
l Ass
ocia
tion
of A
utom
obile
Man
ufac
ture
s of
Sou
th A
frica
(N
AAM
SA)
Rev
iew
and
de
velo
p po
licie
s,
proc
edur
es a
nd
proc
esse
s
% p
olic
ies
and
proc
edur
es
stan
dard
ised
1 W
orks
hops
and
issu
e of
gui
delin
es10
0%LP
G p
rice
regu
latio
ns fo
r res
iden
tial
cust
omer
s in
cl w
orki
ng ru
les
prom
ulga
ted
for
publ
ic c
omm
ent
Inco
rpor
atio
n of
Sta
te L
aw
Advi
sor’s
com
men
t mea
nt
chan
ge o
f cou
rse;
dat
a fo
r zo
ne p
ricin
g sy
stem
not
re
adily
ava
ilabl
e2
Pol
icy
and
stan
dard
s au
dit t
o de
term
ine
the
base
line
1
CC
S re
gula
tory
wor
ksho
p he
ld in
O
ctob
er 2
009;
par
ticip
ants
incl
indu
stry
, go
vern
men
t dep
artm
ents
and
inte
rnat
iona
l ex
perts
, ie
IEA;
repo
rt fro
m c
onsu
ltant
ex
pect
ed to
form
bas
is fo
r pro
posa
l to
dev
elop
CC
S le
gisl
ativ
e/re
gula
tory
fra
mew
ork
2 N
ERSA
indi
cate
d ne
ed fo
r rev
iew
bas
ed
on e
xper
ienc
e in
impl
emen
ting
Gas
Act
; m
eetin
g w
ill be
hel
d to
iden
tify
prop
osed
ch
ange
s an
d if
war
rant
ed, i
nclu
de it
in th
e Pa
rliam
enta
ry 2
010’
11 p
rogr
amm
e
Cha
lleng
e: in
fanc
y st
age
of C
CS
tech
nolo
gy
3 Id
entif
y ga
ps1
Po
licy
gap
in C
CS
2
Nee
d to
revi
ew G
as A
ct3
N
eed
to re
view
Pet
role
um P
rodu
ct
Amen
dmen
t Act
(PPA
A)
4 Ad
dres
s ga
psR
evie
ws:
PPA
A in
201
0; A
men
dmen
t Act
20
11’1
2; H
DSA
Em
pow
erm
ent i
n fo
urth
qu
arte
r 201
0’11
Proj
ect o
n ho
ld to
ac
com
mod
ate
othe
r ur
gent
prio
ritie
s 1
Audi
t to
esta
blis
h nu
mbe
r of
proc
edur
es to
be
deve
lope
d10
0%G
uide
line
for p
ublis
hing
doc
umen
t in
Gov
ernm
ent G
azet
te c
ompl
eted
for t
he
Dire
ctor
ate
PROGRAMME PERFORMANCE - SECTION 2

105
Obj
ectiv
esM
easu
res
Initi
ativ
esTa
rget
s20
09/1
0Pr
ogre
ss a
s at
31 M
arch
201
0C
onst
rain
ts/re
ason
for u
nder
-per
form
ance
Rev
iew
and
de
velo
p po
licie
s,
proc
edur
es a
nd
proc
esse
s
% p
roce
dure
s al
igne
d w
ith
polic
ies
2 D
evel
op a
nd im
plem
ent p
roce
dure
s10
0%D
raft
Stra
tegi
c St
ocks
Pol
icy
final
ised
fo
r con
sulta
tion
with
oth
er g
over
nmen
t de
partm
ents
Effe
ctiv
e Se
rvic
e D
eliv
ery
Allo
catio
n of
ade
quat
e re
sour
ces
% a
lignm
ent o
f res
ourc
es to
op
erat
iona
l nee
dsAl
ign
busi
ness
pla
ns w
ith E
NE
50%
Spen
ding
pla
ns a
re a
ligne
d w
ith w
ork
plan
s de
spite
no
fund
ing
for e
xecu
tion
Build
ac
coun
tabi
lity
% im
plem
enta
tion
of b
alan
ced
scor
ecar
dAs
per
CS
initi
ativ
es10
0%M
anag
ers
mad
e ac
coun
tabl
e th
roug
h m
onth
ly
repo
rtsBu
ild a
nd m
anag
e se
rvic
e le
vel
agre
emen
ts
(SLA
s)
% v
ette
d SL
AsBe
nchm
ark
SLAs
aga
inst
bes
t pr
actic
e10
0%Ag
reem
ents
sig
ned
with
con
sulta
nts
(as
per
supp
ly c
hain
requ
irem
ents
)
% a
dher
ence
to S
LAs
Impl
emen
t and
revi
ew c
ompl
ianc
e w
ith S
LAs
70%
Esta
blis
h se
rvic
e st
anda
rds
% s
tand
ards
est
ablis
hed
Dev
elop
and
impl
emen
t SD
IP10
0%SI
DP
deve
lope
d an
d cu
rrent
ly re
porte
d qu
arte
rly
Und
erst
and
cust
omer
/ st
akeh
olde
r nee
ds
Surv
eys
cond
ucte
d to
det
erm
ine
cust
omer
/ sta
keho
lder
nee
ds1
Dra
ft an
d ci
rcul
ate
cust
omer
sa
tisfa
ctio
n su
rvey
Form
ulat
ing
cust
omer
sat
isfa
ctio
n su
rvey
; to
be fi
nalis
ed b
y fin
anci
al y
eare
nd2
Ana
lyse
resu
lts o
f sur
vey
Stak
ehol
der a
nd C
usto
mer
Rel
atio
nshi
p M
anag
emen
tEd
ucat
e an
d em
pow
er
stak
ehol
ders
Con
vene
freq
uent
wor
ksho
ps,
conf
eren
ces,
sem
inar
s, s
umm
its
and
info
rmat
ion
sess
ions
PPA
A aw
aren
ess
cam
paig
n to
cr
eate
aw
aren
ess
abou
t rul
es a
nd
regu
latio
ns o
f lic
ensi
ng p
etro
leum
op
erat
ions
and
pro
duct
s, c
ompl
ianc
e m
onito
ring
and
enfo
rcem
ent
At le
ast t
wo
road
sho
ws
per
quar
ter/r
egio
n
No
road
sho
ws
nor b
i- an
nual
pre
ss re
leas
e du
e to
fina
ncia
l con
stra
ints
;re
gion
al re
tail
deal
er w
orks
hops
atte
nded
by
Reg
iona
l Dire
ctor
s
No
fund
ing
avai
labl
e
1 Q
uarte
rly
wor
ksho
p pe
r re
gion
2 Bi
-ann
ual
pres
s re
leas
eFr
eque
ncy
of w
orks
hops
, co
nfer
ence
s, s
emin
ars
and
sum
mits
and
info
rmat
ion
sess
ions
con
vene
d
Cle
arly
def
ined
Inte
grat
ed E
nerg
y Pl
anni
ng s
take
hold
er e
ngag
emen
t pr
oces
s as
par
t of I
EP s
trate
gy
Impr
oved
and
in
tegr
ated
en
ergy
pla
nnin
g pr
oces
s
Part
of IE
P de
velo
pmen
t pro
cess
; not
sta
rted
PROGRAMME 5

106
Obj
ectiv
esM
easu
res
Initi
ativ
esTa
rget
s20
09/1
0Pr
ogre
ss a
s at
31 M
arch
201
0C
onst
rain
ts/re
ason
for u
nder
-per
form
ance
Man
age
cust
omer
/ st
akeh
olde
r ex
pect
atio
ns
% ra
ting
of c
lient
sat
isfa
ctio
n su
rvey
Impr
ove
accu
racy
of r
epor
ting
60%
Cus
tom
er s
atis
fact
ion
surv
ey n
ot y
et
form
ulat
ed
Reg
iona
l offi
ces
only
st
arte
d to
rece
ive
appl
icat
ions
; una
ble
to
cond
uct c
usto
mer
sur
vey
Reg
ular
co
nsul
tatio
n an
d fe
edba
ck
Freq
uenc
y of
con
sulta
tion
and
feed
back
ses
sion
sKe
ep re
gula
r tel
epho
nic
cont
act
Wee
kly
Han
dle
all q
uerie
s fro
m P
resi
dent
ial h
otlin
e,
Min
iste
r, D
G a
nd D
DG
with
in s
even
wor
king
da
ys, i
ncl f
eedb
ack
to c
lient
; for
um o
n lic
ensi
ng is
sues
in c
onju
nctio
n w
ith O
pera
tions
D
irect
orat
e es
tabl
ishe
d at
regi
onal
offi
ces
Lear
ning
and
Gro
wth
Attra
ct, d
evel
op
and
reta
in s
kills
% re
duct
ion
in s
taff
turn
over
rate
Im
plem
ent H
R P
lan
2%Ju
nior
sta
ff m
ento
rshi
p a
prio
rity;
pla
nnin
g to
incl
ude
men
tors
hip
in s
uper
viso
rs’
perfo
rman
ce a
gree
men
ts; T
en p
ositi
ons
curre
ntly
vac
ant,
four
of t
en c
andi
date
s m
oved
to h
ighe
r pos
ition
s, tw
o in
tern
s tra
ined
an
d ap
poin
ted
to p
erm
anen
t Ene
rgy
Offi
cer
posi
tions
% re
duct
ion
in v
acan
cies
Impl
emen
t HR
Pla
n5%
Ten
vaca
nt p
ositi
ons
as a
t 31
Mar
ch 2
010;
re
crui
tmen
t ong
oing
% im
plem
enta
tion
of P
DPs
that
ar
e al
igne
d w
ith d
epar
tmen
tal
need
s
Impl
emen
t HR
D P
lan
50%
Offi
cial
s at
tend
trai
ning
rand
omly
acc
ordi
ng to
H
RD
Pla
n
% o
f tra
inee
s su
cces
sful
ly
com
plet
ed s
ecto
r- sp
ecifi
c pr
ogra
mm
es
Men
tor t
rain
ees
regu
larly
70%
Inte
rns
curre
ntly
und
ergo
ing
train
ing
and
men
torin
g w
ithin
Bra
nch
Num
ber o
f em
ploy
ees
on
men
tors
hip/
lear
ners
hip
prog
ram
mes
1 En
sure
ski
lls tr
ansf
er fr
om s
enio
r ex
perie
nced
to ju
nior
sta
ff w
ith
limite
d ex
perie
nce
10St
aff t
rain
ing
on p
etro
leum
pric
ing
ongo
ing,
w
ith o
ther
em
ploy
ees
not i
n pr
icin
g un
it to
tra
nsfe
r kno
wle
dge;
nin
e em
ploy
ees
are
bein
g m
ento
red
2 W
ork
with
em
ploy
ees
to tr
ansf
er
know
ledg
e
PROGRAMME PERFORMANCE - SECTION 2
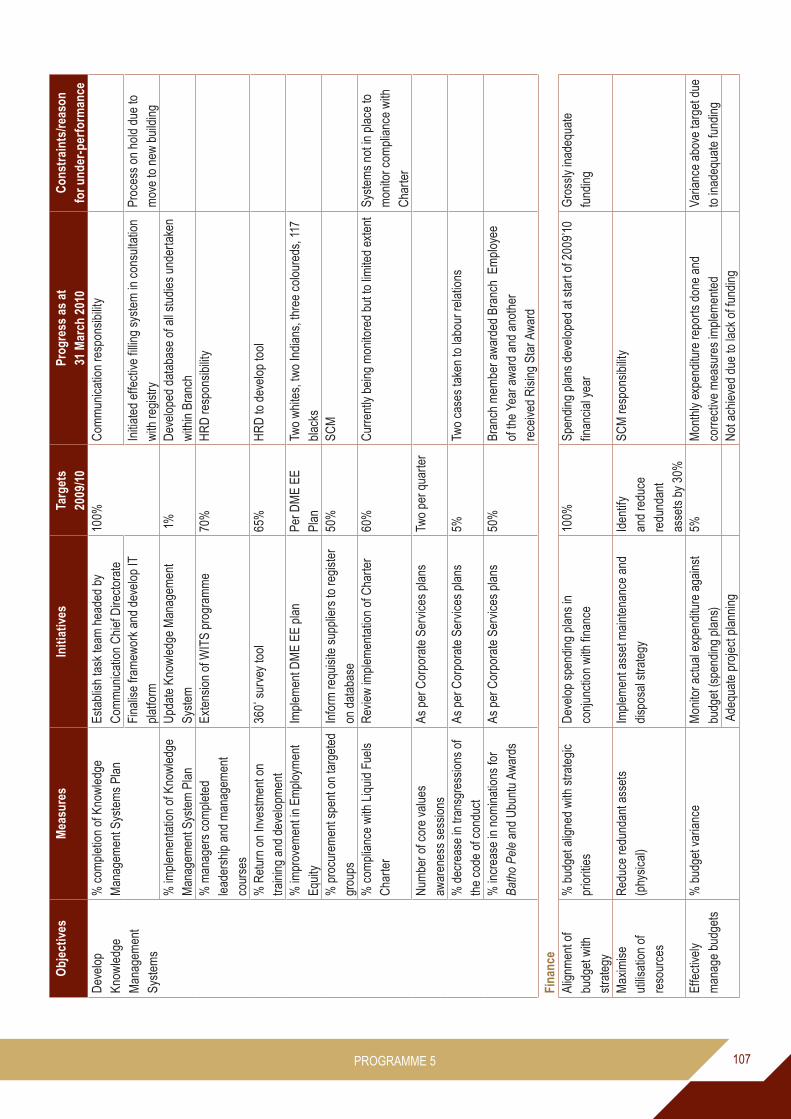
107
Obj
ectiv
esM
easu
res
Initi
ativ
esTa
rget
s20
09/1
0Pr
ogre
ss a
s at
31 M
arch
201
0C
onst
rain
ts/re
ason
for u
nder
-per
form
ance
Dev
elop
Kn
owle
dge
Man
agem
ent
Syst
ems
% c
ompl
etio
n of
Kno
wle
dge
Man
agem
ent S
yste
ms
Plan
Esta
blis
h ta
sk te
am h
eade
d by
C
omm
unic
atio
n C
hief
Dire
ctor
ate
100%
Com
mun
icat
ion
resp
onsi
bilit
y
Fina
lise
fram
ewor
k an
d de
velo
p IT
pl
atfo
rmIn
itiat
ed e
ffect
ive
fillin
g sy
stem
in c
onsu
ltatio
n w
ith re
gist
ryPr
oces
s on
hol
d du
e to
m
ove
to n
ew b
uild
ing
% im
plem
enta
tion
of K
now
ledg
e M
anag
emen
t Sys
tem
Pla
nU
pdat
e Kn
owle
dge
Man
agem
ent
Syst
em 1
%D
evel
oped
dat
abas
e of
all
stud
ies
unde
rtake
n w
ithin
Bra
nch
% m
anag
ers
com
plet
ed
lead
ersh
ip a
nd m
anag
emen
t co
urse
s
Exte
nsio
n of
WIT
S pr
ogra
mm
e70
%H
RD
resp
onsi
bilit
y
% R
etur
n on
Inve
stm
ent o
n tra
inin
g an
d de
velo
pmen
t36
0˚ s
urve
y to
ol65
%H
RD
to d
evel
op to
ol
% im
prov
emen
t in
Empl
oym
ent
Equi
ty
Impl
emen
t DM
E EE
pla
nPe
r DM
E EE
Pl
anTw
o w
hite
s, tw
o In
dian
s, th
ree
colo
ured
s, 1
17
blac
ks%
pro
cure
men
t spe
nt o
n ta
rget
ed
grou
ps
Info
rm re
quis
ite s
uppl
iers
to re
gist
er
on d
atab
ase
50%
SCM
% c
ompl
ianc
e w
ith L
iqui
d Fu
els
Cha
rter
Rev
iew
impl
emen
tatio
n of
Cha
rter
60%
Cur
rent
ly b
eing
mon
itore
d bu
t to
limite
d ex
tent
Syst
ems
not i
n pl
ace
to
mon
itor c
ompl
ianc
e w
ith
Cha
rter
Num
ber o
f cor
e va
lues
aw
aren
ess
sess
ions
As p
er C
orpo
rate
Ser
vice
s pl
ans
Two
per q
uarte
r
% d
ecre
ase
in tr
ansg
ress
ions
of
the
code
of c
ondu
ctAs
per
Cor
pora
te S
ervi
ces
plan
s5%
Two
case
s ta
ken
to la
bour
rela
tions
% in
crea
se in
nom
inat
ions
for
Batho�Pe
le a
nd U
bunt
u Aw
ards
As p
er C
orpo
rate
Ser
vice
s pl
ans
50%
Bran
ch m
embe
r aw
arde
d Br
anch
Em
ploy
ee
of th
e Ye
ar a
war
d an
d an
othe
rre
ceiv
ed R
isin
g St
ar A
war
d
Fina
nce
Al
ignm
ent o
f bu
dget
with
st
rate
gy
% b
udge
t alig
ned
with
stra
tegi
c pr
iorit
ies
Dev
elop
spe
ndin
g pl
ans
in
conj
unct
ion
with
fina
nce
100%
Spen
ding
pla
ns d
evel
oped
at s
tart
of 2
009’
10
finan
cial
yea
rG
ross
ly in
adeq
uate
fu
ndin
g
Max
imis
e ut
ilisat
ion
of
reso
urce
s
Red
uce
redu
ndan
t ass
ets
(phy
sica
l) Im
plem
ent a
sset
mai
nten
ance
and
di
spos
al s
trate
gyId
entif
y an
d re
duce
re
dund
ant
asse
ts b
y 30
%
SCM
resp
onsi
bilit
y
Effe
ctiv
ely
man
age
budg
ets
% b
udge
t var
ianc
eM
onito
r act
ual e
xpen
ditu
re a
gain
st
budg
et (s
pend
ing
plan
s)5%
Mon
thly
exp
endi
ture
repo
rts d
one
and
corre
ctiv
e m
easu
res
impl
emen
ted
Varia
nce
abov
e ta
rget
due
to
inad
equa
te fu
ndin
gAd
equa
te p
roje
ct p
lann
ing
Not
ach
ieve
d du
e to
lack
of f
undi
ng
PROGRAMME 5

108
Obj
ectiv
esM
easu
res
Initi
ativ
esTa
rget
s20
09/1
0Pr
ogre
ss a
s at
31 M
arch
201
0C
onst
rain
ts/re
ason
for u
nder
-per
form
ance
Effe
ctiv
ely
man
age
reve
nue
colle
ctio
n
% in
crea
se o
n lic
ense
fee
reve
nue
colle
ctio
nD
evel
op a
nd im
plem
ent a
pet
role
um
licen
se m
onito
ring
and
eval
uatio
n re
venu
e co
llect
ion
fram
ewor
k
70%
.
Man
age
cost
s ef
fect
ivel
yR
educ
tion
in c
onfir
med
frui
tless
, w
aste
ful a
nd u
naut
horis
ed
expe
nditu
re
Com
pare
exp
endi
ture
s to
bud
get
regu
arly
75%
Mon
thly
exp
endi
ture
repo
rts d
one
Cut
dow
n on
unn
eces
sary
ex
pend
iture
Bran
ch b
udge
t cen
tralis
ed d
ue to
insu
ffici
ent
fund
sPr
omot
e C
orpo
rate
G
over
nanc
e
% c
ompl
ianc
e w
ith P
FMA
Impl
emen
t com
plia
nce
fram
ewor
k10
0%M
onth
ly e
xpen
ditu
re re
ports
don
e to
che
ck
com
plia
nce
with
PFM
A
PROGRAMME PERFORMANCE - SECTION 2

109
HYD
RO
CA
RB
ON
S A
ND
EN
ERG
Y PL
AN
NIN
G B
RA
NC
H
SER
VIC
E D
ELIV
ERY
IMPR
OVE
MEN
T PL
AN
S
Key
Ser
vice
Serv
ice
Ben
efic
iary
Cur
rent
Sta
ndar
d (2
008/
09)
Des
ired
Stan
dard
(200
9/10
)Pr
ogre
ss a
s at
31
Mar
ch 2
010
Issu
e lic
ence
s fo
r Pe
trole
um
prod
ucts
Petro
leum
m
anuf
actu
ring,
w
hole
sale
and
reta
il in
dust
ry
Qua
ntity
Petro
leum
Pro
duct
s Ac
t Lic
ensi
ng
Syst
em (P
PALS
) upd
ated
dai
ly;
upda
te s
tatis
tics
31 M
arch
201
0
Petro
leum
lice
nse
sta
tistic
s as
at
31 M
arch
200
9:
14,1
93 l
icen
ce a
pplic
atio
ns c
aptu
red
and
acce
pted
on
PPAL
S34
7
l
icen
ces
refu
sed
17
lic
ense
s re
ject
ed5,
463
l
icen
ces
gra
nted
3,58
0
lic
ence
s Is
sued
9,39
0
tot
al p
roce
ssed
for a
ll
lic
ense
type
s 4,
428
o
utst
andi
ng a
ccep
ted
ap
plic
atio
ns to
be
pr
oces
sed
Qua
ntity
1,40
0 ne
w li
cens
es fo
r all
licen
se ty
pes
issu
ed p
er
annu
m
NB
A si
te a
nd re
tail
licen
se
for t
his
purp
ose
are
not
acco
unte
d fo
r as
sepa
rate
lic
ense
s
Petro
leum
lice
nse
stat
istic
s as
at e
nd M
arch
201
0:
appr
ox 1
5,19
8 li
cens
e ap
plic
atio
ns c
aptu
red
and
acce
pted
on
PPAL
S
451
licen
ses
refu
sed
22 l
icen
ces
ejec
ted
6,39
9 lic
ense
s gr
ante
d5,
581
licen
ses
issu
ed12
,453
tota
l lic
ense
app
licat
ions
(all
type
) pro
cess
ed2,
745
outs
tand
ing
licen
se a
pplic
atio
ns to
be
proc
esse
d
Prog
ress
31
Dec
embe
r 200
9 to
31
Mar
ch 2
010
• N
o lic
ense
app
licat
ion
refu
sed
durin
g th
is
perio
d (a
pplic
atio
n de
cisi
ons
over
turn
ed b
y M
inis
ter,
and
thro
ugh
rect
ifica
tion
of d
ual
owne
rshi
p in
the
valu
e ch
ain)
• 19
9 lic
ense
app
licat
ions
gra
nted
dur
ing
the
abov
e pe
riod
• 10
1 lic
ense
app
licat
ions
issu
ed d
urin
g th
e ab
ove
perio
d •
300
licen
se a
pplic
atio
ns p
roce
ssed
in to
tal
from
31
Dec
embe
r 200
9 to
31
Mar
ch 2
010
Con
sulta
tion
Com
mun
icat
ion
to A
ssoc
iatio
ns, o
il co
mpa
nies
and
oth
er s
take
hold
ers;
lo
cal r
adio
bro
adca
stin
g
Con
sulta
tion
Roa
d sh
ows,
ad
verti
sem
ents
, vis
ual a
nd
audi
o m
edia
Due
to la
ck o
f fun
ding
this
was
not
impl
emen
ted.
Acce
ssD
ME
web
site
. fax
on
requ
est,
post
on
requ
est
Acce
ssR
egio
nal R
epre
sent
atio
nPr
ovis
ion
of m
obile
ser
vice
sR
egio
nal o
ffice
s ha
ve b
een
oper
atio
naliz
ed w
ith fu
ll st
aff c
ompl
imen
t, th
e w
ebsi
te is
con
stan
tly u
pdat
ed
with
lice
nce
appl
icat
ion
stat
uses
and
app
licat
ion
info
rmat
ion
e.g.
Act
, reg
ulat
ions
, app
licat
ion
form
s.
PROGRAMME 5

110
Key
Ser
vice
Serv
ice
Ben
efic
iary
Cur
rent
Sta
ndar
d (2
008/
09)
Des
ired
Stan
dard
(200
9/10
)Pr
ogre
ss a
s at
31
Mar
ch 2
010
Cou
rtesy
Dev
elop
men
t of g
uide
lines
Hel
p de
skC
ourte
syH
elp
desk
at r
egio
nal o
ffice
s an
d us
er m
anua
ls; u
ser-
frien
dly
licen
ce a
pplic
atio
n gu
idel
ines
Appl
icat
ions
gui
delin
es h
ave
been
dev
elop
ed;
they
will
be d
istri
bute
d to
the
regi
ons
and
post
ed
on o
ur D
oE w
ebsi
te p
endi
ng a
ppro
val f
rom
C
omm
unic
atio
n.
Ope
n an
d tra
nspa
rent
Publ
icat
ion
of in
form
atio
n in
G
over
nmen
t Gaz
ette
and
dis
tribu
tion
to o
il co
mpa
nies
Ope
n an
d tra
nspa
rent
Mor
e m
edia
exp
osur
e th
roug
h ad
verts
in
new
spap
ers,
radi
o an
d TV
Due
to b
udge
tary
con
stra
ints
thes
e is
sues
hav
e no
t be
en im
plem
ente
d
Info
rmat
ion
Info
rmat
ion
avai
labl
e on
requ
est,
via
help
des
k, w
ebsi
teIn
form
atio
nR
egio
nal r
epre
sent
atio
n,
mor
e co
llabo
ratio
n w
ith
stak
ehol
ders
;pa
mph
lets
; wor
ksho
ps a
nd
sem
inar
s, fl
yers
Reg
iona
l offi
ces
esta
blis
hed
and
the
Reg
iona
l D
irect
ors
task
ed w
ith e
ngag
ing
rele
vant
st
akeh
olde
rs; e
duca
tion
thro
ugh
pam
phle
ts a
nd
flyer
s aw
aitin
g fin
anci
al a
ppro
val
R
edre
ssR
edre
ss p
ast i
mba
lanc
es a
ndim
prov
e BE
E pa
rtici
patio
nR
edre
ssIm
prov
e te
chno
logy
use
d to
trac
k pr
ogre
ss o
n H
DSA
pa
rtici
patio
n;
advo
cacy
initi
ativ
es o
n Pe
trole
um s
ecto
r spe
cific
in
itiat
ives
PPLA
S 2
proj
ect h
as b
een
canc
elle
d du
e to
lack
of
del
iver
y fro
m a
ppoi
nted
con
sulta
nts;
CFO
offi
ce
with
Pet
role
um C
ontro
ller’s
offi
ce w
ill em
ploy
new
co
nsul
tant
s to
con
duct
this
pro
ject
Valu
e fo
r m
oney
Nee
d to
impr
ove
clie
nt in
terfa
ceVa
lue
for
mon
eyR
obus
t clie
nt in
terfa
ce a
nd
impr
oved
turn
arou
nd ti
mes
Offi
ce o
f the
Con
trolle
r alw
ays
in c
onsu
ltatio
n w
ith
clie
nts
and
easi
ly a
cces
sibl
e Ti
me
Plan
ning
to is
sue
1,20
0 ne
w li
cens
es
by e
nd M
arch
201
0 N
B: S
ite a
nd
reta
il lic
ense
for t
his
purp
ose
not
acco
unte
d fo
r as
sepa
rate
lice
nses
Tim
eAl
l new
lice
nses
issu
ed
in li
ne w
ith p
resc
ribed
tim
elin
es
A pl
an h
as b
een
put i
n pl
ace
for t
he is
suin
g of
lic
ence
s w
ithin
the
pres
crib
ed ti
mel
ines
; Reg
iona
l D
irect
ors
will
assi
st
Cos
tIn
itiat
ing
prog
ram
mes
to re
ach
out t
o st
akeh
olde
rs; p
rogr
amm
es n
eed
to
be c
oste
d
Cos
tAd
equa
te c
ostin
gR
egio
nal D
irect
ors
curre
ntly
invo
lved
in d
eale
r co
unci
ls m
eetin
g an
d th
e D
irect
orat
e is
als
o av
aila
ble
on re
ques
t for
mee
tings
. H
RAt
tract
and
reta
in s
taff
HR
Impr
oved
pro
duct
ivity
and
em
ploy
ee s
atis
fact
ion.
Tra
in
peop
le to
acq
uire
mor
e qu
alita
tive
and
quan
titat
ive
anal
ysis
ski
lls.
Anal
ysts
and
Reg
iona
l sta
ff u
nder
wen
t a c
ours
e to
giv
e th
em a
goo
d un
ders
tand
ing
of th
e bu
sine
ss
envi
ronm
ent.
This
will
assi
st th
em a
naly
sing
and
ev
alua
ting
appl
icat
ions
bro
ught
in b
y ap
plic
ants
PROGRAMME PERFORMANCE - SECTION 2

111
PROGRAMME 6: ELECTRICITY, NUCLEAR AND CLEAN ENERGY
Purpose: To govern the Electricity, Nuclear and Clean Energy sectors with special emphasis on secure supply, universal access to electricity, development of the nuclear sector, diversification of energy sources and the promotion of clean energy technologies.
Measureable objectives: To ensure a well-managed efficient, safe and cost-effective electricity and nuclear industry in South Africa, through policy, legislation and regulations. Achieving increased access to electricity and globally competitive electricity prices within a safe, clean and healthy industry.
SERVICE DELIVERY
Conditional Grants
Overview�of�conditional�grants
Schedule 6 and 7 Integrated National Electrification Programme – Municipal Programme
Province Total Allocation
R’000
Total Transfer
R’ 000
Total Expenditure
R ‘000Eastern Cape 234,300 234,300 129,252Free State 88,456 87,988 58,709Gauteng 82,580 75,740 61,492Kwa-Zulu Natal 123,303 123,303 83,222Limpopo 139,761 134,681 70,857Mpumalanga 98,436 98,436 44,351Northern Cape 28,675 28,675 13,685North West 59,122 52,967 7,658Western Cape 78,324 78,324 42,204
TOTAL 932,957 914,413 511,430
Eskom Programme
Province Total Allocation
R’000
Total Transfer
R’ 000
Total Expenditure
R ‘000Eastern Cape 397,753 397,753 375,724Free State 50,708 50,708 42,976Gauteng 94,150 94,150 107,744Kwa-Zulu Natal 385,057 385,057 394,533Limpopo 183,416 183,416 120,063Mpumalanga 99,843 99,843 71,218Northern Cape 31,540 31,540 19,915North West 99,209 99,209 85,629Western Cape 125,689 125,689 103,167
TOTAL 1,467,365 1,467,365 1,320,971
PROGRAMME 6

112
Eskom backlog: Schools and Clinics
Province Total Allocation
R’000
Total Transfer
R’ 000
Total Expenditure
R ‘000Eastern Cape 29,184 29,184 4,014Free State 2,500 2,500 12Gauteng - - -Kwa-Zulu Natal 100,929 100,929 20,980Limpopo 9,500 9,500 3Mpumalanga 4,500 4,500 -Northern Cape - - -North West 2,337 2,337 -Western Cape - - -
TOTAL 148,950 148,950 25,009
Connections: Households and Schools
Province Planned household
connections
Actual household connections`2009/10
Total household connections achieved in 2009’10 incl
outstanding connections from previous years
Planned schools
connections
Actual schools connections
Eastern Cape 8,315 75 4,992Free State 8,407 5,356 6,459Gauteng 4,139 0 1,0741Kwa-Zulu Natal 16,763 9,849 16,119Limpopo 17,434 2,153 6,617Mpumalanga 7,122 3,707 8,244 2 2North West 5,588 0 840Northern Cape 1,503 597 1,247Western Cape 6,992 3,343 5,467
TOTAL 76,263 25,080 60,726 2 2
Non-grid Schools
Province Planned Connections Actual ConnectionsEastern Cape 59 59Free StateGautengKwa-Zulu Natal 94 94 LimpopoMpumalangaNorth WestNorthern CapeWestern Cape
TOTAL 153 153
PROGRAMME PERFORMANCE - SECTION 2

113
Socio-economic indicators
Socio-economic indicators for the 2009’10 financial year
Province Total Programme Expenditure
Total BEE /BWO/ SMME Expenditure
BEE Expenditure BWO and SMME Expenditure
Eastern Cape 331,185,046.71 278,560,182.28 190,382,603.34 88,177,578.94Free State 48,754,866.31 22,754,056.16 17,818,338.09 4,935,718.07Gauteng 71,950,766.58 31,927,178.26 23,062,584.20 8,864,594.06Kwa-Zulu Natal 303,134,428.59 166,821,208.82 113,651,919.10 53,169,289.72Limpopo 156,701,639.07 83,794,782,51 63,187,015.31 20,607,767.20Mpumalanga 95,468,626.45 33,942,275.40 26,154,506.30 7,787,769.10North West 78,897,257.50 42,080,093.30 31,871,266.18 10,208,827.12Northern Cape 28,809,747.10 9,946,967.71 7,743,981.35 2,202,986.36Western Cape 52,829,073.54 18,864,091.52 14,040,409.70 4,823,681.82
Total 1,167,731,451.85 688,690,835.96 487,912,623.87 200,778,212.39
PROGRAMME 6

114
MEA
SUR
AB
LE O
BJE
CTI
VES,
KEY
AC
TIVI
TIES
AN
D M
EDIU
M –
TER
M O
UTP
UT
TAR
GET
S
Stak
ehol
der/C
usto
mer
Mea
sure
sO
bjec
tives
Mea
sure
sIn
itiat
ives
Targ
ets
09’1
0Pr
ogre
ss a
s at
31
Dec
embe
r 200
9C
onst
rain
ts/re
ason
for u
nder
-pe
rfor
man
ceIm
prov
e tu
rnar
ound
tim
es%
adh
eren
ce
to p
resc
ribed
/ le
gisl
ated
tim
efra
mes
Com
plia
nce
with
pres
crib
ed ti
mef
ram
es in
le
gisl
atio
n, re
gula
tions
an
d SL
As
100%
34 C
DM
pro
ject
s ap
prov
ed (3
3 PI
Ns
and
4 PD
Ds)
and
15
proj
ects
del
ayed
55 a
utho
risat
ions
issu
ed fo
r nuc
lear
mat
eria
l and
rela
ted
mat
eria
l, an
d nu
clea
r rel
ated
equ
ipm
ent.
Del
ay in
the
sign
ing
of s
ubm
issi
on
Non
e
Res
pons
e to
que
ries
Impl
emen
t doc
umen
t m
anag
emen
t sys
tem
Five
wor
king
da
ysN
ot im
plem
ente
dSy
stem
dev
elop
men
t req
uire
s in
volv
emen
t of o
ther
Dire
ctor
ates
, ie
IT, R
egis
try
SLA
ente
red
into
w
hich
iden
tifie
s st
akeh
olde
rs
Iden
tify
stak
ehol
ders
w
ith w
hom
to e
nter
into
SL
A
100%
Dra
ft SL
A in
pla
ce (N
ucle
ar N
on-P
rolif
erat
ion
Dire
ctor
ate
final
isin
g M
oU w
ith S
ARS
to im
port
/exp
ort n
ucle
ar m
ater
ial,
rela
ted
equi
pmen
t and
mat
eria
l
Dire
ctor
ate
awai
ting
lega
l gui
danc
e fro
m D
oE L
egal
Ser
vice
s
Impr
ove
ener
gy
awar
enes
sN
umbe
r of
awar
enes
s ra
isin
g w
orks
hops
, sw
itch-
ons
and
mee
tings
Hos
ting
of w
orks
hops
, sw
itch-
ons
and
Publ
ic
Safe
ty In
form
atio
n Fo
rum
mee
tings
10•
Nin
e w
orks
hops
on
elec
trific
atio
n pr
ogra
mm
e he
ld in
all
prov
ince
s•
Eigh
t wor
ksho
ps o
n C
DM
hel
d in
Gau
teng
, Kw
a-Zu
lu
Nat
al, F
ree
Stat
e, E
aste
rn C
ape,
Nor
th W
est,
Wes
tern
C
ape
and
Lim
popo
•
Four
ene
rgy
effic
ienc
y w
orks
hops
hel
d •
One
wor
ksho
p pr
esen
ted
on c
ompl
ianc
e fo
r au
thor
isat
ions
of n
ucle
ar m
ater
ial a
nd re
late
d m
ater
ial,
and
nucl
ear-
rela
ted
equi
pmen
t
Wor
ksho
ps fo
r Mpu
mal
anga
and
N
orth
ern
Cap
e ca
ncel
led
due
to lo
w
resp
onse
Impr
ove
Publ
ic/
Priv
ate
Partn
ersh
ips
Intro
duct
ion
of n
ew
gene
ratio
n ca
paci
ty
– re
new
able
/non
- re
new
able
.
Intro
duce
IPP
bid
prog
ram
me
1,10
0 M
WG
uara
ntee
s ob
tain
ed fr
om N
atio
nal T
reas
ury
to p
urch
ase
land
for I
PP; f
inan
cial
clo
se b
efor
e en
d M
arch
201
0 no
t ac
hiev
ed d
ue to
out
stan
ding
mat
ters
and
Esk
om’s
finan
cial
pr
oble
ms;
24
MW
rene
wab
le e
nerg
y pr
ojec
ts a
ppro
ved
durin
g th
e 20
09’1
0 fin
anci
al y
ear
Prot
ract
ed n
egot
iatio
ns a
nd fi
nanc
ial
diffi
culti
es o
f sta
keho
lder
s
PROGRAMME PERFORMANCE - SECTION 2

115
Obj
ectiv
esM
easu
res
Initi
ativ
esTa
rget
s09
’10
Prog
ress
as
at 3
1 D
ecem
ber 2
009
Con
stra
ints
/reas
on fo
r und
er-
perf
orm
ance
Prov
ide
Ener
gy
Polic
y an
d re
gula
tory
fra
mew
ork
and
stre
amlin
e ov
ersi
ght
proc
ess
Num
ber o
f rel
evan
t po
licie
s in
trodu
ced
Dev
elop
new
pol
icie
s an
d im
plem
ent-a
tion
plan
s
4Tw
o po
licie
s co
mpl
eted
, tw
o dr
afte
d N
ucle
ar E
nerg
y Po
licy
Impl
emen
tatio
n Pl
an b
eing
dev
elop
ed
Rev
iew
of R
enew
able
Ene
rgy
Whi
te P
aper
del
ayed
due
to
insu
ffici
ent f
unds
with
in D
epar
tmen
t; nu
clea
r fue
l sup
ply
stra
tegy
bei
ng d
rafte
d w
ith le
gisl
ativ
e re
view
and
ski
lls
dem
and
anal
ysis
per
form
ed a
nd re
quire
d re
gula
tions
id
entif
ied
Lack
of c
oope
ratio
n fro
m E
skom
an
d D
PE to
dev
elop
pro
cure
men
t an
d fu
ndin
g st
rate
gies
(DPE
of
opin
ion
that
fund
ing
stra
tegy
is th
eir
man
date
, the
refo
re b
oth
parti
es d
id
not p
artic
ipat
e in
the
Com
mitt
ee);
budg
etar
y co
nstra
ints
Num
ber o
f re
gula
tory
fra
mew
ork
docu
men
ts a
nd
plan
s in
trodu
ced
for r
enew
able
en
ergy
and
ene
rgy
effic
ienc
y
Dev
elop
men
t of t
he
Reg
ulat
ory
Fram
ewor
k an
d Pl
ans
3D
raft
Sola
r Wat
er H
eatin
g fra
mew
ork
deve
lope
d an
d se
nt
for p
ublic
con
sulta
tion
in N
ovem
ber 2
009;
ene
rgy
effic
ienc
y st
rate
gy re
view
not
com
plet
ed d
ue to
indu
stria
l sec
tor
com
men
ts a
bout
set
ting
ener
gy e
ffici
ency
targ
ets
Biof
uels
impl
emen
tatio
n pl
an n
ot b
e co
mpl
eted
due
to
finan
cing
cha
lleng
es
Prov
ide
Ener
gy
Polic
y an
d R
egul
ator
y Fr
amew
ork
and
stre
amlin
e th
e ov
ersi
ght p
roce
ss
Prom
ulga
tion
of
rele
vant
regu
latio
ns
Dev
elop
regu
latio
ns
unde
r rel
evan
t leg
isla
tion
9 T
he fo
llow
ing
five
(5 )
regu
latio
ns w
ere
deve
lope
d:R
egul
atio
n on
Fee
s fo
r Nuc
lear
Aut
horis
atio
ns p
ublis
hed
Reg
ulat
ions
on
Cat
egor
isat
ion
of N
ucle
ar In
stal
latio
ns
awai
ting
conc
urre
nce
of th
e M
inst
er o
f Fin
ance
Dra
fting
of p
hysi
cal p
rote
ctio
n in
pro
gres
sD
rafti
ng o
f non
-pro
lifer
atio
n re
gula
tions
in p
rogr
ess
Dra
ft EE
regu
latio
ns p
repa
red,
sub
mitt
ed to
lega
l ser
vice
s fo
r co
mm
ent a
nd D
TI e
ngag
emen
ts u
nder
way
Lim
ited
capa
city
Lim
ited
capa
city
DTI
to a
men
d so
me
regu
latio
ns
to e
nfor
ce e
nerg
y ef
ficie
ncy
perfo
rman
ce s
tand
ards
and
re
quire
men
tsAl
ignm
ent o
f SO
E ac
tiviti
es w
ith D
ME
obje
ctiv
es
Rev
iew
sha
reho
lder
co
mpa
cts
and
busi
ness
pl
ans
of id
entif
ied
entit
ies
100%
All s
trate
gic
plan
s, c
orpo
rate
pla
ns a
nd S
hare
hold
er
Com
pact
s fo
r 200
9’10
fina
ncia
l yea
r rev
iew
ed fo
r alig
nmen
t w
ith D
epar
tmen
t’s o
bjec
tives
and
app
rove
d af
ter d
iscu
ssio
n w
ith re
leva
nt S
OEs
Non
e
PROGRAMME 6

116
Obj
ectiv
esM
easu
res
Initi
ativ
esTa
rget
s09
’10
Prog
ress
as
at 3
1 D
ecem
ber 2
009
Con
stra
ints
/reas
on fo
r und
er-
perf
orm
ance
Prov
ide
cred
ible
ac
cess
ible
in
form
atio
n an
d su
ppor
t
Info
rmat
ion
and
docu
men
tatio
n pr
ovid
ed to
targ
eted
au
dien
ce
Hos
ting
of a
war
enes
s ra
isin
g w
orks
hops
, sw
itch-
ons
and
Ener
gy
Foru
ms
100%
9 w
orks
hops
hel
d
Prov
inci
al w
orks
hop
on E
lect
rific
atio
n Pr
ogra
mm
e he
ld in
all
nine
pro
vinc
es
8 p
rovi
ncia
l wor
ksho
ps o
n C
DM
con
duct
ed (G
aute
ng, K
wa-
Zulu
Nat
al, F
ree
Stat
e, E
aste
rn C
ape
,Nor
th W
est,
Wes
tern
C
ape
and
Lim
popo
)
One
wor
ksho
p co
nduc
ted
on a
utho
risat
ion
com
plia
nce
for
nucl
ear a
nd -r
elat
ed m
ater
ial a
nd n
ucle
ar-r
elat
ed e
quip
men
t
None
Wor
ksho
ps fo
r Mpu
mal
anga
and
N
orth
ern
Cap
e w
ere
canc
elle
d du
e to
low
resp
onse
.
Num
ber o
f en
gine
erin
g st
uden
ts d
eplo
yed
at
mun
icip
aliti
es
Co-
ordi
natin
g w
ith a
nd
supp
ortin
g m
unic
ipal
ities
100
100
stud
ents
dep
loye
d at
mun
icip
aliti
es a
nd c
ontra
cts
expi
red
31 D
ecem
ber 2
009;
pro
gram
me
not c
ontin
uing
due
to
lim
ited
fund
s
Non
e
Prom
ote
acce
ssib
le,
affo
rdab
le a
nd
sust
aina
ble
ener
gy
reso
urce
s
Num
ber o
f ho
useh
olds
, sch
ools
co
nnec
ted
and
subs
tatio
ns b
uilt
Plan
, im
plem
ent a
nd
over
see
Inte
grat
ed
Nat
iona
l Ele
ctrif
icat
ion
Prog
ram
me
150,
000
hous
ehol
ds,
2,80
0 sc
hool
s,
10 s
ubst
atio
ns
Year
–to
-dat
e co
nnec
tions
as
at 3
1 M
arch
201
0:
• To
tal c
onne
ctio
ns 1
67,11
9
- Es
kom
:106
393
-
Mun
icip
aliti
es 6
0,72
6 20
09’1
0 –
25,0
80
20
08’0
9 –2
4,64
8
20
06’0
7’08
– 1
1,02
8•
Tota
l sch
ools
ach
ieve
d 1,
035
• To
tal s
ubst
atio
ns, s
even
(7) c
ompl
eted
with
rem
aini
ng
thre
e es
timat
ed to
be
com
plet
ed b
y en
d Ap
ril 2
010
Del
ay d
ue to
mun
icip
aliti
es b
usy
with
pre
viou
s ye
ar’s
proj
ects
; Esk
om
chal
leng
ed b
y la
te d
eliv
ery
of
mat
eria
l; di
fficu
lties
with
terr
ain
on
som
e K
ZN p
roje
cts
Def
ects
iden
tifie
d du
ring
com
mis
sion
ing,
inco
rrect
fo
unda
tions
and
pro
long
ed d
eliv
ery
of c
ontro
l pan
els
Prom
ote
acce
ssib
le,
affo
rdab
le a
nd
sust
aina
ble
ener
gy
reso
urce
s
Soci
o-ec
onom
ic
impa
ct o
f the
im
plem
enta
tion
of
Inte
grat
ed N
atio
nal
Elec
trific
atio
n Pr
ogra
mm
e
Mon
itor a
nd e
valu
ate
Inte
grat
ed N
atio
nal
Elec
trific
atio
n Pr
ogra
mm
e
5,00
0 ne
w jo
bs
crea
ted;
800
ne
w le
arne
rs
train
ed
2008
’09
roll-
over
s:
2,0
28 jo
bs a
nd 3
99 le
arne
rs20
09’1
0:
5,5
09 jo
bs a
nd 3
48
lear
ners
Tota
l to
date
:
7,
537
jobs
and
747
lear
ners
PROGRAMME PERFORMANCE - SECTION 2

117
Inte
rnal
Pro
cess
es
Obj
ectiv
esM
easu
res
Initi
ativ
esTa
rget
s 20
09’1
0Pr
ogre
ss a
s at
31
Mar
ch 2
10C
onst
rain
ts/re
ason
for u
nder
-pe
rfor
man
ce
Effic
ient
Bus
ines
s Pr
oces
ses
Rev
iew
inte
rnal
po
licie
s an
d pr
oced
ures
Num
ber o
f id
entif
ied
polic
ies
and
proc
edur
es
revi
ewed
and
im
plem
ente
d
Iden
tify
all o
utda
ted
polic
ies
and
proc
edur
es
for i
nter
nal b
usin
ess
proc
esse
s an
d al
ign
with
th
e re
vise
d pr
oces
ses
100%
Exis
ting
wor
k pr
oces
ses
and
proc
edur
es s
till v
alid
Dev
elop
Con
sist
ent
Mon
itorin
g an
d En
forc
emen
t G
uide
lines
% g
uide
lines
is
sued
in li
ne w
ith
legi
slat
ion
Dev
elop
gui
delin
es in
lin
e w
ith le
gisl
atio
n10
0%N
ucle
ar a
utho
risat
ions
enf
orce
men
t gui
delin
es in
pla
ce
Impl
emen
tatio
n of
re
leva
nt le
gisl
atio
n%
impr
ovem
ent
in s
take
hold
er
com
plia
nce
(ext
erna
l)
Mon
itor c
ompl
ianc
e w
ith
legi
slat
ion
30%
Nuc
lear
non
- pro
lifer
atio
n ac
com
pani
ed N
ECSA
, Saf
egua
rds
Div
isio
n to
per
form
saf
egua
rds
insp
ectio
ns
Benc
hmar
k ag
ains
t Be
st P
ract
ice
% s
tand
ards
be
nchm
arke
d ag
ains
t bes
t pra
ctic
e
Rev
iew
sta
ndar
ds in
line
w
ith b
est p
ract
ice
Ener
gy m
anag
emen
t sta
ndar
d (S
ANS9
41) i
n co
nsul
tatio
n pr
oces
s (S
ABS
coor
dina
ting)
; Sta
ndar
ds fo
r ene
rgy
effic
ient
bu
ildin
gs (S
ANS2
04),
mea
surin
g, v
erifi
catio
n, a
nd d
ecod
ers
com
plet
ed
Effe
ctiv
e Se
rvic
e D
eliv
ery
Build
acc
ount
abilit
y an
d te
amw
ork
% im
plem
enta
tion
of B
alan
ced
Scor
e C
ard
As p
er C
orpo
rate
Se
rvic
es p
lan
100%
Ref
er to
Cor
pora
te S
ervi
ces
repo
rt
Esta
blis
h se
rvic
e st
anda
rds
and
man
age
Serv
ice
Leve
l Agr
eem
ents
% s
ervi
ce s
tand
ards
es
tabl
ishe
d w
ith
rele
vant
Bra
nche
s
Esta
blis
h se
rvic
e st
anda
rds
with
rele
vant
Br
anch
es
100%
See
atta
ched
ser
vice
del
iver
y im
prov
emen
t pla
ns
% a
dher
ence
to
SLAs
Con
tinuo
us e
ngag
emen
t w
ith re
leva
nt B
ranc
hes
100%
No
inte
r-Bra
nch
SLAs
; con
tinuo
us e
ngag
emen
t with
all
Bran
ches
thro
ugh
EXC
O a
nd IR
P2 p
roce
ss
% a
lignm
ent o
f fin
anci
al re
sour
ces
with
ope
ratio
nal
need
s
Budg
et w
orks
hop
100%
Atte
nded
wor
ksho
ps o
n M
TEF
host
ed b
y N
atio
nal T
reas
ury
Cos
ting
of a
ll ac
tiviti
esSu
bmitt
ed s
pend
ing
plan
sAn
alys
is o
f bud
get
Mon
thly
bud
get i
nput
ana
lysi
s se
nt to
Fin
ance
Su
bmis
sion
of b
udge
t pr
opos
alSu
bmitt
ed p
ropo
sal f
or a
dditi
onal
fund
s ab
ove
base
line
and
capi
tal a
nd in
frast
ruct
ure
proj
ects
to F
inan
ce d
urin
g M
TEF
proc
ess
PROGRAMME 6

118
Obj
ectiv
esM
easu
res
Initi
ativ
esTa
rget
s 20
09’1
0Pr
ogre
ss a
s at
31
Mar
ch 2
10C
onst
rain
ts/re
ason
for u
nder
-pe
rfor
man
ceAl
loca
tion
of
appr
opria
te
reso
urce
s
% re
sour
ces
per
func
tion
Alig
n hu
man
cap
ital
and
othe
r res
ourc
e re
quire
men
ts w
ith
func
tions
100%
In p
rogr
ess;
not
all
reso
urce
requ
irem
ents
fully
alig
ned
with
fu
nctio
ns d
ue to
spl
it of
Dep
artm
ent
Dep
artm
ent’s
spl
it
Und
erst
and
cust
omer
/ st
akeh
olde
r nee
ds
Surv
ey c
ondu
cted
to
und
erst
and
cust
omer
nee
ds
Con
duct
soc
io-
econ
omic
impa
ct s
tudy
on
ele
ctrif
icat
ion
1N
ot c
ondu
cted
C
hief
Dire
ctor
ate:
Ele
ctric
ity
repr
iorit
ised
bud
get f
or im
pact
stu
dy
to th
e El
ectri
city
Sup
ply
Dire
ctor
ate
proj
ect
Con
duct
nuc
lear
st
akeh
olde
r sur
vey
Nuc
lear
sta
keho
lder
sur
vey
not d
ue d
urin
g re
porti
ng p
erio
d,
plan
ned
for 2
010
Con
duct
cle
an e
nerg
y st
akeh
olde
r sur
vey
Stak
ehol
der a
nd C
usto
mer
Rel
atio
nshi
p M
anag
emen
tEd
ucat
e an
d en
gage
st
akeh
olde
rsN
umbe
r of
awar
enes
s ra
isin
g w
orks
hops
, sw
itch-
ons
and
mee
tings
Hos
ting
awar
enes
s ra
isin
g w
orks
hops
, sw
itch-
ons
and
Publ
ic
Safe
ty In
form
atio
n Fo
rum
mee
tings
109
Educ
ate
and
enga
ge
stak
ehol
ders
Num
ber o
f aw
aren
ess
rais
ing
wor
ksho
ps,
switc
h-on
s an
d m
eetin
gs
Hos
ting
of a
war
enes
s ra
isin
g w
orks
hops
, sw
itch-
ons
and
Publ
ic
Safe
ty In
form
atio
n Fo
rum
mee
tings
10Pr
ovin
cial
wor
ksho
p on
Ele
ctrif
icat
ion
Prog
ram
me
held
on
all
nine
pro
vinc
es
Eigh
t pro
vinc
ial w
orks
hops
on
CD
M c
ondu
cted
in G
aute
ng,
Kwa-
Zulu
Nat
al, F
ree
Stat
e, E
aste
rn C
ape,
Nor
th W
est,
Wes
tern
Cap
e an
d Li
mpo
po
One
wor
ksho
p co
nduc
ted
on a
utho
risat
ion
com
plia
nce
for
nucl
ear -
and
rela
ted
mat
eria
l and
nuc
lear
-rel
ated
equ
ipm
ent
Man
age
sust
omer
/ st
akeh
olde
r ex
pect
atio
ns
% ra
ting
on c
lient
sa
tisfa
ctio
n su
rvey
Con
duct
ann
ual c
lient
sa
tisfa
ctio
n su
rvey
60%
Not
don
e
Rev
iew
resu
lts o
f sur
vey
and
addr
ess
iden
tifie
d m
ater
ial i
ssue
s
PROGRAMME PERFORMANCE - SECTION 2

119
Obj
ectiv
esM
easu
res
Initi
ativ
esTa
rget
s 20
09’1
0Pr
ogre
ss a
s at
31
Mar
ch 2
10C
onst
rain
ts/re
ason
for u
nder
-pe
rfor
man
ceR
egul
ar c
onsu
ltatio
n an
d fe
edba
ckFr
eque
ncy
of
cons
ulta
tion
and
feed
back
ses
sion
s
Hos
ting
awar
enes
s ra
isin
g w
orks
hops
, sw
itch-
ons
and
Publ
ic
Safe
ty In
form
atio
n Fo
rum
mee
tings
10Pr
ovin
cial
Wor
ksho
p on
Ele
ctrif
icat
ion
Prog
ram
me
wer
e he
ld
on a
ll ni
ne p
rovi
nces
Seve
n p
rovi
ncia
l wor
ksho
ps o
n C
DM
con
duct
ed in
Gau
teng
, Kw
a-Zu
lu N
atal
, Fre
e St
ate,
Eas
tern
Cap
e, N
orth
Wes
t,
Wes
tern
Cap
e an
d Li
mpo
po
One
wor
ksho
p co
nduc
ted
on a
utho
risat
ion
com
plia
nce
for
nucl
ear -
and
rela
ted
mat
eria
l and
nuc
lear
-rel
ated
equ
ipm
ent
Driv
e in
nova
tion
% in
nova
tion
proj
ects
im
plem
ente
d
Iden
tify,
pla
n, im
plem
ent
and
mon
itor p
roje
cts
10%
Not
don
e
Fina
nce
Alig
nmen
t of b
udge
t w
ith s
trate
gy%
bud
get a
ligne
d w
ith s
trate
gic
prio
ritie
s
Dev
elop
spe
ndin
g pl
ans
in c
onju
nctio
n w
ith
finan
ce
100%
Subm
itted
spe
ndin
g pl
ans
Effe
ctiv
ely
man
age
budg
ets
% b
udge
t var
ianc
eM
onito
r act
ual
expe
nditu
re a
gain
st
budg
et (s
pend
ing
plan
s)
5% v
aria
nce
Spen
t 52%
of t
otal
allo
catio
n
Tran
sfer
s as
at 3
1 M
arch
201
0:To
tal t
rans
fers
R1,
168,
645,
864.
84Es
kom
R
1,1
67,7
31,4
51.8
4M
unic
ipal
ities
R
914
, 413
.00
Non
Grid
No
Fund
s tra
nsfe
rred
in 2
009’
10 fi
nanc
ial y
ear
Out
stan
ding
pay
men
ts a
nd d
elay
in
trans
fer
Tran
sfer
s to
Esk
om b
ased
on
cash
flo
w; n
ot a
ll m
unic
ipal
ities
requ
este
d tra
nsfe
rs; t
ende
ring
proc
ess
took
lo
nger
than
ant
icip
ated
PROGRAMME 6

120
Obj
ectiv
esM
easu
res
Initi
ativ
esTa
rget
s 20
09’1
0Pr
ogre
ss a
s at
31
Mar
ch 2
10C
onst
rain
ts/re
ason
for u
nder
-pe
rfor
man
ceM
anag
e co
sts
effe
ctiv
ely
Red
uctio
n in
co
nfirm
ed fr
uitle
ss,
was
tefu
l and
un
auth
oris
ed
expe
nditu
re
Atte
nd w
orks
hops
co
nduc
ted
by C
FO’s
offic
e
100%
Atte
nded
all
wor
ksho
ps a
rran
ged
Fina
nce
Res
pond
to id
entif
ied
inci
dent
s w
ithin
tim
e-
fram
es d
eter
min
ed b
y C
FO’s
offic
e
Non
e
Ensu
re c
ompl
ianc
e w
ith D
ivis
ion
Of
Rev
enue
Act
(D
OR
A)
Mon
thly
DO
RA
repo
rtsC
ompi
le m
onth
ly re
port
as re
quire
d by
DO
RA
100%
Elec
trific
atio
n Pr
ogra
mm
e Ap
ril re
port
subm
itted
to N
atio
nal
Trea
sury
Mun
icip
aliti
es h
ave
not s
ubm
itted
Nov
embe
r and
Dec
embe
r 20
09 m
onth
ly p
rogr
ess
repo
rts o
n EE
DSM
pro
ject
sPr
omot
e C
orpo
rate
G
over
nanc
eC
ompl
ianc
e w
ith
PFM
A an
d Tr
easu
ry
Reg
ulat
ions
Impl
emen
t com
plia
nce
fram
ewor
k10
0%
ELEC
TRIC
ITY,
NU
CLE
AR
AN
D C
LEA
N E
NER
GY
BR
AN
CH
SER
VIC
E D
ELIV
ERY
IMPR
OVE
MEN
T PL
AN
Key
Ser
vice
sSe
rvic
e B
enef
icia
ryC
urre
nt S
tand
ard
(200
8’09
)D
esire
d St
anda
rd (2
009/
10)
Prog
ress
as
at 3
1 M
arch
201
0
Alle
viat
e po
verty
thro
ugh
incr
ease
d ac
cess
to
Mor
den
Ener
gy C
arrie
s
Hou
seho
lds
and
scho
ols
Qua
ntity
15
0,00
0 ho
useh
olds
700
scho
ols
and
10 b
ulk
subs
tatio
ns
Qua
ntity
150,
000
hous
ehol
ds, 2
,800
sc
hool
s an
d
10 b
ulk
subs
tatio
nsH
ouse
hold
s co
nnec
tions
: 1
67,11
9Sc
hool
con
nect
ions
: 1,0
35Se
ven
subs
tatio
ns c
ompl
eted
; rem
aini
ng
thre
e es
timat
ed c
ompl
etio
n en
d Ap
ril 2
010
with
two
at c
omm
issi
onin
g st
age
Qua
lity
Audi
ted
Qua
lity
Audi
t
Con
sulta
tion
IDP,
Esk
om, M
unic
ipal
ities
Con
sulta
tion
IDP
proc
ess,
Esk
om,
mun
icip
aliti
es, H
ousi
ng, D
PLG
, D
OE
Appr
oved
pro
ject
s ha
s ID
Ps
Acce
ssE-
mai
l, te
leph
one
Acce
ssE-
mai
l, te
leph
one
Cou
rtesy
Ad h
ocC
ourte
syIm
plem
ent�B
atho�Pele
prog
ram
mes
O
pen
and
trans
pare
ntPr
ovin
cial
wor
ksho
psO
pen
and
trans
pare
ntPr
ovin
cial
wor
ksho
psC
ondu
cted
all
plan
ned
wor
ksho
ps
PROGRAMME PERFORMANCE - SECTION 2

121
Key
Ser
vice
sSe
rvic
e B
enef
icia
ryC
urre
nt S
tand
ard
(200
8’09
)D
esire
d St
anda
rd (2
009/
10)
Prog
ress
as
at 3
1 M
arch
201
0
Info
rmat
ion
Ad h
ocIn
form
atio
nW
ebsi
te a
nd w
orks
hops
Red
ress
Ad h
ocR
edre
ssC
lient
feed
back
and
que
ry
esca
latio
n pr
oces
ses
Res
pond
ed to
all
quer
ies
and
subm
itted
fe
edba
ck to
Min
istry
Va
lue
for
mon
eyU
nspe
nt m
unic
ipal
fund
sVa
lue
for m
oney
Allo
cate
d bu
dget
spe
nt in
line
with
pr
iorit
ies
Spen
t 63%
vs
desi
red
+90%
of t
otal
fund
s;
proj
ects
mon
itore
d re
gula
rly to
ens
ure
valu
e fo
r mon
ey is
ach
ieve
dTi
me
End
Mar
ch 2
009
Tim
eEn
d M
arch
201
0D
esire
d st
anda
rd u
nach
ieva
ble
at th
is
stag
e du
e to
late
sta
rt of
mun
icip
al
proj
ects
Cos
tU
nspe
nt m
unic
ipal
fund
sC
ost
Budg
eted
Due
to p
roje
cts
bein
g la
te, f
unds
can
not
be e
xpen
ded
as p
er d
esire
d st
anda
rd.
Faci
litat
e pr
ivat
e se
ctor
pa
rtici
patio
n in
th
e el
ectri
city
se
ctor
Sout
h Af
rican
pu
blic
and
in
dust
ry p
laye
rs
Qua
ntity
100
MW
Qua
ntity
1100
MW
Qua
lit:
Peak
ing
pow
erQ
ualit
yPe
akin
g po
wer
Con
sulta
tion
Esko
m, N
ERSA
Con
sulta
tion
Esko
m, N
ERSA
Acce
ssEm
ail,
tele
phon
e, m
eetin
gAc
cess
Emai
l, te
leph
one,
mee
ting
Cou
rtesy
Ad h
ocC
ourte
syIm
plem
ent B
atho�Pele
prog
ram
mes
Ope
n an
d tra
nspa
rent
Mee
tings
, Gov
ernm
ent G
azet
teO
pen
and
trans
pare
ntM
eetin
gs
Info
rmat
ion
Ad h
ocIn
form
atio
nW
ebsi
te a
nd w
orks
hops
Red
ress
Ad h
ocR
edre
ssC
lient
feed
back
and
que
ry
esca
latio
n pr
oces
ses
Addr
esse
d al
l que
ries
and
subm
itted
fe
edba
ck to
Min
istry
Valu
e fo
r mon
eyAd
hoc
Valu
e fo
r mon
eyBu
dget
spe
nt in
line
with
prio
ritie
s as
allo
cate
dSp
ent 6
3% v
s de
sire
d +9
0% o
f tot
al fu
nds;
pr
ojec
ts m
onito
red
regu
larly
to e
nsur
e va
lue
for m
oney
is a
chie
ved
Tim
eEn
d Ju
ne 2
009
Tim
eEn
d M
arch
201
0D
esire
d st
anda
rd u
nach
ieva
ble
at th
is
stag
e du
e to
late
sta
rt of
mun
icip
al
proj
ects
Cos
tBu
dget
Cos
tBu
dget
Due
to p
roje
cts
bein
g la
te, f
unds
can
not
be e
xpen
ded
as p
er d
esire
d st
anda
rd.
PROGRAMME 6

122
Key
Ser
vice
sSe
rvic
e B
enef
icia
ryC
urre
nt S
tand
ard
(200
8’09
)D
esire
d St
anda
rd (2
009/
10)
Prog
ress
as
at 3
1 M
arch
201
0
Prov
idin
g fu
ndin
g th
roug
h R
enew
able
En
ergy
Fin
ance
an
d Su
bsid
y O
ffice
(REF
SO)
to e
ntre
pren
eurs
an
d BE
Es
Entre
pren
eurs
ap
plyi
ng fo
r fu
ndin
g to
de
velo
p an
d im
plem
ent
rene
wab
le
ener
gy p
roje
cts
Qua
ntity
Th
ree
subs
idis
ed p
roje
cts
Qua
ntity
Five
sub
sidi
sed
proj
ects
One
pro
ject
Qua
lity
Com
mer
cial
ly v
iabl
e re
new
able
en
ergy
pro
ject
sQ
ualit
yC
omm
erci
ally
via
ble
rene
wab
le
ener
gy p
roje
cts
Con
sulta
tion
•Pr
ess
rele
ase
•W
ebsi
te•
Wor
ksho
ps a
cros
s th
e co
untry
Con
sulta
tion
•In
tens
ify a
war
enes
s ca
mpa
ign
•R
enew
able
ene
rgy
inve
stor
co
nfer
ence
Sola
r Wat
er H
eatin
g co
nfer
ence
Acce
ssTh
roug
h of
ficia
ls a
t the
Hea
d O
ffice
Acce
ssIn
volv
e m
unic
ipal
ities
and
wor
k w
ith D
ME
colle
ague
s in
the
regi
onEn
gagi
ng m
unic
ipal
ities
Cou
rtesy
•M
eetin
gs•
Tele
phon
ical
ly•
Wor
ksho
ps a
nd c
onfe
renc
es
Cou
rtesy
•M
eetin
gs•
Tele
phon
ical
ly•
Wor
ksho
ps a
nd c
onfe
renc
es
Hos
ted
CSP
wor
ksho
p; o
ngoi
ng
inte
ract
ion
with
sta
keho
lder
s; e
ngag
e th
em te
leph
onic
ally
Ope
n an
d tra
nspa
rent
Cle
ar a
pplic
atio
n pr
oced
ure
and
appe
al p
roce
ss fo
r agg
rieve
d ap
plic
ants
Ope
n an
d tra
nspa
rent
Cle
ar a
pplic
atio
n pr
oced
ure
and
appe
al p
roce
ss fo
r agg
rieve
d ap
plic
ants
.
Cle
ar a
pplic
atio
n ha
s be
en d
evel
oped
&
post
ed o
n th
e w
ebsi
te
Info
rmat
ion
Proj
ect i
nfor
mat
ion
diss
emin
atio
n he
lp d
esk
Info
rmat
ion
Proj
ect i
nfor
mat
ion
diss
emin
atio
n he
lp d
esk
Hel
p de
sk is
bei
ng e
stab
lishe
d th
roug
h R
EMT
Red
ress
Ad h
ocR
edre
ssC
lient
feed
back
and
que
ry
esca
latio
n pr
oces
ses
Valu
e fo
r mon
eyC
ontri
butio
n of
tota
l sub
sidi
sed
proj
ect i
s 12
4 G
Wh
Valu
e fo
r mon
eyAd
ditio
nal 3
00 G
Wh
per a
nnum
sh
ould
be
adde
d to
ene
rgy
mix
th
roug
h R
EFSO
sup
port
Tim
eM
arch
200
9Ti
me
Mar
ch 2
011
Cos
tR
5 m
illion
Cos
tR1
0 m
illion
50%
has
bee
n di
sbur
sed
Reg
ulat
ory
fram
ewor
k fo
r la
rge
scal
e im
plem
enta
tion
and
mon
itorin
g of
en
ergy
effi
cien
cy
The
Sout
h Af
rican
pub
lic
and
indu
stry
Qua
ntity
Nat
iona
l Ene
rgy
Effic
ienc
y St
rate
gy o
f 200
5 re
view
ed 2
008
Stan
dard
for S
et T
op B
oxes
or
Dec
oder
s
EE re
gula
tions
und
er th
e En
ergy
Ac
t
Qua
ntity
Nat
iona
l Ene
rgy
Effic
ienc
y Po
licy
docu
men
t rev
iew
ed fo
r 200
8 an
d ap
prov
ed b
y C
abin
et fo
r pub
lic
com
men
t with
dis
aggr
egat
ed
targ
ets
for i
ndus
try
Nat
iona
l Ene
rgy
Effic
ienc
y St
rate
gy
publ
ishe
d fo
r pub
lic c
omm
ents
(clo
sing
da
te w
as 1
0 Ju
ly 2
009)
How
ever
DG
ad
vise
d to
del
ay p
roce
ss a
nd fo
cus
on
deve
lopm
ent o
f EE
targ
ets
mon
itorin
g sy
stem
Stan
dard
for S
et T
op B
oxes
com
plet
ed
and
publ
ishe
d by
SAB
S
Dra
ft re
gula
tions
bei
ng p
repa
red
in
cons
ulta
tion
with
DTI
and
will
be c
ircul
ated
to
Bra
nche
s
PROGRAMME PERFORMANCE - SECTION 2

123
Key
Ser
vice
sSe
rvic
e B
enef
icia
ryC
urre
nt S
tand
ard
(200
8’09
)D
esire
d St
anda
rd (2
009/
10)
Prog
ress
as
at 3
1 M
arch
201
0
Qua
lity
Wel
l-dra
fted
docu
men
t with
act
ion
plan
s fo
r the
nex
t thr
ee y
ear c
ycle
Qua
lity
A w
ell-d
rafte
d do
cum
ent w
ith
actio
n pl
ans
until
201
5 an
d st
rate
gic
dire
ctio
n un
til 2
050
DD
G a
dvis
ed d
elay
of s
trate
gy re
view
pr
oces
s an
d ne
ed fo
r foc
us o
n de
velo
ping
m
onito
ring
syst
em fo
r ene
rgy
effic
ienc
y ta
rget
sC
onsu
ltatio
n26
-27
Oct
ober
200
8 w
orks
hops
w
ith a
ll st
akeh
olde
rsC
onsu
ltatio
nC
ontin
ued
cons
ulta
tion
and
esta
blis
hmen
t of
inte
rgov
ernm
enta
l wor
king
gr
oup
to e
nsur
e im
plem
enta
tion
and
coor
dina
tion
at d
iffer
ent
gove
rnm
ent d
epar
tmen
t lev
els
A fo
rum
and
/or b
ody
com
pris
ing
all s
ecto
r pla
yers
to re
view
all
equi
pmen
t sta
ndar
ds
Slow
pro
gres
s w
ith p
roce
ss o
f est
ablis
hing
SA
NED
I
The
Ener
gy E
ffici
ency
Sta
ndar
d Ad
viso
ry
Com
mitt
ee e
stab
lishe
d at
SAB
S to
pr
ovid
e st
rate
gic
dire
ctio
n; n
umbe
r of
mee
tings
hav
e ta
ken
plac
e
Acce
ssAv
aila
ble
on D
ME
web
site
Acce
ssM
akin
g a
mec
hani
sm a
vaila
ble
for i
ndiv
idua
ls, c
ompa
nies
, bu
ildin
g ow
ners
to d
eter
min
e ca
rbon
foot
prin
t bas
ed o
n en
ergy
co
nsum
ptio
n an
d m
easu
red
to
impl
emen
t ene
rgy
effic
ienc
y
Avai
labl
e; li
nk b
etw
een
DM
E an
d ca
rbon
fo
otpr
int w
ebsi
tes
to b
e cr
eate
d
Cou
rtesy
Cur
rent
ly v
olun
tary
to e
nsur
e re
adin
ess
to im
plem
ent b
efor
e m
akin
g it
man
dato
ry
Cou
rtesy
Ret
ain
volu
ntar
y st
atus
but
co
mm
enci
ng w
ith re
gula
tions
w
here
the
volu
ntar
y ap
proa
ch
is n
ot fu
nctio
ning
; inc
entiv
es
anno
unce
d fo
r im
plem
enta
tion
as
soon
as
poss
ible
Dis
cuss
ions
are
und
erw
ay w
ith N
BI to
st
art t
he p
roce
ss o
f sig
ning
new
acc
ords
w
ith th
e M
inis
ter.
A m
eetin
g be
twee
n N
BI
repr
esen
tativ
es a
nd th
e M
inis
ter t
ook
plac
e to
dis
cuss
way
forw
ard
Ope
n an
d tra
nspa
rent
Stra
tegy
pre
sent
ed a
t wor
ksho
ps,
exhi
bitio
ns a
nd c
onfe
renc
esO
pen
and
trans
pare
ntC
ontin
ued
disc
ussi
ons
and
pres
enta
tions
at l
ocal
, nat
iona
l an
d in
tern
atio
nal f
ora
Pres
enta
tions
at w
orks
hops
and
co
nfer
ence
s to
pro
mot
e im
plem
enta
tion
of
EE p
roje
cts
Info
rmat
ion
Doc
umen
t con
tain
s al
l rel
evan
t in
form
atio
n fo
r im
plem
enta
tion
Info
rmat
ion
Prov
idin
g m
ore
info
rmat
ion
for
each
sec
tor i
ncl s
tand
ards
, cod
es
of p
ract
ice,
impl
emen
tatio
n gu
idel
ines
and
che
cklis
ts to
en
sure
larg
e sc
ale
ener
gy
effic
ienc
y im
plem
enta
tion
DD
G a
dvis
ed d
elay
of s
trate
gy re
view
pr
oces
s an
d ne
ed fo
r foc
us o
n de
velo
ping
m
onito
ring
syst
em fo
r ene
rgy
effic
ienc
y ta
rget
s
PROGRAMME 6

124
Key
Ser
vice
sSe
rvic
e B
enef
icia
ryC
urre
nt S
tand
ard
(200
8’09
)D
esire
d St
anda
rd (2
009/
10)
Prog
ress
as
at 3
1 M
arch
201
0
Red
ress
The
stra
tegy
enc
oura
ges
the
esta
blis
hmen
t of S
MM
Es to
un
derta
ke e
nerg
y ef
ficie
ncy
proj
ects
and
the
crea
tion
of jo
bs.
Red
ress
Assi
st S
MM
Es w
ith lo
w in
tere
st
loan
s an
d ot
her i
ncen
tives
and
tra
in m
ore
oper
ator
s on
equ
ipm
ent
at d
iffer
ent l
evel
s by
ens
urin
g un
it st
anda
rds
Dis
cuss
ions
und
erw
ay w
ith N
atio
nal
Trea
sury
and
DTI
on
the
tax
ince
ntiv
es;
DO
E to
dev
elop
EE
regu
latio
ns fo
r im
plem
enta
tion
of in
cent
ives
by
Trea
sury
Valu
e fo
r mon
eyEn
ergy
effi
cien
cy b
y its
nat
ure
prov
ides
val
ue fo
r mon
ey, s
aves
th
e en
viro
nmen
t, sp
urs
the
econ
omy
and
will
ensu
re s
ocia
l de
velo
pmen
t
Valu
e fo
r m
oney
Payb
ack
perio
ds w
ill de
crea
se
as th
e pr
ice
of e
nerg
y in
crea
ses;
m
ore
proj
ects
will
beco
me
finan
cial
ly v
iabl
e w
hich
will
have
a
posi
tive
impa
ct o
n th
e ec
onom
y of
th
e co
untry
Ong
oing
Tim
eTh
e st
rate
gy h
as m
ediu
m-te
rm
targ
et o
f 201
5 lo
ng-te
rm ta
rget
of
2050
Tim
eEn
ergy
effi
cien
cy im
prov
emen
ts in
th
e co
untry
will
have
to c
ontin
ue
and
be a
ccel
erat
ed to
add
ress
gl
obal
war
min
g an
d cl
imat
e ch
ange
up
to 2
050
Proj
ects
und
erw
ay in
indu
stria
l sec
tor
and
enga
gem
ents
with
indu
stry
par
tner
s on
goin
g at
NBI
EE
Tech
nica
l Com
mitt
ee
mee
tings
Appo
intm
ent o
f key
peo
ple
bein
g co
mpl
eted
by
UN
IDO
to im
plem
ent
indu
stria
l ene
rgy
effic
ienc
y pr
ogra
mm
e;
proj
ect s
teer
ing
com
mitt
ee c
o-ch
aire
d by
D
OE
and
DTI
est
ablis
hed
as p
er s
igne
d pr
ojec
t doc
umen
t C
ost
The
mon
itorin
g of
the
targ
ets
mus
t be
don
e; a
ssoc
iate
d co
st R
8 m
illion
ove
r thr
ee y
ears
Larg
e sc
ale
impl
emen
tatio
n of
pr
ojec
ts a
mou
nt to
R1.
55 b
illion
ov
er n
ext t
hree
yea
rs
Cos
tM
onito
ring
will
have
to
cont
inue
unt
il 20
50 b
ut c
osts
w
ill si
gnifi
cant
ly re
duce
on
ce m
odel
ling
mec
hani
sm
impl
emen
ted;
then
onl
y co
st o
f da
ta g
athe
ring
and
pers
onne
l to
anal
yse
data
Con
tinue
d fu
ndin
g of
pro
ject
s re
quire
d to
cre
ate
ince
ntiv
es fo
r im
plem
enta
tion
Dis
cuss
ions
und
erw
ay w
ith S
wis
s D
evel
opm
ent C
orpo
ratio
n to
fina
lise
fund
ing
cont
ract
and
ToR
; dra
ft su
bmitt
ed
to L
egal
Ser
vice
s fo
r con
side
ratio
n
R114
milli
on tr
ansf
erre
d to
mun
icip
aliti
es
to d
ate
to a
ssis
t with
impl
emen
tatio
n of
EE
DSM
pro
gram
me
PROGRAMME PERFORMANCE - SECTION 2

125
PROGRAMME 7: ASSOCIATED SERVICES
Purpose: To provide services in support of the Department’s mandate through funded and non-funded statutory bodies and organizations.
Measurable Objectives: Enhance the Department’s objectives through policies and directives, promoting its legislative mandate and leading to the creation of an environment conducive to sustainable development, investment and the improvement of the quality of life of all South Africans.
(Detailed performance reports are on the individual entities’ annual reports)
1. THE MINE HEALTH AND SAFETY COUNCIL (MHSC)
The Mine Health and Safety Council (MHSC) is a public entity that is mandated, in terms of the MHSA, to advise the Minister of Minerals and Energy on OHS research programmes, and the development of regulations, standards, occupational health and safety policies, procedures and databases focused on minimising the occupational health and safety risk at South African mines.
OHS Performance in the South African Mining Industry
When comparing the safety performance between January to December of 2008 to that of 2009, there has been a marginal reduction from 171 fatalities to 167 fatalities. The provisional fatality rate for 2009 is 0.15 per million hours worked and 0.33 per thousand persons at work. This represents a slight reduction in the fatality rate of 0.16 per million hours worked and 0.35 per thousand persons at work (171 fatalities) for the same period in 2008. From the milestones that were set in 2003, the South African Mining Sector has to improve a minimum of 20% per annum to reach the target. Occupational health impacts remain difficult to quantify since many health effects are not immediately observable. Occupational lung diseases remain a major cause of premature retirement and death at South African mines. Silicosis and noise induce hearing loss continue to plague the industry. The under-reporting on the exposures underestimates the real exposure levels. The reporting of dust and noise exposure data for the previous year is not representative given that only 18% of the operating mines submitted the annual reports. There is a need for mandatory reporting on health indicators in order for the milestones to be achieved.The research needs analysis highlighted the major challenges in accessing health data in order to determine the extent of the problem and hence develop appropriate interventions. The focus for the next financial year will be on improving the collection of health data, in-stope measurement of dust exposure, raising awareness among employees on the hazards of thermal stress and optimising the silicosis tool so that it can be made available to all commodities and technologies for real-time monitoring of noise exposure.
MHSC Research Highlights for the 2009/10 year
In the year of 2009, the following highlights were selected to demonstrate successful transfer of research outcomes.In June 2009, a project focussed on a Hazard Identification Risk Assessment for trackless system was completed. The outcomes of this project provide the user with a template to evaluate the risks associated with trackless mobile equipment. When presented to the SIMRAC members, it was perceived that the research outcomes would prove to be invaluable to reduce the number of injuries, incidents and fatalities associated with trackless mobile equipment. Further to this the research from the programme that focuses on eliminating the risk of rockfalls has provided some insightful, even though provisional, results on the systems that would provide miners with a method of early detection of impending instability. Further work is ongoing to verify these results. In an effort to improve the health of workers and increase the awareness of the dangers of silicosis, an awareness campaign was undertaken. As an outcome of the silicosis elimination programme, a silicosis comic was developed to educate workers about silicosis. Taking into account the high levels of illiteracy within the sector, it was determined that alternatives method should be sought to communicate this message to the workforce. The provinces of Gauteng, North West, Mpumalanga and Free State were chosen for the roll out of the programme. The awareness campaign took place from the 4th to the 27th of November 2009 with the first show held at AngloGold Ashanti’s Moab Khotsong gold mine on the 4th of November 2009. Feedback received from mine employees and mine management highlighted the fact that the roadshow had met the desired intent and impact. The response was very encouraging and the MHSC was commended on the efforts in bringing this message to the respective mines. Further to this, the MHSC has streamlined the research process to firstly ensure that
PROGRAMME 7

126
the research programmes are focussed and directed towards the identified needs based on the health and safety performance and taking into account previous research work and current national and international initiatives to improve OHS. This reviewed process uses technical experts to assist in the reviewing of research progress to guide both the research provider as well as the MHSC in order to achieve optimal outcomes that will have meaningful impact.
Summit Action Plan and Presidential Audit Outcomes
In addition to the research initiatives, the Summit Action Plan and the outcomes of the Presidential Audit remained a key focus area for the MHSC. The Summit action plan incorporates three key themes:
• Health and Safety Culture, • Learning Industry and • Healthy and Safe Workplaces.
The Presidential audit recommendations were incorporated into these themes. Each of the themes had a set identifiable actions and outcomes and these are listed below. For the year 2009/10, efforts were focussed on development of strategies towards the various themes.
One of the major initiatives proposed by the stakeholders in 2008 is the development of a culture transformation framework. The Changing�Minds,�Changing�Mines Project, builds on a survey that indicated that OHS culture in the industry was significantly more negative than international comparisons. The development of the framework was initiated in the 2009/10 financial year and will be complete by August 2010.
2. MINTEK
Mintek, South Africa’s national organisation for research, development and beneficiation of minerals, was established in terms of the Mineral Technology Act, No 30 1989. Mintek strives, through innovative research and development, to be a global leader in the field of mineral and metallurgical research and development and technology transfer.
A serious shortfall in Mintek’s finances, compared to 2008/9, was experienced this year as a result of the impact of the economic slump that engulfed the mining industry. Commercial demand continued but for smaller, bench-scale service work rather than the more lucrative large pilot plants. The majority of our clients remain very price-sensitive and are still reluctant to proceed with expensive pilot plants, which will remain a challenge for us next year. However, we will continue with our cost savings efforts where possible including only filling critical posts and increasing efficiencies.
On the technical front; the ConRoast demonstration furnace, after six years of research, treated 50,000 tons of material signifying the reliability of Mintek’s smelting technology. This also signified the end of the demonstration phase. As a result, Mintek and Braemore Platinum, a wholly owned subsidiary of Jubilee Plc, signed a letter of intent allowing Mintek to fully commercialise the furnace at Mintek. In the Research and Development arena, programmes on gold, platinum and fuel cell catalyst continued with no major setbacks and the Department of Science and Technology (DST) ‘Advanced Metals Development Initiatives’ precious metals catalyst programme advanced well with an in-depth market evaluation of commercial precious metal catalysts.
On the second economy interventions, a number of projects were identified e.g. the manufacturing of bricks/blocks for building, the approval of a Pottery project with the PPC Construction Industry Associations Trust involving the set-up of a pottery manufacturing unit and training of women in pottery/ceramic production in Ndwedwe in KZN, more work on a phosphogypsum dump in Phalaborwa as well as the setting-up of a glass bead manufacturing unit in Mdantsane, in the Eastern Cape. SMME’s were also encouraged to play a prominent role in the rehabilitation of ownerless and derelict asbestos mines in the Department of Mineral Resources’ programme managed by Mintek. To this end, a tour of the affected areas was undertaken with DMR officials late in the year where substantial progress in the rehabilitation of those areas was observed.
PROGRAMME PERFORMANCE - SECTION 2

127
On employee relations, the National Union of Mineworkers (NUM) was officially recognised as a majority union at Mintek in August and subsequently, for the first time in the 75 year history of Mintek, successful negotiations on change of conditions of service for Mintek employees were held in the bargaining chamber.
Following concerns on high staff turnover, we were able to reach our target from 25% in the last 2 years to 7.3%. However, of major concern now is the poor performance of Mintek undergraduate bursars for the 2009 academic year due to a high failure rate of 33%. Although this problem is not unique to Mintek, the selection process was nevertheless reviewed in order to cater for possible future gaps as this impacts on availability of more skills.
Mintek successfully underwent its first integrated certification audit of our Quality, Environmental and Safety Management Systems and was re-certified to the international ISO 9001, 14001, and 18001 standards. Analytical Services Division was re-accredited against the ISO 17025 standard for Testing and Calibration laboratories. This is an important milestone as in itself it advertises the type of standards Mintek upholds in the areas of our competencies.
3. ELECTRICITY DISTRIBUTION INDUSTRY HOLDINGS (EDIH)
HIGHLIGHTS FOR THE YEAR ENDED 31 MARCH 2010
The Department of Minerals and Energy (DME) and EDI Holdings, working with the other stakeholders have made significant progress during the year under review in preparing the municipal electricity business and ESKOM distribution business, to join the envisaged Regional Electricity Distributors (REDs). Despite the constraint of the lack of an enabling legislative environment, 147 of the 187 municipalities that distribute electricity as well as SALGA have signed the Accession & Cooperation Agreements with EDI Holdings thereby committing to the EDI restructuring process. During the year under review, 33 municipal electricity businesses and ESKOM distribution business have been ring fenced.
Extensive ground work and strong promotion of the need for a holistic funding approach for the electricity distribution asset maintenance, refurbishment and strengthening backlog (ADAM) assisted in getting some of the key players to focus on finding solutions to the asset management challenges at hand. This was driven by amongst others, the comprehensive analysis by EDI Holdings revealing that asset management in the distribution industry is not at the level that it should be complementing the NERSA reports that distribution assets are deteriorating due to lack of maintenance and skills shortages. DME, working together with EDI Holdings, managed to have the proposed Constitution 17th Amendment Bill published for public comments and introduced in Parliament in August 2009. The proposed amendment would enable the national government to pass legislation in terms whereof the national government would have powers to further regulate the exercise of executive authority by municipalities relating to the provision of electricity to their communities, amongst other things.Following the agreement between DME and EDI Holdings on the Strategic Implementation Plan (the SIP), which is the roadmap outlining the path from the current scenario to the future we envision, Cabinet would consider and approve the SIP during the 2010/11 financial year whereafter implementation would start in earnest.
4. THE COUNCIL FOR GEOSCIENCE (CGS)
Highlights
The CGS was tasked by the DME to identify all known abandoned, unsafe, mine openings occurring in the Gauteng, Limpopo and North West Provinces and to seal the most dangerous of these shafts. A total of 900 unsafe, abandoned mine-related openings have been located in the Gauteng, Limpopo and North West Provinces, of which 700 are located in Gauteng. A total of 108 extremely dangerous openings, in and around Johannesburg, have been sealed. A proposal to rehabilitate another 145 mine openings in the three above-mentioned provinces over the next three years has been submitted to the DME as a continuation of this project.
The CGS is involved in two projects which have allowed the installation of 12 seismograph stations within the Johannesburg area under the DME-sponsored Strategic Water Management Project. The preparation for the installation of another 10 stations in the Carletonvllle area, in
PROGRAMME 7
128
collaboration with the Japanese government, to monitor earth tremours within the gold-mining and abandoned mine areas is underway, this will assist in understanding, and thus mitigating, the impact of seismic events occurring in these areas.
The contract to undertake the assessment of the CO2 storage potential of South Africa in all onshore and offshore basins that was signed towards
the end of 2008 is progressing as scheduled. The CO2 storage report will be published in two forms: (1) a glossy document intended for a broad
public readership, and (2) a technical report for a scientific/technical readership. These publications should be available by mid 2010.
Geophysical investigations have been carried out around Mafikeng in the North West Province in order to assess the groundwater potential using an integrated exploration approach that involves geophysical and hydrogeological studies. Airborne magnetic data in conjunction with frequency and time-domain electromagnetic methods were used. Six potential targets were identified based on interpretation of the integrated geophysical data sets.
The collection of high-density airborne geophysical data over regions in South Africa is vital for the promotion of the mining industry, especially for small-scale operators who cannot afford exploration on the scale that is done by the mining houses. Airborne flying of geophysical data focused on the northern and eastern sections of the Bushveld Igneous Complex – where previously there was a lack of high-resolution data. This data is currently being interpreted.
The year saw the further consolidation of the CGS Field School as a year-long programme during which the full-time participants are guided and mentored continuously. The programme is structured into four modules lasting three months each, and covering various primary topics, with secondary themes. This year these focused on structural and metamorphic aspects with some basement geology.
Over a period of several years a number of threats have been identified to the quality and supply of groundwater to the Cradle of Humankind World Heritage Site. These include the impact of acid mine drainage, poorly managed sewage, agriculture and the over-abstraction of groundwater. The project, which is funded by BlueIQ and undertaken in collaboration with the CSIR and the University of the Witwatersrand, aims to develop a management framework for groundwater within the area by determining the current status and assessing the various threats. Sampling activities have been undertaken to collect pristine dolomite samples to represent uncontaminated aquifer material. These have been investigated petrologically. A laboratory simulation is underway to investigate the impact of acid mine drainage on dolomite.
The critical challenges that the CGS has to manage on a virtually continuous basis to achieve success are:
• Appropriate financial backing • Adequate and competent scientists• Improving and maintaining high staff morale• The transfer of knowledge, skills and expertise to young scientists• An integrated approach to service delivery• The retention of experienced scientists • A workable balance between statutory and commercial work• A structure that supports its strategy• Developing and implementing a strategic brand within the national priorities framework.
5. NATIONAL NUCLEAR REGULATOR (NNR)
The NNR is established and governed in terms of the National Nuclear Regulator Act, Act 47 of 1999 which came into effect on 20 February 2000. The National Nuclear Regulator (NNR) is responsible for exercising regulatory control over the safety of nuclear installations, certain types of radioactive waste, irradiated nuclear fuel, and the mining & processing of radioactive ores & minerals.
The primary function of the National Nuclear Regulator (NNR) is to provide for the protection of persons (workers & members of public), environment and property from the harmful effects arising from ionising radiation produced by radioactive materials.
PROGRAMME PERFORMANCE - SECTION 2

129
NNR ACTIVITIES AND HIGHLIGHTS
During the financial year 2009/10 the NNR made significant top leadership changes by appointing three new executives, namely the Chief Executive Officer, Chief Technical Officer and Strategy and Stakeholder Relations Executive. All executives and senior managers of the organizations have signed performance contracts. In addition a new Chairperson of the Board was appointed in the last quarter of the financial year.
All nuclear facilities in the country were inspected and found to be compliant with all the required safety standards, as stipulated in the NNR’s conditions of license. There were no nuclear accidents or incidents reported in South Africa during 2009/10.
The facilities and actions regulated by the NNR cover a diverse range of activities, including the operation of nuclear power reactors, research reactors, nuclear fuel fabrication, nuclear technology applications and the mining and processing of uranium and other radioactive ores.
The NNR has to exercise regulatory oversight over these facilities, including safety assessments and compliance inspections of authorised facilities, such as the Koeberg Nuclear Power Station, the Necsa nuclear installations and the mining and minerals processing facilities.
There were no significant incidents that took place at these facilities to report on, and the NNR is satisfied that the said facilities largely complied with the NNR safety standards and regulatory practices, and that the protection of the workers, public and the environment was assured.
Although the NNR is generally satisfied with the overall compliance by authorisation holders with NNR requirements, over the past few years the organisation detected a trend of recurrence of non-compliance by some authorisation holders in the mining and minerals processing facilities. The NNR has engaged with these specific cases, in order to implement measures to ensure improved compliance. We are closely monitoring these holders and they have been put on a regular reporting mechanism, however, the level of deviation is not significant so as to shut down the facility.
New Authorizations
Certificates of Registration
During the period under review, the NNR issued 23 COR for nuclear authorisation of mining and minerals processing facilities. NNR has now issued a total of 144 certificates of registrations of mining and mineral facilities.
Application for nuclear vessel license
During the financial year the NNR granted a Nuclear Vessel Licences to the HMS Spectre from the UK.
Authorisations for the Necsa facilities:
The NNR has issued a total of 15 licences out of the 39 required for Necsa. The rest of the licences will be issued during the next financial year.
INTERNATIONAL OBLIGATIONS
IAEA SAFETY COMMITTEES
The NNR fulfilled all its international obligations in the preceding year by attending all Safety Standards Committee Meetings at the IAEA Headquarters in Vienna, these meetings included:
• Nuclear Safety Standard Committee (NUSSC) meetings
PROGRAMME 7
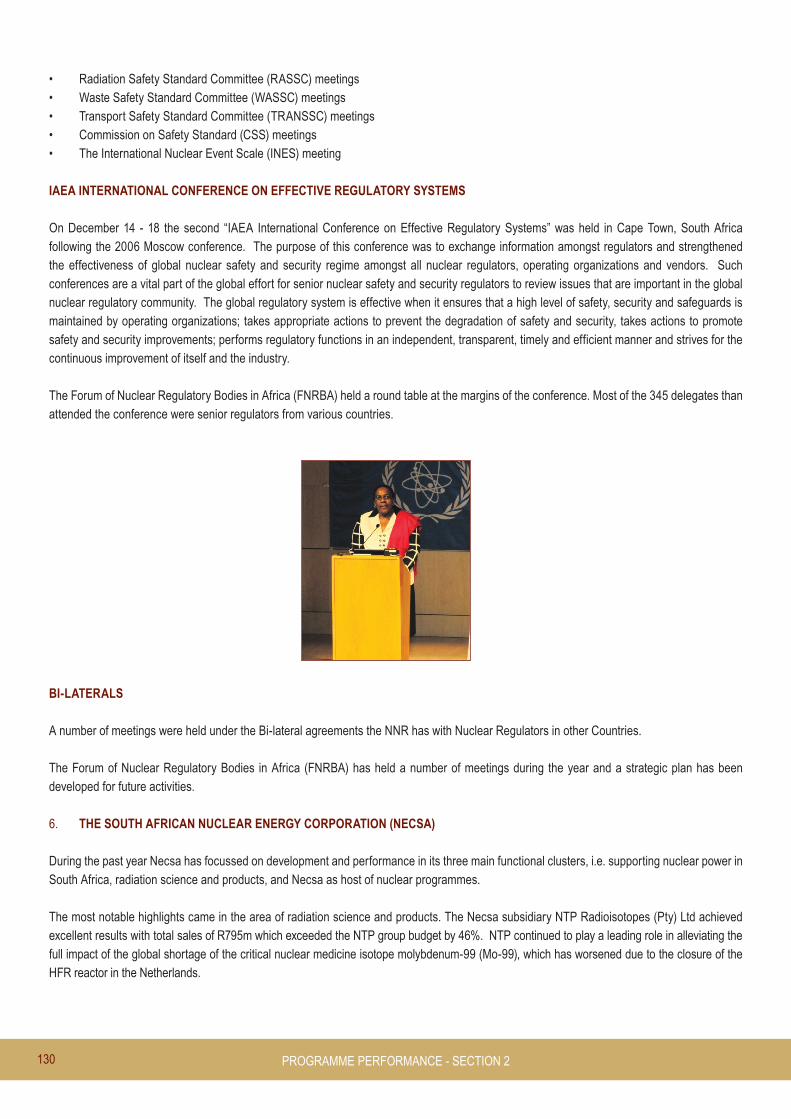
130
• Radiation Safety Standard Committee (RASSC) meetings• Waste Safety Standard Committee (WASSC) meetings• Transport Safety Standard Committee (TRANSSC) meetings • Commission on Safety Standard (CSS) meetings • The International Nuclear Event Scale (INES) meeting
IAEA INTERNATIONAL CONFERENCE ON EFFECTIVE REGULATORY SYSTEMS
On December 14 - 18 the second “IAEA International Conference on Effective Regulatory Systems” was held in Cape Town, South Africa following the 2006 Moscow conference. The purpose of this conference was to exchange information amongst regulators and strengthened the effectiveness of global nuclear safety and security regime amongst all nuclear regulators, operating organizations and vendors. Such conferences are a vital part of the global effort for senior nuclear safety and security regulators to review issues that are important in the global nuclear regulatory community. The global regulatory system is effective when it ensures that a high level of safety, security and safeguards is maintained by operating organizations; takes appropriate actions to prevent the degradation of safety and security, takes actions to promote safety and security improvements; performs regulatory functions in an independent, transparent, timely and efficient manner and strives for the continuous improvement of itself and the industry.
The Forum of Nuclear Regulatory Bodies in Africa (FNRBA) held a round table at the margins of the conference. Most of the 345 delegates than attended the conference were senior regulators from various countries.
BI-LATERALS
A number of meetings were held under the Bi-lateral agreements the NNR has with Nuclear Regulators in other Countries.
The Forum of Nuclear Regulatory Bodies in Africa (FNRBA) has held a number of meetings during the year and a strategic plan has been developed for future activities. 6. THE SOUTH AFRICAN NUCLEAR ENERGY CORPORATION (NECSA)
During the past year Necsa has focussed on development and performance in its three main functional clusters, i.e. supporting nuclear power in South Africa, radiation science and products, and Necsa as host of nuclear programmes.
The most notable highlights came in the area of radiation science and products. The Necsa subsidiary NTP Radioisotopes (Pty) Ltd achieved excellent results with total sales of R795m which exceeded the NTP group budget by 46%. NTP continued to play a leading role in alleviating the full impact of the global shortage of the critical nuclear medicine isotope molybdenum-99 (Mo-99), which has worsened due to the closure of the HFR reactor in the Netherlands.
PROGRAMME PERFORMANCE - SECTION 2

131
NTP is currently the world’s top producer of isotopes that are used internationally in millions of medical procedures per year, resulting in extremely favourable global exposure for the SA nuclear industry. NTP is currently collaborating with the US Department of Energy on the qualification of NTP’s LEU-based Mo-99 in the USA. NTP is also bidding to supply critical radioisotopes, used in medical diagnostics, to the United States market.
The SAFARI-1 conversion programme has been successfully completed in 2009 and the reactor is now fully converted to utilise low enriched uranium (LEU) fuel. Reliability of the SAFARI-1 remained high due to upgrading of its maintenance programme and operational personnel training.
The Nuclear Energy Policy of 2008 confirms Necsa’s role as the national anchor in nuclear energy research, development and innovation. Thorough feasibility studies were conducted by the Nuclear Fuel Cycle (NFC) group that enabled Necsa to develop strategic options for the establishment of fuel cycle operations. The technical viability of some of these options needs to be further evaluated through fundamental experimental work. In this regard good progress was made in establishing laboratories for this research work, in line with Necsa’s research and development mandate. Good progress was also made with the upgrading of the National Nuclear Manufacturing Centre at Necsa for specialised manufacturing of components for nuclear reactors in support of the government’s localisation objectives for the nuclear new build programme. Very good results were achieved with the acceleration of skills transfer to and training of the next generation of nuclear scientists, engineers and technicians in this programme.
Necsa’s research and development programmes focussed on new opportunities for the SA nuclear and radiation industries and eight new innovations capable of delivering economic value saw the light in 2009/10. Research outputs in the form of patents and peer reviewed publications continued to grow.Necsa’s decommissioning and decontamination programme achieved its targets and was able to fully utilise the dedicated funding allocation for this programme.
The Nuclear Skills Development Centre at Necsa, which was opened in 2008, made excellent progress and was fully utilised during the past year. The Centre has received full accreditation from Chieta to do the final trade testing of apprentices to qualify as artisans.
Good progress was made with the establishment of the first phase of a Nuclear Science Centre/ Visitor Centre at Pelindaba. This centre will be opened to the public during 2010 and will supply information on Necsa and the nuclear industry as part of the programme to improve public understanding of nuclear matters.
Despite the difficult financial and trading environment experienced during the past year, the Necsa group was still able to increase its revenue in real terms during the 2009/10 financial year. 7. NATIONAL ENERGY REGULATOR OF SOUTH AFRICA (NERSA).
NERSA HIGHLIGHTS FOR 2009/10
The National Energy Regulator (NERSA) is a regulatory authority established as a juristic person in terms of Section 3 of the National Energy Regulator Act, 2004 (Act No. 40 of 2004). NERSA’s mandate is to regulate the electricity, piped-gas and petroleum pipelines industries in terms of the Electricity Regulation Act, 2006 (Act No. 4 of 2006), Gas Act, 2001 (Act No. 48 of 2001) and Petroleum Pipelines Act, 2003 (Act No. 60 of 2003). The structure of the Energy Regulator consists of nine members, five of whom are part-time and four are full-time including the Chief Executive Officer (CEO). The Energy Regulator is supported by a secretariat under the direction of the CEO.
NERSA believes that its services add value to the electricity, piped-gas and petroleum pipelines industries in support of government’s economic and social objectives. During the last business planning cycle (2009/10), value has been added in each of the following strategic objectives:1. To implement relevant energy policy efficiently and effectively;2. To implement relevant energy law efficiently and effectively;3. To implement relevant energy regulations efficiently and effectively;4. To identify, develop and implement relevant energy rules efficiently and effectively;
PROGRAMME 7

132
5. To establish the credibility, legitimacy and sustainability of NERSA as an independent and transparent energy regulator;6. To create an effective organisation that delivers on its mandate and purpose; and7. To evaluate the Energy Regulator’s effectiveness.
HIGHLIGHTS FOR 2009/10:
NERSA completed a number of programmes and projects during 2009/10 in order to meet its objectives. These programmes and projects are grouped in industry specific regulatory; cross-cutting regulatory; and governance and other. The highlights for 2009/10 include:
Electricity Industry Regulation:• The Energy Regulator approved a 31.3% interim tariff increase for Eskom for 2009/10 on 25 June 2009;• The Energy Regulator approved one hundred and twenty five (125) municipal tariff applications for 2009/10;• The Energy Regulator approved the 2009/10 Free Basic Electricity Tariff in August 2009; • On 29 October 2009, the Energy Regulator approved the second phase of the Renewable Energy Feed-In Tariff (REFIT). The decision
of the Energy Regulator is the following: - Concentrated Solar Power (CSP) trough without storage – R3.14 / kWh; - Large scale grid connected PV systems (≥ 1 MW) – R3.94 / kWh; - Biomass solid – R1.18 / kWh; - Biogas – R0.96 / kWh; and - CSP Tower with storage of 6 hrs per day – R2.31 / kWh.• On 9 December 2009, the Energy Regulator approved the principles to be used in determining the electricity tariff guideline increase for electricity
distributors;• The Energy Regulator approved on 24 February 2010 the Eskom tariff increase for the period 210/11 – 2012/13 as follows: - 24.8% increase in 2010/11; - 25.8% increase in 2011/12; and - 25.9% increase in 2012/13. • On 24 February 2010, the Energy Regulator approved the municipal tariff guideline1 as well as the electricity tariff level benchmarks for
the three years control period 2010/11 - 2012/13;• On 12 March 2010, the Energy Regulator approved Eskom’s schedule of retail tariffs for implementation on 1 April 2010;• On 24 February 2010, the Energy Regulator approved the Inclining Block Rates tariffs (IBTs) structure for implementation by Eskom and
municipalities concurrently with the 2010/11 price increase in order to provide for cross-subsidies for low income domestic customers, as required by the Electricity Pricing Policy (EPP);
• A consultation paper on the rules for the selection criteria of REFIT projects was finalised and published. A public hearing in this regard was held on 30 and 31 March 2010; and
Piped-Gas Industry Regulation:• The Energy Regulator approved the piped-gas Tariff Guidelines on 30 April 2009;• The Energy Regulator approved the European Benchmark Price (EBP) and Sasol Volume Weighted Average Gas Price (SWVAGP) on 9
September 2009;• The Energy Regulator approved the ROMPCO tariff on 9 September 2009;• The Energy Regulator granted twelve (12) construction licences to Sasol Gas.• The Energy Regulator amended six (6) licence granted to Sasol Gas Ltd to extend the construction period as the licensee failed
to complete the construction activities within the period provided for in the original licence conditions, due to delays in obtaining environmental authorizations for the projects.
• The Energy Regulator granted a first licence to trade in compressed natural gas (CNG) to Novo Energy (Pty) Ltd in six areas on 8 December 2009.
1� ��The�municipal�guideline�was�however�revised�and�a�new�one�approved�on�12�April�2010.�This�was�after�discussions�with�stakeholders�and�after�
receipt�of�the�final�Eskom�retail�tariffs
PROGRAMME PERFORMANCE - SECTION 2

133
• The Energy Regulator granted a licence to Transnet Ltd trading as Transnet Pipelines for the operation of the Secunda to Durban gas transmission facility commonly referred to as the “Lilly Pipeline” on 11 November 2009;
• The Energy Regulator decided on 12 October 2009 not to issue licences to Gigajoule Africa Pipe (Cape) (Pty) Ltd for the construction of gas transmission and distribution facilities; and to Gigajoule Africa Gas (Cape) (Pty) Ltd for trading in gas in the Cape West Coast Region of the Western Cape Province; and
• The Energy Regulator denied a licence application by Unigas Import and Export for the construction of gas facilities in the Eastern Cape, Western Cape and KwaZulu-Natal provinces.
Petroleum Pipelines Industry Regulation:• Approval of the Transnet tariffs for 2009/10 by the Energy Regulator on 30 April 2009;• The Energy Regulator approved the Transnet Tarlton Storage tariffs on 4 December 2009;• The Energy Regulator approved the 3rd and 4th Amendments of the tariff Methodology for the Petroleum Pipelines Industry on 23
September and 26 November 2009 respectively;• The Energy Regulator approved the Storage and Loading Facilities Tariff Methodology on 25 March 2010 • On 25 March 2010, the Energy Regulator approved an allowable increase of 11.86% (6.87% tariff increase) for Transnet Limited’s
petroleum pipelines application for 2010/11 as well as the Reasons for Decision;• On 25 March 2010, the Energy Regulator approved the Transnet starting regulatory asset base (SRAB) for its petroleum pipelines and
Tarlton storage facility assets;• The Energy Regulator granted seventeen (17) licences for the operation of existing petroleum pipelines facilities;• The Energy Regulator granted three (3) licences for the construction of petroleum pipelines facilities;• The Energy Regulator decided not to approve the following licence applications: - Total SA, who applied for the operation of pipeline connecting Cape Town harbour and the Paarden Eiland storage facility. This
was due to the fact that the pipeline is not operational after earlier decommissioning due to a lack of structural integrity; and - BP Southern Africa to operate two marine loading facilities located at Hout Bay harbour and V&A Waterfront in the Western Cape.
This was due to the fact that these are actually resellers retailing fuel to small boats and do not require licensing.
Cross-cutting regulation:• The Energy Regulator approved the Stage 2: Performance Evaluation using the NERSA Benchmarking Better Regulation Framework
Report at its meeting of 23 September 2009; • The Energy Regulator approved the Report: Benchmarking the National Energy Regulator of South Africa against international good
practice — Stage 3: Improvement opportunities and implementation plan, at its meeting on 28 November 2009; • As part of the implementation of the Regulatory Reporting Manuals, the following has been approved by the Regulator Executive
Committee as delegated by the Energy Regulator: - Eskom’s Regulatory Reporting Manual Implementation Plan; - Sasol Gas and Rompco Regulatory Reporting Manual Implementation Plans; - Chevron’s Regulatory Reporting Manual Implementation Plan; - Nelson Mandela Bay Municipality’s Implementation Plan; - Transnet Pipelines Regulatory Reporting Manual Implementation Plan; - Engen Regulatory Reporting Manual Implementation Plan; - Transnet Pipelines Regulatory Reporting Manual Cost Allocation Manual; and - ROMPCO’s Regulatory Reporting Manual Cost Allocation Manual.• The electricity component of the Licensee Information System (LIS) was finalised with the adding of an on-line help function and were
rolled out to licensees.
Governance and Other:• NERSA received an unqualified Audit Report for 2008/09; • The proposed levies to be imposed on the piped-gas and petroleum pipelines industries were gazetted on 27 November 2009. No
representation was received from stakeholders;• Approval of the Delegation Matrix for Regulatory Subcommittees by the Energy Regulator;• Approval of the revised Code of Conduct by the Energy Regulator;
PROGRAMME 7

134
• NERSA was appointed as Chairperson of the Regional Electricity Regulatory Authority (RERA) for 2010 and 2011;• Attendance of the SADC Energy Officials and Ministers’ Meeting by two NERSA staff members; • NERSA was invited to attend the Roundtable of Energy Regulators in Rome during June, which was one of the preparatory meetings for
the G8 Summit, which will take place in Italy during July 2009; • The Board of the newly established Swaziland Energy Regulator visited NERSA on 7 and 8 December 2009;• Attachment of two officials from EWURA, Tanzania;• Finalisation on the agreed NORAD programmes;
Delays and Backlogs:
NERSA however also experienced a number of delays and backlogs during 2009/10.
• Delay in the finalization of the Renewable Energy Feed-In Tariff Power Purchase Agreement due to the promulgation of the Regulations on New Generation Capacity by the Minister of Energy on 15 August 2009 as well as the extensive stakeholder engagement followed;
• Delays in the receipt of requested information from licencees, including comments on audit reports, resulting in some projects being delayed;
• Although the licensing of all the existing petroleum facilities applied for progressed to the final stage of the approval process, all the applications for existing facilities could not be finalized;
• High number of complaints received relating to the electricity industry, ranging from tariff increases to disconnections;
8. CEF (PTY) LTD (CEF)
CEF, incorporated in terms of the Central Energy Fund Act, is mandated by the South African government to engage in the acquisition, exploration, generation, marketing and distribution of any energy form and to engage in research relating to the energy sector.
CEF’s activities are housed within CEF (Proprietary) Limited itself and its six active subsidiaries: - The Petroleum Oil and Gas Corporation of South Africa (Pty) Ltd (PetroSA) - South African Agency for Promotion of Petroleum Exploration and Exploitation (Pty) Ltd (Petroleum Agency SA) - The South African Gas Development Company (Pty) Ltd (iGas) - Oil Pollution Control South Africa (Association incorporated under Section 21) (OPCSA) - South African National Energy Research Institute (Pty) Ltd (SANERI) - SFF Association (Association incorporated under Section 21) (SFF).
The current mandate for the CEF group is in terms of a Ministerial Directive, which was issued to CEF by the Minister of Minerals and Energy in December 2003.
The year under review was an exciting one for the CEF Group. The holding company progressed a number of renewable energy projects particularly in landfill gas and solar water heaters. Much of the effort was directed towards bringing the projects under feasibility to the point where commercial decisions could be made. There were some delays in a few of projects due to challenges in project economics and with delays in licensing approvals.
The largest subsidiary in the Group, PetroSA, was intensively involved in projects to secure additional feedstock and in progressing towards a decision on the Mthombo refinery. SFF was able to better utilize the storage facilities at Saldanha, and was able to rent some space at the Milnerton facility. OPCSA effectively managed the environmental responsibilities at the Saldanha port. The iGas subsidiary continued to participate in the Rompco pipeline operations and continued investigations into other pipeline and gas options for the country. CEF Carbon entered into a joint venture with the Finnish company GreenStream Network to create a skills development subsidiary called CarbonStream Africa. This will transfer carbon technical skills to a number of young South Africans.
CEF further has shares in a number of associate companies such as the Darling Wind Farm, in a thin–film photovoltaic joint venture and in a compact fluorescent light assembly facility. The latter is in partnership with Phillips and started production during the year.
PROGRAMME PERFORMANCE - SECTION 2

135
9. STATE DIAMOND TRADER (SDT)
Highlights
The economic downturn impacted negatively on the business of the SDT however that led to heightened reaction by the SDT and therefore resulted in the following actions and results: • Interim Sales Strategy was developed, approved by the Board and implemented. An Interim Sales Strategy is essentially a pre-financed
model of trading. • Pre financed model enabled the SDT to devise a good cash flow within the recession period and buy goods with its own money for
mandate clients and as a result no trading interest payable during the year as no loan monies were used. • Quick turnaround of stock-Zero stock at the year end • Operational expenditure streamlined through implementation of cost cutting measures • All audit queries from 2008/09 Audit report were addressed. • More producers on board and supportive • Four(4) Diamond Trainees were appointed by the DMR for purposes of training at the SDT • Secondment of personnel from both DMR and De Beers continued and therefore provided invaluable contribution to the operations of
the SDT.
Challenges
The major challenge for the SDT remained its funding model and therefore no State funding. This resulted in failure to implement the HR Plan. Other challenges were: • Type of goods purchased by the SDT. In terms of the legislation the SDT is obliged to buy a representative sample of what the producer
produced in a production cycle. This does not leave the SDT with much choice but to sell the run of mine parcels to its clients yet there is a high demand in selected goods
• Challenges for clients: Funding, business management skills and markets which continues to plague trading relations between the SDT and its clients.
10. SOUTH AFRICAN DIAMOND AND PRECIOUS METALS REGULATOR (SADPMR)
The core function of the South African Diamonds and Precious Metals Regulator is to regulate the downstream diamonds and precious metals with emphasis on beneficiation.
Since the implementation of the Diamonds Act of 1986 as amended, as well as the Precious Metals Act, 2005, mixed reactions have been experienced from the industry. With diamonds, a total of 2204 applications for a variety of permits and licenses have been received and, only 1637 have been issued. Out of all the applications, only 17 % of these licenses were obtained for beneficiations purposes. The diamond beneficiation industry has been negatively impacted by the economic downturn, while many jobs have been lost in the process .With the precious metals industry, a total of 1377 applications have been received and only 491 were issued .This industry is dominated by the jewellers who make about 75% of the newly issued licenses. In the jewellery industry, a lower number of applications were received than was anticipated.
Indications are that the jewellery industry has also declined over the past three years due to the high prices of gold and platinum.
The Regulator has an obligation to ensure that the license holders comply with the laws and regulations pertaining to these licenses. These include compliance with Broad- Based Socio –Economic Empowerment beneficiation levels, etc. To strengthen this area the Regulator has deployed Diamonds and Precious Metals Inspectors in Cape Town and Durban. These inspectors are located within the regional offices of the Department of Mineral Resources to service the industry within their respective provinces.
PROGRAMME 7

136
REPORT OF THE AUDIT COMMITTEE
We are pleased to present our report for the financial year ended 31 March 2010.
Audit Committee Members and Attendance:
The Audit Committee consists of the members listed hereunder and meets at least four (4) times per annum as per its approved charter. During the current year six (6) meetings were held. The attendance of the meetings was as follows:
Name of Member Number of Meetings Held Number of meetings AttendedMr S Sithole (Chairperson) 6 6Ms EH Heyns 6 2*Mr DP van der Nest 6 5*Due�to�ill-health
Audit Committee Responsibility
The Audit Committee reports that it has, during the year under review, adopted the reviewed charter in line with the requirements of Sections 38(1) (a) and 77 of the Public Finance Management Act, Act no. 1 of 1999 and Treasury Regulation 3.1. The Audit Committee further reports that it has satisfied its responsibilities for the year and has conducted its affairs in compliance with the charter.
The effectiveness of internal control
The department has designed the system of internal control to provide cost effective assurance that the department’s goals will be economically, effectively, and efficiently achieved.
In line with the PFMA, the International Standards for the Professional Practice of Internal Auditing issued by the Institute and Internal Auditors, and the King II Report on Corporate Governance requirements, Internal Audit provided the Audit Committee and management with assurance that the internal controls are appropriate and effective. This was achieved by means of the Risk Management process review, governance review as well as the identification of corrective actions and suggested enhancements to the controls and processes. From the various reports of the Internal Auditors, the Audit Report on the Annual Financial Statements, and the management report of the Auditor-General, it was noted that deficiencies in the system of internal control and deviations were reported. These matters have been referred to the Department of Mineral Resources for resolution. The Audit Committee has also reviewed the activities of Risk Management within the department. The Audit Committee was also satisfied with the content and quality of monthly and quarterly reports prepared and issued by the Accounting Officer during the year under review.
REPORT OF THE AUDIT COMMITTEE - SECTION 3

137
Accordingly, with the exception of the reported deficiencies and deviations, we can report that the system of internal control over financial reporting for the period under review was adequate, effective, and efficient.
Evaluation of Financial Statements
The Audit Committee has:
• Reviewed and discussed the Audited Annual Financial Statements to be included in the annual report, with the Auditor-General and the Accounting Officer.
• Reviewed the Auditor-General’s management report and management’s response thereto;• Reviewed the department’s compliance with legal and regulatory provisions; and• Reviewed significant adjustments resulting from the audit.
The Audit Committee accepts the Auditor-General’s report on the Annual Financial Statements, and is of the opinion that the Audited Financial Statements, read together with the report of the Auditor-General, be accepted.
Internal Audit
The Audit Committee reviewed the quarterly reports of internal auditors to ensure the internal audit activity’s effectiveness. The Audit Committee is satisfied that the internal audit function is operating effectively and that it has addressed the risks pertinent to the department in its audits.
Auditor-General
The Audit Committee has met with the Auditor-General to ensure that there are no unresolved issues.
…………………………………………….Chairperson

138
ANNUAL FINANCIAL
STATEMENTS

139

140
TABLE OF CONTENTS
ANNUAL FINANCIAL STATEMENTS - SECTION 4
Report of the Accounting Officer 141
Report of the Auditor-General 149
Appropriation Statement 153
Notes to the Appropriation Statement 162
Statement of Financial Performance 165
Statement of Financial Position 166
Statement of Changes in Net Assets 167
Cash Flow Statement 168
Notes to the Annual Financial Statements (including Accounting policies) 169
Disclosures Notes to the Annual Financial Statements 187
Annexures 196

141
REPORT BY THE ACCOUNTING OFFICER TO THE EXECUTIVE AUTHORITY AND PARLIAMENT OF THE REPUBLIC OF SOUTH AFRICA.
1 General review of the state of financial affairs
This report marks the final year of reporting on the Department of Minerals and Energy (DME) following the pronouncement by the President of the Republic of South Africa of the re-organization of government. The split of the DME occurred during the 2009/10 financial year at which point budget allocations were already finalised. In order to ensure continued support for the two new departments, an interim arrangement was adopted whereby the Department of Mineral Resources was providing support services to the Department of Energy as the hosting department. A memorandum of understanding (MoU) was signed between the two Directors General giving effect to the transitional arrangements. The MoU amongst others, made provision for the Director General of Mineral Resources (DMR) to remain the Accounting Officer of the DME.
During the year under review, the department was confronted with financial constraints as the country was going through a recession. This called upon decisive leadership from the department’s executives in implementing measures that would assist in dealing with the containment of costs. Several control measures were adopted and implemented during the reporting period and those included amongst others, curtailment of number of delegates on overseas trips, holding of seminars in the proximity of head quarters, utilizing free venues for meetings, and advertising of certain identified vacancies in government circulars.
Spending outlook
In this reporting period the department was appropriated a total budget of R4, 682 billion. An amount of R396 million was allocated towards Compensation of Employees, R275 million towards acquisition of goods and services, R3, 962 billion transferred to Public and Private corporations, Departmental Agencies and Households, R48 million for the acquisition of capital assets and R926 thousand on writing off of losses.
The table below illustrates the utilization of voted funds per economic classification from 2005/6 to 2009/10.
Table and graph for voted funds:
UTILISATION OF VOTED FUNDS
2009/10 2008/09 2007/08 2006/07 2005/06
R’000 R’000 R’000 R’000 R’000COMPENSATION OF EMPLOYEES 403,323 330,089 290,561 246,154 217,070 GOODS AND SERVICES 263,475 269,408 277,222 254,665 181,577 PAYMENT FOR CAPITAL ASSETS 48,690 18,855 7,470 6,804 5,342 TRANSFER AND SUBSIDIES 3,828,303 3,111,061 2,366,512 2,099,917 1,768,372 THEFT AND LOSSES 925 593 5,602 135 44
UNSPENT 137,288 56,235 27,570 27,425 79,966
TOTALS (BUDGET) 4,682,004 3,786,241 2,974,937 2,635,100 2,252,371
% UNDER SPENDING OF VOTE 2.9% 0.98% 0.93% 1.04% 3.55%

142
The department’s budget was dominated by transfers to public corporations and agencies as they drive the implementation of some of the departmental policies and strategic directives. Taking the major share is the Integrated National Electrification Programme (INEP) with R2.63 billion which constitutes 56.24%of the total budget. Other transfers to entities reporting to the Minister amounted to R1.19 billion.
While the department had allocated R395.590 million of the budget to Compensation of Employees, R403 million was utilized for the reporting period. The spending not only relates to the employees currently on the establishment but costs associated with contractual employees, interns and learners.
An amount of R263,475 million was used against the budget of R274,962 million to defray cost of goods and services acquired for the realization of departmental programmes during 2009/10. The department engaged in several relocation projects which involved major revamping of accommodation facilities that had seriously dilapidated and posing a health and occupational risk to employees. The cost associated with operating leases grew exponentially relative to the comparative year from R19 million to R34 million. Consulting services expenditure increased from R59m to R69m due to costs associated with the Rehabilitation programme. The training expenditure also moderately increased which is the indication of the commitment of the department in developing and nurturing its crucial resource. The inventory costs also grew in relation to increase in personnel numbers.
Table for analysis of unspent funds 2009/10
ANALYSIS OF UNSPENT FUNDS 2009/10
2009/10 2009/10
R’000 %COMPENSATION OF EMPLOYEES (7,733) -5.64%GOODS AND SERVICES 11,487 8.3%FINANCIAL TRANSACTIONS IN ASSETS AND LIABILITIES 1 0.00%PAYMENT FOR CAPITAL ASSETS (541) -0.3%TRANSFER AND SUBSIDIES 134,074 97.66%
TOTAL UNSPENT 137,288 100.00%
ANNUAL FINANCIAL STATEMENTS - SECTION 4
UNSEPNT
THEFT AND LOSSES
TRANSFER AND SUBSIDIES
PAYMENT FOR CAPITAL ASSETS
GOODS AND SERVICES
COMPENSATION OF EMPLOYEES
UTILISATION OF VOTED FUNDS - 2005/06 TO 2009/10
EXPENDITURE ITEM
R’000
100%
R’000
2009/10 2008/09 2007/08 2006/07 2005/06
R’000 R’000 R’000 R’000
90%
80%
70%
40%
60%
30%
10%
50%
20%
0%
REPORT OF THE ACCOUNTING OFFICER for the year ended 31 march 2010

143
The department has for the past three years recorded an under spending below 2 percent. The under spending during the year under review is attributable to non-grid electrification and renewable energy projects. The delay in signing of contracts has resulted in delayed installation of solar home systems in the areas identified in the strategic plan. The department has since finalised the signing of contracts with several service providers in this regard. The grid electrification programme also had R33.4 million remaining during the year owing to municipal agreements that were not finalised on time. Other contributing factors are the renewable energy projects, such as the working for energy and renewable finance & subsidies (REFSO) which had the balance of R5 million apiece. The remaining funds will be surrendered to National Revenue Fund on conclusion of the audit process. Rollover requests have also been made to National Treasury in this regard.
Virement:
The following virement approvals were granted by the Accounting Officer in terms of section 43(1) of the Public Finance Management Act, 1999 (Act 1 of 1999) to utilise savings under main divisions of the vote towards the defrayment of expenditure under other main divisions within the vote:
Shift funds from R’000 MotivationProgramme 1: Administration 1,141 The under spending was due to the implementation of the cost containment
measures.Programme 3: Mineral Regulation 9,902 Under spending due to delays in the implementation of rehabilitation projects and
vacancies resulting from the turn over of staff.Programme 6: Electricity, Nuclear and Clean Energy
1,027 This programme also enjoyed some savings from the implementation of the cost containment measures and other activities that did not realize as anticipated.
Programme 7: Associated Services 4,521 Reprioritization of funds
TOTAL 16,591
Shift funds to R’000 MotivationProgramme 2: Promotion of Mine Health and Safety
5,690 Major spending pressures within the Mine Health and Safety inspectorate relate to the training of Learner Inspectors which was concluded on1 August 2009, payments to IRCA for the development and implementation of the MHSIS system.
Programme 4: Mineral Policy and Promotion 9,213 Spending associated with membership fees to association of African Diamond Producing Countries (ADPA)
Programme 5: Hydrocarbons and Energy Planning
1,688 Major spending pressures within the Hydrocarbons and Energy Planning Branch relate to operational expenditure associated with the licensing and site inspection activities of the Petroleum Controller in regional offices.
TOTAL 16,591
Any other material matter – Soccer World Cup clothing and tickets
The department did not purchase any clothing and tickets for the 2010 soccer world cup
2 Service rendered by the department
2.1 The mission of the Department of Minerals and Energy is to regulate and promote the minerals and energy sectors for the benefit of all. In order to achieve the above mission the department is spilt into five key programmes, which are responsible for; amongst other things:
- executing the department’s statutory mandate to protect the health and safety of the mine employees and people affected by mining activities – Promotion of Mine Health and Safety
- regulating the minerals and mining sector to achieve transformation and sustainable development – Mineral Regulation - formulating mineral related policies and promote the mining and minerals industry of South Africa thus making it attractive to
investors – Mineral Policy and Promotion
REPORT OF THE ACCOUNTING OFFICER for the year ended 31 march 2010

144
- promoting the sustainable use of energy resources through integrated energy planning and the appropriate promotion, including policy and regulation development of petroleum products, coal, gas renewable energy and energy efficiency – Hydrocarbons and Energy Planning
- ensuring the development, monitoring enhancement and implementation of policies governing the electricity and nuclear sectors and to support the achievement of universal access to electricity, including exercising oversight over state owned entities – Electricity and Nuclear.
- support service mainly focussing on providing support service to the department
2.2 Tariff policy
Tariffs are levied in terms of the Minerals Act, 1991 (Act 50 of 1991), for State owned Mineral Rights. The tariffs are predetermined and approved by National Treasury. Prospecting fees and royalties are globally competitive and do not inhibit the initiation of new mining industry projects.
Exploration fees
Exploration fees were charged in terms of the Minerals Act, 1991 (Act 50 of 1991) where the State was the holder of the mineral rights before 1 May 2004. The approved rates, as from 1 April 2003, started at R3, 00/hectare for the first year and escalated at R1, 00/hectare for the maximum period of 5 years determined by a prospecting lease. For any renewal period, the fee doubled and escalated at R2, 00/hectare/year thereafter. For offshore exploration the same rates applied but for square kilometers.
Due to the promulgation of the Mineral and Petroleum Resources Development Act, Act 28 of 2002 (MPRDA), new prescribed rates apply on all new prospecting rights granted including privately owned land as from 1 May 2004 – see regulation 76 of the new MPRDA. Rights already granted at the time of promulgation, will continue with prospecting fees as set out above.
Exploitation fees (Royalties)
Royalties payable are 1% of gross revenue for all minerals and 5% of gross revenue for diamonds for existing rights. Any new mining rights granted from 1 May 2004 carry no royalties until the Royalty Bill is implemented (the royalty Act came into effect on 1 March 2010).
Mining or removal of diamonds during prospecting
The current level of 5 per cent of gross revenue will remain in force for existing rights.
Exploitation of all precious and base minerals (excluding all sand, stone and clay used for construction purposes)
A royalty of 1% of gross revenue/value free on mine of the mineral content in ore removed, or a saleable product, as determined by a “bona fide, arms length” transaction is payable for existing rights as at 1 May 2004.
In the absence of a bona fide arms length transaction (free on mine), the revenue/value of the mineral content in ore removed, or a saleable product, will be the market price as determined by the Minerals Bureau at the relevant time.
Exploitation of construction materials: sand, stone and clay
Where sand, stone or clay is being removed for commercial purposes, the following royalties were payable from 1 April 2004 until Royalty Bill becomes applicable (1 March 2010):
In the case of short-term (two year) permission, the royalties are:Year 1 – R1-00 per cubic meterYear 2 – R1-05 per cubic meterIn the case of longer-term permissions (five years) and mineral leases (existing rights), the relevant royalty will start at R1-00 per cubic meter for
ANNUAL FINANCIAL STATEMENTS - SECTION 4
REPORT OF THE ACCOUNTING OFFICER for the year ended 31 march 2010

145
the first year, escalating at the rate of R0-05 per cubic meter per year for a period of five years.
Where a local authority is removing material for road and general maintenance, or for upgrading townships, or for any purpose that may be considered as being “RDP”, a token royalty will be payable at R180-00 per year, escalating at R15-00 per annum. This amount will be reviewed on a five yearly basis.
Minimum royalties
Minimum royalties are payable, as a “deposit”, in advance. Whether mining takes place or not in any specific year, the State will receive a measure of a return for any “mining permission” granted. Minimum royalties, as always, may be offset against actual royalties payable. The general formula for the determination of minimum royalties is “ten” percent of the average annual royalties payable in terms of the business plan submitted.
Petroleum products licensing fees
The following fees are charged in terms of the Petroleum Products Amendment Act No. 58 of 2003
Site licence fee R 1,000Wholesale licence fee R 1,000Retail licence fee R 500Annual retail licence fee R 500Temporary retail licence fee R 500Duplicate licence fee R 500Site licence transfer fee R 500Amendment licence fee R 500Manufacturing license fee R10 000Manufacturing annual fee R5 000
3 Capacity constraints
During the period under review, the department experienced serious capacity challenges especially in the support services. Although the department did not experience the same high staff turnover rate compared to the previous reporting period the challenges were around the split of the department.
The split of the Department of Minerals and Energy into two separate departments namely the Department of Mineral Resources (DMR) and Department of Energy (DOE) created immediate capacity constraints which forced the departments to make use of a shared support services until the end of the financial year. The resources within support services had to ensure continued service delivery while simultaneously dealing with the split. During this period the organizational structures for both departments were developed and approved for implementation by 1 April 2010. Capacity constraints are still dominant in the Mineral Regulation, Mine Health and Safety, Hydrocarbons and Energy Planning branches. The restructuring process has presented the department with an opportunity to re-align its structures to the new mandates. Vacancies created as a result of this split will be filled as funding becomes available.
In addressing some of the capacity constraints, the department managed to implement a number of training programmes as identified in the Workplace Skills Plan namely the Secretarial Development Programme, Project Management for Middle Management, Advance Management Development Programme and the Emerging Management Development Programme. All these programmes were successfully completed.
REPORT OF THE ACCOUNTING OFFICER for the year ended 31 march 2010

146
4 Utilisation of donor funds
UTILISATION OF DONOR FUNDS
2009/10 2008/09 2007/08 2006/07 2005/06DONOR EXPENDITURE 5,849 17,701 3,321 20,331 8,109
UNSPENT 63 5,913 3,642 3,633 722
TOTALS (BUDGET) 5,912 23,614 6,963 23,964 8,831
% UNDER SPENDING OF DONOR FUNDS 1.08% 25.04% 52.31% 15.16% 8.18%
Departmental donor funds mainly consist of grants received in terms of bilateral agreements for co-operation between the South African, Norwegian and Danish Governments. An amount of R5.849 million was carried over from the 2008/09 to the 2009/10 financial year which mainly consisted of funding in respect of the South African Energy Sector Policy Research and Capacity Development Programme (RSA-3001). The purpose of the programme is the implementation of concrete interventions towards the establishment of enabling frameworks for effective governance and regulation, equitable market liberalisation and sustainable economic growth.
The project was concluded on 31 March 2010, all projects deliverables have been achieved and only the administrative winding down is remaining for finalisation during 2010/11.
5 Trading entities and public entities
The department continues to monitor the performance of the entities under its control with specific reference to governance and financial management. The table below illustrates the performance of the entities reporting to the Minister of Minerals and Energy in relation to the Auditor General’s report for 2008/9 financial year. It is clear from this report that the financial controls and monitoring systems put in place are beginning to bear fruits. During 2009/10 the department continued with its oversight over these entities. Although the Auditor-General’s report for 2009/10 will only be finalised in July 2010, it is expected that the entities will continue in this path.
Entity Funding source Audit opinion for 2008/9National Energy Regulator of SA (NERSA) Own (levies) UnqualifiedCouncil for Mineral Technology and Research (Mintek) Own and government grant UnqualifiedElectricity Distribution Holdings Company (EDIH) Own and government grant UnqualifiedNational Nuclear Regulator (NNR) Own and government grant UnqualifiedNuclear Energy Corporation of South Africa (NECSA) Own and government grant UnqualifiedCentral Energy Fund (CEF) Own UnqualifiedSouth African Diamond and Precious Metals Regulator Own and government grant Unqualified
ANNUAL FINANCIAL STATEMENTS - SECTION 4
DONOR EXPENDITURE
UNSEPNT
UTILISATION OF DONOR FUNDS - 2005/06 TO 2009/10
FINANCIAL YEAR
100%
2005/06 2006/07 2007/08 2008/09 2009/10
90%
80%
70%
40%
60%
30%
10%
50%
20%
0%
REPORT OF THE ACCOUNTING OFFICER for the year ended 31 march 2010
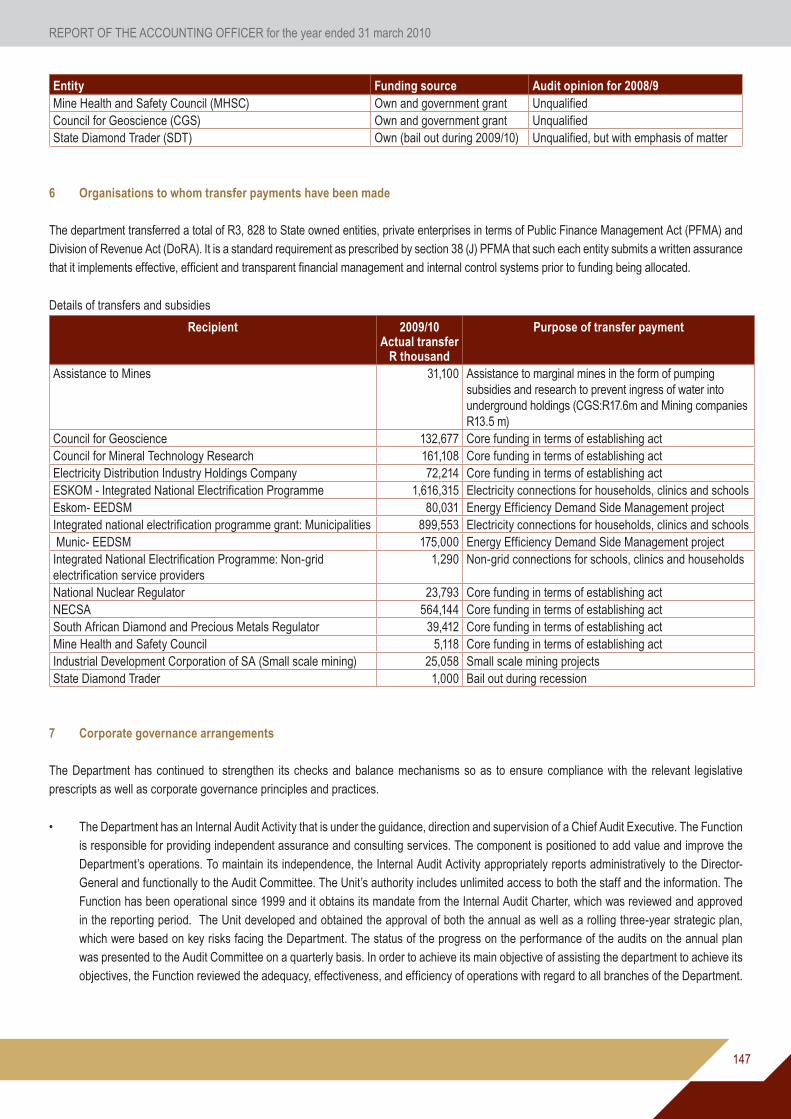
147
Entity Funding source Audit opinion for 2008/9Mine Health and Safety Council (MHSC) Own and government grant UnqualifiedCouncil for Geoscience (CGS) Own and government grant UnqualifiedState Diamond Trader (SDT) Own (bail out during 2009/10) Unqualified, but with emphasis of matter
6 Organisations to whom transfer payments have been made
The department transferred a total of R3, 828 to State owned entities, private enterprises in terms of Public Finance Management Act (PFMA) and Division of Revenue Act (DoRA). It is a standard requirement as prescribed by section 38 (J) PFMA that such each entity submits a written assurance that it implements effective, efficient and transparent financial management and internal control systems prior to funding being allocated.
Details of transfers and subsidies
Recipient 2009/10Actual transfer
R thousand
Purpose of transfer payment
Assistance to Mines 31,100 Assistance to marginal mines in the form of pumping subsidies and research to prevent ingress of water into underground holdings (CGS:R17.6m and Mining companies R13.5 m)
Council for Geoscience 132,677 Core funding in terms of establishing actCouncil for Mineral Technology Research 161,108 Core funding in terms of establishing actElectricity Distribution Industry Holdings Company 72,214 Core funding in terms of establishing actESKOM - Integrated National Electrification Programme 1,616,315 Electricity connections for households, clinics and schoolsEskom- EEDSM 80,031 Energy Efficiency Demand Side Management projectIntegrated national electrification programme grant: Municipalities 899,553 Electricity connections for households, clinics and schools Munic- EEDSM 175,000 Energy Efficiency Demand Side Management projectIntegrated National Electrification Programme: Non-grid electrification service providers
1,290 Non-grid connections for schools, clinics and households
National Nuclear Regulator 23,793 Core funding in terms of establishing actNECSA 564,144 Core funding in terms of establishing actSouth African Diamond and Precious Metals Regulator 39,412 Core funding in terms of establishing actMine Health and Safety Council 5,118 Core funding in terms of establishing actIndustrial Development Corporation of SA (Small scale mining) 25,058 Small scale mining projectsState Diamond Trader 1,000 Bail out during recession
7 Corporate governance arrangements
The Department has continued to strengthen its checks and balance mechanisms so as to ensure compliance with the relevant legislative prescripts as well as corporate governance principles and practices.
• The Department has an Internal Audit Activity that is under the guidance, direction and supervision of a Chief Audit Executive. The Function is responsible for providing independent assurance and consulting services. The component is positioned to add value and improve the Department’s operations. To maintain its independence, the Internal Audit Activity appropriately reports administratively to the Director-General and functionally to the Audit Committee. The Unit’s authority includes unlimited access to both the staff and the information. The Function has been operational since 1999 and it obtains its mandate from the Internal Audit Charter, which was reviewed and approved in the reporting period. The Unit developed and obtained the approval of both the annual as well as a rolling three-year strategic plan, which were based on key risks facing the Department. The status of the progress on the performance of the audits on the annual plan was presented to the Audit Committee on a quarterly basis. In order to achieve its main objective of assisting the department to achieve its objectives, the Function reviewed the adequacy, effectiveness, and efficiency of operations with regard to all branches of the Department.
REPORT OF THE ACCOUNTING OFFICER for the year ended 31 march 2010
148
The audits conducted during the year were mainly compliance, information technology, performance, and financial.
The Unit’s operations are guided by the requirements set out in the legislative prescripts (e.g. the PFMA and the Treasury Regulations) and the standards set by the relevant professional bodies (e.g. the Institute of Internal Auditors).
• The Department has established an Audit Committee in terms of section 77 of the PFMA. The members of the Audit Committee have the requisite knowledge and competence to deal with financial, risk management, governance, ethical and other matters that pertain to its responsibility. The Committee operated in line with its Charter, which was reviewed and approved in the reporting period. During the financial period under review, the Committee met six (6) times. The matters tabled for consideration by the Committee included the review of financial statements, Auditor-General management letters, reports and activities of the Internal Audit Activity and the Risk Management Office, and matters that related to compliance with laws, regulations and policies.
The department continues to minimise risks that it is exposed to by ensuring that all major risks are proactively identified, assessed and managed to acceptable levels. The Department’s risk committee continued in its oversight role of risk management activities in the department. A strategic risk assessment workshop was conducted in order to identify the array of risks the department is exposed to. As a result of this exercise all branch risk profiles were developed and responsibilities for managing these risks were assigned to management and staff. Risk profiles developed from the assessment process are used to inform the department’s internal audit plans.
The department continued to implement its fraud prevention and anti corruption strategy which is in line with minimum anti corruption capacity requirements.
8 Performance information
On a quarterly basis a Quarterly Monitoring Report (QMR) on Performance Information is submitted to the Director-General for approval. These quarterly reports highlight areas of concern for noting while also presenting interventions already in pursuit. Each branch head submits performance information with a signed off Compliance declaration (using the template developed for this reports) to the Compliance Officer, within thirty (30) days of the end of the quarter. The Strategy Risk & Monitoring (SRM/Compliance Office) is responsible for corporate analysis of performance information. This analysis examines performance across the Department in line with the approved strategic plan document. The analysis concentrates on the completeness, reasonability and relevance of the reported information. The SRM then consolidates and forwards
the report to Internal Audit for verification. At year-end, the consolidated report is made available to Auditor- General for audit purposes.
9 Events after reporting date
In May 2010 assets to the value of R15, 428,074.45 were identified and approved for disposal through an auction. These assets are included in the closing balance of assets under note 33. This disposal will be recognised in the asset register and Annual Financial Statements during 2010/11.
10 Approval
The Annual Financial Statements set out on pages 165 to 213 have been approved by the Accounting Officer.
………………………………Advocate Sandile NogxinaDirector-General15 September 2010
ANNUAL FINANCIAL STATEMENTS - SECTION 4
REPORT OF THE ACCOUNTING OFFICER for the year ended 31 march 2010

149
REPORT OF THE AUDITOR-GENERAL TO PARLIAMENT ON THE FINANCIAL STATEMENTS OF VOTE 28: DEPARTMENT OF MINERALS AND ENERGY FOR THE YEAR ENDED 31 MARCH 2010
REPORT ON THE FINANCIAL STATEMENTS
IntroductionI have audited the accompanying financial statements of the Department of Minerals and Energy which comprise the appropriation statement, the statement of financial position as at 31 March 2010 and the statement of financial performance, statement of changes in net assets and cash flow statement for the year then ended, a summary of significant accounting policies and other explanatory information, as set out on pages 153 to 195.
Accounting Officer’s responsibility for the financial statementsThe accounting officer is responsible for the preparation and fair presentation of these financial statements in accordance with the modified cash basis of accounting determined by the National Treasury, as set out in accounting policy note 1, and in the manner required by the Public Finance Management Act of South Africa, 1999 (Act No. 1 of 1999) (PFMA) and the Division of Revenue Act of South Africa, 2009 (Act No. 12 of 2009) (DoRA). This responsibility includes: designing, implementing and maintaining internal control relevant to the preparation and fair presentation of financial statements that are free from material misstatement, whether due to fraud or error; selecting and applying appropriate accounting policies; and making accounting estimates that are reasonable in the circumstances.
Auditor-General’s responsibilityAs required by section 188 of the Constitution of South Africa and section 4 of the Public Audit Act of South Africa, my responsibility is to express an opinion on these financial statements based on my audit.
I conducted my audit in accordance with International Standards on Auditing and General�Notice�1570�of�2009�issued�in�Government�Gazette�32758� of� 27� November� 2009. Those standards require that I comply with ethical requirements and plan and perform the audit to obtain reasonable assurance about whether the financial statements are free from material misstatement.
An audit involves performing procedures to obtain audit evidence about the amounts and disclosures in the financial statements. The procedures selected depend on the auditor’s judgement, including the assessment of the risks of material misstatement of the financial statements, whether due to fraud or error. In making those risk assessments, the auditor considers internal control relevant to the entity’s preparation and fair presentation of the financial statements in order to design audit procedures that are appropriate in the circumstances, but not for the purpose of expressing an opinion on the effectiveness of the entity’s internal control. An audit also includes evaluating the appropriateness of accounting policies used and the reasonableness of accounting estimates made by management, as well as evaluating the overall presentation of the financial statements.
I believe that the audit evidence I have obtained is sufficient and appropriate to provide a basis for my audit opinion.
Basis for qualified opinion
Receivables for departmental revenueIn terms of section 38(1)(a)(i) and section 40(1)(a) the accounting officer of the department did not ensure that full and proper records of the receivables for departmental revenue of the department is kept as prescribed by the norms and standards. The department could not provide sufficient appropriate audit evidence to support the departmental receivables for revenue balance amounting to R25,6 million (2009: R10,4 million), as stated in note 26 to the financial statements. There were no satisfactorily alternative audit procedures that I could perform to obtain reasonable assurance that all the receivables for departmental revenue were properly recorded and disclosed.
Further, interest was not levied and recorded on all outstanding balances and for the individual receivable balances where interest was levied, the rate used was not in accordance with the rate specified by the minister of finance, as required by Treasury Regulation 11.1.

150
Consequently, I did not obtain sufficient appropriate audit evidence to satisfy myself as to the completeness, valuation and rights and obligations of the receivables for departmental revenue.
Qualified OpinionIn my opinion, except for the possible effects of the matters described in the Basis for qualified opinion paragraph, the financial statements present fairly, in all material respects, the financial position of the Department of Minerals and Energy as at 31 March 2010, and its financial performance and its cash flows for the year then ended, in accordance with the modified cash basis of accounting determined by the National Treasury, as set out in accounting policy note 1 and in the manner required by the PFMA and DoRA.
Emphasis of matterI draw attention to the matters below. My opinion is not modified in respect of these matters:
Basis of accountingThe department’s policy is to prepare financial statements on the modified cash basis of accounting determined by the National Treasury, as set out in note 1.1 to the financial statements.
Restatement of corresponding figuresAs disclosed in note 22 and note 35 to the financial statements, the corresponding figures for 31 March 2009 have been restated as a result of an error discovered during the year ended 31 March 2010 in the financial statements of the Department of Minerals and Energy as, and for the year ended, 31 March 2009.
Irregular ExpenditureAs disclosed in note 27 to the financial statements, irregular expenditure to the amount of R4,2 million was incurred, as a result of contravention of the authorised delegations of authority of the department, the irregular expenditure was condoned in the financial year.
Material under spending of budgetAs disclosed in the appropriation statement, the department has materially under spent the budget on Programme 7: Associated services to the amount of R123 million.
AccrualsAccruals which exceed the payment terms of 30 days as detailed in Treasury Regulation 8.2.3 amount to R22,2 million. The amount in turn exceeds the savings on programme 1 to programme 6 totalling R13,7 million. The amount of R8,5 million would therefore have constituted unauthorised expenditure should the amounts due have been paid in time.
Additional mattersI draw attention to the matter below. My opinion is not modified in respect of these matters:
Unaudited supplementaryThe supplementary information set out on pages 196 to 213 does not form part of the financial statements and is presented as additional information. I have not audited these schedule(s) and accordingly I do not express an opinion thereon.
REPORT ON OTHER LEGAL AND REGULATORY REQUIREMENTS
In terms of the PAA of South Africa and General�notice�1570�of�2009,�issued�in�Government�Gazette�No.�32758�of�27�November�2009 I include below my findings on the report on predetermined objectives, compliance with the PFMA, DORA, and financial management (internal control).
ANNUAL FINANCIAL STATEMENTS - SECTION 4
REPORT OF THE AUDITOR-GENERAL for the year ended 31 march 2010
151
Findings
Predetermined objectives
Presentation of reported performance information
Incomplete reporting on all predetermined objectives The actual achievements with regards to 26% of all planned indicators and targets specified in the strategic plan for the year under review for the selected programmes were not reported in the annual performance report submitted for audit purposes.
Timeliness of the reported performance information The reliability of 40% of the targets, as set out on pages 17 to 124 of the annual report, could not be verified, since the information was not received in time for audit purposes.
Usefulness of reported performance informationThe following criteria were used to assess the usefulness of the planned and reported performance:• Consistency: Has the department reported on its performance with regard to its objectives, indicators and targets in its approved strategic
plan, i.e. are the objectives, indicators and targets consistent between planning and reporting documents?• Relevance: Is there a clear and logical link between the objectives, outcomes, outputs, indicators and performance targets?• Measurability: Are objectives made measurable by means of indicators and targets? Are indicators well defined and verifiable, and are
targets specific, measurable, and time bound?
The following audit findings relate to the above criteria:
Planned and reported performance targets not specific, measurable and time boundFor the selected programmes, Programme 3: Mineral Regulation and Programme 6: Electricity, Nuclear and Clean Energy, 53% of the planned and reported targets were not: • specific in clearly identifying the nature and the required level of performance;• measurable in identifying the required performance; • Time bound in specifying the time period or deadline for delivery.
Planned and reported indicators/measures are not valid/accurate and complete when compared to source informationFor the selected programmes, 21% of the reported indicator/target were not valid and accurate on the basis of the source information or evidence provided to support the reported.
Reliability of informationReported targets not accurate, as inadequate supporting source information was providedFor the selected programmes 34% of the reported indicators/targets could not be established as sufficient appropriate audit evidence could not be provided for audit purposes.
Compliance with laws and regulations
PFMA and Treasury Regulations of 2005Non-adherence• Contrary to the requirements of Treasury Regulation 8.2.3 and section 38(1)(f) of the PFMA, the accounting officer did not, in all instances,
pay creditors within 30 days from the date of receipt of invoice.• Contrary to the requirements of paragraph 3.4.3 of National Treasury Practice Note No.8 of 2007/2008, a deviation from the tender process
for procurement in excess of R1 million was not reported to the National Treasury and the Auditor General within 10 working days.
REPORT OF THE AUDITOR-GENERAL for the year ended 31 march 2010

152
INTERNAL CONTROL
I considered internal control relevant to my audit of the financial statements and the report on predetermined objectives and compliance with the PFMA and DORA, but not for the purposes of expressing an opinion on the effectiveness of internal control. The matters reported below are limited to the deficiencies identified during the audit.
LeadershipLeadership did not exercise adequate oversight responsibility to ensure that management has implemented effective internal controls by gaining an understanding of how senior management has met it responsibilities for the reporting of performance information and the management of receivables for departmental revenue.
Financial and performance management • Management did not fulfil their responsibilities in ensuring that performance information that is reported is valid and accurate and agrees
to the actual performance achieved.• The audit qualification in respect of the receivables for departmental revenue is primarily driven by a lack of an appropriate debtors’ system. • Extensive effort was required to obtain sufficient appropriate audit evidence with regards to the audit of predetermined objectives, tangible
capital assets and receivables for departmental revenue.
GovernanceInternal controls are not selected and developed to prevent/detect and correct material misstatements in financial reporting and reporting on pre-determined objectives.
OTHER REPORTS
InvestigationsAn investigation was completed during the year under review concerning the misappropriation of funds via the Basic Accounting System (BAS) in prior years.
Performance auditsA performance audit was completed during the year under review concerning the rehabilitation of abandoned mines. The report was tabled on 27 November 2009.
Pretoria14 September 2010
REPORT OF THE AUDITOR-GENERAL for the year ended 31 march 2010

153
Appropriation per programme
2009/10 2008/09
APPROPRIATION STATEMENT
Adj
uste
d A
ppro
pria
tion
Shift
ing
of F
unds
Vire
men
t
Fina
l A
ppro
pria
tion
Act
ual
Expe
nditu
re
Varia
nce
Expe
nditu
re
as %
of
final
app
ropr
iatio
n
Fina
l A
ppro
pria
tion
Act
ual
Expe
nditu
re
R’000 R’000 R’000 R’000 R’000 R’000 % R’000 R’000
1. Programme 1: Administration Current payment 239,340 (2,465) (11,578) 225,297 224,076 1,221 99.5% 214,322 210,003 Transfers and subsidies 1,284 - (500) 784 450 334 57.4% 1,763 1,660 Payment for capital assets 10,733 2,465 10,937 24,135 24,727 (592) 102.5% 14,360 14,360
2. Programme 2: Promotion of Mine Safety and Health
Current payment 127,453 - 1,696 129,149 129,012 137 99.9% 114,402 113,420 Transfers and subsidies 5,118 - 7 5,125 5,125 - 100.0% 4,922 4,922 Payment for capital assets 456 - 3,987 4,443 4,406 37 99.2% 486 480
3. Programme 3: Mineral Regulation
Current payment 168,066 (2,253) (22,426) 143,387 135,902 7,485 94.9% 149,249 125,159 Transfers and subsidies - - 35 35 35 - 100.0% 11 10 Payment for capital assets - 2,253 12,489 14,742 14,659 83 99.3% 12 11
4. Programme 4: Mineral Policy and Promotion
Current payment 38,505 (10) 5,096 43,591 43,539 52 99.9% 36,712 34,266 Transfers and subsidies 26,058 - - 26,058 26,058 - 100.0% 25,033 24,033 Payment for capital assets - 10 4,117 4,127 4,127 - 100.0% 20 19
5. Programme 5: Hydrocarbons and Energy Planning
Current payment 55,285 - 986 56,271 56,154 117 99.8% 45,241 44,099 Transfers and subsidies - - - - - - 0.0% 100 100 Payment for capital assets - - 702 702 771 (69) 109.8% - -
6. Programme 6: Electricity and Nuclear
Current payment 74,810 (1,000) (27) 73,783 79,039 (5,256) 107.1% 77,868 77,122 Transfers and subsidies 265,153 - - 265,153 255,031 10,122 96.2% 195,546 185,446 Payment for capital assets - 1,000 (1,000) - - - 0.0% 1,806 7
7. Programme 7: Associated Services
Transfers and subsidies 3,669,743 - (4,521) 3,665,222 3,541,605 123,617 96.6% 2,904,388 2,894,889
Subtotal
TOTAL 4,682,004 - - 4,682,004 4,544,716 137,288 97.1 3,786,241 3,730,006
APPROPRIATION STATEMENT for the year ended 31 march 2010

154
2009/10 2008/09
Final Appropriation
Actual Expenditure
Final Appropriation
Actual Expenditure
TOTAL (brought forward)
Reconciliation with statement of financial performance
ADD
Departmental receipts 217,144 264,647Aid assistance - 19,973
Actual amounts per statement of financial performance (total revenue)
4,899,148 4,070,861
ADDAid assistance 5,849 17,703
Actual amounts per statement of financial performance (total expenditure)
4,550,565 3,747,709
Appropriation per economic classification
2009/10 2008/09
Adj
uste
d A
ppro
pria
tion
Shift
ing
of F
unds
Vire
men
t
Fina
l A
ppro
pria
tion
Act
ual
Expe
nditu
re
Varia
nce
Expe
nditu
re
as %
of f
inal
ap
prop
riatio
n
Fina
l A
ppro
pria
tion
Act
ual
expe
nditu
re
R’000 R’000 R’000 R’000 R’000 R’000 % R’000 R’000
Current paymentsCompensation of employees 405,440 (9,850) - 395,590 403,323 (7,733) 101.9% 333,683 330,089Goods and services 298,019 4,120 (27,177) 274,962 263,475 11,487 95.9% 303,532 273,386Interest and rent on land - - - - - - 0.0% - -Financial transactions in assets and liabilities - 2 924 926 924 2 99.8% 599 593
Transfers and subsidies Provinces and municipalities 1,107,957 - - 1,107,957 1,074,553 33,404 97.0% 595,637 589,139Departmental agencies and accounts 291,816 - - 291,816 291,814 2 100.0% 285,342 284,342Public corporations and private enterprises
2,566,299 - (4,521) 2,561,778 2,461,445 100,333 97.2% 2,248,957 2,235,756
Households 1,284 - (458) 826 491 335 59.4% 1,808 1,824
Payments for capital assetsBuildings & Other fixed structures - - 22,960 22,960 22,879 81 99.6% - -Machinery and equipment 9,689 7,128 7,081 23,898 #24,505 (607) 102.5% 12,573 12,565Software and other intangible assets 1,500 (1,400) 1,191 1,291 1,306 (15) 101.2% 2,312 2,312Land and subsoil assets - - - - - - 0.0% 1,798 -
Total 4,682,004 - 4,682,004 4,544,716 137,288 97.1% 3,786,241 3,730,006# This amount includes assets that are classified under buildings and other fixed structures
ANNUAL FINANCIAL STATEMENTS - SECTION 4
APPROPRIATION STATEMENT for the year ended 31 march 2010

155
2009/10 2008/09
Programme 1Detail per sub-programme
Adj
uste
d A
ppro
pria
tion
Shift
ing
of
Fund
s
Vire
men
t
Fina
l A
ppro
pria
tion
Act
ual
Expe
nditu
re
Varia
nce
Expe
nditu
re
as %
of f
inal
ap
prop
riatio
n
Fina
l A
ppro
pria
tion
Act
ual
expe
nditu
re
R’000 R’000 R’000 R’000 R’000 R’000 % R’000 R’000
1.1 Corporate Services Current payment 187,367 (2,135) (12,329) 172,903 199,521 (26,618) 115.3% 170,338 170,283 Transfers and subsidies 1,284 - (500) 784 450 334 57.4% 1,763 1,660 Payment for capital assets 10,733 2,260 8,922 21,915 22,737 (822) 103.8% 14,339 14,339
1.2 Deputy Minister Current payment 1,725 - - 1,725 507 1,2178 29.4% - -
1.3 Management Current payment 21,587 (330) 751 22,008 22,278 (270) 101.2% 18,126 17,624 Payment for capital assets - 205 2,015 2,220 1,990 230 89.6% 21 21
1.4 Minister Current payment 1,725 - - 1,725 1,733 (8) 100.5% 1,505 1,502
1.5 Property Management Current payment 26,936 - - 26,936 37 26,899 0.1% 24,353 20,594
Total 251,357 - (1,141) 250,216 249,253 963 99.6% 230,445 226,023
2009/10 2008/09
Programme 1Per Economic classification
Adj
uste
d A
ppro
pria
tion
Shift
ing
of
Fund
s
Vire
men
t
Fina
l A
ppro
pria
tion
Act
ual
Expe
nditu
re
Varia
nce
Expe
nditu
re
as %
of f
inal
ap
prop
riatio
n
Fina
l A
ppro
pria
tion
Act
ual
expe
nditu
re
R’000 R’000 R’000 R’000 R’000 R’000 % R’000 R’000
Current paymentsCompensation of employees 103,065 (334) - 102,731 109,782 (7,051) 106.9% 86,811 85,983Goods and services 136,275 (2,131) (12,329) 121,815 113,542 8,273 93.2% 127,243 123,732Financial transactions in assets and liabilities - - 751 751 751 - 100.0% 288 288
Transfers and subsidies to:Public corporations and private enterprises - - - - - - 0.0% 100 -Households 1,284 - (500) 784 451 333 57.4% 1,643 1,660
Payment for capital assetsMachinery and equipment 9,233 3,865 5,283 5,283 5,283 - 100.0% 12,048 12,048Software and other intangible assets 1,500 (1,400) 1,191 1,291 1,306 (15) 101.2% 2,312 2,312
Total 251,357 - (1,141) 250,216 249,253 963 99.6% 230,445 226,023
DETAIL PER PROGRAMME for the year ended 31 march 2010

156
2009/10 2008/09
Programme 2Detail per sub-programme
Adj
uste
d A
ppro
pria
tion
Shift
ing
of
Fund
s
Vire
men
t
Fina
l A
ppro
pria
tion
Act
ual
Expe
nditu
re
Varia
nce
Expe
nditu
re
as %
of f
inal
ap
prop
riatio
n
Fina
l A
ppro
pria
tion
Act
ual
expe
nditu
re
R’000 R’000 R’000 R’000 R’000 R’000 % R’000 R’000
2.1 Governance Policy and Oversight
Current payment 46,310 2,999 2,518 51,827 51,825 2 100.0% 48,731 48,346 Transfers and subsidies 5,118 - 2 5,120 5,120 - 100.0% 4,909 4,909 Payment for capital assets 199 - 4,207 4,406 4,406 - 100.0% 473 467
2.2 Mine Health and Safety (Regions)
Current payment 81,143 (2,999) (822) 77,322 77,187 135 99.8% 65,671 65,074 Transfers and subsidies - - 5 5 5 - 100.0% 13 13 Payment for capital assets 257 - (220) 37 - 37 0.0% 13 13
Total 133,027 - 5,690 138,717 138,543 174 99.9% 119,810 118,822
2009/10 2008/09
Programme 2 Per Economic classification
Adj
uste
d A
ppro
pria
tion
Shift
ing
of
Fund
s
Vire
men
t
Fina
l A
ppro
pria
tion
Act
ual
Expe
nditu
re
Varia
nce
Expe
nditu
re
as %
of f
inal
ap
prop
riatio
n
Fina
l A
ppro
pria
tion
Act
ual
expe
nditu
re
R’000 R’000 R’000 R’000 R’000 R’000 % R’000 R’000
Current paymentsCompensation of employees 103,938 (9,456) (300) 94,182 94,046 136 99.9% 85,558 85,240Goods and services 23,515 9,456 1,878 34,849 34,849 - 100.0% 28,837 28,174Financial transactions in assets and liabilities - - 118 118 118 - 100.0% 6 5
Transfers and subsidies to:Departmental agencies and accounts 5,118 - - 5,118 5,118 - 100.0% 4,909 4,909Households - - 7 7 6 1 85.7% 14 14
Payment for capital assets 4,387 4,387 4,406 (19) 100.4%
Machinery and equipment 456 - (400) 56 - 56 0.0% 486 480
Total 133,027 - 5,690 138,717 138,543 174 99.9% 119,810 118,822
ANNUAL FINANCIAL STATEMENTS - SECTION 4
DETAIL PER PROGRAMME for the year ended 31 march 2010

157
2009/10 2008/09
Programme 3Detail per sub-programme
Adj
uste
d A
ppro
pria
tion
Shift
ing
of
Fund
s
Vire
men
t
Fina
l A
ppro
pria
tion
Act
ual
Expe
nditu
re
Varia
nce
Expe
nditu
re
as %
of f
inal
ap
prop
riatio
n
Fina
l A
ppro
pria
tion
Act
ual
expe
nditu
re
R’000 R’000 R’000 R’000 R’000 R’000 % R’000 R’000
3.1 Management Current payment 10,619 - 7,207 17,826 13,925 3,901 78.1% 7,897 7,655
- - 6,991 6,991 6,891 100 98.6% - -
3.2 Mineral Regulation and Administration
Current payment 157,447 (2,253) (29,633) 125,561 121,977 3,584 97.2% 141,352 117,504 Transfers and subsidies - - 35 35 35 - 100,0% 11 10 Payment for capital assets - 2,253 5,498 7,751 7,768 (17) 100.3% 12 11
Total 168,066 - (9,902) 158,164 150,596 7,568 95.2% 149,272 125,180
2009/10 2008/09
Programme 3Per Economic classification
Adj
uste
d A
ppro
pria
tion
Shift
ing
of
Fund
s
Vire
men
t
Fina
l A
ppro
pria
tion
Act
ual
Expe
nditu
re
Varia
nce
Expe
nditu
re
as %
of f
inal
ap
prop
riatio
n
Fina
l A
ppro
pria
tion
Act
ual
expe
nditu
re
R’000 R’000 R’000 R’000 R’000 R’000 % R’000 R’000
Current paymentsCompensation of employees 85,224 - 5,200 90,424 91,292 (868) 101.0% 72,645 71,776Goods and services 82,842 (2,253) (27,638) 52,951 44,598 8,353 84.8% 76,471 53,250Financial transactions in assets and liabilities - - 12 12 12 - 100.0% 133 133
Transfers and subsidies to:Households - - 35 35 35 - 100.0% 11 10
Payment for capital assetsBuildings & Other fixed structure - - 9,163 9,163 9,063 100 98.6 - -Machinery and equipment - 2,253 3,326 5,579 5,596 (17) 100.3% 12 11
Total 168,066 - (9,902) 158,164 150,596 7,568 95.2% 149,272 125,180
DETAIL PER PROGRAMME for the year ended 31 march 2010
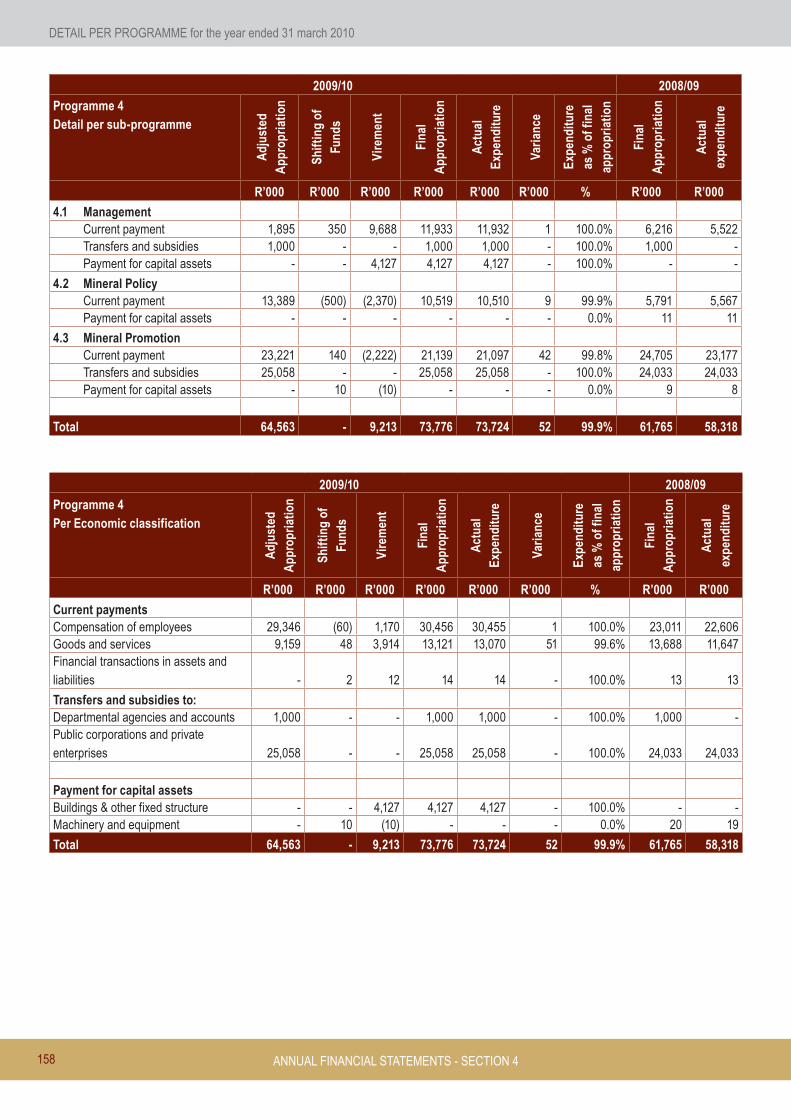
158
2009/10 2008/09
Programme 4Detail per sub-programme
Adj
uste
d A
ppro
pria
tion
Shift
ing
of
Fund
s
Vire
men
t
Fina
l A
ppro
pria
tion
Act
ual
Expe
nditu
re
Varia
nce
Expe
nditu
re
as %
of f
inal
ap
prop
riatio
n
Fina
l A
ppro
pria
tion
Act
ual
expe
nditu
re
R’000 R’000 R’000 R’000 R’000 R’000 % R’000 R’000
4.1 Management Current payment 1,895 350 9,688 11,933 11,932 1 100.0% 6,216 5,522 Transfers and subsidies 1,000 - - 1,000 1,000 - 100.0% 1,000 - Payment for capital assets - - 4,127 4,127 4,127 - 100.0% - -
4.2 Mineral Policy Current payment 13,389 (500) (2,370) 10,519 10,510 9 99.9% 5,791 5,567 Payment for capital assets - - - - - - 0.0% 11 11
4.3 Mineral Promotion Current payment 23,221 140 (2,222) 21,139 21,097 42 99.8% 24,705 23,177 Transfers and subsidies 25,058 - - 25,058 25,058 - 100.0% 24,033 24,033 Payment for capital assets - 10 (10) - - - 0.0% 9 8
Total 64,563 - 9,213 73,776 73,724 52 99.9% 61,765 58,318
2009/10 2008/09
Programme 4Per Economic classification
Adj
uste
d A
ppro
pria
tion
Shift
ing
of
Fund
s
Vire
men
t
Fina
l A
ppro
pria
tion
Act
ual
Expe
nditu
re
Varia
nce
Expe
nditu
re
as %
of f
inal
ap
prop
riatio
n
Fina
l A
ppro
pria
tion
Act
ual
expe
nditu
re
R’000 R’000 R’000 R’000 R’000 R’000 % R’000 R’000
Current paymentsCompensation of employees 29,346 (60) 1,170 30,456 30,455 1 100.0% 23,011 22,606Goods and services 9,159 48 3,914 13,121 13,070 51 99.6% 13,688 11,647Financial transactions in assets and liabilities - 2 12 14 14 - 100.0% 13 13
Transfers and subsidies to:Departmental agencies and accounts 1,000 - - 1,000 1,000 - 100.0% 1,000 -Public corporations and private enterprises 25,058 - - 25,058 25,058 - 100.0% 24,033 24,033
Payment for capital assetsBuildings & other fixed structure - - 4,127 4,127 4,127 - 100.0% - -Machinery and equipment - 10 (10) - - - 0.0% 20 19
Total 64,563 - 9,213 73,776 73,724 52 99.9% 61,765 58,318
ANNUAL FINANCIAL STATEMENTS - SECTION 4
DETAIL PER PROGRAMME for the year ended 31 march 2010

159
2009/10 2008/09
Programme 5Detail per sub-programme
Adj
uste
d A
ppro
pria
tion
Shift
ing
of
Fund
s
Vire
men
t
Fina
l A
ppro
pria
tion
Act
ual
Expe
nditu
re
Varia
nce
Expe
nditu
re
as %
of f
inal
ap
prop
riatio
n
Fina
l A
ppro
pria
tion
Act
ual
expe
nditu
re
R’000 R’000 R’000 R’000 R’000 R’000 % R’000 R’000
5.1 Energy Planning Current payment 14,867 (735) (8,999) 5,133 5,010 123 97.6% 8,283 8,026
5.2 Hydrocarbons Current payment 35,991 785 1,895 38,671 38,669 2 100.0% 32,343 31,519 Transfers and subsidies - - - - - - 0.0% 100 100
5.3 Hydrocarbons and Energy Planning Management
Current payment 4,427 (50) 8,090 12,467 12,475 (8) 100.1% 4,615 4,554 Payment for capital assets - - 702 702 771 (69) 109.8%
Total 55,285 - 1,688 56,973 56,925 48 99.9% 45,341 44,199
2009/10 2008/09
Programme 5Per Economic classification
Adj
uste
d A
ppro
pria
tion
Shift
ing
of
Fund
s
Vire
men
t
Fina
l A
ppro
pria
tion
Act
ual
Expe
nditu
re
Varia
nce
Expe
nditu
re
as %
of f
inal
ap
prop
riatio
n
Fina
l A
ppro
pria
tion
Act
ual
expe
nditu
re
R’000 R’000 R’000 R’000 R’000 R’000 % R’000 R’000
Current paymentsCompensation of employees 46,957 - (6,600) 40,357 40,311 46 99.9% 30,057 29,266Goods and services 8,328 - 7,575 15,903 15,833 70 99.6% 15,216 14,776Financial transactions in assets and liabilities - - 11 11 10 1 90.9% 58 57
Transfers and subsidies to:Households - - - - - - 0.0% 100 100
Payment for capital assetsMachinery and equipment - - 702 702 771 (69) 109.8% - -
Total 55,285 - 1,688 56,973 56,925 48 99.9% 45,341 44,199
DETAIL PER PROGRAMME for the year ended 31 march 2010

160
2009/10 2008/09
Programme 6Detail per sub-programme
Adj
uste
d A
ppro
pria
tion
Shift
ing
of
Fund
s
Vire
men
t
Fina
l A
ppro
pria
tion
Act
ual
Expe
nditu
re
Varia
nce
Expe
nditu
re
as %
of f
inal
ap
prop
riatio
n
Fina
l A
ppro
pria
tion
Act
ual
expe
nditu
re
R’000 R’000 R’000 R’000 R’000 R’000 % R’000 R’000
6.1 Clean Energy Current payment 13,271 - (1,627) 11,644 11,391 253 97.8% - - Transfers and subsidies 265,153 - - 265,153 255,031 10,122 96.2% - -
6.2 Electricity Current payment 38,109 (1,075) (800) 36,234 36,099 135 99.6% 55,923 55,883 Transfers and subsidies - - - - - - 0.0% 195,526 185,426 Payment for capital assets - 1,000 (1,000) - - - 0.0% 1,806 7
6.3 Electricity and Nuclear Management
Current payment 6,226 75 5,400 11,701 17,600 (5,899) 150.4% 6,827 6,688
6.4 Nuclear Current payment 17,204 - (3,000) 14,204 13,949 255 98.2% 15,118 14,551 Transfers and subsidies - - - - - - 0.0% 20 20
Total 339,963 - (1,027) 338,936 334,070 4,866 98.6% 275,220 262,575
2009/10 2008/09
Programme 6Per Economic classification
Adj
uste
d A
ppro
pria
tion
Shift
ing
of
Fund
s
Vire
men
t
Fina
l A
ppro
pria
tion
Act
ual
Expe
nditu
re
Varia
nce
Expe
nditu
re
as %
of f
inal
ap
prop
riatio
n
Fina
l A
ppro
pria
tion
Act
ual
expe
nditu
re
R’000 R’000 R’000 R’000 R’000 R’000 % R’000 R’000
Current paymentsCompensation of employees 36,910 - 530 37,440 37,437 3 100.0% 35,601 35,218Goods and services 37,900 (1,000) (577) 36,323 41,583 (5,260) 114.5% 42,167 41,807Financial transactions in assets and liabilities - - 20 20 19 1 95.0% 100 97
Transfers and subsidies to:Provinces and municipalities 175,000 - - 175,000 175,000 - 100.0% - -Departmental agencies and accounts
- - - - - - 0.0% 10,000 10,000Public corporations and private enterprises 90,153 - - 90,153 80,031 10,122 88.8% 185,506 175,406Households - - - - - - 0.0% 40 40
Payment for capital assetsMachinery and equipment - 1,000 (1,000) - - - 0.0% 8 7Land and subsoil - - - - - - 0.0% 1,798 -
Total 339,963 - (1,027) 338,936 334,070 4,866 98.6% 275,220 262,575
ANNUAL FINANCIAL STATEMENTS - SECTION 4
DETAIL PER PROGRAMME for the year ended 31 march 2010
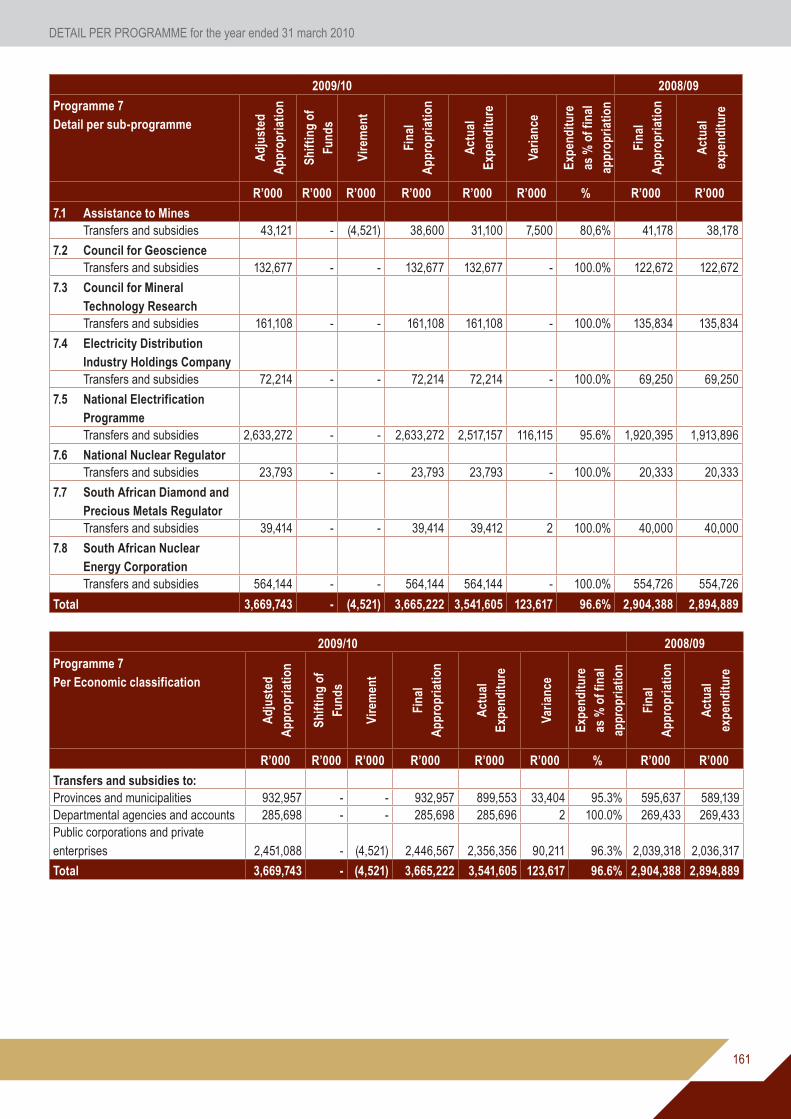
161
2009/10 2008/09
Programme 7Detail per sub-programme
Adj
uste
d A
ppro
pria
tion
Shift
ing
of
Fund
s
Vire
men
t
Fina
l A
ppro
pria
tion
Act
ual
Expe
nditu
re
Varia
nce
Expe
nditu
re
as %
of f
inal
ap
prop
riatio
n
Fina
l A
ppro
pria
tion
Act
ual
expe
nditu
re
R’000 R’000 R’000 R’000 R’000 R’000 % R’000 R’000
7.1 Assistance to Mines Transfers and subsidies 43,121 - (4,521) 38,600 31,100 7,500 80,6% 41,178 38,178
7.2 Council for Geoscience Transfers and subsidies 132,677 - - 132,677 132,677 - 100.0% 122,672 122,672
7.3 Council for Mineral Technology Research
Transfers and subsidies 161,108 - - 161,108 161,108 - 100.0% 135,834 135,834
7.4 Electricity Distribution Industry Holdings Company
Transfers and subsidies 72,214 - - 72,214 72,214 - 100.0% 69,250 69,250
7.5 National Electrification Programme
Transfers and subsidies 2,633,272 - - 2,633,272 2,517,157 116,115 95.6% 1,920,395 1,913,896
7.6 National Nuclear Regulator Transfers and subsidies 23,793 - - 23,793 23,793 - 100.0% 20,333 20,333
7.7 South African Diamond and Precious Metals Regulator
Transfers and subsidies 39,414 - - 39,414 39,412 2 100.0% 40,000 40,000
7.8 South African Nuclear Energy Corporation
Transfers and subsidies 564,144 - - 564,144 564,144 - 100.0% 554,726 554,726
Total 3,669,743 - (4,521) 3,665,222 3,541,605 123,617 96.6% 2,904,388 2,894,889
2009/10 2008/09
Programme 7Per Economic classification
Adj
uste
d A
ppro
pria
tion
Shift
ing
of
Fund
s
Vire
men
t
Fina
l A
ppro
pria
tion
Act
ual
Expe
nditu
re
Varia
nce
Expe
nditu
re
as %
of f
inal
ap
prop
riatio
n
Fina
l A
ppro
pria
tion
Act
ual
expe
nditu
re
R’000 R’000 R’000 R’000 R’000 R’000 % R’000 R’000
Transfers and subsidies to:Provinces and municipalities 932,957 - - 932,957 899,553 33,404 95.3% 595,637 589,139Departmental agencies and accounts 285,698 - - 285,698 285,696 2 100.0% 269,433 269,433Public corporations and private enterprises 2,451,088 - (4,521) 2,446,567 2,356,356 90,211 96.3% 2,039,318 2,036,317
Total 3,669,743 - (4,521) 3,665,222 3,541,605 123,617 96.6% 2,904,388 2,894,889
DETAIL PER PROGRAMME for the year ended 31 march 2010

162
NOTES TO THE APPROPRIATION STATEMENTfor the year ended 31 March 2010
1. Detail of transfers and subsidies as per Appropriation Act (after Virement):
Detail of these transactions can be viewed in the note on Transfers and subsidies, disclosure notes and Annexure 1 (A-D) to the Annual Financial Statements.
2. Detail of specifically and exclusively appropriated amounts voted (after Virement):
Detail of these transactions can be viewed in note 1 (Annual Appropriation) to the Annual Financial Statements.
3. Detail on financial transactions in assets and liabilities
Detail of these transactions per programme can be viewed in the note on financial transactions in assets and liabilities to the Annual Financial Statements.
4. Explanations of material variances from Amounts Voted (after Virement):
4.1 Per Programme Final Appropriation
Actual Expenditure
Variance R’000 Variance as a % of Final Appropriation
Programme 1: Administration 250,216 249,253 963 0.4Programme 2: Promotion of Mine Safety and Health 138,717 138,543 174 0.1Programme 3: Mineral Regulation 158,164 150,596 7,568 4.8Programme 4: Mineral Policy and Promotion 73,776 73,724 52 0.1Programme 5: Hydrocarbons and Energy Planning 56,973 56,925 48 0.1Programme 6: Electricity and Nuclear 338,936 334,070 4,866 1.4Programme 7: Associated Services 3,665,222 3,541,605 123,617 3.4
Total 4,682,004 4,544,716 137,288 2.9
4.2 Per Economic classification Final Appropriation
Actual Expenditure
Variance Variance as a % of Final Appropriation
R’000 R’000 R’000 R’000
Current payments:Compensation of employees 395,590 403,323 (7,733) (1.9)Goods and services 274,962 263,475 11,487 4.1Financial transactions in assets and liabilities 926 924 2 0.2
Transfers and subsidies:Provinces and municipalities 1,107,957 1,074,553 33,404 3.9Departmental agencies and accounts 291,816 291,814 2 0.0Public corporations and private enterprises 2,561,778 2,461,445 100,333 2.8Households 826 492 334 40.6
Payments for capital assets:Buildings & Other fixed structure 22,960 22,879 81 0.4Machinery and equipment 23,898 24,505 (607) (2.5)Software and other intangible assets 1,291 1,306 (15) (1.1)
TOTAL 4,682,004 4,544,716 137,288 2.9
ANNUAL FINANCIAL STATEMENTS - SECTION 4

163
NOTES TO THE APPROPRIATION STATEMENTfor the year ended 31 March 2010
Programme 1: Administration
The under spending of R963 thousand (0.4%) under Programme 1: Administration mainly relates to outstanding lease payments and accommodation charges payable to the Department of Public Works in respect of the Sub-programme: Property Management. The item goods and services consequently reflects an under spending of R8.27 million.
An over spending of R7.05 million under the item compensation of employees is mainly the result of additional human resources requirements that came as a result of preparatory activities associated with the split of the Department and establishment of two separate departments with effect from 1 April 2010. Although funding were provided through the Adjusted Estimates of National Expenditure process for critical positions and the newly created Ministry of Energy, several preparatory activities (asset management, finance, interim staff establishments, labour management) were not funded through the revised budget process.
Programme 2: Promotion of Mine Health and Safety
The Mine Health and Safety Inspectorate’s budget is mostly personnel driven due to the nature of inspection and monitoring activities performed. On 31 March 2010, the Inspectorate reflected an under spending of R174 thousands. This is due to vacancies within the branch. An amount of R5.69 million was however redirected by means of a virement approval to the inspectorate to cater for excess expenditure under the item goods and services which included expenditure for the training of Learner Inspectors which was concluded on1 August 2009, payments to IRCA for the development and implementation of the MHSIS system, payment to De Loitte’s for the development of a business case to support the integration of the MHSI with the Mine Health and Safety Council, and payment to WITS University for the development and presentation of training programmes for Inspectors.
Programme 3: Mineral Regulation
The under spending of R7.56 million mostly relates to delays in contracts and subsequent payments for projects aimed at rehabilitating ownerless and derelict mines. An amount of R27.6 million under the item goods and services was however reallocated to the item payments for capital assets (R12.4 million), R5.2 million to the item compensation of employees and R9.902 million to other programmes to cater for excess expenditure.
Programme 4: Mineral Policy and Promotion
On 31 March 2010, the Mineral Policy and Promotion Branch disbursed R73.72 million which represents 99.9% of its allocated budget of R73.77 million. An amount of R1.17 million was however reallocated from the item goods and services to the item compensation of employees to cater for higher than anticipated expenditure associated with the remuneration of staff and employment of staff additional to the establishment. Programme 5: Hydrocarbons and Energy Planning
On 31 March 2010, the Hydrocarbons and Energy Planning Branch disbursed R56.93 million which represents 99.9% of its allocated budget of R56.97 million. An amount of R6.60 million was however reallocated from the item compensation of employees to the item goods and services to cater for higher than anticipated expenditure. Major spending pressures within the Hydrocarbons and Energy Planning Branch relates to operational expenditure associated with the licensing and site inspection activities of the Petroleum Controller in regional offices.
Programme 6: Electricity, Nuclear and Clean Energy
An under spending of R10.1 million under the item transfers and subsidies is mainly the result of payments that were not disbursed due to delays in finalising agreements and subsequent transfer payments before 31 March 2010.

164
NOTES TO THE APPROPRIATION STATEMENTfor the year ended 31 March 2010
The Department, due to lack of sufficient capacity internally, took a decision that SANERI be appointed as the implementing agency of the Working for Programme (WFE). Processes of effecting the decision took longer than expected i.e. process of concluding Memorandum of Understanding (MOU) with SANERI took over 6 months. Subsequent to the signing of the MOU, the process of getting funds reclassified which requires National Treasury’s approval commenced late in 2009 and was also delayed due to delays in finalising and approving project plans.
Renewable Energy Finance Subsidy Office (Refso): Out of total allocated budget of R10, 678 million has disbursed R5, 246 million. The main reason for the under spend is delays in the approval of the Renewable Energy Feed in Tariff (REFIT) which requires approval by the National Energy Regulator of South Africa (NERSA). Project developers have halted investments in renewable energy projects until REFIT is fully implemented.
Programme 7: Associated Services
An under spending of R123.6 million under the item transfers and subsidies is mainly the result of payments that were not disbursed due to delays in finalising agreements, late submission of fund requests and subsequent transfer payments before 31 March 2010.
The under spending of R7.5 million under the Sub-programme: Assistance to Mines mainly relate to disbursements in respect of pumping subsidies that were not made to mining companies due to the late submission of invoices from beneficiaries of the subsidy. These funds were reserved for the purpose of pumping ingress water from mines in the Wits Basin.
An amount of R889.5 million from R932.9 million were transferred to Municipalities by the end of March 2010.This represents 95.35% of the total allocation. The under spending is mostly due to the late request of funds by municipalities and delays in finalising service level agreements.
The Department of Energy (DOE), through the Integrated National Electrification Programme (INEP) is responsible for planning, funding and administration of the National Electrification Funding (NEF). This funding is intended for implementation of both Grid and Non Grid electrification programmes. The procurement process has taken a considerable amount of time and hence it was only during the end of the 2009/10 financial year that the process was completed. The 2009/10 financial year funding was hence not utilized for the entire period of the financial year due to the abovementioned delays however, Non Grid service providers have now been appointed and are ready to start with implementation of the 2009/10 programme. On 31 March 2009, a total of R82.71 million in respect of transfer payments to non-grid service providers was not disbursed due to delays in procurement procedures and finalization of agreements.
ANNUAL FINANCIAL STATEMENTS - SECTION 4

165
STATEMENT OF FINANCIAL PERFORMANCEfor the year ended 31 March 2010
PERFORMANCE Note 2009/10 2008/09R’000 R’000
REVENUEAnnual appropriation 1 4,682,004 3,786,241Departmental revenue 2 217,144 264,647Aid assistance 3 - 19,973
TOTAL REVENUE 4,899,148 4,070,861
EXPENDITURECurrent expenditureCompensation of employees 4 403,323 330,089Goods and services 5 263,475 269,408Financial transactions in assets and liabilities 6 924 593Aid assistance 3 5,849 7,056
Total current expenditure 673,572 607,146
Transfers and subsidiesTransfers and subsidies 7 3,828,303 3,111,061Aid assistance - 10,647
Total transfers and subsidies 3,828,303 3,121,708
Expenditure for capital assetsTangible capital assets 8 47,384 16,543Software and other intangible assets 8 1,306 2,312
Total expenditure for capital assets 48,690 18,855
TOTAL EXPENDITURE 4,550,565 3,747,709
SURPLUS/(DEFICIT) FOR THE YEAR 348,583 323,152
Reconciliation of Net Surplus/(Deficit) for the yearVoted funds 15 137,288 56,235Departmental revenue 16 217,144 264,647Aid assistance 3 (5,849) 2,270
SURPLUS/(DEFICIT) FOR THE YEAR 348,583 323,152

166
STATEMENT OF FINANCIAL POSITIONfor the year ended 31 March 2010
POSITION Note 2009/10 2008/09R’000 R’000
ASSETS
Current assets 212,761 176,032Cash and cash equivalents 10 192,279 127,225Prepayments and advances 11 5,902 19,133Receivables 12 14,580 29,674
Non-current assets 2,205 2,205Investments 13 2,205 2,205
TOTAL ASSETS 214,966 178,237
LIABILITIES
Current liabilities 211,699 175,188Voted funds to be surrendered to the Revenue Fund 15 137,288 54,105Departmental revenue to be surrendered to the Revenue Fund 16 74,344 115,158Payables �����17 4 13Aid assistance unutilised 3 63 5,912
TOTAL LIABILITIES 211,699 175,188
NET ASSETS 3,267 3,049
Represented by:Capitalisation reserve 2,205 2,205Recoverable revenue 1,062 844
TOTAL 3,267 3,049
ANNUAL FINANCIAL STATEMENTS - SECTION 4
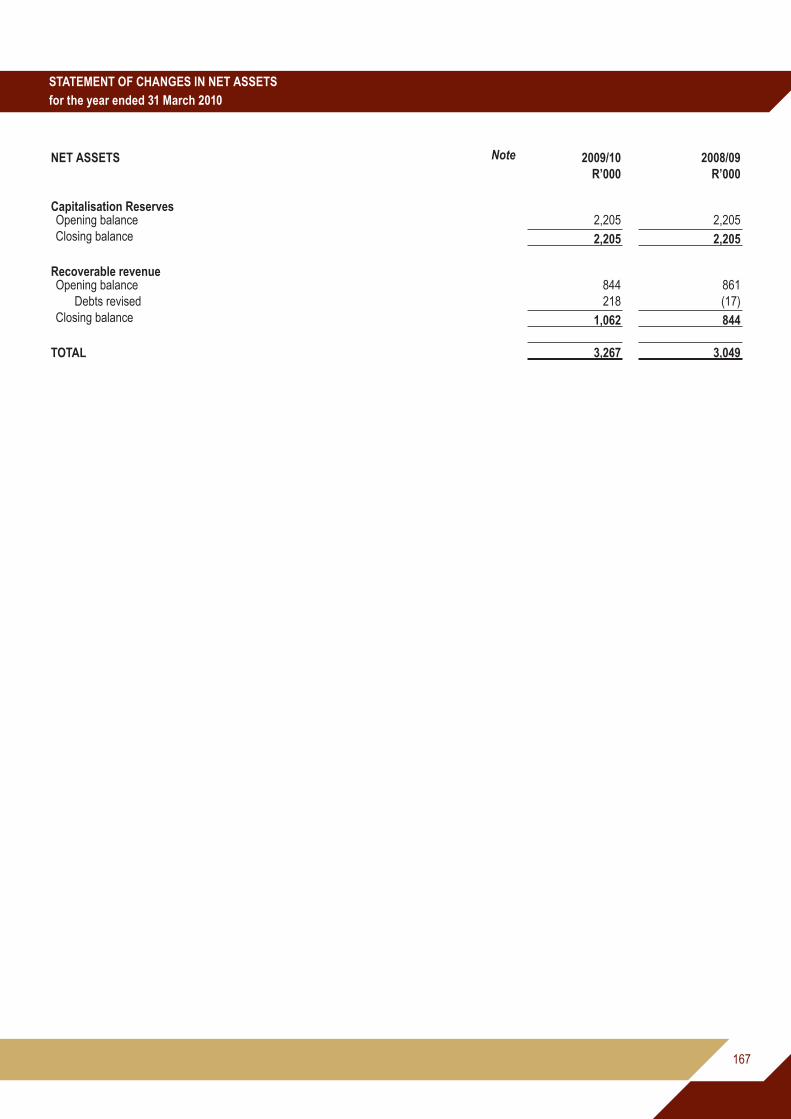
167
STATEMENT OF CHANGES IN NET ASSETSfor the year ended 31 March 2010
NET ASSETS Note 2009/10 2008/09R’000 R’000
Capitalisation ReservesOpening balance 2,205 2,205Closing balance 2,205 2,205
Recoverable revenueOpening balance 844 861
Debts revised 218 (17)Closing balance 1,062 844
TOTAL 3,267 3,049

168
CASH FLOW STATEMENTfor the year ended 31 March 2010
CASH FLOW Note 2009/10 2008/09R’000 R’000
CASH FLOWS FROM OPERATING ACTIVITIESReceipts 4,899,148 4,068,731
Annual appropriated funds received 1.1 4,682,004 3,784,111Departmental revenue received 2 217,144 264,647Aid assistance received 3 - 19,973
Net (increase)/decrease in working capital 28,316 (36,411)Surrendered to Revenue Fund (312,063) (275,658)Current payments (673,572) (607,146)Transfers and subsidies paid (3,828,303) (3,121,708)
Net cash flow available from operating activities 18 113,526 27,808
CASH FLOWS FROM INVESTING ACTIVITIESPayments for capital assets 8 (48,690) (18,855)
Net cash flows from investing activities (48,690) (18,855)
CASH FLOWS FROM FINANCING ACTIVITIESIncrease/(decrease) in net assets 218 (17)
Net cash flows from financing activities 218 (17)
Net increase/(decrease) in cash and cash equivalents 65,054 8,936
Cash and cash equivalents at beginning of period 127,225 118,289
Cash and cash equivalents at end of period 19 192,279 127,225
ANNUAL FINANCIAL STATEMENTS - SECTION 4

169
The Financial Statements have been prepared in accordance with the following policies, which have been applied consistently in all material aspects, unless otherwise indicated. However, where appropriate and meaningful, additional information has been disclosed to enhance the usefulness of the Financial Statements and to comply with the statutory requirements of the Public Finance Management Act, Act 1 of 1999 (as amended by Act 29 of 1999), and the Treasury Regulations issued in terms of the Act and the Division of Revenue Act, Act 2 of 2006.
1. Presentation of the Financial Statements
1.1 Basis of preparation
The Financial Statements have been prepared on a modified cash basis of accounting, except where stated otherwise. The modified cash basis constitutes the cash basis of accounting supplemented with additional disclosure items. Under the cash basis of accounting transactions and other events are recognised when cash is received or paid.
1.2 Presentation currency
All amounts have been presented in the currency of the South African Rand (R) which is also the functional currency of the department.
1.3 Rounding
Unless otherwise stated all financial figures have been rounded to the nearest one thousand Rand (R’000).
1.4 Comparative figures
Prior period comparative information has been presented in the current year’s financial statements. Where necessary figures included in the prior period financial statements have been reclassified to ensure that the format in which the information is presented is consistent with the format of the current year’s financial statements.
1.5 Comparative figures - Appropriation Statement
A comparison between actual amounts and final appropriation per major classification of expenditure is included in the Appropriation Statement.
2. Revenue
2.1 Appropriated funds
Appropriated funds comprises of departmental allocations as well as direct charges against revenue fund (i.e. statutory appropriation).
Appropriated funds are recognised in the financial records on the date the appropriation becomes effective. Adjustments made in terms of the adjustments budget process are recognised in the financial records on the date the adjustments become effective.
The total appropriated funds received during the year are presented in the statement of financial performance.
Unexpended appropriated funds are surrendered to the National/Provincial Revenue Fund. Any amounts owing to the National/Provincial
Revenue Fund at the end of the financial year are recognised as payable in the statement of financial position.
ACCOUNTING POLICIESfor the year ended 31 March 2010

170
ACCOUNTING POLICIESfor the year ended 31 March 2010
2.2 Departmental revenue
All departmental revenue is recognised in the statement of financial performance when received and is subsequently paid into the National/Provincial Revenue Fund, unless stated otherwise.
Any amount owing to the National/Provincial Revenue Fund is recognised as a payable in the statement of financial position.
No accrual is made for the amount receivable from the last receipt date to the end of the reporting period. These amounts are however disclosed in the disclosure note to the annual financial statements.
2.3 Direct Exchequer receipts / payments
All direct exchequer receipts are recognised in the statement of financial performance when the cash is received and subsequently paid into the National/Provincial Revenue Fund, unless otherwise stated.
All direct exchequer payments are recognised in the statement of financial performance when final authorisation for payment is effected on the system (by no later than 31 March of each year).
Any amount owing to the National/Provincial Revenue Funds at the end of the financial year is recognised as a payable in the statement of financial position.
2.4 Aid assistance
Aids assistance is recognised as revenue when received
All in-kind aid assistance is disclosed at fair value on the date of receipt in the annexures to the Annual Financial Statements
The cash payments made during the year relating to aid assistance projects are recognised as expenditure in the statement of financial performance when final authorisation for payments is effected on the system (by no later than 31 March of each year)
The value of the assistance expensed prior to the receipt of funds is recognised as a receivable in the statement of financial position.
Inappropriately expensed amounts using aid assistance and any unutilised amounts are recognised as payables in the statement of financial position.
All CARA funds received must be recorded as revenue when funds are received. The cash payments made during the year relating to CARA earmarked projects are recognised as expenditure in the statement of financial performance when final authorisation for payments effected on the system (by no later then 31 March of each year)
Inappropriately expensed amounts using CARA funds are recognised as payables in the statement of financial position. Any unutilised amounts are transferred to retained funds as they are not surrendered to the revenue fund.
ANNUAL FINANCIAL STATEMENTS - SECTION 4

171
ACCOUNTING POLICIESfor the year ended 31 March 2010
3. Expenditure
3.1 Compensation of employees
3.1.1 Short-term employee benefits
The cost of short-term employee benefits are expensed in the statement of financial performance when financial authorisation for payment is effected on the system (by no later then 31 March each year)
Short-tem employee benefits that give rise to a present legal or constructive obligation are disclosed in the disclosure notes to the financial statements. These amounts must not be recognised in the statement of financial performance or position.
Employee cost are capitalised to the cost of a capital project when an employee spends more than 50% of his/her time in the project. These payments form part of expenditure for capital assets in the statement of financial performance.
3.1.2 Post retirement benefits
Employer contributions (i.e. social contributions) are expensed in the statement of financial performance when the final authorisation for payment is effected on the system (by no later than 31 March each year).
No provision is made for retirement benefits in the financial statements of the department. Any potential liabilities are disclosed in the financial statements of the National Revenue Funds and not in the financial statements of the employer department.
Social contribution (such as medical benefits) made by the department for certain of its ex-employees are classified as transfers to households in the statement of financial performance.
3.1.3 Termination benefits
Termination benefits such as severance packages are recognised as an expense in the statement of financial performance as a transfer (to households) when the final authorisation for payment is effected on the system (by no later than 31 March of each year).
3.1.4 Other long-term employee benefits
Other long-term employee benefits (such as capped leave) are recognised as an expense in the statement of financial performance as a transfer (to households) when the final authorisation for payment is effected on the system (by no later than 31 March of each year).
Long-term employee benefits that give rise to a present legal or constructive obligation are disclosed in the disclosure notes to the financial statements.
3.2 Goods and services
Payments made for goods and/or services are recognised as an expense in the statement of financial performance when the final authorisation for payment is effected on the system (by no later than 31 March of each year).
The expense is classified as capital if the goods and/or services were acquired for a capital project or if the total purchase price exceeds the capitalisation threshold (currently R5, 000). All other expenditures are classified as current.
172
ACCOUNTING POLICIESfor the year ended 31 March 2010
3.3 Interest and rent on land
Interest and rental payments are recognised as an expense in the statement of financial performance when the final authorisation for payment is effected on the system (by no later than 31 March of each year). This item excludes rental for the use of buildings or other fixed structures. If it is not possible to distinguish between payment for the use of land and the fixed structures on it, the whole amount should be recorded under goods and services.
3.4 Financial transactions in assets and liabilities
Debts are written off when identified as irrecoverable. Debts written-off are limited to the amount of savings and/or underspending of appropriated funds. The write off occurs at year-end or when funds are available. No provision is made for irrecoverable amounts but an estimate is included in the disclosure notes to the financial statements amounts.
All other losses are recognised when authorisation has been granted for the recognition thereof.
3.5 Transfers and subsidies
Transfers and subsidies are recognised as an expense when the final authorisation for payment is effected on the system (by no later than 31 March of each year).
3.6 Unauthorised expenditure
When confirmed unauthorised expenditure is recognised as an asset in the statement of financial position until such time as the expenditure is either approved by the relevant authority, recovered from the responsible person or written off as irrecoverable in the statement of financial performance.
Unauthorised expenditure approved with funding is derecognised from the statement of financial position when the unauthorised expenditure is approved and the related funds are received.
Where the amount is approved without funding it is recognised as expenditure in the statement of financial performance on the date of approval.
3.7 Fruitless and wasteful expenditure
Fruitless and wasteful expenditure is recognised as expenditure in the statement of financial performance according to the nature of the payment and not as a separate line item on the face of the statement. If the expenditure is recoverable it is treated as an asset until it is recovered from the responsible person or written off as irrecoverable in the statement of financial performance.
3.8 Irregular expenditure
Irregular expenditure is recognised as expenditure in the statement of financial performance. If the expenditure is not condoned by the relevant authority it is treated as an asset until it is recovered or written off as irrecoverable.
ANNUAL FINANCIAL STATEMENTS - SECTION 4

173
ACCOUNTING POLICIESfor the year ended 31 March 2010
4. Assets
4.1 Cash and cash equivalents
Cash and cash equivalents are carried in the statement of financial position at cost.
Bank overdrafts are shown separately on the face of the statement of financial position.
For the purposes of the cash flow statement, cash and cash equivalents comprise cash on hand, deposits held, other short-term highly liquid investments and bank overdrafts.
4.2 Other financial assets
Other financial assets are carried in the statement of financial position at cost.
4.3 Prepayments and advances
Amounts prepaid or advanced are recognised in the statement of financial position when the payments are made and where the goods and services have not been received by year end.
Prepayments and advances outstanding at the end of the year are carried in the statement of financial position at cost.
4.4 Receivables
Receivables included in the statement of financial position arise from cash payments made that are recoverable from another party or from the sale of goods/rendering of services.
Receivables outstanding at year-end are carried in the statement of financial position at cost plus any accrued interest. Amounts that are potentials irrecoverable are included in the disclosure notes.
4.5 Investments
Capitalised investments are shown at cost in the statement of financial position.
Investments are tested for an impairment loss whenever events or changes in circumstances indicate that the investment may be impaired. Any impairment loss is included in the disclosure notes.
4.6 Loans
Loans are recognised in the statement of financial position when the cash is paid to the beneficiary. Loans that are outstanding at year-end are carried in the statement of financial position at cost plus accrued interest.
Amounts that are potentially irrecoverable are included in the disclosure notes.

174
ACCOUNTING POLICIESfor the year ended 31 March 2010
4.7 Inventory
Inventories that qualify for recognition must be initially reflected at cost. Where inventories are acquired at no cost, or for nominal consideration, their cost shall be their fair value at the date of acquisition.
All inventory items at year-end are reflected using the weighted average cost.
4.8 Capital assets
4.8.1 Movable assets
Initial recognitionA capital asset is recorded on receipt of the item at cost. Cost of an asset is defined as the total cost of acquisition. Where the cost cannot be determined accurately, the movable capital asset is stated at fair value. Where fair value cannot be determined, the capital asset is included in the asset register at R1.
All assets acquired prior to 1 April 2002 are included in the register R1.
Subsequent recognitionSubsequent expenditure of a capital nature is recorded in the statement of financial performance as “expenditure for capital asset” and is capitalised in the asset register of the department on completion of the project.
Repairs and maintenance is expensed as current “goods and services” in the statement of financial performance.
4.8.2 Immovable assets
Initial recognitionA capital asset is recorded on receipt of the item at cost. Cost of an asset is defined as the total cost of acquisition. Where the cost cannot be determined accurately, the immovable capital asset is stated at R1 unless the fair value for the asset has been reliably estimated.
Subsequent recognitionWork-in-progress of a capital nature is recorded in the statement of financial performance as “expenditure for capital asset”. On completion, the total cost of the project is included in the asset register of the department that legally owns the asset or the provincial/national department of public works.
Repairs and maintenance is expensed as current “goods and services” in the statement of financial performance.
5. Liabilities
5.1 Payables
Recognised payables mainly comprise of amounts owing to other governmental entities. These payables are carried at cost in the statement of financial position.
ANNUAL FINANCIAL STATEMENTS - SECTION 4

175
ACCOUNTING POLICIESfor the year ended 31 March 2010
5.2 Contingent liabilities
Contingent liabilities are included in the disclosure notes to the financial statements when it is possible that economic benefits will flow from the department, or when an outflow of economic benefits or service potential is probable but cannot be measured reliably.
5.3 Contingent assets
Contingent assets are included in the disclosure notes to the financial statements when it is possible that an inflow of economic benefits will flow
to the entity.5.4 Commitments
Commitments are not recognised in the statement of financial position as a liability or as expenditure in the statement of financial performance but are included in the disclosure notes.
5.5 Accruals
Accruals are not recognised in the statement of financial position as a liability or as expenditure in the statement of financial performance but are included in the disclosure notes.
5.6 Employee benefits
Short-term employee benefits that give rise to a present legal or constructive obligation are disclosed in the disclosure notes to the financial statements. These amounts are not recognised in the statement of financial performance or the statement of financial position.
5.7 Lease commitments
Finance leaseFinance leases are not recognised as assets and liabilities in the statement of financial position. Finance lease payments are recognised as an expense in the statement of financial performance and are apportioned between the capital and interest portions. The finance lease liability is disclosed in the disclosure notes to the financial statements.
Operating leaseOperating lease payments are recognised as an expense in the statement of financial performance. The operating lease commitments are disclosed in the discloser notes to the financial statement.
5.8 Provisions
Provisions are disclosed when there is a present legal or constructive obligation to forfeit economic benefits as a result of events in the past and it is probable that an outflow of resources embodying economic benefits will be required to settle the obligation and a reliable estimate of the obligation can be made.
176
ACCOUNTING POLICIESfor the year ended 31 March 2010
6. Receivables for departmental revenue
Receivables for departmental revenue are disclosed in the disclosure notes to the annual financial statements.
7. Net Assets
7.1 Capitalisation reserve
The capitalisation reserve comprises of financial assets and/or liabilities originating in a prior reporting period but which are recognised in the statement of financial position for the first time in the current reporting period. Amounts are recognised in the capitalisation reserves when identified in the current period and are transferred to the National/Provincial Revenue Fund when the underlining asset is disposed and the related funds are received.
7.2 Recoverable revenue
Amounts are recognised as recoverable revenue when a payment made in a previous financial year becomes recoverable from a debtor in the current financial year. Amounts are either transferred to the National/Provincial Revenue Fund when recovered or are transferred to the statement of financial performance when written-off.
8. Related party transactions
Specific information with regards to related party transactions is included in the disclosure notes.
9. Key management personnel
Compensation paid to key management personnel including their family members where relevant, is included in the disclosure notes.
10. Public private partnerships
A description of the PPP arrangement, the contract fees and current and capital expenditure relating to the PPP arrangement is included in the disclosure notes.
ANNUAL FINANCIAL STATEMENTS - SECTION 4

177
NOTES TO THE ANNUAL FINANCIAL STATEMENTSfor the year ended 31 March 2010
1. Annual Appropriation
1.1 Annual AppropriationIncluded are funds appropriated in terms of the Appropriation Act (and the Adjustments Appropriation Act) for National Departments (Voted funds):
Final
Appropriation
Actual Funds
Received
Funds not requested/
not received
Appropriationreceived 2008/09
R’000 R’000 R’000 R’000
Administration 250,216 250,216 - 230,445
Promotion of Mine Safety and Health 138,717 138,717 - 119,810
Mineral Regulation 158,164 158,164 - 149,272
Mineral Policy and Promotion 73,776 73,776 - 61,765
Hydrocarbons and Energy Planning 56,973 56,973 - 45,341
Electricity, Nuclear and Clean Energy 338,936 338,936 - 275,220
Associated Services 3,665,222 3,665,222 - 2,904,388
Total 4,682,004 4,682,004 - 3,786,241
2. Departmental revenue
Note 2009/10 2008/09R’000 R’000
Sales of goods and services other than capital assets 2.1 5,512 5,638
Fines, penalties and forfeits 2.2 382 112
Interest, dividends and rent on land 2.3 210,791 256,089
Financial transactions in assets and liabilities 2.4 459 2,808
Departmental revenue collected 217,144 264,647
2.1 Sales of goods and services other than capital assets
Sales of goods and services produced by the department 5,485 5,634
Sales by market establishment 89 83
Administrative fees 5,063 5,385
Other sales 333 166
Sales of scrap, waste and other used current goods 27 4
Total 5,512 5,638
2.2 Fines, penalties and forfeits
Penalties 382 112
Total 382 112

178
NOTES TO THE ANNUAL FINANCIAL STATEMENTSfor the year ended 31 March 2010
2.3 Interest, dividends and rent on land
Note 2009/10 2008/09R’000 R’000
Interest 515 409
Rent on land 210,276 255,680
Total 210,791 256,089
2.4 Financial transactions in assets and liabilities
Receivables 254 433Other Receipts including Recoverable Revenue 205 2,375
Total 459 2,808
3. Aid assistance
3.1 Aid assistance received in cash from RDP
ForeignOpening Balance 5,912 3,642Revenue - 19,973Expenditure (5,849) (17,703)
Current (5,849) (7,056)Transfers - (10,647)
Closing Balance 63 5,912
3.2 Total assistance
Opening Balance 5,912 3,642Revenue - 19,973Expenditure (5,849) (17,703)
Current (5,849) (7,056)Transfers - (10,647)
Closing Balance 63 5,912
Analysis of balanceAid assistance unutilised RDP 63 5,912
Closing balance 63 5,912
3.3 Aid Assistance surplus/ (deficit) for the year
Revenue - 19,973Expenditure (5,849) (17,703)Balance (5,849) 2,270
ANNUAL FINANCIAL STATEMENTS - SECTION 4

179
NOTES TO THE ANNUAL FINANCIAL STATEMENTSfor the year ended 31 March 2010
4. Compensation of employees
4.1 Salaries and Wages
Note 2009/10 2008/09R’000 R’000
Basic salary 259,530 207,803Performance award 9,474 8,401Service Based 1,325 1,944Compensative/circumstantial 7,662 8,595Periodic payments 1,526 2,950Other non-pensionable allowances 76,950 62,499
Total 356,467 292,192
4.2 Social contributions
Employer contributionsPension 33,503 26,771Medical 13,294 11,091Bargaining council 59 35
Total 46,856 37,897
Total compensation of employees 403,323 330,089
Average number of employees 1,272 1,169
5. Goods and services
Administrative fees 3,126 3,614
Advertising 2,829 16,009
Assets less then R5,000 5.1 4,958 3,803
Bursaries (employees) 2,148 2,340
Catering 2,263 2,732
Communication 19,874 17,207
Computer services 5.2 11,712 16,930
Consultants, contractors and agency/outsourced services 5.3 69,196 59,101
Entertainment 16 12
Audit cost – external 5.4 3,436 3,468
Inventory 5.5 9,276 8,537
Operating leases 34,231 19,413
Owned and leasehold property expenditure 5.6 2,740 3,914
Travel and subsistence 5.7 67,458 79,317
Venues and facilities 5,454 11,239
Training and staff development 7,325 6,761
Other operating expenditure 5.8 17,433 15,011
Total 263,475 269,408

180
NOTES TO THE ANNUAL FINANCIAL STATEMENTSfor the year ended 31 March 2010
5.1 Assets less than R5,000
Note 2009/10 2008/09R’000 R’000
Tangible assetsMachinery and equipment 4,956 3,803
Intangible assets 2 -
Total 4,958 3,803
5.2 Computer services
SITA computer services 3,379 6,912External computer service providers 8,333 10,018
Total 11,712 16,930
5.3 Consultants, contractors and agency/outsourced services
Business and advisory services 32,166 18,616Infrastructure and planning 18,665 16,822Legal costs 7,724 12,465Contractors 9,052 8,293Agency and support/outsourced services 1,589 2,905
Total 69,196 59,101
5.4 Audit cost – External
Regularity audits 2,764 2,628Performance audits 672 840
Total 3,436 3,468
5.5 Inventory
Learning and teaching support material 280 371Fuel, oil and gas 13 24Other consumable materials 1,070 705Maintenance material 408 177Stationery and printing 7,502 7,222Medical supplies 3 38Total 9,276 8,537
5.6 Owned and leasehold property expenditure
Municipal services 821 2,681Other 1,919 1,233
Total 2,740 3,914
ANNUAL FINANCIAL STATEMENTS - SECTION 4

181
NOTES TO THE ANNUAL FINANCIAL STATEMENTSfor the year ended 31 March 2010
5.7 Travel and subsistence
Note 2009/10 2008/09R’000 R’000
Local 57,872 54,578Foreign 9,586 24,739
Total 67,458 79,317
5.8 Other operating expenditure
Professional bodies, membership and subscription fees 12,675 10,932Resettlement costs 2,350 2,096Other 2,408 1,983
Total 17,433 15,011
6. Financial transactions in assets and liabilities
Other material losses written off 6.1 174 -Debts written off 6.2 751 593
Total 925 593
6.1 Other material losses written off
Nature of lossesGovernment Garage and Car rental accidents 174 -
Total 174 -
6.2 Debts written off
Nature of debts written offGovernment Garage and Car rental accidents - 156Other debts 751 437
Total 751 593
7. Transfers and subsidies
Provinces and municipalities Annex 1A 1,074,553 589,139Departmental agencies and accounts Annex 1B 291,814 284,342Public corporations and private enterprises Annex 1C 2,461,447 2,235,756Households Annex 1D 489 1,824Gifts, donations and sponsorships made Annex 1G - -
Total 3,828,303 3,111,061
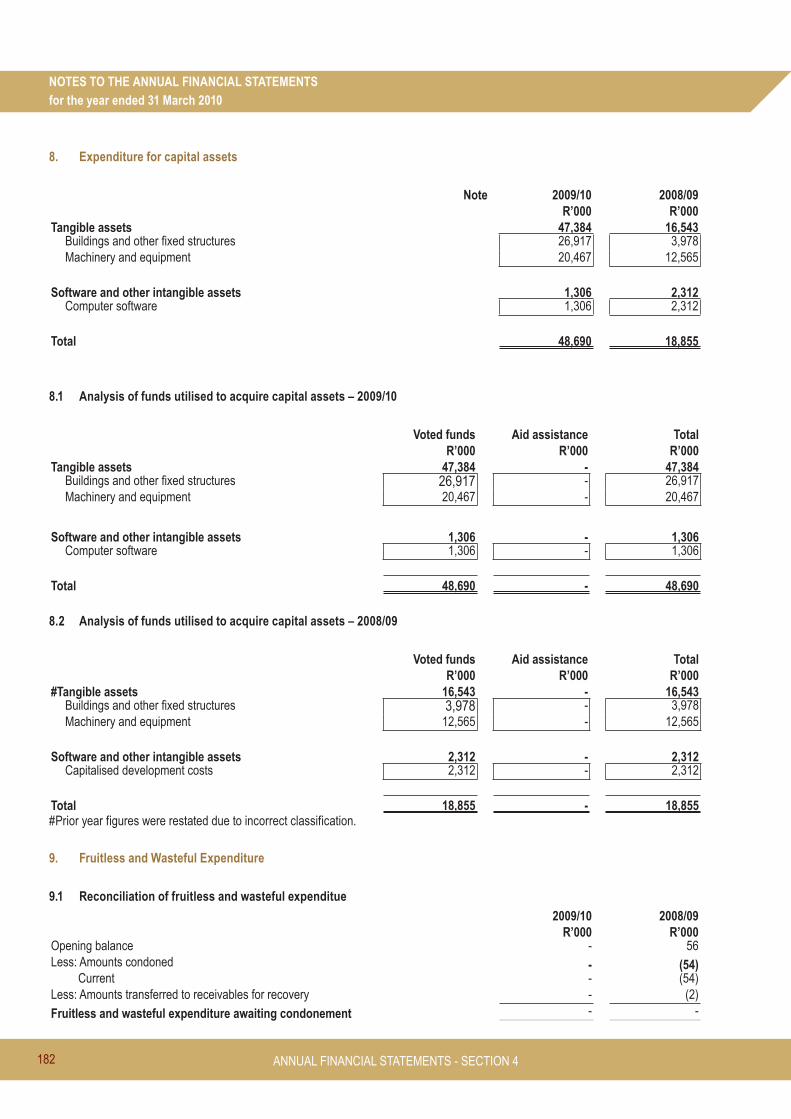
182
NOTES TO THE ANNUAL FINANCIAL STATEMENTSfor the year ended 31 March 2010
8. Expenditure for capital assets
Note 2009/10 2008/09R’000 R’000
Tangible assets 47,384 16,543Buildings and other fixed structures 26,917 3,978Machinery and equipment 20,467 12,565
Software and other intangible assets 1,306 2,312Computer software 1,306 2,312
Total 48,690 18,855
8.1 Analysis of funds utilised to acquire capital assets – 2009/10
Voted funds Aid assistance TotalR’000 R’000 R’000
Tangible assets 47,384 - 47,384Buildings and other fixed structures 26,917 - 26,917Machinery and equipment 20,467 - 20,467
Software and other intangible assets 1,306 - 1,306Computer software 1,306 - 1,306
Total 48,690 - 48,690
8.2 Analysis of funds utilised to acquire capital assets – 2008/09
Voted funds Aid assistance TotalR’000 R’000 R’000
#Tangible assets 16,543 - 16,543Buildings and other fixed structures 3,978 - 3,978Machinery and equipment 12,565 - 12,565
Software and other intangible assets 2,312 - 2,312Capitalised development costs 2,312 - 2,312
Total 18,855 - 18,855#Prior year figures were restated due to incorrect classification.
9. Fruitless and Wasteful Expenditure
9.1 Reconciliation of fruitless and wasteful expenditue
2009/10 2008/09R’000 R’000
Opening balance - 56Less: Amounts condoned - (54) Current - (54)Less: Amounts transferred to receivables for recovery - (2)
Fruitless and wasteful expenditure awaiting condonement - -
ANNUAL FINANCIAL STATEMENTS - SECTION 4
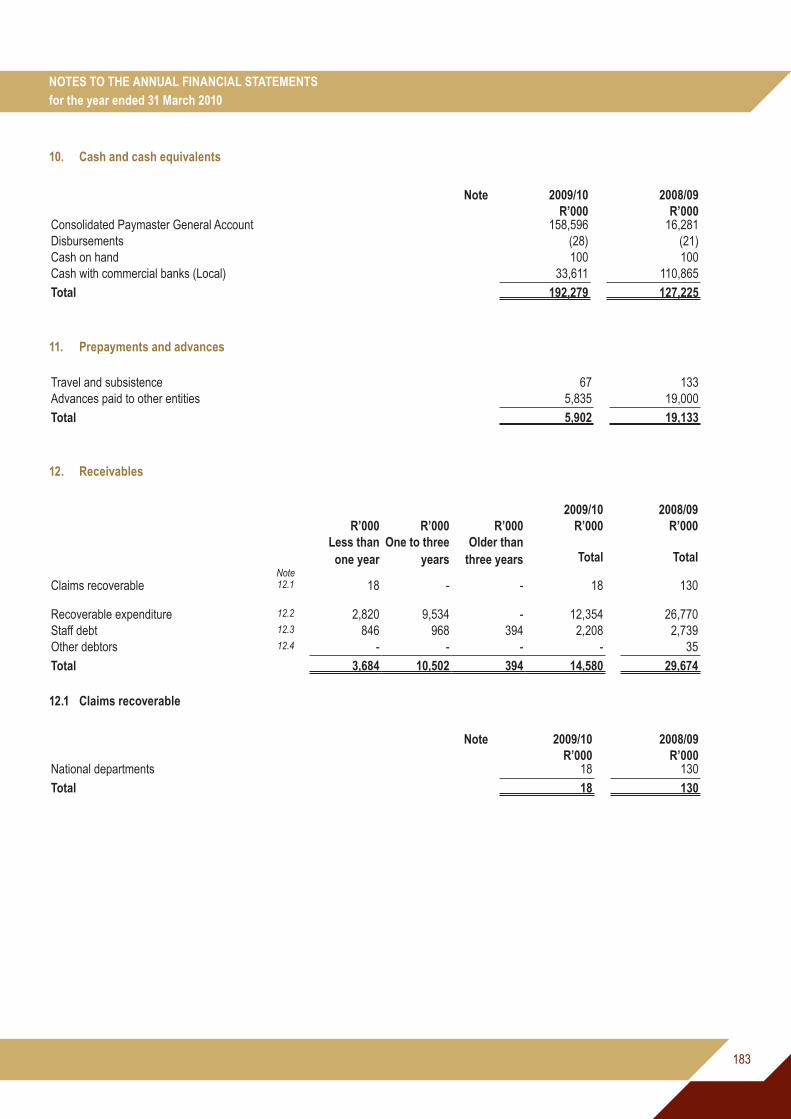
183
NOTES TO THE ANNUAL FINANCIAL STATEMENTSfor the year ended 31 March 2010
10. Cash and cash equivalents
Note 2009/10 2008/09R’000 R’000
Consolidated Paymaster General Account 158,596 16,281Disbursements (28) (21)Cash on hand 100 100Cash with commercial banks (Local) 33,611 110,865
Total 192,279 127,225
11. Prepayments and advances
Travel and subsistence 67 133Advances paid to other entities 5,835 19,000
Total 5,902 19,133
12. Receivables
2009/10 2008/09R’000 R’000 R’000 R’000 R’000
Note
Less than one year
One to three years
Older than three years Total Total
Claims recoverable 12.1 18 - - 18 130
Recoverable expenditure 12.2 2,820 9,534 - 12,354 26,770Staff debt 12.3 846 968 394 2,208 2,739Other debtors 12.4 - - - - 35
Total 3,684 10,502 394 14,580 29,674
12.1 Claims recoverable
Note 2009/10 2008/09R’000 R’000
National departments 18 130
Total 18 130

184
NOTES TO THE ANNUAL FINANCIAL STATEMENTSfor the year ended 31 March 2010
12.2 Recoverable expenditure (disallowance accounts)
Note 2009/10 2008/09R’000 R’000
Disallowance Damages and Losses 7,612 7,765Sal: Recoverable 86 166Sal: Tax Debt 7 4Sal: Income Tax 1,068 981Disallowance Dishonoured Cheques - 2Disallowance Miscellaneous 3,487 17,836Sal: Rent Non Recoverable: CL - 13Sal: Reversal Control:CL 94 3
Total 12,354 26,770
Disallowance damages include fraudulent payments of R7.6 million currently held by the commercial banks. The investigation on this fraud was concluded during the year under review.
12.3 Staff debt
Debtors 2,208 2,739
Total 2,208 2,739
12.4 Other debtors
Mineral Rights Claim Licence - 35
Total - 35
13. Investments
Non-Current Shares and other equity Annex 2B 2,205 2,205
Total 2,205 2,205
Analysis of non current investmentsOpening balance 2,205 2,205
Closing balance 2,205 2,205
14. Loans
The loan to the Portuguese Government towards the Hydro Electrica de Cahora Bassa scheme was written down from R347 million to R1-00 during the 2003/04 financial year. This amount includes capitalised interest of R308 million while the capital amount in respect of the loan was R39 million.
ANNUAL FINANCIAL STATEMENTS - SECTION 4

185
NOTES TO THE ANNUAL FINANCIAL STATEMENTSfor the year ended 31 March 2010
15. Voted funds to be surrendered to the Revenue Fund
Note 2009/10 2008/09R’000 R’000
Opening balance 54,105 27,570Transfer from statement of financial performance 137,288 56,235Voted funds not requested/not received - (2,130)Paid during the year (54,105) (27,570)
Closing balance 137,288 54,105
16. Departmental revenue to be surrendered to the Revenue Fund
Opening balance 115,158 98,599Transfer from Statement of Financial Performance 217,144 264,647Paid during the year (257,958) (248,088)
Closing balance 74,344 115,158
17. Payables – current
Clearing accounts 17.1 4 13
Total 4 13
17.1 Clearing accounts
Salary Pension Funds 4 10Private Telephone - 1Sal: Medical Aid - 2
Total 4 13
18. Net cash flow available from operating activities
Net surplus/(deficit) as per Statement of Financial Performance 348,583 323,152Add back non cash/cash movements not deemed operating activities (235,057) (295,344)(Increase)/decrease in receivables – current 15,094 (17,398)(Increase)/decrease in prepayments and advances 13,231 (18,803)(Increase)/decrease in other current assets - 56Increase/(decrease) in payables – current (9) (266)Expenditure on capital assets 48,690 18,855Surrenders to Revenue Fund (312,063) (275,658)Voted funds not requested/not received - (2,130)
Net cash flow generated by operating activities 113,526 27,808

186
NOTES TO THE ANNUAL FINANCIAL STATEMENTSfor the year ended 31 March 2010
19. Reconciliation of cash and cash equivalents for cash flow purposes
Note 2009/10 2008/09R’000 R’000
Consolidated Paymaster General account 158,596 16,281Disbursements (28) (21)Cash on hand 100 100Cash with commercial banks (Local) 33,611 110,865
Total 192,279 127,225
ANNUAL FINANCIAL STATEMENTS - SECTION 4

187
DISCLOSURE NOTES TO THE ANNUAL FINANCIAL STATEMENTSfor the year ended 31 March 2010
These amounts are not recognised in the Annual Financial Statements and are disclosed to enhance the usefulness of the Annual Financial Statements.
20. Contingent liabilities and contingent assets
20.1 Contingent liabilities
Note 2009/10 2008/09R’000 R’000
Liable to NatureMotor vehicle guarantees Employees Annex 3A 118 329Housing loan guarantees Employees Annex 3A 143 474Other guarantees Annex 3A 38,937 149,618Claims against the department Annex 3B 299,961 100,985Other departments (interdepartmental unconfirmed balances) Annex 5 8,345 2,814Other Annex 3B 19,970 19,580
Total 367,474 273,800
20.1 Potential Liabilities in respect of the environmental rehabilitation comprises of two scenarios: potential liabilities arising from derelict and ownerless mines, where no provision was made by the miner for the rehabilitation of the environment. The responsibility for rehabilitation of these sites reverts to the state. During 2007/8, the department finalised the process of quantifying the State’s potential liability for derelict and ownerless mines. Owing to the fact that it has not been possible to do a detailed assessment of the environmental and safety conditions of all thousands of entries in the database of D&O Mines, and also for the fact that it would not be practical to obtain a detailed cost estimate for rehabilitation of these mines, a number of assumptions had to be made to enable the estimation of the rehabilitation costs. Potential alternatives to rehabilitation such as:
• development of abandoned mines into tourist attractions, • productive non-mining land use on mine sites, • re-issuance of mining permit or rights etc,
were as well not explored and such developments on these mines may change the potential liability by the state and hence the amount of this obligation could not be measured with sufficient reliability. The other scenario relates to potential liabilities arising from the Miner’s inability to restore the environment back to its original state subsequent to mining activities – where provision was made either through a trust fund, bank guarantees or cash guarantees.
It should be noted that the National Strategy for the management and rehabilitation of derelict and ownerless mines in South Africa provides a framework within which the State can implement management measures, including undertaking the rehabilitation of derelict and ownerless mines.
20.2 The department has a potential liability arising from decontamination and decommissioning of past strategic nuclear facilities as per section 1 (xii) (a) of the Nuclear Energy Act, Act No.46 of 1999. In terms of the Cabinet approved Nuclear Liabilities Management Plan, the liability was estimated at R1.8 billion Rands (2004). However this amount cannot be considered a reasonable estimate due to conditions associated with estimated amount. The department has developed a policy procedure for the management of Nuclear Liabilities. In terms of this procedure, the liability must be reassessed every 5 years or earlier if the Minister so requires. During 2009/10, Necsa received R82 million for this purpose.

188
DISCLOSURE NOTES TO THE ANNUAL FINANCIAL STATEMENTSfor the year ended 31 March 2010
21. Contingent Asset
The department has a contingent asset of R5.9 million relating to the payment made for feasibility studies on the land secured for Independent Power Plant project.
22. Commitments
Note 2009/10 2008/09R’000 R’000
Current expenditureApproved and contracted 40,525 77,052
Capital expenditureApproved and contracted 58,477 10,474
Total Commitments 99,002 87,526
The prior year figures were restated with an amount of R10.474 million.
23. Accruals
Listed by economic classification30 Days 30+ Days Total Total
Goods and services 17,932 1,705 19,637 11,818Machinery and equipment 400 - 400
Total 18,332 1,705 20,037 11,818
Note 2009/10 2008/09R’000 R’000
Listed by programme levelAdministration 17,112 6,812Promotion of Mine Safety and Health 1,880 3,015Mineral Regulation 55 25Mineral Policy and Promotion 894 591Hydrocarbons and Energy Planning 59 984Electricity, Nuclear and Clean Energy 37 391
Total 20,037 11,818
Confirmed balances with other departments Annex 5 20,488 1,540
Total 20,488 1,540
24. Employee benefits
Leave entitlement 14,699 11,768Service bonus (Thirteenth cheque) 10,543 8,193Performance awards 5,934 -Capped leave commitments 11,025 10,280
Total 42,201 30,241
An amount of R566 thousand is owed to the department by employees in terms of 477.4 days taken without adequate leave credits.
ANNUAL FINANCIAL STATEMENTS - SECTION 4
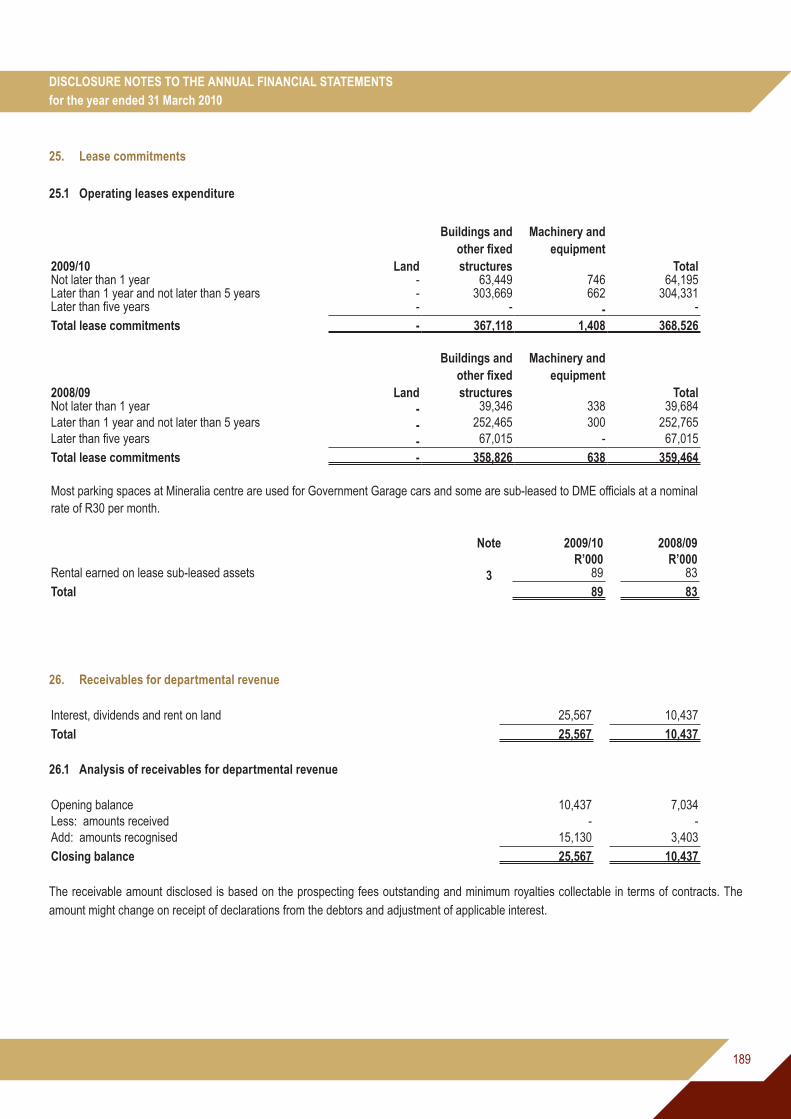
189
DISCLOSURE NOTES TO THE ANNUAL FINANCIAL STATEMENTSfor the year ended 31 March 2010
25. Lease commitments
25.1 Operating leases expenditure
2009/10 Land
Buildings and other fixed structures
Machinery and equipment
TotalNot later than 1 year - 63,449 746 64,195Later than 1 year and not later than 5 years - 303,669 662 304,331Later than five years - - - -
Total lease commitments - 367,118 1,408 368,526
2008/09 Land
Buildings and other fixed structures
Machinery and equipment
TotalNot later than 1 year - 39,346 338 39,684Later than 1 year and not later than 5 years - 252,465 300 252,765Later than five years - 67,015 - 67,015
Total lease commitments - 358,826 638 359,464
Most parking spaces at Mineralia centre are used for Government Garage cars and some are sub-leased to DME officials at a nominal rate of R30 per month.
Note 2009/10 2008/09R’000 R’000
Rental earned on lease sub-leased assets 3 89 83
Total 89 83
26. Receivables for departmental revenue
Interest, dividends and rent on land 25,567 10,437
Total 25,567 10,437
26.1 Analysis of receivables for departmental revenue
Opening balance 10,437 7,034Less: amounts received - -Add: amounts recognised 15,130 3,403
Closing balance 25,567 10,437
The receivable amount disclosed is based on the prospecting fees outstanding and minimum royalties collectable in terms of contracts. The amount might change on receipt of declarations from the debtors and adjustment of applicable interest.

190
DISCLOSURE NOTES TO THE ANNUAL FINANCIAL STATEMENTSfor the year ended 31 March 2010
27. Irregular expenditure
27.1 Reconciliation of irregular expenditure
2009/10 2008/09R’000 R’000
Opening balance - -Add: Irregular expenditure – relating to prior year - -Add: Irregular expenditure – relating to current year 4,203 -Less: Amounts condoned (4, 203) -Less: Amounts recoverable (not condoned) - -Less: Amounts not recoverable (not condoned) - -Irregular expenditure awaiting condonation - -
Analysis of awaiting condonation per age classificationCurrent year - -Prior years - -Total - -
27.2 Details of irregular expenditure – current year
Incident
Non Compliance with Departmental Procedures
Disciplinary steps taken/Criminal proceedings:
Disciplinary Process
2009/10 R’000 4,203
Total 4,203
27.3 Details of irregular expenditure condoned
Incident Condoned by (condoning authority) 2009/10R’000
Non Compliance with Departmental procedures Condoned - No Sanction requiredCondoned – Disciplinary process still in progress
3,366 837
Total 4,203
27.4 Details of irregular expenditure recoverable (not condoned)
Incident 2009/10R’000
-
Total -
27.5 Details of irregular expenditure not recoverable (not condoned)
Incident 2009/10R’000
-
Total -
ANNUAL FINANCIAL STATEMENTS - SECTION 4

191
DISCLOSURE NOTES TO THE ANNUAL FINANCIAL STATEMENTSfor the year ended 31 March 2010
27.6 Details of irregular expenditures under investigation
Incident
2009/10R’000
Condoned but Disciplinary action still in progress 837Total 837
28. Related party transactions
Payments made 2009/10 2008/09R’000 R’000
Goods and services - 40,000Transfers 17,600 18,349Total 17,600 58,349
Entity Nature of Relationship Type of Transactions Elements of TransactionsCouncil for Mineral Technology and Research
An entity under the control of the Minister
Payment for derelict and ownerless mines rehabilitation
Rehabilitation of derelict and ownerless mines
Council for Geoscience An entity under the control of the Minister
Transfers for the implementation of water ingress project – R17,600
Implementation of water ingress project
29. Key management personnel
No. of Individuals 2009/10 2008/09R’000 R’000
Political office bearers (provide detail below)Officials:
Ministers and Director Generals 5 6,038 3,026Level 14 (incl. CFO if at a lower level) 40 27,339 21,712
Total 33,377 24,738
30. Provisions
Potential irrecoverable debtsStaff debtors 394 954Other debtors - 113Interest, Dividends and Rent on land 10,165 6,780
Total 10,559 7,847

192
DISCLOSURE NOTES TO THE ANNUAL FINANCIAL STATEMENTSfor the year ended 31 March 2010
31. Financial Transactions in Assets and Liabilities
Other Losses Written offLaptops - 71Cell phones 57 142
Total 57 213
32. Non-adjusting events after reporting date
In May 2010 assets to the value of R15, 428, 074. 45 were identified and approved for disposal through an auction. These assets are included in the closing balance of assets under note 33. This disposal will be recognised in the asset register and Annual Financial Statements during 2010/11.
33. Movable Tangible Capital Assets
MOVEMENT IN MOVABLE TANGIBLE CAPITAL ASSETS PER ASSET REGISTER FOR THE YEAR ENDED 31 MARCH 2010Opening balance
Curr Year Adjust-ments to prior year balances
Additions Disposals Closing Balance
R’000 R’000 R’000 R’000 R’000
MACHINERY AND EQUIPMENT 32,322 1,342 20,621 1,813 52,472Transport Assets - - 1,990 - 1,990Computer equipment 18,268 664 9,128 1,111 26,949Furniture and office equipment 14,021 678 6,746 702 20,743Other machinery and equipment 33 - 2,757 - 2,790
TOTAL MOVABLE TANGIBLE CAPITAL ASSETS 32,322 1,342 20,621 1,813 52,472
33.1 Additions
ADDITIONS TO MOVABLE TANGIBLE CAPITAL ASSETS PER ASSET REGISTER FOR THE YEAR ENDED 31 MARCH 2010Cash Non-cash (Capital Work in Progress
current costs and finance lease payments)
Received current, not paid(Paid current year, received
prior year)
Total
R’000 R’000 R’000 R’000 R’000
MACHINERY AND EQUIPMENT 20,467 28 - 126 20,621Transport assets 1,990 - - - 1,990Computer equipment 9,025 - - 103 9,128Furniture and office equipment 6,695 28 - 23 6,746Other machinery and equipment 2,757 - - - 2,757
TOTAL ADDITIONS TO MOVABLE TANGIBLE
CAPITAL ASSETS20,467 28 - 126 20,621
ANNUAL FINANCIAL STATEMENTS - SECTION 4

193
DISCLOSURE NOTES TO THE ANNUAL FINANCIAL STATEMENTSfor the year ended 31 March 2010
33.2 Disposals
DISPOSALS OF MOVABLE TANGIBLE CAPITAL ASSETS PER ASSET REGISTER FOR THE YEAR ENDED 31 MARCH 2010Sold for cash Transfer out or
destroyed or scrappedTotal disposals Cash Received
ActualR’000 R’000 R’000 R’000
MACHINERY AND EQUIPMENT - 1,813 1,813 -Computer equipment - 1,111 1,111 -Furniture and office equipment - 702 702 -
TOTAL DISPOSAL OF MOVABLE TANGIBLE CAPITAL ASSETS - 1,813 1,813 -
33.3 Movement for 2008/09
MOVEMENT IN MOVABLE TANGIBLE CAPITAL ASSETS PER ASSET REGISTER FOR THE YEAR ENDED 31 MARCH 2009Opening balance Additions Disposals Closing balance
R’000 R’000 R’000 R’000
MACHINERY AND EQUIPMENT 21,256 11,339 273 32,322Computer equipment 13,459 4,894 85 18,268Furniture and office equipment 7,764 6,445 188 14,021Other machinery and equipment 33 - - 33
TOTAL MOVABLE TANGIBLE ASSETS 21,256 11,339 273 32,322
33.4 Minor assets
MINOR ASSETS OF THE DEPARTMENT AS AT 31 MARCH 2010Intangible assets Heritage assets Machinery and equipment Biological assets Total
R’000 R’000 R’000 R’000 R’000
Minor assets - - 21,621 - 21,621TOTAL - - 21,621 - 21,621
Intangible assets Heritage assets Machinery and equipment Biological assets TotalNumber of minor assets at cost - - 20,459 - 20,459TOTAL NUMBER OF MINOR ASSETS - - 20,459 - 20,459
MINOR ASSETS OF THE DEPARTMENT AS AT 31 MARCH 2009Intangible assets Heritage assets Machinery and equipment Biological assets Total
R’000 R’000 R’000 R’000 R’000
#Minor assets - - 16,661 - 16,661TOTAL - - 16,661 - 16,661
Intangible assets Heritage assets Machinery and equipment Biological assets Total# Number of minor assets - - 17,542 - 17,542TOTAL NUMBER OF MINOR ASSETS - - 17,542 - 17,542
# Prior year figures were adjusted due to reporting guide change in the current financial year for minor assets.

194
DISCLOSURE NOTES TO THE ANNUAL FINANCIAL STATEMENTSfor the year ended 31 March 2010
34 Intangible Capital Assets
MOVEMENT IN INTANGIBLE CAPITAL ASSETS PER ASSET REGISTER FOR THE YEAR ENDED 31 MARCH 2010Opening balance
Current Year Adjustments to prior year balances
Additions Disposals Closing Balance
R’000 R’000 R’000 R’000 R’000
Computer software 5,427 - 1,306 - 6,733Other intangibles 199 - - - 199
TOTAL INTANGIBLE CAPITAL ASSETS 5,626 - 1,306 - 6,932
34.1 Additions
ADDITIONS TO INTANGIBLE CAPITAL ASSETS PER ASSET REGISTER FOR THE YEAR ENDED 31 MARCH 2010Cash Non-Cash (Development
work in progress – current costs)
Received current year, not paid(Paid current year, received prior year)
Total
R’000 R’000 R’000 R’000 R’000
Computer software 1,306 - - - 1,306
TOTAL ADDITIONS TO INTANGIBLE CAPITAL
ASSETS1,306 - - - 1,306
34.2 Movement for 2008/09
MOVEMENT IN INTANGIBLE CAPITAL ASSETS PER ASSET REGISTER FOR THE YEAR ENDED 31 MARCH 2009Opening balance Additions Disposals Closing balance
R’000 R’000 R’000 R’000
Computer software 3,115 2,312 - 5,427Other intangibles 199 - - 199TOTAL INTANGIBLE CAPITAL ASSETS 3,314 2,312 - 5,626
35 IMMOVABLE TANGIBLE CAPITAL ASSETS
MOVEMENT IN IMMOVABLE TANGIBLE CAPITAL ASSETS PER ASSET REGISTER FOR THE YEAR ENDED 31 MARCH 2010Opening balance Additions Disposals Closing balance
R’000 R’000 R’000 R’000
STRUCTURES - 2,829 - 2,829Other Fixed Structure - 2,829 - 2,829LAND AND SUBSOIL ASSETS 228 - - 228Land 228 - - 228TOTAL IMMOVABLE TANGIBLE ASSETS 228 2,829 - 3,057
ANNUAL FINANCIAL STATEMENTS - SECTION 4

195
DISCLOSURE NOTES TO THE ANNUAL FINANCIAL STATEMENTSfor the year ended 31 March 2010
35.1 Additions
ADDITIONS TO IMMOVABLE TANGIBLE CAPITAL ASSETS PER ASSET REGISTER FOR THE YEAR ENDED 31 MARCH 2010Cash Non Cash (Capital work-in progress
current costs and finance lease payments)
Received current, not paid (Paid current year, received
prior year)
Total
R’000 R’000 R’000 R’000 R’000
STRUCTURES 26,917 - (24,088) - 2,829Other Fixed Structure 26,917 - (24,088) - 2,829TOTAL IMMOVABLE TANGIBLE ASSETS 26,917 - (24,088) - 2,829
35.2 Movement for 2008/09
MOVEMENT IN IMMOVABLE TANGIBLE CAPITAL ASSETS PER ASSET REGISTER FOR THE YEAR ENDED 31 MARCH 2009Opening balance Additions Disposals Closing balance
R’000 R’000 R’000 R’000
LAND AND SUBSOIL ASSETS 228 - - 228Land 228 - - 228TOTAL IMMOVABLE TANGIBLE ASSETS 228 - - 228

196
ANN
EXU
RE
1A
STAT
EMEN
T O
F C
ON
DIT
ION
AL G
RAN
TS P
AID
TO
MU
NIC
IPAL
ITIE
S
NA
ME
OF
MU
NIC
IPA
LITY
GR
AN
T A
LLO
CAT
ION
TRA
NSF
ERSP
ENT
2008
/09
Div
isio
n of
Rev
enue
Act
Rol
l Ove
rsA
djus
tmen
tsTo
tal
Avai
labl
e
Act
ual
Tran
sfer
Fund
s
With
held
Re-
allo
catio
ns b
y
Nat
iona
l Tre
asur
y
or N
atio
nal
Dep
artm
ent
Am
ount
rece
ived
by m
unic
ipal
ity
Am
ount
spe
nt
by m
unic
ipal
ity
% o
f av
aila
ble
fund
s sp
ent b
y
mun
icip
ality
Div
isio
n of
Rev
enue
Act
R’0
00R
’000
R’0
00R
’000
R’0
00%
R’0
00R
’000
%R
’000
Aba
qulu
si
9,84
4 -
-9,
844
9
,844
-
-
9,84
4 -
0.0%
8,8
00
Aga
nang
4,
000
- -
4
,000
4,0
00
--
4,
000
-0.
0%
- A
lber
t Lut
huli
12,3
55
- -
12
,355
12,3
55
--
12,
355
1,
086
9.0%
2,00
0 B
avia
ans
- -
-
-
- -
-
-
- 0.
0%
2
,640
B
eauf
ort W
est
32
,836
-
-
32,
836
32,
836
--
32,
836
22,
809
69.0
%
10,0
00
Bel
a-Be
la
2
,300
-
-
2,
300
2
,300
-
-
2,30
0
2
,300
10
0.0%
420
B
itou
1,
688
- -
1,68
8 1
,688
-
- 1
,688
83
3 49
.0%
800
B
loub
erg
10
,194
-
-
10,1
94
10
,194
-
- 10
,194
1,25
8 12
.0%
12,6
12
Bre
ede
Valle
y 6,
000
- -
6,00
0
6,0
00
- -
6
,000
6,00
0 10
0.0%
152
B
uffa
lo C
ity
13
,000
-
-
13,
000
13
,000
-
-
1
3,00
0
3,10
0 24
.0%
32
,712
C
amde
boo
6,
000
- -
6,00
0
6,0
00
- -
6
,000
5,8
00
97.0
%
4,5
00
Ced
erbe
rg
- -
-
-
-
-
-
-
- 0.
0%
5
,752
C
ity o
f Cap
e To
wn
10,
000
- -
10
,000
10,0
00
- -
10,
000
- 0.
0% 2
6,20
0 C
ity o
f Joh
anne
sbur
g
48,2
50
- -
4
8,25
0
4
8,25
0 -
-
4
8,25
0
4
4,83
7 93
.0%
50
,000
C
ity o
f Mat
losa
na
6,80
0 -
-
6
,800
6,
800
- -
6
,800
2,7
11
40.0
%
2,4
00
City
of T
shw
ane
22
,778
-
-
22,
778
22
,778
-
- 2
2,77
8 1
6,65
5 73
.0%
60,
500
Del
mas
2
,260
-
-2,
260
2,2
60
- -
2
,260
2,2
60
100.
0%
200
D
ihla
beng
-
- -
- -
- -
- -
0.0%
3,00
0 D
ikga
tlong
95
2 -
- 95
2
952
-
-
952
47
8 50
.0%
- D
rake
inst
ein
3
,550
-
-
3,55
0 3,
550
- -
3
,550
3
,550
10
0.0%
800
E
kurh
ulen
i
- -
-
-
-
- -
-
-
0.0%
8,9
62
Elia
s M
otso
aled
i 3,
200
- -
3,2
00
1
,742
1,
458
-
1
,742
-
0.0%
- E
lund
ini
5,
000
- -
5,
000
5
,000
-
-
5,0
00
1
,250
25
.0%
5,0
00
Em
alah
leni
3,
924
- -
3,9
24
3
,924
-
-
3,9
24
3
,924
10
0.0%
- E
mfu
leni
-
-
-
-
-
- -
-
- 0.
0% 1
,000
E
mna
mbe
thi-L
adys
mith
- -
-
-
- -
-
-
- 0.
0%
1,65
6 E
mth
anje
ni
708
-
-
708
7
08
- -
708
708
10
0.0%
- E
ngco
bo
65,0
00
- -
65,0
00
65,
000
- -
65,
000
40,
000
62.0
%
-
eTh
ekw
ini
47,8
00
- -
47,8
00
47,
800
- -
4
7,80
0
4
7,80
0 10
0.0%
74
,160
G
arie
p 10
,000
-
- 1
0,00
0 10
,000
-
-
1
0,00
0
2,8
00
28.0
%
8
64
Ga-
sego
nyan
a
2
30
- -
230
2
30
- -
230
-
0.
0%
- G
eorg
e 3,
172
- -
3,17
2
3,1
72
- -
3,
172
1
,760
55
.0%
216
G
ovan
Mbe
ki
2
,492
-
- 2,
492
2,49
2 -
-
2,49
2
7
55
30.0
%
5,88
8 G
reat
Kei
-
- -
- -
- -
- -
0.0%
5,0
00
Gre
ater
Giy
ani
7
,150
-
- 7
,150
7,1
50
- -
7
,150
4
,413
62
.0%
- G
reat
er K
okst
ad
10,
596
- -
1
0,59
6
10,5
96
--
10,5
96
10,5
96
100.
0%
-
Gre
ater
Let
aba
4
,453
-
- 4,
453
4
,453
-
-
4,4
53
- 0.
0%
-
Gre
ater
Tub
atse
1
1,72
6 -
- 1
1,72
6 11
,726
-
-
11
,726
-
0.0%
-
ANNUAL FINANCIAL STATEMENTS - SECTION 4
ANNEXURE TO THE ANNUAL FINANCIAL STATEMENTS for the year ended 31 march 2010
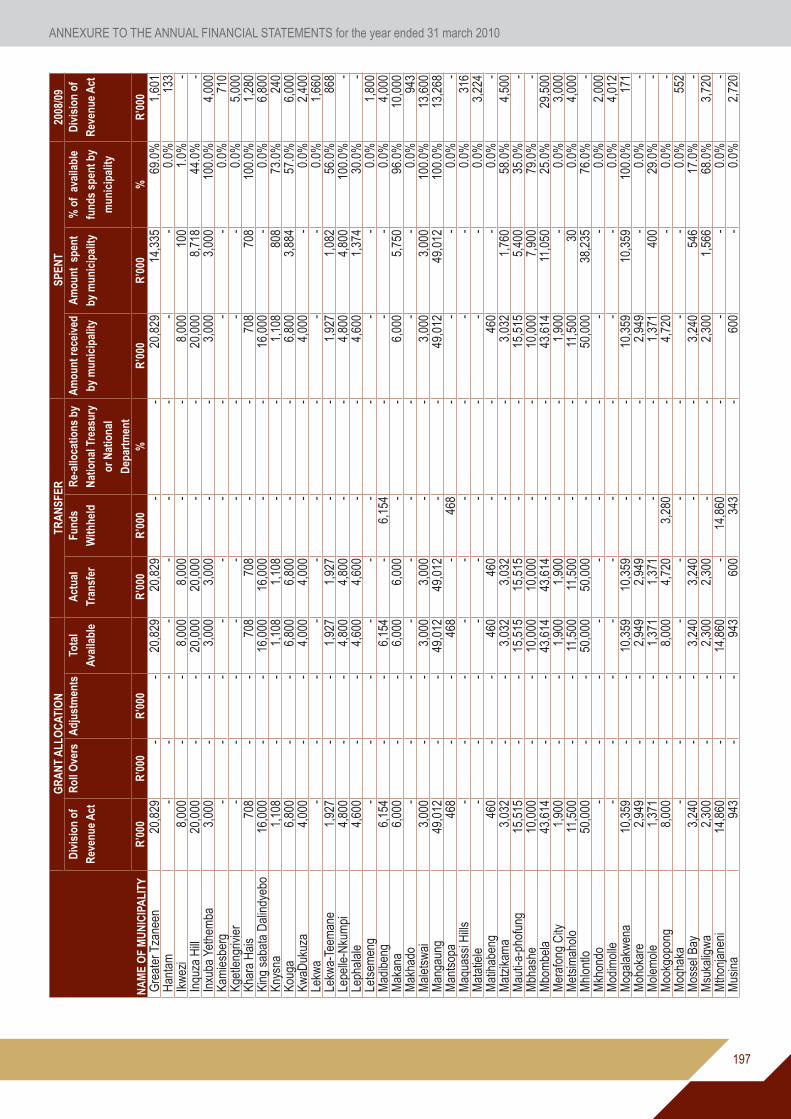
197
NA
ME
OF
MU
NIC
IPA
LITY
GR
AN
T A
LLO
CAT
ION
TRA
NSF
ERSP
ENT
2008
/09
Div
isio
n of
Rev
enue
Act
Rol
l Ove
rsA
djus
tmen
tsTo
tal
Avai
labl
e
Act
ual
Tran
sfer
Fund
s
With
held
Re-
allo
catio
ns b
y
Nat
iona
l Tre
asur
y
or N
atio
nal
Dep
artm
ent
Am
ount
rece
ived
by m
unic
ipal
ity
Am
ount
spe
nt
by m
unic
ipal
ity
% o
f av
aila
ble
fund
s sp
ent b
y
mun
icip
ality
Div
isio
n of
Rev
enue
Act
R’0
00R
’000
R’0
00R
’000
R’0
00%
R’0
00R
’000
%R
’000
Gre
ater
Tza
neen
20
,829
-
- 20
,829
20
,829
-
-
20,
829
14,
335
69.0
%
1,6
01
Han
tam
-
- -
--
--
--
0.0%
133
Ik
wez
i
8,0
00
- -
8
,000
8
,000
-
-
8,0
00
100
1.0%
- In
quza
Hill
20
,000
-
-
20,0
00
20
,000
-
- 2
0,00
0
8
,718
44
.0%
- In
xuba
Yet
hem
ba
3,00
0 -
-
3
,000
3,
000
--
3
,000
3,0
00
100.
0%
4,0
00
Kam
iesb
erg
- -
--
--
--
-0.
0%71
0 K
getle
ngriv
ier
--
- -
--
--
-0.
0%5,
000
Kha
ra H
ais
708
-
- 70
870
8-
-70
870
810
0.0%
1,28
0 K
ing
saba
ta D
alin
dyeb
o
16,
000
- -
1
6,00
0
1
6,00
0 -
-
16,
000
-0.
0%
6,
800
Kny
sna
1
,108
-
-
1,
108
1
,108
-
-
1,
108
80
8 73
.0%
240
K
ouga
6,
800
- -
6
,800
6
,800
-
-
6,80
0
3,8
84
57.0
%
6,0
00
Kw
aDuk
uza
4
,000
-
-
4,0
00
4
,000
-
-
4,0
00
- 0.
0%
2,4
00
Lek
wa
-
-
- -
--
--
-0.
0%
1,6
60
Lek
wa-
Teem
ane
1,
927
- -
1,92
7 1,
927
- -
1,
927
1
,082
56
.0%
868
L
epel
le-N
kum
pi
4
,800
-
-
4,8
00
4
,800
-
-4,
800
4
,800
10
0.0%
-
Lep
hala
le
4
,600
-
-
4,
600
4
,600
-
-
4
,600
1,3
74
30.0
%-
Let
sem
eng
- -
- -
--
--
-0.
0% 1
,800
M
adib
eng
6
,154
-
-
6,
154
-
6,
154
--
-0.
0%
4,0
00
Mak
ana
6
,000
-
-
6,
000
6
,000
-
-
6,0
00
5,7
50
96.0
%
10,0
00
Mak
hado
-
- -
-
-
- -
- -
0.0%
943
M
alet
swai
3,0
00
- -
3,00
0 3,
000
- -
3,00
0
3
,000
10
0.0%
13
,600
M
anga
ung
49
,012
-
-
49,0
12
49,0
12
- -
49,
012
49,0
12
100.
0%
13,2
68
Man
tsop
a
4
68
- -
4
68
-
46
8 -
- -
0.0%
- M
aqua
ssi H
ills
- -
-
-
- -
- -
-0.
0%
3
16
Mat
atie
le
- -
-
-
- -
- -
-0.
0%
3,2
24
Mat
ihab
eng
460
-
- 46
0 4
60
--
460
-0.
0%-
Mat
zika
ma
3,03
2 -
-
3,0
32
3
,032
-
-
3,03
2
1
,760
58
.0%
4
,500
M
auti-
a-ph
ofun
g 1
5,51
5 -
-
15,5
15
15,
515
- -
15
,515
5,
400
35.0
%-
Mbh
ashe
10,0
00
- -
1
0,00
0
10,0
00
- -
1
0,00
0
7
,900
79
.0%
- M
bom
bela
43
,614
-
-
43,6
14
43
,614
-
-
43
,614
11,0
50
25.0
% 2
9,50
0 M
eraf
ong
City
1,9
00
- -
1,90
0
1,9
00
--
1
,900
-
0.0%
3
,000
M
etsi
mah
olo
11
,500
-
-
11,5
00
11
,500
-
- 1
1,50
0
30
0.0%
4
,000
M
hlon
tlo
50
,000
-
-
50,0
00
50
,000
-
-
50
,000
38,
235
76.0
%-
Mkh
ondo
-
- -
--
--
--
0.0%
2
,000
M
odim
olle
-
- -
--
--
--
0.0%
4
,012
M
ogal
akw
ena
10,
359
- -
1
0,35
9 10
,359
-
-
10,3
59
10,3
59
100.
0%
1
71
Moh
okar
e
2,9
49
- -
2,94
9
2,9
49
- -
2
,949
- 0.
0%
-
Mol
emol
e
1,37
1 -
-
1,
371
1
,371
-
-
1,
371
400
29.0
%
-
Moo
kgop
ong
8
,000
-
-
8,
000
4
,720
3,2
80
-
4,
720
-
0.
0%
-
Moq
haka
- -
-
-
-
- -
-
-
0.0%
5
52
Mos
sel B
ay
3
,240
-
-
3,
240
3,2
40
- -
3,2
40
546
17.0
%
-
Msu
kalig
wa
2
,300
-
-
2,
300
2,3
00
- -
2,3
00
1
,566
68
.0%
3
,720
M
thon
jane
ni14
,860
- -
14,8
60-
14,8
60-
--
0.0%
- M
usin
a
94
3 -
-
94
3
60
0
34
3 -
6
00
- 0.
0%
2,7
20
ANNEXURE TO THE ANNUAL FINANCIAL STATEMENTS for the year ended 31 march 2010

198
NA
ME
OF
MU
NIC
IPA
LITY
GR
AN
T A
LLO
CAT
ION
TRA
NSF
ERSP
ENT
2008
/09
Div
isio
n of
Rev
enue
Act
Rol
l Ove
rsA
djus
tmen
tsTo
tal
Avai
labl
e
Act
ual
Tran
sfer
Fund
s
With
held
Re-
allo
catio
ns b
y
Nat
iona
l Tre
asur
y
or N
atio
nal
Dep
artm
ent
Am
ount
rece
ived
by m
unic
ipal
ity
Am
ount
spe
nt
by m
unic
ipal
ity
% o
f av
aila
ble
fund
s sp
ent b
y
mun
icip
ality
Div
isio
n of
Rev
enue
Act
R’0
00R
’000
R’0
00R
’000
R’0
00%
R’0
00R
’000
%R
’000
Nal
a
- -
-
-
- -
-
-
- 0.
0%
2
,000
N
aled
i
1,82
0 -
-
1,8
20
1,
820
--
1,8
20
1
,820
10
0.0%
- N
aled
i 10
,000
-
- 1
0,00
0 10
,000
-
-
10
,000
3,8
65
39.0
%
-
Nam
a Kh
oi
20
,130
-
-
20,
130
20,
130
--
20,
130
9
,081
45
.0%
-
N
dlam
be
5
,000
-
-
5,0
00
5
,000
-
-
5,0
00
4
,715
94
.0%
10
,000
N
elso
n M
ande
la
-
- -
-
-
- -
--
0.0%
30
,790
N
gwat
he
6
,370
-
-
6,3
70
6
,370
-
-
6,3
70
2,14
5 34
.0%
- N
kom
azi
13
,449
-
-
13,4
49
13
,449
-
- 1
3,44
9
13,
449
100.
0%-
Nok
eng
tsa
Taem
ane
11
,552
-
-11
,552
4,7
12
6,84
0 -
4
,712
-
0.0%
8
,385
N
quth
u -
- -
-
-
--
- -
0.0%
280
N
tam
bana
na
17
,800
-
-
17,
800
17
,800
-
-
17,
800
17,
800
100.
0%-
Oud
thoo
rn
2
,600
-
-
2,6
00
2,
600
--
2,
600
-0.
0%-
Ove
rstra
nd
1
,921
-
-
1,9
21
1
,921
-
-
1,9
21
-0.
0%-
Pho
kwan
e
2,44
3 -
-
2,
443
2
,443
-
-
2,4
43
-0.
0%-
Phu
mel
ela
270
-
-
2
70
270
-
-
270
2
70
100.
0%
1,2
00
Pol
okw
ane
37
,607
-
- 37
,607
37,6
07
- -
37,
607
31,6
18
84.0
%
26,4
88
Rus
tenb
urg
31
,340
-
-
31,
340
31,
340
- -
3
1,34
0 -
0.0%
24
,000
S
alda
nha
Bay
2
,000
-
-
2,
000
2
,000
-
-
2,00
0 -
0.0%
- S
akhi
sizw
e
-
- -
-
-
--
-
-
0.0%
3
,000
S
iyan
cum
a 1
,212
-
-
1,
212
1,2
12
--
1,2
12
992
82.0
%-
Ste
llenb
osch
2,0
00
- -
2,00
0
2,0
00
- -
2,0
00
- 0.
0%-
Ste
ve T
shw
ete
7
,624
-
-
7,
624
7
,624
-
-
7,62
4
5,6
80
75.0
%
3,0
92
Sw
artla
nd
- -
-
-
-
-
-
-
-0.
0%
2
,500
S
wlle
ndam
600
-
-
6
00
600
-
-
600
9
6 16
.0%
- T
haba
zim
bi
1
,000
-
-
1,0
00
1
,000
-
-
1
,000
-
0.0%
2
,650
T
heew
ater
sklo
of
2,3
37
- -
2,33
7
2,3
37
-
-
2,3
37
2,
633
113.
0%-
The
mbi
sile
1,4
58
- -
1,4
58
1
,458
-
-
1
,458
988
68
.0%
- T
hula
mel
a
7,2
30
- -
7,23
0
7,2
30
-
-
7,2
30
-0.
0%
4,6
00
Tlo
kwe
1
,000
-
-
1,
000
1
,000
-
-
1
,000
-
0.0%
10
,000
T
okol
ogo
92
-
-
92
9
2 -
-
9
2
32
35.0
%
-
Tso
lwan
a
7,5
00
--
7,50
0
7,5
00
-
-
7,50
0
1,00
0 13
.0%
- U
bunt
u
2,0
12
- -
2,01
2
2,0
12
-
-
2,0
12
1,7
18
85.0
%-
Ulu
ndi
5
,014
-
-
5,0
14
5
,014
-
-
5,0
14
4,7
19
94.0
%-
Um
hlat
huze
3,9
50
- -
3,95
0
3,9
50
-
-
3,9
50
-
0.
0%
1,2
00
Um
jindi
8,9
60
- -
8,96
0
8,9
60
-
-
8,9
60
3,5
93
40.0
%
6,0
00
Um
ngen
i
9,4
39
- -
9,43
9
9,4
39
-
-
9,4
39
2,
307
24.0
%-
Um
sobo
mvu
2
80
- -
28
0
2
80
-
-
280
-
0.0%
- U
mts
hezi
-
- -
--
--
--
0.0%
1
,200
ANN
EXU
RE
1A (C
ON
TIN
UED
)
STAT
EMEN
T O
F C
ON
DIT
ION
AL G
RAN
TS P
AID
TO
MU
NIC
IPAL
ITIE
S
ANNUAL FINANCIAL STATEMENTS - SECTION 4
ANNEXURE TO THE ANNUAL FINANCIAL STATEMENTS for the year ended 31 march 2010
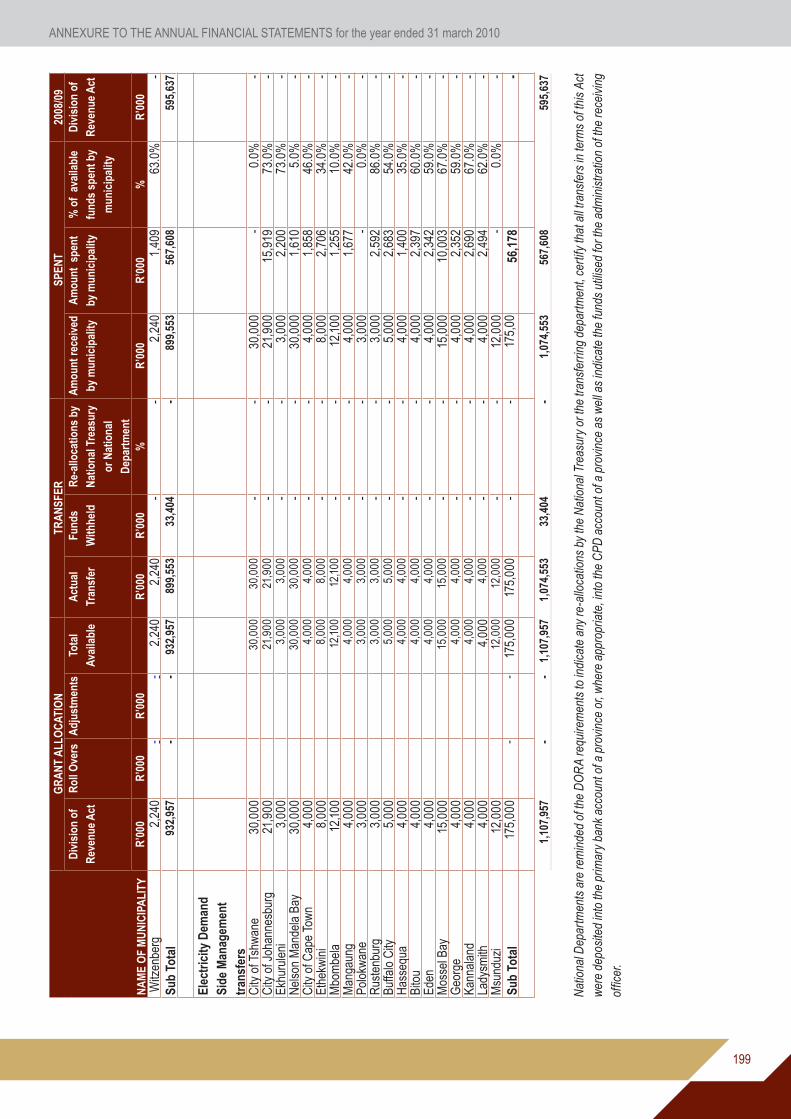
199
NA
ME
OF
MU
NIC
IPA
LITY
GR
AN
T A
LLO
CAT
ION
TRA
NSF
ERSP
ENT
2008
/09
Div
isio
n of
Rev
enue
Act
Rol
l Ove
rsA
djus
tmen
tsTo
tal
Avai
labl
e
Act
ual
Tran
sfer
Fund
s
With
held
Re-
allo
catio
ns b
y
Nat
iona
l Tre
asur
y
or N
atio
nal
Dep
artm
ent
Am
ount
rece
ived
by m
unic
ipal
ity
Am
ount
spe
nt
by m
unic
ipal
ity
% o
f av
aila
ble
fund
s sp
ent b
y
mun
icip
ality
Div
isio
n of
Rev
enue
Act
R’0
00R
’000
R’0
00R
’000
R’0
00%
R’0
00R
’000
%R
’000
Witz
enbe
rg
2,2
40
--
2,24
0
2,2
40
--
2,24
0
1,
409
63.0
%-
Sub
Tota
l 93
2,95
7-
-93
2,95
789
9,55
333
,404
-89
9,55
356
7,60
859
5,63
7
Elec
tric
ity D
eman
d Si
de M
anag
emen
t tr
ansf
ers
City
of T
shw
ane
30,0
0030
,000
30,0
00-
-30
,000
-0.
0%-
City
of J
ohan
nesb
urg
21,9
0021
,900
21,9
00-
-21
,900
15,9
1973
.0%
-Ek
huru
leni
3,00
03,
000
3,00
0-
-3,
000
2,20
073
.0%
-N
elso
n M
ande
la B
ay30
,000
30,0
0030
,000
--
30,0
001,
610
5.0%
-C
ity o
f Cap
e To
wn
4,00
04,
000
4,00
0-
-4,
000
1,85
846
.0%
-Et
hekw
ini
8,00
08,
000
8,00
0-
-8,
000
2,70
634
.0%
-M
bom
bela
12,1
0012
,100
12,1
00-
-12
,100
1,25
510
.0%
-M
anga
ung
4,00
04,
000
4,00
0-
-4,
000
1,67
742
.0%
-Po
lokw
ane
3,00
03,
000
3,00
0-
-3,
000
-0.
0%-
Rus
tenb
urg
3,00
03,
000
3,00
0-
-3,
000
2,59
286
.0%
-Bu
ffalo
City
5,00
05,
000
5,00
0-
-5,
000
2,68
354
.0%
-H
asse
qua
4,00
04,
000
4,00
0-
-4,
000
1,40
035
.0%
-Bi
tou
4,00
04,
000
4,00
0-
-4,
000
2,39
760
.0%
-Ed
en4,
000
4,00
04,
000
--
4,00
02,
342
59.0
%-
Mos
sel B
ay15
,000
15,0
0015
,000
--
15,0
0010
,003
67.0
%-
Geo
rge
4,00
04,
000
4,00
0-
-4,
000
2,35
259
.0%
-Ka
nnal
and
4,00
04,
000
4,00
0-
-4,
000
2,69
067
.0%
-La
dysm
ith4,
000
4,00
04,
000
--
4,00
02,
494
62.0
%-
Msu
nduz
i12
,000
12,0
0012
,000
--
12,0
00-
0.0%
-Su
b To
tal
175,
000
--
175,
000
175,
000
--
175,
0056
,178
-
1,10
7,95
7-
-1,
107,
957
1,07
4,55
333
,404
-1,
074,
553
567,
608
595,
637
National�D
epartments�are�reminded�of�the�DORA�requirements�to�indicate�any�re
-allocations�by�the�National�Treasury�or�the�tra
nsferring�departm
ent,�certify�that�all�tra
nsfers�in�term
s�of�this�Act�
were�deposited�into�the�primary�bank�account�of�a�province�or,�w
here�appropriate,�into�the�CPD
�account�of�a�province�as�well�as�indicate�the�funds�utilised�for�the�adm
inistra
tion�of�the�receiving�
officer.
ANNEXURE TO THE ANNUAL FINANCIAL STATEMENTS for the year ended 31 march 2010

200
AN
NEX
UR
E 1B
STAT
EMEN
T O
F TR
ANSF
ERS
TO D
EPAR
TMEN
TAL
AGEN
CIE
S AN
D A
CC
OU
NTS
DEP
AR
TMEN
T/ A
GEN
CY/
AC
CO
UN
T
TRA
NSF
ER A
LLO
CAT
ION
TRA
NSF
ER20
08/0
9A
djus
ted
App
ropr
iatio
n
Rol
l Ove
rsA
djus
tmen
tsTo
tal A
vaila
ble
Act
ual T
rans
fer
% o
f Ava
ilabl
e
fund
s Tr
ansf
erre
d
App
ropr
iatio
n A
ct
R’0
00R
’000
R’0
00R
’000
R’0
00%
R’0
00
Cou
ncil
For G
eosc
ienc
e15
0,27
7-
-15
0,27
715
0,27
710
0.0%
139,
850
Nat
iona
l Nuc
lear
Reg
ulat
or23
,793
--
23,7
9323
,793
100.
0%20
,333
Elec
trici
ty D
istri
butio
n In
dust
ry72
,214
--
72,2
1472
,214
100.
0%79
,250
Min
e H
ealth
and
Saf
ety
Cou
ncil
5,11
8-
-5,
118
5,11
810
0.0%
4,90
9So
uth
Afric
an D
iam
ond
and
Prec
ious
Met
als
Reg
ulat
or39
,414
--
39,4
1439
,412
100.
0%40
,000
Stat
e D
iam
ond
Trad
er1,
000
--
1,00
01,
000
100.
0%-
291,
812
--
291,
816
291,
814
284,
342
ANNUAL FINANCIAL STATEMENTS - SECTION 4
ANNEXURE TO THE ANNUAL FINANCIAL STATEMENTS for the year ended 31 march 2010

201
AN
NEX
UR
E 1C
STAT
EMEN
T O
F TR
ANSF
ERS/
SUBS
IDIE
S TO
PU
BLIC
CO
RPO
RAT
ION
S AN
D P
RIV
ATE
ENTE
RPR
ISES
NA
ME
OF
PUB
LIC
C
OR
POR
ATIO
N/P
RIV
ATE
ENTE
RPR
ISE
TRA
NSF
ER A
LLO
CAT
ION
EXPE
ND
ITU
RE
2008
/09
Adj
uste
d
App
ropr
iatio
n A
ct
Rol
l Ove
rsA
djus
tmen
tsTo
tal A
vaila
ble
Act
ual T
rans
fer
% o
f Ava
ilabl
e
fund
s Tr
ansf
erre
d
Cap
ital
Cur
rent
App
ropr
iatio
n
Act
R’0
00R
’000
R’0
00R
’000
R’0
00%
R’0
00R
’000
R’0
00Pu
blic
Cor
pora
tions
Tran
sfer
sEs
kom
1,61
6,31
5-
-1,
616,
315
1,61
6,31
510
0.0%
1616
,315
-1,
420,
758
Sout
h Af
rican
Nuc
lear
Ene
rgy
Cor
pora
tion
564,
144
--
564,
144
564,
144
100.
0%12
,833
551,
311
554,
726
Cou
ncil
for M
iner
al T
echn
olog
y16
1,10
8-
-16
1,10
816
1,10
810
0.0%
22,7
8513
8,32
313
5,83
4In
dust
rial D
evel
opm
ent C
orpo
ratio
n of
Sou
th A
frica
25
,058
--
25,0
5825
,058
100.
0%-
25,0
5824
,033
Tota
l2,
366,
625
--
2,36
6,62
52,
366,
625
1,65
1,93
371
4,69
22,
135,
351
Priv
ate
Ente
rpris
esTr
ansf
ers
Esko
m (E
nerg
y En
viro
nmen
t and
Effi
cien
cy)
74,4
75-
-74
,475
74,4
7510
0.0%
-74
,475
78,0
23G
irl G
uide
Mov
emen
t-
--
--
0.0%
--
-So
lar V
isio
n (P
ty) L
td1,
290
--
-1,
290
100.
0%1,
290
-2,
115
Nuo
n R
aps
Util
ity (P
ty) L
td-
--
--
0.0%
00
2,35
4Kw
azul
u N
atal
Ser
vice
s (P
ty) L
td-
--
--
0.0%
--
1,50
8
Subs
idie
sEa
st R
and
Prop
rieta
ry M
ines
--
--
-0.
0%-
-12
,000
Gro
otvl
ei P
ropr
ieta
ry M
ines
21,0
00-
-21
,000
13,5
0064
.0%
-13
,500
12,0
00Be
tlehe
m H
ydro
310
--
310
310
100.
0%-
310
1,72
7R
enew
able
Hyd
ro (P
ty) L
td-
--
--
0.0%
--
225
Dar
ling
Win
d Po
wer
(Pty
) Ltd
--
--
-0.
0%-
-2,
600
Ethe
kwin
i Mun
icip
ality
5,24
7-
-5,
247
5,24
710
0.0%
-5,
247
753
Tota
l10
2,32
2-
-10
2,32
294
,822
1,29
093
,532
113,
305
TOTA
L2,
468,
947
--
2,46
8,94
72,
461,
447
1,65
3,22
380
8,22
42,
248,
656
ANNEXURE TO THE ANNUAL FINANCIAL STATEMENTS for the year ended 31 march 2010

202
ANN
EXU
RE
1D
STAT
EMEN
T O
F TR
ANSF
ERS
TO H
OU
SEH
OLD
S
HO
USE
HO
LDS
TRA
NSF
ER A
LLO
CAT
ION
EXPE
ND
ITU
RE
2008
/09
Adj
uste
d A
ppro
pria
tion
Act
Rol
l Ove
rsA
djus
tmen
tsTo
tal A
vaila
ble
Act
ual T
rans
fer
% o
f Ava
ilabl
e fu
nds
Tran
sfer
red
App
ropr
iatio
n A
ct
R’0
00R
’000
R’0
00R
’000
R’0
00%
R’0
00Tr
ansf
ers
H/H
: Em
ploy
ee B
enef
its1,
284
-(4
58)
826
483
58.0
%1,
223
H/H
: Cla
ims
agai
nst t
he s
tate
--
--
6-
-H
/H: A
ct o
f gra
ce h
ouse
hold
s-
--
--
--
H/H
: Don
atio
ns &
Gift
s-
--
--
--
Tota
l1,
284
-(4
58)
826
489
1,22
3
ANNUAL FINANCIAL STATEMENTS - SECTION 4
ANNEXURE TO THE ANNUAL FINANCIAL STATEMENTS for the year ended 31 march 2010
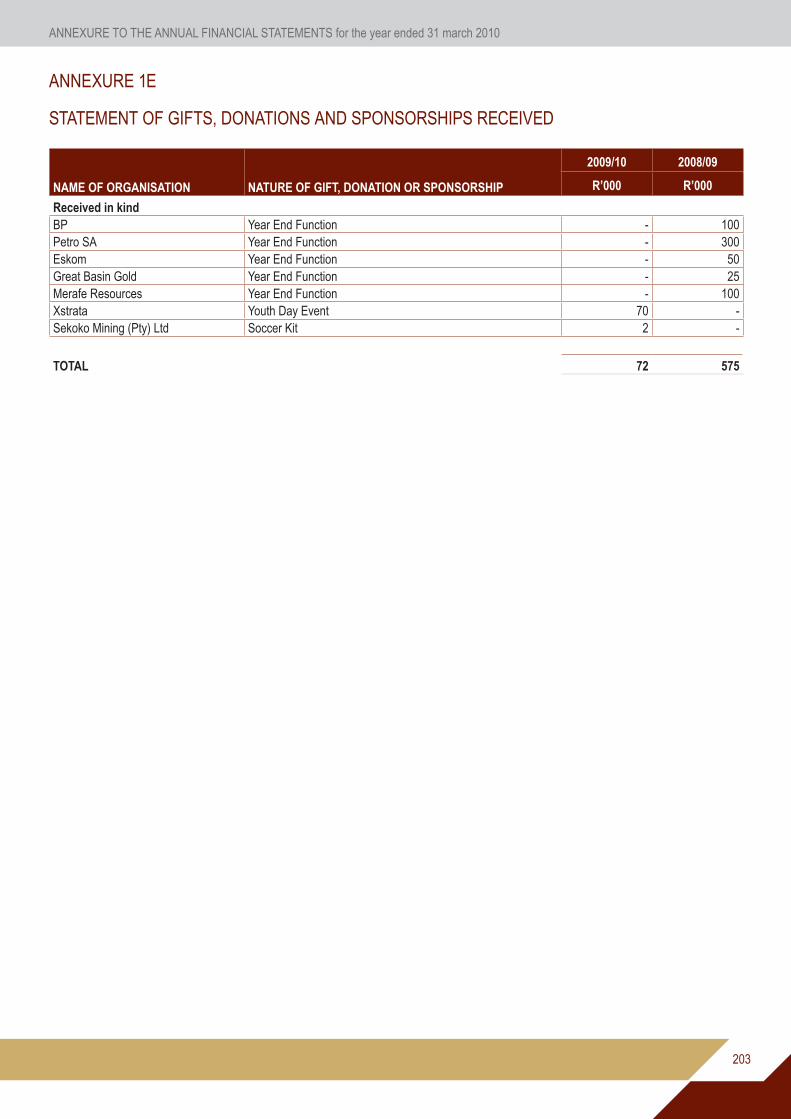
203
ANNEXURE 1E
STATEMENT OF GIFTS, DONATIONS AND SPONSORSHIPS RECEIVED
NAME OF ORGANISATION NATURE OF GIFT, DONATION OR SPONSORSHIP
2009/10 2008/09
R’000 R’000
Received in kindBP Year End Function - 100Petro SA Year End Function - 300Eskom Year End Function - 50Great Basin Gold Year End Function - 25Merafe Resources Year End Function - 100Xstrata Youth Day Event 70 -Sekoko Mining (Pty) Ltd Soccer Kit 2 -
TOTAL 72 575
ANNEXURE TO THE ANNUAL FINANCIAL STATEMENTS for the year ended 31 march 2010

204
ANNEXURE 1F
STATEMENT OF AID ASSISTANCE RECEIVED
NAME OF DONOR PURPOSE OPENING CLOSING
BALANCE REVENUE EXPENDITURE BALANCE
R’000 R’000 R’000 R’000
Received in cash Danish Government Designated National Authority 308 - 4 304
Danish Government Cabaree (REFSO) Support 73 - - 73
Norwegian Government Electricity Sector Policy Capacity 104 - 104 -
Norwegian Government Petroleum Sector Policy Capacity 5,427 - 5,741 (314)
TOTAL 5,912 - 5,849 63
ANNUAL FINANCIAL STATEMENTS - SECTION 4
ANNEXURE TO THE ANNUAL FINANCIAL STATEMENTS for the year ended 31 march 2010

205
ANNEXURE 1G
STATEMENT OF GIFTS, DONATIONS AND SPONSORSHIPS MADE AND REMMISSIONS, REFUNDS AND PAYMENTS MADE AS AN ACT OF GRACE
NATURE OF GIFT, DONATION OR SPONSORSHIP
2009/10 2008/09
R’000 R’000
Paid in cashDonation made to Mrs M Mashinini - 100Donation made to Medical Research Council - 385
Subtotal - 485
Made in kind
Donations made to Imbasa Primary School4 Printers and 1 Typewriter - 4
Donations made to Nkojane Combined School20 Chairs - 925 Filing cabinets - 219 Desks - 24Donation: Venues and Facilities for Mr Rocha Farewell 11 -
Donations made to institutions under the auspices of the Department of Education (Western Cape, North West and Free State)Furniture and Office Equipment 1,039
Donations made to Unemployed Against Poverty Organization in Mbizana (Computers) 2
Subtotal 1,052 58
Remissions, refunds, and payments made as an act of gracePayments made as an act of grace to households 25 100Payments made as an act of grace 51
Subtotal 76 100
TOTAL 1,128 643
ANNEXURE TO THE ANNUAL FINANCIAL STATEMENTS for the year ended 31 march 2010

206
AN
NEX
UR
E 2A
STAT
EMEN
T O
F IN
VEST
MEN
TS IN
AN
D A
MO
UN
TS O
WIN
G B
Y/TO
NAT
ION
AL/P
RO
VIN
CIA
L PU
BLIC
EN
TITI
ES
Nam
e of
Pub
lic E
ntity
Stat
e En
tity’
s PF
MA
Sche
dule
type
(sta
te
year
end
if n
ot 3
1 M
arch
)%
Hel
d
09/1
0
N
umbe
r of s
hare
s he
ldC
ost o
f inv
estm
ent
Net
Ass
et v
alue
of
inve
stm
ent
Prof
it/(L
oss)
for t
he
year
Loss
es
guar
ante
ed
R
’000
R’0
00R
’000
% H
eld
08
/09
2009
/10
2008
/09
2009
/10
2008
/09
2009
/10
2008
/09
2009
/10
2008
/09
Yes/
No
Nat
iona
l/Pro
vinc
ial P
ublic
En
tity
Nuc
lear
Ene
rgy
Cor
pora
tion
of
Sout
h Af
rica
Sch
edul
e 2
100
100
2,20
5 2,
205
2,20
5 2,
205
559,
113
60,7
8216
3,72
180
,329
No
CEF
(Pty
) Ltd
Sch
edul
e 2
100
100
1 1
- -
23,1
96,2
8823
,477
,240
(81,
882)
2,31
4,44
9N
0 El
ectri
city
Dis
tribu
tion
Indu
stry
H
oldi
ngs
Com
pany
Sch
edul
e 3A
100
100
100
100
--
4,63
617
,892
(13,
254)
(2,1
39)
No
TO
TAL
2,
306
2,30
62,
205
2,20
523
,760
,037
23,5
55,9
1468
,585
2,39
2,63
9
ANNUAL FINANCIAL STATEMENTS - SECTION 4
ANNEXURE TO THE ANNUAL FINANCIAL STATEMENTS for the year ended 31 march 2010
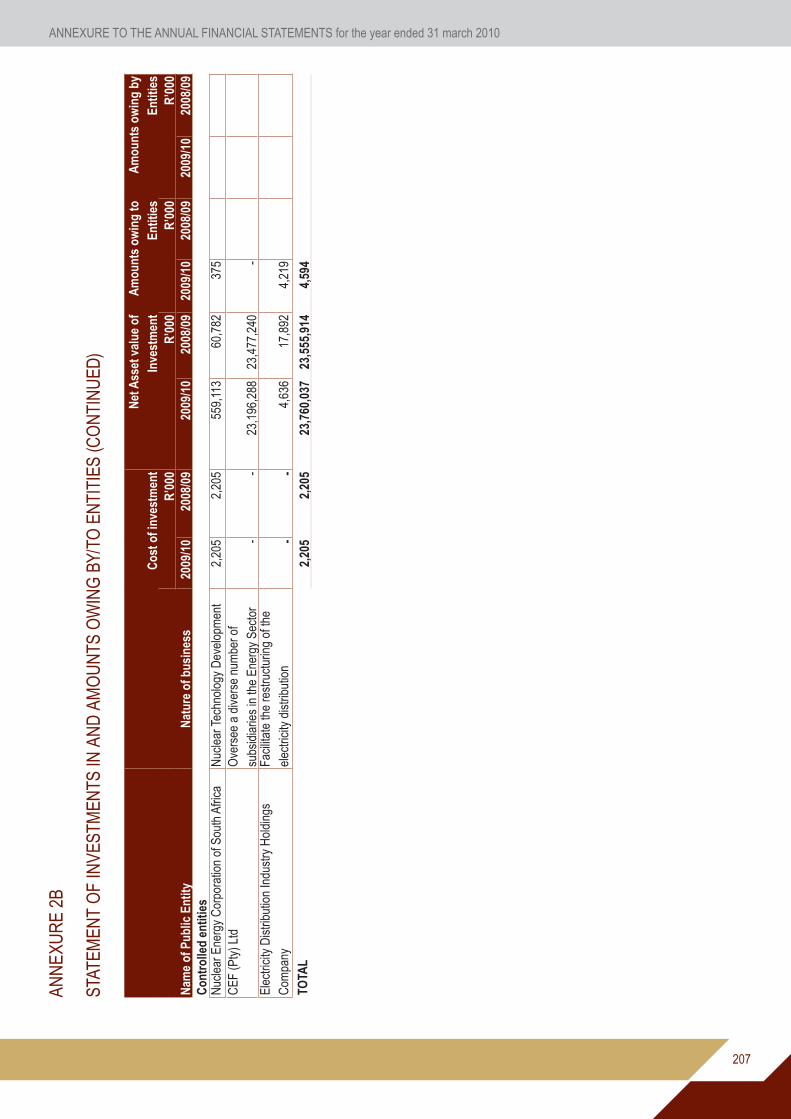
207
ANN
EXU
RE
2B
STAT
EMEN
T O
F IN
VEST
MEN
TS IN
AN
D A
MO
UN
TS O
WIN
G B
Y/TO
EN
TITI
ES (C
ON
TIN
UED
)
Nam
e of
Pub
lic E
ntity
Nat
ure
of b
usin
ess
Cos
t of i
nves
tmen
tN
et A
sset
val
ue o
f In
vest
men
tA
mou
nts
owin
g to
En
titie
sA
mou
nts
owin
g by
En
titie
sR
’000
R’0
00R
’000
R’0
0020
09/1
020
08/0
920
09/1
020
08/0
920
09/1
020
08/0
920
09/1
020
08/0
9C
ontr
olle
d en
titie
s
Nuc
lear
Ene
rgy
Cor
pora
tion
of S
outh
Afri
caN
ucle
ar T
echn
olog
y D
evel
opm
ent
2,2
052,
205
559,
113
60,7
8237
5C
EF (P
ty) L
tdO
vers
ee a
div
erse
num
ber o
f su
bsid
iarie
s in
the
Ener
gy S
ecto
r-
-23
,196
,288
23,4
77,2
40-
Elec
trici
ty D
istri
butio
n In
dust
ry H
oldi
ngs
Com
pany
Faci
litat
e th
e re
stru
ctur
ing
of th
e el
ectri
city
dis
tribu
tion
--
4,63
617
,892
4,21
9
TOTA
L
2,20
52,
205
23,7
60,0
3723
,555
,914
4,59
4
ANNEXURE TO THE ANNUAL FINANCIAL STATEMENTS for the year ended 31 march 2010

208
ANN
EXU
RE
3A
STAT
EMEN
T O
F FI
NAN
CIA
L G
UAR
ANTE
ES IS
SUED
AS
AT 3
1 M
ARC
H 2
010
– LO
CAL
Gua
rant
or
inst
itutio
nG
uara
ntee
in
resp
ect o
f
Orig
inal
gu
aran
teed
ca
pita
l am
ount
Ope
ning
ba
lanc
e 1
Apr
il 20
09
Gua
rant
ees
draw
dow
nsdu
ring
the
year
Gua
rant
ees
repa
ymen
ts/ c
ance
lled/
re
duce
d/ re
leas
ed
durin
g th
e ye
ar
Rev
alua
tions
Clo
sing
ba
lanc
e31
Mar
ch 2
010
Gua
rant
eed
inte
rest
for y
ear
ende
d 31
Mar
ch
2010
Rea
lised
lo
sses
not
re
cove
rabl
e i.e
. cl
aim
s pa
id o
utR
’000
R’0
00R
’000
R’0
00R
’000
R’0
00R
’000
R’0
00M
otor
veh
icle
sSt
anni
cM
otor
Veh
icle
s89
532
9-
211
-11
8-
-Su
b To
tal
895
329
-21
1-
118
--
Hou
sing
ABSA
Hou
sing
183
183
-12
3-
60Ith
ala
Hou
sing
1111
--
-11
--
Firs
t Ran
dH
ousi
ng18
18-
18-
--
-FN
B Fo
rmer
Saa
mbo
uH
ousi
ng40
40-
23-
17-
-N
edba
nkH
ousi
ng82
82-
82-
--
-O
ld M
utua
lH
ousi
ng10
710
7-
85-
22St
anda
rdH
ousi
ng33
33-
--
33-
-Su
b To
tal
474
474
-33
1-
143
--
Oth
erAB
SAN
ecsa
20,0
0020
,000
--
-20
,000
--
Tota
l21
,369
20,8
03-
542
-20
,261
--
ANNUAL FINANCIAL STATEMENTS - SECTION 4
ANNEXURE TO THE ANNUAL FINANCIAL STATEMENTS for the year ended 31 march 2010

209
ANN
EXU
RE
3A (c
ontin
ued)
STAT
EMEN
T O
F FI
NAN
CIA
L G
UAR
ANTE
ES IS
SUED
AS
AT 3
1 M
ARC
H 2
010
– FO
REI
GN
Gua
rant
or
inst
itutio
nG
uara
ntee
in
resp
ect o
f
Orig
inal
gu
aran
teed
ca
pita
l am
ount
Ope
ning
ba
lanc
e 1
Apr
il 20
09
Gua
rant
ees
draw
dow
nsdu
ring
the
year
Gua
rant
ees
repa
ymen
ts/
canc
elle
d/ re
duce
d/
rele
ased
dur
ing
the
year
Rev
alua
tions
Clo
sing
ba
lanc
e31
Mar
ch
2010
Gua
rant
eed
inte
rest
for y
ear
ende
d 31
Mar
ch
2010
Rea
lised
lo
sses
not
re
cove
rabl
e i.e
. cl
aim
s pa
id o
ut
R’0
00R
’000
R’0
00R
’000
R’0
00R
’000
R’0
00R
’000
Oth
erEu
rope
an In
vest
men
t Ban
kFo
reig
n Lo
an27
8,54
370
,004
-36
,458
(15,
529)
18,0
1746
4-
Deu
tche
Ban
kFo
reig
n Lo
an40
3,25
453
,105
-43
,410
(9,6
95)
-45
6-
Tota
l68
1,79
712
3,10
9-
79,8
68(2
5,22
4)18
,017
920
-
ANNEXURE TO THE ANNUAL FINANCIAL STATEMENTS for the year ended 31 march 2010

210
ANNEXURE 3B
STATEMENT OF CONTINGENT LIABILITIES AS AT 31 MARCH 2010
Nature of Liability
Liabilities incurred during
the year
Liabilities paid/cancelled/reduced
during the year
Liabilities recoverable
(Provide details hereunder)
Opening Closing
Balance Balance
1 April 2009 31 March 2010
R’000 R’000 R’000 R’000 R’000
Claims against the department
Claims against the department 100,985 198,976 - - 299,961
Subtotal 100,985 198,976 - - 299,221
Other
Simrac contracts 19,580 7,797 7,407 - 19,970
Subtotal 19,580 7,797 7,407 - 19,970
TOTAL 120,565 206,773 7,407 - 319,931
ANNUAL FINANCIAL STATEMENTS - SECTION 4
ANNEXURE TO THE ANNUAL FINANCIAL STATEMENTS for the year ended 31 march 2010

211
ANNEXURE 4
CLAIMS RECOVERABLE
Government Entity
Confirmed balance outstanding
Unconfirmed balance outstanding Total
31/03/2010 31/03/2009 31/03/2010 31/03/2009 31/03/2010 31/03/2009R’000 R’000 R’000 R’000 R’000 R’000
Department Department of Housing 12 - 12 Department of Education - 12 12 Department of Agriculture - 44 44 Department of Public Service and Administration 8 - 8Department of Trade and Industry - 2 2Kwazulu Natal Economic Development - 23 23Northern Cape Department of Health - 29 29Government Communications 546 - - 546 - Department of Water Affairs - - 1 - 1 - Department of Health:Gauteng - - 17 - 17 South African Police Services - - 10 - 10 -Department of Health and Social Development: Limpopo 8 8
TOTAL 546 20 36 110 582 130
ANNEXURE TO THE ANNUAL FINANCIAL STATEMENTS for the year ended 31 march 2010

212
ANNEXURE 5
INTER-GOVERNMENT PAYABLES
GOVERNMENT ENTITYConfirmed balance outstanding
Unconfirmed balance outstanding TOTAL
31/03/2010 31/03/2009 31/03/2010 31/03/2009 31/03/2010 31/03/2009
R’000 R’000 R’000 R’000 R’000 R’000
DEPARTMENTS
Current Gauteng Provincial Government - 898 - 276 - 1,174 Department of Justice - - 788 72 788 72 Department of Public Works 20,488 - 5,298 2,455 25,786 2,455 Department of Public Service and Administration
- - 34 8 34 8
Department of Safety and Security - 642 - 3 - 645Parliament of the Republic of South Africa
- - 2 - 2 -
Western Cape Government motor Transport
- - 77 - 77 -
Office of the Premier KZN - 2,100 - 2,100 -
Office of the Premier Northern Cape - - 46 - 46 -
Total 20,488 1,540 8,345 2,814 28,833 4,354
ANNUAL FINANCIAL STATEMENTS - SECTION 4
ANNEXURE TO THE ANNUAL FINANCIAL STATEMENTS for the year ended 31 march 2010

213
ANNEXURE 6
INVENTORY
Note Quantity 2009/10
Inventory R’000Opening balance 91,105 856
Add/(Less): Adjustments to prior year balance - -
Add: Additions/Purchases - Cash 372,262 8,940
Add: Additions - Non-cash 7,311 -
(Less): Disposals - -
(Less): Issues (372, 434) (9,172)
Add/(Less): Adjustments - -
Closing Balance before Weighted Average Variance 98,244 624Add/Less: Weighted Average Price Variance - 475
Closing balance 98,244 1,099
ANNEXURE TO THE ANNUAL FINANCIAL STATEMENTS for the year ended 31 march 2010

214
HUMANRESOURCE
MANAGEMENT

215

216
HU
MA
N R
ESO
UR
CE
MA
NA
GEM
ENT
HR
OVE
RSI
GH
T -
APR
IL 2
009
to M
AR
CH
201
0 -
Dep
artm
ent o
f Min
eral
s an
d En
ergy
TAB
LE 1
.1 P
erso
nnel
cos
ts p
er P
rogr
amm
e
Prog
ram
me
Tota
l Vot
ed
Expe
nditu
re
(R'0
00)
Com
pens
atio
n of
Em
ploy
ees
Expe
nditu
re
(R'0
00)
Trai
ning
Ex
pend
iture
(R
'000
)
Prof
essi
onal
and
Sp
ecia
l Ser
vice
s (R
'000
)
Com
pens
atio
n of
Em
ploy
ees
as
perc
ent o
f Tot
al
Expe
nditu
re
Aver
age
Com
pens
atio
n of
Em
ploy
ees
Cos
t pe
r Em
ploy
ee
(R'0
00)
Empl
oym
ent
Adm
inis
tratio
n 24
9,25
310
9,78
53,
712
13,8
8144
.0%
225
489
Asso
ciat
ed S
ervi
ces
3,54
1,60
70
00
0.0%
00
Elec
trici
ty a
nd N
ucle
ar
334,
070
37,4
3613
56,
921
12.0
%33
711
1H
ydro
carb
ons
& En
ergy
Pla
n 56
,925
40,3
1118
1,90
270
.8%
278
145
Min
eral
Pol
icy
and
Prom
otio
n 73
,724
30,4
5559
2,83
541
.3%
285
107
Min
eral
Reg
ulat
ion
150,
596
91,2
9239
313
,165
60.6
%24
537
2Pr
omot
ion
of M
ine
Hea
lth &
Saf
ety
138,
542
94,0
463,
009
6,62
867
.9%
285
330
TOTA
L as
per
Fin
anci
al S
yste
ms
(BA
S)
4,54
4,71
640
3,32
57,
326
45,3
328.
9%26
01,
554
TAB
LE 1
.2 P
erso
nnel
cos
ts b
y sa
lary
ban
d
Sala
ry B
ands
Com
pens
atio
n of
Em
ploy
ees
Cos
t (R
'000
)
Perc
enta
ge o
f To
tal P
erso
nnel
C
ost f
or
Dep
artm
ent
Aver
age
Com
pens
atio
n C
ost p
er
Empl
oyee
(R)
Tota
l Per
sonn
el
Cos
t for
Dep
artm
ent
incl
udin
g G
oods
and
Tr
ansf
ers
(R'0
00)
Num
ber o
f Em
ploy
ees
Low
er s
kille
d (L
evel
s 1-
2)37
30.
10
426,
299
0Sk
illed
(Lev
els
3-5)
28
,173
6.6
116,
417
426,
299
242
Hig
hly
skille
d pr
oduc
tion
(Lev
els
6-8)
61
,396
14.4
182,
184
426,
299
337
Hig
hly
skille
d su
perv
isio
n (L
evel
s 9-
12)
192,
249
45.1
363,
420
426,
299
529
Seni
or m
anag
emen
t (Le
vels
13-
16)
77,6
7518
.268
7,38
942
6,29
911
3C
ontra
ct (L
evel
s 1-
2)12
00
426,
299
0C
ontra
ct (L
evel
s 3-
5)
3,95
40.
991
,953
426,
299
43C
ontra
ct (L
evel
s 6-
8)
5,80
11.
417
5,78
842
6,29
933
Con
tract
(Lev
els
9-12
) 10
,977
2.6
238,
630
426,
299
46C
ontra
ct (L
evel
s 13
-16)
5,
302
1.2
757,
429
426,
299
7Pe
riodi
cal r
emun
erat
ion
263
0.1
3,05
842
6,29
986
Abno
rmal
app
oint
men
t 18
,037
4.2
39,0
4142
6,29
946
2
TOTA
L40
4,21
294
.821
,296
742
6,29
91,
898
*Tot
al n
umbe
r of e
mpl
oyee
s re
mun
erat
ed fo
r the
per
iod
incl
udes
em
ploy
ees
term
inat
ed a
nd re
crui
ted.
HUMAN RESOURCE MANAGEMENT - SECTION 5

217
TAB
LE 1
.3 S
alar
ies,
ove
rtim
e, h
ome
owne
r’s a
llow
ance
and
med
ical
aid
by
Prog
ram
me
Prog
ram
me
Sala
ries
(R'0
00)
Sala
ries
as %
of
Pers
onne
l Cos
tO
vert
ime
(R'0
00)
Ove
rtim
e as
%
of P
erso
nnel
C
ost
HO
A (R
'000
)H
OA
as %
of
Pers
onne
l Cos
tM
edic
al
Ass
. (R
'000
)
Med
ical
Ass
. as
%
of P
erso
nnel
Cos
tTo
tal P
erso
nnel
C
ost p
er
Prog
ram
me
(R'0
00)
Ele
ctric
ity &
Nuc
lear
**
22,0
0758
.814
0.0
757
2.0
1,00
32.
737
,436
Hyd
roca
rbon
s &
Ener
gy P
lann
ing*
*26
,956
66.9
10.
01,
038
2.6
1,22
13.
040
,311
Min
eral
Pol
icy
& Pr
omot
ion
20,2
4566
.511
10.
489
22.
91,
034
3.4
30,4
55M
iner
al R
egul
atio
n
58,4
6664
.01,
134
1.2
1,60
31.
83,
539
3.9
91,2
92Pr
ogra
mm
e 1
Adm
in**
69,3
1763
.12,
400
2.2
2,17
52.
04,
111
3.7
109,
785
Prom
otio
n of
Min
e Sa
fety
& H
ealth
62,5
3866
.527
0.0
1,47
71.
62,
395
2.5
94,0
46
TOTA
L25
9,52
964
.33,
687
0.9
7,94
22.
013
,303
3.3
403,
325
*HO
A: H
ome
owne
r’s a
llow
ance
TAB
LE 1
.4 S
alar
ies,
ove
rtim
e, h
ome
owne
r’s a
llow
ance
and
med
ical
aid
by
sala
ry b
and
Sala
ry b
ands
Sala
ries
(R'0
00)
Sala
ries
as %
of
Pers
onne
l C
ost
Ove
rtim
e (R
'000
)O
vert
ime
as %
of
Per
sonn
el
Cos
t
HO
A (R
'000
)H
OA
as %
of
Pers
onne
l C
ost
Med
ical
A
ss.
(R'0
00)
Med
ical
Ass
. as
%
of P
erso
nnel
Cos
tTo
tal P
erso
nnel
C
ost p
er S
alar
y B
and
(R'0
00)
Low
er s
kille
d (L
evel
s 1-
2)25
066
.81
0.3
246.
452
13.9
374
Skille
d (L
evel
s 3-
5)
19,0
1166
.371
12.
51,
191
4.2
2,48
88.
728
,672
Hig
hly
skille
d pr
oduc
tion
(Lev
els
6-8)
43
,782
69.6
1,19
21.
91,
563
2.5
3,61
15.
762
,866
Hig
hly
skille
d su
perv
isio
n (L
evel
s 9-
12)
145,
459
70.5
1,23
80.
62,
598
1.3
5,37
12.
620
6,33
1Se
nior
man
agem
ent (
Leve
ls 1
3-16
) 62
,142
76.0
70
2,28
62.
81,
244
1.5
81,7
45C
ontra
ct (L
evel
s 1-
2)9
75.0
18.
30
00
012
Con
tract
(Lev
els
3-5)
2,
777
70.0
324
8.2
130
3.3
145
3.7
3,96
9C
ontra
ct (L
evel
s 6-
8)
4,51
276
.519
63.
385
1.4
135
2.3
5,89
5C
ontra
ct (L
evel
s 9-
12)
9,33
175
.66
044
0.4
840.
712
,338
Con
tract
(Lev
els
13-1
6)
4,55
584
.10
025
0.5
450.
85,
419
Perio
dica
l Rem
uner
atio
n 0
00
00
00
052
9Ab
norm
al A
ppoi
ntm
ent
16,4
8790
.80
00
00
018
,149
TOTA
L30
8,31
572
.33,
676
0.9
7,94
61.
913
,175
3.1
426,
299

218
TAB
LE 2
.1 F
illed
pos
ts a
nd v
acan
cies
by
Prog
ram
me
at e
nd o
f per
iod
Prog
ram
me
Num
ber o
f Pos
tsN
umbe
r of P
osts
Fi
lled
Vaca
ncy
Rat
eN
umbe
r of P
osts
Fi
lled
Add
ition
al to
the
Esta
blis
hmen
tEl
ectri
city
& N
ucle
ar**
old,
Per
man
ent
111
9514
.48
Hyd
roca
rbon
s &
Ener
gy P
lann
ing*
*old
, Per
man
ent
145
122
15.9
1M
iner
al P
olic
y &
Prom
otio
n, P
erm
anen
t 10
790
15.9
1M
iner
al R
egul
atio
n, P
erm
anen
t 37
233
310
.57
Prog
ram
me
1 Ad
min
**ol
d, P
erm
anen
t 48
843
311
.384
Prog
ram
me
1 Ad
min
**ol
d, T
empo
rary
1
10
0Pr
omot
ion
of M
ine
Safe
ty &
Hea
lth, P
erm
anen
t 32
927
516
.411
Prom
otio
n of
Min
e Sa
fety
& H
ealth
, Tem
pora
ry
11
00
TOTA
L1,
554
1,35
013
.111
2
TAB
LE 2
.2 F
illed
pos
ts a
nd v
acan
cies
by
sala
ry b
and
at e
nd o
f per
iod
Sala
ry B
and
Num
ber o
f Pos
tsN
umbe
r of P
osts
Fi
lled
Vaca
ncy
Rat
eN
umbe
r of P
osts
Fill
ed
Add
ition
al to
the
Esta
blis
hmen
tLo
wer
ski
lled
(Lev
els
1-2)
, Per
man
ent
42
501
Skille
d (L
evel
s 3-
5), P
erm
anen
t 27
624
212
.37
Hig
hly
skille
d pr
oduc
tion
(Lev
els
6-8)
, Per
man
ent
378
337
10.8
14H
ighl
y sk
illed
supe
rvis
ion
(Lev
els
9-12
), Pe
rman
ent
638
527
17.4
10H
ighl
y sk
illed
supe
rvis
ion
(Lev
els
9-12
), Te
mpo
rary
2
20
0Se
nior
man
agem
ent (
Leve
ls 1
3-16
), Pe
rman
ent
127
111
12.6
3C
ontra
ct (L
evel
s 3-
5), P
erm
anen
t 43
430
43C
ontra
ct (L
evel
s 6-
8), P
erm
anen
t 33
330
29C
ontra
ct (L
evel
s 9-
12),
Perm
anen
t 46
460
3C
ontra
ct (L
evel
s 13
-16)
, Per
man
ent
77
02
TOTA
L1,
554
1,35
013
.111
2
TAB
LE 2
.3 F
illed
pos
ts a
nd v
acan
cies
by
criti
cal o
ccup
atio
n at
end
of p
erio
d
Crit
ical
Occ
upat
ions
Num
ber o
f Pos
tsN
umbe
r of P
osts
Fi
lled
Vaca
ncy
Rat
eN
umbe
r of P
osts
Fi
lled
Add
ition
al to
the
Esta
blis
hmen
tAd
min
istra
tive
rela
ted
pers
onne
l, Pe
rman
ent
152
131
13.8
13Bi
olog
ists
, bot
anis
ts, z
oolo
gist
s &
rela
ted
prof
essi
onal
s, P
erm
anen
t 79
6912
.71
Car
togr
aphe
rs a
nd s
urve
yors
, Per
man
ent
32
33.3
0C
lean
ers
in o
ffice
s, w
orks
hops
, hos
pita
ls, e
tc, P
erm
anen
t 16
160
0C
lient
info
rmat
ion
cler
ks (s
witc
hboa
rd, r
ecep
tion,
info
rmat
ion
cler
ks),
Perm
anen
t 18
1422
.23
HUMAN RESOURCE MANAGEMENT - SECTION 5

219
Crit
ical
Occ
upat
ion
Num
ber o
f Pos
tsN
umbe
r of P
osts
Fi
lled
Vaca
ncy
Rat
eN
umbe
r of P
osts
Fi
lled
Add
ition
al to
the
Esta
blis
hmen
tC
omm
unic
atio
n an
d in
form
atio
n re
late
d pe
rson
nel,
Perm
anen
t 13
127.
71
Econ
omis
ts, P
erm
anen
t 46
4110
.90
Engi
neer
ing
scie
nces
rela
ted
pers
onne
l, Pe
rman
ent
52
60.0
0Fi
nanc
e &
econ
omic
s re
late
d pe
rson
nel,
Perm
anen
t 9
90
0Fi
nanc
ial &
rela
ted
prof
essi
onal
s, P
erm
anen
t 23
230
4Fi
nanc
ial c
lerk
s &
cred
it co
ntro
llers
, Per
man
ent
2725
7.4
10Fo
od s
ervi
ces
aide
s &
wai
ters
, Per
man
ent
63
50.0
0H
ead
of d
epar
tmen
t/chi
ef e
xecu
tive
offic
er, P
erm
anen
t 2
20
0H
uman
reso
urce
s &
orga
nisa
tion
deve
lopm
ent &
rela
ted
prof
essi
onal
s, P
erm
anen
t 47
438.
52
Hum
an re
sour
ces
cler
ks, P
erm
anen
t 25
238.
014
Hum
an re
sour
ces
rela
ted
pers
onne
l, Pe
rman
ent
11
00
Info
rmat
ion
tech
nolo
gy re
late
d pe
rson
nel,
Perm
anen
t 10
730
.00
Lang
uage
pra
ctiti
oner
s, in
terp
rete
rs &
oth
er c
omm
unic
atio
n pe
rson
nel,
Perm
anen
t 5
50
0Le
gal r
elat
ed p
erso
nnel
, Per
man
ent
98
11.1
0Li
brar
ians
& re
late
d pr
ofes
sion
als,
Per
man
ent
33
00
Libr
ary,
mai
l & re
late
d cl
erks
, Per
man
ent
6459
7.8
5Lo
gist
ical
sup
port
pers
onne
l, Pe
rman
ent
1514
6.7
0M
ater
ial-r
ecor
ding
& tr
ansp
ort c
lerk
s, P
erm
anen
t 38
357.
92
Mes
seng
ers,
por
ters
& d
eliv
ery
pers
onne
l, Pe
rman
ent
1212
01
Nat
ural
sci
ence
s re
late
d pe
rson
nel,
Perm
anen
t 17
114
217
.07
Oth
er a
dmin
istra
tive
& re
late
d cl
erks
and
org
anis
ers,
Per
man
ent
104
9310
.64
Oth
er a
dmin
istra
tive
polic
y &
rela
ted
offic
ers,
Per
man
ent
7059
15.7
1O
ther
info
rmat
ion
tech
nolo
gy p
erso
nnel
, Per
man
ent
2622
15.4
5O
ther
mac
hine
ope
rato
rs, P
erm
anen
t 2
20
0O
ther
occ
upat
ions
, Per
man
ent
22
00
Ris
k m
anag
emen
t & s
ecur
ity s
ervi
ces,
Per
man
ent
1312
7.7
0Sa
fety
, hea
lth a
nd q
ualit
y in
spec
tors
, Per
man
ent
206
165
19.9
8Sa
fety
. hea
lth a
nd q
ualit
y in
spec
tors
, Tem
pora
ry
11
00
Secr
etar
ies
& ot
her k
eybo
ard
oper
atin
g cl
erks
, Per
man
ent
119
105
11.8
3Se
curit
y of
ficer
s, P
erm
anen
t 73
695.
525
Seni
or m
anag
ers,
Per
man
ent
119
102
14.3
3Se
nior
man
ager
s, T
empo
rary
1
10
0Tr
ade/
indu
stry
adv
iser
s &
othe
r rel
ated
pro
fess
iona
ls, P
erm
anen
t 19
1615
.80
TOTA
L1,
554
1,35
013
.111
2

220
TAB
LE 3
.1 J
ob e
valu
atio
n
Sala
ry B
and
Num
ber o
f Po
sts
Num
ber o
f Job
s Ev
alua
ted
% o
f Pos
ts
Eval
uate
dN
umbe
r of
Post
s U
pgra
ded
% o
f Upg
rade
d Po
sts
Eval
uate
dN
umbe
r of P
osts
D
owng
rade
d%
of D
owng
rade
d Po
sts
Eval
uate
dLo
wer
ski
lled
(Lev
els
1-2)
4
00
00
00
Con
tract
(Lev
els
3-5)
43
00
00
00
Con
tract
(Lev
els
6-8)
33
00
00
00
Con
tract
(Lev
els
9-12
) 46
00
20
00
Con
tract
(Ban
d A)
2
00
00
00
Con
tract
(Ban
d B)
4
00
10
00
Con
tract
(Ban
d C
) 1
00
00
00
Skille
d (L
evel
s 3-
5)
276
00
10
00
Hig
hly
skille
d pr
oduc
tion
(Lev
els
6-8)
37
81
0.3
110
0.0
00
Hig
hly
skille
d su
perv
isio
n (L
evel
s 9-
12)
640
71.
13
42.9
228
.6Se
nior
Man
agem
ent S
ervi
ce B
and
A 90
00
10
00
Seni
or M
anag
emen
t Ser
vice
Ban
d B
250
00
00
0Se
nior
Man
agem
ent S
ervi
ce B
and
C
70
00
00
0Se
nior
Man
agem
ent S
ervi
ce B
and
D
52
40.0
00
00
TOTA
L1,
554
100.
69
902
20
TAB
LE 3
.2 P
rofil
e of
em
ploy
ees
who
se p
ositi
ons
wer
e up
grad
ed d
ue to
thei
r pos
ts b
eing
upg
rade
d
Ben
efic
iarie
sA
fric
anA
sian
Col
oure
dW
hite
Tota
lFe
mal
e 31
00
233
Mal
e 14
00
014
TOTA
L 45
00
247
Empl
oyee
s w
ith a
dis
abilit
y 0
00
00
TAB
LE 3
.3 E
mpl
oyee
s w
hose
sal
ary
leve
ls e
xcee
d th
e gr
ades
det
erm
ined
by
job
eval
uatio
n [it
o PS
R 1
.V.C
.3]
Occ
upat
ion
Num
ber o
f Em
ploy
ees
Job
Eval
uatio
n Le
vel
Rem
uner
atio
n Le
vel
Rea
son
for
Dev
iatio
nN
o of
Em
ploy
ees
in D
ept
Tota
l 0
0
0 0
0 Pe
rcen
tage
of t
otal
em
ploy
men
t 0
0 0
0 0
TOTA
L 0
0 0
0 0
HUMAN RESOURCE MANAGEMENT - SECTION 5

221
TAB
LE 3
.4 P
rofil
e of
em
ploy
ees
who
se s
alar
y le
vels
exc
eede
d th
e gr
ades
det
erm
ined
by
job
eval
uatio
n [it
o PS
R 1
.V.C
.3]
Ben
efic
iarie
sA
fric
anA
sian
Col
oure
dW
hite
Tota
lFe
mal
e 0
00
00
Mal
e 0
00
00
TOTA
L 0
00
00
Empl
oyee
s w
ith a
dis
abilit
y 0
00
00
TAB
LE 4
.1 A
nnua
l tur
nove
r rat
es b
y sa
lary
ban
d
Sala
ry B
and
Empl
oym
ent a
t Beg
inni
ng
of P
erio
d (A
pril
2009
)A
ppoi
ntm
ents
Term
inat
ions
Turn
over
Rat
e
Skille
d (L
evel
s 3-
5), P
erm
anen
t 23
936
62.
5H
ighl
y sk
illed
prod
uctio
n (L
evel
s 6-
8), P
erm
anen
t 31
930
92.
8H
ighl
y sk
illed
supe
rvis
ion
(Lev
els
9-12
), Pe
rman
ent
469
5136
7.7
Hig
hly
skille
d su
perv
isio
n (L
evel
s 9-
12),
Tem
pora
ry
11
110
0.0
Seni
or M
anag
emen
t Ser
vice
Ban
d A,
Per
man
ent
725
56.
9Se
nior
Man
agem
ent S
ervi
ce B
and
A, T
empo
rary
0
10
0Se
nior
Man
agem
ent S
ervi
ce B
and
B, P
erm
anen
t 21
12
9.5
Seni
or M
anag
emen
t Ser
vice
Ban
d C
, Per
man
ent
50
120
.0Se
nior
Man
agem
ent S
ervi
ce B
and
D, P
erm
anen
t 2
10
0Se
nior
Man
agem
ent S
ervi
ce B
and
D, T
empo
rary
0
20
0O
ther
, Per
man
ent
10
00
Con
tract
(Lev
els
3-5)
, Per
man
ent
3516
38.
6C
ontra
ct (L
evel
s 6-
8), P
erm
anen
t 21
176
28.6
Con
tract
(Lev
els
9-12
), Pe
rman
ent
1935
526
.3C
ontra
ct (B
and
A), P
erm
anen
t 2
32
100.
0C
ontra
ct (B
and
B), P
erm
anen
t 3
33
100.
0C
ontra
ct (B
and
C),
Perm
anen
t 1
00
0
TOTA
L1,
210
202
796.
5
TAB
LE 4
.2 A
nnua
l tur
nove
r rat
es b
y cr
itica
l occ
upat
ion
Occ
upat
ion
Empl
oym
ent a
t Beg
inni
ng o
f Pe
riod
(Apr
il 20
09)
App
oint
men
tsTe
rmin
atio
nsTu
rnov
er R
ate
Adm
inis
trativ
e re
late
d pe
rson
nel,
Perm
anen
t 10
611
1211
.3Ad
min
istra
tive
rela
ted
pers
onne
l, Te
mpo
rary
0
20
0Ag
ricul
ture
, ani
mal
, oce
anog
raph
,y fo
rest
ry &
oth
er s
cien
tific
pro
fess
iona
ls, P
erm
anen
t 5
01
20.0
Biol
ogis
ts, b
otan
ists
, zoo
logi
sts
& re
late
d pr
ofes
sion
als,
Per
man
ent
4710
24.
3C
arto
grap
hers
& s
urve
yors
, Per
man
ent
20
00
Cle
aner
s in
offi
ces,
wor
ksho
ps, h
ospi
tals
, etc
, Per
man
ent
191
00

222
Occ
upat
ion
Empl
oym
ent a
t Beg
inni
ng o
f Pe
riod
(Apr
il 20
09)
App
oint
men
tsTe
rmin
atio
nsTu
rnov
er R
ate
Clie
nt in
form
cle
rks
(sw
itchb
oard
, rec
eptio
n, in
form
atio
n cl
erks
), Pe
rman
ent
143
321
.4C
omm
unic
atio
n &
info
rmat
ion
rela
ted
pers
onne
l, Pe
rman
ent
81
00
Dom
estic
bui
lder
s &
help
ers,
cle
aner
s, s
wee
pers
& la
undr
y pe
rson
nel,
Perm
anen
t 1
00
0Ec
onom
ists
, Per
man
ent
336
13
Engi
neer
ing
scie
nces
rela
ted
prof
essi
onal
s, P
erm
anen
t 4
00
0Fi
nanc
e &
econ
omic
s re
late
d pr
ofes
sion
als,
Per
man
ent
90
00
Fina
nce
rela
ted
prof
essi
onal
s, P
erm
anen
t 17
42
11.8
Fina
ncia
l cle
rks
& cr
edit
cont
rolle
rs, P
erm
anen
t 23
82
8.7
Food
ser
vice
s ai
des
& w
aite
rs, P
erm
anen
t 2
01
50.0
Gen
eral
lega
l adm
inis
tratio
n &
rela
ted
prof
essi
onal
s, P
erm
anen
t 4
00
0H
ead
of d
epar
tmen
t/chi
ef e
xecu
tive
offic
er, P
erm
anen
t 1
00
0H
uman
reso
urce
s &
orga
nisa
tion
deve
lopm
ent &
rela
ted
prof
essi
onal
s, P
erm
anen
t 34
04
11.8
Hum
an re
sour
ces
cler
ks, P
erm
anen
t 19
101
5.3
Hum
an re
sour
ces
rela
ted
pers
onne
l, Pe
rman
ent
100
110
Info
rmat
ion
tech
nolo
gy re
late
d pe
rson
nel,
Perm
anen
t 7
02
28.6
Lang
uage
pra
ctiti
oner
s, in
terp
rete
rs &
oth
er c
omm
unic
atio
n pe
rson
nel,
Perm
anen
t 6
00
0Le
gal r
elat
ed p
rofe
ssio
nals
, Per
man
ent
11
00
Libr
aria
ns &
rela
ted
prof
essi
onal
s, P
erm
anen
t 3
00
0Li
brar
y, m
ail &
rela
ted
cler
ks, P
erm
anen
t 56
93
5.4
Logi
stic
al s
uppo
rt pe
rson
nel,
Perm
anen
t 12
00
0M
ater
ial-r
ecor
ding
& tr
ansp
ort c
lerk
s, P
erm
anen
t 35
50
0M
esse
nger
s, p
orte
rs &
del
iver
ers,
Per
man
ent
111
00
Nat
ural
sci
ence
s re
late
d pe
rson
nel,
Perm
anen
t 13
416
96.
7O
ther
adm
inis
trativ
e &
rela
ted
cler
ks a
nd o
rgan
iser
s, P
erm
anen
t 91
82
2.2
Oth
er a
dmin
istra
tive,
pol
icy
& re
late
d of
ficer
s, P
erm
anen
t 64
101
1.6
Oth
er in
form
atio
n te
chno
logy
per
sonn
el, P
erm
anen
t 18
51
5.6
Oth
er m
achi
ne o
pera
tors
, Per
man
ent
20
00
Oth
er o
ccup
atio
ns, P
erm
anen
t 1
10
0R
ank:
Unk
now
n, P
erm
anen
t 1
00
0R
isk
man
agem
ent &
sec
urity
ser
vice
s pe
rson
nel,
Perm
anen
t 8
51
12.5
Safe
ty h
ealth
& q
ualit
y in
spec
tors
, Per
man
ent
127
5111
8.7
Safe
ty h
ealth
& q
ualit
y in
spec
tors
, Tem
pora
ry
11
110
0Se
cret
arie
s &
othe
r key
boar
d op
erat
ing
cler
ks, P
erm
anen
t 99
163
3Se
curit
y of
ficer
s, P
erm
anen
t 69
43
4.3
Seni
or m
anag
ers,
Per
man
ent
8610
1214
Seni
or m
anag
ers,
Tem
pora
ry
01
00
Trad
e/in
dust
ry a
dvis
ers
& ot
her r
elat
ed p
rofe
ssio
nals
, Per
man
ent
202
00
TOTA
L1,
210
202
796.
5
HUMAN RESOURCE MANAGEMENT - SECTION 5

223
TAB
LE 4
.3 R
easo
ns fo
r em
ploy
ee tu
rnov
er ra
te
Term
inat
ion
Type
Num
ber
Perc
enta
ge o
f Tot
al
Res
igna
tions
Perc
enta
ge o
f Tot
al
Empl
oym
ent
Tota
lTo
tal E
mpl
oym
ent
Dea
th, P
erm
anen
t 9
11.4
0.7
791,
210
Res
igna
tion,
Per
man
ent
4658
.23.
879
1,21
0R
esig
natio
n, T
empo
rary
1
1.3
0.1
791,
210
Expi
ry o
f con
tract
, Per
man
ent
810
.10.
779
1,21
0Tr
ansf
ers,
Per
man
ent
11.
30.
179
1,21
0D
isch
arge
d du
e to
ill-h
ealth
, Per
man
ent
22.
50.
279
1,21
0D
ism
issa
l for
mis
cond
uct,
Perm
anen
t 4
5.1
0.3
791,
210
Ret
irem
ent,
Perm
anen
t 8
10.1
0.7
791,
210
TOTA
L79
100
6.5
791,
210
Res
igna
tions
as
% o
f Em
ploy
men
t
6.5
TAB
LE 4
.3(a
) G
rant
ing
of e
mpl
oyee
Initi
ateg
sev
eran
ce p
acka
ges
Term
inat
ion
Type
No
of A
pplic
atio
ns
Rec
eive
dN
o of
app
licat
ions
re
ferr
ed to
the
MPS
A
No
of a
pplic
atio
ns
supp
orte
d by
the
MPS
A
No
of P
acka
ges
appr
oved
by
the
depa
rtm
ent
Low
er s
kille
d (L
evel
s 1-
2)0
00
0Sk
illed
(Lev
els
3-5)
0
00
0H
ighl
y sk
illed
prod
uctio
n (L
evel
s 6-
8)
00
00
Hig
hly
skille
d su
perv
isio
n (L
evel
s 9-
12)
00
00
Seni
or m
anag
emen
t (Le
vels
13-
16)
00
00
TOTA
L0
00
0
TAB
LE 4
.4 P
rom
otio
n by
cri
tical
occ
upat
ion
Occ
upat
ion
Empl
oym
ent a
t Beg
inni
ng
of P
erio
d (A
pril
2009
)Pr
omot
ions
to
anot
her S
alar
y Le
vel
Sala
ry L
evel
Pr
omot
ions
as
a %
of
Em
ploy
men
t
Prog
ress
ions
to
anot
her N
otch
w
ithin
Sal
ary
Leve
l
Not
ch p
rogr
essi
ons
as
a %
of E
mpl
oym
ent
106
3331
.143
40.6
Agric
ultu
ral,
anim
al, o
cean
ogra
phy,
fore
stry
& o
ther
sci
ence
s pe
rson
nel
50
03
60.0
Biol
ogis
ts, b
otan
ists
, zoo
logi
sts
& re
late
d pr
ofes
sion
als
4710
21.3
1123
.4C
arto
grap
hers
& s
urve
yors
2
00
210
0.0
Cle
aner
s in
offi
ces,
wor
ksho
ps, h
ospi
tals
, etc
19
00
1473
.7C
lient
info
rmat
ion
cler
ks (s
witc
hboa
rd, r
ecep
tion,
info
rmat
ion
cler
ks)
141
7.1
1178
.6

224
Occ
upat
ion
Empl
oym
ent a
t Beg
inni
ng
of P
erio
d (A
pril
2009
)Pr
omot
ions
to
anot
her S
alar
y Le
vel
Sala
ry L
evel
Pr
omot
ions
as
a %
of
Em
ploy
men
t
Prog
ress
ions
to
anot
her N
otch
w
ithin
Sal
ary
Leve
l
Not
ch p
rogr
essi
ons
as
a %
of E
mpl
oym
ent
Com
mun
icat
ion
& in
form
atio
n re
late
d pe
rson
nel
81
12.5
562
.5D
omes
tic b
uild
ers
& he
lper
s, c
lean
ers,
sw
eepe
rs &
laun
dry
pers
onne
l 1
00
00
Econ
omis
ts
339
27.3
721
.24
00
00
Fina
nce
& ec
onom
ics
rela
ted
pers
onne
l9
222
.21
11.1
Fina
ncel
& re
late
d pr
ofes
sion
als
176
35.3
529
.4Fi
nanc
ial c
lerk
s &
cred
it co
ntro
llers
23
313
.011
47.8
Food
ser
vice
s ai
des
& w
aite
rs
20
02
100.
0G
ener
al le
gal a
dmin
istra
tion
& re
late
d pr
ofes
sion
als
40
01
25H
ead
of d
epar
tmen
t/chi
ef e
xecu
tive
offic
er
11
100.
00
0H
uman
reso
urce
s &
orga
nisa
tion
deve
lopm
ent &
rela
ted
prof
essi
onal
s34
617
.629
85.3
Hum
an re
sour
ces
cler
ks
192
10.5
947
.4H
uman
reso
urce
s re
late
d pr
ofes
sion
als
100
01
10.0
Info
rmat
ion
tech
nolo
gy re
late
d pe
rson
nel
71
14.3
228
.6La
ngua
ge p
ract
ition
ers,
inte
rpre
ters
& o
ther
com
mun
icat
ion
pers
onne
l 6
00
350
.0Le
gal r
elat
ed p
rofe
ssio
nals
12
200.
01
100.
0Li
brar
ians
& re
late
d pr
ofes
sion
als
30
00
0Li
brar
y, m
ail &
rela
ted
cler
ks
560
030
53.6
Logi
stic
al s
uppo
rt pe
rson
nel
126
50.0
325
.0M
ater
ial-r
ecor
ding
& tr
ansp
ort c
lerk
s 35
514
.39
25.7
Mes
seng
ers,
por
ters
& d
eliv
erer
s 11
19.
16
54.5
Nat
ural
sci
ence
s re
late
d pr
ofes
sion
als
134
2820
.938
28.4
Oth
er a
dmin
istra
tive
& re
late
d cl
erks
& o
rgan
iser
s 91
99.
942
46.2
Oth
er a
dmin
istra
tive,
pol
icy
& re
late
d of
ficer
s 64
1015
.632
50.0
Oth
er in
form
atio
n te
chno
logy
per
sonn
el
184
22.2
633
.3O
ther
mac
hine
ope
rato
rs
20
01
50.0
Oth
er o
ccup
atio
ns
10
00
0R
ank:
Unk
now
n 1
00
00
Ris
k m
anag
emen
t & s
ecur
ity s
ervi
ces
pers
onne
l8
00
225
.0Sa
fety
, hea
lth &
qua
lity
insp
ecto
rs
128
1612
.544
34.4
Secr
etar
ies
& ot
her k
eybo
ard
oper
atin
g cl
erks
99
88.
155
55.6
Secu
rity
offic
ers
693
4.3
2739
.1Se
nior
man
ager
s 86
1922
.133
38.4
Soci
al w
ork
& re
late
d pr
ofes
sion
als
01
00
0Tr
ade/
indu
stry
adv
iser
s &
othe
r rel
ated
pro
fess
iona
ls
203
15.0
735
.0
TOTA
L1,
210
190
15.7
496
41.0
HUMAN RESOURCE MANAGEMENT - SECTION 5

225
TAB
LE 4
.5 P
rom
otio
ns b
y sa
lary
ban
d
Sala
ry B
and
Empl
oym
ent a
t B
egin
ning
of P
erio
d (A
pril
2009
)
Prom
otio
ns to
an
othe
r Sal
ary
Leve
l
Sala
ry L
evel
Pr
omot
ions
as
a %
of
Em
ploy
men
t
Prog
ress
ions
to
anot
her N
otch
w
ithin
Sal
ary
Leve
l
Not
ch p
rogr
essi
ons
as a
%
of E
mpl
oym
ent
239
156.
313
355
.6H
ighl
y sk
illed
prod
uctio
n (L
evel
s 6-
8), P
erm
anen
t 31
935
11.0
155
48.6
Hig
hly
skille
d su
perv
isio
n (L
evel
s 9-
12),
Perm
anen
t 46
911
324
.116
936
.0H
ighl
y sk
illed
supe
rvis
ion
(Lev
els
9-12
), Te
mpo
rary
1
00
00
Seni
or m
anag
emen
t (Le
vels
13-
16),
Perm
anen
t 10
020
20.0
3535
.0O
ther
, Per
man
ent
10
00
0C
ontra
ct (L
evel
s 3-
5), P
erm
anen
t 35
12.
90
0C
ontra
ct (L
evel
s 6-
8), P
erm
anen
t 21
29.
53
14.3
Con
tract
(Lev
els
9-12
), Pe
rman
ent
191
5.3
15.
3C
ontra
ct (L
evel
s 13
-16)
, Per
man
ent
63
50.0
00
TOTA
L12
1019
015
.749
641
.0
TAB
LE 5
.1 T
otal
num
ber o
f em
ploy
ees
(incl
udin
g em
ploy
ees
with
dis
abili
ties)
per
occ
upat
ion
cate
gory
(SA
SCO
)
Occ
upat
ion
Cat
egor
yM
ale
Fem
ale
Tota
l
Afr
ican
Col
oure
dIn
dian
Tota
l Bla
ckW
hite
Afr
ican
Col
oure
dIn
dian
Tota
l Bla
ckW
hite
Legi
slat
ors,
sen
ior o
ffici
als
& m
anag
ers,
Per
man
ent
533
157
1132
00
322
102
Legi
slat
ors,
sen
ior o
ffici
als
& m
anag
ers,
Tem
pora
ry
10
01
00
00
00
1Pr
ofes
sion
als,
Per
man
ent
100
02
102
1213
01
213
314
261
Tech
nici
ans
& as
soci
ated
pro
fess
iona
ls, P
erm
anen
t 23
64
224
273
180
21
183
1150
9Te
chni
cian
s &
asso
ciat
ed p
rofe
ssio
nals
, Tem
pora
ry
00
00
10
00
00
1C
lerk
s, P
erm
anen
t 82
40
862
225
150
240
3336
1Se
rvic
e &
sale
s w
orke
rs, P
erm
anen
t 50
20
524
240
024
181
Plan
t & m
achi
ne o
pera
tors
& a
ssem
bler
s, P
erm
anen
t 2
00
20
00
00
02
Elem
enta
ry o
ccup
atio
ns, P
erm
anen
t 9
20
110
190
019
030
Oth
er, P
erm
anen
t 0
01
11
00
00
02
TOTA
L53
315
655
410
461
018
363
161
1,35
0
Occ
upat
ion
Cat
egor
yM
ale
Fem
ale
Tota
l
Afr
ican
Col
oure
dIn
dian
Tota
l Bla
ckW
hite
Afr
ican
Col
oure
dIn
dian
Tota
l Bla
ckW
hite
Empl
oyee
s w
ith d
isab
ilitie
s 3
00
33
10
01
07

226
TAB
LE 5
.2 T
otal
num
ber o
f em
ploy
ees
(incl
udin
g em
ploy
ees
with
dis
abili
ties)
per
occ
upat
ion
band
Occ
upat
ion
Ban
dM
ale
Fem
ale
Tota
l
Afr
ican
Col
oure
dIn
dian
Tota
l Bla
ckW
hite
Afr
ican
Col
oure
dIn
dian
Tota
l Bla
ckW
hite
Top
man
agem
ent,
Perm
anen
t 3
00
30
50
05
08
Seni
or m
anag
emen
t, Pe
rman
ent
494
255
1234
00
342
103
Prof
essi
onal
ly q
ualif
ied
and
expe
rienc
ed s
peci
alis
ts &
m
id-m
anag
emen
t, Pe
rman
ent
238
33
244
7218
92
119
219
527
Prof
essi
onal
ly q
ualif
ied
& ex
perie
nced
spe
cial
ists
&
mid
dle
man
agem
ent,
Tem
pora
ry
10
01
10
00
00
2
Skille
d te
chni
cal &
aca
dem
ical
ly q
ualif
ied
wor
kers
, jun
ior
man
agem
ent,
supe
rvis
ors
& fo
rem
en, P
erm
anen
t 85
40
895
193
102
205
3833
7
Sem
i-ski
lled
& di
scre
tiona
ry d
ecis
ion
mak
ing
pers
onne
l, Pe
rman
ent
874
091
314
16
014
71
242
Uns
kille
d &
defin
ed d
ecis
ion
mak
ing
pers
onne
l, Pe
rman
ent
00
11
10
00
00
2
Con
tract
(Top
man
agem
ent),
Per
man
ent
10
01
00
00
00
1C
ontra
ct (S
enio
r man
agem
ent),
Per
man
ent
50
05
01
00
10
6C
ontra
ct (P
rofe
ssio
nally
qua
lifie
d), P
erm
anen
t 27
00
279
90
09
146
Con
tract
(Ski
lled
tech
nica
l), P
erm
anen
t 10
00
100
230
023
033
Con
tract
(Sem
i-ski
lled)
, Per
man
ent
270
027
115
00
150
43
TOTA
L53
315
655
410
461
018
363
161
1,35
0
TAB
LE 5
.3 R
ecru
itmen
t
Occ
upat
iona
l Ban
dsM
ale
Fem
ale
Tota
l
Afr
ican
Col
oure
dIn
dian
Tota
l Bla
ckW
hite
Afr
ican
Col
oure
dIn
dian
Tota
l Bla
ckW
hite
Top
man
agem
ent,
Perm
anen
t 0
00
00
10
01
01
Top
man
agem
ent,
Tem
pora
ry
10
01
10
00
00
2Se
nior
man
agem
ent,
Perm
anen
t3
02
50
10
01
06
Seni
or m
anag
emen
t, Te
mpo
rary
1
00
10
00
00
01
Prof
essio
nally
qua
lified
& e
xper
ienc
ed s
peci
alist
s &
mid
dle
man
agem
ent,
Perm
anen
t 19
10
2014
170
017
051
Pr
ofes
siona
lly q
ualifi
ed &
exp
erie
nced
spe
cial
ists
& m
iddl
e m
anag
emen
t, Te
mpo
rary
0
00
01
00
00
01
Skille
d te
chni
cal &
aca
dem
ical
ly q
ualif
ied
wor
kers
, jun
ior m
anag
emen
t, su
perv
isor
s &
fore
men
, Per
man
ent
131
014
214
00
140
30
Sem
i-ski
lled
& di
scre
tiona
ry d
ecis
ion
mak
ing
pers
onne
l, Pe
rman
ent
131
014
022
00
220
36C
ontra
ct (S
enio
r man
agem
ent),
Per
man
ent
60
06
00
00
00
6C
ontra
ct (P
rofe
ssio
nally
qua
lifie
d), P
erm
anen
t 20
00
204
91
010
135
Con
tract
(Ski
lled
tech
nica
l), P
erm
anen
t 6
00
60
110
011
017
Con
tract
(Sem
i-ski
lled)
, Per
man
ent
80
08
07
10
80
16
TOTA
L90
32
9522
822
084
120
2
HUMAN RESOURCE MANAGEMENT - SECTION 5

227
Occ
upat
ion
Cat
egor
yM
ale
Fem
ale
Tota
l
Afr
ican
Col
oure
dIn
dian
Tota
l Bla
ckW
hite
Afr
ican
Col
oure
dIn
dian
Tota
l Bla
ckW
hite
Empl
oyee
s w
ith d
isab
ilitie
s 0
00
00
00
00
00
TAB
LE 5
.4 P
rom
otio
n
Occ
upat
ion
Ban
dM
ale
Fem
ale
Tota
l
Afr
ican
Col
oure
dIn
dian
Tota
l Bla
ckW
hite
Afr
ican
Col
oure
dIn
dian
Tota
l Bla
ckW
hite
Top
man
agem
ent,
Perm
anen
t 0
00
00
10
01
01
Seni
or m
anag
emen
t, Pe
rman
ent
221
124
820
00
202
54Pr
ofes
sion
ally
qua
lifie
d &
expe
rienc
ed
spec
ialis
ts &
mid
dle
man
agem
ent,
Perm
anen
t
131
32
136
2810
51
010
611
281
Skille
d te
chni
cal &
aca
dem
ical
ly q
ualif
ied
wor
kers
, jun
ior m
anag
emen
t, su
perv
isor
s &f
orem
en, P
erm
anen
t
471
048
111
78
212
714
190
Sem
i-ski
lled
& di
scre
tiona
ry d
ecis
ion
mak
ing
pers
onne
l, Pe
rman
ent
514
055
387
30
900
148
Uns
kille
d &
defin
ed d
ecis
ion
mak
ing
peso
nnel
, Per
man
ent
10
01
00
00
00
1
Con
tract
(Top
man
agem
ent),
Per
man
ent
10
01
01
00
10
2C
ontra
ct (S
enio
r man
agem
ent),
Per
man
ent
10
01
10
00
00
2C
ontra
ct (P
rofe
ssio
nally
qua
lifie
d),
Perm
anen
t 2
00
20
30
03
05
Con
tract
(Ski
lled
tech
nica
l), P
erm
anen
t 1
00
10
00
00
01
TOTA
L25
79
326
941
334
122
348
2768
5
Occ
upat
ion
Cat
egor
yM
ale
Fem
ale
Tota
l
Afr
ican
Col
oure
dIn
dian
Tota
l Bla
ckW
hite
Afr
ican
Col
oure
dIn
dian
Tota
l Bla
ckW
hite
Empl
oyee
s w
ith d
isab
ilitie
s 2
00
23
20
02
07

228
TAB
LE 5
.5 T
erm
inat
ion
of e
mpl
oym
ent
Occ
upat
ion
Ban
dM
ale
Fem
ale
Tota
l
Afr
ican
Col
oure
dIn
dian
Tota
l Bla
ckW
hite
Afr
ican
Col
oure
dIn
dian
Tota
l Bla
ckW
hite
Top
man
agem
ent,
Perm
anen
t 1
00
10
00
00
01
Seni
or m
anag
emen
t, Pe
rman
ent
30
03
21
00
11
7Pr
ofes
sion
ally
qua
lifie
d &
expe
rienc
ed
spec
ialis
ts &
mid
dle
man
agem
ent,
Perm
anen
t
162
119
97
00
71
36
Prof
essi
onal
ly q
ualif
ied
& ex
perie
nced
sp
ecia
lists
& m
iddl
e m
anag
emen
t, Te
mpo
rary
00
00
10
00
00
1
Skille
d te
chni
cal &
aca
dem
ical
ly q
ualif
ied
wor
kers
, jun
ior m
anag
emen
t, su
perv
isor
s &
fore
men
, Per
man
ent
20
02
03
00
34
9
Sem
i-ski
lled
& di
scre
tiona
ry d
ecis
ion
mak
ing
pers
onne
l, Pe
rman
ent
10
01
05
00
50
6
Con
tract
(Sen
ior m
anag
emen
t), P
erm
anen
t 4
00
40
10
01
05
Con
tract
(Pro
fess
iona
lly q
ualif
ied)
, Pe
rman
ent
10
01
12
10
30
5
Con
tract
(Ski
lled
tech
nica
l), P
erm
anen
t 2
00
20
40
04
06
Con
tract
(Sem
i-ski
lled)
, Per
man
ent
10
01
01
10
20
3
TOTA
L31
21
3413
242
026
679
Occ
upat
ion
Cat
egor
yM
ale
Fem
ale
Tota
l
Afr
ican
Col
oure
dIn
dian
Tota
l Bla
ckW
hite
Afr
ican
Col
oure
dIn
dian
Tota
l Bla
ckW
hite
Empl
oyee
s w
ith d
isab
ilitie
s 0
00
00
00
00
00
TAB
LE 5
.6 D
isci
plin
ary
actio
n
Dis
cipl
inar
y A
ctio
nM
ale
Fem
ale
Tota
lN
ot
Avai
labl
eA
fric
anC
olou
red
Indi
anTo
tal B
lack
Whi
teA
fric
anC
olou
red
Indi
anTo
tal B
lack
Whi
teN
umbe
r of e
mpl
oyee
s di
scip
lined
100
010
28
10
80
021
TOTA
L10
00
102
81
08
0
HUMAN RESOURCE MANAGEMENT - SECTION 5

229
TAB
LE 5
.7 S
kills
dev
elop
men
t
Occ
upat
ion
Cat
egor
yM
ale
Fem
ale
Tota
l
Afr
ican
Col
oure
dIn
dian
Tota
l Bla
ckW
hite
Afr
ican
Col
oure
dIn
dian
Tota
l Bla
ckW
hite
Legi
slat
ors,
sen
ior 0
ffici
als
and
man
ager
s 7
20
91
30
03
013
Prof
essi
onal
s 31
01
322
311
032
268
Tech
nici
ans
& as
soci
ate
prof
essi
onal
s 41
10
422
330
033
178
Cle
rks
231
024
098
65
109
313
6Se
rvic
e &
sale
s w
orke
rs
20
02
02
00
20
4Sk
illed
agric
ultu
re &
fish
ery
wor
kers
0
00
00
00
00
00
Cra
ft &
rela
ted
trade
s w
orke
rs
00
00
00
00
00
0Pl
ant &
mac
hine
ope
rato
rs &
ass
embl
ers
00
00
00
00
00
0
Elem
enta
ry o
ccup
atio
ns
50
05
03
00
31
9
TOTA
L 10
94
111
45
170
75
182
730
8
Occ
upat
ion
Cat
egor
yM
ale
Fem
ale
Tota
l
Afr
ican
Col
oure
dIn
dian
Tota
l Bla
ckW
hite
Afr
ican
Col
oure
dIn
dian
Tota
l Bla
ckW
hite
Empl
oyee
s w
ith d
isab
ilitie
s 0
00
00
00
00
00
TAB
LE 6
.1 P
erfo
rman
ce re
war
ds b
y ra
ce, g
ende
r and
dis
abili
ty
Dem
ogra
phic
sN
umbe
r of
Ben
efic
iarie
sTo
tal E
mpl
oym
ent
Perc
enta
ge o
f Tot
al
Empl
oym
ent
Cos
t (R
'000
)Av
erag
e C
ost p
er
Ben
efic
iary
(R)
Afric
an, F
emal
e 30
260
949
.63,
102
10,2
72Af
rican
, Mal
e 22
353
042
.13,
183
14,2
72As
ian,
Fem
ale
23
66.7
2010
,214
Asia
n, M
ale
16
16.7
2424
,084
Col
oure
d, F
emal
e 14
1877
.811
17,
910
Col
oure
d, M
ale
1015
66.7
105
10,4
98To
tal B
lack
, Fem
ale
318
630
50.5
3,23
310
,167
Tota
l Bla
ck, M
ale
234
551
42.5
3,31
214
,152
Whi
te, F
emal
e 58
6195
.160
810
,489
Whi
te, M
ale
5610
155
.41,
287
22,9
78Em
ploy
ees
with
a d
isab
ility
77
100.
080
11,3
93
TOTA
L 67
31,
350
49.9
8,52
012
,659

230
TAB
LE 6
.2 P
erfo
rman
ce re
war
ds b
y sa
lary
ban
d fo
r per
sonn
el b
elow
sen
ior m
anag
emen
t ser
vice
Sala
ry B
and
Num
ber o
f B
enef
icia
ries
Tota
l Em
ploy
men
tPe
rcen
tage
of T
otal
Em
ploy
men
tC
ost (
R'0
00)
Aver
age
Cos
t per
B
enef
icia
ry (R
)Sk
illed
(Lev
els
3-5)
14
624
260
.361
34,
199
Hig
hly
skille
d pr
oduc
tion
(Lev
els
6-8)
20
633
761
.11,
434
6,96
1H
ighl
y sk
illed
supe
rvis
ion
(Lev
els
9-12
) 28
352
953
.54,
926
17,4
06C
ontra
ct (L
evel
s 3-
5)
043
00
0C
ontra
ct (L
evel
s 6-
8)
233
6.1
168,
000
Con
tract
(Lev
els
9-12
) 6
4613
.015
325
,500
Perio
dica
l rem
uner
atio
n 0
860
00
Abno
rmal
app
oint
men
t 0
462
00
0
TOTA
L64
31,
778
36.2
7,14
211
,107
* Onl
y le
vels
bel
ow
SMS
* Inc
lusi
ve o
f abn
orm
al a
ppoi
ntm
ents
TAB
LE 6
.3 P
erfo
rman
ce re
war
ds b
y cr
itica
l occ
upat
ion
Crit
ical
Occ
upat
ions
Num
ber o
f B
enef
icia
ries
Tota
l Em
ploy
men
tPe
rcen
tage
of T
otal
Em
ploy
men
tC
ost (
R'0
00)
Aver
age
Cos
t per
B
enef
icia
ry (R
)Ad
min
istra
tive
rela
ted
pers
onne
l73
131
55.7
1,11
015
,205
Agric
ultu
re, a
nim
al, o
cean
ogra
phy,
fore
stry
& o
ther
sci
ence
s pe
rson
nel
43
133.
336
9,00
0Bi
olog
ists
, bot
anis
ts, z
oolo
gist
s &
rela
ted
prof
essi
onal
s 12
6717
.917
414
,500
Car
togr
aphe
rs &
sur
veyo
rs
22
100.
020
10,0
00C
lean
ers
in o
ffice
s, w
orks
hops
, hos
pita
ls, e
tc
1317
76.5
433,
308
Clie
nt in
form
cle
rks
(sw
itchb
oard
, rec
eptio
n, in
form
atio
n cl
erks
) 11
1573
.348
4,36
4C
omm
unic
atio
n &
info
rmat
ion
rela
ted
pers
onne
l6
1060
.010
116
,833
Econ
omis
ts
1740
42.5
320
18,8
24En
gine
erin
g sc
ienc
es re
late
d pr
ofes
sion
als
02
00
0Fi
nanc
e &
econ
omic
s re
late
d pr
ofes
sion
als
510
50.0
126
25,2
00Fi
nanc
e &
rela
ted
prof
essi
onal
s 9
2240
.911
412
,667
Fina
nce
cler
ks &
cre
dit c
ontro
llers
12
2646
.258
4,83
3Fo
od s
ervi
ces
aide
s &
wai
ters
2
120
0.0
84,
000
Gen
eral
lega
l adm
inis
tratio
n &
rela
ted
prof
essi
onal
s 1
333
.310
10,0
00H
ead
of d
epar
tmen
t/chi
ef e
xecu
tive
offic
er
22
100.
023
811
9,00
0H
uman
reso
urce
s &
orga
nisa
tiona
l dev
elop
men
t & re
late
d pr
ofes
sion
als
3444
77.3
511
15,0
29H
uman
reso
urce
s cl
erks
12
2450
.058
4,83
3H
uman
reso
urce
s re
late
d pe
rson
nel
11
100.
015
15,0
00In
form
atio
n te
chno
logy
rela
ted
pers
onne
l4
757
.156
14,0
00La
ngua
ge p
ract
ition
ers,
inte
rpre
ters
& o
ther
com
mun
unic
atio
n pe
rson
nel
35
60.0
299,
667
Lega
l rel
ated
pro
fess
iona
ls2
450
.050
25,0
00Li
brar
ians
& re
late
d pr
ofes
sion
als
03
00
0
HUMAN RESOURCE MANAGEMENT - SECTION 5

231
Crit
ical
Occ
upat
ions
Num
ber o
f B
enef
icia
ries
Tota
l Em
ploy
men
tPe
rcen
tage
of T
otal
Em
ploy
men
tC
ost (
R'0
00)
Aver
age
Cos
t per
B
enef
icia
ry (R
)Li
brar
y, m
ail &
rela
ted
cler
ks
4162
66.1
195
4,75
6Lo
gist
ical
sup
port
pers
onne
l 8
1457
.152
6,50
0M
ater
ial-r
ecor
ding
&d
trans
port
cler
ks
1236
33.3
645,
333
Mes
seng
ers,
por
ters
& d
eliv
erer
s 7
1258
.328
4,00
0N
atur
al s
cien
ces
rela
ted
pers
onne
l62
139
44.6
1,01
516
,371
Oth
er a
dmin
istra
tive
& re
late
d cl
erks
& o
rgan
iser
s 72
9476
.641
15,
708
Oth
er a
dmin
istra
tive,
pol
icy
& re
late
d of
ficer
s 32
6053
.330
59,
531
Oth
er in
form
atio
n te
chno
logy
per
sonn
el
621
28.6
6110
,167
Oth
er m
achi
ne o
pera
tors
2
210
0.0
84,
000
Oth
er o
ccup
atio
ns
02
00
0R
ank:
Unk
now
n 0
20
00
Ris
k m
anag
emen
t & s
ecur
ity s
ervi
ces
pers
onne
l2
1315
.420
10,0
00Sa
fety
, hea
lth &
qua
lity
insp
ecto
rs
7516
645
.21,
547
20,6
27Se
cret
arie
s &
othe
r key
boar
d op
erat
ing
cler
ks
6510
462
.542
36,
508
Secu
rity
offic
ers
3068
44.1
133
4,43
3Se
nior
man
ager
s 26
9926
.31,
018
39,1
54So
cial
wor
k &
rela
ted
prof
essi
onal
s 0
10
00
Trad
e/in
dust
ry a
dvis
ers
& ot
her r
elat
ed p
rofe
ssio
nals
8
1650
.011
314
,125
TOTA
L67
31,
350
49.9
8,51
812
,657
TAB
LE 6
.4 P
erfo
rman
ce re
late
d re
war
ds (c
ash
bonu
s) b
y sa
lary
ban
d fo
r sen
ior m
anag
emen
t ser
vice
SMS
Ban
dN
umbe
r of
Ben
efic
iarie
sTo
tal
Empl
oym
ent
Perc
enta
ge o
f To
tal E
mpl
oym
ent
Cos
t (R
'000
)Av
erag
e C
ost p
er
Ben
efic
iary
(R)
% o
f SM
S W
age
Bill
Pers
onne
l Cos
t SM
S (R
'000
)Ba
nd A
24
8528
.292
63,
858
1.7
54,7
10Ba
nd B
1
263.
856
5,60
00.
320
,807
Band
C
35
6015
85,
267
2.5
6,42
6Ba
nd D
2
450
238
11,9
004.
65,
221
TOTA
L30
120
251,
378
4,59
3.3
1.6
87,1
64

232
TAB
LE 7
.1 F
orei
gn w
orke
rs b
y sa
lary
ban
d
Sala
ry B
and
Empl
oym
ent
at B
egin
ning
Pe
riod
Perc
enta
ge o
f To
tal
Empl
oym
ent
at E
nd o
f Pe
riod
Perc
enta
ge o
f To
tal
Cha
nge
in
Empl
oym
ent
Perc
enta
ge o
f To
tal
Tota
l Em
ploy
men
t at
Beg
inni
ng
of P
erio
d
Tota
l Em
ploy
men
t at
End
of
Perio
d
Tota
l C
hang
e in
Em
ploy
men
t
Hig
hly
skille
d su
perv
isio
n (L
evel
s 9-
12)
133
.32
50.0
110
0.0
34
1
Perio
dica
l rem
uner
atio
n 1
33.3
250
.01
100.
03
41
Abno
rmal
app
oint
men
t 1
33.3
00
-1-1
00.0
34
1
TOTA
L3
100.
04
100.
01
100.
03
41
TAB
LE 7
.2 F
orei
gn w
orke
rs b
y m
ajor
occ
upat
ion
Maj
or O
ccup
atio
nEm
ploy
men
t at
Beg
inni
ng
Perio
d
Perc
enta
ge o
f To
tal
Empl
oym
ent
at E
nd o
f Pe
riod
Perc
enta
ge o
f To
tal
Cha
nge
in
Empl
oym
ent
Perc
enta
ge o
f To
tal
Tota
l Em
ploy
men
t at
Beg
inni
ng
of P
erio
d
Tota
l Em
ploy
men
t at
End
of
Perio
d
Tota
l Cha
nge
in
Empl
oym
ent
Oth
er o
ccup
atio
ns
266
.72
500
03
41
Prof
essi
onal
s &
man
ager
s 0
01
251
100.
03
41
Tech
nici
ans
& as
soci
ated
pr
ofes
sion
als
133
.31
250
03
41
TOTA
L3
100.
04
100.
01
100.
03
41
TAB
LE 8
.1 S
ick
leav
e fo
r Jan
uary
to D
ecem
ber 2
009
Sala
ry B
and
Tota
l Day
s%
Day
s w
ith
Med
ical
C
ertif
icat
ion
Num
ber o
f Em
ploy
ees
usin
g Si
ck L
eave
% o
f Tot
al
Empl
oyee
s us
ing
Sick
Lea
ve
Aver
age
Day
s pe
r Em
ploy
eeEs
timat
ed C
ost
(R'0
00)
Tota
l num
ber o
f Em
ploy
ees
usin
g Si
ck L
eave
Tota
l num
ber o
f da
ys w
ith m
edic
al
cert
ifica
tion
Skille
d (L
evel
s 3-
5)
1,19
284
.016
719
.77
319
848
1,00
1H
ighl
y sk
illed
prod
uctio
n (L
evel
s 6-
8)
1,47
374
.824
428
.86
659
848
1,10
2
Hig
hly
skille
d su
perv
isio
n (L
evel
s 9-
12)
2,06
580
.933
739
.76
2,33
584
81,
671
Seni
or m
anag
emen
t (Le
vels
13-
16)
292
81.5
556.
55
732
848
238
Con
tract
(Lev
els
3-5)
79
88.6
172.
05
2084
870
Con
tract
(Lev
els
6-8)
81
81.5
182.
15
3884
866
Con
tract
(Lev
els
9-12
) 28
82.1
70.
84
3784
823
Con
tract
(Lev
els
13-1
6)
1788
.23
0.4
647
848
15
TOTA
L5,
227
80.1
848
100.
06
4,18
784
84,
186
HUMAN RESOURCE MANAGEMENT - SECTION 5

233
TAB
LE 8
.2 D
isab
ility
leav
e (te
mpo
rary
and
per
man
ent e
mpl
oyee
s) fo
r Jan
uary
to D
ecem
ber 2
009
Sala
ry B
and
Tota
l Day
s%
Day
s w
ith
Med
ical
C
ertif
icat
ion
Num
ber o
f Em
ploy
ees
usin
g D
isab
ility
Le
ave
% o
f Tot
al
Empl
oyee
s us
ing
Dis
abili
ty
Leav
e
Aver
age
Day
s pe
r Em
ploy
eeEs
timat
ed C
ost
(R'0
00)
Tota
l num
ber
of d
ays
with
m
edic
al
cert
ifica
tion
Tota
l num
ber
of E
mpl
oyee
s us
ing
Dis
abili
ty
Leav
eSk
illed
(Lev
els
3-5)
28
210
0.0
933
.331
7128
227
Hig
hly
skille
d pr
oduc
tion
(Lev
els
6-8)
98
100.
07
25.9
1444
9827
Hig
hly
skille
d su
perv
isio
n (L
evel
s 9-
12)
186
100.
010
37.0
1924
118
627
Seni
or m
anag
emen
t (Le
vels
13-
16)
510
0.0
13.
75
125
27
TOTA
L57
110
0.0
2710
0.0
2136
857
127
TAB
LE 8
.3 A
nnua
l Lea
ve fo
r Jan
uary
to D
ecem
ber 2
009
Sala
ry B
and
Tota
l Day
s Ta
ken
Aver
age
days
per
Em
ploy
eeN
umbe
r of E
mpl
oyee
s w
ho
took
leav
eSk
illed
(Lev
els
3-5)
46
36.8
419
243
Hig
hly
skille
d pr
oduc
tion
(Lev
els
6-8)
67
97.0
019
353
Hig
hly
skille
d su
perv
isio
n (L
evel
s 9-
12)
1059
3.92
1956
8Se
nior
man
agem
ent (
Leve
ls 1
3-16
) 22
79.0
019
117
Con
tract
(Lev
els
3-5)
42
1.00
1138
Con
tract
(Lev
els
6-8)
37
5.00
1135
Con
tract
(Lev
els
9-12
) 46
2.00
1144
Con
tract
(Lev
els
13-1
6)
74.0
08
9
TOTA
L25
,638
.76
181,
407
TAB
LE 8
.4 -
Cap
ped
leav
e fo
r Jan
uary
to D
ecem
ber 2
009
Sala
ry B
and
Tota
l day
s of
ca
pped
leav
e ta
ken
Aver
age
num
ber
of d
ays
take
n pe
r em
ploy
ee
Aver
age
capp
ed
leav
e pe
r em
ploy
ee
as a
t 31
Dec
embe
r 20
08
Num
ber o
f Em
ploy
ees
who
to
ok C
appe
d le
ave
Tota
l num
ber o
f ca
pped
leav
e av
aila
ble
at 3
1 D
ecem
ber 2
008
Num
ber o
f Em
ploy
ees
as a
t 31
Dec
embe
r 200
8
Skille
d (L
evel
s 3-
5)
223
268
1,18
346
Hig
hly
skille
d pr
oduc
tion
(Lev
els
6-8)
55
417
141,
353
80H
ighl
y sk
illed
supe
rvis
ion
(Lev
els
9-12
) 53
441
134,
540
111
Seni
or m
anag
emen
t (Le
vels
13-
16)
367
495
1,36
728
TOTA
L16
64
3240
8,44
326
5
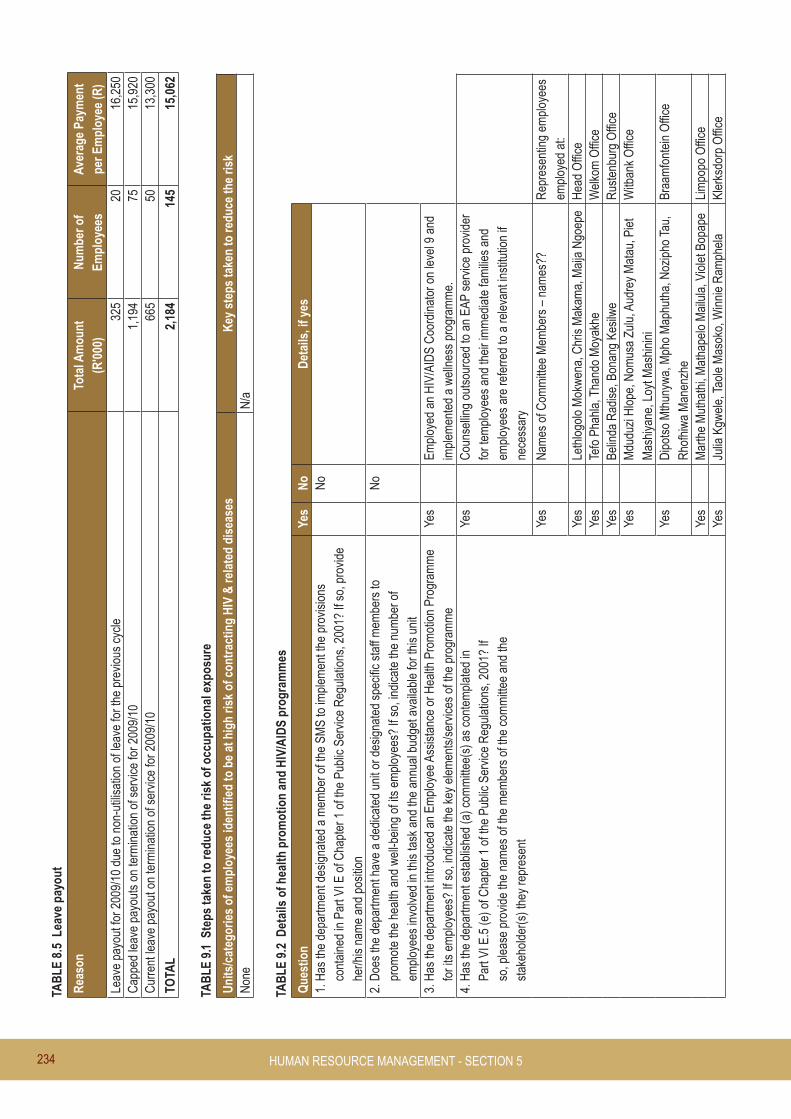
234
TAB
LE 8
.5 L
eave
pay
out
Rea
son
Tota
l Am
ount
(R
'000
)N
umbe
r of
Empl
oyee
sAv
erag
e Pa
ymen
t pe
r Em
ploy
ee (R
)Le
ave
payo
ut fo
r 200
9/10
due
to n
on-u
tilis
atio
n of
leav
e fo
r the
pre
viou
s cy
cle
325
2016
,250
Cap
ped
leav
e pa
yout
s on
term
inat
ion
of s
ervi
ce fo
r 200
9/10
1,
194
7515
,920
Cur
rent
leav
e pa
yout
on
term
inat
ion
of s
ervi
ce fo
r 200
9/10
66
550
13,3
00
TOTA
L2,
184
145
15,0
62
TAB
LE 9
.1 S
teps
take
n to
redu
ce th
e ris
k of
occ
upat
iona
l exp
osur
e
Uni
ts/c
ateg
orie
s of
em
ploy
ees
iden
tifie
d to
be
at h
igh
risk
of c
ontr
actin
g H
IV &
rela
ted
dise
ases
Key
ste
ps ta
ken
to re
duce
the
risk
Non
eN
/a
TAB
LE 9
.2 D
etai
ls o
f hea
lth p
rom
otio
n an
d H
IV/A
IDS
prog
ram
mes
Que
stio
nYe
sN
oD
etai
ls, i
f yes
1. H
as th
e de
partm
ent d
esig
nate
d a
mem
ber o
f the
SM
S to
impl
emen
t the
pro
visi
ons
cont
aine
d in
Par
t VI E
of C
hapt
er 1
of t
he P
ublic
Ser
vice
Reg
ulat
ions
, 200
1? If
so,
pro
vide
he
r/his
nam
e an
d po
sitio
n
No
2. D
oes
the
depa
rtmen
t hav
e a
dedi
cate
d un
it or
des
igna
ted
spec
ific
staf
f mem
bers
to
prom
ote
the
heal
th a
nd w
ell-b
eing
of i
ts e
mpl
oyee
s? If
so,
indi
cate
the
num
ber o
f em
ploy
ees
invo
lved
in th
is ta
sk a
nd th
e an
nual
bud
get a
vaila
ble
for t
his
unit
No
3. H
as th
e de
partm
ent i
ntro
duce
d an
Em
ploy
ee A
ssis
tanc
e or
Hea
lth P
rom
otio
n Pr
ogra
mm
e fo
r its
em
ploy
ees?
If s
o, in
dica
te th
e ke
y el
emen
ts/s
ervi
ces
of th
e pr
ogra
mm
e Ye
sEm
ploy
ed a
n H
IV/A
IDS
Coo
rdin
ator
on
leve
l 9 a
nd
impl
emen
ted
a w
elln
ess
prog
ram
me.
4.
Has
the
depa
rtmen
t est
ablis
hed
(a) c
omm
ittee
(s) a
s co
ntem
plat
ed in
Par
t VI E
.5 (e
) of C
hapt
er 1
of t
he P
ublic
Ser
vice
Reg
ulat
ions
, 200
1? If
so,
ple
ase
prov
ide
the
nam
es o
f the
mem
bers
of t
he c
omm
ittee
and
the
s
take
hold
er(s
) the
y re
pres
ent
Yes
C
ouns
ellin
g ou
tsou
rced
to a
n EA
P se
rvic
e pr
ovid
er
for t
empl
oyee
s an
d th
eir i
mm
edia
te fa
milie
s an
d em
ploy
ees
are
refe
rred
to a
rele
vant
inst
itutio
n if
nece
ssar
y
Yes
Nam
es o
f Com
mitt
ee M
embe
rs –
nam
es??
Rep
rese
ntin
g em
ploy
ees
empl
oyed
at:
Yes
Leth
logo
lo M
okw
ena,
Chr
is M
akam
a, M
aija
Ngo
epe
Hea
d O
ffice
Ye
sTe
fo P
hahl
a, T
hand
o M
oyak
heW
elko
m O
ffice
Yes
Belin
da R
adis
e, B
onan
g Ke
silw
eR
uste
nbur
g O
ffice
Yes
Mdu
duzi
Hlo
pe, N
omus
a Zu
lu, A
udre
y M
atau
, Pie
t M
ashi
yane
, Loy
t Mas
hini
niW
itban
k O
ffice
Yes
Dip
otso
Mth
unyw
a, M
pho
Map
huth
a, N
ozip
ho T
au,
Rho
fhiw
a M
anen
zhe
Braa
mfo
ntei
n O
ffice
Yes
Mar
the
Mut
hath
i, M
atha
pelo
Mai
lula
, Vio
let B
opap
eLi
mpo
po O
ffice
Yes
Julia
Kgw
ele,
Tao
le M
asok
o, W
inni
e R
amph
ela
Kler
ksdo
rp O
ffice
HUMAN RESOURCE MANAGEMENT - SECTION 5

235
Yes
Non
tsin
diso
Tol
wan
a, Z
imkh
itha
Tyal
aPo
rt El
izab
eth
Offi
ceYe
sN
atas
ha W
illiam
sC
ape
Tow
n O
ffice
Yes
Pul
e N
gaqe
la, K
hath
u M
phap
huli
Kim
berle
y O
ffice
Yes
Nko
saza
na M
asek
o, S
ibon
ele
Mkh
ize,
Mus
a Zi
khal
iKw
aZul
u N
atal
Offi
ce5.
Has
the
depa
rtmen
t rev
iew
ed it
s em
ploy
men
t pol
icie
s an
d pr
actic
es to
ens
ure
that
thes
e do
no
t unf
airly
dis
crim
inat
e ag
ains
t em
ploy
ees
on th
e ba
sis
of th
eir H
IV s
tatu
s? If
so,
list
the
empl
oym
ent p
olic
ies/
prac
tices
revi
ewed
Yes
Po
licy
revi
ew p
roce
ss c
urre
ntly
und
erw
ay
6. H
as th
e de
partm
ent i
ntro
duce
d m
easu
res
to p
rote
ct H
IV-p
ositi
ve e
mpl
oyee
s or
thos
e pe
rcei
ved
to b
e H
IV-p
ositi
ve fr
om d
iscr
imin
atio
n? If
so,
list
the
key
elem
ents
of t
hese
m
easu
res
Yes
R
elev
ant p
olic
y de
velo
ped
and
impl
emen
ted
and
an H
IV-p
ositi
ve o
vers
eer e
nsur
es m
ange
men
t co
mpl
ianc
e w
ith th
e po
licy
7. D
oes
the
depa
rtmen
t enc
oura
ge it
s em
ploy
ees
to u
nder
go v
olun
tary
cou
nsel
ling
and
test
ing?
If s
o, li
st th
e re
sults
ach
ieve
d Ye
s
VCT
done
twic
e an
nual
ly; 2
17 H
IV-p
ositi
ve
empl
oyee
s of
who
m 7
0% h
ave
volu
ntar
ily d
iscl
osed
th
eir s
tatu
s
8. H
as th
e de
partm
ent d
evel
oped
mea
sure
s/in
dica
tors
to m
onito
r & e
valu
ate
the
impa
ct o
f its
he
alth
pro
mot
ion
prog
ram
me?
If s
o, li
st th
ese
mea
sure
s/in
dica
tors
.
No
TAB
LE 1
0.1
Col
lect
ive
agre
emen
ts
Subj
ect M
atte
rD
ate
Com
pens
atio
n fo
rove
rtim
e23
/03/
09Jo
b de
scrip
tion
and
job
eval
uatio
n21
/05/
09Em
ploy
men
t rel
atio
ns m
anag
emen
t23
/10/
09In
tegr
ated
fram
ewor
k on
the
poss
ible
impa
ct o
f the
FIF
A So
ccer
Wor
ld C
up24
/11/
09M
atch
ing
and
plac
ing
guid
elin
es24
/11/
09Fa
cilit
ies
man
agem
ent p
olic
y18
/02/
10
TAB
LE 1
0.2
Mis
cond
uct a
nd d
isci
plin
ary
hear
ings
fina
lised
Out
com
es o
f dis
cipl
inar
y he
arin
gsN
umbe
rPe
rcen
tage
of T
otal
Tota
lFi
nalis
ed17
80.9
521
Pend
ing
419
.05
21
TOTA
L21
100.
0021
TAB
LE 1
0.3
Mis
cond
uct a
nd d
isci
plin
ary
hear
ings
Type
of m
isco
nduc
tN
umbe
r of c
ases
com
plet
edPe
rcen
tage
of T
otal
Tota
lIn
subo
rdin
atio
n2
9.52
21Ab
sent
eeis
m2
9.52
21U
se o
f vul
gar l
angu
age
14.
7621
Poor
Wor
k Pe
rform
ance
29.
5221
Mis
use
of G
G v
ehic
le1
4.76
21

236
Type
of m
isco
nduc
tN
umbe
r of c
ases
com
plet
edPe
rcen
tage
of T
otal
Tota
lFa
ilure
to fo
llow
pro
cedu
re1
4.76
21N
on-s
ubm
issi
on o
f log
shee
t2
9.52
21C
orru
ptio
n/ F
raud
419
.05
21M
isre
pres
enta
tion
14.
7621
Failu
re to
sub
mitt
logs
heet
s1
4.76
21In
toxi
cate
d on
dut
y1
4.76
21U
npro
fess
iona
l con
duct
14.
7621
Actin
g w
ithou
t aut
horit
y1
4.76
21Br
ingi
ng th
e D
epar
tmen
t in
disr
eput
e1
4.76
21
TOTA
L21
100.
0021
TAB
LE 1
0.4
Gri
evan
ces
Num
ber o
f grie
vanc
es a
ddre
ssed
Num
ber
Perc
enta
ge o
f Tot
alTo
tal
Fina
lised
2288
.00
25Pe
ndin
g3
12.0
025
TOTA
L25
100.
0025
TAB
LE 1
0.5
Dis
pute
s
Num
ber o
f dis
pute
s ad
dres
sed
Num
ber
% o
f tot
alU
phel
d 1
100.
00D
ism
isse
d 0
0
TAB
LE 1
0.6
Str
ike
actio
n
Strik
e A
ctio
ns-
Tota
l num
ber o
f wor
k da
ys lo
st
0To
tal c
ost (
R’0
00) o
f wor
k da
ys lo
st
0Am
ount
(R’0
00) r
ecov
ered
as
a re
sult
of n
o w
ork
no p
ay
0
TAB
LE 1
0.7
Pre
caut
iona
ry s
uspe
nsio
n
Prec
autio
nary
Sus
pens
ions
-N
umbe
r of p
eopl
e su
spen
ded
6N
umbe
r of p
eopl
e w
hose
sus
pens
ion
exce
eded
30
days
5
Aver
age
num
ber o
f day
s su
spen
ded
148
Cos
t (R
’000
) of s
uspe
nsio
ns
777
HUMAN RESOURCE MANAGEMENT - SECTION 5

237
TAB
LE 1
1.1
Tra
inin
g ne
eds
iden
tifie
d
Occ
upat
iona
l Cat
egor
ies
Gen
der
Empl
oym
ent
Lear
ners
hips
Skill
s Pr
ogra
mm
es &
oth
er s
hort
cou
rses
Oth
er fo
rms
of tr
aini
ngTo
tal
Legi
slat
ors,
sen
ior o
ffici
als
& m
anag
ers
Fem
ale
280
130
13M
ale
610
120
12
Prof
essi
onal
s Fe
mal
e 12
40
108
010
8M
ale
104
010
80
108
Tech
nici
ans
& as
soci
ate
prof
essi
onal
s Fe
mal
e 17
60
189
018
9M
ale
268
026
30
263
Cle
rks
Fem
ale
260
02
02
Mal
e 77
06
06
Serv
ice
& sa
les
wor
kers
Fe
mal
e 24
032
032
Mal
e 53
042
042
Skille
d ag
ricul
ture
& fi
sher
y w
orke
rs
Fem
ale
00
00
0M
ale
00
00
0
Cra
ft &
rela
ted
trade
s w
orke
rs
Fem
ale
00
00
0M
ale
00
00
0
Plan
t & m
achi
ne o
pera
tors
& a
ssem
bler
s Fe
mal
e 2
00
00
Mal
e 0
00
00
Elem
enta
ry o
ccup
atio
ns
Fem
ale
2310
10
11M
ale
104
40
8
Gen
der s
ub to
tals
Fe
mal
e 63
710
345
035
5M
ale
573
443
50
439
TOTA
L
1,21
014
780
079
4
TAB
LE 1
1.2
Tra
inin
g pr
ovid
ed
Occ
upat
iona
l Cat
egor
ies
Gen
der
Empl
oym
ent
Lear
ners
hips
Skill
s Pr
ogra
mm
es &
oth
er s
hort
cou
rses
Oth
er fo
rms
of tr
aini
ngTo
tal
Legi
slat
ors,
sen
ior o
ffici
als
& m
anag
ers
Fem
ale
280
30
3M
ale
610
102
12
Prof
essi
onal
s Fe
mal
e 12
40
3420
54M
ale
104
034
3670
Tech
nici
ans
& as
soci
ate
prof
essi
onal
s Fe
mal
e 17
60
3439
73M
ale
268
044
3276
Cle
rks
Fem
ale
260
011
237
149
Mal
e 77
024
1741
Serv
ice
& sa
les
wor
kers
Fe
mal
e 24
02
13
Mal
e 53
02
24

238
Skille
d ag
ricul
ture
& fi
sher
y w
orke
rs
Fem
ale
00
00
0M
ale
00
00
0
Occ
upat
iona
l Cat
egor
ies
Gen
der
Empl
oym
ent
Lear
ners
hips
Skill
s Pr
ogra
mm
es &
oth
er s
hort
cou
rses
Oth
er fo
rms
of tr
aini
ngTo
tal
Cra
ft &
rela
ted
trade
s w
orke
rs
Fem
ale
00
00
0M
ale
00
00
0
Plan
t & m
achi
ne o
pera
tors
and
ass
embl
ers
Fem
ale
20
00
0M
ale
00
00
0
Elem
enta
ry o
ccup
atio
ns
Fem
ale
2310
412
714
1M
ale
104
586
95
Gen
der s
ub-to
tals
Fe
mal
e 63
710
189
224
423
Mal
e 57
34
119
175
298
TOTA
L
1,21
014
308
399
721
TAB
LE 1
2.1
Inju
ry o
n du
ty
Nat
ure
of in
jury
on
duty
Num
ber
% o
f tot
alR
equi
red
basi
c m
edic
al a
ttent
ion
only
3
75Te
mpo
rary
tota
l dis
able
men
t 1
25Pe
rman
ent d
isab
lem
ent
00
Fata
l 0
0
TOTA
L 4
TAB
LE 1
3.1
Rep
ort o
n co
nsul
tant
app
oint
men
ts u
sing
app
ropr
iate
d fu
nds
Proj
ect T
itle
Tota
l num
ber o
f co
nsul
tant
s th
at w
orke
d on
th
e pr
ojec
t
Dur
atio
n: W
ork
days
Con
trac
t val
ue in
Ran
d
Job
eval
uatio
n of
pos
ts fo
r DM
E fo
r a p
erio
d of
two
year
s3
730
R 2
,000
,000
.00
Appo
intm
ent o
f Car
eway
s G
roup
for t
he E
mpl
oyee
Ass
ista
nt P
rogr
amm
e (E
AP) f
or D
MEf
or a
pe
riod
of th
ree
year
s4
1,09
5R
1,4
85,0
00.0
0
Appo
intm
ent o
f ser
vice
pro
vide
r for
the
deve
lopm
ent o
f the
Bui
sine
ss P
lan
for t
he S
A R
enew
able
En
ergy
Cer
tific
ate
issu
eing
bod
y3
90R
693
,970
.00
The
inve
stig
atio
n in
to th
e ap
plic
atio
n of
a fi
xed
mon
etar
y re
tail
mar
gin
on th
e si
ngle
max
imum
na
tiona
l ret
ail p
rice
for i
llum
inat
ing
para
ffin
290
R 3
97,0
00.0
0
Appo
intm
ent o
f ser
vice
pro
vide
r to
cond
uct f
lu v
acci
natio
n, c
hole
ster
ol d
iabe
tes,
hig
h bl
ood
pres
sure
scr
eeni
ng o
f DM
E em
ploy
ees
for a
per
iod
of tw
o ye
ars
373
0R
200
,000
.00
Proj
ect M
anag
emen
t Tra
inin
g N
QF
Leve
l 05
for D
ME
offic
ials
690
R 9
56,2
50.0
0Ap
prov
al fo
r the
Hea
lth R
isk
Man
ager
for D
ME
- Pro
activ
e H
ealth
Sol
utio
ns4
1095
R 1
55,8
62.7
2Se
cret
aria
l Dev
elop
men
t Tra
inin
g Pr
ogra
mm
e6
183
R 1
,224
,000
.00
The
prod
uctio
n la
yout
/des
ign
and
prin
ting
of th
e D
ME
Annu
al R
epor
t3
365
R 7
41,4
70.8
6
HUMAN RESOURCE MANAGEMENT - SECTION 5

239
Appo
intm
ent o
f a s
ervi
ce p
rovi
der f
or th
e ha
ndlin
g of
ver
ifica
tion
of q
ualif
icat
ion
and
cred
it ch
ecks
fo
r the
DM
E fo
r a p
erio
d of
two
year
s4
730
R 3
9,00
0.00
Proj
ect T
itle
Tota
l num
ber o
f co
nsul
tant
s th
at w
orke
d on
th
e pr
ojec
t
Dur
atio
n: W
ork
days
Con
trac
t val
ue in
Ran
d
Appo
intm
ent o
f a s
ervi
ce p
rovi
der t
o de
velo
p th
e bu
sine
ss p
lan
and
budg
et fo
r the
est
ablis
hmen
t of
the
Nat
iona
l Rad
io A
ctiv
e W
aste
Dis
posa
l Ins
titut
e (N
RW
DI)
260
R 4
56,0
00.0
0
Appo
intm
ent o
f a s
ervi
ce p
rovi
der t
o fa
cilit
ate
the
deve
lopm
ent o
f fra
ud ri
sk p
rofil
e fo
r the
DM
E3
30R
257
,325
.00
The
rene
wal
of t
he m
aint
enan
ce a
nd s
uppo
rt co
ntra
ct3
365
R 5
06,1
60.0
0
Tota
l num
ber o
f pro
ject
sTo
tal i
ndiv
idua
l con
sulta
nts
Tota
l dur
atio
n: W
ork
days
Tota
l con
trac
t val
ue in
R
and
1346
5,65
3R
9,1
12,0
38.5
8
TAB
LE 1
3.2
Ana
lysi
s of
con
sulta
nt a
ppoi
ntm
ents
usi
ng a
ppro
pria
ted
fund
s re
latin
g to
HD
Is
Proj
ect T
itle
Perc
enta
ge o
wne
rshi
p by
H
DI g
roup
sPe
rcen
tage
man
agem
ent
by H
DI g
roup
sN
umbe
r of C
onsu
ltant
s fr
om H
DI g
roup
s th
at w
ork
on th
e pr
ojec
tJo
b ev
alua
tion
of p
osts
for D
ME
for a
per
iod
of tw
o ye
ars
100
100
3Ap
poin
tmen
t of C
arew
ays
Gro
up fo
r the
Em
ploy
ee A
ssis
tant
Pro
gram
me
(EAP
) for
DM
E fo
r a
perio
d of
thre
e ye
ars
2626
4
Appo
intm
ent o
f ser
vice
pro
vide
r for
the
deve
lopm
ent o
f the
bus
ines
s pl
an fo
r the
SA
Ren
ewab
le
Ener
gy C
ertif
icat
e is
suei
ng b
ody
6767
3
The
inve
stig
atio
n in
to th
e ap
plic
atio
n of
a fi
xed
mon
etar
y re
tail
mar
gin
on th
e si
ngle
max
imum
na
tiona
l ret
ail p
rice
for i
llum
inat
ing
para
ffin
00
2
Appo
intm
ent o
f ser
vice
pro
vide
r to
cond
uct f
lu v
acci
natio
n, c
hole
ster
ol d
iabe
tes,
hig
h bl
ood
pres
sure
scr
eeni
ng o
f DM
E em
ploy
ees
for a
per
iod
of tw
o ye
ars
2626
4
Proj
ect M
anag
emen
t Tra
inin
g N
QF
Leve
l 5 fo
r DM
E of
ficia
ls0
06
Appr
oval
for t
he H
ealth
Ris
k M
anag
er fo
r DM
E - P
roac
tive
Hea
lth S
olut
ions
0
4
Secr
etar
ial D
evel
opm
ent T
rain
ing
Prog
ram
me
00
t6Th
e pr
oduc
tion
layo
ut/d
esig
n an
d pr
intin
g of
the
DM
E An
nual
Rep
ort
5050
4Ap
poin
tmen
t of a
ser
vice
pro
vide
r for
the
hand
ling
of v
erifi
catio
n of
qua
lific
atio
n an
d cr
edit
chec
ks
for t
he D
ME
for a
per
iod
of tw
o ye
ars
1313
2
Appo
intm
ent o
f a s
ervi
ce p
rovi
der t
o de
velo
p th
e bu
sine
ss p
lan
and
budg
et fo
r the
est
ablis
hmen
t of
the
Nat
iona
l Rad
io A
ctiv
e W
aste
Dis
posa
l Ins
titut
e (N
RW
DI)
2020
3
Appo
intm
ent o
f a s
ervi
ce p
rovi
der t
o fa
cilit
ate
the
deve
lopm
ent o
f fra
ud ri
sk p
rofil
e fo
r the
DM
E50
503
The
rene
wal
of t
he m
aint
enan
ce a
nd s
uppo
rt co
ntra
ct30
303

240
TAB
LE 1
3.3
Rep
ort o
n co
nsul
tant
app
oint
men
ts u
sing
don
or fu
nds
Proj
ect T
itle
Tota
l num
ber o
f con
sulta
nts
that
wor
ked
on th
e pr
ojec
tD
urat
ion:
Wor
k da
ysD
onor
and
Con
trac
t val
ue in
Ran
d
RSA
300
116
1 ye
arR
4.8
milli
on
Tota
l num
ber o
f pro
ject
sTo
tal i
ndiv
idua
l con
sulta
nts
Tota
l dur
atio
n: W
ork
days
Tota
l con
trac
t val
ue in
Ran
d1
161
year
R 4
.8 m
illion
TAB
LE 1
3.4
Ana
lysi
s of
con
sulta
nt a
ppoi
ntm
ents
usi
ng d
onor
fund
s re
latin
g to
HD
Is
Proj
ect T
itle
Perc
enta
ge o
wne
rshi
p by
HD
I gro
ups
Perc
enta
ge m
anag
emen
t by
HD
I gro
ups
Num
ber o
f Con
sulta
nts
from
HD
I gro
ups
that
wor
k on
the
proj
ect
110
0%10
0%10
HUMAN RESOURCE MANAGEMENT - SECTION 5

DEPAR
TMEN
T OF M
INER
ALS AND
ENER
GY - AN
NU
AL REPO
RT 2009/10
RP69/2010 ISBN: 978-0-621-39345-3
Department of Minerals and Energy
Private Bag x59Arcadia 0007 Tel: 012 444 3217 / 8Fax: 012 444 3160