UNLOCKING AUSTRALIA-INDIA CRITICAL MINERALS ...
100
UNLOCKING AUSTRALIA-INDIA CRITICAL MINERALS PARTNERSHIP POTENTIAL INDIA CRITICAL MINERALS DEMAND REPORT JULY 2021
-
Upload
khangminh22 -
Category
Documents
-
view
0 -
download
0
Transcript of UNLOCKING AUSTRALIA-INDIA CRITICAL MINERALS ...

UNLOCKING AUSTRALIA-INDIA
CRITICAL MINERALS PARTNERSHIP
POTENTIALINDIA CRITICAL MINERALS
DEMAND REPORT
JULY 2021

Disclaimer
Austrade
This report has been prepared by Deloitte India (Deloitte Touche Tohmatsu Limited) and the Commonwealth of Australia represented by the Australian Trade and Investment Commission (Austrade).
The report is a general overview and is not intended to provide exhaustive coverage of the topic. The information is made available on the understanding that the Commonwealth of Australia is not providing professional advice.
While care has been taken to ensure the information in this report is accurate, the Commonwealth does not accept any liability for any loss arising from reliance on the information, or from any error or omission, in the report.
Any person relying on this information does so at their own risk. The Commonwealth recommends the person exercise their own skill and care, including obtaining professional advice, in relation to their use of the information for their purposes. The Commonwealth does not endorse any company or activity referred to in the report, and does not accept responsibility for any losses suffered in connection with any company or its activities.
Copyright © Commonwealth of Australia 2021
The material in this document is licensed under a Creative Commons Attribution – 4.0 International licence, with the exception of:
• the Commonwealth Coat of Arms
• the Australian Trade and Investment Commission’s logo
• any third party material
• any material protected by a trade mark
• any images and photographs.
More information on this CC BY licence is set out at the creative commons website: https://creativecommons.org/licenses/by/4.0/legalcode.
Enquiries about this licence and any use of this document can be sent to: [email protected].
Attribution
Before reusing any part of this document, including reproduction, public display, public performance, distribution, dissemination, communication, or importation, you must comply with the Attribution requirements under the CC BY licence.
Using the Commonwealth Coat of Arms
The terms of use for the Coat of Arms are available from the It’s an Honour website (itsanhonour.gov.au).
July 2021.
Deloitte
Deloitte refers to one or more of Deloitte Touche Tohmatsu Limited, a UK private company limited by guarantee (“DTTL”), its network of member firms, and their related entities. DTTL and each of its member firms are legally separate and independent entities. DTTL (also referred to as “Deloitte Global”) does not provide services to clients. Please see www.deloitte.com/about for a more detailed description of DTTL and its member firms.
This report is prepared pursuant to contract for delivery of a market study report on critical minerals market in India titled “Unlocking India-Australia critical minerals partnership potential” (the ‘Contract’) signed between Deloitte Touche Tohmatsu India Pvt. Ltd (DTTIPL) and Australian Trade and Investment Commission (Austrade) . The Contract is strictly on principal to principal basis between and exclusive to DTTILLP and Austrade and it does not in any manner creates any rights in favour of any party other than DTTILLP and Austrade.
This report is as per the scope, requirements set-out in the Contract. DTTILLP’s assessment, analysis and conclusion is limited to the scope of work as per Contract and is based on the details provided to DTTILLP during DTTILLP’s discussions with Austrade, consultations with stakeholders and data available in public domain at the time of writing this document. DTTILLP was not responsible for undertaking an audit/ verification of such information for the purpose of the exercise. The information contained in this report is selective and is subject to updating, expansion, revision and amendment. It does not, and does not purport to, contain all the information that a recipient may require.
Contents of this report should not be copied or reproduced by any third party or otherwise quoted or referred to, in whole or in part, without the prior written permission of Austrade and DTTILLP. Furthermore, DTTILLP will not be bound to discuss, explain or reply to queries raised by any agency other than Austrade. All services/ deliverables are only intended for Austrade. The mere receipt of any advice, opinions, reports or other work product by any other persons is not intended to create any duty of care, professional relationship or any present or future liability between those persons and DTTILLP. As a consequence, if copies of any advice, opinions, reports or other work product (or any information derived therefrom) are provided to others under the above exclusions, it is on the basis that DTTILLP owes no duty of care or liability to them, or any other persons who subsequently receive the same.
Sharing of this report with any third parties is only for information purpose. Such recipients are third parties vis-a-vis the Contract; accordingly, all disclaimers and protections in favour of DTTL and Deloitte Entities as relating to third parties in the Contract shall equally apply in relation to such recipients as well. The third parties do not acquire any benefits in or rights as a result of their access to the report
DTTILLP does not accept any liability or responsibility for the accuracy, reasonableness or completeness of, or for any errors, omissions or misstatements, negligent or otherwise and does not make any representation or warranty, express or implied, with respect to the information contained in this document. DTTILLP disclaims any and all liabilities including liability for losses, of any nature whatsoever, arising out of any claims which relate to or arise out of any disclosure of this report / document to any third party by Austrade. Any access to or reliance on this report/document by any other party will be at sole discretion and risk of such party alone and at no risk or liability to DTTILLP.

UnLoCKInG AUSTrALIA-InDIA CrITICAL MInErALS PArTnErSHIP PoTEnTIAL 01
CONTENTS
Acknowledgements
Austrade would like to thank Deloitte Touche Tohmatsu LLP India for their collaboration on this report.
For their cooperation and input, we thank the Critical Minerals Facilitation office; the Department of Industry, Science, Energy, and resources; the Department of Foreign Affairs and Trade; the Treasury; Geoscience Australia; and Australia’s state and territory geological agencies.
We also thank those across the Australian and Indian industries whose insights and guidance have helped us shape this report.
Executive summary 09
Recommendations 17
Critical minerals supply scenario in India 23
Supply challenges for critical minerals in India 25
Strategic cooperation for critical minerals supply 27
Prioritising critical minerals in focus categories 28
Deep dive for prioritised critical minerals 31
Lithium 31
Cobalt 40
Graphite 49
nickel 59
Ilmenite and rutile 69
Light rare earths 77
Heavy rare earths 85
Vanadium 89
Annex 96

FIGURES
Figure 1: Key megatrends for 2030 09
Figure 2: Demand and supply dynamics for battery minerals by 2030 12
Figure 3: India’s EV market scale by 2030 13
Figure 4: Tripartite engagement model 19
Figure 5: net import reliance for critical minerals in India, 2020 24
Figure 6: Titanium value chain in India 26
Figure 7: rare earth value chain in India 26
Figure 8: Australian geological potential for critical minerals 28
Figure 9: Total battery demand in India by 2030 29
Figure 10: Cumulative Indian lithium market demand potential (kt) 31
Figure 11: Lithium-ion battery chemistry trends 32
Figure 12: Import of lithium oxide and hydroxide in 2020 34
Figure 13: Imports of lithium carbonate in 2020 35
Figure 14: Australian lithium projects 37
Figure 15: Cumulative Indian cobalt market demand potential (kt) 40
Figure 16: Imports of cobalt sulphate in 2020 44
Figure 17: Imports of cobalt ores, oxides, and hydroxides in 2020 44
Figure 18: Australian cobalt projects 46
Figure 19: Cumulative Indian graphite market demand potential (kt) 49
Figure 20: Indian graphite market forecast by type 51
Figure 21: Imports of natural graphite powder and flakes in 2020 55
Figure 22: Imports of other forms of natural graphite in 2020 55
Figure 23: Australian graphite projects 57
Figure 24: Cumulative Indian nickel demand potential 59
Figure 25: Imports of nickel ores and concentrates in 2020 62
Figure 26 Imports of nickel oxides and hydroxides in 2020 63
Figure 27: Australian nickel projects 64
Figure 28: Cumulative Indian market demand potential for titanium-bearing minerals 69
Figure 29: Australian titanium projects 74
Figure 30: Cumulative Indian market demand potential for ndPr (kt) 77
Figure 31: Cumulative Indian demand potential for samarium (tonnes) 78
Figure 32: Australian rEE projects 83
Figure 33: Cumulative Indian dysprosium market demand potential (tonnes) 85
Figure 34: Cumulative demand potential for terbium in India based on requirement in ndFeB magnets (tonnes) 86
Figure 35: Cumulative demand potential for europium used in manufacturing LED bulbs (kg) 87
Figure 36: Cumulative Indian vanadium market demand potential (kt) 89
Figure 37: Imports of vanadium ores and concentrates in 2020 92
Figure 38: Imports of vanadium pentoxide flakes in 2020 93
Figure 39: Australian vanadium projects 94
UnLoCKInG AUSTrALIA-InDIA CrITICAL MInErALS PArTnErSHIP PoTEnTIAL02

UnLoCKInG AUSTrALIA-InDIA CrITICAL MInErALS PArTnErSHIP PoTEnTIAL 03
TABLES
Table 1: Snapshot of critical minerals in India 23
Table 2: Indian lithium market forecast by volume of end-use segment 32
Table 3: Indian developments in the lithium ecosystem - summary 33
Table 4: Indian imports of lithium and lithium concentrates 35
Table 5: Import duties on lithium-ion batteries in India from April 2021 36
Table 6: Australia’s upcoming lithium projects 38
Table 7: Forecast Indian cobalt market by end-use segment 41
Table 8: Potential end-use industries and buyers 42
Table 9: Indian imports of cobalt concentrates and compound 43
Table 10: Indian import duties on cobalt products from April 2021 45
Table 11: Australia’s operating mines and key advanced projects 47
Table 12: Indian graphite market forecast by end-use segment 50
Table 13: Potential target technologies and manufacturers 52
Table 14: Indian imports of natural graphite 54
Table 15: Indian import duties on natural graphite from April 2021 56
Table 16: Australia’s planned graphite projects 58
Table 17: Indian nickel market forecast by end-use segment 60
Table 18: Potential target technologies and manufacturers 60
Table 19: Indian imports of nickel and nickel products 62
Table 20: Import duties on various nickel products from April 2021 63
Table 21: Australia’s nickel Projects 66
Table 22: Indian titanium dioxide market forecast by end-use segment by volume 70
Table 23: Potential target technologies and manufacturers 70
Table 24: Indian imports of titanium 73
Table 25: Import duties on titanium products from April 2021 73
Table 26: Australia’s advanced titanium minerals projects 75
Table 27: Import duties on LrEE products in April 2021 81
Table 28: Australia’s upcoming LrEE projects 84
Table 29: Import duties on various HrEE products from April 2021 88
Table 30: Indian vanadium market forecast by end-use segment 90
Table 31: Potential end-use industries and buyers 91
Table 32: Indian imports of vanadium concentrates and compound 92
Table 33: Import duties on various vanadium products from April 2021 93
Table 34: Australia’s key advanced vanadium V2o
5 projects 95
Table 35: List of lithium-ion battery ecosystem players in India 96
#Average Annual Exchange rate (2020) of 1 US$ = 1.45 A$ and 1 A$ = 51.14 Inr (https://ofx.com ) has been consistently used across document for conversion wherever applicable.

ABBREVIATIONS
Abbreviation Description
ArCI International Advanced research Centre for Powder Metallurgy and new
Materials
BArC Bhabha Atomic research Centre
BCD Basic Customs Duty
BESS Battery Energy Storage Systems
CAGr Compounded Annual Growth rate
CEEW Council on Energy, Environment and Water
CSIro Commonwealth Scientific and Industrial research organisation
DrC Democratic republic of Congo
EDr Economic Demonstrated resources
ESS Energy Storage System
EV Electric Vehicle
FAME Faster Adoption and Manufacturing of Electric Vehicles
FS Feasibility Study
GDP Gross Domestic Product
GWh Gigawatt Hour
HCL Hindustan Copper Limited
HrEE Heavy rare Earth Elements
IBM Indian Bureau of Mines
IGST Integrated Goods and Services Tax
IrEL Indian rare Earths Limited
JV Joint Venture
KABIL Khanij Bidesh India Limited
KMML Kerala Minerals and Metals Limited
kt Kilo Tonnes
kWh Kilowatt Hour
LCo Lithium Cobalt oxide
LFP Lithium Iron Phosphate
LME London Metal Exchange
LrEE Light rare Earth Elements
METS Mining Equipment, Technology and Services
MIDHAnI Mishra Dhatu nigam Limited
MnrE Ministry of new and renewable Energy
MoU Memorandum of Understanding
MSMEs Micro, Small, and Medium Enterprises
MT Metric Tonnes
Mt Million Tonnes
MW Megawatt
nALCo national Aluminium Company Limited
ndFeB neodymium Iron Boron
ndPr neodymium and Praseodymium
nCA Lithium nickel Cobalt Aluminium oxide
nMC Lithium nickel Manganese Cobalt
nMDC national Mineral Development Corporation
oEM original Equipment Manufacturer
UnLoCKInG AUSTrALIA-InDIA CrITICAL MInErALS PArTnErSHIP PoTEnTIAL04

Abbreviation Description
PFS Pre-feasibility study
PGM Platinum Group Metals
PLI Production Linked Incentive
PMAY Pradhan Mantri Awas Yojna
r&D research and Development
rEE rare Earth Element
rIL reliance Industries Limited
SmCo Samarium Cobalt
SMEs Small and Mid-sized Enterprises
SPG Spherical Graphite
SWS Social Welfare Surcharge
TDSG TDS Lithium-ion Battery Gujarat Private Limited
TGC Total Graphitic Carbon
UKTMP JSC Ust-Kamenogorsk Titanium and Magnesium Plant Joint Stock Company
VrFB Vanadium redox Flow Batteries
ZEV Zero Emission Vehicles
UnLoCKInG AUSTrALIA-InDIA CrITICAL MInErALS PArTnErSHIP PoTEnTIAL 05

06 UnLoCKInG AUSTrALIA-InDIA CrITICAL MInErALS PArTnErSHIP PoTEnTIAL

UnLoCKInG AUSTrALIA-InDIA CrITICAL MInErALS PArTnErSHIP PoTEnTIAL 07
FOREWORD
Australia and India share a close, long-standing and multi-faceted
relationship in the resources sector. To date this has featured
bulk commodity and energy mineral exports from Australia and
extensive links in mining equipment, technology and services
(METS). Australian METS capabilities have supported productivity
and efficiency gains across India’s mining industry.
In June 2020, Australia and India elevated their bilateral
relationship to a Comprehensive Strategic Partnership.
At that time, Australia’s Department of Industry, Science, Energy
and resources and India’s Ministry of Mines signed a memorandum
of understanding (MoU) on increasing trade, investment and
research and development in critical minerals between the
two countries.
To take forward cooperation the two sides formed a joint working
group comprising government, industry and research institution
representatives, tasked with facilitating institutional and
commercial partnerships to support stable and resilient supply
chains for critical minerals.
As part of the MoU work plan, the Australian Trade and
Investment Commission (Austrade) commissioned Deloitte
Touche Tohmatsu LLP India to prepare a report on India’s current
and future demand for critical minerals in India and potential
opportunities for cooperation with Australia.
This report is intended to provide industry and government
with guidance on market dynamics and bilateral commercial
cooperation opportunities across the critical minerals
supply chain.
This report has been produced as part of the Australia India
Business Exchange (AIBX). AIBX is the Australian Government’s
flagship program to increase partnerships and engagement
between Australian and Indian businesses.
As the Australian Government’s trade and investment
promotion agency, Austrade seeks to facilitate international
investment, offtake, technology and research partnerships for
critical minerals.
Austrade uses its extensive offshore network and partnerships
across government and industry to grow Australian exports and
attract productive foreign investment into Australia.
Interested critical mineral investors, project proponents and other
industry and government stakeholders can contact Austrade via
our website (www.austrade.gov.au) or through one of our
offshore offices.

08 UnLoCKInG AUSTrALIA-InDIA CrITICAL MInErALS PArTnErSHIP PoTEnTIAL

UnLoCKInG AUSTrALIA-InDIA CrITICAL MInErALS PArTnErSHIP PoTEnTIAL 09
EXECUTIVE SUMMARY
Critical minerals are essential inputs for many
high-demand manufactured products.
Critical minerals have diverse applications, from
metallurgy and chemical industries to energy
storage systems (ESS) for renewable energy,
electric mobility, power generation, high-end
electronics, aerospace, defence, and data
transmission hardware.
The economic importance of critical minerals for
these industries, along with risks to stable supply,
make them strategically valuable.
over the next decade, economic megatrends are
forecast to drive higher global demand for critical
minerals and processing technologies.
India has an ambitious industrial reform agenda
to expand manufacturing capability and to
transition to a low-carbon and digitised economy.
This includes plans for rapid expansion of
electric mobility and renewable energy
generation, as well as enhanced capability across
high-technology sectors.
These are among the key drivers for India in
seeking to source stable and secure supply of
critical minerals and related processing and
refining technologies.
Figure 1: Key megatrends for 20301
Urbanisation
Industry consolidation
De-carbonisation and
sustainability
Protectionism and
resource nationalism
Industry 4.0
Global
Indian
Self-reliance and
emergence as a
manufacturing hub
The Indian government
has launched ambitious
projects, such as
Atmanirbhar Bharat
and Make in India. As
part of the Atmanirbhar
Bharat, the PLI scheme
was recently introduced
for multiple sectors that
includes ambitious plans
for traditional sectors.
Renewable energy and
battery storage
The government has set an
ambitious target to achieve
175GW by 2022 and 450GW
renewable energy by 2030.
Batteries will enable current
energy transition towards
electric mobility, integration of
renewable energy through grid
scale storage, and improved
energy access in India.
Resource efficiency and
circular economy
Transition to production
is seen through the
recycled route and
utilisation of process
waste entails lower
carbon emissions, and
resource and energy
consumption.
Infrastructure
Investments in
physical and digital
infrastructure via
the smart cities
mission, PMAY, and
digital India will be
instrumental in
meeting needs of
connectivity and
urbanization.
Global
Indian
TRENDS
Notes:
1. Secondary research and Industry sources

Eight mutually important minerals
This report identifies a shortlist of eight critical
mineral categories that are mutually important to
both Australia and India.
The shortlist was formulated based on findings
of the Australian Critical Minerals Prospectus
2020, Critical Minerals Projects in Australia
2020 and Indian government reports such as
Critical Non-Fuel Mineral Resources for India’s
Manufacturing Sector.
These reports, as well as extensive industry
stakeholder consultations, have provided data
on Indian demand projections and Australian
supply capabilities, allowing us to develop a list of
mutually relevant critical minerals.
The eight minerals considered to be of greatest
mutual interest are lithium, cobalt, nickel,
graphite, light rare earth elements (LrEEs),
heavy rare earth elements (HrEEs), titanium
and vanadium.
These have been classified into three categories
based on their end-use industries:
• traditional – titanium and vanadium
• sunrise – lithium
• mixed use – cobalt, nickel, graphite, LrEEs
and HrEEs.
This report also evaluates:
• India’s and Australia’s resource potential
• India’s and Australia’s exploration, mining and
mineral processing capabilities
• projected demand from downstream sectors
in India.
In relation to Australia, the report also examines:
• near-term supply capabilities of operating
mines and processing facilities
• future mining and processing projects
• required investments and technologies
• the possibility of sourcing technologies from
third countries
• pricing dynamics.
Outlook for traditional sectors
India has a mature and globally significant
metallurgical industry and is the second-largest
producer of steel and stainless steel globally. It
also has significant electric arc furnace based
steel making capacity.
India has a large industrial base that includes
mechanical, chemical, electrical, automotive and
defence production.
India’s titanium demand will be driven by rapid
urbanisation and related requirements for paints
and other titanium-based products.
India currently does not have downstream
capacity for titanium metals or alloys as it lacks
commercial-scale local technologies to produce
titanium products.
India also continues to be reliant on imports
for vanadium.
Manufacturers of ferroalloys and master alloys,
which are catalysts for chemical and vanadium
redox flow batteries (VrFB), are among the
consumers of vanadium, but India does not have
economically viable domestic resources.
Outlook for sunrise and mixed-use sectors
The Indian Government has implemented policy
reforms to accelerate new low-carbon sectors
such as renewable energy, energy storage and
electric mobility. This agenda is overseen by the
Ministry of new and renewable Energy (MnrE).
UnLoCKInG AUSTrALIA-InDIA CrITICAL MInErALS PArTnErSHIP PoTEnTIAL10

UnLoCKInG AUSTrALIA-InDIA CrITICAL MInErALS PArTnErSHIP PoTEnTIAL 11
The Indian Government’s ambitious industrial
self-sufficiency and growth program,
Atmanirbhar Bharat (Self-reliant India), includes
production-linked incentives for multiple sunrise
sectors such as advanced chemistry cell battery
storage for electric vehicles.
India aims to have 30 percent of vehicles powered
by electricity by 2030. India has invested Inr
100 billion (A$ 1.95 billion) in the Faster Adoption
and Manufacturing of Electric Vehicles in India
(FAME II) initiative, allocating 86 percent to
incentives and 14 percent to vehicle charging
infrastructure, as per the Department of Heavy
Industry, Ministry of Heavy Industries and Public
Enterprises, Government of India.
As per IEA (International Energy Agency), India
plans to develop 50 Gigawatt hours (GWh) of cell
manufacturing capacity by 2025 but its lithium-
ion battery manufacturing capability is currently
limited. Existing manufacturers import lithium-
ion cells to make batteries.
It is estimated that by 2030 India’s total demand
for lithium-ion batteries will reach about 492
GWh.2 Demand will be driven by grid-scale
storage and EVs, which together are expected
to account for almost 98 percent of the overall
storage requirements.
This will also create strong demand for
permanent magnets (magnets that produce a
permanent magnetic field) and related products.
India’s lithium-ion battery manufacturing
capability is currently limited and existing
manufacturers are largely reliant on imports.
As a result, India plans to establish significant
downstream capacity for EVs and lithium-
ion batteries, as well as modest capacity for
permanent magnets.
The Indian government’s premier policy
think tank, nITI Aayog, formulated a policy
framework for Zero Emission Vehicles (ZEVs) to
develop an EV ecosystem for energy efficient
low-emission vehicles.
India will also need to develop capability for
recycling and recovery of active materials (special
chemicals applied to electrodes in battery cells)
from spent batteries.
India’s demand for LrEEs and HrEEs –
including neodymium, praseodymium,
samarium and dysprosium – is expected to be
driven by the permanent magnet and related
high-technology industries.
But India’s midstream and downstream rEE
value chains are not well developed and India is
dependent on imports of rare earth magnets,
including neodymium magnets, which are the
most widely used.
India’s critical minerals value chain will evolve over
the coming decade but progress will depend on
factors such as technology availability, viability
of processing at mines, user facilities in India,
availability of finance and risk appetite.
Notes:
2. Total EV sales 2020-2030: 2W: 65 Mn, 3W: 3.9 Mn, 4W passenger: 4.3 Mn, 4W commercial: 0.53 Mn, Buses: 84,000; Battery size: 2W: 2kWh, 3W: 6kWh, 4W passenger: 40kWh, 4W commercial: 60kWh, Buses: 200kWh; Grid scale storage – As estimated by Central Electricity Authority for optimal generation mix 2029-30 (Scenario I); storage size in “others” category is calculated assuming a minimum 20% battery penetration; 80% depth of discharge is assumed to calculate battery size. This estimate does not include demand from consumer electronics, UPS and data centres

Figure 2: Demand and supply dynamics for priority critical minerals by 20303
Demand and supply End-use industry# Key impediments to future growth
Lithium Battery Mineral
Demand 2020e1 kt
2030f62-109 kt#
EV and ESS
others*
Supply 100% import dependence
91% 9%
*others include ceramics and paint
Cobalt Battery Mineral
Demand 2020e1 kt
2030f88-165 kt#
EV and ESS
others*
Supply 100% import dependence
78% 22%
*others include superalloys, magnets, and pigments
Graphite** Battery Mineral
Demand 2020e167.8 kt
2030f2806-
3720.5 kt#
EV and ESS
Electrodes
refractories
others *
Supply 60% import dependence
26% 37% 22% 15%
*others include foundries and lubricants
Nickel Battery Mineral
Demand 202061.3 kt
2030f1228.9-
1484.2 kt# Stainless
Steel
EV, ESS, other
batteries
others *
Supply 100% import dependence
75% 23% 2%
*others include alloys, chemicals, and coinage
reliance on the import of raw materials or intermediate materials
Global players’ willingness to collaborate and transfer technologies to Indian firms
Sizeable investments to set up battery and cell manufacturing facilities
Limited long-term technology investments to develop next-generation battery technologies and cell manufacturing
Lack of robust supply chain networks due to limited partnerships with other countries
Notes:
3. Information referred to from individual deep dive section for each mineral
Access to suitable technologies for conversion of ilmenite and rutile into titanium sponge or metal
Limited reserves of heavy rare earth and lack of commercial scale technology for HrEE processing
Limited capacity additions in intermediate value chain such as rEo to metal or magnets
Limited technology investments to develop the manufacturing ecosystem for end-use applications
Low growth of special steel consumption, no primary production despite resources in India
Ilmenite, Rutile Titanium bearing minerals
Demand 2020e200 kt
2030f3120-
3870 kt#
Chemicals, paint, and pigments
others*
Supply Significant import dependence in titanium
dioxide, sponge, and metal
99% 1%
*others include ceramics, electrodes, and paper
Light rare earths##
Demand 2020e1.1 kt
2030f13-28 kt#
Supply 100% import dependence in magnets, limited
capacity in processing of oxides *others includes ICE & electronics
Heavy rare earths###
Demand 2020e68 t
2030f1297-
3687 kt#
EV
others*
Supply 100% import dependence in downstream products
and limited HREE resources
95% 5%
Vanadium Demand 20203 kt
2030f65-87 kt#
Steel
others*
Supply 100% import dependence
85% 15%
*others include VrFB , master alloys, pigments, and dyes
EV
87%
Wind
8%
others*
5%
# represents cumulative demand numbers for 2030; **includes natural and synthetic graphite demand## indicates demand for ndPr ### indicates demand for Dy
UnLoCKInG AUSTrALIA-InDIA CrITICAL MInErALS PArTnErSHIP PoTEnTIAL12

The Indian Government launched Make in India4
in 2014 as a program to facilitate industrial
investment, foster innovation, enhance skill
development and to position India as a global
manufacturing hub.
Make in India aims to increase the manufacturing
sector’s contribution to national GDP to 25 per
cent by 2025. It focuses on a range of sectors
including several key downstream industries
in the critical minerals supply chain such as
automotive, renewables, electronics and defence.
To accelerate industrial and economic
development, in 2020 India launched
Aatmanirbhar Bharat (self-reliant India) with the
dual aims of fast-tracking modern infrastructure
development and increasing India’s attractiveness
as a destination for global investors.
Indian authorities have adopted a number of
measures under these two initiatives that will
support critical minerals downstream industry
growth, including the following.
Production-linked incentive (PLI) scheme5
The PLI scheme seeks to create global champions
in manufacturing and reduce dependence on
import of finished goods. It offers output-based
financial incentives for both greenfield and
brownfield projects.
In its 2021-22 budget, the Indian Government
provided Inr 1.97 lakh crore (A$38 billion) for
the PLI scheme in 13 key sectors including
electronics, automotive, energy storage, steel
and telecommunications.
The scheme provides on average 5 percent of
production value as an incentive and includes
conditions around minimum production scale.
National Electric Mobility Mission Plan 2020
(NEMMP)6
This plan focuses on national energy security,
reducing the carbon footprint of the transport
sector, and supporting electric vehicle
manufacturing capability.
Faster Adoption and Manufacture of Hybrid and
Electric Vehicles (FAME)7 scheme
As part of the nEMMP, India’s Department of
Heavy Industry adopted the FAME scheme
to promote electric and hybrid vehicle
technology manufacturing.
FAME II provides Inr 10,000 crore ($A2
billion) over three years from 2019 to promote
production of electric two wheelers, three
wheelers and buses. FAME is also supporting
construction of 2,700 charging stations, primarily
in major cities.
National Mission on Transformative Mobility and
Battery Storage8
The Indian Government’s policy think tank
nITI Aayog is leading this project that
aims to support establishment of a large
scale, export-competitive battery and cell
manufacturing industry.
nITI Aayog is coordinating with industry to ensure
a cohesive and robust policy framework is in place
to drive growth in the sector.
Indian Government’s downstream industry policy initiatives
Figure 3: India’s EV market scale by 2030
Notes:
4. https://www.makeinindia.com/atmanirbhar-bharat-abhiyaan#:~:text=The%20government’s%20goal%20is%20to,5%20Tn%20economy%20by%202025.&text=Infrastructure%20%2D%20which%20will%20become%20India’s,over%20the%20next%20five%20years.
5. https://www.investindia.gov.in/team-india-blogs/production-linked-incentive-pli-scheme-decoded
6. https://dhi.nic.in/writereaddata/content/nemmp2020.pdf
7. https://fame2.heavyindustry.gov.in
8. https://www.investindia.gov.in/team-india-blogs/opportunities-ev-battery-and-cell-manufacturing-india
100
FY
21
FY
22
FY
23
FY
24
FY
25
FY
26
FY
27
FY
28
FY
29
FY
30
90
80
70
Mn
60
50
40
30
20
10
0
47 Mn - 86 Mn
3 Mn - 6 Mn
3.2 Mn- 6 Mn
0.05 Mn - 0.08 Mn
Expected EV on road by 203053 Mn - 99 Mn
High growth Medium growth Low growth
UnLoCKInG AUSTrALIA-InDIA CrITICAL MInErALS PArTnErSHIP PoTEnTIAL 13

Opportunities for Australia-India cooperation
India’s projected demand for critical minerals
presents significant opportunities to increase
cooperation with Australia.
India offers Australian critical minerals producers
economies of scale for offtake arrangements,
and a robust pipeline of manufacturing-led
commercial innovation opportunities.
With its abundant critical mineral reserves and
world-class mining expertise, Australia can assist
India to achieve its industrial growth goals.
Australian companies and institutions can
evaluate models to:
• supply processed minerals
• export services and technology for
processing, refining, recovering and recycling
critical minerals
• support mineral exploration and mining-related
environmental management in India
• establish joint research projects across the
value chain.
Austrade can assist with tailored introductions
between companies and provision of market
insights to businesses on both sides.
Indian firms are exploring investment
opportunities in Australian mining and mineral
processing assets.
The Indian government’s critical minerals sourcing
agency, Khanij Bidesh India Limited (KABIL), and
the Australian Government’s Critical Minerals
Facilitation office (CMFo), along with Austrade,
can support investment facilitation.
There is also an opportunity for third country
involvement in the value chain to enhance supply
chain efficiency and resilience, and particularly
to address capability gaps in intermediate
mineral processing.
The Australia-India Joint Working Group (JWG)
on critical minerals established under the
bilateral memorandum of understanding (MoU)
on critical minerals will support policy exchange
and cooperation and facilitate linkages between
business and research institutions.
UnLoCKInG AUSTrALIA-InDIA CrITICAL MInErALS PArTnErSHIP PoTEnTIAL14

UnLoCKInG AUSTrALIA-InDIA CrITICAL MInErALS PArTnErSHIP PoTEnTIAL 15

16 UnLoCKInG AUSTrALIA-InDIA CrITICAL MInErALS PArTnErSHIP PoTEnTIAL

UnLoCKInG AUSTrALIA-InDIA CrITICAL MInErALS PArTnErSHIP PoTEnTIAL 17
RECOMMENDATIONS
Based on the findings of this report, we offer
the following recommendations to progress
Australia-India critical minerals commercial
partnerships. These recommendations cover
actions both by Austrade and by partners across
government and industry.
1. Increase understanding of commercial
opportunities and pathways to partnership
• Austrade and partners to develop tailored
market insights for Australian businesses
on cooperation with India for individual
minerals and supply chains, particularly
in sunrise sectors where market
understanding is comparatively low.
• Austrade to continue mapping key
Indian critical mineral and downstream
customers, particularly in sunrise
sectors, to assist Australian businesses in
identifying opportunities.
• Austrade and partners such as Australia
Minerals, the Confederation of Indian
Industry (CII) and the Federation of
Indian Chambers of Commerce and
Industry (FICCI) to continue delivering
industry showcases and roundtables to
improve understanding of commercial
opportunities across industry
and government.
• Australia-India JWG on critical minerals
to sharpen its focus on facilitating
commercial outcomes by including key
industry stakeholders in working group
dialogue and supporting connections
between companies.
2. Identify and facilitate opportunities for
Indian investment in Australian mining and
mineral processing projects
• CMFo to establish a strategic framework
with KABIL to support opportunities
for Indian investment in Australian
critical minerals exploration, mining
and processing.
• Both sides to agree through the JWG
a clear investment focus such as joint
development of mineral processing
capability for the battery value chain.
• Investors and target companies to
explore government funding and support
arrangements including through seed
funding, export finance and facilitation of
offtake arrangements.
• Investors and target companies to
examine other government support
through initiatives such as the Modern
Manufacturing Initiative, northern
Australia Infrastructure Facility and state
government programs.
3. Pursue mineral offtake partnerships
• Austrade to facilitate targeted matching
for Australian critical minerals project
proponents with Indian customers for
offtake partnerships, noting Australia’s
emerging capacity for lithium processing
and that early offtake opportunities are
particularly prospective for traditional
industries such as metals, paints
and chemicals.
• Australian project proponents in the eight
identified mineral categories to consider
government support programs that would
facilitate offtake arrangements, including
through Export Finance Australia, the
Clean Energy Finance Corporation and
Austrade’s Export Market Development
Grants program.
• With support from Austrade, Indian
customers to examine Australian offtake
partnerships in light of Australia’s
extensive resource endowment, high
sustainability and environmental
standards and mature mining ecosystem
that will support further productivity
growth and competitiveness.
4. Seek government and industry partnerships
with third countries to support supply
chain resilience
• Given gaps in the critical minerals
supply chain in areas such as
intermediate processing and component
manufacturing, Australia and India to
explore opportunities to partner with
third countries that are active in the mid-
stream phases of the supply chain.

• Australian and Indian governments to
provide strategic direction and to consider
policy initiatives that support cooperation
through forums such as the Quad
(Australia, India, US, Japan) and the Supply
Chain resilience Initiative (Australia, India,
Japan).
• Austrade and partners to facilitate
connections for Australian and Indian
companies with industry stakeholders
in markets such as Japan and Germany
for dialogue on trilateral or multilateral
commercial partnership arrangements.
5. Expand mining equipment, technology
and services (METS) collaboration to drive
productivity across the supply chain
• Austrade to identify India’s critical mineral
equipment, services and technology needs
and facilitate introductions for Australian
METS suppliers to Indian customers.
• Australian public and private mining
exploration organisations to pursue
partnerships with Indian institutions for
commercial and technical cooperation
in expanding India’s critical minerals
exploration capability.
• Australian mineral processing, digital
mining transformation, mineral recycling
and mining skills companies to seek
targeted cooperation with Indian mining
and downstream companies for provision
of METS that will boost productivity in
India’s critical minerals sector.
• Indian and Australian partners to examine
opportunities to access India’s production-
linked incentive schemes or funding
mechanisms such as the national Mineral
Exploration Trust and national Clean
Energy and Environment Fund (nCEEF) in
order to fast-track project development.
6. Develop a critical minerals community of
practice for collaborative knowledge sharing,
research and development
• Government, industry and research
institutions in both markets to coordinate
knowledge sharing and r&D, under the
auspices of the JWG and with a clear, time-
bound agenda for joint research.
• The Australia-India Strategic research
Fund (AISrF) to offer funding for critical
minerals cooperative projects, particularly
those seeking to address supply chain
and capability gaps in areas such as
mineral processing.
• Indian companies to consider becoming
partners in the Future Batteries
Industry Cooperative research Centre
(FBICrC), including to support joint
research on intermediate processing and
manufacturing capabilities in the battery
supply chain.
• Australian Government to form a coalition
of partners for bilateral research that
could include the Commonwealth Scientific
and Industrial research organisation
(CSIro), Geoscience Australia, the
Australian nuclear Science and
Technology organisation (AnSTo) and the
Future Batteries Industry Cooperative
research Centre.
• Indian Government to form a coalition
of partners for bilateral research that
could include the Clean Energy research
Initiative, the Automotive research
Association of India, technology institutes
and the Council of Scientific and Industrial
research (CSIr) facilities.
UnLoCKInG AUSTrALIA-InDIA CrITICAL MInErALS PArTnErSHIP PoTEnTIAL18

UnLoCKInG AUSTrALIA-InDIA CrITICAL MInErALS PArTnErSHIP PoTEnTIAL 19
Figure 4: Tripartite engagement model
Mineral extraction from
mines in Australia
Export of intermediate
products to company Y
in third country
Export of semi-finished
products by company Y
to company Z in India
Supply of finished
batteries / other
products for Indian EVs/
ESS and export markets
Processing to
precursors / value
added products
by company X in
Australia
Further processing
and manufacture
of components by
company Y
Manufacture of
battery packs /
other products by
company Z

The three nations launched the Supply Chain
resilience Initiative (SCrI) in 2020 to support
resilient and sustainable supply chains. The
global pandemic has exposed supply chain
vulnerabilities. The SCrI aims to achieve balanced
and inclusive growth in the region by sharing best
practice on supply chain resilience and supporting
trade diversification.
Japan is the fifth-largest investor in India and
India imports a range of high-value manufactured
products from Japan. These include electric
machinery, electronics, steel, chemicals and
heavy industrial equipment.
Japanese companies with major investments
in India include Suzuki, Toyota, Honda, nissan,
Toshiba, DEnSo, Mitsui, Mitsubishi, Marubeni,
IToCHU, Sumitomo Mitsui Banking Corporation,
SonY, AGC Inc., rICoH, HITACHI, Mizuho Bank,
and Panasonic.
The Australia-Japan economic relationship is
underpinned by deep complementarity and Japan
is Australia’s second-largest trading partner.
Japanese investments have been essential in
the development of a range of export-oriented
industries in Australia, including in the mining and
energy sectors.
India offers market scale, a competitive
manufacturing base, a highly skilled workforce
and a strategic location. India’s industrial growth
agenda and ambitious plans for EVs and ESS will
drive demand for critical minerals and related
processing technologies. At present, India has
limited declared domestic reserves for a majority
of the identified critical minerals.
In a trilateral arrangement, raw and processed
critical minerals could be exported from
Australia to Japan. These could then be utilised
in production of chemicals and components in
Japan. These products would then be exported to
India where they would become inputs for India’s
downstream industries.
The supply chain could further be bolstered
by investment across the three markets. For
example, Japanese trading majors could consider
investment opportunities in Australian battery
minerals projects, backed by Indian end-user
companies. Similarly, Japanese chemical
processing and automotive sector investment
in India could provide potential channels to the
Indian market for products moving through this
supply chain.
This form of trilateral cooperation would draw
on the close economic links between the three
countries and would maximise each country’s
strengths within the supply chain.
Australia - India - Japan partnership potential9
Notes:
9. https://www.investindia.gov.in/country/japan-plus ; https://www.investindia.gov.in/country/australia ; https://www.dfat.gov.au/geo/japan/Pages/australia-japan-bilateral-relationship ; https://www.dfat.gov.au/geo/japan/Pages/australia-japan-bilateral-relationship#:~:text=Japan%20was%20Australia’s%20second%2Dlargest%20trading%20partner%20in%202018%2D19,of%20our%20total%20goods%20exports ; https://www.tds-g.co.in/
UnLoCKInG AUSTrALIA-InDIA CrITICAL MInErALS PArTnErSHIP PoTEnTIAL20

UnLoCKInG AUSTrALIA-InDIA CrITICAL MInErALS PArTnErSHIP PoTEnTIAL 21
India and Germany have shared a Strategic
Partnership since 2001. They have extensive
institutional links in areas such as defence,
energy, smart cities, urban mobility and
environmental management. There are more
than 150 Indo-German science and technology
joint research projects and 70 direct partnerships
between universities of both the countries.
Germany is India’s largest trading partner in
Europe and the seventh-largest foreign investor
in India, with more than 1,700 German companies
active in India and over 600 Indo-German joint
ventures. German investments in India focus
on sectors such as transportation, electrical
equipment, metallurgical industries, chemicals,
construction and automotive.
Germany has a strong technical base for
processes and components of the lithium-ion
battery value chain. This includes chemical
majors such as BASF, a number of battery and
component manufacturers, and specialised
research institutions.
Australia and India could consider opportunities
to partner with Germany for supply chain
integration. Indian end users could source
processed minerals from Australian mining
companies, with the minerals refined and
transformed in Germany before being sent on to
India for further value addition and assembly.
By way of example, EcoGraf Limited is an
Australian company establishing a vertically
integrated 20,000 tonnes per annum processing
plant in Kwinana, Western Australia, to produce
SPG. The project will utilise a new environmentally
sustainable process to offer battery anode
material to the lithium-ion battery industry.
EcoGraf have a long-term agreement with
German graphite trading group Technografit
GmbH for sourcing and supplying natural flake
graphite to the Kwinana facility. Following initial
scoping and feasibility studies by Gr Engineering
Consultants Australia and CSIro Australia, four
years of pilot plant test work was undertaken in
Germany. This allowed EcoGraf to confirm and
optimise their processing capabilities.
Given India’s clean energy agenda, there is a
potential market in India for companies such as
EcoGraf both for supply of graphite products as
well as for establishment in India of recycling and
processing facilities.
Given each country’s strengths in mining and
downstream industry-related research and
development, this form of trilateral partnership
could also include multi-party r&D collaboration
to maximise efficiencies and productivity across
the supply chain.
Australia - India - Germany partnership potential10
Notes:
10. https://www.investindia.gov.in/country/germany ; https://www.dfat.gov.au/geo/germany/germany-country-brief#:~:text=Economic%20diplomacy,mostly%20goods%20(%2413.7%20billion ; https://www.industry.gov.au/data-and-publications/resources-technology-and-critical-minerals-processing-national-manufacturing-priority-road-map ; https://www.dfat.gov.au/geo/germany/germany-country-brief#:~:text=Australia’s%20economic%20relationship%20with%20Germany,mostly%20goods%20(%2413.7%20billion) ; https://www.ecograf.com.au/business/ecograf/
UnLoCKInG AUSTrALIA-InDIA CrITICAL MInErALS PArTnErSHIP PoTEnTIAL 21

UnLoCKInG AUSTrALIA-InDIA CrITICAL MInErALS PArTnErSHIP PoTEnTIAL22
UnLoCKInG AUSTrALIA-InDIA CrITICAL MInErALS PArTnErSHIP PoTEnTIAL 23
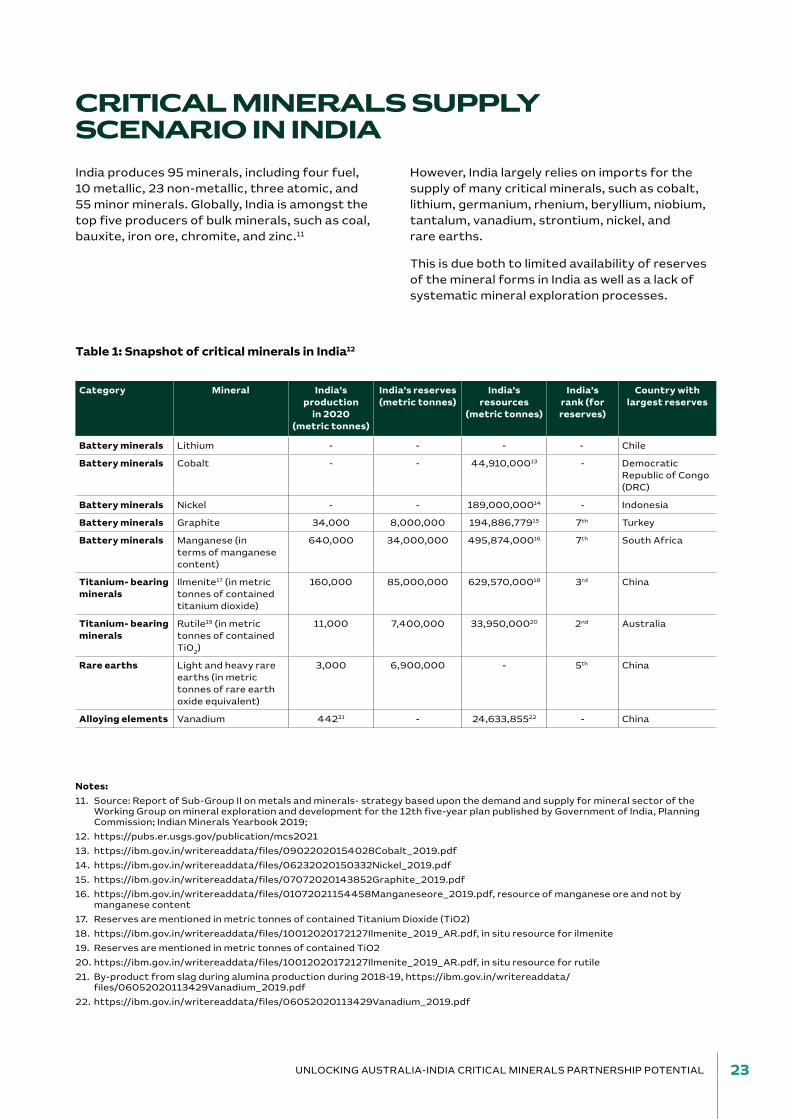
CRITICAL MINERALS SUPPLY SCENARIO IN INDIA
India produces 95 minerals, including four fuel,
10 metallic, 23 non-metallic, three atomic, and
55 minor minerals. Globally, India is amongst the
top five producers of bulk minerals, such as coal,
bauxite, iron ore, chromite, and zinc.11
However, India largely relies on imports for the
supply of many critical minerals, such as cobalt,
lithium, germanium, rhenium, beryllium, niobium,
tantalum, vanadium, strontium, nickel, and
rare earths.
This is due both to limited availability of reserves
of the mineral forms in India as well as a lack of
systematic mineral exploration processes.
Table 1: Snapshot of critical minerals in India12
Category Mineral India’s production
in 2020 (metric tonnes)
India’s reserves (metric tonnes)
India’s resources
(metric tonnes)
India’s rank (for reserves)
Country with largest reserves
Battery minerals Lithium - - - - Chile
Battery minerals Cobalt - - 44,910,00013 - Democratic republic of Congo (DrC)
Battery minerals nickel - - 189,000,00014 - Indonesia
Battery minerals Graphite 34,000 8,000,000 194,886,77915 7th Turkey
Battery minerals Manganese (in terms of manganese content)
640,000 34,000,000 495,874,00016 7th South Africa
Titanium- bearing minerals
Ilmenite17 (in metric tonnes of contained titanium dioxide)
160,000 85,000,000 629,570,00018 3rd China
Titanium- bearing minerals
rutile19 (in metric tonnes of contained Tio
2)
11,000 7,400,000 33,950,00020 2nd Australia
Rare earths Light and heavy rare earths (in metric tonnes of rare earth oxide equivalent)
3,000 6,900,000 - 5th China
Alloying elements Vanadium 44221 - 24,633,85522 - China
Notes:
11. Source: report of Sub-Group II on metals and minerals- strategy based upon the demand and supply for mineral sector of the Working Group on mineral exploration and development for the 12th five-year plan published by Government of India, Planning Commission; Indian Minerals Yearbook 2019;
12. https://pubs.er.usgs.gov/publication/mcs2021
13. https://ibm.gov.in/writereaddata/files/09022020154028Cobalt_2019.pdf
14. https://ibm.gov.in/writereaddata/files/06232020150332nickel_2019.pdf
15. https://ibm.gov.in/writereaddata/files/07072020143852Graphite_2019.pdf
16. https://ibm.gov.in/writereaddata/files/01072021154458Manganeseore_2019.pdf, resource of manganese ore and not by manganese content
17. reserves are mentioned in metric tonnes of contained Titanium Dioxide (Tio2)
18. https://ibm.gov.in/writereaddata/files/10012020172127Ilmenite_2019_Ar.pdf, in situ resource for ilmenite
19. reserves are mentioned in metric tonnes of contained Tio2
20. https://ibm.gov.in/writereaddata/files/10012020172127Ilmenite_2019_Ar.pdf, in situ resource for rutile
21. By-product from slag during alumina production during 2018-19, https://ibm.gov.in/writereaddata/files/06052020113429Vanadium_2019.pdf
22. https://ibm.gov.in/writereaddata/files/06052020113429Vanadium_2019.pdf

Critical mineral Percentage (2020) Major import sources (2020)
Lithium 100 Chile, russia, China, Ireland, Belgium
Cobalt 100 China, Belgium, netherlands, US, Japan
nickel 100 Sweden, China, Indonesia, Japan, Philippines
Vanadium 100 Kuwait, Germany, South Africa, Brazil, Thailand
niobium 100 Brazil, Australia, Canada, South Africa, Indonesia
Germanium 100 China, South Africa, Australia, France, US
rhenium 100 russia, UK, netherlands, South Africa, China
Beryllium 100 russia, UK, netherlands, South Africa, China
Tantalum 100 Australia, Indonesia, South Africa, Malaysia, US
Strontium 100 China, US, russia, Estonia, Slovenia
Zirconium (zircon) 80 Australia, Indonesia, South Africa, Malaysia, US
Graphite (natural) 60 China, Madagascar, Mozambique, Vietnam, Tanzania
Manganese 50 South Africa, Gabon, Australia, Brazil, China
Chromium 2.5 South Africa, Mozambique, oman, Switzerland, Turkey
Silicon <1 China, Malaysia, norway, Bhutan, netherlands
Category Mineral India’s production
in 2020 (metric tonnes)
India’s reserves (metric tonnes)
India’s resources
(metric tonnes)
India’s rank (for reserves)
Country with largest reserves
Alloying elements niobium - - - - Brazil
Alloying elements Chromium (in the form of chromite ore)
4,000,00023 100,000,000 344,016,00024 3rd Kazakhstan
Alloying elements Silicon (as silica in various natural forms, such as quartzite)
55,00025 Abundant Abundant - China26
Others Germanium - - - - China27
Others rhenium - - - - Chile
Others Beryllium - - - - United States
Others Tantalum - - - - Australia
Others Strontium - - - - Spain28
Others Zirconium (as zircon) 11,90629 - 33,710,00030 - Australia
Figure 5: Net import reliance for critical minerals in India, 2020
Notes:
23. High carbon and low carbon ferrochromium combined
24. reserves are shipping-grade chromite ore, which is deposit quantity and grade normalised to 45% Cr2o3
25. Silicon content of ferrosilicon only
26. Country with highest production
27. Country with highest production
28. Country with highest production
29. As reported by IrEL (India) Limited in 2018-19, https://ibm.gov.in/writereaddata/files/09102020171409Zircon_2019.pdf
30. Department of Atomic Energy, Mumbai, https://ibm.gov.in/writereaddata/files/09102020171409Zircon_2019.pdf
The end-use industry in India for rare-earth (e.g. permanent magnets) and titanium bearing minerals
ilmenite and rutile (e.g. titanium metal/alloys) are largely dependent on imports from other countries.
UnLoCKInG AUSTrALIA-InDIA CrITICAL MInErALS PArTnErSHIP PoTEnTIAL24

UnLoCKInG AUSTrALIA-InDIA CrITICAL MInErALS PArTnErSHIP PoTEnTIAL 25
Supply challenges for critical minerals in India
India is entirely dependent on imports for lithium,
cobalt, nickel, vanadium, niobium, germanium,
rhenium, beryllium, tantalum, and strontium. It
does not have declared reserves or resources of
these minerals.
India has modest reserves of cobalt, nickel, and
vanadium. Small amounts of these minerals are
available through recovery processes. India had no
reported reserves of lithium until in 2020, one very
small lithium reserve was discovered.
India has an estimated 44.91 million tonnes (Mt) of
cobalt, with about 69 percent in odisha, according
to the national Mineral Inventory published by
the Indian Bureau of Mines (IBM). The remaining
resources are in Jharkhand and nagaland.31
At present, India does not commercially produce
cobalt from primary resources. The country’s
existing capabilities do not support cost-effective
extraction of cobalt. India’s cobalt refining capacity
is estimated at 2,060 tonnes per year.32
India has an estimated 189 Mt of nickel, according
to the national Mineral Inventory. nickel occurs
principally as oxides, sulphides, and silicates.
India has a source of nickeliferous limonite in the
overburden of chromite in the Sukinda Valley in
Jajpur, odisha.
nickel has also been found in uranium deposits
at Jaduguda, Jharkhand, and a process is being
developed for its recovery. resources are spread
across the Singhbhum East district of Jharkhand
and Jajpur, and the Keonjhar and Mayurbhanj
districts of odisha.
To date, the high cost of detailed exploration
and extraction of nickel has made commercial
production challenging in India.33
India has an estimated 24.6 Mt of vanadium, with
about 64,594 tonnes of vanadium pentoxide
(V2o
5), according to the national Mineral
Inventory.34
Vanadium resources are available in Karnataka,
Maharashtra, and odisha. High exploration
and extraction cost has hindered commercial
production of vanadium in India. reported
production of vanadium as a by-product of slag in
alumina refineries was about 442 tonnes in 2018–
19.35
India is heavily dependent on imports of graphite,
despite having large deposits. It has an estimated
194.89 Mt of graphite (7.96 Mt of this is reserves),
according to the national Mineral Inventory. About
4 percent of India’s total graphite resources
have been translated into economically viable
reserves.36
Graphite reserves are available in Jharkhand,
Tamil nadu, odisha, and Chhattisgarh. Arunachal
Pradesh and Jammu & Kashmir account for about
70 percent of the total resources.
The bulk of the graphite resources are unexplored
and those that have been identified are of poor
grade – only 2.91 Mt of resources contain more
than 40 percent fixed carbon. India can lower its
import dependency by exploring and opening new
mines in the near future.37
India has an estimated 495.87 Mt of manganese
(93.47 Mt is reserves), according to the national
Mineral Inventory. Most of the manganese ore is
available in odisha, Karnataka, Maharashtra, and
Madhya Pradesh, which is the leading producer of
manganese in India.
Manganese ore’s quality varies amongst deposits,
with about 46 percent that is medium-grade and
blast-furnace grade ferromanganese.38 Current
production in key mines contains high proportions
of medium- and low-grade ores. This has led
downstream industries to pursue offtake import
agreements with manganese ore producers
internationally.39
Notes:
31. ttps://ibm.gov.in/writereaddata/files/09022020154028Cobalt_2019.pdf
32. https://ibm.gov.in/writereaddata/files/09022020154028Cobalt_2019.pdf
33. https://ibm.gov.in/writereaddata/files/06232020150332nickel_2019.pdf
34. https://ibm.gov.in/writereaddata/files/06052020113429Vanadium_2019.pdf
35. https://ibm.gov.in/writereaddata/files/06052020113429Vanadium_2019.pdf
36. https://ibm.gov.in/writereaddata/files/07072020143852Graphite_2019.pdf
37. https://ibm.gov.in/writereaddata/files/07072020143852Graphite_2019.pdf
38. https://ibm.gov.in/writereaddata/files/01072021154458Manganeseore_2019.pdf
39. https://moil.nic.in/userfiles/Annual%20report%202019-20.pdf

Despite having the world’s third-largest deposits
of titanium-bearing minerals and fifth-largest
deposits of rare earths, India depends on imports
because it lacks suitable commercial scale
technologies for value addition.
India lacks the downstream value chain for
titanium metal or alloy due to the unavailability
of commercial-scale technologies to produce
titanium sponge.
Globally, six companies are extracting titanium
sponge and slag through proprietary technologies.
These companies include VSMPo-AVISMA in
russia, Ust-Kamenogorsk Titanium and Magnesium
Plant Joint Stock Company (UKTMP JSC) in
Kazakhstan, and Toho Titanium in Japan.
IrEL (India) Limited, the leading producer of
titanium-bearing minerals in India, signed a MoU
with UKTMP JSC to produce titanium slag in India.40
India exports upstream products in the form
of rare earth oxides and imports rare earths
containing intermediate products required for
various applications or finished products, such as
rare earth magnets.
Notes:
40. https://psuwatch.com/irel-signs-mou-with-uktmp-jsc-kazakhstan-for-production-of-titanium-slag
41. Industry analysis
Figure 7: Rare earth value chain in India41
Upstream
ExtractionProcessing Components End-Use
Technologies
Midstream Downstream
Mixed rare Earth ore
Mixed rare Earth
Concentrate
Separation into
Individual rE oxides
Production of rE
Metals
Production of rE based alloys
Production of Permanent
Magnets
Production of Electric Motors
Figure 6: Titanium value chain in India
Upstream
Dredging, Separation & FeedstockFeedstock Upgrades Value added/upgraded End-Use
Industries
Midstream Downstream
Sulfate/Chloride Process
Tio2 Pigment
Paint, Coating,
Plastic, Paper
Dredging / excavation
Heavies Upgradation
Mineral Seperation
Titanium Slag
Titanium Tetrachloride
Titanium Sponge
Titanium Metal – Super alloys
The technology for converting rare earth oxides
into metal or alloy is proprietary, and closely held
by a small number of countries. Commercial-scale
technologies for producing titanium slag, sponge,
and metal are not available in India.
Technology transfer will enable India’s domestic
titanium and rare earth supply.
UnLoCKInG AUSTrALIA-InDIA CrITICAL MInErALS PArTnErSHIP PoTEnTIAL26
UnLoCKInG AUSTrALIA-InDIA CrITICAL MInErALS PArTnErSHIP PoTEnTIAL 27
India’s rare earth value chain is not well developed,
with limited commercial scale production in the
midstream and downstream sectors in India.
While India has significant resource potential in
critical minerals, including cobalt, nickel, graphite,
vanadium and manganese, import dependency in
these minerals is in part due to limited spending
on exploration and the non-availability of
exploration technologies.
Mineral exploration in India is valued at
US$100 million (A$145 million) annually, which
is considerably less than other mineral-rich
geographies, such as Australia and Canada.42
India’s mineral exploration is primarily carried out
by the public sector, although recent reforms
are providing private sector operators limited
opportunities to undertake mineral exploration.
Deep-seated minerals exploration has been limited
in India because of technology gaps for exploring
mineralised zones. Private sector participation
has been limited to sub-contractors performing
drilling and associated works for government
exploration agencies.
Mineral-rich geographies, such as Australia,
Canada, and the United States, have robust
ecosystems for junior mining companies. In
Australia, tax incentives are provided through the
Junior Minerals Exploration Incentive to encourage
investment in exploration.
India could explore similar mechanisms to
encourage private exploration, especially for
critical minerals.
Strategic cooperation for critical minerals supply
Global capacity for extraction and processing of
critical minerals is concentrated in a small number
of markets.
This creates vulnerability in critical minerals
supply chains, including for supplying minerals and
processing, refining and manufacturing metals,
chemicals and intermediates for lithium-ion
batteries, cell chemistry, permanent magnets and
special alloys.
This has paved the way for international
collaboration to build integrated mining and
mineral processing supply chains.
For example, the Supply Chain resilience Initiative
between Australia, India, and Japan can support
development of a reliable supply chain for critical
minerals involving these countries.43
Australia has abundant reserves of critical
minerals, including the world’s largest
concentration of battery minerals. Australian
battery mineral resources include lithium, cobalt,
nickel, and manganese reserves.
Australia is also a leading supplier of titanium
bearing minerals (ilmenite, rutile, and leucoxene),
rare earths, niobium, tantalum, zirconium, and
vanadium, amongst others.
The Australian Government published its Critical
Minerals Strategy in 2019 and the Australian
Critical Minerals Prospectus 2020, with a focus on
financing and supporting projects to extract and
process critical mineral supplies.
A comparison across Australia and India shows
that both the markets have a focus on lithium,
cobalt, rare earths, vanadium, titanium, nickel,
and graphite.
Notes:
42. https://www.brookings.edu/research/indias-mineral-exploration-legacy/
43. https://economictimes.indiatimes.com/news/economy/foreign-trade/india-japan-australia-decide-to-launch-resilient-supply-chain-initiative-in-the-indo-pacific-region/articleshow/77870346.cms?from=mdr

Prioritising critical minerals in focus categories
We have shortlisted priority critical minerals for
bilateral cooperation based on India’s demand and
import dependency, as well as Australia’s reserves
and capability to supply.
Battery minerals
In India, electric mobility and grid storage
requirements will drive growth for battery storage
capacity and an increase in battery manufacturing
over the next decade. The primary minerals
used in lithium-ion batteries are cobalt, lithium,
manganese, nickel, and graphite.
Amongst these, India has considerable reserves
and/or resources of manganese. For that reason,
this report includes a deep dive into four battery
minerals – lithium, cobalt, nickel, and graphite.
India’s lithium-ion battery market is expected
to grow to about 492 GWh by 2030.45 Under
this scenario, grid-scale storage and EVs
will account for 98 percent of the overall
storage requirements.
Notes:
44. Australia’s Critical Minerals Strategy 2019 by Australia Trade and Investment Commission; Australian Critical Minerals Prospectus 2020; Critical non-fuel mineral resources for India’s manufacturing sector – A vision for 2030 by Department of Science & Technology, India & CEEW, 2016; PGM implies Platinum Group Metals
45. Total EV sales 2020-2030: 2W: 65 Mn, 3W: 3.9 Mn, 4W passenger: 4.3 Mn, 4W commercial: 0.53 Mn, Buses: 84,000; Battery size: 2W: 2kWh, 3W: 6kWh, 4W passenger: 40kWh, 4W commercial: 60kWh, Buses: 200kWh; Grid scale storage – As estimated by Central Electricity Authority for optimal generation mix 2029-30 (Scenario I); storage size in “others” category is calculated assuming a minimum 20% battery penetration; 80% depth of discharge is assumed to calculate battery size. This estimate does not include demand from consumer electronics, UPS and data centres
Figure 8: Australian geological potential for critical minerals44
Helium
Vanadium
rhenium
Tungsten
Antimony
Graphite Lithium
Titanium
rare Earth (Light)
rare Earth (Heavy)
niobium
Tantalum Manganese
Zirconium
PGM
ChromiumHafnium
Germanium
Gallium Indium
BismuthBeryllium
Magnesium
Cobalt
Au
st
rali
a’s
ec
on
om
ic d
em
on
st
rat
ed
re
so
urc
e
Hig
h
High
Mo
de
rate
Moderate
Most critical for India
Moderately critical for India
Less critical for India
not critical for India
Australia’s geological potential
nickel
UnLoCKInG AUSTrALIA-InDIA CrITICAL MInErALS PArTnErSHIP PoTEnTIAL28

UnLoCKInG AUSTrALIA-InDIA CrITICAL MInErALS PArTnErSHIP PoTEnTIAL 29
Titanium-bearing minerals and rare earths
India’s mainland coastline is more than 7,500 km
long. Beach sand deposits contain heavy minerals,
including titanium-bearing minerals and rare
earths across large part of the coastline.
However, India imports the majority of its
midstream and downstream value-added products
in the titanium and rare earth value chains due to
lack of local technology or transfer of commercial-
scale proven technology.
Critical minerals with alloy and steel applications
These minerals include nickel, graphite, chromium,
vanadium, manganese, silicon, and niobium, with
applications in steel and alloys. nickel and graphite
are essential due to their applications in battery
storage in addition to alloy and steel applications.
Vanadium is important due to India’s total
import dependence and vanadium’s likely future
applications in battery storage.
India has widespread deposits of chromium and
silicon, and limited import dependency; niobium
consumption in India is minimal. Accordingly,
these minerals were not included in the deep dive
sections that follow.
Other minerals
Minerals such as germanium, rhenium, beryllium,
strontium, zirconium, and tantalum were
not considered for deep dive due to limited
consumption in India, notwithstanding that the
country does rely on import for these minerals.
Figure 9: Total battery demand in India by 2030
Notes:
‘others’ includes demand from solar pumps and the micro grid, railways, telecommunications, diesel generating set replacement and captive power plants
342 GWh 492 GWh 625 GWh
Low growth Medium growth
EVs Grid storage others
High growth
15
25
59
92
108
39
268
375
498

UnLoCKInG AUSTrALIA-InDIA CrITICAL MInErALS PArTnErSHIP PoTEnTIAL30

UnLoCKInG AUSTrALIA-InDIA CrITICAL MInErALS PArTnErSHIP PoTEnTIAL 31
DEEP DIVE FOR PRIORITISED CRITICAL MINERALS
Lithium
As the primary ingredient in lithium-ion batteries,
lithium will become increasingly important as
demand for EVs increases.
Apart from lithium-ion batteries, lithium is used in
glass, ceramics, heat-resistant greases, lubricants,
lightweight aircraft materials, pharmaceuticals,
and dental implants.
India’s lithium-ion battery manufacturing
ecosystem is emerging. Manufacturers may invest
in establishing lithium refining, cell manufacturing
and battery assembly units in India.
Australia has large lithium spodumene reserves
that could help meet increasing Indian demand
for lithium.
Indian market analysis
The India market used an estimated 0.8-1 kilo
tonnes (kt) of lithium in 2020 and is expected to
reach a cumulative demand potential of 62-109 kt
by 2030.46
Figure 10: Cumulative Indian lithium market demand potential (kt) 47
Notes:
46. Analysis based on publicly available information in the following government and other reports – nITI Aayog: India’s Electric Mobility Transformation: Progress To Date and Future opportunities; McKinsey: The unexpected trip: The future of mobility in India beyond CoVID-19; CrISIL: by 2024, nearly half of new three-wheelers sold will be e-autos; Avendus, July 2020: Electric vehicles: Charging towards a bright future; and ICrA press release 2020. While 2020 represents actual consumption for the year based on imports, 2025 and 2030 represent cumulative numbers, based on population of vehicles and installed capacities of ESS in those years.
47. Analysis based on publicly available information in the following government and other reports – nITI Aayog: India’s Electric Mobility Transformation: Progress To Date and Future opportunities; McKinsey: The unexpected trip: The future of mobility in India beyond CoVID-19; CrISIL: by 2024, nearly half of new three-wheelers sold will be e-autos; Avendus, July 2020: Electric vehicles: Charging towards a bright future; and ICrA press release 2020. While 2020 represents actual consumption for the year based on imports, 2025 and 2030 represent cumulative numbers, based on population of vehicles and installed capacities of ESS in those years.
2025f 2030f
Scenarios optimistic Base Conservative optimistic Base Conservative
Total cumulative
demand
22 18 14 109 85 62
2025f
2030f
Conservative scenario Base scenario optimistic scenario
14
62
18
85
22
109
Disclaimer: The demand potential identified shall be subject to the expected development of lithium-ion battery value chain in India.

Lithium demand is primarily driven by lithium-ion batteries, which are typically used in applications such as
EVs, mobile phones, laptops, power backup appliances, and other electrical goods.
The three dominant lithium-ion cathode
chemistries used for manufacturing lithium-
ion batteries are Lithium Iron Phosphate (LFP),
Lithium nickel Manganese Cobalt (nMC) oxide, and
Lithium nickel Cobalt Aluminium (nCA) oxide.
Depending on battery chemistries and
configurations, lithium content is usually 5–6
percent of cathode weight in nMC and 6–7
percent in nCA.49 Lithium is either consumed as
lithium carbonate produced from brine or lithium
hydroxide primarily produced from pegmatite.
Notes:
48. Analysis based on publicly available information in the following government and other reports - nITI Aayog: India’s Electric Mobility Transformation Progress To Date and Future opportunities; McKinsey: The unexpected trip: The future of mobility in India beyond CoVID-19; By 2024, nearly half of new three-wheelers sold will be e-autos, CrISIL; EV -Charging towards a bright future, Avendus, July 2020; and ICrA press release 2020. India is expected to replicate the global application trends. other batteries include demand from solar pumps and micro grid and railway – traction, telecom, DG replacement, and captive power plants
49. Syrah sources
50. Bloomberg new Energy Finance, The Ultimate Guide to the Cobalt Market: 2021–2030 (crux investor)
End-use segment 2020e 2025f 2030f
Electric vehicles 71% 70% 70%
other batteries 14% 20% 21%
other non-battery uses (including ceramics,
lubricants, pharmaceuticals, and research)
15% 10% 9%
Table 2: Indian lithium market forecast by volume of end-use segment48
Figure 11: Lithium-ion battery chemistry trends50
2020 2025f 2030f
nCA LFP
78% 72% 77%
16%
13% 8%
6%15% 15%
nMC
UnLoCKInG AUSTrALIA-InDIA CrITICAL MInErALS PArTnErSHIP PoTEnTIAL32

UnLoCKInG AUSTrALIA-InDIA CrITICAL MInErALS PArTnErSHIP PoTEnTIAL 33
Notes:
51. Secondary research and Industry sources
52. https://www.tatachemicals.com/Asia/Products/Specialty-chemistry/Energy-Sciences/energy-storage-solutions
53. https://www.tds-g.co.in/
54. https://nexcharge.in/
55. https://www.manikaranpowerltd.in/upload/MPL-Lithium-Press-release.pdf
56. https://www.business-standard.com/article/companies/amara-raja-starts-work-on-lithium-ion-cells-sets-up-tech-hub-at-tirupati-121022100451_1.html
57. https://www.ril.com/ar2020-21/pdf/rIL-Integrated-Annual-report-2020-21.pdf
58. Company annual reports and industry discussions
Key industry participants
Key Indian consumers of lithium would be
manufacturers of active cell chemicals (ACC)
and battery cells. While lithium has other
pharmaceutical and manufacturing uses, about
90 percent of lithium demand will be from Indian
lithium-ion battery sector.51
Due to lack of a lithium-processing ecosystem,
India currently imports a significant share of its
lithium-ion batteries and battery materials.
Indian battery manufacturers are seeking to
develop a lithium battery ecosystem to fulfil
anticipated demand from the EV sector. These
manufacturers include:
• Tata Chemicals Limited: Has a plant in
Dholera, Gujarat, and plans to manufacture
up to 10 GWh per year of lithium ion battery
components52
• TDS Lithium-Ion Battery Gujarat Private
Limited (TDSG): A JV between Toshiba
Corporation, DEnSo Corporation, and
Suzuki Motor Corporation, set up a plant to
produce 1 GWh batteries for Suzuki Motor’s
plant in Gujarat53
• Exide Industries: Formed a JV with Swiss firm
Leclanche to build an assembly line to supply
1.5 GWh of lithium-ion batteries and ESS54
• Manikaran Power Limited and neometals
Limited: Conducting a feasibility study for
a lithium refinery in India, with a nominal
capacity of 20,000 Mt of lithium carbonate
equivalent (lithium hydroxide)55
• Amara raja: Announced in 2021 the opening of
a technology hub to develop lithium-ion cells in
Tirupati, Andhra Pradesh56
• reliance Industries: Has announced a plan
for four large-scale production bases to
manufacture all components of their new
energy ecosystem, including batteries for
energy storage57
Table 3: Indian developments in the lithium ecosystem - summary58
Activities Developments
Exploring domestic and
international resources for
lithium
• 2020: India’s first lithium reserve of 1.6 kt is discovered in Karnataka
• 2020: Khanij Bidesh India Limited (KABIL) begins exploration of 17 Mt of
lithium in South America (KABIL was formed in 2019)
Lithium processing and refining • 2020: Manikaran Power Limited and neometals Limited launches a
feasibility study for setting up a lithium refinery in India, with a nominal
capacity of 20 kt of lithium carbonate equivalent (lithium hydroxide)
Component manufacturing • 2020: TATA Chemicals plans to manufacture up to 10 GWh per year of
lithium-ion battery components. Its plant will also have recycling operations
Battery manufacturing and/or
assembly
• 2017: TDSG JV forms to manufacture and supply lithium-ion batteries to the
Suzuki Motor Plant in Gujarat
• 2018: Exide Industries forms a JV with Swiss firm Leclanche to build an
assembly line to supply 1.5 GWh of lithium-ion batteries and ESS
• 2020: Japanese firm Amperex Technology Limited buys land in Haryana,
India, to set up a lithium-ion polymer battery manufacturing unit
• 2021: Amara raja announces it is opening a technology hub to develop
lithium-ion cells in Tirupati

Lithium reserves
Lithium is produced from hard rocks (pegmatite),
brines, or clay-based sedimentary deposits. In
2019, world economic resources of lithium were
19,500 kilo tonnes of lithium metal. In 2020,
world lithium reserves were estimated at 21
million tonnes.59
Expanded global exploration has identified global
lithium resources of 86 million tonnes.60 In 2019,
Australia had Economic Demonstrated resources
(EDr) of 5,702 kilo tonnes (kt) lithium. Australia
produced 45,000 tonnes of lithium in 2019 and
40,000 tonnes in 2020.
At present, eight countries produce lithium, with
Chile, Australia, and Argentina accounting for 85
percent of the global production.61 Chile, Bolivia,
and Argentina produce lithium from brine, while
Australia produces lithium from hard rock. In
China, lithium is produced from both the sources.
Indian supply landscape
In 2020, India discovered its first lithium
pegmatites reserve consisting of 1.6 kt in the
Marlagalla-Allapatna region of Karnataka’s
Mandya district.62
India currently imports 100 percent of its lithium
in various industrial forms, including lithium
oxide (about 1 kt), lithium hydroxide (about 1 kt),
and lithium carbonate (nearly 1 kt). Lithium cells
and battery packs are also imported for smaller
electronics products and mobile phones. Lithium
is primarily imported as lithium-ion batteries
(about 16 kt) for EVs and ESS.63
Figure 12: Import of lithium oxide and hydroxide in 202064
17% others
29%
Chile
12%
Latvia
17% China
26% russian
Federation
Notes:
59. USGS – Lithium Mineral commodities summary, https://pubs.er.usgs.gov/publication/mcs2021, excludes the United States of America
60. _https://pubs.er.usgs.gov/publication/mcs2021
61. McKinsey report: Lithium and cobalt: A tale of two commodities
62. https://pib.gov.in/PressreleasePage.aspx?PrID=1694796
63. Un Comtrade, https://comtrade.un.org/
64. Un Comtrade, https://comtrade.un.org/
UnLoCKInG AUSTrALIA-InDIA CrITICAL MInErALS PArTnErSHIP PoTEnTIAL34
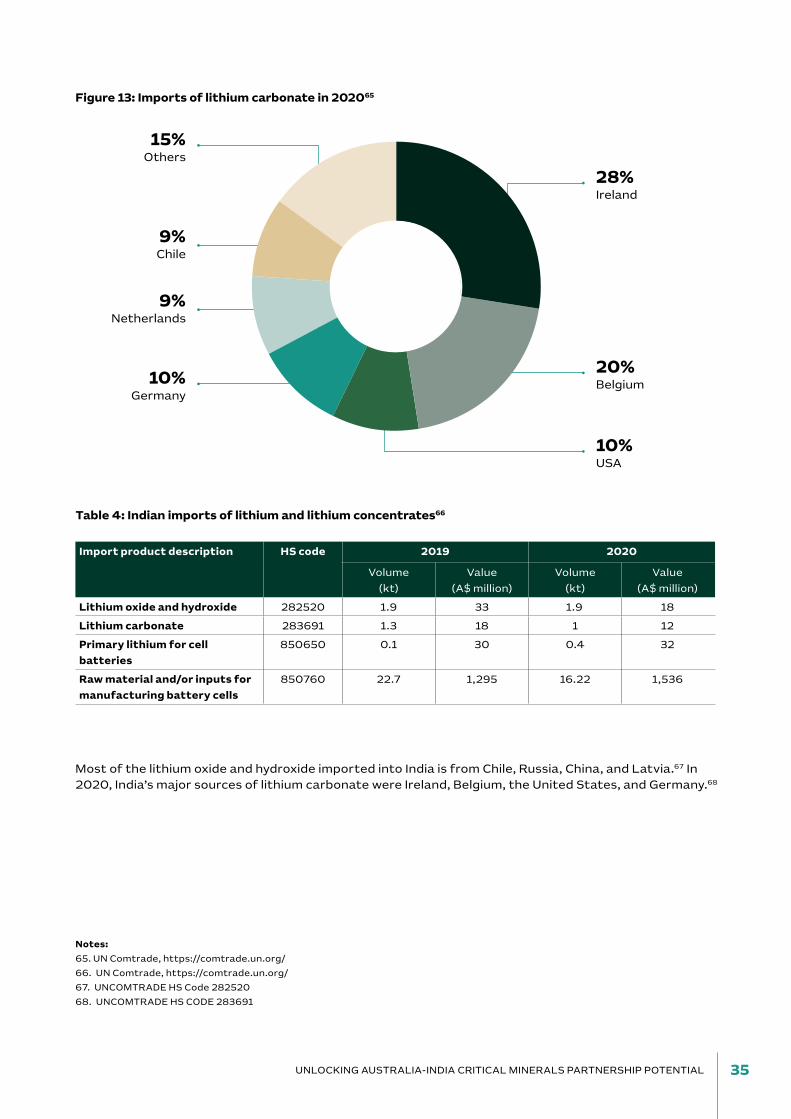
UnLoCKInG AUSTrALIA-InDIA CrITICAL MInErALS PArTnErSHIP PoTEnTIAL 35
Notes:
65. Un Comtrade, https://comtrade.un.org/
66. Un Comtrade, https://comtrade.un.org/
67. UnCoMTrADE HS Code 282520
68. UnCoMTrADE HS CoDE 283691
Figure 13: Imports of lithium carbonate in 202065
15% others
28%
Ireland
9% Chile
9% netherlands
10% Germany
20% Belgium
10% USA
Table 4: Indian imports of lithium and lithium concentrates66
Import product description HS code 2019 2020
Volume
(kt)
Value
(A$ million)
Volume
(kt)
Value
(A$ million)
Lithium oxide and hydroxide 282520 1.9 33 1.9 18
Lithium carbonate 283691 1.3 18 1 12
Primary lithium for cell
batteries
850650 0.1 30 0.4 32
Raw material and/or inputs for
manufacturing battery cells
850760 22.7 1,295 16.22 1,536
Most of the lithium oxide and hydroxide imported into India is from Chile, russia, China, and Latvia.67 In
2020, India’s major sources of lithium carbonate were Ireland, Belgium, the United States, and Germany.68

HS code Basic Customs
Duty (BCD)
Social Welfare
Surcharge
(SWS)
Integrated
Goods and
Services Tax
(IGST)
Total duty
Lithium oxide and hydroxide 2825 10% 10% 18% 29.8%
Lithium carbonate 2836 10% 10% 18% 29.8%
Cells and battery packs 8506 10% 10% 28% 40.8%
Lithium-ion cells for
accumulator in EVs
8507 10% 10% 28% 40.8%
Table 5: Import duties on lithium-ion batteries in India from April 202169
Lack of a commercial value chain and limited
lithium reserves in India gives Australian
manufacturers an opportunity to supply lithium
hydroxide or lithium carbonate to India.
As many Indian companies in the lithium battery
industry or value chain are large conglomerates,
Australian asset owners can seek investments in
mining, upstream projects, and other partnership
alliances, such as r&D.
Australian supply capability
Australia extracts spodumene comprising 58
percent lithium oxide. Spodumene undergoes
chemical processing to form lithium carbonate
and lithium hydroxide for industrial applications.
With 56 percent of the global lithium production,
Australia was ranked as the top lithium producer
in 2019.70 In that year, Australia’s Economic
Demonstrated resources (EDr) of lithium metal
was 5,702 kilo tonnes, ranking it second globally
after Chile, with 29 percent of the world’s EDr.
over 84 percent of Australia’s lithium EDr is held
in four deposits: Greenbushes (Tianqi Lithium
Australia Pty Ltd), Wodgina (Mineral resources
Ltd), Pilgangoora (Pilbara Minerals Ltd), and
Earl Grey (Mount Holland Lithium Project;
jointly owned by Wesfarmers Ltd and Sociedad
Quimica y Minera de Chile). Western Australia has
significant reserves and accounts for nearly 98
percent of Australia’s lithium production, with 0.5
percent in the northern Territory.71
Notes:
69. CBIC -Ministry of Commerce
70. Australian Critical Minerals Prospectus 2020
71. Australian Critical Minerals Prospectus 2020
The Indian Government has recently imposed import duties on lithium products to promote local
manufacturing of batteries. The following table lists Basic Customs Duty (BCD) the government has
imposed on imported lithium products.
note: The IGST is applicable on both imports and Indian manufacture and is an eligible ‘input tax credit’, which can be offset against GST liability.
UnLoCKInG AUSTrALIA-InDIA CrITICAL MInErALS PArTnErSHIP PoTEnTIAL36

UnLoCKInG AUSTrALIA-InDIA CrITICAL MInErALS PArTnErSHIP PoTEnTIAL 37
Figure 14: Australian lithium projects
PNGINDONESIA
200 m1000
m
1000 m200 m
VIC
NSW
SA
NT
QLD
WA
TAS
CANBERRA, ACT
PERTH
HOBART
MELBOURNE
DARWIN
SYDNEY
BRISBANE
ADELAIDEGreenbushes
Wodgina
MountHolland
Pilgangoora (Pilbara Minerals)
Kathleen Valley
Mount Marion
Pilgangoora (Altura Lithium)
Bald Hill
Mount Cattlin
Buldania
Finniss
Narraburra
Anningie and Barrow Creek
Bynoe (Lithium Australia) Bynoe (Lithium Plus)
Buchanan
Dorchap
0 500 km
PP-3548-10
150°E140°E130°E120°E
10°S
20°S
30°S
40°S
Project status
Mineralisation
Deposit
Lithium projects byresource size (kt Li2O)
<500
3,000–4,000
2,000–3,000
1,000–2,000
500–1,000
Australian lithium projects as at 30 June 2020
Background image: Magnetics(greyscale, 0.5 vertical derivativeof total magnetic intensity)
Key advanced project
Operating mine
Source: Australian Critical Minerals Prospectus 2020

Table 6: Australia’s upcoming lithium projects
Critical mineral
Project name Company Project status
Primary mineral(s)
Tonnage (Mt)
Grade Units Contained (kt)
Lithium Greenbushes Talison Lithium Au Pty Ltd
operating Li 157.1 2.25 % Li2o 3,532
Lithium Pilgangoora (Pilbara Min)
Pilbara Minerals Ltd
operating Li, Ta 223.2 1.27 % Li2o 2,835
Lithium Mt Marion ASX:MIn; Gangfeng Lithium
operating Li 72.9 1.37 % Li2o 995
Lithium Pilgangoora (Altura)
Altura Mining Ltd operating Li 45.7 1.06 % Li2o 482
Lithium Mt Cattlin Galaxy resources Ltd
operating Li, Ta 14.6 1.29 % Li2o 188
Lithium Wodgina Mineral resources Ltd
Care and maint
Li, Ta 259.2 1.17 % Li2o 3,032
Lithium Mount Holland Wesfarmers Ltd; SQM
FS Li 189.0 1.50 % Li2o 2,843
Lithium Bald Hill Alita resources Ltd
Care and maint
Li, Ta 26.5 0.96 % Li2o 255
Lithium Finniss Core Lithium Ltd FS Li 14.7 1.32 % Li2o 209
Lithium Kathleen Valley Liontown resources Ltd
PFS Li, Ta 156.0 1.40 % Li2o 2,184
The following table focuses on Australia’s operating mines and a robust project pipeline to meet future
lithium requirements.
Source: Australian Critical Minerals Prospectus 2020
UnLoCKInG AUSTrALIA-InDIA CrITICAL MInErALS PArTnErSHIP PoTEnTIAL38

UnLoCKInG AUSTrALIA-InDIA CrITICAL MInErALS PArTnErSHIP PoTEnTIAL 39
Potential collaboration opportunities
India foresees strong growth in lithium demand,
implying that securing lithium supply is a priority
for the country. Australia has resources to help
meet India’s increasing demand.
Plans to set up battery manufacturing units in
India will lead to demand for lithium raw materials
for processing and assembly, provided cell
chemistry and allied manufacturing facilities are
set up.
Indian manufacturers have ambitious plans for
energy storage solutions but the lack of advanced
cell chemistry capabilities means continued
dependency on imported cells and battery packs.
Cell and related components manufacturers in
Japan, Korea, the EU, and the US have shown
interest in the Indian market. As a result,
potential JVs could help increase production
in India to cater to local demand and export to
other countries.
Against this backdrop, Indian majors and JV
parties could consider long-term offtake
arrangements with Australian miners to secure
supplies.
Key opportunities
• Australian manufacturers could ship lithium
cathode active materials to active chemistry
and cell manufacturers in India.
• Indian companies and JVs (including battery
manufacturing technology partners) could
invest in lithium metals processing capacity
(lithium hydroxide, lithium carbonate etc.)
in Australia.
• Indian companies and JVs (including battery
manufacturing technology partners) could
invest in Australian lithium mining and
processing (spodumene concentrates)
projects, to feed the Indian supply chain.
• Australian lithium projects at the development
stage could offer opportunities for India to
secure long-term offtake opportunities.
• Lithium-ion battery manufacturing in India
could be further encouraged by the Indian
Government, reducing import duties on lithium
hydroxide, lithium carbonate, and spodumene
concentrate. This would help Indian battery
manufacturers become competitive with
international battery manufacturers.
• Indian companies could partner with
Australia’s Future Battery Industries
Cooperative research Centre (CrC) on
battery technology and processing to support
manufacturing capabilities in India. over
this report’s 10-year forecast period, new
emerging battery technologies, such as silicon
compounds, may be commercialised, as a
replacement for graphite anodes in
lithium-ion batteries.

Cobalt
Cobalt will be an important ingredient for India’s
shift to a low carbon economy.
By 2030, 80 percent cobalt demand is expected
to be driven by increased use of lithium-ion
batteries.72 Cobalt is also widely used in a range of
other specialised applications, such as superalloys,
high-temperature alloys, cutting tools,
magnetic materials, petrochemical catalysts,
pharmaceuticals, steel, and glaze materials.
With EV market growth and absence of cobalt
reserves in India, battery and cell chemicals
manufacturers will need to invest upstream
or form strategic alliances with mineral-rich
countries to ensure security and continuity
of supply.73
Australia is well equipped to provide stable
supply on the back of significant cobalt reserves,
accounting for about 19 percent of the global
resources.
Indian market analysis
The Indian cobalt market was estimated to
be 1–1.2 kt in 2020. It is expected to reach a
cumulative demand potential of 88-165 kt
by 2030.74
Notes:
72. UBS report - Battery raw Materials – november 2020
73. Australian Critical Minerals Prospectus 2020
74. Analysis based on publicly available information in following government and other reports- nITI Aayog: India’s Electric Mobility Transformation Progress To Date and Future opportunities ; -19; By 2024, nearly half of new three wheelers sold will be e-autos, CrISIL; EV -Charging towards a bright future, Avendus, July 2020; and ICrA press release 2020
75. Analysis based on publicly available information in following government and other reports- nITI Aayog: India’s Electric Mobility Transformation Progress To Date and Future opportunities; McKinsey: The unexpected trip: The future of mobility in India beyond CoVID-19; By 2024, nearly half of new three-wheelers sold will be e-autos, CrISIL; EV -Charging towards a bright future, Avendus, July 2020; and ICrA press release 2020. While 2020 represents actual consumption for the year based on imports, 2025 and 2030 represent cumulative numbers, based on population of vehicles and installed capacities of ESS in those years.
Figure 15: Cumulative Indian cobalt market demand potential (kt)75
2025f
2030f
Conservative scenario Base scenario optimistic scenario
62
165
125
88
30
23
16
2025f 2030f
Scenarios optimistic Base Conservative optimistic Base Conservative
Total cumulative
demand
30 23 16 165 125 88
Disclaimer: The demand potential identified shall be subject to the expected development of lithium-ion battery value chain in India.
UnLoCKInG AUSTrALIA-InDIA CrITICAL MInErALS PArTnErSHIP PoTEnTIAL40

UnLoCKInG AUSTrALIA-InDIA CrITICAL MInErALS PArTnErSHIP PoTEnTIAL 41
Cobalt’s high melting point and ferromagnetic
properties make it suitable for two major
applications: lithium-ion battery cathodes and
superalloys. Cobalt demand for lithium-ion battery
cathodes, which are primarily used for EVs and
ESS and other batteries, could drive ~80 percent of
the demand by 2030.
The residual demand from other applications,
including superalloys, magnets, and industrial
materials, could contribute about 20 percent to
the cobalt demand potential by 2030.76
As increase in demand for cobalt is expected
to differ amongst end-use industries. Cobalt
consumption across Indian industries is also likely
to vary from 2020 to 2030.
Notes:
76. Analysis based on information publicly available in following government and other reports- nITI Aayog: India’s Electric Mobility Transformation Progress To Date and Future opportunities; McKinsey: The unexpected trip: The future of mobility in India beyond CoVID-19; By 2024, nearly half of new 3-wheelers sold will be e-autos, CrISIL; EV -Charging towards a bright future, Avendus, July 2020; and ICrA press release 2020. While 2020 represents actual consumption for the year based on imports, 2025 and 2030 represent cumulative numbers. other Batteries includes demand from solar pumps & micro grid, railway – traction, Telecom, DG replacement and Captive power plants; While 2020 represents actual consumption for the year based on imports, 2025 and 2030 represent cumulative numbers, based on population of vehicles and installed capacities of ESS in those years.
77. Analysis based on information publicly available in following government and other reports -nITI Aayog: India’s Electric Mobility Transformation Progress To Date and Future opportunities; McKinsey: The unexpected trip: The future of mobility in India beyond CoVID-19; By 2024, nearly half of new 3-wheelers sold will be e-autos, CrISIL; EV -Charging towards a bright future, Avendus, July 2020; and ICrA press release 2020. While 2020 represents actual consumption for the year based on imports, 2025 and 2030 represent cumulative numbers. other Batteries includes demand from solar pumps & micro grid, railway – traction, Telecom, DG replacement and Captive power plants; While 2020 represents actual consumption for the year based on imports, 2025 and 2030 represent cumulative numbers, based on population of vehicles and installed capacities of ESS in those years.
78. Cobalt: demand-supply balances in the transition to electric mobility, JrC Science for Policy report
79. The Ultimate guide to cobalt market 2021-2030, crux investor
Table 7: Forecast Indian cobalt market by end-use segment77
End-use segment 2020e 2025f 2030f
Electric vehicle batteries 25% 56% 63%
other batteries 35% 18% 15%
other non-battery uses (superalloys,
magnets, pigments, others)
40% 26% 22%
The three dominant cathode chemistries used for
manufacturing lithium-ion batteries are LFP, nMC,
and nCA. Depending on battery chemistries and
configurations, cobalt content usually varies by
10–30 percent of cathode weight in nMC and 10–
15 percent in nCA.78 At present, 85–90 percent
of lithium-ion batteries are manufactured using
nMC- or nCA-based technologies.
A shift towards chemistries with reduced cobalt
concentrations is expected over the next decade.79
Cobalt content of lithium-ion batteries is likely
to be reduced rather than eliminated, with a
lower cost mineral (such as nickel) to be used as a
substitute without affecting battery performance.
While ‘cobalt-free’ battery technologies are being
explored due to price, supply, and sustainability
considerations, lithium-ion battery designs with
cobalt cathodes are still likely to dominate the
battery market in the medium to long term (refer
figure 11).

Key industry participants
Most cobalt used in manufacturing in India is
imported in various forms – ores, concentrates,
sulphates, hydroxides, and oxides – depending on
end-use industry requirements.
Indian manufacturers, such as nicomet Industries
Limited in Cuncolim, Goa, and rubamin Limited
in Halol, Gujarat, have developed capabilities
to process cobalt in India. nicomet uses
hydrometallurgy solvent extraction technology to
produce cobalt metal and its derivatives.80
rubamin has developed ecotechnology to
recover elements in spent catalysts. rubamin
manufactures high-grade cobalt sulphate for
non-battery applications, including animal health
formulations, catalysts, fertilisers, and dyes.81
India’s lithium-ion battery manufacturing sector
is in early stages of development. The companies
listed in the table below are actively studying
and planning battery production plants in India.
JVs with international battery manufacturing
technology partners will facilitate development
of India’s lithium-ion battery capability.
Notes:
80. https://ibm.gov.in/writereaddata/files/09022020154028Cobalt_2019.pdf
81. https://rubamin.com/
82. Based on primary and secondary research, news articles, annual reports
Table 8: Potential end-use industries and players82
End-use
segment
Technology/
products
End-use
industries
Mineral
specification
Key industry players Key geographical
locations
Cobalt
processing
Cobalt
sulphate
Lithium-ion
batteries (LCo,
nMC, and nCA)
non-battery
applications,
including
animal health
formulations,
catalysts,
fertilisers, and
dyes
Cobalt
concentrate
Lithium-ion battery
manufacturers
nicomet Industries
Limited and rubamin
Limited
Cuncolim, Goa and Halol,
Gujarat
Battery/
electrode/
cell
chemistry
production
Lithium-ion
battery (LCo,
nMC, and
nCA)
Electronics, EVs,
and construction
and mining
equipment
Battery-
grade cobalt
sulphate
heptahydrate
(CoSo4~7H
2o)
Exide Industries
Limited, Tata
Chemicals Limited,
HBL Power Systems
Limited, Amara
raja Batteries
Limited, Mahindra
Electric Mobility
Limited, TDSG,
and Contemporary
Amperex Technology
Co.*
Major EV battery
components and
chemistry manufacturing
clusters include Dholera
and Hansalpur in Gujarat;
Chandanvelli-Sitarampur
in Hyderabad; Divitipalli
in Telangana; Hubli and
Dharwad in Karnataka;
and other planned
locations across the
country
Superalloys Cobalt-based
superalloys
Defence,
aerospace and
automotive
Cast and
unwrought
cobalt alloy
metals
Mishra Dhatu nigam
Limited (MIDHAnI)
Hyderabad
*https://www.amararaja.com/, https://www.mahindra.com/news-room/press-release/mahindra-and-lg-chem-collaborate-for-li-ion-battery-technology,https://www.tatachemicals.com/Asia/Products/Specialty-chemistry/Material-Sciences/energy-storage-solutions, https://www.businesstoday.in/current/corporate/amara-raja-sets-up-research-hub-to-develop-lithium-ion-cells-at-tirupati/story/431895.html
UnLoCKInG AUSTrALIA-InDIA CrITICAL MInErALS PArTnErSHIP PoTEnTIAL42

UnLoCKInG AUSTrALIA-InDIA CrITICAL MInErALS PArTnErSHIP PoTEnTIAL 43
Supply scenario in India
Global cobalt reserves are highly concentrated in
a handful of countries, including the Democratic
republic of Congo (DrC), Australia, Zambia,
and Cuba.
In 2018, about 98 percent global cobalt
production was through extraction as a by-
product of nickel and copper.83 This means that
cobalt prices are dictated by nickel and copper
prices. About 70 percent of cobalt production
is concentrated in the conflict-prone DrC. In
addition to the resource concentration in the
DrC, about 50 percent of cobalt processing is
concentrated in China.
In 2019, global economic resources of cobalt
were 7,200 kilo tonnes of cobalt. India had 44.91
Mt of cobalt reserves, according to the national
Mineral Inventory.84 It does not currently produce
cobalt. However, it does have modest cobalt
refining capacity estimated at 2 kt (of cobalt
sulphate) annually, with nicomet and rubamin the
leading manufacturers.
India imports cobalt in various forms, including as
waste and scrap, which accounted for about 1.5
kt in 2019 and 1 kt in 2020.85
India primarily imports cobalt ores, oxides, and
hydroxide from Belgium, China, and Finland. It
imports cobalt sulphate from Finland and China.
Notes:
83. EV- Charging towards a bright future, Avendus report, July 2020
84. Indian Mineral Yearbook, 2020 – Cobalt, https://ibm.gov.in/writereaddata/files/09022020154028Cobalt_2019.pdf
85. UnCoMTrADE, ITC Trade map and India Trade Statistics
86. UnCoMTrADE and India Trade Statistics
Table 9: Indian imports of cobalt concentrates and compound86
Import product description HS code 2019 2020
Volume
(kt)
Value
(A$ million)
Volume
(kt)
Value
(A$ million)
Cobalt ores, oxide, and
hydroxide
2605, 2822 0.27 10.6 0.24 8.85
Cobalt sulphate 2833 0.20 2.12 0.26 2.62
Cobalt mattes, powder, and
other intermediate products
of cobalt metallurgy, including
waste and scrap
8105 1.30 92.96 0.76 54.12

Figure 16: Imports of cobalt sulphate in 202087
4% Brazil
3% others
3% others
16% China
77% Finland
Notes:
87. UnCoMTrADE and India Trade Statistics
88. UnCoMTrADE and India Trade Statistics
Figure 17: Imports of cobalt ores, oxides, and hydroxides in 202088
4% Italy
42%
Belgium
22% Finland
29% China
UnLoCKInG AUSTrALIA-InDIA CrITICAL MInErALS PArTnErSHIP PoTEnTIAL44

UnLoCKInG AUSTrALIA-InDIA CrITICAL MInErALS PArTnErSHIP PoTEnTIAL 45
Notes:
89. CBIC -Ministry of Commerce, GoI
90. UBS report – Battery raw Materials – november 2020
91. Australian Critical Minerals Prospectus 2020
92. Geoscience Australia
Category HS code BCD SWS IGST Total duties
Cobalt ores and concentrates 2605 5% 10% 5% 10.8%
Cobalt oxide, hydroxide, and
sulphate
2822, 2833 10% 10% 28% 42%
Cobalt mattes powder and
other intermediate products
of cobalt metallurgy, including
waste and scrap
8105 5% 10% 18% 24.5%
Table 10: Indian import duties on cobalt products from April 202189
The Indian Government has imposed higher duties
on cobalt chemicals and intermediates to support
local manufacturing of lithium-ion batteries,
EVs, and ancillary products. The table below lists
government duties imposed on various forms of
imported cobalt.
While India’s duties on cobalt ores and
concentrates are comparatively low (10.8
percent), almost all of cobalt is a by product of
copper or nickel mining, which include cobalt
sulphate or cobalt metal. There is a need to
reduce the duty on these mid-stream cobalt
products to increase the competitiveness of
India’s lithium-ion battery manufacturing.
International cobalt prices stood at about A$
49,530 a tonne in 2019. These are projected to
reach A$ 80,400 a tonne by 2030.90 Limited
cobalt processing capacity in India provides
an opportunity for Australian mines to supply
battery-grade cobalt sulphate.
Indian battery and chemical manufacturers and
EV organisations can evaluate entering into long-
term arrangements with upstream investment
projects to secure cobalt supply.
The opportunities presented by the global supply
chain and limited domestic resources make
India a strong market proposition for Australian
cobalt suppliers.
Australian supply capability
Australia ranks second in the world for cobalt
economic resources that were estimated at 1,399
kt in 2019 (19 percent of the global economic
cobalt resources).91 In 2019, Australia produced
5.7 kt of cobalt, constituting 5 percent of the
global production and ranking third across the
globe after DrC and russia.
Australia is well equipped with large cobalt
reserves and a cobalt project pipeline to sustain
production growth, making it a viable competitor
to DrC and China in the longer term.
Australia’s cobalt industry is driven by a strong
nickel mining industry, in contrast to other
markets where cobalt is extracted mostly from
copper mining.
Australia accounts for 7 percent of the global
nickel production and hosts 24 percent of the
world’s nickel resources.92 Historically, cobalt
production stemmed from growth in nickel
sulphide mining in Western Australia. However,
more recent developments have seen cobalt
production rise from lateritic nickel operations,
also in Western Australia.
Several advanced Australian cobalt development
projects are seeking funding for construction,
representing an excellent opportunity for Indian
battery manufacturers and EV producers.
International battery technology partners could
also participate in developing Australian cobalt
projects as strategic partners to secure long-
term cobalt sulphate supply.
note: The IGST is applicable on both imports and Indian manufacture and is an eligible ‘input tax credit’, which can be offset against GST liability.

PNGINDONESIA
200 m1000
m
1000 m200 m
Browns Oxide
Wilconi
Claude Hills
See inset a.
See inset c.Windabout
Wollogorang
Cangai Copper
Hurlls Hill
Basil
Rover 1Peko Tailings Mount
OxideLucky Break
Barnes HillAvebury
Jasper Hill
Grimlock
Gorge Creek Highlands
Mount Cobalt/Kilkivan
Mount OxideTailings
MountGilmore
See inset b.
PacificExpress
MG14
VIC
NSW
SA
NT
QLD
WA
TAS
CANBERRA, ACT
PERTH
HOBART
MELBOURNE
DARWIN
SYDNEY
BRISBANE
ADELAIDE
RangeWell
Wingellina
Goongarrie
Sconi
NiWest
Walford Creek
Gladstone
Browns Sulfide
MountThirsty
Savannah
Nova-Bollinger
CapricornCopper
0 500 km
PP-3548-4
Australian cobalt projects as at 30 June 2020
Overlander
Duck CreekWhite Range
Canteen
QLD
E1-Monakoff
Salebury Wee MacGregor
Golden Mile,Evening Star
BelgiumCloncurry, Trump
Barbara Ernest HenryMillenniumRocklands Group
NSW
Hylea CobaltMalamuteHusky
Collerina
Flemington
Nico Young
Sunrise
West Lynn
0 50 km
0 100 km
Cobalt projects byresource size (kt Co) Project status
Mineralisation
Deposit
Background image: Magnetics(greyscale, 0.5 vertical derivativeof total magnetic intensity)
<10
10–20
20–50
50–100
100–200
150°E140°E130°E120°E
10°S
20°S
30°S
40°S
NSWSA
BrokenHill Cobalt
Broken HillKalkaroo
Mutooroo
NorthBroken Hill
North Portia
OpharaCobalt-Gold
Thackaringa
150°E148°E146°E
32°S
34°S
Inset b. Inset c.0 50 km
142°E141°E140°E
32°S
Inset a.
141°E140°E
21°S
Key advanced project
Operating mine
Figure 18: Australian cobalt projects
Source: Australian Critical Minerals Prospectus 2020
UnLoCKInG AUSTrALIA-InDIA CrITICAL MInErALS PArTnErSHIP PoTEnTIAL46

UnLoCKInG AUSTrALIA-InDIA CrITICAL MInErALS PArTnErSHIP PoTEnTIAL 47
The following table highlights operating mines and a robust project pipeline to meet future cobalt
requirements.
Source: Australian Critical Minerals Prospectus 2020
Table 11: Australia’s operating mines and key advanced projects
Critical mineral
Project name Company Project status
Primary mineral(s)
Tonnage (Mt)
Grade Units Contained (kt)
Cobalt Savannah Panoramic resources Ltd
operating ni, Cu, Co 13 0.11 % Co 14
Cobalt Nova-Bollinger IGo Ltd operating ni, Cu, Co 11.6 0.07 % Co 8
Cobalt Barbara ASX:SoL operating Cu, Au 4.8 0.03 % Co 1
Cobalt Capricorn Copper
Capricorn Copper Holdings
operating Cu nA
Cobalt Ernest Henry Glencore Plc operating Cu, Au nA
Cobalt Sunrise Clean TeQ Holdings Ltd
Pre-const ni, Co, Sc 183.3 0.09 % Co 162
Cobalt Wingellina Metals X Ltd FS ni, Co 215.8 0.07 % Co 151
Cobalt SCONI Australian Mines Ltd
FS ni, Co 75.7 0.08 % Co 57
Cobalt Gladstone Gladstone Pacific nickel Ltd
FS ni, Co 70.9 0.06 % Co 43
Cobalt Mount Oxide Zhongjin Lingnan Mining
Care and maint
Cu, Ag 25.1 0.08 % Co 21
Cobalt Rocklands Group
CuDeco Ltd (in liquidation)
Care and maint
Cu, Au 56.7 0.03 % Co 17
Cobalt White Range Young Australian Mines Ltd
FS Cu, Au 29.1 0.04 % Co 11
Cobalt Avebury Allegiance Mining Pty Ltd
Care and maint
ni, Co 29.3 0.02 % Co 7
Cobalt Range Well EV Metals PFS ni, Cr, Co 385.3 0.04 % Co 154
Cobalt Goongarrie Ardea resources Ltd
PFS ni, Co 215.6 0.06 % Co 131
Cobalt Broken Hill Cobalt
Cobalt Blue Holdings Ltd
PFS Co (S, Fe) 111 0.07 % Co 79
Cobalt NiWest GME resources Ltd
PFS ni, Co 85.2 0.07 % Co 55
Cobalt Mt Thirsty Conico; Barra resources
PFS Co, ni 26.8 0.12 % Co 32
Cobalt Kalkaroo Havilah resources Ltd
PFS Cu, Au, Co 193.3 0.01 % Co 23

Potential project cooperation opportunities
India’s lithium-ion battery manufacturing
ecosystem is currently restricted to battery
assembly operations. Indian battery chemical and
cell manufacturers must secure foreign suppliers
to develop and maintain a resilient supply chain of
cobalt to, in turn, support rapid transition to EVs.
Indian demand for cobalt is closely linked to the
development of its lithium-ion battery value chain
Key opportunities
• A number of advanced Australian cobalt
development projects are seeking funding.
This presents an opportunity to involve
Indian battery manufacturers and EV
producers (such as Exide Industries, TDSG,
and Tata Chemicals) and international
battery technology partners (such as
Panasonic, Samsung, and BASF), to support
development of Australian projects and secure
offtake arrangements.
• The majority of Australian cobalt development
projects are nickel-cobalt projects.
Participation in these projects would enable
Indian companies and conglomerates to
establish a secure nickel supply as well.
• India could reduce its import duties on
cobalt sulphate and other mid-stream cobalt
products to make the Indian lithium-ion
battery sector more competitive.
• Indian manufacturers and JVs (including
battery manufacturing technology partners)
could consider investing in cobalt cathode
active materials (finished precursor materials),
either independently or with a buy-back
arrangement through agencies such as KfW
Germany or Japan International Cooperation
Agency (JICA), to feed the Indian supply chain.
UnLoCKInG AUSTrALIA-InDIA CrITICAL MInErALS PArTnErSHIP PoTEnTIAL48

UnLoCKInG AUSTrALIA-InDIA CrITICAL MInErALS PArTnErSHIP PoTEnTIAL 49
Graphite
Graphite is a form of elemental carbon with a high
electrical and thermal conductivity and excellent
thermal stability, making it suitable for a wide
range of industrial applications. These applications
include lithium-ion batteries, refractory products,
electrodes, foundry additives, and lubricants.
The steel industry has historically shaped growth
of the graphite market using electrode and
refractory products. However, graphite is now
becoming an increasingly important element in
lithium-ion battery anodes globally.
India’s use of graphite in battery electrodes and
chemicals is forecast to grow as it establishes its
lithium-ion battery manufacturing capacity. The
country’s focus on cost-competitive and low-
carbon production processes will drive demand
for natural graphite compared with its expensive
synthetic counterpart.
India is currently a net importer of natural
graphite, with about 60 percent of imports
sourced from China.93 Australia’s pipeline of
advanced graphite development projects,
including planned processing into spherical flake
graphite for battery manufacturing, could support
diversification of India’s supply chain.
Indian market analysis
India’s market for natural and synthetic graphite
was estimated at 155–175 kt in 2020. It is forecast
to reach an expected cumulative demand potential
of 3,720 kt by 2030.94
Notes:
93. UnCoMTrADE and India Trade Statistics
94. Analysis based on publicly available information in following government and other reports - nITI Aayog: India’s Electric Mobility Transformation Progress To Date and Future opportunities ; McKinsey: The unexpected trip: The future of mobility in India beyond CoVID-19; By 2024, nearly half of new three-wheelers sold will be e-autos, CrISIL ; EV -Charging towards a bright future, Avendus, July 2020; and ICrA press release 2020 ; India is expected to replicate the global application trends; other batteries include demand from solar pumps and micro grid, railway – traction, Telecom, DG replacement, and Captive power plants; while 2020 represents actual consumption for the year based on imports, 2025 and 2030 represent cumulative numbers
95. Analysis based on publicly available information in following government and other reports - nITI Aayog: India’s Electric Mobility Transformation Progress To Date and Future opportunities; McKinsey: The unexpected trip: The future of mobility in India beyond CoVID-19; By 2024, nearly half of new three-wheelers sold will be e-autos, CrISIL; EV -Charging towards a bright future, Avendus, July 2020; and ICrA press release 2020; while 2020 represents actual consumption for the year based on imports, 2025 and 2030 represent cumulative numbers, based on population of vehicles and installed capacities of ESS in those years.
2025f 2030f
Scenarios optimistic Base Conservative optimistic Base Conservative
Total cumulative
demand
1,302 1,214 1,106 3,720 3,272 2,806
Disclaimer: The demand potential identified shall be subject to the expected development of lithium-ion battery value chain in India
Figure 19: Cumulative Indian graphite market demand potential (kt)95
2025f
2030f
Conservative scenario Base scenario optimistic scenario
1,106
1,214
2,806
3,272
3,720
1,302

In India, graphite demand for use in lithium-
ion battery anodes, mostly for EVs and ESS, is
expected to drive around 25 percent graphite
demand in 2030.
The high growth rate would be a result of the
anticipated rapid shift from internal combustion
engines to EVs over the next decade, with demand
growth expected to slow after that.
With a rise in demand for graphite expected
to vary between end-use industries, graphite
consumption across India’s industries is likely to
vary from 2020 to 2030.
Graphite exists in two forms: natural graphite,
including flake, amorphous, and crystalline,
which is mined; and synthetic graphite, which is
processed from petroleum coke or coal tar. Both
forms compete for applications in batteries,
refractories, foundries, and lubricants.
Electrodes used in electric arc furnace
steelmaking primarily use synthetic graphite.
This is also preferred for lithium-ion batteries due
to its superior consistency and purity. However,
most lithium-ion battery manufacturers use a
combination of natural and synthetic graphite
to balance the needs of energy density and
cycle time.
End-use segment 2020e 2025f 2030f
EV batteries 1% 6% 20%
ESS and other batteries - 6% 6%
Electrodes 54% 46% 37%
refractories 31% 27% 22%
others (incl. lubricants and foundries) 14% 15% 15%
Table 12: Indian graphite market forecast by end-use segment96
Notes:
96. Analysis based on publicly available information in following government and other reports - nITI Aayog: India’s Electric Mobility Transformation Progress To Date and Future opportunities; McKinsey: The unexpected trip: The future of mobility in India beyond CoVID-19; By 2024, nearly half of new three-wheelers sold will be e-autos, CrISIL; EV -Charging towards a bright future, Avendus, July 2020; and ICrA press release 2020; other batteries include demand from solar pumps and micro grid; railway – traction, telecom, DG replacement, and captive power plants
UnLoCKInG AUSTrALIA-InDIA CrITICAL MInErALS PArTnErSHIP PoTEnTIAL50

UnLoCKInG AUSTrALIA-InDIA CrITICAL MInErALS PArTnErSHIP PoTEnTIAL 51
Notes:
97. Primary research and UBS’s battery raw materials, november 2020
98. UBS report - Battery raw Materials – november 2020
Anode chemistries have changed little in the past
few years, but innovations to replace graphite in
battery anodes with silicon and silicon composites
could dampen graphite demand. However, these
technologies are under development and it may be
some time before commercial application becomes
viable.98
An emerging technology breakthrough involving
graphene-based batteries could boost natural
graphite demand exponentially. Another
application that is likely to increase demand for
natural graphite is graphite sheet-based heatsinks
used in power electronics.
Figure 20: Indian graphite market forecast by type97
77%
13%
8%
6%15%
2020e
2030f
38% natural
57% natural
62% Synthetic
43% Synthetic

Key industry participants
India is likely to see a surge in demand for various
forms of graphite from a range of players across
the battery manufacturing landscape. While
battery makers look to source processed SPG,
demand for graphite concentrates might also
arise from battery anode manufacturers.
Notes:
99. https://www.himadri.com/advanced_carbon_materials
100. https://www.epsiloncarbon.com/press/press-release/epsilon-advanced-materials-forays-into-battery-material-business-by-commissioning-manufacturing-facility-to-produce-synthetic-graphite-anode-materials-for-lithium-batteries
101. Based on Primary and secondary research
Table 13: Potential target technologies and manufacturers101
Technology /
products
End-use
industries
Mineral
specification
Key industry players Key geographical
locations
Gra
ph
ite
Pro
ce
ss
ing
Spherical flake
graphite
Lithium-ion
batteries
Flake graphite Himadri Speciality
Chemicals Limited,
Epsilon Carbon
Private Limited
Howrah and Hooghly
(West Bengal), Korba
(Chhattisgarh), and
Vishakhapatnam (Andhra
Pradesh)
Ba
tt
ery
pro
du
ct
ion
Lithium-ion
batteries
(LFP graphite
and LMO/
LCO graphite
battery cells)
Electronics, EVs,
construction and
mining equipment
SPG Exide Industries
Limited, HBL Power
Systems Limited,
Amara raja Batteries
Limited, Mahindra
Electric Mobility
Limited, TDSG and
Contemporary
Amperex
Technology Co.*
Major EV battery
manufacturing clusters
include Dholera and
Hansalpur in Gujarat;
Chandanvelli-Sitarampur
in Hyderabad; Shahabad
and Divitipalli in
Telangana; Hubli and
Dharwad in Karnataka;
and other planned
locations across
the country
Re
fra
ct
ori
es
Oxide-carbon
refractories,
refractory
products for
steel casting,
and unshaped
carbon-
containing
refractories
Steel, cement,
ceramics, and
glass
SPG (92–94% total
graphitic carbon
(TGC))
Flaked graphite
(90–99% TGC)
Flaked graphite
(85–94% TGC)
TrL Krosaki
refractories, rHI
India Private Limited,
Dalmia-oCL Limited,
Carborundum
Universal Limited and
IFGL refractories
Limited
East Godavari and West
Godavari in Andhra
Pradesh; Vriddhachalam
in Tamil nadu; Asansol
in West Bengal; and
Jharsuguda in odisha
are amongst clusters
of Micro, Small, and
Medium Enterprises
(MSMEs). Several other
manufacturers are spread
around the country
Indian companies, such as Himadri Speciality
Chemical Limited and Epsilon Carbon Private
Limited have moved into graphite processing to
produce SPG for battery anode material.99, 100
While Himadri has developed both natural and
synthetic anode materials, Epsilon plans to
supply synthetic anode materials. India’s steel
refractories and foundries will continue to drive
demand for imported graphite.
*https://www.amararaja.com/, https://www.mahindra.com/news-room/press-release/mahindra-and-lg-chem-collaborate-for-li-ion-battery-technology,https://www.tatachemicals.com/Asia/Products/Specialty-chemistry/Material-Sciences/energy-storage-solutions, https://www.businesstoday.in/current/corporate/amara-raja-sets-up-research-hub-to-develop-lithium-ion-cells-at-tirupati/story/431895.html
UnLoCKInG AUSTrALIA-InDIA CrITICAL MInErALS PArTnErSHIP PoTEnTIAL52

UnLoCKInG AUSTrALIA-InDIA CrITICAL MInErALS PArTnErSHIP PoTEnTIAL 53
Technology /
products
End-use
industries
Mineral
specification
Key industry players Key geographical
locations
Re
fra
ct
ori
es
Crucibles (clay
bound)
Steel, cement,
ceramics and
glass
Flaked graphite
(85–94% TGC)
Zircar refractories
Limited, HEG Limited,
Graphite India
Limited, Pandian
Graphites (India)
Limited, rahul
Graphites Limited
and SLV Fortune
Industries India
Private Limited
rajahmundry in Andhra
Pradesh has a cluster
of graphite crucibles
manufacturing SMEs,
but prominent players
have foundries across the
country
Fo
un
dri
es
Foundry
coatings (iron
foundries and
non-ferrous
castings)
Automotive,
electric motors,
food processing
Amorphous and
flaked graphite
(≥85% TGC) – used
as carbon additive
to produce grey
iron and to reduce
chill depth in grey
cast iron
Hinduja Foundries
Limited (part of
Ashok Leyland),
Electrosteel Castings
Limited, nelcast
Limited and other
MSMEs
Major foundry clusters
include Howrah in
West Bengal; Batala,
Jalandhar and Ludhiana
in Punjab; Agra in Uttar
Pradesh; Pune, Kolhapur,
Sholapur and Mumbai in
Maharashtra; rajkot and
Ahmedabad in Gujarat;
Belgaum in Karnataka;
Coimbatore and Chennai
in Tamil nadu. Each of
these foundries caters to
specific end-use markets
Lu
bri
ca
tio
n
Dry lubricant Automotive,
textiles and
general industrial
manufacturing
Flaked graphite
(96–98% TGC)
needs low grit
graphite (ultra-
high purity)
Indian oil Corporation
Limited, Bharat
Petroleum
Corporation Limited,
Gulf oil Lubricants
India Limited
(part of Hinduja
Group), Valvoline
Cummins Private
Limited, ExxonMobil
Lubricants Private
Limited, Elf
Lubricants India
Limited, GS Caltex
India Private Limited
and Tide Water oil Co.
(India) Limited
Players are spread across
the country

Supply scenario in India
natural graphite is globally abundant, with world
economic resources of 308 Mt of graphite in
2019. In 2020, global production was estimated
to be about 1.1 Mt, primarily in China, with the
rest of the world accounting for about 40
percent of the global supply.102
China is also the major supplier of natural
graphite for EV battery anode material, with the
world’s top three producers based in the country.
In 2019, Mozambique was the world’s second-
largest graphite producer at 100 kt (9 percent),
followed by Brazil with 96 kt (9 percent).
India is estimated to have a total of 194 Mt of
graphite, with 7 Mt of reserves, according to the
national Mineral Inventory.103 It is a significant
natural graphite producer, accounting for an
estimated 39.4 kt in 2018–19.104
Notes:
102. https://pubs.er.usgs.gov/publication/mcs2021
103. Indian Mineral Yearbook, 2019 - https://ibm.gov.in/writereaddata/files/07072020143852Graphite_2019.pdf
104. https://ibm.gov.in/writereaddata/files/07072020143852Graphite_2019.pdf
105. UnCoMTrADE
106. UnCoMTrADE
107. UnCoMTrADE and India Trade Statistics
Table 14: Indian imports of natural graphite107
Import product
description
HS code 2019 2020
Volume
(kt)
Value
(A$ million)
Volume
(kt)
Value
(A$ million)
Natural graphite powder
and flakes
25041010,
25041020,
25041090
43.84 28.61 37.76 21.95
Other forms of natural
graphite
25049010,
25049090
1.15 1.21 0.88 0.82
However, India remains a net importer of natural
graphite. Imports accounted for about 45 kt
and 39 kt of natural graphite in 2019 and 2020,
respectively, with China supplying about 60
percent of the total imports.105 India imported
52 kt and 46 kt of artificial graphite in 2019 and
2020, respectively.106
Beneficiation is a process to render mined
graphite as more economic. Graphite miners
operating prominent beneficiation plants in India
include Chotanagpur Graphite Private Limited in
Jharkhand, Agarwal Graphite & Carbon Products
Private Limited in Daltonganj, T.P. Minerals Private
Limited in Sambalpur, Tirupati Graphite Private
Limited in Jharkhand, and Tamil nadu Minerals
Limited in Sivaganga.
UnLoCKInG AUSTrALIA-InDIA CrITICAL MInErALS PArTnErSHIP PoTEnTIAL54
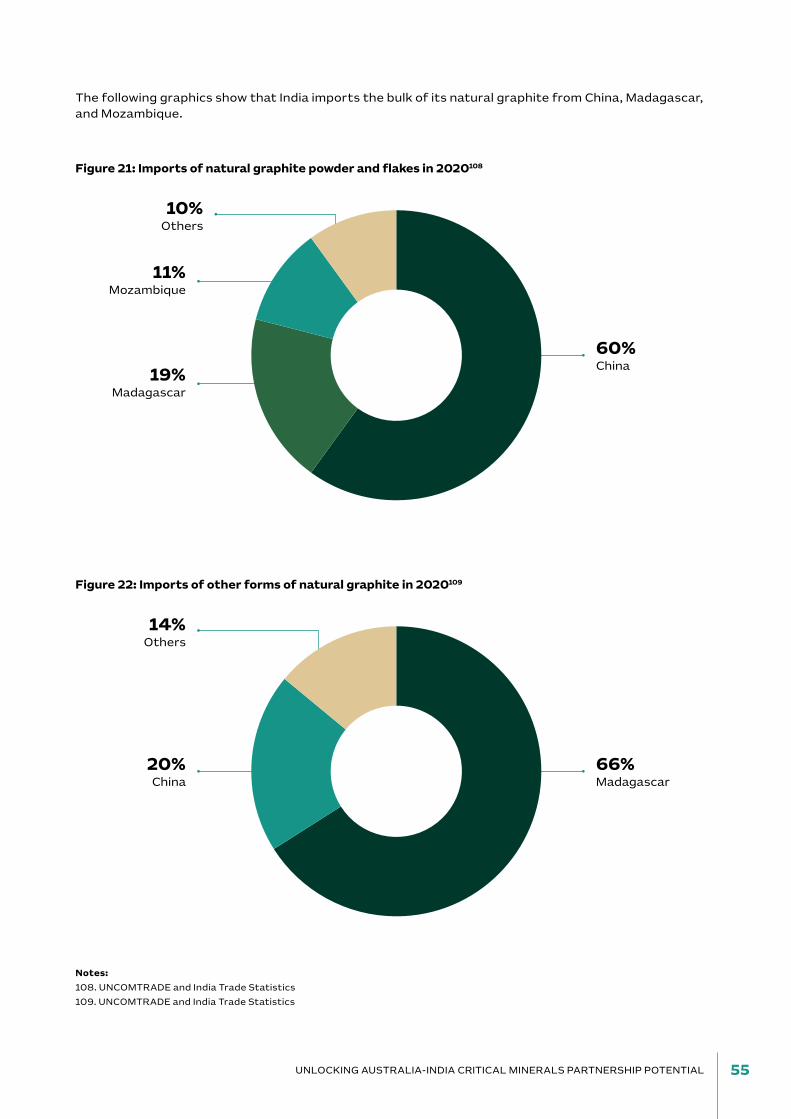
UnLoCKInG AUSTrALIA-InDIA CrITICAL MInErALS PArTnErSHIP PoTEnTIAL 55
Figure 21: Imports of natural graphite powder and flakes in 2020108
Figure 22: Imports of other forms of natural graphite in 2020109
10% others
14% others
11%
Mozambique
19%
Madagascar
60%
China
20% China
66% Madagascar
Notes:
108. UnCoMTrADE and India Trade Statistics
109. UnCoMTrADE and India Trade Statistics
The following graphics show that India imports the bulk of its natural graphite from China, Madagascar,
and Mozambique.

The following table shows import duties imposed by the Indian government on natural graphite.
Table 15: Indian import duties on natural graphite from April 2021110
Notes:
110. CBIC -Ministry of Commerce, GoI
111. UBS report - Battery raw Materials – november 2020
112. Australian Critical Minerals Prospectus 2020
HS code BCD SWS IGST Total duties
Natural graphite 2504 10% 10% 5% 16.55%
The free on board China price for graphite flake,
which is the most commonly traded form of
graphite, was about A$750–1,200 a tonne in
2019. Prices are forecast to increase, potentially
reaching A$ 1,190–1,555 a tonne by 2030.111
India is likely to remain a net importer;
Indian buyers will seek to secure supplies at
competitive prices, providing an opportunity for
international suppliers.
The expected surge in demand for battery-
grade anodes due to the forecast rise of EVs
in India in the latter half of the decade will
create opportunities for Australian suppliers of
natural graphite to establish strategic supply
relationships with Indian companies.
Australian supply capability
Australia ranks seventh globally for EDr of
natural graphite with an estimated 7.97 Mt in
reserves across South Australia, Queensland, and
Western Australia in 2019.112
Australia has a number of advanced projects to
mine flake graphite. Project proponents also plan
to develop battery anode material manufacturing
facilities to convert graphite concentrate into
high-value SPG for the lithium-ion battery market.
note: The IGST is applicable on both imports and Indian manufacture and is an eligible ‘input tax credit’, which can be offset against GST liability.
UnLoCKInG AUSTrALIA-InDIA CrITICAL MInErALS PArTnErSHIP PoTEnTIAL56

UnLoCKInG AUSTrALIA-InDIA CrITICAL MInErALS PArTnErSHIP PoTEnTIAL 57
Figure 23: Australian graphite projects
PNGINDONESIA
200 m1000
m
1000 m200 m
See inset a.
Burke
VIC
NSW
SA
NT
QLD
WA
TAS
CANBERRA, ACT
PERTH
HOBART
MELBOURNE
DARWIN
SYDNEY
BRISBANE
ADELAIDE
Mount Dromedary
McIntosh
MunglinupSpringdale
Yalbra
CroydonEsmeralda
0 500 km
PP-3548-6
150°E140°E130°E120°E
10°S
20°S
30°S
40°S
Graphite projects byresource size (kt TGC)
<100
5,000–10,000
2,000–5,000
1,000–2,000
100–1,000
Australian graphite projects as at 30 June 2020
Project status
Mineralisation
Deposit
Background image: Magnetics(greyscale, 0.5 vertical derivativeof total magnetic intensity)
Operating mine
SA
KookaburraGully
Siviour
Uley
Wilco South
Oakdale
Koppio
Campoona ShaftCampoona Central
Inset a.
0 50 km
136°E135°E
33°S
34°S
35°S
Key advancedproject
Source: Australian Critical Minerals Prospectus 2020

Potential project cooperation opportunities
India’s demand for graphite is likely to grow
significantly due to the development of the
battery electrodes and battery chemicals
industry. Global supply dynamics will be affected
by the concentration of the supply of natural
graphite and SPG in just a few regions.
Australian companies have established
capabilities in battery anode materials. Syrah
resources has opened the first vertically
integrated production facility for active anode
material from natural graphite in Louisiana, US.
EcoGraf Limited has commissioned a SPG
purification plant in Kwinana, Western Australia
utilising cost-effective, environmentally friendly
(HF-free) technology.
Australian suppliers can partner with Indian
original Equipment Manufacturers (oEMs) to
bring these technologies to India and capitalise
on the increasing demand for battery materials.
In addition, they can transfer technology for
recycling and/or recovery of carbon and establish
a sustainable circular economy for the segment.
Key opportunities
• Australian graphite suppliers could explore
offtake opportunities with traditional
downstream industries, such as refractories,
electrode makers, and steelmakers, in India.
• Australian companies could initiate dialogues
with battery chemicals and cell manufacturers
in India to assess market readiness for supply of
natural graphite.
• A number of advanced Australian graphite
development projects are seeking funding
for project construction. They could seek
investment and strategic partnerships with
Indian battery and EV manufacturers for
developing Australian graphite projects and/or
processing in Australia or in India. International
battery technology partners could also
be involved.
• Companies could examine the possibility
of forming Australia-India JVs for graphite
processing, and recycling and recovery
technologies, to ensure compliance with
sustainable mining practices.
Critical mineral
Project name Company Project status
Primary mineral(s)
Tonnage (Mt)
Grade Units Contained (kt)
Graphite Siviour renascor resources Ltd
FS Graphite 87.4 7.50 % TGC 6,600
Graphite Munglinup Mineral Commodities Ltd
FS Graphite 8.0 12.20 % TGC 975
Graphite Uley Quantum Graphite Ltd
Care and maint
Graphite 6.3 11.10 % TGC 697
Graphite Kookaburra Gully
Lincoln Minerals Ltd
FS Graphite 2.0 15.20 % TGC 309
Graphite McIntosh Hexagon Energy Materials
PFS Graphite 23.8 4.45 % TGC 1,060
Table 16: Australia’s planned graphite projects
Source: Australian Critical Minerals Prospectus 2020
UnLoCKInG AUSTrALIA-InDIA CrITICAL MInErALS PArTnErSHIP PoTEnTIAL58

UnLoCKInG AUSTrALIA-InDIA CrITICAL MInErALS PArTnErSHIP PoTEnTIAL 59
Nickel
Key growth drivers for nickel include the rise in the
alloy and stainless-steel sectors and the growth of
lithium-ion battery manufacturing in India. Battery
chemistries requiring nickel are necessary for
applications in EVs and ESS. nickel is also used to
produce superalloys and microphone capsules.
Coated steel, aluminium, plastics, and plain
chromium steel are common substitutes
for stainless steel and nickel alloys in many
construction and transportation applications.
Ultra-chromium stainless steels are being replaced
by austenitic grades in construction.
non-nickel specialty steels are also used in the oil
and petrochemical sectors. To mitigate corrosion,
titanium alloys or specialty plastics are used as
substitutes for nickel alloys in applications.
India is focusing on exploring nickel for commercial
sale, using advanced technologies and strategic
alliances with nickel-rich suppliers. India will have to
depend on imports for this metal till a technology
to recover nickel from the overburden of chromite
ore in odisha is established on a commercial scale.
Australia has the world’s largest EDr (24 percent)
of nickel and is the sixth-largest producer.
Australia has the potential to both increase nickel
supplies to the established alloy and stainless steel
sectors, and meet anticipated demand for nickel
chemistry batteries in India.
Indian market analysis
India’s nickel market was estimated at 60–62 kt in
2020. It is expected to reach a cumulative demand
potential of 1229-1484 kt by 2030112
Figure 24: Cumulative Indian nickel demand potential (kt)113
2025f
2030f
Conservative scenario Base scenario optimistic scenario
62
85 1,484
1,353
1,229
550
531
511
2025f 2030f
Scenarios optimistic Base Conservative optimistic Base Conservative
Total cumulative
demand
550 531 511 1,484 1,353 1,229
Disclaimer: The demand potential identified shall be subject to the expected development of lithium-ion battery value chain in India
Notes:
113. Analysis based on publicly available information in following government and other reports - nITI Aayog: India’s Electric Mobility Transformation Progress To Date and Future opportunities; McKinsey: The unexpected trip: The future of mobility in India beyond CoVID-19; By 2024, nearly half of new 3-wheelers sold will be e-autos, CrISIL; EV -Charging towards a bright future, Avendus, July 2020; and ICrA press release 2020; While 2020 represents actual consumption for the year based on imports, 2025 and 2030 represent cumulative numbers, based on population of vehicles and installed capacities of ESS in those years.

nCA and lithium nMC oxide batteries are dominant
in EVs. India’s demand for these and other new
lithium-ion batteries containing nickel is likely
to increase.
In India, nickel is also used as an alloy metal in
stainless steel and nickel cast iron production,
with applications mainly in chemical plants and
turbines. It is also used as a catalyst in pesticides
and fertilisers. nickel sulphate is used in plating
and green-tinted glasses.
Various end-use industries for nickel are expected
to grow at different rates, with the proportions
of nickel used across India’s industries likely to
change slightly over the coming decade.
Table 17: Indian nickel market forecast by end-use segment114
Table 18: Potential target technologies and manufacturers115
End-use segment 2020e 2025f 2030f
Stainless steel and plating 90% 80% 75%
EVs 4% 10% 15%
other batteries 1% 6% 8%
others (including superalloys, coins, and
chemicals)
5% 4% 2%
Key industry participants
Much of the nickel currently imported for use in
the alloy and stainless steel sector is in the form
of lower-grade nickel alloys, such as ferro nickel.
nickel has a wide range of applications in the
engineering and electrical industries due to its
alloying capacity.
nickel is also used for chemical research or as
an intermediate product in the metallurgical
industry. India’s nickel end-user industry potential
and Australia’s substantial reserves present
a viable case for collaboration to secure and
enhance nickel supply to India.
Segment End-use
industries
Mineral
specification
Key industry players Key geographical locations
Stainless
steel
Power
generation,
automobile
sector,
consumer
durables,
defence,
chemical plants,
food processing
300 series austenitic
(Cr ni)
Jindal Stainless
Limited, MIDHAnI,
Welspun, Mukand
Limited
Delhi, Kolkata, odisha, Mumbai,
and Ahmedabad are major
geographical hubs for stainless
steel
Notes:
114. Analysis based on publicly available information in following government and other reports - nITI Aayog: India’s Electric Mobility Transformation Progress To Date and Future opportunities; McKinsey: The unexpected trip: The future of mobility in India beyond CoVID-19; By 2024, nearly half of new 3-wheelers sold will be e-autos, CrISIL; EV -Charging towards a bright future, Avendus, July 2020; and ICrA press release 2020. *India is expected to replicate the global application trends. * other Batteries includes demand from solar pumps & micro grid, railway – traction, Telecom, DG replacement and Captive power plants
115. Secondary research and Industry sources
UnLoCKInG AUSTrALIA-InDIA CrITICAL MInErALS PArTnErSHIP PoTEnTIAL60

UnLoCKInG AUSTrALIA-InDIA CrITICAL MInErALS PArTnErSHIP PoTEnTIAL 61
Segment End-use
industries
Mineral
specification
Key industry players Key geographical locations
EV batteries Electronics, EVs,
construction,
mining
equipment
nCA and nMC lithium-
ion battery cathodes
use 80% and 33%
nickel, respectively
Tata Chemicals, HBL
Power Systems,
TDSG, Aquachem
Enviro Engineers
Pvt. Ltd. (AEEPL),
and Contemporary
Amperex Technology
Major EV battery manufacturing
clusters include Dholera
and Hansalpur in Gujarat;
Chandanvelli-Sitarampur in
Hyderabad; and Divitipalli in
Telangana, with more planned
across India
Superalloys
and plating
Highly
specialised
industrial,
aerospace,
and military
applications
nickel-based, iron-
based, cobalt-based
MIDHAnI, Super Alloy
Castings Pvt Limited,
Labdhi Engineering
Co.
Hyderabad and Bangalore are
hubs for significant superalloy
manufacturing in India
Supply scenario in India
nickel concentrations naturally occur in
sulphide and laterite ores. nickel laterite ores
are abundant in Brazil, Cuba, Indonesia, the
Philippines, and new Caledonia, while nickel
sulphide deposits are found in russia, South
Africa, and Canada.
Australia has both laterite and sulphide deposits.
Modern exploration technologies are assisting
with the discovery of new nickel sulphide deposits
in Australia. Deep-sea mining is another budding
technology to explore manganese nodules
containing large amounts of nickel and cobalt.
India’s roM ore resources of nickel are estimated
at 189 Mt, according to the national Mineral
Inventory. nickel is found as oxides, silicates,
and sulphides. It is present as an oxide in odisha,
which has 93 percent of India’s nickel resources.
In Jharkhand, nickel is found with copper and
uranium deposits.
nickel is also manufactured as a by-product of
copper mining in Ghatsila, Jharkhand, where
nickel occurs with copper sulphide ore. The
Ghatsila copper smelter is the only Indian foundry
to produce LME grade nickel.
In India, nickel producing companies include
nicomet Industries, Sterlite Industries Limited,
and Jhagadia Copper Limited.116 HCL and MIDHAnI
have entered into a JV to produce value-added
copper-nickel tubes.117
India’s stainless-steel sector uses directly
imported nickel waste and scrap. This scrap and
other intermediary nickel materials (including
sinters, rods, and unwrought nickel) account for
the majority of India’s nickel imports.
The country is likely to remain dependent on
imports for nickel raw materials until its industry
has access to commercially viable mining and
processing technologies and practices.
Australia and India can examine opportunities
for joint exploration and development of
nickel sulphide and laterite deposits in India,
in line with its forecast (increasing demand
for nickel). India could encourage this form of
cooperation by addressing structural barriers to
mining exploration.
These include the need to consolidate
fragmented mineral tenements and resolve long-
standing tenement ownership issues that have
arisen as a result of overlapping and unprocessed
applications, particularly in some states, such as
odisha, Jharkhand, and Chhattisgarh.
Notes:
116. https://ibm.gov.in/writereaddata/files/06232020150332nickel_2019.pdf
117. https://www.thehindubusinessline.com/companies/hcl-sees-a-copperbottomed-plan-in-nickel-alloy-tubes/article9827117.ece

Table 19: Indian imports of nickel and nickel products118
Import product description HS code 2019 2020
Volume
(kt)
Value
(A$ million)
Volume
(kt)
Value
(A$ million)
Nickel ores and concentrates 2604 0.001 0.004 0.03 0.12
Nickel oxides and hydroxides 2825 0.1 12.8 0.4 8.4
Nickel chloride 2827 0.1 0.6 0.1 0.6
Nickel sulphate 2833 2 11 2.3 12.3
Ferro nickel 7202 123 558.9 39 195
Nickel mattes and sinters 7501 0.1 0.6 0.3 1.2
Nickel – unwrought 7502 32 659 30.2 609
Nickel – waste and scrap 7503 3.4 36.9 3.1 38
Nickel – powders and flakes 7504 0.3 12 0.3 9.9
Nickel – bars, rods, profiles, and
wire
7505 4.3 141 4.6 125.7
Nickel – plates, sheets, strip,
and foil
7506 3.6 126.8 4 143.5
Nickel – tubes, pipes, and their
fittings
7507 1.6 63.7 1.6 55.47
Others 7508 0.6 41,6 0.3 37.86
Notes:
118. Un Comtrade, https://comtrade.un.org/
119. Un Comtrade, https://comtrade.un.org/
India imports the majority of its nickel ores and concentrates from Indonesia, Japan, and the UAE.
nickel oxides and hydroxides are imported from Sweden, China, the Philippines, Germany, Belgium, and
Australia.
Figure 25: Imports (%) of nickel ores and concentrates in 2020119
8% United Arab Emirates
38% Japan
54% Indonesia
UnLoCKInG AUSTrALIA-InDIA CrITICAL MInErALS PArTnErSHIP PoTEnTIAL62

UnLoCKInG AUSTrALIA-InDIA CrITICAL MInErALS PArTnErSHIP PoTEnTIAL 63
Table 20: Import duties on various nickel products from April 2021121
Figure 26: Imports (%) of nickel oxides and hydroxides in 2020120
12% others
Notes:
120. Un Comtrade, https://comtrade.un.org/
121. CBIC -Ministry of Commerce, Government of India reports
122. https://publications.jrc.ec.europa.eu/repository/bitstream/JrC123439/roskill
123. https://www.nsenergybusiness.com/features/nickel-reserves-countries/
6% Germany
6% Belgium
47%
Sweden7% Philippines
22% China
The following table lists Indian government duties on imported nickel:
HS code BCD SWS IGST Total duties
Nickel and nickel articles 7,501 to
7,508
5% 10% 18% 24.49%
Ferro nickel 7,202 2.5% 10% 18% 21.25%
Australian supply capability
Australia has EDr of 21.2 Mt of contained nickel,
ranking first in the world with 24 percent of the
global nickel EDr. Australia produced 0.155 Mt of
contained nickel in 2019, ranking sixth in terms of
global production.
Current global demand for nickel is 2.7 Mt per
year; this is expected to rise by a further 2.6
Mt by 2030.122 Indonesia is the largest nickel
producer, but Australia has the world’s largest
reserves and a large pipeline of early-stage
nickel projects and nickel exploration prospects.
Australia is expected to contribute more than 25
percent to the newly mined supply by 2030.123
note: The IGST is applicable on both imports and Indian manufacture and is an eligible ‘input tax credit’, which can be offset against GST liability.

Figure 27: Australian nickel projects
Some of the world’s most significant komatiite-
hosted nickel sulphide and lateritic deposits
occur in Western Australia. In Australia, nickel
exploration drives the development of other
critical minerals. These include cobalt, platinum-
group elements, and scandium.124
Notes:
124. Australian Critical Minerals Prospectus 2020
UnLoCKInG AUSTrALIA-InDIA CrITICAL MInErALS PArTnErSHIP PoTEnTIAL64

UnLoCKInG AUSTrALIA-InDIA CrITICAL MInErALS PArTnErSHIP PoTEnTIAL 65
Source: Geoscience Australia
Nickel
Nickel

Project name Company Project status Mineral
resource
tonnage (Mt)
Actual/expected
product
Prospective
ancillary
product
ne
w S
ou
th W
ale
s
Sunrise Sunrise Energy
Metals Limited
(formerly Clean
TeQ Holdings
Limited)
Pre-construction 160 Battery-grade
nickel sulphate
(niSo4~6H
2o)
Battery-grade
cobalt sulphate
(CoSo4~7H
2o);
scandium
oxide (Sc2o3);
ammonium
sulphate
((nH4)
2So
4)
Nico Young Jervois
Mining Ltd
PFS 3.2 Battery-grade
nickel sulphate
(niSo4~6H
2o)
Cobalt sulphate
crystals
(CoSo4.7H
20)
Qu
ee
ns
lan
d
Sconi Australian
Mines Ltd
FS 93.51 Battery-grade
nickel sulphate
(niSo4~6H
2o)
Cobalt sulphate
crystals
(CoSo4.7H
20);
high-purity
scandium oxide
(Sc2o
3)
We
ste
rn A
us
tra
lia
Beta Hunt rnC Minerals
Corp
operating 0.561 nickel-in-
concentrate
(2.64% ni)
-
Forrestania Western
Areas Ltd
operating 18.18 nickel-in-
concentrate
(14% ni)
-
Long Complex Independence
Group nL
Care and
maintenance
0.035 Mt
contained ni
nickel-in-
concentrate
-
Murrin Murrin Glencore Plc operating 235.8 nickel
briquettes
Cobalt
briquettes
Nickel West BHP Ltd operating 599 nickel powder
and briquettes;
battery-grade
nickel sulphate
(niSo4~6H
2o)
-
Savannah Panoramic
resources Ltd
operating 18.8 nickel-in-
concentrate
-
Nova-Bollinger Independence
Group nL
operating 11.8 nickel-in-
concentrate
-
Honeymoon
Well
PJSC MMC
norilsk nickel
Developing 1.18 Mt
contained ni
nickel-in-
concentrate;
potentially
battery-grade
nickel sulphate
(niSo4 6H
2o)
-
Lake Johnston Poseidon
nickel Ltd
Care and
maintenance
0.075 Mt
contained ni
nickel-in-
concentrate
-
Table 21 – Australia’s Nickel Projects125
Notes:
125. Geoscience Australia
UnLoCKInG AUSTrALIA-InDIA CrITICAL MInErALS PArTnErSHIP PoTEnTIAL66

UnLoCKInG AUSTrALIA-InDIA CrITICAL MInErALS PArTnErSHIP PoTEnTIAL 67
Project name Company Project status Mineral
resource
tonnage (Mt)
Actual/expected
product
Prospective
ancillary
product
Lanfranchi Black Mountain
Metals LLC
Care and
maintenance
0.099 Mt
contained ni
nickel-in-
concentrate
-
North
Kambalda
Mincor
resources nL
Care and
maintenance
0.058 Mt
contained ni
nickel-in-
concentrate
-
South
Kambalda
(Cassini)
Mincor
resources nL
operating 5.20 nickel-in-
concentrate
-
Ravensthorpe First Quantum
Minerals Ltd
Care and
maintenance
326.1 Mixed nickel-
cobalt hydroxide
precipitate
-
Cosmos Western
Areas Ltd
PFS 64.4 Battery-grade,
high-purity
nickel sulphate
(niSo4.6H
20)
-
Goongarrie Ardea
resources Ltd
PFS 259 Battery-grade,
high-purity
nickel sulphate
(niSo4.6H
20)
Battery-grade,
high-purity
cobalt sulphate
(CoSo4.7H
20)
West Musgrave
(Nebo-Babel)
oZ Minerals Ltd PFS 390 Mixed nickel-
cobalt hydroxide
precipitate
-
Wingellina Metals X Ltd FS 182.6 Battery-grade
nickel sulphate
(niSo4~6H
2o)
Cobalt sulphate
crystals
(CoSo4.7H
20)
NiWest GME resources
Limited
PFS 85.2 nickel sulphate
hexahydrate
(niSo4~6H
2o)
Cobalt sulphate
heptahydrate
(CoSo4~7H
2o)
Mt Thirsty Conico; Barra
resources
PFS 22.8 nickel sulphate
(niSo4.6H
20)
Manganese;
cobalt
Ta
sm
an
ia
Barnes Hill nQ Minerals Plc PFS 9.54 22.2% nickel
sulphate
(niSo4.6H
20)
17.7% cobalt
carbonate
(CoCo3); 35.2%
manganese
carbonate
(MnCo2)

Potential project cooperation opportunities
India’s nickel demand is currently driven by the
stainless steel sector, which uses iron-chrome-
nickel alloy. High-performance lithium-ion
batteries require high-grade nickel inputs, such as
nickel metal, nickel hydroxide, or nickel sulphate.
Australian nickel miners can use this potential
growth opportunity through strategic alliances
with Indian companies.
Key opportunities
• Australian nickel suppliers could explore offtake
opportunities with traditional sectors, such as
steel, electrodes, engineering, and defence,
in India.
• Advanced Australian nickel and nickel-cobalt
development projects are seeking funding
for project construction. This presents an
opportunity to involve Indian battery and EV
manufacturers, and international battery
technology partners, as strategic investment
and offtake partners in the development of
Australian nickel and nickel-cobalt projects.
• A number of Australian cobalt development
projects are nickel-cobalt laterite projects.
Participation in these would enable Indian
companies and conglomerates to establish
secure supplies of cobalt.
• Australian companies could partner with Indian
conglomerates with diversified interests to
explore investment in Australian nickel projects
and processing units.
• India could encourage increased exploration
and development of nickel sulphide and laterite
deposits, including by addressing structural
issues that restrict mining exploration.
• Australian and Indian organisations could
explore collaborative research on battery
technologies to evaluate nickel as a viable
substitute in battery chemistries and support
resilient supply chains.
UnLoCKInG AUSTrALIA-InDIA CrITICAL MInErALS PArTnErSHIP PoTEnTIAL68

UnLoCKInG AUSTrALIA-InDIA CrITICAL MInErALS PArTnErSHIP PoTEnTIAL 69
Ilmenite and rutile
Ilmenite and rutile are the most common titanium
minerals. Demand for titanium minerals is driven
by the increasing trends of urbanisation and
industrialisation. More than 90 percent of ilmenite
and rutile are used to produce titanium dioxide,
which has applications in the chemicals, paint, and
pigment industries.126
Sectors such as aerospace, general engineering,
atomic energy, and power generation are other
end-use industries with modest demand for
titanium metal and alloys.
Synthetic rutile has applications in welding
electrodes, a sector that in India is dominated by
SMEs. This sector accounts for almost all of the
demand for rutile in India.127
India has established midstream and downstream
titanium manufacturing capability for products
such as titanium dioxide and titanium sponge.
India could enhance its titanium value chain
through strategic investments and partnerships
for mining and by increasing its capabilities in
the intermediate and downstream titanium
value chain.
Australia is one of the largest suppliers of high-
grade titanium bearing minerals to India. It has
extensive titanium resources to cater to current
and future demand from Indian industries.
Indian market analysis
The Indian ilmenite market was estimated at
180 kt in 2020. It is expected to reach a cumulative
demand potential of 2,833-3,512 kt by 2030.
Furthermore, the Indian rutile market was
estimated to be 12 kt in 2020. It is expected to
reach a cumulative demand potential of 287-355 kt
by 2030.128
2025f 2030f
Scenarios optimistic Base Conservative optimistic Base Conservative
Total cumulative
demand
1,564 1,487 1,414 3,867 3,472 3,120
Disclaimer: The demand potential identified shall be subject to the expected development of manufacturing competence in India
Figure 28: Cumulative Indian market demand potential for titanium-bearing minerals129
2025f
2030f
Conservative scenario Base scenario optimistic scenario
1,414
1,487
3,120
3,472
3,867
1,564
Notes:
126. Mineral Yearbook 2019 (Part II – Metal and Alloys) – 58th edition – Ilmenite and rutile- Advance release – Indian Bureau of Mines
127. Mineral Yearbook 2019 (Part II – Metal and Alloys) – 58th edition – Ilmenite and rutile- Advance release – Indian Bureau of Mines
128. Analysis based on information publicly available in following government and other reports - IrEL sources and UnCoMTrADE.
129. Analysis based on information publicly available in following government and other reports - IrEL sources and UnCoMTrADE

The following table shows that each end use segment’s share of titanium bearing mineral consumption is
likely to be constant from 2020 to 2030.
Key industry participants
There are multiple large players in the
downstream value chain for ilmenite in India.
However, few have capabilities to produce
titanium slag, synthetic rutile, titanium sponge,
and titanium metal and alloy.
India’s industrial self-sufficiency programmes
aim to increase domestic manufacturing and
infrastructure development. Atmanirbhar Bharat
has a focus on the defence and aerospace sectors
and will likely increase India’s demand for ilmenite.
End-use segment 2020 2025f 2030f
Ilmenite Chemicals, pigments, and
paint
99% 99% 99%
Electrodes <1% <1% <1%
others (including
ceramics, ferroalloys,
pulp, and paper)
<1% <1% <1%
Rutile Electrodes 100% 100% 100%
Table 22: Indian titanium bearing mineral market forecast by end-use segment by volume130
Notes:
130. Indian Mineral Yearbook 2019 (Part II – Metal and Alloys) – 58th edition – Ilmenite and rutile- Advance release
131. Secondary research and Industry sources
132. http://www.supraalloys.com/titanium-grades.php
Table 23: Potential target technologies and manufacturers131
End-use
segment
Technology /
product
End-use
industry
Key raw
material132
Key industry players Key geographical
locations
Chemicals,
pigments,
and paint
Titanium
dioxide
Pigments,
ceramics,
paints and
coatings
Titanium
dioxide
Key players in the intermediate
value chain
Travancore Titanium Products
Limited, Kerala Minerals and
Metals Limited (KMML), DCW
Limited, V.V. Mineral, and
Beach Minerals Company
Key players in the downstream
value chain*
Berger Paints, Asian Paints,
Kansai nerolac Paints,
nippon Paint
Gujarat Alkalies and
Chemicals Limited, India
Glycols Limited, Akzonobel
Titanium dioxide
manufacturing
clusters are
in Tamil nadu,
Kerala, and Andhra
Pradesh in the
south; and odisha
is in the east
*https://www.business-standard.com/article/specials/the-tio2-factor-197091001156_1.html ; https://www.bergerpaints.com/ ; https://www.asianpaints.com
UnLoCKInG AUSTrALIA-InDIA CrITICAL MInErALS PArTnErSHIP PoTEnTIAL70

UnLoCKInG AUSTrALIA-InDIA CrITICAL MInErALS PArTnErSHIP PoTEnTIAL 71
End-use
segment
Technology /
product
End-use
industry
Key raw
material132
Key industry players Key geographical
locations
Defence,
aerospace,
and space
Fastening
elements,
airframes,
landing
gear, liquid
propellant
tanks
Defence
vehicles,
aerospace
Titanium
sponge,
titanium
metal,
titanium 6AL-
4, aerospace-
grade alloys
MIDHAnI, KMML, Bharat
Dynamics Limited, Boeing
India Private Limited, Indian
Space research organisation,
Kalyani Group
Aerospace hubs
in Bangalore,
Belgaum,
ramanagara,
Shimoga, Dharwad
and Kolar, all in
Karnataka
Ferro alloys Transformers,
dynamos,
iron, steel,
automobile
valves
Steel,
automotive
parts,
machinery
Ferro titanium,
other alloy-
grade titanium
Key players in the intermediate
value chain
Essel Mining and Industries
Limited, Facor Alloys Limited,
Jindal Steel and Power
Limited, IDCoL Ferro Chrome
and Alloys Limited, Des raj
Bansal Group
Ferroalloy hubs
in Chhattisgarh,
Gujarat and odisha
Automotive Automotive
springs, engine
connecting
rods
Automotive Ferro titanium
and grade 2
titanium
Key players in the downstream
value chain* Tata Motors, Maruti Suzuki,
Hero MotoCorp Limited,
Hyundai Motors, Kia Motors,
Toyota Motors, Bajaj Motors
Major automotive
manufacturing
clusters are in
Gurugram in
Delhi; Mumbai,
Pune and nashik
in Maharashtra;
Chennai in Tamil
nadu; Jamshedpur
In Jharkhand;
Anantapur in
Andhra Pradesh;
and rajkot and
Halol in Gujarat
*https://www.marutisuzuki.com, https://www.tkap.com/,https://tataautocomp.com/thsl/products/

Supply scenario in India
Titanium is the fourth most abundant metal
globally. It is mainly found in ilmenite (50–65
percent titanium dioxide) and rutile (95 percent
titanium dioxide). The most common deposits
of titanium are heavy mineral sand deposits
containing ilmenite, rutile, and leucoxene (an
alteration mineral).
Processed titanium metal accounts for 5 percent
of the total titanium mineral consumption, with
the remainder used in the pigment industry.
Pigments are produced using either a sulphate or
carbochlorination process that converts titanium
dioxide into titanium chloride.
Global resources of ilmenite in 2019 were 800 Mt
and that of rutile were 55Mt.133 Major economic
resources are found in Australia (32 per cent),
China (30 per cent), India (11 percent), Brazil (6
per cent), South Africa (5 per cent), norway (5 per
cent), Canada (4 per cent), Mozambique (2 per
cent) and Madagascar (1 per cent).
World economic resources of rutile are estimated
at 47 Mt that contain titanium. Major economic
resources of rutile are found in Australia (62
percent), India (16 percent), South Africa (13
percent), and Ukraine (5 percent).134
In 2018, major global producers of ilmenite
concentrate were Canada (23 percent), China (16
percent), Mozambique (11 percent), Ukraine (8
percent), norway (7 percent), India (7 percent),
and South Africa (6 percent). Key producers of
rutile concentrate were Australia (29 percent),
Ukraine (15 percent), and Kenya (14 percent).135
However, Australia ranks 3 amongst the largest
ilmenite producers of the world in 2020.136
Indian ilmenite reserves were estimated at 265
Mt in 2019, while rutile reserves were 11 Mt.137
India has 11 percent of the world’s titanium-
bearing minerals. However, it accounted for
1 percent of the installed global production
capacity and currently meets most of its demand
through imports.
In 2020, India imported most of its titanium
concentrate from Mozambique (62 percent),
Australia (12 percent), China (9 percent), South
Africa (3 percent), and Thailand (3 percent). It
imported most of its titanium oxide and dioxide
from China (41 percent) and South Korea (33
percent). Imports of titanium and alloys (including
waste and scrap) were mainly sourced from the
US (26 percent), China (18 percent), Japan (13
percent), and Singapore (8 percent).138
India’s upstream value chain for titanium –
ilmenite, rutile, and leucoxene mineral sands
mining – is dominated by two major state-owned
enterprises: IrEL (India) Limited and KMML.
In the intermediate value chain, KMML produces
titanium dioxide, nano titanium dioxide
pigment (rutile), titanium tetrachloride, and
titanium sponge. Travancore Titanium Products
Limited produces anatase- and rutile-grade
titanium dioxide.
DCW Limited and Cochin Minerals and rutile
Limited produce beneficiated ilmenite (synthetic
rutile) used for pigment manufacturing and
welding electrodes, and as feedstock for titanium
sponge manufacturing.
KMML is India’s only producer of titanium
sponge, with production of 500 tonnes per
year. UKTMP JSC, a titanium sponge and metals
producer in Kazakhstan, signed a MoU with IrEL
to collaborate in the titanium value chain and
produce titanium slag in India.139
MIDHAnI manufactures superalloys and titanium
alloys for materials and components, adding
downstream value. In 2021, MIDHAnI and
Hindustan Aeronautics Limited signed a MoU to
produce composite raw materials for applications
in the aircraft industry.140
India’s titanium dioxide pigments and paint
industries depend on titanium dioxide feedstock.
Indian producers usually import pigments,
mainly from China and South Korea, but also
from Australia.
Notes:
133. Geoscience Australia
134. Mineral Yearbook 2019 (Part II – Metal and Alloys) – 58th edition – Ilmenite and rutile- Advance release – Indian Bureau of Mines
135. Mineral Yearbook 2019 (Part II – Metal and Alloys) – 58th edition – Ilmenite and rutile- Advance release – Indian Bureau of Mines
136. Geoscience Australia
137. Mineral Yearbook 2019 (Part II – Metal and Alloys) – 58th edition – Ilmenite and rutile- Advance release – Indian Bureau of Mines
138. Un Comtrade, https://comtrade.un.org/
139. https://psuwatch.com/irel-signs-mou-with-uktmp-jsc-kazakhstan-for-production-of-titanium-slag
140. https://pib.gov.in/Pressreleaseshare.aspx?PrID=1695265
UnLoCKInG AUSTrALIA-InDIA CrITICAL MInErALS PArTnErSHIP PoTEnTIAL72

UnLoCKInG AUSTrALIA-InDIA CrITICAL MInErALS PArTnErSHIP PoTEnTIAL 73
Notes:
141. Un Comtrade, https://comtrade.un.org/
142. CBIC - Ministry of Commerce, GoI
Australian titanium dioxide pigment
manufacturing companies could explore strategic
partnerships with key Indian paint manufacturers
to supply products for the carbochlorination
process to the industry.
Companies from the two countries could
collaborate to develop the titanium value chain
and address India’s increasing demand for value-
added segments, such as titanium sponge, metal,
and alloy manufacturing for high-value sectors
(including aerospace and defence).
Table 24: Indian imports of titanium141
Import product
description
HS code 2019 2020
Volume
(kt)
Value
(A$ million)
Volume
(kt)
Value
(A$ million)
Titanium ores and
concentrates
2614 146 88 87 61
Titanium oxides 2823 16 65 12 47
Titanium articles
including waste and scrap
8108 8.5 162 8.1 104
Table 25: Import duties on titanium products from April 2021142
HS code BCD SWS IGST Total duties
Titanium dioxide 2605 10% 10% 18% 30.98%
Titanium products
(including waste and
scrap)
8108 5% 10% 18% 24.49%
Titanium oxides 2823 10% 10% 18% 30.98%
Titanium ores and
concentrates
2614 5% 10% 18% 24.49%
Pearlescent pigments
(titanium dioxide, coated
micananeous and lustres
pearl pigment)
3606 10% 10% 18% 30.98%
note: The IGST is applicable on both imports and Indian manufacture and is an eligible ‘input tax credit’, which can be offset against GST liability.

Australian supply capability
Australian heavy mineral sands deposits hold
economic resources of 276 Mt of ilmenite and 35
Mt of contained rutile, ranking second and first in
the world, respectively.
The country produced 1.4 Mt of ilmenite and
0.2 Mt of rutile in 2019, ranking fourth and first
respectively, for global production by country.143
PNGINDONESIA
200 m1000
m1000 m200 m
Seeinset c.
See inset a.
Night Train
Unaly Hill
Lode Rutile
Monogorilby
Governor Broome
BartonTyphoon, Sonoran
TripitakaPerponda South Jaws and Gilligans
GoschenWonnerup
See inset b.
Gabanintha
VIC
NSW
SA
NT
QLD
WA
TAS
CANBERRA, ACT
PERTH
HOBART
MELBOURNE
DARWIN
SYDNEY
BRISBANE
ADELAIDE
Speewah
Balla Balla
Thunderbird
BarrambieAustralian Vanadium
Victory Bore
Fingerboards
Mount Peake
Youanmi
Coburn(Amy)
Balranald
Goondicum Crater
North Stradbroke Island
Atacama
Atlas-CampaspeMedcalf
Dongara,Eneabba
Ginkgo-Crayfish-Snapper
Cyclone
Copi
Keysbrook
Jacinth AmbrosiaEneabba Stockpile
0 500 km
PP-3548-19
WA
North Perth Basin
McCalls
CatabyCooljarloo
South West
Boonanarring
Atlas
116°E115°E
31°SVIC
Bungalally
Donald
WIM 150Avonbank
Wedderburn
Wimmera
Inset c.Inset a.
0 25 km
0 25 km
Australian titanium projects as at 30 June 2020150°E140°E130°E120°E
10°S
20°S
30°S
40°S
Project status
Mineralisation
Deposit
Background image: Magnetics(greyscale, 0.5 vertical derivativeof total magnetic intensity)
Titanium projects byresource size (kt TiO2)
SA
VIC
Braemar
DerrickMercunda
Long TanMindarie C
AmiensHalidon
Lone Pine
Balmoral
Mindarie A1
141°E140°E
35°S
Inset b.0 25 km
143°E142°E37°S
Operating mine
Key advanced project
<1,000
1,000–10,000
10,000–50,000
50,000–100,000
100,000–200,000
Figure 29: Australian titanium projects
Source: Australian Critical Minerals Prospectus 2020
PNGINDONESIA
200 m1000
m1000 m200 m
Seeinset c.
See inset a.
Night Train
Unaly Hill
Lode Rutile
Monogorilby
Governor Broome
BartonTyphoon, Sonoran
TripitakaPerponda South Jaws and Gilligans
GoschenWonnerup
See inset b.
Gabanintha
VIC
NSW
SA
NT
QLD
WA
TAS
CANBERRA, ACT
PERTH
HOBART
MELBOURNE
DARWIN
SYDNEY
BRISBANE
ADELAIDE
Speewah
Balla Balla
Thunderbird
BarrambieAustralian Vanadium
Victory Bore
Fingerboards
Mount Peake
Youanmi
Coburn(Amy)
Balranald
Goondicum Crater
North Stradbroke Island
Atacama
Atlas-CampaspeMedcalf
Dongara,Eneabba
Ginkgo-Crayfish-Snapper
Cyclone
Copi
Keysbrook
Jacinth AmbrosiaEneabba Stockpile
0 500 km
PP-3548-19
WA
North Perth Basin
McCalls
CatabyCooljarloo
South West
Boonanarring
Atlas
116°E115°E
31°SVIC
Bungalally
Donald
WIM 150Avonbank
Wedderburn
Wimmera
Inset c.Inset a.
0 25 km
0 25 km
Australian titanium projects as at 30 June 2020150°E140°E130°E120°E
10°S
20°S
30°S
40°S
Project status
Mineralisation
Deposit
Background image: Magnetics(greyscale, 0.5 vertical derivativeof total magnetic intensity)
Titanium projects byresource size (kt TiO2)
SA
VIC
Braemar
DerrickMercunda
Long TanMindarie C
AmiensHalidon
Lone Pine
Balmoral
Mindarie A1
141°E140°E
35°S
Inset b.0 25 km
143°E142°E37°S
Operating mine
Key advanced project
<1,000
1,000–10,000
10,000–50,000
50,000–100,000
100,000–200,000
Notes:
143. Geoscience Australia, https://www.ga.gov.au/scientific-topics/minerals/mineral-resources-and-advice/australian-resource-reviews/minerals-sands
UnLoCKInG AUSTrALIA-InDIA CrITICAL MInErALS PArTnErSHIP PoTEnTIAL74

UnLoCKInG AUSTrALIA-InDIA CrITICAL MInErALS PArTnErSHIP PoTEnTIAL 75
The following table shows Australia’s operating mines and a robust project pipeline to meet future
titanium requirements.
Critical mineral
Project name Company Project status
Primary mineral(s)
Tonnage (Mt)
Grade Units Contained (kt)
Titanium Cataby Iluka resources Ltd
operating Ti, Zr 308.0 1.75 % Tio2
5,394
Titanium Goondicum Crater
Melior resources Inc
operating Ti,P 92.8 5.20 % Tio2
4,828
Titanium Cooljarloo Tronox Holdings Plc
operating Ti, Zr 416.0 0.79 % Tio2
3,299
Titanium South West Iluka resources Ltd
operating Ti, Zr 83.0 3.96 % Tio2
3,289
Titanium Keysbrook Doral Pty Ltd operating Ti, Zr 78.2 1.26 % Tio2
982
Titanium Jacinth Ambrosia
Iluka resources Ltd
operating Zr, Ti 184.0 0.47 % Tio2
866
Titanium Ginkgo-Crayfish -Snapper
Tronox Holdings Plc
operating Ti, Zr (rEE) 74.0 1.06 % Tio2
783
Titanium Boonanarring Image resources Ltd
operating Ti, Zr 30.3 1.98 % Tio2
601
Titanium Wonnerup Tronox Holdings Plc
operating Ti, Zr 21.0 2.63 % Tio2
552
Titanium Eneabba Stockpile
Iluka resources Ltd
operating Zr, rEE, Ti 1.0 16.92 % Tio2
169
Titanium North Stradbroke
Sibelco Australia Ltd
operating Ti, Zr nA
Titanium Atlas-Campaspe Tronox Holdings Plc
Construction Ti, Zr 88.0 3.16 % Tio2
2,785
Titanium Balla Balla BBI Group Pty Ltd
FS V, Ti 455.9 13.80 % Tio2
62,914
Titanium Donald Astron Ltd FS Zr, Ti, rEE 2,427.0 1.98 % Tio2
47,996
Titanium Thunderbird Sheffield resources Ltd
FS Zr, Ti 3,230.0 1.45 % Tio2
46,893
Titanium Barrambie neometals Ltd FS Ti, V 280.1 9.18 % Tio2
25,713
Titanium WIM150 Murray Zircon Pty Ltd
FS Zr, Ti, rEE 1,650.0 1.29 % Tio2
21,218
Titanium Fingerboards Kalbar resources Ltd
FS Zr, Ti, rEE 530.0 1.60 Tio2
8,689
Titanium Mount Peake TnG Ltd FS V, Ti, Fe 160.0 5.30 % Tio2
8,480
Titanium Coburn (Amy) Strandline resources Ltd
FS Ti, Zr 1,606.0 0.48 % Tio2
7,693
Titanium Balranald Iluka resources Ltd
FS Ti, Zr 45.5 15.68 % Tio2
7,136
Titanium Cyclone Diatreme resources Ltd
FS Zr, Ti 203.0 0.73 % Tio2
1,488
Titanium Dongara Tronox Holdings Plc
FS Ti, Zr 68.0 1.91 % Tio2
1,297
Titanium Atlas Image resources Ltd
FS Ti, Zr 18.1 2.23 % Tio2
404
Titanium Mindarie C Murray Zircon Pty Ltd
Care and maint
Ti, Zr 19.3 1.28 % Tio2
246
Titanium Mindarie A1 Murray Zircon Pty Ltd
Care and maint
Ti, Zr 8.8 1.20 % Tio2
105
Table 26: Australia’s advanced titanium minerals projects

In addition to the above list of advanced titanium
projects, Australia has a number of projects
in early stages (with pre-feasibility studies
underway) that are seeking investment.144
Australia has two types of titanium deposits:
heavy mineral sands deposits (by far the most
common) and titanium-vanadium deposits in
igneous hard rock.
Australian heavy mineral sands deposits
commonly contain titanium minerals (ilmenite,
rutile, anatase, and leucoxene), zirconium, and
rare earth oxides (monazite and xenotime).
Therefore, by investing in one Australian heavy
mineral sands project, an Indian company could
secure supplies of titanium, zirconium, and rEEs.
Similarly, by investing in one Australian igneous
hard rock titanium-vanadium project, an Indian
company could secure supplies of both titanium
and vanadium.
Potential project cooperation opportunities
Australian companies could be alternative
sources of ilmenite and rutile for the Indian
industry. Australian project proponents can
explore collaborative models to gain a significant
market share and assist Indian customers to
adjust their processing capabilities in line with
the qualities of Australian ilmenite and rutile.
Australian titanium dioxide pigment
manufacturing companies could explore giving
prominent Indian paint manufacturing players
preferential long-term supply contracts for
carbochlorination processes for pigments.
This partnership could be elevated to jointly
develop an intermediate value chain for titanium
and establish a global manufacturing hub for the
titanium sponge and titanium metal and alloy
used in aerospace and defence applications.
Australian and Indian companies could examine
setting up mutually beneficial engagement
models for a supply chain to address global need.
Key opportunities
• Australian projects could explore offtake
arrangements with Indian companies
in traditional sectors, such as paint,
pigments, ceramics, steel, and automotive
manufacturing. Key factors to consider include
technical specifications, volumes, and prices.
• Australian companies could assess Indian
customers’ interest in forming strategic
partnerships, including their interest in
investing to develop mineral assets in
Australia. This could include Australian heavy
mineral sands projects with high titanium
content, and Australian igneous hard rock
titanium-vanadium projects.
• Companies could collaborate to manufacture
titanium dioxide pigment in India using ilmenite
concentrates sourced from Australian mineral
sands mines.
• Australian organisations could explore
conducting joint research with Indian
defence organisations to develop bespoke
aerospace-grade alloys.
• Australian METS companies could engage
with Indian companies in the intermediate
value chain to support processing technology
upgrades, expand their capacity to add value in
India, and achieve cost competitiveness.
Notes:
144. Australian Critical Minerals Prospectus 2020
Critical mineral
Project name Company Project status
Primary mineral(s)
Tonnage (Mt)
Grade Units Contained (kt)
Titanium Australian Vanadium
Australian Vanadium Ltd
FS V, Ti 208.2 9.00 % Tio2
18,738
Titanium Avonbank WIM resource Pty Ltd
FS Zr, Ti 490.0 1.54 % Tio2
7,534
Titanium Medcalf Audalia resources Ltd
FS V, Ti 32.0 8.98 % Tio2
2,874
Titanium Copi relentless resources Ltd
PFS Ti, Zr 75.4 1.79 % Tio2
1,353
Source: Australian Critical Minerals Prospectus 2020
UnLoCKInG AUSTrALIA-InDIA CrITICAL MInErALS PArTnErSHIP PoTEnTIAL76

UnLoCKInG AUSTrALIA-InDIA CrITICAL MInErALS PArTnErSHIP PoTEnTIAL 77
Figure 30: Cumulative Indian market demand potential for NdPr (kt)146
Light rare earths
Amongst 16 rare earth elements (rEEs), critical
minerals that are light rare earths (LrEEs) include
neodymium, praseodymium, lanthanum, cerium,
and samarium. of these, the most commonly used
are neodymium and praseodymium (ndPr). ndPr
is widely used for manufacturing neodymium iron
boron (ndFeB) magnets. India depends on imports
for all its ndFeB magnets.
Demand for these magnets will be driven by
increasing wind power capacity and demand for
EVs in India. Samarium is also important because
it is used to manufacture samarium cobalt (SmCo)
magnets. It is also used in industrial pumps, and
the defence, automotive and aerospace sectors.
Indian market analysis
1. Neodymium and praseodymium
The ndPr oxide market was estimated at 1.1 kt in
2020. It is forecast to grow to about 18.6 kt by
2030.145
ndPr elements are used to manufacture bonded
and sintered ndFeB magnets. These magnets have
significant applications in EV traction motors and
wind turbines. They also have multiple industrial
applications, such as in brushless DC motors,
magnetic pulleys, separators, and chucks. ndPr
content in these ndFeB magnets is about 30
percent metal (from ndPr oxide).147
over the next decade, EVs and wind turbines are
likely to drive most demand for ndPr. The quantity
of ndFeB magnets used in EVs varies from 350g
to 2 kg per vehicle.148 As 30 percent of these
magnets (by weight) are ndPr, demand for ndPr
for EVs is expected to reach 6–12 kt by 2030,
provided these magnets are produced in India.
2025f 2030f
Scenarios optimistic Base Conservative optimistic Base Conservative
Total cumulative
demand
8 6 5 28 19 13
Disclaimer: The demand potential identified shall be subject to the expected development of manufacturing competence in India
2025f
2030f
Conservative scenario Base scenario optimistic scenario
5
13
19
28
6
8
Notes:
145. Based on demand of ndFeB magnets in the field of EVs, wind turbine and other sectors.
146. Analysis based on information available in following reports- nITI Aayog: India’s Electric Mobility Transformation Progress To Date and Future opportunities; McKinsey: The unexpected trip: The future of mobility in India beyond CoVID-19; By 2024, nearly half of new 3-wheelers sold will be e-autos, CrISIL; Electric Vehicle EV -Charging towards a bright future, Avendus, July 2020; and ICrA press release 2020, Global Wind Energy Council- India Wind outlook towards 2022; Un Comtrade Permanent Magnets Import Export Data. *While 2020 represents actual consumption for the year based on imports, 2025 and 2030 represent cumulative numbers, based on population of vehicles and installed capacities of ESS in those years.
147. https://www.arultd.com/products.html
148. role of substitution in mitigating the supply pressure of rare earths in electric road transport applications - ScienceDirect

ndPr is also essential in wind turbines. India had
38.8 GW of the installed capacity of wind power
in 2020.149 The country’s estimated capacity will
reach 140 GW by 2030, at a CAGr of 13 percent.150
Vestas, Siemens Gamesa, and reGen Powertech
have about 60 percent market share of the
equipment (which uses ndFeB magnet technology)
for generating wind energy in India.151,152 The
requirement for 30 percent ndPr in these magnets
means demand for ndPr for wind turbines is
expected to reach 3–11 kt by 2030. 153
ndFeB magnets are also used in other applications,
including electronics and industrial magnetic
equipment. Demand for ndPr for these
applications was estimated at 0.9 kt in 2020 and is
expected to reach 4 kt by 2030.
2. Samarium
Samarium reserves are estimated to be about 2
Mt globally, with only 700 tonnes being extracted
worldwide each year.154 India has total monazite
reserves of 6.9 Mt, consisting of about 172 kt
(2.5%) of samarium.155, 156
Samarium is needed to produce Samarium Cobalt
(SmCo) magnets, which consist of 36 percent
samarium and 64 percent cobalt. Due to the
presence of cobalt, SmCo magnets can be more
expensive than ndFeB magnets.157
IrEL has a project underway in India to set up a
3,000 kg SmCo magnet manufacturing facility,
using the entire rare earth supply chain.158 By
2020, India had capacity to produce 160 tonnes
of samarium and gadolinium compounds, while
demand was only 2–3 tonnes.159,160 Cumulative
demand for samarium in India is expected to reach
151-189 tonnes by 2030. 161
Figure 31: Cumulative Indian demand potential for samarium (tonnes)162
2025f
2030f
Conservative scenario Base scenario optimistic scenario
88
93
151
169
189
98
Notes:
149. MnrE-Physical Progress-28-02-2021
150. Global Wind Energy Council- India Wind outlook towards 2022
151. https://about.bnef.com/blog/indias-top-wind-suppliers-in-2019/
152. https://about.bnef.com/blog/indias-top-wind-suppliers-in-2019/#:~:text=The%20top%20two%20turbine%20
makers,together%20grabbed%2047%25%20market%20share.
153. Based on ndFeB requirement in manufacturing of wind turbine and demand of wind turbine by 2030
154. https://mmta.co.uk/metals/sm/
155. https://asia.nikkei.com/Economy/Trade-war/India-scrambles-to-look-overseas-for-rare-earths-used-in-EVs
156. IrEL_PDAC_2014
157. https://www.first4magnets.com/tech-centre-i61/information-and-articles-i70/samarium-cobalt-magnet-information-i85/
what-are-samarium-cobalt-magnets
158. https://www.irel.co.in/projects-under-implementation
159. Industry resources
160. Industry resources
161. Industry resources
162. Estimated based on import data of permanent magnets from Un Comtrade. *The import of ndFeB magnets is expected to be
15% of India’s total permanent magnets import. The trend is estimated based on the import trend of permanent magnets from
2015 to 2020.
UnLoCKInG AUSTrALIA-InDIA CrITICAL MInErALS PArTnErSHIP PoTEnTIAL78

UnLoCKInG AUSTrALIA-InDIA CrITICAL MInErALS PArTnErSHIP PoTEnTIAL 79
3. Lanthanum and cerium
Lanthanum and cerium oxides are produced while
processing rare earth oxides and have limited end-
use applications. Many companies are exploring
innovative commercial applications.
In 2020, India’s domestic production capacity
was 900–950 tonnes of lanthanum compound,
while there was demand for only 10–15 tonnes.163
Cerium production capacity was about 1,900–
2,000 tonnes in 2020, while demand was at about
250–300 tonnes.
Prices for magnetic rEEs, such as ndPr, will
increase significantly, and supplies will become
increasingly scarce after 2025. Adoption of
cerium- and lanthanum-bearing ndFeB magnets
is expected to accelerate, partially helping to
offset the market’s increasing under-supply of
neodymium oxide.
Multiple projects to substitute neodymium and
praseodymium with lanthanum and cerium in
ndFeB magnets are currently underway. Some
lanthanum and cerium mischmetal may soon be
added to magnets to reduce the neodymium
content without changing the magnets’ properties
and performance.
This will help increase demand for lanthanum
and cerium. Toyota Corporation has developed
the world’s first magnet with 50 percent
less neodymium (replacing it with lanthanum
and cerium), while retaining heat-resistant
properties.164
Notes:
163. Industry resources
164. https://global.toyota/en/newsroom/corporate/21139684.html
2025f 2030f
Scenarios optimistic Base Conservative optimistic Base Conservative
Total cumulative
demand
98 93 88 189 169 151
Disclaimer: The demand potential identified shall be subject to the expected development of manufacturing competence in India

Key industry participants
India’s demand for ndFeB magnets is expected
to rise substantially by 2030. This will lead to
increased demand for ndPr.
Due to technology gaps, restricted availability
of raw material that are not radioactive, and
limited participation from the private sector, India
depends on imported ndFeB magnets, mainly
from China and Japan.
Developing an intermediate rare earth value chain
(that is, converting rare earth concentrates into
rare earth oxides, and metal and alloys) would
help India reduce its dependency on imports. The
Indian Government is working towards setting
up a complete value chain for manufacturing
ndFeB magnets. The issues of radioactivity for
concentrate transportation, processing and
waste usage or disposal need to be addressed.
IrEL has entered into a MoU with Bhabha
Atomic research Centre (BArC), the Defence
Metallurgical research Laboratory, and ArCI to
manufacture rare earth permanent magnets.
BArC has developed technology to produce rare
earth phosphors. However, these products do not
yet have commercial applications.165
In December 2015, IrEL signed a sales purchase
agreement with Toyota Corporation and its
subsidiary Toyotsu rare Earths India Private
Limited, to supply rare earth chloride. This is
being produced at IrEL’s monazite processing
plant at its orissa Sands Complex.166
In october 2020, IrEL released an expression
of interest for setting up ndFeB magnet
manufacturing units in India. IrEL proposes to
provide raw materials.167
Key importers or buyers of imported magnets
include the following:
• Permanent Magnets Limited
• Dura Magnets Private Limited
• MAHLE.
Prominent suppliers of rare earth magnets for EV
traction motors in India include the following:
• Jatco (Thailand) Corporation Limited
• Tata AutoComp Systems Limited168
• Hyundai Mobis Corporation Limited.169
Significant manufacturers of rare earth magnets
for brushless DC motors and permanent magnet
synchronous motors (PMSM) include:
• Compage Automation Systems Private Limited
• Mark Elektriks.
Manufacturers of wind turbines that need ndFeB
magnets and have a significant market share in
India include the following:
• Siemens Gamesa170
• Vestas171
• General Electric172
• reGen Powertech.
Notes:
165. https://dae.gov.in/writereaddata/parl/budget2015/rsus1229.pdf
166. https://ibm.gov.in/?c=pages&m=index&id=1473
167. https://www.irel.co.in/documents/20126/0/EoI+for+nd+Magnet.pdf/49e306fb-7b54-cd70-fdb9-c56e4c0fe0f9?
t=1600083348672
168. https://tataautocomp.com/
169. Information Platform (marklines.com)
170. https://onlinelibrary.wiley.com/doi/full/10.1002/we.2499
171. https://www.sciencedirect.com/science/article/pii/S0301420717300077
172. https://www.researchgate.net/publication/257935440_Direct-drive_permanent_magnet_generators_for_high-
power_wind_turbines_Benefits_and_limiting_factors
UnLoCKInG AUSTrALIA-InDIA CrITICAL MInErALS PArTnErSHIP PoTEnTIAL80

UnLoCKInG AUSTrALIA-InDIA CrITICAL MInErALS PArTnErSHIP PoTEnTIAL 81
HS code BCD SWS IGST Total duties
Permanent magnets and articles
intended to become permanent
magnets after magnetisation of
other material
85051190 7.5% 10% 18% 27.74%
Permanent magnets and articles
intended to become permanent
magnets after magnetisation of
other material
85051900 7.5% 10% 18% 27.74%
Notes:
173. https://pubs.usgs.gov/periodicals/mcs2021/mcs2021-rare-earths.pdf
174. https://pubs.usgs.gov/periodicals/mcs2021/mcs2021-rare-earths.pdf
175. Australian Critical Minerals Prospectus 2020
176. Australian Critical Minerals Prospectus 2020
177. https://ibm.gov.in/writereaddata/files/12272016154439IMYB2015_rare%20Earth_27122016_Adv.pdf
178. CBIC - Ministry of Commerce, GoI
Supply scenario in India
During 2020, global production of rare earth
oxide equivalent was estimated at 240 kt. Global
economic resources of rare earth oxides are
expected to reach 115 Mt in 2021.173
According to China’s Ministry of Industry and
Information Technology, in 2020, the country
had a mine production quota of 140 Mt of rare
earth oxides, with 121 Mt allocated to light rare
earth oxides.174 It accounts for 63 percent of the
global production. Its economic resources of rare
earth oxides accounted for 37 percent of the
global economic resources of rare earth oxides in
2019.175
In 2020, India produced 3 kt of rare earth oxides.
This was equivalent to about 3 percent of the
global economic resources of rare earth oxides
(about 6.9 Mt), ranking India sixth globally.176
The principal sources of rEEs globally are
bastnasite, a fluorocarbonate that occurs in
carbonatites and related igneous rocks; xenotime
(yttrium phosphate), which is commonly found
in mineral sands deposits; loparite, which occurs
in alkaline igneous rocks; and monazite, a
phosphate.177
As per the Indian Bureau of Mines (IBM), monazite
is the key source of rEEs. Indian monazite
primarily consists of LrEEs such as 46 percent
cerium, 22 percent lanthanum, 20 percent
neodymium, 5 percent praseodymium, and
about 2.5 percent samarium. IrEL is the primary
producer of India’s rEEs.
India’s midstream and downstream rEE value
chains are not well developed, making the country
dependent on imports of rE magnets, including
neodymium magnets, which are the most widely
used. The key challenge in India is the technology
for processing of rEo into rE metals, alloys and
production of magnets across midstream of
value chain. The current value chain has a very
few players making permanent magnets (only for
small motor applications). Presently , India lacks
the scale, experience and resources of the global
companies, and may be assisted by public-funded
r&D efforts, to develop efficient technologies
and funding and participation from private sector
in the development of mid-stream of the rE
value chain.
The following table lists the duties the Indian
Government imposes imported LrEEs.
Table 27: Import duties on LREE products in April 2021178
note: The IGST is applicable on both imports and Indian manufacture and is an eligible ‘input tax credit’, which can be offset against GST liability.

Notes:
179. Australia’s Identified Mineral resources, 2019 Geoscience Australia; www.ga.gov.au/digital publication/aimr2020/world-rankings
180. Australian Critical Minerals Prospectus 2020, Austrade
181. Geoscience Australia
Australian supply capability
In 2019, Australia had economic resources of
4,030 kt of rare earth oxides, representing 4
percent of the global economic resources of
rare earth oxides and ranking sixth in the world.
Australia ranks fourth worldwide in terms of rare
earth oxides production, manufacturing 18 kt of
rare earth oxides in 2019; almost all of which is
from the Mount Weld mine owned by Lynas rare
Earths.179
Mount Weld produced 19.7 kt of rare earth oxides,
containing 5.9 kt of ndPr in 2019, via its processing
plant in Malaysia.180 Iluka now also produces
zirconium rare earth oxide concentrate from a
stockpile of historical monazite-rich material at its
Eneabba mineral sands mine.
Australia has a number of key advanced
rEE projects that can be divided into two
broad categories:
1. Hard rock projects of several different
geological styles (the Mount Weld mine and
the nolans, Dubbo, Yangibana, and Browns
range projects)
2. Mineral sands projects with high rEE content,
typically associated with high zircon content
(for example, the Eneabba stockpile operation,
Donald Mineral Sands, WIM150, Fingerboards,
and Avonbank projects).
Four of these Australian projects are in pre-
construction stage and another four have
completed bankable feasibility studies. Some of
them are expected to come online in the near term.
Australia also has a number of additional earlier-
stage rEE projects.181
UnLoCKInG AUSTrALIA-InDIA CrITICAL MInErALS PArTnErSHIP PoTEnTIAL82
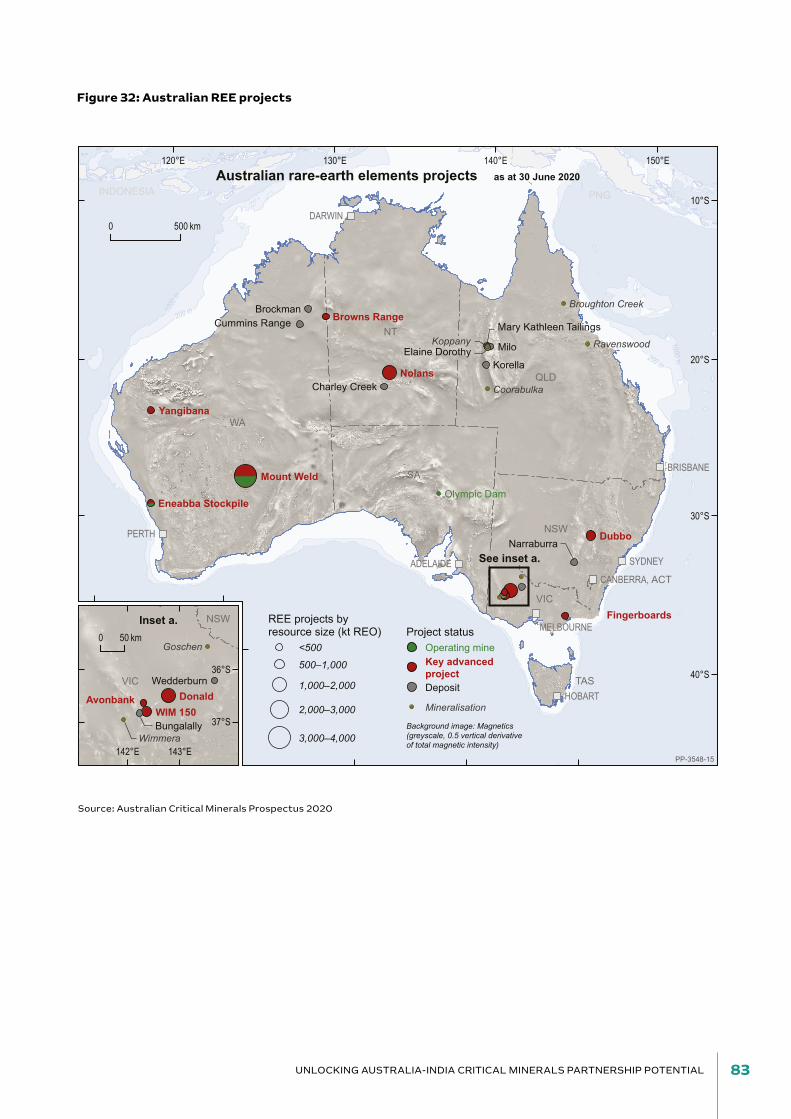
UnLoCKInG AUSTrALIA-InDIA CrITICAL MInErALS PArTnErSHIP PoTEnTIAL 83
PNGINDONESIA
200 m1000
m
1000 m200 m
See inset a.
VIC
NSW
SA
NT
QLD
WA
TAS
CANBERRA, ACT
PERTH
HOBART
MELBOURNE
DARWIN
SYDNEY
BRISBANE
ADELAIDE
Mount Weld
Nolans
Dubbo
Fingerboards
Yangibana
Charley Creek
Mary Kathleen TailingsCummins Range
Milo
Eneabba Stockpile
BrockmanBrowns Range
Narraburra
KorellaElaine Dorothy
Broughton Creek
Coorabulka
Koppany
Olympic Dam
Ravenswood
0 500 km
PP-3548-15
150°E140°E130°E120°E
10°S
20°S
30°S
40°S
Australian rare-earth elements projects as at 30 June 2020
VIC
NSW
DonaldWIM 150
Avonbank
Wedderburn
Bungalally
Goschen
Wimmera
Inset a.0 50 km
143°E142°E
36°S
37°S
Project status
Mineralisation
Deposit
Background image: Magnetics(greyscale, 0.5 vertical derivativeof total magnetic intensity)
Operating mineKey advancedproject
REE projects byresource size (kt REO)
<500
3,000–4,000
2,000–3,000
1,000–2,000
500–1,000
Figure 32: Australian REE projects
Source: Australian Critical Minerals Prospectus 2020

Critical mineral
Project name Company Project status
Primary mineral(s)
Tonnage (Mt)
Grade Units Contained (kt)
rEE Mount Weld Lynas Corporation Ltd
operating rEE 55.4 5.40 % TrEo 3,000
rEE Olympic Dam BHP operating rEE n/A
rEE Eneabba Stockpile
Iluka resources Ltd
operating Zr, rEE, Ti 1.0 10.34 % TrEo 103
rEE Nolans Arafura resources Ltd
Pre-const rEE, P 56.0 2.60 % TrEo 1,456
rEE Dubbo Alkane resources Ltd
Pre-const Zr, nb, Hf, Ta, rEE
75.2 0.88 % TrEo 662
rEE Yangibana Hastings Tech. Metals Ltd
Pre-const rEE 21.3 1.12 % TrEo 238
rEE Browns Range northern Minerals Ltd
Pre-const rEE 9.3 0.67 % TrEo 57
rEE Donald Astron Ltd FS Zr, Ti, rEE 2,427.0 0.06 % TrEo 1,398
rEE WIM 150 Murray Zircon Pty Ltd
FS Zr, Ti, rEE 1,650.0 0.06 % TrEo 908
rEE Fingerboards Kalbar resources Ltd
FS Zr, Ti, rEE 530.0 0.09 % TrEo 490
rEE Avonbank WIM resource Pty Ltd
PFS Zr, Ti 490.0 0.06 % TrEo 308
Table 28: Australia’s upcoming LREE projects
rEE heavy mineral sands project summaries (Donald, WIM 150, Fingerboards and Avonbank) are included
in the titanium section.
Potential project cooperation opportunities
India’s demand for minerals required for rare
earth permanent magnets will depend on its
progress in manufacturing these magnets, given
the Indian Government’s policies to encourage
domestic capabilities.
Key opportunities
• Australian companies could engage with Indian
private-sector companies, such as Tata Group,
Aditya Birla, Mahindra Limited, Permanent
Magnets Limited, Dura Magnets, and MAHLE for
offtake arrangements from advanced Australian
rEE projects.
• Australian METS providers could explore supply
of processing technologies for Indian refining
and separation facilities in the intermediate
value chain.
• Australian project owners could explore
strategic partnerships with Indian public sector
companies, such as IrEL and nMDC, to invest
in midstream processing of rEE concentrates
into rare earth oxides or mixed rare earth
carbonates. Projects could be located in
Australia or India provided the challenges of
transporting and processing radioactive rEE
concentrates in India could be addressed.
• Companies could explore a tripartite
collaboration with countries that can help bridge
the gap in intermediate processing capabilities,
such as Japan, South Korea, Germany, and
the US.
• Australian and Indian institutions could
collaborate to research rEE deposit geology in
India, incorporating the latest global knowledge
of rEE deposit styles, to facilitate the
development of Indian rEE projects.
UnLoCKInG AUSTrALIA-InDIA CrITICAL MInErALS PArTnErSHIP PoTEnTIAL84
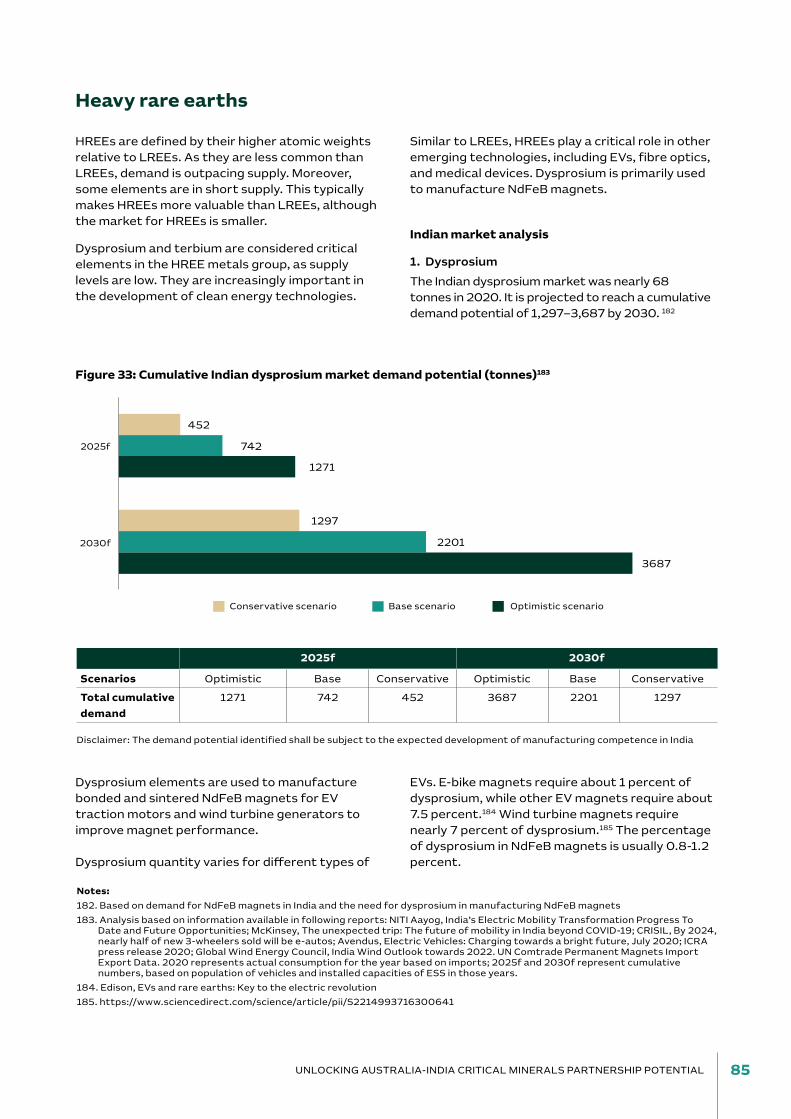
UnLoCKInG AUSTrALIA-InDIA CrITICAL MInErALS PArTnErSHIP PoTEnTIAL 85
Figure 33: Cumulative Indian dysprosium market demand potential (tonnes)183
Heavy rare earths
HrEEs are defined by their higher atomic weights
relative to LrEEs. As they are less common than
LrEEs, demand is outpacing supply. Moreover,
some elements are in short supply. This typically
makes HrEEs more valuable than LrEEs, although
the market for HrEEs is smaller.
Dysprosium and terbium are considered critical
elements in the HrEE metals group, as supply
levels are low. They are increasingly important in
the development of clean energy technologies.
Similar to LrEEs, HrEEs play a critical role in other
emerging technologies, including EVs, fibre optics,
and medical devices. Dysprosium is primarily used
to manufacture ndFeB magnets.
Indian market analysis
1. Dysprosium
The Indian dysprosium market was nearly 68
tonnes in 2020. It is projected to reach a cumulative
demand potential of 1,297–3,687 by 2030. 182
Dysprosium elements are used to manufacture
bonded and sintered ndFeB magnets for EV
traction motors and wind turbine generators to
improve magnet performance.
Dysprosium quantity varies for different types of
EVs. E-bike magnets require about 1 percent of
dysprosium, while other EV magnets require about
7.5 percent.184 Wind turbine magnets require
nearly 7 percent of dysprosium.185 The percentage
of dysprosium in ndFeB magnets is usually 0.8-1.2
percent.
2025f 2030f
Scenarios optimistic Base Conservative optimistic Base Conservative
Total cumulative
demand
1271 742 452 3687 2201 1297
Disclaimer: The demand potential identified shall be subject to the expected development of manufacturing competence in India
2025f
2030f
Conservative scenario Base scenario optimistic scenario
452
1297
2201
3687
742
1271
Notes:
182. Based on demand for ndFeB magnets in India and the need for dysprosium in manufacturing ndFeB magnets
183. Analysis based on information available in following reports: nITI Aayog, India’s Electric Mobility Transformation Progress To Date and Future opportunities; McKinsey, The unexpected trip: The future of mobility in India beyond CoVID-19; CrISIL, By 2024, nearly half of new 3-wheelers sold will be e-autos; Avendus, Electric Vehicles: Charging towards a bright future, July 2020; ICrA press release 2020; Global Wind Energy Council, India Wind outlook towards 2022. Un Comtrade Permanent Magnets Import Export Data. 2020 represents actual consumption for the year based on imports; 2025f and 2030f represent cumulative numbers, based on population of vehicles and installed capacities of ESS in those years.
184. Edison, EVs and rare earths: Key to the electric revolution
185. https://www.sciencedirect.com/science/article/pii/S2214993716300641

2. Terbium
Terbium is used to manufacture LCD and plasma
screens, missile guidance systems, permanent
magnets, solid-state electronics, and sonar
systems. overall, 22 percent of the terbium
production is used to manufacture permanent
magnets, while 48 percent is used to
produce phosphors.
Terbium could be used as an alternative to
dysprosium in magnet production. However, the
annual supply of terbium is far more limited
than that of dysprosium, typically at a supply
ratio of 1:4.186
China is the largest global producer of terbium. In
2019, the country exported about 115 tonnes of
terbium, of which, nearly 94 percent was exported
to Japan (87.3 percent) and the US (6.4 percent).
China exported 7.2 tonnes of terbium to other
countries, including India.187
India’s cumulative demand potential for terbium
for ndFeB magnets is expected to be 549 tonnes
by 2030. The country currently has small terbium
traces in its monazite supply (consisting of 0.06
percent terbium).
Notes:
186. roskill, rare Earths: Changing magnet compositions to manage supply availability
187. https://www.visualcapitalist.com/chinas-dominance-in-rare-earth-metals/
188. Analysis based on information available in following reports: nITI Aayog, India’s Electric Mobility Transformation Progress To Date and Future opportunities; McKinsey, The unexpected trip: The future of mobility in India beyond CoVID-19; CrISIL, By 2024, nearly half of new 3-wheelers sold will be e-autos; Avendus, Electric Vehicles: Charging towards a bright future, July 2020; ICrA press release 2020; Global Wind Energy Council, India Wind outlook towards 2022; Un Comtrade Permanent Magnets Import Export Data. 2020 represents actual consumption for the year based on imports; 2025f and 2030f represent cumulative numbers, based on population of vehicles and installed capacities of ESS in those years.
Figure 34: Cumulative demand potential for terbium in India based on requirement
in NdFeB magnets (tonnes)188
2025f
2030f
Conservative scenario Base scenario optimistic scenario
134
181
376
549
822
266
2025f 2030f
Scenarios optimistic Base Conservative optimistic Base Conservative
Total cumulative
demand
266 181 134 822 549 376
Disclaimer: The demand potential identified shall be subject to the expected development of manufacturing competence in India
UnLoCKInG AUSTrALIA-InDIA CrITICAL MInErALS PArTnErSHIP PoTEnTIAL86

UnLoCKInG AUSTrALIA-InDIA CrITICAL MInErALS PArTnErSHIP PoTEnTIAL 87
3. Europium
Europium oxide has a vital role in computer and
television screens, as a phosphor that emits a pure
red light. This red spectrum is why europium is
used in low-energy light bulbs and powerful street-
lighting mercury vapour tubes to create a more
natural or warm light.
Europium is also employed in the medical field.
The highly sensitive luminescence provided
by europium, attached as a tag to complex
biochemicals, assists in live tracing of these
materials during living tissue research.
Due to its luminescent properties, europium oxide
is the commonly traded form.
Demand for Light Emitting Diode (LED) bulbs that
use europium was 70 million units in 2020, which
equates to 1,600 kg of europium. At present, LEDs
are mostly imported into India. India’s demand
for europium for manufacturing LED bulbs will
increase to 4,000 kg by 2030. The cumulative
demand for europium is forecast to reach 29
tonnes by 2030. 189
Figure 35: Cumulative demand potential for europium used in manufacturing LED bulbs (kg) 190
2025f
2030f
Cumulative demand of Europium
12,218
29,012
Notes:
189. Based on discussions with industry sources
190. Based on discussions with industry sources
191. https://pubs.usgs.gov/sir/2012/5215/pdf/sir2012-5215.pdf
2025f 2030f
Totla cumulative demand 12,218 29,012
Disclaimer: The demand potential identified shall be subject to the expected development of manufacturing competence in India
Key industry participants
ndFeB magnet manufacturing requires HrEEs,
including terbium and dysprosium. ndFeB magnet
customers include:
• Permanent Magnets Limited
• Dura Magnets Private Limited
• MAHLE
Terbium and europium are needed to
manufacture phosphors used in LEDs –
terbium in green phosphors and europium
in red phosphors.191 Significant Indian LED
manufacturers include the following:
• MIC Electronics Limited
• Avni Energy Solutions Private Limited
• Instapower Limited.

Supply scenario in India
IrEL Limited commissioned a new dysprosium
plant in December 2020. The company has
developed a process flowsheet to extract
dysprosium from monazite at its rare earths
division plant in Aluva, Kerala.
India mostly sources its dysprosium and terbium
from China and Myanmar.192 Australian suppliers
have an opportunity to create a niche market to
supply these minerals to India.
Import duties on ndFeB magnets requiring
dysprosium or terbium are high, including BCD of
7.5 percent, IGST of 18 percent, and SWS of 10
percent. Total duties on importing permanent
magnets to India are 27.74 percent.193
Notes:
192. JrC Science for Policy report, The role of rare Earth Elements in Wind Energy and E-Mobility, European Union 2020
193. https://www.cybex.in/indian-custom-duty/electro-magnets-permanent-articles-intended-hs-code-8505.aspx
194. CBIC, Ministry of Commerce, GoI
HS code BCD SWS IGST Total duties
Permanent magnets and
articles intended to become
permanent magnets after
magnetisation of other material
85051190 7.5% 10% 18% 27.74%
Permanent magnets and
articles intended to become
permanent magnets after
magnetisation of other material
85051900 7.5% 10% 18% 27.74%
Lamps and LEDs 85395000 10% 10% 28% 40.8%
Table 29: Import duties on various HREE products from April 2021194
Potential project cooperation opportunities
The market for rare earth metals is driven by their
usage in magnets meant for hybrid and electric
cars, as well as the increasing global shift towards
clean energy. other applications in defence and
high-end electronics add to the projected demand
for these minerals.
Key opportunities
• Indian resources have limited content of heavy
rare earths (HrEEs). Australian project owners
could explore strategic partnerships with Indian
public-sector companies to invest in processing
or refining of Australian rEE concentrates either
in Australia or India.
• Australian companies could engage with Indian
private-sector companies, either involved in
magnet or LED manufacturing, for offtake
arrangements from advanced Australian rEE
projects, to cater to the growing demand.
• Australian project owners could engage with
Indian private sector companies for investments
in Australian HrEE projects, to ensure a long-
term sustainable supply.
• Australian and Indian companies could
explore a tripartite collaboration with other
companies that can assist bridge the gap in the
intermediate processing capabilities.
note: The IGST is applicable on both imports and Indian manufacture and is an eligible ‘input tax credit’, which can be offset against GST liability.
UnLoCKInG AUSTrALIA-InDIA CrITICAL MInErALS PArTnErSHIP PoTEnTIAL88

UnLoCKInG AUSTrALIA-InDIA CrITICAL MInErALS PArTnErSHIP PoTEnTIAL 89
Vanadium
Due to vanadium’s unique characteristics of high
ductility, malleability, and corrosion resistance,
it is in strong demand across the steel, alloy, and
chemical industries.
The steel industry accounts for about 90 percent
of the current demand for vanadium. The
increasing momentum in the Vanadium redox Flow
Batteries (VrFB) technology may further bolster
demand for vanadium in the longer term.
India’s increasing demand for steel, expected
future demand for vanadium in VrFB, limited
domestic sources of vanadium, and heavy import
dependence make vanadium a key critical mineral
for India.
Australia has EDr of 6,019 kt in vanadium, the
second highest globally.195 There are significant
opportunities to secure supplies of vanadium
(commonly found in titanium deposits) from
strategic offtake and investment partnerships in
advanced vanadium mining projects in Australia.
Indian market analysis
India’s vanadium market was estimated at 2.7 –
3.0 kt in 2020. The demand potential is expected
to reach 65–87 kt by 2030.196
Figure 36: Cumulative Indian vanadium market demand potential (kt)197
Notes:
195. Geoscience Australia - https://www.ga.gov.au/digital-publication/aimr2020
196. Analysis based on the following reports - vanadium requirement in steel production has been referred from Bushveld Minerals Vanadium 101 document of 03 May 2018; India is expected to replicate the global application trends and the same has been referred to from the blog Time to grab ferro vanadium-mjunction and Bushveld Minerals Vanadium 101 document of 03 May 2018
197. Analysis based on the following reports - vanadium requirement in steel production has been referred from Bushveld Minerals Vanadium 101 document of 03 May 2018; India is expected to replicate the global application trends and the same has been referred to from the blog Time to grab ferro vanadium-mjunction and Bushveld Minerals Vanadium 101 document of 03 May 2018
2025f 2030f
Scenarios optimistic Base Conservative optimistic Base Conservative
Total cumulative
demand
31 30 26 87 79 65
2025f
2030f
Conservative scenario Base scenario optimistic scenario
26
65
30
79
31
87
Disclaimer: The demand potential identified shall be subject to the expected development of manufacturing competence in India.

In India, vanadium is primarily used as an alloying
element in iron and steel manufacturing.
Special steels containing vanadium are used in
manufacturing structural materials, automobile
parts, tools, rails, surgical instruments, tubes, and
pipes for corrosive materials, wind turbines, space
vehicles, nuclear reactors, and defence equipment.
Vanadium is also used in master alloys,
catalysts for chemicals, dyes for fabrics,
pigments for ceramics, special-coated glasses,
health preparations, electronics, miniature
batteries, and superconducting magnets. These
together account for 10 percent of the total
vanadium demand.
VrFB’s potential future demand may further
increase vanadium demand as India develops
its battery manufacturing capability. VrFB has
the advantage of being scalable. Although the
technology is currently nascent, it is expected to
continue to develop over the next few decades.
While demand across various end-use industries
is expected to increase, a flourishing Indian steel
industry against a backdrop of ambitious economic
development goals would drive demand for
vanadium in the future.
In 2018, China introduced the high-strength
rebar standard to limit and eliminate the use of
inferior steel in construction. If India emulates this
high-strength rebar standard, it could expect a
substantial increase in demand for vanadium due
to its high-strength properties.
If lithium vanadium oxide proves to be
commercially viable as a high–energy density
anode for lithium-ion batteries, ongoing
developments in this application could significantly
affect vanadium demand.
Vanadium oxide–based thin films also have
characteristics suitable for applications, including
optical switching, variable-emittance and anti-
reflective surfaces, catalytic applications, infrared
detectors, and thermochromic devices for smart
thermal control systems in the aerospace sector.
Key industry participants
In India, the ferroalloy industry is most significant
vanadium consumer, where demand for vanadium
from ferrovanadium producing units is primarily
met by importing vanadium pentoxide (V2o
5)
concentrates.
In India, vanadium sludge is produced as a
by-product during the production of alumina
hydrate, including the following operations:
• Bharat Aluminium Company Limited and
Vedanta resources’ Lanjigarh plant
• Hindalco Industries Limited’s Belgavi plant
Notes:
198. Analysis based on the following reports - vanadium requirement in steel production has been referred from Bushveld Minerals Vanadium 101 document of 03 May 2018; India is expected to replicate the global application trends and the same has been referred to from the blog time to grab ferro vanadium-mjunction and Bushveld Minerals Vanadium 101 document of 03 May 2018
End-use segment 2020e 2025f 2030f
Ferrovanadium 90% 88% 85%
others (VrFB, master alloys, dyes,
pigments, and others)
10% 12% 15%
Table 30: Indian vanadium market forecast by end-use segment198
UnLoCKInG AUSTrALIA-InDIA CrITICAL MInErALS PArTnErSHIP PoTEnTIAL90

UnLoCKInG AUSTrALIA-InDIA CrITICAL MInErALS PArTnErSHIP PoTEnTIAL 91
User
segment
Technology/
products
End-use
industries
Mineral/alloy
specification
Key industry players Key geographical
locations
Ferroalloys Ferrovanadium Steel V2o
5Essel Mining and Industries
Limited, rama Ferro Alloys &
Finance Private Limited, Shiva
Industries Private Limited,
refracast Metallurgical Private
Limited, and Premier Alloys &
Chemicals Private Limited
Manufacturers
are spread
across the
country
others Dyes, pigments,
catalysts
Ceramics,
fabrics, glass,
electronics
etc.
V2o
5 and
vanadium
concentrate
Jammu Pigments Limited, Mittal
Pigments Private Limited, and
Gurushree Industries Private
Limited
Manufacturers
are spread
across the
country
Table 31: Potential end-use industries and players200
Notes:
199. Indian Minerals Yearbook ,2019, https://ibm.gov.in/writereaddata/files/06052020113429Vanadium_2019.pdf
200. Based on primary and secondary research
201. Bushveld minerals- https://www.bushveldminerals.com/about-vanadium/
202. UnCoMTrADE, ITC Trade map and India Trade Statistics
203. Indian Minerals Yearbook ,2019, https://ibm.gov.in/writereaddata/files/06052020113429Vanadium_2019.pdf
204. Geological Survey of India
national Aluminium Company Limited (nALCo)
and reliance Industries Limited (rIL) have
completed lab-scale studies to successfully
recover vanadium but they are not yet producing
vanadium sludge on a commercial scale199.
As vanadium recovery highly depends on
improvements in alumina production, India will find
it challenging to generate an adequate quantity
of vanadium sludge to meet increasing domestic
demand in the near term.
Significant developments in vanadium redox flow
batteries may also increase interest in vanadium
amongst battery manufacturers.
Supply scenario in India
Vanadium is typically found within magnetite iron
ore deposits; it is largely mined as a co-product,
not a primary mineral. About 80–85 percent
of the world’s vanadium is sourced from three
countries – China, russia, and South Africa.
China supplies nearly 60 percent of the global
market.201
India imports vanadium in various forms, including
ores, concentrates, and flakes. In 2019, it
imported about 13 kt, increasing to nearly
3.3 kt in 2020.202
Although India is a major vanadium consumer, it
is not a primary producer. IBM’s 2019 national
Mineral Inventory estimated India’s vanadium
resources at 24.6 Mt, with an estimated V2o
5
content of 64.6 kt, mainly in Karnataka, odisha,
and Maharashtra.203 Although these have the
potential to be mined in the future, this would
require significant r&D investments.
The Geological Survey of India has explored a
promising concentration of vanadium in Arunachal
Pradesh, but the deposit has not been fully
studied.204
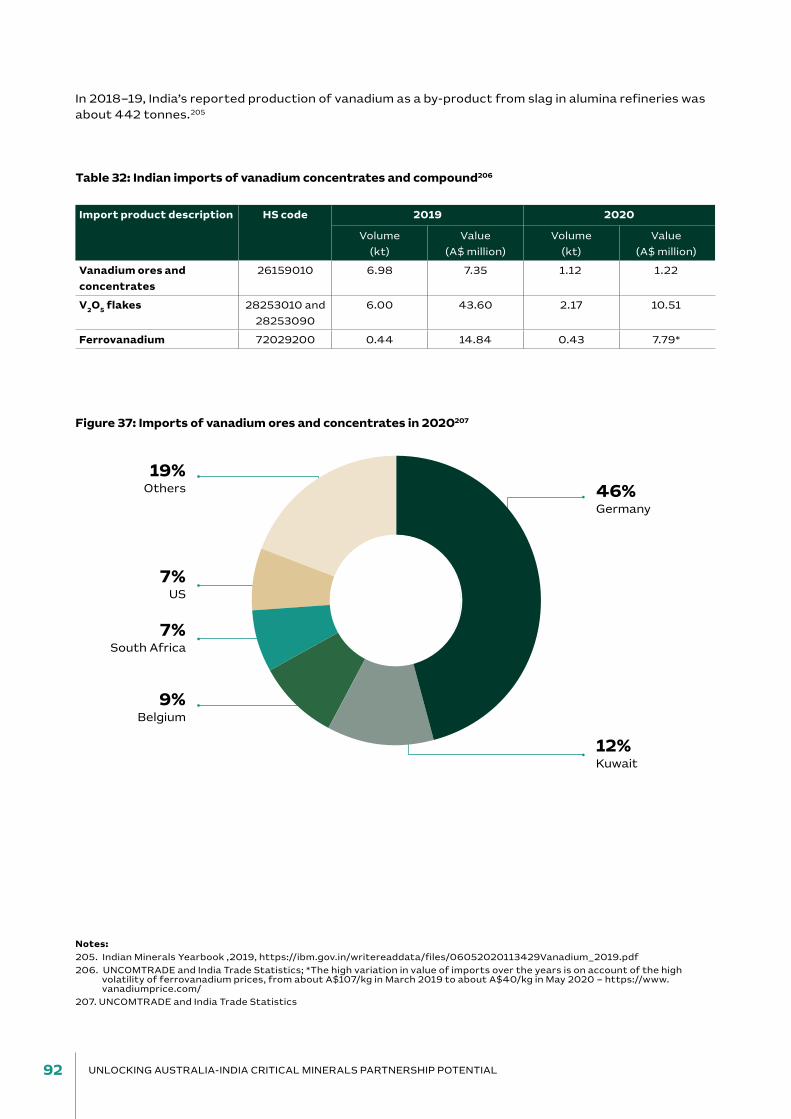
Figure 37: Imports of vanadium ores and concentrates in 2020207
19% others 46%
Germany
7%
US
7%
South Africa
9% Belgium
12% Kuwait
Table 32: Indian imports of vanadium concentrates and compound206
Import product description HS code 2019 2020
Volume
(kt)
Value
(A$ million)
Volume
(kt)
Value
(A$ million)
Vanadium ores and
concentrates
26159010 6.98 7.35 1.12 1.22
V2O
5 flakes 28253010 and
28253090
6.00 43.60 2.17 10.51
Ferrovanadium 72029200 0.44 14.84 0.43 7.79*
Notes:
205. Indian Minerals Yearbook ,2019, https://ibm.gov.in/writereaddata/files/06052020113429Vanadium_2019.pdf
206. UnCoMTrADE and India Trade Statistics; *The high variation in value of imports over the years is on account of the high volatility of ferrovanadium prices, from about A$107/kg in March 2019 to about A$40/kg in May 2020 – https://www.vanadiumprice.com/
207. UnCoMTrADE and India Trade Statistics
In 2018–19, India’s reported production of vanadium as a by-product from slag in alumina refineries was
about 442 tonnes.205
UnLoCKInG AUSTrALIA-InDIA CrITICAL MInErALS PArTnErSHIP PoTEnTIAL92

UnLoCKInG AUSTrALIA-InDIA CrITICAL MInErALS PArTnErSHIP PoTEnTIAL 93
Notes:
208. UnCoMTrADE and India Trade Statistics
209. CBIC – Ministry of Commerce, GoI
210. Viewpoint: V demand to be driven by alternative sources, Argus media
Figure 38: Imports of vanadium pentoxide flakes in 2020208
13% UAE
74%
Canada13% Korea
Category HS code BCD SWS IGST Total duties
Vanadium ores and
concentrates
26159010 5% 10% 5% 10.25%
V2O
5 flakes 28253010 and
28253090
10% 10% 5% 15.5%
Ferrovanadium 72029200 15% 10% 18% 35.7%
Table 33: Import duties on various vanadium products from April 2021209
The following table lists the duties imposed by the Indian Government on the import of vanadium in
various forms.
In addition to import duties on vanadium ores,
concentrates, and compounds, the Indian
Government has imposed a basic customs duty
of 15 percent on ferrovanadium to support India’s
domestic manufacturing industry.
International prices for V2o
5 were around A$
14,700–22,400 per tonne in 2019.210 Vanadium
demand can be closely linked to crude steel
production. Therefore, a robust outlook for the
steel industry means vanadium prices should
trend upwards by 2030.
With no known vanadium mining activity and
limited domestic availability, India will continue
to rely on imports. This presents an opportunity
for Australia’s vanadium miners to supply
various Indian V2o
5 buyers across industries at
competitive prices.
note: The IGST is applicable on both imports and Indian manufacture and is an eligible ‘input tax credit’, which can be offset against GST liability.

Australian supply capability
Australia has economic resources of 6,019 kt of
contained vanadium, representing 20 percent
of the global economic resources and placing
Australia third in global rankings.211
Although Australia has no operating vanadium
mines, there are a number of advanced vanadium
projects; of which, most are associated with
titanium. Increasing vanadium demand, spurred
by rising steel and battery demand, has also
encouraged new exploration and feasibility
studies for mothballed projects.
Most of Australia’s vanadium projects are igneous
hard rock deposits, with vanadium and titanium
associated with magnetite. The majority plan to
produce vanadium and titanium for sale but not
magnetite.
Figure 39: Australian vanadium projects
PNGINDONESIA
200 m1000
m
1000 m200 m
VIC
NSW
SA
NT
QLD
WA
TAS
CANBERRA, ACT
PERTH
HOBART
MELBOURNE
DARWIN
SYDNEY
BRISBANE
ADELAIDE
Speewah
Julia Creek
Richmond
Balla Balla
Australian Vanadium
Barrambie
Gabanintha
Windimurra
Saint Elmo
Victory BoreCanegrass
Youanmi
Mount Peake
Unaly Hill
Toolebuc
Medcalf
MonogorilbyWiluna
Bigrlyi
Nowthanna Hill
Isa
Jervois
0 500 km
PP-3548-21
Vanadium projects byresource size (kt V2O5)
<500
10,000–15,000
5,000–10,000
1,000–5,000
500–1,000
150°E140°E130°E120°E
10°S
20°S
30°S
40°S
Australian vanadium projects as at 30 June 2020
Project status
Mineralisation
Deposit
Background image: Magnetics(greyscale, 0.5 vertical derivativeof total magnetic intensity)
Key advanced project
Operating mine
Source: Australian Critical Minerals Prospectus 2020
Notes:
211. Geoscience Australia- https://www.ga.gov.au/digital-publication/aimr2020
UnLoCKInG AUSTrALIA-InDIA CrITICAL MInErALS PArTnErSHIP PoTEnTIAL94

UnLoCKInG AUSTrALIA-InDIA CrITICAL MInErALS PArTnErSHIP PoTEnTIAL 95
Table 34: Australia’s key advanced vanadium V2O
5 projects
Critical mineral
Project name Company Project status
Primary mineral(s)
Tonnage (Mt)
Grade Units Contained (kt)
Vanadium Windimurra Atlantic Ltd Pre-const V 234.0 0.49 % V2o
51,146
Vanadium Balla Balla BBI Group Pty Ltd
FS V, Ti 455.9 0.66 % V2o
52,988
Vanadium Barrambie neometals Ltd FS Ti, V 280.1 0.44 % V2o
51,234
Vanadium Gabanintha Technology Metals Au Ltd
FS V, Ti 131.0 0.80 % V2o
51,179
Vanadium Mount Peake TnG Ltd FS V, Ti, Fe 160.0 0.28 % V2o
5448
Vanadium Richmond – Julia Creek
Horizon Minerals; rVT
PFS V, Mo, ni 1,838.0 0.36 % V2o
56,650
Vanadium Australian Vanadium Project
Australian Vanadium Ltd
PFS V, Ti 208.2 0.74 % V2o
51,541
Vanadium Saint Elmo Multicom resources
PFS V, Mo 304.5 0.25 % V2o
5762
Vanadium Medcalf Audalia resources Ltd
PFS V, Ti 32.0 0.47 % V2o
5149
Vanadium Wiluna Toro Energy Ltd PFS U, V 96.3 0.03 % V2o
531
Vanadium Bigrlyi Energy Metals Ltd
PFS U, V 7.5 0.12 % V2o
59
Source: Australian Critical Minerals Prospectus 2020
Potential project cooperation opportunities
Vanadium is used primarily as an alloying element
in a growing iron and steel industry, and stabiliser
in titanium and aluminium alloys for aerospace
applications.
Key opportunities
• Australian vanadium project proponents could
explore offtake opportunities in traditional
sectors, such as steel, chemicals, and other
alloys, with Indian companies (including
MIDHAnI, Essel Mining & Industries Limited,
rama Ferro Alloys & Finance Private Limited,
Shiva Industries Private Limited, and Premier
Alloys & Chemicals Private Limited).
• Companies in the Indian steel, chemicals,
and alloy industries could consider strategic
investment in advanced Australian vanadium
projects to secure supply. Many Australian
vanadium projects (igneous hard rock
deposits) also have associated titanium,
enabling potential supply of vanadium and
titanium from the same project.
• Acknowledging the potential for VrFB
development in India, Australian vanadium
projects could initiate dialogue with Indian
battery manufacturers for the joint
development of technology for downstream
vanadium electrolyte processing. Potential
partners include Tata Chemicals, nexcharge
(Exide–Leclanche), and TDSG.
• Australian institutions could explore
collaborative research models with Indian
organisations, such as ArCI, MIDHAnI,
IESA, and other institutes, to support
commercialisation of processing and recycling
technologies.

ANNEX
Table 35: List of lithium-ion battery ecosystem players in India212
Company Partnerships Location of plant
Year announced
Details
TDSG Suzuki, Toshiba and DENSO (50%, 40% and 10%, respectively)
JV – American Electric Power Company
Gujarat January 2020
• Cell technology – Toshiba; module technology – DEnSo
• Target sector – EVs
• Phase 1 was initiated in 2018 and is expected to be completed by December 2020. The investment was Inr1,150 Cr (A$225 million)
• Planned investment for phase 2 production of lithium-ion batteries is Inr3,715 Cr (A$726 million)
ACME Cleantech
Uttarakhand • The current operating capacity is 350 MWh, mainly providing a stationary storage solution
• Planned to ramp up to 2–3 GWh
Pinnacle India
Phylion, China Pune January 2020
• Battery cell technology – Phylion
• Target sector – light passenger and commercial EVs
• Yet to be operational
Exide Exide (75%) and Leclanche SA (25%)
JV – Nexcharge
Gujarat June 2018 • Battery cell technology – Leclanche SA
• Capacity – 1.5 GWh
• Target sector – EVs, grid storage and other stationary storage
• Yet to be operational
XnrGI India
Own technology Gurugram 2019 • opened a 240 MWh battery plant in Gurugram in 2020, targeted at EVs
• Plans to expand to GWh scale as demand picks up
BHEL ISro MOU between ISRO and BHEL
Bangalore 2018 • ISro transferred its ion cell technology to BHEL
• BHEL plans to set up GWh-scale manufacturing setup
Tata Chemicals
MOU with ISRO Gujarat 2019 • Plans to set up a 10 GWh lithium-ion battery plant
• Target sectors – EVs and stationary storage
renon India Ahamani EV tech
Surat, Gujarat
2019 • 200 MWh capacity, with target to expand to 1 GWh in the next few years
• Target sectors – EVs, solar appliances, lights etc.
• Yet to be operational
Li Energy CSIR technology Tamil nadu 2020 • Plans 1 GWh integrated manufacturing plant, to be set up in phases
• Talks underway with Contemporary Amperex Technology Co. Limited to supply cells in the initial year
Greenko To be decided 2020 • Announced US$1 billion investment plan for battery manufacturing
Exicom okaya
• Assembles and supplies battery packs to 2-wheel, 3-wheel, e-rickshaws etc.
Notes:
212. news articles, company annual reports, industry reports
UnLoCKInG AUSTrALIA-InDIA CrITICAL MInErALS PArTnErSHIP PoTEnTIAL96


UnLoCKInG AUSTrALIA-InDIA CrITICAL MInErALS PArTnErSHIP PoTEnTIAL98