Unlocking new opportunities: Jobs in green and ... - WHO/Europe
29
Unlocking new opportunities Jobs in green and healthy transport
-
Upload
khangminh22 -
Category
Documents
-
view
2 -
download
0
Transcript of Unlocking new opportunities: Jobs in green and ... - WHO/Europe

Unlocking new opportunities
Jobs in green and healthy transport
Unlocking new opportunities
Jobs in green and healthy transport
AbstractThe Transport, Health and Environment Pan-European Programme (THE PEP) partnership on jobs in green and healthy transport is exploring potential job creation in greener, healthier, more efficient transport. This publication focuses on potential job creation in public transport, cycling and walking. An analysis of the available evidence suggests that these modes could be significant employers and contributors to the green economy. A simple method was used to estimate the job creation potential of cycling, as this was the mode for which most information was available. It was estimated that about 76 600 jobs could be created if selected cities achieved the same modal share of cycling as the Danish capital, Copenhagen. Additionally, about 10 000 deaths could be avoided each year thanks to the health benefits of cycling. These figures are likely to be underestimates, as they correspond to only one city per country and to only a small proportion of the jobs that could contribute to making transport greener, safer and more efficient.
KeywordsEMPLOYMENTENVIRONMENT AND PUBLIC HEALTHPOLICY MAKINGTRANSPORTATIONURBAN HEALTHWALKING
ISBN 978 9 289 05020 3
Address requests about publications of the WHO Regional Office for Europe to:
Publications WHO Regional Office for Europe UN City, Marmorvej 51 DK-2100 Copenhagen Ø, Denmark
Alternatively, complete an online request form for documentation, health information, or for permission to quote or translate, on the Regional Office web site (http://www.euro.who.int/pubrequest).
© World Health Organization 2014
All rights reserved. The Regional Office for Europe of the World Health Organization welcomes requests for permission to reproduce or translate its publications, in part or in full.
The designations employed and the presentation of the material in this publication do not imply the expression of any opinion whatsoever on the part of the World Health Organization concerning the legal status of any country, territory, city or area or of its authorities, or concerning the delimitation of its frontiers or boundaries. Dotted lines on maps represent approximate border lines for which there may not yet be full agreement.
The mention of specific companies or of certain manufacturers’ products does not imply that they are endorsed or recommended by the World Health Organization in preference to others of a similar nature that are not mentioned. Errors and omissions excepted, the names of proprietary products are distinguished by initial capital letters.
All reasonable precautions have been taken by the World Health Organization to verify the information contained in this publication. However, the published material is being distributed without warranty of any kind, either express or implied. The responsibility for the interpretation and use of the material lies with the reader. In no event shall the World Health Organization be liable for damages arising from its use. The views expressed by authors, editors, or expert groups do not necessarily represent the decisions or the stated policy of the World Health Organization.
Photos: Fotolia.comEditor: Elisabeth HeseltineLayout: Lars Møller
iii
ContentsAuthors, contributors and acknowledgements .....................................................iv
Benefits and challenges of transport in the pan-European Region ........................ 1
Exploring uncharted land: contribution of the Transport, Health and Environment Pan-European Programme (THE PEP) .............................. 2
What is a job in green and healthy transport? ...................................................... 3
There are many opportunities for job creation in public transport, cycling and walking. ............................................................................................ 6
Investing in green and healthy transport generates more jobs than investing in roads. ........................................................................ 9
Investing in green and healthy transport creates local jobs.................................. 10
Investing in green and healthy transport generates a broad range of jobs........... 10
Identifying the true potential for jobs in green and healthy transport remains a challenge. ............................................................... 11
Increasing the level of cycling in selected cities to that of Copenhagen could create 76 600 jobs. .............................................................. 11
If all the selected cities had the same level of cycling as Copenhagen, 10 000 premature deaths could be avoided each year. ....................................... 14
Multiple social benefits could be derived by unlocking the job creation potential of public transport, cycling and walking. .................... 14
Although more research is needed, there is sufficient evidence to take action now. ............................................................................................ 17
References ......................................................................................................... 17
Annex. Methodological aspects .......................................................................... 20
iv
Authors
Ian Skinner, Dawei Wu, Christian Schweizer, Francesca Racioppi, Rie Tsutsumi
ContributorsThis publication was prepared with contributions from the members of the Bureau of the Transport, Health and Environment Pan-European Programme (THE PEP) and participants at the second meeting of THE PEP partnership on jobs in green and healthy transport, 17–18 October 2013, Paris: Nadine Asconchilo (French Ministry of Ecology, Sustainable Development and Energy), Griffin Carpenter (New Economics Foundation), Claus Doll (Fraunhofer Institute), George Georgiadis (United Nations Economic Commission for Europe), Dorota Jarosinska (European Environment Agency), Frank Leys (International Labour Office), Cristina Martinez-Fernandez (Organisation for Economic Co-operation and Development), Pierre Toulouse (French Ministry of Ecology, Sustainable Development and Energy), Rie Tsutsumi (United Nations Environment Programme), Mathieu Verdure (French Ministry of Ecology, Sustainable Development and Energy); and Frank George, Francesca Racioppi and Christian Schweizer (WHO Regional Office for Europe).
AcknowledgementsThis report was produced by THE PEP partnership on jobs in green and healthy transport.
The partnership is especially grateful for the generous financial support of the Governments of Austria, France and Switzerland as well as the United Nations Environment Programme (UNEP).
1
Benefits and challenges of transport in the pan-European Region1
Transport is vital for the functioning of modern economies. It allows people to travel to work and for education and to access a range of services, including leisure and health care. It is also central to and intertwined with the development of the urban environment. The transport system plays an important economic role, as it enables trade and is an important economic sector in its own right. In the European Union, the turnover of the transport industry is equivalent to 10.5% of gross domestic product (GDP), and it employs 10.5 million people, representing nearly 5% of the total workforce (European Commission, 2013).2
The downside of transport is its adverse environmental and health impacts, particularly in urban areas (European Environment Agency, 2013). In many European cities, transport is a major contributor to air pollution, which has important adverse effects on health; for example, people in Europe lose an average of about 9 months of life expectancy as a result of exposure to particulate matter alone (WHO Regional Office for Europe, 2013). Road accidents account for a further 120 000 premature deaths each year (WHO Regional Office for Europe, 2009a).3 Other adverse health impacts result from exposure to excessive levels of noise from road transport, which
1 In the context of this publication, the “pan-European Region” comprises all the member countries of the United Nations Economic Commission for Europe, including the central Asian states that were part of the former Soviet Union, as well as Canada and the United States of America (www.unece.org/oes/member_countries/member_countries.html).2 The figures are for 2010 and include Croatia. Some of the data for 2010 were obtained from earlier editions of the same publication. 3 The figure is for the 49 countries of the WHO European Region that provided data for the report referenced. The Region largely corresponds to the definition of Europe in footnote 1, with the exception of Liechtenstein.
affects almost 70 million people4 (European Environment Agency, 2012). All these adverse health effects affect individuals and burden society with costs, particularly for health care. For example, the costs associated with fatal and non-fatal road traffic injuries can represent up to 3% of a country’s GDP (WHO Regional Office for Europe, 2009).
It is not just the direct impacts on health that are of concern. People living in urban areas are exposed to heavy congestion, which also has an adverse economic impact, while others experience social exclusion that can be increased by busy roads (European Environment Agency, 2013). When it discourages or impedes cycling and walking, transport also reduces opportunities for physical activity, which in the WHO European Region is estimated to be associated with nearly 1 million deaths per year (WHO Regional Office for Europe, 2009). Last but not least, transport accounts for about 24% of total greenhouse gas emissions in Europe and North America,5 which is likely to contribute to a range of negative health impacts (WHO Regional Office for Europe, 2012). The adverse effects of transport activities on health and the environment are part of the external costs of transport, which are not often considered in the economic calculations that support policy development; this cost has been estimated to represent about 4% of GDP6 (CE Delft et al., 2011).
In contrast to this challenging picture, certain transport policies have been shown to have benefits for health, the environment and the economy, such as policies to support public
4 Figures for 2007 for the 27 countries of the European Union plus Norway and Switzerland 5 Figures derived from United Nations Framework Convention on Climate Change at: http://unfccc.int/ghg_data/ghg_data_unfccc/time_series_annex_i/items/3814.php (accessed 12 November 2013); the vast majority of the greenhouse gas emissions from transport are carbon dioxide. The figure is for 2010 and is based on the greenhouse gas emissions of the 39 members of the United Nations Economic Commission for Europe that are Annex I countries under the Kyoto Protocol. Total greenhouse gas emissions used for the calculation include those relating to land use, land use change and forestry.6 The figure reflects the external costs as a proportion of the total GDP of the countries included in the study, which were the 27 members of the European Union, plus Norway and Switzerland.
2
transport, cycling and walking. When the health effects of different transport policies are factored into cost–benefit assessments, the most effective combination of policies is shown to be public transport, cycling and walking (Woodcock et al., 2009; WHO, 2011a). Support for public transport, cycling and walking complements urban traffic management measures, such as congestion charges and parking policies. Some methodological issues remain to be solved, however, such as means for capturing how people adjust their activity overall when they replace car travel by active mobility and for evaluating changes in travel time (Doll et al., 2013).
A more recent, largely unexplored area of growing interest is the potential of these policies for job creation, not only in public transport, cycling and walking but also in other areas that could make transport greener, safer, healthier and more efficient. These include a wide range of jobs in the design, production and servicing of energy-efficient vehicles and in mobility management. Jobs in green and healthy transport could make a potentially important contribution to the green economy because of their environmental, social and economic benefits. This contribution would be of even greater importance in urban areas, where modes such as public transport, cycling and walking have the greatest potential. Already, jobs in green and healthy transport make up a significant proportion of the total number of jobs in the transport sector; e.g. in Spain, such jobs constitute about 60% of transport jobs in the country (see Box 4) (Sustainlabour and Fundacion Biodiversidad, 2012). In view of its apparent benefits, job creation in green and healthy transport in the pan-European Region should be explored further.
Exploring uncharted land: contribution of the Transport, Health and Environment Pan-European Programme (THE PEP)
One of the reasons for creation of THE PEP in 2002 was to integrate environmental and health considerations into transport policy. THE PEP contributes to the development of a green economy by highlighting the links between transport, health and the environment and the need to take greater account of these interactions in policy-making. Currently, however, there is a lack of information on the economic dimension of this relation, particularly with regard to the number of jobs that might be generated by a greater focus on green and healthy transport. In order to strengthen the evidence base, THE PEP has launched a partnership on jobs in green and healthy transport (see Box 1).
This publication contributes to the partnership’s objectives by:
• presenting an overview of studies of the potential for the creation of jobs in green and healthy transport;
• analysing the potential for jobs in green and healthy transport in a scenario that provides policy-makers with a rough estimate of the magnitude of the potential; and
• identifying areas for further international collaboration and research.
This publication is based on a review of the relevant literature, which was prepared at the University of Oxford (Wu, 2013). The review was discussed at a consultation in October 2013, attended by representatives of United
3
Nations Economic Commission for Europe, the United Nations Environment Programme (UNEP), the Organisation for Economic Co-operation and Development (OECD), the International Labour Office (ILO), The European Environment Agency and WHO. This work is, however, only the beginning of a longer process. This publication and the review on which it is based focus on only a narrow range of jobs that might be considered to be associated with green and healthy transport. In particular, it focuses on jobs in public transport and the active modes (cycling and walking), as these are the areas that have been most neglected in the debate about green jobs and yet appear to have potential to contribute to job creation in the pan-European Region.
What is a job in green and healthy transport?A number of activities might be considered jobs in green and healthy transport. Box 2 illustrates the range of such jobs, which also include jobs for managing or reducing car use; jobs in the design, production and development of energy-efficient vehicles, including cars with lower emissions; and jobs associated with new transport services, such as car- and bicycle-sharing schemes. The review on which this publication is based went a step further by proposing a definition of a job in green and healthy transport (see Box 3).
Box 1. THE PEP’s partnership on jobs in green and healthy transport
The purpose of the partnership on jobs in green and healthy transport is to convene interested Member States, experts and policy-makers in the transport, environment and health sectors, to decide on a set of actions and joint projects in order to achieve the following goals.
• Stimulate a debate and shared understanding on what a job in green and healthy transport is by bringing environmental and health considerations into the discussion on the creation of green jobs.
• Document the wide experience in Europe and other parts of the world with new policies and approaches for creating jobs in green and healthy transport.
• Analyse the potential for greening “old” jobs and creating “new green” jobs in transport and mobility and assessing the qualitative and quantitative impacts of such approaches on the environment, health, transport and the economy.
• Share good practice and disseminate experiences, policies and approaches.
• Develop strategies and actions for stakeholders to implement Goal 1 of the Amsterdam Declaration (WHO Regional Office for Europe, 2009b) in order to promote green jobs in transport.
At the first meeting of the partnership in September 2011 in Astana, Kazakhstan, THE PEP introduced the programme and presented a few case studies to highlight the scope of jobs in green and healthy transport in the pan-European Region (WHO and United Nations Economic Commission for Europe, 2011).
4
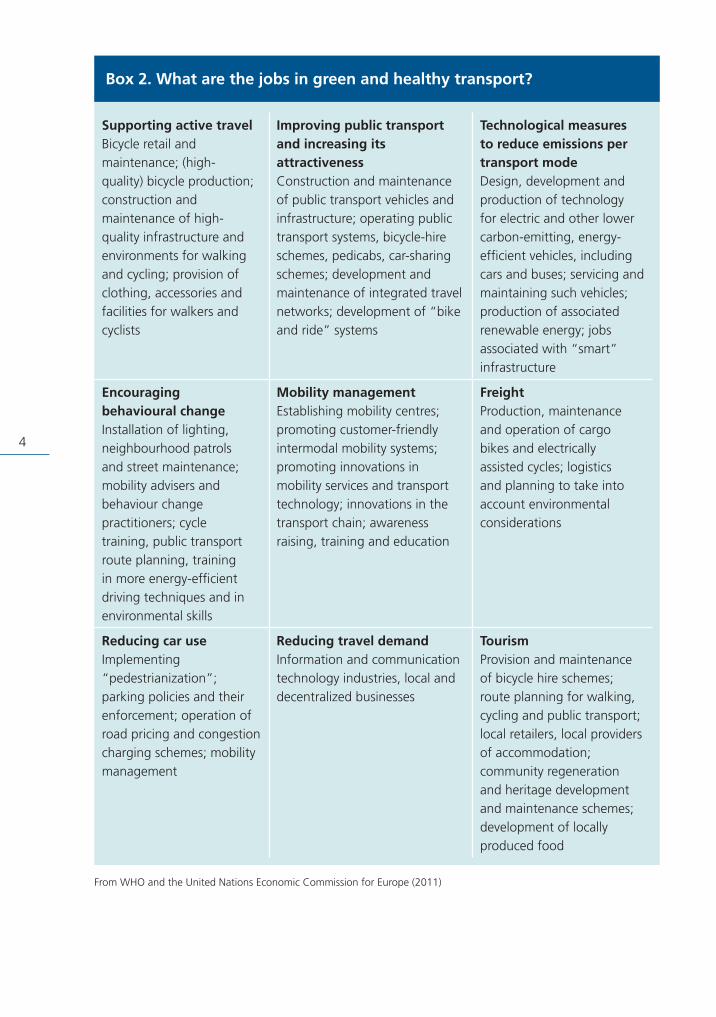
From WHO and the United Nations Economic Commission for Europe (2011)
Box 2. What are the jobs in green and healthy transport?
Supporting active travelBicycle retail and maintenance; (high-quality) bicycle production; construction and maintenance of high-quality infrastructure and environments for walking and cycling; provision of clothing, accessories and facilities for walkers and cyclists
Improving public transportand increasing its attractivenessConstruction and maintenance of public transport vehicles and infrastructure; operating public transport systems, bicycle-hire schemes, pedicabs, car-sharing schemes; development and maintenance of integrated travel networks; development of “bike and ride” systems
Technological measures to reduce emissions per transport modeDesign, development and production of technology for electric and other lower carbon-emitting, energy-efficient vehicles, including cars and buses; servicing and maintaining such vehicles; production of associated renewable energy; jobs associated with “smart” infrastructure
Encouraging behavioural changeInstallation of lighting, neighbourhood patrols and street maintenance; mobility advisers and behaviour change practitioners; cycle training, public transport route planning, training in more energy-efficient driving techniques and in environmental skills
Mobility managementEstablishing mobility centres; promoting customer-friendly intermodal mobility systems; promoting innovations in mobility services and transport technology; innovations in the transport chain; awareness raising, training and education
FreightProduction, maintenance and operation of cargo bikes and electrically assisted cycles; logistics and planning to take into account environmental considerations
Reducing car useImplementing “pedestrianization”; parking policies and their enforcement; operation of road pricing and congestion charging schemes; mobility management
Reducing travel demandInformation and communication technology industries, local and decentralized businesses
TourismProvision and maintenance of bicycle hire schemes; route planning for walking, cycling and public transport; local retailers, local providers of accommodation; community regeneration and heritage development and maintenance schemes; development of locally produced food
5
As with any policy, however, the jobs that might be created by measures to support public transport and active modes could have a negative impact on jobs in other sectors. For example, if a modal shift to public transport and active travel were to lead to a lower demand for cars, jobs in car manufacture and servicing could be lost. Nevertheless, jobs in car manufacture face various other pressures, including overcapacity in Europe and mechanization. These issues will have to be addressed by the industry anyway and are likely
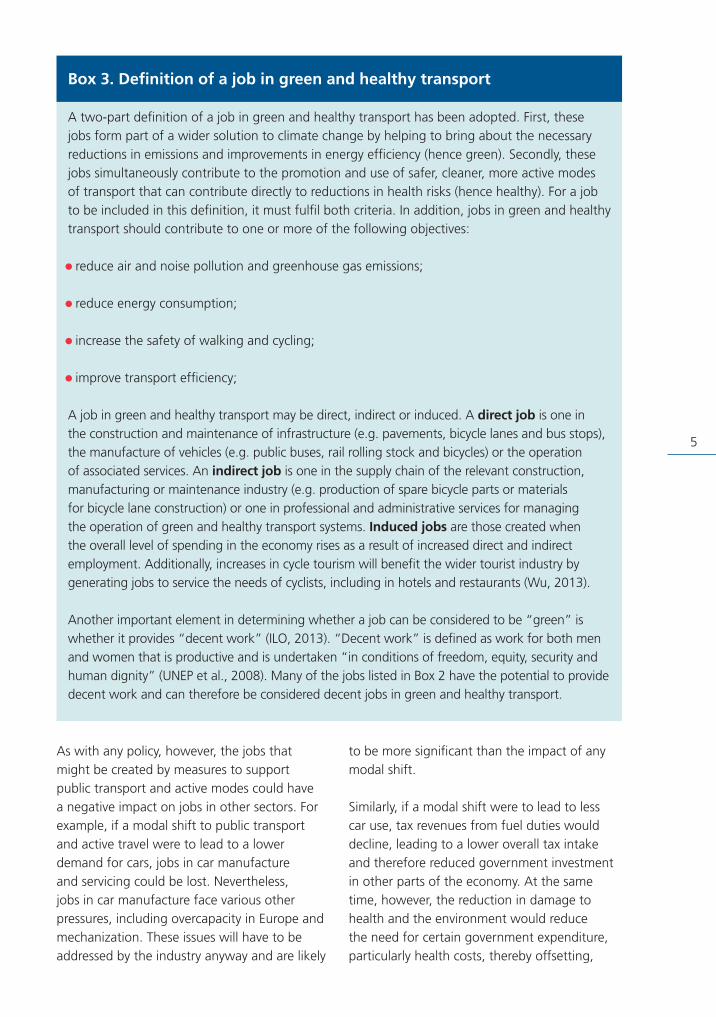
Box 3. Definition of a job in green and healthy transport
A two-part definition of a job in green and healthy transport has been adopted. First, these jobs form part of a wider solution to climate change by helping to bring about the necessary reductions in emissions and improvements in energy efficiency (hence green). Secondly, these jobs simultaneously contribute to the promotion and use of safer, cleaner, more active modes of transport that can contribute directly to reductions in health risks (hence healthy). For a job to be included in this definition, it must fulfil both criteria. In addition, jobs in green and healthy transport should contribute to one or more of the following objectives:
• reduce air and noise pollution and greenhouse gas emissions;
• reduce energy consumption;
• increase the safety of walking and cycling;
• improve transport efficiency;
A job in green and healthy transport may be direct, indirect or induced. A direct job is one in the construction and maintenance of infrastructure (e.g. pavements, bicycle lanes and bus stops), the manufacture of vehicles (e.g. public buses, rail rolling stock and bicycles) or the operation of associated services. An indirect job is one in the supply chain of the relevant construction, manufacturing or maintenance industry (e.g. production of spare bicycle parts or materials for bicycle lane construction) or one in professional and administrative services for managing the operation of green and healthy transport systems. Induced jobs are those created when the overall level of spending in the economy rises as a result of increased direct and indirect employment. Additionally, increases in cycle tourism will benefit the wider tourist industry by generating jobs to service the needs of cyclists, including in hotels and restaurants (Wu, 2013).
Another important element in determining whether a job can be considered to be “green” is whether it provides “decent work” (ILO, 2013). “Decent work” is defined as work for both men and women that is productive and is undertaken “in conditions of freedom, equity, security and human dignity” (UNEP et al., 2008). Many of the jobs listed in Box 2 have the potential to provide decent work and can therefore be considered decent jobs in green and healthy transport.
to be more significant than the impact of any modal shift.
Similarly, if a modal shift were to lead to less car use, tax revenues from fuel duties would decline, leading to a lower overall tax intake and therefore reduced government investment in other parts of the economy. At the same time, however, the reduction in damage to health and the environment would reduce the need for certain government expenditure, particularly health costs, thereby offsetting,
6
at least partially, any reduced income from taxation. Furthermore, as a result of improved vehicle efficiency and, in the medium-term, greater use of electric cars, national finance ministries will see a decline in taxes from fuel duties on petrol and diesel, irrespective of any modal shift away from car use. Hence, government finances will continue to face issues that are likely to have a greater impact than a modal shift. Several studies of such interactions have shown that investment in transport policies that benefit the environment, particularly in relation to climate change, will deliver net employment benefits. This is because public transport and the active modes are more labour-intensive, so the increase in jobs in green and healthy transport will more than make up for any job losses in industries associated with the car industry (Ebinger et al., 1998; Chateau et al., 2011; Doll et al., 2013).
Investment in green and healthy transport will also have benefits that are often not quantified and that indeed may be difficult to quantify. These include improvements in the quality and attractiveness of the urban environment and the health benefits associated with greater uptake of active transport. Further health benefits will come from reduced exposure to air pollution and noise and to road accident injuries, which in turn will reduce the costs to health services and those to employers resulting from days of absence from work.
There is significant potential for more jobs in green and healthy transport, as the modal share is often relatively low. Copenhagen, where 26% of all trips are undertaken by bicycle (City of Copenhagen, 2013), is an exception, as cycling represents a significantly lower proportion of trips in many other cities, e.g. 1% in Madrid, Sofia and Budapest, 2% in Athens and Ottawa and 3% in Paris (European Platform on Mobility Management, 2014).
There are many opportunities for job creation in public transport, cycling and walking. Jobs in public transportThe literature review showed that the public transport sector is a significant employer. In the United Kingdom, the Crossrail project is expected to employ up to 14 000 people in its construction and to create a further 1000 jobs for operation and maintenance of the line once it has been completed (Crossrail Ltd, 2011). When announcing an order for 600 new diesel hybrid buses, Transport for London emphasized that it would safeguard 220 jobs and create 50 new ones. More generally, investment in London’s transport network supports over 50 000 jobs within the United Kingdom supply chain (Transport for London, 2013).
A study conducted in Germany to estimate the potential increases in employment under various policy packages for transport concluded that increasing the modal share of public transport by 10% by 2030 would increase employment in the transport sector by 5.3%. The increase in employment due to measures to increase cycling and walking was estimated to be slightly smaller, at 4.2% (Doll et al., 2013).
Other studies have estimated the number of jobs in green and healthy transport more systematically. A study in Spain concluded that 290 000–565 000 jobs could be created in sustainable transport, depending on the definition used (see Box 4). A similar study in the United Kingdom estimated that the numbers of direct and indirect (i.e. supply chain) jobs associated with the rail, light rail, bus, coach and cycling industries was about 450 000 (Ekosgen, 2010). Comparison of this figure with the total number of transport jobs in the United Kingdom (European Commission,

7
2013) suggests that these jobs represent about 38% of all transport jobs in the country. The proportion of jobs in sustainable transport that were in cycling was 5%, which is similar to the figure for Spain (see Box 4).
Jobs in cycling and walkingA number of estimates have been made of jobs associated with cycling. In the United States of America (USA), over 1.1 million jobs are generated by cycling (Outdoor Industry Foundation, 2006). In Germany, there are
estimated to be 278 000 full-time jobs in the cycling industry, including in retail, tourism and infrastructure (Vivavelo and VSF, 2012). Other studies concluded that about 18 000 jobs were associated with cycling as a mode of transport in Austria and 33 000 in France (see boxes 5 and 6).
An important dimension of jobs in cycling is tourism, which engenders a large number of jobs (see boxes 5 and 6). Cycling tourism benefits wider local economies, as cyclists
Box 4. Jobs in green and healthy transport in Spain
There were an estimated 297 109 jobs in sustainable transport in Spain in 2008, which represented 33% of all transport jobs in the country (in comparison with the total number of transport jobs in Spain in 2010 (European Commission, 2011)). The breakdown of jobs in sustainable transport by category is shown in Fig. 1.
These figures are based on the actual number of jobs in the relevant industries according to the respective public authorities and organizations. They are supplemented by estimates of the number of indirect jobs, such as those in bus manufacture and public transport, including security and cleaning (Avilés Palacios et al., 2011).
Another report estimated that the number of direct and indirect jobs in sustainable transport in Spain was 565 000, representing 62% of the total number of transport jobs (in comparison with the total number of transport jobs in Spain in 2010 (23)). This higher number includes jobs in the manufacture of low-emission vehicles and in “efficient” infrastructure construction (Sustainlabour and Fundacion Biodiversidad, 2012).
Regulated parking
2%Bicycles
4%Car rental and car sharing 5%
Taxis 26%
Buses(including manufacture)
41%
Underground 5%
Railway 17%
Fig. 1. Estimated breakdown of jobs in “sustainable” transport in Spain
8
stay and eat locally, creating jobs in hotels and restaurants. Cycling (and hiking) tourism also supports the establishment of reception facilities, such as small hotels and bed-and-breakfast establishments, which may represent a useful supplement to the incomes of households in areas that attract cyclists. Touring cyclists are likely to spend more than motorized tourists locally, as cyclists tend to travel lighter, with, e.g. less food, and to use facilities away from main roads, and thus benefitting the local economy and jobs (Transform Scotland, 2013).
In a study in Canada, the number of jobs per household was estimated on the assumption that all of Canada had the same modal share of active transport as the city of Victoria, Vancouver. For cycling, this would mean an increase in the modal share from 1.2% to 4.8%, whereas the modal share of walking would rise to 10.4% from 6.6%. It was estimated that such increases nationally would generate 437 additional jobs per 100 000 households (Campbell and Wittgens, 2004).
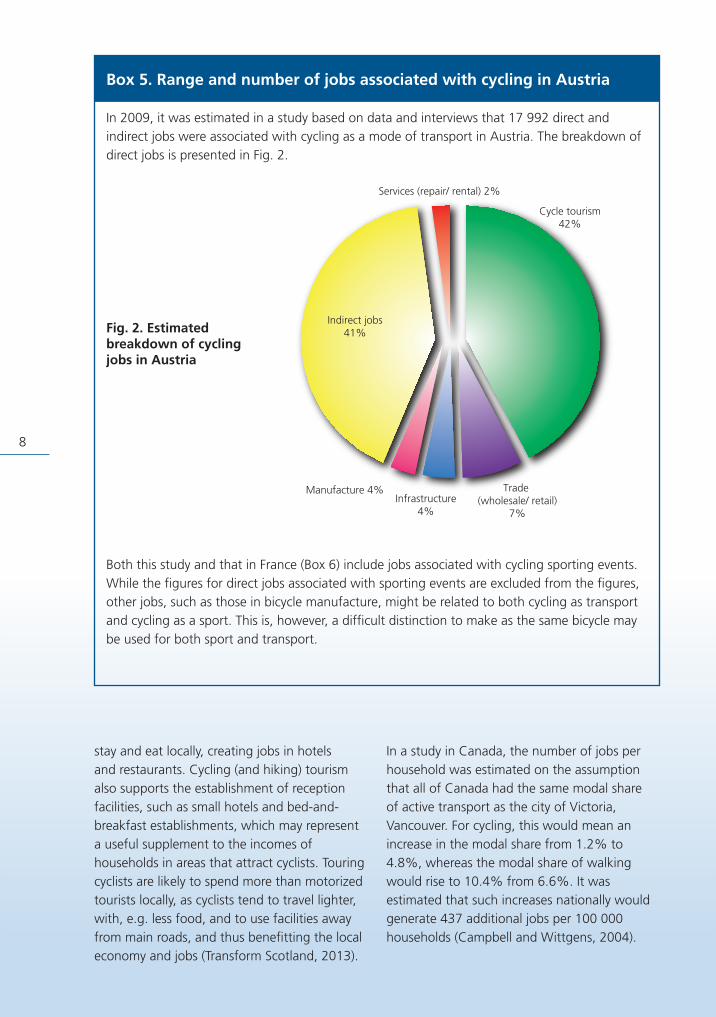
Box 5. Range and number of jobs associated with cycling in Austria
In 2009, it was estimated in a study based on data and interviews that 17 992 direct and indirect jobs were associated with cycling as a mode of transport in Austria. The breakdown of direct jobs is presented in Fig. 2.
Both this study and that in France (Box 6) include jobs associated with cycling sporting events. While the figures for direct jobs associated with sporting events are excluded from the figures, other jobs, such as those in bicycle manufacture, might be related to both cycling as transport and cycling as a sport. This is, however, a difficult distinction to make as the same bicycle may be used for both sport and transport.
Services (repair/ rental) 2%
Indirect jobs41%
Manufacture 4%Infrastructure
4%
Trade (wholesale/ retail)
7%
Cycle tourism42%
Non-commercial 7%
Services 5%
Manufacture9%
Infrastructure6%
Trade (wholesale/retail)
22%
Cycle tourism50%
Induced jobs 22%
Direct and indirect jobs
78%
Fig. 2. Estimated breakdown of cycling jobs in Austria
9
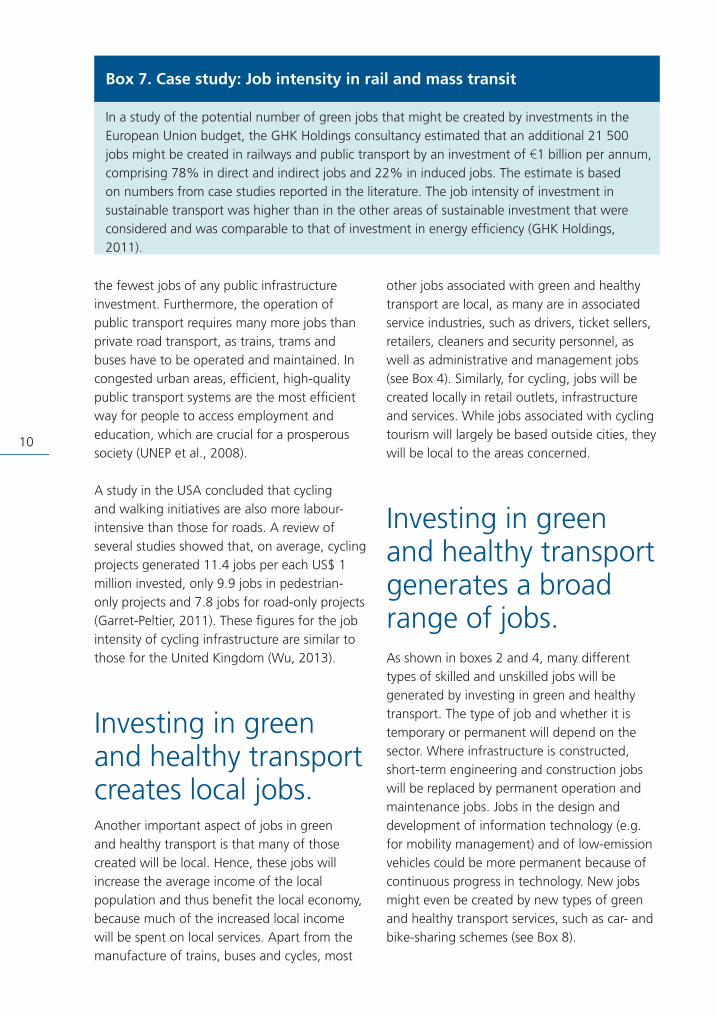
Investing in green and healthy transport generates more jobs than investing in roads.
A number of studies have estimated the “intensity” of jobs in green and healthy transport. In the USA, an estimated US$ 17.8 billion of capital investment and US$ 37.8 billion of spending on operations support two million public transport jobs (American Public Transport Association, 2012). An estimated 36 000 jobs are supported for 1 year by every US$ 1 billion of annual spending on
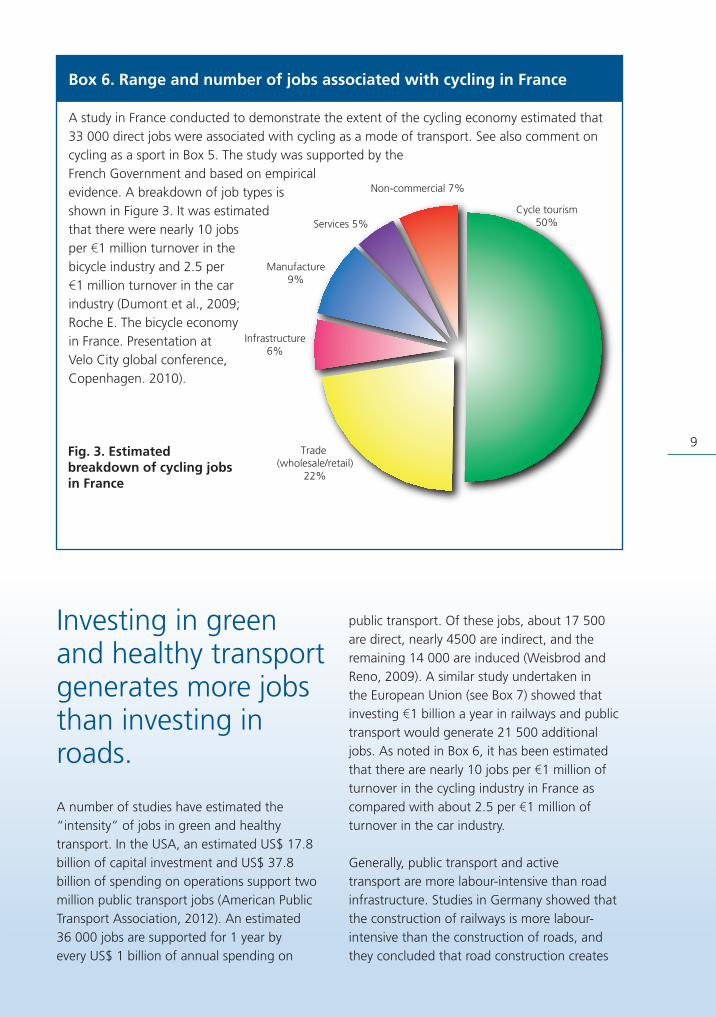
public transport. Of these jobs, about 17 500 are direct, nearly 4500 are indirect, and the remaining 14 000 are induced (Weisbrod and Reno, 2009). A similar study undertaken in the European Union (see Box 7) showed that investing €1 billion a year in railways and public transport would generate 21 500 additional jobs. As noted in Box 6, it has been estimated that there are nearly 10 jobs per €1 million of turnover in the cycling industry in France as compared with about 2.5 per €1 million of turnover in the car industry.
Generally, public transport and active transport are more labour-intensive than road infrastructure. Studies in Germany showed that the construction of railways is more labour-intensive than the construction of roads, and they concluded that road construction creates
Box 6. Range and number of jobs associated with cycling in France
A study in France conducted to demonstrate the extent of the cycling economy estimated that 33 000 direct jobs were associated with cycling as a mode of transport. See also comment on cycling as a sport in Box 5. The study was supported by the French Government and based on empirical evidence. A breakdown of job types is shown in Figure 3. It was estimated that there were nearly 10 jobs per €1 million turnover in the bicycle industry and 2.5 per €1 million turnover in the car industry (Dumont et al., 2009; Roche E. The bicycle economy in France. Presentation at Velo City global conference, Copenhagen. 2010).
Services (repair/ rental) 2%
Indirect jobs41%
Manufacture 4%Infrastructure
4%
Trade (wholesale/ retail)
7%
Cycle tourism42%
Non-commercial 7%
Services 5%
Manufacture9%
Infrastructure6%
Trade (wholesale/retail)
22%
Cycle tourism50%
Induced jobs 22%
Direct and indirect jobs
78%
Fig. 3. Estimated breakdown of cycling jobs in France
10
the fewest jobs of any public infrastructure investment. Furthermore, the operation of public transport requires many more jobs than private road transport, as trains, trams and buses have to be operated and maintained. In congested urban areas, efficient, high-quality public transport systems are the most efficient way for people to access employment and education, which are crucial for a prosperous society (UNEP et al., 2008).
A study in the USA concluded that cycling and walking initiatives are also more labour-intensive than those for roads. A review of several studies showed that, on average, cycling projects generated 11.4 jobs per each US$ 1 million invested, only 9.9 jobs in pedestrian-only projects and 7.8 jobs for road-only projects (Garret-Peltier, 2011). These figures for the job intensity of cycling infrastructure are similar to those for the United Kingdom (Wu, 2013).
Investing in green and healthy transport creates local jobs.Another important aspect of jobs in green and healthy transport is that many of those created will be local. Hence, these jobs will increase the average income of the local population and thus benefit the local economy, because much of the increased local income will be spent on local services. Apart from the manufacture of trains, buses and cycles, most
other jobs associated with green and healthy transport are local, as many are in associated service industries, such as drivers, ticket sellers, retailers, cleaners and security personnel, as well as administrative and management jobs (see Box 4). Similarly, for cycling, jobs will be created locally in retail outlets, infrastructure and services. While jobs associated with cycling tourism will largely be based outside cities, they will be local to the areas concerned.
Investing in green and healthy transport generates a broad range of jobs.As shown in boxes 2 and 4, many different types of skilled and unskilled jobs will be generated by investing in green and healthy transport. The type of job and whether it is temporary or permanent will depend on the sector. Where infrastructure is constructed, short-term engineering and construction jobs will be replaced by permanent operation and maintenance jobs. Jobs in the design and development of information technology (e.g. for mobility management) and of low-emission vehicles could be more permanent because of continuous progress in technology. New jobs might even be created by new types of green and healthy transport services, such as car- and bike-sharing schemes (see Box 8).
Box 7. Case study: Job intensity in rail and mass transit
In a study of the potential number of green jobs that might be created by investments in the European Union budget, the GHK Holdings consultancy estimated that an additional 21 500 jobs might be created in railways and public transport by an investment of €1 billion per annum, comprising 78% in direct and indirect jobs and 22% in induced jobs. The estimate is based on numbers from case studies reported in the literature. The job intensity of investment in sustainable transport was higher than in the other areas of sustainable investment that were considered and was comparable to that of investment in energy efficiency (GHK Holdings, 2011).
11
Identifying the true potential for jobs in green and healthy transport remains a challenge. As shown above, many estimates have been made of the number of jobs associated with green and healthy transport, and determining the true number is a challenge. Most of the figures quoted do not cover all the jobs that might be considered green and healthy (Box 2), are not based on the definition proposed in Box 3 or were obtained with a range of methods to meet a range of objectives. Even the two studies that gave estimates of the numbers of jobs in sustainable transport in their countries studied different types of jobs: the study in the United Kingdom covered direct and indirect jobs in the supply chains of these industries (Ekosgen, 2010), and the study in Spain covered a wider range of jobs, including those in administration and taxi and car rental services (see Box 4) (Avilés Palacios et al., 2011).
It was therefore not possible to determine either all current or all future potential jobs in green and healthy transport. As the information on
cycling was more consistent and comprehensive than that on public transport or walking, we estimated the potential number of additional jobs in green and healthy transport that might be generated from increased levels of investment in cycling.
Increasing cycling in selected cities to the same level as in Copenhagen could create 76 600 jobs.The Danish capital, Copenhagen, is a leader in cycling in the pan-European Region. A bicycle is used for 26% of all trips starting or ending in the City and for 36% of all trips to work or to educational institutions (City of Copenhagen, 2013). These proportions are much higher than those in most other cities in the pan-European Region, and Copenhagen is rivalled only by Amsterdam in the Netherlands (see Table 1). Hence, these two cities were considered for estimating potential job creation resulting from increased investment in cycling. As no information on the number of jobs associated with cycling in Amsterdam was found, however,
Box 8. New opportunities for creating jobs in cycling: bike-share schemes
One of the first large urban bike-sharing schemes was launched in Copenhagen in 1995; subsequently, many similar schemes have been set up around the world, such as in Barcelona, London and Paris. Not only large cities but also smaller cities in central and eastern Europe have set up such schemes, including Bucharest, Ljubljana, Prague, Tirana and Warsaw and, more recently, Moscow. Many of the newer schemes make use of “smart cards” or other types of information technology to facilitate use and to increase security.
From the perspective of job creation, these schemes typically generate 10–50 jobs, depending on the type and extent of the scheme. In larger cities, the number of jobs created can be over 200; e.g., in Barcelona, 230 people are employed (European Platform on Mobility Management, 2012), whereas the schemes in Paris and London have generated over 280 and 300 jobs, respectively (van den Noort, undated; Mayor of London, 2012).
12
whereas such information is available for Copenhagen, figures for the Danish capital were used.
The figure of 650 jobs associated with cycling in Copenhagen is nevertheless an underestimate, as it takes account only of jobs in bicycle shops, wholesale bicycle dealers and companies that design and sell bicycles and not other direct and indirect jobs, such as in bicycle rental, pedicabs or bicycle messenger companies or any induced jobs (City of Copenhagen, 2011).
To estimate the potential number of additional jobs that might be created in cycling in the pan-
European Region, we assumed that one major city in each country achieved the same cycling modal share as Copenhagen. The estimate was made by a simple method, with several assumptions with respect to the data used (see Annex). We estimated that, if the selected cities invested in cycling to attain the same modal share as in Copenhagen, an additional 76 600 jobs could be created.
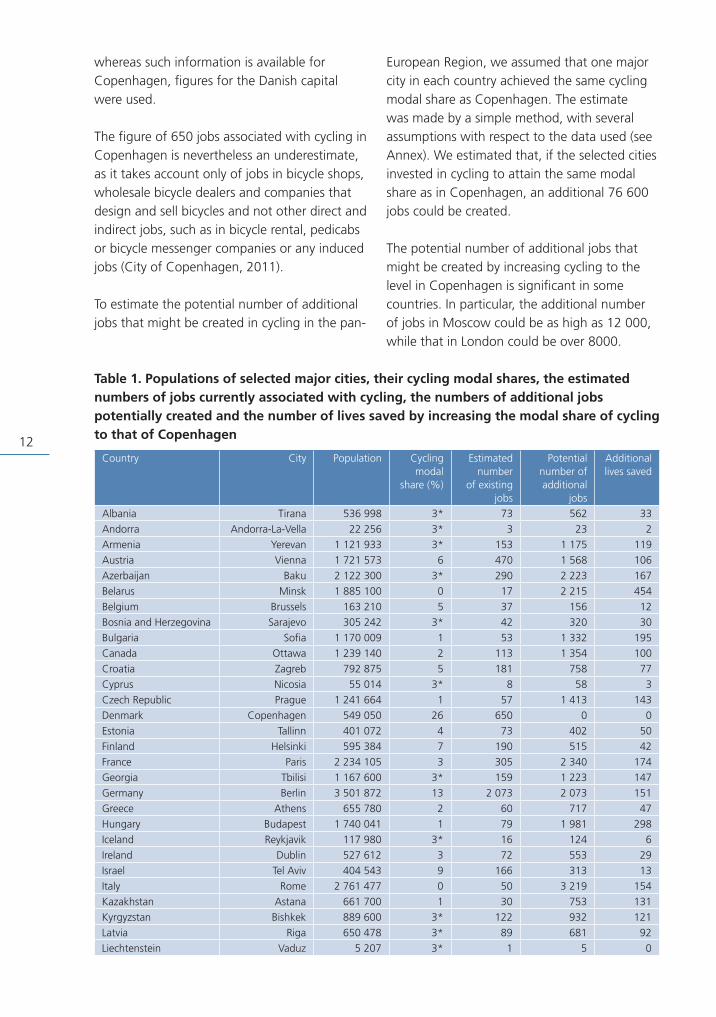
The potential number of additional jobs that might be created by increasing cycling to the level in Copenhagen is significant in some countries. In particular, the additional number of jobs in Moscow could be as high as 12 000, while that in London could be over 8000.
Country City Population Cycling modal
share (%)
Estimated number
of existing jobs
Potential number of additional
jobs
Additional lives saved
Albania Tirana 536 998 3* 73 562 33
Andorra Andorra-La-Vella 22 256 3* 3 23 2
Armenia Yerevan 1 121 933 3* 153 1 175 119
Austria Vienna 1 721 573 6 470 1 568 106
Azerbaijan Baku 2 122 300 3* 290 2 223 167
Belarus Minsk 1 885 100 0 17 2 215 454
Belgium Brussels 163 210 5 37 156 12
Bosnia and Herzegovina Sarajevo 305 242 3* 42 320 30
Bulgaria Sofia 1 170 009 1 53 1 332 195
Canada Ottawa 1 239 140 2 113 1 354 100
Croatia Zagreb 792 875 5 181 758 77
Cyprus Nicosia 55 014 3* 8 58 3
Czech Republic Prague 1 241 664 1 57 1 413 143
Denmark Copenhagen 549 050 26 650 0 0
Estonia Tallinn 401 072 4 73 402 50
Finland Helsinki 595 384 7 190 515 42
France Paris 2 234 105 3 305 2 340 174
Georgia Tbilisi 1 167 600 3* 159 1 223 147
Germany Berlin 3 501 872 13 2 073 2 073 151
Greece Athens 655 780 2 60 717 47
Hungary Budapest 1 740 041 1 79 1 981 298
Iceland Reykjavik 117 980 3* 16 124 6
Ireland Dublin 527 612 3 72 553 29
Israel Tel Aviv 404 543 9 166 313 13
Italy Rome 2 761 477 0 50 3 219 154
Kazakhstan Astana 661 700 1 30 753 131
Kyrgyzstan Bishkek 889 600 3* 122 932 121
Latvia Riga 650 478 3* 89 681 92
Liechtenstein Vaduz 5 207 3* 1 5 0
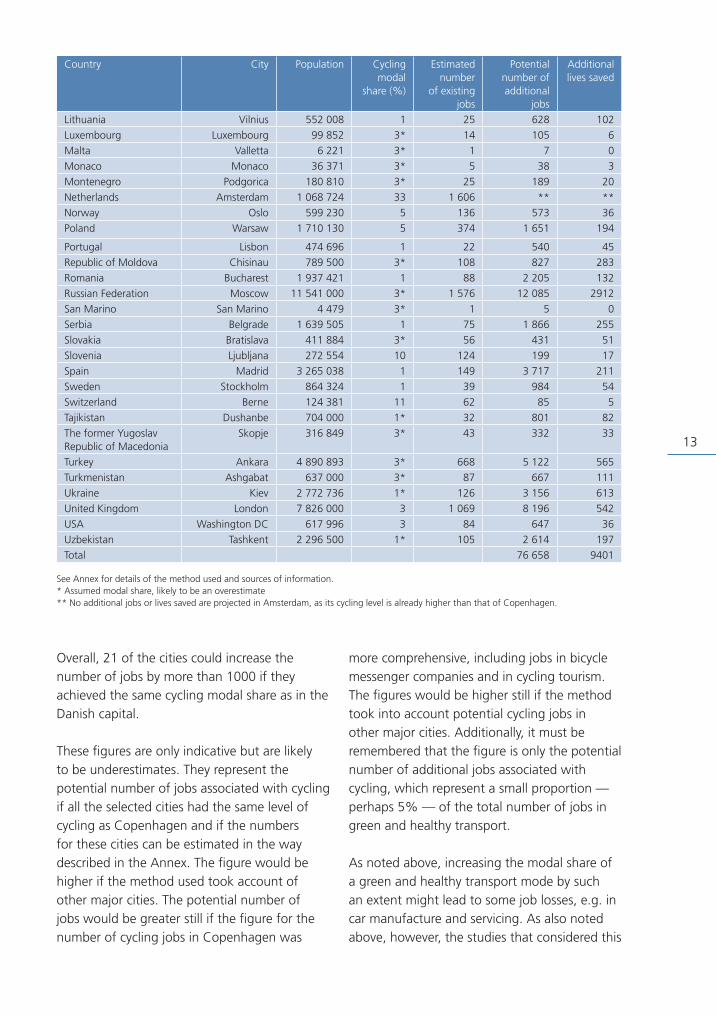
Table 1. Populations of selected major cities, their cycling modal shares, the estimated numbers of jobs currently associated with cycling, the numbers of additional jobs potentially created and the number of lives saved by increasing the modal share of cycling to that of Copenhagen
13
See Annex for details of the method used and sources of information.* Assumed modal share, likely to be an overestimate** No additional jobs or lives saved are projected in Amsterdam, as its cycling level is already higher than that of Copenhagen.
Country City Population Cycling modal
share (%)
Estimated number
of existing jobs
Potential number of additional
jobs
Additional lives saved
Lithuania Vilnius 552 008 1 25 628 102
Luxembourg Luxembourg 99 852 3* 14 105 6
Malta Valletta 6 221 3* 1 7 0
Monaco Monaco 36 371 3* 5 38 3
Montenegro Podgorica 180 810 3* 25 189 20
Netherlands Amsterdam 1 068 724 33 1 606 ** **
Norway Oslo 599 230 5 136 573 36
Poland Warsaw 1 710 130 5 374 1 651 194
Portugal Lisbon 474 696 1 22 540 45
Republic of Moldova Chisinau 789 500 3* 108 827 283
Romania Bucharest 1 937 421 1 88 2 205 132
Russian Federation Moscow 11 541 000 3* 1 576 12 085 2912
San Marino San Marino 4 479 3* 1 5 0
Serbia Belgrade 1 639 505 1 75 1 866 255
Slovakia Bratislava 411 884 3* 56 431 51
Slovenia Ljubljana 272 554 10 124 199 17
Spain Madrid 3 265 038 1 149 3 717 211
Sweden Stockholm 864 324 1 39 984 54
Switzerland Berne 124 381 11 62 85 5
Tajikistan Dushanbe 704 000 1* 32 801 82
The former Yugoslav Republic of Macedonia
Skopje 316 849 3* 43 332 33
Turkey Ankara 4 890 893 3* 668 5 122 565
Turkmenistan Ashgabat 637 000 3* 87 667 111
Ukraine Kiev 2 772 736 1* 126 3 156 613
United Kingdom London 7 826 000 3 1 069 8 196 542
USA Washington DC 617 996 3 84 647 36
Uzbekistan Tashkent 2 296 500 1* 105 2 614 197
Total 76 658 9401
Overall, 21 of the cities could increase the number of jobs by more than 1000 if they achieved the same cycling modal share as in the Danish capital.
These figures are only indicative but are likely to be underestimates. They represent the potential number of jobs associated with cycling if all the selected cities had the same level of cycling as Copenhagen and if the numbers for these cities can be estimated in the way described in the Annex. The figure would be higher if the method used took account of other major cities. The potential number of jobs would be greater still if the figure for the number of cycling jobs in Copenhagen was
more comprehensive, including jobs in bicycle messenger companies and in cycling tourism. The figures would be higher still if the method took into account potential cycling jobs in other major cities. Additionally, it must be remembered that the figure is only the potential number of additional jobs associated with cycling, which represent a small proportion — perhaps 5% — of the total number of jobs in green and healthy transport.
As noted above, increasing the modal share of a green and healthy transport mode by such an extent might lead to some job losses, e.g. in car manufacture and servicing. As also noted above, however, the studies that considered this
14
issue concluded that investment in green and healthy transport would result in a net benefit in terms of the number of jobs. This suggests that investment in cycling would have net benefits in terms of the number of jobs. In view of the many reasons why the estimated number of potential jobs associated with cycling might be an underestimate, it can be concluded that the potential number of jobs created by investing in green and healthy transport in the pan-European Region is probably much higher than 76 600.
If all the selected cities had the same level of cycling as Copenhagen, 9400 premature deaths could be avoided each year.
Thus, increasing the modal share of cycling would result in a wide range of benefits for public health and the environment, in addition to a potential increase in the number of jobs. Estimating the potential environmental and health benefits of increasing the modal share of cycling can be challenging; however, the health economic assessment tool (HEAT) prepared by WHO was designed to estimate the health benefits associated with changes in the levels of cycling and walking (WHO Regional Office for Europe, 2011). On the basis of the increases in the numbers of people who cycle implied in Table 1, the HEAT tool estimated that about 9400 deaths could be avoided each year in the 56 selected cities by increasing the modal share of cycling to that of Copenhagen. Like the potential additional number of jobs that could be created by increasing the modal share of cycling, the figure for avoided deaths would be higher if the method covered more of the major cities in the region.
Thus, a significant number of deaths could be avoided each year in the selected cities of the pan-European Region. For example, it has been estimated that compliance with WHO’s air quality guidelines for 2.5-µm particulate matter in 25 cities in the European Union (including several capitals) would avoid 19 000 premature deaths each year by 2027 (Institut de Veille Sanitaire, 2012). Similarly, an assessment of possible amendments to the European Directive on tobacco products showed that, if the indirect costs of tobacco use were passed on to tobacco manufacturers, 45 000 smoking-related deaths could be avoided per year by 2027 (RAND Europe, 2010). While it is difficult to compare such figures directly, as different methods were used and the coverage of the studies differed, these examples indicate that the health benefits of increasing the levels of cycling to those considered in this publication could be of a similar order of magnitude to those of other public health policies.
Multiple social benefits could be derived by unlocking the job creation potential of public transport, cycling and walking.
Promotion of public and active modes of transport, particularly in urban areas, is increasingly recognized as important to improve the environmental performance of transport. Consideration of the economic benefits of such policies, however, particularly in terms of the potential new jobs, has begun only recently. The partnership on jobs in green and healthy transport under THE PEP seeks to increase understanding of the potential of investment to generate jobs in green and healthy transport.
15
Many activities might be considered to be jobs in green and healthy transport, including many indirect jobs in the supply chains that support such transport.
Sufficient evidence indicates that the green and healthy transport sector could be a significant employer and contributor to the green economy. The evidence on the potential number of jobs and the additional jobs that might be created by investment in public transport, cycling and walking is not, however, consistent or comprehensive. As the figures for cycling were considered to be the most comprehensive, consistent and transparent, we decided to estimate the potential number of additional jobs that might be generated if one major city in each country of the pan-European region achieved the same modal share of cycling as one of the leading cycling cities, the Danish capital Copenhagen. Using a simple method, we estimated that about 76 600 jobs could be created if all the selected cities achieved the same modal share for cycling as Copenhagen, i.e. 26%. In 21 of the cities, the number of jobs could be increased by more than 1000.
These jobs are, however, only part of the potential number of decent jobs that might be created in green and healthy transport, for several reasons. First, the figure is based only on some direct and indirect jobs associated with cycling and therefore does not capture all direct and indirect jobs or induced jobs that might also be created, including those associated with cycling tourism. Secondly, the estimate assumes that such cycling levels are achieved in only one major city in each country of the pan-European Region, whereas more jobs associated with cycling might be created in other major cities. Thirdly, the figure covers only jobs that might be generated by achieving Copenhagen’s current modal share of cycling, whereas the City authorities plan to increase its cycling rates further7 (City of Copenhagen, 2013), which
7 They plan to increase the proportion of trips to work and educational institutions undertaken by bicycle from its current level of 36% to 50%.
16
is likely to create additional jobs. Fourthly, as seen in Box 4, the proportion of jobs in green and healthy transport associated with cycling is small (perhaps 5%). Although public transport has a much higher modal share than cycling in many urban areas, further investment will create even more jobs, perhaps in the order of 21 500 per €1 billion spent (see Box 7). If the number of all potential decent jobs in green and healthy transport (Box 2) was determined, the number of jobs created by investment in the respective modes would probably be much higher.
The jobs created have the added benefit that they will be local, as people will be required to manage, operate and maintain vehicles and the wider transport system. In turn, the creation of additional green and healthy jobs will benefit the local economy, as increased local income will be spent on other local services. A wide variety of skilled and unskilled jobs will also be needed in both urban and rural areas if cycling tourism is encouraged. Investment in public transport, cycling and walking will create more jobs than investment of similar amounts of money in roads.
In addition to the benefits for employment, increasing the number of people cycling to the levels implied in this publication would also potentially have significant benefits for public health. WHO’s HEAT tool was used to estimate that about 10 000 deaths could be avoided each year in the 56 selected cities by increasing the modal share of cycling to that of Copenhagen. This number is of a similar order of magnitude to that for the potential number of deaths avoided by other public health policies.
In urban areas in particular, there are many opportunities to increase the use of public transport and the active modes and thus create jobs and deliver a wide range of economic benefits. In Europe, half of all car journeys are shorter than 5 km, and over 30% are shorter than 3 km. As many of these journeys are in urban areas, they could easily be made by public transport, cycling or walking. Such distances would take 15–20 min to cover by bicycle and 30–50 min at a brisk walking pace. Increasing use of electric bicycles would further reduce the time required for such journeys (WHO Regional Office for Europe, 2006; European Environment Agency, 2013).
17
Although more research is needed, there is sufficient evidence to take action now.This publication presents estimates of the current number of jobs in green and healthy transport and an indication of the potential additional number of jobs that might be created by increasing investment in cycling. There are, however, significant data gaps, and more work should be conducted to determine the actual numbers of decent jobs by taking a consistent, coherent approach and defining and using a common method, including definitions. It might also be useful to define an indicator to measure the potential benefits of investment in green and healthy transport.
Although additional work is required to better understand the scope and potential of investing in decent jobs in green and healthy transport, this should not obviate short-term investment in such jobs. The evidence collated so far shows clear benefits of investing in jobs in green and healthy transport. In urban areas in particular, use of public transport and active modes could be increased. The provision and quality of transport infrastructure are crucial, including that for the active modes according to the density of development (European Environment Agency, 2013).
Investment in green and healthy transport will also help to address a number of other policy challenges. It will improve the environment and health of local populations, not only by reducing the adverse health impacts of transport but also by increasing physical activity and thus reducing health service costs. It will also improve the efficiency of urban transport and thus reduce congestion and benefit local economies. Consequently, increasing investment in public transport and active modes
of transport is a vital step along the path to a green economy.
ReferencesAmerican Public Transportation Association (2012). 2012 public transportation fact book, 63rd ed. Washington DC.
Avilés Palacios C, Buedía García L, Cuena Barron L, Estrada López B, Fradera Tejedor N, Homedes Vilàs E, et al. (2011). Job generation in the sector of collective transport within the scope of sustainable mobility. Valencia: Instituto Sindical de Trabajo, Ambiente y Salud.
Campbell R, Wittgens M (2004). The business case for active transportation: The economic benefits of walking and cycling. Gloucester, Ontario: Go for Green.
CE Delft, INFRAS, Frauenhofer Institute (2011). External costs of transport in Europe. Delft: CE Delft.
Chateau J, Saint-Martin A, Manfredi T (2011). Employment impacts of climate change mitigation policies in OECD: A general-equilibrium perspective. Paris: OECD (OECD Environment Working Papers, No. 32).
City of Copenhagen (2011). Copenhagen, city of cyclists: Bicycle account 2010. Copenhagen.
City of Copenhagen (2013). Copenhagen, city of cyclists: Bicycle account 2012. Copenhagen.
Crossrail Ltd (2011). Crossrail business case update: Summary report. London.
Doll C, Hartwig J, Senger F, Schade W, Maibach M, Sutter D, et al. (2013). Economic aspects of non-technical measures to reduce traffic emissions. Dessau-Roßlau: Federal Environment Agency (Umweltbundesamt).
Dumont M, Mercat N, Baholet S, Giraud H (2009). Économie du vélo (The economics of
18
cycling). Grand Angle; Special edition No. 6, June.
Ebinger F, Cames M, Herold A, Ilgemann U, Loose W, Lüers A (1998). Chief benefits for the future: New jobs created with environmentally-compatible traffic. Freiburg: Öko-Institut.
Ekosgen (2010). Employment in the sustainable transport sector. Report for Passenger Transport Executive Group, Campaign for Better Transport and Sustrans, Manchester.
European Commission (2011). EU transport in figures: Statistical pocketbook 2011. Luxembourg: Publications Office of the European Union.
European Commission (2013). EU Transport in figures: Statistical pocketbook 2013. Luxembourg: Publications Office of the European Union.
European Environment Agency (2012). The contribution of transport to air quality — TERM 2012. Luxembourg: Publications Office of the European Union (European Environment Agency Report, No. 10/2012).
European Environment Agency (2013). A closer look at urban transport — TERM 2013: Transport indicators tracking progress towards environmental targets in Europe. Luxembourg: Publications Office of the European Union (European Environment Agency Report, No. 11/2013).
European Platform on Mobility Management (2012). Bike sharing, e-update. Brussels.
European Platform on Mobility Management (2014). TEMS—The EPOMM modal split tool. Brussels (www.epomm.eu/tems/index.phtml, accessed 13 January 2014).
Garret-Peltier H (2011). Pedestrian and bicycle infrastructure: A national study of employment impacts. Amherst, Massachusetts: Political
Economy Research Institute, University of Massachusetts.
GHK (2011). Evaluating the potential for green jobs in the next multi-annual financial framework. London (Report for Birdlife International, CEE Bankwatch network, Friends of the Earth Europe, Transport and Environment and WWF).
Institut National de Veille Sanitaire (2012). Main results of the Aphekom project. Saint Maurice (http://www.aphekom.org/c/document_library/get_file?uuid=54c0a465-229e-4017-ab67-1b20c3bfc2e2&groupId=10347, accessed 19 February 2014).
International Labour Office (2013). Green jobs becoming a reality: Progress and outlook 2013. Geneva.
Mayor of London (2012). Major expansion of Mayor’s cycle hire scheme goes live, press release. London.
van den Noort PJ (undated). 33 questions & answers to learn everything there is to know about Vélib’ the public bicycle in Paris. Amsterdam: Vélo Mondial (http://c0133251.cdn.cloudfiles.rackspacecloud.com/Case%20Study%20-%20Bike%20Sharing%20Velib%20SF.pdf, accessed 5 March 2014)
Outdoor Industry Foundation (2006). The active outdoor recreation economy. Boulder, Colorado.
RAND Europe (2010). Assessing the impacts of revising the tobacco products Directive, report to European Commission DG Health and Consumer Protection. Cambridge.
Sustainlabour, Fundacion Biodiversidad (2010). Green jobs for sustainable development: A case study for Spain. Madrid: Paralelo Edicion SA.
Transform Scotland (2013). The value of cycle tourism — Opportunities for the Scottish economy. Edinburgh.
19
Transport for London (2013). Mayor heads to Northern Ireland to meet bus workers who benefit from Capital’s investment; press release. London.
UNEP, ILO, International Organization of Employers, International Trade Union Confederation (2008). Green jobs: Towards decent work in a sustainable, low-carbon world. Nairobi, UNEP.
Vivavelo, VSF (2012). Die wirtschaftliche Bedeutung der Fahrradwirtschaft in Deutschland (The economic importance the bicycle industry in Germany), press release. Aurich.
Weisbrod G, Reno A (2009). Economic impact of public transportation investment. Washington DC: American Public Transportation Association.
WHO (2009). Global health risks: Mortality and burden of disease attributable to selected major risks. Geneva (http://www.who.int/healthinfo/global_burden_disease/GlobalHealthRisks_report_full.pdf).
WHO (2011). Health in the green economy: Health co-benefits of climate change mitigation—Transport sector. Geneva (http://extranet.who.int/iris/restricted/bitstream/10665/70913/1/9789241502917_eng.pdf).
WHO Regional Office for Europe (2006). Promoting physical activity and active living in urban environments. Copenhagen.
WHO Regional Office for Europe (2009a). European status report on road safety: Towards safer roads and healthier transport choices. Copenhagen (http://www.euro.who.int/__data/assets/pdf_file/0015/43314/E92789.pdf, accessed 14 January 2014).
WHO Regional Office for Europe (2009b). Amsterdam Declaration. Making THE link: transport choices for our health, environment and prosperity. Copenhagen (http://www.euro.who.int/en/health-topics/environment-and-health/Transport-and-health/publications/2009/amsterdam-declaration, accessed 14 March 2014).
WHO Regional Office for Europe (2011). Health economic assessment tools (HEAT) for cycling. Copenhagen (http://www.heatwalkingcycling.org/, accessed 19 February 2014).
WHO Regional Office for Europe (2012). Environmental health inequalities in Europe. Copenhagen.
WHO Regional Office for Europe (2013). Review of evidence on health aspects of air pollution—REVIHAAP Project. Copenhagen (http://www.euro.who.int/__data/assets/pdf_file/0004/193108/REVIHAAP-Final-technical-report-final-version.pdf, accessed 14 January 2014).
WHO Regional Office for Europe, United Nations Economic Commission for Europe (2011). Green and healthy jobs in transport: Launching a new partnership under THE PEP. Copenhagen: WHO Regional Office for Europe.
Woodcock J, Edwards P, Tonne C, Armstrong BG, Ashiru O, Banister D et al. (2009). Public health benefits of strategies to reduce greenhouse-gas emissions: Urban land transport. Lancet.374:1930–43.
Wu D (2013). Jobs in green and healthy transport: Strengthening the economic case for environment-friendly and health-promoting transport polices. A scoping study on the potential for job creation through green and healthy transport. Oxford: Nuffield Department of Population Health.
20
Annex. Methodological aspects
Overview of the methodThe number of additional jobs that might be created if one major city in each country of the pan-European Region had the same cycling modal share as Copenhagen, i.e. 26% of all trips (City of Copenhagen, 2013), was estimated by a simple extrapolation and a simple statistical method based on a comparison of the populations of the cities with that of Copenhagen and the proportion by which the respective modal shares of cycling would have to increase to reach the share of Copenhagen.
For example, the City of Copenhagen has estimated that the number of jobs associated with cycling in the City is 650 (City of Copenhagen, 2011). As the population of Berlin is about 6.4 times that of Copenhagen (United Nations Economic Commission for Europe, 2013), it could be expected to have about 6.4 times as many cycling jobs, i.e. 4146, if it had the same cycling modal share as Copenhagen. The modal share in Berlin is 13% (European Platform on Mobility Management, 2014), half that of Copenhagen; hence, about half the potential 4146 cycling jobs in Berlin probably exist, so that an additional 2073 jobs would be created if Berlin were to increase its cycling modal share to that of Copenhagen.
It must be emphasized that the extrapolation method used is simple. It is based on the assumption that the potential number of additional jobs can be increased on the basis of both population and the increase in modal share that the cities require to reach the level of Copenhagen. In practice, the number of additional jobs in cycling and a city’s potential for cycling depend on many other factors, including wider policies, the current modal split between active mobility, public transport and
private car use and the city’s size, climate and topography.
The numbers of additional lives saved by increased levels of cycling in each city were calculated with the WHO health economic assessment tool (HEAT) for cycling (WHO Regional Office for Europe, 2011). The difference between two steady-state assessments — with each city’s current modal share of cycling and with the Copenhagen modal share of cycling — was calculated on the basis of the average cycled distance per day in Copenhagen, i.e. 8.4 km (City of Copenhagen, 2011).
Data sources and issuesThe extrapolation required three sets of data: information on jobs associated with cycling in Copenhagen; a recent figure for the modal share of cycling in one major city in each country of the pan-European Region; and the population of each of the cities.
Information on the number of jobs associated with cycling in Copenhagen was taken from a report by Copenhagen City authorities in 2011 (City of Copenhagen, 2011), which did not include all direct and indirect jobs or induced jobs. The authorities confirmed in a personal communication that they had no more recent or comprehensive information on jobs associated with cycling in the city.
Information on cities’ cycling modal share was obtained from various sources. The initial focus was on the capital cities of the pan-European Region. The modal split website of the European Platform on Mobility Management (2014) provided data for 19 capital cities. Information for another 13 capital cities was obtained from various sources, including the Belarussian Association of Experts and Surveyors Transport Scientific and Production Private Unitary Enterprise (2011), the Dutch Cycling Embassy (2012), the European Environment Agency and The United Nations Environment Programme (UNEP) (2007), the European Metropolitan Transport Authorities (2012),
21
Grabow et al. (2012), the Land Transport Authority Academy (2011), Spicycles (2009) and the Urban Planning Institute of Slovenia (2013). For three capital cities — Dushanbe, Kiev and Tashkent — a modal share of 1% was assumed, as the sources suggested almost no cycle use in these cities (Siemens, 2009; Government of the Republic of Tajikistan et al., 2010; Akimov and Banister, 2011). Together, this information covered 65% of the total population of the capital cities of the pan-European R egion, but
data were still missing for 24 countries. For capital cities for which data were not available, data for another major city in the country were used, when available (Abramov, 2013). For the remaining countries, i.e. those for which no information was available for the capital or another major city, a low modal share of 3% was assumed for its capital. This is probably an overestimate, as only about one fourth of the cities for which information was identified had cycling modal shares greater than this.
The populations of the selected cities were taken from United Nations sources, those of the capital cities were taken from United Nations Economic Commission for Europe (2013), and those of other major cities were taken from a United Nations database (United Nations, 2014).
As the data on modal shares were obtained from a variety of sources, their compatibility was difficult to ascertain. The figures correspond to different years and were estimated for various purposes with different methods. Additionally, as mentioned above, percentages had to be assumed for a number of capital cities; however, for many of the capitals for which the cycling modal share was assumed, it was reported anecdotally that cycling levels were relatively low. It was clear, however, the modal share of cycling in many cities was nowhere near that in Copenhagen. It could therefore be expected that additional jobs would be created if cycling in other cities increased to that of the Danish capital.
For the calculations with HEAT, a number of assumptions had to be made. The input data were either the default value provided by HEAT for the number of days cycled per year (124) or data obtained from WHO or national databases (mortality rates, population aged 20–64 years). Mortality rates and age distributions in the cities were assumed to be the same as the national figures; when national data was missing, regional averages were used.
22
References
Abramov R (2013). Tel Aviv is on the bike! MOVE—The CIVITAS Initiative Quarterly Newsletter, June (http://www.civitas.eu/sites/default/files/documents/file/civitas_move_14.pdf, accessed 22 January 2014).
Akimov A, Banister D (2011). Urban transport post-communist transport: The case of Tashkent, Uzbekistan. Canberra: Australian National University (http://cais.anu.edu.au/sites/default/files/Akimov_Banister-Urban%20transport.pdf, accessed 13 January 2014).
Belarussian Association of Experts and Surveyors Transport Scientific and Production Private Unitary Enterprise (2011). The concept of the urban system cycling in Minsk (in Russian). Minsk (http://bike.org.by/sites/bike.org.by/files/documents/2011/06/minsk_bike_concept-2010.pdf, accessed 13 January 2014).
Dutch Cycling Embassy (2012). Dutch Cycling Embassy work visit to Astana. Utrecht (http://www.dutchcycling.nl/library/file/Final%20Report%20work%20visit%20Astana%20may%202012.pdf, accessed 13 January 2014).
City of Copenhagen (2011). Copenhagen, city of cyclists: Bicycle account 2010. Copenhagen.
City of Copenhagen (2013). Copenhagen, city of cyclists: Bicycle account 2012. Copenhagen.
European Environment Agency, UNEP (2007). Sustainable consumption and production in south east Europe and eastern Europe, Caucasus and Central Asia: Joint UNEP-EEA report on the opportunities and lessons learned. Geneva: UNEP (http://www.unep.ch/scoe/documents/SCP_report_final_October_2007.pdf, accessed 13 January 2014).
European Metropolitan Transport Authorities (2012). EMTA barometer of public transport in European metropolitan areas (2009). Paris (http://www.emta.com/IMG/pdf/barometer_
report_2012_data_2009_.pdf, accessed 13 January 2014).
European Platform on Mobility Management (2014). TEMS — The EPOMM modal split tool. Brussels (www.epomm.eu/tems/index.phtml, accessed 13 January 2014).
Government of the Republic of Tajikistan, GEF and UNDP (2010). Support to sustainable transport management in Dushanbe — UNDP-GEF medium-sized project. Vienna: United Nations Development Programme (http://www.undp.org/content/dam/tajikistan/docs/projects/environment_and_sustainable_development/00057057_ProDoc_PID%2000070334_Transport%20management_eng.pdf, accessed 13 January 2014).
Grabow M, Spak SN, Holloway T, Stone B Jr, Mednick AC, Patz JA (2012). Air quality and exercise-related health benefits from reduced car travel in the midwestern United States. Environ Health Perspect. 120:68–76.
Land Transport Authority Academy (2011). Journeys: sharing urban transport solutions. Singapore (http://ltaacademy.lta.gov.sg/doc/JOURNEYS_Nov2011.pdf, accessed 13 January 2014).
Siemens (2009). City portrait: Kiev. Munich (http://www.siemens.com/entry/cc/features/greencityindex_international/all/en/pdf/kiew.pdf, accessed 13 January 2014).
Spicycles (2009). Cycling on the rise: public bicycles and other European experiences. Brussels: European Union (http://spicycles.velo.info/Portals/0/Deliverables/SpicyclesFinal_Booklet_small.pdf, accessed 13 January 2014).
United Nations Economic Commission for Europe (2013). UNECE countries in figures. Geneva.

23
United Nations (2014). UN data — A world of information. New York (http://data.un.org/Data.aspx?d=POP&f=tableCode%3A240, accessed 22 January 2014).
Urban Planning Institute of the Republic of Slovenia (2013). Mid-term evaluation of the GEF/UNDP project Support to the sustainable transport in the city of Belgrade. Ljubljana (http://erc.undp.org/evaluationadmin/manageevaluation/viewevaluationdetail.html?evalid=5288, accessed 13 January 2014).
World Health OrganizationRegional Office for Europe
UN City, Marmorvej 51, DK-2100 Copenhagen Ø, DenmarkTel.: +45 45 33 70 00. Fax: +45 45 33 70 01.
E-mail: [email protected]. Web site: www.euro.who.int
The WHO Regional Office for Europe
The World Health Organization (WHO) is a specialized agency of the United Nations created in 1948 with the primary responsibility for international health matters and public health. The WHO Regional Office for Europe is one of six regional offices throughout the world, each with its own programme geared to the particular health conditions of the countries it serves.
Member StatesAlbaniaAndorraArmeniaAustriaAzerbaijanBelarusBelgiumBosnia and HerzegovinaBulgariaCroatiaCyprusCzech RepublicDenmarkEstoniaFinlandFranceGeorgiaGermanyGreeceHungaryIcelandIrelandIsraelItalyKazakhstanKyrgyzstanLatviaLithuaniaLuxembourgMaltaMonacoMontenegroNetherlandsNorwayPolandPortugalRepublic of MoldovaRomaniaRussian Federation San MarinoSerbiaSlovakiaSloveniaSpainSwedenSwitzerlandTajikistanThe former Yugoslav Republic of MacedoniaTurkeyTurkmenistanUkraineUnited KingdomUzbekistan
Original: English
9 789289 050203 >
ISBN 978-9-289-05020-3