The Enhanced Transitional Jobs Demonstration
536
The Enhanced Transitional Jobs Demonstration Implementation and Early Impacts of the Next Generation of Subsidized Employment Programs Authors: Cindy Redcross Bret Barden Dan Bloom Atlanta: Joseph Broadus, Jennifer Thompson, Sonya Williams Milwaukee: Sam Elkin, Randall Juras, Janaé Bonsu San Francisco: Ada Tso, Bret Barden, Barbara Fink Syracuse: Whitney Engstrom, Johanna Walter, Gary Reynolds Fort Worth: Mary Farrell, Cindy Redcross Indiana: Karen Gardiner, Randall Juras, Arielle Sherman New York City: Melanie Skemer, Yana Kusayeva, Sara Muller-Ravett November 2016
-
Upload
khangminh22 -
Category
Documents
-
view
0 -
download
0
Transcript of The Enhanced Transitional Jobs Demonstration

The Enhanced Transitional Jobs Demonstration
Implementation and Early Impacts of the Next Generation of Subsidized Employment Programs
Authors:
Cindy Redcross Bret Barden Dan Bloom
Atlanta: Joseph Broadus, Jennifer Thompson, Sonya Williams
Milwaukee: Sam Elkin, Randall Juras, Janaé Bonsu
San Francisco: Ada Tso, Bret Barden, Barbara Fink
Syracuse: Whitney Engstrom, Johanna Walter, Gary Reynolds
Fort Worth: Mary Farrell, Cindy Redcross
Indiana: Karen Gardiner, Randall Juras, Arielle Sherman
New York City: Melanie Skemer, Yana Kusayeva, Sara Muller-Ravett
November 2016

The work in this publication was performed under Contract No. GS-10F-0245N awarded by the U.S. Department of Labor (DOL). Work in Chapters 2 and 4 was performed under Contract No. HHSP23320100029YC awarded by the U.S. Department of Health and Human Services (HHS). The content of this publication does not necessarily reflect the views or policies of DOL or HHS, nor does mention of trade names, commercial practices, or organizations imply endorsement by the U.S. government.

iii
Overview
Policymakers and practitioners have long searched for program models that can improve employ-ment outcomes for adults who are considered “hard to employ.” Transitional jobs programs offer temporary subsidized jobs that aim to teach participants basic work skills or help them get a foot in the door with an employer; they also help participants address personal issues and find unsubsidized jobs. Several transitional jobs programs have been evaluated, with mixed results.
The Enhanced Transitional Jobs Demonstration (ETJD), funded by the Employment and Training Administration of the U.S. Department of Labor, is testing seven transitional jobs programs that targeted people recently released from prison or unemployed parents who had fallen behind in child support payments. The ETJD programs were “enhanced” in various ways relative to programs studied in the past. MDRC, a nonprofit, nonpartisan research organization, is leading the project along with two partners: Abt Associates and MEF Associates. The Office of Planning, Research and Evaluation in the U.S. Department of Health and Human Services’ Administration for Children and Families is also supporting the evaluation.
The evaluation uses a random assignment research design. Program group members were given access to the ETJD programs and control group members had access to other services in the community. To date, the evaluation has studied the implementation of the programs and followed the two groups for one year after enrollment. Early results include:
•
•
•
•
The ETJD programs were relatively well implemented. All of the programs met their recruitment goals, enrolling 1,000 people into the study. The project succeeded in testing some models that were quite different from earlier programs, but some of the enhanced approaches did not operate as planned.
All but one of the programs generated large increases in employment in the early months of follow-up; however, these increases were mostly or entirely the result of the transitional jobs and faded as participants left those jobs. At most sites, the program group was substan-tially more likely to work than the control group, indicating that the programs employed many people who would not otherwise have worked. There were still modest impacts on employment at the end of the one-year period at most sites. However, these differences were partly attributa-ble to some participants still working in transitional jobs.
Two of the three programs targeting people recently released from prison appear to have reduced recidivism (the rate at which they committed new crimes or were reincarcerated). These decreases were concentrated among the participants at the highest risk of recidivism.
Most programs increased payment of child support. These impacts were largely consistent with the programs’ impacts on employment, though coordination with child support agencies and some special child support enhancements contributed to the pattern of effects.
It is too early to draw conclusions about the impacts of the ETJD programs. The evaluation will ultimately follow study participants for 30 months, and will include a benefit-cost analysis. A final report is scheduled for 2018.

THIS PAGE INTENTIONALLY LEFT BLANK

v
Contents
Overview iii List of Exhibits vii Acknowledgments ix Executive Summary ES-1 Chapter 1 Introduction 1
Background and Policy Context 4 The ETJD Project 8 The ETJD Evaluation 16
2 GoodTransitions (Atlanta, GA) 27 Executive Summary 29 Background 32 Program Implementation 45 Impacts on Participant Outcomes 57 Conclusion 72
3 Supporting Families Through Work (Milwaukee, WI) 77 Executive Summary 79 Background 82 Program Implementation 92 Impacts on Participant Outcomes 108 Conclusion 126
4 TransitionsSF (San Francisco, CA) 129 Executive Summary 131 Background 134 Program Implementation 145 Impacts on Participant Outcomes 164 Conclusion 182
5 The Parent Success Initiative (Syracuse, NY) 187 Executive Summary 189 Background 192 Program Implementation 203 Impacts on Participant Outcomes 219 Conclusion 235

vi
6 Next STEP (Fort Worth, TX) 237 Executive Summary 239 Background 242 Program Implementation 251 Impacts on Participant Outcomes 263 Conclusion 278
7 RecycleForce, Inc. (Indianapolis, IN) 283 Executive Summary 285 Background 288 Program Implementation 300 RecycleForce Program Impacts 314 Conclusion 336
8 Pathways (New York, NY) 339 Executive Summary 341 Background 344 Program Implementation 354 Impacts on Participant Outcomes 371 Conclusion 392
9 Summary and Conclusion 395
Summary of Implementation Findings 398 Implications of Interim Impact Findings 400 Looking Ahead 401
Appendix A Supplementary Tables for Chapter 2 403
B Supplementary Tables for Chapter 3 409
C Supplementary Tables for Chapter 4 415
D Supplementary Tables for Chapter 5 421
E Supplementary Tables for Chapter 6 427
F Supplementary Tables for Chapter 7 435
G Supplementary Tables for Chapter 8 441
H Survey Response Bias Analysis 449
I Baseline Characteristics of Program and Control Group Members Across Programs 473
J The Analytic Approach to Determining Impacts on Recidivism-Risk Subgroups 487
References 493

vii
List of Exhibits
Table
ES.1 ETJD Individual Program Characteristics ES-5
ES.2 One-Year Impacts on Recidivism, by Program ES-15
1.1 ETJD Individual Program Characteristics 12
1.2 Description of ETJD Enhancements 13
2.1 Characteristics and Employment Histories of Sample Members: Atlanta 42
2.2 Child Support and Criminal Justice Characteristics of Sample Members: Atlanta 44
2.3 One-Year Participation in ETJD Subsidized Jobs and Services Among Program Group Members: Atlanta 50
2.4 One-Year Impacts on Participation and Service Receipt: Atlanta 60
2.5 One-Year Impacts on Employment and Earnings: Atlanta 62
2.6 One-Year Impacts on Employment and Earnings, by Employment Status in the Prior Year: Atlanta 66
2.7 One-Year Impacts on Child Support and Family Relations: Atlanta 68
2.8 One-Year Impacts on Criminal Justice Outcomes: Atlanta 71
2.9 Short-Term Impacts on Well-Being and Self-Confidence: Atlanta 73
2.10 One-Year Impacts on Economic and Personal Well-Being: Atlanta 75
3.1 Characteristics and Employment Histories of Sample Members: Milwaukee 89
3.2 Child Support and Criminal Justice Characteristics of Sample Members: Milwaukee 91
3.3 One-Year Participation in ETJD Subsidized Jobs and Services Among Program Group Members: Milwaukee 96
3.4 One-Year Impacts on Participation and Service Receipt: Milwaukee 109
3.5 One-Year Impacts on Employment and Earnings: Milwaukee 113
3.6 One-Year Impacts on Employment and Earnings, by Employment Status in the Prior Year: Milwaukee 118

viii
Table
3.7 One-Year Impacts on Child Support and Family Relations: Milwaukee 120
3.8 One-Year Impacts on Criminal Justice Outcomes: Milwaukee 123
3.9 One-Year Impacts on Economic and Personal Well-Being: Milwaukee 125
4.1 Characteristics and Employment Histories of Sample Members: San Francisco 142
4.2 Child Support and Criminal Justice Characteristics of Sample Members: San Francisco 144
4.3 One year Participation in ETJD Subsidized Jobs and Services Among Program Group Members: San Francisco 150
4.4 One-Year Impacts on Participation and Service Receipt: San Francisco 165
4.5 One-Year Impacts on Employment and Earnings: San Francisco 169
4.6 One-Year Impacts on Employment and Earnings, by Employment Status in the Prior Year: San Francisco 174
4.7 One-Year Impacts on Child Support and Family Relations: San Francisco 176
4.8 One-Year Impacts on Criminal Justice Outcomes: San Francisco 179
4.9 Short-Term Impacts on Well-Being and Self-Confidence: San Francisco 181
4.10 One-Year Impacts on Economic and Personal Well-Being: San Francisco 183
5.1 Characteristics and Employment Histories of Sample Members: Syracuse 200
5.2 Child Support and Criminal Justice Characteristics of Sample Members: Syracuse 202
5.3 One-Year Participation in ETJD Subsidized Jobs and Services Among Program Group Members: Syracuse 207
5.4 One-Year Impacts on Participation and Service Receipt: Syracuse 221
5.5 One-Year Impacts on Employment and Earnings: Syracuse 224
5.6 One-Year Impacts on Employment and Earnings, by Employment Status in the Prior Year: Syracuse 228
5.7 One-Year Impacts on Child Support and Family Relations: Syracuse 230
5.8 One-Year Impacts on Criminal Justice Outcomes: Syracuse 233
5.9 One-Year Impacts on Economic and Personal Well-Being: Syracuse 234

ix
Table
6.1 Characteristics and Employment Histories of Sample Members: Fort Worth 248
6.2 Child Support and Criminal Justice Characteristics of Sample Members: Fort Worth 250
6.3 One-Year Participation in ETJD Subsidized Jobs and Services Among Program Group Members: Fort Worth 254
6.4 One-Year Impacts on Participation and Service Receipt: Fort Worth 265
6.5 One-Year Impacts on Employment and Earnings: Fort Worth 268
6.6 One-Year Impacts on Criminal Justice Outcomes: Fort Worth 272
6.7 One-Year Impacts on Criminal Justice Outcomes, by Recidivism Risk: Fort Worth 275
6.8 One-Year Impacts on Child Support and Family Relations Among Those Identified as Noncustodial Parents at Enrollment: Fort Worth 279
6.9 One-Year Impacts on Economic and Personal Well-Being: Fort Worth 281
7.1 Characteristics and Employment Histories of Sample Members: Indianapolis 297
7.2 Child Support and Criminal Justice Characteristics of Sample Members: Indianapolis 299
7.3 One-Year Participation in ETJD Subsidized Jobs and Services Among Program Group Members: Indianapolis 304
7.4 One-Year Impacts on Participation and Service Receipt: Indianapolis 315
7.5 One-Year Impacts on Employment and Earnings: Indianapolis 319
7.6 One-Year Impacts on Criminal Justice Outcomes: Indianapolis 324
7.7 One-Year Impacts on Criminal Justice Outcomes, by Follow-Up Time Period: Indianapolis 326
7.8 One-Year Impacts on Criminal Justice and Employment Outcomes, by Recidivism Risk: Indianapolis 329
7.9 One-Year Impacts on Child Support and Family Relations Among Those Identified as Noncustodial Parents at Enrollment: Indianapolis 331
7.10 One-Year Impacts on Economic and Personal Well-Being: Indianapolis 335
8.1 Characteristics and Employment Histories of Sample Members: New York City 353

x
Table
8.2 Child Support and Criminal Justice Characteristics of Sample Members: New York City 355
8.3 One-Year Participation in ETJD Subsidized Jobs and Services Among Program Group Members: New York City 357
8.4 One-Year Impacts on Participation and Service Receipt: New York City 373
8.5 One-Year Impacts on Employment and Earnings: New York City 377
8.6 One-Year Impacts on Criminal Justice Outcomes: New York City 382
8.7 One-Year Impacts on Criminal Justice Outcomes, by Recidivism Risk: New York City 385
8.8 One-Year Impacts on Child Support and Family Relations Among Those Identified as Noncustodial Parents at Enrollment: New York City 387
8.9 One-Year Impacts on Economic and Personal Well-Being: New York City 391
A.1 Additional Characteristics of Sample Members at Enrollment: Atlanta 405
A.2 One-Year Impacts, by Time of Entry into the Program: Atlanta 407
B.1 Additional Characteristics of Sample Members at Enrollment: Milwaukee 411
B.2 One-Year Impacts, by Time of Entry into the Program: Milwaukee 413
C.1 Additional Characteristics of Sample Members at Enrollment: San Francisco 417
C.2 One-Year Impacts, by Time of Entry into the Program: San Francisco 419
D.1 Additional Characteristics of Sample Members at Enrollment: Syracuse 423
D.2 One-Year Impacts, by Time of Entry into the Program: Syracuse 425
E.1 Additional Characteristics of Sample Members at Enrollment: Fort Worth 429
E.2 One-Year Impacts, by Time of Entry into the Program: Fort Worth 431
E.3 One-Year Impacts on Criminal Justice Outcomes, by Follow-up Time Period: Fort Worth 433
F.1 Additional Characteristics of Sample Members at Enrollment: Indianapolis 437
F.2 One-Year Impacts, by Time of Entry into the Program: Indianapolis 439
G.1 Additional Characteristics of Sample Members at Enrollment: New York City 443

xi
Table
G.2 One-Year Impacts on Criminal Justice Outcomes, by Follow-up Time Period: New York City 445
G.3 One Year Impacts, by Time of Entry into the Program: New York City 447
H.1 ETJD 12-Month Survey Response Rates 453
H.2 Selected Baseline Characteristics of Survey Respondents and Nonrespondents, by City 455
H.3 Selected Baseline Characteristics of Survey Respondents, by Research Group and City 460
H.4 Selected One-Year Impacts for the Research and Respondent Samples, by City 465
I.1 Characteristics and Employment Histories of Sample Members: Programs Targeting Noncustodial Parents 475
I.2 Child Support and Criminal Justice Characteristics of Sample Members: Programs Targeting Noncustodial Parents 477
I.3 Additional Characteristics of Sample Members at Enrollment: Programs Targeting Noncustodial Parents 479
I.4 Characteristics and Employment Histories of Sample Members: Programs Targeting Formerly Incarcerated Individuals 481
I.5 Child Support and Criminal Justice Characteristics of Sample Members: Programs Targeting Formerly Incarcerated People 483
I.6 Additional Characteristics of Sample Members at Enrollment: Programs Targeting Formerly Incarcerated People 484
Figure
ES.1 Subsidized Employment in the ETJD Programs ES-8
ES.2 Employment Rate Over Time ES-11
ES.3 Employment Rate in the First Quarter of Year 2 ES-13
1.1 Map of ETJD Programs 11
1.2 Generic Logic Model 15
2.1 GoodTransitions Program Model 37

xii
Figure
2.2 Subsidized Employment Over Time: Atlanta 51
2.3 Favorable Impression of the Value of Transitional Job Support and Preparation for Future Employment: Atlanta 54
2.4 Employment and Earnings Over Time: Atlanta 64
2.5 Formal Child Support Payments Over Time: Atlanta 70
3.1 Subsidized Employment Over Time: Milwaukee 103
3.2 Favorable Impression of the Value of Transitional Job Support and Preparation for Future Employment: Milwaukee 105
3.3 Employment and Earnings Over Time: Milwaukee 115
3.4 Formal Child Support Payments Over Time: Milwaukee 122
4.1 TransitionsSF Program Model 136
4.2 Subsidized Employment Over Time: San Francisco 151
4.3 Favorable Impression of the Value of Transitional Job Support and Preparation for Future Employment: San Francisco 163
4.4 Employment and Earnings Over Time: San Francisco 171
4.5 Formal Child Support Payments Over Time: San Francisco 178
5.1 Parent Success Initiative Partnership Structure 205
5.2 Subsidized Employment Over Time: Syracuse 210
5.3 Favorable Impression of the Value of Transitional Job Support and Preparation for Future Employment: Syracuse 217
5.4 Employment and Earnings Over Time: Syracuse 226
5.5 Formal Child Support Payments Over Time: Syracuse 232
6.1 Next STEP Program Model 244
6.2 Subsidized Employment Over Time: Fort Worth 260
6.3 Favorable Impression of the Value of Transitional Job Support and Preparation for Future Employment: Fort Worth 262
6.4 Employment and Earnings Over Time: Fort Worth 270
6.5 Formal Child Support Payments Over Time: Fort Worth 277

xiii
Figure
7.1 Subsidized Employment Over Time: Indianapolis 305
7.2 Favorable Impression of the Value of Transitional Job Support and Preparation for Future Employment: Indianapolis 312
7.3 Employment and Earnings Over Time: Indianapolis 321
7.4 Formal Child Support Payments Over Time: Indianapolis 333
8.1 Pathways Program Model 348
8.2 Subsidized Employment Over Time: New York City 359
8.3 Favorable Impression of the Value of Transitional Job Support and Preparation for Future Employment: New York City 361
8.4 Employment and Earnings Over Time: New York City 379
8.5 Formal Child Support Payments Over Time: New York City 389
Box
1.1 Technical Assistance in the ETJD Project 9
1.2 How to Read the Impact Tables in this Report 25
2.1 The Fatherhood Program 33
2.2 Child Support Wage Withholding 34
2.3 GoodTransitions Participant Profile 58
3.1 Forgiveness of Interest on State-Owed Arrears as Part of Supporting Families Through Work 94
3.2 Supporting Families Through Work Participant Profile 107
4.1 Transitional Job Tier Assignment Matrix 152
4.2 TransitionsSF Participant Profiles 161
5.1 Parent Success Initiative Participant Profile 220
6.1 Next STEP Participant Profiles 261
7.1 Basic Conditions of Release to Parole/Probation 290
7.2 RecycleForce Participant Profile 300
7.3 RecycleForce Order of Ranking 302

xiv
Box
7.4 OSHA Training Offered by Managepoint 306
8.1 Transitional Jobs Service Providers 346
8.2 Pathways Participant Profile 367

xv
Acknowledgments
The success of the Enhanced Transitional Jobs Demonstration (ETJD) and this report reflect the contributions of many people in the dozens of agencies and organizations participating in the project. We thank the funders at the U.S. Department of Labor (DOL) and the U.S. Department of Health and Human Services (HHS). In particular we thank Eileen Pederson, our DOL project officer, whose commitment and professionalism helped make the project successful. We also thank Heidi Casta, Dan Ryan, and Wayne Gordon for their commitment to the evaluation. We are grateful to Jenn Smith and Michelle Ennis for their teamwork throughout, and Demetra Nightingale for her contributions to the study. From HHS we thank Erica Zielewski, Girley Wright, and Mark Fucello for their insights during the design of the project and for their ongoing partnership and thoughtful collaboration.
We are especially grateful to the hardworking and dedicated administrators and staff members in each of the seven ETJD programs who have given generously of their time throughout the project.
From Atlanta, Georgia: Jenny Taylor, Marylee Putnam, and Cheryl Cornett-Earley.
From Fort Worth, Texas: Debby Kratky, John Torres, Christina Mason, and Robert Sturgeon.
From Indianapolis, Indiana: Gregg Keesling, Brent Matthews, Rhonda Shipley, Calvin Houston, Jannett Keesling, and Thomas Gray.
From Milwaukee, Wisconsin: Nyette Brown-Ellis, Reginald Riley, Marrika Rodgers, Robin Balfanz, and Jennifer de Montmollin.
From New York City, New York: Nadia Sadloski, Felipe Vargas, Valerie Westphal, Zachary Smith, Angela Gerena, and Nathan Gunsch.
From San Francisco, California: at Goodwill, Megan Kenny, David Walker, and Elsie Wong; at the Department of Child Support Services, Karen Roye, Christine Anderson, Sheryl Myers, and Freda Randolph Glenn; and at the Mayor’s Office of Economic and Workforce Development, John Halpin and Monique Forester.
From Syracuse, New York: Michael Pasquale, Marsha Weissman, David Condliffe, Christine Abate, and Michael Irwin.
From DOL, we are also grateful to the Regional Federal Project Officers who provided contract- and program-related technical assistance to the ETJD grantees: in Atlanta, Sherrie Wilson; in Fort Worth, Amanda Denogean; in Indianapolis and Milwaukee, Darren Kroenke; in

xvi
New York City, Rochelle Layne; in San Francisco, Elina Mnatsakanova; and in Syracuse, Michael Hotard.
We thank the many staff members from state and local criminal justice and child sup-port agencies that facilitated our access to the critical administrative data used in this study: the California Department of Justice, the City and County of San Francisco Department of Child Support Services, the California Department of Child Support Services, the Town of Mount Airy Police Department, the Georgia Department of Corrections, the Georgia Division of Child Support Services in the Department of Human Services, the Texas Department of Public Safety, the Texas Department of Criminal Justice, the Tarrant County Sheriff’s Office, the Texas Office of the Attorney General’s Child Support Division, the Indiana State Police, the Indiana Depart-ment of Corrections, the Marion County Sheriff’s Office, the Indiana Department of Child Services, the New York Division of Criminal Justice Statistics, the New York State Department of Corrections and Community Supervision, the New York City Department of Corrections, the New York State Office of Temporary and Disability Assistance’s Division of Child Support Enforcement, the Wisconsin Department of Justice Criminal Information Bureau, the Wiscon-sin Department of Corrections, the Institute for Research on Poverty at the University of Wisconsin-Madison, and the Wisconsin Department of Children and Families. We also thank staff members from HHS who worked to provide us with data from the National Directory of New Hires. The Center for Employment Opportunities graciously provided data to inform the analysis of the New York City program.
At MDRC, we thank Richard Hendra, who served as the impact adviser for the project and offered thoughtful guidance on the analysis. David Navarro ably led the study’s operations in San Francisco. Michelle Manno capably managed the report’s production. In addition to several of the authors, Sally Dai, Danielle Cummings, Chloe Anderson, Brian Bayes, Katherine Wen, Adrienne Yao, Paul Veldman, Josh Vermette, and Brit Henderson were part of the stellar quantitative analysis team that skillfully processed the surveys and dozens of federal, state, and local administrative data sets for the analysis in this report. Gordon Berlin and Charles Micha-lopoulos reviewed several drafts of the report and offered insightful recommendations. The report benefited greatly from the hard work of Danielle Craig, Emily Brennan, Marsha Davison, and Karla Mendez, all of whom helped create the many exhibits and coordinated the report’s production. Sherry Reid provided administrative support to the project. Joshua Malbin carefully and efficiently edited hundreds of pages of text and tables for this report, and Carolyn Thomas prepared it for publication.
From Abt Associates, Steve Bell provided advice on the early design of the project and Glen Schneider led early study operations in Syracuse, New York. Donna DeMarco managed the follow-up survey operations. From Abt SRBI, Jodi Walton, Ray Hildonen, and Ricki

xvii
Jarmon tackled the administration of the follow-up surveys. From MEF Associates, Mike Fishman capably set up and led early operations in Milwaukee, Wisconsin.
We thank David Butler (MDRC), John Wallace (MDRC), and Jennifer Philips who helped early on with site selection. From the National Transitional Jobs Network we’re grateful to Chris Warland, Amy Rynell, and Melissa Young for their advice.
Finally, we extend our deep appreciation to the thousands of men and women who par-ticipated in the study and gave generously of their time to respond to surveys and participate in interviews and focus groups.
The Authors

THIS PAGE INTENTIONALLY LEFT BLANK
ES-1
Executive Summary
For decades, policymakers and practitioners have searched for program models that can increase employment rates and earnings for adults who are considered “hard to employ”: those with limited work experience, low levels of formal education, and other obstacles. One approach that has been implemented and tested fairly extensively is called “transitional jobs.” Transitional jobs programs offer temporary subsidized jobs that aim to teach participants basic work skills or get a foot in the door with an employer. The programs also help partici-pants address personal issues that impede their ability to work and assist them in finding unsubsidized jobs when the transitional jobs end. A number of transitional jobs programs have been evaluated in the past, with mixed results. Several of them targeted individuals recently released from prison.
This report presents early results from the Enhanced Transitional Jobs Demonstration (ETJD), which is using a rigorous random assignment research design to evaluate seven transitional jobs programs that targeted either individuals who had recently been released from prison, or parents who did not have custody of their children (“noncustodial” parents), who owed child support, and who were unable to meet their obligations because they were unem-ployed. The organizations operating the ETJD programs designed their models to address what they thought were the shortcomings of previous transitional jobs programs, as revealed by previous evaluation efforts. The ETJD project was conceived and funded by the Employment and Training Administration of the U.S. Department of Labor (DOL). The Office of Planning, Research and Evaluation in the U.S. Department of Health and Human Services’ Administra-tion for Children and Families is also supporting the evaluation. MDRC, a nonprofit, nonparti-san research organization, is leading the project under contract to DOL along with two partners: Abt Associates and MEF Associates. This report describes the implementation of the ETJD programs and presents information on how they affected participants’ outcomes in the first year after enrollment.
Background and Context The roots of the ETJD project can be traced to two broad policy trends. The first is the ongoing struggle to find effective models to assist people who have great difficulty finding or keeping jobs regardless of overall labor market conditions. Policymakers tend to focus on these individ-uals especially when they incur public costs — for example, by receiving public assistance, by failing to pay child support (which may, in turn, lead to higher public assistance costs for their children), or by committing crimes and ending up in jail or prison.

ES-2
The transitional jobs model has long been considered a promising approach for the hard-to-employ. However, rigorous evaluations of transitional jobs programs have yielded mixed results.1 On the one hand, most programs dramatically increased participants’ employ-ment rates initially, suggesting that they provided jobs and income to many people who would have been unemployed otherwise. On the other hand, in most cases the gains in employment were the result of the subsidized jobs, and those gains faded when the jobs ended. Five of the programs that were evaluated targeted individuals who had recently been released from prison, but only one of them led to sustained reductions in recidivism rates (the rates at which former prisoners commit new crimes or are reincarcerated).2 While many policymakers and practition-ers continued to see transitional jobs as promising, these results highlighted the need to identify new versions of the model that produce longer-lasting impacts.
The second policy trend is the evolution of the corrections and child support-enforcement systems in recent years. Both of these systems have long viewed their missions in narrow terms: The corrections system sought to punish and segregate people who had been convicted of crimes, and the child support system sought to establish and enforce child support orders. However, in recent years, both systems have begun to focus more on improving the outcomes of their “clients,” to some extent to reduce public costs. Transitional jobs programs are seen as a potentially effective approach for these populations, in part because they provide immediate income while participants are learning work skills. Policymakers hope that addition-al income and the acquisition of employment-related skills will reduce their propensity to engage in criminal activity and increase their likelihood of making child support payments.
The ETJD Project and the Evaluation In 2010, DOL held a national competition to select programs to participate in the ETJD project. Applicants were required to describe specific “enhancements” to the basic transitional jobs model that had been tested earlier and to explain why they believed their approaches would achieve better results than previous programs. In addition, applicants were required to identify a
1For a recent summary of evaluations of transitional jobs programs and other subsidized employment
models, see Indivar Dutta-Gupta, Kali Grant, Matthew Eckel, and Peter Edelman, Lessons Learned from 40 Years of Subsidized Employment Programs (Washington DC: Georgetown Center on Poverty and Inequality, 2016).
2See, for example, Erin Jacobs Valentine, Returning to Work After Prison: Final Results from the Transi-tional Jobs Reentry Demonstration (New York: MDRC, 2012); Cindy Redcross, Megan Millenky, Timothy Rudd, and Valerie Levshin, More Than a Job: Final Results of the Center for Employment Opportunities (New York: MDRC, 2012); David Butler, Julianna Alson, Dan Bloom, Victoria Deitch, Aaron Hill, JoAnn Hsueh, Erin Jacobs Valentine, Sue Kim, Reanin McRoberts, and Cindy Redcross, What Strategies Work for the Hard-to-Employ? Final Results of the Hard-to-Employ Demonstration and Evaluation Project and Selected Sites from the Employment Retention and Advancement Project (New York: MDRC, 2012).

ES-3
primary target group — either individuals released from prison in the past 120 days or noncus-todial parents who owed child support but were unable to pay because they were unemployed. Ultimately, DOL selected seven programs — four targeting noncustodial parents and three targeting people released from prison — and provided each one with approximately $6 million over a period of four years.3
The ETJD evaluation set out to answer three broad questions:
•
•
•
How were the ETJD programs designed and operated, and whom did they serve?
How did the ETJD programs affect participants’ receipt of services, and their outcomes in three primary domains: employment, child support, and criminal justice (that is, arrests, convictions, and incarceration)?
How do the programs’ costs compare with any benefits they produce?
The MDRC team is addressing the second question using a random assignment re-search design, the most reliable method for assessing the effectiveness of this type of program; the first and third questions are addressed by the other two study components, the implementa-tion study and the cost-benefit study. To facilitate the evaluation, each ETJD program was required to recruit 1,000 people who wanted to participate in the program, who met the eligibil-ity requirements, and who agreed to participate in the study. These individuals were randomly assigned either to the program group, whose members were invited to participate in the ETJD program, or to the control group, whose members were usually given a list of other services in the community.4 (In some places, the control group was referred to a specific program that provided job-search assistance but not transitional jobs.) The MDRC team is following the program and control groups for two and a half years using surveys and federal, state, and local administrative records to measure outcomes in the three primary areas — employment, criminal justice, and child support — as well as in other, secondary areas such as material and personal well-being, parenting, and relationships with family members.5 If differences emerge between the groups over time and these differences are large enough to reach conventional levels of statistical significance, then one can be fairly confident that the differences are attributable to
3For more information about the grant requirements, see Employment and Training Administration, U.S.
Department of Labor, “Notice of Availability of Funds and Solicitation for Grant Applications Under the Enhanced Transitional Jobs Demonstration (ETJD),” available online at: www.doleta.gov/grants/pdf/SGA-DFA-PY-10-11.pdf.
4As shown in Appendix I of the full report, there were no systematic differences in baseline characteristics between program and control group members.
5Administrative records are data used for the management of programs and public services.

ES-4
the ETJD program.6 Such differences are referred to as “impact estimates.” The evaluation examines the results for each program separately.
This report focuses mostly on the implementation study, but it also describes programs’ early impacts in the first year after people were randomly assigned to the two groups. Owing to the nature of the models, one year of follow-up is not long enough to fully assess the programs’ impacts on primary outcomes. Most important, program group members spent a substantial part of the first year in transitional jobs, so the programs’ long-term impacts on unsubsidized employment are not yet clear. Longer-term impact results based on participants’ outcomes after 30 months will be presented in a later report, as will the findings from the benefit-cost analysis.
The ETJD Programs Table ES.1 briefly describes the seven ETJD programs. As the table shows, most of the grantees were private, nonprofit organizations, though, as described later, these organizations worked very closely with state or local government partners.
Each of the seven programs was designed somewhat differently but, as required by DOL, all of them were enhanced in some ways relative to the transitional jobs models that were studied earlier. Those earlier programs all provided temporary subsidized jobs either within the program itself or with other nonprofit organizations. They also assigned participants to job coaches or case managers (who helped them address barriers to employment) and to job developers (who helped them search for unsubsidized jobs). The ETJD enhancements fell into three general categories:
• Structural changes. The programs that were tested in earlier studies placed participants into relatively sheltered positions with a program operator or a partner organization, and then helped them find regular jobs. Two of the ETJD programs used “staged” models in which participants started in pro-gram jobs, but then progressed to subsidized jobs in the community that more closely resembled “real” jobs. A third program focused entirely on
6The analyses presented in this report are considered “exploratory.” That is, the evaluation as a whole will
be providing suggestive evidence on which program innovations are effective, so that these enhancements can be more widely replicated and studied. As a result, the analysis does not use formal statistical methods to account for the fact that several program-control differences are examined at each of the seven experimental “sites” (a term that encompasses the program, the program group, the control group, and their environment). When many such comparisons are made, there is a greater probability that some of the differences will be found to be statistically significant even though they did occur by chance. The report’s analysis addresses this issue by minimizing the number of comparisons and highlighting those that are most important.

ES-5
Table ES.1
ETJD Individual Program Characteristics
Program Name, Operator, and Location
Target Group Program Overview
Good Transitions Goodwill of North Georgia Atlanta, GA
Noncustodial parents
Participants work at a Goodwill store for approximately one month, then move into a less supported subsidized position with a private employer in the community for about three months. The program offers case management and short-term training.
Supporting Families Through Work YWCA of Southeast Wisconsin Milwaukee, WI
Noncustodial parents
Participants start in a three- to five-day job-readiness workshop. They are then placed in transitional jobs, mostly with private-sector employers. The program supplements wages in unsubsidized employment to bring them up to $10 an hour for six months. The program also provides child support-related assistance.
TransitionsSF Goodwill Industries, with San Francisco Dept. of Child Support Services San Francisco, CA
Noncustodial parents
Participants begin with an assessments followed by two weeks of job-readiness training. Then they are placed into one of three tiers of subsidized jobs depending on their job readiness: (1) nonprofit, private-sector jobs (mainly at Goodwill); (2) public-sector jobs; or (3) for-profit, private-sector jobs. They may receive modest financial incentives for participation milestones and child support assistance.
Parent Success Initiative Center for Community Alternatives Syracuse, NY
Noncustodial parents
Groups of 15-20 participants begin the program together with a two-week job-readiness course. They are then placed in work crews with the local public housing authority, a business improvement district, or a nonprofit organization. The program offers family life-skills workshops, job-retention services, case management, civic restoration services, child support legal aid, and job-search and job-placement assistance.
Next STEP Workforce Solutions of Tarrant County Fort Worth, TX
Formerly incarcerated people
Participants begin with a two-week “boot camp” that includes assessments and job-readiness training. They are then placed in jobs with private employers. The program pays 100 percent of the wages for the first eight weeks and 50 percent for the following eight weeks. Employers are expected to retain participants who perform well. Other services include case management, group meetings, high school equivalency classes, and mental health services.
RecycleForce RecycleForce, Inc. Indianapolis, IN
Formerly incarcerated people
Participants are placed at one of three social enterprises, including an electronics recycling plant staffed by formerly incarcerated workers, who provide training and supervision to participants and serve as their peer mentors. The program also offers occupational training, case management, job development, work-related financial support, and child support-related assistance. Participants may later be hired as unsubsidized employees.
Ready, Willing and Able Pathways2Work The Doe Fund New York, NY
Formerly incarcerated people
After a one-week orientation, participants work on the program’s street-cleaning crews for six weeks, then move into subsidized internships for eight weeks. If an internship does not transition to unsubsidized employment, the program will pay the participant to search for jobs for up to nine weeks. Additional services include case management, job-readiness programs, opportunities for short-term training and certification, and parenting and computer classes.

ES-6
placing participants directly into subsidized jobs in the private sector that were intended to evolve into permanent positions. A fourth used a “tiered” model that placed participants into different types of transitional jobs based on their educational and work histories. For the most part, these new struc-tural approaches were designed to promote smoother transitions from subsi-dized to unsubsidized jobs.
•
•
Enhanced support. Four of the ETJD programs aimed to provide special support or assistance that was not available in the earlier programs studied — for example, opportunities for short-term training in occupational skills, ser-vices to help participants address problematic behavior patterns, or help cor-recting errors in their official criminal records.7
Child support incentives. In two of the four programs targeting noncustodi-al parents, the child support agency offered special “carrots,” “sticks,” or both to encourage participants to remain active in the ETJD program. For ex-ample, in one program, participants’ child support orders were modified downward as long as they participated steadily (a “carrot”). Once they stopped participating, the orders were returned to their original levels (a “stick”).
The programs used these enhancements in various combinations. Three were structured much like traditional transitional jobs programs but included enhanced support or child support incentives. Four programs used one of the innovative structural approaches described above and included one or both of the other types of enhancements.
It is important to note that the programs’ “theories of change” varied somewhat from one to another. For example, the models that placed participants into temporary jobs within the program reflected an assumption that participants were initially not ready to succeed in regular jobs. Rather, they would “learn to work by working” in the temporary jobs and, thus, would be better able to get and keep regular jobs. In contrast, the programs that placed participants into subsidized private-sector jobs assumed that participants were ready to work in regular jobs, but needed help getting a foot in the door. These programs sought to change employers’ hiring decisions and promote a more effective transition from subsidized to unsubsidized employment.
7Three of the programs that added enhanced support also included structural changes or child support sys-
tem enhancements.

ES-7
Early Results • All of the programs achieved their enrollment goals, but some of them
struggled with recruitment and may have begun to accept different kinds of participants than they originally targeted.
The ETJD programs developed relationships with child support and corrections agen-cies and other community partners in order to identify potential participants. Each of the programs used some type of screening process to try to identify people who were able and willing to work, but not so employable that they did not need subsidized jobs. This was a difficult balance to achieve and some of the programs that struggled to meet their goals began to loosen their screening criteria over time. Ultimately, all seven programs were able to recruit 1,000 people into the study.
• In all of the programs, the typical participant was an unmarried black or Hispanic man in his 30s or 40s, with little or no recent work experience.
Data collected from study participants when they entered the study show that there is considerable overlap across the two main target groups: 42 percent of participants in the programs targeting people coming home from prison were noncustodial parents, and 37 percent of those in the programs targeting noncustodial parents had been incarcerated (though often not recently).
Almost all participants in the noncustodial parent programs and more than 80 percent of those in the programs targeting former prisoners had worked for pay at some point in the past. However, as expected, very few of the participants in the latter group of programs had any recent work experience. Even in the programs targeting noncustodial parents, fewer than one-third of participants had worked for more than a year in the previous three years.
• Reflecting the differing program models, the proportion of program group members who worked in transitional jobs ranged from just under 40 percent to 100 percent.
Figure ES.1 shows the percentage of program group members who worked in a tran-sitional job at some point during the one-year follow-up period and the average number of days that elapsed between random assignment and participants’ first transitional job paychecks (for those who worked in such jobs). As the figure illustrates, some programs (notably Indianapolis and Atlanta) put participants into in-house jobs almost immediately and, as a result, everyone or nearly everyone worked in transitional jobs. At the other extreme, the Fort Worth program provided a range of preemployment activities and then attempted to place participants directly into subsidized private-sector jobs. In this model, the program had

In cities where participants began ...the rate of employment was higher.transitional jobs more quickly…
SOURCES: Quarterly wage data from the National Directory of New Hires and responses to the ETJD 12-month survey.
Figure ES.1
Subsidized Employment in the ETJD Programs
4
18
40
21
67
85
119
0 20 40 60 80 100 120
Indianapolis
Atlanta
Syracuse
New York City
Milwaukee
San Francisco
Fort Worth
Average days until first paycheck
100
97
80
79
63
46
39
0 20 40 60 80 100Subsidized employment rate (%)
ES-8

ES-9
to persuade private employers to hire people recently released from prison (and agree to retain them after the subsidy period if all went well). As a result, fewer than half of program group members ever worked in subsidized jobs (though the program was able to place others directly into unsubsidized jobs, because some employers refused the subsidy). The programs in the middle required participants to complete some type of preemployment activity or class before starting work, or had to match participants with jobs in nonprofit agencies in the community. In either case, some participants left the programs before they were placed.
The average number of days worked in a transitional job (among those who worked) ranged from less than 30 in New York City to more than 70 in Indianapolis. To some extent, this variation reflects the program designs — for example, some programs offered fewer days of work per week than others — but it also reflects the greater willingness of some programs to offer extensions to participants who had good attendance but were having difficulty finding unsubsidized jobs.
• In general, the ETJD programs were relatively well implemented; how-ever, some of the enhancements were not put in place as designed.
All of the ETJD grantees had some experience operating transitional jobs programs, but ETJD required them to expand to a larger scale and add new components or services. Thus, it is not surprising that all of them experienced some operational challenges. As noted earlier, some programs had difficulty with recruitment. Many others struggled to place participants into unsubsidized jobs. Nevertheless, the overall conclusion is that all of the grantees implemented functioning transitional jobs programs.
One central question is whether the ETJD programs were truly “enhanced” relative to earlier models. The answer is mixed. Several of the programs successfully implemented the structural changes described above. Others were able to provide enhanced services or child support incentives. At the same time, some of the enhancements did not operate as planned. For example, the Milwaukee program had intended to place many participants into skills training, but the organizational partnerships needed to make this happen never fully materialized. Similarly, the San Francisco program was not able to fully implement its three-tiered transition-al jobs model.
• Most control group members at all sites received help finding jobs; nev-ertheless, there were large differences in service receipt between the program and control groups.
Responses to the 12-month survey indicate that, across the sites, 60 percent to 80 per-cent of the control group received at least some help related to finding or keeping a job. This result is not surprising, because all of the study participants were involved with systems that

ES-10
expected and in some cases required them to seek employment. Nevertheless, the program groups at all sites were still substantially more likely to receive employment and education services, and in addition it seems that the ETJD services were much more intensive and com-prehensive than most other services available in the communities. Most important, with two exceptions (Milwaukee and New York City), it does not appear that substantial numbers of control group members received subsidized or transitional jobs.
• Almost all of the programs generated large increases in employment in the early months of follow-up; however, these increases were mostly or entirely the result of the transitional jobs and faded quickly as partici-pants left those jobs.
Figure ES.2 shows the employment rates for the program and control groups during the one-year follow-up period at three sites: Atlanta, Milwaukee, and Fort Worth. The other sites follow a pattern similar to one of these three.8 The figures show both the overall employment rates (including both subsidized and unsubsidized jobs) and the proportion of the program group working in ETJD transitional jobs (the dashed lines). These data are drawn from unemployment insurance records obtained through the National Directory of New Hires, which show partici-pants’ quarterly earnings in most jobs in the formal labor market. In programs where the transitional jobs were not covered by unemployment insurance, earnings data are drawn from program records.
The figure shows that, at all sites except Fort Worth, the ETJD programs were able to employ many people who would not otherwise have worked. The peak difference between the groups (usually in the first or second quarter) ranged from 27 percentage points to 59 percent-age points, with larger differences at the sites where the programs placed people into transitional jobs immediately (see Figure ES.1). Moreover, while not shown in the figure, all six of those programs significantly increased earnings over the first year, by amounts ranging from a little under $1,000 to more than $3,000.
Finally, in Atlanta and San Francisco, a survey was administered very early in the follow-up period, when many program group members were still working in transitional jobs. In Atlanta, where the transitional job placement rate was nearly 100 percent (see Figure ES.1), the
8The pattern of results in Indianapolis closely resembles the pattern in Atlanta shown in Figure ES.2; at
both sites nearly all program group members worked in transitional jobs. New York City’s results are also similar to Atlanta’s, though in New York City the difference between groups was no longer statistically significant by the end of the follow-up period. The San Francisco and Syracuse results resemble the Milwaukee results shown in Figure ES.2.

ES-11
(continued)
Figure ES.2
Employment Rate Over Time
MilwaukeeEmployment Rate
AtlantaEmployment Rate
0102030405060708090
100
0***
1***
2***
3***
4***
Perc
enta
ge e
mpl
oyed
Quarter after random assignment
Program group total employment
Control group employment
Program group subsidized ETJD employment
0
10
20
30
40
50
60
70
80
90
100
0***
1***
2***
3***
4***
Perc
enta
ge e
mpl
oyed
Quarter after random assignment
Program group total employment
Control group employment
Program group subsidized ETJD employment
ES-12
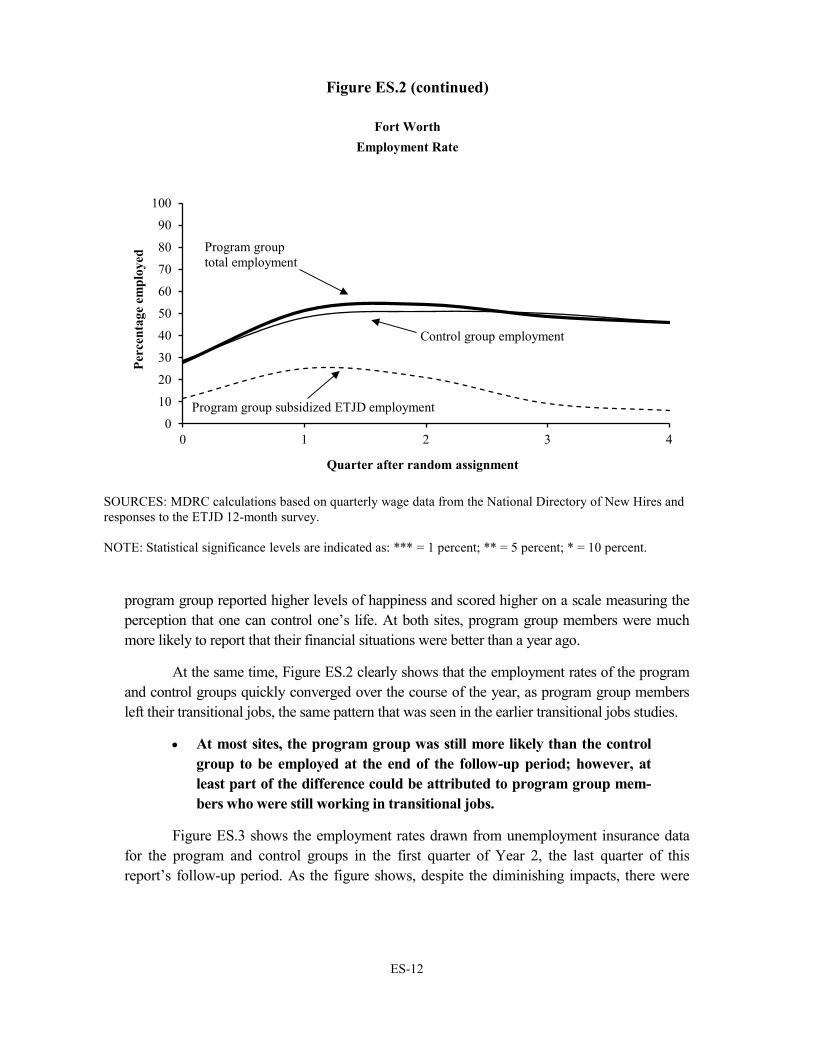
program group reported higher levels of happiness and scored higher on a scale measuring the perception that one can control one’s life. At both sites, program group members were much more likely to report that their financial situations were better than a year ago.
At the same time, Figure ES.2 clearly shows that the employment rates of the program and control groups quickly converged over the course of the year, as program group members left their transitional jobs, the same pattern that was seen in the earlier transitional jobs studies.
• At most sites, the program group was still more likely than the control group to be employed at the end of the follow-up period; however, at least part of the difference could be attributed to program group mem-bers who were still working in transitional jobs.
Figure ES.3 shows the employment rates drawn from unemployment insurance data for the program and control groups in the first quarter of Year 2, the last quarter of this report’s follow-up period. As the figure shows, despite the diminishing impacts, there were
Fort WorthEmployment Rate
Figure ES.2 (continued)
0
10
20
30
40
50
60
70
80
90
100
0 1 2 3 4
Perc
enta
ge e
mpl
oyed
Quarter after random assignment
Program group total employment
Control group employment
Program group subsidized ETJD employment
SOURCES: MDRC calculations based on quarterly wage data from the National Directory of New Hires and responses to the ETJD 12-month survey.
NOTE: Statistical significance levels are indicated as: *** = 1 percent; ** = 5 percent; * = 10 percent.

Figure ES.3
Employment Rate in the First Quarter Of Year 2
68.9
57.655.2
44.345.9
39.943.3
36.4
46.1 45.9 44.1
30.8
41.238.0
9.6
6.72.4
3.9 6.39.3
0.8
0
10
20
30
40
50
60
70
80
90
100
P C P C P C P C P C P C P C
Atlanta Milwaukee San Francisco Syracuse Fort Worth Indianapolis New YorkCity
Perc
enta
ge e
mpl
oyed
Subsidized employmentUnsubsidized employment
SOURCE: MDRC calculations based on quarterly wage data from the National Directory of New Hires.
NOTES: P = ETJD program group, C = control group. Subsidized employment data were only available and are only shown for program group members. Control group members may have sought out and
participated in other, non-ETJD subsidized employment opportunities available in their communities.
ES-13

ES-14
still statistically significant differences between the program and control groups at all of the sites except Fort Worth and New York. Even at those sites, survey data showed that program group members were more likely to report being employed at the time of the interview, suggesting that those programs may have increased employment in jobs that are not covered by unemployment insurance.
At the same time, the figure shows that at almost all sites some participants were still working in transitional jobs in that last quarter. These are likely to be individuals who started transitional jobs earlier in the follow-up period, left the program, and then returned later and were allowed to continue. Alternatively, there may have been a long delay in initially placing them into transitional jobs. In any event, it seems clear that the impacts on employment in the final quarter are at least partly explained by the participants who were still working in transitional jobs. It is not clear whether the differences will persist over time, when all program group members eventually leave their transitional jobs. The evaluation will ultimately follow study participants for 30 months, with a final report that will include 30-month impacts on employment and earnings to be published in 2018.
• There were some decreases in recidivism in two of the three programs targeting people recently released from prison.
As shown in Table ES.2, the ETJD programs in Fort Worth and Indianapolis generated some statistically significant reductions in recidivism. Interestingly, the Fort Worth program generally did not improve employment outcomes, but it was the only ETJD program that offered workshops using cognitive behavioral approaches (a type of intervention that has been shown to reduce recidivism in other studies).9 The Indianapolis program used a highly support-ive peer-mentoring model, and the recidivism effects occurred mostly in the first six months of the follow-up period, when most program group members were still heavily engaged with the program.
The third program targeting people recently released from prison, the one in New York City, did not produce statistically significant reductions in recidivism. However, it is worth noting that New York City has an unusually rich set of services for this population. On the 12-month follow-up survey, more than 80 percent of the control group reported receiving employ-ment services, and the evaluation team was able to determine that more than a third of the control group was served by the Center for Employment Opportunities, a very large transitional jobs program that has also been evaluated and shown to reduce recidivism.10
9The program provided workshops based on the Thinking for a Change curriculum developed by the Na-
tional Institute of Corrections. 10Jacobs Valentine (2012); Redcross, Millenky, Rudd, and Levshin (2012); Butler et al. (2012).

ES-15
Table ES.2
One-Year Impacts on Recidivism, by Program
Program Control Difference Ninety Percent Outcome (%) Group Group (Impact) Confidence Interval
Indianapolis
Arresteda 20.1 23.9 -3.8 [-8.8, 1.2]
Months 1-6 9.2 15.1 -5.8 ** [-9.7, -1.9]
Months 7-12 12.3 11.2 1.1 [-2.9, 5]
Convicted of a crimeb 13.9 16.1 -2.2 [-6.5, 2.1]
Months 1-6 6.0 10.8 -4.8 ** [-8.1, -1.4]
Months 7-12 8.2 6.4 1.7 [-1.5, 4.9]
Incarcerated 49.8 52.6 -2.7 [-7.9, 2.4]
Months 1-6 32.2 36.2 -4.0 [-9, 0.9]
Months 7-12 34.1 33.5 0.6 [-4.3, 5.6]
Arrested, convicted, or admitted to jail or prison 50.8 54.6 -3.8 [-8.9, 1.4]
Months 1-6 33.2 37.2 -4.0 [-9, 0.9]
Months 7-12 35.5 36.4 -0.9 [-5.9, 4.1]
Sample size 501 497
Fort Worth
Arrested 19.0 24.9 -5.9 ** [-10.1, -1.7]
Months 1-6 8.3 9.5 -1.2 [-4.2, 1.8]
Months 7-12 13.3 17.6 -4.3 * [-8, -0.6]
Convicted of a crime 11.6 11.4 0.2 [-3.1, 3.5]
Months 1-6 4.1 4.3 -0.2 [-2.3, 1.9]
Months 7-12 8.5 8.3 0.2 [-2.7, 3.1]
Incarcerated 22.6 26.7 -4.1 [-8.5, 0.3]
Months 1-6 11.5 12.9 -1.4 [-4.8, 2]
Months 7-12 16.2 19.5 -3.3 [-7.2, 0.6]
Arrested, convicted, or admitted to jail or prison 27.0 32.2 -5.2 * [-9.8, -0.6]
Months 1-6 13.5 15.4 -1.9 [-5.6, 1.7]
Months 7-12 20.5 24.2 -3.8 [-8, 0.5]
Sample Size 503 496
(continued)

ES-16
Table ES.2 (continued) Program Control Difference Ninety Percent Outcome (%) Group Group (Impact) Confidence Interval New York City
Arrested 18.8 21.6 -2.7 [-6.7, 1.2]
Months 1-6 9.5 10.2 -0.8 [-3.8, 2.3]
Months 7-12 11.5 13.0 -1.5 [-4.8, 1.7]
Convicted of a crime 12.6 13.2 -0.6 [-3.9, 2.7]
Months 1-6 5.0 5.2 -0.2 [-2.5, 2]
Months 7-12 9.6 8.9 0.7 [-2.1, 3.6]
Incarcerated 11.3 9.2 2.1 [-1.6, 5.9]
Months 1-6 16.0 16.5 -0.5 [-4.3, 3.3]
Months 7-12 20.3 17.3 3.0 [-0.9, 6.9]
Arrested, convicted, or admitted to jail or prison 34.0 32.6 1.4 [-3.3, 6]
Months 1-6 18.9 18.1 0.9 [-3.1, 4.9]
Months 7-12 24.1 22.7 1.5 [-2.8, 5.7]
Sample size 504 501
SOURCE: MDRC calculations based on criminal justice data. NOTES: Results in this table are regression-adjusted, controlling for pre-random assignment characteristics. Estimates of arrest and conviction in Indianapolis are weighted by age, lifetime months in prison prior to random assignment, and program-versus-control ratios. Statistical significance levels are indicated as: *** = 1 percent; ** = 5 percent; * = 10 percent. aArrest and conviction measures in Indianapolis exclude sample members for whom no records could be retrieved due to limitations of the criminal justice data. Data are weighted as noted above to account for these missing records. bThe dates for conviction measures shown in this table are set equal to the arrest dates; actual conviction dates were unavailable. This measure therefore undercounts the number of convictions resulting from arrests that occurred in the year after random assignment, as prosecutions of some of these arrests had not yet resulted in a disposition by the date on which the data were obtained.
• Most of the programs increased payment of child support.
Six of the programs increased the percentage of noncustodial parents who paid child support during the 12-month follow-up period discussed in this report, and three of them led to statisti-cally significant increases in the total amount paid. The child support impacts were largely consistent with the programs’ impacts on employment, but other factors also help to explain the pattern of impacts on the amount of child support paid. For example, the San Francisco program

ES-17
modified participants’ child support orders downward while they participated, which led to a large increase in the proportion paying child support, but no impact on the average amount paid. Some programs routinely notified the child support agency when participants began working in transitional jobs and took an active role in setting up the deduction of child support from their wages, while others did not. These close collaborations with local child support agencies may have contributed to the programs’ impacts on child support payments.
Conclusions and Policy Implications It is too early to draw final conclusions about the impacts of the ETJD programs. It is clear that the employment rates of the program and control groups grew closer together over the course of the first year following random assignment, but it is not clear whether any impacts on employ-ment will persist beyond the follow-up period for this report. It is possible, for example, that program group members are better prepared to retain jobs, in which case impacts may persist or appear later. It is also too early to predict what the benefit-cost analysis will show.
Even at this early point, however, a few conclusions seem warranted. First, the ETJD study has confirmed an important finding from earlier studies: Transitional jobs programs can employ many people who would not otherwise be working.11 The employment rate for the control group ranged from about 35 percent to 45 percent in most cities in a typical quarter, indicating that the ETJD programs targeted people who have serious labor-market difficulties and allowed many of them to hold legitimate jobs, at least temporarily.
Second, the early ETJD results provide further confirmation that some transitional jobs programs can reduce recidivism among people recently released from prison. It is not entirely clear why some programs have this effect and others do not, but it seems clear that simply providing people with temporary low-wage jobs is not sufficient to change recidivism patterns. If that were true, then most of the transitional jobs programs that have been tested would have reduced recidivism (and they have not),12 and the Fort Worth ETJD program would not have done so, because it did not place most of its participants in transitional jobs. Since the cost-savings and public-safety implications of reducing recidivism are so great, it may be worth testing new transitional jobs models that are specifically designed to reduce recidivism — for example, programs that combine transitional jobs with cognitive behavioral interventions and allow people to leave and return to the subsidized jobs as often as needed during the first two to three years after their release from prison (reflecting the fact that the path to steady employment
11Dan Bloom, Transitional Jobs: Background, Program Models, and Evaluation Evidence (Washington, DC: Office of Planning, Research and Evaluation, Administration for Children and Families, U.S. Department of Health and Human Services, 2010).
12Jacobs Valentine (2012); Redcross, Millenky, Rudd, and Levshin (2012); Butler et al. (2012).

ES-18
and desistence from crime often involves stops and starts). Paid employment can be a useful strategy for engaging people in other services that are designed specifically to improve decision making and reduce risky behavior.
Finally, regardless of the longer-term results from the ETJD study, it is important to note that transitional jobs programs are only one particular type of subsidized employment, and that subsidized employment programs may have very different goals. While transitional jobs programs aim to use subsidized employment as a training tool to improve participants’ success in unsubsidized jobs over time, other subsidized employment models are mainly designed to provide opportunities for work and income for people who cannot find jobs in the regular labor market. This latter type of program is particularly critical during recessionary periods — such programs are sometimes called “countercyclical programs” — but the rationale may also apply to populations or geographic areas where joblessness remains high even when the national economy is doing relatively well. Such programs might be evaluated on their ability to place large numbers of people into meaningful jobs quickly, as well as on the value of the work they complete, rather than on their ability to improve participants’ longer-term employment out-comes. The ETJD project does not address the question of whether other kinds of job-creation programs constitute a good use of public resources.

Chapter 1
Introduction

THIS PAGE INTENTIONALLY LEFT BLANK

3
For decades, policymakers and practitioners have searched for program models that can increase employment rates and earnings for adults who are considered “hard to employ”: those with limited work experience, low levels of formal education, and other obstacles to employ-ment. One approach that has been implemented and tested fairly extensively is called “transi-tional jobs.” Transitional jobs programs offer temporary subsidized jobs that aim to teach participants basic work skills or get a foot in the door with an employer. The programs also help participants address personal issues that impede their ability to work (for example, a lack of transportation, identification, clothing, or supplies) and assist them in finding unsubsidized jobs when the transitional jobs end. A number of transitional jobs programs have been evaluated in the past, with mixed results.1
In late 2010, the Employment and Training Administration of the U.S. Department of Labor (DOL) launched the Enhanced Transitional Jobs Demonstration (ETJD), which provided about $40 million to seven transitional jobs programs that were chosen through a national grant competition.2 The programs targeted either low-income parents who did not have custody of their children (“noncustodial” parents, usually fathers) and who owed child support, or individ-uals who had recently been released from prison. They were designed to build on the lessons of past research. MDRC, a nonprofit, nonpartisan research organization, was selected to conduct a multifaceted evaluation of the programs using a random assignment research design. MDRC is partnering with Abt Associates and MEF Associates.
At about the same time, the U.S. Department of Health and Human Services (HHS) launched the Subsidized and Transitional Employment Demonstration (STED), which is evaluating subsidized employment programs for a range of populations. MDRC is leading the STED project as well.3 The two projects are closely coordinated. For example, DOL and HHS agreed to coordinate the timing of the projects’ follow-up surveys and to use many of the same data-collection instruments. Notably, two of the ETJD programs targeting noncustodial parents are also being evaluated as part of the STED evaluation.
This report provides the first evidence about the implementation and effects of the ETJD programs. Each chapter focuses on one of the programs, describing its design, opera-tion, and impacts on participants’ outcomes during a one-year follow-up period. The final chapter summarizes the results and looks forward, identifying unanswered questions that will be addressed in a future report. Because this report includes all seven ETJD programs —
1See, for example, Bloom (2010); Valentine (2012); Redcross, Millenky, Rudd, and Levshin (2012); Butler et al. (2012).
2For additional information, see U.S. Department of Labor, Employment and Training Administration (2011).
3MDRC’s partners for the STED project are MEF Associates, Branch Associates, and Decision Infor-mation Resources.

4
including the two that are also being evaluated under STED — it is funded and released by both DOL and HHS.
The report presents comprehensive information about each program’s implementation. However, the data on the programs’ effects on participants’ outcomes should be considered interim results because one year of follow-up is not sufficient to draw conclusions about models of this type.
Background and Policy Context This section discusses some of the factors that shaped the design of the ETJD and STED projects: a resurgence of interest in subsidized employment, the findings of past studies of transitional jobs programs, and developments in the child support and corrections systems, including policy efforts to address the effects of mass incarceration and the employment needs of people returning to their communities.
A Renewed Focus on Subsidized Employment
Subsidized employment programs use public funds to create jobs for people who can-not find employment in the regular labor market. The first large-scale subsidized employment programs in the United States — the Works Progress Administration and other New Deal programs — employed millions of people during the Great Depression, built thousands of roads and bridges, and improved many other public facilities.4 A smaller subsidized employment program operated in the 1970s under the auspices of the Comprehensive Employment and Training Act. These relatively large, “countercyclical” subsidized employment programs were designed primarily to put money into the pockets of jobless workers during periods of high unemployment, and to stimulate the economy. They were usually targeted broadly, rather than focusing on specific disadvantaged populations.
In 2009, when the national unemployment rate reached 10 percent, states used funds from the American Recovery and Reinvestment Act’s Temporary Assistance for Needy Families Emergency Fund (TANF-EF) to create jobs for about 280,000 people.5 Forty states put at least some people to work in this way before the funding expired in late 2010, and 14 states and the District of Columbia each placed at least 5,000 people in subsidized jobs. In contrast to earlier countercyclical programs that placed workers with public agencies, many of the largest TANF-EF programs placed most subsidized workers with private-sector firms.
4Taylor (2009). 5Farrell, Elkin, Broadus, and Bloom (2011).

5
Importantly, most of the TANF-EF programs (particularly the larger ones) broadly targeted unemployed workers. Eligibility was not limited to recipients of Temporary Assis-tance for Needy Families (TANF), people with criminal records, or other disadvantaged groups (notably, about half the placements nationwide were summer jobs for young people). Also, many of the programs did not put a strong emphasis on helping participants make a transition to unsubsidized jobs. Like other countercyclical programs before them, the TANF-EF programs served many people who had steady work histories, and the models assumed that these people would return to regular jobs once the labor market improved. The TANF-EF programs were popular in many states, with governors from both parties expressing strong support. The experience, while relatively short-lived, rekindled interest in subsidized em-ployment more broadly.6
Evaluations of Transitional Jobs Programs
While the relatively positive experiences of the TANF-EF-funded programs helped cre-ate momentum for research projects like ETJD and STED, the specific models being tested in these projects are quite different from the countercyclical programs described in the previous section. Whereas the countercyclical programs were designed primarily to provide work-based income support to the unemployed, the programs in ETJD and STED use subsidized employ-ment as a training tool to help prepare the hard-to-employ for regular employment, and they typically offer comprehensive services and other forms of support in addition to the jobs themselves. Programs of this type have operated sporadically since the 1970s, usually on a relatively small scale. These programs are usually assessed by measuring whether they improve the longer-term employment patterns of participants, and whether they improve outcomes in related areas like recidivism (for people with a history of incarceration) or reliance on public benefits (for welfare recipients).7
The first rigorous evaluation of this approach, the National Supported Work Demon-stration, operated by MDRC from 1974 to 1980, tested a highly structured subsidized employ-ment model for four disadvantaged groups: long-term welfare recipients, formerly incarcerated people, young people who had dropped out of high school, and recovering substance abusers. That evaluation found mixed results.8 Another study, in the 1980s, tested a model that provided both classroom training and subsidized jobs to recipients of public assistance who were prepar-ing to become home health aides. The program, which was tested in several locations, led to
6Farrell, Elkin, Broadus, and Bloom (2011); Pavetti, Schott, and Lower-Basch (2011). 7In this report “recidivism” refers to the rate at which people with criminal records are rearrested, con-
victed of new crimes, or reincarcerated. For a review of evaluations of subsidized employment programs, see Dutta-Gupta, Grant, Eckel, and Edelman (2016).
8Hollister, Kemper, and Maynard (1984).

6
sustained increases in earnings in most of these locations.9 Interest in this type of model reemerged in the 1990s in the context of state and federal welfare-reform efforts, and the term “transitional jobs” emerged to describe the general approach.
Transitional jobs programs take many forms. In some models, participants work direct-ly for the program sponsor, which may be a social enterprise (a business with a social purpose). In others, they work for nonprofit organizations or businesses in the community but remain on the payroll of the program sponsor, which serves as the “employer of record.” In models with the latter structure, the subsidized workers may be supervised by staff members from the host employer, or by staff members from the program sponsor who are stationed at the work site. Finally, some models place participants with businesses and subsidize only a portion of those individuals’ wages for a set time period; there may be an expectation that the participant will “roll over” and become a permanent employee of the business when the subsidy ends.
Between 2004 and 2010, MDRC (with support from HHS, DOL, and private founda-tions) evaluated six transitional jobs programs, five targeting formerly incarcerated people and one targeting long-term TANF recipients.10 All of the transitional jobs programs provided participants with temporary subsidized jobs, usually lasting two to four months. In some models, the participants worked directly for the program, while in others they worked for other nonprofit organizations in the community. In either case, there were very few opportunities for participants to move into permanent, unsubsidized jobs with the host employers. The programs therefore helped participants look for permanent, unsubsidized jobs, and provided a range of support services. The evaluations randomly assigned eligible applicants to a program group that had access to the transitional jobs program or to a control group that did not. In most of the studies, the control group was offered basic job-search assistance, but not subsidized jobs.
The studies found that all of the programs dramatically increased employment initially: Rates of employment were typically 30 to 50 percentage points higher for the program group than for the control group in the early months of the study period. This difference means that the programs gave jobs to many people who would not have worked otherwise. However, the employment gains were the result of the subsidized jobs themselves, and those gains faded quickly as people left those jobs — a result consistent with previous research on transitional jobs programs. None of the programs consistently increased unsubsidized employment over follow-up periods ranging from two to four years. One of the programs for formerly incarcer-ated people (the New York City-based Center for Employment Opportunities) produced
9Bell and Orr (1994). 10Redcross, Millenky, Rudd, and Levshin (2012); Valentine and Bloom (2011); Valentine (2012).

7
statistically significant reductions in recidivism, but the others did not.11 The results of these evaluations led to a search for transitional jobs models that could produce sustained increases in unsubsidized employment and improvements in other areas.
Developments in the Criminal Justice and Child Support Systems
The ETJD project in particular reflects broader trends in corrections and child support, two systems that interact with many disadvantaged men. Both of these systems are heavily focused on enforcement. Put simply, the corrections system aims to segregate and punish criminals, and the child support system aims to identify noncustodial parents and establish and enforce child support orders. In recent years, however, both systems have begun to rethink their priorities and practices.
After a four-decade surge in incarceration, many states are now looking for ways to re-duce their prison populations by changing sentencing laws and emphasizing alternatives to incarceration, such as drug treatment and mental health services. Similarly, states are increas-ingly providing services and support to individuals who are released from prison, in order to reduce high rates of recidivism. The most recent national data show that two-thirds of individu-als released from state prisons are rearrested and half are reincarcerated within three years.12 While the connection between crime and employment is far from straightforward, employment services are central to most reentry initiatives, probably because work provides a source of legitimate income and an opportunity for individuals to spend time in socially productive activities. These trends can also be seen at the local level, as many municipalities are developing jail reentry programs.13
Parallel changes are occurring in the child support system, which is run by states and counties but heavily funded by the federal government. Over the past three decades, that system has become increasingly adept at collecting child support, primarily by withholding payments from noncustodial parents’ paychecks. The system now works relatively efficiently for parents who are steadily employed in the mainstream economy, but improved enforcement may have different effects for noncustodial parents who do not have the means to pay. These parents may accrue large child support debts (also known as arrears).14 In fact, some argue that tighter
11Researchers hypothesized that the program reduced recidivism because some aspect of its unusual structure — participants worked in small crews supervised by Center for Employment Opportunities staff members — led to changes in participants’ attitudes and behavior.
12Durose, Cooper, and Snyder (2014). 13Counties and cities operate jails, which are used to detain defendants awaiting trial and to incarcerate
people who are given relatively short sentences (that is, those of less than one year). 14Child support debt may be owed to the custodial parent or to the state, since payments made on behalf
of custodial parents who receive public assistance may be retained by the state as reimbursement for those costs. Noncustodial parents are generally required to pay child support until their children reach age 18, but
(continued)

8
enforcement may drive some disadvantaged noncustodial parents underground, where their earnings will be invisible to the system. In recent years, many child support agencies have begun to pay more attention to noncustodial parents’ ability to pay, to rethink the way child support orders are set and modified for parents with little or no earned income, and to provide services to help unemployed or underemployed parents find jobs. This evolution reflects the fact that researchers and policymakers are increasingly emphasizing the role fathers — including noncustodial fathers — play in providing financial and emotional support to their children.
Transitional jobs programs are seen as a potentially effective approach for unemployed noncustodial parents and individuals who are reentering the community from prison, in part because these models provide immediate income while participants are learning work skills. Temporary subsidized jobs also recognize the reality that many private-sector employers are extremely reluctant to hire people with criminal records.
The ETJD Project In 2011, DOL held a national competition to select programs for the ETJD project. The grant competition required each applicant to provide core components of a strong, basic transitional jobs program as well as specific enhancements intended to address the employment barriers of the applicant’s specified population. The applicants had to justify why the particular enhance-ment(s) they proposed were likely to yield stronger long-term outcomes than those achieved by programs previously tested, and they had to conduct screening to ensure that only individuals who were not “job ready” could enroll. DOL also required applicants to demonstrate that they had established partnerships with One-Stop Career Centers and employers.15 DOL identified the top 14 applicants, and then the MDRC team visited each contender to assess the applicant’s ability to operate a strong program and meet the requirements of the evaluation.
Ultimately, seven applicants were selected, and each received a four-year grant totaling approximately $6 million to recruit, screen, and conduct random assignment of 1,000 interested participants, ultimately serving 500 of them. The 4-year grant period included approximately 6 months for planning, 2 years to enroll participants, and an additional 18 months to complete service delivery for all participants. DOL also engaged Coffey Consulting, a small business based in Maryland, to provide technical assistance to the grantees as they set up their programs. (Box 1.1 provides further information about the technical assistance effort.)
the child support system will continue to pursue unpaid debt after a parent is no longer required to pay “current support.” These cases are known as “arrears-only” cases.
15Established under the Workforce Investment Act of 1998, One-Stop Career Centers offer a range of services to job seekers under one roof. They are now known as American Job Centers.
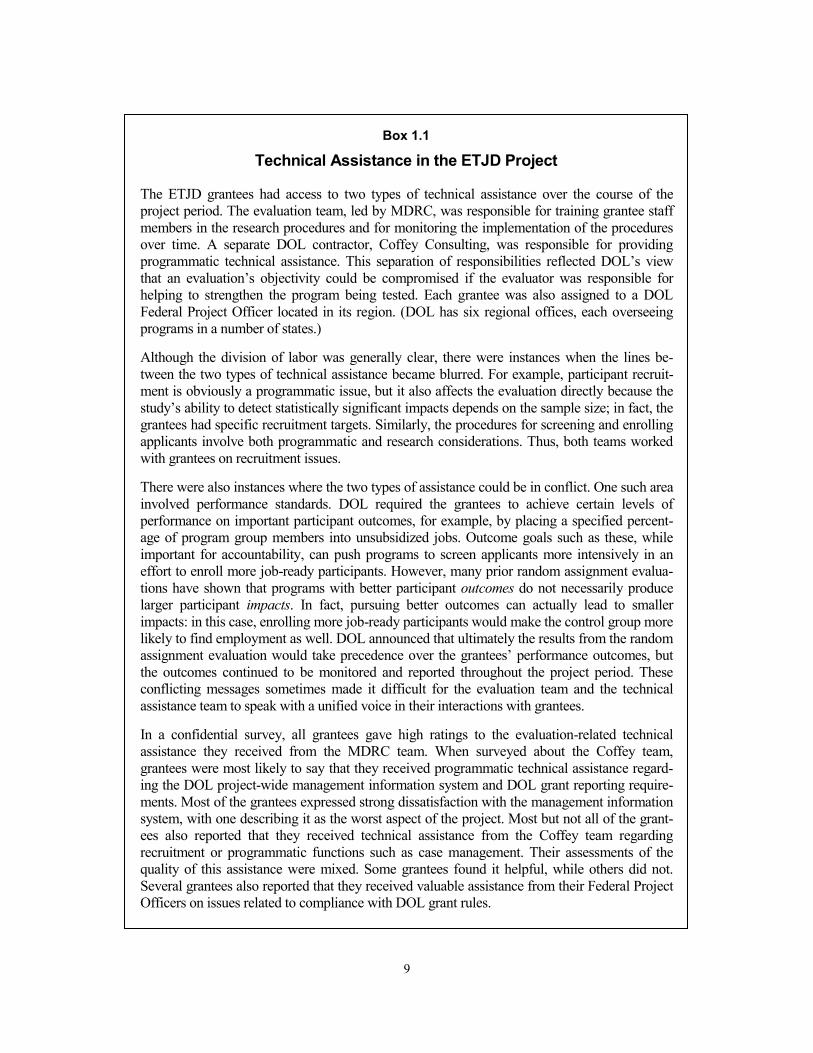
9
Box 1.1
Technical Assistance in the ETJD Project
The ETJD grantees had access to two types of technical assistance over the course of the project period. The evaluation team, led by MDRC, was responsible for training grantee staff members in the research procedures and for monitoring the implementation of the procedures over time. A separate DOL contractor, Coffey Consulting, was responsible for providing programmatic technical assistance. This separation of responsibilities reflected DOL’s view that an evaluation’s objectivity could be compromised if the evaluator was responsible for helping to strengthen the program being tested. Each grantee was also assigned to a DOL Federal Project Officer located in its region. (DOL has six regional offices, each overseeing programs in a number of states.)
Although the division of labor was generally clear, there were instances when the lines be-tween the two types of technical assistance became blurred. For example, participant recruit-ment is obviously a programmatic issue, but it also affects the evaluation directly because the study’s ability to detect statistically significant impacts depends on the sample size; in fact, the grantees had specific recruitment targets. Similarly, the procedures for screening and enrolling applicants involve both programmatic and research considerations. Thus, both teams worked with grantees on recruitment issues.
There were also instances where the two types of assistance could be in conflict. One such area involved performance standards. DOL required the grantees to achieve certain levels of performance on important participant outcomes, for example, by placing a specified percent-age of program group members into unsubsidized jobs. Outcome goals such as these, while important for accountability, can push programs to screen applicants more intensively in an effort to enroll more job-ready participants. However, many prior random assignment evalua-tions have shown that programs with better participant outcomes do not necessarily produce larger participant impacts. In fact, pursuing better outcomes can actually lead to smaller impacts: in this case, enrolling more job-ready participants would make the control group more likely to find employment as well. DOL announced that ultimately the results from the random assignment evaluation would take precedence over the grantees’ performance outcomes, but the outcomes continued to be monitored and reported throughout the project period. These conflicting messages sometimes made it difficult for the evaluation team and the technical assistance team to speak with a unified voice in their interactions with grantees.
In a confidential survey, all grantees gave high ratings to the evaluation-related technical assistance they received from the MDRC team. When surveyed about the Coffey team, grantees were most likely to say that they received programmatic technical assistance regard-ing the DOL project-wide management information system and DOL grant reporting require-ments. Most of the grantees expressed strong dissatisfaction with the management information system, with one describing it as the worst aspect of the project. Most but not all of the grant-ees also reported that they received technical assistance from the Coffey team regarding recruitment or programmatic functions such as case management. Their assessments of the quality of this assistance were mixed. Some grantees found it helpful, while others did not. Several grantees also reported that they received valuable assistance from their Federal Project Officers on issues related to compliance with DOL grant rules.

10
What Is Being Tested in ETJD?
Figure 1.1 shows the locations of the seven ETJD programs, and Table 1.1 provides some basic information about each grantee and its intended model.
As Table 1.1 shows, most of the grantees were private, nonprofit organizations. As discussed in later chapters, all of them worked closely with state or local government partners. Each ETJD grantee was required to choose a primary target population, either noncustodial parents or people recently released from prison. These two groups tend to overlap, since many people involved in the criminal justice system are parents, but each grantee needed to ensure that everyone it served met the eligibility criteria for its chosen target group.16 Table 1.1 shows that four of the grantees targeted noncustodial parents and three targeted formerly incarcerated people. Each of the seven ETJD programs was designed somewhat differently but, as required by DOL, all of them were enhanced in some ways relative to the transitional jobs models that were studied earlier. Those earlier programs all provided temporary subsidized jobs either within the program itself or with other nonprofit organizations. They also assigned participants to job coaches or case managers (who helped them address barriers to employment) and to job developers (who helped them search for unsubsidized jobs). As shown in Table 1.2, the ETJD enhancements fell into three general categories:
• Structural changes. The transitional jobs programs that were tested earlier placed participants into relatively sheltered positions and then helped them find regular jobs. Two of the ETJD programs (those in Atlanta and New York City) used “staged” models in which participants started in program jobs, but then progressed to subsidized jobs in the community that more closely resembled “real” jobs. A third program (the one in Fort Worth) fo-cused entirely on placing participants directly into subsidized jobs in the pri-vate sector that were intended to evolve into permanent positions. A fourth (the one in San Francisco) used a “tiered” model that placed participants into different types of transitional jobs based on their educational and work histo-ries. For the most part, these new structural approaches were designed to promote smoother transitions from subsidized to unsubsidized jobs.
16Eligibility criteria in programs choosing to target noncustodial parents required that participants be
low-income (as defined by Title I of the Workforce Investment Act) divorced, separated, or never-married parents ages 18 or older who were not the primary physical custodians of their children, and who either had child support orders in place or who had agreed to start the process of establishing orders within 30 days of program enrollment. In programs targeting people recently released from prison, eligibility criteria required that participants be offenders ages 18 or older who had been convicted as adults under federal or state law, who had never been convicted of sex-related offenses, and who had been released from state or federal prison within the 120 days before they enrolled.

11

12
Table 1.1
ETJD Individual Program Characteristics
Program Name, Operator, and Location
Target Group Program Overview
GoodTransitions Goodwill of North Georgia Atlanta, GA
Noncustodial parents
Participants work at a Goodwill store for approximately one month, then move into a less supported subsidized position with a private employer in the community for about three months. The program offers case management and short-term training.
Supporting Families Through Work YWCA of Southeast Wisconsin Milwaukee, WI
Noncustodial parents
Participants start in a three- to five-day job-readiness workshop. They are then placed in transitional jobs, mostly with private-sector employers. The program supplements wages in unsubsidized employment to bring them up to $10 an hour for six months. The program also provides child support-related assistance.
TransitionsSF Goodwill Industries, with San Francisco Dept. of Child Support Services San Francisco, CA
Noncustodial parents
Participants begin with an assessment, followed by two weeks of job-readiness training. Then they are placed into one of three tiers of subsidized jobs depending on their job readiness: (1) nonprofit, private-sector jobs (mainly at Goodwill); (2) public-sector jobs; or (3) for-profit, private-sector jobs. They may receive modest financial incentives for participation milestones and child support assistance.
Parent Success Initiative Center for Community Alternatives Syracuse, NY
Noncustodial parents
Groups of 15 to 20 participants begin the program together with a two-week job-readiness course. They are then placed in work crews with the local public housing authority, a business improvement district, or a nonprofit organization. The program offers family life-skills workshops, job-retention services, case management, civic restoration services, child support legal aid, and job-search and job-placement assistance.
Next STEP Workforce Solutions of Tarrant County Fort Worth, TX
Formerly incarcerated people
Participants begin with a two-week “boot camp” that includes assessments and job-readiness training. They are then placed in jobs with private employers. The program pays 100 percent of the wages for the first eight weeks and 50 percent for the following eight weeks. Employers are expected to retain participants who perform well. Other services include case management, group meetings, high school equivalency classes, and mental health services.
RecycleForce RecycleForce, Inc. Indianapolis, IN
Formerly incarcerated people
Participants are placed at one of three social enterprises, including an electronics recycling plant staffed by formerly incarcerated workers, who provide training and supervision to participants and serve as their peer mentors. Participants begin working in subsi-dized jobs on the day of random assignment. The program also offers occupational training, case management, job development, work-related financial support, and child support-related assistance.
Ready, Willing and Able Pathways2Work The Doe Fund New York, NY
Formerly incarcerated people
After a one-week orientation, participants work on the program’s street-cleaning crews for six weeks, then move into subsidized internships for eight weeks. If an internship does not turn into unsubsidized employment, the program will pay the participant to search for jobs for up to nine weeks. Additional services include case management, job-readiness programs, opportunities for short-term training and certification, and parenting and computer classes.

13
Table 1.2
Description of ETJD Enhancements
Enhancement Type
Example of Enhancement Approaches ETJD Programs
Implementing Enhancement
Structure of subsidized job 1. Staged: begin in program transitional job and progress to the private sector in the second stage
2. Tiered: three types based on client need 3. Private-sector subsidy
Atlanta San Francisco Fort Worth New York City
Enhanced support 1. Cognitive behavioral therapy-based workshops 2. Peer mentoring 3. Wage supplement 4. Occupational training 5. Criminal justice system-related assistance
Fort Worth Indianapolis Milwaukee Syracuse New York City
Child support system-generated incentives/sanctions
1. Child support orders modified downward contingent on program participation. Reinstated to prior levels for nonparticipation.
2. Interest on debt forgiven in progressively greater proportions, contingent on length of participation in program, up to 100 percent of state-owed debt.
San Francisco Milwaukee
SOURCE: MDRC implementation research.
•
•
Enhanced support. Several of the ETJD programs aimed to provide special support or assistance that was not available in the earlier programs — for ex-ample, cognitive behavioral workshops, opportunities for short-term training in occupational skills, or help correcting errors in their official criminal rec-ords. However, the ETJD programs did not offer direct services to address is-sues like substance abuse or housing instability.
Child support incentives. In two of the programs targeting noncustodial parents (those in Milwaukee and San Francisco), the child support agency of-fered special “carrots,” “sticks,” or both to encourage participants to remain active in the ETJD program. For example, in San Francisco, participants’ child support orders were reduced as long as they participated steadily in the program.
The programs used these enhancements in various combinations. Some of them were structured much like traditional transitional jobs programs, but included enhanced support or child support incentives. (In subsequent chapters, these programs are referred to as “modified transitional jobs models.”) Others used one of the innovative structural approaches described above and also included one or both of the other types of enhancements.

14
How Were the Programs Intended to Work?
When designing an evaluation, it is critical to understand a program’s “theory of change”: the underlying assumptions about how the program components will ultimately lead to the desired outcomes for participants. Figure 1.2 depicts a generic logic model (a graphical illustration of the theory of change) for the ETJD programs (though it is important to note that the evaluation is not able to measure everything shown in the figure). The left-hand side of the figure shows the major “inputs”: the grantee organizations’ internal resources, their community partners, the DOL grants, and the DOL-funded technical assistance. The next section shows the major program activities or components, including participant recruitment, screening, and assessment; job development (outreach to employers to identify potential job openings) and job placement (help applying for open jobs); and, of course, the subsidized jobs. The grant required the programs to screen for job readiness, as only individuals who were not considered “job ready” were eligible. Each program defined job readiness slightly differently, but each had a screening process in place. As noted earlier, most of the programs also included enhanced support or arrangements with child support agencies to reduce obstacles to participants’ success. The inputs and activities lead to the outputs: hours or days of participation in subsidized jobs (that is, work experience) and other program activities, referrals for assistance to other agencies in the community, and so forth.
Finally, the right side of the figure shows the desired outcomes. While program group members are working in subsidized jobs, the impacts on employment and earnings are likely to be quite large. After the program, in the short term, ETJD is expected to assist participants in obtaining formal, unsubsidized employment. Transitional jobs are designed to make participants more employable not only by providing work experience that can be recorded on a résumé, but also by improving their “soft skills” (the general habits and competencies of a good employee, for example, the ability to show up to work on time, take direction, and work well with others).
Transitional employment can also effect long-run unsubsidized employment by sending signals to employers. Successful completion of ETJD activities can signal to employers that a graduate is ready for the world of work, for example. On the other hand, ETJD programs might send negative signals if employers assume graduates “needed” the program to address issues that may affect their performance on the job. Finally, some of the programs rely on wage subsidies to convince employers to try out employees whom they might not ordinarily hire. The theory is that, with a foot in the door, a subsidized worker who performs well might have a good chance to “roll over” into an unsubsidized position.
It is hypothesized that higher levels of employment among noncustodial parents and people recently released from prison will lead to more regular child support payments and lower recidivism, respectively. In addition, some of the ETJD programs offer specialized assistance to

15
funding
Partnerships with other agencies and systems
Technical assistance from DOL contractor
Figure 1.2
Generic Logic Model
Participant characteristics Community/system context Organizational characteristics
INPUTS
Program staff
Organizational support
DOL grant
Increased child support
Other outcomes
Higher employment rate
Lower recidivism
Improved attitudes toward work, crime, fatherhood
Personal contacts/connections to employers
Improved job readiness via work experience
Other outcomes
Stable employment
Lower recidivism
Increased child support
OUTCOMES
MEDIUM-TERM (12 MONTHS)
SHORT-TERM
LONG-TERM (30 MONTHS)
Screening process
Individual assessment
Subsidized jobs
Ancillary support
Job development/ placement
Days of work in subsidized job
Days of participation in other activities
Referrals for services, jobs, etc.
OUTPUTS
PROGRAM COMPONENTS
ACTIVITIES
Short-term training

16
the two target groups — for example, training in parenting skills for noncustodial parents or cognitive behavioral workshops to address criminal attributes common among the formerly incarcerated. These services may affect child support payments and recidivism directly, not necessarily as a result of employment.17
The ETJD Evaluation The ETJD evaluation set out to answer three broad questions:
• How were the ETJD programs designed and operated, and whom did they serve?
• How did the ETJD programs affect participants’ receipt of services, and their outcomes in three primary domains: employment, child support, and recidi-vism (that is, arrests, convictions, and incarceration)?
• How do the programs’ costs compare with any benefits they produce?
To address these questions, the evaluation includes three main components: an imple-mentation study, an impact study, and a benefit-cost study. This report focuses mainly on the implementation study and also presents early findings from the impact study. Impact findings 30 months after random assignment and results from the benefit-cost study will be presented in a later report.
The central goal of the evaluation is to assess whether the ETJD programs were suc-cessful in improving participants’ outcomes in the first three areas shown in Figure 1.2: em-ployment, recidivism, and child support payments. The basic approach is a randomized con-trolled trial, in which individuals who were eligible for and expressed interest in an ETJD program were assigned, through a lottery-like process, to a program group that had access to program services or a control group that did not. This process created two groups that were comparable at the start of the study in both measurable and unmeasurable ways. Thus, one can be fairly confident that any statistically significant differences in the groups’ outcomes that emerge over time — for example, differences in employment rates — can be attributed to the ETJD program rather than to preexisting differences between the groups.
Three points about the evaluation approach are worth noting. First, there is a critical dis-tinction to be made between a program model as it is written on paper (or in a grant application)
17The link between employment and child support is relatively straightforward, since child support
payments are often deducted directly from noncustodial parents’ paychecks. The link between employment and recidivism is the subject of much scholarly research, and is considerably less direct.

17
and the program services that are actually offered or that participants receive. Models are not always implemented with fidelity and potential participants do not necessarily accept services that programs offer. The implementation study examines all the links in this chain.
Second, the evaluation assumes that program impacts — that is, the differences in out-comes between the program and control groups — are the product of the service contrast — the differences in the services, support, and incentives received by members of the two groups. While the ETJD programs are the central focus of the evaluation, the design assumes that the control group will make use of other services in the community. This assumption is particularly likely to be true because all of the sample members are involved with child support or criminal justice — two systems that may urge or even require their “clients” to get help finding work or addressing barriers to employment. As discussed further below, the evaluation is using surveys to measure the services received by both groups.
Third, the characteristics of the service providers — in this case, the ETJD grantees and their partners — shape the implementation process. Similarly, the characteristics of the clients and the local context (including factors such as the labor market, the service environment, and the operation of the child support and criminal justice systems) shape a program’s implementa-tion, the services the program and control groups receive, and the groups’ outcomes. The implementation study also examines these contextual factors.
Implementation Study
The implementation study set out to describe how ETJD operated on the ground in each city. As discussed earlier, doing so means describing each grantee’s model as it was designed, the steps that local managers took to put it in place, the nature of the services that were ultimate-ly offered to clients, the “dosage” of services that they actually received (that is, the frequency and intensity of those services), and the context in which the program operated. The study especially aimed to assess whether the ETJD programs were truly “enhanced” relative to earlier transitional jobs programs. The implementation study used several data sources:
• Staff interviews and observations. The research team made two formal visits to each program to interview staff members and observe program ac-tivities (plus an additional visit to conduct an early assessment of program operations). In addition, the team gathered important information through regular contact with grantees that was part of providing technical assistance on the research procedures. Lastly, the team conducted a time study in the fall of 2013, in which the staff at each ETJD program recorded the time spent on various ETJD program activities and non-ETJD responsibilities over a two-week period.

18
•
•
•
Management information system data. Grantees were required to track cli-ents’ participation in program activities using a management information sys-tem developed by DOL (that is, a computerized database organized and pro-grammed to produce regular reports on operations). The research team extracted data on client characteristics, service receipt and attendance, work support and incentive payments, and subsidized employment earnings. In some cases, the research team supplemented these data with additional payroll and participation records available from the grantee’s own data systems. It is im-portant to note there were persistent problems with the management infor-mation system throughout the life of the project. Several delays in the devel-opment of the system meant that it was not fully functional until April 2014, four months after the final ETJD participant was enrolled, in December 2013.
Focus group discussions, case-file reviews, and in-depth interviews with participants. The research team conducted focus groups with participants in each program during the first formal site visit. During the second site visit, the team reviewed four to nine case files in each location. In addition, re-searchers conducted a series of longer interviews with four to eight partici-pants in each program to learn more about program offerings and partici-pants’ experiences.
Questionnaires. The team administered four questionnaires to gain “real-time” information from participants, program staff members, employers, and work-site supervisors. The research team attempted to administer the participant questionnaires on paper to all participants working in transition-al jobs at the time of the two site visits to each program. A total of 531 par-ticipant questionnaires were completed. The program staff, employer, and work-site supervisor questionnaires were administered via a website link sent by e-mail in the weeks shortly following each site visit. In total, 93 program staff members, 105 work-site supervisors, and 85 employers com-pleted questionnaires.18
Impact Study
This report provides early, interim evidence on the ETJD programs’ impacts on em-ployment, child support, and recidivism. More than 12 months of follow-up is needed to provide reliable evidence on the longer-term impacts of the ETJD programs. These results lay
18Note that these categories (program staff member, work-site supervisor, and employer) were not mu-
tually exclusive, as some individuals fit into multiple categories.

19
the groundwork for the final report, which will address the impact questions more definitively, based on 30 months of follow-up data.
Because ETJD is testing a variety of new models and enhancements that have not yet been “proven” in rigorous studies, this evaluation is primarily exploratory in nature. That is, the evaluation as a whole will be providing suggestive evidence on which program innovations are effective, so that these enhancements can be more widely replicated and studied. Hence, the evaluation will engage in an analysis that encompasses all measured outcomes for all programs. Hypothesis testing is conducted independently for each outcome for each program, and findings are interpreted as suggestive evidence of program effectiveness.19
Samples and data sources. The evaluation approach is very similar for each experi-mental “site” (a term that encompasses the program, the program group, the control group, and their environment): Grantees recruited eligible participants by establishing connections with child support and corrections agencies and other partners, and interested individuals were referred to the programs. Although the specific process differed from place to place, each grantee took some steps to verify that each potential participant was both eligible and appropri-ate for the program according to the DOL grant requirements for eligibility (which included being in the target population as the grant defined it and having limited employment history and low levels of education) as well as other, program-specific eligibility criteria. After determining eligibility, staff members explained the study and obtained the individual’s consent to partici-pate in it.20 They then logged into a web-based system maintained by MDRC that randomly assigned the individual to the program group or to the control group. Those in the program group were offered access to the ETJD program, with initial activities usually starting within a few days. Control group members were not offered services from the program being tested, but received a list of other services in their communities or, at a few sites, were referred to specific, preexisting programs that provided relatively modest services.21
Individuals were enrolled into the study and randomly assigned to the groups from No-vember 2011 through December 2013. Each grantee was expected to enroll a total of 1,000
19These analyses will be as meaningful and reliable as findings of previous studies that did not stipulate
any confirmatory hypotheses ahead of time (that is, the great majority of rigorous job-training evaluations). 20The steps that were required before random assignment differed from site to site, and these differences
may affect the characteristics of the sample at each site. This issue is discussed further in the program-specific chapters.
21As discussed in the site-specific chapters, at two sites (Milwaukee and New York City) there were other large, transitional jobs programs operating that were not connected with ETJD. Data obtained in New York City suggest that nearly 40 percent of control group members received services from the Center for Employment Opportunities, a very large transitional jobs program that has been shown to reduce recidivism in a previous evaluation. See Jacobs Valentine (2012); Redcross, Millenky, Rudd, and Levshin (2012); Butler et al. (2012).

20
people into the study — 500 in the program group and 500 in the control group — and all of them met that goal.
The evaluation team is collecting the following data for sample members in both re-search groups. In general, a year and a quarter of follow-up data are available for the sample.
Baseline data. The research team extracted baseline data on sample members’ demo-graphic characteristics, work histories, and other information from the management information system described earlier and from MDRC’s web-based random assignment system. Grantee staff members collected this information from sample members during the enrollment process.22
Employment and earnings records. Data from the National Directory of New Hires (NDNH) are used to measure quarterly earnings. Maintained by the federal Office of Child Support Enforcement at HHS, the NDNH contains quarterly earnings data collected by state workforce agencies and quarterly earnings data from federal agencies. These data include jobs covered by unemployment insurance, which comprise most jobs in the formal labor market. Jobs in the informal economy, those in which workers are treated as independent contractors, and some other types of employment are not included.
At some sites, the ETJD grantee was the employer of record for most or all transitional and subsidized jobs. Unfortunately, employer identification numbers were not available to determine which employer a sample member was working for in each quarter. In addition, at some sites (Atlanta, New York City, and San Francisco), at least some of the transitional or subsidized jobs were not reported to state unemployment insurance programs; as a result, earnings from those jobs do not appear in the NDNH data. To address this issue, subsidized job payroll records were obtained from the DOL management information system and combined with the NDNH records, so that the analysis includes both NDNH-reported jobs and transitional
22Due to problems with the DOL management information system, baseline data for the first four
months of study participants were missing at higher-than-normal rates in several important categories. Data in these categories had been entered by program staff members but not retained in the system’s data file. DOL later allowed grantees to reenter the lost data. As a result, data were missing at lower rates for program group members in these areas than for control group members, presumably because program staff members were more likely to be in contact with or know details about program group members (who were their clients) than control group members (who did not receive the grantees’ program services). Because of this imbalance between program and control group members for early enrollees, and general concerns regarding the reliability of baseline data that were entered retroactively, baseline data from the DOL management information system have been used only for descriptive purposes and not as covariates in any impact models. Covariates were drawn only from MDRC’s random assignment system baseline data — which did not suffer from these issues — and from comprehensive administrative records regarding employment, criminal justice involvement, and child support. (Administrative records are data used for the management of programs and public services.)
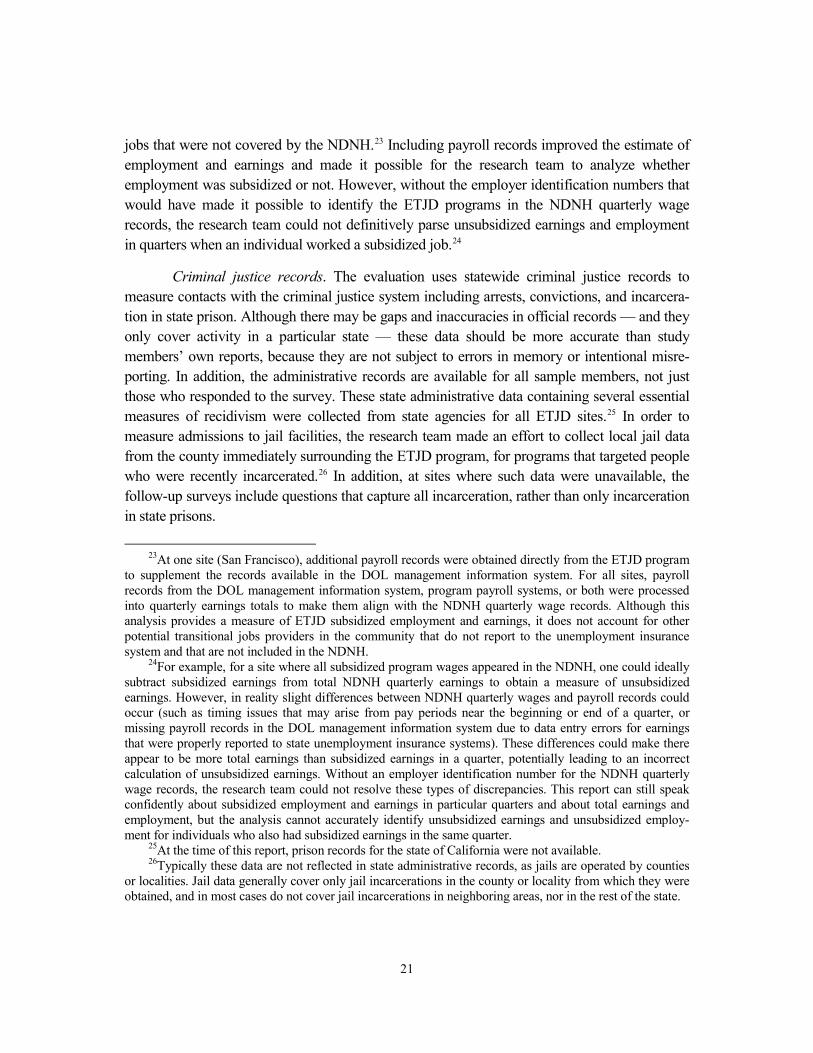
21
jobs that were not covered by the NDNH.23 Including payroll records improved the estimate of employment and earnings and made it possible for the research team to analyze whether employment was subsidized or not. However, without the employer identification numbers that would have made it possible to identify the ETJD programs in the NDNH quarterly wage records, the research team could not definitively parse unsubsidized earnings and employment in quarters when an individual worked a subsidized job.24
Criminal justice records. The evaluation uses statewide criminal justice records to measure contacts with the criminal justice system including arrests, convictions, and incarcera-tion in state prison. Although there may be gaps and inaccuracies in official records — and they only cover activity in a particular state — these data should be more accurate than study members’ own reports, because they are not subject to errors in memory or intentional misre-porting. In addition, the administrative records are available for all sample members, not just those who responded to the survey. These state administrative data containing several essential measures of recidivism were collected from state agencies for all ETJD sites.25 In order to measure admissions to jail facilities, the research team made an effort to collect local jail data from the county immediately surrounding the ETJD program, for programs that targeted people who were recently incarcerated.26 In addition, at sites where such data were unavailable, the follow-up surveys include questions that capture all incarceration, rather than only incarceration in state prisons.
23At one site (San Francisco), additional payroll records were obtained directly from the ETJD program
to supplement the records available in the DOL management information system. For all sites, payroll records from the DOL management information system, program payroll systems, or both were processed into quarterly earnings totals to make them align with the NDNH quarterly wage records. Although this analysis provides a measure of ETJD subsidized employment and earnings, it does not account for other potential transitional jobs providers in the community that do not report to the unemployment insurance system and that are not included in the NDNH.
24For example, for a site where all subsidized program wages appeared in the NDNH, one could ideally subtract subsidized earnings from total NDNH quarterly earnings to obtain a measure of unsubsidized earnings. However, in reality slight differences between NDNH quarterly wages and payroll records could occur (such as timing issues that may arise from pay periods near the beginning or end of a quarter, or missing payroll records in the DOL management information system due to data entry errors for earnings that were properly reported to state unemployment insurance systems). These differences could make there appear to be more total earnings than subsidized earnings in a quarter, potentially leading to an incorrect calculation of unsubsidized earnings. Without an employer identification number for the NDNH quarterly wage records, the research team could not resolve these types of discrepancies. This report can still speak confidently about subsidized employment and earnings in particular quarters and about total earnings and employment, but the analysis cannot accurately identify unsubsidized earnings and unsubsidized employ-ment for individuals who also had subsidized earnings in the same quarter.
25At the time of this report, prison records for the state of California were not available. 26Typically these data are not reflected in state administrative records, as jails are operated by counties
or localities. Jail data generally cover only jail incarcerations in the county or locality from which they were obtained, and in most cases do not cover jail incarcerations in neighboring areas, nor in the rest of the state.

22
Child support payment records. The research team obtained data on child support pay-ments from the state child support agency for each of the ETJD sites. These data were collected for each child support case associated with a noncustodial parent in the sample and were analyzed for all cases combined.
Surveys. The evaluation team attempted to contact each sample member for an inter-view approximately 12 months after his or her random assignment date, and will attempt to do so again at approximately 30 months. The surveys include questions on topics that are not covered in the administrative records described above. This report includes findings from the 12-month survey, which was administered to a total of 5,195 sample members across all seven sites. The response rate was 74.2 percent. The mean time of survey response was 13 months after random assignment. Appendix H contains additional information regarding survey response bias analyses.
An additional survey was administered at the two sites that are part of both ETJD and STED, Atlanta and San Francisco. Known as the “in-program survey,” it was administered to program and control group members at all STED sites about four to six months after random assignment, when many program group members were still working in transitional jobs. The survey was designed to measure some of the potential financial and nonfinancial benefits of employment during a period when there was expected to be a very large difference in the employment rates of the two groups.
The program-specific chapters in this report integrate qualitative and quantitative data from these various sources to create a coherent picture of the implementation of the ETJD program in each city.
Outcomes. Substantively, the measures of effectiveness used in this evaluation fall into three domains: labor market outcomes, child support, and recidivism. As described in the logic model above, the ETJD programs are designed to affect outcomes in each of these domains. All primary outcomes are measured using administrative records.
The analysis of labor-market impacts for the ETJD programs focuses on both employ-ment and earnings. The primary measures in this domain are quarterly employment rates and quarterly earnings; the quarterly time frame for these measures is dictated by the data source (unemployment insurance quarterly wage records obtained from the NDNH). Since each of the programs offers participants a period of paid employment, program group members are ex-pected to experience higher employment and earnings in the program period as long as program participation rates are sufficiently high and the programs target people who would not otherwise be working.

23
The goal of ETJD programs is to permanently alter an individual’s trajectory of em-ployment, earnings, and income through work experience and nonemployment support. However, this report primarily covers a period in which sample members were working in transitional or subsidized jobs. Although participants typically remained in subsidized jobs for only a few months, some of them left the jobs and returned, or entered the subsidized jobs later than initially expected. As a result, at all sites, some program group members were still working in subsidized jobs in the last quarter of the follow-up period. It is therefore too early to answer questions about the programs’ longer-term impacts after participants leave.
The ETJD programs are expected to affect earnings mainly through effects on employ-ment (rather than due to increases in wages). There are three reasons to emphasize employment independently of earnings. First, some people posit that increasing employment provides benefits to society in and of itself, by keeping people at risk of recidivism occupied in the workplace so they have less time to commit crimes and are more likely to develop positive peer relationships, or by helping noncustodial parents be more positive role models to their children. Second, employment is linked more directly to program activities than earnings, which capture many other dimensions of labor-market experiences. Third, few of the programs offered intensive training that could increase participants’ skills. Research suggests that in the segment of the labor market where most ETJD participants find themselves, wages do not rise simply as a result of job experience. Workers in this segment of the labor market are not expected to see increases in wages without skills training.27 As a result, the impact analysis is more likely to detect an impact on employment than wages.28
The primary child support measures included in the report are (1) number of months or quarters in which child support payments are made, and (2) dollar amounts of child support paid. Some of the ETJD programs are modifying child support orders to bring them in line with earnings during the program period. As a result, it is possible that the ETJD programs could lead to a reduction in payment amounts in the first year, even if program group members pay child support at higher rates than control group members. Regardless, effects on child support payments are expected to emerge early in the follow-up period.
The primary recidivism outcomes included in the report are (1) arrests, (2) convictions, and (3) incarcerations during the year following random assignment.29 Recidivism is most likely in the time shortly after release from prison. Therefore, any effects on recidivism would be expected to emerge early in the follow-up period.
27See Hendra and Hamilton (2015) for a review. 28A possible fourth reason is that earnings estimates are highly variable, making it more difficult to de-
tect impacts on earnings than employment. 29Incarceration includes admissions to prison at all sites, and in programs targeting recently released
individuals includes admissions to jail.

24
Secondary outcomes covered in this report include outcomes in these domains meas-ured from the survey as well as a range of other measures of overall well-being.30 In testing for these effects, the analysis uses two-tailed hypothesis test procedures (as is standard), since transitional jobs programs might produce negative effects (for example if they provide a negative signal to employers or if they delay entry into regular employment that would have otherwise occurred).
Analytic methods. To estimate program impacts, the analysis compares the average outcomes of program and control group members. The study’s random assignment design ensures that there are no systematic differences between the program and control groups at the time of randomization. This design ensures that any statistically significant differences in the two groups’ outcomes can be attributed to the intervention. While the simple program-control mean outcome comparison would provide an unbiased estimate of the true impact, the impacts are estimated using multivariate regression models that predict outcomes as a function of assignment to the program group and participant baseline characteristics. This method, which is conventional, is used to improve the statistical precision of the estimates. See Box 1.2 for information on how to read and interpret the tables in the subsequent chapters of the report. Unless otherwise stated, all analytic methods used in this study were prespecified before data analysis in the study’s design report and a subsequent memo to DOL. In brief, linear regression models were used to estimate impacts on all outcomes in the body of the report.31
As noted earlier, because this report includes only one year of follow-up data and is ex-ploratory in nature, it does not draw any firm conclusions about the impacts of the ETJD programs. Nevertheless, the analysis approach recognizes the fact that examining a larger number of outcomes increases the odds that some differences between the program and control
30Survey outcomes are considered secondary because they are only available for the sample of individ-
uals that participated in the survey. Further, the surveys were fielded around a year after random assignment and in some cases capture only point-in-time measures at the time of the survey, or measures that happened up until the time of the survey. Administrative records have more comprehensive data available for primary outcomes over time. Administrative data are also not subject to errors in memory.
31In particular, the analysis estimates models of the following general form: 𝑌𝑌𝑖𝑖 = 𝛼𝛼 + 𝛽𝛽𝑃𝑃𝑖𝑖 + 𝛿𝛿𝑋𝑋𝑖𝑖 + 𝜀𝜀𝑖𝑖
where 𝑌𝑌𝑖𝑖 is the outcome measure for sample member i; 𝑃𝑃𝑖𝑖 equals one for program group members and zero for control group members; 𝑋𝑋𝑖𝑖 is a set of baseline characteristics for sample member i drawn from MDRC’s random-assignment
system and from administrative records; and 𝜀𝜀𝑖𝑖 is a random error term for sample member i. In this model, the coefficient 𝛽𝛽 is interpreted as the impact of the program on the outcome.

25
Box 1.2
How to Read the Impact Tables in This Report
Most tables in this report use a format like the one illustrated below. The table shows two employment outcomes for the program group and the control group. For example, the table shows that about 98 (98.4) percent of the program group and about 71 (70.9) percent of the control group ever was employed in Year 1 in Atlanta.
Because individuals were assigned randomly either to the program group or to the control group, the effects of the program can be estimated by the difference in outcomes between the two groups. The “Difference (Impact)” column in the table shows the estimated differences between the two research groups’ employment rates — that is, the program’s estimated impacts on employment. The estimated impact on employment can be calculated by subtract-ing 70.9 percent from 98.4 percent, yielding 27.5 percentage points.
The number of asterisks in the table indicates whether an estimated impact is statistically significant (or that the impact is large enough that it is unlikely to have occurred by chance). One asterisk corresponds with an estimated impact that is statistically significant at the 10 percent level; two asterisks reflect the 5 percent level; and three asterisks reflect the 1 percent level, meaning there is less than a 1 percent likelihood that a program with no effect could have generated such a large difference by chance. In 90 percent of experiments of this type, the true value of the impact would fall within the range shown in the “confidence interval” col-umn. To illustrate, the program group experienced an impact on employment of 27.5 percent-age points that is statistically significant at the 1 percent level. There is a 90 percent chance that the true value of this impact is between 24.1 and 30.9 percentage points.
One-Year Impacts on Employment and Earnings, Atlanta
Outcome Program
Group Control Group
Difference (Impact)
Ninety Percent Confidence
Interval Employment (%) 98.4 70.9 27.5 *** [24.1, 30.9] Number of quarters employed 3.4 1.9 1.5 *** [1.4, 1.7]
groups will be found to be statistically significant by chance, when there was no real difference. The analysis addresses this issue by limiting the number of outcomes that are examined in each of the primary domains (employment, child support, and criminal justice).
Because of the random assignment design, the crucial difference between the program and control groups is access to ETJD services: Individuals in the program group had access to

26
program services and possibly other, potentially similar services available in the community (for example, One-Stop service providers), while control group members had access only to the other services. In the evaluation literature, the estimate of the average impact of access is referred to as the “intent-to-treat” impact parameter. It measures the impact of having the opportunity to participate in the intervention, not the average impact on program group mem-bers who actually participate in the intervention.
This report examines impacts for the full study sample and for subgroups of the sample. Subgroups were defined using pre-random assignment characteristics hypothesized to affect impacts. These included employment in the year before random assignment for the programs targeting noncustodial parents, and risk of recidivism (based on a risk index determined by age, number of past convictions, and number of months incarcerated) for programs targeting people recently released from prison. At all sites, subgroups were defined based on whether sample members entered the evaluation during the first or second year of recruitment and enrollment. Because of their small sample sizes, subgroup impact estimates are considered less precise than full-sample impact estimates and should therefore be interpreted cautiously. Subgroup impacts also require an additional test of statistical significance to assess the magnitude of differences in impacts across subgroups. Whenever such differences are statistically significant, one can have greater confidence that the underlying impacts for the subgroups involved are actually different from one another.32
In an evaluation such as ETJD, in which distinct programs are implemented in multiple sites, it is important to decide whether to pool results across programs or to study their impacts individually. For this first report, the impacts are estimated separately. There are several reasons why. First, given the nature of this project, readers are likely to be interested to know which enhancements to the basic transitional jobs model have been successful. Second, it is too early to know the long-run effects of the ETJD programs, and it is therefore premature to compare programs or to look for patterns among them.33
32A statistical test was used to test for statistically significant differences in impact estimates across
subgroups. Statistical significance levels for differences in subgroup impacts are indicated in the impact tables using daggers, as follows: ††† = 1 percent; †† = 5 percent; † = 10 percent.
33Pooling data from multiple programs can be an important part of an analysis strategy. It provides larg-er sample sizes and makes it possible to detect smaller effects. Pooling can also be a strategy for reducing the bias that can result from making too many comparisons. Another approach is to pool common interven-tion models or similar target populations as appropriate, based on what is learned about the interventions during implementation. This pooling would also be done to increase statistical power. It would provide additional suggestive evidence regarding the impacts of particular transitional job approaches for particular target populations, without sacrificing the information collected on the effectiveness of the individual programs taken one at a time. The research team and DOL will decide whether to pool results in future reports (overall or for clusters of programs) based on the pattern of implementation findings in this report.

Chapter 2
GoodTransitions (Atlanta, GA)

THIS PAGE INTENTIONALLY LEFT BLANK

29
Executive Summary
The GoodTransitions program provided eligible noncustodial parents with a staged sequence of transitional jobs designed to build participants’ employability and work experience by gradually increasing their responsibilities. It was operated by Goodwill of North Georgia and the Division of Child Support Services (DCSS) in the Georgia Department of Human Services. As described in Chapter 1, the staged approach to subsidized jobs is considered a structural enhancement to previous transitional jobs programs. Following an intensive screening and enrollment process that involved writing assignments, group speaking, drug tests, and assessments, the program placed participants in jobs at local Goodwill retail stores where they received close instruction and supervision from job coaches. Once job coaches observed that participants had demonstrat-ed sufficient preparation and work habits in Goodwill stores, participants moved into place-ments with private, external employers located around greater Atlanta, in positions that more closely resembled “real-world” jobs, with their wages subsidized by GoodTransitions. Finally, employment specialists worked with participants to identify and secure permanent, unsubsi-dized jobs in the regular labor market. Over the course of their participation in the program, participants also received job coaching and individual case management services designed to help them address obstacles to performing well in their transitional jobs or securing unsubsi-dized employment.
Main Findings •
•
Ninety-one percent of participants were black, 94 percent were male, and 70 percent were 35 years old or older. Almost all (99 percent) had work experience, but many were struggling. Almost all of the study partic-ipants had worked before, and almost 85 percent had held a job for at least six months at some point in the past. About 80 percent had at least high school diplomas or equivalents, though only a little over 10 percent had post-secondary degrees. At the same time, it is clear that many participants were struggling: Nearly half had worked for a year or less in the previous three years, and half were staying in someone else’s home. At least two-thirds of participants had past convictions according to state administrative records, and one-third had been incarcerated in prison.
GoodTransitions met its enrollment targets, but recruitment was a chal-lenge. Almost all study participants were referred by the DCSS Fatherhood program, which provides employment services to unemployed noncustodial parents. Over time, it became clear that the pool of Fatherhood participants

30
who were eligible for GoodTransitions (having registered with Selective Service and passed the required drug tests) and who were interested in it was smaller than anticipated. In addition, only a portion of those who were re-ferred ended up enrolling, in part because of GoodTransition’s intensive screening process, which required participants to show up for two and a half days of assessment activities before being randomly assigned to the program or back to Fatherhood services. As a result, the individuals who enrolled in the study were likely to have been relatively highly motivated, which may help to explain the high levels of retention in program services.
•
•
•
GoodTransitions delivered most of its core components as intended, and all program group members received some level of service through the program. Staff members were generally experienced in working with the population, appeared well acquainted with their caseloads, and consulted fre-quently with one another and with employment partners. Almost all program group members (97 percent) were placed into the first stage of subsidized employment at Goodwill, and almost two-thirds (63 percent) worked in a second-stage subsidized job in the community. Those who worked in subsi-dized jobs participated for around the time periods initially intended (one month at Goodwill and three months in a second-stage external employer job). However, the program deviated from the intended model in the types and diversity of second-stage jobs that were available to participants. While these positions offered exposure to real-world work environments, there were a limited number of employers working with the program at this stage and those offered little opportunity for advancement. Most jobs at this second stage of the program were provided by a small number of retail stores and nonprofit organizations.
As expected, many control group members received employment help, but the program group received a more robust array of services. Nearly all GoodTransitions participants (97 percent) received help finding or keep-ing a job, compared with about two-thirds of those in the control group (65 percent). Similarly, program group members received more help than control group members with criminal justice matters, child support and family is-sues, and education and training.
The program group was more likely to work than the control group during the first year of follow-up, and had higher earnings, though the differences between groups diminished over time. Seventy-one percent of the control group worked during the first year, but the employment rate for

31
the program group (including subsidized jobs) was 98 percent. Similarly, program group members earned about $2,000 more, on average, over the course of the year. There was still a statistically significant difference in em-ployment rates at the end of the follow-up period, but it appears that much of the difference between groups could be attributed to program group members who were working in GoodTransitions subsidized jobs, probably because they had reengaged with the program. It remains to be seen whether these differences will translate into longer-term increases in unsubsidized em-ployment, length of employment, or earnings.
• Overall, in the year after random assignment, program group members were 19 percentage points more likely to pay child support, made more consistent payments, and had higher payment amounts on average. This increase is most likely because program group members had higher em-ployment and earnings during this period.
This chapter offers detail on how the GoodTransitions program was structured and im-plemented. The first section provides background on the program model, the intended interven-tion, the recruitment and screening process, and the characteristics of the participants enrolled. The second section describes the implementation of the program, with a particular focus on the ways implementation aligned with or deviated from the intended model. The final section describes the program’s one-year impacts on participation in services, employment, child support payments, and criminal justice outcomes (since two-thirds of the sample had past convictions in the state of Georgia and one-third had been previously incarcerated in prison).

32
GoodTransitions
Background The GoodTransitions program was designed as a partnership between Goodwill of North Georgia and the Georgia Division of Child Support Services’ Fatherhood program. It aimed to improve employment and earnings — as well as child support compliance rates — among low-income noncustodial parents in the Atlanta area who owed child support. It was one of two Enhanced Transitional Jobs Demonstration (ETJD) programs testing a staged transition model, in which participants advanced from highly supported positions within the grantee organization — in this case, working in Goodwill retail stores with close instruction and supervision from job coaches — into private-sector jobs where their wages were subsidized by the program. The following sections provide a detailed overview of the local context in which the program operated, the process by which participants found their way into the program, and the service model and implementation of the GoodTransitions program.
Context
GoodTransitions services were delivered at five Goodwill locations in greater Atlanta, with participants drawn primarily from the five counties that make up the Atlanta metropolitan area: Clayton, Cobb, DeKalb, Gwinnett, and Fulton. The program was administered by Good-will of North Georgia, an independent affiliate of Goodwill Industries International. Goodwill of North Georgia operates employment and training services for people with a variety of barriers to employment in counties throughout northern Georgia.
As one of the largest cities in the south, Atlanta has a diverse economy with several large employers spanning many industries. The area’s largest employers — each employing 10,000 to 20,000 workers — include well-known businesses such as Delta Airlines, Coca-Cola, Walmart, and the Home Depot, as well as preeminent institutions of research and higher education such as Emory University and the Centers for Disease Control and Prevention.1
Despite this diverse economic base, the city experienced high unemployment during the evaluation period, and many study participants came from particularly hard-hit areas. Between 2012 and 2013, unemployment in the city was above 10 percent, and poverty rates ranged from 14 percent to 28 percent across the five counties of the Atlanta metropolitan area.2 GoodTransi-tions’ employment services were primarily intended for those struggling with longer-term
1Metro Atlanta Chamber of Commerce (2013) 2U.S. Census Bureau (2013); Bloch, Ericson, and Giratikanon (2014).

33
Box 2.1
The Fatherhood Program
The Fatherhood program was implemented by DCSS in 1998 in an effort to shift away from strict enforcement. The program works with noncustodial parents, primarily fathers, who owe child support, helping them gain skills and stable employment so that they can make regular child support payments. Noncustodial parents typically learn about Fatherhood services through word of mouth or from letters of interest sent out by DCSS once they become delin-quent in their child support payments. In fiscal year 2011, 4,600 noncustodial parents received services through the Fatherhood program.*
In contrast to the subsidized work and intensive support offered by GoodTransitions, the Fatherhood program offers less comprehensive services, though the program does provide job-search assistance and some light case management. It appeared from interviews with Father-hood staff members that the main incentives to participate are the renewal of one’s driver’s license and the suspension of enforcement actions by DCSS. When noncustodial parents are delinquent in paying child support, their driver’s licenses are typically suspended after 90 days of nonpayment. If they participate in the Fatherhood program, however, their licenses are renewed. Furthermore, participation in Fatherhood suspends any enforcement action such as intercepting tax refunds, reporting delinquency to credit bureaus, seizing bank accounts, and filing contempt-of-court actions, which may result in jail time. __________________________
*Georgia Department of Human Services (n.d.).
barriers to employment, not temporary unemployment resulting from the recession, but this economic context may have made it harder to place participants in unsubsidized positions after they completed the program.
Child support policies also affected participants’ experiences. In general, GoodTransi-tions operated in a child support enforcement environment that offered few accommodations for program participants. Child support enforcement suspended driver’s licenses after 90 days of nonpayment, intercepted tax refunds, reported delinquency to credit bureaus, seized bank accounts, and filed contempt of court actions. (These types of typical enforcement actions can be found in many states.) There were no additional child support incentives to participate in GoodTransitions beyond those already offered for participation in the Fatherhood program. Those incentives included the suspension of enforcement actions during program participa-tion and the reinstatement of driver’s licenses. Box 2.1 describes the Fatherhood program in more detail. While the Fatherhood program did help participants seeking to modify their child support orders, GoodTransitions did not offer specific services to its participants in this area. Participants had to take the initiative on their own to request modifications. As is shown in Box 2.2, many participants were left with very little take-home pay after child support and taxes were deducted from their wages. In one case, a participant’s take-home pay while in the program was as little as $2.31 per hour.

34
Box 2.2
Child Support Wage Withholding
A common refrain MDRC heard during research visits and in calls with GoodTransitions staff members was that it was difficult to keep participants motivated to stick with the program given their sometimes extraordinarily low take-home pay. While some programs in the ETJD project established additional incentives to encourage participation (including staged for-giveness for debt and expedited order modifications), DCSS offered GoodTransitions partici-pants only the same benefits it offered all noncustodial parents who enrolled in Fatherhood services: a halt to enforcement actions and a reinstatement of driver’s licenses. The program did not offer order adjustments or forgiveness of debt for study participants.
The table below shows the amount deducted for child support for 20 randomly chosen pro-gram participants. It shows the hours they worked over a two-week period, their gross pay, the amount withheld for child support (as a percentage of their gross pay and as a dollar amount), and their net pay (both total and hourly).
Child Support Withholding for Goodwill of North Georgia Participants
Participant Hours
Worked Gross
Pay ($) Withheld for Child
Support ($) Withheld for Child
Support (%) Net
Pay ($) Net Pay/ Hour ($)
1 40 290.00 171.47 59.1 92.33 2.31 2 24 174.00 95.70 55.0 78.30 3.26 3 45 326.25 83.80 25.7 242.45 5.39 4 75 540.13 161.04 29.8 334.40 4.49 5 39 279.13 153.51 55.0 125.62 3.26 6 27 192.13 116.51 60.6 62.73 2.37 7 36 257.38 153.23 59.5 82.51 2.32 8 78 565.50 171.66 30.4 392.90 5.04 9 27 195.75 86.10 44.0 96.28 3.57 10 58 420.50 50.24 11.9 370.26 6.38 11 62 445.88 138.97 31.2 255.03 4.15 12 25 181.25 117.81 65.0 63.44 2.54 13 35 253.75 139.56 55.0 114.19 3.26 14 50 362.50 223.67 61.7 120.44 2.41 15 80 580.00 254.37 43.9 325.63 4.07 16 65 467.63 242.88 51.9 222.75 3.45 17 55 400.56 142.23 35.5 258.33 4.68 18 52 377.00 146.33 38.8 230.67 4.44 19 80 580.00 92.99 16.0 487.01 6.09 20 41 293.63 146.80 50.0 120.10 2.97

35
Intended Model
The GoodTransitions program was designed as a sequence of services moving partici-pants from a heavily supported work environment and counseling structure toward a more real-world employment experience. The program design called for all participants to be recruited into the evaluation by case workers in the Fatherhood program. These staff members conducted the initial outreach, screening, and referral to Goodwill for orientation and enrollment. Immedi-ately after enrollment, each participant was assigned a case manager and a Goodwill location to begin the first of two transitional jobs. That participant worked at a Goodwill store for approxi-mately one month while receiving support and constructive criticism from an on-site job coach, and then moved into a less-supported position with a private employer in the community for about three months.3 In interviews, program staff members acknowledged that some partici-pants would need more than a month before they were ready to leave Goodwill stores, while others would be prepared to move on sooner. The one-month period was established, then, as an average length of time during which participants could build the employability skills they would need in the more traditional jobs of the program’s second phase.
These second-stage private placements are referred to here as “community sites.” Par-ticipants were still paid by the program during this stage, and Goodwill remained the employer of record. In some cases, the intention was that a participant would be hired at the community site at the end of the wage-subsidy period; in other cases, the community site was intended instead to offer a more realistic work experience as well as a reference and a line on one’s résumé. Which of these two roles a community site played for a given participant was supposed to depend in part on how specific the participant’s goals were, and in part on whether the participant had skills particularly suited to a certain job or career. In any case, the matching of participants with community sites was intended to be a deliberate process guided by each participant’s long-term goals and by the kinds of skills the participant hoped to develop. At the same time, job developers were to work with participants to prepare them to search for unsubsi-dized jobs and to work with employers who might hire them.
At each stage of the program, participants were to receive personalized case manage-ment and job development services to help them overcome barriers to employment and to prepare them for interviews and for workforce expectations. In addition, for the duration of the program, weekly job club meetings were to allow participants to share job-search strategies and hear from guest speakers providing motivation. Participants would also be required to attend a
3GoodTransitions designed this phased model based on earlier research, including research about the
GoodWorks! model operated in Augusta, Georgia by Goodwill Industries in collaboration with several government agencies. Past research suggested that the phased approach could ease hard-to-employ participants into a “real-world” work environment over time, as they were exposed to progressively greater responsibilities and higher expectations following an initial period of observation and assessment. See Kirby et al. (2002).

36
number of workshops (led by partner organizations) on topics such as anger management, financial literacy, and balancing work and home.
Figure 2.1 illustrates the sequence in which participants were meant to move through the components of the GoodTransitions program.
The staged employment model, central to Goodwill’s enhancement of the transitional jobs intervention, has a theory of change that rests on the following central assumptions:
•
•
•
A staged model builds participants’ skills by gradually increasing their responsibilities and exposure to workplace norms. In several interviews with staff members, this gradual increase was consistently described as the strongest potential benefit of the staged approach. Staff members repeatedly said that the movement from a Goodwill store into a community-site position was intended to build soft skills such as personal presentation, punctuality, accountability, and proper conflict management, as well as confidence and self-esteem. As the program’s proposal put it, “most program participants need a gradual transition after having been unemployed or having little to no work experience. The gradual progression to more independence, less direct supervision ... leads to increases in self-esteem, self-worth, stamina, and skills attainment.” Notably, this rationale assumed that most participants would lack the soft skills needed to get and keep jobs.
The experience of having worked in a real-world, private-sector job makes a participant more appealing to potential future employers. A secondary rationale for the staged approach is the hypothesis that employers may value “real-world” work experience more highly than experience gained in the supportive environment of “program jobs” like the jobs at Goodwill stores.
Subsidies allow potential employers to test participants at no cost before deciding whether to hire them. The program initially planned to partner with employers who would consider hiring participants after their subsidies had expired. In such cases, the employers and participants would effectively be using the subsidy as an “opportunity to try each other out,” as it was put in the grant proposal, at no cost to the employer. Further, employers had the as-surance that the program would be able to help if problems arose on the job.

37
Figure 2.1
GoodTransitions Program Model
Participant enrollment
Transitional job in aGoodwill location
Case managementJob coachingJob developmentWorkshopsJob clubJob search
Stage one
Full subsidyprivate-sector job
Case managementJob searchWorkshopsJob club
Stage two
Unsubsidized employment
Retention servicesVerified employment
Loss of unsubsidized employment
Reconnection to GoodTransitionsJob-placement assistanceRetention services

38
Recruitment and Study Enrollment
The target population for the GoodTransitions program was low-income noncustodial parents in metropolitan Atlanta. The program did not specify eligibility criteria beyond those established by the ETJD grant.4 Referrals to the program came almost exclusively from the Fatherhood program. Evaluation participants were required to pass a program-administered drug test and — as required by the Department of Labor (DOL) — to be registered with Selective Service (for males). Referrals and enrollment into the program occurred every other week between March 2012 and December 2013. The program had an enrollment target of 1,000 people for the study (with 500 randomly assigned to receive services and 500 randomly as-signed to serve as a control group).
● Although the program ultimately met its enrollment target, recruitment proved to be much more difficult than either DCSS or Goodwill antici-pated. The difficulty appeared to be largely due to communication chal-lenges between DCSS and Goodwill and overly optimistic estimates of the pool of interested and eligible noncustodial parents.
The referral process from the Fatherhood program into GoodTransitions began when Fatherhood agents — the case managers responsible for working directly with Fatherhood participants — talked to their current and new clients to gauge their interest in and suitability for GoodTransitions services. Those who were interested and eligible were referred to a GoodTran-sitions orientation and assessment week (discussed below). The Fatherhood agent completed and faxed a short form to Goodwill to provide information about the person referred. Goodwill then called the referred person before the first day of assessment week to encourage that person to show up.
According to Fatherhood staff members, only 30 percent to 40 percent of existing Fa-therhood participants were eligible to participate in GoodTransitions. A large number were excluded because they had not registered with Selective Service, and many were simply not interested. According to Fatherhood staff members, participants who were referred to Good-Transitions but who did not show up at their assigned assessment weeks (without a good reason) were removed from the Fatherhood program and returned to DCSS enforcement. It is unclear whether this policy was truly enforced, however, as certain names appeared multiple
4The ETJD grant required that participants in programs targeting noncustodial parents be low-income, noncustodial parents who either had child support orders in place or who agreed to start the process of establishing orders within 30 days of enrollment. In addition, DOL grants require that male participants register with Selective Service. If an applicant is over age 26 and has not registered, it is no longer possible for him to register and he must seek a waiver of the requirement in order to receive funded services. This issue presented challenges for recruitment at a number of ETJD sites. In GoodTransitions, all participants had child support orders when they entered the program.

39
times on the referral forms faxed to Goodwill. Overall, of those who were eligible and ex-pressed an initial interest in GoodTransitions, about 60 percent made it to the first day of assessment week.
Although GoodTransitions did not have specific eligibility criteria beyond those spec-ified in the ETJD grant, Goodwill did conduct additional screening before enrollment and random assignment to determine whether potential participants would be best served by GoodTransitions or one of Goodwill’s other programs. This determination took place during assessment week, a three-day intake and screening process that culminated in random as-signment.5 Assessment week was generally conducted every two weeks until the sample enrollment targets were met in December 2013. It was led by Goodwill’s vocational evaluator with assistance from other Goodwill staff members. A representative from the Fatherhood program also attended to answer general child support questions and to reengage those participants who were ultimately deemed unsuitable for GoodTransitions or who were assigned to the control group.
Potential participants were administered a drug test, given written assignments and worksheets focusing on motivation and their desired occupations, and engaged in team-building exercises and role-playing in dealing with common workplace scenarios. GoodTransitions provided all potential participants with transportation vouchers (a gas card or public transporta-tion card) to facilitate their attendance.
At the end of the second day, Goodwill and Fatherhood staff members assessed each potential participant using a standardized rubric that measured participants’ suitability in a number of areas.6 Based on the assessments, they decided whether potential participants would be suitable for the GoodTransitions program or for other Goodwill programs. For example, potential participants who lacked motivation or who had significant cognitive or behavioral challenges that the GoodTransitions staff was not prepared to address might be guided to a different program. Similarly, potential participants who did not need all of GoodTransitions’ services (that is, those with no criminal background and stable work histories) were referred to less intensive services available through other Goodwill programs.
5In the early stages of the program, this assessment and screening period lasted four days. It was scaled
back due to concerns about the burden on participants and the additional disappointment it generated among those assigned to the control group.
6The rubric assessed each participant as “below average,” “average,” or “above average” in the following areas: punctuality and attendance; curiosity (the ability to ask appropriate questions); motivation; critical thinking, reasoning, and problem solving; writing skills; employment history; and criminal background. Assessments were based on background information, exercises conducted during the first two days of assessment week, a homework assignment given the first day, and interactions with GoodTransitions and Fatherhood staff members.

40
Potential participants accepted as candidates for GoodTransitions often faced significant barriers to employment such as criminal records, low levels of education, and spotty em-ployment histories.
On the third day of assessment week, those who were still interested in participating (and who had been deemed suitable for participation) returned to be randomly assigned to either the program group (GoodTransitions) or to the control group. Before random assignment, all potential participants were reminded of the details of the ETJD evaluation and had an oppor-tunity to ask questions, after which they signed informed-consent forms and completed baseline information forms. After random assignment, participants assigned to the program group met with GoodTransitions staff members to review the program’s components, rules, and expecta-tions, and to complete sexual harassment training. Participants assigned to the control group met with GoodTransitions and Fatherhood staff members to discuss other options available to them, including returning to the Fatherhood program.
GoodTransitions reported that the intensive assessment process was successful in iden-tifying participants who were appropriate for the program, and it is possible that this success contributed to high program retention. It is also possible that the lengthy process contributed to the program’s difficulty meeting enrollment targets, though, as there was substantial attrition between the beginning and the end of the process. For example, in October 2012 a typical assessment week began with 83 participants referred to Goodwill for orientation and assess-ment. Fifty-seven showed up on the first day (with 17 rescheduling and 9 no-shows); 44 attended through the second and third day; and 39 were ultimately deemed appropriate to participate and enter the evaluation. In short, fewer than half of those who were referred on a typical week ultimately made it to enrollment.
This process almost certainly resulted in participants who were motivated and ready to search for jobs. Those who were not motivated or committed were weeded out through the drug-testing, homework, and attendance requirements of the assessment week.7 It is also possible, of course, that this process discouraged some people who may have otherwise benefit-ed from GoodTransitions services.
Over the course of the evaluation, it became clear that GoodTransitions faced several challenges in managing the referral and enrollment process. The central challenge was simply ensuring that enough participants attended each assessment week to reach the program’s target sample size. Throughout the grant period, Goodwill reported that DCSS was not
7Homework assignments consisted of writing down job goals and the steps needed to accomplish those goals, completing a worksheet about employment preferences, and completing a personality profiling work-sheet. As noted earlier, very high-functioning participants were also screened out through this process and referred to other Goodwill programs with less intensive services.

41
supplying its lists of referred participants in a timely manner, leaving insufficient time for Goodwill to call potential participants before assessment week, which in turn meant that fewer of them ultimately attended. While this problem was discussed repeatedly over the course of the grant period, it also appeared that difficulty in meeting enrollment targets stemmed more simply from there being a smaller pool of eligible and interested people than Goodwill and DCSS had anticipated.
Late in the recruitment phase, when it appeared that Fatherhood would not be able to re-fer enough people to meet GoodTransitions’ enrollment targets, Goodwill began recruiting from a wide variety of community programs that serve noncustodial parents, such as churches, YMCAs, and the Salvation Army. In some cases, staff members recruited people who might be eligible through classified ads and visits to barbershops. These efforts were meant to reach people who may not have learned about the program from Fatherhood’s early outreach. The eligibility criteria remained the same, and interested participants recruited through these channels still had to be formally referred by Fatherhood, so they were typically sent to Father-hood in order to receive an official referral to the GoodTransitions program. Fatherhood also sent out additional mass mailings to noncustodial parents in the area to advertise the program. Finally, Fatherhood began recruiting directly from the parole and probation agency in the fall of 2013, but very few of those recruits made it into GoodTransitions, primarily due to the Selective Service requirement.
Baseline Characteristics
This section presents the characteristics of study participants at the time of random as-signment. The data collected — presented in Tables 2.1 and 2.2 and Appendix Table A.1 — include participant demographic characteristics, family and child support characteristics, and histories of employment, crime, mental health, substance abuse, and receipt of public assistance and benefits.
Overall, 94 percent of the evaluation sample members were men and 91 percent were black/non-Hispanic. The average age of participants was 40 years old. About 80 percent of study participants had at least a high school diploma or equivalent (for example, a General Educational Development [GED] certificate), and 11 percent had a degree beyond high school.
Among the most serious barriers to employment affecting the sample were the relative-ly high levels of past incarceration and other contact with the criminal justice system. As the table shows, two-thirds of the sample had past criminal convictions in the state of Georgia, and

42
Table 2.1 Characteristics and Employment Histories of Sample Members: Atlanta
Atlanta ETJD Programs Targeting Characteristic Program Noncustodial Parents
Male (%) 93.7 93.2
Age (%)
18-24 2.9 7.6 25-34 27.3 32.6 35-44 39.0 34.9
45 or older 30.8 24.9
Average age 39.8 37.6
Race/ethnicity (%)
Black, non-Hispanic 91.3 82.4 White, non-Hispanic 4.3 5.5 Hispanic 2.5 7.9 Asian, non-Hispanic 0.0 1.4 Other/multiracial 1.8 2.9
Educational attainment (%)
No high school diploma or equivalent 19.8 29.2 High school diploma or equivalent 69.4 66.0 Associate's degree or equivalent 4.7 2.6 Bachelor's degree or higher 6.1 2.3
Marital status (%)
Never married 54.6 66.2 Currently married 12.2 8.4 Separated, widowed, or divorced 33.1 25.4
Veteran (%) 12.8 4.9
Has a disability (%) 5.5 5.4
Housing (%)
(continued)
Rents or owns 40.6 45.4 Halfway house, transitional house,
or residential treatment facility 3.6 3.7 Homeless 4.5 7.9 Staying in someone else's apartment, room, or house 51.2 43.0

43
Table 2.1 (continued)
Atlanta ETJD Programs Targeting Characteristic Program Noncustodial Parents
Employment history Ever worked (%) 99.3 95.6
Among those who ever worked:
Worked in the past year (%) 61.2 49.9 Average hourly wage in most recent job ($) 11.74 11.21 Ever worked for the same employer for 6 months or more (%) 84.7 79.5
Months worked in the previous 3 years (%) Did not work 10.5 13.8
Fewer than 6 months 15.5 27.8 6 to 12 months 19.5 28.7 13 to 24 months 19.4 14.1 More than 24 months 35.1 15.6
Sample size 996 3,998
SOURCES: MDRC calculations based on baseline survey data and ETJD management information system data.
one-third had previously been incarcerated in prison.8 Those in the sample who had served time in prison had been out for 58 months on average (almost five years) at the time they enrolled in the evaluation. Fifty-six percent of those who had previously been incarcerated in prison were on parole or probation at the time of enrollment or had other kinds of involvement with the criminal justice system or court supervision. These high rates of criminal justice involvement are a potentially serious barrier to employment and one which justified additional services to help these participants overcome the stigma of their records and connect with the job market.9
8Note that this third of the sample members who had been previously incarcerated represents only those
who had been in state or federal prison. It does not include those who had been incarcerated in jail. This evaluation did not collect administrative data on jail incarceration for programs targeting noncustodial parents, and participants in these programs were not asked about jail incarceration at enrollment. Past convictions include only convictions in the state of Georgia as recorded in administrative records.
9Employment specialists worked with participants on how to discuss their incarceration history in inter-views. Legal assistance and expungement were also offered to participants on a case-by-case basis through a partnership with The Center for Working Families, but very few program group members made use of those services.

44
Table 2.2 Child Support and Criminal Justice Characteristics of Sample Members: Atlanta Atlanta ETJD Programs Targeting Characteristic Program Noncustodial Parents
Parental and child support status
Noncustodial parent (%) 100.0 100.0
Has any minor-age children (%) 88.9 93.2
Among those with minor-age children:
Average number of minor-age children 2.4 2.5
Living with minor-age children (%) 26.5 18.1
Has a current child support order (%) 90.5 86.3
Has an order only for child support debt (%) 9.9 12.7
Criminal history
Ever convicted of a crimea (%) 65.5 76.4
Ever convicted of a felony 24.7 49.2 Ever convicted of a misdemeanor 55.9 63.3
Ever incarcerated in prisonb (%) 33.6 40.2
Among those ever incarcerated in prison:
Average years in prisonc 2.9 3.8
Years between most recent release and program enrollmentd (%) Less than 1 year 38.9 33.2
1 to 3 years 19.1 17.5 More than 3 years 41.9 49.2
Average months since most recent released 58.0 62.2
On community supervision at program enrollmente (%) 55.9 51.6
Sample size 996 3,998
(continued)

45
Table 2.2 (continued)
SOURCES: MDRC calculations based on baseline survey data, ETJD management information system data, and criminal justice administrative records. NOTES: Measures are self-reported unless otherwise noted. aIncludes convictions in the state of Georgia as recorded in administrative records. Does not include federal convictions or convictions from other states. bIncludes self-report of incarceration in state or federal prison and prison incarceration as recorded in Georgia administrative records. cIncludes time spent in Georgia state prisons according to administrative records. Does not include time spent in federal prisons or prisons in other states. dMost recent release can be from prison or jail. eIncludes parole, probation, and other types of criminal justice or court supervision.
Other programs working with noncustodial parents may have similarly high rates of criminal justice system involvement and might consider providing such services.
As the GoodTransitions program targets noncustodial parents, most of the sample (89 percent) had minor-age children (that is, children under 18 — on average, they had between two and three minor-age children), though only about a quarter (27 percent) lived with any minor-age children. Ninety-one percent of the sample had current child support orders, while 10 percent had arrears-only orders.
Almost the entire sample (over 99 percent) had been employed at some point before program enrollment, but almost 40 percent had not worked in the last year. The average wage at the most recent job was $11.74 per hour. About 41 percent of those who had previously worked had earned less than $10 per hour in their most recent jobs (see Appendix Table A.1).
Program Implementation GoodTransitions sought to provide low-income noncustodial parents with a more robust array of employment services than they would typically receive through the state Fatherhood pro-gram. The grant proposal described a staged model consisting of gradually increasing responsi-bility and exposure to workplace expectations, paired with job development and case manage-ment services. While the program did connect almost all participants with transitional jobs, some challenges and adjustments over the course of the grant period led to important deviations from the intended model. (Most notably, the second-stage, community-site jobs offered fewer individually tailored employment options than originally intended; almost all participants worked for a small number of employers and, according to Goodwill, many of them returned to Goodwill stores after losing a second-stage job.) Based on interviews conducted during three site visits, Goodwill staff members appeared to be well trained and knowledgeable about their

46
participants and about best practices in working with people who have barriers to employment. The staff members, who came to their positions with backgrounds in human and employment services, remained fairly constant during the evaluation. They maintained regular contact with employers and followed clear procedures for building relationships with employers. The program’s employment services were likewise closely managed and based on clear internal targets and benchmarks.
This section provides detail on the implementation of the GoodTransitions program, in-cluding changes that were made from the planned intervention. Important strengths and chal-lenges of the program and the model that may have affected the program’s effectiveness are discussed toward the end of the section.
Program Structure and Staffing
As it was conceived, Goodwill would operate the GoodTransitions program in part-nership with two other local organizations: the Center for Working Families, Inc., and the Urban League of Greater Atlanta. While Goodwill was to handle the majority of participants, these partners were to provide some of the assessments, transitional jobs, and job develop-ment, and to lead workshops in financial literacy, anger management, conflict resolution, legal advocacy, healthy parenting, and sexual harassment prevention. In practice, it became clear early on that both partner agencies were struggling to move participants through the program in a manner satisfactory to Goodwill. The partnership was then scaled back so that the Center for Working Families and the Urban League provided only workshop training to participants; Goodwill took on full responsibility for providing assessments, transitional jobs, and job development services.
Within GoodTransitions, services were delivered by about a dozen staff members work-ing with participants in different capacities and at different phases in the program. Members of the GoodTransitions staff brought with them several years of experience working in other Goodwill programs or in other human and employment service positions. All of them received standard Goodwill training in diversity and disability awareness, crisis prevention, and sexual harassment prevention. Job developers received additional training specific to their roles. Each of the staff roles — including more detail on job-specific training and backgrounds — is outlined below. It is also important to note that almost all of these staff members also participat-ed, to a greater or lesser degree, in the biweekly assessment sessions described in the previous section and in the weekly job-club meetings described in more detail below.
A vocational evaluator led the orientation and assessment week, introducing potential participants to GoodTransitions and managing the enrollment process. As the previous section described, the GoodTransitions assessment week involved a number of activities designed to gauge potential participants’ appropriateness and readiness for GoodTransitions services. The

47
intention of these sessions was to ensure that the program did not enroll people who either had too many barriers to employment for the GoodTransitions program to overcome or who were basically job-ready and only needed some light job-development assistance (which was availa-ble through a separate program). These sessions, and the process of determining who was right for the program, were largely managed by the vocational evaluator — in consultation with program managers and other staff members. This staff member remained in the position for the length of the grant and was well qualified for the role, having built up significant assessment and case management experience over more than 10 years with Goodwill.
Case managers worked with participants at each stage of the program to develop their employment goals and connect them with other providers to meet their other needs. Case managers also communicated with community-site employers and assessed participants’ readiness to move into unsubsidized work.
Immediately after being enrolled in the program, each participant was assigned a case manager with whom he or she completed an Individual Employment Plan, detailing employ-ment-specific needs (for example, résumé preparation, improvement in interview skills, or workplace attire), as well as goals and broader needs such as child care, transportation, and housing assistance. This plan helped case managers and participants ensure that barriers to participants’ employability would be addressed over the course of their time in the program. The plan was generally completed during a participant’s initial meeting with a case manager.
Next, case managers met weekly with participants at the Goodwill locations where they were employed. During these meetings, case managers continued to work with participants to address their needs (job-specific or otherwise) and to assess their readiness to enter community-site jobs. They also made routine visits to community sites to check in with participants and employers and to learn about and address any on-the-job issues that may have arisen.
Case managers were assigned participants in part based on their expertise in working with certain types of people. One case manager, for example, typically worked with those clients who had emotional and physical disabilities because she had a background in vocational rehabilitation and mental health; another case manager tended to work with younger men and harder-to-serve former prisoners. The case managers at Goodwill (three or four at any given time) stayed fairly consistent over the course of the evaluation, with minor turnover. Like other staff members, they had experience at Goodwill, having worked in vocational rehabilitation, workforce development, and counseling.
Job coaches worked with participants during the first transitional job phase — the phase in a Goodwill store — providing constructive criticism on their work performance, communicating expectations, and evaluating their readiness to advance into the second stage of the program. Each store had a job coach present to oversee participants’ work and to instruct

48
them in how to present themselves in the workplace, get along with their coworkers, follow instructions, and see tasks through to completion. Job coaches in the Goodwill stores worked exclusively with GoodTransitions participants and typically supervised about 15 to 25 of them at a time. They also helped case managers assess how prepared participants were to move into community-site jobs.
There was slight turnover among job coaches, but there was no indication that it caused any significant interruption in services for participants. Those who filled the positions came to the job with backgrounds in a variety of human services and related fields, including law enforcement/probation, management, education, and workforce development.
Job developers established relationships with community-site employers and provided final employment preparation (in interview skills, self-presentation, and job-search strategies) to connect participants with positions and follow up on applications. Early on, job developers recruited community-site employers for the second phase of the program. As is described elsewhere in this chapter, the number of these employers was fairly small; they consisted primarily of a handful of large retail stores and hardware stores, and a few local nonprofit organizations. As the evaluation went on and more participants moved from Goodwill jobs to community sites, job developers focused more on helping participants find and secure unsubsi-dized employment. To that end, job developers met with case managers and job coaches to assess participants’ readiness for unsubsidized work.
Job developers in GoodTransitions — like job developers in all Goodwill employment programs — received training in how to work with employers to carve out positions for their program participants. They had monthly benchmarks concerning how many employers they were able to build relationships with, how many interviews they were able to secure for partici-pants, how many of their participants were hired in unsubsidized positions, and how well they retained their jobs. They also had a benchmark concerning the average wage among new hires. To meet these targets, they worked with participants to ensure that they were looking for work actively and consistently, that they were prepared to talk about themselves in job interviews, and that they were following up on all applications and interviews.
Job developers at Goodwill received training in conducting needs analyses with em-ployers and finding specific tasks and roles for participants to fill with specific employers. They also used software and online programs such as SalesForce and Hoovers employment reports to generate leads for participants. In general, the job developers were encouraged to focus on “the hidden job market,” rather than simply guiding participants through the process of applying for open, advertised positions. That is, the job developers met often with employ-ers and attempted to find out about positions that might be opening up soon, but that had not

49
yet been posted. They also attempted to identify potential positions that employers might not have yet identified themselves.
There were three or four job developers working for GoodTransitions at any time, over-seen by the Goodwill Director of Employment Initiatives. These staff members had back-grounds in business, marketing, workforce development, and prison reentry services.
A retention specialist was hired midway through the grant and given the task of verify-ing participants’ employment, distributing retention incentives (bonuses to participants for keeping jobs), and reconnecting participants with GoodTransitions if they lost jobs. For the first several months of the grant, job developers were responsible for maintaining contact with participants who had found unsubsidized work. As the number of program participants in-creased, a new staff member was hired to perform this task. As a condition of the grant, DOL set a target for ETJD grantees of ensuring that 75 percent of those who found unsubsidized work maintained their jobs for at least three quarters (nine months), so this program component received increasing emphasis over the course of the grant. (See Chapter 1 for more information about DOL performance measures.)
Once participants found unsubsidized jobs, the retention specialist verified their em-ployment several times over the course of a year. Participants who stayed in contact with the retention specialist at these times and who provided proof of their continued employment (for example, a pay stub) received retention bonuses in the form of $20 to $25 public transportation or gas cards. Two staff members filled the position of retention specialist over the course of the grant. Both of them had experience as job coaches at Goodwill and further experience in the fields of education and social work.
Implementation of Core Program Components
This section draws from three site visits to Atlanta (including several interviews with staff members, partners, employers, and participants) and ongoing conversations with program managers over the course of the grant period to describe how the program implemented and adapted its various components.10 Where relevant, it discusses how and why the delivery of certain components changed from the way they were described in Goodwill’s grant proposal. Table 2.3 and Figure 2.2 present data on participation in core program components including subsidized jobs; they are based on information entered into the program’s management infor-mation system.
10These three site visits include two implementation research site visits and one early assessment visit to
observe how the program was functioning during its early period of operation.

50
Table 2.3
One-Year Participation in ETJD Subsidized Jobs and Services Among Program Group Members: Atlanta
Program Measure Group
Participated in any activity, including a subsidized job (%) 100.0
Worked in a subsidized job (%) 97.2
Stage two community-site subsidized job (%) 62.8
Among those who worked in a subsidized job:
Average number of months in the programa 5.7 Average number of days from random assignment to first subsidized paycheck 18.1 Average number of days worked in a subsidized jobb 62.0
Stage one Goodwill job 28.1 Stage two private-sector job, among those who worked in community-site jobs 52.5
Received a service other than a subsidized job (%) 100.0
Formal assessment/testingc 94.0 Education and job trainingd 56.9 Workforce preparatione 98.8 Work-related supportf 99.6 Child support assistance -- Parenting classg 8.8 Incentive payment -- Other servicesh 0.4
Sample size 501
SOURCES: MDRC calculations based on data from the ETJD management information system and Goodwill GoodTransitions case notes. NOTES: A double dash indicates that the service was not offered. aMeasured as the duration between random assignment and last subsidized paycheck. bCalculated using net hours worked, assuming a seven-hour workday. cIncludes Tests of Adult Basic Education and Career Scope. dIncludes forklift training and training in construction flagging. eIncludes Individualized Education Program, Participant Employability Profile, legal advocacy, and classes in conflict resolution, anger management, and financial literacy. fIncludes transportation services. gIncludes Healthy Parenting class. hIncludes follow-up or job-retention services.

51
Figure 2.2
Subsidized Employment Over Time: Atlanta
0102030405060708090
100
1 2 3 4 5 6 7 8 9 10 11 12Perc
enta
ge w
orki
ng in
subs
idiz
ed jo
bs
Month relative to random assignment
SOURCE: MDRC calculations based on data from the ETJD management information system.
NOTE: Month 1 in this figure is the month in which random assignment occurred.
● Job coaching, case management, and job development services were de-livered as intended, with all activities focused on moving participants toward unsubsidized positions.
As shown in Table 2.3, all individuals assigned to the program received at least one ser-vice, with workforce preparation (for example, skills training or conflict resolution) and work-related support (which includes transportation support) topping the list. The specific value of different portions of the GoodTransitions intervention varied from one participant to the next. However, based on informal interviews with over 30 partner and agency staff members and small, structured focus groups with 12 to 15 participants, as well as reviews of 40 participants’ case files and discussions with partners and employers, it is clear that core staff members at GoodTransitions delivered their services with fidelity to the program model described in Goodwill’s ETJD proposal.
More specifically, interviews with community-site employers suggested that case man-agers did a good job offering support and troubleshooting problems that came up in the work-

52
place. Case managers were in touch with community-site employers between once a week and several times a month on average, and employers reported that they felt well informed about how and when to call upon the GoodTransitions staff for help dealing with problems arising on the job. Likewise, a review of job developers’ records showed that job developers were diligent in meeting their targets related to employer outreach, participant job interviews, and new hires. While field visits did not involve much direct observation of job coaches’ interactions with participants, focus groups and reviews of participant case files suggested that they played the role outlined in the program proposal: supporting and supervising participants in the Goodwill retail jobs and working closely with other staff members to prepare participants for the subse-quent stages of the program.
● GoodTransitions participants were quickly connected to paid work in Goodwill stores. Ninety-seven percent of participants worked in transi-tional jobs through Goodwill. Sixty-three percent worked in community-site jobs.
As discussed in the previous section, Goodwill’s intensive enrollment and screening process seems likely to have resulted in a group of participants who made extensive use of the program’s services. For those who went through the assessment week and enrolled in the program, services began quickly. After enrolling on Wednesday, participants were immediately assigned both a case manager and a Goodwill store location to report to for work on the follow-ing Monday. This approach is based on evidence from multiple evaluations of programs for former prisoners and welfare recipients that suggest that rapid engagement into core services is critical for retaining participants. The three-day gap between enrollment and employment meant there was little time for participants to fall out of touch with the program or to grow frustrated with the pace of activities.
On average, sample members who participated in subsidized jobs did so for around the intended amount of time. The program’s model intended participants to work for one month in a Goodwill transitional job or until job-ready and finished with any necessary training, and then for three months in a community-site job. As Table 2.3 shows, participants worked 28 work days (around 1.4 calendar months) in Goodwill transitional jobs and around 53 work days (around 2.6 months) in community-site jobs (among those who worked in community-site jobs).
● Transitional jobs in Goodwill stores emphasized developing positive workplace habits, building confidence, and beginning the search for un-subsidized employment.
The first core activity for participants was placement in a Goodwill secondhand cloth-ing and goods store. Participants were placed in the stores that were easiest for them to reach

53
from where they lived. They were paid the minimum wage of $7.25 per hour for their work, worked between 20 and 40 hours per week, and generally performed basic tasks such as unloading delivery trucks, sorting donated clothes and goods, stocking the shelves and racks, and assisting customers. These jobs, as one job coach put it, operated on “a hand-holding model,” with an on-site job coach always present to assess participants’ performance, suggest areas for improvement, and connect the lessons they were learning at the Goodwill store to skills they would need once they moved into community-site placements and — ultimately — unsubsidized work. Job coaches also set aside time each day for participants to look for jobs on Goodwill computers; in some cases, depending on the person and the workload, this job search occupied as much as half of the day, while in other cases it was as little as an hour per day.
Job coaches reported that their assessments of participants’ performance were mostly informal, but that they paid particular attention to issues such as punctuality, the ability to take direction and see a task through to the end, and the ability to get along with their coworkers. Coaches also frequently met with participants individually to discuss their performance and their progress toward the goal of moving into a community-site job. In interviews, job coaches said that two of the most valuable services they offered were assistance in developing résumés and the boost they provided to participants’ confidence (through interview prep and a generally optimistic attitude toward participants’ job prospects). As shown in Figure 2.3 (and discussed later in this chapter), most participant questionnaire respondents noted positive experiences with soft-skill development at these transitional jobs. They particularly valued the skills they learned related to working with others (not shown).
● While community-site jobs offered exposure to real-world work envi-ronments, the job options were limited, and there was little opportunity for advancement.
According to its ETJD proposal and early conversations with program managers, Goodwill intended to develop relationships with an array of employers who would agree to take on workers whose wages were subsidized. With a wide network of employers to choose from, the program could place participants in positions based on their skills and long-term job interests. The hope was that some of these jobs could even turn into unsubsidized work for participants who performed well.
Over the course of the evaluation, it became clear that the options in this second phase were more limited than intended, and a majority of participants ended up working in retail positions or with a handful of local nonprofit organizations. According to GoodTransitions managers and staff members, the goals for these community sites simply changed over the course of the evaluation. GoodTransitions’ managers ultimately came to view the positions as

54
and Preparation for Future Employment: Atlanta
Figure 2.3
Favorable Impression of the Value of Transitional Job Support
57%
65%
61%
77%
37%
70%
59%
92%
33%
61%
61%
71%
Preparation for futureemploymentd
Soft skills developmentc
Supervisor supportb
Relationships at worka
Program stage one Program stage two ETJD averagee
Sample size: 49 Sample size: 64 Sample size: 516
Relationships at worka
Supervisor supportb
Soft-skills developmentc
Preparation for future employmentd
(continued)

55
Figure 2.3 (continued)
SOURCE: MDRC calculations based on the ETJD participant questionnaire.
NOTES: The measures presented in this figure, relationships at work, supervisor support, soft-skillsdevelopment, and preparation for future employment were created based on an exploratory factor analysis of a pool of questions. These questions asked participants about their level of agreement with a particular statement on a scale of 1 to 7, where 1 indicates strong disagreement and 7 indicates strong agreement. Based on the results of the factor analysis, questions were grouped into factors and a mean score was calculated across the questions included in a particular factor; the percentages presented above represent the proportion of questionnaire respondents who averaged a score of 6 or higher on the questions in that factor, indicating a high level of satisfaction with their program experiences in that area.
With a few exceptions, questionnaires were administered to participants by the research team during site visits at events and activities when many participants would be available at once. Consequently, the responses obtained are from participants who attended program activities and were therefore likely to be more motivated and engaged than the full sample of program participants. For this reason, the results presented in this figure are not necessarily representative of all participant experiences and should be interpreted with caution; they are likely to be more positive.
aBased on agreement with the following statements: I understand what is expected of me on the job; I know whom at work to ask for help when I need it; My relationships with coworkers are positive and supportive; and My coworkers understand me and want me to succeed.
bBased on agreement with the following statements: I get the support or guidance that I need from my supervisor; My supervisor gives me advice about how to handle situations at work; and My supervisor helps me if personal issues come up that get in the way of working.
cBased on agreement with the following statements: I am learning how to work better with coworkers; I am learning how to cooperate better with supervisors; and This job has helped me learn to present myself better at work.
dBased on agreement with the following statements: The kind of work I am doing will help me get a decent-paying job later; I am learning specific job skills that I will use in the future; and I have met people through this job who may help me find a job in the future.
eTo account for varying questionnaire sample sizes across ETJD programs, the "ETJD average" is a weighted average of all programs such that each program is equally represented.
an extension of the Goodwill jobs and as an opportunity to expose participants to an increasing amount of responsibility in preparation for the regular labor market. The fact that there was no increase in wages for participants, however, and the fact that the jobs, despite being more rigorous, were not always suited to participants’ skills or goals — these were departures from central goals laid out in the program’s proposal.
The research team was not able to determine exactly why the GoodTransitions program struggled to enlist a diverse roster of community-site employers, since the evaluation did not interview employers that had not agreed to work with GoodTransitions. It did appear that, at some level, once GoodTransitions recruited enough retailers and nonprofit organizations to employ its participants, it simply shifted its emphasis to the unsubsidized job search rather than developing a wider array of subsidized opportunities. While there may be good arguments for making a higher priority of unsubsidized placements than subsidized ones, it will be important,

56
when considering the findings from this and other ETJD programs, to further explore the reluctance that may have existed among private employers. A clearer understanding of that reluctance could improve such employer-centered approaches in the future.
● Workshops and weekly job clubs offered an opportunity for partici-pants to maintain momentum and camaraderie through occupational and life-skills classes and motivational visits from outside speakers.
While the transitional jobs and individual employment services were the most intensive elements of the program, participants were required to take part in other activities as well. Weekly group job clubs gave participants a chance to discuss job-search strategies and tips with each other and with the staff, and to hear from guest speakers — former participants, profes-sional motivational speakers, and employers — on issues related to child support and employ-ment. At these sessions, participants also completed worksheets and assessments designed to reveal jobs suited to their skills and goals, and practiced cold-calling employers and answering common interview questions they might encounter.
Similarly, participants were required to take part in a series of workshops led by Goodwill’s partners: the Urban League of Greater Atlanta and the Center for Working Families. These partner organizations led workshops on anger management, conflict resolu-tion, work/home balance, financial literacy, and sexual harassment prevention. Some work-shops also included discussions of family relationships, parenting, and fatherhood, but these were not the workshops’ central focus. As Table 2.3 shows, only 9 percent of participants received these parenting and fatherhood services from Goodwill. Table 2.3 also shows nearly all participants took part in this kind of workforce preparation. Further, 57 percent took part in some “education and training.” For the most part, this training consisted of forklift certifica-tion and construction flagging certification (certification to hold the sign directing traffic around a road construction crew).
Participant focus groups suggested that participants were often motivated by broader goals than child support compliance or increased earnings per se. Several participants, for example, said they were motivated to participate in the program by a desire to take responsibil-ity, do right by their children, or reconnect or strengthen their relationships with their families. It was not clear from these discussions how beneficial participants found the aspects of the program that did not relate directly to employment.
● In focus groups and brief questionnaires administered during their transitional jobs, participants said that they understood what Good-Transitions was offering and what to expect from the program, but that they also felt some frustration with the program’s lack of longer-term employment and training opportunities.

57
Figure 2.3 presents results from questionnaires administered to participants as they were working in their Goodwill or community-site jobs.11 As the figure shows, respondents generally felt most positive about those aspects of the program related to their relationships at work and least positive about the preparation for future employment offered through the positions. There were also notable differences in how positively participants rated their relationships at work between the first and second phases of the program; a much higher percentage of participants gave high marks to their community-site relationships than their Goodwill job relationships (92 percent compared with 71 percent). It is unclear exactly what caused this difference, but participants did confirm in focus groups that the work in their community-site positions was more “real-world” work than the work in the Goodwill jobs.
These questionnaire findings corroborate the reports of participants who took part in fo-cus groups during research site visits. Many of these focus group participants said that they were motivated to live up to their responsibility to their children and that they were resigned to the low pay they were receiving at their community-site jobs. In essence, while they were disappointed to have few options beyond retail jobs, many simply didn’t expect the program to deliver them a job, and instead felt that it was their responsibility to get what they could out of the program. This motivation to live up to their responsibilities, along with the suspension of enforcement action and reinstatement of driver’s licenses, may explain the fact that participants gave low ratings to many aspects of their experience yet still remained in the program. See Box 2.3 for more on one participant’s experiences.
Impacts on Participant Outcomes GoodTransitions’ main goal was to improve the employment and earnings of participants, thereby increasing their compliance with child support orders. These outcomes are important in their own right and may also lead to other positive outcomes such as reduced criminal justice involvement, improved relationships with children, or increased overall well-being. This section compares program and control group members’ labor-market, child support, and criminal justice experiences in the year following random assignment, along with measures related to their overall well-being. This analysis is a first step in assessing the extent to which the program achieved its goals. A more definitive answer to this question requires additional follow-up, which will be provided in a later report.
11The questionnaires mentioned here were administered to a small number of participants working in tran-
sitional jobs at the time of the research team’s site visit. These short questionnaires were used in lieu of interviews to inform the implementation study, and are separate from the in-program and one-year follow-up surveys discussed in the impact analysis.

58
Box 2.3
GoodTransitions Participant Profile
“Richard” is a high school-educated black man in his 40s who lives with his girlfriend. He was referred to GoodTransitions by DCSS’s Fatherhood. He was interested in GoodTransitions because he wanted to “find a steady job — steady income.” He owes about $500 a month in child support for three of his children (two for debt and one current order). His girlfriend pays many of their bills and he would like to contribute more, and pay his child support. He is looking to make at least $12 an hour to cover his expenses.
In the GoodTransitions program he has had three transitional jobs, at a Goodwill store and at two retail stores. He has also earned two certifications and hopes to earn a commercial driver’s license. He reports that his supervisors at the transitional jobs have liked him and wanted to hire him: “I haven’t had any problems on any of the job assignments they put me on.” Yet he is struggling to find permanent employment. His hours have been cut back at his second transitional job and he has been assigned the GoodTransitions case manager who assists participants “at the end of the line.”
Richard’s primary barrier to permanent employment is his criminal history. He has two felony convictions and served two prison sentences. He states that his background has greatly hin-dered his job search: “I’ve had a few interviews and I actually got all the way in the door, and when the background check came through, they couldn’t take me.”
He also has some health issues that limit his ability to perform physical labor. When he started the program, he did not own a car, which caused him to miss appointments and reject job offers that could not be reached by public transportation. His lack of computer skills has also made applying for jobs difficult. Richard is hopeful that with a car and gas card from Good-will, and with assistance from the program with his computer and job-search skills, one of his five weekly job leads will come through soon.
Participation and Service Receipt Outcomes
In order to assess the impact of the program on employment and other outcomes, it is necessary to compare the outcomes of people who were offered GoodTransitions services with the outcomes of similar individuals who were not offered those services. While assignment to the control group means that those sample members did not participate in the GoodTransitions program, control group members did participate in the Fatherhood program and were free to seek out other services available in the community. Examining the differences in participation and service receipt between program and control group members makes it possible to assess the extent to which program group members received different types or amounts of assistance and provides important context for understanding the differences in the outcomes of the two groups.

59
● As expected, a large proportion of the control group received employ-ment services. Nevertheless, the program group had higher rates of par-ticipation and receipt of services, including services related to employ-ment, child support and parenting, and criminal justice issues.
Table 2.4 presents the differences in participation and service receipt between program and control group members. The data for these analyses come from a survey of sample mem-bers administered roughly 12 months after random assignment.
Nearly all program group members (97 percent) received help related to finding or keeping a job, compared with roughly two-thirds of control group members (65 percent). Considering the high rates of participation in GoodTransitions discussed earlier, it is not surprising that the survey results indicate that the program group received employment services at high rates. As the program group’s participation level exceeded the control group’s level by a relatively large margin, these results confirm that GoodTransitions was successful in increasing access to employment services.
It is notable that nearly half of the program group (47 percent) reported receiving voca-tional training; this figure was only 17 percent for the control group. Similarly, there was a 21 percentage point difference between the groups in their receipt of Occupational Safety and Health Administration (OSHA) or forklift certifications, and a 12 percentage point difference in earning other professional licenses or certifications. Further analysis (not shown in the table) indicates that a large proportion of the certifications reported by program group members were related to driving a forklift.
Program group members also reported higher levels of receipt of services related to child support and criminal justice issues. In addition, they were more likely to report receiving support or mentorship from staff members at agencies where they sought services, which is consistent with the information gathered from the participant questionnaires discussed earlier.
Employment and Earnings Outcomes
● In the four quarters after random assignment, program group members were more likely to have been employed, worked more consistently, and had higher earnings on average.
Table 2.5 shows the employment and earnings of the program and control groups in the year after random assignment. The top panel of the table presents measures based on adminis-trative data, including unemployment insurance wage records and GoodTransitions payroll records. The bottom panel of the table presents data from the survey of sample members administered roughly 12 months after random assignment.

60
Table 2.4
One-Year Impacts on Participation and Service Receipt: Atlanta
Outcome (%) Program
Group Control
Group Difference
(Impact)
Ninety Percent Confidence
Interval
Employment support Received help related to finding or keeping a job 96.8 65.1 31.6 *** [27.5, 35.8]
Job search, job readiness, and career planninga 95.8 64.1 31.7 *** [27.5, 36.0] Paying for job-related transportation or equipment
costs 82.8 16.2 66.6 *** [62.2, 71.0]
Education and training Participated in education and training 51.9 28.8 23.1 *** [17.5, 28.6]
ESL, ABE, or high school diploma or equivalentb 7.5 8.1 -0.6 [-3.8, 2.5] Postsecondary education leading to a degree 6.4 12.1 -5.7 *** [-9.1, -2.3] Vocational training 46.6 17.3 29.4 *** [24.2, 34.5]
Received high school diploma or equivalent 2.3 2.2 0.0 [-1.7, 1.8]
Earned professional license or certification (not including OSHA or forklift)c 20.2 8.6 11.7 *** [7.6, 15.7]
Earned OSHA or forklift certification 26.5 5.9 20.6 *** [16.5, 24.6]
Other support and services Among those identified as formerly incarcerated at enrollment:d
Received help related to past criminal convictions 84.8 43.4 41.3 *** [31.9, 50.8]
Handling employer questions about criminal history 81.5 42.3 39.2 *** [29.4, 49.0]
Legal issues related to convictions 62.6 29.2 33.4 *** [23.0, 43.8]
Received help related to child support, visitation, parenting or other family issues 59.9 31.4 28.5 *** [23.1, 34.0]
Modifying child support debt or orders 49.7 22.4 27.3 *** [22.0, 32.6]
Setting up visitation with child(ren) 27.9 12.3 15.6 *** [11.1, 20.2]
Parenting or other family-related issues 37.6 15.6 22.0 *** [17.1, 27.0]
Received advice or support from a staff member at an agency or organization 66.9 30.4 36.5 *** [31.0, 41.9]
(continued)

61
Table 2.4 (continued)
Outcome (%) Program
Group Control
Group Difference
(Impact)
Ninety Percent Confidence
Interval
Received mentoring from a staff member at an agency or organization 62.5 29.5 33.1 *** [27.6, 38.5]
Received mental health assistance 19.1 8.4 10.7 *** [6.7, 14.7]
Sample size 411 401
SOURCE: MDRC calculations based on responses to the ETJD 12-month survey. NOTES: Results in this table are regression-adjusted, controlling for pre-random assignment characteristics. Statistical significance levels are indicated as: *** = 1 percent; ** = 5 percent; * = 10 percent. aIncludes help with job searching, job referrals, developing a résumé, filling out job applications, preparing for job interviews, job-readiness training, and planning for future career or educational goals. bESL = English as a second language, ABE = adult basic education. cOSHA stands for Occupational Safety and Health Administration. In an effort to separate receipt of profes-sional licenses or certifications that require more intensive and lengthy training (for example, a Certified Medical Assistant certificate or a commercial driver’s license) from those that can be earned following more cursory, one-day training, receipt of OSHA and forklift certifications, which fall into the latter group, is presented separately from receipt of other types of licenses or certifications. A review of all reported types of licenses or certifications revealed that OSHA and forklift certifications account for a large majority of the shorter-term, less intensive licenses and certifications received by sample members. dThese measures include only those who were identified as formerly incarcarated at study enrollment (program group = 130; control group = 113; total = 243).
As shown in Figure 2.4 and discussed above, most of the program group members par-ticipated in subsidized employment in the year following random assignment. The overall employment rate in Year 1 was 28 percentage points higher among the program group than the control group and the program group received $2,056 (or 31 percent) more in earnings. These differences in total employment and earnings reflect the participation of program group mem-bers in GoodTransitions subsidized employment: In the year after random assignment, almost all program group members (96 percent) participated in subsidized employment and had average earnings from subsidized employment of $2,017.
Both the administrative records and the survey show that program group members were more likely to be employed one year after random assignment than control group members; the difference between the groups was about 11 percentage points in the unemployment insurance

62
(continued)
Table 2.5
One-Year Impacts on Employment and Earnings: Atlanta
Outcome Program
Group Control
Group Difference
(Impact)
Ninety Percent Confidence
Interval
Primary outcomes (based on administrative data) Employmenta (%) 98.4 70.9 27.5 *** [24.1, 30.9]
ETJD subsidized employment (%) 95.7 --
Number of quarters employed 3.4 1.9 1.5 *** [1.4, 1.7] Average quarterly employment (%) 86.0 48.0 38.1 *** [34.9, 41.3] Employment in all quarters (%) 67.6 20.3 47.4 *** [43.0, 51.8]
Total earnings ($) 8,765 6,709 2,056 *** [1,164, 2,947]
Total e
ETJD subsidized earnings ($) 2,017 --
arnings (%)
$5,000 or more 60.3 42.4 18.0 *** [13.0, 23.0] $7,500 or more 43.6 34.5 9.2 *** [4.2, 14.1] $10,000 or more 32.7 28.0 4.7 * [0.1, 9.4]
Employment in the first quarter of Year 2 (%) 68.9 57.6 11.3 *** [6.4, 16.2] ETJD subsidized employment in the first quarter of
Year 2 (%) 9.6 --
Sample size 501 495
Self-reported outcomes (based on survey data) Ever employed in Year 1 (%) 93.1 80.4 12.7 *** [8.7, 16.6]
Currently employed (%) 72.7 65.1 7.6 ** [2.3, 13.0]
Currently employed in transitional job program (%) 7.4 0.4 7.1 *** [4.8, 9.3]
Type of employment (%) ]
Not currently employed 27.9 35.6 -7.7 ** [-13.1, -2.3Permanent 52.6 40.3 12.3 *** [6.5, 18.1] Temporary, including day labor and odd jobs 18.9 22.3 -3.4 [-8.2, 1.4] Other 0.5 1.8 -1.2 [-2.5, 0.0]
Among those currently employed:b
Hours worked per week 36.7 35.2 1.4
Hourly wage ($) 9.9 11.6 -1.8

63
Table 2.5 (continued)
Outcome Program
Group Control
Group Difference
(Impact)
Ninety Percent Confidence
Interval
Hours worked per week (%)
More than 20 hours 61.4 53.4 8.0 ** [2.3, 13.7]
More than 34 hours 45.0 41.6 3.4 [-2.3, 9.1]
Hourly wage (%)
More than $8.00 45.2 45.4 -0.2 [-6.1, 5.7]More than $10.00 21.0 24.4 -3.4 [-8.5, 1.6]
Sample size 411 401
SOURCES: MDRC calculations based on quarterly wage data from the National Directory of New Hires and responses to the ETJD 12-month survey. NOTES: Results in this table are regression-adjusted, controlling for pre-random assignment characteristics. Statistical significance levels are indicated as: *** = 1 percent; ** = 5 percent; * = 10 percent. aEmployment rates and earnings include both ETJD subsidized jobs and all other jobs covered by unemployment insurance. bThese measures are calculated among those employed at the time of the survey; they are therefore considered nonexperimental and are not tested for statistical significance.
records and 8 percentage points in the survey.12 However, there was no statistically significant difference between the groups in average earnings in the last quarter of follow-up. In addition, it is important to note that about 10 percent of the program group was working in a GoodTransi-tions subsidized job in that final quarter.13 It remains to be seen whether impacts on employ-ment persist after all program group members leave their subsidized jobs.
● The impacts on employment were largest among those with no recent work experience.
Prior research on transitional jobs programs suggests that the model is most effective for those people who are least likely to find jobs on their own and those with lower levels of
12The difference between employment in the first quarter of Year 2 as shown in unemployment insurance
wage records and the survey-based “current” employment rates is most likely because respondents reported employment on the survey that was not covered by unemployment insurance.
13As discussed above, some program group members who were unable to secure unsubsidized employ-ment stayed in their subsidized jobs much longer than originally anticipated.

64
Figure 2.4
Employment and Earnings Over Time: Atlanta
1,255
2,061
2,5602,890 3,068
589
1,502
2,103
2,5162,785
0
500
1,000
1,500
2,000
2,500
3,000
3,500
0***
1***
2**
3*
4
Ave
rage
ear
ning
s ($)
Quarter after random assignment
Program group Control group
Program group without subsidized employment
0102030405060708090
100
0***
1***
2***
3***
4***
Perc
enta
ge e
mpl
oyed
Quarter after random assignment
Program group total employment
Control group employment
Program group ETJD subsidized employment
(continued)

65
Figure 2.4 (continued)
SOURCE: MDRC calculations based on quarterly wage data from the National Directory of New Hires.
NOTE: Results in this figure are regression-adjusted, controlling for pre-random assignment characteristics.Statistical significance levels are indicated as: *** = 1 percent; ** = 5 percent; * = 10 percent.Employment rates and earnings include both ETJD subsidized jobs and all other jobs covered by
unemployment insurance.
recent employment and education.14 ETJD is based on the hypothesis that the programs may be most effective for people who are the least “employable” and who are therefore least likely to find jobs on their own without assistance. To test this hypothesis, the research team examined the program’s impacts on employment among subgroups who had more or less recent work experience when they enrolled in the program. Individuals who had been employed for at least one quarter of the year before random assignment were assumed to be more employable than individuals who had not worked at all during that year. As shown in Table 2.6, employment and earnings levels are much lower during the year of follow-up for control group members who did not work at all in the previous year than they are for those who did work in that previous year, which suggests that preenrollment work experience is a useful indicator of those most in need of ETJD services.
Consistent with the ETJD theory, the program’s impacts on employment in the first year after random assignment are largest for those who did not work at all in the previous year. Among those who did not work at all in the previous year, nearly all program group members (98 percent) were employed at some point during the year (because of the transitional job), compared with just 56 percent of the control group. There were also employment gains for program group members who had worked in the year before the program, but the difference between the employment rates of the program and control groups was significantly smaller.
● Impacts on employment were larger for those enrolled in the first year of the program’s operation.
As discussed above, the program evolved over its course of operation: Its recruitment strategies evolved and its strategies to help program group members after their transitional jobs ended shifted toward assistance with obtaining unsubsidized employment. However, as shown in Appendix Table A.2, program impacts on employment were much larger for those enrolled earlier in the course of the program: There was a 34 percentage point difference in Year 1
14Butler et al. (2012).

66
Table 2.6 One-Year Impacts on Employment and Earnings, by Employment Status in the Prior Year: Atlanta
Did Not Work in Prior Year Worked in Prior Year
Outcome Program
Group Control
Group Difference
(Impact)
NinetyPercent
ConfidenceInterval
Program Group
Control Group
Difference (Impact)
Ninety Percent
Confidence Interval
Difference Between
Subgroup Impactsa
Employmentb (%) 98.6 55.7 42.9 *** [37.1, 48.6] 98.6 84.2 14.5 *** [10.7, 18.2] †††
ETJD subsidized employment (%) 96.2 0.1 96.1 *** [94.0, 98.1] 95.2 -0.1 95.2 *** [93.0, 97.4]
Total earnings ($) 6,711 4,516 2,195 *** [1,187, 3,202] 10,592 8,383 2,210 ** [487, 3,932] Average quarterly employment (%) 83.0 35.9 47.1 *** [42.2, 52.1] 88.8 58.5 30.4 *** [26.2, 34.5] †††
Employment in the first quarter of Year 2 (%) 60.8 44.8 16.1 *** [8.3, 23.8] 75.6 68.3 7.3 * [1.0, 13.6]
Sample size 215 235 286 260
SOURCES: MDRC calculations based on quarterly wage data from the National Directory of New Hires and responses to the ETJD 12-month survey. NOTES: Results in this table are regression-adjusted, controlling for pre-random assignment characteristics. Statistical significance levels are indicated as: *** = 1 percent; ** = 5 percent; * = 10 percent. aWhen comparing impacts between two subgroups, an H-statistic is generated. The H-statistic is used to assess whether the difference in impacts between the subgroups is statistically significant. Statistically significant differences across subgroups are indicated as: ††† = 1 percent; †† = 5 percent; † = 10 percent. bEmployment rates and earnings include both ETJD subsidized jobs and all other jobs covered by unemployment insurance.

67
employment between the program and control group members enrolled in the first year of the program, compared with a 20 percentage point difference for those enrolled in the second year. It is difficult to tell whether these differences reflect changes in the composition of the enrollees, changes in the local labor market, changes in program implementation practices, or other factors. Additional analysis (not shown) found that sample members who enrolled in the study later may have been somewhat more employable. For example, 64 percent of those who enrolled in the second year of the program had worked in the year before enrollment, compared with 59 percent of those who enrolled in the first year. As discussed earlier, program impacts were generally smaller for more employable sample members. Of course, it is also possible that these differences in employment rates reflect an improving labor market.
Child Support and Family Relations Outcomes
● Overall, in the year after random assignment, program group members were more likely to pay child support, made more consistent payments, and paid more on average.
Table 2.7 presents program and control group outcomes related to child support and family relations. The top panel of the table presents measures based on administrative data from the Division of Child Support Services, while the bottom panel presents data from the survey of sample members administered roughly 12 months after random assignment.
Most of the program group members paid formal child support in the year following random assignment. While many of the control group members also paid child support, the program-control difference in payment rates was over 18 percentage points. Program group members also made formal child support payments more consistently than control group members, and paid almost twice as much on average. These results reflect the higher employ-ment and earnings program group members experienced during this period (most, if not all, sample members were subject to automatic child support payments via payroll deduction). As shown in Figure 2.5, most of the increase in formal child support payments occurred in the first two quarters after random assignment, when most program group members were also in subsidized jobs. Impacts on child support compliance did not change much over the course of the program. As shown in Appendix Table A.2, the differences between program and control group child support payments are similar for study members who enrolled in the first year of the program and those who enrolled in the second.
The bottom panel of Table 2.7 shows that increased child support payments due to em-ployment did not appear to reduce the informal child support provided by program group members. Program and control group members reported providing both informal cash and
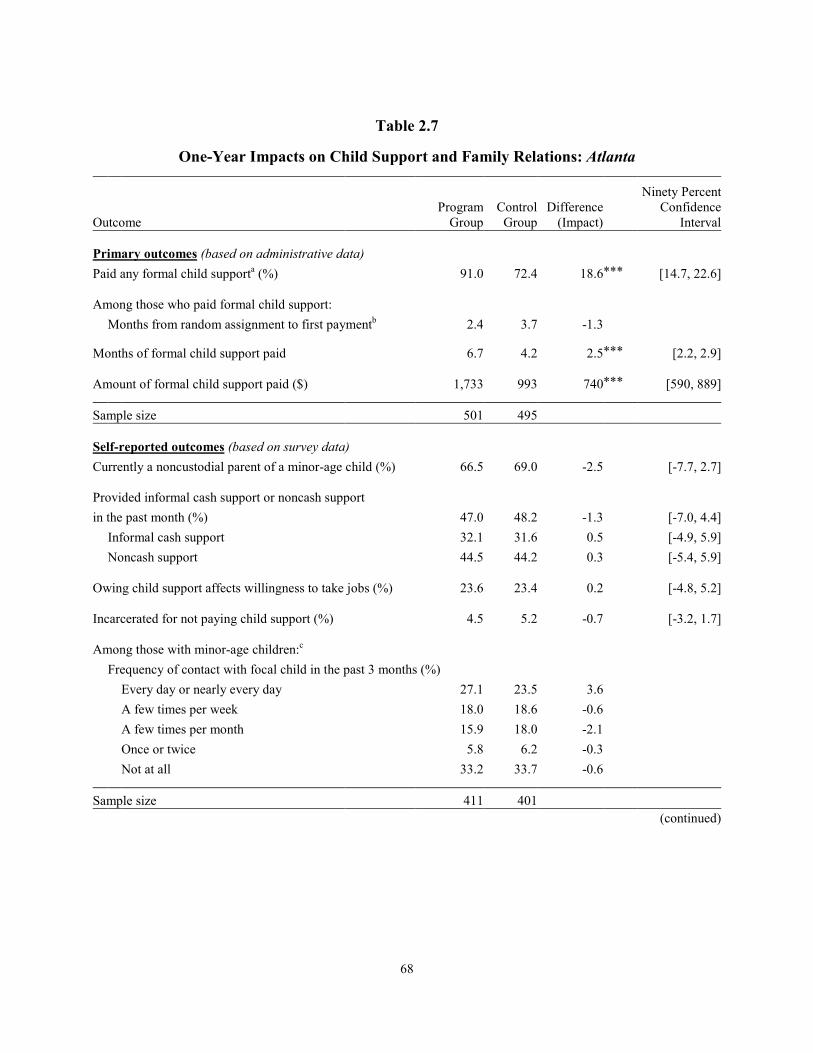
68
Table 2.7
One-Year Impacts on Child Support and Family Relations: Atlanta
Outcome Program
Group Control
Group Difference
(Impact)
Ninety Percent Confidence
Interval
rimar
P y outcomes (based on administrative data)
Paid any formal child supporta (%) 91.0 72.4 18.6 *** [14.7, 22.6]
Among those who paid formal child support:
Months from random assignment to first paymentb 2.4 3.7 -1.3
Months of formal child support paid 6.7 4.2 2.5 *** [2.2, 2.9]
Amount of formal child support paid ($) 1,733 993 740 *** [590, 889]
Sample size 501 495
Self-reported outcomes (based on survey data) Currently a noncustodial parent of a minor-age child (%) 66.5 69.0 -2.5 [-7.7, 2.7]
Provided informal cash support or noncash support
in the past month (%) 47.0 48.2 -1.3 [-7.0, 4.4]
Informal cash support 32.1 31.6 0.5 [-4.9, 5.9] Noncash support 44.5 44.2 0.3 [-5.4, 5.9]
Owing child support affects willingness to take jobs (%) 23.6 23.4 0.2 [-4.8, 5.2]
Incarcerated for not paying child support (%) 4.5 5.2 -0.7 [-3.2, 1.7]
Among those with minor-age children:c
Frequency of contact with focal child in the past 3 months (%)
Every day or nearly every day 27.1 23.5 3.6 A few times per week 18.0 18.6 -0.6 A few times per month 15.9 18.0 -2.1
Once or twice 5.8 6.2 -0.3 Not at all 33.2 33.7 -0.6
Sample size 411 401
(continued)

69
Table 2.7 (continued)
SO URCE: MDRC calculations based on ch ild suppo rt agency dat a and respo nses to the ET JD 12-month
survey. NOTES: Results in this table are regression-adjusted, controlling for pre-random assignment characteristics. Statistical significance levels are indicated as: *** = 1 percent; ** = 5 percent; * = 10 percent. aMeasures of formal child support include all payments made through the state's child support collection and disbursement unit, including funds from employer withholding and other sources (for example, tax intercepts). bThis measure is calculated among those who paid child support during the follow-up period; it is therefore considered nonexperimental and is not tested for statistical significance. cThis measure is calculated among those who reported having a minor-age child at the time of the survey; it is therefore considered nonexperimental and is not tested for statistical significance. The focal child is defined as the youngest minor-age child living outside of the sample member's household; if the sample member reports no minor-age children living outside of his or her household, the focal child is the youngest minor-age child residing within the household.
noncash support to their children for whom they did not have custody. Likewise, program and control group members reported similar levels of contact with their children who lived apart from them.
Criminal Justice Outcomes
● In the year following random assignment, program and control group members had similar, low rates of involvement with the criminal justice system.
The top panel of Table 2.8 contains measures drawn from administrative sources, in-cluding local and state criminal justice agencies. The bottom panel of Table 2.8 presents data from the survey of sample members administered roughly 12 months after random assignment.
Overall, Atlanta sample members were minimally involved in the criminal justice sys-tem in the year after random assignment. Recall that 34 percent of the sample had prison incarceration histories at enrollment, and for most, the most recent incarceration in prison or jail was more than a year before random assignment. The estimated difference in arrest rates between the program and control groups was statistically significant (program group members had a lower arrest rate), but there were no differences in conviction or incarceration rates. The small difference in arrest rates may be an effect of the greater employment rates experienced by program group members or could reflect “noise” in the data. This difference in arrest rates is concentrated among sample members who enrolled in the program’s second year (see Appen-dix Table A.2).

70
(continued)
Figure 2.5
Formal Child Support Payments Over Time: Atlanta
0102030405060708090
100
0***
1***
2***
3***
Perc
enta
ge p
ayin
g fo
rmal
chi
ld su
ppor
t
Quarter after random assignment
Program group
Control group
207
541502 483
69
228
312
385
0
100
200
300
400
500
600
0***
1***
2***
3***
Ave
rage
form
al c
hild
supp
ort p
aid
($)
Quarter after random assignmentProgram group Control group

71
Figure 2.5 (continued)SOURCE: MDRC calculations based on child support agency data.
NOTES: Results in this figure are regression-adjusted, controlling for pre-random assignment characteristics.Statistical significance levels are indicated as: *** = 1 percent; ** = 5 percent; * = 10 percent.Measures of formal child support include all payments made through the state's child support collection and
disbursement unit, including funds from employer withholding and other sources (for example, tax intercepts).
Table 2.8 One-Year Impacts on Criminal Justice Outcomes: Atlanta
Outcome Program
Group Control
Group Difference
(Impact)
Ninety Percent Confidence
Interval
Primary outcomes (based on administrative data) Arrested (%) 14.6 18.7 -4.1 * [-7.8, -0.3]
Convicted of a crime (%) 5.8 6.4 -0.6 [-3.1, 1.8]
Incarcerated in prison (%) 0.8 0.9 -0.1
[-1.0, 0.8]
Total days incarcerated in prison 1.0 1.0 -0.1 [-1.5, 1.4]
Arrested, convicted, or admitted to prison (%) 14.8 19.1 -4.3 * [-8.1, -0.5]
Sample size 501 495
Self-reported outcomes (based on survey data) Incarcerated (%) 9.2 9.6 -0.4 [-3.8, 3.0]
Total days incarcerateda 4.7 3.3 1.3 [-1.3, 4.0]
On parole or probation (%) 25.8 23.0 2.9 [-1.7, 7.5]
Sample size 411 401
SOURCES: MDRC calculations based on crimi nal just ice data and r esponses to the ETJD 12 -month survey. NOTES: Results in this table are regression-adjusted, controlling for pre-random assignment characteristics. Statistical significance levels are indicated as: *** = 1 percent; ** = 5 percent; * = 10 percent. aThis measure includes a small number of outlier values resulting from sample members who were interviewed more than 18 months after study enrollment.

72
Economic and Personal Well-Being Outcomes
● The labor-market gains experienced by the program group produced some immediate impacts on well-being, but the gains did not persist very long after participants left the program. One year after random assign-ment, program and control group members reported similar levels of economic and personal well-being.
Table 2.9 presents program and control group differences for a variety of outcomes re-lated to general well-being, drawn from data collected while program group members were participating in the program. Table 2.10 presents program and control group differences for a similar set of outcomes drawn from the 12-month follow-up survey, which was administered months after most program group members had left the program and their transitional jobs.
There were differences in a few measures of well-being between program and control group members during the period when most program group members were participating in the program and working in their transitional jobs. In particular, program group members were more likely to report that their current financial situations were better than they were a year ago by a margin of 20 percentage points, which could be a reflection of their earnings from the transitional job and participation in the ETJD program. Program group members were also happier and scored higher on the Pearlin Mastery Scale (indicating that they were more likely to believe they could control events in their lives). Only a small proportion of the sample reported having funds left over at the end of the typical month, and control group members were more likely to report doing so. Program and control group members reported similar, high levels of concern about meeting their expenses, and almost 40 percent of both groups had had insuffi-cient food in the past week.
At 12 months after random assignment, program and control group members reported similar levels of personal and economic well-being. These results suggest that the labor-market gains experienced by the program group did produce some immediate impacts on well-being, but the gains did not persist very long after participants left the program.
Conclusion The GoodTransitions program was designed to improve employment and earnings — as well as child support compliance rates — among low-income noncustodial parents in the Atlanta area who owed child support. The program was able to deliver most of its components with high fidelity to the model initially laid out in the proposal. Staff members at the program were knowledgeable about the needs and profiles of the participants on their caseloads. They came to their positions with backgrounds in human and employment services, maintained regular

73
Table 2.9
Short-Term Impacts on Well-Being and Self-Confidence: Atlanta
Outcome
Program
Group Control
Group Difference
(Impact)
Ninety Percent Confidence
Interval
Financial well-being
State of family finances at the end of a typical month (%)
*
Some money left over 3.6 7.0 -3.4 [-6.3, -0.5]Just enough to make ends meet 32.6 32.8 -0.2 [-6.3, 6.0] Not enough to make ends meet 63.8 60.2 3.6 [-2.8, 9.9]
Financial situation is better than it was this time
last year (%) 59.8 39.5 20.3 *** [13.9, 26.7]
Frequency of worry about ability to meet monthly
living expenses (range of 0 to 10, where 0 = never and 10 = all the time) 7.6 7.3 0.4 [-0.1, 0.8]
Had insufficient food in the past week (%) 39.3 37.7 1.6 [-4.8, 8.0]
Personal well-being (%) Experienced serious psychological distress
19.2
in the past montha 23.4 -4.2
[-9.6, 1.1]
Overall happiness
Very happy 13.2 14.4 -1.2 [-5.7, 3.3]Pretty happy 58.0 45.5 12.5 *** [5.9, 19.0]Not too happy 28.9 40.1 -11.3 *** [-17.5, -5.0]
Self-confidence scales
Score on Pearlin Mastery Scaleb 5.3 5.1 0.2 ** [0.1, 0.3]
Score on Work Self-Efficacy Scalec 3.9 3.9 0.0 [0.0, 0.0]
Score on Job Search Self-Efficacy Scaled 4.4 4.4 0.0 [0.0, 0.1]
Sample size 336 316
(continued)

74
Table 2.9 (continued)
SO URCE: M DRC calculat ions based on responses to the ET JD in-prog ram surve y. NOTES: Results in this table are regression-adjusted, controlling for pre-random assignment characteristics. For the in-program survey, only sample members randomly assigned between July 2012 and December 2013 were included. The survey response rate for this subsample was 85 percent. aA score of 13 or higher on the Kessler-6 (K-6) scale is used here to define serious psychological distress. The K-6 assesses how often during the past month a respondent felt so sad that nothing could cheer him or her up; nervous; restless or fidgety; hopeless; that everything was an effort; or worthless. As a result of minor differences between the scale used to administer the K-6 in the ETJD in-program survey and the standard K-6 scale, the percentages presented in this table may slightly underestimate the incidence of serious psychological distress among the ETJD sample. bThe Pearlin Mastery Scale ranges from 0 to 6. The scale assesses the extent to which respondents agree that they can do anything they set their minds to, they can find a way to succeed at something, their ability to get what they want is in their own hands, their futures depend on themselves, and they can do the things they want to do. cThe Work Self-Efficacy scale ranges from 0 to 4. The scale assesses the extent to which respondents agree that they can get to work on time, meet employers' expectations, work well with others, have good relationships with their supervisors, work well as a team, complete assigned tasks, and learn new skills. dThe Job Search Self-Efficacy scale ranges from 0 to 5. The scale assesses how confident respondents are that they can make a list of skills that can be used to find a job, talk to friends and contacts to find out about potential employers or discover promising job openings, complete a good job application and résumé, make contact with potential employers and persuade those employers to consider them, and make the best impression and get points across in a job interview.
contact with each other and with employers, and followed clear procedures for building rela-tionships with employers. The job clubs and workshops in the program focused on building networking relationships among participants and reinforcing the skills they needed to find and secure jobs. The implementation of the community-site jobs, however, differed from the initial program design. These job placements were less tailored to participants’ skills than originally intended, and less likely to offer the possibility of turning into full-time unsubsidized positions. These differences from the design could affect the program’s ability to produce long-term impacts on employment.
Recruitment and service partnerships also proved challenging. The Fatherhood program struggled to make timely referrals. Goodwill had to take on more responsibility for participants than originally planned after its partners proved unable to place participants at a rate that was consistent with GoodTransitions program requirements. Ongoing conversations with Goodwill managers suggested that the program easily absorbed those participants who were meant to be served through partner organizations. The recruitment and enrollment process proved to be a source of ongoing frustration, however. Staff members downplayed the degree to which this frustration interfered with service provision, but GoodTransitions’ experience does reveal how

75
Table 2.10
One-Year Impacts on Economic and Personal Well-Being: Atlanta
Outcome (%) Program
Group Control
Group Difference
(Impact)
Ninety Percent
Confidence Interval
Experienced a financial shortfall in the past 12 months 67.3 64.9 2.4
[-3.2, 7.9]
E
U
C
Could not pay rent or mortgage 51.8 50.1 1.7 [-4.2, 7.6] victed from home or apartment 12.6 11.0 1.6 [-2.2, 5.4] tility or phone service disconnected 45.4 42.1 3.2 [-2.6, 9.1] ould not afford prescription medicine 30.6 29.2 1.4 [-3.9, 6.8]
Had insufficient food in the past month 28.1 30.1 -2.0 [-7.3, 3.3]
Housing in the past month
Rented or owned own apartment or room 40.2 38.0 2.3 [-3.4, 7.9] Lived with family or friendsa 55.0 54.8 0.2 [-5.6, 6.0] Homeless or lived in emergency or temporary housing 3.5 5.4 -1.9 [-4.3, 0.5] Incarcerated, on work release, or living in a halfway house 0.2 0.3 0.0 [-0.6, 0.6] Other 1.0 1.5 -0.5 [-1.8, 0.8]
Is currently in good, very good, or excellent health 76.6 75.8 0.8 [-4.2, 5.7]
Had health coverage in the past month 32.3 30.4 1.9 [-3.5, 7.3]
Health coverage was employer-based 16.4 14.4 2.0 [-2.2, 6.2]
Experienced serious psychological distress in the past monthb 11.7 14.3 -2.7 [-6.6, 1.3]
Sample size 411 401
SO URCE: MDRC calculations based on responses to the ETJD 1 2-month sur vey. NOTES: Results in this table are regression-adjusted, controlling for pre-random assignment characteristics. Statistical significance levels are indicated as: *** = 1 percent; ** = 5 percent; * = 10 percent. aIncludes those who lived with friends or family and paid rent and those who lived with friends or family without paying rent. bA score of 13 or higher on the Kessler-6 (K-6) scale is used here to define serious psychological distress. The K-6 assesses how often during the past month a respondent felt so sad that nothing could cheer him or her up; nervous; restless or fidgety; hopeless; that everything was an effort; or worthless. As a result of minor differences between the scale used to administer the K-6 in the ETJD 12-month survey and the standard K-6 scale, the percentages presented in this table may slightly underestimate the incidence of serious psychological distress among the ETJD sample.

76
important it is to establish clear and realistic enrollment channels in order to ensure that recruit-ment targets do not detract from a program’s mission.
Finally, although it is too early to know how effective the staff was in connecting partic-ipants to stable, long-term employment, the employment services provided by Goodwill appeared strong. Job developers used clearly specified strategies to help participants identify openings they probably would not have found on their own and connect with employers. Job developers’ case files suggest that they assisted participants in locating opportunities in manu-facturing, warehousing, and production, as well as in the transportation, service, and retail sectors. Future reports will offer more details on participants’ success retaining these positions and advancing in them.
The impact results on program participation show that the program was, in fact, suc-cessful in providing services to program participants, increasing their receipt of services related to employment, child support, and criminal justice. The program group also worked more and had higher earnings than the control group in the year following random assignment, largely because of their GoodTransitions subsidized jobs. These increases in employment and earnings were reflected in higher and more regular child support payments. There were few differences between the program and control group’s outcomes related to criminal justice and overall well-being. As the program-control group differences related to employment and child support directly reflect program participation, it is not possible at this point to determine whether GoodTransitions produced long-term impacts. Further follow-up will be needed to determine whether these differences in outcomes will be sustained after participants leave the program.

Chapter 3
Supporting Families Through Work (Milwaukee, WI)

THIS PAGE INTENTIONALLY LEFT BLANK
79
Executive Summary
The Supporting Families Through Work program (SFTW) of the YWCA of Southeastern Wisconsin offered transitional jobs, employment services, and child support-related assistance to noncustodial parents with child support orders in Milwaukee County. Its goals were to support these parents in entering the formal labor market and remaining employed there, primarily by helping them gain experience, references, and skills through a transitional job. It also aimed to help them with their child support situations. SFTW used a modified transitional jobs model in which participants were placed in fully subsidized, temporary jobs. The program made subsidized placements in positions with external employers throughout the community, including both nonprofit organizations and private-sector businesses. The program enhanced the basic transitional jobs model by offering child support system incentives — including for-giveness of some interest on debt owed to the state — and by offering an earnings supplement to make sure participants entering unsubsidized jobs earned at least $10 an hour.
Main Findings •
•
•
The study participants were all noncustodial parents, and almost all were black men. Program participants were somewhat younger than those in other programs serving noncustodial parents. Most had previous work expe-rience but had earned low wages in their previous jobs, less than $10 per hour on average. Seventy-seven percent had worked less than 12 months dur-ing the previous three years. Over 80 percent had criminal convictions and more than half had been incarcerated.
Recruiting enough people proved to be a substantial challenge for SFTW. In order to meet the ETJD sample goals, the YWCA identified a number of referral partners. Primary among them was the Milwaukee De-partment of Child Support Services’ Children First program, but the actual number of referrals from this source fell far short of expectations.
The YWCA implemented several core aspects of its model as intended, but experienced challenges with staffing and the implementation of certain components. The YWCA succeeded in identifying employers to host transitional job placements and also succeeded in providing child sup-port assistance. However, it faced challenges related to recruitment and staff turnover that affected some aspects of service delivery. For example, because staff members played multiple roles in the program, when they

80
spent more time than anticipated on recruitment, it affected their ability to focus on other services.
•
•
•
•
The program experienced attrition in vital program services, including placement in transitional jobs. Program participation dropped off at various stages, and ultimately fewer than two-thirds of participants actually received transitional jobs. Further, there was a substantial delay before many of the transitional job placements. There may have been a trade-off between rapid placement in transitional jobs and the effort to tailor placements to individual circumstances.
The child support enhancement was well implemented, but it only af-fected debt owed to the state, which was a small proportion of the total debt participants owed. The child support enhancement included for-giveness of interest on child support debt owed to the state, the integration of a Legal Action attorney into program operations, and the availability of an on-site child support representative. This aspect of the program was well re-garded by program staff members and participants alike.
While the earnings supplement enhancement appears to have been im-plemented, only a relatively small portion of the program group (9 per-cent) received it. A small proportion of program group members received a wage supplement designed to raise low wages in unsubsidized jobs. The low rate of receipt was in part because of program attrition at earlier stages, but also because the supplement was only available to individuals earning less than $10 per hour. Since the average wage among people who were working was about $10 per hour, it is likely that many who did obtain jobs earned too much to receive the supplement.
Control group members had access to a wide variety of services in the community, but program group members had higher rates of service re-ceipt, especially in the areas of child support assistance and legal assis-tance related to past criminal convictions. Control group members had ac-cess to programs that were not part of SFTW, including the services of the YWCA’s Career Opportunity Center, employment services offered by the nearby Milwaukee Urban League, and two state-funded transitional em-ployment programs. Nonetheless, SFTW significantly increased program group members’ receipt of services related to employment, child support, and criminal justice issues. The program did not significantly increase program

81
group members’ receipt of most educational/vocational services, but these were not a focus of the program model.
•
•
SFTW significantly increased employment and earnings during the one-year follow-up period. Twelve months after enrollment, program group members had higher rates of employment and earnings in unemployment in-surance-covered jobs. The proportion of study participants who were em-ployed during the first year increased from 61 percent in the control group to 86 percent in the program group, and total average earnings during the first year increased from $3,139 to $4,910. Most of this impact is from subsidized employment, which accounted for $1,157 of the program group’s earnings. These employment and earnings impacts are not observed in the survey data, probably because some control group members were employed in jobs not covered by unemployment insurance.
SFTW increased child support payments. Perhaps due to their higher earnings (or at least their higher earnings in unemployment insurance-covered jobs) and perhaps due to the child support services they received, program group members were about 23 percentage points more likely to have paid child support, paid more on average, and paid for more months than control group members. The program did not significantly affect infor-mal or noncash support.
The first section of this chapter provides background information on the SFTW pro-gram model and the characteristics of the study sample. The second section describes the implementation of the program and the third section describes its impacts on participation in program services, employment, child support payments, and criminal justice outcomes, one year after random assignment.

82
Supporting Families Through Work
Background The Supporting Families Through Work (SFTW) program of the YWCA of Southeastern Wisconsin offered transitional jobs, employment services, and child support-related assistance to noncustodial parents with child support orders in Milwaukee County. Its goals were to support these parents in entering the formal labor market and remaining employed there, primarily by helping them gain experience, references, and skills through a transitional job. It also aimed to help them with their child support obligations.
The SFTW program built on the YWCA’s experience with the New Hope program. The New Hope Project was created in 1991 with the goal of lifting men and women out of poverty through work-related benefits and services such as wage supplements and transitional jobs. Services provided as part of New Hope changed over time, and the New Hope Project merged with the YWCA in 2009; as part of the YWCA, the New Hope program served ex-offenders. It ended at the time SFTW began.1
Like New Hope, SFTW made fully subsidized placements in positions with external employers throughout the community. Positions were with private-sector nonprofit and for-profit employers, and were not necessarily intended to become permanent, unsubsidized jobs. This model centered on improving participants’ skills and behaviors through their experiences in transitional jobs, supported by other services such as a job-readiness workshop, case man-agement, and training for selected participants that they would not otherwise have received. While the transitional jobs themselves were not expected to be permanent, the program provid-ed services after the transitional jobs ended that aimed to help participants connect with unsub-sidized jobs they would not have otherwise secured. As part of ETJD, SFTW falls into the group of programs using a modified transitional jobs model.
SFTW’s theory of change posited that employment itself would lead to improved child support payments, facilitated by assistance from an advocate who could help participants understand their orders and potentially adjust them. The Milwaukee County Department of Child Support Services (DCSS), a partner in the project, offered the forgiveness of some child support interest as an incentive to promote engagement in the program at various stages.
1Details on New Hope are available in Redcross et al. (2010).

83
Context
The Great Recession that began in 2007 had a lasting effect on the labor market in Milwaukee, even after its official end in 2009. Unemployment rates in the City of Milwaukee during the time of the program were over 2 percentage points above the national average in 2012 and 2013, at 10.4 and 10.1 percent, respectively.2 Joblessness among black men, who made up the vast majority of SFTW’s service population, was particularly severe in Milwaukee. In 2010, the year before the start of the study, barely more than half of black men in their prime working years (ages 25 to 54) were employed, compared with 85 percent almost 40 years ago.3 Further, a 2012 study found that in 2010, out of 40 metropolitan areas considered, Milwaukee ranked last in employment rates for prime-working-age black men.4
Noncustodial parents’ abilities to keep up with child support orders are inextricably linked to these employment challenges. However, Milwaukee County does have some flexibil-ity to ensure that child support orders reflect these realities. The state of Wisconsin has general guidelines as to what policies should be used when setting orders or compromising on debt, but allows counties discretion within those guidelines. Using that discretion, Milwaukee County takes a liberal interpretation of the state regulations, taking into consideration factors such as employment prospects, living arrangements, and custodial parents’ requests. A child support attorney described the county’s philosophy by saying that the county child support enforcement agency wants to arrange a court order that is reachable, so as to not set noncustodial parents up for failure. The agency realizes that if someone does not have a job or good job prospects, then it is not sensible to set an order amount based on what he or she used to get paid, because many of the high-paying jobs that used to be in the area have disappeared.
A number of other programs available from the YWCA provide employment services, fatherhood-related programs, and, in some cases, even transitional jobs. The YWCA offered a fatherhood group that met monthly, ran a healthy relationships program, and operated a Career Opportunity Center that provided services through the Workforce Investment Act, Wisconsin Works, and FoodShare Employment and Training.5 Both program and control group members were encouraged to take advantage of these services, if they were eligible, and all SFTW participants who were eligible for FoodShare Employment and Training were enrolled in that program alongside SFTW.
2U.S. Department of Labor, Bureau of Labor Statistics (2016f). 3Levine (2012). 4Levine (2012). 5Wisconsin Works is Wisconsin’s Temporary Assistance for Needy Families program; FoodShare Em-
ployment and Training is Wisconsin’s Supplemental Nutrition Assistance Program employment and training program. The Workforce Investment Act has been superseded by the Workforce Innovation and Opportunity Act.

84
Other community-based organizations also provided similar services in Milwaukee. The Milwaukee Urban League, for example, is located less than a 10-minute walk from the YWCA; it provides employment training and assistance with child support orders. In addi-tion, two state-funded transitional jobs programs operated in Milwaukee at the same time as SFTW: the Transitional Jobs Demonstration Project, which began in September 2010 and ran through mid-2013, and the Transform Milwaukee Jobs Program, which began enrollments in mid-2014. Both programs operated through contracts with community organizations. The earlier program was administered by the Department of Children and Families, which had contracts with seven agencies in Milwaukee County to develop partnerships with host employers for the transitional jobs.6 The later program is operated by UMOS, a nonprofit advocacy organization that provides services to improve the employment, educational, health, and housing opportunities of underserved populations. It is possible that control group members made use of one of these other programs.
Intended Model
The YWCA based its program model on the New Hope program’s transitional jobs model, while making use of some other YWCA workforce-, training-, and child support-related services and partnerships. As initially designed, the first component of the SFTW program model was to be a five-day job-readiness workshop. The workshop’s first day focused on assessments of participants’ skills and interests and the types of jobs that would be good matches for them, while the following days focused on job-readiness activities and job-search preparation. On the last day, each participant was assigned to a case manager, met with an attorney from Legal Action of Wisconsin for assistance with child support, and received the first adjustment to the interest on his or her child support debt.
Case management started after the job-readiness workshop and continued throughout program participation. Case managers assessed participants’ service needs, helped them improve their job readiness, provided job coaching, helped them address barriers that could get in the way of work (for example, a lack of clothing, transportation, or housing), helped them develop soft skills, provided referrals to services within the YWCA or elsewhere, and reviewed the results of criminal background checks. Case managers also discussed specific job opportuni-ties with participants.
SFTW used a scattered-site transitional jobs model with placements at external, private-sector employers, including for-profit companies and nonprofit organizations. The jobs lasted four months at up to 30 hours per week, with an optional two-month extension, and paid minimum wage ($7.25 per hour), fully subsidized by the program. The program’s site coordina-
6Davis and Rupinski (2013).

85
tor was responsible for matching participants with transitional jobs based on their skills and interests and on labor-market demands; the goal was to place participants in positions that would develop their skills and prepare them for unsubsidized work. The program did not specify how long it should take to place participants in transitional jobs, but the intention was to make placements quickly yet at the same time to find good matches for participants’ interests and skills.
The model envisioned that participants would work their 30 hours per week over four days, leaving a day for other program activities and unsubsidized job searching, though the program was open to other arrangements if employers preferred them. In the intended model, participants began searching for unsubsidized employment midway through the transitional job, working with a job developer at the YWCA’s Career Opportunity Center (rather than a staff member paid through the program). Participants also spent two hours per week in job-club-like group sessions held every Friday, when they picked up their paychecks. Separate sessions were held for those still in their transitional jobs and those in the unsubsidized job-search phase.
SFTW also included three components thought of as enhancements to the basic transi-tional jobs model:
•
•
•
Child support-related assistance. Legal Action of Wisconsin assisted par-ticipants with their child support cases starting on the last day of the job-readiness workshop. Participants also had the interest frozen on the debt they owed the state, and interest on state-owed debt forgiven wholly or in part at set benchmarks related to program participation (25 percent upon completing the job-readiness workshop, an additional 50 percent after completing the four-month transitional job period, and the final 25 percent upon obtaining an unsubsidized job).
Earnings supplement. The program provided a wage supplement to bring wages up to $10 per hour for the first six months of unsubsidized employ-ment, for those earning less. The supplement was meant as a strategy to keep participants in unsubsidized employment.
Training for a subset of participants. The original program design includ-ed occupational-skills training as a central feature of the model. The intention was to have partners provide it for 150 participants. However, by the time the YWCA began implementing the program, it was not treating this training as a high priority. (This shift is discussed further in the program implementation section of the chapter.)

86
Underlying this design is the idea that these components would help participants enter the formal labor market and stay employed there. The transitional job was meant to provide participants with experience, references, and workplace skills. Case management was meant to improve participants’ job readiness. The child support assistance and earnings supplements were meant as additional economic incentives for entering and retaining formal employment, as was the training, which was intended to help participants earn higher wages.
Recruitment and Study Enrollment
It proved to be a substantial challenge for SFTW to enroll enough people into the study. The YWCA identified a number of referral partners from which it anticipated meeting its enrollment goals. Chief among them was DCSS’s Children First program, but the actual number of referrals from this source fell far short of expectations, for several reasons: Children First case managers were focused on making referrals to a different program (a fatherhood program operating at various locations in Milwaukee), the paperwork involved in making the referrals was daunting, and there were delays in working out a referral process. As referrals were slow to come, the child support enforcement agency agreed to have its own caseworkers also make referrals. In the end, the YWCA reported having received more than 500 referrals from Children First and the Department combined. An interviewee from the child support enforcement agency said it had met its referral target but substantially fewer actually enrolled in the program, for unknown reasons.
A number of referrals were also anticipated from criminal justice agencies, including prison and jail facilities and the Community Corrections Employment Program (CCEP), a program operated by the Wisconsin Department of Corrections that provides employment assistance to individuals returning to their communities. The program did receive a number of referrals from CCEP, but the corrections facilities did not end up being major referral sources.
Many referrals came from the YWCA’s own Career Opportunity Center, including sev-eral people who walked into the facility.
Determined to reach its enrollment goals, in the latter part of the enrollment period the program began to engage all staff members and even current participants in recruitment efforts. The program employed a wide range of recruitment tactics in this last push, including outreach to businesses and organizations within a 10-mile radius (for example, faith-based organizations, barbershops, and public assistance offices), outreach to shelters, public-service announcements on the radio, and incentives for participants who made referrals (in the form of bus tickets). These efforts required a great deal of staff attention. Because these outreach efforts were particularly intensive toward the end of the enrollment period, the program had particularly high enrollments during the last three months of that time (October to December 2013). Enrollments during these months accounted for more than 20 percent of the program’s total.

87
● The program ultimately met the target sample size, but the characteris-tics of individuals enrolled late in the enrollment period may have been different from those recruited earlier.
SFTW targeted unemployed noncustodial parents with Milwaukee County child sup-port orders (or parents who were willing to have orders established), who were identified as “not job-ready.” For most of the program’s enrollment period, the program defined “not job-ready” as being unemployed and meeting at least one of the following criteria:
•
•
•
•
Has no high school diploma or equivalent
Has been actively seeking employment, is ineligible for or exhausted unem-ployment insurance benefits, and has been unemployed for a period of 12 weeks before applying to the program
Has not had any period of continuous employment for one employer for a period of 4 months or more during the past 12 months
Has a major barrier to employment (for example, a substance-abuse issue, a pending criminal justice action, or some other issue that must be resolved be-fore an employer will hire)
These criteria were implemented in July 2012. The original criteria excluded individu-als who had been in transitional jobs programs before, who had child support orders from other counties, or who met a broader definition of “job-ready” that included individuals who had worked for 3 consecutive months in the previous 18. However, because program enrollment started slowly, the program expanded eligibility.
Referral sources (including the YWCA’s own Career Opportunity Center, which han-dled most walk-ins) screened participants using a checklist that asked whether participants met each of the program’s eligibility requirements. A YWCA intake specialist then called each referred noncustodial parent to go over that parent’s information. The intake specialist ran checks on child support, using information provided by a DCSS paralegal at the YWCA, and Selective Service status. The intake specialist invited those whose child support status met program guidelines and who appeared to meet the program’s other eligibility criteria to an information session.7 Interested individuals filled out additional forms at the session and provided documents needed to confirm their eligibility. Case managers conducted random assignment after potential participants were determined to be eligible.
7Individuals who had not registered for Selective Service were still invited to the information session, as
they had the opportunity to register before enrollment.

88
Staff members indicated that the wide-ranging recruitment strategy adopted late in the program’s enrollment period might have affected the characteristics of the sample population. For example, organizations like Children First had prescreened participants before they came to SFTW, but as the program instituted broad canvassing in the community, such prescreened referrals made up a smaller share of the sample. Staff members had a general impression that participants enrolled late in the program were harder to serve, facing more issues like criminal backgrounds, homelessness, substance abuse, and mental health issues. A comparison between those enrolled during the last three months of the enrollment period and earlier enrollees does show modest but statistically significant differences: later enrollees were somewhat older, more likely to have disabilities, and less likely to have ever worked — and if they did, they were less likely to have worked six or more months in the previous three years. More of them were homeless and more of them had received treatment for substance abuse. However, they were not more likely to have received mental health services or to have been incarcerated. Some program staff members suggested that many participants enrolled in December may have just been interested in the immediate prospect of getting a job, not in the program as a whole.
Baseline Characteristics
This section discusses the background characteristics of the evaluation sample in areas such as demographics, educational background, work history, and child support history. These characteristics are presented in Tables 3.1 and 3.2 and Appendix Table B.1.8
The research team obtained data from the baseline information forms and the manage-ment information system for participants enrolled from November 2011 through December 2013. As Table 3.1 shows, virtually all of SFTW participants are black men, and most were between the ages of 18 and 44 when they enrolled. About a third had not earned a high school diploma or equivalent. The vast majority of program participants had been employed at some point in their lives, and 68 percent of the sample had worked for the same employer for six months or more at some point. However, earned wages from participants’ most recent jobs were generally low; more than two-thirds of the sample earned less than $10 per hour (see Appendix Table B.1). Most participants had never been married, and rented or owned their housing at the time of enrollment.
8As expected (given the random assignment design), there were very few statistically significant differ-
ences between the program and control groups with respect to these characteristics. Therefore, for simplicity, Tables 3.1 and 3.2 and Appendix Table B.1 present numbers for the full Milkwaukee sample. For a detailed comparison of the baseline characteristics of program group members and control group members across the ETJD programs, see Appendix I.

89
Table 3.1 Characteristics and Employment Histories of Sample Members: Milwaukee
Milwaukee ETJD Programs Targeting Characteristic Program Noncustodial Parents
Male (%) 97.3 93.2
Age (%)
234
18-24 9.5 7.6 5-34 42.9 32.6 5-44 31.8 34.9 5 or older 15.9 24.9
Average age 35.1 37.6
Race/ethnicity (%)
Black, non-Hispanic 93.1 82.4White, non-Hispanic 2.5 5.5Hispanic 3.2 7.9Asian, non-Hispanic 0.1 1.4Other/multiracial 1.1 2.9
Educational attainment (%) No high school diploma or equivalent 32.2 29.2High school diploma or equivalent 65.8 66.0Associate degree or equivalent 1.6 2.6Bachelor degree or higher 0.3 2.3
Marital status (%)
Never married 84.5 66.2Currently married 4.8 8.4Separated, widowed, or divorced 10.7 25.4
Veteran (%) 3.1 4.9
Has a disability (%) 6.1 5.4
Housing (%)
Rents or owns 85.8 45.4Halfway house, transitional house,
or residential treatment facility 3.7 3.7Homeless 4.7 7.9Staying in someone else's apartment, room, or house 5.8 43.0
(continued)

90
Table 3.1 (continued)
Milwaukee ETJD Programs Targeting Characteristic Program Noncustodial Parents
Employment history Ever worked (%) 92.0 95.6
Among those who ever worked:
Worked in the past year (%) 56.4 49.9 Average hourly wage in most recent job ($) 9.34 11.21 Ever worked for the same employer for 6 months or more (%) 68.1 79.5
Months worked in the previous 3 years (%) Did not work 5.1 13.8
Fewer than 6 months 38.5 27.8 6 to 12 months 33.6 28.7 13 to 24 months 13.9 14.1 More than 24 months 9.0 15.6
3 Sample size 1,00 3,998
SO
URCES: MDRC calculations based on baseline survey data and ETJD management information system data.
Table 3.2 presents the child support and criminal justice characteristics of the study sample. All participants were noncustodial parents and almost all had minor-age children (that is, children under 18). Most participants had active current child support orders at the time of enrollment, while a much smaller number (4 percent) had arrears-only child support orders.
Fifty-five percent of program group members had been incarcerated in prison, mostly for nonviolent offenses. This figure is not surprising, as over half of black men in their 30s in Milwaukee County have served time in state prison.9 About half of the formerly incarcerated participants were on community supervision when they enrolled. This group may have faced particularly steep employment challenges.
SFTW participants were somewhat younger than sample members in other ETJD pro-grams that served noncustodial parents. They were less likely to have ever had a job for the same employer for at least six months, and were also somewhat more likely to have been incarcerated, which may have presented some challenges for employment. They were also
9Pawasarat and Quinn (2013).

91
Table 3.2 Child Support and Criminal Justice Characteristics of Sample Members: Milwaukee Milwaukee ETJD Programs Targeting Characteristic Program Noncustodial Parents
Parental and child support status
Noncustodial parent (%) 100.0 100.0
Has any minor-age children (%) 98.8 93.2
Among those with minor-age children: Average number of minor-age children 2.6 2.5
Living with minor-age children (%) 12.8 18.1
Has a current child support order (%) 95.3 86.3
Has an order only for child support debt (%) 3.8 12.7
Criminal history
Ever convicted of a crimea (%) 82.0 76.4
Ever incarcerated in prisonb (%) 54.6 40.2
Among those ever incarcerated in prison:
d
Average years in prisonc 3.7 3.8
Years between most recent release and program enrollment (%) Less than 1 year 29.3 33.21 to 3 years 17.8 17.5More than 3 years 52.8 49.2
Average months since most recent released 58.2 62.2
On community supervision at program enrollmente (%) 51.9 51.6
Sample size 1,003 3,998
(continued)

92
Table 3.2 (continued)
SO URCES: MDRC calculations based on baseline survey data, ETJD managemen t information system data, and criminal justice administrative records. NOTES: Measures are self-reported unless otherwise noted. aIncludes arrests and convictions in the state of Wisconsin as recorded in administrative records. Does not include federal convictions or convictions from other states. bIncludes self-report of incarceration in state or federal prison and prison incarceration as recorded in Wisconsin administrative records. cIncludes time spent in Wisconsin state prisons according to administrative records. Does not include time spent in federal prisons or prisons in other states. dMost recent release can be from prison or jail. eIncludes parole, probation, and other types of criminal justice or court supervision.
somewhat more likely to have current child support orders. Lastly, they were more likely to be receiving food stamps and less likely to have health care coverage (see Appendix Table B.1).
Program Implementation The YWCA faced a number of challenges in implementing the full structure of the SFTW program. The YWCA succeeded in implementing some core features of the program largely as intended, but other features were not fully implemented, and the program faced challenges related to staffing and recruitment.
Program Structure and Staffing
Plans for staffing varied even at early stages, but initial plans included a full-time pro-gram manager, several case managers (there were three for most of the program), an intake specialist, an instructor for the job-readiness workshop, a site coordinator responsible for transitional job placements, and a quality-assurance specialist. A number of partner organiza-tions also played roles in various aspects of the program: the YWCA’s on-site Career Oppor-tunity Center, which provided some services the SFTW program did not offer directly; DCSS and Legal Action of Wisconsin, which provided child support-related services; and two training providers.
● Turnover in important positions and understaffing affected the program at several times.
The YWCA’s chief operating officer, who was largely responsible for the SFTW pro-gram’s design, left the organization in December 2011. Several partnerships central to the original design were based on her relationships with other organizations in Milwaukee, and in interviews, some staff members at these partner organizations attributed challenges or delays in working with SFTW to her departure.

93
The program was not fully staffed until October 2012, nearly a year after enrollment began. Up to that point, staffing constraints affected the program’s ability to implement all of the model’s components; managers acknowledged that the program had not been able to give sufficient attention to unsubsidized job placement in particular. After October 2012, the pro-gram remained fully or almost fully staffed until the end of 2013, when the job-readiness instructor and site coordinator positions ended (they were only budgeted to continue through that year). Given the late surge in enrollment described above, a number of participants received job-readiness instruction and transitional job placement from other staff members. The depar-ture of the site coordinator may also have affected the pace at which participants were placed into training, as the site coordinator had been serving as the primary point of contact with the training provider.
Initial staffing plans did not include a job developer; those plans assumed that one of the existing job developers at the YWCA’s Career Opportunity Center would help place participants in unsubsidized jobs. The program’s management ultimately decided a job devel-oper would be helpful, however, and added someone in that position in October 2012. Howev-er, due to turnover, this position was vacant for part of 2013. One case manager said that when there was no job developer, individuals finishing their transitional jobs may not have received enough assistance finding unsubsidized employment.
● The program’s partners delivered child support assistance largely as envisioned.
Two partners were responsible for the program’s child support services. DCSS arranged the freeze on and forgiveness of interest on debt owed to the state. That incentive was imple-mented appropriately, though not every participant had forgivable interest. Details on this program feature are discussed more in Box 3.1. An attorney from Legal Action of Wisconsin assisted participants with their child support orders, requesting modifications when appropriate, and helped ensure that the interest forgiveness was applied correctly. A paralegal from DCSS who was already located on-site at the YWCA obtained information for the program about participants’ and potential participants’ child support orders.
● Partnerships with two organizations meant to provide occupational skills training were not put into place as planned.
The YWCA’s initial plans called for occupational skills training to be provided to 150 individuals, or 30 percent of participants. This training was to be provided by two partner organizations: Northwest Side Community Development Corporation, a not-for-profit devel-opment organization with connections to advanced manufacturing employers in the community,

94
•
•
•
Box 3.1
Forgiveness of Interest on State-Owed Debt as Part of Supporting Families Through Work
Through its partnership with DCSS, SFTW was able to offer participants forgiveness of some child support-related debt. Described by the program as forgiveness of “interest of state owed arrears,” in practice this meant forgiveness of interest on state-owed child support debt accrued while a child was on Aid to Families with Dependent Children (AFDC), the federal welfare program in place before the welfare reform of the mid-1990s. Wisconsin has a policy of passing through to the custodial parent any child support related to Temporary Assistance for Needy Families (TANF, the postreform welfare program), which means that forgiveness of interest on TANF debt requires written agreement from the custodial parent. Partway through the life of the program, the department also agreed to forgive interest on foster care-related debt and some birth expenses.
Forgiveness occurred in stages:
When a participant completed the job-readiness workshop, interest was frozen and 25 percent was forgiven. When a participant finished a transitional job, an additional 50 percent of interest and 50 percent of birth expenses were forgiven. When a participant started an unsubsidized job, the remaining interest balance was forgiven.
Before they entered the program, 95 percent of program group members had some child support debt, but only 31 percent had interest on state-owed debt that could be forgiven, and 71 percent owed birth expenses. However, most of those with applicable debt seem to have benefited from the policy; for example, just over a quarter of program group members saw some reduction in the eligible interest they owed, and 10 percent of program group members saw their eligible state-owed interest completely eliminated.
(continued)
and the Wisconsin Regional Training Partnership, a “construction and manufacturing interme-diary” organization that provides training based on industry needs. However, training from these organizations was not a central focus of the program as it was implemented, in part due to the early departure of SFTW’s chief operating officer and in part due to understaffing, which led the program to focus primarily on more basic activities of recruitment, enrollment, and arranging placement in transitional jobs. The training organizations also said that participants needed to have an appropriate level of skills for the employers they work with, though the Wisconsin Regional Training Partnership added that its employers would accommodate

95
Box 3.1 (continued)
While the available data do not show how much of the reduction was due to forgiveness rather than payments, the table below suggests that forgiveness played a large role. It presents average state-owed debt and interest for both the program and control groups.* The program group saw reductions in state-owed debt, presumably in part due to payments (and possibly also forgiveness of birth expenses), but the reductions in interest were much steeper. In con-trast, the control group saw both state-owed debt and interest grow, with interest growing faster.
Before Random
Assignment One Year Later Change Program group
State-owed debt $5,968 $5,597 -6.2% State-owed interest $3,889 $2,279 -41.4%
Control group State-owed debt $5,199 $5,444 4.7%
State-owed interest $3,465 $3,709 7.0% __________________________
*The figures include TANF debt, which was not covered by SFTW’s interest forgiveness. The averag-es in the table cover all members of the program and control groups, including those who did not have each specific type of debt; averages for only those with each type of debt would be substantially higher.
individuals they knew were working with the YWCA. Partnerships with each organization were only fully active for different parts of the program period, and in the end, only a small number of participants received training through the organizations.
Implementation of Program Components
This section draws from the research team’s observations during four site visits to Mil-waukee: an early assessment of operations, an evaluation monitoring visit that occurred about nine months into the enrollment period, and two implementation visits. It also draws on ongoing conversations with program managers over the course of the grant period and information entered by the program’s staff into the ETJD management information system. The site visits included interviews with YWCA staff members, partners, and employers, and a focus group with participants. Table 3.3 presents data from the management information system on partici-pation in core program components.

96
Table 3.3
One-Year Participation in ETJD Subsidized Jobs and Services Among Program Group Members: Milwaukee
Program Measure Group
Participated in any activity, including a subsidized job (%) 92.2
Worked in a subsidized job (%) 62.8
Among those who worked in a subsidized job:
Average number of months in the programa 5.9 Average number of days from random assignment to first subsidized 67
paycheck
Average number of days worked in a subsidized jobb 56
Received a service other than a subsidized job (%) 91.8
Formal assessment/testingc 85.1 Education and job trainingd 8.8 Workforce preparatione 83.5 Work-related supportf 73.1 Child support assistanceg 74.9 Parenting class -- Incentive paymenth 1.8 Other servicesi 72.3
Received a wage supplement during unsubsidized employment (%)
9.4
Among those who received a wage supplement:
Average hourly wage supplement ($)
2.07 Average total wage supplement amount received ($)
631 Average hours worked with wage supplement 308
Sample size 502
(continued)

97
Table 3.3 (continued)
SOU RC ES: MDRC calculations based on data from the ETJD management inf ormation system and the YWCA's wage supplement and work-related support records. NOTES: A double dash indicates that the service was not offered. aMeasured as the duration between random assignment and last subsidized paycheck. bCalculated using net hours worked, assuming a seven-hour workday. cIncludes Tests of Adult Basic Education, Prove-It, Wiscareers, and Accuvision. dIncludes alternate fuel training and manufacturing skills training. eIncludes work-readiness training workshops. fIncludes clothing for interviews and bus tickets. gIncludes order modifications, stipulations, and child support debt compromises. hIncludes gift cards for sustaining unsubsidized employment. iIncludes case management and follow-up services.
● A large majority of program group members received at least one ser-vice from the program.
Table 3.3 shows that 92 percent of individuals who went through random assignment and were assigned to the program group received some type of service from SFTW. The other 8 percent appear not to have returned to the YWCA to participate in the job-readiness workshop (which was usually offered within a week of random assignment) or other services.
● The job-readiness workshop was popular with participants, but was re-duced over time to speed transitional job placements.
The job-readiness workshop was the first activity participants were supposed to attend. It was designed as a five-day workshop, and the material it covered stayed close to the intended model. Several assessments were administered on the first day to gauge participants’ skills and interests and the types of jobs that would be good matches for them. During days two through four, participants learned about different industries, discussed their goals and the steps on the road to making a career decision, and learned how to perform a job search, including working on résumés and cover letters. Participants met with the Legal Action attorney for assistance with child support on the last day. In spring 2013, the workshop was cut to three days to facilitate faster placement in transitional jobs. The program arrived at this decision after interactions with other ETJD programs that did not have preplacement workshops lasting as long.
Focus group participants spoke very highly of the workshop. However, the extent to which the program built on the workshop in later activities is unclear. The job-readiness instructor provided case managers with a short written assessment of each participant based on what he learned about that participant during the workshop, but the case managers acknowl-edged they did not always review it before the initial meeting with a participant. The program did not appear to make an effort to ensure that later activities explicitly built on or referred back

98
to the activities and lessons of the workshop. The program stopped running workshops shortly after the enrollment period ended, and some participants who had not yet completed a workshop by that time received less formal job-readiness training on an ad hoc basis.
Not surprisingly, since it was the program’s first stage, a large majority of individuals served by the program participated in the workshop. Table 3.3 shows that 85 percent received the assessments administered as the first activity in the workshop — which means 15 percent of program group members never participated in the program’s first activity. There was also some attrition during the workshop, as only 75 percent received child support assistance, which typically began on the last day of the workshop and was delivered to anyone who completed the workshop. Based on interviews with program staff members, it appears that some participants did not fully understand the program and left on the first day — potentially even before com-pleting the assessments — after realizing that the transitional job would pay only $7.25 an hour, and that placements in transitional jobs might not be immediate.
● Child support assistance was provided consistently, and participants re-ported that it was a helpful aspect of the program.
Meetings between participants and the Legal Action attorney appear to have taken place regularly at the end of the job-readiness workshops, and participants said in the focus group and in individual interviews that they found this assistance helpful and that they were satisfied with the experience of working with Legal Action. Case managers said that the child support assistance was what attracted many participants to the program in the first place.
● Case management under SFTW was largely implemented as envisioned but not fully so, in part due to other burdens on the case managers.
Case managers worked with participants to understand their strengths and weaknesses, and to identify their needs and connect participants with appropriate services. After getting an understanding of participants’ strengths and interests, case managers worked with the site coordinator to make sure appropriate transitional job placements were arranged. Case managers also reviewed criminal background reports on all participants, and regularly helped them get records of arrests not resulting in convictions removed.
The model called for staff members to have meetings with transitional job employers and participants at 30, 60, and 90 days into participants’ time on the transitional job, but in practice, only the 30-day meetings happened regularly. Staff members appear to have given this responsibility less weight than other, competing demands on their time, including outreach and enrollment. The lack of time devoted to these meetings is also reflected in data collected from the staff for a time study based on activity late in the enrollment period; case management only represented 7 percent of staff time at that point, in part because case managers were spending

99
time on recruitment and on activities related to study sample enrollment.10 Case managers said that it became easier to provide individual services after random assignment ended.
Table 3.3 shows that nearly three-quarters (72 percent) of participants received “other services,” which consisted of case management and follow-up services generally provided by the case managers. This finding suggests that the vast majority of those who finished the job-readiness workshop also received other services from the program. Similarly, nearly three-quarters (73 percent) of participants received some type of work-related support from the program or from other sources at the YWCA (most often bus tickets or clothing for interviews), the need for which was generally determined by case managers.
One noteworthy issue raised by several staff members during interviews was that it was sometimes difficult for the female case managers to build rapport and relationships with their male clients. For much of the program period, the case managers were all female, while the participants were almost all male. Sometimes other, male staff members would get involved. Their involvement could help, because they could sometimes more easily build rapport with the clients, but those relationships could also get in the way of case managers’ efforts to build their own rapport.
● While occupational training was an important part of the intended model, it never became a major part of the program that was actually implemented. Nonetheless, a small number of participants received training of various types.
As discussed earlier, only a small number of participants received occupational training from two partner organizations. The idea of coordinating transitional jobs with training oppor-tunities remains a potentially promising strategy that may be worth evaluating in the future, but the concept was not meaningfully tested in this study.
Some other individuals received other types of education and training through the YWCA’s Career Opportunity Center, in part by enrolling in FoodShare Employment and Training and Workforce Investment Act services. Some participants received training at Milwaukee Area Technical College.
Participants received training in automotive repair, manufacturing, food services, and commercial driver’s license certification. In total, 9 percent of participants received education or job training from the program. In addition, some participants received high school equivalency
10During the fall of 2013, the evaluation team conducted a study that asked staff members to report the
time they spent on each program component during a specified period.

100
test preparation. The most common certifications reported by respondents were related to forklift operation, hazardous materials, and food handling or culinary arts.
● The transitional job placement component was implemented in a man-ner largely consistent with the program model, with some exceptions. The program was generally able to find employers willing to host partic-ipants. However, less than two-thirds of participants actually received transitional jobs. There was a substantial delay in many of the place-ments and the experiences of participants on the job varied.
Transitional job placements were with for-profit and nonprofit employers. The types of positions varied, ranging from janitorial to warehousing to manufacturing to food service to administrative. Employers included a nonprofit environmental-education center, a nonprofit organization operating a food bank and offering other food-related services, a local for-profit food manufacturer, a commercial printing company, and the YWCA itself. The program tried to develop relationships with larger companies that could serve as transitional job sites for a number of program participants. At times it had difficulty establishing these types of arrange-ments, but eventually it identified a small number of larger employers who took on several participants in transitional jobs.
The program did not require employers to commit to consider hiring participants after the transitional job, and it was not common for that to occur, although it did happen. The site coordinator tried to find employers who might do so. He used the earnings supplement as a selling point. The program did not provide much guidance to employers about the role they were supposed to play in preparing participants for unsubsidized employment, and participants therefore had a variety of experiences. At least one nonprofit employer made a deliberate effort to help participants develop their skills and employability, while other employers treated participants as they would other employees.
The site coordinator was responsible for arranging placements. To determine an appro-priate placement for a participant, the site coordinator was supposed to meet with the case manager and job-readiness instructor, and to review the participant’s résumé, referral form, and criminal background check. This meeting did not always happen consistently; instead case managers simply made recommendations to the site coordinator based on their familiarity with participants and knowledge of available placements. Case managers also had more responsibil-ity for placements after the funding budgeted for the site coordinator position ended. Employers had the option to take on or not take on any participants referred to them. While they all screened participants, the extent to which they conducted something approximating a formal interview was at the discretion of the employer.

101
As Table 3.3 indicates, 63 percent of participants held transitional jobs, meaning that more than one-third of program group members did not receive the program model’s central service, largely due to attrition that occurred before they were placed. As noted earlier, only about three-quarters of participants completed the job-readiness workshop, and more than 80 percent of those who completed the workshop entered transitional jobs. Several factors may have contributed to the continuing attrition. Case managers said that some of those who did complete the workshop never showed up for an initial meeting with them. While case managers had responsibility for reengaging participants who dropped off at this stage or later, they may not have given as much attention to reengagement during the time when they were contributing to recruitment and enrollment. (Case managers reported doing more to reach out to such participants after the program stopped enrolling new people.)
Staff members also reported that some participants were difficult to place. It may have been particularly hard to place participants with criminal backgrounds; staff members reported that they did have some employers open to hiring people with criminal backgrounds, but at times those jobs were all full. In an early review of transitional job placements (conducted about a quarter of the way into the enrollment period), case managers reported that about a quarter of those not placed into transitional jobs had either become incarcerated since enrolling in the program or had found unsubsidized employment without going through the transitional job. The actual numbers may have been higher — almost half of those who had not received transitional job placements had disengaged from the program (or never engaged with it in the first place) for reasons unknown to the case managers.
Among those participants placed in transitional jobs, placement occurred roughly two months after random assignment, on average. More precisely, as shown in Table 3.3, the average length of time between random assignment and receipt of the first transitional job paycheck was approximately 67 days. However, the length of time varied from participant to participant. Some were placed relatively quickly: About one-fifth received their first transi-tional job paychecks within 30 days. Since checks are given out only weekly, that means they were placed in jobs only a week or two after completing the job-readiness workshop. Almost half of participants received their first paychecks between 31 and 60 days after random assignment. On the other hand, for almost one-fifth, more than 90 days passed between random assignment and receipt of the first paycheck. Some people in this latter category most likely disengaged from the program after the workshop and then reconnected with it after an extended period of absence.
However, even many of those who stayed engaged with the program experienced some delay in placement due to early program activities and the process involved in matching participants with employers. That delay may account for much of the program’s attrition. About nine months after it began enrolling people, when the extent of the attrition before transitional

102
job placement became clear, the program began to put more emphasis on placing participants rapidly, and less on carefully matching them to jobs.
Table 3.3 shows that the average participant worked in a transitional job for 56 days. About half of those placed worked 61 or more days in one or more transitional job placement, suggesting that they completed the time they expected to spend there, while about half worked 60 or fewer days, suggesting voluntary or involuntary termination.11 Case managers cited on-the-job behavior issues, inconsistent attendance, tardiness, and physical altercations as reasons for program termination. When a participant was terminated from a transitional job, the staff often emphasized more job coaching before placing him or her in a second transitional job or moving straight to unsubsidized job searching. Staff members were hesitant to risk another employer having a negative experience with the program because they placed a participant who had already demonstrated problems with on-the-job behavior.
A relatively small number of participants were still in transitional jobs at the end of the 12-month follow-up period, as shown in Figure 3.1. These participants could reflect lags between random assignment and placement in transitional jobs, or they could be individuals who left the program before completing a first transitional job and who later returned and were given a second placement.
In interviews, participants said they were disappointed with the pay and hours offered by the transitional jobs. Some had misunderstood the pay and hours they would get. They also felt that the staff did not take their individual circumstances into account when making recom-mendations about what transitional jobs to place them in, and expressed frustration with what they saw as the slow pace of placements.12
● The program ran “engagement sessions” or “support sessions,” led by various staff members, designed to keep participants engaged in the program and support them in finding unsubsidized employment.
The program sometimes held sessions designed to improve engagement in the pro-gram’s services. These sessions were usually run separately for those in their transitional jobs or earlier stages and those in the unsubsidized job search stage, but the staff sometimes combined these groups. Participants were expected to attend to help them prepare to search
11Transitional job placements were typically expected to last four months at up to 30 hours per week, so a
placement would be expected to last around 65 to 70 work days. (See footnote b in Table 3.3 for a description of how workdays were measured.)
12As noted later, a sample of participants surveyed after they were already working in transitional jobs had generally positive responses about their experiences.

103
Figure 3.1
Subsidized Employment Over Time: Milwaukee
0102030405060708090
100
1 2 3 4 5 6 7 8 9 10 11 12Perc
enta
ge w
orki
ng in
subs
idiz
ed jo
bs
Month relative to random assignment
SOURCE: MDRC calculations based on data from the ETJD management information system.
NOTE: Month 1 in this figure is the month in which random assignment occurred.
for unsubsidized employment, unless their employers’ requirements made it difficult to be in class at the scheduled time. Sessions focused on employment issues. Participants role-played situations that might come up on the job or in interviews. They talked about how to conduct job searches while still in their transitional jobs, and learned about sexual harassment in the work-place. Various staff members could suggest topics they thought were relevant to participants.
● Job development to help participants find unsubsidized employment was provided inconsistently.
The job developer position was only filled intermittently. A dedicated job developer was only on staff from October 2012 through July 2013, and then after October 2013. Case managers reported that when there was no job developer, they and other staff members pitched in to help participants find unsubsidized jobs, but some individuals didn’t receive consistent help. Staff members said it helped that the site coordinator tried to find employers interested in hiring participants after their transitional jobs. It is not clear from the available data how often
104
employers did hire participants into permanent, unsubsidized jobs in this manner. Anecdotes from the staff suggest it happened at least occasionally.
● The earnings supplement appears to have been implemented as antici-pated. Participants in unsubsidized jobs that paid less than $10 an hour had the supplement available to them. However, only a relatively small portion of the program group received it.
As shown in Table 3.3, only 9 percent of participants received the supplement in the 12 months following random assignment.13 This low percentage may be partly because to receive the supplement, participants had to stay engaged with the program past the transition-al job phase and into their period of unsubsidized employment. The supplement was provided directly to participants who presented pay stubs (though a small number of employers asked to pay the higher wages themselves and have the YWCA reimburse them). The attrition that occurred at earlier stages of program participation may have meant that many program group members with unsubsidized earnings under $10 an hour were not sufficiently connected to the program to obtain the supplement. Further, it may have been difficult for some participants to present their pay stubs.
Survey data on wages earned by the program group (discussed later in this chapter) also suggest that those who did find jobs earned more than $10 per hour on average, so it is likely that many would not have been eligible for the supplement.
● Participants in transitional jobs reported mostly positive experiences in those jobs. However, some had mixed assessments of the program. Some participants expressed disappointment about the types of jobs they were matched with, and about the amount of time it took to get placed.
Information on participants’ perceptions of the SFTW program comes from three main sources: participant questionnaires administered at group engagement and retention meetings during the two implementation site visits, a focus group of program participants conducted during the first implementation site visit, and one-on-one interviews with a small number of participants. Findings from the questionnaire are summarized in Figure 3.2. This figure shows that most participants expressed favorable opinions about their relationships at work, supervisor support, and soft-skills development. This finding is notable, as supervision at the transitional job sites was provided by the employers, not by program staff members, suggesting the program did a good job identifying employers that could provide a supportive transitional job experience.
13Another 7 percent of participants received the supplement after that time.

105
(continued)
Figure 3.2
Favorable Impression of the Value of Transitional Job Support and Preparation for Future Employment: Milwaukee
57%
65%
61%
77%
63%
78%
79%
96%
0 20 40 60 80 100
Preparation for futureemploymentd
Soft skills developmentc
Supervisor supportb
Relationships at worka
Milwaukee ETJD Average
Relationships at worka
Supervisor supportb
Soft-skills developmentc
Preparation for future employmentd
e
Sample size: 57 Sample size: 516

106
Figure 3.2 (continued)
SOURCE: MDRC calculations based on the ETJD participant questionnaire.
NOTES: The measures presented in this figure, relationships at work, supervisor support, soft-skillsdevelopment, and preparation for future employment were created based on an exploratory factor analysis of a pool of questions. These questions asked participants about their level of agreement with a particular statement on a scale of 1 to 7, where 1 indicates strong disagreement and 7 indicates strong agreement. Based on the results of the factor analysis, questions were grouped into factors and a mean score was calculated across the questions included in a particular factor; the percentages presented above represent the proportion of questionnaire respondents who averaged a score of 6 or higher on the questions in that factor, indicating a high level of satisfaction with their program experiences in that area.
With a few exceptions, questionnaires were administered to participants by the research team during site visits at events and activities when many participants would be available at once. Consequently, the responses obtained are from participants who attended program activities and were therefore likely to be more motivated and engaged than the full sample of program participants. For this reason, the results presented in this figure are not necessarily representative of all participant experiences and should be interpreted with caution; they are likely to be more positive.
aBased on agreement with the following statements: I understand what is expected of me on the job; I know who at work to ask for help when I need it; My relationships with coworkers are positive and supportive; and My coworkers understand me and want me to succeed.
bBased on agreement with the following statements: I get the support or guidance that I need from my supervisor; My supervisor gives me advice about how to handle situations at work; and My supervisor helps me if personal issues come up that get in the way of working.
cBased on agreement with the following statements: I am learning how to work better with coworkers; I am learning how to cooperate better with supervisors; and This job has helped me learn to present myself better at work.
dBased on agreement with the following statements: The kind of work I am doing will help me get a decent-paying job later; I am learning specific job skills that I will use in the future; and I have met people through this job who may help me find a job in the future.
eTo account for varying questionnaire sample sizes across ETJD programs, the "ETJD average" is a weighted average of all programs such that each program is equally represented.
(However, since participants were surveyed at group retention meetings, the respondents probably do not make up a representative sample. They do not include participants whose engagement with the program dropped off, who might have had more negative responses.)
Participants appear to have had more varied opinions about the extent to which the tran-sitional jobs would help them get good jobs in the future, because of the skills they were developing, the relationships they were establishing on the job, or the type of work they were getting experience performing. Close to two-thirds (63 percent) gave very positive responses to these questions. While two-thirds is more than half of respondents, it was the lowest-scoring area on the questionnaire. Further, this comparatively low score was consistent with responses given by several participants in the focus group, who expressed disappointment that the pro-gram was not setting them up with transitional jobs well matched to their interests, skills, or long-term goals. In the individual interviews, participants also expressed some frustration with

107
the amount of time it took to get placed in transitional jobs. Box 3.2 describes the experience of a SFTW participant.
Focus group members were strongly positive about some of the other services the pro-gram provided. In particular, participants in the focus group said that they found the job-readiness workshop and the child support-related legal services to be very helpful. These sentiments were echoed by individual participants in interviews.
Box 3.2
Supporting Families Through Work Participant Profile
“Mike” is a 32-year-old black man with four minor-age biological children and one minor-age stepchild. He has never completed high school or received a high school equivalency, and has been struggling to find long-term employment, working a number of odd jobs with temp agencies. He has been incarcerated twice, both times for nonviolent offenses, and was on probation at the time of the research team’s site visit. Mike’s federal probation officer referred him to Supporting Families Through Work because he was having difficulty finding perma-nent employment. This difficulty prevented him from making his child support payments — he had $3,000 in child support debt and three active child support orders when he enrolled in the program. He had been taking on a series of temp-agency jobs as a way to avoid the finan-cial strain of child support payments: Once the child support agency became aware of his income at one job, he would quit and find a new one.
Mike went to the program thinking it would provide him with a job that paid $10/hour. He was disappointed when he found out that the jobs actually pay closer to $7.25/hour. Additionally, he thought the job would be 40 hours a week instead of 30 hours a week. While he was upset that the transitional job paid less and involved fewer hours than expected, he still thought some kind of employment was better than being unemployed. He felt that many components of the program seemed rushed, and some of the information they presented he already knew, but he found the staff to be friendly and helpful.
Mike expects that the program will help him to get a better insight into how to find a more permanent, stable job. He hopes the transitional job will match his interests and that it will be something he can keep for a prolonged period. Depending on transportation and timing, he thinks that he has a 50/50 chance of obtaining a job that meets his expectations. He plans to use the money from his future employment to pay outstanding bills, to pay child support, to take care of himself, to buy himself things, and “to have a little life.” Of all of the programs he has tried, he reported that he thinks Supporting Families Through Work has been the most helpful, and he likes that it takes place over the long term.

108
Impacts on Participant Outcomes
Participation and Service Receipt Outcomes
This section uses data from a survey of program and control group members conducted about a year after random assignment to present information on the receipt of services such as employment support, education and training, and help related to past criminal convictions.14 Only the program group was offered the program’s services. Control group members may have received similar services — including subsidized employment — from other programs or providers: All received a list of alternate service providers following random assignment, and other transitional employment programs operated in the community during the program’s service period. The findings in this section help to inform the analysis of the program’s effects on employment, criminal justice outcomes, and child support, which are presented in the subsequent sections.
● SFTW increased receipt of services related to employment by a small amount, and substantially increased receipt of services related to child support and criminal justice issues. It did not increase receipt of most educational or vocational services, but those were not core components of the program model.
As noted above, services similar to those in SFTW were available from several other programs and providers in the community. Control group members had access to the services of the YWCA’s Career Opportunity Center, including the FoodShare Employment and Training program, and several other community organizations in Milwaukee also offered employment services, including the nearby Milwaukee Urban League. Further, two state-funded transitional employment programs operated in Milwaukee at the same time as SFTW. Data provided by the Wisconsin Department of Children and Families show that about 20 percent of control group members participated in one of these alternate programs. Nonetheless, Table 3.4 shows that the program had a significant effect on the receipt of services in many areas.
The first section of Table 3.4 shows the impacts on receipt of employment support ser-vices. According to the survey data, many sample members — including those in the control group — received help related to finding or keeping a job. However, program group members were significantly more likely to have received such assistance than those in the control group: 93 percent of the program group and 79 percent of the control group reported receiving help
14Survey response rates were 80.2 percent in the program group and 77.4 percent in the control group. An
analysis of nonresponse bias found no evidence that differences in survey response rates biased the results of the impact analysis (see Appendix H).

109
Table 3.4
One-Year Impacts on Participation and Service Receipt: Milwaukee
Outcome (%) Program
Group Control
Group Difference
(Impact)
Ninety Percent Confidence
Interval
Employment support
Received help related to finding or keeping a job 93.3 79.3 14.0 *** [10.1, 17.9]
Job search, job readiness, and career planninga 92.1 78.4 13.7 *** [9.6, 17.8]Paying for job-related transportation or equipment
costs 58.3 35.4 22.8 *** [17.1, 28.6]
Education and training Participated in education and training 42.7 38.1 4.5 [-1.2, 10.2]
ESL, ABE, or high school diploma or equivalentb 14.8 16.1 -1.3 [-5.4, 2.9]Postsecondary education leading to a degree 11.0 8.2 2.8 [-0.7, 6.2]Vocational training 26.9 21.4 5.4 * [0.4, 10.5]
Received high school diploma or equivalent 3.4 3.1 0.3
[-1.8, 2.4]
Earned professional license or certification (not including OSHA or forklift)c 13.9 12.4 1.5 [-2.4, 5.5]
Earned OSHA or forklift certification 7.6 4.3 3.3 ** [0.5, 6.1]
Other support and services Among those identified as formerly incarcerated at enrollment:d
Received help related to past criminal convictions 85.6 53.5 32.1 *** [24.0, 40.3]
Handling employer questions about criminal
history 83.6 52.0 31.6 *** [23.3, 39.9]Legal issues related to convictions 49.0 17.5 31.5 *** [23.1, 39.9]
Received help related to child support, visitation, parenting or other family issues 81.5 39.4 42.2 *** [37.0, 47.3]
Modifying child support debts or orders 79.1 29.7 49.3 *** [44.3, 54.4]Setting up visitation with child(ren) 22.1 11.9 10.2 *** [5.9, 14.6]Parenting or other family-related issues 35.5 22.5 13.0 *** [7.8, 18.3]
Received advice or support from a staff member at an
agency or organization 69.4 46.6 22.7 *** [17.1, 28.3] (continued)

110
Table 3.4 (continued)
Outcome (%) Program
Group Control
Group Difference
(Impact)
Ninety Percent Confidence
Interval
Received mentoring from a staff member at an agency or
organization 64.2 38.9 25.2 *** [19.6, 30.9]
8 Received mental health assistance 12.3 16.1 -3. [-7.8, 0.3]
Sample size 403 388
he ETJD UR E: M -mon ey. SO C DRC calculations based on responses to t 12 th surv NOTES: Results in this table are regression-adjusted, controlling for pre-random assignment characteristics. Statistical significance levels are indicated as: *** = 1 percent; ** = 5 percent; * = 10 percent. aIncludes help with job searching, job referrals, developing a résumé, filling out job applications, preparing for job interviews, job-readiness training, and planning for future career or educational goals. bESL = English as a second language, ABE = adult basic education. cOSHA stands for Occupational Safety and Health Administration. In an effort to separate receipt of professional licenses or certifications that require more intensive and lengthy training (for example, a Certified Medical Assistant certificate or a commercial driver’s license) from those that can be earned following more cursory, one-day training, receipt of OSHA and forklift certifications, which fall into the latter group, is presented separately from receipt of other types of licenses or certifications. A review of all reported types of licenses or certifications revealed that OSHA and forklift certifications account for a large majority of the shorter-term, less intensive licenses and certifications received by sample members. dThese measures include only those who were identified as formerly incarcerated at study enrollment (program group = 172; control group = 158; total = 330).
finding or keeping a job. This difference is likely attributable in large part to SFTW’s mandato-ry job-readiness workshop, which provided job-search preparation and job-readiness assess-ments. Program group members were also more likely than control group members to receive job-search assistance and to receive help paying for job-related transportation or equipment costs. Ninety-two percent of program group members received assistance with job searching, job readiness, and career planning compared with 78 percent in the control group, and 58 percent of program group members received help paying for job-related expenses, compared with only 35 percent in the control group.
The second section of Table 3.4 shows the percentages of the program and control groups who participated in various types of educational and training activities. As mentioned above, educational and occupational skills training was not a central part of the SFTW program model and — according to service data reported in Table 3.3 — only 9 percent of participants received educational or training services through the program. The 12-month survey confirms
111
that the program had few impacts on such activities. Program group members were not signifi-cantly more likely than control group members to have engaged in secondary or postsecondary education activities, were no more likely to have received a high school diploma or equivalent, and were no more likely to have earned a professional license or certification. The program moderately increased the proportion of sample members receiving vocational training (27 percent of the program group versus 21 percent of the control group) and Occupational Health and Safety Administration or forklift certifications received through subsidized employment (8 percent of the program group versus 4 percent of the control group).
As noted earlier, the program provided intensive and well-implemented assistance with child support order modification and debt compromise in partnership with Legal Action of Wisconsin and DCSS. For program participants who had been formerly incarcerated, case managers also provided help getting arrests that had not led to convictions removed from criminal background reports. Table 3.4 shows that program group members were significantly more likely than control group members to report receiving child support assistance or help dealing with past criminal convictions. A large majority of program group members — 82 percent — reported that they received help related to child support, visitation, parenting, or other family issues, compared with only 39 percent of the control group. Program group members were significantly more likely than the control group to have received help with child support modifications, setting up visitation, and other parenting issues. Likewise, a large majority of the program group participants who had been formerly incarcerated received help related to criminal convictions: 86 percent of program group members reported that they received such help compared with 54 percent of the control group.
Finally, the bottom three rows of Table 3.4 show that while many control group mem-bers received other support services, survey respondents in the program group were even more likely than those in the control group to report having received them. A large proportion — 69 percent — of program group members reported receiving advice or support from a staff member, compared with about 47 percent of the control group, and 64 percent of program group members reported receiving mentorship from a staff member, compared with almost 39 percent of the control group. Mental health assistance was not part of the program model, and only a small proportion of study participants received mental health assistance in either the program or control group. The program did not have a significant effect on this outcome.
Employment and Earnings Outcomes
This section presents the program’s 12-month impacts on employment and earnings us-ing unemployment insurance data from the National Directory of New Hires, supplemented by data from the 12-month survey of study participants. Using these two data sources it is possible

112
to describe employment and earnings in jobs that were reported to the unemployment insurance system, and to describe job characteristics as reported by survey respondents.
● Program group members had higher rates of employment and earnings in unemployment insurance-covered jobs than control group members. Most of this impact is the result of subsidized employment.
Table 3.5 and Figure 3.3 present the program’s impacts on employment and earnings. The top panel of Table 3.5 shows one-year impacts estimated using unemployment insurance data, while the bottom panel shows impacts based on survey data. During the first 12 months, unemployment insurance data show that program group members were significantly more likely to have been employed, had more consistent employment, and had higher earnings than control group members. Control group members reported a substantially higher employment rate on the survey than is shown in unemployment insurance data records, which may indicate that control group members were more likely than program group members to be employed in jobs that did not report to unemployment insurance (for example, jobs in the informal economy or jobs where the worker is classified as an independent contractor); in other words, the pro-gram may have moved participants from uncovered employment to unemployment insurance-covered employment. The remainder of this section explores these findings in depth.
The top panel in Table 3.5 presents the program’s impact on unemployment insurance-covered employment and earnings, which includes transitional employment. Even though the program screened participants to determine that they met the eligibility criterion of being “not job-ready,” a majority of control group members — 61 percent — worked in unemployment insurance-covered jobs during the 12 months after random assignment. Program group mem-bers were even more likely to have worked during this time, with more than 86 percent having had unemployment insurance-covered employment (including the 61 percent who had transi-tional jobs provided by the program). Program group members were employed in significantly more quarters than control group members (an average of 2.4 quarters versus 1.5 quarters) and were about twice as likely to have been employed in all four quarters (25 percent versus 13 percent).
Program group earnings were also significantly higher than control group earnings, on average: Program group members earned an average of $4,910 during the 12-month follow-up period while control group members earned an average of $3,139.15 A large portion of this earnings differential can be accounted for by the program group’s earnings from transitional jobs, an average of $1,157.
15These 12-month averages include zeros for program and control group members who were not em-
ployed at all during the follow-up period.

113
Table 3.5
One-Year Impacts on Employment and Earnings: Milwaukee
Outcome Program
Group Control
Group Difference
(Impact)
Ninety Percent Confidence
Interval
Primary outcomes (based on administrative data) Employmenta (%) 86.3 60.6 25.7 *** [21.4, 30.0]
ETJD subsidized employment (%) 60.7 --
Number of quarters employed 2.4 1.5 0.9 *** [0.8, 1.0] Average quarterly employment (%) 59.3 37.0 22.2 *** [18.8, 25.7] Employment in all quarters (%) 24.6 12.8 11.9 *** [8.1, 15.6]
Total earnings ($) 4,910 3,139 1,772 *** [1,273, 2,270]
ETJD subsidized earnings ($) 1,157 --
Total earnings (%)
$5,000 or more 36.5 22.5 14.0 *** [9.5, 18.4] $7,500 or more 22.4 14.8 7.6 *** [3.7, 11.4]
$10,000 or more 14.2 11.0 3.2
[-0.1, 6.4]
Employment in the first quarter of Year 2 (%) 55.2 44.3 10.9 *** [5.8, 16.0]
ETJD subsidized employment in the first quarter of Year 2 (%) 6.7 --
Sample sizeb 500 501
Self-reported outcomes (based on survey data) * Ever employed in Year 1 (%) 77.7 72.5 5.2 [0.1, 10.3]
Currently employed (%) 47.4 46.4 1.0 [-4.9, 6.9]
Currently employed in transitional job program (%) 5.7 2.2 3.4 ** [1.1, 5.7]
Type of employment (%)
*
Not currently employed 53.3 54.9 -1.6 [-7.6, 4.3] Permanent 26.0 20.7 5.3 [0.3, 10.4] Temporary, including day labor and odd jobs 20.5 23.3 -2.8 [-7.7, 2.1] Other 0.2 1.1 -0.9 [-1.8, 0.1]
(continued)

114
Table 3.5 (continued)
Outcome Program
Group Control
Group Difference
(Impact)
Ninety Percent Confidence
Interval
Among those currently employed:c
Hours worked per week 33.5 31.0 2.5
Hourly wage ($) 10.3 9.6 0.7
Hours worked per week (%)
] ]
]
]
More than 20 hours 38.8 30.5 8.4 ** [2.8, 14.0More than 34 hours 25.4 22.0 3.4 [-1.7, 8.5
Hourly wage (%)
More than $8.00 27.4 26.7 0.8 [-4.6, 6.1
More than $10.00 12.5 8.6 3.8 * [0.1, 7.6
Sample size 403 388
SOURCES: MDRC calculations based on quarterly wage data from the National Directory of New Hires and responses to the ETJD 12-month survey. NOTES: Results in this table are regression-adjusted, controlling for pre-random assignment characteristics. Statistical significance levels are indicated as: *** = 1 percent; ** = 5 percent; * = 10 percent. aEmployment rates and earnings include both ETJD subsidized jobs and all other jobs covered by unemployment insurance. bTwo sample members are missing Social Security numbers and therefore could not be matched to employment data. cThese measures are calculated among those employed at the time of the survey; they are therefore considered nonexperimental and are not tested for statistical significance.
The last two rows in the top panel of Table 3.5 present earnings and transitional em-ployment during the first quarter of Year 2, by which time most program group members should have completed their transitional jobs. Although there is still a large and statistically significant impact on employment during this quarter (11 percentage points), much of this impact is probably explained by the fact that almost 7 percent of program group members were still in transitional jobs. It is therefore unclear whether the program’s impact on employment will persist after all program group members have left their transitional jobs.16 Figure 3.3 likewise shows earnings and employment by quarter for the quarter of random assignment and
16It is impossible to know whether these program group members would have been employed if they did
not have subsidized jobs.

115
86.3 64.2 22.158.2
2.5 1.632.3 18.7 13.6
5936.6815 4018.8568 1917.82471001.7947
39.331 25.818 13.51328.204 20.555 7.64921.453 14.319 7.134 ***
(continued)
Figure 3.3
Employment and Earnings Over Time: Milwaukee
0102030405060708090
100
0***
1***
2***
3***
4***
Perc
enta
ge e
mpl
oyed
Quarter after random assignment
Program group total employment
Control group employment
510
1,430 1,549 1,422 1,536
369688
994 1,0871,249
0
500
1,000
1,500
2,000
2,500
3,000
3,500
0**
1***
2***
3***
4**
Ave
rage
ear
ning
s ($)
Quarter after random assignment
Program group Control group
Program group ETJD subsidized employment

116
the subsequent four quarters. While program group earnings and employment exceed control group earnings and employment by a statistically significant margin in each quarter, the difference between the two appears to be shrinking over time. It is not clear whether a substan-tial difference will remain beyond the first year.
The bottom panel of Table 3.5 shows the corresponding impacts measured using data from the follow-up survey. The program’s impacts on survey-reported earnings and employ-ment are smaller than the corresponding impacts measured using unemployment insurance data. In particular, survey respondents in the program group were only somewhat more likely to report having being employed during the first year than respondents in the control group (78 percent versus 73 percent). This 5 percentage point impact is much smaller than the 26 percent-age point impact measured using unemployment insurance data.
In the first quarter of Year 2, program group members were somewhat less likely to re-port being employed than the unemployment insurance measure would suggest, while control group members were somewhat more likely to do so. These discrepancies suggest that control group members were more likely than program group members to be employed in jobs that were not covered by unemployment insurance. The program’s impact on current employment among survey respondents is small and not statistically significant.
The two other groups of outcomes in Table 3.5 demonstrate that survey respondents in the program group were more likely to have worked more than half time than respondents in the control group, and somewhat more likely to report having earned more than $10 per hour than respondents in the control group. Among those currently employed at the time of the 12-month survey, program group members worked an average of 34 hours per week, compared with 31 for the control group. The results in the bottom section of Table 3.5 confirm that at the time of the survey, some study participants in the program group were still in transitional jobs, as were a smaller number in the control group. The difference in transitional jobs between the program and control groups is just over 3 percentage points.
Finally, the research team tested to see whether the program had different effects on participants who enrolled during the first year of random assignment than it did on those who
Figure 3.3 (continued)
SOURCE: MDRC calculations based on quarterly wage data from the National Directory of New Hires.
NOTES: Results in this figure are regression-adjusted, controlling for pre-random assignment characteristics.
Statistical significance levels are indicated as: *** = 1 percent; ** = 5 percent; * = 10 percent.Employment rates and earnings cover both ETJD subsidized jobs and all other jobs covered by
unemployment insurance.

117
enrolled during the second year. These results are presented in Appendix Table B.2. Although the program’s impact on employment was larger for the first-year participants, there were no significant differences between the impacts for first- and second-year participants on total earnings, average quarterly employment, or employment during the first quarter of Year 2.
● The impacts on employment and earnings were largest among those with no recent work experience.
Prior research suggests that employment programs may be more or less effective for certain subgroups of people. ETJD is based on the hypothesis that the programs may be most effective for people who are the least “employable” and who are therefore unlikely to find jobs on their own without assistance.17 The research team therefore examined the program’s impacts on employment among subgroups who had more or less recent work experience when they enrolled in the program. Individuals who had been employed for at least one quarter of the year before random assignment were assumed to be more employable than individuals who had not worked at all during that year. As shown in Table 3.6, levels of employment and earnings are lowest among those who did not work at all in the previous year, suggesting that prior-year employment is a fairly good predictor of employment in the year after random assignment.
Consistent with the ETJD theory, the program’s impacts on employment and earnings in the first year are largest for those who did not work at all in the previous year. Among those who did not work at all in the previous year, 78 percent of program group members were employed at some point during the year after random assignment compared with just 43 percent of the control group, an estimated impact of 35 percentage points. Program group members in this subgroup earned about $1,800 more than their control group counterparts during the follow-up period. Among those who had worked in the previous year, 93 percent of program group members worked at some point during the year after random assignment and 75 percent of control group members also worked, an estimated impact of only 17 percentage points, though the estimated impact on earnings is slightly larger for this subgroup, at around $2,200.
Child Support and Family Relations Outcomes
Transitional jobs may affect child support by affecting program participants’ financial health and ability to comply with child support orders. The program may have also affected child support outcomes through the support services it offered, specifically the child support assistance that was available from DCSS and Legal Action of Wisconsin. As noted above, many sample members said they were more interested in the child support aspects of the program than the employment aspects.
17Butler et al. (2012).

118
Table 3.6
One-Year Impacts on Employment and Earnings, by Employment Status in the Prior Year: Milwaukee
Did Not Work in Prior Year Worked in Prior Year
Ninety Percent Confidence Interval
ifference
(Impact) D
Ninety Percent
Confidence Interval
Difference Between
Subgroup Impactsa
Control Group
m Control PrograGroup
Group Difference
(Impact) Pro gram
Group Outcome
Employmentb (%) 77.9 42.8 35.0 *** [28.0, 42.1]
92.8 75.4 17.4 *** [12.4, 22.4] †††
ETJD subsidized employment (%) 62.0 -- --
]
59.9 -- -- ]
Total earnings ($) 3,631 1,847 1,785 *** [1,190, 2,379] 6,200 4,013 2,188 *** [1,273, 3,102Average quarterly employment (%) 48.9 24.1 24.8 *** [19.7, 29.9 67.8 47.8 20.0 *** [15.2, 24.8] Employment in the first quarter of
Year 2 (%) 42.9 36.7 6.2 [-1.4, 13.8] 65.5 50.9 14.6 *** [7.7, 21.5]
Sample size 236 220 264 281
SOURCE: MDRC calculations based on quarterly wage data from the National Directory of New Hires. NOTES: Results in this table are regression-adjusted, controlling for pre-random assignment characteristics. Statistical significance levels are indicated as: *** = 1 percent; ** = 5 percent; * = 10 percent. aWhen comparing impacts between two subgroups, an H-statistic is generated. The H-statistic is used to assess whether the difference in impacts between the subgroups is statistically significant. Statistically significant differences across subgroups are indicated as: ††† = 1 percent; †† = 5 percent; † = 10 percent. bEmployment rates and earnings include both ETJD subsidized jobs and all other jobs covered by unemployment insurance.

119
● Program group members were more likely to have paid child support, paid more on average, and paid for more quarters than their counter-parts in the control group. The program had no impact on informal or noncash support.
Table 3.7 and Figure 3.4 show that the program had a large impact on child support outcomes: Program group members were substantially more likely to have paid child support, paid for more months, and paid a larger average amount than control group members. The top panel in Table 3.7 presents child support outcomes measured using child support agency data. The top row indicates that program group members were substantially and significantly more likely to have paid any child support during the 12-month follow up period: Almost 87 percent of program group members paid at least some support, compared with about 64 percent of the control group. Sample members in the program group also made their first payments approximately one month earlier, on average, than those in the control group and paid support for significantly more months: an average of five months in the program group compared with three months in the control group. Table 3.7 also shows that program group noncustodial parents paid significantly more in total: $1,003 in the program group and $636 in the control group.
Figure 3.4 indicates that while the largest impact on child support payments occurred during the first two quarters — when the highest proportion of participants would have been in transitional jobs — a significant impact persists for at least three quarters after random assign-ment for both the percentage paying child support and the average amount paid.
Outcomes measured using the 12-month follow-up survey (reported in the second panel of Table 3.7) indicate that the program did not have a significant effect on informal or noncash support. It likewise did not significantly affect the proportion of participants who were incarcer-ated for not paying child support or the proportion of participants who said that owing child support affected their willingness to take a job. Finally, the last group of outcomes in Table 3.7 shows that the program only trivially affected the frequency of contact with the “focal child” (defined in table note c); a majority of both the program and control groups reported that they had contact at least a few times per week.
As with employment outcomes, the research team tested to see whether the program had different effects on participants who enrolled during the first year of random assignment than it did on those enrolled during the second year. There were no statistically significant differences in this area between first- and second-year participants (see Appendix Table B.2).

120
Table 3.7
One-Year Impacts on Child Support and Family Relations: Milwaukee
Outcome Program
Group Control
Group Difference
(Impact)
Ninety Percent Confidence
Interval
Primary outcomes (based on administrative data) Paid any formal child supporta (%) 86.7 63.8 22.9 *** [18.8, 27.0]
Among those who paid formal child support:
Months from random assignment to first paymentb 3.1 4.0 -0.9
Months of formal child support paid 5.0 3.0 2.1 *** [1.8, 2.4]
Amount of formal child support paid ($) 1,003 636 367 *** [227, 507]
Sample size 502 501
Self-reported outcomes (%) (based on survey data) Currently a noncustodial parent of a minor-age child 74.8 72.0 2.8
[-2.2, 7.8]
Provided informal cash support or noncash support in the past month 60.4 59.2 1.2 [-4.3, 6.7]
Informal cash support 45.0 42.6 2.3 [-3.4, 8.0] Noncash support 57.7 56.8 0.9 [-4.6, 6.5]
Owing child support affects willingness to take jobs 17.3 20.0 -2.7 [-7.3, 2.0]
Incarcerated for not paying child support 2.8 4.1 -1.4 [-3.5, 0.8]
cAmong those with minor-age children:
Frequency of contact with focal child in past 3 months
Every day or nearly every day 31.7 33.3 -1.6
A few times per week 26.5 27.0 -0.6 A few times per month 15.0 16.2 -1.2 Once or twice 5.4 4.5 0.8 Not at all 21.5 18.9 2.6
Sample size 403 388
(continued)

121
Table 3.7 (continued)
SOURCES: MDRC calculations based on child support agency data and responses to the ETJD 12-month survey. NOTES: Results in this table are regression-adjusted, controlling for pre-random assignment characteristics. Statistical significance levels are indicated as: *** = 1 percent; ** = 5 percent; * = 10 percent. aMeasures of formal child support include all payments made through the state's child support collection and disbursement unit, including funds from employer withholding and other sources (for example, tax intercepts). bThis measure is calculated among those who paid child support during the follow-up period; it is therefore considered nonexperimental and is not tested for statistical significance. cThis measure is calculated among those who reported having a minor-age child at the time of the survey; it is therefore considered nonexperimental and is not tested for statistical significance. The focal child is defined as the youngest minor-age child living outside of the sample member's household; if the sample member reports no minor-age children living outside of his or her household, the focal child is the youngest minor-age child residing within the household.
Criminal Justice Outcomes
Although the STFW program targeted noncustodial parents, some participants were re-ferred by corrections-related sources such as the Community Corrections Employment Pro-gram. Overall, 55 percent of sample members had previously been incarcerated, of whom 29 percent had been released from prison within the last year. Case managers provided formerly incarcerated program participants with direct support for criminal justice issues such as remov-ing erroneous records from their criminal background reports. Transitional jobs may have also helped reduce recidivism among this group indirectly by reducing the incentive to commit crimes, connecting the formerly incarcerated to more positive social networks and daily routines, and helping to ease their transition into the community after leaving prison.
● Both program and control group members had low rates of involvement with the criminal justice system. The program did not have a significant impact on most criminal justice outcomes.
Table 3.8 presents the program’s impacts on criminal justice outcomes for the 12-month follow-up period based on administrative and survey data. Neither program nor control group members had much involvement with the criminal justice system; fewer than 20 percent of sample members were arrested during the follow-up period. The top panel in Table 3.8 shows that the program had no statistically significant effect on rates of arrests, incarcerations in prison, or time incarcerated in prison. The program did have a statistically significant impact on the rate of convictions: Program group members were slightly more likely to be convicted of a

122
86.3 64.2 22.158.2
2.5 1.632.3 18.7 13.6
5936.6815 4018.8568 1917.82471001.7947
39.331 25.818 13.51328.204 20.555 7.64921.453 14.319 7.134 ***
(continued)
Figure 3.4
Formal Child Support Payments Over Time: Milwaukee
0102030405060708090
100
0***
1***
2***
3***
Perc
enta
ge p
ayin
g fo
rmal
chi
ld su
ppor
t
Quarter after random assignment
Control group
Program group
164
335304
201167 155 162 152
0
100
200
300
400
500
600
0 1***
2***
3**A
vera
ge fo
rmal
chi
ld su
ppor
t pai
d ($
)
Quarter after random assignment
Program group Control group

123
Figure 3.4 (continued)
SOURCE: MDRC calculations based on child support agency data.
NOTE: Results in this figure are regression-adjusted, controlling for pre-random assignment characteristicsStatistical significance levels are indicated as: *** = 1 percent; ** = 5 percent; * = 10 percent.Measures of formal child support include all payments made through the state's child support collection
and disbursement unit, including funds from employer withholding and other sources (for example, tax intercepts).
Table 3.8
One-Year Impacts on Criminal Justice Outcomes: Milwaukee
Outcome Program
Group Control
Group Difference
(Impact)
Ninety Percent Confidence
Interval
Primary outcomes (based on administrative data) Arrested (%) 19.5 18.1 1.4 [-2.6, 5.4]
Convicted of a crime (%) 9.8 6.9 2.9 * [0.1, 5.8]
Incarcerated in prison (%) 8.7 8.7 0.0 [-2.8, 2.8]
Total days incarcerated in prison 7.7 5.8 1.8 [-1.5, 5.1]
Arrested, convicted, or admitted to prison (%) 23.2 22.4 0.8 [-3.4, 5.0]
Sample size 502 501
Self-reported outcomes (based on survey data) Incarcerated (%) 15.5 16.1 -0.6 [-4.8, 3.6]
aTotal days incarcerated 13.9 17.4 -3.5 [-11.0, 4.0]
On parole or probation (%) 26.7 25.6 1.1 [-3.6, 5.8]
Sample size 403 388
SOURCES: MDRC calculations based on criminal justice data and responses to the ETJD 12-month survey. NOTES: Results in this table are regression-adjusted, controlling for pre-random assignment characteristics. Statistical significance levels are indicated as: *** = 1 percent; ** = 5 percent; * = 10 percent. aThis measure includes a small number of outlier values resulting from sample members who were interviewed more than 18 months after study enrollment.

124
crime than control group members (10 percent versus 7 percent). The reasons for this effect are unclear.18
The 12-month survey asked respondents to report their personal experiences with incar-ceration, parole, and probation. These data may cover criminal justice events not available from criminal justice system administrative records, such as incarceration in jail or criminal behavior in other states. However, unlike administrative data, these responses are subject to respondent recall and reporting errors. The bottom panel of Table 3.8 shows that the program had no significant effect on any of these outcomes.
There were no statistically significant differences in this area between first- and second-year participants (see Appendix Table B.2).
Economic and Personal Well-Being Outcomes
This section presents the effects of the program on a range of other outcomes such as experience with financial difficulties, food insufficiency, housing insecurity, and health. The section uses data from the 12-month follow-up survey. The program could have affected these outcomes indirectly, by increasing employment, and directly through support services such as advice, mentorship, and other forms of support provided by case managers.
● There were few differences between the program and control groups in measures of personal well-being.
Table 3.9 shows that there were few differences between the program and control groups in measures of personal well-being. Program group members were more likely to report that they could not pay the rent or mortgage than control group members (64 percent in the program group versus 57 percent in the control group). However, the program had no signifi-cant impact on the three other measures of financial hardship reported in Table 3.9. Program group members were slightly less likely to be homeless or live in emergency or temporary housing than control group members: 8 percent of control group members reported living in such circumstances compared with about 4 percent of the program group. The program did not have a significant impact on other measures of well-being such as food insecurity, health, health insurance, or psychological distress.
18There is some risk that this finding could be due to chance. Taken as a whole, the evidence from admin-
istrative measures in Table 3.8 suggests little to no impact on criminal justice involvement.
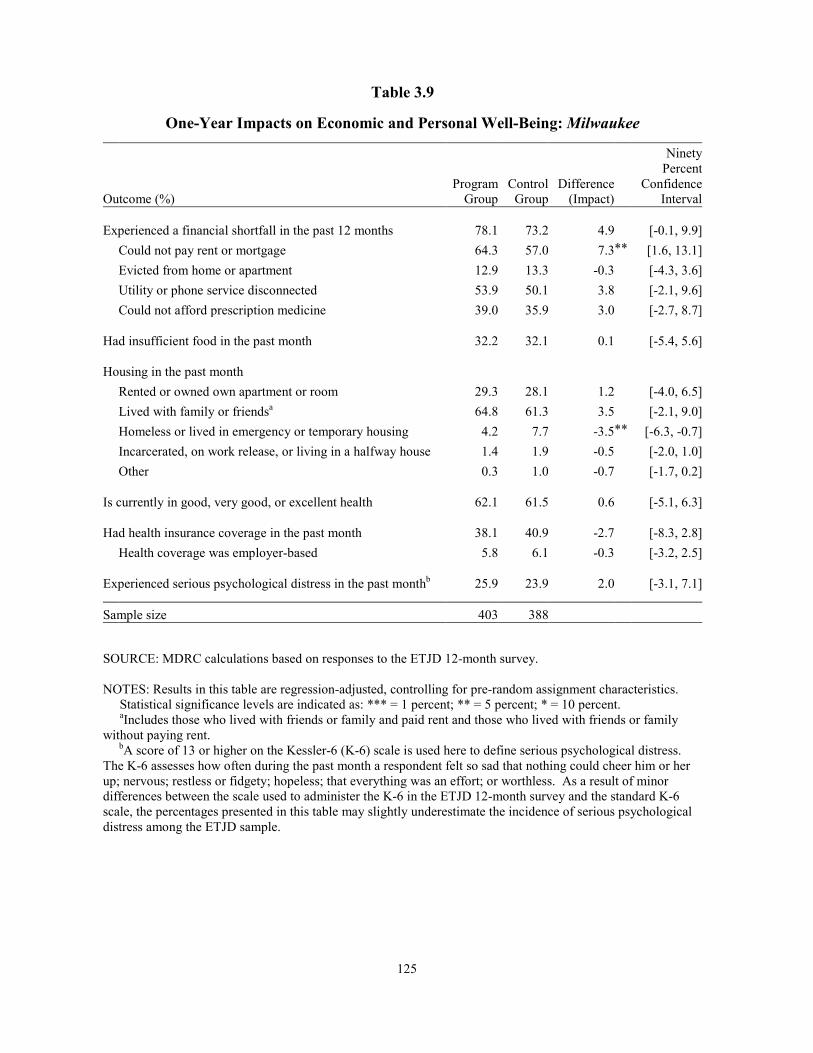
125
Table 3.9
One-Year Impacts on Economic and Personal Well-Being: Milwaukee
Outcome (%) Program
Group Control
Group Difference
(Impact)
Ninety Percent
Confidence Interval
Experienced a financial shortfall in the past 12 months 78.1 73.2 4.9 [-0.1, 9.9]
Could not pay rent or mortgage 64.3 57.0 7.3 ** [1.6, 13.1] Evicted from home or apartment 12.9 13.3 -0.3
[-4.3, 3.6] Utility or phone service disconnected 53.9 50.1 3.8 [-2.1, 9.6] Could not afford prescription medicine 39.0 35.9 3.0 [-2.7, 8.7]
Had insufficient food in the past month 32.2 32.1 0.1 [-5.4, 5.6]
Housing in the past month
Rented or owned own apartment or room 29.3 28.1 1.2
[-4.0, 6.5] Lived with family or friendsa 64.8 61.3 3.5 [-2.1, 9.0] Homeless or lived in emergency or temporary housing 4.2 7.7 -3.5 ** [-6.3, -0.7] Incarcerated, on work release, or living in a halfway house 1.4 1.9 -0.5
[-2.0, 1.0] Other 0.3 1.0 -0.7 [-1.7, 0.2]
Is currently in good, very good, or excellent health 62.1 61.5 0.6 [-5.1, 6.3]
Had health insurance coverage in the past month 38.1 40.9 -2.7
[-8.3, 2.8]
Health coverage was employer-based 5.8 6.1 -0.3 [-3.2, 2.5]
Experienced serious psychological distress in the past monthb 25.9 23.9 2.0 [-3.1, 7.1]
Sample size 403 388
SOURCE: MDRC calculations based on responses to the ETJD 12-month survey. NOTES: Results in this table are regression-adjusted, controlling for pre-random assignment characteristics. Statistical significance levels are indicated as: *** = 1 percent; ** = 5 percent; * = 10 percent. aIncludes those who lived with friends or family and paid rent and those who lived with friends or family without paying rent. bA score of 13 or higher on the Kessler-6 (K-6) scale is used here to define serious psychological distress. The K-6 assesses how often during the past month a respondent felt so sad that nothing could cheer him or her up; nervous; restless or fidgety; hopeless; that everything was an effort; or worthless. As a result of minor differences between the scale used to administer the K-6 in the ETJD 12-month survey and the standard K-6 scale, the percentages presented in this table may slightly underestimate the incidence of serious psychological distress among the ETJD sample.
126
Conclusion The YWCA implemented the intended model of the SFTW program with mixed success. It succeeded in implementing several core aspects of the program largely as anticipated: It identified employers to host transitional jobs placements, provided child support assistance, and administered an earnings supplement for individuals who got unsubsidized jobs with low wages. However, the YWCA also faced a number of significant challenges with program recruitment and staff turnover that affected some aspects of service delivery, including unsubsi-dized job development and some of the planned staff meetings with employers and participants during the transitional jobs. The program did not meaningfully implement one potentially promising enhancement: occupational training for a large fraction of participants.
The program did succeed notably in providing child support assistance. The seamless integration of a Legal Action attorney into the client flow and the availability of an on-site child support agency representative meant that child support assistance was received by most partici-pants, and this assistance was well regarded by program staff members and participants alike. The YWCA’s good relationship with DCSS also enabled the program to arrange for some forgiveness of interest on debt for some of its participants.
Program recruitment was one of YWCA’s principal challenges, and this challenge af-fected implementation in a number of ways. Ultimately, the program succeeded in reaching its target sample size. However, it did so in part by loosening eligibility criteria partway through the enrollment period and by conducting extensive outreach efforts in later months. There is some indication that these factors may have modestly affected the characteristics of the sample enrolled later: Members of the sample enrolled during the last three months of enrollment were somewhat older, were more likely to have disabilities, and had less work experience than individuals enrolled earlier. Comments from transitional jobs employers and training providers about the skill levels and job readiness of participants suggest that the group who ultimately enrolled may have been challenging for them. Further, the staff spent more time than anticipated on recruitment and ended up enrolling a different population than originally anticipated; these two factors together may have affected staff members’ ability to focus on other services.
Program participation dropped off at various stages, and ultimately only 63 percent of participants actually received transitional jobs. Further, a substantial delay preceded many of the transitional job placements. While the program began to emphasize rapid placements in transi-tional jobs later on, doing so may have come at the expense of its ability to tailor placements and services to individual circumstances. Attrition was also one of several reasons that fewer than 10 percent of participants received one of the later services, the earning supplement.

127
The impact analysis shows that the program increased participants’ receipt of services related to employment by a small amount, and substantially increased their receipt of services related to child support and criminal justice issues. In the year following random assignment, program group members also had higher rates of employment and earnings in unemployment insurance-covered jobs than control group members. Most of this impact appears to be the result of subsidized employment, and it is therefore not possible at this point to determine whether the SFTW program will produce employment impacts in the long term. Possibly as a result of their higher earnings, program group members were more likely to pay child support and paid a larger amount than control group members. There were few differences between the program and control groups in outcome measures related to criminal justice or personal and financial well-being.

THIS PAGE INTENTIONALLY LEFT BLANK

Chapter 4
TransitionsSF (San Francisco, CA)

THIS PAGE INTENTIONALLY LEFT BLANK
131
Executive Summary
TransitionsSF served noncustodial parents who were struggling to meet their child support obligations because they were unemployed. It operated as a collaborative effort of the San Francisco Mayor’s Office of Economic and Workforce Development (OEWD), the City and County of San Francisco Department of Child Support Services (DCSS), and Goodwill of San Francisco, San Mateo, and Marin. The program enhanced the basic transitional jobs model through a tiered approach that placed participants in different types of subsidized jobs (nonprof-it, public, or private for-profit) based on their job readiness as measured by previous work experience and education. In addition to enhancing the structure of the model, DCSS provided incentives linked to program participation: It temporarily lowered participants’ child support orders and reinstated driver’s licenses that had been suspended for nonpayment of child support.
Main Findings •
•
A large majority of study participants were black or Hispanic men in their 30s or 40s; nearly all had worked before, but most had little recent work experience. A little more than two-thirds of participants had high school diplomas or equivalents, but very few had postsecondary degrees. Nearly all participants had some work experience — and most had held a job for at least six months at some point — but about 80 percent had worked for a year or less in the previous three years. A large proportion of participants (66 percent) were in unstable housing, either staying with someone else or homeless. About two-thirds had current child support orders, while nearly 30 percent only owed back child support for children who were no longer mi-nors. Twenty-eight percent of participants had been previously incarcerated, and nearly 80 percent had past criminal convictions in the state of California.
While the TransitionsSF model was innovative, the program faced sig-nificant operational challenges. Fewer than half of the program group members (44 percent) ever worked in a subsidized job. This low placement rate occurred, in part, because half of participants were unable to complete the required preemployment activities, which included a drug test that many participants could not pass. In addition, the program struggled to identify subsidized positions with private-sector employers, and there were delays in placing participants in the public tier — both of which caused long waits for job placements and probably contributed to attrition. Ultimately, among par-ticipants who were slated for the private-sector tier, only 24 percent were ac-

132
tually placed in that type of subsidized job (others were placed in nonprofit positions); similarly, only 39 percent of those slated for the public tier worked in that type of position.
•
•
•
•
The child support incentives were important for many participants. DCSS successfully provided substantial benefits to participants through its use of child support-related incentives, including the release of suspended driver’s licenses and modifications of child support orders. However, it had a more limited ability to provide these benefits for participants’ out-of-county cases. This limitation became a problem when the program started to recruit participants with out-of-county cases in an effort to reach its en-rollment target.
Despite its implementation challenges, TransitionsSF had statistically significant impacts on both employment and earnings during the first year after random assignment. Due in part to the subsidized jobs, program group members were more likely to be employed, worked more quarters on average, and had higher earnings on average than control group members. For example, program group members earned more than $2,100 more than control group members on average during the first year (including earnings from subsidized jobs). Employment gains persisted into the first quarter of year two, when very few program group members were still working in sub-sidized jobs, though earnings increases did not. The impact on employment during the first year was largest among those with no recent work experience.
TransitionsSF produced short-term increases in financial security but few other impacts on measures of participant well-being. In a survey ad-ministered around five months after random assignment, program group members reported being more financially secure than control group mem-bers, but did not report greater levels of overall happiness, reduced psycho-logical distress, or increased self-confidence related to employment. Al-though the program produced higher levels of earnings and employment during the first year, these did not translate into positive impacts on measures of personal well-being (for example, health, health insurance coverage, psy-chological distress, or stability of living situation) measured in another sur-vey administered one year after random assignment.
TransitionsSF increased the proportion of participants who paid child support. Program group members were more likely to pay formal child sup-port than control group members during the first year after random assign-

133
ment, and paid child support one month more on average during the course of the year. However, there was not a statistically significant difference in the total amount of formal child support paid, in part because the program low-ered the amount of child support that program group members were required to pay. Put another way, the program lowered participants’ child support ob-ligations to better reflect their ability to pay, and doing so did not result in lower child support collections.
The first section of this chapter provides background on the program model, the intend-ed intervention, the recruitment and screening process, and the characteristics of the participants enrolled. The second section describes the implementation of the program, with a particular focus on the ways implementation aligned with or deviated from the intended model. The final section describes the program’s one-year impacts on participation in services, employment, child support payments, and criminal justice outcomes.

134
TransitionsSF
Background TransitionsSF was established to help unemployed noncustodial parents who were behind in child support payments reconnect with the labor market through transitional jobs. Its tiered approach was designed to allow participants to work in transitional jobs that were appropriate to their backgrounds and abilities. DCSS also viewed the program as an opportunity to experiment with modifying orders to amounts that were manageable to parents. The goal was to first increase payment regularity and later payment amounts. This section begins with an overview of the community context, describes the program model as it was intended to function, and presents information on the characteristics of the study participants.
Context
TransitionsSF was implemented in San Francisco, whose tech boom has received na-tional attention for dramatically, but unevenly, affecting the city’s economic landscape. In 2013, San Francisco’s unemployment rate was 5.7 percent, the third lowest in California. San Francis-co’s median household income was $75,604 between 2009 and 2013, compared with $53,046 for the country. Over half of San Francisco’s population holds a bachelor’s degree or higher. But these indicators, which suggest a strong and healthy economy, belie the scarcity of opportu-nities for those who are less educated and who lack the skills required for the jobs driving the economy forward.
San Francisco lacks businesses and industries that hire large numbers of lower-skilled workers (manufacturing, for example). In 2013, 4 of the top 10 largest employers in San Francisco were government agencies. Only two, the City and County of San Francisco and the University of California, San Francisco, employed more than 10,000 workers. Other large employers in the city were hospitals, banks, institutions of higher education, retailers such as Gap, Inc. (whose headquarters are in the city), and technology companies such as Salesforce.com, Inc. The Director of Workforce Development at OEWD explained that “big box” is considered a dirty phrase in the city, so there are few large chain stores. Opportunities for lower-skilled workers are more common in other nearby areas, such as Alameda County, which operates the region’s port; however, the minimum wages there are lower and commutes via public transportation can be a challenge. For the jobs that are available to them in the city, San Francisco’s lower-skilled residents face competition from workers with similar profiles who live in neighboring areas.
The disparities in income and economic opportunities have made it harder for the poor to live in San Francisco. One of the most prominent manifestations of this difficulty is found in
135
the housing market. A 2014 report by the National Low Income Housing Coalition calculated that an individual needed to earn $29.83 an hour to afford a market-rate one-bedroom apartment in the city, or roughly three times San Francisco’s minimum wage. Many of the region’s poor have already been pushed out of the city due to the cost of living; indeed, it is possible that those who remain in San Francisco (and who are represented in this study’s sample population) are more disadvantaged because they lack the resources to move.
In addition to the local economy and labor market, the child support-enforcement con-text in San Francisco may have also influenced program implementation. California’s child support policies reflect an effort to align child support order amounts with noncustodial parents’ circumstances. Noncustodial parents who are incarcerated for more than 90 days and who do not have any means to pay child support can request that their orders be reviewed for modifica-tion. Similarly, orders can be reviewed for modification for noncustodial parents who are unemployed, disabled, or receiving general assistance or Social Security.
DCSS takes an active approach to such order modifications. DCSS staff members visit county jails on a weekly basis to inform noncustodial parents about their rights. DCSS also reviews wage data on a quarterly basis to monitor changes in income. The state has a Compro-mise of Arrears Program, through which noncustodial parents can reduce the past-due child support they owe the government. Caseworkers at DCSS are required to review their caseloads and refer potential participants as appropriate. Performance in this area is a component of caseworkers’ annual reviews, which demonstrates DCSS’s commitment to assist noncustodial parents struggling with their child support obligations.
DCSS also operates the Custodial and Noncustodial Employment Training Program (C-NET), a program for clients who have barriers that prevent them from being able to fulfill their child support obligations. C-NET shares some features with TransitionsSF, such as individual case management, driver’s license release, and job-search help. However, these services are less robust than the ones offered by TransitionsSF. Further, C-NET does not have some of Transi-tionsSF’s central features, namely, transitional job placement and order modification.
San Francisco is an environment with many services available for disadvantaged peo-ple, so control group members had access to a large number of other resources in the communi-ty, including other employment programs. For example, OEWD runs several other employment and training programs targeting a range of individuals, from low-skilled to higher-skilled; however, these programs tended to offer less comprehensive services.
Intended Model
As described in Chapter 1, the TransitionsSF model reflected both structural enhance-ments to the basic transitional jobs model and child support incentives. As illustrated in Figure

136
4.1, the model included three stages: pre-transitional job, transitional job, and follow-up. The tiered transitional jobs model was based on the subsidized employment program that San Francisco’s Human Services Agency operated using American Recovery and Reinvestment Act funding. The program was considered highly successful, especially because it placed a large number of people with private, for-profit employers. The partners sought to adapt and enhance
Figure 4.1
TransitionsSF Program Model
Participant enrollment
Assessment and tier determination
Tier assignment
Job-readiness training
Tier 2
Public-sector job
Tier 3
Private-sector job
Tier 1
Nonprofit job
Unsubsidized employment
Retention services
No employment
Job-search assistance available

137
this model to serve noncustodial parents who were struggling to pay their child support orders, thereby boosting their earnings so that they could pay their child support. DCSS recognized that standard “guideline” orders were too burdensome for many of these individuals, and it was particularly interested in learning about the effects of lowering these orders to a more managea-ble amount.1
The pre-transitional job period was to focus on preparing participants for employment. During this initial stage, participants would undergo a variety of assessments of their behaviors and needs. If services were needed — for example, substance-use or mental health treatment — case managers would make appropriate referrals. Participants would also begin building the soft skills they needed in the workplace through job-readiness training. This period, expected to last for three weeks, would allow the staff to determine the right type of transitional job for each participant.
Next, participants would be placed in a five-month transitional job in one of three tiers, with assignments based on work experience, educational level, and performance in the pre-transitional job period. Each tier corresponded to a different job sector — nonprofit, public, and private, for-profit — that matched the participants’ level of job readiness from lowest to highest. If participants demonstrated superior performance on the job, or, conversely, revealed that they could not meet the demands of the transitional job, they might move up or down a tier. Other-wise, they would remain in the same tier for the length of the transitional job stage. The jobs in the nonprofit and public tiers were strictly transitional and not expected to become permanent; in contrast, private-sector employers were expected to move individuals who performed well during the subsidy period into regular, unsubsidized jobs.
Several months into the transitional job, the staff would start to work with participants to conduct job searches so that they could successfully make the transition into unsubsidized employment. In the yearlong follow-up period, which started after the transitional jobs ended, the staff would continue the job-search process with participants who had not obtained jobs, or work with them on job retention and advancement if they had.
Throughout each stage of the program, participants were to receive case management services and several other forms of support. Perhaps most substantially, DCSS released their suspended driver’s licenses and modified their child support orders to a below-guideline amount once they began working, so that they would not see large deductions from their paychecks. These incentives were to be removed if participants stopped engaging with the program. If they
1Child support orders are based on guidelines that consider the incomes of both parents and other fac-
tors. A small number of study sample members had received child support order modifications before they entered the study, but the status quo was generally to assign orders based on the guidelines.

138
continued to be nonresponsive, DCSS could bring these participants to court. Participants also received stipends for attending activities like educational classes, among other types of support.
The TransitionsSF program model was based on the following assumptions:
• Participants faced a host of barriers to employment that needed to be addressed before they could stabilize and work. According to the grant proposal, participants were expected to require time to develop “habits for success.” The purpose of the assessments, early case management, referrals, and job-readiness training was to prepare participants for placement. Barriers to employment due to lack of education would be addressed through high school equivalency and digital literacy classes.
• The different tiers of transitional jobs would ensure that participants received work experiences in environments that were beneficial to them and appropriate for their current levels of employability. Partici-pants in Tier 1 (the nonprofit tier) would gain soft skills and learn appropri-ate workplace behavior in a supportive environment. Participants in Tier 2 (the public service tier) would also have a relatively supportive environ-ment and would gain exposure to the public sector. For participants in Tier 3 (the private-sector tier), the purpose of the transitional job was to give employers the opportunity to “test-drive” participants before they were hired. Even if a participant did not get hired, that person would have a new job to add to his or her résumé and an employer reference to use when searching for an unsubsidized job.
• Participants needed incentives to remain engaged with the program. The partners considered a “carrot-and-stick” approach to be critical to keeping participants active in TransitionsSF. DCSS recognized that child support ob-ligations were a barrier to employment for many noncustodial parents. DCSS hoped that if it gave TransitionsSF participants “off-guideline” child support orders that were lower than normal, they would become more open to work-ing and have a chance to get back on their feet.
• Participants’ transitional jobs experience would enable them to become gainfully employed with a living wage so they could take care of them-selves and their children. DCSS speculated that lowering the amount owed each month would allow participants to make payments more consistently and reliably, which in turn would benefit the family by improving relation-ships between custodial and noncustodial parents. TransitionsSF was also in-

139
tended to be a step toward regular employment for participants, thereby in-creasing child support collection in the future.
Three pieces in the original design were underdeveloped and not fully considered until very close to the program’s launch: when to administer the drug test participants would have to pass in order to be placed in transitional jobs (a standard policy at Goodwill); what specific strategies to use to help participants make the transition into unsubsidized employment after their transitional jobs ended; and how Goodwill and the San Francisco Human Services Agency (which operated the transitional jobs in Tier 2) would coordinate providing services and support to participants in Tier 2. The late planning of these elements had ramifications for the program as it unfolded.
Recruitment and Study Enrollment
Although TransitionsSF had fairly broad eligibility criteria and minimal screening, achieving the sample-size goal of 1,000 participants required substantial staff resources and effort. This section describes the recruitment and random assignment process, as well as the challenges the program encountered in trying to reach recruitment targets.
To be eligible for TransitionsSF, individuals had to be noncustodial parents between the ages of 18 and 60, residing in San Francisco, who were unemployed or underemployed. They also had to meet at least one of several child support-based criteria: They had to be behind in child support payments by at least 121 days; have zero/reserved orders because they had low incomes or no income; be required to have orders established within 30 days; or have made payments of less than $100 (aside from income withholding) in the past 120 days. DCSS used its database to identify such individuals and conducted outreach to a selected sample of them each month. The program’s goal was to randomly assign 44 to 52 noncustodial parents each month, in order to enroll monthly cohorts of about 22 to 26 into TransitionsSF.2
● The partners had different perspectives on how much assessment and screening to conduct before random assignment. Ultimately, the decision was made to do minimal screening. As a result some partici-pants were included who were unable or unwilling to fully engage with TransitionsSF.
The first step toward enrolling in the study was for invited individuals to attend an ori-entation session held once a month at the public library, a location DCSS selected because it was familiar to the individuals and potentially more approachable than the DCSS office. At this orientation, attendees learned about the program, the evaluation, and random assignment. Those
2A cohort is a group of participants who join a program at the same time and move through it together.

140
who were interested in participating then completed a consent form and a form that asked for basic information about their criminal justice backgrounds, demographic characteristics, and educational and employment histories. They received an appointment for random assignment at the DCSS office two days later.
At the random assignment appointment, each individual met one-on-one with a member of the DCSS staff, who collected additional background information and then entered the individual into MDRC’s online random assignment system. Participants assigned to the pro-gram group signed a document that described the actions to be taken by DCSS and the require-ments the participants needed to fulfill to be in TransitionsSF, including attending the job-readiness training and working in a transitional job. They were also instructed to go to Goodwill the following morning to begin the program. Participants assigned to the control group signed a similar document, though theirs was for C-NET, DCSS’ existing case management program for unemployed parents. Each of them was also given an appointment time with the DCSS staff person who runs C-NET.3
During the planning phase, the partners disagreed about whether individuals should be assessed before random assignment. DCSS wanted to serve a broad swath of the eligible population, which would also maximize the number who could be randomly assigned, while Goodwill and OEWD wanted more screening so they could identify people who did not seem ready to participate in TransitionsSF. Ultimately, there was no additional screening of partici-pants beyond confirming their eligibility. The random assignment appointment was deliberately scheduled for two days after the orientation so individuals had to make an additional trip to enroll, thereby demonstrating a genuine interest in participating and the ability to keep an appointment. OEWD staff members speculated in an interview that the program struggled to work with certain participants because they lacked the ability or motivation to participate fully.
● DCSS conducted an intensive outreach effort, but meeting the enroll-ment goal for the evaluation proved to be a struggle that became more difficult over time.
A large number of DCSS staff members were involved with the effort to recruit target-ed individuals. DCSS primarily relied on letters and phone calls to invite potential participants to attend the monthly orientation sessions, but it also used other recruitment methods to boost interest. For example, DCSS sent letters to custodial parents, asking them to encourage the noncustodial parents of their children to participate — and also asking them to provide DCSS
3An interview with the C-NET caseworker and case file reviews of three control group members (one
selected at random from each of the three tiers) indicated that few members of the control group ultimately engaged with C-NET.
141
with updated contact information for those noncustodial parents. Staff members also visited halfway houses, jails, community centers, and other places where the program’s target popula-tion might be, to provide information to them about TransitionsSF.
Data that DCSS tracked on recruitment suggest two reasons for the enrollment chal-lenges: (1) the limited number of eligible individuals and (2) the difficulty of persuading eligible parents to attend the orientation. As time went on, DCSS found that it had to reach out to increasing numbers of individuals to achieve its monthly goals. San Francisco is not a particu-larly large city, and the number of new cases each month was small, meaning that the size of the target population did not grow much over the course of the project. Eventually, DCSS largely depleted the individuals available to recruit. Recruitment was also hampered by the negative perception of DCSS held by many noncustodial parents. DCSS staff explained that noncustodial parents see the agency as an aid to custodial parents and as enforcement directed at noncustodial parents. Some were wary of the invitation they received to learn about TransitionsSF, thinking it might be a sting operation. Indeed, several participants interviewed by the evaluation team reported that they had been suspicious of the program when they received their outreach letters.
In the spring of 2013, DCSS began recruiting San Francisco residents who only had child support cases outside the county to expand the pool of eligible individuals. While this strategy did increase the number of noncustodial parents in the recruitment pool, DCSS was not always able to offer these parents certain forms of support that were available to other partici-pants. Those elements had to be approved by the child support departments in the counties where their cases were located. This issue is discussed further below.
Baseline Characteristics
This section discusses the background characteristics of the evaluation sample in areas such as demographics, educational background, work history, and child support history. These characteristics are presented in Tables 4.1 and 4.2 and Appendix Table C.1.4
A large majority of study participants were black or Hispanic men (as shown in Table 4.1). Their average age was 40, a few years older than the average age across all the programs that targeted noncustodial parents. Nearly 35 percent of the participants in San Francisco were 45 or older, compared with about 25 percent of the participants and control group members
4As expected (given the random assignment design), there were very few statistically significant differ-
ences between the program and control groups with respect to these characteristics. Therefore, for simplici-ty, Tables 4.1 and 4.2 and Appendix Table C.1 present numbers for the full San Francisco sample. For a detailed comparison of the baseline characteristics of program group members and control group members across the ETJD programs, see Appendix I.

142
Table 4.1 Characteristics and Employment Histories of Sample Members: San Francisco
San Francisco ETJD Programs Targeting Characteristic Program Noncustodial Parents
Male (%) 88.0 93.2
Age (%)
18-24 4.8 7.6 25-34 25.8 32.6 35-44 34.5 34.9 45 or older 34.9 24.9
Average age 40.1 37.6
Race/ethnicity (%)
Black, non-Hispanic 67.4 82.4 White, non-Hispanic 3.4 5.5 Hispanic 19.3 7.9 Asian, non-Hispanic 4.9 1.4 Other/multiracial 4.9 2.9
Educational attainment (%)
No high school diploma or equivalent 28.5 29.2 High school diploma or equivalent 67.6 66.0 Associate's degree or equivalent 1.6 2.6 Bachelor's degree or higher 2.3 2.3
Marital status (%)
Never married 57.0 66.2 Currently married 8.4 8.4 Separated, widowed, or divorced 34.7 25.4
Veteran (%) 0.9 4.9
Has a disability (%) 0.2 5.4
Housing (%)
Rents or owns 29.9 45.4 Halfway house, transitional house,
or residential treatment facility 4.5 3.7
Homeless 13.7 7.9 Staying in someone else's apartment, room, or house 51.9 43.0
(continued)

143
Table 4.1 (continued)
San Francisco Programs Targeting Characteristic Program Noncustodial Parents
Employment history Ever worked (%) 97.5 95.6
Among those who ever worked:
Worked in the past year (%) 41.4 49.9 Average hourly wage in most recent job ($) 14.25 11.21 Ever worked for the same employer for 6 months or more (%) 87.5 79.5
Months worked in the previous 3 years (%)
Did not work 5.9 13.8 Fewer than 6 months 31.2 27.8 6 to 12 months 43.6 28.7 13 to 24 months 6.2 14.1 More than 24 months 13.1 15.6
Sample size 995 3,998
SOURCES: MDRC calculations based on baseline survey data and ETJD management information system data.
across all the noncustodial parent programs. Several program staff members observed that the participants were older than anticipated, and that their age represented an additional challenge to finding employment for them. The highest level of education reached by two-thirds of the sample was a high school diploma or equivalent (for example, a General Educational Develop-ment [GED] certificate). Twenty-nine percent of the sample did not have a high school diploma or equivalent.
Nearly all participants had employment experience, though their recent work histories appeared to be sporadic: In the previous three years, about 44 percent of the participants had worked between 6 and 12 months, and about 31 percent of the participants had worked, but for less than 6 months (see Table 4.2). The average hourly wage from participants’ last jobs ($14.25) was high relative to other cities ($11.21).5 This high wage is consistent with San
5Table 4.2 shows sample members’ average hourly wage at their most recent jobs before they entered
the study. Appendix Table C.1 presents more detailed information about sample members’ hourly wages in their most recent jobs before they entered the study.

144
Table 4.2
Child Support and Criminal Justice Characteristics of Sample Members: San Francisco
San Francisco ETJD Programs Targeting Characteristic Program Noncustodial Parents
Parental and child support status
Noncustodial parent (%) 100.0 100.0
Has any minor-age children (%) 87.3 93.2
Among those with minor-age children:
Average number of minor-age children 2.1 2.5
Living with minor-age children (%) 19.9 18.1
Has a current child support order (%) 67.2 86.3
Has an order only for child support debt (%) 29.0 12.7
Criminal history Ever convicted of a crimea (%) 79.1 76.4
Ever convicted of a felony 34.8 36.7 Ever convicted of a misdemeanor 56.6 64.6
Ever incarcerated in prison (%) 28.3 40.2
Among those ever incarcerated in prison:
Average time in prison (years) NAb 3.8
Years between most recent release and program enrollment (%)
Less than 1 year 19.6 33.2 1 to 3 years 17.9 17.5 More than 3 years 62.5 49.2
Average months since most recent releasec 94.7 62.2
On community supervision at program enrollmentd (%) 48.8 51.6
Sample size 995 3,998
SOURCES: MDRC calculations based on baseline survey data, ETJD management information system data, and criminal justice administrative records. NOTES: Measures are self-reported unless otherwise noted. NA = not available. aIncludes convictions in the state of California as recorded in administrative records. Does not include federal convictions or convictions from other states. bAdministrative prison records from California were not available on this subject at the time of this report. cMost recent release can be from prison or jail. dIncludes parole, probation, and other types of criminal justice or court supervision.
145
Francisco’s wages as a whole, which are generally higher than the national average across different occupations. Since 2009, the city’s minimum wage has been close to or over $10 per hour.
Given San Francisco’s high rental prices (as described earlier), it is not surprising that housing was a major problem for participants. About 52 percent of participants were staying in someone else’s apartment, room, or house at the time they enrolled in the study and nearly 14 percent reported being homeless. Both these figures are considerably higher in San Francisco than in the other ETJD programs.6
A history of criminal justice involvement posed another barrier to employment for a sizable portion of the sample. Nearly 80 percent of participants had past criminal convictions in the state of California, 35 percent had past felony convictions, and 28 percent had previously been incarcerated in prison.7 Forty-three percent of the sample (over half of those with past convictions) had been convicted of a violent crime (see Appendix Table C.1). Among those who had been to prison, the average time since their most recent release from prison or jail was more than seven years (95 months on average, as shown in Table 4.2), but one-fifth had been released within the past year. Having a criminal history limited job opportunities for some participants.
About 67 percent of participants had current child support orders, while nearly 30 per-cent had only arrears child support orders, meaning that they only owed back child support for children who were no longer minors. The substantial number of participants with arrears-only orders is probably due to the older-skewing sample. Reviews of program participants’ case files conducted by the evaluation team and interviews with selected program participants and staff members indicate that many participants had multiple child support cases, sometimes in different counties. Some participants had both current child support orders and arrears orders.
Program Implementation
Program Structure and Staffing
Each of TransitionsSF’s three primary partner organizations performed a distinct role on the project: OEWD (the San Francisco Mayor’s Office of Economic and Workforce Devel-opment) was responsible for overall project and grant management; DCSS (the City and County
6The rate of homelessness among sample members in San Francisco was high both compared with oth-
er ETJD programs serving noncustodial parents (as shown in Table 4.1) and compared with ETJD programs serving formerly incarcerated individuals (5.8 percent on average, not shown).
7The measure of incarceration in prison does not include incarceration in jail.

146
of San Francisco Department of Child Support Services) conducted recruitment and provided child support-related incentives to participants; and Goodwill provided program services. In addition, the city’s Human Services Agency (HSA), which runs the Public Service Trainee program,8 managed the Tier 2 transitional jobs, including participant placement and relation-ships with the Tier 2 employers. The three primary partners remained actively engaged in TransitionsSF throughout the grant period, and senior managers from all three partners met regularly to discuss program policies and procedures. A program manager from HSA also participated in meetings, but was less involved in the program’s overall design and strategy. DCSS staff members and the Goodwill project manager met weekly to review participants’ status, discussing their attendance, subsidized and unsubsidized job placements, and child support payments.
On the whole, the program had more staffing for the pre-transitional job activities than for job development and postemployment follow-up. Goodwill allocated four full-time-equivalent staff positions (FTEs) to the pre-transitional job stage; three FTEs to case manage-ment during and after the transitional job, and two FTEs to job development for both Tier 3 subsidized positions and unsubsidized jobs.9 Data from a time-use study — in which program staff members reported how they spent their time during a two-week period — confirms that limited time was spent on job development. Just 9 percent of all staff hours spent on Transi-tionsSF were devoted to making contact with potential employers and searching for new transitional job or unsubsidized job opportunities for participants. An additional 10 percent was spent on transitional job and unsubsidized job-search assistance in the form of sharing job opportunities with participants, leading a job club, and other activities. That 10 percent includes time spent by case managers on helping participants with their job searches. The largest propor-tion of the staff’s time, 23 percent, was spent on case management. The small number of staff members working on job development probably contributed to the difficulties TransitionsSF had in creating adequate numbers of Tier 3 (private, for-profit) transitional job openings and in getting participants into unsubsidized employment after their transitional jobs ended. These challenges are described in later sections.
The following staff members (from Goodwill except when noted) provided services di-rectly to TransitionsSF participants.
Assessment specialists, who were all master’s-level counselors, met with participants individually during orientation week and asked about the stability and safety of their living
8The Public Service Trainee program is available to recipients of Temporary Assistance for Needy Families who are enrolled in Jobs Now, a subsidized employment program operated by HSA.
9FTEs indicate the number of full-time employees at an organization plus the number of part-time em-ployees, standardized to a full-time basis. For example, an organization with 4 full-time and 3 half-time employees would have 5.5 FTEs.

147
situations, their transportation needs, their health insurance, their physical and mental health, their work histories, and their education levels. In this meeting, the assessment specialists also reviewed the results of the online assessments that participants took during orientation, which identified their work interests and aptitudes. Using the information they gathered, the assess-ment specialists prepared a written report on each participant and shared it with case managers.
The job-readiness training instructor taught a two-week, 24-lesson course based on a curriculum used at Goodwill programs across the country, covering topics such as interviewing, writing résumés, and handling conflict. The instructor also worked with participants to draft cover letters and résumés and to conduct mock interviews. All participants were required to complete this course before being placed in transitional jobs.
Case management functions were divided between two groups of staff members. Dur-ing orientation week, participants were assigned to a resource specialist, who focused on addressing barriers to employment by helping participants obtain documents such as birth certificates or Social Security cards, providing bus tokens, and making referrals to outside agencies for legal services, housing, mental health counseling, eyeglasses, and work attire. Though resource specialists had access to the reports produced by the assessment specialists, they typically held another “intake” conversation with each participant to identify that person’s needs. The resource specialists explained that this conversation was necessary because partici-pants often failed to disclose sensitive issues like drug use in the first assessment. Resource specialists also helped participants get their drug tests and background checks completed.
Once participants completed the preemployment activities, they began working with a career adviser. Resource specialists and career advisers were paired and worked with the same group of participants; if serious issues emerged, career advisers could refer a participant back to a resource specialist for additional help. The career adviser’s role was to support the participant in his or her transitional job and to help him or her plan for unsubsidized employment.
Case managers accompanied participants in Tiers 1 and 3 to job sites on the first day to meet with the supervisors together. They remained in contact with the job-site supervisors if there were issues with participants’ job performance and conducted formal performance evaluations with all work-site supervisors in Tiers 1 and 3, collecting their appraisals of partici-pants’ job performance in areas such as punctuality, attention to detail, grooming, ability to work independently without supervision, and mastery of job-specific learning objectives. Case managers did not have contact with Tier 2 job sites, an issue discussed further below.
The case managers served as an important link to the job development team as partici-pants searched for unsubsidized employment. Participants were expected to meet with their case

148
managers twice a month while they worked in their transitional jobs and once a month after that, though case managers were available to meet more frequently if needed.10 At these meetings, case managers discussed how the transitional job was going, helped with career exploration and job searching, and shared job leads from the Goodwill job developers. They worked with participants to tailor their résumés, submit job applications, and prepare for interviews.
Goodwill dedicated two job developers to TransitionsSF, with one manager overseeing their work. Job developers cultivated relationships with private, for-profit employers to create subsidized Tier 3 transitional jobs, and identified unsubsidized job leads. The job developers monitored job listings on the Internet and in other places and conducted outreach to employers to encourage them to participate in TransitionsSF. Job developers met once with participants during job-readiness training to learn about their interests and work backgrounds, but after that, they communicated transitional and unsubsidized job opportunities to participants through the case managers. Some participants were able to develop relationships with the job developers through other channels; for example, one job developer led a weekly job club and got to know the participants who attended regularly.
Two DCSS caseworkers assigned to TransitionsSF carried caseloads of about 200 par-ticipants each, considerably lower than the typical DCSS caseload of 600 or more. They were responsible for administering the child support incentives for program participation, including driver’s license release and child support order modification, and for removing these incentives if participants stopped attending the program. In addition, participants were able to call their caseworkers directly, in contrast to standard practice, where DCSS clients called a hotline if they had questions.
During the transitional job, participants were also enrolled in either GED or digital liter-acy classes. Instructors from Five Keys Charter School provided GED preparation, while instructors from Goodwill provided digital literacy classes. The program made arrangements with transitional job employers so that participants could attend these classes at Goodwill for 6 to 10 hours each week. Digital literacy classes were four months long, while the length of GED classes varied depending on when participants were ready for testing.
TransitionsSF was also able to make use of a number of Goodwill’s existing partner-ships with other service providers in the community. Participants who failed their drug tests were referred for counseling to Family Service Agency, which had an office within a Goodwill location. Staff members at Family Service Agency joined case-conferencing meetings with the
10The actual frequency of these meetings is unknown, as they do not appear to have been reliably rec-
orded in the management information system.
149
Goodwill staff to discuss TransitionsSF participants. Participants with more serious substance-use issues were referred to Walden House, which provided rehabilitation services. Both Family Service Agency and Walden House also offered mental health treatment.
Implementation of Core Program Components
This section draws from interviews with staff members, partners, employers, and partic-ipants that were conducted over three site visits by the evaluation team (one visit to conduct an early assessment of the program and two later visits to learn about ongoing program implemen-tation); conversations with program managers over the course of the grant period; and participa-tion data drawn from the management information system, which are presented in Table 4.3 and Figure 4.2.
● Tier assignments were made early during the orientation week. Al-though the program intended to determine tier assignments for partici-pants using a firm set of guidelines based on work experience and edu-cational level, the actual process used was not entirely clear.
The tiered approach to transitional jobs was supposed to place each participant in a transitional job appropriate to that person’s job skills or job readiness. If implemented properly, with all participants assigned to tiers based on clear criteria that were consistently applied, this procedure could have also enabled the study to conduct impact analysis within each tier.11 However, it is not entirely clear what process the staff followed to make these assignments, despite the evaluation team’s efforts to understand it through staff interviews and data analysis. Though the program’s formal policy was that participants should be assigned to job tiers in part based on their attendance and performance in the job-readiness classes, staff members reported that they made tier assignments strictly based on educational attainment and work history (see Box 4.1 for the guidelines). They explained that this approach allowed them to make tier assignments as soon as participants enrolled in TransitionsSF, which sped the process of matching participants with transitional jobs. However, if that were the case then it should have been possible to predict participants’ tier assignments based on the educational and work history information collected by DCSS during the random assignment process, and the assignments Goodwill actually made did not consistently match those predictions. This discrepancy could have arisen from discrepancies between DCSS’s and Goodwill’s participant background forms. Goodwill’s form asked about participants’ full-time work history since 2004, while DCSS’s
11The evaluation team encouraged the TransitionsSF partners to develop and follow clear criteria for
tier assignments specifically so that it would be possible to conduct impact analysis within each tier. In response, the program developed the matrix using education level and work experience shown in Box 4.1.

150
Table 4.3
One-Year Participation in ETJD Subsidized Jobs and Services Among Program Group Members: San Francisco
Program Tier 1 Tier 2 Tier 3 Measure Groupa Started orientation (before job-readiness training) (%) 92.8 98.4 94.2 96.6
Completed initial assessment at Goodwill (%) 80.0 87.2 81.3 85.5
Started job-readiness training (%) 75.4 82.4 77.7 79.3
Completed job-readiness training (%) 59.7 64.2 59.0 66.9
Ever passed a drug test (%) 62.3 70.6 61.9 64.1
Completed job-readiness training and passed a drug test (%) 50.7 55.1 51.8 54.5
Worked in a subsidized job (%) 43.5 49.2 41.7 46.9
Worked in a Tier 1 subsidized job 25.1 47.1 6.5 20.0 Worked in a Tier 2 subsidized job 12.0 1.1 38.8 2.8
Worked in a Tier 3 subsidized job 7.4 1.1 0.0 24.1
Did not work in a subsidized job (%) 56.5 50.8 58.3 53.1
Among those who worked in a subsidized job:
Average number of months in the programb 7.0 6.8 7.5 6.8 Average number of days from random assignment to
first subsidized paycheck 85.2 88.9 91.2 75.1 Average number of days worked in a subsidized jobc 63.4 55.3 69.0 69.6
Assigned to high school equivalency class (%) 25.3 37.4 36.0 3.4
Completed, among those assigned to this class 49.6 42.9 56.0 100.0
Assigned to digital literacy class (%) 62.7 55.6 55.4 90.3
Completed, among those assigned to this class 38.2 46.2 24.7 40.5
Sample size 501 187 139 145
SOURCES: MDRC calculations based on data from TransitionsSF payroll records and participation records, and the ETJD management information system. NOTES: The tier columns reflect initial tier assignments. They do not reflect later movement between tiers. aIncludes 30 individuals for whom no tier assignment was available and who are not included in a tier column. As a result of these 30 individuals, percentages shown in the "Program Group" column may not reflect the averages of the tier columns. bMeasured as the duration between random assignment and last subsidized paycheck. cCalculated using net hours worked, assuming a seven-hour workday.

151
(continued)
Figure 4.2
Subsidized Employment Over Time: San Francisco
0
10
20
30
40
50
60
70
80
90
100
1 2 3 4 5 6 7 8 9 10 11 12
Perc
enta
ge w
orki
ng in
subs
idiz
ed jo
bs
Month relative to random assignment
Tier 1 Tier 2 Tier 3
SOURCES: MDRC calculations based on data from TransitionsSF payroll records and the ETJD management information system.
NOTES: Tier lines reflect initial tier assignments. They do not reflect later movement between tiers.Month 1 in this figure is the month in which random assignment occurred.
background form asked about any type of employment and did not include date restrictions. Goodwill’s form asked whether participants had completed college while DCSS’s form asked whether they had attended college. 12 It is also possible that some participants may have report-
12The form filled out by participants at DCSS before random assignment read: “Check your level of education: No high school diploma / GED High school diploma/GED Some college”
The question about employment asked “Have you ever been employed? Yes No”, then asked participants to “Check the number of years of work experience you have: Less than 1 year 1 - 5 years More than 5 years”
The form filled out by participants upon their arrival at Goodwill read: “(check all that apply): I have completed the [ ] grade; I have a GED; I have a High School Diploma; I have completed college course-work/vocational training, I have a college degree.” The question about employment asked: “Since 2004,

152
Box 4.1
Transitional Job Tier Assignment Matrix
Amount of Work Experience
Highest Level of Education
Tier Assignment
0-1 years No high school diploma or equivalent Nonprofit (1)
1-5 years No high school diploma or equivalent Public sector (2)
5+ years No high school diploma or equivalent Public sector (2)
0-1 years High school diploma or equivalent Nonprofit (1)
1-5 years High school diploma or equivalent Public (2)
5+ years High school diploma or equivalent Private sector (3)
0-1 years Some college Public sector (2) 1-5 years Some college Private sector (3) 5+ years Some college Private sector (3)
ed different educational and work history information once enrolled at Goodwill for reasons
other than the form discrepancies, or that the staff did not adhere entirely to the guidelines and used other factors to make the assignments.
A number of participants ended up working in different tiers than the ones they were in-itially assigned. Changes were occasionally made to accommodate participants’ interests; for example, a few participants slated for Tier 2 did not want to work outside. Some participants who were assigned to Tier 3 got “parked” working in Tier 1 while Goodwill worked to identify appropriate slots for them in Tier 3, but not all of them ended up getting Tier 3 positions. Participants with superior performance ultimately did not move up tiers, as initially planned.
● Pre-transitional job activities were largely implemented as intended, but there was a great deal of attrition during this period. For those who per-sisted in the program, completing these activities required much more
how many years of full time work experience have you had? 1) less than one year full time work experience; 2) One to five years of full time work experience; and 3) More than five years full time work experience.”

153
time than expected. Both management information system data and staff interviews indicate that passing the drug test was a barrier to par-ticipation for many people.
The vast majority of program group members (93 percent) showed up at Goodwill after random assignment and started orientation. As shown in Table 4.3, however, participants dropped out at each successive step: 80 percent of the program group met with the assessment specialist, 75 percent started the job-readiness training classes, and 60 percent completed them.
As shown in Table 4.3, 62 percent of participants passed the drug test. The others either never passed or left the program before passing. The drug-test requirement, which is a Goodwill agency policy, was not known until close to the start of the program; if it had been known, the study’s designers may have decided to conduct random assignment after participants had passed the drug test. Failed drug tests were a primary reason why many participants spent so long in the pre-transitional job period, which lasted for almost three months on average. Three months was considerably longer than the intended three weeks — though job developers acknowledged that three weeks would have been improbable, because a week or two was probably needed to place a participant in a transitional job and for that person to start working. While participants had up to three chances to pass the drug test, failing the first time added a minimum of an additional 45 days before they could retake the test. During the time that participants were working to fulfill the necessary requirements to begin a transitional job, they attended their assigned educational activities (digital literacy or GED classes) and met with their case managers. Some also stopped attending and had to be reengaged by Goodwill and DCSS.
Another reason for attrition was that a substantial number of participants across all tiers independently obtained unsubsidized employment without first working in a transitional job, according to Goodwill. This finding raises the question of whether the program was serving some people who did not need subsidized jobs.
The program intended to push participants to focus on employment, yet the staff ob-served that participants had other needs that had to be addressed. Staff members reported that many participants were not ready for the program because of serious problems such as a lack of stable housing, mental health issues, and substance abuse. The program was not designed to address these, which may have contributed to the high attrition rate. For example, the drug test was intended merely to screen participants for employability, but it often revealed that they needed to undergo serious treatment. While Goodwill could make referrals for this treatment, it was not part of the program model.
● Overall, 44 percent of participants worked in transitional jobs (see Ta-ble 4.3). This low rate can be attributed largely to the high attrition that took place during the preemployment period. Of those who successfully

154
completed the preemployment stage, about 80 percent to 90 percent worked in transitional jobs, though not necessarily in the tiers to which they were originally assigned.
Different participants had different characteristics, and the different tiers had different requirements. As a result, there were considerable variations in both the rates at which eligible participants were placed in transitional jobs and in the number of days that passed between random assignment and the time a participant received his or her first paycheck, as shown in Table 4.3. Among those who completed job-readiness training and passed the drug test, Tier 1 had the highest subsidized jobs placement rate at 89 percent (this figure is derived by dividing 49.2 percent by 55.1 percent — the percentage placed in a subsidized job by the percentage who completed preemployment activities). This result is not surprising, as Goodwill had direct control over transitional jobs at its warehouse and stores, making these among the easiest placements to secure. Tier 1 participants may also have been less likely than participants in other tiers to get jobs on their own and leave the program for that reason.
The placement rate among participants who completed job-readiness training and passed the drug test was lowest in Tier 2, at 81 percent (41.7 percent divided by 51.8 percent). Tier 2 participants also spent the longest time in the program (91 days) before receiving their first paychecks. This duration probably reflects the additional challenges involved in getting placed in a Tier 2 transitional job. Before they could start work, Tier 2 participants had to complete another background check required by HSA’s human resources department. This step could take three to eight weeks, adding to the time participants spent before starting work and also probably contributing to additional attrition. As the table shows, about 7 percent of those assigned to Tier 2 were placed in Tier 1 transitional jobs at Goodwill.
Participants in Tier 3 spent the shortest time in the program before starting their jobs and receiving their first paychecks (75 days). As they were considered the most job-ready participants, they may have been able to move through the pre-transitional period more quickly than participants assigned to other tiers. However, there were sometimes more participants seeking transitional jobs in this tier than there were jobs available, which could result in delays before they were placed. In fact, there were times when no Tier 3 positions were open. These challenges reflected Goodwill’s inexperience with developing transitional jobs in the private, for-profit sector, as well as difficulties posed by San Francisco’s employment market, described earlier in the chapter. The job developers also found that participants tended to be reluctant to work far from central San Francisco, sometimes due to the challenges of commuting. However, many of the transitional jobs were located outside of central San Francisco. In fact, DCSS worked with the probation agency to allow participants who were on probation to bypass the requirement of serving that probation in San Francisco (if that was where their crimes were committed), making it possible for them to work outside of the county.

155
Eighty-six percent of the Tier 3 participants who completed preemployment activities ended up working in subsidized jobs (46.9 percent divided by 54.5 percent). However, as shown in the table, 20 percent of program group members assigned to Tier 3 and 37 percent of those assigned to Tier 3 who completed preemployment activities (20.0 percent divided by 54.5 percent) were placed in Tier 1 jobs, almost as many as were placed in Tier 3 jobs. These assignments probably occurred because Tier 3 participants were “parked” in Tier 1 when no appropriate Tier 3 openings were available.
● For those who were placed, the tier system provided different types of jobs with varying levels of support from employers, as intended.
Participants in Tiers 1 and 3 were expected to work 30 hours per week and received the local minimum wage ($10.24 in 2012 and $10.55 in 2013). Participants in Tier 2 were paid a slightly higher wage due to city regulations. To maintain equity among the tiers, Tier 2 partici-pants worked fewer hours per week (24 to 26 hours per week). Goodwill served as the employer of record for Tier 1 and 3 jobs; for Tier 2, it was HSA.
Table 4.3 shows that across all tiers participants worked an average of 63 days in their transitional jobs (or slightly more than three months), based on a seven-hour workday.13 The average length of time spent working in a transitional job was lower for participants in Tier 1 (about three months on average) than those in Tiers 2 and 3 (about four months). These average lengths of time indicate that some participants who worked did not stay for the full five-month transitional job period.
Participants who lost their transitional jobs for reasons such as poor attendance or punc-tuality were given the opportunity to be placed in a second transitional job at Goodwill. Some participants were forced to leave their transitional jobs for “cause,” for example, because of stealing; they were terminated from the program.
Jobs in the different tiers offered different types of work, different levels of support and supervision, and different relationships with Goodwill staff members. Participants in some tiers also had a better chance than participants in others of being hired into unsubsidized jobs at the end of the program.
13The actual days worked was somewhat higher. The calculation in Table 4.3 assumes participants
worked seven hours a day, following the standard definition of a “workday” used across all ETJD programs in the evaluation to facilitate comparisons. As mentioned in the previous paragraph, participants in Tiers 1 and 3 were scheduled to work 30 hours per week (6 hours a day) and participants in Tier 2 worked a little less, 24 to 26 hours per week. Participants worked fewer than seven hours a day to accommodate their educational activities.

156
Tier 1. This tier, which had the largest number of participants, was generally well im-plemented. Goodwill provided transitional jobs to Tier 1 participants in its warehouse and retail stores. Other nonprofit organizations — for example, an organization that provided housing to a variety of disadvantaged populations — also hosted participants in Tier 1 jobs in administrative, maintenance, and janitorial positions. Tier 1 jobs afforded participants opportunities to learn to arrive to work on time, dress professionally, and acquire workplace-appropriate social skills. Though these jobs were not expected to turn into unsubsidized jobs, some supervisors indicated a willingness to hire participants if positions became available. Indeed, Goodwill reported hiring a number of participants.
Tier 2. Transitional jobs in this tier were highly desirable to some participants who viewed them as opportunities to enter the workforce of the city government, one of the area’s few employers that hires less-skilled individuals and pays relatively well. However, Tier 2, which was operated by HSA, provided participants with an experience that was somewhat removed from the rest of TransitionsSF and that came with unique challenges.
The majority of Tier 2 positions involved working outside and required physical labor. These were jobs such as litter collection, graffiti abatement, landscaping, and weeding for the Department of Public Works and the Recreation and Parks Department, though there were also some janitorial and clerical positions in other departments. HSA oversaw Tier 2 participants while they worked in their transitional jobs and conducted job evaluations with their employers to collect their opinions of participants, rather than allowing Goodwill to do so. Although the participants were still supposed to meet with their case managers every other week, participants ended up having considerably fewer interactions with the Goodwill staff than participants in other tiers, because their jobs were located outside of Goodwill and Goodwill had no oversight responsibilities for the jobs. It was also difficult for the job developers to determine how successful Tier 2 participants were in their jobs because Goodwill did not receive their perfor-mance evaluations. Due to the complex rules of the city hiring process, there was almost no chance that Tier 2 transitional jobs could turn into regular unsubsidized jobs.
Tier 3. Goodwill job developers worked with case managers to match Tier 3 partici-pants who were ready for placement with available jobs. The types of employers in Tier 3 were mostly small businesses, such as auto-repair shops, janitorial cleaning services, and local retailers, and positions tended to be entry-level. Several employers hosted multiple participants. The job developers formed a relationship with a large staffing agency, which placed a few participants. Staff members reported that only a small fraction of Tier 3 jobs turned into unsub-sidized positions.
● To encourage program participation, TransitionsSF provided financial incentives to participants for many activities; however, the high rate of

157
attrition indicates that these incentives were not fully effective. The program also accommodated participants by offering them multiple chances to succeed.
In an effort to increase program participation, participants received stipends for attend-ing program activities. Participants received $100 per week for attending the job-readiness training classes and $75 per week for attending educational (GED or digital literacy) classes. They also received stipends totaling $75 per week for attending job clubs and submitting job-search plans. This last incentive reportedly increased job-club attendance from about half a dozen per week to about 20 participants. However, for other activities (such as the job-readiness training, which lost 17 percent of its participants between the start and the end), it does not appear that the incentives were enough to keep participants involved. Table 4.3 indicates only half of the participants assigned to GED class completed it and fewer than 4 in 10 assigned to digital literacy completed that.
Several Goodwill staff members and managers expressed concern that TransitionsSF was too “enabling,” that it did not hold participants sufficiently accountable for their behavior. As mentioned earlier, a participant who left an initial transitional job for any reason other than “cause” (for example, stealing) was able to obtain another transitional job at Goodwill. Transi-tionsSF overlooked behaviors that the job developers noted would be unacceptable in regular jobs — for example, poor attendance or failing a drug test.
● The most substantial incentives for program participation came from the child support system. In particular, the child support order modifi-cation allowed participants to work while having a considerably smaller amount removed from their paychecks than they would otherwise. But once again, the large number of participants who left the program indi-cates that these benefits were not sufficient to keep them engaged.
After participants began job-readiness training, DCSS released suspended driver’s li-censes and lifted bank levies. Once a participant began a transitional job, a DCSS caseworker modified his or her child support order to $50 per month for the first child, $20 per month for the second child, and $10 per month for each additional child thereafter.14 These amounts were considerably lower than the standard guideline of $267 per month per child for individuals earning minimum wage, and thus removed what was for many a disincentive to work in the
14In cases where the custodial parent received welfare cash assistance from Temporary Assistance for
Needy Families (TANF), regulations allowed DCSS to automatically adjust the child support order amount because the money was owed directly to the state for providing cash assistance. For non-TANF cases, which were a minority among the participants, the custodial parents had to agree to the modifications. They typically did, as they felt that some payment was better than no payment.

158
formal economy. Participants who owed child support debt were ordered to pay $20 per month toward that debt, which was also a much smaller amount than they would have had to pay in the absence of the program. If participants adhered to the program’s requirements, these modifica-tions would remain in place for the entirety of their time in TransitionsSF, including the one-year follow-up period after they completed their transitional jobs.
When participants left the program, DCSS maintained their order modifications and other child support-related incentives for up to 90 days to give them a chance to change their minds and return, another example of TransitionsSF’s effort to accommodate participants. The initially proposed strategy called for using the immediate removal of child support-related incentives as a tool to encourage participation. It is unclear how consistently benefits were removed if participants did not return to the program after the 90-day grace period. The rapidly changing and often complicated nature of a participant’s status made it hard for Goodwill and DCSS to stay on the same page. Further, DCSS had little leverage over participants who were in good standing with DCSS by making payments — or even over those who were not making payments, for the small number of study members who had already obtained modified orders before they entered TransitionsSF.15
Another challenge to implementing these “carrots and sticks” was that DCSS had lim-ited power over participants whose cases were from other counties. Some participants had cases in both San Francisco and outside counties and DCSS could only control the San Francisco-based cases. The issue intensified when DCSS expanded program eligibility to those who had solely out-of-county cases. DCSS made efforts to negotiate with the child support departments and judicial systems of other counties and explain the program, with some success, but it was rare for any county to agree to provide the same terms as were offered by DCSS.
● It was a challenge to connect participants with unsubsidized employ-ment. The program implemented various approaches, but lacked a co-herent strategy. TransitionsSF had originally hoped that many Tier 3 transitional job employers would hire participants into regular em-ployment, but it did not happen often.
Initially, the expectation was that participants who performed well in Tier 3 subsidized jobs with private businesses would get unsubsidized jobs with the same employers. One of the provisions of an agreement signed by both the Tier 3 employer and the participant stated that the employer would hire the participant if the participant performed well and the employer was able to hire. But job developers acknowledged that they did not only recruit employers that
15With the few participants who had previous order modifications, the TransitionsSF program still had
some leverage in the form of releasing bank levies or reinstating driver’s licenses.
159
actually had the potential to hire participants after the transitional job. Goodwill saw value in having companies train participants during the transitional job even if they did not hire them afterwards, and seemed to make a higher priority of that on-the-job training than the potential for permanent hires. This shift in expectations may have been spurred by the ongoing need for Tier 3 employers. A small company that permanently hired a participant at the end of the five-month subsidy would not typically be able to continue to take on additional participants in transitional positions. Ultimately, it appeared that few participants in Tier 3 were hired by their employers after the transitional job period.
In the summer of 2012, as the first cohort of TransitionsSF participants reached the end of their transitional jobs, Goodwill began a weekly job club. The job club was initially created to increase perseverance in searching for jobs among participants who had completed their transitional jobs, by establishing a shared group ethos.16 By fall 2012, participants began to join job club earlier in their tenure, before they had completed their transitional jobs. Job club became a vital mechanism for helping job developers get to know the participants and their interests. However, attendance was generally low, and it was especially difficult for some Tier 2 and 3 participants to attend because of conflicts with their transitional job schedules.
Job leads identified by the job developers were available to all individuals involved with Goodwill programs, not exclusively those in TransitionsSF, meaning that TransitionsSF participants were in essence competing with other candidates at Goodwill. However, Transi-tionsSF had the benefit of a stronger relationship between the job developers and case manag-ers, fostered through weekly meetings where they discussed which participants would be good matches for selected job leads.
One strategy the job developers described was talking with employers to identify the employers’ needs, and then sending them participants who could be successful in those jobs. This strategy boosted the program’s ability to find jobs for participants with specific skill sets or interests.
Goodwill further increased its emphasis on job development during 2013 and 2014, when it brought in employers with jobs to conduct on-site interviews, though these opportuni-ties were open to participants in all Goodwill programs, not only TransitionsSF participants. With the partners feeling pressure to increase job placements, OEWD brought in another organization, Mission Hiring Hall, to work on connecting participants with unsubsidized jobs. However, this relationship ended up being both unsuccessful and brief, and the contract was revoked.
16At the time, Goodwill had been considering shifting all individual job-search activities across its vari-
ous programs to a group-based approach.

160
● At the end of their transitional jobs, some participants still had barriers to employment that the program was unable to address fully, which made it harder for them to find unsubsidized jobs.
Goodwill staff members encountered difficulty in engaging participants in the search for unsubsidized employment, especially after their transitional jobs ended. Job developers and other staff members said that while the transitional jobs were essentially handed to participants, getting unsubsidized jobs required a lot more initiative and legwork from them. Case managers encouraged participants to start looking for permanent jobs while they were still in their transi-tional jobs, and tried to impress on them the temporary nature of the transitional jobs. Neverthe-less, it was easy for participants to get comfortable in their transitional jobs, and many hoped they would become permanent. Even after completing their transitional jobs, some participants had the same barriers to employment as they had upon program entry, such as substance use. According to staff members, many participants lacked the motivation needed to compete for a job, do well in an interview, and show up for work consistently. Job developers observed that some participants, especially those with the least work experience, had expectations for the kinds of jobs they wanted that were not aligned with job-market realities.
● Participants appreciated the job-readiness training and incentives pro-vided by the program, but had mixed views of their transitional jobs.
Data from participant questionnaires, in-depth interviews, and focus groups indicate that participants generally had positive views of the TransitionsSF program.17 Participants (and Goodwill staff members) highly valued the job-readiness classes that gave participants a leg up in applying to jobs, taught valuable soft skills, and increased self-confidence. Participants felt that preparing résumés and conducting mock interviews sharpened their job-search skills and that the job-readiness class and digital literacy class made them more comfortable with the online aspects of conducting a job search. They also expressed appreciation for getting their driver’s licenses back and the assistance from the program that lowered their child support payments to something “sensible,” as one put it.
Participants’ views of their transitional jobs were mixed. In focus groups and individual interviews with participants, it was clear that many liked their work and their supervisors. Those working in jobs in the private sector saw them as a way to “get a foot in the door,” as one participant said. (For a closer look at participants’ experiences, see Box 4.2.) The questionnaires
17The questionnaires mentioned here were administered to a small number of participants working in transitional jobs at the time of the research team’s site visit. These short questionnaires were used in lieu of interviews to inform the implementation study, and are separate from the in-program and one-year follow-up surveys discussed in the impact analysis.

161
Box 4.2
TransitionsSF Participant Profiles
Tier 1
“Santiago” is a Mexican-American man born and raised in the Bay Area. Growing up, Santia-go lived with his alcoholic father and Santiago himself began drinking and committing crimes as a teenager. Santiago has been arrested and gone to prison roughly 8 to 10 times, on charges including possession of a firearm, possession of or selling drugs, and assault with a deadly weapon. He has three children, ages 3, 12, and 18. He has not seen his teenaged daughters in five years, has no contact with them and does not have a good relationship with their mother and her new husband. He has a better relationship with the mother of his 3-year-old son, and through an informal agreement, he regularly visits the boy. He has active child support orders for the two minor-age children and also has child support debt. Santiago moved to San Fran-cisco to get away from his old life and is looking forward to putting his criminal past and substance abuse behind him: “I wasted too many years of my life that I can’t replace. I lost my two daughters that don’t want nothing to do with me because they think that I’m a gang member who sells drugs. I’m not. That’s not who I am today.” When he entered the program, he was living in a Sober Living home and had been out of prison for several months. Transi-tionsSF represented a chance for a fresh start. When Santiago completed the job-readiness training class at Goodwill he was proud of his accomplishment and excited that his mother, his primary source of support, witnessed his success at the graduation ceremony. Santiago has extensive history in food service and hopes to go back to working full time in that area after working in a subsidized job through the program.
Tier 2
“Xavier” is a 42-year-old black man from San Francisco. He has three children, aged 14, 19, and 21. His youngest child, a son, lives in Nevada where Xavier also lived for a time. Xavier currently lives with his aunt, and although none of his children live close by, Xavier talks to his children several times a week and enjoys good relationships with all of them (though he is less involved with one married daughter). Xavier has a criminal history, and describes being in and out of jail since he was 16 years old. Xavier came into the TransitionsSF program with an extensive, but unstable work history. Xavier has held various jobs such as landscaping, being a desk clerk, warehouse work, food concessions at a ball park, sheet-metal work, and mowing lawns and other jobs helping people for cash. Xavier’s primary motivation for joining the program was the promise of help with his child support debt. Although Xavier does not have current child support orders, he owes over $30,000 in debt. Through TransitionsSF, Xavier was placed in a subsidized job with a parks landscaping and maintenance crew for the city of San Francisco. He enjoyed this job tremendously and even though the Goodwill staff told him not to count on being able to keep it, his work-site supervisor told him he wanted to keep him
(continued)

162
completed by Tier 1 participants, summarized in Figure 4.3, show that most participants who completed the questionnaire understood what was expected of them on the job and had positive relationships with their coworkers (71 percent); however, fewer than half felt that their supervi-sors were supportive (44 percent) or thought that their jobs were useful in gaining skills and contacts to help them find employment in the future (51 percent).18 Some participants felt that the transitional jobs were a “waste of time” because of their temporary nature. This view was
18For logistical reasons, the large majority of participant questionnaires about transitional jobs were
administered to a small group of Tier 1 participants who were working at Goodwill. The figure therefore only presents the results for Tier 1 participants.
Box 4.2 (continued)
on full time. Xavier worked at this job until it ended. Xavier attended a job club at Goodwill until he was no longer eligible for the stipend he had received for attending. Xavier found a full-time job at a recycling plant. Child support debt remains an issue for him. Xavier tried to work with both the child support agency and TransitionsSF to reduce his debt, but found it too stressful to figure out, so he eventually “left it alone” and still has payments taken directly out of his paycheck.
Tier 3
“William” is a middle-aged black man who has lived his entire life in San Francisco. He currently lives in single-room-occupancy housing. William began working in electrical engi-neering in high school and completed a college degree in electronics. William has considerable experience in electrical engineering, and worked in the field until an illness forced him to stop working, three years before he started the TransitionsSF program. William has a 16-year-old daughter. Getting help with child support was his primary motivation for joining the program. Previously, William spent a week in county jail for contempt of court for not paying child support. With the help of TransitionsSF, William successfully got his child support payments reduced. William thought that having the child support staff working in cooperation with the Goodwill staff helped his case and appreciated that TransitionsSF staff members appeared in court on his behalf. William was also surprised at how much he learned from the other aspects of the program. William enjoyed the job-readiness training and the chance to build up his résumé and learn interviewing skills. He says he learned improved time-management and job-search skills in the class. While in the program, William was placed as a custodian for proper-ties operated by Mercy Housing, a nonprofit affordable housing organization. Though he did not feel he learned much from this job, William stayed in it until the transitional job period ended. William hopes to return to a job in the engineering field. He gets by on part-time work in food concessions at sports stadiums.

163
for Future Employment: San Francisco
Figure 4.3
Favorable Impression of the Value of Transitional Job Support and Preparation
57%
65%
61%
77%
51%
58%
44%
71%
0 20 40 60 80 100
Preparation for futureemploymentd
Soft skills developmentc
Supervisor supportb
Relationships at worka
San Francisco ETJD Average
Relationships at worka
Supervisor supportb
Soft-skills developmentc
Preparation for future employmentd
fe
Sample size: 41 Sample size: 516
(continued)

164
especially strong among some Tier 2 participants in the focus groups and individual interviews, who were frustrated when the jobs they enjoyed ended, especially when they had been under the impression that their supervisors were interested in keeping them on.
Impacts on Participant Outcomes
Participation and Service Receipt Outcomes
As described above, TransitionsSF offered a wide array of services with a particular fo-cus on work-readiness services provided by Goodwill and child support assistance provided by DCSS. Table 4.4 shows the impacts of TransitionsSF on participation and service receipt, using
Figure 4.3 (continued)
SOURCE: MDRC calculations based on the ETJD participant questionnaire.
NOTES: The measures presented in this figure, relationships at work, supervisor support, soft-skillsdevelopment, and preparation for future employment were created based on an exploratory factor analysis of a pool of questions. These questions asked participants about their level of agreement with a particular statement on a scale of 1 to 7, where 1 indicates strong disagreement and 7 indicates strong agreement. Based on the results of the factor analysis, questions were grouped into factors and a mean score was calculated across the questions included in a particular factor; the percentages presented above represent the proportion of questionnaire respondents who averaged a score of 6 or higher on the questions in that factor, indicating a high level of satisfaction with their program experiences in that area.
With a few exceptions, questionnaires were administered to participants by the research team during site visits at events and activities when many participants would be available at once. Consequently, the responses obtained are from participants who attended program activities and were therefore likely to be more motivated and engaged than the full sample of program participants. For this reason, the results presented in this figure are not necessarily representative of all participant experiences and should be interpreted with caution; they are likely to be more positive.
aBased on agreement with the following statements: I understand what is expected of me on the job; I know whom at work to ask for help when I need it; My relationships with coworkers are positive and supportive; and My coworkers understand me and want me to succeed.
bBased on agreement with the following statements: I get the support or guidance that I need from my supervisor; My supervisor gives me advice about how to handle situations at work; and My supervisor helps me if personal issues come up that get in the way of working.
cBased on agreement with the following statements: I am learning how to work better with coworkers; I am learning how to cooperate better with supervisors; and This job has helped me learn to present myself better at work.
dBased on agreement with the following statements: The kind of work I am doing will help me get a decent-paying job later; I am learning specific job skills that I will use in the future; and I have met people through this job who may help me find a job in the future.
eIncludes Tier 1 respondents only.fTo account for varying questionnaire sample sizes across ETJD programs, the "ETJD average" is a
weighted average of all programs such that each program is equally represented.

165
Table 4.4
One-Year Impacts on Participation and Service Receipt: San Francisco
Outcome (%) Program
Group Control
Group Difference
(Impact)
Ninety Percent Confidence
Interval
Employment support Received help related to finding or keeping a job 92.9 69.4 23.5 *** [18.7, 28.2]
Job search, job readiness, and career planninga 92.9 68.8 24.1 *** [19.3, 28.9] Paying for job-related transportation or equipment 55.8 29.0 26.9 *** [20.7, 33.0]
costs
Education and training Participated in education and training 45.1 26.2 18.8 *** [12.9, 24.8]
ESL, ABE, or high school diploma or equivalentb 20.6 11.2 9.4 *** [4.8, 14.0] Postsecondary education leading to a degree 7.5 5.6 1.9 [-1.3, 5.1] Vocational training 31.1 16.2 14.9 *** [9.5, 20.2]
Received high school diploma or equivalent 2.4 1.2 1.2 [-0.5, 3.0]
Earned professional license or certification (not including OSHA or forklift)c 12.7 8.5 4.2 * [0.2, 8.1]
Earned OSHA or forklift certification 4.3 1.3 3.0 ** [0.8, 5.1]
Other support and services
Among those identified as formerly incarcerated at enrollment:d
Received help related to past criminal convictions 81.2 51.0 30.2 *** [19.3, 41.1]
Handling employer questions about criminal
history 77.7 37.5 40.2 *** [29.0, 51.3]
Legal issues related to convictions 58.8 45.2 13.5 * [1.3, 25.8]
Received help related to child support, visitation, parenting or other family issues 66.0 43.9 22.1 *** [16.0, 28.3]
Modifying child support debts or orders 62.2 37.9 24.3 *** [18.2, 30.4]
Setting up visitation with child(ren) 22.5 17.1 5.4 * [0.3, 10.4]
Parenting or other family-related issues 26.6 21.6 4.9 [-0.5, 10.4]
Received advice or support from a staff member at an agency or organization 57.1 36.8 20.2 *** [14.0, 26.4]
(continued)

166
Table 4.4 (continued)
Outcome (%) Program
Group Control
Group Difference
(Impact)
Ninety Percent Confidence
Interval
Received mentoring from a staff member at an agency or organization 52.9 29.4 23.5 *** [17.4, 29.6]
Received mental health assistance 26.9 20.3 6.7 ** [1.3, 12.1]
Sample size 346 318
SOURCE: MDRC calculations based on responses to the ETJD 12-month survey. NOTES: Results in this table are regression-adjusted, controlling for pre-random assignment characteristics. Statistical significance levels are indicated as: *** = 1 percent; ** = 5 percent; * = 10 percent. aIncludes help with job searching, job referrals, developing a résumé, filling out job applications, preparing for job interviews, job-readiness training, and planning for future career or educational goals. bESL = English as a second language, ABE = adult basic education. cOSHA stands for Occupational Safety and Health Administration. In an effort to separate receipt of professional licenses or certifications that require more intensive and lengthy training (for example, a Certified Medical Assistant certificate or a commercial driver’s license) from those that can be earned following more cursory, one-day training, receipt of OSHA and forklift certifications, which fall into the latter group, is presented separately from receipt of other types of licenses or certifications. A review of all reported types of licenses or certifications revealed that OSHA and forklift certifications account for a large majority of the shorter-term, less intensive licenses and certifications received by sample members. dThese measures include only those who were identified as formerly incarcerated at study enrollment (program group = 98; control group = 85; total = 183).
data drawn from a survey administered about 12 months after random assignment. Unless otherwise indicated, all impact results discussed in this report are statistically significant, with p < 0.10.
● Despite implementation problems, TransitionsSF had statistically signif-icant impacts on service receipt in nearly every domain measured. How-ever, the impacts were not as large as those observed in some of the oth-er ETJD programs, perhaps due to the high rate of attrition among program participants, perhaps because services were widely available to the control group.
As expected, program group members reported receiving help finding or keeping a job at a higher rate than control group members (93 percent versus 69 percent). Program group members were nearly twice as likely to receive assistance with job-related transportation or equipment costs (56 percent versus 29 percent). However, it is worth noting that control group

167
members received job-search, job-readiness, and career-planning services at fairly high rates (over two-thirds received these services), a reflection of how readily available such services were in San Francisco.
Program group members were also more likely to receive GED education and voca-tional training than control group members (45 percent versus 26 percent). Goodwill required individuals without high school diplomas or equivalents (29 percent of the sample) to partici-pate in GED classes, and 21 percent of program group members reported participating in GED classes (program data in Table 4.3 show a similar percentage, at 25 percent). Despite this increase in class attendance, the program did not produce a statistically significant increase in the rate at which participants obtained GED credentials by the end of the first year after random assignment. Program group members reported receiving vocational training at higher rates than control group members (31 percent versus 16 percent, as shown in Table 4.4), but there was only a small estimated impact on receipt of a professional license or certification. That this impact was small is not surprising, as professional certifications were not a focus of the Transi-tionsSF program.
Program group members who had been incarcerated in prison (30 percent of the sam-ple) were much more likely to receive help related to their previous convictions: 81 percent of such members of the program group reported receiving these services versus 51 percent of control group members. In particular, program group members were 40 percentage points more likely to report that they received help regarding how to answer questions about their previous convictions than were control group members (78 percent versus 38 percent).
Nearly two-thirds of the program group received help modifying their child support debt or orders, a rate that was 24 percentage points higher than that among control group members (38 percent). Given TransitionsSF’s heavy emphasis on order modifications as a way to encourage participation in the program, one might expect that nearly all program group members should have received help with their child support orders. However, as discussed earlier in this chapter, a number of factors may have gotten in the way. First, 7 percent of program group members never showed up at Goodwill following random assignment, and therefore may not have had their orders modified. Second, some program group members who participated in TransitionsSF had child support cases exclusively in other counties, where DCSS did not have authority to modify orders or debts.
TransitionsSF did not focus on setting up visitations with children or providing parent-ing assistance, and correspondingly there is little or no impact on receipt of these services.

168
Employment and Earnings Outcomes
Data presented earlier in this chapter showed that fewer than half of the TransitionsSF program group members worked in subsidized jobs. Given this somewhat low participation rate in subsidized employment, and given that the majority of the jobs in Tiers 2 and 3 were unlikely to turn into permanent employment, it is reasonable to wonder whether the program would have an impact on earnings and employment, especially after the subsidized employ-ment period ended.
● TransitionsSF had statistically significant impacts on both employment and earnings during the first year after random assignment. Program group members were more likely to be employed, worked more quar-ters on average, and had higher earnings on average than control group members. Employment gains persisted into the first quarter of year two, at which point most subsidized jobs offered by TransitionsSF had end-ed, though earnings increases did not.
Table 4.5 shows that TransitionsSF had an estimated 25 percentage point impact on employment, according to unemployment insurance wage records and program payroll records, with 78 percent of the program group employed at some point in the first four quarters after random assignment versus 54 percent of control group members. Survey data (shown in the bottom panel of the table) tell a similar story, with an estimated 18 percentage point impact on being employed in the first year after random assignment. Program group members also worked more quarters in the year: On average, program group members worked around one quarter more than control group members.19 Program group members were about twice as likely to work in all four quarters after random assignment as control group members (19 percent versus 11 percent).
Program group members also earned considerably more on average than control group members. During the first year after random assignment, program group members’ earnings ($7,151 on average) were $2,113 higher on average than those of control group members ($5,038). Figure 4.4 shows that quarterly earnings impacts were significant only in the first and second quarter after random assignment, when individuals were most likely to be in subsidized jobs or directly after the subsidized jobs ended. However, the annual earnings impact estimate ($2,113) is larger than the amount program group members earned from their
19Quarterly employment is measured by an individual having positive earnings in a quarter, as recorded
in unemployment insurance wage records and program payroll records. These data indicate that an individu-al worked in a particular quarter, but do not contain information on the number of days or hours worked in the quarter.

169
Table 4.5
One-Year Impacts on Employment and Earnings: San Francisco
Outcome Program
Group Control
Group Difference
(Impact)
Ninety Percent Confidence
Interval
Primary outcomes (based on administrative data) Employmenta (%) 78.4 53.9 24.5 *** [20.0, 29.1]
ETJD subsidized employment (%) 45.6 --
Number of quarters employed 2.1 1.3 0.8 *** [0.7, 0.9] Average quarterly employment (%) 53.0 33.2 19.8 *** [16.5, 23.1] Employment in all quarters (%) 19.3 10.5 8.8 *** [5.3, 12.3]
Total earnings ($) 7,151 5,038 2,113 *** [1,324, 2,902]
ETJD subsidized earnings ($) 1,271 --
Total earnings (%)
$5,000 or more 51.5 30.4 21.1 *** [16.6, 25.6] $7,500 or more 38.8 24.5 14.3 *** [9.9, 18.7] $10,000 or more 25.6 16.4 9.2 *** [5.3, 13.0]
Employment in the first quarter of Year 2 45.9 39.9 6.0 ** [1.0, 11.0]
ETJD subsidized employment in the first quarter of Year 2 2.5 --
Sample sizeb 502 492
Self-reported outcomes (based on survey data) Ever employed in Year 1 (%) 71.7 53.6 18.1 *** [12.0, 24.2]
Currently employed (%) 43.1 34.2 8.8 ** [2.7, 14.9]
Currently employed in transitional job program 3.9 2.6 1.3 [-1.0, 3.6]
Type of employment (%)
Not currently employed 58.1 66.6 -8.6 ** [-14.7, -2.4] Permanent 26.6 16.8 9.8 *** [4.6, 15.1] Temporary, including day labor and odd jobs 15.3 15.3 0.1 [-4.6, 4.8] Other 0.0 1.3 -1.4 ** [-2.4, -0.3]
(continued)

170
Table 4.5 (continued)
Outcome Program
Group Control
Group Difference
(Impact)
Ninety Percent Confidence
Interval
cAmong those currently employed:
Hours worked per week 33.7 28.6 5.1 *** [2.1, 8.0] Hourly wage ($) 14.6 15.7 -1.1
[3.6, 1.4]
Hours worked per week (%)
More than 20 hours 34.2 22.3 12.0 *** [6.3, 17.6] More than 34 hours 23.2 13.1 10.1 *** [5.2, 15.0]
Hourly wage (%)
More than $8.00 37.3 27.1 10.2 *** [4.2, 16.2] More than $10.00 33.8 24.5 9.4 *** [3.5, 15.2]
Sample size 346 318
SOURCES: MDRC calculations based on quarterly wage data from the National Directory of New Hires and responses to the ETJD 12-month survey. NOTES: Results in this table are regression-adjusted, controlling for pre-random assignment characteristics. Statistical significance levels are indicated as: *** = 1 percent; ** = 5 percent; * = 10 percent. aEmployment rates and earnings include both ETJD subsidized jobs and all other jobs covered by unemployment insurance. bOne-year child support administrative data were available for only 903 out of 995 total sample members. cThese measures are calculated among those employed at the time of the survey; they are therefore considered nonexperimental and are not tested for statistical significance.
subsidized jobs ($1,271), indicating that a portion of the annual impact estimate is from unsubsidized employment.
To illustrate whether these employment and earnings gains persisted after the period of subsidized employment ended, Table 4.5 and Figure 4.4 include employment and earnings for the fourth quarter after random assignment (the first quarter of Year 2). During that quarter 46 percent of the program group was employed, which is 6 percentage points higher than the employment rate for the control group (40 percent). Since only 2.5 percent of the program group was working in subsidized jobs at that point, it appears that about half of this difference is accounted for by unsubsidized employment. The survey results tell a similar story, showing an estimated 9 percentage point impact on program group employment at the time of the survey (administered in the third or fourth quarter after random assignment for most respondents). As

171
Figure 4.4
Employment and Earnings Over Time: San Francisco
0102030405060708090
100
0***
1***
2***
3***
4**
Perc
enta
ge e
mpl
oyed
Quarter after random assignment
Program group total employment
Control group employment
515
2,1172,480
2,038 2,073
563
1,052
1,5671,856 1,955
0
500
1,000
1,500
2,000
2,500
3,000
3,500
0 1***
2***
3 4
Ave
rage
ear
ning
s ($)
Quarter after random assignmentProgram group Control group
Program group ETJDsubsidized employment
(continued)

172
Figure 4.4 shows, the percentage of employed program group members declined slightly between Quarters 3 and 4, while control group employment rates remained nearly constant. It is unclear whether a substantial difference in employment rates will continue in future quarters, given these shrinking margins over time.
Earnings impacts did not persist into the first quarter of Year 2, according to unem-ployment insurance wage data and program payroll records. Figure 4.4 shows that in the third and fourth quarters after random assignment, the earnings differences between program and control groups shown in unemployment insurance data were no longer statistically significant. This lack of impact could indicate that although more program group members were employed during the first quarter of Year 2, they had lower-paying jobs or worked for fewer hours. The survey findings are similar: Although more program group members were employed at the time of the survey, it does not appear that the employed members of the program group had higher-paying jobs. Interestingly, among those currently employed, program group members worked more hours per week than control group members. However, these estimates of pay and hours worked are considered nonexperimental, as they are only among those individuals who said they were employed and not the full sample.
● Impacts on employment were largest among those who with no recent work experience.
Prior research suggests that employment programs may be more or less effective for certain subgroups of people.20 ETJD is based on the hypothesis that the programs may be more effective for people who are the least “employable” and who are therefore unlikely to find jobs on their own, without assistance from a program. The research team therefore examined the program’s impacts on employment among subgroups who had more or less recent work experience when they enrolled in the program.21 Individuals who had been employed for at least
20Butler et al. (2012). 21An additional subgroup analysis was conducted examining whether there were differences between
the impacts for participants who enrolled during the first year of program operations and for those who enrolled in the second year. The results of this cohort analysis are presented in Appendix Table C.2. There
(continued)
Figure 4.4 (continued)
SOURCE: MDRC calculations based on quarterly wage data from the National Directory of New Hires.
NOTES: Results in this figure are regression-adjusted, controlling for pre-random assignment characteristics.
Statistical significance levels are indicated as: *** = 1 percent; ** = 5 percent; * = 10 percent.Employment rates and earnings include both ETJD subsidized jobs and all other jobs covered by
unemployment insurance.

173
one quarter in the year before random assignment were assumed to be more employable than individuals who had not worked at all during that year. As shown in Table 4.6, levels of employment and earnings were lowest among those who did not work at all in the previous year, suggesting that prior-year employment is a fairly good predictor of employment in the year after random assignment.
Consistent with the ETJD theory, the program’s impacts on employment in the first year are largest for those who did not work at all in the previous year. Among those who did not work at all in the previous year, 73 percent of program group members were employed at some point during the year after random assignment (in part due to the transitional jobs), compared with just 42 percent of the control group, an estimated impact of 31 percentage points. Among those who worked in the previous year, 86 percent of program group members worked at some point during the year after random assignment, but as expected, a much larger proportion of the control group members also worked (71 percent). The estimated impact on employment was therefore only 15 percentage points among this subgroup. Program group members in the subgroup that did not work at all in the previous year earned about $2,468 more on average than their control group counterparts. Although the impact on earnings appears to be greater for individuals who did not work in the previous year, the difference between the impact for those who did not work in the previous year and the impact for those who did work is not statistically significant. The impacts on employment in the first quarter of Year 2 are not significantly different between the two subgroups.
Child Support and Family Relations Outcomes
As described earlier in this chapter, a central component of TransitionsSF was modifying the current child support orders of program group participants down to $50 per month for the first child, with the idea that this lower child support obligation during the early months of the subsidized job would remove a possible disincentive to work in the formal economy. The program also offered other child support-related incentives for program participation, chief among them reinstatement of suspended driver’s licenses. Given these incentives, and given that presumably any increase in subsidized employment would correspondingly produce an increase in the number of individuals paying child support, the research team and program operators expected to see a positive impact in the number of program group members paying child support. However, one may not expect to see higher child support payment amounts among program group members, because during the period of program participation, program group members with current cases in San Francisco County were only required to pay $50 per month. were statistically significant differences between the two cohorts in impacts on average quarterly employ-ment (with larger impacts for the first-year cohort in both cases), but otherwise impacts were similar across the two.

174
Table 4.6 One-Year Impacts on Employment and Earnings, by Employment Status in the Prior Year: San Francis co
Did Not Work in Prior Year Worked in Prior Year
Outcome Program
Group Control
Group Difference
(Impact)
Ninety Percent Confidence
Interval Program
Group Control
Group Difference
(Impact)
Ninety Percent Confidence
Interval
Difference Between
Subgroup Impactsa
b Employment (%) 72.5 41.6 30.9 *** [0.6, 0.3]
86.1 71.2 14.9 *** [86.0, 21.2] †††
ETJD subsidized employment (%) 46.9 --
43.3 --
Total earnings ($) 5,189 2,721 2,468 *** [1,732, 3,204]
9,757 8,230 1,527
[-54, 3,109] Average quarterly employment (%) 44.2 22.6 21.6 *** [17.5, 25.8]
64.1 48.2 16.0 *** [10.5, 21.5]
Employment in the first quarter of
Year 2 (%) 36.2 32.0 4.2 [-2.4, 10.7] 59.3 50.5 8.8 * [0.9, 16.7]
Sample size 289 283 213 209
SOURCE: MDRC calculations based on quarterly wage data from the National Directory of New Hires.
NOTES: Results in this table are regression-adjusted, controlling for pre-random assignment characteristics. Statistical significance levels are indicated as: *** = 1 percent; ** = 5 percent; * = 10 percent. aWhen comparing impacts between two subgroups, an H-statistic is generated. The H-statistic is used to assess whether the difference in impacts between the subgroups is statistically significant. Statistically significant differences across subgroups are indicated as: ††† = 1 percent; †† = 5 percent; † = 10 percent. bEmployment rates and earnings include both ETJD subsidized jobs and all other jobs covered by unemployment insurance.

175
● The program group was more likely to pay formal child support than the control group during the first year after random assignment. How-ever, there was not a statistically significant difference in the total amount of formal child support paid.
Table 4.7 confirms these expectations: Administrative data from the child support sys-tem showed that program group members were more likely to have paid child support by about 13 percentage points, with 73 percent of program group members paying child support at some point in the year versus 60 percent of control group members. They also paid child support one month more on average than control group members (4.4 months versus 3.5 months). Although program group members were more likely to pay any child support at some point during the year, on average there was no statistically significant difference in the amount of child support paid by program and control group members. In other words, among those who paid child support, program group members paid less than control group members. Again, this finding is not surprising given the child support order modification offered to participating program group members. Notably, although there was no positive impact on child support payment amounts, neither was there a negative impact.
As Figure 4.5 shows, the child support findings in later quarters directly parallel the employment and earnings findings described earlier in this chapter: Although the number of program group members paying child support was higher in these later quarters, the total amount of child support paid was no different, indicating that among those who paid child support in later quarters, control group members paid more. These patterns raise an interesting policy question regarding what is more desirable: more noncustodial parents paying child support in lower amounts, or fewer noncustodial parents paying child support in higher amounts.
Lastly, Table 4.7 shows that there was little difference between research groups in how often sample members had contact with their children, as reported in the 12-month survey. As mentioned earlier, parenting and family services were not a large component of the Transi-tionsSF program and there was little difference in receipt of these services, therefore there was little reason to expect differences in these outcomes.
Criminal Justice Outcomes
Although 79 percent of sample members had past convictions and 28 percent of sample members had been incarcerated before entering the program, most of this involvement with the criminal justice system occurred several years before random assignment. For example, people who had been incarcerated in prison had been released, on average, more than seven years earlier (see Table 4.2). Since recidivism rates are highest in the first few years after release, the

176
Table 4.7
One-Year Impacts on Child Support and Family Relations: San Francisco
Outcome Program
Group Control
Group Difference
(Impact)
Ninety Percent
Confidence Interval
Primary outcomes (based on administrative data)
Paid any formal child supporta (%) 72.7 59.7 13.0 *** [8.7, 17.3]
Among those who paid formal child support:
Months from random assignment to first paymentb 3.6 3.5 0.1
Months of formal child support paid 4.4 3.5 0.9 *** [0.6, 1.3]
Amount of formal child support paid ($) 1,385 1,435 -50 [-364, 264]
Sample size 502 493
Self-reported outcomes (%) (based on survey data)
Currently a noncustodial parent of a minor-age child 57.9 58.2 -0.3 [-6.5, 5.9]
Provided informal cash support or noncash support in
the past month 42.9 43.1 -0.3 [-6.6, 6.0]
Informal cash support 32.8 31.1 1.7 [-4.3, 7.7]
Noncash support 41.1 39.7 1.4 [-4.9, 7.6]
Owing child support affects willingness to take jobs 24.4 21.1 3.2 [-2.2, 8.7]
Incarcerated for not paying child support 0.7 -0.1 0.7 * [0.0, 1.4]
c
Among those with minor-age children:
Frequency of contact with focal child in the past 3 months
Every day or nearly every day 41.8 41.4 0.3A few times per week 19.6 22.2 -2.5A few times per month 14.7 12.1 2.6
Once or twice 5.5 5.5 0.0
Not at all 18.3 18.8 -0.4
Sample size 347 319
(continued)

177
Table 4.7 (continued)
SOURCES: MDRC calculations based on child support agency data and responses to the ETJD 12-month survey. NOTES: Results in this table are regression-adjusted, controlling for pre-random assignment characteristics. Statistical significance levels are indicated as: *** = 1 percent; ** = 5 percent; * = 10 percent. aMeasures of formal child support include all payments made through the state's child support collection and disbursement unit, including funds from employer withholding and other sources (for example, tax intercepts). bThis measure is calculated among those who paid child support during the follow-up period; it is therefore considered nonexperimental and is not tested for statistical significance. cThis measure is calculated among those who reported having a minor-age child at the time of the survey; it is therefore considered nonexperimental and is not tested for statistical significance. The focal child is defined as the youngest minor-age child living outside of the sample member's household; if the sample member reports no minor-age children living outside of his or her household, the focal child is the youngest minor-age child residing within the household.
evaluation team did not expect a large portion of the sample to have criminal justice interactions in the year following random assignment.22 Further, TransitionsSF did not focus on services related to criminal justice — beyond how to talk about past convictions with employers. Therefore, there was not expected to be much difference between program and control group members in this area.
● As expected, there were no statistically significant differences between program group and control group members in criminal justice involve-ment in the year following random assignment.
Table 4.8 shows that 19 percent of sample members were arrested in the year following random assignment, and 9 percent were convicted of a crime. The differences in arrest and conviction rates between the program and control groups were small and not statistically significant. Few sample members in either the program and control group reported on the 12-month survey that they had been incarcerated in jail or prison following random assignment, and there were no statistically significant differences in incarceration rates.
Economic and Personal Well-Being Outcomes
With the increased rates of employment among program group members shown earli-er in this chapter, one might expect that the program might also correspondingly produce positive impacts on measures of personal well-being, such as health, health insurance cover-age, psychological distress, and stability of living situations. Survey results presented in
22Durose, Cooper, and Snyder (2014).

178
Formal Child Support Payments Over Time: San Francisco
Figure 4.5
0102030405060708090
100
0 1***
2***
3***
Perc
enta
ge p
ayin
g fo
rmal
chi
ld su
ppor
t
Quarter after random assignment
Program group
Control group
193
322
450420
327 324 340
444
0
100
200
300
400
500
600
0**
1 2*
3Ave
rage
form
al c
hild
supp
ort p
aid
($)
Quarter after random assignmentProgram group Control group
(continued)

179
Figure 4.5 (continued)
SOURCE: MDRC calculations based on child support agency data.
NOTE: Results in this figure are regression-adjusted, controlling for pre-random assignment characteristics.
Statistical significance levels are indicated as: *** = 1 percent; ** = 5 percent; * = 10 percent.Measures of formal child support include all payments made through the state's child support collection
and disbursement unit, including funds from employer withholding and other sources (for example, tax intercepts).
Table 4.8 One-Year Impacts on Criminal Justice Outcomes: San Francisco
Outcome Program
Group Control
Group Difference
(Impact)
Ninety Percent Confidence
Interval
Primary outcomes (based on administrative data)
Arrested (%) 18.6 20.6 -2.0 [-6.0, 1.9]
Convicted of a crime (%) 9.2 9.1 0.1 [-2.9, 3.1]
Sample size
Self-reported outcomes (based on survey data) Incarcerated (%) 6.8 8.2 -1.4 [-4.8, 2.0]
Total days incarcerateda 3.3 7.2 -3.9 [-8.1, 0.2]
On parole or probation (%) 14.8 16.1 -1.3 [-5.7, 3.1]
Sample size 346 318
SOURCES: MDRC calculations based on criminal justice data and responses to the ETJD 12-month survey. NOTES: Results in this table are regression-adjusted, controlling for pre-random assignment characteristics. aThis measure includes a small number of outlier values resulting from sample members who were interviewed more than 18 months after study enrollment.

180
Table 4.9 show that there were some positive impacts on measures of financial well-being in the early months following random assignment, but there were no other statistically signifi-cant positive impacts on measures of well-being during this early time. There were no positive impacts on well-being measures at the end of the first year, either.
● A few months after random assignment, program group members re-ported feeling more financially secure than control group members.
An early follow-up survey was administered around five and a half months after ran-dom assignment.23 The purpose of this survey was to capture information about sample mem-bers’ well-being at the time when the program group’s employment rate was expected to be much higher than the control group’s. As shown in Table 4.9, during this early period there was a statistically significant impact (of 11 percentage points) on the number of respondents who said they had enough money to make ends meet at the end of a typical month: 49 percent of program group members reported not having enough to make ends meet versus 60 percent of the control group. Similarly, there was a statistically significant impact (of 12 percentage points) on the number of respondents who said that their financial situations were better than they had been a year earlier (57 percent of program group members versus 45 percent of control group members). Despite these impacts on self-reported financial security, there were no statistically significant differences in measures of personal well-being related to happiness or reduced psychological distress, nor in measures of self-confidence.
● Despite higher levels of earnings and employment, and despite early signs of increased financial security, by the end of the first year there were no statistically significant differences in most personal well-being measures surveyed. There were, in fact, negative impacts on some of these measures.
As Table 4.10 shows, at the time of the 12-month follow-up survey program group members were not statistically significantly more likely to have health insurance coverage even though they had higher rates of employment. It is possible that their jobs at the time of the survey were no more likely than those of control group members to offer health insurance. Nor were they more likely to report being in good health than control group members. Program group members were more likely to experience eviction than control group members (9 percent versus 4 percent) and more likely to have had their utility or phone service disconnected (34 percent versus 27 percent). It is unclear why these negative program impacts would occur, or what mechanism related to the program would contribute to them.
23This “in-program” survey was part of the STED project, and was therefore only administered in the
two ETJD cities that are also STED cities: San Francisco and Atlanta.

181
Table 4.9
Short-Term Impacts on Well-Being and Self-Confidence: San Francisco
Outcome
Program
Group Control
Group Difference
(Impact)
Ninety Percent Confidence
Interval
Financial well-being
State of family finances at the end of a typical month (%)
Some money left over 6.9 5.2 1.7 [-1.9, 5.3]Just enough to make ends meet 44.0 34.7 9.4 ** [2.1, 16.6]Not enough to make ends meet 49.1 60.2 -11.1 ** [-18.4, -3.7]
Financial situation is better than it was this time
last year (%) 56.9 44.8 12.1 *** [4.7, 19.4]
Frequency of worry about ability to meet monthly
living expenses (range of 0 to 10, where 0 = never and 10 = all the time) 6.8 7.0 -0.2 [-0.6, 0.3]
Had insufficient food in the past week (%) 37.8 44.9 -7.1 [-14.3, 0.2]
Personal well-being (%)
Experienced serious psychological distress in the past montha 16.9 13.7 3.2 [-2.2, 8.5]
Overall happiness
Very happy 15.4 17.2 -1.9 [-7.4, 3.7]Pretty happy 50.5 47.0 3.6 [-3.8, 11.0]Not too happy 34.1 35.8 -1.7 [-8.7, 5.3]
Self-confidence scales
Score on Pearlin Mastery Scaleb 5.2 5.2 0.1 [-0.1, 0.2]
Score on Work Self-Efficacy Scalec 3.9 3.9 0.0 [0.0, 0.1]
Score on Job Search Self-Efficacy scaled 4.1 4.2 0.0 [-0.1, 0.1]
Sample size 268 247
(continued)

182
Table 4.9 (continued)
SOURCES: MDRC calculations based on responses to the ETJD in-program survey. NOTES: Results in this table are regression-adjusted, controlling for pre-random assignment characteristics. For the in-program survey, only sample members randomly assigned between July 2012 and December 2013 were included. The survey response rate for this subsample was 72 percent. aA score of 13 or higher on the Kessler-6 (K-6) scale is used here to define serious psychological distress. The K-6 assesses how often during the past month a respondent felt so sad that nothing could cheer him or her up; nervous; restless or fidgety; hopeless; that everything was an effort; or worthless. As a result of minor dif-ferences between the scale used to administer the K-6 in the ETJD in-program survey and the standard K-6 scale, the percentages presented in this table may slightly underestimate the incidence of serious psychological distress among the ETJD sample. bThe Pearlin Mastery Scale ranges from 0 to 6. The scale assesses the extent to which respondents agree that they can do anything they set their minds to, they can find a way to succeed at something, their ability to get what they want is in their own hands, their futures depend on themselves, and they can do the things they want to do. cThe Work Self-Efficacy scale ranges from 0 to 4. The scale assesses the extent to which respondents agree that they can get to work on time, meet employers' expectations, work well with others, have good relationships with their supervisors, work well as a team, complete assigned tasks, and learn new skills. dThe Job Search Self-Efficacy scale ranges from 0 to 5. The scale assesses how confident respondents are that they can make a list of skills that can be used to find a job, talk to friends and contacts to find out about potential employers or discover promising job openings, complete a good job application and résumé, make contact with and persuade potential employers to consider them, and make a good impression and get points across in a job interview.
Conclusion TransitionsSF was an ambitious project that sought to increase the employment of noncustodial parents who were struggling to pay child support, and, correspondingly, the rate of compliance with their orders. To achieve this goal, the program offered participants a wide range of services that included intensive case management, three types of transitional jobs tailored to different levels of employment readiness, and support that ranged from stipends for participation in program activities to substantial modifications of child support orders, the latter made possible by the direct involvement of DCSS.
Staff members from all three primary partner agencies — the San Francisco Mayor’s Office of Economic and Workforce Development, DCSS, and Goodwill — invested considera-ble effort into TransitionsSF. A number of components were largely delivered as designed: the assessments and job-readiness training, transitional jobs that offered varying degrees of support, financial incentives, the release of suspended driver’s licenses, and modifications of child support orders. Other components deviated from the intended delivery. The process used to

183
Table 4.10
One-Year Impacts on Economic and Personal Well-Being: San Francisco
Outcome (%) Program
Group Control
Group Difference
(Impact)
Ninety Percent
Confidence Interval
Experienced a financial shortfall in the past 12 months 57.2 52.7 4.5 [-1.9, 11.0]
Could not pay rent or mortgage 43.9 38.3 5.5 [-0.9, 11.9] Evicted from home or apartment 9.3 4.2 5.1 *** [1.9, 8.4] Utility or phone service disconnected 34.1 26.8 7.3**
[1.4, 13.2] Could not afford prescription medicine 22.0 20.6 1.4 [-3.9, 6.7]
Had insufficient food in the past month 31.1 26.4 4.7 [-1.2, 10.6]
Housing in the past month
Rented or owned own apartment or room 32.7 33.1 -0.4 [-6.4, 5.6] Lived with family or friendsa 57.7 54.6 3.1 [-3.3, 9.4] Homeless or lived in emergency or temporary housing 7.1 8.6 -1.5 [-5.0, 2.0] Incarcerated, on work release, or living in a halfway house 0.5 1.4 -0.9 [-2.1, 0.4] Other 2.0 2.3 -0.3 [-2.2, 1.5]
Is currently in good, very good, or excellent health 68.6 70.0 -1.4 [-7.3, 4.5]
Had health insurance coverage in the past month 60.5 54.8 5.7 [-0.6, 12.0]
Health coverage was employer-based 12.9 11.1 1.8 [-2.5, 6.0]
Experienced serious psychological distress in the past monthb 12.9 12.9 0.0 [-4.4, 4.3]
Sample size 346 318
SOURCE: MDRC calculations based on responses to the ETJD 12-month survey. NOTES: Results in this table are regression-adjusted, controlling for pre-random assignment characteristics. Statistical significance levels are indicated as: *** = 1 percent; ** = 5 percent; * = 10 percent.
aIncludes those who lived with friends or family and paid rent and those who lived with friends or family
without paying rent. bA score of 13 or higher on the Kessler-6 (K-6) scale is used here to define serious psychological distress. The K-6 assesses how often during the past month a respondent felt so sad that nothing could cheer him or her up; nervous; restless or fidgety; hopeless; that everything was an effort; or worthless. As a result of minor differences between the scale used to administer the K-6 in the ETJD 12-month survey and the standard K-6 scale, the percentages presented in this table may slightly underestimate the incidence of serious psychological distress among the ETJD sample.

184
assign participants to tiers was not implemented as planned. Child support order modifications were not removed rapidly enough to provide a negative consequence to participants who were not cooperating with the program. And the transitional jobs in Tier 3 rarely turned into regular employment for participants as intended. Future programs should also consider the extent to which they should offer transitional public jobs with state, local, or federal government agen-cies, whose lengthy background checks can delay the start of subsidized employment and whose complex hiring processes can prevent participants from moving into regular, unsubsi-dized jobs.
In implementing TransitionsSF, the partner agencies encountered many challenges that made it take much longer for participants to move through the program than originally antici-pated. Many participants dropped out along the way, often before they had even started working in transitional jobs. Similar programs might need to structure up-front services in a way that can keep participants engaged, as attrition was the primary reason that fewer than half of partici-pants ultimately worked in transitional jobs. The mandatory drug test proved to be a particularly high hurdle for many participants, lengthening the time they spent in the program before entering transitional jobs and causing some to drop out. But staff members noted that substance use remained one of the barriers to finding unsubsidized employment for some participants at the end of the program. Participants may have needed more intensive substance-abuse treatment services than TransitionsSF was designed to provide.
In the planning phases of TransitionsSF, the partners debated and disagreed on how ex-tensively to assess potential participants before random assignment and enrollment. Later on, some staff members pointed to a lack of screening as the cause of many of the program’s challenges. Indeed, the high rate of attrition indicated that there were a large number of partici-pants for whom the program was not a good fit. On the other hand, the study found that the impacts on employment and earnings in the first 12 months after random assignment were largest for those with no recent work experience — participants who might have been screened out of the program had there been assessments in the enrollment process.
TransitionsSF also faced difficulty in connecting participants with unsubsidized em-ployment. While this difficulty was caused by some factors beyond the program’s control — such as the substance use mentioned above — the program would probably have benefited from having more staffing and resources dedicated to job development. It may have also helped if the program had included more opportunities for job developers and participants to interact. The model called for participants to work on searching for jobs with their case managers, who in turn communicated with the job developers, but it appeared that when job developers directly got to know participants who attended job clubs, they were able to provide better assistance.

185
Despite these difficulties in program implementation, TransitionsSF had statistically significant impacts on employment and earnings during the first year after random assignment. The employment gains persisted into the first quarter of Year 2, when most subsidized jobs offered by TransitionsSF had ended, though the earning increases did not. The program also generated statistically significant impacts on the number of participants who paid child support, even though the program had relatively low participation rates in transitional jobs due to attrition. Although there was no positive impact on the total amount of child support paid, there was also no negative impact, meaning that the child support reductions for program group members did not result in a net decrease in child support collection. Additional follow-up is required to assess whether these differences in employment and child support outcomes will continue as more time elapses, program group members become more distant from their experiences in TransitionsSF, and their modified child support orders return to guideline levels.

THIS PAGE INTENTIONALLY LEFT BLANK

Chapter 5
The Parent Success Initiative (Syracuse, NY)

THIS PAGE INTENTIONALLY LEFT BLANK

189
Executive Summary
Led by the Center for Community Alternatives (CCA), the Parent Success Initiative (PSI) was designed to help noncustodial parents in Onondaga County, New York (the county that includes Syracuse) to find and keep employment, increase their child support payments, and strengthen their relationships with their children. First funded in 2000 by a Welfare-to-Work grant from the Department of Labor, subsequently PSI has been supported by five different funding streams, most recently the Enhanced Transitional Jobs Demonstration (ETJD) grant. The program included components designed to assist participants to develop employability skills, establish recent work histories, and change their attitudes about child support and work. Participants who completed a two-week job-readiness workshop were placed in fully subsidized, temporary positions on work crews at partner organizations. Other program services included case man-agement, legal assistance for child support and other civil matters, prisoner-reentry and civic-restoration services, parenting education, and assistance in finding and retaining unsubsidized employment.
Main Findings •
•
Many participants faced significant barriers to employment. The majori-ty of participants in the program were black men, with an average age of 35. Over one-third did not have a high school diploma or equivalent. Study par-ticipants reported limited recent employment; 59 percent had worked for less than six months or did not work at all in the three years before study enroll-ment, with one-third reporting no work during that period. Forty-four percent of participants had previously been incarcerated in prison and, among those, nearly half were still under community supervision at the time of enrollment.
CCA experienced some challenges with recruitment into PSI, but ulti-mately reached its sample goal for the study. The program received fewer referrals than anticipated from several partners, including its contracted refer-ral partner, the Center for Court Innovation. In addition to lower-than-expected referrals from partners, staff members reported that the ETJD eligi-bility criteria were not accounted for in initial estimates. Specifically staff members reported that the requirements related to “hard-to-employ” status and Selective Service registration affected their ability to recruit eligible par-ticipants. CCA added two new strategies in the fall of 2013 to increase en-rollment (small incentives for referrals from existing participants and televi-sion advertisements).

190
•
•
•
Overall, the program implemented the transitional job component as in-tended, with a few modifications. However there were challenges with case management services and job development for most of the grant period. The adaptations made during implementation included instituting a four-month maximum for the transitional job early in the grant period due to capacity and cost constraints. Though the program had hoped to establish crews with private employers in an array of industries that might lead to un-subsidized employment, crews were only established at nonprofit or public organizations with limited opportunities to hire participants in unsubsidized jobs. The program initially engaged two vendors to handle job development and job placement, but brought those functions in-house in the fourth year of the grant. Midway through Year 4, the program was still learning how to es-tablish relationships with employers to identify unsubsidized employment prospects for participants.
A decentralized network of service-delivery and referral partners re-quired a large investment in management and supervision. The pro-gram’s dispersed service-delivery structure (including both grantee staff members and partners under contract to provide case-management services) probably required more resources for coordination than would be associated with a more centralized effort. While most partners demonstrated strong commitment to the program and its evaluation, and a willingness to address logistical and administrative challenges, some partnerships never fully mate-rialized as envisioned. The random assignment nature of the evaluation also may have posed challenges for some partnerships.
The program had positive impacts on receipt of services, and partici-pation rates in employment-related activities were high. Program group members reported higher levels of service receipt than control group mem-bers in almost every area. Four in five program group members (80 per-cent) worked in transitional jobs. Nearly all (96 percent) of the program group members reported receiving help related to finding or keeping a job, including help with job searching, job readiness, and career planning, and assistance paying job-related costs. Among control group members, 59 per-cent reported receiving similar forms of support. There were also impacts on receipt of child support and family relationship services. There were few differences between program and control group members in participation in education, which was not an important part of the program model.

191
•
•
•
Program group members had higher rates of employment and higher earnings in unemployment insurance-covered jobs. The vast majority of program group members (90 percent) worked during the one-year follow-up period, compared with about 59 percent of control group members — an in-crease of over 30 percentage points. Much of this impact is due to subsidized employment.
There was a modest impact on child support payments. Because the re-search team encountered some difficulties in acquiring data for this report, complete data on child support outcomes are available only for sample mem-bers who enrolled during the first year of the program.1 Only small numbers of program group or control group members paid any child support in the first year following enrollment. However, there was a modest impact on pay-ing formal child support: 37 percent of program group members paid child support compared with 30 percent of control group members. According to survey data, program group members were more likely to provide informal and noncash assistance than control group members.
There is little evidence of impacts on criminal justice outcomes. There were no significant effects on arrests, convictions, or incarceration during the follow-up period.
The first section of this chapter provides background about the context in which the program operated, the intended program model, and the characteristics of study participants. The following section discusses the implementation of the program, and the third section describes the program’s impacts on participants’ outcomes.
1A separate analysis found no statistically significant differences in impacts between those who entered
the program in the first year of its operation and those who entered later. (See Appendix Table D.2.)

192
The Parent Success Initiative
Background The Parent Success Initiative (PSI) was designed to assist noncustodial parents who had one or more barriers to employment to “find and keep employment, increase child support payments, and strengthen relationships with their children,” according to its parent organization’s website.2 PSI was conceived as a partnership among several member agencies of Greater Syracuse Works, a consortium of organizations and agencies dedicated to developing innovative methods of creating and sustaining employment for low-income Syracuse-area residents.3 Greater Syracuse Works first implemented PSI in 2000 with funding from a U.S. Department of Labor Welfare-to-Work grant. Since that time, the initiative has been led by different Greater Syracuse Works member agencies and has been implemented nearly continuously in various forms, as funding permitted. The ETJD grant enabled PSI to add transitional jobs to the model for the first time.
The Center for Community Alternatives, a Greater Syracuse Works partner, is a com-munity-based nonprofit organization that “promotes reintegration justice and a reduced reliance on incarceration.”4 CCA served as the lead agency for the ETJD-funded iteration of PSI. Though the agency was awarded an ETJD grant to serve noncustodial parents, many program participants also had criminal backgrounds, as CCA is a well-known service provider among formerly incarcerated individuals and parole officers. PSI was one of three ETJD programs testing a modified transitional jobs program model whereby participants were placed into fully subsidized, temporary positions at partner organizations while receiving assistance in obtaining unsubsidized employment along with various forms of social and economic support.
This section describes the context in which the program operated, its intended mod-el, the recruitment and enrollment of study participants, and the characteristics of study participants.
Context
According to the Bureau of Labor Statistics, the Syracuse unemployment rate fluctu-ated between 5.7 percent and 8.6 percent between March 2011 and March 2015, largely in line with the unemployment rate in the state of New York during the same time period (which
2Greater Syracuse Works (2016). 3See Greater Syracuse Works (2016) for more information about the voluntary collaborative of member
agencies. 4Center for Community Alternatives (2012).

193
fluctuated between 5.7 percent and 8.7 percent).5 Employment declines in the local manufac-turing sector began in the mid-2000s and continued throughout the grant period. Approxi-mately 2,000 fewer people were employed in the manufacturing sector at the end of the grant period than were at its start.6
Staff members and partners saw limited employment opportunities in Syracuse for low-income, low-skilled individuals. During an implementation research visit for the evaluation, one partner noted that everyone who is unemployed in Syracuse is “hard-to-employ” because of the makeup and availability of local jobs. Another partner explained that the local economy during the grant period had been “stable and bad,” and that newly added jobs were for highly educated workers. National retail chains hiring through temp agencies provided occasional temporary-to-permanent opportunities, but most assignments were for the short term. Staff members ex-plained that jobs that might be good fits for participants were often located outside of the city in areas not well served by public transportation. Staff members and partners also explained that individuals with criminal backgrounds had particular difficulty finding employment, as many local employers were unaware of state laws regarding screening and hiring practices.7
Child support enforcement in Syracuse is handled by Child Support Services in the On-ondaga County Bureau of Child Support. Child support orders are set in Family Court, which uses guidelines in the Child Support Standards Act to determine noncustodial parent contribu-tions. The court can deviate from those standards if there are extenuating circumstances; $25 per month is the lowest possible amount for a support order. Orders must be modified through the court. Although the child support enforcement agency will not file petitions (for order modifica-tions, etc.) on behalf of a noncustodial parent, the agency “will help them get started in the right direction,” according to a Bureau of Child Support staff member. Many enforcement tools are available to the agency: It can revoke driver’s licenses, freeze bank accounts, offset tax refunds, intercept insurance awards, and seize property. Though the agency was a partner in PSI, it had little latitude to make concessions administratively given state policies and actions that had to be handled through the courts. Agency staff members said they try to avoid revoking driver’s
5See Bureau of Labor Statistics (2016b, 2016c). 6Bureau of Labor Statistics (2016d). The annual average number of employees in manufacturing de-
clined from 26,100 in 2011 to 24,400 in 2014. 7Until early in the grant period, many local employers were using Criminal History Arrest Incident Re-
porting System (CHAIRS) reports to screen applicants (provided by the sheriff’s office for $10, or at no cost to nonprofits). These reports included only an individual’s list of arrests in the county, with no indication whether those arrests resulted in convictions or dismissals. CCA released a report in 2011 that found a majority of the CHAIRS reports it reviewed included arrests that should not have been disclosed under either state criminal laws or state fair-credit reporting laws. See Center for Community Alternatives (2011) for more detail.

194
licenses, as they recognize transportation challenges can make it difficult for noncustodial parents to obtain and retain employment.
As mentioned above, many study participants (44 percent) also were exposed to the criminal justice system. For formerly incarcerated individuals, employment is mandated as a condition of parole. Staff members from the Probation Commissioner for Onondaga County said in discussions with the research team that parole is shifting from enforcement toward case management. Correctional facilities develop and maintain an employability profile called a Training Achievement and Potential Employability Report for every inmate.8 Parole leaders noted that most parole officers will send offenders leaving prison to “Ready, Set, Work!” (a New York State-developed work-readiness class) and will have them build résumés.9 Parole officers most commonly refer reentering ex-prisoners to substance-abuse treatment providers, and also refer them to temp agencies for employment opportunities. Officers may make refer-rals to employment-training or vocational-readiness providers.
The final contextual factor to consider is the presence of other services in the communi-ty for this target population. Though at times during the grant other community providers offered similar services, program staff members and partners said that employment services in particular were susceptible to fluctuations in grant funds (including other services at CCA). These funding fluctuations may have limited services for control group members.10 No other organizations in Syracuse provided subsidized employment. One partner pointed out that many of the service providers in Syracuse were involved in PSI, and therefore may have either embargoed control group members from services or reserved their spaces for program group members.
Intended Model
A Parent Success Initiative staff member explained that the program aimed to “help people move from where they are to where they want to be, and to help them stay out of the criminal justice system while helping their families. Basically ... to help people find and keep jobs and pay their child support.” The program’s theory of change — how it expected to achieve that goal — included components designed to assist participants to develop employabil-ity skills, establish recent work histories, and change their attitudes about child support and work. To a lesser extent, the program also sought to change attitudes in the community (even
8New York State Department of Corrections and Community Supervision (2015b). 9New York State Division of Criminal Justice Services (2016). 10Control group members were provided a list of services available in the community, including em-
ployment assistance available through the American Job Center and several other organizations. Control group members who were referred to PSI by a specific organization or agency were also encouraged to return to the referring agency for services.

195
within program partners) about participants’ employment prospects and potential contributions to the workforce by having partners and employers interact with participants during the transi-tional job and unsubsidized employment search.
The ETJD-funded iteration of PSI was designed to capitalize on the existing Greater Syracuse Works coalition and partnerships established in previous iterations of the program. The program anticipated working closely with Family Court (with the help of the Center for Court Innovation) and the Onondaga County Bureau of Child Support to identify noncustodial parents eligible for the program.
The program model included the following components:
Case management (before, during, and after the transitional job). Participants were re-ferred to a case manager (known as an Employment Services Specialist) as soon as they enrolled. Case managers were expected to meet with participants within two to three days after they were randomly assigned to the program group, to complete intake paperwork with them and to help them develop goals. During the transitional job, case managers were expected to meet weekly with participants to provide referrals to services they needed, and to work with participants on their job-readiness skills and job searches. Case managers were expected to continue to meet with individuals at least one to two times per month after they left their transitional jobs, until participants had retained unsubsidized employment for 90 days. CCA initially engaged three other organizations to provide case management, and also provided some case management in-house.
Two-week job-readiness workshop (before the transitional job). After enrolling, par-ticipants were required to complete a two-week, unpaid job-readiness class called Learning Expectations and Developing Employment Readiness Skills (LEADERS) before they were assigned to transitional job crews. Originally based on Ready, Set, Work!, the LEADERS curriculum had been expanded and adapted in earlier iterations of the program. Workshop topics covered conflict resolution, work readiness, the program services available to partici-pants, an overview of child support, and the program’s expectations. Participants held mock interviews and prepared résumés. The workshop was also designed to prepare participants to take the National Work Readiness assessment, a web-based assessment of situational judgment, oral language, reading with understanding, and math for problem solving.11
Transitional job. PSI designed the transitional job to help participants practice work skills in the relatively safe, structured, and supervised environment of a “work crew” at a
11For more information on the National Work Readiness Assessment and Credential see National Work
Readiness Council (2016). The program required participants to take the assessment to be placed on work crews, but they were not required to score high enough to earn the National Work Readiness Credential.

196
nonprofit or public-sector host organization. The primary aim of the transitional job was to help participants develop and demonstrate employability skills (such as dependability, motivation, and collaboration) rather than specific occupational skills. The transitional job was 24 hours a week at minimum wage (four days a week for 6 hours a day, with one day off for “develop-ment” activities that included case management and parenting education). The grant application indicated the program would explore creating crew options at private employers in health care, business, construction, and advanced manufacturing, to give participants a wider range of transitional job opportunities that might lead to unsubsidized employment. However, the program did not expect organizations hosting crews to provide participants with permanent, unsubsidized positions. While earlier iterations of PSI did not include transitional jobs, CCA had experience implementing transitional jobs as part of an initiative led by the Center for Employment Opportunities.
Employment assistance (during and after the transitional job). The program engaged Partners in Education and Business (a Greater Syracuse Works member agency) to provide unsubsidized job development and placement assistance. Case managers were expected to share responsibility for job development and placement.
Parenting education (during the transitional job). Early in the transitional job period, participants who had not taken a similar course recently were scheduled to take a family life-skills class facilitated by the Children’s Consortium (also a Greater Syracuse Works member). The classes lasted six hours over three sessions and drew on principles from curricula such as Nurturing Parents and Parents as Teachers. The classes were also designed to teach communica-tion skills that participants could use at work, and to begin to change participants’ attitudes about child support and work.
Educational opportunities (during and after the transitional job, as appropriate). The program expected to provide literacy and high school equivalency services under a contract with the Literacy Coalition of Onondaga County (another Greater Syracuse Works member agency). The program also allocated funds for forms of participant support that could include occupational training.
Retention support (after the transitional job). In addition to the extended case man-agement mentioned above, the program planned to include financial incentives for participants who stayed in unsubsidized employment for 60, 90, and 180 days. The program also planned to offer financial literacy instruction to help participants develop and maintain good budgeting and purchasing habits.
As discussed in Chapter 1, each of the ETJD programs included components designed to enhance the basic transitional jobs model used in previously tested programs. CCA chose the following enhancement components:

197
Legal assistance (during and after the transitional job). CCA engaged two legal aid or-ganizations to provide civil legal services, particularly those related to child support issues. The program needed two providers to address potential conflicts of interest — for example, if one legal aid agency represented the custodial parent on a case, the other could represent the program participant. The program could also assign cases to each provider based on the other types of civil legal assistance it offered (such as landlord/tenant issues).
A Reentry Clinic for individuals with criminal histories (during and after the transi-tional job, as appropriate). Program participants had access to CCA’s Reentry Clinic, which works with individuals who face barriers to employment, education, and licensing as a result of incarceration or criminal convictions. Staff members develop a work plan specific to the participant that typically includes: reviewing the individual’s criminal history, identifying and addressing any errors or needed corrections, helping an individual to apply for a Certificate of Relief from Disabilities or Certificate of Good Conduct, and employment counseling (covering, for example, how to talk to a prospective employer about one’s criminal history).12 Individuals could be referred to these services after they completed the two-week job-readiness workshop.
Recruitment and Study Enrollment
The target population for PSI was low-income noncustodial parents (age 18 or older) in Onondaga County, New York. To qualify, an individual had to have an active child support order or an arrears-only order in New York State. According to Department of Labor policy, males had to be registered with Selective Service. Additionally, individuals had to be unem-ployed and meet at least one of the following “hard-to-employ” criteria:
•
•
•
•
No history of working full time consistently for the same employer (defined as four consecutive quarters)
No high school diploma or equivalent
A criminal history and an ongoing job search of at least 60 days
Release from prison or jail less than 60 days before the time of referral
PSI anticipated referrals from three primary sources — Family Court, Greater Syracuse Works partner agencies, and the Onondaga County Bureau of Child Support — in addition to “walk-ins” to CCA. The program engaged the Center for Court Innovation, a nonprofit organiza-tion closely associated with Family Court, to refer 900 eligible noncustodial parents to the
12The Certificate of Relief from Disabilities and the Certificate of Good Conduct aim to reduce barriers to employment for formerly incarcerated individuals. For more, see New York State Division of Criminal Justice Services (n.d.).

198
program during the enrollment period. (This target was later revised downward to 480.) The program received other referrals from various Greater Syracuse Works partners, including those who served as case management agencies for the program, JOBSPlus!, the New York State Division of Parole, and the Onondaga County Probation Department. Despite this array of referral partners, the primary method of recruitment was through walk-ins to CCA (929 of 1,570 total referrals, according to program records). In part, these numbers reflect overlap between the noncustodial parent population and the population with criminal histories, coupled with the fact that CCA is well-known provider of services to those leaving incarceration.
When PSI received a referral form (either from a partner or from CCA’s front desk in the case of walk-ins), a program staff member called the individual to confirm the information on the form and to schedule him or her for a group orientation. About once a week a program staff member (who had been trained by the child support agency to use the agency’s database) went to the child support office to verify applicants’ obligation amounts, child support debts, payment frequencies, and most recent payments. These visits allowed the program to verify applicants’ status as noncustodial parents before approving them to attend a program orienta-tion. Each month the program created a new cohort (a group of participants who joined the program at the same time and moved through it together). To fill a cohort, typically the program scheduled four orientation opportunities over two to three weeks. At the end of the one-hour orientation session, if they were interested and eligible, individuals signed up for appointments to complete the informed consent process, fill out baseline forms, and be randomly assigned.
The program received fewer referrals than anticipated from several partners, including its contracted referral partner. The Center for Court Innovation referred 285 noncustodial parents to the program, approximately 32 percent of the initial referral target of 900 and 59 percent of the revised goal of 480. The Center for Court Innovation attributes this shortfall to two factors. The first was that Family Court support magistrates (who preside over child support order establishment and modification petitions) were reluctant to refer potential participants to PSI because the random assignment involved in the evaluation gave them reduced chances of receiving services. The second was the unexpected effect of two Parent Success Initiative eligibility criteria (being “hard-to-employ” and being registered with Selective Service). According to the Center for Court Innovation, these criteria were not adequately factored into initial referral estimates. Finally, Center for Court Innovation staff members pointed out that some referrals came through multiple doors (for example, they were referred by the Center for Court Innovation and also walked into CCA), and it was unclear how these referrals were counted. Neither organization felt the relationship unfolded as expected.
The orientation schedule (multiple sessions during a few weeks each month) may have also slowed referrals: Center for Court Innovation staff members also said they felt obligated to

199
report to the magistrate that they succeeded in engaging individuals in services that immediately advanced their job readiness and employment opportunities. They said that in some cases they referred eligible individuals to other activities when an orientation was not imminent. CCA staff members noted that applicants generally waited at most two weeks for an orientation. These delays may have also dampened interest among individuals who were referred.
CCA added two new strategies in fall 2013 to increase enrollment: small incentives for existing participants if they referred other people ($10 gift cards to a local grocery store) and television ads. Participant referrals generated 18 study participants, at a minimal cost to the program. The 15-second television spots cost approximately $12,000. The television ads were described by the staff as “wildly successful,” yielding 102 inquiries and ultimately 59 study participants. On the whole, staff members explained, these participants tended to be from more suburban areas; they may have been less aware of and connected to services than city dwellers.
Despite these recruitment and referral challenges, the program ultimately exceeded its enrollment goal, with 506 individuals in the program group and 498 in the control group. Staff members indicated that the last few months of 2013 were very focused on a final recruitment push, which may have taken their attention away from other aspects of the program and service delivery.
Baseline Characteristics
This section presents the characteristics of all study participants (program and control group members) based on data gathered from baseline information forms they filled out when they enrolled and data entered into the management information system about them at that time. These data — presented in Tables 5.1 and 5.2 and Appendix Table D.1 — cover participants’ demographic characteristics, family and child support characteristics, employ-ment histories, criminal histories, public assistance and benefit histories, and mental health and substance-abuse histories.13
Nearly 94 percent of the sample members were male. Slightly more than three-quarters were black, non-Hispanic (78 percent). The average age of study participants was 35. Two-thirds of participants had never been married. Almost all participants (98 percent) had minor-age children (that is, children under 18). Those who had minor-age children had an average of
13As expected (given the random assignment design), there were very few statistically significant dif-
ferences between the program and control groups with respect to these characteristics. Therefore, for simplicity, Tables 5.1 and 5.2 and Appendix Table D.1 present numbers for the full Syracuse sample. For a detailed comparison of the baseline characteristics of program group members and control group members across the ETJD programs, see Appendix I.

Table 5.1 Characteristics and Employment Histories of Sample Members: Syracuse
200
Syracuse ETJD Programs Targeting Characteristic Program Noncustodial Parents
Male (%) 93.7 93.2
Age (%)
18-24 12.9 7.6 25-34 34.5 32.6 35-44 34.3 34.9 45 or older 18.3 24.9
Average age 35.4 37.6
Race/ethnicity (%)
Black, non-Hispanic 77.8 82.4 White, non-Hispanic 11.7 5.5 Hispanic 6.5 7.9 Asian, non-Hispanic 0.4 1.4 Other/multiracial 3.7 2.9
Educational attainment (%)
No high school diploma or equivalent 35.7 29.2 High school diploma or equivalent 61.3 66.0 Associate's degree or equivalent 2.3 2.6 Bachelor's degree or higher 0.7 2.3
Marital status (%)
Never married 66.8 66.2 Currently married 8.5 8.4 Separated, widowed, or divorced 24.7 25.4
Veteran (%) 3.0 4.9
Has a disability (%) 9.5 5.4
Housing (%)
Rents or owns 23.2 45.4 Halfway house, transitional house,
or residential treatment facility 3.1 3.7 Homeless 8.8 7.9 Staying in someone else's apartment, room, or house 64.9 43.0
(continued)

201
Table 5.1 (continued)
Characteristic
Employment history
Among those who ever worked:
Syracuse Program
40.5
33.0
ETJD Programs Targeting Noncustodial Parents
95.6
49.9
13.8
Ever worked (%)
Worked in the past year (%) Average hourly wage in most recent job ($) Ever worked for the same employer for 6 months or more (%)
Months worked in the previous 3 years (%) Did not work Fewer than 6 months 6 to 12 months 13 to 24 months More than 24 months
93.6
9.41 78.2
26.0 18.7 16.7
5.6
11.21 79.5
27.8 28.7 14.1 15.6
Sample size 1,004 3,998
SO URCES: MDRC calculations based on baseline survey data and ET JD management in formation system data.
2.8 children. However, fewer than one in seven participants reported living with minor-age children. Ninety-two percent had current child support orders, whereas 8 percent had arrears-only orders.
Few participants had stable housing at the time they enrolled. Fewer than one in four study participants owned or rented (about half the rate for all ETJD programs targeting noncus-todial parents). Most participants (65 percent) were staying in someone else’s room, apartment, or house. An additional 9 percent were homeless and 3 percent were living in transitional housing, a residential treatment facility, or a halfway house.
Study participants faced barriers to employment that included limited education, inter-mittent work histories, involvement with the criminal justice system, and histories of substance or alcohol abuse. Thirty-six percent had not earned a high school diploma or equivalent. Most participants had employment experience (94 percent), though only slightly more than 4 in 10 had worked in the year before enrolling in the study. In Syracuse, the average hourly wage reported for the most recent job ($9.41) was considerably below the average for study partici-pants at all programs targeting noncustodial parents; however, it exceeded the wage offered in the subsidized jobs provided by CCA ($7.25).

202
Table 5.2 Child Support and Criminal Justice Characteristics of Sample Members: Syracuse Syracuse ETJD Programs Targeting Characteristic Program Noncustodial Parents
Parental and child support status
Noncustodial parent (%) 100.0 100.0
Has any minor-age children (%) 97.8 93.2
Among those with minor-age children:
Average number of minor-age children 2.8 2.5
Living with minor-age children (%) 13.5 18.1
Has a current child support order (%) 92.1 86.3
Has an order only for child support debt (%) 8.2 12.7
C
riminal history Ever convicted of a crimea (%) 79.1 76.4
Ever convicted of a felony 52.5 49.2 Ever convicted of a misdemeanor 68.6 63.3
1 Ever incarcerated in prisonb (%) 44. 40.2
Among those ever incarcerated in prison:
Average years in prisonc 4.4 3.8
Years between most recent release and program enrollmentd (%) 33.2 Less than 1 year 41.9
1 to 3 years 15.9 17.5 More than 3 years 42.1 49.2
Average months since most recent released 46.3 59.6
On community supervision at program enrollmente(%) 49.4 51.6
Sample size 1,004 3,998
(continued)

203
Table 5.2 (continued)
SOURCES: MDRC calculations based on baseline survey data, ETJD management information system data, and criminal justice administrative records. NOTES: Measures are self-reported unless otherwise noted. aIncludes convictions in the state of New York as recorded in administrative records. Does not include federal convictions or convictions from other states. bIncludes self-report of incarceration in state or federal prison and prison incarceration as recorded in New York administrative records. cIncludes time spent in New York state prisons according to administrative records. Does not include time spent in federal prisons or prisons in other states. dMost recent release can be from prison or jail. eIncludes parole, probation, and other types of criminal justice or court supervision.
Study participants reported limited recent employment: 59 percent had worked for less
than six months or did not work at all in the three years before study enrollment, and a third reported no work during that period, both of which are markedly below the averages for ETJD programs targeting noncustodial parents. These figures suggest participants in Syracuse may have faced a more difficult labor market or had greater barriers to employment than the average sample member for ETJD programs targeting noncustodial parents.
Approximately 80 percent of sample members had ever been convicted of a crime, and 44 percent of had ever been incarcerated in prison. More than one-third had been convicted of a violent offense (see Appendix Table D.1), which may preclude employment in certain fields. Many had been released less than a year before they enrolled (42 percent of those ever incarcer-ated), and nearly half were on community supervision.14
Program Implementation This section provides detail about the implementation of the ETJD-funded incarnation of PSI, including adjustments made to the originally planned intervention.
Program Structure and Staffing
PSI involved many partners, which required strong coordination from CCA. The ap-proach to staffing was based on the assumption that several partners from the Greater Syracuse
14Relatedly, Appendix Table D.1 shows that compared with the average rate for ETJD programs target-
ing noncustodial parents, up to twice as many participants in Syracuse reported ever receiving treatment for alcohol or drug abuse or for mental health problems. These comparatively high rates of service receipt may reflect participants’ connections to the criminal justice system, as parole officers often refer formerly incarcerated people to these services.

204
Works coalition and earlier iterations of PSI would be involved to promote community-wide engagement and the quick start-up of services under the grant.
Figure 5.1 provides an overview of the roles of the main partners in PSI.15 CCA was re-sponsible for fiscal management and oversight of the overall program, as well as service delivery. CCA had the following staff members working on the program: CCA’s deputy director, a grant-funded program director, a research coordinator responsible for recruitment and study enrollment, an operations coordinator responsible for the logistics of the work crews, job-readiness workshop instructors, case managers, a job developer (one during the final 18 months of the grant), Reentry Clinic staff members, and administrative and fiscal support personnel.
Greater Syracuse Works shared responsibility for program and data management and service coordination (contributing approximately three full-time employees to the program). Greater Syracuse Works coalition members provided family life-skills classes (Children’s Consortium) and offered participants legal assistance related to child support and other issues (Hiscock Legal Aid Society and Legal Aid Society of Mid-New York). In addition to CCA, two other agencies were under contract throughout the grant to provide case management: Westcott Community Center and Catholic Charities of Onondaga County.
Three organizations hosted work crews: Syracuse Housing Authority, Catholic Chari-ties of Onondaga County, and the Downtown Committee of Syracuse. CCA provided crew supervisors for the Syracuse Housing Authority and the Downtown Committee of Syracuse. CCA also paid for a portion of a Syracuse Housing Authority employee’s time; that employee managed the work assignments of crew members for the Housing Authority’s crews. Catholic Charities provided supervision for its own crew.
The program engaged two different vendors in succession to provide job development, before it finally brought the function in-house at CCA in September 2013 (see the discussion on job development below). Throughout the grant, case managers were expected to share responsi-bility for job development and placement.
Literacy services and high school equivalency preparation were supposed to be facili-tated by the Literacy Coalition. Specifically, the Literacy Coalition’s role was to find and coordinate services available in these arenas from other community providers. The organization
15The figure does not include the following contractual partners that were engaged with the program in
earlier stages of the grant: Partners in Education in Business (the first job development and job placement vendor), Career Start (the second job development and job placement vendor), and Dunbar Association (an initial case management partner).
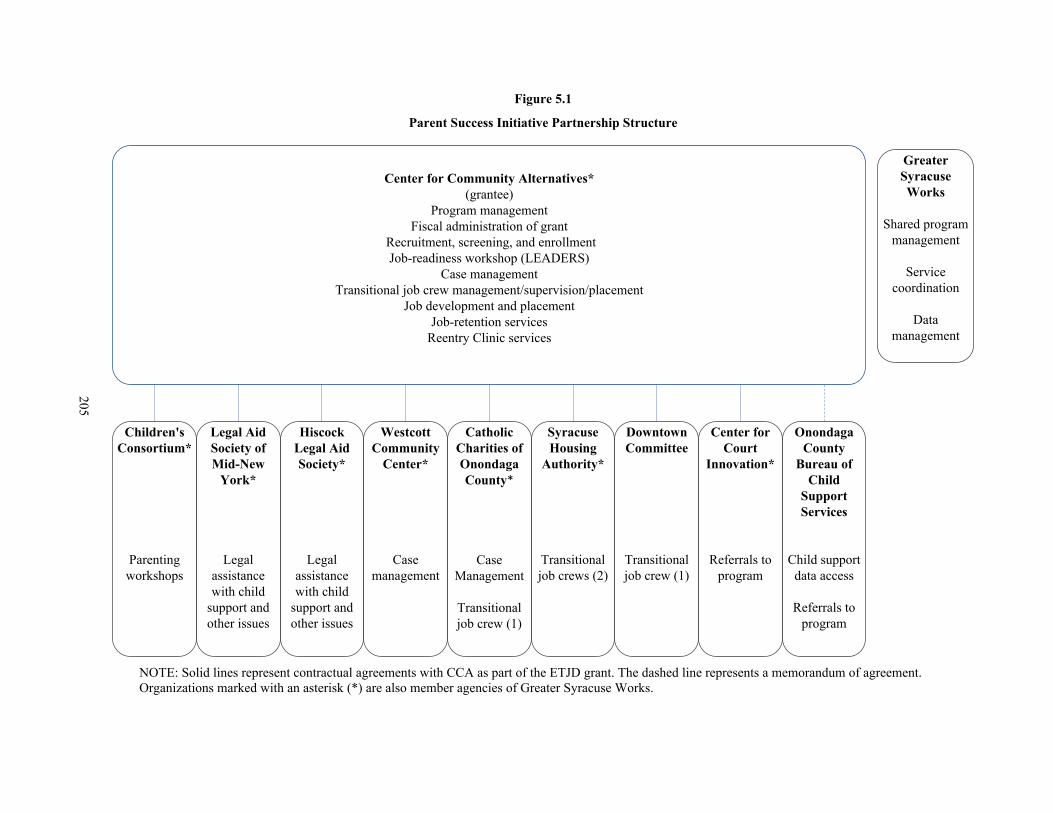
205
Figure 5.1
Parent Success Initiative Partnership Structure
Center for Community Alternatives*(grantee)
Program managementFiscal administration of grant
Recruitment, screening, and enrollmentJob-readiness workshop (LEADERS)
Case managementTransitional job crew management/supervision/placement
Job development and placementJob-retention services
Reentry Clinic services
Greater Syracuse Works
Shared program management
Servicecoordination
Data management
Legal Aid Society of Mid-New
York*
Legal assistance with child
support and other issues
Hiscock Legal Aid Society*
Legal assistance with child
support and other issues
Westcott Community
Center*
Case management
Catholic Charities of Onondaga County*
Case Management
Transitional job crew (1)
Syracuse Housing
Authority*
Transitional job crews (2)
Downtown Committee
Transitional job crew (1)
Children's Consortium*
Parenting workshops
Center for Court
Innovation*
Referrals to program
Onondaga County
Bureau of Child
Support Services
Child support data access
Referrals to program
NOTE: Solid lines represent contractual agreements with CCA as part of the ETJD grant. The dashed line represents a memorandum of agreement. Organizations marked with an asterisk (*) are also member agencies of Greater Syracuse Works.

206
withdrew from the partnership before the program was fully implemented because it had concerns about meeting the program’s outcome goals for literacy gains. The program ultimately reallocated those funds to job placement.
This large network of partners resulted in complex management and supervisory struc-tures (official and unofficial) that probably required more resources for coordination than would be associated with a more centralized effort. To promote coordination, the program held case conferences every week or every other week to discuss the program, participants’ progress on the crews, and their overall job readiness. These meetings typically included the director of operations, the services coordinator, case managers, crew supervisors, and other staff members or leaders as appropriate. Leaders from all subcontractor and partner organizations met monthly as a planning and advisory committee. Parent Success Initiative leaders used these meetings to update attendees on various performance metrics and inform them about any changes in policies or operational procedures. Finally, PSI relied on a project-wide database funded primarily by the ETJD grant, which leaders noted contributed to coordination.
Implementation of Core Program Components
This section draws on the research team’s three site visits to Syracuse (during which the team conducted interviews with staff members, partners, employers, and participants), as well as ongoing discussions with program managers about how the program implemented and modified components of its model.16
● The program implemented the transitional job component largely as in-tended. Transitional jobs were offered in work crews through three partner organizations throughout the grant period.
As shown in Table 5.3, approximately 80 percent of participants worked in transitional (subsidized) jobs, a figure consistent with the program’s expectations as outlined in the grant application. As mentioned above, three organizations hosted work crews: Syracuse Housing Authority, Catholic Charities of Onondaga County, and the Downtown Committee of Syracuse. CCA was the employer of record for participants, and reported quarterly for the purposes of taxes and unemployment insurance.
Syracuse Housing Authority hosted the majority of participants and was the first or-ganization to host a crew. Initially, Syracuse Housing Authority hosted one crew of 17 to 25 participants; it later expanded its participation to host three simultaneous crews (of 17
16The three site visits included an assessment visit to observe how the program was functioning during its early operation period, followed by two implementation research site visits.

207
Table 5.3
One-Year Participation in ETJD Subsidized Jobs and Services Among Program Group Members: Syracuse
Program Measure Group
Participated in any activity, including a subsidized job (%) 100.0
Worked in a subsidized job (%) 80.0
Among those who worked in a subsidized job:
Average number of months in the programa 5.0 Average number of days from random assignment to first subsidized paycheck 39.8 Average number of days worked in a subsidized jobb 37.6
Received a service other than a subsidized job (%) 100.0
Formal assessment/testing -- Education and job training -- Workforce preparationc 91.9 Work-related support -- Child support assistanced 86.8 Parenting classe 58.5 Incentive payment -- Other servicesf 99.8
Attended Retention Counts group meetingg (%) 32.8
Average number of meetings attended, among those who attended 3.9
Attended Work Opportunity Retention Clubg (%) 15.6
Average number of meetings attended, among those who attended 2.9 Average amount paid for attendance, among those who attendedh ($) 72.50
Sample size 506
(continued)
participants each) for most of the grant period. Participants were typically able to start the Monday after completing the job-readiness workshop. They were often paired with housing authority employees to prepare vacant apartments for new residents (by doing painting and minor maintenance, for example) and to do janitorial work in common areas. In a few instances, participants provided clerical support or grounds maintenance. CCA crew supervisors rotated

208
Table 5.3 (continued) SOURCES: MDRC calculations based on data from the ETJD management information system and the Center for Community Alternatives' Quickbase system. NOTES: A double dash indicates that the service was not offered. aMeasured as the duration between random assignment and last subsidized paycheck. bCalculated using net hours worked, assuming a seven-hour workday. cIncludes LEADERS and Reentry Clinic. dIncludes legal services related to child support, work, or family. eIncludes Family Life Skills class. fIncludes meetings with case managers. gThe program did not begin offering this activity until June 2013. hParticipants were paid $25 per meeting attended.
throughout the day to check progress and update each participant’s work log, which document-ed cooperation with the supervisor and coworkers, effort at work, personal presentation, and work reliability.
CCA experienced some degree of turnover among work-site supervisors for the Syra-cuse Housing Authority crews. To ensure continuous coverage when the program was between permanent supervisors, CCA sometimes hired supervisors for a day at a time, including a former program participant. In the final six months of the work crews, the operations coordina-tor increased his visits to the work site to help new supervisors oversee participants the way the program expected.
In March 2012, Catholic Charities became the second organization to host a work crew. At Catholic Charities, a small crew (generally four or five participants) assisted full-time employees with maintenance and light construction at a variety of properties. Crew members received experience in plumbing, welding, masonry, and plasterwork, and were supervised by a Catholic Charities staff member. During the winter, crews assisted with salting and shoveling. Catholic Charities noted it was sometimes a challenge to find work for participants, particularly in the winter.
Beginning in May 2012, a crew of seven or eight individuals picked up litter and shov-eled snow for the Downtown Committee of Syracuse, the business improvement district for the downtown corridor. (The City of Syracuse was named in the application as a potential work-site host, but it referred the program to the Downtown Committee of Syracuse.) Downtown Com-mittee leaders were initially concerned about placing participants downtown because they would be interacting with the public and would be perceived as Downtown Committee repre-sentatives. The program therefore took care to place participants with higher levels of job readiness on this crew (sometimes rotating them in from other crews).

209
In the grant application, CCA said it planned to explore the potential to engage private employers for transitional job placements. Discussions with several potential hosts were unsuccessful because employers had concerns about complex crew logistics, their ability to keep crews busy, or the challenges involved in hosting participants with criminal convictions.
● In early stages of program operations transitional job assignments could last varying lengths of time, but due to capacity constraints the program became stricter in adhering to a four-month maximum.
Transitional jobs were available for a maximum of four months. Some members of the earliest enrollment cohorts were allowed to stay longer than the four-month limit. This practice quickly resulted in PSI facing both capacity and cost constraints, however, as crews absorbed new participants before others had left for unsubsidized employment. The program said some participants stayed longer than anticipated because they became comfortable in their positions on the crews, while others had trouble finding unsubsidized employment. In response, partici-pants were given a one-month reminder about the four-month maximum. While the reminder was intended to reinforce an existing policy, program partners nonetheless reported that some participants who were already on crews felt they had been “fired” from their transitional jobs.
As shown in Table 5.3, among sample members who were ever placed in transitional jobs, the length of program participation (from random assignment to the last subsidized paycheck) was five months. The time from random assignment to the first paycheck was over one month, making the average time in the employment stage of the program around four months. Figure 5.2 shows the trend in transitional jobs participation. For most participants, employment began in the second or third month after random assignment, and by the seventh month after random assignment only 16 percent of the program group was working in subsi-dized jobs.
● Participation rates were high in all services except occupational training and financial literacy, which were not heavily emphasized elements of the program. Most services were implemented as intended. Large num-bers of participants received CCA’s enhanced legal and Reentry Clinic services.
Most participants (92 percent) attended the two-week job-readiness workshop (LEADERS), which they needed to complete before being placed on work crews. LEADERS was offered about every month and met daily for two weeks from 9:30 a.m. to 12:30 p.m. at CCA. The program had a strict attendance policy for the workshop: Participants were allowed one absence without notification (“no call, no show”) before they were required to retake the

210
class with the next cohort. The policy was not meant to be punitive; the intention was for participants to be exposed to all of the course content. In winter 2014, the program made a concerted effort to reengage individuals who had not completed the workshop. Participants who did return and complete the workshop were given the opportunity to join the final work crew. Ultimately 424 of 512 participants completed the LEADERS workshop (not shown).
Most participants (87 percent) received legal assistance, primarily related to child sup-port. Participants met with attorneys during the second week of the job-readiness workshop, and scheduled follow-up appointments at that time. The appointments ranged from 15 minutes to several hours depending upon the complexity of a participant’s situation. Legal aid providers estimated to the research team that they worked on order modifications for about half of participants. Attorneys said that as much as 65 percent of a participant’s first paycheck for the transitional job could be withheld for child support payments. If a child support order was set at $50 a month or less, they would not attempt to modify it. Legal aid providers said that their success in modifying orders varied by Family Court magistrate. If a participant’s income had
Figure 5.2
Subsidized Employment Over Time: Syracuse
0102030405060708090
100
1 2 3 4 5 6 7 8 9 10 11 12Perc
enta
ge w
orki
ng in
subs
idiz
ed jo
bs
Month relative to random assignment
SOURCE: MDRC calculations based on data from the ETJD management information system.
NOTE: Month 1 in this figure is the month in which random assignment occurred.

211
changed by 15 percent or more since the order was established, an attorney could file a change-of-circumstance petition on behalf of the participant.
Legal aid staff members also accompanied participants to the child support enforcement agency to help them complete paperwork, which they noted was particularly important for driver’s license reinstatement. They also worked with the Director of Child Support Services to request administrative concessions on a case-by-case basis (for example, vacating interest penalties on debt). Legal aid attorneys said it was the participant’s decision whether to notify the child support enforcement agency if his or her earnings increased, but the agency would learn about the earnings regardless and that the client could “get out ahead of it” by notifying the agency first.
The program originally budgeted for 200 participants to receive civic-restoration ser-vices from the Reentry Clinic, but had to reallocate resources to meet higher-than-anticipated demand. The program continued to provide these services as needed to participants during their job search (and even after they were hired if they were in a probationary or trial period).
Approximately 6 in 10 participants received parenting education services. Although this proportion is lower than the program desired, it represents an increase over participation rates in earlier iterations of the program. Class sizes fluctuated between 8 and 15 participants. Both program staff members and participants mentioned that transportation to class was sometimes a challenge for participants. Some participants joined classes open to the broader community when there were not enough of them to run a class exclusively for PSI. The parenting education provider explained that the diversity in these groups may have helped Parent Success Initiative participants see that everyone faces parenting challenges.
Occupational training was not a central feature of the model, though the program did allocate resources generally for participant support, which could cover occupational training from outside providers. If a participant wanted to attend training while on a crew, the four-month clock on the transitional job paused. Work-site supervisors said some participants did not take advantage of training because they needed the wages from the transitional job. Some occupational training courses required participants to have a high school diploma or equiva-lent, which also may have kept some of them out. Staff members suggested they would try to provide more of these training opportunities in future iterations of the program. Some partici-pants received Occupational Safety and Health Administration training at the Syracuse Housing Authority or the Educational Opportunity Center, or hazardous waste operations training through a partnership with an Environmental Protection Agency contractor. Neither of these is typically considered occupational training. Some participants also pursued ServSafe certification for food handlers.

212
● Large caseloads combined with some degree of turnover resulted in in-consistent case management.
As Table 5.3 indicates, nearly all participants received case management, which was typically the first service participants received as part of the program.17 In the initial 90-minute intake appointment, the case manager worked with each participant to outline the participant’s goals and service needs, assess his or her mental health, fill out immigration employment paperwork, offer help obtaining a photo identification, provide information on the work crew, conduct a substance-abuse assessment, and complete a résumé worksheet and needs checklist. Case managers met with participants regularly to provide referrals for program and community services, work on job-readiness skills, and assist with participants’ job-search activities. Initial-ly, four agencies located in different parts of the community provided case management services. By engaging multiple providers, program leaders hoped to situate services in areas convenient to participants. In practice, the program ended up assigning participants to the case managers with the lightest caseload at the time.
In the second year of the grant, the contract with one case management agency (Dunbar Association) was terminated due to administrative difficulties. The agency later closed its doors. CCA added a second case manager to its own staff for the remainder of the grant to replace the case manager at Dunbar.
Most case managers had previous experience in similar positions or with employment services before joining the program. Nonetheless, the case managers appeared to have different perspectives on what to emphasize in working with participants on job readiness (for example, working on résumés and mock interviews versus working to influence participant attitudes about being good citizens and “working within the system”).
There was considerable turnover in this position — only one case manager remained throughout the full duration of the grant. Case managers also expressed concerns that other factors may have limited the intensity and consistency of their work. First, they noted that initial intake session was not always long enough to develop a relationship with the participant or to assess him or her for mental health and substance abuse issues or other barriers to participation or employment. Similarly, they observed that they had fewer case management meetings with participants while they were working in the transitional jobs and afterward. These concerns were rooted in their consistently large caseloads (a cumulative total of 506 participants distrib-uted across four case managers), with as many as half of the people in that caseload actively
17In instances where a participant enrolled just before the scheduled start of a job-readiness workshop, it
is possible that the individual may have proceeded directly to the workshop before meeting with a case manager.

213
seeking services from the program at a given time. These large caseloads often made it difficult for case managers to find the time to support every participant.
● Participants did not reach the level of job readiness the program desired and had more difficulty with job retention than expected. These prob-lems led the program to make adaptations to the two-week workshop and to develop additional components.
Through the grant, program staff members said it was difficult to help participants achieve the level of job readiness the program hoped for. The program’s research coordinator held focus groups with participants to identify their challenges in finding and keeping unsubsi-dized employment. In spring 2013, the program added a second facilitator to the job-readiness workshop to improve the tutoring and math preparation participants received before they sat for the National Work Readiness Credential. The new facilitator also enabled the program to split the large group (about 20 participants) into two smaller groups so as to better engage all participants, with the hope they would retain more of the soft skills the program aimed to teach them. The facilitators explained they also made minor modifications to the curriculum. For example, they had participants complete a blank job application, as they found participants were unable to do so properly.
In June 2013, PSI added two new components designed to address participants’ job-readiness and job-retention needs. The first, known as Retention Counts! (available through the New York State Office of Probation Correctional Alternatives), took place while participants were in their transitional jobs. Participants were paid to attend class twice a month, for approx-imately 1.5 to 2 hours each session. About one-third of program participants attended this class. The curriculum covered money management, workplace stress management, and conflict resolution, and generally aimed to reinforce the soft skills presented during LEADERS. The curriculum was designed for formerly incarcerated people, and its facilitator pointed out it was important to be aware that not all participants were formerly incarcerated.
The second new component, called the Work Opportunity Retention Club, took place after the transitional jobs and was designed to help participants retain unsubsidized employ-ment. Table 5.3 shows about 16 percent of participants attended one or more meetings. Offered once a month in the evening, the club was facilitated by case managers and other program staff members, but was primarily designed as a peer support group for participants to share their experiences and lessons learned with searching for, obtaining, and keeping jobs. Listings of potentially relevant job openings and application instructions were also handed out during the meetings, and employment verification was collected from people already working in unsubsi-dized jobs, to confirm their eligibility for the retention incentive payments mentioned earlier. Pizza was provided, and participants received a $25 American Express gift card for their

214
attendance. In the early months of this group, the program sent invitation mailers to participants but found it could not accommodate all of those who were interested. To keep the group size manageable while still engaging a wide range of participants, case managers began to invite only those participants who had begun unsubsidized employment.
● The program’s approach to job development evolved substantially from its initial plans. In the final months of the grant period, the program was still trying to establish relationships with employers to identify unsubsi-dized employment prospects for program participants.
Initially, the program engaged outside entities to provide job development and job placement services, with case managers sharing responsibility for employment outcomes. The contract with a first vendor (Partners in Education and Business) was terminated in April 2012 due to nonperformance. Though the program experienced greater success with Career Start, the second vendor, program leaders felt Career Start focused too much on placing participants with a few employers with which it had staffing contracts. Program staff members also said that Career Start had a different organizational philosophy than PSI when it came to individuals below its desired levels of job readiness. In what was described as a mutual agreement to part ways, PSI allowed Career Start’s contract to expire in mid-July 2013.
CCA decided to bring job development in-house in late September 2013, and began to broaden the pool of employers with which the program had relationships. During the two months when the program did not have a job developer, case managers were expected to work with participants on job searching and job placement (as had been the expectation throughout the grant). Given their large caseloads at the time, and given that enrollment was still in pro-gress, case managers may not have been able to devote enough time to job placement during those months.
Participants met with a job developer when they were deemed “job-ready” by case man-agers, crew supervisors, and operations staff members — generally while the participant was still in a transitional job. At the time of the third site visit, the CCA job developer was attempting to spend less of his time working with participants and more on establishing employer relationships and matching openings with individuals.18 The job developer also created the lists of job open-
18In the fall of 2013, the evaluation team conducted a study that asked staff members to report the time
they spent on each program component during a specified period. Slightly more than 60 percent of the job developer’s time was spent on job-search activities over a two-week period, while nearly 40 percent was spent on establishing employer relationships and matching openings with individuals. Case managers reported spending from 1 percent to 24 percent of their time helping individuals search for unsubsidized jobs.

215
ings and application instructions that were distributed when participants picked up their transi-tional job paychecks and attended Work Opportunity Retention Club meetings.
As the transitional jobs ended in June 2014, the program anticipated shifting the respon-sibilities of several program staff members so they could focus solely on employment activities.19 The program was also busy entering information about participants’ work experience and interests into its data system, so that information would be available to support job placement and job development. This increased emphasis on employment may affect program group members’ employment and earnings, particularly for participants who began the program later in the grant period. For participants whose transitional jobs ended earlier, it is unclear how well the program was able to reengage and support them in their search for unsubsidized employment.
In retrospect, program leaders suggested the program may not have provided enough resources for job development from the beginning of the grant, and they wished they had invested more in this component earlier. The first contractor was provided resources equivalent to less than one full-time employee. The program was able to increase funding for the second vendor by reallocating funds from the planned literacy services component that did not materi-alize. Program leaders said that an ideal arrangement would incorporate both an in-house job developer and an external staffing agency.
● Most program partners expressed strong commitment to the program and its goals, and were willing to work through administrative burdens and logistical challenges in pursuit of those goals.
While the majority of program partners expressed strong support for the program’s leadership, goals, and implementation, a couple of partnerships appeared to be somewhat strained as the grant progressed. Some partnerships seemed hampered by the evaluation’s design (using random assignment), especially the program’s relationship with the Center for Court Innovation and the Family Court, which struggled with the limitation that program services could only be offered to the program group. Other concerns expressed related primarily to frustration with the referral and screening process and limited data sharing from the program regarding participants’ progress. This latter issue was raised despite CCA’s regularly scheduled meetings with partners, which included the sharing of participant data. The child support enforcement agency was particularly upset that CCA did not notify the agency when a partici-pant began working on a transitional job. Because CCA reported earnings for tax and unem-ployment insurance purposes on a quarterly basis, unless a participant notified the child support
19The program anticipated redeploying the services coordinator, the case managers, the job-readiness
and retention workshop facilitator, and a Jesuit volunteer working for the program to focus fully on employment services.

216
enforcement agency directly, that participant could have already left the transitional job before the agency could generate an income execution order.20
● Organizations hosting work crews reported high levels of satisfaction with the program.
Organizations that hosted work crews felt that program participants added to their ex-isting workforce. Partners overcame their initial concerns about hosting crews (related to some participants’ criminal histories and their uncertainty whether participants’ conflict-resolution skills would be adequate to handle potentially difficult interactions with the public). Syracuse Housing Authority leaders said the partnership helped increase the agency’s workforce at a time when it had been diminished drastically due to budget cuts. Staff mem-bers provided written recommendations and served as references for participants, and the organization was attempting to find opportunities to partner with CCA for future transitional jobs crews after the grant’s end.21
A handful of participants were hired permanently by a host organization, even though this outcome was never anticipated in PSI’s plans. That more weren’t hired permanently appeared to have been due more to employers’ financial constraints than to concerns about crew members’ preparedness for employment. Leaders at the Downtown Committee of Syracuse explained that program participants had done very important work: They allowed the Down-town Committee to complete tasks more quickly and expand litter pickup to outlying areas of downtown. One host organization said that the community as a whole benefited merely because crew members became more civic-minded citizens. All hosts agreed they would participate in the program again or a similar program.
● Some participants reported mixed experiences with the program.
A total of 84 participants were asked to complete a questionnaire about their experi-ences in the program, while they were still working in transitional jobs (44 in March 2012 and
20An income execution order sets in motion a process by which child support payments are automatical-
ly deducted from a noncustodial parent’s wages or other income source by the noncustodial parent’s employer or other income payer. See New York State Department of Child Support Enforcement (2016). While CCA acknowledged that this concern was legitimate, it also pointed out that it was in the unique position of being both program operator and employer. As an employer, it would have been inappropriate to share new hire information with the child support enforcement agency. As a program operator, however, CCA actively communicated to participants that they had an obligation to notify the agency about their employment.
21The Syracuse Housing Authority subsequently awarded CCA two contracts to continue the transition-al jobs model on a smaller scale.

217
Favorable Impression of the Value of Transitional Job Support andPreparation for Future Employment: Syracuse
Figure 5.3
(continued)
57%
65%
61%
77%
58%
67%
69%
86%
0 20 40 60 80 100
Preparation for futureemploymentd
Soft skills developmentc
Supervisor supportb
Relationships at worka
SyracuseSample size: 84
ETJD averageSample size: 516
Relationships at worka
Supervisor supportb
Soft-skills developmentc
Preparation for future employmentd
e
40 in March 2013).22 Figure 5.3 shows that 86 percent viewed their relationships at work positively. About two-thirds felt they were improving their soft skills. A smaller percentage,
22These respondents are not representative of all participants, since those surveyed were still involved with the program and thus may have been more satisfied with it than their counterparts who had stopped participating.

218
Figure 5.3 (continued)
SOURCE: MDRC calculations based on the ETJD participant questionnaire.
NOTES: The measures presented in this figure, relationships at work, supervisor support, soft-skillsdevelopment, and preparation for future employment were created based on an exploratory factor analysis of a pool of questions. These questions asked participants about their level of agreement with a particular statement on a scale of 1 to 7, where 1 indicates strong disagreement and 7 indicates strong agreement. Based on the results of the factor analysis, questions were grouped into factors and a mean score was calculated across the questions included in a particular factor; the percentages presented above represent the proportion of questionnaire respondents who averaged a score of 6 or higher on the questions in that factor, indicating a high level of satisfaction with their program experiences in that area.
With a few exceptions, questionnaires were administered to participants by the research team during site visits at events and activities when many participants would be available at once. Consequently, the responses obtained are from participants who attended program activities and were therefore likely to be more motivated and engaged than the full sample of program participants. For this reason, the results presented in this figure are not necessarily representative of all participant experiences and should be interpreted with caution; they are likely to be more positive.
aBased on agreement with the following statements: I understand what is expected of me on the job; I know whom at work to ask for help when I need it; My relationships with coworkers are positive and supportive; and My coworkers understand me and want me to succeed.
bBased on agreement with the following statements: I get the support or guidance that I need from my supervisor; My supervisor gives me advice about how to handle situations at work; and My supervisor helps me if personal issues come up that get in the way of working.
cBased on agreement with the following statements: I am learning how to work better with coworkers; I am learning how to cooperate better with supervisors; and This job has helped me learn to present myself better at work.
dBased on agreement with the following statements: The kind of work I am doing will help me get a decent-paying job later; I am learning specific job skills that I will use in the future; and I have met people through this job who may help me find a job in the future.
eTo account for varying questionnaire sample sizes across ETJD programs, the "ETJD average" is a weighted average of all programs such that each program is equally represented.
though still a majority, felt the transitional job was preparing them for future employment (58 percent).
In individual interviews and focus groups, participants said they enjoyed being in the workforce again. They appreciated the schedule and routine of the transitional job and took pride in their work, and also said they had built good relationships with staff members. Howev-er, participants also mentioned aspects of the transitional job where they were dissatisfied, including a lack of skills training, minimal oversight from crew supervisors, a scarcity of transportation options to and from program activities, and a feeling of being shuffled around among various staff members whose roles were sometimes unclear to them.
Additionally, some participants who worked alongside full-time Syracuse Housing Au-thority employees learned of their wages and subsequently felt “used” as a result of the pay

219
differential. Perhaps the largest source of frustration raised by participants related to their struggles to find unsubsidized jobs. Participants thought they would receive unsubsidized jobs automatically or that jobs would be sorted out for them while they were on a work crew, and seemed to be confused about how much of the onus of finding a job was on them. This confu-sion may mean that the program could have done a better job of communicating with partici-pants. Participants also believed they would be hired by their transitional job host organizations, even though program staff members emphasized that the work crew was a temporary learning and training experience and only a handful of participants had been hired permanently. When participants learned that only a few participants were hired directly from the transitional job, some questioned the effectiveness of the program. Box 5.1 describes one participant’s motiva-tion to enroll and his experiences with the program.
Some participants felt the job-readiness workshop was too long and was “a waste of time,” while others felt they learned a lot and appreciated the feedback they received from the mock interviews. Participants also had mixed feelings regarding staff members’ commitment to the program and participants; some thought program staff “genuinely cared” about participants and appreciated that staff members had experienced some of the same issues they were going through, while others felt they were “only there for their paycheck.” Some participants felt staff members were working with too many individuals, and complained about having to remind case managers that they were still waiting for things to be done.
Impacts on Participant Outcomes
Participation and Service Receipt Outcomes
The recruitment and screening process for study enrollment resulted in two research groups that included similarly hard-to-employ individuals seeking employment-related services. Although those assigned to the control group were not eligible for the grant-funded transitional job, they could seek services from other providers in the community. Table 5.4 presents information on participation in employment-related activities for both research groups, from a follow-up survey conducted about 12 months after random assignment.
● Although control group members had high rates of participation in em-ployment-related activities, program group members reported higher rates of participation in almost all types of services.
Nearly all program group members reported receiving help related to finding or keeping jobs, including help with job searching, job readiness, and career planning, and assistance paying for job-related costs. Among control group members, 59 percent reported receiving similar forms of support.

220
Box 5.1
Parent Success Initiative Participant Profile
“Robert,” a black man in his 50s, was familiar with CCA’s services before joining PSI. He had come to CCA a few years earlier hoping to be in the Second Chance Works program, but learned he was ineligible because he had not been in jail.* A couple of years later he was incarcerated, and upon his release he returned to CCA and went through the lottery for PSI. Robert says he entered the program with the goal of owning a business, and did not need the program’s child support assistance since he had already secured a child support modification. He explains, “I know where I need to go and what I need to do. Certain services I don’t really need or I’m not going to use. I don’t want to waste my time or their money if I don’t really need that service. That’s how I am. I only want to take what I can actually benefit from.” Instead, he was interested in the transitional job.
Robert describes the program as “a stepping stone.” He explains, “The money [from the transitional job] sucks, okay. This is the worst of the worst as far as pay, but it keeps you off the streets. It keeps you in a positive light, and you meet different connections. It’ll work, if you utilize it in the right way.” In his own words, Robert echoes the program’s aim for the transitional job. He explains the transitional job is about “getting people not used to working or having certain skills, getting them prepared for a real job. ’Cause a lot of some of the guys that come to work now, if it had been a real job, they’d have been fired already.” Robert feels he didn’t learn many occupational skills on the transitional job — “What can you learn cleaning a floor?” — but says he did a good job at it.
The program helped Robert obtain occupational training and obtain a license related to his goal of owning a business. He tells other participants about the training resources and to take advantage of all the program offers, but says that it’s up to participants to put in effort, too. He explains the program “connects you to a lot of resources that normally you just don’t have.... You got your own job counselor. But they’re going to do as much as you want them to do. If you don’t put nothing in, they’re not going to slap no job on you.”
Robert says the program staff members he encountered were “genuinely concerned” about participants and provided a lot of support. The program provided an alternative to the bleak situation he describes for some transitioning offenders, explaining, “When you just get out of jail and you ain’t got no family, it’s hard to get back up. You get out of jail and you got to be transitioned again, you got no place to stay, and you got no money. You’re going right back to what got you in jail from the very beginning. That’s the only option out there. Here [in the program] you meet people, hear different stories.... [I try to tell others to] just keep walking straight, you know what I mean? Jails, prisons, rehabs, and the morgues and the graveyards — they all full, but they’re gonna make room for you.... I try to, you know, talk to people that I know and give them some information [and tell them], ‘Man, you ain’t gotta do what I did.’” __________________________
*Second Chance Works was a program for parolees operated by CCA in 2011.

221
Table 5.4
One-Year Impacts on Participation and Service Receipt: Syracuse
Outcome (%) Program
Group Control
Group Difference
(Impact)
Ninety Percent Confidence
Interval
Employment support Received help related to finding or keeping a job 96.4 59.4 37.0 *** [32.4, 41.5]
Job search, job readiness, and career planninga 95.7 57.3 38.3 *** [33.7, 43.0] Paying for job-related transportation or equipment
costs 72.0 18.4 53.6 *** [48.3, 58.8]
Education and training Participated in education and training 42.8 26.6 16.2 *** [10.5, 21.8]
i
ESL, ABE, or high school diploma or equivalentb 18.0 14.1 3.9 [-0.6, 8.4] Postsecondary education leading to a degree 4.9 4.9 0.0 [-2.7, 2.7] Vocational training 27.3 11.6 15.7 *** [10.9, 20.6]
Received high school diploma or equivalent 3.4 2.8 0.6
[-1.5, 2.8]
Earned professional license or certification (not ncluding OSHA or forklift)c 13.4 9.7 3.6 [-0.4, 7.7]
Earned OSHA or forklift certification 10.2 4.0 6.3 *** [3.0, 9.5]
Other support and services Among those identified as formerly incarcerated at enrollment:d
Received help related to past criminal convictions 97.0 28.7 68.3 *** [61.6, 75.1] Handling employer questions about criminal history 94.9 26.4 68.5 *** [61.5, 75.5] Legal issues related to convictions 87.4 15.2 72.2 *** [64.9, 79.4]
Received help related to child support, visitation, parenting or other family issues 84.4 21.7 62.8 *** [57.9, 67.6]
Modifying child support debts or orders 73.0 12.8 60.2 *** [55.3, 65.1] Setting up visitation with child(ren) 28.6 6.6 22.0 *** [17.4, 26.7] Parenting or other family-related issues 62.8 12.5 50.2 *** [45.0, 55.5]
Received advice or support from a staff member at an agency or organization 79.0 31.8 47.2 *** [41.8, 52.7]
(continued)

222
Table 5.4 (continued)
]
]
Outcome (%) Program
Group Control
Group Difference
(Impact)
Ninety PercentConfidence
Interval
Received mentoring from a staff member at an
agency or organization 73.6 26.0 47.6 *** [42.1, 53.1
Received mental health assistance 21.4 22.6 -1.2 [-6.3, 3.9
Sample size 377 334
SOURCE: MDRC calculations based on responses to the ETJD 12-month survey. NOTES: Results in this table are regression-adjusted, controlling for pre-random assignment characteristics. Statistical significance levels are indicated as: *** = 1 percent; ** = 5 percent; * = 10 percent. aIncludes help with job searching, job referrals, developing a résumé, filling out job applications, preparing for job interviews, job-readiness training, and planning for future career or educational goals. bESL = English as a second language, ABE = adult basic education. cOSHA stands for Occupational Safety and Health Administration. In an effort to separate receipt of profession-al licenses or certifications that require more intensive and lengthy training (for example, a Certified Medical Assistant certificate or a commercial driver’s license) from those that can be earned following more cursory, one-day training, receipt of OSHA and forklift certifications, which fall into the latter group, is presented separately from receipt of other types of licenses or certifications. A review of all reported types of licenses or certifications revealed that OSHA and forklift certifications account for a large majority of the shorter-term, less intensive licenses and certifications received by sample members. dThese measures include only those who were identified as formerly incarcerated at study enrollment (program group = 146; control group = 127; total = 273).
Program group members were more likely to have participated in vocational training, which probably reflects participation in Occupational Safety and Health Administration certification courses. Outside of those courses, there was only a small and not statistically significant difference between the two groups in attainment of professional licenses or certifi-cates. There was no difference in participation in postsecondary education, and only a small and not statistically significant difference in participation in secondary or general education. As mentioned earlier, providing resources for occupational training was not a central feature of the model, and although literacy and high school equivalency services were originally part of the program model, after the intended partner withdrew from the program the funds were ultimately reallocated to other activities.
● Nearly three-quarters of program group members reported receiving help modifying child support debt or orders, and there were large im-pacts on the receipt of these services.
As described above, most concessions in child support were those that could be applied administratively, such as reinstatement of driver’s licenses suspended due to failure to pay;

223
order modifications required judicial action. Among the control group, only 13 percent received these services, compared with 73 percent of program group members. Nearly two-thirds of program group members reported having received help with parenting or other family-related issues. Only 13 percent of control group members reported receiving these services.
Among formerly incarcerated program group members, nearly all received help related to their past criminal convictions. Around 29 percent of control group members who had been incarcerated reported receiving these services.
Employment and Earnings Outcomes
Table 5.5 and Figure 5.4 present information on employment and earnings-related out-comes using unemployment insurance data from the National Directory of New Hires and data from the 12-month follow-up survey.23
● There were large impacts on employment and earnings in the first year; most of this impact was due to employment in transitional jobs.
As shown in Table 5.5, 90 percent of program group members ever worked during the one-year follow-up period, compared with 59 percent of control group members, an increase of over 30 percentage points. For program group members, this measure of employment includes the transitional jobs provided by CCA; approximately 80 percent of program group members participated in transitional jobs during this period. In addition, program group members were employed for more time and had slightly higher earnings than control group members.
● Although there is a statistically significant impact on employment in the first quarter of the second year of follow-up, it appears to be in large part the result of participation in transitional jobs.
As shown in Figure 5.4, transitional jobs accounted for most of the increase in em-ployment for program group members during the early part of the follow-up period, and the employment rate for program group members declined by Quarter 3 as these jobs ended. Although the impact on employment was still statistically significant in the first quarter of the second year of follow-up, more than half of this 7 percentage point difference appears to be due to sample members working in transitional jobs. Impacts on earnings follow the same pattern, with bigger effects early in the follow-up period while program group members were working
23Survey response rates were 75 percent in the program group and 67 percent in the control group. The
analysis presented in Appendix H finds no evidence that these differences in response rates biased the results of the impact analysis.

224
Table 5.5
One-Year Impacts on Employment and Earnings: Syracuse
Outcome Program
Group Control
Group Difference
(Impact)
Ninety PercentConfidence
Interval
Primary outcomes (based on administrative data) Employmenta (%) 90.0 58.7 31.4 *** [27.2, 35.5]
ETJD subsidized employment (%) 78.7
--
Number of quarters employed 2.4 1.4 1.1 *** [0.9, 1.2] Average quarterly employment (%) 60.6 33.8 26.8 *** [23.6, 30.1] Employment in all quarters (%) 21.3 10.2 11.1 *** [7.5, 14.7]
Total earnings ($) 3,901 2,928 973 *** [516, 1,430]
ETJD subsidized earnings ($) 1,301 --
Total earnings (%)
$5,000 or more 23.6 20.6 3.0 [-1.1, 7.2] $7,500 or more 14.9 14.0 0.9 [-2.6, 4.5]
$10,000 or more 8.6 9.3 -0.7 [-3.5, 2.1]
Employment in the first quarter of Year 2 (%) 43.3 36.4 6.9 ** [2.0, 11.8]
ETJD subsidized employment in the first quarter of
Year 2 (%) 3.9 --
Sample size b 505 498
Self-reported outcomes (based on survey data) Ever employed in Year 1 (%) 76.2 59.4 16.7 *** [11.0, 22.5]
Currently employed (%) 49.1 36.6 12.5 *** [6.4, 18.7]
Currently employed in transitional job program (%) 1.3 0.3 1.0 [-0.2, 2.2]
Type of employment (%)
Not currently employed 51.8 64.8 -13.0 *** [-19.2, -6.7] Permanent 31.4 23.8 7.6 ** [1.9, 13.2] Temporary, including day labor and odd jobs 16.5 11.1 5.4 ** [0.9, 9.8] Other 0.3 0.3 0.1 [-0.6, 0.7]
(continued)

225
Table 5.5 (continued)
Outcome Program
Group Control
Group Difference
(Impact)
Ninety Percent Confidence
Interval
cAmong those currently employed:
Hours worked per week 30.6 30.9 -0.4
Hourly wage ($) 10.6 9.8 0.8
Hours worked per week (%)
More than 20 hours 34.7 27.3 7.4 ** [1.5, 13.2]
More than 34 hours 21.9 15.6 6.3 ** [1.4, 11.2]
Hourly wage (%) ]
]
More than $8.00 31.4 22.9 8.5 ** [2.8, 14.2
More than $10.00 13.5 7.5 6.0 ** [2.1, 9.9
Sample size 377 334
SOURCES: MDRC calculations based on quarterly wage data from the National Directory of New Hires and responses to the ETJD 12-month survey. NOTES: Results in this table are regression-adjusted, controlling for pre-random assignment characteristics. Statistical significance levels are indicated as: *** = 1 percent; ** = 5 percent; * = 10 percent. aEmployment rates and earnings include both ETJD subsidized jobs and all other jobs covered by unemployment insurance. bOne sample member is missing a Social Security number and therefore could not be matched to employment data. cThese measures are calculated among those employed at the time of the survey; they are therefore considered nonexperimental and are not tested for statistical significance.
in transitional jobs, and smaller effects toward the end. Impacts estimated from the survey also showed statistically significant positive effects on employment.
● Impacts on employment and earnings were largest among those with no recent work experience.
Prior research suggests that employment programs may be more or less effective for certain subgroups of people.24 ETJD is based on the hypothesis that the programs may be more effective for people who are the least “employable” and who are therefore unlikely to find jobs on their own, without assistance from a program. The research team therefore examined the
24Zweig, Yahner, and Redcross (2010).

226
Primary outcomes (based on administrative data)
(continued)
Figure 5.4
Employment and Earnings Over Time: Syracuse
0102030405060708090
100
0***
1***
2***
3**
4**
Perc
enta
ge e
mpl
oyed
Quarter after random assignment
Program group total employment
Control group employment
450
1,3091,100 1,044
1,151
286
662896 1,085 1,117
0
500
1,000
1,500
2,000
2,500
3,000
3,500
0***
1***
2**
3*
4
Ave
raga
ge e
arni
ngs (
$)
Quarter after random assignment
Program group Control group
Program group ETJD subsidized employment

227
Figure 5.4 (continued)
SOURCE: MDRC calculations based on quarterly wage data from the National Directory of New Hires.
NOTES: Results in this figure are regression-adjusted, controlling for pre-random assignment characteristics.
Statistical significance levels are indicated as: *** = 1 percent; ** = 5 percent; * = 10 percent.Employment rates and earnings include both ETJD subsidized jobs and all other jobs covered by
unemployment insurance.
program’s impacts on employment among subgroups of people who had more or less recent work experience when they enrolled in the program. Individuals who had been employed for at least one quarter in the year before random assignment were assumed to be more employable than individuals who had not worked at all during that year. As shown in Table 5.6, levels of employment and earnings are lowest among those who did not work at all in the previous year, suggesting that prior-year employment is a fairly good predictor of employment in the year after random assignment.
Consistent with the ETJD theory, the program’s impacts on employment and earnings in the first year are largest for those who did not work at all in the previous year. Among those who did not work at all in the previous year, 87 percent of program group members were employed at some point during the year after random assignment, compared with just 42 percent of the control group. Program group members in this subgroup earned about $1,200 more than their control group counterparts during the follow-up period.
An additional subgroup analysis was also conducted examining whether there were dif-ferences between the impacts for participants who enrolled in the program in its first year and those who enrolled in its second year. As described earlier, the program evolved over time, with some features being added later in the grant period. It is possible that the added job-readiness components and changes in the approach to job development could have led to differences in impacts for those who enrolled later. However, Appendix Table D.2 shows that impacts on employment and earnings outcomes did not differ by time of program entry.
Child Support and Family Relations Outcomes
The main reason the program might have effects on child support payments would be because it caused changes in employment and earnings. In this case, impacts on employment were expected to occur if only because the program group members received transitional jobs. However, the jobs lasted a very short time and participants may not have reported the employ-ment to the child support agency, so it is possible that income withholding may not have been

228
Table 5.6 One-Year Impacts on Employment and Earnings, by Employment Status in the Prior Year: Syracuse
Did Not Work in Prior Year Worked in Prior Year
Outcome Program
Group Control
Group Difference
(Impact)
Ninety Percent
Confidence Interval
Program Group
Control Group
Difference (Impact)
Ninety Percent
Confidence Interval
Difference Between
Subgroup Impactsa
T
E
S
]
] ] ]
Employmentb (%) 87.2 42.3 44.9 *** [38.9, 50.9] 92.8 77.1 15.8 *** [10.2, 21.3 ††† ETJD subsidized employment (%) 79.3 -- --
77.5 -- --
8 ***
†
otal earnings ($) 3,074 1,841 1,232 *** [711, 1,754] 4,871 4,178 693 [-196, 1,583Average quarterly employment (%) 54.1 22.7 31.4 *** [27.0, 35.8] 67.7 46.9 20. [15.7, 25.9 †
mployment in the first quarter of Year 2 (%) 30.6 26.6 4.0
[-2.5, 10.4] 58.6 47.9 10.8 ** [2.9, 18.6
ample size 283 258 222 240
OUR
erly
om the
l Dire
Hw ires.
data S CE: MDRC calculations based on quart wage fr Nationa ctory of Ne NOTES: Results in this table are regression-adjusted, controlling for pre-random assignment characteristics. Statistical significance levels are indicated as: *** = 1 percent; ** = 5 percent; * = 10 percent. aWhen comparing impacts between two subgroups, an H-statistic is generated. The H-statistic is used to assess whether the difference in impacts between the subgroups is statistically significant. Statistically significant differences across subgroups are indicated as: ††† = 1 percent; †† = 5 percent; † = 10 percent. bEmployment rates and earnings include both ETJD subsidized jobs and all other jobs covered by unemployment insurance.

229
implemented in a timely way. If that were the case, the transitional jobs would have had a smaller effect on child support payments.
● There was a modest impact on paying formal child support for sample members who enrolled during the first year of the program, and that impact occurred at roughly the same time as the transitional jobs.
Due to resource constraints, the state child support agency was not able to provide complete administrative data on child support outcomes for all sample members in time for this report. As a result, the analysis includes only those sample members who enrolled during the first year of the program.25 As shown in Table 5.7, only about a third or fewer sample members in the program and the control group paid any child support in the first year following enroll-ment. However, there was a modest impact on paying formal child support — 37 percent of program group members paid child support compared with 30 percent of the control group. A comparison of the line graphs in Figures 5.4 and 5.5 reveals that although the magnitude of the impact on child support payments does not correspond with the impact on employment, the timing of the impact roughly corresponds with employment in the transitional jobs.
On the 12-month survey, both the program and the control group reported providing in-formal child support at higher levels than formal child support. Program group members were more likely to report having provided informal child support than control group members. More than half of the sample reported seeing their children at least a few times per week. There were no statistically significant differences between program and control group members in how frequently they saw their children during the three months before the survey was administered.
Criminal Justice Outcomes
Although PSI targeted noncustodial parents, CCA’s history in the community as a pro-gram serving formerly incarcerated people meant that many of the noncustodial parents who enrolled had criminal backgrounds. As noted earlier, a little under half of sample members had ever been incarcerated before enrolling in the study. Of them, a large proportion (42 percent) had been released in the previous year. PSI might therefore be expected to affect criminal justice involvement, particularly among sample members who had been incarcerated recently.
25An analysis of the data that were available for all participants found no statistically significant differ-
ences between those who entered the program in the first year of its operation and those who entered later. See Appendix Table D.2.

230
Table 5.7
One-Year Impacts on Child Support and Family Relations: Syracuse
Outcome Program
Group Control
Group Difference
(Impact)
NinetyPercent
ConfidenceInterval
Primary outcomes (based on administrative data)a
Paid any formal child supportb (%) 36.6 29.6 [1.1, 12.9]
Among those who paid child support:
7.0 *
]
]
]
Months from random assignment to first paymentc 4.4 4.5 -0.1
Months of formal child support paid 1.7 1.4 0.3 [0.0, 0.6
Amount of formal child support paid ($) 337 206 131 [-127, 389
Sample size 272 268
Self-reported outcomes (%) (based on survey data) Currently a noncustodial parent of a minor-age child 81.4 80.3 1.0 [-3.8, 5.9
Provided informal cash support or noncash support in the past month 62.8 54.3 8.6 ** [2.5, 14.6]
Informal cash support 47.3 37.0 10.3 *** [4.3, 16.4]
Noncash support 60.2 52.2 8.0 ** [2.0, 14.1]
Owing child support affects willingness to take jobs 21.4 19.4 2.0 [-3.1, 7.1]
Incarcerated for not paying child support 1.6 2.4 -0.8 [-2.5, 0.9]
Among those with minor-age children:d
Frequency of contact with focal child in the past 3 monthsEvery day or nearly every day 31.4 31.2 0.2
A few times per week 25.0 22.1 2.9A few times per month 11.7 12.0 -0.3Once or twice 6.7 6.2 0.4Not at all 25.2 28.4 -3.2
Sample size 377 335
(continued)

231
Table 5.7 (continued)
S OU RCES: MDRC calculations based on child s upport agenc y data and res ponses to th e ETJD 12-mont h survey. NOTES: Results in this table are regression-adjusted, controlling for pre-random assignment characteristics. Statistical significance levels are indicated as: *** = 1 percent; ** = 5 percent; * = 10 percent. aDue to incomplete data, child support measures based on administrative data only include sample members who were randomly assigned during the first year of the program (by December 31, 2012). bMeasures of formal child support include all payments made through the state's child support collection and disbursement unit, including funds from employer withholding and other sources (for example, tax intercepts). cThis measure is calculated among those who paid child support during the follow-up period; it is therefore considered nonexperimental and is not tested for statistical significance. dThis measure is calculated among those who reported having a minor-age child at the time of survey; it is therefore considered nonexperimental and is not tested for statistical significance. The focal child is defined as the youngest minor-age child living outside of the sample member's household; if the sample member reports no minor-age children living outside of his or her household, the focal child is the youngest minor-age child residing within the household.
● The program had little impact on arrests, convictions, or incarceration.
Administrative data on criminal justice outcomes are from state arrest and conviction records, and from the state prison system (jail data were not available). As shown in Table 5.8, around 20 percent of both the program and control groups were arrested during Year 1. While slightly more program group members were convicted of crimes, this difference was not statistically significant. The administrative and survey data both show the program caused a small (not statistically significant) decrease in incarceration during the follow-up period. Although both sources show a reduction in the number of days incarcerated, the survey-based impact is a little larger, and is statistically significant. The differences between the results from the two data sources probably reflect the fact that the administrative data do not cover incarcera-tion in jail, only New York State prison, or incarceration in different jurisdictions. Survey respondents were asked to report on both prison and jail incarceration, in any jurisdiction.
Economic and Personal Well-Being Outcomes
● There were few statistically significant impacts on self-reported personal well-being. Program group members were more likely to report being in good health and were less likely to have experienced serious psychologi-cal distress.
Table 5.9 presents information on a number of measures of economic and personal well-being. There were few differences between the program and control groups. More than two-thirds of sample members had experienced a financial shortfall in the previous year, and over a quarter of both research groups had had insufficient food in the previous month. On
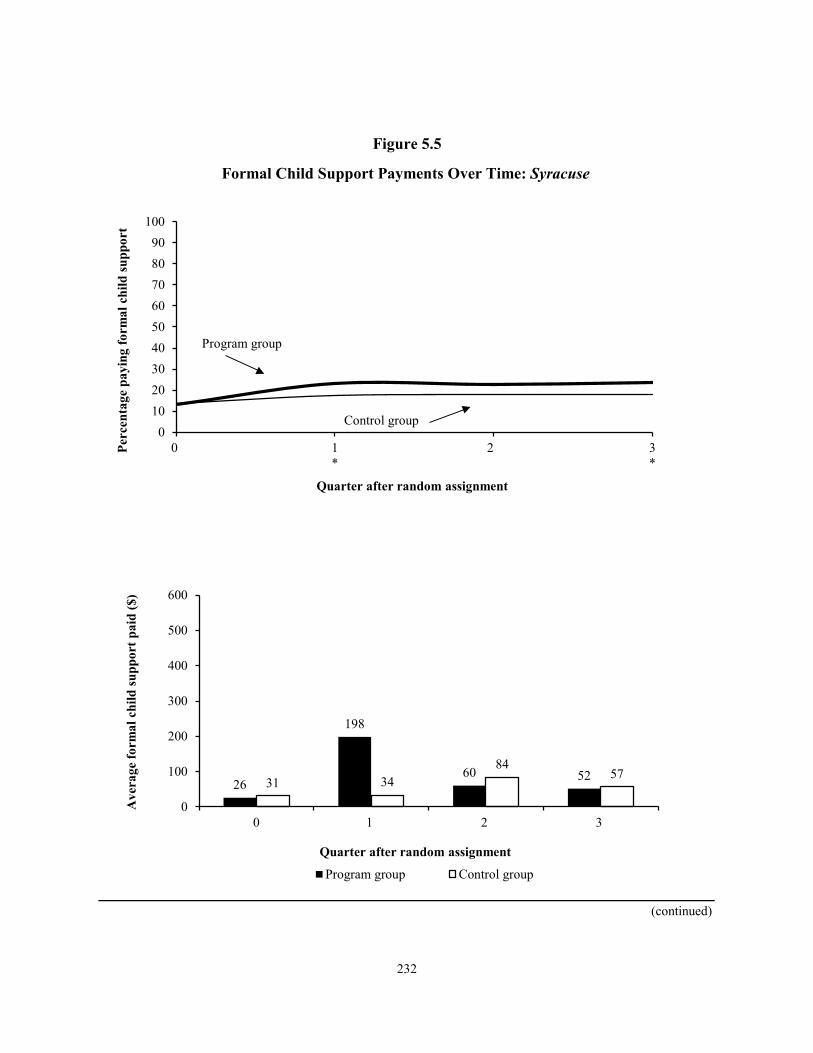
232
Primary outcomes (based on administrative data)
(continued)
Figure 5.5
Formal Child Support Payments Over Time: Syracuse
0102030405060708090
100
0 1*
2 3*
Perc
enta
ge p
ayin
g fo
rmal
chi
ld su
ppor
t
Quarter after random assignment
Program group
Control group
26
198
60 5231 3484
57
0
100
200
300
400
500
600
0 1 2 3
Ave
rage
form
al c
hild
supp
ort p
aid
($)
Quarter after random assignment
Program group Control group

233
Table 5.8
One-Year Impacts on Criminal Justice Outcomes: Syracuse
Figure 5.5 (continued)
SOURCE: MDRC calculations based on child support agency data.
NOTES: Results in this figure are regression-adjusted, controlling for pre-random assignment characteristics.Statistical significance levels are indicated as: *** = 1 percent; ** = 5 percent; * = 10 percent.Due to incomplete data, child support measures based on administrative data only include sample members
who were randomly assigned during the first year of the program (by December 31, 2012). Measures of formal child support include all payments made through the state's child support collection and
disbursement unit, including funds from employer withholding and other sources (for example, tax intercepts).
Outcome Program
Group Control
Group Difference
(Impact)
Ninety Percent Confidence
Interval
Primary outcomes (based on administrative data)
Arrested (%) 20.1 21.2 -1.1 [-5.2, 3.0]
Convicted of a crime (%) 18.2 15.4 2.8 [-1.0, 6.7]
Incarcerated in prison (%) 3.7 4.6 -0.9 [-3.0, 1.2]
Total days incarcerated in prison 4.0 6.7 -2.7 [-5.9, 0.5]
Arrested, convicted, or admitted to prison (%) 22.4 24.0 -1.5 [-5.8, 2.7]
Sample size 506 498
Self-reported outcomes (based on survey data) Incarcerated (%) 21.4 25.5 -4.1 [-9.2, 1.1]
Total days incarcerateda 20.4 30.3 -9.8 * [-18.8, -0.8]
On parole or probation (%) 31.1 33.6 -2.5 [-8.0, 3.0]
Sample size 377 334
SOURCES: MDRC calculations based on criminal justice data and responses to the ETJD 12-month survey. NOTES: Results in this table are regression-adjusted, controlling for pre-random assignment characteristics. Statistical significance levels are indicated as: *** = 1 percent; ** = 5 percent; * = 10 percent. aThis measure includes a small number of outlier values resulting from sample members who were interviewed more than 18 months after study enrollment.

234
Table 5.9
One-Year Impacts on Economic and Personal Well-Being: Syracuse
Outcome (%) Program
Group Control
Group Difference
(Impact)
Ninety Percent
Confidence Interval
Experienced a financial shortfall in the past 12 months 68.4 69.4 -1.0 [-6.8, 4.8]
Could not pay rent or mortgage 50.8 49.4 1.4 [-4.8, 7.6] Evicted from home or apartment 12.5 13.0 -0.5 [-4.7, 3.7] Utility or phone service disconnected 46.2 46.0 0.2 [-6.0, 6.5]
Could not afford prescription medicine 26.9 26.0 0.9 [-4.6, 6.5]
Had insufficient food in the past month 26.4 29.0 -2.6 [-8.1, 3.0]
Housing in the past month
Rented or owned own apartment or room 39.1 37.9 1.1 [-4.8, 7.0] Lived with family or friendsa 53.1 53.3 -0.2 [-6.3, 5.8] Homeless or lived in emergency or temporary housing 4.8 5.7 -0.9 [-3.7, 1.9] Incarcerated, on work release, or living in a halfway house 2.3 2.8 -0.5 [-2.5, 1.4] Other 0.8 0.3 0.5 [-0.4, 1.4]
Is currently in good, very good, or excellent health 73.1 66.9 6.1 * [0.5, 11.7]
Had health insurance coverage in the past month 59.2 57.4 1.8
[-4.2, 7.9]
Health coverage was employer-based 7.4 4.7 2.7 [-0.3, 5.7]
Experienced serious psychological distress in the past monthb 15.2 21.4 -6.2 ** [-11.0, -1.5]
Sample size 377 334
SOURCE: MDRC calculations based on responses to the ETJD 12-month survey. NOTES: Results in this table are regression-adjusted, controlling for pre-random assignment characteristics. Statistical significance levels are indicated as: *** = 1 percent; ** = 5 percent; * = 10 percent. aIncludes those who lived with friends or family and paid rent and those who lived with friends or family without paying rent. bA score of 13 or higher on the Kessler-6 (K-6) scale is used here to define serious psychological distress. The K-6 assesses how often during the past month a respondent felt so sad that nothing could cheer him or her up; nervous; restless or fidgety; hopeless; that everything was an effort; or worthless. As a result of minor differences between the scale used to administer the K-6 in the ETJD 12-month survey and the standard K-6 scale, the percent-ages presented in this table may slightly underestimate the incidence of serious psychological distress among the ETJD sample.

235
average, program group members’ small increase in earnings did not reduce their likelihood of experiencing these problems. However, program group members were more likely to report being in good health, and were less likely to have experienced psychological distress in the past month.
Conclusion PSI was designed to help noncustodial parents develop employability skills, establish recent work histories, and change their attitudes about child support and work. After they completed a two-week job-readiness workshop, participants were placed in fully subsidized, temporary positions on work crews at partner organizations. This transitional employment experience was enhanced with other program services including case management, legal assistance for child support and other civil matters, Reentry Clinic services, parenting education, and assistance in finding and retaining unsubsidized employment.
PSI succeeded in meeting its sample enrollment targets, although it did face and address challenges along the way. Most notably, several expected sources of referrals did not generate the number of prospective applicants anticipated. Ultimately, this required CCA to rely on broader outreach and marketing efforts. Television advertising during the last year of the grant proved to be particularly effective, as was the use of gift card rewards for participants who made referrals to the program.
Overall, the program was implemented as designed. Among those who were randomly assigned to the program, the vast majority attended the two-week job-readiness workshop (92 percent) and entered transitional jobs (80 percent). Nearly all program group members needed and received legal assistance. Several areas required ongoing attention and oversight, however. Although the program had four case managers and a network of partner organizations to help with case management, caseloads were large, particularly during the second half of the grant, and this strained the teams’ ability to provide individual support. The program also had to refine its approach to unsubsidized job development and placement over time. After unsuccessful experiences with two job development and placement vendors, the CCA eventually brought these functions in-house in the fourth year of the grant.
As suggested by the implementation analysis, the program was successful in providing services to program participants, increasing participation in services related to employment, child support, and criminal justice. The program group also worked more and had higher earnings than the control group in the year following random assignment, largely because of high rates of participation in subsidized employment. These large increases in employment and earnings during the first year did not translate directly to sizable impacts on child support, however; there were only modest impacts on child support payments. There were few differ-

236
ences between program and control group outcomes related to criminal justice and overall well-being. It is not possible at this point to determine whether the program produced long-term impacts. Further follow-up is required to determine whether the impacts observed will continue beyond the first year. A 30-month follow-up report is planned.

Chapter 6
Next STEP (Fort Worth, TX)

THIS PAGE INTENTIONALLY LEFT BLANK

239
Executive Summary
Next STEP (for Subsidized Transitional Employment Program) operated a wage-subsidy transitional jobs model in Fort Worth, Texas between November 2011 and June 2014, serving individuals recently released from the Texas state and federal prison systems. The program paid 100 percent of participants’ wages in the first eight weeks of employment and 50 percent in the second eight weeks. In addition to the wage subsidy, Next STEP provided a range of services to help people prepare for and find employment. The services included comprehensive assess-ments and job-readiness workshops for all participants and, for those who could benefit from them, General Educational Development (GED) test preparation, short-term training, counsel-ing, and cognitive behavioral therapy workshops. Once program participants completed the initial job-readiness classes, a job developer began trying to place them in subsidized and unsubsidized jobs.
Main Findings •
•
The study sample consisted of recently released state and federal prison-ers who were highly disadvantaged, with 41 percent homeless or living in transitional housing. The sample was racially diverse relative to the other two programs that targeted the formerly incarcerated population. About half of study participants were black and another third were white, 90 percent were male, and 91 percent were not married when they enrolled. Most (86 percent) had at least a high school diploma or equivalent, which is higher than the average across the three Enhanced Transitional Jobs Demonstration (ETJD) programs targeting formerly incarcerated people (75 percent). Very few had worked at all in the previous year, reflecting their recent incarcera-tion, but 93 percent had some previous work experience. Interestingly, while 45 percent had minor-age children and 35 percent were noncustodial parents, fewer than 10 percent had current child support orders.
Next STEP experienced few challenges with recruiting participants and, after it acquired additional referral sources, met its target sample goals for the study. Next STEP initially focused on recruiting individuals newly released from the Texas state prison system and on parole. Over time, it ex-panded its recruitment efforts to ensure it met the sample target. It began sending letters to individuals whom the Texas Department of Criminal Jus-tice (which oversees state parole) listed as having been recently released, and

240
eventually Next STEP also began recruiting from federal prisons, relying on federal probation officers to refer interested participants.
•
•
•
While participants had access to ample services, just 39 percent of program group members worked in subsidized jobs. The intended mod-el was premised on helping participants to become “job-ready” and then helping them find subsidized jobs that would turn into permanent employ-ment with the same employer. The Next STEP wage subsidy model did not place participants in transitional jobs; rather participants had to search and interview for jobs. This approach resulted in long delays from the times participants enrolled to the times they began working, which caused con-siderable attrition from the program. Most program group members never worked in subsidized jobs.
Next STEP significantly increased participation in nearly all activities and services. Program group members reported significantly higher levels of participation in activities and services than control group members in every activity or service measured, with the exception of postsecondary education, which was not a focus of the model. As expected, estimated impacts on em-ployment-related assistance are especially large, with nearly all program group members reporting getting help with job searching, career planning, and paying for job-related expenses.
Over the first year of follow-up, Next STEP did not significantly in-crease unemployment insurance-covered employment. However, the cli-ent survey suggests that the program did increase employment overall, possibly in areas not covered by the administrative wage records.1 The analysis of administrative data found that just under three-quarters of both program group and control group members were employed at some point during the first year. According to the survey, however, program group members were more likely to report being employed in the first year than control group members (88 percent versus 82 percent) and earned higher hourly wages than control group members. While client surveys often report more stints of employment than are found in administrative wage records, the difference in employment between the two data sources is substantially greater in Fort Worth than in any other ETJD city.
1The administrative data include unemployment insurance wage records from the National Directory of
New Hires and program records detailing subsidies paid to participants, which were not included in the unemployment insurance wage records.

241
• Next STEP reduced arrests and incarceration. This reduction was con-centrated among individuals who had a high risk of recidivism. The pro-gram significantly reduced arrests by 6 percentage points and incarceration in jail by 5 percentage points. Among those who were at high risk of recidivism the program reduced recidivism by 19 percentage points in the first year of follow-up. The program model — which provided individual counseling, cognitive behavioral therapy workshops, and other services — may have been more effective for participants at higher risk and with greater needs.
This chapter is divided into three parts. The first part provides background information that places the intervention and impacts in context. The next section describes staffing and recruitment and the intervention as operated. The final section presents impacts on participation in program services, employment, recidivism, and child support payments.

242
The Next Step Program
Background The Next STEP program, operated by Workforce Solutions for Tarrant County (the workforce development board of the county that includes Fort Worth, Texas) is one of three ETJD pro-grams that targeted formerly incarcerated people. Next STEP tested a wage-subsidy transitional jobs model, in which participants sought subsidized employment usually with private, for-profit firms. The program paid 100 percent of participants’ wages in the first eight weeks of employ-ment and 50 percent in the second eight weeks. A number of contextual and other background factors are important for understanding the implementation and impact of the program.
Context
The Next STEP program delivered its services in Fort Worth, a city in the Dallas-Fort Worth-Arlington Metropolitan Statistical Area, which is the largest metropolitan area in the South. Its economy was doing well during the period of the study, with an unemployment rate in Tarrant County of 5.3 percent in June 2014, down from over 8 percent in 2010.2 Some of the major private companies located in Fort Worth are in the aviation industry, including American Airlines, Lockheed Martin, and Bell Helicopters.3 Other major industries include life sciences, logistics, manufacturing, and natural gas.4 Staff members noted that among the types of jobs that interested Next STEP participants, the county experienced an increase in manufacturing, warehousing, and service jobs and a decrease in oil and gas jobs during the time the program operated. They also noted that while a number of large corporations are headquartered in the Fort Worth area, the employers interested in Next STEP were small and medium-sized.
Although the economy was improving, individuals on parole faced several obstacles to gaining employment and obtaining benefits. They were required to search for employment as a condition of parole, though having a felony conviction may have limited their job opportunities. They also had to juggle other requirements imposed by the Tarrant County parole division that could compete with their job searches, including completing a four-hour substance-abuse class, and possibly attending Narcotics Anonymous, GED classes, and anger-management classes.
Although they often needed financial assistance, members of the study population were eligible for very few public benefits. In Texas, individuals who are convicted of drug offenses and on parole are banned from receiving Supplemental Nutrition Assistance Program (SNAP)
2Workforce Solutions for Tarrant County (2015). 3Fort Worth Chamber of Commerce (2016b). 4Fort Worth Chamber of Commerce (2016a).

243
and Temporary Assistance for Needy Families (TANF) benefits.5 Finally, parolees have financial obligations, including a monthly $10 supervision fee, a monthly $8 crime fee (applied to the Crime Victim Compensation Fund), restitution based on their monthly incomes, and postsecondary education reimbursement for college courses they received in prison.
The Next STEP program was designed to help these individuals soon after their release from prison. Other services were available in Tarrant County to help individuals recently released from prison search for employment, but Next STEP was the only subsidized employ-ment program operating in the county during the grant period. Before Next STEP, Tarrant County operated two prisoner reentry programs. Project Re-Integration of Offenders, a reentry program funded by the state, lost that funding in 2011. Tarrant County STEP, a transitional jobs program that focused on probationers and that was funded by the American Recovery and Reinvestment Act of 2009, also ended in 2011. During the grant period, Texas ReEntry Ser-vices, a nonprofit organization in Fort Worth, provided prisoner reentry services that focused primarily on employment services, case management, supportive housing, and GED assistance; it did not provide subsidized jobs.6
Intended Model
Next STEP was designed to help participants become job-ready first, and then help them find subsidized employment in private-sector jobs that would become permanent. Figure 6.1 illustrates the components of the program model and their sequence.
All participants received a comprehensive job-readiness assessment at the start of the program, conducted by Guinn Healthcare Technologies, an outside organization engaged for this purpose. After the assessment, participants attended an unpaid, two-week job-readiness workshop, referred to as “boot camp.” The assessments and boot camp took place in the first few weeks after enrollment. Case managers met with participants weekly and sometimes daily during this stage of the program. Some participants received one-on-one mental health counsel-ing from Guinn Healthcare. In addition, participants also had access to legal assistance and short-term training to help them become job-ready.
After case managers determined that participants were ready, job developers would begin working with them to help them find subsidized jobs. According to Next STEP’s ETJD grant proposal, job developers were to work with the participants “hand-in-hand to find
5The state legislature lifted the lifetime ban on SNAP benefits in September 2015, though individuals are
only eligible for SNAP after completing their sentences. Crampton (2015). 6Texas ReEntry Services provided employment services to 270 individuals in 2013.

244
Figure 6.1
Next STEP Program Model
Participant enrollment
Comprehensive assessmentTwo-week job readiness
workshopCase managementSearch for employmentNetworking meetingsFinancial incentives
Preemployment stage
Full subsidy with aprivate-sector employer
Employers to sign intent-to-hire form after 30 days of employment
Case managementMonthly retention meetingFinancial incentives
Stage one
Unsubsidized employment with the same employer
Quarterly retention meetingsFinancial incentives
Partial subsidywith the same employer
Case management Monthly incentive meetingFinancial incentives
Stage two

245
appropriate employer placements, based on the participants’ work experience, strengths, passion, skill sets, and career aspirations.” They held networking meetings weekly that provided participants with ongoing assistance and opportunities to meet employers.
Because participants were expected to keep their jobs after the subsidy ended, the pro-gram only entered into subsidy contracts with employers that agreed to retain participants if they performed well. After a participant had spent 30 days in a job, the employer had to sign a form certifying its intent to hire the participant after the end of the subsidy (about three months later). After they started subsidized employment, participants were expected to meet with their case managers weekly to receive transportation assistance, and to attend monthly retention meetings. Once they secured unsubsidized jobs, participants were invited to attend quarterly retention meetings.
The Next STEP program model rests on the following assumptions:
•
•
•
Participants must be ready and able to perform the duties required. The job-readiness boot camp aimed to prepare participants for employment, and for the same reason case managers referred participants to GED preparation, legal services, short-term training, and mental health counseling during the initial period.
The job developer and the participant must work together to search for subsidized employment. The job developer did not place people in jobs. Rather, the participant was required to help identify job leads and had to interview for positions. While the job developer was also expected to identify job leads, the program was designed to teach participants how to conduct a job search, so that when the program ended they could find em-ployment on their own.
After they moved into subsidized employment, retention services would help participants stay employed and make the transition into unsubsi-dized employment. Workforce Solutions for Tarrant County had participat-ed in an earlier evaluation involving TANF recipients that provided financial incentives and intensive postemployment services to employed participants. The program produced modest impacts on employment retention. Workforce Solutions wanted to use some of the components from this earlier program to increase job retention among the Next STEP participants.

246
Recruitment and Study Enrollment
Next STEP initially focused on recruiting individuals newly released from the Texas state prison system and on parole. Parolees in Tarrant County are required to attend a new arrival orientation in Fort Worth, held twice a week, within 72 hours of their release. The parole division invites community partners to the meeting to discuss the services they offer. Next STEP staff members attended the orientations, delivered a presentation on the program, and invited attendees to sign up for an intake meeting.
Over time, Next STEP expanded its recruitment efforts to ensure it enrolled enough people. In February 2012, it began sending invitation letters to individuals listed in the Texas Department of Criminal Justice system as having been recently released. It did so in part to reach recently released individuals who had completed their sentences in prison and who were not subject to parole. Additionally, in the summer of 2012 it began recruiting from federal prisons, relying on federal probation officers to refer interested participants to Next STEP. As state parole officers became more familiar with Next STEP, they too began to make referrals to the program.
● Next STEP experienced few problems recruiting participants.
Next STEP met its sample recruitment goal of 1,000 in the study, with 503 program group participants, with few challenges. It probably went so smoothly because there were few other programs serving this population in the Fort Worth area at the time, and because the program had a strong reputation with parole officers. In addition, the staff was able to present the benefits of the Next STEP program directly to potential participants rather than waiting for them to come in from referral sources.
Eligibility was limited to individuals who had been released from prison within the last 120 days, were residents of Tarrant County, had registered with Selective Service, and met two of the following criteria:
•
•
•
•
•
•
Had not worked in a skilled profession in the last one to three years
Were chronically unemployed, having had three extended unemployment experiences (of 26 weeks or longer) in the previous three years
Were unable to return to fields where they had gained skills from previous work experience due to a conviction
Had no high school diploma or equivalent
Had a high school diploma or equivalent, but read below the ninth-grade level
Were homeless

247
•
•
•
Lacked right-to-work documents (for example, birth certificates)
Had physical or mental limitations or disabilities
Did not have a degree, certificate, or license less than five years old in a de-mand occupation field
This expansive list of criteria meant the program screened out few individuals. Howev-er, those few who were screened out were the most job-ready, and they may not have needed or benefited as much from Next STEP’s services. Almost everyone who entered the program lacked right-to-work documents (because it took a few months to obtain these after their release from prison) and had no recent work experience.
Baseline Characteristics
This section presents the characteristics of program and control group members when they enrolled. The data collected — presented in Tables 6.1 and 6.2 and Appendix Table E.1 — include participant demographic characteristics, family and child support characteristics, employment histories, criminal histories, histories of public assistance and benefits, and mental health and substance abuse histories.7
As Table 6.1 shows, most sample members were single men who possessed a high school diploma or equivalent at program entry. Specifically, 86 percent had at least a high school degree or equivalent, which is higher than the average across the three ETJD programs targeting formerly incarcerated people (75 percent). Almost all (93 percent) had previous work experience, though not recent work experience (only 13 percent had worked in the year before they entered the program), reflecting their recent incarceration. This rate of previous work experience is also higher than the average across the three programs (81 percent). The sample was racially mixed: About half were black/non-Hispanic, one-third were white, and 14 percent were Hispanic. Only 7 percent were living in properties that they rented or owned.8 Over 40 percent were either homeless or living in some form of transitional housing. This percentage
7As expected (given the random assignment design), there were very few statistically significant differ-
ences between the program and control groups with respect to these characteristics. Therefore, for simplicity, Tables 6.1 and 6.2 and Appendix Table E.1 present numbers for the full Fort Worth sample. For a detailed comparison of the baseline characteristics of program group members and control group members across the ETJD programs, see Appendix I.
8Participants who did not have viable housing plans were assigned to live in a halfway house as a condi-tion of parole. Parolees living in halfway houses face more restrictions than parolees released directly into the community: They can only leave the facility at certain times and for approved activities such as working, interviewing for jobs, or attending required classes.
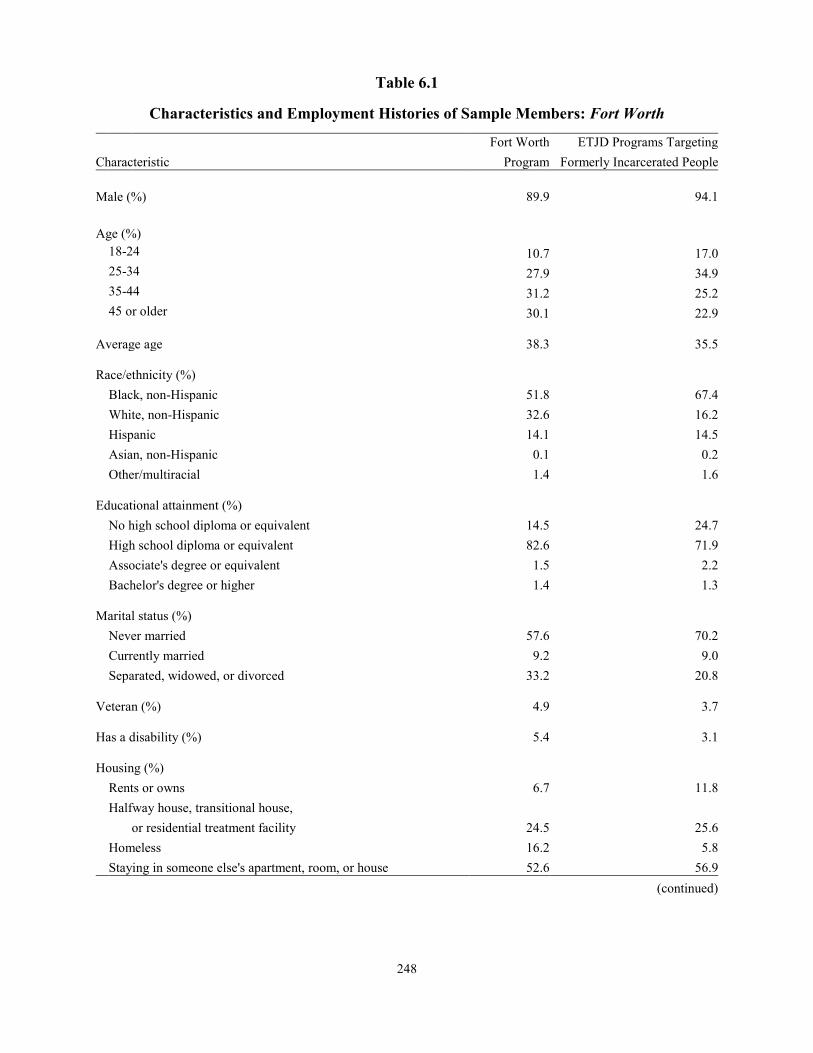
248
Table 6.1 Characteristics and Employment Histories of Sample Members: Fort Worth
Fort Worth ETJD Programs Targeting Characteristic Program Formerly Incarcerated People
Male (%) 89.9 94.1
Age (%)
)
18-24 10.7 17.025-34 27.9 34.935-44 31.2 25.245 or older 30.1 22.9
Average age 38.3 35.5
Race/ethnicity (%)
Black, non-Hispanic 51.8 67.4White, non-Hispanic 32.6 16.2Hispanic 14.1 14.5Asian, non-Hispanic 0.1 0.2Other/multiracial 1.4 1.6
Educational attainment (%)
No high school diploma or equivalent 14.5 24.7High school diploma or equivalent 82.6 71.9Associate's degree or equivalent 1.5 2.2
Bachelor's degree or higher 1.4 1.3
Marital status (%)
Never married 57.6 70.2Currently married 9.2 9.0Separated, widowed, or divorced 33.2 20.8
Veteran (%) 4.9 3.7
Has a disability (%) 5.4 3.1
Housing (%)
Rents or owns 6.7 11.8Halfway house, transitional house,
or residential treatment facility 24.5 25.6
Homeless 16.2 5.8Staying in someone else's apartment, room, or house 52.6 56.9
(continued

249
Table 6.1 (continued)
Fort Worth ETJD Programs Targeting Characteristic Program Formerly Incarcerated People
Employment history
Ever worked (%) 92.8 81.1
Among those who ever worked:
Worked in the past year (%) 13.2 19.9Average hourly wage in most recent job ($) 10.64 10.11Ever worked for the same employer for 6 months or more (%) 77.9 72.9
Months worked in the previous 3 years (%)
Did not work 56.7 46.6Fewer than 6 months 19.7 30.56 to 12 months 12.6 12.913 to 24 months 7.0 6.7More than 24 months 4.0 3.2
Sample size 999 3,002
ETJD SOURCES: MDRC calculations based on baseline survey data and management information system data.
reflects the fact that sample members had recently been released from prison — about one month earlier, on average — and had not yet been able to secure more permanent housing. A higher percentage of sample members in Fort Worth were homeless (16 percent) than the average across the three ETJD programs targeting formerly incarcerated people (6 percent).
Next STEP recruited primarily from state prisons, which is reflected in the statistics — over 90 percent had been released from state prisons (as shown in Table 6.2) and 87 percent were under parole supervision (see Appendix Table E.1); just 7 percent came from federal prisons.
Interestingly, while 45 percent of participants had minor-age children and 35 percent were noncustodial parents, fewer than 10 percent had current child support orders. In Texas, custodial parents are not required to cooperate with the state child support agency unless they are receiving TANF or Medicaid assistance. The state has relatively stringent eligibility criteria for access to these benefits, so a smaller percentage of low-income families receive TANF and Medicaid than is the case in most states.9 This low rate of public benefit receipt is one possible explanation for the low percentage of sample members with child support orders.
9For example, in 2013, Texas was just 1 of 10 states in which fewer than 10 families received TANF cash
assistance for every 100 families living in poverty. Floyd, Pavetti, and Schott (2015).

250
Table 6.2 Child Support and Criminal Justice Characteristics of Sample Members: For
Worth t
Fort Worth ETJD Programs Targeting Characteristic Program Formerly Incarcerated People
Parental and child support status
Noncustodial parent (%) 35.1 42.1
Has any minor-age children (%) 44.7 51.5
Among those with minor-age children:
Average number of minor-age children 2.1 2.1
Living with minor-age children (%) 12.9 14.0
Has a current child support order (%) 9.4 15.2
Has an order only for child support debt (%) 0.6 0.7
Criminal history
Ever convicted of a crimea (%) 96.2 96.3
Ever incarcerated in prison(%)
Ever convicted of a felony 88.7 91.0Ever convicted of a misdemeanor 69.8 65.2
100.0 100.0
bAverage years in jail and prison 2.9 4.8
cAverage months since most recent release 1.1 1.5
Status at program enrollment (%)
Parole 87.4 75.5Probation 4.1 11.9Other criminal justice/court supervision 0.5 9.6None of the above 8.0 2.9
Sample size 999 3,002
SOURCES: MDRC calculations based on baseline survey data, ETJD management information system data, and criminal justice administrative records. NOTES: Measures are self-reported unless otherwise noted. aIncludes convictions in the state of Texas as recorded in administrative records. Does not include federal convictions or convictions from other states. bIncludes time spent in Texas state prisons and Tarrant County jails according to administrative records. Does not include time spent in federal prisons or prisons in other states. cMost recent release can be from prison or jail.

251
Appendix Table E.1 provides additional information about the sample. As this table shows, few sample members received any public assistance, reflecting the state ban on provid-ing SNAP benefits to individuals on parole who had been convicted of a drug-related felony. Almost all lacked health care insurance (96 percent). While 58 percent reported that their families provided them a place to live, over a third said they received no support from family members.
As mentioned above, relative to sample members for the other ETJD programs that served formerly incarcerated individuals, Next STEP sample members had higher levels of education and more work experience, which may bode well for their employment prospects. However, they lacked financial resources and faced more housing issues.
Program Implementation This section provides detail on the implementation of Next STEP, including changes that were made from the original plans.
Structure and Staffing
As noted above, Workforce Solutions for Tarrant County oversaw Next STEP. The program provided services in a space next door to the local workforce center in Fort Worth. The program staff included the program director, two special projects managers (who oversaw program activities and public outreach and supervised other staff members), three case manag-ers, four job developers, and a document specialist responsible for tracking and maintaining the management information system. Additionally, Workforce Solutions partnered with two outside organizations: Guinn Healthcare, which provided mental health assessment and counseling, and Legal Aid of Northwest Texas, which provided legal assistance.
● Case managers spent time one-on-one with their assigned participants in each stage of the program to assess their needs and job readiness, make referrals to services, interact with parole and program partners, and provide support services.
Each participant was assigned to a case manager when he or she enrolled in the pro-gram. The case managers worked with participants on a one-on-one basis, meeting with them at least weekly both before the participants entered employment and after employment, when participants came in to the office for support services and peer-group meetings. Case managers provided participants with forms of material support such as transportation vouchers, clothing, hygiene items, and glasses, and also helped them get started with their job searches, before they began working with a job developer. They developed employment plans with participants, helped them set up e-mail accounts, helped them access the Work in Texas website to conduct a

252
job search, and reviewed their résumés.10 They also led some sessions in the boot camp work-shop, including one where they conducted the StrengthFinders test discussed further below. Additionally, case managers communicated with parole officers, making contact with them when participants’ schedules or plans came in conflict with their parole requirements or when they had not heard from a participant. Based on their one-on-one interaction with participants, the case managers assessed when they were “ready” to begin the job search and referred them to the job developer. Data from a time study suggest that over one-third of program staff time was spent on case management activities.11
● Job developers helped participants with their job searches, developed job leads with employers interested in participating in Next STEP, fa-cilitated workshops on job readiness, and followed up with partici-pants and employers once they secured subsidized and unsubsidized employment.
Participants were assigned job developers when they entered the program, but did not begin formally working with them until their case managers determined they were ready. However, the job developers got to know the participants in the job-readiness stage because they facilitated most of the boot-camp workshops. Part of the goal of the boot camp was to help participants identify their “passions” and find jobs that were consistent with those passions. Once a participant was ready to start his job search, the job developer met weekly with him to review his résumé and provide him with job leads. Program staff members spent just over a quarter of their time on workforce preparation, job development, and work-site management activities.
The job developers asked participants to search for their own jobs as a way to “teach them how to fish” and to help them find jobs in line with their interests. At the same time, the job developers also reached out to employers to generate interest in Next STEP. In some cases, job developers had job leads they could provide to participants. The job developers also con-vened job fairs periodically to bring in employers who were interested in meeting potential workers. Staff members estimated that about half of the jobs participants ended up getting they found themselves, and half were found by job developers.
● Guinn Healthcare conducted one-on-one assessments, led workshops, and provided mental health counseling.
10Work in Texas is a database of posted jobs in the state. 11In the fall of 2013, the evaluation team conducted a study that asked staff members to report the time
they spent on each program component during a specified period.

253
After participants enrolled, typically while they waited for the next boot camp to begin, they met with Guinn Healthcare for a comprehensive assessment. Guinn staff members assessed participants’ cognitive skills, mental health issues, executive functioning (which covers the ability to plan and organize, make considered decisions, manage time, and focus attention), and recidivism risk, and provided the assessment results to the case managers and job developers. In addition, they provided mental health counseling to those whom they found needed additional assistance. Midway through the grant period, because Next STEP staff members realized some participants needed additional services and needed to stay engaged in the program, Guinn began offering workshops on a number of topics, discussed further below.
● The program engaged Legal Aid of Northwest Texas to help expunge or seal participants’ criminal records and help with child support order modifications.
Case managers could make referrals to the Legal Aid representative. Assistance was limited to the removal of barriers to employment, which generally meant determining whether anything in participants’ criminal records could be expunged or sealed, but not helping on criminal issues such as parole violations. Legal Aid could also help with child support order modifications, but did not assist with paternity establishment or visitation issues. The organiza-tion was also not allowed to help a noncustodial parent with a child support order if it was already working with the custodial parent.
● The program partnered with a local staffing agency to process its pay-roll and serve as employer of record.
Participants placed in subsidized employment received wages from the staffing agency. When participants entered the second stage of the subsidy, they received 50 percent of their wages from their employers and 50 percent from the staffing agency.
Implementation of Core Program Components
This section draws from three site visits to Fort Worth (including several interviews with staff members, partners, employers, and participants) and ongoing conversations with program managers over the course of the grant period.12 It describes how the program imple-mented and adapted its various components over the grant period. Table 6.3 presents data on participation in core program components; it is based on information entered by the program’s staff into the ETJD management information system.
12The first visit was an early assessment of operations and the next two were implementation visits.

254
Table 6.3
One-Year Participation in ETJD Subsidized Jobs and Services Among Program Group Members: Fort Worth
Program Measure Group
Participated in any activity, including a subsidized job (%) 95.8
Worked in a subsidized job (%) 38.6
Worked in 100 percent subsidy stage (%) 38.6 Worked in 50 percent subsidy stage (%) 22.6
Among those who worked in a subsidized job:
Average number of months in the programa 6.9 Average number of days from random assignment to first subsidized paycheck 118.8 Average number of days worked in a subsidized jobb 63.6 Average number of months worked in 50 percent subsidy stage, among
those who worked in 50 percent subsidy stage 4.0 Made the transition to unsubsidized employment at subsidized job employer (%) 37.1
Received a service other than a subsidized job (%) 94.2Formal assessment/testingc 83.1Education and job trainingd 19.5Workforce preparatione 93.4Work-related supportf 83.7Child support assistance, among noncustodial parents --Parenting class, among noncustodial parents --Incentive paymentg 57.5
Average total incentive payment amount received, among recipients ($) 323Other servicesh 42.9
Sample size 503
SOURCES: MDRC calculations based on data from the ETJD management information system and WorkforceSolutions for Tarrant County tracking files. NOTES: A double dash indicates that the service was not offered. aMeasured as the duration between random assignment and last subsidized paycheck. bCalculated using net hours worked, assuming a seven-hour workday. cIncludes Strength Finders, Shipley, Wide Range Achievement Test 4, and Tests of Adult Basic Education. dIncludes welding, truck driving, machining, forklift driving, and high school equivalency classes. eIncludes alleviation of barriers to boot camp attendance and networking meetings. fIncludes gas cards, bus passes, clothing/shoes, eye exams, and photo identification. gIssued for attendance at boot camp and workshops. hIncludes additional meetings with case managers.

255
● As intended, Next STEP conducted a comprehensive assessment of par-ticipants’ job readiness at the start of the program. Next STEP staff members found that the assessments identified issues they would not have identified themselves.
Next STEP assessed 83 percent of program group members. Testing typically started at 9 a.m. and took several hours to complete. A counselor from Guinn Healthcare assessed participants’ skills in math, reading, comprehension, and spelling, along with their vocabulary and abstract reasoning. The counselor also screened them for depression, posttraumatic stress disorder, Supplemental Security Income eligibility, learning disabilities, domestic violence, cognitive executive functioning, and recidivism risk.
After the assessments, the counselor met one-on-one with each individual to clarify that person’s responses and to review the assessment results. The counselor had a separate meeting with the case manager and job developer to discuss how to interpret the ranges of scores and to point out warning signs to be aware of in helping the participants. While the counselor’s report made suggestions regarding strategies that might be helpful in light of the issues the assess-ments uncovered, the case managers were responsible for making referrals for any additional services that might be needed, including referrals for counseling.
During the boot camp, case managers also administered the StrengthFinders test, which was designed to identify participants’ strengths and talents. These strengths and talents were then used to identify jobs that might be suitable for each participant. The theory was that participants would stay employed in jobs that matched their skills and interests.
Initially, case managers relied on the StrengthFinders test and worried that negative results coming from the Guinn assessment could discourage some participants from continuing with the program. For example, some results focused on participants’ lack of motivation or lack of empathy. Their worries were allayed after Guinn counselors began meeting with Next STEP staff members and training them how to interpret the results. Counselors also rephrased some of the more negative language in the assessment results before they provided summaries to participants. Next STEP staff members noted that these meetings gave them valuable infor-mation about the participants and highlighted areas they needed to pay attention to in working with them.
● Most program group members participated in the job-readiness work-shop, called “boot camp.” The staff said it was the component that was most helpful to participants and that distinguished Next STEP from other programs.

256
Participants were required to complete the two-week job-readiness workshop in their first month in the program before being referred to a job developer to start their job searches. The workshop took place Monday through Friday from 9 a.m. to 5 p.m. The sessions covered a variety of topics including workplace dos and don’ts; résumés, cover letters, and thank-you letters; mock interviews; time management; problem solving; financial literacy; and network-ing. As mentioned above, case managers also administered the StrengthFinders test during the workshop and participants took turns sharing their results and describing their strengths to their peers. The participants met as a group, though one hour was set aside at the end of each day for participants to visit the computer lab and begin looking at job postings.
As Table 6.3 shows, most program group members (93 percent) received some work-force preparation services, which included the boot camp. Participants were not allowed to continue to the subsidized employment stage without completing the two-week program.
Staff members said that they got to know the participants during these sessions. Boot camp helped them identify participants’ strengths, match these strengths to jobs for which “they had a passion,” and help participants interview better.
The research team interviewed eight participants who at the time were still completing the boot camp requirements. They spoke very positively about their experiences in the work-shop. Two said the boot camp was helping them to learn more about themselves. They felt more confident applying for jobs since they knew what types of questions they might have to answer, especially regarding their criminal background, and had gotten a chance to practice their responses. They appreciated learning in a group setting where they all had something in common and did not have to hide their pasts.
● Next STEP offered a variety of preemployment activities in addition to boot camp to help participants become job-ready; for some participants, these activities probably increased the time between when they enrolled and when they entered employment.
Some participants were able to begin looking for employment around the same time they were in boot camp or shortly thereafter, though staff members felt that some participants were not ready for the job market and needed to focus on barriers to employment they had identified. Case managers might delay referring participants to job developers if they were contending with substance abuse problems, homelessness, or behavior that was particularly problematic for an employer. For example, a participant would not be considered job-ready if that person was not following through on activities or was habitually late. Activities for partici-pants who were not job-ready fell into three broad categories: counseling and cognitive behav-ioral workshops, short-term education and training, and legal services. In addition to these

257
program-specific services, case managers referred participants to other programs in the commu-nity for services such as housing assistance and substance-abuse treatment.
Counseling. Participants who needed mental health counseling were referred to Guinn Healthcare for one-on-one assistance, often as soon as they completed the initial assessments. Participants who may not have wanted or needed intensive counseling were encouraged to attend workshops that the program began operating midway through the grant period. Work-shops were offered throughout the month in five “service areas.”
•
•
•
•
•
Personal Skills for Career Success: Aimed to help participants understand their emotions and behavior in the workplace (three sessions)
Mastering Personal Change and Taking Charge of Your Life: Aimed to help participants improve their problem-solving skills, acquire new abilities, and set and achieve realistic goals (two sessions)
Alternative Problem Solving: Aimed to help clients with cognitive execu-tive functioning problems learn how to compensate for their impairments (one session)
Thinking for a Change: A subset of sessions from a cognitive behavioral curriculum that aimed to help participants at a high risk of recidivism (12 sessions)
Anger Management: Aimed to help participants learn strategies and tech-niques to manage anger (12 sessions)
Education and training. Some participants were interested in short-term education or training. Participants who lacked high school degrees could take GED classes offered on-site at Next STEP. The classes were paid for with another funding source, though Next STEP covered the cost of the GED test. In some cases, these GED classes fulfilled a condition of a partici-pant’s parole. The program also paid for short-term training for participants to become machin-ists, gain commercial driver’s licenses, and learn welding, computerized numerical control, and logistics.13 The welding training took about ten weeks while the commercial driver’s license training took about four weeks. According to the program data shown in Table 6.3, about 20 percent of program group members received some type of education or training.
Legal services. Few participants actually received legal assistance from Legal Aid of Northwest Texas. According to the Legal Aid lawyer, because of the grant that funded his
13“Computerized numerical control” refers to controlling machine tools using a computer, in industrial
manufacturing settings.

258
services, he was limited to helping remove barriers to employment, which primarily meant expunging or sealing participants’ criminal records. He could not address criminal cases or parole violations. Additionally, while he could help with child support order modifications, he could not help with visitation issues.
● In early 2013, because participants were spending a significant amount of time in preemployment activities, the program began providing fi-nancial incentives to participants to encourage engagement and to get them some financial assistance.
The program’s managers recognized that it was taking time for participants to find em-ployment and they needed financial assistance during this period. Additionally, some were leaving the program. To keep participants engaged, Next STEP began offering participants monetary awards for participating in and completing activities, searching for employment, and once employed, retaining their jobs. For example, they received $150 for attending all sessions of the boot camp workshop and $100 for attending 90 percent of the sessions. They received “performance readiness incentives” for milestones such as GED completion ($100) or occupa-tional training ($100). Next STEP also provided awards referred to as “commitment incentives” if participants completed their assessments, attended particular meetings, or registered for Work in Texas, for example. These awards ranged from $25 to $100. Next STEP also offered partici-pants an incentive award of $100 per week for volunteering with a local organization such as a food bank. Retention incentives were provided to participants who gained employment and stayed employed. Finally, participants who left the program in good standing — meaning they attended at least two retention meetings — earned a $200 award.
Overall, about 58 percent of program group participants received financial incentives during the 12-month follow-up period (see Table 6.3). Among those who received incentive payments, the total average amount received was $323. Staff members noted that the incentives not only provided participants with financial assistance, but also helped keep them engaged in the program and involved in the community.
● While the program had also intended to provide assistance with child support issues and fatherhood, in the end, few participants received these services.
As shown on Table 6.2, fewer than 10 percent of the participants had current child sup-port orders when they enrolled. Additionally, the program did not develop a formal relationship with the child support agency. The program made referrals to a fatherhood program operated in the county called “Fathers and Children Together,” but the program was not offered on-site and only 10 to 12 Next STEP fathers participated in it.

259
● While the vast majority (96 percent) participated in some Next STEP ac-tivity, only 39 percent worked in a subsidized job. Interestingly, about the same percentage of program group members went directly into un-subsidized employment without working in subsidized jobs first. Pro-gram records also indicate that a little more than a third of those who worked in subsidized jobs transitioned into unsubsidized employment with the subsidized employer.
The program developers intended for most participants to obtain subsidized employ-ment that would turn into unsubsidized jobs with the same employer. Instead, only 39 percent of all participants received subsidized jobs (as shown in Table 6.3), which is the lowest percentage among all ETJD programs, though some participants who did not receive subsidized jobs moved directly into unsubsidized employment.14 In other words, some participants found jobs on their own that did not require a subsidy. As explained by program staff members, some employers were simply not interested in the subsidy. They did not want the government in their business or were not interested in participating in a “welfare program.” When participants conducted their job searches, they identified positions that were, for the most part, open jobs where the employer had already made a commitment to hire someone. That is, the employer had a hiring need and did not necessarily need a subsidy in order to make a hire.
Among those who worked in a subsidized job, about four months passed from the time they enrolled in the program to the time they started working. They spent a significantly longer period in the program before working compared with the other ETJD programs, which reflects the differences between the Next STEP model and other ETJD models — for example, the fact that participants had to find jobs and were not placed in program jobs, the way participants in other ETJD programs were. The program’s emphasis on getting participants job-ready before they began searching for employment also contributed to the delay.
Participants who worked in subsidized jobs spent 13 weeks, on average, in those subsi-dized jobs (64 days worked, as shown in Table 6.3, divided by five workdays per week). About 59 percent of those who worked in subsidized jobs (23 percent of all program group members, as shown in Table 6.3) moved into the second stage of the subsidy, in which employers paid 50 percent of the participants’ wages and the program paid the remaining 50 percent. Figure 6.2
14According to program records (not shown in Table 6.3), 38 percent of program group members moved directly into unsubsidized employment. Note that the percentage of program group members working in subsidized jobs shown in Table 6.3 differs slightly from the percentage shown working in subsidized jobs in Table 6.5 later in this chapter. This difference arises because the follow-up period captured in the program’s subsidized employment records (the data source for Table 6.3) does not align perfectly with the follow-up period captured in the quarterly unemployment insurance records (the data source for Table 6.5).

260
Figure 6.2
Subsidized Employment Over Time: Fort Worth
0102030405060708090
100
1 2 3 4 5 6 7 8 9 10 11 12Perc
enta
ge w
orki
ng in
subs
idiz
ed
jobs
Month relative to random assignment
SOURCE: MDRC calculations based on data from the ETJD management information system.
displays the percentage of participants working in subsidized jobs in the months following random assignment. Program records show that 37 percent of those who worked in a subsidized job transitioned (“rolled over”) to unsubsidized employment with the subsidized employer.
Box 6.1 describes two participants’ experiences in Next STEP that the staff felt were typical.
● Participants gave mixed reviews to their work situations. Because these were private-sector jobs, employers treated participants like any other employees and did not give them any special treatment.
Figure 6.3 presents selected responses from a questionnaire administered to participants as they were working in subsidized jobs. As the figure shows, just over one-third of the inter-viewed participants felt positively about their relationships at work, the support they received from supervisors, and the development of their soft skills. Participants in Next STEP gave lower marks on these indicators than the average participants in ETJD programs, which probably reflects the fact that these were “real-world” jobs and not transitional jobs designed to provide extra support to participants. About half of the participants said that their jobs were preparing them for future employment.

261
Box 6.1
Next STEP Participant Profiles
Participant 1
“Dave” was 41 years old when he entered Next STEP. After serving time for a conviction related to a controlled substance, he moved in with his parents. He completed the assessments and while he waited for the next boot camp to begin, he attended some of the mini-workshops offered by the program and registered with Work in Texas, the online job-search system. He completed the boot camp and began working with his job developer, “Rick,” to find a job laying concrete, since he had experience doing so. His case manager found a company that worked with decorative concrete; Rick made contact with the employer on Dave’s behalf and got him an interview. After the interview, Rick talked to the employer, who was trying to determine whether there was enough demand for work to hire someone. In the meantime, Rick was pursuing another company for Dave that did rehab work for municipalities and maintained concrete structures. As soon as this company finalized a contract with the county, it would have work for Dave. While these were a couple of promising prospects, three months had passed and Dave needed a job. To keep these other prospects alive and to bring in some needed income, he found a temporary job on his own that involved remodeling foreclosed homes; it paid $11 an hour.
Participant 2
“Richard” was released from prison after serving time for aggravated assault. When he came into the program, he already knew that he wanted to be a truck driver. After Richard completed the assessments and boot camp, Next STEP sent him to truck-driving school to get a commer-cial driver’s license; this training took four weeks. He completed the training and found a job on his own hauling water for oil and gas companies, earning $14.50 an hour. The job was not subsidized and he worked as a contractor. He was unhappy in this position, so his job develop-er found him a job in “earth moving” — transporting rock and dirt; this job was subsidized. Richard spent a couple of months in the position, but his employer became disenchanted with his performance and attendance problems. Richard left this job and disappeared for a month. Staff members were not able to get in touch with him. They later found out he was in Tarrant County jail on assault charges and was probably returning to prison.
These questionnaire findings contradict what researchers learned in interviews with six participants who were working in subsidized jobs. In the interviews, participants said that they were learning new skills and were developing good working relationships with their supervi-sors. One participant noted that he fit right in with his coworkers and felt as though he was part of a “family.” As is true of most private-sector employment, some participants were clearly more likely than others to feel they were getting support and encouragement on the job.
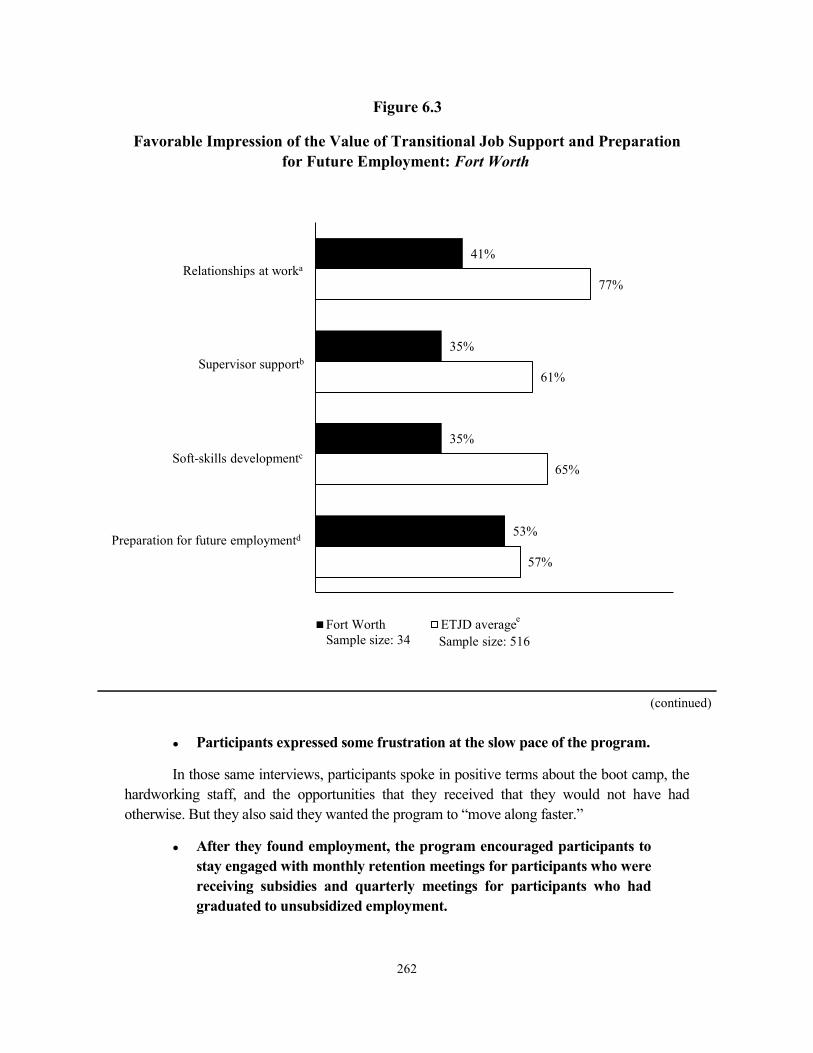
262
Figure 6.3
Favorable Impression of the Value of Transitional Job Support and Preparationfor Future Employment: Fort Worth
57%
65%
61%
77%
53%
35%
35%
41%
0 20 40 60 80 100
Preparation for future employmentd
Soft skills developmentc
Supervisor supportb
Relationships at worka
Fort WorthSample size: 34
ETJD average
Relationships at worka
Supervisor supportb
Soft-skills developmentc
Preparation for future employmentd
e
Sample size: 516
● Participants expressed some frustration at the slow pace of the program.
In those same interviews, participants spoke in positive terms about the boot camp, the hardworking staff, and the opportunities that they received that they would not have had otherwise. But they also said they wanted the program to “move along faster.”
● After they found employment, the program encouraged participants to stay engaged with monthly retention meetings for participants who were receiving subsidies and quarterly meetings for participants who had graduated to unsubsidized employment.
(continued)

263
Figure 6.3 (continued)
SOURCE: MDRC calculations based on the ETJD participant questionnaire.
NOTES: The measures presented in this figure, relationships at work, supervisor support, soft-skillsdevelopment, and preparation for future employment were created based on an exploratory factor analysis of a pool of questions. These questions asked participants about their level of agreement with a particular statement on a scale of 1 to 7, where 1 indicates strong disagreement and 7 indicates strong agreement. Based on the results of the factor analysis, questions were grouped into factors and a mean score was calculated across the questions included in a particular factor; the percentages presented above represent the proportion of questionnaire respondents who averaged a score of 6 or higher on the questions in that factor, indicating a high level of satisfaction with their program experiences in that area.
With a few exceptions, questionnaires were administered to participants by the research team during site visits at events and activities when many participants would be available at once. Consequently, the responses obtained are from participants who attended program activities and were therefore likely to be more motivated and engaged than the full sample of program participants. For this reason, the results presented in this figure are not necessarily representative of all participant experiences and should be interpreted with caution; they are likely to be more positive.
aBased on agreement with the following statements: I understand what is expected of me on the job; I know whom at work to ask for help when I need it; My relationships with coworkers are positive and supportive; and My coworkers understand me and want me to succeed.
bBased on agreement with the following statements: I get the support or guidance that I need from my supervisor; My supervisor gives me advice about how to handle situations at work; and My supervisor helps me if personal issues come up that get in the way of working.
cBased on agreement with the following statements: I am learning how to work better with coworkers; I am learning how to cooperate better with supervisors; and This job has helped me learn to present myself better at work.
dBased on agreement with the following statements: The kind of work I am doing will help me get a decent-paying job later; I am learning specific job skills that I will use in the future; and I have met people through this job who may help me find a job in the future.
eTo account for varying questionnaire sample sizes across ETJD programs, the "ETJD average" is a weighted average of all programs such that each program is equally represented.
The program held the meetings in the evenings to allow participants who worked dur-
ing the day to attend. The meetings gave participants the chance to share their work experi-ences with the group and to help other participants who were encountering challenges at work. As is common in these types of programs, participation in Next STEP declined after participants found jobs. For example, some of the working participants who were interviewed by the research team said they had not had time to come to the program office since they began their jobs.
Impacts on Participant Outcomes This section presents the one-year impacts of Next STEP on service participation, employment and earnings, criminal justice involvement, child support payments, and economic well-being.

264
Participation and Service Receipt Outcomes
As discussed above, in addition to the employment subsidy, Next STEP provided assis-tance with job searching and job readiness. It gave participants financial help for work-related expenses and paid for professional training and certifications in such areas as welding, commer-cial driver’s licensing, and computerized numerical control. Since some of these types of services were also available from other programs in the Fort Worth community, it is important to measure the additional level of services that program group members received because they were able to enroll in Next STEP. Unless otherwise indicated, all impact results discussed in this report are statistically significant, with p < 0.10.
● Next STEP significantly increased participation and service receipt in nearly all activities and services.
As Table 6.4 shows, program group members reported significantly higher levels of participation in activities and services than control group members in every activity or service measured, with the exception of postsecondary education (which was not surprising, since postsecondary education was not a program component). As expected, estimated impacts on employment-related assistance are especially large, with nearly all program group members reporting that they got help with job searching, career planning, and paying for job-related expenses. About 95 percent received job-search help compared with 60 percent of control group members. Control group members may have received services from Texas ReEntry Services or the local workforce center. About 13 percent of program group members received unpaid work experience compared with 3 percent of control group members (not shown in the table). Eighty-four percent of program group members received financial help with job-related transportation or equipment costs compared with just 16 percent of control group members, a statistically significant increase of 68 percentage points.
The program also offered assistance with education and training. As noted above, the program offered GED classes on-site and referred participants to training programs, sometimes at employers’ work sites. About 9 percent of program group members received GED or other education compared with 4 percent of control group members. Almost one-third of program group members received vocational training for professional certifications or licenses, com-pared with 17 percent of control group members. The most common types were forklift training (39 percent) and commercial driver’s license training (22 percent).15 This higher rate of training meant that more program group members also earned professional licenses or certifications. Not including certifications that required only a short time in training (such as Occupational Safety
15Not shown in the table.

265
Table 6.4
One-Year Impacts on Participation and Service Receipt: Fort Worth
Outcome (%) Program
Group Control
Group Difference
(Impact)
Ninety Percent Confidence
Interval
Employment support
]]]
]]]]
)
]
Received help related to finding or keeping a job 96.8 60.7 36.0 *** [31.3, 40.7]
Job search, job readiness, and career planninga 95.4 59.8 35.6 *** [30.8, 40.5]
Paying for job-related transportation or equipment costs 83.8 16.3 67.5 *** [62.8, 72.2]
Education and training Participated in education and training 43.6 27.9 15.7 *** [9.8, 21.6]
ESL, ABE, or high school diploma or equivalentb 9.3 3.5 5.8 *** [2.7, 8.9]
Postsecondary education leading to a degree 7.1 10.1 -2.9 [-6.5, 0.6]Vocational training 31.9 17.2 14.7 *** [9.4, 20.1]
Received high school diploma or equivalent 2.9 5.0 -2.0 [-4.5, 0.4]
Earned professional license or certification (not
including OSHA or forklift)c 20.9 9.8 11.1 *** [6.6, 15.6]
Earned OSHA or forklift certification 9.3 9.6 -0.4 [-4.0, 3.3]
Other support and services Received help related to past criminal convictions 89.0 42.7 46.3 *** [41.0, 51.6
A
Handling employer questions about criminal history 89.1 40.9 48.1 *** [42.9, 53.4Legal issues related to convictions 45.6 13.3 32.3 *** [26.9, 37.8
mong those identified as noncustodial parents at
enrollment:d
Received help related to child support, visitation, parenting, or other family issues 56.3 19.5 36.8 *** [26.6, 47.0
Modifying child support debts or orders 37.0 9.3 27.7 *** [18.7, 36.8
Setting up visitation with child(ren) 22.7 5.6 17.1 *** [9.3, 24.9Parenting or other family-related issues 45.3 15.5 29.8 *** [19.7, 39.9
Received advice or support from a staff member at an agency or organization 78.7 36.4 42.2 *** [36.6, 47.9
(continued

266
Table 6.4 (continued)
Outcome (%) Program
Group Control
Group Difference
(Impact)
Ninety Percent Confidence
Interval
Received mentoring from a staff member at an agency or organization 71.3 30.0 41.2 *** [35.5, 47.0]
Received mental health assistance 23.7 14.6 9.1 *** [4.2, 14.0]
Sample size 346 340
SOURCE: MDRC calculations based on responses to the ETJD 12-month survey. NOTES: Results in this table are regression-adjusted, controlling for pre-random assignment characteristics. Statistical significance levels are indicated as: *** = 1 percent; ** = 5 percent; * = 10 percent. aIncludes help with job searching, job referrals, developing a résumé, filling out job applications, preparing for job interviews, job readiness training, and planning for future career or educational goals. bESL = English as a second language, ABE = adult basic education. cOSHA stands for Occupational Safety and Health Administration. In an effort to separate receipt of professional licenses or certifications that require more intensive and lengthy training (for example, a Certified Medical Assistant certificate or a commercial driver’s license) from those that can be earned following more cursory, one-day training, receipt of OSHA and forklift certifications, which fall into the latter group, is presented separately from receipt of other types of licenses or certifications. A review of all reported types of licenses or certifications revealed that OSHA and forklift certifications account for a large majority of the shorter-term, less intensive licenses and certifications received by sample members. dThese measures include only those who were identified as noncustodial parents at study enrollment (program group = 110; control group = 126; total = 236).
and Health Administration or forklift certifications), 21 percent of program group members earned a certification or professional license, compared with 10 percent of control group members.
The program also increased the proportion who received advice or support from pro-gram or agency staff members. Eighty-nine percent of program group members received help handling employer questions about their criminal histories compared with 41 percent of control group members. This disparity may reflect the topics covered in the boot camp, which devoted time to helping participants answer tough questions from employers. More program group members also received help with legal issues related to their convictions (46 percent versus 13 percent). Since the implementation study found that few participants received assistance from Legal Aid, this figure might also capture help from case managers who contacted parole officers on behalf of their clients when issues arose.
In addition, program group members were more likely to report receiving advice, sup-port, or mentorship from staff members. Almost a quarter of the program group reported

267
receiving mental health assistance, a statistically significant increase of 9 percentage points over the control group. Among those identified as noncustodial parents, more program group members reported receiving help related to child support, visitation, and other family issues than control group members.
Employment and Earnings Outcomes
This section presents one-year impact findings on employment and earning from three data sources: quarterly wage data from the National Directory of New Hires, program payroll records that detail the subsidies paid to program group members, and a survey of sample members conducted about a year after they enrolled in the study. The quarterly wage data only reflect wages in jobs covered by the unemployment insurance system, not employment con-ducted by individuals who are self-employed or who are independent contractors. The Next STEP subsidized wages were not covered by unemployment insurance and thus are added to the quarterly wage records to estimate total employment and earnings. The survey includes uncov-ered employment to the extent that the survey respondents reported it.
● According to the unemployment insurance data and program payroll records, Next STEP did not significantly increase employment in the one-year follow-up period.
As shown in Table 6.5 and Figure 6.4, the program did not significantly increase em-ployment in the first year. Program group members also earned about the same as control group members.
The program may have improved over time as certain service elements were added (for example, the incentives for reaching program milestones and benchmarks). To evaluate whether these additional services improved the program’s effectiveness, a separate analysis was con-ducted for those who entered the program in the first year and for those who entered the program in the second year. The impacts are similar for sample members who enrolled in both time periods — the program did not significantly increase first-year employment for either subgroup (see Appendix Table E.2).
● The client survey tells a different story, suggesting that more program group members were employed than control group members. It may be that program group members were more likely to be employed, but in jobs not covered by the unemployment insurance system.
The survey results show a different pattern of impacts than the unemployment insur-ance data and program records. On the survey, program group members reported higher rates of employment than the control group during the first year. About 88 percent of program group
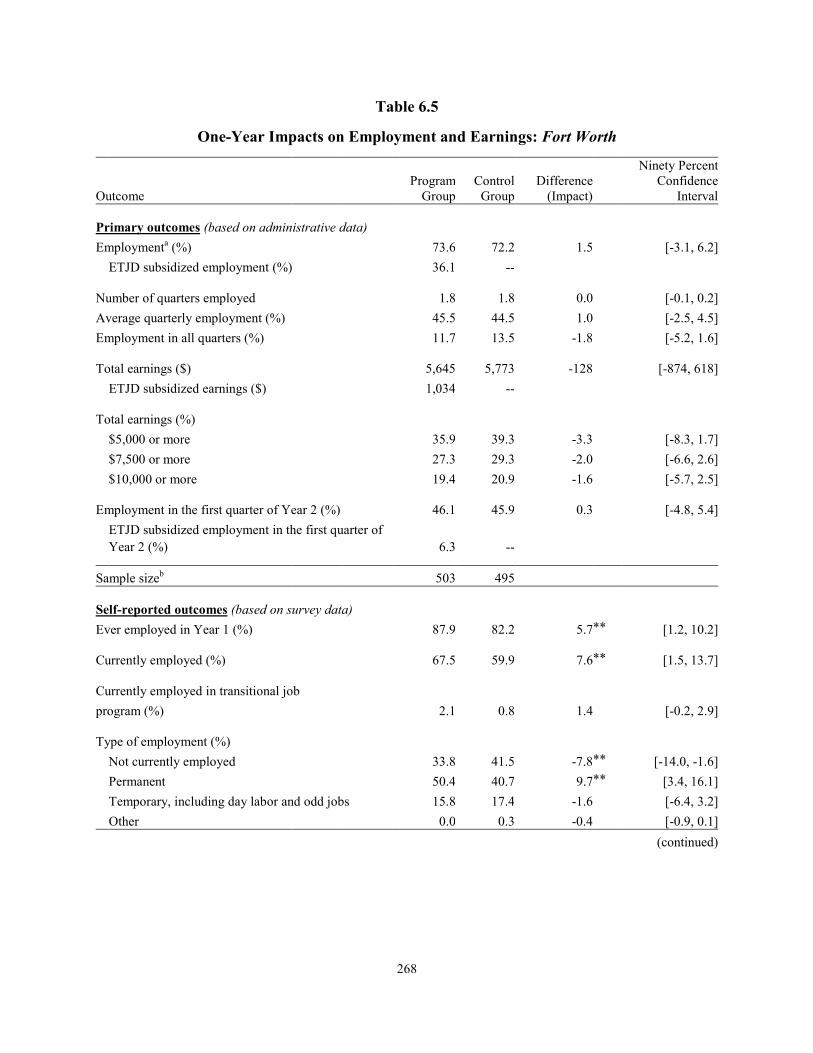
268
Table 6.5
One-Year Impacts on Employment and Earnings: Fort Worth
Outcome Program
Group Control
Group Difference
(Impact)
Ninety Percent Confidence
Interval
Primary outcomes (based on administrative data)
Employmenta (%) 73.6 72.2 1.5 [-3.1, 6.2]
ETJD subsidized employment (%) 36.1 --
Number of quarters employed 1.8 1.8 0.0 [-0.1, 0.2]Average quarterly employment (%) 45.5 44.5 1.0 [-2.5, 4.5]Employment in all quarters (%) 11.7 13.5 -1.8 [-5.2, 1.6]
Total earnings ($) 5,645 5,773 -128 [-874, 618]
ETJD subsidized earnings ($) 1,034 --
Total earnings (%)
$5,000 or more 35.9 39.3 -3.3 [-8.3, 1.7]$7,500 or more 27.3 29.3 -2.0 [-6.6, 2.6]$10,000 or more 19.4 20.9 -1.6 [-5.7, 2.5]
Employment in the first quarter of Year 2 (%) 46.1 45.9 0.3 [-4.8, 5.4]
Y
ETJD subsidized employment in the first quarter of ear 2 (%) 6.3 --
Sample sizeb 503 495
Self-reported outcomes (based on survey data) Ever employed in Year 1 (%) 87.9 82.2 5.7 ** [1.2, 10.2]
Currently employed (%) 67.5 59.9 7.6 ** [1.5, 13.7]
Currently employed in transitional job
program (%) 2.1 0.8 1.4 [-0.2, 2.9]
Type of employment (%)
P
Not currently employed 33.8 41.5 -7.8 ** [-14.0, -1.6]ermanent 50.4 40.7 9.7 ** [3.4, 16.1]
Temporary, including day labor and odd jobs 15.8 17.4 -1.6
[-6.4, 3.2]Other 0.0 0.3 -0.4 [-0.9, 0.1]
(continued)

269
Table 6.5 (continued)
Outcome Program
Group Control
Group Difference
(Impact)
Ninety Percent Confidence
Interval
cAmong those currently employed:
] ]
] ]
Hours worked per week 42.6 41.7 0.9Hourly wage ($) 11.6 11.0 0.6
Hours worked per week (%)
More than 20 hours 62.1 52.8 9.3 ** [3.0, 15.6More than 34 hours 54.8 47.2 7.5 * [1.2, 13.9
Hourly wage (%)
More than $8.00 52.3 43.8 8.5 ** [2.1, 14.9
More than $10.00 34.4 23.6 10.8 *** [5.0, 16.6
Sample size 344 341
SOURCES: MDRC calculations based on quarterly wage data from the National Directory of New Hires and responses to the ETJD 12-month survey. NOTES: Results in this table are regression-adjusted, controlling for pre-random assignment characteristics. Statistical significance levels are indicated as: *** = 1 percent; ** = 5 percent; * = 10 percent. aEmployment rates and earnings include both ETJD subsidized jobs and all other jobs covered by unemployment insurance. bOne sample member is missing a Social Security number and therefore could not be matched to employment data. cThese measures are calculated among those employed at the time of the survey; they are therefore considered nonexperimental and are not tested for statistical significance.
members were employed, according to the survey, compared with 82 percent of control group members, a statistically significant difference of 6 percentage points. According to the survey, program group members were also more likely than the control group to be working at the time of the interview: 68 percent of program group members were working at that time compared with 60 percent of control group members, an impact of 8 percentage points.
The survey also found that program group members were working more hours and at higher wages than control group members: 62 percent of program group members worked more than 20 hours per week compared with 53 percent of control group members, and 34 percent of program group members earned more than $10 per hour compared with 24 percent of control group members. Somewhat surprisingly, the types of jobs reported in the survey suggest these impacts are due to private-sector employment and not temporary, informal jobs, day labor, or self-employment — the types of jobs not covered by unemployment insurance. It may be that

270
Received high school diploma or equivalent
(continued)
Figure 6.4
Employment and Earnings Over Time: Fort Worth
0102030405060708090
100
0 1 2 3 4
Perc
enta
ge e
mpl
oyed
Quarter after random assignment
Program group total employment
Control group employment
367
1,238
1,817
2,036 2,148
447
1,372
1,8942,009 2,075
0
500
1,000
1,500
2,000
2,500
0 1 2 3 4
Ave
rage
ear
ning
s ($)
Quarter after random assignment
Program group Control group
Program group ETJD subsidized employment

271
Figure 6.4 (continued)
SOURCE: MDRC calculations based on quarterly wage data from the National Directory of New Hires.
NOTES: Results in this figure are regression-adjusted, controlling for pre-random assignment characteristics.
Statistical significance levels are indicated as: *** = 1 percent; ** = 5 percent; * = 10 percent.Employment rates and earnings include both ETJD subsidized jobs and all other jobs covered by
unemployment insurance.
some survey respondents were working for private-sector companies and, though they were hired as contractors, they did not consider themselves to be self-employed. Indeed, an analysis of program records that listed employers showed that some of the jobs participants received while in the Next STEP program were with employers that hired them as contractors rather than staff members once the subsidy ended. Employment in these jobs would not show up in unemployment insurance records. The exact percentage of jobs in question could not be determined.
While some other ETJD programs also show higher employment in survey results than in administrative wage records, the difference between the two sources is larger in Fort Worth than in any other city.16 These findings suggest that the Next STEP program may have gotten participants jobs, but not jobs covered by unemployment insurance.
Criminal Justice Outcomes
The program served individuals who had been recently released from prison. Effects on recidivism could occur in a variety of ways. The program could have produced effects by improving participants’ thinking and behaviors, reducing their criminal thinking, engaging them in productive activities for a significant portion of the day, increasing their associations with positive people and networks, and improving their economic well-being. Table 6.6 shows Next STEP’s impacts on criminal justice outcomes and recidivism.
● Next STEP produced a modest reduction in arrests and incarceration injail. Impacts on recidivism were concentrated among those at the high-est risk of recidivism when they enrolled.
16For example, 68 percent of program group members reported being employed at the time of the survey, while administrative wage records show that only 46 percent were employed in the quarter when the survey was administered, a difference of 21 percentage points. In the other cities the corresponding differences range from -8 percentage points in Milwaukee to 14 percentage points in New York City.

272
Table 6.6 One-Year Impacts on Criminal Justice Outcomes: Fort Worth
Outcome Program
Group Control
Group Difference
(Impact)
Ninety Percent Confidence
Interval
Primary outcomes (based on administrative data)
]
] ] ]
]
] ] ]
]
]
] ] ]
] ] ]
]
]
]
]
)
Arrested (%) 19.0 24.9 -5.9 ** [-10.1, -1.7
Convicted of a crime (%) 11.6 11.4 0.2
[-3.1, 3.5
Convicted of a felony 4.8 3.6 1.1 [-0.9, 3.2Convicted of a misdemeanor 7.3 7.7 -0.4 [-3.2, 2.3
Convicted of a violent crime (%) 1.7 1.7 0.1 [-1.3, 1.4
Incarcerated (%) 22.6 26.7 -4.1 [-8.5, 0.3
I
Incarcerated in jail 20.3 24.8 -4.5 * [-8.8, -0.2ncarcerated in prison 9.9 11.5 -1.6
[-4.8, 1.6
Prison admission reason (%)
Admitted to prison for a new crime 3.2 2.4 0.8 [-0.9, 2.5Admitted to prison for a parole or probation
violation 7.1 9.1 -2.0 [-4.9, 0.8
Total days incarcerated 19.2 21.0 -1.8 [-7.2, 3.5
Jail 11.6 12.5 -0.9 [-4.5, 2.8Prison 7.6 8.6 -1.0 [-3.9, 2.0
Arrested, convicted, or admitted to jail or prison (%) 27.0 32.2 -5.2 * [-9.8, -0.6
Months 1 to 6 8.3 9.5 -1.2 [-4.2, 1.8Months 7 to 12 13.3 17.6 -4.3 * [-8, -0.6
Sample size 503 496
Self-reported outcomes (based on survey data)
On parole or probation (%) 87.1 84.4 2.7 [-1.6, 7.1
Received a technical violation of parole or probation (%) 11.9 15.9 -4.0 [-8.4, 0.3
Received a sanction for technical parole violation (%) 9.8 12.4 -2.6 [-6.6, 1.4
Score on personal irresponsibility scalea 20.3 21.4 -1.1 ** [-1.9, -0.3
(range of 10 to 50, where higher scores indicate
higher levels of personal irresponsibility)
Sample size 346 340
(continued

273
Table 6.6 (continued)
SOURCES: MDRC calculations based on criminal justice data and responses to the ETJD 12-month survey. NOTES: Results in this table are regression-adjusted, controlling for pre-random assignment characteristics. Statistical significance levels are indicated as: *** = 1 percent; ** = 5 percent; * = 10 percent. aThis scale is based on responses to six scale questions in the Texas Christian University Criminal Thinking Scales, which assess how strongly a respondent agrees or disagrees with statements about having been in jail or prison (You were locked up because you had a run of bad luck; The real reason you were locked up is because of your race; Nothing you do is going to make a difference in the way you are treated; You are not to blame for everything you have done; Laws are just a way to keep poor people down; and You may have committed crimes, but your environment is to blame). Responses of "strongly disagree" were coded as 1, "disagree" as 2, "neither agree nor disagree" as 3, "agree" as 4, and "strongly agree" as 5. If a respondent answered at least three questions, a sum was then produced using the values of all nonmissing items. The sum was divided by the number of items included, and this average was multiplied by 10.
According to state criminal justice data, about a quarter of all control group members
were arrested during the first year following enrollment in the study. The program was able to reduce arrests to 19 percent of the program group, a 6 percentage point reduction.17 The pro-gram reduced incarceration in jail by 5 percentage points. Since incarceration in jail is typically associated with an arrest, a high correlation between the two outcomes is expected. The estimat-ed effect on convictions is not statistically significant.
State prison admissions were rare and were primarily the result of technical parole vio-lations. There are no statistically significant differences in prison incarceration between the research groups.
Survey results suggest that the program group demonstrated lower levels of “criminal thinking,” as indicated by lower scores on the personal irresponsibility scale. It is possible that reductions in criminal thinking led to the program’s reductions in recidivism. As discussed earlier, the program spent a significant amount of time helping participants become ready for employment, and individuals who were assessed as needing individual counseling were referred to the mental health partner. The workshops the mental health partner offered may have helped participants learn new problem-solving and self-regulation skills, and the job-readiness classes may have also led to improvements in thinking and attitudes. Cognitive behavioral approaches and motivational techniques are becoming increasingly common in programs that work with individuals involved in the criminal justice system, and these approaches and techniques are considered to be effective in reducing recidivism.
17Appendix Table E.3 shows the impacts on criminal justice outcomes for the first six-month follow-up
period (months 1 to 6) and the second six-month follow-up period (months 7 to 12). As that table shows, impacts on arrests occurred in months 7 to 12, but not months 1 to 6.

274
A separate analysis was conducted to determine the program’s impacts on subgroups of sample members who were at higher or lower risk of recidivism when they enrolled in the study.18 As Table 6.7 shows, the impacts on criminal justice outcomes were concentrated among those at high risk of recidivism. In the high-risk subgroup, program group members experienced a 19 percentage point reduction in being arrested, convicted, or admitted to jail or prison; in the low- and moderate-risk subgroup, there was no significant reduction. There were few statistically significant differences in impacts on earnings and employment between these risk groups. This finding, combined with the lack of impacts on employment for the program group overall (as measured by unemployment insurance data), suggests that the reduction in recidivism among the high-risk subgroup was not the result of an impact on employment. Such a conclusion would be consistent with findings from other research, and would suggest that — contrary to the theory of change often guiding subsidized jobs programs for formerly incarcer-ated people — reductions in recidivism are not linearly related to improvements in employment and earnings.19 It would also suggest that program services other than the transitional jobs (for example, the cognitive behavioral services mentioned earlier) may have contributed more to reducing recidivism than the transitional jobs themselves. However, it is unclear the extent to which program group members would have engaged in such services if they had not been offered the incentive of a paid job.
Child Support and Family Relations Outcomes
As mentioned previously and shown in Table 6.2, about 35 percent of sample members were noncustodial parents when they enrolled, though fewer than 10 percent had child support orders. Data from the state child support agency capture child support paid among those who did have child support orders registered with the state (see Figure 6.5).
● Next STEP did not significantly affect child support outcomes.
The Next STEP program did not have a formal arrangement with the child support agency. Perhaps as a result, or perhaps because fewer than 10 percent of sample members had child support orders when they enrolled, rates of child support payments were low. According to state child support data, about 15 percent of program group members and 17 percent of control group members paid any child support during the first year after enrollment (not shown in table). The difference between the two groups is not statistically significant.
18For more information on the analytic methods used to define the risk of recidivism, see Appendix J. 19Zweig, Yahner, and Redcross (2010).

Table 6.7
One-Year Impacts on Criminal Justice Outcomes, by Recidivism Risk: Fort Worth
Lower Risk Higher Risk
Program Control Difference
)
Ninety Percent Confidence
Program Control Difference
Ninety Percent Confidence
Difference Between
Subgroup Outcome Group Group (Impact Interval Group Group (Impact) Interval Impactsa
Criminal justice (%)
]
Arrested 14.7 18.2 -3.5 [-7.9, 1.0]
30.9 46.8 -15.8 ** [-26.1, -5.5] †Convicted of a crime 9.8 9.7 0.1 [-3.5, 3.7] 16.6 17.0 -0.4
[-8.2, 7.5] Convicted of a violent crime 2.1 1.6 0.5 [-1.2, 2.1]
]
]
]
]
] ]
]
0.9 1.6 -0.7 [-3.1, 1.6] Incarcerated 18.8 20.7 -1.9 [-6.7, 2.9 32.8 46.3 -13.5 ** [-23.8, -3.3] †Arrested, convicted, or admitted
] ]
]
]
] ]
]
to jail or prison 22.9 24.6 -1.7 [-6.8, 3.4 38.2 57.2 -19.0 *** [-29.5, -8.6 ††
Months 1 to 6 11.4 12.4 -1.1 [-5.0, 2.9 19.5 24.8 -5.4
[-14.0, 3.2
Months 7 to 12 17.1 18.4 -1.3 [-5.8, 3.3 29.3 43.5 -14.1 ** [-24.4, -3.9 †
Employment and earnings
-
Employmentb (%) 74.8 72.8 2.1 [-3.2, 7.3 69.7 70.4 -0.7 [-10.6, 9.3
S
ETJD subsidized employment (%) 39.3 -- -- 26.9 -- -Total earnings ($) 5,854 6,172 -318 [-1,205, 569 4,899 4,677 222 [-1,091, 1,535Average quarterly employment (%) 47.4 45.7 1.7 [-2.4, 5.8 39.4 41.5 -2.1 [-9.2, 5.0Employment in the first quarter of
Year 2 (%) 48.4 47.8 0.6 [-5.3, 6.5 38.9 40.4 -1.5 [-11.9, 8.9
ample size 371 378 132 118
(continued)
275

276
Table 6.7 (continued)
SOURCE: MDRC calculations based on criminal justice data. NOTES: Results in this table are regression-adjusted, controlling for pre-random assignment characteristics. Statistical significance levels are indicated as: *** = 1 percent; ** = 5 percent; * = 10 percent. See Appendix J for details on how the recidivism risk subgroups were defined. aWhen comparing impacts between two subgroups, an H-statistic is generated. The H-statistic is used to assess whether the difference in impacts between the subgroups is statistically significant. Statistically significant differences across subgroups are indicated as: ††† = 1 percent; †† = 5 percent; † = 10 percent. bEmployment rates and earnings include both ETJD subsidized jobs and all other jobs covered by unemployment insurance.
Restricting the analysis to the 35 percent of the sample who were noncustodial parents, only about one-third paid any child support formally, through the state, in the first year (see Table 6.8). A larger percentage of noncustodial parents (both program and control group members) paid informal cash or noncash support, according to the survey. Among noncustodial parents, about half of program group members and 43 percent of the control group members had provided some informal cash support or noncash support in the month before the survey (the difference is not statistically significant). There were no differences in how often parents reported having contact with a focal child.
Economic and Personal Well-Being Outcomes
Table 6.9 presents the programs impact’s on self-reported measures of financial well-being, food sufficiency, and physical and mental health.
● Next STEP did not significantly improve participants’ economic and personal well-being.
Over half of both research groups experienced a financial shortfall where they were un-able to pay their rent, were evicted, had utility or phone service disconnected, or could not fill a prescription. About a quarter of the research sample had had insufficient food during the previous month.
Somewhat surprisingly, the program increased health insurance coverage by 7 percent-age points, and employer-based health insurance coverage by 6 percentage points. Shortly after program enrollment, staff members from a local health care program met with Next STEP participants to help them gain access to health care services from a county health care program for low-income people.

277
Received high school diploma or equivalent
(continued)
Figure 6.5
Formal Child Support Payments Over Time: Fort Worth
0102030405060708090
100
0 1 2 3Perc
enta
ge p
ayin
g fo
rmal
chi
ld su
ppor
t
Quarter after random assignment
Program group
Control group
34
69
158
200
39
113
181
222
0
50
100
150
200
250
0 1 2 3
Ave
rage
form
al c
hild
supp
ort p
aid
($)
Quarter after random assignment
Program group Control group

278
Figure 6.5 (continued)
SOURCE: MDRC calculations based on child support agency data.
NOTE: Results in this figure are regression-adjusted, controlling for pre-random assignment characteristics.
Statistical significance levels are indicated as: *** = 1 percent; ** = 5 percent; * = 10 percent.Due to incomplete data, child support measures based on administrative data only include sample
members who were randomly assigned during the first year of the program (by December 31, 2012). Measures of formal child support include all payments made through the state's child support collection
and disbursement unit, including funds from employer withholding and other sources (for example, tax intercepts).
Conclusion Next STEP’s model was premised on helping participants become job-ready and then helping them find subsidized jobs that would turn into permanent employment with the same employ-ers. Next STEP provided participants with a wide range of services to help them improve their job readiness, and program group members reported receiving significantly higher levels of services such as job-search assistance, vocational training, and mental health assistance. The model resulted in delays between the time participants enrolled and the time they began work-ing. These delays produced some tensions between participants who wanted and needed jobs immediately and case managers and job developers who felt that participants would not succeed if they moved into employment too quickly. Also, job developers were not inclined to help unmotivated participants who would not perform well on the job once placed. While the program had services in place to help participants improve their motivation and soft skills, individuals who did not show initiative may have fallen behind.
While the program did not generate employment impacts according to unemployment insurance wage records, the survey results suggest that the program may have had a modest impact on employment once one includes employment not covered by unemployment insur-ance. It is not known whether this modest impact on employment will continue into the second year. The program did not generate impacts on child support payments or improve participants’ economic and personal well-being.
It is notable that Next STEP led to significant improvements in recidivism during the first year even though it had few impacts on employment. These impacts on recidivism were especially large among those who were at high risk of reoffending. This finding is consistent with earlier research suggesting that the connection between employment and recidivism is not straightforward.20 The program’s impacts on recidivism may have been caused by other components of the program such as the behavioral workshops or case management.
20Zweig, Yahner, and Redcross (2010).

279
Table 6.8
One-Year Impacts on Child Support and Family Relations Among Those Identified as Noncustodial Parents at Enrollment: Fort Worth
Outcome Program
Group Control
Group Difference
(Impact)
Ninety Percent
Confidence Interval
a
]
]
]
]
] ]
]
]
)
Primary outcomes (based on administrative data)
Paid any formal child supportb (%) 32.5 37.9 -5.4 [-13.5, 2.7
Among those who paid formal child support:
Months from random assignment to first payment 5.5 5.4 0.0
Months of formal child support paid 1.4 1.6 -0.2 [-0.6, 0.2
Amount of formal child support paid ($) 460 556 -95 [-280, 90
Sample size 166 185
Self-reported outcomes (%) (based on survey data) Currently a noncustodial parent of a minor-age child 68.9 65.2 3.7 [-7.1, 14.4
Provided informal cash support or noncash support [
[[
in the past month 51.1 42.7 8.4 -2.8, 19.6
Informal cash support 38.9 34.1 4.7 -6.3, 15.8
Noncash support 47.6 40.5 7.1 -4.0, 18.2
Owing child support affects willingness to take jobs, among those required to pay child supportc 28.5 14.6
Incarcerated for not paying child support 0.0 0.0 0.0 [0.0, 0.0
Among those with minor-age childrend
Frequency of contact with focal child in the past 3 months Every day or nearly every day 41.1 21.2 20.0A few times per week 14.0 29.7 -15.7A few times per month 14.1 12.4 1.8Once or twice 8.7 7.2 1.5Not at all 22.0 29.5 -7.5
Sample size 110 126
(continued

280
Table 6.8 (continued)
SOU RCE S: MDRC calculations based on child s upport agency da ta and respons es to the ETJD 12-mo nth survey. NOTES: Results in this table are regression-adjusted, controlling for pre-random assignment characteristics. aDue to incomplete data, child support measures based on administrative data only include sample members who were randomly assigned during the first year of the program (by December 31, 2012). bMeasures of formal child support include all payments made through the state's child support collection and disbursement unit, including from employer withholding and other sources (for example, tax intercepts). cThis measure is calculated among those required to pay child support; it is therefore considered nonexperimental and is not tested for statistical significance. dThis measure is calculated among those who reported having a minor-age child at the time of the survey; it is therefore considered nonexperimental and is not tested for statistical significance. The focal child is defined as the youngest minor-age child living outside of the sample member's household; if the sample member reports no minor-age children living outside of his or her household, the focal child is the youngest minor-age child residing within the household.

281
Table 6.9
One-Year Impacts on Economic and Personal Well-Being: Fort Worth
Outcome (%) Program
Group Control
Group Difference
(Impact)
Ninety Percent Confidence
Interval
[-4.5, 6.3]
Ex perienced a financial shortfall in the past 12 months Could not pay rent or mortgage
Evicted from home or apartment Utility or phone service disconnected Could not afford prescription medicine
H ad insufficient food in the past month
Housing in the past month Rented or owned own apartment or room
Lived with family or friendsa Homeless or lived in emergency or temporary housing Incarcerated, on work release, or living in a halfway house Other
Is currently in good, very good, or excellent health
H ad health insurance coverage in the past month Health coverage was employer-based
Ex perienced serious psychological distress in the past monthb
53.0
35.4 7.4
33.6 27.5
24.6
24.7
65.8 4.5 3.4 1.6
73.9
36.0
22.9
13.5
55.0 39.3
8.1 36.2 29.7
22.9
23.7
67.4 4.5 3.0 1.3
72.9
28.8
16.4
17.1
-2.1 -3.9 -0.6 -2.7 -2.2
1.8
0.9
-1.6 0.0 0.3 0.4
1.0
7.3 **
6.5 **
-3.5
[-8.3, 4.2]
[-10.0, 2.2] [-4.0, 2.8] [-8.7, 3.4] [-7.9, 3.5]
[-3.6, 7.2]
[-7.4, 4.2] [-2.6, 2.5] [-1.9, 2.5] [-1.1, 1.9]
[-4.5, 6.5]
[1.4, 13.1]
[1.5, 11.5]
[-8.1, 1.0]
Sample size 346 340
SOURCE: MDRC calculations based on responses to the ETJD 12-month survey. NOTES: Results in this table are regression-adjusted, controlling for pre-random assignment characteristics. Statistical significance levels are indicated as: *** = 1 percent; ** = 5 percent; * = 10 percent. aIncludes those who lived with friends or family and paid rent and those who lived with friends or family without paying rent. bA score of 13 or higher on the Kessler-6 (K-6) scale is used here to define serious psychological distress. The K-6 assesses how often during the past month a respondent felt so sad that nothing could cheer him or her up; nervous; restless or fidgety; hopeless; that everything was an effort; or worthless. As a result of minor differences between the scale used to administer the K-6 in the ETJD 12-month survey and the standard K-6 scale, the percentages presented in this table may slightly underestimate the incidence of serious psychological distress among the ETJD sample.

THIS PAGE INTENTIONALLY LEFT BLANK

Chapter 7
RecycleForce, Inc. (Indianapolis, IN)

THIS PAGE INTENTIONALLY LEFT BLANK

285
Executive Summary
RecycleForce, a social enterprise in Indianapolis, provides workforce training to formerly incarcerated individuals. Before the Enhanced Transitional Jobs Demonstration (ETJD) grant, RecycleForce had an established transitional jobs program that included up to 35 hours of paid time, occupational and soft-skills training, peer mentorship from formerly incarcerated individ-uals on staff, and formal and informal case management. As described in Chapter 1, Recy-cleForce enhanced the basic transitional jobs model by providing peer mentoring and additional support. The grant also enabled RecycleForce to build on its existing model by adding job-development activities and child support-related assistance, and by engaging two other social enterprises — New Life Development Ministries and The Changed Life — as additional program providers. Participants could hold transitional jobs for up to four months.
Main Findings •
•
•
Most study participants were black men in their 30s; most had worked in the past, but they had limited recent work experience and other dis-advantages. The average age of the 998 study participants was 34. More than 80 percent of study participants had worked in the past and two-thirds had held a single job for six months or more. However, only 10 percent of the study participants had worked for a year or more in the past three years, presumably because they had been incarcerated. Close to two-thirds of par-ticipants had minor-age children. One-quarter did not have a high school diploma or equivalent. More than 90 percent of the participants were stay-ing in someone else’s home or living in a transitional facility such as a halfway house.
There was a high rate of participation in program services. All partici-pants worked in transitional jobs, almost 95 percent participated in education and job training, and over 90 percent received work-related support. Partici-pants reported high satisfaction with all program services. For example, 84 percent had very favorable views of their relationships at work and 77 per-cent had very favorable views of their preparation for future employment. Among the noncustodial parents in the program group (about half of the sample), over 70 percent received child support assistance, including debt compromise and driver’s license reinstatement.
The two partner organizations experienced difficulty implementing cen-tral program elements. Two social enterprises were engaged to provide the

286
full array of program services to 200 program group members. (These ser-vices included transitional jobs, development time, case management and other forms of support to help participants stay employed, and employment services.) While these enterprises implemented many components of the program, it proved difficult for them to replicate peer mentoring from for-merly incarcerated individuals.
•
•
•
•
Many participants received extensions in the time-limited transitional job. Although transitional jobs were designed to last four months, most par-ticipants requested and were granted extensions if they had not found unsub-sidized work or were deemed unready for unsubsidized employment. Fifty percent of participants were in the program for more than four months.
Participants had multiple barriers to employment, which had implica-tions for program services and unsubsidized employment. Senior pro-gram managers suggested that individuals with multiple barriers to employ-ment might benefit from more structured case management than the program’s informal, participant-initiated approach provided. Staff members also said that while a full-time, unsubsidized job was the ultimate goal for participants, it may not have been a realistic expectation for them after four months in the program. Many participants transitioned to temporary jobs, which give workers the flexibility to attend to the requirements of probation and parole while continuing to develop workplace skills.
The program had positive impacts on receipt of services related to em-ployment, child support, criminal justice issues, mentorship, advice or support from staff members, and mental health assistance in the first year of the follow-up period. For example, the program increased the pro-portion of study participants who reported receiving help finding or keeping a job by 30 percentage points. It more than doubled the proportion receiving help related to criminal convictions, and also more than doubled the propor-tion who reported that they got advice or support from staff members. For the more than half of participants who were noncustodial parents, RecycleForce more than tripled the proportion receiving child support-related services.
The program group had higher rates of employment and earnings in unemployment insurance-covered jobs. During the first year after enroll-ment, the program had statistically significant impacts on employment and earnings. Ninety-six percent of program group members had earnings from unemployment insurance-covered jobs, compared with 62 percent of the con-
287
trol group. Total average earnings during the first year more than doubled, from $2,830 to $6,034. Most of this impact is from subsidized employment, which accounted for $3,260 of the program group’s earnings.
•
•
Impacts on criminal justice involvement occurred early in the follow-up period, while program group members were active in the program; these impacts faded during the second half of the year, resulting in little impact overall on criminal justice involvement. There were no differences in arrests during the full first year, but program participants were less likely to be convicted of a felony (4 percent of participants in the program group versus 10 percent in the control group). However, the program significantly affected several criminal justice outcomes during the first six months after random assignment, when many participants were active in transitional jobs at RecycleForce or one of its partners. For example, during the first six months, about a third fewer of the program group’s members were arrested than control group members (9 percent versus 15 percent), just over half as many were convicted of crimes (6 percent versus 11 percent), and only a quarter as many were admitted to prison for new crimes.
The program had substantial impacts on child support outcomes. The proportion of noncustodial parents in the sample who paid child support in-creased by more than 17 percentage points. Program group noncustodial par-ents also paid child support for more than twice as many months as control group noncustodial parents and paid more than twice as much, on average.
The first section of this chapter provides background about the context in which the program operated, the intended program model, and the characteristics of study participants. The following section discusses the implementation of the program, and the third section describes the program’s impacts on participants’ outcomes. The chapter ends with a conclusion.

288
RecycleForce, Inc.
Background RecycleForce is a social enterprise that provides recycling services and workforce training to formerly incarcerated individuals in Indianapolis.1 As a social enterprise it has three inter-connected goals: (1) To help formerly incarcerated men and women successfully reenter society by providing paid employment and training along with social services; (2) to keep as much material out of landfills as possible; and (3) to fund its operations as much as possible from the sale of recycled materials.2 RecycleForce was one of three ETJD grantees testing a modified transitional jobs program model, wherein participants were placed into fully subsidized, temporary positions at RecycleForce while receiving various forms of social and economic support and assistance in obtaining unsubsidized employment. This chapter is divided into three parts. This section describes the context in which the program operated, the intended model, the recruitment and enrollment of study participants, and study participants’ characteristics.
Context
At the time study enrollment began, the unemployment rate for the Indianapolis-Carmel-Anderson metropolitan statistical area was 8.6 percent.3 The unemployment rate declined steadily over the study period, from 8.0 percent in 2012 to 7.3 percent in 2013, to 5.7 percent in 2014.4 Although the unemployment rate declined during the study period, staff members said that the unemployment rate has little effect on employment opportunities for formerly incarcerated individuals and that the incentives available to hire this group, such as the Work Opportunity Tax Credit,5 do not outweigh the cost of liability insurance for employers.
The largest employment sectors in the Indianapolis area are “office and administrative support” (15 percent of employed individuals), “sales and related” (10 percent), “transportation and material moving” (10 percent), “production” (7 percent), and “healthcare practitioners and technical” (7 percent).6 Program staff members said that in some of these sectors (for example,
1The organization was founded in 2006 under the name Workforce, Inc. 2Revenue from recycling operations covers some program costs. Generally about 50 percent of costs are
covered. This figure ranges from 35 percent to 60 percent depending on commodity pricing. 3U.S. Department of Labor, Bureau of Labor Statistics (2016a). These are annual figures, not seasonally
adjusted. 4Sample enrollment ended in 2013, but RecycleForce’s ETJD program services continued through 2014. 5The Work Opportunity Tax Credit is a federal tax credit offered to employers that hire people with signif-
icant barriers to employment (including people with criminal records). See U.S. Department of Labor, Employment and Training Administration (2016).
6U.S. Department of Labor, Bureau of Labor Statistics (2015a).

289
health care), felony convictions limit opportunities. (As described below, a felony conviction was an eligibility requirement for the program.) Program staff members also indicated that there is a spatial mismatch between the residences of formerly incarcerated individuals (in Indianapo-lis proper) and many of the jobs that program staff members flagged as being good prospects for their participants (for example, warehouse jobs), which were often located in the suburbs. Interviewees cited the lack of good public transportation options as an obstacle to employment after they left the program. Additionally, many formerly incarcerated individuals do not have their own vehicles, or have suspended driver’s licenses due to unpaid traffic tickets or unpaid child support, or are barred from operating motor vehicles under the conditions of their supervi-sion. As mentioned below, these environmental factors affected the program’s approach to post-transitional job employment.
Every year from 2010 to 2014, about 3,500 adults were released to community supervi-sion in Marion County (the county that includes Indianapolis).7 Most individuals convicted of a felony serve about half of their sentences in the community. Once released, they are supervised by probation or parole and must adhere to certain conditions (see Box 7.1). Failure to abide by the conditions of supervision may result in administrative sanctions, such as increased reporting to parole/probation or mandated treatment. More severe violations are met with increasingly severe sanctions that are laid out in a graduated schedule customized to a person’s risk level for reoffending. Probation or parole officers may exercise discretion in the sanctions they impose, but repeated violations or severe violations such as being arrested or traveling out of state without permission typically result in a technical rule violation. Technical rule violations normally lead to a revocation of community supervision and reincarceration.
Looking for and obtaining employment is a condition of release, and those on probation (unlike parole), need earnings to pay for supervision fees.8 According to staff members in the Marion County Superior Court Probation Department, probationers in Marion County pay about $1,000 in fees on average over the course of a year of supervision.9 Yet many parolees
7Indiana Department of Correction (2016). The number of adults released annually decreased over the course of the study, from about 4,200 in 2010 to 2,700 in 2014. Program staff members pointed out that the figure for Marion County is low because it only includes individuals released from Marion County institutions who reside in Marion County after they are released. Individuals incarcerated at facilities in other counties also often return to Marion County after they are released.
8Probation is distinct from parole. Whereas the Department of Corrections sets the terms of parole, courts set the terms of probation at the time of the original sentencing (for example, the sentence might be six years in prison followed by one year on probation). Individuals on probation are required to pay fines or fees as a condition of supervision.
9For example, probationers with a felony conviction pay $30 per month to be on probation. They might also be ordered to pay other fees, for example $100 for public defender services, $250 for treatment services, or $100 for administration.

290
Box 7.1
Basic Conditions of Release to Parole/Probation
• • • • • • • • • • • • • •
Report to parole or probation Maintain a single, verifiable residence approved by supervising agent Seek and maintain employment Do not leave the state without permission Do not use illegal drugs (submit to drug screening and participate in treatment as directed) Do not engage in criminal conduct Do not possess a dangerous weapon Submit to searches of person, vehicle, or property at any time Do not associate with anyone in violation of the law or with a felony conviction Participate in programs as directed by parole or probation officer Support dependent children and abide by court orders for support (probation only) Pay all court-ordered fines, costs, fees, and restitution (probation only) Obtain permission to apply for or renew a license to operate a motor vehicle Obtain permission to purchase or lease a motor vehicle (parole only)
and probationers also need flexible work schedules to accommodate regular drug screenings and meetings with probation or parole officers.
As described below, half of the RecycleForce study participants were noncustodial par-ents. State child support guidelines are used to set child support order amounts and any debt owed. If a noncustodial parent is incarcerated, the order amount can be modified to zero, reflecting the parent’s inability to work and pay support. However, the parent needs to start the modification process and file a petition with the court, which is difficult for a number of reasons. The parent may not know an order modification is possible or the steps for requesting one. If the parent knows a modification is possible, he or she might not have access to the needed documents. Finally, orders are modified in court, so an inmate would need to make arrangements to participate over the phone or be transported to court.10 As a result of these policies, many individuals leave prison having accrued considerable child support debt.11
10At the time of the implementation study in November 2013, both the county and state were making ef-forts to facilitate order modifications for people in prison.
11RecycleForce’s child support consultant received data on debts owed to custodial parents and debts owed to the state. The debts owed to custodial parents ranged from a low of $1,000 to over $65,000, while debts owed to the state ranged from $0 to over $37,000. A few participants owed in excess of $80,000 in child support debt. The data do not indicate what percentages of these debts accumulated during incarceration.
291
Finally, few services in Indianapolis other than RecycleForce specifically target for-merly incarcerated individuals. None provides transitional jobs. WorkOne Indy is the local American Job Center and provides services such as career assessments, job-search work-shops, assistance with résumés, and training and education (although the costs of that training and education may not be covered). Many other community-based organizations offer assistance with basic needs (such as clothing, food, and housing), legal services, and job-readiness services.
Intended Model
The RecycleForce program aims to help formerly incarcerated individuals learn skills and behaviors that will ultimately result in permanent jobs, and to help participants reintegrate into the community through connections to children, families, and positive peer groups. RecycleForce enhanced the basic transitional jobs model primarily through its peer mentoring component. The RecycleForce transitional jobs program was operational before the ETJD grant and peer mentoring was part of its original model. RecycleForce proposed to use the ETJD grant to add a number of components to its existing transitional jobs program: support for the transition to unsubsidized employment; child support consultation services for noncus-todial parents; and a transitional job pathway with a city agency. It added two partners to provide the additional service components: (1) Educational Data Systems, Inc. (EDSI) to handle employment placement, verification, and unsubsidized job retention, and (2) Child Support Consulting of Indiana to assist program participants who were noncustodial parents with child support issues.
RecycleForce needed to increase the number of formerly incarcerated individuals it served in order to meet the ETJD goal of enrolling 500 people into the program group. To build that capacity, it used the grant to engage two additional transitional jobs providers in Indianapo-lis and required them to run their models using the RecycleForce approach.12 Each of these two social enterprises — New Life Development Ministries and The Changed Life — had a grant agreement to serve 100 participants and to permanently hire 10. The Indianapolis Mayor’s Office on Reentry was to provide extended transitional jobs that led to unsubsidized work to an additional subset of participants. The mayor’s office was expected to engage 50 participants in extended transitional jobs and connect them afterward to public-sector jobs, primarily in the Department of Public Works.
The new transitional jobs providers were expected to offer the same services as Recy-cleForce (the original program and the new components) and to adhere to the RecycleForce
12RecycleForce staff described social enterprises as the “minor league” of employment, serving as a bridge
between prison and unsubsidized jobs.

292
philosophy of “continuous approximations” — that is, participant outcomes such as unsubsi-dized employment and reduced recidivism are achieved incrementally and not necessarily in a linear fashion. Multiple failures may occur before success is ultimately achieved. The idea is that little by little, through engagement with the staff (including formerly incarcerated individu-als on staff), program participants will learn not only job skills but also workplace and life skills such as how to be punctual, how to interact with colleagues and supervisors, and how to behave appropriately in the workplace (for example, by not texting on the job). A component of this philosophy is unconditional support for participants. Infractions on the job are teachable moments and not cause for immediate dismissal.13 Staff members aim to develop participants’ motivation to change past behaviors.
All components of the program, from the transitional job to training and case manage-ment, support work because RecycleForce believes that work reduces participants’ likelihood of reoffending. Program staff members note that people who work have less time to commit crimes and a less urgent need to make fast cash. RecycleForce promotes “work is therapy,” a term used to help new participants develop their “work muscle.” On-staff peer mentors, all formerly incarcerated individuals, model positive work practices and appropriate communica-tion. Case managers (known at the program as Employment Assistance Representatives or EARs) focus on support for work. The program is self-paced and participants determine the number of hours they work (there are no negative consequences for working less than a full workweek, or less than a full day), take training modules at their own pace, and initiate meet-ings with case managers as needed. The specific program components are:
Development of job skills. The cornerstone of the RecycleForce program is the transi-tional job. Participants were paid $9 per hour for up to 35 hours per week.14 In the grant-supported version of the program the transitional job could last at least four months, consecu-tively or nonconsecutively (for example, if someone were reincarcerated that person could come back to the program job upon release). RecycleForce’s model also includes Occupational Safety and Health Administration (OSHA) training and soft-skills training.
Development time. Participants are allotted a minimum of five hours of unpaid, ex-cused time each week for nonwork activities such as drug screenings, court hearings, and meetings to address child support-related issues. The grant included funds to pay for drug
13Staff members first deliver this message during orientation. They stress three principles: (1) The staff
understands that there will be mistakes. The goal is for participants to learn from their mistakes and understand the natural consequences that come from them. (2) When participants continue to “do the next right thing,” RecycleForce will be their strongest advocate with the criminal justice oversight system. (3) RecycleForce has a responsibility to that oversight system to report their attendance and other issues related to work.
14Wages increased to $10.10 in March 2014. RecycleForce (2014).

293
testing required as a condition of probation or parole, bus passes, and other forms of support as needed.
Support to help individuals stay in the program and address their employment needs. RecycleForce provides formal and informal case management. In the grant-supported version of the program, case managers were to meet with participants during orientation, at specified milestones (30, 60, and 90 days into the program), and informally as needed. Peer mentors were to supervise participants, teach job-related skills, and model appropriate work-place behavior. Peer mentors and case managers were to meet thrice weekly to share impres-sions and discuss concerns that need to be addressed individually or for the group of partici-pants. Depending on the issue, the resolution might involve reaching out to a participant informally, scheduling a one-on-one session, or addressing the issue anonymously in Circle (discussed below).
The first case manager contact came on the day of random assignment. It involved de-veloping a Plan of Action that articulated participants’ short- and long-term goals and barriers to reaching those goals. Generally participants were expected to address barriers on their own, although case managers did work with groups experiencing a common barrier (for example, the need for photo identification) to facilitate a solution (in this example, driving a group of partici-pants to the Bureau of Motor Vehicles).
Finally, the daily Circle of Trust (“Circle”), another original program component, is the first activity of every day at RecycleForce. It is an opportunity to reflect on and share successes and challenges. Participants are on the clock. A formerly incarcerated person on staff leads the session and generally offers a topic and then facilitates a discussion. For example, if individuals were moving slowly or putting limited effort into searching for jobs, the Circle facilitator would start a conversation by asking all participants what they do not like about looking for work, and what holds them back from putting 100 percent effort into the task. A participant might raise concerns about how to talk about a felony conviction during an interview, and the facilitator or another participant could offer advice based on their own interviewing experiences. Case managers attend daily to learn about issues that are developing and to get a sense of whether they need to check in with any participants. Circle also provides a forum for case managers and peer mentors to raise with all participants issues they heard about through informal or formal channels.
Employment and retention services. Under the grant, EDSI was engaged to develop unsubsidized job leads and prepare job-ready program participants for interviews. EDSI was also expected to verify employment and provide retention services to participants in unsubsi-dized jobs.

294
Child support services. Under the grant, Child Support Consulting of Indiana was to provide assistance with child support issues such as order and arrears modifications and driver’s license reinstatement.
Recruitment and Study Enrollment
● RecycleForce collaborated closely with criminal justice system partners, including probation and parole agencies, and successfully met its sample goal earlier than anticipated.
The recruitment and enrollment process remained largely consistent throughout the study enrollment period. The main referral partners were Marion County Probation, Indianapo-lis Parole District 3, Duvall Residential Center (a work-release facility), and Marion County Reentry Court. Although RecycleForce had a long-standing relationship with a number of probation officers, it had to develop partnerships with new criminal justice partners for the study.15 In January 2012 RecycleForce hosted open houses that enabled potential referral partners to observe physical plant operations, see formerly incarcerated individuals at work, and learn about program services. Staff members said that these open houses secured the coopera-tion of criminal justice system partners. RecycleForce had a steady stream of referrals and met its study enrollment goal (1,000 participants) more than two months earlier than required.
To refer an individual, criminal justice partners completed a one-page referral form con-firming the individual’s eligibility for the program and e-mailed or faxed it to Keys to Work, a subgrantee responsible for study intake. Keys to Work then scheduled the individual for the next available weekly orientation session. Nearly all of the eligible people referred were scheduled for an orientation, and about two-thirds of them reported to the orientation. To be eligible for the program, individuals had to be 18 or older and meet the following criteria, some adopted by RecycleForce and some required by the Department of Labor (DOL):
• Score medium to high on the Indiana Risk Assessment System. All crim-inal justice system partners already used this assessment before a person’s re-lease to determine his or her risk of reoffending (low, medium, or high), which made it easy for them to identify prospective program participants.
15Before the grant, most program participants had been convicted of sex offenses and the primary referral
partner was the Marion County Probation staff working exclusively with this population. Because the Depart-ment of Labor prohibited programs working with formerly incarcerated individuals from spending funds on services to sex offenders, RecycleForce needed to build partnerships with new criminal justice system staff members, including different Marion County probation officers.

295
•
•
Not be in violation of supervision. As mentioned above, individuals who do not comply with the conditions of supervision are subject to technical rule violations. Depending on the sanction level, they may be reincarcerated, and thus be unable to participate in the program.
Meet DOL grant-related requirements. The DOL grant required that par-ticipants must:
o
o
o
o
Have been released from a federal or state prison within the past 120 days.
Have no recent history of working consistently. RecycleForce defined “recent history of working consistently” as having a history of working four quarters with the same employer.
Never have been convicted of a sex offense.
Have been convicted of a crime as an adult under federal or state law.
Aside from satisfying all criteria, referred individuals did not undergo additional as-sessments or other screening activities before random assignment.
Keys to Work facilitated two-day orientations to the study and the program each week. On day one (a Monday), potential participants learned about the program and the study in a group orientation session. Those interested in enrolling in the study were scheduled for one-on-one meetings the following day to complete intake paperwork. On average, about 90 percent of individuals who attended the first day of orientation returned the second day. During the second-day appointment, Keys to Work collected the study informed consent form and gathered study-specific “baseline” information from the individual. The staff then used an online tool created by the evaluation team to conduct random assignment. Control group members received a list of alternative resources in the community;16 program group members were escorted to RecycleForce, which shared a building with Keys to Work, for program orientation.17 Keys to Work then reported attendance and research group assignment to the referring office (for example, probation or parole).
16The alternate services list included employment-related services (for example, American Job Centers,
which are sponsored by the U.S. Department of Labor and provide a full range of services to job seekers, including training referrals, career counseling, and job listings); child support services (for example, the Marion County Child Support Division); and organizations that provide food assistance, clothing, housing services, health services, and legal assistance.
17At this time, participants were formally on the clock and started receiving wages.

296
RecycleForce noted that giving Keys to Work responsibility for all recruitment and in-take activities allowed the RecycleForce staff to focus on service delivery. Keys to Work managed communication with about 35 parole and probation officers and with referred partici-pants, notifying them of the orientation date, sending reminders, and rescheduling orientation dates as needed. The separation of intake and program functions also helped ensure that control group members did not come into contact with the RecycleForce staff and were not inadvertent-ly exposed to program components.
Baseline Characteristics
RecycleForce collected baseline data on study participants before they were randomly assigned to the program group or control group. Tables 7.1 and 7.2 and Appendix Table F.1 presents participant demographic characteristics, criminal histories, employment histories, family and child support information, histories of public assistance and benefits, and health information.18 Box 7.2 includes a profile of a program group participant.
Demographically, sample members in Indianapolis were similar to those for other ETJD programs targeting formerly incarcerated individuals. On average, Indianapolis sample members also had levels of education close to the average for other programs targeting the same population: About one-fourth of sample members lacked a high school diploma or equivalent, while the remainder had earned at least that credential.
As Table 7.1 shows, less stable housing conditions were common. Most Indianapolis study participants (64 percent) were living at the home of a friend or family member when they enrolled in the study, higher than the average for the three ETJD programs targeting formerly incarcerated people (57 percent). Another 30 percent were living in a halfway house, transition-al house, or in a residential treatment facility.19
The same table shows that although most of the Indianapolis sample had worked at some point in the past (83 percent), only 31 percent had worked in the past year (largely because most had been in prison during the previous year, reflecting the eligibility criterion that participants had to have been released from incarceration in the previous 120 days). Sixty-seven percent reported having worked for the same employer for six or more months at some point
18The Programs Targeting Formerly Incarcerated People column includes study participants (program and
control groups) from Indianapolis, Fort Worth, and New York City. For a detailed comparison of the baseline characteristics of program group members and control group members across the ETJD programs, see Appendix I.
19Most of these study participants lived in one of the secure work-release facilities that referred residents to the program.

297
Table 7.1 Characteristics and Employment Histories of Sample Members: Indianapolis
Indianapolis ETJD Programs Targeting Characteristic Program Formerly Incarcerated People
Average
)
Male (%) 96.0 94.1
Age (%) 18-24 21.2 17.025-34 39.5 34.935-44 21.6 25.245 or older 17.6 22.9
age 33.6 35.5
Race/ethnicity (%)
Black, non-Hispanic 81.5 67.4White, non-Hispanic 15.1 16.2Hispanic 1.9 14.5Asian, non-Hispanic 0.0 0.2Other/multiracial 1.5 1.6
Educational attainment (%) No high school diploma or equivalent 24.4 24.7High school diploma or equivalent 69.4 71.9Associate's degree or equivalent 4.1 2.2Bachelor's degree or higher 2.1 1.3
Marital status (%) Never married 77.3 70.2Currently married 7.4 9.0Separated, widowed, or divorced 15.4 20.8
Veteran (%) 4.0 3.7
Has a disability (%) 0.5 3.1
Housing (%) Rents or owns 5.0 11.8Halfway house, transitional house,
or residential treatment facility 30.0 25.6Homeless 1.2 5.8Staying in someone else's apartment, room, or house 63.8 56.9
(continued

298
Table 7.1 (continued)
Indianapolis ETJD Programs Targeting Characteristic Program Formerly Incarcerated People
Employment history
Ever worked (%) 83.4 81.1
Among those who ever worked:
Worked in the past year (%) 31.3 19.9Average hourly wage in most recent job ($) 9.25 10.11Ever worked for the same employer for 6 months or more (%) 67.2 72.9
Months worked in the previous 3 years (%)
Did not work 21.0 46.6Fewer than 6 months 51.8 30.56 to 12 months 16.7 12.913 to 24 months 7.8 6.7More than 24 months 2.7 3.2
Sample size 998 3,002
SOURCES: MDRC calculations based on baseline survey data and ETJD management information system data.
before program entry. Almost three-quarters (73 percent) either had not worked or had worked for less than six months during the previous three years. The average hourly wage at the most recent job was slightly in excess of the transitional job wage ($9.25).
About 94 percent of the sample had been convicted of a felony (see Table 7.2). All In-dianapolis study participants had served time in prison. Their most recent release from incarcer-ation was about two months before program entry, on average. Almost all study participants in Indianapolis were under some form of community supervision when they entered the program. As Table 7.2 shows, the largest share of the sample was under parole supervision (41 percent) followed by probation and other or court supervision (29 percent each). Across the three programs targeting formerly incarcerated people, three-quarters of study participants were on parole.
Table 7.2 shows that 63 percent of the sample had minor-age children; half were non-custodial parents. One-quarter of the full sample (about half of the noncustodial parents in the sample) reported having current child support orders. By way of comparison, fewer of the three-program sample members were noncustodial parents (42 percent), had minor-age children (half), or had current support orders (15 percent).
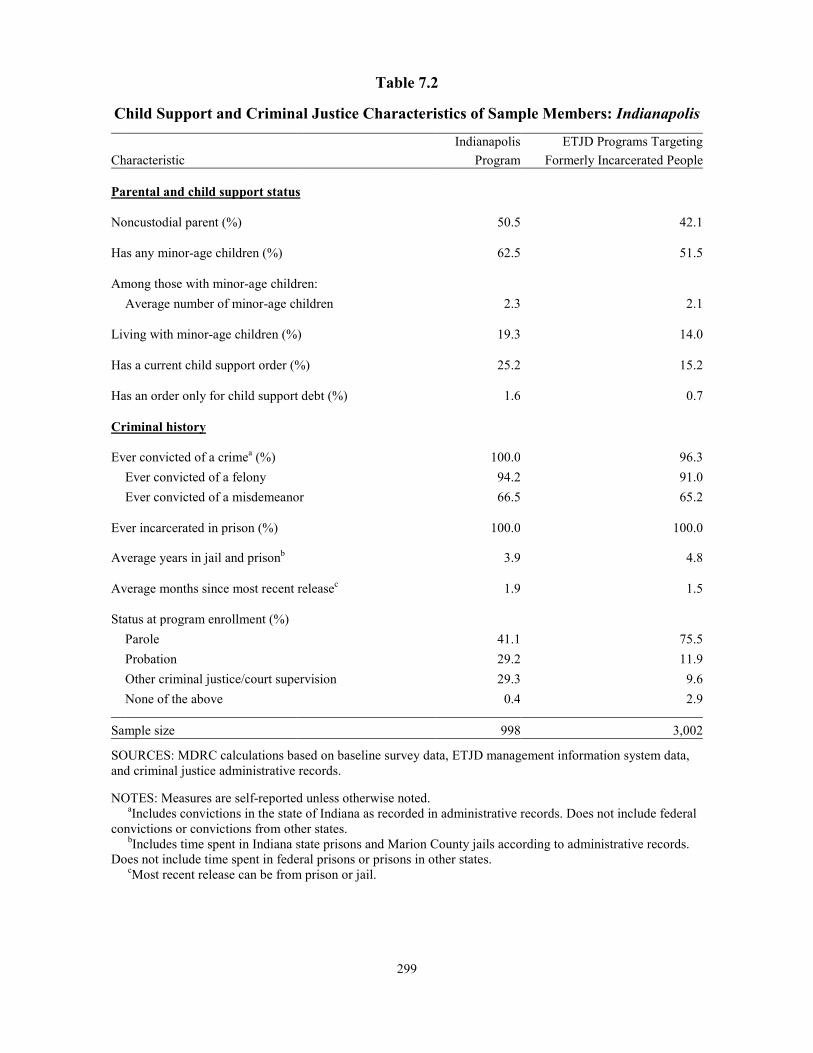
299
Table 7.2 Child Support and Criminal Justice Characteristics of Sample Members: Indianapolis Indianapolis ETJD Programs Targeting Characteristic Program Formerly Incarcerated People
Parental and child support status
Noncustodial parent (%) 50.5 42.1
Has any minor-age children (%) 62.5 51.5
ildren: Among those with minor-age chAverage number of minor-age children 2.3 2.1
Living with minor-age children (%) 19.3 14.0
Has a current child support order (%) 25.2 15.2
Has an order only for child support debt (%) 1.6 0.7
Criminal history
Ever convicted of a crimea (%) 100.0 96.3Ever convicted of a felony 94.2 91.0Ever convicted of a misdemeanor 66.5 65.2
Ever incarcerated in prison (%) 100.0 100.0
Average years in jail and prisonb 3.9 4.8
Average months since most recent releasec 1.9 1.5
Status at program enrollment (%) Parole 41.1 75.5Probation 29.2 11.9Other criminal justice/court supervision 29.3 9.6
None of the above 0.4 2.9
Sample size 998 3,002
SOURCES: MDRC calculations based on baseline survey data, ETJD management information system data, and criminal justice administrative records. NOTES: Measures are self-reported unless otherwise noted. aIncludes convictions in the state of Indiana as recorded in administrative records. Does not include federal convictions or convictions from other states. bIncludes time spent in Indiana state prisons and Marion County jails according to administrative records. Does not include time spent in federal prisons or prisons in other states. cMost recent release can be from prison or jail.

300
Box 7.2
RecycleForce Participant Profile
“Steve” is a black man in his late 40s. He was most recently released from prison after serving 9.5 years for dealing drugs and a firearms violation. His involvement with the criminal justice system began when he was 20, with an arrest for burglary. He has been arrested seven times and served time in prison on four occasions. He has multiple felony convictions. At the time he started the RecycleForce program he was required to meet with his probation officer, complete random drug tests, and pay $55 per month in court fees. He heard about RecycleForce from his probation officer and decided to learn more because he “needed a job.” He thinks he can honor the conditions of supervision so long as he remains employed. From the program he hopes to gain “good working skills” and sees “a lot of benefits” from participating, including assistance with child support issues.
Steve has three adult children aged 19 to 23, as well as grandchildren. He reports positive relationships with his children but says it has been somewhat difficult to reconnect with them since his release because, “I’d been out of their lives so long, they’d grown up without me.” Still, he says that he sees them often. He was not paying child support at the time he entered the RecycleForce program but thinks he owes about $5 per month.* He notes that his driver’s license is suspended due to nonpayment of child support and hopes that the program will help him get it back. He currently lives with his girlfriend and expects to keep doing so.
Steve earned a high school equivalency credential in prison and also took other classes offered, including parenting and training for reintegration into society. He has had “a number of jobs” in his life, most recently working a forklift in a warehouse near the Indianapolis airport. He left this job to attend to a sick parent. He hopes to find a permanent job by the time he leaves the program, but would like RecycleForce to hire him permanently, saying, “I am a very hard worker, and they can tell it, too.” He sees his felony convictions as a significant barrier to permanent employment.
He describes his old associates as a “bad influence” and no longer sees them. He states that he cannot get another felony; if he does, he will go to prison “all day.” Steve says, “I have been through so much in my life, I could write a book.” He would call it Hood Life. His family supports his participation in the program: “They’re happy I am off the streets and working, they are glad for me.” __________________________
*Given the age of the children, it is likely that the monthly support payment is for debt only. The in-terview notes do not specify the nature of the payments, however.
Program Implementation As mentioned above, RecycleForce planned to operate the program in conjunction with two other social enterprises, New Life and Changed Life. RecycleForce expected both to adhere to its overall program philosophy and to adopt all service components as well as its staffing structure. This section first describes staffing at RecycleForce and its subgrantees. Next, it

301
outlines eligibility requirements, the recruitment process, and the random assignment of individuals to the program group and the control group. It then describes the program model as implemented. Findings are based largely on three site visits. The first was an early assessment of operations in February 2012. The second two visits (January 2013 and November 2013) focused on program implementation.
Staffing and Structure
RecycleForce had a small management team composed of a president, a vice-president of operations, and a finance manager. According to a time study analysis, the president spent about one-fourth of his time on ETJD grant-related activities.20 The grant funded a program manager, who oversaw daily program operations and managed subgrantees; an evaluation coordinator responsible for all study-related tasks; and a database manager to compile and enter program data. A site coordinator oversaw participants in their transitional jobs and also support-ed job development. Employee management tasks such as payroll, benefits, and workers’ compensation were handled by an outside company, Managepoint. (Managepoint also conduct-ed OSHA training.)
RecycleForce is supervised and staffed by permanent and transitional workers. The col-or of a worker’s hardhat reveals his or her role. Permanent workers can have a white hat (supervisors, full-time staff members, and peer mentors), a red hat (safety officers and manag-ers), or a blue hat (team leaders, full-time staff members, and peer mentors). Transitional workers have yellow hats. Box 7.3 describes these roles in more detail.
As covered above, peer mentorship from formerly incarcerated staff members is a central component of the program. Not only do peer mentors supervise production, they also help transitional job participants learn workplace skills and behaviors. At the time of the grant there were about 40 peer mentors who had started in transitional jobs (before the grant) and then worked their way to being permanent employees in supervisory positions. Peer mentors at RecycleForce convened monthly and collaborated with case managers to address partici-pants’ issues.
The grant funded three RecycleForce case managers, who helped participants engage in work through one-on-one meetings and informal communication. Case managers did not have assigned caseloads; the assumption was that they should be able to work with anyone who
20In the fall of 2013 the evaluation team conducted a time study that asked staff members to report the
proportion of their time they spent on each component of the program during a specified period. This analysis is useful in understanding the allocation of staff resources to various program activities.

302
Box 7.3
RecycleForce Order of Ranking
Ranking Roles and Qualifications
White hat A white hat denotes a supervisory role and a department head. All white hat wearers are formerly incarcerated people who came through the transitional job program and showed significant progress as leaders. The white hats are the top peer mentors. They have production responsibility and help promote the philosophy that “work is therapy.” White hats report to case managers on transitional job participants’ activities, including attendance.
Red hat The safety director and the operations director wear red hats. A red hat is a management role; a red hat does not need to be a formerly incarcerated individual who came through the transitional jobs program.
Blue hat Blue hats are second-in-charge in a department and work hand in hand with a white hat, like an assistant. They are also peer mentors.
Yellow hat Yellow hats are transitional jobs participants. They are assigned to various departments.
walked into the room and needed assistance. The grantee noted that case management was not a major part of the program model. One of the three case managers was dedicated to orienting new participants and communicating participants’ daily attendance status to referring partners.
A number of roles were specific to the grant. In addition to the program manager, eval-uation coordinator, and database manager, the grant funded three Keys to Work staff members who managed the study intake process. Keys to Work also functioned as a staffing agency that temporarily employed RecycleForce participants (see below). A former Marion County Child Support Division staff member who had moved on to Child Support Consulting of Indiana assisted participants with child support issues. EDSI was added to provide job development services and was also responsible for making contact with participants after their transitional jobs to determine whether they were working, whether their jobs were going well, and whether they needed any assistance.
During the time the organizations were involved in the project, New Life and Changed Life each had a grant-funded case manager and a site coordinator, who was the primary liaison

303
with RecycleForce. In addition, both subgrantees were expected to assign peer mentors, who would be trained by RecycleForce. The child support consultant and EDSI also provided services to participants at New Life and Changed Life.
Implementation of Core Program Components
Before the ETJD grant, the RecycleForce program already included peer mentoring, Circle, OSHA and related training, and case management. Using the grant RecycleForce added two new components: employment services and child support consulting. New Life and Changed Life were supposed to implement all components uniformly.
However, the full set of services was implemented inconsistently across all providers. RecycleForce merely had to continue its existing services while revising its approach to some program elements (employment services and child support consulting) and overseeing new partners. New Life and Changed Life needed to adopt new program components (peer mentor-ing and Circle), as well as a new way of interacting with participants.
● Program group members participated in transitional jobs and educa-tional and training services at high rates; they also received work sup-port at a high rate.
A number of elements were implemented universally. One hundred percent of partici-pants worked in transitional jobs. Participants started on the clock the day of random assign-ment (every Tuesday). Those placed at RecycleForce started with 30 days of “phase training,” in which they rotated through each station of the plant (learning tools, demanufacturing, and logistics and inventory) before being assigned to work in one. Although participants could work up to 35 hours per week in the transitional job, most worked fewer hours due to other obliga-tions such as home detention, parole appointments, or drug testing — the high-risk nature of the population meant that many participants were subject to extensive parole or probation monitor-ing. Table 7.3 indicates the average participant worked in a transitional job for about 72 days total.21 While this average suggests that participants worked about 85 percent of the days available (a four-month period would have about 85 working days), participants frequently received extensions beyond four months. Participants spent an average of five months in the program.22 Figure 7.1 shows the percentage of program group members working in transitional jobs in each month following random assignment.
21Calculated using net hours, assuming a seven-hour workday. 22This span is the duration between the first day in the program and the last day of services. It includes
time in a transitional job and time receiving other services such as employment preparation and case manage-ment. The time in the program also reflects, for some participants, stops and starts due to incarceration.

304
Table 7.3
One-Year Participation in ETJD Subsidized Jobs and Services Among Program Group Members: Indianapolis
Program Measure Group
Participated in any activity, including a subsidized job (%) 100.0
Worked in a subsidized job (%) 100.0Worked at New Life Developmental Ministries 13.0Worked at The Changed Life 12.8
Among those who worked in a subsidized job: Average number of months in the programa 5.3
Average number of days from random assignment to first subsidized paycheck 3.8Average number of days worked in a subsidized jobb 71.8
Received a service other than a subsidized job (%) 99.8Formal assessment/testingc 3.2Education and job trainingd 96.4Workforce preparatione 68.1Work-related supportf 92.0Child support assistance, among noncustodial parents 70.5Parenting class, among noncustodial parents --Incentive payment --Other servicesg 33.5
Arrears modifiction to $1 during subsidized job, among noncustodial parents (%) 52.0Driver's license reinstatement assistance, among noncustodial parents (%) 28.3
Sample size 501
(continued)
As shown in Table 7.3, 96 percent of participants received education and job training services, mainly from Managepoint. Training at RecycleForce occurred every Wednesday from 9 a.m. to 2:30 p.m. in one of the OSHA modules (listed in Box 7.4) or one of three soft-skills modules (prohibited harassment, dealing with conflict in the workplace, or customer service). The curriculum was standardized, but the trainer tried to adapt it through stories to match the participants’ literacy levels. Most modules included a PowerPoint lecture, exercises, and a quiz.

305
Table 7.3 (continued) SOURCES: MDRC calculations based on data from the ETJ D management information system and RecycleForce's data management system. NOTES: A double dash indicates that the service was not offered. aMeasured as the duration between random assignment and last subsidized paycheck. bCalculated using net hours worked, assuming a seven-hour workday. cIncludes only assessments conducted by outside partner organizations. Assessments conducted by RecycleForce were not recorded in the management information system. Includes Department of Labor Occupational Information Network (O*NET) career exploration and assessment tools. dIncludes material handling, forklift driving, refrigeration, and warehouse safety. eIncludes résumé writing workshop, anger management class, job leads, and job fairs. fIncludes drug testing, glasses, bus passes, gas cards, and clothing. gIncludes health care plan selection and meeting with benefits consultant.
Figure 7.1
Subsidized Employment Over Time: Indianapolis
0102030405060708090
100
1 2 3 4 5 6 7 8 9 10 11 12Perc
enta
ge w
orki
ng in
subs
idiz
ed jo
bs
Month relative to random assignment
SOURCE: MDRC calculations based on data from the ETJD management information system.
NOTE: Month 1 in this figure is the month in which random assignment occurred.

306
At the end of each training session, each participant received a printed certificate, which he or she could keep in a portfo-lio to show to prospective employers. Participants said they learned useful skills and staff members added that employers particularly valued forklift certification, which can cost up to $300. Among program group members who received training from RecycleForce, 71 percent received forklift training (not shown).23
The table also shows that 92 percent received forms of work-related financial support like payments for drug testing, bus passes, or gas cards. Criminal justice partners said that this financial support and the program’s work-schedule flexibility (designated development time) helped participants comply with supervision require-ments such as regular drug testing, meetings with probation or parole officers, and court appearances. RecycleForce permitted officers to conduct check-ins with their clients on-site, saving participants a trip to their offices.
Box 7.4
OSHA Training Offered by Managepoint
• • • • • • • • • • • •
Machine Guarding Personal Protective Equipment Warehouse Safety Hazard Communication Bloodborne Pathogens Material Safety Data Sheets Material Handling Basic First Aid for Medical Emergencies Slips, Trips, and Falls Lockout-Tagout Emergency Action and Fire Prevention Forklift Operator Safety
● Case management was implemented as planned.
Case management was implemented universally. Participants were required to check in with case managers less and less often over the life of the program. Initially, case managers had one-on-one meetings with participants three times (at 30 days, 60 days, and 90 days into the program) to assess their progress toward their goals and to help them develop new ones. In early 2013, this schedule changed; case managers met with participants at 45 days and at program exit. Case managers said that little changed between the meeting at enrollment and the one at 30 days, and that they had a great deal of informal contact with participants through conversations following Circle, in hallways, and during impromptu visits participants made to their office. The program also eliminated the 90-day appointments, which staff felt added an unnecessary administrative burden and yielded limited measurable gains.
● Noncustodial parents used the child support assistance offered by RecycleForce.
23Based on data from a survey administered about a year after random assignment.

307
Each week the child support consultant reviewed cases of new participants with child support orders, to determine whether a modification was appropriate (in practice, most orders were set correctly) and to identify participants’ other needs, such as driver’s license rein-statement.24 As shown in Table 7.3, about 71 percent of noncustodial parents received child support services. Per an agreement with the Marion County Child Support Division, wages withheld for child support debt payments could be reduced to $1 per pay period (weekly) while participants were in the program, under the assumption that they would be more likely to make current support payments if they were not overwhelmed with debt, many of which accrued while the parent was in prison.25 According to RecycleForce data, the consultant worked with 173 individuals, resulting in 15 order modifications, 132 child support debt modifications, 107 driver’s license reinstatements, and 3 paternity establishments. The consultant could not advocate on behalf of a participant in court, but she could help the individual fill out pro se paperwork for modifications.
● Peer mentoring — RecycleForce’s enhancement to the standard transi-tional jobs model and a central program component — was not replicat-ed by partners as intended.
The RecycleForce theory of change posits that the intervention can affect a formerly incarcerated individual’s motivation to alter his or her behavior. Peer mentoring is a central program component designed to bring about that change. All peer mentors at RecycleForce were formerly incarcerated and had started at the organization in transitional jobs, so they could relate to program participants in a different way than a supervisor without similar experience could. They worked side-by-side with participants (not in offices), which the program believed broke down barriers between mentor and mentee and provided ample opportunities for interaction.
In addition to job skills, peer mentors addressed participants’ attitudes and workplace behaviors. Peer mentors said that many participants had issues with authority, had worked only sporadically in the past, and were not used to the structure of a work environment. They helped participants learn positive behaviors such as coming in on time, staying on task during work hours, and not letting personal issues affect work time or performance. Peer mentors said that they were “sounding boards”; that is, they did not instruct so much as present options in an
24The consultant received details on each case from a dedicated staff person at the Marion County Child
Support Division, including the order amount, debt owed to the custodial parent and the state, the last payment made, pending court dates (if any), and license suspensions.
25Debts owed to the state and the custodial parent could be reduced. The approval of the custodial parent was needed to reduce debt owed to that person. Debt owed to the state increased to a maximum of $10 per pay period once the participant exited the program, so long as current support continued to be paid. Debt owed to the custodial parent reverted to the previous payment amounts.

308
informal manner. If they sensed an issue in the course of a workday, they addressed it at the time rather than simply referring a participant to the case managers. Peer mentors also spoke regularly (formally and informally) with case managers, and let them know if there were issues that needed their attention.
Peer mentoring proved difficult to replicate at New Life and Changed Life. Both organ-izations identified mentors who then received training at RecycleForce. Although New Life and Changed Life incorporated the element into their programs, it is not clear the spirit of the component — that peer mentors accept participants where they are and bring them along through “continuous approximations” — was implemented. Staff members from New Life and Changed Life said that their cultures were different from RecycleForce’s, in that they were stricter and less forgiving of mistakes. Moreover, the practice of peer mentors working side-by-side with participants and providing occupational skills and other instruction was not adopted by either provider. Mentors were not necessarily production supervisors and it was not clear that all production sites had mentors present. At Changed Life, for example, the office manager served as a peer mentor to participants assigned to off-site microbusinesses. RecycleForce leaders acknowledged that RecycleForce could have provided more guidance and oversight to the subgrantees in this area.
Only at RecycleForce did peer mentors and case managers meet three times a week and informally in between to discuss issues that affected participants’ work.26 At New Life and Changed Life there was less collaboration between case managers and peer mentors.
● Some program elements were not implemented as planned.
RecycleForce did not establish the intended partnership with the Mayor’s Office of Re-entry for 50 transitional jobs that would ultimately lead to public-sector jobs. The mayor’s office identified a site coordinator and worked out logistics for identifying candidates and the duration of transitional jobs (two to four weeks). Ultimately, however, the mayor’s office could not promise a permanent position with the city, only a letter of reference. When the mayor’s office legal team reviewed the contract, they raised a number of concerns regarding Worker’s Compensation and liability that they thought would make it necessary for the participant to be hired by the city before starting the transitional job. In July 2012, about eight months after the start of ETJD study enrollment, RecycleForce stopped pursuing the relationship.
Although transitional jobs extensions were not available through the mayor’s office, in practice, most individuals extended their transitional jobs beyond four months. Starting in spring 2012, RecycleForce and its two partners began providing 30-day extensions to partici-
26Conversations with staff members at New Life and Changed Life suggest that while case managers and supervisors interacted, they did so less regularly.

309
pants who needed extra time to prepare for unsubsidized work or who could not find jobs. Each participant had to develop a new Plan of Action that focused on searching for a job. According to the staff, participants did not focus on job searching until the end of the 30-day period. The staff was also concerned that the possibility of an extension distracted participants from job-search activities. Staff members surmised that participants felt comfortable at RecycleForce and did not want to leave (one staff member noted the “real world” can be a shock, whereas Recy-cleForce is forgiving). Some participants also hoped to obtain employment at RecycleForce, either on the permanent staff or on a large special work contract.27
In an effort to get participants searching for jobs more quickly, starting in spring 2013 RecycleForce reduced extensions to two weeks. RecycleForce eliminated extensions entirely on July 1, 2013 (study enrollment ended in November 2013).
Employment and retention services were restructured as the study progressed. Recy-cleForce and EDSI had expected to collaborate on employment-related services. RecycleForce helped participants register at WorkOne Indy (the local American Job Center), worked with them to develop their résumés, and conducted mock interviews. About 68 percent of partici-pants received these services. EDSI was to provide job development: identifying jobs, spending time in the field talking with employers, discussing the benefits of hiring a RecycleForce participant (for example, they are prescreened and they have forklift certification and other certifications), and describing incentives to hire such as the Work Opportunity Tax Credit and the Federal Bonding Program.28 ESDI was also to verify that participants who were hired were at their jobs at specified milestones (30 days, six months, nine months, and one year after they were hired).
In practice, RecycleForce did much of the job development and verification work. EDSI used an out-of-state call center to verify participants’ employment and to provide reten-tion services (determining how participants were doing in their jobs and whether they needed any assistance). The retention services did not work as planned because the phone center was unable to reach participants. RecycleForce suspected participants did not answer calls from an unrecognizable area code. RecycleForce ended its work with EDSI on June 28, 2013.
The end of the EDSI subgrant was part of a larger shift in RecycleForce’s thinking about participants’ employment after the transitional job. RecycleForce staff members said that
27About 100 participants were employed after their transitional jobs to complete work on a large project
(demanufacturing recalled dehumidifiers). The work lasted for about a year. 28The Work Opportunity Tax Credit is a federal tax credit available to employers for hiring individuals
from certain target groups who have consistently faced significant barriers to employment. The Federal Bonding Program provides Fidelity Bonds that guarantee honesty for “at-risk,” hard-to-place job seekers during the first six months of employment.

310
participants were often unsuccessful in unsubsidized jobs, perhaps because they needed a “buffer” between RecycleForce and full-time, private-sector work. Many were not ready for full-time work, and others needed flexible schedules to attend to personal matters (such as court dates and drug testing). RecycleForce began focusing on temporary jobs as a way to ease participants into the private sector. The EDSI job developer, already knowledgeable about RecycleWorks, moved to the EDSI staffing organization (Ascend) to help RecycleWorks participants get such temporary placements.
Keys to Work, also a staffing agency, won a two-year Department of Public Works temporary staffing contract in 2013. Public Works used contractors to fill staffing gaps in its refuse-collection department, and on any given day up to 15 employees were out due to sched-uled time off and sick days. According to Public Works, RecycleForce participants placed through Keys to Work were good temps because they had OSHA certification and other certifications. Temps were paid $9 per hour (with no benefits). If they had driver’s licenses, they were eligible to apply for permanent jobs after six months of Public Works temporary work experience. As of September 2015 (nearly two years after the last person enrolled in the study), DPW had hired six participants full time. Ascend and Keys to Work also placed participants in catering jobs, warehouse jobs, and community centers (for example, as receptionists).
Circle, an original component of the RecycleForce program, was implemented incon-sistently at New Life and Changed Life. At RecycleForce, participants take part in Circle on the clock. At Changed Life and New Life, Circle was part of unpaid development time and was infused with religious messages. The Circle facilitators also did not collaborate with peer mentors or case managers on discussion topics.
Finally, neither New Life nor Changed Life had the capacity to serve 100 participants. Ultimately, New Life served 64 participants and Changed Life worked with 65. Both partners also failed to permanently hire any program participants. RecycleForce ended its grant agree-ments with both in summer 2013.29
● New, unplanned elements were implemented.
In 2013, RecycleForce added a new case management process with the goal of prevent-ing technical rule violations. Twice per month probation officers and staff members from Duvall Residential Center (a work-release facility) met at RecycleForce with case managers to review cases and address problems if needed. For example, if a probation officer had not been aware that a participant was not working for most of the week, these representatives would discuss how to get him back on track. Participants understood that the staff reported about them
29Participants who had not completed their transitional jobs with these subgrantees transferred to Recy-cleForce.

311
to their probation officers. Participants supervised by probation officers and Duvall work-release facility residents signed a release form to allow the probation officers and RecycleForce case managers to discuss their cases. Peer mentors reinforced the importance of these “joint staffings” to participants.30
● RecycleForce would make changes in the future.
RecycleForce intentionally allocated the majority of its ETJD grant funds to support participants (including money for transitional job wages, direct forms of work support such as bus passes, and drug screening), while devoting substantially less to case management.31 Staff members said that an additional case manager would have helped them handle the many problems that participants faced and to interact with referral partners who needed to confirm that their probationers or parolees were following through on their work and job-search re-quirements. Staff members added that the participant-initiated approach to case management may not have been enough for the target population, given how many barriers to employment they faced.
● Participants viewed the program favorably.
Data from participant questionnaires, one-on-one interviews, and focus groups indicate that participants generally had positive experiences in the program. Among the 129 Recy-cleForce participants who completed the questionnaire, 84 percent viewed their relationships at work positively (see Figure 7.2). Seventy-three percent felt supported by their supervisors. Three-quarters indicated they were developing soft skills, and 77 percent felt better prepared for future employment.
In eight in-depth interviews, participants generally revealed similar sentiments. Overall, participants reported positive relationships with staff members. One said, “They appreciate my hard work; it’s like a family.” Although help was available, some said that participants had to ask for it: “They all try to help you, but you have to ask for help, open your mouth.” Participants appreciated and were encouraged by the fact that their supervisors shared similar backgrounds and experiences. As one said, “If he can make it, I can make it.” And while they reported positive relationships with their peer mentors, they were aware of a hierarchy of supervisors and program participants; one said that supervisors sometimes disregarded the ideas of program participants, which he described as disheartening. Participants had very positive impressions of the RecycleForce leadership team and case managers, though they did not have much in general
30Peer mentors explained that “they’re not watching you to nail you, they’re watching you to keep you
nailing.” 31According to the program, $4.8 million of the $5.6 million grant “went to participants.”

312
(continued)
Figure 7.2
for Future Employment: IndianapolisFavorable Impression of the Value of Transitional Job Support and Preparation
57%
65%
61%
77%
77%
75%
73%
84%
0 20 40 60 80 100
Preparation for future employmentd
Soft skills developmentc
Supervisor supportb
Relationships at worka
IndianapolisSample size: 129
ETJD averageSample size: 516
Relationships at worka
Supervisor supportb
Soft-skills developmentc
Preparation for future employmentd
e

313
Figure 7.2 (continued)
SOURCE: MDRC calculations based on the ETJD participant questionnaire.
NOTES: The measures presented in this figure, relationships at work, supervisor support, soft-skills development,and preparation for future employment were created based on an exploratory factor analysis of a pool of questions. These questions asked participants about their level of agreement with a particular statement on a scale of 1 to 7, where 1 indicates strong disagreement and 7 indicates strong agreement. Based on the results of the factor analysis, questions were grouped into factors and a mean score was calculated across the questions included in a particular factor; the percentages presented above represent the proportion of questionnaire respondents who averaged a score of 6 or higher on the questions in that factor, indicating a high level of satisfaction with their program experiences in that area.
With a few exceptions, questionnaires were administered to participants by the research team during site visits at events and activities when many participants would be available at once. Consequently, the responses obtained are from participants who attended program activities and were therefore likely to be more motivated and engaged than the full sample of program participants. For this reason, the results presented in this figure are not necessarily representative of all participant experiences and should be interpreted with caution; they are likely to be more positive.
aBased on agreement with the following statements: I understand what is expected of me on the job; I know whom at work to ask for help when I need it; My relationships with coworkers are positive and supportive; and My coworkers understand me and want me to succeed.
bBased on agreement with the following statements: I get the support or guidance that I need from my supervisor; My supervisor gives me advice about how to handle situations at work; and My supervisor helps me if personal issues come up that get in the way of working.
cBased on agreement with the following statements: I am learning how to work better with coworkers; I am learning how to cooperate better with supervisors; and This job has helped me learn to present myself better at work.
dBased on agreement with the following statements: The kind of work I am doing will help me get a decent-paying job later; I am learning specific job skills that I will use in the future; and I have met people through this job who may help me find a job in the future.
eTo account for varying questionnaire sample sizes across ETJD programs, the "ETJD average" is a weighted average of all programs such that each program is equally represented.
to say about case management. Participants did often mention the training and certifications they received from Managepoint; participants said that these would be useful in the job market. One said of his certifications, “I want my portfolio to look like a storybook.”
Participants said they were motivated to work as a result of the program. Some said that learning how to collaborate and work as part of a team were important skills they had learned in the transitional job. Some said they viewed themselves as leaders among their peers. Two described themselves as mentors to new program participants. Three of the eight participants interviewed hoped to be hired permanently at RecycleForce.

314
RecycleForce Program Impacts This section describes the program’s impacts on participation in program services, employment, recidivism, child support payments, and economic and personal well-being. Each table in this section presents the program group mean outcome, the control group mean outcome, and the difference between the two as the program impact. All estimates are regression-adjusted. Unless otherwise indicated, all results discussed in the text are statistically significant with p < 0.10.
Participation and Service Receipt Outcomes
As discussed above, in addition to transitional employment, RecycleForce provided support services to program participants such as case management and peer mentoring, em-ployment and retention services, child support services such as debt compromise and driver’s license reinstatement, and assistance paying for bus passes and required drug testing. Only the program group was offered services from RecycleForce, but control group members received an alternate services list following random assignment and may have sought and received services from other providers in the community. This section uses results from a survey administered an average of 14 months after random assignment to describe the program’s impacts on participa-tion and service receipt, compared with the “business-as-usual” condition of the control group.32
● Program group members had substantially higher rates of service re-ceipt than control group members in many areas including employment support, education and training, help with criminal justice and child support issues, and mentorship. The program had a smaller but still sig-nificant effect on the receipt of mental health assistance.
Table 7.4 shows that program group members had substantially higher rates of service receipt than control group members in many areas. Program group members were significant-ly and substantially more likely to have received help finding or keeping a job: 93 percent of the program group and 63 percent of the control group reported receiving such assistance. This impact is reflected in all areas of employment support: program group members were significantly more likely than control group members to have received assistance with job searching, job readiness, and career planning (92 percent versus 62 percent) and more likely to have received help paying job-related transportation or equipment costs (63 percent versus 21 percent).
32Survey response rates were 80 percent in the program group and 77 percent in the control group. An
analysis of nonresponse bias found no evidence that these differences in response rates biased the results of the impact analysis. See Appendix H.

315
Table 7.4
One-Year Impacts on Participation and Service Receipt: Indianapolis
Ninety Percent
Program Control Difference
Confidence
Outcome (%) Group Group (Impact) Interval
i
e
a
Employment support
Received help related to finding or keeping a job 93.0 62.5 30.5 *** [25.9, 35.1]Job search, job readiness, and career planninga 92.3 61.8 30.4 *** [25.8, 35.1]Paying for job-related transportation or equipment
costs 63.1 21.3 41.8 *** [36.5, 47.1]
Education and training Participated in education and training 65.2 30.7 34.5 *** [29.0, 40.1]
ESL, ABE, or high school diploma or equivalentb 12.9 9.7 3.2
[-0.5, 6.9]Postsecondary education leading to a degree 11.6 13.4 -1.8 [-5.7, 2.1]Vocational training 55.8 13.4 42.4 *** [37.4, 47.5]
Received high school diploma or equivalent 3.8 2.2 1.6
[-0.4, 3.6]
Earned professional license or certification (not ncluding OSHA or forklift)c 24.3 5.4 18.9 *** [14.9, 22.9]
Earned OSHA or forklift certification 32.4 4.5 27.9* ** [23.6, 32.2]
Other support and services Received help related to past criminal convictions 76.8 36.9 40.0 *** [34.6, 45.3]
Handling employer questions about criminal history 75.6 35.5 40.1 *** [34.8, 45.5]Legal issues related to convictions 43.9 15.5 28.4 *** [23.3, 33.5]
Among those identified as noncustodial parents at
nrollment:d Received help related to child support, visitation,
parenting, or other family issues 64.1 20.0 44.1 *** [36.6, 51.5]
Modifying child support debts or orders 50.8 10.8 40.1 *** [33.2, 46.9]Setting up visitation with child(ren) 26.1 6.9 19.2 *** [13.2, 25.3]Parenting or other family-related issues 38.7 12.8 26.0 *** [18.9, 33.0]
member
5 **
Received advice or support from a staff at an gency or organization 74.0 32.5 41. * [36.2, 46.8]
(continued)

316
Table 7.4 (continued)
Ninety Percent
Program Control Difference
Confidence
Outcome (%) Group Group (Impact) Interval
Received mentoring from a staff member at an agency or organization 65.0 23.6 41.3 *** [36.1, 46.6]
Received mental health assistance 17.5 12.4 5.2 ** [1.0, 9.3]
Sample size 401 400
SOURCE: MDRC calculations based on responses to the ETJD 12-month survey. NOTES: Results in this table are regression-adjusted, controlling for pre-random assignment characteristics. Statistical significance levels are indicated as: *** = 1 percent; ** = 5 percent; * = 10 percent. aIncludes help with job searching, job referrals, developing a résumé, filling out job applications, preparing for job interviews, job-readiness training, and planning for future career or educational goals. bESL = English as a second language, ABE = adult basic education. cOSHA stands for Occupational Safety and Health Administration. In an effort to separate receipt of professional licenses or certifications that require more intensive and lengthy training (for example, a Certified Medical Assistant certificate or a commercial driver’s license) from those that can be earned following more cursory, one-day training, receipt of OSHA and forklift certifications, which fall into the latter group, is presented separately from receipt of other types of licenses or certifications. A review of all reported types of licenses or certifications revealed that OSHA and forklift certifications account for a large majority of the shorter-term, less intensive licenses and certifications received by sample members. dThese measures include only those who were identified as noncustodial parents at study enrollment (program group = 205; control group = 193; total = 398).
Providing vocational training and certifications, including OSHA and forklift certifi-cation, was an explicit part of the RecycleForce program model. Not surprisingly, the table shows that program group members were more than twice as likely as control group members to have participated in education and training (65 percent versus 31 percent). This statistically significant difference is largely the result of program group members’ receipt of vocational training, which the program increased from 13 percent in the control group to 56 percent in the program group. As expected, more program group participants received OSHA or forklift certifications (32 percent) than control group members (5 percent). Likewise, program group members were significantly more likely to report having received other professional licenses or certifications: 24 percent in the program group and 5 percent in the control group. In addition to OSHA and forklift, program group members also commonly reported receiving certifications in HazMat (handling hazardous materials). Program group members were not significantly more likely than control group members to have engaged in secondary or

317
postsecondary education, which is not surprising since basic and postsecondary education were not major parts of the program model.
Program group members were significantly more likely than control group members to report receiving services in areas related to criminal justice and child support as well. Because RecycleForce targeted formerly incarcerated individuals, it is not surprising that many program group participants received help related to criminal convictions (77 percent of program group members compared with 37 percent of the control group). RecycleForce also engaged a con-sultant to assist participants with child support-related services. A majority of program group members identified as noncustodial parents at enrollment — 64 percent — reported that they received help related to child support, visitation, parenting, or other family issues, compared with only 20 percent of the control group noncustodial parents. Program group noncustodial parents were significantly more likely than those in the control group to have received help with child support modifications, setting up visitation, and other parenting issues. The RecycleForce child support consultant also helped participants reinstate licenses that had been suspended for nonpayment of child support, which could directly affect their ability to find and keep jobs (not shown in the table).
Finally, Table 7.4 shows that survey respondents in the program group were significant-ly more likely than those in the control group to report having received other support services from program staff members. A large proportion — 74 percent — of program group members reported receiving advice or support from a staff member compared with about 33 percent of the control group, and 65 percent of program group members reported receiving mentorship from a staff member compared with only 24 percent of the control group. These increases are in line with a program model in which peer mentors provided the majority of supervision. Pro-gram group members were significantly more likely to receive mental health services than control group members, although only a small fraction received such services in either group: almost 18 percent in the program group and 12 percent in the control group. These small fractions are not surprising, as mental health services were not a core part of the RecycleForce program model.
Employment and Earnings Outcomes
This section presents RecycleForce’s 12-month impacts on employment and earnings using data from the National Directory of New Hires, supplemented by data from a survey of study participants. The survey was administered to participants just under 14 months after random assignment, on average. Using data from the National Directory of New Hires it is possible to precisely describe employment and earnings in jobs that are reported to the unem-ployment insurance system. The survey provides participant-reported information on jobs, whether reported to unemployment insurance or not, as well as richer information on job

318
characteristics. Chapter 1 of this report provides a fuller description of the differences between these two sources of data.
● Program group members had higher rates of employment and earnings in unemployment insurance-covered jobs. Much of this impact is likely to be from subsidized employment, as program group earnings from transitional employment are equivalent to the entire difference in earn-ings between program and control group members.
Table 7.5 and Figure 7.3 present RecycleForce’s impacts on employment, earnings, and job characteristics. The top panel of Table 7.5 shows one-year impacts estimated using unem-ployment insurance data, while the bottom panel shows impacts based on survey data. A majority of control group members — 62 percent — worked in an unemployment insurance-covered job during the 12 months after random assignment. However, program group members were even more likely to have worked during this time, with more than 96 percent having had unemployment insurance-covered employment, which includes employment in the transitional job. Program group members were also employed in almost twice as many quarters as control group members (an average of 2.5 quarters versus 1.3 quarters) and were more than twice as likely to have been employed in all four quarters (22 percent versus 8 percent). These differ-ences are all statistically significant.
Program group members earned more than twice as much as control group members, on average: Program group members earned an average of $6,034 while control group members earned an average of $2,830. However, the entire difference in earnings between the program and control groups can be accounted for by earnings in transitional employment, an average of $3,260.
The last two rows in the top panel of Table 7.5 present employment during the first quarter of Year 2, by which time most program group members should have completed their transitional jobs. Although there is still a large and statistically significant impact on employ-ment during this quarter (13 percentage points), much of this impact is probably explained by the fact that more than 9 percent of program group members were still in transitional jobs.33 It is therefore unclear from these results whether the program’s impact on employment will persist
33This last figure is based on data from DOL’s management information system, which reports subsidized
employment only. It does not imply that any participants had more than 12 months of transitional employment. Some program group members may have left and reentered employment due to incarceration or for other reasons.

319
Table 7.5
One-Year Impacts on Employment and Earnings: Indianapolis
Ninety Percent
Program Control Difference
Confidence
Outcome (%) Group Group (Impact) Interval
Primary outcomes (based on administrative data) Employmenta (%) 96.4 62.0 34.4 *** [31.0, 38.2]
ETJD subsidized employment (%) 99.1 --
Number of quarters employed 2.5 1.3 1.2 *** [1.1, 1.3] Average quarterly employment (%) 62.5 32.4 30.1 *** [27.1, 33.1] Employment in all quarters (%) 21.9 8.3 13.6 *** [10.2, 17.1]
Total earnings ($) 6,034 2,830 3,204 *** [2,747, 3,662]
ETJD subsidized earnings ($) 3,260 --
Total earnings (%)
]
]
]]]])
$5,000 or more 45.3 17.6 27.6 *** [23.2, 32.1]$7,500 or more 31.6 12.3 19.3 *** [15.2, 23.3]$10,000 or more 19.4 8.2 11.1 *** [7.7, 14.5]
Employment in the first quarter of Year 2 44.1 30.8 13.3 *** [8.3, 18.3]
ETJD subsidized employment in the first quarter of Year 2 9.3 --
Sample sizeb 500 496
Self-reported outcomes (based on survey data)
Ever employed in Year 1 (%) 83.9 67.0 16.9 *** [11.9, 21.9]
Currently employed (%) 51.4 38.5 12.9 *** [7.2, 18.6
Currently employed in transitional job program (%) 13.4 0.3 13.1 *** [10.2, 15.9
Type of employment (%)
Not currently employed 50.0 64.4 -14.4 *** [-20.2, -8.7Permanent 28.1 19.2 9.0 *** [4.0, 14.0Temporary, including day labor and odd jobs 20.8 16.2 4.7 * [0.0, 9.3
Other 1.0 0.2 0.8 [-0.1, 1.8
(continued

320
Table 7.5 (continued)
Ninety Percent
Program Control Difference
Confidence
Outcome (%) Group Group (Impact) Interval
S
] ]
] ]
SOU
Among those currently employed:c
Hours worked per week 38.7 36.0 2.7Hourly wage ($) 10.4 9.5 0.9
Hours worked per week (%) More than 20 hours 47.2 33.9 13.3 *** [7.6, 18.9
More than 34 hours 39.9 25.7 14.1 *** [8.8, 19.5
Hourly wage (%)
More than $8.00 40.1 24.9 15.2 *** [9.7, 20.6More than $10.00 18.2 7.0 11.3 *** [7.4, 15.1
ample size 401 400
RCES: MDRC calculations based on quarterly wage data from the National Directory of New Hires and responses to the ETJD 12-month survey. NOTES: Results in this table are regression-adjusted, controlling for pre-random assignment characteristics. Statistical significance levels are indicated as: *** = 1 percent; ** = 5 percent; * = 10 percent. aEmployment rates and earnings include both ETJD subsidized jobs and all other jobs covered by unemployment insurance. bTwo sample members are missing Social Security numbers and therefore could not be matched to employment data. cThese measures are calculated among those employed at the time of the survey; they are therefore considered nonexperimental and are not tested for statistical significance.
after all program group members have left their transitional jobs.34 Figure 7.3 shows earnings and employment by quarter. While program group earnings and employment exceed control group earnings and employment by a significant margin in each quarter, the difference between the two appears to be shrinking over time, as the proportion of program group members working in transitional jobs is declining (shown as the dashed line in Figure 7.3). It is not clear whether a substantial difference will remain in Quarter 5.
The bottom panel of Table 7.5 shows that positive and statistically significant impacts on employment outcomes were also observed in survey data, although the estimated impacts
34It is impossible to know whether these program group members would be employed if they did not have
subsidized jobs.

321
Figure 7.3
Employment and Earnings Over Time: Indianapolis
0102030405060708090
100
0***
1***
2***
3***
4***
Perc
enta
ge e
mpl
oyed
Quarter after random assignment
Program group total employment
Control group employment
1,318
1,8601,528
1,328 1,260
406783 844 797 859
0
500
1,000
1,500
2,000
2,500
3,000
3,500
0***
1***
2***
3***
4***
Ave
rage
ear
ning
s ($)
Quarter after random assignmentProgram group Control group
Program group ETJD subsidized employment
21.9 8.3 13.6
(continued)

322
Figure 7.3 (continued)
SOURCE: MDRC calculations based on quarterly wage data from the National Directory of New Hires.
NOTES: Results in this figure are regression-adjusted, controlling for pre-random assignment characteristics.
Statistical significance levels are indicated as: *** = 1 percent; ** = 5 percent; * = 10 percent.Employment rates and earnings include both ETJD subsidized jobs and all other jobs covered by
unemployment insurance..Although the Indiana ETJD program reported ETJD subsidized employment and earnings to the
unemployment insurance system, ETJD subsidized employment rates among program group members based on payroll records appeared higher than total employment reported in unemployment insurance wage records during the quarter of random assignment. It is possible that timing differences in reporting and payroll periods contributed to this discrepancy.
were somewhat smaller than similar impacts estimated from unemployment insurance data. In particular, the second row of the bottom panel shows the impact on current employment at the time of the survey, which should be comparable to the impact on employment in the first quarter of Year 2 estimated from unemployment insurance data. These two impacts are close to the same size, although the proportion employed in both the program and control groups are higher in the survey data, probably because the survey captures types of employment not recorded in unemployment insurance data.35
The outcomes reported at the bottom of Table 7.5 demonstrate that survey respondents in the program group worked more hours per week and earned higher hourly wages than respondents in the control group. Among those employed at the time of the survey, program group members worked an average of 39 hours per week, compared with 36 for the control group, and earned an average wage of $10.40 per hour, compared with $9.50 in the control group.36 The previous row in Table 7.5 confirms that at the time of the survey, some program group members were in transitional jobs, probably participants who returned to transitional jobs after temporarily leaving the program for a variety of reasons, including incarceration.
As described above, a number of operational changes occurred in RecycleForce during the second year of program operations, so it is possible that the program’s impacts for those
35One concern about using unemployment insurance data to measure employment outcomes is that an impact might be observed if the program steered participants into unemployment insurance-covered jobs, even if the program had no impact on the total number of employed participants. The fact that the impacts shown in unemployment insurance and survey data are comparable alleviates this concern.
36Because the group of study participants who were employed at the time of the survey is endogenously defined (that is, membership in this group could be affected by the intervention), these differences are not tested for statistical significance.

323
enrolled later could differ from those who enrolled earlier. The research team therefore assessed whether RecycleForce’s impacts on employment for those enrolled during the first year of random assignment (the “first-year cohort”) were different from the impacts for those enrolled during the second year (the “second-year cohort”). These results are presented in full in Appen-dix Table F.2. In brief, the program’s impacts on total earnings and average quarterly employ-ment were both significantly larger for the first-year cohort. The impact on earnings was more than 50 percent larger for the first-year cohort, while the impact on average quarterly employ-ment was about a third larger. There were no significant differences between cohorts for employment during the first year or employment during the first quarter of Year 2.
Criminal Justice Outcomes
RecycleForce targeted formerly incarcerated individuals who had been released within the previous four months, aiming to help them successfully reenter society by providing paid employment and training, along with supportive services. The underlying theory of programs like RecycleForce is that employment could reduce the incentive to commit crimes, and may also connect the formerly incarcerated to more positive social networks and daily routines, helping to ease their transition into the community after leaving prison.
● There are some small impacts on criminal justice outcomes in the first year. Program group members were somewhat less likely to be convict-ed of a felony than control group members. In the first six months after random assignment, when many program group members would still have been engaged in the program, there are significant impacts on ar-rests, convictions, and admissions to prison for new crimes.
Table 7.6 presents RecycleForce’s impacts on measures of recidivism for the 12-month follow-up period. The data provide a comprehensive picture of convictions and incarcerations in both prisons and jails. The top panel in Table 7.6, which is based on criminal justice system administrative data on arrests and convictions in jails and prisons, shows that recidivism rates were fairly high for both the program and control groups — as would be expected for a sample of individuals at moderate to high risk of reoffending — and that the program had no statistical-ly significant effect on most measures of recidivism, including the rates of arrests, incarcera-tions, or prison admissions, or total days incarcerated. There was also no overall impact on the number of new convictions. There was one statistically significant difference: Program group members were somewhat less likely to have been convicted of a felony than control group members (4 percent compared with almost 10 percent). However, taken as a whole, the evi-dence from administrative measures in Table 7.6 suggests little to no impact on recidivism during the first year.

324
Table 7.6
One-Year Impac ts on Crim inal Justice O utcomes : Indianapoli s
Ninety Percent
Program Control Difference Confidence
Outcome (%) Group Group (Impact) Interval
Primary outcomes (based on administrative data)
Arresteda (%) 20.1 23.9 -3.8 [-8.8, 1.2]
b
Convicted of a crime (%) 13.9 16.1 -2.2 [-6.5, 2.1]Convicted of a felony 3.9 9.5 -5.6 *** [-8.5, -2.6]Convicted of a misdemeanor 7.6 6.5 1.1
[-2.1, 4.2]
Convicted of a violent crime (%) 2.5 2.1 0.4 [-1.4, 2.3]
Incarcerated (%) 49.8 52.6 -2.7 [-7.9, 2.4]Incarcerated in jail 48.2 50.6 -2.4 [-7.5, 2.8]Incarcerated in prison 15.8 19.5 -3.8 [-7.8, 0.2]
Prison admission reason (%) Admitted to prison for a new crime 2.1 2.9 -0.8 [-2.4, 0.9]Admitted to prison for a parole or probation
violation 13.9 16.2 -2.4 [-6.1, 1.4]
Total days incarcerated 47.0 55.5 -8.5 [-17.8, 0.9]Jail
27.8 33.2 -5.4 [-11.7, 0.8]
Prison 19.2 22.2 -3.1 [-8.7, 2.6]
Arrested, convicted, or admitted to jail or prison (%) 50.8 54.6 -3.8 [-8.9, 1.4]Months 1 to 6 33.2 37.2 -4.0 [-9.0, 0.9]Months 7 to 12 35.5 36.4 -0.9 [-5.9, 4.1]
Sample size 501 497
Self-reported outcomes (based on survey data) On parole or probation (%) 81.2 77.2 4.0 [-0.7, 8.7]
Received a technical violation of parole or
probation (%) 28.4 30.4 -2.0 [-7.3, 3.4]
Received a sanction for a technical parole violation (%) 23.2 25.8 -2.6 [-7.7, 2.5]
Score on personal irresponsibility scalec 22.5 22.9 -0.3 [-1.1, 0.4]
S
(range of 10 to 50, where higher scores indicate
higher levels of personal irresponsibility)
ample size 401 400
(continued)

325
Table 7.6 (continued) SOUR s based on criminal justice data and responses to the ETJD 12-month survey. CES: MDRC calculation
NOTES: Results in this table are regression-adjusted, controlling for pre-random assignment characteristics. Estimates of arrest and conviction are weighted by age, lifetime months in prison prior to random assignment, and program-versus-control ratios. Statistical significance levels are indicated as: *** = 1 percent; ** = 5 percent; * = 10 percent. aArrest and conviction measures exclude sample members for whom no records could be retrieved due to limitations of the criminal justice data. Data are weighted as noted above to account for these missing records. bThe dates for conviction measures shown in this table are set equal to the arrest dates; actual conviction dates were unavailable. This measure therefore undercounts the number of convictions resulting from arrests that occurred in the year after random assignment, as prosecutions of some of these arrests had not yet resulted in dispositions by the date on which the data were obtained. cThis scale is based on responses to six scale questions in the Texas Christian University Criminal Thinking Scales, which assess how strongly a respondent agrees or disagrees with statements about having been in jail or prison (You were locked up because you had a run of bad luck; The real reason you were locked up is because of your race; Nothing you do is going to make a difference in the way you are treated; You are not to blame for everything you have done; Laws are just a way to keep poor people down; and You may have committed crimes, but your environment is to blame). Responses of "strongly disagree" were coded as 1, "disa-gree" as 2, "neither agree nor disagree" as 3, "agree" as 4, and "strongly agree" as 5. If a respondent answered at least three questions, a sum was then produced using the values of all nonmissing items. The sum was divid-ed by the number of items included, and this average was multiplied by 10.
RecycleForce hypothesized that keeping participants in transitional employment would keep them out of jail by removing opportunities to reoffend, generating an impact on criminal justice outcomes during the transitional employment period — that is, during the first several months after random assignment. Table 7.7 shows impacts on criminal justice outcomes broken down by time period, separating the impacts that occurred in the first six months after random assignment from those in the subsequent six months. It reveals there are in fact significant impacts on arrests, convictions, and incarcerations for new crimes during the first six months after random assignment, which suggests that the program had its intended effect during the time period when many participants were active in the program. These impacts largely disap-pear during months 7 through 12, although during this period program group members were still less likely than their control group counterparts to be convicted of a felony, to be admitted to prison for a parole or probation violation, or to be incarcerated in prison.
To supplement the administrative data measures of recidivism, the 12-month survey asked respondents to report their personal experiences with parole violations, and assessed respondents’ personal irresponsibility using a scale constructed from six questions in the Texas Christian University Criminal Thinking Scales. The bottom panel of Table 7.6 shows that RecycleForce had no significant effect on any of these outcomes.

326
Table 7.7
One-Year Impacts on Criminal Justice Outcomes, by Follow-Up Time Period: Indianapolis
Outcome Program
Group Control
Group Difference
(Impact)
Ninety Percent Confidence
Interval
Months 1 to 6 ]
] ] ]
]
] ] ]
]
]
] ] ]
] )
Arresteda (%) 9.2 15.1 -5.8 ** [-9.7, -1.9
vio
I
b Convicted of a crime (%) 6.0 10.8 -4.8 ** [-8.1, -1.4Convicted of a felony 2.6 6.2 -3.6 ** [-6.1, -1.1Convicted of a misdemeanor 2.8 4.6 -1.9
[-4.2, 0.4
Convicted of a violent crime (%) 0.3 1.3 -1.0 [-2.1, 0.1
ncarcerated (%) 32.2 36.2 -4.0 [-9, 0.9Incarcerated in jail 31.6 34.8 -3.2 [-8.1, 1.7Incarcerated in prison 8.1 8.8 -0.7 [-3.6, 2.2
Prison admission reason (%) Admitted to prison for a new crime 0.4 1.6 -1.3 ** [-2.3, -0.2
Admitted to prison for a parole or probation lation 7.5 6.9 0.6
[-2.1, 3.3
Total days incarcerated 15.2 19.2 -4.0 * [-7.9, -0.2Jail 10.4 13.3 -2.9
[-5.8, 0.1Prison 4.8 5.9 -1.2 [-3.3, 1
Arrested, convicted, or admitted to jail or prison (%) 33.2 37.2 -4.0 [-9, 0.9
(continued
● There is little evidence that the program had different impacts on recid-
ivism for those at higher or lower risk of recidivism.
Research has shown that best practices in reducing recidivism are based on the principle of providing services appropriate to an individual’s needs and risk of recidivism.37 Specifically, intensive services should not be provided to people at low risk of recidivism; instead they
37Petersilia (2004); Solomon et al. (2008).

327
Table 7.7 (continued)
Outcome Program
Group Control
Group Difference
(Impact)
Ninety Percent Confidence
Interval
I
]
]]]
]
]]]
]
]
]]]
]
Months 7 to 12
Arresteda (%) 12.3 11.2 1.1
[-2.9, 5
b
Convicted of a crime (%) 8.2 6.4 1.7 [-1.5, 4.9Convicted of a felony 1.4 3.6 -2.3 ** [-4.1, -0.4Convicted of a misdemeanor 2.8 4.2 -1.4
[-3.7, 0.8
Convicted of a violent crime 2.2 0.8 1.5 [0, 3
ncarcerated (%) 34.1 33.5 0.6 [-4.3, 5.6Incarcerated in jail 29.9 28.2 1.7 [-3.1, 6.4Incarcerated in prison 8.3 11.5 -3.2 * [-6.4, 0
Prison admission reason (%) 3Admitted to prison for a new crime 1.8 1.4 0. [-1, 1.6
Admitted to prison for a parole or probation
violation 6.6 9.9 -3.3 * [-6.2, -0.4
Total days incarcerated 31.8 36.3 -4.5 [-11.1, 2.2Jail
17.4 19.9 -2.5 [-6.9, 1.8
Prison 14.4 16.3 -1.9 [-6.3, 2.5
Arrested, convicted, or admitted to jail
or prison (%) 35.5 36.4 -0.9 [-5.9, 4.1
Sample size 501 497
SOURCE: MDRC calculations based on criminal justic e data. NOTES: Results in this table are regression-adjusted, controlling for pre-random assignment characteristics. Estimates of arrest and conviction are weighted by age, lifetime months in prison prior to random assignment, and program-versus-control ratios. Statistical significance levels are indicated as: *** = 1 percent; ** = 5 percent; * = 10 percent. aArrest and conviction measures exclude sample members for whom no records could be retrieved due to limitations of the criminal justice data. Data are weighted as noted above to account for these missing records. bThe dates for conviction measures shown in this table are set equal to the arrest dates; actual conviction dates were unavailable. This measure therefore undercounts the number of convictions resulting from arrests that occurred in the six months or year after random assignment, as prosecutions of some of these arrests had not yet resulted in dispositions by the date on which the data were obtained.

328
should be reserved for people assessed to be at higher risk of recidivism using validated risk-assessment tools (such as the Indiana Risk Assessment System described earlier). Prior rigorous research supports the risk-need-responsivity guidelines and has found that transitional jobs programs are more effective at reducing recidivism among those who are at a higher risk of recidivism.38 Study participants were categorized as being at lower, medium, and higher risk of recidivism using statistical modeling based on their baseline characteristics and criminal histories.39 Table 7.8 compares the program’s impact on several criminal justice outcomes for lower- and moderate-risk participants with its impact for higher-risk participants. The table suggests that the impacts on criminal justice outcomes were not significantly different between risk subgroups. The impacts on employment and earnings, however, were significantly differ-ent: The impacts on total earnings in the first year after random assignment and on average quarterly employment were larger among the higher-risk group than they were among the lower- and moderate-risk group.
● There is little evidence that participants who entered the program at dif-ferent times experienced different criminal justice impacts.
The research team explored whether the program had a different impact on criminal jus-tice outcomes for the first-year cohort than it did for the second-year cohort. There were no such statistically significant differences in impacts on arrests, incarcerations in jail, or incarcerations in prison. However, the program’s impact on convictions was significantly larger for the first-year cohort than the second-year cohort. See Appendix Table F.2 for detailed findings.
Child Support and Family Relations Outcomes
Although the program did not explicitly target them, just over half of program partici-pants were noncustodial parents and more than 25 percent of all participants had current child support orders. As described above, to mitigate the potentially negative impact that child support enforcement actions could have on employment prospects and earnings, RecycleForce engaged a former employee of the child support agency as a consultant to review current orders for potential modification, help with paperwork to reduce debt to $1 (per RecycleForce’s agreement with the child support agency), and help with driver’s license reinstatement. This program component appears to have been well implemented, and according to the management information system, 35 percent of participants in the program group (and 70 percent of those who were noncustodial parents) received child support assistance through RecycleForce.
38Zweig, Yahner, and Redcross (2010). 39For more information on the analytic methods used to define risk of recidivism, please see Appendix J.

329
Table 7.8
One-Year Impacts on Criminal Justice and Employment Outcomes, by Recidivism Risk: Indianapolis
Lower Risk
Higher Risk Ninety Ninety Difference
Percent
Percent Between
Program Control Difference Confidence Program Control Difference Confidence Subgroup
Outcome Group Group (Impact) Interval Group Group (Impact) Interval Impactsa
†
Criminal justice (%)
2
] ] ] ]
] ] ]
]
]]
]
Arrested 14.9 17.1 -2.2 [-7.8, 3.4] 29.2 36.2 -7.0 [-16.9, 2.9Convicted of a crime 9.5 12.2 -2.8 [-7.5, 2.0] 21.7 22.5 -0.8 [-9.6, 8.0Convicted of a violent crime 3.1 1.0 2.1 [0.0, 4.3] 1.7 3.8 -2.1 [-5.7, 1.4Incarcerated 45.5 47.1 -1.6 [-7.6, 4.4] 62.8 68.2 -5.4 [-15.5, 4.7Arrested, convicted,
or admitted to jail or prison 46.0 49.1 -3.2
[-9.2, 2.9] 65.5 70.3 -4.8 [-14.7, 5.2
Months 1 to 6 28.4 33.2 -4.8 [-10.4, 0.8] 47.4 49.0 -1.7 [-12.3, 9.0Months 7 to 12 31.8 30.7 1.1 [-4.5, 6.7] 46.6 52.8 -6.2 [-17.1, 4.7
Employment and earnings
Employmentb (%) 96.1 63.1 33.0 *** [0.3, 0.4] 98.4 57.2 41.2 *** [0.3, 0.5
ETJD subsidized employment (%) 99.4 --
98.4 --
Total earnings ($) 5,808 2,921 2,886 *** [2,350, 3,421] 6,765 ,517 4,248 *** [3,364, 5,132 †† Average quarterly employment (%) 58.2 32.6 25.6 *** [22.2, 29.1] 76.2 31.4 44.8 *** [38.7, 51.0 ††† Employment in the first quarter of
4
Year 2 (%) 0. 0.3 0.1 *** [0.1, 0.2] 0.4 0.3 0.1 ** [0, 0.2
1 Sample size 379 366 122 13(continued)

330
Table 7.8 (continued) SOURCE: MDRC calculations based on criminal justice data and quarterly wage data from the National Directory of New Hires. NOTES: Results in this table are regression-adjusted, controlling for pre-random assignment characteristics. Statistical significance levels are indicated as: *** = 1 percent; ** = 5 percent; * = 10 percent. See Appendix J for details on how the recidivism risk subgroups were defined. aWhen comparing impacts between two subgroups, an H-statistic is generated. The H-statistic is used to assess whether the difference in impacts between the subgroups is statistically significant. Statistically significant differences across subgroups are indicated as: ††† = 1 percent; †† = 5 percent; † = 10 percent. bEmployment rates and earnings include both ETJD subsidized jobs and all other jobs covered by unemployment insurance.
● Program group noncustodial parents were substantially more likely to have paid child support than those in the control group, paid for more months, and paid a larger average amount.
The top panel in Table 7.9 presents child support outcomes, measured using child sup-port agency administrative data, for program and control group members who were noncustodi-al parents. The top row indicates that program group members were substantially and signifi-cantly more likely to have paid any child support during the 12-month follow-up period: Almost 45 percent of program group noncustodial parents paid at least some support, compared with about 27 percent of noncustodial parents in the control group. Noncustodial parents in the program group also made their first payments almost three months earlier, on average, than those in the control group. Program group noncustodial parents paid more than twice as many months of support as those in the control group (three months versus a little over one month) and paid more than double the dollar amount ($734 in the program group and $351 in the control group).
Figure 7.4 shows that a significant impact persists through the third quarter after ran-dom assignment (the last quarter for which administrative data are available) on both the percentage paying child support and the average amount paid. It is too early to determine whether the impact will persist after all participants have left their transitional jobs. Figure 7.4 does reveal that the impact on the percentage paying child support declined in Quarter 3, though the impact on the average amount paid did not. This pattern of findings may be related to the fact that while debt payments were reduced to $1 per pay period while participants were in their transitional jobs, they lost this benefit when they left the program.
Outcomes measured using the 12-month follow-up survey, reported in the second panel of Table 7.9, tell a more nuanced story. Program group members were significantly less likely

331
Table 7.9
One-Year Impacts on Child Support and Family Relations Among Those Identified as Noncustodial Parents at Enrollment: Indianapolis
Program
Group
Ninety Percent
Confidence
Interval Ou tco me (%) Control
Group Difference
(Impact)
ve data)
***
Primary outcomes (based on administrati
Paid any formal child supporta (%) 44.7 27.4 17.3 [10.9, 23.7]
:
Among those who paid formal child support
Months from random assignment to first paymentb 2.2 5.0 -2.8 Months of formal child support paid 2.9 1.2 1.7*** [1.2, 2.1]
*Amount of formal child support paid ($) 734 351 383 ** [225, 542]
Sample size 254 250
Self-reported outcomes (%) (based on survey data) Currently a noncustodial parent of a minor-age child 66.3 78.1 -11.8** [-19.4, -4.2]
Provided informal cash support or noncash support
in the past month 43.1 57.7 -14.6*** [-23.1, -6.1]
Informal cash support 36.1 45.3 -9.2* [-17.6, -0.8]Noncash support 39.8 55.2 -15.4*** [-23.8, -7.0]
Owing child support affects willingness to take jobs, among those required to pay child supportc 20.8 30.4 -9.5
Incarcerated for not paying child support 0.4 0.6 -0.1 [-1.3, 1.1]
d
Among those with minor-age children:
Frequency of contact with focal child in the past
3 months Every day or nearly every day 26.9 26.5 0.4A few times per week 18.7 21.7 -3.0A few times per month 11.7 12.8 -1.1Once or twice 4.7 5.6 -0.9Not at all 38.1 33.4 4.7
Sam ple size 205 193 (continued)

332
Table 7.9 (continued)
SO URCE child s agency ata and responses to the ETJD 12-month S: MDRC calculations based on upport dsurvey. NOTES: Results in this table are regression-adjusted, controlling for pre-random assignment characteristics. Statistical significance levels are indicated as: *** = 1 percent; ** = 5 percent; * = 10 percent. aMeasures of formal child support include all payments made through the state's child support collection and disbursement unit, including funds from employer withholding and other sources (for example, tax intercepts). bThis measure is calculated among those who paid child support during the followup period; it is therefore considered nonexperimental and is not tested for statistical significance. cThis measure is calculated among those required to pay child support; it is therefore considered nonexperimental and is not tested for statistical significance. dThis measure is calculated among those who reported having a minor-age child at the time of the survey; it is therefore considered nonexperimental and is not tested for statistical significance. The focal child is defined as the youngest minor-age child living outside of the sample member's household; if the sample member reports no minor-age children living outside of his or her household, the focal child is the youngest minor-age child residing within the household.
to report that they provided informal support than control group members: 58 percent of control group members provided either cash or noncash support, compared with only 43 percent of program group members. The increase in formal child support payments induced by the program appears to have come at the expense of informal payments.
It is more difficult to explain why program group members are significantly less likely to have reported having a child but not custody than control group members.40 It is possible that this finding reflects improved family situations among program group members (for example, regaining custody of children). Members of the program group did not have contact with their “focal children” markedly more or less often than control group members, however, which tends not to support that theory.41 It is possible that this difference in the rate of reporting having children explains part of the difference in informal support described in the last paragraph, since the analysis assumed that respondents without children provided no informal support.
A test of differences in child support impacts by cohort (first-year cohort versus second-year cohort) yielded no statistically significant findings (see Appendix Table F.2).
40In a call on January 15, 2016, RecycleForce program staff members suggested that program group
members might have declined to report children in an attempt to mislead surveyors and avoid child support. 41While some children would be expected to have reached adulthood over the course of the study, it is
hard to explain why that would occur at different rates between the program and control groups.

333
21.9 8.3 13.6
(continued)
Figure 7.4
Formal Child Support Payments Over Time: Indianapolis
0102030405060708090
100
0***
1***
2***
3**
Perc
enta
ge p
ayin
g fo
rmal
chi
ld su
ppor
t
Quarter after random assignment
Program group
Control group
114
231190 200
4287 108 114
0
100
200
300
400
500
600
0***
1***
2**
3**
Ave
rage
form
al c
hild
supp
ort p
aid
($)
Quarter after random assignmentProgram group Control group

334
Economic and Personal Well-Being Outcomes
A couple of recent studies have shown, perhaps unsurprisingly, that former prisoners are at high risk of experiencing economic hardship and of suffering from health problems, including both mental and physical conditions.42 RecycleForce could have affected outcomes in these areas indirectly, by increasing employment, and directly through support services such as advice, mentorship, mental health assistance, and other forms of support provided by case managers.
● The program resulted in few measurable improvements in economic and personal well-being.
Table 7.10 shows that despite a large impact on receipt of services such as mentorship and the large short-term impact on employment, there were few differences between the program and control groups in self-reported personal well-being. RecycleForce helped program group members sign up for health insurance on the Affordable Care Act exchange, and through this mechanism the program significantly increased the proportion of participants who had health insurance coverage: 38 percent of program group members and 29 percent of control group members reported having any type of health insurance, and 15 percent of program group members and 9 percent of control group members reported having employer-provided health insurance.43
The RecycleForce program had no significant impact on the four measures of financial insufficiency reported in Table 7.10. Likewise, it had no significant effect on food insufficiency, being homeless or living in temporary or emergency housing, health, or psychological distress.
42Wester and Pettit (2010); Mallik-Kane and Visher (2008). 43Due to the large number of tests reported in Table 7.8 and the absence of a clear pattern of impacts, this
finding should be interpreted with caution.
Figure 7.4 (continued)
SOURCE: MDRC calculations based on child support agency data.
NOTES: Results in this figure are regression-adjusted, controlling for pre-random assignment characteristicsStatistical significance levels are indicated as: *** = 1 percent; ** = 5 percent; * = 10 percent.Measures of formal child support include all payments made through the state's child support collection
and disbursement unit, including funds from employer withholding and other sources (for example, tax intercepts).

335
Table 7.10
One-Year Impacts on Economic and Personal Well-Being: Indianapolis
Ninety Percent
Outcom Program Control Difference Confidence
e (%) Group Group (Impact) Interval
I
i
a
4 2 2 4 1
2
43 6 8 9
5
09
3
1
] ] ] ] ]
]
] ] ] ] ]
]
] ]
]
Experienced a financial shortfall in the past 12 months 53. 55.7 -2.2 [-8.0, 3.6Could not pay rent or mortgage 38. 40.2 -2.0 [-7.8, 3.7Evicted from home or apartment 9. 11.2 -2.0 [-5.6, 1.6Utility or phone service disconnected 30. 34.9 -4.5 [-10.0, 0.9Could not afford prescription medicine 26. 23.7 2.3 [-2.7, 7.3
Had insufficient food in the past month 16. 20.5 -4.3 [-8.8, 0.3
Housing in the past month
Rented or owned own apartment or room 27. 21.3 6.1** [1.1, 11.0Lived with family or friendsb 46. 48.8 -2.5 [-8.4, 3.4Homeless or lived in emergency or temporary housing 3. 4.2 -0.6 [-2.9, 1.7Incarcerated, on work release, or living in a halfway house 21. 25.1 -3.3 [-8.2, 1.6Other 0. 0.6 0.3 [-0.7, 1.3
s currently in good, very good, or excellent health 78. 77.8 0.7 [-4.1, 5.5
Had health insurance coverage in the past month 38. 29.4 8.6*** [3.2, 14.1Health coverage was employer-based 14. 8.6 6.3*** [2.5, 10.1
l distress Experienced serious psychologica n the past monthc 13. 15.2 -1.9 [-6.0, 2.2
Sample size 40 400
survey. SOURCE: MDRC calculations based on responses to the ETJD 12-month NOTES: Results in this table are regression-adjusted, controlling for pre-random assignment characteristics. Statistical significance levels are indicated as: *** = 1 percent; ** = 5 percent; * = 10 percent. aRespondents who were incarcerated in the month before the survey are coded as not having experienced food insuffi-ciency. This situation applies to 19 percent of program group respondents and 22 percent of control group respondents. bIncludes those who lived with friends or family and paid rent and those who lived with friends or family without paying rent. cA score of 13 or higher on the Kessler-6 (K-6) scale is used here to define serious psychological distress. The K-6 assesses how often during the past month a respondent felt so sad that nothing could cheer him or her up; nervous; restless or fidgety; hopeless; that everything was an effort; or worthless. As a result of minor differences between the scale used to administer the K-6 in the ETJD 12-month survey and the standard K-6 scale, the percentages presented in this table may slightly underestimate the incidence of serious psychological distress among the ETJD sample.

336
Conclusion RecycleForce aimed to help formerly incarcerated individuals learn skills and appropriate workplace behaviors that would lead to permanent employment, and aimed to help them reintegrate into the community. It was successful at engaging participants in program services. All participants held transitional jobs, and nearly all participated in education and job training. A large majority participated in workforce-preparation activities and received help related to past criminal convictions. Participant questionnaires, focus groups, and in-depth discussions revealed largely uniform and positive assessments of the program. However, after four months in the program, most participants had not found unsubsidized jobs or were deemed unready for unsubsidized employment. The average participant spent more than five months in the program. Staff members noted that individuals with multiple barriers to employment could benefit from more structured case management than the program’s informal, participant-initiated approach provided.
Half of the study participants in Indianapolis were noncustodial parents, and over 70 percent of those noncustodial parents in the program group received child support assistance thanks to a relationship that RecycleForce established with the child support enforcement agency. Many noncustodial parents entered the program with large monthly debt payments in addition to their current support payments; both current and debt payments reduced the earnings they had available for other purposes (for example, probation fees or housing). Many also had had their driver’s licenses suspended for nonpayment, which compromised their ability to commute to work. The child support consultant worked with participants to reach compromises on their debts and reinstate their licenses.
RecycleForce also built relationships with a variety of criminal justice partners, from which it ultimately had a steady stream of referrals. It established new partnerships with Marion County probation officers, Indianapolis Parole District 3, Duvall Residential Center, and Marion County Reentry Court. This strong referral network enabled RecycleForce to meet its grant enrollment target two months early.
In addition to providing services directly to participants, RecycleForce hoped to help other social enterprises in Indianapolis provide employment services to the formerly incarcer-ated. These partner relationships were not entirely successful. The social enterprise partners did implement a number of program activities: transitional jobs, development time (and associated work support), and case management. However, a central component of the program — peer mentoring — proved difficult to export to the subgrantees. Additionally, the subgrantees’ preexisting cultures did not align with RecycleForce’s philosophy of “continuous approxima-tions,” where mistakes are teachable moments.

337
As suggested by the implementation analysis, the program was successful in increasing receipt of services related to employment, and substantially increasing receipt of services related to child support, criminal justice issues, mentorship, advice or support from staff members, and mental health assistance. In the year following random assignment, program group members also had higher rates of employment and earnings in unemployment insurance-covered jobs than control group members. Much of this impact is likely to be from subsidized employment, as program group earnings from transitional employment are equivalent to the entire difference in earnings between program and control group members. It is not possible at this point to determine whether RecycleForce will produce long-term employment impacts. There is little evidence that RecycleForce affected criminal justice outcomes such as arrests or incarcerations at the one-year follow-up point, although program group members were somewhat less likely to be incarcerated for a felony than control group members. Finally, the program had substantial impacts on child support outcomes. Program group members were more likely to have paid child support, paid more on average, and paid for more quarters than control group members.

THIS PAGE INTENTIONALLY LEFT BLANK

Chapter 8
Pathways (New York, NY)

THIS PAGE INTENTIONALLY LEFT BLANK

341
Executive Summary
The Doe Fund, a 30-year-old nonprofit organization, operated the Ready, Willing and Able Pathways2Work program (commonly referred to as “Pathways”) for individuals who were returning to New York City after being released from prison. The program used a staged model in which participants began in a transitional job, usually with a Doe Fund street-cleaning crew, and then moved to a paid internship with an employer partner that more closely resembled a real-world work environment. As described in Chapter 1, the staged approach to the subsidized job is considered a structural enhancement relative to previous transitional jobs programs. Pathways also offered case management, access to short-term training, follow-up services, and special assistance with parenting and child support for participants with minor-age children and child support orders. Participants who found and kept unsubsidized jobs could receive a series of cash bonuses.
Main Findings •
•
•
Almost all of the study participants were black or Hispanic men; most had no recent work history and had other disadvantages. About one-third of the study participants did not have a high school degree or equiva-lent, and nearly two-thirds had not worked in the past three years (a time when most were incarcerated). More than half of the study participants were living in someone else’s home, and approximately one-fourth were in transi-tional housing. On average, participants had spent 7.5 years in prison or jail.
Pathways was generally implemented as designed. All of the essential program components were put in place as planned, with some minor varia-tions. One area where the program struggled was recruitment. Pathways re-lied heavily on parole officers for referrals and, while the program ultimately met its recruitment goal and enrolled 1,000 people into the study, staff mem-bers spent a great deal of time developing and tending to relationships with local parole offices. There are several large, established programs providing prisoner reentry services in New York City; officers were familiar with those other programs and could refer clients to them without having to consider the possibility that the client would be assigned to a control group.
Almost all program group members received at least some services from Pathways, and 79 percent worked in a transitional job. About one in five program group members left Pathways before or during the initial pre-employment stage and never worked in a transitional job. Overall, about half

342
of the program group (two-thirds of those who worked in transitional jobs) ever worked in an internship, the second stage of subsidized employment.
•
•
•
A large proportion of the control group received employment services, and more than one-third participated in other transitional jobs pro-grams. New York City has many services available to help this population, and 80 percent of the control group reported receiving help with employ-ment. The research team obtained data from another large transitional jobs program, the Center for Employment Opportunities (CEO), and found that 36 percent of the control group worked in a transitional job at CEO during the study period. The control group’s access to services very similar to those available to the program group potentially affected Pathways’ ability to pro-duce statistically significant impacts.
Pathways substantially increased employment and earnings in the first year of follow-up. The program’s effect on employment appears to have faded over time, but earnings gains persisted. More than two-thirds of the control group worked in jobs covered by unemployment insurance in the first year of follow-up, but the employment rate was 89 percent for the program group (including Pathways jobs), resulting in a large increase in employment and earnings. By the end of the follow-up period, when the Pathways jobs had ended, the program group was no more likely than the control group to hold an unemployment insurance-covered job, but average earnings were still higher for the program group, possibly because program group members worked more hours per week, earned higher hourly wages, or maintained employment more consistently. In addition, survey data showed a higher employment rate for the program group at the end of the follow-up period, suggesting that Pathways may have increased employ-ment in jobs that are not covered by unemployment insurance (for example, jobs in the informal economy or jobs where the worker is classified as an independent contractor).
Pathways increased formal child support payments among noncusto-dial parents, an effect that can probably be attributed to earnings from participants’ subsidized employment. There is limited evidence that Pathways improved participant outcomes in other domains. Among participants identified as noncustodial parents at the time of study enroll-ment, Pathways produced statistically significant impacts on the payment of formal child support during the follow-up period. However, by the end of the follow-up period, when participants were no longer working in sub-

343
sidized Pathways jobs, this effect diminished. There was no pattern of sta-tistically significant impacts in other domains, including criminal justice involvement and economic and personal well-being.
The first section of this chapter provides background information on the city and the program, the Pathways model, and the characteristics of the study participants. The second section describes the program as it was implemented. The third describes the program’s impacts on participation in services, employment, criminal justice outcomes, child support payments, and other measures of well-being in the first year after random assignment.


345
were employed.6 On a more positive note, the ETJD project occurred during a period of job growth in New York City’s diverse economy. The city’s unemployment rate dropped from 8.5 percent in late 2011, when enrollment into the ETJD evaluation began, to 6.3 percent in late 2014.7
Individuals returning from prison often struggle to find housing in New York City’s high-priced housing market. Many end up living in “three-quarter houses”: for-profit, unregu-lated housing facilities that rent beds to single adults. Virtually all three-quarter houses are “illegal” because they violate building codes and city housing laws. In addition, residents often report unsafe living conditions. Many three-quarter houses tailor their rents to public benefit amounts — $215 per month — and the majority end up being funded by government dollars.8
Unlike many other states, New York offers public assistance benefits to low-income single adults who are not living with children. In order to receive these benefits, all able-bodied beneficiaries must be engaged in an approved work program. However, as discussed further below, the local social service agency did not consider Pathways to be an approved work program.
It is important to note that New York City has many programs that offer assistance to people coming home from prison, including those operated by large, established organizations like the Center for Employment Opportunities (CEO), the Fortune Society, and the Osborne Association. Box 8.1 provides a description of some of the organizations serving formerly incarcerated individuals in New York City.
Intended Model
The Pathways program was designed as a staged model, in which participants would start with an in-house transitional job and then progress to a fully subsidized internship position with an outside employer. Figure 8.1 illustrates how participants were meant to move through the components of the program model. The program’s theory of change is that by working in program jobs, participants would develop soft skills and good work habits in a somewhat sheltered environment, which would then be carried over to the internship stage. The internship would provide a “foot in the door” into a permanent position. The staged model was intended to address the fact that many employers are wary about hiring people with criminal records but may change their minds after interacting with a formerly incarcerated person. The paid
6New York State Division of Criminal Justice Services (2010); Staley and Kim (2010). 7New York State Department of Labor (2016). 8Prisoner Reentry Institute (2013).

346
Box 8.1
Transitional Jobs Service Providers
The following programs provided services for formerly incarcerated individuals similar to those provided by Pathways.
The Center for Employment Opportunities is a comprehensive employment program for formerly incarcerated people. CEO provides temporary, paid jobs and other services to im-prove participants’ employability and reduce the likelihood that they will return to prison. CEO also assists parolees and probationers in New York City in finding and keeping jobs. Accord-ing to the organization’s website, “The CEO Program includes [a] five-day pre-employment workshop, resume and interview help by job coaches, transitional employment, job search and job matching with job developers, and up to $1,000 in rewards after placement.”*
The Osborne Association is the oldest organization in New York State serving men and women involved with the criminal justice system. Osborne operates in several locations, including the Bronx, Brooklyn, Poughkeepsie, and Rikers Island, as well as several state correctional facilities.† The Career Center at the Osborne Association offers career develop-ment and coaching, soft-skills and hard-skills training, environmental and financial literacy education, job-search help, and retention support. In addition, participants can gain skills in construction, computers, food service, and building maintenance and operations.‡
The Fortune Society was founded in 1967 to help incarcerated and formerly incarcerated people “become positive, contributing members of society,” according to its website.§ The Employment Services program aims to help formerly incarcerated people gain the skills necessary to become employed and flourish in the workplace. Program participants complete a two-week job-readiness workshop that focuses on networking, doing well in interviews, solving problems, answering questions related to conviction history, and writing a résumé and cover letter. Career counseling, job-placement support, and job-retention services are available to those who complete the workshop. The program also offers skills training leading to certifi-cations in culinary arts and green construction. Once participants complete the training, they are assisted with job placement.||
Wildcat Service Corporation provides job opportunities and resources for people with little work experience. One of the groups served by the organization is formerly incarcerated people. Wildcat provides transitional employment opportunities to help participants “gain hands-on experience under close supervision,” according to its website.# After completing and excelling in the transitional jobs, participants are connected with employers where they can obtain unsubsidized jobs. Additional help with industry-specific certifications and other forms of job training is available to participants who are looking to move up to more skilled and better-paid positions. Once customers are employed, they can continue to use the organization’s career services.
(continued)

347
Box 8.1 (continued)
Opportunities for a Better Tomorrow provides a range of job-training and support services. The organization serves young adults, adults, and immigrants and does not specifically focus on formerly incarcerated individuals. The job-training program provides an opportunity to obtain a high school equivalency credential, as well as specific skills in basic computer litera-cy, retail customer service, and Microsoft Office. Participants can earn a National Retail Federation Customer Service Certification and the Microsoft Office Specialist Certification. In addition, program participants can work with a job counselor “to create and improve their resumes, practice interview skills, and secure a job interview,” according to the organization’s website.** __________________________
*Center for Employment Opportunities (2016). †Osborne Association (2012b). ‡Osborne Association (2012a). §Fortune Society (2016). ||Fortune Society (2016). #Wildcat (2016). **Opportunities for a Better Tomorrow (2016).
internships offered employers a way to “test out” participants at no financial cost to them. Those participants who did not become permanently employed at the internship stage would then continue into a paid job-search stage.
As originally designed, participants would enter the Pathways program in cohorts (groups of participants who join a program at the same time) and move together through four distinct stages:
Stage 1: Orientation. Two weeks when participants would receive an overview of the program, meet program staff members, attend workshops, complete intake paperwork, and fill out assessments of their occupational skills and career interests.
Stage 2: “Ready, Willing and Able” (RWA) transitional job. An eight-week RWA transitional job in one of two tracks — street-cleaning crews (for the majority of participants), or in a Doe Fund kitchen if the participant wanted to pursue culinary arts. Participants were expected to work three days a week (a total of 21 hours) and spend two days (a total of 15 hours) in the classroom attending job-readiness training and other workshops, and meeting with case managers.
Stage 3: Internship. An eight-week internship with one of The Doe Fund’s employer partners. Participants would remain on the Pathways payroll and would work three days a week.
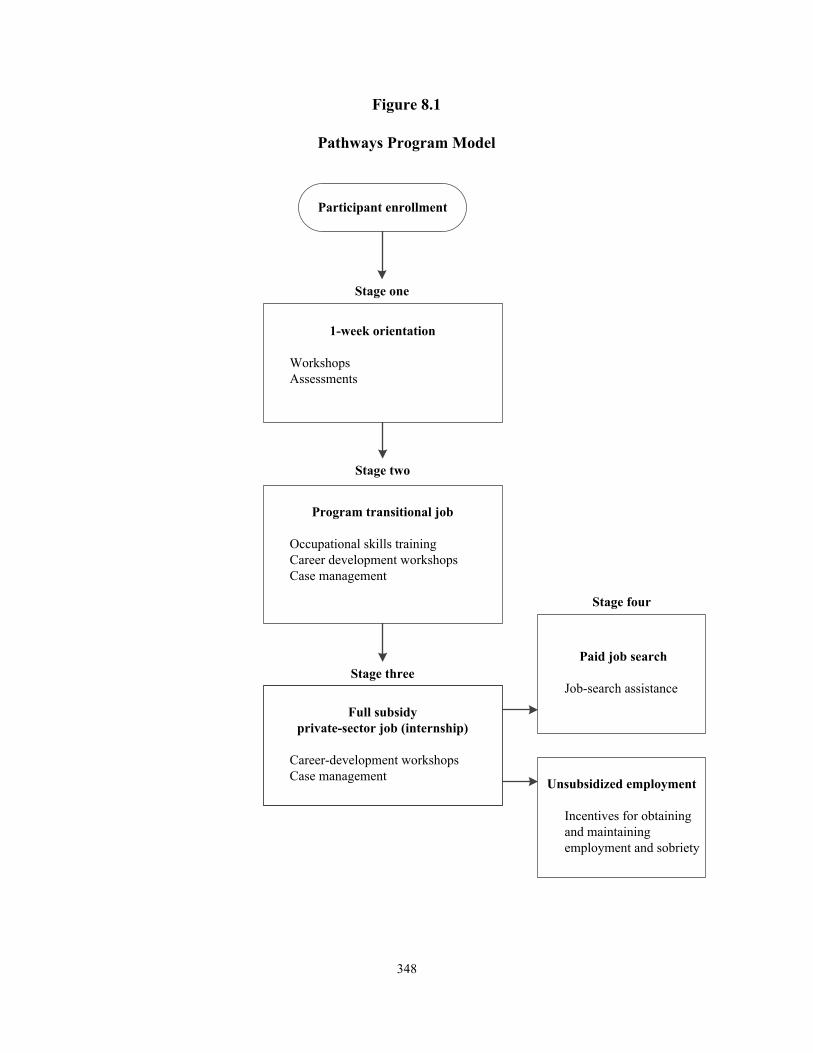
348
1-week orientation
WorkshopsAssessments
Full subsidy private-sector job (internship)
Career-development workshopsCase management
Program transitional job
Occupational skills trainingCareer development workshopsCase management
Figure 8.1
Pathways Program Model
Paid job search
Job-search assistance
Unsubsidized employment
Incentives for obtaining and maintaining employment and sobriety
Participant enrollment
Stage one
Stage two
Stage three
Stage four

349
The internship was designed to expose participants to a more “real-world” work environment where they could work side by side with regular employees. Pathways managers hoped that about half of the internships would evolve into permanent, unsubsidized positions. Participants continued to spend two days a week attending classes and participating in other nonwork program activities during this stage.
Stage 4: Paid job search. If participants were not placed in unsubsidized jobs by the end of their internships, they would move into a six-week “job-search” stage, during which they would receive assistance from the career development staff and participate in office-based job-search activities. During this stage, participants continued to be paid for three full days a week.
Additional services. Pathways intended to provide participants with comprehensive job-readiness activities throughout the various stages of the program. These additional services included case management; classes in computer skills, financial management, wellness, parent-ing, anger management and conflict resolution, and high school equivalency preparation; child support guidance; soft-skills development; employment planning and counseling; and opportu-nities for occupational training and certifications in building maintenance, food handling, being a fireguard (a New York City occupation analogous to a security guard and charged with preventing fires), and Occupational Safety and Health. Once a participant got an unsubsidized job, he or she was eligible to receive a $100 bonus. In addition, Pathways graduates could receive retention bonuses of up to $1,000, given in $200-per-month increments, if they could provide proof of employment of at least 32 hours per week for five months.9
Recruitment and Study Enrollment
While the promise of a paid job was probably the main incentive drawing recently re-leased former prisoners to the Pathways program, parolees also had other potential motivations, including keeping their parole officers happy (and thereby earning themselves some goodwill and leniency), staying busy in order to avoid getting into trouble, and, in general, receiving help getting back on their feet. The Pathways program recruited participants in cohorts. Once enrolled, a cohort of participants would stay together through the various program stages described earlier. Some Pathways staff members reported that the cohort structure was helpful because it built a sense of community, which may have helped participants stay in the program longer than they would have on their own. One staff member reported that age diversity in the cohorts was also beneficial, particularly in the classroom, because members of each generation had their own unique lessons to impart to their peers.
9Pathways did not require participants to be employed in consecutive months to receive bonus payments.

350
● Pathways had special eligibility criteria to try to target the “middle group” of parolees: those who were able to work, but were not likely to find jobs on their own. Some eligibility criteria were relaxed over time to facilitate recruitment.
In addition to the project-wide eligibility criteria described in Chapter 1, Pathways par-ticipants could not have an associate’s degree or higher, could not possess a professional trade license or belong to a union, and could not have A+, Microsoft Certified Solutions Expert, Cisco Certified Network Associate, or Oracle certifications. Participants also had to be drug-free, be able to read at a fifth-grade level, be physically able to work, speak English, not have participated in another Doe Fund program in the previous five years, and not be receiving Social Security benefits that exceeded $700. An additional criterion, added early in the study enroll-ment process, was that participants could not be living in a shelter; program managers deter-mined that individuals living in shelters lacked the stability needed to fully participate in and benefit from the program.
Once potential participants were referred to Pathways, they had to take two drug tests before random assignment took place, followed by routine drug tests throughout the program, usually about twice per week. Sobriety is a central part of The Doe Fund’s organizational philosophy. In the early stages of study enrollment, many potential participants were deter-mined to be ineligible due to failed drug tests. To address this issue, the program exercised some leniency with less serious drugs such as alcohol and marijuana: Positive toxicology results did not exclude these individuals from random assignment, though the sobriety component of the program remained in place after enrollment. Similarly, while Pathways was originally intended to serve men only, the program eventually began to accept women in order to increase enrollment.
Those who were randomly assigned to the control group were provided with a commu-nity resource sheet that listed 17 organizations, including the local American Job Centers.10 CEO was not included on the list because its transitional jobs program was most similar to Pathways and because parole officers and others in the community were already familiar with this program. As discussed later, many control group members nevertheless ended up enrolling in CEO’s transitional jobs program.
10Sponsored by the U.S. Department of Labor, American Job Centers are designed to provide a full range
of services to job seekers, including training referrals, career counseling, job listings, and similar employment-related services.
351
● Pathways had to strengthen relationships with parole offices and make structural changes in the program to reach its sample targets during the study enrollment period.
Pathways relied heavily on referrals from parole officers. The Doe Fund had preexisting relationships with city and state criminal justice agencies, but Pathways nevertheless had to work hard throughout the entire enrollment period to persuade parole officers to make referrals to the program. Pathways managers made it a priority to meet with regional directors and bureau chiefs, explaining the evaluation process and emphasizing the benefits of the program and the study.
Staff members reported that some individual parole officers were reluctant to refer pa-rolees because the random assignment process meant there was no guarantee that those parolees would get into the program. As noted earlier, there are several programs in New York City that serve people with criminal records, and some parole officers preferred to send parolees to those other programs — including some that provided subsidized jobs — because parolees had a greater chance of being served. In general, program managers cited competition from other programs as one of Pathways’ greatest recruitment challenges.
When recruitment lagged behind projections, Pathways managers responded by enrol-ling more frequent, smaller cohorts. Enrollment in cohorts meant that some parolees referred to the program had to wait until a full cohort was recruited before they could start participation, and some of them went elsewhere during this time. The change to more frequent cohorts was designed to reduce this attrition. This change meant that the program structure had to be revised to allow multiple cohorts to be served at the same time (though in different stages of the program).
In addition, Pathways staff members increased the amount of time they spent on recruit-ing. During certain high-intensity periods, case managers estimated that recruitment took up to 60 percent of their time. Work-site supervisors, who were often former Doe Fund participants with histories of incarceration, were also heavily involved in the recruitment process. They were able to connect to potential participants on a personal level by discussing their own experiences and explaining how The Doe Fund had helped them. By the research team’s second implemen-tation site visit in early 2014, it appeared that staff members had figured out a somewhat manageable balance between recruitment and their other duties. A time study conducted in fall 2013 indicated that most case managers spent about a fifth of their time on recruitment, and a few work-site supervisors spent 50 to 70 percent of their time on recruitment. Pathways manag-ers remained heavily involved in recruitment throughout the lifespan of the project. The program’s associate director, in particular, played a vital role in the successful effort to reach the intended study sample size of 1,000.

352
Baseline Characteristics
Tables 8.1 and 8.2 and Appendix Table G.1 present the self-reported characteristics of study participants at the time of random assignment.11 As Table 8.1 shows, almost all of the sample members in New York City are black or Hispanic men. The average age of study participants at random assignment was 35.
The New York City sample appears to have been somewhat less job-ready than the samples for the other ETJD programs targeting people recently released from prison. For example, 35 percent of New York study participants had neither a high school diploma nor the equivalent at the time of random assignment, compared with an average of 25 percent across all three of those programs. Similarly, 67 percent of the New York sample members had ever held a job, compared with the overall average of 81 percent.
More than half of sample members were living in someone else’s home at the time of random assignment, while just under one-fourth rented or owned their own homes. Most of the others were living in halfway houses, transitional houses, or residential treatment centers. Overall, the New York City sample appears to be somewhat more stably housed than sample members for the other programs targeting former prisoners, though it is possible that the percentage renting their own homes includes some sample members who were living in the types of unstable three-quarter housing described earlier.
Forty-one percent of the sample members were noncustodial parents at random assign-ment, while 47 percent reported having minor-age children. However, fewer than 10 percent of sample members lived with minor-age children. Eleven percent reported having current child support orders.
As expected, all of the sample members had been incarcerated in prison, and nearly all were under parole supervision at the time of random assignment. The New York sample members had spent an average of 7.5 years in prison, compared with an average of 4.8 years in all of the ETJD programs targeting former prisoners.
11As expected (given the random assignment design), there were very few statistically significant differ-
ences between the program and control groups with respect to these characteristics. Therefore, for simplicity, Tables 8.1 and 8.2 and Appendix Table G.1 present numbers for the full New York City sample. For a detailed comparison of the baseline characteristics of program group members and control group members across the ETJD programs, see Appendix I.

353
Table 8.1 Characteristics and Employment Histories of Sample Members: New York City
NYC ETJD Programs Targeting Characteristic Program Formerly Incarcerated People
Male (%) 96.3 94.1
Age (%) 18-24 19.1 17.025-34 37.4 34.935-44 22.7 25.245 or older 20.8 22.9
Average age 34.5 35.5
Race/ethnicity (%) Black, non-Hispanic 68.9 67.4White, non-Hispanic 1.2 16.2Hispanic 27.4 14.5Asian, non-Hispanic 0.5 0.2Other/multiracial 2.0 1.6
ducation E al attainment (%) No high school diploma or equivalent 34.9 24.7High school diploma or equivalent 63.7 71.9Associate's degree or equivalent 1.1 2.2Bachelor's degree or higher 0.3 1.3
arital sta M tus (%) Never married 75.7 70.2Currently married 10.2 9.0Separated, widowed, or divorced 14.1 20.8
teran ( Ve %) 2.4 3.7
Has a disability (%) 3.3 3.1
Housing (%) Rents or owns 22.8 11.8Halfway house, transitional house,
or residential treatment facility 22.7 25.6Homeless 0.0 5.8Staying in someone else's apartment, room, or house 54.5 56.9
(continued)

354
Table 8.1 (continued)
NYC ETJD Programs Targeting Characteristic Program Formerly Incarcerated People
Employment history
Ever worked (%) 67.2 81.1
Among those who ever worked: Worked in the past year (%) 15.0 19.9
Average hourly wage in most recent job ($) 10.44 10.11Ever worked for the same employer for 6 months or more (%) 72.8 72.9
Months worked in the previous 3 years (%)
Did not work 62.3 46.6Fewer than 6 months 20.8 30.56 to 12 months 9.1 12.913 to 24 months 5.2 6.7More than 24 months 2.7 3.2
Sample size 1,005 3,002
URCES ETJD ma gement iSO : MDRC calculations based on baseline survey data and na nformation system data.
Program Implementation This section draws from two formal implementation research visits to the Pathways program, plus an early on-site assessment of program operations. The research team interviewed several staff members, partners, employers, and participants during these visits. In addition, the research team reviewed program participation data and participant questionnaire results, and held ongoing telephone conversations with program managers about how the program implemented and adapted its various components.
Program Staffing and Structure
Pathways was a self-contained program that operated in a single location in Brooklyn, separate from all of the other Doe Fund facilities. There were three main teams of Pathways staff: Career Pathways Advisors, who served as case managers, working with participants throughout their time in the program; career development staff members, who were responsi-ble for identifying internship sites and unsubsidized jobs for participants; and work-site supervisors, who provided on-site supervision for participants in street-cleaning crews. The

355
Table 8.2 Child Support and Criminal Justice Characteristics of Sample Members: New York City NYC ETJD Programs Targeting Characteristic Program Formerly Incarcerated People
b
c
a
Parental and child support status
Noncustodial parent (%) 40.8 42.1
Has any minor-age children (%) 47.1 51.5
Among those with minor-age children: Average number of minor-age children 1.9 2.1
Living with minor-age children (%) 9.8 14.0
Has a current child support order (%) 11.0 15.2
Has an order only for child support debt (%) 0.1 0.7
Criminal history
Ever convicted of a crime (%) 93.8 96.3Ever convicted of a felony 91.0 91.0Ever convicted of a misdemeanor 59.6 65.2
Ever incarcerated in prison (%) 100.0 100.0
Average years in jail and prison 7.5 4.8
Average months since most recent release 1.4 1.5
Status at program enrollment (%) Parole 96.1 75.5Probation 3.4 11.9Other criminal justice/court supervision 0.1 9.6None of the above 0.4 2.9
Sample size 1,005 3,002
OS URCES: MDRC calculations based on baseline survey data, ETJD management information system data, and criminal justice administrative records. NOTES: Measures are self-reported unless otherwise noted. aIncludes convictions in the state of New York as recorded in administrative records. Does not include federal convictions or convictions from other states. bIncludes time spent in New York state prisons and New York City jails according to administrative records. Does not include time spent in federal prisons or prisons in other states. cMost recent release can be from prison or jail.

356
teams were integrated and met formally on a weekly basis to discuss the progress of cases. Staff members from each team also reported regular informal communication throughout the week as needed, which they felt strengthened their efforts to support and guide participants.
All told, there were about 26 full-time staff members working on Pathways, including the program director and associate director, an evaluation coordinator, an administrative assistant, five to six Career Pathways Advisors, four career development specialists, a work-force development assistant, two education instructors, a training coordinator, a security guard, a dispatcher, two senior work-site supervisors, and six work-site supervisors. Most staff mem-bers were hired from other Doe Fund programs. Staff members who were hired externally typically had case management backgrounds and were trained in-house.
At the time of the second site visit in February 2014, the career development staff had reorganized to focus more attention on job development.
Implementation of Core Program Components
Table 8.3 shows that 98 percent of program group members participated in at least one Pathways activity, including early assessments as part of orientation and enrollment. Seventy-nine percent worked in subsidized jobs, and just over half worked in internships. Those who worked in subsidized jobs averaged about 29 days of work in all. Assuming three days of work per week, this average would constitute about 10 weeks of work, somewhat below the maxi-mum number of days allowed. Figure 8.2 shows that, as intended, almost all program partici-pants had left subsidized employment by around the sixth month after random assignment.
In fall 2012, Pathways managers shortened the orientation (from two weeks to one) and the first transitional job (from eight weeks to six) in an attempt to reduce attrition rates by moving participants into internships more quickly. The job-search stage was extended from six weeks to nine weeks to provide longer support for participants who had difficulty finding jobs.
Stage 1: Orientation. During orientation, a participant received an overview of the program and met the staff, including his or her assigned case manager. At this time the case managers began conducting an overall assessment, which was to be fully completed within a participant’s first 30 days of enrollment. This assessment covered the participant’s back-ground, legal conflicts, mental health issues, available resources, and goals. The case manager used the assessment to develop an individual service plan for each participant. Pathways staff members also reviewed participants’ rap sheets (so they would be aware of what potential employers might see) and began the sometimes complicated process of helping eligible participants sort out their public benefits with the city’s social service agency, including housing assistance, food stamps, and Medicaid. In order to receive these benefits, and for

357
Table 8.3
One-Year Participation in ETJD Subsidized Jobs and Services Among Program Group Members: New York City
Program Measure Group
Participated in any activity, including a subsidized job (%) 97.8
Worked in a subsidized job (%) 79.0
Worked in an RWA job 79.0Worked in an internship 52.2
Among those who worked in a subsidized job:
Average number of months in the programa 3.1Average number of days from random assignment to first subsidized paycheck 20.9Average number of days worked in a subsidized jobb 28.8
Average number of days worked in an RWA job 15.3Average number of days worked in an internship, among those who worked
in internships 20.5
Received a service other than a subsidized job (%) 97.8
Sam
Formal assessment/testingc 85.9Education and job trainingd 77.4Workforce preparatione 75.8Work-related supportf 88.5Child support assistance, among noncustodial parents 81.5Parenting class, among noncustodial parentsg 61.1Incentive paymenth 49.8Other servicesi 96.6
ple size 504
(continued)
other reasons, many participants also required help gathering documents such as prison release forms, birth certificates, and high school equivalency certificates. During orientation, participants were also informed about the assistance they could receive with managing their child support obligations.
One of the orientation sessions provided information about the two basic tracks offered at Pathways: the culinary arts track, where participants could learn to cook and bake while working in The Doe Fund’s kitchen, and the street-cleaning track, where participants worked in

358
Table 8.3 (continued)
S OURCES: MDRC calculations based on data from the ETJD management inform ation syst em. NOTES: aMeasured as the duration between random assignment and last subsidized paycheck. bCalculated using net hours worked, assuming a seven-hour workday. cIncludes Tests of Adult Basic Education. dIncludes computer literacy, food handler license, and Occupational Safety and Health Administration training. eIncludes Onward and Upward, labor-market information, and financial management education. fIncludes van rides, subway cards, certification/license fees, and clothing. gIncludes 24/7 Dad curriculum. hIncludes job-search payment and payment for obtaining or maintaining unsubsidized employment. iIncludes case management, follow-up services, and rap-sheet requests.
street-cleaning crews. Street-cleaning tasks included picking up trash, sweeping sidewalks, emptying trash cans, shoveling snow, sweeping water out of drains, and pulling down flyers. Other orientation workshops focused on topics such as team building, anger management, and conflict resolution.
Another task participants completed during orientation was intake paperwork and as-sessments. About 86 percent of program group members received a formal assessment, the Test of Adult Basic Education — a math and reading aptitude test. Participants also completed a test of computer skills. Additionally, the career development staff administered a vocational assessment and gathered information from participants about their career interests, employment histories, and geographical preferences for work.
Pathways participants were paid a total of $30 (originally $15) for orientation and orien-tation lasted from 9 a.m. until as late as 5 p.m. Most people finished at 3 p.m., however. In addition, program participants received MetroCards to cover the cost of public transportation to and from the orientation. At the end of orientation, participants signed up for one of the two transitional job tracks and were also invited to attend classes in building maintenance or other classes leading to certifications.
Stage 2: RWA transitional job. Participants worked in the RWA transitional job three days a week. Participants were initially paid $7.40 per hour, slightly above the New York State minimum wage at the time of $7.25. The minimum wage increased to $8.00 as of December 2013, at which time Pathways participants began receiving $8.20 per

359
Figure 8.2
Subsidized Employment Over Time: New York City
0102030405060708090
100
1 2 3 4 5 6 7 8 9 10 11 12Perc
enta
ge w
orki
ng in
subs
idiz
ed jo
bs
Month relative to random assignment
SOURCE: MDRC calculations based on data from the ETJD management information system.
NOTE: Month 1 in this figure is the month in which random assignment occurred.
hour.12 Participants were paid weekly using a debit card. They were not paid for the two days per week they spent participating in nonwork program activities. Pathways considered the pay for subsidized work a stipend, and therefore earnings were not subject to unemployment insurance or income tax. In addition to weekly pay, participants received weekly MetroCards until they received their first checks and brown-bag lunches throughout the RWA transitional job stage, and had the option of eating breakfast or dinner or both at the program site.
● The RWA transitional jobs component operated largely as planned, though there was significant attrition from the program during this stage.
As shown in Table 8.3, participants who started transitional jobs received their first paychecks about 21 days after random assignment, on average. Participants worked in RWA transitional jobs for approximately 15 days, or about five weeks, which suggests that there was
12Beginning December 31, 2013, New York State’s minimum wage increased in a series of three annual changes as follows: $8.00 on December 31, 2013; $8.75 on December 31, 2014; and $9.00 on December 31, 2015.

360
some attrition during this stage of the program; as noted earlier, managers shortened the RWA transitional jobs from eight weeks to six weeks to allow participants to reach the internship stage more quickly. In interviews, participants and staff members noted that some participants disliked working in the street crews, especially in inclement weather. In addition, participants who did not yet have access to benefits like food stamps or Medicaid had difficulty focusing on their work, especially when they had to travel around New York City to obtain these benefits. Since the program recruited citywide but operated in Brooklyn, long commutes became a challenge for some participants. Also, some participants said family or personal issues got in the way of their Pathways work schedules.
While some participants reported dissatisfaction with working in the street crews, others had more positive reactions. In a focus group that included all participants working in RWA transitional jobs at the time of the research team’s first implementation visit (except those absent from work on the day the focus group was held), several participants described feeling a sense of pride at wearing their uniforms, improving the community, and receiving thanks for their efforts from civilians on the street. For some participants, another positive feature of working in the street crews was the camaraderie they created. These participants felt that working together bonded members of the cohort and allowed them to begin supporting one another.
In the field, each participant had a site supervisor who supervised up to 10 participants. Work-site supervisors, who were often former Doe Fund participants, enforced work-site rules, monitored job performance, and provided positive reinforcement and informal mentoring to participants. They were also responsible for providing written evaluations of their supervisees’ performance to the supervisees’ case managers, and met regularly with case managers to discuss participants’ progress. In interviews, work-site supervisors said that one of their main responsibilities was to prepare participants for the internship stage. Specifically, work-site supervisors believed participants needed to learn to accept direct supervision, develop a strong work ethic, resolve conflicts, and be punctual.
As shown in Figure 8.3, the vast majority of participants who completed questionnaires while they were working in RWA transitional jobs strongly agreed that during this stage they were improving their soft skills by, for example, learning to cooperate better with coworkers and supervisors and to present themselves better at work. Similarly, about three-fourths of questionnaire respondents strongly agreed that they enjoyed positive relationships at work; they felt supported by their coworkers, understood what was expected of them, and knew whom to ask for help when they needed it. However, it is important to note that the questionnaire results are based on a small sample and may not be representative of the views of all participants. More specifically, the results may not reflect the views of participants who left the program before completing questionnaires because they were not satisfied with their experiences in street-cleaning crews.
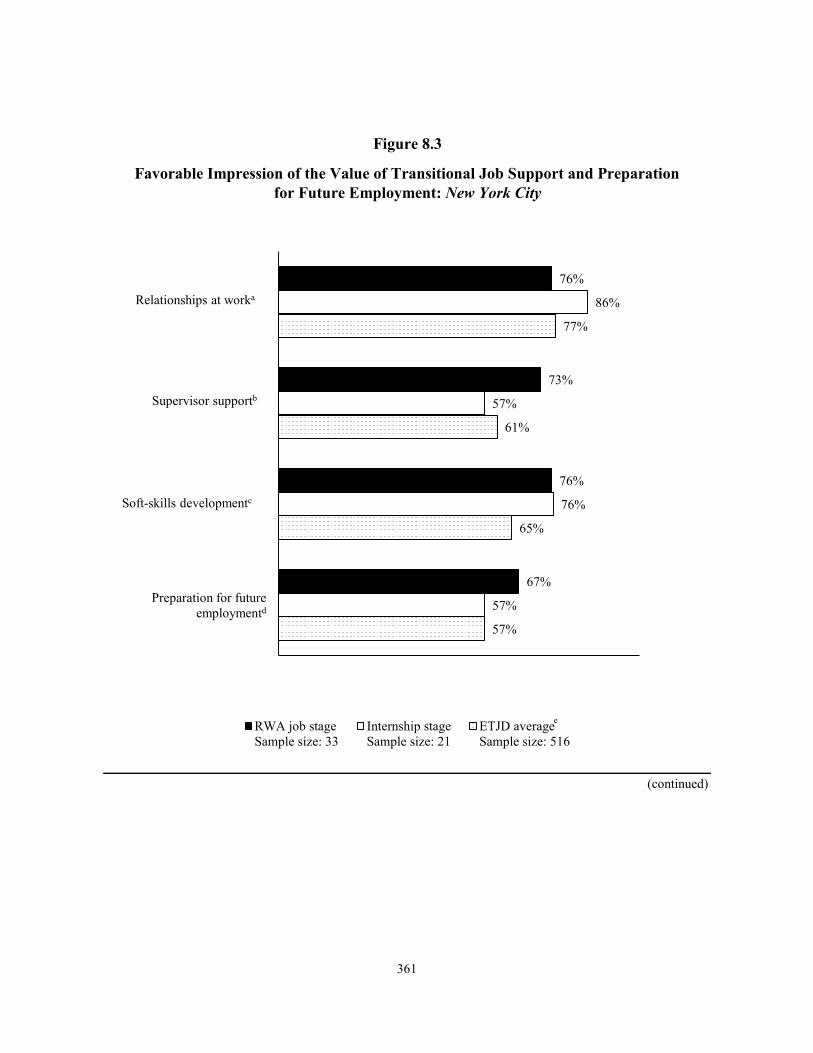
361
(continued)
Figure 8.3
Favorable Impression of the Value of Transitional Job Support and Preparation for Future Employment: New York City
57%
65%
61%
77%
57%
76%
57%
86%
67%
76%
73%
76%
Preparation for futureemploymentd
Soft skills developmentc
Supervisor supportb
Relationships at worka
RWA job stageSample size: 33
Internship stageSample size: 21
ETJD averageSample size: 516
Relationships at worka
Supervisor supportb
Soft-skills developmentc
Preparation for future employmentd
e

362
Figure 8.3 (continued)
SOURCE: MDRC calculations based on the ETJD participant questionnaire.
NOTES: The measures presented in this figure, relationships at work, supervisor support, soft-skillsdevelopment, and preparation for future employment were created based on an exploratory factor analysis of a pool of questions. These questions asked participants about their level of agreement with a particular statement on a scale of 1 to 7, where 1 indicates strong disagreement and 7 indicates strong agreement. Based on the results of the factor analysis, questions were grouped into factors and a mean score was calculated across the questions included in a particular factor; the percentages presented above represent the proportion of questionnaire respondents who averaged a score of 6 or higher on the questions in that factor, indicating a high level of satisfaction with their program experiences in that area.
With a few exceptions, questionnaires were administered to participants by the research team during site visits at events and activities when many participants would be available at once. Consequently, the responses obtained are from participants who attended program activities and were therefore likely to be more motivated and engaged than the full sample of program participants. For this reason, the results presented in this figure are not necessarily representative of all participant experiences and should be interpreted with caution; they are likely to be more positive.
aBased on agreement with the following statements: I understand what is expected of me on the job; I know whom at work to ask for help when I need it; My relationships with coworkers are positive and supportive; and My coworkers understand me and want me to succeed.
bBased on agreement with the following statements: I get the support or guidance that I need from my supervisor; My supervisor gives me advice about how to handle situations at work; and My supervisor helps me if personal issues come up that get in the way of working.
cBased on agreement with the following statements: I am learning how to work better with coworkers; I am learning how to cooperate better with supervisors; and This job has helped me learn to present myself better at work.
dBased on agreement with the following statements: The kind of work I am doing will help me get a decent-paying job later; I am learning specific job skills that I will use in the future; and I have met people through this job who may help me find a job in the future.
eTo account for varying questionnaire sample sizes across ETJD programs, the "ETJD average" is a weighted average of all programs such that each program is equally represented.
Some focus group participants expressed negative views about their work-site supervi-sors, believing that their supervisors, who themselves had been formerly incarcerated, were enjoying their newfound authority a bit too much. They reported that supervisors were looking for something to criticize and intended to intimidate the participants. It is important to note that only about 15 program group members attended focus groups, so it is difficult to know whether this perception was widespread. Additionally, this discussion was held fairly early in focus group participants’ time in their RWA transitional jobs; it may be that supervisors were being particularly tough at the outset in order to get new participants “in line” and expose them to the type of supervision they might experience in future, “real-world” positions.
During the two days a week that participants were not working at their transitional job sites, they attended classes at the Pathways office. As discussed in more detail later in this section, participants received instruction in job readiness and basic computer skills, among other

363
topics. This time was unpaid, and classes took place from 10 a.m. until 3 p.m., leaving time for participants to meet with case managers.
As intended, a large majority of participants worked in street-cleaning crew jobs during this stage. However, about six participants per cohort worked in The Doe Fund kitchen, learning to cook and bake while preparing food for both The Doe Fund shelter that shared the building and a local Boys and Girls Club. The small number of participants who worked in the kitchen learned basic kitchen skills and sanitation. Culinary training at The Doe Fund lasted for five weeks. Participants dedicated their sixth week in this stage to acquiring a food handler’s certificate by attending a five-day class at the New York City Health Academy and passing a test. Pathways reimbursed the $114 test fee if the participant passed. In most cases, participants from the culinary arts track continued on to culinary internship placements.
Stage 3: Internship transitional job. After completing the RWA transitional job, par-ticipants were placed in an eight-week internship at one of Pathways’ employer partners. In this stage, Pathways continued to pay participants’ wages for three days of work per week (at the same hourly rates they had received in the RWA transitional job stage). The internship stage was designed to build soft skills and, in some cases, job-specific skills.
● Pathways was able to develop a large, stable group of employer partners to host program interns. Overall, about half of the program group worked in internships.
Table 8.3 shows that 52 percent of the full program group — about two-thirds of those who worked in first-stage transitional jobs — worked in internships. Among this group, the average number of days worked in internships was 21, or about seven weeks at three days per week — close to the eight weeks required by the program model.
Pathways began the project with 6 employer partners for internships and ended up with more than 40. Career development staff members matched participants to internship openings. Staff members reported that the most important factor in matching a participant to an internship was whether the participant had the skills and background necessary to move into unsubsidized employment with that employer. The possibility of moving into unsubsidized employment often depended on whether the participant had a high school diploma or equivalent, on whether the participant had a driver’s license, and, to a lesser extent, on the particulars of the participant’s criminal history. Career development staff members tried to take participants’ career interests and geographical preferences into account as well.
About 25 of the internship partners were nonprofit organizations, including many social service organizations. Thirteen were private companies, including several in the food-service industry (mostly companies with large, industrial kitchens), and 3 were public agencies. In

364
general, staff members reported that smaller businesses were most open to working with Pathways as a way to give back to the community and that most of the internships were in the building maintenance and culinary fields, in line with the training that participants had received. Other reasons cited by employers for working with the program included the obvious free labor, but also the opportunity for a “test run” with trained, prescreened workers before deciding whether to hire them into full-time, unsubsidized positions. Additionally, the certificates participants earned in food handling, building maintenance, and other areas were often a major selling point for prospective employer partners.
Career development staff members noted that many participants were interested in con-struction, but it was challenging to collaborate with this industry due to union rules and the seasonal nature of the work. Clerical positions and counseling/social work were also fields of interest, but they were difficult to enter because of educational requirements and restrictions related to having a criminal background. Participants’ criminal histories also prevented them from moving into security guard positions, another job track that many participants wished to pursue.
In general, career development staff members acknowledged that they were not able to break into as many employment sectors as they would have liked, in large part due to many employers’ resistance to taking on interns with criminal records. As a result, staff members had to rely more on personal contacts and “what was possible and available.” Career development staff members also noted feeling hemmed in by the training Pathways could provide, which was limited to building maintenance and culinary arts; they wished a broader range of training options were available to participants, which would in turn give them a way to “sell” partici-pants to different types of employers. Notably, this same wish was echoed by both participants themselves and Pathways managers. In particular, Pathways managers said that they would have liked to offer commercial driver’s license and pest-control training, both offered through The Doe Fund’s residential programs. Unfortunately, logistical problems prevented Pathways from offering training in these areas.
Interestingly, the career development staff originally appealed to potential internship providers by emphasizing the opportunity to give back to the community and do good. In the last several months of the program, however, the Pathways staff turned away from this ap-proach, instead choosing to market the internship from a business perspective. They felt their appeals should focus on benefits to employers’ bottom lines, and began to stress that taking on a trained intern for a no-cost trial was simply a good business decision. Program managers said that pitching the participants as “charity cases” was doing a disservice to their level of skill and what they had to offer.
Career development staff members followed up with participants regularly while they were in internship positions. They called or e-mailed the employer once a week and visited

365
work sites frequently. Employers were asked to call the career development staff if issues arose. During an interview with one employer partner, the employer noted that Pathways was very good at addressing concerns with their participants — the Pathways staff took immediate action and met with the participant to discuss the issue. This approach effectively resolved any problems the employer encountered with Pathways interns. Career development staff members said they took this responsibility very seriously, as they did not want to jeopardize their relation-ships with employers and risk losing them as partners.
Some of the employer partners were more likely than others to hire Pathways partici-pants into unsubsidized positions. Career development staff members noted that they were always looking for new partners, as many employers they used in the past had already hired participants into unsubsidized positions, and therefore no longer had vacancies. The research team unfortunately does not have data on the number of internships that turned into unsubsi-dized positions with the same employer. Career development staff members followed up with participants who were hired by employer partners, many of whom were also still providing internships. When visiting work sites, career development staff members checked in with participants who were in the internship stage and former participants now working in unsubsi-dized positions.
Consistent with the model, the “real job” of the internship stage was meant to be a less sheltered environment than the RWA transitional job in street cleaning or culinary arts. Thus, as shown in Figure 8.3, it is to be expected that program group members who completed question-naires during the internship stage were less likely to report receiving strong support from their supervisors than those who completed the questionnaire during the RWA transitional job stage. Surprisingly, respondents in internships were somewhat less likely than those in RWA jobs to report that they were receiving strong preparation for future employment. This result could be because internship participants observed their own skills in “real jobs” relative to other workers’ more advanced skills and felt less prepared for unsubsidized jobs in this context. Notably, internship workers were more likely to report strong relationships at work. As noted earlier, these differences may reflect the views of the relatively small group of participants who completed the questionnaires rather than the full sample of Pathways participants.
Stage 4: Paid job search. Participants who completed an internship without finding a job entered the job-search stage of the program. The job search was structured into course modules that helped participants learn where and how to look and apply for jobs, as well as how to present their criminal histories in the most honest and professional way possible. There was also a weekly job club intended to allow participants the opportunity to learn from and support one another during what is often a frustrating process. Program records show that 38 percent of the full program group — about 72 percent of those who worked in internships — participated in paid job searches.

366
During this time, participants received the same weekly pay that they received in their transitional jobs until the final week, when they were paid $15. They were required to fill out job-search tracking sheets with the names of the contacts they made with various employers and submit them every Friday. The expectation was that they would complete 5 or more in-person applications and 8 or more online applications, though participants rarely hit the required 13 applications. The staff did not penalize participants who failed to meet this goal as long as they showed up and were making a sincere effort. Career development staff members verified that participants were in fact searching for jobs by calling the contacts listed on the tracking sheet. At a certain point, realizing the participants needed more help, career development staff mem-bers began sending job leads to all participants in the paid job-search stage once a week. As noted earlier, the job-search stage was extended from six weeks to nine weeks to allow partici-pants more supported time to find employment. The staff was willing to continue to work with participants after the nine weeks had elapsed, though participants could no longer be paid for their time. For an in-depth look at one participant’s experience moving through the four stages of the Pathways program, see Box 8.2.
Additional services. As shown in Table 8.3, 98 percent of program group members re-ceived services other than subsidized employment, including formal assessments/testing, education and job training, workforce preparation, work-related support, and other services, including case management, follow-up services, and rap-sheet requests. While many of these services have already been mentioned, more information about these additional forms of support is provided in this section.
Education. Pathways taught a two-part job readiness sequence. Career Pathways 101 was offered during the RWA transitional job stages and focused on résumé writing, soft skills, time management, and conflict resolution in the workplace. Career Pathways 102 was offered during the internship stage and focused on the unsubsidized job search, including topics such as interviewing (especially how to handle questions about one’s criminal history), references (for example, whom to list as a reference), and what happens when one receives a job offer (review-ing a hiring letter and completing legal-work-status and tax forms). Career development staff members conducted mock interviews during Career Pathways 102, requiring participants to come dressed for an interview. Help was available for those in need of appropriate interview attire. Additionally, Career Pathways 102 focused on issues that participants faced in their internship placements.
The education coordinator taught a computer-skills class called “Cultivating Literacy in Computers.” This class was provided twice a week for six weeks during the early part of the program and focused on the computer skills needed to conduct a job search. The curricu-lum included the following topics: introduction to e-mails, e-mail etiquette, introduction to

367
Box 8.2
Pathways Participant Profile
“JT” is a 44-year-old black man who was born and raised in Manhattan. He is divorced and has two adult children with whom he has no contact. JT’s last charge was for violating a protective order with criminal intent because he called his ex-girlfriend, and he was sentenced to two years. JT has four other felonies — two robberies in the second degree and two rob-beries in the third degree — as well as an attempted assault and a misdemeanor. He also has a history of domestic violence. JT served 14 years in total.
JT completed 11 grades and has a high school equivalency credential. He attended the Institute of Audio Research for a year and wants to be a music producer. JT participated in VESID (Vocational and Educational Services for Individuals with Disabilities) because he wanted to finish his degree. JT’s work experience encompasses temporary work in culinary and mechan-ical industries through temp agencies. He only has two years of work experience.
JT’s case manager recruited him for the program at the Manhattan parole office. He was initially interested in another program, but after he learned about the internship and opportuni-ties to become certified in a trade, he chose Pathways. During the program, JT had excellent attendance, was committed and independent, took initiative, and was very motivated. He did what he was supposed to do despite having to attend outpatient services three times a week and anger management counseling, and despite living in a three-quarter house. Although JT had used cocaine in the past, all of his drug tests were clean, and his case manager did not think he needed to attend outpatient services. However, outpatient services were required as part of his living arrangement at the three-quarter house.
JT wanted to complete building-maintenance training, but could not do so due to his schedule. He completed his building-maintenance internship, but there were no positions open when he finished, so he did not get an unsubsidized job with that company. When he didn’t get hired by the organization where he interned, he was convinced that it was because of his criminal background, and he found that experience to be incredibly frustrating. His case manager explained that JT is very sensitive about his background and ashamed of it. He does not want to be defined by his criminal past, and he felt that his supervisor did not want to leave him alone in the building. To reassure him that this was not the case, a career development staff member at Pathways called JT’s supervisor to solicit the supervisor’s opinion about him. The supervisor had only positive things to say about JT.
JT completed all nine weeks of paid job searching at Pathways. He is now employed full time (40 hours per week) and making $9 per hour in a permanent job.

368
Microsoft Word and résumé building, cover letters, and introduction to the Internet and online job applications. The education coordinator helped participants create free e-mail accounts if they did not already have them or if they needed more professional e-mail addresses.
All participants with children under the age of 18 were required to attend a parenting class twice a week for six weeks; as shown in Table 8.3, about 60 percent of parents attended the class. Topics covered in this class included family history, a father’s role, communication with the custodial parent, children’s growth, discipline, and being a good role model. Pathways also tried to coordinate events for parents, including a Family Day picnic at a local city park and toy drives during the holiday season.
Various other classes covered topics such as financial management, anger management, conflict resolution, and wellness. The wellness class, a later addition, focused on communica-tion, body language, relationships, and stress management. This class was particularly popular among participants.
Attendance at classes was mandatory, though the staff reported that attendance was fre-quently an issue. The staff balanced the need to be flexible with the importance of preparing participants for a less forgiving job environment. In general, if participants did not go to class, they were not allowed to go to work.
Case management. Case managers were responsible for developing participants’ ser-vice plans and providing overall support to participants throughout the program. Once a week, case managers met with other staff members and discussed any individual cases in need of specific help. These meetings focused on issues that needed to be addressed immediately, for example poor attendance and positive drug test results.
Case managers developed relationships with the parole officers of participants on their caseloads. They would work with parole officers to adjust court dates or reporting schedules in the event that these obligations prevented participants from attending important program activities. They would also report to a participant’s parole officer if something bad happened — for example, if that participant failed a drug test or stopped attending Pathways. Case managers would recommend a course of action to parole officers based on the incident, for example, drug treatment, continued monitoring, etc.
Case managers also noted that part of their role was to help participants coordinate their busy schedules. Participants had many appointments and programs to attend and curfews to obey, which often conflicted with training events and other opportunities. Only recently released from prison, participants were used to being told where to be at all times, and many had forgotten how to manage their own schedules. One case manager said she made color-

369
coded calendars for her participants. Case managers also screened participants for mental health and substance-abuse issues and referred them to outside services as needed.
Overall, case managers believed their role was to assist participants with the transition back into society and help them gain stability, which they viewed as essential to finding and maintaining employment. Each case manager carried a caseload of 15 to 22 participants, all at different stages of the program and in need of different forms of support. Case managers reported that participants often required a lot of their time and attention during the early stages of the program, but by the time they moved into their internship placements, they were usually functioning much more independently and needed only brief, weekly check-ins. Their growing independence helped balance case managers’ workloads, as they had a new cohort to assist by the time an earlier cohort entered the internship stage. In addition to their weekly check-ins, however, case managers continued to have contact with participants in internship placements through an internship support group they facilitated once a week.
Case managers managed conflicts at Pathways using a process called a “sit-down.” When a conflict arose between two participants or between a participant and a staff member, a meeting would be called bringing together all relevant parties. During this meeting, everyone was given an opportunity to present his or her side of the story and be heard on equal footing. This approach was central to building trust with participants. While some participants may still have been upset following the sit-down, they at least got to have their grievances aired and be part of the conversation concerning how to move forward from the incident. The goal of the sit-down process was to calm participants’ emotions and get to the root of a problem in order to reach a solution. More broadly, the process demonstrated to participants how to communicate openly and seek solutions to resolve conflicts, helping them learn to resolve conflicts in a socially acceptable way.
Additional training opportunities. Pathways also offered additional training opportuni-ties. A four-week building-maintenance program met two evenings per week from 5:30 to 9 p.m. and on Saturdays. It could lead to boiler and fireguard certifications (city-sponsored tests) as well as an Occupational Safety and Health Administration (OSHA) certification in construc-tion safety. Participants were not paid to participate in building-maintenance classes, but they could be reimbursed by the program for testing costs associated with earning these certifica-tions. The program also offered driver’s license training (not commercial driver’s license but regular driver’s license training, since a driver’s license is often required for jobs), and paid for road tests.
Child support assistance. During orientation, all Pathways participants were required to sign a waiver granting The Doe Fund’s parenting coordinator permission to check with the Office of Child Support Enforcement (OCSE) whether they had any open child support cases
370
and to gather information about their cases, including the number of children on the case, the required monthly payment amount, debt amounts, and whether a driver’s license had been suspended due to nonpayment. If a participant owed child support to either the custodial parent or the state, Pathways set up a payment plan for the participant. This plan required participants to pay $25 of their wages per month toward child support; these payments were deducted from their transitional job wages. This monthly deduction was meant as a “good-faith” payment to indicate that the parent realized that he or she had a responsibility for the child but could not make larger payments at the moment. (This payment plan option was also available to control group members, thought they would have had to establish the arrangement without Pathways’ help.) Pathways staff members also worked with OCSE to lift the suspension of participants’ driver’s licenses when possible.
It was a more complicated process to actually modify child support orders. For money owed to the state the participant had to undertake an administrative process that involved gathering documents and filing an affidavit. Once the appropriate documents had been collect-ed, the process generally took about eight weeks. Modifying payments or debt owed to a custodial parent required a judicial process that could take six months to a year and that required the noncustodial parent to gather a number of documents. The parenting coordinator helped interested participants to navigate the modification process and provided them with a letter that summarized the Pathways program and described how long the participant had been in it, the amount the participant made per week, and the amount he or she was paying toward child support. Pathways hoped that the “good-faith” payments would help participants when they applied for modifications. However, as of the first implementation site visit by the research team, Pathways reported that few participants had sought modifications.
Follow-up and graduate services. Pathways held a graduation night once a month, giv-ing the staff an opportunity to check in with past participants to see how they were faring and whether they needed any assistance. Additionally, in the fall of 2013, the staff began to reach out to past participants in the hopes of reengaging in Pathways’ job-search services those who did not have jobs. If reengaged participants had not previously exhausted their nine weeks of paid job searching, they could even be paid for their time. In general, the graduate services department at The Doe Fund provides former participants from any program with lifetime case management, including help with housing, employment, and other needs.
Other challenges. Since three-quarter houses were one of the few housing options that participants could afford (in many cases, the only option they could afford), many faced difficulties with their living arrangements during their time in the program. Pathways staff members explained that three-quarter housing was a “quick fix” type of housing that was approved by parole officers because it was linked with outpatient drug-treatment services. However, program staff members reported that these housing facilities were often severely

371
overcrowded and in “deplorable condition.” Most three-quarter houses had poor reputations due to the prevalence of unsafe and unstable conditions like drug use, theft, and violence. These circumstances pose high risks for parolees who are struggling to get their lives on track. Many Pathways participants had substance-abuse problems, anger-management issues, or both, and those could easily be aggravated in this type of environment. Additionally, being near drugs, even involuntarily, put them at risk of violating their parole. Case managers reported that participants living in three-quarter housing were often anxious and tired because of the instabil-ity in their living situations and the fear of violating the terms of their parole or having their belongings stolen.
Drug treatment was a requirement of residing in three-quarter housing, whether or not a parolee had a substance-abuse problem. Some Pathways participants who had no such problem, or who had already completed treatment, were forced to attend treatment services in order to remain in three-quarter housing. This often interfered with their ability to attend training events and participate in other gainful activities. The Pathways staff kept a record of participants who lived in three-quarter housing and were sometimes able to advocate to parole officers on their behalf in order to move them to better living conditions. Pathways managers stated that more affordable housing options in New York City would do a great deal to help this population.
Navigating the city’s social service agency also posed challenges. Case managers re-ported frequent and confusing changes to agency rules and long waits for participants, who had to shuttle among various offices to obtain the benefits they qualified for and greatly needed. In addition to food stamps, many participants urgently needed Medicaid because they were required under the terms of their parole to attend drug-treatment or anger-management pro-grams. Medicaid paid for these programs, but without benefits in place, participants could not attend and were therefore at risk of violating parole. Additionally, according to agency rules, participation in a work program was required for a person to receive housing assistance, but Pathways did not qualify as a work program because it was not open to everyone on public assistance. Some participants who required housing assistance were able to continue in Path-ways, but others were told they would lose this support if they did not participate in an approved work program, and as a result were forced to leave Pathways. During the recruitment period, Pathways staff members were careful to explain these restrictions to potential participants so that they were aware that participating in Pathways could cause them to lose their benefits.
Impacts on Participant Outcomes
Participation and Service Receipt Outcomes
Both program and control group members in New York City received services of vary-ing types from a number of sources. However, only those in the program group were eligible to

372
receive Pathways services. This section compares the services received by the two research groups in the areas of employment, education and training, and other support and services (including help related to past criminal convictions, help related to noncustodial parenting, advice and mentorship, and mental health assistance). Any differences in service receipt between the two research groups represents the service differential — the increase in services over what the control group received that is associated with access to the Pathways program. Without a meaningful service differential, significant impacts on participant outcomes in other domains are very unlikely.
This section presents impacts on participation and service receipt based on data from a survey administered about a year after random assignment. These data capture study members’ reports of activities they participated in and help they received since random assignment. Unless otherwise indicated, all impact results discussed in this report are statistically significant, with p < 0.10. Overall, program group members reported higher levels of participation and service receipt than control group members in almost every area. However, control group members also received a substantial amount of support. As a result the service contrast is relatively modest in some areas, most importantly in the area of employment support, the primary focus of the Pathways program.
● The program group was significantly more likely than the control group to receive employment help, education and training, and other services. However, the control group also received a considerable amount of sup-port, resulting in a modest service differential.
As shown in Table 8.4, about 80 percent of the control group reported receiving help re-lated to finding or keeping a job. Although the program group figure was higher, 93 percent, the difference between the two groups is relatively modest. It is particularly notable that 36 percent of the control group participated in the transitional jobs program at the Center for Employment Opportunities, which offered services comparable to those provided by Pathways (not shown in the table).13
Table 8.4 also shows that 59 percent of the program group participated in education and training, compared with 36 percent of the control group. This 22 percentage point difference is
13An earlier evaluation by MDRC showed that CEO’s program generated sustained decreases in recidi-
vism for individuals who had been recently released from prison. See Redcross, Millenky, Rudd, and Levshin (2012). Although it was not an ETJD grantee, CEO assisted the evaluation by checking for ETJD sample members in its management information system.
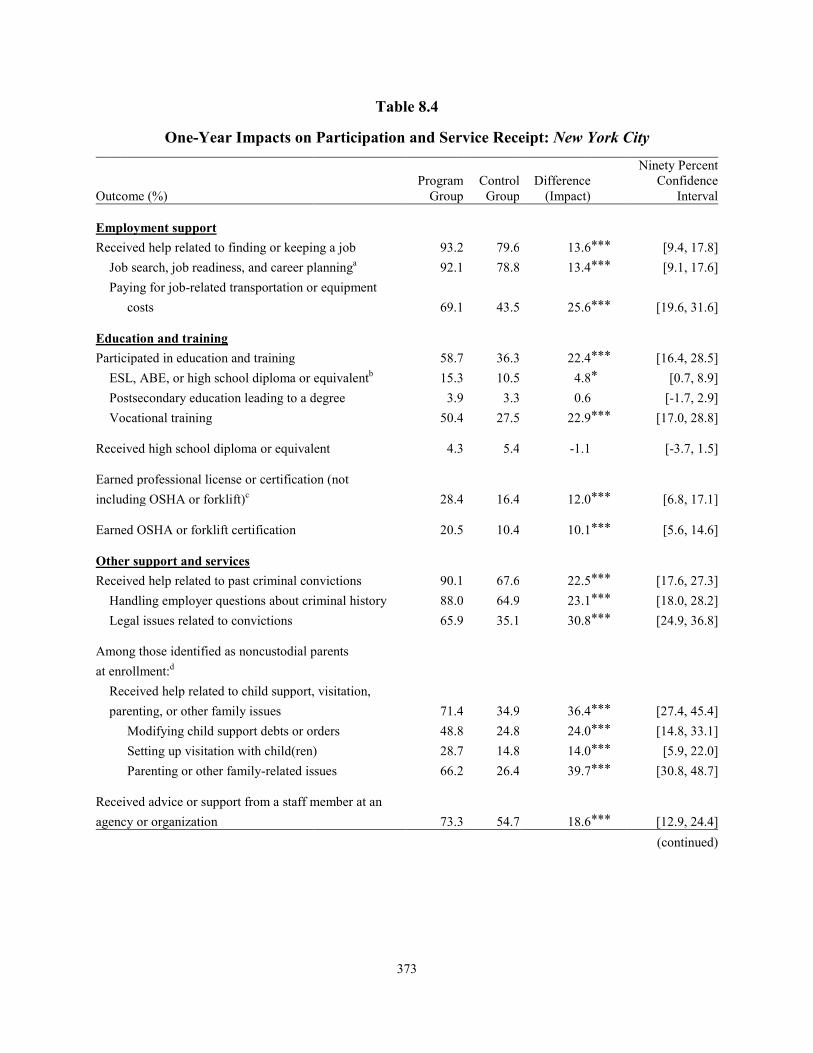
373
Table 8.4
One-Year Impacts on Participation and Service Receipt: New York City
Ninety Percent
Program Control Difference
Confidence
Outcome (%) Group Group (Impact) Interval
Employment support
Received help related to finding or keeping a job 93.2 79.6 13.6*** [9.4, 17.8]
Job search, job readiness, and career planninga 92.1 78.8 13.4*** [9.1, 17.6]Paying for job-related transportation or equipment
costs 69.1 43.5 25.6*** [19.6, 31.6]
Education and training Participated in education and training 58.7 36.3 22.4*** [16.4, 28.5]
ESL, ABE, or high school diploma or equivalentb 15.3 10.5 4.8* [0.7, 8.9]Postsecondary education leading to a degree 3.9 3.3 0.6 [-1.7, 2.9]Vocational training 50.4 27.5 22.9*** [17.0, 28.8]
Received high school diploma or equivalent 4.3 5.4 -1.1 [-3.7, 1.5]
Earned professional license or certification (not including OSHA or forklift)c 28.4 16.4 12.0*** [6.8, 17.1]
Earned OSHA or forklift certification 20.5 10.4 10.1*** [5.6, 14.6]
Other support and services Received help related to past criminal convictions 90.1 67.6 22.5*** [17.6, 27.3]
Handling employer questions about criminal history 88.0 64.9 23.1*** [18.0, 28.2]Legal issues related to convictions 65.9 35.1 30.8*** [24.9, 36.8]
Among those identified as noncustodial parents at enrollment:d
Received help related to child support, visitation,
parenting, or other family issues 71.4 34.9 36.4*** [27.4, 45.4]Modifying child support debts or orders 48.8 24.8 24.0*** [14.8, 33.1]Setting up visitation with child(ren) 28.7 14.8 14.0*** [5.9, 22.0]Parenting or other family-related issues 66.2 26.4 39.7*** [30.8, 48.7]
Received advice or support from a staff member at an agency or organization 73.3 54.7 18.6*** [12.9, 24.4]
(continued)

374
Table 8.4 (continued) Ninety Percent
o
S
Program Control Difference
Confidence Outcome (%) Group Group (Impact) Interval
Received mentoring from a staff member at an agency or rganization 62.1 46.6 15.5 *** [9.4, 21.5]
Received mental health assistance 34.2 37.1 -2.9 [-8.8, 3.0]
ample size 371 353
SOURCE: MDRC calculations based on responses to the ETJD 12-month survey. NOTES: Results in this table are regression-adjusted, controlling for pre-random assignment characteristics. Statistical significance levels are indicated as: *** = 1 percent; ** = 5 percent; * = 10 percent. aIncludes help with job searching, job referrals, developing a résumé, filling out job applications, preparing for job interviews, job-readiness training, and planning for future career or educational goals. b ESL = English as a second language, ABE = adult basic education. cOSHA stands for Occupational Safety and Health Administration. In an effort to separate receipt of professional licenses or certifications that require more intensive and lengthy training (for example, a Certified Medical Assistant certificate or a commercial driver’s license) from those that can be earned following more cursory, one-day training, receipt of OSHA and forklift certifications, which fall into the latter group, is presented separately from receipt of other types of licenses or certifications. A review of all reported types of licenses or certifications revealed that OSHA and forklift certifications account for a large majority of the shorter-term, less intensive licenses and certifications received by sample members. dThese measures include only those who were identified as noncustodial parents at study enrollment (program group = 157; control group = 144; total = 301).
statistically significant.14 It can be attributed to a modest difference between the groups in participation in educational classes (15 percent versus 10 percent) and a relatively large differ-ence in participation in vocational training (50 percent versus 28 percent). While education was not a major part of the Pathways model, interested participants could take high school equiva-lency or pre-equivalency classes through The Doe Fund; additionally, Pathways referred some participants to Literacy Partners, an external provider, for these types of classes. Pathways offered two main vocational training opportunities (in building maintenance and culinary arts), which probably account for much of the difference between the research groups in this area.
Pathways also increased participants’ receipt of professional licenses or certifications. As discussed above, Pathways participants who completed building-maintenance training were
14As a result of rounding, the difference between the program and control groups for the percentages who participated in education and training appears to be 23 percentage points. However, the difference in unround-ed means is actually 22.4 percentage points.

375
encouraged to obtain OSHA, boiler, and fireguard certifications, while those who went through culinary arts training often pursued food handlers’ certificates. These program connections probably explain the statistically significant impact on these outcomes. The program did not result in statistically significant impacts on engagement in postsecondary education or receipt of a high school diploma or equivalent. These findings are not surprising, given the program’s emphasis on work as well as the relatively low percentage of participants pursuing high school diploma or high school equivalency classes.
Finally, the bottom panel of Table 8.4 shows impacts on various other support services. Pathways produced a statistically significant impact on help related to past criminal convictions: 90 percent of program group members reported receiving this type of help compared with 68 percent of control group members. Help related to past criminal convictions includes help handling employer questions about criminal histories and help dealing with legal issues related to convictions. Both of these types of help were offered to Pathways participants via their case managers and job-readiness classes. Additionally, Pathways sometimes referred participants to MFY Legal Services, a partner organization that offers free legal assistance to New York City residents.
Only about 40 percent of the sample were noncustodial parents, but within that sub-group the program had a statistically significant impact of 36 percentage points on help related to child support, parenting, or other family issues: 71 percent of noncustodial parents in the program group reported receiving this type of help compared with 35 percent of noncustodial parents in the control group. Pathways offered parenting classes and counseling from case managers, and also helped noncustodial parents to establish payment plans and, in a small number of cases, to modify their child support debt or orders.
The program also produced positive, significant impacts on receiving advice, support, or mentorship from program or agency staff members. This finding probably reflects partici-pants’ relationships with case managers and other Pathways staff members. However, control group members also reported receiving relatively high levels of this type of service, resulting in differences between the two research groups of less than 20 percentage points. Lastly, Pathways did not have a statistically significant effect on mental health assistance; about one-third of both program and control group members reported that they had received this type of help.
Employment and Earnings Outcomes
Former prisoners are at a severe disadvantage when seeking employment. They often have low levels of education and skills and no recent work experience, and employers are

376
reluctant to hire them.15 As discussed in Chapter 1, transitional jobs programs such as Pathways provide work-based income support to help hard-to-employ populations like former prisoners. However, such programs also generally intend for subsidized employment in a supportive setting to serve as a training tool to improve participants’ outcomes in the regular labor market. Pathways served former prisoners and provided subsidized employment both in a supportive setting (street cleaning and culinary work at The Doe Fund) and in a “real-world” setting intended to more closely mirror the regular labor market (internships at private employers), in the hope of increasing employment and earnings among participants even after the end of the program. Overall, the interim findings discussed in this section indicate that Pathways succeed-ed in providing work-based income support to participants. It is less clear whether the program was effective at improving participants’ employment outcomes in the regular labor market after the subsidy period ended; making that determination will require longer-term follow-up.
● Largely due to the program’s subsidized employment, Pathways pro-duced statistically significant impacts on employment and earnings. Ear-ly results suggest that while the program’s effect on employment was no longer statistically significant after the subsidy period ended, the pro-gram did maintain a positive, statistically significant impact on earnings.
Table 8.5 and Figure 8.4 present one-year impacts on employment and earnings using data from the National Directory of New Hires, payroll data, and data from the 12-month survey.16 Largely due to the subsidized employment available to Pathways participants (about 78 percent of program group members participated in subsidized employment, according to payroll data),17 the program produced a statistically significant impact on employment: 89 percent of program group members ever worked during the follow-up period compared with 69 percent of control group members. Pathways also produced a statistically significant impact on earnings: Program group members earned an average of $5,469 during the follow-up period compared with an average of $4,208 among control group members. This estimated impact of $1,260 is largely accounted for by the program group’s subsidized earnings (about $1,191 during the follow-up period).
15Pager (2003); Holzer, Raphael, and Stoll (2004); Uggen, Wakefield, and Western (2005). 16Pathways treated participants’ subsidized wages as a stipend and therefore did not report these wages to
unemployment insurance. The research team therefore had to include payroll data to capture program group members’ employment and earnings during the follow-up period. The Center for Employment Opportunities — the organization that served many control group members in its transitional jobs program — does report subsidized wages to the unemployment insurance system, so those employment and earnings data for the control group are accounted for in the impact estimates.
17The 1 percentage point difference between this figure and the reported percentage of program group members who participated in subsidized employment according to management information system data is due to a minor difference in the time frames covered by these two data sources.
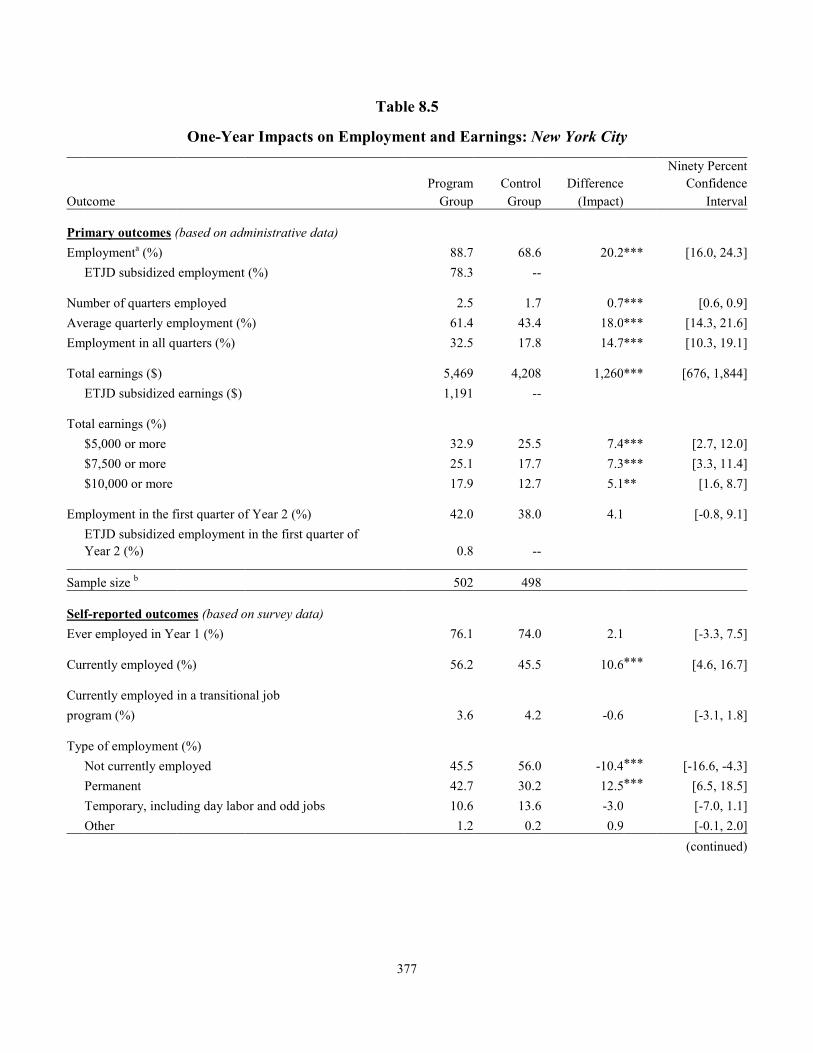
377
Table 8.5
One-Year Impacts on Employment and Earnings: New York City
Ninety Percent Confidence
Interval Outcome Program
Group Control
Group Difference
(Impact)
Primary outcomes (based on administrative data) Employmenta (%) 88.7 68.6 20.2 *** [16.0, 24.3]
ETJD subsidized employment (%) 78.3 --
Number of quarters employed 2.5 1.7 0.7
*** [0.6, 0.9]Average quarterly employment (%) 61.4 43.4 18.0*** [14.3, 21.6]Employment in all quarters (%) 32.5 17.8 14.7*** [10.3, 19.1]
Total earnings ($) 5,469 4,208 1,260 *** [676, 1,844]
ETJD subsidized earnings ($) 1,191 --
Total earnings (%)
$5,000 or more 32.9 25.5 7.4*** [2.7, 12.0]$7,500 or more 25.1 17.7 7.3*** [3.3, 11.4]$10,000 or more 17.9 12.7 5.1** [1.6, 8.7]
Employment in the first quarter of Year 2 (%) 42.0 38.0 4.1
[-0.8, 9.1]
ETJD subsidized employment in the first quarter of Year 2 (%) 0.8 --
Sample size b 502 498
Self-reported outcomes (based on survey data) Ever employed in Year 1 (%) 76.1 74.0 2.1
[-3.3, 7.5]
Currently employed (%) 56.2 45.5 10.6*** [4.6, 16.7]
Currently employed in a transitional job
program (%) 3.6 4.2 -0.6 [-3.1, 1.8]
Type of employment (%)
Not currently employed 45.5 56.0 -10.4*** [-16.6, -4.3]Permanent 42.7 30.2 12.5*** [6.5, 18.5]Temporary, including day labor and odd jobs 10.6 13.6 -3.0 [-7.0, 1.1]Other 1.2 0.2 0.9 [-0.1, 2.0]
(continued)

378
Table 8.5 (continued)
Ninety Percent
Program Control Difference
Confidence
Outcome Group Group (Impact) Interval Among those currently employed:c
Hours worked per week 37.7 35.5 2.2
Hourly wage ($) 11.6 10.8 0.8
]
]
]
]
Hours worked per week (%)
More than 20 hours 48.8 39.1 9.8*** [3.7, 15.9More than 34 hours 42.7 28.1 14.7*** [8.8, 20.6
Hourly wage (%)
ample
More than $8.00 43.3 30.5 12.8*** [6.8, 18.8More than $10.00 23.3 13.6 9.7*** [4.8, 14.7
S size 371 353
SOURCES: MDRC calculations based on quarterly wage data frm the National Directory of New Hires and responses to the ETJD 12-month survey. NOTES: Results in this table are regression-adjusted, controlling for pre-random assignment characteristics. Statistical significance levels are indicated as: *** = 1 percent; ** = 5 percent; * = 10 percent. aEmployment rates and earnings include both ETJD subsidized jobs and all other jobs covered by unemployment insurance. bFive sample members are missing Social Security numbers and therefore could not be matched to employment data. cThese measures are calculated among those employed at the time of the survey; they are therefore considered nonexperimental and are not tested for statistical significance.
As shown in Figure 8.4, subsidized jobs boosted employment during the early part of the follow-up period. However, employment began to decrease following Quarter 1 as these jobs ended. By the fourth quarter after random assignment (when fewer than 1 percent of program group members remained in subsidized jobs), the program group was 4 percentage points more likely than the control group to be employed (42 percent versus 38 percent), a difference which is not statistically significant.
While the program’s significant impact on employment faded quickly, a significant im-pact on earnings persisted throughout the follow-up period. In the last quarter of follow-up, the program group earned an average of $1,845 compared with an average of $1,475 for the control group, an estimated impact of about $370. There are a few possible explanations for the continued significant impact on earnings after statistically significant differences in employment

379
parenting, or other family issues
(continued)
Figure 8.4
Employment and Earnings Over Time: New York City
0
10
20
30
40
50
60
70
80
90
100
0***
1***
2 3 4
Perc
enta
ge e
mpl
oyed
Quarter after random assignment
Program group total employment
Control group employment
857
1,2661,529
1,817 1,845
539
1,0521,232
1,3851,475
0
500
1,000
1,500
2,000
2,500
3,000
3,500
0***
1**
2**
3***
4**
Ave
rage
ear
ning
s ($)
Quarter after random assignmentProgram group Control group
Program group ETJD subsidized employment

380
Figure 8.4 (continued)SOURCE: MDRC calculations based on quarterly wage data from the National Directory of New Hires.
NOTES: Results in this figure are regression-adjusted, controlling for pre-random assignment characteristics.
Statistical significance levels are indicated as: *** = 1 percent; ** = 5 percent; * = 10 percent.Employment rates and earnings include both ETJD subsidized jobs and all other jobs covered by
unemployment insurance.
had dissipated: The program group may have worked more hours per week, maintained em-ployment for longer, earned more per hour, or some combination of these factors. Based on survey data, it appears that employed program group members worked about 2.2 more hours per week and earned about 80 cents more per hour than employed control group members.
The survey-based outcomes are somewhat inconsistent with the results derived from unemployment insurance and payroll data. The survey results tend to show larger impacts. This discrepancy can be seen most clearly in the impacts on employment in the first quarter of Year 2. Unemployment insurance data show that Pathways did not have a statistically significant impact on employment, while the survey shows a statistically significant, 11 percentage point impact on reports of “current employment” (56 percent of program group members reported current employment compared with 46 percent of control group members).18 An analysis of survey-response bias suggests that survey respondents fared better in employment and earnings than is true of the full New York sample (see Appendix Table H.4). However, this trend occurs among both the program and control groups, which indicates that the differences in impacts between the outcomes calculated using unemployment insurance and payroll data and the outcomes calculated using survey results are most likely explained by employment detected by the survey, but not covered by unemployment insurance. Such employment would include jobs in the informal economy or jobs where the worker is classified as an independent contractor. Overall, this analysis suggests that Pathways increased employment in these types of jobs.
The bottom panel of Table 8.5, which presents survey-based outcomes, provides some information about participants’ current employment that is not available in the unemployment insurance data, including measures of hours worked per week, hourly wages, and type of employment (that is, whether employment is permanent or temporary). Pathways had a statisti-cally significant impact on full-time employment, increasing the percentage of those working more than 24 hours per week in the program group by 15 percentage points compared with the control group (43 percent versus 28 percent). Pathways also significantly increased the percent-
18“Current employment” was measured at a point in time roughly coinciding with the first quarter of Year 2 for a large proportion of survey respondents.

381
age of participants receiving hourly wages of more than $8 per hour in their primary current jobs (43 percent of program group members versus 31 percent of control group members), as well as the percentage of participants receiving more than $10 per hour in their primary current jobs (23 percent of program group members versus 14 percent of control group members). Additionally, Pathways appears to have increased permanent employment, which was reported by 43 percent of the program group compared with 30 percent of the control group. All of these differences are driven in large part by the overarching statistically significant impact on current employment.
Among those currently employed, program group members worked 38 hours per week and earned $11.60 per hour, on average, compared with control group members, who worked about 36 hours per week and earned an average of $10.80 per hour. Because these measures are calculated only among those employed at the time of the survey, they do not provide direct evidence of the effects of the program and are not tested for statistical significance. However, they may be helpful in illustrating what current employment looked like for those who were working at the time of the follow-up survey.
Criminal Justice Outcomes
As discussed throughout this chapter, Pathways served people who were recently re-leased from prison. Past research has shown that the risk of recidivism for this group is high: Within three years of being released, about two-thirds of prisoners are rearrested. Among those ultimately rearrested, 57 percent are rearrested within the first year.19 There are several ways Pathways could have affected participants’ criminal behavior and disrupted these trends, including engagement in productive activities (employment, education, and vocational training), increasing their positive behavior (by helping them learn to cooperate with others in job placements and helping them form relationships with Pathways staff members and other participants), and improved economic well-being (resulting from increased earnings). Overall, however, the findings indicate that Pathways did not have a statistically significant effect on participants’ criminal involvement.
● Pathways had no positive, statistically significant impacts on criminal justice outcomes.
Table 8.6 shows Pathways’ impacts on criminal justice outcomes based on administra-tive data from criminal justice agencies and the 12-month survey. There were no statistically significant differences between the program and control groups in their rates of arrest (about
19Durose, Cooper, and Snyder (2014).

382
Table 8.6
One-Year Impacts on Criminal Justice Outcomes: New York City
Ninety Percent
Program Control Difference
Confidence Outcome Group Group (Impact) Interval
Primary outcomes (based on administrative data)
Arrested (%) 18.8 21.6 -2.7 [-6.7, 1.2]
Convicted of a crime (%) 12.6 13.2 -0.6 [-3.9, 2.7]
Convicted of a felony 1.7 2.9 -1.1
[-2.7, 0.4] Convicted of a misdemeanor 9.4 8.2 1.2 [-1.6, 4.0]
Convicted of a violent crime (%) 2.0 2.2 -0.2 [-1.7, 1.3]
Incarcerated (%) 28.6 27.1 1.6 [-2.9, 6.0]
Incarcerated in jail 28.4 26.5 2.0 [-2.5, 6.4]Incarcerated in prison 11.4 9.5 2.0 [-1.2, 5.1]
Prison admission reason (%)
Admitted to prison for a new crime 0.2 0.6 -0.4 [-1.0, 0.3]Admitted to prison for a parole or probation
violation 11.2 8.9 2.3 [-0.8, 5.4]
Total days incarcerated 29.4 30.7 -1.3 [-8.1, 5.4]
Jail 18.1 21.5 -3.5 [-8.3, 1.4]
Prison 11.3 9.2 2.1 [-1.6, 5.9]
Arrested, convicted, or admitted to jail or prison (%) 34.0 32.6 1.4 [-3.3, 6.0]
Months 1 to 6 18.9 18.1 0.9 [-3.1, 4.9]Months 7 to 12 24.1 22.7 1.5 [-2.8, 5.7]
Sample size 504 501
Self-reported outcomes (based on survey data) On parole or probation (%) 92.6 93.6 -1.0 [-4.1, 2.1]
ole or Received a technical violation of par probation (%) 17.4 14.6 2.8 *
[-1.6, 7.2]
Received a sanction for a technical parole violation (%) 14.8 10.6 4.2 [0.2, 8.2]
a
Score on personal irresponsibility scale 22.9 22.9 -0.1 [-0.9, 0.7]
(range of 10 to 50, where higher scores indicate
higher levels of personal irresponsibility)
am ple
siz S e 371 353 (continued)

383
Table 8.6 (continued)
SOURCES: MDRC calculations based on criminal justice data and responses to the ETJD 12-month survey. NOTES: Results in this table are regression-adjusted, controlling for pre-random assignment characteristics. Statistical significance levels are indicated as: *** = 1 percent; ** = 5 percent; * = 10 percent. aThis scale is based on responses to six scale questions in the Texas Christian University Criminal Thinking Scales, which assess how strongly a respondent agrees or disagrees with statements about having been in jail or prison (You were locked up because you had a run of bad luck; The real reason you were locked up is because of your race; Nothing you do is going to make a difference in the way you are treated; You are not to blame for everything you have done; Laws are just a way to keep poor people down; and You may have committed crimes, but your environment is to blame). Responses of "strongly disagree" were coded as 1, "disagree" as 2, "neither agree nor disagree" as 3, "agree" as 4, and "strongly agree" as 5. If a respondent answered at least three questions, a sum was then produced using the values of all nonmissing items. The sum was divided by the number of items included, and this average was multiplied by 10.
one-fifth of both groups) or conviction (13 percent of both groups); both of these rates are relatively low across the two research groups. Nor did Pathways have a statistically significant impact on incarceration in jail or prison: Slightly under 30 percent of both program and control group members were reincarcerated during the follow-up period.
Appendix Table G.2 presents impacts on arrests, convictions, and incarceration for the first six months after participants were enrolled in the study. Rates of program participation and employment were very high among the program group during this time period, therefore one might expect differences in criminal justice outcomes to be concentrated in these six months, when participants were the most engaged and supported. However, there is no evidence that Pathways had a statistically significant effect on contact with the criminal justice system even during this “in-program” period.
Secondary outcomes based on survey data also indicate few statistically significant dif-ferences between program and control group members. Over 90 percent of both research groups were on parole or probation as of the time of the survey; this high percentage is to be expected given the ETJD eligibility criteria for programs serving former prisoners. Seventeen percent of program group members and 15 percent of control group members reported receiving a tech-nical violation, a difference that is not statistically significant. In one statistically significant finding, 15 percent of program group members reported having been sanctioned by their parole officers compared with 11 percent of control group members. One possible explanation is that Pathways participants may have received greater scrutiny from parole officers (many of whom were in regular contact with their parolees’ Pathways case managers); as a result, parole officers may have penalized Pathways participants more heavily for technical violations, viewing their behaviors as more egregious in light of all of the support they were receiving. Alternatively, given the number of significance tests conducted, this finding may simply be spurious.

384
Both program and control group members averaged scores of about 23 points on a per-sonal irresponsibility scale meant to measure participants’ attitudes toward their time in prison, their sense of personal agency, and their perspectives on society more broadly. Twenty-three is a relatively low score on this scale (that is, a score toward the less irresponsible end).
Finally, the research team conducted a subgroup analysis to assess whether Pathways had different effects on criminal justice outcomes for participants at higher and lower levels of risk for reoffending. As shown in Table 8.7, the general direction of the results suggests that reductions in recidivism may have been larger for higher-risk participants, but there were no statistically significant differences in impacts between recidivism risk groups, possibly because the sample sizes are quite small.
Child Support and Family Relations Outcomes
About 40 percent of the Pathways sample members were noncustodial parents at study enrollment, while just 11 percent reported having current child support orders. As discussed earlier in this section, there were statistically significant impacts on the receipt of services related to child support, parenting, and visitation among noncustodial parents; some of these services may have contributed to improvements in participant outcomes in this domain. However, the main way Pathways is likely to have increased child support payments is via increased earnings.
● Program group members were significantly more likely than control group members to have paid child support, probably due to their earn-ings from subsidized employment. Overall, the percentage of sample members who paid child support was low for both research groups.
The top panel of Table 8.8 and Figure 8.5 present impacts on formal child support pay-ments by noncustodial parents. These impacts were based on child support agency administra-tive data. Data were only available for those enrolled into the study through December 2012, which accounts for about half of the noncustodial parents in the New York City sample.
As shown in the first row of Table 8.8, about 16 percent of noncustodial parents in the program group paid any formal child support during the follow-up period, compared with about 8 percent in the control group. This 8 percentage point difference is statistically significant. Among those who paid any formal child support, noncustodial parents in the program group made their first payments about three months earlier, on average, than noncustodial parents in the control group. The Pathways program also produced a statistically significant impact on number of months of child support paid, with program group members paying 0.6 months of child support compared with 0.3 months among the control group. Program group members

385
Table 8.7
One-Year Impacts on Criminal Justice Outcomes, by Recidivism Risk: New York City
Lower Risk
Higher Risk
Ninety Ninety Difference
C e Percent
Percent Between
Program ontrol Differenc
Confidence Program Control Difference Confidence Subgroup Outcome Group Group (Impact) Interval Group Group (Impact) Interval Impactsa
Criminal justice (%)
Arrested 14.5 15.1 -0.7 [-4.9, 3.5] 31.7 41.6 -9.9 [-19.7, 0.0]Convicted of a crime 8.4 7.9 0.5 [-2.8, 3.8] 25.0 29.9 -4.9 [-14.0, 4.2]Convicted of a violent crime 1.4 2.0 -0.6 [-2.2, 0.9] 3.9 2.6 1.3 [-2.5, 5.1]Incarcerated 22.2 19.3 2.9 [-1.9, 7.7] 49.9 49.3 0.5 [-10.1, 11.1]Arrested, convicted, or admitted 28.0 24.1 3.9 [-1.3, 9.0] 53.9 57.4 -3.5 [-14.1, 7.0]to jail or prison
Months 1 to 6 15.8 12.7 3.1 [-1.1, 7.2] 29.2 33.7 -4.5 [-14.5, 5.5]
Months 7 to 12 18.2 16.9 1.3 [-3.3, 5.8] 42.8 39.4 3.4 [-7.0, 13.8]
Employment and earnings Employmentb (%) 88.0 70.4 17.6*** [12.8, 22.3] 90.9 63.1 27.8*** [19.2, 36.4] †
ETJD subsidized employment (%) 78.2 -- -- 78.0 -- --
Total earnings ($) 5,787 4,475 1,313*** [604, 2,021] 4,550 3,344 1,206** [213, 2,200]Average quarterly employment (%) 62.7 45.0 17.7*** [13.4, 22.0] 57.2 38.3 18.9*** [11.6, 26.2]Employment in the first quarter of
ample siz
Year 2 (%) 44.9 41.5 3.4 [-2.4, 9.2] 33.2 27.6 5.6 [-4.0, 15.3]
S e 381 376 123 125 (continued)

386
Table 8.7 (continued) SOURCE: MDRC calculations based on criminal justice data. NOTES: Results in this table are regression-adjusted, controlling for pre-random assignment characteristics. Statistical significance levels are indicated as: *** = 1 percent; ** = 5 percent; * = 10 percent. See Appendix J for details on how the recidivism risk subgroups were defined. aWhen comparing impacts between two subgroups, an H-statistic is generated. The H-statistic is used to assess whether the difference in impacts between the subgroups is statistically significant. Statistically significant differences across subgroups are indicated as: ††† = 1 percent; †† = 5 percent; † = 10 percent.
averaged $101 in total payments over the follow-up period, compared with $82 among control group members; this difference is not statistically significant.
As illustrated in Figure 8.5, which depicts child support payments over time, statistical-ly significant differences between the program and control groups are largest in the first quarter after random assignment, fade substantially by the second quarter, and are no longer statistically significant by the third quarter. A likely explanation for this pattern is that the first quarter after the quarter of random assignment is when many program group members were working in Pathways subsidized jobs, and, as discussed earlier in this chapter, all noncustodial parents who owed child support were required by the program to pay $25 per month toward their child support obligations. By the second quarter after random assignment, the program’s impact on employment began to fade, which probably explains the declining impacts on child support payments at around the same time.
The bottom panel of Table 8.8 shows impacts on child support and family relations from the 12-month survey. According to the survey results, the program did not have a statisti-cally significant impact on informal cash support (that is, cash payments not required by the state) or noncash support (which includes things like providing food, clothing, or child care). About two-thirds of both program and control group members provided either informal cash support or noncash support in the month before the survey. Among those required to pay child support at the time of the survey, 25 percent of program group members reported that owing child support affected their willingness to take jobs, compared with 18 percent of control group members. (This difference is considered a nonexperimental outcome and was not tested for statistical significance.) Incarceration for failure to pay child support was nearly nonexistent among both research groups.
Finally, among noncustodial parents with minor-age children at the time of the survey, program group members reported less frequent contact with their “focal children” than control group members (this result is also considered nonexperimental and is not tested for statistical
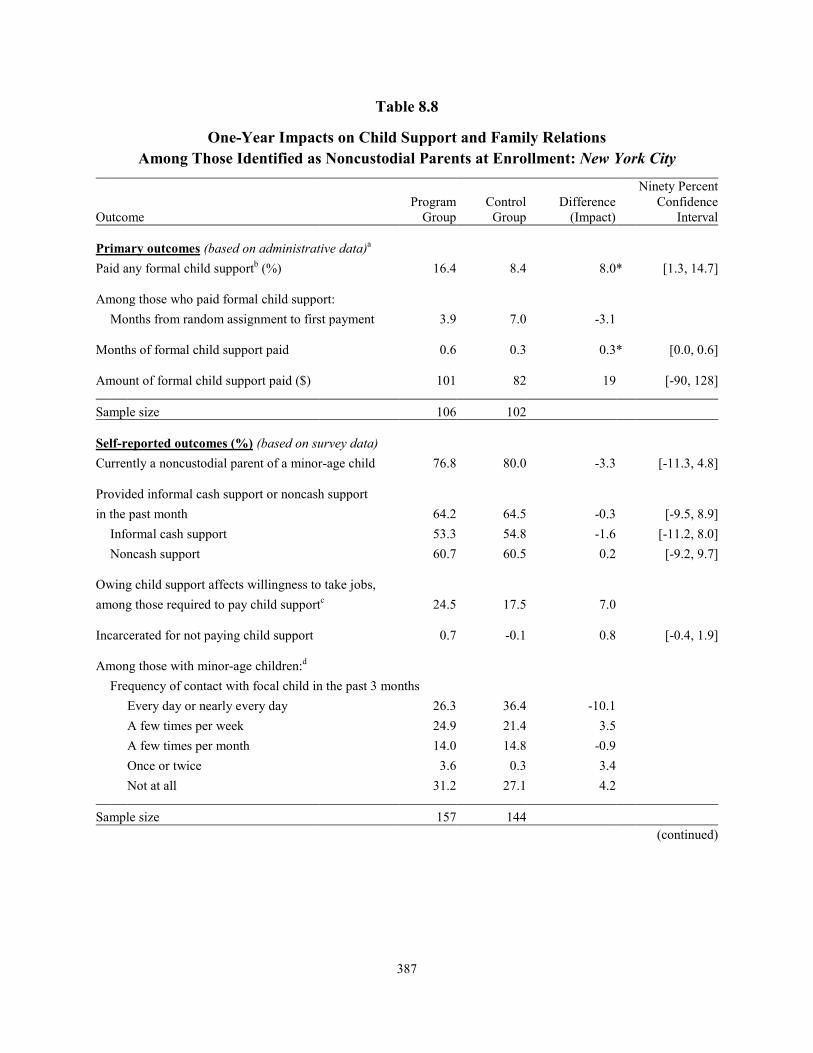
387
Table 8.8
One-Year Impacts on Child Support and Family Relations Among Those Identified as Noncustodial Parents at Enrollment: New York City
Ninety Percent
Program Control Difference
Confidence
Outcome Group Group (Impact) Interval
Primary outcomes (based on administrative data)a Paid any formal child supportb (%) 16.4 8.4 8.0 * [1.3, 14.7]
Among those who paid formal child support:
Months from random assignment to first payment 3.9 7.0 -3.1
Months of formal child support paid 0.6 0.3 0.3 * [0.0, 0.6]
Amount of formal child support paid ($) 101 82 19
[-90, 128]
Sample size 106 102
Self-reported outcomes (%) (based on survey data)
Currently a noncustodial parent of a minor-age child 76.8 80.0 -3.3
[-11.3, 4.8]
Provided informal cash support or noncash support
in the past month 64.2 64.5 -0.3 [-9.5, 8.9]
Informal cash support 53.3 54.8 -1.6 [-11.2, 8.0]
Noncash support 60.7 60.5 0.2 [-9.2, 9.7]
Owing child support affects willingness to take jobs, among those required to pay child supportc 24.5 17.5 7.0
Incarcerated for not paying child support 0.7 -0.1 0.8 [-0.4, 1.9]
dAmong those with minor-age children:
S
Frequency of contact with focal child in the past 3 months
Every day or nearly every day 26.3 36.4 -10.1 A few times per week 24.9 21.4 3.5 A few times per month 14.0 14.8 -0.9 Once or twice 3.6 0.3 3.4 Not at all 31.2 27.1 4.2
ample size 157 144
(continued)

388
Table 8.8 (continued)
SOU RCE S: MDRC calculations based on child s upport agency data and re sponses to the ETJD 12-month s urvey. NOTES: Results in this table are regression-adjusted, controlling for pre-random assignment characteristics. Statistical significance levels are indicated as: *** = 1 percent; ** = 5 percent; * = 10 percent. aDue to incomplete data, child support measures based on administrative sources only include sample members who were randomly assigned during the first year of the program (by December 31, 2012). bMeasures of formal child support include all payments made through the state's child support collection and disbursement unit, including funds from employer withholding and other sources (for example, tax intercepts). cThis measure is calculated among those required to pay child support; it is therefore considered nonexperimental and is not tested for statistical significance. dThis measure is calculated among those who reported having a minor-age child at the time of the survey; it is therefore considered nonexperimental and is not tested for statistical significance. The focal child is defined as the youngest minor-age child living outside of the sample member's household; if the sample member reports no minor-age children living outside of his or her household, the focal child is the youngest minor-age child residing within the household.
significance).20 This result is surprising in light of the parenting classes and other forms of parenting support provided by Pathways, though the nonexperimental nature of the estimate suggests that caution should be used in interpreting it.
Economic and Personal Well-Being Outcomes
A couple of recent studies have shown, perhaps unsurprisingly, that former prisoners are at high risk of experiencing economic hardship and of suffering from health problems, including both mental and physical conditions.21 While Pathways primarily focused on provid-ing employment services and subsidized jobs to help participants improve their chances in the regular labor market, increases in employment and earnings could also result in positive effects on measures of economic and personal well-being, both directly and indirectly. Overall, however, there is little evidence that Pathways improved participants’ economic and personal well-being in the short term.
● There is little evidence that the Pathways program significantly im-proved economic and personal well-being.
Table 8.9 presents Pathways’ impacts on self-reported measures of financial shortfalls, food insufficiency, housing instability, and physical and mental health. Almost no statistically significant differences between the program and control groups were found for the outcomes
20See the table notes for the definition of “focal child.” 21Wester and Pettit (2010); Mallik-Kane and Visher (2008).

389
21.9 8.3 13.6
parenting, or other family issues
(continued)
Average Child Support Paid During Quarter
Figure 8.5
Formal Child Support Payments Over Time: New York City
0
10
20
30
40
50
60
70
80
90
100
0 1***
2*
3
Perc
enta
ge p
ayin
g fo
rmal
chi
ld su
ppor
t
Quarter after random assignment
Program group
Control group
7
26
15
53
39
0
72
0
10
20
30
40
50
60
70
80
90
100
0 1*
2 3
Ave
rage
form
al c
hild
supp
ort p
aid
($)
Quarter after random assignmentProgram group Control group

390
Figure 8.5 (continued)
SOURCE: MDRC calculations based on child support agency data.
NOTES: Results in this figure are regression-adjusted, controlling for pre-random assignment characteristicsStatistical significance levels are indicated as: *** = 1 percent; ** = 5 percent; * = 10 percent.Due to incomplete data, child support measures based on administrative data only include sample
members who were randomly assigned during the first year of the program (by December 31, 2012). Measures of formal child support include all payments made through the state's child support collection
and disbursement unit, including funds from employer withholding and other sources (for example, tax intercepts).
measured in this domain. During the follow-up period, about half of both program and control group members experienced at least one financial shortfall among the four different types that were measured. The most common type of financial shortfall sample members experienced was the inability to pay rent or mortgage, which affected about one-third of both the program and control groups. It is of note that Pathways did not significantly increase participants’ inability to pay rent, in light of the New York City social service agency’s rules mentioned earlier that led some participants to lose their housing assistance. Another financial shortfall experienced by a relatively large portion of both program and control group members was the disconnection of utility or phone services (31 percent of both research groups).
Meanwhile, fewer than one-fourth of both program and control group members had in-sufficient food and fewer than 7 percent of each research group were homeless or lived in emergency or temporary housing in the month before the survey. Eighty-two percent of both research groups reported that they were in good, very good, or excellent health; around two-thirds had health insurance coverage in the month before the survey. Interestingly, Pathways did produce a statistically significant, 8 percentage point impact on participants’ receipt of health insurance from an employer, suggesting that program group members may have been working in somewhat higher-quality jobs with better benefits than their control group counterparts. This difference could also simply reflect the fact that a larger percentage of program group members reported current employment on the follow-up survey than control group members, meaning more of the program group was eligible to receive employer-based health coverage.
Finally, about 9 percent of program group members and 11 percent of control group members experienced psychological distress in the month before the survey. This difference is not statistically significant.

391
Table 8.9
One-Year Impacts on Economic and Personal Well-Being: New York City Ninety Percent
Program Control Difference
Confidence
Outcome (%) Group Group (Impact) Interval
Experienced a financial shortfall in the past 12 months 49.6 51.9 -2.3
[-8.5, 3.9]
Could not pay rent or mortgage 33.0 37.1 -4.1 [-9.9, 1.8] Evicted from home or apartment 4.6 6.8 -2.2 [-5.1, 0.6] Utility or phone service disconnected 30.8 31.3 -0.5 [-6.3, 5.3] Could not afford prescription medicine 16.6 17.2 -0.6 [-5.2, 4.1]
Had insufficient food in the past month 20.9 24.2 -3.3 [-8.5, 1.9]
Housing in the past month
Is currently in good, very goo d, or excellent health
Rented or owned own apartment or room 19.8 17.0 2.7 [-2.0, 7.5] Lived with family or friendsa 64.4 68.0 -3.6 [-9.3, 2.2] Homeless or lived in emergency or temporary housing 6.1 6.7 -0.6 [-3.6, 2.3] Incarcerated, on work release, or living in a halfway house 8.3 7.7 0.6 [-2.8, 3.9] Other 1.4 0.5 0.9 [-0.4, 2.1]
82.0 81.3 0.8 [-3.9, 5.4]
Had health insurance coverage in the past month 64.9 69.3 -4.4 [-10.2, 1.4]
Health insurance was employer-based 14.4 6.1 8.4 *** [4.6, 12.1]
Experienced serious psychological distress in the past monthb 8.5 11.2 -2.6 [-6.3, 1.0]
Sample size 371 353
SOURCE: MDRC calculations based on responses to the ETJD 12-month survey. NOTES: Results in this table are regression-adjusted, controlling for pre-random assignment characteristics. Statistical significance levels are indicated as: *** = 1 percent; ** = 5 percent; * = 10 percent. aIncludes those who lived with friends or family and paid rent and those who lived with friends or family without paying rent. bA score of 13 or higher on the Kessler-6 (K-6) scale is used here to define serious psychological distress. The K-6 assesses how often during the past month a respondent felt so sad that nothing could cheer him or her up; nervous; restless or fidgety; hopeless; that everything was an effort; or worthless. As a result of minor differences between the scale used to administer the K-6 in the ETJD 12-month survey and the standard K-6 scale, the percentages presented in this table may slightly underestimate the incidence of serious psychological distress among the ETJD sample.

392
Conclusion The Doe Fund’s Pathways program served a highly disadvantaged group of (mostly) men who had recently been released from state prison to New York City. The program’s innovative staged model represented a structural enhancement to the traditional transitional jobs approach-es that have been tested in the past. After one to two weeks of preemployment services, partici-pants were placed in an in-house transitional job, usually with a Doe Fund street-cleaning crew, where they were supervised by a Pathways staff member. Those who performed satisfactorily in the first transitional job were placed into internships with local employers. While in internships, participants worked alongside other employees and were supervised by staff members from the host employer, but they remained on the Pathways payroll and their wages were fully subsi-dized; there was an expectation that about half of the internships would evolve into permanent, unsubsidized jobs.
The Pathways program generally operated as designed. The program struggled with re-cruitment, but ultimately met its goal of enrolling 1,000 people into the study, mostly via referrals from parole officers. Some program group members dropped out during the preemployment stage (which was shortened from two weeks to one week partway through the project period), but almost 80 percent were successfully placed in a first-stage transitional job. There was some attrition during the first-stage job; about half of the full program group worked in an internship.
Pathways provided jobs to many people who would not otherwise have worked and, as a result, the program produced large increases in employment and earnings in the first year of the evaluation’s follow-up period. The gains could largely be attributed to the transitional jobs and appeared to decline over time as people left their Pathways jobs, but the program group still earned significantly more than the control group in the first quarter of Year 2 (the end of the follow-up period for this report), when almost no one was still working for Pathways. It is too early to draw any firm conclusions about whether the program will improve employment outcomes in the longer term. There is no evidence that Pathways has decreased recidivism for its participants, even during the period when many program group members were working in subsidized jobs.22
22The research team conducted a subgroup analysis to assess whether Pathways had differential effects on
employment and earnings, criminal justice, and child support outcomes based on participants’ time of entry into the ETJD study — that is, whether participants who enrolled in the first or second year of study recruit-ment had different results. The results of this analysis are presented in Appendix Table G.3. There is no pattern of statistically significant differences in impacts between participants enrolled in the first and second years, indicating that the program’s effects were consistent across these two groups.

393
Pathways is one of several transitional jobs programs that have been found not to re-duce recidivism despite substantially increasing employment. This finding shows quite clearly that the link between crime and employment is not straightforward. At the same time, it is important to note that Pathways operated in an environment where many control group mem-bers received employment services from other organizations. Most striking is the fact that more than a third of the control group enrolled at the Center for Employment Opportunities, a large transitional jobs program that was tested several years ago and found to reduce recidivism for individuals recently released from prison. It is extremely difficult for a program to generate impacts in a random assignment study if a significant portion of the individuals assigned to the control group receive similar services.

THIS PAGE INTENTIONALLY LEFT BLANK

Chapter 9
Summary and Conclusion

THIS PAGE INTENTIONALLY LEFT BLANK

397
A number of studies have tested the basic transitional jobs model, which offers participants a set of core services including a temporary paid job (previously tested programs have offered mainly unskilled jobs created by the program operator or a partner agency), assistance with finding unsubsidized employment when the temporary job ends, case management, job coaching, and other forms of support (such as financial assistance with transportation and other work-related expenses). Though subsidized employment can have wide-reaching goals, the kinds of transitional jobs programs tested in the Enhanced Transitional Jobs Demonstra-tion (ETJD) and prior rigorous studies all had the goals of teaching people basic work habits, improving longer-term labor-market outcomes and, depending upon the target population, reducing recidivism or receipt of public assistance benefits. Previous random assignment studies of the basic transitional jobs model have shown mixed results. For example, transi-tional jobs programs tested in recent years targeting formerly incarcerated men were generally ineffective at improving longer-term employment and, with the exception of one program in New York City, were not successful at reducing recidivism.1 Earlier transitional jobs pro-grams for other populations, such as recipients of Temporary Assistance for Needy Families, also had mixed results in rigorous studies.2
As described in the earlier chapters of this report, the ETJD programs targeted individu-als who had recently been released from prison and noncustodial parents who had fallen behind in child support payments due to unemployment. Most of the participants in both types of program were men. The ETJD evaluation set out to rigorously test transitional jobs programs that included enhancements to the models tested in previous studies. Each of the programs provided enhancements in one or more of three general categories: (1) structural changes to the transitional jobs themselves, (2) enhanced support, and (3) special child support system incen-tives provided by the local child support agency. To assess whether the ETJD evaluation tested truly enhanced models — rather than models that closely resembled the ones previously tested — it is important to determine which of the ETJD programs were able to implement their intended models.
Each chapter in this report focuses on one of the seven programs and describes the in-tended enhanced model, its implementation, and one-year impacts on participants’ outcomes in three domains: employment, child support, and criminal justice. Impacts on other outcomes such as well-being and views on personal circumstances are also assessed. This chapter summa-rizes the interim result of ETJD across the seven programs in the project and looks ahead to next steps for the study.
1Redcross, Millenky, Rudd, and Levshin (2012); Valentine (2012); MDRC Board of Directors (1980). 2For a review of evaluations of subsidized employment programs over the past 40 years, see Dutta-Gupta,
Grant, Eckel, and Edelman (2016).

398
Summary of Implementation Findings While most ETJD grantees were able to implement the transitional jobs models they pro-posed, some struggled to put into operation some of the enhanced components of their models as intended (and even some of the basic components), as described below. Most of the ETJD grantees had experience operating transitional jobs programs, usually with their chosen target populations. Nonetheless, they were required to implement enhancements to their existing models and to dramatically increase the number of participants they served. To meet their sample-size goals, grantees focused a lot of attention on recruitment and on improving relations with referral partners like child support and criminal justice agencies. The timeline of the ETJD project did not allow for a pilot or practice period before the programs had to start implementing their enhancements and enrolling people. Although the programs had been operating before ETJD, they might have benefited from a pilot period to practice the en-hancements and stabilize recruitment.
ETJD programs encountered challenges found commonly in many employment pro-grams. They had difficulty helping participants transition to unsubsidized jobs in the private sector, experienced staff turnover in vital positions, and saw partnerships with other community providers fail. Most of the specific enhancements that ETJD grantees originally proposed for the project were put in place. However, a few particular enhancements that they initially proposed — such as occupational training, wage supplements, and the tiered hybrid model approach — were not implemented as planned. As a result, the ETJD evaluation cannot assess the effects of those particular enhanced models.
Overall, however, despite these challenges encountered in implementation, the ETJD project will provide strong evidence regarding the effectiveness of transitional jobs models with the enhancements mentioned above.
Three grantees successfully implemented transitional jobs programs with structural en-hancements. Two of them (in Atlanta and New York City) used staged approaches providing a gradual progression from a highly supportive transitional job with the program to one that more closely resembled a “real-world” job with a private employer. One (in Fort Worth) operated a model in which participants were placed directly in jobs at private-sector employers, with the employers being provided a subsidy. Notably, these kinds of structural enhancements required a greater commitment from private-sector employers than traditional models. The expectation was that at least some participants would be hired permanently if the transitional period was successful. This expectation was most explicit in the Fort Worth program. As might be ex-pected, ETJD programs that engaged private-sector employers in this way had more trouble placing people into subsidized jobs than programs that placed people in program jobs. Unlike program jobs, which are readily available, subsidized private-sector jobs require commitments from employers and require participants to go through an interview process. As a result, fewer

399
participants in those programs received services at the intended frequency and intensity, especially the transitional work component. It seems likely that most subsidized jobs models that included these kinds of structural enhancements would experience these challenges in implementation. The evaluation therefore provides a fair test of models with this type of enhancement. However, in New York City, where one of the staged models operated, a high proportion of the control group obtained subsidized jobs during the follow-up period at a large transitional jobs program, and as a result impacts for the New York City ETJD program may be underestimated (see Chapter 8).
A fourth grantee, the one in San Francisco, operated a structural enhancement in the form of a tiered approach designed to track people into different types of transitional jobs based on their job readiness at the time of program enrollment. Ultimately the tiered approach was not implemented as planned. The program experienced significant challenges and only two in five people in the program group ever worked in subsidized jobs. In addition, for those who did work in subsidized jobs, the program struggled to identify positions aligned with their intended tier assignments, especially for participants determined to be ready to work in the private sector. Just 24 percent of participants in the private-sector tier actually worked subsidized jobs in the private sector; others ended up working in program jobs.
Child support system partners were highly committed in the two ETJD programs that included enhancements in that category (those in Milwaukee and San Francisco) and those incentives — modified child support orders and forgiveness of interest on debt contingent on program participation — were implemented as planned. However, the incentive related to debt in Milwaukee was affected by the fact that the majority of participants’ debts were owed to custodial parents rather than the state. The child support agency therefore had no jurisdic-tion to offer incentives or adjustments on most of the amounts owed. This reality reduced the number of participants who could benefit from the enhancement, and hence reduced the incentive’s power to affect engagement in the program. Notably, in San Francisco nearly three-fourths of program group members paid child support, and paid at significantly higher rates than the control group. Yet there were no impacts on the average amount of child support paid, probably because program group members’ child support orders were modified downward while they were participating.
Most ETJD programs provided comprehensive support services, the third category of enhancements described earlier. In particular, one program targeting recently released prisoners at a high risk of recidivism (the one in Indianapolis) used a peer-mentoring approach in a highly supportive social enterprise company. Another (in Fort Worth) included a partnership with a mental health provider to provide cognitive behavioral therapy-based workshops — a type of

400
intervention that has been found to be effective in reducing recidivism.3 Although it is not possible to isolate data on participation in those particular activities, other analyses suggest that in both cases the programs that included these specific enhancements generally operated as intended, thus the evaluation can reliably provide information about whether those types of enhancements seem to improve the effectiveness of the transitional jobs program.
Implications of Interim Impact Findings Given the short follow-up period covered by this report, it is too early to draw firm conclusions about the impact of the ETJD programs on participants’ outcomes, especially their longer-term labor-market outcomes. ETJD programs targeted individuals with serious barriers to employ-ment, as shown by the low employment rates among the control groups, ranging from about 35 percent to 45 percent on average in a given quarter (the control group in one city had an average quarterly employment rate of 22 percent). Impacts on employment during the first year were very large in six of the seven cities thanks to the transitional jobs provided to program partici-pants. The one program that operated a private-sector model (the one in Fort Worth) did not generate statistically significant impacts on employment during the first year. Program group members experienced more employment stability throughout the year — that is, they worked more quarters — in nearly all cities. As might be expected, programs that provided nearly immediate access to transitional jobs had larger early impacts on employment and earnings than programs that required a lengthier process before placement in a transitional job. As was hypothesized before the demonstration, subgroup analysis suggests that impacts on employment during the first year were generally larger for those with little to no employment in the prior year, representing the least employable members of the study sample. At some sites, there were a few small impacts on other aspects of material well-being, such as having health insurance through an employer or feeling more financially secure.
The general trend in impact results observed thus far is similar to the trend found in previous studies — that is, the employment rates of the program and control groups converged as program group members left transitional jobs. By the end of the follow-up period covered in this report — the first quarter of the second year after random assignment — program group members were employed at somewhat higher rates than their control group counterparts, but much of this difference still appears to be due to subsidized employment.
ETJD programs also set out to produce positive impacts on other important outcomes such as recidivism and child support payments. For these outcomes, the short-term follow-up covered in this report provides more information about the programs’ success and, indeed, the
3Landenberger and Lipsey (2005).

401
story is somewhat more positive. Two of the three programs targeting recently released prison-ers (those in Fort Worth and Indianapolis) produced some small reductions in recidivism, especially among the people at the highest risk of recidivism when they entered the programs. As in earlier studies, the pattern of those effects suggests that the programs changed individuals’ behavior in some ways, perhaps due to services other than the transitional job. Specifically, one of the programs offered cognitive behavioral therapy-based workshops and the other offered highly supportive peer mentoring. Interestingly, the Fort Worth program, which offered cognitive behavioral workshops, also generated the most consistent reductions in recidivism, even though it never produced impacts on employment, not even at the peak of its subsidized job period. This finding supports prior evidence that the connection between work and crime is complex and that employment may not necessarily be the mechanism that reduces crime in transitional jobs programs.4
In nearly all cities, program group members were more likely to pay child support and paid more child support than control group members. These results largely reflect higher rates of employment and earnings due to the transitional jobs, and the trends in child support impacts often mirror the trends in impacts on employment, with the impacts fading by the end of the first year. Five of the seven ETJD programs (those in Atlanta, Indianapolis, Milwaukee, New York City, and San Francisco) helped participants with child support order modifications or coordinated with the agency for wage withholding. It is not possible to isolate the impacts on child support caused by order modification from the impacts caused by other aspects of the program models, such as the transitional jobs. Notably, the proportion of program group members paying child support was highest in the programs that had close coordination with the local child support agency for order modifications and wage withholding (the programs in Atlanta, Milwaukee, and San Francisco).
Looking Ahead The ETJD evaluation will follow sample members for a total of 30 months and the final report, scheduled to be released in 2018, will assess impacts on longer-term outcomes. This longer period of follow-up will provide more conclusive evidence to policymakers and other stake-holders about the effects of transitional jobs programs.
As discussed above, ETJD successfully targeted many individuals with severe labor-market challenges. It is important to note that many of the enhancements included in the ETJD programs were designed to affect longer-term labor-market outcomes than the immedi-ate measures available in this report. These enhancements designed to produce effects in the
4Redcross, Millenky, Rudd, and Levshin (2012); Valentine (2012); MDRC Board of Directors (1980).

402
long term included workshops to build cognitive skills and improve attitudes and behaviors, private-sector jobs that were expected to become permanent, financial incentives for main-taining employment, and other job-retention services. The findings from ETJD and previous studies suggest that many people are able to find jobs on their own within a few months — typically between 70 percent and 80 percent of the control group worked at some point in the year. But the employment challenges experienced by this population are likely to manifest themselves in employment instability. Longer-term follow-up will be critical in assessing the extent to which the programs can improve labor-market outcomes. Other studies of interven-tions that focused on employment stability and job quality have found that impacts can take as long as three years to emerge fully.5
It is possible that ETJD will not lead to long-term improvements in labor-market out-comes. It may be that subsidized employment is needed on a longer-term basis for people with substantial barriers to employment, like those in the ETJD target groups. At least one-fourth of the study sample would not have worked at all in the first year if not for the transitional jobs and, at any given time during the year, far fewer than half would have been employed. Regardless of their longer-term effects, ETJD and prior studies have shown that transitional jobs are a success-ful way to provide people much-needed income and work. For some populations, periods of high unemployment are persistent rather than cyclical. Just as other types of subsidized jobs programs have been initiated during periods of high national unemployment, it may make sense to recon-ceive transitional jobs as long-term subsidized jobs providing important support for individuals with little education and work experience and other barriers to employment, like criminal records. Research has shown that long-term joblessness can harm people in a number of ways.6
One of the ETJD programs produced some reductions in recidivism, and those reduc-tions were apparently not directly connected to employment. Whether or not those impacts continue to be seen at 30 months, this finding offers valuable policy lessons about the complex relationship between employment and recidivism, and about the importance of behavior change in improving outcomes for those leaving prison. The final report will assess the financial benefits of reduced incarceration.
Finally, ETJD and prior studies have demonstrated that transitional jobs may be an effec-tive engagement strategy to boost participation in other types of services, like cognitive behavioral workshops designed to alter unproductive ways of thinking and reduce criminal activity. As these important results continue to emerge, ETJD is adding to the body of evidence policymakers can draw upon to make informed decisions about when and how to use transitional jobs as a strategy.
5Martinson and Hendra (2006); Navarro; van Dok, and Hendra (2007). 6Pager (2003); Holzer, Raphaeal, and Still (2004); Wester and Pettit (2010); Mallik-Kane and Visher (2008).

Appendix A
Supplementary Tables for Chapter 2

THIS PAGE INTENTIONALLY LEFT BLANK

405
Appendix Table A.1
Additional Characteristics of Sample Members at En rollment: Atlanta
Atlanta ETJD Programs Targeting Characteristic Program Noncustodial Parents
Number of minor-age children (%)
None 11.1 6.8 1
31.2 31.8
2
26.1 25.4 3 or more 31.7 36.1
Among participants with child support orders:
Average age of youngest child (years) 10.4 8.9
Ever convicted of a violent crimea (%) 25.8 35.4
Ever incarcerated in prisonb (%) 33.6 40.2
Among those ever incarcerated in prison:
Total time incarcerated in prisonc (%)
Less than 2 years 55.1 39.3
2 to 4 years 19.3 24.6 More than 4 years 25.6 36.1
Most recently released from (%)
State prison 42.8 78.1 County/city jail 53.0 15.0 Federal prison 4.2 7.0
Among those who ever worked:
Hourly wage in most recent job (%)
$0.01 - $7.25 11.4 13.9 $7.26 - $9.99 29.3 34.3 $10.00 - $14.99 40.1 36.7 $15.00 or more 19.3 15.0
Had income at enrollment (%) 34.1 23.5
Receipt of public assistance (%)
No public assistance 44.8 38.4 Food stamps (SNAP) 48.2 49.7 General assistance or welfare 0.3 4.7 Other government assistance program/multiple programs 6.7 7.2
(continued)

406
Appendix Table A.1 (continued)
Atlanta ETJD Programs Targeting Characteristic Program Noncustodial Parents
Family assists with (%)
Place to live 34.7 35.5 Financial support 7.2 8.3 Transportation 3.5 3.3 Job 0.9 0.8 Multiple forms of support 17.0 4.7 None 36.7 47.3
Medical benefits (%)
None 92.1 71.5 Medicaid 2.0 19.9 Medicare 0.3 1.9 Private health insurance 1.6 1.2 Other 4.0 5.6
Previous alcohol-abuse or drug-use treatment (%) 8.5 31.6
Receiving alcohol-abuse or drug-use treatment at enrollment (%) 1.4 5.1
Ever received mental health treatment (%) 5.6 13.0
Sample size 996 3,998
SOURCES: MDRC calculations based on baseline survey data, ETJD management information system data, and criminal justice administrative records. NOTES: Measures are self-reported unless otherwise noted. SNAP = Supplemental Nutrition Assistance Program. aIncludes convictions in the state of Georgia as recorded in administrative records. Does not include federal convictions or convictions from other states. bIncludes self-report of incarceration in state or federal prison and prison incarceration as recorded in Georgia administrative records. cIncludes time spent in Georgia state prisons according to administrative records. Does not include time spent in federal prisons or prisons in other states.

407
Appendix Table A.2
On e-Year I mpacts , by Time of Entry into th e Program : Atlanta
First Year Second Year
Outcome Program
Group Control
Group Difference
(Impact)
Ninety Percent Confidence
Interval Program
Group Control
Group Difference
(Impact)
Ninety Percent
Confidence Interval
Difference Between
Subgroup Impactsa
Employment and earnings
Employmentb (%) 99.0 64.8 34.2 *** [29.2, 39.3] 97.5 77.6 19.9 *** [15.3, 24.4] †††
ETJD subsidized employment (%) 97.0 -- --
94.3 -- --
Total earnings ($) 8,600 5,802 2,798 *** [1,720, 3,875] 9,034 7,569 1,465 * [148, 2,783] Average quarterly employment (%) 88.9 43.9 44.9 *** [42.2, 52.1] 82.5 52.8 29.7 *** [25.2, 34.3] †††
Employment in the first quarter of
Year 2 (%) 69.1 51.2 17.9 *** [10.8, 25.0] 67.8 65.1 2.7
[-0.0, 9.4] †† Currently employed (based on
survey)c (%) 71.1 68.6 2.5
[-5.0, 10.1] 73.9 61.9 12.0 *** [4.5, 19.5]
Child support Months of formal child support paid 6.8 3.9 2.9 *** [2.3, 3.4] 6.6 4.5 2.1 *** [1.6, 2.7]
Amount of formal child support paid ($) 1,713 866 847 *** [648, 1,046]
1,750 1,131 619 *** [393, 845]
Criminal justice Arrested, convicted, or admitted to 12.9 14.5 -1.6
[-6.5, 3.2] 16.9 23.9 -7.0 * [-12.9, -1.1]
prison (%) Convicted of a crime (%) 5.6 6.6 -1.0
[-4.5, 2.4] 6.3 6.0 0.3
[-3.3, 3.9]
Incarcerated in prison (%) 1.1 0.9 0.2
[-1.3, 1.7] 0.4 0.8 -0.4
[-1.6, 0.8] Total days incarcerated in prison 1.0 0.2 0.8 [-0.6, 2.2] 0.9 1.9 -0.9 [-3.6, 1.7]
Sample size 256 254 245 241
(continued)

408
Appendix Table A.2 (continued) SOURCES: MDRC calculations based on quarterly wage data from the National Directory of New Hires, responses to the ETJD 12-month survey, child support agency data, and criminal justice data. NOTES: Results in this table are regression-adjusted, controlling for pre-random assignment characteristics. Statistical significance levels are indicated as: *** = 1 percent; ** = 5 percent; * = 10 percent. aWhen comparing impacts between two subgroups, an H-statistic is generated. The H-statistic is used to assess whether the difference in impacts between the subgroups is statistically significant. Statistically significant differences across subgroups are indicated as: ††† = 1 percent; †† = 5 percent; † = 10 percent. bEmployment rates and earnings include both ETJD subsidized jobs and all other jobs covered by unemployment insurance. cSample sizes for survey respondents were 256 program group members and 254 control group members in the first-year cohort, and 245 program group members and 241 control group members in the second-year cohort.

Appendix B
Supplementary Tables for Chapter 3

THIS PAGE INTENTIONALLY LEFT BLANK

411
Appendix Table B.1 A dditional Characteristics of Sample Members at Enrollm ent: Milwaukee
Milwaukee ETJD Programs Targeting Characteristic Program Noncustodial Parents
Number of minor-age children (%)
None 1.2 6.8 1
31.5 31.8 2 25.2 25.4 3 or more 42.1 36.1
Among participants with child support orders:
Average age of youngest child (years) 7.4 8.9
Ever incarcerated in prisona (%) 54.6 40.2
Among those ever incarcerated in prison:
Total time incarcerated in prisonb (%)
Less than 2 years 39.8 39.3 2 to 4 years 24.5 24.6 More than 4 years 35.8 36.1
Most recently released from (%)
State prison 89.9 78.1 County/city jail 2.2 15.0 Federal prison 7.9 7.0
Among those who ever worked:
Hourly wage in most recent job (%)
$0.01 - $7.25 19.8 13.9 $7.26 - $9.99 47.8 34.3 $10.00 - $14.99 26.8 36.7 $15.00 or more 5.6 15.0
Had income at enrollment (%) 17.0 23.5
Receipt of public assistance (%)
No public assistance 9.9 38.4 Food stamps (SNAP) 87.2 49.7 General assistance or welfare 0.2 4.7
Other government assistance program/multiple programs 2.6 7.2
(continued)

412
Appendix Table B.1 (continued)
Milwaukee ETJD Programs Targeting Characteristic Program Noncustodial Parents
Family assists with (%)
Place to live 34.0 35.5 Financial support 3.8 8.3 Transportation 3.9 3.3 Job 2.0 0.8 Multiple forms of support 1.0 4.7 None 55.3 47.3
Medical benefits (%)
None 80.6 71.5 Medicaid 6.0 19.9 Medicare 6.1 1.9 Private health insurance 0.6 1.2 Other 6.7 5.6
Previous alcohol-abuse or drug-use treatment (%) 23.1 31.6
Receiving alcohol-abuse or drug-use treatment at enrollment (%) 6.1 5.1
Ever received mental health treatment (%) 8.6 13.0
Sample size 1,003 3,998
SOURCES: MDRC calculations based on baseline survey data, ETJD management information system data, and criminal justice administrative records. NOTES: Measures are self-reported unless otherwise noted. SNAP = Supplemental Nutrition Assistance Program. aIncludes self-report of incarceration in state or federal prison and prison incarceration as recorded in Wisconsin administrative records. Does not include federal convictions or convictions from other states. bIncludes time spent in Wisconsin state prisons according to administrative records. Does not include time spent in federal prisons or prisons in other states.

413
Appendix Table B.2
One-Year Impac ts, by T ime of E ntry into the Pr og ram: M ilwauke e
First Year Second Year
Outcome Program
Group Control
Group Difference
(Impact)
Ninety Percent
Confidence Interval
Program Group
Control Group
Difference (Impact)
Ninety Percent
Confidence Interval
Difference Between
Subgroup Impactsa
Employment and earnings
Employmentb (%) 88.5
54.8 33.7 *** [27.4, 40.0] 84.1 66.0
18.2 *** [12.3, 24.0] †††
ETJD subsidized employment (%) 67.1 -- --
55.1 -- --
Total earnings ($) 4,391 2,422 1,969 *** [1,337, 2,602] 5,354 3,813 1,541 *** [782, 2,299] Average quarterly employment (%) 58.3 33.2 25.0 *** [20.1, 30.0] 59.9 40.8 19.0 *** [14.2, 23.8] Employment in the first quarter of Year 2 (%) 52.1 41.9 10.3 ** [2.7, 17.9] 57.9 46.6 11.2 *** [4.2, 18.2] Currently employed (based on survey)c (%) 46.4 44.2 2.2
[-6.8, 11.1] 47.7 48.8 -1.1
[-9.0, 6.7]
Child support Months of formal child support paid 5.1 3.2 1.9 *** [1.5, 2.4] 5.0 2.7 2.2 *** [1.8, 2.7]
Amount of formal child support paid ($) 1,021 671 350 ** [126, 573] 979 611 368 *** [194, 541]
Criminal justice Arrested, convicted, or admitted to prison (%) 24.2 20.7 3.4
[-2.7, 9.6] 22.8 23.6 -0.7 [-6.6, 5.2]
Convicted of a crime (%) 7.6 3.7 3.8 * [0.4, 7.3] 12.1 9.5 2.6 [-1.9, 7.1] Incarcerated in prison (%) 10.2 7.4 2.7
[-1.4, 6.9] 7.7 9.4 -1.8 [-5.7, 2.2]
Total days incarcerated in prison 8.7 3.8 4.9 * [0.2, 9.5] 6.9 7.5 -0.6 [-5.3, 4.0]
Sample size 238 239 264 262
(continued)

414
Appendix Table B.2 (continued) SOURCES: MDRC calculations based on quarterly wage data from the National Directory of New Hires, responses to the ETJD 12-month survey, child support agency data, and criminal justice data. NOTES: Results in this table are regression-adjusted, controlling for pre-random assignment characteristics. Statistical significance levels are indicated as: *** = 1 percent; ** = 5 percent; * = 10 percent. aWhen comparing impacts between two subgroups, an H-statistic is generated. The H-statistic is used to assess whether the difference in impacts between the subgroups is statistically significant. Statistically significant differences across subgroups are indicated as: ††† = 1 percent; †† = 5 percent; † = 10 percent. bEmployment rates and earnings include both ETJD subsidized jobs and all other jobs covered by unemployment insurance. cSample sizes for survey respondents were 238 program group members and 239 control group members in the first-year cohort, and 264 program group members and 262 control group members in the second-year cohort.

Appendix C
Supplementary Tables for Chapter 4

THIS PAGE INTENTIONALLY LEFT BLANK

417
Appendix Table C.1 Additional Characteristics of Sample Members at Enrollment: San Francisco San Francisco ETJD Programs Targeting Characteristic Program Noncustodial Parents
Number of minor-age children (%)
None 12.7 6.8 1
37.7 31.8 2 23.9 25.4 3 or more 25.7 36.1
Among participants with child support orders:
Average age of youngest child (years) 10.0 8.9
Ever convicted of a violent crimea (%) 43.4 35.4
Ever incarcerated in prison (%) 28.3 40.2
Among those who ever worked:
Hourly wage in most recent job (%)
$0.01 - $7.25 2.2 13.9 $7.26 - $9.99 12.7 34.3 $10.00 - $14.99 55.8 36.7 $15.00 or more 29.4 15.0
Receipt of public assistance (%)
No public assistance 55.5 38.4 Food stamps (SNAP) 13.0 49.7 General assistance or welfare 17.5 4.7 Other government assistance program/multiple programs 14.0 7.2
Family assists with (%)
Place to live 28.4 35.5 Financial support 5.2 8.3 Transportation 2.0 3.3 Job 0.5 0.8 Multiple forms of support 1.8 4.7
61.9 47.3
None (continued)

418
Appendix Table C.1 (continued)
San Francisco ETJD Programs Targeting Characteristic Program Noncustodial Parents
Previous alcohol-abuse or drug-use treatment (%) NAb 31.6
Receiving alcohol-abuse or drug-use treatment at enrollment (%) NAb 5.1
Sample size 995 3,998
SOURCES: MDRC calculations based on baseline survey data, ETJD management information system data, and criminal justice administrative records. NOTES: Measures are self-reported unless otherwise noted. SNAP = Supplemental Nutrition Assistance Program. NA = not available. Some baseline measures shown in other chapters had very low response rates in San Francisco and are therefore not shown in this table. aIncludes convictions in the state of California as recorded in administrative records. Does not include federal convictions or convictions from other states. bTransitionSF did not collect baseline information regarding substance abuse.
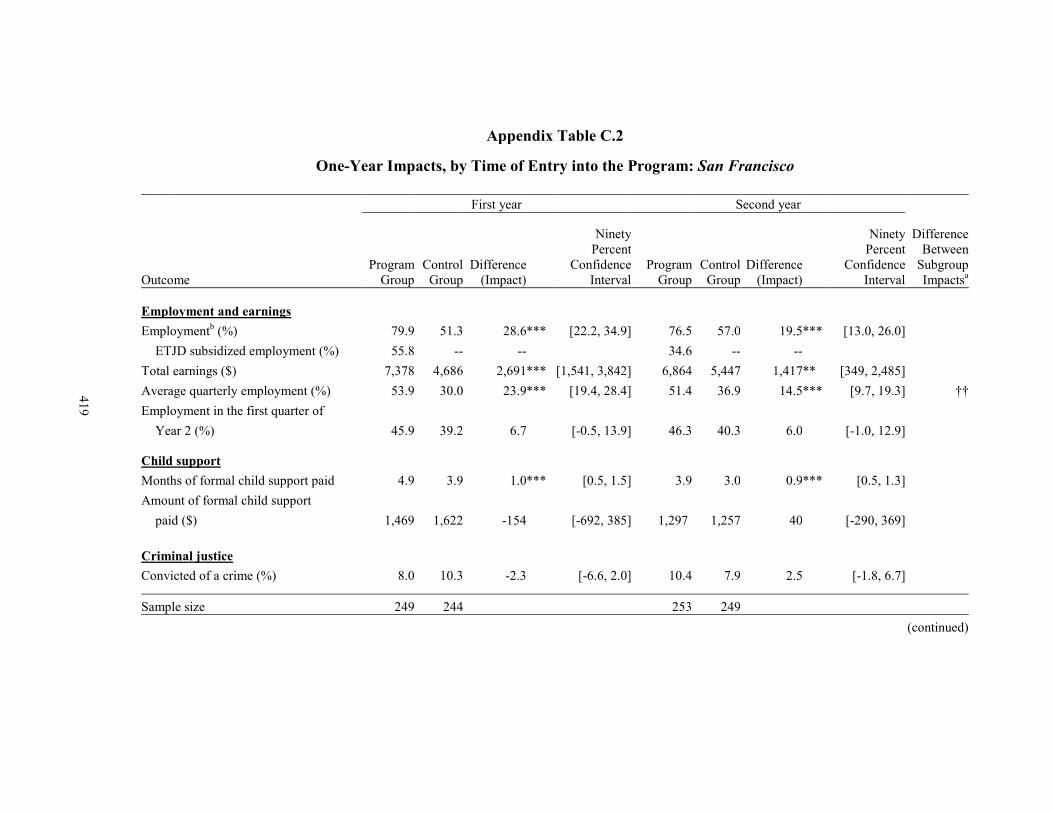
419
Appendix Table C.2 One-Year Impacts, by Time of Entry into the Program: San Francisco
First year Second year
Outcome Program
Group Control
Group Difference
(Impact)
Ninety Percent
Confidence Interval
Program Group
Control Group
Difference
(Impact)
Ninety Percent
Confidence Interval
Difference Between
Subgroup Impactsa
Employment and earnings Employmentb (%) 79.9 51.3 28.6 *** [22.2, 34.9] 76.5 57.0 19.5 *** [13.0, 26.0]
ETJD subsidized employment (%) 55.8 -- --
34.6 -- -- Total earnings ($) 7,378 4,686 2,691 *** [1,541, 3,842] 6,864 5,447 1,417 ** [349, 2,485]
Average quarterly employment (%) 53.9 30.0 23.9 *** [19.4, 28.4] 51.4 36.9 14.5 *** [9.7, 19.3] †† Employment in the first quarter of
Year 2 (%) 45.9 39.2 6.7 [-0.5, 13.9] 46.3 40.3 6.0 [-1.0, 12.9]
Child support Months of formal child support paid 4.9 3.9 1.0 *** [0.5, 1.5] 3.9 3.0 0.9 *** [0.5, 1.3]
Amount of formal child support
paid ($) 1,469 1,622 -154 [-692, 385] 1,297 1,257 40 [-290, 369]
Criminal justice Convicted of a crime (%) 8.0 10.3 -2.3 [-6.6, 2.0] 10.4 7.9 2.5 [-1.8, 6.7]
Sample size 249 244 253 249
(continued)

420
Appendix Table C.2 (continued)
SOU R CES: MDRC calculations based on q uarterly w age data f rom the Nati onal Directory of Ne w Hires, res ponses to th e ETJD 12 -mon th survey, child support agency data, and criminal justice data. NOTES: Results in this table are regression-adjusted, controlling for pre-random assignment characteristics. Statistical significance levels are indicated as: *** = 1 percent; ** = 5 percent; * = 10 percent. Prison data from the state of California were not available at the time of this publication. aWhen comparing impacts between two subgroups, an H-statistic is generated. The H-statistic is used to assess whether the difference in impacts between the subgroups is statistically significant. Statistically significant differences across subgroups are indicated as: ††† = 1 percent; †† = 5 percent; † = 10 percent. bEmployment rates and earnings include both ETJD subsidized jobs and all other jobs covered by unemployment insurance.

Appendix D
Supplementary Tables for Chapter 5

THIS PAGE INTENTIONALLY LEFT BLANK

423
Appendix Table D.1 Additional Characteristics of Sample Members at Enrollment: Syracuse Syracuse ETJD Programs Targeting Characteristic Program Noncustodial Parents
Number of minor-age children (%)
None 2.2 6.8 1
26.7 31.8 2 26.3 25.4 3 or more 44.8 36.1
Among participants with child support orders:
Average age of youngest child (years) 8.3 8.9
Ever convicted of a violent crimea 37.1 35.4
Ever incarcerated in prisonb (%) 43.7 36.7
Among those ever incarcerated in prison:
Total time incarcerated in prisonc (%)
Less than 2 years 30.5 39.3 2 to 4 years 27.5 24.6 More than 4 years 42.1 36.1
Most recently released from (%)
State prison 91.9 78.1 County/city jail 0.6 15.0 Federal prison 7.5 7.0
Among those who ever worked:
Hourly wage in most recent job (%) $0.01 - $7.25 22.8 13.9
$7.26 - $9.99 48.3 34.3 $10.00 - $14.99 23.6 36.7 $15.00 or more 5.3 15.0
Had income at enrollment (%) 19.3 23.5
Receipt of public assistance (%)
No public assistance 44.6 38.4 Food stamps (SNAP) 49.9 49.7 General assistance or welfare 0.3 4.7 Other government assistance program/multiple programs 5.2 7.2
(continued)

424
Appendix Table D.1 (continued)
Characteristic
Medical benefits (%)
Previous alcohol-abuse or drug-use treatment (%)
Receiving alcohol-abuse or drug-use treatment at enrollment (%)
Syracuse Program
ETJD Programs Targeting Noncustodial Parents
71.5
5.1
Family assists with (%) Place to live 44.1 35.5 Financial support Transportation Job
16.5 3.6 0.0
8.3 3.3 0.8
Multiple forms of support None
0.0 35.8
4.7 47.3
None Medicaid Medicare Private health insurance Other
Ever received mental health treatment (%)
45.8
50.5 0.2 1.0 2.5
59.2
7.9
23.7
19.9 1.9 1.2 5.6
31.6
13.0
Sample size 1,004 3,998
SOURCES: MDRC calculations based on baseline survey data, ETJD management information system data, and criminal justice administrative records. NOTES: Measures are self-reported unless otherwise noted. SNAP=Supplemental Nutrition Assistance Program. aIncludes convictions in the state of New York as recorded in administrative records. Does not include federal convictions or convictions from other states. bIncludes self-report of incarceration in state or federal prison and prison incarceration as recorded in New York administrative records. cIncludes time spent in New York state prisons according to administrative records. Does not include time spent in federal prisons or prisons in other states.

425
Appendix Table D.2 One-Year Impacts, by Time of Entry into the Program: Syracuse
First Year Second Year
Outcome Program
Group Control
Group Difference
(Impact)
Ninety Percent
ConfidenceInterval
Program
GroupControl
Group Difference
(Impact)
Ninety Percent Confidence
Interval
Difference Between
Subgroup Impactsa
Employment and earnings
Employmentb (%) 90.7 60.6 30.1 *** [24.6, 35.6] 89.1 56.7 32.4 *** [26.2, 38.6]
ETJD subsidized employment (%) 80.0 -- --
77.1 -- --
Total earnings ($) 4,099 3,029 1,070*** [403, 1,737] 3,679 2,807 873 ** [275, 1,470] Average quarterly employment (%) 59.5 35.157 24.4 *** [20.0, 28.7] 61.8 32.3 29.5 *** [24.7, 34.3] Employment in the first quarter of
Year 2 (%) 41.6 36.7 5.0 [-1.6, 11.5] 45.2 36.2 8.9 ** [1.6, 16.2] Currently employed (based on
survey)c (%) 46.0 40.6 5.4 [-3.3, 14.2] 52.0 33.5 18.5 *** [9.7, 27.2] †
Child support
Months of formal child support paid 1.7 1.4 0.3 [0.0, 0.6] NA NA NA NA Amount of formal child support paid ($) 337 206 131 [-127, 389] NA NA NA NA
Criminal justice Arrested, convicted, or admitted to 22.9 23.8 -0.9 [-6.7, 5.0] 21.6 24.5 -2.9 [-9.0, 3.2]
prison (%)
Convicted of a crime (%) 19.0 16.1 2.9 [-2.4, 8.2] 17.3 14.6 2.6 [-2.9, 8.2] Incarcerated in prison (%) 2.6 4.5 -1.9 [-4.4, 0.7] 5.0 5.0 0.0 [-3.3, 3.3] Total days incarcerated in prison 2.6 6.0 -3.4 [-7.2, 0.4] 5.6 7.6 -1.9 [-7.2, 3.3]
Sample size 272 268 234 230
(continued)

426
Appendix Table D.2 (continued)
SOURCES: MDRC calculations based on quarterly wage data from the National Directory of New Hires, responses to ETJD 12-month survey, child support agency data, and criminal justice data. NOTES: Results in this table are regression-adjusted, controlling for pre-random assignment characteristics. NA=not available. Statistical significance levels are indicated as: *** = 1 percent; ** = 5 percent; * = 10 percent. aWhen comparing impacts between two subgroups, an H-statistic is generated. The H-statistic is used to assess whether the difference in impacts between the subgroups is statistically significant. Statistically significant differences across subgroups are indicated as: ††† = 1 percent; †† = 5 percent; † = 10 percent. bEmployment rates and earnings include both ETJD subsidized jobs and all other jobs covered by unemployment insurance. cSample sizes for survey respondents were 272 program group members and 268 control group members in the first-year cohort, and 234 program group members and 230 control group members in the second-year cohort.

Appendix E
Supplementary Tables for Chapter 6

THIS PAGE INTENTIONALLY LEFT BLANK

429
Appendix Table E.1 Additional Characteristics of Sample Members at Enrollment: Fort Worth Fort Worth ETJD Programs Targeting Characteristic Program Formerly Incarcerated People
Number of minor-age children (%)
None 55.3 48.5 1
19.5 22.7 2 13.1 14.6 3 or more 12.1 14.2
Among participants with child support orders:
Average age of youngest child (years) 10.4 9.6
Ever convicted of a violent crimea (%) 44.9 49.4
Total time incarcerated in jail or prisonb (%)
Less than 2 years 43.5 31.4 2 to 4 years 31.6 28.1 More than 4 years 24.9 40.6
Most recently released from (%)
State prison 91.3 89.6 County/city jail 1.8 4.8
Federal prison 6.9 5.6
Among those who ever worked:
Hourly wage in most recent job (%) $0.01 - $7.25 18.8 22.9
$7.26 - $9.99 35.1 38.0 $10.00 - $14.99 32.4 28.2 $15.00 or more 13.7 10.9
Had income at enrollment (%) 1.0 3.9
Receipt of public assistance (%)
No public assistance 83.2 68.5 Food stamps (SNAP) 15.8 23.6 General assistance or welfare 0.0 4.2
Other government assistance program/multiple programs 1.0 3.8
(continued)

430
Appendix Table E.1 (continued)
Fort Worth ETJD Programs Targeting Characteristic Program Formerly Incarcerated People
Family assists with (%)
Place to live 58.2 55.4 Financial support 1.5 7.8 Transportation 3.1 4.8 Job 1.0 0.4 Multiple forms of support 0.5 3.0 None 34.3 28.0
Medical benefits
None 96.2 70.2 Medicaid 1.3 21.2 Medicare 0.0 0.2 Private health insurance 0.4 0.8 Other 2.0 7.6
Previous alcohol-abuse or drug-use treatment (%) 43.0 48.2
Receiving alcohol-abuse or drug-use treatment at enrollment (%) 17.3 25.3
Ever received mental health treatment (%) 8.6 9.3
Sample size 999 3,002
SOURCES: MDRC calculations based on baseline survey data, ETJD management information system data, and criminal justice administrative records. NOTES: Measures are self-reported unless otherwise noted. SNAP = Supplemental Nutrition Assistance Program. aIncludes convictions in the state of Texas as recorded in administrative records. Does not include federal convictions or convictions from other states. bIncludes time spent in Texas state prisons and Tarrant County jails according to administrative records. Does not include time spent in federal prisons or prisons in other states.

431
Appendix Table E.2 One-Year Impacts, by Time of Entry into the Program: Fort Worth
First Year Second Year
Outcome Program
Group Control
Group Difference
(Impact)
5,446
Ninety Percent Confidence
Interval Program
Group Control
Group Difference
(Impact)
Ninety Percent Confidence
Interval
Difference Between
Subgroup Impactsa
Employment and earnings
Employmentb (%) 76.4 71.3 5.1 [-0.0, 11.5] 70.5 73.0 -2.5 [-0.1, 0.0]
ETJD subsidized employment (%) 41.5 -- --
30.1 -- --
Total earnings ($) 5,843 6,093 -250 [-1,348, 848] 5,419 -27 [-1,036, 982] Average quarterly employment (%) 47.2 43.8 3.4 [-1.6, 8.3] 43.5 45.4 -2.0 [-7.0, 3.2] Employment in the first quarter of Year 2 (%) 47.2 46.8 0.4 [-0.1, 0.1] 44.4 45.5 -1.1 [-0.1, 0.1] Currently employed (based on survey)c (%) 66.6 64.1 2.5 [-5.9, 10.9] 68.1 55.5 12.7 ** [3.7, 21.7]
Criminal justice
Arrested, convicted, or incarcerated (%) 24.1 31.7
-7.6 * [-14.0, -1.2] 30.3 32.8 -2.5 [-9.4, 4.3] Convicted of a crime (%) 9.0 12.3 -3.2
[-7.8, 1.3] 14.5 10.5 4.0 [-0.8, 8.8] †
Incarcerated in jail (%) 17.4 24.5 -7.2 ** [-13.0, -1.4] 23.6 24.9 -1.3 [-7.7, 5.2] Incarcerated in prison (%) 8.5 9.7 -1.2
[-5.5, 3.0] 11.7 13.2 -1.5 [-6.5, 3.4] Total days incarcerated 15.6 18.8 -3.2
[-10.1, 3.7] 23.1 23.4 -0.3 [-8.6, 7.9]
Child supportd Months of formal child support paid 1.7 1.6 0.0
[-0.7, 0.7] 1.2 1.5 -0.3 [-0.9, 0.3]
Amount of formal child support paid ($) 529 548 (19)
[-301, 263] 413 544 -130 [-390, 129]
Sample size 263 254 240 242 (continued)

432
Appendix Table E.2 (continued)
SOU R CES: MDRC calculations based on q uarterly w age data f rom the Nati onal Directory of N ew Hires, res ponses to the ETJD 1 2-mont h survey, ch ild support agency data, and criminal justice data. NOTES: Results in this table are regression-adjusted, controlling for pre-random assignment characteristics. Statistical significance levels are indicated as: *** = 1 percent; ** = 5 percent; * = 10 percent. aWhen comparing impacts between two subgroups, an H-statistic is generated. The H-statistic is used to assess whether the difference in impacts between the subgroups is statistically significant. Statistically significant differences across subgroups are indicated as: ††† = 1 percent; †† = 5 percent; † = 10 percent. bEmployment rates and earnings include both ETJD subsidized jobs and all other jobs covered by unemployment insurance. cSample sizes for survey respondents were 263 program group members and 254 control group members in the first-year cohort, and 240 program group members and 242 control group members in the second-year cohort. dAmong those identified as noncustodial parents at enrollment.

433
Appendix Table E.3
One-Year Impacts on Criminal Justice Outcomes, by Follow-Up Time Period: Fort Worth
Outcome Program
Group Control
Group Difference
(Impact)
Ninety Percent Confidence
Interval
Months 1 to 6 Arrested (%) 8.3 9.5 -1.2
[-4.2, 1.8]
Convicted of a crime (%) 4.1 4.3 -0.2 [-2.3, 1.9]
Convicted of a felony 1.0 0.8 0.2 [-0.8, 1.2]
Convicted of a misdemeanor 2.7 3.5 -0.8 [-2.6, 1]
Convicted of a violent crime (%) 0.2 0.6 -0.4 [-1.1, 0.2]
Incarcerated (%) 11.5 12.9 -1.4 [-4.8, 2]
Incarcerated in jail 10.6 11.9 -1.3 [-4.6, 2]
Incarcerated in prison 3.4 4.0 -0.5 [-2.5, 1.4]
Prison admission reason (%)
Admitted to prison for a new crime 0.8 0.4 0.4 [-0.4, 1.2] Admitted to prison for a parole or probation
violation 2.6 3.6 -1.0 [-2.8, 0.8]
Total days incarcerated 4.5 5.8 -1.3 [-3.3, 0.7]
Jail 2.9 3.9 -1.0 [-2.3, 0.3] Prison 1.6 1.9 -0.3 [-1.4, 0.8]
Arrested, convicted, or admitted to jail or prison (%) 13.5 15.4 -1.9 [-5.6, 1.7]
Months 7 to 12 Arrested (%) 13.3 17.6 -4.3 * [-8, -0.6]
Convicted of a crime (%) 8.5 8.3 0.2
[-2.7, 3.1]
Convicted of a felony 4.0 2.8 1.1 [-0.7, 3] Convicted of a misdemeanor 4.8 5.1 -0.3 [-2.6, 1.9]
Convicted of a violent crime (%) 1.6 1.0 0.5 [-0.7, 1.7]
Incarcerated (%) 16.2 19.5 -3.3 [-7.2, 0.6]
Incarcerated in jail 13.9 16.2 -2.3 [-5.9, 1.4] Incarcerated in prison 7.4 7.8 -0.5 [-3.2, 2.3]
(continued)

434
Appendix Table E.3 (continued)
Prison admission reason (%)
503
0.6
Ninety Percent
Confidence Interval
[-3.2, 1.5]
Arrested, convicted, or admitted to jail or prison (%)
5.8
15.3
24.2
5.0
Sample size
Program Group
Control Group
496
Difference (Impact)
[-8, 0.5]
Outcome
Admitted to prison for a new crime 2.6 2.0 [-1, 2.1]
Admitted to prison for a parole or probation violation
-0.8
Total days incarcerated 14.7 -0.6 [-4.6, 3.5] Jail 8.7 8.6 0.1 [-2.8, 3.1] Prison 6.0 6.7 -0.7 [-3.1, 1.7]
20.5
-3.8
SO UR CE: MDRC calculations based on criminal j ustice data. NOTES: Results in this table are regression-adjusted, controlling for pre-random assignment characteristics. Statistical significance levels are indicated as: *** = 1 percent; ** = 5 percent; * = 10 percent.

Appendix F
Supplementary Tables for Chapter 7

THIS PAGE INTENTIONALLY LEFT BLANK

4
37
Appendix Table F.1 Additional Characteristics of Sample Members at Enrollment: Indianapolis Indianapolis ETJD Programs Targeting Characteristic Program Formerly Incarcerated People
Number of minor-age children (%)
None 37.5 48.5 1
24.1 22.7 2 18.2 14.6
3 or more 20.1 14.2
Among participants with child support orders:
Average age of youngest child (years) 8.0 9.6
Ever convicted of a violent crimea (%) 39.6 49.4
Total time incarcerated in jail or prisonb (%)
Less than 2 years 33.4 31.4 2 to 4 years 30.2 28.1 More than 4 years 36.4 40.6
Most recently released from (%)
State prison 83.0 89.6 County/city jail 10.9 4.8 Federal prison 6.1 5.6
Among those who ever worked:
Hourly wage in most recent job (%)
$0.01 - $7.25 25.2 22.9 $7.26 - $9.99 47.1 38.0 $10.00 - $14.99 22.3 28.2 $15.00 or more 5.4 10.9
Had income at enrollment (%) 3.0 3.9
Receipt of public assistance (%)
No public assistance 77.7 68.5 Food stamps (SNAP) 16.8 23.6 General assistance or welfare 0.0 4.2 Other government assistance program/multiple programs 5.5 3.8
(continued)

438
Appendix Table F.1 (continued)
Indianapolis ETJD Programs Targeting Characteristic Program Formerly Incarcerated People
Family assists with (%)
Place to live 49.0 55.4 Financial support 8.8 7.8 Transportation 10.2 4.8 Job 0.1 0.4 Multiple forms of support 4.4 3.0 None 27.2 28.0
Medical benefits
None 76.4 70.2 Medicaid 2.1 21.2 Medicare 0.0 0.2 Private health insurance 0.4 0.8 Other 21.0 7.6
Previous alcohol-abuse or drug-use treatment (%) 34.7 48.2
Receiving alcohol-abuse or drug-use treatment at enrollment (%) 5.2 25.3
Ever received mental health treatment (%) 8.3 9.3
Sample size 998 3,002
SOURCES: MDRC calculations based on baseline survey data, ETJD management information system data, and criminal justice administrative data. NOTES: Measures are self-reported unless otherwise noted. SNAP = Supplemental Nutrition Assistance Program. aIncludes convictions in the state of Indiana as recorded in administrative records. Does not include federal convictions or convictions from other states. bIncludes time spent in Indiana state prisons and Marion County jails according to administrative records. Does not include time spent in federal prisons or prisons in other states.
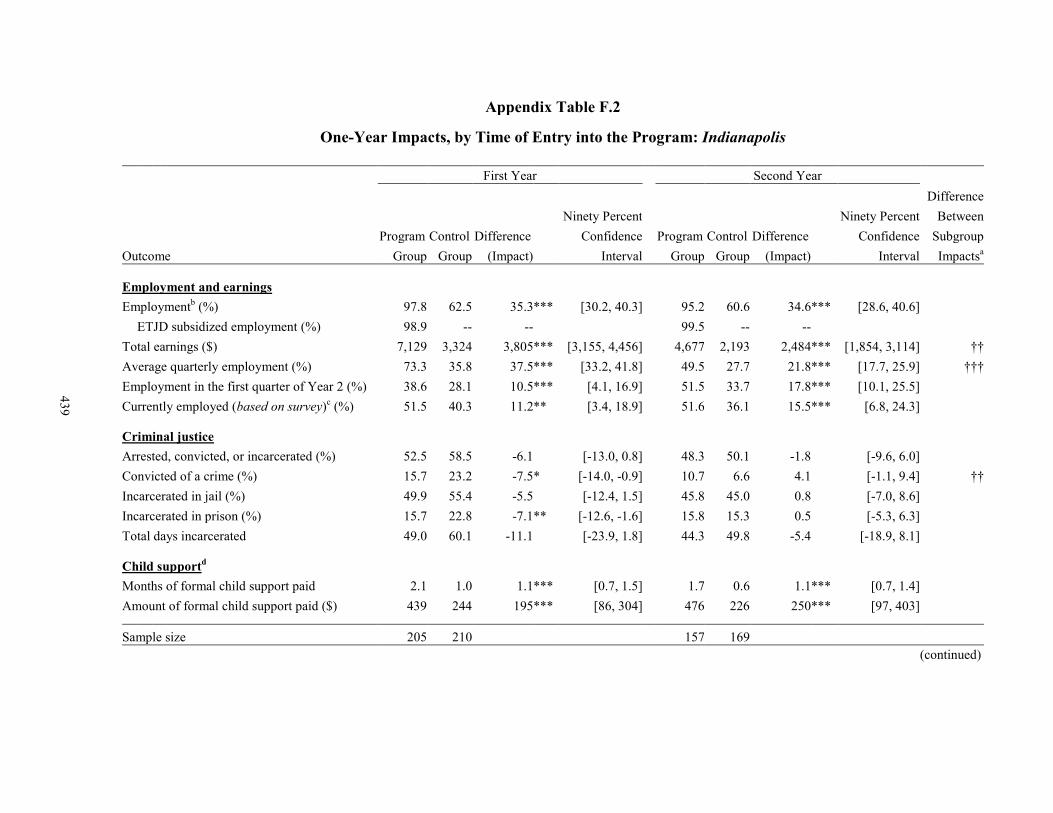
439
Appendix Table F.2 One-Year Impacts, by Time of Entry into the Program: Indianapolis
First Year Second Year
Difference
Ninety Percent
Ninety Percent Between
Program Control Difference Confidence Program Control Difference Confidence Subgroup Outcome Group Group (Impact) Interval
Group Group (Impact) Interval Impactsa
Employment and earnings Employmentb (%) 97.8 62.5 35.3 *** [30.2, 40.3]
95.2 60.6 34.6 *** [28.6, 40.6]
ETJD subsidized employment (%) 98.9 -- --
99.5 -- --
Total earnings ($) 7,129 3,324 3,805 *** [3,155, 4,456] 4,677 2,193 2,484 *** [1,854, 3,114] †† Average quarterly employment (%) 73.3 35.8 37.5 *** [33.2, 41.8] 49.5 27.7 21.8 *** [17.7, 25.9] ††† Employment in the first quarter of Year 2 (%) 38.6 28.1 10.5 *** [4.1, 16.9] 51.5 33.7 17.8 *** [10.1, 25.5]
Currently employed (based on survey)c (%) 51.5 40.3 11.2 ** [3.4, 18.9] 51.6 36.1 15.5 *** [6.8, 24.3]
Criminal justice
Arrested, convicted, or incarcerated (%) 52.5 58.5 -6.1
[-13.0, 0.8]
d
48.3 50.1 -1.8 [-9.6, 6.0] Convicted of a crime (%) 15.7 23.2 -7.5 * [-14.0, -0.9] 10.7 6.6 4.1 [-1.1, 9.4] ††
Incarcerated in jail (%) 49.9 55.4 -5.5
[-12.4, 1.5] 45.8 45.0 0.8
[-7.0, 8.6] Incarcerated in prison (%) 15.7 22.8 -7.1 ** [-12.6, -1.6] 15.8 15.3 0.5 [-5.3, 6.3] Total days incarcerated 49.0 60.1 -11.1 [-23.9, 1.8] 44.3 49.8 -5.4 [-18.9, 8.1]
Child support Months of formal child support paid 2.1 1.0 1.1 *** [0.7, 1.5] 1.7 0.6 1.1 *** [0.7, 1.4]
Amount of formal child support paid ($) 439 244
195 *** [86, 304] 476 226 250 *** [97, 403]
Sample size 205 210 157 169
(continued)

440
Appendix Table F.2 (continued)
SOURCES: MDRC calculations based on quarterly wage data from the National Directory of New Hires, responses to the ETJD 12-month survey, child support agency data, and criminal justice data. NOTES: Results in this table are regression-adjusted, controlling for pre-random assignment characteristics. Statistical significance levels are indicated as: *** = 1 percent; ** = 5 percent; * = 10 percent. aWhen comparing impacts between two subgroups, an H-statistic is generated. The H-statistic is used to assess whether the difference in impacts between the subgroups is statistically significant. Statistically significant differences across subgroups are indicated as: ††† = 1 percent; †† = 5 percent; † = 10 percent. bEmployment rates and earnings include both ETJD subsidized jobs and all other jobs covered by unemployment insurance. cSample sizes for survey respondents were 205 program group members and 210 control group members in the first-year cohort, and 157 program group members and 169 control group members in the second-year cohort. dAmong those identified as noncustodial parents at enrollment.

Appendix G
Supplementary Tables for Chapter 8

THIS PAGE INTENTIONALLY LEFT BLANK

443
Appendix Table G.1 Additional Characteristics of Sample Members at Enrollment: New York City NYC ETJD Programs Targeting Characteristic Program Formerly Incarcerated People
Number of minor-age children (%)
None 52.9 48.5
1
24.3 22.7 2
12.5 14.6
3 or more 10.4 14.2
Among participants with child support orders:
Average age of youngest child (years) 10.8 9.6
Ever convicted of a violent crimea (%) 60.9 49.4
Total time incarcerated in jail or prisonb (%)
Less than 2 years 17.6 31.4 2 to 4 years 22.6 28.1 More than 4 years 59.9 40.6
Most recently released from (%)
State prison 94.3 89.6 County/city jail 1.8 4.8 Federal prison 3.9 5.6
Among those who ever worked:
Hourly wage in most recent job (%)
$0.01 - $7.25 25.8 22.9 $7.26 - $9.99 30.6 38.0 $10.00 - $14.99 29.8 28.2 $15.00 or more 13.8 10.9
Had income at enrollment (%) 7.3 3.9
Receipt of public assistance (%)
No public assistance 45.5 68.5 Food stamps (SNAP) 37.6 23.6 General assistance or welfare 12.2 4.2
Other government assistance program/multiple programs 4.8 3.8
(continued)

444
Appendix Table G.1 (continued)
Characteristic
Financial support Medical benefits (%)
Previous alcohol-abuse or drug-use treatment (%)
NYC Program
ETJD Programs Targeting Formerly Incarcerated People
55.4
70.2
48.2
25.3
Family assists with (%) Place to live
Transportation Job Multiple forms of support None
None Medicaid Medicare Private health insurance Other
Receiving alcohol-abuse or drug-use treatment at enrollment (%)
Ever received mental health treatment (%)
58.7 13.0
1.4 0.2 3.9
22.7
41.0
56.6 0.5 1.4 0.5
65.6
51.2
10.9
7.8 4.8 0.4 3.0
28.0
21.2 0.2 0.8 7.6
9.3
Sample size 1,005 3,002
SOURCES: MDRC calculations based on baseline survey data, ETJD management information system data, and criminal justice administrative records. NOTES: Measures are self-reported unless otherwise noted. aIncludes convictions in the state of New York as recorded in administrative records. Does not include federal convictions or convictions from other states. bIncludes time spent in New York state prisons and New York City jails according to administrative records. Does not include time spent in federal prisons or prisons in other states.
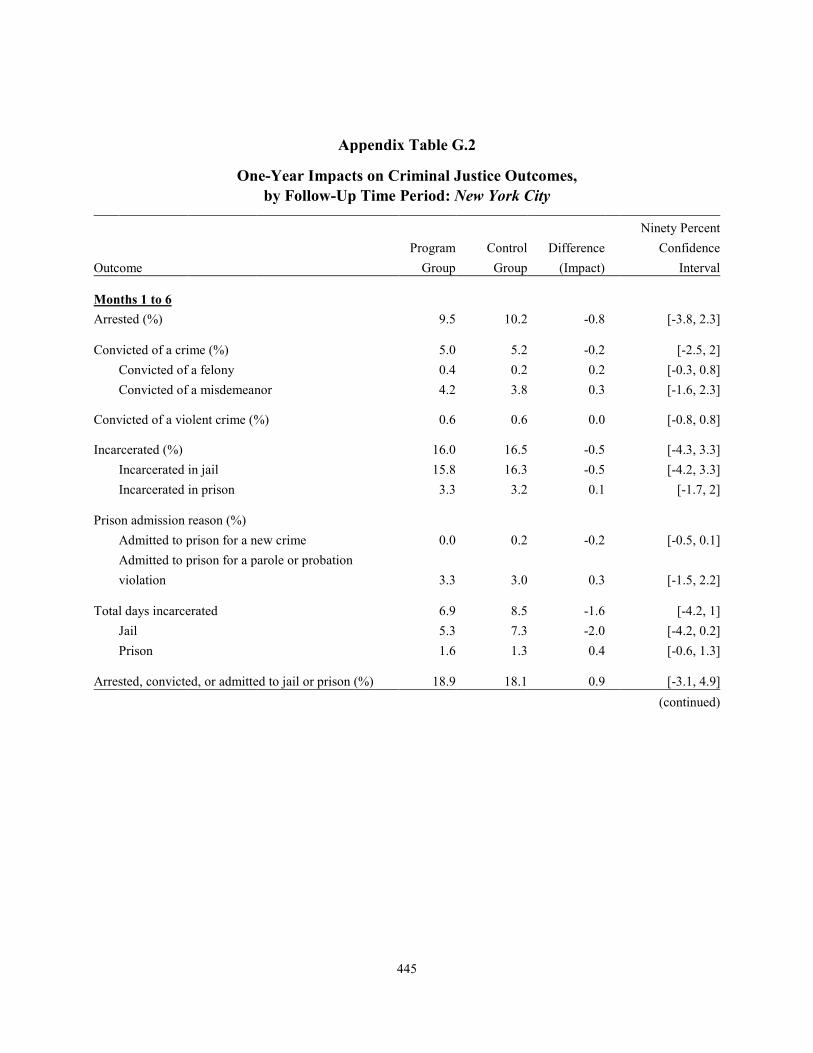
445
Appendix Table G.2
One-Year Impacts on Criminal Justice Outcomes, by Follow-Up Time Period: New York City
Ninety Percent
Program Control Difference
Confidence
Outcome Group Group (Impact) Interval
Months 1 to 6
Arrested (%) 9.5 10.2 -0.8 [-3.8, 2.3]
Convicted of a crime (%) 5.0 5.2 -0.2 [-2.5, 2]
Convicted of a felony 0.4 0.2 0.2 [-0.3, 0.8] Convicted of a misdemeanor 4.2 3.8 0.3 [-1.6, 2.3]
Convicted of a violent crime (%) 0.6 0.6 0.0 [-0.8, 0.8]
Incarcerated (%) 16.0 16.5 -0.5 [-4.3, 3.3]
Incarcerated in jail 15.8 16.3 -0.5 [-4.2, 3.3] Incarcerated in prison 3.3 3.2 0.1 [-1.7, 2]
Prison admission reason (%)
Admitted to prison for a new crime 0.0 0.2 -0.2 [-0.5, 0.1] Admitted to prison for a parole or probation
violation 3.3 3.0 0.3 [-1.5, 2.2]
Total days incarcerated 6.9 8.5 -1.6 [-4.2, 1]
Jail 5.3 7.3 -2.0 [-4.2, 0.2]
Prison 1.6 1.3 0.4 [-0.6, 1.3]
Arrested, convicted, or admitted to jail or prison (%) 18.9 18.1 0.9 [-3.1, 4.9] (continued)

446
Appendix Table G.2 (continued)
Ninety Percent
Program Control Difference
Confidence
Outcome Group Group (Impact) Interval
Months 7 to 12
Arrested (%) 11.5 13.0 -1.5 [-4.8, 1.7]
Convicted of a crime (%) 9.6 8.9 0.7 [-2.1, 3.6]
Convicted of a felony 1.3 2.7 -1.4 [-2.8, 0.1] Convicted of a misdemeanor 7.0 5.0 2.0 [-0.4, 4.3]
Convicted of a violent crime (%) 1.4 1.6 -0.3 [-1.5, 1]
Incarcerated (%) 20.3 17.3 3.0 [-0.9, 6.9]
Incarcerated in jail 17.5 14.5 3.0 [-0.7, 6.6]
Incarcerated in prison 8.7 6.5 2.2 [-0.5, 4.9]
Prison admission reason (%)
Admitted to prison for a new crime 0.2 0.4 -0.2 [-0.7, 0.4] Admitted to prison for a parole or probation
violation 8.5 6.1 2.4 [-0.3, 5.1]
Total days incarcerated 22.4 22.2 0.3 [-4.8, 5.4]
Jail 12.8 14.3 -1.5 [-5.2, 2.2]
Prison 9.7 7.9 1.8 [-1.5, 5]
Arrested, convicted, or admitted to jail or prison (%) 24.1 22.7 1.5 [-2.8, 5.7]
Sample size 504 501
SOURCE: MDRC calculations based on criminal justice data. NOTES: Results in this table are regression-adjusted, controlling for pre-random assignment characteristics. Statistical significance levels are indicated as: *** = 1 percent; ** = 5 percent; * = 10 percent.
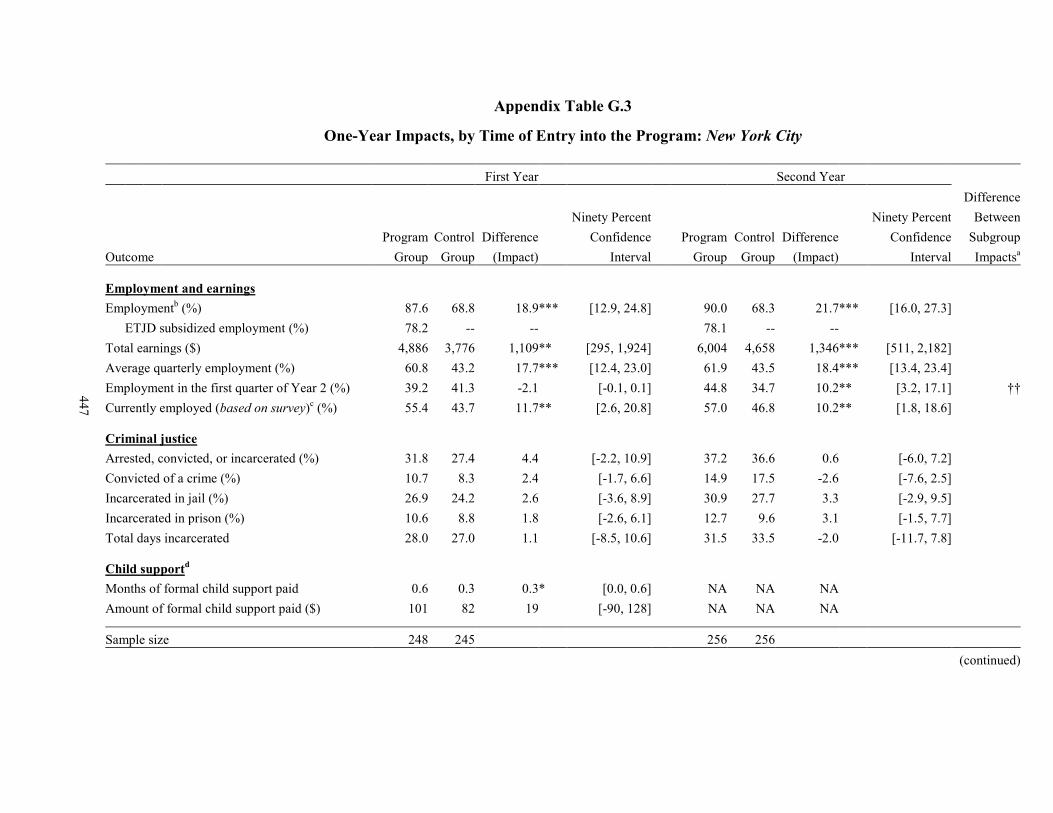
447
Appendix Table G.3
One-Year Impacts, by Time of Entry into the Program: New York City
First Year Second Year Difference
Ninety Percent Ninety Percent Between
Program Control Difference
Confidence
Program Control Difference
Confidence Subgroup
Outcome Group Group (Impact) Interval Group Group (Impact) Interval Impactsa
Employment and earnings Employmentb (%) 87.6 68.8 18.9 *** [12.9, 24.8]
90.0 68.3 21.7 *** [16.0, 27.3]
ETJD subsidized employment (%) 78.2 -- --
78.1 -- --
Total earnings ($) 4,886 3,776 1,109 ** [295, 1,924]
6,004 4,658 1,346 *** [511, 2,182] Average quarterly employment (%) 60.8 43.2 17.7 *** [12.4, 23.0] 61.9 43.5 18.4 *** [13.4, 23.4] Employment in the first quarter of Year 2 (%) 39.2 41.3 -2.1
[-0.1, 0.1] 44.8 34.7 10.2 ** [3.2, 17.1] ††
Currently employed (based on survey)c (%) 55.4 43.7 11.7 ** [2.6, 20.8] 57.0 46.8 10.2 ** [1.8, 18.6]
Criminal justice Arrested, convicted, or incarcerated (%) 31.8 27.4 4.4
[-2.2, 10.9]
37.2 36.6 0.6 [-6.0, 7.2] Convicted of a crime (%) 10.7 8.3 2.4 [-1.7, 6.6] 14.9 17.5 -2.6 [-7.6, 2.5] Incarcerated in jail (%) 26.9 24.2 2.6 [-3.6, 8.9] 30.9 27.7 3.3 [-2.9, 9.5] Incarcerated in prison (%) 10.6 8.8 1.8 [-2.6, 6.1] 12.7 9.6 3.1 [-1.5, 7.7] Total days incarcerated 28.0 27.0 1.1 [-8.5, 10.6] 31.5 33.5 -2.0 [-11.7, 7.8]
dChild support
Months of formal child support paid 0.6 0.3 0.3 *
[0.0, 0.6]
NA NA NA
Amount of formal child support paid ($) 101 82 19
[-90, 128] NA NA NA
Sample size 248 245 256 256 (continued)

448
Appendix Table G.3 (continued)
SOURCES: MDRC calculations based on quarterly wage data from the National Directory of New Hires, responses to the ETJD 12-month survey, child support agency data, and criminal justice data. NOTES: Results in this table are regression-adjusted, controlling for pre-random assignment characteristics. NA = not available. Statistical significance levels are indicated as: *** = 1 percent; ** = 5 percent; * = 10 percent. aWhen comparing impacts between two subgroups, an H-statistic is generated. The H-statistic is used to assess whether the difference in impacts between the subgroups is statistically significant. Statistically significant differences across subgroups are indicated as: ††† = 1 percent; †† = 5 percent; † = 10 percent. bEmployment rates and earnings include both ETJD subsidized jobs and all other jobs covered by unemployment insurance. cSample sizes for survey respondents were 248 program group members and 245 control group members in the first-year cohort, and 256 program group members and 256 control group members in the second-year cohort. dAmong those identified as noncustodial parents at enrollment. At the time of this report's publication, child support data were not available from New York State for sample members in the second-year cohort.

Appendix H
Survey Response Bias Analysis

THIS PAGE INTENTIONALLY LEFT BLANK
451
This appendix assesses the reliability of the impact results captured by the Enhanced Transi-tional Jobs Demonstration (ETJD) 12-month survey for each of the seven program locations discussed in this report: Atlanta, Milwaukee, San Francisco, Syracuse, Fort Worth, Indianapolis, and New York. It also examines whether the program impacts for the survey respondents can be considered to represent the impacts for the full research sample. First, the appendix describes how the survey was administered, including survey response rates for the full research sample and the program and control groups in each city. Next, it examines the differences between survey respondents and nonrespondents, then compares the differences between the program and control groups among the survey respondents. Finally, it compares the administrative data outcomes of the respondent sample with those of the full research sample.
This appendix concludes that while there are some minor differences between survey respondents and nonrespondents, there are few differences in any city between the program group members and control group members who responded to the survey. Therefore, any program-group-versus-control-group impacts measured with survey data are unlikely to be biased due to survey nonresponse rates, and the impact results for the survey respondent sample can be generalized to the full research sample.
Survey Administration and Response Rates The ETJD 12-month survey was administered by two survey firms: Decision Information Resources administered the survey in Atlanta and San Francisco while Abt SRBI administered the survey in all other cities. Interviewers from the survey firms made contact with all members of the full research sample on a rolling basis, 12 months after they enrolled into the study. For example, if a sample member was randomly assigned into the study in January 2012, a survey firm would begin attempting to reach this sample member in January 2013.
All sample members randomly assigned within the same month were considered a “co-hort.” To meet report deadlines, the last several cohorts in the five Abt SBRI cities (Milwaukee, Syracuse, Fort Worth, Indianapolis, and New York) were interviewed early, some as much as four months early. In all cities other than Atlanta (where response rates were consistently high), survey firms continued to try to reach cohorts for longer than the standard window of three to four months because it was difficult to locate some respondents. Some respondents also called the survey firms after their interview windows closed, and they were still interviewed. Finally, in many places it was difficult to gain permission to interview incarcerated sample members, and in some cases it was not possible. Abt SRBI succeeded in gaining access to prisons and jails where ETJD sample members from three cities were incarcerated: Fort Worth (9 interviews with incarcerated people), Indianapolis (144 interviews with incarcerated people), and Milwau-kee (9 interviews with incarcerated people). Approval to visit prisons and jails was granted on a rolling basis, facility by facility, starting in Indianapolis about halfway through the survey

452
fielding period (11 facilities), followed by Milwaukee about three-quarters of the way through the fielding period (9 facilities), and culminating in Fort Worth in the last few months of surveying (2 facilities). Table H.1 shows the response rate for each city and the percentage of responses that were “on time” (defined as completing one’s survey interview between 11 and 18 months after study enrollment), overall and for the program and control groups.
Response rates lower than the goal of 80 percent are not de facto evidence of nonre-sponse bias. However, higher response rates are desirable as they decrease the likelihood that “missing” data (data from nonrespondents that cannot be collected) are missing at random. That is, since certain social and demographic characteristics are generally associated with responding to surveys (for example, being older, being female, being employed, having a stable living situation, etc.), it is likely that survey respondents generally differ from nonrespondents to some degree. However, these differences are not necessarily problematic as long as the differences between respondents and nonrespondents are similar among both program and control group members. Since the primary purpose of the ETJD 12-month survey was to estimate the impacts of the various ETJD programs, it is important to examine the extent to which program and control group members responded to the survey at different rates. An imbalance in response rates could lead to an imbalance in the characteristics of program group respondents compared with control group respondents. One location, Syracuse, saw a fairly large difference in re-sponse rates between the program and control groups (7 percentage points), while another, San Francisco, saw a moderate difference in response rates between research groups (4 percentage points); in both cases, program group members were more likely to complete a survey interview than control group members.
Variation in the timing of survey administration can introduce bias as well, as it affects the reference period respondents use when providing information about service participation, employment, criminal justice, child support, and other outcomes.1 In some cities more inter-views were collected “on time” than in others, ranging from 99 percent on time in Atlanta to 76 percent in Syracuse. As with response rates in general, program-versus-control-group differ-ences in response timing raise the most critical issues for assessing potential response bias. In two cities, Fort Worth (7 percentage point difference) and Indianapolis (5 percentage point difference), more program group interviews were on time than control group interviews. In New York (6 percentage point difference) and Milwaukee (4 percentage point difference), more of the control group was interviewed on time than the program group.
1To the extent possible, survey-based outcome measures were constructed to account for differences in
reference periods, but doing so was not possible for all outcomes.

453
Appendix Table H.1 ETJD 12-Month Survey Response Rates
Overall Response Rate (%)
On-Time Response Rate (%)
City Program Group Control Group Total Program Group Control Group Total
Atlanta (sample size = 996) 82.0 81.0 81.5 98.3 99.0 98.6 Milwaukee (sample size = 1,003) 80.3 77.4 78.9 80.1 84.5 82.3 San Francisco (sample size = 995) 69.1 64.7 66.9 95.4 92.8 94.1 Syracuse (sample size = 1,004) 74.5 67.3 70.9 76.7 74.9 75.8 Fort Worth (sample size = 999) 68.8 68.8 68.8 85.3 78.3 81.8 Indianapolis (sample size = 998) 80.2 80.7 80.5 85.1 80.5 82.8 New York (sample size = 1,005) 73.6 70.5 72.0 73.0 78.5 75.7
SOU RC E : MDRC calculations based on the ETJD 12-m onth survey. NOTE: "On-time" responses were those occurring 11 to 18 months after random assignment.

454
Comparisons Between Respondents and Nonrespondents Within the Research Sample To test whether survey respondents differ from nonrespondents, a series of statistical tests (t-test and chi-square) were conducted for selected baseline characteristics: sample members’ ages, genders, and races/ethnicities; whether they had ever worked; whether they had worked in the previous year; their number of prior convictions; whether they had ever been incarcerated in prison (for programs targeting noncustodial parents — those in Atlanta, Milwaukee, San Francisco, and Syracuse); whether they were noncustodial parents (for programs targeting former prisoners — those in Fort Worth, Indianapolis, and New York); and the quarter when they were randomly assigned. A global test was also conducted — a joint test of all of the selected baseline characteristics, plus research group assignment. The joint test assesses whether the selected baseline characteristics as a whole predict survey response status (whether a person is a respondent or nonrespondent); the individual tests indicate which specific baseline charac-teristics are associated with response status.
It is not uncommon to find baseline characteristics that predict response status. These associations may indicate some level of nonresponse bias, but this bias would primarily affect level estimates rather than impact estimates. Generally, survey respondents tend to be faring better than nonrespondents, so their responses may overstate outcome levels to some degree. Because this phenomenon affects both the program and control groups, however, impact estimates are less likely to be biased than level estimates.
As shown in Table H.2, in all cities there were significant differences between survey respondents and nonrespondents for at least one baseline characteristic, and in all but two of the cities (Atlanta and Indianapolis) the global test was significant, indicating that the tested characteristics predicted the likelihood of survey response.
•
•
•
Atlanta: Respondents were more likely to be female than nonrespondents, but respondents and nonrespondents were similar in all of the other tested characteristics and the global test was not statistically significant.
Milwaukee: Respondents were slightly older than nonrespondents, more likely to be female, less likely to have been incarcerated, and were randomly assigned a bit later in the enrollment period.
San Francisco: Respondents were more likely than nonrespondents to be female, more likely to be black, and less likely to be Hispanic.

455
Appendix Table H.2
Selected Baseline Char acteristics o f Survey Respond ents
and Nonrespondents, by City
Characteristic Nonrespondents Respondents Total
Atlanta 39.9 39.3 39.8 Age
Female (%) 7.1 2.7 6.3** *
Race/ethnicity (%) 4.7 2.7 4.3
Black, non-Hispanic White, non-Hispanic
91.3
91.1 92.4 2.5
Other Hispanic 2.6 2.2
1.8
1.6 2.7
99.3 99.5 Ever worked (%) 99.3
Worked in the past year (%) 60.5 60.9 62.3
Number of prior convictionsa 2.4 2.4 2.5
Ever incarcerated in prisonb (%) 33.3 33.6 35.3
Quarter of random assignment 5.6 5.5 5.6
Sample size 812 184 996
Milwaukee 35.4 34.1 35.1* Age
Female (%) 3.4 0.0 2.7** *
Race/ethnicity (%) 2.4 2.9 2.5
Black, non-Hispanic White, non-Hispanic
93.1 Hispanic
93.0 93.3 3.2
Other 3.2 3.4
1.2
1.4 0.5
Ever worked (%) 91.9 92.5 92.0
Worked in the past year (%) 51.2 55.2 52.0
2.8 3.0 2.8 Number of prior convictionsc
Ever incarcerated in prisond (%) 63.7 54.6** * 52.2
5.8** * Quarter of random assignment 5.9 5.4
Sample size 791 212 1,003 (continued)

456
Appendix Table H.2 (continued)
C haracteristic Respon dents Nonrespondents Total
San Francisco
Age 40.5 39.5 40.1
Female (%) 13.7 8.5 12.0 **
Race/ethnicity (%) *** White, non-Hispanic 3.2 3.7 3.3 Black, non-Hispanic 71.2 60.1 67.5 Hispanic 17.9 22.3 19.4 Other 7.7 14.0 9.8
Ever worked (%) 97.5 97.6 97.5
Worked in the past year (%) 40.7 40.1 40.5
eNumber of prior convictions 5.9 5.4 5.8
Ever incarcerated in prison (%) 27.5 30.1 28.3
Quarter of random assignment 5.8 5.2 5.6 ***
Sample size 666 329 995
Syracuse
Age 36.1 33.7 35.4 ***
Female (%) 7.7 2.7 6.3 ***
Race/ethnicity (%)
White, non-Hispanic 11.5 12.0 11.7 Black, non-Hispanic 78.3 76.4 77.8 Hispanic 6.0 7.5 6.5 Other 4.1 4.1 4.1
Ever worked (%) 94.7 91.1 93.6 *
Worked in the past year (%) 40.2 32.5 38.0 **
fNumber of prior convictions 3.3 3.5 3.4
gEver incarcerated in prison (%) 38.6 57.5 44.1** *
Quarter of random assignment 5.6 4.9 5.4 ***
Sample size 712 292 1,004 (continued)

457
C haracteristic Fort Worth Age 38.8 37.2 38.3 **
Female (%) 11.2 7.7 10.1 *
Race/ethnicity (%) *** White, non-Hispanic 28.5 41.2 32.5 Black, non-Hispanic 57.0 40.5 51.9 Hispanic 12.9 17.0 14.2 Other 1.6 1.3 1.5
Ever worked (%) 93.3 91.7 92.8
Worked in the past year (%) 12.2 12.2 12.2
hNumber of prior convictions 5.0 5.5 5.2 **
Noncustodial parent (%) 34.4 36.9 35.1
Quarter of random assignment 5.2 5.2 5.2
Sample size 687 312 999
Indianapolis
Age 34.0 31.9 33.6 ***
Female (%) 4.2 3.1 4.0
Race/ethnicity (%)
White, non-Hispanic 14.6 16.9 15.1 Black, non-Hispanic 81.7 80.5 81.5 Hispanic 2.0 1.5 1.9 Other 1.6 1.0 1.5
Ever worked (%) 84.6 78.5 83.4 *
Worked in the past year (%) 26.4 24.6 26.1
iNumber of prior convictions 3.0 3.1 3.0
Noncustodial parent (%) 49.6 54.4 50.5
Quarter of random assignment 5.0 4.9 5.0
Respon dents Nonre spondents Total
803 195
Sample size 998 (continued)
Appendix Table H.2 (continued)

458
Appendix Table H.2 (continued)
Characteristic Respondents Nonrespondents Total
New York Age 35.2 32.5 34.5 ***
Female (%) 3.7 3.6 3.7
Race/ethnicity (%) White, non-Hispanic Black, non-Hispanic Hispanic Other
1.2 68.9 27.2
2.6
1.1 68.9 27.9
2.1
1.2 68.9 27.4
2.5
Ever worked (%) 68.2 63.4 66.9
Worked in the past year (%) 9.4 12.3 10.2
fNumber of prior convictions 5.4 6.0 5.6
Noncustodial parent (%) 41.6 38.8 40.8
Quarter of random assignment 5.6 5.0 5.4 ***
Sample size 724 281 1,005
SO URCES: MDRC calcul ations based on baseline sur vey data, ETJD m anagement inform ation syste m data, and criminal justice administrative records.
NOTES: Measures are self-reported unless otherwise noted. Statistical significance levels are indicated as: *** = 1 percent; ** = 5 percent; * = 10 percent. aIncludes convictions in the state of Georgia as recorded in administrative records. Does not include federal convictions or convictions from other states. bIncludes self-reports of incarceration in state or federal prison and prison incarceration as recorded in Georgia administrative records. cIncludes convictions in the state of Wisconsin as recorded in administrative records. Does not include federal convictions or convictions from other states. dIncludes self-reports of incarceration in state or federal prison and prison incarceration as recorded in Wisconsin administrative records. eIncludes convictions in the state of California as recorded in administrative records. Does not include federal convictions or convictions from other states. fIncludes convictions in the state of New York as recorded in administrative records. Does not include federal convictions or convictions from other states. gIncludes self-reports of incarceration in state or federal prison and prison incarceration as recorded in New York administrative records. hIncludes convictions in the state of Texas as recorded in administrative records. Does not include federal convictions or convictions from other states. iIncludes convictions in the state of Indiana as recorded in administrative records. Does not include federal convictions or convictions from other states.

459
•
•
•
•
Syracuse: Almost all of the tested characteristics were significantly associat-ed with survey response, but the respondent sample had characteristics more similar to the full research sample. Nonrespondents were younger than both the respondents and the full research sample, less likely to be female, less likely to have ever worked, less likely to have worked in the year before study enrollment, and more likely to have a history of incarceration.
Fort Worth: Respondents were slightly older than nonrespondents, were more likely to be female, were more likely to be black, and had fewer prior convictions.
Indianapolis: Respondents were older than nonrespondents and were also more likely to have ever worked. The global test of differences between re-spondents and nonrespondents was not statistically significant.
New York City: Respondents were older than nonrespondents and were randomly assigned later in the enrollment period.
Comparisons Between the Research Groups in the Survey Respondent Sample When it comes to estimating program impacts, the primary concern is whether there are any differences between the survey respondents in the program group and the respondents in the control group. To test whether program group respondents differed from control group respond-ents, the same series of statistical tests were conducted as discussed in the previous section. However, in this section, the joint test assesses whether the selected baseline characteristics as a whole predict research group assignment among survey respondents, while the individual tests indicate which specific baseline characteristics are associated with research group assignment. As shown in Table H.3, within the respondent samples, some cities had one or two baseline characteristics where the program group and control group survey respondents were significant-ly different, but the global test found that overall, program group survey respondents were not significantly different from control group respondents in any city.
Comparisons Between the Research Sample and the Respondent Sample Another way to assess possible bias from survey response rates is to examine differences between the full research sample and the respondent sample in impacts estimated using admin-istrative data. If the differences between the program and control groups in the respondent

460
(continued)
Appendix Table H.3
Sel ected Baseline Charact eristics of S urvey Respon dents,
by Research Group and City
Characteristic
Atlanta Age 40.2 39.6 39.9
Female (%) 5.4 9.0 7.1 **
Race/ethnicity (%)
White, non-Hispanic 4.6 4.8 4.7 Black, non-Hispanic 90.0 92.2 91.1 Hispanic 3.4 1.8 2.6 Other 1.9 1.3 1.6
Ever worked (%) 99.3 99.3 99.3
Worked in the past year (%) 63.5 57.5 60.5 *
aNumber of prior convictions 2.4 2.3 2.4
bEver incarcerated in prison (%) 34.8 31.7 33.3
Quarter of random assignment 5.6 5.6 5.6
Sample size 411 401 812
Milwaukee
Age 35.5 35.2 35.4
Female (%) 3.2 3.6 3.4
Race/ethnicity (%)
White, non-Hispanic 3.0 1.8 2.4 Black, non-Hispanic 92.5 93.5 93.0 Hispanic 3.5 2.8 3.2 Other 1.0 1.8 1.4
Ever worked (%) 91.1 92.8 91.9
Worked in the past year (%) 49.1 53.4 51.2
cNumber of prior convictions 2.8 2.7 2.8
dEver incarcerated in prison (%) 54.1 50.3 52.2
Quarter of random assignment 5.9 6.0 5.9
Program Group
Control Group
Total
403
Sample size 388
791

461
Appendix Table H.3 (continued)
Control Group
Program Group
Characteristic Total
San Francisco Age 40.6 40.4 40.5
Female (%) 13.5 13.8 13.7
Race/ethnicity (%)
White, non-Hispanic 4.1 2.2 3.2 Black, non-Hispanic 69.4 73.1 71.2 Hispanic 17.2 18.7 17.9 Other 9.3 6.0 7.7
Ever worked (%) 98.0 96.9 97.5
Worked in the past year (%) 38.6 43.0 40.7
eNumber of prior convictions 6.1 5.7 5.9
Ever incarcerated in prison (%) 28.2 26.7 27.5
Quarter of random assignment 5.8 5.7 5.8
Sample size 347 319 666
Syracuse
Age 35.6 36.7 36.1
Female (%) 9.6 5.7 7.7
Race/ethnicity (%)
White, non-Hispanic 11.9 11.1 11.5 Black, non-Hispanic 77.7 79.0 78.3 Hispanic 5.0 7.2 6.0 Other 5.3 2.7 4.1
Ever worked (%) 93.4 96.1 94.7
Worked in the past year (%) 39.3 41.2 40.2
fNumber of prior convictions 3.4 3.3 3.3
gEver incarcerated in prison (%) 38.7 38.5 38.6
Quarter of random assignment 5.5 5.7 5.6
Sample size 377 335 712
*
*
(continued)

462
Appendix Table H.3 (continued)
Female (%) 10.7 11.7 11.2
Race/ethnicity (%) White, non-Hispanic 31.7 25.3 28.5 Black, non-Hispanic 54.9 59.1 57.0 Hispanic 12.2 13.5 12.9 Other 1.2 2.1 1.6
Ever worked (%) 94.2 92.4 93.3
Worked in the past year (%) 14.2 10.3 12.2
hNumber of prior convictions 5.0 5.0 5.0
Noncustodial parent (%) 31.8 37.0 34.4
Quarter of random assignment 5.3 5.1 5.2
Sample size 346 341 687
Indianapolis
Age 34.9 33.2 34.0 **
Female (%) 4.7 3.7 4.2
Race/ethnicity (%)
White, non-Hispanic 15.3 14.0 14.6 Black, non-Hispanic 81.0 82.5 81.7 Hispanic 2.0 2.0 2.0 Other 1.8 1.5 1.6
Ever worked (%) 84.8 84.3 84.6
Worked in the past year (%) 27.4 25.4 26.4
iNumber of prior convictions 3.0 3.1 3.0
Noncustodial parent (%) 51.0 48.1 49.6
Quarter of random assignment 4.9 5.1 5.0
38.9 38.6 38.8 Age
Sample size 402 401 803
Characteristic
Fort Worth
P rogram Group
Control Group
Total
(continued)

463
Appendix Table H.3 (continued)
Characteristic
New York Age 35.1 35.3 35.2
Female (%) 3.8 3.7 3.7
Race/ethnicity (%)
White, non-Hispanic 1.1 1.4 1.2 Black, non-Hispanic 68.1 69.7 68.9 Hispanic 27.3 27.2 27.2 Other 3.5 1.7 2.6
Ever worked (%) 66.3 70.3 68.2
Worked in the past year (%) 10.7 8.0 9.4
fNumber of prior convictions 5.5 5.3 5.4
Noncustodial parent (%) 42.3 40.8 41.6
Quarter of random assignment 5.7 5.6 5.6
Sample size 371 353 724
P rogram Group
Control Group
Total
SO URCES: MDR C calculations based on baseline surve y data, ETJD m anagement inform ation syste m data, and criminal justice administrative records. NOTES: Measures are self-reported unless otherwise noted. Statistical significance levels are indicated as: *** = 1 percent; ** = 5 percent; * = 10 percent. aIncludes convictions in the state of Georgia as recorded in administrative records. Does not include federal convictions or convictions from other states. bIncludes self-reports of incarceration in state or federal prison and prison incarceration as recorded in Georgia administrative records. cIncludes convictions in the state of Wisconsin as recorded in administrative records. Does not include federal convictions or convictions from other states. dIncludes self-reports of incarceration in state or federal prison and prison incarceration as recorded in Wisconsin administrative records. eIncludes convictions in the state of California as recorded in administrative records. Does not include federal convictions or convictions from other states. fIncludes convictions in the state of New York as recorded in administrative records. Does not include federal convictions or convictions from other states. gIncludes self-reports of incarceration in state or federal prison and prison incarceration as recorded in New York administrative records. hIncludes convictions in the state of Texas as recorded in administrative records. Does not include federal convictions or convictions from other states. iIncludes convictions in the state of Indiana as recorded in administrative records. Does not include federal convictions or convictions from other states.

464
sample are not similar to those observed for the full research sample, it may indicate that the respondent sample is not representative and so survey estimates may be biased. Table H.4 compares the impact estimates for the full research samples and the respondent samples for outcomes in three domains (employment and earnings, criminal justice, and child support), by city.2
In general, survey respondents in both research groups had higher levels of employment and earnings than the full research sample, a lower incidence of criminal justice events, and higher levels of compliance with child support payments. However, the differences between the program and control group respondents were similar to those seen between program and control group members in the full research sample. The differences in criminal justice outcome levels between the respondent sample and the full research sample indicate that the inability to interview many incarcerated sample members may explain some of the variation between the respondent and full research samples, where that variation exists. Since there were only fairly small differences in criminal justice outcomes between the program and control groups for most programs, there is no reason for substantial concern about bias arising from survey nonresponse.
2Estimates shown may differ slightly from those in the main body of the report due to minor specification
issues.

465
Appendix Table H.4
Selected One-Year Impacts for the Research and Respondent Samples, by City
Outcome
Atlanta Employed (%)
Research sample 98.4 70.9 27.5 *** [24.1, 30.9] Respondent sample 98.7 70.9 27.8 *** [24.0, 31.5] Total earnings ($)
Research sample 8,765 6,709 2,056 *** [1,164, 2,947] Respondent sample 8,700 6,903 1,797 *** [819, 2,774] Arrested (%)
Research sample 14.6 18.7 -4.1 * [-7.8, -0.3] Respondent sample 13.2 17.7 -4.5 * [-8.6, -0.5] Convicted of a crime (%)
Research sample 5.8 6.4 -0.6 [-3.1, 1.8] Respondent sample 6.2 5.1 1.0 [-1.6, 3.7] Arrested, convicted, or admitted to prison (%)
Research sample 14.8 19.1 -4.3 * [-8.1, -0.5] Respondent sample 13.2 17.7 -4.5 * [-8.6, -0.5] Amount of formal child support paid ($)
Research sample 1,733 993 740 *** [590, 889] Respondent sample 1,753 993 760 *** [592, 928] Months of formal child support paid
Research sample 6.7 4.2 2.5 *** [2.2, 2.9] Respondent sample 6.9 4.2 2.7 *** [2.3, 3.1] Sample size
Program
Group
Control
Group
Difference
(Impact)
Ninety Percent Confidence
Interval
Research sample (total = 996) Respondent sample (total = 812)
501 411
495
401 (continued)

466
Appendix Table H.4 (continued)
Outcome
Research sample 86.3 60.6 25.7 *** [21.4, 30.0] Respondent sample 88.5 62.1 26.4 *** [21.8, 31.1] Total earnings ($)
Research sample 4,910 3,139 1,772 *** [1,273, 2,270] Respondent sample 5,166 3,274 1,892 *** [1,337, 2,446] Arrested (%)
Research sample 19.5 18.2 1.3 [-2.7, 5.3] Respondent sample 18.5 15.8 2.7 [-1.6, 7.1] Convicted of a crime (%)
Research sample 9.8 6.9 2.9 * [0.1, 5.8] Respondent sample 9.4 6.5 2.9 [-0.3, 6.1] Arrested, convicted, or admitted to prison (%)
Research sample 23.2 22.5 0.8 [-3.4, 5.0] Respondent sample 21.7 19.5 2.2 [-2.4, 6.8] Amount of formal child support paid ($)
Research sample 1,007 631 376 *** [234, 518] Respondent sample 1,051 639 412 *** [247, 578] Months of formal child support paid
Research sample 5.1 2.9 2.1 *** [1.8, 2.4] Respondent sample 5.3 3.0 2.2 *** [1.9, 2.6]
Program
Group
Control
Group
Difference
(Impact)
Ninety Percent Confidence
Interval
M ilwauke e
Sample size
Employed (%)
Research sample (total = 1,003) Respondent sample (total = 791)
502 403
501
388 (continued)

467
Appendix Table H.4 (continued)
Outcome
Research sample
80.2 52.3 27.9 *** [23.3, 32.5]
Respondent sample 81.7 53.9 27.8 *** [22.3, 33.2] Total earnings ($)
Research sample 7,952 4,614 3,337 *** [2,508, 4,116] Respondent sample 8,287 4,656 3,631 *** [2,648, 4,615] Arrested (%)
Research sample 18.6 20.6 -2.0 [-6.0, 1.9] Respondent sample 15.9 18.1 -2.1 [-6.8, 2.5] Convicted of a crime (%)
Research sample 9.2 9.1 0.0 [-2.9, 3.0] Respondent sample 7.9 7.4 0.5 [-2.9, 3.8] Amount of formal child support paid ($)
Research sample 1,390 1,430 -40 [-358, 278] Respondent sample 1,361 1,311 51 [-240, 341] Months of formal child support paid
Research sample 4.4 3.4 1.0 *** [0.6, 1.3] Respondent sample 4.4 3.6 0.8 *** [0.4, 1.2] Sample size
Respondent sample (total = 666)
Program
Group
Control
Group
Difference
(Impact)
Ninety Percent Confidence
Interval
Sa n Franc isco
Employed (%)
Research sample (total = 995)
502 347
493
319 (continued)

468
Appendix Table H.4 (continued)
Outcome
Research sample
90.0 58.7 31.4 *** [27.2, 35.5]
Respondent sample 92.0 62.1 29.9 *** [25.2, 34.6] Total earnings ($)
Research sample 3,901 2,928 973 *** [516, 1,430] Respondent sample 4,072 3,123 948 *** [399, 1,498] Arrested (%)
Research sample 20.1 21.1 -1.0 [-5.1, 3.0] Respondent sample 15.0 15.9 -0.9 [-5.3, 3.5] Convicted of a crime (%)
Research sample 18.3 15.4 2.9 [-0.9, 6.7] Respondent sample 13.9 12.4 1.5 [-2.6, 5.7] Arrested, convicted, or admitted to prison (%)
Research sample 22.5 24.0 -1.5 [-5.7, 2.7] Respondent sample 15.7 18.4 -2.7 [-7.2, 1.9] Amount of formal child support paida ($)
Research sample 318 189 129 [-89, 348] Respondent sample 377 142 235 [-84, 555] Months of formal child support paida
Research sample 1.7 1.4 0.3 * [0.0, 0.6] Respondent sample 1.8 1.2 0.7 *** [0.3, 1.0] Sample size
Program
Group
Control
Group
Difference
(Impact)
Ninety Percent Confidence
Interval
Sy racuse Employed (%)
Research sample (total = 1,004) Respondent sample (total = 712)
506 377
498
335 (continued)

469
Appendix Table H.4 (continued)
Outcome
Research sample
73.6 72.2 1.5 [-3.1, 6.2] Respondent sample 78.3 75.6 2.8 [-2.5, -8.1] Total earnings ($)
Research sample 5,645 5,773 -128 [-874, 618] Respondent sample 6,356 6,332 24 [-895, 943] Arrested (%)
Research sample 18.9 24.9 -6.0 ** [-10.2, -1.8] Respondent sample 10.6 19.5 -8.9 *** [-13.3, -4.5] Convicted of a crime (%)
Research sample 11.6 11.4 0.1 [-3.2, 3.4] Respondent sample 6.3 10.3 -3.9 * [-7.4, -0.5] Arrested, convicted, or admitted to jail or prison (%)
Research sample 27.0 32.3 -5.3 * [-10.0, -0.7] Respondent sample 17.2 25.7 -8.5 *** [-13.6, -3.4] Amount of formal child support paid ($)
Research sample 204 247 -43 [-115, 29] Respondent sample 231 252 -21 [-107, 64] Months of formal child support paid
Research sample 0.6 0.7 -0.1 [-0.3, 0.1] Respondent sample 0.7 0.7 0.0 [-0.2, 0.2] Sample size
Program
Group
Control
Group
Difference
(Impact)
Ninety Percent Confidence
Interval
F ort Worth
Employed (%)
Research sample (total = 999) Respondent sample (total = 687)
503 346
496
341 (continued)

470
Appendix Table H.4 (continued)
Outcome
Research sample
96.4 62.0 34.4 *** [31.0, 38.2]
Respondent sample 97.0 63.0 34.0 *** [29.7, 38.2] Total earnings ($)
Research sample 6,034 2,830 3,204 *** [2,747, 3,662]
Respondent sample 6,359 2,934 3,425 *** [2,899, 3,951]
Arrestedb (%)
Research sample 19.7 23.7 -4.1 [-9.1, 0.9] Respondent sample 17.2 22.8 -5.6 * [-11.0, -0.2] c Convicted of a crime (%)
Research sample 13.5 15.9 -2.3 [-6.6, 2.0] Respondent sample 12.5 15.2 -2.7 [-7.5, 2.0] Amount of formal child support paid ($)
Research sample 455 237 218 *** [127, 309] Respondent sample 449 280 168 *** [69, 268] Months of formal child support paid
Research sample 1.9 0.8 1.1 *** [0.8, 1.3] Respondent sample 2.0 0.9 1.1 *** [0.8, 1.4] Sample size
Program
Group
Control
Group
Difference
(Impact)
Ninety Percent Confidence
Interval
Indianapolis Employed (%)
Research sample (total = 998) Respondent sample (total = 803)
501 402
497
401 (continued)

471
Appendix Table H.4 (continued)
Outcome
New York
Research sample 88.7 68.6 20.2 *** [16.0, 24.3] Respondent sample 91.7 70.9 20.8 *** [16.2, 25.4] Total earnings ($)
Research sample 5,469 4,208 1,260 *** [676, 1,844] Respondent sample 6,316 4,620 1,696 *** [986, 2,405] Arrested (%)
Research sample 18.9 21.6 -2.7 [-6.7, 1.3] Respondent sample 13.3 14.0 -0.7 [-4.7, 3.3] Convicted of a crime (%)
Research sample 12.7 13.2 -0.6 [-3.9, 2.7] Respondent sample 9.5 9.3 0.2 [-3.2, 3.5] Arrested, convicted, or admitted to jail or prison (%)
Research sample 34.1 32.6 1.4 [-3.2, 6.1] Respondent sample 26.4 24.3 2.1 [-3.0, 7.2] Amount of formal child support paida ($)
Research sample 58 34 24 [-21, 69] Respondent sample 77 49 28 [-37, 93] Months of formal child support paida
Research sample 0.3 0.2 0.1 [0.0, 0.2] Respondent sample 0.4 0.2 0.2 * [0.0, 0.4]
Program
Group
Contro
Groupl
Difference
(Impact)
Ninety Percent Confidence
Interval
Sample size Research sample (total = 1,005)
Employed (%)
Respondent sample (total = 724)
504 371
501
353 (continued)

472
Appendix Table H.4 (continued)
SOU RCES: MDR C calculat ions based on the ETJD 12-mon th survey, q uarterly wa ge data from the National Directory of New Hires, criminal justice data, and child support agency data. NOTES: Results in this table are regression-adjusted, controlling for pre-random assignment characteristics. Statistical significance levels are indicated as: *** = 1 percent; ** = 5 percent; * = 10 percent. Employment rates and earnings include both ETJD subsidized jobs and all other jobs covered by unemployment insurance. Measures of formal child support include all payments made through the state's child support collec-tion and disbursement unit, including those from employer withholding and other sources (for example, tax intercepts). aDue to incomplete administrative data, these child support measures include only sample members who were randomly assigned during the first year of the study (by December 31, 2012). bIndianapolis arrest and conviction measures exclude sample members for whom no records could be retrieved due to limitations of the criminal justice data. cThe dates for Indianapolis conviction measures are set equal to the arrest dates; actual conviction dates were unavailable. This measure therefore undercounts the number of convictions resulting from arrests that occurred in the year after random assignment, as prosecutions of some of these arrests had not yet resulted in a disposition by the date on which the data were obtained.
Appendix I
Baseline Characteristics of Program and Control Group Members Across Programs

THIS PAGE INTENTIONALLY LEFT BLANK

475
(continued)
Characteristic
Program Group
Control Group
Male (%) 93.1 93.3
Age (%)
18-24 7.8 7.3 25-34 33.0 32.3 35-44 34.4 35.4 45 or older 24.9 25.0 Average age 37.6
37.6
Race/ethnicity (%)
Black, non-Hispanic 81.5 83.3 White, non-Hispanic 5.9 5.1 Hispanic 7.8 7.9 Asian, non-Hispanic 1.4 1.3 Other/multiracial 3.3 2.4 Educational attainment (%)
No high school diploma or equivalent 27.9 30.6 High school diploma or equivalent 66.8 65.0 Associate's degree or equivalent 2.9 2.2 Bachelor's degree or higher 2.4 2.2 Marital status (%)
Never married 67.2 65.1 Currently married 8.0 8.7 Separated, widowed, or divorced 24.8 26.1 Veteran (%) 5.4 4.2 *
Has a disability (%) 5.9 4.9
Housing (%)
Rents or owns 44.3 46.5 Halfway house, transitional house, or residential treatment facility 3.6 3.8 Homeless 7.3 8.5 Staying in someone else's apartment, room, or house 44.7 41.2
Appendix Table I.1 Characteristics and Employment Histories of Sample M embers:
Programs Targeting Noncustodial Parents

476
Appendix Table I.1 (continued)
Control Group
r workEve ed (%) 95.2 96.0
Among those who ever worked:
orkedW in the past year (%) 49.7 50.2 A Ever worked for the same employer for 6 months or more (%)
verage hourly wage in most recent job ($) 11.23 11.20 80.4 78.6
onthsM worked in the previous 3 years (%) *** Did not work 13.8 13.8 Fewer than 6 months 22.8 33.2 6 to 12 months 32.2 24.9 13 to 24 months 14.4 13.8 More than 24 months 16.8 14.2
ple sizSam e 2,011 1,987
Characteristic
Employment history
Program Group
SO URCES: MDRC calculations based on baseline survey data and E TJD manage ment informat ion system data. NOTE: Statistical significance levels are indicated as: *** = 1 percent; ** = 5 percent; * = 10 percent.

477
Appendix Table I.2 Child Support and Criminal Justice Characteristics of Sam ple Members :
Programs Targeting Noncustodial Parents Characteristic
Parental and child support status
Noncustodial parent (%) 100.0 100.0
Has any minor-age children (%) 93.3 93.2
Among those with minor-age children:
Average number of minor-age children 2.5 2.5 Living with minor-age children (%) 16.5 19.7 **
Has a current child support order (%) 86.4 86.3
Has an order only for child support debt (%) 12.8 12.6
Criminal history
aEver convicted of a crime (%) 76.8 76.0 bEver convicted of a felony 49.9 48.5
bEver convicted of a misdemeanor 63.7 62.9
cEver incarcerated in prison (%) 41.0 39.5
Among those ever incarcerated in prison: dAverage years in prison 3.8 3.8
Years between most recent release and program enrollmente (%)
Less than one year 33.9 32.5 One to three years 18.2 16.8 More than three years 47.9 50.6
eAverage months since most recent release 59.6 64.9
On community supervision at program enrollmentf (%) 54.3 48.9 *
Sample size 2,011 1,987
Program Group
Control Group
(continued)

478
Appendix Table I.2 (continued)
SOU RC ES: MDRC calculations based on baseline survey data, ETJD management in formation sys tem data, and criminal justice administrative records. NOTES: Measures are self-reported unless otherwise noted. Statistical significance levels are indicated as: *** = 1 percent; ** = 5 percent; * = 10 percent. aIncludes convictions in the state in which the program operated as recorded in administrative records. Does not include federal convictions or convictions from other states. bAdministrative records from Wisconsin were not available on this subject. Therefore this measure reflects data only from Atlanta, San Francisco, and Syracuse. cFor Atlanta, Milwaukee, and Syracuse, this measure includes participants' reports of incarceration in state or federal prison and prison incarceration as recorded in administrative records from the state in which the program operated. For San Francisco, this measure only includes participants' reports of incarceration. Administrative prison records from California were not available on this subject at the time of this report. dIncludes time spent in state prisons in the state in which the program operated, according to administrative records. Does not include time spent in federal prisons or prisons in other states. Administrative prison records from California were not available on this subject at the time of this report, so this measure only reflects data from Atlanta, Milwaukee, and Syracuse. eMost recent release can be from prison or jail. fIncludes parole, probation, and other types of criminal justice or court supervision.

479
Number of minor-age children (%) None 6.7 6.8 1 32.0 31.5 2 25.3 25.4 3 or more 35.9 36.3
Among participants with child support orders:
Average age of youngest child (years) 8.8 8.9 a Ever convicted of a violent crime (%) 35.8 35.1 bEver incarcerated in prison (%) 41.0 39.5 Among those ever incarcerated in prison:
cTotal time incarcerated in prison (%)
Most recently released fromd (%)
Less than 2 years 37.4 41.3 2 to 4 years 25.7 23.4 More than 4 years 36.9 35.4
State prison 76.4 80.2 County/city jail 16.2 13.7 Federal prison 7.4 6.1 Among those who ever worked:
Hourly wage in most recent job (%)
$0.01 - $7.25 14.2 13.7 $7.26 - $9.99 34.5 34.1 $10.00 - $14.99 36.1 37.3 $15.00 or more 15.2 14.8
Had income at enrollmentd (%) 24.2 22.1 Receipt of public assistance (%) ***
No public assistance 43.5 33.1 Food stamps (SNAP) 47.7 51.8 General assistance or welfare 2.9 6.6 Other government assistance program/multiple programs 5.9 8.5
Program Group
ontrol Group
C
Characteristic
(continued)
Appendix Table I.3
Additional Characteristics of Sample Members at En rollment : Programs Targeting Noncustodial Parents

480
Appendix Table I.3 (continued)
Characteristic
Family assists with (%)
Place to live 34.5 36.6 Financial support 8.1 8.5 Transportation 3.3 3.3 Job 0.6 1.1 Multiple forms of support 4.9 4.5 None 48.5 46.0
dMedical benefits (%)
None 72.4 70.8 Medicaid 20.0 21.8 Medicare 2.0 2.2 Private health insurance 1.1 1.1 Other 4.5 4.0
Previous alcohol-abuse or drug-use treatmentd (%) 31.0 32.3
Receiving alcohol-abuse or drug-use treatment at enrollmentd (%) 4.9 5.4
Ever received mental health treatment (%) 13.1 13.0
Sample size 2,011 1,987
Pro gram Group
Con trol
Group
SO UR CES: MDRC calculations based on baseline survey data, ETJD manage ment infor mation system data, and criminal justice administrative records. NOTES: Measures are self-reported unless otherwise noted. SNAP = Supplemental Nutrition Assistance Program. Statistical significance levels are indicated as: *** = 1 percent; ** = 5 percent; * = 10 percent. aIncludes convictions in the state in which the program operated as recorded in administrative records. Does not include federal convictions or convictions from other states. Administrative records from Wisconsin were not available on this subject. Therefore this measure reflects data only from Atlanta, San Francisco, and Syracuse. bFor Atlanta, Milwaukee, and Syracuse, this measure includes participants' reports of incarcera-tion in state or federal prison and prison incarceration as recorded in administrative records from the state in which the program operated. For San Francisco, this measure only includes participants' reports of incarceration. Administrative prison records from California were not available on this subject at the time of this report. cIncludes time spent in state prisons in the state in which the program operated, according to administrative records. Does not include time spent in federal prisons or prisons in other states. Administrative prison records from California were not available on this subject at the time of this report, so this measure only reflects data from Atlanta, Milwaukee, and Syracuse. dThis baseline measure had very low response rates in San Francisco. Therefore, this table reflects data only from Atlanta, Milwaukee, and Syracuse.
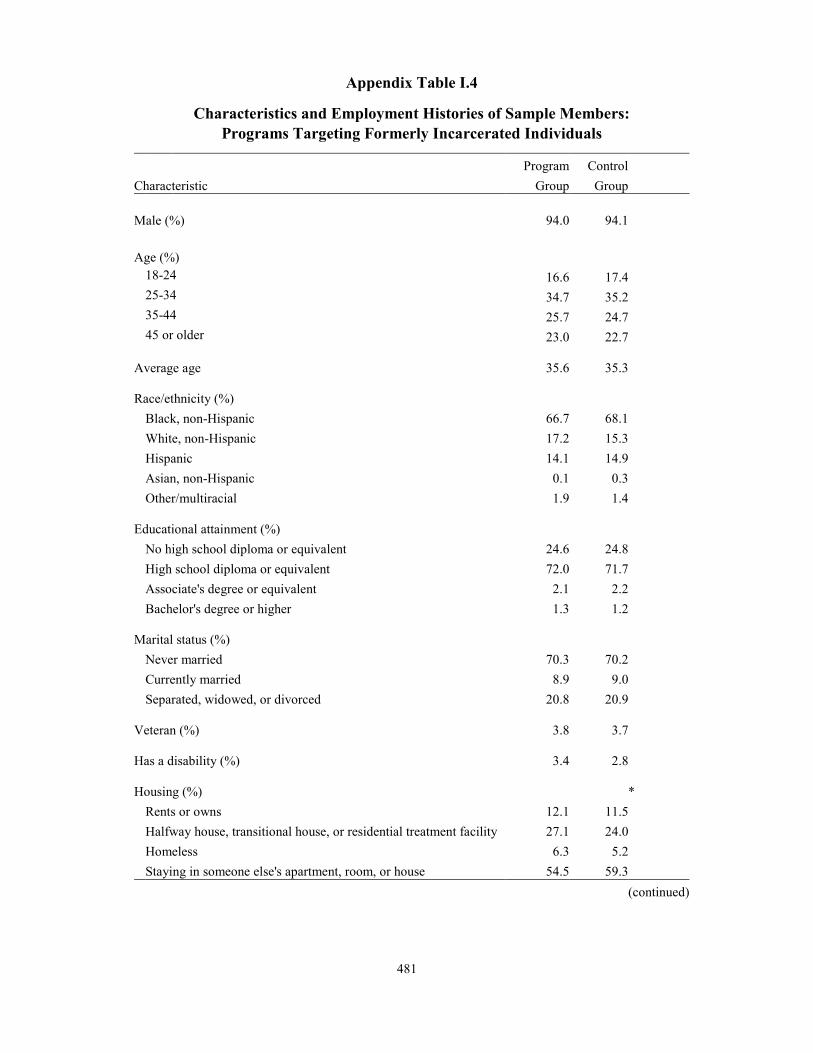
481
Male (%) 94.0 94.1
Age (%)
18-24 16.6 17.4 25-34 34.7 35.2 35-44 25.7 24.7 45 or older 23.0 22.7 Average age 35.6
35.3
Race/ethnicity (%)
Black, non-Hispanic 66.7 68.1 White, non-Hispanic 17.2 15.3 Hispanic 14.1 14.9 Asian, non-Hispanic 0.1 0.3 Other/multiracial 1.9 1.4
Educational attainment (%)
No high school diploma or equivalent 24.6 24.8 High school diploma or equivalent 72.0 71.7 Associate's degree or equivalent 2.1 2.2 Bachelor's degree or higher 1.3 1.2
Marital status (%)
Never married 70.3 70.2 Currently married 8.9 9.0 Separated, widowed, or divorced 20.8 20.9
Veteran (%) 3.8 3.7
Has a disability (%) 3.4 2.8
Housing (%) *
Rents or owns 12.1 11.5 Halfway house, transitional house, or residential treatment facility 27.1 24.0 Homeless 6.3 5.2 Staying in someone else's apartment, room, or house 54.5 59.3
Program Group
Control
Group
Characteristic
(continued)
Appendix Table I.4 Characteristics and Employment Histories of Sample M embers:
Programs Targeting Formerly Incarcerated Individuals

482
Appendix Table I.4 (continued)
Ever worked (%)
A
mong those who ever worked:
Worked in the past year (%) 20.3 19.5 Average hourly wage in most recent job ($) 10.11 10.10 Ever worked for the same employer for 6 months or more (%) 74.0 71.8
Months worked in the previous 3 years (%)
Did not work 46.0 47.2 Fewer than 6 months 31.1 29.9 6 to 12 months 13.8 12.1 13 to 24 months 6.3 7.1 More than 24 months 2.7 3.7
1,508 1,494 Sample size
Characteristic
Employment history
Program Group
Control Group
80.7
81.5
SO URCES: MDRC calculations based on baseline survey data and ETJD manage ment infor mation system data. NOTE: Statistical significance levels are indicated as: *** = 1 percent; ** = 5 percent; * = 10 percent.

483
Appendix Table I.5 Child Support and Criminal Just ice Characteristics of S ample Members:
Programs Targeting Formerly Incarcerated People
Noncustodial parent (%) 41.8 42.4
Has any minor-age children (%) 51.8 51.1
Average number of minor-age children
2.1
2.1
iving with minor-age children (%) 14.2 13.7
Has a current child support order (%) 15.6 14.8
Has an order only for child support debt (%) 0.8 0.7
Criminal history
Ever convicted of a felony Ever convicted of a misdemeanor
96.1
90.5 66.1
96.6
91.5 64.3
ver incarcerated in prison(%) 100.0 100.0
bAverage years in jail and prison 4.7 4.9
cAverage months since most recent release 1.4 1.5
tatus at program enrollment (%) Parole
74.5
76.6
Probation 12.6 11.2 Other criminal justice/court supervision None of the above
10.4 2.5
8.8 3.3
Sample size 1,508 1,494
Among those with minor-age children:
L
Ever convicted of a crimea (%)
E
S
Characteristic
Program Group
Control Group
Parental and child support status
SO UR CES: MDRC calculations based on baseline survey data, ETJD manage ment informatio n system data, and criminal justice administrative records. NOTES: Measures are self-reported unless otherwise noted. Statistical significance levels are indicated as: *** = 1 percent; ** = 5 percent; * = 10 percent. aIncludes convictions in the the state in which the program operated as recorded in administrative records. Does not include federal convictions or convictions from other states. bIncludes time spent in state prisons and local jails in the state in which the program operated according to administrative records. Does not include time spent in federal prisons or prisons in other states. cMost recent release can be from prison or jail.

484
Appendix Table I.6
Additional Characteristics of Sample Mem bers at En rollment: Programs Targeting Formerly Incarcerated People
Number of minor-age children (%)
Program Group
Control Group
Characteristic
None 48.2 48.9 1 22.8 22.5
2 14.6 14.6 3 or more 14.3 14.1
Among participants with child support orders:
Average age of youngest child (years) 9.6 9.6
aEver convicted of a violent crime (%) 49.2 49.6
b (%)Total time incarcerated in jail or prison
Less than two years 33.1 29.6 Two to four years 26.9 29.2 More than four years 39.9 41.2
Most recently released from (%)
State prison 89.0 90.2 County/city jail 4.7 4.9 Federal prison 6.3 4.9
Among those who ever worked:
Hourly wage in most recent job (%)
$0.01 - $7.25 22.2 23.6 $7.26 - $9.99 37.4 38.6 $10.00 - $14.99 30.1 26.4 $15.00 or more 10.4 11.4
Had income at enrollment (%) 4.0 3.7
Receipt of public assistance (%)
No public assistance 69.5 67.5 Food stamps (SNAP) 21.9 25.3 General assistance or welfare 4.5 3.9 Other government assistance program/multiple programs 4.1 3.4
(continued)

485
Appendix Table I.6 (continued)
Characteristic
Family assists with (%)
Transportation
Multiple forms of support
Place to live 54.6 56.2
Financial support
Job
7.6 4.5 0.5
8.15.00.4
None 3.0
28.9 2.9
27.1
Medical benefits
None 70.3 70.1Medicaid 20.8 21.6Medicare 0.3 0.1Private health insurance 0.8 0.8Other 7.9 7.4
Previous alcohol-abuse or drug-use treatment (%)
Receiving alcohol-abuse or drug-use treatment at enrollment (%)
Ever received mental health treatment (%)
48.3
24.7
11.1
48.2
25.9 7.5 ***
Sample size 1,508 1,494
Pro gram Group
C ontrol Group
SO U RCES: MDRC calculations based on baseline survey data, ETJD ma nagement inf ormation system data, and criminal justice administrative records. NOTES: Measures are self-reported unless otherwise noted. SNAP = Supplemental Nutrition Assistance Program. Statistical significance levels are indicated as: *** = 1 percent; ** = 5 percent; * = 10 percent. aIncludes convictions in the the state in which the program operated as recorded in administrative records. Does not include federal convictions or convictions from other states. bIncludes time spent in state prisons and local jails in the state in which the program operated according to administrative records. Does not include time spent in federal prisons or prisons in other states.

THIS PAGE INTENTIONALLY LEFT BLANK

Appendix J
The Analytic Approach to Determining Impacts on Recidivism-Risk Subgroups

THIS PAGE INTENTIONALLY LEFT BLANK

489
The methodological approach used for determining whether impacts vary with study partici-pants’ risk of recidivism draws on the approach described in Zweig, Yahner, and Redcross (2010).1 It focuses on formerly incarcerated individuals’ probability of rearrest, reconviction, and reincarceration in the year following random assignment.2 The research goal is to differen-tiate formerly incarcerated individuals into lower-to-moderate-risk and higher-risk subgroups, depending on their risk of recidivism as predicted before study participation, and then to examine the impact each Enhanced Transitional Jobs Demonstration (ETJD) program targeting formerly incarcerated individuals had on each subgroup’s recidivism.
Given the random assignment research design of the evaluation, the observed and un-observed baseline characteristics of study sample members assigned to the control group should reflect, on average, those of sample members assigned to the program group. The evaluation capitalizes on the opportunity presented by experimental data to estimate the risk of recidivism for formerly incarcerated individuals in the program group, using characteristics measured before program participation, based on observations of such risk in the control group. It then classifies participants into lower-to-moderate-risk and higher-risk subgroups based on these risk scores and evaluates the impact of the Fort Worth, Indianapolis, and New York City ETJD programs on recidivism within each subgroup.
Toward this end, the analytic strategy is threefold. The first step is to examine the pre-dictive associations between all baseline characteristics and recidivism in the year after random assignment for each site. The candidate covariates (predictors) were the covariates used for the full sample impact models presented through this report.3 For this analysis, a bootstrap valida-tion procedure was employed to derive the best-fitting, most parsimonious model to predict recidivism risk at each site (Fort Worth, Indianapolis, and New York City). The bootstrap procedure was implemented as follows:
• Generate 100 bootstrap samples (sample with replacement) from the control group data at each site
• Estimate the model from each bootstrap sample using stepwise selection
1The Zweig, Yahner, and Redcross approach is a modified version of the procedure described in Kemple
and Snipes (2001). 2Recidivism in this analysis is defined as having any criminal justice event in the year following random
assignment. This measure of “any criminal justice event,” featured elsewhere in this report, is derived from state and local criminal justice records covering arrests, convictions, jail admissions, and prison admissions.
3One exception is that child support-specific variables were excluded. In addition, the two work-experience covariates — (1) ever worked and (2) worked in the year before random assignment — were combined into a single work-experience variable with three categories: (1) never worked, (2) worked earlier than the year before random assignment but not during the year before random assignment, and (3) worked during the year before random assignment. These changes were made to simplify model estimation.

490
• Estimate model optimism by comparing model performance with the boot-strap sample and the original sample4
The final model covariates are determined by examining the covariates selected in each of the bootstrap models. If a variable is “truly” representative of the model it will occur in the majority of the bootstrap models (in at least 50 of the 100 models). Overall accuracy is indicated by a summary of the bootstrap model optimism estimates. Model performance is assessed using the “c” statistic (the area under the receiver operating characteristic curve, or “AUC”), which provides an overall measure of how well the model correctly classifies the outcome.5
The results showed that the models were able to accurately predict recidivism about 64 percent of the time in Fort Worth, 61 percent of the time in Indianapolis, and 71 percent of the time in New York City, and that the potential bias due to overfitting in each was small.6
The analysis culminated by identifying participants’ ages and numbers of previous con-victions as important predictors of recidivism across all three sites, months incarcerated as important predictors of recidivism in Fort Worth and New York City, and work experience as an important predictor of recidivism in Fort Worth.7 At each of the three sites, older sample members were less likely to reoffend than younger sample members, all else being equal. Also, sample members with more previous convictions were more likely to reoffend than those with fewer previous convictions. In Fort Worth and New York City, sample members who had spent more months incarcerated were more likely to reoffend that those who had spent fewer months incarcerated. Lastly, in Fort Worth, sample members with the least recent work experience (those who had either never worked or had not worked in the year before random assignment) were more likely to reoffend than those who had worked in the year before random assignment.
4An important threat to the validity of the predictions for new subjects is overfitting: the possibility that a
given model is not generalizable due to specifics and idiosyncrasies in the sample. Overfitting leads to an optimistic impression of model performance for the purposes of generating predictions in new subjects.
5AUC is problematic when comparing competing model specifications (Hand, 2009; Hand and Anag-nostopoulos, 2013), but it is used here to compare one model across data sets (bootstrap sample versus original sample).
6In Fort Worth, on average, the AUC for the bootstrap samples (corrected for optimism) was 0.64, ranging from 0.59 to 0.71 with a mean optimism correction of 0.03. In Indianapolis, on average, the AUC for the bootstrap samples (corrected for optimism) was 0.61, ranging from 0.56 to 0.68 with a mean optimism correction of 0.03. In New York City, on average, the AUC for the bootstrap samples (corrected for optimism) was 0.71, ranging from 0.66 to 0.78 with a mean optimism correction of 0.02.
7Age appeared in all bootstrap models in Fort Worth and New York, and 98 of the 100 bootstrap models in Indianapolis. Number of previous convictions appeared in 96 bootstrap models in Fort Worth, 85 bootstrap models in Indianapolis, and all bootstrap models in New York City. Months incarcerated (including months in both prison and jail) appeared in the majority of bootstrap models in Fort Worth (55) and New York City (86), and work experience appeared in the majority of bootstrap models in Fort Worth (52).

491
The second step is to estimate the probability (risk) of recidivism for the full sample, by applying the estimated regression coefficients from the bootstrapping model parameters to both the program group and the control group at each site. For each study participant at a site, a risk-of-recidivism score is generated and used to create subgroups of lower-to-moderate-risk and higher-risk offenders.8 The distribution of risk scores for the control group was examined to identify the 75th-percentile scores at each site. Participants with risk scores lower than the 75th percentile at their site are said to be at lower to moderate risk of reoffending, while those with risk scores above the 75th percentile at their site are said to be at higher risk.
The third and final step is to analyze the impact of each ETJD program targeting for-merly incarcerated people within each subgroup by estimating a series of regression models. Each outcome model uses the same predictors as those in the model estimating risk scores but includes an additional variable measuring ETJD program group status. From each model’s output, adjusted outcomes are generated for the program and control participants to show the size of the ETJD program’s impact, while determining the significance of the impact by the p-value associated with the program variable’s coefficient in each outcome model.
8So that results can be more easily interpreted and presented for use by practitioners, the study takes a
subgroup-based approach rather than using the continuous risk-score index.

THIS PAGE INTENTIONALLY LEFT BLANK

493
References
Austin, James, and Michael Jacobson. 2013. How New York City Reduced Mass Incarceration: A Model for Change? New York: Vera Institute of Justice.
Badger, Emily, and Christopher Ingraham. 2014. “What You’d Need to Make in Every County in America to Afford a Decent One-Bedroom.” Washington Post. Website: www.washingtonpost.com/news/wonk/wp/2014/04/22/what-youd-need-to-make-in-every-county-in-america-to-afford-a-decent-one-bedroom.
Bell, Stephen H., and Larry L. Orr. 1994. “Is Subsidized Employment Cost Effective for Welfare Recipients? Experimental Evidence from Seven State Demonstrations.” Journal of Human Resources 29, 1: 42-61.
Bloch, Matthew, Matthew Ericson, and Tom Giratikanon. 2014. “Mapping Poverty in America.” New York Times. Website: www.nytimes.com/newsgraphics/2014/01/05/ poverty-map.
Bloom, Dan. 2010. Transitional Jobs: Background, Program Models, and Evaluation Evidence. New York: MDRC.
Butler, David, Julianna Alson, Dan Bloom, Victoria Deitch, Aaron Hill, JoAnn Hsueh, Erin Jacobs Valentine, Sue Kim, Reanin McRoberts, and Cindy Redcross. 2012. What Strategies Work for the Hard-to-Employ? Final Results of the Hard-to-Employ Demonstration and Evaluation Project and Selected Sites from the Employment Retention and Advancement Project. New York: MDRC.
California Department of Child Support Services. 2016. “Compromise of Arrears Program (COAP).” Website: www.childsup.ca.gov/payments/compromiseofarrearsprogram.aspx.
Carson, Ann. 2015. “Prisoners in 2015.” Washington, DC: U.S. Department of Justice.
Center for Community Alternatives. 2011. “The Use of CHAIRS Reports as Criminal Background Checks.” Syracuse, NY: Center for Community Alternatives. Available online at: www.communityalternatives.org/pdf/CHAIRS-FullReport-FINAL-March2011-1.pdf.
Center for Community Alternatives. 2012. “Innovative Solutions for Justice: Mission.” Website: www.communityalternatives.org/about/mission.html.
Center for Employment Opportunities. 2016. “Participants: How We Can Help.” Website: www.ceoworks.org/services/who-we-serve/participants.
City and County of San Francisco, Office of Labor Standards Enforcement. “Minimum Wage Ordinance (MWO).” Website: http://sfgov.org/olse/minimum-wage-ordinance-mwo. Accessed on March 7, 2016.

494
Crampton, Liz. 2015. “Some Convicted Felons Eligible for Food Stamps.” Texas Tribune. Website: www.texastribune.org/2015/06/25/some-convicted-felons-now-eligible-food-stamps.
Davis, Angela, and Timothy Rupinski. 2013. Evaluation of the Transitional Jobs Demonstration Project. Madison, WI: Wisconsin Department of Children and Families. Available online at: http://dcf.wisconsin.gov/w2/pdf/tjdp_final_evaluation.pdf.
Durose, Matthew, Alexia D. Cooper, and Howard N. Snyder. 2014. “Recidivism of Prisoners Released in 30 States in 2005: Patterns from 2005 to 2010.” Washington, DC: U.S. Department of Justice, Bureau of Justice Statistics. Available online at: www.bjs.gov/ content/pub/pdf/rprts05p0510.pdf.
Dutta-Gupta, Indivar, Kali Grant, Matthew Eckel, and Peder Edelman. 2016. Lessons Learned from 40 Years of Subsidized Employment Programs: A Framework, Review of Models, and Recommendations for Helping Disadvantaged Workers. Washington, DC: Georgetown Center on Poverty and Inequality.
Farrell, Mary, Sam Elkin, Joseph Broadus, and Dan Bloom. 2011. Subsidized Employment Opportunities for Low-Income Families: A Review of State Employment Programs Created Through the TANF Emergency Fund. New York: MDRC.
Floyd, Ife, Ladonna Pavetti, and Liz Schott. 2015. “TANF Continues to Weaken as a Safety Net.” Washington, DC: Center on Budget and Policy Priorities. Available online at: www.cbpp.org/sites/default/files/atoms/files/6-16-15tanf.pdf.
Fortune Society. 2016. “Homepage.” Website: http://fortunesociety.org/#programs.
Fort Worth Chamber of Commerce. 2016a. “Industry Clusters.” Website: http://fortworthecodev.com/expand-relocate/industry-clusters.
Fort Worth Chamber of Commerce. 2016b. “Major Employers.” Website: http://fortworthecodev.com/fort-worth-overview/facts-figures/major-employers.
Georgia Department of Human Services. n.d. “Fatherhood Program.” Atlanta, GA: Georgia Department of Human Services. Available online at: http://dhs.georgia.gov/sites/ dhs.georgia.gov/files/related_files/document/DCSS.%20Fatherhood%20Fact%20Sheet%205.12.pdf.
Greater Syracuse Works. 2016. “Parent Success Initiative.” Website: www.greatersyracuseworks.org.
Halkovic, Alexis, Michelle Fine, John Bae, Leslie Campbell, Desheen Evans, Chaka Gary, Andrew Greene, Marc Ramirez, Robert Riggs, Michael Taylor, Ray Tebout, and Aenora Tejawi. 2013. Higher Education and Reentry: The Gifts They Bring. New York: Prisoner Reentry Institute. Available online at: http://johnjayresearch.org/pri/files/2013/11/Higher-Education-in-Reentry.pdf
Hand, David J. 2009. “Measuring Classifier Performance: A Coherent Alternative to the Area Under the ROC Curve.” Machine Learning 77, 1: 103-123.

495
Hand, David J., and Christoforos Anagnostopoulos. 2013 “When Is the Area Under the Receiver Operating Characteristic Curve an Appropriate Measure of Classifier Performance?” Pattern Recognition Letters 34, 5: 492-495.
Hendra, Richard, and Gayle Hamilton. 2015. “Improving the Effectiveness of Education and Training Programs for Low-Income Individuals: Building Knowledge from Three Decades of Rigorous Experiments.” Pages 411-440 in Carl Van Horn, Tammy Edwards, and Todd Green (eds.), Transforming U.S. Workforce Development Policies for the 21st Century. Atlanta: Federal Reserve Bank of Atlanta.
Hollister, Robinson G., Jr., Peter Kemper, and Rebecca A. Maynard (eds.). 1984. The National Supported Work Demonstration. Madison, WI: University of Wisconsin Press.
Holzer, Harry J., Stephen Raphael, and Michael A. Stoll. 2004. “Will Employers Hire Former Offenders? Employer Preferences, Background Checks, and Their Determinants.” Pages 205-243 in Mary Pattillo, David Weiman, and Bruce Western (eds.), Imprisoning America: The Social Effects of Mass Incarceration. New York: Russell Sage Foundation.
Indiana Department of Correction. 2016. “Adult Releases by Committing County: CY 2015 (January 1, 2015 - December 31, 2015).” Indianapolis, IN: Indiana Department of Correction. Available online at: www.in.gov/idoc/files/Adult_REL_CY2015.pdf.
Kemple, James J., and Jason C. Snipes. 2001. “A Regression-Based Strategy for Defining Subgroups in a Social Experiment.” New York: MDRC.
Kirby, Gretchen, Heather Hill, LaDonna Pavetti, Jon Jacobson, Michelle Derr, and Pamela Winston. 2002. Transitional Jobs: Stepping Stones to Unsubsidized Employment. Princeton, NJ: Mathematica Policy Research.
Landenberger, Nana A., and Mark W. Lipsey. 2005. “The Positive Effects of Cognitive-Behavioral Programs for Offenders: A Meta-Analysis of Factors Associated with Effective Treatment. Journal of Experimental Criminology 1, 4: 451-476.
Levine, Marc V. 2012. Race and Male Employment in the Wake of the Great Recession: Black Male Employment Rates in Milwaukee and the Nation’s Largest Metro Areas 2010. Working Paper. Milwaukee, WI: University of Wisconsin-Milwaukee. Available online at: www4.uwm.edu/ced/publications/black-employment_2012.pdf.
Mallik-Kane, Kamala, and Christy A. Visher. 2008. Health and Prisoner Reentry: How Physical, Mental, and Substance Abuse Conditions Shape the Process of Reintegration. Washington, DC: The Urban Institute. Available online at: www.urban.org/sites/default/ files/alfresco/publication-pdfs/411617-Health-and-Prisoner-Reentry.PDF.
Martinson, Karin, and Richard Hendra. 2006. Results from the Texas Site in the Employment Retention and Advancement Project. New York: MDRC.
Metro Atlanta Chamber of Commerce. 2013. “Metro Atlanta Top Employers.” Atlanta, GA: Metro Atlanta Chamber of Commerce. Available online at: www.metroatlantachamber.com/docs/resources/top-employers-.pdf.

496
MDRC Board of Directors. 1980. Summary of Findings of the National Supported Work Demonstration. Cambridge, MA: Ballinger Publishing Company.
National Work Readiness Council. “National Work Readiness Credential.” Website: www.workreadiness.com/nwrcred.html. Accessed on March 7, 2016.
Navarro, David, Mark van Dok, and Richard Hendra. 2007. Results from the Post-Assistance Self-Sufficiency (PASS) Program in Riverside, California: The Employment Retention and Advancement Project. New York: MDRC.
New York State Commission on Correction. “Inmate Population Statistics.” Website: www.scoc.ny.gov/pop.htm. Accessed on April 7, 2016.
New York State Department of Child Support Enforcement. “Support Enforcement.” Website: www.newyorkchildsupport.com/dcse/support_enforcement.html. Accessed on April 7, 2016.
New York State Department of Corrections and Community Supervision. 2014. “Return Rate for Parolees Committing New Felony Crimes Hits Historic Low.” Press release. Albany, NY: New York State Department of Corrections and Community Supervision. Available online at: www.doccs.ny.gov/PressRel/2014/Recidivism_Rates_2010.pdf.
New York State Department of Corrections and Community Supervision. 2015a. Community Supervision Legislative Report 2015. Albany, NY: New York State Department of Corrections and Community Supervision. Website. www.doccs.ny.gov/Research/Reports/ 2015/2015_Legislative_Report.pdf.
New York State Department of Corrections and Community Supervision. 2015b. “Vocational Education.” Vocational Instructor’s Handbook; Program Services Manual. Albany, NY: New York State Department of Corrections and Community Supervision. Available online at: www.doccs.ny.gov/Directives/4806.pdf.
New York State Department of Corrections and Community Supervision. 2016a. “Admissions and Releases Calendar Year 2015: Preliminary Data.” Albany, NY: New York State Department of Corrections and Community Supervision. Available online at: www.doccs.ny.gov/Research/Reports/2016/Admissions_and_Releases_2015.pdf.
New York State Department of Corrections and Community Supervision. 2016b. “DOCCS Fact Sheet.” Albany, NY: New York State Department of Corrections and Community Supervision. Available online at: www.doccs.ny.gov/FactSheets/PDF/currentfactsheet.pdf.
New York State Department of Labor. “Local Area Unemployment Statistics Program.” Website: https://labor.ny.gov/stats/laus.asp. Accessed on March 7, 2016.
New York State Division of Criminal Justice Services. n.d. “Certificates of Relief From Disabilities and Certificates of Good Conduct Licensure and Employment of Offenders.” Albany, NY: New York State Division of Criminal Justice Services. Available online at: www.criminaljustice.ny.gov/opca/pdfs/ certificatesofrelieffromforfeituresanddisabilitiesqanda.pdf.

497
New York State Division of Criminal Justice Services. 2010. New York State Criminal Justice 2009 Crimestat Report. Albany, NY: New York State Division of Criminal Justice Services. Available online at: www.criminaljustice.ny.gov/pio/annualreport/ 2009-crimestat-report.pdf.
New York State Division of Criminal Justice Services. “Pathways to Employment.” Website: www.criminaljustice.ny.gov/opca/pathways_employment.htm#rsw. Accessed on March 7, 2016.
Opportunities for a Better Tomorrow. “Adult Services.” Website: http://obtjobs.org/programs/ adult-services. Accessed on March 7, 2016.
Osborne Association. 2012a. “About the Career Center.” Website: www.osborneny.org/ programs.cfm?programID=52.
Osborne Association. 2012b. “Overview and History.” Website: www.osborneny.org/ about.cfm?pageID=15.
Pager, Devah. 2003. “The Mark of a Criminal Record.” American Journal of Sociology 108: 937-975.
Pavetti, LaDonna, Liz Schott, and Elizabeth Lower-Basch. 2011. “Creating Subsidized Employment for Low Income Parents: The Legacy of the TANF Emergency Fund.” Washington, DC: Center on Budget and Policy Priorities.
Pawasarat, John, and Lois M. Quinn. 2013. Wisconsin’s Mass Incarceration of African American Males: Workforce Challenges for 2013. Milwaukee, WI: University of Wisconsin-Milwaukee, Employment and Training Institute. Available online at: www4.uwm.edu/eti/2013/BlackImprisonment.pdf.
Petersilia, Joan. 2004. “What Works for Prisoner Reentry? Reviewing and Questioning the Evidence.” Federal Probation 68, 2: 4-8.
Prisoner Reentry Institute. 2013. “Three-Quarter House: The View from the Inside.” New York: Prisoner Reentry Institute, John Jay College of Criminal Justice. Available online at: http://johnjayresearch.org/pri/files/2013/10/PRI-TQH-Report.pdf.
RecycleForce. 2014. “RecycleForce Answers Obama’s Call, Offers Ex-Offenders Minimum Wage of $10.10.” Website: www.recycleforce.org/news/article/recycleforce-answers-obamas-call-offers-ex-offenders-minimum-wage-of-1010.
Redcross, Cindy, Dan Bloom, Erin Jacobs, Michelle Manno, Sara Muller-Ravett, Kristin Seefeldt, Jennifer Yahner, Alford A. Young, Jr., and Janine Zweig. 2010. Work After Prison: One-Year Findings from the Transitional Jobs Reentry Demonstration. New York: MDRC.
Redcross, Cindy, Megan Millenky, Timothy Rudd, and Valerie Levshin. 2012. More Than a Job: Final Results of the Center for Employment Opportunities (CEO) Transitional Jobs Program. New York: MDRC.

498
San Francisco Center for Economic Development. 2014. “Largest Employers in San Francisco.” San Francisco: San Francisco Center for Economic Development. Available online at: http://sfced.org/wp-content/uploads/2014/02/Largest-Employers-SF-2013.pdf.
Solomon, Amy, Jesse Jannetta, Brian Elderbloom, Laura Winterfield, Jenny Osborne, Peggy Burke, Richard P. Stroker, Edward E. Rhine, and William D. Burrell. 2008. Putting Public Safety First: 13 Strategies for Successful Supervision and Reentry. Washington, DC: The Urban Institute.
Staley, Michele, and RyangHui Kim. 2010. 2006 Releases: Three Year Post-Release Follow-Up. Albany, NY: State of New York Department of Correctional Services. Available online at: www.doccs.ny.gov/Research/Reports/2011/2006_releases_3yr_out.pdf.
State of California Employment Development Department, Labor Market Information Division. 2014. “Monthly Labor Force Data for Counties Annual Average 2012 - Revised.” Sacramento, CA: State of California Employment Development Department, Labor Market Information Division. Available online at: www.calmis.ca.gov/file/lfhist/12aacou.pdf.
Taylor, Nick. 2009. American-Made: The Enduring Legacy of the WPA: When FDR Put the Nation to Work. New York: Random House.
Uggen, Christopher, Sara Wakefield, and Bruce Western. 2005. “Work and Family Perspectives in Reentry.” Pages 209-243 in Jeremy Travis and Christy Visher (eds.), Prisoner Reentry and Crime in America. New York: Cambridge University Press.
U.S. Census Bureau. 2013. “Below Poverty.” Website: www.census.gov/content/dam/Census/ newsroom/releases/2014/cb14-170_graphic_acs_poverty.pdf.
U.S. Census Bureau. 2015. “California Quick Facts.” Website: www.census.gov/quickfacts/ table/PST045214/00,06,06075.
U.S. Department of Health and Human Services, Office of Child Support Enforcement. 2012. “Realistic Child Support Orders for Incarcerated Parents.” Washington, DC: U.S. Department of Health and Human Services, Office of Child Support Enforcement. Available online at: www.acf.hhs.gov/sites/default/files/ocse/realistic_child_support_ orders_for_incarcerated_parents.pdf.
U.S. Department of Labor, Bureau of Labor Statistics. 2008. “Local Area Unemployment Statistics.” Website: www.bls.gov/lau.
U.S. Department of Labor, Bureau of Labor Statistics. 2016a. “Economy at a Glance. Indianapolis-Carmel, IN.” Website: http://data.bls.gov/cgi-bin/print.pl/eag/ eag.in_indianapolis_msa.htm.
U.S. Department of Labor, Bureau of Labor Statistics. 2016b. “Economy at a Glance: Syracuse, NY.” Website: www.bls.gov/eag/eag.ny_syracuse_msa.htm.
U.S. Department of Labor, Bureau of Labor Statistics. 2016c. “Local Area Employment Statistics: Syracuse, NY.” Website: http://data.bls.gov/timeseries/ LAUMT364506000000003?data_tool=XGtable.

499
U.S. Department of Labor, Bureau of Labor Statistics. 2015a. “Occupational Employment and Wages in Indiana-Carmel — May 2014.” Website: www.bls.gov/regions/midwest/news-release/occupationalemploymentandwages_indianapolis.htm.
U.S. Department of Labor, Bureau of Labor Statistics. 2015b. “Occupational Employment Statistics, May 2014 Metropolitan and Nonmetropolitan Area Occupational Employment and Wage Estimates, San Francisco-San Mateo-Redwood City, CA Metropolitan Division.” Website: www.bls.gov/oes/current/oes_41884.htm#00-0000.
U.S. Department of Labor, Bureau of Labor Statistics. “State and Area Employment, Hours, and Earnings.” Website: http://data.bls.gov/timeseries/SMU36450603000000001? data_tool=XGtable. Accessed on March 7, 2016d.
U.S. Department of Labor, Bureau of Labor Statistics. “Unemployment Rates for the 50 Largest Cities.” Website: www.bls.gov/lau/lacilg12.htm; www.bls.gov/lau/lacilg13.htm. Accessed on June 13, 2016f.
U.S. Department of Labor, Employment and Training Administration. 2011. “Notice of Availability of Funds and Solicitation for Grand Applications Under the Enhanced Transitional Jobs Demonstration.” Website: https://www.doleta.gov/grants/pdf/SGA-DFA-PY-10-11.pdf.
U.S. Department of Labor, Employment and Training Administration. 2016. “Work Opportunity Tax Credit.” Website: www.doleta.gov/business/incentives/opptax.
Valentine, Erin Jacobs. 2012. Returning to Work After Prison: Final Results from the Transitional Jobs Reentry Demonstration. New York: MDRC.
Valentine, Erin Jacobs, and Dan Bloom. 2011. Alternative Employment Strategies for Hard-to-Employ TANF Recipients: Final Results from a Test of Transitional Jobs and Pre-employment Services in Philadelphia. OPRE Report 2011-19. Washington, DC: U.S. Department of Health and Human Services, Office of Planning, Research and Evaluation.
Wester, Bruce, and Becky Pettit. 2010. “Incarceration and Social Inequality.” Daedalus 139, 3: 9-19.
Wildcat. 2016. “What We Do for Our Customers.” Website: www.wildcatnyc.org/what_we_do/ for_our_customers.
Workforce Investment Act of 1998. Pub. L. 105-220. 112 Stat. 936. 20 U.S.C. §9201. Available online at: www.gpo.gov/fdsys/pkg/PLAW-105publ220/html/PLAW-105publ220.htm.
Workforce Solutions for Tarrant County. 2015. “Tarrant County Workforce Development Area: June 2015.” Website: http://workforcesolutions.net/wp-content/uploads/2013/10/ tarrantcountywda-june.pdf.
Zweig, Janine, Jennifer Yahner, and Cindy Redcross. 2010. Recidivism Effects of the Center for Employment Opportunities (CEO) Program Vary by Former Prisoners’ Risk of Reoffending. New York: MDRC.

THIS PAGE INTENTIONALLY LEFT BLANK