unlocking barriers and opportunities for land-use based ...
228
UNLOCKING BARRIERS AND OPPORTUNITIES FOR LAND-USE BASED CLIMATE CHANGE MITIGATION ACTIVITIES IN SOUTH AFRICA
-
Upload
khangminh22 -
Category
Documents
-
view
0 -
download
0
Transcript of unlocking barriers and opportunities for land-use based ...

UNLOCKING BARRIERS AND OPPORTUNITIES FOR LAND-USE BASED CLIMATE CHANGE MITIGATION ACTIVITIES IN SOUTH AFRICA

PREPARED BY
CIRRUS GROUP
105 Dunkley House
32 Barnet Street
Gardens, Cape Town
This report was kindly funded through the GIZ implemented Climate
Support Programme, which is part of the International Climate Initiative
(IKI). The Federal Ministry for the Environment, Nature Conservation,
Building and Nuclear Safety (BMUB) supports the IKI on the basis of a
decision adopted by the German Bundestag.
IN CONSORTIUM WITH
ECOMETRIX
6 Hood Avenue
Rosebank, Johannesburg
2021 South Africa
PALMER DEVELOPMENT
GROUP (PTY) LTD
Ubunye House
70 Rosmead Avenue
Kenilworth
BEATUS
Derdepark
Pretoria
GEOTERRA IMAGE (PTY) LTD
477 Witherite Street
Die Wilgers
Pretoria
LAYOUT BY
(SOW) JOON MASON
1 Grand Boulevard
Monteseel
KwaZulu-Natal
CONTACT INFORMATION
DEPARTMENT OF
ENVIRONMENTAL AFFAIRS
Environment House
473 Steve Biko Street
Arcadia
Pretoria 0001
South Africa
Tel: +27 86 111 2468
www.environment.gov.za
On behalf of:
of the Federal Republic of Germany
Federal Ministryfor the Environment, Nature Conservation, Building and Nuclear Safety
AUTHORS
Tony Knowles, Lodewijk Nel, Henk Sa, Richard Lechmere-Oertel, Ayanda Sigwela,
James Bliqnaut, Derek Berliner, Stuart Christie, Greg Martindale, Bruce Taplin,
Gillian Sykes, Cara Hartley and Mark Thompson
UNLOCKING BARRIERS AND OPPORTUNITIES FOR LAND-USE BASED CLIMATE CHANGE MITIGATION ACTIVITIES IN SOUTH AFRICA
FOREWORD 6
ACRONYMS AND ABBREVIATIONS 8
EXECUTIVE SUMMARY 10
SECTION ONEDEVELOPING A NATIONAL VISION FOR THE SOUTH AFRICAN AFOLU SECTOR1. Working landscapes as the foundation
of rural social development and stability 26
1.1 Integration at scale to ensure efficiency, effectiveness and equity 28
1.2 A strategy to realise opportunities and address barriers 32
1.3 Drivers, enablers, activities and measures 37
1.4 Implementation models and institutional support 40
1.5 Exploration of Tier 1: National scale 42
1.6 Tier 2: Regional scale 46
1.7 Tier 3: Local scale – grasslands, subtropical thicket and forests 50
SECTION TWO
GRASSLANDS2. Grasslands: Introduction 56
2.1 What and where are the grasslands? 56
2.2 What is the value of grasslands? 58
2.3 People in grasslands 60
2.4 Drivers of degradation in grasslands 61
3. Grasslands: Defining the gap – status quo vs national readiness 64
3.1 Land uses and required activities 64
3.2 Grasslands: National and provincial scale measures (Tier 1 and 2) 68
3.3 Grasslands: Indicative field implementation costs 69
SECTION THREESUBTROPICAL THICKET RESTORATION AND MANAGEMENT4. Subtropical thicket: Introduction 72
4.1 What and where is subtropical thicket? 72
4.2 What is the value of subtropical thicket? 74
4.3 People in subtropical thicket 75
4.4 Drivers of degradation in subtropical thicket 77
4.5 Existing initiatives within subtropical thicket 79
5. Subtropical thicket: Defining the gap – status quo vs national readiness
5.1 Land uses and required activities 80
5.2 Subtropical thicket: National and provincial scale measures (Tier 1 and 2) 85
5.3 Subtropical thicket: Tier 3 – Development of pilot restoration areas 86
5.4 Indicative costs of subtropical thicket restoration 94
TABLE OF CONTENTS
SECTION FOUR
INDIGENOUS FOREST RESTORATION AND MANAGEMENT6. Forests: Introduction
6.1 What and where is the forest biome? 100
6.2 What is the value of forests? 100
6.3 People and forests 102
6.4 Current state of forests 104
6.5 Drivers of degradation in forests 108
7. Forests: Defining the gap – status quo
vs national readiness 110
7.1 Land uses and required activities – Forests contexts 110
7.2 Forests: National and provincial scale measures (Tier 1 and 2) 115
7.3 Forests: Local scale activities and measures (Tier 3) 116
SECTION FIVE
REALISING OPPORTUNITIES FOR BIOGAS DIGESTERS8. Introductory brief – Biogas Digesters 120
8.1 South African Context 120
8.2 Concept and climate value 128
8.3 Prior and existing projects 134
9. Defining the gap – Status quo vs. national-scale readiness 136
9.1 Technical scope 136
9.2 Drivers and barriers 142
9.3 Forms of implementation 147
SECTION SIX
REALISING BIOMASS TO ENERGY OPPORTUNITIES10. Introductory brief – Biomass energy 154
10.1 Biomass energy South African context 154
10.2 Invasive Alien Plants (IAP) 156
10.3 Bush encroachment 161
10.4 Bagasse 164
10.5 Biomass from forest plantations and processing 169
10.6 Concept and climate value 176
11. Defining the gap – Status quo vs. national-scale readiness 180
11.1 Technical scope 181
11.2 Forms of implementation 184
11.3 Monitoring, Reporting and Verification (MRV) 188
SECTION SEVEN
INSTITUTIONAL AND FUNDING CONSIDERATIONS12. Institutional and funding considerations 194
12.1 Review of finance and funding opportunities 194
12.2 Institutional Readiness Analysis 200
12.3 Current analysis of Tier 1 institutions 202
12.4 Proposed institutional framework 206
12.5 Bottom-up institutional framework 211
12.6 Suggested implementation frameworks 212
12.7 Gap identification 218
12.8 Summary of current and relevant government programmes 219
12.9 Current gaps identified in the institutional context 222
REFERENCES 224
FOOTNOTES 224
ANNEXURE 226
UNLOCKING BARRIERS AND OPPORTUNITIES FOR LAND-USE BASED CLIMATE CHANGE MITIGATION ACTIVITIES IN SA6
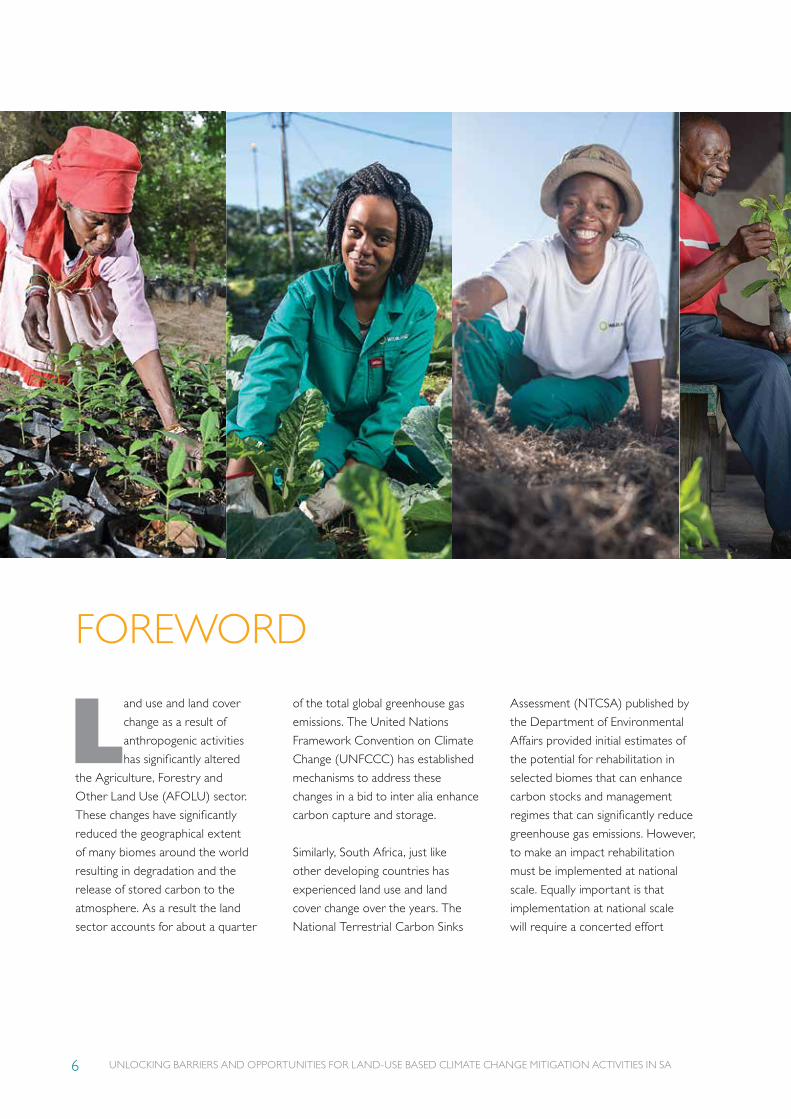
FOREWORD
Land use and land cover
change as a result of
anthropogenic activities
has significantly altered
the Agriculture, Forestry and
Other Land Use (AFOLU) sector.
These changes have significantly
reduced the geographical extent
of many biomes around the world
resulting in degradation and the
release of stored carbon to the
atmosphere. As a result the land
sector accounts for about a quarter
of the total global greenhouse gas
emissions. The United Nations
Framework Convention on Climate
Change (UNFCCC) has established
mechanisms to address these
changes in a bid to inter alia enhance
carbon capture and storage.
Similarly, South Africa, just like
other developing countries has
experienced land use and land
cover change over the years. The
National Terrestrial Carbon Sinks
Assessment (NTCSA) published by
the Department of Environmental
Affairs provided initial estimates of
the potential for rehabilitation in
selected biomes that can enhance
carbon stocks and management
regimes that can significantly reduce
greenhouse gas emissions. However,
to make an impact rehabilitation
must be implemented at national
scale. Equally important is that
implementation at national scale
will require a concerted effort
UNLOCKING BARRIERS AND OPPORTUNITIES FOR LAND-USE BASED CLIMATE CHANGE MITIGATION ACTIVITIES IN SA 7
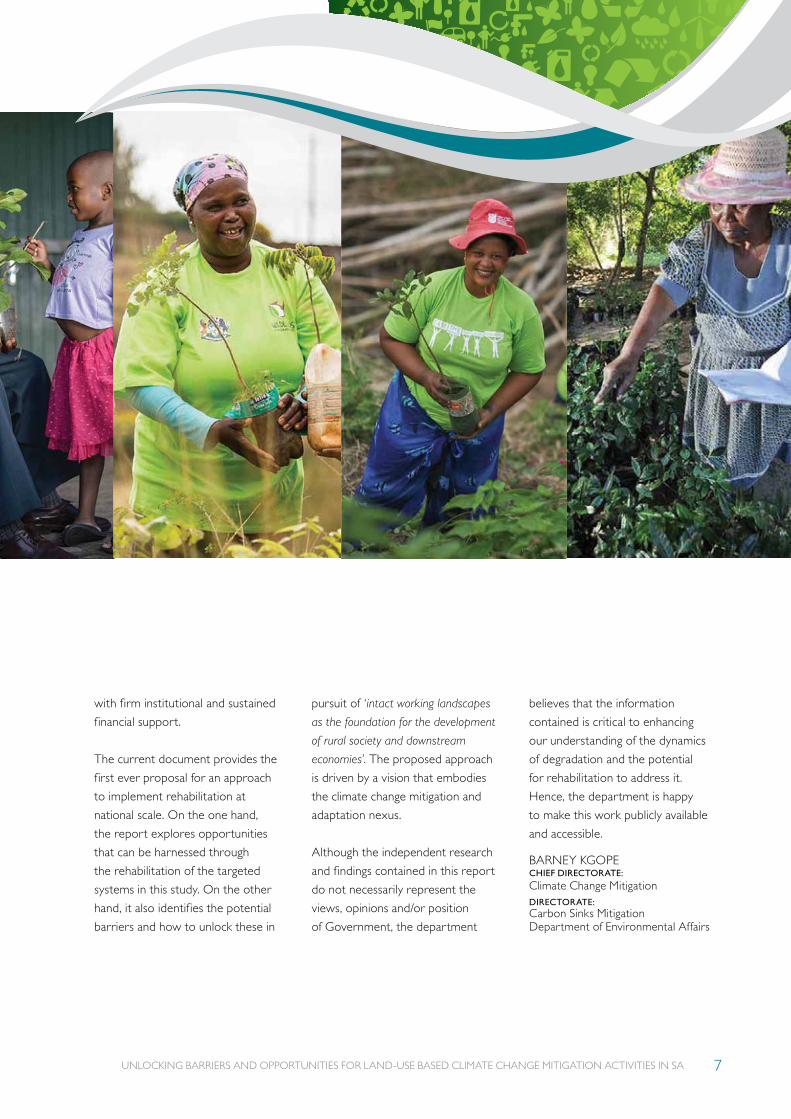
with firm institutional and sustained
financial support.
The current document provides the
first ever proposal for an approach
to implement rehabilitation at
national scale. On the one hand,
the report explores opportunities
that can be harnessed through
the rehabilitation of the targeted
systems in this study. On the other
hand, it also identifies the potential
barriers and how to unlock these in
pursuit of ‘ intact working landscapes
as the foundation for the development
of rural society and downstream
economies’. The proposed approach
is driven by a vision that embodies
the climate change mitigation and
adaptation nexus.
Although the independent research
and findings contained in this report
do not necessarily represent the
views, opinions and/or position
of Government, the department
believes that the information
contained is critical to enhancing
our understanding of the dynamics
of degradation and the potential
for rehabilitation to address it.
Hence, the department is happy
to make this work publicly available
and accessible.
BARNEY KGOPECHIEF DIRECTORATE: Climate Change MitigationDIRECTORATE: Carbon Sinks Mitigation Department of Environmental Affairs
UNLOCKING BARRIERS AND OPPORTUNITIES FOR LAND-USE BASED CLIMATE CHANGE MITIGATION ACTIVITIES IN SA8
ADAnaerobic digestion
AFOLUAgriculture, Forestry and Other Land Use
AIPAlien Invasive Plant
CBGCompressed Biogas
CBNRMCommunity Based Natural Resource Management
CDMClean Development Mechanism
CEPFCritical Ecosystem Partnership Fund
CH4 Methane
CMACatchment Management
Association
CO2Carbon dioxide
CO2eCarbon dioxide equivalent
COGTADepartment of Cooperative Governance and Traditional Affairs
COPConference of Parties
CSTRContinuously Stirred Tank Reactor
DAFFDepartment of Agriculture, Forestry and Fisheries
DBSADevelopment Bank of South Africa
DEADepartment of Environmental Affairs
DOEDepartment of Energy
DRDLRDepartment of Rural Development and Land Reform
DSTDepartment of Science and Technology
DWSDepartment of Water and Sanitation
EPWPExpanded Public Works Programme
ETSEmission Trading Scheme
GCFGreen Climate Fund
GEF Global Environmental Facility
GHG Greenhouse Gas Emission
GIS Geographic Information System
GJGigajoule
ha Hectare
IPCCIntergovernmental Panel on Climate Change
IPPIndependent Power Producer
IUCNInternational Union for the Conservation of Nature
ACRONYMS AND ABBREVIATIONS
UNLOCKING BARRIERS AND OPPORTUNITIES FOR LAND-USE BASED CLIMATE CHANGE MITIGATION ACTIVITIES IN SA 9
km Kilometre
M&EMonitoring and evaluation
MJMega joule
MRVMonitoring, Reporting and Verification
MWeMegawatt electric
MWhMegawatt hour
N2ONitrous Oxide
NFUNational Facilitation Unit
NGONon-Governmental Organisation
NRMNatural Resource Management
NTCSASouth African National Terrestrial Carbon Sink Assessment
O&MOperation and maintenance
PAMsPolicies and measures
PFMParticipatory Forestry Management
REDD+Reducing emissions from deforestation and forest degradation in developing countries; and the role of conservation, sustainable management of forests and enhancement of forest carbon stocks in developing countries
REIPPPRenewable Energy Independent Power Producer Programme
SABIASouth Africa Biogas Industry Association
SAEONSouth African Earth Observation Network
SANBISouth African National Biodiversity Institute
SARECSouth African Renewable Energy Council
SFMSustainable Forestry Management
SIPStrategic Infrastructure Plan
SMMESmall and medium and micro-scale enterprises
SPLUMASpatial Planning and Land Use Management Act
TOR Terms of Reference
UNUnited Nations
UNDPUnited Nations Development Program
UNFCCCUnited Nations Framework Convention on Climate Change
UNREDDUnited Nations programme aimed at REDD
USDUnited States Dollar
VCSVerified Carbon Standard
WfEWorking for Energy
ZARSouth African Rand

UNLOCKING BARRIERS AND OPPORTUNITIES FOR LAND-USE BASED CLIMATE CHANGE MITIGATION ACTIVITIES IN SA10
INTACT WORKING LANDSCAPES AS THE FOUNDATION FOR THE DEVELOPMENT RURAL SOCIETY AND DOWNSTREAM URBAN ECONOMIES
Ninety-two percent of
South Africa’s land
surface is rural land,
which delivers most
of the country’s food, water and
energy resources. Yet, perhaps due
to a historical bias towards urban
development, this area of 1.1 million
km2 is often under-appreciated in
terms of the services it provides
to local residents as well as to
downstream urban populations
and economies. The management
of landscapes is often seen as a
separate matter, distinct from
mainstream development and not a
pivotal national priority.
In practice, intact functioning
landscapes are fundamental for
providing access to affordable food,
water and energy: the cornerstones
of economic development.
Landscape restoration is therefore
a means of achieving several of the
goals listed in South Africa’s National
Development Plan. In addition to
meeting Outcome 10 – protecting
and enhancing our environmental
assets and natural resources – it
can fulfil a far broader suite of
national development, security
and social stability goals. It could
make substantial contributions to:
Outcome 4 (employment through
EXECUTIVE SUMMARY

UNLOCKING BARRIERS AND OPPORTUNITIES FOR LAND-USE BASED CLIMATE CHANGE MITIGATION ACTIVITIES IN SA 11
of the country (e.g. in the form
of functional fertile soils), but also
creates industries and related
employment and skills development
in remote rural areas where such
opportunities are often rare.
However, this will only be realised
if a markedly different
implementation approach is
adopted. Internationally, the nature
of these activities has changed
considerably in response to years
of trial and error. The principle
shifts have been in the form of scale
and institutional support; with a
move from small, isolated projects
developed by private sector entities,
inclusive economic growth),
Outcome 5 (skill development),
Outcome 6 (infrastructure – water)
and Outcome 7 (equitable and
sustainable rural communities
contributing to food security
for all).
The restoration of natural
landscapes, and the development
of associated opportunities in
the form of livestock production,
biogas digesters, biomass-energy
and others, is a mechanism through
which to foster rural development
and achieve the broad set of
outcomes listed above. It not
only restores the natural assets
to landscape or even national-scale
projects facilitated by government.
In South Africa, the few existing
formal reforestation projects
operate at a local-scale on private
land. There is no larger-scale
implementation on communal lands
that could deliver a broader suite
of socio-economic, climate change
adaptation and ecosystem service
benefits (Figure E1). Similarly, biogas
developers have focused only on the
financially attractive opportunities
associated with commercial feedlots
and dairy operations, rather than
developing projects that operate at
the rural household or village-scale.
UNLOCKING BARRIERS AND OPPORTUNITIES FOR LAND-USE BASED CLIMATE CHANGE MITIGATION ACTIVITIES IN SA12
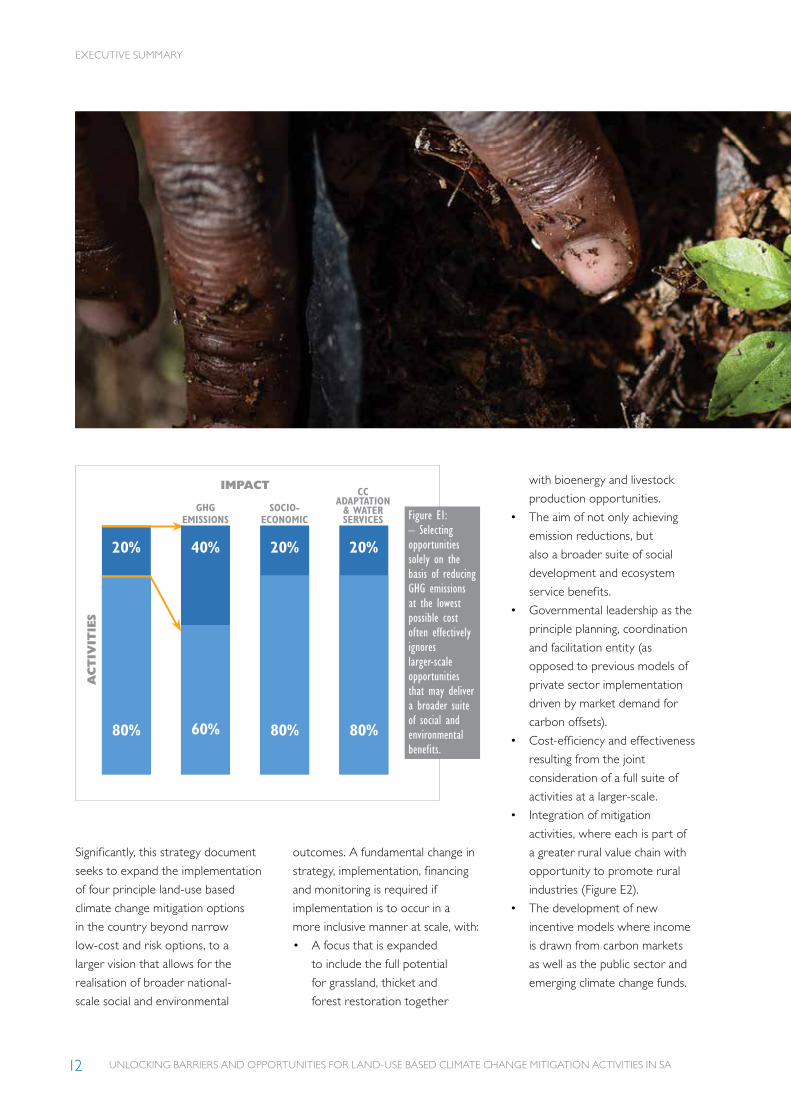
Significantly, this strategy document
seeks to expand the implementation
of four principle land-use based
climate change mitigation options
in the country beyond narrow
low-cost and risk options, to a
larger vision that allows for the
realisation of broader national-
scale social and environmental
outcomes. A fundamental change in
strategy, implementation, financing
and monitoring is required if
implementation is to occur in a
more inclusive manner at scale, with:
• A focus that is expanded
to include the full potential
for grassland, thicket and
forest restoration together
with bioenergy and livestock
production opportunities.
• The aim of not only achieving
emission reductions, but
also a broader suite of social
development and ecosystem
service benefits.
• Governmental leadership as the
principle planning, coordination
and facilitation entity (as
opposed to previous models of
private sector implementation
driven by market demand for
carbon offsets).
• Cost-efficiency and effectiveness
resulting from the joint
consideration of a full suite of
activities at a larger-scale.
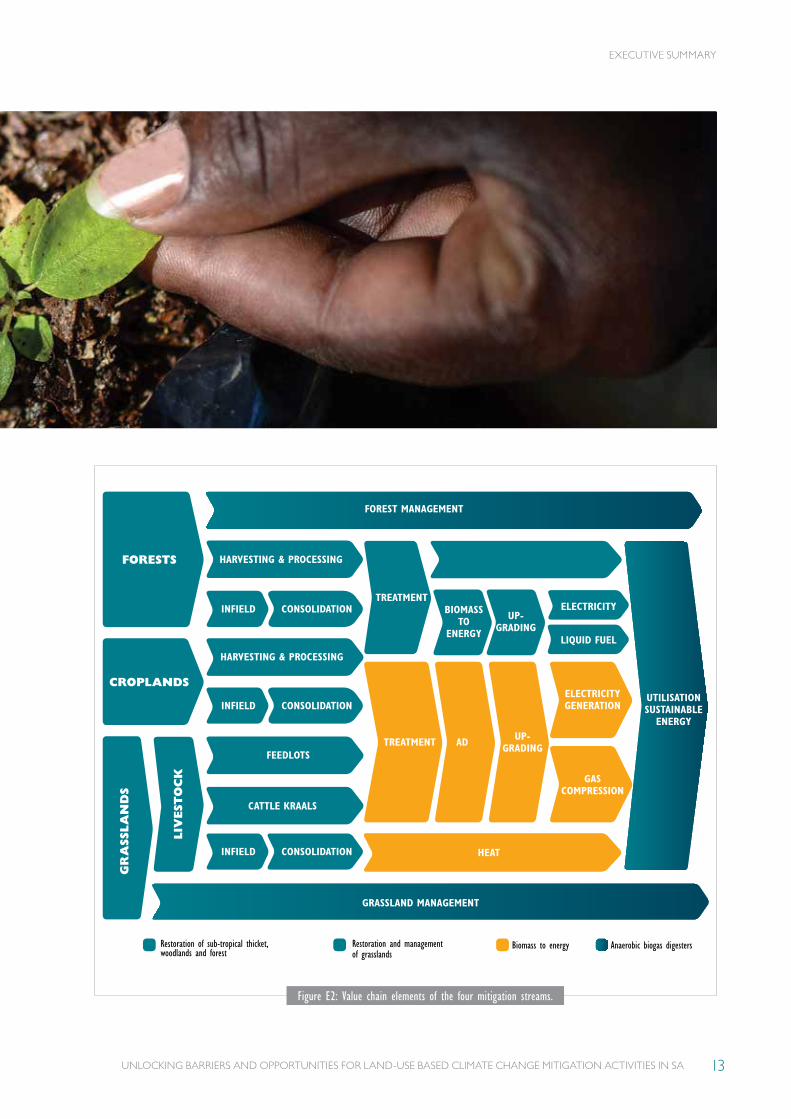
• Integration of mitigation
activities, where each is part of
a greater rural value chain with
opportunity to promote rural
industries (Figure E2).
• The development of new
incentive models where income
is drawn from carbon markets
as well as the public sector and
emerging climate change funds.
20%
80%
Figure E1: – Selecting opportunities solely on the basis of reducing GHG emissions at the lowest possible cost often effectively ignores larger-scale opportunities that may deliver a broader suite of social and environmental benefits.
AC
TIV
ITIE
S
IMPACT
40%
60%
GHG EMISSIONS
CC ADAPTATION & WATER SERVICES
20%
80%
SOCIO-ECONOMIC
20%
80%
EXECUTIVE SUMMARY
UNLOCKING BARRIERS AND OPPORTUNITIES FOR LAND-USE BASED CLIMATE CHANGE MITIGATION ACTIVITIES IN SA 13
HARVESTING & PROCESSING
HARVESTING & PROCESSING
CROPLANDS
GR
ASS
LA
ND
S
CONSOLIDATION
CONSOLIDATION
CONSOLIDATION
FOREST MANAGEMENT
GRASSLAND MANAGEMENT
INFIELD
INFIELD
INFIELD
FEEDLOTS
CATTLE KRAALS
HEAT
HEAT
TREATMENT
UTILISATION SUSTAINABLE
ENERGY
BIOMASS TO
ENERGY
AD
UP-GRADING
ELECTRICITY
LIQUID FUEL
ELECTRICITY GENERATION
GAS COMPRESSION
UP-GRADING
LIV
EST
OC
K
FORESTS
TREATMENT
Restoration of sub-tropical thicket, woodlands and forest
Biomass to energyRestoration and management of grasslands
Anaerobic biogas digesters
Figure E2: Value chain elements of the four mitigation streams.
EXECUTIVE SUMMARY
UNLOCKING BARRIERS AND OPPORTUNITIES FOR LAND-USE BASED CLIMATE CHANGE MITIGATION ACTIVITIES IN SA14
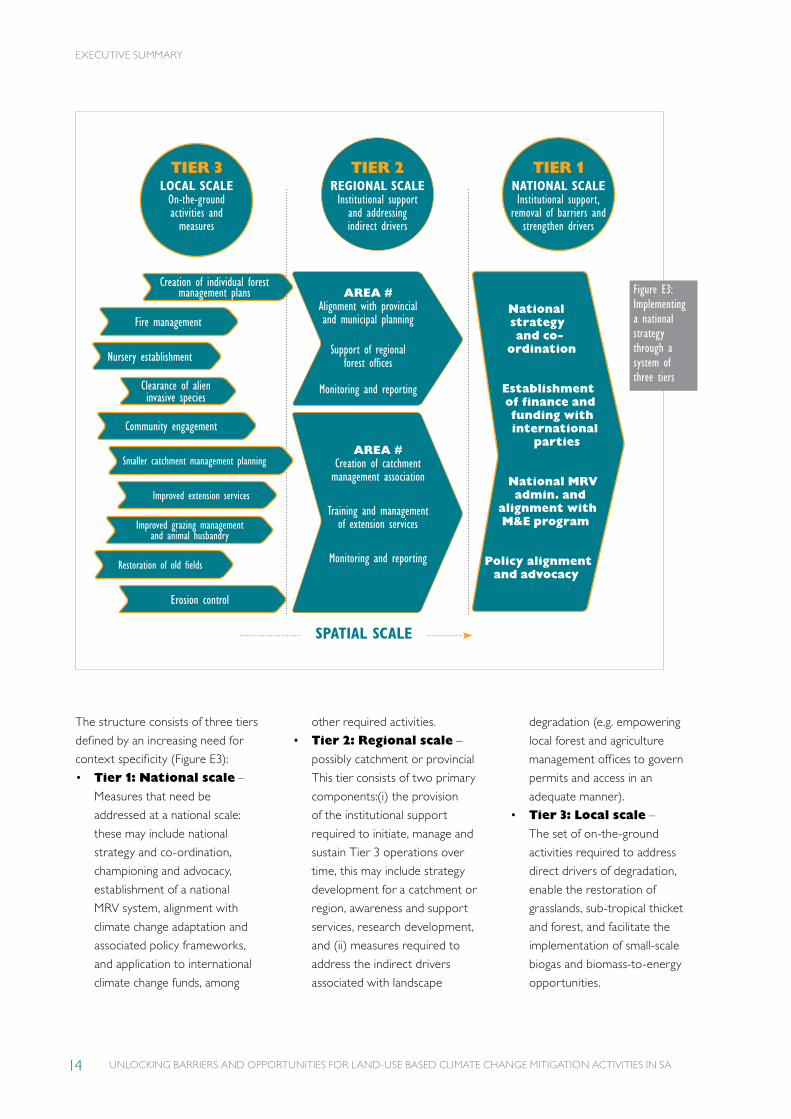
The structure consists of three tiers
defined by an increasing need for
context specificity (Figure E3):
• Tier 1: National scale –
Measures that need be
addressed at a national scale:
these may include national
strategy and co-ordination,
championing and advocacy,
establishment of a national
MRV system, alignment with
climate change adaptation and
associated policy frameworks,
and application to international
climate change funds, among
other required activities.
• Tier 2: Regional scale –
possibly catchment or provincial
This tier consists of two primary
components:(i) the provision
of the institutional support
required to initiate, manage and
sustain Tier 3 operations over
time, this may include strategy
development for a catchment or
region, awareness and support
services, research development,
and (ii) measures required to
address the indirect drivers
associated with landscape
degradation (e.g. empowering
local forest and agriculture
management offices to govern
permits and access in an
adequate manner).
• Tier 3: Local scale –
The set of on-the-ground
activities required to address
direct drivers of degradation,
enable the restoration of
grasslands, sub-tropical thicket
and forest, and facilitate the
implementation of small-scale
biogas and biomass-to-energy
opportunities.
Community engagement
National strategy and co-
ordination
Establishment of finance and funding with international
parties
National MRV admin. and
alignment with M&E program
Policy alignment and advocacy
TIER 3LOCAL SCALEOn-the-ground activities and measures
TIER 1NATIONAL SCALEInstitutional support,
removal of barriers and strengthen drivers
SPATIAL SCALE
Creation of individual forest management plans AREA #
Alignment with provincial and municipal planning
Support of regional forest offices
Monitoring and reporting
AREA #Creation of catchment management association
Training and management of extension services
Monitoring and reporting
Fire management
Nursery establishment
Smaller catchment management planning
Improved grazing management and animal husbandry
Clearance of alien invasive species
Improved extension services
Restoration of old fields
Erosion control
Figure E3:Implementing a national strategy through a system of three tiers
TIER 2REGIONAL SCALEInstitutional support
and addressing indirect drivers
EXECUTIVE SUMMARY

UNLOCKING BARRIERS AND OPPORTUNITIES FOR LAND-USE BASED CLIMATE CHANGE MITIGATION ACTIVITIES IN SA 15
THE STRUCTURE CONSISTS OF THREE TIERS (Defined by an increasing need for context specificity)
TIER 1NATIONAL SCALE
Measures and enablers that need
be addressed at a national scale
may include national coordination,
championing and advocacy,
establishment of a national
MRV system and alignment with
national monitoring and evaluation
(M&E), alignment with climate
change adaptation and associated
policy frameworks, and application
to international climate change
funds, among other required
activities.
TIER 2REGIONAL SCALE.
Possibly catchment or provincial.
This tier consists of two primary
components:
• Provision of the institutional
support required to initiate,
manage and sustain Tier
3 operations over time,
which may include strategy
development for a catchment
or region, awareness and
support services, and research
development.
• Measures required to address
the indirect drivers associated
with landscape degradation,
which may include reforming
policy, facilitating the SPLUMA
process or empowering
local forest and agriculture
management offices.
This support would not be
mitigation type specific (that is,
only for reforestation or grassland
initiatives), but would rather
provide integrated support for all
activities and measures within a
greater landscape.
It is suggested that a suite of
regional pilot areas be developed
initially, based on the location of
early Tier 3 initiatives.
TIER 3LOCAL SCALE
A set of on-the-ground activities
is required to address direct
drivers of degradation, enable
the restoration of grasslands,
subtropical thicket and forest,
and facilitate the implementation
of small-scale biogas and biomass-
to-energy opportunities. Many
key elements are not well
understood at this scale (for
example, costs of implementation,
broader business plans or the
socio-economic benefits of
different implementation models)
and research and development
through early implementation is
required. This is not plausible at
a full national scale and therefore
a set of early pilot areas that are
located so as to best inform future
national-scale roll-out is suggested.
EXECUTIVE SUMMARY
UNLOCKING BARRIERS AND OPPORTUNITIES FOR LAND-USE BASED CLIMATE CHANGE MITIGATION ACTIVITIES IN SA16
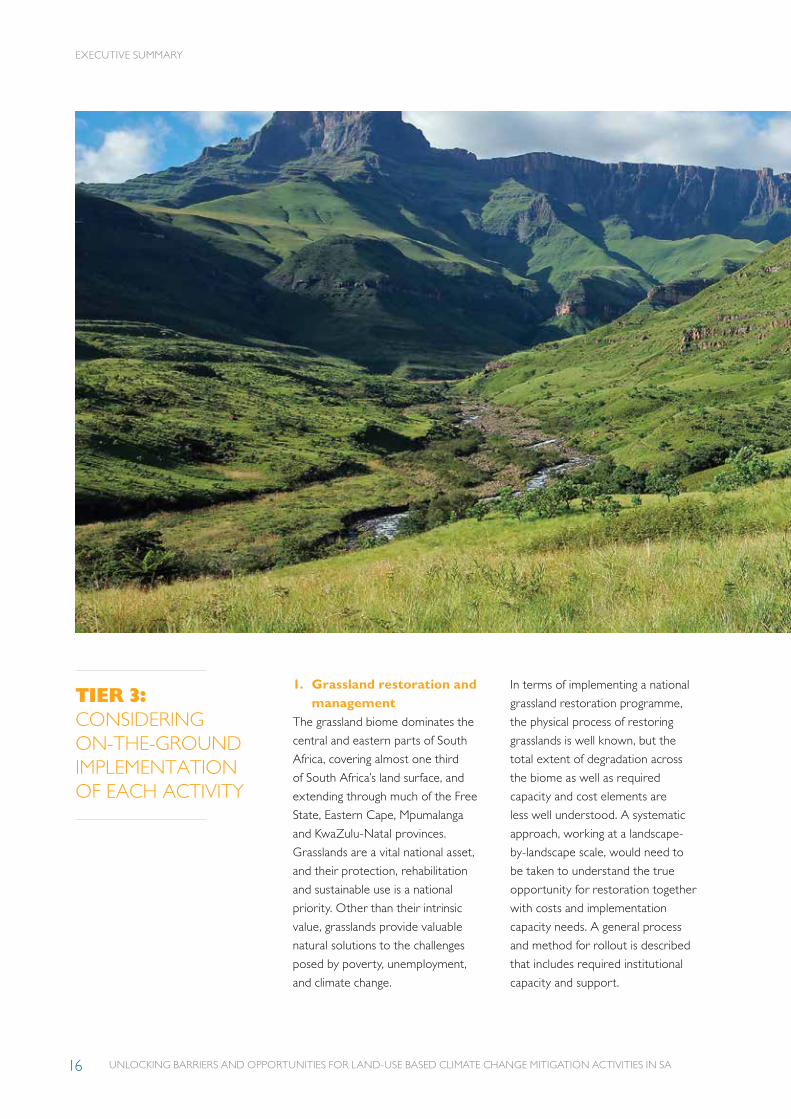
TIER 3: CONSIDERING ON-THE-GROUND IMPLEMENTATION OF EACH ACTIVITY
1. Grassland restoration and management
The grassland biome dominates the
central and eastern parts of South
Africa, covering almost one third
of South Africa’s land surface, and
extending through much of the Free
State, Eastern Cape, Mpumalanga
and KwaZulu-Natal provinces.
Grasslands are a vital national asset,
and their protection, rehabilitation
and sustainable use is a national
priority. Other than their intrinsic
value, grasslands provide valuable
natural solutions to the challenges
posed by poverty, unemployment,
and climate change.
In terms of implementing a national
grassland restoration programme,
the physical process of restoring
grasslands is well known, but the
total extent of degradation across
the biome as well as required
capacity and cost elements are
less well understood. A systematic
approach, working at a landscape-
by-landscape scale, would need to
be taken to understand the true
opportunity for restoration together
with costs and implementation
capacity needs. A general process
and method for rollout is described
that includes required institutional
capacity and support.
EXECUTIVE SUMMARY
UNLOCKING BARRIERS AND OPPORTUNITIES FOR LAND-USE BASED CLIMATE CHANGE MITIGATION ACTIVITIES IN SA 17
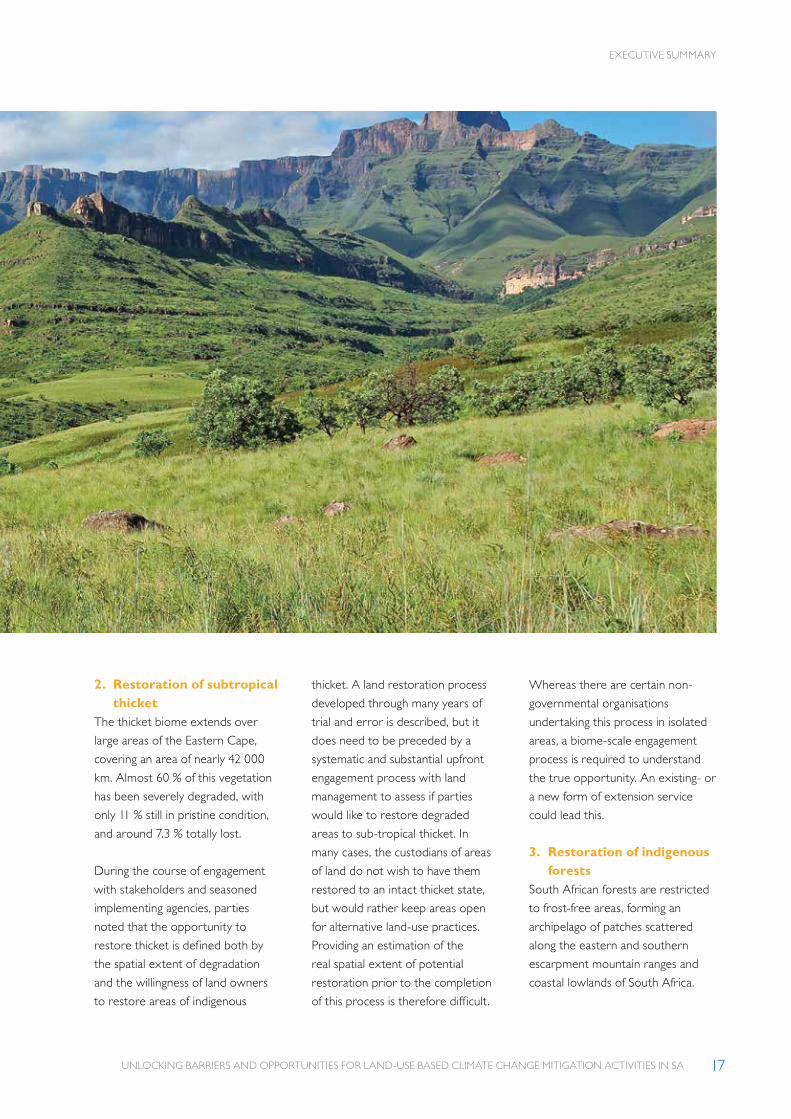
2. Restoration of subtropical thicket
The thicket biome extends over
large areas of the Eastern Cape,
covering an area of nearly 42 000
km. Almost 60 % of this vegetation
has been severely degraded, with
only 11 % still in pristine condition,
and around 7.3 % totally lost.
During the course of engagement
with stakeholders and seasoned
implementing agencies, parties
noted that the opportunity to
restore thicket is defined both by
the spatial extent of degradation
and the willingness of land owners
to restore areas of indigenous
thicket. A land restoration process
developed through many years of
trial and error is described, but it
does need to be preceded by a
systematic and substantial upfront
engagement process with land
management to assess if parties
would like to restore degraded
areas to sub-tropical thicket. In
many cases, the custodians of areas
of land do not wish to have them
restored to an intact thicket state,
but would rather keep areas open
for alternative land-use practices.
Providing an estimation of the
real spatial extent of potential
restoration prior to the completion
of this process is therefore difficult.
Whereas there are certain non-
governmental organisations
undertaking this process in isolated
areas, a biome-scale engagement
process is required to understand
the true opportunity. An existing- or
a new form of extension service
could lead this.
3. Restoration of indigenous forests
South African forests are restricted
to frost-free areas, forming an
archipelago of patches scattered
along the eastern and southern
escarpment mountain ranges and
coastal lowlands of South Africa.
EXECUTIVE SUMMARY
UNLOCKING BARRIERS AND OPPORTUNITIES FOR LAND-USE BASED CLIMATE CHANGE MITIGATION ACTIVITIES IN SA18
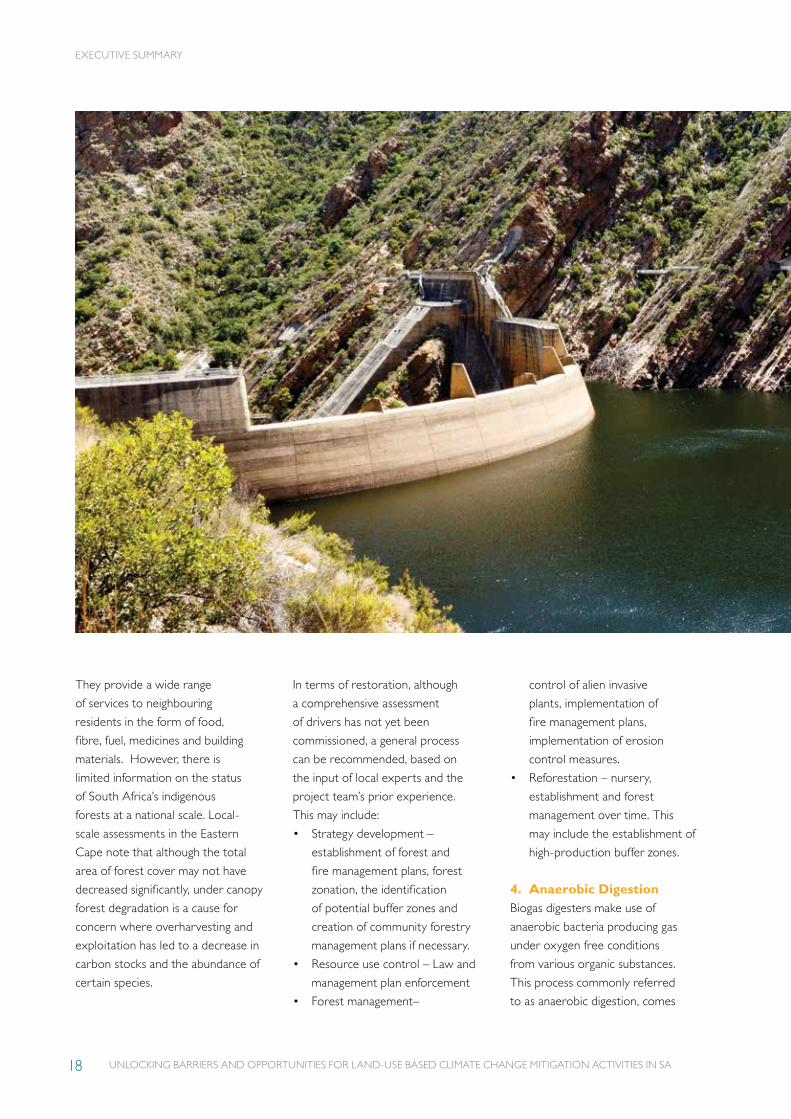
They provide a wide range
of services to neighbouring
residents in the form of food,
fibre, fuel, medicines and building
materials. However, there is
limited information on the status
of South Africa’s indigenous
forests at a national scale. Local-
scale assessments in the Eastern
Cape note that although the total
area of forest cover may not have
decreased significantly, under canopy
forest degradation is a cause for
concern where overharvesting and
exploitation has led to a decrease in
carbon stocks and the abundance of
certain species.
In terms of restoration, although
a comprehensive assessment
of drivers has not yet been
commissioned, a general process
can be recommended, based on
the input of local experts and the
project team’s prior experience.
This may include:
• Strategy development –
establishment of forest and
fire management plans, forest
zonation, the identification
of potential buffer zones and
creation of community forestry
management plans if necessary.
• Resource use control – Law and
management plan enforcement
• Forest management–
control of alien invasive
plants, implementation of
fire management plans,
implementation of erosion
control measures.
• Reforestation – nursery,
establishment and forest
management over time. This
may include the establishment of
high-production buffer zones.
4. Anaerobic DigestionBiogas digesters make use of
anaerobic bacteria producing gas
under oxygen free conditions
from various organic substances.
This process commonly referred
to as anaerobic digestion, comes
EXECUTIVE SUMMARY
UNLOCKING BARRIERS AND OPPORTUNITIES FOR LAND-USE BASED CLIMATE CHANGE MITIGATION ACTIVITIES IN SA 19
in various shapes and sizes with
on-farm facilities using manure as
feedstock being one of the most
common globally. With a total
estimated GHG mitigation potential
of 3.6 million tCO2, biogas from
farm manure was identified in the
South African Terrestrial Carbon
Sink Assessment as one of the
largest climate change mitigation
opportunities within the land-use
sector.
During the course of engagement
it became apparent that there is
significant opportunity for anaerobic
digesters at a farm scale that
remains to be unlocked. Although
potential for biogas use in rural
households exists, in practice uptake
is limited to households currently
not using electricity for cooking and
heating. It was suggested that the
required change is more inhibited by
social factors than by cost.
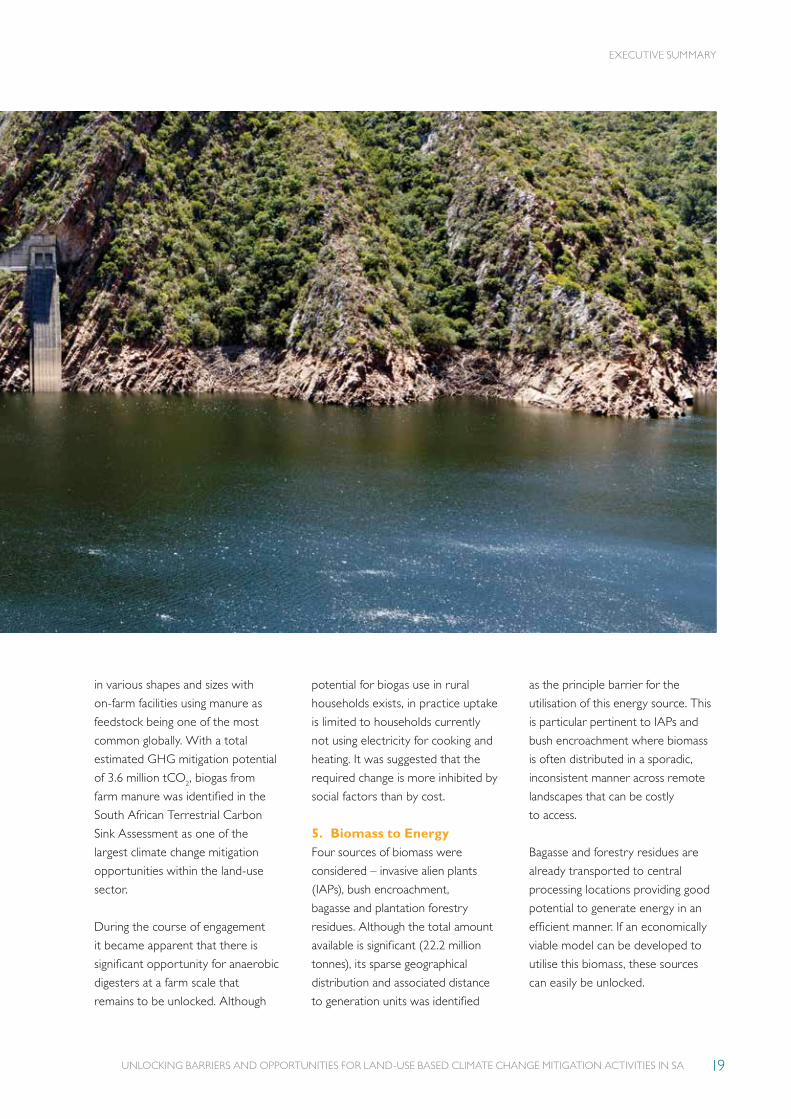
5. Biomass to EnergyFour sources of biomass were
considered – invasive alien plants
(IAPs), bush encroachment,
bagasse and plantation forestry
residues. Although the total amount
available is significant (22.2 million
tonnes), its sparse geographical
distribution and associated distance
to generation units was identified
as the principle barrier for the
utilisation of this energy source. This
is particular pertinent to IAPs and
bush encroachment where biomass
is often distributed in a sporadic,
inconsistent manner across remote
landscapes that can be costly
to access.
Bagasse and forestry residues are
already transported to central
processing locations providing good
potential to generate energy in an
efficient manner. If an economically
viable model can be developed to
utilise this biomass, these sources
can easily be unlocked.
EXECUTIVE SUMMARY

UNLOCKING BARRIERS AND OPPORTUNITIES FOR LAND-USE BASED CLIMATE CHANGE MITIGATION ACTIVITIES IN SA20
Two broad outcomes
that would need to be
achieved at a Tier 2
level:
1. The provision of the
institutional and operational
support required to initiate,
manage and sustain Tier
3 operations – this may
include: strategy development
for a catchment or region,
engagement with relevant
Government departments
(national and provincial),
operational support and
governance of payment
mechanisms, awareness and
support services, primary
ecological, social and economic
TIER 2: REQUIRED CAPACITY AT A REGIONAL SCALE
EXECUTIVE SUMMARY
UNLOCKING BARRIERS AND OPPORTUNITIES FOR LAND-USE BASED CLIMATE CHANGE MITIGATION ACTIVITIES IN SA 21
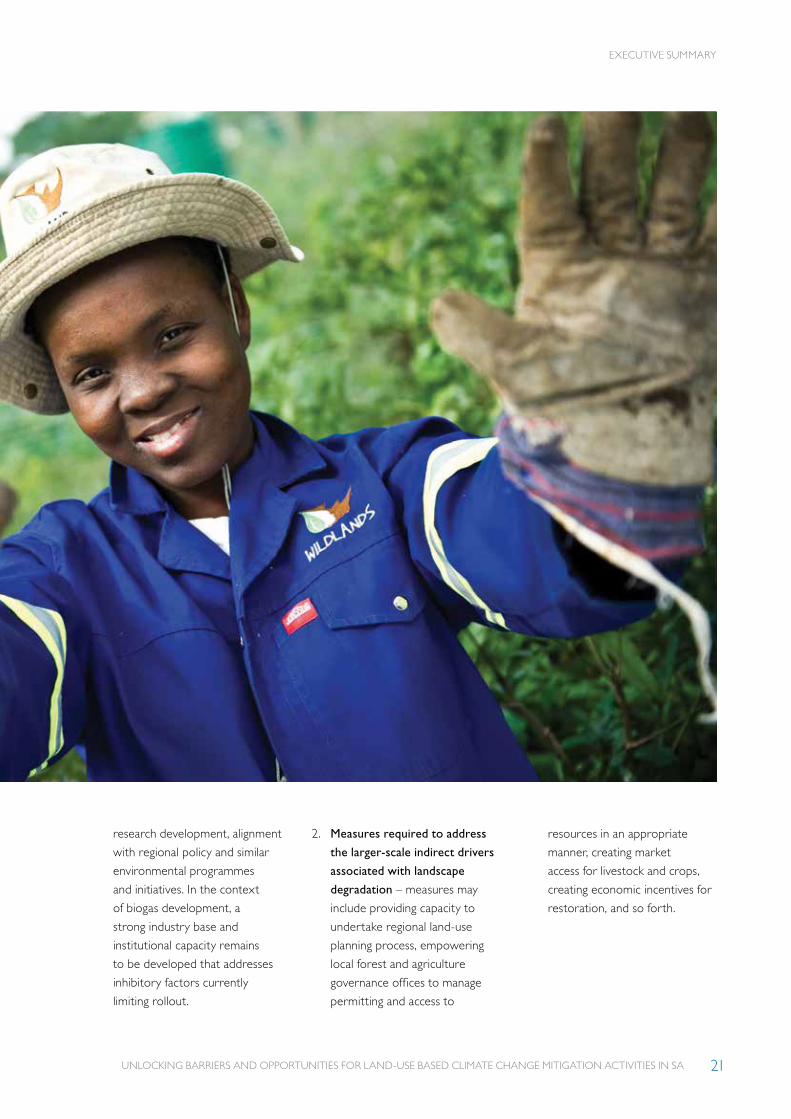
research development, alignment
with regional policy and similar
environmental programmes
and initiatives. In the context
of biogas development, a
strong industry base and
institutional capacity remains
to be developed that addresses
inhibitory factors currently
limiting rollout.
2. Measures required to address
the larger-scale indirect drivers
associated with landscape
degradation – measures may
include providing capacity to
undertake regional land-use
planning process, empowering
local forest and agriculture
governance offices to manage
permitting and access to
resources in an appropriate
manner, creating market
access for livestock and crops,
creating economic incentives for
restoration, and so forth.
EXECUTIVE SUMMARY

UNLOCKING BARRIERS AND OPPORTUNITIES FOR LAND-USE BASED CLIMATE CHANGE MITIGATION ACTIVITIES IN SA22
The tasks that need
to be provided by
Government and other
parties to establish and
sustain the implementation models
and measures over the long-term -
these would include:
• A national institutional home,
champion and strategy lead
• National co-ordination and
management
• Strategy development
• Facilitating roll-out: Area
identification and early landscape
development team
• Continued extension and
support services
• The implementation of a cost
efficient national MRV system
• Income creation and
management
• Incentive mechanisms and
disbursements
• Alignment with national and
international policy
• Research development
PARTICULAR TO ANAEROBIC DIGESTION OPPORTUNITIESThe national biogas platform and
industry association (SABIA) is
relatively well developed. However:
• Input and collaboration from
industry is largely based
on voluntary collaboration.
A dedicated budget could
strengthen institutional capacity
making working groups more
effective in delivering results in a
shorter period of time.
• SABIA needs to grow a paying
membership base to ensure its
long-term financial viability.
• SABIA needs to join SAREC,
thereby joining the more
dominant larger scale
renewables representatives
(wind, solar PV) with a voice
from the smaller scale bio-
energy industry.
TIER 1: REQUIRED INSTITUTIONAL SUPPORT
EXECUTIVE SUMMARY
UNLOCKING BARRIERS AND OPPORTUNITIES FOR LAND-USE BASED CLIMATE CHANGE MITIGATION ACTIVITIES IN SA 23
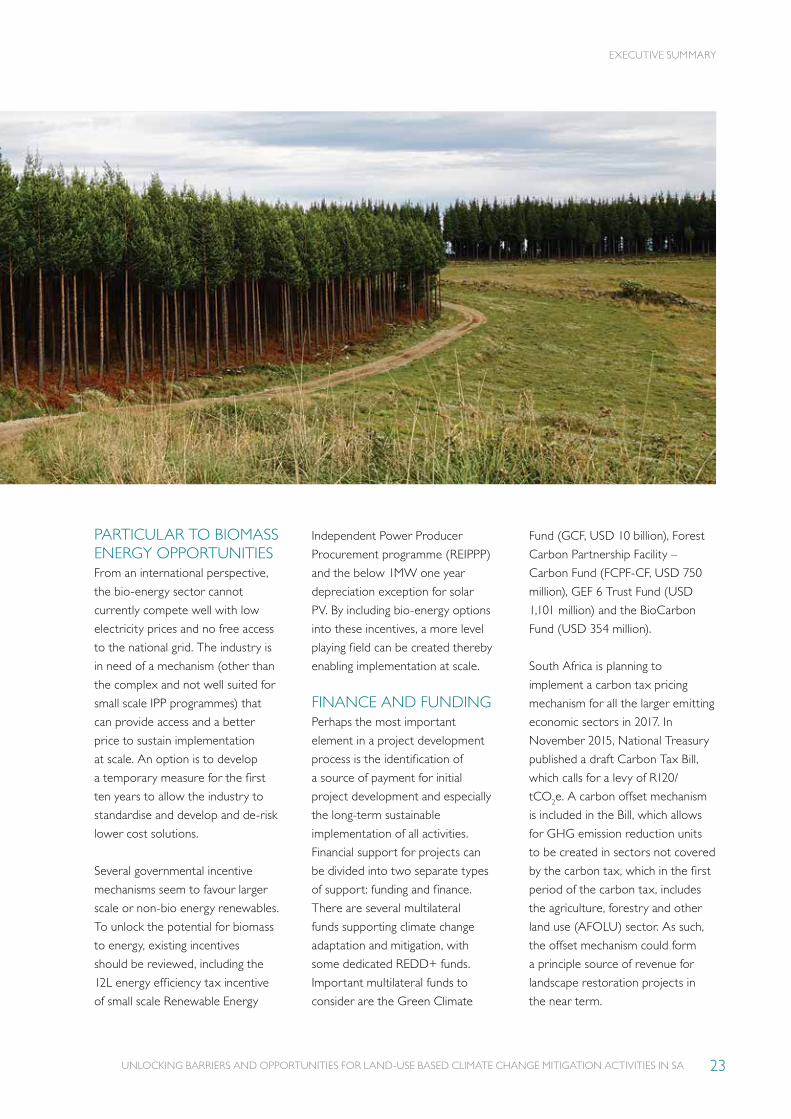
PARTICULAR TO BIOMASS ENERGY OPPORTUNITIESFrom an international perspective,
the bio-energy sector cannot
currently compete well with low
electricity prices and no free access
to the national grid. The industry is
in need of a mechanism (other than
the complex and not well suited for
small scale IPP programmes) that
can provide access and a better
price to sustain implementation
at scale. An option is to develop
a temporary measure for the first
ten years to allow the industry to
standardise and develop and de-risk
lower cost solutions.
Several governmental incentive
mechanisms seem to favour larger
scale or non-bio energy renewables.
To unlock the potential for biomass
to energy, existing incentives
should be reviewed, including the
12L energy efficiency tax incentive
of small scale Renewable Energy
Independent Power Producer
Procurement programme (REIPPP)
and the below 1MW one year
depreciation exception for solar
PV. By including bio-energy options
into these incentives, a more level
playing field can be created thereby
enabling implementation at scale.
FINANCE AND FUNDING Perhaps the most important
element in a project development
process is the identification of
a source of payment for initial
project development and especially
the long-term sustainable
implementation of all activities.
Financial support for projects can
be divided into two separate types
of support: funding and finance.
There are several multilateral
funds supporting climate change
adaptation and mitigation, with
some dedicated REDD+ funds.
Important multilateral funds to
consider are the Green Climate
Fund (GCF, USD 10 billion), Forest
Carbon Partnership Facility –
Carbon Fund (FCPF-CF, USD 750
million), GEF 6 Trust Fund (USD
1,101 million) and the BioCarbon
Fund (USD 354 million).
South Africa is planning to
implement a carbon tax pricing
mechanism for all the larger emitting
economic sectors in 2017. In
November 2015, National Treasury
published a draft Carbon Tax Bill,
which calls for a levy of R120/
tCO2e. A carbon offset mechanism
is included in the Bill, which allows
for GHG emission reduction units
to be created in sectors not covered
by the carbon tax, which in the first
period of the carbon tax, includes
the agriculture, forestry and other
land use (AFOLU) sector. As such,
the offset mechanism could form
a principle source of revenue for
landscape restoration projects in
the near term.
EXECUTIVE SUMMARY

DEVELOPING A NATIONAL VISION FOR THE SOUTH AFRICAN AFOLU SECTOR
SECTION ONE
UNLOCKING BARRIERS AND OPPORTUNITIES FOR LAND-USE BASED CLIMATE CHANGE MITIGATION ACTIVITIES IN SA26
SECTION ONE – DEVELOPING A NATIONAL VISION FOR THE SOUTH AFRICAN AFOLU SECTOR
Ninety-two percent of
South Africa’s land
surface is rural land,
which is home to
19 million people – approximately
35% of the national population
(Stats SA, 2009). It is an area that
delivers most of the country’s food,
water and energy resources, and
contributes meaningfully to the
recreational and spiritual needs
of the nation’s residents (van
Jaarsveld et al., 2005). Yet, perhaps
due to a historical bias towards
urban development, this 1.1 million
km2 area is under-appreciated in
terms of the services it provides
to local residents as well as to
distant urban populations and
economies. The management of
intact rural landscapes is generally
seen as a side-line conservation
or environmental issue, separate
to mainstream development,
and not a pivotal component
of national development and
stability. Furthermore, there is
a perception that the services
provided by intact landscapes
could be substituted by engineered
solutions, such as replacing natural
catchment functions with the
construction of additional dams.
The under-appreciation of our rural
environment and the belief that
we can replace it with engineered
solutions will ultimately lead to
irreversible degradation of vital
national resources and services.
In practice, intact functional
landscapes are fundamental for
WORKING LANDSCAPES AS THE FOUNDATION OF RURAL SOCIAL DEVELOPMENT AND STABILITY
1
UNLOCKING BARRIERS AND OPPORTUNITIES FOR LAND-USE BASED CLIMATE CHANGE MITIGATION ACTIVITIES IN SA 27
Ecosystem restoration has typically
been constrained to a narrow
definition in South Africa’s National
Development Plan, being seen
primarily as a means of meeting
Outcome 10 – protecting and
enhancing our environmental
assets and natural resources.
However, ecosystem restoration
can realistically fulfil a far broader
suite of national development,
security and social stability goals,
contributing to: Outcome 3 (safety),
Outcome 4 (employment through
inclusive economic growth),
Outcome 5 (skill development),
Outcome 6 (infrastructure – water)
and Outcome 7 (equitable and
sustainable rural communities
contributing to food security
for all).
SECTION ONE – DEVELOPING A NATIONAL VISION FOR THE SOUTH AFRICAN AFOLU SECTOR
providing access to affordable
food, water and energy: the
principle cornerstones of economic
development (Blignaut, 2009). A
lack of access to these primary
services, especially in remote rural
areas, leads to a decrease in human
well-being, disquiet and an increase
in potential for social instability at
scales ranging from local to national.
This primary link between intact
working ecosystems and social
stability and well-being has been
repeatedly demonstrated as being
a crucial factor in the rise and fall of
societies over time (Diamond, 2005,
Scholes and Scholes, 2013).
The restoration of natural
landscapes, and the development
of associated opportunities in the
form of improved water security,
livestock production, biogas
digesters, biomass-energy and
others, are mechanisms to foster
and maintain national economic
development. These not only
restore the natural capital on
which development depends
(the natural assets of the country,
which include functional fertile
soils, grasslands, woodlands and
forests), but also create sustainable
rural industries with related
employment and skills development.
A national rural restoration
programme requires planning,
implementation, governance,
policy, research and monitoring –
stimulants for extensive capacity
development and sustainable
rural jobs.

UNLOCKING BARRIERS AND OPPORTUNITIES FOR LAND-USE BASED CLIMATE CHANGE MITIGATION ACTIVITIES IN SA28
Land-use based climate
change mitigation activities
provide an opportunity
to restore a significant
fraction of South Africa’s landscapes
and to develop rural industries that
contribute to local and national
energy needs. However, this will
only be realised if a markedly
different implementation approach
is adopted, compared to current
approaches. Internationally, the
nature of these activities has
changed considerably in response
to years of trial and error, and the
gradual development of international
climate change policy. The principle
shift has been one of scale; with a
move from small, isolated projects
developed by private sector entities,
to landscape- or even national-scale
projects facilitated by government.
Previously, under the Clean
Development Mechanism (CDM)
and similar early frameworks, climate
change mitigation measures were
generally confined to the project
scale with each type of activity
considered in isolation. This was
because the CDM and voluntary
initiatives only recognised certain
types of activities within the AFOLU
sector and required extensive
documentation and auditing
processes beyond the means of
most landowners.
Further, the majority of CDM
implementers were private sector
entities that required commercial
viability and low investment
risk. This generally constrained
implementation to pockets of
private land that met the numerous
constraints, with limited rollout at
a larger scale, especially in areas
under communal land-tenure (see
Appendix A for a list of existing
projects registered through the
Verified Carbon Standard (VCS)
and CDM projects).
In the past, private sector
developers found that restoration
projects in indigenous African
SECTION ONE – DEVELOPING A NATIONAL VISION FOR THE SOUTH AFRICAN AFOLU SECTOR
1.1INTEGRATION AT SCALE TO ENSURE EFFICIENCY, EFFECTIVENESS AND EQUITY
UNLOCKING BARRIERS AND OPPORTUNITIES FOR LAND-USE BASED CLIMATE CHANGE MITIGATION ACTIVITIES IN SA 29
woodlands and grasslands required
a minimum scale of 50,000 to
100,000 ha to be financially viable
(Knowles, 2011). The relative costs
of administration, implementation
and ‘monitoring, reporting and
verification’ (MRV) are only
financially viable at larger spatial
scales, making the relatively high
fixed costs of human capacity and
logistics less per unit area (DEA,
2015). The emergence of ‘reducing
emissions from deforestation and
forest degradation’ (REDD+) as a
recognised form of climate change
mitigation, required a broader
consideration of degradation
drivers outside the immediate
project boundaries. Implementers
were often forced to consider a
broader suite of regional activities
and measures to halt deforestation.
This was beyond the capacity of
individual projects and required
national government support.
Evolving international climate
change policy has also been a
pivotal driver in the shift from
local to landscape or national-scale
implementation. Early local-scale
activities in developing countries
were principally developed for
registration through the CDM,
which allowed parties to the Kyoto
Protocol to reach their emission
targets in a more flexible and
cost-efficient manner. This context
promoted concise, financially
attractive, low-risk ventures that
would generate emission reduction
units for trade through international
carbon markets. It largely ignored
landscape or national-scale
environmental, economic and social
development issues.
International climate change policy
has moved towards national-scale
implementation and nationally
determined responses to climate
change. Recent policies allow
countries to self-determine their
contributions to climate change
mitigation, and, importantly, to align
them with the broader social and
environmental development agenda
of the nation. Such a nationally
determined climate change
mitigation system is gradually being
developed through the formulation
of Nationally Appropriate Mitigation
Actions, Desired Emission
Reduction Outcomes and Nationally
Determined Contributions.
Previously, driven by the need to
deliver emission reduction units
at a low cost and low risk, project
developers tended to focus only
SECTION ONE – DEVELOPING A NATIONAL VISION FOR THE SOUTH AFRICAN AFOLU SECTOR
In the past, private sector
developers found that restoration
projects in indigenous African
woodlands and grasslands
required a minimum scale of
50,000 to 100,000 ha to be
financially viable
(Knowles, 2011)
UNLOCKING BARRIERS AND OPPORTUNITIES FOR LAND-USE BASED CLIMATE CHANGE MITIGATION ACTIVITIES IN SA
SECTION ONE – DEVELOPING A NATIONAL VISION FOR THE SOUTH AFRICAN AFOLU SECTOR
30
20%
80%
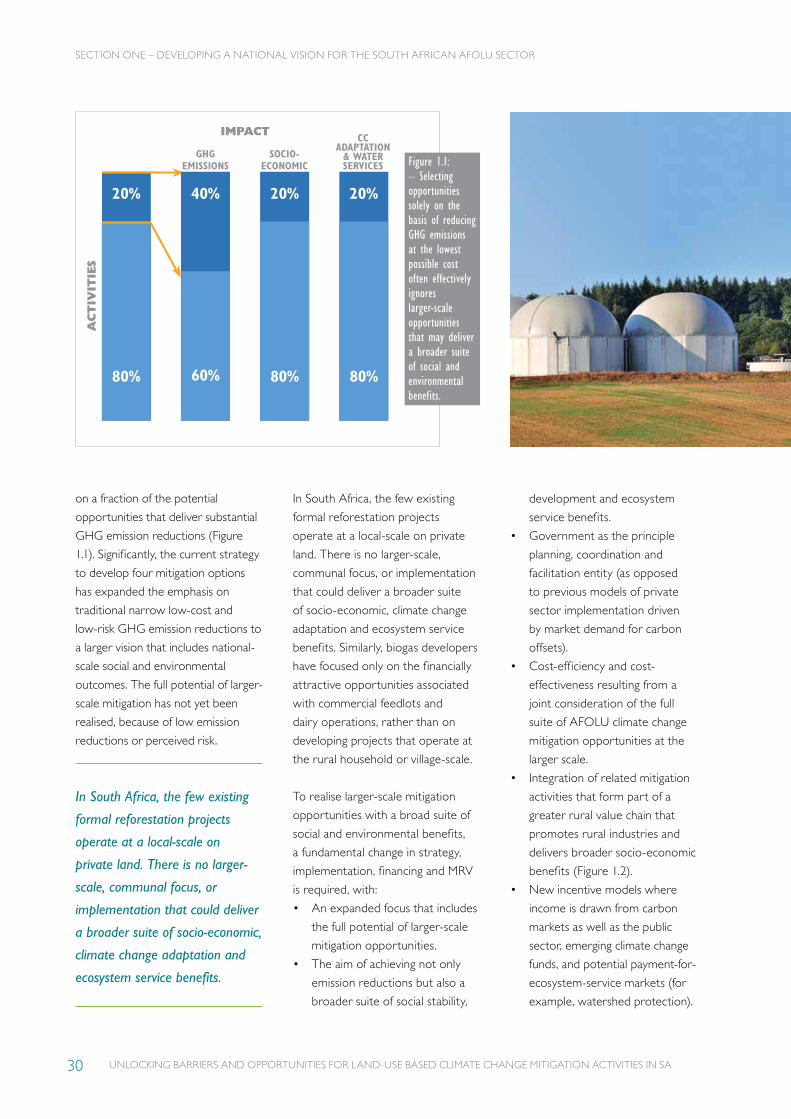
Figure 1.1: – Selecting opportunities solely on the basis of reducing GHG emissions at the lowest possible cost often effectively ignores larger-scale opportunities that may deliver a broader suite of social and environmental benefits.
AC
TIV
ITIE
S
IMPACT
40%
60%
GHG EMISSIONS
CC ADAPTATION & WATER SERVICES
20%
80%
SOCIO-ECONOMIC
20%
80%
on a fraction of the potential
opportunities that deliver substantial
GHG emission reductions (Figure
1.1). Significantly, the current strategy
to develop four mitigation options
has expanded the emphasis on
traditional narrow low-cost and
low-risk GHG emission reductions to
a larger vision that includes national-
scale social and environmental
outcomes. The full potential of larger-
scale mitigation has not yet been
realised, because of low emission
reductions or perceived risk.
In South Africa, the few existing
formal reforestation projects
operate at a local-scale on private
land. There is no larger-scale,
communal focus, or implementation
that could deliver a broader suite
of socio-economic, climate change
adaptation and ecosystem service
benefits. Similarly, biogas developers
have focused only on the financially
attractive opportunities associated
with commercial feedlots and
dairy operations, rather than on
developing projects that operate at
the rural household or village-scale.
To realise larger-scale mitigation
opportunities with a broad suite of
social and environmental benefits,
a fundamental change in strategy,
implementation, financing and MRV
is required, with:
• An expanded focus that includes
the full potential of larger-scale
mitigation opportunities.
• The aim of achieving not only
emission reductions but also a
broader suite of social stability,
development and ecosystem
service benefits.
• Government as the principle
planning, coordination and
facilitation entity (as opposed
to previous models of private
sector implementation driven
by market demand for carbon
offsets).
• Cost-efficiency and cost-
effectiveness resulting from a
joint consideration of the full
suite of AFOLU climate change
mitigation opportunities at the
larger scale.
• Integration of related mitigation
activities that form part of a
greater rural value chain that
promotes rural industries and
delivers broader socio-economic
benefits (Figure 1.2).
• New incentive models where
income is drawn from carbon
markets as well as the public
sector, emerging climate change
funds, and potential payment-for-
ecosystem-service markets (for
example, watershed protection).
In South Africa, the few existing
formal reforestation projects
operate at a local-scale on
private land. There is no larger-
scale, communal focus, or
implementation that could deliver
a broader suite of socio-economic,
climate change adaptation and
ecosystem service benefits.
SECTION ONE – DEVELOPING A NATIONAL VISION FOR THE SOUTH AFRICAN AFOLU SECTOR
UNLOCKING BARRIERS AND OPPORTUNITIES FOR LAND-USE BASED CLIMATE CHANGE MITIGATION ACTIVITIES IN SA 31
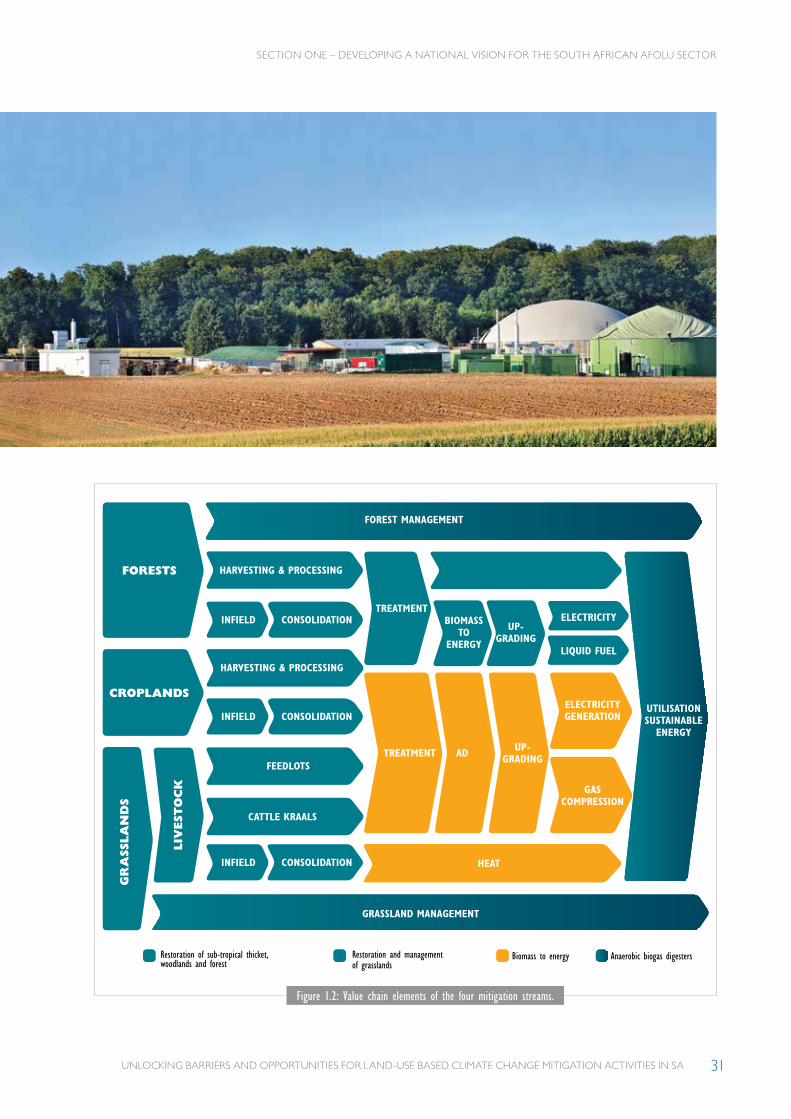
HARVESTING & PROCESSING
HARVESTING & PROCESSING
CROPLANDS
GR
ASS
LA
ND
S
CONSOLIDATION
CONSOLIDATION
CONSOLIDATION
FOREST MANAGEMENT
GRASSLAND MANAGEMENT
INFIELD
INFIELD
INFIELD
FEEDLOTS
CATTLE KRAALS
HEAT
HEAT
TREATMENT
UTILISATION SUSTAINABLE
ENERGY
BIOMASS TO
ENERGY
AD
UP-GRADING
ELECTRICITY
LIQUID FUEL
ELECTRICITY GENERATION
GAS COMPRESSION
UP-GRADING
LIV
EST
OC
K
FORESTS
TREATMENT
Restoration of sub-tropical thicket, woodlands and forest
Biomass to energyRestoration and management of grasslands
Anaerobic biogas digesters
Figure 1.2: Value chain elements of the four mitigation streams.
UNLOCKING BARRIERS AND OPPORTUNITIES FOR LAND-USE BASED CLIMATE CHANGE MITIGATION ACTIVITIES IN SA32
SECTION ONE – DEVELOPING A NATIONAL VISION FOR THE SOUTH AFRICAN AFOLU SECTOR
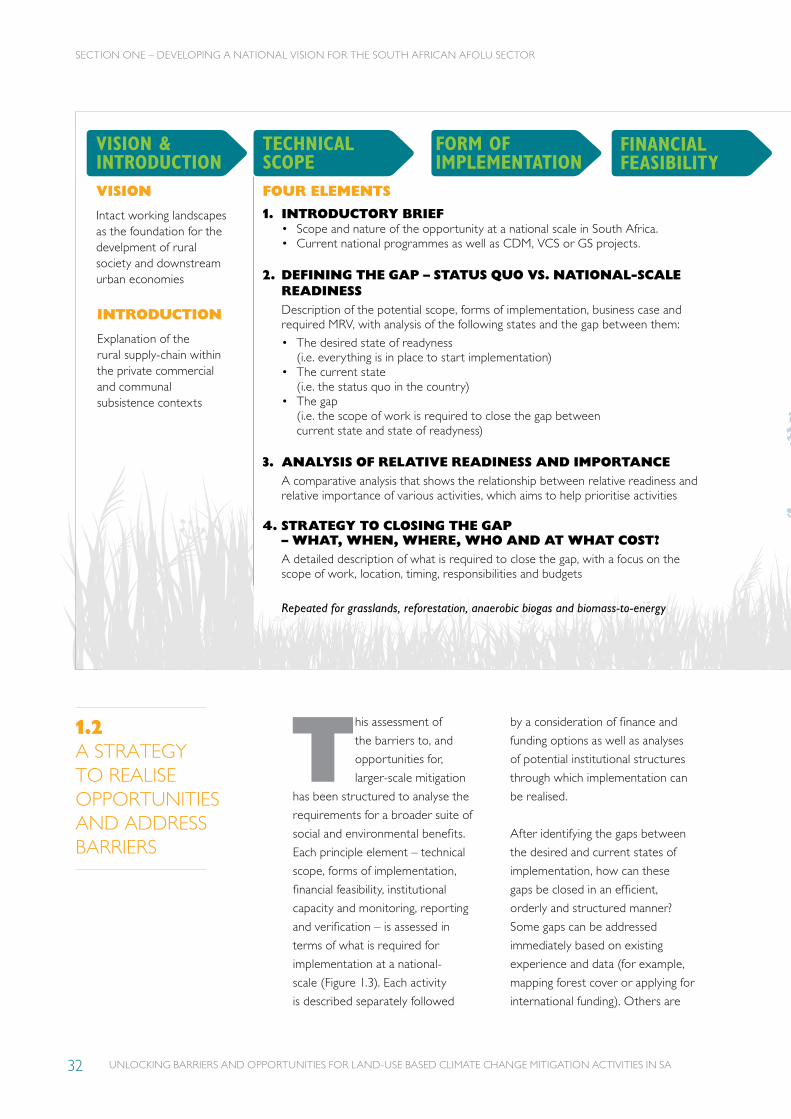
TECHNICAL SCOPE
VISION & INTRODUCTION
1.2A STRATEGY TO REALISE OPPORTUNITIES AND ADDRESS BARRIERS
VISION
Intact working landscapes as the foundation for the develpment of rural society and downstream urban economies
INTRODUCTION
Explanation of the rural supply-chain within the private commercial and communal subsistence contexts
FORM OF IMPLEMENTATION
FINANCIAL FEASIBILITY
FOUR ELEMENTS
This assessment of
the barriers to, and
opportunities for,
larger-scale mitigation
has been structured to analyse the
requirements for a broader suite of
social and environmental benefits.
Each principle element – technical
scope, forms of implementation,
financial feasibility, institutional
capacity and monitoring, reporting
and verification – is assessed in
terms of what is required for
implementation at a national-
scale (Figure 1.3). Each activity
is described separately followed
by a consideration of finance and
funding options as well as analyses
of potential institutional structures
through which implementation can
be realised.
After identifying the gaps between
the desired and current states of
implementation, how can these
gaps be closed in an efficient,
orderly and structured manner?
Some gaps can be addressed
immediately based on existing
experience and data (for example,
mapping forest cover or applying for
international funding). Others are
1. INTRODUCTORY BRIEF • Scope and nature of the opportunity at a national scale in South Africa. • Current national programmes as well as CDM, VCS or GS projects.
2. DEFINING THE GAP – STATUS QUO VS. NATIONAL-SCALE READINESS
Description of the potential scope, forms of implementation, business case and required MRV, with analysis of the following states and the gap between them:
• The desired state of readyness (i.e. everything is in place to start implementation)
• The current state (i.e. the status quo in the country)
• The gap (i.e. the scope of work is required to close the gap between current state and state of readyness)
3. ANALYSIS OF RELATIVE READINESS AND IMPORTANCEA comparative analysis that shows the relationship between relative readiness and relative importance of various activities, which aims to help prioritise activities
4. STRATEGY TO CLOSING THE GAP – WHAT, WHEN, WHERE, WHO AND AT WHAT COST?
A detailed description of what is required to close the gap, with a focus on the scope of work, location, timing, responsibilities and budgets
Repeated for grasslands, reforestation, anaerobic biogas and biomass-to-energy
UNLOCKING BARRIERS AND OPPORTUNITIES FOR LAND-USE BASED CLIMATE CHANGE MITIGATION ACTIVITIES IN SA 33
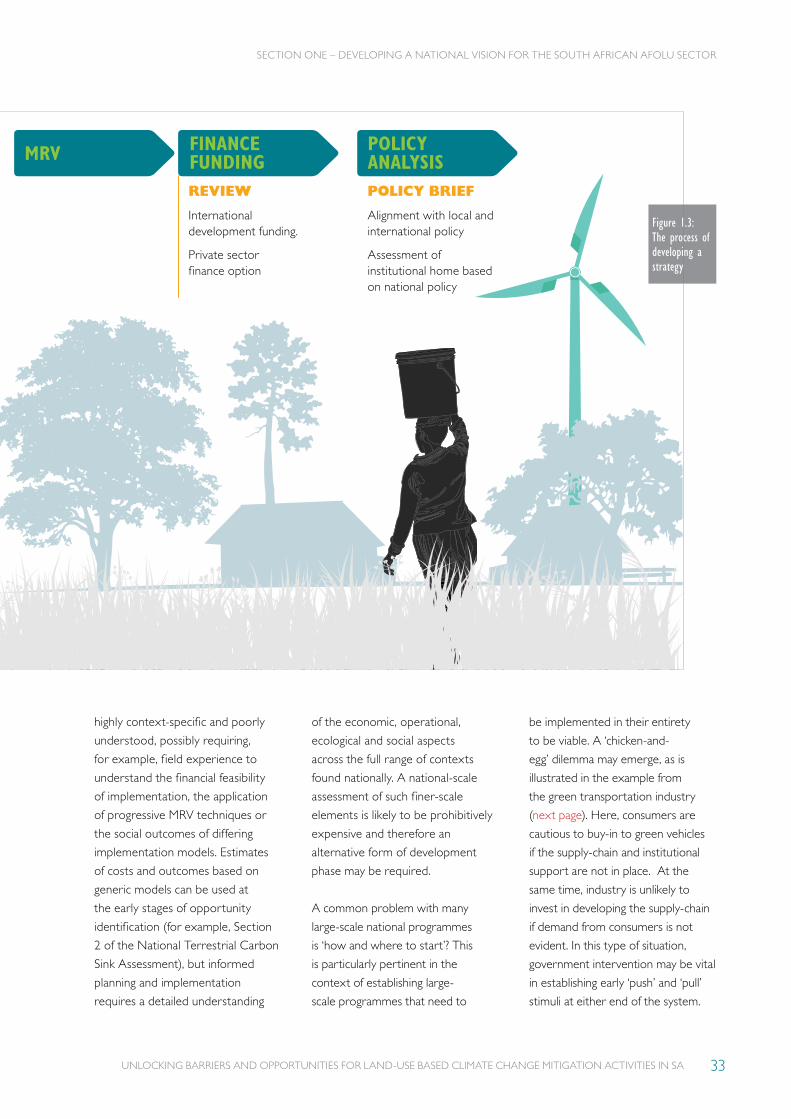
SECTION ONE – DEVELOPING A NATIONAL VISION FOR THE SOUTH AFRICAN AFOLU SECTOR
REVIEW
International development funding.
Private sector finance option
POLICY BRIEF
Alignment with local and international policy
Assessment of institutional home based on national policy
MRV FINANCE FUNDING
POLICY ANALYSIS
highly context-specific and poorly
understood, possibly requiring,
for example, field experience to
understand the financial feasibility
of implementation, the application
of progressive MRV techniques or
the social outcomes of differing
implementation models. Estimates
of costs and outcomes based on
generic models can be used at
the early stages of opportunity
identification (for example, Section
2 of the National Terrestrial Carbon
Sink Assessment), but informed
planning and implementation
requires a detailed understanding
of the economic, operational,
ecological and social aspects
across the full range of contexts
found nationally. A national-scale
assessment of such finer-scale
elements is likely to be prohibitively
expensive and therefore an
alternative form of development
phase may be required.
A common problem with many
large-scale national programmes
is ‘how and where to start’? This
is particularly pertinent in the
context of establishing large-
scale programmes that need to
be implemented in their entirety
to be viable. A ‘chicken-and-
egg’ dilemma may emerge, as is
illustrated in the example from
the green transportation industry
(next page). Here, consumers are
cautious to buy-in to green vehicles
if the supply-chain and institutional
support are not in place. At the
same time, industry is unlikely to
invest in developing the supply-chain
if demand from consumers is not
evident. In this type of situation,
government intervention may be vital
in establishing early ‘push’ and ‘pull’
stimuli at either end of the system.
Figure 1.3:The process of developing a strategy
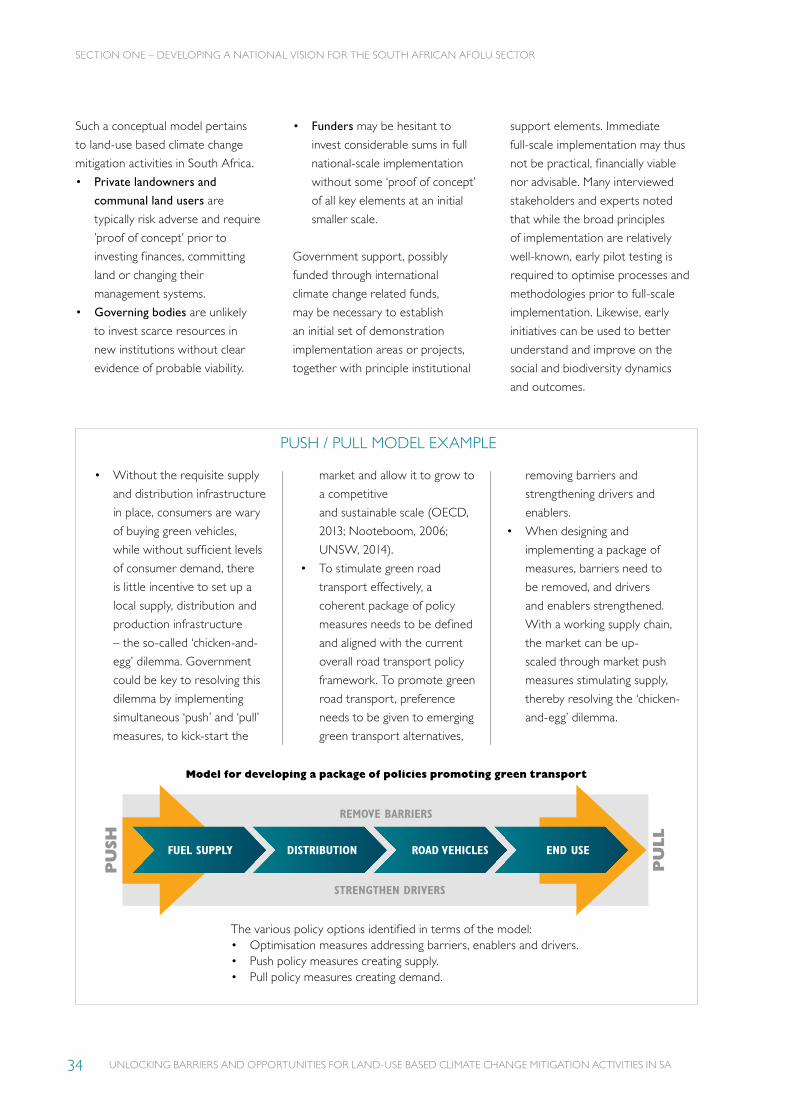
UNLOCKING BARRIERS AND OPPORTUNITIES FOR LAND-USE BASED CLIMATE CHANGE MITIGATION ACTIVITIES IN SA34
• Without the requisite supply
and distribution infrastructure
in place, consumers are wary
of buying green vehicles,
while without sufficient levels
of consumer demand, there
is little incentive to set up a
local supply, distribution and
production infrastructure
– the so-called ‘chicken-and-
egg’ dilemma. Government
could be key to resolving this
dilemma by implementing
simultaneous ‘push’ and ‘pull’
measures, to kick-start the
market and allow it to grow to
a competitive
and sustainable scale (OECD,
2013; Nooteboom, 2006;
UNSW, 2014).
• To stimulate green road
transport effectively, a
coherent package of policy
measures needs to be defined
and aligned with the current
overall road transport policy
framework. To promote green
road transport, preference
needs to be given to emerging
green transport alternatives,
removing barriers and
strengthening drivers and
enablers.
• When designing and
implementing a package of
measures, barriers need to
be removed, and drivers
and enablers strengthened.
With a working supply chain,
the market can be up-
scaled through market push
measures stimulating supply,
thereby resolving the ‘chicken-
and-egg’ dilemma.
PU
SH
PU
LL
FUEL SUPPLY END USEDISTRIBUTION ROAD VEHICLES
STRENGTHEN DRIVERS
Such a conceptual model pertains
to land-use based climate change
mitigation activities in South Africa.
• Private landowners and
communal land users are
typically risk adverse and require
’proof of concept’ prior to
investing finances, committing
land or changing their
management systems.
• Governing bodies are unlikely
to invest scarce resources in
new institutions without clear
evidence of probable viability.
• Funders may be hesitant to
invest considerable sums in full
national-scale implementation
without some ‘proof of concept’
of all key elements at an initial
smaller scale.
Government support, possibly
funded through international
climate change related funds,
may be necessary to establish
an initial set of demonstration
implementation areas or projects,
together with principle institutional
support elements. Immediate
full-scale implementation may thus
not be practical, financially viable
nor advisable. Many interviewed
stakeholders and experts noted
that while the broad principles
of implementation are relatively
well-known, early pilot testing is
required to optimise processes and
methodologies prior to full-scale
implementation. Likewise, early
initiatives can be used to better
understand and improve on the
social and biodiversity dynamics
and outcomes.
REMOVE BARRIERS
PUSH / PULL MODEL EXAMPLE
SECTION ONE – DEVELOPING A NATIONAL VISION FOR THE SOUTH AFRICAN AFOLU SECTOR
Model for developing a package of policies promoting green transport
The various policy options identified in terms of the model:• Optimisation measures addressing barriers, enablers and drivers.• Push policy measures creating supply. • Pull policy measures creating demand.
UNLOCKING BARRIERS AND OPPORTUNITIES FOR LAND-USE BASED CLIMATE CHANGE MITIGATION ACTIVITIES IN SA 35
SECTION ONE – DEVELOPING A NATIONAL VISION FOR THE SOUTH AFRICAN AFOLU SECTOR
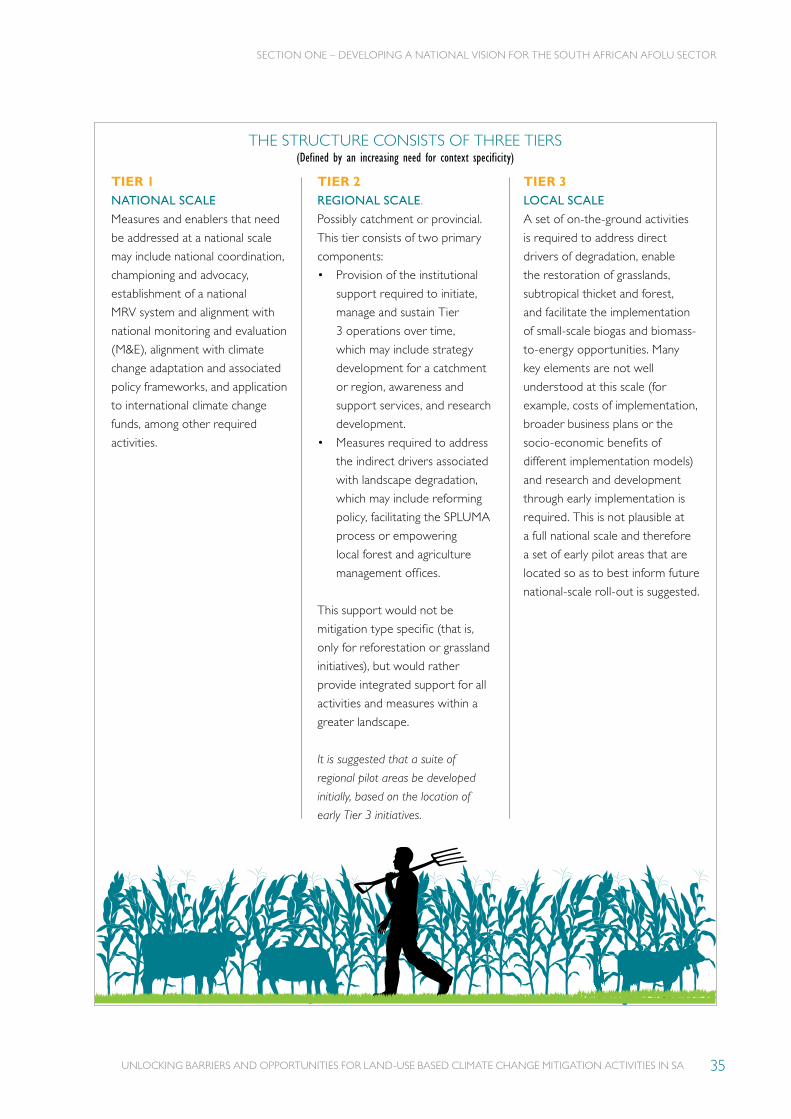
THE STRUCTURE CONSISTS OF THREE TIERS (Defined by an increasing need for context specificity)
TIER 1NATIONAL SCALE
Measures and enablers that need
be addressed at a national scale
may include national coordination,
championing and advocacy,
establishment of a national
MRV system and alignment with
national monitoring and evaluation
(M&E), alignment with climate
change adaptation and associated
policy frameworks, and application
to international climate change
funds, among other required
activities.
TIER 2REGIONAL SCALE.
Possibly catchment or provincial.
This tier consists of two primary
components:
• Provision of the institutional
support required to initiate,
manage and sustain Tier
3 operations over time,
which may include strategy
development for a catchment
or region, awareness and
support services, and research
development.
• Measures required to address
the indirect drivers associated
with landscape degradation,
which may include reforming
policy, facilitating the SPLUMA
process or empowering
local forest and agriculture
management offices.
This support would not be
mitigation type specific (that is,
only for reforestation or grassland
initiatives), but would rather
provide integrated support for all
activities and measures within a
greater landscape.
It is suggested that a suite of
regional pilot areas be developed
initially, based on the location of
early Tier 3 initiatives.
TIER 3LOCAL SCALE
A set of on-the-ground activities
is required to address direct
drivers of degradation, enable
the restoration of grasslands,
subtropical thicket and forest,
and facilitate the implementation
of small-scale biogas and biomass-
to-energy opportunities. Many
key elements are not well
understood at this scale (for
example, costs of implementation,
broader business plans or the
socio-economic benefits of
different implementation models)
and research and development
through early implementation is
required. This is not plausible at
a full national scale and therefore
a set of early pilot areas that are
located so as to best inform future
national-scale roll-out is suggested.

UNLOCKING BARRIERS AND OPPORTUNITIES FOR LAND-USE BASED CLIMATE CHANGE MITIGATION ACTIVITIES IN SA36
SECTION ONE – DEVELOPING A NATIONAL VISION FOR THE SOUTH AFRICAN AFOLU SECTOR
A solution may be a multi-scaled
tiered approach that focuses on the
entire set of elements. Whereas cer-
tain nationally generic components
can be developed immediately at
scale, a small initial suite of pilot areas
would be used to test and develop
context specific components, for
example, cost, implementation and
MRV models (Figure 1.4).
The effective and efficient devel-
opment of Tier 2, and to a certain
extent Tier 1, is based on the scope
of Tier 3 being well understood
and defined. The tiers are therefore
introduced in a reverse ‘bottom-up’
manner. Because there are currently
different levels of understanding of
forms of implementation for each
biome, Tier 3 is approached and
described in a different manner for
each project type. For example, in
the subtropical thicket biome, the
form of implementation required
is well known and can be closely
described. In comparison, the form
of implementation required across
the entire grassland biome is less
well known and therefore a broader
process is described, from which
detailed implementation can be
developed.
In addition, the concept of direct
and indirect drivers is adopted.
Initially conceived in the context
of REDD+ project development,
this concept can be used to identify
and articulate the broad range of
elements to be considered, at a
range of scales, to ensure successful
and sustainable implementation.

UNLOCKING BARRIERS AND OPPORTUNITIES FOR LAND-USE BASED CLIMATE CHANGE MITIGATION ACTIVITIES IN SA 37
SECTION ONE – DEVELOPING A NATIONAL VISION FOR THE SOUTH AFRICAN AFOLU SECTOR
Community engagement
National strategy and co-
ordination
Establishment of finance and funding with international
parties
National MRV admin. and
alignment with M&E program
Policy alignment and advocacy
TIER 3LOCAL SCALEOn-the-ground activities and measures
TIER 1NATIONAL SCALEInstitutional support,
removal of barriers and strengthen drivers
SPATIAL SCALE
Creation of individual forest management plans AREA #
Alignment with provincial and municipal planning
Support of regional forest offices
Monitoring and reporting
AREA #Creation of catchment management association
Training and management of extension services
Monitoring and reporting
Fire management
Nursery establishment
Smaller catchment management planning
Improved grazing management and animal husbandry
Clearance of alien invasive species
Improved extension services
Restoration of old fields
Erosion control
Figure 1.4:Implementing a national strategy through a system of three tiers
1.3DRIVERS, ENABLERS, ACTIVITIES AND MEASURES
1.3.1 Direct and indirect drivers
Current land cover and land use
in a particular area is the result of
many drivers interacting across
multiple scales. These include basic
abiotic drivers that broadly define
the current vegetation or agriculture
(for example, soil type and climate),
as well as human drivers that may
directly or indirectly influence land
use (for example, beef markets,
grazing strategies and
fire management).
Direct drivers are observable
actions that directly affect a
landscape, for example, ploughing
land, burning grasslands, harvesting
forests or collecting fuelwood.
Indirect drivers are generally not
observable, yet still have a profound
influence on land use in an area,
for example, land-use policies
or demand for fuelwood and
agricultural commodities.
The distinction between direct and
indirect drivers is widely used in
the development of land-use based
climate change mitigation activities
to identify and address required
elements in an orderly manner. For
example, in the case of a project
TIER 2REGIONAL SCALEInstitutional support
and addressing indirect drivers
UNLOCKING BARRIERS AND OPPORTUNITIES FOR LAND-USE BASED CLIMATE CHANGE MITIGATION ACTIVITIES IN SA
SECTION ONE – DEVELOPING A NATIONAL VISION FOR THE SOUTH AFRICAN AFOLU SECTOR
38
aimed at reducing emissions from
deforestation and forest degradation
(REDD+), the developer would seek
to identify all direct and indirect
drivers that lead to deforestation
within a landscape. This may be
through engagement with local
experts and residents, through policy
and market analysis, or historical
land-use trend analysis from
remotely-sensed data. Thereafter,
the implementer would attempt to
address all the drivers in a systematic
manner to halt forest degradation
and avoid offsite ‘leakage’. Certain
drivers, especially indirect drivers
such as regional demand for
inexpensive fuelwood, may not be
solvable at a local scale, but could
be communicated to regional or
national authorities mandated to
address them at an appropriate scale.
The drivers concept is adopted
in this analysis of barriers and
opportunities, particularly for
programmes focused on restoration
of landscapes and prevention of
further degradation (Sections
2 to 4) as it enables systematic
identification of all drivers across
all tiers. Thereafter, appropriate
activities and measures can be
developed and implemented to
address them comprehensively
and efficiently.
1.3.2 Activities and enablers• ‘Activities’ are on-the-ground
actions that address observed
direct drivers (for example,
livestock management or the
implementation of sustainable
wood harvesting regimes).
• ‘Enablers’ are additional
elements required to enable
a programme to occur (for
example, implementation
or monitoring capacity or
the creation of an incentive
mechanism). Although not
drivers in themselves, enablers
are added to the list of drivers
in certain sections and are
addressed through suggested

SECTION ONE – DEVELOPING A NATIONAL VISION FOR THE SOUTH AFRICAN AFOLU SECTOR
UNLOCKING BARRIERS AND OPPORTUNITIES FOR LAND-USE BASED CLIMATE CHANGE MITIGATION ACTIVITIES IN SA 39
activities and measures. Different
parties generally implement
activities and measures at
different scales or tiers. The
clear separation of activities
and measures allows parties in
different implementation tiers
to understand their role and
how it forms part of a greater
integrated programme (Section
7 expands on these management
and governance aspects).
1.3.3 Required measures‘Measures’ are those initiatives
required to resolve the indirect
drivers that inhibit the roll-out
of landscape restoration in a
sustainable manner. Measures
may include:
• Reform of policy or market
incentives that lead to land
degradation.
• Integrated land-use planning
that includes the restoration
and long-term management of
landscapes (the realisation of
SPLUMA).
• Creation of a national focal
point that leads a national-scale
programme, including
the development of strategy,
income streams, incentive
mechanisms and required
monitoring, reporting and
verification support.
Whereas many of the measures
are implemented at national Tier 1
level, several measures are required
at a Tier 2 or Tier 3 level to
address indirect drivers. These
may include local-scale land-use
planning and negotiation, law and
regulatory enforcement, and the
creation of agricultural extension
support services.
Each of these measures is described
in the exploration of tiers that
follows.
UNLOCKING BARRIERS AND OPPORTUNITIES FOR LAND-USE BASED CLIMATE CHANGE MITIGATION ACTIVITIES IN SA
SECTION ONE – DEVELOPING A NATIONAL VISION FOR THE SOUTH AFRICAN AFOLU SECTOR
40
1.4IMPLEMENTATION MODELS AND INSTITUTIONAL SUPPORT
Following the full
articulation of drivers,
enablers, activities and
measures, appropriate
implementation models need to
be developed and supporting
institutional capacity needs to be
identified. Implementation models
are the structures through which
enablers, activities and measures
can be realised. Such models may
include established public or private-
sector entities (for example, private
landowners or the Expanded Public
Works programme) or new entities
designed to address areas that are
not under the remit of current
programmes.
Institutional support, provided by
government and other parties,
helps establish and sustain the
implementation models over the
long term. These may include
SECTION ONE – DEVELOPING A NATIONAL VISION FOR THE SOUTH AFRICAN AFOLU SECTOR
UNLOCKING BARRIERS AND OPPORTUNITIES FOR LAND-USE BASED CLIMATE CHANGE MITIGATION ACTIVITIES IN SA 41
awareness and education, extension
services, research and development,
funding and finance management,
as well as monitoring, reporting and
verification. Although principally
led by government, external
parties such as private sector
or NGO service providers may
be commissioned to implement
activities in the short term and the
early trial of implementation and
monitoring models.
Each mitigation activity is
described in detail in Sections
2-6. However, they often have
common institutional support
requirements at a Tier 1 and Tier
2 level. To avoid repetition in the
document, Tier 1 and Tier 2 are
each discussed in more detail once,
rather than for each of the biomes.
Similarly, a single description is given
under Tier 3 for the landscape
restoration and management
opportunities within the three
biomes –grassland, subtropical
thicket and forest biomes. The
nature of implementation for
the two energy-related projects
differs in some respects. For these
activities, a separate description of
Tier 3 implementation is included
in Section 5 (biogas digesters) and
6 (biomass-to-energy), together
with further Tier 2 and Tier 3
considerations.
UNLOCKING BARRIERS AND OPPORTUNITIES FOR LAND-USE BASED CLIMATE CHANGE MITIGATION ACTIVITIES IN SA
SECTION ONE – DEVELOPING A NATIONAL VISION FOR THE SOUTH AFRICAN AFOLU SECTOR
42
1.5EXPLORATION OF TIER 1: NATIONAL SCALE
Various tasks need
to be carried out
by government,
associated
departments and other agencies to
establish and sustain implementation
models and measures over the
long term, for example awareness
and education, extension services,
research and development, funding
and finance management, and MRV.
1.5.1 A national institutional home, champion and strategy lead
An appropriate institutional home
for a national AFOLU sector
mitigation programme will need
to be developed internally by
government. Initial indications are
that it may need to be a multi-
departmental working group that
includes representatives from
DEA, DAFF, DWS, DOE and
other entities. This would not only
be a caucus that meets at regular
intervals – it would be a formally
mandated entity that has the
capacity and staff to champion the
national programme and provide
strategic leadership. The intention
here is to understand the scope
of tasks that the national entity
would need to undertake, and the
associated capacity requirements.
• National coordination and
management: Operational
support is required at a
national scale. The majority
of field operations will likely
be implemented at Tier 3 and
Tier 2 levels, but a programme
management unit and secretariat
may be required to provide
oversight and coordination,
national legal and policy reviews,
human resource management,
financial management, funding,
and annual reporting at a
national scale.
• Strategy development:
Two broad levels of strategy
development are required.
The first level focuses on
the long-term vision of the
programme and roll-out, and
strategic alignment with other
SECTION ONE – DEVELOPING A NATIONAL VISION FOR THE SOUTH AFRICAN AFOLU SECTOR
UNLOCKING BARRIERS AND OPPORTUNITIES FOR LAND-USE BASED CLIMATE CHANGE MITIGATION ACTIVITIES IN SA 43
government programmes,
ecological infrastructure and
development efforts, and
government policies and
priorities. The second level
focuses on the realisation of this
vision, and how to strategically
entrench that vision in a long-
term roll-out plan informed by
that vision. It is anticipated that
the first level of strategy (the
long-term vision and direction
of the programme), will be
undertaken with guidance from
a steering committee, including
members of Treasury, DWA,
DAFF, and other relevant entities
within government as well as
the private and NGO sectors.
The second level of strategy
(operational strategy) would be
developed with entities in each
landscape.
• Facilitating roll-out – Area
identification and early
landscape development team:
The process of identifying and
establishing Tiers 2 and 3 needs
to be undertaken by the Tier 1
entity. An initial team goes into
each catchment or landscape
and develops the programme
from the ground up. This not
only has ecological and technical
elements, but also requires
substantial local government,
industry, private land-owner
and community engagement
to create awareness of the
opportunity, and negotiate buy-
in in a stepwise manner (one
portion of land at a time).
• Continued extension and
support services: It is anticipated
that a form of extension
service will be provided where
extension staff provide a suite
of activities to land-owners and
communities on the ground.
• The implementation of a cost
efficient national MRV system:
One of the main obstacles to
the roll-out of projects to date
has been the high transaction
costs associated with MRV
through international standards.
To address this, a robust and
transparent MRV system would
need to be created for each of
the principal implementation
options These MRV structures
should dovetail with the national
MRV programme currently
being developed by DEA,
and support existing capacity
where possible. An extension
officer or established industry
structures would undertake the
initial monitoring of activities
in the field. Taking pertinent
monitoring and verification
standards for land-use based
activities established in 2015
into account, the principle focus
for climate change mitigation
reporting in future should be
operational aspects and the
actual implementation of a
monitoring framework. An
understanding of institutional
capacity and governance
elements is required to progress
towards an efficient system.
To date the focus has been
narrow and very much on the
net change in atmospheric
carbon dioxide resulting from

UNLOCKING BARRIERS AND OPPORTUNITIES FOR LAND-USE BASED CLIMATE CHANGE MITIGATION ACTIVITIES IN SA
SECTION ONE – DEVELOPING A NATIONAL VISION FOR THE SOUTH AFRICAN AFOLU SECTOR
44
project activities. In future,
a broader set of social and
biodiversity safeguards may
need to be monitored. At the
same time, a working monitoring
system (comprising remote
sensing, field measurements,
data-entry, and data-housing
and reporting components),
provides a potential framework
and the capacity to monitor a
broader suite of climate change
adaptation, ecosystem service,
socio-economic, landscape
production and degradation
parameters, which are
required for national reporting
to UNFCCC as well as for
regional and national strategy
development.
• Economic instruments/
incentives: Economic
instruments and incentives
already exist for nature reserves
declared on private land through
Section 23 of the National
Environmental Management:
Protected Areas Act (Act No.
57 of 2003). Section 37D of
the Income Tax Act (Act No.
58 of 1962) allows a landowner
to deduct 4% of the value of
the land declared each year
over a 25-year period, thus
allowing for the full value of
the land to be deducted over
that period. Section 17 of the
Local Government: Municipal
Property Rates Act (Act No. 6
of 2004) provides for municipal
property rates exemptions on
land declared as a nature reserve
in terms of Section 23 of the
Protected Areas Act. These
economic instruments could be
further developed and enhanced
to enable landowners who
declare their land and implement
land-use practices that promote
the sequestration and storage of
carbon to be incentivised
and rewarded.
• Income creation and
management: Further to the
economic incentives noted
above, the Tier 1 entity needs
to pursue and develop a
comprehensive funding and
financing programme based on
an analysis of funding and finance
opportunities (Section 7). An
understanding of the full scope
of work is required, together
with the human and institutional
capacity that will be required
over the long term, including
consideration of an appropriate
institutional home. In addition,
an entity is required to manage
the trade of generated emissions
reductions that are generated
from the programme as a whole,
as well as to secure additional,
alternative sources of revenue,
for example payment for other
ecosystem services (water),
bilateral funding, national fiscus,
accessing new international
payment systems for climate
change mitigation (Nationally
Appropriate Mitigation Action
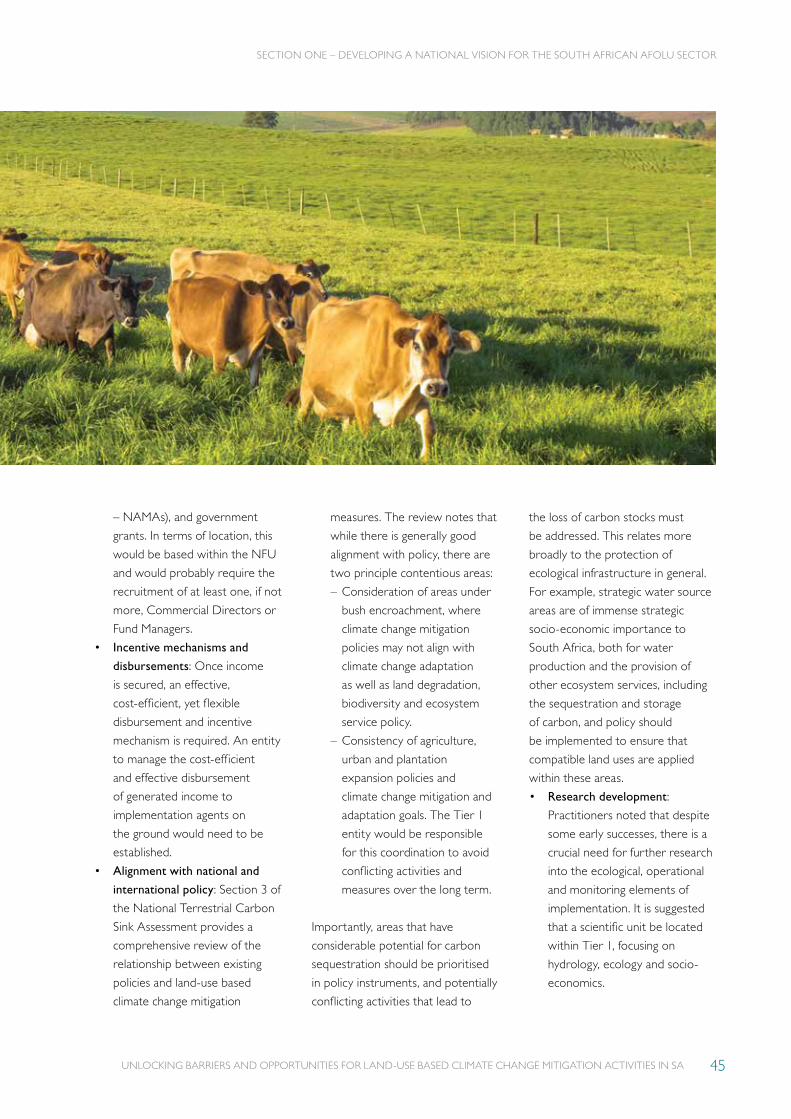
SECTION ONE – DEVELOPING A NATIONAL VISION FOR THE SOUTH AFRICAN AFOLU SECTOR
UNLOCKING BARRIERS AND OPPORTUNITIES FOR LAND-USE BASED CLIMATE CHANGE MITIGATION ACTIVITIES IN SA 45
– NAMAs), and government
grants. In terms of location, this
would be based within the NFU
and would probably require the
recruitment of at least one, if not
more, Commercial Directors or
Fund Managers.
• Incentive mechanisms and
disbursements: Once income
is secured, an effective,
cost-efficient, yet flexible
disbursement and incentive
mechanism is required. An entity
to manage the cost-efficient
and effective disbursement
of generated income to
implementation agents on
the ground would need to be
established.
• Alignment with national and
international policy: Section 3 of
the National Terrestrial Carbon
Sink Assessment provides a
comprehensive review of the
relationship between existing
policies and land-use based
climate change mitigation
measures. The review notes that
while there is generally good
alignment with policy, there are
two principle contentious areas:
– Consideration of areas under
bush encroachment, where
climate change mitigation
policies may not align with
climate change adaptation
as well as land degradation,
biodiversity and ecosystem
service policy.
– Consistency of agriculture,
urban and plantation
expansion policies and
climate change mitigation and
adaptation goals. The Tier 1
entity would be responsible
for this coordination to avoid
conflicting activities and
measures over the long term.
Importantly, areas that have
considerable potential for carbon
sequestration should be prioritised
in policy instruments, and potentially
conflicting activities that lead to
the loss of carbon stocks must
be addressed. This relates more
broadly to the protection of
ecological infrastructure in general.
For example, strategic water source
areas are of immense strategic
socio-economic importance to
South Africa, both for water
production and the provision of
other ecosystem services, including
the sequestration and storage
of carbon, and policy should
be implemented to ensure that
compatible land uses are applied
within these areas.
• Research development:
Practitioners noted that despite
some early successes, there is a
crucial need for further research
into the ecological, operational
and monitoring elements of
implementation. It is suggested
that a scientific unit be located
within Tier 1, focusing on
hydrology, ecology and socio-
economics.
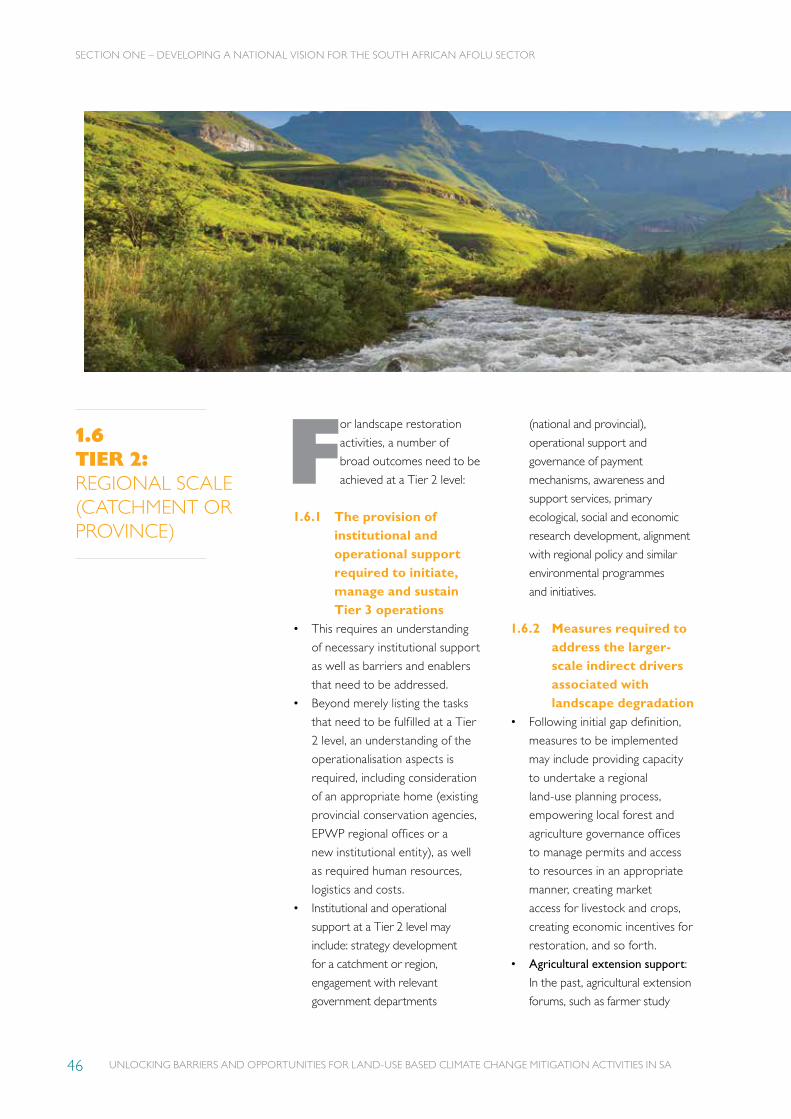
UNLOCKING BARRIERS AND OPPORTUNITIES FOR LAND-USE BASED CLIMATE CHANGE MITIGATION ACTIVITIES IN SA
SECTION ONE – DEVELOPING A NATIONAL VISION FOR THE SOUTH AFRICAN AFOLU SECTOR
46
1.6TIER 2: REGIONAL SCALE (CATCHMENT OR PROVINCE)
For landscape restoration
activities, a number of
broad outcomes need to be
achieved at a Tier 2 level:
1.6.1 The provision of institutional and operational support required to initiate, manage and sustain Tier 3 operations
• This requires an understanding
of necessary institutional support
as well as barriers and enablers
that need to be addressed.
• Beyond merely listing the tasks
that need to be fulfilled at a Tier
2 level, an understanding of the
operationalisation aspects is
required, including consideration
of an appropriate home (existing
provincial conservation agencies,
EPWP regional offices or a
new institutional entity), as well
as required human resources,
logistics and costs.
• Institutional and operational
support at a Tier 2 level may
include: strategy development
for a catchment or region,
engagement with relevant
government departments
(national and provincial),
operational support and
governance of payment
mechanisms, awareness and
support services, primary
ecological, social and economic
research development, alignment
with regional policy and similar
environmental programmes
and initiatives.
1.6.2 Measures required to address the larger-scale indirect drivers associated with landscape degradation
• Following initial gap definition,
measures to be implemented
may include providing capacity
to undertake a regional
land-use planning process,
empowering local forest and
agriculture governance offices
to manage permits and access
to resources in an appropriate
manner, creating market
access for livestock and crops,
creating economic incentives for
restoration, and so forth.
• Agricultural extension support:
In the past, agricultural extension
forums, such as farmer study
SECTION ONE – DEVELOPING A NATIONAL VISION FOR THE SOUTH AFRICAN AFOLU SECTOR
UNLOCKING BARRIERS AND OPPORTUNITIES FOR LAND-USE BASED CLIMATE CHANGE MITIGATION ACTIVITIES IN SA 47
groups that collaborated to
implement accepted best
practices, were widespread in the
agriculture sector in South Africa.
Through these mechanisms,
accepted best practices based
on empirical assessments of,
for example, veld condition,
were well known and widely
implemented. Such practices have
largely fallen away and empirical
assessments are no longer widely
undertaken. They are required,
however, if farm planning targeted
at livestock grazing practices is to
be effective. Together with tools
such as the SANBI Grazing and
Burning Guidelines (Lechmere-
Oertel, 2014), practices that
promote compatibility of
biodiversity conservation and
livestock production should
be pursued. This requires the
re-establishment of professional
agricultural extension services that
allow for sustainable rangeland
management in both commercial
agricultural environments and
on communal land, following
the types of approaches that
Conservation South Africa has
developed through their Meat
Naturally programme.
• Land-use planning: The
protection of ecological
infrastructure, which relates
to the protection of carbon
stocks and the ability to adapt
to climate change, should be
embedded in all land-use policy.
Furthermore, issues such as
carbon sequestration potential
and regions of potentially
high carbon stocks should be
identified in spatial planning
instruments such as regional and
provincial conservation plans,
which may then be translated
into bioregional plans as identified
in Section 40 of the National
Environmental Management:
Biodiversity Act (Act No.10 of
2004). As the bioregional plans
form the basis for environmental
planning in district and local
municipal planning instruments
such as spatial development
frameworks, this will enable areas
of high potential carbon stocks
to be identified and captured in
appropriate national, provincial
and local planning instruments,
such as the municipal Integrated
Development Plans and Spatial
Development Frameworks.
Such areas should be identified
specifically in planning
instruments formulated in
terms of the Spatial Land Use
Management Act (SPLUMA)
to ensure that appropriate land
uses are applied in areas of
high ecological infrastructure
importance that will also be
important for the protection of
carbon stocks.
1.6.3 Regulation and law enforcement
• Regulation and law enforcement
should focus largely on existing
instruments and ensure that they
are appropriately implemented,
but efforts should also be
made to ensure that conflicting
legislation is not undermining
efforts to protect carbon stocks.
For example, legislation related
to the control and eradication
of alien invasive plants (AIP)
requires that landowners take
responsibility and undertake
measures to address AIP
infestations, but in many
instances there is little or no
compliance with such legislation.
UNLOCKING BARRIERS AND OPPORTUNITIES FOR LAND-USE BASED CLIMATE CHANGE MITIGATION ACTIVITIES IN SA
SECTION ONE – DEVELOPING A NATIONAL VISION FOR THE SOUTH AFRICAN AFOLU SECTOR
48
This is true of many government
entities that own and are
responsible for land such as
provincial and national road and
rail authorities. It is incumbent
on government to set the
example in addressing issues such
as invasive alien plant control,
which poses a significant threat
to carbon stocks and ecological
infrastructure in general.
• Potentially conflicting legislative
imperatives, which may lead to
loss of biodiversity and ecological
function with little or no
socio-economic benefit, should
be addressed. Examples of
potentially conflicting legislation
include some aspects of the
Preservation and Development
of Agricultural Land Bill, which
seeks to promote the conversion
of virgin land to arable land,
which may lead to considerable
loss of important biodiversity
and ecological infrastructure, and
ultimately to further loss of soil
carbon stocks within grasslands.
1.6.4 Identification of broad areas of interest and specific pilot projects
The intention is not to choose sites
that will optimise carbon benefits,
but rather a suite of locations that
will provide insight into the nature
of implementation across the entire
country in terms of operational
requirements, costs, MRV, climate
mitigation and adaptation benefits, as
well as social, ecological infrastructure
and other non-carbon outcomes.
Pilot projects need to be broadly
applicable (that is, scalable) and not
once-off examples selected just
because they will deliver immediate
returns. They will be selected because
they cover the range of variation for
activities, required implementation
models, payment mechanisms, MRV
processes, and so forth.
Factors to be considered include:
• Vegetation type, rainfall and
geology.
• Carbon stocks, type and level of
degradation or threat.
• Type of land tenure.
• Potential activities and associated
implementation models.
• Socio-economic indicators
(poverty and resource
dependency).
• Co-benefits – important areas
for water, biodiversity and
ecological infrastructure.
A spatially explicit model could be
used to identify broad candidate
SECTION ONE – DEVELOPING A NATIONAL VISION FOR THE SOUTH AFRICAN AFOLU SECTOR
UNLOCKING BARRIERS AND OPPORTUNITIES FOR LAND-USE BASED CLIMATE CHANGE MITIGATION ACTIVITIES IN SA 49
areas based on existing data and
simple GIS-based prioritisation
methods. Once the broad
areas have been delineated, the
identification of pilot projects
will require a logical evaluation
framework that considers the
following principles:
• The public must be made aware
of the project, especially those
people directly affected.
• Social benefits to the people
who live in the area are essential.
• Local residents should be
empowered to manage their
landscape, rather than having
outside teams coming in to do
the work.
• An integrated landscape
approach must be applied,
rather than attempts to restore
individual components of the
landscape. For example, in a sub-
catchment, grasslands, forests
and wetlands should be restored
together as their ecological
functionality is linked.
• Where appropriate, mutually-
beneficial partnerships with
existing projects should
be arranged. Rather than
establishing new ‘green fields’
pilot programmes, collaboration
with existing projects may be
more expedient, cost-efficient
and allow for leverage of
existing data and longer-term
estimates of outcomes. For the
existing initiative, it provides
an opportunity to benefit from
inclusion in a possible future
national programme.
Tier 2 initiatives would be
established at each of the Tier 3
pilot landscapes:
• At the start, a set of guiding
principles could be applied
across all landscapes to facilitate
efficiency, effectiveness,
completeness, robustness and
sustainability over the long term.
A suite of regional pilot areas
should be developed initially,
based on the location of early
Tier 3 initiatives.
• To ensure efficiency and
effectiveness, Tier 2 capacity
should be developed in response
to the required list of activities,
measures and barriers listed
in the inception phase – a
bottom-up, context-appropriate
response, but leveraging existing
capacity and institutions where
possible.
UNLOCKING BARRIERS AND OPPORTUNITIES FOR LAND-USE BASED CLIMATE CHANGE MITIGATION ACTIVITIES IN SA
SECTION ONE – DEVELOPING A NATIONAL VISION FOR THE SOUTH AFRICAN AFOLU SECTOR
50
1.7TIER 3:LOCAL SCALE – GRASSLANDS, SUBTROPICAL THICKET AND FORESTS
On-the-ground
activities are
required to:
• Address direct drivers of
degradation.
• Enable the restoration of
grasslands, subtropical thicket
and forest.
• Facilitate the implementation of
small-scale biogas and biomass-
to-energy opportunities.
As many local-scale dynamics are
poorly understood (for example,
costs of implementation, broader
business plans or the socio-economic
benefits of different implementation
models), strategic research and
development through early
implementation is required. This is
not plausible at the outset at a full
national scale and therefore a set of
early pilot areas that are strategically
located to inform national-scale roll-
out should be identified.
The establishment of pilot areas
will allow for developing and
testing approaches and activities
that will inform regional- and
national-scale implementation.
The success or failure of different
implementation approaches and
specific rehabilitation activities often
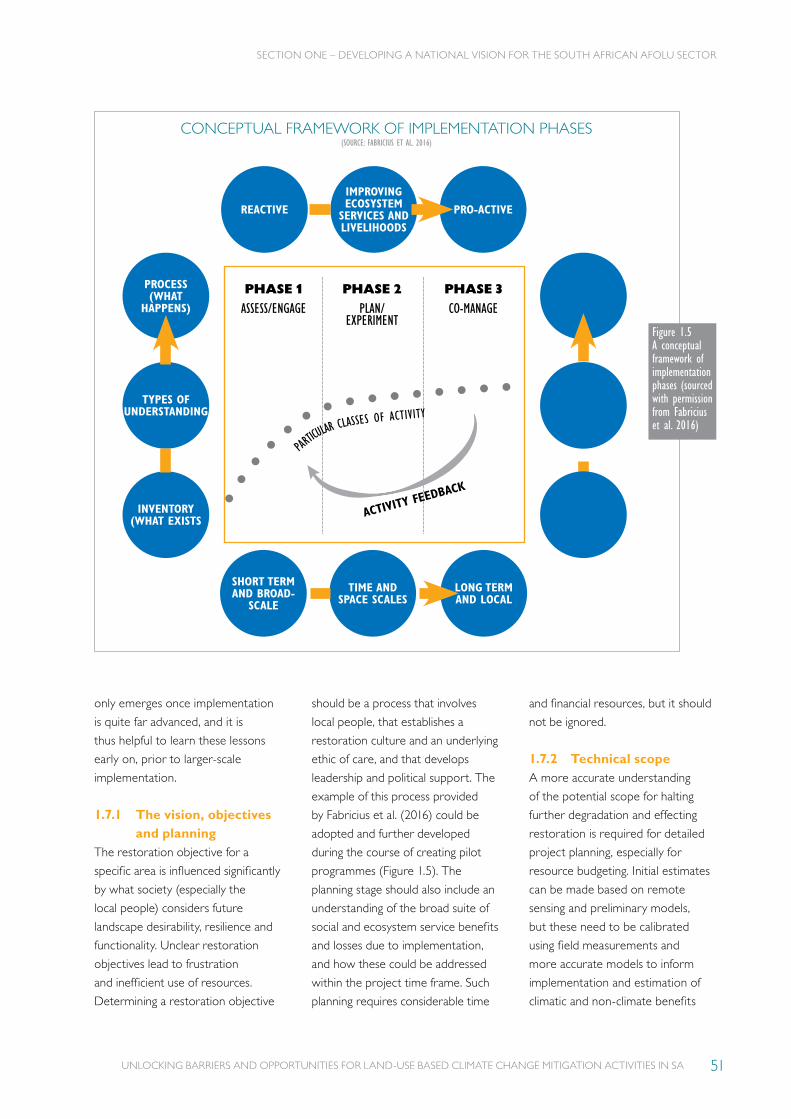
SECTION ONE – DEVELOPING A NATIONAL VISION FOR THE SOUTH AFRICAN AFOLU SECTOR
UNLOCKING BARRIERS AND OPPORTUNITIES FOR LAND-USE BASED CLIMATE CHANGE MITIGATION ACTIVITIES IN SA 51
CONCEPTUAL FRAMEWORK OF IMPLEMENTATION PHASES (SOURCE: FABRICIUS ET AL. 2016)
PHASE 1ASSESS/ENGAGE
ACTIVITY FEEDBACK
PHASE 2PLAN/
EXPERIMENT
PHASE 3CO-MANAGE
LONG TERM AND LOCAL
SHORT TERM AND BROAD-
SCALE
TIME AND SPACE SCALES
PARTICU
LAR CLASSES OF ACTI
VITYTYPES OF
UNDERSTANDING
INVENTORY (WHAT EXISTS
PROCESS (WHAT
HAPPENS)
IMPROVING ECOSYSTEM
SERVICES AND LIVELIHOODS
REACTIVE PRO-ACTIVE
ADAPTIVE CO-MANAGERS
ABILITY TO JOINTLY MANAGE SYSTEM
POWERLESS SPECTATORS
Figure 1.5A conceptual framework of implementation phases (sourced with permission from Fabricius et al. 2016)
only emerges once implementation
is quite far advanced, and it is
thus helpful to learn these lessons
early on, prior to larger-scale
implementation.
1.7.1 The vision, objectives and planning
The restoration objective for a
specific area is influenced significantly
by what society (especially the
local people) considers future
landscape desirability, resilience and
functionality. Unclear restoration
objectives lead to frustration
and inefficient use of resources.
Determining a restoration objective
should be a process that involves
local people, that establishes a
restoration culture and an underlying
ethic of care, and that develops
leadership and political support. The
example of this process provided
by Fabricius et al. (2016) could be
adopted and further developed
during the course of creating pilot
programmes (Figure 1.5). The
planning stage should also include an
understanding of the broad suite of
social and ecosystem service benefits
and losses due to implementation,
and how these could be addressed
within the project time frame. Such
planning requires considerable time
and financial resources, but it should
not be ignored.
1.7.2 Technical scopeA more accurate understanding
of the potential scope for halting
further degradation and effecting
restoration is required for detailed
project planning, especially for
resource budgeting. Initial estimates
can be made based on remote
sensing and preliminary models,
but these need to be calibrated
using field measurements and
more accurate models to inform
implementation and estimation of
climatic and non-climate benefits
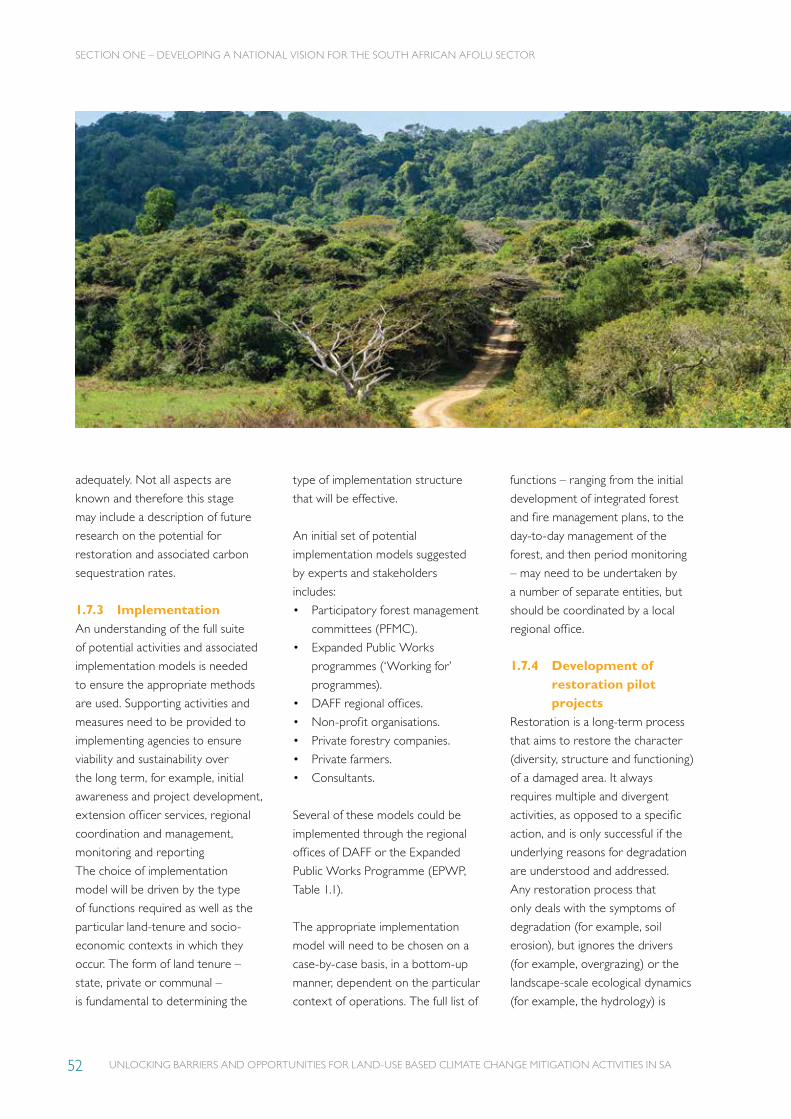
UNLOCKING BARRIERS AND OPPORTUNITIES FOR LAND-USE BASED CLIMATE CHANGE MITIGATION ACTIVITIES IN SA
SECTION ONE – DEVELOPING A NATIONAL VISION FOR THE SOUTH AFRICAN AFOLU SECTOR
52
adequately. Not all aspects are
known and therefore this stage
may include a description of future
research on the potential for
restoration and associated carbon
sequestration rates.
1.7.3 ImplementationAn understanding of the full suite
of potential activities and associated
implementation models is needed
to ensure the appropriate methods
are used. Supporting activities and
measures need to be provided to
implementing agencies to ensure
viability and sustainability over
the long term, for example, initial
awareness and project development,
extension officer services, regional
coordination and management,
monitoring and reporting
The choice of implementation
model will be driven by the type
of functions required as well as the
particular land-tenure and socio-
economic contexts in which they
occur. The form of land tenure –
state, private or communal –
is fundamental to determining the
type of implementation structure
that will be effective.
An initial set of potential
implementation models suggested
by experts and stakeholders
includes:
• Participatory forest management
committees (PFMC).
• Expanded Public Works
programmes (‘Working for’
programmes).
• DAFF regional offices.
• Non-profit organisations.
• Private forestry companies.
• Private farmers.
• Consultants.
Several of these models could be
implemented through the regional
offices of DAFF or the Expanded
Public Works Programme (EPWP,
Table 1.1).
The appropriate implementation
model will need to be chosen on a
case-by-case basis, in a bottom-up
manner, dependent on the particular
context of operations. The full list of
functions – ranging from the initial
development of integrated forest
and fire management plans, to the
day-to-day management of the
forest, and then period monitoring
– may need to be undertaken by
a number of separate entities, but
should be coordinated by a local
regional office.
1.7.4 Development of restoration pilot projects
Restoration is a long-term process
that aims to restore the character
(diversity, structure and functioning)
of a damaged area. It always
requires multiple and divergent
activities, as opposed to a specific
action, and is only successful if the
underlying reasons for degradation
are understood and addressed.
Any restoration process that
only deals with the symptoms of
degradation (for example, soil
erosion), but ignores the drivers
(for example, overgrazing) or the
landscape-scale ecological dynamics
(for example, the hydrology) is
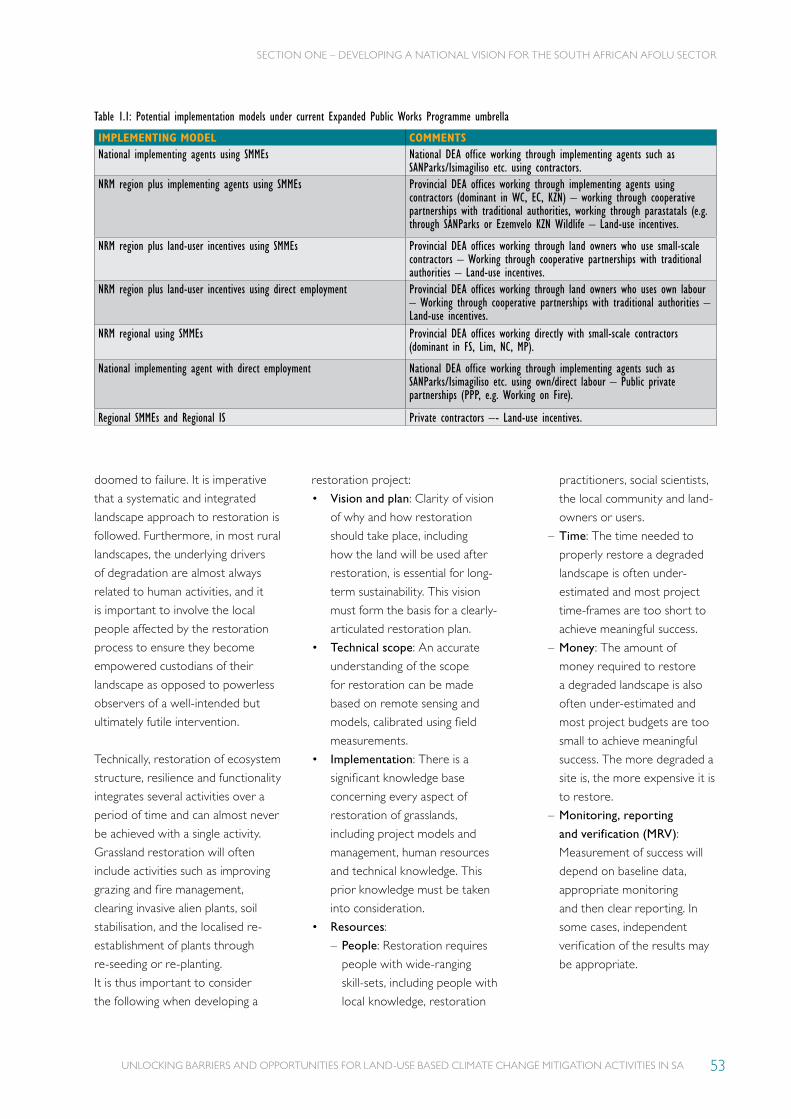
SECTION ONE – DEVELOPING A NATIONAL VISION FOR THE SOUTH AFRICAN AFOLU SECTOR
UNLOCKING BARRIERS AND OPPORTUNITIES FOR LAND-USE BASED CLIMATE CHANGE MITIGATION ACTIVITIES IN SA 53
doomed to failure. It is imperative
that a systematic and integrated
landscape approach to restoration is
followed. Furthermore, in most rural
landscapes, the underlying drivers
of degradation are almost always
related to human activities, and it
is important to involve the local
people affected by the restoration
process to ensure they become
empowered custodians of their
landscape as opposed to powerless
observers of a well-intended but
ultimately futile intervention.
Technically, restoration of ecosystem
structure, resilience and functionality
integrates several activities over a
period of time and can almost never
be achieved with a single activity.
Grassland restoration will often
include activities such as improving
grazing and fire management,
clearing invasive alien plants, soil
stabilisation, and the localised re-
establishment of plants through
re-seeding or re-planting.
It is thus important to consider
the following when developing a
restoration project:
• Vision and plan: Clarity of vision
of why and how restoration
should take place, including
how the land will be used after
restoration, is essential for long-
term sustainability. This vision
must form the basis for a clearly-
articulated restoration plan.
• Technical scope: An accurate
understanding of the scope
for restoration can be made
based on remote sensing and
models, calibrated using field
measurements.
• Implementation: There is a
significant knowledge base
concerning every aspect of
restoration of grasslands,
including project models and
management, human resources
and technical knowledge. This
prior knowledge must be taken
into consideration.
• Resources:
– People: Restoration requires
people with wide-ranging
skill-sets, including people with
local knowledge, restoration
practitioners, social scientists,
the local community and land-
owners or users.
– Time: The time needed to
properly restore a degraded
landscape is often under-
estimated and most project
time-frames are too short to
achieve meaningful success.
– Money: The amount of
money required to restore
a degraded landscape is also
often under-estimated and
most project budgets are too
small to achieve meaningful
success. The more degraded a
site is, the more expensive it is
to restore.
– Monitoring, reporting
and verification (MRV):
Measurement of success will
depend on baseline data,
appropriate monitoring
and then clear reporting. In
some cases, independent
verification of the results may
be appropriate.
Table 1.1: Potential implementation models under current Expanded Public Works Programme umbrella
IMPLEMENTING MODEL COMMENTSNational implementing agents using SMMEs National DEA office working through implementing agents such as
SANParks/Isimagiliso etc. using contractors.NRM region plus implementing agents using SMMEs Provincial DEA offices working through implementing agents using
contractors (dominant in WC, EC, KZN) – working through cooperative partnerships with traditional authorities, working through parastatals (e.g. through SANParks or Ezemvelo KZN Wildlife – Land-use incentives.
NRM region plus land-user incentives using SMMEs Provincial DEA offices working through land owners who use small-scale contractors – Working through cooperative partnerships with traditional authorities – Land-use incentives.
NRM region plus land-user incentives using direct employment Provincial DEA offices working through land owners who uses own labour – Working through cooperative partnerships with traditional authorities – Land-use incentives.
NRM regional using SMMEs Provincial DEA offices working directly with small-scale contractors (dominant in FS, Lim, NC, MP).
National implementing agent with direct employment National DEA office working through implementing agents such as SANParks/Isimagiliso etc. using own/direct labour – Public private partnerships (PPP, e.g. Working on Fire).
Regional SMMEs and Regional IS Private contractors –- Land-use incentives.


GRASSLANDS RESTORATION AND MANAGEMENT
SECTION TWO

UNLOCKING BARRIERS AND OPPORTUNITIES FOR LAND-USE BASED CLIMATE CHANGE MITIGATION ACTIVITIES IN SA56
SECTION TWO – GRASSLAND RESTORATION AND MANAGEMENT
GRASSLANDS: INTRODUCTION
2.1 WHAT AND WHERE ARE THE GRASSLANDS?
The Grassland Biome
dominates the central
and eastern parts of
South Africa, covering
almost one third of South Africa’s
land surface, and extending through
much of the Gauteng, Free State,
Eastern Cape, Mpumalanga and
KwaZulu-Natal provinces. Grassland
also occurs as a mosaic with other
vegetation types in other biomes,
such as the Indian Ocean Coastal
Belt and the Savanna Biome.
Unsurprisingly, grasslands are visually
dominated by various species of
indigenous grass. However, in terms
of species composition there is
often also a very high diversity of
non-grass plants, especially bulbs
and soft-leaved herbaceous plants
(collectively called forbs) and ferns.
Scattered trees or tree clumps may
also be present, but their canopy
cover is negligible.
Grasslands span an altitudinal
range from sea level to more than
3,000 m, and include highly varied
topography – from the sandy coastal
plains and rolling hills adjacent
to the coast, through the steep
slopes, valleys and ridges of the
sub-escarpment, up onto the peaks
and plateaus of the high escarpment
and into the rolling plains of the
Highveld. This topographic variation
is underlain by significant changes
in geology and soils, and further
influenced by significant climatic
gradients – all of which lead to an
incredible diversity of grassland
vegetation types distributed across
these complex environmental
gradients. The grassland biome
2
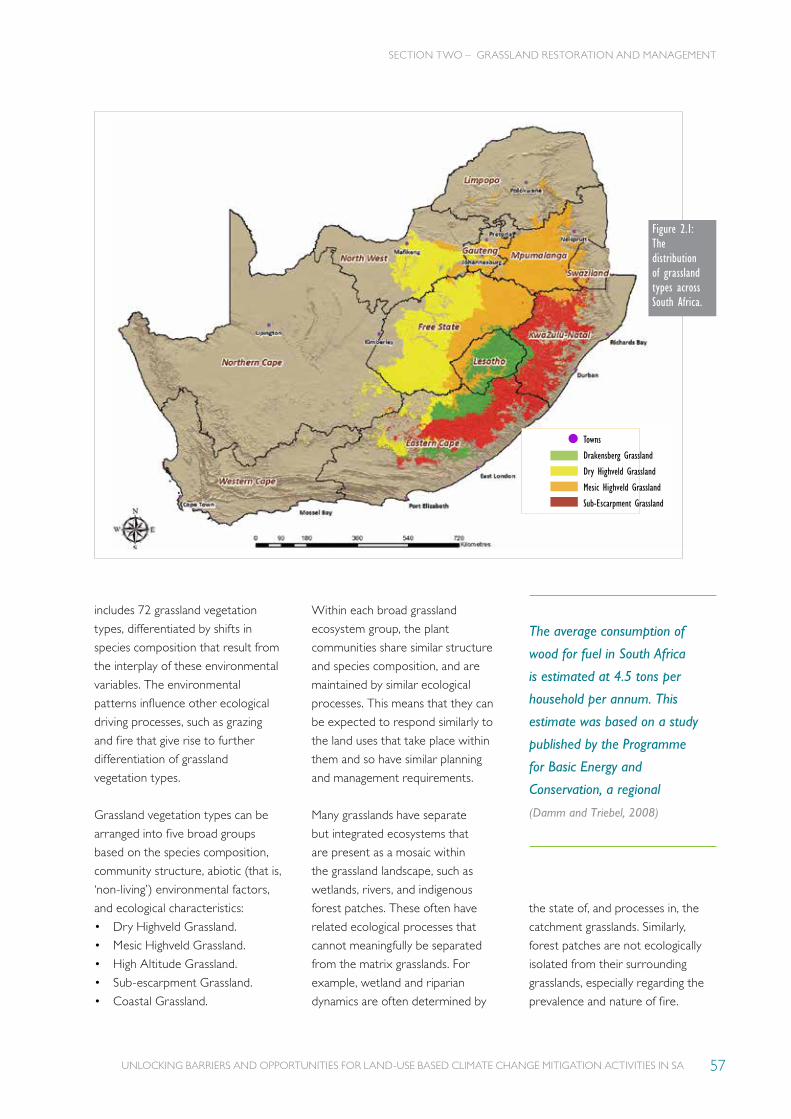
UNLOCKING BARRIERS AND OPPORTUNITIES FOR LAND-USE BASED CLIMATE CHANGE MITIGATION ACTIVITIES IN SA 57
SECTION TWO – GRASSLAND RESTORATION AND MANAGEMENT
Towns
Drakensberg Grassland
Dry Highveld Grassland
Mesic Highveld Grassland
Sub-Escarpment Grassland
includes 72 grassland vegetation
types, differentiated by shifts in
species composition that result from
the interplay of these environmental
variables. The environmental
patterns influence other ecological
driving processes, such as grazing
and fire that give rise to further
differentiation of grassland
vegetation types.
Grassland vegetation types can be
arranged into five broad groups
based on the species composition,
community structure, abiotic (that is,
‘non-living’) environmental factors,
and ecological characteristics:
• Dry Highveld Grassland.
• Mesic Highveld Grassland.
• High Altitude Grassland.
• Sub-escarpment Grassland.
• Coastal Grassland.
Within each broad grassland
ecosystem group, the plant
communities share similar structure
and species composition, and are
maintained by similar ecological
processes. This means that they can
be expected to respond similarly to
the land uses that take place within
them and so have similar planning
and management requirements.
Many grasslands have separate
but integrated ecosystems that
are present as a mosaic within
the grassland landscape, such as
wetlands, rivers, and indigenous
forest patches. These often have
related ecological processes that
cannot meaningfully be separated
from the matrix grasslands. For
example, wetland and riparian
dynamics are often determined by
the state of, and processes in, the
catchment grasslands. Similarly,
forest patches are not ecologically
isolated from their surrounding
grasslands, especially regarding the
prevalence and nature of fire.
Figure 2.1: The distribution of grassland types across South Africa.
The average consumption of
wood for fuel in South Africa
is estimated at 4.5 tons per
household per annum. This
estimate was based on a study
published by the Programme
for Basic Energy and
Conservation, a regional
(Damm and Triebel, 2008)

UNLOCKING BARRIERS AND OPPORTUNITIES FOR LAND-USE BASED CLIMATE CHANGE MITIGATION ACTIVITIES IN SA58
2.2WHAT IS THE VALUE OF GRASSLANDS?
30% of its sheep.
• 92% of the country’s commercial
plantation forestry.
South Africa’s grasslands are an
irreplaceable biodiversity asset of
global significance, and grassland
ecosystems are also home to many
of the country’s rare, endangered
and endemic animal species,
including 52 important bird areas,
one third of South Africa’s 107
threatened butterflies, 15 endemic
mammals and nearly 3,500
plant species.
Grasslands are critically important
water production landscapes and
provide the natural resources
and ecological infrastructure that
supports most of South Africa’s
important economic activities, and
millions of rural livelihoods.
Some of the most important
SECTION TWO – GRASSLAND RESTORATION AND MANAGEMENT
Grasslands are a vital
natural asset, and
their protection,
rehabilitation and
sustainable use is a national priority.
Other than their intrinsic value,
grasslands provide valuable natural
solutions to the challenges posed
by poverty, unemployment, and
climate change. Their rich store of
biodiversity, diverse ecosystems and
abundant ecological infrastructure
provides the foundation for
economic growth, social
development and human
well-being.
Grassland landscapes are home to:
• 40% of South Africa’s human
population.
• 60% of the country’s commercial
crops and 50% of subsistence
croplands.
• 45% of the country’s cattle and
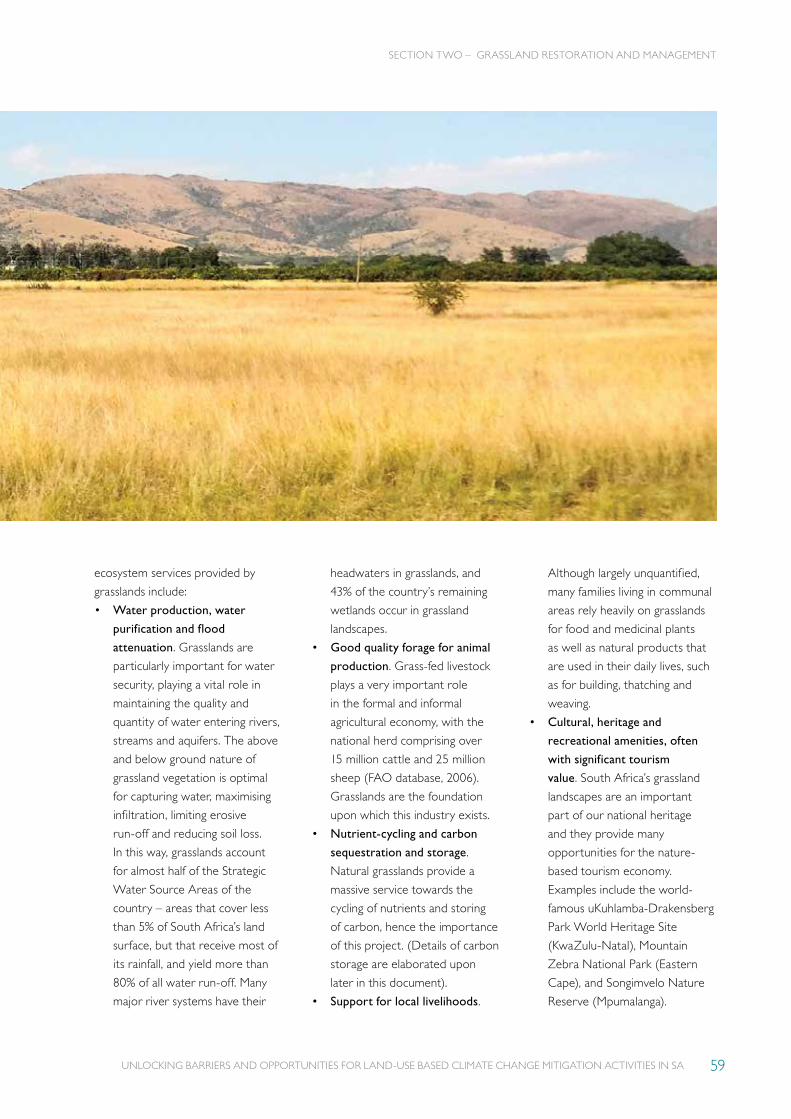
UNLOCKING BARRIERS AND OPPORTUNITIES FOR LAND-USE BASED CLIMATE CHANGE MITIGATION ACTIVITIES IN SA 59
SECTION TWO – GRASSLAND RESTORATION AND MANAGEMENT
ecosystem services provided by
grasslands include:
• Water production, water
purification and flood
attenuation. Grasslands are
particularly important for water
security, playing a vital role in
maintaining the quality and
quantity of water entering rivers,
streams and aquifers. The above
and below ground nature of
grassland vegetation is optimal
for capturing water, maximising
infiltration, limiting erosive
run-off and reducing soil loss.
In this way, grasslands account
for almost half of the Strategic
Water Source Areas of the
country – areas that cover less
than 5% of South Africa’s land
surface, but that receive most of
its rainfall, and yield more than
80% of all water run-off. Many
major river systems have their
headwaters in grasslands, and
43% of the country’s remaining
wetlands occur in grassland
landscapes.
• Good quality forage for animal
production. Grass-fed livestock
plays a very important role
in the formal and informal
agricultural economy, with the
national herd comprising over
15 million cattle and 25 million
sheep (FAO database, 2006).
Grasslands are the foundation
upon which this industry exists.
• Nutrient-cycling and carbon
sequestration and storage.
Natural grasslands provide a
massive service towards the
cycling of nutrients and storing
of carbon, hence the importance
of this project. (Details of carbon
storage are elaborated upon
later in this document).
• Support for local livelihoods.
Although largely unquantified,
many families living in communal
areas rely heavily on grasslands
for food and medicinal plants
as well as natural products that
are used in their daily lives, such
as for building, thatching and
weaving.
• Cultural, heritage and
recreational amenities, often
with significant tourism
value. South Africa’s grassland
landscapes are an important
part of our national heritage
and they provide many
opportunities for the nature-
based tourism economy.
Examples include the world-
famous uKuhlamba-Drakensberg
Park World Heritage Site
(KwaZulu-Natal), Mountain
Zebra National Park (Eastern
Cape), and Songimvelo Nature
Reserve (Mpumalanga).
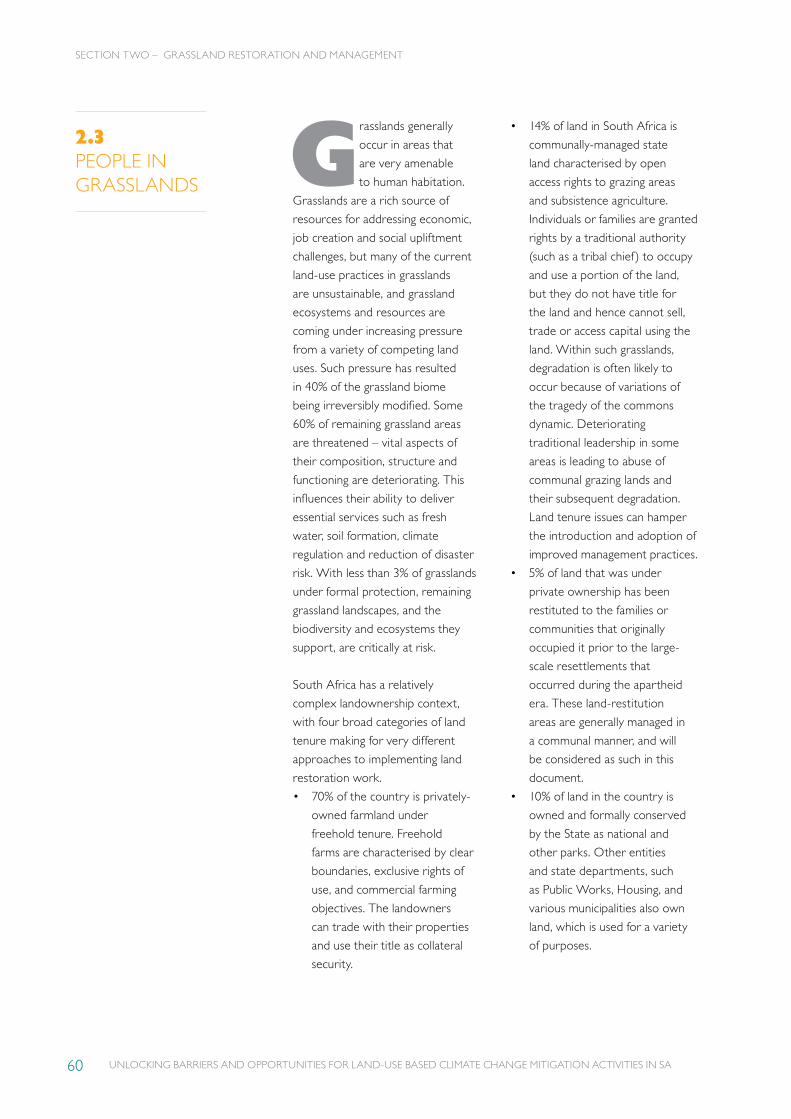
UNLOCKING BARRIERS AND OPPORTUNITIES FOR LAND-USE BASED CLIMATE CHANGE MITIGATION ACTIVITIES IN SA60
• 14% of land in South Africa is
communally-managed state
land characterised by open
access rights to grazing areas
and subsistence agriculture.
Individuals or families are granted
rights by a traditional authority
(such as a tribal chief) to occupy
and use a portion of the land,
but they do not have title for
the land and hence cannot sell,
trade or access capital using the
land. Within such grasslands,
degradation is often likely to
occur because of variations of
the tragedy of the commons
dynamic. Deteriorating
traditional leadership in some
areas is leading to abuse of
communal grazing lands and
their subsequent degradation.
Land tenure issues can hamper
the introduction and adoption of
improved management practices.
• 5% of land that was under
private ownership has been
restituted to the families or
communities that originally
occupied it prior to the large-
scale resettlements that
occurred during the apartheid
era. These land-restitution
areas are generally managed in
a communal manner, and will
be considered as such in this
document.
• 10% of land in the country is
owned and formally conserved
by the State as national and
other parks. Other entities
and state departments, such
as Public Works, Housing, and
various municipalities also own
land, which is used for a variety
of purposes.
SECTION TWO – GRASSLAND RESTORATION AND MANAGEMENT
Grasslands generally
occur in areas that
are very amenable
to human habitation.
Grasslands are a rich source of
resources for addressing economic,
job creation and social upliftment
challenges, but many of the current
land-use practices in grasslands
are unsustainable, and grassland
ecosystems and resources are
coming under increasing pressure
from a variety of competing land
uses. Such pressure has resulted
in 40% of the grassland biome
being irreversibly modified. Some
60% of remaining grassland areas
are threatened – vital aspects of
their composition, structure and
functioning are deteriorating. This
influences their ability to deliver
essential services such as fresh
water, soil formation, climate
regulation and reduction of disaster
risk. With less than 3% of grasslands
under formal protection, remaining
grassland landscapes, and the
biodiversity and ecosystems they
support, are critically at risk.
South Africa has a relatively
complex landownership context,
with four broad categories of land
tenure making for very different
approaches to implementing land
restoration work.
• 70% of the country is privately-
owned farmland under
freehold tenure. Freehold
farms are characterised by clear
boundaries, exclusive rights of
use, and commercial farming
objectives. The landowners
can trade with their properties
and use their title as collateral
security.
2.3PEOPLE IN GRASSLANDS

UNLOCKING BARRIERS AND OPPORTUNITIES FOR LAND-USE BASED CLIMATE CHANGE MITIGATION ACTIVITIES IN SA 61
2.4 DRIVERS OF DEGRADATION IN GRASSLANDS
SECTION TWO – GRASSLAND RESTORATION AND MANAGEMENT
Understanding the
dynamics that
drive ecosystem
degradation
and species loss in grasslands
is important to planning or
implementing rehabilitation efforts.
Direct drivers are those that
affect the land and vegetation in
themselves, while indirect drivers
are often ‘unseen’ dynamics that
cause a cascade of other effects that
result in a direct driver occurring.
DIRECT DRIVERSPoor range management practices
dominate direct processes, although
the following all have an impact:
• Non-sustainable farming
practises (no crop rotation,
over-fertilisation, inefficient
irrigation, etc.).
• Shifting slash-and-burn
subsistence cultivation.
• Subsistence or commercial use
of medicinal plants.
• Inappropriate fire use.
• Poor grazing practices (over-,
under- or selective-grazing).
• Bush-encroachment.
• Exposure of soil leading to
soil erosion.
• Spread of invasive alien species.
• Encroachment by karroid
species.
• Habitat loss or fragmentation
due to modification by urban
development, increased game
fencing, roads, and other
infrastructure.
INDIRECT DRIVERSIndirect drivers may include:
• Poor regulation and control of
cultivation on virgin land.
• Poor government extension
services to promote sustainable
agriculture.
• Poverty leading to increased
reliance on natural resources
for survival, with few alternatives
or incentives.
• Poor enforcement of existing
laws and policy.
• Economies of scale trends in
agriculture forcing farmers to
expand their operations.
Many of these indirect drivers
also apply to other biomes, and
can only be addressed at a regional
or national scale. More detail is
provided in Section 1 (Tiers).
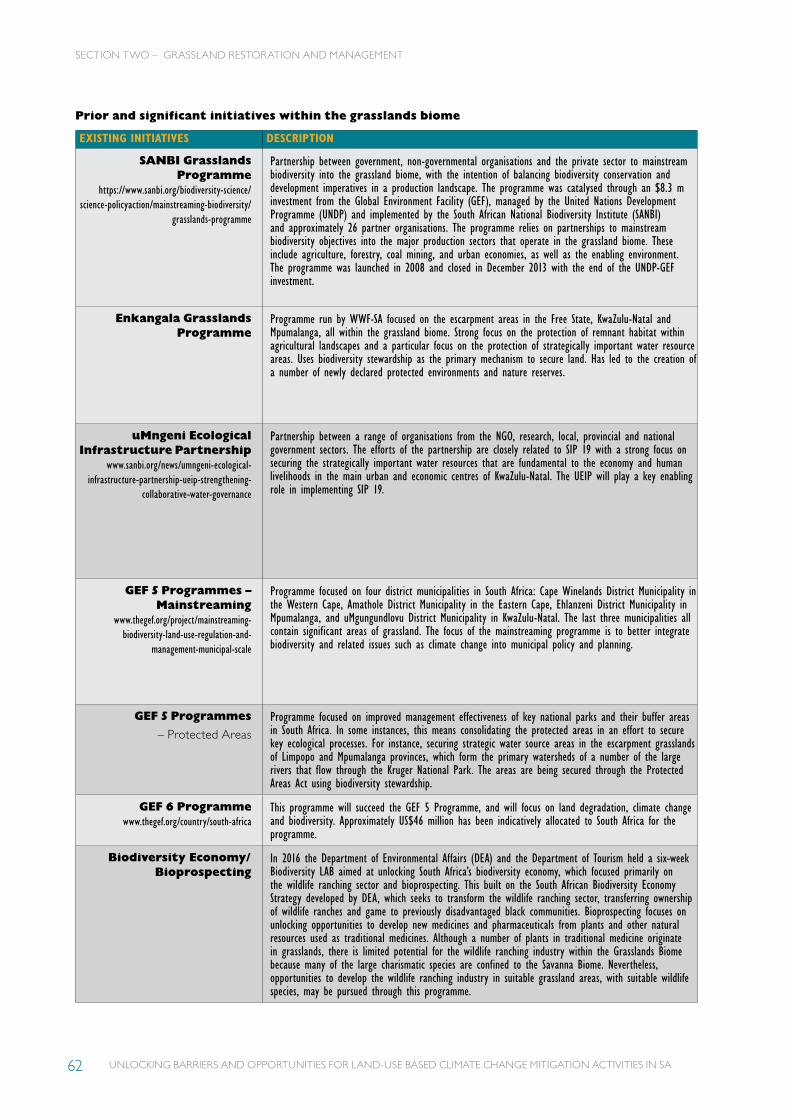
UNLOCKING BARRIERS AND OPPORTUNITIES FOR LAND-USE BASED CLIMATE CHANGE MITIGATION ACTIVITIES IN SA62
SECTION TWO – GRASSLAND RESTORATION AND MANAGEMENT
EXISTING INITIATIVES DESCRIPTION
SANBI Grasslands Programme
https://www.sanbi.org/biodiversity-science/science-policyaction/mainstreaming-biodiversity/
grasslands-programme
Partnership between government, non-governmental organisations and the private sector to mainstream biodiversity into the grassland biome, with the intention of balancing biodiversity conservation and development imperatives in a production landscape. The programme was catalysed through an $8.3 m investment from the Global Environment Facility (GEF), managed by the United Nations Development Programme (UNDP) and implemented by the South African National Biodiversity Institute (SANBI) and approximately 26 partner organisations. The programme relies on partnerships to mainstream biodiversity objectives into the major production sectors that operate in the grassland biome. These include agriculture, forestry, coal mining, and urban economies, as well as the enabling environment. The programme was launched in 2008 and closed in December 2013 with the end of the UNDP-GEF investment.
Enkangala Grasslands Programme
Programme run by WWF-SA focused on the escarpment areas in the Free State, KwaZulu-Natal and Mpumalanga, all within the grassland biome. Strong focus on the protection of remnant habitat within agricultural landscapes and a particular focus on the protection of strategically important water resource areas. Uses biodiversity stewardship as the primary mechanism to secure land. Has led to the creation of a number of newly declared protected environments and nature reserves.
uMngeni Ecological Infrastructure Partnership
www.sanbi.org/news/umngeni-ecological-infrastructure-partnership-ueip-strengthening-
collaborative-water-governance
Partnership between a range of organisations from the NGO, research, local, provincial and national government sectors. The efforts of the partnership are closely related to SIP 19 with a strong focus on securing the strategically important water resources that are fundamental to the economy and human livelihoods in the main urban and economic centres of KwaZulu-Natal. The UEIP will play a key enabling role in implementing SIP 19.
GEF 5 Programmes – Mainstreaming
www.thegef.org/project/mainstreaming-biodiversity-land-use-regulation-and-
management-municipal-scale
Programme focused on four district municipalities in South Africa: Cape Winelands District Municipality in the Western Cape, Amathole District Municipality in the Eastern Cape, Ehlanzeni District Municipality in Mpumalanga, and uMgungundlovu District Municipality in KwaZulu-Natal. The last three municipalities all contain significant areas of grassland. The focus of the mainstreaming programme is to better integrate biodiversity and related issues such as climate change into municipal policy and planning.
GEF 5 Programmes
– Protected AreasProgramme focused on improved management effectiveness of key national parks and their buffer areas in South Africa. In some instances, this means consolidating the protected areas in an effort to secure key ecological processes. For instance, securing strategic water source areas in the escarpment grasslands of Limpopo and Mpumalanga provinces, which form the primary watersheds of a number of the large rivers that flow through the Kruger National Park. The areas are being secured through the Protected Areas Act using biodiversity stewardship.
GEF 6 Programme www.thegef.org/country/south-africa
This programme will succeed the GEF 5 Programme, and will focus on land degradation, climate change and biodiversity. Approximately US$46 million has been indicatively allocated to South Africa for the programme.
Biodiversity Economy/Bioprospecting
In 2016 the Department of Environmental Affairs (DEA) and the Department of Tourism held a six-week Biodiversity LAB aimed at unlocking South Africa’s biodiversity economy, which focused primarily on the wildlife ranching sector and bioprospecting. This built on the South African Biodiversity Economy Strategy developed by DEA, which seeks to transform the wildlife ranching sector, transferring ownership of wildlife ranches and game to previously disadvantaged black communities. Bioprospecting focuses on unlocking opportunities to develop new medicines and pharmaceuticals from plants and other natural resources used as traditional medicines. Although a number of plants in traditional medicine originate in grasslands, there is limited potential for the wildlife ranching industry within the Grasslands Biome because many of the large charismatic species are confined to the Savanna Biome. Nevertheless, opportunities to develop the wildlife ranching industry in suitable grassland areas, with suitable wildlife species, may be pursued through this programme.
Prior and significant initiatives within the grasslands biome

UNLOCKING BARRIERS AND OPPORTUNITIES FOR LAND-USE BASED CLIMATE CHANGE MITIGATION ACTIVITIES IN SA 63
SECTION TWO – GRASSLAND RESTORATION AND MANAGEMENT
EXISTING INITIATIVES DESCRIPTION
Maputo-Pondoland-Albany Subtropical
Hotspotwww.cepf.net
The Critical Ecosystems Partnership Fund (CEPF) funded a five-year biodiversity conservation programme, focused on the Maputo-Pondoland-Albany Subtropical Hotspot, which covers much of the north-eastern part of the Eastern Cape, most of Kwazulu-Natal, parts of Mpumalanga, Swaziland, and the southern part of Mozambique. The areas covered includes extensive areas of grassland. The CEPF project used biodiversity stewardship as the primary tool to secure land, leading to the creation of a number of new protected areas in the grassland biome, which covered a range of grassland types from coastal grasslands in the Pondoland Centre of Endemism to high altitude grasslands in the Drakensberg.
Offset programmes – For example, N2 and Spring Grove Dam
An offset being implemented in the grassland biome is the newly-established Spring Grove Dam, which has been constructed by the Department of Water Affairs and Sanitation to enable an inter-basin transfer from the Mooi River catchment into the uMngeni River catchment. As part of the environmental authorisation for the dam, an offset was required to compensate for the loss of grasslands, wetlands and river channels. The offset is being secured using biodiversity stewardship to create new protected areas. Over 1,800 ha of grasslands will be protected through this mechanism. Landowners are incentivised to enter the offset through the provision of financial support for wetland restoration and improved livestock grazing practices, which include the realignment of fences and relocation of water points. The offset envisaged for the proposed N2 development through the Eastern Cape will provide the opportunity to secure several important areas of remnant grassland within the Pondoland Centre of Endemism.
Conservation South Africa’s Meat Naturally
Programmewww.conservation.org/publications/Documents/
CI_South-Africa_CSA_Meat-Naturally-Sustainable-Farming_Factsheet.pdf
Programme focused on enabling rural communities to develop opportunities to breed and sell cattle commercially while improving historically damaging communal grazing practices that have led to overgrazing and the degradation of grasslands. The programme is based on the use of herders to control grazing practices and allow for the rotational rest and recovery of areas that have been utilised for grazing. The flagship project for the programme is the Umzimvubu Demonstration Project, being implemented in more than six villages. Cattle gained weight and condition through the improved livestock management applied in this programme and several community members received relatively substantial amounts for the sale of their cattle on auction. The programme provides a model for improved communal rangeland management that has significant potential to improve rural livelihoods through sustainable livestock production.
Research – SAEON and NRF
http://gfw.dirisa.org
Tertiary institutions such as universities are conducting a range of relevant research on grassland ecology and conservation in South Africa that is being coordinated at a national level, for example, research by the South African Environment Observation Network (SAEON) and the National Research Foundation (NRF) on the Grasslands-Forests-Wetlands Node. The objective of the node is to create and maintain integrated observation platforms that provide long-term, rare parameter data sets on the hydrological, energy balance and carbon cycles, and the interlinked processes within these. SAEON intends to use the long-term observation platforms to facilitate improved process understanding research through collaboration with academic partners, to reduce uncertainty surrounding the impacts of human-induced global change on ecosystem services at regional scales. The nodes COSMOS Probes are located at Mike’s Pass in the Cathedral Peak region of the Drakensberg.
SIP 19 Programme focused on the protection of strategically important water resources that play a critical role in supporting human livelihoods. One of the focuses of SIP 19 is on securing the ecological infrastructure within the uMngeni River Catchment, which is fundamental to the water security of Pietermaritzburg and eThekwini Municipality (Durban). SIP 19 will focus on protecting remnant habitat, and implementing ecological restoration and rehabilitation efforts in an effort to ensure properly functioning grasslands and wetlands to ensure the protection of water resources.

UNLOCKING BARRIERS AND OPPORTUNITIES FOR LAND-USE BASED CLIMATE CHANGE MITIGATION ACTIVITIES IN SA64
GRASSLANDS: DEFINING THE GAP – STATUS QUO VS NATIONAL READINESS
3.1LAND USES AND REQUIRED ACTIVITIES
GRASSLAND CONTEXTSGrasslands can be described in a
variety of ways, but in terms of this
work it is best to view them as being
in one of five contexts:
• Grasslands in protected areas.
• Grasslands on communally-
managed land.
• Grasslands under state (but not
conservation) management.
• Grasslands under private
management.
The context will influence the timing,
responsibility and type of activities
that should be applied to the various
land-use or mitigation scenarios.
Within the significant heterogeneity
of South Africa’s Grassland biome,
stakeholders and experts identified
a set of common land-use types
that cover most of the biome, and a
set of activities that are required to
achieve the national readiness. The
activities may apply to any number
of the land-use types. Each land use
and activity is described in more
detail in Table 3.1.
GRASSLAND LAND-USE TYPES• Arable – current fields
(within 10 years of last use).
• Arable – old fields (last use
3
SECTION TWO – GRASSLAND RESTORATION AND MANAGEMENT
more than 10 years ago so
successional recovery to
grassland has started).
• Natural grassland (across
a gradient from pristine to
degraded, including over-sown
or ‘improved’ grasslands).
• Heavily eroded areas –
sheet erosion.
• Heavily eroded areas –
gulley erosion.
• Areas heavily invaded by alien
invasive woody plants such as
bramble, wattle or gum.
GRASSLAND ACTIVITIES Control of Alien Invasive Plants
(AIP)
Alien invasive plants are not a
new problem in South Africa and
considerable research into their
ecology and control has been
undertaken over the past fifty or
so years. The national Agricultural
Research Council as well as
several university-led programmes
have had a strong emphasis on
research into AIP control. Although
there is always scope for further
research, lack of information and
understanding is not generally
the limiting factor in AIP control
in South Africa. One exception
may be the poor understanding of
manipulating natural successional
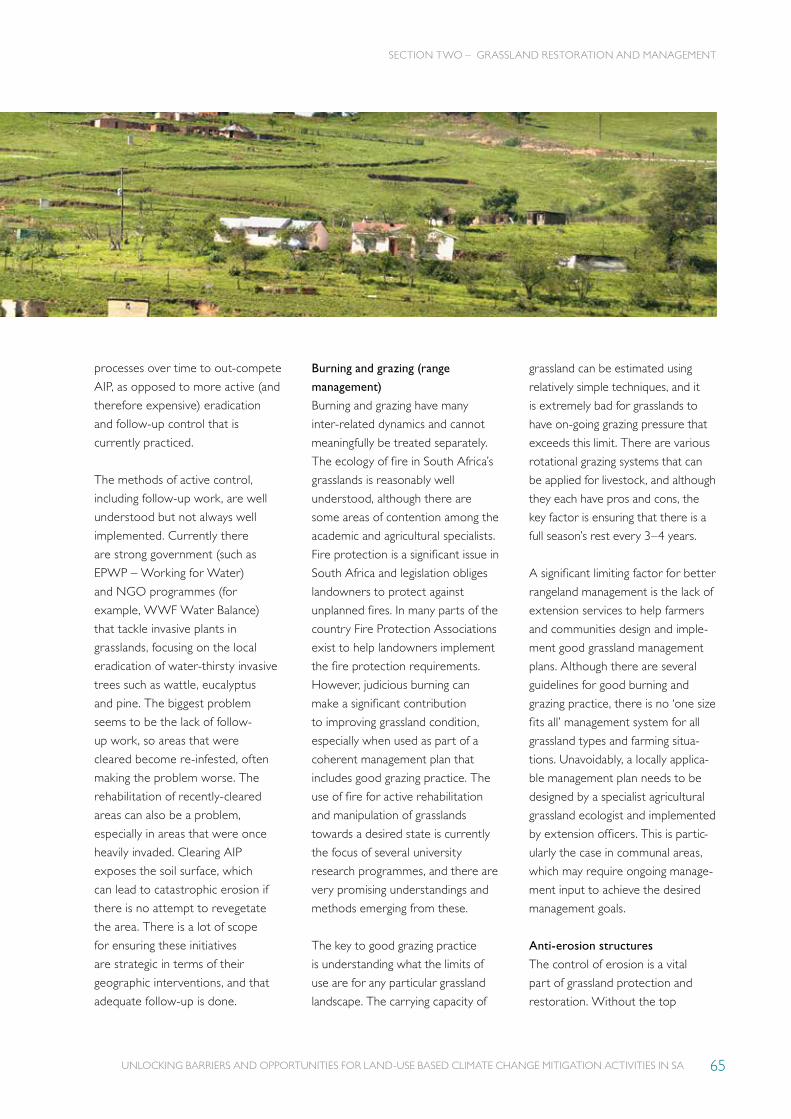
UNLOCKING BARRIERS AND OPPORTUNITIES FOR LAND-USE BASED CLIMATE CHANGE MITIGATION ACTIVITIES IN SA 65
SECTION TWO – GRASSLAND RESTORATION AND MANAGEMENT
processes over time to out-compete
AIP, as opposed to more active (and
therefore expensive) eradication
and follow-up control that is
currently practiced.
The methods of active control,
including follow-up work, are well
understood but not always well
implemented. Currently there
are strong government (such as
EPWP – Working for Water)
and NGO programmes (for
example, WWF Water Balance)
that tackle invasive plants in
grasslands, focusing on the local
eradication of water-thirsty invasive
trees such as wattle, eucalyptus
and pine. The biggest problem
seems to be the lack of follow-
up work, so areas that were
cleared become re-infested, often
making the problem worse. The
rehabilitation of recently-cleared
areas can also be a problem,
especially in areas that were once
heavily invaded. Clearing AIP
exposes the soil surface, which
can lead to catastrophic erosion if
there is no attempt to revegetate
the area. There is a lot of scope
for ensuring these initiatives
are strategic in terms of their
geographic interventions, and that
adequate follow-up is done.
Burning and grazing (range
management)
Burning and grazing have many
inter-related dynamics and cannot
meaningfully be treated separately.
The ecology of fire in South Africa’s
grasslands is reasonably well
understood, although there are
some areas of contention among the
academic and agricultural specialists.
Fire protection is a significant issue in
South Africa and legislation obliges
landowners to protect against
unplanned fires. In many parts of the
country Fire Protection Associations
exist to help landowners implement
the fire protection requirements.
However, judicious burning can
make a significant contribution
to improving grassland condition,
especially when used as part of a
coherent management plan that
includes good grazing practice. The
use of fire for active rehabilitation
and manipulation of grasslands
towards a desired state is currently
the focus of several university
research programmes, and there are
very promising understandings and
methods emerging from these.
The key to good grazing practice
is understanding what the limits of
use are for any particular grassland
landscape. The carrying capacity of
grassland can be estimated using
relatively simple techniques, and it
is extremely bad for grasslands to
have on-going grazing pressure that
exceeds this limit. There are various
rotational grazing systems that can
be applied for livestock, and although
they each have pros and cons, the
key factor is ensuring that there is a
full season’s rest every 3–4 years.
A significant limiting factor for better
rangeland management is the lack of
extension services to help farmers
and communities design and imple-
ment good grassland management
plans. Although there are several
guidelines for good burning and
grazing practice, there is no ‘one size
fits all’ management system for all
grassland types and farming situa-
tions. Unavoidably, a locally applica-
ble management plan needs to be
designed by a specialist agricultural
grassland ecologist and implemented
by extension officers. This is partic-
ularly the case in communal areas,
which may require ongoing manage-
ment input to achieve the desired
management goals.
Anti-erosion structures
The control of erosion is a vital
part of grassland protection and
restoration. Without the top
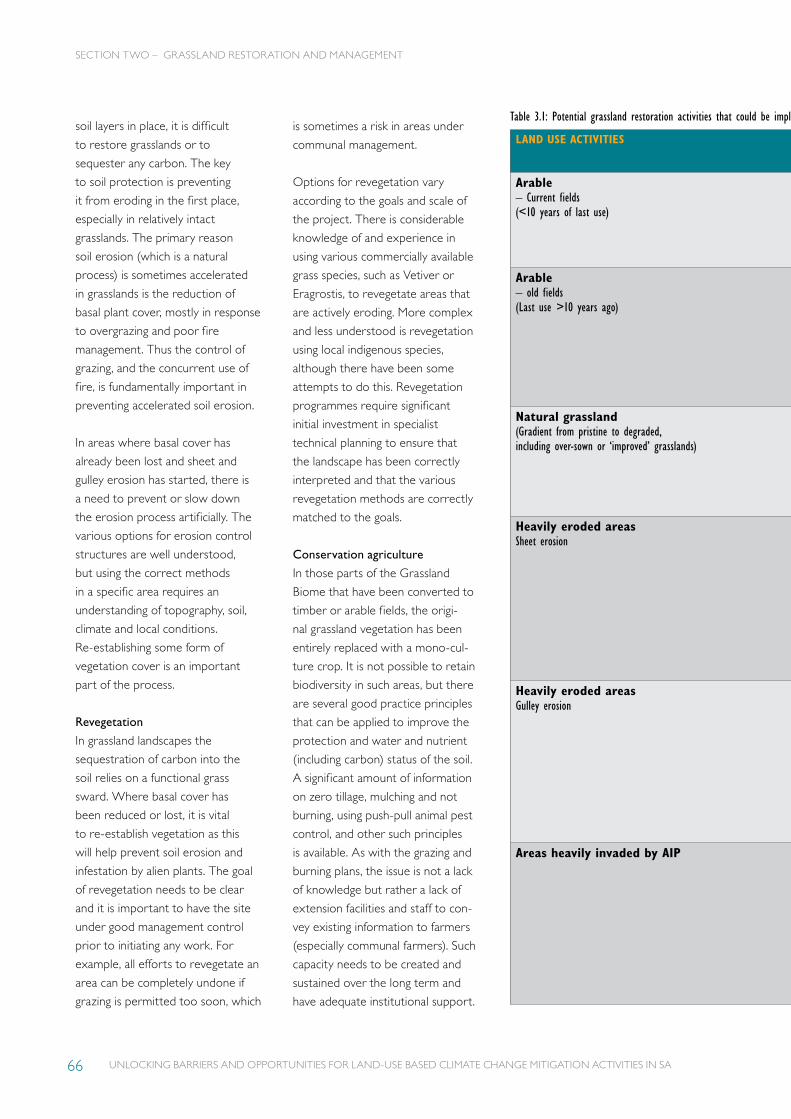
UNLOCKING BARRIERS AND OPPORTUNITIES FOR LAND-USE BASED CLIMATE CHANGE MITIGATION ACTIVITIES IN SA66
Table 3.1: Potential grassland restoration activities that could be implemented in each form of land use.
LAND USE ACTIVITIES ALIEN INVASIVE PLANT (AIP) CONTROL
BURNING GRAZING ANTI-EROSION STRUCTURES
REVEGETATION CONSERVATION AGRICULTURE
Arable – Current fields (<10 years of last use)
n/a n/a n/a n/a n/a Apply appropriate techniques to improve soil health, such as zero-till, contouring, mulching, not burning residues, reduced fertilisation.
Arable – old fields (Last use >10 years ago)
Annual cut/spray to prevent establishment of AIP infestations (only if follow-up is guaranteed, or the problem becomes worse). Alternatively, a directed successional approach can be adopted in some circumstances.
Aim for periodic hot fires (every 4–5 years) to prevent bush encroachment.
Aim for a non-selective grazing regime with a full season’s rest every three years followed by a hot burn.
Use appropriate technology and structures to prevent sheet or gulley erosion in areas where the soil is exposed.
Sow indigenous grass seeds on larger areas.
Plant indigenous grass plugs in smaller areas.
Withhold grazing until grasses have properly established.
Establish a thick mulch layer to protect soil and prevent the germination of weed and AIP seeds.
Natural grassland (Gradient from pristine to degraded, including over-sown or ‘improved’ grasslands)
Annual cut/spray to prevent establishment of AIP infestations.
Prioritise new or expanding AIP infestations.
Develop a fire management plan to prevent grassland becoming moribund, and which prevents bush encroachment.
Aim for non-selective grazing pressure with 1 full season rest every 3–4 years.
Use appropriate technology and structures to prevent gullies forming in localised areas such as livestock paths, water troughs and feedlots.
Plant indigenous grass plugs in areas where localised destruction of grassland has occurred, such as around water points.
Apply SANBI burning and grazing best practice guidelines to all grazing lands.
Heavily eroded areas Sheet erosion
Annual cut/spray to prevent establishment of AIP infestations.
Withhold fire until fully re-vegetated.
Where appropriate, use high intensity short-duration grazing to promote the ecological dynamics that assist re-vegetation.
Use appropriate technology and structures such as rock lines, logs, brush-strips, hollows, mulching, or geomats.
Plant rows of vetiver grass along the contours. Sow indigenous grass seeds on larger areas.
Plant indigenous grass plugs in smaller areas.
Withhold grazing until grasses have properly established.
Establish a thick mulch layer to protect the soil and prevent the germination of weed and AIP seeds.
Heavily eroded areas Gulley erosion
Annual cut/spray to prevent establishment of AIP infestations.
Where appropriate, use high-intensity short-duration grazing to promote the ecological dynamics that assist re-vegetation.
Use appropriate technology and structures such as reshaping, gabions, brush packs, etc., to prevent further head erosion and to stabilise the gully walls.
Plant vetiver grass to stabilise the walls and floors of the gulleys.
Plant hardy indigenous trees to help stabilise the gulleys.
Withhold grazing until grasses have properly established.
n/a
Areas heavily invaded by AIP Design a landscape-scale clearing plan prioritising newer infestations that has sufficient emphasis on rehabilitation of cleared areas.
Use hot fire to control woody invasive plants and stimulate mass germination of AIP seeds which can then be killed with chemicals.
Under certain conditions use livestock to help crush dense infestations of AIP, especially bramble. This should be followed by active rehabilitation.
Use appropriate technology and structures to stabilise the exposed soil, such as rock lines, logs, brush-strips, hollows, mulching, or geomats.
Plant rows of vetiver grass along the contours. Sow indigenous grass seeds on larger areas.
Plant indigenous grass plugs in smaller areas.
Withhold grazing until grasses have properly established.
Following clearing, establish a thick mulch layer to protect the soil and prevent the germination of weed and AIP seeds.
soil layers in place, it is difficult
to restore grasslands or to
sequester any carbon. The key
to soil protection is preventing
it from eroding in the first place,
especially in relatively intact
grasslands. The primary reason
soil erosion (which is a natural
process) is sometimes accelerated
in grasslands is the reduction of
basal plant cover, mostly in response
to overgrazing and poor fire
management. Thus the control of
grazing, and the concurrent use of
fire, is fundamentally important in
preventing accelerated soil erosion.
In areas where basal cover has
already been lost and sheet and
gulley erosion has started, there is
a need to prevent or slow down
the erosion process artificially. The
various options for erosion control
structures are well understood,
but using the correct methods
in a specific area requires an
understanding of topography, soil,
climate and local conditions.
Re-establishing some form of
vegetation cover is an important
part of the process.
Revegetation
In grassland landscapes the
sequestration of carbon into the
soil relies on a functional grass
sward. Where basal cover has
been reduced or lost, it is vital
to re-establish vegetation as this
will help prevent soil erosion and
infestation by alien plants. The goal
of revegetation needs to be clear
and it is important to have the site
under good management control
prior to initiating any work. For
example, all efforts to revegetate an
area can be completely undone if
grazing is permitted too soon, which
is sometimes a risk in areas under
communal management.
Options for revegetation vary
according to the goals and scale of
the project. There is considerable
knowledge of and experience in
using various commercially available
grass species, such as Vetiver or
Eragrostis, to revegetate areas that
are actively eroding. More complex
and less understood is revegetation
using local indigenous species,
although there have been some
attempts to do this. Revegetation
programmes require significant
initial investment in specialist
technical planning to ensure that
the landscape has been correctly
interpreted and that the various
revegetation methods are correctly
matched to the goals.
Conservation agriculture
In those parts of the Grassland
Biome that have been converted to
timber or arable fields, the origi-
nal grassland vegetation has been
entirely replaced with a mono-cul-
ture crop. It is not possible to retain
biodiversity in such areas, but there
are several good practice principles
that can be applied to improve the
protection and water and nutrient
(including carbon) status of the soil.
A significant amount of information
on zero tillage, mulching and not
burning, using push-pull animal pest
control, and other such principles
is available. As with the grazing and
burning plans, the issue is not a lack
of knowledge but rather a lack of
extension facilities and staff to con-
vey existing information to farmers
(especially communal farmers). Such
capacity needs to be created and
sustained over the long term and
have adequate institutional support.
SECTION TWO – GRASSLAND RESTORATION AND MANAGEMENT
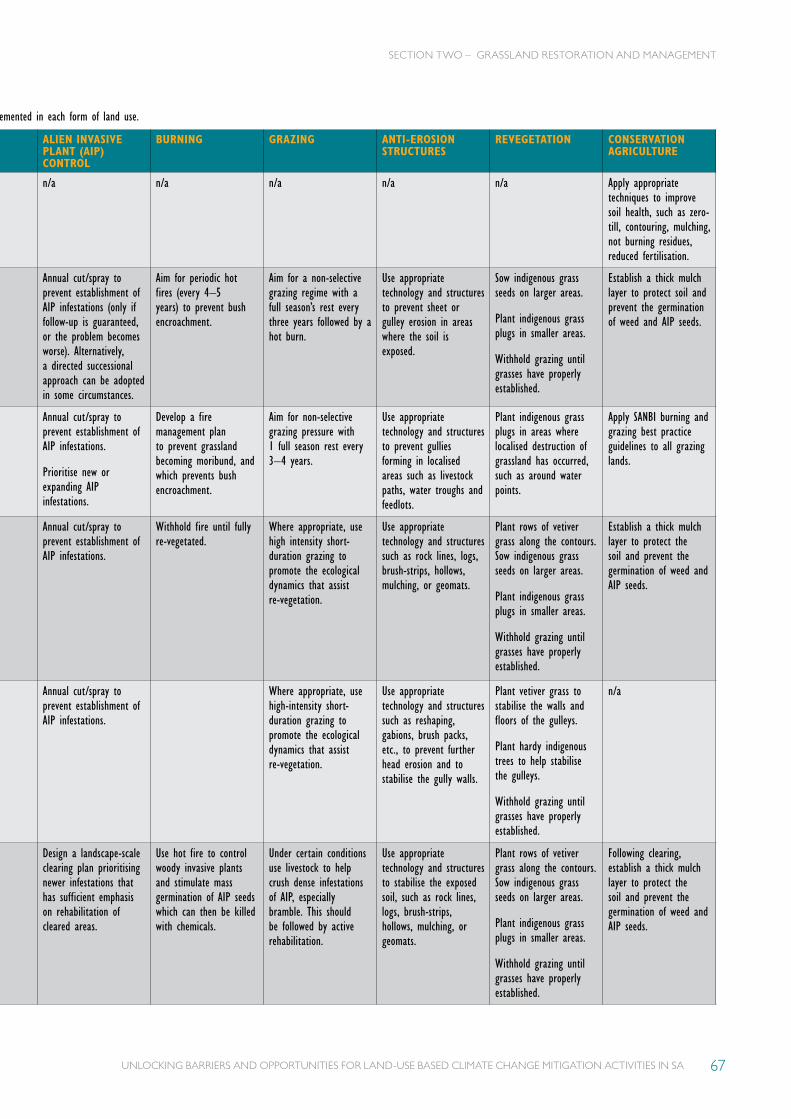
UNLOCKING BARRIERS AND OPPORTUNITIES FOR LAND-USE BASED CLIMATE CHANGE MITIGATION ACTIVITIES IN SA 67
Table 3.1: Potential grassland restoration activities that could be implemented in each form of land use.
LAND USE ACTIVITIES ALIEN INVASIVE PLANT (AIP) CONTROL
BURNING GRAZING ANTI-EROSION STRUCTURES
REVEGETATION CONSERVATION AGRICULTURE
Arable – Current fields (<10 years of last use)
n/a n/a n/a n/a n/a Apply appropriate techniques to improve soil health, such as zero-till, contouring, mulching, not burning residues, reduced fertilisation.
Arable – old fields (Last use >10 years ago)
Annual cut/spray to prevent establishment of AIP infestations (only if follow-up is guaranteed, or the problem becomes worse). Alternatively, a directed successional approach can be adopted in some circumstances.
Aim for periodic hot fires (every 4–5 years) to prevent bush encroachment.
Aim for a non-selective grazing regime with a full season’s rest every three years followed by a hot burn.
Use appropriate technology and structures to prevent sheet or gulley erosion in areas where the soil is exposed.
Sow indigenous grass seeds on larger areas.
Plant indigenous grass plugs in smaller areas.
Withhold grazing until grasses have properly established.
Establish a thick mulch layer to protect soil and prevent the germination of weed and AIP seeds.
Natural grassland (Gradient from pristine to degraded, including over-sown or ‘improved’ grasslands)
Annual cut/spray to prevent establishment of AIP infestations.
Prioritise new or expanding AIP infestations.
Develop a fire management plan to prevent grassland becoming moribund, and which prevents bush encroachment.
Aim for non-selective grazing pressure with 1 full season rest every 3–4 years.
Use appropriate technology and structures to prevent gullies forming in localised areas such as livestock paths, water troughs and feedlots.
Plant indigenous grass plugs in areas where localised destruction of grassland has occurred, such as around water points.
Apply SANBI burning and grazing best practice guidelines to all grazing lands.
Heavily eroded areas Sheet erosion
Annual cut/spray to prevent establishment of AIP infestations.
Withhold fire until fully re-vegetated.
Where appropriate, use high intensity short-duration grazing to promote the ecological dynamics that assist re-vegetation.
Use appropriate technology and structures such as rock lines, logs, brush-strips, hollows, mulching, or geomats.
Plant rows of vetiver grass along the contours. Sow indigenous grass seeds on larger areas.
Plant indigenous grass plugs in smaller areas.
Withhold grazing until grasses have properly established.
Establish a thick mulch layer to protect the soil and prevent the germination of weed and AIP seeds.
Heavily eroded areas Gulley erosion
Annual cut/spray to prevent establishment of AIP infestations.
Where appropriate, use high-intensity short-duration grazing to promote the ecological dynamics that assist re-vegetation.
Use appropriate technology and structures such as reshaping, gabions, brush packs, etc., to prevent further head erosion and to stabilise the gully walls.
Plant vetiver grass to stabilise the walls and floors of the gulleys.
Plant hardy indigenous trees to help stabilise the gulleys.
Withhold grazing until grasses have properly established.
n/a
Areas heavily invaded by AIP Design a landscape-scale clearing plan prioritising newer infestations that has sufficient emphasis on rehabilitation of cleared areas.
Use hot fire to control woody invasive plants and stimulate mass germination of AIP seeds which can then be killed with chemicals.
Under certain conditions use livestock to help crush dense infestations of AIP, especially bramble. This should be followed by active rehabilitation.
Use appropriate technology and structures to stabilise the exposed soil, such as rock lines, logs, brush-strips, hollows, mulching, or geomats.
Plant rows of vetiver grass along the contours. Sow indigenous grass seeds on larger areas.
Plant indigenous grass plugs in smaller areas.
Withhold grazing until grasses have properly established.
Following clearing, establish a thick mulch layer to protect the soil and prevent the germination of weed and AIP seeds.
SECTION TWO – GRASSLAND RESTORATION AND MANAGEMENT
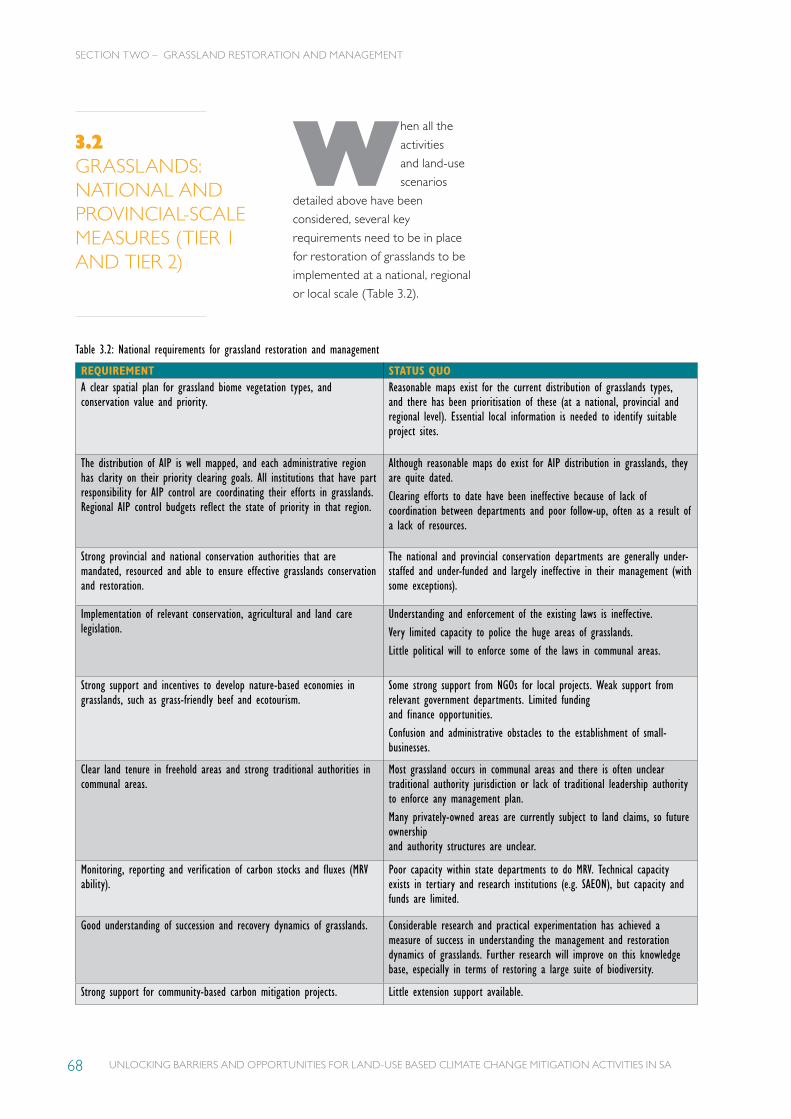
UNLOCKING BARRIERS AND OPPORTUNITIES FOR LAND-USE BASED CLIMATE CHANGE MITIGATION ACTIVITIES IN SA68
3.2GRASSLANDS: NATIONAL AND PROVINCIAL-SCALE MEASURES (TIER 1 AND TIER 2)
SECTION TWO – GRASSLAND RESTORATION AND MANAGEMENT
Table 3.2: National requirements for grassland restoration and management
REQUIREMENT STATUS QUOA clear spatial plan for grassland biome vegetation types, and conservation value and priority.
Reasonable maps exist for the current distribution of grasslands types, and there has been prioritisation of these (at a national, provincial and regional level). Essential local information is needed to identify suitable project sites.
The distribution of AIP is well mapped, and each administrative region has clarity on their priority clearing goals. All institutions that have part responsibility for AIP control are coordinating their efforts in grasslands. Regional AIP control budgets reflect the state of priority in that region.
Although reasonable maps do exist for AIP distribution in grasslands, they are quite dated.Clearing efforts to date have been ineffective because of lack of coordination between departments and poor follow-up, often as a result of a lack of resources.
Strong provincial and national conservation authorities that are mandated, resourced and able to ensure effective grasslands conservation and restoration.
The national and provincial conservation departments are generally under-staffed and under-funded and largely ineffective in their management (with some exceptions).
Implementation of relevant conservation, agricultural and land care legislation.
Understanding and enforcement of the existing laws is ineffective.Very limited capacity to police the huge areas of grasslands.Little political will to enforce some of the laws in communal areas.
Strong support and incentives to develop nature-based economies in grasslands, such as grass-friendly beef and ecotourism.
Some strong support from NGOs for local projects. Weak support from relevant government departments. Limited funding and finance opportunities.Confusion and administrative obstacles to the establishment of small-businesses.
Clear land tenure in freehold areas and strong traditional authorities in communal areas.
Most grassland occurs in communal areas and there is often unclear traditional authority jurisdiction or lack of traditional leadership authority to enforce any management plan.Many privately-owned areas are currently subject to land claims, so future ownership and authority structures are unclear.
Monitoring, reporting and verification of carbon stocks and fluxes (MRV ability).
Poor capacity within state departments to do MRV. Technical capacity exists in tertiary and research institutions (e.g. SAEON), but capacity and funds are limited.
Good understanding of succession and recovery dynamics of grasslands. Considerable research and practical experimentation has achieved a measure of success in understanding the management and restoration dynamics of grasslands. Further research will improve on this knowledge base, especially in terms of restoring a large suite of biodiversity.
Strong support for community-based carbon mitigation projects. Little extension support available.
When all the
activities
and land-use
scenarios
detailed above have been
considered, several key
requirements need to be in place
for restoration of grasslands to be
implemented at a national, regional
or local scale (Table 3.2).
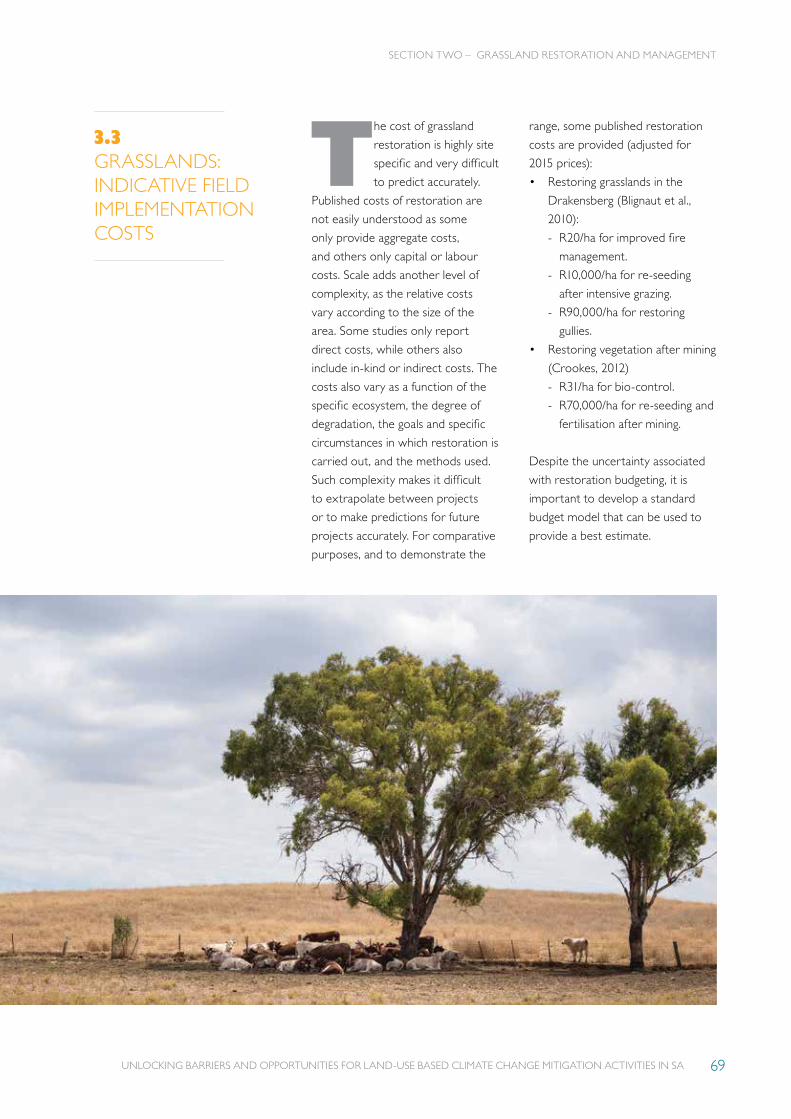
UNLOCKING BARRIERS AND OPPORTUNITIES FOR LAND-USE BASED CLIMATE CHANGE MITIGATION ACTIVITIES IN SA 69
SECTION TWO – GRASSLAND RESTORATION AND MANAGEMENT
3.3GRASSLANDS: INDICATIVE FIELD IMPLEMENTATION COSTS
The cost of grassland
restoration is highly site
specific and very difficult
to predict accurately.
Published costs of restoration are
not easily understood as some
only provide aggregate costs,
and others only capital or labour
costs. Scale adds another level of
complexity, as the relative costs
vary according to the size of the
area. Some studies only report
direct costs, while others also
include in-kind or indirect costs. The
costs also vary as a function of the
specific ecosystem, the degree of
degradation, the goals and specific
circumstances in which restoration is
carried out, and the methods used.
Such complexity makes it difficult
to extrapolate between projects
or to make predictions for future
projects accurately. For comparative
purposes, and to demonstrate the
range, some published restoration
costs are provided (adjusted for
2015 prices):
• Restoring grasslands in the
Drakensberg (Blignaut et al.,
2010):
- R20/ha for improved fire
management.
- R10,000/ha for re-seeding
after intensive grazing.
- R90,000/ha for restoring
gullies.
• Restoring vegetation after mining
(Crookes, 2012)
- R31/ha for bio-control.
- R70,000/ha for re-seeding and
fertilisation after mining.
Despite the uncertainty associated
with restoration budgeting, it is
important to develop a standard
budget model that can be used to
provide a best estimate.


SUBTROPICAL THICKET RESTORATION AND MANAGEMENT
SECTION THREE
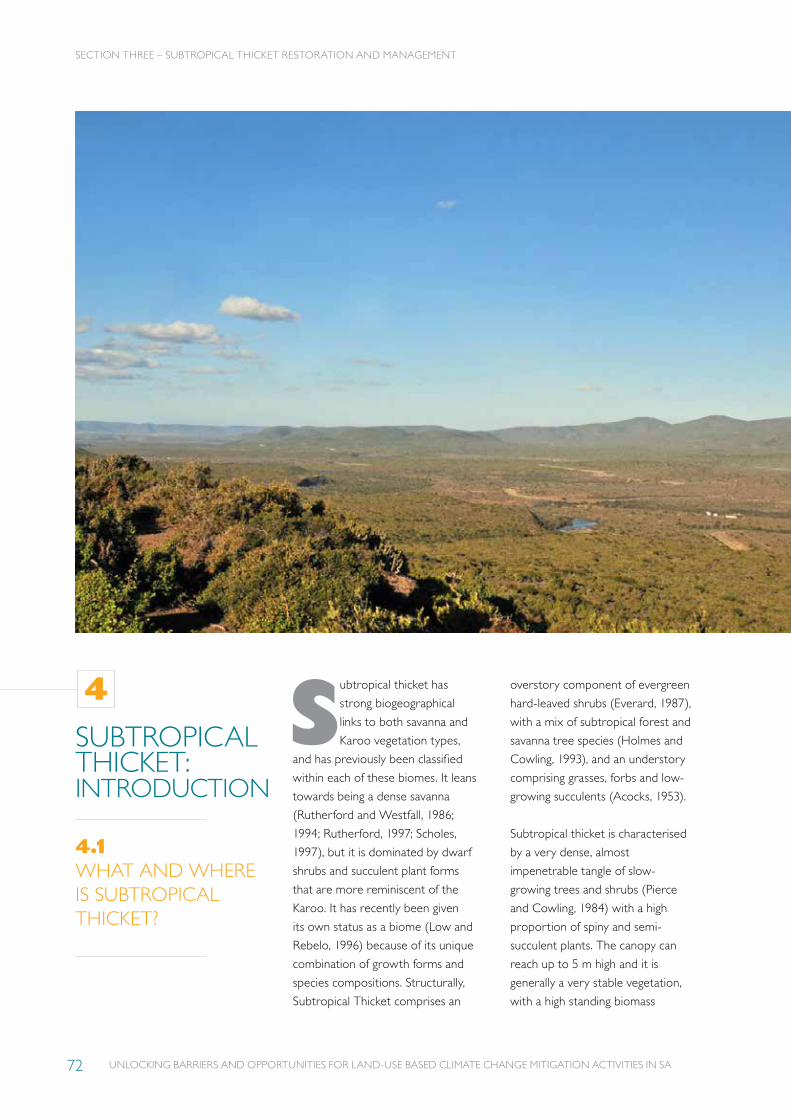
UNLOCKING BARRIERS AND OPPORTUNITIES FOR LAND-USE BASED CLIMATE CHANGE MITIGATION ACTIVITIES IN SA72
SECTION THREE – SUBTROPICAL THICKET RESTORATION AND MANAGEMENT
SUBTROPICAL THICKET: INTRODUCTION
4.1WHAT AND WHERE IS SUBTROPICAL THICKET?
Subtropical thicket has
strong biogeographical
links to both savanna and
Karoo vegetation types,
and has previously been classified
within each of these biomes. It leans
towards being a dense savanna
(Rutherford and Westfall, 1986;
1994; Rutherford, 1997; Scholes,
1997), but it is dominated by dwarf
shrubs and succulent plant forms
that are more reminiscent of the
Karoo. It has recently been given
its own status as a biome (Low and
Rebelo, 1996) because of its unique
combination of growth forms and
species compositions. Structurally,
Subtropical Thicket comprises an
overstory component of evergreen
hard-leaved shrubs (Everard, 1987),
with a mix of subtropical forest and
savanna tree species (Holmes and
Cowling, 1993), and an understory
comprising grasses, forbs and low-
growing succulents (Acocks, 1953).
Subtropical thicket is characterised
by a very dense, almost
impenetrable tangle of slow-
growing trees and shrubs (Pierce
and Cowling, 1984) with a high
proportion of spiny and semi-
succulent plants. The canopy can
reach up to 5 m high and it is
generally a very stable vegetation,
with a high standing biomass
4
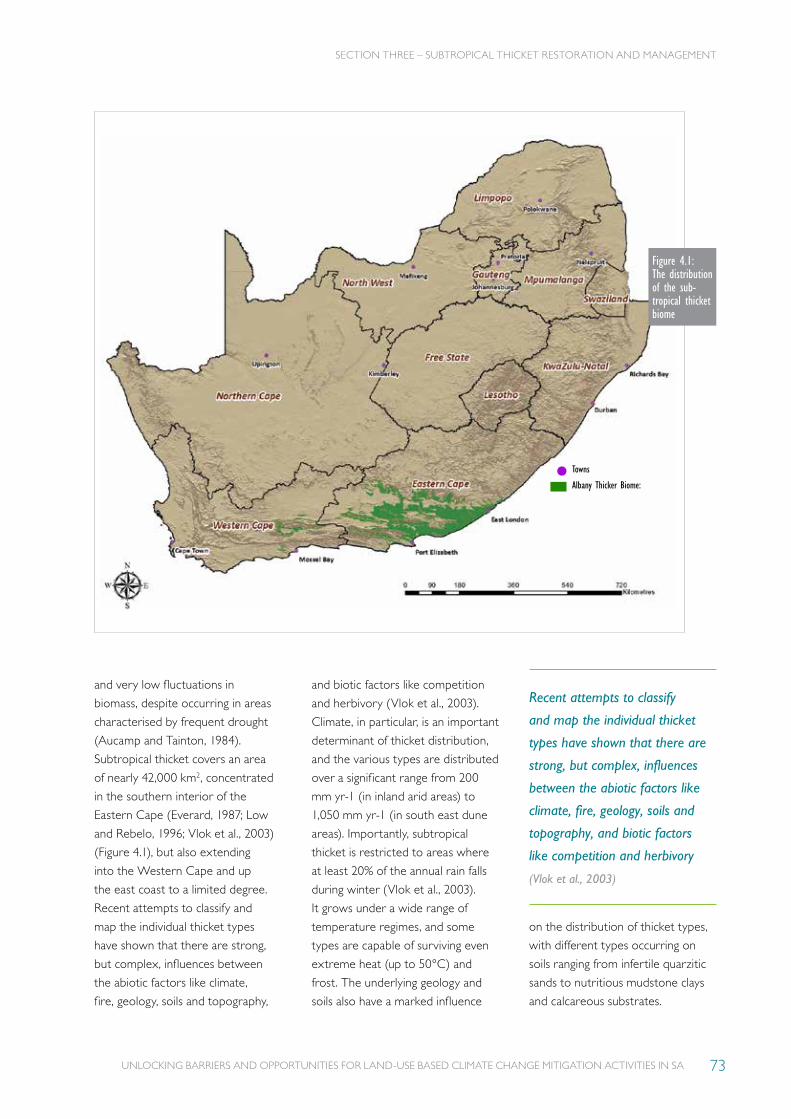
UNLOCKING BARRIERS AND OPPORTUNITIES FOR LAND-USE BASED CLIMATE CHANGE MITIGATION ACTIVITIES IN SA 73
SECTION THREE – SUBTROPICAL THICKET RESTORATION AND MANAGEMENT
and very low fluctuations in
biomass, despite occurring in areas
characterised by frequent drought
(Aucamp and Tainton, 1984).
Subtropical thicket covers an area
of nearly 42,000 km2, concentrated
in the southern interior of the
Eastern Cape (Everard, 1987; Low
and Rebelo, 1996; Vlok et al., 2003)
(Figure 4.1), but also extending
into the Western Cape and up
the east coast to a limited degree.
Recent attempts to classify and
map the individual thicket types
have shown that there are strong,
but complex, influences between
the abiotic factors like climate,
fire, geology, soils and topography,
and biotic factors like competition
and herbivory (Vlok et al., 2003).
Climate, in particular, is an important
determinant of thicket distribution,
and the various types are distributed
over a significant range from 200
mm yr-1 (in inland arid areas) to
1,050 mm yr-1 (in south east dune
areas). Importantly, subtropical
thicket is restricted to areas where
at least 20% of the annual rain falls
during winter (Vlok et al., 2003).
It grows under a wide range of
temperature regimes, and some
types are capable of surviving even
extreme heat (up to 50°C) and
frost. The underlying geology and
soils also have a marked influence
Towns
Albany Thicker Biome:
Figure 4.1: The distribution of the sub-tropical thicket biome
Recent attempts to classify
and map the individual thicket
types have shown that there are
strong, but complex, influences
between the abiotic factors like
climate, fire, geology, soils and
topography, and biotic factors
like competition and herbivory
(Vlok et al., 2003)
on the distribution of thicket types,
with different types occurring on
soils ranging from infertile quarzitic
sands to nutritious mudstone clays
and calcareous substrates.
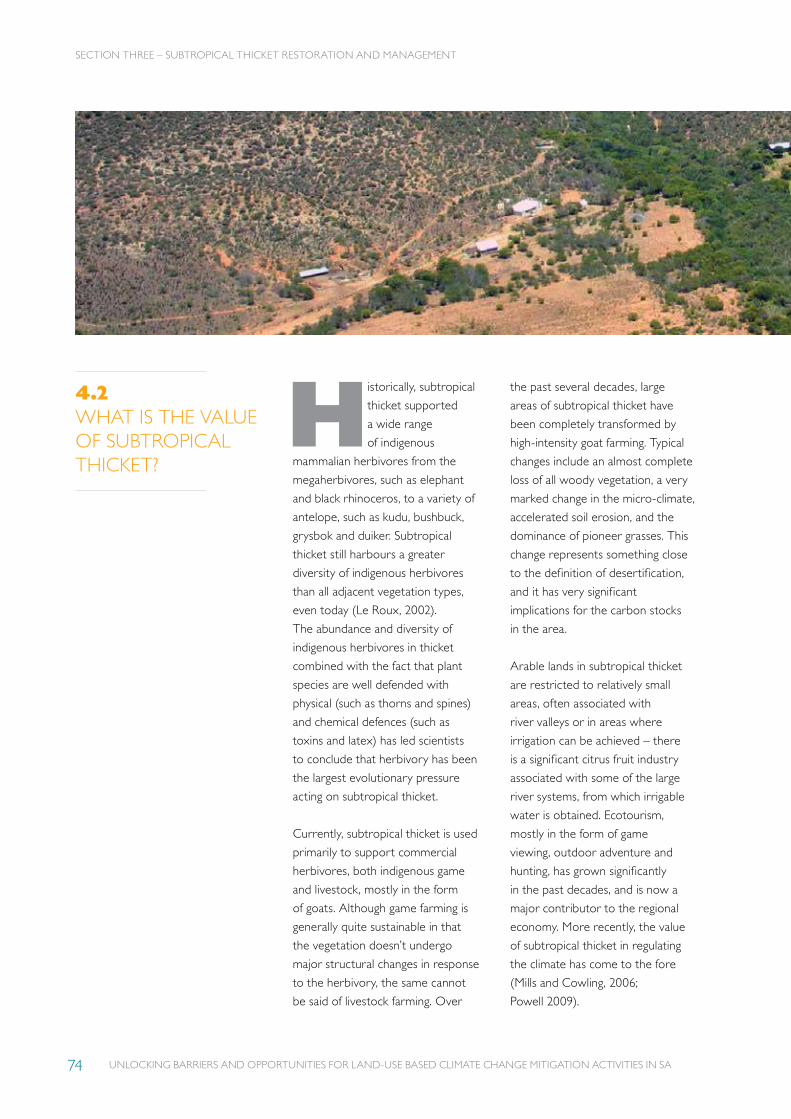
UNLOCKING BARRIERS AND OPPORTUNITIES FOR LAND-USE BASED CLIMATE CHANGE MITIGATION ACTIVITIES IN SA74
4.2WHAT IS THE VALUE OF SUBTROPICAL THICKET?
Historically, subtropical
thicket supported
a wide range
of indigenous
mammalian herbivores from the
megaherbivores, such as elephant
and black rhinoceros, to a variety of
antelope, such as kudu, bushbuck,
grysbok and duiker. Subtropical
thicket still harbours a greater
diversity of indigenous herbivores
than all adjacent vegetation types,
even today (Le Roux, 2002).
The abundance and diversity of
indigenous herbivores in thicket
combined with the fact that plant
species are well defended with
physical (such as thorns and spines)
and chemical defences (such as
toxins and latex) has led scientists
to conclude that herbivory has been
the largest evolutionary pressure
acting on subtropical thicket.
Currently, subtropical thicket is used
primarily to support commercial
herbivores, both indigenous game
and livestock, mostly in the form
of goats. Although game farming is
generally quite sustainable in that
the vegetation doesn’t undergo
major structural changes in response
to the herbivory, the same cannot
be said of livestock farming. Over
the past several decades, large
areas of subtropical thicket have
been completely transformed by
high-intensity goat farming. Typical
changes include an almost complete
loss of all woody vegetation, a very
marked change in the micro-climate,
accelerated soil erosion, and the
dominance of pioneer grasses. This
change represents something close
to the definition of desertification,
and it has very significant
implications for the carbon stocks
in the area.
Arable lands in subtropical thicket
are restricted to relatively small
areas, often associated with
river valleys or in areas where
irrigation can be achieved – there
is a significant citrus fruit industry
associated with some of the large
river systems, from which irrigable
water is obtained. Ecotourism,
mostly in the form of game
viewing, outdoor adventure and
hunting, has grown significantly
in the past decades, and is now a
major contributor to the regional
economy. More recently, the value
of subtropical thicket in regulating
the climate has come to the fore
(Mills and Cowling, 2006;
Powell 2009).
SECTION THREE – SUBTROPICAL THICKET RESTORATION AND MANAGEMENT
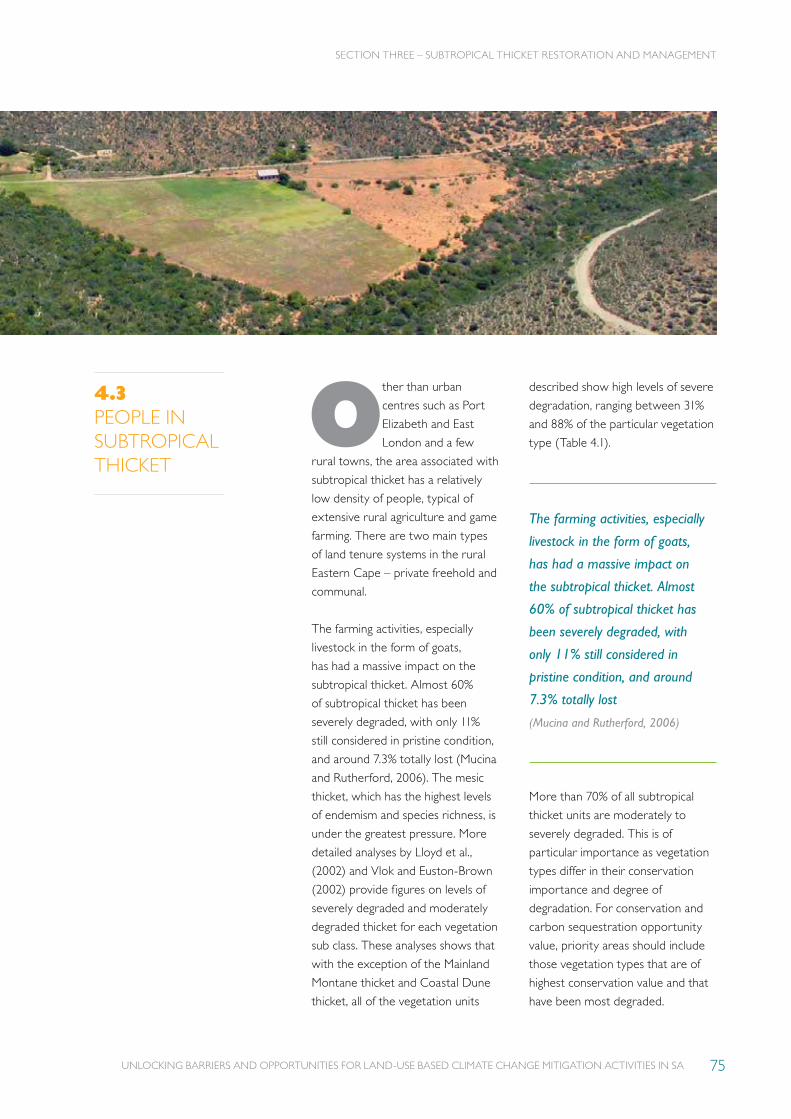
UNLOCKING BARRIERS AND OPPORTUNITIES FOR LAND-USE BASED CLIMATE CHANGE MITIGATION ACTIVITIES IN SA 75
4.3PEOPLE IN SUBTROPICAL THICKET
Other than urban
centres such as Port
Elizabeth and East
London and a few
rural towns, the area associated with
subtropical thicket has a relatively
low density of people, typical of
extensive rural agriculture and game
farming. There are two main types
of land tenure systems in the rural
Eastern Cape – private freehold and
communal.
The farming activities, especially
livestock in the form of goats,
has had a massive impact on the
subtropical thicket. Almost 60%
of subtropical thicket has been
severely degraded, with only 11%
still considered in pristine condition,
and around 7.3% totally lost (Mucina
and Rutherford, 2006). The mesic
thicket, which has the highest levels
of endemism and species richness, is
under the greatest pressure. More
detailed analyses by Lloyd et al.,
(2002) and Vlok and Euston-Brown
(2002) provide figures on levels of
severely degraded and moderately
degraded thicket for each vegetation
sub class. These analyses shows that
with the exception of the Mainland
Montane thicket and Coastal Dune
thicket, all of the vegetation units
described show high levels of severe
degradation, ranging between 31%
and 88% of the particular vegetation
type (Table 4.1).
More than 70% of all subtropical
thicket units are moderately to
severely degraded. This is of
particular importance as vegetation
types differ in their conservation
importance and degree of
degradation. For conservation and
carbon sequestration opportunity
value, priority areas should include
those vegetation types that are of
highest conservation value and that
have been most degraded.
SECTION THREE – SUBTROPICAL THICKET RESTORATION AND MANAGEMENT
The farming activities, especially
livestock in the form of goats,
has had a massive impact on
the subtropical thicket. Almost
60% of subtropical thicket has
been severely degraded, with
only 11% still considered in
pristine condition, and around
7.3% totally lost
(Mucina and Rutherford, 2006)

UNLOCKING BARRIERS AND OPPORTUNITIES FOR LAND-USE BASED CLIMATE CHANGE MITIGATION ACTIVITIES IN SA76
Subtropical thicket types that have
been especially degraded and
modified by overgrazing in the
past century are those rich in the
succulent and nutritious spekboom
(Portulacaria afra). There is evidence
that even in the short space of a
decade, heavy browsing, especially
by mohair-producing angora goats,
can convert dense shrublands into
a desert-like state. The dominant
palatable species such as spekboom
are poorly adapted to browsing
from small stock, but are better
adapted to use from large wild
herbivores such as elephants and
Table 4.1: The areas (km2) and percentages of modification and degradation for each type of subtropical thicket (data from Vlok et al., 2003)
THICKET TYPE PRISTINE THICKET % MODERATELY
DEGRADED % SEVERELY DEGRADED % MODIFIED %
Dune thicket 6,219 28.3 11,609 52.8 1,451 6.6 2,695 12.3 Valley thicket 206,681 22.9 367,341 40.7 290,432 32.2 38,351 4.2 Arid thicket 62,606 7.9 240,057 30.3 484,053 61.2 4,561 0.6 Thicket mainland-montane 119,821 40.9 121,687 41.5 38,144 13.0 13,267 4.5 Thicket mainland-basin 10,987 46.9 7,878 33.6 4,561 19.5 - -
Total 406,314 20.0 750,645 36.9 818,640 40.2 58,874 2.9
kudu that utilise the top of the plant
rather than eating sensitive growth
points from underneath the plant
(Stuart-Hill, 1991).
Of 16,000 km2 formerly covered in
spekboom-rich subtropical thicket,
some 46% has undergone severe
degradation and 34% moderate
disturbance. This is predominantly
from overgrazing, although clearing
for arable use is another major
threat to the subtropical thicket.
Land has been cleared along the
rivers, and lucerne and other crops
are grown under irrigation. Land
has also been cleared for orange
orchards in the Addo region.
Unfortunately, removing livestock
and resting subtropical thicket from
browsers does not lead to natural
recovery of the vegetation, as
fundamental changes in microclimate
and soil health preclude the
recruitment and establishment
of the indigenous plants. Thus,
restoration of subtropical thicket
requires active intervention to
overcome these biophysical barriers
until a reasonable canopy has been
re-established to moderate the
microclimate and protect the soil.
SECTION THREE – SUBTROPICAL THICKET RESTORATION AND MANAGEMENT
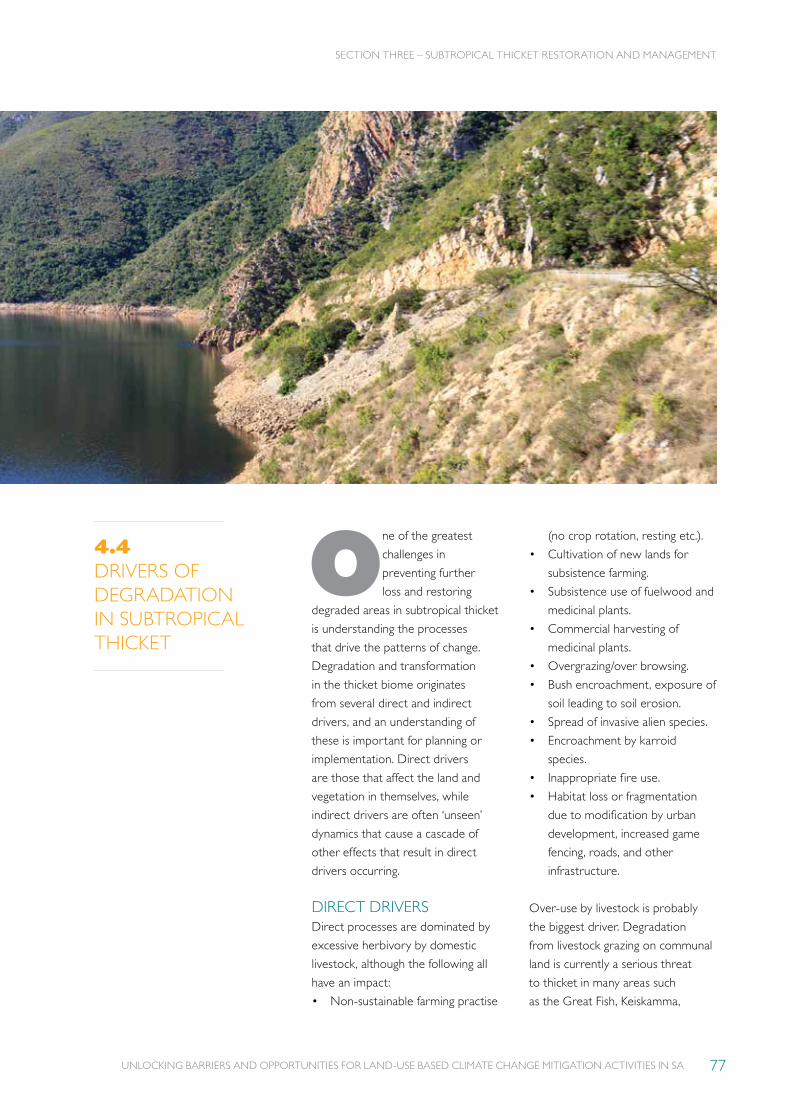
UNLOCKING BARRIERS AND OPPORTUNITIES FOR LAND-USE BASED CLIMATE CHANGE MITIGATION ACTIVITIES IN SA 77
4.4DRIVERS OF DEGRADATION IN SUBTROPICAL THICKET
One of the greatest
challenges in
preventing further
loss and restoring
degraded areas in subtropical thicket
is understanding the processes
that drive the patterns of change.
Degradation and transformation
in the thicket biome originates
from several direct and indirect
drivers, and an understanding of
these is important for planning or
implementation. Direct drivers
are those that affect the land and
vegetation in themselves, while
indirect drivers are often ‘unseen’
dynamics that cause a cascade of
other effects that result in direct
drivers occurring.
DIRECT DRIVERSDirect processes are dominated by
excessive herbivory by domestic
livestock, although the following all
have an impact:
• Non-sustainable farming practise
(no crop rotation, resting etc.).
• Cultivation of new lands for
subsistence farming.
• Subsistence use of fuelwood and
medicinal plants.
• Commercial harvesting of
medicinal plants.
• Overgrazing/over browsing.
• Bush encroachment, exposure of
soil leading to soil erosion.
• Spread of invasive alien species.
• Encroachment by karroid
species.
• Inappropriate fire use.
• Habitat loss or fragmentation
due to modification by urban
development, increased game
fencing, roads, and other
infrastructure.
Over-use by livestock is probably
the biggest driver. Degradation
from livestock grazing on communal
land is currently a serious threat
to thicket in many areas such
as the Great Fish, Keiskamma,
SECTION THREE – SUBTROPICAL THICKET RESTORATION AND MANAGEMENT
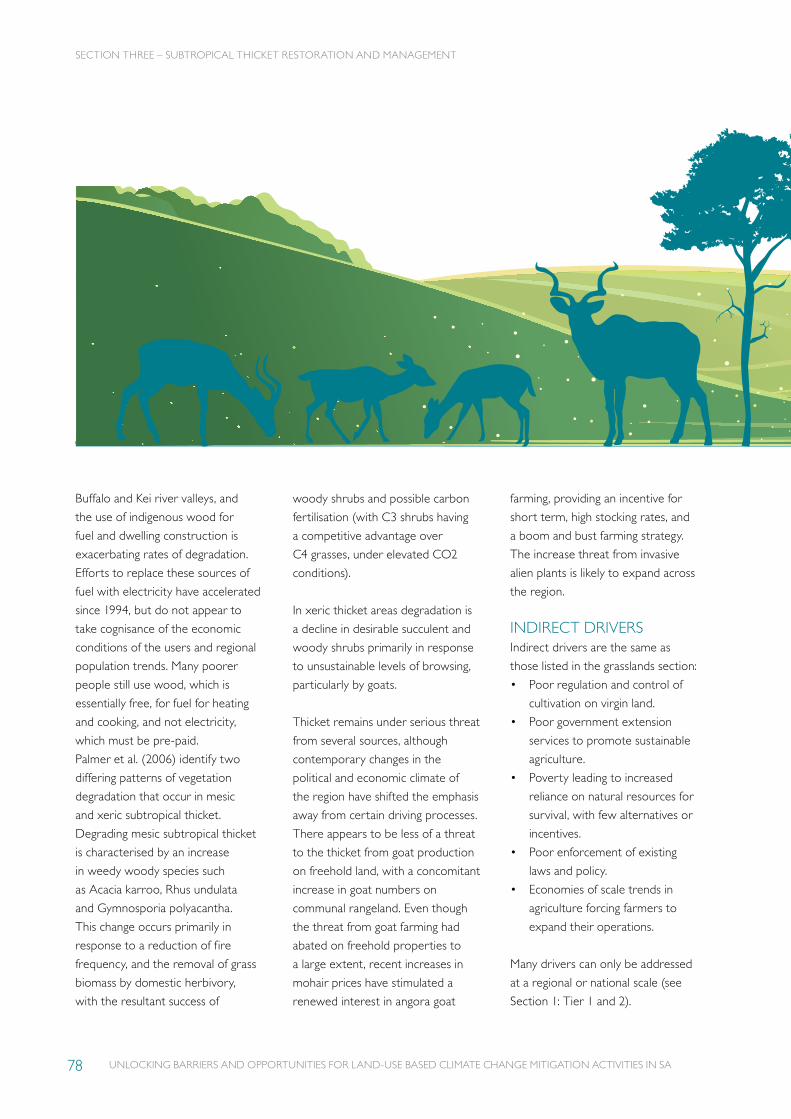
UNLOCKING BARRIERS AND OPPORTUNITIES FOR LAND-USE BASED CLIMATE CHANGE MITIGATION ACTIVITIES IN SA78
Buffalo and Kei river valleys, and
the use of indigenous wood for
fuel and dwelling construction is
exacerbating rates of degradation.
Efforts to replace these sources of
fuel with electricity have accelerated
since 1994, but do not appear to
take cognisance of the economic
conditions of the users and regional
population trends. Many poorer
people still use wood, which is
essentially free, for fuel for heating
and cooking, and not electricity,
which must be pre-paid.
Palmer et al. (2006) identify two
differing patterns of vegetation
degradation that occur in mesic
and xeric subtropical thicket.
Degrading mesic subtropical thicket
is characterised by an increase
in weedy woody species such
as Acacia karroo, Rhus undulata
and Gymnosporia polyacantha.
This change occurs primarily in
response to a reduction of fire
frequency, and the removal of grass
biomass by domestic herbivory,
with the resultant success of
woody shrubs and possible carbon
fertilisation (with C3 shrubs having
a competitive advantage over
C4 grasses, under elevated CO2
conditions).
In xeric thicket areas degradation is
a decline in desirable succulent and
woody shrubs primarily in response
to unsustainable levels of browsing,
particularly by goats.
Thicket remains under serious threat
from several sources, although
contemporary changes in the
political and economic climate of
the region have shifted the emphasis
away from certain driving processes.
There appears to be less of a threat
to the thicket from goat production
on freehold land, with a concomitant
increase in goat numbers on
communal rangeland. Even though
the threat from goat farming had
abated on freehold properties to
a large extent, recent increases in
mohair prices have stimulated a
renewed interest in angora goat
farming, providing an incentive for
short term, high stocking rates, and
a boom and bust farming strategy.
The increase threat from invasive
alien plants is likely to expand across
the region.
INDIRECT DRIVERSIndirect drivers are the same as
those listed in the grasslands section:
• Poor regulation and control of
cultivation on virgin land.
• Poor government extension
services to promote sustainable
agriculture.
• Poverty leading to increased
reliance on natural resources for
survival, with few alternatives or
incentives.
• Poor enforcement of existing
laws and policy.
• Economies of scale trends in
agriculture forcing farmers to
expand their operations.
Many drivers can only be addressed
at a regional or national scale (see
Section 1: Tier 1 and 2).
SECTION THREE – SUBTROPICAL THICKET RESTORATION AND MANAGEMENT
UNLOCKING BARRIERS AND OPPORTUNITIES FOR LAND-USE BASED CLIMATE CHANGE MITIGATION ACTIVITIES IN SA 79
EXISTING INITIATIVES DESCRIPTION
GEF 5 Programmes – Mainstreamingwww.thegef.org/project/mainstreaming-biodiversity-land-use-regulation-and-management-municipal-scale
The mainstreaming component is focused on four district municipalities in South Africa: Cape Winelands District Municipality in the Western Cape, Amathole District Municipality in the Eastern Cape, Ehlanzeni District Municipality in Mpumalanga, and uMgungundlovu District Municipality in KwaZulu-Natal. The Amathole municipality contain significant areas of subtropical thicket. The focus of the mainstreaming programme is to better integrate biodiversity and related issues such as climate change into municipal policy and planning.
Maputo-Pondoland-Subtropical Hotspotwww.cepf.net
The Critical Ecosystems Partnership Fund (CEPF) funded a five-year biodiversity conservation programme, focused on the Maputo-Pondoland-Subtropical Hotspot, which covers much of the north-eastern part of the Eastern Cape, most of KwaZulu-Natal, parts of Mpumalanga, Swaziland and the southern part of Mozambique. The areas covered include extensive areas of grassland.
Subtropical Thicket Ecosystem Planning (STEP) 2003bgis.sanbi.org/STEP/project.asp
The Subtropical Thicket Ecosystem Project (STEP) began in 2000 with a four-year planning phase supported by the Global Environment Facility (GEF) and implemented by the Terrestrial Ecology Research Unit (TERU) at the Nelson Mandela Metropolitan University. The main aim of the planning phase was to conduct a thorough conservation planning exercise in South Africa’s thicket biome with key stakeholders, and provide management guidelines for sustainable use.
Please also see the
equivalent table in
Chapter 2, which
addresses relevant
national initiatives that are larger
than the subtropical thicket biome,
but still relevant to it.
4.5EXISTING INITIATIVES WITHIN SUBTROPICAL THICKET
SECTION THREE – SUBTROPICAL THICKET RESTORATION AND MANAGEMENT

UNLOCKING BARRIERS AND OPPORTUNITIES FOR LAND-USE BASED CLIMATE CHANGE MITIGATION ACTIVITIES IN SA80
SUBTROPICAL THICKET: DEFINING THE GAP – STATUS QUO VS NATIONAL READINESS5.1LAND USES AND REQUIRED ACTIVITIES
SUBTROPICAL THICKET CONTEXTSubtropical thicket can be described
in a variety of ways, but in terms
of this work it is best to view it
according to four tenure contexts:
• Subtropical thicket in protected
areas.
• Subtropical thicket on
communally-managed land.
• Subtropical thicket under
state (but not conservation)
management.
• Subtropical thicket under private
management.
5 The context will influence the
timing, responsibility and type of
activities that should be applied to
the various land use or mitigation
scenarios.
There is a set of common land-use
types that covers most subtropical
thicket vegetation types, and a set
of activities that are required to
achieve the national readiness. The
activities may apply equally to one
or more land-use types. Each land
use and activity is further explored
in Table 5.1.
SECTION THREE – SUBTROPICAL THICKET RESTORATION AND MANAGEMENT
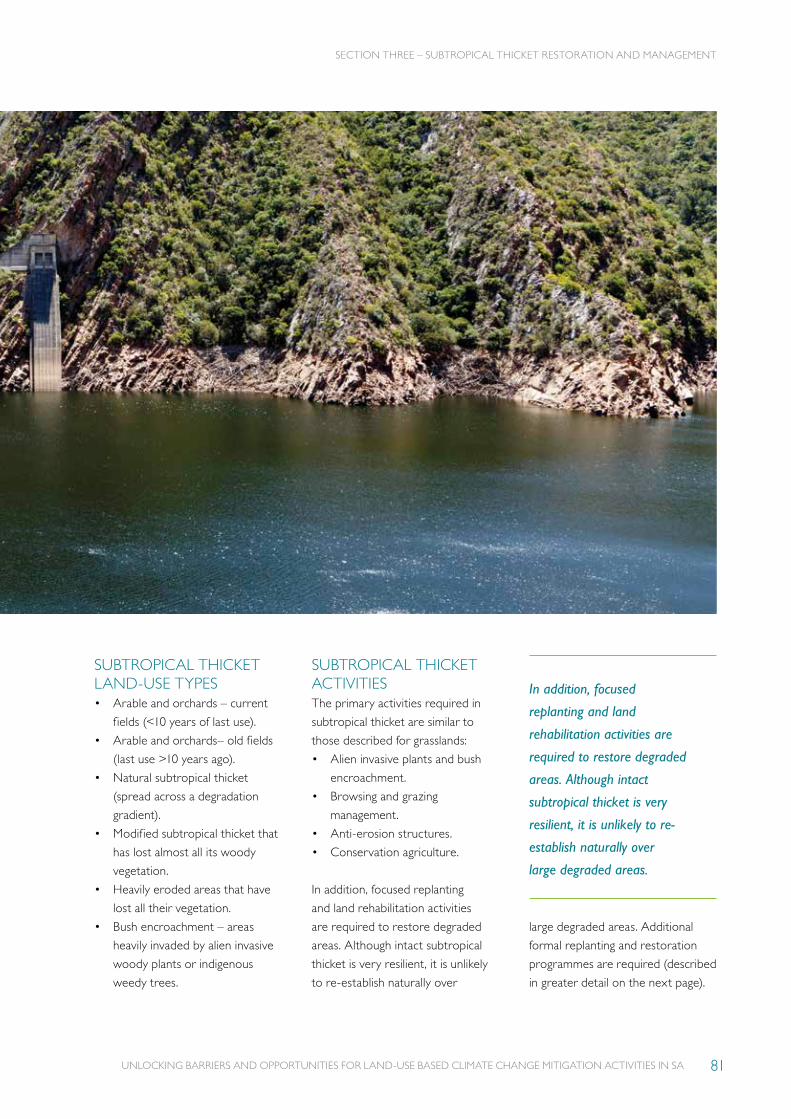
UNLOCKING BARRIERS AND OPPORTUNITIES FOR LAND-USE BASED CLIMATE CHANGE MITIGATION ACTIVITIES IN SA 81
SUBTROPICAL THICKET LAND-USE TYPES• Arable and orchards – current
fields (<10 years of last use).
• Arable and orchards– old fields
(last use >10 years ago).
• Natural subtropical thicket
(spread across a degradation
gradient).
• Modified subtropical thicket that
has lost almost all its woody
vegetation.
• Heavily eroded areas that have
lost all their vegetation.
• Bush encroachment – areas
heavily invaded by alien invasive
woody plants or indigenous
weedy trees.
SUBTROPICAL THICKET ACTIVITIES The primary activities required in
subtropical thicket are similar to
those described for grasslands:
• Alien invasive plants and bush
encroachment.
• Browsing and grazing
management.
• Anti-erosion structures.
• Conservation agriculture.
In addition, focused replanting
and land rehabilitation activities
are required to restore degraded
areas. Although intact subtropical
thicket is very resilient, it is unlikely
to re-establish naturally over
large degraded areas. Additional
formal replanting and restoration
programmes are required (described
in greater detail on the next page).
In addition, focused
replanting and land
rehabilitation activities are
required to restore degraded
areas. Although intact
subtropical thicket is very
resilient, it is unlikely to re-
establish naturally over
large degraded areas.
SECTION THREE – SUBTROPICAL THICKET RESTORATION AND MANAGEMENT
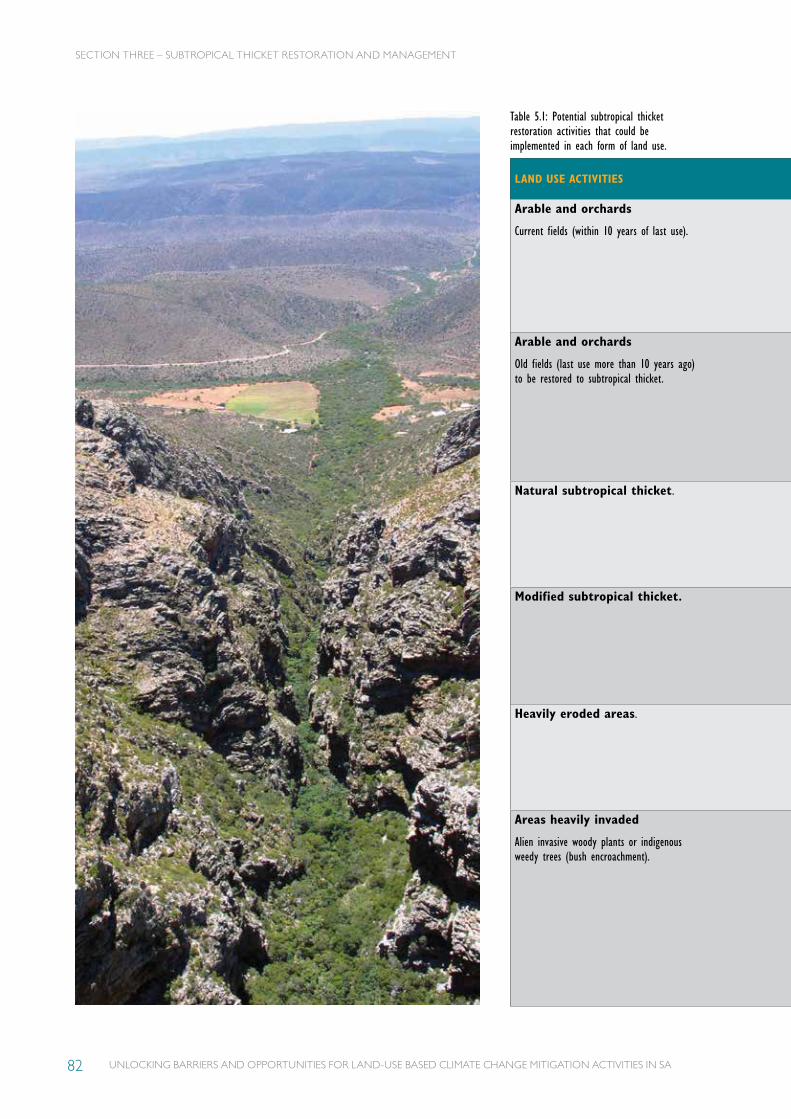
UNLOCKING BARRIERS AND OPPORTUNITIES FOR LAND-USE BASED CLIMATE CHANGE MITIGATION ACTIVITIES IN SA82
LAND USE ACTIVITIESALIEN INVASIVE PLANT AND BUSH ENCROACHMENT CONTROL
LIVESTOCK AND GAME BROWSING AND GRAZING
ANTI-EROSION STRUCTURES REVEGETATION CONSERVATION
AGRICULTURE
Arable and orchards
Current fields (within 10 years of last use).
n/a n/a n/a n/a Apply appropriate techniques to improve soil health, such as zero-till, contouring, mulching, not burning residues, reduced fertilisation.
Conservative irrigation systems should be used to ensure water is not wasted.
Arable and orchards
Old fields (last use more than 10 years ago) to be restored to subtropical thicket.
If AIP or weedy trees are taking over the area, then a directed successional approach may be appropriate to facilitate the establishment of indigenous woody species, using the undesirable species to create a nursery environment.
Aim for very low grazing intensity to allow for a good cover of grass to establish to protect the soil.
Withhold browsers unless they are being specifically used to introduce seeds or to control undesirable elements of AIP or weeds.
Use appropriate technology and structures to prevent sheet or gulley erosion in areas where the soil is exposed.
Sow indigenous grass seeds on larger areas.Investigate hydro-mulching options.Plant indigenous plugs and seedlings in smaller areas.Withhold grazing until grasses have properly established.
Establish a thick mulch layer to protect the soil and prevent the germination of weedy and AIP seeds.
Natural subtropical thicket. Annual cut/spray to prevent establishment of AIP infestations. Prioritise new or expanding AIP infestations.
Avoid browsing with more than the recommended intensity of animals, especially goats.
Consider switching to game farming.
Use appropriate technology and structures to prevent gullies forming in localised areas such as livestock paths, water troughs and feedlots.
Plant indigenous species in areas where localised destruction has occurred, such as around water points.
Apply the SANBI burning and grazing best practice guidelines to all grazing lands.Use thicket best practice guidelines to guide browsing management.
Modified subtropical thicket. Annual cut/spray to prevent establishment of AIP infestations.
Where appropriate, use high-intensity short-duration grazing to promote the ecological dynamics that assist re-vegetation.
Use appropriate technology and structures such as rock lines, logs, brush-strips, hollows, mulching, or geomats.
Plant rows of vetiver grass along the contours.
Sow indigenous grass seeds on larger areas.Withhold grazing until grasses have properly established.
Establish a thick mulch layer to protect the soil and prevent the germination of weed and AIP seeds.
Heavily eroded areas. Annual cut/spray to prevent establishment of AIP infestations.
Where appropriate, use high-intensity short-duration grazing to promote the ecological dynamics that assist re-vegetation.
Use appropriate technology and structures such as reshaping, gabions, brush packs, etc., to prevent further head erosion and to stabilise the gully walls.
Plant vetiver grass to stabilise the walls and floors of the gulleys.Plant hardy indigenous trees to help stabilise the gulleys.
n/a
Areas heavily invaded
Alien invasive woody plants or indigenous weedy trees (bush encroachment).
Design a landscape-scale clearing plan that prioritises newer infestations and that has sufficient emphasis on rehabilitation of cleared areas.Annual cut/spray to prevent establishment of AIP infestations (only if follow-up is guaranteed, or the problem becomes worse). Alternatively, a directed successional approach can be adopted in some circumstances.
Aim for very low grazing intensity to allow for a good cover of grass to establish to protect the soil.Withhold browsers unless they are being specifically used to introduce seeds or to control undesirable elements of AIP or weeds.Under certain conditions use livestock to help crush dense infestations of AIP. This should be followed by active rehabilitation.
Use appropriate technology and structures to stabilise the exposed soil, such as rock lines, logs, brush-strips, hollows, mulching, or geomats.
Plant rows of vetiver grass along the contours.Sow indigenous grass seeds on larger areas.Plant indigenous grass plugs in smaller areas.Withhold grazing until grasses have properly established.
Following clearing, establish a thick mulch layer to protect the soil and prevent the germination of weed and AIP seeds.
Table 5.1: Potential subtropical thicket restoration activities that could be implemented in each form of land use.
SECTION THREE – SUBTROPICAL THICKET RESTORATION AND MANAGEMENT
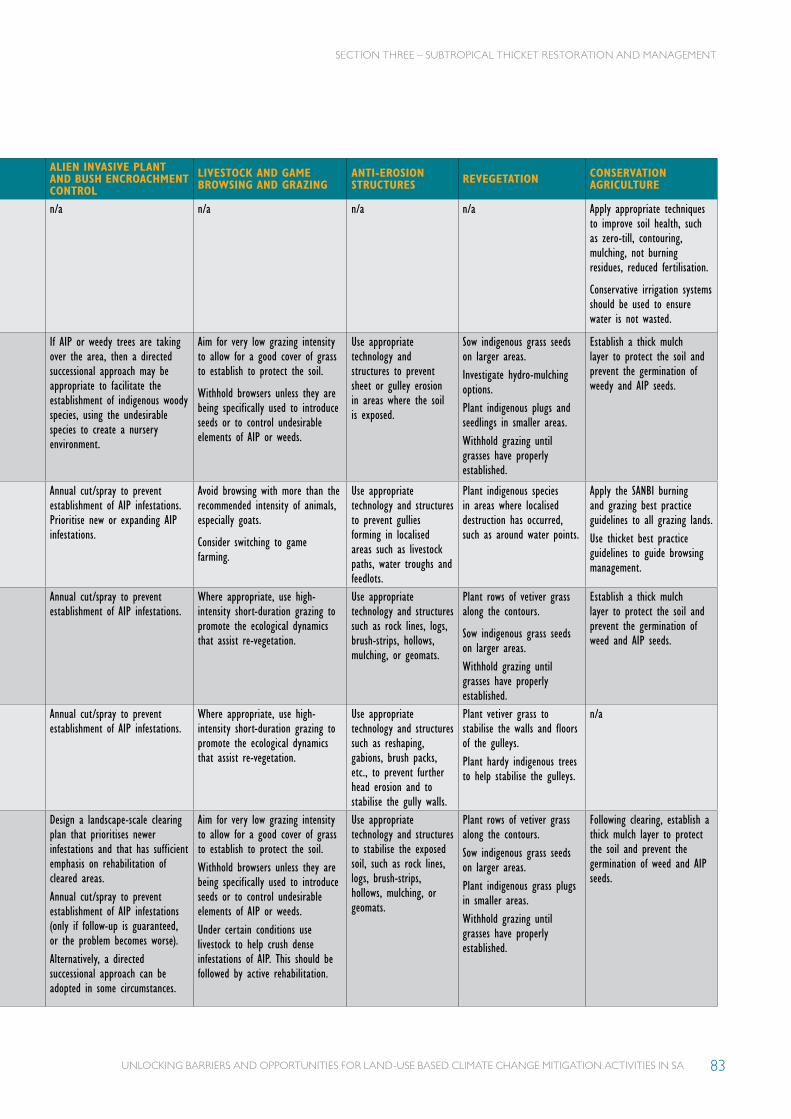
UNLOCKING BARRIERS AND OPPORTUNITIES FOR LAND-USE BASED CLIMATE CHANGE MITIGATION ACTIVITIES IN SA 83
LAND USE ACTIVITIESALIEN INVASIVE PLANT AND BUSH ENCROACHMENT CONTROL
LIVESTOCK AND GAME BROWSING AND GRAZING
ANTI-EROSION STRUCTURES REVEGETATION CONSERVATION
AGRICULTURE
Arable and orchards
Current fields (within 10 years of last use).
n/a n/a n/a n/a Apply appropriate techniques to improve soil health, such as zero-till, contouring, mulching, not burning residues, reduced fertilisation.
Conservative irrigation systems should be used to ensure water is not wasted.
Arable and orchards
Old fields (last use more than 10 years ago) to be restored to subtropical thicket.
If AIP or weedy trees are taking over the area, then a directed successional approach may be appropriate to facilitate the establishment of indigenous woody species, using the undesirable species to create a nursery environment.
Aim for very low grazing intensity to allow for a good cover of grass to establish to protect the soil.
Withhold browsers unless they are being specifically used to introduce seeds or to control undesirable elements of AIP or weeds.
Use appropriate technology and structures to prevent sheet or gulley erosion in areas where the soil is exposed.
Sow indigenous grass seeds on larger areas.Investigate hydro-mulching options.Plant indigenous plugs and seedlings in smaller areas.Withhold grazing until grasses have properly established.
Establish a thick mulch layer to protect the soil and prevent the germination of weedy and AIP seeds.
Natural subtropical thicket. Annual cut/spray to prevent establishment of AIP infestations. Prioritise new or expanding AIP infestations.
Avoid browsing with more than the recommended intensity of animals, especially goats.
Consider switching to game farming.
Use appropriate technology and structures to prevent gullies forming in localised areas such as livestock paths, water troughs and feedlots.
Plant indigenous species in areas where localised destruction has occurred, such as around water points.
Apply the SANBI burning and grazing best practice guidelines to all grazing lands.Use thicket best practice guidelines to guide browsing management.
Modified subtropical thicket. Annual cut/spray to prevent establishment of AIP infestations.
Where appropriate, use high-intensity short-duration grazing to promote the ecological dynamics that assist re-vegetation.
Use appropriate technology and structures such as rock lines, logs, brush-strips, hollows, mulching, or geomats.
Plant rows of vetiver grass along the contours.
Sow indigenous grass seeds on larger areas.Withhold grazing until grasses have properly established.
Establish a thick mulch layer to protect the soil and prevent the germination of weed and AIP seeds.
Heavily eroded areas. Annual cut/spray to prevent establishment of AIP infestations.
Where appropriate, use high-intensity short-duration grazing to promote the ecological dynamics that assist re-vegetation.
Use appropriate technology and structures such as reshaping, gabions, brush packs, etc., to prevent further head erosion and to stabilise the gully walls.
Plant vetiver grass to stabilise the walls and floors of the gulleys.Plant hardy indigenous trees to help stabilise the gulleys.
n/a
Areas heavily invaded
Alien invasive woody plants or indigenous weedy trees (bush encroachment).
Design a landscape-scale clearing plan that prioritises newer infestations and that has sufficient emphasis on rehabilitation of cleared areas.Annual cut/spray to prevent establishment of AIP infestations (only if follow-up is guaranteed, or the problem becomes worse). Alternatively, a directed successional approach can be adopted in some circumstances.
Aim for very low grazing intensity to allow for a good cover of grass to establish to protect the soil.Withhold browsers unless they are being specifically used to introduce seeds or to control undesirable elements of AIP or weeds.Under certain conditions use livestock to help crush dense infestations of AIP. This should be followed by active rehabilitation.
Use appropriate technology and structures to stabilise the exposed soil, such as rock lines, logs, brush-strips, hollows, mulching, or geomats.
Plant rows of vetiver grass along the contours.Sow indigenous grass seeds on larger areas.Plant indigenous grass plugs in smaller areas.Withhold grazing until grasses have properly established.
Following clearing, establish a thick mulch layer to protect the soil and prevent the germination of weed and AIP seeds.
SECTION THREE – SUBTROPICAL THICKET RESTORATION AND MANAGEMENT

UNLOCKING BARRIERS AND OPPORTUNITIES FOR LAND-USE BASED CLIMATE CHANGE MITIGATION ACTIVITIES IN SA84
SECTION THREE – SUBTROPICAL THICKET RESTORATION AND MANAGEMENT
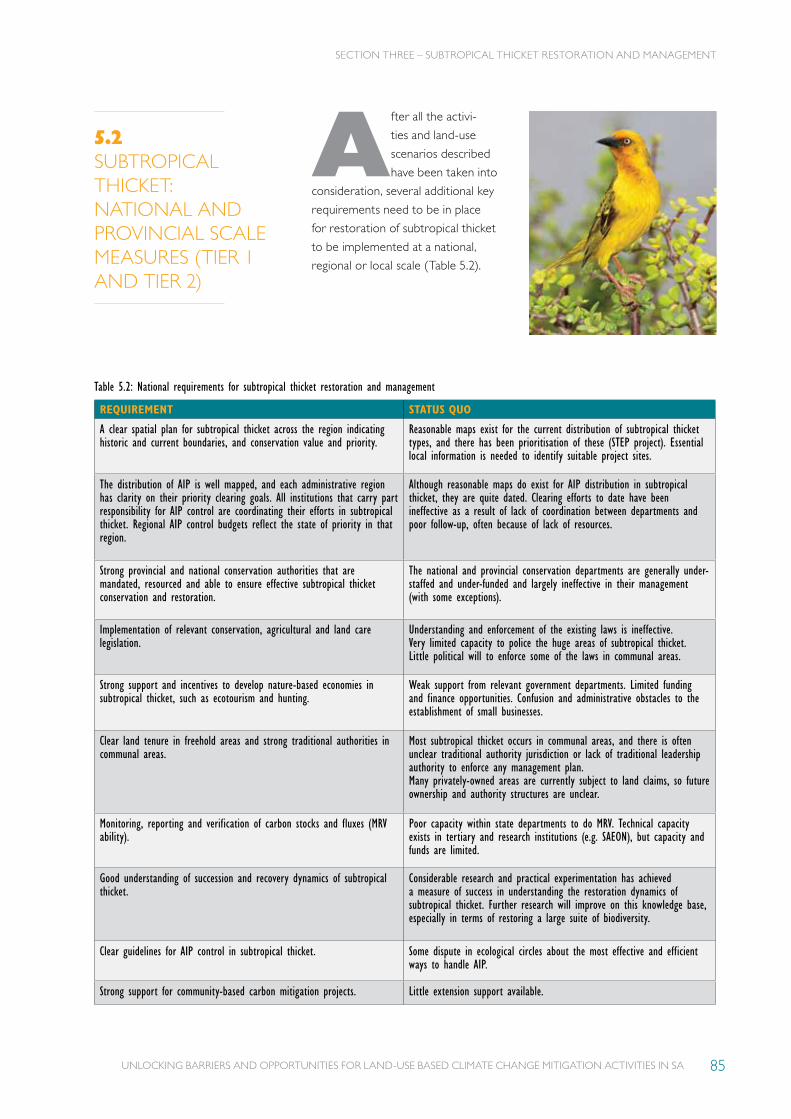
UNLOCKING BARRIERS AND OPPORTUNITIES FOR LAND-USE BASED CLIMATE CHANGE MITIGATION ACTIVITIES IN SA 85
5.2SUBTROPICAL THICKET: NATIONAL AND PROVINCIAL SCALE MEASURES (TIER 1 AND TIER 2)
Table 5.2: National requirements for subtropical thicket restoration and management
REQUIREMENT STATUS QUO
A clear spatial plan for subtropical thicket across the region indicating historic and current boundaries, and conservation value and priority.
Reasonable maps exist for the current distribution of subtropical thicket types, and there has been prioritisation of these (STEP project). Essential local information is needed to identify suitable project sites.
The distribution of AIP is well mapped, and each administrative region has clarity on their priority clearing goals. All institutions that carry part responsibility for AIP control are coordinating their efforts in subtropical thicket. Regional AIP control budgets reflect the state of priority in that region.
Although reasonable maps do exist for AIP distribution in subtropical thicket, they are quite dated. Clearing efforts to date have been ineffective as a result of lack of coordination between departments and poor follow-up, often because of lack of resources.
Strong provincial and national conservation authorities that are mandated, resourced and able to ensure effective subtropical thicket conservation and restoration.
The national and provincial conservation departments are generally under-staffed and under-funded and largely ineffective in their management (with some exceptions).
Implementation of relevant conservation, agricultural and land care legislation.
Understanding and enforcement of the existing laws is ineffective. Very limited capacity to police the huge areas of subtropical thicket.Little political will to enforce some of the laws in communal areas.
Strong support and incentives to develop nature-based economies in subtropical thicket, such as ecotourism and hunting.
Weak support from relevant government departments. Limited funding and finance opportunities. Confusion and administrative obstacles to the establishment of small businesses.
Clear land tenure in freehold areas and strong traditional authorities in communal areas.
Most subtropical thicket occurs in communal areas, and there is often unclear traditional authority jurisdiction or lack of traditional leadership authority to enforce any management plan.Many privately-owned areas are currently subject to land claims, so future ownership and authority structures are unclear.
Monitoring, reporting and verification of carbon stocks and fluxes (MRV ability).
Poor capacity within state departments to do MRV. Technical capacity exists in tertiary and research institutions (e.g. SAEON), but capacity and funds are limited.
Good understanding of succession and recovery dynamics of subtropical thicket.
Considerable research and practical experimentation has achieved a measure of success in understanding the restoration dynamics of subtropical thicket. Further research will improve on this knowledge base, especially in terms of restoring a large suite of biodiversity.
Clear guidelines for AIP control in subtropical thicket. Some dispute in ecological circles about the most effective and efficient ways to handle AIP.
Strong support for community-based carbon mitigation projects. Little extension support available.
After all the activi-
ties and land-use
scenarios described
have been taken into
consideration, several additional key
requirements need to be in place
for restoration of subtropical thicket
to be implemented at a national,
regional or local scale (Table 5.2).
SECTION THREE – SUBTROPICAL THICKET RESTORATION AND MANAGEMENT
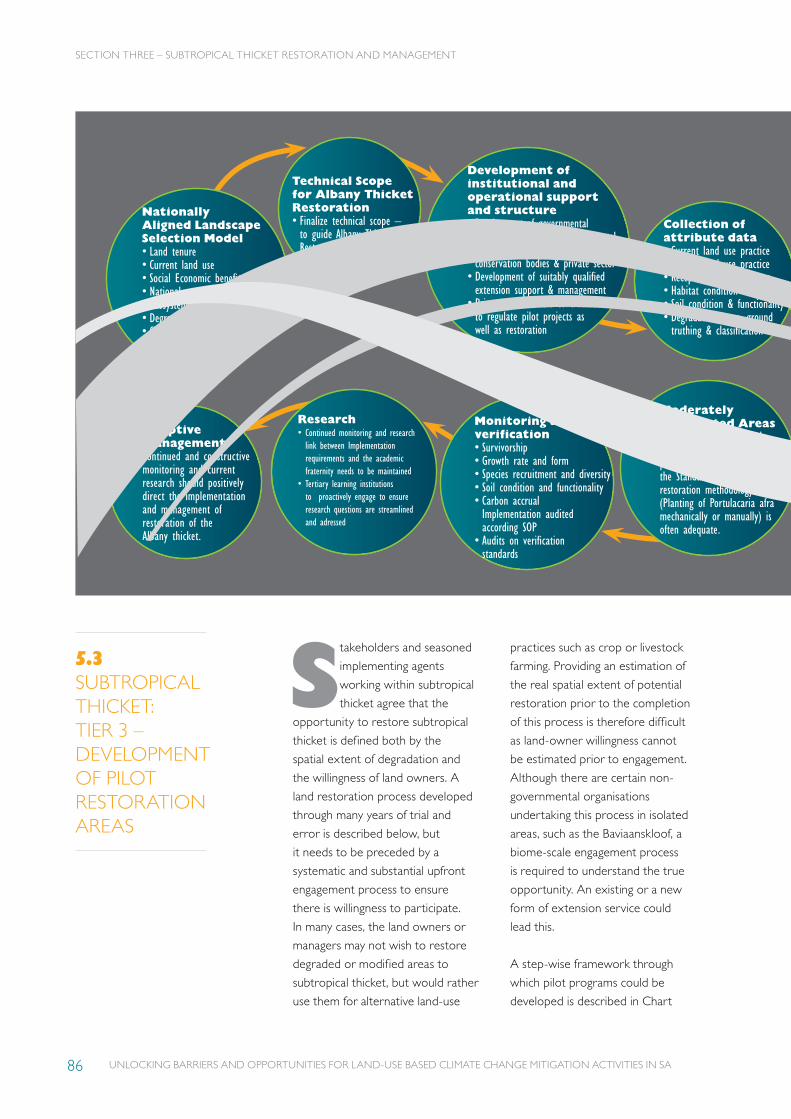
UNLOCKING BARRIERS AND OPPORTUNITIES FOR LAND-USE BASED CLIMATE CHANGE MITIGATION ACTIVITIES IN SA86
Nationally Aligned Landscape Selection Model • Land tenure• Current land use • Social Economic benefits • National economic drivers • Ecosystem service benefits• Degradation status and extent • Climate mitigation potential • Ease of implementation
Technical Scope for Albany Thicket Restoration• Finalize technical scope – to guide Albany Thicket Restoration across biome
Development of institutional and operational support and structure • Development of governmental structure – Provincial environmental & agricultural capacity – including conservation bodies & private sector
• Development of suitably qualified extension support & management
• Private practitioners contracted to regulate pilot projects as well as restoration
Collection of attribute data• Current land use practice• Desired land use practice• Receptiveness land tenure • Habitat condition • Soil condition & functionality• Degradation layer- ground truthing & classification
Moderately Degradated Areas Due to these areas already having ground cover and partial thicket representation the Standardized Albany Thicket restoration methodology – SOP (Planting of Portulacaria afra mechanically or manually) is often adequate.
Monitoring and verification • Survivorship• Growth rate and form• Species recruitment and diversity • Soil condition and functionality• Carbon accrual Implementation audited according SOP
• Audits on verification standards
Research • Continued monitoring and research
link between Implementation requirements and the academic fraternity needs to be maintained
• Tertiary learning institutions to proactively engage to ensure research questions are streamlined and adressed
Adaptive managementContinued and constructive monitoring and current research should positively direct the implementation and management of restoration of the Albany thicket.
Stakeholders and seasoned
implementing agents
working within subtropical
thicket agree that the
opportunity to restore subtropical
thicket is defined both by the
spatial extent of degradation and
the willingness of land owners. A
land restoration process developed
through many years of trial and
error is described below, but
it needs to be preceded by a
systematic and substantial upfront
engagement process to ensure
there is willingness to participate.
In many cases, the land owners or
managers may not wish to restore
degraded or modified areas to
subtropical thicket, but would rather
use them for alternative land-use
5.3SUBTROPICAL THICKET: TIER 3 – DEVELOPMENT OF PILOT RESTORATION AREAS
practices such as crop or livestock
farming. Providing an estimation of
the real spatial extent of potential
restoration prior to the completion
of this process is therefore difficult
as land-owner willingness cannot
be estimated prior to engagement.
Although there are certain non-
governmental organisations
undertaking this process in isolated
areas, such as the Baviaanskloof, a
biome-scale engagement process
is required to understand the true
opportunity. An existing or a new
form of extension service could
lead this.
A step-wise framework through
which pilot programs could be
developed is described in Chart
SECTION THREE – SUBTROPICAL THICKET RESTORATION AND MANAGEMENT

UNLOCKING BARRIERS AND OPPORTUNITIES FOR LAND-USE BASED CLIMATE CHANGE MITIGATION ACTIVITIES IN SA 87
Defining Desired State Post Restoration/Rehabilitation Efforts• Depending on the land tenure, specific objective & land use, not all restoration outcomes will be aligned.
• Agriculturally productive and financially viable
• Ecologically sound & in natural successive state of recovery
• Pristine Albany Thicket
Fine Scale Planning• Development of 3-5 year land
management & restoration plan• Contractual obligation• Land use practise post rehabilitation• Delineation and prioritization of
degraded areas• Herbivory exclusion or inclusion • Restoration methodology• Operational requirements• Budget • Time frame
Methodology selection and implementationThe restoration of Albany Thicket largely depends on the following factors:• Severity of degradation• Desired state of selected area post restoration efforts
• Herbivory during & post restoration phase
Procedure Chart A: Strategy Framework: Tier 3 Understanding field implementation – Approach and development of pilot areas - A tabulated representation of a holistic stepwise approach to Albany Thicket restoration
Severely Degradated Areas A combination of restoration interventions need to be applied to ensure: improved water infiltration, reduced water runoff, loosening of capped soils, stimulation of ground cover and the initiation of a natural restoration processes
Risk Benefit AnalysisThrough systematically evaluating risks and benefits of potential restoration with invested stakeholders, a streamlined restoration approach can be established
A and Table 5.3. This structure is
based on input from stakeholders
and several years of in-field
experience within the sub-thicket
biome. Whereas there is certainly
opportunity to develop and
calibrate the framework further, this
is viewed as a reasonable starting
process for early pilot project
development. Although it does
include (and repeat) some Tier
1 and Tier 2 elements, these are
included so that the reader can see
how the full comprehensive process
may fit together. The framework
is followed by a description of
replanting and practical restoration
techniques that have been
developed through trial and error
within the biome.
SECTION THREE – SUBTROPICAL THICKET RESTORATION AND MANAGEMENT
Collection of attribute data• Current land use practice• Desired land use practice• Receptiveness land tenure • Habitat condition • Soil condition & functionality• Degradation layer- ground truthing & classification
Moderately Degradated Areas Due to these areas already having ground cover and partial thicket representation the Standardized Albany Thicket restoration methodology – SOP (Planting of Portulacaria afra mechanically or manually) is often adequate.

UNLOCKING BARRIERS AND OPPORTUNITIES FOR LAND-USE BASED CLIMATE CHANGE MITIGATION ACTIVITIES IN SA88
STEPWISE STRUCTURE OVERVIEW
ACTION REQUIRED RESPONSIBLE STAKEHOLDER MEASURE
1 Nationally aligned landscape selection model based on:• Land tenure• Current land use • Socio-economic benefits • National economic drivers • Ecosystem service benefits• Degradation status and extent • Climate mitigation potential • Ease of implementation.
Development of a subtropical thicket restoration landscape matrix which will assist in the selection of suitable areas to invest in restoration.
Government, with the aid of a suitably qualified environmental practitioner if required.
Complete and functional tool aligned to other climate mitigation restoration area selection tools.
2 Technical scope for subtropical thicket restoration
Development of finalised technical scope for the restoration of subtropical thicket, using knowledge and experience gained over the last 8 to 10 years of implementation
Government to initiate, with the aid of a suitably qualified environmental practitioner if required. Stakeholder involvement to include: • Past and current implementation
agencies• Scientific and tertiary education
institutions• Conservation authorities • Environmental practitioners• Current landowners
Complete and functional technical scope which guides the successful restoration of subtropical thicket
3 Institutional and operational support and structure
Development of a functional institutional and operational support structure that is effective in coordinating the successful restoration of subtropical thicket:• Planning and upscaling of
existing efforts• Development of legal framework• Networking – nationally and
internationally • Sourcing of funding• Administrative processes• Operationalising • Supporting• Monitoring• Researching • Validating
Government to initiate with the aid of:• Private business/investors • Environmental practitioners• Legal practitioners • Implementing agents • Extension officers • Conservation authorities• Tertiary education institutions • Landowners
Fully functional institutional and operational industry built around subtropical thicket restoration with multiple benefits which can be measured accordingly:• Socio-economic benefits• Ecosystem services• Biodiversity improvement• Food security• Taxable income • Climate change mitigation
4 Collection of attribute data to be utilised prior to the development of subtropical thicket restoration projects with identified landscape
The following critical attribute data are required to be sourced prior to project development, which provide the necessary information to make a calculated judgment on the overall value of project establishment:• Current land-use practice• Desired land-use practice by the
current owners/users of the land • Receptiveness to restoration
across all forms of land tenure • Habitat condition • Soil condition and functionality• Degradation layer ground
truthing and classification.
Government to initiate with well-constructed pilot areas across all forms of land tenure. Environmental practitioners or internal capacity could facilitate this at pilot level.This process could later be coordinated and implemented by the private sector, sourcing assistance though:• Environmental practitioners• Extension officers trained during
the pilot studies.This information could also be used by the environmental and agricultural departments as national attribute data.
The quality and quantity of attribute data.
Table 5.3: A tabulated representation of a stepwise approach to subtropical thicket restoration.
SECTION THREE – SUBTROPICAL THICKET RESTORATION AND MANAGEMENT
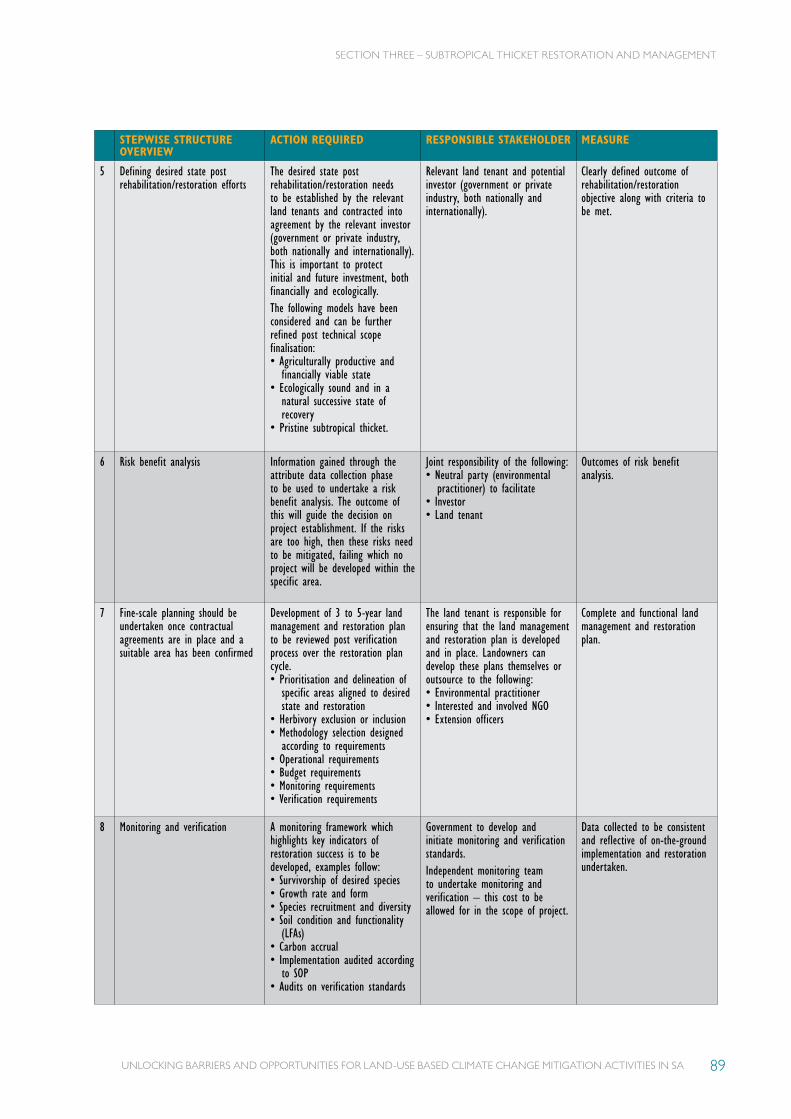
UNLOCKING BARRIERS AND OPPORTUNITIES FOR LAND-USE BASED CLIMATE CHANGE MITIGATION ACTIVITIES IN SA 89
STEPWISE STRUCTURE OVERVIEW
ACTION REQUIRED RESPONSIBLE STAKEHOLDER MEASURE
5 Defining desired state post rehabilitation/restoration efforts
The desired state post rehabilitation/restoration needs to be established by the relevant land tenants and contracted into agreement by the relevant investor (government or private industry, both nationally and internationally). This is important to protect initial and future investment, both financially and ecologically. The following models have been considered and can be further refined post technical scope finalisation:• Agriculturally productive and
financially viable state• Ecologically sound and in a
natural successive state of recovery
• Pristine subtropical thicket.
Relevant land tenant and potential investor (government or private industry, both nationally and internationally).
Clearly defined outcome of rehabilitation/restoration objective along with criteria to be met.
6 Risk benefit analysis Information gained through the attribute data collection phase to be used to undertake a risk benefit analysis. The outcome of this will guide the decision on project establishment. If the risks are too high, then these risks need to be mitigated, failing which no project will be developed within the specific area.
Joint responsibility of the following:• Neutral party (environmental
practitioner) to facilitate • Investor• Land tenant
Outcomes of risk benefit analysis.
7 Fine-scale planning should be undertaken once contractual agreements are in place and a suitable area has been confirmed
Development of 3 to 5-year land management and restoration plan to be reviewed post verification process over the restoration plan cycle.• Prioritisation and delineation of
specific areas aligned to desired state and restoration
• Herbivory exclusion or inclusion • Methodology selection designed
according to requirements • Operational requirements• Budget requirements• Monitoring requirements• Verification requirements
The land tenant is responsible for ensuring that the land management and restoration plan is developed and in place. Landowners can develop these plans themselves or outsource to the following:• Environmental practitioner • Interested and involved NGO• Extension officers
Complete and functional land management and restoration plan.
8 Monitoring and verification A monitoring framework which highlights key indicators of restoration success is to be developed, examples follow: • Survivorship of desired species • Growth rate and form• Species recruitment and diversity • Soil condition and functionality
(LFAs)• Carbon accrual• Implementation audited according
to SOP• Audits on verification standards
Government to develop and initiate monitoring and verification standards.Independent monitoring team to undertake monitoring and verification – this cost to be allowed for in the scope of project.
Data collected to be consistent and reflective of on-the-ground implementation and restoration undertaken.
SECTION THREE – SUBTROPICAL THICKET RESTORATION AND MANAGEMENT
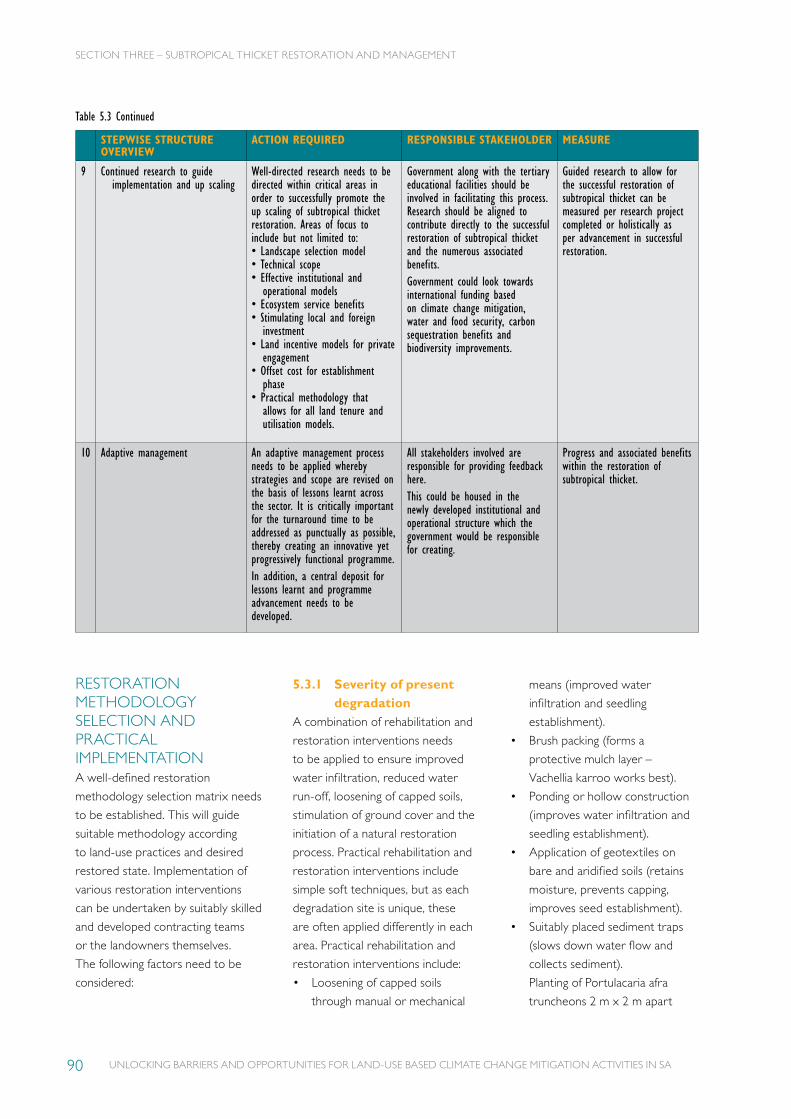
UNLOCKING BARRIERS AND OPPORTUNITIES FOR LAND-USE BASED CLIMATE CHANGE MITIGATION ACTIVITIES IN SA90
STEPWISE STRUCTURE OVERVIEW
ACTION REQUIRED RESPONSIBLE STAKEHOLDER MEASURE
9 Continued research to guide implementation and up scaling
Well-directed research needs to be directed within critical areas in order to successfully promote the up scaling of subtropical thicket restoration. Areas of focus to include but not limited to:• Landscape selection model• Technical scope• Effective institutional and
operational models• Ecosystem service benefits • Stimulating local and foreign
investment• Land incentive models for private
engagement• Offset cost for establishment
phase• Practical methodology that
allows for all land tenure and utilisation models.
Government along with the tertiary educational facilities should be involved in facilitating this process. Research should be aligned to contribute directly to the successful restoration of subtropical thicket and the numerous associated benefits.Government could look towards international funding based on climate change mitigation, water and food security, carbon sequestration benefits and biodiversity improvements.
Guided research to allow for the successful restoration of subtropical thicket can be measured per research project completed or holistically as per advancement in successful restoration.
10 Adaptive management An adaptive management process needs to be applied whereby strategies and scope are revised on the basis of lessons learnt across the sector. It is critically important for the turnaround time to be addressed as punctually as possible, thereby creating an innovative yet progressively functional programme.In addition, a central deposit for lessons learnt and programme advancement needs to be developed.
All stakeholders involved are responsible for providing feedback here.This could be housed in the newly developed institutional and operational structure which the government would be responsible for creating.
Progress and associated benefits within the restoration of subtropical thicket.
RESTORATION METHODOLOGY SELECTION AND PRACTICAL IMPLEMENTATIONA well-defined restoration
methodology selection matrix needs
to be established. This will guide
suitable methodology according
to land-use practices and desired
restored state. Implementation of
various restoration interventions
can be undertaken by suitably skilled
and developed contracting teams
or the landowners themselves.
The following factors need to be
considered:
5.3.1 Severity of present degradation
A combination of rehabilitation and
restoration interventions needs
to be applied to ensure improved
water infiltration, reduced water
run-off, loosening of capped soils,
stimulation of ground cover and the
initiation of a natural restoration
process. Practical rehabilitation and
restoration interventions include
simple soft techniques, but as each
degradation site is unique, these
are often applied differently in each
area. Practical rehabilitation and
restoration interventions include:
• Loosening of capped soils
through manual or mechanical
means (improved water
infiltration and seedling
establishment).
• Brush packing (forms a
protective mulch layer –
Vachellia karroo works best).
• Ponding or hollow construction
(improves water infiltration and
seedling establishment).
• Application of geotextiles on
bare and aridified soils (retains
moisture, prevents capping,
improves seed establishment).
• Suitably placed sediment traps
(slows down water flow and
collects sediment).
Planting of Portulacaria afra
truncheons 2 m x 2 m apart
Table 5.3 Continued
SECTION THREE – SUBTROPICAL THICKET RESTORATION AND MANAGEMENT
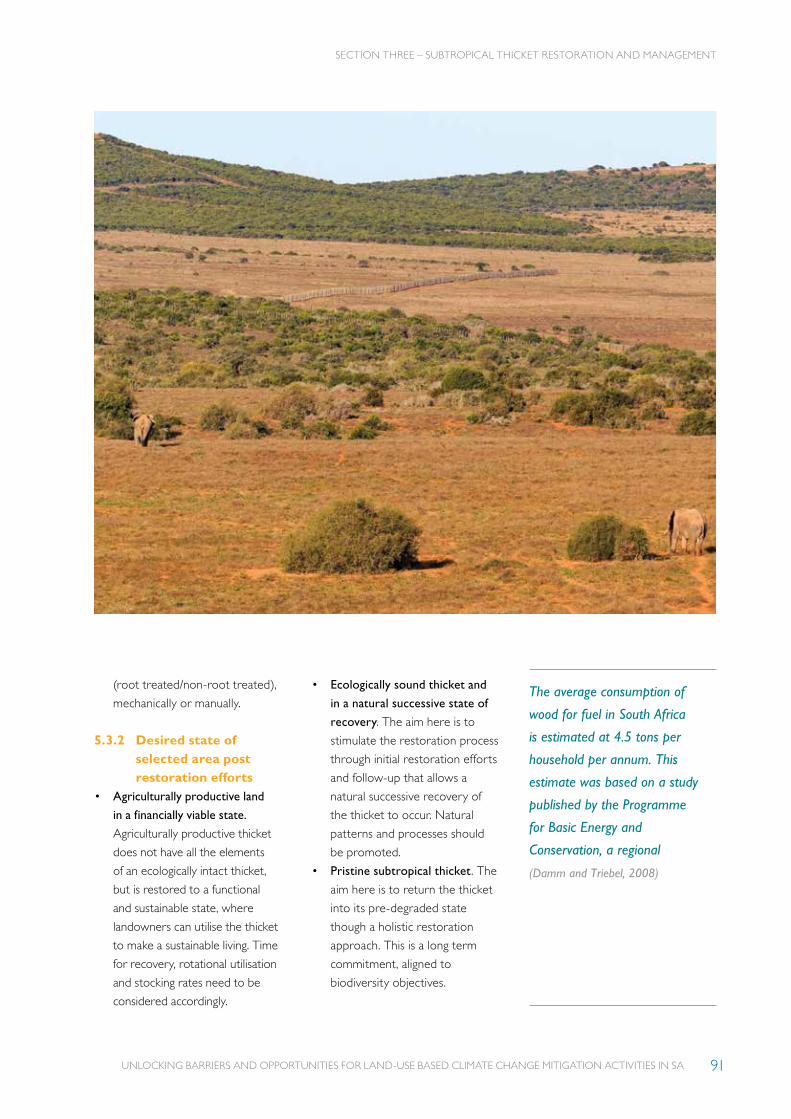
UNLOCKING BARRIERS AND OPPORTUNITIES FOR LAND-USE BASED CLIMATE CHANGE MITIGATION ACTIVITIES IN SA 91
(root treated/non-root treated),
mechanically or manually.
5.3.2 Desired state of selected area post restoration efforts
• Agriculturally productive land
in a financially viable state.
Agriculturally productive thicket
does not have all the elements
of an ecologically intact thicket,
but is restored to a functional
and sustainable state, where
landowners can utilise the thicket
to make a sustainable living. Time
for recovery, rotational utilisation
and stocking rates need to be
considered accordingly.
• Ecologically sound thicket and
in a natural successive state of
recovery. The aim here is to
stimulate the restoration process
through initial restoration efforts
and follow-up that allows a
natural successive recovery of
the thicket to occur. Natural
patterns and processes should
be promoted.
• Pristine subtropical thicket. The
aim here is to return the thicket
into its pre-degraded state
though a holistic restoration
approach. This is a long term
commitment, aligned to
biodiversity objectives.
The average consumption of
wood for fuel in South Africa
is estimated at 4.5 tons per
household per annum. This
estimate was based on a study
published by the Programme
for Basic Energy and
Conservation, a regional
(Damm and Triebel, 2008)
SECTION THREE – SUBTROPICAL THICKET RESTORATION AND MANAGEMENT

UNLOCKING BARRIERS AND OPPORTUNITIES FOR LAND-USE BASED CLIMATE CHANGE MITIGATION ACTIVITIES IN SA92
A) A severely degraded area where the soil crust is capped and standardised planting of Portulacaria afra truncheons and cuttings in isolation will not yield desired restoration results.
C) An isolated Portulacaria afra truncheon that has responded successfully due to improved water retention and reduced water run-off created by holistic rehabilitation methods.
B) A severely degraded area where holistic rehabilitation methods such as ponding, sediment trap placement and brush packing has yielded promising results.
5.3.3 Herbivory Excluded or reduced herbivory
within the first 2–5 years of the
restoration process has proven
extremely successful throughout
restoration efforts conducted
in thicket-wide research plots.
Although herbivory is a natural
process within thicket environments,
reduced utilisation of vulnerable and
newly establishing plants promotes
the restoration process.
Experience in practical restoration
of severely degraded subtropical
thicket has shown that the common
practice of planting spekboom
(Portulacaria afra) truncheons and
cuttings in isolation does not yield
optimal restoration results for the
following reasons:
• The modified landscape has a
very unforgiving micro-climate
and eroded and capped soils
prevent water penetration and
retention.
• Spekboom truncheons and
cuttings planted in bare, open
landscapes are exposed to
extreme conditions and suffer
high mortality as a result of
low temperatures and frost
or desiccation caused by
extreme heat.
• In severely degraded areas,
spekboom truncheons and
cuttings are often the only food
source for herbivores and are
thus heavily utilised. This can be
avoided by excluding herbivory
from the area.
Spekboom truncheons and
cuttings planted in bare, open
landscapes are exposed to
extreme conditions and suffer
high mortality as a result of
low temperatures and frost
or desiccation caused by
extreme heat.
SECTION THREE – SUBTROPICAL THICKET RESTORATION AND MANAGEMENT
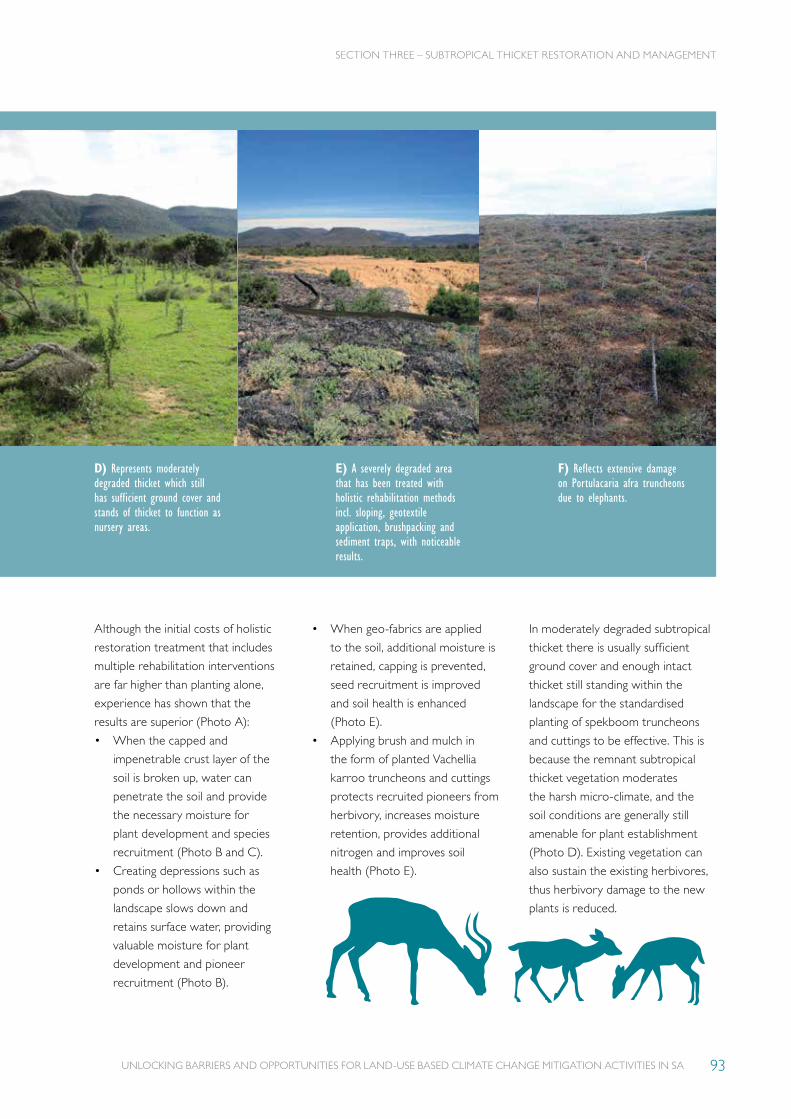
UNLOCKING BARRIERS AND OPPORTUNITIES FOR LAND-USE BASED CLIMATE CHANGE MITIGATION ACTIVITIES IN SA 93
E) A severely degraded area that has been treated with holistic rehabilitation methods incl. sloping, geotextile application, brushpacking and sediment traps, with noticeable results.
F) Reflects extensive damage on Portulacaria afra truncheons due to elephants.
D) Represents moderately degraded thicket which still has sufficient ground cover and stands of thicket to function as nursery areas.
Although the initial costs of holistic
restoration treatment that includes
multiple rehabilitation interventions
are far higher than planting alone,
experience has shown that the
results are superior (Photo A):
• When the capped and
impenetrable crust layer of the
soil is broken up, water can
penetrate the soil and provide
the necessary moisture for
plant development and species
recruitment (Photo B and C).
• Creating depressions such as
ponds or hollows within the
landscape slows down and
retains surface water, providing
valuable moisture for plant
development and pioneer
recruitment (Photo B).
• When geo-fabrics are applied
to the soil, additional moisture is
retained, capping is prevented,
seed recruitment is improved
and soil health is enhanced
(Photo E).
• Applying brush and mulch in
the form of planted Vachellia
karroo truncheons and cuttings
protects recruited pioneers from
herbivory, increases moisture
retention, provides additional
nitrogen and improves soil
health (Photo E).
In moderately degraded subtropical
thicket there is usually sufficient
ground cover and enough intact
thicket still standing within the
landscape for the standardised
planting of spekboom truncheons
and cuttings to be effective. This is
because the remnant subtropical
thicket vegetation moderates
the harsh micro-climate, and the
soil conditions are generally still
amenable for plant establishment
(Photo D). Existing vegetation can
also sustain the existing herbivores,
thus herbivory damage to the new
plants is reduced.
SECTION THREE – SUBTROPICAL THICKET RESTORATION AND MANAGEMENT
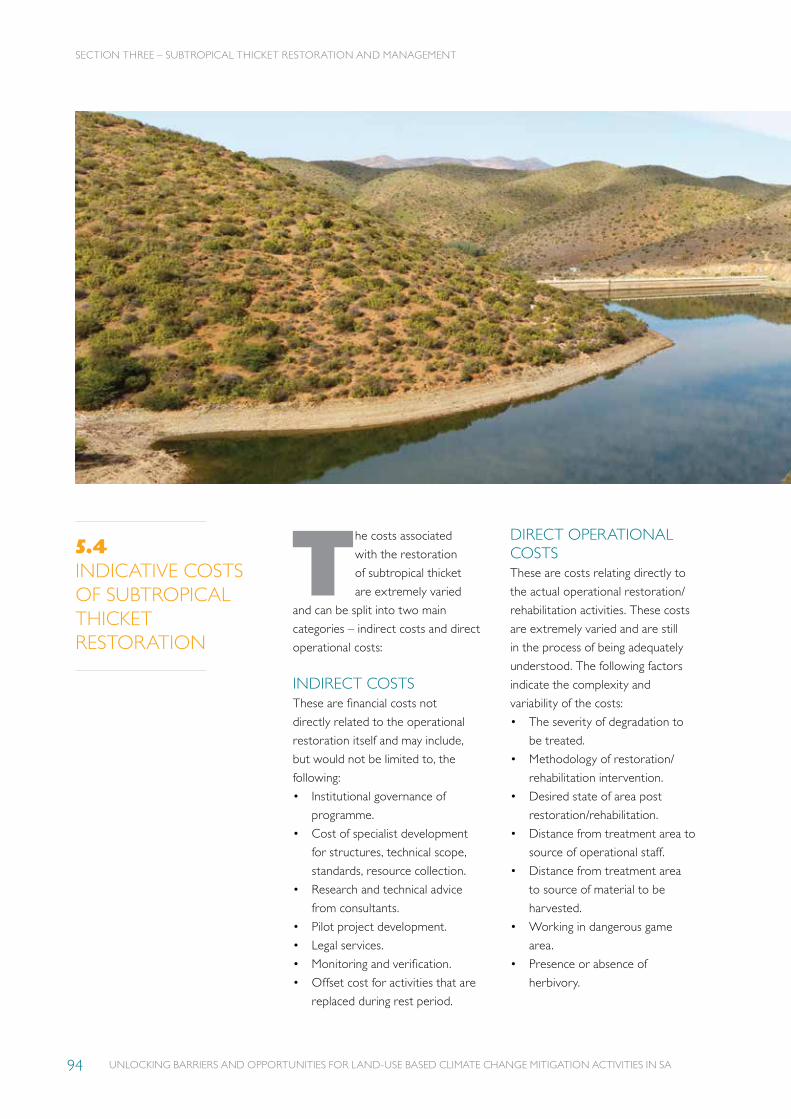
UNLOCKING BARRIERS AND OPPORTUNITIES FOR LAND-USE BASED CLIMATE CHANGE MITIGATION ACTIVITIES IN SA94
The costs associated
with the restoration
of subtropical thicket
are extremely varied
and can be split into two main
categories – indirect costs and direct
operational costs:
INDIRECT COSTSThese are financial costs not
directly related to the operational
restoration itself and may include,
but would not be limited to, the
following:
• Institutional governance of
programme.
• Cost of specialist development
for structures, technical scope,
standards, resource collection.
• Research and technical advice
from consultants.
• Pilot project development.
• Legal services.
• Monitoring and verification.
• Offset cost for activities that are
replaced during rest period.
5.4INDICATIVE COSTS OF SUBTROPICAL THICKET RESTORATION
DIRECT OPERATIONAL COSTSThese are costs relating directly to
the actual operational restoration/
rehabilitation activities. These costs
are extremely varied and are still
in the process of being adequately
understood. The following factors
indicate the complexity and
variability of the costs:
• The severity of degradation to
be treated.
• Methodology of restoration/
rehabilitation intervention.
• Desired state of area post
restoration/rehabilitation.
• Distance from treatment area to
source of operational staff.
• Distance from treatment area
to source of material to be
harvested.
• Working in dangerous game
area.
• Presence or absence of
herbivory.
SECTION THREE – SUBTROPICAL THICKET RESTORATION AND MANAGEMENT
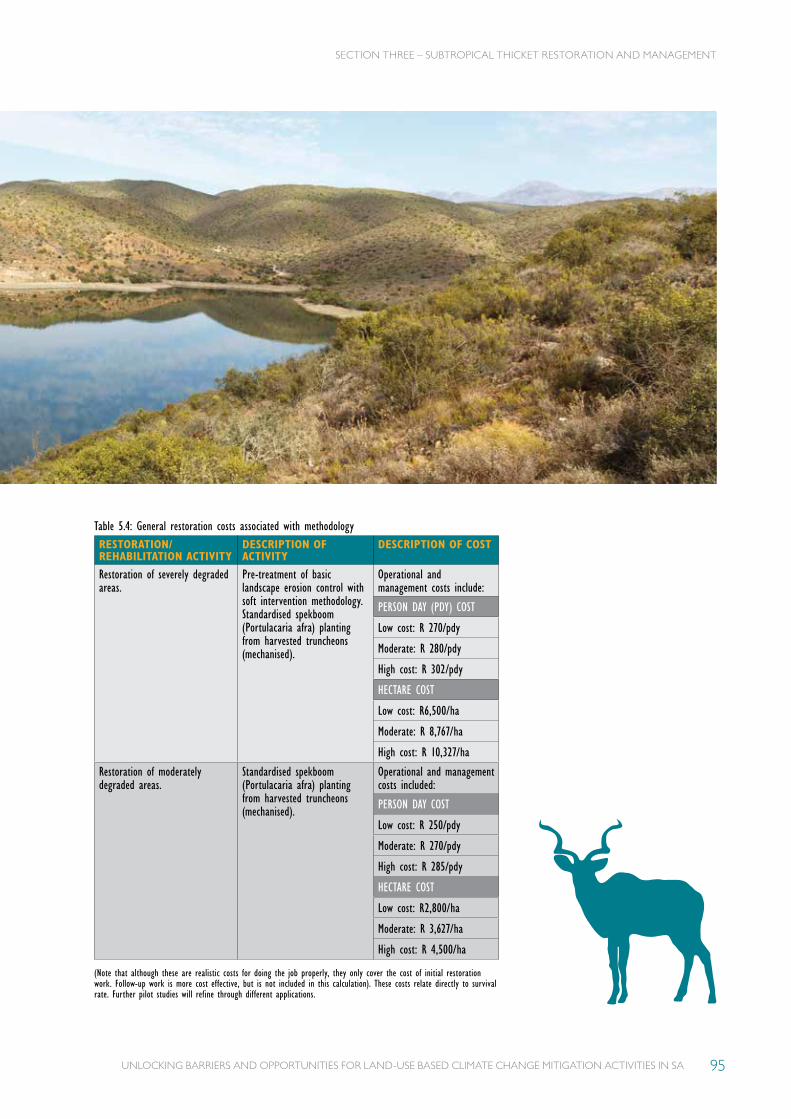
UNLOCKING BARRIERS AND OPPORTUNITIES FOR LAND-USE BASED CLIMATE CHANGE MITIGATION ACTIVITIES IN SA 95
Table 5.4: General restoration costs associated with methodologyRESTORATION/REHABILITATION ACTIVITY
DESCRIPTION OF ACTIVITY
DESCRIPTION OF COST
Restoration of severely degraded areas.
Pre-treatment of basic landscape erosion control with soft intervention methodology. Standardised spekboom (Portulacaria afra) planting from harvested truncheons (mechanised).
Operational and management costs include:
PERSON DAY (PDY) COST
Low cost: R 270/pdy
Moderate: R 280/pdy
High cost: R 302/pdy
HECTARE COST
Low cost: R6,500/ha
Moderate: R 8,767/ha
High cost: R 10,327/ha
Restoration of moderately degraded areas.
Standardised spekboom (Portulacaria afra) planting from harvested truncheons (mechanised).
Operational and management costs included:
PERSON DAY COST
Low cost: R 250/pdy
Moderate: R 270/pdy
High cost: R 285/pdy
HECTARE COST
Low cost: R2,800/ha
Moderate: R 3,627/ha
High cost: R 4,500/ha
(Note that although these are realistic costs for doing the job properly, they only cover the cost of initial restoration work. Follow-up work is more cost effective, but is not included in this calculation). These costs relate directly to survival rate. Further pilot studies will refine through different applications.
SECTION THREE – SUBTROPICAL THICKET RESTORATION AND MANAGEMENT


INDIGENOUS FOREST RESTORATION AND MANAGEMENT
SECTION FOUR
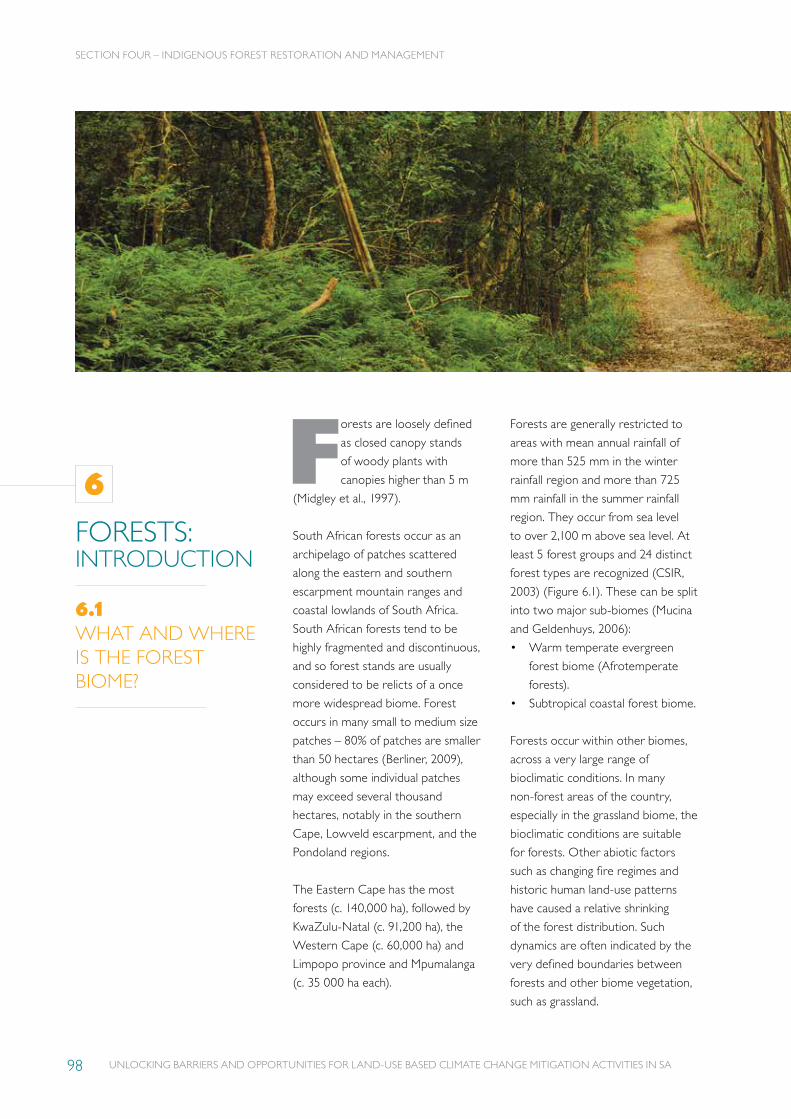
UNLOCKING BARRIERS AND OPPORTUNITIES FOR LAND-USE BASED CLIMATE CHANGE MITIGATION ACTIVITIES IN SA98
SECTION FOUR – INDIGENOUS FOREST RESTORATION AND MANAGEMENT
FORESTS: INTRODUCTION
6.1WHAT AND WHERE IS THE FOREST BIOME?
Forests are loosely defined
as closed canopy stands
of woody plants with
canopies higher than 5 m
(Midgley et al., 1997).
South African forests occur as an
archipelago of patches scattered
along the eastern and southern
escarpment mountain ranges and
coastal lowlands of South Africa.
South African forests tend to be
highly fragmented and discontinuous,
and so forest stands are usually
considered to be relicts of a once
more widespread biome. Forest
occurs in many small to medium size
patches – 80% of patches are smaller
than 50 hectares (Berliner, 2009),
although some individual patches
may exceed several thousand
hectares, notably in the southern
Cape, Lowveld escarpment, and the
Pondoland regions.
The Eastern Cape has the most
forests (c. 140,000 ha), followed by
KwaZulu-Natal (c. 91,200 ha), the
Western Cape (c. 60,000 ha) and
Limpopo province and Mpumalanga
(c. 35 000 ha each).
Forests are generally restricted to
areas with mean annual rainfall of
more than 525 mm in the winter
rainfall region and more than 725
mm rainfall in the summer rainfall
region. They occur from sea level
to over 2,100 m above sea level. At
least 5 forest groups and 24 distinct
forest types are recognized (CSIR,
2003) (Figure 6.1). These can be split
into two major sub-biomes (Mucina
and Geldenhuys, 2006):
• Warm temperate evergreen
forest biome (Afrotemperate
forests).
• Subtropical coastal forest biome.
Forests occur within other biomes,
across a very large range of
bioclimatic conditions. In many
non-forest areas of the country,
especially in the grassland biome, the
bioclimatic conditions are suitable
for forests. Other abiotic factors
such as changing fire regimes and
historic human land-use patterns
have caused a relative shrinking
of the forest distribution. Such
dynamics are often indicated by the
very defined boundaries between
forests and other biome vegetation,
such as grassland.
6
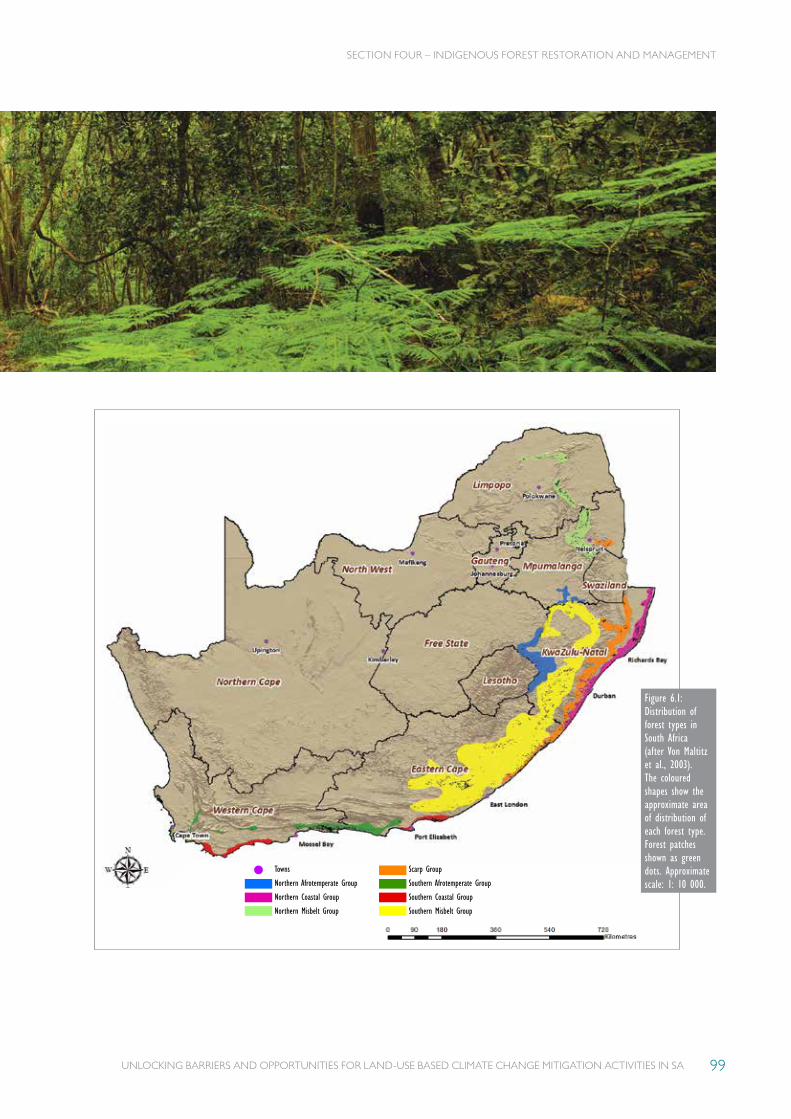
UNLOCKING BARRIERS AND OPPORTUNITIES FOR LAND-USE BASED CLIMATE CHANGE MITIGATION ACTIVITIES IN SA 99
SECTION FOUR – INDIGENOUS FOREST RESTORATION AND MANAGEMENT
Towns
Northern Afrotemperate Group
Northern Coastal Group
Northern Misbelt Group
Scarp Group
Southern Afrotemperate Group
Southern Coastal Group
Southern Misbelt Group
Figure 6.1: Distribution of forest types in South Africa (after Von Maltitz et al., 2003). The coloured shapes show the approximate area of distribution of each forest type. Forest patches shown as green dots. Approximate scale: 1: 10 000.
UNLOCKING BARRIERS AND OPPORTUNITIES FOR LAND-USE BASED CLIMATE CHANGE MITIGATION ACTIVITIES IN SA100
SECTION FOUR – INDIGENOUS FOREST RESTORATION AND MANAGEMENT
6.2 WHAT IS THE VALUE OF FORESTS?
Although forests cover
only 0.4% of South
Africa’s surface
area, they have
disproportionately high conservation
and intrinsic value.
BIODIVERSITYForest provides important habitat to
a large number of plant, vertebrate
and invertebrate animal species.
Despite the relative small area of the
biome, forest has the highest density
of plant species per unit area (0.38
plant species per km2) with the next
highest being the fynbos biome (0.11
plant species per km2). If species
richness is considered per unit area
of forest, South African forests have
by far the highest number of tree
species of any temperate forest in
the world (Silander, 2001; Cowling,
2002). Forest occurs adjacent to all
South Africa’s major biomes, with
the exception of the succulent karoo
and nama karoo biomes. Forest
margins and ecotones have a high
diversity of plant species as they may
contain species common to adjacent
biomes (Mucina and Geldenhuys,
2006).
Overall, of the 56 species of vascular
plants listed as IUCN red data
species occurring in forests in South
Africa, 2 are listed as extinct in the
wild, 4 as critically endangered, 8 as
endangered, 20 as vulnerable, and
22 as near threatened (Berliner,
2009). Most of the red data plants
occur in coastal and scarp forest
types, with just two forest types,
Pondoland scarp and eastern scarp,
containing more than half of all
recorded forest red data plants
(Berliner, 2009). Despite their
conservation importance, both
these types have low levels
of formal protection and face
increased pressure, primarily from
subsistence harvesting and alien
plant infestation.
Many vertebrate and invertebrate
animal species make use of forests
for habitat, foraging or breeding,
although it is seldom exclusive. A
large proportion of forest fauna,
even those considered as typical
‘forest species’ will make use of
the forest–matrix ecotone as well
as surrounding areas. Surprisingly,
a higher proportion of forest
vertebrate species are threatened
than species in other biomes.
Overall, approximately 13% of all
vertebrate species that depend on
the forest biome for their survival
are listed as threatened by the
IUCN. Approximately 26% of all
forest amphibians, 25% of forest
mammals, 15% of forest reptiles and
11% of forest birds are threatened.
The isolation of fragmented patches
has given rise to highly-limited
distributions of immobile species
such as anthropoids, and some
amphibians and dwarf chameleons.
For example, the Dlinza forest
pinwheel snail occurs only in the
Dlinza Forest, and the Pondoland
cannibal snail (Herbert, 2004)
occurs only in the Ngele Forest in
KwaZulu-Natal.
Although South African forest is
highly-fragmented, often embedded
within a variety of matrix land-use
types and vegetation types, and
existing where the matrix has been
converted to agriculture, the forest
patches have an unusually high
landscape connectivity value – acting
as ‘stepping stones’, or ecological
corridors, connecting remaining
intact habitat.
SECTION FOUR – INDIGENOUS FOREST RESTORATION AND MANAGEMENT
UNLOCKING BARRIERS AND OPPORTUNITIES FOR LAND-USE BASED CLIMATE CHANGE MITIGATION ACTIVITIES IN SA 101
Many of small patches have been
totally lost or are now highly
degraded and should be considered
as priorities for reforestation/
rehabilitation carbon mitigation
projects.
Forests have a wide range of
critically important ecosystem
services:
• Ecosystem regulation (climate
regulation, carbon storage, water
production and storage).
• Socio-economic and
livelihood value (food, fibre,
fuel, medicines, and building
materials).
• Cultural, spiritual, and
recreational value.
Although South African forest
is highly-fragmented, often
embedded within a variety
of matrix land-use types and
vegetation types, and existing
where the matrix has been
converted to agriculture, the
forest patches have an unusually
high landscape connectivity value
– acting as ‘stepping stones’, or
ecological corridors, connecting
remaining intact habitat.
SECTION FOUR – INDIGENOUS FOREST RESTORATION AND MANAGEMENT
their imminent natural death or
for some other legitimate reason,
and are auctioned standing to the
highest bidder. Extraction is done
under very controlled conditions,
sometimes even by helicopter,
giving an indication of the value
of the timber.
Timber and non-timber forest
products are vital components of
local livelihoods in many rural areas,
acting as a form of livelihood safety
net (Shackleton et al., 2007). People
obtain food, medicines and other
products from the forest when
they do not have the resources
to purchase them. Consequently,
there is an urgent need to integrate
forest conservation planning with
rural development and poverty
alleviation. Community-based
natural resource management
strategies, that promote sustainable
forest resource use in conjunction
with conservation management,
need to be employed.
Forests patches often have a high
cultural and spiritual value to people,
both locally and regionally. Many
local communities access forest
patches for burial, ancestral worship
and circumcision ceremonies.
The forests of the southern
Cape are very important socio-
economically, forming part of the
Garden Route tourism centre, and
in the Drakensberg, Karkloof and
Maputaland areas many eco-tourism
ventures are centred on forests.
ECOSYSTEM SERVICESSouth African forests are rich in
biodiversity and provide a wide
range of extremely valuable
ecosystem services. In the steep
river valleys and gorges, the old
growth forests contain some of
the highest carbon densities in the
world, for comparable forest biomes
(Berliner, 2015). Conserving forests
conserves their valuable carbon
stocks, and rehabilitation projects
have the potential to sequester
significant additional amounts of
carbon. Arresting forest degradation
needs to be a priority carbon loss
mitigation action. This will require
an ecologically integrated and
participatory approach and full
implementation of existing forestry
policy and principles, as provided for
in the National Forestry Act, of 1998
and the White paper on Forestry in
South Africa.
SOCIO-ECONOMIC AND CULTURAL VALUESCurrently, all indigenous forest in
South Africa is protected from
harvesting by law, except for certain
permitted situations. During the
colonial era, forests were heavily
logged for various hardwood
species and other products, and
entire industries existed around
this resource base. Currently,
limited harvesting of individual
hardwood tree is permitted under
very controlled conditions in the
southern Cape forests – where
the trees are selected because of
SECTION FOUR – INDIGENOUS FOREST RESTORATION AND MANAGEMENT
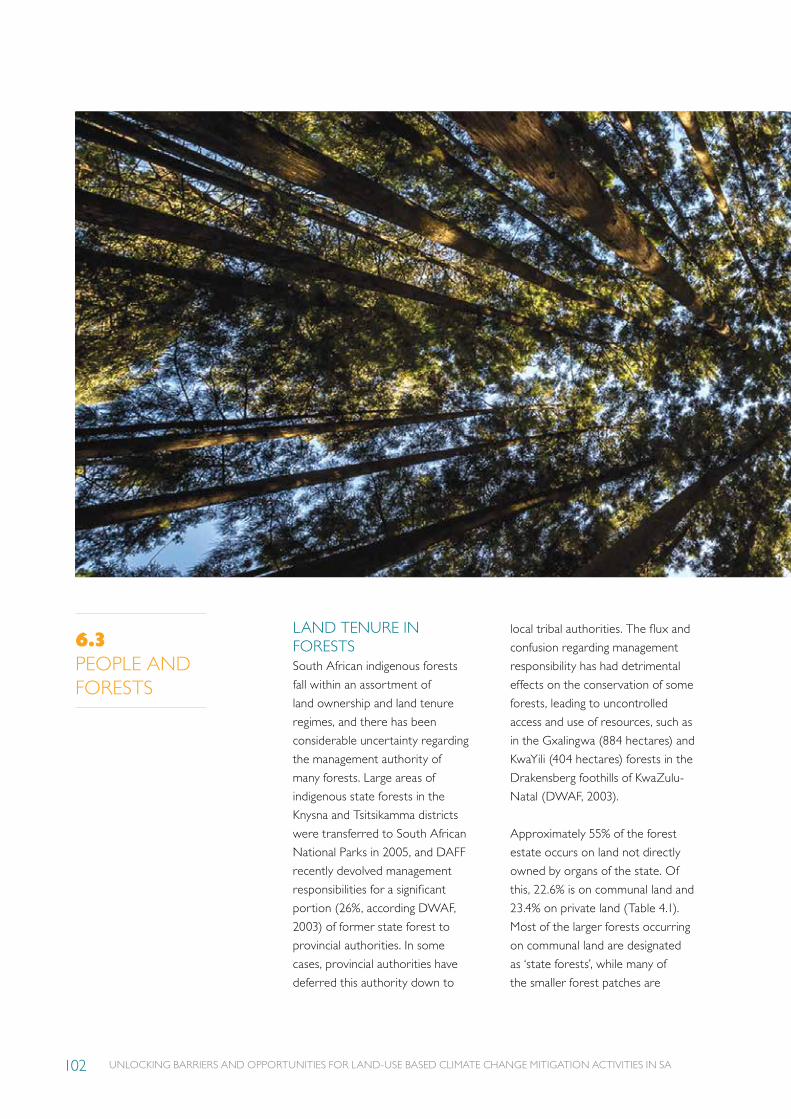
UNLOCKING BARRIERS AND OPPORTUNITIES FOR LAND-USE BASED CLIMATE CHANGE MITIGATION ACTIVITIES IN SA102
6.3PEOPLE AND FORESTS
LAND TENURE IN FORESTSSouth African indigenous forests
fall within an assortment of
land ownership and land tenure
regimes, and there has been
considerable uncertainty regarding
the management authority of
many forests. Large areas of
indigenous state forests in the
Knysna and Tsitsikamma districts
were transferred to South African
National Parks in 2005, and DAFF
recently devolved management
responsibilities for a significant
portion (26%, according DWAF,
2003) of former state forest to
provincial authorities. In some
cases, provincial authorities have
deferred this authority down to
local tribal authorities. The flux and
confusion regarding management
responsibility has had detrimental
effects on the conservation of some
forests, leading to uncontrolled
access and use of resources, such as
in the Gxalingwa (884 hectares) and
KwaYili (404 hectares) forests in the
Drakensberg foothills of KwaZulu-
Natal (DWAF, 2003).
Approximately 55% of the forest
estate occurs on land not directly
owned by organs of the state. Of
this, 22.6% is on communal land and
23.4% on private land (Table 4.1).
Most of the larger forests occurring
on communal land are designated
as ‘state forests’, while many of
the smaller forest patches are
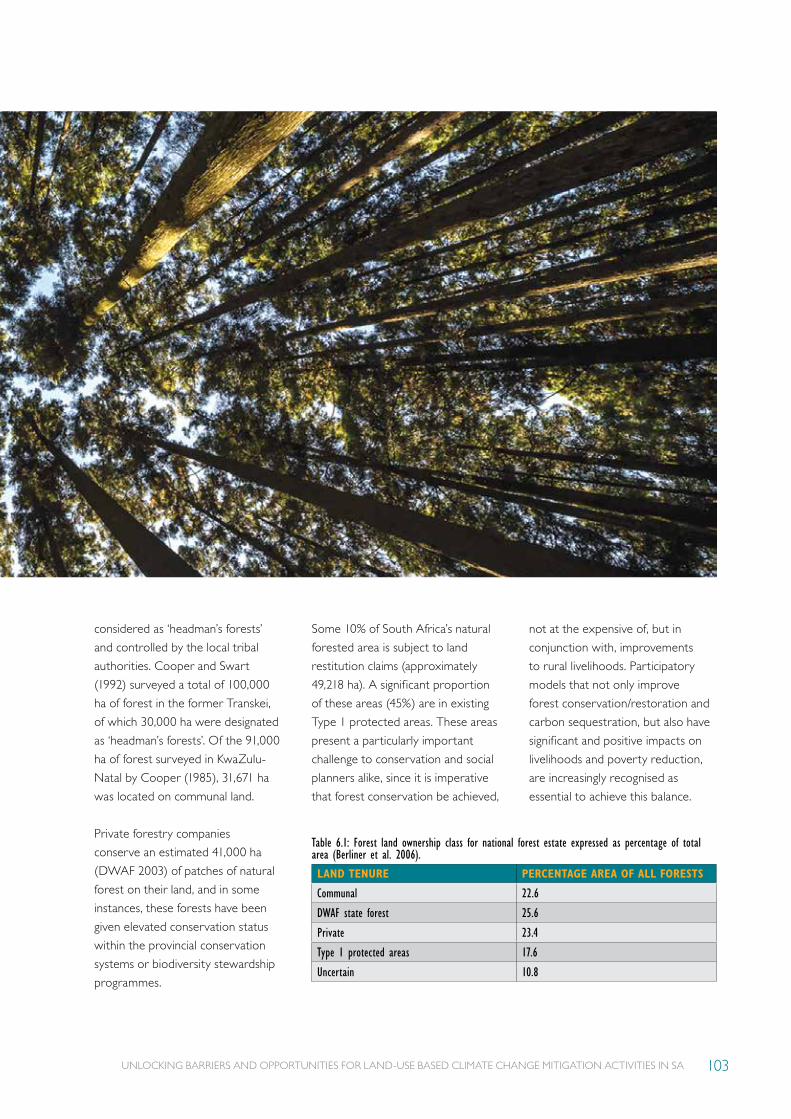
UNLOCKING BARRIERS AND OPPORTUNITIES FOR LAND-USE BASED CLIMATE CHANGE MITIGATION ACTIVITIES IN SA 103
considered as ‘headman’s forests’
and controlled by the local tribal
authorities. Cooper and Swart
(1992) surveyed a total of 100,000
ha of forest in the former Transkei,
of which 30,000 ha were designated
as ‘headman’s forests’. Of the 91,000
ha of forest surveyed in KwaZulu-
Natal by Cooper (1985), 31,671 ha
was located on communal land.
Private forestry companies
conserve an estimated 41,000 ha
(DWAF 2003) of patches of natural
forest on their land, and in some
instances, these forests have been
given elevated conservation status
within the provincial conservation
systems or biodiversity stewardship
programmes.
Some 10% of South Africa’s natural
forested area is subject to land
restitution claims (approximately
49,218 ha). A significant proportion
of these areas (45%) are in existing
Type 1 protected areas. These areas
present a particularly important
challenge to conservation and social
planners alike, since it is imperative
that forest conservation be achieved,
not at the expensive of, but in
conjunction with, improvements
to rural livelihoods. Participatory
models that not only improve
forest conservation/restoration and
carbon sequestration, but also have
significant and positive impacts on
livelihoods and poverty reduction,
are increasingly recognised as
essential to achieve this balance.
Table 6.1: Forest land ownership class for national forest estate expressed as percentage of total area (Berliner et al. 2006).
LAND TENURE PERCENTAGE AREA OF ALL FORESTS
Communal 22.6
DWAF state forest 25.6
Private 23.4
Type 1 protected areas 17.6
Uncertain 10.8
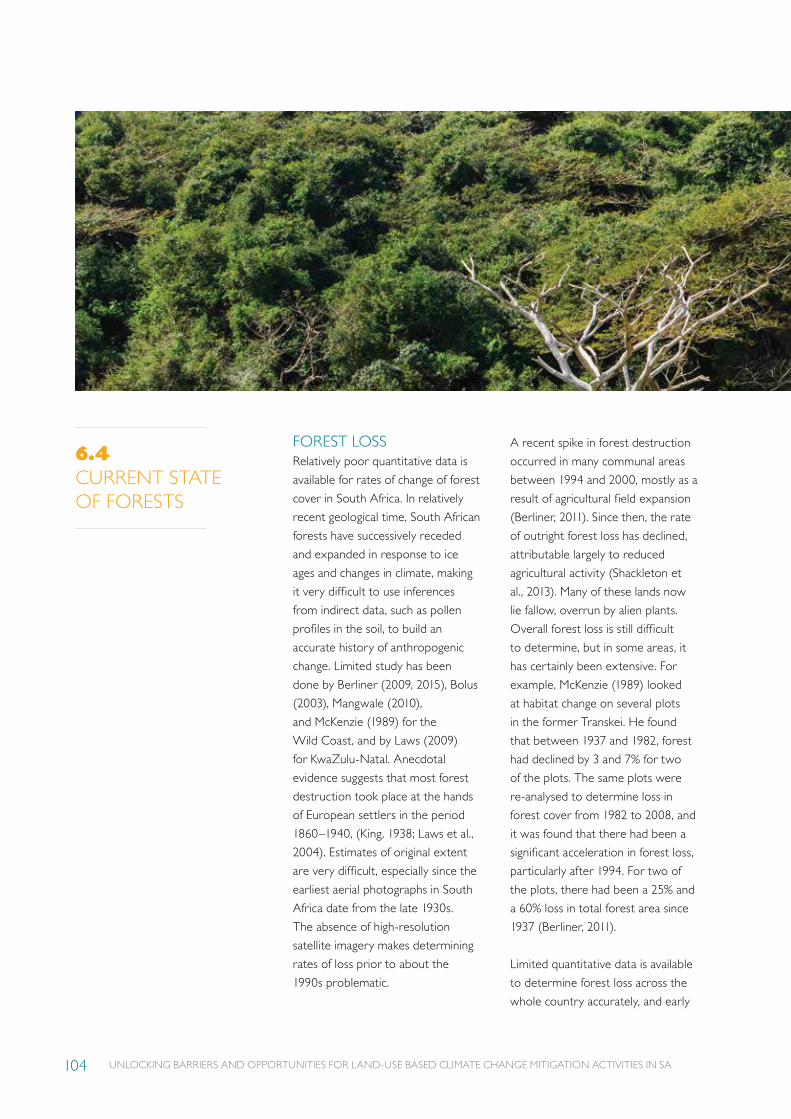
UNLOCKING BARRIERS AND OPPORTUNITIES FOR LAND-USE BASED CLIMATE CHANGE MITIGATION ACTIVITIES IN SA104
6.4CURRENT STATE OF FORESTS
FOREST LOSSRelatively poor quantitative data is
available for rates of change of forest
cover in South Africa. In relatively
recent geological time, South African
forests have successively receded
and expanded in response to ice
ages and changes in climate, making
it very difficult to use inferences
from indirect data, such as pollen
profiles in the soil, to build an
accurate history of anthropogenic
change. Limited study has been
done by Berliner (2009, 2015), Bolus
(2003), Mangwale (2010),
and McKenzie (1989) for the
Wild Coast, and by Laws (2009)
for KwaZulu-Natal. Anecdotal
evidence suggests that most forest
destruction took place at the hands
of European settlers in the period
1860–1940, (King, 1938; Laws et al.,
2004). Estimates of original extent
are very difficult, especially since the
earliest aerial photographs in South
Africa date from the late 1930s.
The absence of high-resolution
satellite imagery makes determining
rates of loss prior to about the
1990s problematic.
A recent spike in forest destruction
occurred in many communal areas
between 1994 and 2000, mostly as a
result of agricultural field expansion
(Berliner, 2011). Since then, the rate
of outright forest loss has declined,
attributable largely to reduced
agricultural activity (Shackleton et
al., 2013). Many of these lands now
lie fallow, overrun by alien plants.
Overall forest loss is still difficult
to determine, but in some areas, it
has certainly been extensive. For
example, McKenzie (1989) looked
at habitat change on several plots
in the former Transkei. He found
that between 1937 and 1982, forest
had declined by 3 and 7% for two
of the plots. The same plots were
re-analysed to determine loss in
forest cover from 1982 to 2008, and
it was found that there had been a
significant acceleration in forest loss,
particularly after 1994. For two of
the plots, there had been a 25% and
a 60% loss in total forest area since
1937 (Berliner, 2011).
Limited quantitative data is available
to determine forest loss across the
whole country accurately, and early
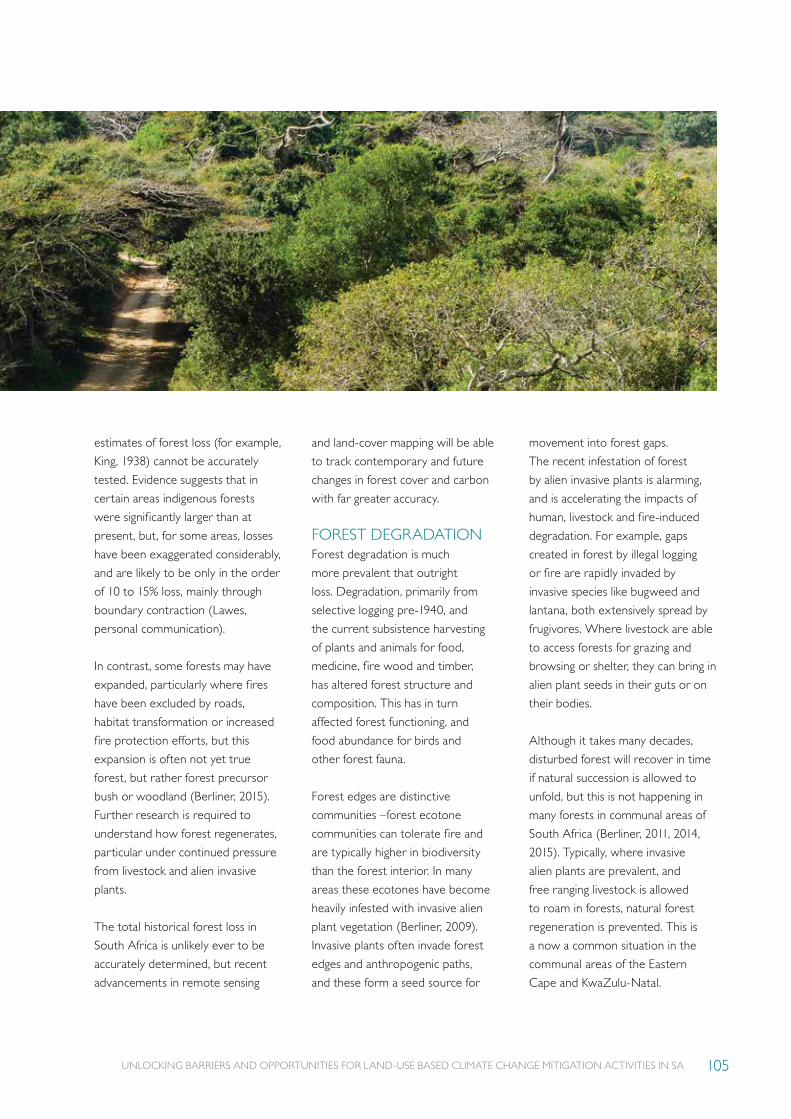
UNLOCKING BARRIERS AND OPPORTUNITIES FOR LAND-USE BASED CLIMATE CHANGE MITIGATION ACTIVITIES IN SA 105
estimates of forest loss (for example,
King, 1938) cannot be accurately
tested. Evidence suggests that in
certain areas indigenous forests
were significantly larger than at
present, but, for some areas, losses
have been exaggerated considerably,
and are likely to be only in the order
of 10 to 15% loss, mainly through
boundary contraction (Lawes,
personal communication).
In contrast, some forests may have
expanded, particularly where fires
have been excluded by roads,
habitat transformation or increased
fire protection efforts, but this
expansion is often not yet true
forest, but rather forest precursor
bush or woodland (Berliner, 2015).
Further research is required to
understand how forest regenerates,
particular under continued pressure
from livestock and alien invasive
plants.
The total historical forest loss in
South Africa is unlikely ever to be
accurately determined, but recent
advancements in remote sensing
and land-cover mapping will be able
to track contemporary and future
changes in forest cover and carbon
with far greater accuracy.
FOREST DEGRADATIONForest degradation is much
more prevalent that outright
loss. Degradation, primarily from
selective logging pre-1940, and
the current subsistence harvesting
of plants and animals for food,
medicine, fire wood and timber,
has altered forest structure and
composition. This has in turn
affected forest functioning, and
food abundance for birds and
other forest fauna.
Forest edges are distinctive
communities –forest ecotone
communities can tolerate fire and
are typically higher in biodiversity
than the forest interior. In many
areas these ecotones have become
heavily infested with invasive alien
plant vegetation (Berliner, 2009).
Invasive plants often invade forest
edges and anthropogenic paths,
and these form a seed source for
movement into forest gaps.
The recent infestation of forest
by alien invasive plants is alarming,
and is accelerating the impacts of
human, livestock and fire-induced
degradation. For example, gaps
created in forest by illegal logging
or fire are rapidly invaded by
invasive species like bugweed and
lantana, both extensively spread by
frugivores. Where livestock are able
to access forests for grazing and
browsing or shelter, they can bring in
alien plant seeds in their guts or on
their bodies.
Although it takes many decades,
disturbed forest will recover in time
if natural succession is allowed to
unfold, but this is not happening in
many forests in communal areas of
South Africa (Berliner, 2011, 2014,
2015). Typically, where invasive
alien plants are prevalent, and
free ranging livestock is allowed
to roam in forests, natural forest
regeneration is prevented. This is
a now a common situation in the
communal areas of the Eastern
Cape and KwaZulu-Natal.
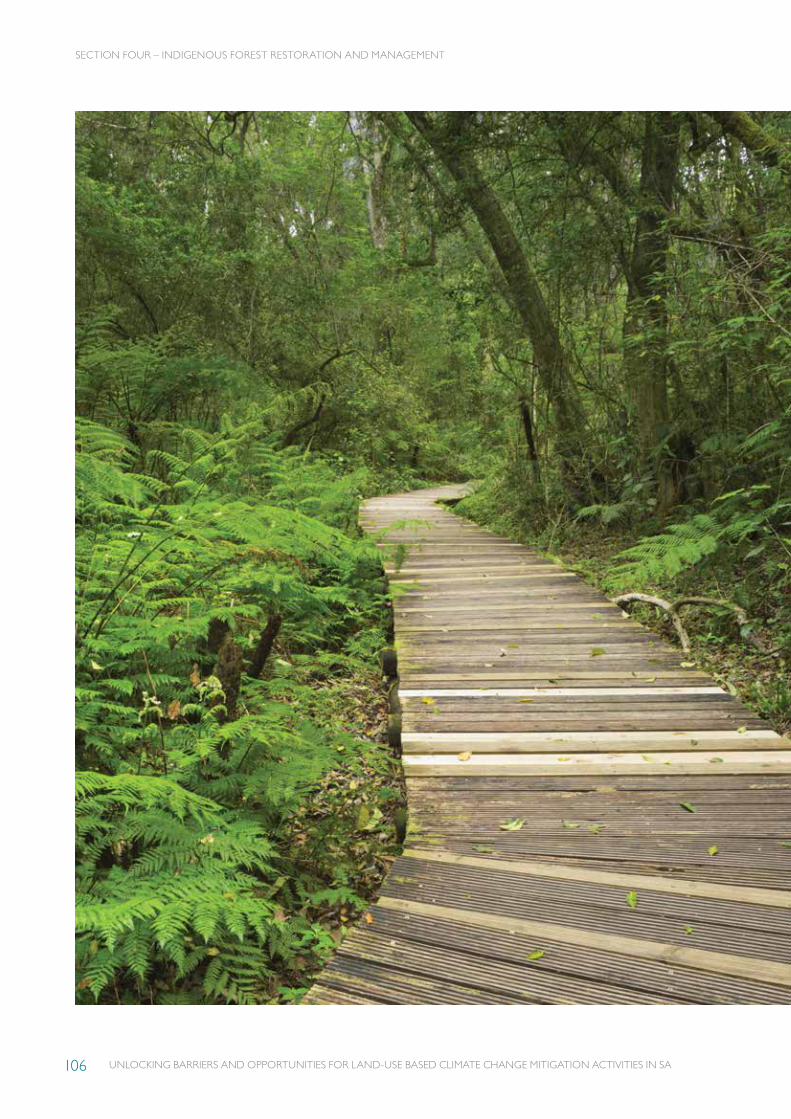
UNLOCKING BARRIERS AND OPPORTUNITIES FOR LAND-USE BASED CLIMATE CHANGE MITIGATION ACTIVITIES IN SA106
SECTION FOUR – INDIGENOUS FOREST RESTORATION AND MANAGEMENT
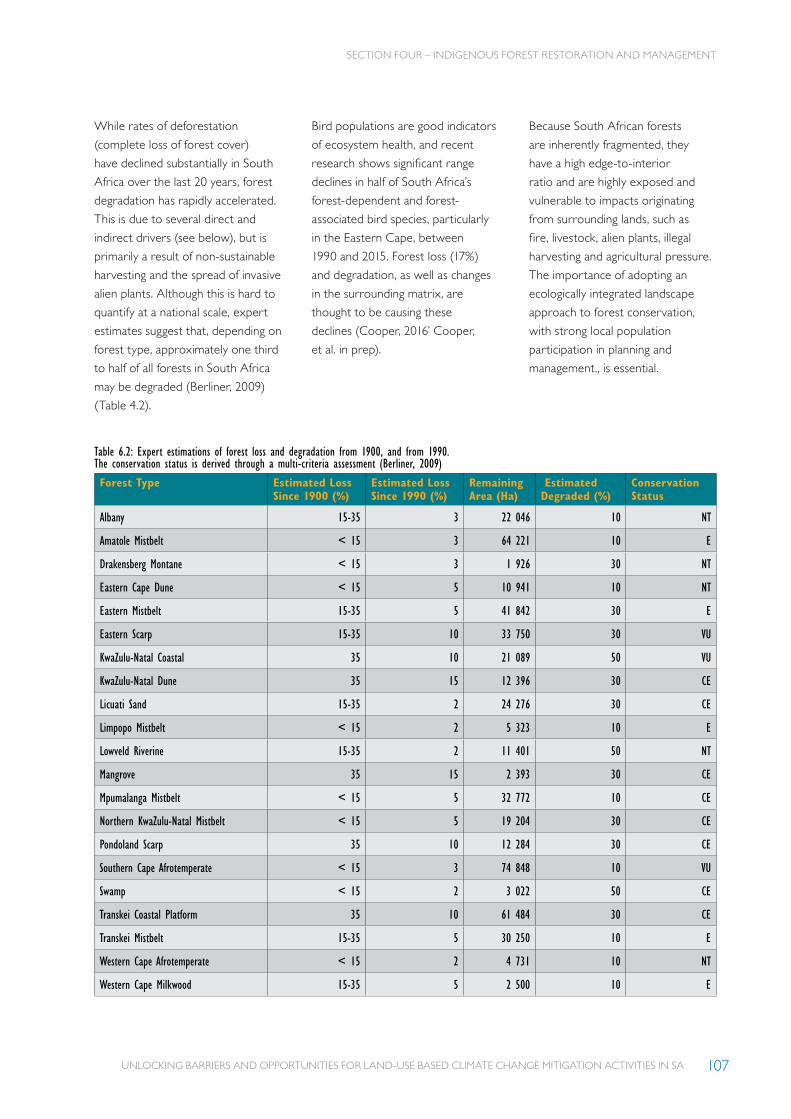
UNLOCKING BARRIERS AND OPPORTUNITIES FOR LAND-USE BASED CLIMATE CHANGE MITIGATION ACTIVITIES IN SA 107
While rates of deforestation
(complete loss of forest cover)
have declined substantially in South
Africa over the last 20 years, forest
degradation has rapidly accelerated.
This is due to several direct and
indirect drivers (see below), but is
primarily a result of non-sustainable
harvesting and the spread of invasive
alien plants. Although this is hard to
quantify at a national scale, expert
estimates suggest that, depending on
forest type, approximately one third
to half of all forests in South Africa
may be degraded (Berliner, 2009)
(Table 4.2).
Table 6.2: Expert estimations of forest loss and degradation from 1900, and from 1990. The conservation status is derived through a multi-criteria assessment (Berliner, 2009)
Forest Type Estimated Loss Since 1900 (%)
Estimated Loss Since 1990 (%)
Remaining Area (Ha)
Estimated Degraded (%)
Conservation Status
Albany 15-35 3 22 046 10 NT
Amatole Mistbelt < 15 3 64 221 10 E
Drakensberg Montane < 15 3 1 926 30 NT
Eastern Cape Dune < 15 5 10 941 10 NT
Eastern Mistbelt 15-35 5 41 842 30 E
Eastern Scarp 15-35 10 33 750 30 VU
KwaZulu-Natal Coastal 35 10 21 089 50 VU
KwaZulu-Natal Dune 35 15 12 396 30 CE
Licuati Sand 15-35 2 24 276 30 CE
Limpopo Mistbelt < 15 2 5 323 10 E
Lowveld Riverine 15-35 2 11 401 50 NT
Mangrove 35 15 2 393 30 CE
Mpumalanga Mistbelt < 15 5 32 772 10 CE
Northern KwaZulu-Natal Mistbelt < 15 5 19 204 30 CE
Pondoland Scarp 35 10 12 284 30 CE
Southern Cape Afrotemperate < 15 3 74 848 10 VU
Swamp < 15 2 3 022 50 CE
Transkei Coastal Platform 35 10 61 484 30 CE
Transkei Mistbelt 15-35 5 30 250 10 E
Western Cape Afrotemperate < 15 2 4 731 10 NT
Western Cape Milkwood 15-35 5 2 500 10 E
Bird populations are good indicators
of ecosystem health, and recent
research shows significant range
declines in half of South Africa’s
forest-dependent and forest-
associated bird species, particularly
in the Eastern Cape, between
1990 and 2015. Forest loss (17%)
and degradation, as well as changes
in the surrounding matrix, are
thought to be causing these
declines (Cooper, 2016’ Cooper,
et al. in prep).
Because South African forests
are inherently fragmented, they
have a high edge-to-interior
ratio and are highly exposed and
vulnerable to impacts originating
from surrounding lands, such as
fire, livestock, alien plants, illegal
harvesting and agricultural pressure.
The importance of adopting an
ecologically integrated landscape
approach to forest conservation,
with strong local population
participation in planning and
management., is essential.
SECTION FOUR – INDIGENOUS FOREST RESTORATION AND MANAGEMENT

UNLOCKING BARRIERS AND OPPORTUNITIES FOR LAND-USE BASED CLIMATE CHANGE MITIGATION ACTIVITIES IN SA108
6.5DRIVERS OF DEGRADATION IN FORESTS
Causative agent of forest
loss and degradation are
seldom isolated but act
in concert and are com-
pounded. For example, a breakdown
in resource use control encourages
poaching and land clearing, and this
in turn opens up gaps in the forest
and margins. These are rapidly in-
vaded by alien plants, which tend to
be highly flammable, promoting fires
that eat at forest margins.
Causes of forest loss and
degradation need to be understood
systemically, and solutions need to
address both root causes, and their
secondary effects.
INDIRECT DRIVERSIndirect drivers (or root causes)
are often socio-economic in origin
and mostly beyond the scope of
the individual site or project to
respond to. These include:
• Poor resource management
control.
• Increasing population pressure.
• Poverty, resulting in increased
dependency on natural
resources.
• Culturally-acceptable non-
sustainable agricultural practices
(shifting agriculture and field
abandonment).
• Increased demand from urban
centres for medicinal plant and
animal products.
Commercialisation, modernisation,
social change and the breakdown
of traditional authority structures
and introduction of inappropriate
policies, all contribute to upsetting
the equilibrium that once existed
between traditional communities
SECTION FOUR – INDIGENOUS FOREST RESTORATION AND MANAGEMENT
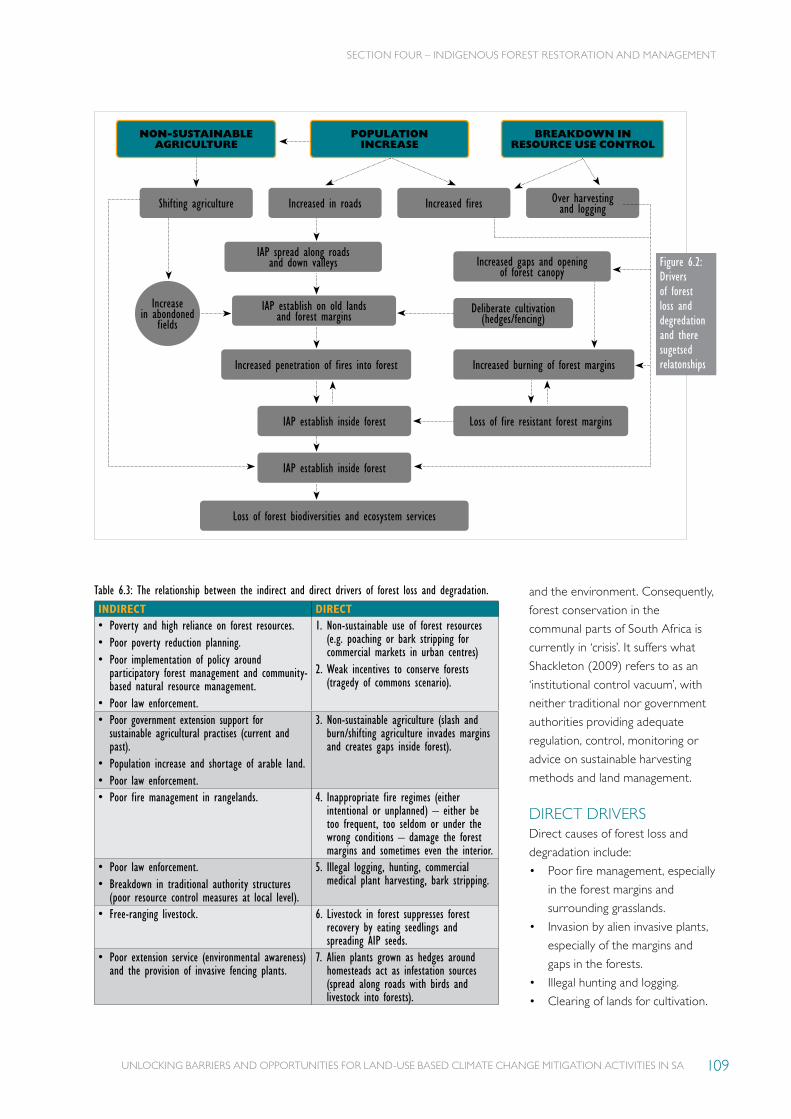
UNLOCKING BARRIERS AND OPPORTUNITIES FOR LAND-USE BASED CLIMATE CHANGE MITIGATION ACTIVITIES IN SA 109
and the environment. Consequently,
forest conservation in the
communal parts of South Africa is
currently in ‘crisis’. It suffers what
Shackleton (2009) refers to as an
‘institutional control vacuum’, with
neither traditional nor government
authorities providing adequate
regulation, control, monitoring or
advice on sustainable harvesting
methods and land management.
DIRECT DRIVERSDirect causes of forest loss and
degradation include:
• Poor fire management, especially
in the forest margins and
surrounding grasslands.
• Invasion by alien invasive plants,
especially of the margins and
gaps in the forests.
• Illegal hunting and logging.
• Clearing of lands for cultivation.
Figure 6.2: Drivers of forest loss and degredation and there sugetsed relatonships
NON-SUSTAINABLE AGRICULTURE
Shifting agriculture Increased in roads
IAP spread along roads and down valleys
IAP establish on old lands and forest margins
Deliberate cultivation (hedges/fencing)
Increased gaps and opening of forest canopy
Increased burning of forest marginsIncreased penetration of fires into forest
IAP establish inside forest
IAP establish inside forest
Loss of forest biodiversities and ecosystem services
Loss of fire resistant forest margins
Increase in abondoned
fields
Increased fires Over harvesting and logging
POPULATION INCREASE
BREAKDOWN IN RESOURCE USE CONTROL
Table 6.3: The relationship between the indirect and direct drivers of forest loss and degradation.
INDIRECT DIRECT • Poverty and high reliance on forest resources.• Poor poverty reduction planning. • Poor implementation of policy around
participatory forest management and community-based natural resource management.
• Poor law enforcement.
1. Non-sustainable use of forest resources (e.g. poaching or bark stripping for commercial markets in urban centres)
2. Weak incentives to conserve forests (tragedy of commons scenario).
• Poor government extension support for sustainable agricultural practises (current and past).
• Population increase and shortage of arable land.• Poor law enforcement.
3. Non-sustainable agriculture (slash and burn/shifting agriculture invades margins and creates gaps inside forest).
• Poor fire management in rangelands. 4. Inappropriate fire regimes (either intentional or unplanned) – either be too frequent, too seldom or under the wrong conditions – damage the forest margins and sometimes even the interior.
• Poor law enforcement.• Breakdown in traditional authority structures
(poor resource control measures at local level).
5. Illegal logging, hunting, commercial medical plant harvesting, bark stripping.
• Free-ranging livestock. 6. Livestock in forest suppresses forest recovery by eating seedlings and spreading AIP seeds.
• Poor extension service (environmental awareness) and the provision of invasive fencing plants.
7. Alien plants grown as hedges around homesteads act as infestation sources (spread along roads with birds and livestock into forests).
SECTION FOUR – INDIGENOUS FOREST RESTORATION AND MANAGEMENT
UNLOCKING BARRIERS AND OPPORTUNITIES FOR LAND-USE BASED CLIMATE CHANGE MITIGATION ACTIVITIES IN SA110
FOREST CONTEXTForests can be described in a variety
of ways, but in terms of this work it
is best to view them as being in one
of five land-use contexts:
• Forest in protected areas.
• High value priority forests (larger
forest patches > 1,000 ha) on
communal land.
• Small forest patches on
communal land (headman’s
forest).
• Indigenous forests on
commercial timber estates
(private or state).
• Forests on private farms.
The context will influence the
timing, responsibility and types of
activities that should be applied to
the various land-use or mitigation
scenarios.
FOREST ZONES AND LAND USES There are a set of common land-
use types that cover most forest
contexts, and a set of activities that
are required to achieve national
readiness. These activities may apply
to any number of the land-use types.
Each land use and activity is further
explored in Table 7.1.
Within forest contexts, there are
several forest zones and land-use
scenarios:
• Forest interior:
The forest interior is reasonably
robust and generally only
vulnerable to illegal hunting
and harvesting of plant
products. Although very
difficult to control, these
should be managed primarily
through Participatory Forest
Management (PFM) and
traditional authorities. The
FORESTS: DEFINING THE GAP – STATUS QUO VS NATIONAL READINESS
7.1LAND USES AND REQUIRED ACTIVITIESFORESTS CONTEXTS
7 current condition of the forest
interior can be classified along
a gradient from intact to
degraded.
• Forest edges or margins:
Forest edges are vulnerable
to invasion by alien plants,
which should be removed with
appropriate methods and regular
follow up. Margins should be
burnt periodically with cool
burns to reduce the fuel load
that naturally accumulates there
and increases the risk of fire
penetrating the forest canopy.
The current condition of the
forest margin can be classified
along a gradient from intact to
degraded.
• Arable lands in a margin or
within a forest:
In some forests, land is cleared in
the margin or interior for arable
purposes, for example to hide
illegal crops such as cannabis.
The nature of the farming is
often akin to typical slash-
and-burn shifting agricultural
systems that can cause a lot of
damage to forest ecosystems.
Not only is the forest physically
damaged by the removal of the
natural vegetation, but the soil
is depleted of organic matter
and nutrients. Once the soil is
exhausted, the crop is planted
elsewhere, and the soil is left
exposed to erosion. The area
often becomes heavily invaded
by AIP, which then have an
increased chance of penetrating
other areas of the forest.
• Natural gaps, glades and opened
areas within a forest that are
regularly subject to livestock
grazing and sheltering:
Forest gaps should be protected
SECTION FOUR – INDIGENOUS FOREST RESTORATION AND MANAGEMENT
UNLOCKING BARRIERS AND OPPORTUNITIES FOR LAND-USE BASED CLIMATE CHANGE MITIGATION ACTIVITIES IN SA 111
from livestock, which graze
and trample the emerging
plants that are integral to the
successional dynamics of forest
re-establishment. Gaps are also
prone to infestation by AIP,
particularly woody pioneers
and creepers, and these require
monitoring and clearing.
• Areas that are frequently
accessed to extract forest
products:
Some areas within a forest
are accessed frequently by
members of the local community
extracting resources for use
as timber, medicines and
food. These areas are prone
to degradation as plant and
animal populations decline. The
disturbance associated with
human activities increases the
likelihood of AIP infestation.
• Surrounding matrix areas
that have influence over the
forest patch:
Areas around the forest patch
can have a particularly strong
influence on the forest patch.
For example, grassland areas
downslope of a forest patch can
increase the risk of catastrophic
fires running upslope into the
margins and interior of the forest.
Planting commercial timber or
community woodlots immediately
adjacent to a forest increases the
likelihood of AIP infestation in the
margins and interior. Management
consideration of the forest should
take such areas into account.
FOREST ACTIVITIESA range of activities can be done
in forests either to preserve their
integrity or to help them recover
from transformation or modification.
7.1.1 Forest zonation, planning, mapping and biodiversity inventory:
Zonation, planning, mapping and
inventory can be conducted at
multiple scales. At a provincial
or regional scale, a systematic
conservation planning approach is
required to identify representative
samples of each forest type for
priority conservation areas.
At a local scale, ground surveys are
required to:
• Map ecological zones or land
uses.
• Identify and delineate high-
value conservation areas for
special forest PAs (under NFA),
sustainable use areas, and sacred
forests.
• Quantify biodiversity.
• Map areas of forest loss and
degradation.
• Measure health or condition of
different degraded zones.
• Identify priority degraded forests
areas for restoration projects.
7.1.2 Community-based participatory forest management:
The National Forests Act, 1998 (Act
84 of 1998), and the Forestry Law
Amendment Act, 2005 (Act 35 of
2005) emphasise the principles of
Sustainable Forest Management
(SFM), and Participatory Forest
Management (PFM). This involves
the formation of community forest
management committees with a
constitution and elected members.
SFM has a set of principles, criteria
and indicators that require on-
going monitoring. It requires
forest management zonation,
allowing for core conservation
areas, low utilisation buffer areas,
and sustainable use areas. It also
promotes the development of non-
timber forest product enterprises
(such as crafts, and bee-keeping) and
ecotourism, as well as community-
based forest monitoring and
reporting. PFM plans are designed
to establish traditional authorities’
roles in controlling grazing in forests,
obtain consensus, and provide the
communal basis for sustainable
harvesting rates, law enforcement,
and use of forest products (such
as medicinal plants, firewood, and
structural timber).
All forest management activities,
including control of access,
harvesting, hunting, fire management
and livestock management should
be conducted using SFM and PFM
principles, where appropriate. In
cases where there is no community
to be involved, management is done
by the relevant authority only.
Forest edges are vulnerable
to invasion by alien plants,
which should be removed
with appropriate methods
and regular follow up.
Margins should be burnt
periodically with cool burns
to reduce the fuel load that
naturally accumulates there
and increases the risk of fire
penetrating the forest canopy.
The current condition of the
forest margin can be classified
along a gradient from intact
to degraded.
SECTION FOUR – INDIGENOUS FOREST RESTORATION AND MANAGEMENT

UNLOCKING BARRIERS AND OPPORTUNITIES FOR LAND-USE BASED CLIMATE CHANGE MITIGATION ACTIVITIES IN SA112
Table 7.1: Required activities in each forest land type.
KEY ACTIVITIES FOREST CONTEXT 1. FOREST ZONATION, PLANNING, MAPPING AND BIODIVERSITY INVENTORY
2. COMMUNITY-BASED PARTICIPATORY FOREST MANAGEMENT
3. FOREST RESTORATION 4. REFORESTATION
Forest in protected areas Each forest patch in the PA should be correctly surveyed and mapped so that the various land-use and forest zones are delineated, and health condition classes assigned to each zone.
The forest should be included in the provincial or regional conservation plan to assess its conservation priority.
Where a community has a historic access claim to forest within a PA, then appropriate PFM methods should be used to agree on the conditions of access, ensuring any use or extraction is sustainable.
The forest should be specifically included in the PA management plan, with appropriate resource allocation for the management actions.
Degraded forests or zones within a forest should be managed towards a healthier condition, as the focus is biodiversity conservation.
Actions should focus on:• Removal of AIP.• Reintroduction of forest trees and fauna.• Management of the margins to prevent fuel
load accumulation.
Reforestation may only be applicable in exceptional cases where deforestation may have occurred prior to proclamation. The complexity of reforestation is such that it is not possible to give more detail here, other than to say that there must be adequate planning and consultation with technical experts to ensure success.
High-value priority forests (larger forest patches >1,000 ha) on communal land e.g. Nstubane forest, Pondoland
The forest should be included in the provincial or regional conservation plan to assess its conservation priority.
Within the area under communal jurisdiction, the following need to be identified and delineated:• Sacred forest areas.• Forests with unique biodiversity features (endemic
species).• Current resource-use patterns.• Management zones (core protected areas, low
utilisation areas, buffer zones, resource extraction areas).
• Key ecological connectivity (stepping stone) patches.• Priority matrix areas.
Support existing, or establish new, Participatory Forest Management Committees (PFMCs) to oversee the following:• Work with conservation extension staff (state or
NGO) to develop a management plan for the forest.• Develop small business enterprises that use non-
timber forest products.• Develop ecotourism plans if appropriate. • Develop a community forest ranger system to
ensure enforcement and forest monitoring and reporting.
Identify and manage on-going drivers of degradation using the forest ranger system.
Degraded forests or zones should be prioritised for restoration using appropriate soil stabilisation and re-vegetation techniques.
Many high-value forests in communal areas of EC and KZN have lost sections to slash and burn farming that are no longer used. Re-forestation should be started through ongoing removal of AIP, protection of livestock, and directed succession by planting of pioneer forest species.
Small forest patches on communal land (headman’s forest)
The forest should be included in the provincial or regional conservation plan to assess its conservation priority.
Within the area under headman’s jurisdiction, the following need to be identified and delineated:• Sacred forest areas.• Forests with unique biodiversity features (endemic
species).• Current resource-use patterns.• Management zones (core protected areas, low
utilisation areas, buffer zones, resource extraction areas).
• Key ecological connectivity (stepping stone) patches.• Priority matrix areas.
Support an existing, or establish a new, Participatory Forest Management committee (PFMC) to see that all resource extraction, livestock access and fire management needs are identified and catered for with the communal management system.
Small patches within ecological corridors should be prioritised for restoration.
The surrounding matrix should be management by the PFM committee.
Where small patches are under heavy pressure consider establishment of woodlots as buffers and alternative wood sources.
Areas that were once forest are unlikely to be reforested in such contexts, so management should focus on soil stability and AIP control, aiming for the land to be managed towards either a stable natural vegetation type or a productive farming unit.
Suitable areas can be identified for the establishment of community agro-forestry and food forest projects (possibly timber) using indigenous species.
Indigenous forests on timber estates
The forest should be included in the provincial or regional conservation plan to assess its conservation priority.
Each forest patch on the estate should be correctly surveyed and mapped and then detailed in the estate management plan with adequate resource allocation, particularly for the management of AIP and fire, both of which are key issues on timber estates. Matrix areas that have influence over the forest need to be clearly considered in the plan.
Where a community has a historic claim to forest within an estate then appropriate PFM methods should be used to agree on the conditions of access, ensuring any use or extraction is sustainable.
Companies, which are obliged to clear AIP under NEMA regulation and certification schemes (if relevant), should have a detailed AIP management plan with a budget.
Small patches within ecological corridors should be prioritised for restoration.
Where plantations are decommissioned, these area should be managed to follow natural forest succession pathways, but with a very strong emphasis on long-term AIP control.
Forests on private farms The forest should be included in the provincial or regional conservation plan to assess its conservation priority.Regional conservation extension services should assist with the survey and mapping, which should then be detailed in the estate management plan with adequate resource allocation, particularly for the management of AIP and fire, both of which are key issues.
Where a community has a historic claim to forest within a farm, then appropriate PFM methods should be used to agree on the conditions of access, ensuring any use or extraction is sustainable.
Where priority sites are identified for restoration, farmers should approach local extension staff or NGOs for assistance with the technical processes and planning.
Where sites are identified in regional conservation plans for reforestation, small-scale projects could be initiated by various NGOs (e.g. Green-pop).
7.1.3 Forest restoration:Restoration of degraded forests
is only sustainable if the drivers of
forest degradation are identified
and addressed, particularly alien
plant invasions, livestock grazing/
trampling, and poaching. For
community forests outside of the
high-value priority forests, the
focus of forest restoration should
be on removing AIPs, key species
enrichment planting, and fire and
ecotone management.
7.1.4 Reforestation: Only areas that sustained forests
within the last 50 years should be
considered for reforesting as it is
unlikely that anything beyond this
could be reasonably identified or
re-forested. Anecdotal evidence
combined with historical imagery
is required to identify such areas,
which should then be prioritised
according to the potential for
optimising social and ecosystem
services in conjunction with carbon
sequestration. Management
objectives for reforestation should
take cognisance of the type of forest
and the reforestation zones. The
aim of reforestation of sections of
high-value priority forests should be
restoring original forest biodiversity,
while the aim of reforestation of
smaller, community or headman’s
forests should be developing forests
with high utility value, focusing on
establishing useful species according
to the principles of agro-forestry
and food forests.
SECTION FOUR – INDIGENOUS FOREST RESTORATION AND MANAGEMENT

UNLOCKING BARRIERS AND OPPORTUNITIES FOR LAND-USE BASED CLIMATE CHANGE MITIGATION ACTIVITIES IN SA 113
Table 7.1: Required activities in each forest land type.
KEY ACTIVITIES FOREST CONTEXT 1. FOREST ZONATION, PLANNING, MAPPING AND BIODIVERSITY INVENTORY
2. COMMUNITY-BASED PARTICIPATORY FOREST MANAGEMENT
3. FOREST RESTORATION 4. REFORESTATION
Forest in protected areas Each forest patch in the PA should be correctly surveyed and mapped so that the various land-use and forest zones are delineated, and health condition classes assigned to each zone.
The forest should be included in the provincial or regional conservation plan to assess its conservation priority.
Where a community has a historic access claim to forest within a PA, then appropriate PFM methods should be used to agree on the conditions of access, ensuring any use or extraction is sustainable.
The forest should be specifically included in the PA management plan, with appropriate resource allocation for the management actions.
Degraded forests or zones within a forest should be managed towards a healthier condition, as the focus is biodiversity conservation.
Actions should focus on:• Removal of AIP.• Reintroduction of forest trees and fauna.• Management of the margins to prevent fuel
load accumulation.
Reforestation may only be applicable in exceptional cases where deforestation may have occurred prior to proclamation. The complexity of reforestation is such that it is not possible to give more detail here, other than to say that there must be adequate planning and consultation with technical experts to ensure success.
High-value priority forests (larger forest patches >1,000 ha) on communal land e.g. Nstubane forest, Pondoland
The forest should be included in the provincial or regional conservation plan to assess its conservation priority.
Within the area under communal jurisdiction, the following need to be identified and delineated:• Sacred forest areas.• Forests with unique biodiversity features (endemic
species).• Current resource-use patterns.• Management zones (core protected areas, low
utilisation areas, buffer zones, resource extraction areas).
• Key ecological connectivity (stepping stone) patches.• Priority matrix areas.
Support existing, or establish new, Participatory Forest Management Committees (PFMCs) to oversee the following:• Work with conservation extension staff (state or
NGO) to develop a management plan for the forest.• Develop small business enterprises that use non-
timber forest products.• Develop ecotourism plans if appropriate. • Develop a community forest ranger system to
ensure enforcement and forest monitoring and reporting.
Identify and manage on-going drivers of degradation using the forest ranger system.
Degraded forests or zones should be prioritised for restoration using appropriate soil stabilisation and re-vegetation techniques.
Many high-value forests in communal areas of EC and KZN have lost sections to slash and burn farming that are no longer used. Re-forestation should be started through ongoing removal of AIP, protection of livestock, and directed succession by planting of pioneer forest species.
Small forest patches on communal land (headman’s forest)
The forest should be included in the provincial or regional conservation plan to assess its conservation priority.
Within the area under headman’s jurisdiction, the following need to be identified and delineated:• Sacred forest areas.• Forests with unique biodiversity features (endemic
species).• Current resource-use patterns.• Management zones (core protected areas, low
utilisation areas, buffer zones, resource extraction areas).
• Key ecological connectivity (stepping stone) patches.• Priority matrix areas.
Support an existing, or establish a new, Participatory Forest Management committee (PFMC) to see that all resource extraction, livestock access and fire management needs are identified and catered for with the communal management system.
Small patches within ecological corridors should be prioritised for restoration.
The surrounding matrix should be management by the PFM committee.
Where small patches are under heavy pressure consider establishment of woodlots as buffers and alternative wood sources.
Areas that were once forest are unlikely to be reforested in such contexts, so management should focus on soil stability and AIP control, aiming for the land to be managed towards either a stable natural vegetation type or a productive farming unit.
Suitable areas can be identified for the establishment of community agro-forestry and food forest projects (possibly timber) using indigenous species.
Indigenous forests on timber estates
The forest should be included in the provincial or regional conservation plan to assess its conservation priority.
Each forest patch on the estate should be correctly surveyed and mapped and then detailed in the estate management plan with adequate resource allocation, particularly for the management of AIP and fire, both of which are key issues on timber estates. Matrix areas that have influence over the forest need to be clearly considered in the plan.
Where a community has a historic claim to forest within an estate then appropriate PFM methods should be used to agree on the conditions of access, ensuring any use or extraction is sustainable.
Companies, which are obliged to clear AIP under NEMA regulation and certification schemes (if relevant), should have a detailed AIP management plan with a budget.
Small patches within ecological corridors should be prioritised for restoration.
Where plantations are decommissioned, these area should be managed to follow natural forest succession pathways, but with a very strong emphasis on long-term AIP control.
Forests on private farms The forest should be included in the provincial or regional conservation plan to assess its conservation priority.Regional conservation extension services should assist with the survey and mapping, which should then be detailed in the estate management plan with adequate resource allocation, particularly for the management of AIP and fire, both of which are key issues.
Where a community has a historic claim to forest within a farm, then appropriate PFM methods should be used to agree on the conditions of access, ensuring any use or extraction is sustainable.
Where priority sites are identified for restoration, farmers should approach local extension staff or NGOs for assistance with the technical processes and planning.
Where sites are identified in regional conservation plans for reforestation, small-scale projects could be initiated by various NGOs (e.g. Green-pop).
SECTION FOUR – INDIGENOUS FOREST RESTORATION AND MANAGEMENT
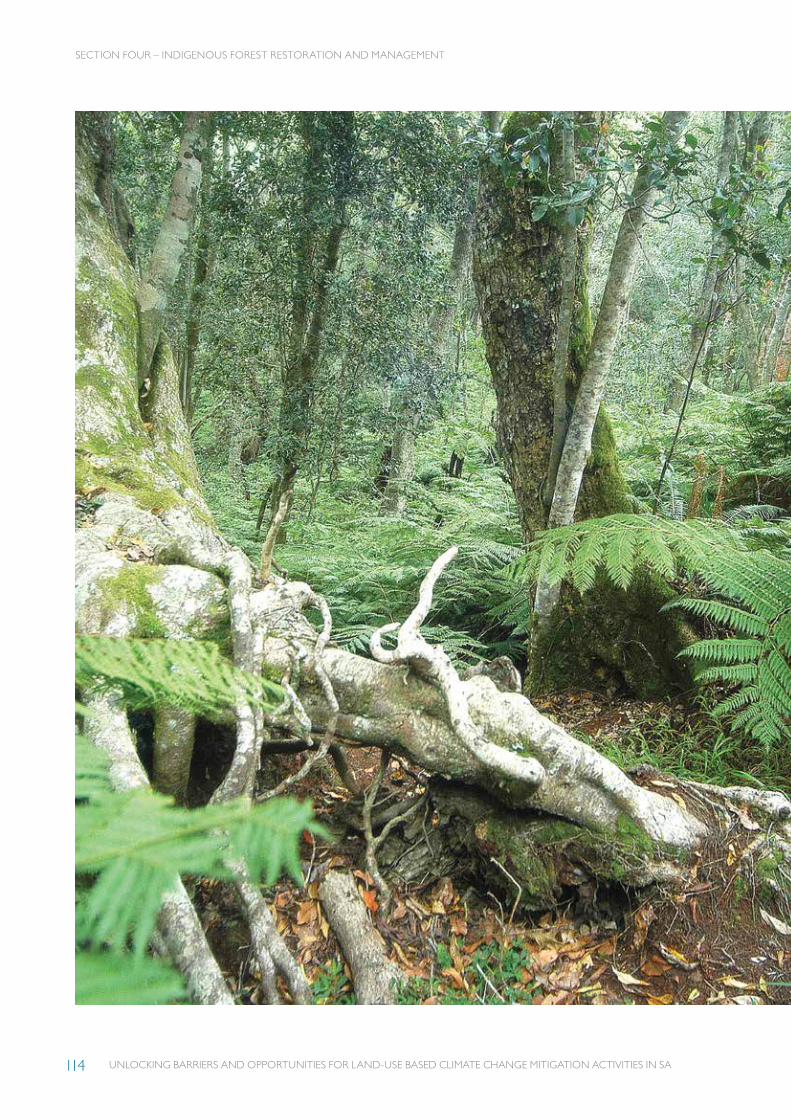
UNLOCKING BARRIERS AND OPPORTUNITIES FOR LAND-USE BASED CLIMATE CHANGE MITIGATION ACTIVITIES IN SA114
SECTION FOUR – INDIGENOUS FOREST RESTORATION AND MANAGEMENT
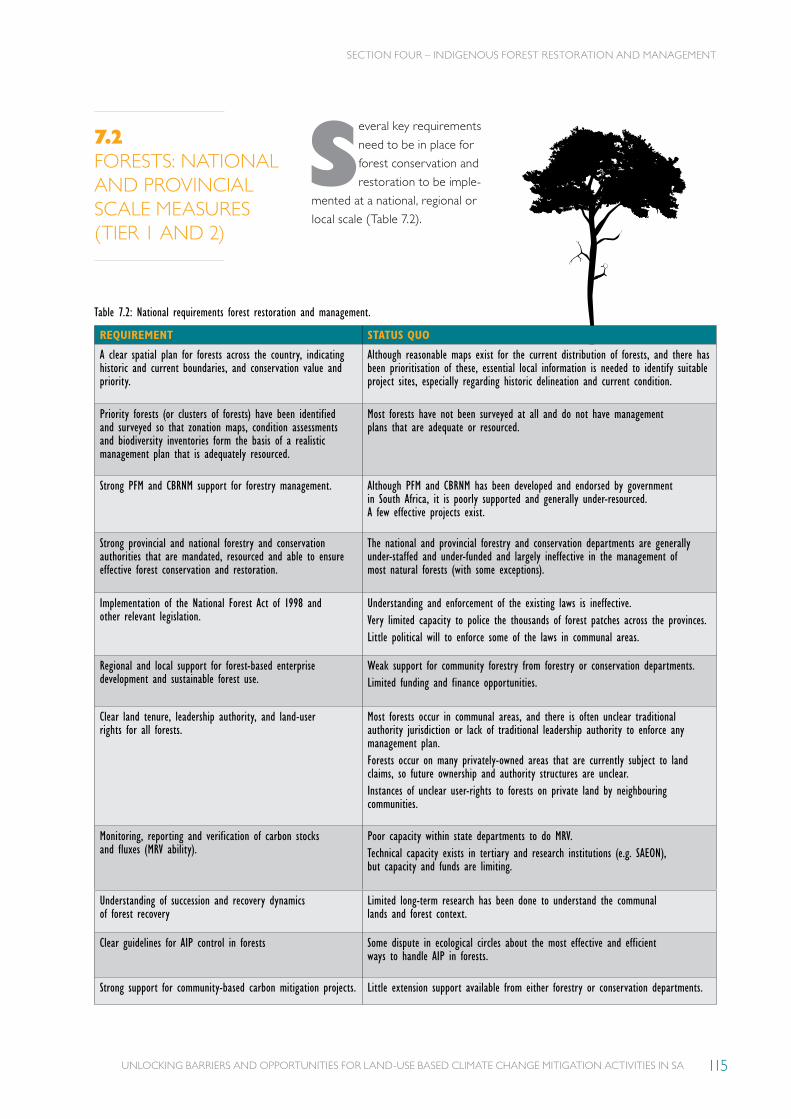
UNLOCKING BARRIERS AND OPPORTUNITIES FOR LAND-USE BASED CLIMATE CHANGE MITIGATION ACTIVITIES IN SA 115
7.2FORESTS: NATIONAL AND PROVINCIAL SCALE MEASURES (TIER 1 AND 2)
Table 7.2: National requirements forest restoration and management.
REQUIREMENT STATUS QUO
A clear spatial plan for forests across the country, indicating historic and current boundaries, and conservation value and priority.
Although reasonable maps exist for the current distribution of forests, and there has been prioritisation of these, essential local information is needed to identify suitable project sites, especially regarding historic delineation and current condition.
Priority forests (or clusters of forests) have been identified and surveyed so that zonation maps, condition assessments and biodiversity inventories form the basis of a realistic management plan that is adequately resourced.
Most forests have not been surveyed at all and do not have management plans that are adequate or resourced.
Strong PFM and CBRNM support for forestry management. Although PFM and CBRNM has been developed and endorsed by government in South Africa, it is poorly supported and generally under-resourced. A few effective projects exist.
Strong provincial and national forestry and conservation authorities that are mandated, resourced and able to ensure effective forest conservation and restoration.
The national and provincial forestry and conservation departments are generally under-staffed and under-funded and largely ineffective in the management of most natural forests (with some exceptions).
Implementation of the National Forest Act of 1998 and other relevant legislation.
Understanding and enforcement of the existing laws is ineffective. Very limited capacity to police the thousands of forest patches across the provinces. Little political will to enforce some of the laws in communal areas.
Regional and local support for forest-based enterprise development and sustainable forest use.
Weak support for community forestry from forestry or conservation departments.Limited funding and finance opportunities.
Clear land tenure, leadership authority, and land-user rights for all forests.
Most forests occur in communal areas, and there is often unclear traditional authority jurisdiction or lack of traditional leadership authority to enforce any management plan.Forests occur on many privately-owned areas that are currently subject to land claims, so future ownership and authority structures are unclear.Instances of unclear user-rights to forests on private land by neighbouring communities.
Monitoring, reporting and verification of carbon stocks and fluxes (MRV ability).
Poor capacity within state departments to do MRV.Technical capacity exists in tertiary and research institutions (e.g. SAEON), but capacity and funds are limiting.
Understanding of succession and recovery dynamics of forest recovery
Limited long-term research has been done to understand the communal lands and forest context.
Clear guidelines for AIP control in forests Some dispute in ecological circles about the most effective and efficient ways to handle AIP in forests.
Strong support for community-based carbon mitigation projects. Little extension support available from either forestry or conservation departments.
Several key requirements
need to be in place for
forest conservation and
restoration to be imple-
mented at a national, regional or
local scale (Table 7.2).
SECTION FOUR – INDIGENOUS FOREST RESTORATION AND MANAGEMENT
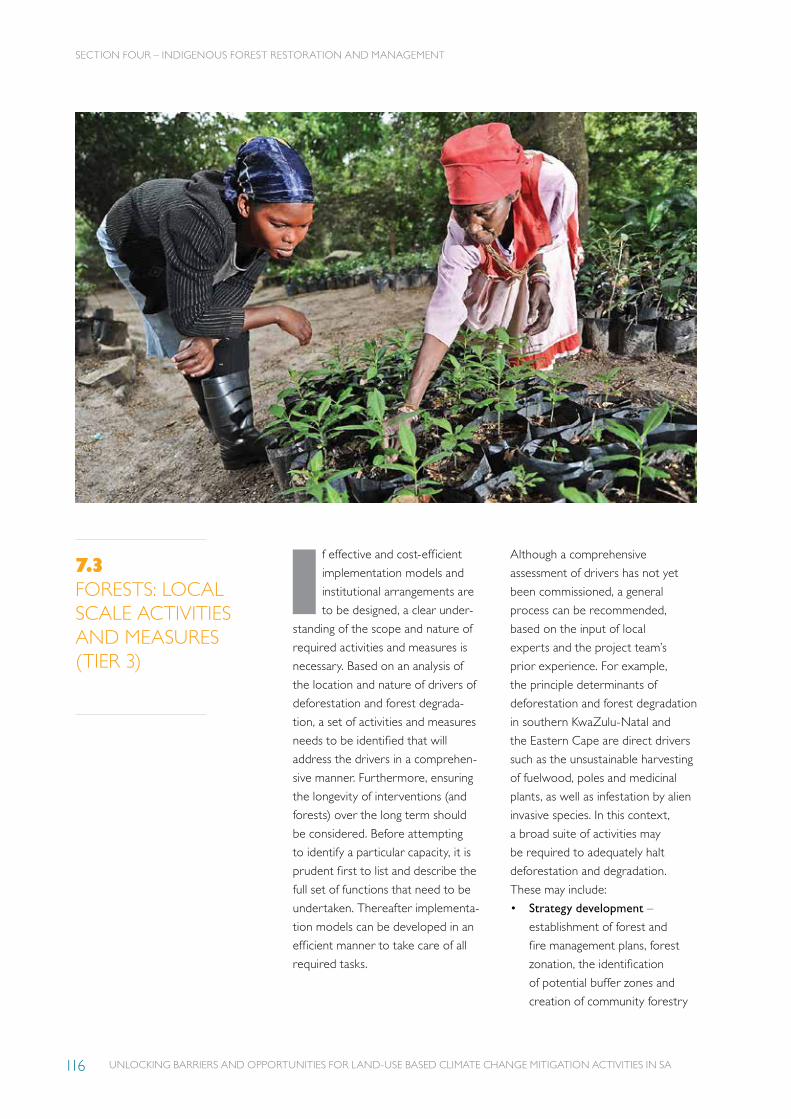
UNLOCKING BARRIERS AND OPPORTUNITIES FOR LAND-USE BASED CLIMATE CHANGE MITIGATION ACTIVITIES IN SA116
7.3FORESTS: LOCAL SCALE ACTIVITIES AND MEASURES (TIER 3)
If effective and cost-efficient
implementation models and
institutional arrangements are
to be designed, a clear under-
standing of the scope and nature of
required activities and measures is
necessary. Based on an analysis of
the location and nature of drivers of
deforestation and forest degrada-
tion, a set of activities and measures
needs to be identified that will
address the drivers in a comprehen-
sive manner. Furthermore, ensuring
the longevity of interventions (and
forests) over the long term should
be considered. Before attempting
to identify a particular capacity, it is
prudent first to list and describe the
full set of functions that need to be
undertaken. Thereafter implementa-
tion models can be developed in an
efficient manner to take care of all
required tasks.
Although a comprehensive
assessment of drivers has not yet
been commissioned, a general
process can be recommended,
based on the input of local
experts and the project team’s
prior experience. For example,
the principle determinants of
deforestation and forest degradation
in southern KwaZulu-Natal and
the Eastern Cape are direct drivers
such as the unsustainable harvesting
of fuelwood, poles and medicinal
plants, as well as infestation by alien
invasive species. In this context,
a broad suite of activities may
be required to adequately halt
deforestation and degradation.
These may include:
• Strategy development –
establishment of forest and
fire management plans, forest
zonation, the identification
of potential buffer zones and
creation of community forestry
SECTION FOUR – INDIGENOUS FOREST RESTORATION AND MANAGEMENT
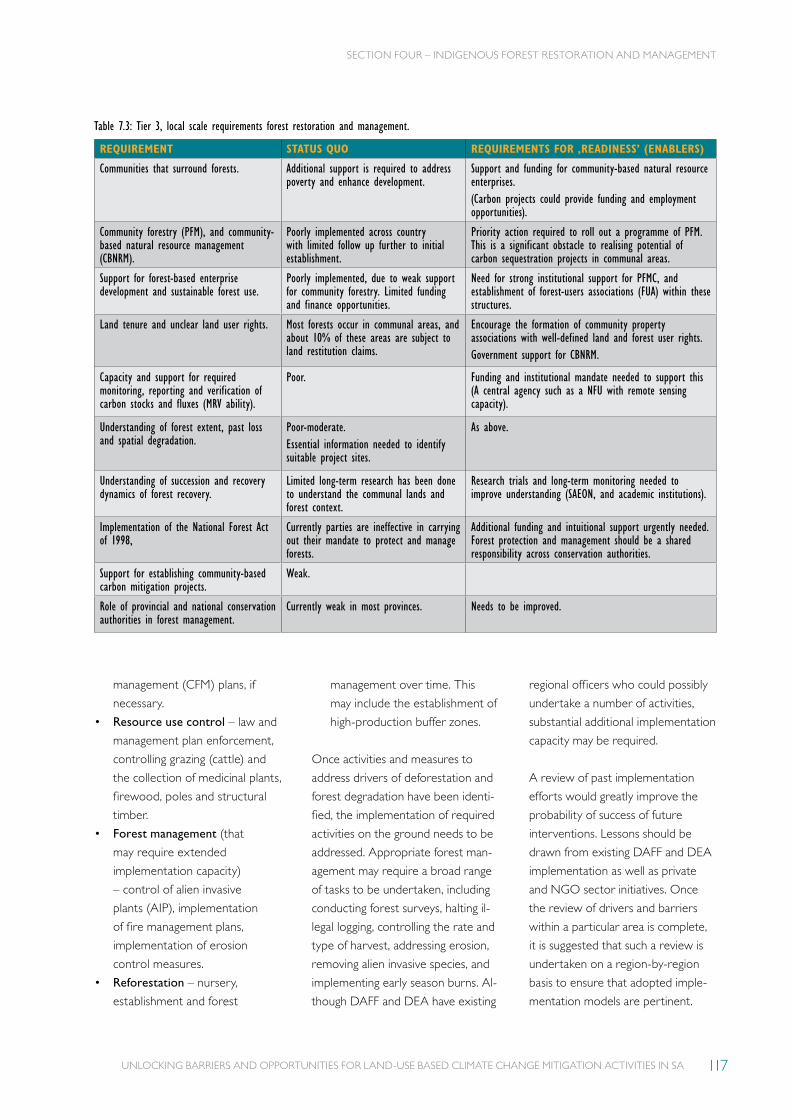
UNLOCKING BARRIERS AND OPPORTUNITIES FOR LAND-USE BASED CLIMATE CHANGE MITIGATION ACTIVITIES IN SA 117
management (CFM) plans, if
necessary.
• Resource use control – law and
management plan enforcement,
controlling grazing (cattle) and
the collection of medicinal plants,
firewood, poles and structural
timber.
• Forest management (that
may require extended
implementation capacity)
– control of alien invasive
plants (AIP), implementation
of fire management plans,
implementation of erosion
control measures.
• Reforestation – nursery,
establishment and forest
management over time. This
may include the establishment of
high-production buffer zones.
Once activities and measures to
address drivers of deforestation and
forest degradation have been identi-
fied, the implementation of required
activities on the ground needs to be
addressed. Appropriate forest man-
agement may require a broad range
of tasks to be undertaken, including
conducting forest surveys, halting il-
legal logging, controlling the rate and
type of harvest, addressing erosion,
removing alien invasive species, and
implementing early season burns. Al-
though DAFF and DEA have existing
Table 7.3: Tier 3, local scale requirements forest restoration and management.
REQUIREMENT STATUS QUO REQUIREMENTS FOR ‚READINESS’ (ENABLERS)
Communities that surround forests. Additional support is required to address poverty and enhance development.
Support and funding for community-based natural resource enterprises.(Carbon projects could provide funding and employment opportunities).
Community forestry (PFM), and community-based natural resource management (CBNRM).
Poorly implemented across country with limited follow up further to initial establishment.
Priority action required to roll out a programme of PFM. This is a significant obstacle to realising potential of carbon sequestration projects in communal areas.
Support for forest-based enterprise development and sustainable forest use.
Poorly implemented, due to weak support for community forestry. Limited funding and finance opportunities.
Need for strong institutional support for PFMC, and establishment of forest-users associations (FUA) within these structures.
Land tenure and unclear land user rights. Most forests occur in communal areas, and about 10% of these areas are subject to land restitution claims.
Encourage the formation of community property associations with well-defined land and forest user rights.Government support for CBNRM.
Capacity and support for required monitoring, reporting and verification of carbon stocks and fluxes (MRV ability).
Poor. Funding and institutional mandate needed to support this (A central agency such as a NFU with remote sensing capacity).
Understanding of forest extent, past loss and spatial degradation.
Poor-moderate.Essential information needed to identify suitable project sites.
As above.
Understanding of succession and recovery dynamics of forest recovery.
Limited long-term research has been done to understand the communal lands and forest context.
Research trials and long-term monitoring needed to improve understanding (SAEON, and academic institutions).
Implementation of the National Forest Act of 1998,
Currently parties are ineffective in carrying out their mandate to protect and manage forests.
Additional funding and intuitional support urgently needed. Forest protection and management should be a shared responsibility across conservation authorities.
Support for establishing community-based carbon mitigation projects.
Weak.
Role of provincial and national conservation authorities in forest management.
Currently weak in most provinces. Needs to be improved.
regional officers who could possibly
undertake a number of activities,
substantial additional implementation
capacity may be required.
A review of past implementation
efforts would greatly improve the
probability of success of future
interventions. Lessons should be
drawn from existing DAFF and DEA
implementation as well as private
and NGO sector initiatives. Once
the review of drivers and barriers
within a particular area is complete,
it is suggested that such a review is
undertaken on a region-by-region
basis to ensure that adopted imple-
mentation models are pertinent.
SECTION FOUR – INDIGENOUS FOREST RESTORATION AND MANAGEMENT

REALISING OPPORTUNITIES FOR BIOGAS DIGESTERS
SECTION FIVE
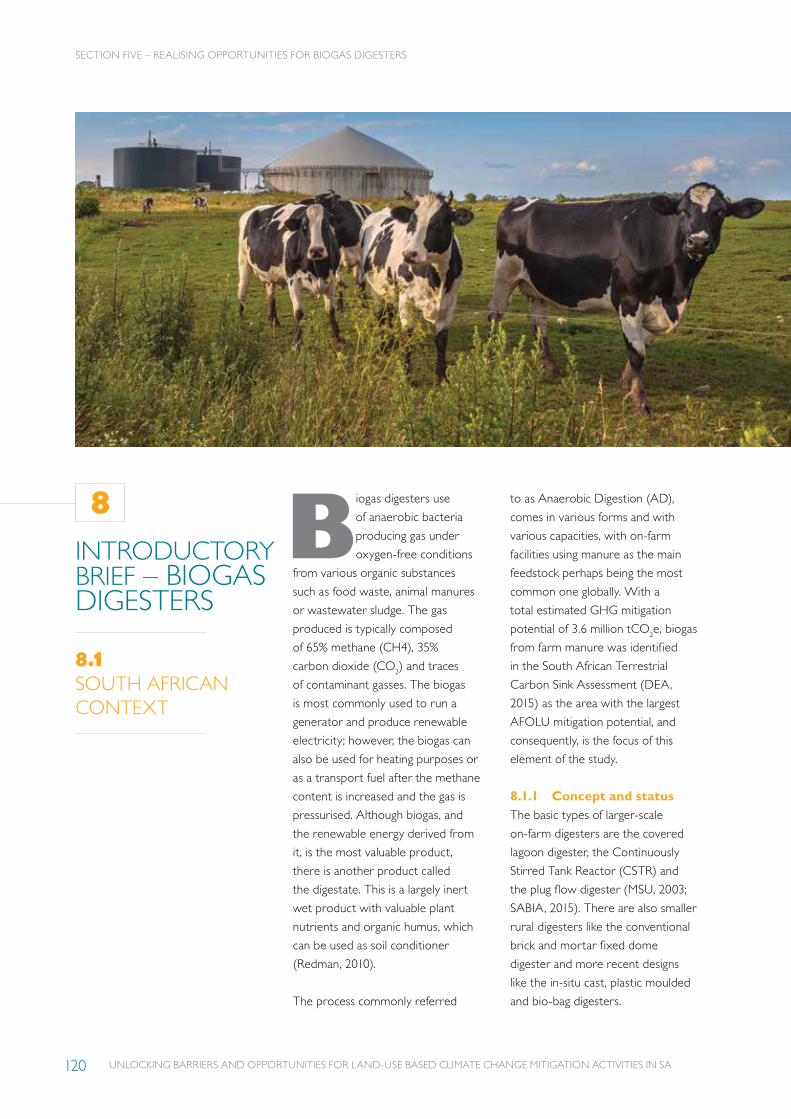
UNLOCKING BARRIERS AND OPPORTUNITIES FOR LAND-USE BASED CLIMATE CHANGE MITIGATION ACTIVITIES IN SA120
SECTION FIVE – REALISING OPPORTUNITIES FOR BIOGAS DIGESTERS
INTRODUCTORY BRIEF – BIOGAS DIGESTERS
8.1SOUTH AFRICAN CONTEXT
Biogas digesters use
of anaerobic bacteria
producing gas under
oxygen-free conditions
from various organic substances
such as food waste, animal manures
or wastewater sludge. The gas
produced is typically composed
of 65% methane (CH4), 35%
carbon dioxide (CO2) and traces
of contaminant gasses. The biogas
is most commonly used to run a
generator and produce renewable
electricity; however, the biogas can
also be used for heating purposes or
as a transport fuel after the methane
content is increased and the gas is
pressurised. Although biogas, and
the renewable energy derived from
it, is the most valuable product,
there is another product called
the digestate. This is a largely inert
wet product with valuable plant
nutrients and organic humus, which
can be used as soil conditioner
(Redman, 2010).
The process commonly referred
to as Anaerobic Digestion (AD),
comes in various forms and with
various capacities, with on-farm
facilities using manure as the main
feedstock perhaps being the most
common one globally. With a
total estimated GHG mitigation
potential of 3.6 million tCO2e, biogas
from farm manure was identified
in the South African Terrestrial
Carbon Sink Assessment (DEA,
2015) as the area with the largest
AFOLU mitigation potential, and
consequently, is the focus of this
element of the study.
8.1.1 Concept and statusThe basic types of larger-scale
on-farm digesters are the covered
lagoon digester, the Continuously
Stirred Tank Reactor (CSTR) and
the plug flow digester (MSU, 2003;
SABIA, 2015). There are also smaller
rural digesters like the conventional
brick and mortar fixed dome
digester and more recent designs
like the in-situ cast, plastic moulded
and bio-bag digesters.
8

UNLOCKING BARRIERS AND OPPORTUNITIES FOR LAND-USE BASED CLIMATE CHANGE MITIGATION ACTIVITIES IN SA 121
SECTION FIVE – REALISING OPPORTUNITIES FOR BIOGAS DIGESTERS
FEED EFFLUENT
BIOGAS
Biogas under cover
First LagoonSecond Lagoon
FARMBIOGAS
PUMP
COLLECTOR
GAS HOLDER
MANUREEFFLUENTHEAT EXCHANGER
FEED
BIOGAS STORAGE
UNDERGROUND BASIN EFFLUENT
LARGER SCALE ON-FARM DIGESTERS. The three basic types of larger scale on-farm digesters are described below:
Figure 8.1: Covered lagoon digester – a 120 kWe lagoon digester facility is located at a farm north of Pretoria.
Figure 8.3: Illustration of a plug flow digester.
Figure 8.2: Continuously Stirred Tank Reactor – Bio2Watt’s 4.4 MWe plant in Bronkhorstspruit, situated on the premises of Beefcore, one of South Africa’s largest feedlots, is a good local example of a CSTR.
COVERED LAGOON DIGESTERDiluted liquid manure, generally
with less than 2% solids, is first
fed into a deep anaerobic lagoon
with an airtight cover trapping
the gas produced (Figure
8.1). Biogas is produced and
recovered, depending on
temperature, as the lagoon
is not heated. Although this
is not optimal, the covered
lagoon is attractive because of
its low capital requirements.
The effluent is not suitable for
discharge to receiving waters and
is therefore treated further in
aerobic or facultative lagoons.
CONTINUOUSLY STIRRED TANK REACTOR (CSTR) The CSTR is an engineered
tank that provides for
continuous heating and mixing
of the substrate (Figure 8.2).
Generally, these tanks are built
above ground. CSTRs treat
slurry manure with a solids
concentration in the range of
3–10% and are compatible with
scraped and flushed manure.
The CSTR is more expensive
to install, operate and maintain
than a plug flow digester and
is generally only used for
commercial applications.
PLUG FLOW DIGESTER: A plug flow digester handles
greater amounts of solids
(typically 8–13%) than either a
covered lagoon or a complete
mix digester (Figure 8.3). The
manure/contents needs to be
thick enough to keep particles
from settling to the bottom of the
tank. Swine manure for example
cannot be treated because of its
lack of fibre. Plug flow digesters
are typically five times longer than
they are wide and have the basin
underground. Depending on the
design, they can be stirred and
heated if required.
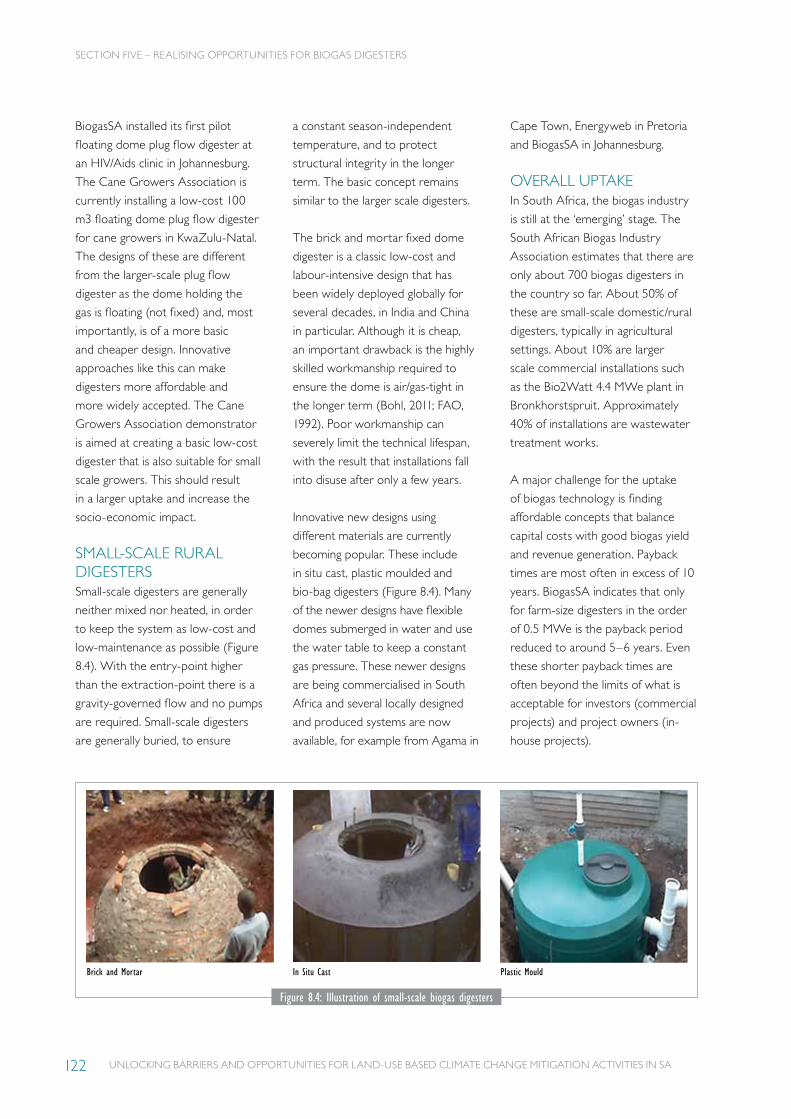
UNLOCKING BARRIERS AND OPPORTUNITIES FOR LAND-USE BASED CLIMATE CHANGE MITIGATION ACTIVITIES IN SA122
BiogasSA installed its first pilot
floating dome plug flow digester at
an HIV/Aids clinic in Johannesburg.
The Cane Growers Association is
currently installing a low-cost 100
m3 floating dome plug flow digester
for cane growers in KwaZulu-Natal.
The designs of these are different
from the larger-scale plug flow
digester as the dome holding the
gas is floating (not fixed) and, most
importantly, is of a more basic
and cheaper design. Innovative
approaches like this can make
digesters more affordable and
more widely accepted. The Cane
Growers Association demonstrator
is aimed at creating a basic low-cost
digester that is also suitable for small
scale growers. This should result
in a larger uptake and increase the
socio-economic impact.
SMALL-SCALE RURAL DIGESTERSSmall-scale digesters are generally
neither mixed nor heated, in order
to keep the system as low-cost and
low-maintenance as possible (Figure
8.4). With the entry-point higher
than the extraction-point there is a
gravity-governed flow and no pumps
are required. Small-scale digesters
are generally buried, to ensure
a constant season-independent
temperature, and to protect
structural integrity in the longer
term. The basic concept remains
similar to the larger scale digesters.
The brick and mortar fixed dome
digester is a classic low-cost and
labour-intensive design that has
been widely deployed globally for
several decades, in India and China
in particular. Although it is cheap,
an important drawback is the highly
skilled workmanship required to
ensure the dome is air/gas-tight in
the longer term (Bohl, 2011; FAO,
1992). Poor workmanship can
severely limit the technical lifespan,
with the result that installations fall
into disuse after only a few years.
Innovative new designs using
different materials are currently
becoming popular. These include
in situ cast, plastic moulded and
bio-bag digesters (Figure 8.4). Many
of the newer designs have flexible
domes submerged in water and use
the water table to keep a constant
gas pressure. These newer designs
are being commercialised in South
Africa and several locally designed
and produced systems are now
available, for example from Agama in
Cape Town, Energyweb in Pretoria
and BiogasSA in Johannesburg.
OVERALL UPTAKEIn South Africa, the biogas industry
is still at the ‘emerging’ stage. The
South African Biogas Industry
Association estimates that there are
only about 700 biogas digesters in
the country so far. About 50% of
these are small-scale domestic/rural
digesters, typically in agricultural
settings. About 10% are larger
scale commercial installations such
as the Bio2Watt 4.4 MWe plant in
Bronkhorstspruit. Approximately
40% of installations are wastewater
treatment works.
A major challenge for the uptake
of biogas technology is finding
affordable concepts that balance
capital costs with good biogas yield
and revenue generation. Payback
times are most often in excess of 10
years. BiogasSA indicates that only
for farm-size digesters in the order
of 0.5 MWe is the payback period
reduced to around 5–6 years. Even
these shorter payback times are
often beyond the limits of what is
acceptable for investors (commercial
projects) and project owners (in-
house projects).
SECTION FIVE – REALISING OPPORTUNITIES FOR BIOGAS DIGESTERS
Figure 8.4: Illustration of small-scale biogas digesters
In Situ CastBrick and Mortar Plastic Mould
UNLOCKING BARRIERS AND OPPORTUNITIES FOR LAND-USE BASED CLIMATE CHANGE MITIGATION ACTIVITIES IN SA 123
In order to realise a larger uptake,
investment costs need to be further
reduced and revenues need to be
increased. Innovative standardised
concepts such as the bio-bag can
reduce investment costs while
government intervention pricing
in the co-benefits such as GHG
emission reduction, job creation
and access to biogas electricity as
an energy source and compressed
biogas as a transport fuel, would
be helpful.
8.1.2 Current initiatives and governance
Although the biogas industry
is still emerging, it is relatively
well organised, with an active
industry association and a
national platform:
• South Africa Biogas Industry
Association (SABIA)
– Established in 2014, it currently
has about 40 members.
– The steering committee has
industry representatives.
– It is focused on promoting the
needs of industry stakeholders
and facilitating the
development of a prosperous
biogas industry in southern
Africa.
– It has an Info-hub, which
co-organises a (bi-)annual
conference and working
groups.
• National Biogas Platform
– Established in 2013, this a
collaboration between the
public and private sector.
– It is led by the Department
of Energy, in partnership with
SABIA and GIZ.
– GIZ has been appointed
to facilitate and coordinate
activities.
– Members include government
departments, provincial and
local government, industries,
Eskom, research institutes, and
financing institutions.
– It is focused on sharing lessons
learned, creating a conducive
regulatory framework,
and unlocking/creating
financing options.
– It has established working
groups covering focus areas
and co-organises a bi-annual
conference.
In order to stimulate the uptake
of biogas technology, both
organisations are working with the
relevant government departments
to develop clearer licensing
processes adapted to the specifics
of biogas projects. They are also
working on the development of
appropriate incentives to enhance
the financial attractiveness of
projects and unlock financing
opportunities.
Biogas projects are generally
(erroneously) perceived to be
more complex to rollout than,
for example solar and wind energy
projects. As a result, the uptake of
biogas technology in the country,
both on a small and on a large scale,
is minimal, and overshadowed by
other forms of renewable energy.
Biogas is hampered by the size
of activities, which is limited by
biomass volumes available at site
or close by, and a relatively high
price per unit of energy required
to make projects viable. Several
governmental initiatives do include
biogas components but they often
lack an emphasis on biogas in
particular, resulting in a slow and
low uptake of biogas technology
within these initiatives.
The Renewable Energy Independent
Power Producer Programme
(REIPPP), introduced in 2011,
has been successful in promoting
renewable electricity overall, but it
has not delivered in terms of biogas
or biomass to electricity.
The separate IPP programme for
small-scale projects (< 5 MWe),
running alongside the REIPPP,
does not currently include any
biogas projects.
One of the commitments under the
Green Accord was the formation of
the South African Renewable Energy
Council (SAREC) to “establish an
organisation that will facilitate the
renewable energy sector working
in partnership with other social
partners in the development of
the sector” (Green Accord, 2011).
SAREC focuses on solar electric,
solar thermal, wind and energy
efficiency. The four participating
industry associations (SAWEA,
SAPVIA, SASTELA and SESSA)
represent these specific areas. At
the time SAREC was formed, the
biogas industry did not yet have an
association and therefore SABIA is
currently not participating in SAREC.
SECTION FIVE – REALISING OPPORTUNITIES FOR BIOGAS DIGESTERS
Innovative standardised
concepts such as the bio-bag
can reduce investment costs while
government intervention pricing
in the co-benefits such as GHG
emission reduction, job creation
and access to biogas electricity as
an energy source and compressed
biogas as a transport fuel,
would be helpful.
UNLOCKING BARRIERS AND OPPORTUNITIES FOR LAND-USE BASED CLIMATE CHANGE MITIGATION ACTIVITIES IN SA124
The Eastern Cape Department
of Economic Development,
Environmental Affairs and Tourism
is one of the few organisations
with a specific programme
targeting the rural application of
bio-energy – the provincial Bio-
Energy Implementation Support
Plan. It is run by the renewable
energy unit of the Eastern Cape
Rural Development Agency. The
focus of this programme includes
biogas from municipal waste,
rural household biogas digesters,
agricultural biogas for vehicles, as
well as bio-energy villages managed
by service cooperatives.
The off-grid electrification
programme of the New Household
Electrification Strategy, implemented
as a collaboration between the DoE
and the Department of Cooperative
Governance and Traditional Affairs
(COGTA), does include biogas but
is currently focused on Solar Home
Systems (SHS). The full spectrum
including biogas and biomass still
needs to be unlocked.
The Department of Energy (DoE)’s
Water for Energy Programme
targets the development and
implementation of labour-intensive
energy related initiatives including
‘biofuels development and
implementation in rural applications’.
Biogas initiatives in the Eastern
Cape and Limpopo have so far
been implemented as part of
this programme.
The Department of Environmental
Affairs (DEA) runs a ‘Green
Programmes and Fund’ funded by
and in collaboration with UNIDO
and GEF. The objective of this
programme is to promote market-
based adoption of integrated
biogas technology in small, medium
and micro-scale enterprises
(SMMEs). The programme has four
components: capacity building/
technology support; market and
regulatory framework development;
technology demonstration and
scaling up. The programme is
in the process of selecting 5–10
demonstration projects for funding.
8.1.3 The value of biogasIn addition to its contribution to
the mitigation of GHGs, biogas
technology can deliver substantial
socio-economic benefits to farming
and rural communities. On the one
hand this may be seen as a co-
benefit, it could also be seen as a
prerequisite. People need favourable
conditions for improving their
livelihood and business environment
in order to support any biogas
uptake initiative.
The nature of biogas technology –
requiring feedstock supply and active
operation of the facility – does make
it more complex to implement than,
for example, solar panels on a roof.
However, this has the positive
benefit of greater local permanent
job creation. While the job creation
potential is difficult to quantify, it is
fair to say that, per MW electricity,
the job creation potential for biogas
is higher than for solar and wind.
RURAL AGRICULTURAL HOUSEHOLDSAccording to the General
Household Survey (2015), there
is a total of 5.0 million households
in rural areas. The “Biogas
Industry in South Africa” study
(GIZ, 2016), which was based on
multiple governmental sources,
estimates that 3.1 million of these
rural households hold livestock, of
which 2.5 million (81%) hold from
1–10 cows. For a rural small-scale
digester to be viable, a minimum
of 2–4 cattle are required (GIZ,
2016; Lawbuary, 2000). However,
food waste and other organic
waste streams could be added to
complement a low number of cows.
It can therefore be assumed that 2.5
million rural agricultural households
would qualify for anaerobic biogas
digesters. This number corresponds
with the 3 million subsistence
farmers recorded by DAFF (2012).
The estimated 2.5 million rural
agricultural households holding
cattle could benefit from biogas in
various ways depending on whether
the household is connected to the
grid or not:
• Biogas to rural agricultural
households without access to
the grid:
– About 337,500 households are
not grid connected (StatsSA,
2016).
– Current cooking fuels are:
wood, paraffin and coal.
– Ease of cooking and no fuel
SECTION FIVE – REALISING OPPORTUNITIES FOR BIOGAS DIGESTERS
According to the General
Household Survey (2015), there
is a total of 5.0 million households
in rural areas. The “Biogas
Industry in South Africa” study
(GIZ, 2016), which was based on
multiple governmental sources,
estimates that 3.1 million of these
rural households hold livestock,
of which 2.5 million (81%) hold
from 1–10 cows.

UNLOCKING BARRIERS AND OPPORTUNITIES FOR LAND-USE BASED CLIMATE CHANGE MITIGATION ACTIVITIES IN SA 125
collection has potential for time
and cost savings.
– Biogas is a clean burning
alternative, improving indoor
air quality.
– Digestate can be used as
fertilizer with a high availability
of nutrients and high crop
yields.
• Biogas to rural agricultural
households with access to
the grid:
– About 1,652,500 households
use electricity for cooking
(StatsSA, 2016).
– About 510,000 households
with access do not use
electricity for cooking.
– Biogas can be used as an
alternative for electricity.
– Same benefits as for non-grid-
connected households.
– Digestate can used as fertilizer
with a high availability of
nutrients and high crop yields.
The actual uptake of bio-digesters
by rural agricultural households
will depend on their advantages
relative to the existing energy used
for cooking. The most important
factor in this regard will be the
cost, although ease of use, reduced
efforts to obtain fuel, and cleanliness
of cooking, will also play a role.
Although there are other benefits
to using biogas, cost will remain the
main driver for poor households
when comparing it to wood, paraffin
and coal. The cost of cooking on
biogas should be significantly lower
than cooking on electricity, as this
is the most significant competitive
benefit that could motivate a switch.
It can be assumed that when biogas
is equal in cost or slightly cheaper
compared to wood, paraffin and
coal, there will be greater uptake.
FARM-SCALE DIGESTERSThe total number of commercial
cattle farmers in South Africa is
estimated at 50,000 holding 11
million cattle, with emerging farmers
and communal farmers estimated at
240,000 and 3 million respectively,
holding 5.6 million cattle. Among
the 50,000 commercial farmers
in South Africa, there are
approximately 70 feedlots, with the
largest 13 feedlots accounting for
77% of total feedlot capacity. Karan
Beef in Heidelberg is the largest
feedlot with 120,000 standing cattle
capacity (27%), followed by Bull
Brand with 40,000 standing cattle
capacity (9%) (DAFF, 2012).
Feedlots are ideally suited for the
application of biogas digesters as
large volumes of fresh manure can
be collected daily at a single location.
Nevertheless, smaller-sized farms
can also apply biogas digesters as
long as the type and configuration of
the digester is adjusted accordingly,
to simplify and reduce the upfront
investment.
SECTION FIVE – REALISING OPPORTUNITIES FOR BIOGAS DIGESTERS
WESTERN CAPE EASTERN CAPE NORTHERN CAPE FREE STATE KWAZULU NATAL NORTH WEST GAUTENG MPUMALANGA LIMPOPO
Source: Community Survey 2016, Agricultural Households (StatsSA, 2016) http://cs2016.statssa.gov.za/wp-content/uploads/2016/07/NT-30-06-2016-RELEASE-for-CS-2016-_Statistical-releas_1-July-2016.pdf
In addition to cattle farmers, South
Africa has 3,665 dairy farmers,
holding a total of 671,517 cows
with an average of 399 cows per
farm. The provinces with the
largest number of milk producers
are Western Cape (502), Eastern
Cape (251), KwaZulu-Natal (253)
and Free State (280). The provinces
with the largest cows in milk per
producer are Eastern Cape (863)
and KwaZulu-Natal. Figure 8.5
below illustrates the intensity of
dairy farming on a district level
(Milk SA, 2016).
The 240,000 emerging farmers and
3 million communal/subsistence
farmers, holding 5.6 million cattle,
are assumed to be included in the
rural agricultural households. If
each of the reported 2.5 million
households holding cattle holds 2.2
head on average, the 5.6 million
holding capacity is reached. It
therefore appears that the numbers
of cattle are spread thinly across
the many household that hold some
cattle for subsistence farming, and
Figure 8.5: The number of agricultural households per province (expressed as a percentage)
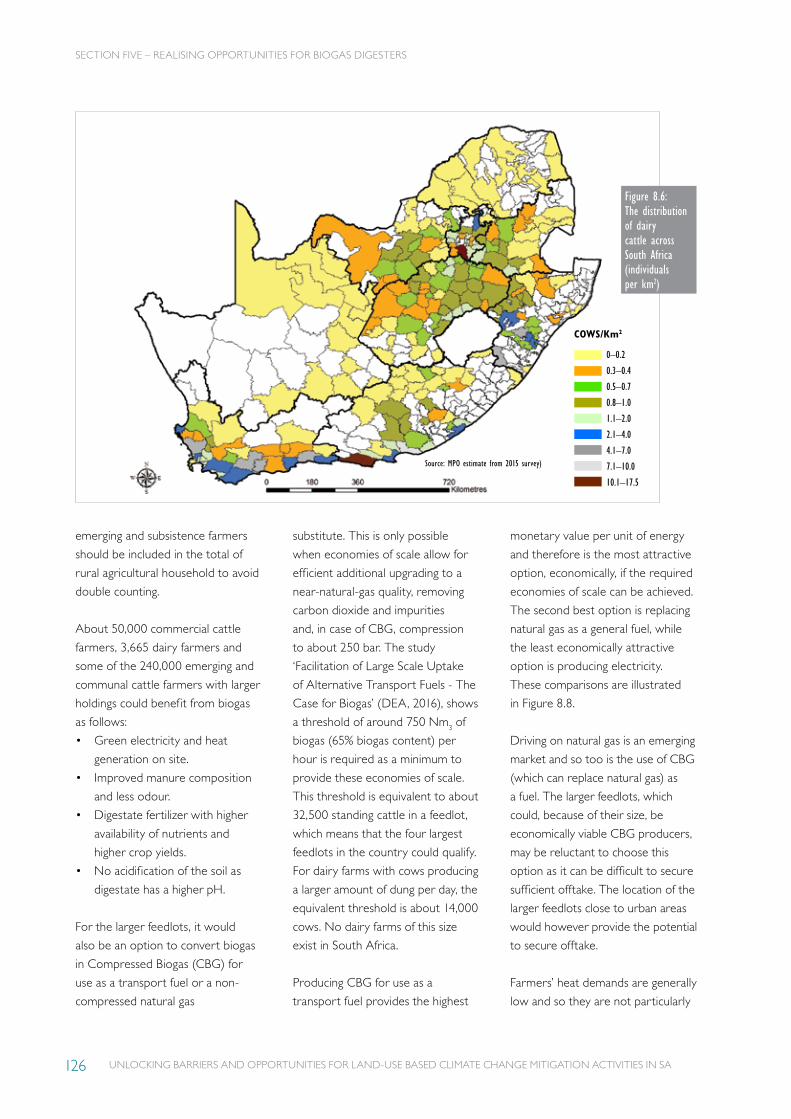
UNLOCKING BARRIERS AND OPPORTUNITIES FOR LAND-USE BASED CLIMATE CHANGE MITIGATION ACTIVITIES IN SA126
emerging and subsistence farmers
should be included in the total of
rural agricultural household to avoid
double counting.
About 50,000 commercial cattle
farmers, 3,665 dairy farmers and
some of the 240,000 emerging and
communal cattle farmers with larger
holdings could benefit from biogas
as follows:
• Green electricity and heat
generation on site.
• Improved manure composition
and less odour.
• Digestate fertilizer with higher
availability of nutrients and
higher crop yields.
• No acidification of the soil as
digestate has a higher pH.
For the larger feedlots, it would
also be an option to convert biogas
in Compressed Biogas (CBG) for
use as a transport fuel or a non-
compressed natural gas
substitute. This is only possible
when economies of scale allow for
efficient additional upgrading to a
near-natural-gas quality, removing
carbon dioxide and impurities
and, in case of CBG, compression
to about 250 bar. The study
‘Facilitation of Large Scale Uptake
of Alternative Transport Fuels - The
Case for Biogas’ (DEA, 2016), shows
a threshold of around 750 Nm3 of
biogas (65% biogas content) per
hour is required as a minimum to
provide these economies of scale.
This threshold is equivalent to about
32,500 standing cattle in a feedlot,
which means that the four largest
feedlots in the country could qualify.
For dairy farms with cows producing
a larger amount of dung per day, the
equivalent threshold is about 14,000
cows. No dairy farms of this size
exist in South Africa.
Producing CBG for use as a
transport fuel provides the highest
monetary value per unit of energy
and therefore is the most attractive
option, economically, if the required
economies of scale can be achieved.
The second best option is replacing
natural gas as a general fuel, while
the least economically attractive
option is producing electricity.
These comparisons are illustrated
in Figure 8.8.
Driving on natural gas is an emerging
market and so too is the use of CBG
(which can replace natural gas) as
a fuel. The larger feedlots, which
could, because of their size, be
economically viable CBG producers,
may be reluctant to choose this
option as it can be difficult to secure
sufficient offtake. The location of the
larger feedlots close to urban areas
would however provide the potential
to secure offtake.
Farmers’ heat demands are generally
low and so they are not particularly
SECTION FIVE – REALISING OPPORTUNITIES FOR BIOGAS DIGESTERS
Figure 8.6:The distribution of dairy cattle across South Africa (individuals per km2)
0–0.2
0.3–0.4
0.5–0.7
0.8–1.0
1.1–2.0
2.1–4.0
4.1–7.0
7.1–10.0
10.1–17.5
COWS/Km2
Source: MPO estimate from 2015 survey)
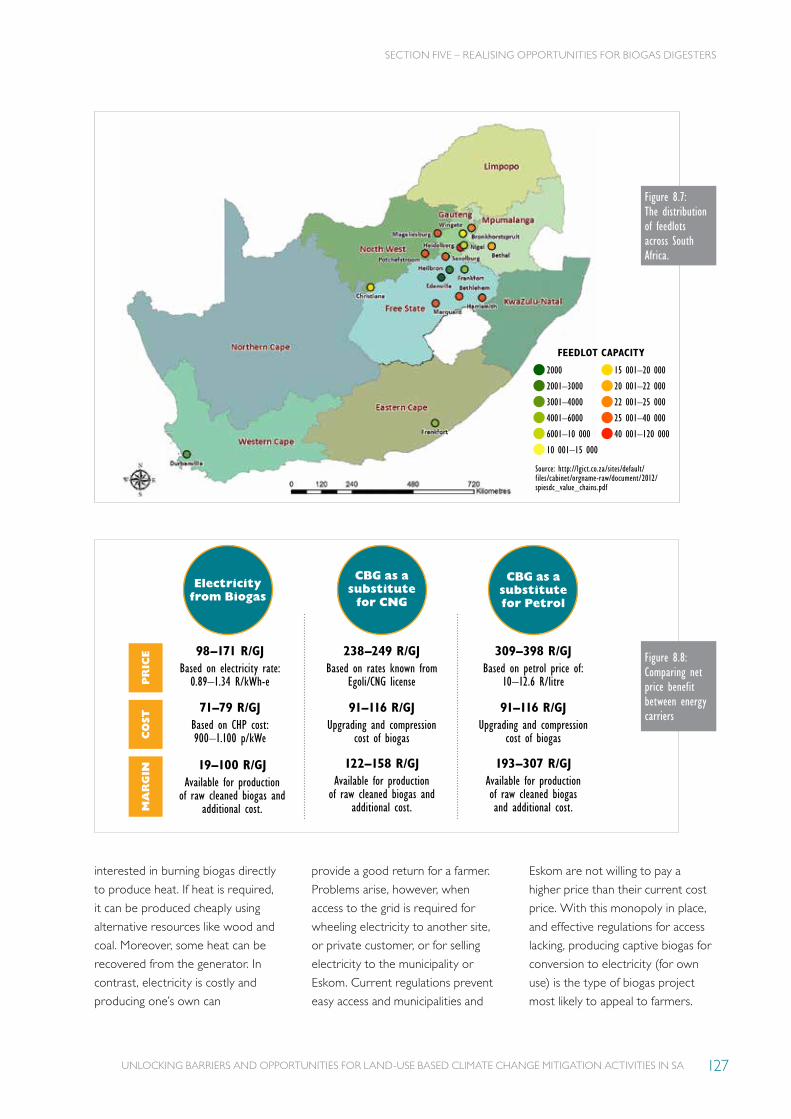
UNLOCKING BARRIERS AND OPPORTUNITIES FOR LAND-USE BASED CLIMATE CHANGE MITIGATION ACTIVITIES IN SA 127
Electricity from Biogas
CBG as a substitute
for CNG
CBG as a substitute for Petrol
SECTION FIVE – REALISING OPPORTUNITIES FOR BIOGAS DIGESTERS
Figure 8.8: Comparing net price benefit between energy carriers
interested in burning biogas directly
to produce heat. If heat is required,
it can be produced cheaply using
alternative resources like wood and
coal. Moreover, some heat can be
recovered from the generator. In
contrast, electricity is costly and
producing one’s own can
provide a good return for a farmer.
Problems arise, however, when
access to the grid is required for
wheeling electricity to another site,
or private customer, or for selling
electricity to the municipality or
Eskom. Current regulations prevent
easy access and municipalities and
Eskom are not willing to pay a
higher price than their current cost
price. With this monopoly in place,
and effective regulations for access
lacking, producing captive biogas for
conversion to electricity (for own
use) is the type of biogas project
most likely to appeal to farmers.
Figure 8.7:The distribution of feedlots across South Africa.
2000
2001–3000
3001–4000
4001–6000
6001–10 000
10 001–15 000
15 001–20 000
20 001–22 000
22 001–25 000
25 001–40 000
40 001–120 000
FEEDLOT CAPACITY
Source: http://lgict.co.za/sites/default/files/cabinet/orgname-raw/document/2012/spiesdc_value_chains.pdf
71–79 R/GJBased on CHP cost: 900–1.100 p/kWe
91–116 R/GJUpgrading and compression
cost of biogas
91–116 R/GJUpgrading and compression
cost of biogasCO
ST
19–100 R/GJAvailable for production
of raw cleaned biogas and additional cost.
122–158 R/GJAvailable for production
of raw cleaned biogas and additional cost.
193–307 R/GJAvailable for production of raw cleaned biogas and additional cost.M
AR
GIN
98–171 R/GJBased on electricity rate:
0.89–1.34 R/kWh-e
238–249 R/GJBased on rates known from
Egoli/CNG license
309–398 R/GJBased on petrol price of:
10–12.6 R/litrePR
ICE

UNLOCKING BARRIERS AND OPPORTUNITIES FOR LAND-USE BASED CLIMATE CHANGE MITIGATION ACTIVITIES IN SA128
8.2CONCEPT AND CLIMATE VALUE
8.2.1 The ConceptWhen looking at biogas digestion
from a mitigation perspective, it
is important to determine how
the biogas produced will be put
to use, to allow for comparison
with conventional uses that are
generally based on fossil fuels.
Figure 8.9 shows the concept of
biogas digestion and the different
modalities of using the biogas, that is,
as electricity, transport fuel, or heat.
In addition, the digestate produced
can be used as high-quality fertiliser.
As discussed under Section 1.1.3,
‘The value of biogas’, the dominant
application of biogas for farmers is
conversion to electricity, while for
rural agricultural households the use
of biogas for cooking and heating is
most common. Using these facts as
a basis, carbon mitigation potential is
assessed against a so-called baseline
– the activity in the absence of the
use of biogas.
RURAL AGRICULTURAL HOUSEHOLDS – BIOGAS FOR COOKING AND HEATINGEven when electrified, poor rural
households can often only afford to
use electricity for lighting, running
entertainment appliances, and
charging phones. Cooking and space
heating are more energy intensive
and therefore it is more economical
to use wood, LPG, paraffin or coal.
Some of these are the most polluting
indoor methods, which continue to
affect indoor air quality (IARC, 2010;
Stats SA, 2009 and 2015).
According to the 2016 Community
Survey of agricultural households
by Statistics South Africa (StatsSA,
2016, rural agricultural households
use the following alternative fuels for
cooking and heating. These figures
are being used to establish the
baseline:
• Wood 72%
• LPG 13%
• Paraffin 11%
• Coal 2%
• Other (i.e. animal dung) 2%
SECTION FIVE – REALISING OPPORTUNITIES FOR BIOGAS DIGESTERS
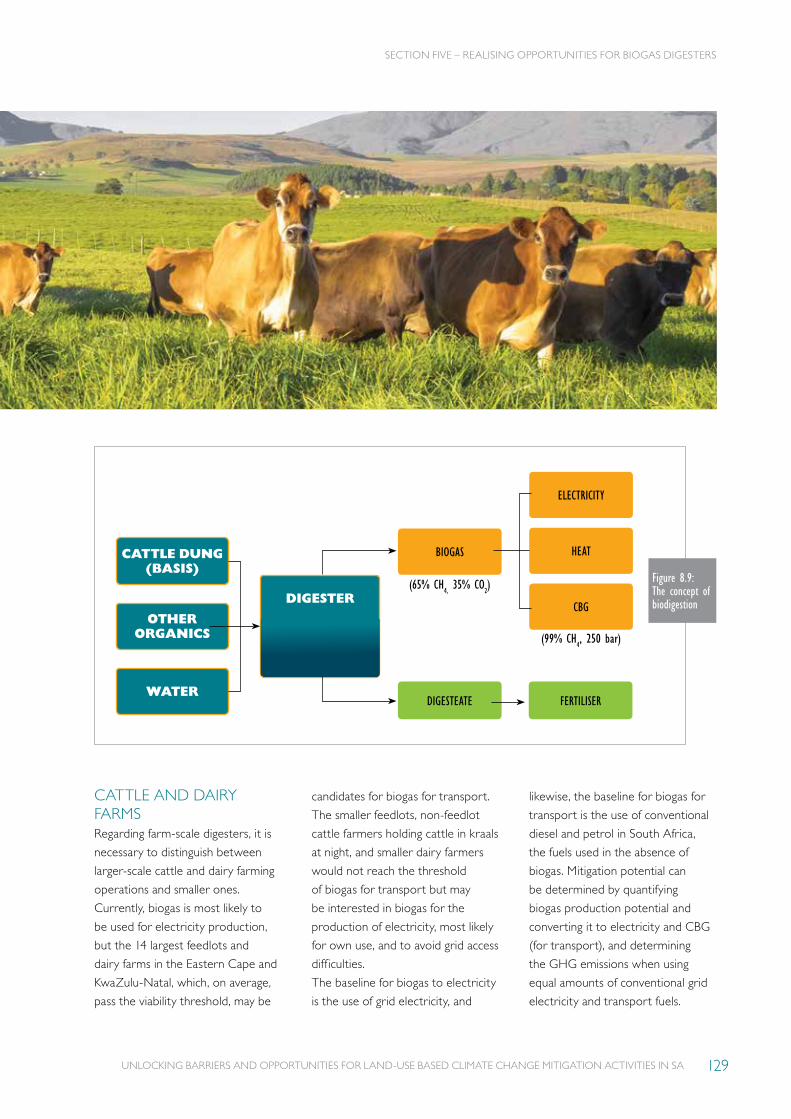
UNLOCKING BARRIERS AND OPPORTUNITIES FOR LAND-USE BASED CLIMATE CHANGE MITIGATION ACTIVITIES IN SA 129
CATTLE AND DAIRY FARMSRegarding farm-scale digesters, it is
necessary to distinguish between
larger-scale cattle and dairy farming
operations and smaller ones.
Currently, biogas is most likely to
be used for electricity production,
but the 14 largest feedlots and
dairy farms in the Eastern Cape and
KwaZulu-Natal, which, on average,
pass the viability threshold, may be
candidates for biogas for transport.
The smaller feedlots, non-feedlot
cattle farmers holding cattle in kraals
at night, and smaller dairy farmers
would not reach the threshold
of biogas for transport but may
be interested in biogas for the
production of electricity, most likely
for own use, and to avoid grid access
difficulties.
The baseline for biogas to electricity
is the use of grid electricity, and
likewise, the baseline for biogas for
transport is the use of conventional
diesel and petrol in South Africa,
the fuels used in the absence of
biogas. Mitigation potential can
be determined by quantifying
biogas production potential and
converting it to electricity and CBG
(for transport), and determining
the GHG emissions when using
equal amounts of conventional grid
electricity and transport fuels.
BIOGAS
(65% CH4, 35% CO
2)
(99% CH4, 250 bar)
DIGESTEATE FERTILISER
ELECTRICITY
HEAT
CBGDIGESTER
CATTLE DUNG (BASIS)
OTHER ORGANICS
WATER
SECTION FIVE – REALISING OPPORTUNITIES FOR BIOGAS DIGESTERS
Figure 8.9: The concept of biodigestion

UNLOCKING BARRIERS AND OPPORTUNITIES FOR LAND-USE BASED CLIMATE CHANGE MITIGATION ACTIVITIES IN SA130
8.2.2 Potential and carbon impact
For the two main groups with
biogas mitigation potential –
dairy farms and rural agricultural
households with cattle – the total
mitigation potential is estimated and
subsequently compared, since the
realised biogas potential is currently
very limited.
RURAL AGRICULTURAL HOUSEHOLDS – BIOGAS FOR COOKING AND HEATINGThe potential for the use of
biogas for cooking and heating is
quantified assessing the number
of households currently not using
gas or electricity for cooking, and
their heat consumption. By installing
biogas digesters, conventional fuels
for cooking could be replaced by
biogas. A successful introduction of
biogas digesters could also result in a
surplus of biogas, above the current
needs, being produced. However,
if biogas is not used to replace
conventional fuels, it may reduce the
amount of GHG in the atmosphere
and therefore not form a climate
change mitigation activity.
The average consumption of wood
for fuel in South Africa is estimated
at 4.5 tons per household per
annum. This estimate was based on
a study published by the Programme
for Basic Energy and Conservation,
a regional programme implemented
by the German Agency for Technical
Cooperation (Damm and Triebel,
2008). This study takes into account
several micro-studies at local level
and determines an average via
analysis. The equivalent energy value
of annual wood usage is estimated
to be 92 GJ/year based on the total
annual energy for cooking
and heating, including paraffin
and coal usage.
The average 92GJ/a or 253 MJ/d
energy demand of a rural household
cannot easily be satisfied by biogas
from a small-scale digester. A farmer
would need 59 cows to get enough
biogas to meet this demand from a
small-scale digester running mainly
on dung collected from cattle
kraaled only at night. Although
the variance in consumption of
wood per household is high, from
0.6–7.7 tons (Gandar, 1981, 1983;
Liengme, 1983; Banks, et al
1996), in most cases 1–10 cows
would be insufficient to fulfil
total energy demand.
With biogas being insufficient to
meet total demand, biogas potential
limits the total offset potential.
For the effective implementation
of biogas in rural agricultural
households, it may be necessary to
combine a variety of organic waste
streams in order to make biogas an
attractive and viable solution.
If cattle dung is to be used, it would
require rural households to kraal
cattle overnight, which is currently
not always done. For calculation
purposes, we assumed a range
of 40%–80% being kraaled
overnight. The circumstances
around practical implementation
and viability are dealt with in more
detail in Section 2 of this report,
‘Defining the gap’.
The calculation of baseline emissions
for rural agricultural household
cooking and heating not using
electricity is based on the known
fuel-mix of wood, LPG, paraffin and
coal (StatsSA, 2016). It is assumed
that these baseline emissions can
be offset by the use of biogas to
the extent that biogas can replace
conventional fuels. The dominant
factors for GHG mitigation are the
total energy value of biogas and
the GHG intensity (tCO2/GJ) of
the baseline for the specific fuel-
mix. There may be some leakage
of methane from biogas systems,
but generally the risk of leakage
is limited if systems are installed
and operated correctly. For rural
agricultural households cooking on
electricity the GHG intensity (tCO2/
GJ) of the baseline is determined
by the grid and is derived from the
known grid emission factor of 1.03
tCO2/MWh, as indicated in Eskom’s
annual report of 2011.
As illustrated in Figure 8.1, the
GHG mitigation potential for biogas
in rural agricultural households is
estimated to be 444,845 to 667,267
tonnes CO2 per annum. Under the
carbon tax offset mechanism (NT,
2015) this would represent a value
of 53 to 80 million Rand annually.
SECTION FIVE – REALISING OPPORTUNITIES FOR BIOGAS DIGESTERS
The average consumption of
wood for fuel in South Africa
is estimated at 4.5 tons
per household per annum.
This estimate was based
on a study published by the
Programme for Basic Energy
and Conservation, a regional
programme implemented
by the German Agency for
Technical Cooperation
(Damm and Triebel, 2008)

UNLOCKING BARRIERS AND OPPORTUNITIES FOR LAND-USE BASED CLIMATE CHANGE MITIGATION ACTIVITIES IN SA 131
A lack of data makes it impossible
to determine what percentage
of fuel wood might be collected
sustainably, but it is reasonable
to assume that wood collected
for cooking and heating is generally
harvested unsustainably. If this
is not the case, the emission
reduction potential reduces
the share of wood in the total
household energy needs
by 72%.
One of the major challenge for
realising the mitigation potential
of rural agricultural households
is convincing households currently
able to afford electricity to convert
partially to biogas.
CATTLE AND DAIRY FARMSAs mentioned above, the biogas mit-
igation potential for cattle and dairy
farmers is determined on the basis
of electricity generation offsetting
grid electricity. Data regarding head
of cattle and different ownership
categories was sourced from the De-
partment for Agriculture, Forestry
and Fisheries (DAFF, 2012/2015),
and data regarding dairy farming
from Milk South Africa’s Lacto Data
(MilkSA, 2016).
For calculations purposes, assump-
tions have been made regarding the
percentage of cattle or cows being
‘kraaled’. At feedlots, cattle stay pre-
dominantly where they are fed, and
have only very limited freedom to
walk around. Conservatively, it can
be assumed that 80%–90% of dung
can be collected. Commercial cattle
in the field are often not kraaled
at night and a kraaled percentage
of 20%–40% has been assumed.
Dairy farms generally gather cows
twice a day at the sheds to milk and
feed them. Most of the manure is
produced during this time. Con-
servatively, it can be assumed that
60%–80% of manure produced can
be collected at the sheds for biogas
production purposes.
Electricity is produced by means
of a generator that typically has an
electrical efficiency in the range of
30%–40%. For calculation purposes,
an electrical efficiency of 35% has
been used.
Table 8.1: Rural Agricultural Households – Mitigation potential biogas for cooking and heating
SECTION FIVE – REALISING OPPORTUNITIES FOR BIOGAS DIGESTERS
Source: Emission factors: Schedule 1 of the Draft Carbon Tax Bill (NT, 2015). Heating values: DEFRA, 2012 and WSP, 2010. Grid emission factor: Eskom annual report, 2011. Household cooking preferences: StatsSA, 2016.
FUEL FUEL (–) EMISSION FACTOR (TCO2/T FUEL)
HEATING VALUE (GJ/T)
CARBON INTENSITY (TCO2/GJ)
CONTRIBUTION FUEL MIX (TCO2/GJ)
Wood 72% 1.78 20.5 0.087 0.064
Lpg 13% 1.69 46.1 0.037 0.005
Paraffin 11% 2.96 43.9 0.067 0.007
Coal 2% 1.85 23.7 0.078 0.002
Other 2% Not Included Not Included Not Included Not Included
Weighted Average Fuel Mix Carbon Intensity 0.078
Total energy potential based on 5.54 million cattle – 100% kraaled 8.6 million GJ/a
Additional 20% for adding other waste 10.3 million GJ/a
Rural Households Not Using Electricity For Cooking 847.500
17%
0.078
Percentage of total rural households
Average GHG footprint of a household per GJ tCO2/GJ
Sub-Total 136.133
Rural Households Using Electricity For Cooking 1.652.500
33%
0.286
Percentage of total rural households
Average GHG footprint of a household per GJ tCO2/GJ
Sub-Total 975.979
Total emission reduction potential (100% kraaled) 1.112.112 tCO2/a
Total emission reduction potential (40–80% kraaled) 444.845–667.267 tCO2/a
Annual monetary value at 120 R/ton (NT, 2015) 53–80 tCO2/a
UNLOCKING BARRIERS AND OPPORTUNITIES FOR LAND-USE BASED CLIMATE CHANGE MITIGATION ACTIVITIES IN SA132
SECTION FIVE – REALISING OPPORTUNITIES FOR BIOGAS DIGESTERS
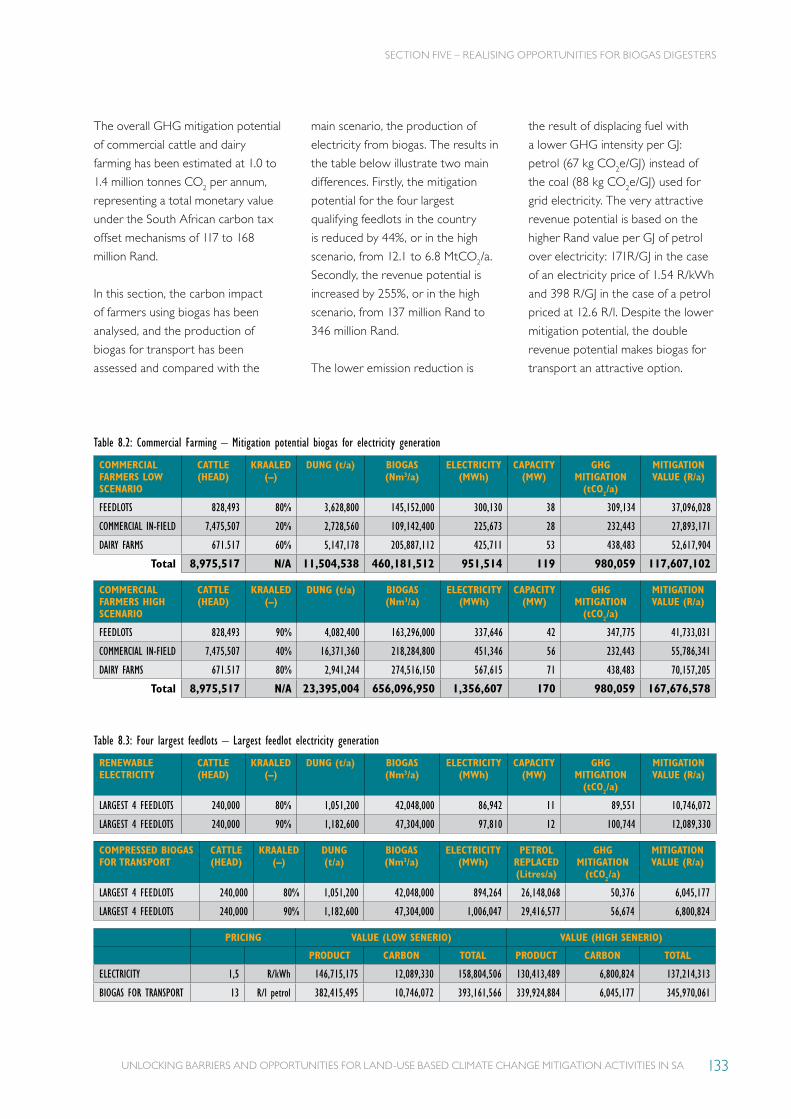
UNLOCKING BARRIERS AND OPPORTUNITIES FOR LAND-USE BASED CLIMATE CHANGE MITIGATION ACTIVITIES IN SA 133
The overall GHG mitigation potential
of commercial cattle and dairy
farming has been estimated at 1.0 to
1.4 million tonnes CO2 per annum,
representing a total monetary value
under the South African carbon tax
offset mechanisms of 117 to 168
million Rand.
In this section, the carbon impact
of farmers using biogas has been
analysed, and the production of
biogas for transport has been
assessed and compared with the
main scenario, the production of
electricity from biogas. The results in
the table below illustrate two main
differences. Firstly, the mitigation
potential for the four largest
qualifying feedlots in the country
is reduced by 44%, or in the high
scenario, from 12.1 to 6.8 MtCO2/a.
Secondly, the revenue potential is
increased by 255%, or in the high
scenario, from 137 million Rand to
346 million Rand.
The lower emission reduction is
the result of displacing fuel with
a lower GHG intensity per GJ:
petrol (67 kg CO2e/GJ) instead of
the coal (88 kg CO2e/GJ) used for
grid electricity. The very attractive
revenue potential is based on the
higher Rand value per GJ of petrol
over electricity: 171R/GJ in the case
of an electricity price of 1.54 R/kWh
and 398 R/GJ in the case of a petrol
priced at 12.6 R/l. Despite the lower
mitigation potential, the double
revenue potential makes biogas for
transport an attractive option.
SECTION FIVE – REALISING OPPORTUNITIES FOR BIOGAS DIGESTERS
Table 8.2: Commercial Farming – Mitigation potential biogas for electricity generation
COMMERCIAL FARMERS LOW SCENARIO
CATTLE (HEAD)
KRAALED (–)
DUNG (t/a) BIOGAS (Nm3/a)
ELECTRICITY (MWh)
CAPACITY(MW)
GHG MITIGATION
(tCO2/a)
MITIGATION VALUE (R/a)
FEEDLOTS 828,493 80% 3,628,800 145,152,000 300,130 38 309,134 37,096,028
COMMERCIAL IN-FIELD 7,475,507 20% 2,728,560 109,142,400 225,673 28 232,443 27,893,171
DAIRY FARMS 671.517 60% 5,147,178 205,887,112 425,711 53 438,483 52,617,904
Total 8,975,517 N/A 11,504,538 460,181,512 951,514 119 980,059 117,607,102
Table 8.3: Four largest feedlots – Largest feedlot electricity generation
RENEWABLE ELECTRICITY
CATTLE (HEAD)
KRAALED (–)
DUNG (t/a) BIOGAS (Nm3/a)
ELECTRICITY (MWh)
CAPACITY(MW)
GHG MITIGATION
(tCO2/a)
MITIGATION VALUE (R/a)
LARGEST 4 FEEDLOTS 240,000 80% 1,051,200 42,048,000 86,942 11 89,551 10,746,072
LARGEST 4 FEEDLOTS 240,000 90% 1,182,600 47,304,000 97,810 12 100,744 12,089,330
COMPRESSED BIOGAS FOR TRANSPORT
CATTLE (HEAD)
KRAALED (–)
DUNG (t/a)
BIOGAS (Nm3/a)
ELECTRICITY (MWh)
PETROL REPLACED(Litres/a)
GHG MITIGATION
(tCO2/a)
MITIGATION VALUE (R/a)
LARGEST 4 FEEDLOTS 240,000 80% 1,051,200 42,048,000 894,264 26,148,068 50,376 6,045,177
LARGEST 4 FEEDLOTS 240,000 90% 1,182,600 47,304,000 1,006,047 29,416,577 56,674 6,800,824
PRICING VALUE (LOW SENERIO) VALUE (HIGH SENERIO)
PRODUCT CARBON TOTAL PRODUCT CARBON TOTAL
ELECTRICITY 1,5 R/kWh 146,715,175 12,089,330 158,804,506 130,413,489 6,800,824 137,214,313
BIOGAS FOR TRANSPORT 13 R/l petrol 382,415,495 10,746,072 393,161,566 339,924,884 6,045,177 345,970,061
COMMERCIAL FARMERS HIGH SCENARIO
CATTLE (HEAD)
KRAALED (–)
DUNG (t/a) BIOGAS (Nm3/a)
ELECTRICITY (MWh)
CAPACITY(MW)
GHG MITIGATION
(tCO2/a)
MITIGATION VALUE (R/a)
FEEDLOTS 828,493 90% 4,082,400 163,296,000 337,646 42 347,775 41,733,031
COMMERCIAL IN-FIELD 7,475,507 40% 16,371,360 218,284,800 451,346 56 232,443 55,786,341
DAIRY FARMS 671.517 80% 2,941,244 274,516,150 567,615 71 438,483 70,157,205
Total 8,975,517 N/A 23,395,004 656,096,950 1,356,607 170 980,059 167,676,578
UNLOCKING BARRIERS AND OPPORTUNITIES FOR LAND-USE BASED CLIMATE CHANGE MITIGATION ACTIVITIES IN SA134
Project developers cur-
rently see captive proj-
ects producing electricity
for own consumption as
the main option. Farms with a sub-
stantial amount of manure and other
organic waste available can produce
sufficient electricity to cover the bio-
gas to electricity potential. However,
each case is different, and to unlock
the full potential, grid access and
feed-in rate issues also need to be
addressed.
For larger cattle farms, dairy farms
without milk processing, and the
larger feedlots, captive power can
be limited by on-farm demand.
Wheeling electricity via the grid to
a customer, or selling electricity to
Eskom or a municipality, although
not impossible, is a complex and
lengthy process as the regulations
that standardise a project-viable
feed-in rate and allow for easy
access are lacking. In practice, there
are more captive biogas projects
than grid-connected biogas projects,
which is a sign that material barriers
for the development of grid-
connected projects exist.
There is currently no up-to-date
national database available. A
project list has been compiled using
multiple sources:
• SABIA’s list of projects (SABIA,
2014).
• A recent GIZ study of projects
in the Eastern Cape (GIZ, 2016).
• Stakeholder engagement and
desk research.
Only biogas projects that concern
farms or agricultural households
have been selected. The intention
was initially to focus only on realised
initiatives, but some projects
in the planning phase have also
been included. The status of the
projects is indicated in a separate
column in Table 8.4, and it is
evident that projects which were
successfully commissioned did not
always became operational, or,
after becoming operational, some
projects ran into problems.
The table illustrates that farm-
related projects are all aimed
at electricity production or a
combination of electricity and heat
production, while rural household
projects are aimed at producing
heat, mainly for cooking purposes.
Only one feedlot with biogas
projects has been identified, while
the 14 largest feedlots in South
8.3PRIOR AND EXISTING PROJECTS
SECTION FIVE – REALISING OPPORTUNITIES FOR BIOGAS DIGESTERS
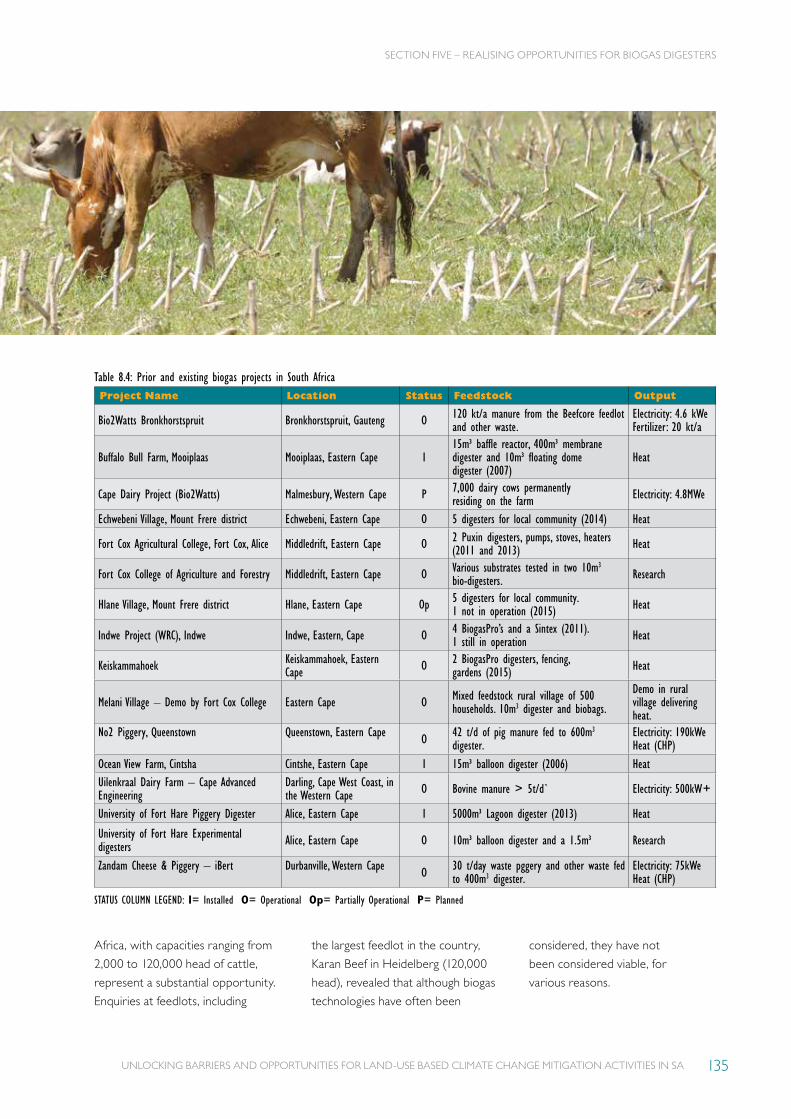
UNLOCKING BARRIERS AND OPPORTUNITIES FOR LAND-USE BASED CLIMATE CHANGE MITIGATION ACTIVITIES IN SA 135
Africa, with capacities ranging from
2,000 to 120,000 head of cattle,
represent a substantial opportunity.
Enquiries at feedlots, including
Table 8.4: Prior and existing biogas projects in South AfricaProject Name Location Status Feedstock Output
Bio2Watts Bronkhorstspruit Bronkhorstspruit, Gauteng O 120 kt/a manure from the Beefcore feedlot and other waste.
Electricity: 4.6 kWe Fertilizer: 20 kt/a
Buffalo Bull Farm, Mooiplaas Mooiplaas, Eastern Cape I15m³ baffle reactor, 400m³ membrane digester and 10m³ floating dome digester (2007)
Heat
Cape Dairy Project (Bio2Watts) Malmesbury, Western Cape P 7,000 dairy cows permanently residing on the farm Electricity: 4.8MWe
Echwebeni Village, Mount Frere district Echwebeni, Eastern Cape O 5 digesters for local community (2014) Heat
Fort Cox Agricultural College, Fort Cox, Alice Middledrift, Eastern Cape O 2 Puxin digesters, pumps, stoves, heaters (2011 and 2013) Heat
Fort Cox College of Agriculture and Forestry Middledrift, Eastern Cape O Various substrates tested in two 10m3 bio-digesters. Research
Hlane Village, Mount Frere district Hlane, Eastern Cape Op 5 digesters for local community. 1 not in operation (2015) Heat
Indwe Project (WRC), Indwe Indwe, Eastern, Cape O 4 BiogasPro’s and a Sintex (2011). 1 still in operation Heat
Keiskammahoek Keiskammahoek, Eastern Cape O 2 BiogasPro digesters, fencing,
gardens (2015) Heat
Melani Village – Demo by Fort Cox College Eastern Cape O Mixed feedstock rural village of 500 households. 10m3 digester and biobags.
Demo in rural village delivering heat.
No2 Piggery, Queenstown Queenstown, Eastern Cape O 42 t/d of pig manure fed to 600m3 digester.
Electricity: 190kWe Heat (CHP)
Ocean View Farm, Cintsha Cintshe, Eastern Cape I 15m³ balloon digester (2006) HeatUilenkraal Dairy Farm – Cape Advanced Engineering
Darling, Cape West Coast, in the Western Cape O Bovine manure > 5t/d` Electricity: 500kW+
University of Fort Hare Piggery Digester Alice, Eastern Cape I 5000m³ Lagoon digester (2013) Heat
University of Fort Hare Experimental digesters Alice, Eastern Cape O 10m³ balloon digester and a 1.5m³ Research
Zandam Cheese & Piggery – iBert Durbanville, Western Cape O 30 t/day waste pggery and other waste fed to 400m3 digester.
Electricity: 75kWe Heat (CHP)
STATUS COLUMN LEGEND: I= Installed O= Operational Op= Partially Operational P= Planned
the largest feedlot in the country,
Karan Beef in Heidelberg (120,000
head), revealed that although biogas
technologies have often been
considered, they have not
been considered viable, for
various reasons.
SECTION FIVE – REALISING OPPORTUNITIES FOR BIOGAS DIGESTERS
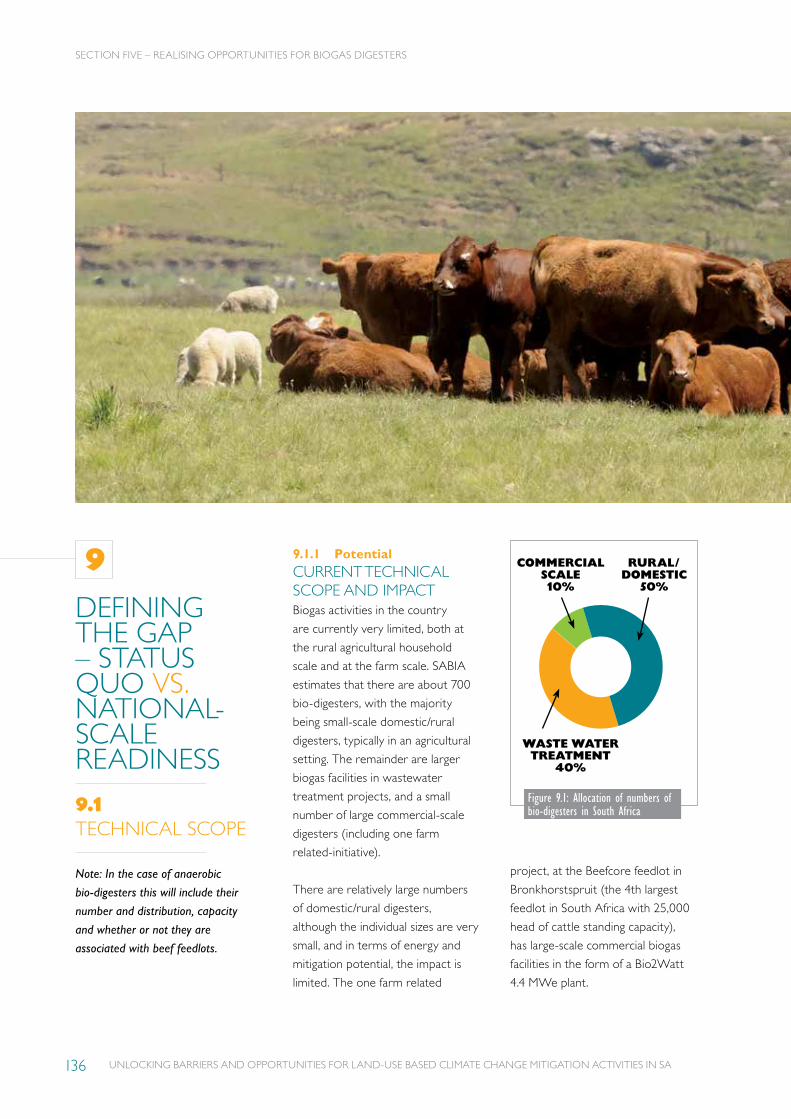
UNLOCKING BARRIERS AND OPPORTUNITIES FOR LAND-USE BASED CLIMATE CHANGE MITIGATION ACTIVITIES IN SA136
DEFINING THE GAP – STATUS QUO VS. NATIONAL-SCALE READINESS
9.1TECHNICAL SCOPE
Note: In the case of anaerobic
bio-digesters this will include their
number and distribution, capacity
and whether or not they are
associated with beef feedlots.
9.1.1 PotentialCURRENT TECHNICAL SCOPE AND IMPACTBiogas activities in the country
are currently very limited, both at
the rural agricultural household
scale and at the farm scale. SABIA
estimates that there are about 700
bio-digesters, with the majority
being small-scale domestic/rural
digesters, typically in an agricultural
setting. The remainder are larger
biogas facilities in wastewater
treatment projects, and a small
number of large commercial-scale
digesters (including one farm
related-initiative).
There are relatively large numbers
of domestic/rural digesters,
although the individual sizes are very
small, and in terms of energy and
mitigation potential, the impact is
limited. The one farm related
project, at the Beefcore feedlot in
Bronkhorstspruit (the 4th largest
feedlot in South Africa with 25,000
head of cattle standing capacity),
has large-scale commercial biogas
facilities in the form of a Bio2Watt
4.4 MWe plant.
RURAL/DOMESTIC
50%
COMMERCIAL SCALE10%
9
SECTION FIVE – REALISING OPPORTUNITIES FOR BIOGAS DIGESTERS
WASTE WATER TREATMENT
40%
Figure 9.1: Allocation of numbers of bio-digesters in South Africa

UNLOCKING BARRIERS AND OPPORTUNITIES FOR LAND-USE BASED CLIMATE CHANGE MITIGATION ACTIVITIES IN SA 137
LIVESTOCK NO OF ANIMALS MITIGATION POTENTIAL [TCO2]
Cattle 13,840,000 2,406,176
Sheep 24,332,571 944,513
Chicken 142,687,572 886,189
Dairy 671,517 729,853
Goats 6,039,490 234,434
Pigs 1,566,655 182,438
Total 189,137,805 5,383,603
The current numbers of biogas
projects and the relatively few
realised farm-related initiatives
mentioned in Section 1.3 show
that the overall potential of the
fledgling biogas industry in South
Africa is still to be unlocked.
OPTIMAL SCOPE AND POTENTIALTaking into account the faeces from
cattle, dairy cows, chickens, pigs,
sheep and goats, the theoretical
potential in South Africa is 5.4 Mt
CO2, assuming that all biogas for
offsetting electricity from the grid
has a 35% biogas to electricity
Note: Underlying faeces per day and biogas yields as per Austin & Blignaut, 2007.
Table 9.1: Theoretical biogas potential from animal faeces
SECTION FIVE – REALISING OPPORTUNITIES FOR BIOGAS DIGESTERS
efficiency (see table above). To
estimate practical potential, one
needs to consider the extent to
which each type of animal is held
in large numbers, at specific point
sources, where fresh faeces can be
collected effectively.
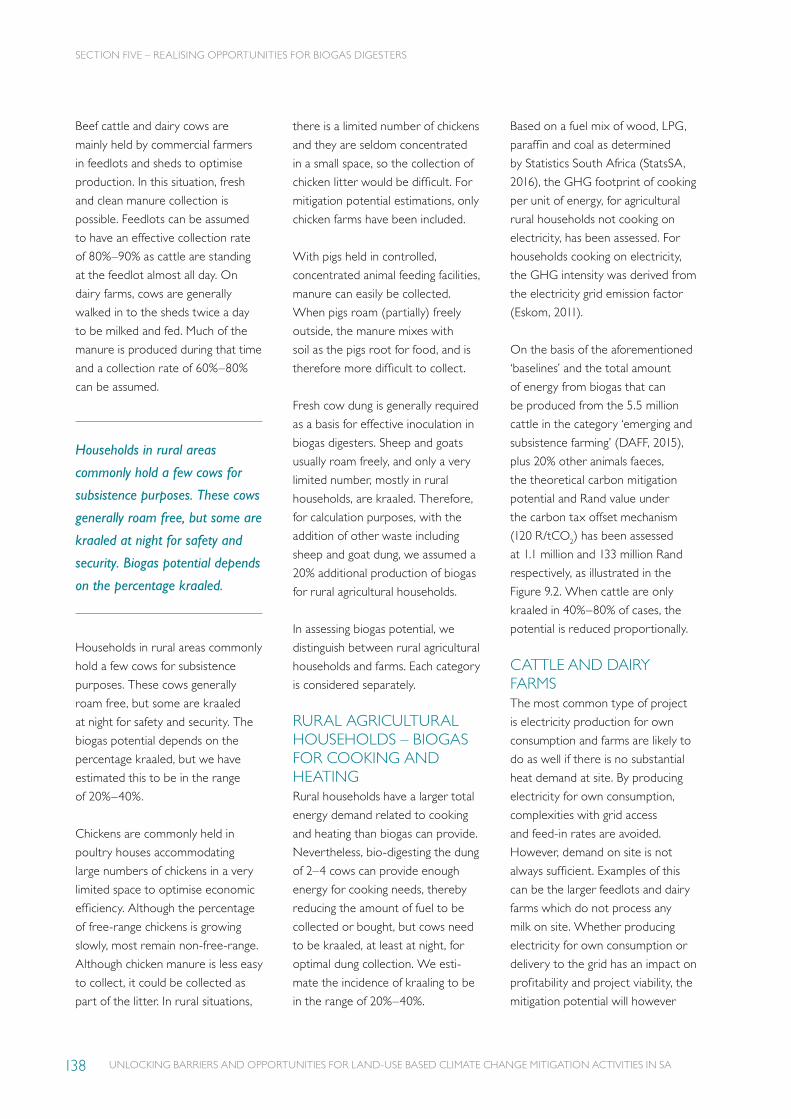
UNLOCKING BARRIERS AND OPPORTUNITIES FOR LAND-USE BASED CLIMATE CHANGE MITIGATION ACTIVITIES IN SA138
Beef cattle and dairy cows are
mainly held by commercial farmers
in feedlots and sheds to optimise
production. In this situation, fresh
and clean manure collection is
possible. Feedlots can be assumed
to have an effective collection rate
of 80%–90% as cattle are standing
at the feedlot almost all day. On
dairy farms, cows are generally
walked in to the sheds twice a day
to be milked and fed. Much of the
manure is produced during that time
and a collection rate of 60%–80%
can be assumed.
Households in rural areas commonly
hold a few cows for subsistence
purposes. These cows generally
roam free, but some are kraaled
at night for safety and security. The
biogas potential depends on the
percentage kraaled, but we have
estimated this to be in the range
of 20%–40%.
Chickens are commonly held in
poultry houses accommodating
large numbers of chickens in a very
limited space to optimise economic
efficiency. Although the percentage
of free-range chickens is growing
slowly, most remain non-free-range.
Although chicken manure is less easy
to collect, it could be collected as
part of the litter. In rural situations,
there is a limited number of chickens
and they are seldom concentrated
in a small space, so the collection of
chicken litter would be difficult. For
mitigation potential estimations, only
chicken farms have been included.
With pigs held in controlled,
concentrated animal feeding facilities,
manure can easily be collected.
When pigs roam (partially) freely
outside, the manure mixes with
soil as the pigs root for food, and is
therefore more difficult to collect.
Fresh cow dung is generally required
as a basis for effective inoculation in
biogas digesters. Sheep and goats
usually roam freely, and only a very
limited number, mostly in rural
households, are kraaled. Therefore,
for calculation purposes, with the
addition of other waste including
sheep and goat dung, we assumed a
20% additional production of biogas
for rural agricultural households.
In assessing biogas potential, we
distinguish between rural agricultural
households and farms. Each category
is considered separately.
RURAL AGRICULTURAL HOUSEHOLDS – BIOGAS FOR COOKING AND HEATINGRural households have a larger total
energy demand related to cooking
and heating than biogas can provide.
Nevertheless, bio-digesting the dung
of 2–4 cows can provide enough
energy for cooking needs, thereby
reducing the amount of fuel to be
collected or bought, but cows need
to be kraaled, at least at night, for
optimal dung collection. We esti-
mate the incidence of kraaling to be
in the range of 20%–40%.
Based on a fuel mix of wood, LPG,
paraffin and coal as determined
by Statistics South Africa (StatsSA,
2016), the GHG footprint of cooking
per unit of energy, for agricultural
rural households not cooking on
electricity, has been assessed. For
households cooking on electricity,
the GHG intensity was derived from
the electricity grid emission factor
(Eskom, 2011).
On the basis of the aforementioned
‘baselines’ and the total amount
of energy from biogas that can
be produced from the 5.5 million
cattle in the category ‘emerging and
subsistence farming’ (DAFF, 2015),
plus 20% other animals faeces,
the theoretical carbon mitigation
potential and Rand value under
the carbon tax offset mechanism
(120 R/tCO2) has been assessed
at 1.1 million and 133 million Rand
respectively, as illustrated in the
Figure 9.2. When cattle are only
kraaled in 40%–80% of cases, the
potential is reduced proportionally.
CATTLE AND DAIRY FARMSThe most common type of project
is electricity production for own
consumption and farms are likely to
do as well if there is no substantial
heat demand at site. By producing
electricity for own consumption,
complexities with grid access
and feed-in rates are avoided.
However, demand on site is not
always sufficient. Examples of this
can be the larger feedlots and dairy
farms which do not process any
milk on site. Whether producing
electricity for own consumption or
delivery to the grid has an impact on
profitability and project viability, the
mitigation potential will however
SECTION FIVE – REALISING OPPORTUNITIES FOR BIOGAS DIGESTERS
Households in rural areas
commonly hold a few cows for
subsistence purposes. These cows
generally roam free, but some are
kraaled at night for safety and
security. Biogas potential depends
on the percentage kraaled.

UNLOCKING BARRIERS AND OPPORTUNITIES FOR LAND-USE BASED CLIMATE CHANGE MITIGATION ACTIVITIES IN SA 139
be unaffected, as it still concerns the
replacement of grid electricity.
Producing heat from biogas is not
likely to be a viable business case as
alternatives like wood and coal can
be available at a much lower cost.
Offsetting grid electricity in that
sense makes most economic sense.
Moreover, with electricity prices
likely to further rise in the future and
continued risk regarding security of
supply in the country it remains an
attractive case.
Using the effective collection rate
estimates (see above) based on
animal husbandry practices like
kraaling animals for the night, holding
of animals in stables and feedlots,
the numbers of animals, dung per
animal per day and a biogas yield,
the practical biogas potential has
been calculated and compared with
the theoretical potential using a
100% collection rate. The overall
results are presented in Figure 9.3.
Subsistence farming has been
included in the potential for rural
agricultural households.
Figure 9.3: Beef and dairy farming mitigation potential
Cooking on electricity (847,500 households)
Not cooking on electricity (1,652,500 households)
Baseline electricity: 0.286 tCO
2/GJ
Baseline fuel-mix: 0.078 tCO
2/GJ
5,54 million cattle (8,6 mil GJ/a biogas)+20% for other waste (10,3 mil GJ/a biogas)
Dung kraaled cattle: 5kg/night
(Austin & Blignaut, 2007)Biogas yield (60% methane):
40 Nm3/t
EFFECTIVE COLLECTION RATES
TYPE THEORETICAL HIGH LOW
Feedlots 100% 80% 90%
Commercial In-field 100% 20% 40%
Dairy Farms 100% 60% 80%
THEORETICAL POTENTIAL
100%
KRA
ALED
80%
KRA
ALED
40%
667 kt CO2e
R80 mil
445 kt CO2e
R53 mil
PRACTICAL POTENTIAL
2 500 000
2 000 000
1 500 000
1 000 000
500 000
0FARMING TOTAL COMMERCIAL IN-FIELDFEEDLOTS DAIRY FARMS
SECTION FIVE – REALISING OPPORTUNITIES FOR BIOGAS DIGESTERS
Figure 9.2:Rural agricultural households mitigation potential
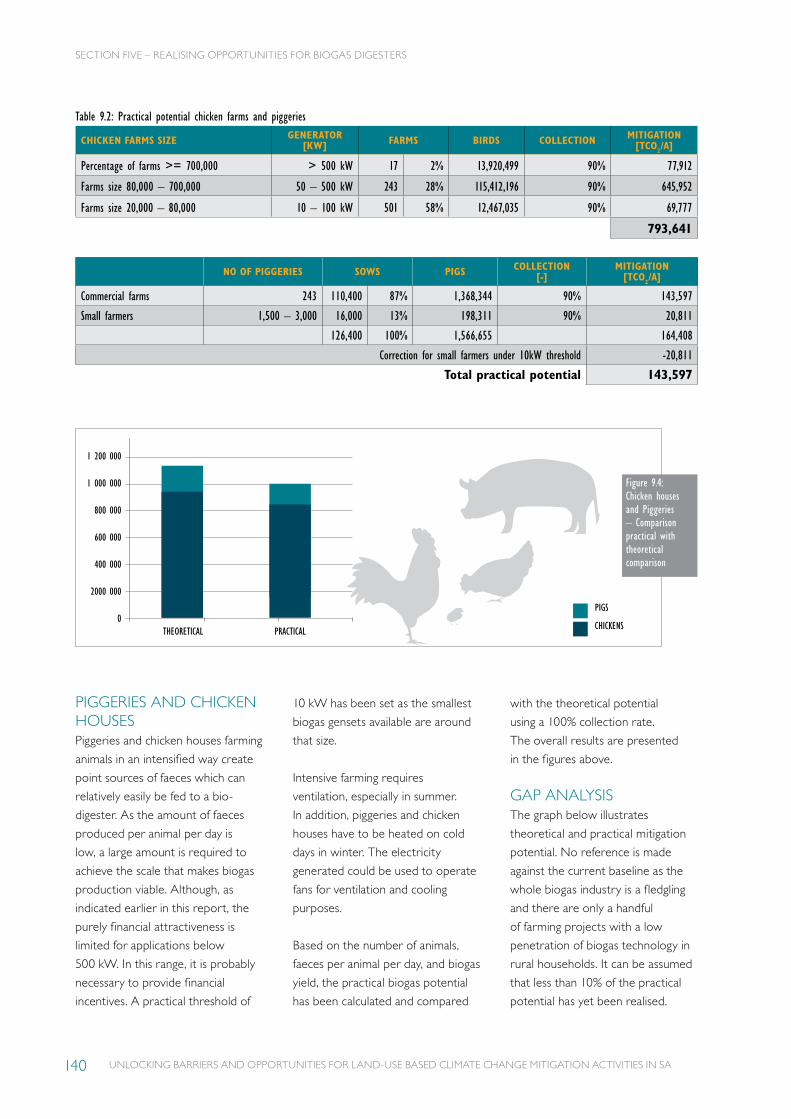
UNLOCKING BARRIERS AND OPPORTUNITIES FOR LAND-USE BASED CLIMATE CHANGE MITIGATION ACTIVITIES IN SA140
Table 9.2: Practical potential chicken farms and piggeries
CHICKEN FARMS SIZE GENERATOR [KW] FARMS BIRDS COLLECTION MITIGATION
[TCO2/A]
Percentage of farms >= 700,000 > 500 kW 17 2% 13,920,499 90% 77,912
Farms size 80,000 – 700,000 50 – 500 kW 243 28% 115,412,196 90% 645,952
Farms size 20,000 – 80,000 10 – 100 kW 501 58% 12,467,035 90% 69,777
793,641
NO OF PIGGERIES SOWS PIGS COLLECTION [-]
MITIGATION [TCO2/A]
Commercial farms 243 110,400 87% 1,368,344 90% 143,597
Small farmers 1,500 – 3,000 16,000 13% 198,311 90% 20,811
126,400 100% 1,566,655 164,408
Correction for small farmers under 10kW threshold -20,811
Total practical potential 143,597
PIGGERIES AND CHICKEN HOUSESPiggeries and chicken houses farming
animals in an intensified way create
point sources of faeces which can
relatively easily be fed to a bio-
digester. As the amount of faeces
produced per animal per day is
low, a large amount is required to
achieve the scale that makes biogas
production viable. Although, as
indicated earlier in this report, the
purely financial attractiveness is
limited for applications below
500 kW. In this range, it is probably
necessary to provide financial
incentives. A practical threshold of
1 200 000
1 000 000
800 000
600 000
400 000
2000 000
0THEORETICAL PRACTICAL
PIGS
CHICKENS
SECTION FIVE – REALISING OPPORTUNITIES FOR BIOGAS DIGESTERS
10 kW has been set as the smallest
biogas gensets available are around
that size.
Intensive farming requires
ventilation, especially in summer.
In addition, piggeries and chicken
houses have to be heated on cold
days in winter. The electricity
generated could be used to operate
fans for ventilation and cooling
purposes.
Based on the number of animals,
faeces per animal per day, and biogas
yield, the practical biogas potential
has been calculated and compared
with the theoretical potential
using a 100% collection rate.
The overall results are presented
in the figures above.
GAP ANALYSISThe graph below illustrates
theoretical and practical mitigation
potential. No reference is made
against the current baseline as the
whole biogas industry is a fledgling
and there are only a handful
of farming projects with a low
penetration of biogas technology in
rural households. It can be assumed
that less than 10% of the practical
potential has yet been realised.
Figure 9.4: Chicken houses and Piggeries – Comparison practical with theoretical comparison

UNLOCKING BARRIERS AND OPPORTUNITIES FOR LAND-USE BASED CLIMATE CHANGE MITIGATION ACTIVITIES IN SA 141
TOTAL POTENTIAL
CHICKEN FARMS
RURAL HOUSEHOLDS
DAIRY FARMS
COMMERCIAL IN-FIELD CATTLE
FEEDLOTS (STANDING CATTLE)
PIGGERIES
0 1 000 3 0002 000 4 000 5 000
SECTION FIVE – REALISING OPPORTUNITIES FOR BIOGAS DIGESTERS
The total theoretical potential is 4.5
million tCO2/a, of which 3.0 million
tCO2/a can practically be realised
in an optimistic high scenario, and
2.6 million tCO2/a can practically be
realised in a low scenario. Although
the practically achievable mitigation
potential of the low and high
scenarios for the different categories
is of the same order of magnitude, it
should be noted that the potential of
rural households and commercial in-
field cattle will be harder to realise
because they constitute a wide
spread of small point sources across
the country. Nevertheless, in these
categories, biogas technology can
improve the lives of rural farming
communities significantly and
therefore is attractive from a socio-
economic standpoint.
Figure 9.5: Unrealised potential in farming and agricultural rural households

UNLOCKING BARRIERS AND OPPORTUNITIES FOR LAND-USE BASED CLIMATE CHANGE MITIGATION ACTIVITIES IN SA142
9.2DRIVERS AND BARRIERS
CURRENT DRIVERS AND BARRIERSThe project team engaged with
farmers and project developers to
identify and assess opportunities
and barriers. This included attending
the national biogas conference in
November 2015 in the context of
a biogas for transport study. From
these engagements and previous
studies concerning biogas in South
Africa, the following main drivers
and barriers have been identified
and categorised according to three
subcategories:
• Policy and regulations.
• Economics.
• Technical and operational
The identified barriers and drivers
are discussed per subcategory,
below.
POLICY AND REGULATIONS As described in Section 7 of this
report, there is a myriad of acts and
regulations one needs to comply
with when developing a project. The
approval process can
be complex and costly, involving
several specialist studies. Although
the specific regulations are intended
to ensure the development of
environmentally sustainable projects,
they can be quite cumbersome and
the approval processes can take
3–5 years to conclude. However,
not all project developers have
the same experience and in some
cases licences have been obtained
smoothly. Part of the problem, in
the context of these regulations,
is dealing with the new concepts
associated with a new type of
technology, which requires expertise
on the part of both project
developers and government.
There are two main regulatory
issues inhibiting the unlocking of the
potential of biogas to electricity:
clear regulations facilitating grid
access and a feed-in rate. Although
government is running a successful
REIPPP programme for utility-scale
renewables, this programme is not
suited for smaller-scale biogas to
electricity projects. Moreover,
the small scale IPP programme
Note: The exploration of drivers and barriers is equally applicable to both the realization of biogas digester opportunities as well as biomass-to-energy initiatives. It is only considered once here to avoid unnecessary replication.
SECTION FIVE – REALISING OPPORTUNITIES FOR BIOGAS DIGESTERS

UNLOCKING BARRIERS AND OPPORTUNITIES FOR LAND-USE BASED CLIMATE CHANGE MITIGATION ACTIVITIES IN SA 143
(1-5 MWe) running alongside the
REIPPP programme is not getting
much traction and it does not
include any biogas projects so far.
For project developers who
are not preferred bidders in a
government IPP programme,
obtaining a licence is a non-standard
process. The Bio2Watt project
in Bronkhorstspruit managed
to get a licence from NERSA
through agreements with the City
of Tshwane and Eskom for the
wheeling of the power between
the project developer and the
power purchaser, BMW. However,
this was only achieved after a long
and complex process developing
and concluding new wheeling
arrangements.
Currently, under the Electricity
Regulation Act of 2006, one is
allowed to construct and operate
any generation plant for own use,
or a captive project. The electricity
regulation second amendment bill,
when promulgated, will place a limit
of 1 MWe on this exemption. It is
currently not clear if net-metering
(using grid electricity, but also
delivering to the grid, and only being
charged for the net usage) would
fall under ‘own usage’. This could,
however, assist in optimising captive
projects economically.
In terms of policy, biogas and other
renewables are promoted according
the 2003 White Paper on Renew-
able Energy and the subsequent
Green Accord of 2011, which
commit government to developing
future renewable energy resources
strategically in a systematic way.
In line with these policies, renew-
able energy is firmly embedded
in several national, provincial and
municipal strategies, programmes
and projects. Several governmental
initiatives do include biogas, but they
often lack an emphasis on biogas,
in particular, resulting in a slow and
low uptake of biogas as part of these
initiatives. Examples of this, such as
the NHES, IPP programmes and
SAREC, were provided in Section
1.1.2 of this report, ‘Social context
and governance’.
The Working for Energy (WfE)
programme managed by the DoE in
collaboration with SANEDI includes
‘biogas to energy from agricultural
waste’ and also has other renewable
energy priority areas focused on
smaller-scale applications and job
creation. The WfE programme
incentivises several biogas projects,
but the current projects have
not been very successful, possibly
resulting from of a lack of sufficient
expertise to bring small scale
projects to fruition. The Greening
Programmes and Fund, led by the
DEA in partnership with UNIDO
and GEF, also promotes biogas and
funds demonstration projects but this
has not funded any projects as yet.
ECONOMICSOne major limitation for the uptake
of biogas technology in South Africa
is its profitability. Payback times,
more often than not, exceed 10
years. BiogasSA indicates that only
in the case of farm-size digesters
in the order of 0.5 MWe or above
is the payback period reduced to
5–6 years.
SECTION FIVE – REALISING OPPORTUNITIES FOR BIOGAS DIGESTERS
UNLOCKING BARRIERS AND OPPORTUNITIES FOR LAND-USE BASED CLIMATE CHANGE MITIGATION ACTIVITIES IN SA144
Circumstances in South Africa are
different from, for example, Europe,
and spicifically Germany, where a
biogas market has developed rapidly
over the last decade, driven by a
high electricity price, subsidies, easy
access to the electricity/gas grid, as
well as waste disposal restrictions
and gate-fees.
A major challenge for the biogas
industry is developing affordable
concepts while maximising outputs
for revenue generation to stimulate
the uptake of biogas technology.
Government could play a role in
providing fair compensation for the
renewable energy and co-benefits
the biogas industry could deliver.
The small size and relative
complexity of biogas projects makes
them less attractive for financiers
and funders. With a lack of biogas-
dedicated funds, attention shifts to
larger projects in other renewable
energy sectors, such as solar and
wind. To some extent, government
is also more focused on solar and
wind, with the IPP programmes
dominated by these. The section
12B three-year accelerated
allowance for renewable energy
machinery investments includes
a special provision for small scale
solar PV (<1 MW) in the case of
self-consumption, allowing a 100%
investment allowance in year one.
This provision does not apply to
other forms of renewable energy,
even though biogas, which is limited
in scale by its nature, could benefit
greatly from such a provision.
One significant economic driver for
the uptake of biogas technology is
‘energy independence’, which would
protect ‘for-own-use’ producers
from power interruptions. Although
supply and demand became
more balanced since 2015, there
is still a risk of load shedding. In
rural areas, failure in transmission
infrastructure is a common cause
of power interruptions for farmers.
Energy independence would also
protect producers from Eskom price
increases. Over the period 2007 to
2015, electricity tariffs tripled, and
the price increase for 2016/17 was
9%. There is a considerable risk that
further price hikes are in store.
Biogas that is converted into
Compressed Biogas (CBG) and sold
as a transport fuel is not liable for
the levies and taxes applicable to
fuel goods as it is not recognised as
a fuel good. Consequently, a gross
tax advantage of about 33.6% is
achieved over conventional fuels.
In contrast to fuel goods, however,
CBG is liable to 14% VAT. The
total net benefit is therefore about
20%. How long this ‘informal tax
incentive’ deriving from a loophole
in tax regulations is likely to
continue, is uncertain.
TECHNICAL AND OPERATIONALCertain characteristics of biogas
technology make the development
of successful projects more
complex than, for example, solar
PV projects, whereby the end user,
after installation, can continue using
electricity as usual. For the end-
user of electricity produced from a
biogas digester installation, there is a
much higher degree of involvement
with the operation: biomass needs
to be sourced frequently, and new
systems need to be operated and
maintained. From stakeholder
engagement with the application
of biogas digesters on farms and in
rural households, it has emerged
that a lack of understanding of what
is required to feed and operate
the bio-digester correctly can
lead to bio-digesters becoming
dysfunctional. While this should
be prevented through proper
instruction upon installation and
ongoing support afterwards, the
result is that biogas sometimes gets
a bad reputation.
SABIA indicates that the fledgling
biogas industry could benefit from
further professionalisation through
the introduction of quality standards
and by comprehensive training of
installers. Further professionalisation
would ensure that installations are
done correctly and with the right
support to end-users for biogas
digesters to be managed optimally.
The industry would also benefit
from the development of new
concepts that perform better under
local market circumstances, and the
effective adaptation of imported
concepts. Industrial R&D could
support such developments.
OPTIMAL SITUATION WITH KEY DRIVERS IN PLACEFollowing the categorisation of
barriers and drivers above, the
optimal situation in which barriers
are eliminated and drivers are
strengthened is described below. In
the process, the gap between the
current state of play and the desired
optimal situation becomes visible.
SECTION FIVE – REALISING OPPORTUNITIES FOR BIOGAS DIGESTERS

UNLOCKING BARRIERS AND OPPORTUNITIES FOR LAND-USE BASED CLIMATE CHANGE MITIGATION ACTIVITIES IN SA 145
Table 9.3: A summary of barriers and drivers to implementationPOLICY AND REGULATIONS
Barrier Or Driver Optimal Situation
Barr
ier Complex compliance to acts and regulations Guidelines for streamlining the licensing of biogas installations both for project developers and govern-
ment officials.Regulations adjusted on biogas critical points to facilitate streamlining of licensing.
Barr
ier Non-standardized grid access and feed-in
tariff for electricity producers not qualifying for government’s IPP programmes.
Access to the grid for small-scale producers can be arranged with NERSA for wheeling electricity over the grid.A feed-in rate is established for small-scale producers not able to participate in IPP programmes.
Dri
ver
Electricity Regulation Act of 2006, genera-tion license exemption for own use. Future limitation: < 1MWe
The exemption is maintained and a future limitation removed or increased to 5MWe such that practi-cally any biogas to electricity projects for own use is exempt. Net metering allowed as along as small scale project abide overall consume thereby abiding to the ‘for own use’ principle.
Dri
ver
Renewable energy policies including biogas as part of a larger portfolio
Strengthened biogas components in off-grid electrification programme of the New Household Electrifica-tion Strategy (NHES) and consider inclusion of SABIA in SAREC.A simplified small-scale RE IPP programme acknowledging scale or replacement by providing an alterna-tive access and feed-in tariff for small scale RE IPPs (see barrier above).
Dri
ver Working for Energy (WfE) programme and
Greening Programmes and Fund.The WfE programme and Greening Programmes and Fund support respectively successful rural and larger scale demos with assistance of experts with in-depth knowledge of biogas and viable concepts.
ECONOMY Barrier Or Driver Optimal Situation
Barr
ier Profitability of current biogas to energy
concepts.New standardized biogas concepts are developed which are profitable in a South African context, enabling project developers to attract financing.
Barr
ier Small-scale nature inhibiting interest from
financiers.Programmatic approaches aggregate volume and/or concepts are standardized and de-risked increas-ing attractiveness to financiers.Biogas dedicated funds are in place to finance projects and programmes without competition of e.g. solar and wind.
Dri
ver 12B three-year accelerated allowance The special provision for solar allowing full appreciation in the first year is extended to small-scale
biogas projects.
Dri
ver
Energy independence Drive for energy independence by making use of renewable resources is maintained through:- Matured and more cost effective biogas industry- Culture of sustainable self-reliance- Continued financial incentives
TECHNOLOGY AND OPERATIONSBarrier Or Driver Optimal Situation
Barr
ier Complexity of implementation End-users are able to optimally run their bio-digesters through support in terms of guidelines,
training and examples of good practice.
Barr
ier
Skills and experience base A matured industry with:- Quality and industry standards- R&D centres- Recognized courses- Local production capacityAs per National Biogas Platform 2017 priorities, local test centres established to assess practical yields of case specific substrates.
Barr
ier Lack of trust in performance Successful documented demonstration projects providing confidence in the market:
- Rural small scale applications- Farm scale applications
Dri
ver New standardized simplified small scale concepts Local industry picks up on international new small scale standardized concepts and adds local value
by further development reduce complexity and decreasing cost.
SECTION FIVE – REALISING OPPORTUNITIES FOR BIOGAS DIGESTERS

UNLOCKING BARRIERS AND OPPORTUNITIES FOR LAND-USE BASED CLIMATE CHANGE MITIGATION ACTIVITIES IN SA146
OVERALL GAP ANALYSISA summary overview of the gaps
identified in the three categories
Policy and Regulations; Economics
and Technology and Operations
is provided in Figure 9.6. Scales
for specific sub-categories and
positions on the scales indicate the
significance of gap.
Regarding regulations and policies,
there is a suite of policies promoting
the uptake of renewable energy in
general. As illustrated, the generic
approach to renewable energy
does not always work for biogas,
specifically, and some changes are
recommended. An important gap is
the lack of a practical and accessible
incentive for grid connected biogas
to electricity projects in the absence
of an open electricity market. In
addition, streamlining environmental
regulations for biogas would be very
helpful in easing required licensing
processes.
On the economic side, current
biogas concepts should be enhanced
to increase profitability. Although
this will be realised with industry
maturation, biogas-specific incentives
are required in the first phase to
get the industry going and facilitate
competition with other renewable
energy alternatives. In addition, the
POLICY AND REGULATIONS
GENERIC SPECIFIC
MONOPOLIZED MARKET OPEN MARKET
COMPLEX LICENSING SIMPLE LICENSING
LACK OF SUPPORTING POLICIES SUPPORTED POLICIES
ECONOMICS
LOW PROFITABILITY HIGH PROFITABILITY
GENERIC RE FUNDING AND ACTIVITIES SPECIFIC RE FUNDING AND ACTIVITIES
LOCALISED AFFORDABLE CONCEPTS
TECHNICAL AND OPERATIONAL
HIGH RISK NOVEL APPLICATION TRUSTED PROVEN APPLICATIONS
CASE BY CASE STANDARDISED
EXPERIENCE BASED FORMALISED QUALIFICATIONS
industry would benefit from R&D
targeted at adapting concepts to
the local market.
From a technical and operational
standpoint, risks could be
reduced through industry
guidelines for development and
implementation, documented
successful demonstration projects,
and professional training to
get the industry to the level of
a trusted, proven, renewable
energy application for various
implementation areas such as
agricultural households, cattle and
dairy farmers, as well as chicken
farmers and piggeries.
Figure 9.6: A summary of the gap to national readiness
SECTION FIVE – REALISING OPPORTUNITIES FOR BIOGAS DIGESTERS
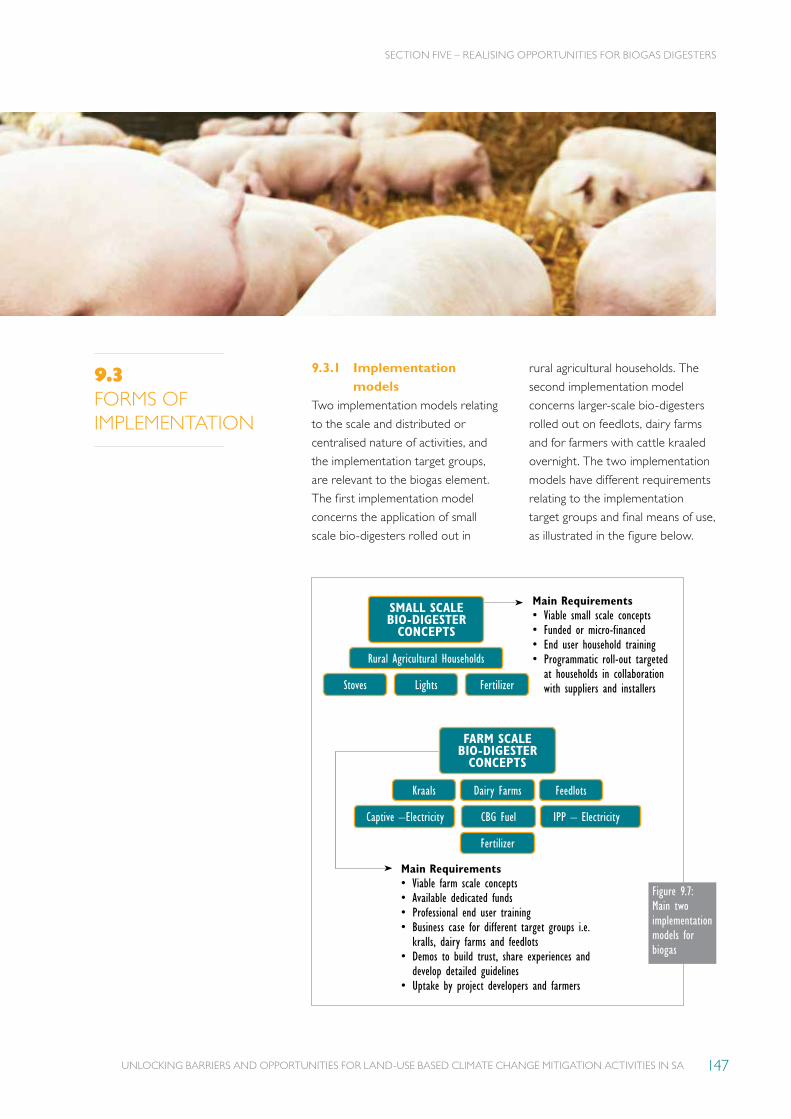
UNLOCKING BARRIERS AND OPPORTUNITIES FOR LAND-USE BASED CLIMATE CHANGE MITIGATION ACTIVITIES IN SA 147
9.3FORMS OF IMPLEMENTATION
9.3.1 Implementation models
Two implementation models relating
to the scale and distributed or
centralised nature of activities, and
the implementation target groups,
are relevant to the biogas element.
The first implementation model
concerns the application of small
scale bio-digesters rolled out in
Main Requirements• Viable small scale concepts• Funded or micro-financed• End user household training• Programmatic roll-out targeted
at households in collaboration with suppliers and installers
Main Requirements• Viable farm scale concepts• Available dedicated funds• Professional end user training• Business case for different target groups i.e.
kralls, dairy farms and feedlots• Demos to build trust, share experiences and
develop detailed guidelines• Uptake by project developers and farmers
rural agricultural households. The
second implementation model
concerns larger-scale bio-digesters
rolled out on feedlots, dairy farms
and for farmers with cattle kraaled
overnight. The two implementation
models have different requirements
relating to the implementation
target groups and final means of use,
as illustrated in the figure below.
Figure 9.7: Main two implementation models for biogas
SECTION FIVE – REALISING OPPORTUNITIES FOR BIOGAS DIGESTERS
SMALL SCALEBIO-DIGESTER
CONCEPTS
Rural Agricultural Households
LightsStoves Fertilizer
FARM SCALEBIO-DIGESTER
CONCEPTS
Fertilizer
Dairy FarmsKraals Feedlots
CBG FuelCaptive –Electricity IPP – Electricity
UNLOCKING BARRIERS AND OPPORTUNITIES FOR LAND-USE BASED CLIMATE CHANGE MITIGATION ACTIVITIES IN SA148
SMALL-SCALE BIO-DIGESTERSSmall-scale bio-digesters for rural
agricultural households will need
to be funded or (partially) micro-
financed as rural households are
not generally able to afford a
bio-digester. Government and
donor funding will potentially
need to step in to overcome the
investment hurdle with subsidies or
a combination of subsidies and small
micro-financed loans. The second
option could assist in ensuring that
end-users are committed to make
the bio-digester installation
a success.
Viable concepts for rural households
need to be defined or developed by
government together with biogas
industry stakeholders, taking into
account simplicity of implementation
and use, water requirements and
cost. Moreover, as it has become
apparent from previous programmes
in rural contexts, the concept will
need to include thorough training
upon implementation, and ongoing
after-implementation support, to
ensure that bio-digesters stay in use
and households get the full benefit
from the bio-digester in terms of gas
yield and fertiliser usage.
Government could take the
primary initiative, and a direct
active involvement in rolling out
the programme in certain areas,
or delegated this role to potential
donors with expertise in the
provision of rural bio-digesters.
As the expertise required by rural
bio-digester programmes is different
from farm-scale programmes, it is
important to ensure that the correct
rural-biogas-specific expertise is on
board, together with the robust
project management skills that
will enable programs to deal with
the complex nature of distributed
rollouts of small scale digesters.
FARM-SCALE BIO-DIGESTERSFarm-scale bio-digesters require
initiative and investment from both
project developers and farmers.
Government will not need to
subsidise such bio-digesters as
long as viable farm-scale concepts
are identified, developed and
demonstrated, to build trust among
farmers as well as financiers. It
would be beneficial to realise
demonstration projects for each
of the target groups, that is, kraals,
commercial farmers, dairy farmers
and feedlots, to show financiers
and other stakeholders how biogas
technology can be successful both in
technical and financial terms.
In the preparation stages of
demonstration projects, it is
essential to develop business cases
that work with the current market
constraints for biogas to electricity
projects. If possible, larger projects
delivering electricity to the grid
(IPP projects) and a project aimed
at producing CBG for transport
should also be covered. The latter
can only be realised by one of the
largest feedlots in the country,
and the value of its replication
potential versus the effort
required to develop a biogas for
transport demo, should be carefully
considered.
Important needs to address are the
building of trust through successful
demonstrations, the provision
of biogas-dedicated funding and
financing facilities to kick start the
industry, the simplification and
streamlining of licensing procedures,
and the introduction of professional
training and quality standards.
Apart from the demo projects,
government’s role will be to create
an enabling environment and
enabling mechanisms for the uptake
of biogas technology at farm scale,
rather than being involved in actual
projects.
Existing organisational infrastructure,
such as the National Biogas Platform
and the South African Biogas
Industry Association, could assist in
the creation of conditions conducive
to the successful widespread
take-up of biogas technology in
South Africa. Many of the aspects
mentioned above are already
covered by existing working groups
within the Platform and in SABIA.
An investigation into how these
working groups could become
more efficient and more effective
in delivering tangible results in the
short term should be undertaken.
One consideration might be to
reserve budgets for the working
groups to commission supporting
studies or include specific elements
as deliverables in the subsidised
demonstration projects. It might also
be desirable to introduce incentives
to reward significant commitments
of time and effort, for the greater
good of the industry.
OPENING UP THE ELECTRICITY MARKET Market reform of the electricity
sector goes beyond the scope of the
uptake of biogas and the promotion
of biomass-to-energy activities
and is part of a national debate.
Part of this debate is the proposed
establishment of an Independent
SECTION FIVE – REALISING OPPORTUNITIES FOR BIOGAS DIGESTERS
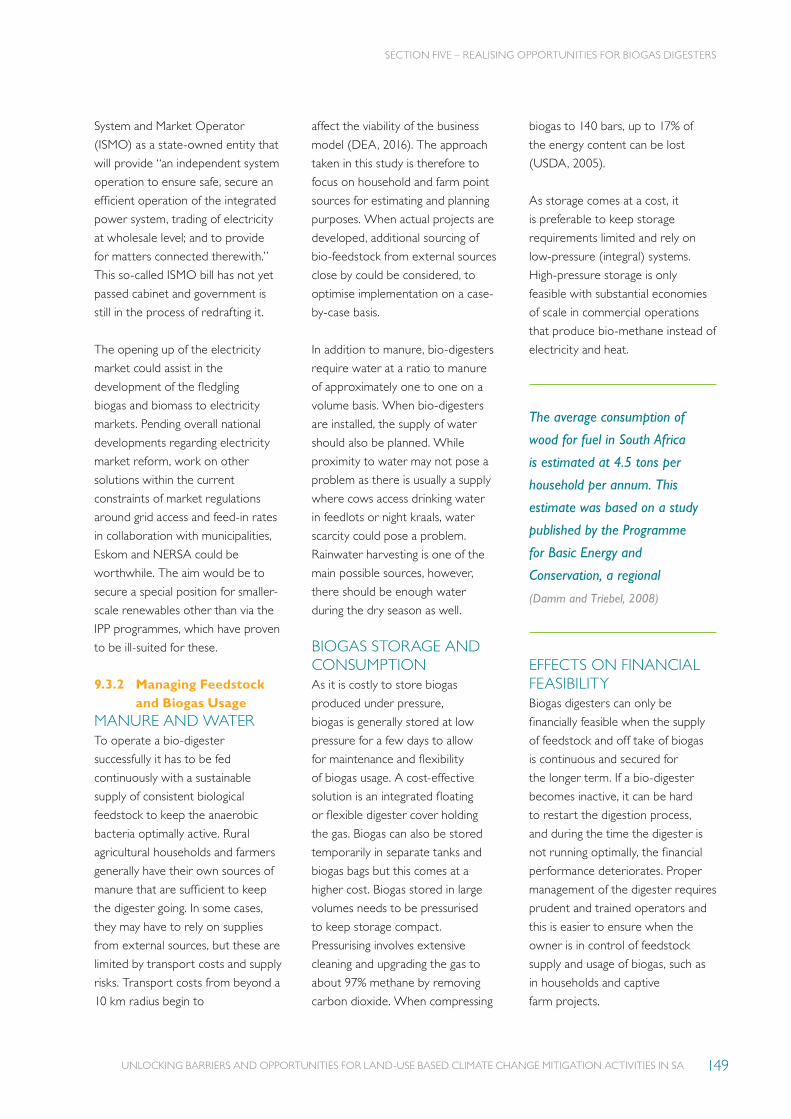
UNLOCKING BARRIERS AND OPPORTUNITIES FOR LAND-USE BASED CLIMATE CHANGE MITIGATION ACTIVITIES IN SA 149
System and Market Operator
(ISMO) as a state-owned entity that
will provide “an independent system
operation to ensure safe, secure an
efficient operation of the integrated
power system, trading of electricity
at wholesale level; and to provide
for matters connected therewith.”
This so-called ISMO bill has not yet
passed cabinet and government is
still in the process of redrafting it.
The opening up of the electricity
market could assist in the
development of the fledgling
biogas and biomass to electricity
markets. Pending overall national
developments regarding electricity
market reform, work on other
solutions within the current
constraints of market regulations
around grid access and feed-in rates
in collaboration with municipalities,
Eskom and NERSA could be
worthwhile. The aim would be to
secure a special position for smaller-
scale renewables other than via the
IPP programmes, which have proven
to be ill-suited for these.
9.3.2 Managing Feedstock and Biogas Usage
MANURE AND WATER To operate a bio-digester
successfully it has to be fed
continuously with a sustainable
supply of consistent biological
feedstock to keep the anaerobic
bacteria optimally active. Rural
agricultural households and farmers
generally have their own sources of
manure that are sufficient to keep
the digester going. In some cases,
they may have to rely on supplies
from external sources, but these are
limited by transport costs and supply
risks. Transport costs from beyond a
10 km radius begin to
affect the viability of the business
model (DEA, 2016). The approach
taken in this study is therefore to
focus on household and farm point
sources for estimating and planning
purposes. When actual projects are
developed, additional sourcing of
bio-feedstock from external sources
close by could be considered, to
optimise implementation on a case-
by-case basis.
In addition to manure, bio-digesters
require water at a ratio to manure
of approximately one to one on a
volume basis. When bio-digesters
are installed, the supply of water
should also be planned. While
proximity to water may not pose a
problem as there is usually a supply
where cows access drinking water
in feedlots or night kraals, water
scarcity could pose a problem.
Rainwater harvesting is one of the
main possible sources, however,
there should be enough water
during the dry season as well.
BIOGAS STORAGE AND CONSUMPTIONAs it is costly to store biogas
produced under pressure,
biogas is generally stored at low
pressure for a few days to allow
for maintenance and flexibility
of biogas usage. A cost-effective
solution is an integrated floating
or flexible digester cover holding
the gas. Biogas can also be stored
temporarily in separate tanks and
biogas bags but this comes at a
higher cost. Biogas stored in large
volumes needs to be pressurised
to keep storage compact.
Pressurising involves extensive
cleaning and upgrading the gas to
about 97% methane by removing
carbon dioxide. When compressing
biogas to 140 bars, up to 17% of
the energy content can be lost
(USDA, 2005).
As storage comes at a cost, it
is preferable to keep storage
requirements limited and rely on
low-pressure (integral) systems.
High-pressure storage is only
feasible with substantial economies
of scale in commercial operations
that produce bio-methane instead of
electricity and heat.
EFFECTS ON FINANCIAL FEASIBILITYBiogas digesters can only be
financially feasible when the supply
of feedstock and off take of biogas
is continuous and secured for
the longer term. If a bio-digester
becomes inactive, it can be hard
to restart the digestion process,
and during the time the digester is
not running optimally, the financial
performance deteriorates. Proper
management of the digester requires
prudent and trained operators and
this is easier to ensure when the
owner is in control of feedstock
supply and usage of biogas, such as
in households and captive
farm projects.
SECTION FIVE – REALISING OPPORTUNITIES FOR BIOGAS DIGESTERS
The average consumption of
wood for fuel in South Africa
is estimated at 4.5 tons per
household per annum. This
estimate was based on a study
published by the Programme
for Basic Energy and
Conservation, a regional
(Damm and Triebel, 2008)
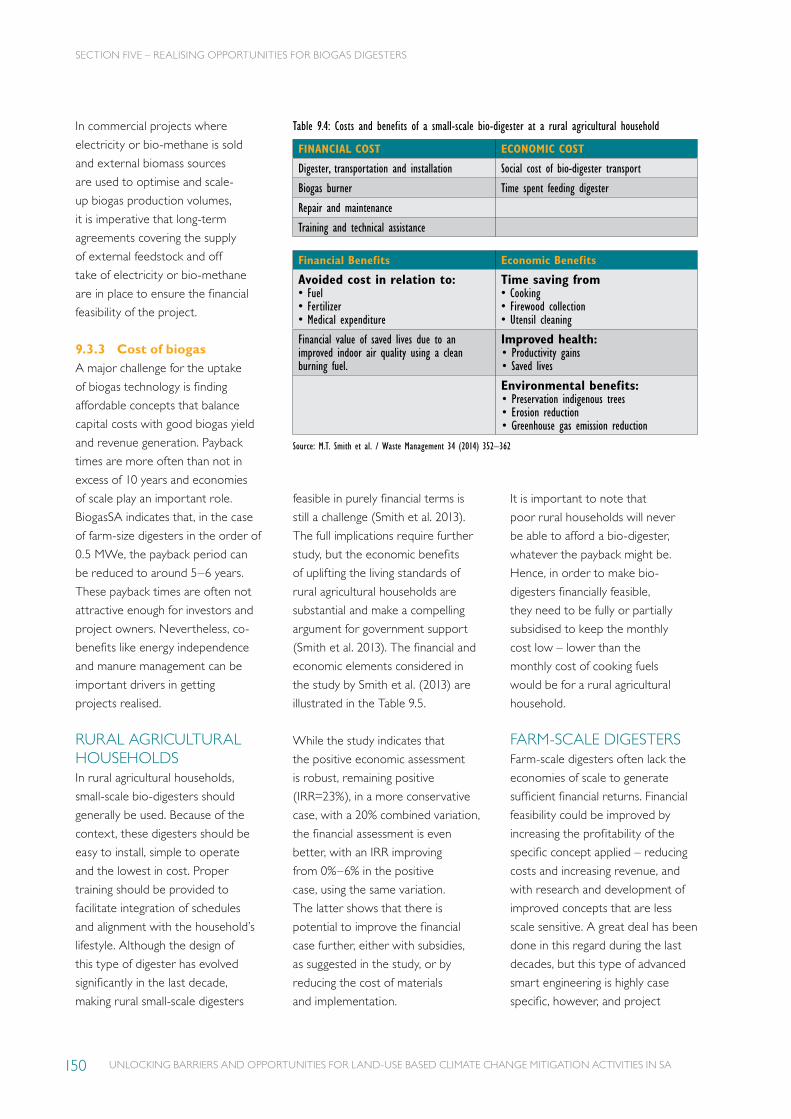
UNLOCKING BARRIERS AND OPPORTUNITIES FOR LAND-USE BASED CLIMATE CHANGE MITIGATION ACTIVITIES IN SA150
In commercial projects where
electricity or bio-methane is sold
and external biomass sources
are used to optimise and scale-
up biogas production volumes,
it is imperative that long-term
agreements covering the supply
of external feedstock and off
take of electricity or bio-methane
are in place to ensure the financial
feasibility of the project.
9.3.3 Cost of biogasA major challenge for the uptake
of biogas technology is finding
affordable concepts that balance
capital costs with good biogas yield
and revenue generation. Payback
times are more often than not in
excess of 10 years and economies
of scale play an important role.
BiogasSA indicates that, in the case
of farm-size digesters in the order of
0.5 MWe, the payback period can
be reduced to around 5–6 years.
These payback times are often not
attractive enough for investors and
project owners. Nevertheless, co-
benefits like energy independence
and manure management can be
important drivers in getting
projects realised.
RURAL AGRICULTURAL HOUSEHOLDSIn rural agricultural households,
small-scale bio-digesters should
generally be used. Because of the
context, these digesters should be
easy to install, simple to operate
and the lowest in cost. Proper
training should be provided to
facilitate integration of schedules
and alignment with the household’s
lifestyle. Although the design of
this type of digester has evolved
significantly in the last decade,
making rural small-scale digesters
feasible in purely financial terms is
still a challenge (Smith et al. 2013).
The full implications require further
study, but the economic benefits
of uplifting the living standards of
rural agricultural households are
substantial and make a compelling
argument for government support
(Smith et al. 2013). The financial and
economic elements considered in
the study by Smith et al. (2013) are
illustrated in the Table 9.5.
While the study indicates that
the positive economic assessment
is robust, remaining positive
(IRR=23%), in a more conservative
case, with a 20% combined variation,
the financial assessment is even
better, with an IRR improving
from 0%–6% in the positive
case, using the same variation.
The latter shows that there is
potential to improve the financial
case further, either with subsidies,
as suggested in the study, or by
reducing the cost of materials
and implementation.
It is important to note that
poor rural households will never
be able to afford a bio-digester,
whatever the payback might be.
Hence, in order to make bio-
digesters financially feasible,
they need to be fully or partially
subsidised to keep the monthly
cost low – lower than the
monthly cost of cooking fuels
would be for a rural agricultural
household.
FARM-SCALE DIGESTERSFarm-scale digesters often lack the
economies of scale to generate
sufficient financial returns. Financial
feasibility could be improved by
increasing the profitability of the
specific concept applied – reducing
costs and increasing revenue, and
with research and development of
improved concepts that are less
scale sensitive. A great deal has been
done in this regard during the last
decades, but this type of advanced
smart engineering is highly case
specific, however, and project
Table 9.4: Costs and benefits of a small-scale bio-digester at a rural agricultural household
FINANCIAL COST ECONOMIC COST
Digester, transportation and installation Social cost of bio-digester transport
Biogas burner Time spent feeding digester
Repair and maintenance
Training and technical assistance
Financial Benefits Economic Benefits
Avoided cost in relation to: • Fuel• Fertilizer• Medical expenditure
Time saving from• Cooking• Firewood collection• Utensil cleaning
Financial value of saved lives due to an improved indoor air quality using a clean burning fuel.
Improved health: • Productivity gains• Saved lives
Environmental benefits:• Preservation indigenous trees• Erosion reduction• Greenhouse gas emission reduction
Source: M.T. Smith et al. / Waste Management 34 (2014) 352–362
SECTION FIVE – REALISING OPPORTUNITIES FOR BIOGAS DIGESTERS

UNLOCKING BARRIERS AND OPPORTUNITIES FOR LAND-USE BASED CLIMATE CHANGE MITIGATION ACTIVITIES IN SA 151
developers do not easily share
competitive information. The myriad
of types of digesters and concepts
under consideration indicate that
optimal solutions have not been
found as yet.
Maturing the industry by providing
subsidies and/or preferential
financing (long tenure, low interest)
could provide opportunities
for the industry to develop and
gain experience. Insight into the
performance characteristics of the
different technologies and concepts
in a South African context, and the
development of new and improved
concepts, could assist the industry
in developing the solutions that are
best for this country.
9.3.4 Revenue generated by biogas
As argued earlier in this study,
the main case for biogas is the
generation of electricity, with
the option of heat generated as
well, to increase the temperature
of the bio-digester or fulfil other
specific heat requirements. The
price of electricity can range from
Table 9.5: Pricing of preferred biomass bidders in the small scale IPP programme
Project Name Capacity Fully Indexed Price* (Zar/Mwh)
Partially Indexed Price* (Zar/Mwh)
Portion Indexed
Busby Renewables 5 MW R 1 400,00 R 1 939,52 30,0%
George Small Scale Biomass 5 MW R 1 400,00 R 2 025,00 30,0%
TOTAL 10 MW
Table 9.6: Pricing of preferred biomass bidders in the small scale IPP programmeRURAL AGRICULTURAL HOUSEHOLDS
Current Situation Preventing Uptake Optimal
Negative financial performance New localized low-cost household concepts
Lack of purchase power Government subsidy for rural households
Government programme
New localized low-cost farm scale conceptsFirm national base for small scale biogas/biomass preferential electricity pricing
as low as 67 Rct (Eskom Megaflex –
bottom of range) per kWh up to
2R per kWh (municipal – top
of range), depending on pricing
schedule, monthly usage and grid
connection (municipal or Eskom).
The revenue potential of electricity
generation is therefore highly
dependent on the location of the
owner (captive project) or the
electricity off-taker.
An alternative revenue generation
model is participation in the small
scale IPP programme. Although no
contracts have been awarded as
yet and no biogas projects are in
the pipeline, the pricing of the two
biomass preferred bidders ranges
from R1.4 per kWh to R2.0 per
kWh, depending on whether the
price is indexed or not.
The large overlap of grid price range
67Rct up to 2R per kWh, and the
small scale IPP range of R1.4 to R2.0
per kWh, indicates that whether or
not the small scale IPP electricity
rates will be an attractive alternative
for own use, or possibly wheeling,
will be largely dependent on the
circumstances. When assessing
potential rates, project developers
also need to take into account the
chances of successfully achieving a
certain rate, and the efforts required.
The size of the two preferred-
bidder biomass projects illustrates
the importance of scale, as both
projects are positioned at the top
of the 1 to 5 MW range targeted.
One could question, therefore, if
an IPP programme is the correct
approach for promoting small scale
renewable biomass and biogas
projects. As argued earlier in the
study the biogas industry would
benefit sicnificantly if the electricity
grid was opened up for small scale
biogas and biomass projects to feed
into the grid at a preferential rate, or
to allow wheeling to an off-taker at a
transmission rate.
9.3.5 Gap analysis A summary overview of the
gaps identified regarding financial
feasibility for rural agricultural
households and farmers is provided
in the Table 9.6.
SECTION FIVE – REALISING OPPORTUNITIES FOR BIOGAS DIGESTERS


REALISING BIOMASS TO ENERGY OPPORTUNITIES
SECTION SIX

UNLOCKING BARRIERS AND OPPORTUNITIES FOR LAND-USE BASED CLIMATE CHANGE MITIGATION ACTIVITIES IN SA154
SECTION SIX – REALISING BIOMASS TO ENERGY OPPORTUNITIES
INTRODUCTORY BRIEF– BIOMASS ENERGY
10.1BIOMASS ENERGYSOUTH AFRICAN CONTEXT
Bio energy can be
defined as ‘energy
derived from organic
sources’ encompassing
all types of organic resources (for
example, liquid, solid, waste stream
or purpose grown, etc.) as well as
all possible methods of extracting
different types of energy (for
example, electricity, steam, etc.)
from organic sources. The South
African National Terrestrial Carbon
Sink Assessment (DEA, 2015)
provides more focus by making the
following distinctions:
• Biomass energy (invasive alien
plants and bush encroachment).
• Biomass energy (bagasse).
• Anaerobic biogas digesters.
Climate change is caused by the
emission of anthropogenic (man-
made) GHGs into the atmosphere.
Although there is a wide range of
sources of GHGs, the majority come
in the form of CO2 and are the
result of some form of combustion.
It is important to make a distinction
between two types of emissions:
• Long cycle: Where the carbon
sequestered in organic material a
long time ago (millions of years)
is released into the atmosphere
in a relatively short period,
(primarily) in the form of CO2,
through the combustion of fossil
fuels such as oil, coal, natural
gas, etc.
• Short cycle: Where the carbon
absorbed by organic material
(biomass) such as bagasse,
wood, manure, etc. over only
the last few decades is released
into the atmosphere when
the biomass is combusted,
resulting in emissions of
(primarily) CO2.
10

UNLOCKING BARRIERS AND OPPORTUNITIES FOR LAND-USE BASED CLIMATE CHANGE MITIGATION ACTIVITIES IN SA 155
SECTION SIX – REALISING BIOMASS TO ENERGY OPPORTUNITIES
Irrespective of the timeframe over
which the carbon was sequestered,
emissions from both long and
short cycle sources increase
the concentration of GHG in
our atmosphere and therefore
contribute to climate change.
However, if the biomass that
forms the short cycle fuel source
is replenished at the same rate at
which it is combusted, the CO2
emissions are ‘re-sequestered’
within the growing organic material
and can therefore be considered
‘carbon neutral’.
For this reason, substituting the
use of (long-cycle) fossil fuels with
biomass energy – from sources that
are replenished at the same rate
as they are utilised – will reduce
the country’s carbon emissions. In
contrast, all biomass that is used for
the generation of energy, but not
‘re-grown’, reduces the country’s
carbon reservoir, and increases the
national carbon emissions.
For the purpose of this study,
only the share of biomass energy
derived from three sources –
Invasive Alien Plants (IAP) and
bush encroachment; bagasse; and
anaerobic digestion – is taken into
account. The cumulative biomass
energy GHG mitigation potential
for IAP, bush encroachment and
bagasse is estimated to range from
2,3 to 2,8 million tCO2e/year (DEA,
2015). Although wood waste from
commercial forests operations was
not included in the scope of this
study, it is a potential sources of
biomass energy that warrants
future study.
The use of sustainable biomass as an
energy source not only reduces the
long term impact on global climate
change, it also contributes to energy
security, energy independence and
energy (rural) proliferation.
Before going into the social context
and governance of biomass
energy in more depth, it is useful
to consider the origins, relevant
energy conversion technologies
and current practical applications
of the three potential biomass
energy sources. To convert available
biomass into energy it first needs
to be aggregated at a central point
where it can be pre-treated and
combusted. This aggregation can
happen in two ways: either it is
aggregated as part of the primary
production process (as with
bagasse) or it is collected specifically
for conversion into energy (as
with IAPs and bush encroachment,
for example).
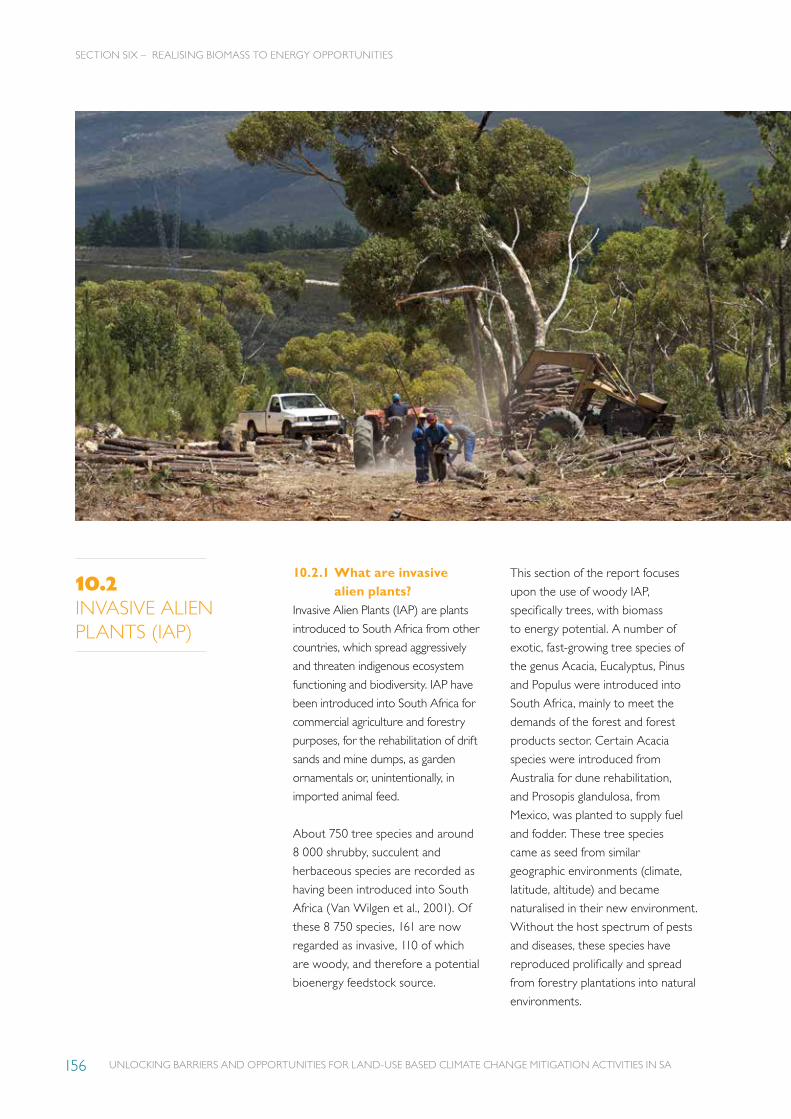
UNLOCKING BARRIERS AND OPPORTUNITIES FOR LAND-USE BASED CLIMATE CHANGE MITIGATION ACTIVITIES IN SA156
10.2INVASIVE ALIEN PLANTS (IAP)
10.2.1 What are invasive alien plants?
Invasive Alien Plants (IAP) are plants
introduced to South Africa from other
countries, which spread aggressively
and threaten indigenous ecosystem
functioning and biodiversity. IAP have
been introduced into South Africa for
commercial agriculture and forestry
purposes, for the rehabilitation of drift
sands and mine dumps, as garden
ornamentals or, unintentionally, in
imported animal feed.
About 750 tree species and around
8 000 shrubby, succulent and
herbaceous species are recorded as
having been introduced into South
Africa (Van Wilgen et al., 2001). Of
these 8 750 species, 161 are now
regarded as invasive, 110 of which
are woody, and therefore a potential
bioenergy feedstock source.
This section of the report focuses
upon the use of woody IAP,
specifically trees, with biomass
to energy potential. A number of
exotic, fast-growing tree species of
the genus Acacia, Eucalyptus, Pinus
and Populus were introduced into
South Africa, mainly to meet the
demands of the forest and forest
products sector. Certain Acacia
species were introduced from
Australia for dune rehabilitation,
and Prosopis glandulosa, from
Mexico, was planted to supply fuel
and fodder. These tree species
came as seed from similar
geographic environments (climate,
latitude, altitude) and became
naturalised in their new environment.
Without the host spectrum of pests
and diseases, these species have
reproduced prolifically and spread
from forestry plantations into natural
environments.
SECTION SIX – REALISING BIOMASS TO ENERGY OPPORTUNITIES
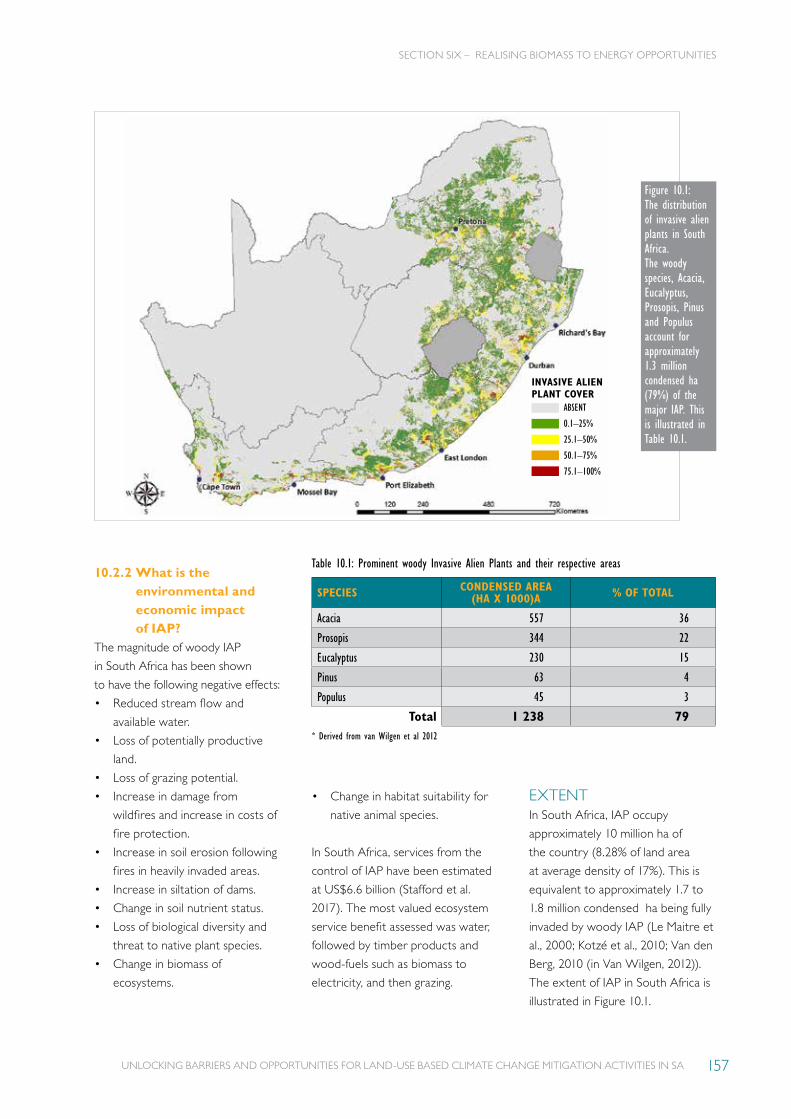
UNLOCKING BARRIERS AND OPPORTUNITIES FOR LAND-USE BASED CLIMATE CHANGE MITIGATION ACTIVITIES IN SA 157
10.2.2 What is the environmental and economic impact of IAP?
The magnitude of woody IAP
in South Africa has been shown
to have the following negative effects:
• Reduced stream flow and
available water.
• Loss of potentially productive
land.
• Loss of grazing potential.
• Increase in damage from
wildfires and increase in costs of
fire protection.
• Increase in soil erosion following
fires in heavily invaded areas.
• Increase in siltation of dams.
• Change in soil nutrient status.
• Loss of biological diversity and
threat to native plant species.
• Change in biomass of
ecosystems.
Figure 10.1:The distribution of invasive alien plants in South Africa.The woody species, Acacia, Eucalyptus, Prosopis, Pinus and Populus account for approximately 1.3 million condensed ha (79%) of the major IAP. This is illustrated in Table 10.1.
• Change in habitat suitability for
native animal species.
In South Africa, services from the
control of IAP have been estimated
at US$6.6 billion (Stafford et al.
2017). The most valued ecosystem
service benefit assessed was water,
followed by timber products and
wood-fuels such as biomass to
electricity, and then grazing.
EXTENTIn South Africa, IAP occupy
approximately 10 million ha of
the country (8.28% of land area
at average density of 17%). This is
equivalent to approximately 1.7 to
1.8 million condensed ha being fully
invaded by woody IAP (Le Maitre et
al., 2000; Kotzé et al., 2010; Van den
Berg, 2010 (in Van Wilgen, 2012)).
The extent of IAP in South Africa is
illustrated in Figure 10.1.
SPECIES CONDENSED AREA (HA X 1000)A % OF TOTAL
Acacia 557 36
Prosopis 344 22
Eucalyptus 230 15
Pinus 63 4
Populus 45 3
Total 1 238 79* Derived from van Wilgen et al 2012
Table 10.1: Prominent woody Invasive Alien Plants and their respective areas
ABSENT
0.1–25%
25.1–50%
50.1–75%
75.1–100%
INVASIVE ALIEN PLANT COVER
SECTION SIX – REALISING BIOMASS TO ENERGY OPPORTUNITIES

UNLOCKING BARRIERS AND OPPORTUNITIES FOR LAND-USE BASED CLIMATE CHANGE MITIGATION ACTIVITIES IN SA158
BIOMASSIn South Africa, the woody biomass
of IAP ranges from 32 to 198 t/ha
(Mugido et al., 2014; Van Laar and
Theron, 2004; Le Maitre et al., 2000;
Le Maitre et al., 2001). The woody
IAP biomass is estimated at 168
million tonnes.
A key consideration when defining
an IAP eradication strategy is
that clearing IAP will result in a
decreased carbon density. This is
clearly illustrated in Table 10.3.
10.2.3 Social context and governance
Key objectives associated with
the eradication of IAP and bush
encroachment are increased
land-use potential, water quality
and quantity, biodiversity and
creation job opportunities. From a
governance perspective, there are
potentially conflicting objectives
with respect to the management
of IAP and bush encroachment and
it will be important to formulate
appropriate management strategies
to mitigate any perceived conflicts.
Removing barriers and identifying
opportunities for the reduction
of GHG in the AFOLU sectors
is a prime consideration of this
study, and the use of feedstock
from IAP and bush encroachment
as a bioenergy feedstock is one
such opportunity. Although other
major benefits are attached to
the eradication of IAPs and bush
encroachment, it does not, in
itself, reduce GHG emissions.
Key to a successful reduction in
GHG using bioenergy is that the
source of feedstock is renewable,
and eradicating IAPs and bush
encroachment may not provide a
Table 10.2: Invasive Alien Plants – Biomass Stocks (Tg)q
PROVINCE ACACIA EUCALYPTS PINE POPLAR, WILLOW AND PROSOPIS TOTAL
Eastern Cape 28.8 9.4 5.5 3.8 47.5
Free State 0.8 7.2 1.1 3.6 12.7
Gauteng 1.5 7.7 0.4 0.9 10.5
KwaZulu-Natal 15.1 16.5 2.7 0.7 35
Limpopo 1.1 3.7 0.8 0.7 6.3
Mpumalanga 6.4 18.1 2.8 3.6 30.9
Northern Cape 0 0 0 2.9 2.9
North West 0.4 3.1 0.1 0.5 4.1
Western Cape 6.6 2.8 8.5 0.4 18.3
Total 60.7 68.5 21.9 17.1 168.2• Stafford 2014
Table 10.3: A comparison of biomass density (t/ha) between indigenous plants and IAP for the same ecosystem (le Maitre 2015)
INDIGENOUS T/HA T/HA IAP T/HA MULTIPLE
Renosterveld 14.0 104 Pinus pinaster 104.0 7.4
Proteiod fynbos 17.8 58.16 Acacia saligna 58.2 3.3
Strandveld 18.0 57 Acacia cyclops 57.0 3.2
sustainable source of biomass for
energy use. There is conjecture that
the various initiatives to eradicate
IAP have not been successful, and
that IAP regrowth, either through
seed germination or coppice
regeneration, implies that it is indeed
a renewable resource.
Since biological invasions are a
pervasive threat to biodiversity,
South Africa is under an international
obligation to regulate IAP.
Consequently, government has
enacted a variety of national and
provincial laws and regulations
with the main aim of managing and
conserving biodiversity, protecting
species and ecosystems, promoting
the sustainable use of indigenous
biological resources, and ensuring
benefits arising from the natural
environment are shared fairly
and equitably. The most relevant
legislation on a national level includes:
• The Environment Conservation
Act, No. 73, 1989 – which
provides the legislative
foundation for the protection
and controlled utilisation of the
environment. The Act mandates
policy creation for the effective
conservation of the natural
environment in South Africa.
• The National Environmental
Management Act, No. 107,
1998 – which institutionalises
legislation regarding the
environment by providing for
cooperative, environmental
governance. For example,
through setting principles for
decision making by creating
the institutions that promote
cooperative governance,
and through procedures
for environmental functions
exercised by government.
SECTION SIX – REALISING BIOMASS TO ENERGY OPPORTUNITIES
UNLOCKING BARRIERS AND OPPORTUNITIES FOR LAND-USE BASED CLIMATE CHANGE MITIGATION ACTIVITIES IN SA 159
• The National Environmental
Management: Biodiversity Act,
No. 10, 2004 (NEMBA) –
which provides the legislative
framework to regulate the
management and conservation
of South Africa’s biodiversity
within the context of the
National Environmental
Management Act, 1998.
Among other things, NEMBA
establishes and governs the
functions of the South African
National Biodiversity Institute
(SANBI), which engages in
restoration and rehabilitation of
the ecosystem, advises on policy
and best practices, coordinates
research, and monitors
and reports on the state of
biodiversity in the country.
• NEMBA Invasive Species
Regulation, 2014 – which, among
other things, provides for the
categorisation of invasive species
and regulation on exempted
species, develops monitoring,
control and eradication plans,
and sets up a risk assessment
framework.
• NEMBA Invasive Species List,
2016 – which provides a full
overview of invasive species,
exempted and prohibited
alien species.
• NEMBA Guidelines for
Monitoring and Control
Plans – which were circulated
on 16 October 2016 by the
Department of Environmental
Affairs. These provide guidelines
for managers of state land to
document, monitor, control and
manage invasive plants.
In addition, the Department of
Environmental Affairs published the
National Strategy for Dealing with
Biological Invasions in South Africa
(DEA, 2014), on 25 March 2014.
The main objective of the strategy
is to provide a comprehensive
overview of biological invasions
and to streamline the legislative
framework so that the problem can
be effectively managed. Attention is
also given to awareness raising and
capacity building.
On a decentralised level,
the regulatory framework is
complemented by legislation
for IAP in several provinces and
metropolitan areas. In some
cases, this concerns policies to
implement and/or enforce existing
national legislation. In other cases,
it expands on national legislation to
provide further safeguards for local
biodiversity and ecosystems. For
example, the City of Cape
Town has a framework in place
for local needs and challenges
pertaining to eradicating IAS
(CoCT, 2008).
10.2.4 Prior and existing programmes
The Department of Environmental
Affairs (DEA) administers twelve
Natural Resource Management
(NRM) programmes that have been
designed to also create significant
socio-economic benefits, including
substantial job creation and poverty
reduction outcomes. In this context,
using biomass to generate electricity
,through the Working for Energy
Programme under the auspices of
the Department of Energy, also
plays an important role.
WORKING FOR WATERThe eradication of IAP is mainly done
through the Working for Water
(WfW) programme, launched in
1995, with a contribution from the
Working for Wetlands programme.
The socio-economic component of
WfW has been formalised as part of
a national Expanded Public Works
Programme (EPWP).
The initial focus of WfW was
purely on the management of IAP
known to have negative impacts
on streamflow. Subsequently, other
NRM programmes such as Working
on Fire, Working for Wetlands,
Working for Ecosystems, Working
for Forests, and Eco Furniture
programmes have been involved in
employment and rural development
as well as the restoration of areas
cleared of IAP.
In addition to the Department of
Environmental Affairs, Working
for Water partners with other
government departments including
Tourism, Agriculture, and Trade and
Industry, as well as with provincial
departments of agriculture,
conservation and the environment,
research foundations and private
companies.
One of the most important
Working for Water partnerships
is with local communities, working
for job creation. Since its inception,
WfW has intervened in more than
one million ha of IAP, providing jobs
and training to approximately 20
000 people per annum, from the
most marginalised sectors of society.
Of these, 52% are women. WfW
currently runs over 300 projects in
all nine of South Africa’s provinces.
SECTION SIX – REALISING BIOMASS TO ENERGY OPPORTUNITIES
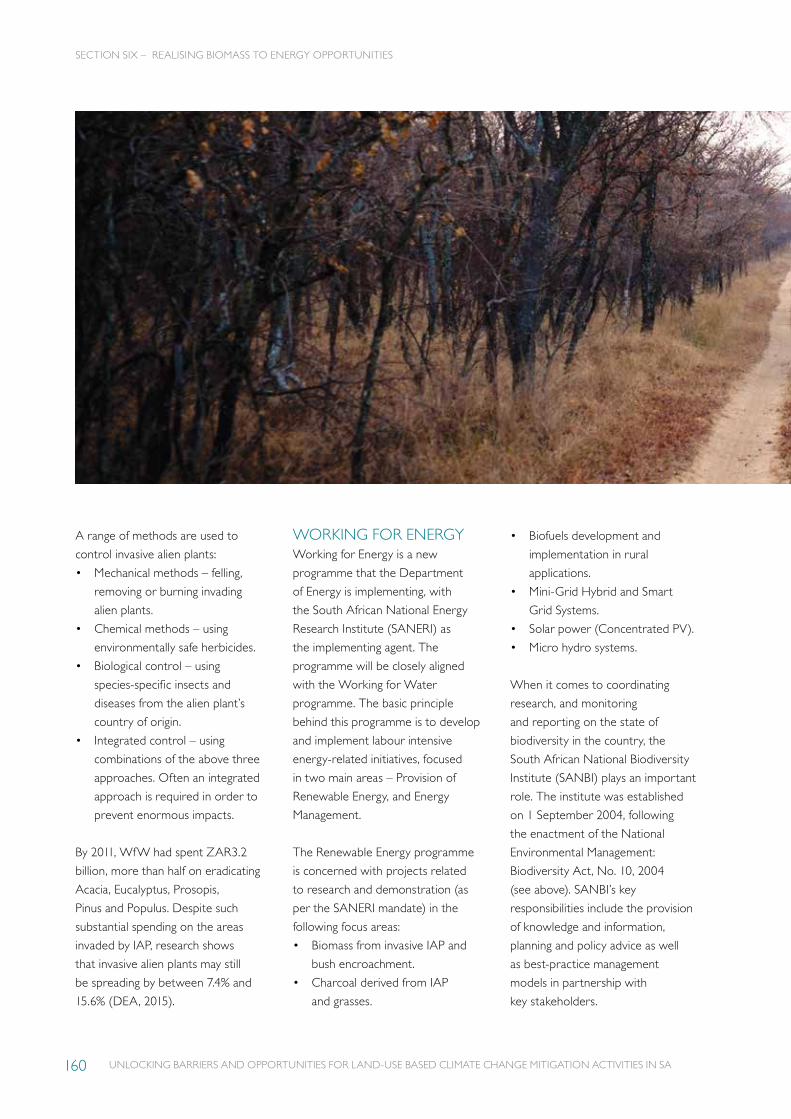
UNLOCKING BARRIERS AND OPPORTUNITIES FOR LAND-USE BASED CLIMATE CHANGE MITIGATION ACTIVITIES IN SA160
A range of methods are used to
control invasive alien plants:
• Mechanical methods – felling,
removing or burning invading
alien plants.
• Chemical methods – using
environmentally safe herbicides.
• Biological control – using
species-specific insects and
diseases from the alien plant’s
country of origin.
• Integrated control – using
combinations of the above three
approaches. Often an integrated
approach is required in order to
prevent enormous impacts.
By 2011, WfW had spent ZAR3.2
billion, more than half on eradicating
Acacia, Eucalyptus, Prosopis,
Pinus and Populus. Despite such
substantial spending on the areas
invaded by IAP, research shows
that invasive alien plants may still
be spreading by between 7.4% and
15.6% (DEA, 2015).
WORKING FOR ENERGYWorking for Energy is a new
programme that the Department
of Energy is implementing, with
the South African National Energy
Research Institute (SANERI) as
the implementing agent. The
programme will be closely aligned
with the Working for Water
programme. The basic principle
behind this programme is to develop
and implement labour intensive
energy-related initiatives, focused
in two main areas – Provision of
Renewable Energy, and Energy
Management.
The Renewable Energy programme
is concerned with projects related
to research and demonstration (as
per the SANERI mandate) in the
following focus areas:
• Biomass from invasive IAP and
bush encroachment.
• Charcoal derived from IAP
and grasses.
• Biofuels development and
implementation in rural
applications.
• Mini-Grid Hybrid and Smart
Grid Systems.
• Solar power (Concentrated PV).
• Micro hydro systems.
When it comes to coordinating
research, and monitoring
and reporting on the state of
biodiversity in the country, the
South African National Biodiversity
Institute (SANBI) plays an important
role. The institute was established
on 1 September 2004, following
the enactment of the National
Environmental Management:
Biodiversity Act, No. 10, 2004
(see above). SANBI’s key
responsibilities include the provision
of knowledge and information,
planning and policy advice as well
as best-practice management
models in partnership with
key stakeholders.
SECTION SIX – REALISING BIOMASS TO ENERGY OPPORTUNITIES
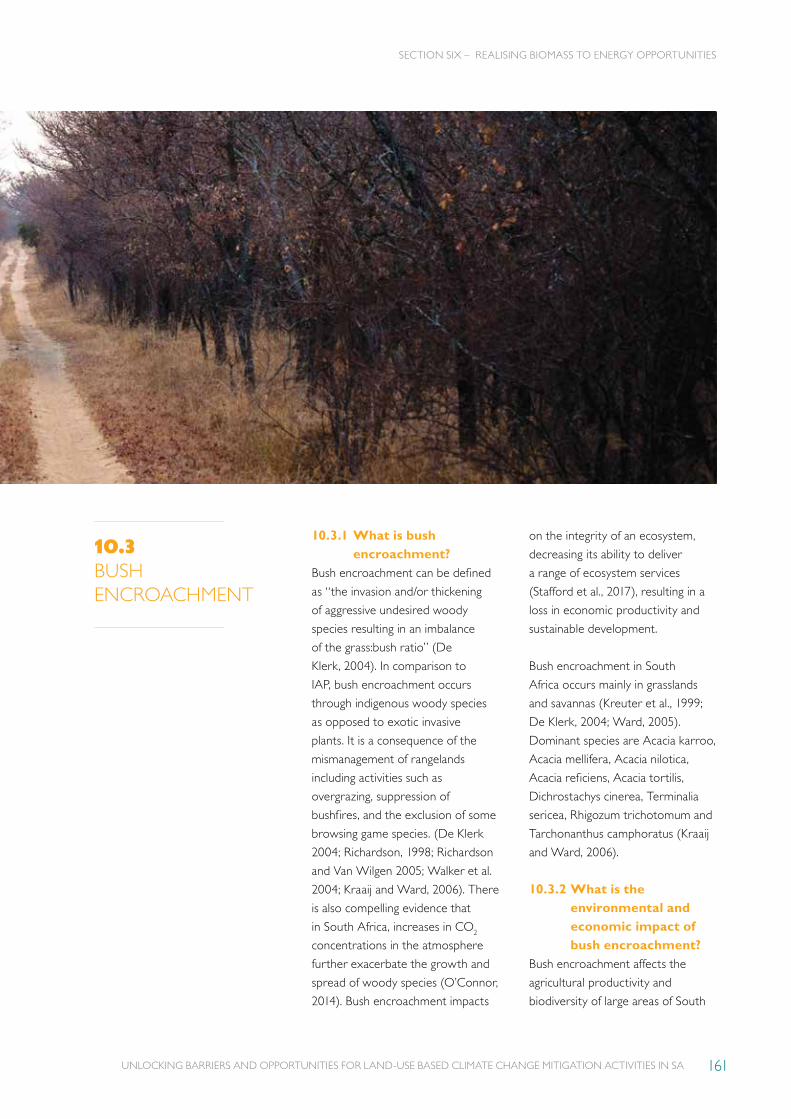
UNLOCKING BARRIERS AND OPPORTUNITIES FOR LAND-USE BASED CLIMATE CHANGE MITIGATION ACTIVITIES IN SA 161
10.3 BUSH ENCROACHMENT
10.3.1 What is bush encroachment?
Bush encroachment can be defined
as “the invasion and/or thickening
of aggressive undesired woody
species resulting in an imbalance
of the grass:bush ratio” (De
Klerk, 2004). In comparison to
IAP, bush encroachment occurs
through indigenous woody species
as opposed to exotic invasive
plants. It is a consequence of the
mismanagement of rangelands
including activities such as
overgrazing, suppression of
bushfires, and the exclusion of some
browsing game species. (De Klerk
2004; Richardson, 1998; Richardson
and Van Wilgen 2005; Walker et al.
2004; Kraaij and Ward, 2006). There
is also compelling evidence that
in South Africa, increases in CO2
concentrations in the atmosphere
further exacerbate the growth and
spread of woody species (O’Connor,
2014). Bush encroachment impacts
on the integrity of an ecosystem,
decreasing its ability to deliver
a range of ecosystem services
(Stafford et al., 2017), resulting in a
loss in economic productivity and
sustainable development.
Bush encroachment in South
Africa occurs mainly in grasslands
and savannas (Kreuter et al., 1999;
De Klerk, 2004; Ward, 2005).
Dominant species are Acacia karroo,
Acacia mellifera, Acacia nilotica,
Acacia reficiens, Acacia tortilis,
Dichrostachys cinerea, Terminalia
sericea, Rhigozum trichotomum and
Tarchonanthus camphoratus (Kraaij
and Ward, 2006).
10.3.2 What is the environmental and economic impact of bush encroachment?
Bush encroachment affects the
agricultural productivity and
biodiversity of large areas of South
SECTION SIX – REALISING BIOMASS TO ENERGY OPPORTUNITIES
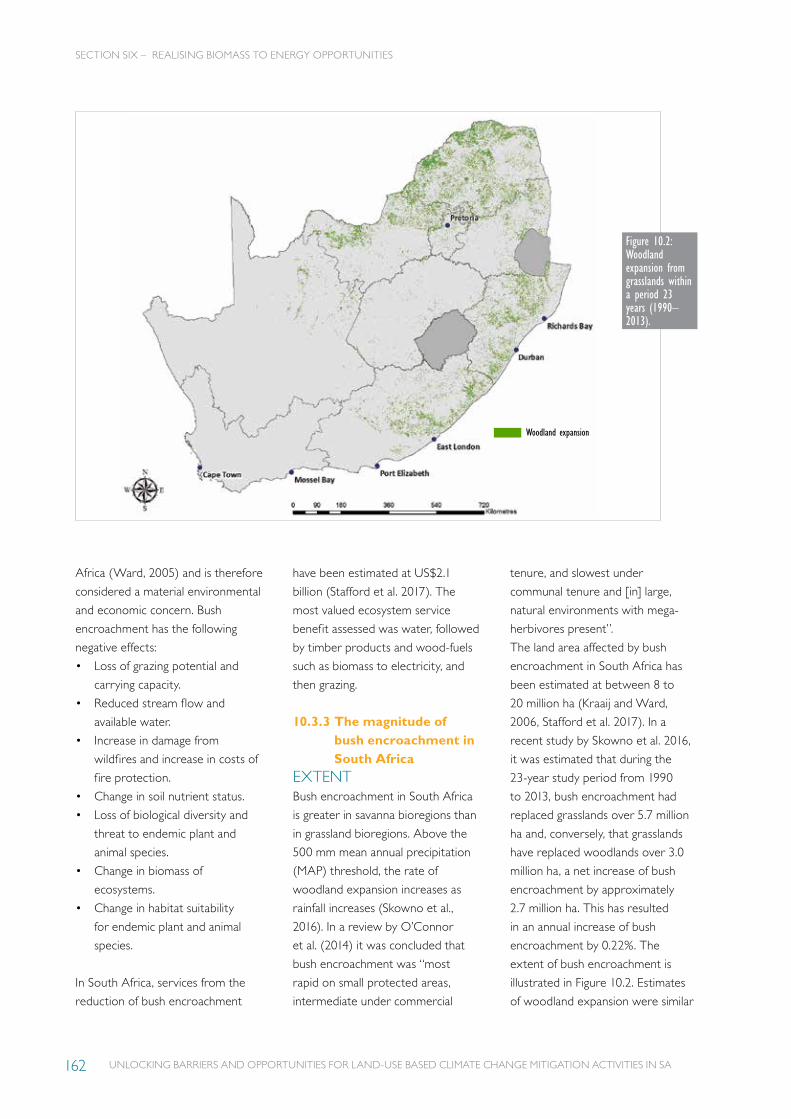
UNLOCKING BARRIERS AND OPPORTUNITIES FOR LAND-USE BASED CLIMATE CHANGE MITIGATION ACTIVITIES IN SA162
Figure 10.2: Woodland expansion from grasslands within a period 23 years (1990–2013).
Africa (Ward, 2005) and is therefore
considered a material environmental
and economic concern. Bush
encroachment has the following
negative effects:
• Loss of grazing potential and
carrying capacity.
• Reduced stream flow and
available water.
• Increase in damage from
wildfires and increase in costs of
fire protection.
• Change in soil nutrient status.
• Loss of biological diversity and
threat to endemic plant and
animal species.
• Change in biomass of
ecosystems.
• Change in habitat suitability
for endemic plant and animal
species.
In South Africa, services from the
reduction of bush encroachment
have been estimated at US$2.1
billion (Stafford et al. 2017). The
most valued ecosystem service
benefit assessed was water, followed
by timber products and wood-fuels
such as biomass to electricity, and
then grazing.
10.3.3 The magnitude of bush encroachment in South Africa
EXTENTBush encroachment in South Africa
is greater in savanna bioregions than
in grassland bioregions. Above the
500 mm mean annual precipitation
(MAP) threshold, the rate of
woodland expansion increases as
rainfall increases (Skowno et al.,
2016). In a review by O’Connor
et al. (2014) it was concluded that
bush encroachment was “most
rapid on small protected areas,
intermediate under commercial
tenure, and slowest under
communal tenure and [in] large,
natural environments with mega-
herbivores present”.
The land area affected by bush
encroachment in South Africa has
been estimated at between 8 to
20 million ha (Kraaij and Ward,
2006, Stafford et al. 2017). In a
recent study by Skowno et al. 2016,
it was estimated that during the
23-year study period from 1990
to 2013, bush encroachment had
replaced grasslands over 5.7 million
ha and, conversely, that grasslands
have replaced woodlands over 3.0
million ha, a net increase of bush
encroachment by approximately
2.7 million ha. This has resulted
in an annual increase of bush
encroachment by 0.22%. The
extent of bush encroachment is
illustrated in Figure 10.2. Estimates
of woodland expansion were similar
SECTION SIX – REALISING BIOMASS TO ENERGY OPPORTUNITIES
Woodland expansion

UNLOCKING BARRIERS AND OPPORTUNITIES FOR LAND-USE BASED CLIMATE CHANGE MITIGATION ACTIVITIES IN SA 163
to those reviewed by O’Connor et
al. (2014).
BIOMASSStafford et. al. (2017) estimated
the biomass of bush encroachment
to be 4, 8 and 12 t/ha for areas
of light, medium and dense bush
encroachment, respectively, with a
total biomass of bush encroachment
of approximately 58 million tonnes.
10.3.4 Social context and governance
As with IAP, there are potentially
conflicting objectives with
respect to the management of
bush encroachment and it will
be important to formulate the
desired strategy to mitigate
perceived conflict. Key objectives
associated with the control of
bush encroachment are increased
land-use potential, water quality
and quantity, biodiversity, and the
creation of job opportunities.
Unlike IAP where eradication is
a key objective, key elements to
consider with respect to bush
encroachment are management
objectives and the desired state one
wishes to achieve. Integral to this is
current land tenure. Management
objectives on community land,
commercial land and protected
areas will be fundamentally different.
Defining the correct, appropriate
grassland to bushland ratio
Table 10.4: Management considerations with respect to bush encroachment
RESTORATION OF BUSH ENCROACHED AREAS MAINTAINING STATUS QUO OF BUSH ENCROACHED AREAS
• Increased stream flow and water availability• Restoration of ecosystem to previous state• Increased carrying capacity for livestock and other grazing animals• Reduced risk of intense fires• Job opportunities
• Sustainable supply of fuelwood for bio-energy• Increased fuelwood, poles and building material• Increased carrying capacity for browsers• Decrease in biodiversity• Land tenure
should take a number of salient
considerations into account, see
Table 10.4.
Removing barriers and identifying
opportunities for the reduction of
GHG in the AFOLU sectors is a
prime consideration of this study
and the use of feedstock from
bush encroachment clearing as a
bioenergy feedstock is one such
opportunity. Key to a successful
reduction in GHG using bioenergy
is a renewable source of feedstock.
Although there are major benefits of
bush encroachment control, it may
work against providing a sustainable
source of biomass for energy use,
and does not, in itself, reduce GHG
emissions. A number of studies have
indicated that bush encroachment
is increasing (O’Connor et al., 2014;
Skowno et al. 2016) in which case
bush encroachment, either through
seed germination or coppice
regeneration, implies that it is indeed
a renewable resource.
Apart from the National
Environmental Management:
Biodiversity Act, No. 10, 2004,
the issue of bush encroachment is
regulated by the following legislation:
• The Conservation of Agricultural
Resources Act, No. 43, 1983
– which replaced the Soil
Conservation Act, No. 76, 1969,
and provides the legislative
framework for the regulation
of bush encroachment. More
generally, the Act provides
for control of the utilisation of
natural agricultural resources in
South Africa. Its main objective
is to promote the conservation
of soil, water resources and
vegetation through combating
weeds and invasive plants.
• The Conservation of Agricultural
Resources Act, No. 43, 1983,
Regulations – which aim to give
substance to the main Act by,
among other things, defining
indicators of bush encroachment
and listing indigenous plants
that are regarded as indicator
plants of such encroachment,
listing the areas where they
are most pervasive (in addition
to listing non-indigenous
invader plants and methods of
combatting them).
SECTION SIX – REALISING BIOMASS TO ENERGY OPPORTUNITIES
Bush encroachment in South
Africa is greater in savanna
bioregions than in grassland
bioregions. Above the 500 mm
mean annual precipitation
(MAP) threshold, the rate of
woodland expansion increases
as rainfall increases
(Skowno et al., 2016)
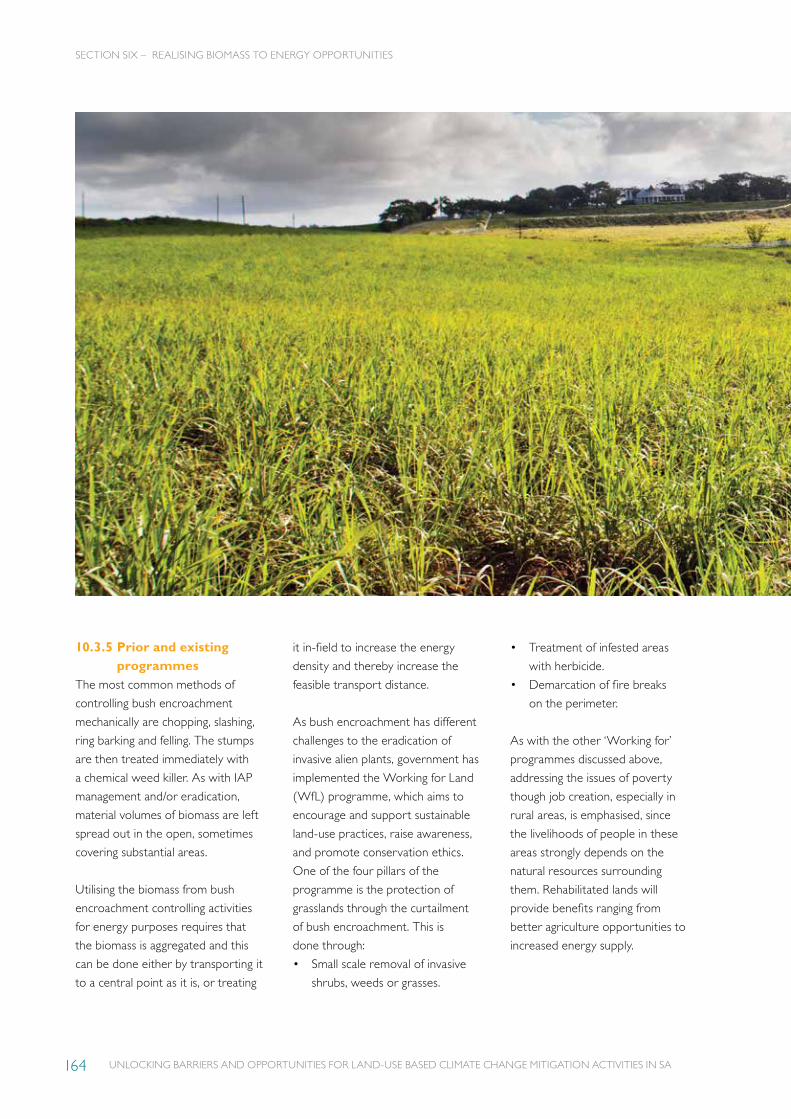
UNLOCKING BARRIERS AND OPPORTUNITIES FOR LAND-USE BASED CLIMATE CHANGE MITIGATION ACTIVITIES IN SA164
10.3.5 Prior and existing programmes
The most common methods of
controlling bush encroachment
mechanically are chopping, slashing,
ring barking and felling. The stumps
are then treated immediately with
a chemical weed killer. As with IAP
management and/or eradication,
material volumes of biomass are left
spread out in the open, sometimes
covering substantial areas.
Utilising the biomass from bush
encroachment controlling activities
for energy purposes requires that
the biomass is aggregated and this
can be done either by transporting it
to a central point as it is, or treating
it in-field to increase the energy
density and thereby increase the
feasible transport distance.
As bush encroachment has different
challenges to the eradication of
invasive alien plants, government has
implemented the Working for Land
(WfL) programme, which aims to
encourage and support sustainable
land-use practices, raise awareness,
and promote conservation ethics.
One of the four pillars of the
programme is the protection of
grasslands through the curtailment
of bush encroachment. This is
done through:
• Small scale removal of invasive
shrubs, weeds or grasses.
• Treatment of infested areas
with herbicide.
• Demarcation of fire breaks
on the perimeter.
As with the other ‘Working for’
programmes discussed above,
addressing the issues of poverty
though job creation, especially in
rural areas, is emphasised, since
the livelihoods of people in these
areas strongly depends on the
natural resources surrounding
them. Rehabilitated lands will
provide benefits ranging from
better agriculture opportunities to
increased energy supply.
SECTION SIX – REALISING BIOMASS TO ENERGY OPPORTUNITIES

UNLOCKING BARRIERS AND OPPORTUNITIES FOR LAND-USE BASED CLIMATE CHANGE MITIGATION ACTIVITIES IN SA 165
10.4BAGASSE
10.4.1 What is bagasse?Bagasse is the fibrous matter that
remains after sugarcane or sor-
ghum stalks are crushed to extract
their juice. For each 10 tonnes of
sugarcane crushed, a sugar factory
produces nearly 3 tonnes of wet
bagasse as a by-product. It is best
used as a fuel source for sugar mills –
when burned in quantity, it produces
sufficient heat energy to supply all
the needs of a typical sugar mill, with
energy to spare. Bagasse is also uti-
lised in a range of other applications
including the manufacture of pulp
and building materials.
The South African sugar industry,
agricultural cane growing and milling
sectors are well established in
KwaZulu-Natal and Mpumalanga.
All of the 14 sugar mills, owned
by six different companies, use
bagasse to generate steam and
electricity for own use and are
energy self-sufficient (Conningarth,
2013). Through improved sugar mill
energy efficiencies, technology and
agricultural yield improvements,
these factories can be modified to
produce from 2 to 7 times more
power, for export to the national
grid (Govender, 2016). Over the
period 2010 to 2014, the 14 mills
generated an average of around
612,924 MWh/year, which indicates
an available biomass to electricity
potential of 195 MW to 681 MW.
SECTION SIX – REALISING BIOMASS TO ENERGY OPPORTUNITIES

UNLOCKING BARRIERS AND OPPORTUNITIES FOR LAND-USE BASED CLIMATE CHANGE MITIGATION ACTIVITIES IN SA166
In addition to the bagasse-to-energy
potential, an additional possible
source of sustainable biomass is
what is referred to in the industry
as ‘tops and leaves’. The tops and
leaves are removed from the sugar
cane and left in the field when the
cane itself is transported to the mill.
By expanding harvesting processes,
the tops and leaves could be
collected and used as a sustainable
biomass, either at the sugar mill,
or by the communities around the
sugar fields. The biomass could be
dried and used directly as fuel,
or alternatively, it could be placed
in an anaerobic digester to generate
energy. Although still in the early
stages of development, the Cane
Growers Associations is currently
running a pilot project for the
anaerobic digestion of tops and
leaves for rural applications.
10.4.2 What is the magnitude and impact of the South African sugar sector?
South Africa is one of the top 15
sugar producing countries in the
world. The local sugar industry is
significant in size, generating annual
estimated turnover of approxi-
mately ZAR 12 billion, and making a
substantial contribution to the South
African economy. Sugarcane, from
which dry, fibrous bagasse is derived,
is grown by approximately 24,000
registered growers, responsible for
creating some 79,000 direct jobs and
an estimated 350,000 indirect jobs,
especially in rural areas. Overall, the
industry produces some 15 million
tons of sugar, of which 75% is con-
sumed within the South African Cus-
toms Union (SACU). The remainder
is exported to world markets, gen-
erating substantial foreign exchange
inflows for the country.
Although the industry is cost-
competitive internationally, recent
severe droughts have reduced
yields and put pressure on margins.
This has triggered a search by major
producers for opportunities to
reduce operating costs, for example,
through co-generation and/or the
development of renewable energy
projects as Independent Power
Producers (IPPs). For example,
Tongaat Hulett currently produces
52 MW at its four plants and
estimates a potential of between
320 and 360 MW. Illovo reports
that in 2012/13 it exported some
36.95 GWh to the national grid.
These developments not only
reduce the carbon footprint
towards climate change
mitigation, but also contribute to
energy security and electricity
independence, and create
new jobs .
Figure 10.3: The distribution cane growing areas and sugar mills in South Africa
SECTION SIX – REALISING BIOMASS TO ENERGY OPPORTUNITIES
Sugar cane
SUGAR CANE PRODUCTION
Sugar cane millINVASIVE ALIEN PLANT COVER
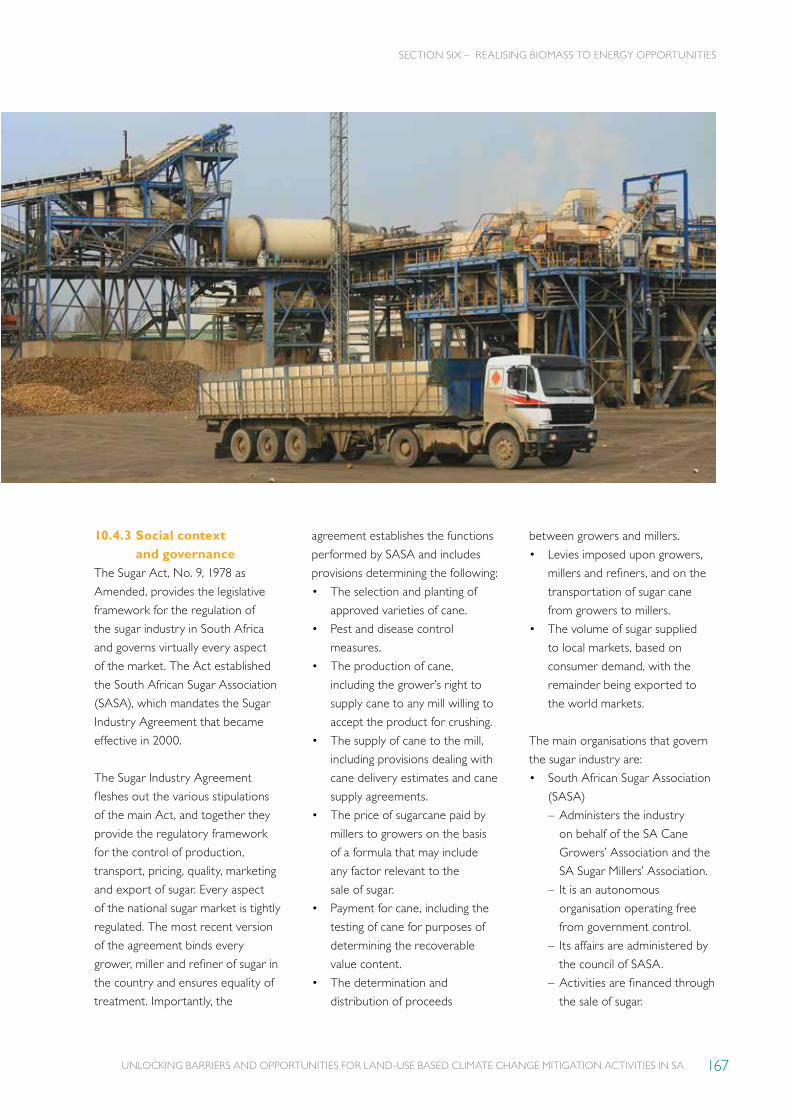
UNLOCKING BARRIERS AND OPPORTUNITIES FOR LAND-USE BASED CLIMATE CHANGE MITIGATION ACTIVITIES IN SA 167
10.4.3 Social context and governance
The Sugar Act, No. 9, 1978 as
Amended, provides the legislative
framework for the regulation of
the sugar industry in South Africa
and governs virtually every aspect
of the market. The Act established
the South African Sugar Association
(SASA), which mandates the Sugar
Industry Agreement that became
effective in 2000.
The Sugar Industry Agreement
fleshes out the various stipulations
of the main Act, and together they
provide the regulatory framework
for the control of production,
transport, pricing, quality, marketing
and export of sugar. Every aspect
of the national sugar market is tightly
regulated. The most recent version
of the agreement binds every
grower, miller and refiner of sugar in
the country and ensures equality of
treatment. Importantly, the
agreement establishes the functions
performed by SASA and includes
provisions determining the following:
• The selection and planting of
approved varieties of cane.
• Pest and disease control
measures.
• The production of cane,
including the grower’s right to
supply cane to any mill willing to
accept the product for crushing.
• The supply of cane to the mill,
including provisions dealing with
cane delivery estimates and cane
supply agreements.
• The price of sugarcane paid by
millers to growers on the basis
of a formula that may include
any factor relevant to the
sale of sugar.
• Payment for cane, including the
testing of cane for purposes of
determining the recoverable
value content.
• The determination and
distribution of proceeds
between growers and millers.
• Levies imposed upon growers,
millers and refiners, and on the
transportation of sugar cane
from growers to millers.
• The volume of sugar supplied
to local markets, based on
consumer demand, with the
remainder being exported to
the world markets.
The main organisations that govern
the sugar industry are:
• South African Sugar Association
(SASA)
– Administers the industry
on behalf of the SA Cane
Growers’ Association and the
SA Sugar Millers’ Association.
– It is an autonomous
organisation operating free
from government control.
– Its affairs are administered by
the council of SASA.
– Activities are financed through
the sale of sugar.
SECTION SIX – REALISING BIOMASS TO ENERGY OPPORTUNITIES
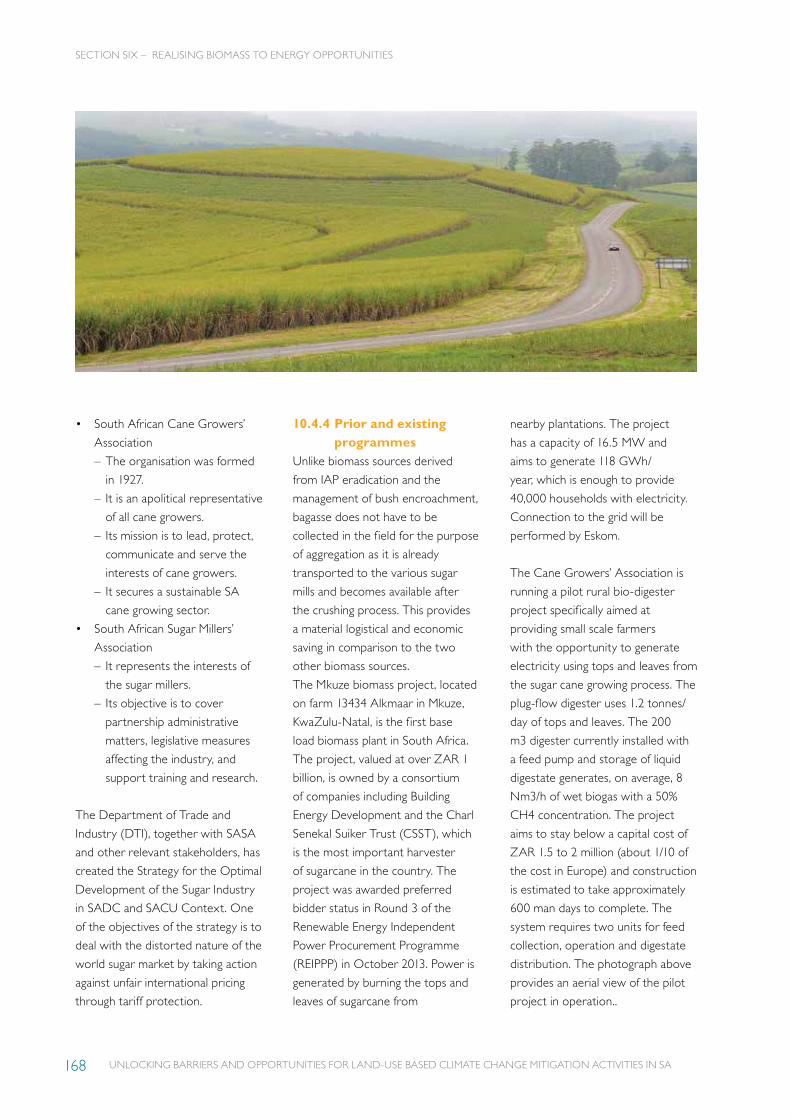
UNLOCKING BARRIERS AND OPPORTUNITIES FOR LAND-USE BASED CLIMATE CHANGE MITIGATION ACTIVITIES IN SA168
• South African Cane Growers’
Association
– The organisation was formed
in 1927.
– It is an apolitical representative
of all cane growers.
– Its mission is to lead, protect,
communicate and serve the
interests of cane growers.
– It secures a sustainable SA
cane growing sector.
• South African Sugar Millers’
Association
– It represents the interests of
the sugar millers.
– Its objective is to cover
partnership administrative
matters, legislative measures
affecting the industry, and
support training and research.
The Department of Trade and
Industry (DTI), together with SASA
and other relevant stakeholders, has
created the Strategy for the Optimal
Development of the Sugar Industry
in SADC and SACU Context. One
of the objectives of the strategy is to
deal with the distorted nature of the
world sugar market by taking action
against unfair international pricing
through tariff protection.
10.4.4 Prior and existing programmes
Unlike biomass sources derived
from IAP eradication and the
management of bush encroachment,
bagasse does not have to be
collected in the field for the purpose
of aggregation as it is already
transported to the various sugar
mills and becomes available after
the crushing process. This provides
a material logistical and economic
saving in comparison to the two
other biomass sources.
The Mkuze biomass project, located
on farm 13434 Alkmaar in Mkuze,
KwaZulu-Natal, is the first base
load biomass plant in South Africa.
The project, valued at over ZAR 1
billion, is owned by a consortium
of companies including Building
Energy Development and the Charl
Senekal Suiker Trust (CSST), which
is the most important harvester
of sugarcane in the country. The
project was awarded preferred
bidder status in Round 3 of the
Renewable Energy Independent
Power Procurement Programme
(REIPPP) in October 2013. Power is
generated by burning the tops and
leaves of sugarcane from
nearby plantations. The project
has a capacity of 16.5 MW and
aims to generate 118 GWh/
year, which is enough to provide
40,000 households with electricity.
Connection to the grid will be
performed by Eskom.
The Cane Growers’ Association is
running a pilot rural bio-digester
project specifically aimed at
providing small scale farmers
with the opportunity to generate
electricity using tops and leaves from
the sugar cane growing process. The
plug-flow digester uses 1.2 tonnes/
day of tops and leaves. The 200
m3 digester currently installed with
a feed pump and storage of liquid
digestate generates, on average, 8
Nm3/h of wet biogas with a 50%
CH4 concentration. The project
aims to stay below a capital cost of
ZAR 1.5 to 2 million (about 1/10 of
the cost in Europe) and construction
is estimated to take approximately
600 man days to complete. The
system requires two units for feed
collection, operation and digestate
distribution. The photograph above
provides an aerial view of the pilot
project in operation..
SECTION SIX – REALISING BIOMASS TO ENERGY OPPORTUNITIES

UNLOCKING BARRIERS AND OPPORTUNITIES FOR LAND-USE BASED CLIMATE CHANGE MITIGATION ACTIVITIES IN SA 169
10.5BIOMASS FROM FOREST PLANTATIONS AND PROCESSING
10.5.1 Sources of biomassSouth African forest plantations
occupy a net area of approximately
1.224 million hectares, or 1.0% of
South Africa’s land area. Annually,
approximately 17.9 million m3 of
wood from eucalypt, pine and acacia
species is sustainably harvested
from these plantations for the
manufacture of pulp and paper,
saw timber, plywood, panel board
and woodchips (FSA 2017). The
distribution of forestry plantations
is illustrated in Figure 10.4.
South African plantation forests
are carbon reservoirs, containing
biomass of about 50% C. These
reservoirs store significant amounts
of carbon, estimated at between
110 to 120 million tC. Currently
there is no clear evidence that the
current South African plantation
estate constitutes a net carbon
sink (that is, it continually adds
carbon to the carbon reservoir)
and given the complex interaction
between genotypes, site, climate
and management regimes, it is best
to assume that it is carbon neutral.
It is better to adopt the position
that plantation forests act as a
carbon pump, adding continuously
to the reservoir of carbon in wood
products. Biomass residues from the
harvesting of timber and subsequent
processing are a significant resource.
HARVESTING AND THINNING RESIDUESForestry plantations in South Africa
are managed on a rotation basis with
harvested areas being replanted.
The rotation length depends on
the species, growing conditions,
and the intended end product. For
example, the rotation length for
fast-growing eucalypts for pulpwood
is approximately 7–10 years, whereas
the rotation length for slower-
growing pine for the saw-timber
market is approximately 25–30 years.
SECTION SIX – REALISING BIOMASS TO ENERGY OPPORTUNITIES
Figure 10.4: The distribution of forestry plantations in South Africa.
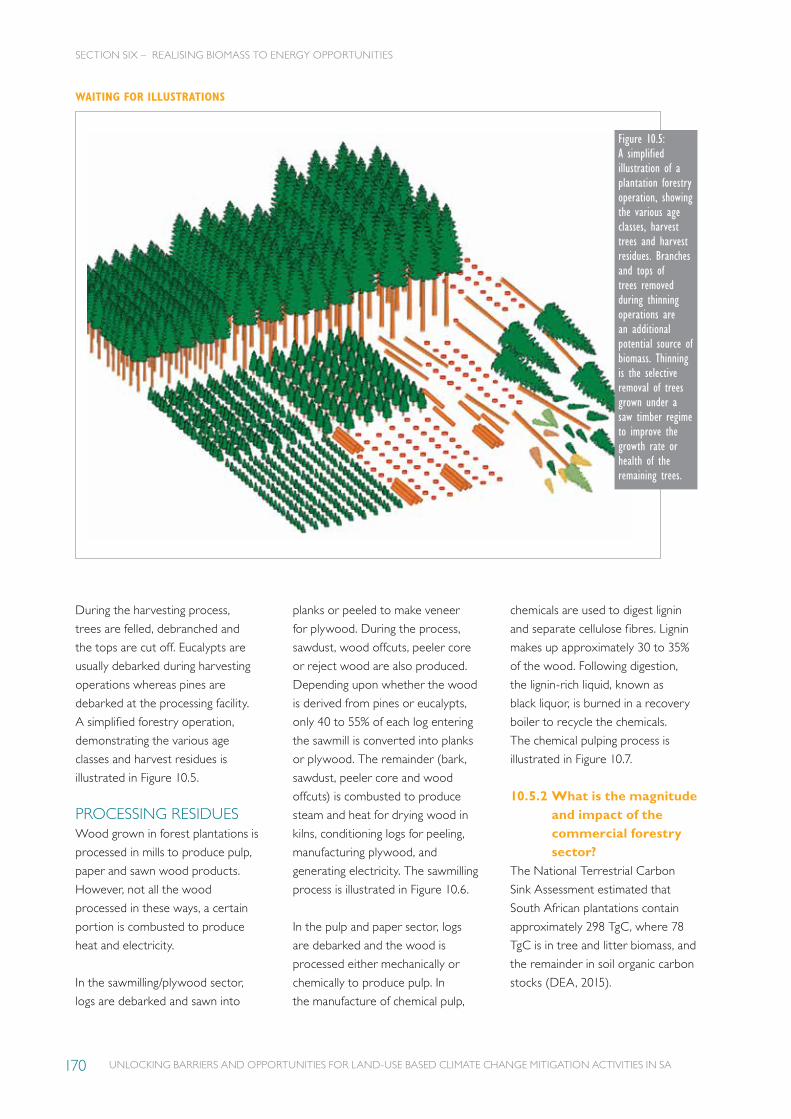
UNLOCKING BARRIERS AND OPPORTUNITIES FOR LAND-USE BASED CLIMATE CHANGE MITIGATION ACTIVITIES IN SA170
During the harvesting process,
trees are felled, debranched and
the tops are cut off. Eucalypts are
usually debarked during harvesting
operations whereas pines are
debarked at the processing facility.
A simplified forestry operation,
demonstrating the various age
classes and harvest residues is
illustrated in Figure 10.5.
PROCESSING RESIDUESWood grown in forest plantations is
processed in mills to produce pulp,
paper and sawn wood products.
However, not all the wood
processed in these ways, a certain
portion is combusted to produce
heat and electricity.
In the sawmilling/plywood sector,
logs are debarked and sawn into
planks or peeled to make veneer
for plywood. During the process,
sawdust, wood offcuts, peeler core
or reject wood are also produced.
Depending upon whether the wood
is derived from pines or eucalypts,
only 40 to 55% of each log entering
the sawmill is converted into planks
or plywood. The remainder (bark,
sawdust, peeler core and wood
offcuts) is combusted to produce
steam and heat for drying wood in
kilns, conditioning logs for peeling,
manufacturing plywood, and
generating electricity. The sawmilling
process is illustrated in Figure 10.6.
In the pulp and paper sector, logs
are debarked and the wood is
processed either mechanically or
chemically to produce pulp. In
the manufacture of chemical pulp,
Figure 10.5: A simplified illustration of a plantation forestry operation, showing the various age classes, harvest trees and harvest residues. Branches and tops of trees removed during thinning operations are an additional potential source of biomass. Thinning is the selective removal of trees grown under a saw timber regime to improve the growth rate or health of the remaining trees.
chemicals are used to digest lignin
and separate cellulose fibres. Lignin
makes up approximately 30 to 35%
of the wood. Following digestion,
the lignin-rich liquid, known as
black liquor, is burned in a recovery
boiler to recycle the chemicals.
The chemical pulping process is
illustrated in Figure 10.7.
10.5.2 What is the magnitude and impact of the commercial forestry sector?
The National Terrestrial Carbon
Sink Assessment estimated that
South African plantations contain
approximately 298 TgC, where 78
TgC is in tree and litter biomass, and
the remainder in soil organic carbon
stocks (DEA, 2015).
SECTION SIX – REALISING BIOMASS TO ENERGY OPPORTUNITIES
WAITING FOR ILLUSTRATIONS

UNLOCKING BARRIERS AND OPPORTUNITIES FOR LAND-USE BASED CLIMATE CHANGE MITIGATION ACTIVITIES IN SA 171
Figure 10.6: Schematic layout of the sawmilling process. Sources of biogenic fuels are indicated in red text
Figure 10.7: Schematic layout of the chemical pulping process. Sources of biogenic fuels are indicated in red text
Annually, approximately 8.8 million
tons of wood is harvested from
commercial plantations in South
Africa (FSA 2017). The biomass
potential from forestry plantations
and processing facilities is illustrated
in Table 10.5. During harvesting
operations, approximately 2.2
million tons of harvest residues are
produced. Not all of the harvest
residue is available as a biomass
resource – availability is determined
by factors such as:
• The quantity of available residues
(tonnes/ha).
• Residue collection and transport
systems.
• The economics of collection and
transport.
• Cost of power production.
• Site sustainability and
productivity.
Sawmilling operations produced
approximately 527,000 tons/annum
of residues. A substantial portion
of these residues is already used
to generate process heat and
electricity for own and third party
consumption. Approximately 47,000
tons/annum of bark biomass is
produced by pulp mills.
Table 10.5: The biomass potential from forestry plantations and processing facilities in South Africaa
DRY MASS (‘000 TONS)
SOFTWOOD B HARDWOOD C TOTAL
Harvest residues 544 1 692 2 236 Tops and branches. Thinning’s excluded
Saw and veneer mills 480 47 527 Sawdust, bark and offcuts
Pulp mills 47 - 47 Bark. Black liquor excluded
Total 1 071 1 739 2 810
a. Derived from FSA 2017, Ackerman et. al 2013b. Pine species; cEucalypt and acacia species
SECTION SIX – REALISING BIOMASS TO ENERGY OPPORTUNITIES
WAITING FOR ILLUSTRATIONS
Logs
Finished product Wood drying kiln
Breakdown saw Cants Edging and crosscuttingSawdust and offcuts
Debarking drumBark
Debarking drumBark
Chipper Washer Refiner, pulp washerand
screens
Headbox
Fourdrinier machine
DigesterRecovery boiler
Black liquor
Planning and sandingSawdust and shavings
Cutting and edgingSawdust and offcuts
Debarked logs
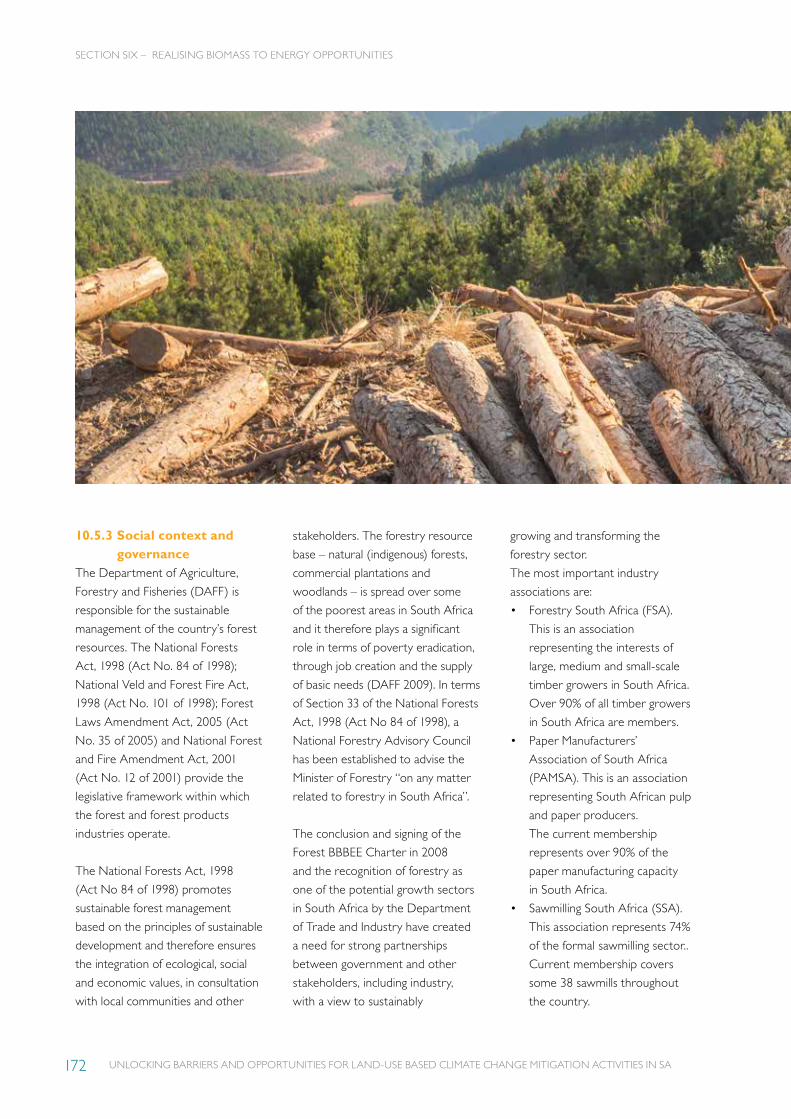
UNLOCKING BARRIERS AND OPPORTUNITIES FOR LAND-USE BASED CLIMATE CHANGE MITIGATION ACTIVITIES IN SA172
10.5.3 Social context and governance
The Department of Agriculture,
Forestry and Fisheries (DAFF) is
responsible for the sustainable
management of the country’s forest
resources. The National Forests
Act, 1998 (Act No. 84 of 1998);
National Veld and Forest Fire Act,
1998 (Act No. 101 of 1998); Forest
Laws Amendment Act, 2005 (Act
No. 35 of 2005) and National Forest
and Fire Amendment Act, 2001
(Act No. 12 of 2001) provide the
legislative framework within which
the forest and forest products
industries operate.
The National Forests Act, 1998
(Act No 84 of 1998) promotes
sustainable forest management
based on the principles of sustainable
development and therefore ensures
the integration of ecological, social
and economic values, in consultation
with local communities and other
stakeholders. The forestry resource
base – natural (indigenous) forests,
commercial plantations and
woodlands – is spread over some
of the poorest areas in South Africa
and it therefore plays a significant
role in terms of poverty eradication,
through job creation and the supply
of basic needs (DAFF 2009). In terms
of Section 33 of the National Forests
Act, 1998 (Act No 84 of 1998), a
National Forestry Advisory Council
has been established to advise the
Minister of Forestry “on any matter
related to forestry in South Africa”.
The conclusion and signing of the
Forest BBBEE Charter in 2008
and the recognition of forestry as
one of the potential growth sectors
in South Africa by the Department
of Trade and Industry have created
a need for strong partnerships
between government and other
stakeholders, including industry,
with a view to sustainably
growing and transforming the
forestry sector.
The most important industry
associations are:
• Forestry South Africa (FSA).
This is an association
representing the interests of
large, medium and small-scale
timber growers in South Africa.
Over 90% of all timber growers
in South Africa are members.
• Paper Manufacturers’
Association of South Africa
(PAMSA). This is an association
representing South African pulp
and paper producers.
The current membership
represents over 90% of the
paper manufacturing capacity
in South Africa.
• Sawmilling South Africa (SSA).
This association represents 74%
of the formal sawmilling sector..
Current membership covers
some 38 sawmills throughout
the country.
SECTION SIX – REALISING BIOMASS TO ENERGY OPPORTUNITIES
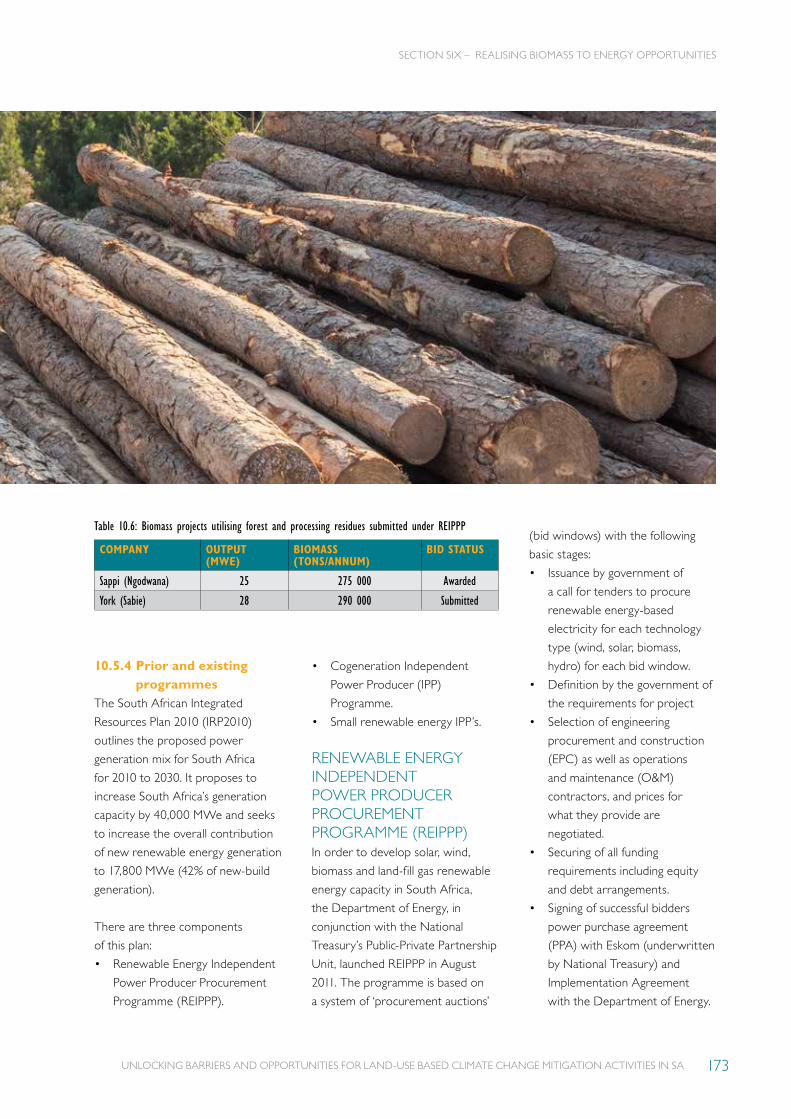
UNLOCKING BARRIERS AND OPPORTUNITIES FOR LAND-USE BASED CLIMATE CHANGE MITIGATION ACTIVITIES IN SA 173
10.5.4 Prior and existing programmes
The South African Integrated
Resources Plan 2010 (IRP2010)
outlines the proposed power
generation mix for South Africa
for 2010 to 2030. It proposes to
increase South Africa’s generation
capacity by 40,000 MWe and seeks
to increase the overall contribution
of new renewable energy generation
to 17,800 MWe (42% of new-build
generation).
There are three components
of this plan:
• Renewable Energy Independent
Power Producer Procurement
Programme (REIPPP).
COMPANY OUTPUT (MWE)
BIOMASS (TONS/ANNUM)
BID STATUS
Sappi (Ngodwana) 25 275 000 Awarded
York (Sabie) 28 290 000 Submitted
• Cogeneration Independent
Power Producer (IPP)
Programme.
• Small renewable energy IPP’s.
RENEWABLE ENERGY INDEPENDENT POWER PRODUCER PROCUREMENT PROGRAMME (REIPPP)In order to develop solar, wind,
biomass and land-fill gas renewable
energy capacity in South Africa,
the Department of Energy, in
conjunction with the National
Treasury’s Public-Private Partnership
Unit, launched REIPPP in August
2011. The programme is based on
a system of ‘procurement auctions’
Table 10.6: Biomass projects utilising forest and processing residues submitted under REIPPP
SECTION SIX – REALISING BIOMASS TO ENERGY OPPORTUNITIES
(bid windows) with the following
basic stages:
• Issuance by government of
a call for tenders to procure
renewable energy-based
electricity for each technology
type (wind, solar, biomass,
hydro) for each bid window.
• Definition by the government of
the requirements for project
• Selection of engineering
procurement and construction
(EPC) as well as operations
and maintenance (O&M)
contractors, and prices for
what they provide are
negotiated.
• Securing of all funding
requirements including equity
and debt arrangements.
• Signing of successful bidders
power purchase agreement
(PPA) with Eskom (underwritten
by National Treasury) and
Implementation Agreement
with the Department of Energy.

UNLOCKING BARRIERS AND OPPORTUNITIES FOR LAND-USE BASED CLIMATE CHANGE MITIGATION ACTIVITIES IN SA174
The updated RFP for Round 4 has
removed certain requirements such
as the submission of fully developed
shareholders’ agreements and
Memorandum of Incorporation
(MOI); detailed heads of terms to
be entered into with contractors
or equipment suppliers; and land
use and environmental consent
applications.
There has been a delay in the signing
of power purchase agreements
for 26 renewable energy projects,
despite these already having been
adjudicated under the REIPPP, and
Round 4.5 bid announcements have
been delayed.
Proposed and existing REIPPP
projects are summarised in
Table 13.6.
COGENERATION INDEPENDENT POWER PRODUCER (IPP) PROGRAMMEThe cogeneration IPP procurement
programme has been designed to
procure a target of 800 MWe of
energy-generation capacity from
cogeneration. However, the energy
minister indicated that the bidding
process would be for 1,800 MWe
and the department was seeking
concurrence from the energy
regulator to increase the size of
the determination. The bidding
process would be pursued under
a revised model in an effort to
‘expedite the approval process and
financial close’ Cogeneration under
this IPP procurement programme
encompasses:
Table 10.7: Key elements of industrial biomass within the CoGen IPP programme
Description Projects utilising an energy source which is a co-product, by-product, waste product or residual product of an industrial process and or sustainable agricultural or forestry activity, to produce an energy output.
Primary fuels
Sugar bagasse; field trash and other sugar related renewable wastes associated with the Host Facility process; and
Mill wastes, including chips, saw dust, shavings, soaps, methanol, sludges, bark and black liquor.
Agricultural or Forestry residue including alien vegetation clearing.
Exceptions from COFIT Guideline (primary fuels)
Bidders are not limited to primary fuels described in COFIT Guideline. The mill wastes described by the COFIT Guideline should merely be considered examples of the types of mill waste that may be utilised as a primary fuel.
Minimum % primary fuel Minimum of seventy-five per cent (75%) of the primary fuel must be sourced from the primary fuel classifications above.
Supplementary fuel
1. All supplementary fuels must be sourced from any one (1) (or more) of the primary fuels listed for any of the Waste to Energy, Combined Heat and Power and Industrial Biomass Technologies above; and
2. the aggregate of the supplementary fuels used cannot compromise the primary fuel minimum per-centages for the respective Technologies, for example, for a Waste to Energy Project, a maximum of forty percent (40%) of the total fuel requirements of the Facility can be made up of supplementary fuels.
Efficiency requirements for the Facility
No minimum efficiency requirements, however, Bidders must inform the efficiency values in their proposal if the Facility produces Useful Thermal Energy.
Allowable technologies Boiler and steam turbine.
Links with the Host Facility All primary fuel must be supplied from or directly associated with the Host Facility.
Electrical Connection Not stated
SECTION SIX – REALISING BIOMASS TO ENERGY OPPORTUNITIES
• Simultaneous generation of
energy and useful thermal
energy (Combined Heat and
Power – CHP).
• Generation of energy with
possible generation of useful
thermal energy (Waste
to Energy).
• Industrial biomass.
The biomass component is
summarised in Table 10.7.
SMALL PROJECTS IPP PROCUREMENT PROGRAMMEThe Department of Energy has
developed a Small Projects IPP
procurement programme that seeks
to procure renewable
energy from small-scale independent
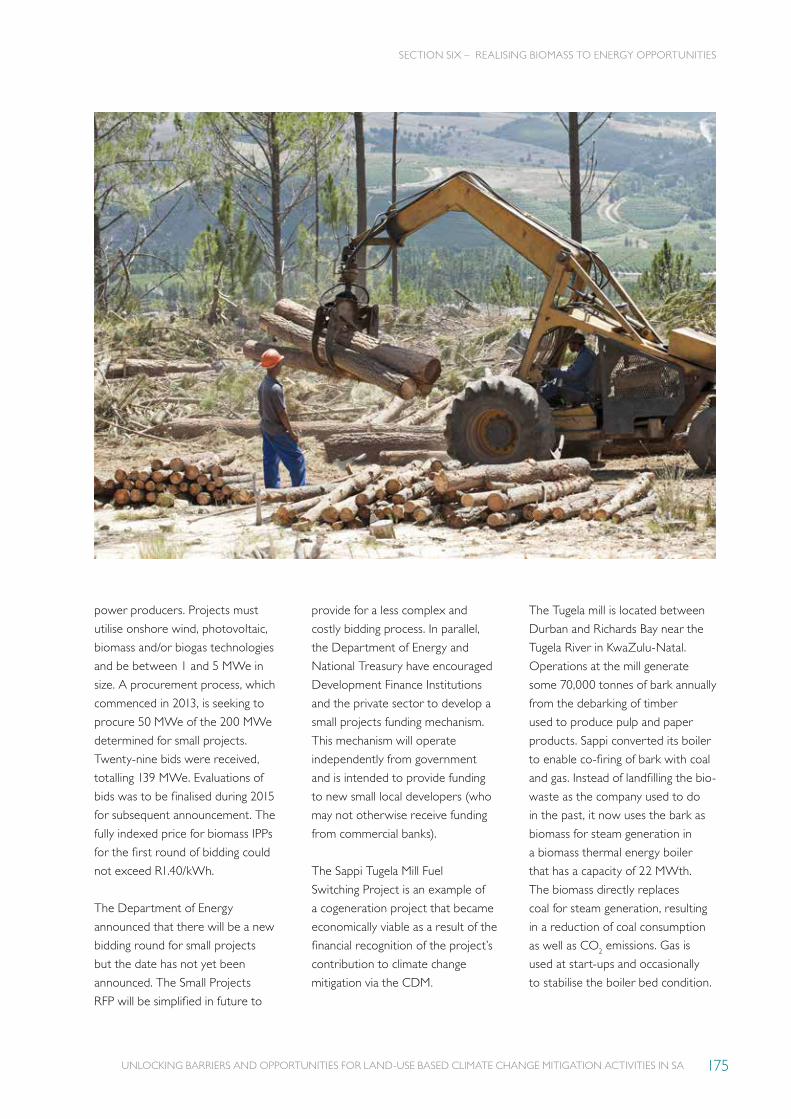
UNLOCKING BARRIERS AND OPPORTUNITIES FOR LAND-USE BASED CLIMATE CHANGE MITIGATION ACTIVITIES IN SA 175
SECTION SIX – REALISING BIOMASS TO ENERGY OPPORTUNITIES
power producers. Projects must
utilise onshore wind, photovoltaic,
biomass and/or biogas technologies
and be between 1 and 5 MWe in
size. A procurement process, which
commenced in 2013, is seeking to
procure 50 MWe of the 200 MWe
determined for small projects.
Twenty-nine bids were received,
totalling 139 MWe. Evaluations of
bids was to be finalised during 2015
for subsequent announcement. The
fully indexed price for biomass IPPs
for the first round of bidding could
not exceed R1.40/kWh.
The Department of Energy
announced that there will be a new
bidding round for small projects
but the date has not yet been
announced. The Small Projects
RFP will be simplified in future to
provide for a less complex and
costly bidding process. In parallel,
the Department of Energy and
National Treasury have encouraged
Development Finance Institutions
and the private sector to develop a
small projects funding mechanism.
This mechanism will operate
independently from government
and is intended to provide funding
to new small local developers (who
may not otherwise receive funding
from commercial banks).
The Sappi Tugela Mill Fuel
Switching Project is an example of
a cogeneration project that became
economically viable as a result of the
financial recognition of the project’s
contribution to climate change
mitigation via the CDM.
The Tugela mill is located between
Durban and Richards Bay near the
Tugela River in KwaZulu-Natal.
Operations at the mill generate
some 70,000 tonnes of bark annually
from the debarking of timber
used to produce pulp and paper
products. Sappi converted its boiler
to enable co-firing of bark with coal
and gas. Instead of landfilling the bio-
waste as the company used to do
in the past, it now uses the bark as
biomass for steam generation in
a biomass thermal energy boiler
that has a capacity of 22 MWth.
The biomass directly replaces
coal for steam generation, resulting
in a reduction of coal consumption
as well as CO2 emissions. Gas is
used at start-ups and occasionally
to stabilise the boiler bed condition.

UNLOCKING BARRIERS AND OPPORTUNITIES FOR LAND-USE BASED CLIMATE CHANGE MITIGATION ACTIVITIES IN SA176
SECTION SIX – REALISING BIOMASS TO ENERGY OPPORTUNITIES
ELECTRICITY CONSUMPTION
ELECTRICITY GENERATION (STEAM TURBINE, GENERATOR
COMBUSTIONBIOMASS TRANSPORT
10.6CONCEPT AND CLIMATE VALUE
10.6.1 The biomass to energy concept
Biomass from IAPs, bush
encroachment and bagasse can be
used to generate different types
of energy such as heat, steam and
electricity. Since heat generation is
easily achieved by combusting the
biomass, and energy in the form
of steam is primarily relevant in an
industrial environment, this section
focuses mainly on the generation of
electricity from sustainable biomass.
In essence, after the biomass has
been harvested and transported
to the power generation facility,
it is combusted in a boiler. The
steam generated by the boiler is
run through a steam turbine, which
drives a generator that produces
electricity for either internal
consumption or supply to the
electricity grid. The diagram
below provides a schematic
overview of the biomass to
electricity process.
The infield processing stage is not
necessary for a biomass source
that is already centralised as
part of the transportation of the
primary product, such for bagasse
that arrives at the sugar mill as
part of the sugar making process.
The primary driver behind infield
processing is to increase the energy
density (decrease the volume) of the
biomass before transporting it. This
not only makes handling the biomass
easier, it also extends the range
over which it can be transported
economically.
10.6.2 The energy valueThe South African National
Terrestrial Carbon Sink Assessment
(DEA, 2015) derives the annual
BIOMASS HARVESTING
IN FIELD PROCESSING (CHIPPING)
OPTIONAL
Figure 10.8: Biomass to energy process (electricity)
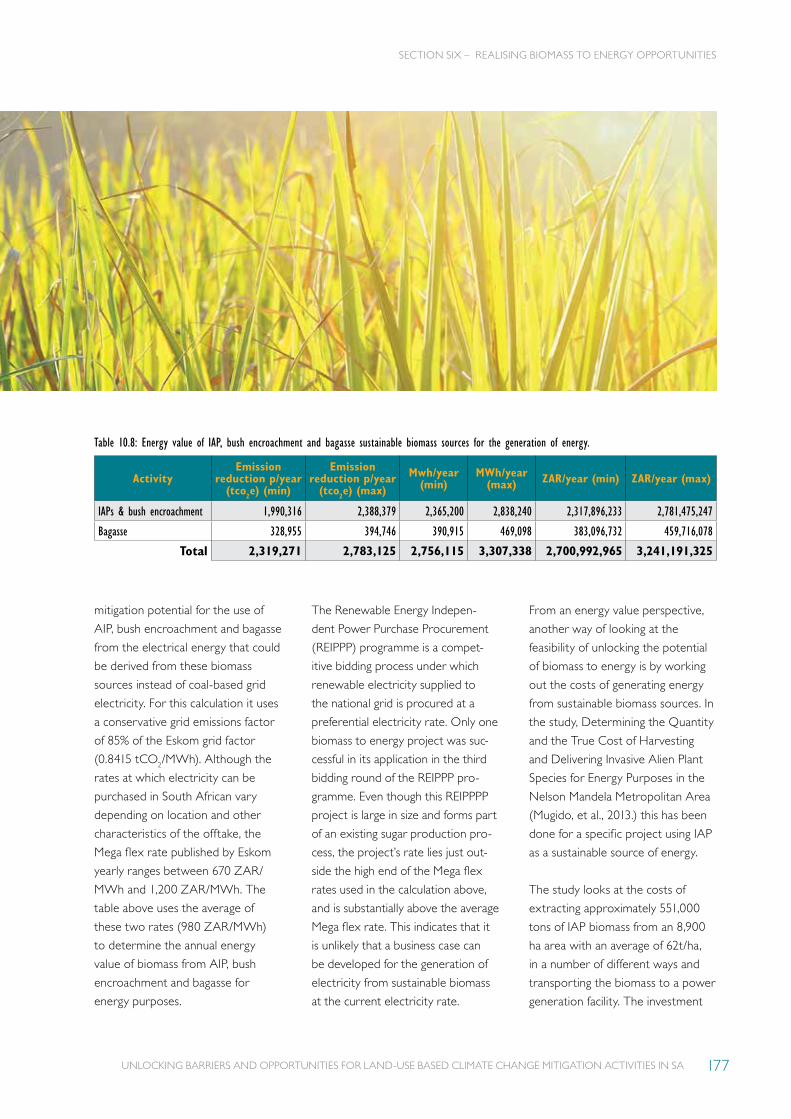
UNLOCKING BARRIERS AND OPPORTUNITIES FOR LAND-USE BASED CLIMATE CHANGE MITIGATION ACTIVITIES IN SA 177
Table 10.8: Energy value of IAP, bush encroachment and bagasse sustainable biomass sources for the generation of energy.
ActivityEmission
reduction p/year (tco2e) (min)
Emission reduction p/year
(tco2e) (max)
Mwh/year (min)
MWh/year (max) ZAR/year (min) ZAR/year (max)
IAPs & bush encroachment 1,990,316 2,388,379 2,365,200 2,838,240 2,317,896,233 2,781,475,247
Bagasse 328,955 394,746 390,915 469,098 383,096,732 459,716,078
Total 2,319,271 2,783,125 2,756,115 3,307,338 2,700,992,965 3,241,191,325
mitigation potential for the use of
AIP, bush encroachment and bagasse
from the electrical energy that could
be derived from these biomass
sources instead of coal-based grid
electricity. For this calculation it uses
a conservative grid emissions factor
of 85% of the Eskom grid factor
(0.8415 tCO2/MWh). Although the
rates at which electricity can be
purchased in South African vary
depending on location and other
characteristics of the offtake, the
Mega flex rate published by Eskom
yearly ranges between 670 ZAR/
MWh and 1,200 ZAR/MWh. The
table above uses the average of
these two rates (980 ZAR/MWh)
to determine the annual energy
value of biomass from AIP, bush
encroachment and bagasse for
energy purposes.
The Renewable Energy Indepen-
dent Power Purchase Procurement
(REIPPP) programme is a compet-
itive bidding process under which
renewable electricity supplied to
the national grid is procured at a
preferential electricity rate. Only one
biomass to energy project was suc-
cessful in its application in the third
bidding round of the REIPPP pro-
gramme. Even though this REIPPPP
project is large in size and forms part
of an existing sugar production pro-
cess, the project’s rate lies just out-
side the high end of the Mega flex
rates used in the calculation above,
and is substantially above the average
Mega flex rate. This indicates that it
is unlikely that a business case can
be developed for the generation of
electricity from sustainable biomass
at the current electricity rate.
From an energy value perspective,
another way of looking at the
feasibility of unlocking the potential
of biomass to energy is by working
out the costs of generating energy
from sustainable biomass sources. In
the study, Determining the Quantity
and the True Cost of Harvesting
and Delivering Invasive Alien Plant
Species for Energy Purposes in the
Nelson Mandela Metropolitan Area
(Mugido, et al., 2013.) this has been
done for a specific project using IAP
as a sustainable source of energy.
The study looks at the costs of
extracting approximately 551,000
tons of IAP biomass from an 8,900
ha area with an average of 62t/ha,
in a number of different ways and
transporting the biomass to a power
generation facility. The investment
SECTION SIX – REALISING BIOMASS TO ENERGY OPPORTUNITIES

UNLOCKING BARRIERS AND OPPORTUNITIES FOR LAND-USE BASED CLIMATE CHANGE MITIGATION ACTIVITIES IN SA178
required to convert the biomass
into energy is not taken into account
as the study is concerned with the
costs of replacing fossil fuel delivered
to an existing power generation
facility. The study shows an average
cost of getting IAP to the gate of a
power generation facility of 3.58 c/
MJ, which is cheaper than the cost
of a supply of coal, which the study
indicates as being 4.9 c/MJ.
However, most of the scenarios
in the study exclude the cost of
harvesting AIP, assuming these
costs will be borne by the Natural
Resource Management programmes
(such as WfW) as part of their
objective to manage and eventually
eradicate AIP from South Africa.
The one scenario that includes
harvesting costs shows a cost of
6.25 c/MJ, substantially higher than
the coal baseline costs.
It appears then, from the scenarios
discussed above, that in some cases
the use of IAP as an alternative
sustainable fuel can compete with
fossil fuels for the production of
energy, provided non-biomass to
energy incentives are used (such
as WfW harvesting IAP) In other
cases, additional incentives such as a
feed-in tariff from the REIPPPP for a
biomass to energy project would be
required. However, these scenarios
do not directly consider other
sustainable biomass benefits such as
climate change mitigation, or other
sustainable biomass co-benefits such
as energy independence.
10.6.3 The climate valueOnly the share of AIP and bush
encroachment that is replenished
on an annual basis can be
considered as a sustainable biomass
that reduces the country’s GHG
emission when used to substitute
fossil fuel based energy.
South Africa is committed to moving
towards a lower-carbon economy.
At the 2015 climate change
conference in Paris, South Africa
submitted its Intended Nationally
Determined Contribution (INDC),
which commits the country to
an emission reduction target in
the effort to limit the increase of
average global temperatures to 2°C.
The South African government, like
others, has three instruments at its
disposal to change the behaviour of
its industries and citizens:
• Command and control – where
the emissions above a certain
level are illegal, and exceeding
the determined level of GHG
could result in penalties and/
or termination of the emitting
activity.
• Stick approach – where the
emission of GHG is not illegal
but comes at a cost to industry
and/or citizens. The penalty can
be collected in a number
of ways, one of which is the
introduction of a carbon tax.
• Carrot approach – where an
incentive for the reduction of
GHG by industry and/or citizens
is provided, and the desired
behaviour is rewarded. This
reward can be given in a variety
of ways, one of which is the
issuance and commercialisation
of carbon credits.
With the ratification of the
Kyoto Protocol, the South Africa
Government adopted a carrot
approach instrument in the form of
the Clean Development Mechanism
(CDM). Currently, the government
is in the process of developing a
stick approach instrument in the
form of ‘The South African Carbon
Tax’, scheduled for implementation
by mid-2017. The legislation calls
for a levy of 120 ZAR/tCO2e
emitted, which may be adjusted
by the Minister of Finance as part
of the annual budgetary process.
Although the details are still being
discussed, a basic tax-free threshold
would be set at 60% to 70% for all
sectors, with a maximum obtainable
tax-free threshold of 75% to 95%
when taking into account various
adjustments to the basic threshold.
The proposed carbon tax would
effectively introduce a carbon price
into the South African economy at
an initial rate of 120 ZAR/tCO2e.
Although the tax targets
SECTION SIX – REALISING BIOMASS TO ENERGY OPPORTUNITIES
Table 10.9: Climate value of IAP, bush encroachment and bagasse sustainable biomass sources for the generation of energy.
ACTIVITY EMISSION REDUCTION P/YEAR (TCO2E) (MIN)
EMISSION REDUCTION P/YEAR (TCO2E) (MAX)
ZAR/YEAR (MIN)
ZAR/YEAR (MAX)
IAPs & bush encroachment 1,990,316 2,388,379 238,837,920 286,605,480
Bagasse 328,955 394,746 39,474,600 47,369,520
Total 2,319,271 2,783,125 278,312,520 333,975,000
UNLOCKING BARRIERS AND OPPORTUNITIES FOR LAND-USE BASED CLIMATE CHANGE MITIGATION ACTIVITIES IN SA 179
the GHG emissions of large carbon
intensive industries, it can serve
as a proxy for the economy-wide
carbon price. This is because the
introduction of such a legislation
would have a ripple effect. For
example, if a company uses coal in
its operations it would be taxed at
120 ZAR/tCO2e. However, if the
company replaces part or all of its
coal use with sustainable biomass
from harvested AIP, for example, it
would not have to pay carbon tax
for the sustainable biomass used.
In this way, the sustainable biomass
for energy purposes represents a
value of 120 ZAR/tCO2e (assuming
the Draft Carbon Tax Bill is aligned
to the international practice of
distinguishing between long and
short cycle based emission types).
Table 10.9 uses the annual mitigation
potential of the three-biomass
sources this study is concerned
with, as well as the carbon tax rate,
to determine the climate value
of these sustainable biomass to
energy sources. Figures are sourced
from the ’South African National
Terrestrial Carbon Sink Assessment’
(DEA, 2015).
The table shows that the average
annual climate value of the three
sustainable biomass sources is
around 300 million ZAR per year.
National Treasury has indicated that
it intends to increase the rate on an
annual basis, at a rate higher than
inflation, to increase the price signal
into the economy over time.
10.6.4 Biomass to energy co-benefits
There is a range of environmental
and social co-benefits that can be
derived from the management
and/or eradication of AIP and the
management of bush encroachment.
In addition to the energy and climate
value of the sustainable component
of the three biomass sources
– AIP and bush encroachment
management and bagasse – the
following co-benefits can be derived:
• Energy proliferation: Rural
energy demand in South Africa
is generally small and highly
geographically disbursed. As a
result, it is expensive to connect
this demand to the national
energy infrastructure, and it is
unlikely to happen in the near
future. However, the sustainable
biomass sources available in rural
environments potentially make
the implementation of biomass
to energy activities a way of
distributing access to energy
across the country.
• Energy security: The
implementation of a sustainable
biomass to energy activity in an
area where energy infrastructure
and supply already exists,
increases the reliability of supply
and thereby the user’s level of
energy security.
• Energy independence: At a
national level, dependence on a
third party for the provision of
fuel and electricity runs the risk
of supply interruption. At a local
level, dependence on an energy
provider that might terminate
supply or increase the cost to an
unaffordable extent is a risk. The
implementation of sustainable
biomass to energy activities can
provide a higher level of energy
independence in these instances.
Although these energy co-benefits
are valuable attributes of sustainable
biomass to energy activities, they
are difficult to quantify in monetary
terms in the way that has been done
for the energy and climate value of
these activities.
SECTION SIX – REALISING BIOMASS TO ENERGY OPPORTUNITIES

UNLOCKING BARRIERS AND OPPORTUNITIES FOR LAND-USE BASED CLIMATE CHANGE MITIGATION ACTIVITIES IN SA180
DEFINING THE GAP – STATUS QUO VS. NATIONAL-SCALE READINESS
SOUTH AFRICAN CONTEXT
Historically, coal has
been an abundant
and affordable
source of energy
in South Africa for both industrial
and domestic use. Throughout
the country there are examples
of where coal or other fossil fuels
are used for energy purposes even
where biomass is readily available
on industrial or other sites where
energy is needed. Instead of being
used as a fuel source, the available
biomass is landfilled, burned or
otherwise discarded.
Over the last decade or so South
Africa’s economy has developed
more and more links to the global
economy, resulting in a gradual
increase in the cost of fossil fuels
in alignment with international
commodity prices. In combination
with increasing concern about
climate change, this has resulted in
a drive to replace fossil fuels with
sustainable biomass as an energy
source. However, the uptake of
sustainable biomass as a source of
energy has been marginal in relation
to its full potential.
11
SECTION SIX – REALISING BIOMASS TO ENERGY OPPORTUNITIES
UNLOCKING BARRIERS AND OPPORTUNITIES FOR LAND-USE BASED CLIMATE CHANGE MITIGATION ACTIVITIES IN SA 181
11.1TECHNICAL SCOPE W
hen looking at
the technical
scope of
sustainable
biomass for energy potential, it
is evident that the gap between
current use and total available
biomass in relation to actual
potential is overestimated, in some
cases, grossly so. For this reason,
distinctions are made:
• Theoretical potential is the total
available volume of a source of
biomass per year, and its GHG
mitigation potential. An example
of this would be the total
amount of bagasse biomass that
is produced per year.
• Actual potential, is the
theoretical potential minus
the volume that is either not
extractable, is already used
towards the main process, or does
not result in direct or indirect
GHG emissions.
• Current uptake is the volume
of biomass and the mitigation
contribution of biomass already
used for the generation of energy
outside of the primary process.
In essence, the gap or ‘what we are
missing out on’, is the difference
between the actual potential and
the current uptake.
11.1.1 PotentialIn this section, the theoretical
potential, actual potential and
current uptake of biomass
for energy from IAPs, bush
encroachment and bagasse in tonnes
is provided, and their potential in
tCO2e per source is evaluated.
SECTION SIX – REALISING BIOMASS TO ENERGY OPPORTUNITIES
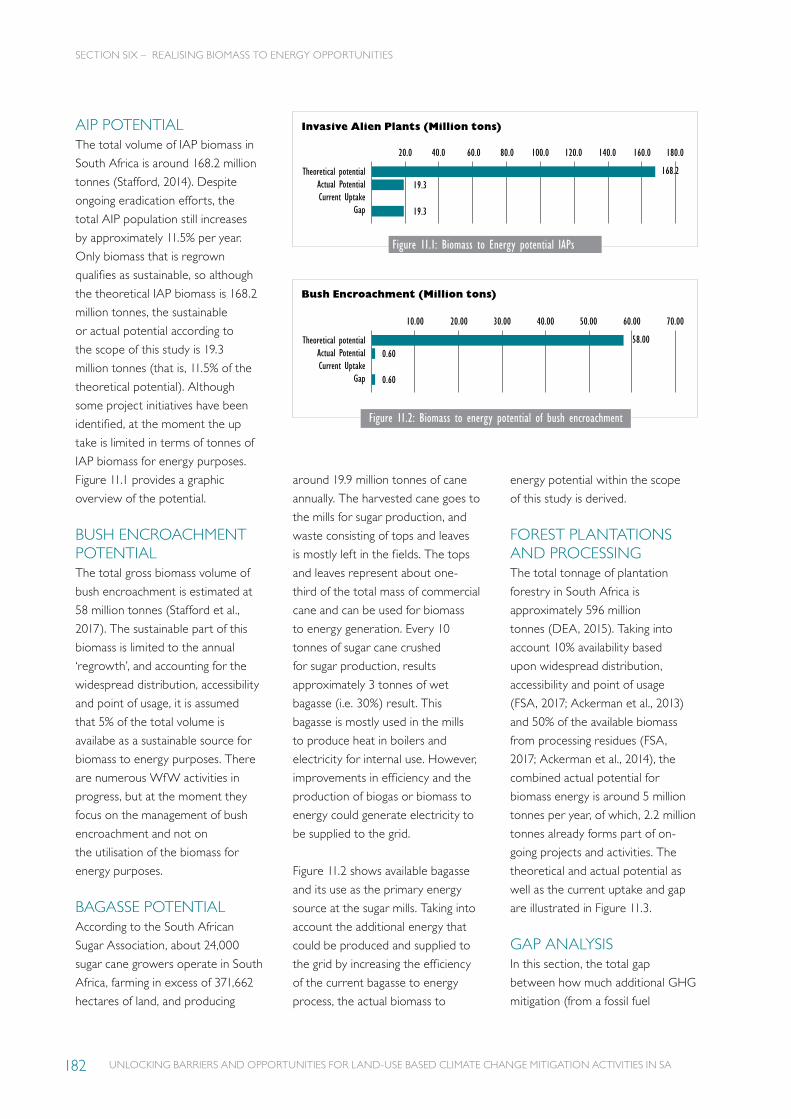
UNLOCKING BARRIERS AND OPPORTUNITIES FOR LAND-USE BASED CLIMATE CHANGE MITIGATION ACTIVITIES IN SA182
AIP POTENTIALThe total volume of IAP biomass in
South Africa is around 168.2 million
tonnes (Stafford, 2014). Despite
ongoing eradication efforts, the
total AIP population still increases
by approximately 11.5% per year.
Only biomass that is regrown
qualifies as sustainable, so although
the theoretical IAP biomass is 168.2
million tonnes, the sustainable
or actual potential according to
the scope of this study is 19.3
million tonnes (that is, 11.5% of the
theoretical potential). Although
some project initiatives have been
identified, at the moment the up
take is limited in terms of tonnes of
IAP biomass for energy purposes.
Figure 11.1 provides a graphic
overview of the potential.
BUSH ENCROACHMENT POTENTIALThe total gross biomass volume of
bush encroachment is estimated at
58 million tonnes (Stafford et al.,
2017). The sustainable part of this
biomass is limited to the annual
‘regrowth’, and accounting for the
widespread distribution, accessibility
and point of usage, it is assumed
that 5% of the total volume is
availabe as a sustainable source for
biomass to energy purposes. There
are numerous WfW activities in
progress, but at the moment they
focus on the management of bush
encroachment and not on
the utilisation of the biomass for
energy purposes.
BAGASSE POTENTIALAccording to the South African
Sugar Association, about 24,000
sugar cane growers operate in South
Africa, farming in excess of 371,662
hectares of land, and producing
Invasive Alien Plants (Million tons)
Bush Encroachment (Million tons)
around 19.9 million tonnes of cane
annually. The harvested cane goes to
the mills for sugar production, and
waste consisting of tops and leaves
is mostly left in the fields. The tops
and leaves represent about one-
third of the total mass of commercial
cane and can be used for biomass
to energy generation. Every 10
tonnes of sugar cane crushed
for sugar production, results
approximately 3 tonnes of wet
bagasse (i.e. 30%) result. This
bagasse is mostly used in the mills
to produce heat in boilers and
electricity for internal use. However,
improvements in efficiency and the
production of biogas or biomass to
energy could generate electricity to
be supplied to the grid.
Figure 11.2 shows available bagasse
and its use as the primary energy
source at the sugar mills. Taking into
account the additional energy that
could be produced and supplied to
the grid by increasing the efficiency
of the current bagasse to energy
process, the actual biomass to
energy potential within the scope
of this study is derived.
FOREST PLANTATIONS AND PROCESSINGThe total tonnage of plantation
forestry in South Africa is
approximately 596 million
tonnes (DEA, 2015). Taking into
account 10% availability based
upon widespread distribution,
accessibility and point of usage
(FSA, 2017; Ackerman et al., 2013)
and 50% of the available biomass
from processing residues (FSA,
2017; Ackerman et al., 2014), the
combined actual potential for
biomass energy is around 5 million
tonnes per year, of which, 2.2 million
tonnes already forms part of on-
going projects and activities. The
theoretical and actual potential as
well as the current uptake and gap
are illustrated in Figure 11.3.
GAP ANALYSISIn this section, the total gap
between how much additional GHG
mitigation (from a fossil fuel
Theoretical potentialActual PotentialCurrent Uptake
Gap
20.0
19.3
19.3
40.0 60.0 80.0 100.0 120.0 140.0 160.0 180.0
168.2
Theoretical potentialActual PotentialCurrent Uptake
Gap
10.00
0.60
0.60
20.00 30.00 40.00 50.00 60.00 70.00
58.00
Figure 11.2: Biomass to energy potential of bush encroachment
Figure 11.1: Biomass to Energy potential IAPs
SECTION SIX – REALISING BIOMASS TO ENERGY OPPORTUNITIES
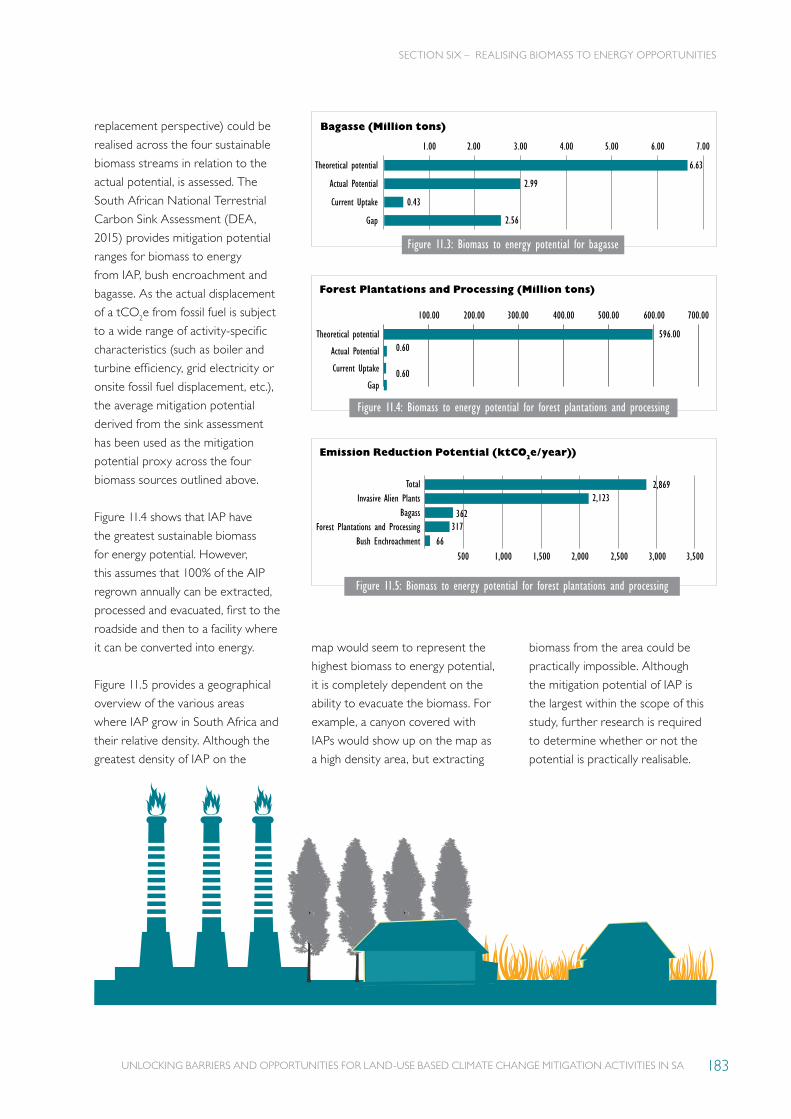
UNLOCKING BARRIERS AND OPPORTUNITIES FOR LAND-USE BASED CLIMATE CHANGE MITIGATION ACTIVITIES IN SA 183
Bagasse (Million tons)
Forest Plantations and Processing (Million tons)
Emission Reduction Potential (ktCO2e/year))
replacement perspective) could be
realised across the four sustainable
biomass streams in relation to the
actual potential, is assessed. The
South African National Terrestrial
Carbon Sink Assessment (DEA,
2015) provides mitigation potential
ranges for biomass to energy
from IAP, bush encroachment and
bagasse. As the actual displacement
of a tCO2e from fossil fuel is subject
to a wide range of activity-specific
characteristics (such as boiler and
turbine efficiency, grid electricity or
onsite fossil fuel displacement, etc.),
the average mitigation potential
derived from the sink assessment
has been used as the mitigation
potential proxy across the four
biomass sources outlined above.
Figure 11.4 shows that IAP have
the greatest sustainable biomass
for energy potential. However,
this assumes that 100% of the AIP
regrown annually can be extracted,
processed and evacuated, first to the
roadside and then to a facility where
it can be converted into energy.
Figure 11.5 provides a geographical
overview of the various areas
where IAP grow in South Africa and
their relative density. Although the
greatest density of IAP on the
map would seem to represent the
highest biomass to energy potential,
it is completely dependent on the
ability to evacuate the biomass. For
example, a canyon covered with
IAPs would show up on the map as
a high density area, but extracting
biomass from the area could be
practically impossible. Although
the mitigation potential of IAP is
the largest within the scope of this
study, further research is required
to determine whether or not the
potential is practically realisable.
Theoretical potential
Actual Potential
Current Uptake
Gap
2.99
2.56
0.43
1.00 2.00 3.00 4.00 5.00 6.00 7.00
6.63
Theoretical potential
Actual Potential
Current Uptake
Gap
100.00
0.60
0.60
200.00 300.00 400.00 500.00 600.00 700.00
596.00
TotalInvasive Alien Plants
BagassForest Plantations and Processing
Bush Enchroachment
500 2,0001,000 2,5001,500 3,000 3,500
2,123
317362
66
2,869
Figure 11.4: Biomass to energy potential for forest plantations and processing
Figure 11.5: Biomass to energy potential for forest plantations and processing
Figure 11.3: Biomass to energy potential for bagasse
SECTION SIX – REALISING BIOMASS TO ENERGY OPPORTUNITIES
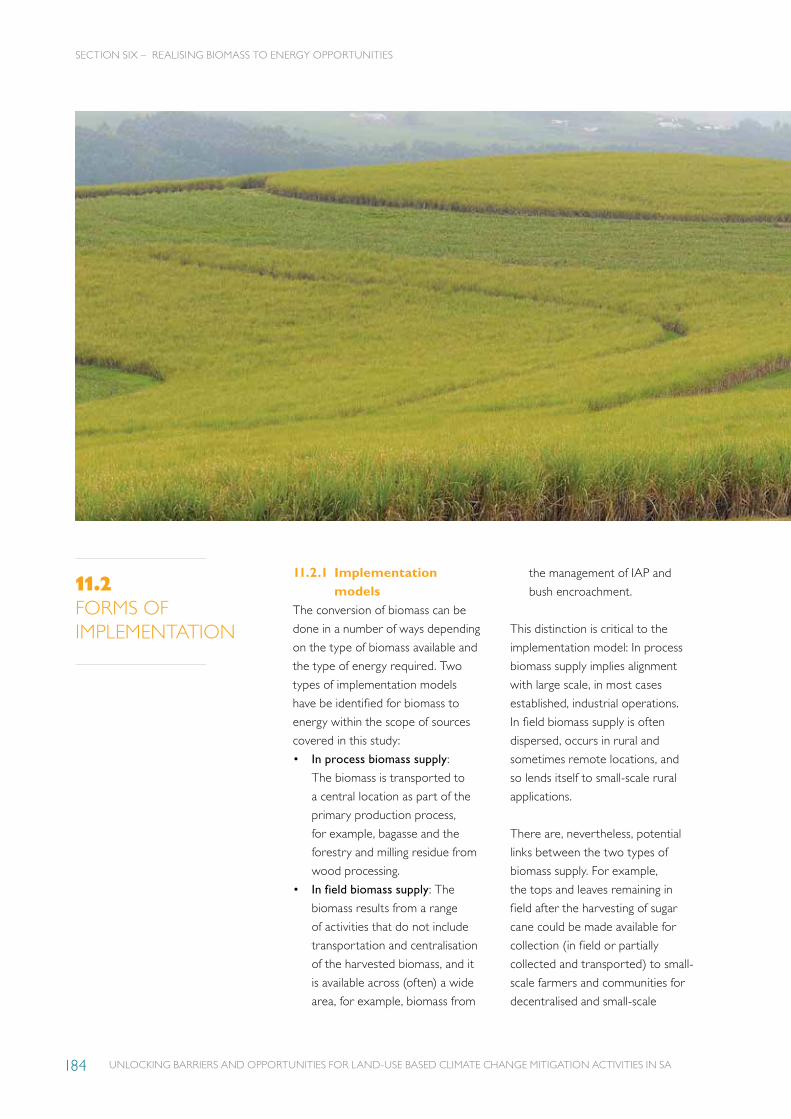
UNLOCKING BARRIERS AND OPPORTUNITIES FOR LAND-USE BASED CLIMATE CHANGE MITIGATION ACTIVITIES IN SA184
11.2FORMS OF IMPLEMENTATION
11.2.1 Implementation models
The conversion of biomass can be
done in a number of ways depending
on the type of biomass available and
the type of energy required. Two
types of implementation models
have be identified for biomass to
energy within the scope of sources
covered in this study:
• In process biomass supply:
The biomass is transported to
a central location as part of the
primary production process,
for example, bagasse and the
forestry and milling residue from
wood processing.
• In field biomass supply: The
biomass results from a range
of activities that do not include
transportation and centralisation
of the harvested biomass, and it
is available across (often) a wide
area, for example, biomass from
the management of IAP and
bush encroachment.
This distinction is critical to the
implementation model: In process
biomass supply implies alignment
with large scale, in most cases
established, industrial operations.
In field biomass supply is often
dispersed, occurs in rural and
sometimes remote locations, and
so lends itself to small-scale rural
applications.
There are, nevertheless, potential
links between the two types of
biomass supply. For example,
the tops and leaves remaining in
field after the harvesting of sugar
cane could be made available for
collection (in field or partially
collected and transported) to small-
scale farmers and communities for
decentralised and small-scale
SECTION SIX – REALISING BIOMASS TO ENERGY OPPORTUNITIES
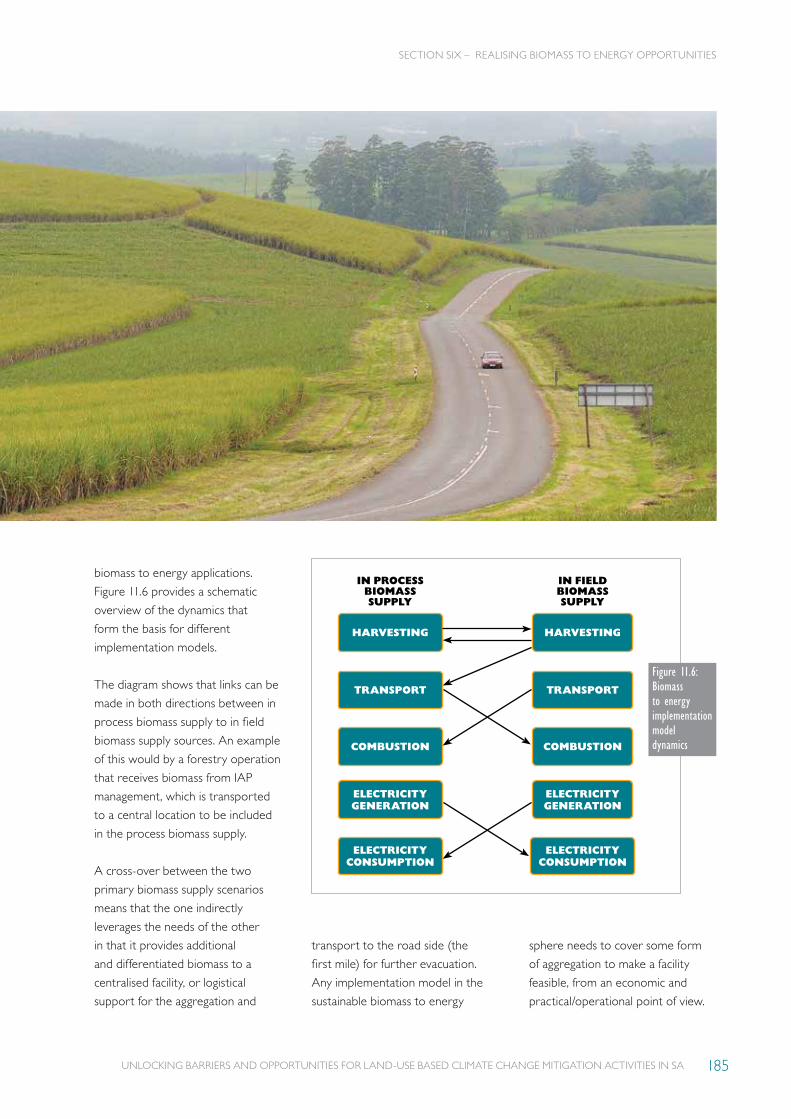
UNLOCKING BARRIERS AND OPPORTUNITIES FOR LAND-USE BASED CLIMATE CHANGE MITIGATION ACTIVITIES IN SA 185
biomass to energy applications.
Figure 11.6 provides a schematic
overview of the dynamics that
form the basis for different
implementation models.
The diagram shows that links can be
made in both directions between in
process biomass supply to in field
biomass supply sources. An example
of this would by a forestry operation
that receives biomass from IAP
management, which is transported
to a central location to be included
in the process biomass supply.
A cross-over between the two
primary biomass supply scenarios
means that the one indirectly
leverages the needs of the other
in that it provides additional
and differentiated biomass to a
centralised facility, or logistical
support for the aggregation and
transport to the road side (the
first mile) for further evacuation.
Any implementation model in the
sustainable biomass to energy
sphere needs to cover some form
of aggregation to make a facility
feasible, from an economic and
practical/operational point of view.
HARVESTING HARVESTING
TRANSPORT TRANSPORT
COMBUSTION COMBUSTION
ELECTRICITY GENERATION
ELECTRICITY GENERATION
ELECTRICITY CONSUMPTION
ELECTRICITY CONSUMPTION
IN PROCESS BIOMASS SUPPLY
IN FIELD BIOMASS SUPPLY
SECTION SIX – REALISING BIOMASS TO ENERGY OPPORTUNITIES
Figure 11.6: Biomass to energy implementation model dynamics

UNLOCKING BARRIERS AND OPPORTUNITIES FOR LAND-USE BASED CLIMATE CHANGE MITIGATION ACTIVITIES IN SA186
11.2.2 Financial feasibility (applicable to anaerobic biogas digesters as well)
Although sustainable biomass
could replace fossil fuel (coal) or
unsustainable biomass in some
applications, this is unlikely to be
significant in rural households as
the economic situation there means
that biomass, usually available for
free, is already used in preference to
unaffordable coal or other fossil fuel
based energy. Except when biomass
in the form of wood, charcoal, etc.
is used on a small-scale to make
fire for heating and lighting, an
aggregation model for biomass for
the generation of energy is needed,
driven by the implicit need to realise
economics of scale. The realisation
of economics of scale is based on
the assumption that biomass would
be used to generate electricity as
the primary energy form.
A consideration of electricity
generation must take into account
the different possible levels of
quality. The quality of electricity
includes both the technical quality
(that is, voltage, frequency, etc.)
and reliability (for example, a
refrigerator needs a constant
supply of electricity). The quality of
electricity in a biomass to energy
project is improved considerably if
a connection to the national grid is
also available, or can be established
at reasonable cost, within a
reasonable time frame.
The financial viability (of both large
and smaller-scale applications) hinges
on two considerations:
• The investment and operating
costs of the biomass boiler,
steam turbine and generator,
in relation to the costs of grid
electricity.
• The affordability of the capital
expenditure and operating costs
of the electricity generation
facility and local (island) grid for
the household/community.
Except in cases where some of the
costs can be allocated to others
(for example, WfW pays for the
harvesting of IAP biomass), the
current price of electricity generally
precludes an economically viable
business case for the development
of a biomass to energy facility.
The calculations and project
examples given apply to large-scale
facilities that have an electrical
capacity of several megawatts.
A biomass to energy plant costs
around 1 million USD/MW installed
capacity and requires dedicated
operation and maintenance (O&M)
of around 20,000 USD/year (that
is, 2% of the capital costs). In South
African Rand (ZAR) at an exchange
rate of 13.41 ZAR/USD (as at
06/02/17), this equates to a capital
expenditure of 13.4 million ZAR and
O&M costs of 268,000 ZAR/year.
An average household uses between
400 and 800 kWh/month (SA
Census, 2014) which amounts to
an installed capacity required of
0.82 MW, assuming an average
consumption of 7.2 MWh/year,
requiring an installed capacity of 0.82
KW, assuming an average load over
time. This means an investment of
11,021.92 ZAR and annual operating
and O&M costs of 220.44 ZAR/year.
Although this sounds affordable for
a household with funds available,
this calculation assumes that the
costs, both capital and O&M, can be
downscaled in a linear fashion from
1MW, which is not the case. Not
only is 1MW at the lower end of the
scale of containerised power, but
the capital plant cost below 1MW
reduces by less than half in relation
to the capacity between 1MW
and 250 kW, and below that, by
almost nothing. Which means that
in practical terms the capital costs
and O&M costs at a household level
(in an optimal setup) are actually
around 20,941.64 ZAR and 1,775.33
ZAR/year.
Running even a very small size
biomass to electricity plant would
require at least one skilled and
qualified operator, who, even on a
part-time basis, would cost more
than 1,775.33 ZAR/year. The plant’s
maintenance costs would then still
have to be taken into account.
Small-scale biomass to energy
SECTION SIX – REALISING BIOMASS TO ENERGY OPPORTUNITIES
A consideration of electricity
generation must take into
account the different possible
levels of quality. The quality
of electricity includes both the
technical quality (that is, voltage,
frequency, etc.) and reliability
(for example, a refrigerator
needs a constant supply of
electricity). The quality of
electricity in a biomass to energy
project is improved considerably
if a connection to the national
grid is also available, or can be
established at reasonable cost,
within a reasonable time frame.
UNLOCKING BARRIERS AND OPPORTUNITIES FOR LAND-USE BASED CLIMATE CHANGE MITIGATION ACTIVITIES IN SA 187
facilities are therefore not
economically viable with the current
state of this type of technology and
the associated costs. Accumulation
of biomass is essential to realising
economics of scale. However, this
does provide government with the
opportunity, firstly, of developing
innovative community-scale initiative
(>500 KW) and, secondly, of driving
the development of small-scale
biomass to energy installations at
(closer to) linear costs up to 1MW.
This might seem like a unachievable
target but there are many studies
about societies (often in developing
countries) ‘leap-frogging’ to
more advanced technology and
skipping the developmental stages
in between (for example, some
sectors such as rural South Africa
skipped the roll-out a physical
phone-line network and leaped
directly into the mobile phone age).
Making very small-scale biomass to
energy facilities affordable might
not be simple but it could just be
the way for developing countries’
governments to realise practical
‘power to the people’.
11.2.3 Matching supply and demand
A ‘merchant’ power plant is
different from a historical electricity
supply utility in that it is funded
by investors, on risk. It does not
necessarily have long-term power
purchase agreements in place at the
start, or a captive customer base,
and sells power in a competitive
market. Avoiding mismatches of
supply and demand is key to such
a project’s economic viability. To
attract finance for a biomass to
energy plant a reliable source of
biomass needs to be established.
The supply of biomass is inherently
unreliable, especially when
considering unavoidable natural
phenomena such as fire, drought,
etc. This supply uncertainty can
be mitigated to some extent by
the diversification of biomass
sources, but, in smaller applications
specifically, and when considering
transport cost constraints, the
management of supply-side risk
is complicated and proposals are
sometimes unrealistic.
Although South Africa has
experienced rolling black-outs
on the demand side, there is
no longer an acute shortage of
electricity. However, considering
future economic and population
growth, new supplies to the grid and
reductions in demand from the grid
are important considerations that
would make valuable contributions
to a more balanced supply and
demand situation. From a technical
perspective, an offtake in addition
to own consumption would assist in
negotiating regulatory, bureaucratic,
political and monopolistic barriers.
If the risks associated with
sustainable biomass supply can be
reduced by diversification of source,
or if security can be provided
against the risk, for example, by a
government guarantee, then the
investment risks can be reduced or
possibly even eliminated
11.2.4 Gap analysis – determining financial feasibility gap
In summary, if the capital costs,
especially for small-scale sustainable
biomass to energy activities, can be
reduced then sustainable biomass to
energy projects become viable.
Alternatively, if the supply side risk
can be mitigated and/or the revenue
stream for biomass energy can be
improved with respect to current
power rates, either by a reduction of
the electricity rate or a preferential
rate of sustainable biomass to
energy generated electricity, the
gap can be closed.
The financial feasibility gap can
therefore be summarised as follows:
• Capital cost linear downsizing:
If biomass to energy plants
could be scalable to a smaller
size, from a capital and O&M
perspective, biomass to energy
would be a viable option for
rural applications.
• Supply side risk mitigation:
If biomass supplies could be
more organised and structured
on a national scale, biomass to
energy activities would become
more financeable. Small-scale
applications of biomass to
energy would require some
form of (government) guarantee.
• Revenue contribution: Electricity
was fairly cheap in South Africa
in the past, but increased global
exposure and local changes to
the power sector mean that this
is no longer the case. The ‘pure’
cost of energy still does not,
however, justify investment in
a large-scale biomass to energy
power plant, let alone a small-
scale plant.
Obviously, the financial viability of
sustainable biomass energy is just
one of the aspects to consider. The
value of indirect benefits has to
be quantified as well, for example,
climate change mitigation and
energy independence, and then the
financial dynamics change somewhat.
SECTION SIX – REALISING BIOMASS TO ENERGY OPPORTUNITIES
UNLOCKING BARRIERS AND OPPORTUNITIES FOR LAND-USE BASED CLIMATE CHANGE MITIGATION ACTIVITIES IN SA188
11.3MONITORING, REPORTING AND VERIFICATION (MRV)
The collection of reliable
and complete datasets
is a complex process
in any type of research
project and scientists, industry, and
government all struggle to collect
relevant data. The available data
on sustainable biomass and biogas
to energy activities (especially
at a small scale) are limited and
sometimes unreliable. Various
sources of data are sometimes used
to develop datasets for drawing
conclusions and informing the
decision-making process. However,
to obtain detailed, purpose-specific,
monitoring information that can be
verified and used for reporting in
a more meaningful way, it should
be a requirement for projects to
provide data, and some sort of
incentive could be provided to make
it worthwhile for the information
provider to do so.
The South African government
is in the process of introducing a
carbon tax according to which the
relevant sectors will be taxed on
GHG emissions, derived from their
total volume of fossil fuels consumed
per year. This would provide
government with revenue and data
on fossil fuel use. A reduction in
fossil fuel use over time would imply
that the use of biomass or biogas
to energy is slowly displacing fossil
fuel consumption. It would not,
however, provide an indication of
the number and impact of specific
sustainable biomass or biogas to
energy activities. The design of the
carbon tax includes the use of so-
called carbon credits, which can be
converted into carbon tax
offsets, and (via offsetting), used
to reduce the taxable volume of
GHG emissions. The carbon tax
offset records could be a source of
reliable, verified data for reporting
purposes.
A mitigation project is required
to register under one of the
international carbon credits
standards and the carbon credits
issued to them can be converted
into carbon tax offsets provided
they meet the eligibility criteria as
defined in the draft carbon tax bill.
Table 11.7 provides an overview of
these eligibility criteria.
Biomass energy and anaerobic
digesters (AD) are included in
the positive list in the table. This
means that sustainable biomass and/
or AD projects will measure and
report verified data to government
via this process. According to the
draft carbon tax offsets regulations,
an entity within the Department
of Energy (DEA), entitled the
Designated National Authority
(DNA), will be tasked with assessing
the eligibility of carbon tax offset
projects using the issuance of
an Extended Letter of Approval
(ELoA). Once an approved project
issues carbon credits under a project
that has received an ELoA, the
DNA, upon receipt of a certificate
of cancellation of the carbon credits
under one of the international
standards, will issue the owner of
the carbon credits with carbon tax
offsets. These carbon tax offsets
represent an independently verified
volume of tCO2e that has not been
emitted into the atmosphere.
SECTION SIX – REALISING BIOMASS TO ENERGY OPPORTUNITIES
Note: This exploration of drivers and
barriers is applicable to the realisation
of both biogas digester opportunities
and biomass to energy initiatives. It is
only considered once in this study to
avoid unnecessary duplication.
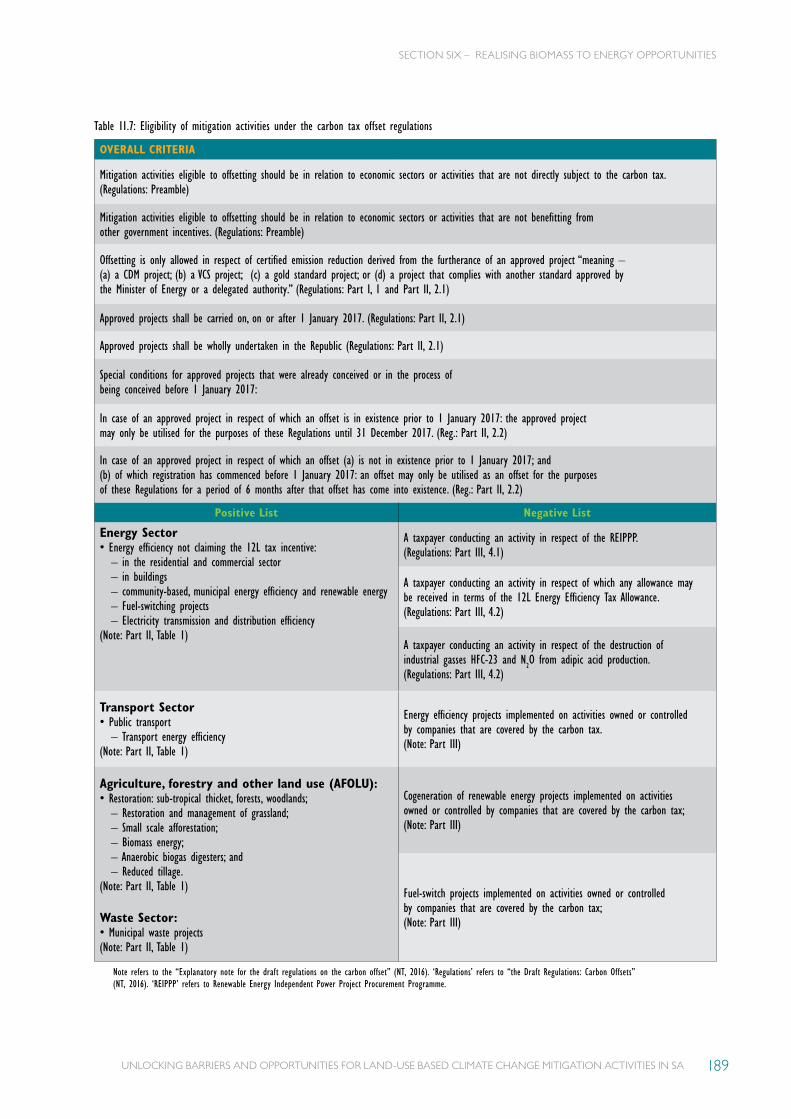
UNLOCKING BARRIERS AND OPPORTUNITIES FOR LAND-USE BASED CLIMATE CHANGE MITIGATION ACTIVITIES IN SA 189
Table 11.7: Eligibility of mitigation activities under the carbon tax offset regulations
OVERALL CRITERIA
Mitigation activities eligible to offsetting should be in relation to economic sectors or activities that are not directly subject to the carbon tax. (Regulations: Preamble)
Mitigation activities eligible to offsetting should be in relation to economic sectors or activities that are not benefitting from other government incentives. (Regulations: Preamble)
Offsetting is only allowed in respect of certified emission reduction derived from the furtherance of an approved project “meaning – (a) a CDM project; (b) a VCS project; (c) a gold standard project; or (d) a project that complies with another standard approved by the Minister of Energy or a delegated authority.” (Regulations: Part I, 1 and Part II, 2.1)
Approved projects shall be carried on, on or after 1 January 2017. (Regulations: Part II, 2.1)
Approved projects shall be wholly undertaken in the Republic (Regulations: Part II, 2.1)
Special conditions for approved projects that were already conceived or in the process of being conceived before 1 January 2017:
In case of an approved project in respect of which an offset is in existence prior to 1 January 2017: the approved project may only be utilised for the purposes of these Regulations until 31 December 2017. (Reg.: Part II, 2.2)
In case of an approved project in respect of which an offset (a) is not in existence prior to 1 January 2017; and (b) of which registration has commenced before 1 January 2017: an offset may only be utilised as an offset for the purposes of these Regulations for a period of 6 months after that offset has come into existence. (Reg.: Part II, 2.2)
Positive List Negative List
Energy Sector• Energy efficiency not claiming the 12L tax incentive:
– in the residential and commercial sector – in buildings – community-based, municipal energy efficiency and renewable energy – Fuel-switching projects – Electricity transmission and distribution efficiency
(Note: Part II, Table 1)
A taxpayer conducting an activity in respect of the REIPPP. (Regulations: Part III, 4.1)
A taxpayer conducting an activity in respect of which any allowance may be received in terms of the 12L Energy Efficiency Tax Allowance. (Regulations: Part III, 4.2)
A taxpayer conducting an activity in respect of the destruction of industrial gasses HFC-23 and N
2O from adipic acid production.
(Regulations: Part III, 4.2)
Transport Sector• Public transport
– Transport energy efficiency(Note: Part II, Table 1)
Energy efficiency projects implemented on activities owned or controlled by companies that are covered by the carbon tax. (Note: Part III)
Agriculture, forestry and other land use (AFOLU):• Restoration: sub-tropical thicket, forests, woodlands;
– Restoration and management of grassland; – Small scale afforestation; – Biomass energy; – Anaerobic biogas digesters; and – Reduced tillage.
(Note: Part II, Table 1)
Cogeneration of renewable energy projects implemented on activities owned or controlled by companies that are covered by the carbon tax; (Note: Part III)
Fuel-switch projects implemented on activities owned or controlled by companies that are covered by the carbon tax; (Note: Part III)Waste Sector:
• Municipal waste projects(Note: Part II, Table 1)
Note refers to the “Explanatory note for the draft regulations on the carbon offset” (NT, 2016). ‘Regulations’ refers to “the Draft Regulations: Carbon Offsets” (NT, 2016). ‘REIPPP’ refers to Renewable Energy Independent Power Project Procurement Programme.
SECTION SIX – REALISING BIOMASS TO ENERGY OPPORTUNITIES

UNLOCKING BARRIERS AND OPPORTUNITIES FOR LAND-USE BASED CLIMATE CHANGE MITIGATION ACTIVITIES IN SA190
Via this channel, the South African
government will receive accurate
information about planned and
operational biomass to energy
and AD mitigation projects, and
be able to determine the success
of its initiatives around supporting
biomass to energy and biogas
project activities over time.
However, the carbon tax offset
eligibility criteria exclude mitigation
activities by entities that are already
covered by the carbon tax. The
rationale for this is the prevention of
double benefitting. When an entity
implements an AD project, for
example, it reduces its carbon tax as
a result of reduced reliance
on fossil fuel, and benefits from
the commercial value that the
ownership of carbon tax offsets
represents. Industrial biomass and
biogas sources are not required to
provide government with this kind
of critical data, and consequently,
bagasse, feedlots and commercial
forestry waste are some of the
sectors that would fall outside
of this monitoring, reporting and
verification channel.
The sink assessment study points
out that one of the main obstacles
to the roll-out of projects to date
has been the high transaction costs
associated with MRV through
international standards. To address
this, a robust and transparent
MRV system would need to be
created for each of the principal
implementation options. These
MRV structures should dovetail
with the national MRV programmes
currently being developed by the
DEA, and support existing capacity
where possible. It is anticipated that
the initial monitoring of activities
in the field will be undertaken by
the extension officer or established
industry structures. The collected
data will be managed and archived
both at the Centres of Development
level and at a Tier 1 level. At a
national Tier 1 level, there will be
SECTION SIX – REALISING BIOMASS TO ENERGY OPPORTUNITIES
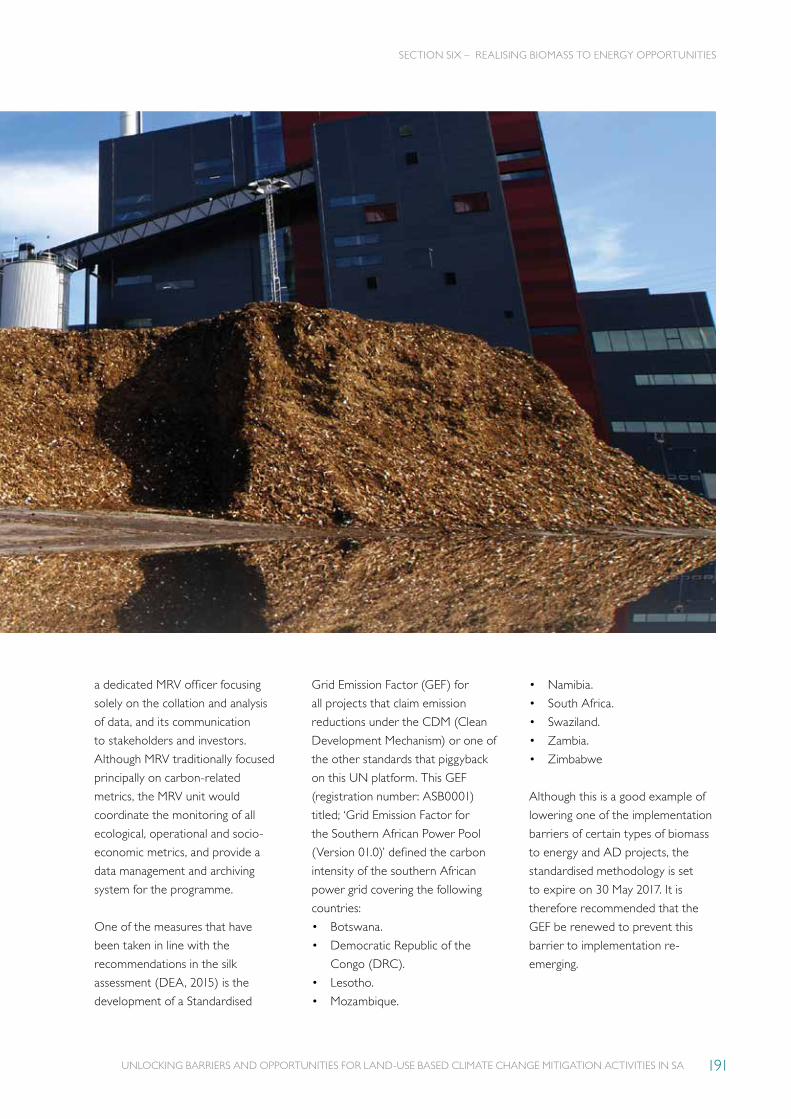
UNLOCKING BARRIERS AND OPPORTUNITIES FOR LAND-USE BASED CLIMATE CHANGE MITIGATION ACTIVITIES IN SA 191
a dedicated MRV officer focusing
solely on the collation and analysis
of data, and its communication
to stakeholders and investors.
Although MRV traditionally focused
principally on carbon-related
metrics, the MRV unit would
coordinate the monitoring of all
ecological, operational and socio-
economic metrics, and provide a
data management and archiving
system for the programme.
One of the measures that have
been taken in line with the
recommendations in the silk
assessment (DEA, 2015) is the
development of a Standardised
Grid Emission Factor (GEF) for
all projects that claim emission
reductions under the CDM (Clean
Development Mechanism) or one of
the other standards that piggyback
on this UN platform. This GEF
(registration number: ASB0001)
titled; ‘Grid Emission Factor for
the Southern African Power Pool
(Version 01.0)’ defined the carbon
intensity of the southern African
power grid covering the following
countries:
• Botswana.
• Democratic Republic of the
Congo (DRC).
• Lesotho.
• Mozambique.
• Namibia.
• South Africa.
• Swaziland.
• Zambia.
• Zimbabwe
Although this is a good example of
lowering one of the implementation
barriers of certain types of biomass
to energy and AD projects, the
standardised methodology is set
to expire on 30 May 2017. It is
therefore recommended that the
GEF be renewed to prevent this
barrier to implementation re-
emerging.
SECTION SIX – REALISING BIOMASS TO ENERGY OPPORTUNITIES

INSTITUTIONAL AND FUNDING CONSIDERATIONS
SECTION SEVEN
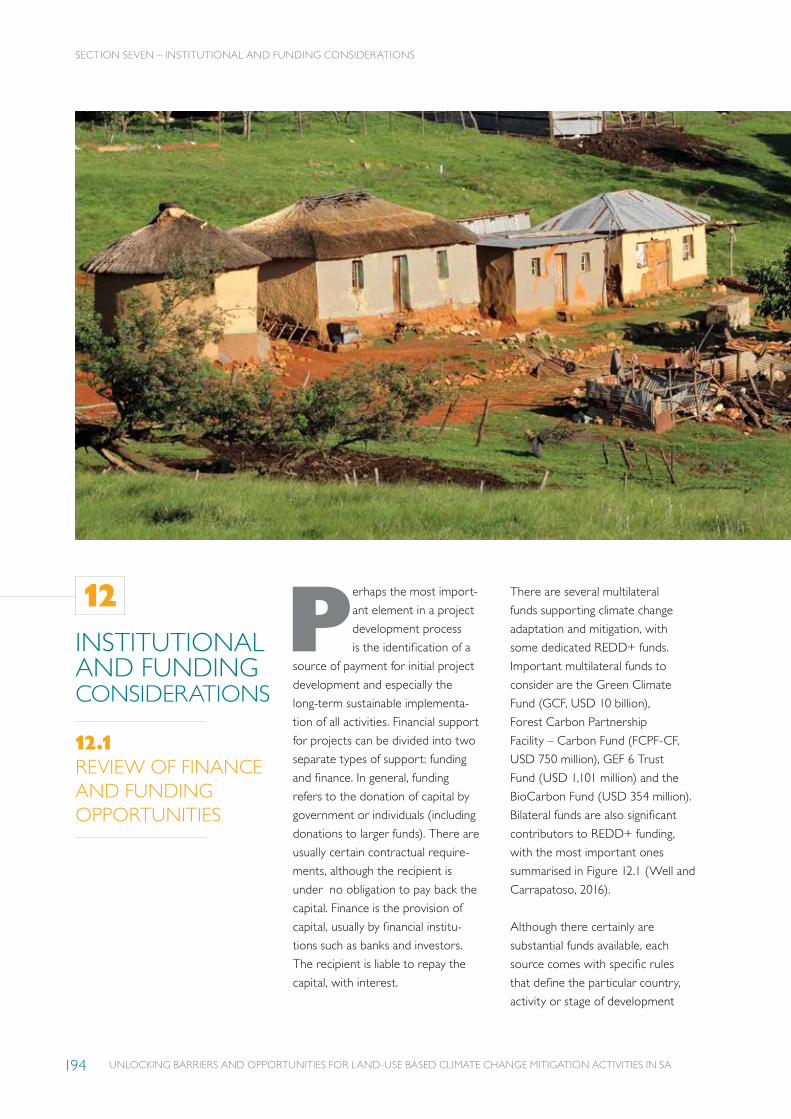
UNLOCKING BARRIERS AND OPPORTUNITIES FOR LAND-USE BASED CLIMATE CHANGE MITIGATION ACTIVITIES IN SA194
SECTION SEVEN – INSTITUTIONAL AND FUNDING CONSIDERATIONS
INSTITUTIONAL AND FUNDING CONSIDERATIONS
12.1REVIEW OF FINANCE AND FUNDING OPPORTUNITIES
Perhaps the most import-
ant element in a project
development process
is the identification of a
source of payment for initial project
development and especially the
long-term sustainable implementa-
tion of all activities. Financial support
for projects can be divided into two
separate types of support: funding
and finance. In general, funding
refers to the donation of capital by
government or individuals (including
donations to larger funds). There are
usually certain contractual require-
ments, although the recipient is
under no obligation to pay back the
capital. Finance is the provision of
capital, usually by financial institu-
tions such as banks and investors.
The recipient is liable to repay the
capital, with interest.
There are several multilateral
funds supporting climate change
adaptation and mitigation, with
some dedicated REDD+ funds.
Important multilateral funds to
consider are the Green Climate
Fund (GCF, USD 10 billion),
Forest Carbon Partnership
Facility – Carbon Fund (FCPF-CF,
USD 750 million), GEF 6 Trust
Fund (USD 1,101 million) and the
BioCarbon Fund (USD 354 million).
Bilateral funds are also significant
contributors to REDD+ funding,
with the most important ones
summarised in Figure 12.1 (Well and
Carrapatoso, 2016).
Although there certainly are
substantial funds available, each
source comes with specific rules
that define the particular country,
activity or stage of development
12

UNLOCKING BARRIERS AND OPPORTUNITIES FOR LAND-USE BASED CLIMATE CHANGE MITIGATION ACTIVITIES IN SA 195
SECTION SEVEN – INSTITUTIONAL AND FUNDING CONSIDERATIONS
PLEDGED BILATERAL
FUNDS
$3,480MIL NORWAY International
Climate and Forest Initiative
$1,082MILGERMANY International
Climate Initiative2
$216MILAUSTRALIA
International Forest Carbon
Initiative
$6,002MILUK
International Climate Fund3
that fund seeks to address.
Consequently, the allocation criteria
and process for funds can vary
considerably.
The programme or project
framework is divided into 3 distinct
phases: Phase 1 (early preparation),
Phase 2 (development and
implementation) and Phase 3 (MRV
and long-term implementation).
Each phase has specific elements
and tasks, which could potentially
receive financial support from
a range of sources. Table 12.1
summarises the key elements and
tasks of each phase and provides
an indication of the type of financial
support they are likely to receive.
A significant portion of finance is
used to fund Phase 1 ‘readiness’
activities. This preliminary phase
involves the initial development of
each of the elements of the phase,
occurring within a 2 to 5 year
timeframe. Readiness activities
such as the project potential
assessment, required capacity
and MRV systems are preparatory
and do not generate direct financial
returns. As a result, this phase
is likely to be funded by government
funds and international public funds.
Figure 12.1: REDD+ focused multilateral funds and key bilateral funds, USD million (CFU, 2016))
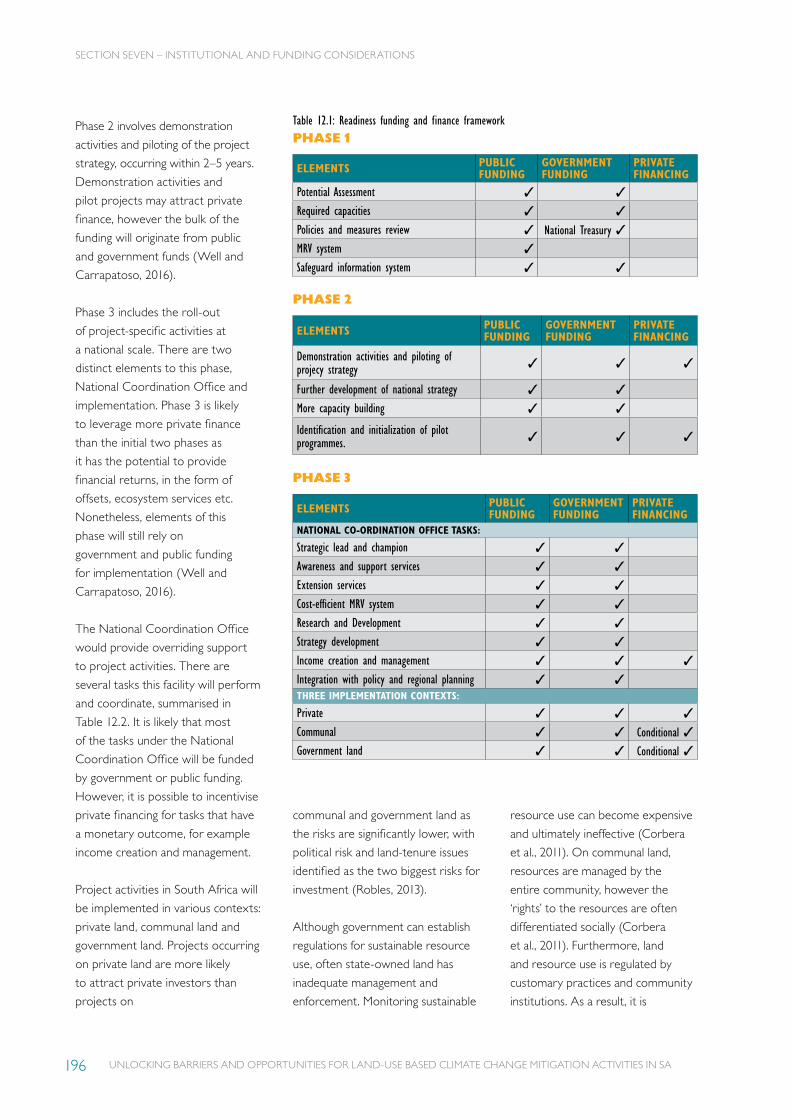
UNLOCKING BARRIERS AND OPPORTUNITIES FOR LAND-USE BASED CLIMATE CHANGE MITIGATION ACTIVITIES IN SA196
PHASE 1
ELEMENTS PUBLIC FUNDING
GOVERNMENT FUNDING
PRIVATE FINANCING
Potential Assessment ✓ ✓
Required capacities ✓ ✓
Policies and measures review ✓ National Treasury ✓MRV system ✓
Safeguard information system ✓ ✓
PHASE 2
ELEMENTS PUBLIC FUNDING
GOVERNMENT FUNDING
PRIVATE FINANCING
Demonstration activities and piloting of projecy strategy ✓ ✓ ✓
Further development of national strategy ✓ ✓
More capacity building ✓ ✓
Identification and initialization of pilot programmes. ✓ ✓ ✓
PHASE 3
ELEMENTS PUBLIC FUNDING
GOVERNMENT FUNDING
PRIVATE FINANCING
NATIONAL CO-ORDINATION OFFICE TASKS:
Strategic lead and champion ✓ ✓
Awareness and support services ✓ ✓
Extension services ✓ ✓
Cost-efficient MRV system ✓ ✓
Research and Development ✓ ✓
Strategy development ✓ ✓
Income creation and management ✓ ✓ ✓
Integration with policy and regional planning ✓ ✓THREE IMPLEMENTATION CONTEXTS:
Private ✓ ✓ ✓
Communal ✓ ✓ Conditional ✓Government land ✓ ✓ Conditional ✓
Phase 2 involves demonstration
activities and piloting of the project
strategy, occurring within 2–5 years.
Demonstration activities and
pilot projects may attract private
finance, however the bulk of the
funding will originate from public
and government funds (Well and
Carrapatoso, 2016).
Phase 3 includes the roll-out
of project-specific activities at
a national scale. There are two
distinct elements to this phase,
National Coordination Office and
implementation. Phase 3 is likely
to leverage more private finance
than the initial two phases as
it has the potential to provide
financial returns, in the form of
offsets, ecosystem services etc.
Nonetheless, elements of this
phase will still rely on
government and public funding
for implementation (Well and
Carrapatoso, 2016).
The National Coordination Office
would provide overriding support
to project activities. There are
several tasks this facility will perform
and coordinate, summarised in
Table 12.2. It is likely that most
of the tasks under the National
Coordination Office will be funded
by government or public funding.
However, it is possible to incentivise
private financing for tasks that have
a monetary outcome, for example
income creation and management.
Project activities in South Africa will
be implemented in various contexts:
private land, communal land and
government land. Projects occurring
on private land are more likely
to attract private investors than
projects on
communal and government land as
the risks are significantly lower, with
political risk and land-tenure issues
identified as the two biggest risks for
investment (Robles, 2013).
Although government can establish
regulations for sustainable resource
use, often state-owned land has
inadequate management and
enforcement. Monitoring sustainable
resource use can become expensive
and ultimately ineffective (Corbera
et al., 2011). On communal land,
resources are managed by the
entire community, however the
‘rights’ to the resources are often
differentiated socially (Corbera
et al., 2011). Furthermore, land
and resource use is regulated by
customary practices and community
institutions. As a result, it is
Table 12.1: Readiness funding and finance framework
SECTION SEVEN – INSTITUTIONAL AND FUNDING CONSIDERATIONS

UNLOCKING BARRIERS AND OPPORTUNITIES FOR LAND-USE BASED CLIMATE CHANGE MITIGATION ACTIVITIES IN SA 197
necessary for potential investors
to carry out a consultation process
with local communities to discuss
how the investment will affect
their access to natural resources
and to clarify who has the rights
to the benefits and to what extent
(Bernard et al., 2012).
In addition, changes in land use on
both government and communal
land are complicated by intersecting
social and political processes, which
require effective coordination and
cooperation across government
agencies and relevant local
stakeholders (Corbera et al., 2011).
This requires additional resources
and both community and political
willingness – a further challenge.
On the other hand, private land
owners are likely to be interested
in different programmes if they
are economically attractive and
technically feasible. In general, benefit
sharing on private land is significantly
less complex than in communal and
government land tenure regimes
(Corbera et al., 2011).
Nonetheless, if the implementation
and management of activities on
communal and government land
generate a net benefit, that can be
measured and evaluated, private
investors may be enticed to invest in
the programme. Carbon offsets are
not the only marketable commodity
from REDD+ programmes; other
outputs include ecosystem services,
improved reputation through corpo-
rate social responsibility, and green
commodities (Bernard et al., 2012).
Besides the different allocation
of funding and finance to various
phases, funding agencies and private
investors have other allocation
criteria and project-approval
processes that vary considerably.
Allocation criteria have a bearing
on the rate of project approval
and on fund disbursement and
accountability.
Table 12.2 highlights the differences
between the UN-REDD and FIP
funds. FIP has 16 criteria and 29
indictors, whereas UN-REDD
has fewer criteria, does not have
specific indicators and tends to
be more flexible.
Mobilising bilateral finance is
contingent on good cooperation
between the recipient and the
donor countries. As with multilateral
funds, bilateral funding initiatives
are guided by various objectives
applying to official development
assistance (ODA) criteria. For
example, Norway inclines to
participation in large-scale funding in
tropical countries (Brazil, Indonesia,
etc.), Germany emphasises the
connection between REDD+ and
diversity conservation, and the
USA’s REDD+ funding initiatives
focus on REDD+ and development
goals (Well and Carrapatoso, 2016).
Because the criteria of the various
funds differ, a comprehensive
analysis of each potential source,
relative to well-identified and
articulated needs, is required.
The Green Climate Fund (GCF) is
a source of funding that is expected
to play an increasingly important
role in REDD+ finance in the future.
The GCF is a multilateral financial
mechanism under the UNFCCC,
created with the aim of addressing
both climate change mitigation and
the adaptation needs of developing
countries. The fund aims to mobilise
USD 100 billion by 2020, with an
initial contribution of USD 30 billion
by 2012. A significant portion of the
funds will be channelled towards
low-emission and climate-resilient
projects and programmes in Least
Developed Countries (LDCS), Small
Island Developing States (SIDS)
and African states (GCF, 2016a).
Given the ambitious target of USD
100 billion by 2020, it is of concern
that recent data shows that total
endowments to the fund currently
only amount to USD 10,225 million
(CFU, 2016).
Figure 12.1 provides an overview
of the process of proposal approval.
Proposals are submitted to the
GCF though, and in consultation
with, the National Designated
Authority (NDA), which acts as an
executing entity and the point of
contact with the GCF (Schalatek
et al., 2015). Project proposals
are assessed against a set of 6
investment criteria and 15 sub-
criteria (GCF, 2014).
SECTION SEVEN – INSTITUTIONAL AND FUNDING CONSIDERATIONS
UN-REDD FIP
Criteria
Indictors
Project approval
Funds disbursement
Accountability
Table 12.2: Comparison between UN-REDD and FIP
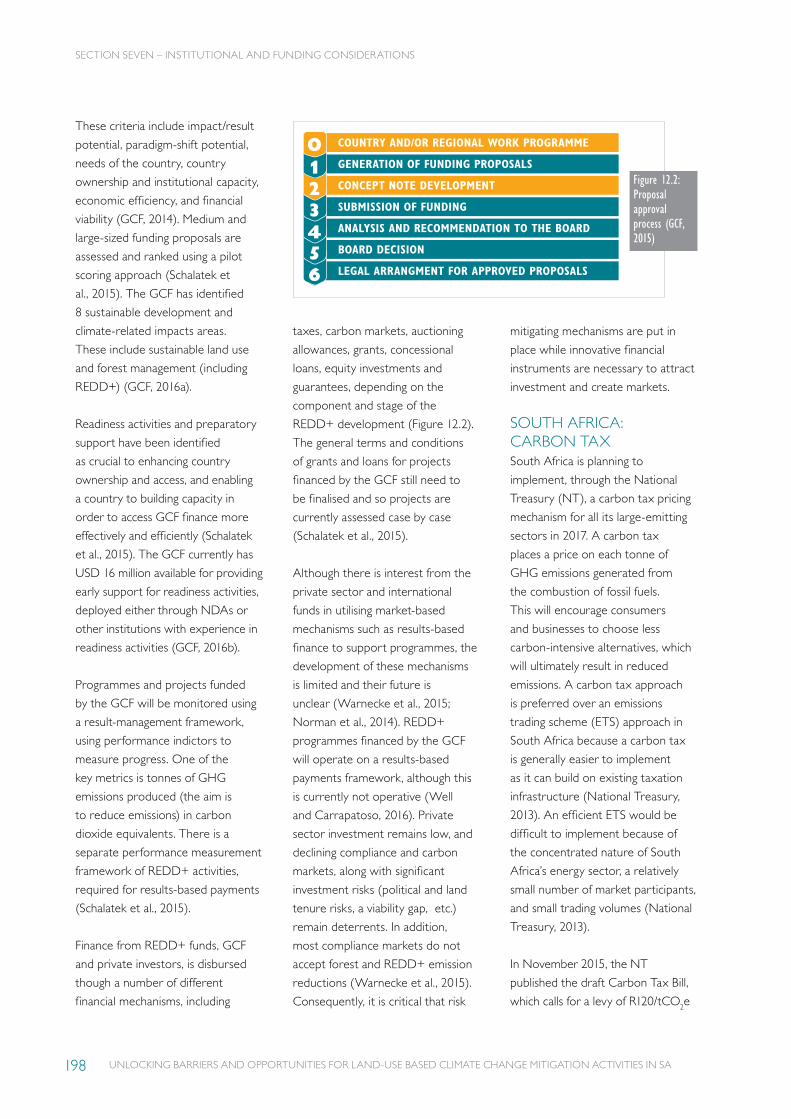
UNLOCKING BARRIERS AND OPPORTUNITIES FOR LAND-USE BASED CLIMATE CHANGE MITIGATION ACTIVITIES IN SA198
These criteria include impact/result
potential, paradigm-shift potential,
needs of the country, country
ownership and institutional capacity,
economic efficiency, and financial
viability (GCF, 2014). Medium and
large-sized funding proposals are
assessed and ranked using a pilot
scoring approach (Schalatek et
al., 2015). The GCF has identified
8 sustainable development and
climate-related impacts areas.
These include sustainable land use
and forest management (including
REDD+) (GCF, 2016a).
Readiness activities and preparatory
support have been identified
as crucial to enhancing country
ownership and access, and enabling
a country to building capacity in
order to access GCF finance more
effectively and efficiently (Schalatek
et al., 2015). The GCF currently has
USD 16 million available for providing
early support for readiness activities,
deployed either through NDAs or
other institutions with experience in
readiness activities (GCF, 2016b).
Programmes and projects funded
by the GCF will be monitored using
a result-management framework,
using performance indictors to
measure progress. One of the
key metrics is tonnes of GHG
emissions produced (the aim is
to reduce emissions) in carbon
dioxide equivalents. There is a
separate performance measurement
framework of REDD+ activities,
required for results-based payments
(Schalatek et al., 2015).
Finance from REDD+ funds, GCF
and private investors, is disbursed
though a number of different
financial mechanisms, including
taxes, carbon markets, auctioning
allowances, grants, concessional
loans, equity investments and
guarantees, depending on the
component and stage of the
REDD+ development (Figure 12.2).
The general terms and conditions
of grants and loans for projects
financed by the GCF still need to
be finalised and so projects are
currently assessed case by case
(Schalatek et al., 2015).
Although there is interest from the
private sector and international
funds in utilising market-based
mechanisms such as results-based
finance to support programmes, the
development of these mechanisms
is limited and their future is
unclear (Warnecke et al., 2015;
Norman et al., 2014). REDD+
programmes financed by the GCF
will operate on a results-based
payments framework, although this
is currently not operative (Well
and Carrapatoso, 2016). Private
sector investment remains low, and
declining compliance and carbon
markets, along with significant
investment risks (political and land
tenure risks, a viability gap, etc.)
remain deterrents. In addition,
most compliance markets do not
accept forest and REDD+ emission
reductions (Warnecke et al., 2015).
Consequently, it is critical that risk
mitigating mechanisms are put in
place while innovative financial
instruments are necessary to attract
investment and create markets.
SOUTH AFRICA: CARBON TAXSouth Africa is planning to
implement, through the National
Treasury (NT), a carbon tax pricing
mechanism for all its large-emitting
sectors in 2017. A carbon tax
places a price on each tonne of
GHG emissions generated from
the combustion of fossil fuels.
This will encourage consumers
and businesses to choose less
carbon-intensive alternatives, which
will ultimately result in reduced
emissions. A carbon tax approach
is preferred over an emissions
trading scheme (ETS) approach in
South Africa because a carbon tax
is generally easier to implement
as it can build on existing taxation
infrastructure (National Treasury,
2013). An efficient ETS would be
difficult to implement because of
the concentrated nature of South
Africa’s energy sector, a relatively
small number of market participants,
and small trading volumes (National
Treasury, 2013).
In November 2015, the NT
published the draft Carbon Tax Bill,
which calls for a levy of R120/tCO2e
SECTION SEVEN – INSTITUTIONAL AND FUNDING CONSIDERATIONS
Figure 12.2: Proposal approval process (GCF, 2015)
COUNTRY AND/OR REGIONAL WORK PROGRAMME
GENERATION OF FUNDING PROPOSALS
CONCEPT NOTE DEVELOPMENT
SUBMISSION OF FUNDING
BOARD DECISION
ANALYSIS AND RECOMMENDATION TO THE BOARD
LEGAL ARRANGMENT FOR APPROVED PROPOSALS
0
3
1
4
2
56

UNLOCKING BARRIERS AND OPPORTUNITIES FOR LAND-USE BASED CLIMATE CHANGE MITIGATION ACTIVITIES IN SA 199
Figure 12.3: The type of available funding and finance is dependent on the particular component and then stage of REDD+ development (Warnecke et al., 2015)
(Rand per tonne of carbon dioxide
equivalent) emitted, escalating by
10% per year. The Carbon Tax Bill
contains a number of clauses that
are of particular importance to the
forestry and forest products sector.
An inclusion within the most recent
draft is the so-called ‘sequestration
component’ (S) which enables the
various sectors to deduct their
sequestered GHG emissions from
their fossil fuel combustion emissions.
This is relevant, in the case of forests,
to the capture of carbon through
the process of photosynthesis and
its storage as biomass. The bill could
have important ramifications for
the South African forest and forest
products sector as GHG emissions
from wood processing operations
are liable to taxation under the
Carbon Tax Bill but forestry
operations are excluded in the initial
phase (until 2020). Furthermore,
within the ‘sum of the percentage
of allowances’ (C), provision is
made for an ‘offset allowance’
which could also has important
consequences for the forest and
forest products sector.
In June 2016, Carbon Offset
Regulations were developed jointly
by the NT, the Department of
Energy and the Department of
Environmental Affairs (DEA), in
terms of the draft Carbon Tax
Bill. The carbon offset scheme
aims to encourage GHG emission
reductions in sectors or activities not
covered by the carbon tax, including
agriculture, forestry and other land
use (AFOLU), and waste sectors.
The carbon offset regulations set out
procedures for taxpayers to reduce
their carbon tax liability using carbon
offsets. Eligible carbon credits, issued
under a number of global carbon
standards, could be converted to
Carbon Tax Offsets. It is proposed
that businesses will be able to reduce
their carbon tax liability by
up to 10% of their actual emissions,
using carbon offsets.
Offsets generated in the AFOLU
sector as a result of the carbon
tax need to be able to compete in
terms of risks and returns. Existing
international carbon offset standards
such as the Clean Development
Mechanism (CDM), Verified Carbon
Standard (VCS) and the Gold
Standard (GS), will be used. The
specific eligibility criteria for carbon
offset projects are proposed in
the regulations.
Eligible carbon offset projects in the
AFOLU sector (Republic of South
Africa, 2016) include:
• Restoration of sub-tropical
thicket, forests and woodlands.
• Restoration and management of
grassland.
• Small-scale afforestation.
• Biomass energy.
• Anaerobic digesters.
• Reduced tillage.
GRANT/CONCESSIONAL
FINANCE (e.g. ODA) PAYMENT FOR
ECO SYSTEMS SERVICES
(e.g. REDD)
ADVANCED MARKET
COMMITMENTS (e.g. FIT)
PAYMENTS FOR MITIGATION
(e.g. CER PURCHASE & RETIREMENT)
CARBON MARKET
MECHANISMS (e.g. CDM)
UPFRONT PAYMENTPAYMENT ON
RESULTS – QUANTITIVE/QUALITATIVE
PAYMENT ON RESULTS – tCO2e
BASED
TRADABLE UNITS/OFFSETS – tCO2e
PAYMENT FOR MITIGATION (e.g. NAMA)
Long term (indirect) impactsDevelopment benefitsAddress multiple barriers
RANGE OF RBF VARIETY
Methodological stringencyHigh certainty of outputs
Strong verification need
SECTION SEVEN – INSTITUTIONAL AND FUNDING CONSIDERATIONS
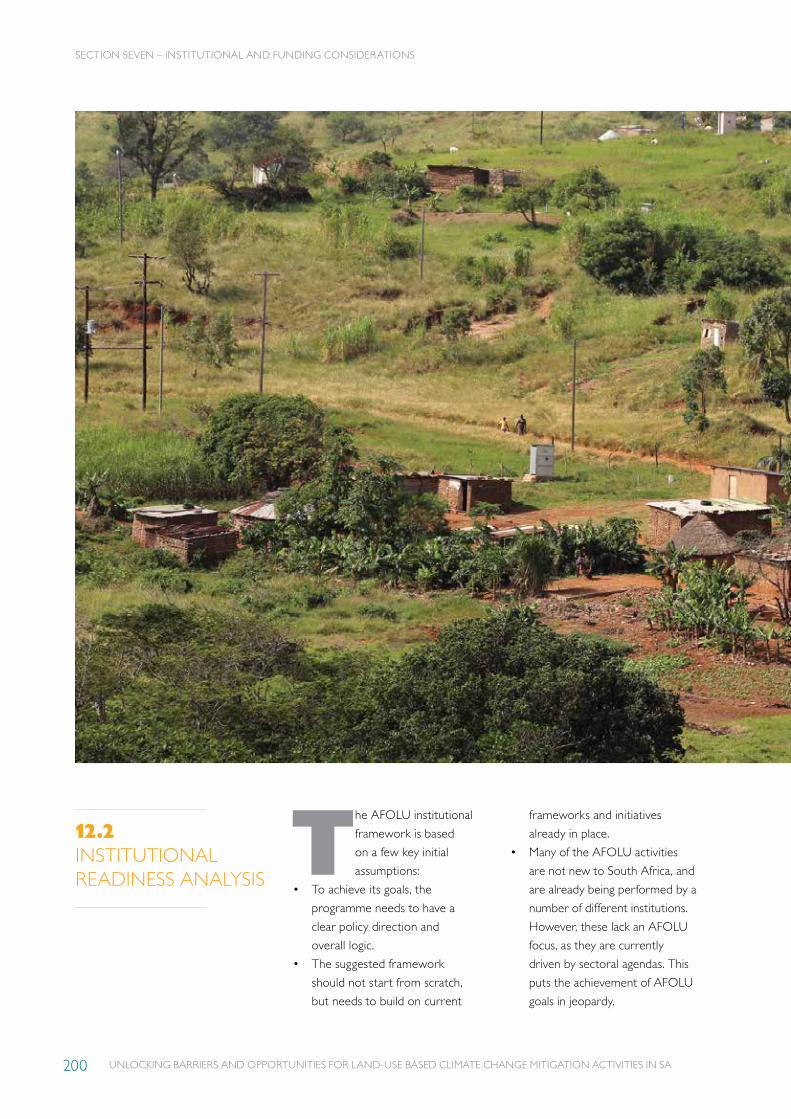
UNLOCKING BARRIERS AND OPPORTUNITIES FOR LAND-USE BASED CLIMATE CHANGE MITIGATION ACTIVITIES IN SA200
The AFOLU institutional
framework is based
on a few key initial
assumptions:
• To achieve its goals, the
programme needs to have a
clear policy direction and
overall logic.
• The suggested framework
should not start from scratch,
but needs to build on current
frameworks and initiatives
already in place.
• Many of the AFOLU activities
are not new to South Africa, and
are already being performed by a
number of different institutions.
However, these lack an AFOLU
focus, as they are currently
driven by sectoral agendas. This
puts the achievement of AFOLU
goals in jeopardy.
SECTION SEVEN – INSTITUTIONAL AND FUNDING CONSIDERATIONS
12.2INSTITUTIONAL READINESS ANALYSIS
UNLOCKING BARRIERS AND OPPORTUNITIES FOR LAND-USE BASED CLIMATE CHANGE MITIGATION ACTIVITIES IN SA 201
• The establishment of new
organisations is not currently
feasible, given the current
economic situation.
• While some complementary
institutions or processes exist,
they are currently either not fully
functional, or have not been fully
implemented. This challenge is
faced across all sectors, but the
proposed institutional
framework is premised on the
belief that these processes
should be supported and
strengthened. Consequently,
this framework recommends
working through existing
channels, even where these are
not operating at full capacity.
• Achieving the AFOLU
agenda’s goals will require the
coordination and alignment of
various departments and existing
institutions.
• Successful implementation will
require the support of different
levels of government, including
national, provincial and local.
SECTION SEVEN – INSTITUTIONAL AND FUNDING CONSIDERATIONS
UNLOCKING BARRIERS AND OPPORTUNITIES FOR LAND-USE BASED CLIMATE CHANGE MITIGATION ACTIVITIES IN SA202
12.3CURRENT ANALYSIS OF TIER 1 INSTITUTIONS
12.3.1 The context of the NDP and the Outcome Delivery Agreements
The National Development Plan
(NDP) aims to ensure that all
South Africans attain a decent
standard of living through the
reduction of inequality and the
eventual elimination of poverty.
The plan provides a common goal
for the country to work towards,
up until 2030, and identifies the
steps that need to be taken and
the roles that the various sectors
of society need to play in reaching
that goal. The 2014–2019 Medium
Term Strategic Framework (MTSF)’s
5-year planning cycle identified
ten strategic priority areas. Twelve
key outcomes were developed,
with accompanying outputs and
strategic activities and metrics.
These outcomes and the agreed
implementation arrangements, as
specified in the various delivery
agreements, provide the basic
building blocks for the AFOLU
institutional framework.
Coordinating structures have been
established to ensure that the key
partners work together to achieve
Delivery Agreement outputs.
These structures are intended to
coordinate the implementation of
the outcomes, provide a reviewing
progress, and facilitate decisions on
interventions when required.
The central outcome for the
purposes of the AFOLU framework
is Outcome 10, as described below.
OUTCOME 10: ENVIRONMENTAL ASSETS AND NATURAL RESOURCES THAT ARE WELL PROTECTED AND CONTINUALLY ENHANCED. The lead department responsible
for achieving Outcome 10 is the
Department of Environmental
Affairs (DEA), which is supported
by other spheres of government (as
management of the environment
and protection of resources is a
concurrent function) and other
sector departments (Table 12.3).
SECTION SEVEN – INSTITUTIONAL AND FUNDING CONSIDERATIONS
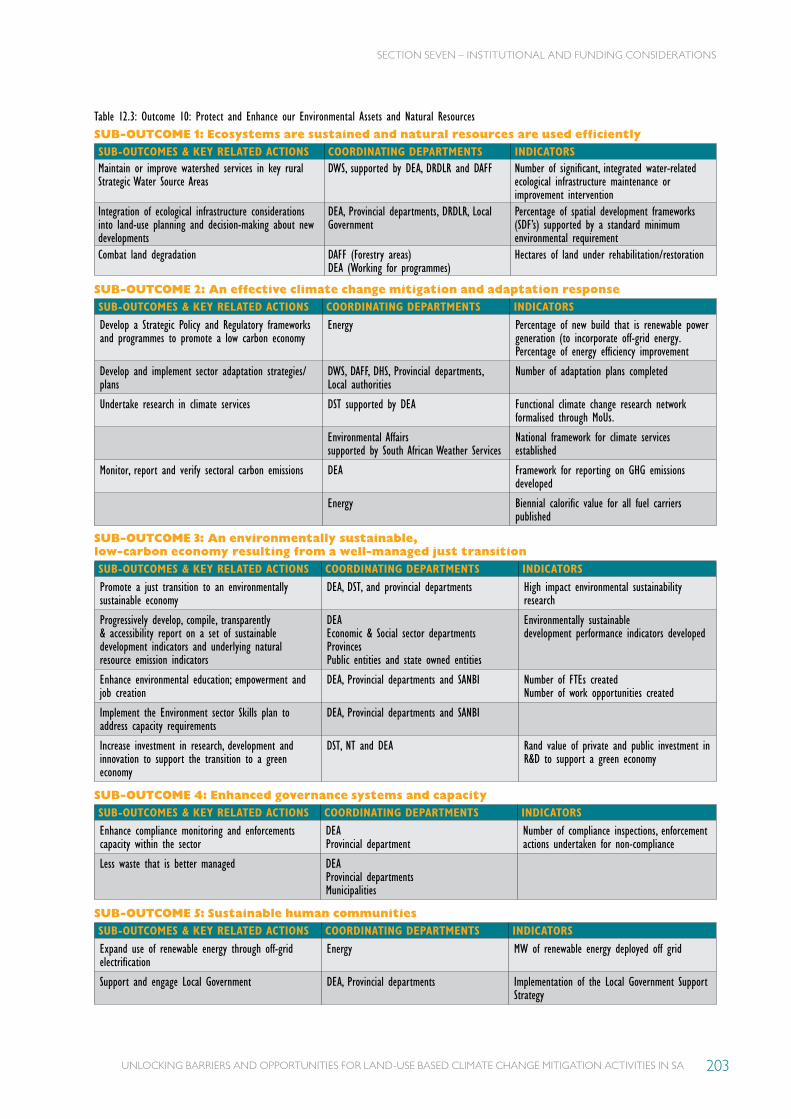
UNLOCKING BARRIERS AND OPPORTUNITIES FOR LAND-USE BASED CLIMATE CHANGE MITIGATION ACTIVITIES IN SA 203
SUB-OUTCOME 1: Ecosystems are sustained and natural resources are used efficiently SUB-OUTCOMES & KEY RELATED ACTIONS COORDINATING DEPARTMENTS INDICATORSMaintain or improve watershed services in key rural Strategic Water Source Areas
DWS, supported by DEA, DRDLR and DAFF Number of significant, integrated water-related ecological infrastructure maintenance or improvement intervention
Integration of ecological infrastructure considerations into land-use planning and decision-making about new developments
DEA, Provincial departments, DRDLR, Local Government
Percentage of spatial development frameworks (SDF’s) supported by a standard minimum environmental requirement
Combat land degradation DAFF (Forestry areas) DEA (Working for programmes)
Hectares of land under rehabilitation/restoration
SUB-OUTCOME 2: An effective climate change mitigation and adaptation responseSUB-OUTCOMES & KEY RELATED ACTIONS COORDINATING DEPARTMENTS INDICATORS
Develop a Strategic Policy and Regulatory frameworks and programmes to promote a low carbon economy
Energy Percentage of new build that is renewable power generation (to incorporate off-grid energy.Percentage of energy efficiency improvement
Develop and implement sector adaptation strategies/plans
DWS, DAFF, DHS, Provincial departments, Local authorities
Number of adaptation plans completed
Undertake research in climate services DST supported by DEA Functional climate change research network formalised through MoUs.
Environmental Affairs supported by South African Weather Services
National framework for climate services established
Monitor, report and verify sectoral carbon emissions DEA Framework for reporting on GHG emissions developed
Energy Biennial calorific value for all fuel carriers published
SUB-OUTCOME 3: An environmentally sustainable, low-carbon economy resulting from a well-managed just transitionSUB-OUTCOMES & KEY RELATED ACTIONS COORDINATING DEPARTMENTS INDICATORS
Promote a just transition to an environmentally sustainable economy
DEA, DST, and provincial departments High impact environmental sustainability research
Progressively develop, compile, transparently & accessibility report on a set of sustainable development indicators and underlying natural resource emission indicators
DEAEconomic & Social sector departmentsProvincesPublic entities and state owned entities
Environmentally sustainable development performance indicators developed
Enhance environmental education; empowerment and job creation
DEA, Provincial departments and SANBI Number of FTEs createdNumber of work opportunities created
Implement the Environment sector Skills plan to address capacity requirements
DEA, Provincial departments and SANBI
Increase investment in research, development and innovation to support the transition to a green economy
DST, NT and DEA Rand value of private and public investment in R&D to support a green economy
SUB-OUTCOME 4: Enhanced governance systems and capacitySUB-OUTCOMES & KEY RELATED ACTIONS COORDINATING DEPARTMENTS INDICATORS
Enhance compliance monitoring and enforcements capacity within the sector
DEAProvincial department
Number of compliance inspections, enforcement actions undertaken for non-compliance
Less waste that is better managed DEAProvincial departmentsMunicipalities
SUB-OUTCOME 5: Sustainable human communitiesSUB-OUTCOMES & KEY RELATED ACTIONS COORDINATING DEPARTMENTS INDICATORS
Expand use of renewable energy through off-grid electrification
Energy MW of renewable energy deployed off grid
Support and engage Local Government DEA, Provincial departments Implementation of the Local Government Support Strategy
SECTION SEVEN – INSTITUTIONAL AND FUNDING CONSIDERATIONS
Table 12.3: Outcome 10: Protect and Enhance our Environmental Assets and Natural Resources
UNLOCKING BARRIERS AND OPPORTUNITIES FOR LAND-USE BASED CLIMATE CHANGE MITIGATION ACTIVITIES IN SA204
Other implementation parties
include: SALGA; Cities Network;
SAWS; CSIR; WRC; ARC; SANBI;
National Centre for Carbon
Capture and Storage; National
Energy Efficiency Agency (NEEA);
SANParks; World Heritage
Management authorities; and
provincial conservation agencies.
One of the 6 impact indicators
identified for Outcome 10 is
Reduced total emissions of CO2.
The Minister of the DEA is
responsible for reporting on this
indicator on a national basis, and
consequently, it makes sense for the
DEA to assume overall responsibility
for defining the metrics, baseline
and information to be collected in
support of AFOLU activities.
There are two other outcomes that
provide complementary goals and
programmes:
• Outcome 4: Decent
employment through inclusive
economic growth, aligned with
the labour-intensive nature of
many AFOLU activities.
• Outcome 7: Vibrant, equitable
and sustainable rural communities
with food security for all, with
potential links between AFOLU
activities and socioeconomic
benefits in rural areas.
SECTION SEVEN – INSTITUTIONAL AND FUNDING CONSIDERATIONS
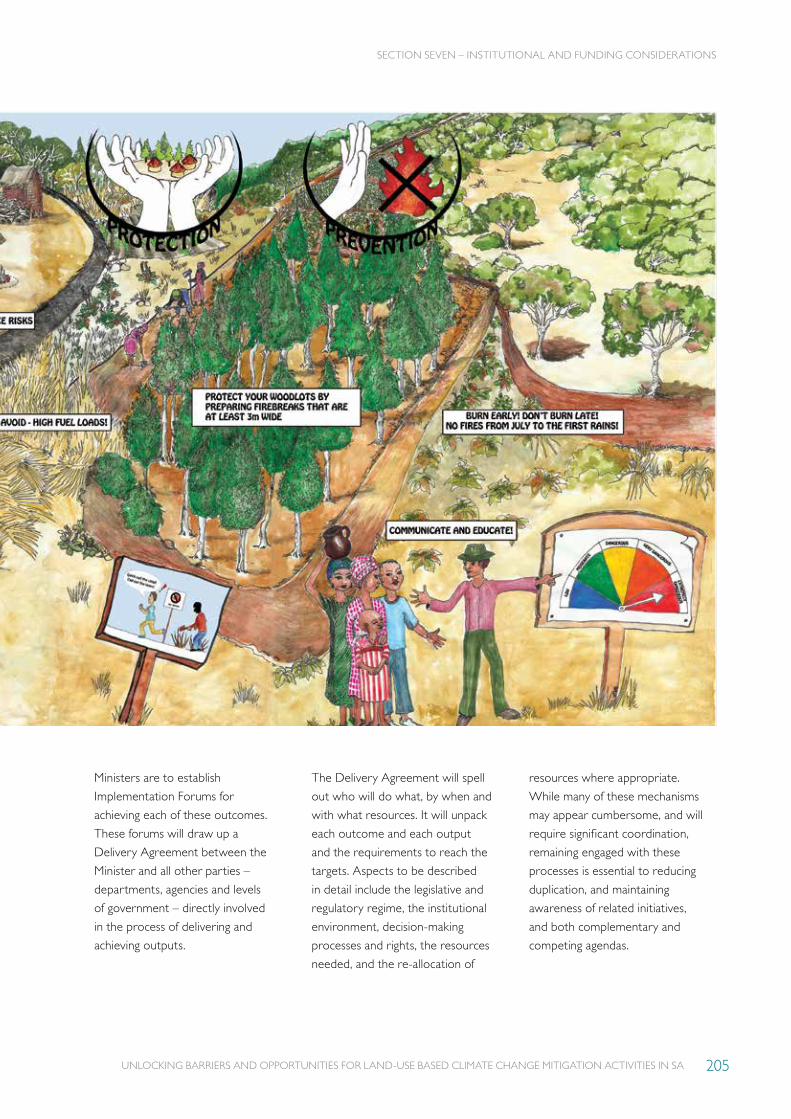
UNLOCKING BARRIERS AND OPPORTUNITIES FOR LAND-USE BASED CLIMATE CHANGE MITIGATION ACTIVITIES IN SA 205
SECTION SEVEN – INSTITUTIONAL AND FUNDING CONSIDERATIONS
Ministers are to establish
Implementation Forums for
achieving each of these outcomes.
These forums will draw up a
Delivery Agreement between the
Minister and all other parties –
departments, agencies and levels
of government – directly involved
in the process of delivering and
achieving outputs.
The Delivery Agreement will spell
out who will do what, by when and
with what resources. It will unpack
each outcome and each output
and the requirements to reach the
targets. Aspects to be described
in detail include the legislative and
regulatory regime, the institutional
environment, decision-making
processes and rights, the resources
needed, and the re-allocation of
resources where appropriate.
While many of these mechanisms
may appear cumbersome, and will
require significant coordination,
remaining engaged with these
processes is essential to reducing
duplication, and maintaining
awareness of related initiatives,
and both complementary and
competing agendas.
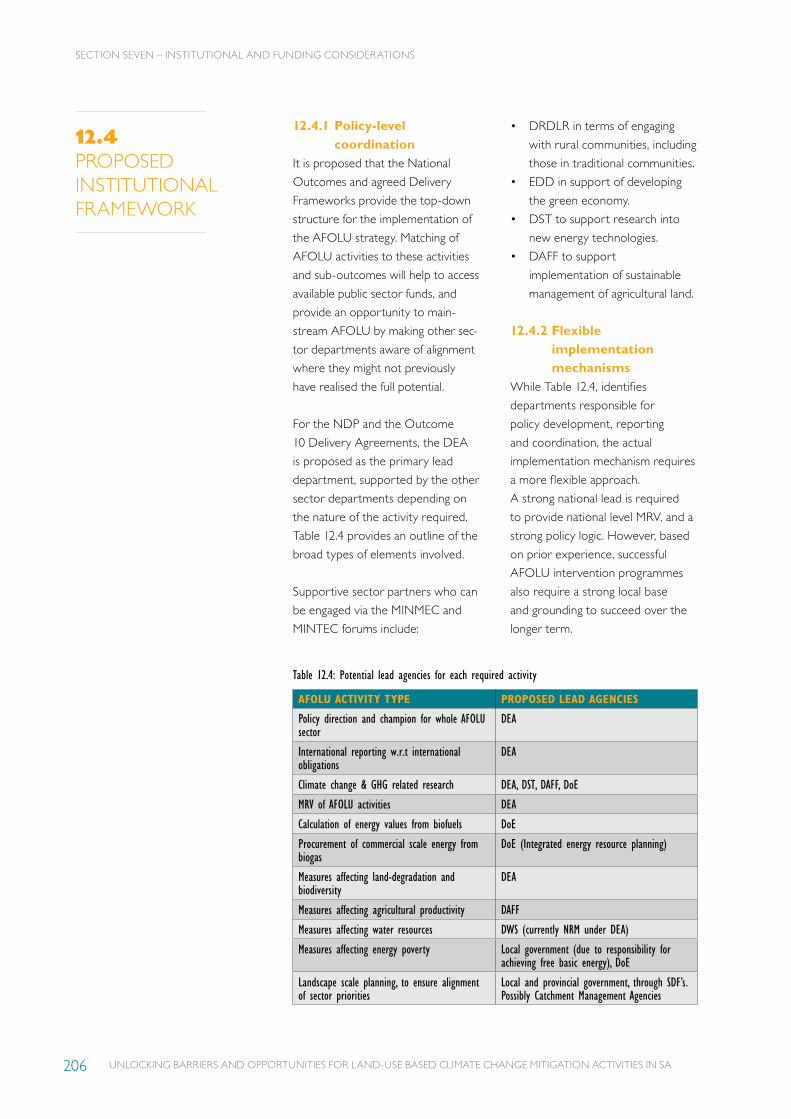
UNLOCKING BARRIERS AND OPPORTUNITIES FOR LAND-USE BASED CLIMATE CHANGE MITIGATION ACTIVITIES IN SA206
12.4PROPOSED INSTITUTIONAL FRAMEWORK
12.4.1 Policy-level coordination
It is proposed that the National
Outcomes and agreed Delivery
Frameworks provide the top-down
structure for the implementation of
the AFOLU strategy. Matching of
AFOLU activities to these activities
and sub-outcomes will help to access
available public sector funds, and
provide an opportunity to main-
stream AFOLU by making other sec-
tor departments aware of alignment
where they might not previously
have realised the full potential.
For the NDP and the Outcome
10 Delivery Agreements, the DEA
is proposed as the primary lead
department, supported by the other
sector departments depending on
the nature of the activity required.
Table 12.4 provides an outline of the
broad types of elements involved.
Supportive sector partners who can
be engaged via the MINMEC and
MINTEC forums include:
AFOLU ACTIVITY TYPE PROPOSED LEAD AGENCIES
Policy direction and champion for whole AFOLU sector
DEA
International reporting w.r.t international obligations
DEA
Climate change & GHG related research DEA, DST, DAFF, DoE
MRV of AFOLU activities DEA
Calculation of energy values from biofuels DoE
Procurement of commercial scale energy from biogas
DoE (Integrated energy resource planning)
Measures affecting land-degradation and biodiversity
DEA
Measures affecting agricultural productivity DAFF
Measures affecting water resources DWS (currently NRM under DEA)
Measures affecting energy poverty Local government (due to responsibility for achieving free basic energy), DoE
Landscape scale planning, to ensure alignment of sector priorities
Local and provincial government, through SDF’s.Possibly Catchment Management Agencies
• DRDLR in terms of engaging
with rural communities, including
those in traditional communities.
• EDD in support of developing
the green economy.
• DST to support research into
new energy technologies.
• DAFF to support
implementation of sustainable
management of agricultural land.
12.4.2 Flexible implementation mechanisms
While Table 12.4, identifies
departments responsible for
policy development, reporting
and coordination, the actual
implementation mechanism requires
a more flexible approach.
A strong national lead is required
to provide national level MRV, and a
strong policy logic. However, based
on prior experience, successful
AFOLU intervention programmes
also require a strong local base
and grounding to succeed over the
longer term.
SECTION SEVEN – INSTITUTIONAL AND FUNDING CONSIDERATIONS
Table 12.4: Potential lead agencies for each required activity

UNLOCKING BARRIERS AND OPPORTUNITIES FOR LAND-USE BASED CLIMATE CHANGE MITIGATION ACTIVITIES IN SA 207
The 3 Tiers approach provides
a flexible and responsive
implementation framework. It does
not require the establishment of any
new institutions, but rather builds on
established programmes and units as
much as possible.
Tier 1 consists of the national
departments that have primary
responsibility for related outcomes,
providing policy support as
described in the previous section.
Tier 2 are sub-national-level
initiatives which can oversee
and guide on-the-ground
implementation, reduce duplication,
and identify and address indirect
drivers of land degradation or
deforestation. It is a core proposal
of the AFOLU implementation
framework that these initiatives
be landscape based. Regional
coordinating structures might
include local authorities, CMAs,
or provincial departments. These
structures would be responsible for:
• Convening stakeholders (state
and non-state).
• Sharing information on national
law and policy.
• Facilitating landscape
stakeholders’ access to specific
opportunities from Tier 1.
• Providing landscape-level
communications (speaking with
one voice as a stakeholder
association: conducting research,
polls, media campaigns).
• Building specific stakeholders’
capacity to implement strategies
(e.g. securing specific training for
all farmers in an area).
• Negotiating, communicating, and
managing conflict.
Tier 3 stakeholders are a variety of
individuals, groups, NGOs and public
entities with a stake in a local area.
They might choose to participate in
Tier 2 engagements, convened as
described above. They are indepen-
dent stakeholders that implement
their own operations (government,
private, civil society, community, etc.)
in a way that responds to relevant
law, policy, and incentives. They
might not have a single, common
reason for working together.
The goal of these initiatives
should be to achieve some type
of environmental goal that is
complementary to the AFOLU goal,
and not necessarily GHG reductions
directly. It is important for any Tier
2 initiative to identify and accurately
understand the interests and
motivations of the main stakeholders
in the landscape (Figure 12.4).
The choice of initiating stakeholder
and the type of shared structure/
initiative will differ significantly from
landscape to landscape, which is
considered to be an inevitable part
of mainstreaming, and the complex
linkages that AFOLU activities have
to the broader economy.
Most of these landscape-level
associations/committees/networks
are likely to focus on one strategy
only (afforestation, land degradation,
commercial energy generation,
communal energy access), depending
on the primary AFOLU problem
in that landscape, and on what is
currently driving the stakeholder
actions affecting this outcome.
TIER 3ON-THE-GROUND ACTIVITIES AND MEASURES
LOCAL ACTORSAct in their own interest based on the available information
EXAPLES:FARMERS
TRADITIONAL LEADERS
VILLAGE COMMUNITY
COMPANY WITH SICNIFICANT PRESENCE IN THE LANDSCAPE
NATIONAL PARKS
LOCAL AND PROVINCIAL MUNICIPALITY
NATIONAL GOVERNMENTDEA as lead, with other departments as relevant
to instuments
SHARED INITIATIVEWith a common environmental goal (not necessarily AFOLU or reducing
GHG emissions)
TIER 2INSTITUTIONAL SUPPORT AND ADDRESSING
INDIRECT DRIVERS
SPACIAL SCALE
TIER 1INSTITUTIONAL SUPPORT, REMOVAL OF BARRIERS
COMMUNICATE
LINK TO INCENTIVES AND DISINCENTIVES
COORDINATE ACTIONS
Initiatore.g. CMA
SECTION SEVEN – INSTITUTIONAL AND FUNDING CONSIDERATIONS
Figure 12.4: A illustration of potential institutions and actors within each of the three tiers of implementation

UNLOCKING BARRIERS AND OPPORTUNITIES FOR LAND-USE BASED CLIMATE CHANGE MITIGATION ACTIVITIES IN SA208
The fundamental assumption is that
each individual actor will respond
according to its own particular
interests, and that it will continue to
do so. Consequently, the success of
every Tier 3 activity depends on each
actor considering the AFOLU activity
as being in their own interest. For
example, if the aim is to reduce the
cutting down of trees, one strategy
would be to make tree-felling illegal
in certain areas. However, where the
cut wood is being sold to generate
an income , the prevention strategy
is unlikely to succeed without costly
law enforcement, resulting in greater
hardship for the affected individuals
in the community, and growing
resentment.
In many cases the best strategy will
simply be to maintain the affected
actors’ welfare at the same level
(by providing EPWP employment in
restoration activities), but in others
there may be an opportunity to
both meet the AFOLU goal, and
develop plant nurseries for re-
establishment).
12.4.3 Underlying rationale
The proposed institutional
framework recognises the need for
an adaptive structure that can be
tailored to meet the needs of any
particular community. A common
goal is the best basis for local
organisation, with established state
institutions providing coordination
support tailored to the specific
intervention.
To achieve a specific environmental
outcome such as a reduction in
atmospheric GHG emissions from
the AFOLU sector, stakeholders
need only be invested in the
intermediate or immediate results
of the proposed intervention. A
generic example of this logic is
provided in Figure 12.5.
Figures 12.6 and 12.7 illustrate a
key challenge and opportunity
for the institutional framework.
While the AFOLU logic must run
through the whole project cycle,
given its global implications, it
does not always provide a strong
motivational logic for most of the
local stakeholders. There are many
intermediate sector goals, which are
aligned with the same outcomes,
where specific sectors are best
placed to take the lead.
Locally important issues such
as water, energy, and rural
development provide much stronger
grounds for organisation at the local,
Tier 3 level, than abstract issues of
GHG emission reductions.
AN EXAMPLE OF WHAT A TIER 2, LANDSCAPE-BASED AFOLU ORGANISATION MIGHT LOOK LIKE
The uMngeni Ecological Infrastructure Partnership (UEIP) was formally established in 2001, with the signing of a Memorandum of Understanding (MoU) by key stakeholders from national, provincial and local government departments, business, academic institutions and civil society. The signatory partners committed to finding ways of integrating ecological infrastructure solutions to support built infrastructure investments in order to address challenges of water security in the uMngeni catchment area.
The partnership currently consists of over 20 organisations from national, provincial and local government departments, business, academic institutions and civil society; and is co-chaired by SANBI and eThekwini Metropolitan Municipality. SANBI has been the centre of coordination since the inception of the partnership. A appointed Programme Coordinator, Dr Pearl Gola, provides programme support and drives ecological infrastructure implementation.
SECTION SEVEN – INSTITUTIONAL AND FUNDING CONSIDERATIONS

UNLOCKING BARRIERS AND OPPORTUNITIES FOR LAND-USE BASED CLIMATE CHANGE MITIGATION ACTIVITIES IN SA 209
DEA
DEA:EP
DAFF
DWS
DoE
Loose collection of stakeholders
UN
DE
RLY
ING
RA
TIO
NA
LEIN
STIT
UT
ION
AL
FRA
ME
WO
RK
AFOLU intervention selected to reduce GHG emissions
ACTOR (whose behaviour
must change to achieve promote AFOLU goal)
e.g. chopping firewood for
sale
CHOICE OF ACTIONPotential impact of chosen actions
on well-being or motivation of actor
IDENTIFICATIONProper problem definition and identification of relevant actors
OUTCOMESDirect and indirect
outcomes
Reduction in GHG
emissions
Refinement in AFOLU strategy dependent on climate policy
TIER 2Regional/landscape
based, determined by issue and nature of
stakeholders
e.g. farming association, within feeder area for
biomass collection
TIER 3Natural sector
departments monitor and coordinate within excisting programmes
e.g. DoE
TIER 1Identification of
stakeholder/organising principle
e.g. poultry farmers for biomass to
generate at scale
Coordinating committees chaired by appropriate existing organisations. E.g. munics, CMAs where active, agri forums.
DEA/DAFF/DOE/DWS existing branch programmes responsible for over-seeing project in terms of sector goals.
As sector lead, DEA responsible for MRV related to GHG emissions and international obligations
Achive some other goal
e.g. rural economic development
Achive AFOLU goal e.g. aforrestation
Reduced GHG emissions
IMPROVE e.g. former
woodcutters now running seedling
nursery
MAINTAIN e.g. employed on EPWP type programme
WORSEN e.g. criminalise woodcutting
without a license
SECTION SEVEN – INSTITUTIONAL AND FUNDING CONSIDERATIONS
Figure 12.6: Exploring the working relationship between tiers
Figure 12.5: Exploring the working relationship between tiers.
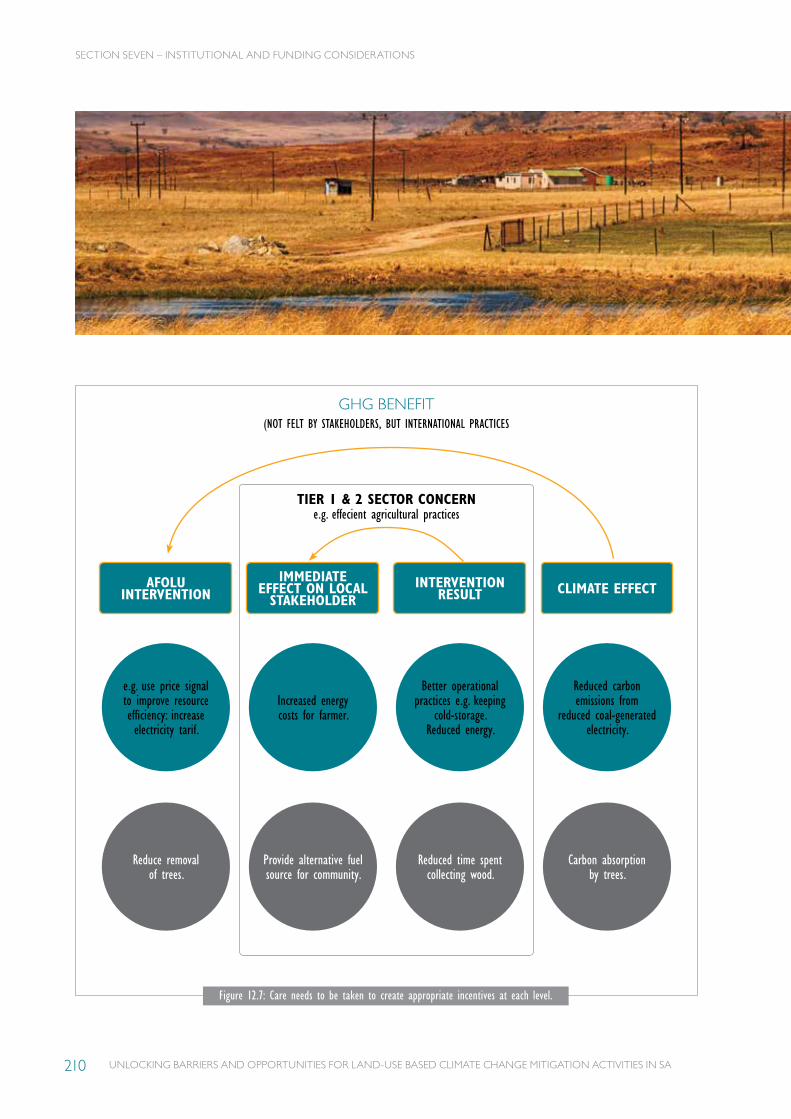
UNLOCKING BARRIERS AND OPPORTUNITIES FOR LAND-USE BASED CLIMATE CHANGE MITIGATION ACTIVITIES IN SA210
GHG BENEFIT (NOT FELT BY STAKEHOLDERS, BUT INTERNATIONAL PRACTICES
TIER 1 & 2 SECTOR CONCERNe.g. effecient agricultural practices
AFOLU INTERVENTION
e.g. use price signal to improve resource efficiency: increase electricity tarif.
Reduce removal of trees.
IMMEDIATE EFFECT ON LOCAL
STAKEHOLDER
Increased energy costs for farmer.
Provide alternative fuel source for community.
INTERVENTION RESULT
Better operational practices e.g. keeping
cold-storage. Reduced energy.
Reduced time spent collecting wood.
CLIMATE EFFECT
Reduced carbon emissions from
reduced coal-generated electricity.
Carbon absorption by trees.
SECTION SEVEN – INSTITUTIONAL AND FUNDING CONSIDERATIONS
Figure 12.7: Care needs to be taken to create appropriate incentives at each level.

UNLOCKING BARRIERS AND OPPORTUNITIES FOR LAND-USE BASED CLIMATE CHANGE MITIGATION ACTIVITIES IN SA 211
12.5BOTTOM-UP INSTITUTIONAL FRAMEWORK
While the
previous
section laid
out the
national outcomes and key sector
departments, a central element of
the AFOLU institutional framework
is the requirement for strong local
engagement. However, the range
of AFOLU activities is broad, and
covers a wide range of possible
actors.
Although local government in South
Africa faces many challenges, and
while it is not a substitute for civil
society, it does have the following
strengths:
• Understanding local concerns
and priorities, as expressed in
the Integrated Development
Plan (IDP).
AFFORESTATION GRASSLANDS COMMERCIAL BIOGAS
COMMUNITY-SCALE BIOGAS/BIOMASS
• Landowners (public, private or communal)
• Local government• Job seekers• Commercial forestry• Conservation agencies• Traditional leaders
• Landowners (public, private or communal)
• Local & provincial government• Job seekers• Commercial farmers• Subsistence farmers• Traditional leaders• Agricultural extension workers• Conservation agencies
• DoE• ESKOM (i.t.o purchase agreements)
• Renewable energy project developers
• Local communities• Private companies/entities with useful biomass
• DRDLR, DoE, DEA• Local Government• Non-electrified communities• Remote communities/energy poverty
• Ability to provide formal
structures for interacting with
target communities, at least in
the early stages of a project
development.
Local government also has the
following responsibilities and
obligations:
• To develop a Spatial
Development Framework.
• To prepare and implement
adaptation and mitigation plans,
and develop EPWP projects,
making it a willing partner
in many of these processes,
particularly where there is a lack
of local capacity.
However, local government
boundaries can be a handicap for
landscape-scale initiatives.
SECTION SEVEN – INSTITUTIONAL AND FUNDING CONSIDERATIONS
Possible actors, by AFOLU activity:
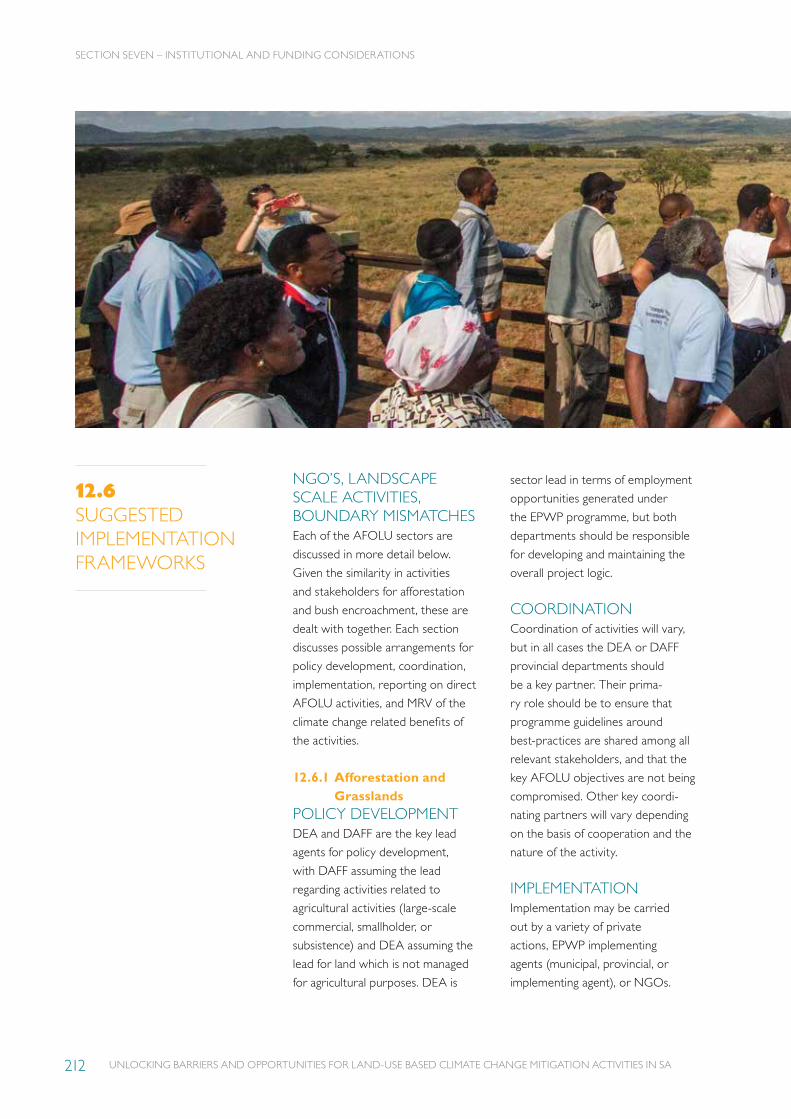
UNLOCKING BARRIERS AND OPPORTUNITIES FOR LAND-USE BASED CLIMATE CHANGE MITIGATION ACTIVITIES IN SA212
SECTION SEVEN – INSTITUTIONAL AND FUNDING CONSIDERATIONS
12.6SUGGESTED IMPLEMENTATION FRAMEWORKS
NGO’S, LANDSCAPE SCALE ACTIVITIES, BOUNDARY MISMATCHESEach of the AFOLU sectors are
discussed in more detail below.
Given the similarity in activities
and stakeholders for afforestation
and bush encroachment, these are
dealt with together. Each section
discusses possible arrangements for
policy development, coordination,
implementation, reporting on direct
AFOLU activities, and MRV of the
climate change related benefits of
the activities.
12.6.1 Afforestation and Grasslands
POLICY DEVELOPMENTDEA and DAFF are the key lead
agents for policy development,
with DAFF assuming the lead
regarding activities related to
agricultural activities (large-scale
commercial, smallholder, or
subsistence) and DEA assuming the
lead for land which is not managed
for agricultural purposes. DEA is
sector lead in terms of employment
opportunities generated under
the EPWP programme, but both
departments should be responsible
for developing and maintaining the
overall project logic.
COORDINATIONCoordination of activities will vary,
but in all cases the DEA or DAFF
provincial departments should
be a key partner. Their prima-
ry role should be to ensure that
programme guidelines around
best-practices are shared among all
relevant stakeholders, and that the
key AFOLU objectives are not being
compromised. Other key coordi-
nating partners will vary depending
on the basis of cooperation and the
nature of the activity.
IMPLEMENTATION Implementation may be carried
out by a variety of private
actions, EPWP implementing
agents (municipal, provincial, or
implementing agent), or NGOs.
UNLOCKING BARRIERS AND OPPORTUNITIES FOR LAND-USE BASED CLIMATE CHANGE MITIGATION ACTIVITIES IN SA 213
AFFORESTATION GRASSLANDS/BUSH ENCROACHMENT
Directly relevant sub-outcomes
10.1: Ecosystems are sustained and natural resources used efficiently
Supportive outcomes (with lead dept)
10.2: Effective climate change mitigation and adaptation response – DEA
10.2: Effective climate change mitigation and adaptation response – DEA
10.3: Environmentally sustainable, low carbon economy (employment in environmental activities) – DEA
10.3: Environmentally sustainable, low carbon economy
10.5: Sustainable human communities 10.5: Sustainable human communities
4.5: Spatial imbalances in economic opportunities are addressed through expanded employment in agriculture – DAFF
4.9: Public employment schemes provide relief for the unemployed and build community solidarity and agency
4.9: Public employment schemes provide relief for the unemployed and build community solidarity and agency – DEA
7.4: Improved employment opportunities and promotion of economic livelihoods in rural areas (DRDLR, DAFF)
7.4: Improved employment opportunities and promotion of economic livelihoods in rural areas (DRDLR, DAFF)
Lead Department per outcome
DAFF combat land degradationDEA (“Working for” programmes)DWS (Water resource protection, watershed services)
DEA “working for” programmesDAFF combat land degradation
Directly relevant unit if any
DAFF Prog 5: Forestry and NRM (explicitly works on land degradation & Outcome 10.1)Also Prog 2&4.Working for ForestsWorking for Ecosystems
DEA Prog 6: Environmental ProgrammesDEA Land user incentive schemePeople & Parks
DEA Prog 5: Biodiversity and ConservationDEA Prog 6: Environmental Programmes (NRM & EPIP)
DEA Land user incentive schemeWorking for EcosystemsWorking for LandPeople & Parks
Other national departments DRDLR, DWS Tourism, DRDLR, DWS
Other relevant stakeholders/groups
ARC, CSIR, commercial agriculture SANBI, SANParks, provincial parks authorities, private landowners, CSIR, Traditional leaders
SECTION SEVEN – INSTITUTIONAL AND FUNDING CONSIDERATIONS

UNLOCKING BARRIERS AND OPPORTUNITIES FOR LAND-USE BASED CLIMATE CHANGE MITIGATION ACTIVITIES IN SA214
AFOLU MRV AND CLIMATE CHANGE POLICY
Directly relevant sub-outcomes 10.2 Effective climate change mitigation and adaptation response
10.4 Enhanced governance systems and capacityLead Department per outcome DEA Climate changeDirectly relevant unit if any DEA Climate change and Air Quality Branch: Chief
Directorate – Climate Change Monitoring and Evaluation
Other relevant stakeholders/groups WWF, CSIR,
COMMUNITY SCALE
Directly relevant Outcomes 10.1 Ecosystems are sustained and natural resources used efficiently
10.2 Effective climate change mitigation and adaptation response10.3 Environmentally sustainable, low-carbon economy6.2: Ensure reliable generation, distribution and transmission of
electricity (DoE)
Supporting outcomes 10.5 Off-grid electrification – Energy4.10: Investment in research, innovation and supporting the
development of new industries. (led by DTI, supported by DoE and DAFF in this case)
4.2: Support green economy as a jobs driver – EDD7.6: Growth of sustainable rural enterprises and industries
(DTI and DoE?)
Lead Department per outcome
DOE for promotion of biogas/biomass production of commercial scale (above 1MW?)DAFF for assistance to agri-producers
Existing important programmes, branches and initiatives
DOE Programme 6: Clean energyTo manage and facilitate the development and implementation of clean and renewable energy initiatives as well as EEDSM.(commercial scale projects)
Other national departments and involvement
DAFF has piloted a biogas production integrated crop-livestock system.DAFF also has an APAP (Agricultural Policy Action Plan). There is a sectoral intervention specifically around biofuels.EDD: Economic Planning and Coordination Programme. Green Economy sub-programme (jobs focus)
Other relevant stakeholders/groups
National Biogas PlatformNERSA (registration of biogas projects)
SECTION SEVEN – INSTITUTIONAL AND FUNDING CONSIDERATIONS
REPORTING ON DIRECT ACTIVITIESReporting on whichever direct
sector activity is occurring will be
required, and may be focused on
non-AFOLU goals, such as job
creation or agricultural productivity.
This should be managed by the
relevant sector department.
MONITORING, REPORTING AND VERIFICATION OF AFOLU BENEFITSThese activities are the specific
mandate of the DEA.
DEA’s Climate Change and Air
Quality Branch (Chief Directorate
-Climate Change Monitoring and
Evaluation) is responsible for the
MRV of GHG emission reduction
activities, and should guide and
inform the data collection process
for this information.
There is also an opportunity to
develop a specific on-the-ground
monitoring EPWP programme
as one of the environmental
programmes, or ‘working for’
programmes.
UNLOCKING BARRIERS AND OPPORTUNITIES FOR LAND-USE BASED CLIMATE CHANGE MITIGATION ACTIVITIES IN SA 215
SECTION SEVEN – INSTITUTIONAL AND FUNDING CONSIDERATIONS
12.6.2 Non-commercial biomass to energy
These projects are characterised as
dispersed sources of energy, which
generate less than 1MW of energy,
or are not viable at a commercial
scale. A useful approach for such
projects is extending access to safe
and sustainable energy services for
poor households, particularly those
in remote areas.
POLICY DEVELOPMENTDoE and DEA are the sector leads
with regard to policy development,
with DoE taking the lead in terms
of extending access to energy for
poor communities. DoE should be
responsible for the development
of a programmatic approach to
using biomass to generate safe,
affordable energy sources for poor
communities. The DEA and DST
can assist from a piloting perspective
to develop technologies suitable
according to a programmatic
approach.
IMPLEMENTATIONLocal authorities are key
implementation partners as they
bear direct legislative responsibility
for expanding access to energy
services for all households in
their jurisdiction. The Free Basic
Alternative Energy policy may be
of particular relevance here, as it
is concerned with replacing unsafe
and harmful fuel sources with safe,
sustainable and affordable energy
sources. Local government is also
responsible for providing permission
for any activities involving burning (in
accordance with both public safety
and air quality considerations).
REPORTING WITH REGARD TO ENERGY ACCESS, OR OTHER DIRECT PROJECT GOALSLocal government, the DoE and
StatsSA are the primary channels
for collecting information on
household access to basic services.
Programmes that target the paid
collection of biomass would be
suitable for EPWP funding, and
would therefore fall under those
existing reporting channels.
MONITORING, REPORTING AND VERIFICATION WITH REGARD TO AFOLUDoE is responsible for determining
the calorific values of fuel-sources. It
should assist in the development of
programmatic assumptions that may
be used to assess the reductions in
GHG emissions through the use of
biomass to energy alternatives. This
can be supported by ‘Working for
Energy’ type teams that are trained
to monitor and maintain the correct
use of this technology to ensure
that the emissions reductions
goals are met.

UNLOCKING BARRIERS AND OPPORTUNITIES FOR LAND-USE BASED CLIMATE CHANGE MITIGATION ACTIVITIES IN SA216
COMMERCIAL SCALE
Directly relevant Outcomes 10.1 Ecosystems are sustained and natural resources used efficiently
10.2 Effective climate change mitigation and adaptation response
10.3 Environmentally sustainable, low carbon economy6.2: ensure reliable generation, distrib & transmission of
electricity (DoE)
Supporting outcomes 10.5 Off-grid electrification – Energy4.10: Investment in research, and innovation… and supporting
the development of new industries. (led by DTI, supported by DoE and DAFF in this case)
4.2: Support green economy as a jobs driver – EDD7.6: Growth of sustainable rural enterprises and industries
(DTI & DoE?)
Lead Department per outcome
DOE for promotion of Biogas/biomass production of commercial scale (above 1MW?)DAFF for assistance to agri-producers
Existing important programmes, branches & initiatives
DOE Programme 6: Clean Energy To manage and facilitate the development and implementation of clean and renewable energy initiatives as well as EEDSM. (commercial scale projects)
Other national departments & involvement
DAFF has piloted a biogas production integrated crop-livestock system.DAFF also has an APAP: Agricultural Policy Action Plan. There is a Sectoral Intervention specifically around Biofuels.EDD: Economic planning and Coordination Programme.
Green Economy sub-programme (jobs focus)
Other relevant stakeholders/groups
National Biogas PlatformNERSA (registration of biogas projects)
SECTION SEVEN – INSTITUTIONAL AND FUNDING CONSIDERATIONS
12.6.3 Commercial-scale biomass to energy
Commercial scale biomass to energy
has a highly developed institutional
framework in place already, which
will not be replicated in detail
here. The scale of the project will
influence the regulatory process
required: Renewable energy IPPs
wishing to generate electricity for
sale into the national grid have to
undergo the regulatory processes
established under the Renewable
Energy IPP process, and adhere to
the requirements for environmental
impact assessments, waste
management licences, atmospheric
emission licences, biodiversity
authorisations, water use licences,
and regulations regarding major
hazard installations, Eskom grid
connections and land-use planning.
The regulatory process is outlined
in Appendix A (p.226).
The regulation of small-scale
embedded generation (entities
that connect to the distribution
system rather than the transmission
system, less than 1MW) is under
development, but is currently largely
targeted at the roof-top solar market.
However it does allow for generators
of energy from biomass and biogas.
POLICY DEVELOPMENTAspects of the broad motivation for
commercial scale biomass to energy:
• The policy goal of increasing the
share of renewable energy, and
the targets for renewable energy
set in the national Integrated
Energy Plan (still in development)
and the Integrated Resource Plan,
both the responsibility of the DoE.
• The development of a
commercially viable project.
COORDINATIONThe IPP Procurement programme
and the DoE are responsible for
the setting of renewable energy
targets, and the procurement of
that energy from Independent
Power Producers (IPPs). The
generation capacity allocated in
the IPP Procurement Programme
to biomass amounts to 210 MW,
and 110 MW to biogas. Small IPP
projects are classified as those
between 1 MW and 5 MW, and are
governed under a sub-component
of the broader Renewable IPP
programme
IMPLEMENTATION Implementation will be carried
out by private energy developers.
The biogas industry is South Africa
is already represented on the
National Biogas Platform (Figure
12.8). The objectives of the 2nd
National Biogas Conference, held
in 2015, were to formulate the
position of the DoE with respect
to biogas industry development,
get an update on current barriers
faced by developers, and develop
tangible biogas-related outputs
for particular sectors such as rural
areas, agriculture, abattoirs, applied
research, and transport.

UNLOCKING BARRIERS AND OPPORTUNITIES FOR LAND-USE BASED CLIMATE CHANGE MITIGATION ACTIVITIES IN SA 217
MEMBERS OF THE NATIONAL BIOGAS PLATFORM
NATIONAL BIOGAS
PLATFORM
GOVERNMENT DEPARTMENTS
DOEDEANERSADTIDSTDAFFDWA
FINANCING INSTITUTIONS AND DONORS
DBSAIDCAFD
UNIDO
NGOs AND CONSULTANCIES
GREEN CAPECAPE EAPrac
PROVINCES AND LOCAL
GOVERNMENTSALGA
Gauteng EDCity of Tshwane
RESEARCHSANEDI
UJUNISACSIRARC
ESKOM
INDUSTRIESSABIA
Project developers outside of SABIAIntensive energy
user group
SECTION SEVEN – INSTITUTIONAL AND FUNDING CONSIDERATIONS
Figure 12.8: The National Biogas Platform
REGULATION OF SMALL-SCALE RENEWABLE ENERGY PROJECTSNERSA is responsible for the
regulation of IPPs, and varies the
reporting requirements according to
the type/scale of entity.
MONITORING, REPORTING AND VERIFICATION WITH REGARD TO GHG EMISSIONSThese tasks remain the same as in
previous sections, with the DEA
assuming responsibility through the
National Greenhouse Gas Inventory.
The National Atmospheric Emissions
Inventory System/National GHG
reporting regulations. Currently
the department reports only on
projects with over 10 MW capacity.

UNLOCKING BARRIERS AND OPPORTUNITIES FOR LAND-USE BASED CLIMATE CHANGE MITIGATION ACTIVITIES IN SA218
12.7GAPIDENTIFICATION M
uch of the
institutional
framework for
AFOLU activities
is already in place, with a few key
exceptions. These include:
• The lack of a clear institutional
home for coordination and
tracking of activities at a
landscape scale.
• The Catchments Management
Agency described in the National
Water Act of 1998 provides
one interesting prospect which
should be investigated further,
given the proven links between
land-use management and
water resources. However
the implementation of CMAs
to date remains poor, and
the scope of CMAs has been
limited primarily to water
licensing and compliance
activities. Investigation into
a possible expansion of their
role to coordinate or at least
track land-use activities in their
jurisdiction would be of value
to several sectors that depend
on landscape scale, rather
than provincial or municipal
boundaries.
• A catchment management
strategy must set principles
for allocating water to existing
and prospective users, “taking
into account all matters
relevant to the protection, use,
development, conservation,
management and control of
water resources.” For example,
Part 4 of the NWA states: “The
person who owns, controls,
occupies or uses the land in
question is responsible for
taking measures to prevent
pollution of water resources. If
these measures are not taken,
the catchment management
agency concerned may itself
do whatever is necessary
to prevent the pollution or
remedy its effects, and recover
all reasonable costs from
the persons responsible for
the pollution.” There is an
important connection between
water pollution from agricultural
sources, and opportunities for
bio-energy.
• Confirmation of the difference
between communal, not for
profit, energy generation aimed
at meeting basic energy needs of
communities is lacking.
• MRV for capturing small-scale
energy projects, below 1 MW,
is not currently happening.
There may be scope for the
development of a programmatic
approach, to enable the use
of generic factors, rather than
costly MRV requirements, which
may act as a deterrent to small
generators.
• A ‘Working for Data’
programme could add value
not only to the AFOLU sector,
but to other stakeholders
such as DWS (water readings),
the research community, the
weather community, and
agricultural stakeholders.
The creation of a new EPWP
Environmental Programme for
data-collection, which trains
and employs workers to take
field observations, and check
on correct usage of installations
(non-commercial) and practices,
is a possibility.
SECTION SEVEN – INSTITUTIONAL AND FUNDING CONSIDERATIONS
UNLOCKING BARRIERS AND OPPORTUNITIES FOR LAND-USE BASED CLIMATE CHANGE MITIGATION ACTIVITIES IN SA 219
12.8SUMMARY OF CURRENT AND RELEVANT GOVERNMENT PROGRAMMES
At its simplest,
AFOLU and its
related GHG
reduction activities
are clearly a DEA function, and this
ownership drives the overall project
design and tracking. However, the
current underlying institutional
framework regarding AFOLU
activities, stakeholders and agendas
is complex, once all the different
dimensions are taken into account.
These include:
• Energy services (commercial
generation and access to basic
energy services for
poor households).
• Sustainable land management
practices (subsistence and
commercial, conservation and
production) under varying forms
of tenure (public, communal
and private).
• Economic development
(encompassing energy security,
innovation, rural livelihoods, and
unemployment).
A variety of different government
stakeholders are involved,
depending on the specific issue
under consideration. The various
affected departments and their
related focus areas include:
• DEA: biodiversity and
conservation, air quality
management, climate change
policy, sustainable resource use.
• DAFF: agriculture (subsistence
and commercial), sustainable
land use practices.
• DWS: protection of water
resources, watersheds key rural
strategic water source areas.
• DOE: energy generation,
distribution and transmission,
energy access for the poor,
renewable energy generation.
• DRDLR: spatial planning, rural
development and land reform.
• DCOG and local government:
energy services in rural
settlements.
• DTI: energy prices, new
economic opportunities.
• EDD: Green Economy.
• DST: Innovation.
• Tourism: employment,
conservation.
Given this institutional complexity,
and the ‘remoteness’ of the
GHG reduction goal, it would be
advantageous, generally, to have
the various sector departments
head-up the related initiatives.
However, to maintain the overall
logic, it is essential that DEA
staff have oversight of the entire
chain of activities from an MRV
perspective and to enable reporting
on international obligations. The
challenge will be to ensure that DEA
staff allow their sector colleagues
sufficient leeway to meet their own
sector goals, while still retaining
enough influence to meet the GHG
reduction targets.
SECTION SEVEN – INSTITUTIONAL AND FUNDING CONSIDERATIONS
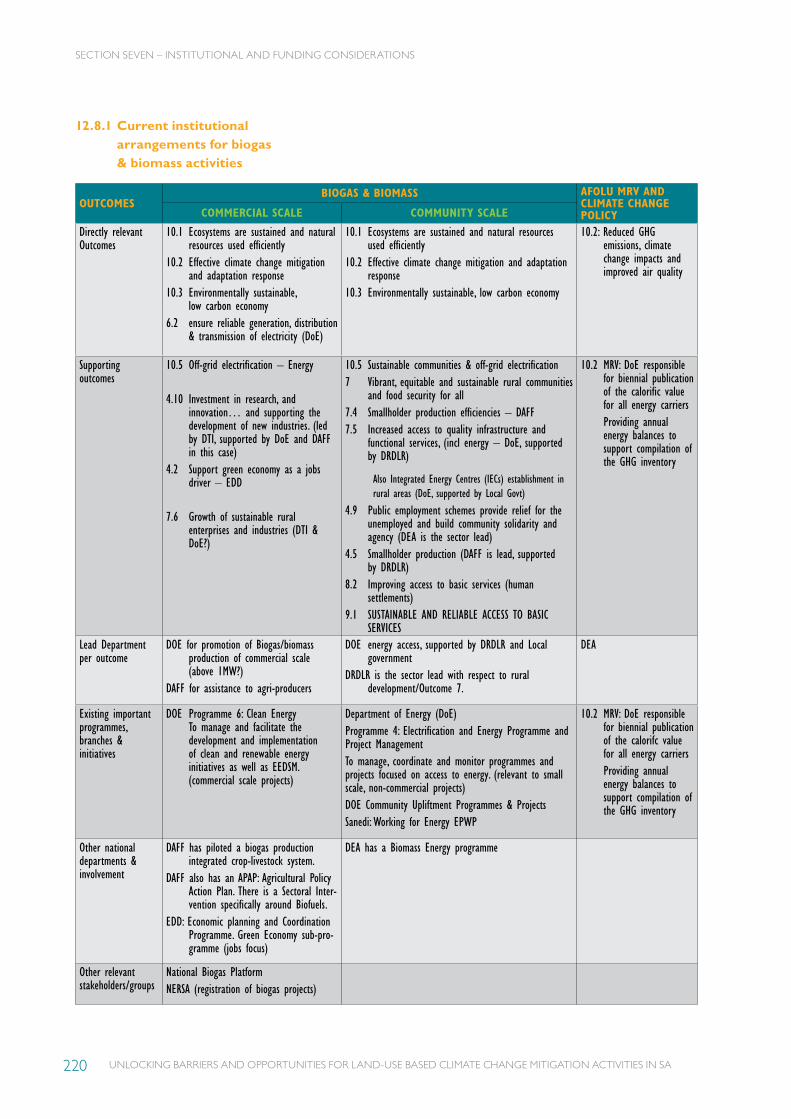
UNLOCKING BARRIERS AND OPPORTUNITIES FOR LAND-USE BASED CLIMATE CHANGE MITIGATION ACTIVITIES IN SA220
12.8.1 Current institutional arrangements for biogas & biomass activities
OUTCOMESBIOGAS & BIOMASS AFOLU MRV AND
CLIMATE CHANGE POLICYCOMMERCIAL SCALE COMMUNITY SCALE
Directly relevant Outcomes
10.1 Ecosystems are sustained and natural resources used efficiently
10.2 Effective climate change mitigation and adaptation response
10.3 Environmentally sustainable, low carbon economy
6.2 ensure reliable generation, distribution & transmission of electricity (DoE)
10.1 Ecosystems are sustained and natural resources used efficiently
10.2 Effective climate change mitigation and adaptation response
10.3 Environmentally sustainable, low carbon economy
10.2: Reduced GHG emissions, climate change impacts and improved air quality
Supporting outcomes
10.5 Off-grid electrification – Energy
4.10 Investment in research, and innovation… and supporting the development of new industries. (led by DTI, supported by DoE and DAFF in this case)
4.2 Support green economy as a jobs driver – EDD
7.6 Growth of sustainable rural enterprises and industries (DTI & DoE?)
10.5 Sustainable communities & off-grid electrification7 Vibrant, equitable and sustainable rural communities
and food security for all7.4 Smallholder production efficiencies – DAFF7.5 Increased access to quality infrastructure and
functional services, (incl energy – DoE, supported by DRDLR)
Also Integrated Energy Centres (IECs) establishment in rural areas (DoE, supported by Local Govt)
4.9 Public employment schemes provide relief for the unemployed and build community solidarity and agency (DEA is the sector lead)
4.5 Smallholder production (DAFF is lead, supported by DRDLR)
8.2 Improving access to basic services (human settlements)
9.1 SUSTAINABLE AND RELIABLE ACCESS TO BASIC SERVICES
10.2 MRV: DoE responsible for biennial publication of the calorific value for all energy carriers
Providing annual energy balances to support compilation of the GHG inventory
Lead Department per outcome
DOE for promotion of Biogas/biomass production of commercial scale (above 1MW?)
DAFF for assistance to agri-producers
DOE energy access, supported by DRDLR and Local government
DRDLR is the sector lead with respect to rural development/Outcome 7.
DEA
Existing important programmes, branches & initiatives
DOE Programme 6: Clean Energy To manage and facilitate the development and implementation of clean and renewable energy initiatives as well as EEDSM. (commercial scale projects)
Department of Energy (DoE)Programme 4: Electrification and Energy Programme and Project ManagementTo manage, coordinate and monitor programmes and projects focused on access to energy. (relevant to small scale, non-commercial projects)DOE Community Upliftment Programmes & ProjectsSanedi: Working for Energy EPWP
10.2 MRV: DoE responsible for biennial publication of the calorifc value for all energy carriers
Providing annual energy balances to support compilation of the GHG inventory
Other national departments & involvement
DAFF has piloted a biogas production integrated crop-livestock system.
DAFF also has an APAP: Agricultural Policy Action Plan. There is a Sectoral Inter-vention specifically around Biofuels.
EDD: Economic planning and Coordination Programme. Green Economy sub-pro-gramme (jobs focus)
DEA has a Biomass Energy programme
Other relevant stakeholders/groups
National Biogas PlatformNERSA (registration of biogas projects)
SECTION SEVEN – INSTITUTIONAL AND FUNDING CONSIDERATIONS
UNLOCKING BARRIERS AND OPPORTUNITIES FOR LAND-USE BASED CLIMATE CHANGE MITIGATION ACTIVITIES IN SA 221
12.8.2 Existing mechanisms that might aid tracking?
Under Outcome 10.2, the depart-
ments of Water and Sanitation,
Agriculture, Forestry and
SECTION SEVEN – INSTITUTIONAL AND FUNDING CONSIDERATIONS
Fisheries, Human Settlements,
and provincial departments including
local authorities are responsible
for the development and implemen-
tation of sector adaptation
strategies/plans.
These would provide a possible
mechanism for tracking and
reporting on AFOLU activities, but
would require support to provide
the correct information.
UNLOCKING BARRIERS AND OPPORTUNITIES FOR LAND-USE BASED CLIMATE CHANGE MITIGATION ACTIVITIES IN SA222
SECTION SEVEN – INSTITUTIONAL AND FUNDING CONSIDERATIONS
12.9CURRENT GAPS IDENTIFIED IN THE INSTITUTIONAL CONTEXT
The current institutional
framework is already
clear for the following
Tier 1 components:
• National strategy and co-
ordination: DEA has been tasked
and this current initiative is a key
contribution to its development.
• Establishment of finance and
funding with international
parties: DEA is currently dealing
with this, DoE hosts the CDM
Designated National Authority.
• National MRV administration
and alignment with M&E
program: DEA for first part,
unclear on 2nd part?
• Policy alignment and advocacy:
this appears to be the main gap
and challenge.

UNLOCKING BARRIERS AND OPPORTUNITIES FOR LAND-USE BASED CLIMATE CHANGE MITIGATION ACTIVITIES IN SA 223
SECTION SEVEN – INSTITUTIONAL AND FUNDING CONSIDERATIONS
The current gap is ensuring that
the AFOLU logic is maintained
through the project chain. What
capacity is there in provincial
departments to track and monitor
AFOLU projects implemented by
other sector departments, with
DEA/provincial staff engaging to
ensure complementary GHG goals
are achieved?

UNLOCKING BARRIERS AND OPPORTUNITIES FOR LAND-USE BASED CLIMATE CHANGE MITIGATION ACTIVITIES IN SA224
REFERENCES
Banks, D. I., Griffin, N. J., Shackleton, C., Shackleton, S. E., & Mavrandonis, J. M. (1996). Wood supply and demand around two rural settlements in a semi-arid savanna, South Africa. Biomass and Bioenergy, 11(4), 319–331.
Berliner, D. D. (2009). Systematic conservation planning for South Africa’s forest biome: an assessment of the conservation status of South Africa’s forests and recommendations for their conservation. University of Cape Town.
Berliner, D. D. (2011). The conservation status of forest on the East Cape’s, Wild Coast, South Africa. In Fifth Natural Forest and Woodlands Symposia. Richards Bay.
Berliner, D. D., van der Merwe, I., Benn, G., & Rouget, M. (2006). Sys-tematic conservation planning for the forest biome of South Africa: approach, methods and results used for the selec-tion of priority forests. Pretoria.
Blignaut, J. N. (2009). Fixing both the symptoms and causes of degradation: The need for an integrated approach to economic development and restoration. Journal of Arid Environments, 696–698.
Blignaut, J., Aronson, J., & de Groot, R. (2013). Restoration of natural capital: A key strategy on the path to sustain-ability. Ecological Engineering. http://doi.org/10.1016/j.ecoleng.2013.09.003
Bohl, J., Sahoo, B. B., & Mishra, C. K. (2011). Biogas digesters in India – A Review. National Conference on Renewable and New Energy Systems. Dhenkanal, Odisha.
Bond, W. J., Midgley, G. F., & Wood-ward, F. I. (2003). What controls South African vegetation – climate or fire? South African Journal of Botany, 69, 79–91.
Cooper, T. (2016). Why are forest birds declining? PhD dissertation, University of Stellenbosch.
Cooper, T., Wannenburgh, A. M., & Cherry, M. I. (n.d.). Atlas data indicate forest dependent bird species declines in South Africa.
Crookes, D. (2012). Modelling the ecological-economic impacts of restor-ing natural capital, with a special focus on water and agriculture, at eight sites in South Africa. University of Stellenbosch.
DAFF. (2012). A Profile of the South Af-rican Beef Market Value Chain – 2012. Department of Agriculture, Forestry and Fisheries. Arcadia, South Africa.
Damm, O., & Triebel, R. (2008). A Synthesis Report on Biomass Energy Consumption and Availability in South Africa. A report prepared for ProBEC – Programme for Basic Energy and Conservation.
DEA. (2015). Development of potential verification standards and methodol-ogies for carbon offset projects in the AFOLU sector in South Africa. Pretoria. Retrieved from www.environment.gov.za
DEFRA. (2012). Guidelines to Defra / DECC’s GHG Conversion Factors for Company Reporting, Version: 1.0. London.
Diamond, J. M. (2005). Collapse: How societies choose to fail or succeed. New York: Penguin.
DOE. (n.d.). Energy Price Report. Directorate: Energy Data Collection, Management and Analysis (Compiled by: M. Motiang, R. Nembahe). Pretoria, South Africa.
du Toit, C. J. L., Meissner, H. H., & van Niekerk, W. A. (2013). Direct meth-ane and nitrous oxide emissions of South African dairy and beef cattle. South African Journal of Animal Science, 43(3).
Ellery, W. N., Scholes, R. J., & Mentis, M. T. (1991). An initial approach to predicting the sensitivity of the South African grassland biome to climate change. South African Journal of Science, 87, 499–503.
Fabricius, C., Biggs, H., & Powell, M. (2016). Ntabelanga and Laleni Ecological Infrastructure Project. Pretoria, South Africa.
FOOTNOTES
1 NERSA Consultation Paper,
Cogeneration Regulatory Rules
and Feed-In Tariffs. 2011
2 Works closely with GIZ
3 Managed by a cross-
departmental project team from
the Department for International
Development (DfID), the
Department of Energy and
Climate Change (DECC),
the Finance Ministry, The
Department for Environment,
Food and Rural Affairs
(DEFRA), and the Foreign and
Commonwealth Office (FCO)
(CFU, 2016)
UNLOCKING BARRIERS AND OPPORTUNITIES FOR LAND-USE BASED CLIMATE CHANGE MITIGATION ACTIVITIES IN SA 225
FAO. (1992). Biogas processes for sustainable development. Rome, Italy.
Gandar, M. (1983). Wood as a source of fuel in South Africa. South African Forestry Journal.
GIZ. (2016). Biogas Industry in South Africa – An Assessment of the Skills Needs and Estimation of the Job Poten-tial. Pretoria, South Africa.
Herbert, D. G., & Kilburn, R. N. (2004). Field guide to the land snails and slugs of eastern South Africa. Pieter-maritzberg, South Africa.
IARC. (2010). Household Use of Solid Fuels. Lyon, France.
King, N. L. (1938). Historical sketch of the development of forestry in South Africa. Journal of the South African Forestry Associa-tion, 1, 4–16.
Knowles, T. (2011). Realising REDD in Africa : Risk , feasibility and supporting policy. University of Stellenbosch.
Labuary, J. (2000). Biogas Technology in India: More than Gandhi’s dream.
Lawes, M. J., Macfarlane, D. M., & Eeley, H. A. C. (2004). Forest landscape pattern in the KwaZulu–Natal midlands, South Africa: 50 years of change or stasis? Austral Ecology, 29(613–623).
Liengme, C. A. (1980). A study of wood use for fuel and building in an area of Gazanku-lu. Bothalia, 13, 501–518.
McKensie, B. (1989). Medium-Term Changes of Vegetation Pattern in Transkei. South African Forestry Journal, 150.
Milk Sa. (2016). LACTODATA Statis-tics. Vol 19, No1. Pretoria, South Africa.
Mills, A. J., & Cowling, R. M. (2006). Rate of carbon sequestration at two thicket restoration sites in the Eastern Cape, South Africa. Restoration Ecology, 14, 38–49.
Powell, M. J. (2009). Restoration of degraded subtropical thickets in the Baviaanskloof MegaReserve, South Africa. Master Thesis, Rhodes University.
Sankaran, M., Hanan, N. P., Scholes, R. J., Ratnam, J., Augustine, D. J., Cade, B. S., … Zambatis, N. (2005). Determinants of woody cover in African savannas. Nature, 438, 846–849.
Scholes, M. C., & Scholes, R. J. (2013). Dust unto dust. Science, 565(2013). http://doi.org/10.1126/science.1244579
Scholes, R. J., von Maltitz, G. P., Ar-chibald, S. A., Wessels, K., van Zyl, T., Swanepoel, D., & Steenkamp, K. (2013). National Carbon Sink Assess-ment: First estimate of terrestrial stocks and fluxes. Pretoria.
Shackleton, C. M., Shackleton, S. E., Buiten, E., & Bird, N. (2007). The importance of dry woodlands and forests in rural livelihoods and poverty alleviation in South Africa. Forest Policy and Economics, 9, 558–577.
Statistics South Africa. (2009). Census of commercial agriculture 2007 (preliminary).
van Jaarsveld, A. S., Biggs, R., Scholes, R. J., Bohensky, E., Reyers, B., Lynam, T., … Fabricius, C. (2005). Measuring conditions and trends in ecosystem services at multiple scales: the Southern African Millennium Ecosystem Assessment (SAfMA) experience. Philosophical Transac-tions of the Royal Society: B, 360(1454), 425–441.
PHOTO CREDITS
Kelvin Trautman p.6, p.7, p.9, p.12, p.20, p.38, p.42, p.102, p.116 and p.204
Em Gatland p.7 and p.102
Tony Knowles p.108
Courtesy BiogasSA (In Situ Cast) – p.122
Courtesy Energyweb (Plastic Mould, Little Green Monster) – p.122
Working on Fire Africa p.205
Chris Galliers p.212
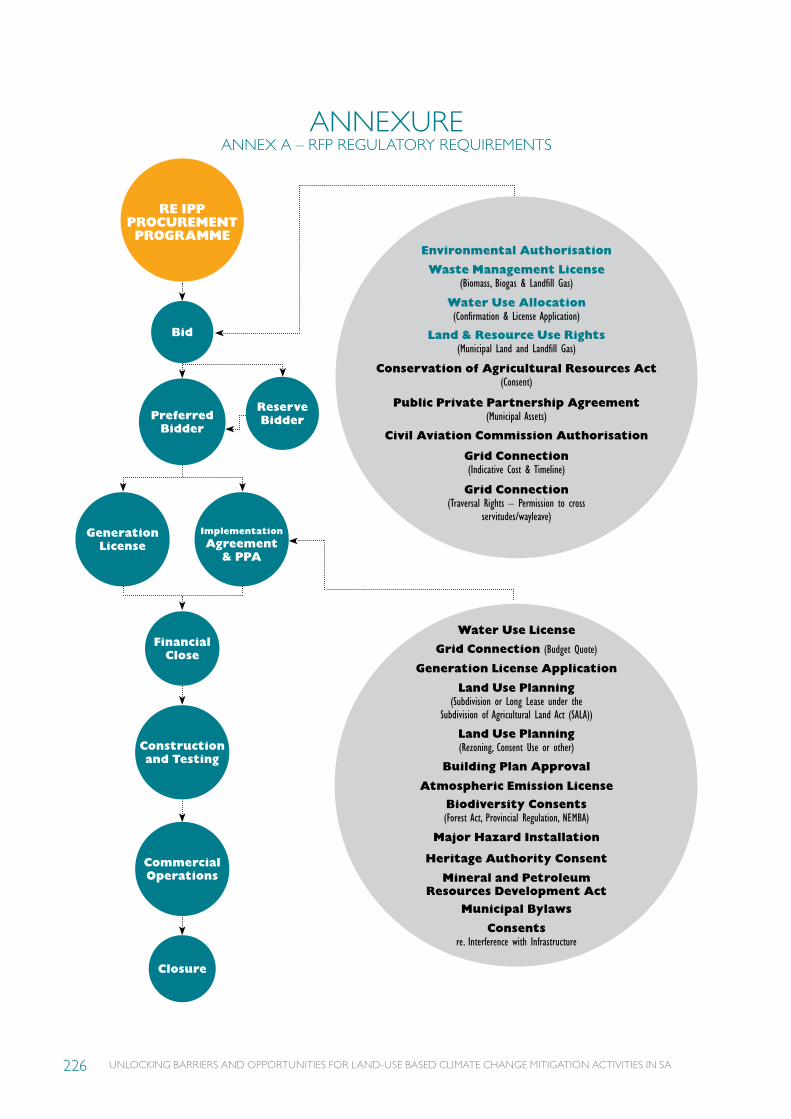
UNLOCKING BARRIERS AND OPPORTUNITIES FOR LAND-USE BASED CLIMATE CHANGE MITIGATION ACTIVITIES IN SA226
ANNEXUREANNEX A – RFP REGULATORY REQUIREMENTS
RE IPPPROCUREMENTPROGRAMME
Bid
Preferred Bidder
Generation License
Environmental Authorisation
Water Use Allocation (Confirmation & License Application)
Land & Resource Use Rights (Municipal Land and Landfill Gas)
Conservation of Agricultural Resources Act (Consent)
Public Private Partnership Agreement (Municipal Assets)
Civil Aviation Commission Authorisation
Grid Connection(Indicative Cost & Timeline)
Grid Connection(Traversal Rights – Permission to cross
servitudes/wayleave)
Waste Management License (Biomass, Biogas & Landfill Gas)
Water Use License
Grid Connection (Budget Quote)
Generation License Application
Land Use Planning (Subdivision or Long Lease under the
Subdivision of Agricultural Land Act (SALA))
Land Use Planning (Rezoning, Consent Use or other)
Building Plan Approval
Atmospheric Emission License
Biodiversity Consents (Forest Act, Provincial Regulation, NEMBA)
Major Hazard Installation
Heritage Authority Consent
Mineral and Petroleum Resources Development Act
Municipal Bylaws
Consents re. Interference with Infrastructure
Implementation Agreement
& PPA
Financial Close
Construction and Testing
Commercial Operations
Closure
Reserve Bidder

CONTACT INFORMATION
Department of Environmental Affairs
Environment House
473 Steve Biko Street
Arcadia
Pretoria 0001
South Africa