QUANTIFYING TRADE BARRIERS: HAS PROTECTION ...
50
WORKING PAPER NO. 105 QUANTIFYING TRADE BARRIERS: HAS PROTECTION DECLINED SUBSTANTIALLY IN INDIAN MANUFACTURING? DEB KUSUM DAS JULY 2003 INDIAN COUNCIL FOR RESEARCH ON INTERNATIONAL ECONOMIC RELATIONS Core-6A, 4 th Floor, India Habitat Centre, Lodi Road, New Delhi-110 003
-
Upload
khangminh22 -
Category
Documents
-
view
1 -
download
0
Transcript of QUANTIFYING TRADE BARRIERS: HAS PROTECTION ...
WORKING PAPER NO. 105
QUANTIFYING TRADE BARRIERS: HAS PROTECTION DECLINEDSUBSTANTIALLY IN INDIAN MANUFACTURING?
DEB KUSUM DAS
JULY 2003
INDIAN COUNCIL FOR RESEARCH ON INTERNATIONAL ECONOMIC RELATIONSCore-6A, 4th Floor, India Habitat Centre, Lodi Road, New Delhi-110 003
Content
Foreword............................................................................................................................. i
I Introduction ........................................................................................................... 1
II Protection in Indian Industry: An Overview..................................................... 3
III Quantifying Trade Barriers: Methodology and Database ................................ 6
III.1 Measuring Effective Rate of Protection ............................................................................. 7III.2 Measuring Non Tariff Barriers......................................................................................... 10III.3 Measuring Import Penetration Ratio ................................................................................ 14
IV Empirical Measures of Protection ..................................................................... 15
Trends in Effective Rate of Protection ........................................................................................... 19Trends in Non-Tariff Barriers......................................................................................................... 25Trends in Import Penetration Rate.................................................................................................. 32
V Conclusion............................................................................................................ 37
Appendix .......................................................................................................................... 40
References ........................................................................................................................ 45
i
Foreword
This paper on Quantifying Trade Barriers: Has Protection Declined Substantiallyin Indian Manufacturing forms a part of a larger study on Productivity Growth and TradeRegimes: A study of Indian Manufacturing Industries in the 1980s and 1990s beingundertaken at ICRIER. This study is the first attempt at quantifying trade barriers at thelevel of disaggregate industry groups for Indian manufacturing for a period of 20 yearsstarting from the 1980s. The paper seeks to carry out this exercise to examine whetherprotection has indeed declined in Indian manufacturing.
The study undertakes a quantification of trade barriers for Indian manufacturingindustries by examining both the tariff and the non-tariff barriers. It documents the tradebarriers for around 72 industries belonging to intermediate, capital and consumer goodssectors for period 1980-2000 and the phases of trade reforms therein. Our estimatessuggest levels of effective rate of protection and percentage of imports subject tolicensing declined during the nineties while import penetration rates show an increaseonly in the second half of the nineties. This suggests that there may be considerable lagsbetween reduction of tariffs and non-tariff barriers and measurable impact on imports andon the economy
Dr. Arvind VirmaniDirector & Chief Executive
ICRIERJune 2003
1
Quantifying Trade Barriers: Has Protection Declined Substantially inIndian Manufacturing?*
I Introduction**
The emphasis on trade policy reforms as an integral component of structural
adjustment programs has intensified the ongoing debate about the benefits of
liberalization of trade regimes. This in turn has raised questions about how to measure
trade orientation (openness) of an industry. Openness is not directly observable, nor is
there a generally accepted and unique measure derived from theory.
Indian industry has had a very restrictive trade regime from the late 1950s. Up to
the 1970s the focus of trade policy was on regulating the utilization of foreign exchange
through the use of quantitative restrictions. The industrial stagnation that marked the
period from the mid-1960s to the late 70s led to rethinking on the role of trade-policy in
India [Alexander (1977), Hussain (1984) and Narasimhan(1985)]. Thus the 1980s
witnessed changes taking place in the trade regime with regard to imports of intermediate
inputs and capital goods with many items of intermediate inputs and capital goods being
brought under the open general licensing (OGL). The 1982-83 trade policy allowed
imports to promote technological up-gradation and modernization of Indian industry. The
reforms initiated in 1985 made an attempt to bring stability and continuity in the external
sector by spelling out a three-year trade policy (1985-88). Reduction and rationalization
of duty rates backed up the expansion of items under the OGL lists. A significant feature
* The study undertakes a quantification of trade barriers for Indian manufacturing industries by
examining both the tariff and the non-tariff barriers. It documents the trade barriers for around 72industries belonging to intermediate, capital and consumer goods sectors for period 1980-2000 and thephases of trade reforms therein. Our estimates suggest levels of effective rate of protection andpercentage of imports subject to licensing declined only in the third and fourth phases of trade reforms.Import penetration rates show an improvement only in the fourth phase of trade Liberalization.
** This paper forms a part of a larger study on "Productivity Growth and Trade Regimes: A Study ofManufacturing Industries in the 1980s and 1990s" being undertaken at Indian Council for Research onInternational Economic Relations (ICRIER). An earlier version of the paper was presented at the Southand Southeast Asia meet of the Econometric Society, Lahore, December 2002. I thank K.L.Krishna, SD. Tendulkar, B.N. Goldar, A Virmani, A. Bhattacharjea, M Pandey and Saqib Jafarey for helpfulcomments. I am grateful to Sasanka Sarmah for helping me map the trade and industry concordance.The usual disclaimers apply. Address for correspondence: [email protected]
2
of the 1988-91 export-import policy was the provision for ‘flexibility’ in regard to the
Replenishment (REP) license, which continues to be freely transferable. The major
change in the trade policy of 1992-97 is a negative list of products banned due to health,
defense and environmental concerns. Except for consumer goods, all most all items of
capital and intermediate goods can be freely imported subject to tariffs. The removal of
quantitative restrictions on imports was accompanied by a gradual lowering of customs
duties in each of the budgets presented from 1991 onwards. A number of changes were
also made to simplify the system- reduction in inter-product variations and rationalization
of the tariff structure.
We can discern 4 distinct phases of India's trade liberalization. The first phase
saw the emergence of thinking about the need for change in trade policies as discussed
above. The second phase starts with the Long Term Fiscal Policy proposing the removal
of import licensing and simplification of the tariff structure and, importantly, the first
instance of a 3-year trade policy. The third phase starts with the comprehensive trade
policy changes in 1991-92. The final phase starts with the EXIM Policy of 1997-2002
that aims at simplified procedures and rationalized tariff rates.
This paper makes an attempt to quantify the trade barriers operating in Indian
industry in order to understand whether protection levels actually decrease following
trade liberalization. In particular, we compute several measures of trade liberalization
covering both tariff and non-tariff barriers- effective rate of protection, import coverage
ratios and import penetration rates under different phases of trade reforms. The plan of
the paper is as follows. An overview of studies covering different aspects of protection in
Indian manufacturing sector is presented in section 2. The various measures of trade
barriers, particularly the tariff and non- tariff based measures of protection, are outlined
in section 3. The next section discusses the empirical findings of our study. Section 5
concludes the paper.
3
II Protection in Indian Industry: An Overview
A major reason for the poor industrial performance with respect to growth and
productivity can be attributed to the policy regime facing the manufacturing sector. In
particular, protection from foreign competition and absence of a competitive domestic
industrial environment has resulted in inefficient, high cost and low quality
manufacturing industries. There are several studies documenting the protectionist regime
facing the industrial sector of India. These can be grouped as: (1) studies exploring the
structure of nominal tariffs, (2) studies trying to analyze the level and structure of inter-
industry protection and (3) those that attempt to quantify the extent of non- tariff barriers
in Indian industry. The overall scenario that emerges from these studies is that the
protective environment created on one hand a large and diversified industrial base and on
the other neglected considerations of comparative advantage.
Goldar, Narayana and Hasheem (1992) examine the pattern of tariff, statutory and
realized during the 1980s at the level of broad groups and detailed product classes
whereas Mehta (1999) documents the tariff rates for the 1990s by different sections and
chapters of HS classification. The level and structure of inter-industry protection have
been examined using both nominal tariffs and effective rates of protection [World Bank
(1989), Aksoy (1991), Aksoy and Ettori (1992), Goldar and Hasheem (1992), Gang and
Pandey (1998) and Hasheem (2001)]. Despite attempts to liberalize India’s import trade
regime, the structure of import licensing has remained restrictive and complex. There
have however been a few attempts to quantify non-tariff barriers according to the
manufacturing sectors [Aksoy (1991), Mehta (1997), Pandey (1999) and Hasheem
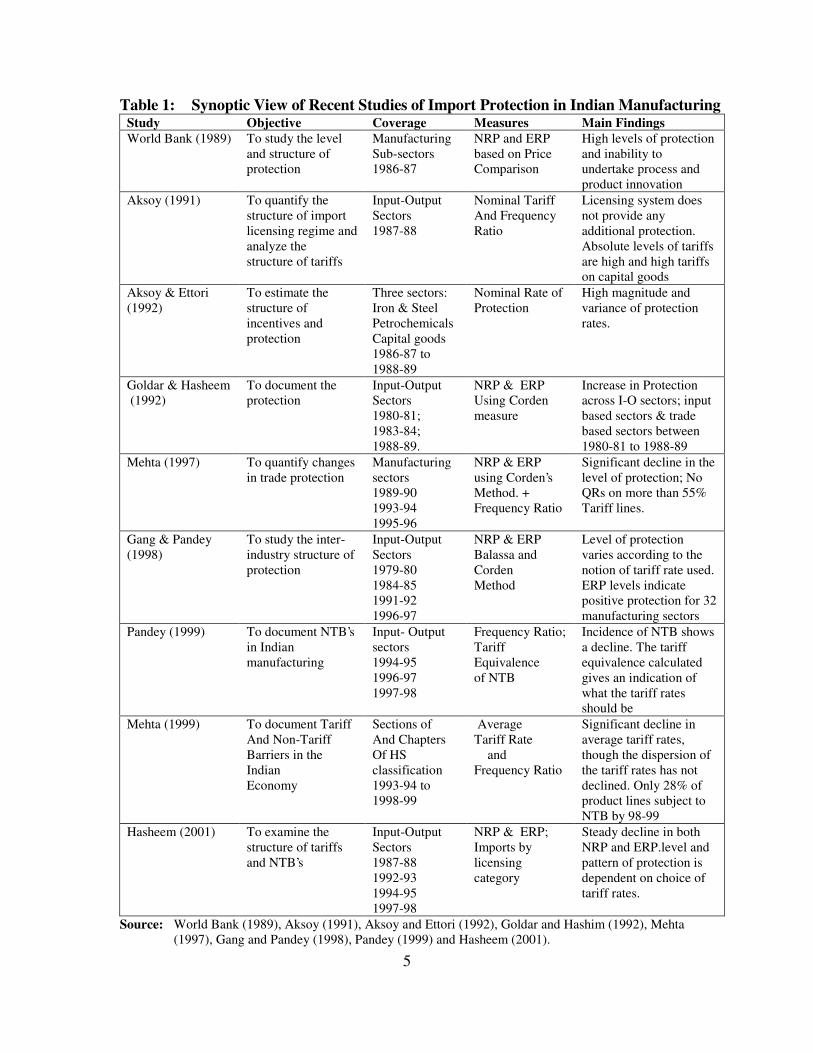
(2001)]. Table 1 highlights the studies that addressed a range of issues pertaining to the
effects of the protectionist trade regime on industrial performance.
Evidence from the studies covering tariff as well as non-tariff barriers suggests
that there has been a conscious effort to dismantle the import licensing regime via
reductions in the number of products listed under banned/ restricted category. The
effective tariff structure throughout the 1980s and part of 1990s has been very complex
4
due to the presence of various exemptions applicable on the basic duty rate. Further, the
tariff rates have not only been high but have been covering almost all product categories
in intermediate, capital and consumer goods sectors. Efforts have however been made in
the 1990s to rationalize the structure of tariffs. Majority of the studies has estimated
nominal as well as effective rate of protection. Most of the estimates of ERP are either
based on tariff data or the collection rate1. One particular study has attempted to use both
published and realized tariff data for arriving at ERP estimates. The Corden measure of
ERP is used very widely [Goldar and Hasheem (1992b), Gang and Pandey (1998), Mehta
(1997) and Hasheem (2001]. The popularity of the Corden’s measure is reflective of the
fact that it takes into account both the direct and indirect value added, while the Balassa
measure accounts for only the direct value added2. The extremely high tariffs apart from
fulfilling the primary purpose of providing protection were aimed at generating revenue.
In the pre-90 period, India’s policy regime for imports was complex and
cumbersome. There were different categories of importers, several types of licenses and
alternative ways of importing. This made the quantification of QRs very difficult.3
Majority of the studies computed either the frequency ratio or the import coverage ratio.
These have been worked out for the whole -economy as well as manufacturing sub
branches. Mehta (1997) and Pandey (1999) compute the NTB indices for the use-based
sectors, whereas Aksoy (1991) and Hasheem (2001) provide estimates of share of imports
according to licensing categories for broad manufacturing sub-sectors. A major limitation
of these exercises is that all these studies pertain to select time points. The review of the
1 It would be important to point out that the early generation studies [Panchamuki (1978) and Nambiar
(1983)] did make an effort to measure ERP via price–based data. Further, studies by the World Bank(1989), Aksoy (1991) and Aksoy and Ettori (1992) also provided estimates of ERP based on pricecomparison for a single year, resulting in the inability to undertake time-series evaluations.
2 Other measures take into account both the exchange rate distortions and the direct price distortion. Thesemeasures are also known as sophisticated Corden’s and Balassa method and the measure of realeffective exchange rate of protection.
3 The major problems with quantification arise from, (1) the descriptions in different licensing listsvarying in coverage from very specific to very general, (2) the classification of items in the importpolicy was not organized according to the HS codes used to report imports and exports and (3) customsdoes not record imports by licensing categories, so the magnitude of imports under different licensingcategory cannot be observed.
5
Table 1: Synoptic View of Recent Studies of Import Protection in Indian ManufacturingStudy Objective Coverage Measures Main FindingsWorld Bank (1989) To study the level
and structure ofprotection
ManufacturingSub-sectors1986-87
NRP and ERPbased on PriceComparison
High levels of protectionand inability toundertake process andproduct innovation
Aksoy (1991) To quantify thestructure of importlicensing regime andanalyze thestructure of tariffs
Input-OutputSectors1987-88
Nominal TariffAnd FrequencyRatio
Licensing system doesnot provide anyadditional protection.Absolute levels of tariffsare high and high tariffson capital goods
Aksoy & Ettori(1992)
To estimate thestructure ofincentives andprotection
Three sectors:Iron & SteelPetrochemicalsCapital goods1986-87 to1988-89
Nominal Rate ofProtection
High magnitude andvariance of protectionrates.
Goldar & Hasheem (1992)
To document theprotection
Input-OutputSectors1980-81;1983-84;1988-89.
NRP & ERPUsing Cordenmeasure
Increase in Protectionacross I-O sectors; inputbased sectors & tradebased sectors between1980-81 to 1988-89
Mehta (1997) To quantify changesin trade protection
Manufacturingsectors1989-901993-941995-96
NRP & ERPusing Corden’sMethod. +Frequency Ratio
Significant decline in thelevel of protection; NoQRs on more than 55%Tariff lines.
Gang & Pandey(1998)
To study the inter-industry structure ofprotection
Input-OutputSectors1979-801984-851991-921996-97
NRP & ERPBalassa andCordenMethod
Level of protectionvaries according to thenotion of tariff rate used.ERP levels indicatepositive protection for 32manufacturing sectors
Pandey (1999) To document NTB’sin Indianmanufacturing
Input- Outputsectors1994-951996-971997-98
Frequency Ratio;TariffEquivalenceof NTB
Incidence of NTB showsa decline. The tariffequivalence calculatedgives an indication ofwhat the tariff ratesshould be
Mehta (1999) To document TariffAnd Non-TariffBarriers in theIndianEconomy
Sections ofAnd ChaptersOf HSclassification1993-94 to1998-99
AverageTariff Rate andFrequency Ratio
Significant decline inaverage tariff rates,though the dispersion ofthe tariff rates has notdeclined. Only 28% ofproduct lines subject toNTB by 98-99
Hasheem (2001) To examine thestructure of tariffsand NTB’s
Input-OutputSectors1987-881992-931994-951997-98
NRP & ERP;Imports bylicensingcategory
Steady decline in bothNRP and ERP.level andpattern of protection isdependent on choice oftariff rates.
Source: World Bank (1989), Aksoy (1991), Aksoy and Ettori (1992), Goldar and Hashim (1992), Mehta(1997), Gang and Pandey (1998), Pandey (1999) and Hasheem (2001).
6
empirical findings points towards substantial reduction in the NTB levels across
manufacturing sectors in the 1990s as compared to 1980s.
We conclude that tariffs and quantitative restrictions were important instruments
of trade policy and played a crucial role in providing protection to domestic industry
throughout the 1980s and part of 90s. It is also widely held that the protective regime has
been responsible for inefficiency in resource-use, which constrained the growth
performance of Indian industries. These studies however did not explore the effect of the
protection on industrial growth and efficiency4.
III Quantifying Trade Barriers: Methodology and Database
Trade interventions in developing countries are of two types: tariff and non-tariff
barriers5. Import tariffs are simply indirect taxes, which apply on a discriminatory basis,
to imports. They may be ad valorem or specific.6 The range of instruments that qualify as
non-tariff barrier is diverse, with some being fiscal, some quantitative, some involving
monitoring and so on. Moreover depending on how one defines NTB, the list could be
still longer.7 Findings of Balassa (1982) and Krueger et al. (1981) confirm that the use of
NTBs is more pervasive in developing countries than in developed countries. Section 3.1
outlines the method for computing the Corden measure of effective rate of protection.
The various measures of non-tariff barriers are presented in section 3.2. The final
subsection outlines a combined measure of both tariff and non-tariff restrictions.
4 Goldar and Ranganathan (1990) and Goldar and Hasheem (1994) examined the contribution of tariffs
on industrial growth, factor remuneration and exports.5 See Table 2.1 in Greenaway and Milner (1993) for the list of instruments under tariff and non- tariff
measures6 The ad-valorem import tax has the advantage of being index linked, whilst the specific import tax has
the desirable feature of reducing opportunities for under invoicing and other illegal practices aimed atminimizing the tax liability. Further, some times particular tariff can be used as a quasi non-tariffbarrier, for example when it applies on a seasonal basis or when it is linked to a quota.
7 From a documentary standpoint the diversity of NTB is a major problem. One cannot easily ‘addtogether’ the restrictive impact of deliberately complicated customs valuation procedures with that ofprice surveillance, or an import quota. Greenaway and Milner (1993) argue that it is in part for thisreason that summary statistics are hard to come by. The situation is further complicated by the fact thatmany NTBs are quite deliberately opaque.
7
III.1 Measuring Effective Rate of Protection
Tariff schedules are inadequate guides to nominal protection when quantitative
restrictions and not tariffs, are the binding instrument of trade policy8. Further, the
nominal protection rate disregards the fact that the degree of protection conferred on an
activity will depend not only on the any interventions which affect the price of the final
good produced, but also by any interventions which affect the price paid for inputs into
the production process. This major shortcoming can be over come by estimating the
effective protection rate9. The concept of effective protection discussed in Meade (1951)
has been extensively refined by Johnson (1960) and Corden (1966).
The effective rate of protection (ERP) based on Corden’s formula is the
percentage excess of domestic value-added, vis-à-vis world value-added, introduced
because of tariff and other trade barriers.
ERPj = (VAj*-VAj) / VAj (1)
Where VAj* = value-added of the final product j at free trade prices and VAj = value
added of the final product j at tariff distorted prices.
This measures the distortion introduced due to tariff on the input prices as well as
the final output prices, and therefore measures protection to domestic factors of
production. The incentive structure of the domestic production process is described by
8 Given the significance of NTBs, the first issue to be addressed in connection with measuring the height
of protection is to obtain direct price comparison. For the problems associated with obtaining pricecomparisons refer to Krueger (1984).
9 Krueger (1984) points out that in developing countries, number of reasons exists for believing thatERPs might not straightforwardly indicate protection to value added. First, factor prices often fail toreflect opportunity costs, due to the presence of subsidies to inputs of capital, labor marketimperfections and minimum wage legislation. In the presence of inappropriate factor costs, the netdirection of resource pulls will be influenced by both the height of protection and the degree ofdivergence from a well functioning market. Second, it was a frequent observation that few firmsproduce any single product resulting in exploitation of monopoly power in sheltered home market. Thusthe extent of protection to value added as reflected in the ERP measure would overstate (to the extent ofmonopoly profits) and misstate (to the extent factors were implicitly subsidized) the additional domesticresources employed per unit of value added in the protected industries.

8
the return to primary factors of production and the measure of protection based on value
added is able to capture it.
Given the assumptions10, we can define VAj and VAj* as follows
VAj = (1-Σaij ) (2)VAj* = (1+tj) - Σ(1+ aij) (3)
If (2) and (3) are substituted into (1) and rearranged we can write:
ERPj = (Tj–ÓaijTi)/(1-Óai j ), (4)
Where ERPj is the effective rate of protection of the j’th activity (product), Tj is
the nominal tariff rate for j’th activity, Ti (i=1,2,…n) are the nominal tariff rates of the
tradeable intermediate inputs used in the j’th activity. aij (i=1,2,…n) are the cost shares of
inputs in total value of production of the jth activity. The cost shares are computed after
valuing output and tradeable inputs at world prices. The data on costs of production are
obtained from the input-output tables.11. Óaij is the sum of the shares of intermediate
inputs(i ….. n) in the final value of j and Σaij is the weighted average of input tariffs on all
intermediate inputs with weights according to input shares. The concept of effective
protection is well behaved in that domestic and international value added are both
positive.12
10 The following assumptions are used: (1) there are fixed physical input coefficients in the production of
j, (2) the domestic price is equal to the border price plus tariffs, i.e. there are no tariff redundancies ornon- tariff barriers. The assumptions of fixed technical coefficients implies that price distortions do notaffect technology used and that there is no substitution between traded and non-traded inputs because ofprice distortions [Refer to Grubel (1971)].The assumption of the domestic price being equal to borderprice plus tariffs usually does not hold for countries like India, which have extensive non-tariff barriers[Refer to Goldar and Hasheem (1992)]
11 It was not possible to use the cost data for the three-digit industries, as detailed data were not availablefor all the years of the study. A mapping was established between the I-O sectors and ASI sectors, so asto enable the I-O coefficients to substitute for the input costs of the industries. Use has been made of115 sector I-O tables (1983-84, 1989-90 and 1993-94) for the years 1980-81 to 1988-89,1989-90 to1994-95 and 1995-96 to 1999-00 respectively. This implicitly involves the assumptions that input-output coefficients remained the same during the period under study.
12 In empirical work, both negative numerators and denominators have been observed.. Each gives rise toan estimated negative rate of effective protection, but the interpretation must be quite different. SeeKrueger (1984) for an economic interpretation of the negative numerator and denominator.
9
There are two ways of obtaining the free-trade input coefficients. First is to
assume that a developed country [like USA, which has low levels of nominal tariffs]
input coefficients could approximate the world input-output coefficient. The second is to
assume that free trade prices are equal to the protected prices deflated by appropriate
tariff rates. This gives the free trade coefficients as
aij = Pij / Pj = [P*ij /(1+Ti )] / [P*J / (1+Tj )], where the * refers to the domestic prices.
Thus, aij = a*ij [(1+Tj) / (1+Ti)].
We compute the Corden measure of ERP for the sample industries numbering 72
in all, as well as the use-based classification- consumer goods, intermediate goods and
capital goods sectors for the four phases of trade reforms [1980-81 to 1985-86, 1986-87
to 1990-91, 1991-91 to 1994-95 and 1995-96 to 1999-00].
The industry wise ERP’s are calculated by mapping the different tariff codes with
the three-digit ASI industries13. The tariff rates for various product categories (items in
the tariff working-schedule under BTN or HS codes) have been derived from the
Customs Tariff Working Schedule.14 For each product category, the effective rate of duty
was arrived at taking into account quantifiable exemptions and was restricted to basic and
auxiliary duties. The ERP for a three-digit industry was based on the computed NRP
valued at international prices. These ERP estimates are not adjusted for any exchange rate
overvaluations, but nonetheless are representative of the sorts of levels and heights of
effective protection found in developing countries.
13 See Das (2001)14 The customs tariff working-schedule was not available for some years of the study and hence the same
information was collected from private sources such as Centax Publications and Cencus Publications.
10
III.2 Measuring Non Tariff Barriers
Non Tariff barriers [NTBs] dominate the trade regimes of most developing
countries.15 NTBs consists of all barriers to trade that are not tariffs. It is even more
general than that, since the term is often used to include trade interventions such as export
subsidies that serve to stimulate rather than retard trade and therefore are not barriers to
trade at all. It also includes well-known trade distorting policies such as import quotas
and voluntary export restraints.16 The measures range from narrowly conceived ones
affecting particular products, industries and countries to more general ones that are rooted
in national, institutions and policies.17 Thus it may be difficult to devise accurate
quantification of many of these NTB measures. Some of the barriers may be formal and
are explicitly stated in official and governmental mandates18. It is important to mention
that there is no single useful way of measuring the “size” of an NTB. NTBs require
several parameters to characterize them fully. In this connection it is important to know
the various characteristics of NTBs, even though that it may be difficult to capture them
empirically.19 In order to quantify the particular occurrence of an NTB, it is important to
15 Deardorff (1987) offers some possible explanations as to why governments in developing countries
prefer non-tariff barriers to tariffs. They are: (1) institutional constraints such as are built intoGATT/WTO rules and into national constitutions that limit the use of tariffs, (2) the roles of firms andworkers in influencing the policies, (3) considerations of reaction or retaliations against the policies oftrading partners and (4) uncertainty about the ways in which different policies may perform. Deardorfffavors the last of these explanations insofar as governments perceive that tariffs will not workeffectively in reducing imports in an uncertain world and only an explicit quantitative restriction can berelied upon.
16 Deardorff and Stern (1999) state that NTBs also include a potentially unlimited plethora of policies,perhaps as yet not invented, that alter however indirectly the prices and quantities of trade. Therefore notypology of NTBs can possibly be complete.
17 See Deardorff and Stern (1999), chapter 218 There are also informal barriers arising from: (1) administrative procedures and unpublished
government regulations and policies, (2) market structure and (3) political, social and culturalinstitutions. The impediments associated with informal barriers may be the result of a conscious effortby government to favor domestic over foreign interests, or these may be the byproducts of practices andpolicies that are rooted in domestic institutions. See Deardorff and Stern (1999)
19 (1) reduction in the quantity of imports, (2) the increase in price of imports, (3) the change in theelasticity of demand for imports, (4) the variability of NTBs, (5) the uncertainty of imports, (6) welfarecosts and (7) resource costs of NTBs.[ See Deardorff and Stern (1999)]
11
look at the specific details of the implementation of that NTB.20 The specific details
encompass direct information, which needs to be converted into useful form that can be
understood and compared to other forms of trade interventions. There are however
serious disadvantages to this direct approach especially as one is looking for a broad
measure of NTBs21. Even though direct information about NTBs is likely to be very
accurate, it does not necessarily provide for a good starting point for a general analysis.
Four different methods can be used for measuring NTBs. These are classified as:
(1) frequency-type measures based upon inventory listings of observed NTBs that apply
to a particular sector or categories of trade; (2) price-comparison measures calculated in
terms of tariff equivalents or price relatives; (3) quantity-impact measures based upon
econometric estimates of models of trade flows; and (4) measures of equivalent nominal
rates of assistance.22 An issue that arises in common for all of these methods is how to
aggregate the measurements once they have been obtained for disaggregated product
categories. The own-country imports and own-country production levels are the weights
used in the research but they have their quota of drawbacks23. It is possible to construct a
variety of measures that indicate the frequency of occurrence of NTBs. Such measures
may be unweighted, or they may be weighted by imports or by production. The former is
defined as frequency ratio and the latter as import coverage ratio.
20 Quota usually permits an announced quantity of imports of a certain type, so that an analysis of quota
should start with direct information pertaining to that quantity. A variable levy is defined in terms of aspecified price of an imported good and that price provides the most direct information about what thelevy entails.
21 (1)The direct approach only captures those NTBs that have been identified. If an industry makes use ofa particular form of NTB, that an investigator does not take into account, then trade appears much freethan it is actually. (2) Even for the NTBs that are included, it is extremely difficult to process thediverse direct information that is available on each NTB in a way that will be comparable across NTBsand thus allow them to be added-up to obtain a total measure of trade interference.. (3) If more than oneNTB is present in given industry, it is conceivable that the presence of one reduces the effects ofanother, so that analysis of each of them separately may lead to an overstatement of their total effects.More generally, in evaluating overall levels of protection by NTBs, general equilibrium effects arebound to matter (such as the effects of barriers on one sector on trade in another and the effects of alltogether on exchange rates).
22 Deardorff and Stern (1999) discuss these measures along with specific NTB methods.23 The drawback with import weights is that most NTBs reduce imports to zero and do not show up in the
aggregate, whereas in the case of own country production levels, protective NTBs stimulate domesticproduction above levels that would other wise obtain. It may be therefore worthwhile subject toavailability of data to use world production levels or world trade as weights.

12
We calculated for purpose of quantifying non-tariff trade barriers, the import
coverage ratio for the 72 three-digit industries and three use-based industry groups for the
four phases of the trade reform as well as 1980-0024.
The import coverage ratio is defined as:
Cj = ΣΣ DiMi / ΣΣ Mi, (5)
Where Di is as usual a dummy variable defined as:
Di = 1, if the product is listed under R [banned/restricted, limited permissible,
canalized]25
= 0, if the product is listed under F [OGL list].
j stands for a particular industry and i represents a product line within that
particular industry. Di is a dummy variable, Each product category (4-digit HS codes) is
given either a number 1 or 0 depending whether the product is affected by a NTB or not.
We made the following simplifications, items were treated as affected by NTB if they fall
under the category: restricted (R). R covers all of the restrictive lists (banned/restricted,
limited permissible and canalized) and hence given a weight of 1. The items under OGL
were treated as free (F) and consequently given a weight of 0. Though this has obvious
limitations, yet one was constrained to making this simplification in order to build a
24 To calculate measures of NTB for to the three-digit industries, we need to map the product wise
information on import licensing status data to the three-digit industries, as the ASI does not provide anysuch information for the industries. For details and the procedure of mapping refer Das (2001).
25 The data from 1993-94 onwards, was available at a much higher level of disaggregation and a 4-digitHS code was treated as R if all 6 & 8 HS digit codes were restricted and similarly as F if all sub codeswere free. However in some cases, a 4-digit HS code was listed as R, if majority of the sub codes wereR (same for F). In some cases a 4-digit code was also listed as RF (RCF) if an equal number of subcodes were split between R and F (R, F and C) and given a weight of.50 (.66). Since the detailedinformation for 1993-94 pertains to the trade policy document 1992-97, the years in the third phase onlywere classified according to this rule. For the fourth phase, we follow the trade policy document 1997-2002.
13
consistent series for the entire period 1980-2000.26 Mi is the value of imports of the i th
product category [4digit HS code] which is subject to NTBs [R in our study] and ΣMi, is
the sum of the value of imports of all the product lines within the industry.
The measure has the virtue of simplicity, both in its computation and
interpretation, but also has some limitations.27 NTBs can also be gauged in terms of its
impact on the domestic price in comparison to some reference price. Price comparisons
have provided the basis for much of the general empirical work that has tried to quantify
them and not just identify where they occur.28
For computing these measures of NTB according to the three-digit industries, we
need the following data: [1] information on the product lines within an industry subject to
NTB and [2] import values for product lines. ASI does not provide information on
industry according to product lines, thus necessitating a mapping of product lines [4-digit
HS codes] to the respective three-digit industries.29 The yearly import-export policy
documents, published by the Ministry of Commerce, Government of India were utilized
26 We have a single weighting scheme within NTBs, i.e. we provide a weight of 1 if the product is
banned/restricted or limited permissible or canalized. Further, since majority of these categories wasabolished after 1991-92, we were constrained to treat them all as one composite category called R inorder to have a comparable series for the 1980s, when information is available separately on eachlicensing status. For the period post 1991-92, the only available information in this category is thebanned status.
27 First, NTBs are recorded as present or absent. Thus it does not matter if product x has “n” number ofNTBs whilst product y has only one; both enter the ratio with equal weights. Second, it is implicitlyassumed that all measures are equally restrictive. A quota on product a is treated in the same way as oneon product b, even if the former applies to 10 percent of the market and the latter applies to 90 percentof the market. Thus although variations in the ratio through time can give some idea as to trends in theuse of NTBs, they have to be treated cautiously. Third, both Fj and Cj does not provide any informationon the possible deterrent effects that NTBs may have upon the pricing or quantity decisions of foreignexporters. Fourth, Fj and Cj ratios refer primarily to border measures and thus ignore the entire range ofinternal governmental measures and the restrictive actions of imperfectly competitive firms. Finally,these measures provide no information on the economic impact that NTBs have on prices, production,consumption and trade. Worse, they may be misleading in this regard, if a large number of relativelysmall or non-binding NTBs divert attention from a smaller number in other industries or countries thathave more serious effects.
28 See Greenaway and Milner (1993) for the tariff-equivalence analysis. Deardorff and Stern (1999)provide description for other techniques such as quantity-impact measures and special purpose methodsfor calculating NTBs.
29 See Das (2001) for details regarding the mapping of product lines with ASI industry codes.
14
to determine the number of product categories subject to NTB. The import values at four-
digit HS codes was obtained from the yearly issue of the Monthly Statistics of Foreign
Trade, published by the Directorate General of Commercial Intelligence and Statistics
(DGCIS), Ministry of Commerce, Government of India.
The calculation of import coverage ratio over a period of time allows us to
quantify the change in NTBs over time by industries. Though coverage ratios are useful
indicators of non- tariff barriers, they do not actually show the impact in terms of the
price advantage domestic producers get nor do they give us any idea of its likely impact
on industrial performance. Due to lack of suitable time-series data on domestic and
international prices by industry groups, we are unable to compute tariff-equivalent
indicator of NTB30
III.3 Measuring Import Penetration Ratio
In the trade regime of India, where both QRs and tariffs played a dominant role, it
is important to assess the combined impact of changes in both constituents of trade
policy. Lowering of tariffs combined with shifting of products from restricted list to OGL
should lead to an increase in the imports. The opposite results from a hike in tariffs and
reverse shift in quantitative restrictions. We calculate the import penetration rate for
three-digit industry as the ratio of industry imports to domestic availability. Domestic
availability is defined as production plus imports minus exports. Aggregating the exports
and imports of the product lines situated within a particular industry, we arrive at industry
exports and imports.
MPRj=Mj/(Pj+Mj-X)j, (6)
j stands for the industry. P, M and X represent production, imports and exports.
ASI does not provide values of export and import by industry groups for any level of
30 Pandey (1999), computes the tariff-equivalence of the non-tariff barrier at the product level for the
period of 1990s.A major limitation of the exercise is that, the products cover only the agriculture sectorand no effort has been made to compute the same for industrial products, which are under QRs.
15
disaggregation. We generate industry wise export and import data by establishing a
mapping between trade data (imports and exports) available at product levels and ASI
three-digit industries.31 Value of the gross output is used, as information on physical
production by industry groups is not available. The yearly data on import and export data
is available in the Monthly Statistics of Foreign Trade whereas the production data is
substituted by the gross output from ASI.
IV Empirical Measures of Protection
An attempt is made in the following sections to document the trends in some of
the important indicators of trade liberalization for the manufacturing sectors during the
four phases of trade reform from a sample of 72 three-digit industries. The effective rate
of protection by three-digit industry groups and use-based industrial classifications are
provided for the four phases of trade reforms as well as 1980-2000. As an indicator of the
non-tariff barriers, the import coverage ratio is documented over time as well as across
use-based industries. Finally, to assess the joint effects of both tariffs as well as non-tariff
protection, we computed the import penetration ratio for the industry groups and use-
based sectors.
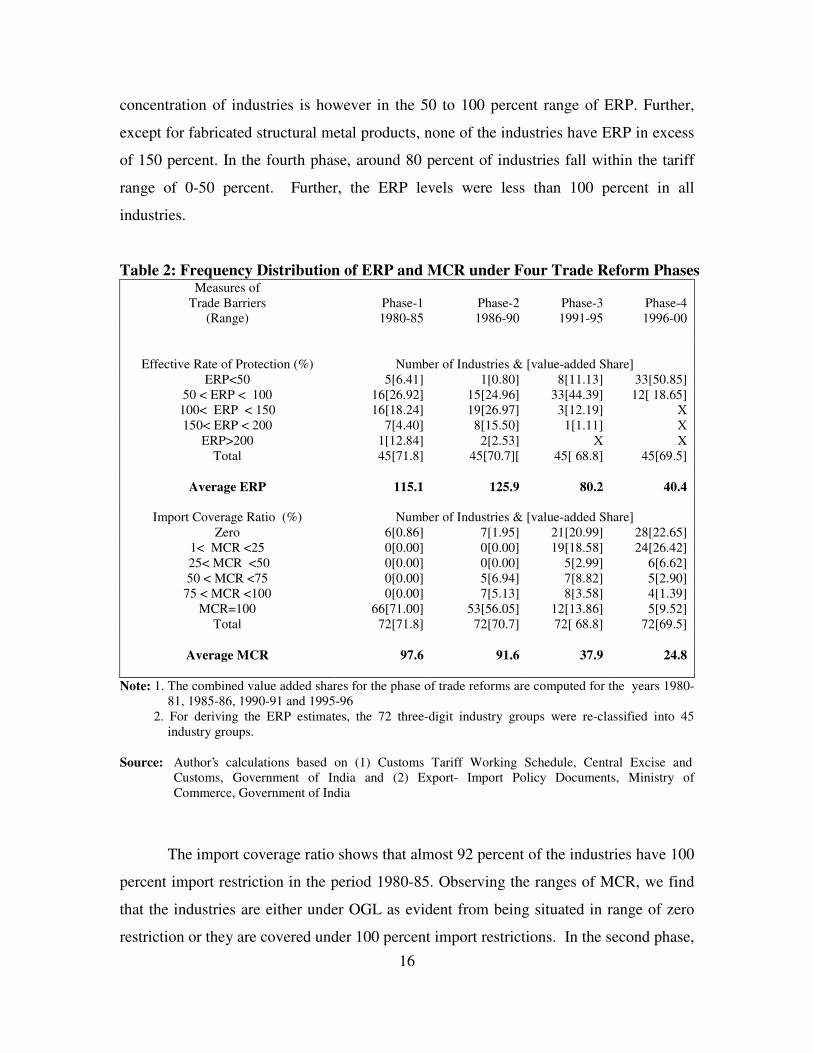
Table 2 shows the frequency distribution of ERP and MCR. In the first phase,
nearly 70 percent of the industries with a combined value added share of 45 percent has
ERP in the range of 50 to 150 percent. Only two industry namely iron & steel and
fabricated structural metal products have ERP more than 200 percent in the first phase.
The second phase of trade reforms, culminating in the liberalization of imports along with
a relaxation of investment controls in order to make cheaper and better quality inputs
available to entrepreneurs however did not show-up in an increase in the number of
industries in the ERP range below 50 percent. By 1991-92, we observe that around 80
percent of the industries are situated in the ERP range of 50 to 150 percent. The largest
31 The details of the mapping are given in Das (2001).The data for the period of early 1980s is however at
the ITC (Revision-2) classification and from 1986-87 at the ITC (HS) codes. This further required us toestablish mapping between the ITC (Revision-2) three-digit codes and ITC (HS) four-digit codes, so asto arrive at a uniform data series for the period 1980-81 to 1994-95. The mapped product categorieswere in turn mapped onto the ASI three-digit industries [See Table 1V.6 in Das (2001)].
16
concentration of industries is however in the 50 to 100 percent range of ERP. Further,
except for fabricated structural metal products, none of the industries have ERP in excess
of 150 percent. In the fourth phase, around 80 percent of industries fall within the tariff
range of 0-50 percent. Further, the ERP levels were less than 100 percent in all
industries.
Table 2: Frequency Distribution of ERP and MCR under Four Trade Reform PhasesMeasures of
Trade Barriers(Range)
Phase-11980-85
Phase-21986-90
Phase-31991-95
Phase-41996-00
Effective Rate of Protection (%) Number of Industries & [value-added Share]ERP<50 5[6.41] 1[0.80] 8[11.13] 33[50.85]
50 < ERP < 100 16[26.92] 15[24.96] 33[44.39] 12[ 18.65]100< ERP < 150 16[18.24] 19[26.97] 3[12.19] X150< ERP < 200 7[4.40] 8[15.50] 1[1.11] X
ERP>200 1[12.84] 2[2.53] X XTotal 45[71.8] 45[70.7][ 45[ 68.8] 45[69.5]
Average ERP 115.1 125.9 80.2 40.4
Import Coverage Ratio (%) Number of Industries & [value-added Share]Zero 6[0.86] 7[1.95] 21[20.99] 28[22.65]
1< MCR <25 0[0.00] 0[0.00] 19[18.58] 24[26.42] 25< MCR <50 0[0.00] 0[0.00] 5[2.99] 6[6.62]50 < MCR <75 0[0.00] 5[6.94] 7[8.82] 5[2.90]
75 < MCR <100 0[0.00] 7[5.13] 8[3.58] 4[1.39]MCR=100 66[71.00] 53[56.05] 12[13.86] 5[9.52]
Total 72[71.8] 72[70.7] 72[ 68.8] 72[69.5]
Average MCR 97.6 91.6 37.9 24.8
Note: 1. The combined value added shares for the phase of trade reforms are computed for the years 1980-81, 1985-86, 1990-91 and 1995-96
2. For deriving the ERP estimates, the 72 three-digit industry groups were re-classified into 45industry groups.
Source: Author’s calculations based on (1) Customs Tariff Working Schedule, Central Excise andCustoms, Government of India and (2) Export- Import Policy Documents, Ministry ofCommerce, Government of India
The import coverage ratio shows that almost 92 percent of the industries have 100
percent import restriction in the period 1980-85. Observing the ranges of MCR, we find
that the industries are either under OGL as evident from being situated in range of zero
restriction or they are covered under 100 percent import restrictions. In the second phase,
17
we observe that 12 industries have around 50 to less than 100 percent imports subject to
restrictions. A large majority of industries are still concentrated in the 100 percent
restriction range. For the period 1991-95, we observe that around half the industries have
import restrictions of less than 50 percent. By 1996-00, we find that 38 percent of the
sample industries had zero import restrictions. There were only 5 industries with 100
percent import restrictions. In comparison, to the first two phases however the number of
industries with 100 percent restrictions has declined sharply in the second and fourth
phases of trade reforms.
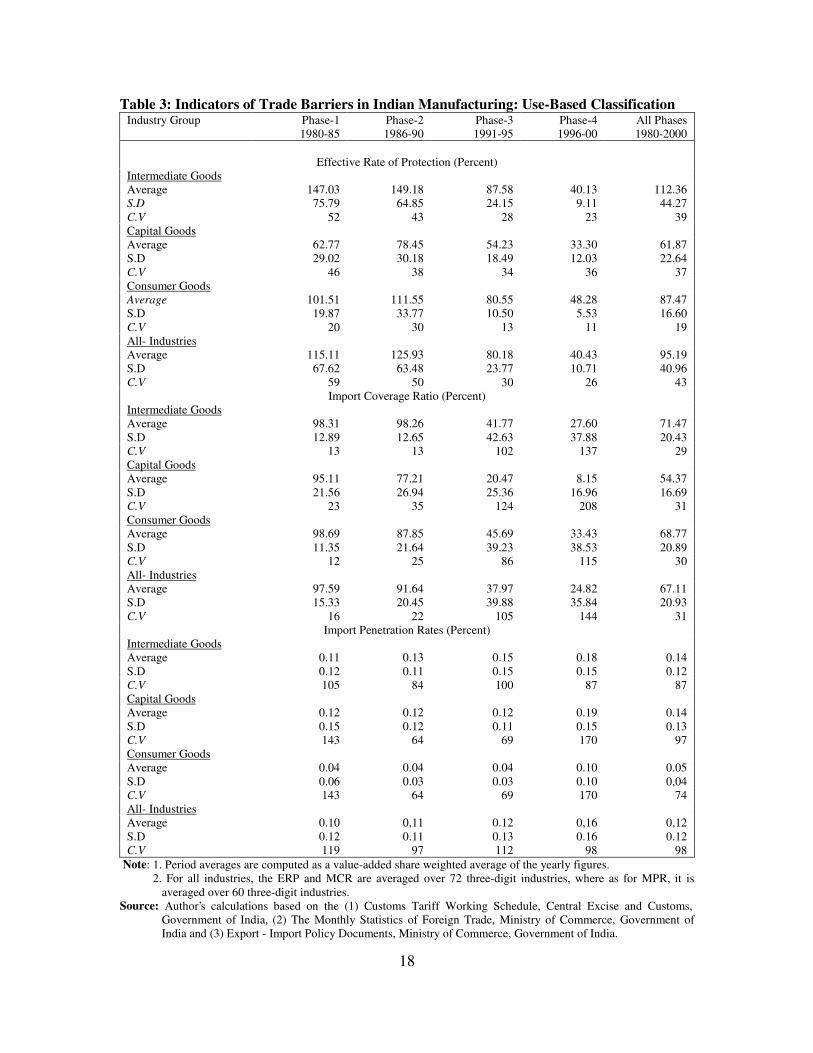
The indicators of trade barriers for the three-use based sectors are presented in
table 3 for the three phases of trade reforms. The sector wise appraisal shows some
interesting results. The average ERP levels increased in the second phase of trade reforms
before falling to low levels in the period 1991-95. This pattern holds true across all the
use-based sectors and the all- industries. The coefficient of variation of ERP declined
across all the three-use based sectors from the first to the third phase of trade reforms
The first and second phase of trade reforms do not show much change in the share
of imports subject to restrictions for the intermediate goods sector. Capital and consumer
goods based sectors however, show a decline in the second phase of reforms. In the third
phase of reforms, the import coverage ratio for intermediate and capital goods sectors
declined to 41 and 20 percent from a high of 98 and 77 percent in the previous phase of
reforms. All the three use-based sectors showed further decline in the fourth phase, with
the capital goods sector accounting for only 8 percent of import restrictions by the end of
1999-00. The standard deviation of MCR increased across most sectors from the first to
the fourth phase.
18
Table 3: Indicators of Trade Barriers in Indian Manufacturing: Use-Based ClassificationIndustry Group Phase-1
1980-85Phase-21986-90
Phase-31991-95
Phase-41996-00
All Phases1980-2000
Effective Rate of Protection (Percent)Intermediate GoodsAverage 147.03 149.18 87.58 40.13 112.36S.D 75.79 64.85 24.15 9.11 44.27C.V 52 43 28 23 39Capital GoodsAverage 62.77 78.45 54.23 33.30 61.87S.D 29.02 30.18 18.49 12.03 22.64C.V 46 38 34 36 37Consumer GoodsAverage 101.51 111.55 80.55 48.28 87.47S.D 19.87 33.77 10.50 5.53 16.60C.V 20 30 13 11 19All- IndustriesAverage 115.11 125.93 80.18 40.43 95.19S.D 67.62 63.48 23.77 10.71 40.96C.V 59 50 30 26 43
Import Coverage Ratio (Percent)Intermediate GoodsAverage 98.31 98.26 41.77 27.60 71.47S.D 12.89 12.65 42.63 37.88 20.43C.V 13 13 102 137 29Capital GoodsAverage 95.11 77.21 20.47 8.15 54.37S.D 21.56 26.94 25.36 16.96 16.69C.V 23 35 124 208 31Consumer GoodsAverage 98.69 87.85 45.69 33.43 68.77S.D 11.35 21.64 39.23 38.53 20.89C.V 12 25 86 115 30All- IndustriesAverage 97.59 91.64 37.97 24.82 67.11S.D 15.33 20.45 39.88 35.84 20.93C.V 16 22 105 144 31
Import Penetration Rates (Percent)Intermediate GoodsAverage 0.11 0.13 0.15 0.18 0.14S.D 0.12 0.11 0.15 0.15 0.12C.V 105 84 100 87 87Capital GoodsAverage 0.12 0.12 0.12 0.19 0.14S.D 0.15 0.12 0.11 0.15 0.13C.V 143 64 69 170 97Consumer GoodsAverage 0.04 0.04 0.04 0.10 0.05S.D 0.06 0.03 0.03 0.10 0,04C.V 143 64 69 170 74All- IndustriesAverage 0.10 0,11 0.12 0,16 0,12S.D 0.12 0.11 0.13 0.16 0.12C.V 119 97 112 98 98
Note: 1. Period averages are computed as a value-added share weighted average of the yearly figures. 2. For all industries, the ERP and MCR are averaged over 72 three-digit industries, where as for MPR, it is
averaged over 60 three-digit industries.Source: Author’s calculations based on the (1) Customs Tariff Working Schedule, Central Excise and Customs,
Government of India, (2) The Monthly Statistics of Foreign Trade, Ministry of Commerce, Government ofIndia and (3) Export - Import Policy Documents, Ministry of Commerce, Government of India.
19
The pattern of the import penetration levels is devoid of any clear trends for the
period 1980-00. There was hardly any noticeable change in the first three phases of trade
reforms across the use-based sectors. We do find evidence of marginal improvements in
the period 1996-00. The level of import penetration in both capital and intermediate
goods sector has been higher than the consumer goods sector through out the phases of
trade reform. The near zero level of import penetration in the consumer goods sector is in
line with the import policy facing the products of this sector, where large restrictions are
still in force. Finally, the tariff and non- tariff changes introduced in the trade policies
from the early 1980s are not reflected in the trends in import penetration as evidenced
from the levels for the three phases of trade reforms. This is probably reflective of a
lagged impact of trade policy changes.
IV.1 Trends in Effective Rate of Protection
In this section, we present our estimates of ERP for 45 broad industry groups.32
classified into three use-based sectors, based on a simple average of tariff rates. We
observe both across as well as within the groups, variations in the average tariff rates.33
The estimates are constructed using the Corden methodology and documented for the
phases of trade reform: (1980-85, 1986-90,1991-95 and 1996-00). The ERP level across
use-based sectors show fluctuations over time and across industries. The tariff rates were
increased in the 1980s on considerations of revenue generation and adverse balance of
payments situation and this is reflected in the ERP levels for most industries in the
second phase of trade reforms. The period of 1990s is indicative of rapid declines in
protection rates across most industry groups. Table 4 and figure 1 presents the trends
according to the use-based sectors.
32 It was not possible to define an exact mapping between I-O sectors, tariff lines for each of the 72 three-
digit industries, requiring us to re-classify some of these industries into broad industry groups as singleI-O sectors corresponds to several three-digit industries. For example I-O sector 42 corresponds to theindustry groups 230, 231, 234, 235,236.
33 The tariff data used for the estimation was available according to the BTN classification till 1985-86and as a result the estimates of protection are not exactly comparable, though the difference does notseriously impair the comparability of protection estimates for different years.
20
The tables provide estimates for the effective rates of protection not adjusted for
exchange rate overvaluation and hence measured protection accorded to domestic
industries does not capture the exchange rate movements. Further, since major changes in
the exchange rate system were going on during the reform period, our estimates of the
1990s need to be interpreted with caution. Nonetheless they are representative of the level
and heights of effective protection found across industries in developing countries.
Within the intermediate goods sector, we see that most of the industries have ERP
in the range of 50 to 150 percent. This holds across all the three sub-periods of the study.
Thread & cordages, synthetic rubber & manmade fibers, paints & varnishes, iron & steel,
structural metal products are some of the industry groups with high rates of ERP across
the four phases. Only three industries namely fertilizer & pesticides, coke oven and other
coal tar products record ERP levels of 50-60 percent for the phase 1980-85. There is an
increase in the ERP level across all industries in the second phase. For the third period,
all the intermediate goods industries show a decline in the level of ERP and the average is
around 87 percent. Industry groups like, iron & steel, paints & varnishes etc and
structural metal products still record ERP levels of over 100 percent. By the end of 1999-
00, the average ERP levels declined to around 40 percent. The maximum decline
amongst the industry groups was observed for paints & varnishes iron & steel and
fabricated structural products.
21
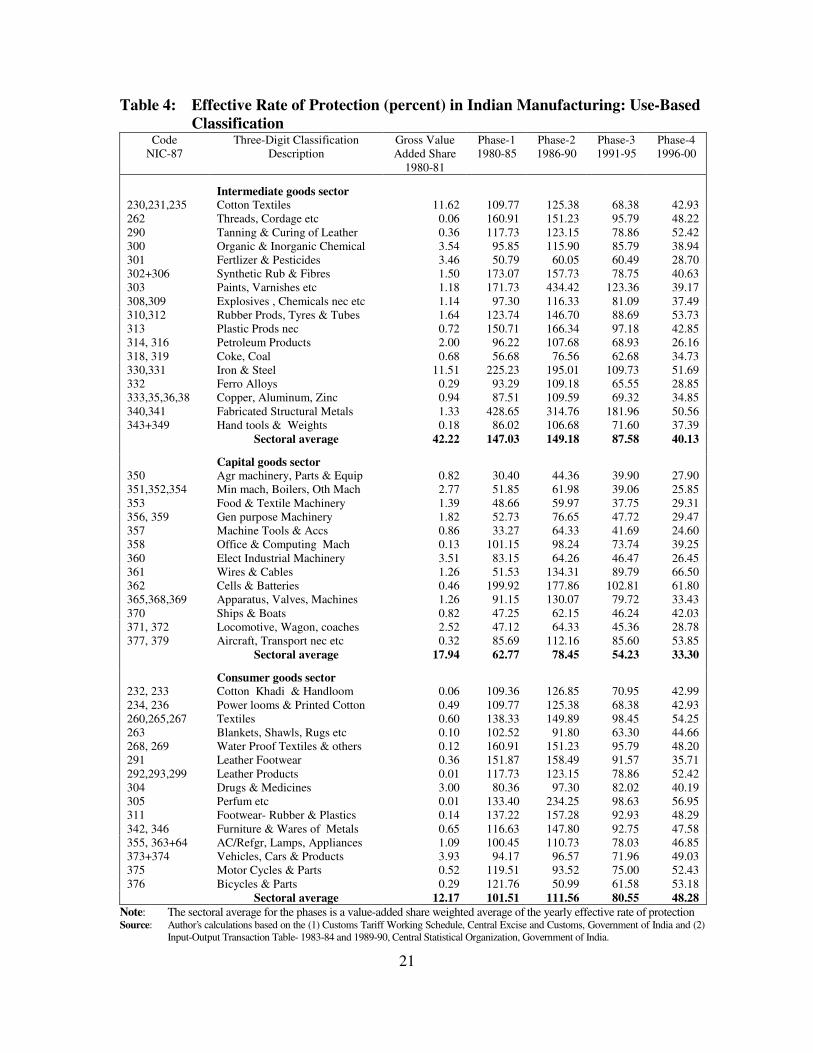
Table 4: Effective Rate of Protection (percent) in Indian Manufacturing: Use-BasedClassification
CodeNIC-87
Three-Digit ClassificationDescription
Gross ValueAdded Share
1980-81
Phase-11980-85
Phase-21986-90
Phase-31991-95
Phase-41996-00
Intermediate goods sector230,231,235 Cotton Textiles 11.62 109.77 125.38 68.38 42.93262 Threads, Cordage etc 0.06 160.91 151.23 95.79 48.22290 Tanning & Curing of Leather 0.36 117.73 123.15 78.86 52.42300 Organic & Inorganic Chemical 3.54 95.85 115.90 85.79 38.94301 Fertlizer & Pesticides 3.46 50.79 60.05 60.49 28.70302+306 Synthetic Rub & Fibres 1.50 173.07 157.73 78.75 40.63303 Paints, Varnishes etc 1.18 171.73 434.42 123.36 39.17308,309 Explosives , Chemicals nec etc 1.14 97.30 116.33 81.09 37.49310,312 Rubber Prods, Tyres & Tubes 1.64 123.74 146.70 88.69 53.73313 Plastic Prods nec 0.72 150.71 166.34 97.18 42.85314, 316 Petroleum Products 2.00 96.22 107.68 68.93 26.16318, 319 Coke, Coal 0.68 56.68 76.56 62.68 34.73330,331 Iron & Steel 11.51 225.23 195.01 109.73 51.69332 Ferro Alloys 0.29 93.29 109.18 65.55 28.85333,35,36,38 Copper, Aluminum, Zinc 0.94 87.51 109.59 69.32 34.85340,341 Fabricated Structural Metals 1.33 428.65 314.76 181.96 50.56343+349 Hand tools & Weights 0.18 86.02 106.68 71.60 37.39
Sectoral average 42.22 147.03 149.18 87.58 40.13
Capital goods sector350 Agr machinery, Parts & Equip 0.82 30.40 44.36 39.90 27.90351,352,354 Min mach, Boilers, Oth Mach 2.77 51.85 61.98 39.06 25.85353 Food & Textile Machinery 1.39 48.66 59.97 37.75 29.31356, 359 Gen purpose Machinery 1.82 52.73 76.65 47.72 29.47357 Machine Tools & Accs 0.86 33.27 64.33 41.69 24.60358 Office & Computing Mach 0.13 101.15 98.24 73.74 39.25360 Elect Industrial Machinery 3.51 83.15 64.26 46.47 26.45361 Wires & Cables 1.26 51.53 134.31 89.79 66.50362 Cells & Batteries 0.46 199.92 177.86 102.81 61.80365,368,369 Apparatus, Valves, Machines 1.26 91.15 130.07 79.72 33.43370 Ships & Boats 0.82 47.25 62.15 46.24 42.03371, 372 Locomotive, Wagon, coaches 2.52 47.12 64.33 45.36 28.78377, 379 Aircraft, Transport nec etc 0.32 85.69 112.16 85.60 53.85
Sectoral average 17.94 62.77 78.45 54.23 33.30
Consumer goods sector232, 233 Cotton Khadi & Handloom 0.06 109.36 126.85 70.95 42.99234, 236 Power looms & Printed Cotton 0.49 109.77 125.38 68.38 42.93260,265,267 Textiles 0.60 138.33 149.89 98.45 54.25263 Blankets, Shawls, Rugs etc 0.10 102.52 91.80 63.30 44.66268, 269 Water Proof Textiles & others 0.12 160.91 151.23 95.79 48.20291 Leather Footwear 0.36 151.87 158.49 91.57 35.71292,293,299 Leather Products 0.01 117.73 123.15 78.86 52.42304 Drugs & Medicines 3.00 80.36 97.30 82.02 40.19305 Perfum etc 0.01 133.40 234.25 98.63 56.95311 Footwear- Rubber & Plastics 0.14 137.22 157.28 92.93 48.29342, 346 Furniture & Wares of Metals 0.65 116.63 147.80 92.75 47.58355, 363+64 AC/Refgr, Lamps, Appliances 1.09 100.45 110.73 78.03 46.85373+374 Vehicles, Cars & Products 3.93 94.17 96.57 71.96 49.03375 Motor Cycles & Parts 0.52 119.51 93.52 75.00 52.43376 Bicycles & Parts 0.29 121.76 50.99 61.58 53.18
Sectoral average 12.17 101.51 111.56 80.55 48.28Note: The sectoral average for the phases is a value-added share weighted average of the yearly effective rate of protectionSource: Author’s calculations based on the (1) Customs Tariff Working Schedule, Central Excise and Customs, Government of India and (2)
Input-Output Transaction Table- 1983-84 and 1989-90, Central Statistical Organization, Government of India.
22
The capital goods sector has the lowest ERP levels amongst all the use-based
sectors for all the phases. Majority of the industries record ERP levels of less than 100
percent across the four periods. Cells & batteries is the only industry group to register an
ERP of over 100 percent for the first three phase. The electrical industrial machinery
industry, with the largest value added share of 3.52 within the capital goods sector
records an ERP level of 83, 64, 46 and 26 percent in the phases of trade reform. In the
second phase, even though the tariff rates were hiked across all major products, the ERP
levels for most industries remain in the low to moderate range of 50 to 75 percent. The
1990s brought about sharp reductions in the tariff rates for most industry groups,
resultantly a fall in the ERP levels from 54 percent in the first half of 1990s to around 33
percent in the second half. In the second period of the 1990s, wires & cables, cells &
batteries and aircraft building etc were the only industry group with ERP levels above 50
percent.
As with the other use-based sectors, the industries within the consumer goods
sector also record sharp variations in protection levels. Drugs & medicines and motor
vehicles are the only industries to record less than 100 percent ERP for the period 1980-
85. Further, most of the industries belonging to the cotton textile, textile products and
leather have very high ERP levels in the range of 100 to 175 percent. The second phase
shows an increase in ERP levels across most industries, however four industries show a
decline in the ERP levels namely, blankets, rugs & shawls etc, water-proof textiles, motor
cycles & related products and bicycles & parts. In the third phase majority of the
industries are concentrated in the range of 60-90 percent ERP. The fourth phase saw a
decline in many industry groups from the levels achieved in the first half of 1990s. By the
1999-00, we find that average protection level had declined to below 50 percent from a
high of 100 percent in 1980-81. Despite the lowering of tariff rates across most product
lines, the consumer goods belonging to the textile, leather, rubber & plastic, metal
products industry groups record relatively high levels of protection.
23
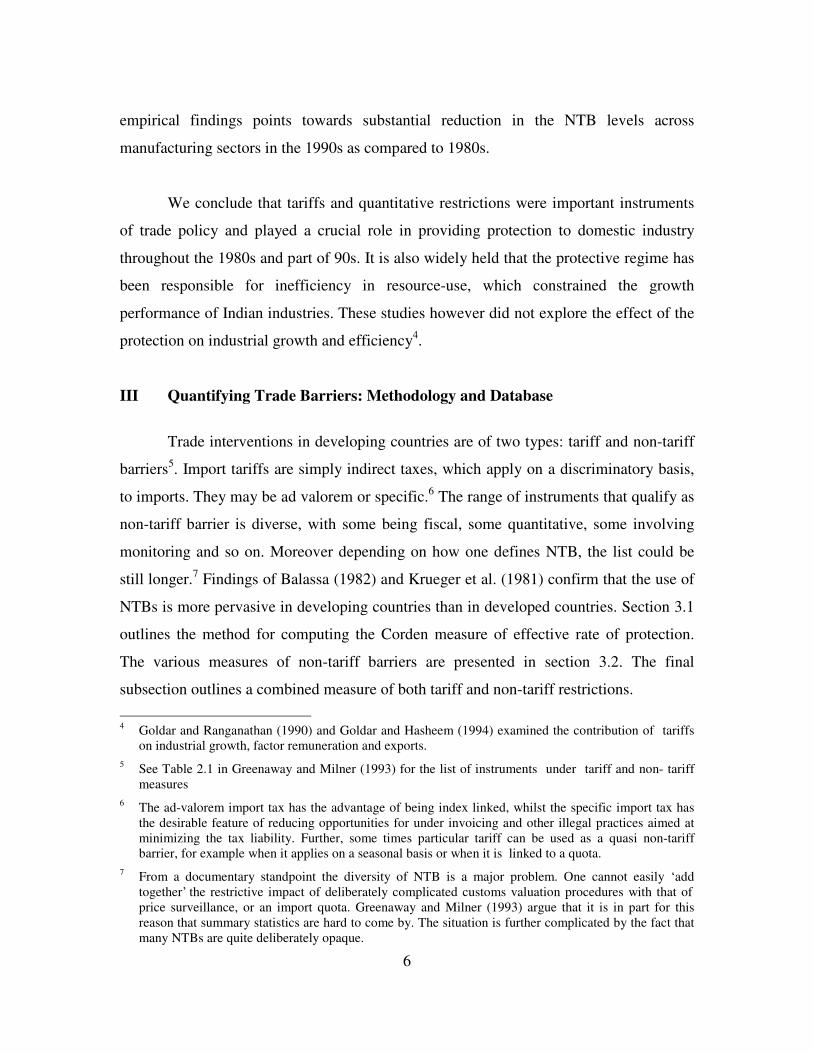
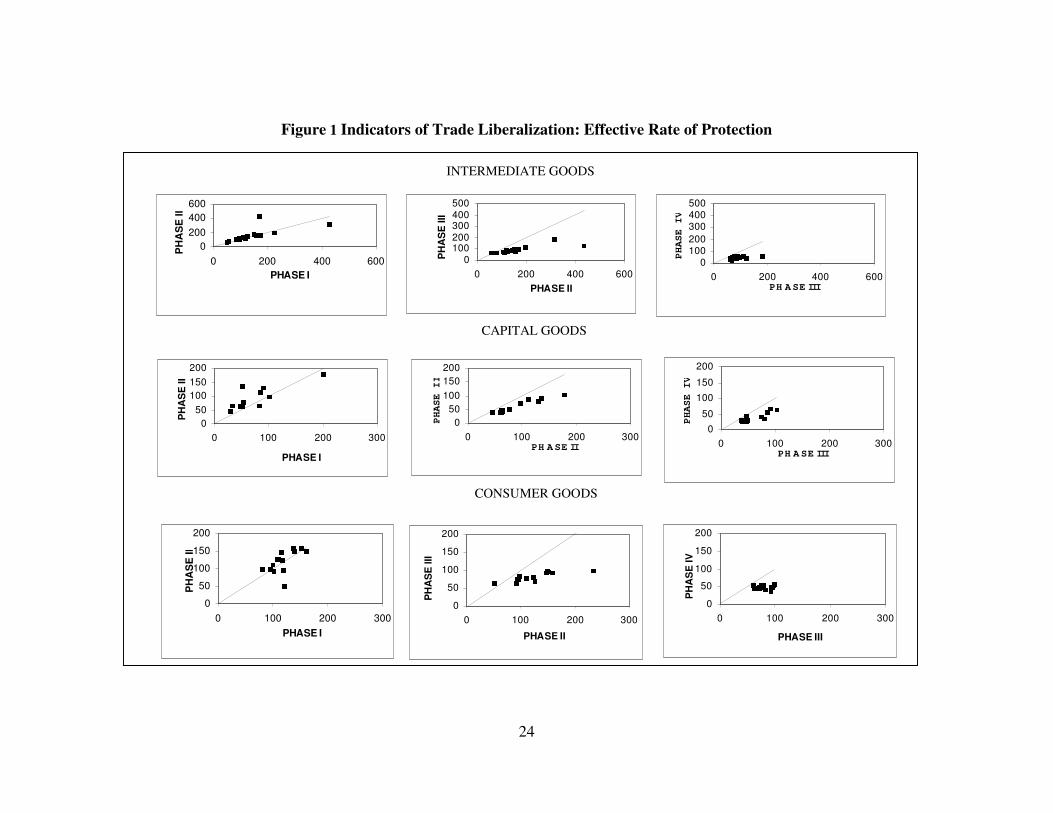
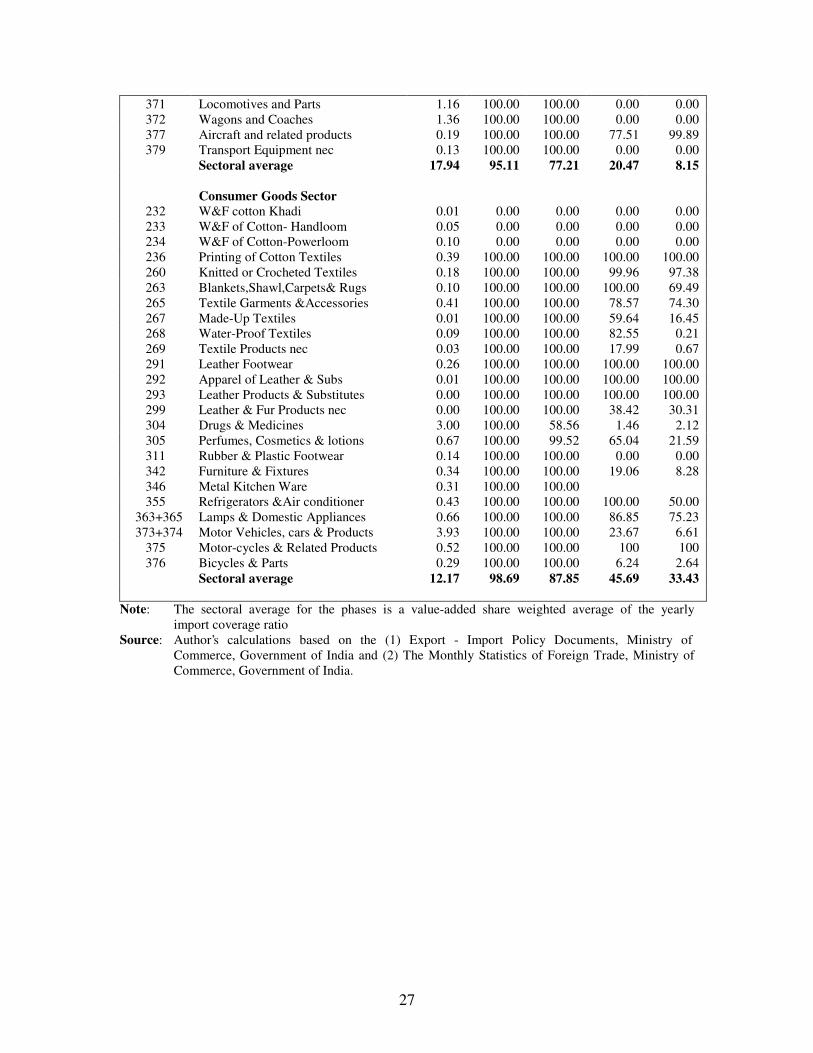
Figure1 and appendix chart1 shows the ERP levels for different phases of trade
reforms and the decade of 1980s and 1990s for the use-based classifications. Comparing
each phase of trade reforms with the previous phase shows that the ERP levels decline in
most industries within each use-based sector. In the case of second phase, we however
see that the level of ERP rises across industry groups. Observing the fourth phase of trade
reforms as against the first half of the 1990s [third phase], we observe rapid declines in
ERP levels across the three use-based sectors. For some industries [paints & varnishes
(303), iron & steel (330,331), fabricated structural products (340) and cells & batteries
(362)], the second half of 1990s saw major reductions in the ERP levels.
Observing the decades of 1980s and 1990s we find that the level of ERP declined
across the three use-based sectors. In case of two industries belonging to the intermediate
goods sector [paints and varnishes (303) and fabricated structural products (340)], the
decline is sharp. The ERP level of most capital goods industries was low in the 1980s in
comparison to the intermediate and consumer goods sectors. The 1990 saw further
reduction in the ERP levels across all industries. The consumer goods industries, though
for the early part of the 1990s still under licensing, yet show a decline in the ERP level in
the 1990s. This holds across all the three digit industries belonging to this sector.
24
Figure 1 Indicators of Trade Liberalization: Effective Rate of Protection
050
100150200
0 100 200 300
PHASE I
PH
AS
E II
050
100150200
0 100 200 300 PH ASE II
PHASE III
050
100
150
200
0 100 200 300 PH A SE III
PHASE IV
0
50
100
150
200
0 100 200 300 PHASE I
PH
AS
E II
0
50
100
150
200
0 100 200 300
PHASE II
PH
AS
E II
I
0
50
100
150
200
0 100 200 300
PHASE III
PH
AS
E IV
INTERMEDIATE GOODS
CAPITAL GOODS
CONSUMER GOODS
0200400600
0 200 400 600 PHASE I
PH
AS
E II
0100200300400500
0 200 400 600 PHASE II
PH
AS
E II
I
0100200300400500
0 200 400 600 PH ASE III
PHASE IV
25
IV.2 Trends in Non-Tariff Barriers
Non-tariff barriers operating through the import licensing system have long been
the principal means of regulating imports and protecting domestic industries.34 The
complexity of the import regime makes it very difficult to quantify the impact and
significance of the QRs.35 We quantify the extent of non-tariff barriers by three-digit
industries for the period 1980-81 to 1999-00 using the import coverage ratio.36 The
information available from the import-export policy documents in the eighties and early
nineties was not at a very detailed level of product description, the summary measures
constructed according to the industry groups therefore are at best an approximation into
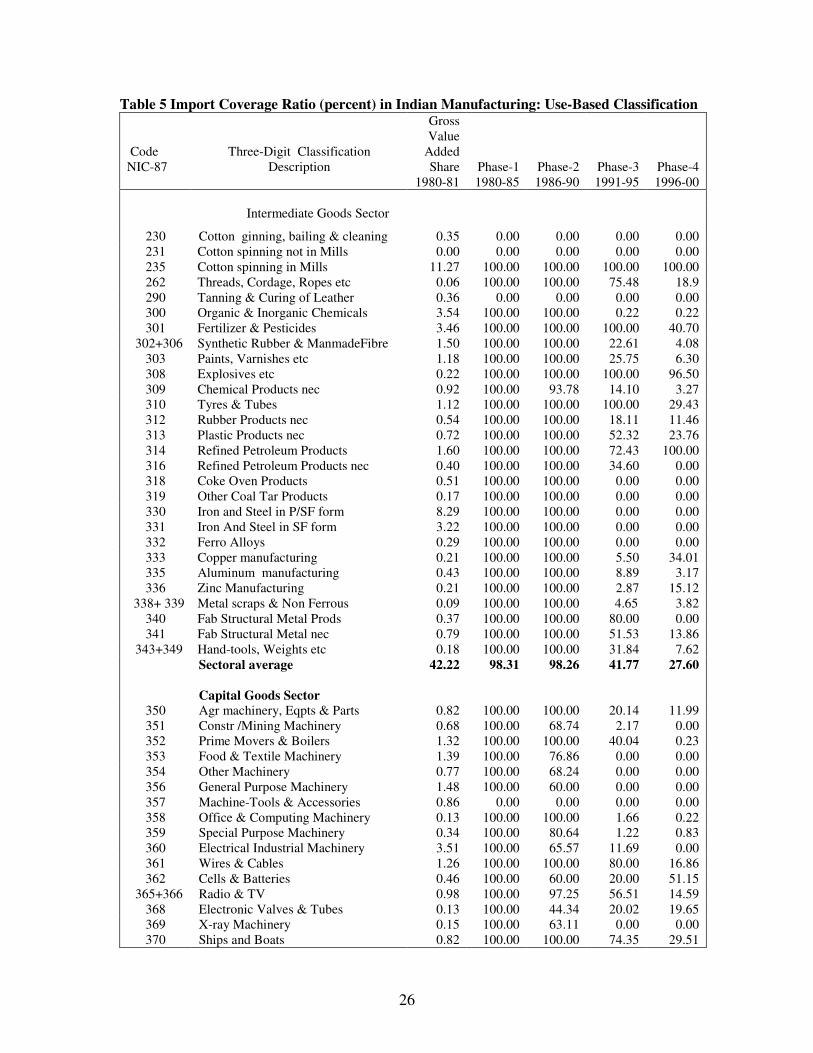
the extent of non-tariff barriers prevailing in the industrial sector. Table 5 and figure 2
depicts the trends in sector-wise import coverage ratio.
The percentage of imports subject to QRs in the intermediate goods sector was
similar for the first and the second phases of trade reforms. At the level of the individual
industries, there was hardly any change in the import coverage ratio. The products of the
cotton textiles and leather sectors such as yarn and leather were however not subject to
any import restrictions. In the second phase, some of the products belonging to the
chemical n.e.c industries were freed from import restrictions and this resulted in a
marginal reduction in the coverage ratio by around 6 percentage points.
34 The import control mechanism in India was first introduced as a result of the foreign exchange crises of
the 11 Plan (1956-61). From 1960-77 these controls were increasingly tightened and more complex. SeeWorld Bank (1989) and Aksoy (1991) for a detailed description of the import-licensing regime.
35 Attempts have been made to estimate the share of imports subject to different licensing categories.Pursell (1988) has made rough estimates of imports under OGL for the 1980s, Aksoy (1991) presentsshare of imports in different licensing categories for 1986-87. Hasheem extends the Aksoy frameworkfor the 1990s.
36 It is possible to construct a variety of measures that indicate the frequency of occurrence of NTBs. Suchmeasures may unweighted, or they may be weighted by imports or by production. Further they may beclassified according to various categories of NTBs. For details, see OECD (1995).
26
Table 5 Import Coverage Ratio (percent) in Indian Manufacturing: Use-Based Classification
CodeNIC-87
Three-Digit ClassificationDescription
GrossValue
AddedShare
1980-81Phase-11980-85
Phase-21986-90
Phase-31991-95
Phase-41996-00
Intermediate Goods Sector
230 Cotton ginning, bailing & cleaning 0.35 0.00 0.00 0.00 0.00231 Cotton spinning not in Mills 0.00 0.00 0.00 0.00 0.00235 Cotton spinning in Mills 11.27 100.00 100.00 100.00 100.00262 Threads, Cordage, Ropes etc 0.06 100.00 100.00 75.48 18.9290 Tanning & Curing of Leather 0.36 0.00 0.00 0.00 0.00300 Organic & Inorganic Chemicals 3.54 100.00 100.00 0.22 0.22301 Fertilizer & Pesticides 3.46 100.00 100.00 100.00 40.70
302+306 Synthetic Rubber & ManmadeFibre 1.50 100.00 100.00 22.61 4.08303 Paints, Varnishes etc 1.18 100.00 100.00 25.75 6.30308 Explosives etc 0.22 100.00 100.00 100.00 96.50309 Chemical Products nec 0.92 100.00 93.78 14.10 3.27310 Tyres & Tubes 1.12 100.00 100.00 100.00 29.43312 Rubber Products nec 0.54 100.00 100.00 18.11 11.46313 Plastic Products nec 0.72 100.00 100.00 52.32 23.76314 Refined Petroleum Products 1.60 100.00 100.00 72.43 100.00316 Refined Petroleum Products nec 0.40 100.00 100.00 34.60 0.00318 Coke Oven Products 0.51 100.00 100.00 0.00 0.00319 Other Coal Tar Products 0.17 100.00 100.00 0.00 0.00330 Iron and Steel in P/SF form 8.29 100.00 100.00 0.00 0.00331 Iron And Steel in SF form 3.22 100.00 100.00 0.00 0.00332 Ferro Alloys 0.29 100.00 100.00 0.00 0.00333 Copper manufacturing 0.21 100.00 100.00 5.50 34.01335 Aluminum manufacturing 0.43 100.00 100.00 8.89 3.17336 Zinc Manufacturing 0.21 100.00 100.00 2.87 15.12
338+ 339 Metal scraps & Non Ferrous 0.09 100.00 100.00 4.65 3.82340 Fab Structural Metal Prods 0.37 100.00 100.00 80.00 0.00341 Fab Structural Metal nec 0.79 100.00 100.00 51.53 13.86
343+349 Hand-tools, Weights etc 0.18 100.00 100.00 31.84 7.62Sectoral average 42.22 98.31 98.26 41.77 27.60
Capital Goods Sector350 Agr machinery, Eqpts & Parts 0.82 100.00 100.00 20.14 11.99351 Constr /Mining Machinery 0.68 100.00 68.74 2.17 0.00352 Prime Movers & Boilers 1.32 100.00 100.00 40.04 0.23353 Food & Textile Machinery 1.39 100.00 76.86 0.00 0.00354 Other Machinery 0.77 100.00 68.24 0.00 0.00356 General Purpose Machinery 1.48 100.00 60.00 0.00 0.00357 Machine-Tools & Accessories 0.86 0.00 0.00 0.00 0.00358 Office & Computing Machinery 0.13 100.00 100.00 1.66 0.22359 Special Purpose Machinery 0.34 100.00 80.64 1.22 0.83360 Electrical Industrial Machinery 3.51 100.00 65.57 11.69 0.00361 Wires & Cables 1.26 100.00 100.00 80.00 16.86362 Cells & Batteries 0.46 100.00 60.00 20.00 51.15
365+366 Radio & TV 0.98 100.00 97.25 56.51 14.59368 Electronic Valves & Tubes 0.13 100.00 44.34 20.02 19.65369 X-ray Machinery 0.15 100.00 63.11 0.00 0.00370 Ships and Boats 0.82 100.00 100.00 74.35 29.51
27
371 Locomotives and Parts 1.16 100.00 100.00 0.00 0.00372 Wagons and Coaches 1.36 100.00 100.00 0.00 0.00377 Aircraft and related products 0.19 100.00 100.00 77.51 99.89379 Transport Equipment nec 0.13 100.00 100.00 0.00 0.00
Sectoral average 17.94 95.11 77.21 20.47 8.15
Consumer Goods Sector232 W&F cotton Khadi 0.01 0.00 0.00 0.00 0.00233 W&F of Cotton- Handloom 0.05 0.00 0.00 0.00 0.00234 W&F of Cotton-Powerloom 0.10 0.00 0.00 0.00 0.00236 Printing of Cotton Textiles 0.39 100.00 100.00 100.00 100.00260 Knitted or Crocheted Textiles 0.18 100.00 100.00 99.96 97.38263 Blankets,Shawl,Carpets& Rugs 0.10 100.00 100.00 100.00 69.49265 Textile Garments &Accessories 0.41 100.00 100.00 78.57 74.30267 Made-Up Textiles 0.01 100.00 100.00 59.64 16.45268 Water-Proof Textiles 0.09 100.00 100.00 82.55 0.21269 Textile Products nec 0.03 100.00 100.00 17.99 0.67291 Leather Footwear 0.26 100.00 100.00 100.00 100.00292 Apparel of Leather & Subs 0.01 100.00 100.00 100.00 100.00293 Leather Products & Substitutes 0.00 100.00 100.00 100.00 100.00299 Leather & Fur Products nec 0.00 100.00 100.00 38.42 30.31304 Drugs & Medicines 3.00 100.00 58.56 1.46 2.12305 Perfumes, Cosmetics & lotions 0.67 100.00 99.52 65.04 21.59311 Rubber & Plastic Footwear 0.14 100.00 100.00 0.00 0.00342 Furniture & Fixtures 0.34 100.00 100.00 19.06 8.28346 Metal Kitchen Ware 0.31 100.00 100.00355 Refrigerators &Air conditioner 0.43 100.00 100.00 100.00 50.00
363+365 Lamps & Domestic Appliances 0.66 100.00 100.00 86.85 75.23 373+374 Motor Vehicles, cars & Products 3.93 100.00 100.00 23.67 6.61
375 Motor-cycles & Related Products 0.52 100.00 100.00 100 100376 Bicycles & Parts 0.29 100.00 100.00 6.24 2.64
Sectoral average 12.17 98.69 87.85 45.69 33.43
Note: The sectoral average for the phases is a value-added share weighted average of the yearlyimport coverage ratio
Source: Author’s calculations based on the (1) Export - Import Policy Documents, Ministry ofCommerce, Government of India and (2) The Monthly Statistics of Foreign Trade, Ministry ofCommerce, Government of India.
28
Figure 1: Indicators of Trade Liberalization: Effective Rate of Protection
0
50
1 00
1 50
0 20 40 60 80 1 00 1 20
PHASE I
PH
AS
E II
0
50
100
150
0 50 100 150PHASE II
PH
AS
E II
I
0
50
100
150
0 50 100 150PHASE III
PH
AS
E IV
0
50
100
150
0 50 100 150
PHASE I
PH
AS
E II
0
50
100
150
0 50 100 150PHASE II
PH
AS
E II
I
0
50
100
150
0 50 100 150
PHASE III
PH
AS
E IV
0
50
1 00
1 50
0 20 40 60 80 1 00 1 20
PHASE I
PH
AS
E II
0
50
100
150
0 50 100 150PHASE II
PH
AS
E II
I
0
50
1 00
1 50
0 20 40 60 80 1 00 1 20P H A S E I I I
INTERMEDIATE GOODS
CAPITAL GOODS
CONSUMER GOODS
29
The intermediate goods industries witnessed major changes in the non-tariff
barriers only during the third phase of trade reforms. These changes can be listed as [1]
drastic- Industries where the import coverage ratio declined from 100 to zero percent, [2]
moderate- import coverage ratio declined from 100 to around 30 percent and [4] low-
percentage of products under import licensing still around 75 percent. Iron & steel,
ferroalloys, copper, coal & coal tar, coke oven, industrial chemicals are the industries
where the imports are no longer subject to any kind of licensing. Some of the industries
continue to have 100 percent imports subject to licensing. The entire import of fertilizer
is in the hands of public sector agencies in the form of canalization. Further, the industry
has been subject to rigid price controls for several years. Both these aspects of the
fertilizer industry have been dictated to a large extent due to its link with the agricultural
sector. Further since 1992, the fertilizer prices of the phosphate and potassic variety have
been de-controlled. Majorities of the products for the explosives, arms & ammunition
industry are classified as hazardous items and imports streamlined via the public sector
agencies. The structural metal industry consisting of products such as structures of
iron/steel, grill & nets are also subject to strict import controls through out the period of
study. Products such as inner tubes, rubber tyres also have 100 percent restrictions on
imports. The average for the intermediate goods sector for the four phases of trade reform
was around 90 percent in the eighties and about 33 percent in the first half of the nineties.
For the period 1980-85, 100 percent of the imports of the capital goods sectors
was under import licensing. This is reflective of the trade policy stance towards the
capital goods sector in the early eighties. The import policy for the capital goods sector
consists of banned items and items under OGL, the imports of which is allowed only to
actual users on the basis of essentiality certificates and indigenous clearance. Though the
trade policy announced every year did highlight some new schemes for the capital goods
sector, but most of the changes taking place were essentially shifts from one kind of
licensing categories to another.
The second phase of trade reforms beginning with the 1985-86 trade policy
changes did attempt to improve the quality of domestic production via technological up-
30
gradation. This was made possible by transferring to the OGL lists items of machinery
and equipment for industrial as well as non-industrial uses. Construction & mining,
machinery other than food & textiles, electrical industrial machinery, x-ray machines, are
some of the three-digit industries, which records modest decline in the share of imports
subject to controls. An electronic valve, tubes etc is the only industry with 50 percent of
its imports under restrictions. Trade reforms initiated in 1991-92 saw large number of
items of machinery and components falling within the capital goods sector being
transferred to the OGL or free list. This was evident in the import coverage ratios for
industries belonging to the two-digit groups 35-36. Around half of the twenty industries
comprising the capital goods sector has less than 25 percent of the imports subject to
import licensing. More notable is the industries belonging to the transport-equipment
sector, where the percentage of products covered by QRs dropped to around 20 percent in
the third phase from 100 percent NTB levels in the first two phases. Machine tools is the
only industry within the capital goods sector to have no import licensing requirements for
its products in any phase of trade reforms.
The consumer goods sector is characterized by restrictions on imports even after
the policy changes in the 1990s. All items of consumer goods are banned from imports in
the first two phases of trade reforms. The EXIM policy of 1992-93 however did allow
imports of some items via special import license.37 A notable exception being different
categories of cotton [carded or combed, not carded or combed, waste, and sewing thread]
falling under various three-digit groups of cotton textiles that were free from import
restrictions throughout the period of the study. The second phase of reforms saw change
in only drugs & pharmaceuticals industry. This is primarily due to the change in the
import licensing status of certain essential raw materials, fine chemicals, vaccines,
medicaments and pharmaceutical products.
Drugs & pharmaceuticals, rubber & plastic footwear along with the industries
falling with cotton textile groups are the only industries, which have, zero percent of
37 See Annexures V and VI for an illustrative list of items under consumer goods, in Mishra and Goldar
(1996).
31
imports subject to restrictions in the third phase. This period also saw substantial
reductions in the import coverage ratio for textile products NEC, leather products and
metal furniture & fixtures industries. It is important to bear in mind when quantifying the
QRs, that many consumer goods howsoever described, of industrial, agricultural, mineral
or animal origin, whether in CKD/SKD condition or ready to assemble or in finished
form are still listed as restricted items. Industries with an import coverage ratio of 100 in
the third phase cover a wide range of products: varieties of cotton fabrics, other woven
cotton fabrics, knitted or crocheted fabrics, knitted or crocheted finished products,
carpets, rugs and floor coverings leather footwear, leather apparels, leather articles, metal
products such as heating equipment, cutlery, ladles, skinners, stoves, cookers etc,
airconditioners, refrigerators and motorcycles/ mopeds.
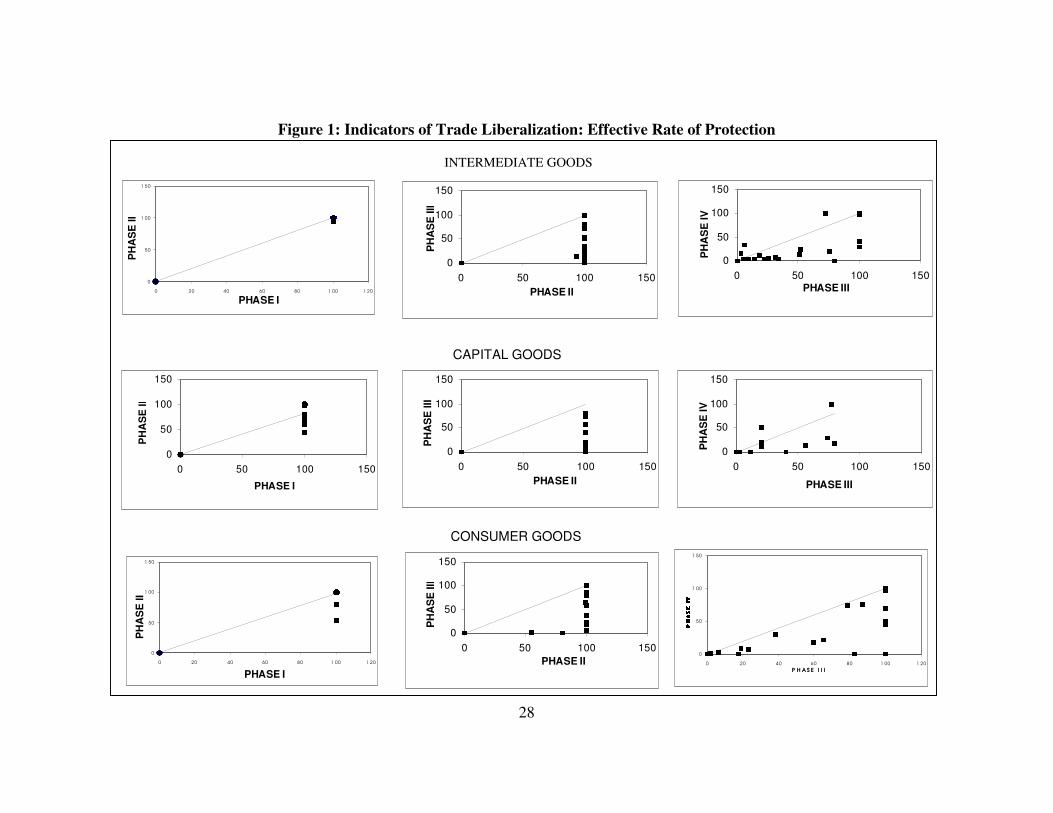
Figure 2 presents a phase wise comparison of the import coverage ratio. For
intermediate goods industries, the first two phases of trade reforms do not show any
change in the import coverage ratios. The third and the fourth phases saw drastic
reductions in the percentage of imports subject to licensing and is evident in the
comparison of the fourth phase with the third. Same holds true for the capital goods
sector also, though some attempts at freeing of imports from non tariff barriers started in
the mid 1980s. The consumer goods industries has around 33 percent of imports subject
to licensing in the fourth phase. The decline in this sector has been slow in comparison
with the other sectors. This is in line with the policy stance towards consumer goods
import.
Appendix chart2 shows the pattern of import coverage ratio by industry groups
for the decade of 1980s and 1990s. Observing all the three sectors, we find that for the
1980s, the import coverage ratio was almost 100 percent. The 1990s see a substantial
decline for intermediate and capital goods industries. For consumer goods sector, though
there is evidence of a decline in the 1990s, it is still relatively lower when compared to
the other sectors.
32
IV.3 Trends in Import Penetration Rate
The import-export policy announced in April 1985 incorporating the
recommendations of the Hussein committee favored a greater role for tariffs in regulating
imports. Simultaneously there were changes taking place in the import-licensing regime
necessitating the shifting of products from one category of licenses to another. The trade
liberalization attempt initiated with the announcement of the trade policy changes in
1991-92 aimed at creating a globally competitive environment via reducing the degree of
licensing and regulatory controls on foreign trade. A major focus of the new trade regime
related to lowering the structure of import duties and quantitative restrictions on
imports.38 The lowering of tariffs and abolition of import controls are intended to bring
about competition via imports in the manufacturing sectors. We document the import
penetration rates for the industries in order to assess the joint impact of both tariff and
non-tariff barriers on the manufacturing sector. The import penetration ratios are
documented for 60 industries and three use-based sectors for the three phases of trade
reform39 as evident from table 6 and figure .3.
38 The Trade Policy (1991-92) listed the following categories: (a) the prohibited items (tallow, fats, oils,
lard, poultry, animal rennet and un-manufactured ivory) and (b) the restricted list. The restricted listfurther categorized items into (1) consumer goods, (2) security related items; (3) environment relateditems, (4) electronics and (5) Drugs and chemicals. Successive policy statements have further prunedthe list. A phased reduction in the peak rate of customs duty was also undertaken in successive budgetannouncements. The customs duty on power projects and related machinery was brought down to 25percent and the duty on fertilizer projects was reduced to zero by the end of 1994-95.
39 The import penetration ratios were available for only 60 three-digit industries as an exact mappingcould not be established for some of the three-digit industries.
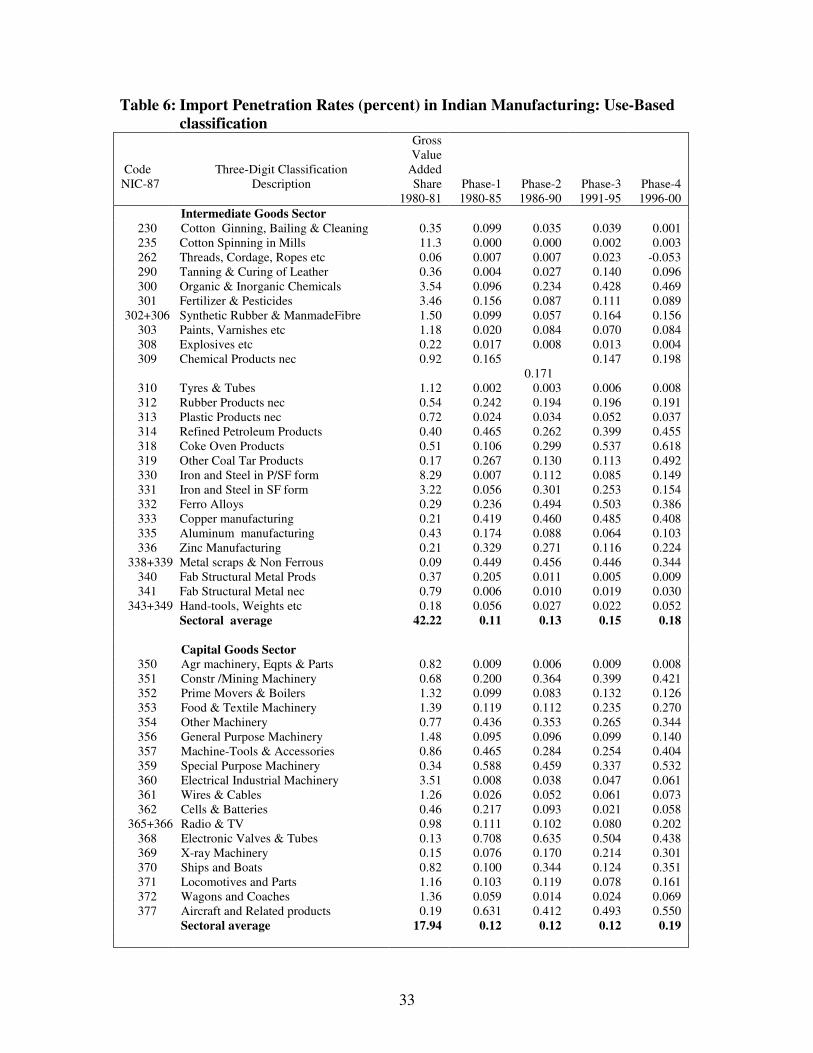
33
Table 6: Import Penetration Rates (percent) in Indian Manufacturing: Use-Basedclassification
CodeNIC-87
Three-Digit ClassificationDescription
GrossValue
AddedShare
1980-81Phase-11980-85
Phase-21986-90
Phase-31991-95
Phase-41996-00
Intermediate Goods Sector230 Cotton Ginning, Bailing & Cleaning 0.35 0.099 0.035 0.039 0.001235 Cotton Spinning in Mills 11.3 0.000 0.000 0.002 0.003262 Threads, Cordage, Ropes etc 0.06 0.007 0.007 0.023 -0.053290 Tanning & Curing of Leather 0.36 0.004 0.027 0.140 0.096300 Organic & Inorganic Chemicals 3.54 0.096 0.234 0.428 0.469301 Fertilizer & Pesticides 3.46 0.156 0.087 0.111 0.089
302+306 Synthetic Rubber & ManmadeFibre 1.50 0.099 0.057 0.164 0.156303 Paints, Varnishes etc 1.18 0.020 0.084 0.070 0.084308 Explosives etc 0.22 0.017 0.008 0.013 0.004309 Chemical Products nec 0.92 0.165
0.1710.147 0.198
310 Tyres & Tubes 1.12 0.002 0.003 0.006 0.008312 Rubber Products nec 0.54 0.242 0.194 0.196 0.191313 Plastic Products nec 0.72 0.024 0.034 0.052 0.037314 Refined Petroleum Products 0.40 0.465 0.262 0.399 0.455318 Coke Oven Products 0.51 0.106 0.299 0.537 0.618319 Other Coal Tar Products 0.17 0.267 0.130 0.113 0.492330 Iron and Steel in P/SF form 8.29 0.007 0.112 0.085 0.149331 Iron and Steel in SF form 3.22 0.056 0.301 0.253 0.154332 Ferro Alloys 0.29 0.236 0.494 0.503 0.386333 Copper manufacturing 0.21 0.419 0.460 0.485 0.408335 Aluminum manufacturing 0.43 0.174 0.088 0.064 0.103336 Zinc Manufacturing 0.21 0.329 0.271 0.116 0.224
338+339 Metal scraps & Non Ferrous 0.09 0.449 0.456 0.446 0.344340 Fab Structural Metal Prods 0.37 0.205 0.011 0.005 0.009341 Fab Structural Metal nec 0.79 0.006 0.010 0.019 0.030
343+349 Hand-tools, Weights etc 0.18 0.056 0.027 0.022 0.052Sectoral average 42.22 0.11 0.13 0.15 0.18
Capital Goods Sector350 Agr machinery, Eqpts & Parts 0.82 0.009 0.006 0.009 0.008351 Constr /Mining Machinery 0.68 0.200 0.364 0.399 0.421352 Prime Movers & Boilers 1.32 0.099 0.083 0.132 0.126353 Food & Textile Machinery 1.39 0.119 0.112 0.235 0.270354 Other Machinery 0.77 0.436 0.353 0.265 0.344356 General Purpose Machinery 1.48 0.095 0.096 0.099 0.140357 Machine-Tools & Accessories 0.86 0.465 0.284 0.254 0.404359 Special Purpose Machinery 0.34 0.588 0.459 0.337 0.532360 Electrical Industrial Machinery 3.51 0.008 0.038 0.047 0.061361 Wires & Cables 1.26 0.026 0.052 0.061 0.073362 Cells & Batteries 0.46 0.217 0.093 0.021 0.058
365+366 Radio & TV 0.98 0.111 0.102 0.080 0.202368 Electronic Valves & Tubes 0.13 0.708 0.635 0.504 0.438369 X-ray Machinery 0.15 0.076 0.170 0.214 0.301370 Ships and Boats 0.82 0.100 0.344 0.124 0.351371 Locomotives and Parts 1.16 0.103 0.119 0.078 0.161372 Wagons and Coaches 1.36 0.059 0.014 0.024 0.069377 Aircraft and Related products 0.19 0.631 0.412 0.493 0.550
Sectoral average 17.94 0.12 0.12 0.12 0.19
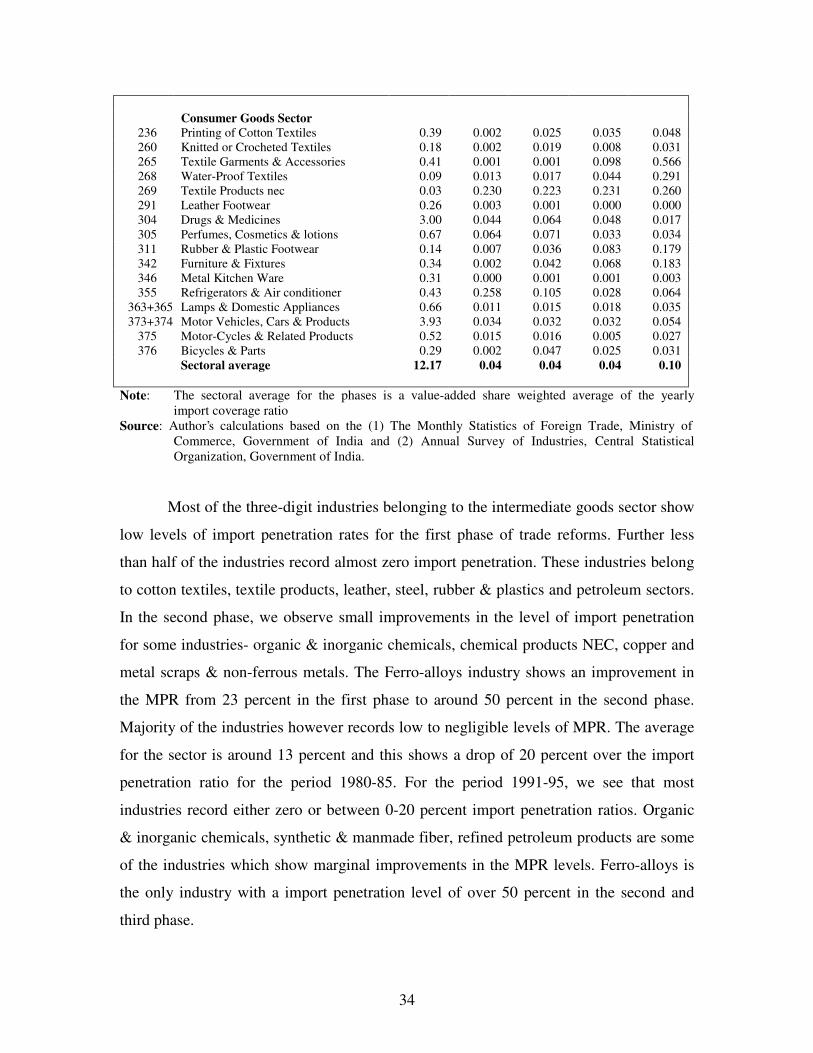
34
Consumer Goods Sector236 Printing of Cotton Textiles 0.39 0.002 0.025 0.035 0.048260 Knitted or Crocheted Textiles 0.18 0.002 0.019 0.008 0.031265 Textile Garments & Accessories 0.41 0.001 0.001 0.098 0.566268 Water-Proof Textiles 0.09 0.013 0.017 0.044 0.291269 Textile Products nec 0.03 0.230 0.223 0.231 0.260291 Leather Footwear 0.26 0.003 0.001 0.000 0.000304 Drugs & Medicines 3.00 0.044 0.064 0.048 0.017305 Perfumes, Cosmetics & lotions 0.67 0.064 0.071 0.033 0.034311 Rubber & Plastic Footwear 0.14 0.007 0.036 0.083 0.179342 Furniture & Fixtures 0.34 0.002 0.042 0.068 0.183346 Metal Kitchen Ware 0.31 0.000 0.001 0.001 0.003355 Refrigerators & Air conditioner 0.43 0.258 0.105 0.028 0.064
363+365 Lamps & Domestic Appliances 0.66 0.011 0.015 0.018 0.035 373+374 Motor Vehicles, Cars & Products 3.93 0.034 0.032 0.032 0.054
375 Motor-Cycles & Related Products 0.52 0.015 0.016 0.005 0.027376 Bicycles & Parts 0.29 0.002 0.047 0.025 0.031
Sectoral average 12.17 0.04 0.04 0.04 0.10
Note: The sectoral average for the phases is a value-added share weighted average of the yearlyimport coverage ratio
Source: Author’s calculations based on the (1) The Monthly Statistics of Foreign Trade, Ministry ofCommerce, Government of India and (2) Annual Survey of Industries, Central StatisticalOrganization, Government of India.
Most of the three-digit industries belonging to the intermediate goods sector show
low levels of import penetration rates for the first phase of trade reforms. Further less
than half of the industries record almost zero import penetration. These industries belong
to cotton textiles, textile products, leather, steel, rubber & plastics and petroleum sectors.
In the second phase, we observe small improvements in the level of import penetration
for some industries- organic & inorganic chemicals, chemical products NEC, copper and
metal scraps & non-ferrous metals. The Ferro-alloys industry shows an improvement in
the MPR from 23 percent in the first phase to around 50 percent in the second phase.
Majority of the industries however records low to negligible levels of MPR. The average
for the sector is around 13 percent and this shows a drop of 20 percent over the import
penetration ratio for the period 1980-85. For the period 1991-95, we see that most
industries record either zero or between 0-20 percent import penetration ratios. Organic
& inorganic chemicals, synthetic & manmade fiber, refined petroleum products are some
of the industries which show marginal improvements in the MPR levels. Ferro-alloys is
the only industry with a import penetration level of over 50 percent in the second and
third phase.
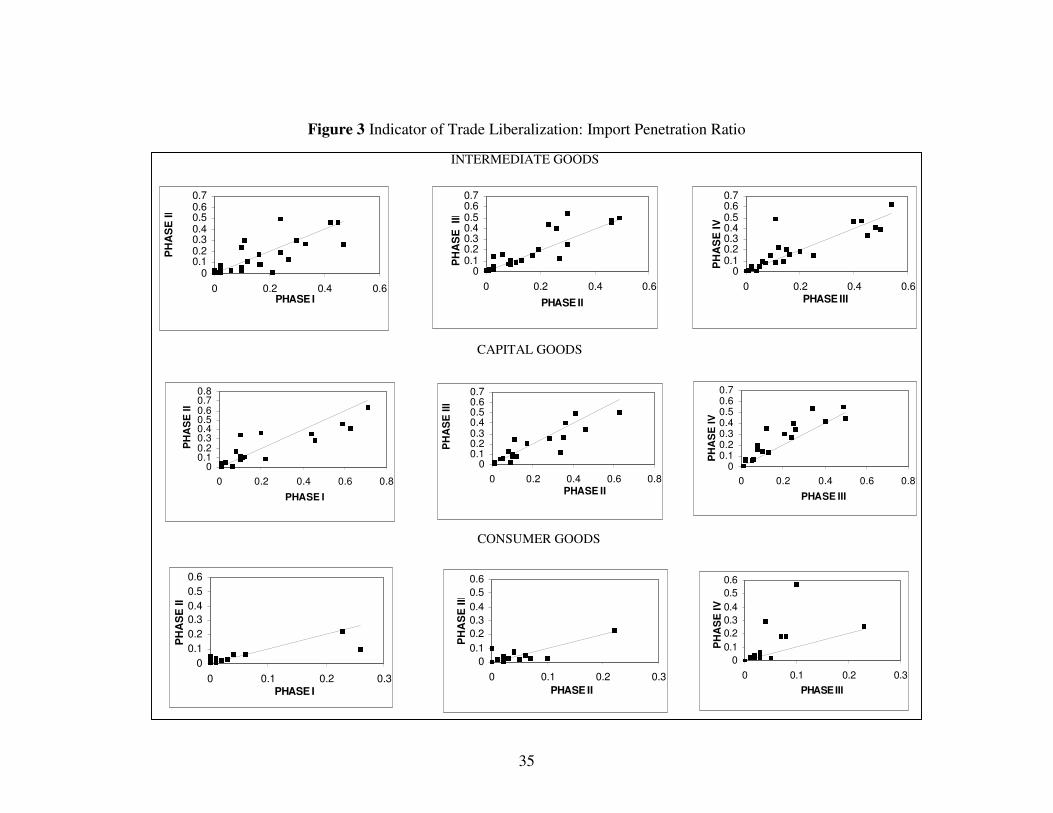
35
Figure 3 Indicator of Trade Liberalization: Import Penetration Ratio
00.10.20.30.40.50.60.70.8
0 0.2 0.4 0.6 0.8
PHASE I
PH
AS
E II
00.10.20.30.40.50.60.7
0 0.2 0.4 0.6 0.8PHASE II
PH
AS
E II
I
00.10.20.30.40.50.60.7
0 0.2 0.4 0.6 0.8
PHASE III
PH
AS
E IV
00.10.20.30.40.50.6
0 0.1 0.2 0.3PHASE I
PH
AS
E II
00.10.20.30.40.50.6
0 0.1 0.2 0.3PHASE II
PH
AS
E II
I
00.10.20.30.40.50.6
0 0.1 0.2 0.3PHASE III
PH
AS
E IV
INTERMEDIATE GOODS
CAPITAL GOODS
CONSUMER GOODS
00.10.20.30.40.50.60.7
0 0.2 0.4 0.6PHASE I
PH
AS
E II
00.10.20.30.40.50.60.7
0 0.2 0.4 0.6
PHASE II
PH
AS
E I
II
00.10.20.30.40.50.60.7
0 0.2 0.4 0.6PHASE III
PH
AS
E IV
36
The capital goods sector has seen gradual expansion in the OGL lists starting
from the early 1980s, the industries however show low levels of import penetration in the
first period. Special purpose machinery, electronic valves, tubes & components, aircraft
& related products are some of the industries with an import penetration level of 0.50 and
above. The machine tools industries has none of the products subject to any kind of
import licensing yet the import penetration level is around 46 percent. The average for
the second phase is around 22 percent. Two industries namely, construction & mining
industries and ship & boat building show an improvement in the levels of import
penetration ratios. In the rest of the industries, there is either a decline or no significant
change. This is assumes significance given that changes in non- tariff barriers have been
in the items of machinery and non-electrical machinery sector. The average level of
import penetration declines in the third phase. This is also reflected in the trends across
the industries. Machine tools industry registers a further decline in import penetration
level as compared to the second phase. Most of the industries record very low import
penetration levels.
The average import penetration rates for the consumer goods sector, is the lowest
amongst the three use-based sectors across the three-trade reform phase. Further, given
that consumer goods were banned from imports for most of the 1980s and first half of the
1990s, it is not surprising to find that majority of the industries are recording zero or
negligible levels of import penetration rates. Only two industries textile products NEC
and white goods like air-conditioners, refrigerators have MPR levels of around 25
percent, whereas motor vehicles and pharmaceuticals items have insignificant levels of
import penetration. The second phase of trade reforms saw no change in the import
policy towards items of this sector except for some products like medicines, sugar and oil
seeds etc. Further, import of these items was essentially in the hands of the government
through the public sector agencies or the state trading corporations. The average for the
sector was almost zero. Textile Products n.e.c. is the only industry with an import
penetration rate of around 0.22. The consumer goods in the 1990s is still a sector with
nearly 100 percent restriction on imports. The export-import policy document [1992-97]
lists majority of the items of consumer durables /non-durables as restricted and in only a
37
few cases can be imported against a special import license. Observing the third phase,
we find that there is zero level of import penetration across the industries. Textile product
nec remains the only industry with an import penetration level of around 20 percent in all
three phases of trade reform.
The first three phases of trade reform do not show any noticeable changes in
import penetration rates. The fourth phase however sees a marginal increase in the import
penetration rates. This holds true across all use-based categories. Figure3 shows the phase
wise comparison of import penetration ratios. A look at the appendix chart 3, we observe
that for the decades of 1980s and 1990s, only for some industries there is an improvement
in the import penetration. By and large, the 1990s do not bring about substantial increases
in import penetration.
The import penetration levels evident from the use- based sectors for the three
phases of trade reforms is devoid of any clear trend. The lowering of tariffs and removal
of QRs brought about by changes in trade policies from the early 1980s are not reflected
in the trends in import penetration as evident from the first three phases of trade reforms.
The puzzle of import penetration not increasing despite trade liberalization could be
explained by the replacement of quantitative restrictions by tariff-based protection and /or
the depreciation of real exchange rate.40
V Conclusion
Despite attempts to liberalize the import trade regime in India, the structure of
import licensing and tariff rates, throughout the 1980s and early part of 1990s remained
restrictive and complicated. Previous research on trade orientation for Indian industries
40 Bhagwati (1965) demonstrated that in the absence of perfect competition in the domestic market, tariff
and quantitative restrictions are not equivalent and resultantly do not lead to the same level of imports.This argument holds for the Indian industries, as they by and large operate in imperfectly competitivemarkets. Further, under imperfect competition, the replacement of QRs by tariffs would allow importsto exert greater competitive pressure even if import penetration did not change significantly. Inaddition, the major thrust of the exchange rate policy in India was to have a depreciating currency inorder to expand exports. Though the rupee was devalued in 1991, yet till 1992-93 there was howeverhardly any appreciation in both nominal and real effective exchange rates.
38
was confined to computing effective rates of protection for broad input-output sectors
[Goldar and Hasheem (1992), Gang and Pandey (1998), Hasheem (2001)] due to the non-
availability of information on import licensing according to industrial classification.41
Similarly attempts were made to quantify the non-tariff barriers for broad industry groups
[Aksoy (1991), Mehta (1997) Hasheem (2001)]. Further, most of these studies calculated
the indices of trade barriers only for selected time-points. The unavailability of trade
statistics at the individual industry level required extensive mapping of trade and industry
data sources and this leads to some unavoidable measurement errors. Finally the
complexity of the trade regime for much of the 1980s and 1990s makes it very difficult to
provide an accurate quantification of the protectionist regime.
We have documented the following measures- effective rate of protection, import
coverage ratio and import penetration rates for around 72 three-digit industries divided
into three-use based sectors for the four phases of trade reform. Observing the individual
industries we find that the effective protection levels were the highest in the second phase
of trade reforms. The 1990s saw a rapid decline in the levels of protection based on
effective rates of protection. There was hardly any change in the percentage of products
subject to import licensing in the first two phases of trade reforms. From a near 100
percent non-tariff barrier level, we see a decline to around 25 percent import restrictions
by the end of 1990s. The import penetration rates do not exhibit any trend in the first
three phases of trade reforms. In the second half of 1990s, we see a marginal
improvement across industry groups.
The results for the use-based sectors are interesting. The ERP level is the highest
for the intermediate goods sector. ERP has increased across all the three-sectors in the
second phase of trade reforms. Within intermediate goods sector industries such as
fabricated structural metal products and iron & steel have high levels of protection across
all the phases. Capital goods sector has average ERP levels of less than 100 percent in
each of the phases and this is true of most of the industries in this sector. Consumer goods
41 The Annual Survey of Industries does not provide any trade-related information at any level of
diaaggregation.
39
industries on the other hand record a high level of ERP. The third phase of trade reforms
sees a sharp fall in ERP levels across all the three-use based sectors. The decline in the
fourth phase is even sharper across all use-based sectors.
The share of imports subject to import licensing show insignificant changes for
the first two phases. Most of the industries have 100 percent of their imports covered by
import licensing. Machine tools and Cotton textile industries are the only exceptions.
Within intermediate goods, chemicals n.e.c is the only industry to show a fall in import
coverage ratio. The removal of QRs in the 1980s was mostly concentrated in the items of
machinery and this is reflected in the import coverage ratios for many capital goods
industries in the second phase. The period 1991-95 however records significant changes
in the import coverage ratio for many industries in the intermediate and capital goods
sectors. There is a large decline in the averages for these sectors. In the fourth phase, we
observe significant declines in all three use-based sectors including the consumer goods
industries, which had 100 percent import restrictions in the first three phases of trade
reforms. Drugs & medicines, is the only industry where relaxation of import restrictions
started in the mid1980s.
The import penetration rates show that for most industries there was no change in
the ratios. In the intermediate goods sector, there was some evidence of marginal
improvement across the phases of trade reforms. For capital and consumer goods sector,
the first three periods of trade liberalization show no change in the ratio of imports to
domestic availability. The fourth phase however shows an improvement in import
penetration rates across all the use-based sectors.
Our evidence when compared with the post reforms protection levels (average
tariff rates of manufactures) of many developing countries [Indonesia (1999- 10.7%),
Malaysia (1997- 7.5%) and Sri Lanka (1997- 19 %)] show that the protection level for
Indian manufacturing at the end of four phase of trade liberalization still remains high.
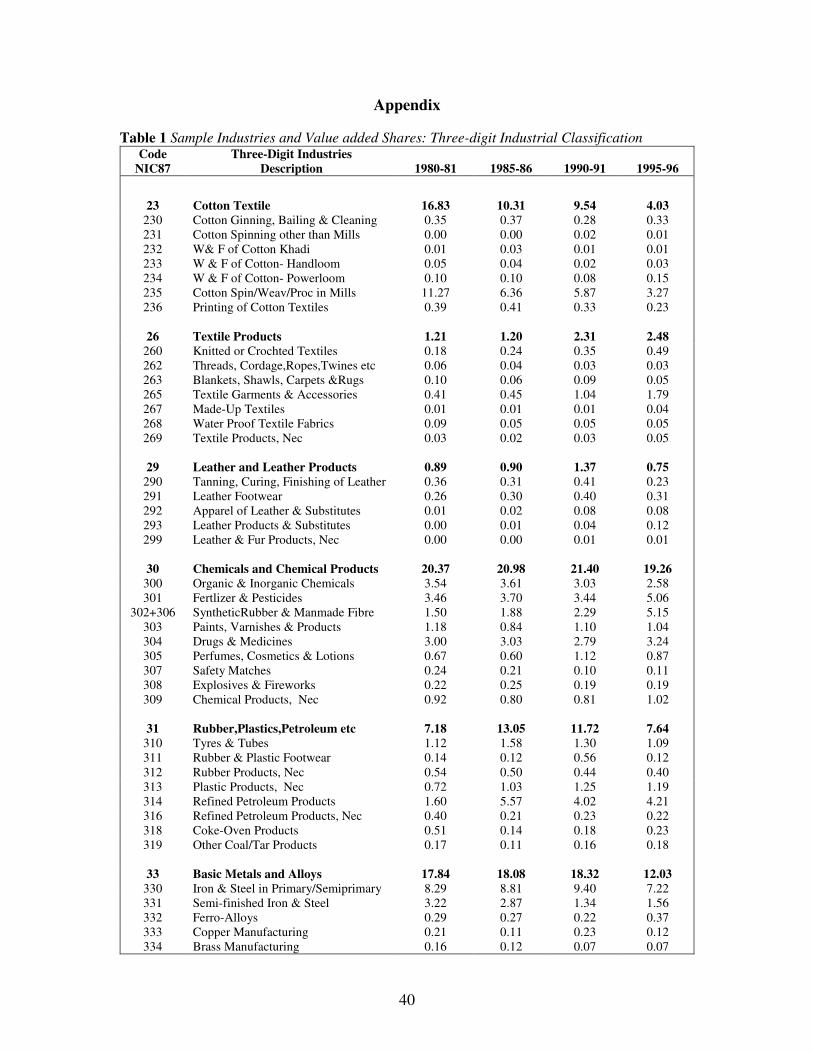
40
Appendix
Table 1 Sample Industries and Value added Shares: Three-digit Industrial ClassificationCode
NIC87Three-Digit Industries
Description 1980-81 1985-86 1990-91 1995-96
23 Cotton Textile 16.83 10.31 9.54 4.03230 Cotton Ginning, Bailing & Cleaning 0.35 0.37 0.28 0.33231 Cotton Spinning other than Mills 0.00 0.00 0.02 0.01232 W& F of Cotton Khadi 0.01 0.03 0.01 0.01233 W & F of Cotton- Handloom 0.05 0.04 0.02 0.03234 W & F of Cotton- Powerloom 0.10 0.10 0.08 0.15235 Cotton Spin/Weav/Proc in Mills 11.27 6.36 5.87 3.27236 Printing of Cotton Textiles 0.39 0.41 0.33 0.23
26 Textile Products 1.21 1.20 2.31 2.48260 Knitted or Crochted Textiles 0.18 0.24 0.35 0.49262 Threads, Cordage,Ropes,Twines etc 0.06 0.04 0.03 0.03263 Blankets, Shawls, Carpets &Rugs 0.10 0.06 0.09 0.05265 Textile Garments & Accessories 0.41 0.45 1.04 1.79267 Made-Up Textiles 0.01 0.01 0.01 0.04268 Water Proof Textile Fabrics 0.09 0.05 0.05 0.05269 Textile Products, Nec 0.03 0.02 0.03 0.05
29 Leather and Leather Products 0.89 0.90 1.37 0.75290 Tanning, Curing, Finishing of Leather 0.36 0.31 0.41 0.23291 Leather Footwear 0.26 0.30 0.40 0.31292 Apparel of Leather & Substitutes 0.01 0.02 0.08 0.08293 Leather Products & Substitutes 0.00 0.01 0.04 0.12299 Leather & Fur Products, Nec 0.00 0.00 0.01 0.01
30 Chemicals and Chemical Products 20.37 20.98 21.40 19.26300 Organic & Inorganic Chemicals 3.54 3.61 3.03 2.58301 Fertlizer & Pesticides 3.46 3.70 3.44 5.06
302+306 SyntheticRubber & Manmade Fibre 1.50 1.88 2.29 5.15303 Paints, Varnishes & Products 1.18 0.84 1.10 1.04304 Drugs & Medicines 3.00 3.03 2.79 3.24305 Perfumes, Cosmetics & Lotions 0.67 0.60 1.12 0.87307 Safety Matches 0.24 0.21 0.10 0.11308 Explosives & Fireworks 0.22 0.25 0.19 0.19309 Chemical Products, Nec 0.92 0.80 0.81 1.02
31 Rubber,Plastics,Petroleum etc 7.18 13.05 11.72 7.64310 Tyres & Tubes 1.12 1.58 1.30 1.09311 Rubber & Plastic Footwear 0.14 0.12 0.56 0.12312 Rubber Products, Nec 0.54 0.50 0.44 0.40313 Plastic Products, Nec 0.72 1.03 1.25 1.19314 Refined Petroleum Products 1.60 5.57 4.02 4.21316 Refined Petroleum Products, Nec 0.40 0.21 0.23 0.22318 Coke-Oven Products 0.51 0.14 0.18 0.23319 Other Coal/Tar Products 0.17 0.11 0.16 0.18
33 Basic Metals and Alloys 17.84 18.08 18.32 12.03330 Iron & Steel in Primary/Semiprimary 8.29 8.81 9.40 7.22331 Semi-finished Iron & Steel 3.22 2.87 1.34 1.56332 Ferro-Alloys 0.29 0.27 0.22 0.37333 Copper Manufacturing 0.21 0.11 0.23 0.12334 Brass Manufacturing 0.16 0.12 0.07 0.07
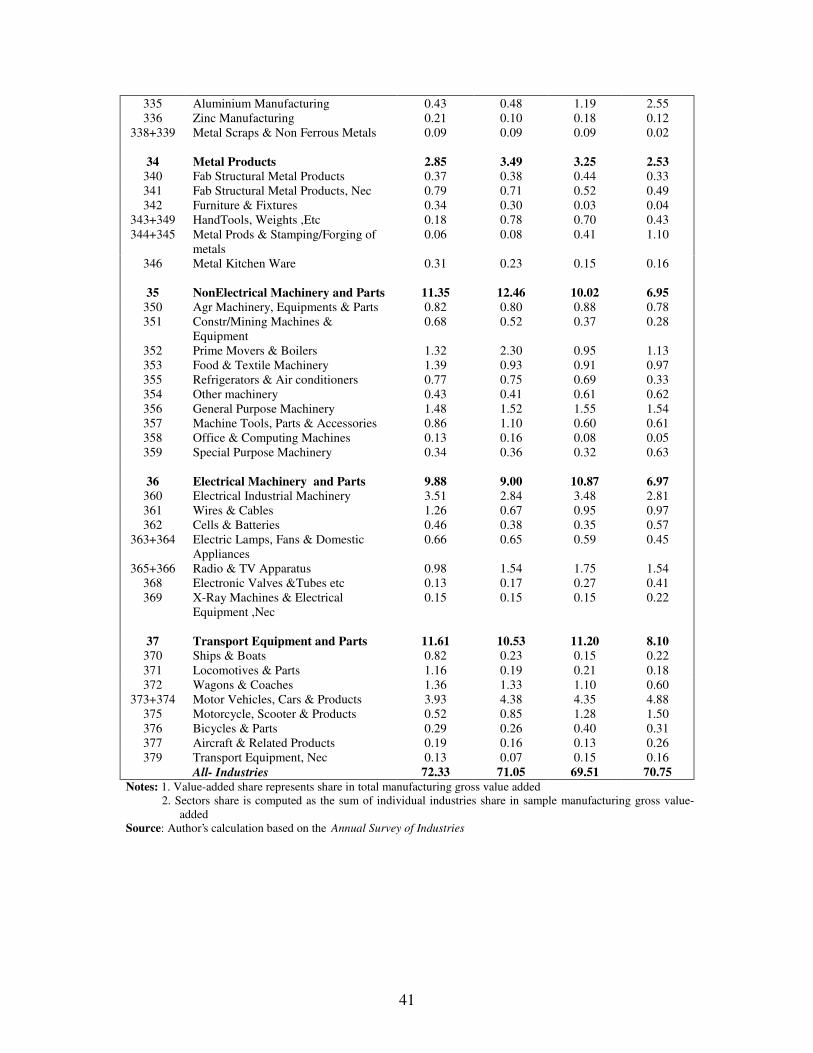
41
335 Aluminium Manufacturing 0.43 0.48 1.19 2.55336 Zinc Manufacturing 0.21 0.10 0.18 0.12
338+339 Metal Scraps & Non Ferrous Metals 0.09 0.09 0.09 0.02
34 Metal Products 2.85 3.49 3.25 2.53340 Fab Structural Metal Products 0.37 0.38 0.44 0.33341 Fab Structural Metal Products, Nec 0.79 0.71 0.52 0.49342 Furniture & Fixtures 0.34 0.30 0.03 0.04
343+349 HandTools, Weights ,Etc 0.18 0.78 0.70 0.43344+345 Metal Prods & Stamping/Forging of
metals0.06 0.08 0.41 1.10
346 Metal Kitchen Ware 0.31 0.23 0.15 0.16
35 NonElectrical Machinery and Parts 11.35 12.46 10.02 6.95350 Agr Machinery, Equipments & Parts 0.82 0.80 0.88 0.78351 Constr/Mining Machines &
Equipment0.68 0.52 0.37 0.28
352 Prime Movers & Boilers 1.32 2.30 0.95 1.13353 Food & Textile Machinery 1.39 0.93 0.91 0.97355 Refrigerators & Air conditioners 0.77 0.75 0.69 0.33354 Other machinery 0.43 0.41 0.61 0.62356 General Purpose Machinery 1.48 1.52 1.55 1.54357 Machine Tools, Parts & Accessories 0.86 1.10 0.60 0.61358 Office & Computing Machines 0.13 0.16 0.08 0.05359 Special Purpose Machinery 0.34 0.36 0.32 0.63
36 Electrical Machinery and Parts 9.88 9.00 10.87 6.97360 Electrical Industrial Machinery 3.51 2.84 3.48 2.81361 Wires & Cables 1.26 0.67 0.95 0.97362 Cells & Batteries 0.46 0.38 0.35 0.57
363+364 Electric Lamps, Fans & DomesticAppliances
0.66 0.65 0.59 0.45
365+366 Radio & TV Apparatus 0.98 1.54 1.75 1.54368 Electronic Valves &Tubes etc 0.13 0.17 0.27 0.41369 X-Ray Machines & Electrical
Equipment ,Nec0.15 0.15 0.15 0.22
37 Transport Equipment and Parts 11.61 10.53 11.20 8.10370 Ships & Boats 0.82 0.23 0.15 0.22371 Locomotives & Parts 1.16 0.19 0.21 0.18372 Wagons & Coaches 1.36 1.33 1.10 0.60
373+374 Motor Vehicles, Cars & Products 3.93 4.38 4.35 4.88375 Motorcycle, Scooter & Products 0.52 0.85 1.28 1.50376 Bicycles & Parts 0.29 0.26 0.40 0.31377 Aircraft & Related Products 0.19 0.16 0.13 0.26379 Transport Equipment, Nec 0.13 0.07 0.15 0.16
All- Industries 72.33 71.05 69.51 70.75Notes: 1. Value-added share represents share in total manufacturing gross value added 2. Sectors share is computed as the sum of individual industries share in sample manufacturing gross value-
addedSource: Author’s calculation based on the Annual Survey of Industries
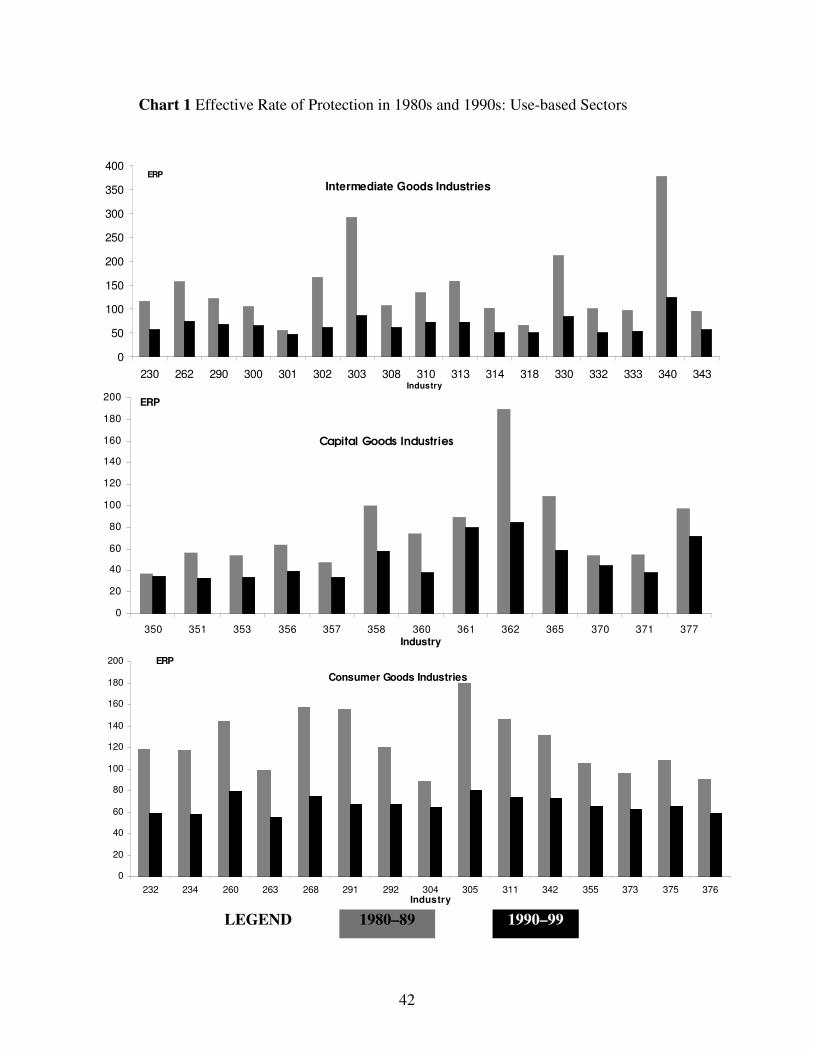
42
Chart 1 Effective Rate of Protection in 1980s and 1990s: Use-based Sectors
Intermediate Goods Industries
0
50
100
150
200
250
300
350
400
230 262 290 300 301 302 303 308 310 313 314 318 330 332 333 340 343Industry
ERP
Capital Goods Industries
0
20
40
60
80
100
120
140
160
180
200
350 351 353 356 357 358 360 361 362 365 370 371 377Industry
ERP
Consumer Goods Industries
0
20
40
60
80
100
120
140
160
180
200
232 234 260 263 268 291 292 304 305 311 342 355 373 375 376Industry
ERP
LEGEND 1980–89 1990–99
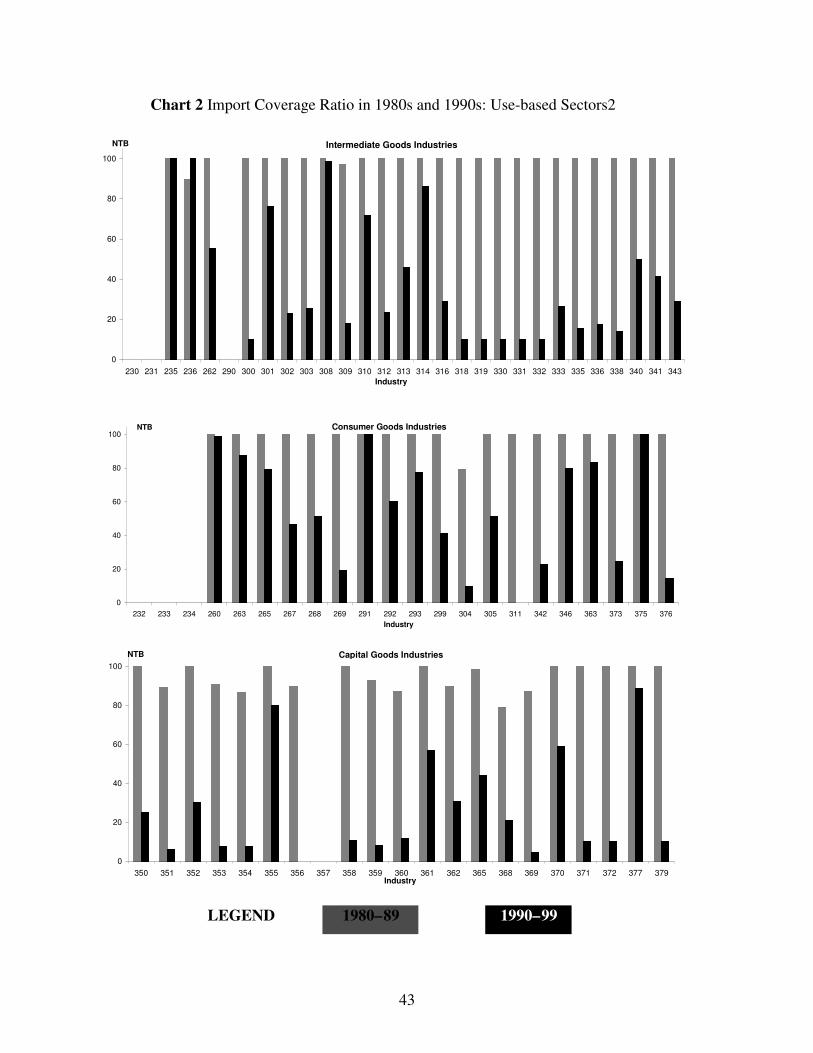
43
Chart 2 Import Coverage Ratio in 1980s and 1990s: Use-based Sectors2
Intermediate Goods Industries
0
20
40
60
80
100
230 231 235 236 262 290 300 301 302 303 308 309 310 312 313 314 316 318 319 330 331 332 333 335 336 338 340 341 343Industry
NTB
Capital Goods Industries
0
20
40
60
80
100
350 351 352 353 354 355 356 357 358 359 360 361 362 365 368 369 370 371 372 377 379Industry
NTB
Consumer Goods Industries
0
20
40
60
80
100
232 233 234 260 263 265 267 268 269 291 292 293 299 304 305 311 342 346 363 373 375 376Industry
NTB
LEGEND 1980–89 1990–99
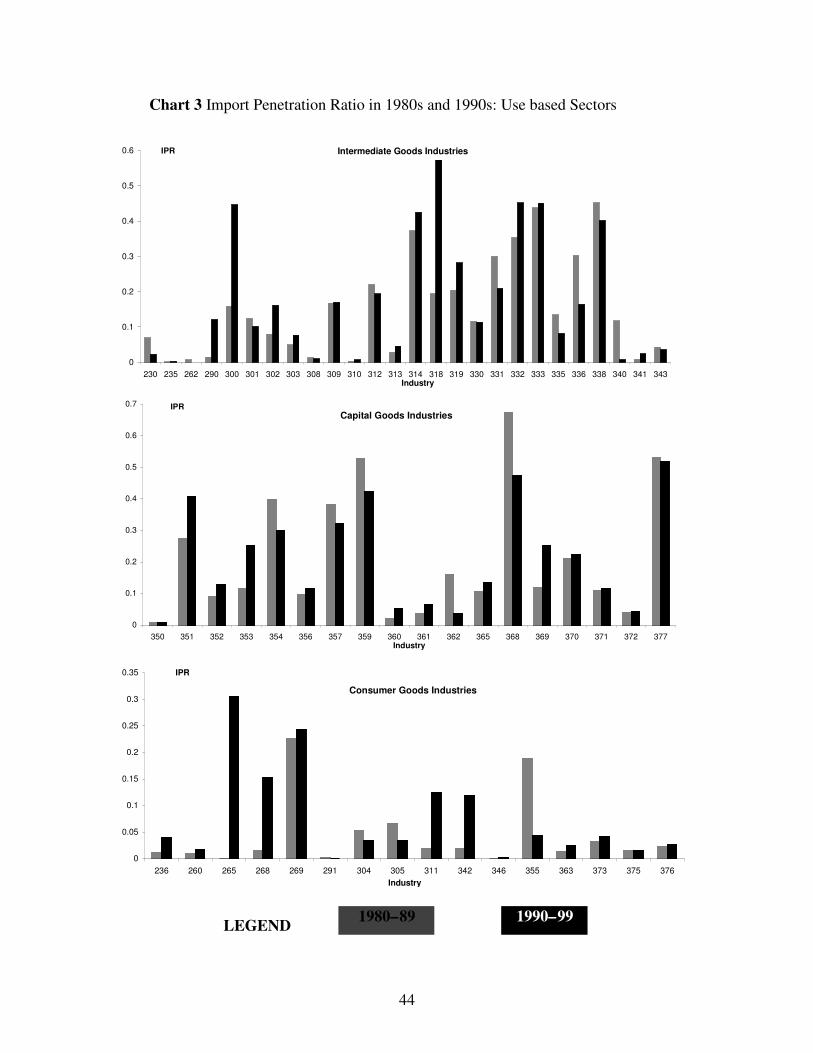
44
Chart 3 Import Penetration Ratio in 1980s and 1990s: Use based Sectors
Intermediate Goods Industries
0
0.1
0.2
0.3
0.4
0.5
0.6
230 235 262 290 300 301 302 303 308 309 310 312 313 314 318 319 330 331 332 333 335 336 338 340 341 343Industry
IPR
Capital Goods Industries
0
0.1
0.2
0.3
0.4
0.5
0.6
0.7
350 351 352 353 354 356 357 359 360 361 362 365 368 369 370 371 372 377Industry
IPR
Consumer Goods Industries
0
0.05
0.1
0.15
0.2
0.25
0.3
0.35
236 260 265 268 269 291 304 305 311 342 346 355 363 373 375 376Industry
IPR
LEGEND 1980–89 1990–99
45
References
Aksoy, A.(1991), ‘The Indian Trade Regime’, Policy Research Working Paper # 989,The World Bank, Washington DC.
Aksoy. A. and F.M. Ettori (1992), ‘Protection and Industrial Structure in India’ PolicyResearch Working Paper # 990, The World Bank, Washington DC
Alexander, P.C. (1977), Report on the Committee on Import-Export Policies andProcedures, Ministry of Commerce, Government of India.
Bhagwati, J.N. (1965), ‘On the Equivalence of Tariffs and Quotas’ in Baldwin, R (ed.)(1989), Trade, Growth and The Balance of Payments’ North Holland,Amsterdam ( Rand McNally and Corporation, Chicago).
Bhagwati, J.N. and T.N.Srinivasan (1975), Foreign Trade Regimes and EconomicDevelopment: India, NBER, NewYork.
Chadha, R. (2000), ‘The Decade of India’s Economic Transformation: Impact Analysis ofUnilateral and Global Changes in Trade Policy,’ Paper presented at theConference to Honour Professor K.L.Krishna, Centre for DevelopmentEconomics, Delhi School of Economics, Dec20-22.
Chelliah, R.J. (1992), Tax Reforms Committee: Final Report, Parts 1 & 2, Government ofIndia.
Corden, W. M. (1974), Trade Policy and Economic Welfare, Clarendon Press, Oxford.
Deardorff, A. (1987), ‘Why do Governments Prefer Non-tariff Barrier?’, Carnegie-Rochester Conference Series on Public Policy, 26, 191-216.
Deardorff, A. and R. Stern (1999), Measurement of Non-tariff Barriers, University ofMichigan Press, Ann Arbor.
Gang, I.and M.Pandey (1998), ‘What was Protected? Measuring India’s Tariff Barriers1968-1997,’ Indian Economic Review, Vol. xxxiii, No.2, 119-152.
Greenaway, D. (1988), ‘Evaluating the Structure of Production in Less DevelopedCountries in D.Greenway (ed.) Economic Development and InternationalTrade, Macmillan, London.
Greenaway, D. and C. Milner (1993), Trade and Industrial Policy in DevelopingCountries- A Manual for Policy Analysis, Macmillan, London.
46
Goldar, B.N., A.V.L.Narayana and S.N.Hasheem (1992), ‘Structure of Nominal TariffRates in India’ , Studies in Industrial Development, Office of the EconomicAdvisor, Ministry of Industry, Government of India.
Goldar,B.N. and S.N.Hasheem (1992), ‘India’s Tariff Structure: Effective Rates ofProtection of Indian Industries,’ Studies in Industrial Development, Office of theEconomic Advisor, Ministry of Industry, Government of India.
Goldar,B.N. and S.N.Hasheem (1994), ‘Study of India’s Tariff Structure: Effect of TariffProtection on Domestic Industries,’ Studies in Industrial Development, Office ofthe Economic Advisor, Ministry of Industry, Government of India.
Goldar, B.N. and V.S. Renganathan (1990), ‘Economic Reforms and R&D Expenditure inIndustrial Firms in India,’ Indian Economic Review, Vol.46, No.2, 60-75.
Hasheem, S.N. (2001), Protection in Indian Manufacturing: An Empirical Study,Macmillan India Ltd, Delhi.
Hussain, Abid (1984), Report of the Committee on Trade Policies, Ministry ofCommerce, Government of India.
Johnson,H.G. (1960), ‘The Costs of Protection and Scientific Tariff,’ Journal of PoliticalEconomy, 68,327-345.
Joshi, V. and I.M.D. Little (1994), India’s Economic Reforms 1991-2001, OxfordUniversity Press, Delhi.
Krueger, A. O. (1981), ‘Interactions between Inflation and Trade Objectives inStabilization Programs ‘in Cline, W. and S. Weintraub (ed), EconomicStabilization in Developing Countries, Brookings Institution, Washington DC.
Krueger, A.O. (1984), ‘Trade Policies in Developing Countries’ in Jones, R.W andP.B.Kennen (ed.) Handbook of International Economics, Vol-1, Elsevier SciencePublishers.
Meade, J. (1951), The Theory of Commercial Policy, Vol-1: The Balance of Payments,Oxford University Press, Oxford.
Mehta, R. (1997), ‘Trade Policy Reforms, 1991-92 to 1995-96: Their Impact on ExternalTrade’, Economic and Political Weekly, April 12, 779-784.
Mehta, R. and S.K Mohanty (1999), WTO and Industrial Tariffs: An EmpiricalAnalysis for India, Research and Information System for the Non-Aligned andOther Developing Countries, Delhi.
47
Mishra.S.N. and B.N.Goldar (1996) India’s Trade and Investment Policies, Mimeo,Institute of Economic Growth, February.
Narasimham, M. (1984) Report of the Committee to Examine the Principles of aPossible Shift from Physical to Financial Controls, Government of India.
Nambiar, R.G. (1983), ‘Protection to Domestic Industry: Fact and Theory,’ Economicand Political Weekly, 1-8 January, 27-32.
Panchmukhi,V.R. (1983), Trade Policies of India: A Quantitative Assessment ConceptsPublishing house, New Delhi.
Pandey,M. (1999) Trade Liberalization: Non Tariff Barriers in India, ReportSubmitted to the Ministry of Finance, Government of India.
Pursell, G. (1988), ‘Trade Policies and Protection in India’, The World Bank, WashingtonDC, August.
Rao, N. (1985), Exchange Rate and Commercial Policy in a Controlled Trade Regime:A Case Study of India, Ph.D Dissertation, Oxford University.
Srinivasan, T.N. (1993) Agriculture and Trade in China and India- Policies andPerformance since 1950, ICEG- California
World Bank (1989) India-An Industrializing Economy in Transition, A World BankCountry Study, The World Bank, Washington DC.