The leading digit distribution of the worldwide Illicit Financial Flows
13
arXiv:1201.3432v3 [physics.soc-ph] 15 Nov 2012 November 16, 2012 1:26 arxiv The leading digit distribution of the worldwide Illicit Financial Flows T. A. Mir * Nuclear Research Laboratory, Astrophysical Sciences Division, Bhabha Atomic Research Centre, Srinagar-190 006, Jammu and Kashmir, India * [email protected] 1. Abstract Benford’s law states that in data sets from different phenomena leading digits tend to be distributed logarithmically such that the numbers beginning with smaller digits occur more often than those with larger ones. Particularly, the law is known to hold for different types of financial data. The Illicit Financial Flows (IFFs) exiting the developing countries are frequently discussed as hidden resources which could have been otherwise properly utilized for their development. We investigate here the distribution of the leading digits in the recent data on estimates of IFFs to look for the existence of a pattern as predicted by Benford’s law and establish that the frequency of occurrence of the leading digits in these estimates does closely follow the law. 2. Keywords Benford’s law; developing countries; illicit financial flows 3. Introduction The leading digit phenomenon stands for a counter-intuitive observation first made by S. Newcomb who found the starting pages of logarithmic table books to be dirtier than the last ones and attributed this effect to the fact that numbers with smaller first non-zero digits are more often looked for [1]. The curious observation went quite unnoticed till F. Benford rediscovered it and by analyzing data from diverse fields established the law in the form of following empirical mathematical equation [2] P (d)= log 10 (1 + 1 d ),d =1, 2, 3..., 9 (1) 1
-
Upload
independent -
Category
Documents
-
view
3 -
download
0
Transcript of The leading digit distribution of the worldwide Illicit Financial Flows
arX
iv:1
201.
3432
v3 [
phys
ics.
soc-
ph]
15
Nov
201
2
November 16, 2012 1:26 arxiv
The leading digit distribution of the worldwide Illicit
Financial Flows
T. A. Mir∗
Nuclear Research Laboratory, Astrophysical Sciences Division,
Bhabha Atomic Research Centre,
Srinagar-190 006, Jammu and Kashmir, India∗[email protected]
1. Abstract
Benford’s law states that in data sets from different phenomena leading digits tend
to be distributed logarithmically such that the numbers beginning with smaller
digits occur more often than those with larger ones. Particularly, the law is known
to hold for different types of financial data. The Illicit Financial Flows (IFFs) exiting
the developing countries are frequently discussed as hidden resources which could
have been otherwise properly utilized for their development. We investigate here
the distribution of the leading digits in the recent data on estimates of IFFs to look
for the existence of a pattern as predicted by Benford’s law and establish that the
frequency of occurrence of the leading digits in these estimates does closely follow
the law.
2. Keywords
Benford’s law; developing countries; illicit financial flows
3. Introduction
The leading digit phenomenon stands for a counter-intuitive observation first made
by S. Newcomb who found the starting pages of logarithmic table books to be dirtier
than the last ones and attributed this effect to the fact that numbers with smaller
first non-zero digits are more often looked for [1]. The curious observation went quite
unnoticed till F. Benford rediscovered it and by analyzing data from diverse fields
established the law in the form of following empirical mathematical equation [2]
P (d) = log10(1 +1
d), d = 1, 2, 3..., 9 (1)
1
November 16, 2012 1:26 arxiv
2
where P (d) is the probability of a number having the first non-zero digit d and log10is logarithmic to base 10. Thus in any given data set the theoretical probability of
occurrence of digits 1 to 9 as the leading digit is as shown in Table 1.
Table 1: The Benford distribution of leading digits
Digit 1 2 3 4 5 6 7 8 9Proportion 0.301 0.176 0.125 0.097 0.079 0.067 0.058 0.051 0.046
Though a complete explanation of Benford’s law is outstanding, significant advances
have been made in the understanding of this ubiquitous law [3]. It has been found
to be scale invariant, being the only digit law to be so, which means that a change
in the units of data measurement does not affect the validity of the law [4]. This
scale-invariance was further shown to imply base-invariance, being independent of
the base 2, 8 or 10 in which numbers are expressed [5]. Further the law has been
shown to arise naturally for processes whose time evolutions are governed by mul-
tiplicative fluctuations [6].
Data from a variety of phenomena have been found to follow Benford’s law. The
leading digits of demographic data like populations of cities [2], countries [7] and
world religions [8] are distributed according to this law. Similarly scientific data like
complex atomic spectra [9], full decay widths of hadrons [10] and magnitude of earth
quakes [11] follow the law. But interest in the peculiar law surged due to its frequent
appearance amongst the various types of financial data. The leading digits of stock
market data [6, 12], winning bids for certain eBay auctions [13], health insurance
data [14] and the invoice data of oil companies [15] are distributed as predicted by
Benford’s law.
Benford’s law has been used to assess the quality of the macroeconomic data sub-
mitted by countries to the World Bank and significant deviations from the law
suggesting deliberate falsification have been found for the data from the developing
countries [16, 17]. Further, deviations from Benford’s law support the hypothesis
of occasional misreporting of economic data by some countries for strategic pur-
poses [18]. A recent example is the macroeconomic data relevant to the deficit
criteria reported by Greece, a member state of European Union, to Eurostat for
which greatest deviation from Benford’s law was found amongst the data from all
euro states [19].
In the context of the current financial crisis an overhaul of the whole global finan-
cial system is necessitated. Therefore, the estimates of IFFs have generated a lot
of media and public interest [21, 22]. Due to their direct relation to corruption and
crime, IFFs have also been identified as major impediments to upliftment of social
standards across developing countries [20]. We investigate here whether the data
on IFFs from developing countries exhibits the pattern in the distribution of the
leading digits as predicted by Benford’s law.
November 16, 2012 1:26 arxiv
3
4. Data
The data source for the present analysis is the Global Financial Integrity (GFI),
a research and advocacy organization working to curtail IFFs out of developing
countries [23]. Researchers at GFI by the application of the current economic models
to the most recent macroeconomic data available, estimate the volume and pattern
of IFFs exiting the developing world over different periods of time. We analyze four
reports of GFI for checking the conformity of the data to Benford’s law [24–27].
4.1. Data analysis and Results
Based on the macroeconomic data available from international financial institutions,
the GFI reports study the IFFs from 160 developing countries of the world grouped
into five regions. The entire list is normalized to exclude the countries for which
the illicit flows don’t exist by subjecting it to a two-stage filtration process (i) out
of the five years period outflows must exist for at least three years and (ii) exceed
the threshold (10 percent) with respect to exports [24]. The restrictions imposed by
the filtration process give conservative or low end estimates of such financial flows
from developing countries. Countries that fail to pass through either stages of the
filtration process are eliminated from the list. Thus for each report we have a large
non-normalized and a slightly smaller normalized list of countries and consequently
for each report we analyze both the lists.
We detail the statistical analysis of the IFFs data from the four reports in Tables
2-5. The NObs, the number of times each digit from 1 to 9 (column 1) appears as
leading digit are shown in subsequent columns along with NBen the corresponding
frequency as predicted by Benford’s law:
NBen = Nlog10(1 +1
d) (2)
where N is the total number of countries for which the IFFs data is reported. A vi-
sual inspection of the tables shows clearly that the observed digit frequencies closely
match those predicted by Benford’s law. However, impossibility of having an actual
proportion of leading digits that is exactly equal to Benford proportion necessitates
a quantification of the degree of closeness of the two [28]. To determine an accept-
able range for the observed distribution we use three statistical approaches. First to
assess whether the observed frequencies of the leading digits are consistent with an
acceptable range of the theoretically predicted values we calculate the corresponding
confidence intervals (CI) by the following formula [29]
E = Zcritical
√
P (d)(1 − P (d))/N (3)
where Zcritical is the Z-value associated with the desired CI, P (d) is defined in
equation (1). The CI’s are shown in brackets along with NBen, the predicted digit
frequencies. For 95% CI the Zcritical is 1.96 [30]. For example, as shown in column
2 of Table 2 out of a total of N=144, the observed count for digit 1 as leading digit
is 37 whereas that expected from Benford’s law is 43.3 with a confidence interval of
November 16, 2012 1:26 arxiv
4
±7.5.
Further, to determine the overall behavior of the observed distribution with re-
spect to that predicted by Benford’s law we state the Null Hypothesis, HO that
the observed and predicted distributions of the leading digits are same and then to
examine the goodness-of-fit we use Pearson’s χ2 test defined as
χ2(n− 1) =
n∑
i=1
(NObs −NBen)2
NBen
(4)
For a data set with n − 1 = 9 − 1 = 8 degrees of freedom, the critical value of
χ2 at 5% level of significance is 15.507. If the value of the calculated χ2 is less than
the critical value then we accept the null hypothesis and conclude that the data fits
Benford’s law.
χ2 test is the primary choice of researchers for examining the goodness-of-fit of
a set of data to a Benford distribution. However, rejection of the null hypothesis
becomes difficult if the number of observations in a data set is small. Further,
for a distribution decreasing like a Benford one, the Kolmogorov-Smirnoff (K-S)
goodness-of-fit test has been shown to be more powerful than the traditional χ2 [31].
The K-S test is based on the cumulative density function and uses the largest of
the absolute of the differences between the expected and the observed cumulative
proportions of the leading digits. The critical values of the K-S test are given by
the equation
K − Scritical =1.36√N
(5)
where 1.36 is the constant for 5% level of significance and N is the number of
observations [28].
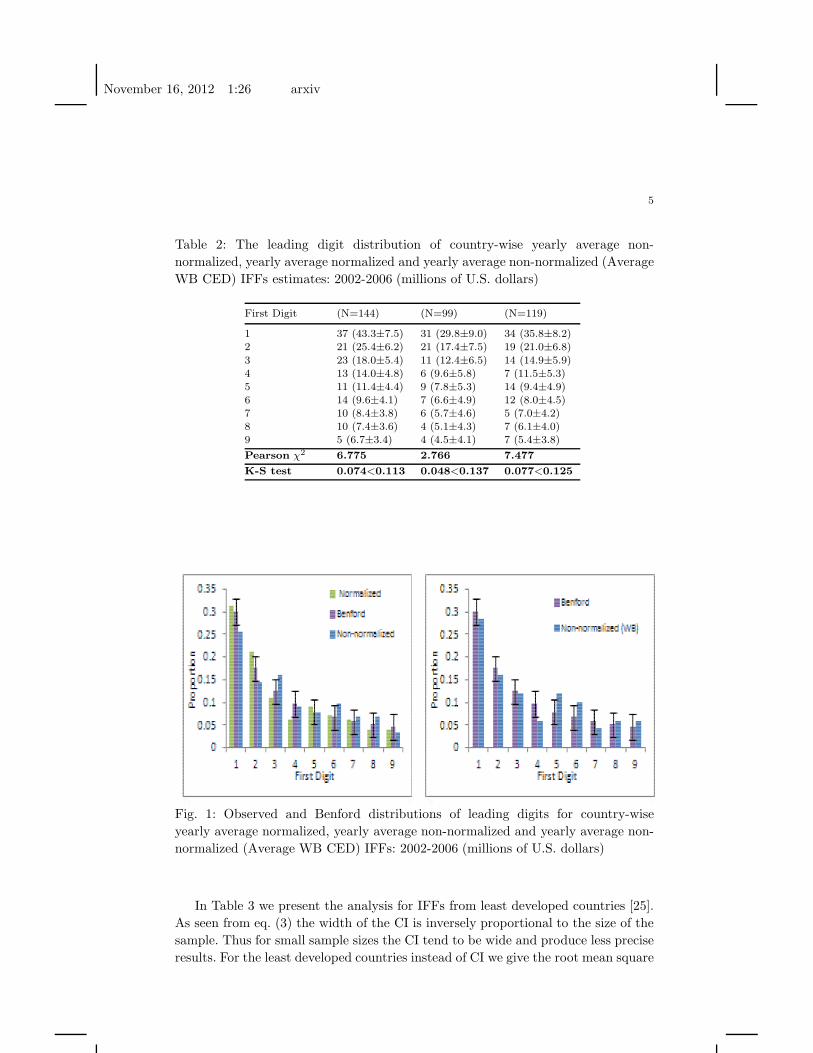
In Table 2 we summarize the observed distribution of the leading digits for the three
data sets from the 2008 report (Tables 18 and 19) of GFI which covers the IFFs
data for the period of 2002-2006 [24]. For each data set, the calculated χ2 and the
K-S test statistic are respectively shown in the last two rows of Table 2. As can
be seen from column 2 of last but one row, the χ2 of 6.775 for the non-normalized
list is less than the critical value of 15.507. Further, for the same data set the
calculated K-S test statistic (the last row and column 2) is 0.074, a value which is
again less than the critical value (as shown) of 0.113. Hence both the tests call for
the acceptance of the null hypothesis which means that the non-normalized IFFs
data closely resembles a Benford distribution. After elimination of the 45 countries
via the normalization only 99 countries (column 3) are left in the list for which
again both the χ2 of 2.766 and K-S test statistic of 0.048 turn out be far less than
the respective critical values of 15.507 and 0.137 and the null hypothesis again is
accepted. Furthermore, in column 4 we show the statistics for the non-normalized
IFFs data of 119 countries estimated using the World Bank Changes in External
Debt (WB CED) model. Both the χ2 of 7.477 and K-S statistic of 0.077 again
turn out to be less than the respective cutoff values making the null hypothesis
acceptable.
November 16, 2012 1:26 arxiv
5
Table 2: The leading digit distribution of country-wise yearly average non-
normalized, yearly average normalized and yearly average non-normalized (Average
WB CED) IFFs estimates: 2002-2006 (millions of U.S. dollars)
First Digit (N=144) (N=99) (N=119)
1 37 (43.3±7.5) 31 (29.8±9.0) 34 (35.8±8.2)2 21 (25.4±6.2) 21 (17.4±7.5) 19 (21.0±6.8)
3 23 (18.0±5.4) 11 (12.4±6.5) 14 (14.9±5.9)4 13 (14.0±4.8) 6 (9.6±5.8) 7 (11.5±5.3)5 11 (11.4±4.4) 9 (7.8±5.3) 14 (9.4±4.9)6 14 (9.6±4.1) 7 (6.6±4.9) 12 (8.0±4.5)7 10 (8.4±3.8) 6 (5.7±4.6) 5 (7.0±4.2)8 10 (7.4±3.6) 4 (5.1±4.3) 7 (6.1±4.0)9 5 (6.7±3.4) 4 (4.5±4.1) 7 (5.4±3.8)
Pearson χ26.775 2.766 7.477
K-S test 0.074<0.113 0.048<0.137 0.077<0.125
Fig. 1: Observed and Benford distributions of leading digits for country-wise
yearly average normalized, yearly average non-normalized and yearly average non-
normalized (Average WB CED) IFFs: 2002-2006 (millions of U.S. dollars)
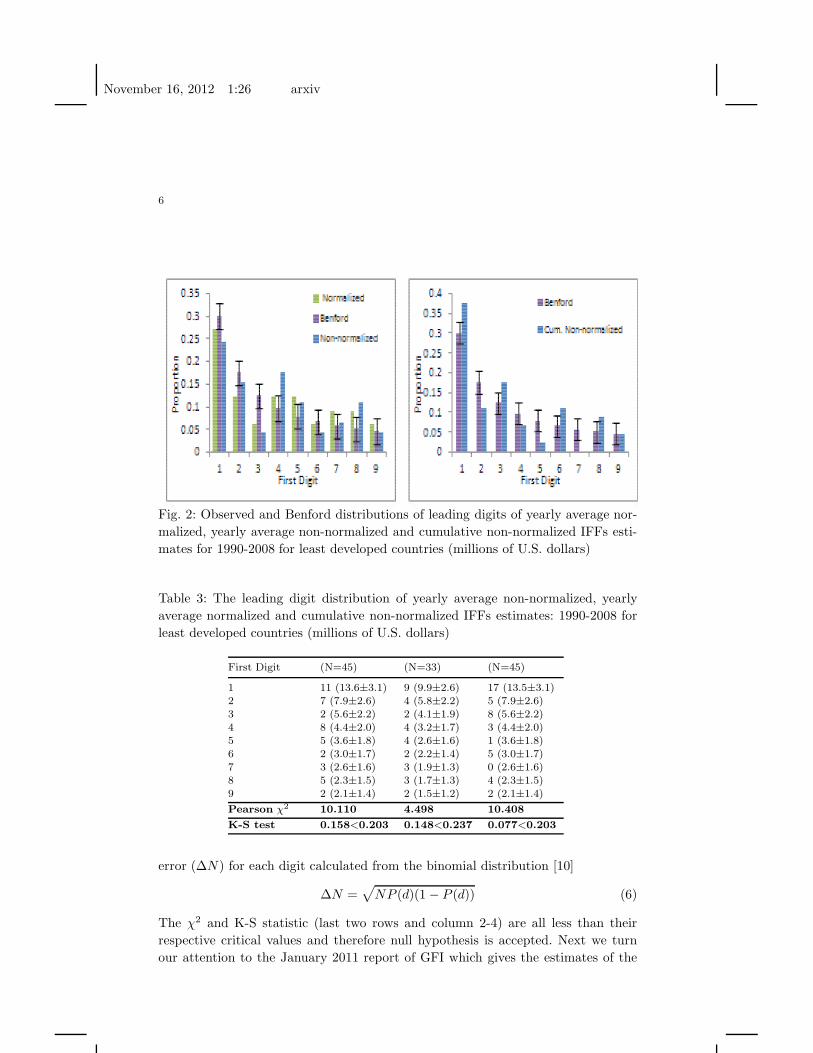
In Table 3 we present the analysis for IFFs from least developed countries [25].
As seen from eq. (3) the width of the CI is inversely proportional to the size of the
sample. Thus for small sample sizes the CI tend to be wide and produce less precise
results. For the least developed countries instead of CI we give the root mean square
November 16, 2012 1:26 arxiv
6
Fig. 2: Observed and Benford distributions of leading digits of yearly average nor-
malized, yearly average non-normalized and cumulative non-normalized IFFs esti-
mates for 1990-2008 for least developed countries (millions of U.S. dollars)
Table 3: The leading digit distribution of yearly average non-normalized, yearly
average normalized and cumulative non-normalized IFFs estimates: 1990-2008 for
least developed countries (millions of U.S. dollars)
First Digit (N=45) (N=33) (N=45)
1 11 (13.6±3.1) 9 (9.9±2.6) 17 (13.5±3.1)2 7 (7.9±2.6) 4 (5.8±2.2) 5 (7.9±2.6)3 2 (5.6±2.2) 2 (4.1±1.9) 8 (5.6±2.2)4 8 (4.4±2.0) 4 (3.2±1.7) 3 (4.4±2.0)5 5 (3.6±1.8) 4 (2.6±1.6) 1 (3.6±1.8)6 2 (3.0±1.7) 2 (2.2±1.4) 5 (3.0±1.7)7 3 (2.6±1.6) 3 (1.9±1.3) 0 (2.6±1.6)8 5 (2.3±1.5) 3 (1.7±1.3) 4 (2.3±1.5)9 2 (2.1±1.4) 2 (1.5±1.2) 2 (2.1±1.4)
Pearson χ210.110 4.498 10.408
K-S test 0.158<0.203 0.148<0.237 0.077<0.203
error (∆N) for each digit calculated from the binomial distribution [10]
∆N =√
NP (d)(1 − P (d)) (6)
The χ2 and K-S statistic (last two rows and column 2-4) are all less than their
respective critical values and therefore null hypothesis is accepted. Next we turn
our attention to the January 2011 report of GFI which gives the estimates of the
November 16, 2012 1:26 arxiv
7
Table 4: The leading digit distribution of country-wise largest average non-
normalized, largest average normalized , cumulative non-normalized, cumulative
normalized IFFs estimates: 2000-2008 (millions of U.S. dollars)
First Digit (N=152) (N=125) (N=154) (N=127)
1 41 (45.6±7.3) 40 (37.6±8.0) 44 (46.4±7.3) 43 (38.2±8.0)2 27 (26.8±6.1) 21 (22.0±6.7) 28 (27.1±6.0) 19 (22.4±6.6)
3 20 (19.0±5.3) 18 (15.6±5.8) 20 (19.2±5.2) 21 (15.9±5.8)4 15 (14.7±4.7) 13 (12.1±5.2) 18 (14.9±4.7) 10 (12.3±5.2)5 19 (12.0±4.3) 12 (9.9±4.7) 15 (12.2±4.3) 13 (10.1±4.7)6 10 (10.2±4.0) 6 (8.4±4.4) 11 (10.3±4.0) 8 (8.5±4.4)7 10 (8.8±3.7) 8 (7.2±4.1) 4 (8.9±3.7) 4 (7.4±4.1)8 6 (7.8±3.5) 4 (6.4±3.9) 6 (7.9±3.5) 4 (6.5±3.8)9 4 (7.0±3.3) 3 (5.7±3.7) 8 (7.0±3.3) 5 (5.8±3.6)
Pearson χ26.409 4.008 4.803 6.695
K-S test 0.031<0.110 0.054<0.122 0.038<0.110 0.056<0.121
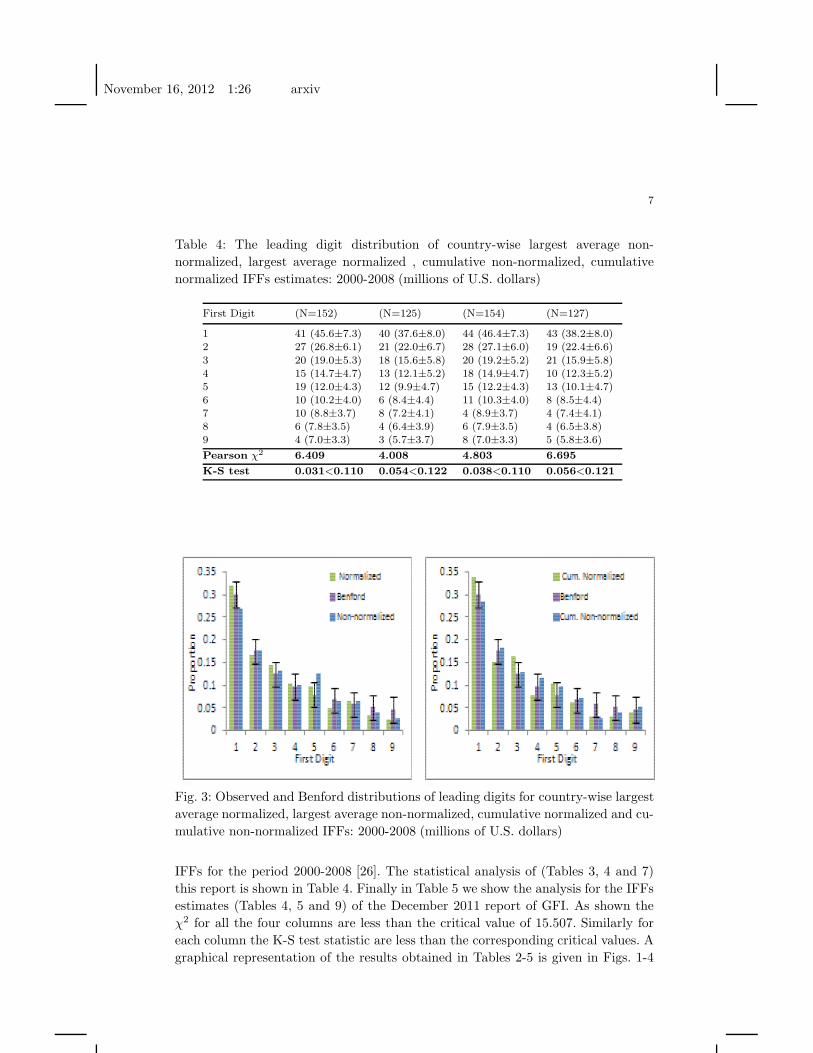
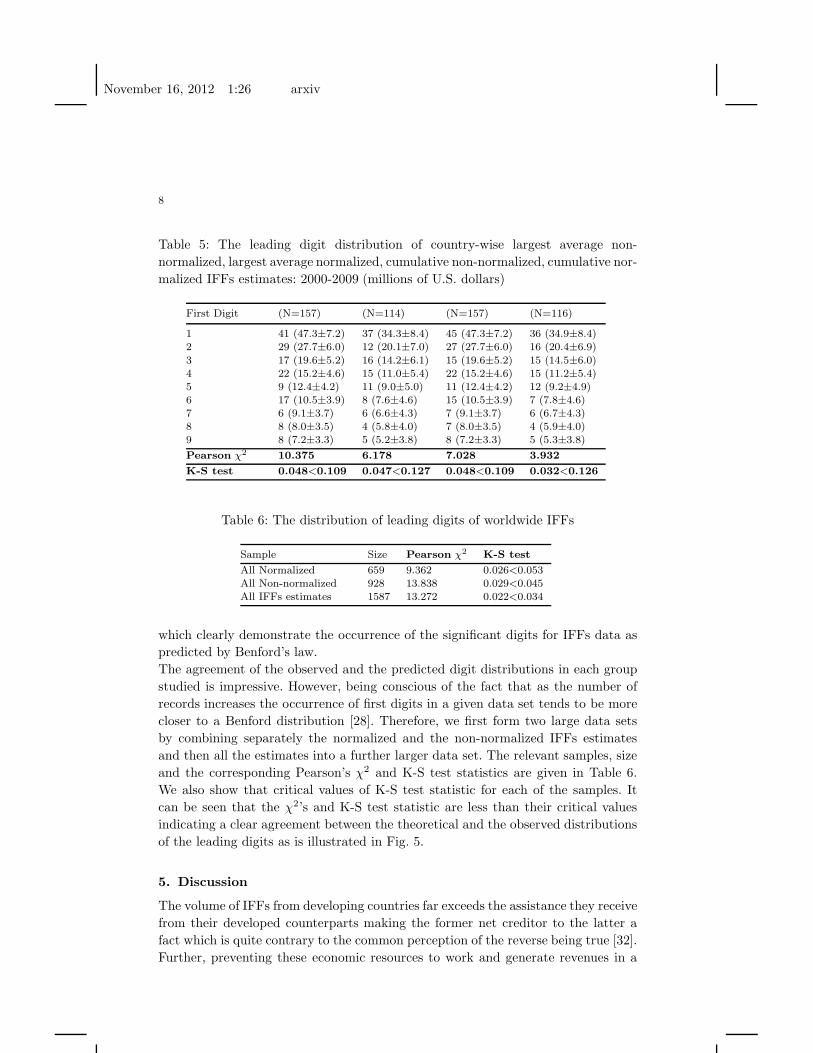
Fig. 3: Observed and Benford distributions of leading digits for country-wise largest
average normalized, largest average non-normalized, cumulative normalized and cu-
mulative non-normalized IFFs: 2000-2008 (millions of U.S. dollars)
IFFs for the period 2000-2008 [26]. The statistical analysis of (Tables 3, 4 and 7)
this report is shown in Table 4. Finally in Table 5 we show the analysis for the IFFs
estimates (Tables 4, 5 and 9) of the December 2011 report of GFI. As shown the
χ2 for all the four columns are less than the critical value of 15.507. Similarly for
each column the K-S test statistic are less than the corresponding critical values. A
graphical representation of the results obtained in Tables 2-5 is given in Figs. 1-4
November 16, 2012 1:26 arxiv
8
Table 5: The leading digit distribution of country-wise largest average non-
normalized, largest average normalized, cumulative non-normalized, cumulative nor-
malized IFFs estimates: 2000-2009 (millions of U.S. dollars)
First Digit (N=157) (N=114) (N=157) (N=116)
1 41 (47.3±7.2) 37 (34.3±8.4) 45 (47.3±7.2) 36 (34.9±8.4)2 29 (27.7±6.0) 12 (20.1±7.0) 27 (27.7±6.0) 16 (20.4±6.9)
3 17 (19.6±5.2) 16 (14.2±6.1) 15 (19.6±5.2) 15 (14.5±6.0)4 22 (15.2±4.6) 15 (11.0±5.4) 22 (15.2±4.6) 15 (11.2±5.4)5 9 (12.4±4.2) 11 (9.0±5.0) 11 (12.4±4.2) 12 (9.2±4.9)6 17 (10.5±3.9) 8 (7.6±4.6) 15 (10.5±3.9) 7 (7.8±4.6)7 6 (9.1±3.7) 6 (6.6±4.3) 7 (9.1±3.7) 6 (6.7±4.3)8 8 (8.0±3.5) 4 (5.8±4.0) 7 (8.0±3.5) 4 (5.9±4.0)9 8 (7.2±3.3) 5 (5.2±3.8) 8 (7.2±3.3) 5 (5.3±3.8)
Pearson χ210.375 6.178 7.028 3.932
K-S test 0.048<0.109 0.047<0.127 0.048<0.109 0.032<0.126
Table 6: The distribution of leading digits of worldwide IFFs
Sample Size Pearson χ2K-S test
All Normalized 659 9.362 0.026<0.053All Non-normalized 928 13.838 0.029<0.045All IFFs estimates 1587 13.272 0.022<0.034
which clearly demonstrate the occurrence of the significant digits for IFFs data as
predicted by Benford’s law.
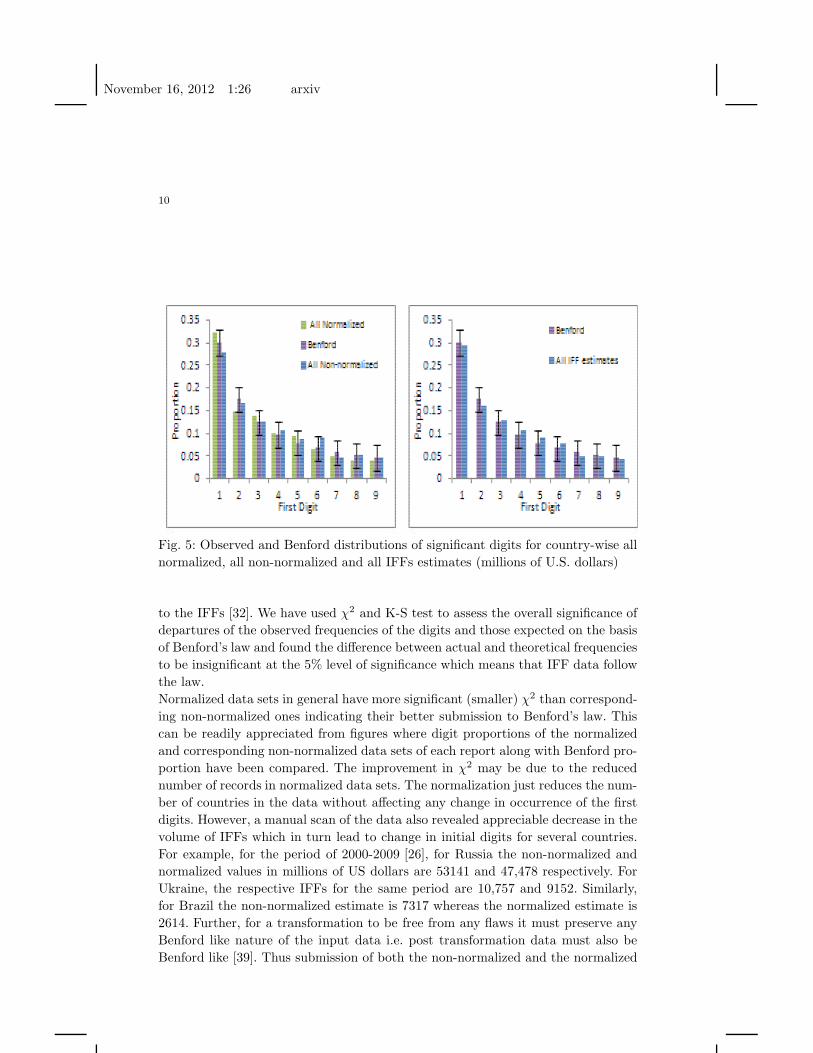
The agreement of the observed and the predicted digit distributions in each group
studied is impressive. However, being conscious of the fact that as the number of
records increases the occurrence of first digits in a given data set tends to be more
closer to a Benford distribution [28]. Therefore, we first form two large data sets
by combining separately the normalized and the non-normalized IFFs estimates
and then all the estimates into a further larger data set. The relevant samples, size
and the corresponding Pearson’s χ2 and K-S test statistics are given in Table 6.
We also show that critical values of K-S test statistic for each of the samples. It
can be seen that the χ2’s and K-S test statistic are less than their critical values
indicating a clear agreement between the theoretical and the observed distributions
of the leading digits as is illustrated in Fig. 5.
5. Discussion
The volume of IFFs from developing countries far exceeds the assistance they receive
from their developed counterparts making the former net creditor to the latter a
fact which is quite contrary to the common perception of the reverse being true [32].
Further, preventing these economic resources to work and generate revenues in a
November 16, 2012 1:26 arxiv
9
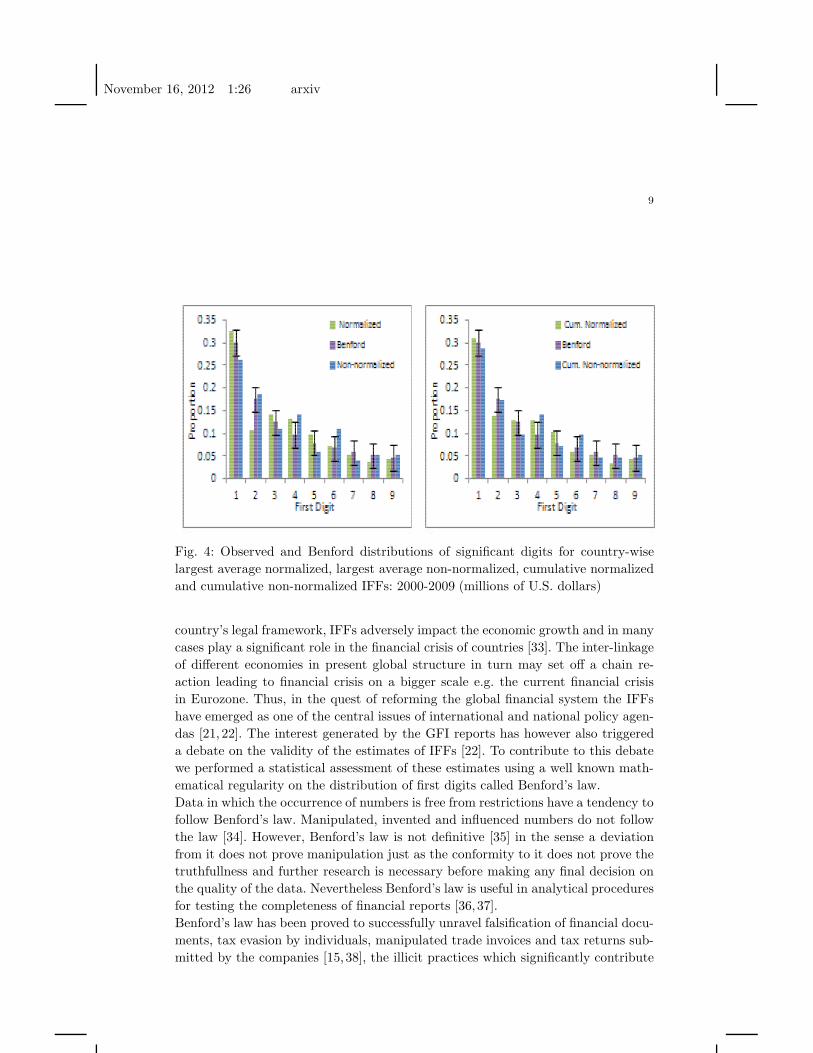
Fig. 4: Observed and Benford distributions of significant digits for country-wise
largest average normalized, largest average non-normalized, cumulative normalized
and cumulative non-normalized IFFs: 2000-2009 (millions of U.S. dollars)
country’s legal framework, IFFs adversely impact the economic growth and in many
cases play a significant role in the financial crisis of countries [33]. The inter-linkage
of different economies in present global structure in turn may set off a chain re-
action leading to financial crisis on a bigger scale e.g. the current financial crisis
in Eurozone. Thus, in the quest of reforming the global financial system the IFFs
have emerged as one of the central issues of international and national policy agen-
das [21, 22]. The interest generated by the GFI reports has however also triggered
a debate on the validity of the estimates of IFFs [22]. To contribute to this debate
we performed a statistical assessment of these estimates using a well known math-
ematical regularity on the distribution of first digits called Benford’s law.
Data in which the occurrence of numbers is free from restrictions have a tendency to
follow Benford’s law. Manipulated, invented and influenced numbers do not follow
the law [34]. However, Benford’s law is not definitive [35] in the sense a deviation
from it does not prove manipulation just as the conformity to it does not prove the
truthfullness and further research is necessary before making any final decision on
the quality of the data. Nevertheless Benford’s law is useful in analytical procedures
for testing the completeness of financial reports [36, 37].
Benford’s law has been proved to successfully unravel falsification of financial docu-
ments, tax evasion by individuals, manipulated trade invoices and tax returns sub-
mitted by the companies [15, 38], the illicit practices which significantly contribute
November 16, 2012 1:26 arxiv
10
Fig. 5: Observed and Benford distributions of significant digits for country-wise all
normalized, all non-normalized and all IFFs estimates (millions of U.S. dollars)
to the IFFs [32]. We have used χ2 and K-S test to assess the overall significance of
departures of the observed frequencies of the digits and those expected on the basis
of Benford’s law and found the difference between actual and theoretical frequencies
to be insignificant at the 5% level of significance which means that IFF data follow
the law.
Normalized data sets in general have more significant (smaller) χ2 than correspond-
ing non-normalized ones indicating their better submission to Benford’s law. This
can be readily appreciated from figures where digit proportions of the normalized
and corresponding non-normalized data sets of each report along with Benford pro-
portion have been compared. The improvement in χ2 may be due to the reduced
number of records in normalized data sets. The normalization just reduces the num-
ber of countries in the data without affecting any change in occurrence of the first
digits. However, a manual scan of the data also revealed appreciable decrease in the
volume of IFFs which in turn lead to change in initial digits for several countries.
For example, for the period of 2000-2009 [26], for Russia the non-normalized and
normalized values in millions of US dollars are 53141 and 47,478 respectively. For
Ukraine, the respective IFFs for the same period are 10,757 and 9152. Similarly,
for Brazil the non-normalized estimate is 7317 whereas the normalized estimate is
2614. Further, for a transformation to be free from any flaws it must preserve any
Benford like nature of the input data i.e. post transformation data must also be
Benford like [39]. Thus submission of both the non-normalized and the normalized
November 16, 2012 1:26 arxiv
11
IFF estimates, input and output for normalization, to Benford’s law might be an
indication of validity of the normalization process.
The current financial crisis has severely reduced the capacity of the developed coun-
tries to provide assistance to the developing countries. Therefore, developing coun-
tries, have been forced to uncover their own financial resources and thus guided
by the GFI estimates of IFFs, have initiated measures for curbing the exit of il-
licit financial flows besides recovering their stolen assets. An extensive review on
comparison of various estimates of IFFs has found that those of GFI correspond
well with the calculations of other researchers [21]. Particularly, for the least devel-
oped countries, a majority of which belong to African continent, the studies [25,32]
found similar estimates of capital flight in spite of the difference in sample size and
considerable data issues.
6. Conclusion
IFFs from developing countries have generated a lot of public interest. We analyzed
the distribution of leading digits of data on the IFFs from developing countries
and found that data follows the predictions of the Benford’s law. In the light of
the present global financial crisis and the debate it has triggered on the illegal
capital flows of the countries, we think our study may further contribute to the
understanding of the IFFs estimates.
Acknowledgments
The author thanks GFI for free access to data and Dev Kar for helpful comments.
Suggestions from P. M. Ishtiaq are gratefully acknowledged.
References
1. S. Newcomb, Note on the frequency of use of different digits in natural numbers,
Am. J. Math. 4 (1881) 39-40.
2. F. Benford, The law of anomalous numbers, Proc. Am. Phil. Soc. 78 (1938)
551-572.
3. A. Berger, T. P. Hill, Benford’s law strikes back: no simple explanation in sight
for mathematical gem, The Mathematical Intelligencer, 33 (1) (2011) 85-91.
4. R. S. Pinkham, On the distribution of first signcant digits, Ann. Math. Statist.
32 (1961) 1223-1230.
5. T. P. Hill, The significant-digit phenomenon, Am. Math. Monthly 102 (4) (1995)
322-327.
6. L. Pietronero et al., Explaining the uneven distribution of numbers in nature:
the laws of Benford and Zipf, Physica A 293 (2001) 297-304.
7. F. Sandron, Do populations conform to the law of anomalous numbers? Popu-
lation, 57 (2002) 755761.
8. T. A. Mir, The law of the leading digits and the world religions, Phyica A, 391
(2012) 792-798.
November 16, 2012 1:26 arxiv
12
9. J.C. Pain, Benford’s law and complex atomic spectra, Phys. Rev. E, 77 (2008)
012102
10. L. Shao, B.Q. Ma, First digit distribution of hadron full width, Mod. Phys.
Lett. A, 24 (2009) 3275-3282.
11. M. Sambridge et al., Benford’s law in the natural sciences, Geo. Phys. Res.
Lett. A, 37 (2010) L22301.
12. E. Ley, On the Peculiar Distribution of the U.S. stock indexes digits, The Am
Stat. 50 (4) (1996) 311-313.
13. D. E. Giles, Benford’s law and naturally occurring prices in certain eBay auc-
tions, App. Econ. Lett. 14 (2007) 157-161.
14. M. Maher, M. Akers, Using Benford’s law to detect fraud in insurance industry,
Int. Buissness and Economic Res. Jour. 1 (2) (2002) 1-12.
15. M. J. Nigrini, Taxpayer compliance application of Benford’s law, The J. Am.
Tax. Assoc. 18 (1) (1996) 72-92.
16. J. Nye, C. Moul, The political economy of numbers: on the application of Ben-
ford’s law to international macroeconomic statistics, B. E. J. Macroeconomics,
7 (1) (2007) article 17
17. J. Gonzalez-Garcia, G. Pastor, Benford’s law and macroeconomic data quality,
IMF working paper, WP/09/10, (2009)
available at http : //www.imf.org/external/pubs/ft/wp/2009/wp0910.pdf
18. T. Michalski, G. Stoltz, Do countries falsify economic data strategically? Some
evidence that they might, Rev. Econ. and Statis., doi : 10.1162/REST−a−00274
19. B. Rauch et al., Fact and fiction in EU-Governmental economic data, German
Economic Review, 12 (3) (2011) 243-255.
20. United Nations Office on Drug and Crime Research Report, Estimating illicit
financial flows resulting from drug trafficking and other transnational organized
crimes (Oct 2011) available at
www.unodc.org/documents/data−and−analysis/Illicit−financial−flows−2011−web.pdf
21. Tax Havens and development, Official Norwegian Report No. 2009:19, June
18, 2009 (prepared under Government Commission on Capital Flight from
Poor Countries appointed by Royal Decree of June 27, 2008) available at
www.regjeringen.no/upload/UD/V edlegg/Utvikling/tax−report.pdf .
22. P. Reuter, Draining development?, World Bank (2012) available at
http : //elibrary.worldbank.org/content/book/9780821388693
23. Global Financial Integrity, http : //www.gfintegrity.org
24. Dev Kar, Devon Cartwright-Smith, Illicit financial flows from developing coun-
tries: 2002-2006, (2008)
25. Dev Kar, Illicit financial flows from least developed countries: 1990-2008 (May
2011), Discussion paper commissioned by United Nations Development Pro-
gramme (UNDP) at United Nations IV conference on the Least Developed Coun-
tries (LDCs), Istanbul, Turkey in May 2011.
26. Dev Kar, Karly Curcio, Illicit financial flows from developing countries: 2000-
November 16, 2012 1:26 arxiv
13
2009 Update with a focus on Asia (January 2011)
27. Dev Kar, Sarah Freitas, Illicit financial flows from developing countries over the
decade ending 2009 (December 2011)
28. M. J. Nigrini, Benford’s law: applications for forensic accounting, auditing and
fraud detection, Wiley Publications (2012)
29. S. Minteer, Analysis of Benford’s law applied to 3x+1 Problem (2004), available
at
www.math.osu.edu/vigre/ntwg/3x+ 1/minteer−AnalysisofBenford.doc
30. C. Durtschi et al., The effective use of Benford’s waw to assist in detecting
fraud in accounting data, J. Forensic Accounting (2004) 17-34.
31. M. Steele, J. Chaseling, Power of discrete goodness-of-fit test statistics for a
uniform null against a selection of alternative distributions, Com. Statistics-
Simulation and Computation, 35 (2006) 1067-1075.
32. L. Ndikumana, J. K. Boyce, Measurement of capital flight: Methodology and
results for Sub-Saharan African countries, African Development Rev., 22 (4)
(2010) 471-481.
33. G. Fabre, Prospering on crime: money laundering and financial crisis, Working
papers in contemporary Asian studies, availabe at
www.ace.lu.se/images/Syd−och−sydostasienstudier/working−papers/Fabre.pdf
34. T. P. Hill, The difficulty of faking data, Chance, 12 (3) (1999) 27-31.
35. G. Judge, L. Schechter, Detecting problems in survey data using Benford’s law,
J. Hum. Resour. 44 (2009) 1-24.
36. M. J. Nigrini, L. J. Mittermaier, The use of Benford’s law as an aid in analytical
procedures, Auditing: J. Pract. Theory, 16 (2) (1997) 52-67.
37. S. Bhattacharya, An ANN-based auditor decision support system using Ben-
ford’s law, Decision Support Systems, 50 (2011) 576-584.
38. K. Kumar, S. Bhattacharya, Benford’s law and its application in financial fraud
detection, Adv. in Financial Planning and Forcasting 11 (2003) 57-70.
39. H. Varian, Benford’s law, Am. Stat., 23 (1972) 65-66.