Worldwide Market Forecast
186
Worldwide Market Forecast 2020-2040 March 2021 Japan Aircraft Development Corporation
-
Upload
khangminh22 -
Category
Documents
-
view
1 -
download
0
Transcript of Worldwide Market Forecast

Worldwide Market Forecast 2020-2040
Worldwide Market Forecast
2020-2040
March 2021
Japan Aircraft Development Corporation

Worldwide Market Forecast 2020-2040

Worldwide Market Forecast 2020-2040
Preface
The aircraft industry is knowledge intensive and has a great ripple effect on industries, making it
effective in advancing the structure of industry as a whole. Accordingly, in Japan, which aims to
become a scientific powerhouse, many efforts have been made for the development and advancement
of the aircraft industry as an essential industry.
It is believed that ongoing information collection and analysis of the world’s commercial aircraft
markets are vital to the further development of Japan’s aircraft industry. Therefore, Japan Aircraft
Development Corporation (JADC) collects and investigates information on the commercial aircraft
markets of the world, including air transportation, aircraft, airlines, and aircraft manufacturers,
forecasting demand for air passengers, air cargo, and aircraft, based on the analysis.
This document, which summarizes our forecasts, is intended to be provided to all parties concerned
as well as to the public through our website (http://www.jadc.jp/en/).
Since 2020, the world has been in disruption caused by the COVID-19 and been forced to fight
against it with no preventive medicine or a cure. And the countries have been striving to prevent and
control infection by severely restricting the movement of people. As a result, demand for both air
passenger transportation and aircraft dropped significantly, causing both airlines and aircraft
manufacturers to face a painful struggle.
At the end of 2020, however, the long-awaited vaccine became available and started to be given
first to medical personnel who are constantly exposed to the virus and others who are at high risk for
infection. Since then, not only the effect of infection prevention, but also the effect of psychological
stability started to be heard, showing the first glimmer of hope that the pandemic will subside.
Looking back in history, airlines around the world have been thrown into disruption and suffered
losses due to terrorism, diseases, and so on in the past. But each time they faced such difficulties, air
transportation demand has always recovered in a curve that converges to the long-term forecast growth
curve made before the disruption occurred within several years of the elimination of the cause.
In this document, for the short term, the time when air transportation demand will start to pick up
is estimated based on the progress of vaccinations and the time when the demand for aircraft will
rebound is also estimated in light of past epidemics or pandemics. While, for the long term, demand
for air transportation and aircraft are estimated on forecasted data such as the GDP data with the impact
of the COVID-19 based on the analysis on actual data for the past 20 years. And this document also
attempts to sort out factors that may be related to the possibility that the world and air transportation
market will have a different character and scale than before after the recovery from pandemic.
March 2021
Japan Aircraft Development Corporation
YGR-5113

Worldwide Market Forecast 2020-2040

Worldwide Market Forecast 2020-2040
Table of Contents
1. Overview ꞏꞏꞏꞏꞏꞏꞏꞏꞏꞏꞏꞏꞏꞏꞏꞏꞏꞏꞏꞏꞏꞏꞏꞏꞏꞏꞏꞏꞏꞏꞏꞏꞏꞏꞏꞏꞏꞏꞏꞏꞏꞏꞏꞏꞏꞏꞏꞏꞏꞏꞏꞏꞏꞏꞏꞏꞏꞏꞏꞏꞏꞏꞏꞏꞏꞏꞏꞏꞏꞏꞏꞏꞏꞏꞏꞏꞏꞏꞏꞏ 1
2. Introduction ꞏꞏꞏꞏꞏꞏꞏꞏꞏꞏꞏꞏꞏꞏꞏꞏꞏꞏꞏꞏꞏꞏꞏꞏꞏꞏꞏꞏꞏꞏꞏꞏꞏꞏꞏꞏꞏꞏꞏꞏꞏꞏꞏꞏꞏꞏꞏꞏꞏꞏꞏꞏꞏꞏꞏꞏꞏꞏꞏꞏꞏꞏꞏꞏꞏꞏꞏꞏꞏꞏꞏꞏꞏꞏꞏꞏꞏ 5
3. Summary of the Airline Industry ꞏꞏꞏꞏꞏꞏꞏꞏꞏꞏꞏꞏꞏꞏꞏꞏꞏꞏꞏꞏꞏꞏꞏꞏꞏꞏꞏꞏꞏꞏꞏꞏꞏꞏꞏꞏꞏꞏꞏꞏꞏꞏꞏꞏꞏꞏꞏꞏꞏꞏꞏꞏꞏ 7
3.3 Until COVID-19 Calms Down ꞏꞏꞏꞏꞏꞏꞏꞏꞏꞏꞏꞏꞏꞏꞏꞏꞏꞏꞏꞏꞏꞏꞏꞏꞏꞏꞏꞏꞏꞏꞏꞏꞏꞏꞏꞏꞏꞏꞏꞏꞏꞏꞏꞏꞏ 19
3.4 After COVID-19 Calms Down ꞏꞏꞏꞏꞏꞏꞏꞏꞏꞏꞏꞏꞏꞏꞏꞏꞏꞏꞏꞏꞏꞏꞏꞏꞏꞏꞏꞏꞏꞏꞏꞏꞏꞏꞏꞏꞏꞏꞏꞏꞏꞏꞏꞏꞏ 27
4. Passenger Aircraft Demand Forecast ꞏꞏꞏꞏꞏꞏꞏꞏꞏꞏꞏꞏꞏꞏꞏꞏꞏꞏꞏꞏꞏꞏꞏꞏꞏꞏꞏꞏꞏꞏꞏꞏꞏꞏꞏꞏꞏꞏꞏꞏꞏꞏꞏꞏꞏꞏ 33
5. Air Passenger Demand Forecast ꞏꞏꞏꞏꞏꞏꞏꞏꞏꞏꞏꞏꞏꞏꞏꞏꞏꞏꞏꞏꞏꞏꞏꞏꞏꞏꞏꞏꞏꞏꞏꞏꞏꞏꞏꞏꞏꞏꞏꞏꞏꞏꞏꞏꞏꞏꞏꞏꞏꞏꞏ 57
6. Factors Related to Air Transportation ꞏꞏꞏꞏꞏꞏꞏꞏꞏꞏꞏꞏꞏꞏꞏꞏꞏꞏꞏꞏꞏꞏꞏꞏꞏꞏꞏꞏꞏꞏꞏꞏꞏꞏꞏꞏꞏꞏꞏꞏꞏꞏꞏꞏꞏ 83
7. Freighter Aircraft Demand Forecast ꞏꞏꞏꞏꞏꞏꞏꞏꞏꞏꞏꞏꞏꞏꞏꞏꞏꞏꞏꞏꞏꞏꞏꞏꞏꞏꞏꞏꞏꞏꞏꞏꞏꞏꞏꞏꞏꞏꞏꞏꞏꞏꞏꞏꞏꞏ 103
8. Air Cargo Traffic Forecast ꞏꞏꞏꞏꞏꞏꞏꞏꞏꞏꞏꞏꞏꞏꞏꞏꞏꞏꞏꞏꞏꞏꞏꞏꞏꞏꞏꞏꞏꞏꞏꞏꞏꞏꞏꞏꞏꞏꞏꞏꞏꞏꞏꞏꞏꞏꞏꞏꞏꞏꞏꞏꞏꞏꞏꞏꞏ 111
9. Regional Overview ꞏꞏꞏꞏꞏꞏꞏꞏꞏꞏꞏꞏꞏꞏꞏꞏꞏꞏꞏꞏꞏꞏꞏꞏꞏꞏꞏꞏꞏꞏꞏꞏꞏꞏꞏꞏꞏꞏꞏꞏꞏꞏꞏꞏꞏꞏꞏꞏꞏꞏꞏꞏꞏꞏꞏꞏꞏꞏꞏꞏꞏꞏꞏꞏꞏꞏ 115
10. Airplane Sales Forecast ꞏꞏꞏꞏꞏꞏꞏꞏꞏꞏꞏꞏꞏꞏꞏꞏꞏꞏꞏꞏꞏꞏꞏꞏꞏꞏꞏꞏꞏꞏꞏꞏꞏꞏꞏꞏꞏꞏꞏꞏꞏꞏꞏꞏꞏꞏꞏꞏꞏꞏꞏꞏꞏꞏꞏꞏꞏꞏꞏꞏꞏ 155
11. Aero Engine Sales Forecast ꞏꞏꞏꞏꞏꞏꞏꞏꞏꞏꞏꞏꞏꞏꞏꞏꞏꞏꞏꞏꞏꞏꞏꞏꞏꞏꞏꞏꞏꞏꞏꞏꞏꞏꞏꞏꞏꞏꞏꞏꞏꞏꞏꞏꞏꞏꞏꞏꞏꞏꞏꞏꞏꞏꞏꞏ 161
12. Methodology ꞏꞏꞏꞏꞏꞏꞏꞏꞏꞏꞏꞏꞏꞏꞏꞏꞏꞏꞏꞏꞏꞏꞏꞏꞏꞏꞏꞏꞏꞏꞏꞏꞏꞏꞏꞏꞏꞏꞏꞏꞏꞏꞏꞏꞏꞏꞏꞏꞏꞏꞏꞏꞏꞏꞏꞏꞏꞏꞏꞏꞏꞏꞏꞏꞏꞏꞏꞏꞏꞏꞏꞏꞏ 163
Appendix A Definition of Airplane Segments ꞏꞏꞏꞏꞏꞏꞏꞏꞏꞏꞏꞏꞏꞏꞏꞏꞏꞏꞏꞏꞏꞏꞏꞏꞏꞏꞏꞏꞏꞏꞏꞏꞏꞏꞏꞏꞏꞏ 165
Appendix B Definition of Aero Engine Segments ꞏꞏꞏꞏꞏꞏꞏꞏꞏꞏꞏꞏꞏꞏꞏꞏꞏꞏꞏꞏꞏꞏꞏꞏꞏꞏꞏꞏꞏꞏꞏꞏꞏ 166
Appendix C Air Passenger Traffic ꞏꞏꞏꞏꞏꞏꞏꞏꞏꞏꞏꞏꞏꞏꞏꞏꞏꞏꞏꞏꞏꞏꞏꞏꞏꞏꞏꞏꞏꞏꞏꞏꞏꞏꞏꞏꞏꞏꞏꞏꞏꞏꞏꞏꞏꞏꞏꞏꞏꞏꞏ 167
Appendix D Air Cargo Traffic ꞏꞏꞏꞏꞏꞏꞏꞏꞏꞏꞏꞏꞏꞏꞏꞏꞏꞏꞏꞏꞏꞏꞏꞏꞏꞏꞏꞏꞏꞏꞏꞏꞏꞏꞏꞏꞏꞏꞏꞏꞏꞏꞏꞏꞏꞏꞏꞏꞏꞏꞏꞏꞏꞏꞏꞏ 168
Appendix E Airplane Demand ꞏꞏꞏꞏꞏꞏꞏꞏꞏꞏꞏꞏꞏꞏꞏꞏꞏꞏꞏꞏꞏꞏꞏꞏꞏꞏꞏꞏꞏꞏꞏꞏꞏꞏꞏꞏꞏꞏꞏꞏꞏꞏꞏꞏꞏꞏꞏꞏꞏꞏꞏꞏꞏꞏꞏꞏ 169
Appendix F Evaluation of Secondary Demand ꞏꞏꞏꞏꞏꞏꞏꞏꞏꞏꞏꞏꞏꞏꞏꞏꞏꞏꞏꞏꞏꞏꞏꞏꞏꞏꞏꞏꞏꞏꞏꞏꞏꞏꞏꞏ 171
Appendix G Trends in Cargo Transportation Result of Major Airlines ꞏꞏꞏꞏꞏꞏꞏꞏꞏ 172
Appendix H Approach to Successfully Putting SAF on Track ꞏꞏꞏꞏꞏꞏꞏꞏꞏꞏꞏꞏꞏꞏꞏꞏꞏꞏꞏ 174
Glossary of Terms ꞏꞏꞏꞏꞏꞏꞏꞏꞏꞏꞏꞏꞏꞏꞏꞏꞏꞏꞏꞏꞏꞏꞏꞏꞏꞏꞏꞏꞏꞏꞏꞏꞏꞏꞏꞏꞏꞏꞏꞏꞏꞏꞏꞏꞏꞏꞏꞏꞏꞏꞏꞏꞏꞏꞏꞏꞏꞏꞏꞏꞏꞏꞏꞏꞏꞏꞏꞏꞏꞏꞏꞏꞏꞏꞏ 176
Abbreviations ꞏꞏꞏꞏꞏꞏꞏꞏꞏꞏꞏꞏꞏꞏꞏꞏꞏꞏꞏꞏꞏꞏꞏꞏꞏꞏꞏꞏꞏꞏꞏꞏꞏꞏꞏꞏꞏꞏꞏꞏꞏꞏꞏꞏꞏꞏꞏꞏꞏꞏꞏꞏꞏꞏꞏꞏꞏꞏꞏꞏꞏꞏꞏꞏꞏꞏꞏꞏꞏꞏꞏꞏꞏꞏꞏꞏꞏꞏꞏꞏ 177
Reference Materials ꞏꞏꞏꞏꞏꞏꞏꞏꞏꞏꞏꞏꞏꞏꞏꞏꞏꞏꞏꞏꞏꞏꞏꞏꞏꞏꞏꞏꞏꞏꞏꞏꞏꞏꞏꞏꞏꞏꞏꞏꞏꞏꞏꞏꞏꞏꞏꞏꞏꞏꞏꞏꞏꞏꞏꞏꞏꞏꞏꞏꞏꞏꞏꞏꞏꞏꞏꞏꞏꞏꞏꞏꞏ 179
The content pertaining to the impact of COVID-19 is mainly explained in sections 3.3
and 3.4.

Worldwide Market Forecast 2020-2040

Worldwide Market Forecast 2020-2040
1
1. Overview
Long-term forecasts for the demand in the commercial aircraft market provide useful
information for market risk assessment and examination, medium- to long-term business
planning, and product strategy development, to be carried out in the course of conducting
commercial aircraft business. JADC forecasted demand for air passengers, air cargo, aircraft
(passenger jets, passenger turboprops, and cargo jets), and aircraft engines for the 21 years
from 2020 to 2040 using the 2019 level as the baseline, based on our analysis of the data for
the past 20 years.
In 2020, the COVID-19 pandemic brought serious damage to the world economy including the
air transportation sector. This impact is expected to gradually wane over the next several years.
Although airlines around the world have been thrown into disruption due to terrorism, diseases,
and so on in the past, air transportation demand recovered within several years of the
elimination of the cause in a curve that converges to the long-term forecast growth curve made
before the disruption occurred. In this forecast, the impact of the COVID-19 pandemic on air
transportation and aircraft demand has been estimated in the “With” and “Post” COVID-19
period. (Related Part: 3.3 to 3.4)
The world economic growth rate (GDP) in the forecast period is expected to be 2.47% on an
annual average.
(In our forecast we used the GDP data, which strongly influences on air transportation demand, as of the end of 2020 that
takes into account the impact of COVID-19. Thereafter, the IMF, the OECD, and other institutions presented forecasts for a
faster and higher level of recovery by taking into account the effect of the spread of vaccinations. If such forecasts are correct,
air transportation and aircraft demand can be expected to shift to a higher level than our forecast.)
2019 actual 2040 forecast Growth Rate Sales (2019 US$billion)
World Economic Growrh Rate (GDP) 2.47%p.a.
Passenger Demand (RPK :×109 passenger km) 8,486 17,847 3.6%p.a.
Passenger Jet Airplane Fleet 24,015 * 38,868 2.3%p.a.
New Passenger Jet Airplane Deliveries 33,494 5,160
Cargo Demand (RTK :×109 ton km) 253 524 3.5%p.a.
Jet Freighter Fleet 2,023 * 3,041 2.0%p.a.
New Jet Freighter Deliveries 736 225
Total New Jet Airplane Deliveries 34,230 5,385
Passenger Turboprop Airplane Fleet 3,583 * 4,160 0.7%p.a.
New Passenger Turboprop Airplane Deliveries 3,311 73
New Engine Deliveries 82,871 1,213
(*:This data is based on the database of Cirium. )

Worldwide Market Forecast 2020-2040
2
Revenue Passenger Kilometers (RPK) will increase 2.1 times from 8.49 × 10¹² passenger km
in 2019 to 17.8 × 10¹² passenger km by 2040, with an annual average growth rate of 3.6%
during that period.
(In addition to the already declining growth rate in the Middle East region, in which long-distance routes are mainly operated
[set to an equivalent of 3.1% on an annual average], China is predicted to transit from the fast growing model of developing
country type to the slow growing model of developed country type as a result of an increase in income in the country during
the forecast period [set to an equivalent of 4.5% on an annual average].)
The number of passenger jets in service will increase from 24,015 at the end of 2019 to 38,868
by the end of 2040. The number of new airplanes to be delivered in the next 20 years will be
33,494, with sales of 5.16 trillion dollars (based on the prices listed in the 2019 catalog). The
highest number of new airplanes to be delivered will be the 170 to 229 seat class aircraft, with
11,500 airplanes. By region, North America (23%), Europe (23%), and China (16%) are the
top delivery locations, accounting for 62% of the total airplanes delivered in the world.
The number of passenger turboprops in service will increase from 3,583 in 2019 to 4,160 by
2040. The number of new airplanes to be delivered will be 3,311, with sales of 73 billion dollars
(based on the prices listed in the 2019 catalog). The highest number of new airplanes to be
delivered will be the 60 to 79 seat class aircraft, with 1,206 airplanes. There will be no
particular regions with a high number of airplanes to be delivered, showing a tendency of being
purchased evenly from all over the world, but there will be high demand for new airplanes in
the Southeast Asia (505 airplanes) and South Asia (564 airplanes) regions.
Air Cargo Demand (RTK) will increase 2.1 times from 253 × 109 ton km in 2019 to 524 × 109
ton km by 2040, with an annual average growth rate of 3.5% during that period.
The number of cargo jets in service will increase from 2,023 in 2019 to 3,041 in 2040. The
demand for newly built airplanes will be 736 airplanes (In addition, 1,783 planes will be
converted from passenger jets.), with sales of 225 billion dollars (based on the prices listed in
the 2019 catalog). The breakdown of demand for newly built airplanes will be 293 large jets
and 443 medium wide body jets.
The world engine demand (including spares) will be 82,871 units, amounting to 1.21 trillion
dollars (based on the market price in 2019). The breakdown of the demand is 75,583 jet engines,
with sales of 1.20 trillion dollars, and 7,288 turboprop engines, with sales of 16.1 billion dollars.

Worldwide Market Forecast 2020-2040
3
WorldNew Deliveries
Economy (GDP) 2.47% 37,541
Pax. Traffic (RPK) 3.6% Sales
Cargo Traffic (RTK) 3.3% (2019US$B)
Airline Fleet 2.1% 5,458
Growth Rate
North AmericaNew Deliveries
Economy (GDP) 1.8% 8,280
Pax. Traffic (RPK) 3.0% Sales
Cargo Traffic (RTK) 2.4% (2019US$B)
Airline Fleet 0.8% 1,092
Growth Rate
EuropeNew Deliveries
Economy (GDP) 1.2% 8,236
Pax. Traffic (RPK) 3.5% Sales
Cargo Traffic (RTK) 2.9% (2019US$B)
Airline Fleet 2.4% 1,219
Growth Rate
Asia-PacificNew Deliveries
Economy (GDP) 3.6% 14,383
Pax. Traffic (RPK) 4.5% Sales
Cargo Traffic (RTK) 3.8% (2019US$B)
Airline Fleet 3.3% 2,117
Growth Rate
Latin AmericaNew Deliveries
Economy (GDP) 2.4% 2,069
Pax. Traffic (RPK) 2.7% Sales
Cargo Traffic (RTK) 1.9% (2019US$B)
Airline Fleet 1.3% 219
Growth Rate
Middle EastNew Deliveries
Economy (GDP) 2.1% 2,100
Pax. Traffic (RPK) 3.1% Sales
Cargo Traffic (RTK) 4.4% (2019US$B)
Airline Fleet 2.9% 523
Growth Rate
CISNew Deliveries
Economy (GDP) 1.6% 13,540
Pax. Traffic (RPK) 1.7% Sales
Cargo Traffic (RTK) 3.5% (2019US$B)
Airline Fleet 0.8% 162
Growth Rate
AfricaNew Deliveries
Economy (GDP) 2.8% 1,119
Pax. Traffic (RPK) 2.7% Sales
Cargo Traffic (RTK) 3.6% (2019US$B)
Airline Fleet 0.2% 128
Growth Rate
( Airline Fleet, New Deliveries and Sales in the above graph are the sum of that for passenger jets, passenger turboprops and jet freighters.)
(The terms and abbreviations used in this document are listed on page 176 and subsequent pages.)

Worldwide Market Forecast 2020-2040
4
Intentionally Blank

Worldwide Market Forecast 2020-2040
5
2. Introduction
The development of an airplane takes nearly 10 years from the planning stage to the delivery of the
first airplane, costs some billions of dollars in development costs, and takes years to recover the
investment. Once developed, the airplane will then continue to be produced for several decades
including the development of derived types. And once delivered, the aircraft will be in service as a
long-lasting product, for a decade in a short lifecycle or for over 40 years in a long lifecycle. For this
reason, the aircraft industry is said to be an industry with high business risk.
The airlines to purchase and operate aircrafts are subject to the impact of the economic situation
and social conditions at that time, such as deregulation, privatization, competition with new entrants
such as low cost carriers (LCC), and soaring fuel costs. In order to minimize the business and market
risks in such a business environment, it is important to continue to observe and analyze the trends in
the economic and social environments surrounding the aircraft industry and airlines.
JADC has continued to collect, investigate, and analyze information on the world’s commercial
aircraft markets, including aircraft, air transportation, and airlines and has been forecasting the long-
term demand for air transportation and aircraft since the latter half of the 1970s in order to support for
Japan’s aircraft industry and all other parties concerned to plan long-term product strategies and to
develop long-term business plans.
This edition of "Worldwide Market Forecast," which is a long-term forecast of JADC, covers air
passenger transportation and air cargo transportation in the forecast period of 2020 to 2040, setting
2019 as the baseline for the report, and forecasts the demand for passenger turboprops with 15 or more
seats, passenger jets with 20 or more seats, cargo jets, and aircraft engines. This report is intended to
make the results of our forecast available to the public.
Factors Considered in Demand Forecast
Alternative Means of Transport
Airlines’ Strategies
Aircraft
Air Policy
Environment
Business Models
Travel/Tourism Trend
Economic Trend
Route Network
Oil Price
Infrastructure
Demographics
Long-term Demand Forecast

Worldwide Market Forecast 2020-2040
6
Intentionally Blank

Worldwide Market Forecast 2020-2040
7
3. Summary of the Airline Industry
3.1 Summary of the Airline Business
Global Situation
In 2020, the entire world was affected by COVID-19.
We were required to maintain our economic activities while preventing the spread of infection
without preventive medicine or a cure, so our lives and production activities were subject to various
restrictions. As a result, the world’s real GDP growth rate in 2020 is estimated to be −4.3% (IBRD) to
−3.5% (IMF). On the contrary, the world’s real GDP growth rate in 2021 is expected to be 4.0%
(IBRD) to 5.5% (IMF). Although different organizations give different forecasts, the world’s real GDP
in 2021 is expected to grow and recover to the 2019 level, nearly making up for the economic
shrinkage in 2020. The growth rate is expected to be 3.7% (OECD) to 4.2% (IMF) in 2022, and then,
decrease gradually from 2021 to 2040, averaging 2.87% (IHS). After 2021, if the conditions permit,
the world economy is expected to recover rapidly although it depends on the progress of vaccination.
The airline business experienced a more drastic shrinkage than the overall economy. RPK, which
indicates the actual transportation volume, dropped in 2020 by as much as 66% (IATA) relative to
2019, and is expected to remain around 50% (IATA, Nov. 2020) in 2021.
Generally, an increase or decrease in air transportation demand has a clear correlation with the
increase or decrease in economic activities, based on which various demands are forecast. To prevent
the spread of COVID-19 infection, however, epidemic control measures were implemented. As a result,
immigration on international flights was prohibited or, even if permitted, required self-isolation for a
certain period after arrival and other unusual burdens were imposed, which became a decisive factor
that strongly suppressed the transportation demand. As for domestic flights, although such
immigration restrictions were not imposed, we were requested to refrain from traveling between
different regions and many worried about the health condition of the passengers sitting next to them,
which eventually caused the RPK to fall. In the fight against the invisible virus and people’s anxiety
about it, the RPK fell drastically in 2020, completely separated from its normal correlation with the
GDP and other economic indicators.
The RPK and revenue of the airline business disappeared due to this pandemic, and we were forced
to wait for about two years until collective immunity was reached. During this period, financing is a
matter of life and death to airlines, which are currently making every effort to overcome it, going so
far as to sell their aircraft, postpone or cancel the delivery of aircraft they ordered, and lay off their
employees. Also, aircraft manufacturers, which should be thought of as airlines’ counterparts, are
forced to reschedule their delivery or significantly reduce their production. Amid such a situation, the
first emergency use of the long-awaited vaccines started in December 2020, about one year after the
emergence of COVID-19. Although there are concerns about things such as there being a short supply,

Worldwide Market Forecast 2020-2040
8
the vaccines are expected to be a trump card against COVID-19, and the diffusion of vaccines has
been incorporated into each institution’s GDP forecast. We expect that if vaccination proceeds
smoothly, the RPK of domestic and regional flights in major developed countries will start to recover
in 2021, and the revenue, including that from some international flights, will recover considerably in
2022.
Current Situation of the Airline Business
With regard to the global air transportation demand in 2020, IATA (Nov. 2020) estimates that the
passenger transportation volume (RPK) and operating profit will drop by 66.3% and 338%,
respectively, compared to the previous year. Then, looking at the financial results for 2020, the total
sales of all the airlines in the world is 328 billion dollars, smaller than the previous year by 60.9%,
and the net profit is 118.5 billion dollars, suffering a record deficit. In this situation, the revenue from
passengers dropped by 68.8% compared to the previous year but the revenue from cargo transportation
rose by 14.9%, resulting in a decrease in the total revenue by 56.8%.
The unit price of fuel dropped by 43%, but the passenger yield also dropped by 8.0% compared to
the previous year. Despite such a drastic drop in the RPK, the passenger load factor was maintained at
65.5%, but because of a significant shortage in cargo transportation capacity (lower hold in passenger
flights) due to a significant decrease in passenger flights, the cargo yield recorded a significant increase
by 30% compared to the previous year.
The net profit to sales ratio was significantly negative in every region.
Trends in Air Passenger Transportation Volume (RPK) and Sales Profit
Operating profit (× 109 dollars)
RPK (× 1012 passenger km)
Operating profit

Worldwide Market Forecast 2020-2040
9
According to the Ministry of Land, Infrastructure, Transport and Tourism (Nov. 2020), the year-to
date RPK of Japanese airlines in 2021 dropped by 55.4% for domestic flights and 78.9% for
international flights from the previous year. If limited to the period after the declaration of a state of
emergency in April, the RPK dropped by 68.9% for domestic flights and 95.8% for international
flights.
Net Profit to Sales Ratio of Airlines
Ne
t p
rofi
t to
sa
les
ra
tio
(%
)
Africa Asia Pacific Middle East Central andSouth America
North America Europe

Worldwide Market Forecast 2020-2040
10
3.2 Aircraft Orders and Deliveries
As of the end of 2019, 24,015 passenger jets, 3,583 passenger turboprops, and 2,023 cargo jets were
in service in the world.
As of the end of 2020, according to the database, 18,317 passenger jets, 2,773 passenger turboprops,
and 2,117 cargo jets were in service, however in actual, many of them were stationed on the ground
due to COVID-19 and there were many surplus aircraft, greatly affecting aircraft orders and deliveries.
The number of passenger planes in storage that can possibly be returned to service was 3,314 at the
end of 2019 and increased to 9,403 at the end of 2020.
Order Situation
The annual number of orders*4 for variants for passenger jets*3, cargo jets, etc. were 570 in 2020
and dropped by 1,002 compared to the previous year. In addition to the decrease in the number of
orders due to the suspension of delivery of the 737MAX beginning in 2019 (the number of orders
dropped by 741 compared to 2018, out of which 553 aircraft were 737MAX), COVID-19 dictated the
order situation in 2020.
Among the aircraft ordered, 77 aircraft are wide body jets (the number of orders for wide body jets
accounts for 14% of the total number of orders in 2020, dropping by 314 compared to 2019), 489
aircraft are narrow body jets (the number of orders for narrow body jets accounts for 86% of the total
number of orders in 2020, dropping by 484 compared to 2019), and 4 aircraft are regional jets (the
number of orders for regional jets accounts for 0.7% of the total number of orders in 2020, dropping
Trends in Orders*2 for Jets*1 No. of orders
Source: Airbus, Boeing, Bombardier, Embraer, Cirium, JADC (Some estimates are included.)
Other
Embraer
Bombardier
Boeing
Airbus
*1) Passenger planes (including combi and quick-change) and its variants (cargo, military, etc.)
*2) Net orders. Canceled orders have been subtracted from the number of orders in the year when each order was placed.

Worldwide Market Forecast 2020-2040
11
by 183 compared to 2019). Among the wide body jets ordered, the number of orders for variants for
cargo jets etc.*5 in 2020 is 23 (dropped by 5), and the number of orders for major passenger turboprops
in 2020 is 5 (dropped by 74).
(*3: Including combi aircraft and quick change aircraft)
(*4: Actual number of aircraft orders, which is obtained by subtracting
the number of canceled orders from the nominal number of orders)
(*5: Including cargo jets, VIP aircraft, and aerial refueling aircraft)
Delivery Situation
The annual number of deliveries of jets in 2020 is 821, decreasing from 1,377 in the previous year
by 556. The numbers of deliveries of jets by Airbus and Boeing decreased by 297 and 223, respectively.
The decrease in the number of deliveries by Boeing is partly attributable to the suspension of
delivery of the 737MAX from March 2019, but the delivery of the 737MAX was resumed in December
2020, since which 43 737-series aircraft have been delivered in total (of which 27 aircraft are
737MAX). During this period, Airbus delivered 446 A320-series aircraft (642 aircraft in 2019). With
regard to cargo jets*2, 46 aircraft were delivered in 2020 (52 aircraft in 2019). With regard to major
passenger turboprops, 32 aircraft were delivered in 2020 (89 aircraft in 2019).
(*2: Newly build wide body cargo aircraft. The number is out of the number of jets delivered.)
Trends in Deliveries of Jets*1
*1: Passenger planes (including combi and quick-change) and its variants (cargo, military, etc.)
Other
Embraer
Bombardier
Boeing
Airbus
No. of deliveries

Worldwide Market Forecast 2020-2040
12
Backlog Situation
The number of backlogs for passenger aircraft and cargo aircraft began increasing in 2005, when
the crude oil (fuel) price began skyrocketing. The number of orders for energy-efficient new aircraft
rose beyond the production capacity and the number of backlogs continued to rise year by year until
2013 and 2014 which were said to be a bubble in the aircraft manufacturing industry. After 2015, when
the crude oil price dropped sharply, the number of orders decreased and became almost the same as
the number of deliveries, bringing the number of backlogs into a stable state. At the end of 2019, the
total number of backlogs for passenger jets and variants such as cargo jets, etc. is 14,525.
When the COVID-19 pandemic began in 2020, the transportation demand dropped rapidly and the
financial health of airlines deteriorated rapidly, resulting in the cancellation of some aircraft orders.
The total number of backlogs for passenger jets and variants such as cargo jets, etc. as of the end of
2020 was 13,450, dropping by 1,075 from the end of the previous year, but no noticeable changes were
seen in the backlogs share by region.

Worldwide Market Forecast 2020-2040
13
(In this chart, the backlogs in the Middle-East before 2007 is included in “Other.”
Asian-Pacific
North America
Other
Middle-East
Europe
Number of Backlogs by Region (Cumulative) (No. of backlogs)
Number of Backlogs by Region
Share of Backlogs by Region
Other
Middle East
Asia Pacific
North America
Europe
(No. of backlogs) Europe
North America
Asia Pacific
Middle East
Other
Other
Middle East
Asia Pacific
North America
Europe

Worldwide Market Forecast 2020-2040
14
Looking at the distribution of firm orders (backlogs) for passenger jets, there is a characteristic
tendency that the delivery of ordered aircraft is postponed.
Distribution of firm orders for passenger jets (RJ + NJ + WJ): At the end of 2019, orders for
more than 1,500 aircraft were secured for the next year's scheduled delivery, and from the next year
onward, the number of confirmed orders gradually decreased while leaving room for sales activities.
In 2020, however, only 42% of aircraft scheduled to be delivered as of the end of 2019 were delivered.
In addition, the number of firm orders for delivery in 2021 or later dropped below 1,100 per year.
In the chart, this decrease in the number of firm orders appears as the postponement of deliveries,
and the annual number of firm orders increases from 2025 to 2027 by nearly 300, and after that, over
120 aircraft are scheduled to be delivered every year until 2034, showing the trend that deliveries are
postponed but are not easily canceled. In a similar trend, there are many cases where an order is
maintained but the delivery date is left open, and as a result, the number of such ‘open’ orders at the
end of 2020 increases by approximately 400 from the previous year.
The total number of firm orders after 2020 is 9,813 as of the end of 2019 (including 273 planes
whose delivery date is undetermined), but as of the end of 2020, it decreases to 9,398 (including 703
planes delivered in actual in 2020 and 644 planes whose delivery date is undetermined).
Distribution of firm orders for Widebody Jets (WJ): With regard to wide body jets, the number
of planes scheduled to be delivered in 2020 was 307 as of the end of 2019, but that of delivered in
actual was 142 (46%). The number of planes scheduled to be delivered for 2021 to 2022 decreases to
around 160. The chart shows that this decrease appears as the postponement of deliveries to 2023 and
subsequent years, and the number of planes scheduled to be delivered in each year for 2023 to 2025 is
nearly 200, which is larger than that for 2019. After that, the number of firm orders in each year
decreases and returns to almost the same level as 2019 in 2027.
The total number of firm orders for 2020 to 2039 is 1,538 (including 99 planes whose delivery date
is undetermined) as of the end of 2019, but has decreased to 1,450 (including 142 planes delivered in
actual in 2020 and 147 planes whose delivery date is undetermined) as of the end of 2020.
While 142 planes delivered in actual in 2020, 167 planes are scheduled to be delivered in 2021 and
152 planes scheduled in 2022. These are nearly the same as the number of aircraft delivered in 2020
and is considered to be a feasible level reached as a result of coordination between airlines and
manufacturers.
Distribution of firm orders for Narrowbody Jets (NJ): The number of planes scheduled to be
delivered in 2020 was originally 1,135, but 474 planes (42%) were delivered in actual.
The numbers of planes scheduled to be delivered for 2021 to 2023 decrease but the chart shows that
this decrease appears as the postponement of deliveries to 2024 and subsequent years.

Worldwide Market Forecast 2020-2040
15
Distribution of Firm Orders for Passenger Jets (RJ + NJ + WJ)
Planned year of delivery
Distribution of Firm Orders for Widebody Jets (WJ)
Distribution of Firm Orders for Narrowbody Jets (NJ)
No. of firm orders/year
No. of firm orders/year
No. of firm orders/year
This indicates the sum of the number of deliveries in 2020 and the number of backlogs for 2020. D
eliv
ery
da
te
un
dete
rmin
ed
Result for 2020
De
live
ry d
ate
u
nde
term
ined
D
eliv
ery
da
te
un
dete
rmin
ed
Result for 2020
Planned year of delivery
Planned year of delivery

Worldwide Market Forecast 2020-2040
16
The numbers of planes scheduled to be delivered for 2025 to 2027 are larger than that originally
scheduled during this period by 200 to 300 in each year, and this trend continues until around 2035*.
(*: The increase in the number of planes scheduled from 2030 to 2035 is mainly
contributed by airlines in Southeast Asia and India.)
The total number of confirmed orders since 2020 is 7,703 as of the end of 2019 (included 166 planes
whose the delivery date is undecided), but has decreased to 7,492 as of the end of 2020 (including 474
planes delivered in actual in 2020 and 342 whose delivery date is undecided).
The number of narrow body jets scheduled to be delivered in 2021 is 764, which is 290 more planes
than that of delivered in actual in 2020, a 1.6-fold increase. However, the RPK just started to recover
in 2021, and airlines will probably be struggling with severe financial hardship. Therefore, there is
some doubt about whether or not the delivery of this number of narrow body jets is feasible.
Negotiations between airlines and manufacturers are probably ongoing.
The planned monthly productions of Airbus and Boeing aircraft for 2021 and 2022 are shown in the
next section. For wide body jets, the planned annual production for 2021 and 2022 is 168 each year,
which is almost consistent with the numbers of wide body jets scheduled to be delivered in 2021 and
2022 (167 to 152). For narrow body jets, the planned production for 2021 is 720*1, which is almost
consistent with the number of scheduled to be delivered in 2021 (764). Both companies plan to
increase the production of narrow body jets in 2022, and the planned annual production is 1,080
planes*1, which is larger than 814 planes scheduled to be delivered for the year. And the number is
close to the number of firm orders for 2022 as of the end of 2019, i.e., before the emergence of COVID-
19*2. (*1: In addition to this, shipments of 737 MAX in stock will be added.) (*2: Related Page: P. 50)
2021 2022
Airbus Boeing Monthly
production (total)
Annual production
Airbus Boeing Monthly
production (total)
Annual production
Widebody Jet 2+5 2+5 14 168 2+5 2+5 14 168
Narrowbody Jet 5+40 15 ? 60 720 14+45 31 90 1080
(This table is an excerpt from the table below.)
Production Situation
As shown in the section describing the delivery situation, passenger plane manufacturers had been
increasing their production capacity year by year since 2005. For example, in 2019, Airbus and Boeing
planned to produce 50 to 60 planes to accommodate the orders for A320- and 737-series narrow body
jets. However, the delivery of the 737MAX was suspended in 2019, after which the numbers of planes
produced and delivered decreased remarkably. In addition, in 2020, the air transportation demand
dropped rapidly due to the COVID-19 pandemic, dealing significant damage to airlines that resulted
in financial difficulties that threatened their existence. As a result, many deliveries have been
postponed, and aircraft manufacturers have been forced to reschedule their production plans and have

Worldwide Market Forecast 2020-2040
17
announced that they will reduce the production of each model.
No. of deliveries
made in 1st half
Nominal monthly production Nominal monthly production
2018 2019 2020 2021 2022
Q1 Q2 Q3 Q4 No. of
deliveries made
Q1 Q2 Q3 Q4 No. of
deliveries made
Q1 Q2 Q3 Q4 No. of
deliveries made
Q1 Q2 Q3 Q4 Plan Q1 Q2 Q3 Q4 Plan
737 (NG+MAX)
52 580 52 40 127 34 Production increased from
a single-digit figure.
Target: 31 aircraft per month by Q1
9 Production of MAX resumed on May 27. 43
767 14 16 30 3 3
777&777X 4.5 48 4.5 45 10 16 (5) 26 2 2
787 14 145 14 157 36 17 (10) 53 6 → 5 5
A220 33 48 11 27 (4) 38 4 5 14
A319 8 6
157
289 (40)
3
40
43
45
45 A320 417 430 256
A321 201 206 187
A330 49 53 5 14 (2) 19 2 2
A350 93 112 23 36 (5) 59 5 5
737MAX: The monthly production was originally 52. The service and delivery were suspended in
March 2019. After April 2019, the shipment of the 737MAX was suspended but 40 aircraft were
produced per month to maintain the supply chain. The production of the 737MAX was suspended
in January 2020, and then resumed production in May and delivery in December. While
producing new 737MAX aircraft, Boeing will accelerate the modification and delivery of about
400 backlogged 737MAX aircraft produced in 2019, which, however, is expected to take about
two years. In 2021, Boeing will gradually accelerate its production, aiming to achieve a monthly
production of 31 aircraft by Q1 2022. For the 737MAX10, the Entry Into Service (EIS) is
scheduled in 2023 after countermeasures for the accident have been incorporated.
787: Due to the trade conflict between the United States and China, a reduction in production had been
planned before the COVID-19 pandemic, and was reduced further after COVID-19 started
spreading. In 2020, 787s were found to have manufacturing defects in their horizontal stabilizer
and fuselage. To address them, the delivery of 787s was suspended in November 2020 but
resumed in March 2021.
Old plan: Monthly production 12 (current) → 10 (late 2020) → 10 to 8 (2021) → 7 (2022)
New plan: Monthly production 6 (late 2020) → 5 (2021) → 5 (2022)
777X: The EIS was rescheduled from 2020 to late 2023 mainly because of a delay in engine
development, the rapidly decreasing demand for aircraft due to the COVID-19 pandemic, and the
increasingly stringent certification requirements and engineering changes after the 737MAX
accident. (For this reason, a delay of more than one year is expected in the delivery of some firm
orders, and as a result, the right of cancellation arises on the ordering party side.) Including the
production of 777 cargo aircraft, the monthly production of 777s and 777Xs will be reduced to 2
by the end of 2021.
No. of deliveries made in 2nd half (nominal monthly production)

Worldwide Market Forecast 2020-2040
18
A320 series: The target monthly production of A320 series aircraft (A319, A320, and A321) was
originally 60, but was decreased to 40 in 2020. Airbus plans to accelerate production after Q3
2021 and increase the monthly production to 45 in 2022.
A330: Airbus originally planned to produce 40 A330neo aircraft in 2020 (equivalent to a monthly
production of 3.3 aircraft), but delivered only 19 aircraft. Airbus decided to reduce the monthly
production to 2 after Q3 2020.
A350: Airbus originally planned to produce 9 or 10 A350XWB aircraft per month but decided to
reduce the monthly production to 5 after Q3 2020.
********************
The chart below shows the number of deliveries, planned production, backlogs for each year, and
forecasts of wide body jets.
We expect that the number of deliveries of wide body jets will start to recover in 2023 after
decreasing due to the COVID-19 pandemic. However, since a delay is expected in the recovery of the
GDP (or the RPK), the number of deliveries of wide body jets will probably remain below the level
before the COVID-19 pandemic for the time being, and be an average of around 300 per year until
around 2030. (Related Part: 4.2.2)
0
100
200
300
400
500
2017
2018
2019
2020
2021
2022
2023
2024
2025
2026
2027
2028
2029
2030
unit/year Delivery of Widebody Jets(Actual & Forecast)Backlog(End of 2019)Backlog(End of 2020)Delivered+Planned
Forecast(JADC)Forecast(averaged)

Worldwide Market Forecast 2020-2040
19
3.3 Until COVID-19 Calms Down
Airlines in the world have so far experienced disruptions such as terrorism and the pandemic, but
after the cause of each disruption was eliminated, the transportation demand recovered and returned
to the growth curve, predicted before the disruption, within several years. This section estimates the
path to overcoming COVID-19 and the influence of COVID-19, focusing on things that can be
determined from actual data.
Current Situation
Since the emergence of COVID-19, our world has been forced to fight against it without preventive
medicine or a cure. To block the spread of infection, each country is restricting movement of people,
and the demand for transportation, especially transportation on international flights, disappeared,
depriving airlines of a large part of their profits. Even in this situation, airlines are forced to spend a
lot of money every month and securing enough operating capital is a vital challenge to them. They are
making every effort to address this situation, such as getting loans from financial institutions, selling
their aircraft to get cash, laying off their employees, and trying to postpone payments for their ordered
aircraft by postponing the delivery of them. Amid this situation, the first emergency use of the long-
awaited vaccines started in some countries in December 2020. However, the vaccine production
capacity is still insufficient, and it probably will not be until late 2021 at the earliest that the air
transportation demand will recover after collective immunity is established in each country.
Cost Structure
According to Airlines for America (A4A), the operating expenses of American airlines in Q4 2019
directly related to flights include fuel expenses (18%), transportation-related expenses (13%), and
landing fees (2%). With no flights, these expenses, or 33% of the total expenses, may be unnecessary,
but the reality is that 67%*1 of the total expenses remain, so airlines are trying to cut these remaining
expenses by laying off employees and reducing the number of new hires.
(*1: Labor expenses account for 33% out of the 67%.)
The expenses necessary to own aircraft (e.g., depreciation expenses, lease expenses) account for
7%. In addition, not only that, if an ordered aircraft is delivered, the airline is required to spend billions
of yen*2 to receive it. (*2: For small narrow body jets)
Recovery of Demands and Orders
Currently, the delivery of many new aircraft has been postponed, and manufacturers have decided
to reduce production. The number of planes delivered in 2020 is in the 40% range of originally planned.
The demand for new aircraft depends on the balance between the increase in number of passenger
planes required to address a growing transportation demand and the decrease in number of planes in
service due to retirement of them. Currently, however, because of the influence of COVID-19, the

Worldwide Market Forecast 2020-2040
20
transportation demand has disappeared and airlines are forced to reduce their flights and leave many
of their aircraft on the ground. Because airlines have many surplus aircraft, there is no demand for
new aircraft. After that, the recovery of demand for new planes follows the recovery of transportation
demand (RPK), but the delivery of planes already ordered will be resumed first, and the new orders
will be made after the financial condition of airlines is further improved.
Past Epidemics
In the past 20 years, we have experienced two world-wide epidemics, SARS (in 2003) and Pandemic
H1N1 2009 (in 2009). The following looks back over these epidemics.
SARS (2003):
Name: Severe acute respiratory syndrome (SARS)
Symptoms: Severe atypical pneumonia
An outbreak is likely to occur with close contact with infected people.
Cause: Novel coronavirus (SARS-CoV)
Emergence: November 16, 2002 (Guangdong province, China)
Termination: On July 5, 2003, the WHO declared that SARS was under control.
Affected areas: 8,096 cases in 32 regions and countries (774 deaths)
(Excerpt from an article of the National Institute of Infectious Diseases (NIID))
https://www.niid.go.jp/niid/ja/kansennohanashi/414-sars-intro.html
-6
-4
-2
0
2
4
6
8
-60
-40
-20
0
20
40
60
80
1996 2001 2006 2011 2016
Operating Profit
Net Profit
RPK
Order
RPK, Profit, Ordersat the previous epidemicsProfit
(×10 9 US$ )PPK ( ×10 12 )
Orders ( ×10 3 )
Source : IATA, ICAO, Airbus, Boeing, Bombardier, Embraer
Skyrocketing Fuel Prices
European Debt Crisis911 SARS Financial Crisis
2009H1N1
Resuming Orders
(2005)
RPK initial Recovery
(2004)
Resuming Orders
(2011)
RPK initial Recovery
(2010)
after Pandemic 2009H1N1after SARS

Worldwide Market Forecast 2020-2040
21
SARS emerged before the wounds inflicted by the 9/11 attack was healed, and made the process of
RPK recovery from the incident prolonged.
The termination of SARS itself was declared in summer 2003. In the RPK recovery process after
the termination, the RPK dropped to 87% of its expected value*1 in 2003, but increased to 95% in
2004, showing a remarkable initial recovery. Furthermore, (despite the rocketing rise in the fuel price,)
the RPK continued a gradual recovery until 2007, eventually to 98.7% of the expected value*2.
In this recovery process, the airline business moved back into the black (although the surplus was
small) in terms of operating profit in 2004, and in 2006, moved back into the black in terms of net
profit. During this period, orders recovered drastically*3 in 2005 and returned to the level before the
9/11 attack.
(*1: The growth curve of the RPK through 1999 was extrapolated based on the average growth
rate from 1999 to 2019.)
(*2: After 2008, the RPK dropped again due to the disruption caused by the Global Financial
Crisis.)
(*3: It is natural that the return to profitability led to the recovery of orders, but in addition, it
became clear that crude oil prices began to rise in 2005, and airlines with sufficient sales
and financial resources seemed to have begun to order new models with excellent fuel
efficiency.)
H1N1 (2009)
Name: Pandemic (H1N1) 2009
Symptoms: Sore throat, soaring fever, cough, runny nose, fatigue, etc. H1N1 cannot be
distinguished from seasonal flu. The fatality rate in Mexico was 0.4 to 0.5%, which
is higher than the 0.05% of seasonal flu, and is almost the same as that of Asian flu.
More than half of those who died from H1N1 had underlying diseases, such as
asthma, diabetes, heart diseases, and diminished immune systems.
Cause: Novel influenza (Influenza A (H1N1) pdm: AH1pdm)
Emergence: April 12, 2009 (reported in Mexico)
Termination: In Japan, the H1N1 epidemic ended in March 2010.
(Excerpt from an article of the National Institute of Infectious Diseases (NIID))
https://idsc.niid.go.jp/iasr/30/356/tpc356-j.html etc.
The H1N1 influenza epidemic occurred during the process of recovery from the disruption due to
global financial crisis in 2008, and airlines were influenced by the H1N1, the financial crisis and the
skyrocketing fuel prices at the same time.

Worldwide Market Forecast 2020-2040
22
The H1N1 epidemic itself ended in spring 2010. Comparing the subsequent RPK recovery process
with the expected RPK value for each year, the RPK bottomed out at 87% of the expected value in
2009 but saw an initial recovery from 2010 to 2011, recovering to 90.6% and 92.4% respectively of
the expected values. During this period, the fuel prices stayed high, which affected the recovery of the
RPK. However, the RPK continued a gradual recovery until 2014 and eventually reached 95.7% of
the expected value.
In the recovery process, the airline business moved back into the black in terms of operating profit
in 2010, and orders began recovering in 2010 and, in 2011, returned to the level before the H1N1
epidemic and financial crisis.
Recovery from COVID-19
From these two cases, the recovery pattern can be read as follows:
- An epidemic having calmed down, the RPK immediately begins recovering and the ‘initial recovery’
ends by the end of the following year.
In the case of SARS, the RPK recovered to 95% of the expected value.
- Following the initial recovery, the RPK continues a gradual recovery for about three years. In the
case of SARS, the RPK recovered to 99% of the expected value.
- The airline business moves into the black in terms of operating profit after the initial recovery of the
RPK, and in the following year, moves into the black in terms of net profit and sees a recovery in
new aircraft orders.
Based on the above, the process of recovery from COVID-19 can be presumed as follows:
- Vaccines, the trump card against COVID-19, were developed speedily thanks to the efforts of those
involved, and the emergency use of some vaccines was started at the end of 2020. However, it will
probably take at least the full 2021 to spread vaccines and establish collective immunity on a
regional scale even in areas with fast progress such as developed countries. In developed countries,
the recovery of domestic and regional flights will proceed during this period, and after that, the
recovery of international flights between the vaccinated developed countries, such as Atlantic routes,
will take place. We expect that the demand for international flights will begin recovery when each
country relaxes its epidemic controls by confirming the level of collective immunity in destination
countries. However, it will take a long time for vaccinations to spread in developing countries, and
it will take another two or three years for the RPK to recover completely all over the world.
- The RPK will begin to recover in Q3 or Q4 2021 with the start of vaccination, but the RPK for the
full year 2021 will be still low as it lacks the contribution before Q3*1. The initial recovery is
expected to take place from 2022 and 2023, mainly in domestic and regional flights*2. It will be

Worldwide Market Forecast 2020-2040
23
around 2022 that the operating balance and financial power of airlines begin recovery and the
number of deliveries of backlogs starts to increase.
(*1: The RPK is expected to be 50% of the 2019 level. [IATA])
(*2: The RPK for 2022 is expected to be 75 to 80% of the 2019 level. [JADC. See the next section.])
- New orders for passenger planes are expected to resume in 2023, the year following the return of
airlines to profitability due to the initial recovery of RPK.
0
5,000
10,000
15,000
20,000
1990
1992
1994
1996
1998
2000
2002
2004
2006
2008
2010
2012
2014
2016
2018
2020
2022
2024
2026
2028
2030
2032
2034
2036
2038
RPK(×10 9) Recovery of RPK from COVID‐19 (projection)
RPK(Actual Value)RPK(Forecast : Standard Model)RPK(Expected in the past) Projected deficit due to COVID‐19

Worldwide Market Forecast 2020-2040
24
RPK Recovery Models
Forecasts from 2021 to 2023
(JADC)
NA: North America, WE: Western Europe, EE: Eastern Europe, ME: Middle East
JA: Japan, OC: Oceania, NE: Northeast Asia, SE: Southeast Asia, AF: Africa
RPK (by route, compared to the same month of 2019)
Europe – Other regions Vaccination rate
RPK (by route, compared to the same month of 2019)
North America – Other regions
RPK (by route, compared to the same month of 2019)
China – Other regions
Results from January to December 2020 (IATA)
Within Europe North America (Atlantic route)
Vaccination rate
Within North America
Europe (Atlantic route)
Within China

Worldwide Market Forecast 2020-2040
25
Some of the RPK recovery models used for the analysis in the previous section are shown here.
Even in developed countries that are leading the way in securing vaccines, the vaccination to the
general public of the working-age generation, who are the main passengers of airlines, are expected to
be started after 2021Q2 at the earliest, since many countries give priority of vaccination for medical
personnel and the elderly. Therefore, we expect that the recovery of RPK resulting from vaccinations
will not proceed satisfactorily in the first half of 2021 but will be proceed in the last half of 2021.
Collective immunity is said to begin when the vaccination rate reaches about 70% of the population
of each country. In addition, at that situation, when you get on board a domestic flight, passengers
sitting next to you are highly likely to have been vaccinated. You will regain trust in your immunity
and have high expectations for the collective immunity of the general public and the health of their
neighbors, and use airlines on the sense of security. As a result, the RPK of domestic flights in
developed countries and flights within Europe is expected to rapidly recover especially from Q4 in
2021 or Q1 2022 at the latest. Likewise, international flights between developed countries will recover
about one quarter behind domestic flights and the RPK is expected to reach the normal level for most
of 2022 although this depends on the situation in destination countries.
On the other hand, vaccine acquisition is slow* and the number of infected patients has not
decreased in developing countries and such regions. To these countries, prevention measures by
vaccinated countries will be maintained to restrict traffic. As a result, the recovery of the RPK of
international flights with these countries will be slow. Hopefully, these countries will also obtain
sufficient vaccines in a few years as vaccine production including licensed production increases
around the world.
(* Emerging countries may experience more delays in vaccine acquisition due to lack of their purchasing power and
production power. In addition, if the duration of the antibody by the vaccine is not long, the vaccine will be procured
repeatedly for developed countries to make subsequent rounds of inoculation, and will be in short supply for developing
countries to procure. If the world must deal with new variants, the same thing may happen although this should be
addressed through production increase.)
The chart below shows the actual RPK of domestic flights. Although the RPK dropped below 20%
in each country when the pandemic started, the RPKs of domestic flights have often recovered to 40
to 60% of the normal level even before vaccinations spread, particularly in countries with large land
areas where airplane transportation is essential to living, indicating that the demand for transport is
solid.

Worldwide Market Forecast 2020-2040
26
In this document, the global RPK is expected to recover to 45 to 50% of the 2019 RPK in 2021,
75 to 80% in 2022 (start of the initial recovery) ,based on the assumed recovery models and the
composition ratio of each route in the global RPK at normal times. If vaccinations proceed smoothly,
the global RPK will recover to 90 to 95% in 2023 (completion of initial recovery), hopefully
exceeding 100% in 2024.
Maintenance of Airlines’ Transportation Capacity
Influenced by COVID-19, the airline industry has been suffering hardship for more than one year,
continuously facing financial difficulties. In response to this situation, airlines have reduced the
number of aircraft and cut their workforce. Airlines cut their workforce little by little through attrition
or early retirement, avoiding large-scale downsizing. Many airlines used government subsidy
programs to keep their employees, but some airlines and airport companies have announced that they
will start large-scale downsizing if such government subsidy programs are terminated*1.
(*1: Around fall 2020, some airlines announced that they decided to cut their workforce by 20% or so.)
Therefore, in 2020, airlines had almost the same numbers of aircraft and employees as in 2019, and
only the demand for passenger transportation dropped, but in 2021, airlines may be forced to dispose
of some aircraft and cut their workforce, resulting in a potential decrease in their available
transportation capacity, or ASK.
In the latter half of 2021, the RPK of domestic flights in developed countries is expected to begin
recovering, but if there is a delay in airlines recruiting staff, the ASK, which decreased temporarily
due to the reduced numbers of aircraft and employees, will probably be used up, resulting in a slight
delay in the recovery of the RPK to the 2019 level.
0
20
40
60
80
100
120
1 2 3 4 5 6 7 8 9 10 11 12
% 国内線RPKの推移 (対2019年同月比:2020年1~12月)
China
Russia
Brazil
Japan
India
United States
Australia
Within Europe
Source:IATA
Trends in RPK of Domestic Flights (compared to the same month of 2019: January to December 2020)
Worldwide Market Forecast 2020-2040
27
3.4 After COVID-19 Calms Down
The world economy and airline business will fully recover when COVID-19 becomes preventable
and curable. However, COVID-19 forced us to restrict the movement of people and impose constraints
on our industrial and economic activities, and therefore, caused the greatest loss since the Great
Depression to our economic activities and lives. The impact of COVID-19 on the GDP and RPK is
expected to remain for a while. The following attempts to estimate the impact of COVID-19 on the
GDP and RPK based on currently available information.
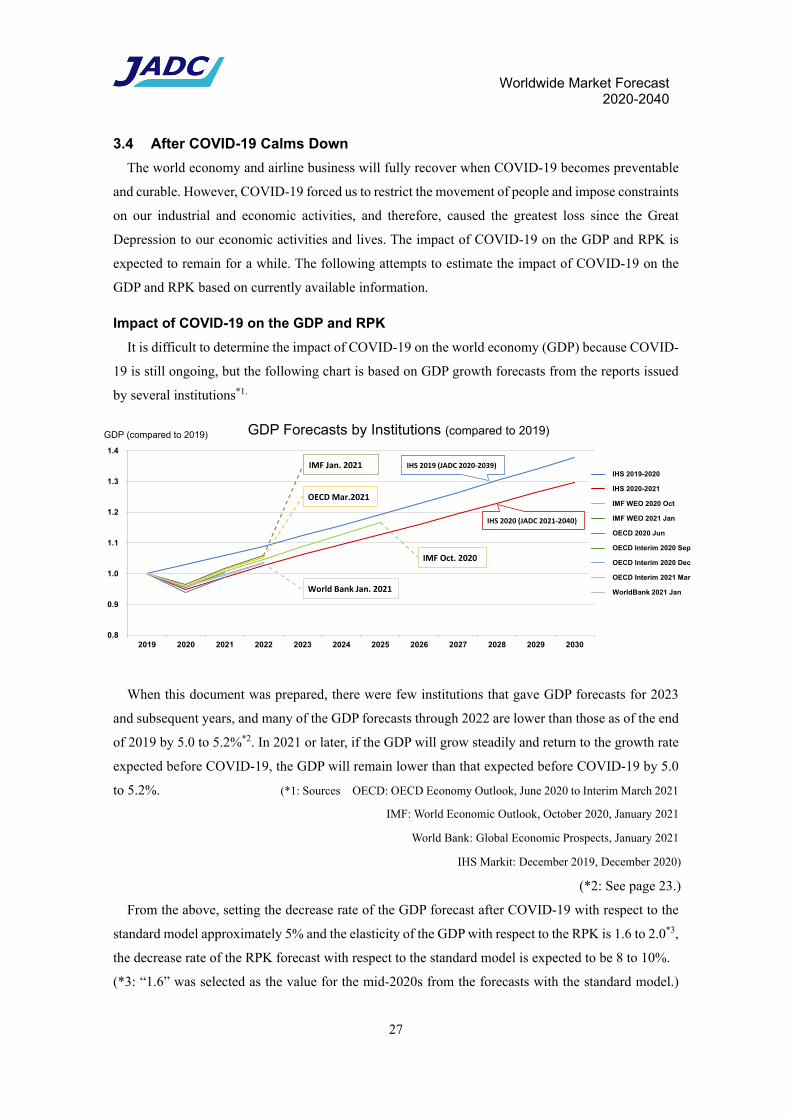
Impact of COVID-19 on the GDP and RPK
It is difficult to determine the impact of COVID-19 on the world economy (GDP) because COVID-
19 is still ongoing, but the following chart is based on GDP growth forecasts from the reports issued
by several institutions*1.
When this document was prepared, there were few institutions that gave GDP forecasts for 2023
and subsequent years, and many of the GDP forecasts through 2022 are lower than those as of the end
of 2019 by 5.0 to 5.2%*2. In 2021 or later, if the GDP will grow steadily and return to the growth rate
expected before COVID-19, the GDP will remain lower than that expected before COVID-19 by 5.0
to 5.2%. (*1: Sources OECD: OECD Economy Outlook, June 2020 to Interim March 2021
IMF: World Economic Outlook, October 2020, January 2021
World Bank: Global Economic Prospects, January 2021
IHS Markit: December 2019, December 2020)
(*2: See page 23.)
From the above, setting the decrease rate of the GDP forecast after COVID-19 with respect to the
standard model approximately 5% and the elasticity of the GDP with respect to the RPK is 1.6 to 2.0*3,
the decrease rate of the RPK forecast with respect to the standard model is expected to be 8 to 10%.
(*3: “1.6” was selected as the value for the mid-2020s from the forecasts with the standard model.)
0.8
0.9
1.0
1.1
1.2
1.3
1.4
2019 2020 2021 2022 2023 2024 2025 2026 2027 2028 2029 2030
GDP(2019年⽐) 各機関によるGDP予測 (2019年⽐)
IHS 2019-2020
IHS 2020-2021
IMF WEO 2020 Oct
IMF WEO 2021 Jan
OECD 2020 Jun
OECD Interim 2020 Sep
OECD Interim 2020 Dec
OECD Interim 2021 Mar
WorldBank 2021 JanWorld Bank Jan. 2021
OECD Mar.2021
IMF Jan. 2021
IMF Oct. 2020
IHS 2019 (JADC 2020‐2039)
IHS 2020 (JADC 2021‐2040)
GDP Forecasts by Institutions (compared to 2019) GDP (compared to 2019)

Worldwide Market Forecast 2020-2040
28
“2.0” was selected as a representative value from the results of analysis of actual RPK, GDP, and
yield values.)
Assuming that the RPK will be lower than the standard model by 8 to 10% at the end of the gradual
recovery and grow at the same rate as the standard model, or 4.0% per year, this decrease is equivalent
to the growth for 2 to 2.5 years. It can be seen that the subsequent RPK will be delayed by about 2 to
3 years from the standard model.
0
5,000
10,000
15,000
20,000
1990
1992
1994
1996
1998
2000
2002
2004
2006
2008
2010
2012
2014
2016
2018
2020
2022
2024
2026
2028
2030
2032
2034
2036
2038
RPK(×10 9) Recovery of RPK from COVID‐19 (projection)
RPK(Actual Value)RPK(Forecast : Standard Model)RPK(Post COVID‐19 : ‐7% estimated line) Projected deficit due to COVID‐19
Asymptotic Recovery completion
Equivalent to a delay of 2 to 3 years ( shift to right )
Initial Recovery completion
The recovery of the RPK and the number of aircraft deliveries after COVID-
19 forecast by JADC are based on the information available as of the time of
editing. JADC plans to prepare an updated version for the next fiscal year with
new input information, such as the latest GDP forecasts.

Worldwide Market Forecast 2020-2040
29
Estimation of the Number of Aircraft Deliveries
If the RPK grows 2 or 3 years behind the standard model as mentioned above, the number of
deliveries, which depends on the RPK, will grow 2 or 3 years behind the standard model as well, and
some expected deliveries will be postponed for 2 or 3 years and not done within the forecast period.
The table below estimates how the number of deliveries within the forecast period changes by using
this method on the standard model*4. (*4: Based on the data as of the end of 2019)
Number of Deliveries within the Forecast Period (2020-2039)
NJ (Narrowbody Jet)
Standard model (without COVID-19)
One-year delay
Two-year delay
Three-year delay
WJ (Widebody Jet)
Standard model
(without COVID-19)
NJ 24,989
WJ 7,808
Total 32,797
One-year delay
NJ 23,890
WJ 7,354
Total 31,244
Two-year delay
NJ 23,890 NJ 22,776
WJ 6,898 WJ 6,898
Total 30,788 Total 29,674
Three-year delay
NJ 22,776 NJ 21,663
WJ 6,438 WJ 6,438
Total 29,214 Total 28,101
The recovery of the passenger transportation demand relies fundamentally on the establishment of
collective immunity by the spread of vaccinations, which have been started in some countries. Each
country will speed up vaccinations, and as vaccinations proceed, the RPK will recover for domestic
flights, regional flights, and then international flights between vaccinated developed countries. As a
result, the RPK is expected to see an initial recovery from 2022 to 2023, then transit to gradual recovery.
In 2020 and in 2021, only the already scheduled firm orders will be received by airlines, but in 2022
and later, it is expected that the number of planes received will increase due to the recovery of
operating profit. In addition, demand for short- and medium-range narrow-body jets is expected to
begin to recover ahead of demand for long-range wide-body jets.
Separate from the method used in the previous section, the table below was obtained by directly
calculating the number of deliveries within the forecast period with new data*5, such as GDP forecasts
that take the impact of COVID-19 into consideration.
(*5: Based on the data as of the end of 2020)

Worldwide Market Forecast 2020-2040
30
Number of Deliveries within the Forecast Period (2020-2039)
YGR-5111 (2021)
NJ (Narrowbody Jet)
Standard model (without
COVID-19)
One-year delay Two-year delay (resumption of
delivery in 2022)
Three-year delay
(resumption of delivery in 2023)
WJ (Widebody Jet)
Standard model
(without COVID-19)
NJ 24,989
WJ 7,808
Total 32,797
One-year delay
Two-year delay (resumption of
delivery in 2022)
NJ 23,469
WJ 6,425
Total 29,894
Three-year delay (resumption of
delivery in 2023)
NJ 23,469 NJ 22,794 WJ 6,200 WJ 6,200 Total 29,669 Total 28,994
The area in dark green in this table, (resumption of delivery of NJ2022 and WJ2023) will be
explained in Chapter 4.
(Although the term “resumption” is used here, the delivery of backlogs will be carried out in 2020 and 2021 as well.)
In the calculation for this table and Chapter 4, the GDP data from IHS Markit (Dec. 2020) among
the reports listed on page 21 were used. Then, in spring 2021, IMF (Oct. 2020, Jan. 2021) and OECD
(Mar. 2021) suggested the possibility that the global GDP may recover earlier to a higher level (see
the graph on page 21). Since the detailed GDP data for each country are unavailable, JADC cannot
use that data in its calculations, but if the GDP recovers as suggested by IMF and OECD, the
transportation demand, or the RPK, is expected to be at a higher level after the gradual recovery period
(after 2025), and in addition, the aircraft demand is expected to be higher as well.
However, since COVID-19 caused serious financial damage to airlines, there may be a delay in the
recovery of their purchasing power. Also, the RPK of domestic flights is relatively small, accounting
for only about one-third of the global RPK, and therefore, the recovery of the RPK of international
flights is considered important for the full recovery of the financial power of the airline business.
Therefore, hopefully, we expect that the distribution of vaccines will be accelerated throughout the
world with the enhancement of vaccine production by countries capable of producing vaccines and
the framework like the COVAX Facility*, and it will lead to the recovery of the demand for
international flights. If the Southeast Asian countries and Central and South American countries fall
behind in vaccinations and international flights to these countries stand idle, the recovery of the RPK
of international flights will be greatly affected. In addition, in any region, suppressing the number of
infections is effective in reducing the possibility of the emergence of new variants.
(*: COVID-19 Vaccines Global Access Facility)

Worldwide Market Forecast 2020-2040
31
Other Factors
The table below shows the COVID-19-related factors that are likely to affect air transportation
demand and aircraft demand.
Factors that Affect Airlines and Aircraft Demand during and after COVID-19
Factor Key points Related
Part
Basic premise Establishment and diffusion of vaccines and treatments
Progress of vaccination delay or increase in production, handling of variants, antibody duration, procurement power of each country (purchasing power and international coordination) 3.3
Social changes
Epidemic control (immigration and movement restrictions) Shrinkage and recovery of GDP Changes in relationships between countries (triggered by COVID-19)
Termination timing and scope of epidemic control (directly related to the RPK of international flights) Period and progress of recovery (strongly related to RPK and GDP) Reconstruction of supply chain Changes in the movement of people and cargo
–
New way of doing things
Utilization of non-face-to-face media and remote media
Does such media partially replace air transportation and decrease the demand for transportation?
Video conferencing (substitute for conventional meetings: useful for remote persons and urgent meetings Does business traffic demand decrease?)
VR (virtual reality) (substitute for conventional sightseeing trip: inexpensive and easy Does consumer traffic demand decrease?)
Can such media be used as new media to attract customers and increase traffic demand?
VR (development of libraries: We can preview the proposed travel plan as if we actually visited each location.)
–
Hygiene measures
Hygiene, disinfection, elimination of anxiety
(acceleration of recovery of the RPK of domestic flights)
For Passengers: Vaccination, personal devices (masks, etc.)
For Airlines and airports: Disinfection of cabin equipment and airport facilities Screening by symptoms, such as fever Vaccine passport
–
Airlines Measures for survival
(securing operating capital)
Increase of debt, support from the government Airlines will have a large debt when they resume
flights and may refrain from placing new orders. –
(reduction of expenses)
Decrease of airplanes: Cancellation of orders, Retirement of airplanes
Downsizing: Layoff/dismissal Airlines may need to limit their transportation after
resuming flights, which could cause a delay in the recovery of their operating profit.
–
Environmental measures
Commencement of CO2 emissions regulations
Reduction of fuel consumption, driver to boost the demand to renew old models
5.3.1
The factors in the colored areas in this table have been reflected in this forecast calculation, or their
impact has been estimated.
In this forecast, the most reliable result is shown in the range that can be predicted quantitatively at
present, but the long-term recovery level of the RPK could be affected depending on the degree of
realization of each factor.

Worldwide Market Forecast 2020-2040
32
Intentionally Blank

Worldwide Market Forecast 2020-2040
33
4. Passenger Aircraft Demand Forecast
Chapter 4 describes the forecast of the number of passenger aircraft using the standard model.
The forecast of transportation demand (RPK), which is the basis for the number of aircraft
forecast, is presented in Chapter 5.
4.1 Number of Aircraft in Service
4.1.1 Income Level and Number of Aircraft in Service
In 1998, 15,820 passenger aircraft* were in service worldwide, and in 2018, 26,365 passenger
aircraft were in service, which means that the number of passenger aircraft in service increased by
10,545, or 1.67-fold, in 20 years.
(*: Total number of passenger jets and passenger turboprops. For passenger aircraft only.)
The number of passenger aircraft in service is increasing as transportation and travel demands
increase with the growing economy and increasing income. There is a positive correlation between the
number of aircraft in service per million people and the GDP per capita although it varies depending
on the land area and the degree of development of the ground transportation network.
Also, since it is known that in countries and regions with a GDP per capita of less than 10,000
dollars travel demand increases sharply as income increases, we expect that not only in China, which
has been growing remarkably, but also in Southeast Asian and South Asian countries, air transportation
demand will grow at a high rate, causing passenger aircraft demand to increase depending on the
population of each region.
(AF: Africa, CH: China, CI: CIS, EE: Eastern Europe, JA: Japan, LA: Latin America,
ME: Middle East, NA: North America, NE: Northeast Asia, OC: Oceania, SE: Southeast Asia,
SW: South Asia, WE: Western Europe)
For passenger jets in service only. Sources: IHS, Cirium
Trends in the Number of Passenger Aircraft (Jet + TP) per Million People (1996-2018)
Num
ber
of p
asse
nger
ai
rcra
ft in
ser
vice
pe
r m
illio
n pe
ople

Worldwide Market Forecast 2020-2040
34
4.1.2 Distribution of ASK by Route Distance
Airlines select suitable aircraft according to the distance of each route. According to the distribution
of ASK by route distance for regular non-stop flight routes, aircraft are operated as follows:
- Most turboprop aircraft are used for routes with a distance of 1,000 km or less, and the largest
number of turboprop aircraft are used for routes with a distance of 400 to 600 km.
- Regional jets are used mainly for routes with a distance of 400 to 1,500 km in all regions except
North America, but are used for routes with a distance of up to 2,000 km in North America, which
is a leading market.
- Narrow-body aircraft are operated on routes between 400 and 4,000 km. They are mainly used for
routes with a distance of 900 to 2,000 km. On routes up to 3,500 km, narrow-body aircraft provide
90% of the total ASK, and on routes up to 4,500 km, 98% of the total ASK. In all, narrow-body
aircraft provide 52% of the total ASK worldwide.
- Wide body jets are used for a wide range of route distances, but mainly for routes with a distance
of 5,500 to 10,000 km. Wide body jets supplied for routes with a distance of 4,500 to 13,000 km
account for 78% of the total ASK of wide body jets.
0
200
400
600
800
1000
1200
1400
(×109)
Distribution of ASK (Available Seat Kilometers) by Route Distance
Regional jet
ASK (× 109)
Turboprop
Regional jet
Narrow body jet
Wide body jet
Short range
Medium range
Long range
Source: Data by OAG as of September 2019
Non-stop route distance (km)

Worldwide Market Forecast 2020-2040
35
4.1.3 Distribution of ASK by Number of Seats
The distribution of ASK by number of seats in different route distances is as follows:
- For routes with a distance of 1 to 1,000 km, the bars for turboprop aircraft and regional jets with 40
to 99 seats are slightly higher than the other bars, and the bars for narrow body jets with 120 to 169
seats (e.g., A320, 737-700/800) are noticeably higher, showing that aircraft with 120 to 169 seats
are the mainstream.
- For routes with a distance of 1,000 to 2,000 km, aircraft with 120 to 169 seats are the most
commonly used as well. In addition, narrow body jets with 170 to 229 seats (e.g., A321, 737-900ER,
757) and wide body jets with 230 to 399 seats are also in service.
- For routes with a distance of 2,000 to 4,500 km, aircraft with 120 to 169 seats are the mainstream.
In addition, narrow body jets with 170 to 229 seats and wide body jets with 230 to 399 seats (e.g.,
A330, 767/787) are also in service. In this range of distances, due to the longer distances compared
to routes with a distance of 1,000 to 2,000 km, relatively large aircraft, such as narrow body jets
with 170 to 229 seats and wide body jets with 230 to 399 seats, are increasing.
- For routes with a distance of 4,500 km or more, the number of aircraft with 310 to 399 seats (e.g.,
A340, 777) is largest, followed by aircraft with 230 to 309 seats (e.g., A330, 787), aircraft with 500
to 800 seats (A380), and aircraft with 400 to 499 seats (747). In recent years, the number of aircraft
with 400 to 499 seats is decreasing due to the decreasing number of 747 aircraft.
1-1000
1001-2000
2001-4500
4501-
0
200
400
600
800
1000
1200
1400
1600
1800
2000
001-019
020-039 040-
059060-079 080-
099 100-119 120-
169 170-229 230-
309 310-399 400-
499 500-800
Distribution of ASK by Number of Seats – Global Total Annual ASK (× 109)
Regional jets and turboprop aircraft
Route distance (km)
Source: Data by OAG as of September 2019
Narrow body jets
Wide body jets
Number of seats (seats)

Worldwide Market Forecast 2020-2040
36
4.1.4 Increase in the Average Number of Seats (Adoption of Larger Aircraft with
More Seats)
Comparison of the relationship between the number of takeoffs and landings and the number of
passengers at the world’s top 50 airports between 2007 and 2019 shows that the number of takeoffs
and landings did not increase or decrease significantly but the number of passengers increased. The
average number of passengers per takeoff and landing in 2007 was 98, but it increased to 134 in 2019
by 37%. During this period, the world’s annual load factor increased from 76.1% to 81.9% by 5.8%.
Even with this in mind, the average number of seats per aircraft has increased, indicating that airlines
are working to increase the number of seats (increase the density) or increase the aircraft size to address
the increasing number of passengers.
The average number of seats per aircraft decreased until the mid-2000s because of the emergence
of regional jets, the adoption of twin-engine aircraft, which can be used for long-range flights, and
increased use of small aircraft in high frequency. After that, however, the average number of seats per
aircraft started to increase around 2004 first for routes with a distance of 2,000 km or less, due to the
rise of LCCs (high-density seat arrangement), the restricted number of takeoff-and-landing slots at
airports (difficulty in increasing flights), and the mergers of airlines which lead the reduction of
redundant routes and flights (streamlining). Then, the annual average load factor rose above 80% in
dealing with the skyrocketing fuel prices after 2005 (increased cost per seat). After around 2012, when
many four-engine aircraft had retired, the average number of seats per aircraft started to increase even
for mid- and long-range routes with a distance of over 2,000 km. On the whole, aircraft have an
increasing number of seats (high-density seat arrangement or shift to larger models of the same family).
0
20
40
60
80
100
120
0 200 400 600 800 1,000 1,200
2007 2018
Source :IATAWATS+ 2019 & 2008
Number of Passengers at the World’s Top 50 Airports
Number of takeoffs and landings (1,000 times)
Num
ber
of p
asse
nger
s (m
illio
ns)

Worldwide Market Forecast 2020-2040
37
4.1.5 Retirement (Trends through around 2019)
The retirement and renewal of passenger aircraft depends mainly on fluctuations in economy
(transportation demand), fluctuations in fuel prices, application of noise control and other regulations,
and emergence of new aircraft with the latest technologies and the demand for them. In the past, the
enforcement of large-scale noise control regulations and the sharp and prolonged rise in fuel prices led
to the retirement of many aircraft and also produced a large demand for new aircraft for renewal, which
served as a driving force for advancing technologies and increasing economic efficiency in airline
industry through the replacement of old aircraft with new aircraft.
By 2002, many old aircraft which fell under Chapter 2 of the ICAO noise regulations (aircraft
around 30 years old) retired. The next few years after the older aircraft were retired were a period of
relative tranquility, with aircraft around 25 years old taking center stage in the annual retiring of
aircraft.
After 2005, however, the skyrocketing fuel prices forced airlines to replace their old aircraft, and
even relatively new aircraft that require higher maintenance costs with more fuel-efficient aircraft. As
a result, especially after 2009, the average retirement age dropped rapidly, and many aircraft that were
22 to 25 years old, and even aircraft around 18 years old retired. After 2015, because fuel prices had
stabilized, the temporary rush of requirement and renewal slowed down but the average retirement age
remains below 23 years. The stabilized fuel prices helped stop the average retirement age from
dropping, but because of a substantial number of backlogs, the average retirement age is expected to
remain at the current level for the time being.
Recently, more aircraft are exposed to heavy use because of the rise of LCCs, and these heavily
Trends in the Average Number of Seats per Aircraft
1,000 km or less
4,500 km or more

Worldwide Market Forecast 2020-2040
38
used aircraft are expected to retire earlier than the average retirement age. Since LCC is a new industry,
not many aircraft have reached their service life, but the number of aircraft that will retire early is
expected to increase noticeably in the future, causing the average retirement age, mainly of narrow
body jets, to drop.
Looking at passenger jets manufactured by Western companies, 227 aircraft retired in 2003, and the
average retirement age was 26.6, but after 2008, about 400 aircraft retired every year and between
2012 and 2015, over 500 aircraft retired every year. After 2015, when the fuel prices dropped, the
number of retired aircraft dropped but was 538 in 2019. During this period, the average retirement age
dropped from 27 to 28 years to 23 years or so, and was 22.8 years in 2019. Currently, many of the
aircraft delivered between 1990 and 2002 are retiring.
As for passenger turboprops manufactured by Western companies, only 20 aircraft retired every
year around 1980 and the average retirement age was about 21 years. After that, however, the annual
number of retired aircraft increased linearly and reached 80 in 2003, since which an average of 88
aircraft have retired every year. The average retirement age was on the increase between the 1960s
and 1985. After that, the average retirement age remained stable at around 23 years, and since 2005,
it has been increasing gradually and reached 26.8 years in 2019.
The number of retired passenger turboprops, like the number of retired passenger jets, dropped after
the peak. However, the average retirement age has been increasing gradually in the past 50 years, and
even in recent years remains at 26 to 28 years, which unlike the average retirement age of passenger
jets, is showing no declining trend.
There is a tendency for passenger turboprops to be used longer than passenger jets because their
good fuel economy was reconsidered when the fuel prices rose rapidly and appropriate alternative
models are not being produced for turboprops with certain numbers of seats.

Worldwide Market Forecast 2020-2040
39

Worldwide Market Forecast 2020-2040
40
Secondary Demand
In order to stay in the transportation business, airlines are required to maintain the required
transportation capacity, i.e., a sufficient number of aircraft, therefore, the retirement of passenger
aircraft will be linked to the procurement of alternative aircraft.
In the past, the average age of retired passenger aircraft was about 25 years, and had a dispersion of
about 4 to 5 years around there, but recently more than a few aircraft are being retired at less than 20
years. It is presumed that many of these aircraft are used heavily by LCCs and FSCs for their short-
range flights, and because of the recent rise of LCCs, the number of such early retired aircraft is
expected to increase.
In such cases, some of the aircraft delivered in the early stage of the forecast period in this document
will retire before the end of the period and new aircrafts will be delivered, causing the number of
deliveries in the period to increase. Appendix F shows the results of assessment of this “secondary
demand”.
During this period, the fuel prices remained extremely high.
(No. of retired aircraft per year)
Trends in the Number of Retired Aircraft (5-year Moving Average)
(years) Trends in the Average Retirement Age (5-year Moving Average)

Worldwide Market Forecast 2020-2040
41
4.2. Aircraft Demand Forecast
4.2.1 Air Passenger Demand Forecast (RPK)
In the previous forecast*, which was conducted before COVID-19 (standard model), the global RPK
was expected to grow by an average of 4.0% per year between 2020 and 2040 and increase by a factor
of 2.3 from 8.49 × 10¹² passenger km in 2019 to 19.3 × 10¹² passenger km in 2040. According to this
forecast, which is based on the GDP forecast and other data that incorporates the influence of COVID-
19 (COVID-19 forecast), the RPK in 2040 is 17.8 × 10¹² passenger km and the annual average growth
rate through 2040 is 3.6%. This forecast has been affected by the revised GDP with COVID-19, the
RPK is expected to drop by around 7% compared to the forecast before COVID-19 and the growth
rate is expected to drop as well. (For details on RPK, refer to Chapter 5.)
(*: Worldwide Market Forecast 2020-2039) [JADC, YGR-5102])
0
4
8
12
16
20
2000 2005 2010 2015 2020 2025 2030 2035 2040
with COVID-19
Actual
no COVID-19
ForecastActual
5.1% p.a.
World Air Passenger Traffic (RPK)RPK (×1012 )
3.6%
2.7 x
2.1 x
0 2 4 6 8
AfricaCIS
Latin AmericaMiddle East
North America(East Europe)(West Europe)
Europe(Japan)
(Northeast Asia)(Oceania)
(South Asia)(Southeast Asia)
(China)Asia-Pacific
World Air Passenger Traffic by Region
Results in 2019
Growth in 2020-2040
RPK (×1012 passenger km)
4.5%
6.5%2.9%2.0%2.9%
3.5%3.3%
5.7%
3.1%2.7%
3.0%
1.7%2.7%
4.8%
4.5%
Breakdown of Europe
Breakdown ofAsia‐Pacific
(Annual Growth Rate)

Worldwide Market Forecast 2020-2040
42
With regard to the air passenger demand, or RPK, by region, North America and Europe (Western
Europe and Eastern Europe) are expected to see a 20-year average growth rate of 3.0% and 3.5%,
respectively, relatively lower than the global growth rate because these markets have already matured.
With these growth rates, the RPK of North American airlines is expected to increase from 1.92 × 10¹²
passenger km in 2019 to 3.56 × 10¹² passenger km in 2040, and that of European airlines from 1.97 ×
1012 passenger km to 4.04 × 10¹² passenger km. As a result, the market share of North American
airlines is expected to change from 23% in 2019 to 20% in 2040, and that of European airlines from
22% to 21%.
The market shares of European and American airlines are expected to drop but those of Asian and
Pacific airlines* are expected to grow. (*: Indicated in brownish colors in the chart)
In the past 20 years, airlines in the Asia-Pacific region saw an annual growth rate of 7.3% in RPK,
forming the world’s largest market. The airlines in the region, including mainly airlines in China,
ASEAN countries, and India, are expected to continuously grow by a factor of 2.5 at an annual rate of
4.5%, from 2.90 × 10¹² passenger km in 2019 to 7.27 × 10¹² passenger km in 2040, and their market
share is expected to expand from 34% to 41%.
Looking at the annual average growth rate in air passenger demand by region, Chinese airlines saw
an average growth rate of 12.4% in the past 20 years, but in the next 20 years, their growth rate is
expected to drop to 4.5% because of the recent decline in the economic growth rate and the maturity
of the market. However, their growth rate is expected to remain higher than the global average, and
the RPK in 2040 is expected to be 3.39 × 10¹² passenger km, 2.5 times 1.33 × 1012 passenger km in
2019.
South Asian airlines, including Indian airlines, and Southeast Asian airlines are expected to grow at
annual rates of 6.5% and 4.8%, respectively. According to the economic forecast revised after COVID-
19, these regions are expected to be more severely affected by COVID-19 than the global average, and
their growth rates in RPK are forecast to be lower than in other regions, but still remain higher than
the global average. The sum of their RPKs is 0.92 × 10¹² in 2019, 69% of China’s, but because of the
North America 20%
North America 23%
Western Europe 21%
Western Europe 22%
Eastern Europe 2%
Eastern Europe 1%
China 19%
China 16%
Southeast Asia10%
Southeast Asia8%
Northeast Asia 2%
Northeast Asia 3%
South Asia 6%
South Asia 3%
Japan 2%
Japan 2%
Oceania 2%
Oceania 2%
Middle East8%
Middle East9%
Africa 2%
Africa 2%
Latin America 4%
Latin America
5%
CIS2%
CIS3%
0% 10% 20% 30% 40% 50% 60% 70% 80% 90% 100%
2040
2019
Breakdown of Air Passenger Demand (RPK) by Region

Worldwide Market Forecast 2020-2040
43
high growth rate, is expected to increase to 2.77 × 10¹² in 2040, 82% of China’s.
Middle Eastern airlines saw an annual average growth rate of 11.6% in the past 20 years, harnessing
the transit passenger demand, but are seeing a decline in the growth rate beginning in 2016. In this
forecast, with an annual average growth rate of 3.1%, their RPK is expected to increase from 0.77 ×
1012 passenger km in 2019 to 1.47 × 10¹² passenger km in 2040, but their share is expected to decrease
slightly from 9% to 8%.
Based on these RPK and load factor forecasts, the global ASK is expected to grow at an annual rate
of 3.7% in the next 20 years, and increase to 21.5 × 10¹² seat km in 2040, which is 2.1 times the 2019
figure.
(Note: The forecast made after COVID-19 on the recovery of RPK and deliveries are based on
information available at the time of editing. JADC plans to revise its forecast for the next fiscal
year based on new input information, including the revised GDP forecast.)
5.1
2.7
6.0
3.7
9.5
5.0
11.6
3.9
1.0
12.4
4.4
6.8
9.4
8.6
3.6 3.0 2.7 3.3
5.7
2.73.1
2.9 2.9
4.5
2.0
4.8
6.5
1.7
0
5
10
15
20
World NorthAmerica
LatinAmerica
WestEurope
EastEurope
Africa MiddleEast
Oceania Japan China NortheastAsia
SoutheastAsia
SouthAsia
CIS
2000-2019 Results
2020-2040 Forecast
RPK Growth Rate by RegionRPK AnnualGrowth Rate (%)
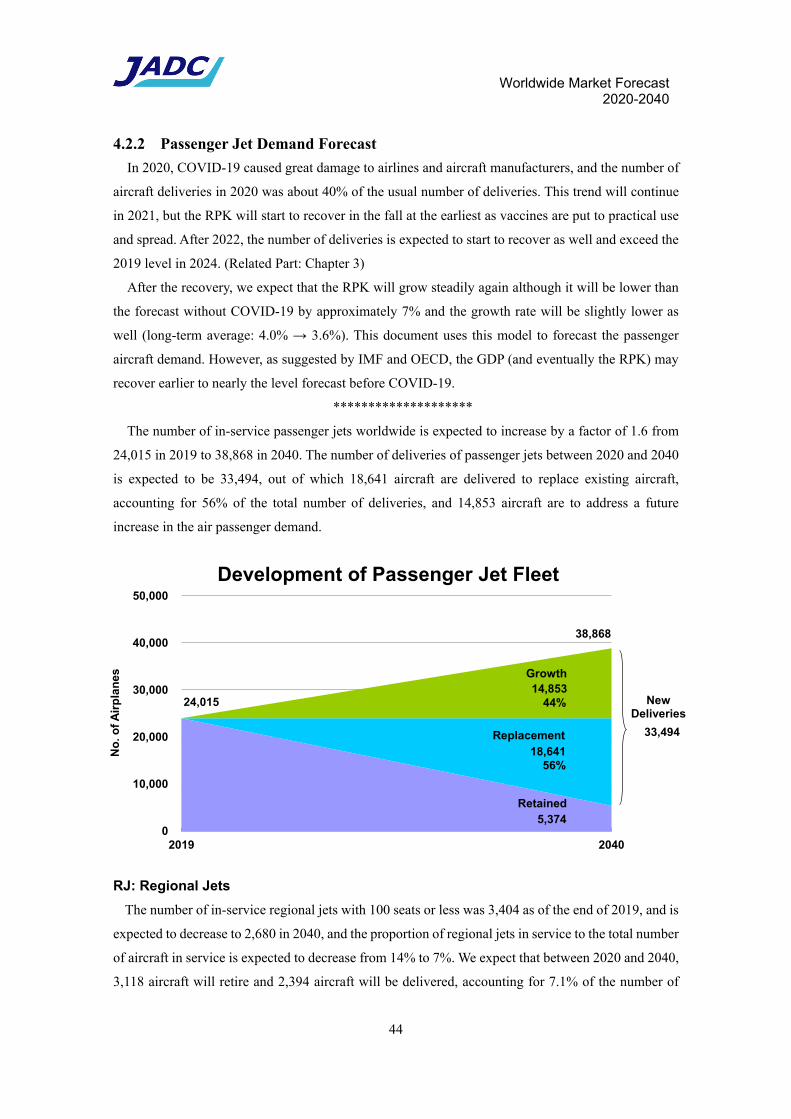
Worldwide Market Forecast 2020-2040
44
4.2.2 Passenger Jet Demand Forecast
In 2020, COVID-19 caused great damage to airlines and aircraft manufacturers, and the number of
aircraft deliveries in 2020 was about 40% of the usual number of deliveries. This trend will continue
in 2021, but the RPK will start to recover in the fall at the earliest as vaccines are put to practical use
and spread. After 2022, the number of deliveries is expected to start to recover as well and exceed the
2019 level in 2024. (Related Part: Chapter 3)
After the recovery, we expect that the RPK will grow steadily again although it will be lower than
the forecast without COVID-19 by approximately 7% and the growth rate will be slightly lower as
well (long-term average: 4.0% → 3.6%). This document uses this model to forecast the passenger
aircraft demand. However, as suggested by IMF and OECD, the GDP (and eventually the RPK) may
recover earlier to nearly the level forecast before COVID-19.
********************
The number of in-service passenger jets worldwide is expected to increase by a factor of 1.6 from
24,015 in 2019 to 38,868 in 2040. The number of deliveries of passenger jets between 2020 and 2040
is expected to be 33,494, out of which 18,641 aircraft are delivered to replace existing aircraft,
accounting for 56% of the total number of deliveries, and 14,853 aircraft are to address a future
increase in the air passenger demand.
RJ: Regional Jets
The number of in-service regional jets with 100 seats or less was 3,404 as of the end of 2019, and is
expected to decrease to 2,680 in 2040, and the proportion of regional jets in service to the total number
of aircraft in service is expected to decrease from 14% to 7%. We expect that between 2020 and 2040,
3,118 aircraft will retire and 2,394 aircraft will be delivered, accounting for 7.1% of the number of
0
10,000
20,000
30,000
40,000
50,000
2019 2040
No
. of
Air
pla
nes
Development of Passenger Jet Fleet
38,868
24,015 14,853
18,641
5,374
33,494 Replacement
Growth
Retained
44%
56%
New Deliveries

Worldwide Market Forecast 2020-2040
45
deliveries during this period.
Current regional jets were created through successful development of business jets with the CF34,
an excellent engine that was converted into a commercial engine based on the TF34 military engine
in the early 1980s. First, regional jets with 50 seats were put on the market in the early 1990s and they
attracted many orders to fill the demand for alternatives to turboprop aircraft, take over low-demand
routes from the main lines, and explore new routes. Around 2000, 70-seat class regional jets were put
on the market.
After that, mainly because of the airline slump after the terrorist attacks in the United States on
September 11, 2001 and the skyrocketing fuel prices, airlines rushed to shift from the aircraft of this
class, which require higher cost per seat (CASK) due to their compactness, to the 70-seat class aircraft,
which are more economically efficient. In addition, these aircraft have a shorter service life because
of the airframe structure inherited from the base business jet. For these reasons, the number of regional
jets decreased. The production of aircraft with 50 seats or less, such as the CRJ100/200 and ERJ
135/145, which is said to be the First generation, was discontinued in 2007 due to the skyrocketing
fuel prices, and after that, aircraft with 70 to 100 seats, such as the CRJ700/900 and EMB170/190,
which are the Second generation, were put on the market.
These models are mainly used for feeder lines connecting to main lines, but many of them are
covered by the Scope Clause and airlines are subject to restrictions on their service. In the North
American market, the largest market for regional jets in the world, a typical condition of the Scope
Clause is that the number of seats be 76 or less and the maximum takeoff weight be 86,000 lb. or less.
Because of this condition, airlines operating feeder lines cannot shift to large aircraft that can carry
more passengers and are economically efficient. As a result, the market for 70-seat class regional jets
has been formed, due to the effect of damming up the shift to larger aircraft with more seats.
During the period when improving operational economic efficiency was a critical challenge to
address the skyrocketing fuel prices, there was a movement to relax the scope clause to increase the
number of seats per aircraft. However, today, fuel prices are stable, and airlines are in a more stable
financial position than before. As a result, there is no movement to relax the scope clause which could
cause a dispute between labor and management.
Currently, the second-generation 70 seat-class aircraft are being produced, and at the same time, the
third-generation aircraft are under development, which are equipped with more economically efficient
next-generation geared turbo fan engines instead of the CF34 that supported the first-and second-
generation regional aircraft. The Embraer E2 series and Mitsubishi SpaceJet are included in this third
generation of aircraft.
As for regional jets, only those with 70 seats or more are being supplied. As suggested by the fact
that airlines shifted to 70-seat class aircraft to pursue operational economic efficiency, supplying new
aircraft with 50 seats (or less) in the future would require realizing measures to improve economic

Worldwide Market Forecast 2020-2040
46
efficiency that takes advantage of the characteristics of aircraft with 50 seats (or less) and achieving
the same level of economic efficiency as 70-seat class aircraft. However, it is unlikely for the time
being that improvement measures* applicable only to 50-seat class aircraft will be realized.
(*: New fuel-efficient engines, one-person operation that uses unmanned aircraft technologies, etc.)
This forecast assumes that for regional jets with 50 seats or less, no new aircraft will be supplied in
the next 20 years. The previous forecasts calculated that there was a certain level of demand for
regional jets with 50 seats or less by setting a virtual regional jet, but this forecast does not include
such an assumption. As a result, the number of deliveries of regional jets in this forecast is smaller
than the previous ones.
Incidentally, the salary of pilots is generally proportional to the number of seats of aircraft they
operate, which also applies to regional jets. In addition, the salary of copilots is said to be about half
that of captains, and it takes about 10 years to be promoted to captain. Therefore, regional jet pilot is
not an attractive job, and not many people want to be a regional jet pilot. In addition, there were times
when regional jet pilots were recruited to make up for the shortage of pilots for main lines. In order
for regional jets to be continuously used with a certain aircraft demand, these conditions must be
improved.
NJ: Narrow Body Jet
As for narrow body jets with over 100 seats, 15,937 aircraft were in service as of the end of 2019,
and 28,515 aircraft are expected to be in service in 2040, accounting for 73% of the total number of
passenger jets. We expect that between 2020 and 2040, 11,939 will retire and 24,517 new aircraft will
3,404 2,680 2,394
15,937 28,515 24,517
4,674 7,673 6,583
0%
20%
40%
60%
80%
100%
2019 Fleet 2040 Fleet New Deliveries 2020-2040
Sh
are
Fleet and New Deliveries
Regional Jet Narrowbody Widebody

Worldwide Market Forecast 2020-2040
47
be delivered. The number of deliveries of narrow body jets with over 100 seats accounts for 73% of
the total number of deliveries.
As for narrow body jets with 100 to 119 seats, which is classified as the smallest narrow body jet,
the release of the A220-100 (CS100) attracted a lot of attention recently. The DC-9 and 737 used to
belong to this class, but these models became larger and larger, through model changes, as the
generation proceeded and so no longer belong to this class. There were some short body variants of
large aircraft, such as the 737-700, but they did not attract attention mainly because of their low
operational economic efficiency. The A220 is the first brand-new aircraft to enter this class which had
been virtually empty for some time, and its 5 abreast configuration is a good choice for this class of
aircraft. Once, in this class, the airliner of 6 abreast configuration was used and called as "thick and
short." It is still fresh in our minds that when the A220 first entered this blank area, a "300% tariff"
fuss involving the US Department of Commerce was caused. Because the tariffs were denied by the
U.S. Government's International Trade Commission ruling, and the A220 project was brought under
the umbrella of Airbus, and the A220s will be finally assembled at the factory in the United States, it
is expected to be a stable business along with the A220-300 which is one class larger.
The class of Aircraft with 100 to 119 seats include the A220-100 of Narrowbody Jet and E195E2 of
large Regional Jet. The number of aircraft of this class is expected to increase to capture part of the
passenger demand that has been covered by aircraft with 120 to 169 seats, and the expected number
of deliveries in the next 20 years is 2,825.
1,064
1
2,340
285 580 103
12,534
3,208 2,823
687
2,582
646 1,697
379 395 65 0
2,394 2,825
10,192
11,500
3,404 3,171
8 0
2,000
4,000
6,000
8,000
10,000
12,000
14,000
16,000
18,000
2019 2040 2019 2040 2019 2040 2019 2040 2019 2040 2019 2040 2019 2040 2019 2040
Total Fleet :
End of 2019 24,015
End of 2040 38,868
New Deliveries :
2020-2040 33,494
1
2,679 2,928
13,400
12,187
4,050 3,550
73
20-59 Seats
60-99 Seats
100-119 Seats
120-169 Seats
170-229 Seats
230-309 Seats
310-399 Seats
Over 400 Seats
Wide body Jet Narrow body JetRegional Jet
No. of Airplanes Passenger Jet Fleet and Delivery Forecast by Size
2019 2040
ExistingRetained
New Deliveries

Worldwide Market Forecast 2020-2040
48
As for narrowbody jets with 120 seats or more, because of economic efficiency and airport
congestion issues, slightly larger aircraft such as the A320/A321 and 737-800/MAX-8 are more
popular compared with the A318/319 and 737-700. The class of aircraft with 120 to 169 seats has the
largest fleet of aircraft, and orders for aircraft with 170 to 229 are on the increase as well.
The forecast results show that aircraft with 170 to 229 seats have the largest number of deliveries,
or 11,500, and the number of aircraft of this class in service is expected to be 12,187 in 2040.
Previously, it was expected that demand would gradually shift from the 120-169 seat class to this class,
but as specific types of aircraft such as the A321LR / XLR announced its candidacy to the market and
the ordering trend changed, this class is expected to have the largest number of orders in the forecast
period. At the same time, aircraft with 120 to 169 seats, which were expected to have the largest
number of deliveries in the previous forecasts, still have a large number of deliveries at 10,192 and the
number of aircraft of this class in service is expected to be 13,400 in 2040, still forming the largest
group.
Looking at the number of deliveries of narrow body jets by classifying them by number of seats in
increments of 50, the numbers of deliveries of aircraft with 101 to 150 seats, with 151 to 200 seats,
and with 201 to 250 seats are expected to be 8,062, 14,429, and 1,870, respectively.
This forecast basically classifies models with 100 seats or more but less than 230 seats as
narrowbody jets. All the currently supplied aircraft in this range are single-aisle aircraft, but there were
twin-aisle aircraft with 220 seats (two classes) such as the 767-200, and single-aisle aircraft with 240
seats (two classes) such as the 757-300. The class of around 230 seats has the property of forming a
boundary region. Since the production of 767 passenger jets was discontinued, no aircraft has belonged
to this class, giving a clear classification of aircraft by number of seats. Recently, however, the
successor to the 757 is getting attention, and the NMA has been named as a candidate. Airbus revealed
a plan to build the A321XLR after putting the A321LR on the market. Airbus decided to build long-
range A320-series aircraft with an increased number of seats and swiftly put them on the market to
capture as much of the niche market as possible. Boeing decided to aim to develop a new fuselage
with new cross section for its NMA, consisting of a twin-aisle cabin (enhanced passenger comfort)
and a single-aisle cargo compartment (enhanced economic efficiency with reduced drag).
As mentioned above, the 5 abreast layout is suitable for narrowbody jets of the smallest class (with
100 seats or less), which therefore require a different fuselage than those with a 6 abreast layout, which
is the standard for narrow body jets, and should be planed as a different model. The DC-9 series is an
example of aircraft with a 5 abreast layout, and the MD80/90 was supplied in two-class configuration,
and was in service for a long time with the number of seats increased up to 150. Depending on where
the number of seats, which is the boundary between the 5 abreast layout and the 6 abreast layout, is
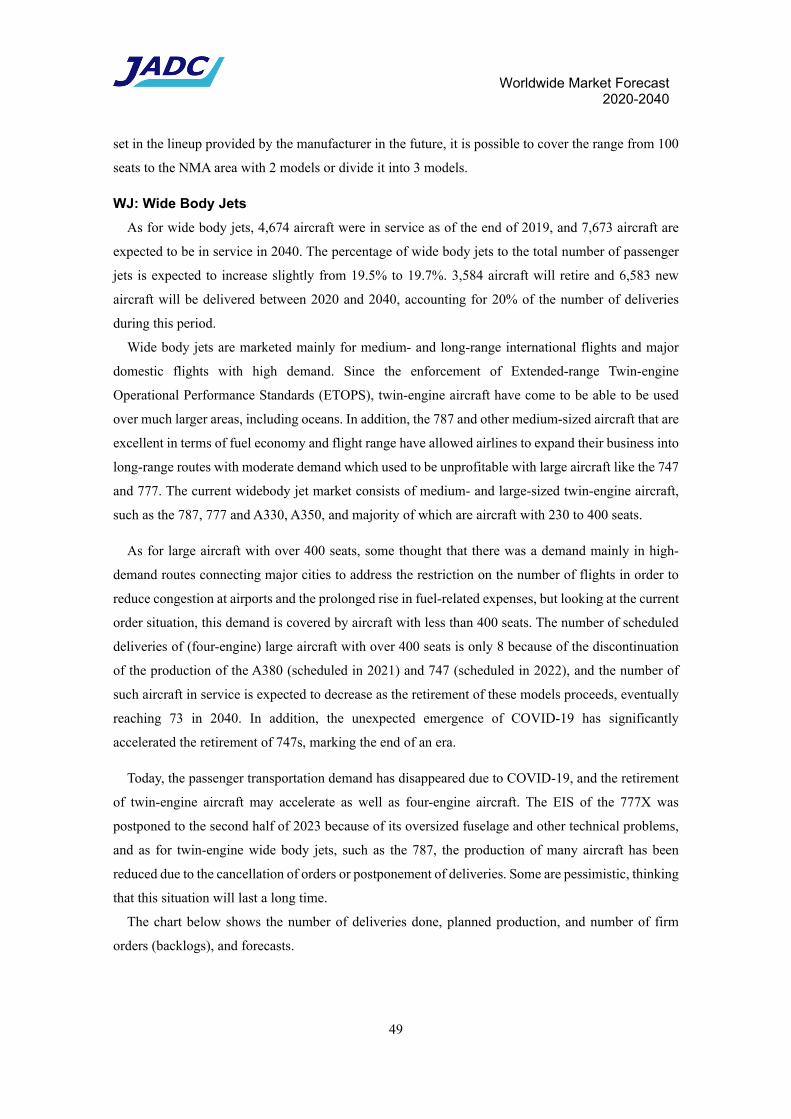
Worldwide Market Forecast 2020-2040
49
set in the lineup provided by the manufacturer in the future, it is possible to cover the range from 100
seats to the NMA area with 2 models or divide it into 3 models.
WJ: Wide Body Jets
As for wide body jets, 4,674 aircraft were in service as of the end of 2019, and 7,673 aircraft are
expected to be in service in 2040. The percentage of wide body jets to the total number of passenger
jets is expected to increase slightly from 19.5% to 19.7%. 3,584 aircraft will retire and 6,583 new
aircraft will be delivered between 2020 and 2040, accounting for 20% of the number of deliveries
during this period.
Wide body jets are marketed mainly for medium- and long-range international flights and major
domestic flights with high demand. Since the enforcement of Extended-range Twin-engine
Operational Performance Standards (ETOPS), twin-engine aircraft have come to be able to be used
over much larger areas, including oceans. In addition, the 787 and other medium-sized aircraft that are
excellent in terms of fuel economy and flight range have allowed airlines to expand their business into
long-range routes with moderate demand which used to be unprofitable with large aircraft like the 747
and 777. The current widebody jet market consists of medium- and large-sized twin-engine aircraft,
such as the 787, 777 and A330, A350, and majority of which are aircraft with 230 to 400 seats.
As for large aircraft with over 400 seats, some thought that there was a demand mainly in high-
demand routes connecting major cities to address the restriction on the number of flights in order to
reduce congestion at airports and the prolonged rise in fuel-related expenses, but looking at the current
order situation, this demand is covered by aircraft with less than 400 seats. The number of scheduled
deliveries of (four-engine) large aircraft with over 400 seats is only 8 because of the discontinuation
of the production of the A380 (scheduled in 2021) and 747 (scheduled in 2022), and the number of
such aircraft in service is expected to decrease as the retirement of these models proceeds, eventually
reaching 73 in 2040. In addition, the unexpected emergence of COVID-19 has significantly
accelerated the retirement of 747s, marking the end of an era.
Today, the passenger transportation demand has disappeared due to COVID-19, and the retirement
of twin-engine aircraft may accelerate as well as four-engine aircraft. The EIS of the 777X was
postponed to the second half of 2023 because of its oversized fuselage and other technical problems,
and as for twin-engine wide body jets, such as the 787, the production of many aircraft has been
reduced due to the cancellation of orders or postponement of deliveries. Some are pessimistic, thinking
that this situation will last a long time.
The chart below shows the number of deliveries done, planned production, and number of firm
orders (backlogs), and forecasts.

Worldwide Market Forecast 2020-2040
50
With regard to the delivery of wide body jets, it is assumed that the number of deliveries of ordered
aircraft will start to recover in 2023 after a decline due to COVID-19. Because the recovery of aircraft
demand is delayed due to the delay in recovery of GDP (and RPK), in addition the demand on the
widebody planes side (230-309 seat class) is partly sucked in due to the attractive model on the
narrowbody planes side (170-229 seat class), the demand of widebody jets will not reach the level
before the COVID disaster for the time being, but it is expected to deliver around 300 aircraft per year
on average until around 2030. As can be seen in the chart, the total planned production of Airbus and
Boeing in 2021 and 2022 are very consistent with the number of backlogs scheduled to be delivered
in 2021 and 2022 as of the end of 2020 (firm orders: deliveries that can be made in each year).
(In addition, the forecasting calculation assumes the emergence of 767-class aircraft in the 2030s,
which is expected to cause the demand for narrow body jets to shift back to wide body jets, and the
annual production of wide body jets is expected to recover to 350 to 400.)
With regard to the delivery of narrow body jets, it is assumed that, stimulated by the demand for
domestic flights, the number of deliveries of ordered aircraft will start to recover in 2022 after a decline
due to COVID-19. The planned production of aircraft manufacturers is consistent with the number of
backlogs for 2021, but the planned production in 2022 is shown to exceed the number of backlogs for
2022.
Attractive narrow body jets, such as the A321XLR, helps shift part of the demand for wide body
jets to narrow body jets, and the annual number of deliveries is expected to stay between 1,200 and
1,500 for the time being to make up for the shortage in deliveries from 2019. The number of new
aircraft to be produced in the years following the start of the recovery of deliveries will be the number
of aircraft delivered in each of the years shown in the figure, minus the 737MAX shipments that have
been delayed since 2019.
0
100
200
300
400
500
2017
2018
2019
2020
2021
2022
2023
2024
2025
2026
2027
2028
2029
2030
unit/year Delivery of Widebody Jets(Actual & Forecast)Backlog(End of 2019)Backlog(End of 2020)Delivered+Planned
Forecast(JADC)Forecast(averaged)
(~2020) (2021,2022)

Worldwide Market Forecast 2020-2040
51
Classification by Region
Looking at the forecasts by region, the number of passenger jets in service as of the end of 2019 is
largest in North America, where 6,697 aircraft were in service. In 2040, the number of aircraft in
service in North America is expected to increase to 8,244, the second largest after Europe by a slight
margin. The proportion of the number of aircraft in service in North America to the total number of
aircraft in service is expected to decrease from 28% to 21%, during which, however, the number of
deliveries in North America is 7,533, which is the second largest, accounting for 22% of the total
number of deliveries in the world, and being the second largest market.
The number of aircraft in service in Europe is expected to increase from 4,931 as of the end of 2019
to 8,694 in 2040, and the proportion of the number of aircraft in service in Europe is expected to
increase from 21% to 22%. During this period, the number of deliveries in Europe is expected to be
7,714, accounting for 23% of the total number of deliveries in the world, and being the largest market.
The number of aircraft in service in China was 3,719 as of the end of 2019, the third largest in the
world. It is expected to increase to 6,944 in 2040, still the third largest following North America and
Europe, but grow to over 80% of the numbers of aircraft in service in North America and Europe.
During this period, the number of deliveries in China is expected to be 5,443, accounting for 16% of
the total number of deliveries in the world. Out of 5,443 aircraft deliveries, 1,110 are wide body jets
(which accounts for 17% of the total number of deliveries of wide body jets), the second largest
following Europe (1,464 aircraft, 22%), exceeding the numbers of deliveries of wide body jets in the
Middle East (1,018 aircraft, 15%) and North America (1,070 aircraft, 16%).
0
400
800
1200
1600
20002017
2018
2019
2020
2021
2022
2023
2024
2025
2026
2027
2028
2029
2030
unit/year Delivery of Narowbody Jets(Actual & Forecast)Backlog(End of 2019)Backlog(End of 2020)Delivered+Planned
Forecast(JADC)(~2020) (2021,2022)

Worldwide Market Forecast 2020-2040
52
Chinese airlines have been growing rapidly mainly in medium-range (up to 4,500 km) routes. The
average growth rate of the RPK in the past 20 years (between 2000 and 2019) reaches 12.4%, and
Chinese airlines have been a pillar supporting the global aircraft demand, but its growth rate dropped
to 8.1% in 2019. Future growth of RPK is expected to change from a fast-growing type of developing
countries to a slow-growth type of developed countries. In this forecast, 2024 is set as the inflection
point, referring to the actual changes that have already occurred in other regions, and set the growth
rate after that close to the global average. As a result, the number of deliveries dropped by
approximately 1,600 from the previous forecast (between 2019 and 2038), including affected by the
downward revision of the GDP forecast due to COVID-19. (Related Part: Section 5.3.3)
As for Southeast Asia (mainly ASEAN countries), the Middle East, and South Asia (India, etc.), the
passenger demand is expected to grow at a higher rate than the global average, and the number of
aircraft in service is expected to increase as well. The numbers of aircraft in service in Southeast Asia,
the Middle East, and South Asia in 2040 are expected to be 3,628, 2,333, and 2,218, respectively. The
numbers of deliveries are expected to be 3,026, 1,979, and 2,114, respectively.
In the Middle East, the number of deliveries of widebody jets will be 1,018, accounting for 51% of
the total number of deliveries in this region. Especially since 2003, Middle Eastern airlines had been
actively expanding their business, and had captured the long-distance transit passenger demand under
“the sixth freedom of the air.” They had been showing an annual growth rate of more than 10%, or
even 20% at times mainly in routes with long distances (4,500 km or more), and achieving rapid scale
6,697
711
4,931
980
7,686
2,654
608 215
3,719
1,501 560
132
1,580 602 690 104 529 100
1,328 354
1,449 308 807
139 1,117
228
7,533 7,714
12,619
720
5,443
586
3,026
2,114 730
1,979 1,705
786 1,158
0
2,000
4,000
6,000
8,000
10,000
12,000
14,000
16,000
18,0002
01
9
20
40
20
19
20
40
20
19
20
40
20
19
20
40
20
19
20
40
20
19
20
40
20
19
20
40
20
19
20
40
20
19
20
40
20
19
20
40
20
19
20
40
20
19
20
40
20
19
20
40
Total Fleet : End of 2019 End of 2040
New Deliveries : 2020-2040 33,494
24,01538,868
Retained
No.of Airplanes
New Deliveries
8,244
NorthAmerica
Europe AsiaPacific
MiddleEast
8,694
15,273
2,333
LatinAmerica
Africa CIS
2,013 925 1,386
Japan OceaniaSouthAsia
SoutheastAsia
NortheastAsia
China
Passenger Jet Fleet and Delivery Forecast by Region
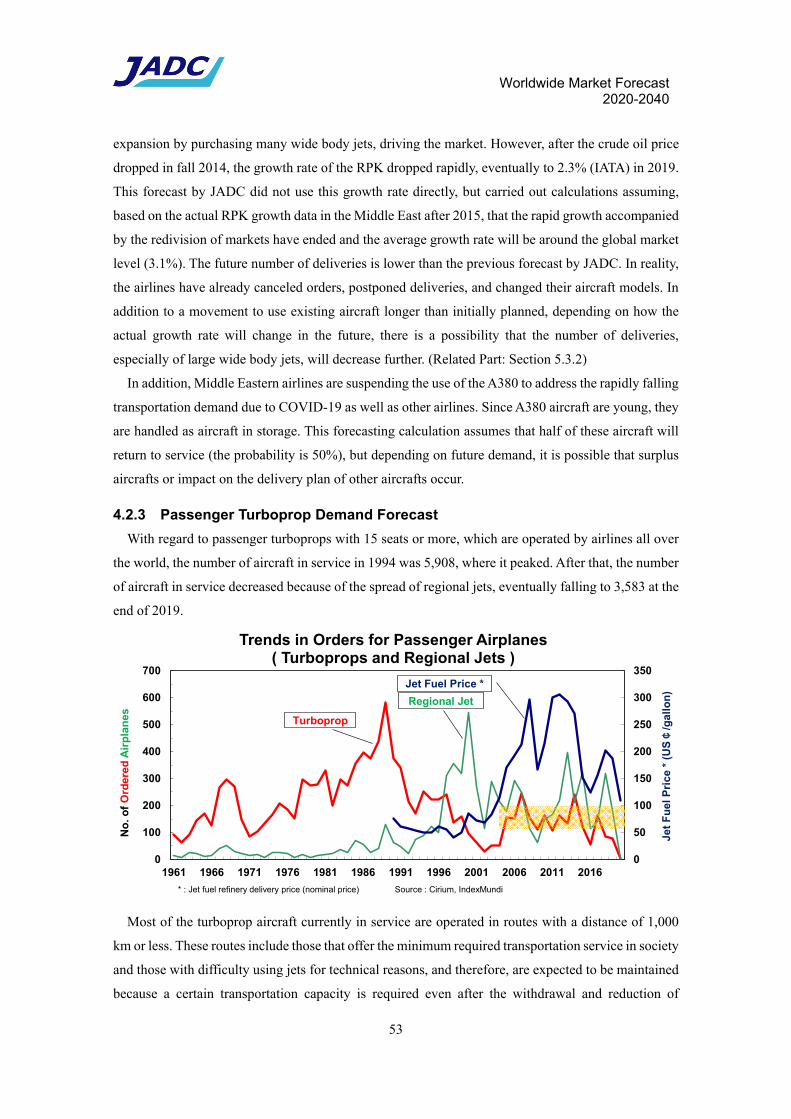
Worldwide Market Forecast 2020-2040
53
expansion by purchasing many wide body jets, driving the market. However, after the crude oil price
dropped in fall 2014, the growth rate of the RPK dropped rapidly, eventually to 2.3% (IATA) in 2019.
This forecast by JADC did not use this growth rate directly, but carried out calculations assuming,
based on the actual RPK growth data in the Middle East after 2015, that the rapid growth accompanied
by the redivision of markets have ended and the average growth rate will be around the global market
level (3.1%). The future number of deliveries is lower than the previous forecast by JADC. In reality,
the airlines have already canceled orders, postponed deliveries, and changed their aircraft models. In
addition to a movement to use existing aircraft longer than initially planned, depending on how the
actual growth rate will change in the future, there is a possibility that the number of deliveries,
especially of large wide body jets, will decrease further. (Related Part: Section 5.3.2)
In addition, Middle Eastern airlines are suspending the use of the A380 to address the rapidly falling
transportation demand due to COVID-19 as well as other airlines. Since A380 aircraft are young, they
are handled as aircraft in storage. This forecasting calculation assumes that half of these aircraft will
return to service (the probability is 50%), but depending on future demand, it is possible that surplus
aircrafts or impact on the delivery plan of other aircrafts occur.
4.2.3 Passenger Turboprop Demand Forecast
With regard to passenger turboprops with 15 seats or more, which are operated by airlines all over
the world, the number of aircraft in service in 1994 was 5,908, where it peaked. After that, the number
of aircraft in service decreased because of the spread of regional jets, eventually falling to 3,583 at the
end of 2019.
Most of the turboprop aircraft currently in service are operated in routes with a distance of 1,000
km or less. These routes include those that offer the minimum required transportation service in society
and those with difficulty using jets for technical reasons, and therefore, are expected to be maintained
because a certain transportation capacity is required even after the withdrawal and reduction of
0
50
100
150
200
250
300
350
0
100
200
300
400
500
600
700
1961 1966 1971 1976 1981 1986 1991 1996 2001 2006 2011 2016
Jet
Fu
el P
ric
e *
(US
¢/g
allo
n)
No
. of
Ord
ere
dA
irp
lan
es
Trends in Orders for Passenger Airplanes( Turboprops and Regional Jets )
* : Jet fuel refinery delivery price (nominal price) Source : Cirium, IndexMundi
Regional Jet
Jet Fuel Price *
Turboprop

Worldwide Market Forecast 2020-2040
54
unprofitable routes and flights has proceeded. In addition, because fuel prices remained extremely
high for a long time, fuel-efficient turboprop aircraft have been preferred again, showing a recovery
in orders after 2005. (However, orders dropped rapidly in 2020 due to COVID-19.)
The forecast expects that the number of turboprop aircraft in service will increase from 3,583 at the
end of 2019 to 4,160 at the end of 2040. During this period, 2,734 aircraft will retire and 3,311 new
aircraft will be delivered.
3,583
849
2,734
0
1,000
2,000
3,000
4,000
5,000
2019 2040
No
. of
Air
pla
nes
Development of Passenger Turboprop Fleet
4,160
Replacement
Retained
3,311
New Deliveries
Growth 17%
83%
577
672
102
571
135
1,096
382
55 26 74 32 34 18
319 150
248 81
366 75 45 17
448
84
520
84 231
45
407 450
1,565
33 91 9
505 564
363
37
350 329
173
0
400
800
1,200
1,600
2,000
2,400
201
9
204
0
201
9
204
0
201
9
204
0
201
9
204
0
201
9
204
0
201
9
204
0
201
9
204
0
201
9
204
0
201
9
204
0
201
9
204
0
201
9
204
0
201
9
204
0
201
9
204
0
Passenger Turboprop Fleet and Delivery Forecast by Region
Total Fleet : End of 2019 3,583 End of 2040 4,160
New Deliveries : 2020-2040 3,311
Retained
No. of Airplanes
New Delivery
509
North
AmericaEurope
AsiaPacific
Middle East
585
1,947
54
434 413
218
Latin America
Africa CISJapan China OceaniaSouthAsia
SoutheastAsia
NortheastAsia
655
438
645

Worldwide Market Forecast 2020-2040
55
Looking at the number of turboprop aircraft in service by region, the numbers of aircraft in North
America and Europe are slightly larger than those in other regions, but 300 to 500 aircraft are currently
used in Latin America, Africa, Oceania, Southeastern Asia, and other regions, revealing a characteristic
that turboprop aircraft are used widely in almost every region without unevenly distribution.
Turboprop aircraft are continuously required in routes that require the minimum required air
transportation service even if they are unprofitable and routes with special geographical conditions,
such as isolated islands. We expect that, in these routes, turboprop aircraft with 15 to 19 seats will
continue to be in service, and 632 aircraft will be delivered in the next 20 years.
As of 2019, not many aircraft of this class were produced and supplied, and airlines are forced to
prolong the service life of their aircraft to continue service. The average age of aircraft in service is
28.3 years, but 46% of aircraft are over 30 years old, 14% of which are over 40 years old. 80% of
aircraft 40 years old or older are DHC-6 (186 aircraft), and when thinking of aircraft that are 30 years
old or older, many Do228, Jetstream31, and EMB110 aircraft are included as well as DHC-6 aircraft.
There are also Beech 1900 (255 machines) in the range of 30 to 20 years old, which will gradually
begin to exceed 30 years old.
The previous forecasts by JADC set virtual aircraft in this class for demand calculation. However,
Cessna, an American aircraft manufacturer, announced that it would develop SkyCourier, which is its
first new model in a while and is a passenger aircraft with 19 seats. This has significantly increased
the expected number of deliveries. We expect that because aircraft of this class will absorb the demands
for aircraft of other classes, and the number of deliveries of aircraft of neighboring classes, or aircraft
with 20 to 39 seats, will decrease.
In 2019, 490 aircraft with 20 to 39 seats were in service. In this class, many DHC8-200 and
SAAB340 aircraft are in service, accounting for 70% of the total number of aircraft of this class in
1,196
130
510
12
599
82
1,278
625
0 0
632 656 433
1,206
384
0
500
1,000
1,500
2,000
2,500
2019 2040 2019 2040 2019 2040 2019 2040 2019 2040
Total Fleet : End of 2019 3,583
End of 2040 4,160
New Deliveries :
2020-2040 3,311
668 515
No. of Airplanes
1,831
762
384
Passenger Turboprop Fleet and Delivery Forecast by Size
2019 2040
ExistingRetained
New Deliveries
15-19 Seats 20-39 Seats 40-59 Seats 60-79 Seats 80-99 Seats

Worldwide Market Forecast 2020-2040
56
service. 72% of aircraft in this class are 20 years old or older but younger than 30 years. Although
these aircraft are not old now, they are expected to reach their economic life in the early 2020s.
Therefore, alternative aircraft are increasingly required especially among North American airlines, but
suitable alternative aircraft of this class have not been produced. JADC carried out calculations
assuming high-speed cruise turboprop aircraft with 30 seats as aircraft of this class, and expects that
there will be a new demand for 656 aircraft in the next 20 years and the number of aircraft in service
will be 668 aircraft in 2040. However, since no aircraft is supplied in reality, the average age was 26.3
as of the end of 2019, showing an aging of the aircrafts. The supply of suitable aircraft is required.
Approximately 16% of aircraft with 40 to 59 seats in service are over 40 years old, most of which
are An-24/26 aircraft. 70% of aircraft in this class are less than 30 years old, most of which are ATR42
and DHC-8-300 aircraft. Among these models, the ATR42 is in production but the annual number of
deliveries stays at around 5 on average. The DHC-8-300 is no longer produced, so cannot be renewed.
Some airlines are modifying them to extend their service life. In-service aircraft in this class in 2019
are 24.4 years old on average.
Almost all aircraft with 60 to 79 seats in service are ATR72 and DHC-8-400 aircraft. For both
models, new aircraft are supplied smoothly, and the both models are accounting for most of the
turboprop airliner orders since 2005. And the average age of the aircraft in this class is 7.8 years young
at the end of 2019.
The number of aircraft that will be delivered in the next 20 years in the 40-59 seat class and the 60-
79 seat class also increased compared to the previous forecast, but this was largely due to an influx of
aircraft demand to the turboprop side, since the hypothetical supply of aircraft in the 50-seat class (and
below) regional jets, for which new production of aircraft are not expected, was stopped in the forecast.
Both turboprop and regional jets exist in this class, and therefore, the aircraft demand is filled by either
of them.
As for turboprop aircraft with 80 to 99 seats, no new aircraft are currently supplied, and therefore,
JADC carried out calculations assuming high-speed cruise turboprop aircraft with 90 seats as virtual
aircraft and expect that there will be a demand for 384 aircraft in the next 20 years. Turboprop aircraft
of this class are expected to compete with regional jets, but in short-range routes, there is no large
difference in flight time between these turboprop aircraft and regional jets and ground time at the
airfield is also added to reduce the impact.

Worldwide Market Forecast 2020–2040
57
5. Air Passenger Demand Forecast
5.1 Air Passenger Demand (RPK)
In recent years, the world has experienced 911 attacks in 2001, SARS and the Iraq War in 2003, the
financial crisis in the United States in 2008 and the debt crisis in Europe following it. The global air
traffic volume (RPK) decreased every time these incidents occurred. In addition, the escalation of fuel
prices from 2005 to 2014 weighed on airlines and decreased passenger demand. However, as fuel
prices started dropping in autumn 2014, the RPK began recovering, then increased at a rapid pace of
around 6.5% every year, and seemed to have almost returned to the growth line estimated with the
data before 2001 by 2019.
In this way, air passenger demand is affected by the impact and burden from the external
environment, but tends to start growing again and return to the initial growth curve every time.
As shown by the red line in the figure, the global RPK grew by 5.1% on annual average,
experiencing ups and downs, during the past 20-year evaluation period between 2000 and 2019 (from
the end of 1999 to the end of 2019) and, at the end of the period, increased 2.7 times compared with
the beginning of the period. JADC made a forecast with the results of a correlation analysis between
RPK and the GDP and other factors during this period. The RPK forecast based on the GDP and other
factors made before the COVID-19 pandemic is shown as the ‘standard model’ in the figure. Likewise,
the RPK forecast based on the GDP*1 and other factors made at the end of 2020, taking the impact of
COVID-19 into account, is shown as the ‘RPK forecast’. According to the standard model, it is
Source: IATA, ICAO, JADC
Equivalent to a 1.6 to 2-year delay.
Air
pass
enge
r tr
affi
c vo
lum
e (R
PK
: × 1
012 p
asse
nger
-km
)
Trends in Global Air Passenger Traffic Volume (RPK)
Average growth rate (%)
2.7 times
Actual RPK
Forecast RPK
5.1%/year
Standard model Recovery forecast
Old expected value
2.04 times
(based on new GDP, etc.) (Loss due to COVID-19 and recovery forecast in Chapter 3)
2.12 times
* Hatched sections indicate aviation recessions, etc. The orange frame indicates the escalation period of crude oil prices.

Worldwide Market Forecast 2020–2040
58
anticipated that the global RPK will be 2.2 times that of 2019 in 2039 and that the annual average
growth rate will be 4.0% during this period. However, the RPK forecast*2 made this time indicates that
the global RPK will be 2.04 times that of 2019 in 2039, that the annual average growth rate will be
3.64%, and that the RPK after 2025 will be lower than that in the standard model by about 6 to 7%.
(*1: Source: IHS)
(*2: The JADC forecast the recovery of RPK and the number of aircraft deliveries after the COVID-19 pandemic based
on the information available at the time of editing. The JADC plans to obtain new input information including revised
GDP forecasts and update this document in the next year.)
5.2 Forecast of RPK
5.2.1 Composition of RPK
The air passenger demand (RPK) is known to change depending on the income, airfare, population,
distance, number of flights, season, availability of alternative transportation, and other factors and be
particularly strongly related to income levels (GDP) and airfares (yield).
As shown in the figure, when RPK increases, GDP basically increases as well. They behave very
similarly and have a clear positive correlation. In contrast, airfares generally decrease when RPK
increases, showing a negative correlation. The future trend of the RPK is mostly forecast by using
long-term forecast values and assumed values of GDP and yield in these relationships.
The yield and RPK moved in the same direction at some places in the figure. For example, in 2001
(the 9/11 attack) and 2008 (the global financial crisis), the economic (GDP) disruption caused by these
incidents spoiled transport demand (RPK) and airlines were overwhelmed regardless of their desperate
efforts to attract customers by lowering ticket prices (yield). The RPK is affected by factors such as
-8
-6
-4
-2
0
2
4
6
8
10
12
-16
-12
-8
-4
0
4
8
12
16
20
24
1989 1994 1999 2004 2009 2014 2019
GD
P G
row
th (
%)
RP
K G
row
th(%
),
Yie
ld G
row
th (
%)
Relationship between RPK, Real GDP and Real Yield
Financial CrisisH1N1 Pandemic
Iraq WarSARS
9/11 Attacks
Gulf War
Yield
RPKGDP
Stablization of Crude Oil Prices

Worldwide Market Forecast 2020–2040
59
conflicts, terrorism, disease, and financial crisis. While the RPK often recovers after a short period
once the causes are removed, some temporarily cause significant drops. It is therefore an important
challenge for airline management to address fluctuations in air transportation demand due to these
external factors (or event risks).
It is noteworthy that, in the past, even if the growth of RPK was affected by the oil crisis, etc., it did
not show a decrease to the extent that it became zero growth. However in recent years RPK has clearly
shown a decrease when an big incident occures.
Chapter 5 explains the RPK which is base of aircraft demand forecast. In this forecast, the reference year should be 2020,
but the data acquisition in 2020 is not smooth, or even if it can be processed, it will often be temporary and peculiar data,
and is not suitable for the base of long-term forecast. Therefore, we used 2019 as the reference year and data at normal
times before 2019 as environmental data for the forecast.

Worldwide Market Forecast 2020–2040
60
5.2.2 Economic Trend (GDP)
In 2020, the COVID-19 pandemic took the world by storm, largely affecting the economy and
people’s lives in society. By no preventive medicine or a cure, the world has experienced restriction
and resumption of economic activity, expansion and contraction of infections repeatedly, and even the
emergence of variants, and is still under constraints and anxiety as of the spring of 2021.
However, long-awaited vaccinations finally started in December 2020. Hopefully, vaccinations will
spread in each country with an accelerated increase in production, leading to a decrease in infected
patients, a lower possibility of generation of new variants, and establishment of collective immunity,
which will mitigate anxiety in society and restore economic activities and movement of people.
The global real GDP growth rate is said to be 4.3% (IBRD) to 3.5% (IMF) in 2020, but is expected
to be 4.0% (IBRD) to 5.5% (IMF) in 2021. It is generally expected to recover to the level in 2019 by
almost completely making up for the economic shrinkage in 2020 by the growth in 2021, although
forecast values differ by organization. The growth rate is expected to continue to be 3.7% (OECD) to
4.2% (IMF) in 2022 and then gradually decrease. The 20-year average between 2021 and 2040 is
expected to be 2.87% (IHS). If conditions are good, the world economy can rapidly recover after 2021
although it largely depends on vaccinations.
In the long run, the annual average growth rate of the global real GDP (calculated in 2015 USD) is
forecast to be 2.47% between 2020 and 2040 (reference year is 2019). China, Southeast Asia (mainly
ASEAN), and South Asia (such as India) are expected to keep relatively high GDP growth rates during
this period.
2.47%
3.62%
1.81%
1.23%
1.15%
2.05%
0.63%
2.11%
4.27%
1.51%
3.88%
4.98%
2.07%
2.40%
2.80%
1.64%
3.02%
5.21%
2.09%
1.75%
1.63%
3.48%
0.88%
2.71%8.78%
3.83%
5.20%
6.13%
3.81%
1.94%
3.93%
3.94%
0% 1% 2% 3% 4% 5% 6% 7% 8% 9% 10%
WorldAsia‐Pacific
North AmericaEurope
Westen EuropeEastern Europe
JapanOceaniaChina
North‐East AsiaSouth‐East Asia
South Asia
Middle East
Latin AmericaAfrica
CIS
Average Growth Rate of Real GDP
Economic Forecast by Region (Real GDP Growth Rate)
2020‐2040
2000‐2019Breakdown of Europe
Breakdown of Asia‐Pacific

Worldwide Market Forecast 2020–2040
61
In particular, China will continue to produce significant GDP growth partly due to its scale, although
its growth rate will be 4.3% for the next 20 years, which is lower than the annual average growth rate
of 8.8% for the past 20 years. In addition, Southeast Asia and South Asia are also anticipated to have
a growth rate of 3.9% and 5.0%, respectively. In developed regions, the economic growth rate is
expected to be 1.81% in North America, 1.23% in Europe, and 0.63% in Japan. The economic growth
rate in the Middle East is expected to be 2.07%. The total global real GDP is expected to be 140 trillion
dollars in 2040, a 1.67-time increase from 84 trillion dollars in 2019.
5.2.3 Passenger Yield
The global real passenger yield has decreased by 2.0% on annual average for the 20 years between
1999 and 2019. Major factors that decreased the real yield during this period are a reduction in
operating costs as a result of updating to new planes with good operational economy and streamlining
NA 23%
NA 26%
EUR 19%
EUR 24%
CH 25%
CH 17%
SE 5%
SE 4%
NE 2%
NE 3%
SW 7%
SW 4%
JA 4%
JA 5%
OC 2%
OC 2%
ME 3%
ME 3%
AF 3%
AF 3%
LA6%
LA6%
CIS2%
CIS2%
0% 10% 20% 30% 40% 50% 60% 70% 80% 90% 100%
2040
2019
GDP Share by Region
0
5
10
15
20
25
1989 1994 1999 2004 2009 2014 2019
Trends of Real Yield by Region2015 UScent/RPK
World
Source : AEA, A4A, ICAO, IATA, Cirium
North America
Western Europe

Worldwide Market Forecast 2020–2040
62
efforts by airlines. The rise of LCCs and their competition with existing airlines are additional
important factors.
The escalation of fuel prices that continued for about 10 years ended, and airfares will probably
continue to drop as a result of further improvement in the operational economic efficiency of aircraft,
corporate efforts by airlines, and competition among airlines including LCCs. However, cost reduction
by airlines seems to be about to hit a wall and so, naturally, airlines seek to increase yields. As a result,
the reduction in airfares is expected to slow down.
During the forecast period, the real passenger yield is forecast to decrease by about 0.8% on annual
average given the competition among airlines and impact of fluctuations in fuel prices as well.
5.2.4 Passenger Load Factor
The global annual average of the passenger load factor was 82.0% in 2019. The passenger load
factor was 68.6% in 1999 and has increased by about 13% in 20 years. In 2019, the annual average
reached 84.0% and 84.6% in North America and Europe and reached 88% in the U.S. during the busy
season. The load factor in other regions also increased year by year and the annual average is above
80% in many regions.
This high passenger load factor resulted from a decrease in revenue caused by a reduction in airfares
due to competition among airlines including LCCs and the efforts to improve the RASK (revenue per
ASK) by keeping an increase in the ASK lower than that in the RPK to address a significant rise in the
breakeven point of the load factor caused by an increase in operating costs due to the escalation of fuel
costs and other causes.
Because the crude oil prices, which continued to soar for about 10 years, dropped significantly
starting in the autumn of 2014, economic pressures on airlines were largely mitigated. A subsequent
sharp drop in orders for new fuel-efficient aircraft showed their sense of relief. However, because a
significant reduction in CO2 emissions will be demanded in the future, airlines are expected to incur
40
50
60
70
80
90
100
NorthAmerica
Europe Asia-Pacific
MiddleEast
LatinAmerica
Africa CIS World
Load Factor (%) Passenger Load Factor by Region199920192039

Worldwide Market Forecast 2020–2040
63
new costs to purchase CO2 emissions credits and expensive SAF (sustainable aviation fuel) and it will
remain difficult to increase fuel consumption without careful consideration.
Besides, passenger airfares are not expected to largely rise in the future partly due to competition
among airlines. Therefore, the passenger load factor seems like it will remain high in the future through
precise supply and demand adjustment by airlines. For this forecast, the passenger load factor is
assumed to change from 82.0% in 2019 to 83.0% in 2039 across the world.
For example, in the U.S., the load factor has a clear seasonality. Summer is the peak season and the
load factor hits a peak centered around July. As shown in the figure, the load factor steadily rose in the
2000’s and was fixed at around 87% during the busy season for the last 10 years or so. Certain airlines
have had a load factor of over 90% during the busy season and are said to be racking their brains trying
to increase the number of passengers. For example, they try to make more seats available to customers
by asking employees and their family members to avoid using their employee discount. Winter is the
(domestic and international flights)
Monthly
Passenger Load Factor of U.S. Airlines
Annual average
(Escalation period of fuel prices)

Worldwide Market Forecast 2020–2040
64
low season and the load factor is much lower than the busy season. However, the lower limit has
steadily risen as shown in the figure probably due to the effects of upgraded seat selling logic. In recent
years, the low limit is the same level to the upper limit of around 2000. Because the upper limit has
been fixed at the constant level and the lower limit rose, airlines had been always crowded throughout
the year. Although both the upper and lower limits seemed to further rise in 2019, passenger demand
dropped sharply due to COVID-19 in 2020. The load factor also dramatically dropped and then
recovered to about 50% at the end of 2020.
5.2.5 Crude Oil Prices
Crude oil prices, and therefore fuel prices, largely affect the economy of air transportation.
Escalation of crude oil prices shrinks the world economy (GDP). Escalation of fuel prices hinders the
growth of air transportation demand (RPK) via a rise in airfares (yield). Although the last escalation
of crude oil prices ended after continuing for about 10 years, crude oil prices and fuel prices could
fluctuate again in the future due to changes in the supply-demand balance or incidental or external
factors. In 2018, a rise in crude oil prices reduced the profit of airlines although it was temporary. In
2020, crude oil prices temporarily dropped below zero due to the disruption caused by COVID-19, but
regained value with expectation for practical application of vaccinations in 2021.
0
20
40
60
80
100
120
140
1968Q1
1969Q3
1971Q1
1972Q3
1974Q1
1975Q3
1977Q1
1978Q3
1980Q1
1981Q3
1983Q1
1984Q3
1986Q1
1987Q3
1989Q1
1990Q3
1992Q1
1993Q3
1995Q1
1996Q3
1998Q1
1999Q3
2001Q1
2002Q3
2004Q1
2005Q3
2007Q1
2008Q3
2010Q1
2011Q3
2013Q1
2014Q3
2016Q1
2017Q3
2019Q1
2020Q3
2022
2025
2028
2031
2034
2037
2040
2043
(2015USD/bbl.)Trends in Imported Crude Oil Prices in the U.S.
(Real price: 2015 USD)暦年平均
EIA Imported Crude Oil Price
IHS Brent Forecast
0
20
40
60
80
100
120
140
160
180
200
1991
1992
1993
1994
1995
1996
1997
1998
1999
2000
2001
2002
2003
2004
2005
2006
2007
2008
2009
2010
2011
2012
2013
2014
2015
2016
2017
2018
2019
2020
USD/bbl. Trends in Crude Oil and Jet Fuel Prices (Real price: 2015 USD)
Jet Fuel(U.S. Gulf Coast)
WTI Crude
Brent Crude
First oil crisis
Second oil crisis
Gulf War
Production increase in
Saudi Arabia Financial crisis COVID-19
Source: IHS, EIA
Source: IHS, EIA

Worldwide Market Forecast 2020–2040
65
The argument for raising prices and the argument for maintaining prices both have ground to stand
on in the long run, but the input conditions that the JADC used in the forecast take into consideration
that supply will not be tightened but slowly rise in the future due to the increase of production in non-
OPEC countries, the reduction of demand for conventional crude oil due to practical application of
shale oil in North America and the fact that many oil-producing countries want to increase the
production of crude oil to ensure revenue since their primary balance is still negative on the current
level of crude oil prices. The crude oil price setting of JADC based on the price assumed by IHS is
also shown in the graph. This is incorporated into the RPK forecast via the yield.
After the COVID-19 pandemic calms down, crude oil prices are expected to temporarily return to
the price level of around 2017, slowly rise until around 2030, and then mostly maintain a certain real
price level. The real price of Brent crude oil is expected to stabilize around $65 after 2030. This price
level is lower than 2018 and close to the level in 2019.
5.2.6 Environmental Issues
In the past, noise and air pollution problems around airports were spotlighted as environmental
issues in the airline industry. However, as interest in global warming is recently increasing, CO2
emissions from aircraft* are also gathering attention. (*: Accounts for 1.8% of global annual CO2
emissions.)
It is thought that there will be strong demands for dealing with environmental problems in the future.
Airlines will make further efforts such as updating to fuel-efficient aircraft, adopting efficient flight
methods that lead to fuel saving, and use of alternative fuels in the future.
Although past issues such as noise and exhaust gas were not a part of the economy of passenger
planes, one characteristic of recent CO2 emission controls is that they are tied to emissions trading and
so are directly incorporated into the airline’s economy. Because demand for new generation passenger
0
20
40
60
80
100
120
140
160
1990 2000 2010 2020 2030 2040 2050
Ave
rag
e S
po
t P
rice
(2
015
US
$/b
bl.
)
Trends in Crude Oil Prices (Actual and forecast prices based on the Brent crude oil prices)
Brent Crude (real)
IHS Brent (& JADC) 2020
IHS Brent (& JADC) 2021
Source : IHS Markit

Worldwide Market Forecast 2020–2040
66
planes that employ new environmentally conscious technologies increases accordingly, environmental
measures will drive aircraft updates, in addition to the conventional fuel economy.
CO2
CO2 emissions from international air transportation was 604 × 106 tons in 2018, increasing by 4.2%
from 2017. These CO2 emissions account for about 1.8% of the global total CO2 emissions, but are
forecast to continuously increase in the future in line with the growth of air traffic volume.
In the 37th session of the Assembly in 2010, the ICAO set a reduction goal that involves improving
fuel efficiency by 2% every year until 2050 and not letting CO2 emissions increase after 2020, that
applies to both developed and developing countries. Then in the 38th session of the Assembly in 2013,
the ICAO decided to establish an emissions reduction system that uses the market mechanism
(emissions trading) within 2016 and apply it from 2020. In the 39th session of the ICAO Assembly in
2016, 191 countries agreed on a framework to regulate greenhouse gas emissions from international
flights. This agreement was made to prevent CO2 emissions by aircraft from increasing after 2020 and
obliges each airline to purchase emissions credits for excess amount.
In 2017, the ICAO established a system to promote the agreement in the 2016 Assembly, the
CORSIA (Carbon Offsetting and Reduction Scheme for International Aviation)*1. The reference CO2
emissions as of 2020 was defined*2 and each airline is obliged to purchase emissions credits for the
CO2 emissions above this reference value after 2021. According to data from the Ministry of Land,
Infrastructure, Transport and Tourism, the costs that airlines in Japan incur to purchase emissions
-250
-50
150
350
550
750
950
1150
0
100
200
300
400
500
600
700
1995 2000 2005 2010 2015
RTK
(×10 9ton km : Int. + Dom.)
CO
2Em
issions(×10 6ton : International )
Trends in Traffic Volume (RTK)
and CO2 Emissions in Air Transportation
Source: IEA, ICAO, IATA
Electriciry and Heat Production 41.7%
Other Energy Industry own use
4.8%
Manuf. industries and Construction 18.4%
Others 8.6%
Road 18.2%
International Aviation 1.8%
International Marine 2.1%
others 2.6%その他
Share of CO2 Emissions (2018)
24.6%
Transport
( Pax. + Cargo )
円グラフはラベルオプションでリフレッシュさせる。「運輸24.6%」と2018年は手書き。

Worldwide Market Forecast 2020–2040
67
credits are expected to start at over a billion yen a year in 2021 and increase to several tens of billions
of yen a year by 2035.
(*1: The CORSIA applies to international flights between participating countries and does not apply
to flights of which place of departure or arrival is not a participating country, airlines whose CO2
emissions from international flights are 10,000 tons or less per year, and emissions from aircraft
with a maximum take-off weight of 5.7 tons.)
(*2: The reference emissions based on which the amount of CO2 emissions credits to be purchased is
determined after 2021 is the average emissions in 2019 and 2020.)
The above regulation applies to international aviation. CO2 emissions on domestic routes in each
country are included in total emissions by country from the other domestic industries in the country
and each country shall seek to reduce CO2 emissions on the government’s responsibility toward the
reduction target according to the Kyoto Protocol and the subsequent Paris Agreement.
For exhaust gas regulations based on each aircraft size, the CO2 emissions standard for aircraft was
newly enacted as the Volume III to Annex 16 of the Convention on International Civil Aviation
(Chicago Convention). This standard makes it obligatory to keep an indicator based on the fuel
consumption rate of aircraft below a certain value. This standard applies to jet aircraft with a maximum
take-off weight of over 5.7 tons and propeller aircraft with a maximum take-off weight of over 8.6
tons. The standard takes effect on the following dates and it is prohibited to manufacture new aircraft
that do not meet the requirements after the effective date.
1) January 1, 2020 for models newly developed for which a new type certificate is applied for
(January 1, 2023 for jet aircraft with a maximum take-off weight of 60 tons or less and a maximum
seating capacity of fewer than 19 seats)
2) January 1, 2023 for models currently in production for which a type change will be applied for
3) January 1, 2028 for other aircraft that continue to be manufactured
Because the generation of CO2 directly corresponds to fuel combustion, constant efforts to improve
the fuel efficiency of aircraft that have been underway for some time directly contribute to a reduction
in CO2 emissions through a reduction in fuel consumption. However, it has become clear that it is
difficult to achieve the goals only through technological innovations of airframe and engines as
research on reducing CO2 emissions progresses. Therefore, research is being conducted toward the
practical application of SAF (sustainable aviation fuel) as an aviation fuel to replace fossil fuels, based
on the concept of carbon neutral. However, the low supply capacity and high prices have been pointed
out about SAF from the very beginning.
Various measures must be implemented together to achieve CO2 emissions reduction goals. Besides
fuel efficiency improvement and carbon neutrality, prospective measures are reduction in taxi time
and changes in takeoff climbing and gliding approach patterns at airports using the GBAS to reduce

Worldwide Market Forecast 2020–2040
68
fuel consumption. It is also expected for the SBAS to shorten flight distances directly to reduce fuel
consumption by removing the constraints of island-based navigation system and use ocean flight paths
as great-circle routes.
Noise
Large-scale noise regulations were implemented multiple times from the mid 1980’s to the early
2000’s to address noise problems around airports. The technological innovations and generation
changes in airplanes has been done through the replacement of many passenger planes and freighters.
Although aircraft that make much less noise than in the past are widely used now, the noise problems
still remain. Measures against noise such as restrictions on take-off, landing, and night flights are
implemented at many major airports.
Although the increase in number of flights and the flight of large aircraft are required to keep up
with the growth of air traffic volume, it is not easy to relax the restrictions on take-off and landing at
existing airports, expand airports, build new airports etc. partly due to concerns about environmental
deterioration around airports.
Under these circumstance, the ICAO adopted ‘Chapter 14’ noise standard, which is stricter than the
previous standard, in the 38th session of ICAO Assembly in August 2013. The new standard applies
to aircraft for which a type certificate is applied for after January 1, 2019*.
(*: The standard takes effect at the end of 2020 for aircraft with a maximum take-off weight of less
than 55 tons.)

Worldwide Market Forecast 2020–2040
69
5.2.7 Travel Demand
As data from the World Tourism Organization (UNWTO) shows, income levels are
correlated with the number of times people travel. Demand for overseas travel* increases in line with
an increase in real GDP per capita. (*: Overseas trips include land and sea travel as well in UNWTO
data.)
As shown in the figure, in developed countries with a real GDP per capita of over $20,000, the
overseas travel demand moderately changes with changes in income levels. Whereas, in emerging and
developing countries with a real GDP per capita of around $10,000, the overseas travel demand clearly
rises sharply with an increase in income levels.
0.01
0.10
1.00
10.00
0 10,000 20,000 30,000 40,000 50,000 60,000 70,000 80,000 90,000
Trips ab
road
per capita per year
GDP per capita (2015US$)
Relationship between Income Level and Trips Abroad* (1) (2015)
Source : UN, IBRD, IHS
United States
ItaliaRussia
China
Brazil
India
Switzerland
France
Japan
HungaryGermany
Canada
Australia
Netherland
United Kingdom
New Zealand
( * : Trips include land and sea routes)
0.00
0.01
0.10
1.00
10.00
0 10,000 20,000 30,000 40,000 50,000 60,000 70,000 80,000 90,000
Trips ab
road
per capita per year
GDP per capita (2015$US)
Relationship between Income Level and Trips Abroad* (2) (2015)
UK USA
Frnace Japan
Russia Czech
S.Korea Colombia
China India
Thailand
Source : UN, IBRD, IHS
( * : Trips include land and sea routes)
0.0010.001
Source: UN, IBRD, IHS
Japan
China
Korea U.S.
U.K.
France Russia
Czech Republic
India
Thailand
Worldwide Market Forecast 2020–2040
70
This suggests that if income levels rise through an economic growth in future particularly in
emerging countries and regions with large populations where income levels are still low, a large
middle-income group will be formed and will greatly contribute to increase air transportation demand.
Currently, Southeast Asian countries, Southwest Asian countries including India, and many African
countries fall in this category. China has also been in this group for a long time and has largely grown.
It is also pointed out that the fast growing model of developing country type will transit qualitatively
to the slow growing model of developed country type when the real GDP per capita reaches around
$10,000. Although developed countries are already passed this range, Northeast Asian countries
experienced the transition in the late 1990’s. Now (2019), the real GDP per capita of China has just
reached $10,000. In other words, the growth rate of RPK in China is likely to experience this transition
after a short time and then drop, although the country has contributed to the market growth with the
high growth rate. The real GDP per capita has just reached $10,000 in the Middle East region and
around $13,000 in Eastern Europe region where the growth rate of RPK is high with the success of
LCCs. Their future trends are worthy of attention.
The transition may happen gently and continuously at normal times, but could instantaneously occur
due to the impact of a political or economic incident. The transition in Northeast Asia region was
caused by the impact of the Asian currency crisis (1997). In the world as it is today, things that can be
the cause such as the U.S.-China economic conflict and COVID-19 are occurring one after another.

Worldwide Market Forecast 2020–2040
71
5.3 Study of RPK
5.3.1 Impact of Reduction in CO2 Emissions
We have experienced phenomena probably caused by global warming such as heat waves, torrential
rain, floods, and changes in agricultural products suitable for the region around us. A reduction in CO2
emissions is recognized as an important issue that human beings can control to some extent to prevent
global warming and its destructive effects on people’s lives. The agreement based on ICAO’s CORSIA
obliges airlines to purchase CO2 emissions credits to promote CO2 emission reduction in the air
transportation field as well. Once the application starts, airlines must incur new costs, most of which
are eventually born by passengers in the form of airfare. This is likely to affect the growth of transport
demand and aircraft demand through a rise in yield. (Related Part: Section 5.2.6)
********************
Regarding the purchase of emissions credits, airlines do not have to purchase emissions credits for
CO2 emissions up to the reference amount specified based on the past record up to 2020, but are
obliged to purchase credits for the excess amount.
The following are CO2 emissions and financial costs to purchase associated CO2 emissions credits
for the next 20 years estimated by combining actual data released by various organizations and the
results* of the forecast of transport demand and aircraft demand made by the JADC.
(Source: Carbon Markets Express)
OperationalImprovements
Inte
rnat
ion
al a
viat
ion
net
CO
2 E
mis
sio
ns(
MT
)
CO2 Emissions Forecast and Emissions Reduction Goals for International Routes
Carbon neutral growth from 2020
2010 Technology and 2010 Operational Efficiency
Aircraft technologies
Sustainable alternative fuelsand Market-Based Measures

Worldwide Market Forecast 2020–2040
72
5.3.1.1 Forecast of CO2 emissions
Actual values Studying the correspondence between the global air traffic volume (RTK, which
covers passengers and freight) and CO2 emissions, fuel efficiency has been constantly improved ever
since the 1970’s and the slope that corresponds to the quotient of annual CO2 emissions divided by the
RTK has been shallowed over time. During this time, the slope was very similar in the 1970’s, 1990’s,
and between 2013 and 2018, whereas CO2 emissions barely increased even though the RTK increased
between 2010 and 2013. During this period, many old-generation aircraft retired and had been rapidly
replaced with new ones in response to the escalation of fuel costs. In contrast, the slope did not shallow
for the 10 years between 2000 and 2010.
Emissions forecast 1 By combining the line* ,extrapolated from the line connecting the point in
2018 (the latest actual value) and the origin, and the forecast value of global transport demand (RTK)
between 2018 and 2039 (horizontal axis), the CO2 emissions in each year can be estimated on the
extrapolated line in the case where the technical level remains the same in future. (*:the slope the line
(CO2 emissions divided by RTK) corresponds to the technical level of fuel saving) As shown in the
figure, annual CO2 emissions in 2039 are estimated to be 1.89 × 10⁹ tons (navy blue line in the figure).
The figure also shows the transition of CO2 emissions in cases where the fuel efficiency is improved
by 1.0%, 2.0%, and 3.5% on annual average after 2018. According to the ICAO’s CO2 emissions
reduction plan, airlines are expected to reduce CO2 emissions by 2.0% every year. If improved the fuel
efficiency by 3.5% every year, CO2 emissions will hardly increase even if air traffic volume increases
in the future.
Emissions forecast 2 The CO2 emissions have continued to decrease every year by about -1.2%
to -1.6% year-on-year for the past 6 years from 2013 to 2018 as a result of airlines’ efforts including
the effects of aircraft updates. If extrapolating the straight line (from 2013 to 2018) assuming that this
slope is maintained in the future, CO2 emissions will be 1.75 × 10⁹ tons in 2039. This means that the
(Source: ICAO, IATA, IEA, JADC)
Amount for which emissions credits must be purchased (example with an annual growth rate of 2%)
Air Traffic Volume (RTK of passengers and freight, international and domestic flights) and CO2 Emissions
CO2 emissions in 2039 assuming the efficiency of around 2018
1%/year
CO2 emissions if the efficiency is improved by 2% every year
CO2 emissions in 2019
3.5%/year
RTK2039E (forecast RTK in 2039)

Worldwide Market Forecast 2020–2040
73
fuel efficiency will be improved by 0.6% per year on average for the next 20 years (green line in the
next figure).
Emissions forecast 3 By combining the composition of passenger planes (number of planes in
service per model in each year) to be used by global airlines for the next 20 years that was obtained
when forecasting demand for passenger planes shown in Chapter 4 of this document and the fuel
economy index per model*, the transition of CO2 emissions was estimated, including the effects of
fuel efficiency improvement by replacing old planes with new models during this period (e.g., 737NG
→ 737MAX → successor model). (*: Assumptions such as the EIS time, economic performance, and
number of deliveries of each model of aircraft are included.)
The figure shows the result on the presumption that the fuel economy is improved by 20% with
every generation of aircraft as a result of technological progress in airframe and engines (yellow line
in the figure). This means that the fuel efficiency will be improved on the long-term average of
0.90%/year for the next 20 years. Likewise, the long-term average improvement rate is 0.77%/year
and 1.03%/year, respectively, when the improvement rate is 15% and 25%.
Airlines are expected to reduce CO2 emissions by 2% every year. Although the above-mentioned
effects of updating aircraft are anticipated to cover around 1% of the reduction, additional measures
are required to reduce the remaining amount. Possible measures include the purchase of CO2
emissions credits and the use of SAF.
Air Traffic Volume (RTK of passengers and freight, international and domestic flights) and CO2 Emissions CO2 emissions in 2039
assuming the efficiency of around 2018
Extrapolated line assuming the pace between 2013 and 2018 (corresponds to improvement by 0.6% every year on average)
Forecast based on the demand forecast by the JADC
(example of fuel saving by 20% at every generation change that corresponds to improvement by 0.9% every year on average for 20 years)
RTK2039E (forecast RTK in 2039)
CO2 emissions in 2019

Worldwide Market Forecast 2020–2040
74
5.3.1.2 Purchase costs of CO2 emissions credits
Keeping CO2 emissions at the 2019 level in the future corresponds to emissions reduction by about
3.5%/year on average. The amount exceeding 0.9 to 1.0%/year mentioned above will probably be
covered mainly by the use of alternative fuels (SAF: sustainable aviation fuel) and the purchase of
CO2 emissions credits. However, it is often unclear about SAF, and the current manufacturing unit
price of SAF is said to be two to six times as high as the jet fuel used now*1. This fuel is not only
expensive, but also future price expectations are unclear. (*1: If fuel prices rise by six times from
around 2019, airfare is expected to be more than double the current price.)
Global airlines will have to purchase CO2 emissions credits equivalent to 23.3 × 109 USD*2 in 2035
based on the purchase amount of CO2 emissions credits*2 estimated with the condition of forecast 3 in
the previous section (0.9%/year) on the assumption that SAF is not used. Likewise, it is expected that
airlines in Japan will have to pay 38 billion yen*2 in 2035. The cumulative cost from 2021 to 2035 is
anticipated to be 240 billion yen*2 and the cumulative cost until 2039 is anticipated to be 450 billion
yen*2.
(*2: Calculated in 2015 USD. The dollar to yen rate is fixed to 105 yen/dollar for the entire period.)
Unit 2020 2030 2040 Reference CO2 emissions (purchase of emissions credits not required) 106 CO2 tons 700 700 700
Assumed price of CO2 emissions credits Euro/CO2 ton 25 30 45
As long as SAF is expensive, it is realistic to purchase emissions credits for the amount short of the
CO2 reduction target. However, given the future supply amount of emissions credits and possible
escalation of market price, the use of emissions credits may also become unstable and the costs can
further increase in the future.
As mentioned above, airlines in Japan will eventually purchase CO2 emissions credits equivalent to
several tens of billions of yen a year. The price of CO2 emissions credits could soar and the costs may
0
60
120
180
240
300
360
420
480
0
10
20
30
40
50
60
70
80
2021
2022
2023
2024
2025
2026
2027
2028
2029
2030
2031
2032
2033
2034
2035
2036
2037
2038
2039
Sum total ( since_2021 )( ×10 9 yen )
(×10 9 Yen
per year)Trends in Purchase Amount of
CO2 Emissions Credits of Airlines in Japan

Worldwide Market Forecast 2020–2040
75
continue to be endless. Therefore, it is sufficiently meaningful to proactively conduct research and
development regarding future costs as current funds to reduce future costs rather than just continue to
pay costs in the future. For example, Japan has always imported oil, but can be an exporter of SAF.
SAF does not depend on underground resources and so provides an opportunity to any country that
has the will and technological capabilities.
5.3.1.3 Estimation of the costs of CO2 emissions credits
The impact of the costs of CO2 emissions credits on RPK was estimated based on the study result
in the previous section. The impact on RPK was estimated with the equivalent fuel price (and
equivalent crude oil price) and forecasted yield. The equivalent fuel price was calculated by adding
the purchase costs of emissions credits to fuel prices, And the yield was forecasted based on the
equivalent fuel price, assuming that all the purchase costs of CO2 emissions credits will be reflected
in airfares (yield). (Related Part: Section 5.2.6)
The equivalent crude oil prices to which the costs of CO2 emissions credits are added will be about
$68/bbl. in 2030 and about $73/bbl. in 2040. The amount added to the crude oil prices at each point in
time is expected to be about $3/bbl. in 2030 and about $8/bbl. in 2040. Based on the real Brent price,
$68/bbl. to $72/bbl. corresponds to the level around 2018 when crude oil prices were temporarily high.
Although this price level is not as high as around 2008 or 2012, passengers will incur the costs in the
form of ‘CO2 surcharge’, etc., and airlines and manufacturers will be required to make efforts to reduce
fuel consumption, for example, by improving operations and introducing new technologies.
Using these equivalent crude oil prices, the average growth rate of RPK for the next 20 years was
estimated to drop by about 0.02% as shown in the table. The costs could increase if more SAF is used
in the future.
0
20
40
60
80
100
120
140
160
180
1990 2000 2010 2020 2030 2040 2050
Ave
rag
eS
po
tP
rice
(201
5U
S$
/bb
l.)
IHS Brent& JADC 2021
Brent Crude (real)
Source : IHS Markit
Costs of CO2 emissions credits
Trends in Equivalent Crude Oil Price (Actual and forecast values based on the Brent crude oil prices)

Worldwide Market Forecast 2020–2040
76
Average growth rate of RPK Remark 2020-2039 2020-2029 2030-2039
IHS Brent & JADC 2020 4.02% 4.29% 3.75% Standard model
IHS Brent & JADC 2021 4.04% 4.33% 3.75% Drop in crude oil prices Cost of CO2 emissions credits added
(derived from 2021) 4.02% 4.32% 3.72% Costs of emissions credits
5.3.1.4 Estimation of the introduction costs of SAF (SAF: sustainable aviation fuel)
Major countries have accelerated their effort to reduce CO2 emissions with the goal of almost
halving the emissions by around 2030 and effectively achieving zero by around 2050. If the air
transportation industry aims to reduce CO2 emissions at a similar pace, the use of SAF is expected to
be the core. In this section, we made an assumption about the price of SAF and its gradually decreasing
trend and estimated the impact of each case on the growth of global RPK with the following
assumptions.
- Future annual CO2 emissions from global airlines are calculated by multiplying the RTK (passengers
and freight) forecast in this document by the fuel consumption efficiency in 2018.
- Effective CO2 emissions from the use of SAF corresponds to 20% of that from the same amount of
conventional fuel.
- SAF will be introduced to halve CO2 emissions in 2030 compared to that of 2019.
- The unit price of SAF will be 160 or 240 USD/bbl. in 2025 (about double or triple the jet fuel prices
in 2019). After 2025, the price will gradually decrease at a rate of decrease of 0 to 4% every year.
- By 2025, the use of SAF is sequentially increased while conventional fuel is mainly used. Although
SAF is still expensive, the escalation of equivalent fuel price is prevented as a whole by using CO2
emissions credits as well.
SAF will have to account for 77%*1 of the fuel consumption in 2030 under the above assumptions.
The upper right figure shows an example where the unit price of SAF will reach 160USD/bbl. in 2025
and then gradually decrease by 3% every year. As the amount of SAF usage quickly increases until
2030, the equivalent fuel prices will also rise which is the overall mean including SAF and
conventional fuel. After 2030, the equivalent fuel price will start to decline due to the slowdown of
increase of the ratio of SAF in the total fuel and the gradual decrease in unit price (3% per year).
SAF Adoption Rate Unit Price of Crude Fuel and SAF (USD/bbl.)
Equivalent jet fuel unit price CO2 emissions credits
(*1: This corresponds to 102% of the fuel consumption in 2019.)

Worldwide Market Forecast 2020–2040
77
Likewise, the equivalent crude oil prices (Brent base) calculated by the combination of the unit
prices of SAF in 2025 (160 or 240 USD/bbl.) and rates of decrease (0 to 4%) are illustrated in the
graph. The equivalent crude oil prices (real prices) in 2030 almost match the price range from 2011 to
2014 in the $160 group and, in the $240 group, reach an unprecedented price range. In both groups, if
the rate of decrease is about 1%/year, the equivalent prices do not drop but remain high. The rate of
decrease must be at least 3%/year to make the prices drop after 2030.
We estimated a rise in yield (a rise in airfares) through adoption of SAF based on the current yield
structure and estimated its impact on the growth of transport demand*2. In the case of the initial unit
price as of 2025 is $160 and the rate of decrease is 1%/year, between 2025 and 2040, the total RPK
integrated in the period decreases by 2.8% and the growth rate of RPK drops from 4.16% to 3.96%,
compared with the case where SAF is not introduced (principal value in this document). If the rate of
decrease is 3%, the integral value of RPK decreases by 1.9% and the growth rate drops to 4.07%. If
0
50
100
150
200
1990 1995 2000 2005 2010 2015 2020 2025 2030 2035 2040Ave
rag
e S
po
t P
rice
(20
19U
S$/
bb
l.)
Estimation of Equivalent Fuel Prices ( SAF + CO2 emission credits + conventional fuel based on the Brent crude oil price)
SAF240-0 (Gradual rate 0%)
SAF240-1 (Gradual rate 1%)
SAF240-2 (Gradual rate 2%)
SAF240-3 (Gradual rate 3%)
SAF240-4 (Gradual rate 4%)
SAF160-0 (Gradual rate 0%)
SAF160-1 (Gradual rate 1%)
SAF160-2 (Gradual rate 2%)
SAF160-3 (Gradual rate 3%)
Brent (IHS/JADC 2021)
Brent Crude (real)Source : IHS Markit, JADC
Brent Crude Oil Price( Average Spot Price )
0
5,000
10,000
15,000
20,000
25,000
2015
2020
2025
2030
2035
2040
RPK (×10 9) SAF導⼊の負担がRPKに及ぼす影響の試算
YGR‐5111 (with/after COVID‐19)
160ドル 3%
240ドル 0%
YGR‐5102 標準モデル (no COVID‐19)
(If CO2 emissions are assumed to be halved from the current amount by 2030, it is required to drastically reduce emissions in
the future. Because CO2 emissions credits do not actually reduce emissions, the estimation in this section assumes that SAF
is used to reduce the emissions.)
Estimated Impact of SAF Introduction Costs on RPK
YGR-5102 standard model (COVID-19 not considered)
YGR-5111 (during and after the COVID-19 pandemic)
$160, 3%
$240, 0%

Worldwide Market Forecast 2020–2040
78
the initial unit price is $240, the impact will be larger and the required rate of decrease will increase
accordingly. (*2: This only refers to the impact via airfare and does not include the impact via economy in general such as GDP.)
Initial unit price /bbl. $160 $160 $160 $240 $240 $240 YGR-5111 Principal
value of this forecast
YGR-5102 Standard
model Gradually decreasing rate /year 1% 2% 3% 0% 2% 4%
RPK integration 2025-2040 ×10^9 214,841 215,887 216,875 208,005 210,647 213,069 221,132 238,558
Comparison 97.2% 97.6% 98.1% 94.1% 95.3% 96.4% 100.0% 107.9%
Growth rate 2020-2040 /year 3.45% 3.49% 3.53% 3.24% 3.36% 3.45% 3.60% 4.00%
Growth rate 2025-2040 /year 3.96% 4.01% 4.07% 3.69% 3.84% 3.96% 4.16% 4.68%
Period
It is important to both keep the initial unit price low when SAF starts being used in full swing and
to subsequently gradually decrease the unit price every year to reduce the impact on the air
transportation demand and the transport industry while introducing SAF. The prerequisite to realize
them is to always ensure a sufficient supply of SAF for the demand.
5.3.2 RPK in the Middle East Region (Slowdown in the Long-Distance Range)
Airlines in the Middle East have adopted aggressive expansion policies particularly since around
2003, and have captured the demand of long-distance transit passengers through “the sixth freedom of
the air.” As the RPK has quickly expanded the scale at an annual growth rate of well above 10% and
even above 20% for a while mainly in the long-distance range (4,500 km or longer), they have
procured many widebody passenger planes and have driven the market. However, when crude oil
prices dropped after the autumn of 2014, the growth rate quickly decreased. The growth rate of RPK
dropped to 2.3% (IATA, total in all the distance ranges) in 2019.
In this JADC forecast, the calculation was performed on the assumption that the growth rate of RPK
in the entire Middle East region, after the rapid growth of RPK of market redivision type ceased, will
be equivalent to the growth rate of the world (3.1%: total of all distance ranges). The forecast shows
that the number of deliveries of passenger planes for the next 20 years will be smaller than that shown
in the past forecast by the JADC. Airlines have already canceled or postponed orders, reviewed models,
and made other adjustments. And the airlines also aim to use existing aircraft longer, the number of
deliveries of passenger planes could further decrease mainly in large widebody jets depending on the
actual change in the growth rate in the future.
********************
The RPK of airlines in the Middle East differ in characteristics between the short-distance range
(up to 1,000 km) to the medium-distance range (up to 4,500 km) and the long-distance range (4,500
km or longer). Both the past rapid expansion and sharp slowdown occurred in the long-distance range.
The figure below shows the RPK in the long-distance range estimated by the JADC. For example,
the average growth rate was 17.3%, much higher than the global average growth rate of RPK, which
was 5.2%, between 2004 and 2014. This suggests that most of the growth did not result from market

Worldwide Market Forecast 2020–2040
79
growth, but redivision of existing air transportation demand among airlines. This sort of growth will
saturate and rely on the market growth rate when they eventually dominate the whole market share
even if carried out perfectly.
And since the fall of 2014, the growth rate of RPK in this distance range has been declining as if in
line with the decline in crude oil prices, with an average growth rate of 4.1% from 2016 to 2019 and
2.0% in 2019. The average growth rate in the long-distance range after COVID-19 calms down is
assumed to be 2.7% for the forecast.
The results of correlation analysis between the RPK and the GDP or yield in the medium- (2,000 to
4,500 km) and shorter-distance ranges suggest that residents in the Middle East region mainly use
flights in these distance ranges. No RPK bending has been observed so far. By analyzing the actual
RPK, GDP, and yield values for the past 20 years or so and forecasting the future RPK using the
forecast future GDP and yield values based on this data, the annual average growth rate is expected to
be 4.1% in the medium-distance range, for example, after the COVID-19 pandemic ends. The average
growth rate of RPK of the airlines in the Middle East is expected to be 3.1% for the next 20 years in
all the distance ranges including the long-distance range as well.
(Actual and forecast RPK in the long-distance range:
The future growth rate is assumed to be higher than the actual value in 2019.)
10
100
1000
10000
1995 2000 2005 2010 2015 2020 2025 2030 2035 2040
RPK (Bil.) Long Range Traffic Forecast - M.East
ForecastHistory
17.3% 3.2%

Worldwide Market Forecast 2020–2040
80
(Actual and forecast RPK in the medium-distance range:
The market characteristics are different from the long-distance range.)
Average growth rate of RPK Number of aircraft deliveries Number of aircraft in
service at the end of the forecast period
All the distance ranges
Long-distance range RJ NJ WJ Total
Old forecast 2018-2037 6.02 % 6.46 % 60 880 1,410 2,350 2,654
This forecast 2020-2040 3.11 % 2.65 % 47 914 1,018 1,979 2,333
5.3.3 RPK in the China region (Transition to the Moderate Growth Model)
Airlines in China (CH) have rapidly grown mainly in the short- and medium-distance ranges
(up to 4,500 km). With an average growth rate of RPK for the past 20 years that reached 12.4%, China
is one of the pillars that supports the global aircraft demand. However, the growth rate dropped to
8.1% in 2019. Besides, the GDP per capita has just reached $10,000 in China and the future RPK is
expected to transit* from the fast growing model of a developing country type to the slow-growing
model of a developed country type during the forecast period. (*: Related Part: Section 5.2.7)
For this forecast, we assume that $13,000 in 2024 is an inflection point with reference to the actual
transition that has already happened in other region and that the subsequent growth rate will be close
to the global average. As a result, the number of aircraft deliveries for the next 20 years decreased
from the last forecast by about 900. This qualitative change may progress drastically due to some
external political or economic impact. The transition is expected to happen early during the forecast
period (from 2020 to 2040), though what will trigger the transition in China is unknown.
********************
10
100
1000
10000
1995 2000 2005 2010 2015 2020 2025 2030 2035 2040
RPK (Bil.) Medium Range Traffic Forecast - M.East
ForecastHistory
4.1%

Worldwide Market Forecast 2020–2040
81
Although the transition is expected to happen after the GDP per capita in the region exceeds $10,000,
the GDP per capita in China has just reached $10,000 in 2019 and the transition has not yet occurred.
We used the Northeast Asia (NE) region* whose actual data is available and that is economically closer
as a model to estimate the time of the transition.
(*: The Northeast Asia region here refers to Taiwan and South Korea.)
The figure below shows the RPK (including all the distance ranges) and the actual GDP per capita
in the NE region. As the figure shows, the region experienced the transition when the GDP per capita
was around $13,000. The growth rate of RPK in the region dropped from the previous high value to
about 4%/year after the transition period and stabilized. The transition occurred for a short period due
to the strong impact of the Asian currency crisis in 1997 that decreased not only the RPK but also the
GDP.
For this forecast, we estimate that the transition occurs when the GDP per capita reaches around
$13,000 based on the actual example in the Northeast Asia region and applied this estimation to the
forecast value of the GDP of China to conclude that the transition will occur in 2024.
Although it is unknown whether this transition will be rapid or moderate, the transition is likely to
proceed early during the forecast period (2020–2040).
This forecast assumes that the transition proceeds for a short period and that the average growth rate
of RPK after the transition is on the same level as the global average. In addition, the transition is
presumed to affect all the distance ranges in the same way.
Average growth rate of RPK Number of aircraft deliveries Number of aircraft in
service at the end of the forecast period Entire period After transition RJ NJ WJ Total
Old forecast 2019–2038 5.66 % – 187 4,568 2,286 7,041 8,433
This forecast 2020–2040 4.54 % 3.85 % 236 4,097 1,110 5,443 6,944

Worldwide Market Forecast 2020–2040
82
0
50
100
150
200
250
5000 10000 15000 20000 25000 30000
RPK ( 10^9 )
GDP per Capita (2015USD)
NE GDP per Cap. ~ RPK
‐30%
‐20%
‐10%
0%
10%
20%
30%
40%
1993
1994
1995
1996
1997
1998
1999
2000
2001
2002
2003
2004
2005
2006
2007
2008
2009
2010
2011
2012
2013
2014
NE RPK 成長率(前年比)
0
5,000
10,000
15,000
20,000
25,000
30,000
1981
1984
1987
1990
1993
1996
1999
2002
2005
2008
2011
2014
2017
2020
2023
2026
2029
2032
2035
2038
2041
2044
CHのGDP per Capitaの推移(実績と推移:2015USD)
Asian currency crisis (1997)
Source: ICAO, IATA
Source: ICAO, IATA, IHS
Source: IHS
RPK growth rate in the NE region (year-on-year)
Development of GDP per Capita in China (Actual and Forecast values, in 2015USD)
$13,000 (2015USD)

Worldwide Market Forecast 2020-2040
83
6 Factors Related to Air Transportation
6.1 Changes in the Airline Industry
6.1.1 Mergers
Although numerous emerging airlines entered into the airline industry where competition became
much more open from the 1980s as a result of deregulation, this led to over competition. When the
industry briefly regained balance, the number of airlines in the U.S. was actually smaller than that
before the deregulation due to companies merging or closing down.
A merger is often an effective measure for airlines. A merger is useful as a measure against over
competition and abrupt changes in external loads such as escalation of fuel costs. In addition,
absorbing the flight authorizations for routes, arrival and departure slots at airports, usage rights for
airport facilities, and other properties of the merged airlines has large effects and very quick impact in
expanding their network and market share. An example is Pan American Airways, which sold its
Pacific and Latin American routes to United Airlines and its European routes to Lufthansa in the mid-
1980s before it finally went bankrupt in 1991.
Recently, Delta Air Lines and Northwest Airlines (2008), United Airlines and Continental Airlines
(2010), and American Airlines and US Airways (2013) merged in the U.S. As a result of these mergers
and integrations, the U.S. airline industry is now becoming increasingly oligopolistic. These 3 biggest
airlines and the largest LCC, Southwest Airlines, which absorbed ATA Airlines and AirTran Airways
in the 2000s, accounted for 78% of the ASK in the U.S. domestic market (2018). Meanwhile, many
prestigious airlines founded before World War II disappeared.
Similar airline reorganization is also under way in Europe and Latin America.
Although mergers have happened as effective measures in this way, they now face risks related to
antimonopoly laws as consolidation proceeds. In addition, foreign investment regulations apply to
investment in foreign airlines and mergers with them. Foreign companies are usually not allowed to
have more than 50% of the stocks with some exceptions, which is why international mergers are rare.
In this context, airlines have established global alliances since the 1990s.
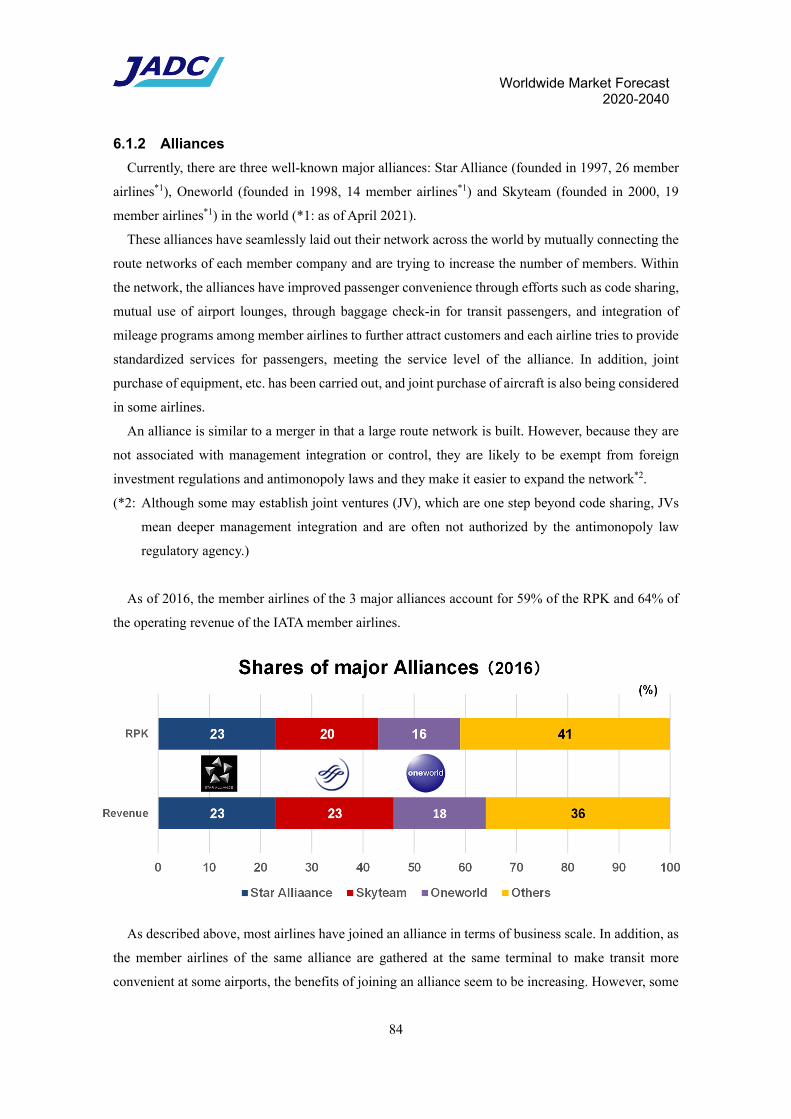
Worldwide Market Forecast 2020-2040
84
6.1.2 Alliances
Currently, there are three well-known major alliances: Star Alliance (founded in 1997, 26 member
airlines*1), Oneworld (founded in 1998, 14 member airlines*1) and Skyteam (founded in 2000, 19
member airlines*1) in the world (*1: as of April 2021).
These alliances have seamlessly laid out their network across the world by mutually connecting the
route networks of each member company and are trying to increase the number of members. Within
the network, the alliances have improved passenger convenience through efforts such as code sharing,
mutual use of airport lounges, through baggage check-in for transit passengers, and integration of
mileage programs among member airlines to further attract customers and each airline tries to provide
standardized services for passengers, meeting the service level of the alliance. In addition, joint
purchase of equipment, etc. has been carried out, and joint purchase of aircraft is also being considered
in some airlines.
An alliance is similar to a merger in that a large route network is built. However, because they are
not associated with management integration or control, they are likely to be exempt from foreign
investment regulations and antimonopoly laws and they make it easier to expand the network*2.
(*2: Although some may establish joint ventures (JV), which are one step beyond code sharing, JVs
mean deeper management integration and are often not authorized by the antimonopoly law
regulatory agency.)
As of 2016, the member airlines of the 3 major alliances account for 59% of the RPK and 64% of
the operating revenue of the IATA member airlines.
As described above, most airlines have joined an alliance in terms of business scale. In addition, as
the member airlines of the same alliance are gathered at the same terminal to make transit more
convenient at some airports, the benefits of joining an alliance seem to be increasing. However, some

Worldwide Market Forecast 2020-2040
85
airlines are going against the tide. For example, Emirates Airlines and Hawaiian Airlines note the
disadvantages of joining an alliance and are trying to expand their network and improve convenience
on their own and Etihad Airways finances other companies and takes them in as equity partners.
In addition, although partnerships including code sharing were initially supposed to stay within
alliance member airlines, some alliance member companies have recently started sharing codes with
airlines in other alliances.
In 2016, the first LCC alliance called Value Alliance (currently, five member airlines) was
founded mainly in the Southeast Asia region. The functions of this alliance are very limited
compared with the 3 major alliances, this alliance is said to provide transit reservations, through
ticketing, and reservation of ancillary services between member airlines as well. This is noteworthy
because LCCs that only cover short-distance routes up to about 2,000 km can establish a wide-range
network without largely changing their business models if things go well.
6.1.3 LCC
A recent trend in the airline industry is the rise of LCCs. There are two types of LCCs, independent
LCCs and LCCs that are subsidiaries of full-service airlines. And many LCCs that have successfully
established and continued business are so-called Southwest clones.
The efforts that Southwest Airlines made after the Deregulation are considered to have created the
first LCC business model. Congestion at large airports worsened due to security enhancement after
the 9/11 terror attacks in 2001 is said to have partly contributed to today’s rise of LCCs. Although
LCCs had still small presence at that time, passengers who got sick of the temporal and physical
burdens of the pre-boarding procedure including security checks after the 9/11 terror attacks at large,
crowded airports took an interest in LCCs that provide flights at secondary airports that are less
crowded. As a result, despite its casual service, it gained popularity for its ease of use combined with
its simple flight style, and it is believed that LCCs were rapidly gaining recognition in American
society during this period. LCCs also appear to have had the character of a new mode pushed out by
economic and social shocks.
Besides North America, a liberalization framework was also established in Europe after 1993 and
the spread and rise of LCCs have been reported in various regions since the 2000s. LCCs were also
founded in Japan and Taiwan, which had been called the blank area of LCCs, in 2012. In addition,
many LCCs were founded in emerging countries in line with the progress of aviation liberalization.
As shown in the figure, in 2019, LCCs supplied over 30% of the available seats of whole airlines even
in Europe and the U.S., where income levels are high. They show a particularly high proportion of the
seat supply in regions with relatively low income levels such as South Asia (mainly India). This
suggests that low airfares offered by LCCs are suitable for exploring air transportation demand in these
regions.

Worldwide Market Forecast 2020-2040
86
Characteristics of LCC flights include single model (or family), narrow body (fuel-efficient) jet,
many seats (high seat-density), frequent flights, and no-frills services. LCCs seem to realize many of
these characteristics by only offering short-distance flights (i.e., short time flights).
Although some LCCs have started offering long-distance flights after gaining a certain share of
short-distance flights, few have clearly succeeded. However, there are many cases where the route is
suspended soon after it is opened, and cases where the business condition goes dark.
This is not only attributed to the procurement costs of long-distance aircraft. Providing medium to
long flights probably disrupts the core of the LCC business model that has been specialized for short
flights.
A drop in utilization* is another example. One of the prerequisites for the success of medium- and
long-distance LCCs is to improve utilization by using aircraft more efficiently. ZIPAIR, founded in
2020 as a medium- and long-distance LCC, combines a long-distance flight between Narita and
Bangkok and a short-distance flight between Narita and Inchon and is worthy of attention as one of
such measure.
(*: Utilization here means how many hours per day a passenger aircraft is flying.)
Establishment of the first LCC alliance, Value Alliance, in 2016 is also noteworthy. LCCs operating
in the Southeast Asia region will work together via the alliance to provide services including transit
reservation and through ticketing. If this alliance gets into gear, each LCC could perhaps also provide
effective medium- to long-distance transportation services for passengers with smooth transit, while
maintaining the business model dedicated to short-distance routes.
0
10
20
30
40
50
60
70
2007
2019
Source:Cirium, OAG, JADC
Change in Proportion of LCCs in Seating Capacity
North America
Pro
port
ion
of L
CC
s in
sea
ting
capa
city
(%
)
Western Europe
Eastern Europe
Japan China North- east Asia
South-east Asia
South Asia
Oceania Middle East
Latin America
Africa CIS World

Worldwide Market Forecast 2020-2040
87
fewer Spare airplaneslower Airplane unit price
Limiting the range of Single Model or lower Training costs route distance → Single Family → lower Maintenance costs
lower Related investmentsVital !
→ Narrow Body Jet → lower Fuel costsShort Range Compromizing on (low Drag) ↓ comfortShort Time → High Density → more Seats
(No. of seats) (per Airplane)
→ no frills → lower Beverage costsLoading food and drink
Having crew takeCabin cleaning charge or → less ground → lower Labor costs low cost, low fare
abolishing works workers ↓Cargo loading low margin and
short TAT Operating → more Flights → more Passengers high turnoverTaxiing more frequently (availability) (Airline overall) ↑
larger scale→ higher Utilization → more capital turnover capital efficiency
Independent company (Slots)
Point to Point → Secondary less Landing fee → lower cost LCC !no Network connection airport Facility usage fee
(not crowded) (Ground side conditions)

Worldwide Market Forecast 2020-2040
88
6.2 ETOPS
6.2.1 Establishment of ETOPS
In the past, twin-engine aircraft were not allowed to fly in airspaces 60 or more minutes away from
the nearest airfield where they could make an emergency landing at a speed with one engine stopped.
However, with the improvement of engine reliability and other improvements, aircraft have been
allowed to fly in airspaces more than 60 minutes from the nearest airfield since 1985 on the condition
that the aircraft and airlines satisfy certain conditions. This standard is called ETOPS.
First, a 75-minute exception was made for the A300 in 1977. Then, the ETOPS system started when
AC120-42 took effect as an exceptional authorization of FAR 121.161 in 1985. The first ETOPS
(ETOPS-120) rating was given to the 767 in 1986. Then, ETOPS-180 was provided in AC120-42A
(1988) and aircraft such as the 757 and 767 were rated for ETOPS-180. In addition, the concept of
assigning an ETOPS rating before entry into service started in 1995.
As a result, in the 20 years since 1985 ETOPS-180 became the mainstream. If aircraft can fly with
ETOPS-180 rating, twin-engine aircraft can fly across most airspaces in the world including oceans.
So, now, multi-engine aircraft are rarely required.
ETOPS largely affected the fate of twin-, three-, and four-engine aircraft and airlines’ procurement
trend of aircraft.
Although ETOPS like concepts are known by several names, ETOPS is the most common. EDTO
is not intended to replace ETOPS.
6.2.2 From Multi-Engine Aircraft to Twin-Engine Aircraft
In 1964*, three-engine aircraft were excluded from the conventional 60-minute rule (FAR 121.161)
and were allowed to fly in airspaces 60 minutes or more away from an airfield regardless of the aircraft
size. As a result, three-engine aircraft were able to fly on long-distance routes including over oceans
like four-engine aircraft. This largely increased the degree of operation freedom. Because three-engine
aircraft were also able to fly over oceans where twin-engine aircraft were not, the 727 became the
bestselling product and the L-1011 and the DC-10 opened an era of wide body jet with the 747 as
aircraft for North America transcontinental routes and long-distance ocean routes. Some call this
period as the era of three-engine aircraft. (*: The 727 entered into service in 1964.)
However, when ETOPS started in 1985, a group of new twin-engine aircraft that had just been
launched quickly replaced existing three-engine aircraft because of the higher economic performance
of twin engines, the new engines, two pilots, and other features. On Atlantic routes on which ETOPS
was initially applied, ETOPS flights quickly increased after 1985. The number of twin-engine aircraft
flights exceeded the total number of three- and four-engine aircraft flights in 1991 and reached double
their number in 1997. Partly because new three-engine aircraft of just the right size were not available,
this trend became firmly established in just five years or so. The supply of new three-engine aircraft
ended when the MD-11 was discontinued in 2000. In addition, as the importance of three-engine

Worldwide Market Forecast 2020-2040
89
aircraft dropped, the ETOPS system started applying to three- and four-engine aircraft in 2007 and
multi-engine aircraft lost their institutional advantage over twin-engine aircraft.
Twin-engine aircraft from small aircraft (the 737 and the A320) to large aircraft (the 777)
complied with ETOPS before around 2000. With the launch of the 777, the 747 was no longer
ordered (by 2002, passenger model) and had begun to retire in earnest. Four-engine aircraft projects
following the 747 did not proceeded as expected. As the A340 was already discontinued (2012) and
both the A380 and the 747 were set to be discontinued by 2022, the era of four-engine aircraft seems
to be coming to an end.
Airspaces corresponding to ETOPS-60
(60 minutes, 400 nm)
There remain areas where aircraft cannot fly not
only over ocean, but also over land. Whereas
twin-engine aircraft were bounded by this 60-
minute rule before ETOPS, the rule did not apply
to three- and four-engine aircraft.
ETOPS-120 (120 minutes, 800 nm)
The areas where twin-engine aircraft can fly
have largely expanded including Atlantic routes
between the U.S. and Europe, Pacific routes
between Japan and the U.S., and the Kangaroo
Route. However, Arctic routes were still out of
reach. The routes between Hawaii to the U.S.
mainland and those between Australia and the
U.S. mainland were not covered, either.
ETOPS-180 (180 minutes, 1200 nm)
Twin-engine aircraft can fly in most areas and on
most routes both over land and ocean.
Comparison of Area where Aircraft Can Fly according to ETOPS
(The figures are taken from ICAO data.
Blue indicates areas where aircraft cannot fly.)

Worldwide Market Forecast 2020-2040
90
ET
OP
S
(min
ute
s)
370
370
min
.
A3
50-9
00
(be
fore
EIS
)
EA
SA
330
330m
in.
33
0min
.3
30m
in.
78
77
47-
8
FA
AF
AA
FA
A
285
285m
in.
285
min
.
240
240m
in.
A3
30/E
AS
A(A
330
-90
0 o
pti
on
)(A
330
-800
op
tio
n)
207
207
min
.
FA
AE
arly
ET
OP
S77
7(3
co
mp
an
ies
in N
A)
AC
120-
42A
to
ok
eff
ect
EP
L2
0-1
(FA
A)
180
180
180
18
0min
.1
80m
in.
180m
in.
18
0min
.1
80m
in.
180m
in.
180
min
.
767
/AA
etc
.7
57/
A3
00-
600
777/
FA
A7
67/
AN
A/J
CA
BA
320
/319
/32
1A
330
-900
/EA
SA
A3
30-8
00/E
AS
A
A3
30/E
AS
AE
AS
AA
220
/EA
SA
AC
12
0-42
120
120
120
min
.12
0m
in.
767/
TW
A e
tc.
757
/76
7/A
NA
737
/Alo
ha
JCA
B
75
75m
in. E
xce
ptio
n
A3
00,
Ea
ster
n A
irlin
es
etc
.
60
AC
120
-42B
10
'50
'51
'52
'53
'54
'55
'56
'57
'58
'59
'60
'61
'62
'63
'64
'65
'66
'67
'68
'69
'70
'71
'72
'73
'74
'75
'76
'77
'78
'79
'80
'81
'82
'83
'84
'85
'86
'87
'88
'89
'90
'91
'92
'93
'94
'95
'96
'97
'98
'99
'00
'01
'02
'03
'04
'05
'06
'07
'08
'09
'10
'11
'12
'13
'14
'15
'16
'17
'18
'19
'20
'21
'22
'23
'24
'25
'26
'27
'28
'29
'30
'78
De
reg
ula
tio
n
'73
Oil
Cri
sis
'79
2n
d O
il C
ris
is
'86
Co
llap
se o
f O
PE
C
FA
A n
ois
e r
eg
ula
tio
n (
un
til 1
985)
707
, DC
-8, 7
27
A3
10E
IS
DC
-9 E
IS7
67E
ISA
300
-600
EIS
MD
me
rge
d75
7E
IS’9
3 A
340
EIS
'12
A34
0 d
isco
nti
nu
ed
↓↓
↓D
eve
lop
me
nt
star
ted
'68
'71
DC
-10
EIS
'89
DC
-10
dis
co
n.
Dev
elo
pm
en
t st
arte
d '6
8'7
2 L
-10
11
EIS
'81
L-1
01
1 d
isc
on
.'9
0 M
D-1
1 E
IS'0
0 M
D-1
1 d
isc
on
.
'64
727
EIS
'84
72
7 d
isc
on
.('
85 E
TO
PS
)
'68
73
7 E
IS’8
5 7
37C
FM
I EIS
'98
737
NG
EIS
'86
737
-200
ET
OP
S
777
(Tre
nd
par
tic
ula
rly
on
Atl
an
tic
rou
tes)
ET
OP
S fl
igh
ts q
uic
kly
inc
reas
ed
aft
er
19
85.
'91
, th
e n
um
ber
of
flig
hts
of
twin
-en
gin
e a
irc
raft
exc
eed
ed
th
e to
tal
of t
ho
se
of
thre
e-an
d f
ou
r-e
ng
ine
air
cra
ft.
'97
,Th
e n
um
be
r o
f flig
hts
of
twin
-en
gin
e ai
rcra
ft r
eac
he
d
do
ub
le t
he
tota
l o
f th
ree
-an
d f
ou
r-e
ng
ine
airc
raft
.
'85,
To
ok
effe
ct a
s e
xce
pti
on
al a
uth
ori
za
tion
of
AC
120
-42
: F
AR
12
1.1
61.
ET
OP
S a
lso
ap
plie
s to
th
ree
-a
nd
fo
ur-
en
gin
e ai
rcra
ft f
rom
200
7.
75
1-34
0 d
raft
wa
s c
on
firm
ed.
Dev
elo
pm
en
t o
f 76
7s
tart
ed.
De
vel
op
men
t o
f D
C-9
s
tart
ed
.'64
,th
ree
-en
gin
e ai
rcra
ft
ex
clu
ded
(Th
e B
727
en
tere
d in
to
se
rvic
e i
n t
he
sam
e y
ear
)
'52
,FA
R 1
21
.161
Tw
in-e
ng
ine
air
cra
ft a
nd
th
ree
-en
gin
e a
irc
raft
With
in 6
0 m
inu
tes
’66
AA
re
qu
es
ted
(tw
in-e
ng
ine
airc
raft
)
'87
A3
40 a
nd
A33
0
De
velo
pm
en
t s
tart
ed
’90
737
-30
0 ac
qu
ire
d E
TO
PS
for
the
fir
st t
ime
.’9
973
7-7
00 a
cq
uir
ed
ET
OP
S
for
the
firs
t ti
me
.
Ea
rly E
TO
PS
/ E
TO
PS
be
fore
ent
ry i
nto
se
rvic
e m
eans
tha
t a
ircra
ft ca
n b
e r
ate
d fo
r E
TO
PS
up
to
180
min
utes
up
on i
ts E
IS i
f ce
rta
in r
eq
uire
men
ts a
re s
atis
fied.
Ea
rly E
TO
PS
gra
dua
lly b
eca
me
wid
esp
read
af
ter
19
95.

Worldwide Market Forecast 2020-2040
91
Names for “ETOPS”
6.3 Infrastructure
Building of infrastructure including air routes, airspace control, and airports is critical to the
development of air transportation.
6.3.1 Development of Air Routes
~ North Pole Route or Northbound Flights to Europe
The route connecting Asia and Europe used to be operated as the southbound European route via
the Middle East and India. It was also a detour to avoid flying over the communist bloc, but it was far,
time consuming and costly.
Once Scandinavian Airlines System (SAS) successfully developed the grid navigation and opened
the North Pole route in 1957, this route had frequently used until the beginning of the 1990s. Japan
Airlines also started the northbound European flights using the DC-8-33 and the grid navigation in
1961, which reduced the required time by about 11 hours compared to the southbound flight. (The
flight time between Japan and the U.K. was shortened from about 30 hours to about 19 hours.)
Route
On this route, Anchorage was used as a relay
point throughout the Cold War as part of a
detour to avoid flying over the Soviet Union.
Both passenger planes and freighters were
refueled here. On the route departing from
Japan, both the Pacific route to the United
States and the European route were refueled and
branched here.
ETOPS (Extended Twin OPerationS) DT: Up to 180 minutes
Subject: Twin-engine aircraft only
ETOPS (ExTended OPerationS) DT: Can be 180 minutes or longer
Subject: Twin-, three-, and four-engine aircraft
ETOPS (Extended Twin OPerationS) DT: Can be 180 minutes or longer
Subject: Twin-engine aircraft
LROPS (Long Range OPerationS) DT: Can be 180 minutes or longer
Subject: Three- and four-engine aircraft
EDTO (Extended Diversion Time Operations)
DT: Can be 180 minutes or longer Subject: Twin-, three-, and four-engine
aircraft

Worldwide Market Forecast 2020-2040
92
Grid navigation
Practical application of grid navigation made it possible to open the North Pole route. Although grid
navigation required research and development of dedicated equipment and techniques*1, the
pioneering efforts of SAS put it into practical use and the North Pole route was opened in 1957.
Because a normal magnetic compass is not usable in the polar zones, a gyrocompass and the polar grid
map were used as alternative measures in grid navigation. Because drift occurred due to the accuracy
of manufacturing or bearings, and errors gradually accumulated even though a high rotation speed
gyrocompass was used, pilots used to fly planes while correcting for the errors based on celestial
observation. (*1: Survival equipment in case of emergency landing was included in addition to navigation equipment.)
In 1958, in the year following the opening of the North Pole route by SAS, the first-ever nuclear
submarine, SSN-571 Nautilus, successfully entered the Arctic Ocean from the Bering Strait, reached
the North Pole while still submerged, and exited to the Europe side. Nautilus used an INS for
submersible navigation without using radio waves or celestial observation.
Grid navigation also had disadvantages such as the need for celestial observation and complex
calculations and fell into disuse as navigation with an INS became popular*2. However, the pioneering
efforts by SAS that opened a new route and changed the movement of people and cargo are impressive.
(*2: Japan Airlines introduced the INS for the first time in 1970 with the 747.)
The North Pole route, which was explored by SAS with grid navigation, continued to be used for
more than 30 years while navigation systems were being changed. Because Russia granted permission
to fly through their airspace for a fee in the 1990’s, the routes via Anchorage gradually fell into disuse.
However, these routes may be used again and aircraft suitable for the route may come to be needed
depending on future changes in international situations.

Worldwide Market Forecast 2020-2040
93
6.3.2 Airport
Europe, the U.S., and Japan are
currently establishing next-
generation flight control systems to
use airspaces efficiently, mitigate
congestion, and improve economic
performance.
Major airports in each country
have already been faced with delays
due to airport congestion and
shortage of arrival and departure
slots that hinders the increase of
flights and opening of new routes.
Delays of 30 minutes to one hour
have already become an everyday
affair during peak times at many
major airports around the world.
Eurocontrol forecasts that the
delay time per flight will increase
from 8.8 minutes in 2012 to 14.2
minutes in 2035 in 28 EU countries
and that the total amount of loss of
passengers’ time value due to these
delays will expand from 4 billion
euros in 2012 to 13.4 billion euros in
2035.
Infrastructure building including
the construction of new airports,
expansion of runways and aircraft
parking aprons at existing airports,
and extension and renovation of
airport terminal facilities are required
to prevent such delays. However, this
not only takes a large amount of
money and time, but because
Changes in Number of Incoming and Outgoing Passengers by Airport
Nu
mb
er
of
inco
min
g a
nd
ou
tgo
ing
pa
sse
nge
rs
(mill
ion
/ye
ar)
Atla
nta
Beijin
g
Dub
ai
Toky
o - H
aned
a
Los
Ange
les
Chi
cago
Lond
on -
Hea
thro
w
Hon
g Ko
ng
Shan
ghai
Paris
Amst
erda
m
Dal
las
- For
t Wor
th
Gua
ngzh
ou
Fran
kfur
t
Ista
nbul
New
Del
hi
Jaka
rta
Sing
apor
e
Inch
on
Den
ver
Changes in Amount of Cargo by Airport
Ca
rgo
am
oun
t (m
illio
n to
ns)
Hon
g Ko
ng
Mem
phis
Shan
ghai
Seou
l - In
chon
Anch
orag
e (*
1)
Dub
ai
Loui
sville
Toky
o - N
arita
Taip
ei
Paris
Fran
kfur
t
Sing
apor
e
Los
Ange
les
Mia
mi
Beijin
g
Doh
a
Lond
on -
Hea
thro
w
Can
ton
Amst
erda
m
Chi
cago
*1) Some 2010 data was not available.
Changes in Number of Take-Offs and Landings by Airport
Nu
mb
er
of t
ake
-offs
and
land
ing
s
(mill
ion
tim
es/
yea
r)
Atla
nta
Chi
cago
Los
Ange
les
Dal
las
- For
t Wor
th
Beijin
g
Den
ver
Cha
rlotte
Las
Vega
s
Amst
erda
m
Shan
ghai
(*1)
Paris
Lond
on -
Hea
thro
w
Fran
kfur
t
Toro
nto
Gua
ngzh
ou (*
1)
Ista
nbul
(*1)
San
Fran
cisc
o
Toky
o - H
aned
a
Hou
ston
Mex
ico
City
*1) Some 2010 data was not available.

Worldwide Market Forecast 2020-2040
94
environment awareness has recently risen, it is also necessary to obtain consent from neighborhood
residents about noise and air pollution around the airport.
In this way, infrastructure building tends to fall behind the curve even though a long-term approach
to infrastructure building is strongly desired to address the future growth of air transportation demand.
In order to satisfy transportation demand with a limited number of arrival and departure slots in this
situation, airlines select larger passenger aircraft with more seats to increase the number of passengers
per flight. Therefore, the number of seats per flight (per aircraft) is on the increase as a whole and large
wide body jet that are usually used for long-distance international flights are often operated even on
short-distance routes if transportation demand is particularly large. Aside from that, it has become
common to actively use secondary airports around crowded large airports to distribute the departure
and arrival load. One example of that is LCCs.
6.3.3 Navigation and Routes
The current air traffic system is facing challenges such as delays due to traffic volume beyond its
capacity, constraints on flights resulting from inflexible operation of airspaces and routes, and an
increase in workload on flight control officers and pilots. To address these challenges, the International
Civil Aviation Organization (ICAO) put together the operation concept of ATM (air traffic
management) and presented its future vision toward 2025 in 2003 and then continuously requested the
promotion of action planning, necessary research and development, and other efforts in regions,
countries, and industries using the ATM operation concept as guidelines again in the ICAO Assembly
in 2007. Taking this opportunity, SESAR created a future vision (ATM master plan) in Europe and
NextGen created a future vision in the U.S. in 2008. In Japan, CARATS created a roadmap to realize
CARATS in 2011. This section describes navigation and flight practices, routes, and flight paths.
SESAR (Single European Sky Atm Research)
NextGen (Next Generation Air Transportation System)
CARATS (Collaborative Actions for Renovation of Air Traffic Systems)
Flight practices
An example of flight practices already in use is RNAV.
Autonomous flight
The aircraft receives radio waves from ground facilities such as VOR/DME and flies toward the source of the radio waves.
Passive flight
The flight depends on navigation equipment and ground facilities. Navigation support facilities are identified.
Because the aircraft measures its position based on signals from VOR/DME, GPS, etc. and makes calculations based on that data, flight courses and other settings can be flexibly specified.
Positioning and calculation
VOR/DME, GPS, etc.
The flight depends on navigation performance (precision). Navigation support facilities are not identified.
Technological innovation
Navigation principles of RNAV (Source: https://www.mlit.go.jp/koku/15_bf_000379.html)

Worldwide Market Forecast 2020-2040
95
The navigation system before RNAV largely depended on the precision of the aeronautical
navigation aid facilities in that aircraft fly along the path set with radials from VOR or the final
approach path instructed by the ILS, for example. Therefore, aircraft had to be equipped with receivers
for each navigation aid facility and satisfy requirements such as high category operation using the ILS
as needed.
In contrast, with RNAV, aircraft fly an arbitrary path consisting of way points and other elements,
identifying its own location as latitude and longitude by using the GNSS, VOR/DME, and INS, IRS,
and other sensors. This enables efficient use of airspaces through flexible path setting, safety
improvement, meeting increasing air transportation demand, enhancement of operation efficiency and
in-service rate, and reduction in environmental load.
RNAV (Area Navigation) VOR (VHF Omnidirectional Radio range)
ILS (Instrument Landing System) GNSS (Global Navigation Satellite System)
VOR/DME (Distance Measuring Equipment)
INS (Inertial Navigation System) IRS (Inertial Reference System)
In Japan, RNAV was operated for evaluation in the en-route area in 1992 and the departure and
arrival method (path) using the FMS was operated for evaluation between Hakodate airport and
Kumamoto airport in 1997. In 2005, four airports (Shin-Chitose, Hakodate, Hiroshima, and Naha)
started using the RNAV approach method.
For reference, during general RNAV flight, an airborne system monitors navigation performance
but does not have a function to issue an alert to the pilot if the required navigation performance may
not be satisfied. However, RNP (required navigation performance) such as RNP10 and RNP4 is a sort
of RNAV flight with an airborne system that monitors navigation performance and has a function to
issue an alert to the pilot if required navigation performance may not be satisfied.
As a revised version of “RNAV Roadmap (2007, version 2),” the “New Roadmap for RBM
Introduction and Deployment Plan (Draft)” sets nationwide deployment of RNAV and RNP paths as
a short-term goal (by FY2024), promotion of satellite navigation (adoption of RNP) in all flight phases
as a mid-term goal (by FY2030), and realization of TBO (realization of satellite navigation in all flight
phases including the time axis) as a long-term goal (from FY2031). Among them, consideration of
advanced RNP in areas around airports starts as a high precision RNP including the time axis in 2024.
Overseas examples of RNAV introduction include the RNP-AR approach method at Los Angeles
airport in the U.S. and the RNP to ILS approach method at Charles de Gaulle airport in France and
Bremen airport in Germany. RNP-AR (Required Navigation Performance Authorization Required)
RNP to ILS (Required Navigation Performance to Instrument Landing System)

Worldwide Market Forecast 2020-2040
96
Flight paths
There are four types of ocean flight paths: 1 fixed path, 2 variable path, 3 UPR, and 4 DARP.
An efficient flight path is set using RNP navigation.
(1) Fixed path
Fixed paths have been used as air routes for a long time. Examples include Fukuoka FIR (flight
information region) in the airspace controlled by Japan and the NOPAC (North Pacific) path at the
northern edge of Anchorage FIR controlled by the U.S. A horizontal control interval is ensured
between each path. These paths are important air routes between Asia and North America.
(2) Variable path
Variable paths are set based on daily weather forecasts. An example in the Pacific Ocean is the
PACOTS (pacific organized track system) path. Variable paths are set by an air traffic control
organization based on the weather forecast about 24 hours before flights.
(3) UPR (User Preferred Route)
UPRs are set to each aircraft. The operator considers the aircraft model, takeoff weight, flight time,
fuel consumption, and weather forecast of each flight and sets the optimal path. UPRs may be
different even between flights to the same city that depart at the same time, depending on
differences in model and airline flight policy.
(4) DARP (Dynamic Airborne Reroute Procedure)
Procedure to request to change to a more efficient path to the air traffic control organization during
flight.
Japan (CARATS), the U.S. (NextGen), and Europe (SESAR) took the proposal of the ATM
operation concept by ICAO as an opportunity to individually develop next-generation flight control
systems. Japan has already started operation of the RNAV flight practices and, as a result, can improve
safety, satisfy increasing air transportation demand, enhance flight efficiency and in-service rate, and
mitigate environmental load. In addition, efficient flight paths are set by leveraging RNP navigation
as air routes for ocean flights, which were fixedly set in the past.
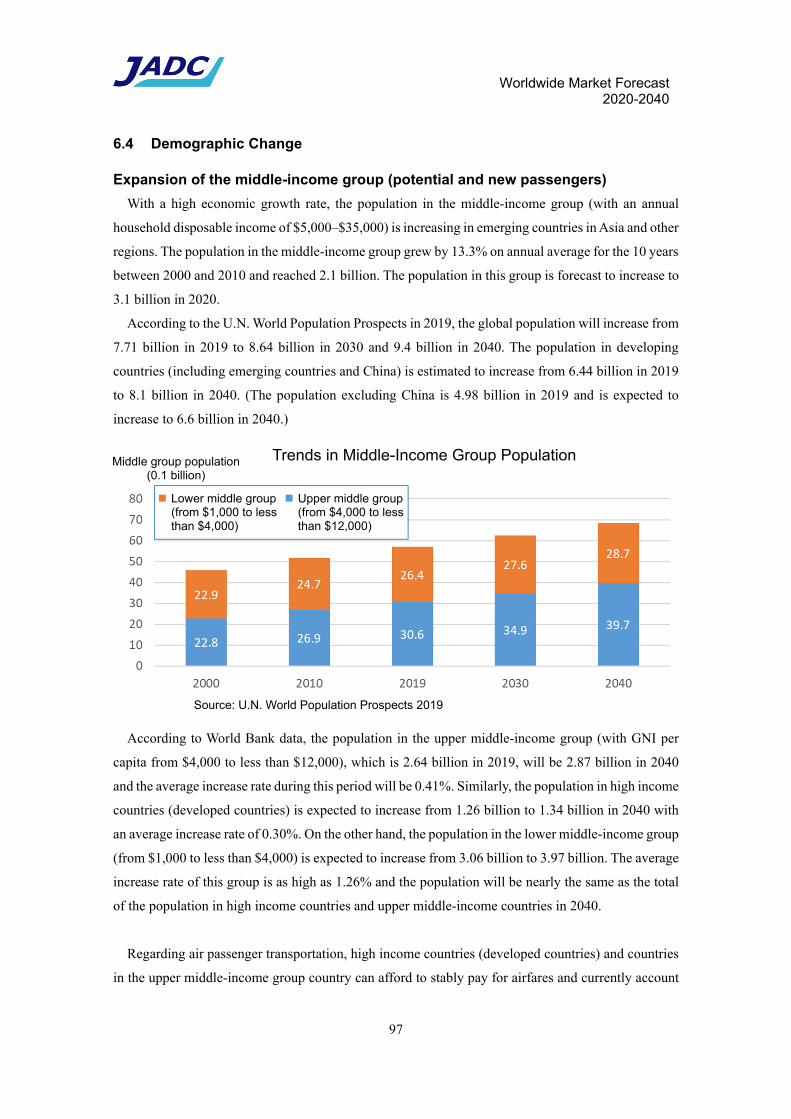
Worldwide Market Forecast 2020-2040
97
6.4 Demographic Change
Expansion of the middle-income group (potential and new passengers)
With a high economic growth rate, the population in the middle-income group (with an annual
household disposable income of $5,000–$35,000) is increasing in emerging countries in Asia and other
regions. The population in the middle-income group grew by 13.3% on annual average for the 10 years
between 2000 and 2010 and reached 2.1 billion. The population in this group is forecast to increase to
3.1 billion in 2020.
According to the U.N. World Population Prospects in 2019, the global population will increase from
7.71 billion in 2019 to 8.64 billion in 2030 and 9.4 billion in 2040. The population in developing
countries (including emerging countries and China) is estimated to increase from 6.44 billion in 2019
to 8.1 billion in 2040. (The population excluding China is 4.98 billion in 2019 and is expected to
increase to 6.6 billion in 2040.)
According to World Bank data, the population in the upper middle-income group (with GNI per
capita from $4,000 to less than $12,000), which is 2.64 billion in 2019, will be 2.87 billion in 2040
and the average increase rate during this period will be 0.41%. Similarly, the population in high income
countries (developed countries) is expected to increase from 1.26 billion to 1.34 billion in 2040 with
an average increase rate of 0.30%. On the other hand, the population in the lower middle-income group
(from $1,000 to less than $4,000) is expected to increase from 3.06 billion to 3.97 billion. The average
increase rate of this group is as high as 1.26% and the population will be nearly the same as the total
of the population in high income countries and upper middle-income countries in 2040.
Regarding air passenger transportation, high income countries (developed countries) and countries
in the upper middle-income group country can afford to stably pay for airfares and currently account
Trends in Middle-Income Group Population Middle group population (0.1 billion)
Lower middle group (from $1,000 to less than $4,000)
Upper middle group (from $4,000 to less than $12,000)
Source: U.N. World Population Prospects 2019

Worldwide Market Forecast 2020-2040
98
for half of the global population. However, their population increase rate is already of the developed
country type or similar to it being as low as 0.3 or 0.4%/year. Therefore, the future growth of air
transportation demand resulting from a population increase will be accordingly small. In contrast, the
lower middle-income group has a high increase rate and the population increase is also large. Those
with relatively high incomes in this group can become a new customer segment of air passenger
transportation depending on the population and increase rate.
India is currently at this stage. Although the GDP per capita is still as low as $1,900 (2019), demand
has grown particularly for short-distance routes and aircraft demand is also high due to its large
population (about 1.8 billion in 2019). If supply and demand are balanced in a way comparable to the
ability to pay for airfares, the airline and aircraft markets are expected to grow in India. However, at
present, airlines have competed with one another to gain market share even though general consumers
cannot afford to pay for airfares yet. As a result, the whole industry became busy without making
profit. In 2019, Jet Airways liquidated. It was the second largest domestic airline. The remaining
airlines increased their share of the market as a result of the discontinuation of Jet Airways and are
said to have stopped the airfare discount battle for the time being. However, it is also said that the
resumption of this battle is unavoidable. It will be interesting to see if the Indian airline industry can
enter a stable growth trajectory.
Population by Income Group
Developed countries
Upper middle-income group
Lower middle-income group
Poverty group

Worldwide Market Forecast 2020-2040
99
Progression of urbanization and concentration of population (passengers)
Urbanization has also proceeded in the world in line with economy growth and population increase.
The ratio of urban population to global population was 29.6% in 1950 but has continued to increase
since then and is expected to be 56.2% in 2020 and 59.8% in 2030.
In the past, the hub-and-spoke business model was effective for air transportation and has been used
for a long time. In this model, small passenger aircraft are used between small airports in small cities
and the nearest large airport to collect and distribute passengers and large passenger aircraft are used
for mass transportation between large airports. This model assumes that the number of passengers is
not large at small airports at the ends of the spokes.
However, when large cities increase in line with global urbanization, those urban areas are expected
to ensure a sufficient number of passengers to each destination. If this happens, nonstop flights can be
provided between large cities without collection, distribution or transfer of passengers. For this
Global Future Population Estimates (Median Estimate) P
opul
atio
n (
106
)
*Developed countries refer to North America, Europe, Japan, Australia and New Zealand.Source: UN World Population Prospects: The 2019 Revision
Middle East Latin America
World 0.92% p.a.
Asia and Oceania
Africa
Emerging countries 1.09% p.a.
Developed countries* 0.07% p.a.
Ratio of Urban Population to Global Population

Worldwide Market Forecast 2020-2040
100
purpose, long-distance medium-sized aircraft will be suitable for international flights with a number
of seats that keeps the load factor high according to the number of passengers traveling between cities.
6.5 Competition
High-speed rail
Although rail transportation is an important partner for air transportation as it collects and
distributes passengers around airports, at the same time, high-speed rail is also in competition with
short-distance flights. The flight speed of aircraft is three times as fast as high-speed rail and this
advantage becomes clearer with longer-distance routes. Therefore, their competition mainly occurs
on short-distance routes.
Although high-speed rail connects large cities with large populations, many passengers travel
between these large cities and many of them are business users. Therefore, these routes are also
important for airlines.
Many people use high-speed rail because rail transportation is safe, reliable, convenient, and
comfortable. Specifically, passengers can directly travel between city centers. Trains are punctual and
not as susceptible to the weather. No time is required for security checks like at airports and they offer
more spacious seats. In addition, passengers can have a meal even if they don’t have a high-class seat
and can use mobile phones and the Internet while traveling.
Competition is particularly intense on routes where the flight time is 1 to 2 hours. It is said that
high-speed rail is more competitive when the travel time is within 4 hours by rail. Recently, Brazil,
India, the U.S., Indonesia, and other countries are advancing plans to build new high-speed rails. On
top of that, a modal shift from air to rail has also been made in cargo transportation from the viewpoint
of CO2 emission reduction in addition to passenger high-speed rail.
Trends in Global Urban Population
Cities with 10 million or more residents
Cities with 5 to 10 million residents
Cities with 1 to 5 million residents
Cities with 500,000 to 1 million residents
Cities with 300,000 to 500,000 residents
Cities with 300,000 or fewer residents
Pop
ula
tion
( 1
06)

Worldwide Market Forecast 2020-2040
101
On the other hand, because building and maintenance of railroads takes a lot of money and time and
cost recovery also takes time, long-term demand forecasts and good business judgment are required
to execute a plan. In contrast, opening of airline routes can take less money and time and is easy to
participate in because routes can be opened just by constructing an airfield. For this reason, air
transportation may start first in countries where rail transportation and other infrastructure are not yet
established.
Ocean cargo transportation
Air cargo transportation is advantageous in that cargo can be quickly transported to distant
destinations with its uniquely high speed. However, air cargo transportation is not suitable to carry
large or heavy cargo and airfares are rather expensive than other modes of transportation. Therefore,
this transportation is only used to carry electronic parts, fresh food, high-profile products, and other
lightweight expensive goods that can cover the airfare.
On the other hand, most goods that support society and people’s lives are transported by train or
ship. Both types of transportation are excellent at transporting a large amount of goods at low cost
regardless of the weight and volume.
Therefore, normal long-distance freight relies on low-cost ocean transportation. If demand
overflows from ocean transportation for some reason, it will usually be handled as air cargo. Possible
reasons include economic boom, emergency, and inventory building during economic recovery.
Because the volume of freight handled by ocean transportation is much larger than that of air cargo,
even if only a part of it flows in, the handling volume of air cargo will fluctuate greatly, causing
fluctuations in busyness.
Actual Traffic Volume of Global High-Speed Rail T
raffi
c vo
lum
e (
109
pass
enge
r-km
)
China
Japan
Korea
Taiwan
France
Germany
Spain
Italy
Other
Source: UIC (Union Internationale de Chemins de Fer)

Worldwide Market Forecast 2020-2040
102
Teleconference systems and virtual reality
People travel to see relatives or friends who live far away and travel for business for communication.
Aircraft satisfies these demands as high-speed transportation. Some say that speed and time reduction
should be pursued with SST.
On the other hand, now that we are in the era of the Internet, a means of high-capacity high-speed
electronic communication has been developed meaning you can have a teleconference, which was
once considered a thing of the future, even on a home PC. Teleconference systems for business use
are actually being used and allow for a high degree of expression. With a teleconference system, it is
possible to eliminate the time and cost for travel even if the other party is in a remote location. In
addition, the more urgent the matter, the larger the effects of instantaneous connection. In addition, as
a teleconference system is not associated with actual movement, it leads to little CO2 emissions and is
a reasonable choice when pursuing CO2 emission reduction as a measure against recent global
warming.
There is a deep-rooted belief that it is critical to meet face-to-face and shake hands for human
communication. However, if telework is promoted and spreads as a measure against the current
COVID-19 pandemic, on-screen communication will be accepted for the most part. This can be a
starting point for using teleconferencing as an alternative to air transportation for some purposes in
the future. Similarly, some airlines and travel agencies are said to be studying ways of letting customers
have virtual “local experiences” at destinations without traveling using an avatar, etc.

Worldwide Market Forecast 2020 - 2040
103
7. Freighter Aircraft Demand Forecast
7.1 Fleet Analysis
Number of aircraft in operation
The number of jet freighters being operated by airlines around the world gradually decreased from
1,754 in 2010 to 1,673 in 2013, but afterwards the number began to increase until it reached 2,117 in
2020 (777 narrowbody aircraft, 686 medium widebody aircraft, and 654 large widebody aircraft).
Regarding the share of freighters by size, the share of large aircraft trended upwards from 2010 to
2013, but after 2013, the number of large aircraft decreased and the numbers of both medium widebody
aircraft and narrowbody aircraft increased.

Worldwide Market Forecast 2020 - 2040
104
Converted Aircraft
Historically, many converted passenger aircraft have been used in the freighter market. In 2020,
50% of aircraft were passenger-to-freighter conversions. These conversions occur after the aircraft
are over 10 years old, with most conversions taking place when the aircraft are between 15 to 20
years old.
Looking at the delivery record of new and converted aircraft since 2000, there have been no new,
Western-made, narrowbody aircraft, other than the 757 freighter aircraft manufactured in the 1990s.
For this reason, there is a relatively stable demand for converted aircraft in the narrowbody freighter
market. In particular, a large number of 737-300/400 and 757 passenger aircraft have been converted.
In the future, many surplus 737-800 are expected to convert into freighters with the resumption of
737-8 service. Many surplus A320ceo Family also are expected to convert into freighters with
increasing the number of A320neo Family in operation. Freighters converted from Airbus passenger
airplanes has been in operation since 2020.
As for widebody aircraft, many aircraft such as the A300/A310 and DC-10 and the 747, 767, and
MD-11 were converted into freighters in the 1990s and the 2000s, respectively. Since 2008, due to
sluggish demand for air cargo and soaring fuel costs, there was a significant reduction in the number
of converted Trijets and Quadjets. Moreover, deliveries for new aircraft such as the 767F, 777F, and
747-8F have been increasing over the past few years due to various factors such as a shortage of used
767 and A300 passenger aircraft that are retired and suitable for conversion, the short amount of time
that has passed since the converted A330 cargo aircraft was introduced in 2017, and the launch of the
converted 777 cargo aircraft in October 2019, as well as the longer service life and lower maintenance

Worldwide Market Forecast 2020 - 2040
105
costs associated with new aircraft.
In 2020, deliveries of new aircraft did not increase because of airline's financial difficulties due to
Covid-19.
In 2020, freight capacity of the lower holds of passenger aircraft sharply gone down due to
significant decreasing of passenger flights. The result most of air cargo transport relied on freighters.
In this situation, some suspended passenger aircraft were converted into “Preighter” by removing seats
to compensate for luck of freighter. In 2020, 155 passenger aircrafts were transferred into Preighters,
at the end of 2020 96 aircrafts has been operated as Preighter.
Example of removing only the seats from a passenger aircraft to temporarily use it as a cargo
aircraft (Preighter)

Worldwide Market Forecast 2020 - 2040
106
7.2 Jet Freighter Demand Forecast
Trends in cargo traffic volume
Freighter cargo traffic fluctuates drastically per annual by economic condition, trade war and
unpredictable risk like Covid-19, but it in terms of RTK trend increase over the period between 1999
and 2019.
In 2020, freighter cargo traffic decreased 10.6% to compared last year due to Corvid-19, but as
described in section 7.1 traffic share of freighter increased temporarily because of suspension
passenger flights.
Result of Jet Freighter Demand Forecast
Demand of jet freighter of airlines fluctuate drastically more than demand of passenger plane. In
the long term the number of jet freighters operated by airlines is forecast to increase from 2,023 in
2019 to 3,041 in 2040. The breakdown is 522 existing aircraft, 1,501 replacement demand, and 1018
new aircraft. In the next 21 years, 2,519 aircrafts including replacement demand plus new demand are
forecast to be delivered.
With regard to the number of jet freighters by size and share, in 2019, narrowbody aircraft made up
37%, medium widebody aircraft 32%, and large aircraft 31%, in 2040 e-commerce is predicted to
increase but the change of other social system is unpredictable, change of the number of jet freighters
share by size is not much, narrowbody aircraft made up 38%, medium wide body aircraft 31%, and
large aircraft 31 % are forecast.

Worldwide Market Forecast 2020 - 2040
107

Worldwide Market Forecast 2020 - 2040
108
Deliveries of jet freighters by size will be 1,151 narrowbody, 739 medium widebody, and 629 large
freighters, totaling 2,519 units. Their shares will be 45.7%, 29.3%, and 25.0% respectively. Of these,
736 deliveries will be newly manufactured aircraft. The breakdown of these aircraft will be 443
medium widebody and 293 large aircraft, which will comprise 40% of the total.
As there will be no newly manufactured narrowbody freighters, the majority of the fleet will be
conversions from A320/321, MD80, 737, and 757 passenger jets. There are even a small number of
freighters converted from regional jets such as the CRJ100/200 and the BAe146, so there is a
possibility that freighters converted from aircraft such as the CRJ700/900 and E-Jet will appear.
While newly manufactured widebody jets, such as the A330-200F, 767-300F, 777F, 747-8F already
exist, we expect to see the A330neo, A350, 787, and 777X aircraft in the future. In the future, freighters
converted from retired A330, 777 and 747-8I passenger aircraft can be expected.

Worldwide Market Forecast 2020 - 2040
109
Regionally, over the period from 2020 to 2040, the number of units in service in North America will
increase from 950 units to 1091 units; the Asia-Pacific region from 366 units to 865 units; Europe
from 300 units to 362 units; the Middle East from 81 units to 266 units; Latin America from 114 units
to 168 units; Africa from 65 units to 126 units; and the CIS from 147 units to 163 units. As a market
for freighters, North America will remain the largest throughout this period. Emerging countries in the
Asia-Pacific region, the Middle East, and Latin America will put more units into service, with the rate
of growth particularly high in the Asia-Pacific region.
The number of new deliveries (newly manufactured freighters and converted freighters) will be the
greatest in North America with 870 units, followed by the Asia-Pacific region with 737 units, Europe
with 282 units, the Middle East with 215 units, Latin America with 162 units, the CIS with 136 units
and Africa with 117 units.

Worldwide Market Forecast 2020 - 2040
110
Demand for newly manufactured jet freighters in North America will be 340 units, followed by the
Asia-Pacific region with 199 units, the Middle East with 84 units, Europe with 72 units, and the CIS
with 23 units. North America and the Asia-Pacific region have the largest new freighter markets.
Ramp-cargo-door type freighters, which are principally a commercial version of the former Soviet-
era military freighters such as the An-124 and Il-76, are operating in the HOM (Heavy and Oversize
air cargo Market) to transport heavy and oversize cargo. The market share of HOM is very small in
terms of RTK, at only about 0.5% of total air cargo traffic, but that market is expected to grow faster
than average for global air cargo traffic due to growing demand in the aerospace, precision machinery
and the mining industries, as well as in the fields of humanitarian operations and disaster relief. As no
replacements for current freighters such as the An-124, An-225, and Il-76 exist at the moment, and
they operate infrequently, these airplanes are expected to be in service over the forecast period.
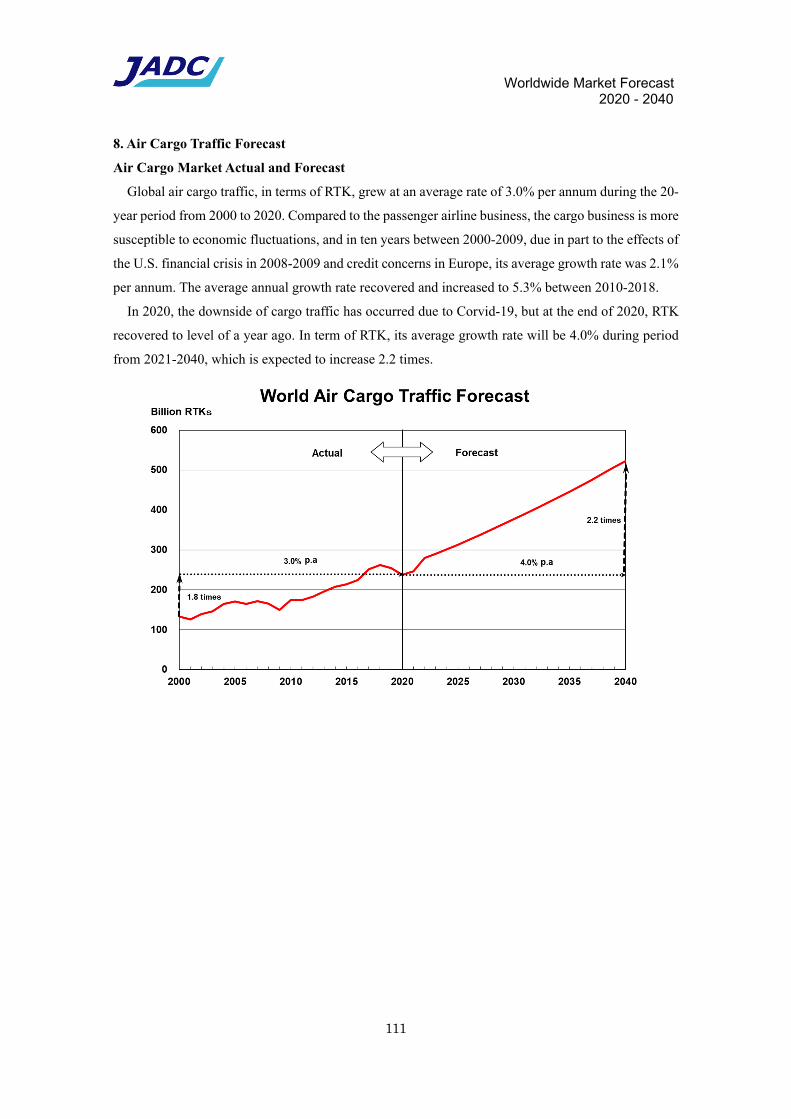
Worldwide Market Forecast 2020 - 2040
111
8. Air Cargo Traffic Forecast
Air Cargo Market Actual and Forecast
Global air cargo traffic, in terms of RTK, grew at an average rate of 3.0% per annum during the 20-
year period from 2000 to 2020. Compared to the passenger airline business, the cargo business is more
susceptible to economic fluctuations, and in ten years between 2000-2009, due in part to the effects of
the U.S. financial crisis in 2008-2009 and credit concerns in Europe, its average growth rate was 2.1%
per annum. The average annual growth rate recovered and increased to 5.3% between 2010-2018.
In 2020, the downside of cargo traffic has occurred due to Corvid-19, but at the end of 2020, RTK
recovered to level of a year ago. In term of RTK, its average growth rate will be 4.0% during period
from 2021-2040, which is expected to increase 2.2 times.

Worldwide Market Forecast 2020 - 2040
112
Regionally, the number of cargo traffic of the Asia-Pacific airlines is most of all, reflecting the
geographical spread and high economic growth, 896 million RTK in 2020 will increase 2.2 times to
1,992 million TK. Meanwhile that of North America airlines will incrase from 580 to 1046, Europ
from 495 to 965, Eest Asia will increase 3.1 times from 279 to 854 taking advantae of geographical
location.

Worldwide Market Forecast 2020 - 2040
113
Cargo Load Factor
The cargo load factor system, when viewed as a combination of transportation by freighters and
transportation in the lower holds of passenger airplanes, increased from 50.1% in 2000 to 53.8% in
2020, fluctuating within ±5% of 50%, according to demand.
The freighter load factor decreased slightly to 62.8% in 2019, after increasing from 66.0% in 2000
to 69.8% in 2010. This appears to have happened due to the fact that even though airlines introduced
freighters to expand their transportation capacity in anticipation of increased air freight demand,
freight transportation demand declined due to global trade conflicts, slowing Chinese economic
growth over the last few years, and increased cargo volume in the lower holds of passenger airplanes.
In 2020, the amount of freight transport decreased 10.6% compared to 2019. As a result of the
increased suspension of passenger flights aircraft due to Covid-19, cargo volume in the lower holds of
passenger aircraft decreased. As a result, freighter transport increased, and it’s load factor also
increased.

Worldwide Market Forecast 2020 - 2040
114
Cargo yield
The real global cargo yield, an indicator of cargo revenue, decreased by an annual average of 1.4%
in the 40-year period from 1980 to 2019, and it decreased by an annual average of 2.2% in the 20-year
period from 1999 to 2018. From 1985 to 1998, the real cargo yield showed a significant decline due
to deregulation and the entry of international courier companies into the general air cargo arena.
Soaring fuel prices caused a sharp increase in 2004-2005, but afterwards, the yield started again on a
downward trend.
In 2020, as a result of the increasing suspension of passenger flights aircraft due to Covid-19, the
cargo volume in the lower holds of passenger aircraft decreased. As a result, demand of freighter
transport increased, and it’s cargo yields also is expected to increase.

Worldwide Market Forecast 2020 - 2040
115
9. Regional Overview
For the past 20 years (2000-2019), global GDP has grown at an average rate of 3.0% per year,
passenger traffic at 5.1%, and cargo traffic at 3.7%. In the meantime, airline liberalization has
progressed around the world, reorganizations of airlines including new entry, amalgamation, shakeout,
privatization of state-owned airlines have been implemented, and furthermore, many LCCs have
entered the market. Airlines have been shifting their business strategy from forming individual
networks on their own, to forming networks by groups of airlines called “alliances.” In addition,
previously it was airlines from the U.S. and Western Europe that drove the growth of air transport, but
in recent years, airlines from the Asia-Pacific region and the Middle East have grown remarkably. In
this way, airline business models and network strategies have been changing with the times; and the
airlines and the regions experiencing growth have changed as well.
In addition, requirements for airplanes are different by region. Airlines in the Middle East, due to
their regional requirements, have been demanding widebody jets that can fly long distances, while
airlines in Europe have been using widebody jets which have a cruising range of 12,000 km or less.
In North America, narrowbody jets are operated on all routes ranging from Regional Range to Trans-
continental lines. Many LCCs that have experienced remarkable expansion also use narrowbody jets.
Circumstances characterizing airlines differ depending on business models and regions to which these
airlines belong, and their demand for airplanes also differs.
Passenger demand, cargo demand, and airplane demand by region shown below are the cumulative
sums of the demand for passengers and cargo transported by, and number of airplanes operated by
airlines, as well as number of airplanes delivered to airlines by region which contains countries in
which airlines are registered as a corporation or have their head office.
Europe
Africa Latin America
North America
CIS
Asia-Pacific
Middle East
(In the following description, “Regional Range” means less than 1,000 km, “Short Range” means 1,000 to less than
2,000 km, “Medium Range” means 2,000 to less than 4,500 km, and “Long Range” means 4,500 km or longer.)

Worldwide Market Forecast 2020 - 2040
116
9.0 Regional Economic Characteristics
For each region covered in this report, its economic character is described below by trends in
population and real GDP per capita from 20 years in the past to 20 years in the future (1996-2019/2019-
2040). The horizontal axis shows the real GDP per capita of regions, and the vertical axis shows the
population. Also, the hyperbola (5, 10, 20, 40 × 1012 USD) shows the product of both (GDP per capita
× population = GDP).
・In North America (NA), GDP per capita has grown rapidly in the past and will continue to do so in
the future, with the population showing a slightly increasing tendency. The increase of its transport
demand is caused by further economic growth rather than population growth, which has already
become the slow-growth model seen in developed countries.
・Western Europe (WE), Japan (JA), and Oceania (OC), are similar to NA in that GDP per capita
continues to grow despite stagnant (or decreasing) population growth.
・China (CH) has impressed rapid population growth in the past. However, it will pass its peak of the
population by around 2030. Afterward, it will enter a gradual decline process and will face with a
rapidly aging of the population. The increasing burden of supporting dependents will also slow
down its economic growth. Meanwhile, GDP, underpinned by the large population size, will grow
to a level comparable to NA around 2040. GDP per capita does not still come up to those of Europe
and the U.S., but will exceed $20,000 during the forecast period (2020-2040). As a result, the RPK
is expected to transit from the rapid growth model of developing country type to the slow growth
model of developed country type early in the forecasting period.
・Increase in per capita economic power in South Asia (SW: India, etc.) is slow, and the region is still
characterized by rapid population growth. Africa (AF), even more than SW, is also characterized by
slow growth of per capita economic power and rapid population growth.
・In addition, the Middle East (ME) and Latin America (LA) will soon reach a GDP per capita of
$10,000. Eastern Europe (EE) is currently around $13,000.
0
4
8
12
16
20
24
0 10000 20000 30000 40000 50000 60000 70000 80000Regional Population
(×10 8)
GDP (real) per Capita (2015USD)
Population 〜 GDP(real) per Capita
( 1996‐2019(〇) / 2020‐2040(×) )
NA
EE
CI
SW
AF
SE LA
ME
NE
CH
JA
WE
OC
GDP 40E12
20E1210E12
5E12

Worldwide Market Forecast 2020 - 2040
117
9.1 North America
Azimuthal Equidistant Projection
Center: Los Angeles
Isometric Circles:
in 5,000km increments
Azimuthal Equidistant Projection
Center: New York
Isometric Circles:
in 5,000km increments
Worldwide Market Forecast 2020 - 2040
118
In 2020, the United States recorded one of the highest numbers of infected people in the world
due to the relatively gradual epidemic prevention measures against COVID-19 and the delay in
the initial response. However, at the same time, the development and procurement of vaccines
using new technology and the preparations for urgent approval were also underway.
Since the inauguration of the new president in 2021, the vaccination plan has been accelerated
with the approval of new vaccines and the increase in supply due to the start of production.
Currently, it is planned to complete one or more vaccinations for all adults by early July. The
military, dentists, veterinarians, medical students, etc. are also mobilized for inoculation, and
large-scale inoculation venues are operated 24 hours a day. It also plans to produce a large amount
of vaccines by the end of 2021, which will significantly exceed the total population of the United
States. (For example, J & J alone for 1 billion people, etc.)
In this way, the progress of vaccination and the acquisition of immunity in the United States
will progress rapidly, including the major age groups using air transportation, and the number of
domestic passengers and RPK in the United States will recover rapidly in the second half of 2021.
Moreover, it is expected that domestic flights throughout 2022 will achieve the same level of
transportation performance as usual before COVID-19.
Domestic flights account for 72% of the annual operating revenues of US airlines during
normal times before COVID-19, and 84% when combined with Atlantic flights. (Source: BTS,
2019) (Related: Section 3.3)
The U.S.-China feud, which initially surfaced in the form of trade friction, became serious after
concerns about Huawei, response to Hong Kong and Taiwan, and suspicion of theft of U.S.
intellectual property via the Internet. The situation has now changed to the point for the United
States to point out that China is the only competitor potentially capable to mount a sustained
challenge to a stable and open international system. If the world is restructured after COVID-19,
supply chain reorganization may occur, which may affect the form of passenger and freight traffic.
Airlines in North America were significantly damaged by the 9/11 terrorist attacks in 2001.
Since then, in the process of recovery, they have proceeded with the streamlining of their
organizations, and mergers with other companies. As a result, major airlines in the U.S. have been
nearly consolidated into three companies: American Airlines, Delta Air Lines, and United
Airlines; and regional airlines also into three companies: SkyWest Airlines, Republic Airlines,
and Trans States Airlines. Currently, four companies (American Airlines, Delta Air Lines, United
Airlines, and Southwest Airlines) account for nearly 70% of the U.S. domestic market on an RPK
basis, and these airlines are becoming increasingly dominant.

Worldwide Market Forecast 2020 - 2040
119
Now, airlines in North America are the most profitable in the world, resulting from the
improved financial situation due to restructuring and precise supply/demand adjustments. Airlines
in North America, responding to soaring fuel prices, took emergency measures to reduce
personnel costs from around 2004 to around 2006, which was maintained for nearly 10 years, and
then, they brought their distribution to personnel costs back up to the previous level in the wake
of lower fuel prices after 2015. Nevertheless, in 2018, their net profits accounted for
approximately 45% (approximately 22% in terms of RPK) of the net profits earned by airlines
worldwide.
In autumn 2017, the U.S. Department of Commerce made a preliminary decision to impose a
292% tariff on Bombardier (a Canadian airplane manufacturer) C series passenger planes (the
current Airbus A220) to be imported to the U.S. While this decision was rejected by the U.S.
International Trade Commission in January, 2018, this fuss at once led to the realization of a
partnership between Bombardier and Airbus, and the C Series planes were set to be produced as
the Airbus A220 at an Airbus factory in the United States. Such an unexpected outcome may
change the long-term, strategic balance of sales force.
*******************
Although 4,500 km is almost the same as the north american transcontinental lines, regional
jets and narrowbody planes are mostly used up to this distance in the North America region, and
the number of widebody planes used is quite small. Even on the Atlantic route (NY-London great-
circle distance of approximately 5,600 km), the 757, which is a large, narrowbody planes, has
been used for a long time. Widebody planes increase in number when route length gets 5,000 km
or longer and they are mainly used up to about 9,000 km. The number of planes operated is not
much at longer distances than 9,000km, but they are used up to about 14,000km.
Regional jets are heavily used in a Regional Range, with their usage concentrated at around a
route distance of 600 km, and while the number is gradually decreasing as the route distance
increases, they are used up to a Short Range (2,000 km or less). Passenger turboprops are used
in a Regional Range, and small planes with less than 40 seats are mainly used in a Regional
Range of 600 km or less, with their peak usage around route length of 200 to 300 km. Medium
and large planes with 40 seats or more are used extensively in a Regional Range up to 1,000 km,
and they are most heavily used for around 600 km.

Worldwide Market Forecast 2020 - 2040
120
RPK in the North America region in 2019 was 1.923×10¹² passenger kilometers, of which the
Long Range (4500 km or longer), Medium Range (2000 to 4500 km), and Short Range (1000 to
2000 km) markets account for 28%, 34%, and 25% in RPK respectively. In addition, the average
growth rates in RPK of the markets over the next 20 years are expected to be 3.2%, 3.3%, and
3.0%, respectively, and the Medium-range market is expected to continue to be the largest
category in transport demand in the region even in 2040.
LR 2.8% 3.2%MR 3.2% 3.3%SR 3.2% 3.0%RR 1.1% 1.0%
Total 2.7% 3.0%
LR : Long RangeMR : Medium RangeSR : Short RangeRR : Regional Range
2000-2019
2020-2040
RPK AverageGrowth Rate
200 206 249 302 259 323 483
889 345 412 645
1260
317 381
546
1041
0
1000
2000
3000
4000
1999 2009 2019 ・・・ 2040
( ×109 ) RPK by Distance Range ‐North America
RR SR MR LR
18% 16% 13% 9%
23% 24% 25%25%
31% 31% 34% 36%
28% 29% 28% 30%
0%
20%
40%
60%
80%
100%
1999 2009 2019 ・・・ 2040
RPK share by Distance Range ‐North America
RR SR MR LR

Worldwide Market Forecast 2020 - 2040
121
The number of planes in service in the North America region (including freighters) will increase
from 8,319 in 2019 to 9,844 in 2040. Over this period, the number of planes to be delivered and
the sales value (at 2019 list price) are expected to be 8,810 units and 1.09 trillion U.S. dollars,
respectively. Narrowbody planes will account for 70% of all passenger planes deliveries (7,533
units).
In the North America region, over the past 20-year period from 2000 to 2019, GDP grew at an
average annual rate of 2.1%, passenger demand at 2.7%, and cargo demand at 2.5%. As for the
growth rate forecast for 2020 to 2040, GDP will grow at 1.8%, passenger demand at 3.0% and
cargo demand at 2.4%. The average growth rate of transport demand in the mature North
American market is forecast to be slightly lower than the global average for both passenger and
cargo transport. In addition, 83% of the planes to be delivered in the forecast period will be
replacements for existing planes.
8,319
1,034
0
7,285
0
1,525
0
2,000
4,000
6,000
8,000
10,000
12,000
2019 2040
No
. of
Air
pla
ne
s
Fleet Developments of Airlines in North America
Replacement
Growth
Retained
New Deliveriesdf
8,810
9,844
83%
17%
North America New Deliveries New Deliveries
2019 2040 2020-2040 2019 2040 2020-2040
Passenger Turboprops (TP) Jet Freighters (JF : New + Converted) 15-39 seats 401 242 229 Narrowbody 273 312 312 40-59 seats 109 55 47 Medium Widebody 400 535 406 60 seats and larger 162 212 131 Large 277 244 152 (Total) TP 672 509 407 (Total) JF 950 1,091 870
Passenger Jets (JP) (Grand total) TP + JP + JF 8,319 9,844 8,810 20-59 seats 759 2 0 60-99 seats 1,239 1,386 1,213 (subtotal) Regional Jets (RJ) 1,998 1,388 1,213 Growth Indices (2020-2040)
100-119 seats 179 895 869 GDP 1.8 %
120-169 seats 2,706 2,234 2,013 RPK 3.0 %
170-229 seats 1,120 2,549 2,368 RTK 2.4 %
(subtotal) Narrowbody Jets (NJ) 4,005 5,678 5,250 Fleet 0.8 %
230-309 seats 458 793 721 Sales (2019 List Price) 1,092 US$ billion 310-399 seats 231 385 349 400 seats and larger 5 0 0 (subtotal) Widebody Jets (WJ) 694 1,178 1,070 (Total) JP = RJ + NJ + WJ 6,697 8,244 7,533
FleetFleet

Worldwide Market Forecast 2020 - 2040
122
9.2 Europe
It is difficult to be optimistic about the future of Europe’s politics and economy, due to the
changes and confusion expected to take place due to the BREXIT, the skeptical trends about the
EU over issues such as terrorism and immigrants/refugees, and the risks including government
debt of some countries although it's not much talked about now. However, despite these issues,
Europe is one of the three major markets including North America and China, which shore up
global demand for air transport.
Although Europe has promoted market integration, freedom of movement of people and goods,
and liberalization of aviation, in response to the COVID-19, quarantine measures such as
immigration restrictions or waiting after entering, have been executed by country even within the
region. As a result, the decline in air transportation within Europe was greater than that of
domestic flights in the United States which is a single country.
The long-awaited vaccination began in the region in 2021, and immunity will be widely
established by the end of 2021, and the condition will restore air transport demand within Europe,
as well as the Atlantic route to the United States / North America which will have acquired
collective immunity.
Azimuthal Equidistant Projection
Center: London
Isometric Circles:
in 5,000km increments

Worldwide Market Forecast 2020 - 2040
123
Europe, as defined by JADC, includes the countries of Western Europe, Eastern Europe,
Northern Europe, and Turkey. European countries have their core parts almost within a range of
an equilateral triangle of 4,500 km on a side, and if a circle of 10,000 km radius is drawn with
London in its center, it will encompass the main parts of the globe. If the radius is expanded to
12,000 km, it will reach Singapore.
Almost all of countries in the region are EU member countries that constitute a single aviation
market in continental scale, in which the member states have open access to one another even for
respective domestic operations under the agreements. Over the past 20 years, passenger demand
showed a steady growth. Major airlines in Western Europe have already almost been
consolidated into three groups: Air France-KLM, IAG (BA, among others), and Lufthansa. In
addition, Europe’s LCCs have rapidly developed after the 1993/1997 liberalization and have now
come to account for about 37% of the available seat capacity in European airlines as of 2019.
With regard to airplanes used in the Western European region, while widebody planes are used
for Long-Range, narrowbody planes are mainly used in a Short and Medium range. The number
density of narrowbody planes peaks in a route range of around 500 km, and the number
monotonically decreases as the route hength increase toward around 3,500 km. Although in the
Regional Range market, regional jets are also used mostly in a route range of around 600 km, the
number in use is significantly fewer than in the North American region, and far fewer than in the
Short Range market. In the Regional Range, passenger turboprop planes are also used along with
regional jets, but they are mostly used in a route length of around 300 km, indicating that they are
operated in shorter length than regional jets are. Many medium and large passenger turboprop planes
with 40 seats or more are used. Small turboprop planes with less than 40 seats are used in the range of
600km or less with their peak usage at around 200km.
The great majority of airplanes used in the Eastern European region are narrowbody planes.
They are mainly used in the Short Range of 900 to 1,900 km*, and with regard to longer range
than this range, they are used for ranges up to around 4,000 km with their number gradually
decreasing. The number of widebody planes is small. They are used for lines between 5000 to
10000 km, with their usage a little concentrated in around 5500 to 7000 km. In the Regional
Range, passenger turboprop planes with 40 seats or more are used in a range of 300 to 700 km,
mainly around 400 km. At longer distances than 700 km, the number of turboprop planes
decreases, but some are used up to 1000 km. The market is split between middle- and large-
sized turboprops and narrowbody jets with the boundary around 700km. Regional jets are used in
the range of 300-1500 km, but they are not many in number.
(* In Eastern Europe, Wizz Air, an LCC, is performing well).

Worldwide Market Forecast 2020 - 2040
124
RPK in Europe (Western Europe and Eastern Europe) in 2019 was 1.974×10¹² passenger
kilometers, of which the Long Range (4,500 km or longer) market accounted for the largest share
of 41%. Average growth rates of RPK in the next 20 years are expected to be 6.3% and 4.3% in
the Medium Range and Short Range markets respectively, relative to 2.5% in the Long Range
market, and in 2040. While the Long Range market will increase to 31% in RPK, the Short Range
and Medium Range markets are expected to increase to 32% and 27%, respectively. It is expected
that the presence of lines within Europe will increase.
The number of planes (including freighters) in service in Europe will increase from 5,802 at
the end of 2019 to 9,641 in 2040. Over this period, the number of planes to be delivered and the
sales value (at 2019 list price) are expected to be 8,446 units and 1.22 trillion U.S. dollars,
respectively. Of the units to be delivered, 55% will be replacements for existing planes.
Narrowbody planes will constitute 77% of passenger planes delivered (7,714 units).
LR 2.4% 2.5%MR 7.6% 6.3%SR 6.3% 4.3%RR 2.2% 1.9%
Total 3.8% 3.9%
LR : Long RangeMR : Medium RangeSR : Short RangeRR : Regional Range
2000-2019
2020-2040
RPK AverageGrowth Rate
180 207 276 407 145 268 493
1203 91 162
389
1393
513 493
816
1376
0
1000
2000
3000
4000
5000
1999 2009 2019 ・・・ 2040
( ×109 ) RPK by Distance Range ‐Europe
RR SR MR LR
19% 18% 14% 9%
16% 24% 25% 27%
10%14% 20%
32%
55%44% 41%
31%
0%
20%
40%
60%
80%
100%
1999 2009 2019 ・・・ 2040
RPK share by Distance Range ‐Europe
RR SR MR LR

Worldwide Market Forecast 2020 - 2040
125
In Europe, over the past 20 years from 2000 to 2019, GDP grew at an average annual rate of
1.7%, passenger demand at 3.8%, and cargo demand at 2.6%. As for the growth rate forecast from
2020 to 2040, GDP will grow annually at an average rate of 1.2%, passenger demand at 3.5% and
cargo demand at 2.9%. Although growth in demand for air transport in Europe is slightly lower
than the global average since Western Europe (growth rate of 3.3%), like the U.S., is a mature
market, the growth rate in Europe as a whole is expected to be nearly the same as the global
average since the growth rate of passenger service in Eastern Europe (5.7%) is particular high.
5,802
1,195
0
4,607
0
3,839
0
2,000
4,000
6,000
8,000
10,000
12,000
2019 2040
No
. of
Air
pla
ne
s
Fleet Developments of Airlines in Europe
Replacement
Growth
Retained
NewDeliveries
55%
9,641
8,446
45%
42%
Europe New Deliveries New Deliveries2019 2040 2020-2040 2019 2040 2020-2040
Passenger Turboprops (TP) Jet Freighters (JF : New + Converted) 15-39 seats 207 135 125 Narrowbody 140 166 166 40-59 seats 53 56 53 Medium Widebody 71 109 84 60 seats and larger 311 394 272 Large 89 87 32 (Total) TP 571 585 450 (Total) JF 300 362 282
Passenger Jets (JP) (Grand total) TP + JP + JF 5,802 9,641 8,446 20-59 seats 58 0 0 60-99 seats 371 359 317 (subtotal) Regional Jets (RJ) 429 359 317 Growth Indices (2020-2040)
100-119 seats 131 827 790 GDP 1.2 %
120-169 seats 2,889 2,818 2,174 RPK 3.5 %
170-229 seats 509 3,050 2,969 RTK 2.9 %
(subtotal) Narrowbody Jets (NJ) 3,529 6,695 5,933 Fleet 2.4 %
230-309 seats 542 871 742 Sales (2019 List Price) 1,219 US$ billion 310-399 seats 308 760 722 400 seats and larger 123 9 0 (subtotal) Widebody Jets (WJ) 973 1,640 1,464 (Total) JP = RJ + NJ + WJ 4,931 8,694 7,714
FleetFleet

Worldwide Market Forecast 2020 - 2040
126
9.3 Asia-Pacific
The Asia-Pacific region is expected to see strong economic growth well into the future, given
the expanding middle-class population, based on the region’s large population and the impressive
economic growth rate. Currently, China is exercising strong economic traction with its capacity
based on both its population and economic growth rate, and also creating massive demand for air
travel.
Its economic growth is expected to
continue through this forecast period
(2020 to 2040), during which, the
economic growth and expanded demand
for air travel (RPK) are also forecasted
for the Southeast Asian countries
(ASEAN) including Thailand, Vietnam,
and Indonesia.
However, China’s demographic bonus
ended by about 2015, and its total
population will begin to decline after
passing its peak about 2030, and the
aging of Chinese society will be set to accelerate rapidly.
A deregulation for Airline business has been in progress in this region as well. LCCs have been
established even in Japan and Taiwan, where no LCCs had existed before, and open skies (full
liberalization within the region) in the ASEAN began to emerge from 2016, along with the launch
of the AEC (ASEAN Economic Community).
9,148
3,164
0
5,984
0
8,937
0
5,000
10,000
15,000
20,000
2019 2040
No
. of
Air
pla
nes
Fleet Developments of Airlines in Asia-Pacific
Replacement
Growth
Retained
NewDeliveries
%
14,921
18,085
40%
60%
Japan
Northeast Asia
SoutheastAsia
South Asia
Oceania
China

Worldwide Market Forecast 2020 - 2040
127
The Asia-Pacific region covers a geographically large area, with the seas and mountains therein.
Its ground transportation networks have not yet been fully developed due to being separated by
the sea and mountains, and therefore, air transportation is suitable for the region.
In the region, over the past 20-year period from 2000 to 2019, GDP grew at an average annual
rate of 5.2%, passenger demand at 7.3%, and cargo demand at 3.6%. In the meantime, the region
shored up the growth of global air transport. In the period from 2020 to 2040, the region is
expected to continue growing significantly; GDP will grow at an average annual rate of 3.6%,
passenger demand at 4.5%, and cargo demand at 3.8%. It is a growth market where 60% of planes
to be delivered during the forecast period will be for new demand.
The number of planes in service (including freighters) in the region will increase from 9,148 in
2019 to 18,085 in 2040. Over this period, new deliveries and the sales value (at 2019 list price)
are expected to be 14,921 units and 2.1 trillion U.S. dollars, respectively. Partly because massive
domestic (Regional- and Short-Range) markets also exist in India and China, and partly because
there is great demand for planes by LCCs, narrowbody planes will account for 76% of the number
of passenger planes to be delivered (12,619 units).
Asia-Pacific New Deliveries New Deliveries2019 2040 2020-2040 2019 2040 2020-2040
Passenger Turboprops (TP) Jet Freighters (JF : New + Converted) 15-39 seats 432 573 519 Narrowbody 182 422 412 40-59 seats 153 193 152 Medium Widebody 49 122 95 60 seats and larger 511 1,181 894 Large 135 321 230 (Total) TP 1,096 1,947 1,565 (Total) JF 366 865 737
Passenger Jets (JP) (Grand total) TP + JP + JF 9,148 18,085 14,921 20-59 seats 9 0 0
60-99 seats 318 503 487
(subtotal) Regional Jets (RJ) 327 503 487 Growth Indices (2020-2040)
100-119 seats 64 656 637 GDP 3.6 %
120-169 seats 4,603 5,871 4,090 RPK 4.5 %
170-229 seats 883 5,202 4,854 RTK 3.8 %
(subtotal) Narrowbody Jets (NJ) 5,550 11,729 9,581 Fleet 3.3 %
230-309 seats 1,015 1,626 1,330 Sales (2019 List Price) 2,117 US$ billion 310-399 seats 682 1,401 1,221 400 seats and larger 112 14 0 (subtotal) Widebody Jets (WJ) 1,809 3,041 2,551 (Total) JP = RJ + NJ + WJ 7,686 15,273 12,619
FleetFleet

Worldwide Market Forecast 2020 - 2040
128
[ China ]
China is a continental market with a vast territory, and transport demand (RPK) is mainly for
regional and short range domestic routes. China, along with Europe and North America, will be
one of the three major markets pillaring the global air passenger traffic demand at the end of the
forecast period (2040).
China's economic growth has been accompanied so far by a rapid increase in air passenger
demand. During that time, China was within a range for a long time where GDP per capita is less
than $10,000 and the demand for travel increases rapidly as income levels rise. In consequence,
the average RPK growth rate was 12.4% per year over the past 20 years. However, as a result of
economic growth, GDP per capita has reached $10,000, and as that is expected to continue to
increase, China transition of growth model from the rapid growth model of developing countries
type to the slow growth model of developed countries type will occur at an early stage within the
forecast period. Therefore, future RPK growth rate is expected to decline.
(Related Part: sections 5.2.7, 5.3.3)
RPK in the region in 2019 was 1.333×10¹² passenger kilometers, of which the Short Range
(1,000 to 2,000 km) market was the largest accounting for 44%, and together with the Regional
Range market accounted for 59%. They are expected to grow at an annual average rate of 5.0%
and 4.6% respectively in the next 20 years, and of these, in 2040, the Short Range market is
expected to account for 48% in RPK, and together with the Regional Range market 63%.
Azimuthal Equidistant Projection
Center: Shanghai
Isometric Circles:
in 5,000km increments
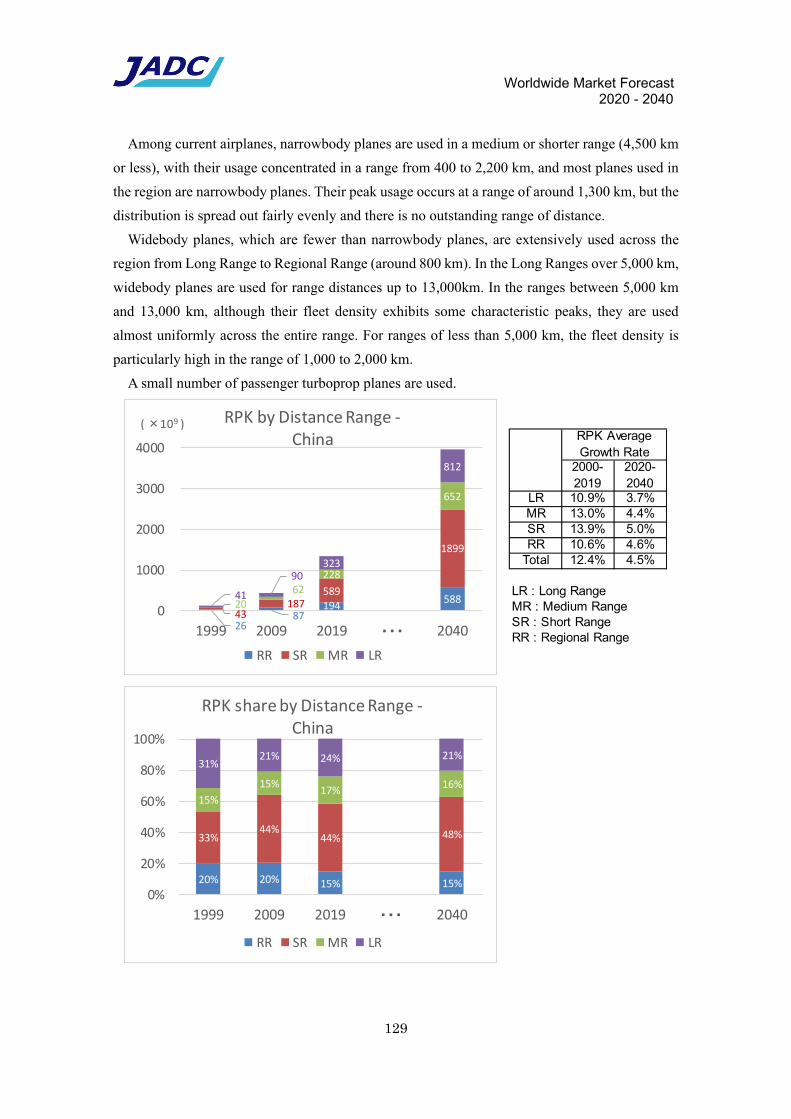
Worldwide Market Forecast 2020 - 2040
129
Among current airplanes, narrowbody planes are used in a medium or shorter range (4,500 km
or less), with their usage concentrated in a range from 400 to 2,200 km, and most planes used in
the region are narrowbody planes. Their peak usage occurs at a range of around 1,300 km, but the
distribution is spread out fairly evenly and there is no outstanding range of distance.
Widebody planes, which are fewer than narrowbody planes, are extensively used across the
region from Long Range to Regional Range (around 800 km). In the Long Ranges over 5,000 km,
widebody planes are used for range distances up to 13,000km. In the ranges between 5,000 km
and 13,000 km, although their fleet density exhibits some characteristic peaks, they are used
almost uniformly across the entire range. For ranges of less than 5,000 km, the fleet density is
particularly high in the range of 1,000 to 2,000 km.
A small number of passenger turboprop planes are used.
LR 10.9% 3.7%MR 13.0% 4.4%SR 13.9% 5.0%RR 10.6% 4.6%
Total 12.4% 4.5%
LR : Long RangeMR : Medium RangeSR : Short RangeRR : Regional Range
2000-2019
2020-2040
RPK AverageGrowth Rate
26 87
194 588
43 187
589
1899
20 62
228
652
41
90 323
812
0
1000
2000
3000
4000
1999 2009 2019 ・・・ 2040
( ×109 ) RPK by Distance Range ‐China
RR SR MR LR
20% 20% 15% 15%
33%44%
44% 48%
15%
15%17%
16%
31%21% 24% 21%
0%
20%
40%
60%
80%
100%
1999 2009 2019 ・・・ 2040
RPK share by Distance Range ‐China
RR SR MR LR

Worldwide Market Forecast 2020 - 2040
130
Demand for air transport in China is mainly for Regional Range lines and Short Range lines up
to 2,000 km, of which 90% is considered to be for domestic lines (when combined with Medium
Range lines, 80% is for domestic lines). The airplanes used on these lines are narrowbody planes,
and China’s domestic-made C919 passenger plane is applicable for these ranges, in addition to
the 737 and A320 families.
As thus described, since there is sufficiently large demand for narrowbody planes even in the
domestic route market alone, even if it is not feasible to export the C919 due to issues such as
type approval, it is conceivable that China can develop domestic plane production and the aviation
industry by generating demand from its domestic market, given the approval by the Civil Aviation
Administration of China and China’s vast territory. In aiming to become an aviation power, it is
conceivable for China to adopt an import substitution policy, and even if it is currently using the
737 or A320, to shift to procurement focused on domestic aircraft. If that is the case, even though
transport demand in the region is large, China’s market size might substantially shrink in the next
20 years from the viewpoint of the U.S. & European manufacturers. In addition, the outlook for
US-China relations has not been optimistic in recent years, and the business environment may
change in the future.

Worldwide Market Forecast 2020 - 2040
131
Intentionally Blank

Worldwide Market Forecast 2020 - 2040
132
[ Southeast Asia ]
The Southeast Asia region, defined by JADC, consists of the 10 ASEAN member countries and
East Timor.
RPK in Southeast Asia in 2019 was 648×109 passenger kilometers, of which the Long Range
(4,500 km or longer) market was the largest accounting for 32%, followed by the Medium Range
(2,000 to 4,500 km) market which accounted for 32%. Average growth rates in distance ranges
over the next 20 years are 5.1% in the Medium Range market and 5.6% and 5.6% in the Short
and Regional Range markets respectively. As a result of the growth of the Regional and Short
Range markets, in 2040, in RPK, the ranges of 2,000 km or shorter will account for 46% in total,
and the range of 4,500 km or shorter will account for 83% in total.
Narrowbody planes are the main planes in fleet of the region, and mainly used in the range
from 300 to 3,500 km, with their peak density of planes at a range from 500 to 700 km. They are
especially utilized in the range up to 2,000 km. Medium and large passenger turboprop planes
with 40 seats or more are used in the Regional Range market of 700 km or less, and heavily used
around 300 km. Widebody planes are used in a range from Long Range (up to around 14,000
km) to Short Range market, but the number of them is low.
LCCs are flourishing in Southeast Asia as well. Of the number of seats provided by airlines in
the region, that provided by LCCs exceeds 50%, which is the second highest after South Asia
(India, etc.). Since income levels have not yet been so high (overall average GDP per capita is
slightly less than $3,000 in the region), the low-cost fares offered by LCCs appear to be suitable
for eliciting the potential air transportation demand. In 2016, the “Value Alliance” was established
as the first alliance by LCCs, which is for LCCs operating in the Southeast Asian region to
cooperate with each other to provide services such as transit reservations and through-ticketing.
Azimuthal Equidistant Projection
Center: Singapore
Isometric Circles:
in 5,000km increments
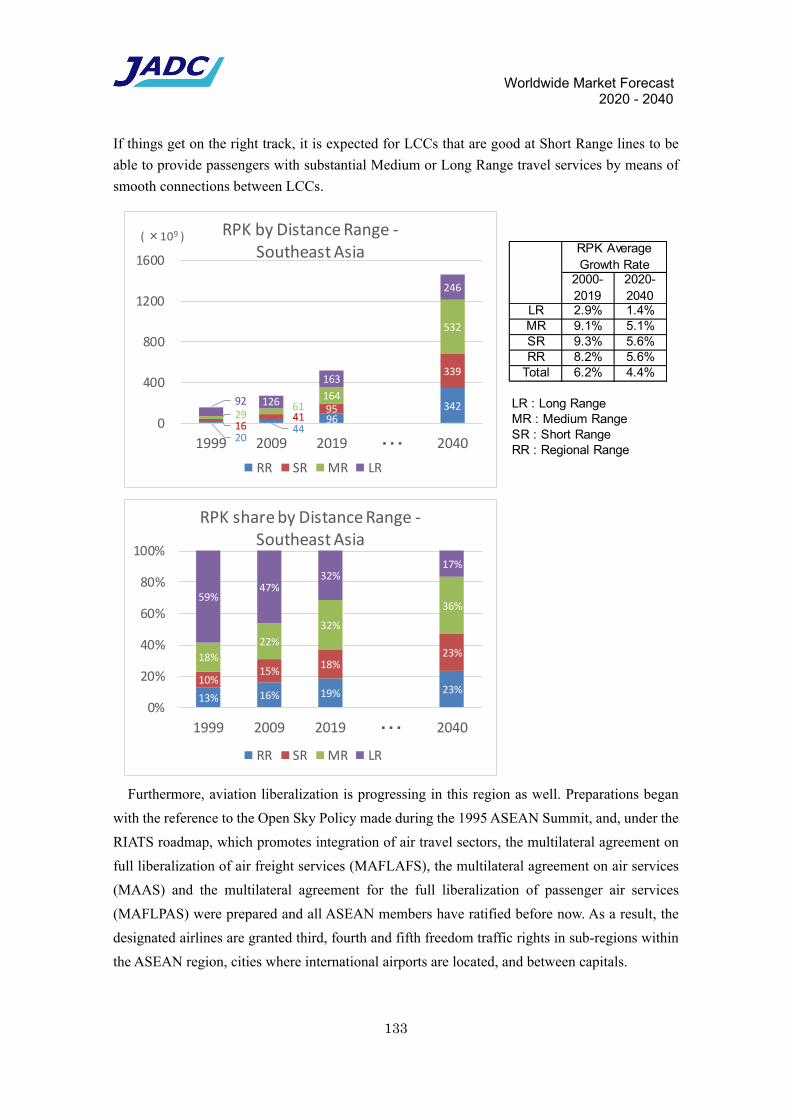
Worldwide Market Forecast 2020 - 2040
133
If things get on the right track, it is expected for LCCs that are good at Short Range lines to be
able to provide passengers with substantial Medium or Long Range travel services by means of
smooth connections between LCCs.
Furthermore, aviation liberalization is progressing in this region as well. Preparations began
with the reference to the Open Sky Policy made during the 1995 ASEAN Summit, and, under the
RIATS roadmap, which promotes integration of air travel sectors, the multilateral agreement on
full liberalization of air freight services (MAFLAFS), the multilateral agreement on air services
(MAAS) and the multilateral agreement for the full liberalization of passenger air services
(MAFLPAS) were prepared and all ASEAN members have ratified before now. As a result, the
designated airlines are granted third, fourth and fifth freedom traffic rights in sub-regions within
the ASEAN region, cities where international airports are located, and between capitals.
LR 2.9% 1.4%MR 9.1% 5.1%SR 9.3% 5.6%RR 8.2% 5.6%
Total 6.2% 4.4%
LR : Long RangeMR : Medium RangeSR : Short RangeRR : Regional Range
2000-2019
2020-2040
RPK AverageGrowth Rate
20 44
96 342
16 41
95
339
29 61
164
532
92 126
163
246
0
400
800
1200
1600
1999 2009 2019 ・・・ 2040
( ×109 ) RPK by Distance Range ‐Southeast Asia
RR SR MR LR
13% 16% 19% 23%10%
15%18%
23%18%
22%
32%
36%59%
47%32%
17%
0%
20%
40%
60%
80%
100%
1999 2009 2019 ・・・ 2040
RPK share by Distance Range ‐Southeast Asia
RR SR MR LR

Worldwide Market Forecast 2020 - 2040
134
[ South Asia ]
The region, including the Indian subcontinent, has a large interior space. In addition, many
migrant workers are sent from the countries in the region to the Middle East. The Middle East
(Dubai) is in medium range (2,000 to 4,500 km) and at a reachable location from anywhere in
the region.
RPK in South Asia in 2019 was 275×109 passenger kilometers, of which the Short Range (1,000
to 2,000 km) market was the largest accounting for 36%, followed by the Medium Range (2,000
to 4,500 km) market accounting for 30%. The average growth rates in the distance ranges over
the next 20 years are expected to be 6.7% to 7.4% in the Medium and Short Range markets, and
6.8% in the Regional Range market. As for the breakdown of RPK in 2040, it is expected that the
Medium Range and the Short Range markets will account for 32% and 43% respectively. In those
markets, including the Regional Range market, air transport demand on the Indian subcontinent
will expand.
Narrowbody planes are the main planes in fleet of the region, which are used in distances for
500 to 4,000 km, and especially used heavily for 500 to 2,000 km. Between 2,000 km and 4,000
km, the number of planes to be operated decreases as the distance increases. Widebody planes are
used in distances of 2,000 km or longer, and used in combination with narrowbody planes in
distance up to 4,000 km. Only widebody planes are used beyond that. The number of widebody
planes to be operated is small. Many passenger turboprop planes are used in the Regional Range
of 100 to 800 km, with their peak usage at 300 km.
Azimuthal Equidistant Projection
Center: New Delhi
Isometric Circles: in 5,000km increments

Worldwide Market Forecast 2020 - 2040
135
India is representative of
this region in terms of both
population and economic
scale, and in recent years has,
along with experiencing
remarkable economic grow-
th as a cornerstone of BRICs,
increased RPK and been
strongly motivated toward
procurement of new planes
as well. GDP per capita in
India is at a level of around
$2,000, indicating that India is in a rapid growth stage where travel demand is rapidly increasing
as income levels rise. However, it is characterized that GDP is expanding due to the increase in
population and the increase in GDP per capita is gradual. Therefore, the income level and thus the
ability to pay air fare are still low. In this environment, in which domestic airlines compete fiercely
for market share and have been unable to generate satisfactory profits, Jet Airways, the second
largest airline in India, was forced to liquidate the company and disappeared in 2019.
Immediately after the bankruptcy of Jet Airways, the yield of the remaining airlines increased,
but a recurrence of market share competition is reported to be inevitable. Based on the actual data
for the past 20 years and the future economic outlook, this forecast predicts that the RPK in this
region, excluding Long-Range markets, will grow at a rate of around 7%. To realize this growth,
however, it will be necessary to establish a long-term sustainable balance between income levels
and airline yields in the region.
LR 5.5% 1.2%MR 11.3% 6.7%SR 11.3% 7.4%RR 8.6% 6.8%
Total 9.4% 6.5%
LR : Long RangeMR : Medium RangeSR : Short RangeRR : Regional Range
2000-2019
2020-2040
RPK AverageGrowth Rate
10 18 52
227
11 33 98
482
10 30
83
354
14 32
42
58
0
400
800
1200
1999 2009 2019 ・・・ 2040
( ×109 ) RPK by Distance Range ‐South Asia
RR SR MR LR
22% 16% 19% 20%
25%29%
36%43%
22% 27%
30%32%
31% 28%15% 5%
0%
20%
40%
60%
80%
100%
1999 2009 2019 ・・・ 2040
RPK share by Distance Range ‐South Asia
RR SR MR LR

Worldwide Market Forecast 2020 - 2040
136
[ Northeast Asia ]
The Northeast Asia region, defined by JADC, consists of Taiwan, North and South Korea, and
Mongolia, and Taiwan and South Korea form the cores of the region in terms of economic power
as well as in terms of RPK. The land areas of the countries are small, much of the air transport
are flights to outside regions, and Long Range markets occupied 48% of the RPK in 2019.
Meanwhile, from the region, all of the Southeast Asia area falls within a Medium Range (~4,500
km), and besides, the lines between Taiwan and Korea fall within a range of 2,000 km. Similarly,
the lines between Taiwan and Japan’s Kansai area are within a range of 2,000 km as well, and
even Taiwan to Hokkaido within a range of 3,000 km. In recent years, LCCs have become much
more active in the region.
RPK in Northeast Asia in 2019 was 232×109 passenger kilometers, of which the Long Range
(4,500 km or longer) market was the largest, accounting for 48%, followed by the Medium Range
(2,000 to 4,500 km) market, accounting for 30%, and the Short Range (1,000 to 2,000 km) and
Regional Range (up to 1000km) markets, accounting for around 11% respectively. Average
Azimuthal Equidistant Projection
Center: Taipei
Isometric Circles:
in 5,000km increments

Worldwide Market Forecast 2020 - 2040
137
growth rates in the distance ranges over the next 20 years are expected to be 3.7% and 3.0% in
the Short Range and Medium Range markets respectively, indicating growths in the Short and
Medium Range markets. And in 2040, the Long Range and Medium Range markets are expected
to account for 40% and 37% in RPK respectively.
Among current fleet, while passenger turboprop planes are used in the Regional Range, but not
longer than 300 km, and in the 300 to 3,700 km range, narrowbody planes are used, with their
peak utilization between 400 to 500 km. Widebody planes are used at the distance of 500 km up
to 13,000 km. Widebody planes are used alongside narrowbody planes in the Short Range and
Medium Range, and the number of planes in use is almost the same as that of narrowbody planes
used in each range. For ranges of 4,000 km or longer, only widebody planes are used, and
especially used in ranges of 9,000 km or longer.
LR 3.5% 1.1%MR 6.8% 3.0%SR 6.4% 3.7%RR 2.3% 0.8%
Total 4.4% 2.0%
LR : Long RangeMR : Medium RangeSR : Short RangeRR : Regional Range
2000-2019
2020-2040
RPK AverageGrowth Rate
16 19 26 32 7
10 25 57
19 27
69
138
56 89
112
149
0
100
200
300
400
1999 2009 2019 ・・・ 2040
( ×109 ) RPK by Distance Range ‐Northeast Asia
RR SR MR LR
17% 13% 11% 9%
7% 7% 11% 15%
19%18%
30%37%
57% 61%48%
40%
0%
20%
40%
60%
80%
100%
1999 2009 2019 ・・・ 2040
RPK share by Distance Range ‐Northeast Asia
RR SR MR LR

Worldwide Market Forecast 2020 - 2040
138
[ Japan ]
The great-circle distance from Japan (Tokyo) to the West Coast of the United States is
approximately 9,000 km, and that to the East Coast is about 11,000 km. The main part of Europe
is also located about 10,000 km away from Japan in great-circle distance. Even among Southeast
Asian countries which are considered to be “close” to Japan, it is only Thailand (Bangkok), the
Philippines, Vietnam, Myanmar (Naypyidaw), etc. that can be reached from Tokyo on the
Medium Range lines (covering up to 4,500 km), and Malaysia, Singapore and Indonesia are more
than 4,500 km away from Tokyo, falling under Long Ranges. The destinations which airplanes
can reach from Japan on the Short Range lines up to 2,000 km are limited to places such as Beijing,
Shanghai, and Northern Taiwan. The Regional Range lines of 1,000 km or less include all
domestic routes, as well as the main routs of Tokyo-Sapporo and Tokyo-Fukuoka.
RPK in Japan in 2019 was 204×109 passenger kilometers, of which the Long Range (4,500 km
or longer) market was the largest accounting for 39%, followed by the Regional Range (up to
1,000 km), Short Range (1,000 to 2,000 km) and Medium Range (2,000 to 4,500 km) markets
accounting for 33%, 18% and 10% in RPK respectively. The average growth rate of each distance
range over the next 20 years is expected to be 4.9% for Medium Range and 3.5% for Short Range,
Azimuthal Equidistant Projection
Center: Tokyo
Isometric Circles:
in 5,000km increments

Worldwide Market Forecast 2020 - 2040
139
and as a result of the increase in Short to Medium Ranges than the present, the breakdown in RPK
in 2040 is 37%, 14%, 20% and 29% in order from longer distance range.
Among current fleet, narrowbody planes are mainly used in a range from 500 to 2,000 km, and
many are used in a range up to around 1,300 km. Widebody planes are used in ranges from the
Long Range (up to 11,000 km) to the Regional Range lines. Both narrowbody and widebody
planes have their pre-eminent peak of fleet density especially in the 900 km distance range.
Regional Jets and passenger turboprop planes are used in the Regional Range; and both are used
in almost the same number as widebody planes, in the range from 500 to 700 km. Turboprop
planes of small size are mostly used in the range of less than 500 km, with their peak fleet density
at 300 km.
LR -0.5% 2.6%MR 1.9% 4.9%SR 3.6% 3.5%RR 1.8% 2.2%
Total 1.0% 2.9%
LR : Long RangeMR : Medium RangeSR : Short RangeRR : Regional Range
RPK AverageGrowth Rate
2000-2019
2020-2040
47 54 68 104 18 24
37
73
13 12 20
51
88 52
80
132
0
100
200
300
400
1999 2009 2019 ・・・ 2040
( ×109 ) RPK by Distance Range ‐Japan
RR SR MR LR
29%38% 33% 29%
11%
17%18% 20%
8%
8% 10% 14%
53%37% 39% 37%
0%
20%
40%
60%
80%
100%
1999 2009 2019 ・・・ 2040
RPK share by Distance Range ‐Japan
RR SR MR LR

Worldwide Market Forecast 2020 - 2040
140
[ Oceania ]
The Oceania region, defined by JADC, consists of Australia, New Zealand, Papua New Guinea
and the island states which lie to the east of these countries. These are in isolated positions in the
Pacific Ocean, and, for example, even if a circle is drawn with a radius of 10,000 km centered on
Sydney, no major land masses can be reached and contact with only Southeast Asia area is
possible. One must fly 7,000 to 8,000 km to reach Japan and Singapore from around the Sydney
area, even utilizing a Great-Circle route. Even within the region, the distance between Sydney
and Wellington is approximately 2,500 km.
RPK in the Oceania region in 2019 was 211×109 passenger kilometers, of which, reflecting its
geographical features, the Long Range (4,500 km or longer) market is the largest accounting for
46%. Average growth rates of RPK in each distance range markets in the next 20 years are
expected to be 4.1% and 4.2% in the Medium Range and Short Range markets respectively, and
as the results of increases in the Short Range and Medium Range markets, in 2040, the Long
Range market (35%) and the Medium Range market (33%) are expected to have a larger share in
RPK.
Azimuthal Equidistant Projection
Center: Sydney
Isometric Circles:
in 5,000 km increments

Worldwide Market Forecast 2020 - 2040
141
Among current fleet, many small, medium and large passenger turboprop planes are used in
the Regional Range of 700 km or less, mostly around 400 km. Narrowbody planes are main force
of the fleet in a range of 700 to 4,500 km, and, especially they are heavily used in the range from
500 to 2,700 km. Widebody planes, the number is not so many, are used in a range from the Long
Range (up to 13,400 km) to the Medium Range (2,200 km or longer ).
LR 3.1% 1.6%MR 5.1% 4.1%SR 5.4% 4.2%RR 3.3% 2.5%
Total 3.9% 2.9%
LR : Long RangeMR : Medium RangeSR : Short RangeRR : Regional Range
2000-2019
2020-2040
RPK AverageGrowth Rate
16 23
30 53 10
19 29
72
21 39
55
133
52
71
96
140
0
100
200
300
400
1999 2009 2019 ・・・ 2040
( ×109 ) RPK by Distance Range ‐Oceania
RR SR MR LR
16% 15% 14% 13%
10% 12% 14% 18%
21% 26% 26%33%
53% 47% 46%35%
0%
20%
40%
60%
80%
100%
1999 2009 2019 ・・・ 2040
RPK share by Distance Range ‐Oceania
RR SR MR LR

Worldwide Market Forecast 2020 - 2040
142
9.4 Middle East
The Middle East region is located at the junction of the Eurasian and African continents. For
example, in Great-Circle distance, Dubai-London is 5,500 km, Dubai-Cape Town is 7,700 km,
Dubai-Singapore is 5,900 km, and Dubai-Tokyo is 8,000 km. Utilizing passenger planes capable
of cruising ranges of about 10,000 km, passengers can reach Europe, Africa, and Asia by
connecting in Dubai. (11,500 km from Dubai to Washington, 14,000 km from Dubai to Los Angeles)
Taking advantage of its geographical features, airlines in the region have captured global Long
Range air transport demand in a form of the sixth freedom of the air, and have experienced double-
digit growth in both passenger and freight demand over the past 20 years. In particular, Emirates,
Etihad Airways and Qatar Airways have expanded their lines around the world, centering on
Dubai, Abu Dhabi and Doha, and have captured much of the transfer flight demand.
RPK in the region in 2019 was 774×109 passenger kilometers, of which the Long Range (4,500
km or longer) market accounted for 63%, and this market showed annual growth rate of more
than 15% year after year, over the past 20 years, driving growth in the air transport of this region.
Since 2015, however, the pace of growth has slowed. It is conceivable that the acquisition of
transport demand, due to the opening of new routes or the re-splitting exist transport demand in
other airlines, have come to an end, resulting in saturated conditions.
Azimuthal Equidistant Projection
Center: Dubai
Isometric Circles:
in 5,000km increments

Worldwide Market Forecast 2020 - 2040
143
Among current fleet in the region, narrowbody planes are the main passenger planes in service
and have the highest fleet density in the range of 4,000 km or shorter. And widebody planes are
also used frequently in ranges between 2,000km and 4,000 km. Only widebody planes are used
at distances further than 4000 km, and especially heavily used in the range of 4,500km to 6,500km.
A particular concentration is also observed in the 11,000 to 12,000 km range.
In this forecast, the average growth rate in RPK for Long Range market over the next 20 years
is expected to be 2.7%. It is expected that the Medium Range and Short Range markets will show
growth rates of 4.1% and 3.5% respectively, and even if growth in the Long Range market slows
down, transport demand in this region is expected to keep growing. However, their volumes are
small (37% of RPK in 2019) compared to the Long Range market (57%), therefore average
growth rate over all distance ranges is expected to be 3.1%.
LR 14.0% 2.7%MR 10.2% 4.1%SR 8.5% 3.5%RR 6.2% 2.9%
Total 11.6% 3.1%
LR : Long RangeMR : Medium RangeSR : Short RangeRR : Regional Range
2000-2019
2020-2040
RPK AverageGrowth Rate
12 22 41
74 12
33 62 127
26 83 183
427
36 162
488
845
0
400
800
1200
1600
1999 2009 2019 ・・・ 2040
( ×109 ) RPK by Distance Range ‐Middle East
RR SR MR LR
14% 7% 5% 5%
14%11% 8% 9%
30%
28%24% 29%
41%54%
63% 57%
0%
20%
40%
60%
80%
100%
1999 2009 2019 ・・・ 2040
RPK share by Distance Range ‐Middle East
RR SR MR LR

Worldwide Market Forecast 2020 - 2040
144
The Long Range market, which has grown by capturing the capturing transit-type demand,
carries mostly passengers who live outside the Middle East region, but RPK analysis shows that
the Medium Range and shorter routes are mainly used by people living in the region.
Airlines in the Middle East have developed primarily around Long Range routes, but airline
liberalization has even started in the Middle East. In Saudi Arabia, Flynas (formerly Nas Air),
which is an LCC and the only private airline in the country, was founded in 2007 and operates
domestic and Short Range international flights. In the UAE, flydubai was founded as an LCC in
2008. The airline, in cooperation with Emirates, has expanded their routes including the opening
of direct flights from Dubai to Helsinki (with 737MAX8).
Major airlines in this region have proactively engaged in the air freight transport “belly cargo”
business using vacant spaces in lower hold of their large widebody passenger planes, and they
have achieved remarkable growth while major global airlines have been struggling to grow or
maintain their air freight transport businesses (refer to Appendix G). Emirates has increased its
RTK by focusing on belly cargo, and in addition, it has begun strengthening transport by freighter
jets since 2013. However, its total RTK growth has slightly stagnated since 2016. Qatar Airways
has increased its RTK by belly cargo and freighter jets at a ratio of almost 1:1, and the growth
was also recorded in 2018.
In June, 2017, four countries including Saudi Arabia broke their diplomatic relations with Qatar
and closed their border roads, and, at the same time, decided to refuse to allow planes from Qatar
to fly over their territory. The decision blockaded Qatar’s land transport, and Qatar has been forced
to rely on the conveyance by sea and air to have food, daily commodities and others. In January
2021, an agreement was reached between these countries to restore diplomatic relations. Air
routes are also expected to be normalized.
In the Middle East region, over the past 20 years from 2000 to 2019, GDP grew at an average
annual rate of 3.9%, passenger traffic demand at 12.4%, and cargo demand at 12.9%. It is expected
for the period from 2020 to 2040, that, while becoming gradually stabilized, growth will continue,
with GDP set to grow at an average annual rate of 2.1%, passenger traffic demand at 3.1%, and
cargo demand at 4.4%.
The number of planes in service in the Middle East (including freighters) will increase from
1,454 in 2019 to 2,653 in 2040. Over this period, the units delivered and the sales value (at 2019
list price) are expected to be 2,231 units, worth 522.6 billion U.S. dollars, respectively. Of the
units delivered, 54% will be new demand. In addition, widebody planes will account for 51% of
new deliveries (2,217 units) for passenger planes.
Previously, airlines in the Middle East required large, widebody planes with excellent load
capacity as well as a long flight range, and their purchasing power allowed them to exert great
influence on airplane manufacturers. Development of the 777X began with purchase orders from

Worldwide Market Forecast 2020 - 2040
145
airlines in the Middle East, while the A380 came to an end due to order cancellation. Since then,
as the RPK growth rate in the Long Range market has declined, airlines have already canceled or
postponed orders placed, and reviewed plane types of their fleet. Depending on changes in the
actual growth rate in the future, along with a trend towards continuing to use existing planes, the
number of deliveries may be further reduced, especially for large, widebody planes.
In response to the decrease in transportation demand due to the COVID-19 disaster, airlines in
the region are also suspending the operation of A380. Since the A380s are so young that they are
all in storage and it is possible for them to return to service post COVID-19. JADC calculated the
forecast on the assumption that half of the A380s will return to service again, therefore, passenger
planes (or ASK) in the region are expected to be in excess during the period 2025-2030, including
future planes to be delivered such as the 777X.
1,454
422
0
1,032
0
1,199
0
1,000
2,000
3,000
2019 2040
No
. o
f A
irp
lan
es
Fleet Developments of Airlines in Middle East
Replacement
Growth
Retained
NewDeliveries
%
46%
2,653
2,231
54%
Middle East New Deliveries New Deliveries2019 2040 2020-2040 2019 2040 2020-2040
Passenger Turboprops (TP) Jet Freighters (JF : New + Converted) 15-39 seats 10 10 8 Narrowbody 3 27 27 40-59 seats 9 3 3 Medium Widebody 23 41 37 60 seats and larger 26 41 26 Large 55 198 151 (Total) TP 45 54 37 (Total) JF 81 266 215
Passenger Jets (JP) (Grand total) TP + JP + JF 1,454 2,653 2,231 20-59 seats 11 0 0 60-99 seats 40 47 47 (subtotal) Regional Jets (RJ) 51 47 47 Growth Indices (2020-2040)
100-119 seats 12 70 68 GDP 2.1 %
120-169 seats 476 609 483 RPK 3.1 %
170-229 seats 62 385 363 RTK 4.4 %
(subtotal) Narrowbody Jets (NJ) 550 1,064 914 Fleet 2.9 %
230-309 seats 239 413 341 Sales (2019 List Price) 523 US$ billion 310-399 seats 342 759 669 400 seats and larger 146 50 8 (subtotal) Widebody Jets (WJ) 727 1,222 1,018 (Total) JP = RJ + NJ + WJ 1,328 2,333 1,979
FleetFleet

Worldwide Market Forecast 2020 - 2040
146
9.5 Latin America
The Latin America region, defined by JADC, consists of Mexico, the Central American region
south of Mexico, the South American continent, and the Caribbean region. Along with Asia, Latin
America has shown significant growth over the period called resources boom. With a surge in
direct investment in Latin America thanks to the development of resources and the Free Trade
Agreement, nominal GDP more than doubled during the period of over ten years from 2000, and
the real GDP growth rate from 2003 to 2008 was 5.1%. However, with the end of the boom, the
economic situation in Latin American countries has deteriorated.
The analytical institution has shown an average growth rate of 2.4% in real GDP for the region
over the next 20 years, and JADC is making forecasts based on that. However, the average growth
rate of real GDP from 2015 to 2019 is around 0.9%, and the medium-term economic growth rate
may be lower.
Airline mergers took place in Latin America as in the U.S. and Western Europe. Among major
airlines, cross-border mergers have taken place between AVIANCA in Colombia and TACA
International Airlines in El Salvador, and between LAN Airlines in Chile and TAM Airlines in
Azimuthal Equidistant Projection
Center: Quito
Isometric Circles:
in 5,000km increments

Worldwide Market Forecast 2020 - 2040
147
Brazil, respectively. As a result, airlines in this region have been consolidated into two major
companies. Airline restructuring in Brazil made progress as the result of domestic mergers. In
addition, in this region too, the progress of airline liberalization has led to the founding of LCCs
such as GOL Airlines in Brazil, Interjet and Volaris in Mexico, and Viva Colombia in Colombia.
With regard to available seat capacity for intra-regional routes, the share of LCCs rose by about
12 times, from about 3% in 2001 to 35% in 2017. In addition, in order to attract domestic demand
in countries other than their own, LCCs have established subsidiaries to operate in those countries.
RPK in the region in 2019
was 442×109 passenger
kilometers, of which the
Long Range market was the
largest, accounting for 41%,
followed by the Short Range
market, which accounted for
26%. Over the next 20 years,
while the Short Range
market share will grow,
relatively high, at an average rate of 4.0%, the other markets will grow at an average rate ranging
from 2.3% to 2.9%. It is expected that in 2040 the Short Range market share will have expanded,
while the Long Range market will have dwindled.
As for current fleet, narrowbody planes are the main airplanes and used for distances between
300 to 5,000 km. The number of planes being operated is particularly large in the range of 300 to
LR 4.4% 2.3%MR 6.9% 2.3%SR 6.4% 4.0%RR 4.5% 2.9%
Total 6.0% 2.7%
LR : Long RangeMR : Medium RangeSR : Short RangeRR : Regional Range
RPK AverageGrowth Rate
2000-2019
2020-2040
41 57
98 170
32 54
111
239
11 18
42
65
73 79
173
262
0
200
400
600
800
1999 2009 2019 ・・・ 2040
( ×109 ) RPK by Distance Range ‐Latin America
RR SR MR LR
26% 28% 23% 23%
20%26%
26% 32%
7%9% 10%
9%
47%38% 41% 36%
0%
20%
40%
60%
80%
100%
1999 2009 2019 ・・・ 2040
RPK share by Distance Range ‐Latin America
RR SR MR LR

Worldwide Market Forecast 2020 - 2040
148
1,300 km, followed by in the rage of up to 2,500 km. Widebody planes are used in the 6,500 to
13,000 km range, but not in large numbers. Turboprop planes are commonly used in the Regional
Range of less than 700 km, and their peak usage occurs around the 300 km range. Regional jets
are also used in the 400 to1,000 km range. In the Regional Range (up to 1,000 km), all three
categories other than widebody planes are used.
In the region, over the past 20 years from 2000 to 2019, GDP grew at an average growth rate
of 2.1 %, passenger demand at 6.0%, and cargo demand at 1.5%. With regard to the growth rates
from 2020 to 2040, while GDP will grow at the rate of 2.4%, which will be almost the same as
that worldwide, the rate of passenger demand will decrease to 2.7%. Cargo demand is expected
to grow at 1.9%.
2,011
398
0
1,613
0
604
0
1,000
2,000
3,000
2019 2040
No
. of
Air
pla
nes
Fleet Developments of Airlines in Latin America
Replacement
Growth
Retained
NewDeliveries%
2,615
2,217
73%
27%
Latin America New Deliveries New Deliveries2019 2040 2020-2040 2019 2040 2020-2040
Passenger Turboprops (TP) Jet Freighters (JF : New + Converted) 15-39 seats 279 204 193 Narrowbody 85 125 125 40-59 seats 74 87 66 Medium Widebody 28 40 34 60 seats and larger 95 143 91 Large 1 3 3 (Total) TP 448 434 350 (Total) JF 114 168 162
Passenger Jets (JP) (Grand total) TP + JP + JF 2,011 2,615 2,217 20-59 seats 51 0 0 60-99 seats 133 162 153 (subtotal) Regional Jets (RJ) 184 162 153 Growth Indices (2020-2040)
100-119 seats 71 247 233 GDP 2.4 %
120-169 seats 941 955 726 RPK 2.7 %
170-229 seats 95 468 453 RTK 1.9 %
(subtotal) Narrowbody Jets (NJ) 1,107 1,670 1,412 Fleet 1.3 %
230-309 seats 132 119 87 Sales (2019 List Price) 219 US$ billion 310-399 seats 26 62 53 400 seats and larger 0 0 0 (subtotal) Widebody Jets (WJ) 158 181 140 (Total) JP = RJ + NJ + WJ 1,449 2,013 1,705
FleetFleet

Worldwide Market Forecast 2020 - 2040
149
9.6 Africa
Africa has abundant underground resources such as oil and minerals, and in recent years it has
been growing rapidly by focusing on development of these resources. Chinese investment in these
resources has been well reported. There is a view that air transport demand will grow because of
the expanding middle class which will serve as a driver force for consumption. However, there
are many problems which are yet to be solved such as poverty, regional conflicts and infectious
disease. GDP per capita in Africa as a whole will show little increase over the next 20 years, and
the increase in GDP is expected to be brought about by population growth.
RPK in the region in 2019 was 180×109 kilometers, of which the Long Range (4,500 km or
longer) market accounted for the most significant share at 37%. In this forecast, the Medium
Range market in the next 20 years is expected to grow at an average rate of 4.1%, followed by
the Short Range market at 2.7%. RPK in 2040 is expected to be 312×109 passenger kilometers,
of which the Medium Range market will be the largest, accounting for 37%
Currently, narrowbody planes are the main airplanes in the region, and heavily used for
distances between 400 to 2,000 km. They are also used for distances up to 4,500 km, with
gradually decreasing in number as the distance increases. Turboprop planes are mainly used in
Azimuthal Equidistant Projection
Isometric Circles: in 5,000km increments

Worldwide Market Forecast 2020 - 2040
150
the Regional Range of 700 km or less, and small planes and medium-sized planes are heavily
used with their peak of fleet density at the 200 km and in the range of 300 to 500 km, respectively.
Regional jets are also mainly used for distances around 500 km.
In the region, over the past 20 years from 2000 to 2019, GDP grew at an average growth rate
of 4.0%, passenger demand at 5.0%, and cargo demand at 9.0%. As for the growth rate forecast
from 2020 to 2040, GDP will grow at an average growth rate of 2.8%, passenger demand at 2.7%,
and cargo demand at 3.6%.
LR 4.3% 1.8%MR 6.7% 4.1%SR 5.2% 2.7%RR 3.9% 1.2%
Total 5.0% 2.7%
LR : Long RangeMR : Medium RangeSR : Short RangeRR : Regional Range
2000-2019
2020-2040
RPK AverageGrowth Rate
11 13 24 31 14 22 39
68 13 27 50
115
29 40
67
97
0
100
200
300
400
1999 2009 2019 ・・・ 2040
( ×109 ) RPK by Distance Range ‐Africa
RR SR MR LR
16% 13% 13% 10%
21% 22% 22% 22%
20% 27% 28% 37%
43% 39% 37% 31%
0%
20%
40%
60%
80%
100%
1999 2009 2019 ・・・ 2040
RPK share by Distance Range ‐Africa
RR SR MR LR

Worldwide Market Forecast 2020 - 2040
151
1,392
232
0
1,160
0
72
0
1,000
2,000
2019 2040
No
. of
Air
pla
ne
s
Fleet Developments of Airlines in Africa
Replacement
Growth
Retained
NewDeliveries
%
1,232
1,464
94%
6%
AFRICA New Deliveries New Deliveries2019 2040 2020-2040 2019 2040 2020-2040
Passenger Turboprops (TP) Jet Freighters (JF : New + Converted) 15-39 seats 308 155 135 Narrowbody 38 70 70 40-59 seats 86 78 71 Medium Widebody 15 28 28 60 seats and larger 126 180 123 Large 12 28 19 (Total) TP 520 413 329 (Total) JF 65 126 117
Passenger Jets (JP) (Grand total) TP + JP + JF 1,392 1,464 1,232 20-59 seats 109 (1) 0 60-99 seats 75 56 47 (subtotal) Regional Jets (RJ) 184 55 47 Growth Indices (2020-2040)
100-119 seats 45 91 90 GDP 2.8 %
120-169 seats 397 351 272 RPK 2.7 %
170-229 seats 7 212 212 RTK 3.6 %
(subtotal) Narrowbody Jets (NJ) 449 654 574 Fleet 0.2 %
230-309 seats 116 121 86 Sales (2019 List Price) 128 US$ billion 310-399 seats 58 95 79 400 seats and larger 0 0 0 (subtotal) Widebody Jets (WJ) 174 216 165 (Total) JP = RJ + NJ + WJ 807 925 786
FleetFleet

Worldwide Market Forecast 2020 - 2040
152
9.7 CIS
Led by Russia which has overcome the destructive economic crisis after the collapse of the
former Soviet Union and recorded 8 consecutive years of economic growth since 2000, the
economies of the CIS member countries, such as Ukraine*, which has tried to promote a
transparent market economy, Kazakhstan and Turkmenistan which have shown steady economic
development utilizing their rich resources, have continued to grow. In Russia, the average wage
rose from 2,200 rubles in 2000 to 12,500 rubles in 2007, and the number of people with middle-
income increased significantly. Unstable situation, however, has continued in recent years, due to
falling crude oil prices and Western economic sanctions over the Crimea crisis.
(*: Still included in the CIS, in this forecast, in order to maintain statistical continuity.)
As the region are spread out over a vast land area, and thus distances between cities are vast,
air transport is important for movement within the region. Accordingly, there has been strong
demand for air transport in the region. Especially during the ten years period from 2004 to 2014,
when economy in the region grew steadily, the average growth rate of RPK reached 8.9%.
Although it has stopped growing since then due to the economic slowdown in emerging
Azimuthal Equidistant Projection
Center: Moscow
Isometric Circles:
in 5,000km increments

Worldwide Market Forecast 2020 - 2040
153
countries, RPK in 2019 seems to be 290×109 passenger kilometers.
Of RPK, the Medium Range (2,000 to 4,500 km) market accounted for 44%, followed by the
Short Range (1,000 to 2,000 km) market accounting for 26%. For 2040, it is expected that the
average growth rate of the Regional and Short Range markets will be 2.3 and 2.1% each, which
is relatively high, and the growth rate of the Medium and Long Range markets will be 1.6 and
1.5% each. The mix of intra-regional shares of RPK in 2040 is expected to be almost the same as
that in 2019.
LR 7.6% 1.5%MR 9.4% 1.6%SR 9.4% 2.1%RR 6.1% 2.3%
Total 8.6% 1.7%
LR : Long RangeMR : Medium RangeSR : Short RangeRR : Regional Range
RPK AverageGrowth Rate
2000-2019
2020-2040
6 7
20 33 13
22 76
119
22 38
129
180
15 21
65
89
0
100
200
300
400
500
1999 2009 2019 ・・・ 2040
( ×109 ) RPK by Distance Range ‐CIS
RR SR MR LR
11% 8% 7% 8%
23% 25% 26% 28%
39% 43% 44% 43%
27% 24% 22% 21%
0%
20%
40%
60%
80%
100%
1999 2009 2019 ・・・ 2040
RPK share by Distance Range ‐CIS
RR SR MR LR

Worldwide Market Forecast 2020 - 2040
154
Among the airplanes operated in the region, those manufactured in the former Soviet Union
have been decreasing in number, with a shift to planes mainly manufactured in the U.S. and
Western Europe. As of the end of 2016, 72% of planes in service being operated by airlines in the
CIS and 82% of the backlog are planes by Western manufacturers including Airbus and Boeing.
In the region, over the past 20 years from 2000 to 2019, GDP grew at an average growth rate
of 4.0%, passenger demand at 8.6%, and cargo demand at 11.7%. As for the average growth rate
from 2020 to 2040, it is expected that GDP will grow at the rate of 1.6%, passenger demand at
1.7% and cargo demand at 3.5%.
1,495
300
0
1,195
0
272
0
1,000
2,000
2019 2040
No
. of
Air
pla
nes
Fleet Developments of Airlines in CIS
Replacement
Growth
Retained
NewDeliveries
%
1,767
1,467
81%
19%
CIS New Deliveries New Deliveries2019 2040 2020-2040 2019 2040 2020-2040
Passenger Turboprops (TP) Jet Freighters (JF : New + Converted) 15-39 seats 99 111 79 Narrowbody 27 41 39 40-59 seats 105 43 41 Medium Widebody 63 60 55 60 seats and larger 27 64 53 Large 57 62 42 (Total) TP 231 218 173 (Total) JF 147 163 136
Passenger Jets (JP) (Grand total) TP + JP + JF 1,495 1,767 1,467 20-59 seats 67 0 0 60-99 seats 164 166 130 (subtotal) Regional Jets (RJ) 231 166 130 Growth Indices (2020-2040)
100-119 seats 78 142 138 GDP 1.6 %
120-169 seats 522 562 434 RPK 1.7 %
170-229 seats 147 321 281 RTK 3.5 %
(subtotal) Narrowbody Jets (NJ) 747 1,025 853 Fleet 0.8 %
230-309 seats 80 107 97 Sales (2019 List Price) 162 US$ billion 310-399 seats 50 88 78 400 seats and larger 9 0 0 (subtotal) Widebody Jets (WJ) 139 195 175 (Total) JP = RJ + NJ + WJ 1,117 1,386 1,158
FleetFleet

Worldwide Market Forecast 2020 - 2040
155
10. Airplane Sales Forecast
This section shows the number of units (passenger planes and freight planes) to be newly built
and delivered during the current forecast period (2020-2039), as well as the sales amount and
share.
The sales amount is calculated by multiplying each price by the number of units delivered by
model determined in the demand forecast calculation, and the price for each model is mainly
based on the sales price each manufacturer makes available to the public. These prices are so-
called “catalog prices”, and the prices in actual contracts are said to be 60% or 70% of these, but
since individual contract details are not disclosed, catalog prices will be used for our calculations.
10.1 Jet Airplane (Passenger and Cargo) Sales Forecast
7,873 7,786
12,818
2,063 1,719
790 1,181
1,084 1,208
2,081
522
212 121 158
0
1,000
2,000
3,000
0
5,000
10,000
15,000
North America Europe Asia-Pacific Middle East Latin America Africa CIS
No. of Airplanes
34,230 Airplanes5,385 US$ billion
Total
2019 PriceUS$ billion
*Total of passenger jets and jet freighters
Jet Airplane Sales Forecast by Region
North America Europe Asia-Pacific Middle East Latin America Africa CIS
North America20%
Europe 22% Asia/Pacific 39%Middle East
10%
Latin America 2%
Africa 4%
CIS 3%
0% 10% 20% 30% 40% 50% 60% 70% 80% 90% 100%
Jet Airplane Sales Share by Region ( Pax. & Cargo )

Worldwide Market Forecast 2020 - 2040
156
10.2 Passenger Jet Sales Forecast
Most sales will be seen in the 170-229-seat class. The number of delivered aircraft will be only
slightly more than the 120-169-seat class aircraft, but the sales amount will be higher due to the
larger body size and higher per unit price.
Narrowbody aircraft cost less per unit, but the number of airplanes is larger. For that reason,
their total sales amount exceeds that of widebody aircraft.
0
2,394 2,825
10,192
11,500
3,404 3,171
8 0
4,000
8,000
12,000
16,000
20-59 60-99 100-119 120-169 170-229 230-309 310-399 400 over
1,600
1,200
800
400
0
Passenger Jet Sales Forecast by SizeNo. of Airplanes2019 PriceUS$ billion
114
205
1,075
1,567
1,001
1,195
4
Size ( No. of Seats )
Narrow body Wide body
0
Total33,494 Units
5,160 US$ billion
Regional Jet
20-590%
60-992%
100-1194%
120-16921%
170-22930%
230-30920%
310-39923%
400 over0%
Passenger Jet Sales Share
NarrowbodyWidebody
(Seats)
43%55%

Worldwide Market Forecast 2020 - 2040
157
In terms of the number of aircraft delivered by region, North America, Europe, and China are
the largest in that order, and sales by region are highest in Europe ($ 1.19 trillion), North America
($ 0.99 trillion), and China ($ 0.86 trillion).
7,533 7,714
12,619
1,979 1,705
786 1,158
993
1,188
2,010
489
208 120 153
0
1,000
2,000
3,000
0
5,000
10,000
15,000
North America Europe Asia-Pacific Middle East Latin America Africa CIS
No. of Airplanes
33,494 Airplanes5,160 US$ billion
Total
2019 PriceUS$ billion
*Total of passenger jets and jet freighters
Passenger Jet Sales Forecast by Region
North America Europe Asia-Pacific Middle East Latin America Africa CIS
6,697
711
4,931
980
7,686
2,654
608 215
3,719
1,501 560
132
1,580 602 690 104 529 100
1,328 354
1,449 308 807
139 1,117
228
7,533 7,714
12,619
720
5,443
586
3,026
2,114 730
1,979 1,705
786 1,158
0
2,000
4,000
6,000
8,000
10,000
12,000
14,000
16,000
18,000
20
19
20
40
20
19
20
40
20
19
20
40
20
19
20
40
20
19
20
40
20
19
20
40
20
19
20
40
20
19
20
40
20
19
20
40
20
19
20
40
20
19
20
40
20
19
20
40
20
19
20
40
2019 Year End: 2040 Year End: 2020-2040 Deliveries:
Total Fleet24,01538,86833,494
Retained
No.of Airplanes
New Delivery
8,244
NorthAmerica
Europe AsiaPacific
MiddleEast
8,694
15,273
2,333
LatinAmerica
Africa CIS
2,013 925 1,386
Japan OceaniaSouthAsia
SoutheastAsia
NortheastAsia
China
Passenger Jet Fleet and Delivery Forecast by Region

Worldwide Market Forecast 2020 - 2040
158
10.3 Passenger Turboprop Airplane Sales Forecast
Compared to the jet airliner market, the number of new deliveries of turboprop airliners over
the next 20 years is only about 10%, and sales are only about 1.4%.
632 656
433
1,206
384
0
500
1,000
1,500
2,000
15-19 20-39 40-59 60-79 80-99
Total3,311 Units
73 US$ billion
Size ( No. of Seats )
Passenger Turboprop Airplane Sales Forecastby SizeNo. of Airplanes
2019 PriceUS$ billion
5
129
35
12
40
30
20
10
0
407 450
1,565
37
350 329
173 8 11
36
1.0
6 7 3
0
15
30
45
60
75
0
400
800
1200
1600
2000
North America Europe Asia-Pacific Middle East Latin America Africa CIS
Passenger Turboprop Sales Forecast by RegionNo. of Airplane
3,311 Airplanes73 US$ billion
Total
2019 PriceUS$ billion
North America Europe Asia-Pacific Middle East Latin America Africa CIS

Worldwide Market Forecast 2020 - 2040
159
Demand for turboprop aircraft is highest in the Asia-Pacific region, with Southeast Asia and
South Asia (mainly India) being the two largest, followed by Oceania. There is very little demand
in China. With the exception of a few regions, turboprop aircraft are so in steady demand in each
regions that they appear to be essential links for the local residents of each region.
672
102
571
135
1,096
382
55 26 74 32 34 18
319 150
248 81
366 75 45 17
448
84
520
84 231
45
407 450
1,565
33 91 9
505 564
363
37
350 329
173
0
400
800
1,200
1,600
2,000
2,400
2019
2040
2019
2040
2019
2040
2019
2040
2019
2040
2019
2040
2019
2040
2019
2040
2019
2040
2019
2040
2019
2040
2019
2040
2019
2040
Passenger Turboprop Fleet and Delivery Forecast by Region
Total Fleet 2019 Year End: 3,583 2040 Year End: 4,160 2020-2040 Deliveries:
3,311
Retained
No. of Airplanes
New Delivery
509
North America
EuropeAsia
PacificMiddle East
585
1,947
54
434 413
218
Latin America
Africa CISJapan China OceaniaSouthAsia
SoutheastAsia
NortheastAsia
655
438
645

Worldwide Market Forecast 2020 - 2040
160
10.4 Airplane Sales (total) (passenger jets, passenger turboprops, and jet freighters)
For new freighters, 736 aircraft will be delivered and sales will be $ 225 billion, of which the
most demanded large aircraft sales at $ 115 billion and medium-sized wide-body aircraft at $ 110
billion.
8,280 8,236
14,383
2,100 2,069 1,119 1,354
1,092 1,219
2,117
523
219 128 162
0
1,000
2,000
3,000
4,000
0
5,000
10,000
15,000
20,000
North America Europe Asia-Pacific Middle East Latin America Africa CIS
No. of Airplanes
37,541 Airplanes5,458 US$ billion
Total
2019 PriceUS$ Billion
*Total of passenger jets, passenger turboprops and jet freighters
Airplane Sales Forecast by Region
North America Europe Asia-Pacific Middle East Latin America Africa CIS
North America 20%
North America 22%
Europe 22%
Europe 22%
Asia‐Pacific 39%
Asia‐Pacific 38%
Middle East10%
Middle East6%
Latin America 4%
Latin America 6%
Africa 2%
Africa 3%
CIS 3%
CIS 4%
0% 10% 20% 30% 40% 50% 60% 70% 80% 90% 100%
Total Sales
NewDeliveries
Market Share of Sales and Airplane Demand by Region 2020‐2040( Passenger Airplanes (Jet+TBP) and Cargo Airplanes )
New Deliveries Units
Total Sales US$ billion
37,541
5,458

Worldwide Market Forecast 2020 - 2040
161
11. Aero Engine Sales Forecast
This forecast covers new engine deliveries and the associated sales amount for the forecast period
(2020-2040). Aero engine demand is comprised of two segments: demand for engines installed on
airplanes at the time of delivery, and demand for spares (finished products). The former is calculated
by multiplying the number of airplanes newly delivered by the number of engines mounted on the
airplanes, and the latter is calculated by multiplying the number of engines mounted on airplanes at
the time of delivery by a spare ratio of 10%. An engine is the most expensive equipment to purchase
among the components of an airplane, and the engine price is estimated to account for about 20% of
the price of an airplane.
7,288 2,607
55,235
3,586
14,154
0
20,000
40,000
60,000
80,000
TurboProp <12 12-35 35-65 65-115
No.of Engines Value(US$billion)
Turboprop 7,288 16Jet 75,583 1,197
Total 82,871 1,213
CRJ700/900/1000E-Jets E1
ARJ21
ATR42/72DHC-8L410
Aero Engine Delivery and Sales Forecastby Thrust RatingNo. of Engines
016 14
629
61
494
200
2019 Price(US$ billion)
Thrust(×1,000 lbs)
400
800
A318,A319,A320,A321A340-200/-300, 737
A220-100/-300MRJ M90/M100
E-Jets E2
A300-600,A310A340-500/-600
747,757RS,767RS
A380A350,A330
777,787* Including 10% of total number of engines installed on airplanes as spare engines.
600
17,486 17,998
31,309
4,469 4,539 2,471 2,971
255 274
478
11851
30 38
0
200
400
600
800
0
10,000
20,000
30,000
40,000
North America Europe Asia-Pacific Middle East Latin America Africa CIS
Aero Engine Delivery and Sales Forecast by RegionNo. of Engines
North America Europe Asia-Pacific Middle East Latin America Africa CIS
Total82,871 units
1,213 US$ billion
2019 Price(US$ billion)
* Including 10% of total number of engines installed on airplanes as spare engines.

Worldwide Market Forecast 2020 - 2040
162
Intentionally Blank

Worldwide Market Forecast 2020 - 2040
163
12. Methodology
Passenger Forecast Methodology
The forecast flow is divided into three parts ('air traffic', 'Open ASK', and 'aircraft sales
forecast') as shown below:
In the forecast of 'air traffic', air passenger demand (RPK) is obtained by econometric methods
as a function of GDP and Passenger Yield because the correlation with income and fare is clear.
However, RPK is also affected by major policy changes such as the deregulation and promotion
of CO2 reduction measures, by entry of new formats such as LCCs, and by competition with other
transportation modes such as high-speed rail. Therefore, JADC not only analyzes based on actual
data using a causal model using GDP and Passenger Yield, but also predicts RPK in consideration
of the effects of possible events in the future. The forecasts are made by classifying RPK into
regional categories (13 categories) and distance categories (4 categories).
In the 'Open ASK', the transportation capacity (ASK) and its distribution (seat size,
transportation distance) required to actually transport the predicted RPK are calculated. In
addition, based on the actual retirement age of passenger planes, the decrease in the transportation
capacity due to the existing planes is predicted, and the transportation capacity that needs to be
added (delivered) in the future is calculated. The Forecasts are made by classifying ASK into seat
size categories (15 categories in total) in addition to regional categories (13 categories) and
distance categories (4 categories).
In the 'Aircraft sales forecast', the results of the Open ASK are assigned to specific models of
passenger planes based on the performance of each model such as the number of seats and cruising
range, and on the sales force of the manufacturer. The number of each model is calculated for
each category and aggregated.

Worldwide Market Forecast 2020 - 2040
164
Cargo Forecast Methodology
Cargo demand forecasting flow is divided into three parts (traffic forecast, capacity forecast
and freighter forecast) as shown below:
Air cargo demand is known to have a correlation with GDP and cargo yields as is the case with
passenger plane. JADC forecasts air cargo demand by analyzing actual data basing on causal
models using GDP and cargo yields and by evaluating various factors that affect the air cargo
demand considering present and future trends. After consolidating the global flight routes into 33
markets, the air cargo demand is forecasted by market.
A forecast for supplied transport capacity of freighters is calculated using macroeconomic
forecasting methodology (Top Down Analysis), in which the forecast is categorized by region (7
regions) and payload (3 segments). Air cargo is transported by freighters or by the lower hold of
passenger planes. The forecasts of cargo transport demand (RTK) and supplied transport capacity
(ATK) of freighters can be calculated by deducting those carried by lower hold of passenger
planes from the forecasted air cargo demand. The RTK and ATK to be carried by passenger planes
are estimated based on the forecasted passenger plane fleet.
Cargo transport volume (CTV) = CTV carried by lower hold of passenger planes
+ CTV carried by freighters
Due to analyzing the fleet composition by airplane type and flight routes and considering the
service life of freighters, the supplied transport capacity needed in the future is forecasted by
category. The forecasted number of aircraft to be delivered is calculated by allocating the supplied
transport capacity needed in the future to specific type of airplanes in view of airplane
performance, including payloads and cruising distance, and the ratio of newly-built freighters and
converted freighters.
Cargo Demand
Economic Forecast
(GDP)
YieldForecast
Cargo Capacityneeded
FreighterCapacityneeded
FreighterDemand
Production Freighter Deliveries
Lower HoldCapacity
PassengerForecast
Retirement
Converted Freighter
Network Analysis
FleetAnalysis
Traffic Forecast Capacity Forecast Freighter Forecast
Freighter Demand Forecast Flow Chart

Worldwide Market Forecast 2020 - 2040
165
Appendix A: Definitions of Airplane Segments
Passenger Turboprops
15-19 seats DHC6-400, Do228, BE1900, L410
20-39 seats DHC8-200, Saab 340, Do328, Su-80
40-59 seats ATR42, DHC8-300, An-140, MA60/600
60-79 seats ATR72, DHC8-400, Il-114
80-99 seats (ATR92)
Passenger Jets
Regional Jets
20-39 seats ERJ135, Do328JET
40-59 seats CRJ100/200, ERJ140/145
60-79 seats CRJ700, E170, E175, MSJ M100, An-148
80-99 seats CRJ900/1000, E175E2, E190/E2, MSJ M90, ARJ21, SSJ100
Narrowbody
100-119 seats A220-100, E195/E2, A318, 737-600
120-169 seats A319ceo/neo, A320ceo/neo, 737-700/-800, 737MAX-7/-8,
A220-300, C919-200, MS21-200/-300, Tu234
170-229 seats A321ceo/neo~XLR, 737-900ER, 737MAX-9/-10, 757,
Widebody
230-309 seats 787-8/-9, A330ceo/neo, 767, A300, A310, Il-96
310-399 seats A350-900/-1000, 787-10, 777-8/9, 777, A340
400-499 seats 747
>500 seats A380
Jet Freighters
Narrowbody (< 50 ton) A320, A321, BAe146, CRJ100/200, DC-8, DC-9, MD-80,
707, 727, 737, 757, Tu-204
Medium Widebody (40-70 ton) A300, A310, A330, DC-10-10, 767, Il-76
Large (>70 ton) DC-10-30/-40, MD-11, 747, 777, An-124, An-225
Note: Aircraft are segmented according to number of seats based on 1-class seat configuration for 99 seats or less, 2-class seat configuration for 100–229 seats, and 3-class seat configuration for 230 seats or more.

Worldwide Market Forecast 2020 - 2040
166
Appendix B: Definitions of Aero Engine Segments
Engine ManufacturerThrust
(x1000 lb)Aircraft Type (No. of Engines)
65~115 CF6-80E1 GE 67~72 A330(2)
GEnx GE 67~73 B787(2), B747-8(4)
GE90 GE 75~115 B777(2)
GP7000 GE/PW 76~82 A380(4)
PW4000-100 PW 64~70 A330(2)
PW4000-112 PW 74~98 B777(2)
TRENT 700 RR 67~71 A330(2)
TRENT 800 RR 75~95 B777(2)
TRENT 900 RR 68~84 A380(4)
TRENT 1000 RR 64~74 B787(2)
TRENT 7000 RR 68~72 A330neo(2)
TRENT XWB RR 83~92 A350XWB(2)
CF6-50 GE 46~54 B747(4), A300(2)
CF6-80A GE 48~50 B767(2), A310(2)
CF6-80C2 GE 52~62 B747(4), B767(2), A300-600(2), A310(2)
MD-11(3)
JT9D PW 43~56 B747(4), B767(2), A300(2), A310(2)
PW4000-94 PW 52~68 B747(4), B767(2), A300-600(2), A310(2)
MD-11(3)
RB211-524G/H RR 58~61 B747-400(4), B767-300(2)
TRENT 500 RR 56 A340-500/600(4)
PW2000 PW 38~42 B757(2)
RB211-535C/E4 RR 37~43 B757(2)
12~35 V2500 IAE 22~30 A319(2), A320(2), A321(2), MD-90(2)
CFM56 CFM INT'L 18~34 B737-300/400/500(2),
B737-600/700/800/900(2)
A318(2), A319(2), A320(2), A321(2),
A340-200/300(4)
LEAP-1 CFM INT'L 18~33 A319neo(2), A320neo(2), A321neo(2),
737MAX(2), C919(2)
PW1000G PW 15~35 MSJ M100/90(2), A220-100/300(2), MS-21(2)
A319neo(2), A320neo(2), A321neo(2)
E175E2(2), E190E2(2), E195E2(2)
JT8D-200 PW 18~21 MD-80(2)
PW6000 PW 20~23 A318(2)
BR700 BMW/RR 18~22 717(2)
SMI46 SNECMA/NPO 17.4 SSJ100(2)
~12 CF34 GE 8.6~20 CRJ100/200(2), CRJ700(2), CRJ900(2), CRJ1000(2)
E170(2), E175(2), E190(2), E195(2),
ARJ21(2)
AE3007 ALLISON 7.2~12 ERJ135(2), ERJ140(2), ERJ145(2)
PW300 PWC 4.2~5.7 328JET(2)
CT7 GE 1700~1940 SHP CN235(2), SAAB340(2), L610(2)
PW100 PWC 2000~5000 SHP ATR42(2), ATR72(2),
DHC8-100(2)/300(2)/400(2), Do328(2)
EMB120(2)
PT6A PWC 700~1300 SHP DHC-6-400(2), BEECH1900
TPE 331 GARRETT 700~1100 SHP CASA212(2), Metro(2), Do228(2)
Turboprop
ThrustCategory(x1000 lb)

Worldwide Market Forecast 2020 - 2040
167
Appendix C: Air Passenger Traffic
Region
1999 2019 2040 2020-2040
North America 1,121 1,923 3,560 3.0%
Europe 928 1,975 4,040 3.5%
Western Europe 912 1,877 3,727 3.3%Eastern Europe 16 98 312 5.7%
Asia-Pacific 714 2,903 7,269 4.5%
Japan 166 204 375 2.9%China 130 1,333 3,391 4.5%Northeast Asia 98 232 354 2.0%Southeast Asia 175 648 1,741 4.8%South Asia 46 275 1,027 6.5%Oceania 99 211 381 2.9%
Middle East 86 774 1,473 3.1%
Latin America 139 442 775 2.7%
Africa 68 180 312 2.7%
CIS 55 290 418 1.7%
World 3,111 8,486 17,847 3.6%
AverageGrowthRPK ( ×10 9 person km)

Worldwide Market Forecast 2020 - 2040
168
Appendix D: Air Cargo Traffic
Region
1999 2019 2040 2019-2040
North America 38 62 105 2.4%
Europe 31 52 96 2.9%
Asia-Pacific 43 88 199 3.8%
Middle East 3 33 85 4.4%
Latin America 5 7 10 1.9%
Africa 1 5 10 3.6%
CIS 1 8 17 3.5%
World 122 254 524 3.3%
AverageGrowthRTK ( ×10 9 ton km)
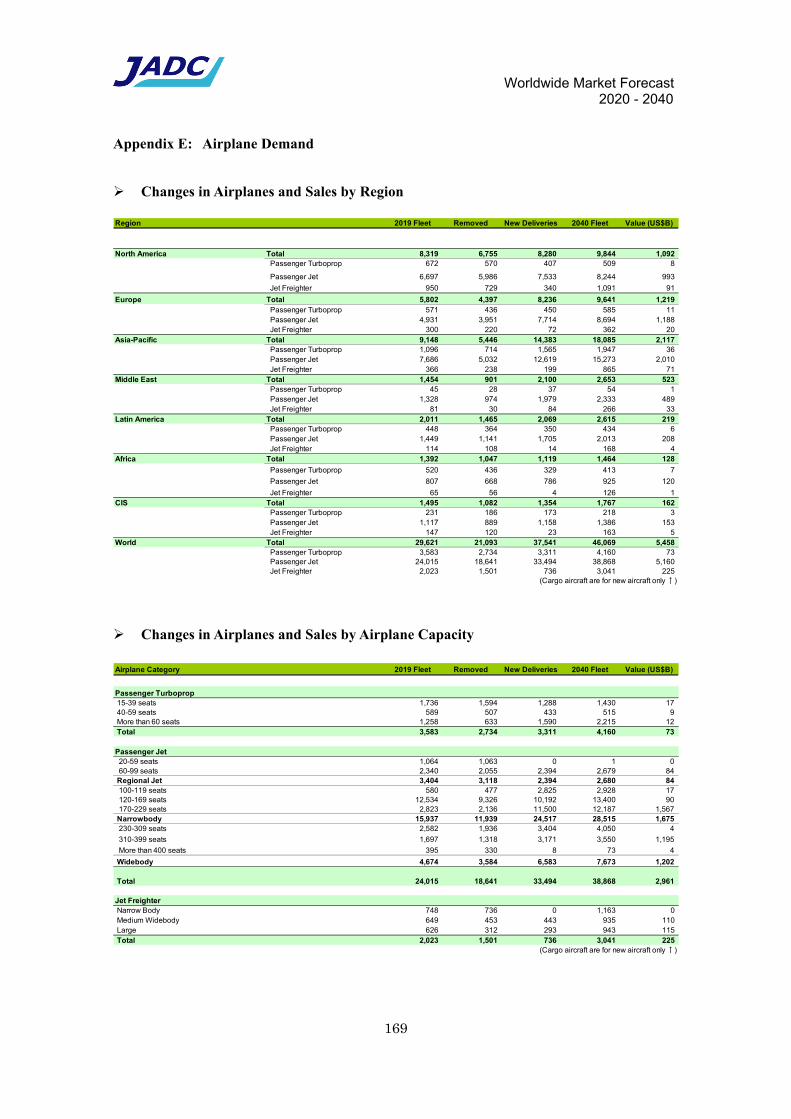
Worldwide Market Forecast 2020 - 2040
169
Appendix E: Airplane Demand
Changes in Airplanes and Sales by Region
Changes in Airplanes and Sales by Airplane Capacity
Region 2019 Fleet Removed New Deliveries 2040 Fleet Value (US$B)
North America Total 8,319 6,755 8,280 9,844 1,092 Passenger Turboprop 672 570 407 509 8
Passenger Jet 6,697 5,986 7,533 8,244 993
Jet Freighter 950 729 340 1,091 91
Europe Total 5,802 4,397 8,236 9,641 1,219 Passenger Turboprop 571 436 450 585 11 Passenger Jet 4,931 3,951 7,714 8,694 1,188 Jet Freighter 300 220 72 362 20
Asia-Pacific Total 9,148 5,446 14,383 18,085 2,117 Passenger Turboprop 1,096 714 1,565 1,947 36 Passenger Jet 7,686 5,032 12,619 15,273 2,010 Jet Freighter 366 238 199 865 71
Middle East Total 1,454 901 2,100 2,653 523 Passenger Turboprop 45 28 37 54 1 Passenger Jet 1,328 974 1,979 2,333 489 Jet Freighter 81 30 84 266 33
Latin America Total 2,011 1,465 2,069 2,615 219 Passenger Turboprop 448 364 350 434 6 Passenger Jet 1,449 1,141 1,705 2,013 208 Jet Freighter 114 108 14 168 4
Africa Total 1,392 1,047 1,119 1,464 128
Passenger Turboprop 520 436 329 413 7
Passenger Jet 807 668 786 925 120
Jet Freighter 65 56 4 126 1CIS Total 1,495 1,082 1,354 1,767 162
Passenger Turboprop 231 186 173 218 3 Passenger Jet 1,117 889 1,158 1,386 153 Jet Freighter 147 120 23 163 5
World Total 29,621 21,093 37,541 46,069 5,458 Passenger Turboprop 3,583 2,734 3,311 4,160 73 Passenger Jet 24,015 18,641 33,494 38,868 5,160 Jet Freighter 2,023 1,501 736 3,041 225
(Cargo aircraft are for new aircraft only ↑)
Airplane Category 2019 Fleet Removed New Deliveries 2040 Fleet Value (US$B)
Passenger Turboprop 15-39 seats 1,736 1,594 1,288 1,430 17 40-59 seats 589 507 433 515 9 More than 60 seats 1,258 633 1,590 2,215 12 Total 3,583 2,734 3,311 4,160 73
Passenger Jet 20-59 seats 1,064 1,063 0 1 0 60-99 seats 2,340 2,055 2,394 2,679 84 Regional Jet 3,404 3,118 2,394 2,680 84 100-119 seats 580 477 2,825 2,928 17 120-169 seats 12,534 9,326 10,192 13,400 90 170-229 seats 2,823 2,136 11,500 12,187 1,567 Narrowbody 15,937 11,939 24,517 28,515 1,675 230-309 seats 2,582 1,936 3,404 4,050 4
310-399 seats 1,697 1,318 3,171 3,550 1,195
More than 400 seats 395 330 8 73 4
Widebody 4,674 3,584 6,583 7,673 1,202
Total 24,015 18,641 33,494 38,868 2,961
Jet Freighter Narrow Body 748 736 0 1,163 0 Medium Widebody 649 453 443 935 110 Large 626 312 293 943 115 Total 2,023 1,501 736 3,041 225
(Cargo aircraft are for new aircraft only ↑)

Worldwide Market Forecast 2020 - 2040
170
Fleet and New Deliveries by Region
2019 Fleet
North America Europe Asia-Pacific Middle East Latin America Africa CIS World
Passenger Turboprop 15-39 seats 401 207 432 10 279 308 99 1,736 40-59 seats 109 53 153 9 74 86 105 589 More than 60 seats 162 311 511 26 95 126 27 1,258Total 672 571 1,096 45 448 520 231 3,583
Passenger Jet 20-59 seats 759 58 9 11 51 109 67 1,064 60-99 seats 1,239 371 318 40 133 75 164 2,340 Regional Jet 1,998 429 327 51 184 184 231 3,404 100-119 seats 179 131 64 12 71 45 78 580 120-169 seats 2,706 2,889 4,603 476 941 397 522 12,534 170-229 seats 1,120 509 883 62 95 7 147 2,823 Narrowbody 4,005 3,529 5,550 550 1,107 449 747 15,937 230-309 seats 458 542 1,015 239 132 116 80 2,582 310-399 seats 231 308 682 342 26 58 50 1,697 More than 400 seats 5 123 112 146 0 0 9 395 Widebody 694 973 1,809 727 158 174 139 4,674Total 6,697 4,931 7,686 1,328 1,449 807 1,117 24,015
Jet Freighter Narrow Body 273 140 182 3 85 38 27 748 Medium Widebody 400 71 49 23 28 15 63 649 Large 277 89 135 55 1 12 57 626Total 950 300 366 81 114 65 147 2,023
2040 Fleet
North America Europe Asia-Pacific Middle East Latin America Africa CIS World
Passenger Turboprop 15-39 seats 242 135 573 10 204 155 111 1,430 40-59 seats 55 56 193 3 87 78 43 515 More than 60 seats 212 394 1,181 41 143 180 64 2,215Total 509 585 1,947 54 434 413 218 4,160
Passenger Jet 20-59 seats 2 0 0 0 0 -1 0 1 60-99 seats 1,386 359 503 47 162 56 166 2,679 Regional Jet 1,388 359 503 47 162 55 166 2,680 100-119 seats 895 827 656 70 247 91 142 2,928 120-169 seats 2,234 2,818 5,871 609 955 351 562 13,400 170-229 seats 2,549 3,050 5,202 385 468 212 321 12,187 Narrowbody 5,678 6,695 11,729 1,064 1,670 654 1,025 28,515 230-309 seats 793 871 1,626 413 119 121 107 4,050 310-399 seats 385 760 1,401 759 62 95 88 3,550 More than 400 seats 0 9 14 50 0 0 0 73 Widebody 1,178 1,640 3,041 1,222 181 216 195 7,673Total 8,244 8,694 15,273 2,333 2,013 925 1,386 38,868
Jet Freighter Narrow Body 312 166 422 27 125 70 41 1,163 Medium Widebody 535 109 122 41 40 28 60 935 Large 244 87 321 198 3 28 62 943Total 1,091 362 865 266 168 126 163 3,041
2020-2040 New Deliveries
North America Europe Asia-Pacific Middle East Latin America Africa CIS World
Passenger Turboprop 15-39 seats 229 125 519 8 193 135 79 1,288 40-59 seats 47 53 152 3 66 71 41 433 More than 60 seats 131 272 894 26 91 123 53 1,590Total 407 450 1,565 37 350 329 173 3,311
Passenger Jet 20-59 seats 0 0 0 0 0 0 0 0 60-99 seats 1,213 317 487 47 153 47 130 2,394 Regional Jet 1,213 317 487 47 153 47 130 2,394 100-119 seats 869 790 637 68 233 90 138 2,825 120-169 seats 2,013 2,174 4,090 483 726 272 434 10,192 170-229 seats 2,368 2,969 4,854 363 453 212 281 11,500 Narrowbody 5,250 5,933 9,581 914 1,412 574 853 24,517 230-309 seats 721 742 1,330 341 87 86 97 3,404 310-399 seats 349 722 1,221 669 53 79 78 3,171 More than 400 seats 0 0 0 8 0 0 0 8 Widebody 1,070 1,464 2,551 1,018 140 165 175 6,583Total 7,533 7,714 12,619 1,979 1,705 786 1,158 33,494
Jet Freighter (New Build) Narrow Body 0 0 0 0 0 0 0 0 Medium Widebody 287 58 62 8 14 2 12 443 Large 53 14 137 76 0 2 11 293Total 340 72 199 84 14 4 23 736
Jet Freighter (Converted) Narrow Body 312 166 412 27 125 70 39 1,151 Medium Widebody 119 26 33 29 20 26 43 296 Large 99 18 93 75 3 17 31 336Total 530 210 538 131 148 113 113 1,783

Worldwide Market Forecast 2020 - 2040
171
Appendix F: Evaluation of Secondary Deliveries
This forecast covers the next 20 years. The recent average retirement age of passenger planes
has been around 25 years, which is longer than 20 years, so the number of short-lived planes
which would be delivered within the forecast period and would retire within the period, has not
been counted in the main part of this forecast. However, in recent years, cases of retirement at
under 20 years have begun to increase. These are presumed to be airplane that were frequently
operated on short-distance domestic flights of LCCs or FSCs, and in view of the recent rise of
LCCs, it is expected that the number of young retired planes of this type would increase in the
future.
In order for airlines to continue their transportation business, if one airplane is retired, one new
plane will need to be replenished. Therefore, the retirement of the short-lived airplanes in the
forecast period will in turn lead to secondary demand for airplanes. Here, of the passenger planes
which would be delivered within the forecast period (i.e. the primary deliveries), the number of
planes to be retired within the period is predicted, and the number is shown in light orange in the
figure as the secondary deliveries.
(The secondary deliveries are not included in the number of units in the main part of this forecast.)
Of the secondary deliveries, 1,683 units will be narrow-body airplanes with 100 to 229 seats
and 358 units will be widebody airplanes with 230 or more seats, accounting for 6.9% and 5.4%
of the primary deliveries, respectively.
(Fleet: passenger planes that are in service at the beginning of the forecast period* (i.e. initial fleet))
(Remaining: passenger planes which will be left in service at the end of the period* out of the initial fleet)
(Primary retired: passenger planes which will be retired during the period* out of the initial Fleet)
(Primary deliveries: passenger planes to be delivered to replace for the primary retired planes)
(Secondary retired: passenger planes which will be retired during the period* out of the primary deliveries)
(Secondary deliveries: passenger planes to be delivered to replace for the secondary retired planes) (* 2020-2040)
0161 103
1031
457 150 20800
2394 2825
10192
11500
34043171
81 285
103
3208
687 646 379 651063
2055
477
9326
2136 19361318
330
‐2000
0
2000
4000
6000
8000
10000
12000
14000
16000
20 〜 59seats
60 〜 99seats
100
〜119seats
120
〜169seats
170
〜229seats
230
〜309seats
310
〜399seats
400seats
over
Passenger Jet Fleet and Delivery Forecast by Seat Category
234025822823
12534
580
13400
29282679
1 395
1697
73
35504050
12187
1064
2040 Remaining
2020‐2040 Retired (Primary)
2020‐2040 Delivery (Primary)
2040 Fleet
2020‐2040 Delivery (Secondary)
195
2019 Fleet
11223 2020‐2040 Total Deliveries
8
30202555
0
33793554
11957
20 〜 59 60 〜 99 100 〜 119 120 〜 169 170 〜 229 230 〜 309 310 〜 399 400 over
( seats )

Worldwide Market Forecast 2020 - 2040
172
Appendix G: Trends in Cargo Transportation Results by Major Airlines (2006-2019)
There are two types of freight transportation by airlines: one is by freighter, and the other is by
using the cargo compartment (Lower Hold) * of passenger flights to transport general freight. At
airlines, the average size of airplanes is increasing due to wide-body aircraft, and there is room
for capacity and weight even in the cargo compartment of passenger flights. If the surplus capacity
is used to transport general freight other than passengers' luggage, it is possible to make a profit
from freight transportation at a small additional cost. In addition, it is easy to deal with
fluctuations in the busyness of transportation demand seen in air freight transportation.
In recent years, major airlines in Middle East region have taken positive measures in freight
transportation and have greatly increased their RTK.
On the other hand, there are many cases where even major airlines are struggling to maintain
the total RTK (by freighters plus by cargo compartment of passenger planes), reducing the
freighters only to shift to the cargo compartment of passenger planes. Some airlines have
completely abolished freighters and only transport cargo by the cargo compartment of passenger
planes.
(*: lower hold cargo or belly cargo)
0
2
4
6
8
10
0 2 4 6 8 10 12 14 16 18
RT
K b
y Lo
we
r H
old
of P
asse
nger
Pla
nes
( ×10 9 )
RTK by Freighters ( ×10 9 )
Trends in Cargo Transportation by Major Airlines(2006-2019)
Emirates Qatar Airways
Air France British Airways
Lufthansa Federal Express
Japan Airlines All Nippon Airways
Singapore Airlines Cathay Pacific Airways
China Airlines EVA Air
China Eastern Airlines China Southern Airlines
Air China Korean Air
5 4
3
Source : IATA WATS
Cathay
Qatar
Emirates
ANABA
Singapore
A.China
KAL
China AL
EVA
C.South
JAL
AF
C.East
LH
FedEx

Worldwide Market Forecast 2020 - 2040
173
For all airlines in the world, RTK continued to increase in the 1990s under the leadership of
freighters, but since 2004, the trend has changed significantly to increase transportation capacity
by utilizing the cargo compartments of passenger planes. RTK by freighter decreased or leveled
off. However, the RTK by freighter have resumed to increase around 2013, and is now increasing
somewhat predominantly. As of 2019, freighters accounted for 53% of the total cargo RTK, and
cargo compartments of passenger planes accounted for 47%.
Freight transportation in 2020 was responded to by a decrease in cargo compartment
transportation of passenger plane due to a significant reduction in passenger flights and by an
increase in transportation by freighter, but overall it decreased by 10.6% compared to 2019 results
(IATA). The breakdown of RTK in 2020 is still unknown, but considering the response to the
decrease in ASK, it seems that the RTK by freighter in 2020 increased to about 1.2 to 1.3 times
the actual result in 2019 (red line part in the figure).
0
50
100
150
200
0 50 100 150 200
RTK
by Lower Hold of Passen
ger Planes(
RTK:×109)
RTK by Freighters( RTK:×109)
Volume of Air Cargo Transported by World Airlines(1990‐2019; scheduled air service only)
JADC (1990‐2004)
IATA WATS (2005‐ )
***
***
2009
2004
2017
〜 2019
2012
1990
×1.3
×1.2
Line indicating the level of total RTK for 2020

Worldwide Market Forecast 2020 - 2040
174
Appendix H: Approach to Successfully Putting the SAF on Track
Although the introduction of new aircraft with excellent fuel consumption is an effective means
that can be adopted for CO2 emissions reduction, that alone is not sufficient to achieve the CO2
reduction goal. Therefore, CO2 emissions credits should be purchased for the time being to offset
the insufficiency. However, there is a concern about the stable supply in the future of such credits.
In addition, the future CO2 emissions reduction goals will become more challenging, SAF will
be more necessary going forward even though it is expensive. In that case, reducing the initial
price and gradually decreasing the subsequent prices will be important. It is considered that the
key is to always secure a sufficient production scale to meet the demand for SAF.
SAF will probably be manufactured mainly through the Fischer-Tropsch (FT) process while
collecting CO2 in the atmosphere in the future. Synthetic petroleum produced by the FT method
has always been costly compared to regular petroleum and people have not paid much attention
to while they had access to ordinary petroleum resources. It was, however, used in former
Germany, South Africa, and other countries that had no choice but to use it, and they are
considered to have achieved a certain level of success by working and using it with nationwide
initiative. For such countries, it was a key to ensure a large enough production scale while
receiving policy-based support such as subsidies and guaranteed profit. In future efforts to put
SAF into practical use, it is anticipated that getting out of the vicious circle of low production
volume due to lack of use and lack of use due to the high cost. Ensuring sufficient initial demand
and preparing a level of mass production capability that meets such demand would provide the
breakthrough they need. To this end, it would be a key to seek a collaboration with fuels used in
other fields such as automotive without limiting the concept of alternative fuel only to aviation
fuels.
In 2018, global CO2 emissions originated from automobiles was 18.2% out of total, and so it
can be said that automobiles emit 10 times more CO2 and have a 10 times larger fuel market size
than international air transportation (accounting for 1.8% of the global CO2 emissions) (Related
part: 5.2.6). If these industries work together to secure alternative fuels *, it will be possible to
secure production scale and reduce costs with a much larger hinterland than the aviation industry
alone. And I think this will be the surest way to get the spread of SAF on track at an early stage.
If the SAF becomes practical, passenger planes will not only reduce substantial CO2 emissions,
but will also be able to maintain high cruising efficiency as before by consuming fuel during flight
and reducing the weight of the aircraft. As for automobiles, if Green / Blue fuels become available
as alternative fuels, not only EVs and FCVs that will be produced in the future, but also
conventional automobiles that have already been produced and are used in the world will be
equivalent to Green / Blue cars just by replacing their fuels.

Worldwide Market Forecast 2020 - 2040
175
(*: Fuel manufacturing technology and equipment such as the FT method will be shared
between aviation fuel and automobile fuel, and will be branched to jet fuel, light oil, gasoline,
etc. at the final refinery stage.)

Worldwide Market Forecast 2020 - 2040
176
Glossary of Terms
ASK or Available Seat Kilometers
Passenger transport capacity
The number of seats × Transportation distance (kilometers)
RPK or Revenue Passenger Kilometers
Transportation performance with revenue passengers on board and flown
The number of revenue passengers × Transportation distance (kilometers)
Passenger Load Factor
A numerical value indicating the ratio of the number of revenue passengers on board
to the total number of seats, that is, an indicator for measuring seat sales
Revenue passenger kilometers (RPK) ÷ Available seat kilometers (ASK)
Different from a boarding rate which does not include non-revenue passengers
Yield
Revenue per kilometer (or per mile) for one passenger
Obtained by “Passenger revenue ÷ Revenue passenger kilometers”
In the case of cargo, revenue per kilometer (or per mile) for one ton of cargo
Obtained by “Cargo revenue ÷ Revenue ton kilometers”
CASK or Cost per ASK
An indicator for cost per unit passenger transport capacity
Obtained as cost per seat kilometer (ASK)
ATK or Available Ton Kilometers
Air cargo capacity
Payload capacity (tons) × Transportation distance (kilometers)
RTK or Revenue Ton Kilometers
Transportation performance with revenue cargo on board and flown
Revenue Cargo (tons) × Transportation distance (kilometers)
Cargo load factor
Revenue ton kilometers (RTK) ÷ Available ton kilometers (ATK)

Worldwide Market Forecast 2020 - 2040
177
Abbreviations
A4A Airlines for America
AAPA Association of Asia Pacific Airlines
ACI Airports Council International
AEA Association of European Airlines
ASEAN Association of Southeast Asian Nations
BRICs Brazil, Russia, India, China
BTS Bureau of Transport Statistics, U.S. Department of Transportation
CAPA Centre for Asia Pacific Aviation
CIS Commonwealth of Independent States
COVID-19 Coronavirus disease 2019
DOT United States Department of Transportation
EIA Energy Information Administration
ETS Emission Trading Scheme
EU European Union
FTA Free Trade Agreement
GDP Gross Domestic Product
HOM Heavy and Oversize air cargo Market
IATA International Air Transport Association
ICAO International Civil Aviation Organization
IEA International Energy Agency
JADC Japan Aircraft Development Corporation
JETRO Japan External Trade Organization
JICA Japan International Cooperation Agency
MLIT Ministry of Land, Infrastructure, Transport and Tourism
NIID National Institute of Infectious Diseases
OPEC Organization of the Petroleum Exporting Countries
SARS Severe Acute Respiratory Syndrome
UIC Union Internationale des Chemins de fer
(International Union of Railways)
UN United Nations
UNWTO UN World Tourism Organization

Worldwide Market Forecast 2020 - 2040
178
Abbreviations (cont.)
ASK Available Seat Kilometers
ATK Available Ton Kilometers
CASK Cost per ASK
FFP Frequent Flyer Program
FSC Full-Service Carrier
LCC Low-Cost Carrier
RASK Revenue per ASK
RPK Revenue Passenger Kilometers
RTK Revenue Ton Kilometers
TEU Twenty-Foot Equivalent unit

Worldwide Market Forecast 2020 - 2040
179
Reference Materials
In preparing the "Japan Aircraft Development Corporation, Worldwide Market Forecast 2020-
2040", data and materials published by the following organizations and groups were used.
AACO Arab Air Carriers Organization
AAPA Association of Asia Pacific Airlines
ACI Airports Council International
AEA Association of European Airlines
AFRAA African Airlines Association
ALTA Latin America and Caribbean Air Transport Association
A4A Airlines for America
BTS Bureau of Transportation Statistics, U. S. Department of Transportation
CAAC Civil Aviation Administration of China
DOT U.S. Department of Transportation
EIA U.S. Energy Information Administration
ERAA European Regional Airline Association
EUROCONTROL European Organisation for the Safety of Air Navigation
IATA International Air Transport Association
ICAO International Civil Aviation Organization
IEA International Energy Agency
JETRO Japan External Trade Organization
MLIT Ministry of Land, Infrastructure, Transport and Tourism
RAA Regional Airline Association
UN United Nations
Air Transport World Aviation Week
Aviation Daily Aviation Week
Cirium Cirium
IHS Connect IHS Markit
OAG OAG Aviation Worldwide Limited

Worldwide Market Forecast 2020 - 2040
180
The “Worldwide Market Forecast 2020–2040” can be found on our website at: http://www.jadc.jp
Although the preparation of this material is based on various data believed to be reliable under
the present conditions, risk data and uncertainty factors are also included in past performance data,
and we neither guarantee its accuracy nor completeness.
The association is not liable for any decision made or action taken by users which is based on this
material, or any consequences thereof. Users assume personal responsibility for any decision
made when referring to this forecast.
When copying this material, either in whole or in part, permission of the copyright owner is
required; please contact us regarding this matter. Be sure to cite Japan Aircraft Development
Corporation when quoting any content of the forecast.
Contact details:
Strategic Planning & Market Analysis Department
Japan Aircraft Development Corporation
Osamu Kato ( [email protected] )
Address:
Hibiya Kokusai Bldg. 7F
2-2-3, Uchisaiwai-cho
Chiyoda-ku, Tokyo
100-0011, Japan
URL: http://www.jadc.jp