
Larry Williams Forecast 2017 Report
70
Larry Williams’ 12th Annual Market Analysis and Forecast Predictions Larry Williams Forecast 2017 December 2016
-
Upload
khangminh22 -
Category
Documents
-
view
1 -
download
0
Transcript of Larry Williams Forecast 2017 Report

L arr y Wi l l iams’ 12th Annual Market Analysis and Fore c ast Pre dictions
Larry Williams
Forecast 2017 December 2016

Forecast Road Maps
US Stock Market 3 Presidential Clout Trading Strategy 16 Major Markets of the World 17 US Treasury Bonds 23 Currencies 28 Metals 35 Meats 39 Soft s 42 Grains 47 Energies 57 Select Stocks 61
Final Comments 67
What Else We Do 68
Disclaimer 70
Forecast 2017
© Copyright 2016 Larry Williams CTI Publishing. All Rights Reserved.
IMPORTANT: Th e risk of loss in trading futures, options, cash currencies and other leveraged transaction products can be substantial. Th erefore only “risk capital” should be used. Futures, options, cash currencies and other leveraged transaction products are not suitable investments for everyone. Th e valuation of futures, op-tions, cash currencies and other leveraged transaction products may fl uctuate and as a result clients may lose more than the amount originally invested and may also have to pay more later. Consider your fi nancial condition before deciding to invest or trade.

US Stock Market
I’ve been waiting 10 years to write this report.

Page 4
It’s true. I have been waiting 10 years to sit down and make my 2017 forecast because of the amazing “7” year pattern. My fi rst chart shows the average of all years ending in seven. It paints a very pretty and reliable picture; 1907, 1917, 1927, 1937, 1947, 1957, 1967, 1977, 1987, 1997 and 2007.
Years Ending in 7’s
Th e picture is clear, concise and for the last 110 years, reliable. Stock prices for some mystic reason sell off in the late summer of these years. Based on this study I am expecting a “Trump Tumble” in stocks this coming year.
In some years ending in 7, the decline has started as early as July (1947) while other years in September, around the fall equinox. Th ere has been no consistent pattern of exactly when the knockout punch gets thrown or how powerful the punch will be.
Chart 1 DJIA 7 Year Pattern

Page 5
Th e 1987 crash greatly infl uences the pattern. So our next clip shows all years, except the 1987 outlier in blue, vs all years in red. Dropping out 1987 suggests the selloff begins during the middle of July 2017.
We may add some insight by looking at the powerful 2 year cycle pattern I have mentioned so oft en in these reports.
For new readers this is simply the pattern of a traditional de-trended cycle of 24 months. Nothing fancy here; yet it is eff ective. Th e next chart shows the pattern. You can judge for yourself its infl uence over the last 16 years.
Chart 2 DJIA 1987 Crash Infl uence

Page 6
For a more “up close and personal” look I am next showing a view of the pattern for 2017.
Th e suggestion here is for a rally in late 2016 into a peak in May 2017, with the down move to accelerate the fi rst week of July - not too far off from the 7 year pattern forecast. (Th is part of the report was written in August 2016 so there is no DJIA data to the end of the year… which will allow you to see how well the 2 year pattern played out in real time).
Chart 3 DJIA Two Year Cycle 2000 - 2016
Chart 4 DJIA Two Year Cycle Pattern 2014 - 2017

Page 7
How Trump Trips Up Wall StreetOur New President And What It Means For Investors
Th e biggest news of 2016 was the election of our new president, Donald Trump. Th is election is destined to have a huge impact on economic activity. Th e question is; will it be good, bad or ugly?
We may be able to glean the answer by a study of what’s happened in the past presidential elections. Th e following charts, from my friend Dimitri Speck (based on my work) show what has typically happened during an election year such as the one we are just wrapping up. Source: http://www.seasonalcharts.com
Th e usual pattern in election years has been to see lows in late May then a rally into August (both occurred this year). Despite the Trump/Clinton campaign, the market has pretty much followed the typical or traditional pattern seen in years the United States has elected a President.
Chart 5 DJIA Election Years

Page 8
Th at was then, and this is now. So what happens in years following the election? Th e answer to that is shown in our next chart.
Typically we see a selloff from early January into a February low then a nice rally begins into July. What follows is a signifi cant decline lasting into mid-November before we see a traditional year-end rally. Based on averages from the past, that is what we should expect in 2017.
As you may have noticed Chart 6 is based on data from 1897 to 2009. You will be seeing this chart and others similar to it as you look at the forecasts for 2017. In my view these are not the best charts to look at - the best one is the one I am about to show you.
I say that because election years have varied greatly in the last 120 years. Some presidents took offi ce during the middle of the year, some later in the year. Plus, I have a resolute belief that once the Federal Reserve took charge of the economy (about 1950) there was a massive cycle shift .
For that reason I went back and looked at all election years from 1965 forward and here is what that shows - an exclusive for my readers.
Chart 6 DJIA Post Election Years

Page 9
I believe that 50 year time span represents modern economics and modern politics. Th is is the road map we should study. What it shows is there have been decent rallies, in the year following an election, beginning in April. But they don’t last long; by the middle of June prices peak out and decline all the way to the Th anksgiving holiday.
I believe this will be a much more reliable presidential pattern to follow than the ones you will see bandied about on the Internet and in other reports. Th is one is based on what I think is the most signifi cant years that should have an eff ect on stock prices.
I will be looking at actual price action versus the election year pattern. When prices are stronger than the pattern I will want to be aggressive on the long side. When the current price is weaker than this pattern, I will want to be aggressive on the short side. Th is general road map also suggests what we are looking for, a mid-2017 year selloff .
Chart 7 Years Aft er Election

Page 10
Fundamentals Still Matter
We have seen that cycles can predict things a long time in advance, but clearly they don’t do a great job of forecasting the magnitude of the move. It is my belief that the magnitude of price moves come from the fundamental conditions at the time we arrive at a cyclical turning point, be that up or down.
To shoot down big-game in the stock market you have to use both barrels; cycles and fundamentals. Cycles give us the timing while fundamentals give us the potential for the move.
Th ere are several excellent long-term fundamental indicators that will help you judge the integrity, strength or weakness, of the market averages. Th ose would include the yield curve, P/E ratios, nonfarm payroll reports, unemployment report, and several leading indicators of when recessions should occur. Let’s take a look at a few of those.
Th e yield curve is the diff erence between interest rates on a short-term basis and longer-term basis. It is one of the better predictive tools in the marketplace. It has done a good job of calling in advance most stock market declines and/or recessions. When the yield curve is fl at or inverted it suggests stock prices will decline. Th e last time we saw this was 2007. As they say… the rest is history… one of the largest declines on record. Th ere is a reason for this; what causes an inverted or declining curve? When ‘smart money’ is frightened of the future they demand a higher rate of return on short-term notes than on longer-term ones. When this condition occurs, it suggests informed money is alarmed about the current economy.
Th e chart below shows the current status of the yield curve.
Chart 8 Yield Curve

Page 11
What we see is a positive yield curve with an upward slant. Th at has in the past been associated with bull markets. Until the yield curve begins to descend, it would be highly unusual to see a bear market begin. You can follow this yourself on http://www.stockcharts.com website.
Th e Fed Is Our FriendAs I wrote last year, if I had one and only one long-term fundamental indicator to rely on to tell us the probabilities of entering a recession, it would most likely be the Anxious Index.
In the past whenever this index has risen above 40, we have been close to, or at, the start of a recession. Th e past is prologue, while it’s fun to visit the past we don’t want to live there. We want to live in the future, and what we are seeing in this gauge suggests we are not starting a recession - which is bullish for stock prices.
Th is index is published four times a year by the Federal Reserve Bank of Philadelphia. You can learn more about it on their web site. It is a survey of professional forecasters. So in theory, it suggests what informed people are thinking about the future. Th ese people are probably smarter than you or I as their track record proves. Th at’s why the Federal Reserve Bank surveys them, not us.
Chart 9 Anxious Index
Page 12
For 2016 the forecasters were predicting growth of 2.8%. We actually came in at a growth rate of 2.5%. I pointed out in last year’s forecast that this growth rate of 2.8%, as forecast, was indicating we would not have a robust economic growth. Th at, in part, is why the Fed has not raised interest rates to any substantial degree and why most economic readings are for more of a holding pattern than a straight up or down move. For this coming year, they are predicting at an anemic growth rate of 2.2%. Unemployment, as they see it, hangs in the 4.9% zone.
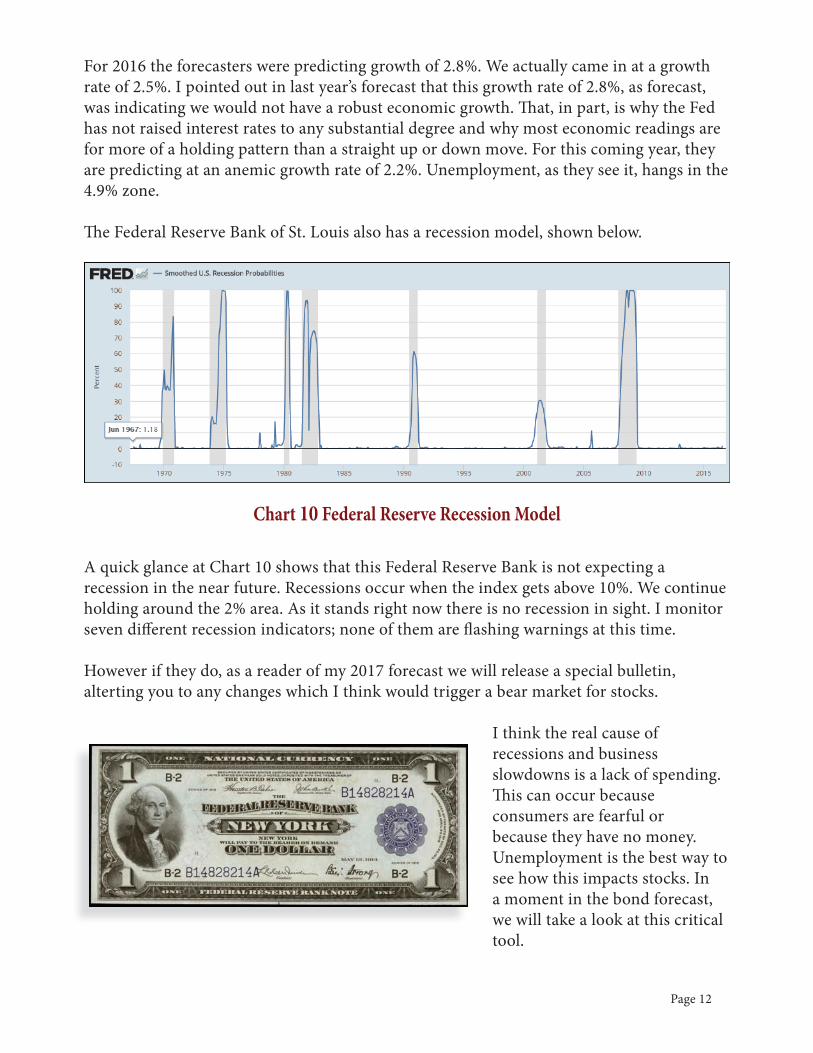
Th e Federal Reserve Bank of St. Louis also has a recession model, shown below.
A quick glance at Chart 10 shows that this Federal Reserve Bank is not expecting a recession in the near future. Recessions occur when the index gets above 10%. We continue holding around the 2% area. As it stands right now there is no recession in sight. I monitor seven diff erent recession indicators; none of them are fl ashing warnings at this time.
However if they do, as a reader of my 2017 forecast we will release a special bulletin, alterting you to any changes which I think would trigger a bear market for stocks.
I think the real cause of recessions and business slowdowns is a lack of spending. Th is can occur because consumers are fearful or because they have no money. Unemployment is the best way to see how this impacts stocks. In a moment in the bond forecast, we will take a look at this critical tool.
Chart 10 Federal Reserve Recession Model

Page 13
2017 FORECASTHere it is… hot off the press... Our forecast for stock prices for 2017
Knowing the future is very, very diffi cult while seeing the past has total clarity.
With that thought in mind, here is the forecast for 2016 - in red - and how the Dow Jones actually traded. All in all, this “Natural” cycle of stock prices blazed an easy to follow path.
2016 Forecast Updated
As good as the forecast was, it is water under the bridge. Can we do as well in 2017?
No one knows. But on balance we have been fortunate with these forecasts, and I suspect our good fortunes will continue.
Next is the 2017 forecast.
Chart 11 DJIA 2016 Natural Cycle Forecast

Page 14
My interpretation of the road map is that we begin a selloff shortly aft er the New Year starts. Th is leads into a very good buy point around the fi rst of March. A rally should carry into the 4th of July Holiday. From there on, caution is the word of the day. Expect a bounce in early September. Stock prices have usually rallied at this time following an election year.
We’ll have a much better idea about how bad this decline will be once we start getting economic data during the fi rst and middle part of 2017. If we see unemployment numbers turning up in conjunction with rate increases, technical deterioration in the advance decline line and other such indicators, I would look for a real shellacking to take place in stock prices. Th is fi ts in nicely with the two-year cycle as well as the pattern of years ending in 7.
Keep in mind that the red line is my natural cycle (which seems to work in all freely traded markets) and is just a projection. Th e exact magnitude and what takes place when we get to these projections is more determined by the news and data of the day. What we have here is a great advance warning of when to be on high alert for stock prices in 2017.
I will be looking for my buy point in October. Th e suggestion is around the 23rd or 24th of the month based on the above forecast as well as other work I do. Stock prices have almost always rallied at this time of the year following an election.
Chart 12 DJIA 2017 Natural Cycle Forecast

Page 15
A Very Long Term View…
For those that want an even longer term road map, below is the trail I am seeing that prices will wander around out to 2020. Th is is a very roughshod forecast and the fi rst long term one I have ever made. So I am treating it as a general guideline.
Keep in mind cycles are better at the “when” than the magnitude. Th e next great-grand buying point comes about the start of 2019.
As we get closer we will know more as the truth of markets unfold.
Before we turn our attention to the other major markets of the world, I have a strategy I would like to share with you.
Chart 13 Long Range Projection

Page 16
Presidential Clout Trading Strategy
We introduced this trading strategy in our 2015 annual forecast for the S&P E-minis. It’s based at least partially on the Presidential Cycle. I’ve written about the cycle before. I’m certain you have read about in other places. It’s one thing to have a conceptual idea. It’s another to make it into a specifi c trading strategy, which was what I tried to do back in 2015.
Th rough December 18, 2016 there were 27 trades, making $8,588 with 88% accuracy.
Buy Signal Rules
1. For this rule we must be in an uptrend. Th at means today’s 200 day moving average is greater than it was three days ago. If that condition is true, we will buy tomorrow if tomorrow is Trading Day of the Year 21, 64, 100, 213, 220, 233, 236 or 255 and we are not in the month of May.
2. For this rule we require today to be an outside day. Th at’s a day with a higher high and lower low than the prior day’s high and low. Th e outside day must close less than the prior day’s low and the prior day’s low must have closed less than the low of the day before that. Take this trade on all days but Monday. Th e entry is to buy tomorrow on the open.
3. Th is is an October trade. If it is October and tomorrow is the 3rd trading day left in October, we will buy on the opening tomorrow.
4. Th is is a November trade. We will buy on the opening tomorrow if it is a Tuesday and the trading day of the month is less than six.
5. Here is another trend fi ltered rule. If the 200 day moving average is greater than three days ago, today was not an outside bar with an up close, tomorrow is not Friday or Tuesday, and the trading day of the month is not trading day four or seven... we then buy on the opening tomorrow if it is the 2nd, 10th, 12th, 19th, 22nd or 23rd trading day left in the month.
Sell Signal Rule
It is not August. Th e calendar day of the month is not 16. Today is the ninth trading day left in the month and tomorrow is not a Monday, Tuesday or Th ursday. If all those conditions exist, sell short tomorrow on the open.
Th e exit rule is to exit on the fi rst profi table opening or a $3,000 stop if long or $1,600 stop if short. US Federal Holidays do not count as trading days. Use the electronic trading session opening.

Stock Indexes

Page 18
DAX-Germany
It looks like stocks in Germany will pretty much follow the pattern of stocks in America. Th ere should be a buy point in early March, a signifi cant selloff starting in June, perhaps a double top the middle of July, and then a decline that should last until early October.
Chart 14 Germany 2017 Natural Cycle Forecast

Page 19
Australia
I’m still not wildly pleased with my 2016 forecast of the Australian stock market, but we do have more data this year which helps make these forecasts. Th e suggestion is, just as in Germany, a buy point in March. Th ere is another one in the middle of June but then we go into what looks like a choppy trading range aff air. Th e most signifi cant selling point should be the fi rst of May.
Chart 15 Australia 2017 Natural Cycle Forecast
Page 20
Japan
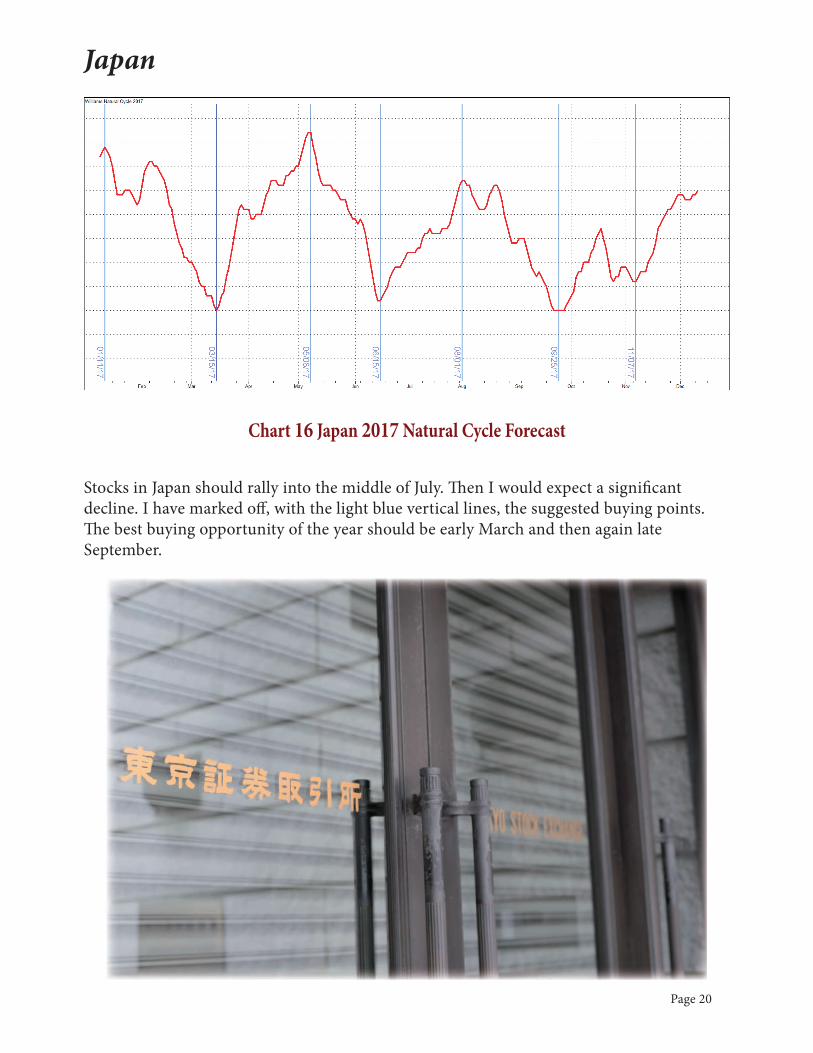
Stocks in Japan should rally into the middle of July. Th en I would expect a signifi cant decline. I have marked off , with the light blue vertical lines, the suggested buying points. Th e best buying opportunity of the year should be early March and then again late September.
Chart 16 Japan 2017 Natural Cycle Forecast

Page 21
Russia
It looks like stocks in Russia will also get tagged in May and continue declining until October. I expect a bear trend here for the entire year once we get past the February to May rally.
Chart 17 Russia 2017 Natural Cycle Forecast

Page 22
China
In China we have a similar problem to Australia… I’d like to have more data to make these projections. Nonetheless, we see an evolving uptrend until July and then prices come right back down again. Th is pattern is greatly infl uenced by the decline one year ago in China. So I would not pay a great deal of attention to the magnitude that you see here. Pay attention more to the turning points.
Chart 18 China 2017 Natural Cycle Forecast

Interest Rates and Th e Bond Market

Page 24
Interest Rates And Th e Bond MarketGross Federal Debt appears to have been driven higher by mandatory payments. We have now reached the point where Debt is greater than our GDP! Th is ratio has surpassed 100% in each of the past fi ve years.
Th e Negative Spin Off Of Debt
Th e presumption of policy makers is that more defi cit spending and debt is needed to address economic underperformance. Th ere are negative consequences to these good intentions; this economic thinking unwittingly causes an even faster rate of economic deterioration. Let me prove that point.
As the government piles on debt to support household income, consumers believe that saving for retirement or contingency is not important because the government promises to
Chart 19 Gross Fed Debt

Page 25
fund our income and medical problems. Th at causes a drop in savings, or as Shakespeare said, “Necessity is the mother of invention… and necessity must be obeyed”. Since savings from income must equal real investment, the latter drops. With real investment weaker, productivity, profi tability and economic growth follow suit.
Debt reduces savings, a reduction in savings cuts back investments… a cut back in investments is a cut back in jobs and growth.
A quick turn of our attention to Japan proves the point. In Japan household gross saving rate fell from THE WORLD’S highest at 26.6% in 1989 to 6.6% in 2015. Productivity growth averaged 3.2% from the start of the data in the early 1980s through 1991, and dropped to 0.5% in the latest 10-year period.
Japan reached the 90% government debt-to-GDP ratio in 1999 and has exceeded that level every year since then. Th e rest is history; Japan has fl oundered and we seem to be repeating that history in the USA.
Th e economic malaise of Japan helped produce the following chart.
With fewer births, labor force entries declined. Of course, so does employment, which means slower economic growth.
With that in mind let’s take a look at the same data for the USA.
Chart 20 Japan Annual Births

Page 26
We see the same truths to be self-evident; birth rates in the United States have dropped precipitously, most likely driven at least in part by the decline in economic growth. A point to consider is that immigrants to America have a much higher birth rate than non-immigrants. At some point, should the trend of immigration continue, these two lines are going to cross.
Debt is good the Fed says. But, too much of anything is not good that’s where we are as we enter 2017. In the latest tally of federal debt we saw an increase by $2.2 trillion while GDP gained only 450 billion. Debt is at an all-time high relative to GDP. Any hike in interest rates by the Federal Reserve will only serve to lower GDP which is already staggering from a Mike Tyson like punch from massive debt. Unless the Federal Reserve is destined to destroy productivity, and I don’t think they are, interest rates will remain stable in 2017.
Do you now see how this all comes together to produce a lackluster economy? Th is trend is - for the foreseeable future - irreversible.
Chart 21 US Birth Rate

Page 27
What Does Th is Mean For Investors?
With slowing nominal economic growth, I can see only one course of action for the Fed; rates will stay low and probably go lower. Th e bond bull market is not over.
We can cut through all the economic gibberish with our study of cycles. Th ey may be wrong, but they will be clearly wrong while economics is always unclear, right or wrong!
Th e suggestion is that bond prices selloff at the fi rst of the year, rally into March with a pull back into a low in early May... then starts the 2017 bull market in bonds.
Chart 22 Treasury Bonds 2017 Natural Cycle Forecast

Currencies
Page 29
2017 Currencies
Let’s march through the major currencies of the world in alphabetical order, starting with the Australian Dollar and ending up with United States Dollar. Typically in the past, most currencies have performed just the opposite of the US dollar. Th is year it looks like some will be in sync and some will be out of sync. Notably the United States Dollar should be declining most of the year, as you’ll see in a moment.
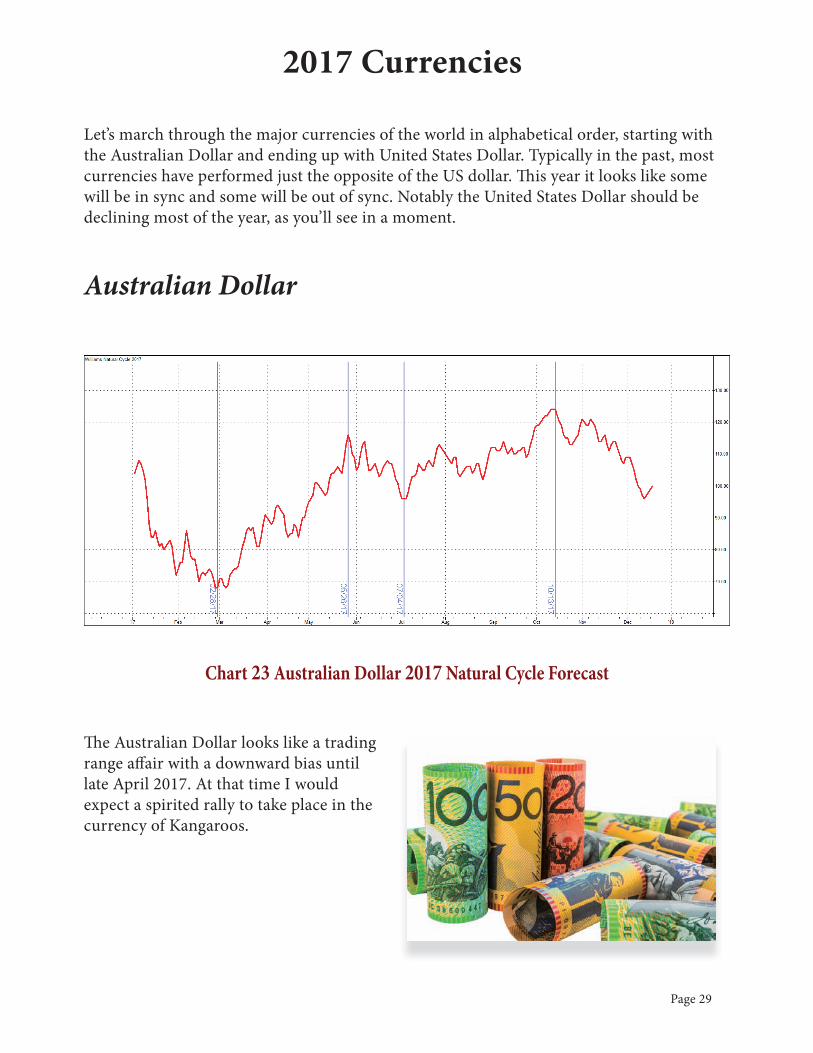
Australian Dollar
Th e Australian Dollar looks like a trading range aff air with a downward bias until late April 2017. At that time I would expect a spirited rally to take place in the currency of Kangaroos.
Chart 23 Australian Dollar 2017 Natural Cycle Forecast
Page 30
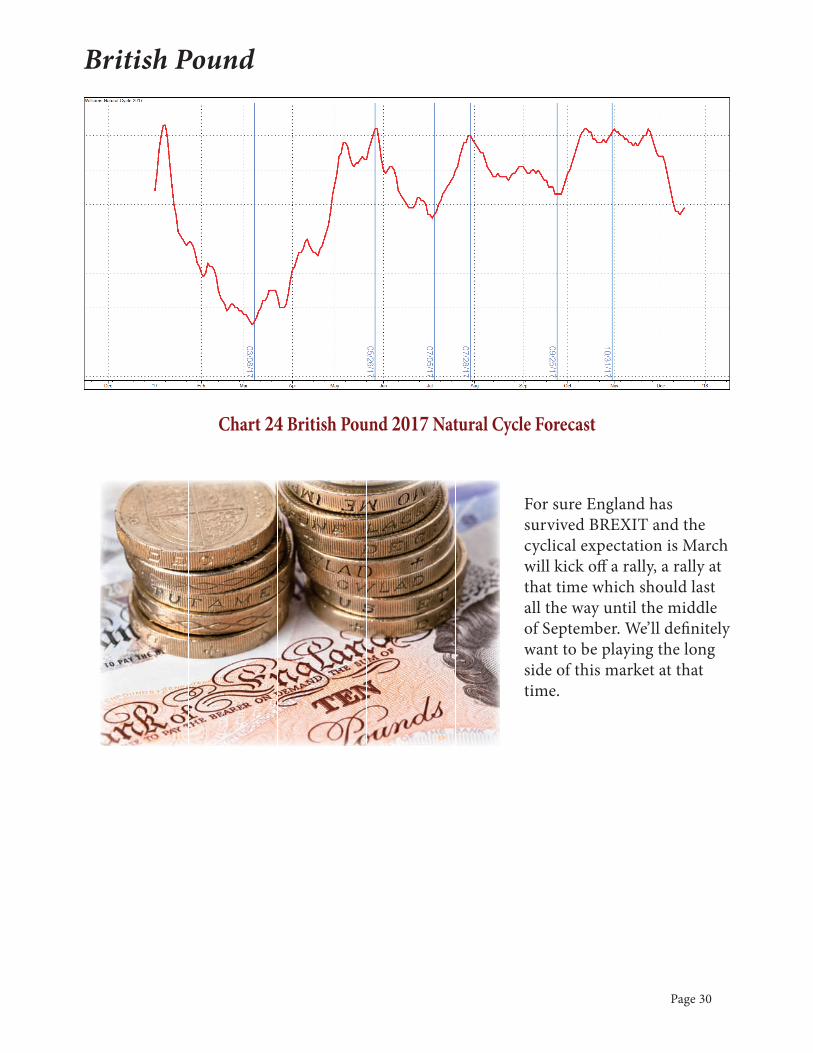
British Pound
For sure England has survived BREXIT and the cyclical expectation is March will kick off a rally, a rally at that time which should last all the way until the middle of September. We’ll defi nitely want to be playing the long side of this market at that time.
Chart 24 British Pound 2017 Natural Cycle Forecast

Page 31
Canadian Dollar
Th e Canadian Dollar typically moves in unison with the price of Crude Oil. Not certain that will happen this year, but you should compare this pattern with the forecast for crude oil.
Th e expectation for the Looney is that it sells off at the fi rst of the year then expect a buy signal the fi rst week of March, giving away to the best rally of the year lasting until May. Aft er that we decline into a sideways market.
Th e best use of these road maps is a show of when to expect cyclical
turning points as I’ve marked off for you.
Chart 25 Canadian Dollar 2017 Natural Cycle Forecast

Page 32
European Currency
Across the pond in Europe I would expect a bullish market starting in late February or early March, lasting all the way to December.
Th e idea here would be to buy pullbacks and oversold conditions in this market as they develop. Th e expectation is for a bull market in the European currency.
Chart 26 Euro Currency 2017 Natural Cycle Forecast

Page 33
Japanese Yen
Th e economy of Japan appears to still be fl oundering. Th e forecast for the Yen is suggesting the same; a further deterioration in the yen until August 2017. Aft er that we should expect a very good rally in this market almost through the end of the year. Th e bottom line is weakness in the fi rst of the year, strength in the latter part of the year.
Chart 27 Japanese Yen 2017 Natural Cycle Forecast

Page 34
Dollar Index
Last but not least comes to US dollar index.
Typically this market rallies at the beginning of every year. Th at has been the seasonal pattern.
Our natural cycle forecast suggests this rally can last until the fi rst week of March aft er that… It’s a new ball game. I would expect lower prices the rest of the year.
At some point there will be an attack on the US dollar relative to other currencies. Coupled with the fact that a high US dollar will drive down US exports, caution is needed aft er the peak suggested in March.
Chart 28 Dollar Index 2017 Natural Cycle Forecast

Precious Metals

Page 36
Metals
It’s surprising how strong the seasonal infl uence is for metal markets. You would almost think they are harvested like wheat and soybeans.
Th is seasonal pattern, I believe, is caused not only by buying and selling jewelry for Christmas (with buying in August) but also for industrial usage.
Gold
My forecast for gold says we should rally into the end of February, then have a gentle downward drift until the middle of August. A seasonal trend kicks in then, giving us a strong rally until the end of November.
Chart 29 Gold 2017 Natural Cycle Forecast

Page 37
Silver
It looks like Silver will be more volatile than gold and perhaps have more of a trading range. Signifi cant selling points should be at the end of February, the fi rst of June, and the middle of October. I’ve marked the buy points off for you.
Copper
Chart 30 Silver 2017 Natural Cycle Forecast
Chart 31 Copper 2017 Natural Cycle Forecast

Page 38
Copper appears to be more in step with stock prices than gold or silver. It looks like the best rally opportunity of the year should be from the middle February until the middle of April. Th en it’s down, setting up a buy point the fi rst week of July. Th at buy should last until August, when we then turn back to the downside.
PlatinumPlatinum bulls should be happy until the middle of May or early June. Th en I would expect prices to move sideways if not to the downside. More importantly, I suggest you pay attention to the turning points to help you navigate the ebb and fall of platinum.
In late May I would expect there will be a great deal of bullishness, just don’t get carried away with it.
Chart 32 Platinum 2017 Natural Cycle Forecast

Meats

Page 40
MeatsOh how I miss trading pork bellies! Th ey were one of the most seasonal of all markets. Now we’re just left with hogs and cattle.
Lean Hogs
Th e projection for the hog market is a trading range aff air until the middle of April. Th en we go down until the end of August. Typically hogs rally in August. So we have confi rmation from not only the seasonal pattern, but also my natural cycle forecasts a rally to start in early August that carries through to the end of the year.
Chart 33 Lean Hogs 2017 Natural Cycle Forecast

Page 41
Cattle
Cattlemen cried all year long in 2016 about sharply lower prices, and the ones I talk with are worried to death about 2017. I tell them not to worry. Th e “Make America Great Again” crowd are steak eaters. Expect a strong bull market from March into July as well as a premium price structure once December goes off the board. If this premium continues we could get a commercial bull market in cattle. So pay attention to this market.
Chart 34 Cattle 2017 Natural Cycle Forecast

Soft s

Page 43
Cocoa
Th e suggestion here is that chocolate bars should get cheaper in 2017. Expect a seasonal high in February, then lower prices until June at which point a bull market could carry the rest of the year.
Sugar
Chart 36 Sugar 2017 Natural Cycle Forecast
Chart 35 Cocoa 2017 Natural Cycle Forecast

Page 44
My projections for sugar call for this market to continue to the downside until early October of 2017. Th en we should see a violent rally to the upside lasting the rest of the year.
Coff ee
Coff ee appears to give us another year of large trading range activity. We will want to buy the big dips and sell the big rallies.
Hopefully my natural cycle forecast has spotted the turns, long in advance, as marked off above.
Chart 37 Coff ee 2017 Natural Cycle Forecast
Page 45
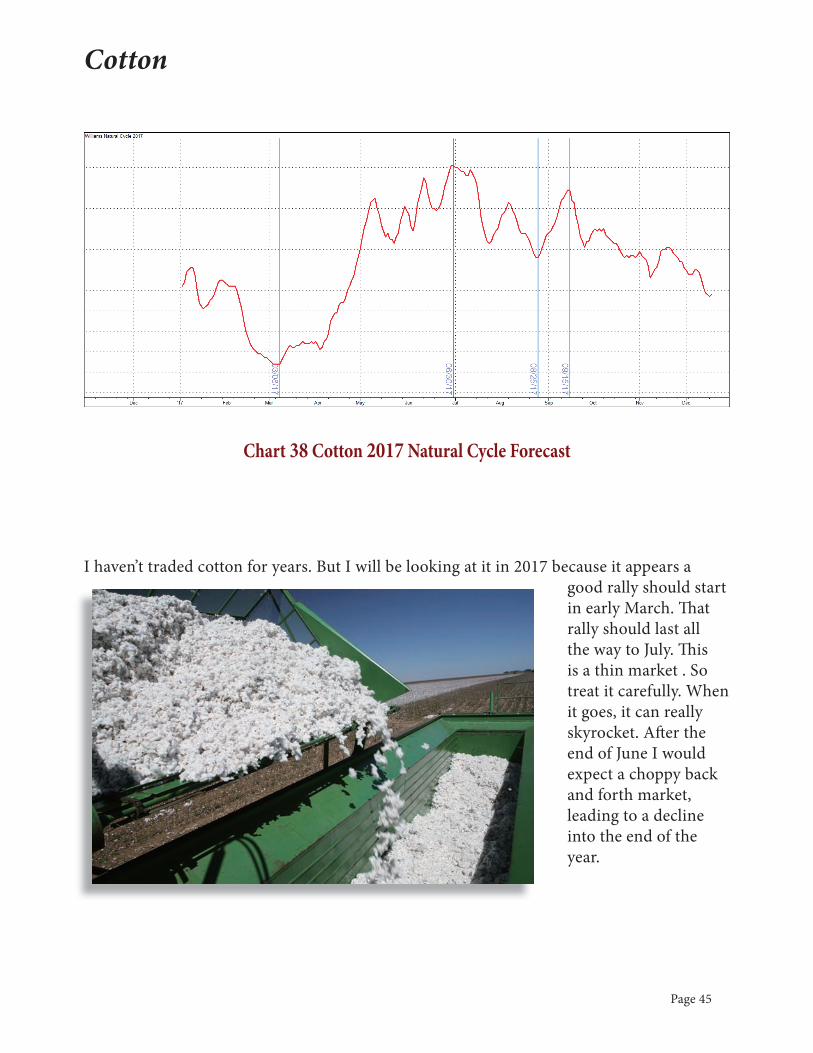
Cotton
I haven’t traded cotton for years. But I will be looking at it in 2017 because it appears a good rally should start in early March. Th at rally should last all the way to July. Th is is a thin market . So treat it carefully. When it goes, it can really skyrocket. Aft er the end of June I would expect a choppy back and forth market, leading to a decline into the end of the year.
Chart 38 Cotton 2017 Natural Cycle Forecast

Page 46
Lumber
No one seems to pay attention to Lumber these days. Yet it is tradable and has strong seasonal and cyclical swings. Above all, prices of this market have been a good leading indication of the bond market. Th e message for 2017 is to look for a bullish bias with a June sell off and even stronger slide starting in late August or early September.
Chart 39 Lumber 2017 Natural Cycle Forecast

Grains

Page 48
Gains In Th e Grains For 2017?As long-term followers of my work know we have learned to place a great deal of importance on the decennial or 10 year cyclical pattern for not only stock prices but also grain markets. Th ere is some indication the same cycle is alive, well and working, in treasury bonds too.
Th e following chart shows the average of all years ending in six versus soybean meal for 2016. It wasn’t a bad forecast!
Next let’s take a look at the same ‘6’ cyclical forecast for soybeans.
Chart 40 Soybean Meal Years Ending in 6
Page 49
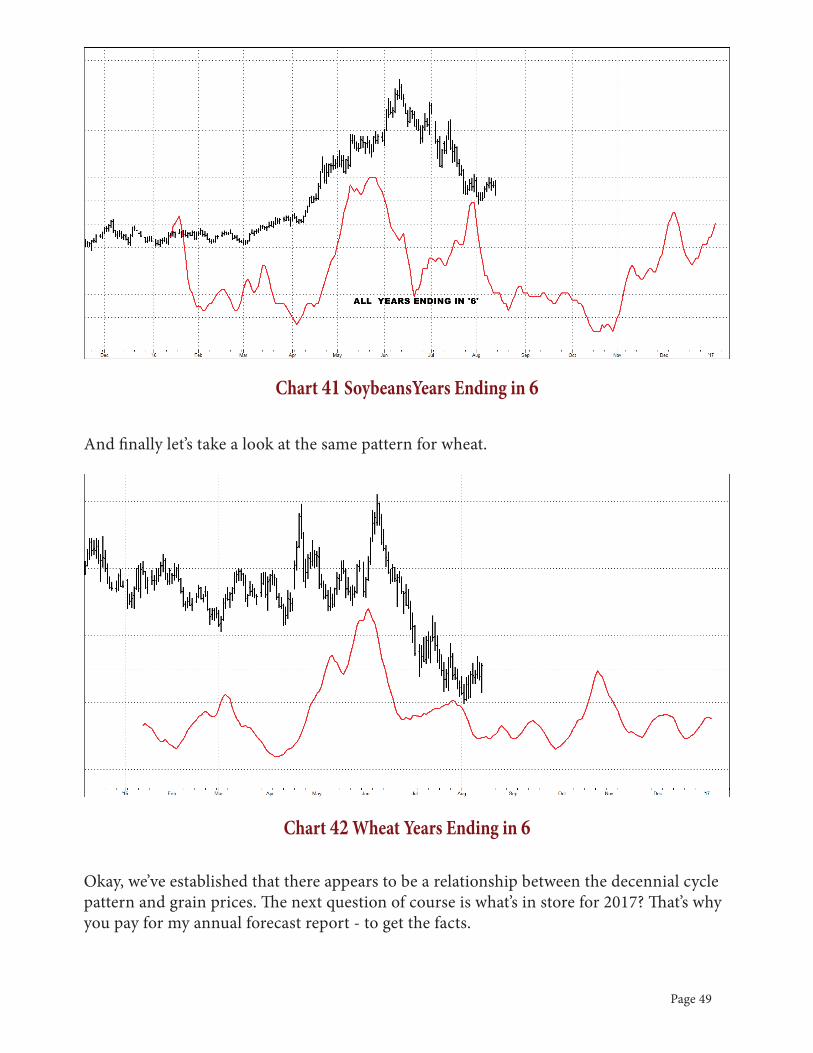
And fi nally let’s take a look at the same pattern for wheat.
Okay, we’ve established that there appears to be a relationship between the decennial cycle pattern and grain prices. Th e next question of course is what’s in store for 2017? Th at’s why you pay for my annual forecast report - to get the facts.
Chart 41 SoybeansYears Ending in 6
Chart 42 Wheat Years Ending in 6

Page 50
Here they are. Th e next fi ve charts show the decennial pattern for corn, soybeans, soybean meal, soybean oil, and wheat for this coming year. Th ese are certainly guidelines traders will want to pay attention to.
Corn
Soybeans
Chart 43 Corn Years Ending in 7
Chart 44 Soybeans Years Ending in 7

Page 51
Soybean Meal
Soybean Oil
Chart 46 Soybean Oil Years Ending in 7
Chart 45 Soybean Meal Years Ending in 7

Page 52
Wheat
With that behind us let’s take a look at my more specifi c natural cycle forecast for the grains. While the seven-year patterns look at a specifi c set of years, the natural cycle forecast is based on fi nding years that fi t similar patterns to the year we have just gone through. Th en it uses the years following that to come up with the forecast. Here’s what that study shows is in store for 2017.
Chart 47 Wheat Years Ending in 7
Chart 48 Wheat 2017 Natural Cycle Forecast

Page 53
Th e suggestion here is that we should have a decent rally starting in late February. Th at leads up to a May top. Th e expected decline could last until September but then a substantial up move should begin. Note this also fi ts in quite well with the 10 year decennial pattern. Traders will want to pay a lot of attention to the Commitment of Traders Report starting in August to see if the Commercials are accumulating long positions. If they are, that should represent one of the best trades of the year for wheat.
Corn
Th e pattern is not dissimilar from what we are expecting for Wheat. We should see choppy action with an upside bias until June, then a signifi cant selloff that sets up a very powerful buying opportunity in September.
Th e decennial pattern suggests the low point comes in the middle of August. So, just like wheat, we will want to focus attention on the Commitment of Traders Report. Also notice both forecasts suggest a selloff starting in May and June.
Chart 49 Corn 2017 Natural Cycle Forecast

Page 54
Soybeans
In the case of soybeans, we should be looking for a buying opportunity the fi rst part of March for a strong rally that goes into June. Th en that gives way to a signifi cant decline. Th e decline should end with a nice rally starting the latter part of September.
Th e 10 year decennial pattern suggests a rally might start a little earlier.
Th e point is, we want to be looking for a large commercial long position and trend changes in soybeans at this time.
Chart 50 Soybeans 2017 Natural Cycle Forecast

Page 55
Soybean Meal
Th ere’s a confl ict between the natural cycle forecast for soybean meal and the decennial pattern. Th ey both agree we should see a selloff in the May/June time. Th ey agree on a rally starting in October. But as you can see from studying the charts, they disagree on the potential magnitude for these moves.
Th is is where it is important to keep in mind that all a cycle can forecast is when turning point should occur - they do not do an excellent job of telling us how big or small that move will be. Th at’s why when we get to these turning points we want to look at exogenous data (such as the Commitment of Traders Report, valuation, accumulation and one could add seasonal infl uences) to help us understand what should happen when we get to these turning points.
My inclination is to trust the natural cycle. My experience shows the most important thing is to watch price relative to these two patterns to see which one, this year, it is following. In other words, let the market tell us which one to pay attention to.
Chart 51 Soybean Meal 2017 Natural Cycle Forecast

Page 56
Soybean Oil
Again I will be looking for a rally in March into mid-May. Th at should be the best buying opportunity for soybean oil this coming year.
I expect a dip from mid-May to mid-June, setting up another buy point with a market top around the fi rst week of August.
Th e decline that sets up should last until the fi rst week of October.
Chart 52 Soybean Oil 2017 Natural Cycle Forecast

Energies 2017

Page 58
Love may make the world go around but without the energy markets, the world will stop spinning. Nothing has become more critical to society than hydrocarbons, and it appears a Trump administration will be taking an expansive view towards exploration and production.
Th ere are more people employed in the production of solar and wind energy than coal and oil. Th at is a staggering thought. Clearly more energy is produced per person in the hydrocarbon business than alternative energy.
Perhaps that’s why our natural cycle forecast is for a brief dip in the fi rst part of 2017 then a strong rally into August.
Crude Oil
Expect Crude Oil to put in a bottom in late February that kicks off a rally into early June. Th en our forecast suggests a dip into the fi rst of July and rally into the fi rst of August that may well be the high for the year. Interesting how close this follows our stock market forecast for 2017.
Chart 53 Crude Oil 2017 Natural Cycle Forecast

Page 59
Heating Oil
Of course heating oil moves pretty much like crude oil. But this year the suggestion is heating oil may top fi rst, somewhere in the middle of June. From that point on prices should move to the downside.
Chart 54 Heating Oil 2017 Natural Cycle Forecast

Page 60
Natural Gas
Natural gas has been in pretty much a perpetual bear market. If that is to change it would take place in early September 2017. It looks like a trading range until then.
Chart 55 Natural Gas 2017 Natural Cycle Forecast

Select Stocks

Page 62
General Electric GE
Apple AAPL
Chart 56 General Electric 2017 Natural Cycle Forecast
Chart 57 Apple 2017 Natural Cycle Forecast

Page 63
Altria MO
IBM
Chart 58 Altria 2017 Natural Cycle Forecast
Chart 59 IBM 2017 Natural Cycle Forecast

Page 64
Home Depot HD
Cocoa-Cola KO
Chart 60 Home Depot 2017 Natural Cycle Forecast
Chart 61 Coca-Cola 2017 Natural Cycle Forecast

Page 65
General Mills GIS
Microsoft MSFT
Chart 62 General Mills 2017 Natural Cycle Forecast
Chart 63 Microsoft 2017 Natural Cycle Forecast

Page 66
Exxon XOM
Walmart WMT
Chart 65 Walmart 2017 Natural Cycle Forecast
Chart 64 Exxon 2017 Natural Cycle Forecast

Page 67
Final Comments
I hope you’ve enjoyed this year’s presentation of my forecasts. We have developed a very loyal following over the years. Here’s a great big THANK YOU to my longtime readers, and WELCOME to the family for those of you who are new to my forecasts. Most people think it’s virtually impossible to forecast the future with any degree of accuracy… my longtime readers know… we’ve had some absolutely spot on calls with these forecasts.
A recent example was while most investors and traders were blown out by the BREXIT mini crash this year our road map called for a low on 6/30... we were ready for one of the best buy points of the year!
Th ey are not always going to be 100% accurate. Don’t expect that. We have hit the bull’s eye oft en enough that we know we get a much better glimpse of the future than anyone else in this business.
Please keep in mind your purchase of this forecast includes any major stock market buy and sell signals I will get this coming year based on my recession indicators. At this time I do not see any sell signals in the off ering, but one never knows.
Sometimes in the past I’ve done a midyear report… for which we charge as it is lengthy and takes a great deal of my time. Sometimes we just do a mini bulletin for which there is no charge. Th ere are absolutely no promises on what I will do this coming year. We will stay in touch with you, of course.
A special thanks to Louise Stapleton who edits, formats and publishes this work. Without her my work would never see the light of day. Also thanks to Chad Noble for the ability to take my ideas and turn them into the reality of forecasts.
Best Wishes For 2017,
Larry Williams
LnL Publishing, LLCSt Croix, U.S. Virgin Islands

Page 68
What Else We DoI hope you have enjoyed our 2017 forecast report. If you’re not aware of the other market services we off er let me introduce them to you.
Larry TVTh is is my weekly video market commentary where I point out immediate trading opportunities, discuss why these markets are set up, as well as give potential entry points with stops and targets. Th is is more than just a buy/sell recommendation service. I also teach what makes markets move as well as timing techniques. If you are an active trader this is the most valuable service we off er. https://www.ireallytrade.com/larrytv/
Mechanical Trading StrategiesWe off er two mechanical trading strategies at TradeStation for those who would like to trade the S&P E-mini’s or bonds. Th ese can be set up to trade automatically, or of course you can monitor the strategy and choose to take/not take each signal.
Here’s the equity curve of the E-mini trading system. Th is strategy has been available in TradeStation for 3 years now.
Since January1, 2016 we have had 30 trades, 76.6% were profi table with a net profi t of $16,087. Pretty good results; which explains why trade this with our own money right along with you.

Page 69
We also off er a bond mechanical trading strategy here’s the equity curve.
Since January 1, 2016 the strategy has had 30 trades with a net profi t of $14,030, and just like with the E-mini system we trade this with our own money. I think I am the only mechanical strategy guy who trades his own systems with his own money.
If you’d like more information about either of these strategies and are a TradeStation user go to their app store for more information:
https://tradestation.tradingappstore.com/products/LarryWilliamsSPE-MiniStrategyhttps://tradestation.tradingappstore.com/products/LarryWilliamsBondStrategy
Th ese strategies are also available at Robbins brokerage fi rm where they will trade the strategies on your behalf. Contact us for more information.
Online Courses
Finally, for those of you who want to learn how to be an independent trader, we have our online courses. You can get started with my introductory course, Cracking the Money Code: https://www.ireallytrade.com/crackingthecode.htm
Of course, you can fi nd all we off er by simply going to https://www.ireallytrade.com

Page 70
Disclaimer
NO REPRESENTATION IS BEING MADE THAT ANY ACCOUNT WILL, OR IS LIKE-LY TO ACHIEVE PROFITS OR LOSSES SIMILAR TO THOSE DISCUSSED WITHIN THIS DOCUMENT, SUPPORT AND TEXTS. OUR COURSE(S), PRODUCTS AND SERVICES SHOULD BE USED AS LEARNING AIDS. IF YOU DECIDE TO INVEST REAL MONEY, ALL TRADING DECISIONS ARE YOUR OWN. OUR TRACK RECORD IS FROM TRADES GIVEN TO SUBSCRIBERS IN ADVANCE AND ARE NOT HIND-SIGHT. THE RESULTS MAY HAVE UNDER-OR-OVER COMPENSATED FOR THE IMPACT, IF ANY, OF CERTAIN MARKET FACTORS, SUCH AS LACK OF LIQUIDITY. HYPOTHETICAL OR SIMULATED PERFORMANCE RESULTS HAVE CERTAIN LIM-ITATIONS. UNLIKE AN ACTUAL PERFORMANCE RECORD, SIMULATED RESULTS DO NOT REPRESENT ACTUAL TRADING. SIMULATED TRADING PROGRAMS ARE SUBJECT TO THE FACT THAT THEY ARE DESIGNED WITH THE BENEFIT OF HINDSIGHT. THE RISK OF LOSS IN TRADING COMMODITIES CAN BE SUB-STANTIAL. YOU SHOULD THEREFORE CAREFULLY CONSIDER WHETHER SUCH TRADING IS SUITABLE FOR YOU IN LIGHT OF YOUR FINANCIAL CONDITION.
CFTC RULE 4.41 - HYPOTHETICAL OR SIMULATED PERFORMANCE RESULTS HAVE CERTAIN LIMITATIONS. UNLIKE AN ACTUAL PERFORMANCE RECORD, SIMULATED RESULTS DO NOT REPRESENT ACTUAL TRADING. ALSO, SINCE THE TRADES HAVE NOT BEEN EXECUTED, THE RESULTS MAY HAVE UNDER-OR-OVER COMPENSATED FOR THE IMPACT, IF ANY, OF CERTAIN MARKET FACTORS, SUCH AS LACK OF LIQUIDITY. SIMULATED TRADING PROGRAMS IN GENERAL ARE ALSO SUBJECT TO THE FACT THAT THEY ARE DESIGNED WITH THE BENEFIT OF HINDSIGHT. NO REPRESENTATION IS BEING MADE THAT ANY ACCOUNT WILL OR IS LIKELY TO ACHIEVE PROFIT OR LOSSES SIMILAR TO THOSE SHOWN.