Connector Industry Forecast - March 2021 - Bishop ...
12
-
Upload
khangminh22 -
Category
Documents
-
view
3 -
download
0
Transcript of Connector Industry Forecast - March 2021 - Bishop ...

Connector Industry Forecast
Bishop & Associates Inc. Copyright © 2021 2
Report No.: F-2021-01
March 2021
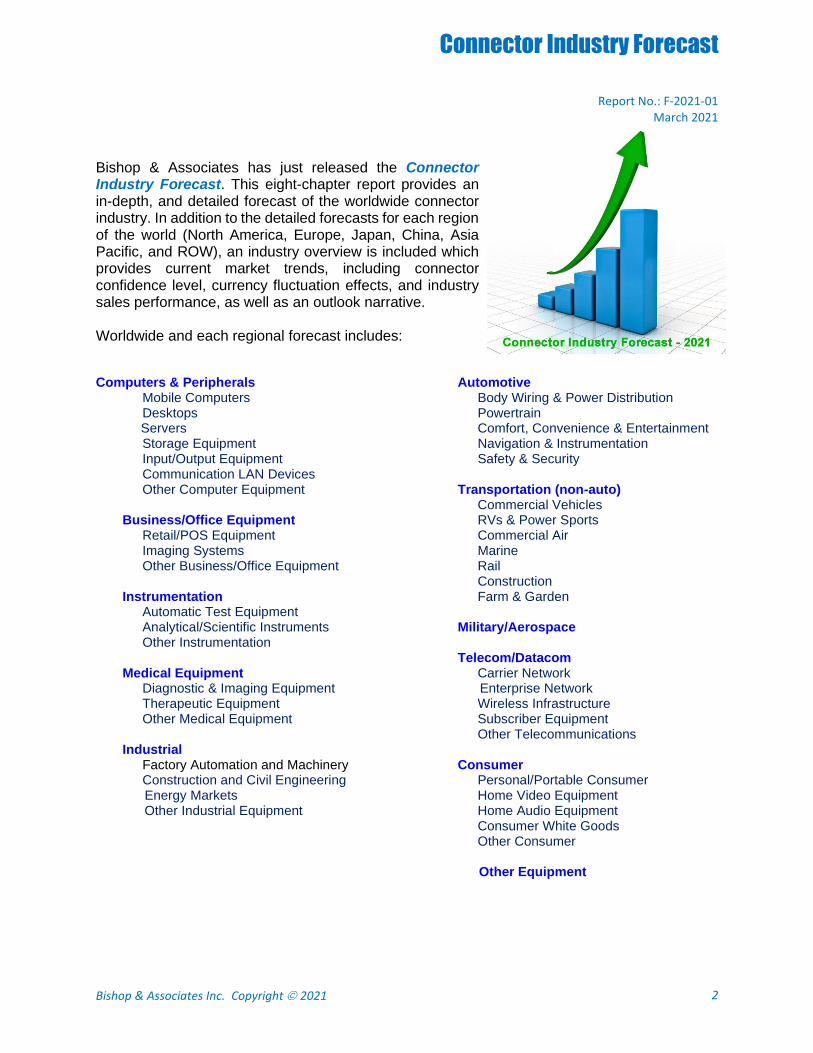
Bishop & Associates has just released the Connector Industry Forecast. This eight-chapter report provides an in-depth, and detailed forecast of the worldwide connector industry. In addition to the detailed forecasts for each region of the world (North America, Europe, Japan, China, Asia Pacific, and ROW), an industry overview is included which provides current market trends, including connector confidence level, currency fluctuation effects, and industry sales performance, as well as an outlook narrative. Worldwide and each regional forecast includes: Computers & Peripherals Mobile Computers Desktops Servers Storage Equipment Input/Output Equipment Communication LAN Devices Other Computer Equipment Business/Office Equipment Retail/POS Equipment Imaging Systems Other Business/Office Equipment Instrumentation Automatic Test Equipment Analytical/Scientific Instruments Other Instrumentation Medical Equipment Diagnostic & Imaging Equipment Therapeutic Equipment Other Medical Equipment Industrial Factory Automation and Machinery Construction and Civil Engineering Energy Markets Other Industrial Equipment
Automotive Body Wiring & Power Distribution Powertrain Comfort, Convenience & Entertainment Navigation & Instrumentation Safety & Security Transportation (non-auto) Commercial Vehicles RVs & Power Sports Commercial Air Marine Rail Construction Farm & Garden Military/Aerospace Telecom/Datacom Carrier Network Enterprise Network Wireless Infrastructure Subscriber Equipment Other Telecommunications Consumer Personal/Portable Consumer Home Video Equipment Home Audio Equipment Consumer White Goods Other Consumer Other Equipment

Connector Industry Forecast
Bishop & Associates Inc. Copyright © 2021 3
2018 2019 YOY 2020 YOY
Quarter Actual Actual Change Actual Change
1Q $16,212 $15,890 -2.0% $15,397 -3.1%
2Q $16,875 $16,097 -4.6% $13,333 -17.2%
3Q $17,150 $16,475 -3.9% $16,689 1.3%
4Q $16,473 $15,707 -4.7% $17,308 10.2%
Total $66,710 $64,169 -3.8% $62,727 -2.2%
$ Millions
2020 – A Year Full of Surprises! 2020 ended up being a year full of surprises. We started off 2020 anticipating connector sales would grow 3.5%. By March, with the pandemic rearing its head and numerous economies, including key economies like China and the US going into lockdown, we revisited our previous forecast. Based on lengthy discussions with top management at key connector manufacturers, we revised our forecast, to reflect a decrease in connector sales of 30.8%. This decrease represented a decline in connector sales dollars of nearly $20 billion. April, May, and June proved to be challenging months, with worldwide connector industry sales declining in the double digits. By September though, sales had once again moved into positive territory. And, in October, the industry recorded the highest year-over-year growth since July of 2018. At that time, based on input from key connector companies, Bishop once again adjusted their forecast, this time forecasting sales down 9.4%. A far cry from the -30.8% previously forecasted! Fortunately, the industry proved to be even more resilient than any of us had anticipated and fourth quarter 2020 proved be outstanding, recording the highest quarterly sales in connector industry history.
Connector Industry Quarterly Sales Results
2018, 2019, and 2020
Industry Performance by Region As the chart on the following page shows, not all regions fared as well as others. China, who came out of lockdown the earliest, was the only region to see connector sales grow, increasing 3.6%. North America, who proved to the world that they could rapidly divert manufacturing capacity from one industry to another, saw connector sales drop 2.8%. The greatest decline was seen in Japan, where connector industry sales dropped 9.4%, or over $460 million dollars.

Connector Industry Forecast
Bishop & Associates Inc. Copyright © 2021 4
Percent
Region 2019 2020 Change
North America $13,887.0 $13,491.5 -2.8%
Europe $13,544.2 $12,837.5 -5.2%
Japan $4,891.4 $4,430.9 -9.4%
China $19,477.4 $20,184.3 3.6%
Asia-Pacific $9,435.4 $9,045.0 -4.1%
ROW $2,933.7 $2,737.5 -6.7%
Total World $64,169.1 $62,726.7 -2.2%
$ Millions
2019 and 2020 Connector Sales by Region
With Percent Change
2019 and 2020 Market Share by Region
2019 2019
2020
Connector Industry Forecast
Bishop & Associates Inc. Copyright © 2021 5
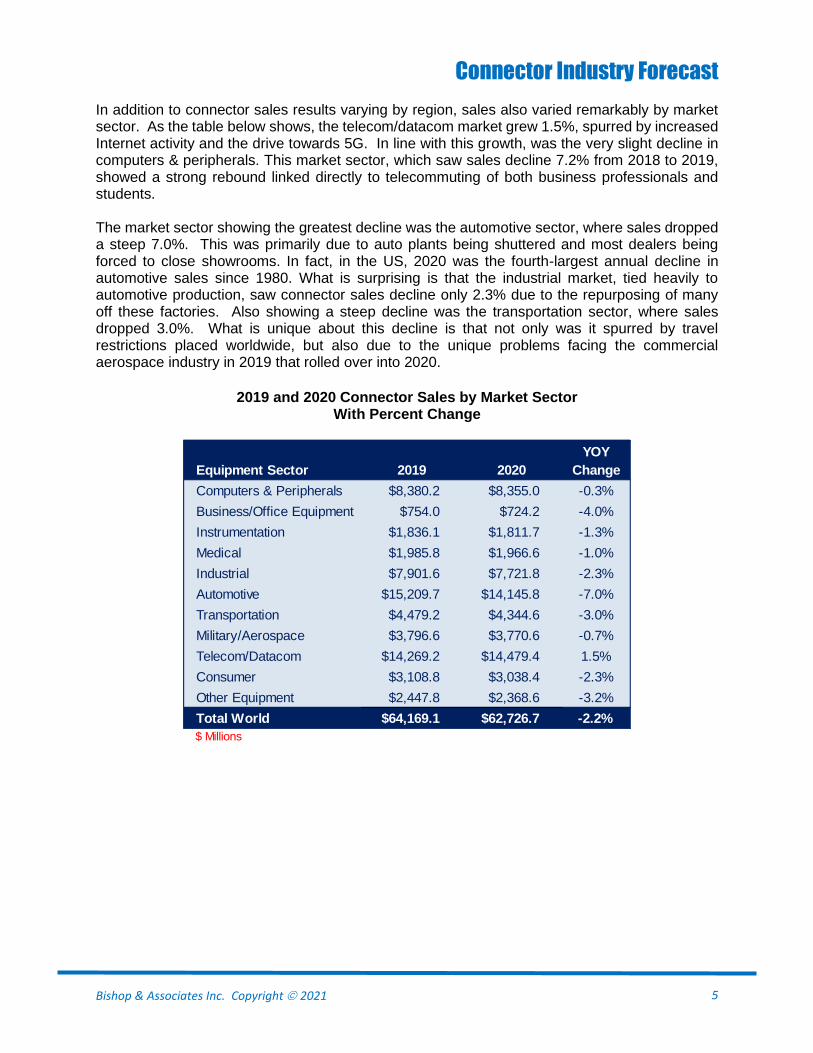
In addition to connector sales results varying by region, sales also varied remarkably by market sector. As the table below shows, the telecom/datacom market grew 1.5%, spurred by increased Internet activity and the drive towards 5G. In line with this growth, was the very slight decline in computers & peripherals. This market sector, which saw sales decline 7.2% from 2018 to 2019, showed a strong rebound linked directly to telecommuting of both business professionals and students. The market sector showing the greatest decline was the automotive sector, where sales dropped a steep 7.0%. This was primarily due to auto plants being shuttered and most dealers being forced to close showrooms. In fact, in the US, 2020 was the fourth-largest annual decline in automotive sales since 1980. What is surprising is that the industrial market, tied heavily to automotive production, saw connector sales decline only 2.3% due to the repurposing of many off these factories. Also showing a steep decline was the transportation sector, where sales dropped 3.0%. What is unique about this decline is that not only was it spurred by travel restrictions placed worldwide, but also due to the unique problems facing the commercial aerospace industry in 2019 that rolled over into 2020.
YOY
Equipment Sector 2019 2020 Change
Computers & Peripherals $8,380.2 $8,355.0 -0.3%
Business/Office Equipment $754.0 $724.2 -4.0%
Instrumentation $1,836.1 $1,811.7 -1.3%
Medical $1,985.8 $1,966.6 -1.0%
Industrial $7,901.6 $7,721.8 -2.3%
Automotive $15,209.7 $14,145.8 -7.0%
Transportation $4,479.2 $4,344.6 -3.0%
Military/Aerospace $3,796.6 $3,770.6 -0.7%
Telecom/Datacom $14,269.2 $14,479.4 1.5%
Consumer $3,108.8 $3,038.4 -2.3%
Other Equipment $2,447.8 $2,368.6 -3.2%
Total World $64,169.1 $62,726.7 -2.2%
$ Millions
2019 and 2020 Connector Sales by Market Sector With Percent Change
Connector Industry Forecast
Bishop & Associates Inc. Copyright © 2021 6
Percent
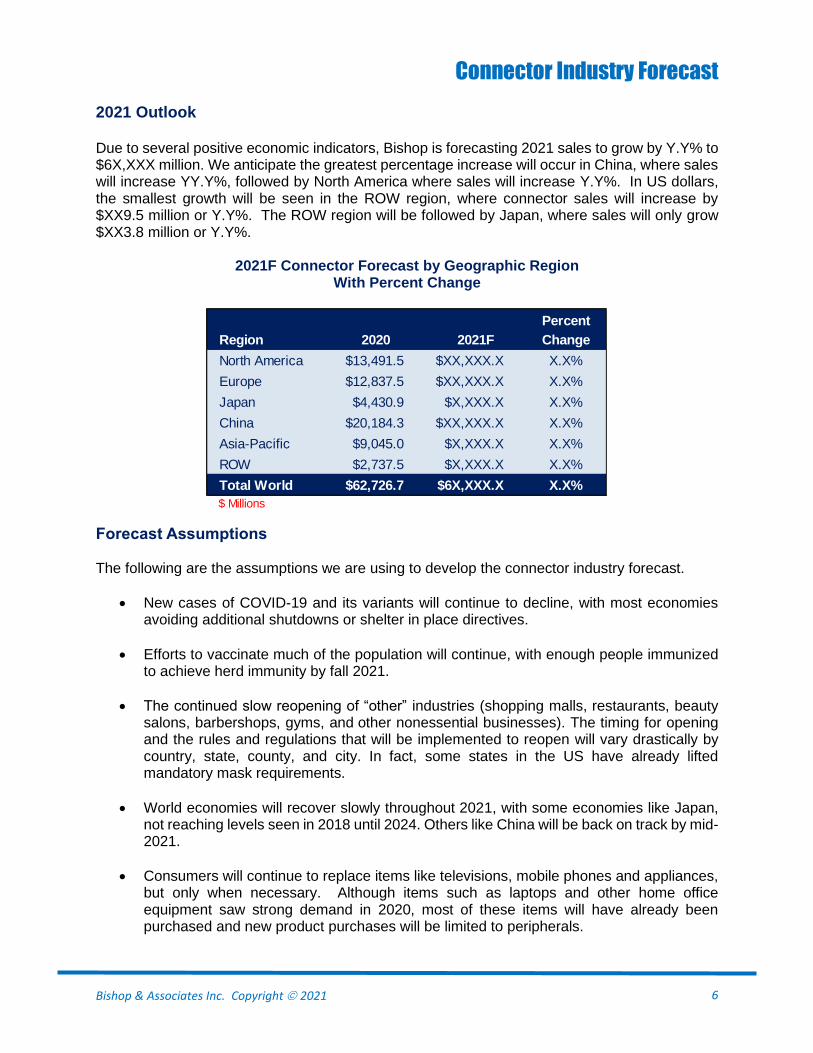
Region 2020 2021F Change
North America $13,491.5 $XX,XXX.X X.X%
Europe $12,837.5 $XX,XXX.X X.X%
Japan $4,430.9 $X,XXX.X X.X%
China $20,184.3 $XX,XXX.X X.X%
Asia-Pacific $9,045.0 $X,XXX.X X.X%
ROW $2,737.5 $X,XXX.X X.X%
Total World $62,726.7 $6X,XXX.X X.X%
$ Millions
2021 Outlook Due to several positive economic indicators, Bishop is forecasting 2021 sales to grow by Y.Y% to $6X,XXX million. We anticipate the greatest percentage increase will occur in China, where sales will increase YY.Y%, followed by North America where sales will increase Y.Y%. In US dollars, the smallest growth will be seen in the ROW region, where connector sales will increase by $XX9.5 million or Y.Y%. The ROW region will be followed by Japan, where sales will only grow $XX3.8 million or Y.Y%.
2021F Connector Forecast by Geographic Region With Percent Change
Forecast Assumptions The following are the assumptions we are using to develop the connector industry forecast.
• New cases of COVID-19 and its variants will continue to decline, with most economies avoiding additional shutdowns or shelter in place directives.
• Efforts to vaccinate much of the population will continue, with enough people immunized to achieve herd immunity by fall 2021.
• The continued slow reopening of “other” industries (shopping malls, restaurants, beauty salons, barbershops, gyms, and other nonessential businesses). The timing for opening and the rules and regulations that will be implemented to reopen will vary drastically by country, state, county, and city. In fact, some states in the US have already lifted mandatory mask requirements.
• World economies will recover slowly throughout 2021, with some economies like Japan, not reaching levels seen in 2018 until 2024. Others like China will be back on track by mid-2021.
• Consumers will continue to replace items like televisions, mobile phones and appliances, but only when necessary. Although items such as laptops and other home office equipment saw strong demand in 2020, most of these items will have already been purchased and new product purchases will be limited to peripherals.

Connector Industry Forecast
Bishop & Associates Inc. Copyright © 2021 7
• Demand for consumer items such as recreational vehicles and personal boats will continue, but not at the rate seen in 2020. Consumers still unable to take previously planned vacations will continue to rely on closer to home, self-contained trips such as those typically taken with a RV or motorboat.
Connector Industry Forecast
Bishop & Associates Inc. Copyright © 2021 8
The following table of contents shows the detail provided in this new report.
Table of Contents Chapter 1 – 2020 – A Year Full of Surprises! Connector Industry Quarterly Sales Results 2018, 2019, and
2020 Industry Sales Performance by Region 2019 and 2020 Connector Sales by Region with Percent
Change 2019 and 2020 Market Share by Region 2019 and 2020 Connector Sales by Market Sector with
Percent Change Change in Market Share Market Share by Region 2011 through 2021F Industry Sales Performance by Month Industry Sales Performance by Market Sector 2018 and 2019
with Percent Change Change in Percent Growth 2018 versus 2019 Industry Sales Performance by Market Sector 2019 and 2020
with Percent Change Change in Percent Growth 2019 versus 2020 Industry Sales Performance by Market Sector 2020 and
2021F with Percent Change Change in Percent Growth 2020 versus 2021F Historical Sales Performance Connector Industry Business Cycles Growth Cycles
Highlighted Historical Percentage Change in Connector Demand 2021 YTD Currency Impact on Regional Industry Growth Local Currency to One USD January 2020 versus January
2021 Industry Sales Performance January 2021 USD-vs-Local
Currencies 2020 Outlook 2021F Connector Forecast by Geographical Region with
Percent Change Forecast Assumptions Five-Year Outlook (2021-2026) Five Year Forecast – Region Percent Year-Over-Year
Change Sales Five Year Forecast – Equipment Sector Percent Year-Over-
Year Change Sales Market Outlook and Comments Computers-Peripherals Sector Overview Current and Future Paradigms Global Market Conditions Server Market by Region 2019-30 Ux000 World Server Market by Regional Consumptions World Server & Connector Market by Regional Consumption
2020-30 Computer, Business Equipment, and Consumer Electronics
Connector Sales 2020 and 2026F with 6-Year CAGR Gartner Take on PC Market Other Potential Issues with this Forecast Keys to Increasing Server Demand and Connector Content Keys to Increasing PC/Tablet and Connector Demand Some of the Overall Trends Affecting the Computer Market
Sector Trends by Subsector Regional View North America Europe Japan
Chapter 1 – 2020 – A Year Full of Surprises! (continued) China Asia Pacific 2021F World Computer and Peripheral Connector Forecast –
Market Share by Region Business/Office Equipment Sector Global Market Conditions Trends by Subsector Overall 2021F World Business/Office Equipment Connector Forecast
- Market Share by Region Instrumentation Sector Global Market Conditions Economic Considerations Monthly Sales Performance Year-Over-Year Driving Factors for TMI Connectors The Analytical and Scientific Instrument Market RF (including Microwave and Millimeter Wave) Text
Equipment Portability and Miniaturization China Marketplace Technology Considerations in the TMI Market Connector Trends in the TMI Marketplace Potential Concerns Market and Technology Trends ATE (Semiconductor, PCB Assemblies, LCD Display Panels)
Test Analytical and Scientific Instruments Other Instruments Regional View North America Europe Japan China Asia Pacific ROW 2021F World Instrumentation Connector Forecast - Market
Share by Region Medical Equipment Sector Global Market Conditions COVID Impacts Prevention COVID Impact on Connector Growth Projections North American Conditions European Conditions Japanese Conditions Chinese Conditions Asia Pacific Conditions ROW Conditions Diagnostics and Imaging Equipment Market Conditions Therapeutic Equipment Market Conditions Other Equipment Market Conditions 2021F World Medical Connector Forecast - Market Share by
Region Industrial Equipment Sector Introduction and Market Definitions Traditional Industrial Market - Main Market Segments Industrial Internet of Things – IIoT Market Segments Key Market Segments for the Industrial Connector Market Outlook for the Global Industrial Market for Connectors

Connector Industry Forecast
Bishop & Associates Inc. Copyright © 2021 9
Chapter 1 – 2020 – A Year Full of Surprises! Industrial Connector Market Sales Performance by Region
2019 – 2021F Regional Connector Industry Sales Performance USD vs
Local Currency 2020 Industrial Connector Market Sales Performance by Subsector
2019-2021F GDP Growth and Forecast by Country-Region 2019-2026F In 2020, Global GDP Decreased with -4.3% YOY, 2021 is
Expected Growth +4.5% Global Industrial Production 2010-2021 Regional View North America Annual YoY Growth Rates and Forecast through 2026 of the
NA Industrial Market for Connectors Europe Annual YoY Growth Rates and Forecast through 2026 of the
European Industrial Market for Connectors Japan Annual YoY Growth Rates and Forecast through 2026 of the
Japanese Industrial Market for Connectors China Annual YoY Growth Rates and Forecast through 2026 of the
Chinese Industrial Market for Connectors Asia Pacific Annual YoY Growth Rates and Forecast through 2026 of the
AP Industrial Market for Connectors ROW Annual YoY Growth Rates and Forecast through 2026 of the
ROW Industrial Market for Connectors Industrial Market for Connectors – Market Outlook 2021F
through 2026F Industrial Market for Connector Five-Year CAGR 2021F
through 2026F by Subsector Industrial Market for Connectors by Region 2019, 2020F, and
2026F Industrial Market for Connectors by Segment 2019, 2020F,
and 2026F Six-Year CAGR by Region for the Industrial Market for
Connectors 2020F to 2026F Annual YoY Growth Rates and Forecast through 2026 of the
World Industrial Market for Connectors 2021F World Industrial Connector Forecast - Market Share by
Region Automotive Sector Global View Automotive Connector Sales by Region 2019, 2020, and
2021F with Percent Growth Automotive Light Vehicle Production 2019-2025 2016, 2021F, and 2026F Worldwide Automotive Connector
Market by Region with 5- and 10-Year CAGR 2021F World Automotive Connector Forecast – Market Share
by Region Transportation – Non-Automotive Commercial Vehicles Civil Aviation Rail RV and Power Sport (Motorcycles, ATVs, and Other Similar
Equipment) and Marine 2021F World Transportation Connector Forecast – Market
Share by Region Military/Aerospace Sector Global Market Conditions 2021F World Military/Aerospace Connector Forecast - Market
Share by Region Telecom Equipment Sector Global Market Conditions 5G Networks Technology and Market Trends
Chapter 1 – 2020 – A Year Full of Surprises! Internet Protocol Equipment Regional View North America Europe Japan China Asia Pacific ROW 2021F World Telecom/Datacom Connector Forecast - Market
Share by Region Consumer Electronics Market Sector Global Market Performance & Forecast Consumer Electronic Market Segments Current Nature of this Market and Connector Applications Overall Observation and Comments Latest Input: 2021 CES 2021F World Consumer Connector Forecast - Market Share
by Region
Chapter 2 – World Connector Forecast
World Connector Market Forecast – Year-to-Year Dollar Change
World Connector Market Forecast – Year-to-Year Percent Change
World Connector Market Forecast by Region Year-to-Year Change by Region Top Six End-Use Equipment Categories World End-Use Equipment Forecast - Summary 2020-2021F Percent Change and 2021F-2026F Five-Year
CAGR 2021F and 2026F Market Share by Equipment Sector World End-Use Equipment Forecast - Detail Computers & Peripherals Mobile Computers Desktops Servers Storage Equipment Input/Output Equipment Communication LAN Devices Other Computer Equipment Business/Office Equipment Retail/POS Equipment Imaging Systems Other Office Equipment Instrumentation Automatic Test Equipment Analytical & Scientific Instruments Other Instruments Medical Diagnostic & Imaging Equipment Therapeutic Equipment Other Medical Equipment Industrial Factory Automation and Machinery Construction and Civil Engineering Energy Markets Other Industrial Equipment Automotive Body Wiring & Power Distribution Powertrain Comfort, Convenience & Entertainment Navigation & Instrumentation Safety & Security Transportation Commercial Vehicles RV’s & Power Sports Commercial Air

Connector Industry Forecast
Bishop & Associates Inc. Copyright © 2021 10
Chapter 2 – World Connector Forecast (continued) Marine Rail Construction Farm & Garden Military Telecom/Datacom Carrier Network Enterprise Network Mobile & Wireless Wireless Infrastructure Subscriber Equipment Cable-Equipment-Infrastructure Other Telecommunications Consumer Personal/Portable Consumer Electronics Home Video Equipment Home Audio Equipment Consumer White Goods Other Consumer Other Equipment World End-Use Equipment Forecast by Region Computers & Peripherals Business/Retail/Education Equipment Instrumentation Equipment Medical Equipment Industrial Equipment Automotive Transportation Equipment Military/Aerospace Equipment Telecom/Datacom/ Equipment Consumer Equipment Other Equipment Chapter 3 – North American Connector Forecast North American Connector Market Forecast – Year-to-Year
Dollar Change North American Connector Market Forecast – Year-to-Year
Percent Change Top Six End-Use Equipment Categories North American End-Use Equipment Forecast - Summary 2020-2021F Percent Change and 2021F-2026F Five-Year
CAGR 2021F and 2026F Market Share by Equipment Sector North American End-Use Equipment Forecast - Detail Computers & Peripherals Mobile Computers Desktops Servers Storage Equipment Input/Output Equipment Communication LAN Devices Other Computer Equipment Business/Office Equipment Retail/POS Equipment Imaging Systems Other Office Equipment
Chapter 3 – North American Connector Forecast
(continued) Instrumentation Automatic Test Equipment Analytical & Scientific Instruments Other Instruments Medical Diagnostic & Imaging Equipment Therapeutic Equipment Other Medical Equipment Industrial Factory Automation and Machinery Construction and Civil Engineering Energy Markets Other Industrial Equipment Automotive Body Wiring & Power Distribution Powertrain Comfort, Convenience & Entertainment Navigation & Instrumentation Safety & Security Transportation Commercial Vehicles RV’s & Power Sports Commercial Air Marine Rail Construction Farm & Garden Military Telecom/Datacom Carrier Network Enterprise Network Mobile & Wireless Wireless Infrastructure Subscriber Equipment Cable-Equipment-Infrastructure Other Telecommunications Consumer Personal/Portable Consumer Electronics Home Video Equipment Home Audio Equipment Consumer White Goods Other Consumer Other Equipment Chapters 4 Thru 8 Provide the Same Detail Level as
Chapter 3 Chapter 4 – European Connector Forecast Chapter 5 – Japanese Connector Forecast Chapter 6 – Chinese Connector Forecast Chapter 7 – Asia Pacific Connector Forecast Chapter 8 – ROW Connector Forecast
Connector Industry Forecast
Bishop & Associates Inc. Copyright © 2021 11
To Order Connector Industry Forecast
Research Report F-2021-01, Connector Industry Forecast is available for $3,950. Additional print copies of this report are available for $395. If you would like additional information about this report, or would like to place an order, please complete the following information, and e-mail, or mail it to Bishop & Associates, Inc. To place your order on our website: http://store.bishopinc.com/.
Name:
Title:
Company:
Address:
City: State: Zip:
Phone: Fax:
E-Mail Address:
Signature:
Connector Industry Forecast
Print Copy @ $3,950 Print Copy + Multi-User Corporate License @ $5,135
Invoice Me Check Enclosed Visa Master Card American Express
Additional $85.00 for International Airmail Illinois Customers Add 8.0% Sales Tax
Credit Card No.
Expiration Date
Mo. Yr.
1209 Fox Glen Drive - St. Charles, IL 60174 Phone: 630.443.2702
E-mail: [email protected] Website: www.connectorindustry.com
Online Store: http://store.bishopinc.com/
For Questions in Europe: Mr. Arthur Visser
Bishop & Associates, Inc. Phone: (32) 2.660.3696
Email Arthur Visser

Connector Industry Forecast
Bishop & Associates Inc. Copyright © 2021 12
What’s New ?
Bishop & Associates has recently completed several new research reports about the worldwide connector industry. A table of contents for each report can be found at https://store.bishopinc.com.
Report F-2021-01 Connector Industry Forecast (March 2020) NEW
Report M-510-21 World Telecom Connector Market 2020-2025 (January 2021) NEW
Report M-1601-20 Top 50 Medical Interconnect Solutions Companies (December 2020) NEW
Report P-675-20 High-Speed Copper & Fiber Optic Connectors (November 2020) NEW
Report M-980-20 5G Infrastructure – How 5G is Impacting Infrastructure Hardware and Connector Buying Trends (September 2020) NEW
Report M-121-20 2020 Top 100 Connector Manufacturers (August 2020)
Report M-1501-20 Medical Electronics Market for Interconnect Solutions (July 2020)
Report P-780-20 World RF Coax Connector Market 2020 (June 2020)
Report C-122-20 2020 Connector Industry Yearbook (June 2020)
Report M-799-20 2020 World Cable Assembly Market (May 2020)
Report M-700-20 World Connector Market Handbook (April 2020)
Report M-4100-20 Non-Automotive Transportation Market for Connectors (February 2020)
Report P-606-19 Connector Types and Technologies Poised for Growth (October 2019)
Report M-1010-19 World Automotive Connector Market (August 2019)
THE BISHOP REPORT - CONNECTOR INDUSTRY YEARBOOK
An annual subscription to THE BISHOP REPORT (12 issues) is available for $1,750. The Bishop Report subscription includes access, through Bishopinc.com, to prior issues of The Bishop Report, 30-40 yearly News Briefs, Industry Financial Benchmarks, and various connector industry indices. In addition, your subscription will include the Connector Industry Yearbook report (normally $1,500). An annual Corporate Subscription is available for $2,950, which includes an unlimited number of subscribers and one PDF version of the Connector Industry Yearbook.
Click here to view an expanded report description, and a complete table of contents, for all Bishop & Associates’ research reports.
Bishop & Associates Inc. 1209 Fox Glen Drive • St. Charles, IL 60174
Phone: 630.443.2702 • [email protected] • ConnectorIndustry.com Online Ordering: https://store.bishopinc.com