Chapter 14: Transportation - FEIS - NYC.gov
117
M1 Hotels Text Amendment Final EIS 1 Transportation 14 Transportation This chapter considers the possible effects of the proposed action on transportation conditions. The transportation analyses evaluate traffic operations and mobility, public transportation facilities and services, pedestrian elements and flow, safety of all roadway users (pedestrians, cyclists, transit users and motorists) and on- and off-street parking or goods movement. Introduction The proposed action would create a zoning text amendment to establish a City Planning Commission (CPC) special permit for new hotel development in M1 districts citywide, except for areas that are airport property or areas adjacent to airports that are predominantly non-residential. The proposed action is not expected to induce development where it would not have occurred absent the proposed action. However, the proposed action may result in a change in the geographic distribution of where hotels could site in the city. As such, additional analysis was conducted to determine how the proposed action might affect transportation conditions in proximity to prototypical hotel sites.
-
Upload
khangminh22 -
Category
Documents
-
view
0 -
download
0
Transcript of Chapter 14: Transportation - FEIS - NYC.gov

M1 Hotels Text Amendment Final EIS
1 Transportation
14 Transportation This chapter considers the possible effects of the proposed action on transportation conditions. The transportation analyses evaluate traffic operations and mobility, public transportation facilities and services, pedestrian elements and flow, safety of all roadway users (pedestrians, cyclists, transit users and motorists) and on- and off-street parking or goods movement.
Introduction The proposed action would create a zoning text amendment to establish a City Planning Commission (CPC) special permit for new hotel development in M1 districts citywide, except for areas that are airport property or areas adjacent to airports that are predominantly non-residential. The proposed action is not expected to induce development where it would not have occurred absent the proposed action. However, the proposed action may result in a change in the geographic distribution of where hotels could site in the city. As such, additional analysis was conducted to determine how the proposed action might affect transportation conditions in proximity to prototypical hotel sites.

M1 Hotels Text Amendment Final EIS
2 Transportation
This is a generic, city-wide action and the possible effects of hotel development in the future No-Action and With-Action conditions will be analyzed by means of a prototypical analysis, which will be based on existing trends and reasonable projections for the future.
Since the proposed action would not change any rules regulating as-of-right development outside of M1 districts, the prototypical sites are assessed to describe the possible effects of shifting from one use (such as a different commercial, residential or manufacturing use) in the No-Action condition to a commercial hotel use in the With-Action condition. Accordingly, such effects or differences would not be evaluated as or considered to be significant adverse impacts under CEQR.
This chapter describes in detail the existing transportation conditions in proximity to prototypical hotel sites. Possible effects from project-generated trips are then identified and described.
Principal Conclusions Analyses were conducted on the prototypical sites to assess traffic, transit, pedestrians, vehicular and pedestrian safety and parking pertaining to the shift from non-hotel use (i.e., a residential or different commercial use) in the No-Action condition to commercial hotel use in the With-Action condition.
Traffic
A detailed traffic analysis would not be warranted for the prototypical sites in Manhattan below 59th Street, South Slope, Brownsville, and Williamsburg, as significant effects on traffic conditions would be unlikely for these areas. The proposed action could affect traffic conditions for the prototypical sites in the Long Island City, Jamaica and Downtown Brooklyn areas:
› For the prototypical site in Long Island City, the proposed action could result in effects on traffic conditions at one intersection during the weekday midday peak hour.
› For the prototypical site in Jamaica, the proposed action could result in effects on traffic conditions at five intersections during the weekday a.m. peak hour, four intersections during the weekday midday peak hour, five intersections during the weekday p.m. peak hour and three intersections during the Saturday midday peak hour.
› For the prototypical site in Downtown Brooklyn, the proposed action could result in effects on traffic conditions at one intersection during the weekday midday and p.m. peak hours.

M1 Hotels Text Amendment Final EIS
3 Transportation
Transit
The proposed action’s incremental subway/rail trips would not exceed the CEQR Technical Manual analysis threshold of 200 peak-hour trips at any station in the weekday a.m. or p.m. peak commuter hours.
Similarly, the proposed action’s incremental bus trips would not exceed the CEQR Technical Manual analysis threshold of 50 peak-hour bus trips on a single route in one direction.
Pedestrians
The proposed action’s incremental pedestrian trips would not exceed the CEQR Technical Manual analysis threshold of 200 peak-hour walk trips at any single pedestrian element, and therefore a detailed pedestrian analysis is not warranted.
Vehicular and Pedestrian Safety
Crash data for the traffic study area intersections were obtained from the New York City Department of Transportation (DOT) for the most recent three-year period in which data were available (January 2014 through December 2016). A review of the crash data identified five intersections as high-crash locations (defined as those with 48 or more total reportable and non-reportable crashes or five or more pedestrian/bicyclist injury crashes occurring in any consecutive 12 months of the most recent three-year period for which data are available):
Long Island City Prototypical Site
› Queens Boulevard and Jackson Avenue/Queens Plaza East
Jamaica Prototypical Site
› Jamaica Avenue and Sutphin Boulevard
› Archer Avenue and Sutphin Boulevard
› 94th Avenue/Atlantic Avenue and the Van Wyck Expressway East Service Road
Downtown Brooklyn Prototypical Site
› Flatbush Avenue/Flatbush Avenue Extension and Fulton Street
With the proposed action, these intersections could be projected to experience low to moderate increases in project-generated vehicles making turns that could conflict with pedestrians in crosswalks. All of these intersections lie within a priority area of the NYC Vision Zero Program. As part of its Vision Zero initiatives, the City will explore additional measures for potential implementation at these high-crash locations and others in the study area to enhance traffic and pedestrian safety.

M1 Hotels Text Amendment Final EIS
4 Transportation
Parking
As a detailed traffic analysis would not be warranted for the prototypical sites in Manhattan below 59th Street, South Slope, Brownsville and Williamsburg, a detailed parking analysis would not be needed for these areas. The parking demand generated by the proposed action at the prototypical sites in the Long Island City and Downtown Brooklyn areas could be accommodated at off-street parking facilities within a quarter-mile radius.
For the prototypical site in Jamaica, the parking demand generated by the proposed action during the weekday midday peak period could be accommodated at off-street parking facilities within a quarter-mile radius. Although there could be a shortfall of 330 parking spaces during the weekday overnight period, the proposed action would slightly reduce the parking shortfall identified for the No-Action condition, and if some of the existing public parking facilities that are currently closed during the weekday overnight period (which have a combined capacity of 729 spaces) were to open in the future, this would sufficiently address it. Although the proposed action and the surrounding area’s inability to accommodate the project’s future parking demand would be considered a parking shortfall, there are many available alternative modes of transportation, as indicated in the CEQR Technical Manual, for proposed actions located in Manhattan or other CBD areas.
Prototypical Analysis Sites
As described in Chapter 1, “Project Description,” the proposed action would create a zoning text amendment to establish a CPC special permit for new hotel development in M1 districts citywide, except for areas that are airport property or non-residential areas adjacent to airports. Since the proposed action is a citywide action and has broad applicability, it is difficult to predict the universe of sites where development would be affected by the proposed action. For this reason, the proposed action is analyzed in this environmental review as a generic action. Generic actions are programs and plans that have wide application or affect the range of future alternative policies. The possible effects of hotel development in the future No-Action and With-Action conditions will be analyzed by means of a prototypical analysis, as detailed below, based on existing trends and reasonable projections for the future. Since the proposed action would not change any rules regulating as-of-right development outside of M1 districts, the prototypical sites are assessed to describe the possible effects of shifting from one use (such as a different commercial or residential use) in the No-Action condition to a commercial hotel use in the With-Action condition. Accordingly, such effects or differences would not be evaluated as or considered to be significant adverse impacts under CEQR.
To assess the possible effects of the proposed action, a Reasonable Worst-Case Development Scenario (RWCDS) was established using both the current zoning (future No-Action) and proposed zoning (future With-Action) conditions. The

M1 Hotels Text Amendment Final EIS
5 Transportation
RWCDS identifies prototypical sites in seven different neighborhoods, the general locations of which are shown in Figure 14-1:
› Area 1: Manhattan below 59th Street
› Area 2: Long Island City, Queens
› Area 3: Jamaica, Queens
› Area 4: South Slope, Brooklyn
› Area 5: Downtown Brooklyn
› Area 6: Brownsville, Brooklyn
› Area 7: Williamsburg, Brooklyn
Figure 14-1 Prototypical Site Locations
The incremental difference between the future No-Action and future With-Action conditions are the basis of the transportation analyses of the prototypical analysis. Tables 14-1 through 14-7 summarize the incremental net change of component sizes by land use for each of the prototypical sites. Table 14-8 provides a similar summary of the incremental net change of total component sizes by land use for the seven prototypical sites. As shown in Table 14-8, under the RWCDS, overall the proposed action would result in a net increase of approximately 1,477 hotel rooms and net reductions of approximately 510 residential dwelling units, 60,975 gross square feet (gsf) of office uses, 34,211 gsf of local retail uses and 2,300 gsf of community facility uses, compared to the No-Action condition.

M1 Hotels Text Amendment Final EIS
6 Transportation
Table 14-1 RWDCS Summary for Area 1: Manhattan Below 59th Street
Land Use No-ActionCondition
With-Action Condition
Net Increment
Residential (dwelling units) 3 0 -3
Local Retail (gsf) 763 0 -763
Hotel (rooms) 0 91 91
Community Facility (gsf) 2,300 0 -2,300
Table 14-2 RWDCS Summary for Area 2: Long Island City
Land Use No-ActionCondition
With-Action Condition
Net Increment
Office (gsf) 60,975 0 -60,975
Hotel (rooms) 0 203 203
Table 14-3 RWDCS Summary for Area 3: Jamaica
Land Use No-ActionCondition
With-Action Condition
Net Increment
Residential (dwelling units) 349 0 -349
Local Retail (gsf) 22,648 0 -22,648
Hotel (rooms) 0 753 753
Table 14-4 RWDCS Summary for Area 4: South Slope
Land Use No-ActionCondition
With-Action Condition
Net Increment
Residential (dwelling units) 14 0 -14
Local Retail (gsf) 1,350 0 -1,350
Hotel (rooms) 0 23 23
Table 14-5 RWDCS Summary for Area 5: Downtown Brooklyn
Land Use No-ActionCondition
With-Action Condition
Net Increment
Residential (dwelling units) 66 0 -66
Hotel (rooms) 0 155 155

M1 Hotels Text Amendment Final EIS
7 Transportation
Table 14-6 RWDCS Summary for Area 6: Brownsville
Land Use No-ActionCondition
With-Action Condition
Net Increment
Local Retail (gsf) 9,450 0 -9,450
Hotel (rooms) 0 85 85
Table 14-7 RWDCS Summary for Area 7: Williamsburg
Land Use No-ActionCondition
With-Action Condition
Net Increment
Residential (dwelling units) 78 0 -78
Hotel (rooms) 0 167 167
Table 14-8 RWDCS Combined Summary for All Prototypical Sites
Land Use No-ActionCondition
With-Action Condition
Net Increment
Residential (dwelling units) 510 0 -510
Local Retail (gsf) 34,211 0 -34,211
Office (gsf) 60,975 0 -60,975
Hotel (rooms) 0 1,477 1,477
Community Facility (gsf) 2,300 0 -2,300
Preliminary Analysis Methodology and Screening Assessment The CEQR Technical Manual describes a two-step screening procedure for the preparation of a preliminary analysis to determine whether quantified operational analyses of transportation conditions are warranted. As discussed in the following sections, the preliminary analysis begins with a trip generation analysis (Level 1) to estimate the amount of person and vehicle trips generated by the proposed action. According to the CEQR Technical Manual, if the proposed action is expected to result in fewer than 50 peak hour vehicle trips and fewer than 200 peak hour transit or pedestrian trips, further quantified analyses are not warranted.
When these thresholds are exceeded, detailed trip assignments (Level 2) are to be performed to estimate the incremental trips that could occur at specific transportation elements and to identify potential locations for further analyses. If the trip assignments show that the proposed action would generate 50 or more peak hour vehicle trips at an intersection, 200 or more peak hour subway trips at a station, 50 or more peak hour bus trips in one direction along a bus route or 200 or more

M1 Hotels Text Amendment Final EIS
8 Transportation
peak hour pedestrian trips traversing a sidewalk, corner area or crosswalk, further quantified operational analyses may be warranted to assess the possible effects on traffic, transit, pedestrians, parking and vehicular and pedestrian safety.
Level 1 Screening Assessment
A Level 1 trip generation screening assessment was conducted to estimate the amount of person and vehicle trips expected to be generated by the prototypical sites during the weekday a.m., midday, p.m. and Saturday midday peak hours. These estimates were then compared to the CEQR Technical Manual analysis thresholds to determine if Level 2 screening and/or quantified operational analyses are warranted. The Level 1 screening assessment is described below.
As shown in Table 14-8, under the RWCDS, overall the proposed action would result in a net increase of approximately 1,477 hotel rooms and net reductions of approximately 510 residential dwelling units, 60,975 gross square feet (gsf) of office uses, 34,211 gsf of local retail uses and 2,300 gsf of community facility uses compared to the No-Action condition.
Transportation Planning Factors
Transportation planning factors—including trip generation rates, temporal distributions and in/out splits, modal splits, vehicle occupancies and truck trip factors—were used to forecast travel demand for the land uses in the RWCDS for each of the seven prototypical sites during the weekday a.m. and p.m. peak hours (the typical peak periods for commuter travel demand) and the weekday midday and Saturday midday peak hours (the typical peak periods for retail establishments such as local eateries and shops). The travel demand factors used to determine the number of trips generated by the proposed action are presented in the Transportation Planning Factors technical memorandum provided in Appendix A.6.
Travel Demand Forecast
The incremental difference in person and vehicle trips expected to result from the proposed action by the analysis year of 2028 were derived based on the net change in land use component sizes at each of the seven prototypical sites and the transportation planning factors, both of which are detailed in Appendix A.6. Table 14-9 provides a summary of the incremental person and vehicle, subway/rail, bus and pedestrian trips that would be generated by the proposed action for each of the prototypical sites during the weekday a.m., midday, p.m. and Saturday midday peak hours.
As discussed above, the CEQR Technical Manual Level 1 screening threshold for traffic and parking is 50 incremental vehicles during any peak hour. The information presented in Table 14-9 indicates that Area 1 (Manhattan below 59th Street), Area 4 (South Slope) and Area 6 (Brownsville) would generate less than 50 vehicle trips during the weekday a.m., midday, p.m., and Saturday midday peak hours. Consequently, the proposed action is not expected to affect traffic conditions in

M1 Hotels Text Amendment Final EIS
9 Transportation
these areas based on CEQR Technical Manual criteria and a detailed analysis of traffic conditions is not warranted. As the incremental vehicle trips would be greater than 50 vehicles in one or more peak hours for Area 2 (Long Island City), Area 3 (Jamaica), Area 5 (Downtown Brooklyn) and Area 7 (Williamsburg), a Level 2 screening assessment (presented in the section below) was conducted to determine if there is a need for additional quantified traffic analysis.
Table 14-9 Summary of Incremental Trips Generated by the Proposed Action
Trip Type Peak Hour Area 1 Area 2 Area 3 Area 4 Area 5 Area 6 Area 7
Vehicle Trips
Weekday
a.m. 18 4 122 5 30 15 33
Midday 28 81 237 7 54 14 62
p.m. 21 24 200 6 48 20 55
Saturday Midday 16 43 75 2 38 14 40
Subway/ Rail
Trips
Weekday
a.m. 14 4 73 -3 -9 15 -8
Midday 20 99 304 2 35 22 37
p.m. 19 32 194 -2 8 24 8
Saturday Midday 13 65 76 -3 -4 13 -2
Bus
Trips
Weekday
a.m. 2 -13 -29 0 1 0 1
Midday 2 -5 -20 0 2 -5 2
p.m. 2 -14 -32 0 2 -1 1
Saturday Midday 2 1 -39 0 2 -4 0
Pedestrian Trips
Weekday
a.m. 68 20 180 1 65 20 64
Midday 98 106 186 -14 176 -164 186
p.m. 97 93 264 -5 133 -41 135
Saturday Midday 62 134 -35 -12 82 -98 84 Notes: Trips exceeding CEQR Level 1 screening thresholds are marked in boldface. Pedestrian trips include walk-only trips as well as the walk component of trips made by other modes.
As discussed above, according to general thresholds specified in the CEQR Technical Manual used by MTA agencies, if a proposed action is projected to result in fewer than 200 peak hour subway/rail or bus transit riders, further transit analyses are not typically required, as the proposed action is considered unlikely to create a significant transit impact. The information presented in Table 14-9 indicates that each of the prototypical sites would generate fewer than 200 trips by transit subway/rail during the weekday a.m. and p.m. peak hours, the critical commuter hours for which a transit analysis is typically prepared. Although Area 3 (Jamaica) is projected to result in more than 200 new peak hour transit subway/rail trips in the weekday midday peak hour, these trips would be off-peak when the subway and bus rail systems typically have ample capacity and would not affect traffic conditions during this off-peak period. The information presented in Table 14-9 also indicates that the incremental bus trips for each of the prototypical sites would be below the CEQR analysis threshold of 50 peak hour bus trips on a single route in one direction.

M1 Hotels Text Amendment Final EIS
10 Transportation
Consequently, the proposed action is not expected to affect subway/rail or bus transit conditions based on CEQR Technical Manual criteria and a detailed analysis of transit services is not warranted.
Level 2 Screening Assessment
As shown in Table 14-9, incremental vehicle trips resulting from the proposed action would exceed the CEQR Technical Manual Level 1 screening threshold for Area 2 (Long Island City), Area 3 (Jamaica), Area 5 (Downtown Brooklyn) and Area 7 (Williamsburg) in one or more peak hours, warranting trip assignment (Level 2) screening assessments for traffic. Additionally, the incremental pedestrian trips resulting from the proposed action would also exceed the CEQR Technical Manual Level 1 screening threshold for Area 3 (Jamaica) in one peak hour, warranting a trip assignment (Level 2) screening assessment for pedestrians.
For the Level 2 screening assessments, project-generated trips were assigned to specific intersections and pedestrian elements in the study area to determine whether individual locations are expected to experience volumes exceeding CEQR thresholds and to identify the various study areas for which detailed analyses of traffic effects would be prepared. The process used to assign trips is detailed in the Transportation Planning Factors technical memorandum provided in Appendix A.6.
Long Island City Prototypical Site (Area 1)
As discussed above, the prototypical site in Long Island City would generate more than 50 net incremental vehicle trips in the weekday midday peak hour. This site is located on the block bounded on the north by 42nd Road, on the east by Hunter Street and on the west by 27th Street and would have frontages on 42nd Road and Hunter Street.
As further detailed in the Transportation Planning Factors technical memorandum provided in Appendix A.6, project-generated vehicle trips were preliminarily assigned to the intersections near the prototypical site during the weekday midday peak hour. In consultation with DCP and DOT, based on a review of the preliminary traffic assignments and taking into consideration existing bottleneck locations and prevailing travel patterns in the study area, a total of three intersections were selected for detailed analysis during the weekday midday peak hours:
› Queens Boulevard and Jackson Avenue/Queens Plaza East;
› Jackson Avenue and 42nd Road; and
› 42nd Road and Hunter Street/28th Street.
To assess the proposed action’s potential for a parking shortfall, a detailed parking analysis was also performed to inventory existing off-street parking levels within a quarter-mile radius of the prototypical site.

M1 Hotels Text Amendment Final EIS
11 Transportation
Jamaica Prototypical Site (Area 3)
Traffic and Parking
As discussed above, the prototypical site in Jamaica would generate more than 50 net incremental vehicle trips during all peak hours. This site includes the development of hotels on two separate blocks. One hotel would be located on the block bounded on the north by Jamaica Avenue, on the south by Archer Avenue, on the east by 149th Street and on the west by 148th Street, with frontages on Archer Avenue, 148th Street and 149th Street. The other hotel would be located on the block bounded on the north by Jamaica Avenue, on the south by Archer Avenue, on the east by 148th Street and on the west by 147th Place, with frontages on Archer Avenue, 147th Place and 148th Street.
As further detailed in the Transportation Planning Factors technical memorandum provided in Appendix A.6, project-generated vehicle trips were preliminarily assigned to the intersections near the prototypical site during the weekday a.m., midday, p.m., and Saturday midday peak hours. In consultation with DCP and DOT, based on a review of the preliminary traffic assignments and taking into consideration existing bottleneck locations and prevailing travel patterns in the study area, a total of twelve intersections were selected for detailed analysis during the weekday a.m., midday, p.m., and Saturday midday peak hours:
› Jamaica Avenue and Sutphin Boulevard;
› Jamaica Avenue and 147th Place;
› Jamaica Avenue and 148th Street;
› Jamaica Avenue and 149th Street;
› Archer Avenue and 143rd Street;
› Archer Avenue and Sutphin Boulevard;
› Archer Avenue and 147th Place;
› Archer Avenue and 148th Street;
› Archer Avenue and 149th Street;
› Archer Avenue and 150th Street;
› 94th Avenue/Atlantic Avenue and Van Wyck Expressway East Service Road; and
› 94th Avenue and 143rd Street.
To assess the proposed action’s potential for a parking shortfall a detailed parking analysis was also performed to inventory existing off-street parking levels within a quarter-mile radius of the prototypical site.
Pedestrians
As discussed above, the prototypical site in Jamaica would generate more than 200 pedestrian trips in the weekday p.m. peak hour. As further detailed in the Transportation Planning Factors technical memorandum provided in Appendix A.6,

M1 Hotels Text Amendment Final EIS
12 Transportation
project-generated pedestrian trips were preliminarily assigned to sidewalks, corner areas, and crosswalks near the prototypical site during the weekday p.m. peak hour. No single pedestrian element would be expected to process 200 or more project-generated walk trips. Accordingly, no further analysis is warranted.
Downtown Brooklyn Prototypical Site (Area 5)
As discussed above, the prototypical site in Downtown Brooklyn would generate more than 50 net incremental vehicle trips in the weekday midday peak hour. This site is located on the block bounded on the north by Fulton Street, on the south by Livingston Street, on the east by Nevins Street and on the west by Hanover Place, with frontages on Fulton Street and Hanover Place.
As further detailed in the Transportation Planning Factors technical memorandum provided in Appendix A.6, project-generated vehicle trips were preliminarily assigned to the intersections near the prototypical site during the weekday midday peak hour. In consultation with DCP and DOT, based on a review of the preliminary traffic assignments and taking into consideration existing bottleneck locations and prevailing travel patterns in the study area, the intersection of Flatbush Avenue/Flatbush Avenue Extension and Fulton Street was selected for detailed traffic analysis during the weekday a.m., midday, and p.m. peak hours. To assess the proposed action’s potential for a parking shortfall or effects on parking conditions, a detailed parking analysis was also performed to inventory existing off-street parking levels within a quarter-mile radius of the prototypical site.
Williamsburg Prototypical Site (Area 7)
As discussed above, the prototypical site in Williamsburg would generate more than 50 net incremental vehicle trips in the weekday midday and p.m. peak hours. This site is located on the block bounded on the north by North 6th Street, on the south by North 5th Street, on the east by Berry Street and on the west by Wythe Avenue, with frontages on North 5th Street and Wythe Avenue.
As further detailed in the Transportation Planning Factors technical memorandum provided in Appendix A.6, project-generated vehicle trips were preliminarily assigned to the intersections near the prototypical site during the weekday midday and p.m. peak hours. No intersection is expected to incur the 50 or more net incremental vehicle trips necessary to exceed the CEQR Technical Manual threshold. The highest concentration would occur adjacent to the site at the intersection of Wythe Avenue and North 5th Street, with a total of 35 vehicles in the weekday midday peak hour. Accordingly, the proposed action is not expected to affect traffic and parking conditions in this area based on CEQR Technical Manual criteria, and no further analysis is warranted.

M1 Hotels Text Amendment Final EIS
13 Transportation
Detailed Analysis Methodologies
Traffic
Capacity analyses at traffic analysis locations were performed using the methodologies presented in the 2000 Highway Capacity Manual (HCM) and Highway Capacity Software (HCS+ 5.5). The HCM methodology expresses the quality of traffic flow in terms of levels of service (LOS), which is based on the amount of delay that a driver typically experiences at a signalized intersection. Levels of service range from A, representing minimal delay (10 seconds or less per vehicle), to F, which represents long delays (greater than 80 seconds per vehicle). The HCM methodology also produces a volume-to-capacity (v/c) ratio for each signalized intersection approach. The v/c ratio represents the ratio of traffic volume on an approach to the approach’s carrying capacity. A v/c ratio of less than 0.90 is generally considered indicative of non-congested conditions in dense urban areas; when higher than this value, the ratio reflects increasing congestion. At a v/c ratio between 0.95 and 1.0, near-capacity conditions are reached and delays can become substantial. Ratios of greater than 1.0 indicate saturated queuing conditions.
For unsignalized intersections, the HCM methodology generally assumes that traffic on major streets is not affected by traffic flows on minor streets. Left turns from a major street are assumed to be affected by the opposing, or oncoming, traffic flow on that major street. Traffic on minor streets is affected by all conflicting movements. Similar to signalized intersections, the HCM methodology expresses the quality of traffic flow at unsignalized intersections in terms of LOS based on the amount of delay that a driver experiences. Level of service definitions used to characterize traffic flows at unsignalized intersections differ somewhat from those used for signalized intersections, primarily because drivers anticipate different levels of performance from the two different kinds of intersections. For unsignalized intersections, LOS ranges from A, representing minimal delay (10 seconds or less per vehicle, as it is for signalized intersections), to F, which represents long delays (greater than 50 seconds per vehicle, compared to greater than 80 seconds per vehicle for signalized intersections).
Table 14-10 shows the LOS/delay relationship for signalized and unsignalized intersections using the HCM methodology. Levels of service A, B and C generally represent highly favorable to fair levels of traffic flow. At LOS D, the influence of congestion becomes noticeable. LOS E is considered to be the limit of acceptable delay, and LOS F is considered to be unacceptable to most drivers. In these traffic analyses, a signalized lane grouping operating at LOS E or F or a v/c ratio of 0.90 or more is identified as congested. For unsignalized intersections, a movement with LOS E or F is also identified as congested.

M1 Hotels Text Amendment Final EIS
14 Transportation
Table 14-10 Intersection Level of Service Criteria
Level of Service (LOS) Description
Average Delay per Vehicle (seconds)
Signalized Intersections
Unsignalized Intersections
A Satisfactory – Little/No Delay less than 10.1 less than 10.1B Satisfactory – Minor Delay 10.1 to 20.0 10.1 to 15.0C Satisfactory – With Some Delay 20.1 to 35.0 15.1 to 25.0D Borderline Congestion 35.1 to 55.0 25.1 to 35.0E Marginally Acceptable Congestion 55.1 to 80.0 35.1 to 50.0
F Unsatisfactory – Highly Congested greater than 80.0
greater than 50.0
Source: 2000 Highway Capacity Manual
The identification of traffic impacts at analyzed intersections is based on criteria presented in the CEQR Technical Manual. If a lane group in the With-Action condition would be LOS A, B or C, or marginally acceptable LOS D (i.e., delay less than or equal to 45.0 seconds/vehicle for signalized intersections and 30.0 seconds/vehicle for unsignalized intersections), the impact is not considered significant. A significant traffic impact is identified if the lane-group LOS would deteriorate from LOS A, B or C in the No-Action condition to worse than mid-LOS D or to LOS E or F in the With-Action condition. For a lane group that would operate at LOS D in the No-Action condition, an increase in delay of 5.0 or more seconds in the With-Action condition is considered a significant impact if the With-Action delay would exceed mid-LOS D. For a lane group that would operate at LOS E in the No-Action condition, a projected With-Action increase in delay of 4.0 or more seconds is considered a significant impact. For a lane group that would operate at LOS F in the No-Action condition, a projected With-Action increase in delay of 3.0 or more seconds is considered a significant impact.
The same criteria apply to signalized and unsignalized intersections. However, for traffic on a minor street at an unsignalized intersection to result in a significant impact, 90 passenger car equivalents (PCEs) must be projected in the With-Action condition in any peak hour.
However, since the proposed action would not change any rules regulating as-of-right development outside of M1 districts, the prototypical sites are assessed to describe the possible effects of shifting from one use (such as a different commercial, residential or manufacturing use) in the No-Action condition to a commercial hotel use in the With-Action condition. Accordingly, any such effects or differences would not be evaluated as or considered to be significant adverse impacts under CEQR.

M1 Hotels Text Amendment Final EIS
15 Transportation
Vehicular and Pedestrian Safety Evaluation
An evaluation of vehicular and pedestrian safety is necessary for locations in the traffic and pedestrian study areas that have been identified as high-crash locations, where 48 or more total reportable and non-reportable crashes or five or more pedestrian/bicyclist injury crashes occurred in any consecutive 12 months of the most recent three-year period for which data are available. For these locations, crash trends are identified to determine whether project-generated vehicular and pedestrian traffic would further impact safety at these locations. The determination of potential safety impacts depends on the location and nature of the impact, traffic and pedestrian volumes affected by or affecting such impacts, crash types and severity, and other contributing factors. Where appropriate, measures to improve traffic and pedestrian safety are identified and coordinated with NYCDOT.
Since the proposed action would not change any rules regulating as-of-right development outside of M1 districts, the prototypical sites are assessed to describe the possible effects of shifting from one use (such as a different commercial, residential or manufacturing use) in the No-Action condition to a commercial hotel use in the With-Action condition. Accordingly, such effects or differences would not be evaluated as or considered to be significant adverse impacts under CEQR.
Parking
The parking analysis identifies the extent to which area parking facilities are available and utilized. It takes into consideration anticipated changes in parking supply and provides a comparison of parking needs versus availability to determine if a parking shortfall is likely to result from additional demand generated by a proposed action. The displacement of existing parking capacity attributable to the proposed action is also considered. Typically, the analysis encompasses the parking facilities—public parking lots and garages and on-street curb spaces—that vehicular traffic destined to the prototypical site or area would likely utilize. According to the CEQR Technical Manual, a quarter-mile radius around a project site is generally assumed as the distance that someone driving to the site would be willing to walk. If the analysis concludes that there would be a shortfall in parking within the quarter-mile study area, the study area may be extended to a half-mile to identify additional parking supply.
For proposed actions located in Manhattan or other CBD areas, while the inability of the proposed action or the surrounding area (on-street and off-street) to accommodate the action’s future parking demand is considered a parking shortfall, there are many available alternative modes of transportation.

M1 Hotels Text Amendment Final EIS
16 Transportation
Traffic
Long Island City Prototypical Site
Existing Conditions
As described above, three intersections have been selected for analysis in the weekday midday peak period. Two of the intersections are signalized and one is unsignalized. Traffic data were collected in January 2018 via a combination of video turning movement/classification counts and continuous (seven-day) Automatic Traffic Recorder (ATR) machine counts. These volumes were used along with field observations of traffic conditions to determine the levels of service for the weekday peak hour of 1:00 to 2:00 p.m. Physical inventory data needed for operational analysis—e.g., the number of traffic lanes, lane widths, pavement markings, turn prohibitions, bus stops and typical parking regulations—were also recorded. In addition, official signal timings obtained from NYCDOT were used in the analyses for all the signalized intersections. Existing traffic volumes for the weekday midday peak hour are shown in Figure 14-2.

M1 Hotels Text Amendment Final EIS
17 Transportation
Figure 14-2 2018 Existing Traffic Volumes – Weekday Midday Peak Hour – Long Island City Prototypical Site

M1 Hotels Text Amendment Final EIS
18 Transportation
Study Area Street Network
The roadway network around the prototypical site generally consists of a grid of major arterials and local streets through an area characterized by commercial and residential uses, with many sites currently under construction. Descriptions of the study area roadways are provided below.
Queens Boulevard is a major arterial that generally runs in an east-west direction within the study area, below the elevated structure of New York City Transit’s IRT Flushing Line, and has three moving lanes in each direction. On the east side of its intersection with Jackson Avenue, Queens Boulevard is one of the few roadways that crosses over Sunnyside Yard, where it provides a connection to the Long Island Expressway via Van Dam Street. On the west side of Jackson Boulevard, Queens Boulevard continues as Queens Plaza, which provides access to and from the lower level of the Ed Koch Queensboro Bridge. Queens Plaza South is the eastbound service road for Queens Plaza. The Q32 and Q60 bus routes operate along Queens Boulevard and Queens Plaza; the B62, Q67, and Q100 bus routes operate along Queens Plaza South. As shown in Figure 14-2, at the intersection with Jackson Avenue, during the weekday midday peak hour, eastbound volumes on Queens Plaza are approximately 1,305 vehicles per hour (vph) and westbound volumes on Queens Boulevard are approximately 920 vph. Queens Boulevard and Queens Plaza are designated through truck routes.
Jackson Avenue is another key arterial, running generally in a north-south direction within the study area. The southern end of Jackson Avenue provides access to the Long Island Expressway, Pulaski Bridge, and Queens Midtown Tunnel. The roadway continues into Queens in a northeasterly direction as Northern Boulevard—except that it is named Queens Plaza East for the one block segment between Queens Boulevard and 41st Avenue. Within the study area, Jackson Avenue is approximately 56 feet in width and typically contains two travel lanes in each direction, with an additional curb lane in some areas that is used for bus stops or parking. The B62, Q39, Q67, Q69, Q100 and Q102 bus routes operate along portions of Jackson Avenue. Immediately south of Queens Boulevard, Jackson Avenue carries approximately 305 vph in the northbound direction and 470 vph in the southbound direction. Jackson Avenue and Northern Boulevard are designated through truck routes.
42nd Road begins at Jackson Avenue and generally runs in an east-west direction, operating as a two-way street until the intersection of 28th Street/Hunter Street, after which it continues as a one-way street in the westbound direction. Between 28th Street/Hunter Street and Jackson Avenue, 42nd Road is approximately 53 feet in width and generally operates with one travel lane in each direction with a curbside lane that is primarily used for bus stops. The B62, Q39, Q67, Q69, Q100 and Q102 bus routes operate along 42nd Road within the study area. Two-way traffic volumes on 42nd Road are approximately 235 vph.

M1 Hotels Text Amendment Final EIS
19 Transportation
28th Street is a short bi-directional street, approximately 52 feet in width, running between Queens Plaza South and 42nd Road in a north-south direction and generally providing one travel lane in each direction with a curbside lane used for bus stops. The B62, Q39, Q66, Q67, Q69 and Q102 bus routes operate along 28th Street. During the weekday midday peak hour, traffic volumes on 28th Street are approximately 35 vph in the northbound direction and 185 vph in the southbound direction.
Hunter Street is a one-way street running in a northeasterly direction between Crescent Street and 42nd Road. The roadway is approximately 30 feet in width, has one moving lane with parking on both sides of the street, and has traffic volumes of 40 vph during the weekday midday peak hour.
Intersection Capacity Analysis
Table 14-11 presents the existing LOS by approach “movements”1 for signalized and unsignalized intersections in the traffic study area. As shown in the table, the analyzed intersections generally operate at acceptable levels during the weekday midday peak hour, except for one congested movement: at the unsignalized intersection of Hunter Street/28th Street and 42nd Road, the westbound 42nd Road through movement operates at LOS E with a delay of 35.7 seconds.
1 A “movement” represents a component of intersection traffic flow at the approaches, for instance, a through-, left-, or right-turn
movement.

M1 Hotels Text Amendment Final EIS
20 Transportation
Table 14-11 2018 Existing Level of Service Analysis – Long Island City Prototypical Site
Control
INTERSECTION & APPROACH Mvt. V/C Delay LOS
SIGNALIZED INTERSECTIONS
JACKSON AVENUE @ QUEENS PLAZA/QUEENS BOULEVARDJackson Avenue NB TR 0.68 52.7 D
SB L 0.28 40.8 DT 0.38 37.1 D
Queens Plaza EB T 0.81 32.2 CT 0.06 17.1 BR 0.44 13.7 B
Queens Boulevard WB LTR 0.67 19.8 B
Overall Intersection - 0.59 28.3 C
JACKSON AVENUE @ 42ND ROADJackson Avenue NB L 0.14 6.3 A
TR 0.27 6.7 ASB LTR 0.40 13.0 B
42nd Road EB LTR 0.59 54.6 DParking Lot Driveway WB LTR 0.05 39.1 D
Overall Intersection - 0.47 17.2 B
UNSIGNALIZED INTERSECTIONS
HUNTER STREET/28TH STREET @ 42ND ROADHunter Street NB LTR - 7.8 A28th Street SB LTR - 9.3 A42nd Road WB T - 35.7 E
R - 11.7 B
Overall Intersection - - 12.9 B
Notes:
(1) Control delay is measured in seconds per vehicle.
(2) Level of service (LOS) for signalized intersections is based upon average control delay per vehicle (sec/veh)
for each lane group as listed in the 2000 Highway Capacity Manual -- TRB.
(3) Level of service (LOS) for unsignalized intersections is based upon control delay per vehicle (sec/veh) for each
minor-approach as listed in the 2000 Highway Capacity Manual -- TRB.
(4) Overall intersection V/C ratio is the critical lane groups' V/C ratio, not the weighted average of all the movements.
(5) Shading denotes congested approach movement.
Midday (1:00-2:00 p.m.)

M1 Hotels Text Amendment Final EIS
21 Transportation
Future Conditions without the Proposed Action
This section establishes the baseline (No-Action) condition against which possible effects impacts of the proposed action can be identified. Future-year conditions were analyzed for the year 2028. Between 2018 and 2028, it is expected that traffic demand in the study area will increase due to background growth, development that could occur pursuant to existing zoning (i.e., as-of-right development) and development projects likely to occur within and in the vicinity of the study area in the No-Action condition. No-Action traffic volumes were established by applying a background growth of 0.25 percent per year for the first five years (2018 to 2023) and 0.125 percent per year for the remaining years (2023 to 2028), in accordance with CEQR Technical Manual guidelines for projects in Long Island City. When compounded, this represents a total background growth rate of approximately 1.9 percent from 2018 to 2028. This background growth rate is applied to existing traffic volumes and accounts for smaller projects and general increases in travel demand.
In addition to background growth, the effects of projected future development independent of the proposed action were included in the No-Action traffic analysis. This includes development on the prototypical site pursuant to existing zoning and other No-Action development projects in Long Island City. Absent the proposed action, it is assumed that the prototypical site would be developed with 60,975 gsf of office space, converted from industrial/warehouse and office space.
As detailed in Appendix A.6, a substantial number of development projects (57 in total) that are being planned for the study area were identified. They would be expected to be developed by the year 2028. After reviewing the development programs for each of the planned projects, it was determined that background growth will address the increase in traffic volumes for 15 of the smaller-sized projects in the study area. Vehicle trips generated by the remaining 42 projects were then determined and incorporated in the 2028 No-Action traffic analysis. Discrete trips generated by No-Action projects lying within the traffic study area, including the as-of-right development on the prototypical site, were assigned to the roadway network. The remaining No-Action projects were grouped into three clusters based on their proximity to each other, and traffic attributable to these projects was accounted for by incorporating the portion of vehicle trips that would pass through the study area. Figure 14-3 shows the No-Action traffic volumes at analyzed intersections in the study area, which were projected by layering background growth and trips generated by No-Action projects in the study area on top of the existing traffic volumes.
In the existing conditions analysis, the curbside lane of the northbound Jackson Avenue approach to Queens Boulevard was closed due to construction. This approach was analyzed as one through lane and one shared through and right-turn lane in the existing conditions, but was restored to its prior configuration of two through lanes and one right-turn lane in the No-Action and With-Action conditions analyses.

M1 Hotels Text Amendment Final EIS
22 Transportation
Table 14-12 summarizes LOS by approach movements at signalized and unsignalized intersections for the future No-Action condition. The results of the analysis indicate that most of the analyzed intersections would continue to operate at acceptable levels during the weekday midday peak hour, except for two congested movements:
› At the unsignalized intersection of Hunter Street/28th Street and 42nd Road, the westbound 42nd Road through movement would deteriorate to LOS F with a delay of 86.0 seconds, compared to LOS E with a delay of 35.7 seconds in existing conditions;
› At the intersection of Jackson Avenue and 42nd Road, the eastbound 42nd Road approach will become congested, operating at LOS E with a delay of 68.3 seconds.

M1 Hotels Text Amendment Final EIS
23 Transportation
Table 14-12 2028 No-Action Level of Service Analysis – Long Island City Prototypical Site
Control
INTERSECTION & APPROACH Mvt. V/C Delay LOS
SIGNALIZED INTERSECTIONS
JACKSON AVENUE @ QUEENS PLAZA/QUEENS BOULEVARDJackson Avenue NB T 0.69 52.5 D
R 0.35 46.9 DSB L 0.33 43.0 D
T 0.54 41.5 DQueens Plaza EB T 0.83 33.6 C
T 0.07 17.3 BR 0.57 17.7 B
Queens Boulevard WB DefL 0.58 29.5 CTR 0.73 22.1 C
Overall Intersection - 0.66 30.9 C
JACKSON AVENUE @ 42ND ROADJackson Avenue NB L 0.35 9.4 A
TR 0.36 7.6 ASB LTR 0.54 15.3 B
42nd Road EB LTR 0.78 68.3 EParking Lot Driveway WB LTR 0.15 40.8 D
Overall Intersection - 0.63 20.6 C
UNSIGNALIZED INTERSECTIONS
HUNTER STREET/28TH STREET @ 42ND ROADHunter Street NB LTR - 7.9 A28th Street SB LTR - 9.3 A42nd Road WB T - 86.0 F
R - 12.2 B
Overall Intersection - - 32.9 D
Notes:
(1) Control delay is measured in seconds per vehicle.
(2) Level of service (LOS) for signalized intersections is based upon average control delay per vehicle (sec/veh)
for each lane group as listed in the 2000 Highway Capacity Manual -- TRB.
(3) Level of service (LOS) for unsignalized intersections is based upon control delay per vehicle (sec/veh) for each
minor-approach as listed in the 2000 Highway Capacity Manual -- TRB.
(4) Overall intersection V/C ratio is the critical lane groups' V/C ratio, not the weighted average of all the movements.
(5) Shading denotes congested approach movement.
Midday (1:00-2:00 p.m.)

M1 Hotels Text Amendment Final EIS
24 Transportation
Figure 14-3 2028 No-Action Traffic Volumes – Weekday Midday Peak Hour – Long Island City Prototypical Site

M1 Hotels Text Amendment Final EIS
25 Transportation
Future Conditions with the Proposed Action
As shown in Table 14-9 above, the proposed action would result in approximately 81 incremental vehicle trips during the weekday midday peak hour. As discussed in the Level 2 screening assessment and the Transportation Demand Factors memorandum included in Appendix A.6, project-generated vehicle trips were assigned to the roadway network. The incremental peak hour trips resulting from the proposed action are shown in Figure 14-4. The With-Action traffic volumes are shown in Figure 14-5, which were developed by layering the project generated vehicle trips on top of the No-Action traffic volumes.
Table 14-13 presents a comparison of LOS by approach movements at signalized and unsignalized intersections in the No-Action and With-Action conditions. Of the three intersections analyzed, the proposed action could affect traffic conditions at one intersection during the weekday midday peak hour. The affected movement is the westbound 42nd Road through movement at the intersection of Hunter Street/28th Street and 42nd Road.

M1 Hotels Text Amendment Final EIS
26 Transportation
Table 14-13 2028 With-Action Level of Service Analysis – Long Island City Prototypical Site
Control ControlINTERSECTION & APPROACH Mvt. V/C Delay LOS Mvt. V/C Delay LOS
SIGNALIZED INTERSECTIONS
JACKSON AVENUE @ QUEENS PLAZA/QUEENS BOULEVARD
Jackson Avenue NB T 0.69 52.5 D T 0.69 52.7 D
R 0.35 46.9 D R 0.35 46.9 D
SB L 0.33 43.0 D L 0.33 43.2 D
T 0.54 41.5 D T 0.55 41.7 D
Queens Plaza EB T 0.83 33.6 C T 0.83 33.8 C
T 0.07 17.3 B T 0.08 17.4 B
R 0.57 17.7 B R 0.61 19.3 B
Queens Boulevard WB DefL 0.58 29.5 C DefL 0.61 29.7 C
TR 0.73 22.1 C TR 0.73 22.1 C
Overall Intersection - 0.66 30.9 C - 0.68 31.1 C
JACKSON AVENUE @ 42ND ROAD
Jackson Avenue NB L 0.35 9.4 A L 0.43 11.1 A
TR 0.36 7.6 A TR 0.36 7.6 A
SB LTR 0.54 15.3 B LTR 0.57 16.0 B
42nd Road EB LTR 0.78 68.3 E LTR 0.79 70.2 E
Parking Lot Driveway WB LTR 0.15 40.8 D LTR 0.15 40.8 D
Overall Intersection - 0.63 20.6 C - 0.66 21.1 C
UNSIGNALIZED INTERSECTIONS
HUNTER STREET/28TH STREET @ 42ND ROAD *
Hunter Street NB LTR - 7.9 A LTR - 7.9 A
28th Street SB LTR - 9.3 A LTR - 9.3 A
42nd Road WB T - 86.0 F T - 159.5 F
R - 12.2 B R - 12.3 B
Overall Intersection - - 32.9 D - - 64.2 F
Notes:
(1) Control delay is measured in seconds per vehicle.
(2) Level of service (LOS) for signalized intersections is based upon average control delay per vehicle (sec/veh) for each lane group as listed
in the 2000 Highway Capacity Manual -- TRB.
(3) Level of service (LOS) for unsignalized intersections is based upon control delay per vehicle (sec/veh) for each minor-approach as listed
in the 2000 Highway Capacity Manual -- TRB.
(4) Overall intersection V/C ratio is the critical lane groups' V/C ratio, not the weighted average of all the movements.
(5) Shading denotes approach movement subject to significant adverse impact.
No-Action With-Action

M1 Hotels Text Amendment Final EIS
27 Transportation
Figure 14-4 Project Generated Traffic Volumes – Weekday Midday Peak Hour – Long Island City Prototypical Site

M1 Hotels Text Amendment Final EIS
28 Transportation
Figure 14-5 2028 With-Action Traffic Volumes – Weekday Midday Peak Hour – Long Island City Prototypical Site

M1 Hotels Text Amendment Final EIS
29 Transportation
Jamaica Prototypical Site
Existing Conditions
As described above, 12 intersections have been selected for analysis in the weekday a.m., midday, p.m., and Saturday midday peak periods. Eight of the intersections are signalized and four are unsignalized. Traffic data were collected in January 2018 via a combination of video turning movement/classification counts and continuous (nine-day) ATR machine counts. These volumes were used along with field observations of traffic conditions to determine the levels of service for the weekday peak hours of 7:30 to 8:30 a.m., 1:00 to 2:00 p.m., and 4:00 to 5:00 p.m. as well as the Saturday peak hour of 2:45 to 3:45 p.m. Physical inventory data needed for operational analysis—e.g., the number of traffic lanes, lane widths, pavement markings, turn prohibitions, bus stops, and typical parking regulations—were also recorded. In addition, official signal timings obtained from NYCDOT were used in the analyses for all the signalized intersections. Existing traffic volumes for the weekday a.m., midday, and p.m., and Saturday midday peak hours are shown in Figures 14-6 through 14-9, respectively.
Study Area Street Network
The roadway network around the prototypical site is generally a grid of minor arterials and local streets through an area characterized by commercial and transportation land uses. The key east-west corridors within the study area are Jamaica, Archer, and 94th Avenues, which provide access to and/or from the Van Wyck Expressway). The street grid is bisected by Long Island Rail Road (LIRR) tracks located on an embankment, which run in an east-west direction between Archer Avenue and 94th Avenue. The key north-south corridors within the study area are Sutphin Avenue, 150th Street, and the Van Wyck Expressway East Service Road, each of which has an underpass crossing below the LIRR tracks and provides access to and/or from the Grand Central Parkway. Descriptions of the major roadways within the study area are provided below.
Jamaica Avenue is a major two-way corridor that extends from East New York in Brooklyn to the Nassau County line, where it becomes Jericho Turnpike. Within the study area, Jamaica Avenue is a two-way street, approximately 42 feet in width, which operates with one travel lane per direction, a curbside bus lane in the westbound direction that is in effect on weekdays from 6:00 to 10:00 a.m. and 4:00 to 7:00 p.m., and has metered curbside parking on both sides of the street (parking is only permitted on the north side of the street during the times when the bus lane is not in effect). Bus routes that operate along portions of Jamaica Avenue in the study area include the Q6, Q8, Q9, Q24, Q25, Q30, Q31, Q34, Q41, Q43, Q54, Q56, Q60, and Q65. As shown in Figures 14-6 through 14-9, eastbound traffic volumes on Jamaica Avenue range from approximately 280-370 vph and westbound traffic volumes on Jamaica Avenue range from approximately 290-555 vph during the analyzed peak hours.

M1 Hotels Text Amendment Final EIS
30 Transportation
Figure 14-6 2018 Existing Traffic Volumes – Weekday a.m. Peak Hour – Jamaica Prototypical Site

M1 Hotels Text Amendment Final EIS
31 Transportation
Figure 14-7 2018 Existing Traffic Volumes – Weekday Midday Peak Hour – Jamaica Prototypical SiteN
See Inset A
Inset A
Not to Scale

M1 Hotels Text Amendment Final EIS
32 Transportation
Figure 14-8 2018 Existing Traffic Volumes – Weekday p.m. Peak Hour – Jamaica Prototypical SiteN
See Inset A
Inset A
Not to Scale

M1 Hotels Text Amendment Final EIS
33 Transportation
Figure 14-9 2018 Existing Traffic Volumes – Saturday Midday Peak Hour – Jamaica Prototypical SiteN
See Inset A
Inset A
Not to Scale

M1 Hotels Text Amendment Final EIS
34 Transportation
Archer Avenue is another major two-way, east-west street that runs along the north side of the LIRR embankment. The roadway ranges from 28 to 65 feet in width and generally has one travel lane per direction with curbside parking in some locations. Between Sutphin Boulevard and 150th Street, there is a curbside bus lane in the eastbound direction; curbside bus lanes are present in both directions east of 150th Street. Bus routes that operate along portions of Archer Avenue in the study area include the N4, N4X, Q4, Q5, Q20A, Q20B, Q24, Q25, Q30, Q31, Q34, Q42, Q43, Q44 SBS, Q65, Q83, Q85, Q85—some of these buses provide service to the bus terminal at the Jamaica Center–Parsons/Archer subway station (E, J, and Z lines), which is a major transfer point between the subway and bus lines serving eastern Queens and Nassau County. Two-way traffic volumes on the segment of Archer Avenue between Sutphin Boulevard and 150th Street generally range from 510-665 vph during the analyzed peak hours.
94th Avenue is a local two-way, east-west street that runs along the south side of the LIRR embankment and is designated as a local truck route. West of the study area, it continues into Brooklyn as Atlantic Avenue. The roadway ranges from 29 to 38 feet in width and generally has one moving lane in each direction with no curbside parking. The Q41 bus route operates along 94th Avenue. Between the Van Wyck Expressway East Service Road and 143rd Street, two-way traffic volumes on 94th Avenue generally range from 680 to 840 vph during the analyzed peak hours.
Sutphin Boulevard is major north-south corridor that extends from Hillside Avenue in the north to Rockaway Boulevard in the south. The roadway ranges from 31 to 58 feet in width and generally contains one to two moving lanes in each direction, with bus lanes in each direction north of Archer Avenue. Bus routes that operate along portions of Sutphin Boulevard in the study area include the Q6, Q8, Q9, Q20A, Q20B, Q25, Q34, Q40, Q41, Q43, Q44 SBS, Q60, and Q65. The street runs adjacent to the Jamaica LIRR Station and the Jamaica AirTrain Station. Two-way traffic volumes on Sutphin Boulevard range from approximately 600-775 vph north of Archer Avenue and from approximately 835-990 vph south of Archer Avenue during the analyzed peak hours.
150th Street runs in a north-south direction that operates as a one-way street in the southbound direction north of Jamaica Avenue and a bi-directional street south of Jamaica Avenue. The roadway ranges from 35-43 feet in width and operates with one moving lane in each direction. Bus routes that operate along portions of 150th Street in the study area include the Q25, Q34, Q65, and Q83. A short segment of 150th Street south of Archer Avenue is also used by other buses to enter the western portion of the Jamaica Center Bus Terminal, which includes a bus layover area and a “teardrop” canopy. Northbound volumes on 150th Street range from approximately 70-130 vph north of Archer Avenue and approximately 160-365 vph south of Archer Avenue during the analyzed peak hours; southbound volumes range from approximately 225-295 vph north of Archer Avenue to approximately 285-410 vph south of Archer Avenue.
The Van Wyck Expressway East Service Road serves as the northbound service road for the Van Wyck Expressway and provides access to the highway’s entrance and exit

M1 Hotels Text Amendment Final EIS
35 Transportation
ramps. The roadway is approximately 30 feet in width and provides three moving lanes. The northbound service road carries approximately 1,850, 1,130, 1,465, and 1,400 vph during the weekday a.m., midday, p.m., and Saturday midday peak hours, respectively. The expressway and its service roads are a designated through truck route.
143rd Street is a bi-directional street that runs in a north-south direction. The roadway is generally 25-30 feet in width but narrows to a width of 19 feet at the underpass below the LIRR embankment between Archer Avenue and 94th Avenue. Two-way traffic volumes on 143rd Street at the underpass range from approximately 410 to 650 vph during the analyzed peak hours.
147th Place, 148th Street, and 149th Street are one-way local streets that are approximately 30 feet in width and provide one moving lane with parking on both sides of the street. Traffic volumes on these streets generally range from 65 to 135 vph during the analyzed peak hours.
Intersection Capacity Analysis
Table 14-14 presents the existing LOS by approach “movements” for signalized and unsignalized intersections in the traffic study area. Although most approach movements operate at overall acceptable levels, individual approach movements at several intersections are considered congested. These movements are listed below:
Archer Avenue and 143rd Street
› Northbound 143rd Street approach (weekday a.m. peak hour)
Archer Avenue and Sutphin Boulevard
› Northbound Sutphin Boulevard approach (weekday a.m. peak hour)
› Westbound Archer Avenue approach (weekday a.m. and p.m. peak hours)
Archer Avenue and 150th Street
› Westbound Archer Avenue approach (weekday a.m. and p.m. peak hours)
94th Avenue/Atlantic Avenue and Van Wyck Expressway East Service Road
› Northbound Van Wyck Expressway East Service Road approach (weekday a.m., p.m., and Saturday midday peak hours)
› Eastbound Atlantic Avenue left-turn movement (weekday a.m., midday, p.m., and Saturday midday peak hours)
› Westbound 94th Avenue approach (weekday p.m. peak hour)
94th Avenue and 143rd Street
› Eastbound 94th Avenue approach (weekday a.m. and midday peak hours)

M1 Hotels Text Amendment Final EIS
36 Transportation
Table 14-14 2018 Existing Level of Service Analysis – Jamaica Prototypical Site
Control Control Control ControlINTERSECTION & APPROACH Mvt. V/C Delay LOS Mvt. V/C Delay LOS Mvt. V/C Delay LOS Mvt. V/C Delay LOS
SIGNALIZED INTERSECTIONS
SUTPHIN BOULEVARD @ JAMAICA AVENUESutphin Boulevard NB LT 0.73 35.6 D LT 0.56 34.0 C LT 0.52 31.3 C LT 0.51 32.2 C
R 0.44 30.4 C R 0.48 34.0 C R 0.61 38.6 D R 0.50 34.4 CSB LT 0.52 33.3 C LT 0.45 31.0 C LT 0.58 34.8 C LT 0.42 30.4 C
R 0.49 44.0 D R 0.48 41.2 D R 0.49 44.9 D R 0.63 52.7 DJamaica Avenue EB LTR 0.59 30.6 C LTR 0.58 30.5 C LTR 0.71 35.2 D LTR 0.55 29.4 C
WB LT 0.87 41.7 D LT 0.54 28.8 C LT 0.80 43.5 D LT 0.59 29.7 CR 0.29 23.7 C R 0.23 23.7 C R 0.10 21.4 C R 0.14 22.0 C
Overall Intersection - 0.80 35.0 D - 0.58 31.3 C - 0.71 36.6 D - 0.61 31.7 C
147TH PLACE/148TH STREET @ JAMAICA AVENUE147th Place/148th Street NB LTR 0.28 32.5 C LTR 0.26 34.4 C LTR 0.36 38.2 D LTR 0.32 35.6 DJamaica Avenue EB LT 0.68 24.9 C LT 0.51 17.9 B LT 0.70 25.1 C LT 0.50 17.6 B
WB T 0.80 28.4 C T 0.52 20.1 CTR 0.62 20.6 C TR 0.59 19.8 B
R 0.13 13.9 B R 0.05 13.1 B
Overall Intersection - 0.61 26.6 C - 0.49 20.8 C - 0.56 24.7 C - 0.49 20.9 C
149TH STREET @ JAMAICA AVENUE149th Street NB LTR 0.46 39.1 D LTR 0.26 34.3 C LTR 0.22 33.5 C LTR 0.25 34.1 CJamaica Avenue EB LT 0.58 19.8 B LT 0.45 17.1 B LT 0.55 18.7 B LT 0.48 17.7 B
WB T 0.75 26.8 C T 0.51 18.6 BTR 0.73 26.9 C TR 0.67 23.7 C
R 0.13 12.7 B R 0.10 12.4 B
Overall Intersection - 0.66 25.6 C - 1.00 24.1 C - 0.43 19.8 B - 0.52 22.6 C
143RD STREET @ ARCHER AVENUE143rd Street NB LTR 0.98 60.7 E LTR 0.43 25.1 C LTR 0.57 28.3 C LTR 0.43 25.1 C
SB LTR 0.13 20.9 C LTR 0.11 20.6 C LTR 0.28 23.1 C LTR 0.17 21.4 CArcher Avenue EB LTR 0.32 12.5 B LTR 0.27 11.9 B LTR 0.42 13.8 B LTR 0.33 12.6 B
WB LTR 0.53 13.4 B LTR 0.44 13.6 B LTR 0.47 13.3 B LTR 0.52 14.7 B
Overall Intersection - 0.70 32.6 C - 0.44 16.8 B - 0.51 18.6 B - 0.49 17.1 B
Weekday a.m. (7:30-8:30 a.m.) Weekday Midday (1:00-2:00 p.m.) Weekday p.m. (4:00-5:00 p.m.) Saturday Midday (2:45-3:45 p.m.)

M1 Hotels Text Amendment Final EIS
37 Transportation
Table 14-14 2018 Existing Level of Service Analysis – Jamaica Prototypical Site (continued)
SUTPHIN BOULEVARD @ ARCHER AVENUESutphin Boulevard NB LTR 0.92 50.9 D LTR 0.58 26.6 C LTR 0.79 39.7 D LTR 0.58 26.8 C
SB LTR 0.42 24.8 C LTR 0.37 22.2 C LTR 0.87 43.1 D LTR 0.41 23.0 CArcher Avenue EB L 0.17 23.1 C L 0.14 24.2 C L 0.15 24.8 C L 0.17 24.8 C
TR 0.87 51.4 D TR 0.62 35.4 D TR 0.76 42.9 D TR 0.60 33.6 CWB LTR 0.94 50.3 D LTR 0.81 44.3 D LTR 0.95 57.7 E LTR 0.84 47.5 D
Overall Intersection - 0.92 45.5 D - 0.69 30.9 C - 0.91 44.4 D - 0.71 31.5 C
150TH STREET @ ARCHER AVENUE150th Street NB LTR 0.76 30.7 C LTR 0.33 17.7 B LTR 0.47 20.8 C LTR 0.33 17.8 B
SB LTR 0.65 32.0 C LTR 0.84 44.4 D LTR 0.74 35.3 D LTR 0.66 31.8 CArcher Avenue EB LTR 0.62 21.6 C LTR 0.61 23.2 C LTR 0.61 21.8 C LTR 0.48 19.9 B
WB LTR 1.05 84.4 F LTR 0.69 28.1 C LTR 0.97 60.9 E LTR 0.73 29.4 C
Overall Intersection - 1.03 45.4 D - 0.83 29.9 C - 0.94 37.3 D - 0.78 25.7 C
VAN WYCK E SR @ ATLANTIC AVENUE/94TH AVENUEVan Wyck E SR NB LTR 1.05 61.6 E LTR 0.89 33.9 C LTR 1.01 53.7 D LTR 0.97 44.3 DAtlantic Avenue EB L 0.97 68.0 E L 0.93 41.4 D L 0.97 53.7 D L 0.96 48.8 D
T 0.29 16.5 B T 0.25 13.3 B T 0.23 13.1 B T 0.21 12.9 B94th Avenue WB TR 0.78 36.0 D TR 0.75 38.8 D TR 0.91 49.4 D TR 0.80 40.1 D
Overall Intersection - 1.06 53.1 D - 0.92 33.4 C - 1.03 48.3 D - 0.99 41.0 D
143RD STREET @ 94TH AVENUE143rd Street NB LTR 0.39 10.3 B LTR 0.18 8.2 A LTR 0.20 8.3 A LTR 0.12 7.8 A
SB LTR 0.45 11.1 B LTR 0.38 10.2 B LTR 0.68 15.3 B LTR 0.52 12.1 B94th Avenue EB LTR 0.94 51.0 D LTR 0.91 43.7 D LTR 0.80 33.0 C LTR 0.85 37.3 D
WB LTR 0.80 32.0 C LTR 0.60 22.4 C LTR 0.78 30.2 C LTR 0.62 22.8 C
Overall Intersection - 0.64 27.2 C - 0.58 25.2 C - 0.72 23.0 C - 0.65 22.6 C
Control Control Control ControlINTERSECTION & APPROACH Mvt. V/C Delay LOS Mvt. V/C Delay LOS Mvt. V/C Delay LOS Mvt. V/C Delay LOS
Weekday a.m. (7:30-8:30 a.m.) Weekday Midday (1:00-2:00 p.m.) Weekday p.m. (4:00-5:00 p.m.) Saturday Midday (2:45-3:45 p.m.)

M1 Hotels Text Amendment Final EIS
38 Transportation
Table 14-14 2018 Existing Level of Service Analysis – Jamaica Prototypical Site (continued)
Control Control Control ControlINTERSECTION & APPROACH Mvt. V/C Delay LOS Mvt. V/C Delay LOS Mvt. V/C Delay LOS Mvt. V/C Delay LOS
Weekday a.m. (7:30-8:30 a.m.) Weekday Midday (1:00-2:00 p.m.) Weekday p.m. (4:00-5:00 p.m.) Saturday Midday (2:45-3:45 p.m.)
UNSIGNALIZED INTERSECTIONS
148TH STREET @ JAMAICA AVENUEJamaica Avenue WB LT - 9.6 A LT - 13.2 B LT - 13.9 B LT - 21.8 C
Overall Intersection - - 0.5 A - - 1.0 A - - 0.8 A - - 1.8 A
147TH PLACE @ ARCHER AVENUEArcher Avenue EB LT - 13.9 B LT - 10.6 B LT - 13.1 B LT - 10.5 B
Overall Intersection - - 0.8 A - - 0.7 A - - 1.0 A - - 0.8 A
148TH STREET @ ARCHER AVENUE148th Street SB LR - 15.0 C LR - 14.2 B LR - 15.0 B LR - 14.9 B
Overall Intersection - - 1.8 A - - 2.4 A - - 2.3 A - - 2.6 A
149TH STREET @ ARCHER AVENUEArcher Avenue EB LT - 12.4 B LT - 9.7 A LT - 10.9 B LT - 9.6 A
Overall Intersection - - 0.5 A - - 0.3 A - - 0.3 A - - 0.6 A
Notes:(1) Control delay is measured in seconds per vehicle.(2) Level of service (LOS) for signalized intersections is based upon average control delay per vehicle (sec/veh) for each lane group as listedin the 2000 Highway Capacity Manual -- TRB.(3) Level of service (LOS) for unsignalized intersections is based upon control delay per vehicle (sec/veh) for each minor-approach as listedin the 2000 Highway Capacity Manual -- TRB.(4) Overall intersection V/C ratio is the critical lane groups' V/C ratio, not the weighted average of all the movements.(5) Shading denotes congested approach movement.

M1 Hotels Text Amendment Final EIS
39 Transportation
Future Conditions without the Proposed Action
This section establishes the baseline (No-Action) condition against which possible effects of the project can be identified. Future year conditions were analyzed for the year 2028.Between 2018 and 2028, it is expected that traffic demand in the study area will increase due to background growth, development that could occur pursuant to existing zoning (i.e., as-of-right development), and development projects likely to occur within and in the vicinity of the study area in the No-Action Condition. No-Action traffic volumes were established by applying a background growth of 0.50 percent per year for the first five years (2018 to 2023) and 0.25 percent per year for the remaining years (2023 to 2028) in accordance with CEQR Technical Manual guidelines for projects in this area of Queens. When compounded, this represents a total background growth rate of approximately 3.8 percent from 2018 to 2028. This background growth rate is applied to existing traffic volumes and accounts for smaller projects and general increases in travel demand.
In addition to background growth, the effects of projected future development independent of the proposed action were included in the No-Action traffic analysis. This includes development on the prototypical site pursuant to existing zoning and other No-Action development projects in Jamaica. Absent the proposed action, it is assumed that the prototypical site would be developed with 349 residential dwelling units and 22,648 gsf of retail space, converted from industrial/warehouse, office, and retail space and a parking lot.
As detailed in Appendix A.6, a substantial number of development projects, 44 in total, were identified in coordination with DCP that are being planned for the study area and would be expected to be developed by the year 2028. After reviewing the development programs for each of the planned projects, it was determined that background growth will address the increase in traffic volumes for one of the smaller-sized projects in the study area. Vehicle trips generated by the remaining 43 projects were then determined and incorporated in the 2028 No-Action traffic analysis. Discrete trips generated by No-Action projects lying within the traffic study area, including the as-of-right development on the prototypical site, were assigned to the roadway network. The remaining No-Action projects were grouped into six clusters based on their proximity to each other and traffic attributable to these projects was accounted for by incorporating the portion of vehicle trips that would pass through the study area. Figures 14-10 through 14-13 show the No-Action traffic volumes at analyzed intersections in the study area, which were projected by layering background growth and trips generated by No-Action projects in the study area on top of the existing traffic volumes.

M1 Hotels Text Amendment Final EIS
40 Transportation
Figure 14-10 2028 No-Action Traffic Volumes – Weekday a.m. Peak Hour – Jamaica Prototypical SiteN
See Inset A
Inset A
Not to Scale

M1 Hotels Text Amendment Final EIS
41 Transportation
Figure 14-11 2028 No-Action Traffic Volumes – Weekday Midday Peak Hour – Jamaica Prototypical SiteN
See Inset A
Inset A
Not to Scale

M1 Hotels Text Amendment Final EIS
42 Transportation
Figure 14-12 2028 No-Action Traffic Volumes – Weekday p.m. Peak Hour – Jamaica Prototypical SiteN
See Inset A
Inset A
Not to Scale

M1 Hotels Text Amendment Final EIS
43 Transportation
Figure 14-13 2028 No-Action Traffic Volumes – Saturday Midday Peak Hour – Jamaica Prototypical SiteN
See Inset A
Inset A
Not to Scale

M1 Hotels Text Amendment Final EIS
44 Transportation
Table 14-15 summarizes LOS by approach movements at signalized and unsignalized intersections for future No-Action conditions. The results of the analysis indicate that most of the analyzed intersections would continue to operate at acceptable levels during the weekday a.m., midday, p.m., and Saturday midday peak hours. The congested movements in existing conditions could worsen with increased levels of traffic from background growth and No-Action projects, and there would be several new congested traffic movements:
Jamaica Avenue and Sutphin Boulevard
› Eastbound Jamaica Avenue approach (weekday p.m. peak hour)
› Westbound Jamaica Avenue shared left-turn and through movement (weekday a.m. and p.m. peak hours)
Jamaica Avenue and 147th Place/148th Street
› Westbound Jamaica Avenue approach (weekday a.m. peak hour)
Archer Avenue and Sutphin Boulevard
› Northbound Sutphin Boulevard approach (weekday p.m. peak hour)
› Southbound Sutphin Boulevard approach (weekday p.m. peak hour)
› Eastbound Archer Avenue shared through and right-turn movement (weekday a.m. and p.m. peak hours)
› Westbound Archer Avenue approach (weekday midday and Saturday midday peak hours)
Archer Avenue and 150th Street
› Northbound 150th Street approach (weekday a.m. peak hour)
› Southbound 150th Street approach (weekday midday and p.m. peak hours)
94th Avenue/Atlantic Avenue and Van Wyck Expressway East Service Road
› Northbound Van Wyck Expressway East Service Road approach (weekday midday peak hour)
› Westbound 94th Avenue approach (weekday a.m., midday, and Saturday midday peak hours)
94th Avenue and 143rd Street
› Eastbound 94th Avenue approach (weekday p.m. and Saturday midday peak hours)
› Westbound 94th Avenue approach (weekday a.m. and p.m. peak hours)

M1 Hotels Text Amendment Final EIS
45 Transportation
Table 14-15 2028 No-Action Level of Service Analysis – Jamaica Prototypical Site
Control Control Control ControlINTERSECTION & APPROACH Mvt. V/C Delay LOS Mvt. V/C Delay LOS Mvt. V/C Delay LOS Mvt. V/C Delay LOS
SIGNALIZED INTERSECTIONS
SUTPHIN BOULEVARD @ JAMAICA AVENUESutphin Boulevard NB LT 0.88 37.5 D LT 0.72 38.1 D LT 0.68 32.2 C LT 0.64 35.0 D
R 0.47 29.1 C R 0.53 33.9 C R 0.68 33.3 C R 0.53 34.3 CSB LT 0.63 37.1 D LT 0.58 34.5 C LT 0.73 41.2 D LT 0.52 32.7 C
R 0.51 45.4 D R 0.49 42.2 D R 0.52 47.1 D R 0.66 55.0 DJamaica Avenue EB LTR 0.73 36.3 D LTR 0.87 48.2 D LTR 1.02 76.6 E LTR 0.47 26.9 C
WB LT 1.04 71.0 E LT 0.73 34.0 C LT 1.09 100.9 F LT 0.70 32.7 CR 0.35 24.4 C R 0.32 25.0 C R 0.20 22.9 C R 0.20 22.9 C
Overall Intersection - 0.96 45.4 D - 0.80 38.7 D - 0.91 62.7 E - 0.69 32.9 C
147TH PLACE/148TH STREET @ JAMAICA AVENUE147th Place/148th Street NB LTR 0.40 35.2 D LTR 0.39 37.5 D LTR 0.54 43.4 D LTR 0.42 38.0 DJamaica Avenue EB LT 0.75 27.0 C LT 0.62 20.4 C LT 0.85 27.3 C LT 0.57 19.4 B
WB T 0.91 35.1 D T 0.65 23.3 CTR 0.78 24.8 C TR 0.69 22.1 C
R 0.14 13.9 B R 0.06 13.3 B
Overall Intersection - 0.68 31.0 C - 0.65 24.4 C - 0.71 27.9 C - 0.59 23.2 C
149TH STREET @ JAMAICA AVENUE149th Street NB LTR 0.53 41.3 D LTR 0.33 35.9 D LTR 0.28 34.7 C LTR 0.30 35.0 DJamaica Avenue EB LT 0.65 21.2 C LT 0.57 19.3 B LT 0.66 20.5 C LT 0.55 19.2 B
WB T 0.84 33.2 C T 0.65 22.5 CTR 0.88 40.1 D TR 0.78 29.2 C
R 0.14 12.7 B R 0.10 12.4 B
Overall Intersection - 0.75 29.6 C - 0.70 31.9 C - 0.52 22.5 C - 0.62 26.2 C
143RD STREET @ ARCHER AVENUE143rd Street NB LTR 1.02 68.3 E LTR 0.45 25.0 C LTR 0.59 28.0 C LTR 0.45 25.0 C
SB LTR 0.13 20.9 C LTR 0.11 20.7 C LTR 0.30 23.3 C LTR 0.17 21.4 CArcher Avenue EB LTR 0.37 13.1 B LTR 0.35 12.9 B LTR 0.50 15.4 B LTR 0.38 13.1 B
WB LTR 0.65 14.8 B LTR 0.56 13.8 B LTR 0.57 13.9 B LTR 0.62 14.5 B
Overall Intersection - 0.79 34.9 C - 0.52 16.7 B - 0.58 18.9 B - 0.55 17.0 B
Saturday Midday (2:45-3:45 p.m.)Weekday Midday (1:00-2:00 p.m.)Weekday AM (7:30-8:30 a.m.) Weekday PM (4:00-5:00 p.m.)

M1 Hotels Text Amendment Final EIS
46 Transportation
Table 14-15 2028 No-Action Level of Service Analysis – Jamaica Prototypical Site (continued)
Control Control Control ControlINTERSECTION & APPROACH Mvt. V/C Delay LOS Mvt. V/C Delay LOS Mvt. V/C Delay LOS Mvt. V/C Delay LOS
Saturday Midday (2:45-3:45 p.m.)Weekday Midday (1:00-2:00 p.m.)Weekday AM (7:30-8:30 a.m.) Weekday PM (4:00-5:00 p.m.)
SUTPHIN BOULEVARD @ ARCHER AVENUESutphin Boulevard NB LTR 1.04 79.3 E LTR 0.70 30.2 C LTR 0.99 67.9 E LTR 0.67 29.4 C
SB LTR 0.70 32.1 C LTR 0.73 31.8 C LTR 1.65 328.9 F LTR 0.68 30.0 CArcher Avenue EB L 0.20 23.7 C L 0.17 24.9 C L 0.17 25.2 C L 0.20 25.5 C
TR 0.95 63.8 E TR 0.74 41.4 D TR 0.91 57.8 E TR 0.66 35.9 DWB LTR 1.33 185.6 F LTR 1.19 132.0 F LTR 1.46 247.0 F LTR 1.15 119.4 F
Overall Intersection - 1.18 89.1 F - 0.94 54.7 D - 1.56 176.4 F - 0.90 50.3 D
150TH STREET @ ARCHER AVENUE150th Street NB LTR 0.96 56.7 E LTR 0.52 21.9 C LTR 0.71 29.5 C LTR 0.47 20.4 C
SB LTR 0.85 45.8 D LTR 1.17 127.0 F LTR 1.06 87.3 F LTR 0.89 49.5 DArcher Avenue EB LTR 0.87 28.1 C LTR 0.86 33.7 C LTR 0.85 24.1 C LTR 0.64 23.2 C
WB LTR 1.25 159.7 F LTR 0.81 37.3 D LTR 1.17 125.5 F LTR 0.83 37.1 D
Overall Intersection - 1.13 74.3 E - 1.06 62.1 E - 1.18 69.8 E - 0.93 33.9 C
VAN WYCK E SR @ ATLANTIC AVENUE/94TH AVENUEVan Wyck E SR NB LTR 1.11 83.7 F LTR 0.98 45.4 D LTR 1.11 88.9 F LTR 1.04 62.6 EAtlantic Avenue EB L 1.14 112.1 F L 1.05 77.1 E L 1.06 83.6 F L 1.07 82.7 F
T 0.31 16.8 B T 0.28 13.6 B T 0.26 13.4 B T 0.23 13.1 B94th Avenue WB TR 0.99 52.4 D TR 0.97 58.3 E TR 1.15 109.8 F TR 0.96 55.1 E
Overall Intersection - 1.30 73.5 E - 1.13 49.0 D - 1.30 83.3 F - 1.20 59.2 E
143RD STREET @ 94TH AVENUE143rd Street NB LTR 0.41 10.5 B LTR 0.19 8.3 A LTR 0.21 8.4 A LTR 0.13 7.8 A
SB LTR 0.51 11.8 B LTR 0.45 11.0 B LTR 0.72 16.2 B LTR 0.58 12.9 B94th Avenue EB LTR 1.21 140.3 F LTR 1.14 106.8 F LTR 1.10 93.4 F LTR 1.05 77.6 E
WB LTR 1.03 70.1 E LTR 0.76 28.9 C LTR 1.00 60.9 E LTR 0.75 28.0 C
Overall Intersection - 0.79 62.2 E - 0.71 49.7 D - 0.86 49.4 D - 0.76 37.5 D

M1 Hotels Text Amendment Final EIS
47 Transportation
Table 14-15 2028 No-Action Level of Service Analysis – Jamaica Prototypical Site (continued)
Control Control Control ControlINTERSECTION & APPROACH Mvt. V/C Delay LOS Mvt. V/C Delay LOS Mvt. V/C Delay LOS Mvt. V/C Delay LOS
Saturday Midday (2:45-3:45 p.m.)Weekday Midday (1:00-2:00 p.m.)Weekday AM (7:30-8:30 a.m.) Weekday PM (4:00-5:00 p.m.)
UNSIGNALIZED INTERSECTIONS
148TH STREET @ JAMAICA AVENUEJamaica Avenue WB LT - 15.6 C LT - 14.3 B LT - 24.7 C LT - 9.8 A
Overall Intersection - - 0.5 A - - 1.1 A - - 1.1 A - - 2.2 A
147TH PLACE @ ARCHER AVENUEArcher Avenue EB LT - 14.8 B LT - 11.6 B LT - 11.1 B LT - 15.3 C
Overall Intersection - - 0.8 A - - 0.9 A - - 1.3 A - - 0.8 A
148TH STREET @ ARCHER AVENUE148th Street SB LR - 21.6 C LR - 20.3 C LR - 19.8 C LR - 21.3 C
Overall Intersection - - 3.1 A - - 3.1 A - - 2.8 A - - 3.5 A
149TH STREET @ ARCHER AVENUEArcher Avenue EB LT - 11.9 B LT - 10.3 B LT - 10.0 B LT - 13.2 B
Overall Intersection - - 0.6 A - - 0.5 A - - 0.5 A - - 0.7 A
Notes:(1) Control delay is measured in seconds per vehicle.(2) Level of service (LOS) for signalized intersections is based upon average control delay per vehicle (sec/veh) for each lane group as listedin the 2000 Highway Capacity Manual -- TRB.(3) Level of service (LOS) for unsignalized intersections is based upon control delay per vehicle (sec/veh) for each minor-approach as listedin the 2000 Highway Capacity Manual -- TRB.(4) Overall intersection V/C ratio is the critical lane groups' V/C ratio, not the weighted average of all the movements.(5) Shading denotes congested approach movement.

M1 Hotels Text Amendment Final EIS
48 Transportation
Future Conditions with the Proposed Action
As shown in Table 14-9 above, the proposed action would result in approximately 122, 237, 200, and 75 incremental vehicle trips during the weekday a.m., midday, p.m., and Saturday midday peak hours, respectively. As discussed in the Level 2 screening assessment and the Transportation Demand Factors memorandum included in Appendix A.6, project-generated vehicle trips were assigned to the roadway network. The incremental peak hour trips resulting from the proposed action are shown in Figures 14-14 to 14-17. The With-Action traffic volumes are shown in Figures 14-18 to 14-21, which were developed by layering the project generated vehicle trips on top of the No-Action traffic volumes.

M1 Hotels Text Amendment Final EIS
49 Transportation
Figure 14-14 Project Generated Traffic Volumes – Weekday a.m. Peak Hour – Jamaica Prototypical Site N
See Inset A
Inset A
Not to Scale

M1 Hotels Text Amendment Final EIS
50 Transportation
Figure 14-15 Project Generated Traffic Volumes – Weekday Midday Peak Hour – Jamaica Prototypical Site N
See Inset A
Inset A
Not to Scale

M1 Hotels Text Amendment Final EIS
51 Transportation
Figure 14-16 Project Generated Traffic Volumes – Weekday p.m. Peak Hour – Jamaica Prototypical Site N
See Inset A
Inset A
Not to Scale

M1 Hotels Text Amendment Final EIS
52 Transportation
Figure 14-17 Project Generated Traffic Volumes – Saturday Midday Peak Hour – Jamaica Prototypical Site N
See Inset A
Inset A
Not to Scale

M1 Hotels Text Amendment Final EIS
53 Transportation
Figure 14-18 2028 With-Action Traffic Volumes – Weekday a.m. Peak Hour – Jamaica Prototypical Site N
See Inset A
Inset A
Not to Scale

M1 Hotels Text Amendment Final EIS
54 Transportation
Figure 14-19 2028 With-Action Traffic Volumes – Weekday Midday Peak Hour – Jamaica Prototypical Site N
See Inset A
Inset A
Not to Scale

M1 Hotels Text Amendment Final EIS
55 Transportation
Figure 14-20 2028 With-Action Traffic Volumes – Weekday p.m. Peak Hour – Jamaica Prototypical Site N
See Inset A
Inset A
Not to Scale

M1 Hotels Text Amendment Final EIS
56 Transportation
Figure 14-21 2028 With-Action Traffic Volumes – Saturday Midday Peak Hour – Jamaica Prototypical Site N
See Inset A
Inset A
Not to Scale

M1 Hotels Text Amendment Final EIS
57 Transportation
Tables 14-9 through 14-12 present a comparison of LOS by approach movements at signalized and unsignalized intersections in the No-Action and With-Action conditions. Of the 12 intersections analyzed, the proposed action could affect traffic conditions at five intersections during the weekday a.m. peak hour, four intersections during the weekday midday peak hour, five intersections during the weekday p.m. peak hour, and three intersections during the Saturday midday peak hour. The affected traffic movements are identified below:
Jamaica Avenue and Sutphin Boulevard
› Eastbound Jamaica Avenue approach (weekday p.m. peak hour)
› Westbound Jamaica Avenue shared left-turn and through movement (weekday a.m. and p.m. peak hours)
Archer Avenue and Sutphin Boulevard
› Northbound Sutphin Boulevard approach (weekday a.m. and p.m. peak hours)
› Eastbound Archer Avenue shared through and right-turn movement (weekday a.m., midday and p.m. peak hours)
› Westbound Archer Avenue approach (weekday a.m., midday, p.m., and Saturday midday peak hours)
Archer Avenue and 150th Street
› Northbound 150th Street approach (weekday a.m. peak hour)
› Southbound 150th Street approach (weekday a.m., midday, and p.m. peak hours)
› Westbound Archer Avenue approach (weekday p.m. peak hour)
94th Avenue/Atlantic Avenue and Van Wyck Expressway East Service Road
› Northbound Van Wyck Expressway East Service Road approach (weekday a.m., midday, and p.m. peak hours)
› Eastbound Atlantic Avenue left-turn lane (weekday a.m., midday, and Saturday midday peak hours)
› Westbound 94th Avenue approach (weekday a.m., midday, p.m., and Saturday midday peak hours)
94th Avenue and 143rd Street
› Eastbound 94th Avenue approach (weekday a.m., midday, p.m., and Saturday midday peak hours)
› Westbound 94th Avenue approach (weekday a.m. and p.m. peak hours)

M1 Hotels Text Amendment Final EIS
58 Transportation
Table 14-16 2028 With-Action Level of Service Analysis – Weekday a.m. Peak Hour – Jamaica Prototypical Site
Control ControlINTERSECTION & APPROACH Mvt. V/C Delay LOS Mvt. V/C Delay LOS
SIGNALIZED INTERSECTIONS
SUTPHIN BOULEVARD @ JAMAICA AVENUESutphin Boulevard NB LT 0.88 37.5 D LT 0.95 41.2 D
R 0.47 29.1 C R 0.48 29.3 CSB LT 0.63 37.1 D LT 0.66 38.9 D
R 0.51 45.4 D R 0.51 45.4 DJamaica Avenue EB LTR 0.73 36.3 D LTR 0.76 37.7 D
WB LT 1.04 71.0 E LT 1.06 75.4 ER 0.35 24.4 C R 0.34 24.1 C
Overall Intersection - 0.96 45.4 D - 1.00 47.8 D
147TH PLACE/148TH STREET @ JAMAICA AVENUE147th Place/148th Street NB LTR 0.40 35.2 D LTR 0.39 35.0 CJamaica Avenue EB LT 0.75 27.0 C LT 0.79 28.7 C
WB T 0.91 35.1 D T 0.92 36.1 D
R 0.14 13.9 B R 0.14 13.9 B
Overall Intersection - 0.68 31.0 C - 0.72 32.0 C
149TH STREET @ JAMAICA AVENUE149th Street NB LTR 0.53 41.3 D LTR 0.55 42.0 DJamaica Avenue EB LT 0.65 21.2 C LT 0.65 21.1 C
WB T 0.84 33.2 C T 0.85 33.3 C
R 0.14 12.7 B R 0.14 12.7 B
Overall Intersection - 0.75 29.6 C - 0.75 29.8 C
143RD STREET @ ARCHER AVENUE143rd Street NB LTR 1.02 68.3 E LTR 1.02 67.5 E
SB LTR 0.13 20.9 C LTR 0.13 20.9 CArcher Avenue EB LTR 0.37 13.1 B LTR 0.40 13.5 B
WB LTR 0.65 14.8 B LTR 0.70 15.6 B
Overall Intersection - 0.79 34.9 C - 0.82 34.4 B
No-Action With-Action

M1 Hotels Text Amendment Final EIS
59 Transportation
Table 14-16 2028 With-Action Level of Service Analysis – Weekday a.m. Peak Hour – Jamaica Prototypical Site (continued)
SUTPHIN BOULEVARD @ ARCHER AVENUESutphin Boulevard NB LTR 1.04 79.3 E LTR 1.06 84.6 F
SB LTR 0.70 32.1 C LTR 0.70 31.7 CArcher Avenue EB L 0.20 23.7 C L 0.21 24.2 C
TR 0.95 63.8 E TR 0.99 73.8 EWB LTR 1.33 185.6 F LTR 1.69 344.8 F
Overall Intersection - 1.18 89.1 F - 1.36 133.7 F
150TH STREET @ ARCHER AVENUE150th Street NB LTR 0.96 56.7 E LTR 1.03 74.3 E
SB LTR 0.85 45.8 D LTR 0.90 51.6 DArcher Avenue EB LTR 0.87 28.1 C LTR 0.87 26.8 C
WB LTR 1.25 159.7 F LTR 1.25 160.5 F
Overall Intersection - 1.13 74.3 E - 1.13 80.1 E
VAN WYCK E SR @ ATLANTIC AVENUE/94TH AVENUEVan Wyck E SR NB LTR 1.11 83.7 F LTR 1.12 88.5 FAtlantic Avenue EB L 1.14 112.1 F L 1.18 128.0 F
T 0.31 16.8 B T 0.31 16.8 B94th Avenue WB TR 0.99 52.4 D TR 1.05 67.1 E
Overall Intersection - 1.30 73.5 E - 1.38 80.8 E
143RD STREET @ 94TH AVENUE143rd Street NB LTR 0.41 10.5 B LTR 0.41 10.5 B
SB LTR 0.51 11.8 B LTR 0.55 12.3 B94th Avenue EB LTR 1.21 140.3 F LTR 1.25 155.8 F
WB LTR 1.03 70.1 E LTR 1.07 79.9 E
Overall Intersection - 0.79 62.2 E - 0.82 68.8 E
Control ControlINTERSECTION & APPROACH Mvt. V/C Delay LOS Mvt. V/C Delay LOS
No-Action With-Action

M1 Hotels Text Amendment Final EIS
60 Transportation
Table 14-16 2028 With-Action Level of Service Analysis – Weekday a.m. Peak Hour – Jamaica Prototypical Site (continued)
UNSIGNALIZED INTERSECTIONS
148TH STREET @ JAMAICA AVENUEJamaica Avenue WB LT - 15.6 C LT - 24.6 C
Overall Intersection - - 0.5 A - - 0.5 A
147TH PLACE @ ARCHER AVENUEArcher Avenue EB LT - 14.8 B LT - 11.4 B
Overall Intersection - - 0.8 A - - 0.9 A
148TH STREET @ ARCHER AVENUE148th Street SB LR - 21.6 C LR - 19.7 C
Overall Intersection - - 3.1 A - - 3.0 A
149TH STREET @ ARCHER AVENUEArcher Avenue EB LT - 11.9 B LT - 10.2 B
Overall Intersection - - 0.6 A - - 0.7 A
Notes:(1) Control delay is measured in seconds per vehicle.(2) Level of service (LOS) for signalized intersections is based upon average control delay per vehicle (sec/veh) for each lane group as listein the 2000 Highway Capacity Manual -- TRB.(3) Level of service (LOS) for unsignalized intersections is based upon control delay per vehicle (sec/veh) for each minor-approach as listedin the 2000 Highway Capacity Manual -- TRB.(4) Overall intersection V/C ratio is the critical lane groups' V/C ratio, not the weighted average of all the movements.(5) Shading denotes approach movement subject to significant adverse impact.
Control ControlINTERSECTION & APPROACH Mvt. V/C Delay LOS Mvt. V/C Delay LOS
No-Action With-Action

M1 Hotels Text Amendment Final EIS
61 Transportation
Table 14-17 2028 With-Action Level of Service Analysis – Weekday Midday Peak Hour – Jamaica Prototypical Site
Control ControlINTERSECTION & APPROACH Mvt. V/C Delay LOS Mvt. V/C Delay LOS
SIGNALIZED INTERSECTIONS
SUTPHIN BOULEVARD @ JAMAICA AVENUESutphin Boulevard NB LT 0.72 38.1 D LT 0.79 37.6 D
R 0.53 33.9 C R 0.56 32.4 CSB LT 0.58 34.5 C LT 0.57 34.2 C
R 0.49 42.2 D R 0.49 42.2 DJamaica Avenue EB LTR 0.87 48.2 D LTR 0.91 52.6 D
WB LT 0.73 34.0 C LT 0.75 34.8 CR 0.32 25.0 C R 0.31 24.7 C
Overall Intersection - 0.80 38.7 D - 0.86 40.0 E
147TH PLACE/148TH STREET @ JAMAICA AVENUE147th Place/148th Street NB LTR 0.39 37.5 D LTR 0.45 39.2 DJamaica Avenue EB LT 0.62 20.4 C LT 0.69 20.9 C
WBTR 0.78 24.8 C TR 0.79 25.3 C
Overall Intersection - 0.65 24.4 C - 0.68 25.2 C
149TH STREET @ JAMAICA AVENUE149th Street NB LTR 0.33 35.9 D LTR 0.37 36.6 DJamaica Avenue EB LT 0.57 19.3 B LT 0.57 19.2 B
WBTR 0.88 40.1 D TR 0.89 41.3 D
Overall Intersection - 0.70 31.9 C - 0.72 32.6 C
143RD STREET @ ARCHER AVENUE143rd Street NB LTR 0.45 25.0 C LTR 0.45 24.9 C
SB LTR 0.11 20.7 C LTR 0.11 20.7 CArcher Avenue EB LTR 0.35 12.9 B LTR 0.41 13.8 B
WB LTR 0.56 13.8 B LTR 0.65 15.0 B
Overall Intersection - 0.52 16.7 B - 0.58 17.1 B
No-Action With-Action

M1 Hotels Text Amendment Final EIS
62 Transportation
Table 14-17 2028 With-Action Level of Service Analysis – Weekday Midday Peak Hour – Jamaica Prototypical Site (continued)
Control ControlINTERSECTION & APPROACH Mvt. V/C Delay LOS Mvt. V/C Delay LOS
No-Action With-Action
SUTPHIN BOULEVARD @ ARCHER AVENUESutphin Boulevard NB LTR 0.70 30.2 C LTR 0.72 31.2 C
SB LTR 0.73 31.8 C LTR 0.70 30.4 CArcher Avenue EB L 0.17 24.9 C L 0.19 25.5 C
TR 0.74 41.4 D TR 0.81 46.5 DWB LTR 1.19 132.0 F LTR 1.69 351.1 F
Overall Intersection - 0.94 54.7 D - 1.18 115.5 F
150TH STREET @ ARCHER AVENUE150th Street NB LTR 0.52 21.9 C LTR 0.64 26.0 C
SB LTR 1.17 127.0 F LTR 1.23 153.3 FArcher Avenue EB LTR 0.86 33.7 C LTR 0.89 36.4 D
WB LTR 0.81 37.3 D LTR 0.83 38.9 D
Overall Intersection - 1.06 62.1 E - 1.11 72.2 F
VAN WYCK E SR @ ATLANTIC AVENUE/94TH AVENUEVan Wyck E SR NB LTR 0.98 45.4 D LTR 1.01 53.2 DAtlantic Avenue EB L 1.05 77.1 E L 1.08 89.2 F
T 0.28 13.6 B T 0.28 13.6 B94th Avenue WB TR 0.97 58.3 E TR 1.08 89.1 F
Overall Intersection - 1.13 49.0 D - 1.24 61.6 F
143RD STREET @ 94TH AVENUE143rd Street NB LTR 0.19 8.3 A LTR 0.19 8.3 A
SB LTR 0.45 11.0 B LTR 0.50 11.6 B94th Avenue EB LTR 1.14 106.8 F LTR 1.19 126.0 F
WB LTR 0.76 28.9 C LTR 0.82 32.6 C
Overall Intersection - 0.71 49.7 D - 0.76 56.3 E

M1 Hotels Text Amendment Final EIS
63 Transportation
Table 14-17 2028 With-Action Level of Service Analysis – Weekday Midday Peak Hour – Jamaica Prototypical Site (continued)
Control ControlINTERSECTION & APPROACH Mvt. V/C Delay LOS Mvt. V/C Delay LOS
No-Action With-Action
UNSIGNALIZED INTERSECTIONS
148TH STREET @ JAMAICA AVENUEJamaica Avenue WB LT - 14.3 B LT - 16.3 C
Overall Intersection - - 1.1 A - - 1.2 A
147TH PLACE @ ARCHER AVENUEArcher Avenue EB LT - 11.6 B LT - 16.4 C
Overall Intersection - - 0.9 A - - 1.0 A
148TH STREET @ ARCHER AVENUE148th Street SB LR - 20.3 C LR - 24.9 C
Overall Intersection - - 3.1 A - - 4.3 A
149TH STREET @ ARCHER AVENUEArcher Avenue EB LT - 10.3 B LT - 12.4 B
Overall Intersection - - 0.5 A - - 0.6 A
Notes:(1) Control delay is measured in seconds per vehicle.(2) Level of service (LOS) for signalized intersections is based upon average control delay per vehicle (sec/veh) for each lane group as listedin the 2000 Highway Capacity Manual -- TRB.(3) Level of service (LOS) for unsignalized intersections is based upon control delay per vehicle (sec/veh) for each minor-approach as listedin the 2000 Highway Capacity Manual -- TRB.(4) Overall intersection V/C ratio is the critical lane groups' V/C ratio, not the weighted average of all the movements.(5) Shading denotes approach movement subject to significant adverse impact.

M1 Hotels Text Amendment Final EIS
64 Transportation
Table 14-18 2028 With-Action Level of Service Analysis – Weekday p.m. Peak Hour – Jamaica Prototypical Site
Control ControlINTERSECTION & APPROACH Mvt. V/C Delay LOS Mvt. V/C Delay LOS
SIGNALIZED INTERSECTIONS
SUTPHIN BOULEVARD @ JAMAICA AVENUE
Sutphin Boulevard NB LT 0.68 32.2 C LT 0.75 33.7 CR 0.68 33.3 C R 0.71 34.0 C
SB LT 0.73 41.2 D LT 0.72 40.9 DR 0.52 47.1 D R 0.52 47.1 D
Jamaica Avenue EB LTR 1.02 76.6 E LTR 1.05 86.6 F
WB LT 1.09 100.9 F LT 1.13 105.9 F
R 0.20 22.9 C R 0.19 22.1 C
Overall Intersection - 0.91 62.7 E - 0.95 66.9 D
147TH PLACE/148TH STREET @ JAMAICA AVENUE147th Place/148th Street NB LTR 0.54 43.4 D LTR 0.57 44.7 DJamaica Avenue EB LT 0.85 27.3 C LT 0.91 39.7 D
WB T 0.65 23.3 C T 0.66 22.3 C
R 0.06 13.3 B R 0.06 13.2 B
Overall Intersection - 0.71 27.9 C - 0.76 33.6 C
149TH STREET @ JAMAICA AVENUE149th Street NB LTR 0.28 34.7 C LTR 0.31 35.4 DJamaica Avenue EB LT 0.66 20.5 C LT 0.66 21.1 C
WB T 0.65 22.5 C T 0.64 22.2 C
R 0.10 12.4 B R 0.10 12.4 B
Overall Intersection - 0.52 22.5 C - 0.55 22.8 C
143RD STREET @ ARCHER AVENUE143rd Street NB LTR 0.59 28.0 C LTR 0.59 27.5 C
SB LTR 0.30 23.3 C LTR 0.30 23.3 CArcher Avenue EB LTR 0.50 15.4 B LTR 0.55 16.4 B
WB LTR 0.57 13.9 B LTR 0.68 15.4 B
Overall Intersection - 0.58 18.9 B - 0.64 19.4 C
No-Action With-Action

M1 Hotels Text Amendment Final EIS
65 Transportation
Table 14-18 2028 With-Action Level of Service Analysis – Weekday p.m. Peak Hour – Jamaica Prototypical Site (continued)
Control ControlINTERSECTION & APPROACH Mvt. V/C Delay LOS Mvt. V/C Delay LOS
No-Action With-Action
SUTPHIN BOULEVARD @ ARCHER AVENUESutphin Boulevard NB LTR 0.99 67.9 E LTR 1.02 74.9 E
SB LTR 1.65 328.9 F LTR 1.64 325.9 FArcher Avenue EB L 0.17 25.2 C L 0.19 25.7 C
TR 0.91 57.8 E TR 0.99 71.6 EWB LTR 1.46 247.0 F LTR 2.03 498.7 F
Overall Intersection - 1.56 176.4 F - 1.82 237.9 F
150TH STREET @ ARCHER AVENUE150th Street NB LTR 0.71 29.5 C LTR 0.83 40.1 D
SB LTR 1.06 87.3 F LTR 1.12 108.1 FArcher Avenue EB LTR 0.85 24.1 C LTR 0.88 27.2 C
WB LTR 1.17 125.5 F LTR 1.19 135.5 F
Overall Intersection - 1.18 69.8 E - 1.22 80.6 F
VAN WYCK E SR @ ATLANTIC AVENUE/94TH AVENUEVan Wyck E SR NB LTR 1.11 88.9 F LTR 1.14 99.0 FAtlantic Avenue EB L 1.06 83.6 F L 1.06 83.6 F
T 0.26 13.4 B T 0.26 13.4 B94th Avenue WB TR 1.15 109.8 F TR 1.27 163.6 F
Overall Intersection - 1.30 83.3 F - 1.33 100.3 F
143RD STREET @ 94TH AVENUE143rd Street NB LTR 0.21 8.4 A LTR 0.21 8.4 A
SB LTR 0.72 16.2 B LTR 0.77 18.0 B94th Avenue EB LTR 1.10 93.4 F LTR 1.14 109.0 F
WB LTR 1.00 60.9 E LTR 1.06 76.2 E
Overall Intersection - 0.86 49.4 D - 0.91 58.3 E

M1 Hotels Text Amendment Final EIS
66 Transportation
Table 14-18 2028 With-Action Level of Service Analysis – Weekday p.m. Peak Hour – Jamaica Prototypical Site (continued)
UNSIGNALIZED INTERSECTIONS
148TH STREET @ JAMAICA AVENUEJamaica Avenue WB LT - 24.7 C LT - 15.5 C
Overall Intersection - - 1.1 A - - 1.0 A
147TH PLACE @ ARCHER AVENUEArcher Avenue EB LT - 11.1 B LT - 12.5 B
Overall Intersection - - 1.3 A - - 1.4 A
148TH STREET @ ARCHER AVENUE148th Street SB LR - 19.8 C LR - 23.5 C
Overall Intersection - - 2.8 A - - 4.0 A
149TH STREET @ ARCHER AVENUEArcher Avenue EB LT - 10.0 B LT - 10.7 B
Overall Intersection - - 0.5 A - - 0.6 A
Notes:(1) Control delay is measured in seconds per vehicle.(2) Level of service (LOS) for signalized intersections is based upon average control delay per vehicle (sec/veh) for each lane group as listin the 2000 Highway Capacity Manual -- TRB.(3) Level of service (LOS) for unsignalized intersections is based upon control delay per vehicle (sec/veh) for each minor-approach as listein the 2000 Highway Capacity Manual -- TRB.(4) Overall intersection V/C ratio is the critical lane groups' V/C ratio, not the weighted average of all the movements.(5) Shading denotes approach movement subject to significant adverse impact.
Control ControlINTERSECTION & APPROACH Mvt. V/C Delay LOS Mvt. V/C Delay LOS
No-Action With-Action

M1 Hotels Text Amendment Final EIS
67 Transportation
Table 14-19 2028 With-Action Level of Service Analysis – Saturday Midday Peak Hour – Jamaica Prototypical Site
Control ControlINTERSECTION & APPROACH Mvt. V/C Delay LOS Mvt. V/C Delay LOS
SIGNALIZED INTERSECTIONS
SUTPHIN BOULEVARD @ JAMAICA AVENUESutphin Boulevard NB LT 0.64 35.0 D LT 0.67 35.3 D
R 0.53 34.3 C R 0.54 33.7 CSB LT 0.52 32.7 C LT 0.52 32.7 C
R 0.66 55.0 D R 0.66 55.0 DJamaica Avenue EB LTR 0.47 26.9 C LTR 0.75 37.3 D
WB LT 0.70 32.7 C LT 0.72 33.8 CR 0.20 22.9 C R 0.19 22.8 C
Overall Intersection - 0.69 32.9 C - 0.71 35.5 D
147TH PLACE/148TH STREET @ JAMAICA AVENUE147th Place/148th Street NB LTR 0.42 38.0 D LTR 0.42 38.2 DJamaica Avenue EB LT 0.57 19.4 B LT 0.59 19.2 B
WBTR 0.69 22.1 C TR 0.70 22.5 C
Overall Intersection - 0.59 23.2 C - 0.59 23.3 C
149TH STREET @ JAMAICA AVENUE149th Street NB LTR 0.30 35.0 D LTR 0.32 35.5 DJamaica Avenue EB LT 0.55 19.2 B LT 0.56 19.2 B
WBTR 0.78 29.2 C TR 0.77 28.5 C
Overall Intersection - 0.62 26.2 C - 0.62 25.9 C
143RD STREET @ ARCHER AVENUE143rd Street NB LTR 0.45 25.0 C LTR 0.45 25.0 C
SB LTR 0.17 21.4 C LTR 0.17 21.4 CArcher Avenue EB LTR 0.38 13.1 B LTR 0.40 13.4 B
WB LTR 0.62 14.5 B LTR 0.67 15.2 B
Overall Intersection - 0.55 17.0 B - 0.59 17.2 B
No-Action With-Action

M1 Hotels Text Amendment Final EIS
68 Transportation
Table 14-19 2028 With-Action Level of Service Analysis – Saturday Midday Peak Hour – Jamaica Prototypical Site (continued)
Control ControlINTERSECTION & APPROACH Mvt. V/C Delay LOS Mvt. V/C Delay LOS
No-Action With-Action
SUTPHIN BOULEVARD @ ARCHER AVENUESutphin Boulevard NB LTR 0.67 29.4 C LTR 0.68 29.9 C
SB LTR 0.68 30.0 C LTR 0.67 29.4 CArcher Avenue EB L 0.20 25.5 C L 0.21 25.9 C
TR 0.66 35.9 D TR 0.69 36.9 DWB LTR 1.15 119.4 F LTR 1.39 223.2 F
Overall Intersection - 0.90 50.3 D - 1.01 76.8 E
150TH STREET @ ARCHER AVENUE150th Street NB LTR 0.47 20.4 C LTR 0.52 21.7 C
SB LTR 0.89 49.5 D LTR 0.92 53.5 DArcher Avenue EB LTR 0.64 23.2 C LTR 0.64 23.2 C
WB LTR 0.83 37.1 D LTR 0.83 37.3 D
Overall Intersection - 0.93 33.9 C - 0.94 35.4 D
VAN WYCK E SR @ ATLANTIC AVENUE/94TH AVENUEVan Wyck E SR NB LTR 1.04 62.6 E LTR 1.06 66.4 EAtlantic Avenue EB L 1.07 82.7 F L 1.09 90.1 F
T 0.23 13.1 B T 0.23 13.1 B94th Avenue WB TR 0.96 55.1 E TR 1.01 65.5 E
Overall Intersection - 1.20 59.2 E - 1.25 64.4 E
143RD STREET @ 94TH AVENUE143rd Street NB LTR 0.13 7.8 A LTR 0.13 7.8 A
SB LTR 0.58 12.9 B LTR 0.61 13.3 B94th Avenue EB LTR 1.05 77.6 E LTR 1.07 82.6 F
WB LTR 0.75 28.0 C LTR 0.77 29.1 C
Overall Intersection - 0.76 37.5 D - 0.78 39.2 D

M1 Hotels Text Amendment Final EIS
69 Transportation
Table 14-19 2028 With-Action Level of Service Analysis – Saturday Midday Peak Hour – Jamaica Prototypical Site (continued)
Control ControlINTERSECTION & APPROACH Mvt. V/C Delay LOS Mvt. V/C Delay LOS
No-Action With-Action
UNSIGNALIZED INTERSECTIONS
148TH STREET @ JAMAICA AVENUEJamaica Avenue WB LT - 9.8 A LT - 9.9 A
Overall Intersection - - 2.2 A - - 1.9 A
147TH PLACE @ ARCHER AVENUEArcher Avenue EB LT - 15.3 C LT - 16.1 C
Overall Intersection - - 0.8 A - - 0.8 A
148TH STREET @ ARCHER AVENUE148th Street SB LR - 21.3 C LR - 21.0 C
Overall Intersection - - 3.5 A - - 3.5 A
149TH STREET @ ARCHER AVENUEArcher Avenue EB LT - 13.2 B LT - 13.6 B
Overall Intersection - - 0.7 A - - 0.8 A
Notes:(1) Control delay is measured in seconds per vehicle.(2) Level of service (LOS) for signalized intersections is based upon average control delay per vehicle (sec/veh) for each lane group as listedin the 2000 Highway Capacity Manual -- TRB.(3) Level of service (LOS) for unsignalized intersections is based upon control delay per vehicle (sec/veh) for each minor-approach as listedin the 2000 Highway Capacity Manual -- TRB.(4) Overall intersection V/C ratio is the critical lane groups' V/C ratio, not the weighted average of all the movements.(5) Shading denotes approach movement subject to significant adverse impact.

M1 Hotels Text Amendment Final EIS
70 Transportation
Downtown Brooklyn Prototypical Site
Existing Conditions
As described above, one signalized intersection has been selected for analysis in the weekday a.m., midday and p.m. peak periods. Traffic data were collected in January 2018 via a combination of video turning movement/classification counts and continuous (seven-day) ATR machine counts. These volumes were used along with field observations of traffic conditions to determine the levels of service for the weekday peak hours of 7:15 to 8:15 a.m., 12:00 to 1:00 p.m., and 4:45 to 5:45 p.m.. Physical inventory data needed for operational analysis—e.g., the number of traffic lanes, lane widths, pavement markings, turn prohibitions, bus stops, and typical parking regulations—were also recorded. In addition, official signal timings obtained from NYCDOT were used in the analyses. Existing traffic volumes for the weekday a.m., midday and p.m. peak hours are shown in Figure 14-22.

M1 Hotels Text Amendment Final EIS
71 Transportation
Figure 14-22 2018 Existing Traffic Volumes – Downtown Brooklyn Prototypical Site
Weekday a.m. Peak Hour Weekday Midday Peak Hour Weekday p.m. Peak Hour

M1 Hotels Text Amendment Final EIS
72 Transportation
Study Area Street Network
Flatbush Avenue—also referred to as Flatbush Avenue Extension north of Fulton Street—is a major arterial that generally runs in a north-south direction and provides direct access to/from the Manhattan Bridge to the north of the study area. The roadway is approximately 70 to 80 feet in width at its intersection with Fulton Street and operates with three northbound through lanes, two to three southbound through lanes, and one southbound left-turn lane. As shown in Figure 14-22, peak hour traffic volumes approaching Fulton Street typically range from 825-1,095 vph in the northbound direction and 1,035 to 1,545 vph in the southbound direction. Flatbush Avenue is a designated through truck route.
Fulton Street is a two-way street that generally runs in an east-west direction. The segment of Fulton Street on the west side of Flatbush Avenue is referred to as the Fulton Mall, a transit and pedestrian mall with a 22-foot wide roadway and through traffic restricted to buses. Limited access is permitted for other vehicular traffic, such as service/delivery vehicles and other vehicles traveling northbound on Hanover Street, which must turn right onto Fulton Street. East of Flatbush Avenue, the roadway widens to approximately 36 feet with no traffic restrictions. Bus routes operating along Fulton Street include the B25, B26, B38, and B52. Peak hour traffic volumes approaching Flatbush Avenue typically range from 75-125 vph on the eastbound approach and 320-415 vph on the westbound approach.
Intersection Capacity Analysis
Table 14-20 presents the existing LOS by approach “movements” for the intersection of Flatbush Avenue and Fulton Street. Although most approach movements operate at overall acceptable levels, individual approach movements are considered congested. These movements are listed below:
› The southbound Flatbush Avenue left-turn movement operates at a v/c ratio of 0.91 and LOS F with a delay of 92.1 seconds during the weekday a.m. peak hour, LOS E with a delay of 74.2 seconds during the weekday midday peak hour, and a v/c ratio of 0.95 and LOS F with a delay of 89.1 seconds during the weekday p.m. peak hour.
› The westbound Fulton Street approach operates at LOS E with a delay of 55.7 seconds during the weekday a.m. peak hour, LOS E with a delay of 59.5 seconds during the weekday midday peak hour, and at a v/c ratio of 0.96 and LOS F with a delay of 97.3 seconds during the weekday p.m. peak hour.

M1 Hotels Text Amendment Final EIS
73 Transportation
Table 14-20 2018 Existing Level of Service Analysis – Downtown Brooklyn Prototypical Site
Control Control ControlINTERSECTION & APPROACH Mvt. V/C Delay LOS Mvt. V/C Delay LOS Mvt. V/C Delay LOS
SIGNALIZED INTERSECTIONS
FLATBUSH AVENUE @ FULTON STREETFlatbush Avenue NB T 0.82 37.9 D T 0.67 35.0 C T 0.79 39.4 D
SB L 0.91 92.1 F L 0.83 74.2 E L 0.95 89.1 FTR 0.64 18.9 B TR 0.76 23.1 C TR 0.54 16.0 B
Fulton Street EB LTR 0.42 41.2 D LTR 0.67 53.3 D LTR 0.56 46.5 DWB LT 0.70 55.7 E LT 0.74 59.5 E LT 0.96 97.3 F
R 0.62 29.1 C R 0.47 22.7 C R 0.40 20.4 C
Overall Intersection - 0.77 35.5 D - 0.78 34.6 C - 0.66 35.9 D
(1) Control delay is measured in seconds per vehicle.(2) Level of service (LOS) for signalized intersections is based upon average control delay per vehicle (sec/veh) for each lane group as listedin the 2000 Highway Capacity Manual -- TRB.(3) Overall intersection V/C ratio is the critical lane groups' V/C ratio, not the weighted average of all the movements.
AM MD PM
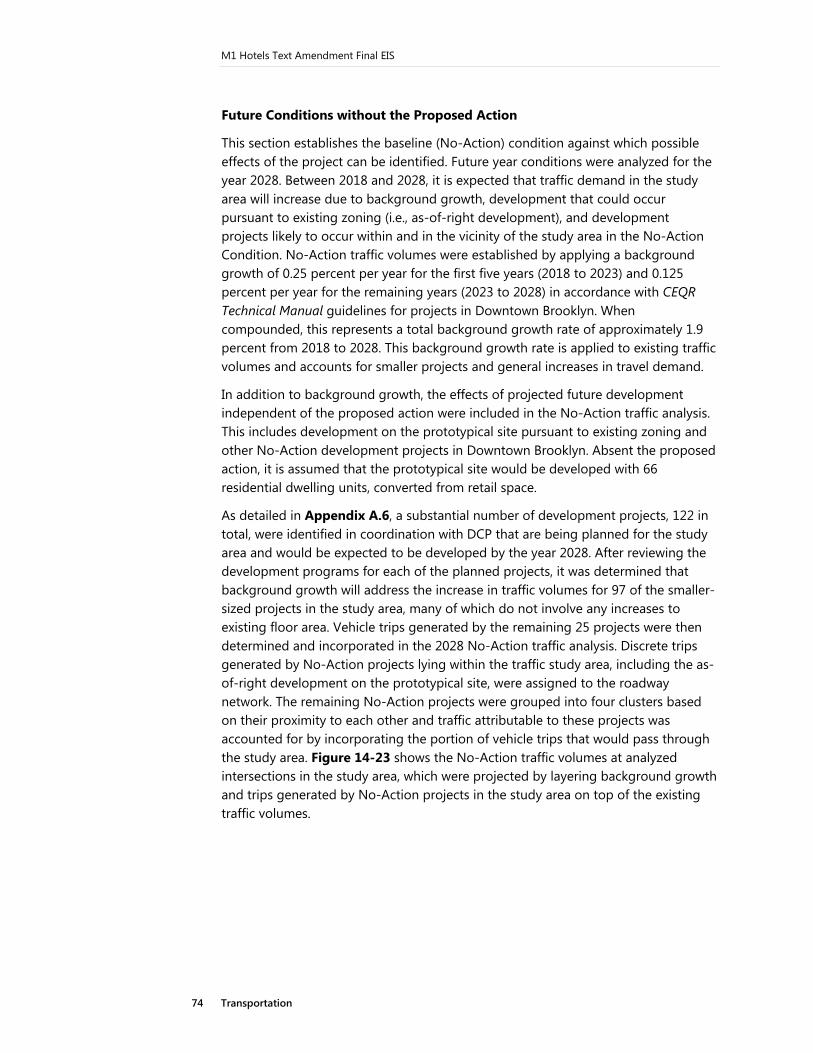
M1 Hotels Text Amendment Final EIS
74 Transportation
Future Conditions without the Proposed Action
This section establishes the baseline (No-Action) condition against which possible effects of the project can be identified. Future year conditions were analyzed for the year 2028. Between 2018 and 2028, it is expected that traffic demand in the study area will increase due to background growth, development that could occur pursuant to existing zoning (i.e., as-of-right development), and development projects likely to occur within and in the vicinity of the study area in the No-Action Condition. No-Action traffic volumes were established by applying a background growth of 0.25 percent per year for the first five years (2018 to 2023) and 0.125 percent per year for the remaining years (2023 to 2028) in accordance with CEQR Technical Manual guidelines for projects in Downtown Brooklyn. When compounded, this represents a total background growth rate of approximately 1.9 percent from 2018 to 2028. This background growth rate is applied to existing traffic volumes and accounts for smaller projects and general increases in travel demand.
In addition to background growth, the effects of projected future development independent of the proposed action were included in the No-Action traffic analysis. This includes development on the prototypical site pursuant to existing zoning and other No-Action development projects in Downtown Brooklyn. Absent the proposed action, it is assumed that the prototypical site would be developed with 66 residential dwelling units, converted from retail space.
As detailed in Appendix A.6, a substantial number of development projects, 122 in total, were identified in coordination with DCP that are being planned for the study area and would be expected to be developed by the year 2028. After reviewing the development programs for each of the planned projects, it was determined that background growth will address the increase in traffic volumes for 97 of the smaller-sized projects in the study area, many of which do not involve any increases to existing floor area. Vehicle trips generated by the remaining 25 projects were then determined and incorporated in the 2028 No-Action traffic analysis. Discrete trips generated by No-Action projects lying within the traffic study area, including the as-of-right development on the prototypical site, were assigned to the roadway network. The remaining No-Action projects were grouped into four clusters based on their proximity to each other and traffic attributable to these projects was accounted for by incorporating the portion of vehicle trips that would pass through the study area. Figure 14-23 shows the No-Action traffic volumes at analyzed intersections in the study area, which were projected by layering background growth and trips generated by No-Action projects in the study area on top of the existing traffic volumes.

M1 Hotels Text Amendment Final EIS
75 Transportation
Figure 14-23 2028 No-Action Traffic Volumes – Downtown Brooklyn Prototypical Site
Weekday a.m. Peak Hour Weekday Midday Peak Hour Weekday p.m. Peak Hour

M1 Hotels Text Amendment Final EIS
76 Transportation
Table 14-21 summarizes LOS by approach movements for future No-Action conditions. The results of the analysis indicate that most of the analyzed movements would continue to operate at acceptable levels during the analyzed peak hours, except for the two movements listed below:
› The southbound Flatbush Avenue left-turn movement will deteriorate to a v/c ratio of 0.97 and within LOS F to a delay of 104.4 seconds during the weekday a.m. peak hour, will deteriorate within LOS E to a delay of 79.9 seconds during the weekday midday peak hour, and will deteriorate to a v/c ratio of 1.00 and within LOS F to a delay of 101.0 seconds during the weekday p.m. peak hour.
› The westbound Fulton Street approach will deteriorate within LOS E to a delay of 56.7 seconds during the weekday a.m. peak hour, will deteriorate within LOS E to a delay of 61.0 seconds during the weekday midday peak hour, and will deteriorate to a v/c ratio of 0.98 and within LOS F to a delay of 102.4 seconds during the weekday p.m. peak hour.

M1 Hotels Text Amendment Final EIS
77 Transportation
Table 14-21 2028 No-Action Level of Service Analysis – Downtown Brooklyn Prototypical Site
Control Control ControlINTERSECTION & APPROACH Mvt. V/C Delay LOS Mvt. V/C Delay LOS Mvt. V/C Delay LOS
SIGNALIZED INTERSECTIONS
FLATBUSH AVENUE @ FULTON STREETFlatbush Avenue NB T 0.84 39.1 D T 0.68 35.5 D T 0.81 40.5 D
SB L 0.97 104.5 F L 0.88 79.9 E L 1.00 101.0 FTR 0.68 19.9 B TR 0.77 23.6 C TR 0.55 16.2 B
Fulton Street EB LTR 0.42 41.3 D LTR 0.61 48.5 D LTR 0.56 46.2 DWB LT 0.72 56.7 E LT 0.75 61.0 E LT 0.98 102.4 F
R 0.64 30.0 C R 0.49 23.2 C R 0.42 20.7 C
Overall Intersection - 0.82 37.2 D - 0.79 35.3 D - 0.69 37.8 D
(1) Control delay is measured in seconds per vehicle.(2) Level of service (LOS) for signalized intersections is based upon average control delay per vehicle (sec/veh) for each lane group as listedin the 2000 Highway Capacity Manual -- TRB.(3) Overall intersection V/C ratio is the critical lane groups' V/C ratio, not the weighted average of all the movements.
AM MD PM

M1 Hotels Text Amendment Final EIS
78 Transportation
Future Conditions with the Proposed Action
As shown in Table 14-9 above, the proposed action would result in approximately 30, 54, and 48 incremental vehicle trips during the weekday a.m., midday, and p.m. peak hours, respectively. As discussed in the Level 2 screening assessment and the Transportation Demand Factors memorandum included in Appendix A.6, project-generated vehicle trips were assigned to the roadway network. The incremental peak hour trips resulting from the proposed action are shown in Figure 14-24. The With-Action traffic volumes are shown in Figure 14-25, which were developed by layering the project generated vehicle trips on top of the No-Action traffic volumes.

M1 Hotels Text Amendment Final EIS
79 Transportation
Figure 14-24 Project Generated Traffic Volumes – Downtown Brooklyn Prototypical Site
Weekday a.m. Peak Hour Weekday Midday Peak Hour Weekday p.m. Peak Hour

M1 Hotels Text Amendment Final EIS
80 Transportation
Figure 14-25 2028 With-Action Traffic Volumes – Downtown Brooklyn Prototypical Site
Weekday a.m. Peak Hour Weekday Midday Peak Hour Weekday p.m. Peak Hour

M1 Hotels Text Amendment Final EIS
81 Transportation
Table 14-22 presents a comparison of LOS by approach movements at signalized and unsignalized intersections in the No-Action and With-Action conditions. The proposed action could affect traffic conditions at one movement during the weekday midday peak hour and two movements during the weekday p.m. peak hour. The affected traffic movements at the intersection of Flatbush Avenue and Fulton Street are identified below:
› Southbound Flatbush Avenue left-turn movement (weekday p.m. peak hour)
› Eastbound Fulton Street approach (weekday midday and p.m. peak hours)
› Westbound Fulton Street shared left-turn and through movement (weekday p.m. peak hour)

M1 Hotels Text Amendment Final EIS
82 Transportation
Table 14-22 2028 With-Action Level of Service Analysis – Downtown Brooklyn Prototypical Site
WEEKDAY MIDDAYFLATBUSH AVENUE @ FULTON STREETFlatbush Avenue NB T 0.68 35.5 D T 0.68 35.5 D
SB L 0.88 79.9 E L 0.90 83.3 FTR 0.77 23.6 C TR 0.79 24.2 C
Fulton Street EB LTR 0.61 48.5 D LTR 0.83 71.5 EWB LT 0.75 61.0 E LT 0.78 64.4 E
R 0.49 23.2 C R 0.49 23.2 C
Overall Intersection - 0.79 35.3 D - 0.80 37.5 D
Control ControlINTERSECTION & APPROACH Mvt. V/C Delay LOS Mvt. V/C Delay LOS
SIGNALIZED INTERSECTIONS
WEEKDAY A.M.FLATBUSH AVENUE @ FULTON STREETFlatbush Avenue NB T 0.84 39.1 D T 0.84 39.1 D
SB L 0.97 104.5 F L 0.97 105.7 FTR 0.68 19.9 B TR 0.69 20.1 B
Fulton Street EB LTR 0.42 41.3 D LTR 0.51 45.0 DWB LT 0.72 56.7 E LT 0.74 59.2 E
R 0.64 30.0 C R 0.64 30.0 C
Overall Intersection - 0.82 37.2 D - 0.82 37.6 D
NO ACTION WITH ACTION
WEEKDAY P.M.FLATBUSH AVENUE @ FULTON STREETFlatbush Avenue NB T 0.81 40.5 D T 0.81 40.5 D
SB L 1.00 101.0 F L 1.01 104.8 FTR 0.55 16.2 B TR 0.55 16.3 B
Fulton Street EB LTR 0.56 46.2 D LTR 0.76 61.8 EWB LT 0.98 102.4 F LT 1.02 114.8 F
R 0.42 20.7 C R 0.42 20.7 C
Overall Intersection - 0.69 37.8 D - 0.70 39.6 D
Notes:
(1) Control delay is measured in seconds per vehicle.
(2) Level of service (LOS) for signalized intersections is based upon average control delay per vehicle (sec/veh) for each lane group as listed
in the 2000 Highway Capacity Manual -- TRB.
(3) Level of service (LOS) for unsignalized intersections is based upon control delay per vehicle (sec/veh) for each minor-approach as listed
in the 2000 Highway Capacity Manual -- TRB.
(4) Overall intersection V/C ratio is the critical lane groups' V/C ratio, not the weighted average of all the movements.
(5) Shading denotes approach movement subject to significant adverse impact.
M1 Hotels Text Amendment Final EIS
83 Transportation
Vehicular and Pedestrian Safety Evaluation Crash data for intersections in the traffic study areas were obtained from NYCDOT for the three-year period between January 1, 2014 and December 31, 2016, the most recent period available. These data are developed based on information provided by the New York State Department of Transportation (NYSDOT), New York State Department of Motor Vehicles (NYSDMV), and New York City Police Department (NYPD). The data quantify the total number of reportable (involving a fatality, injury, or more than $1,000 in property damage) and non-reportable crashes as well as the total number of crashes involving injuries to pedestrians or bicyclists.
According to the CEQR Technical Manual, a high-crash location is one where there were 48 or more reportable and non-reportable crashes or five or more pedestrian/bicyclist-related crashes in any consecutive 12 months within the most recent three-year period for which data are available.
Long Island City Prototypical Site
Table 14-23 provides a summary of total accident characteristics by location for the 2014 to 2016 period at the study area intersections for the Long Island City prototypical site. As shown in Table 14-23, during the three-year reporting period, there were a total of 72 reportable and non-reportable crashes, zero fatalities, and nine pedestrian/bicyclist-related injury crashes.

M1 Hotels Text Amendment Final EIS
84 Transportation
Table 14-23 Summary of Motor Vehicle Crash Data – Long Island City Prototypical Site
Intersection
Pedestrian Injury Crashes
Bicycle Injury Crashes
Total Pedestrian/Bicycle
Injury Crashes Total Crashes Total Fatalities
Total Injuries2014 2015 2016 2014 2015 2016 2014 2015 2016 2014 2015 2016
Queens Blvd and Jackson Ave/Queens Plz E 1 0 1 4 1 1 5 1 2 22 15 30 0 54
Jackson Ave and 42nd Rd 1 0 0 0 0 0 1 0 0 3 1 1 0 542nd Rd and Hunter St/28th St 0 0 0 0 0 0 0 0 0 0 0 0 0 0
Source: NYSDOT accident data from January 1, 2014 through December 31, 2016.
Note: Shading denotes high crash locations.

M1 Hotels Text Amendment Final EIS
85 Transportation
No intersection had 48 or more crashes in any consecutive 12 months during this period. A review of the crash data identified that the intersection of Queens Boulevard and Jackson Avenue/Queens Plaza East has experienced five or more pedestrian and/or cyclist injury crashes in a consecutive 12-month period, which is identified as a high-crash location.
The intersection of Queens Boulevard and Jackson Avenue/Queens Plaza East is currently signalized and has pedestrian signals with countdown timers, high visibility crosswalks on all approaches, and a leading pedestrian interval on the north crosswalk, the latter of which was implemented in 2014. Northbound left turns, eastbound left turns, and southbound right turns are prohibited. There is a protected left-turn signal phase on the westbound approach. The intersection lies within a priority area of the NYC Vision Zero Program and on Queens Boulevard, which is categorized as a priority corridor as part of City’s Vision Zero initiatives. A total of five pedestrian- and bicycle-related crashes occurred in 2014, compared to one pedestrian/bicycle crashes in 2015 and two pedestrian/bicycle crashes in 2016. Based on a review of the crash data, of the five pedestrian/bicycle crashes in 2014, three occurred outside of daylight hours. As for turning vehicles, a maximum of up to 14 project-generated vehicles (one turning vehicle approximately every four minutes) could potentially conflict with pedestrians in the west crosswalk during the weekday midday peak hour, although it is likely that many of these turns would occur during the protected left-turn signal phase, which does not conflict with the west crosswalk. There would also be 13 project-generated vehicles making eastbound right turns during this same peak hour, a movement which crosses over the west crosswalk and is controlled by a stop sign. The decline in crashes from 2014 to 2015 and 2016 likely reflects implementation of safety improvement measures and City initiatives in recent years. The City has plans to install upgraded signage to help drivers navigate the area and to move the locations of existing signs for greater visibility.
Jamaica Prototypical Site
Table 14-24 provides a summary of total accident characteristics by location for the 2014 to 2016 period at the study area intersections for the Jamaica prototypical site. As shown in Table 14-24, during the three-year reporting period, there were a total of 116 reportable and non-reportable crashes, one fatality, and 45 pedestrian/bicyclist-related injury crashes.

M1 Hotels Text Amendment Final EIS
86 Transportation
Table 14-24 Summary of Motor Vehicle Crash Data – Jamaica Prototypical Site
Intersection
Pedestrian Injury Crashes
Bicycle Injury Crashes
Total Pedestrian/Bicycle
Injury Crashes Total Crashes Total Fatalities
Total Injuries2014 2015 2016 2014 2015 2016 2014 2015 2016 2014 2015 2016
Jamaica Ave
Sutphin Blvd 7 6 2 0 1 0 7 7 2 11 10 3 0 22147th Pl/148th
St 0 0 0 0 0 0 0 0 0 1 1 1 0 2
148th St 1 1 0 0 1 0 1 2 0 1 2 0 0 3149th St 0 0 0 0 0 0 0 0 0 1 0 1 0 2
Archer Ave
143rd St 0 0 0 0 1 0 0 1 0 3 3 2 0 11Sutphin Blvd 3 2 3 0 0 2 3 2 5 10 4 9 0 25
147th Pl 0 0 0 1 0 0 1 0 0 1 1 0 0 1148th St 0 0 0 0 0 0 0 0 0 1 0 0 0 1149th St 0 0 0 0 0 0 0 0 0 0 0 1 0 0150th St 0 1 2 1 0 0 1 1 2 3 3 2 0 7
94th Ave
Van Wyck Expwy E Service
Rd 1 1 4 0 0 1 1 1 5 10 9 12 1 31
143rd St 1 1 1 0 0 0 1 1 1 3 2 5 0 13Source: NYSDOT accident data from January 1, 2014 through December 31, 2016.
Note: Shading denotes high crash locations.

M1 Hotels Text Amendment Final EIS
87 Transportation
No intersection had 48 or more crashes in any consecutive 12 months during this period. A review of the crash data identified three intersections that have experienced five or more pedestrian and/or cyclist injury crashes in a consecutive 12-month period, which are identified as high-crash locations:
› Jamaica Avenue and Sutphin Boulevard;
› Archer Avenue and Sutphin Boulevard; and
› 94th Avenue/Atlantic Avenue and Van Wyck Expressway East Service Road.
The intersection of Jamaica Avenue and Sutphin Boulevard is currently signalized and has pedestrian signals with countdown timers, a signal timing plan that has been modified to reflect slower walking speeds, leading pedestrian intervals on all four crosswalks, textured crosswalks on the north, south, and west sides of the intersection, a high visibility crosswalk on the east side of the intersection, and advance stop bars. Left turns are prohibited on all approaches during the analyzed peak hours for all vehicles except buses. The intersection is categorized as a priority intersection within a priority area in the NYC Vision Zero Program and lies along Jamaica Avenue, which is an arterial slow zone and has had signals retimed for 25 mph, and Sutphin Boulevard, which is a priority corridor in the City’s Vision Zero initiatives. A total of seven pedestrian- and bicycle-related crashes occurred at this intersection in both 2014 and 2015, compared to two pedestrian/bicycle crashes in 2016. Based on a review of the crash data, of the 14 pedestrian/bicycle crashes that occurred between 2014 and 2015, five involved pedestrians crossing against the signal. With the proposed action, this intersection would not experience any net increases in project-generated vehicles making turns that could conflict with crosswalks. The decline in crashes from 2014 and 2015 to 2016 likely reflects implementation of safety improvement measures and City initiatives in recent years, which include the lead pedestrian intervals and advance stop bars at this location..
The intersection of Archer Avenue and Sutphin Boulevard is currently signalized and has pedestrian signals with countdown timers, a signal timing plan that has been modified to reflect slower walking speeds, a leading pedestrian interval on the east and west crosswalks, high visibility crosswalks on all approaches, and advance stop bars. Eastbound left turns are prohibited except for buses. The intersection is categorized as a priority intersection within a priority area in the NYC Vision Zero Program and lies along Archer Avenue and Sutphin Boulevard, both of which are priority corridors in the City’s Vision Zero initiatives. A total of five pedestrian- and bicycle-related crashes occurred at this intersection in 2016, compared to three pedestrian/bicycle crashes in 2014 and two pedestrian/bicycle crashes in 2015. Based on a review of the crash data, no prevailing trends or factors potentially contributing to the spike in pedestrian/bicycle crashes in 2016 were identified. This intersection is located adjacent to subway and commuter rail stations where there are typically increased levels of pedestrian volumes. With the proposed action, this intersection would experience modest increases in conflicting turning volumes in the analyzed peak hours (approximately 30-60 vehicles, or one vehicle every one to two minutes). Independent of the proposed action, state funding has been allocated for improvements to the Jamaica Transportation Center Station Plaza to make the area

M1 Hotels Text Amendment Final EIS
88 Transportation
safer and more accessible to both pedestrians and vehicles. These include proposed plans to install new center medians along Archer Avenue, which would create a shorter two-part pedestrian crossing with a pedestrian refuge area.
The intersection of 94th Avenue/Atlantic Avenue and the Van Wyck Expressway East Service Road is currently signalized and has pedestrian signals with countdown timers, a signal timing plan that has been modified to reflect slower walking speeds, and high visibility crosswalks, the latter of which were added between 2016 and 2017. There is a protected left-turn signal phase on the eastbound approach. The intersection is located within a priority area of the NYC Vision Zero Program and lies at the end of Atlantic Avenue, which is a priority corridor in the City’s Vision Zero initiatives. A total of five pedestrian- and bicycle-related crashes occurred at this intersection in 2016 (including one fatality), compared to one pedestrian/bicycle crash in both 2014 and 2015. Based on a review of the crash data, of the five pedestrian/bicycle accidents that occurred in 2016, three occurred at dusk or night (including the fatality, which occurred between the hours of 12:00 a.m. and 1:00 a.m.). With the proposed action, this intersection would experience relatively modest increases in conflicting turning volumes in the analyzed peak hours (approximately 12 to 33 vehicles, or one vehicle every two to five minutes).
Downtown Brooklyn Prototypical Site
Table 14-25 provides a summary of total accident characteristics by location for the 2014 to 2016 period at the study area intersection for the Downtown Brooklyn prototypical site. As shown in Table 14-25, during the three-year reporting period, there were a total of 42 reportable and non-reportable crashes, zero fatalities, and 11 pedestrian/bicyclist-related injury crashes.

M1 Hotels Text Amendment Final EIS
89 Transportation
Table 14-25 Summary of Motor Vehicle Crash Data – Downtown Brooklyn Prototypical Site
Intersection
Pedestrian Injury Crashes
Bicycle Injury Crashes
Total Pedestrian/Bicycle
Injury Crashes Total Crashes Total Fatalities
Total Injuries2014 2015 2016 2014 2015 2016 2014 2015 2016 2014 2015 2016
Flatbush Ave and Fulton St 7 2 1 1 0 0 8 2 1 21 12 9 0 41Source: NYSDOT accident data from January 1, 2014 through December 31, 2016.
Note: Shading denotes high crash locations.

M1 Hotels Text Amendment Final EIS
90 Transportation
The intersection of Flatbush Avenue and Fulton Street did not have 48 or more crashes in any consecutive 12 months during this period. A review of the crash data identified that the intersection has experienced five or more pedestrian and/or cyclist injury crashes in a consecutive 12-month period, which is identified as a high-crash location.
The intersection of Flatbush Avenue/Flatbush Avenue Extension and Fulton Street is currently signalized, has pedestrian signals with countdown timers, a signal timing plan that has been modified to reflect slower walking speeds, and high visibility crosswalks, and a leading pedestrian interval on the north and south crosswalks. Northbound left turns and right turns are prohibited. There is a protected left-turn signal phase on the southbound approach. The intersection is located within a priority area and lies along Flatbush Avenue and Fulton Street, both of which are priority corridors in the NYC Vision Zero Program. Flatbush Avenue is also designated as an arterial slow zone and the Fulton Street and Flatbush Avenue (south of Fulton Street) corridors have had signals retimed for 25 mph as part of the City’s Vision Zero initiatives. Geometric and operational characteristics affecting safety at this intersection include its skewed geometry and the relatively long (up to 120 feet) crossing distances on Atlantic Avenue. With the proposed action, this intersection would experience relatively modest increases in conflicting turning volumes in the analyzed peak hours (approximately 14-27 vehicles, or one vehicle every two to four minutes). Based on a review of the crash data, a total of eight pedestrian- and bicycle-related crashes occurred in 2014, compared to two pedestrian/bicycle crashes in 2015 and one pedestrian/bicycle crash in 2016. Based on a review of the crash data, no prevailing trends or factors potentially contributing to the spike in pedestrian/bicycle crashes in 2014 were identified. The decline in crashes from 2014 to 2015 and 2016 likely reflects implementation of safety improvement measures and City initiatives in recent years.
Parking
Long Island City Prototypical Site
Existing Conditions
Inventories of on- and off-street parking resources within a quarter-mile of the prototypical site were conducted in January 2018. Curbside parking regulations for all block faces within a quarter-mile radius of the prototypical site were compiled; these are shown in Figure 14-26 and listed in Table 14-26. The curbside parking regulations in the area generally include no parking and no standing regulations during weekday business hours. One-hour or two-hour metered parking is generally allowed in areas with commercial activity, such as Queens Plaza and Jackson Avenue. Based on general observations, on-street parking in the study area is generally at or near full utilization with limited metered parking spaces available.

M1 Hotels Text Amendment Final EIS
91 Transportation
Figure 14-26 On-Street Parking Regulations – Long Island City Prototypical Site

M1 Hotels Text Amendment Final EIS
92 Transportation
Table 14-26 On-Street Parking Regulation Code Definitions – Long Island City Prototypical Site
Code Regulation 1 1 Hour Metered Parking Mon-Fri 9 a.m.-4 p.m. Sat 9 a.m.-7 p.m. 2 1 Hour Metered Parking 10 a.m.-4 p.m. Except Sun3 1 Hour Metered Parking 9 a.m.-4 p.m. Except Sun4 1 Hour Metered Parking 9 a.m.-7 p.m. Except Sun5 1 Hour Metered Parking 9 a.m.-7 p.m. Mon-Fri6 1 Hour Parking 9 a.m.-7 p.m. Mon-Fri7 2 Hour Metered Parking 9 a.m.-7 p.m. Except Sun8 2 Hour Metered Parking 9 a.m.-7 p.m. Mon-Fri9 Bus Layover Area No Standing Anytime 10 No Parking 3 a.m.-6 a.m. Mon & Thurs11 No Parking 8:30-10 a.m. Fri12 No Parking 8:30-10 a.m. Thurs13 No Parking 8-9 a.m. Except Sun14 No Parking 9:30-11 a.m. Mon15 No Parking 9:30-11 a.m. Tues16 No Parking 9:30-11 a.m. Friday17 No Parking 8:30-10 a.m. Mon18 No Parking 8:30-9 a.m. Mon & Thurs19 No Parking 3 a.m.-6 a.m. Tues & Fri20 No Parking 9:30-11 a.m. Thurs21 No Parking 8:30-10 a.m. Tues22 No Parking 8:30-9 a.m. Tues & Fri23 No Parking 8-9:30 a.m. Tues & Fri24 No Parking 6 a.m.-6 p.m. Mon-Fri25 No Parking 7 a.m.-7 p.m. Except Sun26 No Parking 7 a.m.-7 p.m. Mon-Fri27 No Parking 8 a.m.-4 p.m. Mon-Fri28 No Parking 8 a.m.-6 p.m. Except Sun29 No Parking 8 a.m.-6 p.m. Mon-Fri30 No Parking Anytime31 No Parking Anytime Except Authorized Vehicles32 No Standing Anytime Temporary Construction Regulation 33 No Standing 4 p.m.-7 p.m. Mon-Fri34 No Standing 7-10 a.m. 4-7 p.m. Mon-Fri35 No Standing 7-10 a.m. 4-7 p.m. Except Sun36 No Standing 7 a.m.-7 p.m. Mon-Fri Except Authorized Vehicles 37 No Standing Anytime38 No Standing Anytime Except Authorized Vehicles39 No Standing Except Taxis

M1 Hotels Text Amendment Final EIS
93 Transportation
Code Regulation 40 No Standing Except Trucks Loading & Unloading 7 a.m.-6 p.m. 41 No Standing School Days 7 a.m.-4 p.m.42 No Standing School Days 7 a.m.-5 p.m.43 No Stopping Anytime44 Authorized Vehicles Only - Press NYP License Plates Only
45 Authorized Vehicles Only - NYC Dept of Transportation Mon-Fri 9 a.m.-6 p.m.
46 Authorized Vehicles Only - Police Department 6 a.m.-8 p.m. Mon-Fri 47 Authorized Vehicles Only - Dept of Education School Days 7 a.m.-5 p.m.48 Authorized Vehicles Only - District Attorney Vehicles49 Authorized Vehicles Only - NYSJ 7 a.m.-7 p.m. Mon-Fri50 Authorized Vehicles Only - Police Department51 Authorized Vehicles Only - TA Official Vehicles Only52 Authorized Vehicles Only - US Mail53 Truck Loading Only 8 a.m.-6 p.m. Except Sun54 Truck Loading Only 6 a.m.-6 p.m. Mon-Fri55 Truck Loading Only 7 a.m.-5 p.m. Mon-Fri56 Truck Loading Only 7 a.m.-7 p.m. Mon-Fri
Note: Codes on Figure 14-26.
For off-street public parking lots and garages, interviews were conducted with parking attendants and visual inspections were made, where possible, to obtain utilization levels during the midday and overnight periods on a typical weekday. Figure 14-27 shows the locations of existing off-street public parking facilities and Table 14-27 provides a summary of the name, address, license number, capacity, and estimated utilization of each parking lot or garage. As shown in Table 14-27, the fourteen off-street parking facilities have a combined capacity of 2,059 spaces during the weekday midday; this is reduced to 1,759 spaces during the weekday overnight period when three facilities are closed. During the weekday midday period, approximately 69 percent of spaces are utilized, leaving a residual supply of 643 available parking spaces. During the weekday overnight period, approximately 36 percent of spaces are utilized, leaving a residual supply of approximately 1,127 available parking spaces.

M1 Hotels Text Amendment Final EIS
94 Transportation
Figure 14-27 Off-Street Parking Facilities – Long Island City Prototypical Site

M1 Hotels Text Amendment Final EIS
95 Transportation
Table 14-27 Existing Off-Street Parking Facilities – Long Island City Prototypical Site
Map ID Name
Business Address(es)
License Number
Licensed Capacity
Weekday Midday Weekday Overnight
Estimated Utilization
Available Capacity
Estimated Utilization
Available Capacity
1 23 Operating LIC LLC 23-10 41st Ave 2010119 23 100% 0 100% 02 TPEC Crescent LLC 41-10 Crescent St 2011234 125 55% 56 10% 1123 24 St Operating LIC LLC 41-42 24th St 2036350 108 75% 27 55% 494 23rd Street Parking Inc 42-02 23rd St 0949204 100 75% 25 CLOSED5 LIC LOT, LLC 23-02 42nd Rd 1283038 85 95% 4 5% 816 Champion Parking North LLC 29-17 Queens Plz N 2040594 60 100% 0 100% 07 LIC LOT, LLC 27-03 42nd Rd 1460299 42 75% 10 50% 218 MBA Parking Corp 27-02 Queens Plz S n/a 50 75% 12 CLOSED9 One Parking Gotham Inc 42-09 28th St 2003571 162 90% 16 35% 10510 Quik Park Crescent LLC 43-08 Crescent St 2004674 202 100% 0 100% 011 43-25 Hunter Street Parking Corp 43-25 Hunter St 2051385 49 100% 0 15% 4212 Alex Operating Corp 27-50 Jackson Ave 926484 150 65% 52 CLOSED
13 Court Square Municipal Parking Garage 45-40 Court Square n/a 703 60% 281 25% 527
14 LIC Operating LLC 27-28 Thomson Ave 1262963 200 20% 160 5% 190TOTAL 2,059 69% 643 36% 1,127

M1 Hotels Text Amendment Final EIS
96 Transportation
Future Conditions without the Proposed Action
Between 2018 and 2028, demand for off-street parking is expected to increase due to background growth, development that could occur pursuant to existing zoning, and the No-Action development projects listed in Appendix A.6. Similar to the traffic analysis, a total background growth rate of 1.89 percent was applied to existing parking utilization levels. Other No-Action development projects are expected to displace one public facility with a capacity of 125 spaces, add one public facility with a capacity of 338 spaces, and add 1,363 accessory parking spaces. As shown in Table 14-28, the utilization of off-street parking spaces in the No-Action condition is expected to increase to 98 and 89 percent during the weekday midday and overnight periods, respectively.
Table 14-28 Existing and No-Action Off-Street Parking Capacity, Demand and Utilization – Long Island City Prototypical Site
Notes: 1. Reflects displacement of existing public parking facility (Facility #2 in Table 14-27) on the prototypical
site in the No-Action condition. 2. Reflects annual background growth rates of 0.25 percent per year for the 2018 through 2023 period
and 0.125 percent for the 2023 through 2028 period. 3. Demand from No-Action developments not accommodated by accessory parking.
Future Conditions with the Proposed Action
Table 14-29 shows the net incremental hourly parking demand for the proposed action compared to the No-Action Condition. As shown in the table, parking demand generated by the hotel would typically peak during the overnight hours, whereas the parking demand generated by office uses would typically peak during the midday hours (the net decrease in office parking demand reflects net reductions in this land use on the prototypical site under the RWCDS). Overall, under the
Weekday Midday
Weekday Overnight
Capacity 2018 Existing Capacity 2,059 1,759Capacity Added by No-Action Developments 338 338Capacity Displaced by No-Action Developments1 125 125
2028 No-Action Capacity 2,272 1,972Demand 2018 Existing Demand 1,416 632Demand from Background Growth2 27 12
Demand from No-Action Developments3 790 1,1072028 No-Action Demand 2,233 1,751
Utilization 2028 No-Action Utilization 98% 89%2028 No-Action Available Capacity 39 221

M1 Hotels Text Amendment Final EIS
97 Transportation
proposed action, parking demand would decrease by 63 spaces during the weekday midday peak period (12:00-1:00 p.m.) and would increase by 18 spaces during the weekday overnight period.
Table 14-29 With-Action Net Incremental Weekday Hourly Parking Accumulation by Land Use – Long Island City Prototypical Site
Time Period Hotel Office Total12:00 a.m. - 1:00 a.m. 18 0 181:00 a.m. - 2:00 a.m. 18 0 182:00 a.m. - 3:00 a.m. 18 0 183:00 a.m. - 4:00 a.m. 18 0 184:00 a.m. - 5:00 a.m. 18 0 185:00 a.m. - 6:00 a.m. 18 0 186:00 a.m. - 7:00 a.m. 18 0 187:00 a.m. - 8:00 a.m. 18 -4 148:00 a.m. - 9:00 a.m. 15 -48 -339:00 a.m. - 10:00 a.m. 11 -81 -7010:00 a.m. - 11:00 a.m. 8 -78 -7011:00 a.m. - 12:00 p.m. 5 -78 -7312:00 p.m. - 1:00 p.m. 14 -77 -631:00 p.m. - 2:00 p.m. 13 -78 -652:00 p.m. - 3:00 p.m. 11 -78 -673:00 p.m. - 4:00 p.m. 9 -81 -724:00 p.m. - 5:00 p.m. 7 -58 -515:00 p.m. - 6:00 p.m. 11 -8 36:00 p.m. - 7:00 p.m. 8 -1 77:00 p.m. - 8:00 p.m. 12 0 128:00 p.m. - 9:00 p.m. 14 0 149:00 p.m. - 10:00 p.m. 15 0 1510:00 p.m. - 11:00 p.m. 17 0 1711:00 p.m. - 12:00 a.m. 18 0 18
Note: Parking demand derived from forecasts of daily auto trips from these land uses.
No new accessory off-street parking spaces would be provided under the proposed action. A comparison of projected No-Action and With-Action Condition parking capacity and demand is provided in Table 14-30. During the weekday midday peak period, off-street parking utilization would decrease to 96 percent, leaving a total of 102 spaces available. During the weekday overnight period, off-street parking utilization would increase to 90 percent, leaving a total of 203 spaces available. As such, the proposed action is not expected to result in the potential for parking shortfalls.

M1 Hotels Text Amendment Final EIS
98 Transportation
Table 14-30 No-Action and With-Action Off-Street Capacity, Demand and Utilization – Long Island City Prototypical Site
Note: Includes demand not otherwise accommodated by on-site accessory parking. The numbers reflect the net incremental change compared to the No-Action RWCDS.
Jamaica Prototypical Site
Existing Conditions
Inventories of on- and off-street parking resources within a quarter-mile of the prototypical site were conducted in January 2018. Curbside parking regulations for all block faces within a quarter-mile radius of the prototypical site were compiled; these are shown in Figure 14-28 and listed in Table 14-31. The curbside parking regulations in the area generally include alternate-side-of-the-street parking. Regulations along key arterials are generally more restrictive, consisting of primarily no parking/no standing regulations to facilitate traffic flow. Based on general observations, on-street parking in the study area is generally at or near full utilization with limited metered parking spaces available.
Weekday Midday
Weekday Overnight
Capacity 2028 No-Action Capacity 2,272 1,972Capacity Added by Proposed Action 0 0 Capacity Displaced by Proposed Action 0 0
2028 With-Action Capacity 2,272 1,972Demand 2028 No-Action Demand 2,233 1,751Demand Added by Proposed Action1 -63 18
2028 With-Action Demand 2,170 1,769Utilization 2028 With-Action Utilization 96% 90%2028 With-Action Available Spaces 102 203

M1 Hotels Text Amendment Final EIS
99 Transportation
Figure 14-28 On-Street Parking Regulations – Jamaica Prototypical Site

M1 Hotels Text Amendment Final EIS
100 Transportation
Table 14-31 On-Street Parking Regulation Code Definitions – Jamaica Prototypical Site
Code Regulation 1 1 Hour Metered Parking Mon-Fri 10 a.m.-4 p.m. Sat 9 a.m.-7 p.m. 2 1 Hour Metered Parking 10 a.m.-4 p.m. Except Sun3 1 Hour Metered Parking 10 a.m.-7 p.m. Except Sun4 1 Hour Metered Parking 8:30 a.m.-7 p.m. Except Sun5 1 Hour Metered Parking 8 a.m.-7 p.m. Except Sun6 1 Hour Metered Parking 9 a.m.-4 p.m. Except Sun7 1 Hour Metered Parking 9 a.m.-7 p.m. Except Sun8 2 Hour Metered Parking 8:30 a.m.-7 p.m. Except Sun9 2 Hour Metered Parking 8 a.m.-7 p.m. Except Sun10 2 Hour Metered Parking 9 a.m.-7 p.m. Except Sun11 2 Hour Parking 8:30a.m.-7 p.m. Except Sun12 bus layover only No Standing Anytime 13 Drop-off Only 14 No Parking Midnight to 3 a.m. Fri15 No Parking Midnight to 3 a.m. Thurs16 No Parking Midnight to 3 a.m. Mon, Wed & Fri17 No Parking Midnight to 3 a.m. Tues, Thurs & Sat18 No Parking 7:30 a.m.-8 a.m. Except Sun19 No Parking 8-8:30 a.m. Mon & Thurs20 No Parking 8-8:30 a.m. Tues & Fri21 No Parking 8:30-10 a.m. Mon & Thurs22 No Parking 8:30-10 a.m. Tues & Fri23 No Parking 8:30-9 a.m. Mon & Thurs24 No Parking 8:30-9 a.m. Tues & Fri25 No Parking 8:30-9 a.m. Except Sun26 No Parking 8-8:30 a.m. Except Sun27 No Parking 8-9 a.m. Except Sun28 No Parking 9:30-11 a.m. Mon & Thurs29 No Parking 9:30-11 a.m. Tues & Fri30 No Parking 3 a.m.-6 a.m. Tuesday31 No Parking 10 a.m.-4 p.m. Mon-Fri32 No Parking 6 a.m.-5 p.m. Mon-Fri33 No Parking 7 a.m.-5 p.m. Mon-Fri34 No Parking 7 a.m.-6 p.m. Except Sun35 No Parking 7 a.m.-7 p.m. Except Sun36 No Parking 7 a.m.-7 p.m. Sat37 No Parking 8 a.m.-6 p.m. Except Sun38 No Parking 8 a.m.-6 p.m. Mon-Fri39 No Parking 8 a.m.-7 p.m. Except Sun

M1 Hotels Text Amendment Final EIS
101 Transportation
Code Regulation 40 No Parking Anytime
41 No Standing Commuter Van Stop/Authorized Commuter Vans Only
42 No Standing 6 a.m.-10 a.m. 4 p.m.-7 p.m. Mon-Fri43 No Standing 6 a.m.-9 a.m. 4 p.m.-7 p.m. Except Sun44 No Standing 7 a.m.-10 a.m. 4 p.m.-7 p.m. all days45 No Standing 7 a.m.-10 a.m. Except Sun46 No Standing 7 a.m.-7 p.m. Mon-Fri Except Authorized Vehicles 47 No Standing Anytime48 No Standing Anytime, Temporary Construction49 No Standing School Days 7 a.m.-4 p.m.50 No Stopping Anytime51 Authorized Vehicles Only - Police Dept Vehicles
52 Authorized Vehicles Only - Department of Finance 8 a.m.-6 p.m. Mon-Fri
53 Authorized Vehicles Only - Long Island Rail Road 7 a.m.-7 p.m. Mon-Fri
54 Authorized Vehicles Only - NYC Dept of Health & Mental Hygiene 8 a.m.-6 p.m. Mon-Fri
55 Authorized Vehicles Only - MTA Police56 Authorized Vehicles Only - US Mail57 Authorized Vehicles Only - US Govt Vehicles Only58 Truck Loading Only 6 a.m.-8 a.m. Except Sun59 Truck Loading Only 6 a.m.-9 a.m. Except Sun60 Truck Loading Only 9 a.m.-4 p.m. Except Sun61 Truck Loading Only 6 a.m.-4 p.m. Except Sun62 Truck Loading Only 9 a.m.-6 p.m. Except Sun
Note: Codes on Figure 14-28.
For off-street public parking lots and garages, interviews were conducted with parking attendants and visual inspections were made, where possible, to obtain utilization levels during the midday and overnight periods on a typical weekday. Figure 14-29 shows the locations of existing off-street public parking facilities and Table 14-32 provides a summary of the name, address, license number, capacity, and estimated utilization of each parking lot or garage. As shown in Table 14-32, the eleven off-street parking facilities have a combined capacity of 899 spaces during the weekday midday and 170 spaces during the weekday overnight period when all but two facilities are closed (it is noted that these facilities are not attended 24 hours, but allow customers to leave their cars overnight). During the weekday midday period, approximately 70 percent of spaces are utilized, leaving a residual supply of 266 available parking spaces. During the weekday overnight period, approximately ten percent of spaces are utilized, leaving a residual supply of approximately 153 available parking spaces.

M1 Hotels Text Amendment Final EIS
102 Transportation
Figure 14-29 Off-Street Parking Facilities – Jamaica Prototypical Site

M1 Hotels Text Amendment Final EIS
103 Transportation
Table 14-32 Existing Off-Street Parking Facilities – Jamaica Prototypical Site
Map ID Name
Business Address(es)
License Number
Licensed Capacity
Weekday Midday Weekday Overnight
Estimated Utilization
Available Capacity
Estimated Utilization
Available Capacity
1 LM Sutphin Parking LLC 88-22 Sutphin Blvd 2037953 99 80% 20 CLOSED2 GB Parking 148-15 89th Ave 1003796 78 45% 43 CLOSED3 Excel Parking 89-36 Sutphin Blvd 2024664 118 20% 94 10% 1064 First Parking Systems Corp 90-10 Sutphin Blvd 1466051 36 60% 14 CLOSED5 Budhu Parking LLC 144-32 Jamaica Ave 2037121 42 100% 0 CLOSED6 Soge Associates LLC 145-20 Jamaica Ave 1462898 56 90% 6 CLOSED
7 KJL Property Management Corp 92-15 147th Place 147-37 Archer Ave
13349511334946 100 65% 35 CLOSED
8 Queens Family Court Garage 149-15 Archer Ave n/a 210 95% 10 CLOSED9 South Side Parking Systems Inc 143-19 94th Ave 1248142 52 100% 0 10% 47
10 CG Parking 145-04 Atlantic Ave95-02 Sutphin Blvd 0994343 33 80% 7 CLOSED
11 CG Parking 145-11 97th Ave 1224220 75 50% 37 CLOSEDTOTAL 899 70% 266 10% 153

M1 Hotels Text Amendment Final EIS
104 Transportation
Future Conditions without the Proposed Action
Between 2018 and 2028, demand for off-street parking is expected to increase due to background growth, development that could occur pursuant to existing zoning, and the No-Action development projects listed in Appendix A.6. Similar to the traffic analysis, a total background growth rate of 3.81 percent was applied to existing parking utilization levels. As-of-right development on the prototypical site is expected to displace one public facility with a capacity of 100 spaces but would add 174 on-site accessory parking spaces. Other No-Action development projects are expected to add 1,313 accessory parking spaces. As shown in Table 14-33, the utilization of off-street parking spaces in the No-Action condition is expected to increase to 99 and 319 percent during the weekday midday and overnight periods, respectively, with ten available spaces during the weekday midday and a shortfall of 372 spaces during the weekday overnight period. It is noted that the nine existing public parking facilities that are currently closed during the weekday overnight period have a combined capacity of 729 spaces, and if some of these were to open in the future, this would address the shortfall.
Table 14-33 Existing and No-Action Off-Street Parking Capacity, Demand and Utilization – Jamaica Prototypical Site
Notes: 1. Reflects displacement of existing public parking facility (Facility #7 in Table 14-32) on the prototypical
site in the No-Action condition. 2. Reflects annual background growth rates of 0.5 percent per year for the 2018 through 2023 period
and 0.25 percent for the 2023 through 2028 period. 3. Demand from No-Action developments not accommodated by accessory parking.
Future Conditions with the Proposed Action
Table 14-34 shows the net incremental hourly parking demand for the proposed action compared to the No-Action Condition. As shown in the table, parking
Weekday Midday
Weekday Overnight
Capacity 2018 Existing Capacity 899 170Capacity Added by No-Action Developments 0 0 Capacity Displaced by No-Action Developments1 100 0
2028 No-Action Capacity 799 170Demand 2018 Existing Demand 633 17Demand from Background Growth2 24 1
Demand from No-Action Developments3 132 5242028 No-Action Demand 789 542
Utilization 2028 No-Action Utilization 99% 319%2028 No-Action Available Capacity 10 -372

M1 Hotels Text Amendment Final EIS
105 Transportation
demand generated by the hotel and residential uses would typically peak during the overnight hours, whereas the parking demand generated by retail uses would typically peak during the midday hours (the net decrease in residential and retail parking demand reflects net reductions in these land uses on the prototypical site under the RWCDS). The hotel would generate a parking demand of 53 and 68 spaces during the weekday midday (12:00-1:00 p.m.) and overnight time periods, respectively. Overall, under the proposed action, parking demand generated by the prototypical site would decrease by 82 and 152 spaces during the weekday midday and overnight time periods, respectively.
Table 14-34 With-Action Net Incremental Weekday Hourly Parking Accumulation by Land Use – Jamaica Prototypical Site
Time Period Residential HotelLocal Retail Total
12:00 a.m. - 1:00 a.m. -220 68 0 -152 1:00 a.m. - 2:00 a.m. -220 68 0 -152 2:00 a.m. - 3:00 a.m. -220 68 0 -152 3:00 a.m. - 4:00 a.m. -220 68 0 -152 4:00 a.m. - 5:00 a.m. -220 68 0 -152 5:00 a.m. - 6:00 a.m. -220 68 0 -152 6:00 a.m. - 7:00 a.m. -217 68 0 -149 7:00 a.m. - 8:00 a.m. -200 67 -2 -136 8:00 a.m. - 9:00 a.m. -160 57 -2 -105 9:00 a.m. - 10:00 a.m. -137 40 -3 -100 10:00 a.m. - 11:00 a.m. -131 29 -4 -106 11:00 a.m. - 12:00 p.m. -131 21 -4 -114 12:00 p.m. - 1:00 p.m. -131 53 -4 -82 1:00 p.m. - 2:00 p.m. -131 49 -4 -86 2:00 p.m. - 3:00 p.m. -131 41 -4 -94 3:00 p.m. - 4:00 p.m. -138 33 -4 -109 4:00 p.m. - 5:00 p.m. -156 26 -4 -133 5:00 p.m. - 6:00 p.m. -183 41 -4 -146 6:00 p.m. - 7:00 p.m. -206 31 -4 -179 7:00 p.m. - 8:00 p.m. -222 45 -4 -181 8:00 p.m. - 9:00 p.m. -229 54 -3 -179 9:00 p.m. - 10:00 p.m. -220 58 0 -162
10:00 p.m. - 11:00 p.m. -220 63 0 -157 11:00 p.m. - 12:00 a.m. -220 68 0 -152 Note: Parking demand for residential land use based on 2012-2016 5-year American Community
Survey data on average vehicles per household for Census tracts in the rezoning area and forecasts of daily auto trips for this land use. Parking demand for all other land uses derived from forecasts of daily auto trips from these land uses.
The proposed action would include 66 on-site accessory parking spaces. The on-site parking supply would adequately accommodate the prototypical site’s parking

M1 Hotels Text Amendment Final EIS
106 Transportation
demand during the weekday midday period and would accommodate all but two spaces of the site’s parking demand during the weekday overnight period. It is assumed that the remaining overnight parking demand would need to be accommodated by other parking resources in the surrounding area. A comparison of projected No-Action and With-Action Condition parking capacity and demand is provided in Table 14-35. During the weekday midday peak period, off-street parking utilization would remain at 99 percent, with ten available spaces. During the weekday overnight period, off-street parking utilization would decrease to 294 percent, with a shortfall of 330 spaces.
Table 14-35 No-Action and With-Action Off-Street Capacity, Demand and Utilization – Jamaica Prototypical Site
Note: Includes demand not otherwise accommodated by on-site accessory parking. The numbers reflect the net incremental change compared to the No-Action RWCDS.
As described above, No-Action development projects in the study area—primarily new residential dwelling units—would result in an increased parking demand of 524 spaces during the weekday overnight period and result in a parking shortfall in the No-Action condition. The proposed action would reduce this parking shortfall by 42 spaces in the With-Action condition. Additionally, as noted above, the nine existing public parking facilities that are currently closed during the weekday overnight period have a combined capacity of 729 spaces, and if some of these were to open in the future to accommodate the new demand generated by residential development in the No-Action condition, this would address the shortfall. As stated in the CEQR Technical Manual and above in the parking analysis methodology section, for proposed actions located in Manhattan or other CBD areas, while the inability of the proposed action or the surrounding area to accommodate the project’s future parking demand is considered a parking shortfall, there are many available alternative modes of transportation.
Weekday Midday
Weekday Overnight
Capacity 2028 No-Action Capacity 799 170Capacity Added by Proposed Action 0 0 Capacity Displaced by Proposed Action 0 0
2028 With-Action Capacity 799 170Demand 2028 No-Action Demand 789 542Demand Added by Proposed Action1 0 -42
2028 With-Action Demand 789 500Utilization 2028 With-Action Utilization 99% 294%2028 With-Action Available Spaces 10 -330

M1 Hotels Text Amendment Final EIS
107 Transportation
Downtown Brooklyn Prototypical Site
Existing Conditions
Inventories of on- and off-street parking resources within a quarter-mile of the prototypical site were conducted in January 2018. Curbside parking regulations for all block faces within a quarter-mile radius of the prototypical site were compiled; these are shown in Figure 14-30 and listed in Table 14-36. The curbside parking regulations in the area generally include alternate-side-of-the-street parking. Regulations along the Fulton Street commercial corridor and major arterials, such as segments of Flatbush Avenue, consist of primarily no standing regulations to facilitate traffic flow. Based on general observations, on-street parking in the study area is generally at or near full utilization with limited metered parking spaces available.

M1 Hotels Text Amendment Final EIS
108 Transportation
Figure 14-30 On-Street Parking Regulations – Downtown Brooklyn Prototypical Site

M1 Hotels Text Amendment Final EIS
109 Transportation
Table 14-36 On-Street Parking Regulation Code Definitions – Downtown Brooklyn Prototypical Site
Code Regulation 1 1 Hour Metered Parking Mon-Fri 10 a.m.-4 p.m. Sat 9 a.m.-7 p.m. 2 1 Hour Metered Parking Mon-Fri 9 a.m.-4 p.m. 7 p.m.-10 p.m. Sat 9 a.m.-10 p.m.3 1 Hour Metered Parking 8 a.m.-7 p.m. Except Sun4 1 Hour Metered Parking 9 a.m.-10 p.m. Except Sun5 1 Hour Metered Parking 9 a.m.-4 p.m. Except Sun6 1 Hour Metered Parking 9 a.m.-7 p.m. Except Sun7 1 Hour Metered Parking 9 a.m.-7 p.m. Sat8 1 Hour Parking 8 a.m.-7 p.m. Except Sun9 2 Hour Metered Parking 9 a.m.-7 p.m. Except Sun10 2 Hour Metered Parking 10 a.m.-7 p.m. Mon-Fri 9 a.m.-7 p.m. Sat 11 6 Hour Metered Parking 8 a.m.-10 p.m. Except Sun12 6 Hour Metered Parking 9 a.m.-10 p.m. Except Sun13 No Parking Midnight-3 a.m. Mon, Wed & Fri14 No Parking Midnight-3 a.m. Tues, Thurs & Sat15 No Parking 7:30-8 a.m. Except Sun16 No Parking 7 a.m.-7:30 a.m. Except Sun17 No Parking 8:30-10 a.m. Fri18 No Parking 8:30-10 a.m. Mon19 No Parking 8:30-10 a.m. Tues20 No Parking 8-8:30 a.m. Except Sun21 No Parking 9:30-11 a.m. Mon22 No Parking 9:30-11 a.m. Thurs23 No Parking 9:30-11 a.m. Tues24 No Parking 9:30-11 a.m. Fri25 No Parking 3 a.m.-6 a.m. Tues, Thurs & Sat26 No Parking 8:30-10 a.m. Thurs27 No Parking 8:30-10 a.m. Tues Fri28 No Parking 3 a.m.-6 a.m. Mon, Wed & Fri29 No Parking 7 a.m.-4 p.m. Except Sun30 No Parking 7 a.m.-7 p.m. Except Sun31 No Parking 8 a.m.-6 p.m. Except Sun32 No Parking 8 a.m.-6 p.m. Mon-Fri33 No Parking 8 a.m.-7 p.m. Except Sun34 No Parking 8 a.m.-7 p.m. Mon-Fri35 No Parking 8 a.m.-Midnight Except Sun36 No Parking Anytime37 No Parking 7 a.m.-5 p.m. Mon-Fri38 No Standing 7p.m.-7 a.m. All Days39 No Standing 4-7 p.m. Except Sun40 No Standing 7 a.m.-10 a.m. Mon-Fri

M1 Hotels Text Amendment Final EIS
110 Transportation
Code Regulation 41 No Standing 7 a.m.-7 p.m. Mon-Fri Except Authorized Vehicles 42 No Standing Anytime43 No Standing Anytime Temporary Construction Regulation 44 No Standing Anytime Except Authorized Vehicles45 No Standing Hotel Loading Zone46 No Standing 4-7 p.m. Mon-Fri47 No Standing 7a.m.-10 a.m. 4 p.m.-7 p.m. Mon-Fri48 No Standing 7 a.m.-7 p.m. Mon-Fri49 No Standing Commuter Van Stop/Authorized Commuter Vans Only 50 No Standing Access-a-Ride Bus Stop51 No Stopping Anytime52 Authorized Vehicles only - NYSDHCR53 Authorized Vehicles Only - Press NYP License Plates Only 7 a.m.-7 p.m. Mon-Fri54 Authorized Vehicles Only - MTA Police 7 a.m.-7 p.m. Mon-Fri
55 Authorized Vehicles Only - NYC Dept of Health & Mental Hygiene 8 a.m.-6 p.m. Except Sun
56 Authorized Vehicles Only - Dept of Education School Days 7 a.m.-4 p.m. 57 Authorized Vehicles Only - Dept of Env Protection 7 a.m.-7 p.m. Mon-Fri58 Authorized Vehicles Only - Fire Department59 Authorized Vehicles Only - Human Resources Admin 8 a.m.-6 p.m. Mon-Fri60 Authorized Vehicles Only - NYS Dept of Labor 7 a.m.-7 p.m. Mon-Fri 61 Authorized Vehicles Only - NYS Justice Center62 Authorized Vehicles Only - NYSJ 7 a.m.-7 p.m. Mon-Fri63 Authorized Vehicles Only - Police Dept64 Authorized Vehicles Only - Police Dept Mon-Fri 7 a.m.-7 p.m. 65 Authorized Vehicles Only - Ambulance Ambulette Only 5 a.m.-11 p.m. Except Sun66 Authorized Vehicles Only - Doctor License Plates only 7 a.m.-7 p.m. all days67 Authorized Vehicles Only - Doctor Vehicles Only68 Authorized Vehicles Only - For-Hire Vehicles Only69 Taxi Stand 70 Truck - Farmers Market Only June 1 - Nov 30 Fri 8 a.m.-5 p.m. 71 Truck Loading Only72 Truck Loading Only 7 a.m.-3 p.m. Except Sun73 Truck Loading Only 7 a.m.-4 p.m. All Days74 Truck Loading Only 7 a.m.-7 p.m. Except Sun75 Truck Loading Only 8 a.m.-6 p.m. Except Sun76 Truck Loading Only 10 a.m.-4 p.m. Mon-Fri77 Truck Loading Only 6 a.m.-6 p.m. Mon-Fri78 Truck Loading Only 7 a.m.-10 a.m. Mon-Fri79 Truck Loading Only 8 a.m.-6 p.m. Mon-Fri
Note: Codes on Figure 14-30.

M1 Hotels Text Amendment Final EIS
111 Transportation
For off-street public parking lots and garages, interviews were conducted with parking attendants and visual inspections were made, where possible, to obtain utilization levels during the midday and overnight periods on a typical weekday. Figure 14-31 shows the locations of existing off-street public parking facilities and Table 14-37 provides a summary of the name, address, license number, capacity, and estimated utilization of each parking lot or garage. As shown in Table 14-37, the ten off-street parking facilities have a combined capacity of 1,495 spaces during the weekday midday and overnight periods. During the weekday midday period, approximately 60 percent of spaces are utilized, leaving a residual supply of 595 available parking spaces. During the weekday overnight period, approximately 63 percent of spaces are utilized, leaving a residual supply of approximately 560 available parking spaces.

M1 Hotels Text Amendment Final EIS
112 Transportation
Figure 14-31 Off-Street Parking Facilities – Downtown Brooklyn Prototypical Site

M1 Hotels Text Amendment Final EIS
113 Transportation
Table 14-37 Existing Off-Street Parking Facilities – Downtown Brooklyn Prototypical Site
Map ID Name
Business Address(es)
License Number
Licensed Capacity
Weekday Midday Weekday Overnight
Estimated Utilization
Available Capacity
Estimated Utilization
Available Capacity
1 388 Garage LLC 388 Bridge St 2028510 142 50% 71 50% 71
2 Brooklyn Metro Parking/Icon Parking Systems LLC 100 Willoughby St n/a 45 50% 22 20% 36
3 Laz Parking New York/New Jersey LLC 97 Dekalb Ave 1435944 155 80% 31 50% 77
4 Manhattan Parking Group/Lardon 1350 LLC
395 Flatbush Ave 470 Hudson Ave 1187231 140 70% 42 40% 84
5 Central Parking System of New York, Inc 74 Dekalb Ave 2059807 126 65% 44 80% 25
6 Discount Parking, Inc 180 Ashland Pl 1009614 316 70% 95 100% 0
7 WOC Schermerhorn Garage Company LLC/Cielo Garage 189 Schermerhorn St 2041027 200 25% 150 70% 60
8 Edison ParkFast 182 Schermerhorn St n/a 114 90% 11 40% 689 Quik Park SCH Garage LLC 236 Livingston St 1412999 109 90% 11 40% 65
10 AP Schermerhorn Management LLC 200 Schermerhorn St 2051014 148 20% 118 50% 74
TOTAL 1,495 60% 595 63% 560

M1 Hotels Text Amendment Final EIS
114 Transportation
Future Conditions without the Proposed Action
Between 2018 and 2028, demand for off-street parking is expected to increase due to background growth, development that could occur pursuant to existing zoning, and the No-Action development projects listed in Appendix A.6. Similar to the traffic analysis, a total background growth rate of 1.89 percent was applied to existing parking utilization levels. No-Action development projects are expected to add 863 accessory parking spaces. As shown in Table 14-38, the utilization of off-street parking spaces in the No-Action condition is expected to increase to 82 and 84 percent during the weekday midday and overnight periods, respectively.
Table 14-38 Existing and No-Action Off-Street Parking Capacity, Demand and Utilization – Downtown Brooklyn Prototypical Site
Notes: 1. Reflects annual background growth rates of 0.25 percent per year for the 2018 through 2023
period and 0.125 percent for the 2023 through 2028 period. 2. Demand from No-Action developments not accommodated by accessory parking.
Future Conditions with the Proposed Action
Table 14-39 shows the net incremental hourly parking demand for the proposed action compared to the No-Action Condition. As shown in the table, parking demand generated by the hotel and residential uses would typically peak during the overnight hours (the net decrease in residential parking demand reflects net reductions in this land use on the prototypical site under the RWCDS). Overall, under the proposed action, parking demand would decrease by six spaces during the weekday midday peak period (12:00-1:00 p.m.) and seven spaces during the overnight period.
Weekday Midday
Weekday Overnight
Capacity 2018 Existing Capacity 1,495 1,495Capacity Added by No-Action Developments 0 0 Capacity Displaced by No-Action Developments 0 0
2028 No-Action Capacity 1,495 1,495Demand 2018 Existing Demand 900 935Demand from Background Growth1 17 18
Demand from No-Action Developments2 313 3032028 No-Action Demand 1,230 1,256
Utilization 2028 No-Action Utilization 82% 84%2028 No-Action Available Capacity 265 239

M1 Hotels Text Amendment Final EIS
115 Transportation
Table 14-39 With-Action Net Incremental Weekday Hourly Parking Accumulation by Land Use – Downtown Brooklyn Prototypical Site
Time Period Residential Hotel Total 12:00 a.m. - 1:00 a.m. -21 14 -7 1:00 a.m. - 2:00 a.m. -21 14 -7 2:00 a.m. - 3:00 a.m. -21 14 -7 3:00 a.m. - 4:00 a.m. -21 14 -7 4:00 a.m. - 5:00 a.m. -21 14 -7 5:00 a.m. - 6:00 a.m. -21 14 -7 6:00 a.m. - 7:00 a.m. -21 14 -7 7:00 a.m. - 8:00 a.m. -20 14 -6 8:00 a.m. - 9:00 a.m. -18 12 -6 9:00 a.m. - 10:00 a.m. -17 8 -9 10:00 a.m. - 11:00 a.m. -16 6 -11 11:00 a.m. - 12:00 p.m. -16 4 -12 12:00 p.m. - 1:00 p.m. -16 11 -6 1:00 p.m. - 2:00 p.m. -16 10 -6 2:00 p.m. - 3:00 p.m. -16 8 -8 3:00 p.m. - 4:00 p.m. -17 7 -10 4:00 p.m. - 5:00 p.m. -18 5 -12 5:00 p.m. - 6:00 p.m. -19 8 -11 6:00 p.m. - 7:00 p.m. -20 6 -14 7:00 p.m. - 8:00 p.m. -21 9 -12 8:00 p.m. - 9:00 p.m. -21 11 -10 9:00 p.m. - 10:00 p.m. -21 12 -9 10:00 p.m. - 11:00 p.m. -21 13 -8 11:00 p.m. - 12:00 a.m. -21 14 -7
Note: Parking demand for residential land use based on 2012-2016 5-year American Community Survey data on average vehicles per household for Census tracts in the rezoning area and forecasts of daily auto trips for this land use. Parking demand for hotel use derived from forecast of daily auto trips from this land use.
No new accessory off-street parking spaces would be provided under the proposed action. A comparison of projected No-Action and With-Action Condition parking capacity and demand is provided in Table 14-40. During the weekday midday peak period, off-street parking utilization would remain at 82 and 84 percent during the weekday midday and overnight periods, respectively, leaving a total of 271 and 246 spaces available during these same time periods. As such, the proposed action is not expected to result in the potential for parking shortfalls.

M1 Hotels Text Amendment Final EIS
116 Transportation
Table 14-40 No-Action and With-Action Off-Street Capacity, Demand and Utilization – Downtown Brooklyn Prototypical Site
Notes: Includes demand not otherwise accommodated by on-site accessory parking. The numbers reflect the net incremental change compared to the No-Action RWCDS.
Conclusion The analyses conducted on the prototypical sites to assess traffic, transit, pedestrians, vehicular and pedestrian safety, and parking pertaining to the shift from non-hotel use in the No-Action condition to commercial hotel use in the With-Action condition concluded that the effects resulting from incremental development on the proposed sites would vary.
The traffic screening analysis determined that a detailed traffic analysis would not be warranted for the prototypical sites in Manhattan below 59th Street, South Slope, Brownsville and Williamsburg, as significant effects on traffic conditions would be unlikely for these areas. However, the proposed action could affect traffic conditions for the prototypical sites in the Long Island City, Jamaica, and Downtown Brooklyn areas.
The transit analysis concluded that the proposed action’s incremental subway/rail trips would not exceed the CEQR Technical Manual analysis threshold of 200 peak-hour trips at any station in the weekday a.am. or p.m. peak commuter hours. Similarly, the proposed action’s incremental bus trips would not exceed the CEQR Technical Manual analysis threshold of 50 peak-hour bus trips on a single route in one direction.
The pedestrian analysis concluded that the proposed action’s incremental pedestrian trips would not exceed the CEQR Technical Manual analysis threshold of 200 peak-hour walk trips at any single pedestrian element, and therefore a detailed pedestrian analysis is not warranted.
Weekday Midday
Weekday Overnight
Capacity 2028 No-Action Capacity 1,495 1,495Capacity Added by Proposed Action 0 0 Capacity Displaced by Proposed Action 0 0
2028 With-Action Capacity 1,495 1,495Demand 2028 No-Action Demand 1,230 1,256Demand Added by Proposed Action1 -6 -7
2028 With-Action Demand 1,224 1,249Utilization 2028 With-Action Utilization 82% 84%2028 With-Action Available Spaces 271 246

M1 Hotels Text Amendment Final EIS
117 Transportation
The vehicular and pedestrian safety analysis concluded that, with the proposed action, one intersection at the Long Island City prototypical site, three intersections at the Jamaica prototypical site, and one intersection at the Downtown Brooklyn prototypical site could be projected to experience low to moderate increases in project-generated vehicles making turns that could conflict with pedestrians in crosswalks. All of these intersections lie within a priority area of the NYC Vision Zero Program. As part of its Vision Zero initiatives, the City will explore additional measures for potential implementation at these high-crash locations and other in the study are to enhance traffic and pedestrian safety.
As a detailed traffic analysis would not be warranted for the prototypical sites in Manhattan below 59th Street, South Slope, Brownsville and Williamsburg, a detailed parking analysis would not be needed for these areas. The parking demand generated by the proposed action at the prototypical sites in the Long Island City and Downtown Brooklyn areas could be accommodated at off-street parking facilities within a quarter-mile radius. For the prototypical site in Jamaica, the parking demand generated by the proposed action during the weekday midday peak period could be accommodated at off-street parking facilities within a quarter-mile radius.