17DCP069R: 125 Edgewater Street - NYC.gov
360
125 Edgewater Street CEQR No. 17DCP069R Prepared for: Pier 21 Development LLC Prepared by: VHB Inc. & EPDSCO Inc. May 5, 2017 1 1 This revised EAS supersedes the original EAS dated December 7, 2016. The changes in this revised EAS are contained in Section 2.12, “Air Quality,” and in Appendix D. Figure 1-2 is also updated.
-
Upload
khangminh22 -
Category
Documents
-
view
1 -
download
0
Transcript of 17DCP069R: 125 Edgewater Street - NYC.gov

125 Edgewater Street CEQR No. 17DCP069R
Prepared for: Pier 21 Development LLC
Prepared by:
VHB Inc. & EPDSCO Inc.
May 5, 20171
1 This revised EAS supersedes the original EAS dated December 7, 2016. The changes in this revised EAS are contained in Section 2.12, “Air Quality,” and in Appendix D. Figure 1-2 is also updated.

125 Edgewater Street - CEQR No. 17DCP069R Environmental Assessment Statement
Table of Contents
Environmental Assessment Statement Full Form
Attachment 1: Project Description
Attachment 2: Additional Technical Information for EAS Part II
Appendices

EAS SHORT FORM PAGE 1
City Environmental Quality Review ENVIRONMENTAL ASSESSMENT STATEMENT (EAS) SHORT FORM FOR UNLISTED ACTIONS ONLY Please fill out and submit to the appropriate agency (see instructions)
Part I: GENERAL INFORMATION 1. Does the Action Exceed Any Type I Threshold in 6 NYCRR Part 617.4 or 43 RCNY §6-15(A) (Executive Order 91 of 1977, as amended)? YES NO
If “yes,” STOP and complete the FULL EAS FORM.
2. Project Name 125 Edgewater Street 3. Reference Numbers CEQR REFERENCE NUMBER (to be assigned by lead agency) 17DCP069R
BSA REFERENCE NUMBER (if applicable)
ULURP REFERENCE NUMBER (if applicable) 150402 ZMR, N150401 ZRR, N150403ZAR, N150404ZCR
OTHER REFERENCE NUMBER(S) (if applicable) (e.g., legislative intro, CAPA)
4a. Lead Agency Information NAME OF LEAD AGENCY New York City Department of City Planning
4b. Applicant Information NAME OF APPLICANT Pier 21 Development LLC
NAME OF LEAD AGENCY CONTACT PERSON Robert Dobruskin, AICP, Director, EARD
NAME OF APPLICANT’S REPRESENTATIVE OR CONTACT PERSON Caroline G. Harris
ADDRESS 120 Broadway, 31st Floor ADDRESS 475 Park Avenue South, Suite 2803 CITY New York STATE NY ZIP 10271 CITY New York STATE NY ZIP 10016 TELEPHONE 212-720-3423 EMAIL
[email protected] TELEPHONE 212-835-2651
EMAIL [email protected]
5. Project Description see Attachment 1, "Project Description" Project Location
BOROUGH Staten Island COMMUNITY DISTRICT(S) 1 STREET ADDRESS 1 Edgewater Street and 125 Edgewater Street
TAX BLOCK(S) AND LOT(S) Block 2820; Lots 90, 95, and portions of Lots 105 and 110
ZIP CODE 10305
DESCRIPTION OF PROPERTY BY BOUNDING OR CROSS STREETS Bounded by Edgewater Street to the southwest, the pierhead line to the northeast, Greenfield Avenue to the northwest, and approximately the midblock between Sylvaton Terrace and Lynhurst Avenue to the southeast EXISTING ZONING DISTRICT, INCLUDING SPECIAL ZONING DISTRICT DESIGNATION, IF ANY M2-1 ZONING SECTIONAL MAP NUMBER 21d 6. Required Actions or Approvals (check all that apply) City Planning Commission: YES NO UNIFORM LAND USE REVIEW PROCEDURE (ULURP)
CITY MAP AMENDMENT ZONING CERTIFICATION CONCESSION ZONING MAP AMENDMENT ZONING AUTHORIZATION UDAAP ZONING TEXT AMENDMENT ACQUISITION—REAL PROPERTY REVOCABLE CONSENT SITE SELECTION—PUBLIC FACILITY DISPOSITION—REAL PROPERTY FRANCHISE HOUSING PLAN & PROJECT OTHER, explain: SPECIAL PERMIT (if appropriate, specify type: modification; renewal; other); EXPIRATION DATE:
SPECIFY AFFECTED SECTIONS OF THE ZONING RESOLUTION 62-811(b), 62-822(c), Article XI, Chapter 6 (116-00), Appendix F Board of Standards and Appeals: YES NO
VARIANCE (use) VARIANCE (bulk) SPECIAL PERMIT (if appropriate, specify type: modification; renewal; other); EXPIRATION DATE:
SPECIFY AFFECTED SECTIONS OF THE ZONING RESOLUTION Department of Environmental Protection: YES NO If “yes,” specify: Other City Approvals Subject to CEQR (check all that apply)

EAS SHORT FORM PAGE 2
LEGISLATION FUNDING OF CONSTRUCTION, specify: RULEMAKING POLICY OR PLAN, specify: CONSTRUCTION OF PUBLIC FACILITIES FUNDING OF PROGRAMS, specify: 384(b)(4) APPROVAL PERMITS, specify: OTHER, explain:
Other City Approvals Not Subject to CEQR (check all that apply) PERMITS FROM DOT’S OFFICE OF CONSTRUCTION MITIGATION AND
COORDINATION (OCMC) LANDMARKS PRESERVATION COMMISSION APPROVAL OTHER, explain:
State or Federal Actions/Approvals/Funding: YES NO If “yes,” specify: NYSDEC Tidal Wetlands Permit 7. Site Description: The directly affected area consists of the project site and the area subject to any change in regulatory controls. Except where otherwise indicated, provide the following information with regard to the directly affected area. Graphics: The following graphics must be attached and each box must be checked off before the EAS is complete. Each map must clearly depict the boundaries of the directly affected area or areas and indicate a 400-foot radius drawn from the outer boundaries of the project site. Maps may not exceed 11 x 17 inches in size and, for paper filings, must be folded to 8.5 x 11 inches.
SITE LOCATION MAP ZONING MAP SANBORN OR OTHER LAND USE MAP TAX MAP FOR LARGE AREAS OR MULTIPLE SITES, A GIS SHAPE FILE THAT DEFINES THE PROJECT SITE(S) PHOTOGRAPHS OF THE PROJECT SITE TAKEN WITHIN 6 MONTHS OF EAS SUBMISSION AND KEYED TO THE SITE LOCATION MAP
Physical Setting (both developed and undeveloped areas) Total directly affected area (sq. ft.): Project Area - 1,592,073 (includes waterbody area); Development Site - 795,590 (The Seaward lot is 428,755 sf. in area and begins at the U.S. Bulkhead Line and extends to the U.S. Pierhead Line. The Upland Lot begins at the U.S. Bulkhead line and extends, in its southern portion 572 feet to Edgewater Street. On its northern portion it extends approximately 582 feet to its boundary with Lot 95. This Upland Lot has an area of 366,835 sf. Only a portion of this Upland Lot is above water. This portion of land is 144,258 SF in area)
Waterbody area (sq. ft) and type: Development Site - 651,332
Roads, buildings, and other paved surfaces (sq. ft.): Development Site - 144,258
Other, describe (sq. ft.):
8. Physical Dimensions and Scale of Project (if the project affects multiple sites, provide the total development facilitated by the action) SIZE OF PROJECT TO BE DEVELOPED (gross square feet): 480,966 NUMBER OF BUILDINGS: 3 GROSS FLOOR AREA OF EACH BUILDING (sq. ft.): Building A - 212,964;
Building B - 228,800; Building C - 36,930 HEIGHT OF EACH BUILDING (ft.): Building A - 130 Feet; Building B - 120 Feet; Building C - 62 Feet
NUMBER OF STORIES OF EACH BUILDING: Building A - 13 stories; Building B - 12 stories; Building C - 6 stories
Does the proposed project involve changes in zoning on one or more sites? YES NO If “yes,” specify: The total square feet owned or controlled by the applicant: 795,590 (includes waterbody area) The total square feet not owned or controlled by the applicant: 806,483 (includes waterbody area) Does the proposed project involve in-ground excavation or subsurface disturbance, including, but not limited to foundation work, pilings, utility
lines, or grading? YES NO If “yes,” indicate the estimated area and volume dimensions of subsurface permanent and temporary disturbance (if known): AREA OF TEMPORARY DISTURBANCE: 144,258 sq. ft. (width x length) VOLUME OF DISTURBANCE: cubic ft. (width x length x depth) AREA OF PERMANENT DISTURBANCE: 144,258 sq. ft. (width x length)
Description of Proposed Uses (please complete the following information as appropriate) Residential Commercial Community Facility Industrial/Manufacturing Size (in gross sq. ft.) 351,567 (RWCDS 1)
or 375,608 (RWCDS 2)
24,173 (RWCDS 1) or 0 (RWCDS 2)
Type (e.g., retail, office, school)
371 (RWCDS 1) or 396 (RWCDS 2) units
Retail
Does the proposed project increase the population of residents and/or on-site workers? YES NO

!
!
!
!
!
!
!
!
!
!
!
!
!
!
!
!
!
!
!
!
!
!
!
!
!
!
!
!
!
!
!
!!!
!!
!!
!!
!!
!!
!!
!!
!!
!!
!!
!!
!
!
!
!
!
!
!
!
!
!
!
!
!
!
!
!
!
!
!
!
!
!
!
!
!
!
!
!
!
!
!
!
!
!
!
!
!
!
!
!
!
!
!
!
!
!
!!
STATEN ISLAND RAILWAY
CLIFTON STATION
FRONT STREET
BAY STREET
BAYSTREET
EDGEWATER STREET
LYNHURST AVENUE
WILLOW AVENUE
GREENFIELD AVENUE
CHESTNUT AVENUE
SYLVATON TERRACE
TOWNSEND AVENUE
NORWOODAVENUE
CAMDEN STREET
Date: 11/29/2016
Development Site
!
! ! !
!!
!!! Project Area
400-Foot Radius
Figure
1Site Location125 Edgewater Street
Staten Island, New York
0 250 500Feet

!
!
!
!
!
!
!
!
!
!
!
!
!
!
!
!
!
!
!
!
!
!
!
!
!
!
!
!
!
!
!
!
!
!!
!!
!!
!!
!!
!!
!!
!!
!!
!!
!!
!!
!!!
!
!
!
!
!
!
!
!
!
!
!
!
!
!
!
!
!
!
!
!
!
!
!
!
!
!
!
!
!
!
!
!
!
!
!
!
!
!
!
!
!
!
!
!
!!
BAY STREET
2822
BAYSTREET
EDGEWATER STREET
LYNHURST AVENUE
WILLOW AVENUE
GREENFIELD AVENUE
CHESTNUT AVENUE
SYLVATON TERRACE
TOWNSEND AVENUE
NORWOODAVENUE
CAMDEN STREET
2820
487
2841
2825
2842
28302827
2823
496
2844
2822
2845
2840
2836
2839
2846
95
90
105
1
140
119
134
132
110
30
32
5
Date: 11/29/2016
Development Site
!
! ! !
!!
!!! Project Area
400-Foot Radius
Tax Block and Lot
Figure
2Tax Map125 Edgewater Street
Staten Island, New York
0 250 500Feet

!
!
!
!
!
!
!
!
!
!
!
!
!
!
!
!
!
!
!
!
!
!
!
!
!
!
!
!
!
!
!
!!!
!!
!!
!!
!!
!!
!!
!!
!!
!!
!!
!!
!
!
!
!
!
!
!
!
!
!
!
!
!
!
!
!
!
!
!
!
!
!
!
!
!
!
!
!
!
!
!
!
!
!
!
!
!
!
!
!
!
!
!
!
!
!
!!
BAY STREET
BAYSTREET
EDGEWATER STREET
LYNHURST AVENUE
WILLOW AVENUE
GREENFIELD AVENUE
CHESTNUT AVENUE
SYLVATON TERRACE
TOWNSEND AVENUE
NORWOODAVENUE
CAMDEN STREET
Date: 11/28/2016
Development Site
!
! ! !
!! Project Area
400-Foot Land Use Study Area Radius
Land UseOne & Two Family Buildings
MultiFamily Walkup Buildings
MultiFamily Elevator Buildings
Mixed Commercial/Residential Buildings
Commercial/Office Buildings
Industrial/Manufacturing
Transportation/Utility
Public Facilities & Institutions
Open Space
Parking Facilities
Vacant Land
Figure
3Land Use125 Edgewater Street
Staten Island, New York
0 250 500Feet
FRONT STREET

M2-1
R6/C2-2/SW
BAYSTREET
EDGEWATER STREET
LYNHURST AVENUE
WILLOW AVENUE
GREENFIELD AVENUE
SYLVATON TERRACE
2820
2830
95
90
105
1
140
119
134
132
110
C4-2A
M3-1
M3-1R3A
R3-2
R3X
R4 PARK
SW
R6/SWSubarea E
M2-1/SWSubarea D
Date: 12/5/2016
Proposed Zoning
Proposed Commercial Overlay
Proposed Special District Extension
Zoning District
C1-2 Commercial Overlay
C2-2 Commercial Overlay
C1-1 Commercial Overlay
Special District
Tax Lot
Figure
4Proposed Zoning125 Edgewater Street
Staten Island, New York
0 250 500Feet
90

12/0
5/16
Figu
re 5Zo
ning
Map
Cha
nge
125
Edge
wat
er S
tree
tSt
aten
Isla
nd, N
ew Y
ork

Existing Proposed
Map 1: Special Stapleton Waterfront District, Subareas and Public Spaces
125 Edgewater StreetStaten Island, New York
Figure
6
12/05/16

12/0
5/16
1. V
iew
of E
dgew
ater
Stre
et fa
cing
nor
th fr
om W
illow
Ave
nue.
2. V
iew
of t
he n
orth
wes
t cor
ner o
f Edg
ewat
er S
treet
and
Will
ow A
venu
e.
3. V
iew
to th
e so
uthe
ast f
rom
the
corn
er o
f Edg
ewat
er S
treet
and
Will
ow A
venu
e
123
N
Site
Figu
re
7aSi
te a
nd S
tudy
Are
a Ph
otos
125
Edge
wat
er S
tree
tSt
aten
Isla
nd, N
ew Y
ork

12/0
5/16
4. V
iew
of B
ay S
treet
faci
ng n
orth
from
Will
ow A
venu
e.5.
Vie
w o
f Bay
Stre
et fa
cing
sou
th fr
om W
illow
Ave
nue.
6. V
iew
of t
he s
outh
east
cor
ner o
f Bay
Stre
et a
nd W
illow
Ave
nue.
6
5
4
N
Site
Figu
re
7bSi
te a
nd S
tudy
Are
a Ph
otos
125
Edge
wat
er S
tree
tSt
aten
Isla
nd, N
ew Y
ork

12/0
5/16
7. V
iew
of t
he n
orth
east
cor
ner o
f Bay
Stre
et a
nd L
ynhu
rst A
venu
e.8.
Vie
w o
f Lyn
hurs
t Ave
nue
faci
ng e
ast f
rom
Bay
Stre
et.
9. W
est s
ide
of B
ay S
treet
sou
th o
f Lyn
hurs
t Ave
nue.
9
87
N
Site
Figu
re
7cSi
te a
nd S
tudy
Are
a Ph
otos
125
Edge
wat
er S
tree
tSt
aten
Isla
nd, N
ew Y
ork

12/0
5/16
10. V
iew
of E
dgew
ater
Stre
et fa
cing
sou
th fr
om S
ylva
ton
Terr
ace.
11. V
iew
faci
ng n
orth
east
from
the
corn
er o
f Edg
ewat
er S
treet
and
Syl
vato
n Te
rrac
e.
12. V
iew
of t
he n
orth
wes
t cor
ner o
f Edg
ewat
er S
treet
and
Syl
vato
n Te
rrac
e.
121110
N
Site
Figu
re
7dSi
te a
nd S
tudy
Are
a Ph
otos
125
Edge
wat
er S
tree
tSt
aten
Isla
nd, N
ew Y
ork

12/0
5/16
13. V
iew
of E
dgew
ater
Stre
et fa
cing
nor
th fr
om S
ylva
ton
Terr
ace.
14. W
est s
ide
of E
dgew
ater
Stre
et s
outh
of L
ynhu
rst A
venu
e.
15. E
ast s
ide
of E
dgew
ater
Stre
et s
outh
of L
ynhu
rst A
venu
e.
1514
13
N
Site
Figu
re
7eSi
te a
nd S
tudy
Are
a Ph
otos
125
Edge
wat
er S
tree
tSt
aten
Isla
nd, N
ew Y
ork

12/0
5/16
16. V
iew
of E
dgew
ater
Stre
et fa
cing
sou
th fr
om L
ynhu
rst A
venu
e.17
. Eas
t sid
e of
Edg
ewat
er S
treet
sou
th o
f Lyn
hurs
t Ave
nue.
(Site
at l
eft)
18. E
ast s
ide
of E
dgew
ater
Stre
et s
outh
of L
ynhu
rst A
venu
e. (S
ite)
18
17
16
N
Site
Figu
re
7fSi
te a
nd S
tudy
Are
a Ph
otos
125
Edge
wat
er S
tree
tSt
aten
Isla
nd, N
ew Y
ork

12/0
5/16
19. E
ast s
ide
of E
dgew
ater
Stre
et s
outh
of L
ynhu
rst A
venu
e. (S
ite)
20. V
iew
into
the
Site
, fac
ing
Eas
t.
21. V
iew
into
the
Site
, fac
ing
Eas
t.
2120
19
N
Site
Figu
re
7gSi
te a
nd S
tudy
Are
a Ph
otos
125
Edge
wat
er S
tree
tSt
aten
Isla
nd, N
ew Y
ork

12/0
5/16
Site
22. E
ast s
ide
of E
dgew
ater
Stre
et s
outh
of L
ynhu
rst A
venu
e. (S
ite)
23. V
iew
into
the
Site
, fac
ing
Eas
t.
2322
N
Figu
re
7hSi
te a
nd S
tudy
Are
a Ph
otos
125
Edge
wat
er S
tree
tSt
aten
Isla
nd, N
ew Y
ork

EAS SHORT FORM PAGE 3 If “yes,” please specify: NUMBER OF ADDITIONAL RESIDENTS: 983
(RWCDS 1) or 1049 (RWCDS 2) NUMBER OF ADDITIONAL WORKERS: 96 (RWCDS 1) or 24 (RWCDS 2)
Provide a brief explanation of how these numbers were determined: Population based on 2.65 residents per household from 2010 Census Tract 6, 8, and 27 Average Household Size (NYC Department of city Planning); Worker Population based on 1 employee per 25 dwelling units, 1 employee per 50 parking spaces, and 1 employee per 333 sf of retail uses. Does the proposed project create new open space? YES NO If “yes,” specify size of project-created open space: 44,754 sq. ft. Has a No-Action scenario been defined for this project that differs from the existing condition? YES NO If “yes,” see Chapter 2, “Establishing the Analysis Framework” and describe briefly: 9. Analysis Year CEQR Technical Manual Chapter 2 ANTICIPATED BUILD YEAR (date the project would be completed and operational): 2019 ANTICIPATED PERIOD OF CONSTRUCTION IN MONTHS: 26 WOULD THE PROJECT BE IMPLEMENTED IN A SINGLE PHASE? YES NO IF MULTIPLE PHASES, HOW MANY? 3 BRIEFLY DESCRIBE PHASES AND CONSTRUCTION SCHEDULE: Construction would begin in the third quarter of 2017. It is assumed that development across the site would occur in phases and, based on a feasible development timeline, the full build out on the project area would be completed by the end of 2019. Altogether, it is projected that construction activities would occur on the site over a period of two and a quarter years. Construction would begin in mid-2017 with demolition, excavation, and foundation work in the area of Building A. Construction of Building A would continue with superstructure work beginning in the first quarter of 2018. Building A superstructure work would continue through mid-2018, with the enclosure of the building starting in the second quarter of 2018 and overlapping with the completion of the superstructure construction. Enclosure of the building would continue into the fourth quarter of 2018. Interior buildout would start in mid-2018 and would continue into the second quarter of 2019. Overall, construction of Building A, and the shore public walkway in this portion of the site, would take 20 months. Construction of Buildings B and C would follow the same pattern as Building A. Building B would take the longest to construct (21 months). Building C would take 12 months to complete. Construction of all three buildings would overlap for approximately 7 months between the start of the fourth quarter of 2018 and the end of the third quarter of 2019. 10. Predominant Land Use in the Vicinity of the Project (check all that apply)
RESIDENTIAL MANUFACTURING COMMERCIAL PARK/FOREST/OPEN SPACE OTHER, specify: Transportation and Utility

EAS SHORT FORM PAGE 4
Part II: TECHNICAL ANALYSIS INSTRUCTIONS: For each of the analysis categories listed in this section, assess the proposed project’s impacts based on the thresholds and criteria presented in the CEQR Technical Manual. Check each box that applies.
If the proposed project can be demonstrated not to meet or exceed the threshold, check the “no” box.
If the proposed project will meet or exceed the threshold, or if this cannot be determined, check the “yes” box.
For each “yes” response, provide additional analyses (and, if needed, attach supporting information) based on guidance in the CEQR Technical Manual to determine whether the potential for significant impacts exists. Please note that a “yes” answer does not mean that an EIS must be prepared—it means that more information may be required for the lead agency to make a determination of significance.
The lead agency, upon reviewing Part II, may require an applicant to provide additional information to support the Short EAS Form. For example, if a question is answered “no,” an agency may request a short explanation for this response.
YES NO 1. LAND USE, ZONING, AND PUBLIC POLICY: CEQR Technical Manual Chapter 4
(a) Would the proposed project result in a change in land use different from surrounding land uses? (b) Would the proposed project result in a change in zoning different from surrounding zoning? (c) Is there the potential to affect an applicable public policy? (d) If “yes,” to (a), (b), and/or (c), complete a preliminary assessment and attach. (e) Is the project a large, publicly sponsored project?
o If “yes,” complete a PlaNYC assessment and attach.
(f) Is any part of the directly affected area within the City’s Waterfront Revitalization Program boundaries? o If “yes,” complete the Consistency Assessment Form.
2. SOCIOECONOMIC CONDITIONS: CEQR Technical Manual Chapter 5 (a) Would the proposed project:
o Generate a net increase of 200 or more residential units? o Generate a net increase of 200,000 or more square feet of commercial space? o Directly displace more than 500 residents? o Directly displace more than 100 employees? o Affect conditions in a specific industry?
3. COMMUNITY FACILITIES: CEQR Technical Manual Chapter 6 (a) Direct Effects
o Would the project directly eliminate, displace, or alter public or publicly funded community facilities such as educational facilities, libraries, hospitals and other health care facilities, day care centers, police stations, or fire stations?
(b) Indirect Effects o Child Care Centers: Would the project result in 20 or more eligible children under age 6, based on the number of low or
low/moderate income residential units? (See Table 6-1 in Chapter 6) o Libraries: Would the project result in a 5 percent or more increase in the ratio of residential units to library branches?
(See Table 6-1 in Chapter 6) o Public Schools: Would the project result in 50 or more elementary or middle school students, or 150 or more high school
students based on number of residential units? (See Table 6-1 in Chapter 6) o Health Care Facilities and Fire/Police Protection: Would the project result in the introduction of a sizeable new
neighborhood?
4. OPEN SPACE: CEQR Technical Manual Chapter 7 (a) Would the proposed project change or eliminate existing open space? (b) Is the project located within an under-served area in the Bronx, Brooklyn, Manhattan, Queens, or Staten Island?
o If “yes,” would the proposed project generate more than 50 additional residents or 125 additional employees? (c) Is the project located within a well-served area in the Bronx, Brooklyn, Manhattan, Queens, or Staten Island?
o If “yes,” would the proposed project generate more than 350 additional residents or 750 additional employees? (d) If the project in located an area that is neither under-served nor well-served, would it generate more than 200 additional
residents or 500 additional employees?

EAS SHORT FORM PAGE 5 YES NO 5. SHADOWS: CEQR Technical Manual Chapter 8
(a) Would the proposed project result in a net height increase of any structure of 50 feet or more? (b) Would the proposed project result in any increase in structure height and be located adjacent to or across the street from a
sunlight-sensitive resource?
6. HISTORIC AND CULTURAL RESOURCES: CEQR Technical Manual Chapter 9 (a) Does the proposed project site or an adjacent site contain any architectural and/or archaeological resource that is eligible
for or has been designated (or is calendared for consideration) as a New York City Landmark, Interior Landmark or Scenic Landmark; that is listed or eligible for listing on the New York State or National Register of Historic Places; or that is within a designated or eligible New York City, New York State or National Register Historic District? (See the GIS System for Archaeology and National Register to confirm)
(b) Would the proposed project involve construction resulting in in-ground disturbance to an area not previously excavated? (c) If “yes” to either of the above, list any identified architectural and/or archaeological resources and attach supporting information on
whether the proposed project would potentially affect any architectural or archeological resources. 7. URBAN DESIGN AND VISUAL RESOURCES: CEQR Technical Manual Chapter 10
(a) Would the proposed project introduce a new building, a new building height, or result in any substantial physical alteration to the streetscape or public space in the vicinity of the proposed project that is not currently allowed by existing zoning?
(b) Would the proposed project result in obstruction of publicly accessible views to visual resources not currently allowed by existing zoning?
8. NATURAL RESOURCES: CEQR Technical Manual Chapter 11 (a) Does the proposed project site or a site adjacent to the project contain natural resources as defined in Section 100 of
Chapter 11?
o If “yes,” list the resources and attach supporting information on whether the proposed project would affect any of these resources.
(b) Is any part of the directly affected area within the Jamaica Bay Watershed? o If “yes,” complete the Jamaica Bay Watershed Form, and submit according to its instructions.
9. HAZARDOUS MATERIALS: CEQR Technical Manual Chapter 12 (a) Would the proposed project allow commercial or residential uses in an area that is currently, or was historically, a
manufacturing area that involved hazardous materials? (b) Does the proposed project site have existing institutional controls (e.g., (E) designation or Restrictive Declaration) relating to
hazardous materials that preclude the potential for significant adverse impacts? (c) Would the project require soil disturbance in a manufacturing area or any development on or near a manufacturing area or
existing/historic facilities listed in Appendix 1 (including nonconforming uses)? (d) Would the project result in the development of a site where there is reason to suspect the presence of hazardous materials,
contamination, illegal dumping or fill, or fill material of unknown origin? (e) Would the project result in development on or near a site that has or had underground and/or aboveground storage tanks
(e.g., gas stations, oil storage facilities, heating oil storage)? (f) Would the project result in renovation of interior existing space on a site with the potential for compromised air quality;
vapor intrusion from either on-site or off-site sources; or the presence of asbestos, PCBs, mercury or lead-based paint? (g) Would the project result in development on or near a site with potential hazardous materials issues such as government-
listed voluntary cleanup/brownfield site, current or former power generation/transmission facilities, coal gasification or gas storage sites, railroad tracks or rights-of-way, or municipal incinerators?
(h) Has a Phase I Environmental Site Assessment been performed for the site? o If “yes,” were Recognized Environmental Conditions (RECs) identified? Briefly identify:
10. WATER AND SEWER INFRASTRUCTURE: CEQR Technical Manual Chapter 13 (a) Would the project result in water demand of more than one million gallons per day? (b) If the proposed project located in a combined sewer area, would it result in at least 1,000 residential units or 250,000
square feet or more of commercial space in Manhattan, or at least 400 residential units or 150,000 square feet or more of commercial space in the Bronx, Brooklyn, Staten Island, or Queens?
(c) If the proposed project located in a separately sewered area, would it result in the same or greater development than the amounts listed in Table 13-1 in Chapter 13?
(d) Would the proposed project involve development on a site that is 5 acres or larger where the amount of impervious surface would increase?
(e) If the project is located within the Jamaica Bay Watershed or in certain specific drainage areas, including Bronx River, Coney Island Creek, Flushing Bay and Creek, Gowanus Canal, Hutchinson River, Newtown Creek, or Westchester Creek, would it involve development on a site that is 1 acre or larger where the amount of impervious surface would increase?

EAS SHORT FORM PAGE 6 YES NO
(f) Would the proposed project be located in an area that is partially sewered or currently unsewered? (g) Is the project proposing an industrial facility or activity that would contribute industrial discharges to a Wastewater
Treatment Plant and/or generate contaminated stormwater in a separate storm sewer system?
(h) Would the project involve construction of a new stormwater outfall that requires federal and/or state permits? 11. SOLID WASTE AND SANITATION SERVICES: CEQR Technical Manual Chapter 14
(a) Using Table 14-1 in Chapter 14, the project’s projected operational solid waste generation is estimated to be (pounds per week): 25,777 o Would the proposed project have the potential to generate 100,000 pounds (50 tons) or more of solid waste per week?
(b) Would the proposed project involve a reduction in capacity at a solid waste management facility used for refuse or recyclables generated within the City?
12. ENERGY: CEQR Technical Manual Chapter 15 (a) Using energy modeling or Table 15-1 in Chapter 15, the project’s projected energy use is estimated to be (annual BTUs):
49,772,158,800 (b) Would the proposed project affect the transmission or generation of energy?
13. TRANSPORTATION: CEQR Technical Manual Chapter 16 (a) Would the proposed project exceed any threshold identified in Table 16-1 in Chapter 16? (b) If “yes,” conduct the screening analyses, attach appropriate back up data as needed for each stage and answer the following questions:
o Would the proposed project result in 50 or more Passenger Car Equivalents (PCEs) per project peak hour?
If “yes,” would the proposed project result in 50 or more vehicle trips per project peak hour at any given intersection? **It should be noted that the lead agency may require further analysis of intersections of concern even when a project generates fewer than 50 vehicles in the peak hour. See Subsection 313 of Chapter 16 for more information.
o Would the proposed project result in more than 200 subway/rail or bus trips per project peak hour?
If “yes,” would the proposed project result, per project peak hour, in 50 or more bus trips on a single line (in one direction) or 200 subway trips per station or line?
o Would the proposed project result in more than 200 pedestrian trips per project peak hour?
If “yes,” would the proposed project result in more than 200 pedestrian trips per project peak hour to any given pedestrian or transit element, crosswalk, subway stair, or bus stop?
14. AIR QUALITY: CEQR Technical Manual Chapter 17 (a) Mobile Sources: Would the proposed project result in the conditions outlined in Section 210 in Chapter 17? (b) Stationary Sources: Would the proposed project result in the conditions outlined in Section 220 in Chapter 17?
o If “yes,” would the proposed project exceed the thresholds in Figure 17-3, Stationary Source Screen Graph in Chapter 17? (Attach graph as needed)
(c) Does the proposed project involve multiple buildings on the project site? (d) Does the proposed project require federal approvals, support, licensing, or permits subject to conformity requirements? (e) Does the proposed project site have existing institutional controls (e.g., (E) designation or Restrictive Declaration) relating to
air quality that preclude the potential for significant adverse impacts?
15. GREENHOUSE GAS EMISSIONS: CEQR Technical Manual Chapter 18 (a) Is the proposed project a city capital project or a power generation plant? (b) Would the proposed project fundamentally change the City’s solid waste management system? (c) If “yes” to any of the above, would the project require a GHG emissions assessment based on the guidance in Chapter 18?
16. NOISE: CEQR Technical Manual Chapter 19 (a) Would the proposed project generate or reroute vehicular traffic? (b) Would the proposed project introduce new or additional receptors (see Section 124 in Chapter 19) near heavily trafficked
roadways, within one horizontal mile of an existing or proposed flight path, or within 1,500 feet of an existing or proposed rail line with a direct line of site to that rail line?
(c) Would the proposed project cause a stationary noise source to operate within 1,500 feet of a receptor with a direct line of sight to that receptor or introduce receptors into an area with high ambient stationary noise?
(d) Does the proposed project site have existing institutional controls (e.g., (E) designation or Restrictive Declaration) relating to noise that preclude the potential for significant adverse impacts?
17. PUBLIC HEALTH: CEQR Technical Manual Chapter 20


125 Edgewater Street - CEQR No. 17DCP069R Environmental Assessment Statement
Page 1-1
ATTACHMENT 1: Project Description
Chapter 1.1: Introduction The Applicant, Pier 21 Development LLC, is seeking a series of land use approvals (the “proposed actions”) to facilitate a mixed-use development with a waterfront public access area (the “proposed project”) on a property located at 125 Edgewater Street (Block 2820, Lot 90; the “development site”) in the Rosebank neighborhood in Staten Island, Community District 1. The affected area (Block 2820, Lot 95, and parts of Lots 105 and 110, the “project area”) is currently zoned M2-1 and is bounded by Edgewater Street to the southwest, the pierhead line to the northeast, Greenfield Avenue to the northwest, and approximately the midblock between Sylvaton Terrace and Lynhurst Avenue to the southeast. (see EAS Figures 1 through 3, 6a through 6h). As described in more detail below, the discretionary land use actions include:
Zoning Map Amendments (see EAS Figure 4 and 5):
o To extend the Special Stapleton Waterfront District (SW) to include the project area;
o To change a portion of an existing M2-1 district to an M2-1(SW), R6(SW), and R6/C2-2 (SW) zoning district;
Zoning Text Amendments (see Appendix A):
o To establish two new subareas ("Subareas D” and “Subarea E") of the Special Stapleton Waterfront District coterminous with the project area and to establish regulations for these subareas (see EAS Figure 6);
o To amend the Stapleton Waterfront District Plan Appendix Maps 1-5 to include the project area;
o To amend Appendix F to establish a Mandatory Inclusionary Housing (MIH) area coterminous with Subarea E;
A Zoning Authorization from the New York City Planning Commission (CPC) pursuant to ZR Section 62-822(c) for the phased development of waterfront public access areas; and,
A Zoning Certification from the Chairperson of the CPC pursuant to ZR Section 62-811(b), Waterfront public access and visual corridors. This is a ministerial action not subject to environmental review (together the above are the “proposed actions”).
In addition, a tidal wetland permit approval, a State action, by the New York State Department of Environmental Conservation (NYSDEC) would be required. The Applicant expects to seek this approval at a later date. A coordinated environmental review, which is not required for these unlisted actions, will not be conducted.
The proposed actions would create two new subareas (Subareas D and E) in the Special Stapleton Waterfront District. Subarea E would cover the Applicant’s property (Block 2820, Lot 90) and would

125 Edgewater Street - CEQR No. 17DCP069R Environmental Assessment Statement
Page 1-2
be rezoned from M2-1 to R-6 and R-6/C2-2. Subarea D would cover Block 2820, Lot 95 which is not under the Applicant’s control and would remain zoned M2-1.
The discretionary land use actions are subject to review and approval by the CPC and the City Council; these actions are subject to the City Environmental Quality Review (CEQR) process. The New York City Department of City Planning (DCP) is the lead agency for the environmental review. A complete description of the proposed project is provided below. The development site is the only site expected to be redeveloped as a result of the proposed actions. The proposed actions would facilitate the development of three mixed use buildings at the development site, Buildings “A”, “B”, and “C” (see Figures 1-1 through 1-3). In total the development would consist of 371 dwelling units comprising a total residential floor area of 351,567 gross square feet (gsf); 24,173 gsf of commercial space (5,073 gsf of physical and cultural establishment space, 6,450 gsf of eating or drinking establishment space, and 12,650 of retail space); and 346 parking spaces on the property located at 125 Edgewater Street.1 The property is currently developed with a vacant one- to two-story masonry structure and a one-story steel shed; and is occupied on a short term basis for open storage.
The proposed project would provide affordable housing pursuant to the Mandatory Inclusionary Housing program and is seeking: Option 1, which requires 25 percent of units be reserved for households with incomes at or below 60 percent of the Area Median Income (AMI), Option 2, which requires 30 percent of units be reserved for households with incomes at or below 80 percent of the AMI, or the Workforce Option which requires 30 percent of units be reserved for households with incomes at or below 115 percent of the AMI. Which of the MIH options would be available in the proposed MIH area (Subarea E) will not be finalized until the conclusion of the public review process.3 In addition, the proposed project would create new open space totaling approximately one acre (44,754 sf) of which approximately 0.84 acres (36,481 sf) would be qualifying waterfront public access area comprised of an upland connection/visual corridor and shore public walkway (see Figure 1-4). The upland connection and visual corridor would extend to the waterfront from the termination of Lynhurst Avenue at Edgewater Street.
The build year for the proposed project is 2019, with the estimated completion of the first phase of the project in the second quarter of 2019 and the second and third phase in the fourth quarter of 2019.
Chapter 1.2: Project Area The project area consists of Block 2820, Lots 90 and 95 and portions of Lots 105 and 110 in the Rosebank neighborhood of Staten Island. The project area encompasses the entirety of Lots 90 and 95 but only small portions of Lots 105 and 110 and is zoned entirely M2-1. All of the tax lots extend out to the pierhead line and consist of both lands above water and under water; all of the lots have frontage on Edgewater Street and Lot 105 has frontage on Front Street.
The development site, Block 2820, Lot 90 (125 Edgewater Street), is a waterfront lot comprising 144,258
1 The number of dwelling units is based on an assumption of an average unit size of 947 sf. This reflects a conservative assumption as compared to the New Stapleton Waterfront Development Plan FEIS (CEQR # 06DME0014, September 2016) which assumes an average dwelling unit size of 1,094 sf.
3 For the purposes of analysis, it is assumed that 20 percent of units would be affordable to incomes of on average of 80 percent of the Area Median Income (AMI).

11/3
0/16
Sour
ce: C
alie
ndo
Arc
hite
cts
For I
llust
rativ
e P
urpo
ses
Onl
y.
* The
App
lican
t is
boun
d to
por
tions
of t
he s
ite p
lan
labe
led
as th
e W
ater
front
Pub
lic A
cces
s A
rea
(WPA
A) a
nd a
nthi
ng re
late
d to
it. E
very
thin
g ou
tsid
e of
the
boun
dary
of t
he W
PAA
is il
lust
rativ
e.
Figu
re
1-1
With
-Act
ion
RW
CD
S:
Site
Pla
n12
5 Ed
gew
ater
Str
eet
Stat
en Is
land
, New
Yor
k

05/04/17Source: Caliendo Architects
For Illustrative Purposes Only
WIL
LOW
LYN
HU
RST
AVE
AV
E.
ADJACENT PARKING
ADJACENT PARKING
THIS AREA NOT A UPLANDCONNECTION OR VISUAL
CORRIDOR
Figure
1-2With-Action RWCDS: Elevations
125 Edgewater StreetStaten Island, New York

11/3
0/16
Sour
ce: C
alie
ndo
Arc
hite
cts
For I
llust
rativ
e P
urpo
ses
Onl
y
Figu
re
1-3
With
-Act
ion
RW
CD
S:
Ren
derin
g12
5 Ed
gew
ater
Str
eet
Stat
en Is
land
, New
Yor
k

11/3
0/16
Sour
ce: C
alie
ndo
Arc
hite
cts
For I
llust
rativ
e P
urpo
ses
Onl
y.
* The
App
lican
t is
boun
d to
por
tions
of t
he s
ite p
lan
labe
led
as th
e W
ater
front
Pub
lic A
cces
s A
rea
(WPA
A) a
nd a
nthi
ng re
late
d to
it. E
very
thin
g ou
tsid
e of
the
boun
dary
of t
he W
PAA
is il
lust
rativ
e.
Figu
re
1-4
With
-Act
ion
RW
CD
S:
Wat
erfr
ont P
ublic
Acc
ess
Are
as12
5 Ed
gew
ater
Str
eet
Stat
en Is
land
, New
Yor
k

125 Edgewater Street - CEQR No. 17DCP069R Environmental Assessment Statement
Page 1-3
sf of upland (dry) land area and 651,332 sf of land area located under water. The remaining portions of the project area are not under the Applicant’s control. The lot has approximately 200 feet of frontage on Edgewater Street and is predominantly vacant. In 2001 the Metropolitan Transit Authority (MTA) issued a Request for Proposals (RFP) for the disposition of the development site, which was awarded to the Applicant in 2002, at which time the Applicant signed a contract. The actual real estate closing and transfer of the Site to the Applicant was in 2007. Lot 90 is the only lot within the project area that is projected for development as a result of the proposed actions. The site is developed with two small buildings and is occupied on a short term basis by two business for open storage. The buildings consist of a vacant one to two-story masonry structure of approximately 8,948 gross sf at the north end of the site and a one-story steel shed with approximately 5,247 gross sf of area at the south end of the site. The development site has an existing FAR of 0.02. A 70-foot-wide New York City Department of Environmental Protection (DEP) sewer easement extends through the development site from Edgewater Street and Lynhurst Avenue to the shore line. A 34-foot wide vehicular and pedestrian easement extends from Willow Avenue at its intersection with Edgewater Street through Lot 95 to the development site. Lot 95 (1 Edgewater Street) is improved with a seven-story approximately 256,000 gsf office building and a parking lot. The office building (Pouch Terminal Building) is tenanted with doctors’ offices, the New York Police Department Staten Island Property Clerk’s office, the Richmond County Board of Elections, and the offices of Community District 1. Lot 105 is a city-owned lot used for open storage of transportation and utility realted supplies and materials; and Lot 110 (181 Edgewater Street) is developed with a vacant two-story 33,100 sf manufacturing building. A small narrow triangular portion of these lots (Lots 1 and 105 to the north and Lot 110 to the south) extending from Edgewater Street towards the pierhead line fall within the project area (see EAS Figure 2).
Surrounding Area
The surrounding area consists of the area generally within 400-feet of the project area. There are a mix of land uses and building types in the surrounding area. These land uses include industrial types of uses along the waterfront, some open uses such as parking or storage, some retail, utility, and residential uses. The zoning of the surrounding area is primarily designated manufacturing along the waterfront with an M2-1 district encompassing the area from the waterfront to Bay Street and from Sylvaton Terrace to the prolongation of Greenfield Avenue. To the west of Bay Street the area is primarily R3A with C1-2 overlays along Bay Street to a point midblock between Lynhurst and Willow Avenues. The R3A is a lower density residential district and the commercial overlay typically permits ground floor commercial uses. The R3A area was part of a DCP rezoning in 2001. The area north of the R3A changes to M3-1. M3 districts are the only districts that allow the uses found in Use Group 18, uses which may involve industrial processes with danger of fire, explosion or other hazards to the public or generate a great deal of pedestrian or freight traffic. An M3-1 district permits a maximum FAR of 2.0. North of the Project Area, and to the east of Front Street is the existing Special Stapleton Waterfront District, which was part of a rezoning to C4-2A in 2006. Immediately south of the Project Area on Block 2820, Lot 110, the abutting use is currently vacant industrial and manufacturing buildings of two and three stories and open areas used for boat storage. Immediately south of that on Lot 119 there are two, two-story buildings with institutional uses that surround on three sides a marina used for pleasure craft. South of that on Lot 132 is a seven-story

125 Edgewater Street - CEQR No. 17DCP069R Environmental Assessment Statement
Page 1-4
industrial manufacturing building. This Lot was granted a variance (146-04-BZ) on September 12, 2006 that permitted conversion of the seven-story building to residential use. For the 12 years prior to the granting of the variance the building had been vacant. In approving the application the BSA noted that with the change in use and the location of the site on a waterfront block a shore public walkway, upland connection and visual corridor would be required to be developed on the site. Across Edgewater St. on Block 2825, starting at the corner of Edgewater Street and Sylvaton Terrace (now Lot 4) there is a vacant industrial building. West of current Lot 4 is Lot 1. These two lots had previously been one lot, denoted as Lot 1. This original Lot 1 was granted a variance (324-01-BZ) on February 4, 2003 allowing development of a mixed-use project that was to have two mixed-use buildings joined together by a parking structure. The variance was needed since the property was in an M2-1 zoning district that did not allow residential use. One building on the east side of the lot was to be a new five-story plus cellar building with commercial uses in the cellar and 40 residential units in the floors above. A second building was to be an alteration of an existing shell with five-stories of office use. The buildings were to be linked together by a three-story parking structure with 163 parking spaces. In late 2005 a reopening and amendment to the above approval was requested in order to modify the proposed five-story office building to allow the three upper floors of the five-story building to be used for residential use instead of office use. This amendment was granted on July 25, 2006. Next to it, on Lot 16 there is a telephone company building with open parking. The Power Authority of New York occupies the remainder of the frontage, to Lynhurst Avenue. The facility located here is a small natural gas powered generating plant. There are six of these types of generating plants in New York City. North of Lynhurst Avenue to Willow Street, on Block 2823, there is an industrial building, a former residential building now commercially occupied, a vacant lot and then a row of commercial stores in a single building with parking oriented to Willow Street. North of Willow Street to Camden Street (Block 2822) there is a gas station. On the small triangular block (Block 2822) from Camden Street to where Edgewater Street and Bay Street merge the use is parking. North of the Project Area on Block 2820, Lot 105 there is vacant land owned by NYC along the shoreline east of Edgewater St., then, on Lot 1, land owned by the New York Transit Authority with a very large shed-like building (one story) used for the Staten Island Railroad (SIR). Just to the west of this building, on Lot 30 are the tracks of the SIR. Across Bay Street from this, between Vanderbilt Avenue to Greenfield Avenue, bounded on the west, the uses are predominantly one and two family houses of two to three stories. The exceptions to this are retail and service uses on the western frontage of Bay Street from Vanderbilt Avenue to Townsend Avenue. On the irregular shaped Block 2841 between Greenfield Avenue and Willow Avenue there is a mix of utility uses, industrial uses, the SIR rail line and on Greenfield Avenue near Tompkins Avenue a row of six one and two-family houses. On the south side of Willow Avenue (on Block 2842) there is a two-story office building and utility use. Exclusive of the Bay Street frontage, the remainder of the area within six hundred feet of the Project Area to Virginia Avenue is predominantly residential, one and two-family houses with a few small multifamily buildings, scattered vacant lots and a church. Along the west side of Bay Street the uses are predominantly commercial, with a mix of office, retail and service use and residential. The major thoroughfare in the surrounding area is Bay Street, which is the main route between the Verrazano-Narrows Bridge, the Stapleton area and the St. George neighborhood and ferry terminal. The street has two-way traffic with one parking lane and one travel lane in each direction. Mass transit is provided to the project area by both bus and the SIR. Two bus routes service the area, the #S51 that provides full time service and the #S81 route that provides part time service. Both routes go from the ferry terminal in St. George to the Midland beach area. The SIR provides service from the ferry terminal

125 Edgewater Street - CEQR No. 17DCP069R Environmental Assessment Statement
Page 1-5
in St. George all the way to Tottenville at the southern tip of the Island. The nearest station to the Project Area is the Clifton Station at the north end of the Surrounding Area, a distance of approximately 1,000 feet from the Development Site and 400 feet from the edge of the Project Area. There are no schools, parks or other significant city facilities in the surrounding area or any hospitals, landmarks, etc. The major feature of the area is the waterfront, which is largely inaccessible to the public.
Chapter 1.3: Purpose and Need This section describes the purpose and need for the proposed actions, without which the proposed project could not be developed.
The underlying zoning of project area (M2-1) restricts the use of the development site to only commercial uses (excluding Use Group 5 (hotel) and Use Group 15 (commercial amusement)) and medium manufacturing Use Group 17 and limits the development FAR to 2.00. The proposed actions would modify these restrictions in order to facilitate a mixed use development with new affordable housing units and local retail uses.
A zoning map amendment is also needed to rezone the development site from M2-1 to R6 and to establish a C2-2 commercial overlay district over a small, upland portion of the development site. The Applicant believes that the R6 zoning is needed to develop an economically feasible project that produces a substantial amount of affordable and market rate housing on the site. The proposed R6 zoning would be consistent with zoning map amendments, establishing new C4-2A districts, proposed by the earlier Stapleton Waterfront Development Plan (CEQR No. 06DME001R, ULURP Nos. 060471, 060293, 060468, 060469, and 060470). The proposed retail overlay district would facilitate the introduction of a new retail use on the development site that responds to community needs and takes advantage of the development site’s proximity to the Clifton station.
A zoning text amendment is needed to extend the boundary of the Special Stapleton District and create Subarea D and Subarea E, to further enhance the bulk and use provisions of the underlying waterfront zoning applicable to the development site, to foster and promote to cohesive urban design with the existing special district and promote public engagement, safety, and access to the waterfront and waterfront uses. As a condition of the proposed rezoning, a zoning text amendment will also be proposed to establish a mandatory inclusionary housing area, coterminous with Subarea E, to ensure the inclusion of affordable units in perpetuity-consistent with the larger mayoral mission for increased affordable units in the City.
In addition, a zoning authorization is needed to allow the development of the proposed project in phases. Due to the size and scope of the proposed project, a phased development would allow a portion of the proposed development to be constructed, providing that a proportionate portion of the public access area and shore public walkway are also developed. The phased construction of the proposed project enables a greater construction financing and allows the project to be “shovel ready.” If this zoning authorization is not granted, the time to produce the financing to start the project in its entirety would add increased delay to the final build year of the proposed project.
Lastly, and ministerial in nature, a zoning certification is required to ensure that the proposed public access areas and shore public walk ways comply with the waterfront regulations and the proposed text amendments pertaining to the proposed Subarea E.

125 Edgewater Street - CEQR No. 17DCP069R Environmental Assessment Statement
Page 1-6
Overall, the purpose and need of the proposed actions is to facilitate the transformation of the development site from, in the Applicant’s opinion, an underutilized property that detracts from the surrounding area into a mixed use development with much-needed affordable and market rate housing and retail uses that are better suited to the needs of the neighborhood. The existing structures and open uses on the development site will most likely remain if these actions are not approved, thereby stagnating the development within the surrounding area and precluding access to a large area of waterfront. Without the proposed actions, the project as proposed, could not be developed.
Chapter 1.4: Proposed Actions The Applicant is proposing a series of land use actions to activate a site along the Stapleton Waterfront with a new mixed use development which would include market-rate and affordable housing, commercial retail space, and public open space. These actions are described in detail below (see Appendix A for the Proposed Text Amendments).
Zoning Map Amendment
The discretionary Zoning Map Amendment would extend the existing Special Stapleton Waterfront District to encompass the project area thus making the properties subject to the special district regulations; in addition, the Zoning Map Amendment would change the zoning district designation of the southern portion of the project area (consisting of Lot 90 and a portion of Lot 110; Subarea E) from the existing M2-1 district, which permits manufacturing and commercial uses but not residential use, to an R6 and an R6/C2-2 district. The northern portion of the project area (Subarea D) would remain zoned M2-1. The proposed zoning of Subarea E would be consistent with the basic zoning of the Special District, C4-2A, which is equivalent to the R6A residential district. The proposed R6/C2-2 zoning district permits Use Groups 1-9 and 14, allows for a residential FAR up to 2.43, a commercial FAR up to 2.0 and community facility FAR up to 4.8. The C2-2 commercial overlay would be mapped to a distance of 200-feet south of Lynhurst Avenue and 215-feet deep onto the development site. The Stapleton Waterfront District provides for mixed buildings with ground floor retail uses on the waterfront. The district includes controls on streetwall provisions and building height.
Zoning Text Amendment
The discretionary Zoning Text Amendments consist of modification to the Special Stapleton Waterfront District Text (Section 116-00) and to Appendix F, “Mandatory Inclusionary Housing Areas,” of the Zoning Resolution.
These changes described below are intended to create two new Subareas (‘D’ and ‘E’) of the Special Stapleton Waterfront District and to modify various portions of the Special Regulations Applying in the Waterfront Area (Section 62-00 Et. Seq.) in Subarea E to reflect the unusual shape and dimensions of the development site (Subarea E) and to also apply the regulations to the adjoining property (Subarea D), which would be included in the Special District but remain zoned M2-1, consistent with the seven-story office building on that property. Among the changes to the special district are:

125 Edgewater Street - CEQR No. 17DCP069R Environmental Assessment Statement
Page 1-7
Text Map Modifications
Changes to the Special Stapleton Waterfront District maps in the Appendix to the chapter. Map 1 would be modified to show the additional subareas being created and the overall boundaries of the Special District. Map 2 is modified to show the new boundaries of the Special District. Map 3 is modified to show the new boundaries of the Special District. Map 4 is modified to show the new boundaries of the Special District. Map 5 is modified to show the new boundaries of the district and the location of upland connections and visual corridors (including the new upland connection and visual corridor in Subarea E). The required visual corridor begins at Edgewater Street and ends at the Pierhead line. The visual corridor begins south of the prolongation of Lynhurst Avenue and is 60’ wide. These changes delineate the areas in which the new regulations of the text apply;
Changes to Use Regulations
Special use regulations in Subarea E to allow ground floor parking within 30 feet of a street wall. This change affects all three buildings since they have street walls that front on either an upland connection or shore public walkway or both and have parking occupying most of the ground floors. The development site is in the flood plain and is subject to flooding. Without this change some other use would have to be provided in these area that would require dry flood proofing, substantially raising the project’s cost. Additionally, required parking would then have to occupy a part of a third level of the buildings either causing a reduction in the number of units being provided or a request to increase the height of the building;
Regulations to allow Waterfront Enhancing Uses to be located anywhere within an enlarged building provided that no commercial use is located above a dwelling unit. Section 62-29 (d) requires that commercial uses be located below the level of the first story ceiling of a building. Building ‘C’ is proposed to have an eating or drinking establishment of approximately 6,450 sf on its second floor. Therefore, this provision allows 6,450 sf of retail that would otherwise not be permitted at this location;
Permitting physical culture or health establishments as-of-right; which would have to conform to parking requirement category PRC-B. Physical Culture or Health Establishments are typically not permitted as-of-right. Under current regulations establishment of a Physical Culture or Health Establishment use requires the granting of special permit by the Board of Standards and Appeals, pursuant to ZR Section 73-36. Pursuant to the proposed text change the Applicant would be able to provide as-of-right a facility in the building is equipped and arranged to provide instruction, services or activities which improve a person’s physical condition by physical exercise or massage. Physical exercise programs include aerobics, martial arts or the use of exercise equipment. This facility would be located in Building ‘B’;
Changes to Bulk Regulations
Special bulk regulations are being established by Section 116-621 (Required Yards) modifying Section 62-332 (Rear Yards and Waterfront Yards) concerning waterfront yards that allows up to a five-foot reduction (normally 40 feet) of the depth of a waterfront yard when the lot dimension measured perpendicular along the landward edge of the stabilized shore, bulkhead or natural shore is less than 150 feet; As with the change described in the following section it would apply along the frontage of Building ‘B’ on the shore public walkway.

125 Edgewater Street - CEQR No. 17DCP069R Environmental Assessment Statement
Page 1-8
Establishment of Section 116-632 (Waterfront Public Access Area) modifying Section 62-52 (Applicability of Waterfront Public Access Area Requirements). This modification serves two purposes: it allows at various point along the shore public walkway a reduction in the width of the walkway from 40 feet to 35 feet at various locations where Building ‘B’ fronts on the shore public walkway; It also requires that where there is an existing building to remain that the shore public walkway occupy the entire distance between the existing building and shoreline be used for a shore public walkway with a required 8-foot-wide circulation path.
Changes in the height and setback regulations, including initial setback distance, measurement of height (setting the base plane), minimum/maximum base height, maximum height of buildings and floor plate sizes at varying elevations, street wall articulation facing a shore public walkway, streetscape requirements relative to lobbies and special requirements for garage walls screening them from the street and waterfront public access areas. The initial setback distance required in Section 62-341 is reduced on portions of the zoning lot where the distance between the landward edge of the stabilized shore and the landward zoning lot line is less than 150 feet may be reduced to 5 feet provided that at least 40 percent of the width of each story is no less than 10 feet from the shore public walkway. Rather than using the procedures specified in Section 62-341(a)(3) for determining base plane the new text specifies that the base plane is 16.8 above Richmond Datum. The new text specifies that rather than a maximum base height of 60 feet in the R6 district that the maximum base height is reduced to 55 feet and a minimum of base height of 2-stories or 25 feet whichever is less is required and that building portions that exceed 55 feet or five stories whichever is less shall be considered a tower. Buildings with tower portions fronting on Edgewater Street (Building ‘A’) are limited to 120 feet or 12-stories above the base plane, whichever is less while any other building with tower portions is limited to 11-stories or 110 feet above the base plane (Building ‘B’). The proposed text also specifies requirements for street wall articulation specifying the dimensions and locational requirements for recesses. The garage wall requirement ensures that the vehicles on the ground level are appropriately screened from the shore public walkway by partially opaque street walls and plantings and trees.
Modifications of the Design Requirements for Waterfront Public Access
Reducing the minimum amount of required waterfront public access area and modifying the regulations for an upland connection. These proposed regulations specify the specific location, dimensions and orientation of the visual corridor so that it conforms to the previously required visual corridor. Other changes include allow decreasing the width of the shore public walkway from the 40 feet required by existing regulations to a minimum of 35 feet and modifying the upland connection regulations by reducing the 10-foot minimum width requirement for the area abutting a turnaround for a Type 2 upland connection.

125 Edgewater Street - CEQR No. 17DCP069R Environmental Assessment Statement
Page 1-9
Mandatory Inclusionary Housing Area
A zoning text amendment to Appendix F of the Zoning Resolution, “Mandatory Inclusionary Housing Areas,” would establish a Mandatory Inclusionary Housing Area that is coterminous with the Subarea E (see Appendix A).4
Zoning Authorization
The third requested action is for approval of a Zoning Authorization pursuant to ZR Section 62-822(c) (Zoning Authorization for phased development of waterfront public access areas). This discretionary action is needed since the Applicant would be developing the overall project in three different phases. The Applicant needs permission to develop the required waterfront public access area in separate phases consistent with the development. It is the intent of the Applicant to provide the required waterfront public access areas proportionate to the lot area being developed in each phase. The proposed phasing of development of the lot and the waterfront public access areas.
Certification
The fourth and final action is the Chairperson’s Zoning Certification pursuant to ZR Section 62-811(b) that a site plan has been provided showing compliance with the provisions of ZR Sections 62-50 and 62-60 and additional text amendments made as part of this application, a ministerial action. The proposed project would incorporate waterfront public open space, visual corridors, and upland connections which would be subject to certification by the CPC Chairperson.
Chapter 1.5: Proposed Project The development site is the only portion of the project area projected to be developed as a result of the proposed actions. The remainder of the project area would remain as per existing conditions. The proposed project consists of two new buildings (Buildings ‘A’ and ‘B’) and the substantial enlargement of a third building (Building ‘C’) to create a mixed residential/commercial development with accessory parking. The proposed zoning for the project site permits a maximum residential FAR of 2.43, commercial of 2.0, and community facility of 4.8. The proposed zoning permits a maximum height of 120 feet above the based plane for tower portions of buildings fronting on Edgewater Street and a maximum height of 110 feet above the base plane for any other building with tower portions. The maximum base height within the study area is 55 feet or five stories above the base plane, whichever is less. The base plane is defined as 16.8 feet above Richmond County datum. The proposed project would result in the development of 478,694 gsf of floor area at an FAR of approximately 1.02 (Residential FAR of approximately 0.96 and commercial FAR of approximately 0.07). 24,173 gsf of floor area would be commercial use (5,073 gsf of physical and cultural establishment space, 6,450 gsf of eating or drinking establishment, and 12,650 of retail space), 351,567 gsf would be
4 For the purposes of analysis, it is assumed that 20 percent of units would be affordable to incomes of on average of 80 percent of the Area Median Income (AMI). At this time, it has not been determined which of the MIH options would be applicable to the Subarea E. The option will be determined through the public review process.

125 Edgewater Street - CEQR No. 17DCP069R Environmental Assessment Statement
Page 1-10
residential use, and 102,954 gsf would be parking floor area. The proposed project would have approximately 371 dwelling units and 346 parking spaces. At this time, it has not been determined which of the MIH options would be applicable to the proposed project. The option will be determined through the public review process. However, for analysis purposes it is assumed that 20 percent of units would be affordable to household with incomes of 80 percent of AMI. As part of the development a visual corridor, upland connection, shore public walkway and a public access area would be provided. The existing building at the north end of the development site would be enlarged (Building C), while the steel shed at the south end of the development site would be demolished. Building ‘A’ Building ‘A’ would be located at the southern end of the development site and would be oriented perpendicular to the shoreline. The building would be 13-stories (130 feet) in height (119 feet as measured from the base plane).5 The portion of the building facing the shoreline and along Edgewater Street would have three setbacks. The building would be 212,964 gsf in area with 144,592 gsf of residential space; 12,650 gsf of commercial space; and 55,722 gsf of parking space. On the lowest floor would be 87 parking spaces. The second floor (the first floor above the base plane) would contain 64 parking spaces, 12,650 sf of retail and eating or drinking establishment uses. The building would have approximately 163 dwelling units and would provide 151 total parking spaces. Building ‘B’ Building ‘B’ would be located in the middle of the development site, extending along the shore public walkway and parallel to the shoreline. The building would be 12-stories (120 feet) in height (110 feet as measured from the base plane) in the form of a base with two residential towers with the base rising 7-stories. The building would have a total of 228,800 gsf of floor area consisting of 182,615 gsf of residential space, 5,073 gsf of commercial space, and 41,112 gsf of parking space. One of the commercial uses planned for the building is a physical culture establishment. It is expected that the first floor of the building would contain 106 parking spaces and separate residential and commercial lobbies. The second floor of the building would contain 34 parking spaces, commercial space, lobby space, and residential space. The remaining floors in the building would be all residential space. There would be a total of 184 dwelling units and 140 total parking spaces provided. Building ‘C’ Building ‘C’ would be located at the northern end of the development site, and would be an enlargement of the small existing building at this location. Currently, the half of the building closest to the shoreline is two-stories (22 feet) in height while the remaining portion of the building is partly one story and partly a building shell with no roof. The enlarged building would be a rectangular building with its narrower side facing the shoreline. The building’s height would be six-stories (62 feet) in height (52 feet as measured from the base plane). The building would have a total of 36,930 gsf of floor area which 24,360 gsf would be residential space, 6,450 would be commercial space, and 6,120 would be parking space. There would be 24 dwelling units and 38 total parking spaces provided.
5 Heights are actual physical heights unless otherwise noted (such as heights measured from the base plane).

125 Edgewater Street - CEQR No. 17DCP069R Environmental Assessment Statement
Page 1-11
Vehicular Access and Parking Vehicular access to the development site would be provided from Edgewater Street at three locations. The first location begins approximately 23 feet north of the southern property line. At this location there is a 22-foot wide curb cut that provides access to the parking areas in Building ‘A’. The next access is approximately 130-feet further north along Edgewater Street and is located partly in the prolongation of Lynhurst Avenue. This 24-foot-wide curb cut would be located in the proposed visual corridor and extends from Edgewater Street to the shore public walk. From this access both the lobbies and the parking areas in both Buildings ‘A’ and ‘B’ can be accessed. A third access is provided 377-feet north on Edgewater Street and is a prolongation of Willow Avenue. This access to the development site is provided across Lot 95 and is permitted through a previously established easement agreement with the owner of Lot 95. It begins at a 28-foot wide curb cut at Edgewater Street, traverses Lot 95 at a width of 34 feet (the width of the easement including a six-foot sidewalk) and terminates at the open, publically accessible area between Buildings ‘B’ and ‘C’ from which garages in both buildings can be reached. All access-ways provide entry and exit-ways to the parking areas in each building. In total the three garages and on street parking on the private driveway would provide 346 parking spaces. 186 Bicycle parking spaces would also be provided. Site Improvements Site improvements consist of a visual corridor, an upland connection, a shore public walkway shore public walkway, and a public access area. A 23,114.5 sf shore public walkway and a 13,366.6 sf upland connection would be provided as part of the proposed project resulting in a total of 36,481 sf of qualifying waterfront public access area. In addition, 8,273 sf of open space would also be provided as a public access area. The visual corridor begins at Edgewater Street and traverses the site out to and past the shoreline. The visual corridor is 60 feet in width and aligns with a point just south of the termination of Lynhurst Avenue. Most of the visual corridor traverses the private driveway that provides site access from Edgewater Street. The corridor is bounded on both its south and north sides by elements of the upland connection and then by Building ‘A’ to its south and Lot 95 and then Building ‘B’ to the north. The upland connection is a Type 2 upland connection with elements on both sides of the private driveway, whose alignment it follows. On the south side of the private driveway the connection is a total of 20 feet in width. The upland connection includes a required 70-foot-wide turnaround for the Fire Department, located just before the shore public walkway. This area also provides access to the parking in Building “B”. The shore public walkway begins at the southern end of the development site (a gate is provided at this location to access a potential continuation of a shore public walkway on the adjacent property to the south). The shore public walkway terminates at the north end of the Site, also with a gate provided to access a potential continuation of a shore public walkway on the property to the north. The shore public walkway varies in width. From its southern beginning to the northern boundary of the upland connection the width is 40 feet. It is then reduced in width to 35 feet since the width of the zoning lot is narrowed in this area. It continues at this width until reaching Building ‘C’, the existing building to remain, where it is further narrows to 13’. The shore public walkway contains a continuous 12-foot-wide walkway from one end of the Site to the other end and would be developed with plantings consisting of grasses, shrubs, and trees; benches; moveable chairs; benches with tables and trash

125 Edgewater Street - CEQR No. 17DCP069R Environmental Assessment Statement
Page 1-12
receptacles; and lighting. In between Building ‘B’ and Building ‘C’ there is a 91-foot-wide public access area that while accessible to the public is not part of the waterfront public access area. Because of its limited size and the uses to which it is devoted the area is not designed to meet the requirements of a waterfront public access area. It lacks the required seating and the required plantings. This public access area is at the termination of an existing vehicular and pedestrian easement that traverses the adjacent property and ends at Edgewater Street. This easement area provides both vehicular and pedestrian access to the open area, from which the garages in Buildings ‘B’ and ‘C’ are reached. The public access area also provides space for a required Fire Department turn around. Neither the public access area nor the easement area leading to Edgewater Street is a required visual corridor or upland connection. The public access area is bounded on its south side by the shore public walkway and provides access to it.
Chapter 1.6: Analysis Framework
Build Year
Assuming that the proposed actions are effective in 2017, the build year for the proposed project is 2019. Redevelopment of the development site is expected to commence by mid-2017 and be completed by the fourth quarter of 2019.
Future No-Action Condition
Absent the proposed actions, it is assumed that the development site would not be redeveloped. The project would remain zoned M2-1 and no new as-of-right development would occur as the zoning controls preclude residential or community facility uses on the site. Market conditions in the area are not supportive of new manufacturing or ‘free-standing’ (without the development of residential uses) commercial uses at this location. Therefore, the future No-Action condition considers the project area in the 2019 build year in its current condition, vacant and undeveloped with the existing zoning remaining in place.
Future With-Action Condition
As noted above the Applicant-owned property, Lot 90 (the development site), is the only lot within the rezoning area projected to be developed under the future With-Action condition. Lot 95 (1 Edgewater Street) is fully developed with an occupied, seven-story approximately 256,000 gsf office building and a parking lot and would remain zoned M2-1.6 Only very small portions of the remaining lots (Lots 105 and 110) are located within the rezoning area. As such, the development site is the only site expected to be redeveloped as a result of the proposed actions.
The proposed actions would set the parameters of the proposed project. However, the proposed actions would not tie development to any particular program. As such, both a mixed use building and a fully-
6 An informational meeting was held with DCP concerning the possible redevelopment of Lot 95.

125 Edgewater Street - CEQR No. 17DCP069R Environmental Assessment Statement
Page 1-13
residential building could be developed at the proposed development site. In order to fully address the environmental impact of the proposed project, two scenarios, RWCDS 1 and 2, were identified for the future With-Action condition and are analyzed in Attachment 2, “Supplemental Analyses.” The first scenario is the proposed project as described above. The second scenario assumes an entirely residential program but is identical to the proposed project in all other ways.
The overall development program under the No-Action and With-Action conditions for both RWCDS is shown in Table 1-1, below.
Table 1-1: Reasonable Worst-Case Development Scenarios
Land Use No-ActionCondition
With-Action Condition
(RWCDS 1)
With-Action Condition
(RWCDS 2) Increment (RWCDS 1)
Increment (RWCDS 2)
Residential
Residential 0 DU 351,567 sf (371 DU)
375,608 sf (396 DU)
+ 351,567 sf (371 DU)
+ 375,608 sf (396 DU)
Commercial Retail 0 sf 12,650 sf 0 sf + 12,650 sf + 0 sf Eating or Drinking Establishments 0 sf 6,450 sf 0 sf + 6,450 sf + 0 sf
Physical and Cultural Establishment 0 sf 5,073 sf 0 sf + 5,073 sf + 0 sf
Commercial 0 sf 24,173 sf 0 sf + 24,173 sf + 0 sf Other Uses
Open Space 0 acres 1.03 acres 1.03 + 1.03 acres + 1.03 acres Vacant 3.31 acres 0 acres 0 acres - 3.31 acres - 3.31 acres
Parking Parking Spaces 0 spaces 346 spaces 346 spaces + 346 spaces + 346 spaces
Population Residents 0 983 1,049 + 983 + 1,049 Workers 0 95 23 + 95 + 23 Notes: 1 Population based on 2.65 residents per household from 2010 Census Tract 6, 8, and 27 Average Household Size (NYC
Department of City Planning); Worker Population based on 1 worker per 25 dwelling units, 1 employee per 50 parking spaces, and 1 employee per 333 sf of retail uses.
2 The number of dwelling units is based on an assumption of an average unit size of 947 sf. This reflects a conservative assumption as compared to the New Stapleton Waterfront Development Plan FEIS (CEQR # 06DME0014, September 2016) which assumes an average dwelling unit size of 1,094 sf.
The EAS will analyze the proposed actions for each technical area of concern. In order to assess the possible effects of the proposed actions, both RWCDS (represented in Table 1-1) will be used to determine the potential for environmental impacts from the rezoning. For the purposes of conservative analysis, the RWCDS that could result in the greater environmental impact will be analyzed where appropriate (e.g., for the analysis of community facilities, the RWCDS that results in the greater number of residential units will be analyzed). For assessments in which there is no objectively greater impact, both RWCDSs would be analyzed. In some cases, there would be no distinction between the impacts associated with either RWCDS, in these instances the proposed project will be described as the future With-Action condition.

125 Edgewater Street - CEQR No. 17DCP069R Environmental Assessment Statement
Page 2.1-1
ATTACHMENT 2: Supplemental Analyses
Chapter 2.1: Land Use, Zoning, and Public Policy
2.1.1 Introduction
This chapter considers the potential for the proposed project to result in significant adverse impacts to land use, zoning, and public policy. Under the guidelines of the CEQR Technical Manual, this analysis evaluates the uses in the area that may be affected by the proposed project and determines whether the proposed project is compatible with those uses or may otherwise affect them. The analysis also considers the proposed project’s compatibility with zoning regulations and other applicable public policies in the area, including the City’s Waterfront Revitalization Program (WRP).
As discussed in detail below, the proposed actions consist of: a) a Zoning Map Amendment to extend the Special Stapleton Waterfront District (SW) to include the project area, and to change an existing M2-1 Zoning District to an M2-1(SW), R6(SW) and R6/C2-2 (SW) Zoning Districts; b) Zoning Text Amendments to establish two new subareas ("Subareas D” and “Subarea E") of the Special Stapleton Waterfront District coterminous with the project area, to modify portions of the Special District regulations for these subareas, and to establish a Mandatory Inclusionary Housing (MIH) area coterminous with the Subarea E; c) a Zoning Authorization from the CPC for the phased development of waterfront public access areas; and d) a Zoning Certification from the CPC Chairperson’s pursuant to ZR Section 62-811(B), Waterfront public access and visual corridors, a ministerial action (see Appendix A).
The proposed project would consist of three buildings developed with a mix of uses including residential, commercial, and parking uses; in addition, the proposed project would result in the development of the waterfront with an upland connection, visual corridor, and public access area. Two Reasonable Worst Case Development Scenarios (RWCDS) have been established to provide a conservative analysis for the proposed project. As described in Attachment A, “Project Description,” the proposed project (RWCDS 1) would result in the development of 371 residential dwelling units and 24,173 gsf of commercial space. RWCDS 2 would be entirely residential consisting of 396 dwelling units. Under both RWCDSs 1.03 acres of open space and 346 parking spaces would be provided and 20 percent of units would be reserve as affordable to incomes averaging 80 percent of area median income (AMI).
2.1.2 Methodology
This preliminary analysis of land use, zoning, and public policy follows the guidelines set forth in the 2014 CEQR Technical Manual for a preliminary assessment (Section 320). According to the CEQR Technical Manual, a preliminary land use and zoning assessment includes a basic description of existing and future land uses and zoning information, and describes any changes in zoning that could cause changes in land use. It also characterizes the land use development trends in the area surrounding the

125 Edgewater Street - CEQR No. 17DCP069R Environmental Assessment Statement
Page 2.1-2
project area that might be affected by the proposed action, and determines whether the proposed project is compatible with those trends or may alter them.
The CEQR Technical Manual stipulates that a preliminary assessment of public policy should identify and describe any public policies (formal plans, published reports) that pertain to the study area, and should determine whether the proposed project could conform or conflict with the identified policies. If so, a detailed assessment should be conducted; otherwise, no further assessment is needed.
The following land use, zoning, and public policy assessment follows this guidance and provides a description of the Existing Conditions of the development site and the surrounding area. This is followed by an assessment of the future No-Action condition and With-Action condition, and a conclusion that no further analysis is needed.
The land use study area is typically defined as the area within 400-feet of the project area, which for this project is generally bounded to the north by Townsend Avenue, to the south by Sylvaton Terrace, to the west by Bay Street, and to the east by the waters of Upper New York Bay (see EAS Figure 3).
2.1.3 Preliminary Assessment
Land Use
Existing Conditions
Development Site
The development site is identified as 125 Edgewater Street (Tax Block 2820, Lot 90) located between Edgewater Street and the pierhead line and between Greenfield Avenue and a point approximately 175 feet south of Lynhurst Avenue at its intersection with Bay Street. The site totals 795,590 sf in area and is comprised of 144,258 sf of upland/dry land area and 651,332 sf of land under water. The site has 660 feet of frontage along the shoreline and 200 feet of frontage along Edgewater Street.
The development site is currently developed with a vacant one- to two-story masonry structure containing approximately 8,948 gsf of floor area and one vacant one-story steel shed containing approximately 5,246 gsf of floor area and is occupied on a short term basis for open storage. The remainder of the site is paved with asphalt. The property was formerly utilized by the MTA as a bus depot for the parking of buses.
Project Area
The project area is located between Edgewater Street and the pierhead line and between the eastern prolongation of Greenfield Avenue to the north and a point approximately 175 feet south of Lynhurst Avenue at its intersection with Edgewater Street to the south. There are no streets that bound the project area to the north or south. The prolongations of Willow Avenue and Lynhurst Avenue intersect the project area. The project area is on Block 2820 and consists of the entirety of Lots 90 and 95 and portions of Lots 105 and 110. Lot 90 is the only portion of the development site under the Applicant’s control. All of the tax lots extend out to their pierhead lines and consist of both lands above water and under

125 Edgewater Street - CEQR No. 17DCP069R Environmental Assessment Statement
Page 2.1-3
water portions. The lands above water constitute between a quarter and a third of the lot areas. There are no piers within the project area.
1 Edgewater Street (Block 2820, Lot 95) – This lot totals 795,385 sf in area with 23,455 sf within the project area. It is an irregular shaped lot with its longest frontage on Edgewater Street and a shorter frontage along the pierhead line. The lot is developed with one seven-story, 256,000 square foot office building and parking lot.
Murray Hulbert Avenue (Block 2820, Lot 105) – This lot totals 859,800 sf in area with 30,533 sf within the project area. It is an irregular shaped lot with frontage along Murray Hulbert Avenue and Front Street. The portion of Lot 105 in the project area is a long, narrow triangle extending from Edgewater Street to the Pierhead Line, located north of Lot 95. The parcel is a City-owned lot used for open storage of transportation and utility related supplies and materials.
181 Edgewater Street (Block 2820, Lot 110) – This lot totals 100,941 sf in area with 4,134 sf within the project area. It is an irregular L-shaped lot with 353 feet of frontage along Edgewater Street. The portion of Lot 110 in the project area is a long, narrow triangle just south of Lot 90. The lot is developed with a one two-story, 33,100 sf manufacturing building.
Study Area
The study area consists of a mixture of commercial, light industrial, and transportation and utility uses, parking, and vacant land as well as the waters of Upper New York Bay. Two 1-story transportation and utility buildings border the development site immediately to the south. The remainder of the waterfront is generally used for parking or industrial uses; many of the lots on the waterfront are vacant and underutilized. A New York City Power Authority building with associated parking is located across Edgewater Street from the development to the west. Buildings with frontage on Edgewater Street and Bay Street are generally local retail and service establishments such as restaurants, banks, and supermarkets but also include uses such as car washes and gas stations. North of Willow Avenue the Staten Island Railway curves to the north where it meets the Clifton Station which is improved on Front Street.
Nearly all other land uses within land use study area consist of residential uses, parking, and vacant land. Residential neighborhoods are located west of Bay Street and south of Willow Avenue or west of Bay Street and north of Greenfield Avenue.
Future No-Action Condition
Absent the proposed action for the project build year of 2019, it is assumed that the development site would remain in its existing vacant and unutilized condition (with the possible exception of temporary storage uses such as those currently located on the property). No additional development is anticipated to occur within the project area.

125 Edgewater Street - CEQR No. 17DCP069R Environmental Assessment Statement
Page 2.1-4
The entire first phase (Phase I) of the Stapleton Waterfront Development Plan (CEQR # 06DME001R) will be completed by the project build year. Phase I development would occur just outside of the 400-foot study area and would result in the development of 30,323 gsf of commercial retail space and 950 dwelling units (comprising 581,319 gsf of residential floor area) and 6.9 acres of open space (of which 2.13 acres is already existing and open) along the Stapleton Waterfront.1 Phase II and III would be completed between 2020 and 2024 respectively. The Stapleton Waterfront Development Plan would result in the development of new mixed use buildings and open space on vacant land and lots occupied by marginal commercial and industrial/manufacturing uses. Additionally, the development would enhance the Stapleton neighborhood by linking the upland neighborhood to the Stapleton waterfront and would reactivate Bay Street through the introduction of ground-floor retail activity, mixed-use development, and open space. While the development is outside the 400-foot study area, it is included in the below and subsequent analyses as it will substantially affect land uses surrounding the project area.
Other than development associated with the Stapleton Waterfront Development Plan, surrounding land uses within the immediate study area are expected to remain largely unchanged by the project build year of 2019.
Future With-Action Condition
The development site is the only portion of the project area projected to be redeveloped as a result of the proposed actions. The proposed project would redevelop the currently vacant site primarily for residential purposes with accessory retail space and accessory parking to serve project residents and other persons in the surrounding community. As compared to the future No-Action Scenario, both RWCDS 1 and RWCDS 2 would result in a substantial increase in residential units (including affordable housing), parking spaces, and publicly-accessible open space. RWCDS 1 would result in mixed use building while RWCDS 2 would result in entirely residential buildings with a slightly greater number of units as compared to RWCDS 1.
Both RWCDS 1 and RWCDS 2 would be consistent with the mixed-use character of the surrounding study area and planned development as part of the Stapleton Waterfront Development Plan. Both RWCDS 1 and 2 would connect upland neighborhoods with the waterfront. RWCDS 1 would activate Edgewater Street and the waterfront with new retail uses. The retail uses would provide local services for the surrounding community and the open space would help foster and active and revitalized waterfront. The inclusion of affordable housing in both RWCDSs would contribute to the City’s goal of fostering economically diverse neighborhoods and affirmatively furthering fair housing. The medium-density residential uses associated with the proposed project would be compatible with the study area (which is developed with a large amount of open space proximate to the development site). The Stapleton Waterfront Development Plan Phase I by the 2019 build year will have created a trend towards a more active waterfront with residential uses and local retail along Bay Street. While the proposed project would not establish connectivity along the waterfront, the rezoning would put in place a mechanism such that the open space created by the proposed project and the open space associated with the Stapleton Waterfront Development Plan could be joined at a later date.
Both RWCDSs would contribute to the development of the Bay Street and Edgewater Street as a vibrant mixed use corridor and the Stapleton Waterfront as an active and attractive open space. Both RWCDSs
1 The environmental review for the Stapleton Waterfront Development Plan analyzed a total unit count of 1,050 dwelling units for Phase 1. The developer is
only constructing a total of 907 units, however, for the purposes of conservative analysis a total of 950 units will be analyzed as part of the environmental review.

125 Edgewater Street - CEQR No. 17DCP069R Environmental Assessment Statement
Page 2.1-5
would be consistent with the Stapleton Waterfront Development Plan rezoning and would enhance the pedestrian experience along Edgewater Street.
The proposed project would solely facilitate development on the development site and would not result in any other land use changes in the project area. The study area would continue to have a mix of uses and an on-going trend of mixed use development. As described above both the proposed project and the RWCDS 2 would be compatible with the land use character of the surrounding area. In addition, new publicly-accessible open space and affordable housing would provide important benefits to the surrounding community. Overall the proposed project would be consistent with and supportive of land uses in the surrounding area and would not result in significant adverse land use impacts.
Zoning
Existing Conditions
Development Site and Project Area
The development site and project area are zoned M2-1. For zoning calculation purposes, the zoning lot is 366,835 square feet in size. Because the dry land portion of the property is smaller than the area generating floor area, there are physical limitations to accommodating the FAR generated by the lot.
The M2-1 district is primarily mapped in older manufacturing areas of the City. M2 districts occupy the middle ground between light and heavy industrial uses and are designed for manufacturing and related activities that can meet a medium level of performance standards. The district permits general industrial uses and most commercial uses with the exception of certain retail uses which are prohibited or limited to developments of 10,000 square feet or less. Residential and community facility uses are not permitted in this zone. The M2-1 zone has an allowable commercial or manufacturing FAR of 2.0.
Study Area
Most of the study area surrounding the site is zoned M2-1. Other zoning districts within the study area include an M3-1 zone to the south and a second area zoned M3-1 to the west. Small portions of the area to the west of the project area are zoned R3A and R4 and a small portion of the R3A district is mapped with a C1-2 commercial overlay. Other zoning designations mapped within the study area include the Lower Density Growth Management Areas and the City’s Food Retail Expansion to Support Health (FRESH) program. The Special Stapleton Waterfront District is located north of the project area. The underlying zoning district of the special district is a C4-2A commercial district (R6A residential equivalent).
M3 districts are for heavy industries that generate noise, traffic, or pollutants. Typical uses include power plants, solid waste transfer facilities and recycling plants, and fuel supply depots. M3 districts are usually located near the waterfront and are buffered from residential uses. Only manufacturing and commercial uses are permitted within this district. Uses with potential nuisance effects in M3 districts are required to conform to minimum performance standards. The M3-1 district permits a maximum commercial or manufacturing FAR of 2.0. The district permits a maximum building height of 60 feet.

125 Edgewater Street - CEQR No. 17DCP069R Environmental Assessment Statement
Page 2.1-6
The R3A zoning district allows detached one- and two-family dwellings and community facility uses. It is the lowest density district to allow zero lot line buildings, and is mapped in many older neighborhoods in the city. The minimum lot area requirement is 2,375 square feet and the minimum lot width is 25 feet. The maximum residential FAR is 0.5 plus a 20 percent allowance for attic space, and one parking space is required per unit. The maximum community facility FAR is 1.0.
The R4 zoning district is a low density zone permitting multiple dwellings. A variety of housing types, including garden apartments and rowhouses, are common in this district. The R4 zone permits a maximum residential FAR of 0.75 with an attic allowance of up to 0.15 for a total FAR of 0.9, a maximum 45 percent lot coverage, and a maximum building height of 35 feet resulting in buildings generally no taller than three stories, and requires one parking space per dwelling unit. The maximum community facility FAR is 2.0. Lots sizes are a minimum of 3,800 square feet for detached one- and two-family houses and 1,700 square feet for all other types of units.
C1 overlay districts accommodate the retail and personal service shops needed in residential neighborhoods, and are generally mapped along major avenues. The maximum commercial FAR for C1 overlays in R3A zones is 1.0. Residential uses are permitted within these overlays with residential bulk being governed by the provisions of the surrounding residential zone. Parking requirements vary by use within the C1 zone with one parking space required for each 300 square feet of general retail floor area.
A Lower Density Growth Management Area (LDGMA) is mapped to the west of the development site over the area zoned R3A. In the LDGMA, special zoning controls aim to match future development to the capacity of supporting services and infrastructure in parts of the city experiencing rapid growth. Residentially zoned portions of Community District 1 in Staten Island in which the project area is located are designated as a Lower Density Growth Management Areas. Within an LDGMA, special regulations apply to any development in an R1, R2, R3, R4-1, R4A, or C3A district; any development accessed by a private road in a R1, R2, R3, R4, R5; or C3A district, and C1, C2, and C4 districts in the borough of Staten Island.
The development site and the study area are located within the boundaries of the City’s Food Retail Expansion to Support Health (FRESH) program. The City has established the FRESH program in response to the issues raised in neighborhoods that are underserved by grocery stores. FRESH provides zoning and financial incentives to promote the establishment and retention of neighborhood grocery stores in underserved communities throughout the five boroughs. The FRESH program is open to grocery store operators renovating existing retail space or developers seeking to construct or renovate retail space that will be leased by a full-line grocery store operator. The project area and the study area are eligible for various tax incentives related to grocery store development and operation.
The Special Stapleton Waterfront District (SW) located just north of the project area, on the north shore of Staten Island, is part of a comprehensive plan to develop the former U.S. Navy homeport into a 12-acre waterfront esplanade with a mixed extension to the Stapleton town center. Special commercial district regulations provide for mixed buildings with ground floor retail uses, such as waterfront restaurants and other water-related uses, in a walkable neighborhood. Design controls, including street wall provisions and a low building height to frame the public park, respect the character and scale of the upland portions of Stapleton. To encourage similar development on key streets linking the town center to the waterfront, space used for non-residential uses on the ground floor of buildings containing residential uses will not count as floor

125 Edgewater Street - CEQR No. 17DCP069R Environmental Assessment Statement
Page 2.1-7
area. Although not subject to waterfront design rules, pedestrian connections to the waterfront esplanade and unobstructed visual corridors are required at regular intervals as extensions of the streets of the Stapleton town center.
Waterfront Zoning
In 1993, to support the Comprehensive Waterfront Plan and the Waterfront Revitalization Program (WRP), the City adopted the Waterfront Zoning Regulations (NYC Zoning Resolution, Article VI, Chapter 2), which were amended in 2016. The Regulations have the following stated purposes:
To maintain and reestablish physical and visual public access to and along the waterfront;
To promote a greater mix of uses in waterfront developments in order to attract the public and enliven the waterfront;
To encourage water-dependent uses along the City's waterfront;
To create a desirable relationship between waterfront development and the water's edge, public access areas and adjoining upland communities;
To preserve historic resources along the City’s waterfront; and
To protect natural resources in environmentally sensitive areas along the shore.
The waterfront zoning regulations apply to properties within waterfront blocks, which are blocks adjacent to or intersected by the shoreline. All residential and commercial developments are required to provide a waterfront yard that is 30 to 40 feet wide, depending on the district, along the entire shoreline of the zoning lot. For the project site, the waterfront yard depth requirement is 40 feet.
In all districts, with few exceptions, residential, commercial, and community facility developments on waterfront zoning lots are required to provide and maintain public open space at the water’s edge with pedestrian links to upland communities. In districts allowing a FAR of 4.0 or less where development would require public access, a minimum of 15 percent of the lot area must be improved or maintained for this purpose; a minimum of 20 percent is required in districts permitting an FAR greater than 4.0. Waterfront public access includes shore public walkways, upland connections, and supplemental public access areas, as needed to fulfill the minimum square footage requirement for public access. The waterfront zoning regulations stipulate certain design requirements related to seating, planting, signage and other design elements. Waterfront zoning also requires visual corridors, which are open areas that provide an unobstructed view from upland streets through a waterfront zoning lot to the shoreline.
Waterfront zoning bulk regulations apply to developments within waterfront blocks in all zoning districts. In low-density residence districts and medium and high-density contextual districts, waterfront development generally follows the same bulk rules as upland development with slight modifications that tailor the regulations to waterfront sites. For instance, to maintain an open area along the shoreline, waterfront yards substitute for rear yards.
In non-contextual medium- and high-density districts, taller buildings are permitted, but a sense of openness at the water’s edge is ensured by rules controlling height, the length of buildings parallel to the shoreline and the footprint of towers. To create a varied skyline at the water’s edge, additional floors are allowed if the building top is set back along all sides of the building. To prevent excessive density and bulk generated by portions of land under water on a waterfront zoning lot, lot area

125 Edgewater Street - CEQR No. 17DCP069R Environmental Assessment Statement
Page 2.1-8
seaward of the bulkhead line may not be used to generate floor area. Piers and platforms, however, may transfer floor area to the landward portion of the zoning lot.
For most developments on waterfront blocks, the Chairperson of the CPC must certify that the proposed project complies with requirements for public access and visual corridors. Once certified, a maintenance and operation agreement with the DPR must be filed and recorded before a building permit can be issued by the Department of Buildings (DOB). The review procedure helps the city enforce maintenance obligations and the public’s right of access to these areas during required hours of operation and, for planning purposes, track the progress of waterfront development throughout the city.
Future No-Action Condition
In the 2019 build year absent the proposed actions the development site and project area would continue to be governed by the provisions of the existing M2-1 zoning district.
No rezoning actions are presently being contemplated by the NYC Department of City Planning (DCP) for the study area by the final project build year of 2019 Therefore, the R3A, R4, and C1-2 commercial overlay districts as well as the Special Stapleton Waterfront District, the Lower Density Growth Management Areas, and the FRESH program areas are anticipated to remain as they currently exist.
Future With-Action Condition
Development Site and Project Area
The proposed actions (discussed further below) would increase the permitted density of the project area and allow new commercial, community facility, and residential uses. As described above, the proposed mix of uses and density that would result from the proposed actions would be compatible with surrounding uses. Furthermore, zoning controls would constrain the proposed project to the appropriate form for waterfront development. Compared to the future No-Action condition, the proposed project would provide substantial benefits to the surrounding community including affordable housing, new publicly-accessible open space, and improvements to the streetscape.
As described in Chapter 1, “Project Description,” the proposed actions include the following zoning changes.
The proposed actions would extend the existing Special Stapleton Waterfront District (SW) to encompass the project area thus making the properties subject to the special district regulations and would create two new subareas (Subareas D and E) in the SW district. Subarea E would cover the Applicant’s property (Block 2820, Lot 90) and would be rezoned from M2-1 zoning district to R-6 and R-6/C2-2. Subarea D would cover Block 2820, Lot 95 and would remain zoned M2-1. The proposed zoning for Subarea E would be consistent with the basic zoning of the Special District, C4-2A, which is equivalent to the R6A residential district. The proposed R6/C2-2 zoning district permits Use Groups 1-9 and 14, allows for a residential FAR up to 2.43, a commercial FAR up to 2.0 and community facility FAR up to 4.8. The C2-2 commercial overlay would be mapped to a distance of 200-feet south of Lynhurst Avenue and 215-feet deep onto the development site. The Stapleton Waterfront District provides for mixed buildings with ground floor retail uses on the waterfront. The district includes controls on streetwall provisions and building height.

125 Edgewater Street - CEQR No. 17DCP069R Environmental Assessment Statement
Page 2.1-9
The Zoning Text Amendments consist of modification to the Special Stapleton Waterfront District Text (Section 116-00) and to Appendix F, “Inclusionary Housing Designated Areas and Mandatory Inclusionary Housing Areas,” of the Zoning Resolution.
These changes described below are intended to modify various portions of the Special Regulations Applying in the Waterfront Area (Section 62-00 Et. Seq.) in Subarea E to reflect the unusual shape and dimensions of the development site (Subarea E) and to apply the regulations to the adjoining property (Subarea D), which would be included in the Special District but remain zoned M2-1, consistent with the seven-story office building on that property (see Appendix A). Among the changes to the special district are:
Text Map Modifications
Changes to the Special Stapleton Waterfront District maps in the Appendix to the chapter. Map 1 would be modified to show the additional subareas being created and the overall boundaries of the Special District. Map 2 is modified to show the new boundaries of the Special District. Map 3 is modified to show the new boundaries of the Special District. Map 4 is modified to show the new boundaries of the Special District. Map 5 is modified to show the new boundaries of the district and the location of upland connections and visual corridors (including the new upland connection and visual corridor in subarea E). The required visual corridor begins at Edgewater Street and ends at the Pierhead line. The visual corridor begins south of the prolongation of Lynhurst Avenue and is 60’ wide. These changes delineate the areas in which the new regulations of the text apply;
Changes to Use Regulations
Special use regulations in Subarea E to allow ground floor parking within 30 feet of a street wall. This change affects all three buildings since they have street walls that front on either an upland connection or shore public walkway or both and have parking occupying most of the ground floors. The development site is in the flood plain and is subject to flooding. Without this change some other use would have to be provided in these area that would require dry flood proofing, substantially raising the project’s cost. Additionally, required parking would then have to occupy a part of a third level of the buildings either causing a reduction in the number of units being provided or a request to increase the height of the building;
Regulations to allow Waterfront Enhancing Uses to be located anywhere within an enlarged building provided that no commercial use is located above a dwelling unit. Section 62-29 (d) requires that commercial uses be located below the level of the first story ceiling of a building. Building ‘C’ is proposed to have an eating or drinking establishment of approximately 6,450 sf on its second floor. Therefore, this provision allows 6,450 sf of retail that would otherwise not be permitted at this location;
Permitting physical culture or health establishments as-of-right; which would have to conform to parking requirement category PRC-B. Physical Culture or Health Establishments are typically not permitted as-of-right. Under current regulations establishment of a Physical Culture or Health Establishment use requires the granting of special permit by the Board of Standards and Appeals, pursuant to Section 73-36. Pursuant to the proposed text change the Applicant would be able to provide as-of-right a facility in the building is equipped and

125 Edgewater Street - CEQR No. 17DCP069R Environmental Assessment Statement
Page 2.1-10
arranged to provide instruction, services or activities which improve a person’s physical condition by physical exercise or massage. Physical exercise programs include aerobics, martial arts or the use of exercise equipment. This facility would be located in Building ‘B’;
Changes to Bulk Regulations
Special bulk regulations are being established by Section 116-621 (Required Yards) modifying Section 62-332 (Rear Yards and Waterfront Yards) concerning waterfront yards that allows up to a five-foot reduction (normally 40 feet) of the depth of a waterfront yard when the lot dimension measured perpendicular along the landward edge of the stabilized shore, bulkhead or natural shore is less than 150 feet; As with the change described in the following section it would apply along the frontage of Building ‘B’ on the shore public walkway.
Establishment of Section 116-632 (Waterfront Public Access Area) modifying Section 62-52 (Applicability of Waterfront Public Access Area Requirements). This modification serves two purposes: it allows at various point along the shore public walkway a reduction in the width of the walkway from 40 feet to 35 feet at various locations where Building ‘B’ fronts on the shore public walkway; It also requires that where there is an existing building to remain that the shore public walkway occupy the entire distance between the existing building and shoreline be used for a shore public walkway with a required 8-foot-wide circulation path.
Changes in the height and setback regulations, including initial setback distance, measurement of height (setting the base plane), minimum/maximum base height, maximum height of buildings and floor plate sizes at varying elevations, street wall articulation facing a shore public walkway, streetscape requirements relative to lobbies and special requirements for garage walls screening them from the street and waterfront public access areas. The initial setback distance required in Section 62-341 is reduced on portions of the zoning lot where the distance between the landward edge of the stabilized shore and the landward zoning lot line is less than 150 feet may be reduced to 5 feet provided that at least 40 percent of the width of each story is no less than 10 feet from the shore public walkway. Rather than using the procedures specified in Section 62-341(a)(3) for determining base plane the new text specifies that the base plane is 16.8 above Richmond Datum. The new text specifies that rather than a maximum base height of 60 feet in the R6 district that the maximum base height is reduced to 55 feet and a minimum of base height of 2-stories or 25 feet whichever is less is required and that building portions that exceed 55 feet or five stories whichever is less shall be considered a tower. Buildings with tower portions fronting on Edgewater Street (Building ‘A’) are limited to 120 feet or 12-stories above the base plane, whichever is less while any other building with tower portions is limited to 11-stories or 110 feet above the base plane (Building ‘B’). The proposed text also specifies requirements for street wall articulation specifying the dimensions and locational requirements for recesses. The garage wall requirement ensures that the vehicles on the ground level are appropriately screened from the shore public walkway by partially opaque street walls and plantings and trees.
Modifications of the Design Requirements for Waterfront Public Access
Reducing the minimum amount of required waterfront public access area and modifying the regulations for an upland connection. These proposed regulations specify the specific location, dimensions and orientation of the visual corridor so that it conforms to the previously required

125 Edgewater Street - CEQR No. 17DCP069R Environmental Assessment Statement
Page 2.1-11
visual corridor. Other changes include allow decreasing the width of the shore public walkway from the 40 feet required by existing regulations to a minimum of 35 feet and modifying the upland connection regulations by reducing the 10-foot minimum width requirement for the area abutting a turnaround for a Type 2 upland connection.
Mandatory Inclusionary Housing Area
A zoning text amendment to Appendix F of the Zoning Resolution, “Mandatory Inclusionary Housing Areas,” would establish a Mandatory Inclusionary Housing area that is coterminous with the Subarea E (see Appendix A). Which of the MIH options would be available in the proposed MIH area (Subarea E) will not be finalized until the conclusion of the public review process.2
Study Area
The proposed residential and commercial development would be in conformance with the use and bulk provisions of the proposed zoning. The proposed actions have been designed to accommodate the proposed uses and bulk of the project.
No significant impacts to zoning patterns in the study area would be expected. The mapping of the proposed R6, R6/C2-2, and special district zoning on the project area would be appropriate for its waterfront location and would not be inconsistent with the mixture of R3-2, R3X, and R4 zoning districts mapped within the study area.
The proposed actions would permit a new development that would be compatible with and beneficial to the surrounding residential, commercial, and other uses. Given the character and development of the immediate vicinity, the most appropriate contextual scenario for the project area would be the proposed residential, commercial overlay, and Special Stapleton Waterfront District zoning and the associated development project.
The proposed actions would therefore not have a significant impact on the extent of conformity with the current zoning in the surrounding area, and would not adversely affect the viability of conforming uses on nearby properties.
Based on the above analyses, it has been determined that no potentially significant adverse impacts related to zoning are expected to occur as a result of the proposed actions. Therefore, further analysis of zoning is not warranted.
Public Policy
Existing Conditions
Beyond zoning, many other public policies can affect land use and development. The public policies applicable to the proposed project are OneNYC; Vision 2020: New York City’s Comprehensive Waterfront Plan; Housing New York: A Five-Borough, Ten-Year Plan; Vision 2020: New York City’s Comprehensive Waterfront Plan; and the Waterfront Revitalization Program.
2 For the purposes of analysis, it is assumed that 20 percent of units would be affordable to incomes of on average of 80 percent of the Area Median Income
(AMI).

125 Edgewater Street - CEQR No. 17DCP069R Environmental Assessment Statement
Page 2.1-12
OneNYC
In April 2007, the Mayor’s Office of Long Term Planning and Sustainability released PlaNYC: A Greener, Greater New York (PlaNYC). Since that time, updates to PlaNYC have been issued that build upon the goals set forth in 2007 and provide new objectives and strategies. In 2015, One New York: The Plan for a Strong and Just City (OneNYC) was released by the Mayor's Office of Sustainability and the Mayor’s Office of Recovery and Resiliency. OneNYC builds upon the sustainability goals established by PlaNYC and focuses on growth, equity, sustainability, and resiliency. Goals outlined in the report include those related to housing (ensuring access to affordable, high-quality housing) and thriving neighborhoods (ensuring that neighborhoods will be well-served).
Growth: To meet the needs of a growing population at a time of rising housing costs, the City will create and preserve 200,000 affordable housing units and support the creation of 160,000 additional new housing units by 2024, and support the creation of at least 250,000 to 300,000 additional housing units by 2040. The City will also foster job growth, spurring the creation of more than 4.9 million jobs by 2040, and invest in transportation infrastructure, to ensure that average New Yorkers can reach 1.8 million jobs by transit within 45 minutes by 2040.
Equity: The City aims to lift 800,000 New Yorkers out of poverty or near poverty by 2025 by raising the minimum wage and launching high-impact initiatives to support education and job growth. The City also seeks to reduce premature mortality by 25 percent by ensuring that all New Yorkers have access to physical and mental healthcare services and by addressing hazards in homes.
Sustainability: The City’s sustainability goals include reducing greenhouse gas emissions by 80 percent by 2050 (relative to 2005 levels), sending zero waste to landfills by 2030, having the best air quality among all large U.S. cities by 2030, and reducing the risk of stormwater flooding in most affected communities. Contaminated land will be cleaned up to address disproportionately high exposures in low-income communities and convert land to safe and beneficial use, and major investments will be made to ensure that underserved New Yorkers have more access to parks.
Resiliency: The City seeks to eliminate long-term displacement from homes and jobs after shock events by 2050. City neighborhoods will be made safer by: strengthening community, social, and economic resiliency; upgrading private and public buildings to be more energy efficient and resilient to the impacts of climate change; adapting infrastructure systems to withstand severe weather events; and strengthening coastal defenses against flooding and sea level rise.
Housing New York: A Five-Borough, Ten-Year Plan
On May 5, 2014, the de Blasio administration released Housing New York: A Five-Borough, Ten-Year Housing Plan (“Housing New York”), a plan to build or preserve 200,000 affordable residential units. To achieve this goal, the plan aims to double the New York City Department of Housing Preservation and Development (HPD)’s capital budget, target vacant and underused land for new development, protect tenants in rent-regulated apartments, streamline rules and processes to unlock new development opportunities, contain costs, and accelerate affordable construction. The plan details the key policies and programs for implementation, including developing affordable housing on underused public and private sites.

125 Edgewater Street - CEQR No. 17DCP069R Environmental Assessment Statement
Page 2.1-13
Vision 2020: New York City’s Comprehensive Waterfront Plan
The Comprehensive Waterfront Plan presented a 10-year plan to expand the use of the waterfront for parks, housing and economic development, and the use of waterways for transportation, recreation, and natural habitats. The Comprehensive Waterfront Plan, issued in 2011 and building on the original 1992 plan, identifies eight goals for the New York City Waterfront: to expand public access to the waterfront and waterways on public and private property for all New Yorkers and visitors alike; enliven the waterfront with a range of attractive uses integrated with adjacent upland communities; support economic development and activity on the working waterfront; improve water quality through measures that benefit natural habitats, support public recreation, and enhance waterfront and upland communities; restore degraded natural waterfront areas, and protect wetland and shorefront habitats; enhance the public experience of the waterways that surround New York; improve government regulation, coordination, and oversight of the waterfront and waterways; and identify and pursue strategies to increase the City’s resilience to climate change and sea level rise. The plan identifies strategies and projects to achieve these goals. The citywide strategies presented in Vision 2020 will affect every stretch of waterfront in the city. But because New York’s 520 miles of shoreline are incredibly diverse, a local strategy was identified for each area as well. The Comprehensive Waterfront Plan of 1992 divided the city’s waterfront into 22 segments, or reaches (a nautical term for a continuous expanse of water). The project area falls within Reach 18 - Staten Island North Shore. Strategy 6 for the Edgewater/Rosebank include to, “Support creation of public access to extend the North Shore Promenade as redevelopment occurs;” and to “Consider rezoning for residential development incorporated with public access.”
Waterfront Revitalization Program
The project area is located in the City’s Coastal Zone, as designated by New York State and City, and is therefore subject to the Coastal Zone management policies of both the City and the State. The WRP is the City’s principal coastal zone management tool. As originally adopted in 1982 and revised in 2016, it establishes the City’s policies for development and use of the waterfront. Revisions to the WRP were adopted by the City Council in 2013, and were then approved by the New York State Secretary of State in February, 2016. The WRP contains 10 major policies, each with several objectives focused on: improving public access to the waterfront; reducing damage from flooding and other water-related disasters; protecting water quality, sensitive habitats (such as wetlands), and the aquatic ecosystem; reusing abandoned waterfront structures; and promoting development with appropriate land uses. All proposed actions subject to CEQR, Uniform Land Use Review Procedure (ULURP), or other local, state, or federal agency discretionary actions that are situated within New York City’s designated Coastal Zone Boundary must be reviewed and assessed for their consistency with the WRP.
Future No-Action Condition
There are no changes to public policy expected in the study area in the future No-Action condition. Existing public policies are expected to remain in effect.

125 Edgewater Street - CEQR No. 17DCP069R Environmental Assessment Statement
Page 2.1-14
Future With-Action Condition
OneNYC
The proposed project would be consistent with the City’s sustainability goals outlined in OneNYC. In particular, the proposed project would support OneNYC’s land use goals of creating substantial new housing opportunities at a range of incomes, including permanently affordable housing; fostering job growth; redeveloping underutilized sites along the waterfront with active uses (including recreational space); focusing development in areas that are served by mass transit; and fostering walkable retail destinations. Additionally, the proposed project would involve the clean-up of potentially contaminated land and would provide greater access to open space for the Rosebank community. As described below, the proposed project would be consistent with WRP policies. Overall, the proposed actions would be supportive of the applicable goals and objectives of OneNYC.
Housing New York: A Five-Borough, Ten-Year Plan
The proposed project would be consistent with the Housing New York plan and would result in a substantial amount of new permanently affordable housing. As noted in Chapter 1, “Project Description,” the creation of housing, including much-needed affordable housing, is a key goal of the proposed project. The number of affordable units has not yet been determined; however, for analysis purposes RWCDS 1 would create 74 dwelling units affordable to incomes at 80 percent AMI and RWCDS 2 would create 79 dwelling units affordable to incomes at 80 percent AMI. Therefore, the proposed actions would be supportive of this key public policy goal.
Vision 2020: New York City’s Comprehensive Waterfront Plan
The proposed project would result in the redevelopment of vacant and degraded land along the Stapleton waterfront with new housing, commercial space, and publicly-accessible open space. As described above, the project area falls within Reach 18 - Staten Island North Shore. The proposed project would be consistent with and supportive of neighborhood strategies (specifically strategy 6) identified for the Edgewater/Rosebank. The proposed project would result in the activation of the waterfront with upland connections to a new waterfront open space and would expand the Stapleton Development Plan. Clear visual and pedestrian access to the waterfront open space would be provided through the project area in accordance with waterfront zoning. The proposed project would incorporate any hazardous material remediation deemed necessary at the project area. Overall, the proposed project would be supportive of and consistent with the goals and objectives of the Vision 2020.
Waterfront Revitalization Program
As noted above, the project area is located within the City’s Coastal Zone and, therefore, the proposed project is subject to DCP review for consistency with the policies of the WRP. The WRP includes policies designed to maximize the benefits derived from economic development, environmental preservation, and public use of the waterfront while minimizing the conflicts among those objectives. The WRP Consistency Form (see Appendix B) lists the WRP policies and indicates whether the proposed project would promote or hinder that policy, or if that policy would not be applicable. This section provides additional information for the policies that have been checked “promote” or “hinder” in the WRP Consistency Assessment Form.

125 Edgewater Street - CEQR No. 17DCP069R Environmental Assessment Statement
Page 2.1-15
Policy 1.1: Encourage commercial and residential redevelopment in appropriate Coastal Zone areas.
The proposed project would transform a vacant site on the Stapleton waterfront with 341,455 sf of residential space, 24,173 sf of commercial space, and 1.03 acres of publicly-accessible open space. Approximately 20 percent of the proposed project’s residential units would be permanently affordable. The proposed project would be located in and proximate to areas that are transitioning away from their industrial past due to new mixed-use development as a result of the Stapleton Waterfront Development Plan. Therefore, the proposed project would be consistent with this policy.
Policy 1.2: Encourage non-industrial development with uses and design features that enliven the waterfront and attract the public.
The project area is a prominent location near the waterfront and its redevelopment would contribute to enlivening the waterfront and improving the visual character of the area. The proposed project would provide new publicly-accessible open space, and retail space for the community. Active second-floor retail uses would enhance the pedestrian experience, as would the creation of waterfront open space and upland connections. The proposed project is expected to enliven the project area with new residents, workers, and visitors; a 24-hour population would be located to this currently vacant site. Further, the proposed project would result in the development of a waterfront open space. Therefore, the proposed project would be consistent with this policy.
Policy 1.3: Encourage redevelopment in the Coastal Zone where public facilities and infrastructure are adequate or will be developed.
As described above, the project area is located in an area with connections to public mass transportation and roadways. The surrounding community is developed with community facilities within the neighborhoods of both Rosebank and Clifton. Bayley Seton Hospital is located in Clifton and schools are located in surrounding neighborhoods. Therefore, the proposed project would be consistent with this policy.
Policy 1.5: Integrate consideration of climate change and sea level rise into the planning and design of waterfront residentialand commercial development, pursuant to WRP Policy 6.2.
See response to WRP policy 6.2.
Policy 5.1: Manage direct or indirect discharges to waterbodies
Stormwater generated on-site would be directed to water quality settling chambers prior to discharge to the existing storm sewer on site. The storm sewer discharges into the Upper Bay. With the removal of sediments, there would be no harmful effect on the waters of New York Harbor.
Policy 6.1: Minimize losses from flooding and erosion by employing non-structural and structural management measures appropriate to the site, the use of the property to be protected, and the surrounding area.
See response to WRP policy 6.2, below.

125 Edgewater Street - CEQR No. 17DCP069R Environmental Assessment Statement
Page 2.1-16
Policy 6.2: Integrate consideration of the latest New York City projections of climate change and sea level rise (as published in New York City Panel on Climate Change 2015 Report, Chapter 2: Sea Level Rise and Coastal Storms) into the planning and design of projects in the City’s Coastal Zone
The project area is located within the 100-year floodplain (area with a one percent chance of flooding each year) (see Figure 2.1-1). As shown in Figure 2.1-1, Buildings A, B, and C are all entirely located in Flood Zone AE. Additionally, the majority of Building A and the entirety of Buildings B and C are located within the limit of moderate wave action during hundred-year storm events.
The proposed project would be designed to accommodate flood levels projected for the year 2100 for all critical infrastructure and residential and commercial uses. This would account for the New York City Panel on Climate Change’s (NPCC) “High Estimate” level of +30 inches for the 2050s and +75 inches for the end of the century (2100). In terms of the absolute elevations, the design would account for potential future “100-year” flood levels; for a portion of Building A and the entirety of Buildings B and C this would be 19.3 feet (NAVD88); for the other portion of Building A this would be 18.3 feet (NAVD88).
The elevation at grade for all three buildings would be 8.9 feet (NAVD88), the greatest base flood elevation would be consistent for all three buildings at 18.9 feet (NAVD88), and the design flood elevation for all three buildings would be 20.9 feet (NAVD88). The proposed project would not include any below-grade space. The first floor of all three buildings would be used exclusively for parking spaces and lobby areas (9.9 feet NAVD88); the second floor levels of Buildings A and B would be developed with parking spaces and commercial space and the second floor level of Building C would be developed with entirely commercial space (20.9 feet NAVD88).3 Residential floor area would be located above the second floor in all three buildings. All first floor lobby and parking areas within the three buildings would be wet flood-proofed. The second floor would be located above the base flood elevation, as such, no flood-proofing measures would be required.
All critical infrastructure, including but not limited to electricity connections, generators and fuel, communications, and elevators would be designed to withstand flooding up to the design flood elevation (20.9 feet NAVD88). Buildings A, B, and C, would all have critical systems elevated. Elevators at the first floor lobby of all three buildings would be dry flood-proofed.
Any plantings in at-grade open spaces would be water- and salt-tolerant species to the extent practicable. The proposed project would include coastal protection measures that would mitigate potential flood events. The proposed project would not substantially affect flood levels in the surrounding area. Based on the above review and design commitments, the proposed project would be consistent with New York City policies regarding adaptation to climate change, and the proposed actions would be consistent with this policy.
The proposed project would comply with applicable flood mitigation requirements.
Policy 7.1: Manage solid waste material, hazardous wastes, toxic pollutants, substances hazardous to the environment, and the unenclosed storage of industrial materials to protect public health, control pollution and prevent degradation of coastal ecosystems.
As described in Chapter 2.12, “Hazardous Materials,” given the presence of former and surrounding industrial land uses, there is a potential for to have impacted the subsurface soil and groundwater quality beneath the project area and for impacted fill materials to be present at the site. As part of the
3 Building heights given are measured from grade (thus the first floor is one foot above grade).


125 Edgewater Street - CEQR No. 17DCP069R Environmental Assessment Statement
Page 2.1-17
proposed project an “E” designation for hazardous materials would be placed on the development site. Therefore, any hazardous materials conditions found at the project area would be mitigated prior to the development of the proposed project. Therefore, the proposed project would be consistent with this policy.
Policy 8.1: Preserve, protect, maintain, and enhance physical, visual and recreational access to the waterfront.
See response to WRP Policy 8.2.
Policy 8.2: Incorporate public access into new public and private development where compatible with proposed land use and coastal location.
The proposed project would incorporate the development of a new waterfront open space, visual corridors, and upland connections. A 23,114.5 sf shore public walkway and a 13,366.6 sf upland connection would comprise the qualifying waterfront public access areas on-site; in addition, 8,273 sf of public access area would also be provided as part of the proposed project. Therefore, the proposed actions would be consistent with this policy.
Policy 8.3: Provide Visual access to the waterfront where physically practical.
As described in Policy 8.2, the proposed project would incorporate upland connections and visual corridors along the prolongation of Lynhurst Avenue. The newly created open space would be publicly accessible. Therefore, the proposed actions would be consistent with this policy.
Policy 8.6: Design waterfront public spaces to encourage the waterfront’s identity and encourage stewardship.
The design of publicly-accessible open space and of parkland would be tailored to ensure access to the site, provide opportunities for the public to get the water’s edge, make open space and upland connections inviting, and provide access to amenities. Further, the proposed project would install lighting, sea rails, views of water, and incorporate the appropriate balance of both sunny and shaded space. Where possible, landscaping elements would incorporate water- and salt-tolerant plantings in areas subject to flooding and salt spray, maximize water-absorption functions of planted areas, preserve and enhance natural shoreline edges, and be designed in such a way as to anticipate climate change. Therefore, the proposed actions would be consistent with this policy.
Policy 9.1: Protect and improve visual quality associated with New York City’s urban context and historic and working waterfront.
The proposed project, particularly in comparison to the future No-Action condition, would result in an improved visual quality and urban context surrounding the waterfront. The proposed project would add interest to existing scenic elements and result in the development of a vacant and blighted former industrial site. Therefore, the proposed actions would be consistent with this policy.
Policy 9.2: Protect and enhance scenic values associated with natural resources.
See Policy 9.1.

125 Edgewater Street - CEQR No. 17DCP069R Environmental Assessment Statement
Page 2.1-18
2.1.4 Conclusion
Overall, the proposed project would not result in significant adverse impacts to land use, zoning, and public policy.

125 Edgewater Street - CEQR No. 17DCP069R Environmental Assessment Statement
Page 2.2-1
Chapter 2.2: Socioeconomic Conditions
2.2.1 Introduction
This chapter assesses whether the proposed project would result in significant adverse impacts to the socioeconomic character of the area within and surrounding the project area. As described in the 2014 CEQR Technical Manual, the socioeconomic character of an area includes its population, housing, and economic activities. Socioeconomic changes may occur when a project directly or indirectly changes any of these elements. Although some socioeconomic changes may not result in impacts under CEQR, they are disclosed if they would affect land use patterns, low-income populations, the availability of goods and services, or economic investment in a way that changes the socioeconomic character of the area. In some cases, these changes may be substantial but not adverse. The objective of the CEQR analysis is to disclose whether any changes created by the action would have a significant adverse impact compared to what would happen in the future without the proposed action.
The proposed project would consist of three buildings developed with a mix of uses including residential, commercial, and parking uses; in addition, the proposed project would result in the development of the waterfront with an upland connection, visual corridor, and public access areas. Two Reasonable Worst Case Development Scenarios (RWCDS) have been established to provide a conservative analysis for the proposed project. As described in Attachment A, “Project Description,” the proposed project (RWCDS 1) would result in the development of 371 residential dwelling units and 24,173 gsf of commercial space. RWCDS 2 would be entirely residential consisting of 396 dwelling units. Under both RWCDSs 20 percent of units would be reserve as affordable to incomes averaging 80 percent of area median income (AMI). As such under RWCDS 1, 74 dwelling units would be reserved as affordable pursuant to MIH and under RWCDS 2, 79 dwelling units would be reserved as affordable pursuant to MIH.
The threshold of development which triggers an analysis of direct residential population displacement is 500 residents. As described in Chapter 1.0, “Project Description,” in the existing condition the development site is not, and under the No-Action condition the development site would not, be developed with residential uses. Therefore, no residents would be directly displaced as a result of the proposed actions and no analysis of direct residential displacement is warranted.
The threshold of development which triggers an analysis of direct business displacement is 100 employees. Absent the proposed action for the project build year of 2019, it is assumed that the development site would remain in its existing vacant and underutilized condition (with the possible exception of temporary storage uses such as those currently located on the property). No businesses now operate on the project site, which is a former MTA bus depot. Two off-site companies are currently using the site for storage purposes, but no employees are based on the site, the use of the site is not vital to the operation of either business, and the use is on a temporary basis, subject to termination on 90 days’ notice. Therefore, no employees would be directly displaced as a result of the proposed actions and no analysis of direct business displacement is warranted.
The proposed action would not introduce new development that is markedly different from existing uses, development, and activities in the study area. The proposed project would result in the creation of 24,173 gsf of commercial space relative to the future No-Action condition. The threshold of development which triggers an analysis of indirect business displacement due to increased rents is

125 Edgewater Street - CEQR No. 17DCP069R Environmental Assessment Statement
Page 2.2-2
200,000 gsf of commercial space; additionally, the threshold for an indirect business displacement analysis due to retail market saturation is 200,000 gsf. Therefore, an analysis of indirect business displacement due to increased rents or retail market saturation is not warranted and no further analysis is necessary.
A significant adverse impact on a specific industry would generally occur only in the case of a regulatory change affecting the city as a whole, but it can also occur in the case of a local action that affects an area in which a substantial portion of that sector is concentrated, relative to the city as a whole. The proposed action would not affect citywide policy or regulatory mechanisms, and no economic sector is concentrated in the vicinity of the project site. The proposed action would not have a significant adverse impact on any of the city’s economic sectors.
The threshold for indirect residential displacement is 500 residents. RWCDS 2 would result in the creation of 396 dwelling units accommodating an estimated 1,092 residents, as such, an analysis of the potential for displacement is provided below. The CEQR Technical Manual specifies that the objective of the indirect residential displacement analysis is to determine whether the proposed action may either introduce a trend or accelerate a trend of changing socioeconomic conditions that may potentially displace a vulnerable population. Such an impact could occur if (1) the proposed project would introduce new market rate housing into a predominantly low and moderate income area; (2) the number of new action-generated residents would exceed 5 percent of the future No-Action study area population, indicating the potential for changes in demographic and real estate market conditions; and (3) a substantial number of households (more than 5 percent of the households in the study area) are at risk of involuntary displacement because they have incomes sufficiently low to be vulnerable to sharp rent increases and live in unprotected rental housing units (i.e., rental units that are not reserved for low or moderate income families and are not protected by rent control, rent stabilization, or other government regulations restricting rent increases).
The preliminary analysis concludes that the study area is predominantly a moderate income area and that the number of market rate housing units to be constructed as a result of the proposed project is expected to exceed 5 percent of the number of existing households in the study area. Further analysis, however, concludes that few if any study area renter households would be at risk of displacement, because they do not live in locations that are likely to experience substantial market changes as a result of the proposed project. The proposed project would not be expected to cause a significant adverse socioeconomic impact related to indirect residential displacement.
2.2.2 Methodology
Data Sources
The principal data sources for this analysis consist of the decennial Census Bureau enumeration of population and housing and the American Community Survey information provided by the Department of City Planning for the Stapleton-Rosebank Neighborhood Tabulation Area. Local realtors were also consulted about local market conditions.

125 Edgewater Street - CEQR No. 17DCP069R Environmental Assessment Statement
Page 2.2-3
Study Area Definitions
The CEQR Technical Manual suggests that:
“A project that would result in a relatively large increase in population may be expected to affect a larger study area. Therefore, a 0.5-mile study area is appropriate for projects that would increase population by 5 percent compared to the expected No-Action population in a quarter-mile (0.25 mile) study area. When the percent increase will not be known until after a preliminary analysis is conducted, the applicant may begin with a 0.25-mile study area for the preliminary analysis and then increase it to a 0.5-mile study area if the analysis reveals that the increase in population would exceed 5 percent in the 0.25-mile study area.”
Accordingly, this analysis uses a quarter-mile study area for the preliminary assessment but, since the preliminary assessment of the potential for indirect residential displacement reveals that the proposed action is expected to increase the population of that study area by more than the 5 percent threshold, a half-mile study area is used for the detailed assessment of indirect residential displacement.
The study areas were adjusted to coincide with census tract boundaries. If at least half of a tract’s area is within the quarter-mile or half-mile radius, it is included; if less than half of the tract is within the radius, it is excluded. The majority of only one census tract, Richmond County tract 8, is located within a quarter-mile radius of the project site. Three census tracts (Tract 6, Tract 8, and Tract 27) are located within a half-mile radius of the site.
The Census Bureau collects only basic demographic and housing data as part of its decennial enumerations. It collects socioeconomic information through its ongoing American Community Survey (ACS) and each year releases estimates based on one to five years’ surveys. The five-year estimates are most useful for small geographical areas because they are based on the largest number of responses, but even these are based on information from too small a percentage of total households for the estimates to be sufficiently accurate (that is, within an acceptable margin of error) at the census tract level.1 Consequently, the New York City Department of City Planning (DCP) provides socioeconomic estimates for identified neighborhood tabulation areas (NTAs). Income levels and other socioeconomic information for the quarter-mile and half-mile study areas are those for the Stapleton-Rosebank NTA.
Figures 2.2-1 through 2.2-3 show the quarter-mile and half-mile study areas and the boundaries of the Stapleton-Rosebank NTA.
2.2.3 Preliminary Assessment
Indirect Residential Displacement
The objective of the indirect residential displacement preliminary assessment is to determine whether the proposed project would introduce or accelerate a trend of changing real estate market conditions that might displace a vulnerable population to the extent that the socioeconomic character of a
1 Previously, this was not the case. Through the year 2000, the Census Bureau collected such information as part of the decennial census by sending “long
forms” rather than “short forms” to approximately one in six households, providing large enough sample sizes for the estimates to be reliable at the tract level. The number of households contacted annually through the ACS is increasing, but the ratio of sample size to total population is not yet as large as under the former system.
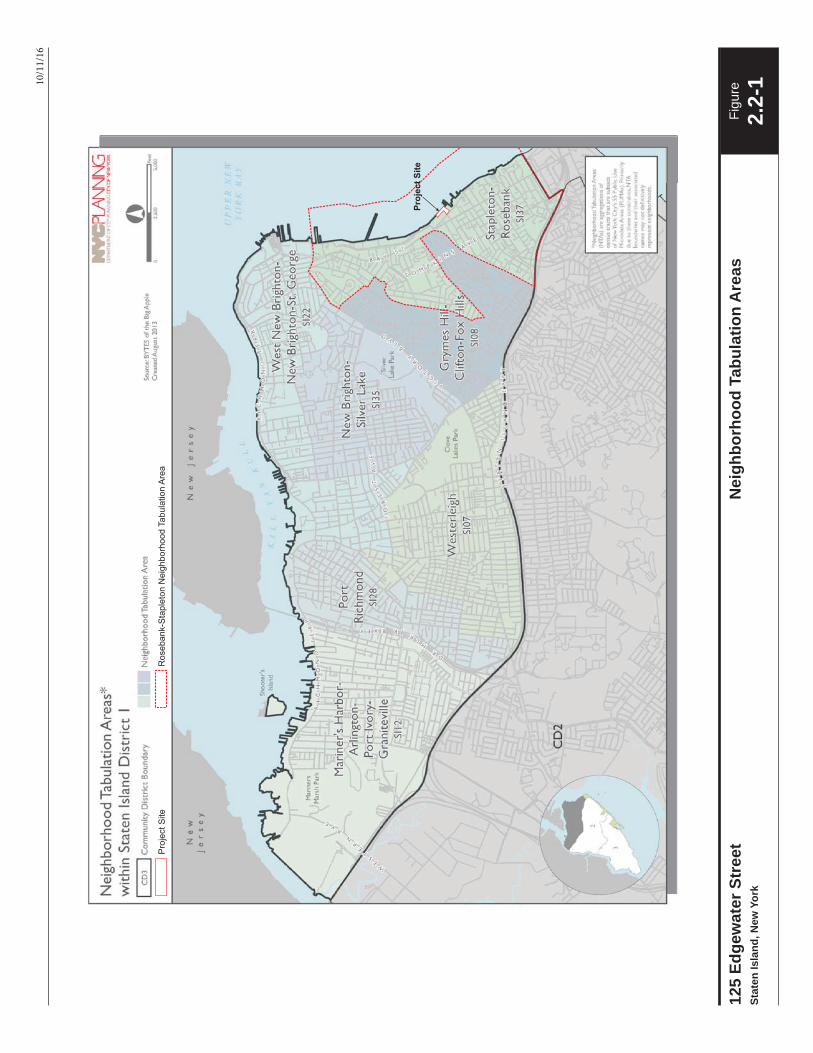
10/1
1/16
Ro
se
ba
nk-S
ta
ple
to
n N
eig
hb
orh
oo
d Ta
bu
la
tio
n A
re
aP
ro
je
ct S
ite
Pro
je
ct S
ite
Figu
re
2.2-
1N
eigh
borh
ood
Tabu
latio
n A
reas
125
Edge
wat
er S
tree
tSt
aten
Isla
nd, N
ew Y
ork

10/1
1/16
North
¼ M
ile
Le
ge
nd
Pro
je
ct S
ite
1/4
-M
ile
S
tu
dy A
re
a
Ce
nsu
s T
ra
ct B
ou
nd
arie
s
Ce
nsu
s T
ra
ct N
um
be
r
12
3
6
27
8
36
20.01
29
40
21
33
39
59
75
18
20.02
50
47
Ce
nsu
s T
ra
cts o
f W
hich
50
% Is W
ith
in
1
/4
M
ile
o
f S
ite
Figu
re
2.2-
2So
cioe
cono
mic
Con
ditio
nsPr
elim
inar
y A
naly
sis
Stud
y A
rea
125
Edge
wat
er S
tree
tSt
aten
Isla
nd, N
ew Y
ork

10/1
1/16
North
½ M
ile
Le
ge
nd
Pro
je
ct S
ite
1/2
-M
ile
S
tu
dy A
re
a
Ce
nsu
s T
ra
ct B
ou
nd
arie
s
Ce
nsu
s T
ra
ct N
um
be
r
12
3
6
27
8
36
20.01
29
40
21
33
39
59
75
18
20.02
50
47
Ce
nsu
s T
ra
cts o
f W
hich
50
% Is W
ith
in
1
/2
M
ile
o
f S
ite
Figu
re
2.2-
3So
cioe
cono
mic
Con
ditio
nsD
etai
led
Ana
lysi
s St
udy
Are
a12
5 Ed
gew
ater
Str
eet
Stat
en Is
land
, New
Yor
k

125 Edgewater Street - CEQR No. 17DCP069R Environmental Assessment Statement
Page 2.2-4
neighborhood would change. The CEQR Technical Manual outlines a three-step analysis for this assessment:
Step 1: Determine if the proposed project would add new population with higher average incomes compared to the average incomes of the existing populations and any new population expected to reside in the study area without the project. If so, move on to Step 2.
Step 2: Determine if the proposed project’s increase in population is large enough relative to the size of the population expected to reside in the study area without the project to affect real estate market conditions in the study area. An increase equal to at least 5 percent of the study area’s no-action population would be considered substantial. If the increase would be between 5 and 10 percent, move on to Step 3. If the increase would be greater than 10 percent, skip Step 3, and move on to a detailed analysis.
Step 3: Consider whether the study area has already experienced a readily observable trend toward increasing rents and the likely effect of the action on such trends.
To answer the question in Step 1, income data from the 2008-2012 American Community Survey (ACS) 5-Year Estimates for the Stapleton-Rosebank Neighborhood Tabulation (NTA), in which the project area is located, were compared with that for Staten Island and the city as a whole and with the 2015 New York City income limits for low and moderate income households. Since this assessment is based on the assumption that only 20 percent of the proposed floor area (i.e., 20 percent of the proposed housing units) would be reserved for low income households, the assumption is that 80 percent of the new households would need incomes high enough to afford newly developed unsubsidized, market rate housing. For the purposes of the assessment, it is assumed that their average incomes would be higher than those in a low to moderate income area.
To answer the question in Step 2, the current study area population was determined from the 2010 Census. The number of action-generated new residents was then estimated by multiplying the projected number of new housing units by the occupancy rate and average household size for the study area as of the 2010 Census, and this number was divided by the estimated future No-Action study area population to determine whether it would exceed the threshold of 5 percent of that population.
If the analysis shows that the proposed project would be located in an area with a substantial low income population and if the action would introduce a “substantial” new population (equaling more than 5 percent of the population in the study area without the proposed action) with higher incomes than are prevalent in the area, then a detailed analysis is warranted. The detailed analysis must assess the number of households at risk of involuntary displacement and assess its significance according to CEQR Technical Manual guidelines. Only households occupying unprotected rental units who would be vulnerable to involuntary displacement as a result of considerations related to income, the nature of the housing, and geography would be considered at risk. According to the CEQR Technical Manual, if the detailed assessment identifies a vulnerable population potentially subject to indirect displacement that exceeds 5 percent of the study area, it may substantially affect the socioeconomic character of the study area and a significant adverse impact may occur.
Income Level and Poverty Rate within Quarter-mile Study Area
Table 2.2-1 provides income range distributions and (where available) median household incomes, as of the 2008-2012 ACS 5-Year Estimates for the Stapleton-Rosebank NTA, the borough, and the city.2 As
2 Incomes from the four earlier survey years were converted to 2012 dollars.

125 Edgewater Street - CEQR No. 17DCP069R Environmental Assessment Statement
Page 2.2-5
the table shows, study area income levels were low relative to Staten Island, with higher percentages of its households in all income levels below $50,000 and lower percentages of its households in all income levels above $50,000. Median household income is not reported for the NTA, but 48.2 percent of its households had incomes of under $50,000, so it can be ascertained that the median household income is not much above $50,000, which is substantially lower than the $73,496 median for the borough as a whole. The study area’s median household income is quite similar to the City’s, which was $51,865 for the period, and the distribution of its income levels is also similar to that in the City as a whole. In Stapleton-Rosebank and in the City, 27 or 28 percent of households reported incomes under $25,000, 20 or 21 percent incomes from $25,000 to $49,999, 27 percent incomes from $50,000 to $99,999, and 25 percent incomes of $100,000 or more.
Table 2.2-1 2008-2012 Income LevelsHouseholds Earning: Stapleton-Rosebank NTA Staten Island New York City Total households 9,115 100.0% 163,675 100.0% 3,063,393 100.0%
Less than $10,000 977 10.7% 10,360 6.3% 323,004 10.5%
$10,000 to $14,999 521 5.7% 6,523 4.0% 187,795 6.1%
$15,000 to $24,999 1,078 11.8% 12,210 7.5% 325,271 10.6%
$25,000 to $34,999 758 8.3% 11,848 7.2% 287,430 9.4%
$35,000 to $49,999 1,067 11.7% 16,632 10.2% 364,781 11.9%
$50,000 to $74,999 1,193 13.1% 25,836 15.8% 489,426 16.0%
$75,000 to $99,999 1,249 13.7% 24,012 14.7% 331,359 10.8%
$100,000 to $149,999 1,490 16.3% 30,585 18.7% 378,540 12.4%
$150,000 to $199,999 526 5.8% 14,733 9.0% 164,074 5.4%
$200,000 or more 256 2.8% 10,936 6.7% 211,713 6.9%
Median household income N/A $73,496 $51,865
Source: DP03: Selected Economic Characteristics, 2008-20012 American Community Survey 5-Year Estimates, New York City and Boroughs and Neighborhood Tabulation Areas
It is also useful to compare the Stapleton-Rosebank income levels with New York City’s maximum permitted income levels for households considered to be in the very low, low, and moderate income ranges for purposes of eligibility for income-restricted housing. The income limits vary by household size, and the average household size in the Stapleton-Rosebank NTA during the years 2008 through 2012 was 2.7. As listed on the New York City Department of Housing Preservation and Development (HPD) and the New York City Housing Development Corporation (HDC) websites, the 2015 income limits for the very low income category are $34,550 for a two-person household and $38,850 for a three-

125 Edgewater Street - CEQR No. 17DCP069R Environmental Assessment Statement
Page 2.2-6
person household, those for the low income category are $41,460 for a two-person household and $46,620 for a three-person household, and those for the moderate income category are $58,735 for a two-person household and $66,045 for a three-person household. The area’s presumed median household income during the 2008-2012 survey period was above the income ranges for two- and three-person low income households but within the ranges for two- and three-person moderate income households.
The quarter-mile study area is within a moderate income area. It is assumed that the residents of the new market rate housing would have higher average incomes than most existing study area households.
Percent Change in Study Area Population as a Result of the Proposed Project
The quarter-mile study area consists entirely of Census Tract 8, which is bounded by Bay Street, Mosel Avenue, Tompkins Avenue, and North Road. As of the 2010 Census, 5,583 people lived in the tract, all of them in households rather than group quarters.
Under the RWCDS, construction of 317 market rate housing units is anticipated.
Applying Census Tract 8’s 2010 housing unit occupancy rate of 93.4 percent, it is estimated that 296 of the units would be occupied. Applying the tract’s 2010 average household size of 2.97 persons, it is estimated that the 296 households would contain 879 residents. That would be equal to 15.7 percent of the existing study area population.
The number of action-induced residents in market rate housing would be substantial relative to the study area population (exceeding the CEQR Technical Manual 5 and 10 percent thresholds). A detailed assessment is required.
2.2.4 Detailed Assessment of the Potential for Indirect Residential Displacement
Introduction
Because the proposed action would introduce new market rate housing into a moderate income area and the number of new action-generated residents would exceed 10 percent of the existing study area population, indicating the potential for changes in demographic and real estate market conditions, a detailed analysis was performed. The purpose of the detailed analysis is to determine whether the study area contains a population at risk of indirect displacement resulting from rent increases due to changes in the real estate market caused by the new population. At-risk households are renter households who live in housing units that are not reserved for low or moderate income families or disadvantaged populations and are not protected by rent regulations from precipitous rent increases, who have incomes sufficiently low to be vulnerable to sharp rent increases, and who live in locations that could be affected by market changes caused by the proposed action. An at-risk population equal to at least 5 percent of the total study area population would be considered substantial.
In accordance with guidance in the CEQR Technical Manual, the analysis was performed for the half-mile study area shown in Figure 2.2-3 rather than for the quarter-mile study area addressed in the preliminary assessment.

125 Edgewater Street - CEQR No. 17DCP069R Environmental Assessment Statement
Page 2.2-7
Existing Conditions
Population
Table 2.2-2 shows the population and the number of households in the study area, the borough, and the City, in 2000 and in 2010. As of 2010, the study area was home to 10,208 residents. There were 3,578 households, and the average household size was 2.65.
Between 2000 and 2010, the study area’s population increased by 11.6 percent, and the number of households increased by 9.8 percent. Over the decade, the growth rate for the area was higher than it was for the borough as a whole, which was itself higher than the population growth rate for the City as a whole.
Housing
The 2010 census enumerated 3,850 housing units in the study area, of which 92.9 percent were occupied and 7.1 percent were vacant. The occupied units were about equally divided between owner and renter occupancy: 1,775 owner-occupied units and 1,803 renter-occupied units.
The study area’s occupancy rate was close to those of the borough and the City, but the study area differed from both in terms of tenure. The percentage of renter-occupied units in the area (50.4 percent) was substantially higher than that in Staten Island as a whole (35.9 percent) but substantially lower than in the entire City (69.0 Percent).
2000 2010 2000 2010Tract 6 2,534 2,408 -126 -5.0% 1,165 1,236 71 6.1% 1.93Tract 8 4,822 5,583 761 15.8% 1,740 1,877 137 7.9% 2.97Tract 27 1,788 2,217 429 24.0% 354 465 111 31.4% 3.28Study area 9,144 10,208 1,064 11.6% 3,259 3,578 319 9.8% 2.65
Staten Island 443,728 468,730 25,002 5.6% 156,341 165,516 9,175 5.9% 2.78New York City 8,008,278 8,175,133 166,855 2.1% 3,021,588 3,109,784 88,196 2.9% 2.57Source: Table PL-P1 NYC: Total Population, New York City and Boroughs, 2000 and 2010; Table SF1 P-5: TotalHouseholds, New York City, Boroughs and Census Tracts, 2000 and 2010
Table 2.2-2 Residents and Households in 2000 and 2010
126Change
71Change 010
Population 010Households Avg. Household
Size 2010

125 Edgewater Street - CEQR No. 17DCP069R Environmental Assessment Statement
Page 2.2-8
Table 2.2-3 Housing Units and Tenure in 2010
HousingUnits
Occupied Housing Units
Owner-OccupiedUnits
Renter-Occupied Units
Vacant Housing Units
Tract 6 1,336 1,236 92.5% 508 41.1% 728 58.9% 100 7.5%
Tract 8 2,009 1,877 93.4% 1,156 61.6% 721 38.4% 132 6.6%
Tract 27 505 465 92.1% 111 23.9% 354 76.1% 40 7.9%
Study area 3,850 3,578 92.9% 1,775 49.6% 1,803 50.4% 272 7.1%
Staten Island 176,656 165,516 93.7% 106,135 64.1% 59,381 35.9% 11,140 6.3%
New York City 3,371,062 3,109,784 92.2% 962,892 31.0% 2,146,892 69.0% 261,278 7.8%
Source: Table SF-H1: Total Housing Units by Occupancy Status and Tenure, New York City and Boroughs and Census Tracts, 2010
Rents
Census Bureau information about rents is not available at the tract level, so the only information available for the area is that for the Stapleton-Rosebank NTA, which is considerably larger than the study area. The available information is for gross rents, which includes both the contract rent and the cost of utilities (gas and electric). Table 2.2-4 shows 2008-2012 gross rents within Stapleton-Rosebank, Staten Island, and New York City.
Within Stapleton-Rosebank, approximately 40 percent of rental households paid under $1,000 a month in shelter costs, approximately a third paid at least $1,000 but less than $1,500, and slightly more than a quarter paid at least $1,500. Within the borough as a whole, approximately 36 percent of rental households paid under $1,000 a month, approximately 39 percent paid at least $1,000 but less than $1,500, and 25 percent paid at least $1,500. Within all of New York City, approximately 37 percent of rental households paid under $1,000 a month, approximately 34 percent paid at least $1,000 but less than $1,500, and 29 percent paid at least $1,500.
Whereas rent levels in the area do not diverge substantially from those that prevail throughout the borough and the City, a higher percentage of the area’s rental households are burdened by the rents they pay. Sixty percent of the area’s rental households pay at least 30 percent of their income for rent and utilities, compared with 54 percent of the borough’s rental households and 53 percent of the City’s. A majority (53 percent) of Stapleton-Rosebank rental households pay at least 35 percent of their income for gross rent, compared with 46 percent on Staten Island and 44 percent within the city as a whole.

125 Edgewater Street - CEQR No. 17DCP069R Environmental Assessment Statement
Page 2.2-9
Table 2.2-4 Gross Rents 2008-2012
Stapleton-Rosebank NTA Staten Island New York City
GROSS RENT
Occupied units paying rent 4,420 100.0% 47,625 100.0% 2,020,636 100.0%
Less than $200 148 3.3% 786 1.7% 26,280 1.3%
$200 to $299 349 7.9% 2,142 4.5% 96,491 4.8%
$300 to $499 275 6.2% 2,879 6.0% 117,638 5.8%
$500 to $749 413 9.3% 4,077 8.6% 199,061 9.9%
$750 to $999 604 13.7% 7,405 15.5% 312,463 15.5%
$1,000 to $1,499 1,457 33.0% 18,443 38.7% 682,378 33.8%
$1,500 or more 1,174 26.6% 11,893 25.0% 586,325 29.0%
GROSS RENT AS A PERCENTAGE OF HOUESHOLD INCOME
Units paying rent for which the percentage can be computed 4,321 100.0% 46,424 100.0% 1,973,649 100.0%
Less than 15.0 percent 449 10.4% 5,370 11.6% 266,852 13.5%
15.0 to 19.9 percent 415 9.6% 6,032 13.0% 220,010 11.1%
20.0 to 24.9 percent 447 10.3% 5,366 11.6% 224,379 11.4%
25.0 to 29.9 percent 409 9.5% 4,474 9.6% 218,088 11.0%
30.0 to 34.9 percent 312 7.2% 3,750 8.1% 179,887 9.1%
35.0 percent or more 2,289 53.0% 21,432 46.2% 864,433 43.8%
Source: DP04: Selected Housing Characteristics, Neighborhood tabulation areas, New York City and Boroughs, 2008-2012ACS 5-Year Estimates
There is little sold information about rents for newly available market rate apartments within the study area. Although approximately half of the study area’s housing is rental, there appears to be rather little turnover. There are few listings for rentals, considerably fewer than there are for for-sale homes and condominiums, and real estate brokers claim to be less familiar with the rental market in Rosebank than they are with the sales market. Most of the available rental units are in small buildings and attached to owner-occupied units: portions of two-family homes or apartments carved out of single-family homes. Such units generally rent for between $1,300 and $1,700 a month if they are two-bedroom apartments, more if they are three-bedrooms and less if they are one-bedrooms.

125 Edgewater Street - CEQR No. 17DCP069R Environmental Assessment Statement
Page 2.2-10
Future No-Action Condition
Absent the proposed action, it is assumed that the project site would remain in its existing vacant and unutilized condition (with the possible exception of temporary storage uses such as those currently located on the property). No new as-of-right development would occur on the property as the property’s existing M2-1 zoning precludes the development of any residential uses on the site and market conditions in the area are not supportive of the development of new manufacturing or free-standing commercial uses at this location.
The entire first phase of the Stapleton Waterfront Development Plan will be completed by the 2019 build year. Phase 1 is located just outside of the half-mile study area; however, Phase II (which would be completed after the project build year) is located within the socioeconomic study area. As such, for the purposes of conservative analysis it is considered in this analysis. Phase I would result in the development of 30,323 gsf of commercial retail space and 950 dwelling units (comprising 581,319 gsf of residential floor area) along the Stapleton Waterfront.
Applying the study area’s average household size (2.65) to the 950 anticipated housing units, it is estimated that the Stapleton development will be home to 2,518 residents. Added to an existing population of 10,208 persons and existing inventory of 3,578 occupied housing units, the Stapleton development would bring the future No-Action condition study area population and housing inventory to 12,726 persons and 4,528 occupied housing units.
Future With-Action Condition
RWCDS 2 would result in a greater number of dwelling units than the RWCDS 1, as such RWCDS 2 is the more conservative assumption for the socioeconomic analysis and is analyzed below. The proposed project would result in the development of 396 dwelling units of which 20 percent (79) of the units would be reserved as permanently affordable to incomes averaging 80 percent AMI. For assessment purposes it is conservatively assumed that 80 percent (317) of the units would be market rate.
It is assumed that the the average household size would reflect 2010 census data for the study area: 2.65 persons per household. There would thus be an estimated containing 1,049 residents. As such the proposed project would include be 79 low income households occupied by 209 residents and 317 market rate households tenanted by 840 residents.
The construction of this housing would bring the total within the study area to 13,775 residents and 4,924 households.
Assessment of Impact Potential
Since it has been determined that the proposed project would add substantial new population with potentially different socioeconomic characteristics compared to the size and character of the existing population in the study area, and thus could lead to displacement pressures on low and moderate income at-risk households in the study area, analyses are needed to quantify the size of the at-risk population and determine whether it constitutes more than 5 percent of the population in the study area. At-risk households are renter households who live in housing units that are not reserved for low or moderate income families or disadvantaged populations and are not protected by rent regulations from precipitous rent increases, who have incomes sufficiently low to be vulnerable to sharp rent

125 Edgewater Street - CEQR No. 17DCP069R Environmental Assessment Statement
Page 2.2-11
increases, and who live in locations that could be affected by market changes caused by the proposed action.
This assessment starts with the last of those characteristics – that households are at risk only if they live in locations where market conditions could reasonably be expected to change as a result of the proposed project.
Census tract 27 is located to the northwest of the project site (See Figure 2.2-3). It is bounded by Vanderbilt Avenue on the south, Bay Street on the east, Canal Street on the north, and Tompkins Avenue on the west. Its southern portion is occupied by the Bayley Seton Campus of Richmond University Medical Center, which separates the residential area to the north from the project site. That residential area is directly across Bay Street from the large Stapleton Homeport development, which is underway. Market conditions in Census Tract 27 may be affected by the Homeport development but not by the proposed project.
Census Tract 6 is bounded by Canal Street on the north, Bay Street on the west, North Road on the south, and the bay on the east. Tract 8 is adjacent to tract 6 on its western side, bounded by Bay Street on the east, a line continuing from the end of North Road on the south, Tompkins Avenue on the west, and Greenfield Avenue on the north. The two tracts are located mainly to the south and southwest of the project site. Blocks of industrial properties to the south and west of the site separate the site from the nearest residential properties.
Although Census Tract 6 contains a mix of land uses, it cannot be characterized as a mixed-use area because the uses are geographically separated from each other; rather, the tract is a patchwork of distinct areas with their own characters. The southern part of the tract, between Nautilus Street and North Road, is a distinct neighborhood known as Shore Acres, historically more upscale than the Rosebank neighborhood to the north. A large-scale land use, consisting of Coast Guard housing, separates Shore Acres from the part of Rosebank within the tract. Market conditions in the southern part of the tract could not reasonably be expected to change as a result of the proposed project. The central part of the tract contains a few elevator apartment buildings, blocks of small-scale housing, and Alice Austen Park. To the north is an area with a number of industrial properties between Edgewater and Bay Streets and industrial and commercial properties along the eastern side of Edgewater Street. Unlike the Homeport site redevelopment in Stapleton, which will completely alter an entire lengthy stretch of the waterfront, the proposed project would alter only one lot with 200 feet of street frontage. The residential neighborhood to the south would continue to face an old industrial landscape, which cannot be redeveloped without separate discretionary actions, since these blocks would continue to be zoned M2-1 and M3-1. Overall, the proposed project would not be likely to have a significant impact on market conditions in the established residential portions of Census Tract 6.
Finally, it should be stressed that the proposed project would be a distinctive development, geographically at the northeastern corner of the Rosebank neighborhood, consisting of a type of housing quite different from what is found in most of the well-established Rosebank neighborhood, with waterfront amenities and views that cannot be replicated inland. In contrast, Census Tract 8 is part of a low scale residential neighborhood. The tract contains hardly any multi-family walkup buildings and no elevator apartment buildings, and the low density residential zoning ensures that this will not change. None of the residential properties in Census Tract 8 has direct waterfront access. Because of the distinctive nature of the proposed development, it would not be likely to have a significant impact on property values or rental costs in the low-scale residential neighborhood to the west. Although the proposed project would provide a shorefront public walkway accessible via an upland connection from the public street, this new amenity would not be likely to increase property

125 Edgewater Street - CEQR No. 17DCP069R Environmental Assessment Statement
Page 2.2-12
values because waterfront access is already available at Alice Austen Park. For these reasons, the proposed development is not likely to cause significant market changes in Census Tract 8.
2.2.5 Conclusion
In summary, few if any study area renter households, even those who live in housing units that are not reserved for low or moderate income families or disadvantaged populations and are not protected by rent regulations from precipitous rent increases, and who have incomes sufficiently low to be vulnerable to sharp rent increases, would be at risk of displacement, because they do not live in locations that are likely to experience substantial market changes as a result of the proposed action. The proposed action would not be expected to cause a significant adverse socioeconomic impact related to indirect residential displacement.

125 Edgewater Street - CEQR No. 17DCP069R Environmental Assessment Statement
Page 2.3-1
Chapter 2.3: Community Facilities and Services
2.3.1 Introduction
This chapter assesses the potential impacts of the proposed actions on community facilities and services. The 2014 City Environmental Quality Review (CEQR) Technical Manual defines community facilities as public or publicly-funded facilities including schools, libraries, child care centers, health care facilities, and fire and police protection services. CEQR methodology focuses on direct impacts on community facilities and services and on increased demand for community facilities and services generated by increases in population.
Two Reasonable Worst Case Development Scenarios (RWCDS) have been established to provide a conservative analysis for the proposed project. As described in Attachment A, “Project Description,” the proposed project (RWCDS 1) would result in the development of 371 residential dwelling units and 24,173 gsf of commercial space. RWCDS 2 would be entirely residential consisting of 396 dwelling units. Under both RWCDSs 20 percent of units would be reserve as affordable to incomes averaging 80 percent of area median income (AMI). As such under RWCDS 1, 74 dwelling units would be reserved as affordable pursuant to MIH and under RWCDS 2, 79 dwelling units would be reserved as affordable pursuant to MIH.
The analysis of community facilities and services has been conducted in accordance with the guidelines established in the CEQR Technical Manual and the latest data and guidance from agencies such as the New York City Department of Education (DOE), the New York City Administration for Children’s Services (ACS), the New York Public Library (NYPL), the New York City School Construction Authority (SCA), and the New York City Department of City Planning (DCP).
Direct Effects
The proposed action would not physically displace or affect any existing community facilities, and would therefore have no direct impact on any community facilities or services. Therefore, further assessment of direct impacts is not warranted.
Indirect Effects
The CEQR Technical Manual provides a set of thresholds to use in determining whether detailed studies of potentially significant adverse indirect impacts related to community facilities and services are warranted. RWCDS 1 under the proposed action includes the development of 371 dwelling units (20 percent affordable/80 percent market rate based on FAR) of housing on the project site while RWCDS 2 includes the development of 396 dwelling units (20 percent affordable/80 percent market rate). The No-Action RWCDS does not include any new development on the property. Therefore, the proposed action would result in the development of a net increase of between 371 and 396 dwelling units on the site. As 396 dwelling units would result in potentially greater impacts to community facilities, 396 units will be used for the remainder of the analysis.

125 Edgewater Street - CEQR No. 17DCP069R Environmental Assessment Statement
Page 2.3-2
Other Community Facilities
Based on CEQR Technical Manual criteria (Table 6-1), the development of 396 dwelling units of housing on the project site would not be anticipated to exceed the thresholds of concern for any community facilities or services other than public elementary and middle schools. A day care analysis is required for projects in Staten Island containing at least 217 low- to moderate-income dwelling units. As the project would include at most only 79 affordable units, a day care analysis is not required. Therefore, based on the CEQR Technical Manual, the proposed action would have no adverse impacts to public high schools, libraries, child care centers, health care facilities, or fire and police protection.
Public Schools
Based on CEQR Technical Manual criteria (Table 6-1), the development of 396 dwelling units would exceed the minimum threshold of 165 dwelling units which triggers a detailed analysis of impacts to public elementary and middle schools in the Borough of Staten Island. Based on the factors contained in CEQR Table 6-1a, the 396 new dwelling units resulting from RWCDS 2 would be anticipated to generate a total of 119 public school students consisting of 83 elementary school and 36 middle school pupils. The 396 dwelling units would be anticipated to generate a total of 55 public high school students, which would fall below the threshold of concern of 150 high school level pupils. A detailed analysis of public elementary and intermediate schools is provided below.
2.3.2 Methodology
This analysis assesses the potential effects of the proposed actions on public elementary and intermediate schools serving the project area. According to the guidelines presented in the CEQR Technical Manual, the study area for the analysis of elementary and intermediate schools is the school district’s “sub-district” (also known as “regions” or “school planning zones”) in which the project is located. The project area is located in Sub-district 4 of CSD 31 (see Figure 2.3-1).
An analysis of schools focuses only on potential impacts on public schools operated by the DOE. Therefore, private and parochial education facilities are excluded from the analysis of schools. Charter schools are excluded from the quantitative analysis presented in this chapter.
An analysis of public schools presents the most recent DOE data on school capacity, enrollment, and utilization rates for elementary, intermediate, and high schools and the SCA projections of future enrollment in the respective study areas. The existing conditions analysis uses data provided in the DOE’s Utilization Profiles: Enrollment/Capacity/Utilization, 2015-2016 edition. Future conditions are predicted based on SCA enrollment projections and data obtained from the SCA’s Capital Planning Division on the number of new housing units and students expected at the sub-district and borough levels. The future utilization rate for school facilities is calculated by adding the estimated enrollment from proposed and planned residential projects in the study area to DOE’s project enrollment, and then comparing that number with projected school capacity. DOE’s enrollment projections for years 2015-2024, the most recent data currently available, was provided by DCP. These enrollment projections are based on broad demographic trends and do not explicitly account for discrete new residential projects planned for the study area. Therefore, the estimated student population from the other new projects expected to be completed within the study area have been obtained from SCA’s Capital Planning Division and are added to the projected enrollment to ensure a more conservative prediction of future enrollment and utilization. In addition, new capacity from any new school projects identified in the DOE

Date: 12/5/2016
Figure
2.3-1Elementary and Intermediate Schools Within Community School District 31
125 Edgewater StreetStaten Island, New York
0 3,000 6,000Feet
Sub-district 4Elementary Schools (refer to Table 2.3-1)
Intermediate Schools (refer to Table 2.3-2)
2
1
3
4
!1
!A
!2
!18
!16
!1,3
!19
!17
!12
!15
!13!10
!4!7
!5,6!8
!9
!14
!11
!20
!21,F
!A
!B,C!D
!E
Development Site
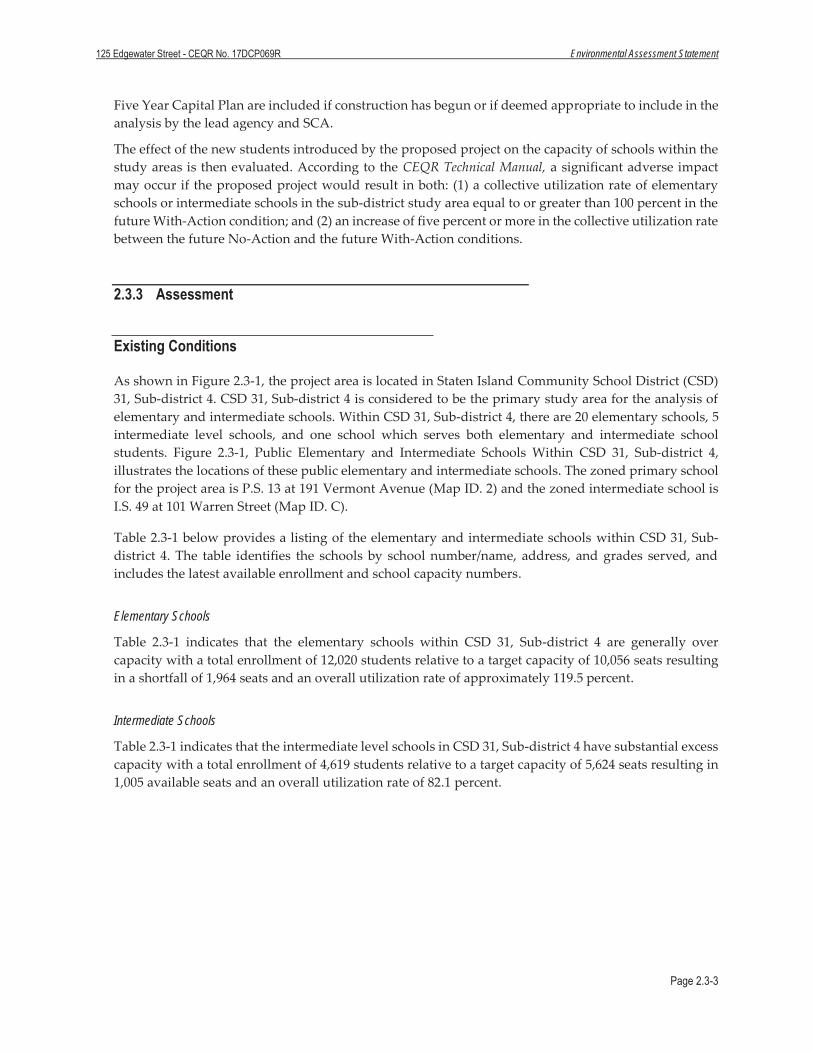
125 Edgewater Street - CEQR No. 17DCP069R Environmental Assessment Statement
Page 2.3-3
Five Year Capital Plan are included if construction has begun or if deemed appropriate to include in the analysis by the lead agency and SCA.
The effect of the new students introduced by the proposed project on the capacity of schools within the study areas is then evaluated. According to the CEQR Technical Manual, a significant adverse impact may occur if the proposed project would result in both: (1) a collective utilization rate of elementary schools or intermediate schools in the sub-district study area equal to or greater than 100 percent in the future With-Action condition; and (2) an increase of five percent or more in the collective utilization rate between the future No-Action and the future With-Action conditions.
2.3.3 Assessment
Existing Conditions
As shown in Figure 2.3-1, the project area is located in Staten Island Community School District (CSD) 31, Sub-district 4. CSD 31, Sub-district 4 is considered to be the primary study area for the analysis of elementary and intermediate schools. Within CSD 31, Sub-district 4, there are 20 elementary schools, 5 intermediate level schools, and one school which serves both elementary and intermediate school students. Figure 2.3-1, Public Elementary and Intermediate Schools Within CSD 31, Sub-district 4, illustrates the locations of these public elementary and intermediate schools. The zoned primary school for the project area is P.S. 13 at 191 Vermont Avenue (Map ID. 2) and the zoned intermediate school is I.S. 49 at 101 Warren Street (Map ID. C).
Table 2.3-1 below provides a listing of the elementary and intermediate schools within CSD 31, Sub-district 4. The table identifies the schools by school number/name, address, and grades served, and includes the latest available enrollment and school capacity numbers.
Elementary Schools
Table 2.3-1 indicates that the elementary schools within CSD 31, Sub-district 4 are generally over capacity with a total enrollment of 12,020 students relative to a target capacity of 10,056 seats resulting in a shortfall of 1,964 seats and an overall utilization rate of approximately 119.5 percent.
Intermediate Schools
Table 2.3-1 indicates that the intermediate level schools in CSD 31, Sub-district 4 have substantial excess capacity with a total enrollment of 4,619 students relative to a target capacity of 5,624 seats resulting in 1,005 available seats and an overall utilization rate of 82.1 percent.

125 Edgewater Street - CEQR No. 17DCP069R Environmental Assessment Statement
Page 2.3-4
Table 2.3-1: Elementary and Intermediate Schools Serving CSD 31, Sub-district 4 Enrollment, Capacity, and Utilization Data, 2015-2016 School Year1
MapID.2
School Number (Building ID) Address Grades
Served Enrollment Capacity Available Seats
Utilization (%)
ELEMENTARY SCHOOLS
1FORT HILL COLLABORATIVE ELEMENTARY SCHOOL3
80 MONROE AVENUE PK-5 95 -- -95 --
2 P.S. 13 191 VERMONT AVENUE PK-5 853 550 -303 155.1 3 P.S. 16 80 MONROE AVENUE PK-5 617 621 4 99.4 4 P.S. 18 221 BROADWAY PK-5 622 582 -40 106.9 5 P.S. 19 780 POST AVENUE PK-5 557 513 -44 108.6 6 P.S. 19 - Transportable4 780 POST AVENUE PK-5 100 -- -100 --7 P.S. 20 161 PARK AVENUE PK-5 492 265 -227 185.7 8 P.S. 21 168 HOOKER PLACE PK-5 405 348 -57 116.4 9 P.S. 22 1860 FOREST AVENUE PK-5 1042 913 -129 114.1 10 P.S. 29 1581 VICTORY BLVD PK-5 701 454 -247 154.4 11 P.S. 30 200 WARDWELL AVE PK-5 786 660 -126 119.1 12 P.S. 31 55 LAYTON AVENUE PK-5 465 528 63 88.1 13 P.S. 35 60 FOOTE AVENUE PK-5 373 186 -187 200.5 14 P.S. 44 80 MAPLE PARKWAY PK-5 970 758 -212 128.0 15 P.S. 45 58 LAWRENCE AVENUE PK-5 900 701 -199 128.4 16 P.S. 57 140 PALMA DRIVE PK-5 704 773 69 91.1
17 THE HARBOR VIEW SCHOOL 300 RICHMOND TERRACE PK-5 189 475 286 39.8
18 P.S. 65 98 GRANT STREET PK-5 396 324 -72 122.2 19 P.S. 74 211 DANIEL LOW TERRACE PK-5 312 245 -67 127.3 20 P.S. 078 100 TOMPKINS AVENUE PK-5 845 708 -137 119.4 21 P.S. 861 280 REGIS DRIVE PK-85 596 452 -144 131.9
Sub-district 4 of CSD 31 Totals 12,020 10,056 -1,964 119.5 INTERMEDIATE SCHOOLS
A I.S. 27 11 CLOVE LAKE PLACE 6-8 1,038 1,421 383 73
BTHE EAGLE ACADEMY FOR YOUNG MEN OF STATEN ISLAND
101 WARREN STREET 6-8 127 157 30 80.9
C I.S. 49 101 WARREN STREET 6-8 775 938 163 82.6 D I.S. 51 20 HOUSTON STREET 6-8 1,264 1,299 35 97.3 E I.S. 61 445 CASTLETON AVENUE 6-8 1,118 1,584 466 70.6 F P.S. 861 280 REGIS DRIVE PK-85 297 225 -72 132
Sub-district 4 of CSD 31 Totals 4,619 5,624 1,005 82.1 Source: DOE Utilization Profiles: Enrollment/Capacity/Utilization, 2015-2016. Notes: 1 Excludes all Re-Start Program Data; PS/IS schools broken down by school percentages provided in DOE profiles 2 See Figure 2.3-1. 3 Fort Hill Collaborative Elementary School is a new school; as such, its capacity is not available. Further information is provided below. 4 Transportable classrooms are included for enrollment purposes but are excluded for capacity purposes 5 66.74 percent PS; 33.26 percent IS (SCA)
Future No-Action Condition
Projected Capacity Changes
Projected capacity changes were determined for the future 2019 No-Action condition.
Elementary Schools
DOE’s FY 2015-2019 Five Year Capital Plan - Proposed November 2016 proposes for Community School District 31, Sub-district 4: a new 90-seat pre-kindergarten center at the Forest Avenue Community

125 Edgewater Street - CEQR No. 17DCP069R Environmental Assessment Statement
Page 2.3-5
Education Complex at 1625 Forest Avenue (Project #DSF0000800050) and a new 108-seat pre-kindergarten center at 120 Stuyvesant Place (Project #DSF0000800256). Both pre-kindergarten centers are projected to be completed by the 2015 school year. As such the additional 198 elementary school seat capacity is included in the sub-district level analysis of elementary schools in the future No-Action condition.
On October 11, 2013 the Panel for Education Policy approved the opening and co-location of a new district elementary school (subsequently named “Fort Hill Collaborative Elementary School”) for CSD 31 in Sub-district 4 within the existing P.S. 16 building. The 330 seat school will be fully utilized by the 2019 school year per The Educational Impact Statement: The Proposed Opening and Co-location of New District Elementary School 31R010 with Existing School P.S. 16 John J. Driscoll (31R016) in Building R016 Beginning in 2014-2015. In response, P.S. 19 (31R016), which is located on the same site, will reduce its enrollment and capacity to 516 seats by the 2019 school year. The colocation would result in a combined capacity of 846 seats for the two schools. However, the methodology for calculating target capacity has changed since the publication of the original Educational Impact Statement. As such, for the purposes of conservative analysis a capacity of 621 seats for both schools is assumed based on the most recent DOE Utilization Profile (2015-2016).
There are no other elementary school capacity changes anticipated within CSD 31, Sub-district 4 by 2019 in the No-Action condition.
Intermediate Schools
DOE’s FY 2015-2019 Five Year Capital Plan - Proposed November 2016 proposes for Community School District 31, Sub-district 4: a new 309-seat intermediate school (Project #DSF0000798214; I.S. 82) to be located at 104 Gordon Street. The new intermediate school is expected to be completed by September 2017. As such the additional 309 intermediate school seat capacity is included in the sub-district level analysis of intermediate schools in the future No-Action condition.
There are no other intermediate school capacity changes anticipated within CSD 31, Sub-district 4 by 2019 in the future No-Action condition.
Enrollment Projections
The latest available DOE enrollment projections for CSD 31, Sub-district 4 estimate the expected growth in elementary and intermediate school enrollment through 2024 at the district level. 2019 data provides a breakdown of enrollment at the sub-district level for each district.1 These enrollment projections form the baseline projected enrollment in the future No-Action condition, shown in Table 2.3-2 below. Additional increases in enrollment derived from the SCA’s, Projected New Housing Starts data are shown under “Students Introduced by Residential Projects in the Future Without the Proposed Actions” in the table. Together the projected enrollment and the Projected New Housing Starts data form the total future No-Action enrollment projections.2
1 DOE Enrollment Projections (Projected 2015-2024). 2 Per CEQR guidance public school enrollment projections do not include No-Build projects. These projects are assumed to be included
in the DOE’s enrollment projections and the Projected New Housing Starts data.

125 Edgewater Street - CEQR No. 17DCP069R Environmental Assessment Statement
Page 2.3-6
Elementary Schools
As shown in Table 2.3-2, elementary schools in CSD 31, Sub-district 4 would operate over capacity (127.0 percent utilization) with a deficit of 2,766 seats in the future No-Action condition.
Intermediate Schools
As shown in Table 2.3-2, intermediate schools in CSD 31, Sub-district 4 would operate under capacity (86.0 percent utilization) with a surplus of 830 seats in the future No-Action condition.
Table 2.3-2 Future No-Action Condition: Estimated Enrollment, Capacity, and Utilization
School Level 2019
Projected Enrollment
Students Introduced by Residential Projects in the Future Without the Proposed Actions
Total Future Enrollment Capacity Available
Seats Utilization
(%)
Elementary Schools
Sub-district 4 12,615 405 13,020 10,254 -2,766 127.0
Intermediate Schools
Sub-district 4 4,900 203 5,103 5,933 830 86.0 Source: DOE Enrollment Projections: Projected 2015-2024.
Future With-Action Condition
The demand for community facilities and services is directly related to the type and size of the new population generated by development resulting from the proposed actions. Based on the rates given in CEQR Technical Manual Table 6-1a, the proposed actions would result in the additional introduction of approximately 83 elementary and 36 intermediate school students as compared to future No-Action condition.
A significant adverse impact may occur on elementary, intermediate, or high schools if an action would result in both of the following conditions: (1) a utilization rate of the elementary schools in the sub-district study area that is equal to or greater than 100 percent in the future With-Action condition; and (2) an increase of five percentage points or more in the collective utilization rate between the future No-Action and With-Action conditions.
Elementary Schools
In the future With-Action Condition, there would be a shortfall of 2,849 elementary school seats in CSD 31, Sub-district 4. As shown in Table 2.3-3, the addition of 83 elementary school students generated by the proposed actions would increase the utilization of elementary schools in Sub-district 4 from 127.0 percent to 127.8 percent (0.8 percentage point increase) from the future No-Action to With-Action condition. CSD 31, Sub-district 4 elementary schools would experience a utilization rate that is greater than 100 percent in the future With-Action condition. However, the proposed project would not increase utilization more than 5 percentage points as compared to the No-Action condition; therefore, the proposed actions would not result in a significant adverse impact on elementary schools within CSD 31, Sub-district 4.

125 Edgewater Street - CEQR No. 17DCP069R Environmental Assessment Statement
Page 2.3-7
Intermediate Schools
In the future With-Action Condition, there would be a surplus of 794 intermediate school seats in CSD 31, Sub-district 4. As shown in Table 2.3-3, the addition of 36 intermediate school students generated by the proposed actions would increase the utilization of intermediate schools in Sub-district 4 from 86.0 percent to 86.6 percent (0.6 percentage point increase) from the future No-Action to With-Action condition. CSD 31, Sub-district 4 intermediate schools would experience a utilization rate less than 100 percent in the future With-Action condition and the proposed project would not increase utilization more than 5 percentage points as compared to the No-Action condition; therefore, the proposed actions would not result in a significant adverse impact on intermediate schools within CSD 31, Sub-district 4.
Table 2.3-3 Future With-Action Condition: Estimated Public School Enrollment, Capacity, and Utilization
School Level No-ActionEnrollment
Students Introduced by the Proposed
Actions
TotalFuture
Enrollment Capacity Available
Seats UtilizationRate (%)
Increase in
Utilization(%) from
No-ActionCondition
Elementary Schools Sub-district 4 13,020 83 13,103 10,254 -2,849 127.8 0.8
Intermediate Schools Sub-district 4 5,103 36 5,139 5,933 794 86.6 0.6
2.3.4 Conclusion
According to the CEQR Technical Manual, a significant impact on schools may occur if the following two conditions are met. A significant impact may occur if the project results in a collective utilization rate of the elementary and/or intermediate schools in the Sub-district study area that is equal to or greater than 100 percent in the With-Action Condition, and if the project results in an increase of five percent or more in the collective utilization rate between the No-Action and With-Action conditions. With the proposed action, the intermediate schools in Sub-district 4 would remain below 100 percent utilization while the elementary schools would be substantially more than 100 percent utilized. However, the difference between the No-Action and With-Action utilization rate of the elementary schools within Sub-district 4 would be 0.8 percent. Therefore, the proposed project would not be expected to result in a significant adverse impact on elementary or intermediate schools. No further analysis of the proposed action on public schools is therefore required.

125 Edgewater Street - CEQR No. 17DCP069R Environmental Assessment Statement
Page 2.4-1
Chapter 2.4: Open Space
2.4.1 Introduction
This chapter assesses the potential impacts of the proposed actions on open space. The 2014 City Environmental Quality Review (CEQR) Technical Manual defines open space as publicly or privately owned land that is publicly accessible and operates, functions, or is available for leisure, play, or sport, or set aside for the protection and/or enhancement of the natural environment. Open space that is used for sports, exercise, or active play is classified as active, while open space that is used for relaxation, such as sitting or strolling, is classified as passive. According to the CEQR Technical Manual, an analysis of open space is conducted to determine whether a proposed action would have a direct impact resulting from the elimination or alteration of open space and/or an indirect impact resulting from overtaxing available open space.
The proposed project would consist of three buildings developed with a mix of uses including residential, commercial, and parking uses; in addition, the proposed project would result in the development of the waterfront with an upland connection, visual corridor, and public access areas. Two Reasonable Worst Case Development Scenarios (RWCDS) have been established to provide a conservative analysis for the proposed project. As described in Attachment A, “Project Description,” the proposed project (RWCDS 1) would result in the development of 371 residential dwelling units and 24,173 gsf of commercial space. RWCDS 2 would be entirely residential consisting of 396 dwelling units. Under both RWCDSs 1.03 acres (44,754 sf) of open space (of which 0.84 acres [36,481 sf] would be qualifying waterfront public access areas) and 346 parking spaces would be provided.
2.4.2 Methodology
Direct Effects
The proposed project would not result in any direct impacts to open space resources. The project would not eliminate or reduce the size of any existing open space facilities, would not limit access to any open spaces, and would not alter any open space areas so that they no longer serve the same user population. The proposed project would not directly affect any open space resources by causing substantial noise, odors, air pollutant emissions, or other nuisances that would interfere with the public’s ability to enjoy the open space. In addition, the project area is not located near any open space areas and the proposed project would not directly affect open space through the creation of new shadows or other impacts.
Indirect Effects
Per guidance in the CEQR Technical Manual, an open space analysis is generally conducted if a proposed project would generate more than 200 new residents or 500 new employees. However, the need for an analysis varies in certain areas of the City that have been identified as either well-served or

125 Edgewater Street - CEQR No. 17DCP069R Environmental Assessment Statement
Page 2.4-2
underserved by open space.1 If a project is located in an underserved area, the threshold for an open space analysis is 50 new residents or 125 new employees. If a project is located in a well-served area, the threshold for an open space analysis is 350 new residents or 750 new employees. The project area is located in an area that is neither underserved nor well-served by open space. Compared to the future No-Action scenario, both RWCDS 1 and RWCDS 2 would result in a net increase in the number of employees and residents. RWCDS 1 would generate a greater number of employees than RWCDS 2, however neither scenario would result in more than 200 employees. As such a nonresidential open space analysis is not warranted. RWCDS 2 would result in a greater number of residents than RWCDS 1, as such a residential open space analysis is presented below; this analysis considers RWCDS 2 as the future With-Action scenario. The proposed project would result in an increase in residential population but would not occur in an area (the 0.5-mile study area) with a substantial nonresidential population. As such a nonresidential open space ratio is not presented below.
The open space analysis was conducted in accordance with the methodology outlined in the CEQR Technical Manual. The purpose of the analysis was to provide an evaluation of the study area’s existing open space conditions relative to the open space needs of the study area’s open space users, and to predict and compare open space conditions relative to open space needs in the future No-Action and With-Action scenarios. Since the proposed project would introduce additional residents to the area, which would place demands on the study area’s open space resources, the analysis examined the amount of open space available in the future No-Action and With-Action scenarios in order to quantify the potential for a project-related impact.
An initial quantitative open space assessment involves a determination of an area’s open space ratio based on the population of the study area and the acreage of all publicly accessible open space resources within this study area. If an area’s open space ratio decreases significantly as a result of a proposed project or if an area has a very low open space ratio, a more detailed assessment may be required.
Based on the calculation of the ratio of publicly accessible open space acres to the study area population, a determination of the adequacy of open space resources in the study area was quantified. The resultant computation for the study area was then compared with the median ratio for New York City, which is 1.5 acres per 1,000 residents, and with the planning benchmark of 2.5 acres per 1,000 population established by the DCP.
The CEQR Technical Manual considers an action to result in significant impacts to open space resources if it would decrease the open space ratio substantially, thereby reducing the availability of open spaces for an area’s population. A decrease in the open space ratio of 5 percent or more is generally considered to be a significant adverse impact on open space resources. If the existing open space ratio is low even an open space ratio change of less than 1 percent may result in potential significant open space impacts. However, the closer the ratio is to 2.5 acres per 1,000 residents, or when the open space in the area exceeds this ratio, a greater percentage of change (more than 5 percent) may be tolerated.
The CEQR Technical Manual states that residential users typically travel as far as 0.5-miles to use local active and passive open space areas. Therefore, in order to analyze the indirect open space impacts of the proposed project, a half-mile radius was drawn around the development site. In accordance with CEQR Technical Manual criteria, the population of potential users of the available open space resources was determined for the census tracts that are at least 50 percent within the half-mile study area and the
1 The CEQR Technical Manual defines underserved areas as areas of high population density in the city that are generally the greatest distance from parkland,
where the amount of open space per 1,000 residents is currently less than 2.5 acres. Well-served areas are defined as having an open space ratio above 2.5 accounting for existing parks that contain developed recreational resources, or are located within 1/4-mile (i.e., approximately a 10-minute walk) from developed and publicly accessible portions of regional parks.

125 Edgewater Street - CEQR No. 17DCP069R Environmental Assessment Statement
Page 2.4-3
open space ratio was computed based on open space with at least 50 percent of its area within the half-mile study area (See Figure 2.4-1).
2.4.3 Assessment
Existing Conditions
The study area population was estimated using data from the 2010 U.S. Census of Population and Housing for the census tracts located fully or at least 50 percent within the half-mile study area. As shown in Table 2.4-1, in 2010 the study area contained a total of 10,208 residents within the three relevant census tracts.
Table 2.4-1 Study Area Population
Census Tract
Total Population (2010)
6 2,4088 5,583
27 2,217Study Area Total 10,208
The half-mile open space study area is generally bounded by Canal Street to the north, School Road to the south, Tomkins Avenue to the west, and the waters of Upper New York Bay to the east. There are four publicly accessible open spaces within the study area, as listed in Table 2.4-2 and shown on Figure 2.4-1. In addition, a portion of the open space being developed as part of Phase I of the Stapleton Waterfront Development Plan was completed in 2016 and is therefore considered part of the existing condition.
These facilities in total provide 33.53 acres of open space for use by the surrounding community.
Table 2.4-2 Inventory of Open Space Resources
Map Key Open Space Resource Size (ac) A Alice Austen Park 15.52B Kaltenmeier Playground 1.02C White Playground 0.92D Von Briesen Park 13.94
E1 Stapleton Waterfront 2.13Total 33.53
1 This portion of the open space associated with Phase 1 of the Stapleton Waterfront Development was completed in 2016. Additional open space associated with Phase 1, the Cove, a neighborhood park, will be completed by 2017 and is therefore considered as part of the No-Action condition.
Assessment of Open Space Adequacy
The open space ratio was calculated based on the study area population shown in Table 2.4-1 and the total open space acreage shown in Table 2.4-2. The resultant ratio is approximately 3.285 acres per 1,000

BAYSTREET
HYLAN BOULEVARD
NARROWS ROAD SOUTH
BROAD
STREET
TOMPKINS AVENUE
VANDERBILT AVENUE
FINGERBOARD ROAD
BEACH STREET
SCHOOL ROAD
NARROWS ROAD NORTH
ST MARYS AVENUE
VIRGINIA AVENUE
GREENFIELD AVENUE
WRIGHT STREET
MERLE PLACE
OSGOOD AVENUE
CANAL STREET F
RONT
STREET
CLIFTON AVENUE
TOMPKINS AVENUE
86
27
Date: 11/28/2016
Development Site
Project Area
0.5-Mile Radius
0.5-Mile Open Space Study Area
Census Tracts
Open Space Resources
Open Space Resources located outside of the Study Area
Figure
2.4-1Open Space Study Areaand Inventory
125 Edgewater StreetStaten Island, New York
0 750 1,500Feet
AB
C D
# A
E
* Open Space 'E' comprises both existing open space and open space created in the future No-Action condition.

125 Edgewater Street - CEQR No. 17DCP069R Environmental Assessment Statement
Page 2.4-4
residents. This ratio exceeds the citywide average of 1.5 acres and the DCP benchmark of 2.5 acres per 1,000 residents, indicating that the area has an above average amount of public open space resources.
Future No-Action Condition
The 2010 census population of the half mile open space study area was 10,208 persons. As described in Chapter 2.1, “Land Use, Zoning, and Public Policy,” 950 new residential dwelling units associated with Phase I of the Stapleton Waterfront Development Plan are expected to be developed by the 2019 build year. While these units are located just outside the half-mile open space study area, the population is included in the No Action condition for purposes of a conservative analysis since residents of Stapleton Phase I are expected to use the 2.13 acres of Stapleton waterfront open space that has been completed as well as the additional Stapleton Phase I open space that will be completed in 2017. This space—the Cove—will be a neighborhood waterfront park totaling 4.8 acres of space.
As described in Chapter 2.2, “Socioeconomic Conditions,” the average household size within the half-mile study area is 2.65 persons. Therefore, by the 2019 build year, 2,518 new residents and 4.8 acres of new open space will be introduced to the study area resulting in a total population in the future No-Action scenario of 12,726 residents and a total open space acreage of 38.33. As such, the open space ratio in the future No-Action scenario would be 3.009 acres per 1,000 residents.
Future With-Action Condition
Based on the average household size within the half-mile study area, the proposed project is expected to generate approximately 1,050 new residents resulting in a total study area population of 13,776. Additionally, the proposed project would result in the creation of 1.03 acres of publicly accessible open space resulting in a total open space inventory of 39.36 acres.
Table 2.4-3 shows the calculation of open space ratios for the existing, the future No-Action, and the future With-Action conditions.
Table 2.4-3 Future No-Action and With-Action Open Space Ratios
ExistingConditions
No-Action Scenario
With-Action Scenario
Publicly Accessible Open Space (acres) 33.53 38.33 39.36
Study Area Population 10,208 12,726 13,776Open Space Ratio
(acres/1,000 residents) 3.285 3.009 2.855
The open space ratio in future With-Action scenario would be 2.855 acres per 1,000 residents compared with a ratio of 3.009 acres per 1,000 residents in the future No-Action scenario. This represents a decrease of approximately 0.154 acres or a 5.12 percent decrease in the open space ratio as compared to the future No-Action scenario. Despite this decrease, the study area would continue to have an open space ratio well above the median ratio for New York City, which is 1.5 acres per 1,000 residents, and above the planning benchmark of 2.5 acres per 1,000 population established by the DCP.

125 Edgewater Street - CEQR No. 17DCP069R Environmental Assessment Statement
Page 2.4-5
As noted above, a decrease in the open space ratio of 5 percent or more may generally considered to be a significant adverse impact on open space resources; however, the closer the ratio is to 2.5 acres per 1,000 residents, or when the open space in the area exceeds this ratio, a greater percentage of change (more than 5 percent) may be tolerated. Because the study area would continue to be well served in terms of open space with a ratio above 2.5 acres per 1,000 residents, the proposed project would not result in significant adverse impacts on open space. The proposed project would satisfy a significant portion of its passive open space needs on site by providing approximately 1.03 acres of open space along the entire waterfront frontage of the site and an upland connection and public access area. The 1.03 acres of open space to be provided on the development site would be publicly accessible to the surrounding community.
2.4.4 Conclusion
The project would not displace or encroach upon existing open space resources and would therefore have no direct impact upon open space resources.
The project would introduce approximately 1.03 acres of open space along the entire waterfront frontage of the site and an upland connection and public access area as well as a new residential population. The open space ratio in future With-Action scenario would be 2.85 acres per 1,000 residents compared with a ratio of 3.009 acres per 1,000 residents in the future No-Action scenario, a decrease of approximately 0.154 acres or a 5.12 percent decrease in the open space ratio as compared to the future No-Action scenario. However, because the study area would continue to be well served in terms of open space with a ratio above 2.5 acres per 1,000 residents, the proposed project would not result in significant adverse impacts on open space.

125 Edgewater Street - CEQR No. 17DCP069R Environmental Assessment Statement
Page 2.5-1
Chapter 2.5: Shadows
2.5.1 Introduction
This chapter examines whether the proposed actions would result in new shadows on any sunlight-sensitive publicly accessible resources or other resources of concern, and assesses the potential for the proposed actions to result in significant adverse shadows. According to the 2014 City Environmental Quality Review (CEQR) Technical Manual, resources of concern include public open space, sunlight-dependent features of historic architectural resources, and natural resources that depend on sunlight.
According to the CEQR Technical Manual, a shadows assessment is required if a project would result in structures (or additions to existing structures) of 50 feet or more, or would be located adjacent to or across the street from a sunlight-sensitive resource. As discussed in Chapter 1, “Project Description,” the reasonable worst-case development scenario (RWCDS) for the proposed actions (both RWCDS 1 and RWCDS 2) would allow for the development of three new buildings totaling 130 feet, 120 feet, and 62 feet in height. Therefore, a shadows analysis is warranted.
2.5.2 Methodology
According to the CEQR Technical Manual, the longest shadow a structure will cast in New York City is 4.3 times its height. For actions resulting in structures less than 50 feet high, a shadows assessment is generally not necessary unless the site is adjacent to a park, historic resource, or important sunlight dependent natural feature.
First, a preliminary screening assessment must be conducted to ascertain whether shadows resulting from a project could reach any sunlight-sensitive resource at any time of year. The CEQR Technical Manual defines sunlight-sensitive resources as those resources that depend on sunlight or for which direct sunlight is necessary to maintain the resource’s usability or architectural integrity. The following are considered to be sunlight-sensitive resources:
Public open space (e.g., parks, beaches, playgrounds, plazas, schoolyards, greenways, landscaped medians with seating). Planted areas within unused portions of roadbeds that are part of the Greenstreets program are also considered sunlight-sensitive resources.
Features of architectural resources that depend on sunlight for their enjoyment by the public. Such sunlight-sensitive features might include: design elements that depend on the contrast between light and dark (e.g., recessed balconies, arcades, deep window reveals); elaborate, highly carved ornamentation; stained glass windows; historic landscapes and scenic landmarks; and features for which the effect of direct sunlight is described as playing a significant role in the structure’s importance as a historic landmark. Only the sunlight-sensitive features need be considered, as opposed to the entire resource.

125 Edgewater Street - CEQR No. 17DCP069R Environmental Assessment Statement
Page 2.5-2
Natural resources where the introduction of shadows could alter the resource’s condition or microclimate. Such resources could include surface water bodies, wetlands, or designated resources such as coastal fish and wildlife habitats.
The preliminary screening assessment consists of three tiers of analysis. The first tier determines a simple radius around the proposed buildings representing the longest shadow that could be cast. If there are sunlight-sensitive resources within the radius, the analysis proceeds to the second tier, which reduces the area that could be affected by project-generated shadows by accounting for a specific range of angles that can never receive shade in New York City due to the path of the sun in the northern hemisphere.
If the second tier of analysis does not eliminate the possibility of new shadows on sunlight-sensitive resources, a third tier of screening analysis further refines the area that could be reached by new shadows by looking at specific representative days of the year and determining the maximum extent of shadow over the course of each representative day.
If the third tier of analysis does not eliminate the possibility of new shadows on sunlight-sensitive resources, a detailed shadow analysis may be warranted to determine the extent and duration of the incremental shadow resulting from the project. The detailed analysis provides the data needed to assess the shadow impacts. The effects of the new shadows on the sunlight-sensitive resources are described, and their degree of significance is considered. The results of the analysis and assessment are documented with graphics, a table of incremental shadow durations, and narrative text.
2.5.3 Preliminary Assessment
A base map was developed showing the location of the project area and the surrounding street layout (see Figure 2.5-1). In coordination with the information regarding open space, historic, and cultural resources presented in other sections of this Environmental Assessment Statement, potential sunlight-sensitive resources were identified and shown on the map. In addition, the analysis accounts for the waters of the Upper New York Harbor, which is considered a natural resource. As shown in Figure 2.5-1, there are no existing open space or historic and cultural resources within the area of potential shadow effects. In the future No Action condition, new open space will be developed as part of the Stapleton development to the north of the project area (the future Stapleton Waterfront Esplanade). Therefore, this analysis focuses on the potential shadow increments on the future Stapleton Waterfront Esplanade and on the waters of the Upper New York Harbor adjacent to the site, since this is a natural resource (surface water) within the study area.
Tier 1 Screening Assessment
For the Tier 1 assessment, the longest shadow that would be cast by new buildings resulting from the proposed actions is calculated, and, using this length as the radius, a perimeter is drawn around the proposed footprint. Anything outside this perimeter representing the longest possible shadow could never be affected by project-generated shadow, while anything inside the perimeter needs additional assessment.

SYLVA LANE
BAY STREET
GREENFIELDAVENUE
MERIVALELANE
DRIVEWAYDRIVEWAY
WIMAN PLACE
ANDERSONSTREET
TILSON
PLACE
CAMDEN
STREET
WIMAN
PLACEMERIVALELANE
CLIFTON AVENUE
TOWNSEND
AVENUE
WILLOW AVENUE
CHESTNUT
AVENUE
ORMOND PLACE
ST MARYS AVENUE
KALTENMEIER
LANE
CHESTNUT AVENUE
BUTLER PLACE
FRONT S
TREET
LYNHURST AVENUE
EDGEWATERSTREET
CHURCH LANE
SYLVATON TERRACE
LANGERE
PLACE
30
20
10
40
30
20
10
40
20
40
40
20
10
20
10
10
10
BAYY STREET
GREENFIELDAVAA
ENUEMERIVAVV
LELLANE
CAMDEN
STREET
MERIVALELLLLANE
TOWNSEND
AVENUE
WILLLOW AVENUE
FRONTT STR
EET
LLYNHURST AAVENUE
LLLAANGPPLLLAA
20
1020
10
20
10
10
598 feet
SYLLVAA LLLAAANE
DRIVEWAYYDRIVEWAWW YYA
WIMANPPLLACE
AANDERSONSTREET
TILSON
PPLLACE
WIMAN
PPLLLACE
CLIFFTON AAVENUE
CHESTNUT
AVENUE
ORMONDPPPLLLAAACE
ST MARYS AAVENUE
KALLTENMEIER
LLLLANE
CHESTNUT AAVENUE
BUTLER PPPLLAACE
LYN
EDGEWATERSTREET
CHURCH LLLLANE
SYLVATON TERRACEGEREACE
30
20
10
4040
3044440
20
440
440 10
Date: 11/3/2016
Figure
2.5-1Tier 1 and Tier 2 Shadow Screening125 Edgewater Street
Staten Island, New York
¯
0 500 1,000Feet
Upper New York Harbor
Future Stapleton Waterfront Esplanade
108°-108°
Site
Topography (10ft contours)
Tier 1 Screening Buffer (598ft)
Area that cannot be shaded by the proposed project

125 Edgewater Street - CEQR No. 17DCP069R Environmental Assessment Statement
Page 2.5-3
According to the CEQR Technical Manual, the longest shadow that a structure can cast at the latitude of New York City occurs on December 21, the winter solstice, at the very start of the analysis day at 8:51 AM, and is equal to 4.3 times the height of the structure.
As described Chapter 1, “Project Description,” the proposed actions would allow for the development of three new buildings on the project site: Building A would be 13 stories in height (130 feet); Building B would be 12 stories (120 feet) in height; and Building C would be 6 stories (62 feet) in height. For the purposes of this analysis, it is assumed the proposed building’s bulkhead would rise an additional 9 feet, bringing the maximum building height to 139 feet. Therefore, the proposed project is anticipated to have a maximum shadow radius of 598 feet. Using this length as the radius, a perimeter was drawn around the project site (see Figure 2.5-1).
There is one potential sunlight-sensitive resource within the maximum potential shadow radius of the proposed project: the future Stapleton Waterfront Esplanade and the waters of the Upper New York Harbor. Therefore, a Tier 2 screening assessment was undertaken.
Tier 2 Screening Assessment
Because of the path that the sun travels across the sky in the northern hemisphere, no shadow can be cast in a triangle area south of any given project area. In New York City, this area lies between -108 and +108 degrees from true north. Therefore, sunlight-sensitive resources located in the area to the south of the project site (where no project shadows could fall) are excluded from further assessment.
Figure 2.5-1 illustrates this triangular area south of the project site. The complementing area to the north within the longest shadow study area represents the remaining area that could potentially experience new project generated shadows. As illustrated in the figure, the waters of Upper New York Harbor and the future Stapleton Waterfront Esplanade fall within the area that could be affected by the proposed project. As such, a Tier 3 analysis was undertaken for this resource.
Tier 3 Screening Assessment
In accordance with the CEQR Technical Manual, a Tier 3 screening assessment was performed because the Tier 1 and Tier 2 assessments identified resources of concern within the area of the longest shadow for the proposed project.
As the sun travels across the sky during the day, shadows fall in a curve on the ground opposite the sun. When the sun rises, shadows fall to the west. Because the sun rises in the east and travels across the southern part of the sky throughout the day to set in the west, a project’s earliest shadows would be cast almost entirely westward. Throughout the day, shadows would shift clockwise, until sunset, when they would fall east. Midday shadows are always shorter than those at other times of the day because the sun is highest in the sky at that time. Further, because of the tilt of the earth’s axis, the angle at which the sun’s rays strike the earth varies throughout the year, so that during the summer, the sun is higher in the sky and shadows are shorter than during the winter. Winter shadows, although the longest, move the most quickly along their paths and do not affect the growing season of outdoor trees and plants.
The Tier 3 screening assessment was performed for the four representative days of the year set forth in the CEQR Technical Manual: December 21, the winter solstice and shortest day of the year;

125 Edgewater Street - CEQR No. 17DCP069R Environmental Assessment Statement
Page 2.5-4
March 21 / September 21, the equinoxes; May 6 / August 6, the midpoints between the summer solstice and the equinoxes; and June 21, the summer solstice and the longest day of the year. The CEQR Technical Manual defines the temporal limits of a shadow analysis period to fall from an hour and a half after sunrise to an hour and a half before sunset. A three-dimensional computer model was developed in Sketchup to represent the proposed project. In accordance with the CEQR Technical Manual, surrounding buildings are not included in the Tier 3 shadow assessment model. The results of the Tier 3 shadow assessment for the proposed project are illustrated in Figures 2.5-2a through 2.5-2d.
As illustrated in the figures, projected shadows from the proposed development would fall on portions of the waters of Upper New York Bay during the identified analysis periods. Because the tallest portions of the proposed development would be located at the very southern portion of the site (Building A), and only a 71-foot tall building in the northern most portions of the development site (Building C), project-generated shadows would not reach the future Stapleton Waterfront Esplanade.
Table 2.5-1 describes the duration of shadows on the Upper New York Harbor.
Table 2.5-1: Tier 3 Screening Shadow Duration from Proposed Project on Identified Resources Analysis Day/
Timeframe Window December 21
8:51 AM - 2:53 PM March 21 / Sept. 21 7:36 AM - 4:29 PM
May 6 / August 6 6:27 AM - 5:18 PM
June 21 5:57 AM - 6:01 PM
Waters of Upper New York Harbor Shadow Enter –
Exit Times 9:06 AM - 2:53 PM 11:42 AM - 4:29 PM 12:59 PM - 5:18 PM 1:49 PM - 6:01 PM
Shadow Duration 5 Hours, 47 Minutes
4 Hours, 47 Minutes
4 Hours, 19 Minutes
4 hours, 12 Minutes
Notes: (1) Daylight savings time not used; times shown are eastern standard time (EST) (2) All times are approximate
Shadows would be cast on the Upper New York Harbor to varying degrees during all four analysis periods (see Figures 2.5-2a through 2.5-2d), for varying durations (see Table 2.5-1). In the beginning of all analysis days, incremental shadow would cover small portions of the water adjacent to the shoreline, then stretch farther as the sun moves to the west. Shadow cast by the proposed buildings would move over the course of the day such that only very small portions of the water would be cast in shadow for the full shadow duration.
In the September 2006 New Stapleton Waterfront Development Plan Final Environmental Impact Statement (2006 FEIS), similar shadows increments on the waters of the harbor were analyzed in connection with the Stapleton development to the north of the development site. That analysis concluded that any reduction in light within the shadow footprint would have a negligible impact on phytoplankton populations. The 2006 FEIS further noted that the phytoplankton communities would be carried by tidal currents and would be exposed to the shadows for a relatively short period, moving through the area in shadow to areas outside the shadow exposure. The 2006 FEIS concluded that there would be no significant adverse shadows impacts on the harbor.
Typically, if a Tier 3 screening assessment indicates that a project has the potential to result in shadow increments on identified resources of concern, a detailed analysis is undertaken to determine the extent and duration of the incremental shadows and to assess their potential effects. The detailed analysis considers existing and planned buildings in the vicinity of the project site in the three-dimensional model so that shadows cast by existing (or future) buildings

SYLVA LANE
BAY STREET
GREENFIELDAVENUE
MERIVALELANE
D RIVEWAYDRIVEWAY
WIMAN PLACE
ANDERSONSTREET
TILSON
PLACE
CAMDEN
STREET
WIMAN
PLACEMERIVALELANE
CLIFTON AVENUE
TOWNSEND
AVENUE
WILLOW AVENUE
CHESTNUT
AVENUE
ORMOND PLACE
ST MARYS AVENUE
KALTENMEIER
LANE
CHESTNUT AVENUE
BUTLER PLACE
FRONT S
TREET
LYNHURST AVENUE
EDGEWATER STREETCHURCH LANE
SYLVATON TERRACE
LANGERE
PLACE
Figure
BAYY STREET
GREENFIELDAVENUE
MERIVAVVLE
LLANE
CAMDEN
STREET
MERIVALELLANE
TOWNSEND
AVENUE
WILLLOW AAVENUE
FRONT STR
EET
URST AAVENUE
7:36A8:30A
9:30A10:30A
11:30A 12:30P1:30P
2:30P3:30P4:29P
Tier 3 March 21 Shadow Screening
Entry time: 11:42AMExit time: N/A
2.5-2a
598 feet
125 Edgewater StreetStaten Island, New York
Shadow Study Area No-Action Open Space
Date: 11/3/2016
0 500 1,000Feet
¯Future Stapleton
Waterfront Esplanade
1. Upper NewYork Harbor
Bldg A
Bldg B
Bldg C

SYLVA LANE
BAY STREET
GREENFIELDAVENUE
MERIVALELANE
D RIVEWAYDRIVEWAY
WIMAN PLACE
ANDERSONSTREET
TILSON
PLACE
CAMDEN
STREET
WIMAN
PLACEMERIVALELANE
CLIFTON AVENUE
TOWNSEND
AVENUE
WILLOW AVENUE
CHESTNUT
AVENUE
ORMOND PLACE
ST MARYS AVENUE
KALTENMEIER
LANE
CHESTNUT AVENUE
BUTLER PLACE
FRONT S
TREET
LYNHURST AVENUE
EDGEWATER STREETCHURCH LANE
SYLVATON TERRACE
LANGERE
PLACE
Figure
BAYY STREET
GREENFIELDAVENUE
MERIVAVVLE
LLANE
CAMDEN
STREEET
MERIVALELLANE
TOWNSEND
AVENUE
WILLLOW AAVENUE
FRONT STR
EET
URST AAVENUE
6:27A7:30A
8:30A9:30A10:30A
11:30A12:30P
1:30P2:30P3:30P
4:30P5:18P
Tier 3 May 06 Shadow Screening
Entry time: 12:59PMExit time: N/A
2.5-2b
598 feet
125 Edgewater StreetStaten Island, New York
Shadow Study Area No-Action Open Space
Date: 11/3/2016
0 500 1,000Feet
¯Future Stapleton
Waterfront Esplanade
1. Upper NewYork Harbor
Bldg A
Bldg B
Bldg C

SYLVA LANE
BAY STREET
GREENFIELDAVENUE
MERIVALELANE
D RIVEWAYDRIVEWAY
WIMAN PLACE
ANDERSONSTREET
TILSON
PLACE
CAMDEN
STREET
WIMAN
PLACEMERIVALELANE
CLIFTON AVENUE
TOWNSEND
AVENUE
WILLOW AVENUE
CHESTNUT
AVENUE
ORMOND PLACE
ST MARYS AVENUE
KALTENMEIER
LANE
CHESTNUT AVENUE
BUTLER PLACE
FRONT S
TREET
LYNHURST AVENUE
EDGEWATER STREETCHURCH LANE
SYLVATON TERRACE
LANGERE
PLACE
Figure
BBBBBBBAAAAAYY STREET
GREENFIELDAVENUE
MERIVAVVLE
LLANE
CAMDEN
STREET
MERIVALELLANE
TOWNSEND
AVENUE
WILLLOW AAVENUE
FRONT STR
EET
URST AAVENUE
5:57A
7A8A
9A 10A11A 12P1P2P3P
4P5P 6:01P
Tier 3 June 21 Shadow Screening
Entry time: 1:49PMExit time: N/A
2.5-2c
598 feet
125 Edgewater StreetStaten Island, New York
Shadow Study Area No-Action Open Space
Date: 11/3/2016
0 500 1,000Feet
¯Future Stapleton
Waterfront Esplanade
1. Upper NewYork Harbor
Bldg A
Bldg B
Bldg C

SYLVA LANE
BAY STREET
GREENFIELDAVENUE
MERIVALELANE
D RIVEWAYDRIVEWAY
WIMAN PLACE
ANDERSONSTREET
TILSON
PLACE
CAMDEN
STREET
WIMAN
PLACEMERIVALELANE
CLIFTON AVENUE
TOWNSEND
AVENUE
WILLOW AVENUE
CHESTNUT
AVENUE
ORMOND PLACE
ST MARYS AVENUE
KALTENMEIER
LANE
CHESTNUT AVENUE
BUTLER PLACE
FRONT S
TREET
LYNHURST AVENUE
EDGEWATER STREETCHURCH LANE
SYLVATON TERRACE
LANGERE
PLACE
Figure
BAYY STREET
GREENFIELDAVENUE
MERIVAVVLE
LLANE
CAMDEN
STREET
MERIVALELLANE
TOWNSEND
AVENUE
WILLLOW AAVENUE
FRONT STR
EET
8:51A 10A11A
12P 1P 2P 2:53P
Tier 2 December 21 Shadow Screening
Entry time: 9:06AMExit time: N/A
2.5-2d
598 feet
125 Edgewater StreetStaten Island, New York
Shadow Study Area No-Action Open Space
Date: 11/3/2016
0 500 1,000Feet
¯Future Stapleton
Waterfront Esplanade
1. Upper NewYork Harbor
Bldg A
Bldg B
Bldg C

125 Edgewater Street - CEQR No. 17DCP069R Environmental Assessment Statement
Page 2.5-5
are accounted for. For the 125 Edgewater project, a detailed analysis was not undertaken since the Tier 3 analysis undertaken above is sufficient to demonstrate that the proposed project would not result in significant adverse impacts on the waters of the Upper New York Harbor.

125 Edgewater Street - CEQR No. 17DCP069R Environmental Assessment Statement
Page 2.6-1
Chapter 2.6: Historic and Cultural Resources Pursuant to the 2014 CEQR Technical Manual, an assessment of historic and cultural resources iswarranted if there is the potential to affect either archaeological or architectural resources.Archaeological resources usually need to be assessed for projects that would result in any in grounddisturbance. An in ground disturbance is any disturbance to an area not previously excavated,including new excavation that is deeper and/or wider than previous excavation on site. The proposedproject would result in new in ground disturbance. The New York City Landmarks PreservationCommission (LPC) found that the development site has no archaeological significance (see AppendixC). Therefore, the proposed project would not result in a significant adverse impact on archaeologicalresources.
Generally, architectural resources should be surveyed and assessed if the proposed project wouldresult in any of the following, whether or not any known historic resources are located near the projectsite: new construction, demolition, or significant physical alteration to any building, structure, or object;a change in scale, visual prominence, or visual context of any building, structure, or object or landscapefeature; construction, including but not limited to, excavating vibration, subsidence, dewatering, andthe possibility of falling objects; additions to or significant removal, grading, or replanting of significanthistoric landscape features; screening or elimination of publicly accessible views; introduction ofsignificant new shadows or significant lengthening of the duration of existing shadows on a historiclandscape or on a historic structure if the features that make the structure significant depending onsunlight. The project area is not located on or adjacent to a site containing any architectural resourcethat is eligible or has been designated (or is been calendared for consideration) as a New York CityLandmark, Interior Landmark, or Scenic Landmark; listed or eligible for listing on the New York Stateor National Register of Historic Places; or within a designated or eligible New York City, New YorkState, or National Register Historic District. LPC found that the development site has no architecturalsignificance (see Appendix C). As the development site has no architectural significance and is notlocated adjacent to the any architectural resources; the proposed project would not result in asignificant adverse impact on architectural resources and no further analyses are warranted.

125 Edgewater Street - CEQR No. 17DCP069R Environmental Assessment Statement
Page 2.7-1
Chapter 2.7: Urban Design and Visual Resources
2.7.1 Introduction
An assessment of urban design is needed when a project may have effects on any of the elements that contribute to the pedestrian experience of public space. A preliminary assessment is appropriate when there is the potential for a pedestrian to observe, from the street level, a physical alteration beyond that allowed by existing zoning, including the following:
1. Projects that permit the modification of yard, height, and setback requirements;
2. Projects that result in an increase in built floor area beyond what would be allowed as-of-right or in the future without the proposed project.
The proposed project would consist of three buildings developed with a mix of uses including residential, commercial, and parking uses; in addition, the proposed project would result in the development of the waterfront with an upland connection, visual corridor, and public access area. Two Reasonable Worst Case Development Scenarios (RWCDS) have been established to provide a conservative analysis for the proposed project. The RWCDSs would result in the same urban design elements, the major differences between the two being internal programming. Under both RWCDSs 1.03 acres of open space and 346 parking spaces would be provided. As such, RWCDS 1 is analyzed below.
The proposed actions would introduce new urban design provisions, including a new upland connection and visual corridor through the proposed development site, and a maximum building height of 120 feet above the base plane. The actions proposed as a part of this project would also permit the modification of the existing yard, height, and setback requirements relevant to the property, and a preliminary urban design assessment is therefore warranted.
2.7.2 Methodology
In accordance with the 2014 CEQR Technical Manual guidelines, the following preliminary urban design and visual resources assessment considers a 400-foot radius study area where the proposed action would be most likely to influence the built environment. As stipulated in the CEQR Technical Manual, since the purpose of the preliminary assessment is to determine whether any physical changes proposed by the project would significantly impact elements of urban design and visual resources, the following information, if known, is included in a preliminary assessment:
A concise narrative of the existing project area, and conditions under the future No-Action and With-Action conditions;
An aerial photograph of the study area and ground-level photographs of the site area with immediate context;
Zoning and floor area calculations of the existing and future With-Action conditions;

125 Edgewater Street - CEQR No. 17DCP069R Environmental Assessment Statement
Page 2.7-2
Lot and tower coverage, and building heights; and
A three-dimensional representation of the future With-Action and No-Action (if relevant) condition streetscape.
If the preliminary assessment determines that a change to the pedestrian experience is minimal and unlikely to disturb the vitality, walkability or the visual character of the area, then no further assessment is necessary. However, if it shows that changes to the pedestrian environment and/or visual resources are significant enough to require greater explanation and further study, then a detailed analysis may be appropriate.
The following preliminary urban design and visual resources assessment follows these guidelines and provides a characterization of existing conditions followed by a description of urban design and visual resources under the future No-Action and With-Action conditions, and an analysis determining the extent to which physical changes resulting from the proposed action would alter the pedestrian experience.
2.7.3 Assessment
Existing Conditions
Urban Design
Project Area
The project area consists of Block 2820, Lots 90 and 95 and portions of Lots 105 and 110 in the Rosebank neighborhood of Staten Island. The project area encompasses the entirety of Lots 90 and 95 but only small portions of Lots 105 and 110 and is zoned entirely M2-1.
The development site, Block 2820, Lot 90 (125 Edgewater Street), is a waterfront lot comprising 144,258 sf of upland (dry) land area and 651,332 sf of land area located under water. The lot has approximately 200 feet of frontage on Edgewater Street and is predominantly vacant. The site is developed with two small buildings and is occupied on a short term basis by two business for open storage. The buildings consist of a vacant one to two-story masonry structure of approximately 8,948 gross sf at the north end of the site and a one-story steel shed with approximately 5,247 gross sf of area at the south end of the site. The development site has an existing FAR of 0.018. A 70-foot-wide New York City Department of Environmental Protection (DEP) sewer easement extends through the development site from Edgewater Street and Lynhurst Avenue to the shore line. A 34-foot wide vehicular and pedestrian easement extends from Willow Avenue at its intersection with Edgewater Street through Lot 95 to the development site and is current accessible up to the development site boundary. An aerial image of the site and photographs of the site and the surrounding project area are provided in Figure 2.7-1 through 2.7-3.
With an FAR of 2.0 permitted in M2-1 zoning districts and an Upland Lot Area of 366,835 square feet, the zoning floor area capacity of the 795,590 square feet proposed development site is approximately 733,670 square feet of manufacturing and/or commercial space.

Date: 10/28/2016
Figure
2.7-1Aerial Photograph of Development Site125 Edgewater Street
Staten Island, New York
0 200 400Feet
¯
Source: Esri, DigitalGlobe, GeoEye, Earthstar Geographics, CNES/AirbusDS, USDA, USGS, AeroGRID, IGN, and the GIS User Community
Urban Design Study Area
400’
400’
Site
Bay Street
Lynhurst Avenue
Willow Avenue
Front Street
Edgewater Street
Bay Street
Lynhurst Avenue
Willow Avenue
Front Street
Edgewater Street

12/0
1/20
16
Phot
o 4
Vie
w n
orth
of f
ront
age
cond
ition
s at
1 E
dgew
ater
Str
eet,
whe
re p
e-de
stri
an fa
cilit
ies
are
not p
rovi
ded
alon
g th
e ea
ster
n si
de o
f the
str
eet.
Phot
o 3
Vie
w n
orth
east
of a
djac
ent 7
sto
ry c
omm
erci
al b
uild
ing,
with
the
deve
lopm
ent s
ite in
the
fore
grou
nd
Phot
o 1
Sout
heas
t vie
w a
long
Edg
ewat
er S
tree
t to
fron
tage
of d
evel
opm
ent
site
with
cha
in li
nk fe
nce
Phot
o 2
Cur
rent
sho
relin
e co
nditi
ons
of 1
25 E
dgew
ater
Str
eet
Site
and
Stu
dy A
rea
Phot
os12
5 Ed
gew
ater
Str
eet
Stat
en Is
land
, New
Yor
k
Figu
re
2.7-
2

12/0
1/20
16
Phot
o 8
Vie
w s
outh
alo
ng B
ay S
tree
t, th
e pr
inci
pal t
rans
port
atio
n an
d re
tail
corr
idor
thro
ugh
the
area
. NYP
A P
ouch
term
inal
is s
how
n on
the
left
Phot
o 7
Vie
w e
ast t
o 1
Edge
wat
er S
tree
t alo
ng W
illow
Ave
nue.
An
ease
men
t ex
tend
s al
ong
the
prol
onga
tion
of W
illow
Ave
nue
to th
e de
velo
pmen
t site
Phot
o 5
Vie
w e
ast a
cros
s Ed
gew
ater
Str
eet t
o 1
Edge
wat
er S
tree
t, w
here
the
stre
et is
bui
lt ou
t to
appr
oxim
atel
y 30
feet
Phot
o 6
Vie
w e
astw
ard
alon
g Ly
nhur
st A
venu
e to
war
ds th
e de
velo
pmen
t si
te, U
pper
New
Yor
k H
arbo
r, an
d 1
Edge
wat
er S
tree
t
Site
and
Stu
dy A
rea
Phot
os12
5 Ed
gew
ater
Str
eet
Stat
en Is
land
, New
Yor
k
Figu
re
2.7-
3

125 Edgewater Street - CEQR No. 17DCP069R Environmental Assessment Statement
Page 2.7-3
Along the Edgewater Street frontage of the site, a chain link fence provides a physical barrier between the development site and the street. As shown in Photo 1, the chain link fence forms a continuous barrier around the upland portions of the site, and there is no requirement for public access to portions of the site. The site is open to the water at the waterfront edge; Photo 2 shows the current shoreline conditions.
In the vicinity of the development site, Edgewater Street is a 50 foot-width final mapped street with two-way traffic. Edgewater Street is built to a width of approximately 30 feet along the street frontage of the development site and is mapped to be widened. There are no sidewalks or street trees currently provided along the Edgewater Street frontage of the development site.
Study Area
The study area predominately consists of a mixture of commercial, light industrial, transportation and utility uses, parking, and vacant land as well as the waters of Upper New York Bay. One 7-story commercial office building is located on the site that borders the site directly to the north, as shown in Photo 3. A 1-story transportation and utility building is located on the site that borders the development site immediately to the south (181 Edgewater Street). The waters of Upper New York Bay border the development site to its east and Edgewater Street borders a portion of the development to its west. A utility use with at-grade parking is located across Edgewater Street from the development site to the west. Nearly all other land uses within the study area consist of commercial, light industrial, and transportation and utility uses, parking, and vacant land. Two single/two-family residences and five mixed-use residential/commercial buildings are located along the extreme western edge of the 400-foot radius project study area.
While sidewalks are provided on the western side of Edgewater Street, there are currently no publicly accessible sidewalks on the eastern side of the street. There are few street trees provided along the length of Edgewater Street. Existing street conditions are shown in Photos 4 through 8.
Bay Street is the principal corridor through the area and provides connections between St. George, Tompkinsville, Stapleton, Clifton, Rosebank, and the Verrazano Bridge. As such, Bay Street has its own urban design character separate from that of adjacent streets within the urban design study area, which are predominately manufacturing/industrial in nature and include sites such as the Sandy Hook Pilots, Edgewater Plaza, and the New York Power Authority Pouch Terminal.
Visual Resources
The open waters of Upper New York Bay are the sole visual resource within the study area. Partial views of the Bay are available through the site from Edgewater Street as well as along the prolongation of Willow Street across the adjacent Lot 95 and the proposed development site.
It should be noted that views are available from the proposed development site to locations outside the urban design study area (beyond 400 feet), including the Manhattan skyline, Verrazano Bridge, Stapleton Waterfront Esplanade, and Shore Park and Parkway are available from the proposed development site. Partial views of the Manhattan skyline, Shore Park (Brooklyn), and New York Harbor are also available from Edgewater Street through the site.

125 Edgewater Street - CEQR No. 17DCP069R Environmental Assessment Statement
Page 2.7-4
Future No-Action Condition
Under the No-Action condition, it is assumed that the development site would remain in its existing vacant and underutilized condition (with the possible exception of temporary storage uses such as those currently located on the property). No new as-of-right development would occur on the property. No formal parking spaces would be developed on the property.
No changes would result in the urban design and visual character of the property. The existing vacant masonry building and steel shed on the asphalt paved property would remain as they are currently. The existing chain link fence around the majority of the site would remain, and the industrial/manufacturing character of the surrounding project study area would not change significantly. Designated street widening would remain on the proposed development site. Partial views of New York Harbor would continue to be available from Edgewater Street through the site, however, public access would continue to be precluded to the site.
Beyond the urban design study area, in the No-Action condition, the Stapleton Waterfront Esplanade would be developed pursuant to the Stapleton Waterfront Redevelopment Plan, which would result in a new visual resource from the development site. Urban design details of future phases of the Stapleton Waterfront Esplanade, including those nearest to the proposed development site, have not yet been announced, and therefore the urban design components of the proposed Shore Public Walkway would not be inconsistent with the urban design components of the Stapleton Waterfront Esplanade.
Future With-Action Condition
The proposed actions would facilitate the development of three mixed-use residential/commercial buildings as described in Table 2.7-1 below. The development site is the only portion of the project area projected to be redeveloped as a result of the proposed actions.
Table 2.7-1: Development Program by Proposed Building (RWCDS 1) Building A Building B Building C Total
Gross Floor Area (sqft) 212,964.0 228,799.7 36,930.0 478,693.7 Zoning Floor Area (sqft) 157,242 187,688.2 30,810 375,740.2 Residential DUs 163 184 24 371 Commercial (sqft) 12,650 5,073.3 6,450 24,173.3 Parking Spaces 168 (151 inside) 140 38 346 Building Footprint (sqft) 36,000 29,829 7,200 71,971 Tower Footprint (sqft) 10,000 7,300 (each) N/A -Stories 13 12 6 -
The future With-Action Development Scenario would result in taller and denser site compared to the future No-Action condition. The With-Action Scenario (RWCDS) would entail the following development on the proposed development site:

125 Edgewater Street - CEQR No. 17DCP069R Environmental Assessment Statement
Page 2.7-5
The existing vacant structures on the development site would be demolished, including the 1-story steel structure located within the existing 70 feet sewer easement, the 1-to-2-story buildings located at the very northern end of the site, and the existing chain link fence.
In areas of the site mapped for street widening, the proposed development would be set back to the existing street widening line located at the Edgewater Street frontage.
The proposed development would be designed around and located outside both the existing 80-foot-wide sewer easement located on the site and the proposed new 60-foot-wide upland connection and visual corridor.
The proposed buildings would be separated by a minimum of 90 feet pursuant to ZR 23-711, and the proposed building separation would allow for new pedestrian and visual connections to the New York Harbor.
A 660 feet long Shore Public Walkway with a footprint of approximately 23,114.5 square feet would be provided along the entire waterfront frontage of the site, which would vary in width between 13 feet and 40 feet. Urban design elements such as trash receptacles, pole lighting, benches, chairs, tables, bike racks, signage, fences, gates, and bollards would be incorporated into the Shore Public Walkway design.
Two 70 feet radius turnarounds would be provided on the site to accommodate FDNY vehicles.
Vehicular access to the site would be provided from Edgewater Street at three locations:
a. The first location would be located approximately 23 feet north of the southern property line along the Edgewater Street frontage. At this location there would be a 22-foot wide curb cut that would provide access to the parking areas in Building A.
b. The second access would be approximately 130 feet further north along Edgewater Street. This access would be located within the proposed visual corridor and extend from Edgewater Street to the shore public walkway. This curb cut would be 24 feet wide and located partially within the prolongation of Lynhurst Avenue. The curb cut would be offset approximately 20-feet to the south of Lynhurst Avenue. Both the lobbies and the parking areas in both Buildings A and B would be able to be reached directly from this vehicular accessway.
c. A third vehicular access would be provided 377 feet further north on Edgewater Street where there is an existing curb cut and easement across Lot 95 to the proposed development site. The existing 28-foot wide curb cut at Edgewater Street and 34 feet wide easement would be used to allow vehicles to traverse Lot 95 and access the parking garages in proposed Buildings B and C.
The proposed development has been designed with the local context in mind, in that:
a. Building A has been designed to “step up” from Edgewater Street, with up to a seven story streetwall up against Edgewater Street, and taller building portions designed to be located beyond 100 feet of Edgewater Street, where lower building heights prevail.
b. All of the proposed buildings have been designed to extend along the proposed shore public walkway for a distance less than 130 feet, except for Building B, which has been designed with a recess to comply with the provisions of the special district.

125 Edgewater Street - CEQR No. 17DCP069R Environmental Assessment Statement
Page 2.7-6
c. A total of 137 new trees are proposed to be distributed throughout the site, including 97 trees within the publicly accessible Shore Public Walkway.
d. The proposed features within the Shore Public Walkway, including lighting, public seating, ADA access features, guardrails, paving and plantings have been designed to comply with the provisions of ZR Article 6 Chapter 2.
Site plans and renderings of the proposed development’s building envelopes are shown in Figures 1-1 through 1-4 and Figures 2.7-4 through 2.7-8.
As described above, the proposed project would result in a positive impact relative to the visual resources in the vicinity of the development site. Under the existing and Future No-Action conditions, partial views to the open waters of Upper New York Bay are available from the streets and publicly accessible areas bordering the Proposed Development Site, but public access is not available through the site to the waterfront. The With-Action condition would ensure a visual corridor, unobstructed from the ground to the sky, is provided from Edgewater Street through the Site to the Upper New York Bay. The proposed project would also include a publicly accessible Shore Public Walkway along the entire waterfront frontage of the Site, which would provide a significant new publicly accessible passive open space to the surrounding community with views of visual resources beyond the 400 feet study area, including the Manhattan skyline, Shore Park (along the Brooklyn foreshore), the Verrazano Bridge, and the future improvements to the Stapleton Waterfront Esplanade.
Zoning calculations of future With-Action conditions on the Site, including floor area calculations, lot coverage, and building heights, are shown in Table 2.7-2 below.
Table 2.7-2: Zoning Calculations Relevant to Urban Design Analysis Item Existing Condition No-Action Condition With-Action Condition
Uses 1 vacant masonry building; 1 vacant steel shed; open storage uses; asphalt paving
1 vacant masonry building; 1 vacant steel shed; open storage uses; asphalt paving
3 buildings with 371 DUs, 24,173.3 square feet retail (divided between 3 bldgs), 346 parking spaces
Base Permissible FAR
2.0 2.0 2.43
Permissible Zoning Floor Area (sqft)
733,670 733,670 891,409
Zoning Floor Area 14,194 square feet 14,194 square feet
375,740.2square feet 351,567.2 residential 24,173 commercial
Built Floor Area Ratio 0.04 0.04 1.02
Lot Coverage 9,720 sf (6.7%) 9,720 sf (6.7%) 46,125 sf (12.6%)
Building Heights (above base plane)
1-2 stories, 30 feet 1-2 stories, 30 feet One 13-story, feet 120 feet bldg; one 12-story, feet 109 feet-8” bldg; one 6-story, 51 feet-8” bldg

12/0
1/20
16
For I
llust
rativ
e P
urpo
ses
Onl
y.
* The
App
lican
t is
boun
d to
por
tions
of t
he s
ite p
lan
labe
led
as th
e W
ater
front
Pub
lic A
cces
s A
rea
(WPA
A) a
nd a
nthi
ng re
late
d to
it. E
very
thin
g ou
tsid
e of
the
boun
dary
of t
he W
PAA
is il
lust
rativ
e.
125
Edge
wat
er S
tree
tSt
aten
Isla
nd, N
ew Y
ork
With
-Act
ion
RW
CD
S:G
roun
d Fl
oor P
lan
Figu
re
2.7-
4

12/0
1/20
16
For I
llust
rativ
e P
urpo
ses
Onl
y.
* The
App
lican
t is
boun
d to
por
tions
of t
he s
ite p
lan
labe
led
as th
e W
ater
front
Pub
lic A
cces
s A
rea
(WPA
A) a
nd a
nthi
ng re
late
d to
it. E
very
thin
g ou
tsid
e of
the
boun
dary
of t
he W
PAA
is il
lust
rativ
e.
125
Edge
wat
er S
tree
tSt
aten
Isla
nd, N
ew Y
ork
With
-Act
ion
RW
CD
S:
Site
Fur
nish
ings
/Am
eniti
es P
lan
Figu
re
2.7-
5

12/01/2016
With
-Act
ion
sect
iona
l dra
win
gs a
nd k
ey m
ap
For I
llust
rativ
e P
urpo
ses
Onl
y.
125
Edge
wat
er S
tree
tSt
aten
Isla
nd, N
ew Y
ork
With
-Act
ion
RW
CD
S:Si
te S
ectio
nal D
raw
ings
Figu
re
2.7-
6

12/0
1/20
16
Vie
w e
ast a
long
Lyn
hurs
t Ave
nue
tow
ards
Bui
ldin
g A
and
the
prop
osed
vi
sual
cor
rido
rV
iew
eas
t alo
ng L
ynhu
rst A
venu
e to
war
ds B
uild
ing
A a
nd th
e pr
opos
ed
visu
al c
orri
dor
For I
llust
rativ
e P
urpo
ses
Onl
y.
125
Edge
wat
er S
tree
tSt
aten
Isla
nd, N
ew Y
ork
No-
Act
ion
and
With
-Act
ion
RW
CD
SB
uild
ing
Mas
sing
sFi
gure
2.7-
7

12/0
1/20
16
Vie
w n
orth
wes
t alo
ng E
dgew
ater
Str
eet,
whe
re B
uild
ing
A’s
fron
tage
can
be
see
n in
the
fore
grou
nd.
Vie
w n
orth
sho
ws
the
rela
tions
hip
betw
een
the
prop
osed
dev
elop
men
t and
the
surr
ound
ings
, inc
ludi
ng E
dgew
ater
Pla
za a
nd th
e ha
rbor
.
For I
llust
rativ
e P
urpo
ses
Onl
y.
125
Edge
wat
er S
tree
tSt
aten
Isla
nd, N
ew Y
ork
Figu
re
2.7-
8N
o-A
ctio
n an
d W
ith-A
ctio
n R
WC
DS
Bui
ldin
g M
assi
ngs

125 Edgewater Street - CEQR No. 17DCP069R Environmental Assessment Statement
Page 2.7-7
2.7.4 Conclusion
The proposed development site is located in an area primarily characterized by a mixture of commercial, light industrial, transportation and utility uses, parking, vacant land and the waters of Upper New York Bay. The site currently consists of two small vacant buildings, storage uses and asphalt pavement, and the proposed project would improve the site with a mixed residential and local retail project with accessory parking, new roadways/driveways, publicly accessible walkways, extensive new landscaping and public amenities, and a visual corridor. The proposed development would be a substantial improvement in terms of urban design as the project would convert the development site from its current underutilized and poorly maintained condition into a vibrant new mixed-use development with three new buildings of between six- and thirteen-stories in height.
The proposed development would result in a substantial positive urban design impact to both the underutilized and poorly maintained development site and the surrounding area, as it would provide a residential presence on the waterfront and would link the development site with the residential areas further to the west through the provision of publicly accessible walkways, new landscaping and public amenities, and a visual corridor through the Site. Given the character and development of the surrounding area including the residential neighborhoods further to the west and the Site’s location along the waterfront, the proposed development (and associated proposed zoning) is appropriate for the surrounding context, and consistent with other more recent developments along Staten Island’s North Shore.
The With-Action Development Scenario would also result in a positive effect and would provide views of the Upper New York Bay water that are currently only partial views through the provision of a publicly accessible Shore Public Walkway and a visual corridor through the site. The With-Action scenario would also add new locations to view other, more distant visual resources.
No significant adverse impacts to urban design or visual resources would occur as a result of the proposed action and a detailed urban design analysis would not be required.

125 Edgewater Street - CEQR No. 17DCP069R Environmental Assessment Statement
Page 2.8-1
Chapter 2.8: Natural Resources
2.8.1 Introduction
This chapter examines the potential impacts from the proposed actions on terrestrial and aquaticnatural resources and floodplains near the project area. According to 2014 CEQR Technical Manualguidelines, a natural resources assessment considers species in the context of the surroundingenvironment, habitat, or ecosystem and examines a project’s potential to impact those resources.
The proposed project would consist of three buildings developed with a mix of uses residential,commercial, and parking uses; in addition, the proposed project would result in the development ofthe waterfront with an upland connection, visual corridor, and public access areas. No otherdevelopment within the project area is expected as a result of the proposed actions.
2.8.2 Methodology
As defined in Section 200 of the Natural Resources section of the CEQR Technical Manual, the projectarea is substantially devoid of natural resources. However, the project area adjoins the open waters ofUpper New York Bay to the east which is part of New York Harbor. New York Harbor is a tidallyinfluenced estuary subject to the mixing of salt water from the ocean with fresh water primarily fromthe Hudson River. It is divided at the Verrazano Narrows into Upper and Lower New York Bays.
Regulatory Context
The following sections identify the federal and state legislation and regulatory programs that pertainto coastal areas, surface waters, floodplains, wetlands, and protected species that would apply to theproposed actions.
Federal
Clean Water Act (33 U.S. Code [USC] §§ 1251 1387)
The objective of the Clean Water Act, also known as the Federal Water Pollution Control Act, is torestore and maintain the chemical, physical, and biological integrity of the waters of the United States.It regulates point sources of water pollution, such as discharges of municipal sewage, industrialwastewater, and stormwater runoff; the discharge of dredged or fill material into navigable waters andother waters; and non point source pollution (e.g., runoff from streets, construction sites, etc.) that enterwater bodies from sources other than the end of a pipe. Applicants for discharges to navigable watersin New York must obtain a Water Quality Certificate from the NYSDEC.
Rivers and Harbors Act of 1899
Section 10 of the Rivers and Harbors Act of 1899 requires authorization from the Secretary of the Army,acting through the U.S. Army Corps of Engineers (USACE), for the construction of any structure in orover any navigable water of the United States, the excavation from or deposition of material in these

125 Edgewater Street - CEQR No. 17DCP069R Environmental Assessment Statement
Page 2.8-2
waters, or any obstruction or alteration in navigable waters of the United States. The purpose of thisAct is to protect navigation and navigable channels. Any structures placed in or over navigable waters,such as pilings, piers, or bridge abutments up to the mean high water line, are regulated pursuant tothis Act.
Endangered Species Act of 1973 (16 USC §§ 1531 1544)
The Endangered Species Act of 1973 recognizes that endangered species of wildlife and plants are ofaesthetic, ecological, educational, historical, recreational, and scientific value to the nation and itspeople. The Act provides for the protection of critical habitats on which endangered or threatenedspecies depend for survival. The Act also prohibits the importation, exportation, taking, possession,and other activities involving illegally taken species covered under the Act, and interstate or foreigncommercial activities. Species protected under the Act have the potential to occur in the study area.
National Flood Insurance Act of 1968 (44 Committee of the Federal Register [CFR] § 59) and FloodplainManagement Executive Order 11988 (42 Federal Register [FR] 26951)
Development in floodplains defined by the Federal Emergency Management Agency (FEMA) mappingis regulated at the Federal level by the Floodplain Management Executive Order 11988 and NationalFlood Insurance Act of 1968 (44 CFR § 59). Executive Order 11988 requires Federal agencies to avoid tothe extent possible the long and short term adverse impacts associated with the occupancy andmodification of floodplains and to avoid direct and indirect support of floodplain developmentwherever there is a practicable alternative.
Magnuson Stevens Act (16 USC §§ 1801 TO 1883)
Section 305(b)(2) (4) of the Magnuson Stevens Act outlines the process for the National MarineFisheries Service (NMFS) and the Regional Fishery Management Councils (in this case, the MidAtlantic Fishery Management Council) to comment on activities proposed by federal agencies (issuingpermits or funding projects) that may adversely impact areas designated as Essential Fish Habitat(EFH). EFH is defined as those waters and substrate necessary to fish for spawning, breeding, feeding,or growth to maturity (16 USC §1802(10)).
Adverse impacts on EFH, as defined in 50 CFR 600.910(A), include any impact that reduces the qualityand/or quantity of EFH. Adverse impacts may include:
Direct impacts, such as physical disruption or the release of contaminants;
Indirect impacts, such as the loss of prey or reduction in the fecundity (number of offspringproduced) of a managed species; and
Site specific or habitat wide impacts that may include individual, cumulative, or synergeticconsequences of a federal action.
State
Tidal Wetlands Act, Article 25, ECL, Implementing Regulations 6 NYCRR § 661.
Tidal wetlands regulations apply anywhere tidal inundation occurs on a daily, monthly, or intermittentbasis. In New York, tidal wetlands occur along the tidal waters of the Hudson River up to the salt lineand along the saltwater shore, bays, inlets, canals, and estuaries of Long Island, New York City, andWestchester County. NYSDEC administers the tidal wetlands regulatory program and the mapping ofthe State’s tidal wetlands. A permit is required for almost any activity that would alter wetlands or theadjacent areas (up to 300 feet inland from the wetland boundary or up to 150 feet inland within New

125 Edgewater Street - CEQR No. 17DCP069R Environmental Assessment Statement
Page 2.8-3
York City). NYSDEC regulated tidal wetland adjacent areas may exist along the New York Harborshoreline within the project area.
Endangered and Threatened Species of Fish and Wildlife; Species of Special Concern (ECL, Sections 11 0535[1][2], 11 0536[2], [4], Implementing Regulations 6 NYCRR § 182)
The Endangered and Threatened Species of Fish and Wildlife, Species of Special Concern Regulationsprohibit the taking, import, transport, possession, or selling of any endangered or threatened speciesof fish or wildlife, or any hide, or other part of these species as listed in 6 NYCRR §182.6. Under theseregulations, adverse modification of occupied habitat of endangered or threatened species is prohibitedwithout authorization from NYSDEC.
State Pollutant Discharge Elimination System (SPDES) (N.Y. Environmental Conservation Law [ECL] Article3, Title 3; Article 15; Article 17, Titles 3, 5, 7, and 8; Article 21; Article 70, Title 1; Article 71, Title 19;Implementing Regulations 6 New York Codes, Rules and Regulations [NYCRR] Articles 2 and 3)
Title 8 of Article 17, ECL, Water Pollution Control, authorized the creation of the SPDES to regulatedischarges to New York State’s waters. Activities requiring a SPDES permit include point sourcedischarges of wastewater into surface or groundwater of the state, including the intake and dischargeof water for cooling purposes, constructing or operating a disposal system (sewage treatment plant),discharge of stormwater, and construction activities that disturb one or more acres. The proposedactions would require the management of stormwater and would involve construction on a site overone acre in size. Soil disturbing activities resulting from the proposed actions would be conducted inaccordance with the NYSDEC SPDES General Permit for Stormwater Discharges from ConstructionActivity (GP 0 10 001). To obtain coverage under this permit, a Storm Water Pollution Prevention Plan(SWPPP) would be prepared and a Notice of Intent (NOI) would be submitted to the NYSDEC. TheSWPPP would comply with all of the requirements of GP 0 10 001, NYSDEC’s technical standard forerosion and sediment control, presented in “New York Standards and Specifications for Erosion andSediment Control,” and NYSDEC’s technical standard for post construction stormwater controlpractices presented in the New York State Stormwater Management Design Manual.
Local
New York City Street Tree Zoning Amendment and Local Law 3 of 2010
The City of New York passed a zoning text amendment that requires trees to be planted along the curbof City streets following the construction of new buildings and certain types of alterations citywide.All applicants must apply to the New York City Department of Parks and Recreation (DPR) for streettree planting permits. The current zoning requires all new buildings and all enlargements exceeding20 percent of the floor area to have one tree for every 25 feet of road frontage, including existing trees.Like other zoning rules, these requirements must be satisfied in order for the builder to obtain aCertificate of Occupancy. Species shall be selected from the list of approved street trees for New YorkCity. The methodology used to determine the number and size of trees to be replanted (e.g., caliperreplacement method) is determined in consultation with DPR in accordance with this zoningamendment and local law and Chapter 5 Title 56 of the Rules of the City of New York (RCNY).

125 Edgewater Street - CEQR No. 17DCP069R Environmental Assessment Statement
Page 2.8-4
2.8.3 Assessment
Existing Conditions
The project area contains no built resource that is known to contain or may be used as a habitat by aprotected species as defined in the Federal Endangered Species Act (50 CFR 17) or the State sEnvironmental Conservation Law (6 NYCRR Parts 182 and 193). Stormwater generated on thedevelopment site currently discharges into an existing storm sewer on site which discharges into theUpper Bay. A rip rap shoreline is developed along the waterfront. The project area contains nosubsurface conditions the disruption of which might affect the function or value of an adjacent ornearby natural resource.
Future No-Action Condition
Under the future No Action condition the project area would remain as per existing conditions. Therip rap shoreline which fronts on the waterfront would remain as per existing conditions. Storm watergenerated on site would continue to be discharged to the existing storm sewer on site.
Future With-Action Condition
The shoreline of the development site is lined with rip rap fronting the waters of New York Bay whichwould remain and would not be altered for the proposed project. There are no freshwater wetlandsadjacent to or near the development site. There is no tidal wetlands vegetation along the rip rap facingthe Upper Bay.
As part of the proposed project an SWPPP would be filed with the NYS Department of EnvironmentalConservation (NYSDEC). The SWPPP would comply with all of the requirements of GP 0 10 001,NYSDEC’s technical standard for erosion and sediment control, presented in “New York Standardsand Specifications for Erosion and Sediment Control,” and NYSDEC’s technical standard for postconstruction stormwater control practices presented in the New York State Stormwater ManagementDesign Manual. Under the With Action scenario stormwater generated on the development site wouldbe directed to water quality settling chambers prior to discharge to the existing storm sewer on sitewhich discharges into the Upper Bay. With the removal of sediments, there would be no harmful effecton the waters of Upper Bay.
As discussed in Section 2.1, “Land Use, Zoning, and Public Policy,” the proposed project would bedeveloped within the 100 year flood plain. The proposed project would be designed to accommodateflood levels projected for the year 2100 for all critical infrastructure and residential and commercialuses. This would account for the New York City Panel on Climate Change’s (NPCC) “High Estimate”level of +30 inches for the 2050s and +75 inches for the end of the century (2100). In terms of the absoluteelevations, the design would account for potential future “100 year” flood levels; for a portion ofBuilding A and the entirety of Buildings B and C this would be 19.3 feet (NAVD88); for the otherportion of Building A this would be 18.3 feet (NAVD88).
The elevation at grade for all three buildings would be 8.9 feet (NAVD88), the greatest base floodelevation would be consistent for all three buildings at 18.9 feet (NAVD88), and the design flood

125 Edgewater Street - CEQR No. 17DCP069R Environmental Assessment Statement
Page 2.8-5
elevation for all three buildings would be 20.9 feet (NAVD88). The proposed project would not includeany below grade space. The first floor of all three buildings would be used exclusively for parkingspaces and lobby areas (9.9 feet NAVD88); the second floor levels of Buildings A and B would bedeveloped with parking spaces and commercial space and the second floor level of Building C wouldbe developed with entirely commercial space (20.9 feet NAVD88).1 Residential floor area would belocated above the second floor in all three buildings. All first floor lobby and parking areas within thethree buildings would be wet flood proofed. The second floor would be located above the base floodelevation, as such, no flood proofing measures would be required.
All critical infrastructure, including but not limited to electricity connections, generators and fuel,communications, and elevators would be designed to withstand flooding up to the design floodelevation (20.9 feet NAVD88). Buildings A, B, and C, would all have critical systems elevated. Elevatorsat the first floor lobby of all three buildings would be dry flood proofed.
As discussed in Section 2.5, “Shadows,” the proposed project would result in new shadow incrementson the Upper New York Harbor to varying degrees during all seasons. Shadow cast by the proposedbuildings would move over the course of the day such that only very small portions of the water wouldbe cast in shadow for the full shadow duration. The impacts of shadows cast by the proposed projecton the waters of Upper New York Bay would primarily be of concern as related to vegetation locatedin the area to be in shadow. As noted above, there are no freshwater wetlands adjacent to or near thedevelopment site, and there is no tidal wetlands vegetation along the rip rap on the development sitefacing the Upper Bay. The reduction in light within the shadow footprint would not adversely affectthe Harbor’s phytoplankton communities, which are carried by tidal currents, and would only beexposed to the shadows for a relatively short period as they move through the area in shadow to areasoutside the shadow exposure. Overall, shadows from the proposed project would not result insignificant adverse impacts on natural resources.
As the duration of shadows cast by the project would be relatively modest at less than four hoursduring the warmer months of the year, there would be more than the minimum of four hours a day ofsunlight available to plants in the growing season which is the minimum sunlight requirement notedin the CEQR Technical Manual. No adverse impacts to plant life in the adjacent waters of Upper NewYork Bay would therefore be anticipated.
The Upper Bay of New York Harbor is a very busy waterway affected by lights, noise, and activitiesoccurring within and adjacent to the Harbor including noise generated by the nearby Staten IslandRailway and traffic along Bay and Edgewater Streets. The proposed project is a residential projectwhich would produce a much lower noise level than would be permitted by developments allowedunder the existing M2 1 of the development site. The proposed buildings would also provide a barrierbetween the Upper Bay and existing noise. Proposed lighting for the project would be typical lightingfor a residential development and it would not be directed at the Harbor but rather at the walkways ofthe development and the entrances to the proposed buildings. The transient wildlife of sea gulls andwaterfowl which occasionally rest on the waters adjacent to the development site would not besignificantly affected by this development.
1 Building heights given are measured from grade (thus the first floor is one foot above grade).

125 Edgewater Street - CEQR No. 17DCP069R Environmental Assessment Statement
Page 2.8-6
2.8.4 Conclusion
Due to the absence of significant natural resources in the project area and as the proposed project wouldnot disturb the adjacent waters of Upper New York Bay, no adverse impacts to natural resources wouldoccur, and further assessment of natural resources is not warranted.

125 Edgewater Street - CEQR No. 17DCP069R Environmental Assessment Statement
Page 2.9-1
Chapter 2.9: Hazardous Materials
2.9.1 Introduction
This chapter assesses the potential hazardous materials impacts of the proposed actions and identifiespotential issues of concern that could pose a hazard to workers, the community, and/or theenvironment during or after development of the proposed actions.
The project area consists of Block 2820, Lots 90 and 95 and portions of Lots 105 and 110 in the Rosebankneighborhood of Staten Island. The development site consists of Block 2820, Lot 90 (125 EdgewaterStreet). The proposed project would consist of the redevelopment of Lot 90 with three buildings witha mix of uses including residential, commercial, and parking uses; in addition, the proposed projectwould result in the development of the waterfront with an upland connection, visual corridor, andpublic access areas.
As indicated in the 2014 CEQR Technical Manual, the goal of a hazardous materials assessment is todetermine whether the proposed project would lead to a potential increased exposure of hazardousmaterials to people or the environment, or whether the increased exposure would lead to significantpublic health impacts or environmental damage.
2.9.2 Methodology
The potential for hazardous materials was evaluated based on the following reports:
Phase I ESA, dated May 12, 2015, prepared by Permanent Engineering P.C. (2015 Phase I).
Additionally, the 2015 Phase I references the Phase II and associated soil and groundwater remediationconducted by URS Corporation in 2005 and the Phase I ESA conducted by Giorgio EngineeringInternational, P.C. in 2007.
The 2015 Phase I was prepared in accordance with the American Society for Testing and Materials(ASTM) in accordance with ASTM E 1527 05, recognized environmental conditions (RECs) inconnection with the site with regard to hazardous materials as defined by the ComprehensiveEnvironmental Response, Compensation and Liability Act (CERCLA), and petroleum products.Additionally, several ASTM “Non Scope” items, including asbestos containing materials, lead basedpaints, and radon, are also discussed. The purpose of a Phase I ESA is to identify RECs that mayadversely affect the subsurface conditions (i.e., soil, groundwater and/or soil vapor) at the project site.

125 Edgewater Street - CEQR No. 17DCP069R Environmental Assessment Statement
Page 2.9-2
2.9.3 Assessment
Existing Conditions
Site Description and Surroundings
The development site is located on the east side of Edgewater Street between Willow Avenue andLynhurst Avenue (Staten Island Block 2820, Lot 90). The site is an L shaped waterfront property. Thelot area is 8.2 acres. Two buildings are located on the site; both buildings were constructed circa 1970.The first is commercial in use with a one story metal storage and the second is a two story vacantbuilding with a cellar. There are three commercial spaces, partially paved parking areas, no residentialunits and no medical offices. At the time of inspection, the commercial spaces were occupied as follows:
• CAC Construction co.
• Tudor Perini
• Top One Road Markings
The immediate neighbors to the development site include a seven story commercial building withpaved parking areas to the north (Pouch Terminal Building), a two story commercial building to thesouth, the Brooklyn Staten Island Upper Bay to the east, and Edgewater Street and a New York PowerAuthority power generation plant to the west.
The development site is located in a commercial area. All areas around the site are fully developed.The site is surrounded by other buildings, roads, sidewalks, and parking lots. Abutting thedevelopment site are commercial buildings on the north and south. There are no gasoline stations, autobody repair shops, dry cleaners or similar types of properties within the surrounding area that couldinfluence the environmental stability of the site.
Site and Surrounding Area History
Research into the history of the subject property based on Sanborn maps shows that the site wasdeveloped with six 1 story buildings and storage in 1922; five 1 story storage, a one story metalstorage, and two story offices in 1937; three one story storage, a metal shed, and two story offices in1977; two story offices/garage, a one story storage shed, and bus parking in 1981. Based on the mostrecent 2007 Sanborn maps and a site visit, conditions on the site remain as they were in 1981.
As shown on Sanborn maps, adjacent properties to the north, south, east, and west were developed asfollows:
1922 – north: one story commercial space, south: commercial building, east: Brooklyn StatenIsland Narrow steel/wood pier, west: Edgewater Street;
1937 – north: one story commercial space, south: two story storage building, east: BrooklynStaten Island Narrow steel/wood pier, west: seven story commercial offices;
1981 – north: one story commercial space, south: one story warehouse, east: Brooklyn StatenIsland Narrow steel/wood pier, west: seven story commercial offices;

125 Edgewater Street - CEQR No. 17DCP069R Environmental Assessment Statement
Page 2.9-3
1993 – north: paved parking, south: one story warehouse, east: Brooklyn Staten IslandNarrow steel/wood pier, west: seven story commercial offices.
Based on the most recent 2007 Sanborn maps and a site visit, conditions on the adjacent propertiesremain as they were in 1981.
Current Site Operations and Hazardous Materials
Description of Site
Based on site reconnaissance, the building/site is presently being used for commercial use. No medicalcare facility, doctor s office, dentist s office or laboratory was located in the building/on the site. Thereis no evidence of bio hazardous waste being generated in the building/on the site.
Hazardous Substances Usage/Storage
Refrigerant, lubricant (machine oil), algicide and cleaning products are neither stored nor usedregularly in the building/on the site. These are hazardous materials but commonly used as institutionalchemicals. These materials are stored in either 55 gallon drums or 5 gallon containers. No stained orimproperly disposed materials were observed.
Petroleum Products Usage/Storage
The only occupied building at the site is heated by electric and gas fired heating systems located ineach commercial space. The site does not have a Petroleum Bulk Storage tank registered with the NewYork State Department of Environmental Conservation (NYSDEC). There is no emergency electricsystem. No fuel storage tanks associated with this type of equipment are located at the site. There areno gasoline storage tanks in the garage.
Underground and Aboveground Storage Tanks
There are no other buried storage tanks on the site. An aboveground storage tank, approximately 500gallon is located in the cellar of the two story vacant building. The building was flooded during Superstorm Sandy; at the time of the site inspection there was approximately one foot of water in the cellarof the building where the storage tank is located. The content of the storage tank could not be identified.
PCBs Usage
Polychlorinated Biphenyls (PCBs) were widely used in electrical equipment until the U.S.Environmental Protection Agency (EPA) banned manufacture of PCBs in 1979. Transformers oftencontain dielectric liquid for the primary purpose of increasing resistance of the unit to arcing and actingas a heat transfer media, helping cool the coils. The majority of transformers are filled with mineral oil,but a small percentage of these liquid filled transformers contain PCB Askarel coolant liquid. The termAskarel is a generic term used to a group of nonflammable synthetic chlorinated hydrocarbons. All
types of Askarels sold prior to 1979 contained 60 to 100 percent PCBs and are generally used inhazardous locations where flammability is of concern.
There are three EPA categories of transformers:

125 Edgewater Street - CEQR No. 17DCP069R Environmental Assessment Statement
Page 2.9-4
PCB Transformers: Any transformer containing 500 ppm PCBs or greater.
PCB Contaminated Transformer: Any transformer containing 40 499 ppm PCBs. Thesetransformers are not subject to parts of the regulations such as marking requirements or, ifdrained of liquid, to the disposal requirements. Any liquid drained from these transformersmust be stored and disposed of in accordance with the regulations.
Non PCB Transformer: Any transformer containing less than 50 ppm PCBs.
Two suspect PCB Transformers are located in the cellar of the two story vacant building. The thirdtransformer is believed to be a dry type transformer.
Stains, Corrosion, Stained Vegetation
All areas outside the building appeared to be well maintained. At the time of inspection, there was noevidence that hazardous chemicals or petroleum products were stored outside the building. Strong,pungent or noxious odors were not identified. Stains or chemical leaks were noticeable outside thebuilding. The stains covered small areas and on the surface soil.
Surrounding areas (establishments and hazardous facilities within a 0.25 mile radius) were alsoevaluated for any obvious waste or hazardous materials which might affect the subsurface quality (soiland/or groundwater quality) of the subject property. No interactions with surrounding areas werefound to be environmentally harmful to this property. To the extent visually or physically observed,stressed vegetation was not found.
Solid Waste Disposal
Waste from the commercial spaces is carted by private haulers.
Waste water and Sewage
Waste water and sewage from the building is collected in the sewer system maintained by the City ofNew York.
Wells
The building is provided with drinking water from the New York City Municipal System. There havenever been, nor were there any at the time of inspection, any monitoring wells, or groundwater supplywells on the site.
Drains and Sumps
Storm water drains are collected in the sewer system maintained by the City of New York. There areno sumps on the site.
Pits Ponds and Lagoons
There are no pits, ponds or lagoons on the site.

125 Edgewater Street - CEQR No. 17DCP069R Environmental Assessment Statement
Page 2.9-5
Asbestos
All accessible areas of the building were inspected including the cellar and roof. The EPA identifiesthree categories of asbestos containing material, (ACM), used in building materials:
Surfacing Materials ACM sprayed or troweled on surfaces (walls, ceilings, structural members)for acoustical, decorative, or fireproofing purposes. This includes plaster and fireproofinginsulation.
Thermal System lnsulation lnsulation used to inhibit heat transfer or prevent condensation onpipes, boiler, tanks, ducts, and various other components of hot and cold water systems andheating, ventilation, and air conditioning (HVAC) systems. This includes pipe lagging, pipe wrap;block, batt, and blanket insulation; cements and muds ; and a variety of other products such asgaskets and ropes.
Miscellaneous Materials Other, largely non friable products and materials such as floor tile,ceiling tile, roofing felt, concrete pipe, outdoor siding, and fabrics.
The inspection revealed the following:
No Surfacing Material was used as a building material.
No damaged, friable asbestos containing Thermal System Insulation was found at the site.
Miscellaneous Materials in the form of 9 x 9 floor tiles were noted on the first floor of the vacanttwo story building.
Lead Paint
Lead based paint is commonly found in a building of this age. No apparent peeling or cracking onpainted surface was observed. The presence of lead based paint in the building can be determined onlyby testing.
Mold
Mold can produce compounds that become airborne along with the mold spores. A toxic substancecalled mycotoxin and other substances may be found within spores. Mold growth can originate wherethere is high humidity, mild temperature and an organic surface to grow on. Excessive mold growthin a building could become an indoor air quality problem, even though the environmental hazard isnot encompassed by CERCLA s appropriate inquiry responsibilities, accessible areas of the buildingwere inspected during the site visit No areas of mold growth or conditions for mold growth wereobserved.
Other Issues of Concern
Generally, formaldehyde and other hazards are commonly found in this type of building.Formaldehyde may be emitted from certain types of foam insulation. This type of wall insulation wasnot observed in the building. According to the Building Superintendent, no record of eye irritation orodor complaint was noted by the personnel or tenants in the building.

125 Edgewater Street - CEQR No. 17DCP069R Environmental Assessment Statement
Page 2.9-6
Regulatory Agency Database Information
Project Site
A review was conducted of Federal, State, local and tribal records pertaining to past or present potentialREC at the subject property. The property is not shown on any Federal, State, local or tribal recordslists with the following exception.
There are two NYSDEC reported spill incidents listed at the subject property as follows:
Spill #8910576 was reported to NYSDEC on February 5, 1990 due to an unknown oil sheen on thesurface water of the Upper New York Bay. The case was closed on February 7, 1990.
Spill #0130008 was reported to NYSDEC on September 14, 1993 due to groundwater contaminationat the site. The case was close on November 30, 2004.
Surrounding Area
A review was conducted of Federal, State, local and tribal records pertaining to past or present potentialREC within the surrounding area. The surrounding area is shown on the following Federal, State, localand tribal records lists.
Federal Database Lists
Two sites were identified on the CERC NFRAP database list within 0.5 miles of the project site. Twosites were identified on the RCRA Large Generator database list within 0.25 miles of the project site.Seven sites were identified on the RCRA Small Generator database list within 0.25 miles of the projectsite. The 2015 Phase I determined that these sites do not represent significant environmental conditions.
State and Local Database Lists
Three sites were identified on the State Hazardous Waste Sites database list within 1.0 mile of theproject site. One site was identified on the State Landfill database list within 0.5 miles of the projectsite. Eleven sites were identified on the State Leaking AST & UST Storage Tanks database list within0.5 miles of the project site. Seven sites were identified on the State UST (PBS) database list within 0.25miles of the project site. Five sites were identified on the State AST database list within 0.25 miles ofthe project site. One site was identified on the CBS AST database list within 0.25 miles of the projectsite. Two sites were identified on the MOSF AST database list within 0.5 miles of the project site. Onesite was identified on the NY Brownfields database list within 0.5 miles of the project site. Twenty onesites were identified on the SPILLS (PBS, CBS) database list within 0.125 miles of the project site. The2015 Phase I determined that these sites do not represent significant environmental conditions.
Data Gaps
Based on the site inspection and review of available data the following data gap was observed:
The site has been listed by USEPA in its Facility Index System (FINDS). An Air Program permitwas issued for the site by USEPA; USEPA Registry ID #110019832225. Details of the activities at thesite are not known. Currently there are no activities at the site that would require air quality permit.Past activity at the site could have been related to use of a pier that existed at the site at one time.Currently no pier was observed at the site. No violations were found. The recognized data gap in

125 Edgewater Street - CEQR No. 17DCP069R Environmental Assessment Statement
Page 2.9-7
the available information is significant and is considered as a Historical Recognized EnvironmentalCondition (HREC).
Future No-Action Condition
Absent the proposed actions, it is assumed that the project site would remain vacant and underutilized.Therefore, the future No Action condition considers the project site in the 2019 build year in its currentcondition with the existing zoning remaining in place. In the future without the proposed actions, ahazardous materials (E) Designation would not be placed on the development site to ensure thatappropriate testing and measures to protect human health are taken. As such, any potential impactswould remain in place and go unmitigated.
Future With-Action Scenario
The New York City Department of Environmental Protection (DEP) has reviewed the proposed project.In a letter dated October 23, 2015m DEP recommended that a hazardous materials (E) designationwould be placed on Block 2820; Lots 90, 95, 105, and 110 to ensure that appropriate testing andmeasures to protect human health and the environment are incorporated into future development (seeAppendix C). Prior to development, the future developer would be required to ensure that testing andmitigation would be provided as necessary. Further hazardous materials assessments would bedirected through the New York City Office of Environmental Remediation (OER).
The (E) designation text (E 401) related to hazardous materials is as follows:
Task 1
The applicant submits to OER, for review and approval, a Phase I ESA of the site along with asoil and groundwater testing protocol (a.k.a. Remedial Investigation Work Plan [RIWP] alongwith a site specific Health and Safety Plan (HASP), including a description of methods and aproject site map with all sampling locations clearly and precisely represented.
If site sampling is required, no sampling should begin until written approval of a protocol isreceived from OER. The number and location of sample sites should be selected to adequatelycharacterize the site, the specific source of suspected contamination (i.e., petroleum basedcontamination and non petroleum based contamination), and the remainder of the site’scondition. The characterization should be complete enough to determine what remediationstrategy (if any) is necessary after review of sampling data. Guidelines and criteria for selectingsampling locations and collecting samples are provided by OER upon request.
Task 2
A written report with findings and a summary of the data must be submitted to OER aftercompletion of the testing phase and laboratory analysis for review and approval. After receivingsuch results, a determination is made by OER if the results indicate that remediation isnecessary. If OER determines that no remediation is necessary, written notice shall be given byOER.

125 Edgewater Street - CEQR No. 17DCP069R Environmental Assessment Statement
Page 2.9-8
If remediation is indicated from the test results, a proposed RAP must be submitted to OER forreview and approval. The applicant must complete such remediation as determined necessaryby OER in accordance with the approved RAWP. The applicant should then provide properdocumentation that remedial action has been satisfactorily completed.
An OER approved CHASP would be implemented during evacuation and construction andactivities to protect workers and the community from potentially significant adverse impactsassociated with contaminated soil and/or groundwater. This plan would be submitted to OERfor review and approval prior to implementation.
All demolition or rehabilitation would be conducted in accordance with applicablerequirements for disturbance, handling and disposal of suspect lead paint and asbestoscontaining materials.
2.9.4 Conclusion
With the implementation of the (E) designation (E 401), no significant adverse impacts related tohazardous materials would occur.

125 Edgewater Street - CEQR No. 17DCP069R Environmental Assessment Statement
Page 2.10-1
Chapter 2.10: Water and Sewer Infrastructure
2.10.1 Introduction
This chapter evaluates the potential for the proposed actions to result in significant adverse impacts to the City’s water supply, as well as its wastewater and stormwater conveyance and treatment infrastructure. As shown on “NYC’s Drainage and Sewer Systems” map included in the Water and Sewer Infrastructure chapter of the CEQR Technical Manual, the development site is located in an area identified as “Other.” Therefore, a discussion is provided below of the potential impacts of the proposed project on water supply, waste water, and storm water infrastructure. As RWCDS 2 would generate a greater amount of sanitary sewage than RWCDS 1, RWCDS 2 is analyzed.1
2.10.2 Assessment
Water Supply
The proposed project does not require an analysis of impacts to water supply as it would not result in an exceptionally large demand for water (i.e., more than one million gallons per day) and the project area is not located in an area that experiences low water pressure (such as areas at the end of the water supply distribution system).
Sanitary Sewage
Based on the sewage generation rate factors shown in Table 13-2 of the Water and Sewer Infrastructure chapter of the CEQR Technical Manual, the proposed project (RWCDS 2) would generate 104,900 gallons per day (gpd) of sanitary sewage as shown in the table below.
Table 2.10-1 Project Sanitary Sewage Generation
Use Rate Persons Sewage Generation Amount (gallons per day)
Residential 100gpd/person1 1,0492 104,900
Notes: 1. CEQR Technical Manual Table 13-2 2. Population based on 2.65 residents per household from 2010 Census Tract 6, 8, and 27 Average Household Size (NYC Department of City Planning)
The sanitary flows from each of the three proposed buildings would be directed through 8-inch on-site sanitary connections to several existing sanitary sewer lines in Edgewater Street (see Figure 2.10-1).
1 Based on a generation rate of 100 gallons per person per day for residential uses and 0.24 gallons per day per square foot for
commercial uses per CEQR Technical Manual Table 13-2.

10/1
4/16
Sour
ce: W
ohl &
O’M
ara,
L.L.
P.
Figu
re
2.10
-1Sa
nita
ry a
nd S
torm
Dra
inag
e Pl
an12
5 Ed
gew
ater
Str
eet
Stat
en Is
land
, New
Yor
k

125 Edgewater Street - CEQR No. 17DCP069R Environmental Assessment Statement
Page 2.10-2
Storm water
Storm water flows generated by the proposed project would be less than current flows as the development site is currently totally covered with impervious surfaces for buildings, pavement, etc. The proposed project would create additional unpaved and landscaped areas on the development site relative to current conditions and therefore storm water flows off-site would decrease. In addition, the developed site storm water runoff would be directed into two storm water detention systems to be built on-site. The storm water will be discharged from each system at the NYC Department of Environmental Protection (DEP) approved allowable rate to the 13’ x 6’ storm sewer that traverses the site. The permitted flow would then connect into the storm sewer line in the bed of Edgewater Street.
The total storm water flows on the development site following completion of the project are anticipated to be 16.18 cubic feet per second (cfs) while the total DEP allowable flow would be 14.78 cfs. There will be a total overland flow to Upper New York Bay of 2.13 cfs. The remaining flow of 14.05 cfs would be retained on site via two detention basins with a combined flow out to the existing storm sewer of 12.65 cfs (see Figures 2.10-1 and 2.10-2).
The combined sanitary and storm sewer flows from the proposed project would flow to the Port Richmond Wastewater Treatment Plant (WWTP) which has a capacity of 60 million gallons per day.
2.10.3 Conclusion
It is not anticipated that the relatively modest increase in sanitary sewage flows generated by the project would exceed the capacity of existing sewer lines servicing the project area or the design capacity of the Port Richmond WWTP. As discussed above, storm water flows would not increase with the proposed project and would mostly be retained on site prior to release to the existing storm sewer in Edgewater Street. No significant adverse impacts to the water and sewer infrastructure would be anticipated.

10/1
4/16
Sour
ce: W
ohl &
O’M
ara,
L.L.
P.
Figu
re
2.10
-2Sa
nita
ry a
nd S
torm
Dra
inag
e D
etai
ls12
5 Ed
gew
ater
Str
eet
Stat
en Is
land
, New
Yor
k

125 Edgewater Street - CEQR No. 17DCP069R Environmental Assessment Statement
Page 2.11-1
Chapter 2.11: Transportation
2.11.1 Introduction
According to the 2014 CEQR Technical Manual, the objective of a transportation analysis is to determinewhether a proposed project may result in significant adverse impacts to travelers (commuting bymeans of private car, taxi, subway and rail, bus, ferry, bicycle, and foot) within their respective studyareas near the project site, and to identify and incorporate improvement measures as part of the projectto avoid significant impacts.
2.11.2 Methodology and Analytical Framework
According to the 2014 CEQR Technical Manual procedures for transportation analysis, a two tieredscreening process is to be undertaken to determine whether a quantified analysis is necessary. The firststep, the Level 1 (Trip Generation) screening, determines whether the volume of peak hour person andvehicle trips generated the proposed project would remain below the minimum thresholds for furtherstudy. These thresholds are:
50 peak hour vehicle trip ends;
200 peak hour subway/rail or bus transit riders; and
200 peak hour pedestrian trips.
If the proposed project results in increments that would exceed any of these thresholds, a Level 2 (TripAssignment) screening assessment is usually performed. Under this assessment, project generatedtrips that exceed Level 1 thresholds are assigned to and from the site through their respective networks(streets, buses, subway lines, sidewalks, etc.) based on expected origin destination patterns and travelroutes. This determines the volume of peak hour vehicular traffic that would be added per intersection,the volume of riders that would be added per subway line or bus route, and the walk trips that wouldbe added per individual pedestrian network element (crosswalk, corner reservoir area, etc.). If the Level2 screening assessment determines that any single traffic location, transit line or station element, orpedestrian network element would experience an increase of trips beyond the above thresholds for anypeak hour, then a detailed analysis is typically warranted.
The proposed project’s reasonable worst case development scenario (RWCDS 1) would result in thedevelopment of 478,694 gsf of floor area spanning over three buildings. At Building ‘A’, located at thesouthern end of the site, 163 residential dwelling units (DUs) 5,450 square feet (sf) of eating and drinkestablishment space (restaurant), and 7,200 sf of retail space would be developed. Building ‘B’, locatedin the middle of the development site, would have 184 residential units and 5,073 sf of physical andculture establishment space (health club). Building ‘C’ would be located at the northern end of thedevelopment site and would have 24 residential DUs and 6,450 sf of restaurant space. The projectwould also include 1.03 acres of parkland (half of which would be with active open space and the otherhalf would be passive open space) and 346 parking spaces. Another scenario, RWCDS 2, where there

125 Edgewater Street - CEQR No. 17DCP069R Environmental Assessment Statement
Page 2.11-2
would be 396 residential DUs developed but with no supporting commercial space would also beassessed. The development program and all residential scenario are shown in Table 2.11 1.
Table 2.11-1 – Summary of Proposed Development Scenarios
Use
RWCDS 1 With-Action
Development Program
RWCDS 2 All Residential Scenario Development Program
Residential 371 DUs 396 DUs Local Retail 7,200 sf - Restaurant 11,900 sf - Health Club 5,073 sf - Open Space 1.03 acres 1.03 acres Parking 346 spaces 346 spaces
Vehicular access to the development site would be provided from Edgewater Street at three locations.As shown in Figure 2.11 1, driveway access would be provided along Edgewater Street south ofLynhurst Avenue (with access to Building ‘A”), at the intersection of Edgewater Street and LynhurstAvenue (with access to Buildings ‘A’ and ‘B’), and at the intersection of Edgewater Street and WillowAvenue (with access to Buildings ‘B’ and ‘C’).
Level 1 Screening Assessment (Trip Generation) The travel demand factors used to calculate the projected number of trips generated by the proposedproject were identified based on discussions with NYCDCP, and were obtained primarily from the2014 CEQR Technical Manual and previously approved New York City EISs and EASs such as the NewStapleton Waterfront Development Plan FEIS Technical Memorandum 1 (2010), and Staten Island LighthousePoint EAS (2013). Table 2.11 2 provides the travel demand assumptions used for the weekday AM,midday, and PM peak hours.

Figu
re12
5 Ed
gew
ater
Str
eet D
evel
opm
ent
Stat
en Is
land
, New
Yor
k 10
305
Prop
osed
Pro
ject
Site
Pla
n2.
11-1
Dat
e: 1
0.31
.201
6
NS
ourc
e: G
eral
d J.
Cal
iend
o R
A A
IA

125 Edgewater Street - CEQR No. 17DCP069R Environmental Assessment Statement
Page 2.11-3
Table 2.11-2 – Travel Demand Assumptions
Residential Restaurant Local Retail Health Club Active Open
Space Passive Open
Space
Weekday Person Trip Gen Rate 8.075 1 203.44 3 205.0 1 44.7 1 139 1 44 1
per dwelling unit per 1,000 SF per 1,000 SF per 1,000 SF per acre per acre
Temporal Distribution Weekday AM Peak 10.0% 1 1.0% 3 3.0% 1 4.0% 1 3% 1 3% 1
Weekday Midday Peak 5.0% 1 9.0% 3 19.0% 1 9.0% 1 5% 1 5% 1
Weekday PM Peak 11.0% 1 10.0% 3 10.0% 1 5.0% 1 6% 1 6% 1
Modal Split Auto 61.2% 5 25.0% 3 9.0% 2 68.0% 6 15.0% 3 15.0% 3
Taxi 1.0% 5 3.0% 3 2.0% 2 2.0% 6 0.0% 3 0.0% 3
Bus 20.4% 5 5.0% 3 7.0% 2 13.0% 6 2.5% 3 2.5% 3
Staten Island Railway 12.3% 5 5.0% 3 7.0% 2 8.0% 6 2.5% 3 2.5% 3
Walk/Other 5.1% 5 62.0% 3 75.0% 2 9.0% 6 80.0% 3 80.0% 3
Vehicle Occupancy Auto 1.12 5 2.00 3 1.65 2 2.00 6 2.50 3 2.50 3
Taxi 1.12 5 2.00 3 1.40 2 2.00 6 2.50 3 2.50 3
Directional Split (Ins) Weekday AM Peak 16.0% 2 50.0% 3 50.0% 2 60.0% 4 80% 3 80% 3
Weekday Midday Peak 59.0% 2 50.0% 3 50.0% 2 53.0% 4 50% 3 50% 3
Weekday PM Peak 75.0% 2 50.0% 3 50.0% 2 50.0% 4 45% 3 45% 3
Weekday Truck Trip Gen Rate 0.06 1 0.79 3 0.35 1 0.04 4 0.02 3 0.02 3
per dwelling unit per 1,000 SF per 1,000 SF per 1,000 SF per acre per acre
Truck Temporal Distribution AM Peak 12.0% 1 10.0% 3 8.0% 1 8.0% 4 6.0% 3 6.0% 3
Midday Peak 9.0% 1 8.0% 3 11.0% 1 11.0% 4 6.0% 3 6.0% 3
PM Peak 2.0% 1 1.0% 3 2.0% 1 1.0% 4 1.0% 3 1.0% 31. 2014 CEQR Technical Manual 2. New Stapleton Waterfront Development Plan FEIS Technical Memorandum 1, 2010 3. Staten Island Lighthouse Point EAS, 2013 4. La Central DEIS, 2016 5. ACS 2010 - 2014 Journey to Work Data (Table B08006) for Staten Island Census Tracts 6, 8, and 40; ferry trips were assumed to use auto, bus, and the SIR to reach the ferry terminal 6. New Stapleton Waterfront Development Plan FEIS, 2006
Residential
The weekday trip generation rate of 8.075 daily trips per dwelling unit (DU) and temporal distribution(10 percent, 5 percent, and 11 percent for the weekday AM, midday, and PM peak hours, respectively)for the residential use were obtained from the 2014 CEQR Technical Manual. Directional distributionsof 16 percent “in”, 59 percent “in”, and 75 percent “in” for the weekday AM, midday, and PM peakhours, respectively, were obtained from the New Stapleton Waterfront Development Plan FEIS TechnicalMemorandum 1 (2010). The modal split and vehicle occupancy were based on the American CommunitySurvey 2010 – 2014 Journey to Work Data for Staten Island census tracts 6, 8, and 40. Modal splits of61.2 percent by auto, 1.0 percent by taxi, 20.4 percent by bus, 12.3 percent by Staten Island Railway(SIR), and 5.1 percent by walk or other modes, and vehicle occupancies of 1.12 persons per auto or taxiwere used. Approximately 10 percent of residents within these census tracts use the ferry to commuteto work – these trips were assumed to travel to the St. George ferry terminal via auto, bus, and the SIR.

125 Edgewater Street - CEQR No. 17DCP069R Environmental Assessment Statement
Page 2.11-4
Similar to the daily person trip calculations, daily delivery trip rates were obtained from the 2014 CEQRTechnical Manual. Weekday trip generation rates of 0.06 daily trucks per DU and temporal distributionof 12 percent, 9 percent, 2 percent, and 9 percent for the weekday AM, midday, and PM peak hours,respectively, were used for the analysis.
Restaurant
For the restaurant use, a weekday trip generation rate of 203.44 daily person trips per 1,000 sf wasobtained from the Staten Island Lighthouse Point EAS (2013) for a high turnover sit down restaurant. Thetemporal distribution, modal splits, vehicle occupancy rates, and directional distributions wereobtained from the Staten Island Lighthouse Point EAS (2013). Temporal distributions of 1 percent, 9percent, and 10 percent were used for the weekday AM, midday, and PM peak hours, respectively, anddirectional distribution of 50 percent “in” were assumed for all peak analysis hours. The modal splitsused for the weekday AM, midday, and PM peak hours were 25 percent by auto, 3 percent by taxi, 6percent by bus, 6 percent by SIR, and 60 percent by walk or other modes. Vehicle occupancies of 2.00persons per auto and taxi were used for all peak hours analyzed.
For restaurant delivery trips, a weekday trip generation rate of 0.79 daily trucks per 1,000 sf andtemporal distributions of 10 percent, 8 percent, and 1 percent for the weekday AM, midday, and PMpeak hours, respectively, were obtained from the Staten Island Lighthouse Point EAS (2013).
Local Retail
For the local retail use, a trip generation rate of 205 daily person trips per 1,000 sf for weekdays wasobtained from the 2014 CEQR Technical Manual. Vehicle occupancy, modal split, and directionaldistributions were obtained from the New Stapleton Waterfront Development Plan FEIS TechnicalMemorandum 1 (2010) and the temporal distributions were obtained from the 2014 CEQR TechnicalManual. The modal split assumed for the weekday AM, midday, and PM peak hours are 9 percent byauto, 2 percent by taxi, 7 percent by bus, 7 percent by SIR, and 75 percent by walk or other modes.Vehicle occupancies of 1.65 persons per auto and 1.40 persons per taxi were used for all peak analysishours. The temporal distributions used were 3 percent, 19 percent, and 10 percent for the weekday AM,midday, and PM peak hours, respectively, and the directional distribution used was 50 percent “in”for all peak analysis hours.
For local retail delivery trips, a weekday trip generation rate of 0.35 daily trucks per 1,000 sf andtemporal distributions of 8 percent, 11 percent, and 2 percent for the weekday AM, midday, and PMpeak hours, respectively, were obtained from the 2014 CEQR Technical Manual.
Health Club
For the health club use, a weekday trip generation rate of 44.7 daily person trips per 1,000 sf andtemporal distributions of 4 percent, 9 percent, and 5 percent for the weekday AM, midday, and PMpeak hours, respectively, were obtained from the 2014 CEQRTechnical Manual. Modal splits and vehicleoccupancies were obtained from the New Stapleton Waterfront Development Plan FEIS (2006). The modalsplits assumed for the weekday AM, midday, and PM peak hours were 68 percent by auto, 2 percentby taxi, 13 percent by bus, 8 percent by SIR, and 9 percent by walk or other modes. Vehicle occupanciesof 2.00 persons per auto and 2.00 persons per taxi were used for all peak hours analyzed. The directionaldistributions of 60 percent “in”, 53 percent “in”, and 50 percent “in” were assumed for the weekdayAM, midday, and PM peak hours, respectively, and were obtained from the La Central DEIS (2016).
For health club delivery trips, a weekday trip generation rate of 0.04 daily trucks per 1,000 sf andtemporal distributions of 8 percent, 11 percent, and 1 percent for the weekday AM, midday, and PMpeak hours, respectively, were obtained from the La Central DEIS (2016).

125 Edgewater Street - CEQR No. 17DCP069R Environmental Assessment Statement
Page 2.11-5
Open Space
For the open space use, a weekday trip generation rate of 139 daily person trips per acre sf was usedfor active open space and a trip generation rate of 44 daily person trips per acre was used for passiveopen space. The temporal distributions of 3 percent, 5 percent, and 6 percent for the weekday AM,midday, and PM peak hours, respectively, were used for both active and passive open space. Tripgeneration rates and temporal distributions were obtained from the 2014 CEQR Technical Manual.Modal splits and vehicle occupancies were obtained from the Staten Island Lighthouse Point EAS (2013).The modal splits assumed for the weekday AM, midday, and PM peak hours were 15 percent by auto,2.5 percent by bus, 2.5 percent by SIR, and 80 percent by walk or other modes. Vehicle occupancies of2.50 persons per auto and 2.50 persons per taxi were used for all peak hours analyzed. The directionaldistributions of 80 percent “in”, 50 percent “in”, and 45 percent “in” were assumed for the weekdayAM, midday, and PM peak hours, respectively, and were also obtained from the Staten Island LighthousePoint EAS (2013).
For open space delivery trips, a weekday trip generation rate of 0.02 daily trucks per acre and temporaldistributions of 6 percent, 6 percent, and 1 percent for the weekday AM, midday, and PM peak hours,respectively, were obtained from the Staten Island Lighthouse Point EAS (2013).
Level 1 Screening Results
Traffic
As shown in Table 2.11 3, the increase in hourly vehicle trips for the proposed project (RWCDS 1)would be 182 vehicles per hour (vph) during the weekday AM peak hour, 149 vph in the weekdaymidday peak hour, and 240 vph in weekday PM peak hour. The increase in hourly vehicle trips underthe proposed project (RWCDS 1) would be similar to the number of hourly vehicle trips generated byan all residential scenario (RWCDS 2) during the weekday AM peak hour, but would be higher duringthe weekday midday and PM peak hours. Therefore, further traffic analysis would be conducted basedon the program developed for the proposed project (RWCDS 1).
Since the incremental volume of vehicle trips generated by the proposed development would exceedthe 50 vehicle trip threshold during all peak hours analyzed, a Level 2 vehicle trip assignment anddetailed analyses will be conducted.
Table 2.11-3: Trip Generation Summary – Vehicle Trips
Mode
Weekday AMPeak Hour
Weekday MiddayPeak Hour
Weekday PMPeak Hour
In Out Total In Out Total In Out Total
RWCDS 1
Auto 32 142 174 74 59 133 157 67 224
Taxi 2 2 4 8 8 16 8 8 16
Truck 2 2 4 0 0 0 0 0 0
Total 36 146 182 82 67 149 165 75 240
RWCDS 2
Auto 28 146 174 52 36 88 144 48 192
Taxi 4 4 8 2 2 4 4 4 8
Truck 1 1 2 1 1 2 0 0 0
Total 33 151 184 55 39 94 148 52 200

125 Edgewater Street - CEQR No. 17DCP069R Environmental Assessment Statement
Page 2.11-6
Transit and Pedestrians
Transit and pedestrian trips generated by the proposed project (RWCDS 1) would exceed the 2014CEQR Technical Manual Level 1 screening thresholds for transit and for pedestrians. As shown in Table2.11 4 below, the increase in transit trips would be 107 person trips during the weekday AM peak hour,117 person trips in the weekday midday peak hour, and 156 person trips in the weekday PM peak hour.The net increase in pedestrian trips (walk plus transit) is expected to be 171 person trips during theweekday AM peak hour, 464 person trips during the weekday midday peak hour, and 440 person tripsduring the weekday PM peak hour. The increase in hourly pedestrian trips under the proposed projectwould be higher than the number of pedestrian trips generated by an all residential scenario during allpeak hours. Therefore, further pedestrian analysis would be conducted based on the programdeveloped for the proposed project.
Since the number of peak hour pedestrian trips expected to be generated by the proposed action wouldexceed the CEQR thresholds of 200 pedestrian trips per hour for the weekday midday and PM peakhours, a Level 2 pedestrian assignment is needed to assess if there is a need to perform detailedpedestrian analyses.
Table 2.11-4: Trip Generation Summary – Pedestrian Trips
Mode
Weekday AMPeak Hour
Weekday MiddayPeak Hour
Weekday PMPeak Hour
In Out Total In Out Total In Out Total
RWCDS 1
Bus 13 53 66 35 30 65 63 29 92
Staten Island Railway 8 33 41 28 24 52 42 22 64
Walk/Other 27 37 64 174 173 347 146 138 284
Total 48 123 171 237 227 464 251 189 440
RWCDS 2
Bus 10 55 65 19 13 32 54 18 72
Staten Island Railway 6 33 39 12 8 20 32 11 43
Walk/Other 3 14 17 5 3 8 13 4 17
Total 19 102 121 36 24 60 99 33 132
Level 2 Screening Assessment (Trip Assignment) As shown above, the number of trips generated by the proposed project would exceed the 2014 CEQRTechnical Manual Level 1 screening thresholds for vehicle and pedestrian trips during the peak hoursanalyzed. Project generated trips were assigned through the surrounding street network based onexpected routes to and from the project site.
Traffic
Vehicle trip increments shown in Table 2.11 3 were assigned through the surrounding street networkbased on expected routes to the project site, the configuration of the roadway network, and theanticipated entrances to the site. Vehicular trip assignments are provided in Figure 2.11 2 through2.11 4. Trip assignments for each land use are discussed below.

0110
2316
4
6
40
53 5
50
21
39
0
0
0
0
00
00
40
000
550
390
53
01
0
00
0
0130
740
02330
02921
4447
12
30
100
201
0 1
42
250
3
0
0
50
0
LYNHURST AVENUE
VANDERBILT AVENUE
FRONT STREET
BAY STREET
BAY STREET
EDGEWATER STREET
HYLAN BOULEVARDTOM
PKINS AVENUE
WILLOW AVENUE
LYNHURST AVE
WILLOW AVE
PROJECT AREA
Edgewater Street between Willow Avenue and Lynhurst Avenue
0
0
N
Date: 12.2.2016
Figure125 Edgewater Street DevelopmentStaten Island, New York 10305
Project Generated Traffic Volume IncrementAM Peak Hour 2.11-2
Proposed Project Site Entrance

0225
912
14
11
51
2213
20
46
21
0
0
0
0
00
00
20
100
12130
21
0
22
03
0
00
0
0300
1660
0812
012
8
2319
41
31
201
433
11
22
1 21
3
0
013
0
0
LYNHURST AVENUE
VANDERBILT AVENUE
FRONT STREET
BAY STREET
BAY STREET
EDGEWATER STREET
HYLAN BOULEVARDTOM
PKINS AVENUE
WILLOW AVENUE
LYNHURST AVE
WILLOW AVE
PROJECT AREA
Edgewater Street between Willow Avenue and Lynhurst Avenue
0
0
N
Date: 12.2.2016
Figure125 Edgewater Street DevelopmentStaten Island, New York 10305
Project Generated Traffic Volume IncrementMidday Peak Hour 2.11-3
Proposed Project Site Entrance

0546
1013
22
24
111
2521
24
100
23
0
0
0
0
00
00
20
100
25210
23
025
02
0
00
0
0650
35120
01014
01410
2321
71
42
331
946
2 3
22
1 264
0
026
0
0
LYNHURST AVENUE
VANDERBILT AVENUE
FRONT STREET
BAY STREET
BAY STREET
EDGEWATER STREET
HYLAN BOULEVARDTOM
PKINS AVENUE
WILLOW AVENUE
LYNHURST AVE
WILLOW AVE
PROJECT AREA
Edgewater Street between Willow Avenue and Lynhurst Avenue
0
0
N
Date: 12.2.2016
Figure125 Edgewater Street DevelopmentStaten Island, New York 10305
Project Generated Traffic Volume IncrementPM Peak Hour 2.11-4
Proposed Project Site Entrance

125 Edgewater Street - CEQR No. 17DCP069R Environmental Assessment Statement
Page 2.11-7
Residential
Residential auto assignments were based on the NYCDCP’s journey to work data (Part 3 TableA302103) for Staten Island census tracts 6, 8, and 40. Approximately half of the project generatedvehicle trips (52 percent) were assumed to be destined for other sections of Staten Island. Of theremaining trips, approximately 20 percent of vehicle trips were assigned to Brooklyn, 11 percent toManhattan, 8 percent to New Jersey, 6 percent to Queens, and 3 percent to the Bronx. Approximatelytwo thirds of these trips were assigned to the Staten Island Expressway (SIE) through routes along BayStreet, Hylan Boulevard, and Vanderbilt Avenue.
Vehicle trips destined for areas within Staten Island were assigned along key roadways such as HylanBoulevard (approximately 25 percent), Bay Street (approximately 15 percent), Vanderbilt Avenue(approximately 9 percent), and Front Street (approximately 3 percent). Trips to other parts of New YorkCity (approximately 40 percent) were assigned to Bay Street (approximately 30 percent) and HylanBoulevard (approximately 10 percent) to access the SIE. New Jersey trips were assigned to the SIE viaHylan Boulevard (approximately 6 percent) and Vanderbilt Avenue (approximately 2 percent).
Local Retail/Restaurant/Health Club
The local retail, restaurant, and health club uses are expected to serve the immediately surroundingarea. Therefore, auto trips were generally assigned from local origins within the neighborhood andadjacent residential areas. Auto trips would access the site along roadways such as Bay Street, HylanBoulevard, Vanderbilt Avenue, and Front Street. A modest number of trips were assigned via the sidestreets such as Lynhurst Avenue and Virginia Avenue. Departing trips were assigned along the sameroutes as arrivals.
Transit and Pedestrians
Transit and pedestrian trips were assigned through the pedestrian network based on logical and directtravel routes to and from the project site from neighborhood attractions, SIR stations and/or bus stops,to determine if the number of additional pedestrian trips generated by the proposed project wouldexceed 200 peak hour pedestrian trips at any single pedestrian element (e.g. crosswalk, sidewalk,corner reservoir area) approaching the site the threshold for detailed pedestrian analysis.
The closest bus stop is located along Bay Street between Willow Avenue and Lynhurst Avenue andprovides service to the S51 bus route. S52 and S78 bus service is also available along Tompkins Avenueapproximately one third of a mile away from the project site. The Clifton SIR station is approximatelyone quarter mile to the north of the project site. Transit trips were assigned through sidewalks,crosswalks, and corner elements to and from the project site.
Project generated walk trips were assigned to residential pockets to the west of the project site, and tothe commercial establishments along Bay Street. A modest number of walk trips were assigned alongEdgewater Street which has limited amount of sidewalk and crosswalk facilities in place. Pedestriantrip assignments are provided in Figures 2.11 5 through 2.11 6.
2.11.3 Transportation Analysis
The Level 1 and Level 2 screening assessments show that detailed traffic and pedestrian analyses areneeded. Further analysis was conducted using methodologies presented in the Highway CapacityManual (HCM) as detailed in the 2014 CEQR Technical Manual.

Figu
re12
5 Ed
gew
ater
Str
eet D
evel
opm
ent
Stat
en Is
land
, New
Yor
k 10
305
Proj
ect G
ener
ated
Ped
estr
ian
Volu
me
Incr
emen
tM
idda
y Pe
ak H
our
2.11
-5
Dat
e: 1
1.11
.201
6
N

Figu
re12
5 Ed
gew
ater
Str
eet D
evel
opm
ent
Stat
en Is
land
, New
Yor
k 10
305
Proj
ect G
ener
ated
Ped
estr
ian
Volu
me
Incr
emen
tPM
Pea
k H
our
2.11
-6
Dat
e: 1
1.11
.201
6
N

125 Edgewater Street - CEQR No. 17DCP069R Environmental Assessment Statement
Page 2.11-8
Traffic
Analyses of traffic conditions in urban areas are based on critical conditions at intersections and aredefined in terms of levels of service. The capacity analyses were performed using Synchro 8 softwarewhich uses the methodologies presented in the HCM to determine the operating characteristics of anintersection. According to the HCM, levels of service (LOS) at signalized intersections are defined interms of a vehicle’s control delay at the intersection, as follows:
LOS A describes operations with very low delays, i.e., 10.0 seconds or less per vehicle. This occurswhen signal progression is extremely favorable and most vehicles arrive during the green phase.Most vehicles do not stop at all.
LOS B describes operations with delays in excess of 10.0 seconds up to 20.0 seconds per vehicle.This generally occurs with good progression and/or short cycle lengths. Again, most vehicles donot stop at the intersection.
LOS C describes operations with delays in excess of 20.0 seconds up to 35.0 seconds per vehicle.These higher delays may result from fair progression and/or longer cycle lengths. The number ofvehicles stopping is noticeable at this level, although many still pass through the intersectionwithout stopping.
LOS D describes operations with delays in excess of 35.0 seconds up to 55.0 seconds per vehicle.At LOS D, the influence of congestion becomes more noticeable. Longer delays may result fromsome combination of unfavorable progression, long cycle lengths, or high volume to capacity (v/c)ratios. Many vehicles stop, and the proportion of vehicles not stopping declines.
LOS E describes operations with delays in excess of 55.0 seconds up to 80.0 seconds per vehicle.These high delay values generally indicate poor progression, long cycle lengths, and high v/c ratios.
LOS F describes operations with delays in excess of 80.0 seconds per vehicle. This is considered tobe unacceptable to most drivers. This condition often occurs with oversaturation, i.e., when arrivalflow rates exceed the capacity of the intersection. It may also occur at high v/c ratios with cyclefailures. Poor progression and long cycle lengths may also contribute to such delays. Often,vehicles do not pass through the intersection in one signal cycle.
Based on CEQR Technical Manual guidelines, LOS A, B, and C are considered acceptable, LOS D isgenerally considered marginally acceptable up to mid LOS D (45 seconds of delay for signalizedintersections) and unacceptable above mid LOS D, and LOS E and F indicate congestion. Theseguidelines are applicable to individual traffic movements and overall intersection levels of service.
For unsignalized intersections, delay is defined as the total elapsed time from when a vehicle stops atthe end of the queue until the vehicle departs from the stop line: LOS A describes operations with verylow delay, i.e., 10.0 seconds or less per vehicle; LOS B describes operations with delays in excess of 10.0seconds up to 15.0 seconds; LOS C has delays in excess of 15.0 seconds up to 25.0 seconds; LOS D,excess of 25.0 seconds up to 5.0 seconds per vehicle; and LOS E, excess of 35.0 seconds up to 50.0seconds per vehicle, which is considered to be the limit of acceptable delay. LOS F describes operationwith delays in excess of 50.0 seconds per vehicle, which is considered unacceptable to most drivers.This condition exists when there are insufficient gaps of suitable size in a major vehicular traffic streamto allow side street traffic to cross safely.

125 Edgewater Street - CEQR No. 17DCP069R Environmental Assessment Statement
Page 2.11-9
Pedestrians
Analyses of pedestrian conditions in urban areas are based on the time and space available forpedestrians and the levels of service is defined by the average pedestrian space (sf/p). The level ofservice criteria is presented in Table 2.11 5 below.
Table 2.11-5: Level of Service Criteria for Pedestrian Elements
LOS
Sidewalks Corner Reservoirs andCrosswalksNon Platoon Flow Platoon Flow
A > 60 sf/p > 530 sf/p > 60 sf/p
B > 40 and 60 sf/p > 90 and 530 sf/p > 40 and 60 sf/p
C > 24 and 40 sf/p > 40 and 90 sf/p > 24 and 40 sf/p
D > 15 and 24 sf/p > 23 and 40 sf/p > 15 and 24 sf/p
E > 8 and 15 sf/p > 11 and 23 sf/p > 8 and 15 sf/p
F 8 sf/p 11 sf/p 8 sf/p
Source: 2014 CEQR Technical Manual
Significant Impact Criteria Traffic
A quantified analysis is needed to determine if a proposed project may result in a significant trafficimpact as defined by the 2014 CEQR Technical Manual. Traffic movements that operate at acceptablelevels of service under the No Action conditions (45 seconds of delay or less for signalizationintersections and 30 seconds of delay or less for unsignalized intersections) that deteriorate tounacceptable levels of service under the With Action condition, and experience an increase in delay inexcess of five seconds, would be considered a significantly impact. These impacted movements wouldneed to be mitigated to acceptable LOS D or better for the impact to be considered mitigated.
For traffic movements operating at unacceptable LOS D under the No Action condition, an increase indelay in excess of five seconds under the With Action condition would be considered a significanttraffic impact. An increase in delay under the With Action condition in excess of four seconds for atraffic movement operating at LOS E, and in excess of three seconds for a traffic movement operatingat LOS F, would be considered a significant impact. Mitigation measures identified would need torestore the significantly impacted movement to the No Action delay or better.
For unsignalized intersections, the same criteria would apply. However, the minor street would needto carry at least 90 passenger car equivalents (PCEs) in the With Action condition for significantimpacts to be triggered.
Pedestrians
The identification of significant pedestrian impacts is dependent on the area type (CBD or non CBD)and is determined by the decrease of time and space available for pedestrians between the No Actionand With Action conditions. The 2014 CEQR Technical Manual identifies significant impacts for thepedestrian sidewalk, crosswalk, and corner elements on a sliding scale detailed below. With Actionpedestrian level of service that is considered acceptable (LOS C or better in non CBD areas, and midLOS D or better in CBD areas) would not have a potential for significant impacts.
For sidewalks, the assessment of potential significant impacts is based on a sliding scale formulaprovided in the 2014 CEQR Technical Manual. Consideration as to whether pedestrian flow along the

125 Edgewater Street - CEQR No. 17DCP069R Environmental Assessment Statement
Page 2.11-10
sidewalk is platooning or non platooning, and whether the sidewalk being analyzed is in a CBD ornon CBD condition is necessary.
For sidewalks with non platoon pedestrian flow, the formula used to determine the decrease inpedestrian space from the No Action to With Action condition that would trigger a significant impactis Y (X / 9.0) – 0.31, where Y is the decrease in pedestrian space (sf/p) to be considered a potentialsignificant impact and X is the No Action pedestrian space (sf/p). If the decrease in pedestrian space isgreater than Y and the With Action level of service is considered to be unacceptable, the sidewalk isconsidered to be significantly impacted. For sidewalks with platoon pedestrian flow, the formula todetermine if the decrease in pedestrian space would trigger a significant impact is Y X / (9.5 – 0.321).Table 2.11 6 provides a summary of the sliding scale guidelines provided in the 2014 CEQR TechnicalManual.
For corners and crosswalks, the assessment of potential significant impacts is also based on a slidingscale formula provided in the 2014 CEQR TechnicalManual. The formula used to determine the decreasein pedestrian space from the No Action to With Action condition that would trigger a significantimpact is Y (X / 9.0) – 0.31, where Y is the decrease in pedestrian space (sf/p) to be considered apotential significant impact and X is the No Action pedestrian space (sf/p). If the decrease in pedestrianspace is greater than Y and the With Action level of service is considered to be unacceptable, the corneror crosswalk is considered to be significantly impacted. Table 2.11 7 provides a summary of the slidingscale guidelines provided in the 2014 CEQR Technical Manual.

125 Edgewater Street - CEQR No. 17DCP069R Environmental Assessment Statement
Page 2.11-11
Table 2.11-6 – Significant Impact Criteria for Sidewalks
Non Platoon Flow Platoon Flow
Non CBD Areas CBD Areas Non CBD Areas CBD AreasNo ActionPed Space
(sf/p)
With Action PedSpace Reduction
(sf/p)
No ActionPed Space
(sf/p)
With Action PedSpace Reduction
(sf/p)
No ActionPed Space
(sf/p)
With Action PedSpace Reduction
(sf/p)
No ActionPed Space
(sf/p)
With Action PedSpace Reduction
(sf/p)
>26.6
With ActionCondition
< 24.0 >21.5
With ActionCondition
< 19.5 >44.3
With ActionCondition
< 40.0 >39.2
With ActionCondition
< 31.525.8 to 26.6 2.6 21.3 to 21.5 2.1 43.5 to 44.3 4.3 38.7 to 39.2 3.824.9 to 25.7 2.5 20.4 to 21.2 2.0 42.5 to 43.4 4.2 37.8 to 38.6 3.724.0 to 24.8 2.4 19.5 to 20.3 1.9 41.6 to 42.4 4.1 36.8 to 37.7 3.623.1 to 23.9 2.3 18.6 to 19.4 1.8 40.6 to 41.5 4.0 35.9 to 36.7 3.522.2 to 23.0 2.2 17.7 to 18.5 1.7 39.7 to 40.5 3.9 34.9 to 35.8 3.421.3 to 22.1 2.1 16.8 to 17.6 1.6 38.7 to 39.6 3.8 34.0 to 34.8 3.320.4 to 21.2 2.0 15.9 to 16.7 1.5 37.8 to 38.6 3.7 33.0 to 33.9 3.219.5 to 20.3 1.9 15.0 to 15.8 1.4 36.8 to 37.7 3.6 32.1 to 32.9 3.118.6 to 19.4 1.8 14.1 to 14.9 1.3 35.9 to 36.7 3.5 31.1 to 32.0 3.017.7 to 18.5 1.7 13.2 to 14.0 1.2 34.9 to 35.8 3.4 30.2 to 31.0 2.916.8 to 17.6 1.6 12.3 to 13.1 1.1 34.0 to 34.8 3.3 29.2 to 30.1 2.815.9 to 16.7 1.5 11.4 to 12.2 1.0 33.0 to 33.9 3.2 28.3 to 29.1 2.715.0 to 15.8 1.4 10.5 to 11.3 0.9 32.1 to 32.9 3.1 27.3 to 28.2 2.614.1 to 14.9 1.3 9.6 to 10.4 0.8 31.1 to 32.0 3.0 26.4 to 27.2 2.513.2 to 14.0 1.2 8.7 to 9.5 0.7 30.2 to 31.0 2.9 25.4 to 26.3 2.412.3 to 13.1 1.1 7.8 to 8.6 0.6 29.2 to 30.1 2.8 24.5 to 25.3 2.311.4 to 12.2 1.0 6.9 to 7.7 0.5 28.3 to 29.1 2.7 23.5 to 24.4 2.210.5 to 11.3 0.9 6.0 to 6.8 0.4 27.3 to 28.2 2.6 22.6 to 23.4 2.19.6 to 10.4 0.8 5.1 to 5.9 0.3 26.4 to 27.2 2.5 21.6 to 22.5 2.08.7 to 9.5 0.7 < 5.1 0.2 25.4 to 26.3 2.4 20.7 to 21.5 1.97.8 to 8.6 0.6 – – 24.5 to 25.3 2.3 19.7 to 20.6 1.86.9 to 7.7 0.5 – – 23.5 to 24.4 2.2 18.8 to 19.6 1.76.0 to 6.8 0.4 22.6 to 23.4 2.1 17.8 to 18.7 1.65.1 to 5.9 0.3 21.6 to 22.5 2.0 16.9 to 17.7 1.5
< 5.1 0.2 20.7 to 21.5 1.9 15.9 to 16.8 1.419.7 to 20.6 1.8 15.0 to 15.8 1.318.8 to 19.6 1.7 14.0 to 14.9 1.217.8 to 18.7 1.6 13.1 to 13.9 1.116.9 to 17.7 1.5 12.1 to 13.0 1.015.9 to 16.8 1.4 11.2 to 12.0 0.915.0 to 15.8 1.3 10.2 to 11.1 0.814.0 to 14.9 1.2 9.3 to 10.1 0.713.1 to 13.9 1.1 8.3 to 9.2 0.612.1 to 13.0 1.0 7.4 to 8.2 0.511.2 to 12.0 0.9 6.4 to 7.3 0.410.2 to 11.1 0.8 < 6.4 0.39.3 to 10.1 0.78.3 to 9.2 0.67.4 to 8.2 0.56.4 to 7.3 0.4
< 6.4 0.3Source: 2014 CEQR Technical Manual

125 Edgewater Street - CEQR No. 17DCP069R Environmental Assessment Statement
Page 2.11-12
Table 2.11-7 – Significant Impact Criteria for Corners and Crosswalks Non CBD Areas CBD Areas
No ActionPed Space (sf/p)
With ActionPed Space Reduction (sf/p)
No ActionPed Space (sf/p)
With ActionPed Space Reduction (sf/p)
>26.6 With Action Condition < 24.0 >21.5 With Action Condition <19.5
25.8 to 26.6 2.6 21.3 to 21.5 2.1
24.9 to 25.7 2.5 20.4 to 21.2 2.0
24.0 to 24.8 2.4 19.5 to 20.3 1.9
23.1 to 23.9 2.3 18.6 to 19.4 1.8
22.2 to 23.0 2.2 17.7 to 18.5 1.7
21.3 to 22.1 2.1 16.8 to 17.6 1.6
20.4 to 21.2 2.0 15.9 to 16.7 1.5
19.5 to 20.3 1.9 15.0 to 15.8 1.4
18.6 to 19.4 1.8 14.1 to 14.9 1.3
17.7 to 18.5 1.7 13.2 to 14.0 1.2
16.8 to 17.6 1.6 12.3 to 13.1 1.1
15.9 to 16.7 1.5 11.4 to 12.2 1.0
15.0 to 15.8 1.4 10.5 to 11.3 0.9
14.1 to 14.9 1.3 9.6 to 10.4 0.8
13.2 to 14.0 1.2 8.7 to 9.5 0.7
12.3 to 13.1 1.1 7.8 to 8.6 0.6
11.4 to 12.2 1.0 6.9 to 7.7 0.5
10.5 to 11.3 0.9 6.0 to 6.8 0.4
9.6 to 10.4 0.8 5.1 to 5.9 0.3
8.7 to 9.5 0.7 < 5.1 0.2
7.8 to 8.6 0.6
6.9 to 7.7 0.5
6.0 to 6.8 0.4
5.1 to 5.9 0.3
< 5.1 0.2
Source: 2014 CEQR Technical Manual.
Roadway Network and Study Area The traffic study area encompasses eight intersections (four signalized and four unsignalized) as shownin Figure 2.11 7 and are listed below.
1. Bay Street and Vanderbilt Avenue2. Bay Street and Edgewater Street/Front Street3. Bay Street and Willow Avenue4. Bay Street and Lynhurst Avenue (unsignalized intersection)5. Bay Street and Hylan Boulevard6. Edgewater Street and Willow Avenue (unsignalized intersection)7. Edgewater Street and Lynhurst Avenue (unsignalized intersection)8. Edgewater Street and Hylan Boulevard (unsignalized intersection)

LYNHURST AVENUE
VANDERBILT AVENUE
FRONT STREET
BAY STREET
BAY STREET
EDGEWATER STREET
HYLAN BOULEVARDTOM
PKINS AVENUE
WILLOW AVENUE
LYNHURST AVE
WILLOW AVE
PROJECT AREA
Edgewater Street between Willow Avenue and Lynhurst Avenue
N
Date: 11.29.2016
Figure125 Edgewater Street DevelopmentStaten Island, New York 10305
Transportation Study Locations2.11-7
Proposed Project Site Entrance

125 Edgewater Street - CEQR No. 17DCP069R Environmental Assessment Statement
Page 2.11-13
The pedestrian study area encompasses three pedestrian elements along Bay Street between WillowAvenue and Lynhurst Avenue and within the project site, and are shown in Figure 2.11 7. Pedestriananalysis was performed for the weekday midday and PM peak hours.
1. East sidewalk along Bay Street between Willow Avenue and Lynhurst Avenue2. Southeast corner of Bay Street and Willow Avenue3. South sidewalk along Lynhurst Avenue east of the Edgewater Street (analysis will be performed
for the future With Action condition since this location does not currently exist)
Bay Street
Bay Street is a key north south roadway through the study area and extends from St. George ferryterminal to the north and to the Verrazano Bridge on the southern end. It consists of one travel lane ineach direction. Parking lanes are provided in each direction throughout most of the study area.
Hylan Boulevard
Hylan Boulevard is the key north south commuter roadway along the eastern region of Staten Island,extending from Edgewater Street to the north near the Alice Austen Park to Satterlee Street to the southnear the Conference House Park. Within the study area, Hylan Boulevard runs in the east westdirection and consists of one travel lane in each direction. Parking is generally allowed in bothdirections near the analysis locations.
Edgewater Street
Edgewater Street is a north south roadway that provides access to the proposed project. It consists ofone travel lane in each direction and parking is generally allowed along the east curb of the roadway.
Lynhurst Avenue
Lynhurst Avenue is a one way eastbound roadway extending between Tompkins Avenue to the westand Edgewater Street to the east. Parking is allowed along the north curb of this roadway.
Willow Avenue
Willow Avenue is an east west roadway extending between Tompkins Avenue and the project site. Itconsists of one travel lane in each direction. Parking is allowed on both sides along certain sections ofthe roadway.
Existing Conditions – Year 2016 Traffic
Traffic Volumes
Existing traffic counts traffic counts were conducted in June 2013 for the weekday AM, midday, andPM peak periods using manual turning movement counts and 24 hour Automatic Traffic Recorder(ATR) machine counts. These counts were supplemented with traffic count data collected for the BayStreet Corridor Rezoning and Related Actions EIS in November 2015 and adjusted for ATR counts collectedin June 2016 to develop the 2016 existing traffic condition volumes. These volumes were used alongwith observations of traffic conditions to determine the levels of service for the weekday peak hours of7:45 AM to 8:45 AM, 2:30 PM to 3:30 PM, and 4:45 PM to 5:45 PM.
Within the study area, traffic volumes along northbound Bay Street range from approximately 355 vphto 455 vph during the weekday AM and midday peak hours and are higher during the weekday PMpeak hour (approximately 370 vph to 500 vph). Southbound Bay Street carries approximately 415 vph

125 Edgewater Street - CEQR No. 17DCP069R Environmental Assessment Statement
Page 2.11-14
to 530 vph during the weekday AM and midday peak hours and 385 vph to 605 vph in the weekdayPM peak hour.
Traffic volumes along eastbound Hylan Boulevard within the study area range from approximately150 vph to 255 vph during the weekday AM and midday peak hours and approximately 135 vph to200 vph during the weekday PM peak hour. Westbound Hylan Boulevard within the study area carriesapproximately 195 vph during the weekday AM peak hour, approximately 180 vph to 270 vph duringthe weekday midday peak hour, and approximately 215 vph to 295 vph during the weekday PM peakhour.
Traffic volumes along northbound Edgewater Street range from approximately 150 vph to 190 vphduring the weekday AM and midday peak hours and approximately 135 vph to 220 vph during theweekday PM peak hour. Southbound Edgewater Street carries approximately 140 vph to 190 vph inthe weekday AM peak hour, approximately 115 vph to 175 vph during the weekday midday peak hour,and approximately 90 vph to 210 vph during the weekday PM peak hour.
Traffic volumes along Willow Avenue and Lynhurst Avenue are modest and range fromapproximately 25 vph to 75 vph during peak hours analyzed.
Existing traffic volumes are provided in Figures 2.11 8 through 2.11 10.
Levels of Service
Tables 2.11 8 and 2.11 9 provide an overview of levels of service that characterize existing “overall”intersection conditions and individual traffic movements, respectively, during the weekday AM,midday, and PM peak hours. Detailed existing conditions traffic levels of service are provided in Table2.11 10.
Table 2.11-8 – 2016 Existing Traffic Levels of Service – Overall Intersections Weekday AM
Peak HourWeekday Midday
Peak HourWeekday PM
Peak Hour
Intersections at Overall LOS A/B/C 8 8 8Intersections at Overall LOS D 0 0 0Intersections at Overall LOS E 0 0 0
Intersections at Overall LOS F 0 0 0
Note: Includes four signalized and four unsignalized intersections
Table 2.11-9 – 2016 Existing Traffic Levels of Service – Traffic Movements Weekday AM
Peak HourWeekday Midday
Peak HourWeekday PM
Peak Hour
Traffic Movements at LOS A/B/C orAcceptable LOS D
30 32 29
Traffic Movements at UnacceptableLOS D
1 0 3
Traffic Movements at LOS E 1 0 0
Traffic Movements at LOS F 0 0 0
Number of Individual TrafficMovements
32 32 32
Note: Traffic movement with delays less than or equal to 45 seconds for signalized movements, and less than or equal to 30seconds for unsignalized movements, are considered to be operating at acceptable levels of service.

813
146729065
116
403
10430
500 5
194
160
340
106
153
69
6
623
791
1120
3041015
3048020
0
5
20
251525
5155
3795124
6534142
0398103
964121
75115
140
20
175
11550
5
515
5
5
20
45
10
10
LYNHURST AVENUE
VANDERBILT AVENUE
FRONT STREET
BAY STREET
BAY STREET
EDGEWATER STREET
HYLAN BOULEVARDTOM
PKINS AVENUE
WILLOW AVENUE
LYNHURST AVE
WILLOW AVE
PROJECT AREA
Edgewater Street between Willow Avenue and Lynhurst Avenue
N
Date: 11.9.2016
Figure125 Edgewater Street DevelopmentStaten Island, New York 10305
2016 Existing Traffic VolumesAM Peak Hour 2.11-8

28
112407
28672
67
376
10405
515 5
178
150
317
112
126
98
12
35
540
1370
1537525
1547525
510
35
351010
101510
6067125
8330248
0368155
116899
20125
135
15
155
10510
25
25
15
20
10
10
20
15
10
LYNHURST AVENUE
VANDERBILT AVENUE
FRONT STREET
BAY STREET
BAY STREET
EDGEWATER STREET
HYLAN BOULEVARDTOM
PKINS AVENUE
WILLOW AVENUE
LYNHURST AVE
WILLOW AVE
PROJECT AREA
Edgewater Street between Willow Avenue and Lynhurst Avenue
N
Date: 11.9.2016
Figure125 Edgewater Street DevelopmentStaten Island, New York 10305
2016 Existing Traffic VolumesMidday Peak Hour 2.11-9

3489384
27893
51
359
15480
595 5
213
136
328
111
162
1158
21
621
2120
1546025
1554015
1010
45
401520
15355
3954109
8233131
0444159
5107101
10195
140
20
200
85 5
15
354030
10
2525
15
15
LYNHURST AVENUE
VANDERBILT AVENUE
FRONT STREET
BAY STREET
BAY STREET
EDGEWATER STREET
HYLAN BOULEVARDTOM
PKINS AVENUE
WILLOW AVENUE
LYNHURST AVE
WILLOW AVE
PROJECT AREA
Edgewater Street between Willow Avenue and Lynhurst Avenue
N
Date: 11.9.2016
Figure125 Edgewater Street DevelopmentStaten Island, New York 10305
2016 Existing Traffic VolumesPM Peak Hour 2.11-10

Control Control ControlINTERSECTION & APPROACH Mvt. V/C Delay LOS Mvt. V/C Delay LOS Mvt. V/C Delay LOS
SIGNALIZED INTERSECTIONS
Bay Street and Vanderbilt AvenueVanderbilt Avenue EB L 0.30 24.7 C L 0.26 26.3 C L 0.29 31.2 C
R 0.37 26.0 C R 0.17 25.4 C R 0.16 28.6 CBay Street NB L 0.18 2.6 A L 0.23 8.4 A L 0.23 18.1 B
T 0.32 2.5 A T 0.33 8.4 A T 0.26 18.1 BSB T 0.42 21.4 C T 0.47 9.0 A T 0.39 6.8 A
R 0.20 7.5 A R 0.23 2.8 A R 0.19 1.1 A
Overall Intersection 14.0 B 11.1 B 13.7 B
Bay Street and Edgewater Street/Front StreetFront Street WB LR 0.63 50.8 D LR 0.55 36.9 D LR 0.54 47.2 DBay Street NB TR 0.61 11.8 B TR 0.68 30.7 C TR 0.50 21.5 C
SB LT 0.67 21.4 C LT 0.67 38.8 D LT 0.46 15.2 BEdgewater Street NB LR 0.42 17.2 B LR 0.41 12.3 B LR 0.85 52.2 D
Overall Intersection 23.1 C 33.7 C 30.4 C
Bay Street and Willow AvenueWillow Avenue EB LTR 0.06 32.6 C LTR 0.08 23.1 C LTR 0.12 33.5 C
WB LTR 0.10 33.6 C LTR 0.19 25.3 C LTR 0.24 36.4 DBay Street NB LTR 0.54 10.5 B LTR 0.59 11.0 B LTR 0.55 18.0 B
SB LTR 0.71 23.7 C LTR 0.67 16.6 B LTR 0.60 12.8 B
Overall Intersection 18.6 B 15.0 B 17.3 B
Bay Street and Hylan BoulevardHylan Boulevard EB LTR 0.62 24.9 C LTR 0.62 42.7 D LTR 0.56 40.4 D
WB LTR 0.77 59.2 E LTR 0.69 44.1 D LTR 0.74 54.7 DBay Street NB LT 0.76 37.1 D LT 0.77 32.2 C LT 0.72 44.6 D
R 0.13 15.8 B R 0.19 15.0 B R 0.16 26.0 CSB T 0.64 20.3 C T 0.60 23.0 C T 0.72 22.9 C
R 0.17 8.3 A R 0.27 5.1 A R 0.22 6.4 A
Overall Intersection 30.1 C 28.9 C 33.8 C
UNSIGNALIZED INTERSECTIONS
Bay Street and Lynhurst AvenueLynhurst Avenue EB LTR 29.1 D LTR 23.7 C LTR 33.0 DBay Street NB TR 0.0 A TR 0.0 A TR 0.0 A
SB LT 0.2 A LT 0.2 A LT 0.2 A
Overall Intersection 2.1 A 1.5 A 2.5 A
Edgewater Street and Willow AvenueWillow Avenue EB LTR 9.1 A LTR 8.1 A LTR 8.4 A
WB LTR 8.4 A LTR 8.0 A LTR 8.7 AEdgewater Street NB LTR 9.0 A LTR 8.8 A LTR 9.8 A
SB LTR 9.3 A LTR 8.3 A LTR 8.5 A
Overall Intersection 9.1 A 8.5 A 9.1 A
Edgewater Street and Lynhurst AvenueLynhurst Avenue EB LR 10.6 B LR 10.0 A LR 10.6 BEdgewater Street NB T 0.0 A T 0.0 A T 0.0 A
SB T 0.0 A T 0.0 A T 0.0 A
Overall Intersection 0.9 A 0.9 A 1.0 A
Edgewater Street and Hylan BoulevardHylan Boulevard EB L 7.5 A L 7.5 A L 7.5 AEdgewater Street SB R 9.2 A R 9.1 A R 9.4 A
Overall Intersection 8.5 A 8.4 A 8.7 A
(1) Control delay is measured in seconds per vehicle.(2) Overall intersection V/C ratio is the critical lane groups V/C ratio.
TABLE 12.11 10125 EDGEWATER STREET
2016 EXISTING CONDITION
Weekday AM Peak Hour Weekday Midday Peak Hour Weekday PM Peak Hour

125 Edgewater Street - CEQR No. 17DCP069R Environmental Assessment Statement
Page 2.11-15
The summary overview of existing conditions indicates that:
During the weekday AM peak hour, none of the eight intersections operate at overall level ofservice E or F. “Overall” LOS E or F means that serious congestion exists – either one specific trafficmovement has severe delays, or two or more of the specific traffic movements at the intersectionsare at LOS E or F with significant delays (the overall intersection level of service is a weightedaverage of all the individual traffic movements). One individual traffic movement (e.g. left turnsfrom one street to another, through traffic passing through the intersections, etc.), the westboundapproach of Hylan Boulevard at its intersection with Bay Street, operates at LOS E and onemovement operates at unacceptable LOS D.
In the weekday midday peak hour, all eight intersections operate at overall acceptable levels orservice. No individual movements operate at unacceptable levels of service.
In the weekday PM peak hour, all eight intersections operate at overall acceptable levels of service.No individual movement operate at LOS E or F. Three movements operate at unacceptable LOS Dduring this peak hour.
Pedestrian
Existing pedestrian volume counts were conducted in September 2016 for the weekday midday andPM peak periods. The weekday midday peak hour of 12:30 PM to 1:30 PM and weekday PM peak hourof 5:30 PM to 6:30 PM were selected for this analysis.
The pedestrian analysis determined that all of the pedestrian facilities analyzed operate at LOS A orLOS B during each of the peak hours analyzed. The existing peak hour volumes and levels or servicefor each pedestrian element analyzed are presented in Tables 2.11 11 and 2.11 12 below.
Table 2.11-11 – 2016 Existing Sidewalk Levels of ServiceWeekday Midday Peak Hour Weekday PM Peak Hour
Sidewalk Elements
Sidewalk
Effe
ctiv
eW
idth
,ft
Vol
ume,
ped/
hr
Avg
Ped
Spac
e,SF
/P
LOS
Vol
ume,
ped/
hr
Avg
Ped
Spac
e,SF
/P
LOS
Bay Street east sidewalkbetween Willow Avenue andLynhurst Avenue (platoonflow)
3.7 69 451.7 B 20 1,658.3 A

125 Edgewater Street - CEQR No. 17DCP069R Environmental Assessment Statement
Page 2.11-16
Table 2.11-12 – 2016 Existing Corner Levels of ServiceWeekday Midday Peak Hour Weekday PM Peak Hour
Corner Elements
Intersection
Cor
ner
Vol
ume,
ped/
hr
Avg
Ped
Spac
e,sf
/p
LOS
Vol
ume,
ped/
hr
Avg
Ped
Spac
e,sf
/p
LOS
Bay Street and WillowAvenue
Southeast 72 858.0 A 7 3,616.4 A
No-Action Conditions – Year 2019 This section establishes the baseline (No Action) condition against which potential impacts of theproject can be identified. Future year conditions were analyzed for the year 2019. No Action trafficvolumes were established by applying a background growth of one percent per year in accordancewith the 2014 CEQR Technical Manual guidelines for Staten Island projects. The St. George WaterfrontRedevelopment and the first phase of the New Stapleton Waterfront Development were also includedas part of the No Action condition analysis. The development program for the background projectsincludes 950 residential dwelling units, a 36 capsule observation wheel, 15,000 square feet of restaurantspace, 6.9 acres of open space, 340,000 sf retail outlet center, a 200 room hotel, a 400 seat cateringfacility, and 30,323 square feet of local retail.
Traffic improvements were identified for several analysis locations along Bay Street as part of theproject improvements or mitigation measures for these two background projects. These improvementsare discussed in detail below. Project improvements were also identified for the intersection of BayStreet and Edgewater Street/Front Street as part of the New Stapleton Waterfront Development andwould include the following measures: (1) eliminating northbound Edgewater Street left turns andthrough movements (to Bay Street) by creating a traffic island that would only allow for right turns toFront Street; (2) prohibiting parking along the east side of northbound Bay Street to provide anadditional travel lane along the approach and receiving sides; (3) restriping the westbound Front Streetapproach to one left turn lane (to Edgewater Street) and one shared left right turn lane (to Bay Street);and (4) eliminating the northbound Edgewater Street phase from the intersection’s signal phasing.These measures were expected to be implemented for the 2015 Build year identified in theNew StapletonWaterfront Development FEIS Technical Memorandum 1 (2010). However, per discussions with the NewYork City Economic Development Corporation, these measures are now expected to be in place afterthe first phase of the New Stapleton Waterfront Development project (first phase to be completed in2018, second phase to be completed in 2022, and third phase to be completed in 2024) and would notbe in place by the year 2019.
Bay Street and Vanderbilt Avenue
Parking along the south curb of eastbound Vanderbilt Avenue would be prohibited for 250 feetfrom the intersection during the weekday PM peak period. This improvement was identified in theNew Stapleton Waterfront Development FEIS Technical Memorandum 1 (2010).

125 Edgewater Street - CEQR No. 17DCP069R Environmental Assessment Statement
Page 2.11-17
Signal timing modifications at this intersection were identified in the New Stapleton WaterfrontDevelopment FEIS Technical Memorandum 1 (2010) and St. George Waterfront Redevelopment FEIS(2013) during the weekday midday and PM peak hours. These measures would result in a shift offive seconds during the weekday midday peak hour and three seconds during the weekday PMpeak hour from the eastbound phase to the northbound/southbound phase.
Bay Street and Hylan Boulevard
Geometric changes to the intersection of Bay Street and Hylan Boulevard were identified in theNew Stapleton Waterfront Development FEIS Technical Memorandum 1 (2010).
Parking along the south curb of eastbound Hylan Boulevard and north curb of westbound HylanBoulevard would be prohibited for 120 feet from the intersection during all times. Parking wouldalso be prohibited along the east curb of northbound Bay Street for 120 feet from the intersectionduring the weekday AM, midday, PM, and Saturday peak periods.
The centerline along eastbound Hylan Boulevard would be shifted two feet to the north and theapproach would be restriped to one 11 foot wide left turn lane and one 11 foot wide sharedthrough right lane for 120 feet.
The centerline along the westbound Hylan Boulevard approach would be shifted three feet to thesouth and the approach would be restriped to one 10 foot wide left turn lane and one 10 foot wideshared through right lane for 120 feet.
The northbound approach would be restriped to one 11 foot wide travel lane, and one 10 foot widetravel lane for 120 feet which would serve as a “de facto” right turn lane during the peak hours,.
Modification of the signal phasing and timing plan at this intersection was also identified but thesemeasures were not incorporated due to changes to the signal phasing operations that wereimplemented by New York City Department of Transportation (NYCDOT) in 2016.
Traffic
Traffic Volumes
The St. George Waterfront Redevelopment is expected to generate 1,078 vph during the weekdaymidday peak hour and 1,069 vph during the weekday PM peak hour. Phase 1 of the New StapletonWaterfront Development is expected to generate 377 vph during the weekday AM peak hour, 209 vphduring the weekday midday peak hour, and 438 vph during the weekday PM peak hour.Approximately half of these trips would travel through the project’s study locations.
Traffic volumes along Bay Street within the study area between Front Street and Hylan Boulevard areexpected to increase by approximately 15 vph to 25 vph in the northbound direction during theweekday AM peak hour and by approximately 255 vph to 315 vph during the weekday midday andPM peak hours. In the southbound direction, the volumes would increase by approximately 75 vphduring the weekday AM peak hour, and by approximately 255 vph in the southbound direction duringthe weekday midday and PM peak hours.
During the weekday AM peak hour, traffic volumes would be expected to increase by approximately10 vph along eastbound Hylan Boulevard and by approximately 50 vph in the westbound direction.During the weekday midday and PM peak hours, volumes along eastbound Hylan Boulevard west ofBay Street is expected to increase by approximately 115 vph to 145 vph and by approximately 115 vphin the westbound direction. East of Bay Street, increases in traffic volumes along Hylan Boulevardwould be modest ranging from approximately 10 vph to 50 vph in each direction.

125 Edgewater Street - CEQR No. 17DCP069R Environmental Assessment Statement
Page 2.11-18
Traffic volumes along Edgewater Street would be expected to increase by approximately 10 vph to 50vph during the peak hours analyzed, peaking in the weekday PM peak hour. In the opposite direction,traffic volumes are expected to increase by approximately and 10 vph to 45 vph, peaking during theweekday AM peak hour.
No Action traffic volumes are provided in Figures 2.11 11 through 2.11 13.
Levels of Service
Based on the traffic increases mentioned above, the 2019 No Action traffic levels or service weredetermined for the eight analysis locations. Due to a substantial increase in traffic volumes resultingfrom the background projects, severe deterioration in traffic levels of service along the Bay Streetcorridor are expected. Tables 2.11 13 and 2.11 14 provide an overview of the levels of service thatcharacterize the 2019 No Action overall intersection conditions and individual traffic movements,respectively, during the weekday AM, midday, and PM peak hours. Detailed traffic levels of servicefor the No Action condition are provided in Table 2.11 15.
Table 2.11-13 – 2016 Existing vs. 2019 No-Action Traffic Levels of Service – Overall Intersections2016 Existing 2019 No Action
WeekdayAM Peak
Hour
WeekdayMidday
Peak Hour
WeekdayPM Peak
Hour
WeekdayAM Peak
Hour
WeekdayMidday
Peak Hour
WeekdayPM Peak
HourIntersections at OverallLOS A/B/C
8 8 8 6 6 5
Intersections at OverallLOS D
0 0 0 2 0 1
Intersections at OverallLOS E
0 0 0 0 0 1
Intersections at OverallLOS F
0 0 0 0 2 1
Note: Includes four signalized and four unsignalized intersections
Table 2.11-14 – 2016 Existing vs. 2019 No-Action Traffic Levels of Service – Traffic Movements
2016 Existing 2019 No-Action Weekday AM Peak
Hour
Weekday Midday
Peak Hour
Weekday PM Peak
Hour
Weekday AM Peak
Hour
Weekday Midday
Peak Hour
Weekday PM Peak
Hour Traffic Movements at Overall LOS A/B/C or acceptable LOS D
30 32 29 30 29 26
Traffic Movements at Unacceptable LOS D 1 0 3 0 0 4
Traffic Movements at Overall LOS E 1 0 0 3 0 0
Traffic Movements at Overall LOS F 0 0 0 1 5 4
Number of individual traffic movements 32 32 32 34 34 34
The summary overview of the 2019 No Action condition indicates that:

818
448129967
120
415
10459
591 6
248
176
350
114
180
1476
624
971
1250
3143816
3157121
0
521
261526
5155
38103133
7336343
0465127
987152
77128
193
21
190
16752
6
515
5
5
21
46
10
10
LYNHURST AVENUE
VANDERBILT AVENUE
FRONT STREET
BAY STREET
BAY STREET
EDGEWATER STREET
HYLAN BOULEVARDTOM
PKINS AVENUE
WILLOW AVENUE
LYNHURST AVE
WILLOW AVE
PROJECT AREA
Edgewater Street between Willow Avenue and Lynhurst Avenue
N
Date: 11.29.2016
Figure125 Edgewater Street DevelopmentStaten Island, New York 10305
2019 No-Action Traffic VolumesAM Peak Hour 2.11-11

29
125661
52974
69
629
10673
788 5
193
169
561
161
174
11712
45
780
1550
1564226
1574726
510
36
361010
101510
6275236
9446049
0531267
1175108
20143
149
15
174
11810
26
26
15
21
10
10
20
15
10
LYNHURST AVENUE
VANDERBILT AVENUE
FRONT STREET
BAY STREET
BAY STREET
EDGEWATER STREET
HYLAN BOULEVARDTOM
PKINS AVENUE
WILLOW AVENUE
LYNHURST AVE
WILLOW AVE
PROJECT AREA
Edgewater Street between Willow Avenue and Lynhurst Avenue
N
Date: 11.29.2016
Figure125 Edgewater Street DevelopmentStaten Island, New York 10305
2019 No-Action Traffic VolumesMidday Peak Hour 2.11-12

35
109625
52796
53
599
16810
867 6
236
188
579
161
200
1448
21
1391
2660
1579026
1581215
1010
46
411521
15365
4077236
11153332
0607269
5117114
10249
162
22
252
105 5
15
364131
10
2625
15
15
LYNHURST AVENUE
VANDERBILT AVENUE
FRONT STREET
BAY STREET
BAY STREET
EDGEWATER STREET
HYLAN BOULEVARDTOM
PKINS AVENUE
WILLOW AVENUE
LYNHURST AVE
WILLOW AVE
PROJECT AREA
Edgewater Street between Willow Avenue and Lynhurst Avenue
N
Date: 11.29.2016
Figure125 Edgewater Street DevelopmentStaten Island, New York 10305
2019 No-Action Traffic VolumesPM Peak Hour 2.11-13

Control Control ControlINTERSECTION & APPROACH Mvt. V/C Delay LOS Mvt. V/C Delay LOS Mvt. V/C Delay LOS
SIGNALIZED INTERSECTIONS
Bay Street and Vanderbilt AvenueVanderbilt Avenue EB L 0.34 26.8 C L 0.44 34.4 C L 0.41 32.2 C
R 0.40 28.0 C R 0.20 31.0 C R 0.15 27.5 CBay Street NB L 0.18 2.3 A L 0.36 7.9 A L 0.36 12.8 B
T 0.32 2.3 A T 0.55 6.7 A T 0.47 12.2 BSB T 0.42 19.9 B T 0.70 8.3 A T 0.62 6.3 A
R 0.22 6.9 A R 0.28 1.7 A R 0.23 0.9 A
Overall Intersection 13.7 B 10.8 B 11.3 B
Bay Street and Edgewater Street/Front StreetFront Street WB LR 1.04 101.5 F LR 0.63 39.3 D LR 0.67 51.6 DBay Street NB TR 0.66 16.8 B TR 1.16 110.5 F TR 0.92 47.8 D
SB LT 0.72 23.2 C LT 1.91 443.1 F LT 0.75 26.1 CEdgewater Street NB LR 0.47 20.4 C LR 0.46 14.6 B LR 1.04 94.0 F
Overall Intersection 40.9 D 221.1 F 48.9 D
Bay Street and Willow AvenueWillow Avenue EB LTR 0.06 32.6 C LTR 0.08 23.1 C LTR 0.12 33.5 C
WB LTR 0.10 33.7 C LTR 0.19 25.3 C LTR 0.25 36.6 DBay Street NB LTR 0.58 10.3 B LTR 0.96 18.6 B LTR 0.90 27.4 C
SB LTR 0.83 28.7 C LTR 1.01 33.3 C LTR 0.89 29.5 C
Overall Intersection 21.5 C 26.2 C 29.0 C
Bay Street and Hylan BoulevardHylan Boulevard EB L 0.63 31.9 C L 0.95 88.6 F L 1.11 129.0 F
TR 0.25 17.1 B TR 0.29 34.8 C TR 0.24 28.4 CWB L 0.73 58.2 E L 0.53 39.3 D L 0.53 46.9 D
TR 0.31 38.7 D TR 0.28 30.1 C TR 0.38 40.0 DBay Street NB LT 1.00 71.9 E LT 1.73 357.3 F LT 2.04 496.4 F
R 0.16 15.8 B R 0.23 14.4 B R 0.24 26.8 CSB T 0.75 23.3 C T 0.87 30.9 C T 0.98 50.8 D
R 0.21 8.1 A R 0.46 6.9 A R 0.36 9.0 A
Overall Intersection 38.6 D 121.1 F 165.8 F
UNSIGNALIZED INTERSECTIONS
Bay Street and Lynhurst AvenueLynhurst Avenue EB LTR 46.2 E LTR 349.2 F LTR 952.7 FBay Street NB TR 0.0 A TR 0.0 A TR 0.0 A
SB LT 0.2 A LT 0.2 A LT 0.3 A
Overall Intersection 3.0 A 14.1 B 47.3 E
Edgewater Street and Willow AvenueWillow Avenue EB LTR 9.0 A LTR 8.2 A LTR 8.7 A
WB LTR 8.6 A LTR 8.2 A LTR 9.1 AEdgewater Street NB LTR 9.5 A LTR 9.1 A LTR 10.8 B
SB LTR 10.2 B LTR 8.5 A LTR 8.9 A
Overall Intersection 9.7 A 8.7 A 9.8 A
Edgewater Street and Lynhurst AvenueLynhurst Avenue EB LR 11.3 B LR 10.2 B LR 11.2 BEdgewater Street NB T 0.0 A T 0.0 A T 0.0 A
SB T 0.0 A T 0.0 A T 0.0 A
Overall Intersection 0.8 A 0.8 A 0.9 A
Edgewater Street and Hylan BoulevardHylan Boulevard EB L 7.5 A L 7.5 A L 7.6 AEdgewater Street SB R 9.6 A R 9.2 A R 9.6 A
Overall Intersection 8.8 A 8.4 A 8.7 A
(1) Control delay is measured in seconds per vehicle.(2) Overall intersection V/C ratio is the critical lane groups V/C ratio.
TABLE 12.11 15125 EDGEWATER STREET
2019 NO ACTION CONDITION
Weekday AM Peak Hour Weekday Midday Peak Hour Weekday PM Peak Hour

125 Edgewater Street - CEQR No. 17DCP069R Environmental Assessment Statement
Page 2.11-19
During the weekday AM peak hour, none of the eight intersections analyzed would operate atoverall LOS E or F (similar to the existing conditions). Four individual traffic movements out ofthe approximately 34 movements analyzed would operate at LOS E or F compared to one in theexisting conditions, while no movements would operate at unacceptable LOS D compared to twoin the existing conditions.
In the weekday midday peak hour, two of the eight intersections analyzed would operate at overallLOS E or F (compared to none in the existing conditions). Five individual traffic movements wouldoperate at LOS E or F (compared to none in the existing conditions), and no movement wouldoperate at unacceptable LOS D similar to the existing conditions.
In the weekday PM peak hour, Two of the eight intersections analyzed would operate at overallLOS E or F (compared to none in the existing conditions). Four individual traffic movementswould operate at LOS E or F compared to none in the existing conditions, while four movementswould operate at unacceptable LOS D (compared to three in the existing conditions).
Based on the analysis results, the majority of traffic movements would continue to operate at acceptablelevels of service. The following movements would operate at unacceptable LOS E or F during eachpeak hour:
Bay Street and Edgewater Street/Front Street westbound approach (weekday AM peak hour)Bay Street and Edgewater Street/Front Street Bay Street northbound approach (weekday middaypeak hour)Bay Street and Edgewater Street/Front Street Bay Street southbound approach (weekday middaypeak hour)Bay Street and Edgewater Street/Front Street Edgewater Street northbound approach (weekdayPM peak hour)Bay Street and Hylan Boulevard eastbound left turn movement (weekday midday and PM peakhours)Bay Street and Hylan Boulevard westbound left turn movement (weekday AM peak hour)Bay Street and Hylan Boulevard northbound shared left through movement (weekday AM,midday, and PM peak hours)Bay Street and Lynhurst Avenue eastbound approach (weekday AM, midday, and PM peak hours)
Pedestrian
Existing pedestrian volumes were grown by one percent per year in accordance with the 2014 CEQRTechnical Manual to develop the 2019 No Action pedestrian volumes. The pedestrian conditions wouldcontinue to operate at LOS A or LOS B for the pedestrian elements analyzed during each peak hour.The No Action peak hour volumes and levels of service for each pedestrian element analyzed arepresented in Tables 2.11 16 and 2.11 17 below.

125 Edgewater Street - CEQR No. 17DCP069R Environmental Assessment Statement
Page 2.11-20
Table 2.11-16 – 2019 No-Action Sidewalk Levels of ServiceWeekday Midday Peak Hour Weekday PM Peak Hour
Sidewalk Elements
Sidewalk
Effe
ctiv
eW
idth
,ft
Vol
ume,
ped/
hr
Avg
Ped
Spac
e,SF
/P
LOS
Vol
ume,
ped/
hr
Avg
Ped
Spac
e,SF
/P
LOS
Bay Street east sidewalkbetween Willow Avenueand Lynhurst Avenue(platoon flow)
3.7 71 438.9 B 20 1,658.3 A
Table 2.11-17 – 2019 No-Action Corners Levels of ServiceWeekday Midday Peak Hour Weekday PM Peak Hour
Corner Elements
Intersection
Cor
ner
Vol
ume,
ped/
hr
Avg
Ped
Spac
e,sf
/p
LOS
Vol
ume,
ped/
hr
Avg
Ped
Spac
e,sf
/p
LOS
Bay Street and WillowAvenue
Southeast 74 846.5 A 7 3,616.4 A
With-Action Conditions – Year 2019 Traffic
The proposed project includes 371 residential dwelling units and 24,173 sf commercial/retail space.This development would be expected to generate 182 total vehicle trips (36 “ins” and 146 “outs”)during the weekday AM peak hour, 149 total vehicle trips (82 “ins” and 67 “outs”) during the weekdaymidday peak hour, and 240 vehicle trips (165 “ins” and 75 “outs”) during the weekday PM peak hour.These project generated trips were added to the No Action peak hour volumes to develop the WithAction condition traffic volumes.
Traffic Volume Increments
Project generated trips were assigned to the project site entrances primarily along Bay Street, HylanBoulevard, and Edgewater Street. The locations of these entrances are provided in the site plan shownin Figure 2.11 1.
Traffic volumes along Bay Street north of Willow Avenue would be expected to increase byapproximately 10 vph to 45 vph in each direction during the peak hours analyzed. South of WillowAvenue, northbound Bay Street volumes are expected to increase by less than 15 vph and southboundBay Street volumes are expected to increase by approximately 20 vph to 60 vph during the peak hoursanalyzed.
Traffic volumes south of Willow Avenue, along eastbound Hylan Boulevard and northboundEdgewater Street, are expected to increase by approximately 20 vph to 50 vph during the weekday AMand midday peak hours, and by approximately 30 vph to 100 vph during the weekday PM peak hour.

125 Edgewater Street - CEQR No. 17DCP069R Environmental Assessment Statement
Page 2.11-21
In the opposite direction, traffic volumes are expected to increase by approximately 25 vph during theweekday midday and PM peak hours, and by approximately 50 vph during the weekday AM peakhour. Traffic volume increases along Edgewater Street north of Willow Avenue are modest, it wouldnot be expected to be more than 5 vph.
Traffic volume increases along eastbound Willow Avenue and Lynhurst Avenue leading to the projectsite is expected to approximately 5 vph to 35 vph for each roadway during the peak hours analyzed.Westbound Willow Avenue traffic volumes are expected to increase by approximately 45 vph duringthe weekday midday and PM peak hours, and by approximately 90 vph during the weekday AM peakhour.
With Action traffic volumes are provided in Figures 2.11 14 through 2.11 16.
Levels of Service
The 2019 With Action traffic levels of service were determined for the eight analysis locations. Tables2.11 18 and 2.11 19 provide an overview of the levels of service that characterize the 2019 With Action“overall” intersection conditions and individual traffic movements during the weekday AM, midday,and PM peak hours, respectively. Detailed traffic level of service comparisons for No Action and WithAction conditions are provided in Tables 2.11 20 through 2.11 22.
Table 2.11-18 – 2019 No-Action vs. 2019 With-Action Traffic Levels of Service – Overall Intersections
2019 No Action 2019 With ActionWeekdayAM Peak
Hour
WeekdayMidday
Peak Hour
WeekdayPM Peak
Hour
WeekdayAM Peak
Hour
WeekdayMidday
Peak Hour
WeekdayPM Peak
HourIntersections at OverallLOS A/B/C
6 6 5 6 4 4
Intersections at OverallLOS D
2 0 1 2 1 1
Intersections at OverallLOS E
0 0 1 0 1 1
Intersections at OverallLOS F
0 2 1 0 2 2
Number of intersectionswith significant impacts
2 3 3
Note: Includes four signalized and four unsignalized intersections

818
549132283
124
421
14459
64411
298
196
389
114
180
1476
624
971
1290
3143816
3657621
39
574
261626
5155
38116133
8036743
0488157
9116173
4447
78130
1960
1021
20191
16753
48
7 658
5
21
51
10
10
LYNHURST AVENUE
VANDERBILT AVENUE
FRONT STREET
BAY STREET
BAY STREET
EDGEWATER STREET
HYLAN BOULEVARDTOM
PKINS AVENUE
WILLOW AVENUE
LYNHURST AVE
WILLOW AVE
PROJECT AREA
Edgewater Street between Willow Avenue and Lynhurst Avenue
0
0
N
Date: 12.2.2016
Figure125 Edgewater Street DevelopmentStaten Island, New York 10305
2019 With-Action Traffic VolumesAM Peak Hour 2.11-14
Proposed Project Site Entrance

29
127686
53886
83
640
15674
81018
214
215
582
161
174
11712
45
780
1570
1664226
2776026
26
10
58
361310
101510
62105236
11046649
0539279
1187116
2319
24144
1521
2016
43177
11911
48
27
36
24
10
10
33
15
10
LYNHURST AVENUE
VANDERBILT AVENUE
FRONT STREET
BAY STREET
BAY STREET
EDGEWATER STREET
HYLAN BOULEVARDTOM
PKINS AVENUE
WILLOW AVENUE
LYNHURST AVE
WILLOW AVE
PROJECT AREA
Edgewater Street between Willow Avenue and Lynhurst Avenue
0
0
N
Date: 12.2.2016
Figure125 Edgewater Street DevelopmentStaten Island, New York 10305
2019 With-Action Traffic VolumesMidday Peak Hour 2.11-15
Proposed Project Site Entrance

35
114671
537109
75
623
27811
89227
260
288
602
161
200
1448
21
1391
2680
1679026
4083315
3310
71
411721
15365
40142236
14654532
0617283
5131124
2321
17250
1662
3323
94258
107 8
37
37
6735
10
2651
15
15
LYNHURST AVENUE
VANDERBILT AVENUE
FRONT STREET
BAY STREET
BAY STREET
EDGEWATER STREET
HYLAN BOULEVARDTOM
PKINS AVENUE
WILLOW AVENUE
LYNHURST AVE
WILLOW AVE
PROJECT AREA
Edgewater Street between Willow Avenue and Lynhurst Avenue
0
0
N
Date: 12.2.2016
Figure125 Edgewater Street DevelopmentStaten Island, New York 10305
2019 With-Action Traffic VolumesPM Peak Hour 2.11-16
Proposed Project Site Entrance

125 Edgewater Street - CEQR No. 17DCP069R Environmental Assessment Statement
Page 2.11-22
Table 2.11-19 – 2019 No-Action vs. 2019 With-Action Traffic Levels of Service –Traffic Movements
2019 No Action 2019 With ActionWeekdayAM Peak
Hour
WeekdayMidday
Peak Hour
WeekdayPM Peak
Hour
WeekdayAM Peak
Hour
WeekdayMidday
Peak Hour
WeekdayPM Peak
HourTraffic Movements atOverall LOS A/B/C oracceptable LOS D
30 29 26 30 29 24
Traffic Movements atUnacceptable LOS D
0 0 4 1 0 5
Traffic Movements atOverall LOS E
3 0 0 1 1 2
Traffic Movements atOverall LOS F
1 5 4 3 5 4
Number of significantlyimpacted movement
3 5 6
Number of individualtraffic movements
34 34 34 35 35 35
The summary overview of the 2019 With Action condition indicates that:
During the weekday AM peak hour, none of the eight intersections analyzed would operate atoverall LOS E or F (similar to the No Action conditions). Four individual traffic movements out ofthe approximately 35 movements analyzed would operate at LOS E or F (similar to the No Actionconditions), while one movement would operate at unacceptable LOS D (compared to none in theNo Action conditions). Two of the eight intersections would have significant impacts at threemovements.
In the weekday midday peak hour, three intersections would operate at overall LOS E or F(compared to two in the No Action conditions). Six individual traffic movements would operateat LOS E or F (compared to five in the No Action conditions), while no movements would operateat unacceptable LOS D (similar to the No Action conditions). Three intersections would havesignificant impacts at five movements.
In the weekday PM peak hour, three intersections would operate at overall LOS E or F (comparedto two in the No Action conditions). Six individual movements would operate at LOS E or F(compared to four in the No Action conditions), and five movements would operate atunacceptable LOS D (compared to four in the No Action conditions). Three intersections wouldhave significant impacts at six movements.
Based on the analysis results, the majority of traffic movements would continue to operate at acceptablelevels of service. Traffic movements that operate at LOS E or F under the No Action conditions wouldcontinue to do so under the With Action conditions. Of the eight intersections analyzed, the proposedproject would result in significant adverse traffic impacts at the intersections of Bay Street and WillowAvenue, and Bay Street and Hylan Boulevard during the weekday AM, midday, and PM peak hours,and the intersection of Bay Street and Edgewater Street/Front Street during the weekday midday andPM peak hours.

Control ControlINTERSECTION & APPROACH Mvt. V/C Delay LOS Mvt. V/C Delay LOS
SIGNALIZED INTERSECTIONS
Bay Street and Vanderbilt AvenueVanderbilt Avenue EB L 0.34 26.8 C L 0.34 26.7 C
R 0.40 28.0 C R 0.41 28.3 CBay Street NB L 0.18 2.3 A L 0.23 2.5 A
T 0.32 2.3 A T 0.35 2.3 ASB T 0.42 19.9 B T 0.43 20.2 C
R 0.22 6.9 A R 0.22 7.0 A
Overall Intersection 13.7 B 13.5 B
Bay Street and Edgewater Street/Front StreetFront Street WB LR 1.04 101.5 F LR 1.04 102.1 FBay Street NB TR 0.66 16.8 B TR 0.71 21.2 C
SB LT 0.72 23.2 C LT 0.78 26.4 CEdgewater Street NB LR 0.47 20.4 C LR 0.48 21.2 C
Overall Intersection 40.9 D 42.9 D
Bay Street and Willow AvenueWillow Avenue EB LTR 0.06 32.6 C LTR 0.06 32.6 C
WB LTR 0.10 33.7 C LTR 0.54 45.6 DBay Street NB LTR 0.58 10.3 B LTR 0.59 9.8 A
SB LTR 0.83 28.7 C LTR 0.85 29.5 C
Overall Intersection 21.5 C 23.8 C
Bay Street and Hylan BoulevardHylan Boulevard EB L 0.63 31.9 C L 0.71 38.9 D
TR 0.25 17.1 B TR 0.27 17.3 BWB L 0.73 58.2 E L 0.84 69.7 E
TR 0.31 38.7 D TR 0.42 41.1 DBay Street NB LT 1.00 71.9 E LT 1.06 90.7 F
R 0.16 15.8 B R 0.17 15.9 BSB T 0.75 23.3 C T 0.79 29.1 C
R 0.21 8.1 A R 0.26 9.1 A
Overall Intersection 38.6 D 46.1 D
UNSIGNALIZED INTERSECTIONS
Bay Street and Lynhurst AvenueLynhurst Avenue EB LTR 46.2 E LTR 71.4 FBay Street NB TR 0.0 A TR 0.0 A
SB LT 0.2 A LT 0.4 A
Overall Intersection 3.0 A 4.6 A
Edgewater Street and Willow AvenueWillow Avenue EB LTR 9.0 A LTR 9.6 A
WB LTR 8.6 A LTR 9.8 AEdgewater Street NB LTR 9.5 A LTR 11.1 B
SB LTR 10.2 B LTR 11.1 B
Overall Intersection 9.7 A 10.7 B
Edgewater Street and Lynhurst AvenueLynhurst Avenue EB LTR 11.3 B LTR 15.4 C
WB LR 16.0 CEdgewater Street NB TR 0.0 A TR 0.0 A
SB LT 0.0 A LT 0.0 A
Overall Intersection 0.8 A 3.9 A
Edgewater Street and Hylan BoulevardHylan Boulevard EB L 7.5 A L 7.5 AEdgewater Street SB R 9.6 A R 10.0 A
Overall Intersection 8.8 A 9.0 A
(1) Control delay is measured in seconds per vehicle.(2) Overall intersection V/C ratio is the critical lane groups V/C ratio.(3) Significantly impacted movements are highlighted and bordered
2019 No Action 2019 With Action
TABLE 12.11 20125 EDGEWATER STREET
2019 NO ACTION VS 2019 WITH ACTION LEVELS OF SERVICE COMPARISON WEEKDAY AM PEAK HOUR

Control ControlINTERSECTION & APPROACH Mvt. V/C Delay LOS Mvt. V/C Delay LOS
SIGNALIZED INTERSECTIONS
Bay Street and Vanderbilt AvenueVanderbilt Avenue EB L 0.44 34.4 C L 0.44 34.7 C
R 0.20 31.0 C R 0.24 31.8 CBay Street NB L 0.36 7.9 A L 0.43 2.9 A
T 0.55 6.7 A T 0.56 2.0 ASB T 0.70 8.3 A T 0.71 8.5 A
R 0.28 1.7 A R 0.28 1.6 A
Overall Intersection 10.8 B 9.3 A
Bay Street and Edgewater Street/Front StreetFront Street WB LR 0.63 39.3 D LR 0.63 39.4 DBay Street NB TR 1.16 110.5 F TR 1.20 126.6 F
SB LT 1.91 443.1 F LT 2.06 506.5 FEdgewater Street NB LR 0.46 14.6 B LR 0.46 14.8 B
Overall Intersection 221.1 F 253.5 F
Bay Street and Willow AvenueWillow Avenue EB LTR 0.08 23.1 C LTR 0.09 23.3 C
WB LTR 0.19 25.3 C LTR 0.42 31.1 CBay Street NB LTR 0.96 18.6 B LTR 0.97 19.2 B
SB LTR 1.01 33.3 C LTR 1.07 56.0 E
Overall Intersection 26.2 C 38.0 D
Bay Street and Hylan BoulevardHylan Boulevard EB L 0.95 88.6 F L 0.96 92.3 F
TR 0.29 34.8 C TR 0.34 36.0 DWB L 0.53 39.3 D L 0.59 42.3 D
TR 0.28 30.1 C TR 0.33 30.9 CBay Street NB LT 1.73 357.3 F LT 1.80 387.0 F
R 0.23 14.4 B R 0.27 14.9 BSB T 0.87 30.9 C T 0.88 30.3 C
R 0.46 6.9 A R 0.48 7.0 A
Overall Intersection 121.1 F 126.0 F
UNSIGNALIZED INTERSECTIONS
Bay Street and Lynhurst AvenueLynhurst Avenue EB LTR 349.2 F LTR 903.6 FBay Street NB TR 0.0 A TR 0.0 A
SB LT 0.2 A LT 0.9 A
Overall Intersection 14.1 B 37.4 E
Edgewater Street and Willow AvenueWillow Avenue EB LTR 8.2 A LTR 8.6 A
WB LTR 8.2 A LTR 8.7 AEdgewater Street NB LTR 9.1 A LTR 9.9 A
SB LTR 8.5 A LTR 8.8 A
Overall Intersection 8.7 A 9.2 A
Edgewater Street and Lynhurst AvenueLynhurst Avenue EB LTR 10.2 B LTR 20.0 C
WB LR 29.8 DEdgewater Street NB TR 0.0 A TR 0.0 A
SB LT 0.0 A LT 0.1 A
Overall Intersection 0.8 A 5.1 A
Edgewater Street and Hylan BoulevardHylan Boulevard EB L 7.5 A L 7.7 AEdgewater Street SB R 9.2 A R 9.3 A
Overall Intersection 8.4 A 8.5 A
(1) Control delay is measured in seconds per vehicle.(2) Overall intersection V/C ratio is the critical lane groups V/C ratio.(3) Significantly impacted movements are highlighted and bordered
TABLE 12.11 21125 EDGEWATER STREET
2019 NO ACTION VS 2019 WITH ACTION LEVELS OF SERVICE COMPARISON WEEKDAY MIDDAY PEAK HOUR
2019 No Action 2019 With Action

Control ControlINTERSECTION & APPROACH Mvt. V/C Delay LOS Mvt. V/C Delay LOS
SIGNALIZED INTERSECTIONS
Bay Street and Vanderbilt AvenueVanderbilt Avenue EB L 0.41 32.2 C L 0.41 31.1 C
R 0.15 27.5 C R 0.22 27.5 CBay Street NB L 0.36 12.8 B L 0.44 13.4 B
T 0.47 12.2 B T 0.48 12.1 BSB T 0.62 6.3 A T 0.65 6.8 A
R 0.23 0.9 A R 0.23 1.2 A
Overall Intersection 11.3 B 11.6 B
Bay Street and Edgewater Street/Front StreetFront Street WB LR 0.67 51.6 D LR 0.68 52.3 DBay Street NB TR 0.92 47.8 D TR 0.95 52.8 D
SB LT 0.75 26.1 C LT 0.84 65.9 EEdgewater Street NB LR 1.04 94.0 F LR 1.05 95.6 F
Overall Intersection 48.9 D 64.2 E
Bay Street and Willow AvenueWillow Avenue EB LTR 0.12 33.5 C LTR 0.13 33.7 C
WB LTR 0.25 36.6 D LTR 0.54 46.4 DBay Street NB LTR 0.90 27.4 C LTR 0.91 29.9 C
SB LTR 0.89 29.5 C LTR 0.99 68.2 E
Overall Intersection 29.0 C 49.4 D
Bay Street and Hylan BoulevardHylan Boulevard EB L 1.11 129.0 F L 1.17 151.6 F
TR 0.24 28.4 C TR 0.36 31.1 CWB L 0.53 46.9 D L 0.62 51.8 D
TR 0.38 40.0 D TR 0.42 41.0 DBay Street NB LT 2.04 496.4 F LT 2.20 563.2 F
R 0.24 26.8 C R 0.31 28.5 CSB T 0.98 50.8 D T 1.00 53.0 D
R 0.36 9.0 A R 0.38 9.8 A
Overall Intersection 165.8 F 178.4 F
UNSIGNALIZED INTERSECTIONS
Bay Street and Lynhurst AvenueLynhurst Avenue EB LTR 952.7 F LTR (3) FBay Street NB TR 0.0 A TR 0.0 A
SB LT 0.3 A LT 1.5 A
Overall Intersection 47.3 E 490.9 F
Edgewater Street and Willow AvenueWillow Avenue EB LTR 8.7 A LTR 9.4 A
WB LTR 9.1 A LTR 9.9 AEdgewater Street NB LTR 10.8 B LTR 12.3 B
SB LTR 8.9 A LTR 9.4 A
Overall Intersection 9.8 A 10.9 B
Edgewater Street and Lynhurst AvenueLynhurst Avenue EB LTR 11.2 B LTR 23.6 C
WB LR 29.4 DEdgewater Street NB TR 0.0 A TR 0.0 A
SB LT 0.0 A LT 0.1 A
Overall Intersection 0.9 A 4.8 A
Edgewater Street and Hylan BoulevardHylan Boulevard EB L 7.6 A L 7.8 AEdgewater Street SB R 9.6 A R 9.7 A
Overall Intersection 8.7 A 8.8 A
(1) Control delay is measured in seconds per vehicle.(2) Overall intersection V/C ratio is the critical lane groups V/C ratio.(3) Delay for this movement exceeds the model s reporting threshold(4) Significantly impacted movements are highlighted and bordered
TABLE 12.11 22125 EDGEWATER STREET
2019 NO ACTION VS 2019 WITH ACTION LEVELS OF SERVICE COMPARISON WEEKDAY PM PEAK HOUR
2019 No Action 2019 With Action

125 Edgewater Street - CEQR No. 17DCP069R Environmental Assessment Statement
Page 2.11-23
The following traffic movements were significantly impacted for the following peak hours:
Bay Street and Edgewater Street/Front Street Bay Street northbound approach (weekday middayand PM peak hours)Bay Street and Edgewater Street/Front Street Bay Street southbound approach (weekday middayand PM peak hours)Bay Street and Willow Avenue westbound approach (weekday AM and PM peak hours)Bay Street and Willow Avenue southbound approach (weekday midday and PM peak hours)Bay Street and Hylan Boulevard eastbound left turn movement (weekday midday and PM peakhours)Bay Street and Hylan Boulevard westbound left turn movement (weekday AM peak hour)Bay Street and Hylan Boulevard northbound shared left through movement (weekday AM,midday, and PM peak hours)
The following are improvements identified to avoid traffic impacts at the impacted intersections:
Bay Street and Edgewater Street/Front Street
Modify signal timing:
o For the weekday midday peak hour, shift two seconds of green time from the westboundphase to the Bay Street northbound/southbound phase.
Modification to the signal offset at the adjacent intersection of Bay Street and Willow wouldeliminate significant impacts identified at this intersection during the weekday PM peak hour.
Bay Street and Willow Avenue
Modify signal timing:
o For the weekday midday peak hour, shift two seconds of green time from theeastbound/westbound phase to the northbound/southbound phase.
o For the weekday PM peak hour, shift one second of green time from thenorthbound/southbound phase to the eastbound/westbound phase.
Modify the signal offset for the weekday PM peak hour from 22 seconds to 8 seconds to coordinatewith the intersection of Bay Street and Edgewater Street/Front Street.
Bay Street and Hylan Boulevard
Modify signal timing:
o For the weekday AM peak hour, shift two seconds of green time from the eastboundlead/southbound right turn lag phase to the eastbound/westbound phase and two secondsof green time from the eastbound lead/southbound right turn lag phase to thenorthbound/southbound phase.
o For the weekday midday peak hour, shift one second of green time from the eastboundlead/southbound right turn lag phase to the eastbound/westbound phase, and one secondof green time from the eastbound lead/southbound right turn lag phase to thenorthbound/southbound phase.

125 Edgewater Street - CEQR No. 17DCP069R Environmental Assessment Statement
Page 2.11-24
o For the weekday PM peak hour, shift two seconds of green time from the eastboundlead/southbound right turn lag phase to the eastbound/westbound phase, and one secondof green time from the eastbound lead/southbound right turn lag phase to thenorthbound/southbound phase.
Proposed Traffic Improvements
Also, as part of the project improvements, an all way stop control would be installed at the intersectionof Edgewater Street at Lynhurst Avenue. This would allow for pedestrian crosswalks to beimplemented across Edgewater Street. An all way stop control warrant analysis was performed at thisintersection and it was determined that the warrant would be satisfied.
Detailed traffic level of service comparisons for No Action, With Action, and With Action withImprovements conditions are provided in Tables 2.11 23 through 2.11 25. With the proposedimprovements there would be no further deterioration of level of service and no significant impacts.
Pedestrian
The project generated increase in pedestrian volumes shown in Figures 2.11 5 and 2.11 6 wereincorporated into the 2019 No Action pedestrian volume to develop the 2019 With Action pedestrianvolumes. The With Action peak hour volumes and levels of service for each pedestrian elementanalyzed are presented in Tables 2.11 26 and 2.11 27 below.
Table 2.11-26 – 2019 With-Action Sidewalk Levels of ServiceWeekday Midday Peak Hour Weekday PM Peak Hour
Sidewalk Elements
Sidewalk
Effe
ctiv
eW
idth
,ft
Vol
ume,
ped/
hr
Avg
Ped
Spac
e,SF
/P
LOS
Vol
ume,
ped/
hr
Avg
Ped
Spac
e,SF
/P
LOS
Bay Street east sidewalkbetween Willow Avenueand Lynhurst Avenue(platoon flow)
3.7 335 92.8 B 242 136.9 B
Lynhurst Avenue southsidewalk east of EdgewaterStreet (non platoon flow)
8.0 345 233.6 A 266 303.0 A

Control Control Control Traffic ImprovementsINTERSECTION & APPROACH Mvt. V/C Delay LOS Mvt. V/C Delay LOS Mvt. V/C Delay LOS
SIGNALIZED INTERSECTIONS
Bay Street and Vanderbilt AvenueVanderbilt Avenue EB L 0.34 26.8 C L 0.34 26.7 C L 0.34 26.7 C No improvements needed
R 0.40 28.0 C R 0.41 28.3 C R 0.41 28.3 CBay Street NB L 0.18 2.3 A L 0.23 2.5 A L 0.23 2.5 A
T 0.32 2.3 A T 0.35 2.3 A T 0.35 2.3 ASB T 0.42 19.9 B T 0.43 20.2 C T 0.43 20.2 C
R 0.22 6.9 A R 0.22 7.0 A R 0.22 7.0 A
Overall Intersection 13.7 B 13.5 B 13.5 B
Bay Street and Edgewater Street/Front StreetFront Street WB LR 1.04 101.5 F LR 1.04 102.1 F LR 1.04 102.1 F No improvements neededBay Street NB TR 0.66 16.8 B TR 0.71 21.2 C TR 0.71 20.0 B
SB LT 0.72 23.2 C LT 0.78 26.4 C LT 0.78 26.7 CEdgewater Street NB LR 0.47 20.4 C LR 0.48 21.2 C LR 0.48 21.2 C
Overall Intersection 40.9 D 42.9 D 42.6 D
Bay Street and Willow AvenueWillow Avenue EB LTR 0.06 32.6 C LTR 0.06 32.6 C LTR 0.06 31.9 C Modify signal timing: shift 1 sec of green time from NB/SB
WB LTR 0.10 33.7 C LTR 0.54 45.6 D LTR 0.52 44.0 D phase to EB/WB phase [NB/SB phase green time shifts from 70Bay Street NB LTR 0.58 10.3 B LTR 0.59 9.8 A LTR 0.59 11.6 B sec to 69 sec; LPI phase green time remains the same; EB/WB
SB LTR 0.83 28.7 C LTR 0.85 29.5 C LTR 0.87 31.8 C phase green time shifts from 33 sec to 34 sec].
Overall Intersection 21.5 C 23.8 C 25.5 C
Bay Street and Hylan BoulevardHylan Boulevard EB L 0.63 31.9 C L 0.71 38.9 D L 0.65 34.4 C Modify signal timing: shift 2 sec of green time from EB lead/
TR 0.25 17.1 B TR 0.27 17.3 B TR 0.28 18.2 B SBR lag phase to EB/WB phase and shift 2 sec of green timeWB L 0.73 58.2 E L 0.84 69.7 E L 0.78 61.1 E from EB lead/SBR lag phase to NB/SB phase [NB/SB phase
TR 0.31 38.7 D TR 0.42 41.1 D TR 0.39 38.9 D green time shifts from 54 sec to 56 sec; EB lead/SBR lag phaseBay Street NB LT 1.00 71.9 E LT 1.06 90.7 F LT 0.98 66.1 E green time shifts from 13 sec to 9 sec; EB/WB phase green
R 0.16 15.8 B R 0.17 15.9 B R 0.17 15.5 B time shifts from 31 sec to 33 sec; LPI phase green time remainsSB T 0.75 23.3 C T 0.79 29.1 C T 0.76 27.7 C the same].
R 0.21 8.1 A R 0.26 9.1 A R 0.27 9.5 A
Overall Intersection 38.6 D 46.1 D 38.5 D
UNSIGNALIZED INTERSECTIONS
Bay Street and Lynhurst AvenueLynhurst Avenue EB LTR 46.2 E LTR 71.4 F LTR 72.3 F No improvements neededBay Street NB TR 0.0 A TR 0.0 A TR 0.0 A EB Lynhurst Avenue carries less than 90 passenger car
SB LT 0.2 A LT 0.4 A LT 0.4 A equivalents, therefore no significant impacts wereidentified for this approach.
Overall Intersection 3.0 A 4.6 A 4.6 A
Edgewater Street and Willow AvenueWillow Avenue EB LTR 9.0 A LTR 9.6 A LTR 9.6 A No improvements needed
WB LTR 8.6 A LTR 9.8 A LTR 9.8 AEdgewater Street NB LTR 9.5 A LTR 11.1 B LTR 11.1 B
SB LTR 10.2 B LTR 11.1 B LTR 11.1 B
Overall Intersection 9.7 A 10.7 B 10.7 B
Edgewater Street and Lynhurst AvenueLynhurst Avenue EB LTR 11.3 B LTR 15.4 C LTR 8.7 A No improvements needed
WB LR 16.0 C LR 9.0 A Install all way stop control at this intersection to allow forEdgewater Street NB TR 0.0 A TR 0.0 A TR 9.9 A pedestrian crosswalks to be implemented across Edgewater
SB LT 0.0 A LT 0.0 A LT 10.0 B Street.
Overall Intersection 0.8 A 3.9 A 9.7 A
Edgewater Street and Hylan BoulevardHylan Boulevard EB L 7.5 A L 7.5 A L 7.5 A No improvements neededEdgewater Street SB R 9.6 A R 10.0 A R 10.0 A
Overall Intersection 8.8 A 9.0 A 9.0 A
(1) Control delay is measured in seconds per vehicle.(2) Overall intersection V/C ratio is the critical lane groups V/C ratio.(3) Significantly impacted movements are highlighted and bordered
TABLE 12.11 23125 EDGEWATER STREET
2019 NO ACTION VS 2019 WITH ACTION VS 2019 WITH ACTION W IMPROVEMENTS LEVELS OF SERVICE COMPARISON WEEKDAY AM PEAK HOUR
2019 No Action 2019 With Action 2019 With Action w Improvements

Control Control Control Traffic ImprovementsINTERSECTION & APPROACH Mvt. V/C Delay LOS Mvt. V/C Delay LOS Mvt. V/C Delay LOS
SIGNALIZED INTERSECTIONS
Bay Street and Vanderbilt AvenueVanderbilt Avenue EB L 0.44 34.4 C L 0.44 34.7 C L 0.44 34.7 C No improvements needed
R 0.20 31.0 C R 0.24 31.8 C R 0.24 31.8 CBay Street NB L 0.36 7.9 A L 0.43 2.9 A L 0.43 4.2 A
T 0.55 6.7 A T 0.56 2.0 A T 0.56 3.9 ASB T 0.70 8.3 A T 0.71 8.5 A T 0.71 8.5 A
R 0.28 1.7 A R 0.28 1.6 A R 0.28 1.6 A
Overall Intersection 10.8 B 9.3 A 9.9 A
Bay Street and Edgewater Street/Front StreetFront Street WB LR 0.63 39.3 D LR 0.63 39.4 D LR 0.70 45.0 D Modify signal timing: shift 2 sec of green time from the WBBay Street NB TR 1.16 110.5 F TR 1.20 126.6 F TR 1.14 98.5 F phase to the NB/SB phase [NB/SB Bay Street phase green time
SB LT 1.91 443.1 F LT 2.06 506.5 F LT 1.76 374.9 F shifts from 35 sec to 37 sec; WB phase green time shifts fromEdgewater Street NB LR 0.46 14.6 B LR 0.46 14.8 B LR 0.46 14.8 B 18 sec to 16 sec; NB Edgewater Street phase green time
remains the same].Overall Intersection 221.1 F 253.5 F 191.9 F
Bay Street and Willow AvenueWillow Avenue EB LTR 0.08 23.1 C LTR 0.09 23.3 C LTR 0.09 24.9 C Modify signal timing: shift 2 sec of green time from EB/WB
WB LTR 0.19 25.3 C LTR 0.42 31.1 C LTR 0.47 34.4 C phase to the NB/SB phase [NB/SB phase green time shifts fromBay Street NB LTR 0.96 18.6 B LTR 0.97 19.2 B LTR 0.93 15.2 B 46 sec to 48 sec; LPI phase green time remains the same; EB/
SB LTR 1.01 33.3 C LTR 1.07 56.0 E LTR 1.03 37.4 D WB green time shifts from 27 sec to 25 sec].
Overall Intersection 26.2 C 38.0 D 27.4 C
Bay Street and Hylan BoulevardHylan Boulevard EB L 0.95 88.6 F L 0.96 92.3 F L 0.92 83.0 F Modify signal timing: shift 1 sec of green time from EB lead/
TR 0.29 34.8 C TR 0.34 36.0 D TR 0.35 37.0 D SBR lag phase to EB/WB phase and shift 1 sec of green timeWB L 0.53 39.3 D L 0.59 42.3 D L 0.56 39.7 D from EB lead/SBR lag phase to NB/SB phase [ NB/SB phase
TR 0.28 30.1 C TR 0.33 30.9 C TR 0.31 29.8 C green time shifts from 37 sec to 38 sec; EB lead/SBR lag phaseBay Street NB LT 1.73 357.3 F LT 1.80 387.0 F LT 1.66 324.0 F green time shifts from 9 sec to 7 sec; EB/WB phase green
R 0.23 14.4 B R 0.27 14.9 B R 0.26 14.7 B time shifts from 22 sec to 23 sec; LPI phase green time remainsSB T 0.87 30.9 C T 0.88 30.3 C T 0.86 29.4 C the same].
R 0.46 6.9 A R 0.48 7.0 A R 0.50 9.2 A
Overall Intersection 121.1 F 126.0 F 108.6 F
UNSIGNALIZED INTERSECTIONS
Bay Street and Lynhurst AvenueLynhurst Avenue EB LTR 349.2 F LTR 903.6 F LTR 973.1 F No improvements neededBay Street NB TR 0.0 A TR 0.0 A TR 0.0 A EB Lynhurst Avenue carries less than 90 passenger car
SB LT 0.2 A LT 0.9 A LT 0.9 A equivalents, therefore no significant impacts wereidentified for this approach.
Overall Intersection 14.1 B 37.4 E 40.3 E
Edgewater Street and Willow AvenueWillow Avenue EB LTR 8.2 A LTR 8.6 A LTR 8.6 A No improvements needed
WB LTR 8.2 A LTR 8.7 A LTR 8.7 AEdgewater Street NB LTR 9.1 A LTR 9.9 A LTR 9.9 A
SB LTR 8.5 A LTR 8.8 A LTR 8.8 A
Overall Intersection 8.7 A 9.2 A 9.2 A
Edgewater Street and Lynhurst AvenueLynhurst Avenue EB LTR 10.2 B LTR 20.0 C LTR 8.2 A No improvements needed
WB LR 29.8 D LR 8.1 A Install all way stop control at this intersection to allow forEdgewater Street NB TR 0.0 A TR 0.0 A TR 9.1 A pedestrian crosswalks to be implemented across Edgewater
SB LT 0.0 A LT 0.1 A LT 8.6 A Street.
Overall Intersection 0.8 A 5.1 A 8.8 A
Edgewater Street and Hylan BoulevardHylan Boulevard EB L 7.5 A L 7.7 A L 7.7 A No improvements neededEdgewater Street SB R 9.2 A R 9.3 A R 9.3 A
Overall Intersection 8.4 A 8.5 A 8.5 A
(1) Control delay is measured in seconds per vehicle.(2) Overall intersection V/C ratio is the critical lane groups V/C ratio.(3) Significantly impacted movements are highlighted and bordered
TABLE 12.11 24125 EDGEWATER STREET
2019 NO ACTION VS 2019 WITH ACTION VS 2019 WITH ACTION W IMPROVEMENTS LEVELS OF SERVICE COMPARISON WEEKDAY MIDDAY PEAK HOUR
2019 No Action 2019 With Action 2019 With Action w Improvements

Control Control Control Traffic ImprovementsINTERSECTION & APPROACH Mvt. V/C Delay LOS Mvt. V/C Delay LOS Mvt. V/C Delay LOS
SIGNALIZED INTERSECTIONS
Bay Street and Vanderbilt AvenueVanderbilt Avenue EB L 0.41 32.2 C L 0.41 31.1 C L 0.41 31.1 C No improvements needed
R 0.15 27.5 C R 0.22 27.5 C R 0.22 27.5 CBay Street NB L 0.36 12.8 B L 0.44 13.4 B L 0.44 13.2 B
T 0.47 12.2 B T 0.48 12.1 B T 0.48 11.8 BSB T 0.62 6.3 A T 0.65 6.8 A T 0.65 6.8 A
R 0.23 0.9 A R 0.23 1.2 A R 0.23 1.2 A
Overall Intersection 11.3 B 11.6 B 11.5 B
Bay Street and Edgewater Street/Front StreetFront Street WB LR 0.67 51.6 D LR 0.68 52.3 D LR 0.68 52.3 D Coordinate the signal offset with the intersection of Bay StreetBay Street NB TR 0.92 47.8 D TR 0.95 52.8 D TR 0.95 42.0 D and Willow Avenue
SB LT 0.75 26.1 C LT 0.84 65.9 E LT 0.84 36.6 DEdgewater Street NB LR 1.04 94.0 F LR 1.05 95.6 F LR 1.05 95.6 F
Overall Intersection 48.9 D 64.2 E 50.3 D
Bay Street and Willow AvenueWillow Avenue EB LTR 0.12 33.5 C LTR 0.13 33.7 C LTR 0.13 32.9 C Modify the signal offset from 22 seconds to 8 seconds to
WB LTR 0.25 36.6 D LTR 0.54 46.4 D LTR 0.52 44.7 D coordinate with the intersection of Bay Street and EdgewaterBay Street NB LTR 0.90 27.4 C LTR 0.91 29.9 C LTR 0.92 28.4 C Street/Front Street.
SB LTR 0.89 29.5 C LTR 0.99 68.2 E LTR 1.01 40.2 D Modify signal timing: shift 1 sec of green time from NB/SBphase to the EB/WB phase [NB/SB phase green time shifts from
Overall Intersection 29.0 C 49.4 D 35.2 D 70 sec to 69 sec; LPI phase green time remains the same; EB/WB green time shifts from 33 sec to 34 sec].
Bay Street and Hylan BoulevardHylan Boulevard EB L 1.11 129.0 F L 1.17 151.6 F L 1.08 121.2 F Modify signal timing: shift 2 sec of green time from EB lead/
TR 0.24 28.4 C TR 0.36 31.1 C TR 0.37 32.1 C SBR lag phase to EB/WB phase and shift 1 sec of green timeWB L 0.53 46.9 D L 0.62 51.8 D L 0.58 47.9 D from EB lead/SBR lag phase to NB/SB phase [NB/SB phase
TR 0.38 40.0 D TR 0.42 41.0 D TR 0.40 38.8 D green time shifts from 54 sec to 55 sec; EB lead/SBR lag phaseBay Street NB LT 2.04 496.4 F LT 2.20 563.2 F LT 2.02 485.3 F green time shifts from 13 sec to 10 sec; EB/WB phase green
R 0.24 26.8 C R 0.31 28.5 C R 0.31 28.4 C time shifts from 31 sec to 33 sec; LPI phase green time remainsSB T 0.98 50.8 D T 1.00 53.0 D T 0.98 41.4 D the same].
R 0.36 9.0 A R 0.38 9.8 A R 0.39 5.3 A
Overall Intersection 165.8 F 178.4 F 152.3 F
UNSIGNALIZED INTERSECTIONS
Bay Street and Lynhurst AvenueLynhurst Avenue EB LTR 952.7 F LTR (3) F LTR (3) F No improvements neededBay Street NB TR 0.0 A TR 0.0 A TR 0.0 A EB Lynhurst Avenue carries less than 90 passenger car
SB LT 0.3 A LT 1.5 A LT 1.5 A equivalents, therefore no significant impacts wereidentified for this approach.
Overall Intersection 47.3 E 490.9 F 490.9 F
Edgewater Street and Willow AvenueWillow Avenue EB LTR 8.7 A LTR 9.4 A LTR 9.4 A No improvements needed
WB LTR 9.1 A LTR 9.9 A LTR 9.9 AEdgewater Street NB LTR 10.8 B LTR 12.3 B LTR 12.3 B
SB LTR 8.9 A LTR 9.4 A LTR 9.4 A
Overall Intersection 9.8 A 10.9 B 10.9 B
Edgewater Street and Lynhurst AvenueLynhurst Avenue EB LTR 11.2 B LTR 23.6 C LTR 9.1 A No improvements needed
WB LR 29.4 D LR 8.7 A Install all way stop control at this intersection to allow forEdgewater Street NB TR 0.0 A TR 0.0 A TR 11.5 B pedestrian crosswalks to be implemented across Edgewater
SB LT 0.0 A LT 0.1 A LT 9.6 A Street.
Overall Intersection 0.9 A 4.8 A 10.5 B
Edgewater Street and Hylan BoulevardHylan Boulevard EB L 7.6 A L 7.8 A L 7.8 A No improvements neededEdgewater Street SB R 9.6 A R 9.7 A R 9.7 A
Overall Intersection 8.7 A 8.8 A 8.8 A
(1) Control delay is measured in seconds per vehicle.(2) Overall intersection V/C ratio is the critical lane groups V/C ratio.(3) Delay for this movement exceeds the model s reporting threshold(4) Significantly impacted movements are highlighted and bordered
TABLE 12.11 25125 EDGEWATER STREET
2019 NO ACTION VS 2019 WITH ACTION VS 2019 WITH ACTION W IMPROVEMENTS LEVELS OF SERVICE COMPARISON WEEKDAY PM PEAK HOUR
2019 No Action 2019 With Action 2019 With Action w Improvements

125 Edgewater Street - CEQR No. 17DCP069R Environmental Assessment Statement
Page 2.11-25
Table 2.11-27 – 2019 With-Action Corner Levels of ServiceWeekday Midday Peak Hour Weekday PM Peak Hour
Corner Elements
Intersection
Cor
ner
Vol
ume,
ped/
hr
Avg
Ped
Spac
e,sf
/p
LOS
Vol
ume,
ped/
hr
Avg
Ped
Spac
e,sf
/p
LOS
Bay Street and WillowAvenue
Southeast 96 204.4 A 19 304.0 A
Pedestrian levels of service in the With Action condition would continue to operate at LOS A or LOSB. Therefore, the proposed project would not result in any significant adverse pedestrian impacts.
Parking
A parking analysis was performed to determine whether the projected parking demand associatedwith the proposed project could be accommodated. The weekday peak parking demand would occurduring the nighttime and overnight hours when residents of the proposed project would park andleave their cars overnight. The weekday peak parking demand of 257 spaces would be expected tooccur between 6 PM and 7 PM and could be accommodated by 346 parking spaces proposed by theproject. Table 2.11 28 provides the projected hourly parking accumulation for the weekday conditions.

125 Edgewater Street - CEQR No. 17DCP069R Environmental Assessment Statement
Page 2.11-26
Table 2.11-28: Project Parking Demand
Time Auto In Auto Out Parking Demand
12 AM to 1 AM 14 14 241
1 AM to 2 AM 7 5 243
2 AM to 3 AM 0 0 243
3 AM to 4 AM 0 0 243
4 AM to 5 AM 0 0 243
5 AM to 6 AM 2 0 245
6 AM to 7 AM 4 0 249
7 AM to 8 AM 16 45 220
8 AM to 9 AM 32 142 110
9 AM to 10 AM 43 89 64
10 AM to 11 AM 50 63 51
11 AM to 12 PM 53 48 56
12 PM to 1 PM 68 53 71
1 PM to 2 PM 54 48 77
2 PM to 3 PM 74 59 92
3 PM to 4 PM 62 67 87
4 PM to 5 PM 126 69 144
5 PM to 6 PM 157 67 234
6 PM to 7 PM 95 72 257
7 PM to 8 PM 72 73 256
8 PM to 9 PM 42 48 250
9 PM to 10 PM 31 33 248
10 PM to 11 PM 30 37 241
11 PM to 12 AM 20 20 241
Safety
Accident data was obtained for the study area intersections from the NYCDOT for the most recentthree year period (2012 through 2014). This information is based on data provided by the New YorkState Department of Transportation (NYSDOT), New York State Department of Motor Vehicles(NYSDMV), and the New York City Police Department (NYPD).
The data obtained details reported crashes (crashes resulting in death, injury, or property damage inexcess of $1,000), fatalities, injuries, and pedestrian and bicycle injuries annually. According to the 2014CEQR Technical Manual, a location is considered a high accident location when there are 48 or moretotal reportable and non reportable crashes, or five or more pedestrian/bicyclist injury crashes in anyconsecutive 12 months during the most recent three year period of which data is available.

125 Edgewater Street - CEQR No. 17DCP069R Environmental Assessment Statement
Page 2.11-27
Table 2.11 29 presents a summary of total accidents in the study area intersections during the threeyear period of 2012 through 2014, and also shows total fatalities, injuries, and pedestrian and bicycleaccidents. None of the eight intersections analyzed are considered high accident locations.
Table 2.11-29: Accident Summary
Intersection
Total Accidents by YearPedestrian and
Bicycle Accidentsby Year
2012 2013 2014Total
FatalitiesTotal
Injuries2012 2013 2014
Bay Street and Vanderbilt Avenue 1 3 2 0 7 0 0 1Bay Street and Edgewater Street/FrontStreet
0 0 1 0 3 0 0 0
Bay Street and Willow Avenue 1 0 3 0 5 0 0 1
Bay Street and Lynhurst Avenue 0 1 2 0 2 0 0 0
Bay Street and Hylan Boulevard 3 0 3 0 7 1 0 1
Edgewater Street and Willow Avenue 0 0 0 0 0 0 0 0
Edgewater Street and Lynhurst Avenue 1 0 0 0 0 0 0 0
Edgewater Street and Hylan Boulevard 1 0 0 0 0 0 0 0
Although none of the intersections analyzed are identified as a “Priority Intersection” according to theNew York City Vision Zero Action Plan, two corridors within the study area (Bay Street and VanderbiltAvenue) were identified as “Priority Corridors.” The Vision Zero Staten Island Pedestrian Safety ActionPlan identified strategies to improve pedestrian safety at key locations including expanding pedestriancrossing times and proactively designing for pedestrian safety, installing signage and enforcing thespeed limit, expanding the bicycle network, and coordinating with the Metropolitan Transit Agencyand communities to promote a safe pedestrian environment.
2.11.4 Conclusion
The number of transit trips generated under the With Action condition compared to the No Actioncondition would not exceed CEQR Level 1 (trip generation) screening thresholds for further transitanalysis. The proposed project would generate traffic volumes exceeding transportation screeningthresholds and, as a result, a detailed traffic analysis was performed at eight intersections. Trafficimprovements to accommodate the project generated vehicle trips were identified at four intersectionsand would be incorporated as part of the project. The results of the analysis show that, with theseimprovements in place, the proposed project would not result in significant adverse transportationimpacts. The proposed project would also generate pedestrian volumes exceeding the transportationscreening thresholds and a detailed pedestrian analysis was performed for three pedestrian elements.These pedestrian elements currently operate at acceptable levels of service and would continue to doso in the future conditions.

125 Edgewater Street - CEQR No. 17DCP069R Environmental Assessment Statement
Page 2.12-1
Chapter 2.12: Air Quality
2.12.1 Introduction
This chapter examines the potential for the proposed project to result in significant adverse air quality
impacts. Air quality impacts can be either direct or indirect. Direct impacts result from emissions
generated by stationary sources at a development site, such as emissions from on‐site fuel combustion
for heat and hot water systems. Indirect impacts are caused by off‐site emissions associated with a
project, such as emissions from nearby existing stationary sources or by emissions from on‐road vehicle
trips generated by the proposed project or other changes to future traffic conditions due to a project.
The following key areas are addressed in this chapter:
The potential for emissions associated with project‐generated vehicular travel under the
reasonable worst‐case development scenario (RWCDS) to result in significant mobile
source air quality impacts.
The potential for emissions generated by marine vessels to significantly impact the
proposed project.
The potential of the heating, ventilation, and air conditioning (HVAC) emissions of the
proposed buildings to significantly impact other proposed development sites (project‐on‐
project impact) or existing land uses (project‐on‐existing impact);
The potential from industrial air toxics emissions generated by nearby existing sources to
significantly impact the proposed project.
The potential from the HVAC systems of existing “large” or “major” emission sources that
have Title V or State Facility Permits to significantly impact the proposed project.
The air quality analyses performed for the proposed project followed the procedures and
methodologies prescribed in the 2014 New York City Environmental Quality Review (CEQR) Technical
Manual.
2.12.2 Pollutants of Concern
Air pollution is of concern because of its demonstrated effects on human health. Of special concern are
the respiratory effects of the pollutants and their potential toxic effects, as described below.
Ambient concentrations of CO, PM, NO2, SO2, and lead are regulated by the U.S. Environmental
Protection Agency (EPA) under the Clean Air Act (CAA), and are referred to as “criteria pollutants”;
emissions of VOCs, NOx, and other precursors to criteria pollutants are also regulated by EPA.

125 Edgewater Street - CEQR No. 17DCP069R Environmental Assessment Statement
Page 2.12-2
Carbon Monoxide
Carbon Monoxide (CO), a colorless and odorless gas, is produced in the urban environment primarily
by the incomplete combustion of gasoline and other fossil fuels. In urban areas, approximately 80 to 90
percent of CO emissions are from motor vehicles. CO concentrations can diminish rapidly over
relatively short distances; elevated concentrations are usually limited to locations near crowded
intersections, heavily traveled and congested roadways, parking lots, and garages. Consequently, CO
concentrations must be predicted on a local, or microscale, basis.
The proposed action would result in an increase in additional vehicle trips higher than the CEQR
Technical Manual CO screening threshold of 170 trips at one intersection in the study area. Therefore, a
mobile source analysis was conducted at this intersection to evaluate future CO concentrations with
and without the proposed project.
Additionally, the proposed project is located near the Sandy Hook Pilots Association (SHPA) base
station at 201 Edgewater Street, which provides pilotage services for the Port of New York/New Jersey,
the Hudson River, the East River, Atlantic City, Jamaica Bay, and Long Island Sound. A detailed CO
analysis was conducted to assess the impacts from emissions from these ship operations onto the
sensitive receptors that would be introduced by the proposed project.
Nitrogen Oxides, VOCs, and Ozone
Nitrogen Oxides (NOx) are of principal concern because of their role, together with Volatile Organic
Compounds (VOCs), as precursors in the formation of ozone. Ozone is formed through a series of
reactions that take place in the atmosphere in the presence of sunlight. Because the reactions are slow,
and occur as the pollutants are advected downwind, elevated ozone levels are often found many miles
from sources of the precursor pollutants. Therefore, the effects of NOx and VOC emissions from all
sources are generally examined on a regional basis. The contribution of any action or project to regional
emissions of these pollutants would include any added stationary or mobile source emissions.
In addition to being a precursor to the formation of ozone, NO2 (one component of NOx) is also a
regulated pollutant. Since NO2 is mostly formed from the transformation of NO in the atmosphere, it
has mostly been of concern further downwind from large stationary point sources, and not a local
concern from mobile sources. (NOx emissions from fuel combustion consist of approximately 90
percent NO and 10 percent NO2 at the source.) While NO2 emissions are a concern from stationary
sources of combustion, with the promulgation of the 2010 1‐hour average standard for NO2, local
sources such as vehicular emissions may also become of greater concern for this pollutant in the future.
The emissions of NO2 were analyzed to determine potential significant adverse impacts for marine
vessel emissions, as well as from existing “large” or “major” emission sources that have Title V or State
Facility Permits.
Lead
Airborne lead emissions are currently associated principally with industrial sources. Lead in gasoline
has been banned under the CAA and would not be emitted from any other component of the proposed
project. Therefore, an analysis of this pollutant was not warranted.

125 Edgewater Street - CEQR No. 17DCP069R Environmental Assessment Statement
Page 2.12-3
Respirable Particulate Matter - PM10 and PM2.5
Particulate Matter (PM) is a broad class of air pollutants that includes discrete particles of a wide range
of sizes and chemical compositions, as either liquid droplets (aerosols) or solids suspended in the
atmosphere. The constituents of PM are both numerous and varied, and they are emitted from a wide
variety of sources (both natural and anthropogenic). Natural sources include the condensed and
reacted forms of naturally occurring VOCs; salt particles resulting from the evaporation of sea spray;
wind‐borne pollen, fungi, molds, algae, yeasts, rusts, bacteria, and material from live and decaying
plant and animal life; particles eroded from beaches, soil, and rock; and particles emitted from volcanic
and geothermal eruptions, and forest fires. Naturally occurring PM is generally greater than 2.5
micrometers in diameter. Major anthropogenic sources include the combustion of fossil fuels (e.g.,
vehicular exhaust, power generation, boilers, engines, and home heating), chemical and manufacturing
processes, construction and agricultural activities, and wood‐burning stoves and fireplaces. PM also
acts as a substrate for the adsorption (accumulation of gases, liquids, or solutes on the surface of a solid
or liquid) of other pollutants, often toxic, and some likely carcinogenic compounds.
As described below, PM is regulated in two size categories: particles with an aerodynamic diameter of
less than or equal to 2.5 micrometers (PM2.5), and particles with an aerodynamic diameter of less than
or equal to 10 micrometers (PM10, which includes PM2.5). PM2.5 has the ability to reach the lower regions
of the respiratory tract, delivering with it other compounds that adsorb to the surfaces of the particles,
and is also extremely persistent in the atmosphere. PM2.5 is mainly derived from combustion material
that has volatilized and then condensed to form primary PM (often soon after the release from a source)
or from precursor gases reacting in the atmosphere to form secondary PM.
Gasoline‐powered and diesel‐powered vehicles, especially heavy duty trucks and buses operating on
diesel fuel, are a significant source of respirable PM, most of which is PM2.5; PM concentrations may,
consequently, be locally elevated near roadways. The proposed project would result in project‐
generated traffic exceeding the PM2.5 vehicle emissions screening analysis thresholds as defined in
Chapter 17, Sections 210 and 311 of the CEQR Technical Manual at certain intersections in the study area.
Therefore, the potential impacts from vehicle‐based PM2.5 emissions were assessed at these critical
intersections.
An assessment of PM emissions from the HVAC systems of the proposed project as well as from
existing nearby combustion sources onto the proposed project were conducted, following the CEQR
Technical Manual and EPA guidelines. Additionally, PM was analyzed to determine potential
significant adverse impacts from marine vessel emissions.
Sulfur Dioxide
Sulfur Dioxide (SO2) emissions are primarily associated with the combustion of sulfur‐containing fuels
(oil and coal). SO2 is also of concern as a precursor to PM2.5 and is regulated as a PM2.5 precursor under
the New Source Review permitting program for large sources. Due to the federal restrictions on the
sulfur content in diesel fuel for on‐road and non‐road vehicles, no significant quantities are emitted
from vehicular sources. Vehicular sources of SO2 are not significant and therefore, analysis of SO2 from
mobile and/or non‐road sources was not warranted.
Emissions of SO2 were analyzed to determine potential significant adverse impacts for marine vessel
emissions.

125 Edgewater Street - CEQR No. 17DCP069R Environmental Assessment Statement
Page 2.12-4
Non-Criteria Pollutants
In addition to the criteria pollutants discussed above, non‐criteria air pollutants, also called air toxics,
may be of concern. Air toxics are those pollutants that are known or suspected to cause serious health
effects in small doses. Air toxics are emitted by a wide range of manmade and naturally occurring
sources. Emissions of air toxics from industries are regulated by EPA.
Federal ambient air quality standards do not exist for non‐criteria pollutants; however, the New York
State Department of Environmental Conservation (NYSDEC) has issued standards for certain non‐
criteria compounds, including beryllium, gaseous fluorides, and hydrogen sulfide. NYSDEC has also
developed guideline concentrations for numerous non‐criteria pollutants. The NYSDEC guidance
document DAR‐1 (February 2014) contains a compilation of annual and short term (1‐hour) guideline
concentrations for these compounds. The NYSDEC guidance thresholds represent ambient levels that
are considered safe for public exposure. EPA has also developed guidelines for assessing exposure to
non‐criteria pollutants. These exposure guidelines are used in health risk assessments to determine the
potential effects to the public.
As the development site is located in a manufacturing district, the potential from industrial air toxics
emissions generated by existing sources to significantly impact the proposed residential project was
addressed in this chapter.
2.12.3 Applicable Standards and Significant Impact Criteria
The predicted concentrations of pollutants of concern associated with a proposed project are compared
with either the National Ambient Air Quality Standards (NAAQS) for criteria air pollutants or ambient
guideline concentrations for non‐criteria pollutants. In general, if a project would cause the standards
for any pollutant to be exceeded, it would likely result in a significant adverse air quality impact. In
addition, for CO from mobile sources and for PM2.5, the de minimis criteria are also used to determine
significance of impacts.
National Ambient Air Quality Standards
The CAA requires the USEPA to set standards on the pollutants that are considered harmful to public
health and the environment. The NAAQS were implemented as a result of the CAA, amended in 1990
(see Table 2.12‐1)1. The NAAQS applies to six principal (“criteria”) pollutants: CO, NO2, PM10, PM2.5,
SO2, and ozone.
CO De Minimis Criteria
New York City has developed de minimis criteria to assess the significance of the increase in CO
concentrations that would result from the impact of proposed projects or actions on mobile sources, as
set forth in the CEQR Technical Manual. These criteria set the minimum change in CO concentration
that defines a significant environmental impact. Significant increases of CO concentrations in New
York City are defined as: (i) an increase of 0.5 parts per million (ppm) or more in the maximum 8‐hour
average CO concentration at a location where the predicted No‐Action 8‐hour concentration is equal
to or between 8 and 9 ppm; or (ii) an increase of more than half the difference between baseline (i.e.,
1 United States Environmental Protection Agency (October 2011). National Ambient Air Quality Standards. Retrieved from
http://www.epa.gov/air/criteria.html.

125 Edgewater Street - CEQR No. 17DCP069R Environmental Assessment Statement
Page 2.12-5
No‐Action) concentrations and the 8‐hour standard, when No‐Action concentrations are below 8.0
ppm.
Table 2.12-1: National Ambient Air Quality Standards
Pollutant Primary Secondary
ppm µg/m3 ppm µg/m3 Carbon Monoxide (CO)
8-hour Average1 9 10,000 N/A
1-hour Average1 35 40,000 Lead
Rolling 3-month Average2 N/A 0.15 N/A 0.15 Nitrogen Dioxide (NO2)
1-hour Average3 0.100 188 N/A Annual Average 0.053 100 0.053 100
Ozone (O3) 8-hour Average4,5 0.070 140 0.070 140
Respirable Particulate Matter (PM10) 24-Hour Average1 N/A 150 N/A 150
Fine Respirable Particulate Matter (PM2.5) Annual Mean6 N/A 12 N/A 15 24-Hour Average7 N/A 35 N/A 35
Sulfur Dioxide (SO2)8 1-hour Average9 0.075 196 N/A N/A Maximum 3-hour Average1 N/A N/A 0.50 1,300
Source: 40 CFR Part 50: National Primary and Secondary Ambient Air Quality Standards. Notes: ppm – parts per million (unit of measure for gases only) µg/m3 – micrograms per cubic meter (unit of measure for gases and particles, including lead) N/A – not applicable All annual periods refer to calendar year. Standards are defined in ppm. Approximately equivalent concentrations in μg/m3 are presented. 1 Not to be exceeded more than once a year. 2 EPA has lowered the NAAQS down from 1.5 µg/m3, effective January 12, 2009. 3 Three-year average of the annual 98th percentile daily maximum 1-hr average concentration. Effective April 12, 2010. 4 Three-year average of the annual fourth highest daily maximum 8-hr average concentration. 5 EPA has lowered the NAAQS down from 0.070 ppm, effective December 2015. 6 Three-year average of annual mean. EPA has lowered the primary standard from 15 µg/m3, effective March 2013. 7 Not to be exceeded by the annual 98th percentile when averaged over 3 years. 8 EPA revoked the 24-hour and annual primary standards, replacing them with a 1-hour average standard, effective August 23, 2010. 9 Three-year average of the annual 99th percentile daily maximum 1-hr average concentration.
PM2.5 De Minimis Criteria
For projects subject to CEQR, the de minimis criteria currently employed for determination of potential
significant adverse PM2.5 impacts are as follows:
Predicted increase of more than half the difference between the applicable background
concentration and the 24‐hour standard; or
Annual average PM2.5 concentration increments that are predicted to be greater than 0.1 μg/m3
at ground level on a neighborhood scale (i.e., the annual increase in concentration representing
the average over an area of approximately one square kilometer, centered on the location

125 Edgewater Street - CEQR No. 17DCP069R Environmental Assessment Statement
Page 2.12-6
where the maximum ground‐level impact is predicted for stationary sources; or at a distance
from a roadway corridor similar to the minimum distance defined for locating neighborhood
scale monitoring stations); or
Annual average PM2.5 concentration increments that are predicted to be greater than 0.3 μg/m3
at any discreet receptor location for stationary sources.
Actions under CEQR predicted to increase PM2.5 concentrations by more than the CEQR de minimis
criteria above will be considered to have a potential significant adverse impact.
The above de minimis criteria have been used to evaluate the significance of predicted impacts on PM2.5
concentrations and determine the need to minimize particulate matter emissions resulting from the
proposed project.
Non‐Criteria Pollutant Thresholds
Non‐criteria, or toxic, air pollutants include a multitude of pollutants of ranging toxicity. No federal
ambient air quality standards have been promulgated for toxic air pollutants. However, EPA and
NYSDEC have issued guidelines that establish acceptable ambient levels for these pollutants based on
human exposure.
The NYSDEC DAR‐1 guidance document presents guideline concentrations in micrograms per cubic
meter for the 1‐hour and annual average time periods for various air toxic compounds. These values
are provided in Table 2.12‐2 for the compounds that could potentially affect receptors located at the
development site. The compounds listed are those emitted by existing sources of air toxics in the
proposed rezoning area.
In order to evaluate impacts of non‐carcinogenic toxic air emissions, EPA developed a methodology
called the “Hazard Index Approach.” The acute hazard index is based on short‐term exposure, while
the chronic non‐carcinogenic hazard index is based on annual exposure limits. If the combined ratio of
pollutant concentration divided by its respective short‐term or annual exposure threshold for each of
the toxic pollutants is found to be less than one, no significant air quality impacts are predicted to occur
due to these pollutant releases.
In addition, EPA has developed unit risk factors for carcinogenic pollutants. EPA considers an overall
incremental cancer risk from a proposed action of less than one‐in‐one million to be insignificant. Using
these factors, the potential cancer risk associated with each carcinogenic pollutant, as well as the total
cancer risk of the releases of all of the carcinogenic toxic pollutants combined, can be estimated. If the
total incremental cancer risk of all of the carcinogenic toxic pollutants combined is less than one‐in‐one
million, no significant air quality impacts are predicted to occur due to these pollutant releases.

125 Edgewater Street - CEQR No. 17DCP069R Environmental Assessment Statement
Page 2.12-7
Table 2.12-2: NYSDEC Air Guideline Concentrations for Non-Criteria Pollutants Pollutant CAS Number SGC (µg/m3) AGC (µg/m3)
Ethanol 00064-17-5 --- 45,000 Isopropyl Alcohol 00067-63-0 98,000 7,000 Acetone 00067-64-1 180,000 30,000 1-Butanol 00071-36-3 --- 1,500 Propane 00074-98-6 --- 43,000 Isobutyl Alcohol 00078-83-1 --- 360 MethylEthyl Ketone 00078-93-3 13,000 5,000 Butyl BenzylPhthalate 00085-68-7 --- 0.42 Ethylbenzene 00100-41-4 --- 1,000 Butane 00108-88-3 238,000 --- Toluene 00108-88-3 37,000 5,000 Ethylenglycolmonobutyl 00111-76-2 14,000 1,600 Butyl Carbitol 00112-34-5 370 200 Butyl Acetate 00123-86-4 95,000 17,000 Tetrachloroethylene 00127-18-4 300 4 Ethylacetate 00141-78-6 --- 3,400 Carbon Monoxide 00630-08-0 14,000 --- Ethyl 3-Ethoxyproprioanate 00763-69-9 140 64 Xylene M,O& P Mix 01330-20-7 22,000 100 Sulfur Dioxide 07446-09-5 197 80 Oil Mist (Mineral) 08012-95-1 380 12 Mineral Spirits 08032-32-4 --- 900 Stoddard Solvents 08052-41-3 --- 900 Aliphatic Hydrocarbons 64742-89-8 --- 3,200 Aromatic Petroleum Distillates 64742-94-5 --- 100 Particulates1 NY075-02-52 88 12 Liquid Mist NEC NY105-00-0 380 12 Oxides of Nitrogen NY210-00-0 188.1 100 Misc. VOC NY990-00-0 98,000 7,000
Source: NYSDEC, DAR-1 AGC/SGC Tables, February 2014. Notes: 1 Pollutant includes emissions from both Particulates (NY075-00-0) and Total Solid Particulate (NY079-00-0). 2 Conservatively assumes all particulate emissions would be PM2.5. SGC and AGC from Particulate (PM-2.5) used.
2.12.4 Methodology
Mobile Sources
As stated above, the proposed project’s incremental traffic volumes are expected to exceed the CO
screening threshold of 170 vehicles in a peak hour at one intersection, as well as the PM2.5 screening
thresholds discussed in Chapter 17, Sections 210 and 311 of the CEQR Technical Manual at three
intersections. Therefore, based on discussions with the Department if City Planning (DCP) on site

125 Edgewater Street - CEQR No. 17DCP069R Environmental Assessment Statement
Page 2.12-8
selection, a detailed microscale modeling analysis was conducted near the worst‐case intersection. Both
CO and PM levels were estimated for future (2019) conditions with and without the proposed action.
Intersection Analysis
For microscale, or localized, analyses, air quality predictions are made for specific locations, such as
intersections, and at those locations, for specific geographic points. These prediction locations are called
“receptor locations,” or simply “receptors.” The prediction of vehicle‐generated emissions and their
dispersion in an urban environment incorporates meteorological phenomena, traffic conditions, and
physical configuration. Air pollutant dispersion models mathematically simulate how traffic,
meteorology, and physical configuration combine to affect pollutant concentrations. The mathematical
expressions and formulations contained in the various models attempt to describe an extremely
complex physical phenomenon as closely as possible. However, because all models contain
simplifications and approximations of actual conditions and interactions, and since it is necessary to
predict the reasonable worst‐case condition, most dispersion analyses predict conservatively high
concentrations of pollutants, particularly under adverse meteorological conditions.
The mobile source analyses for the proposed project employ models approved by EPA that have been
widely used for evaluating the air quality impacts of projects in New York City, other parts of New
York State, and throughout the country. The modeling approach includes a series of conservative
assumptions relating to meteorology, traffic, and background concentration levels resulting in a
conservatively high estimate of expected pollutant concentrations that could ensue from the proposed
project.
Analysis Sites
Intersections in the study area were reviewed for analysis based on the CEQR Technical Manual
guidelines. The incremental traffic volumes for the weekday AM, Midday, and PM periods were
reviewed and intersections with increments exceeding the CO and PM volume thresholds were
identified. Of those intersections, only the intersection of Edgewater Street and Lynhurst Avenue is
predicted to exceed the CO screening threshold of 170 peak hour trips as set forth in the CEQR Technical
Manual. Three intersections—Edgewater Street and Lynhurst Avenue, Edgewater Street and Willow
Avenue, and Edgewater Street and Hylan Boulevard—are predicted to exceed the PM screening
threshold as set forth in the CEQR Technical Manual.
The intersection of Edgewater Street and Lynhurst Avenue was selected for PM microscale analysis
because it exceeds the CO screening threshold and also generates the highest number of equivalent
trucks therefore it would be considered a worst‐case intersection. In addition, the intersection of
Edgewater Street and Willow Avenue would also be included in the microscale analysis since traffic
data and emissions would be included for all roadway segments (“links”) within 1,000 feet of the
intersection of concern per the CEQR Technical Manual.
Vehicle Emissions
Vehicular cruise and idle emission factors for CO and PM (PM10 and PM2.5) to be utilized in the
dispersion modeling were computed using EPA’s mobile source emissions model, the Motor Vehicle
Emission Simulator (MOVES). The emissions model is capable of calculating engine emission factors
for various vehicle types, based on the fuel type (gasoline, diesel, or electricity), meteorological

125 Edgewater Street - CEQR No. 17DCP069R Environmental Assessment Statement
Page 2.12-9
conditions, vehicle speeds, vehicle age, roadway types, number of starts per day, engine soak time, and
various other factors that influence emissions, such as inspection maintenance programs.
The analyses were performed using the latest version of the model: MOVES2014a.2 Project specific
traffic data (e.g., traffic volumes, speeds and vehicle classification data) used in the model were
obtained through field data collection studies. Some default input files (e.g., source type age
distribution) were obtained from NYSDEC and processed using EPA’s Age Distribution Projection Tool
for MOVES2014.3 Other required input files (i.e., fuel data, county‐specific hourly temperature and
relative humidity data, IM coverage, etc.) were exported from the MOVES2014a model itself after
specifying the county, analysis year and modeled peak hour for the analysis.
Road Dust
In order to account for the suspension of fugitive road dust in the air from vehicular traffic, PM2.5 and
PM10 emission factors will include fugitive road dust in local microscale analyses. However, fugitive
road dust will not be included in the neighborhood scale PM2.5 analyses, since it is considered it to have
an insignificant contribution on that scale. Road dust emission factors were calculated according to the
latest procedure delineated by EPA and the CEQR Technical Manual.
Traffic Data
Traffic data for the air quality analysis was derived from existing traffic counts, projected future growth
in traffic, and other information developed as part of the traffic analysis for the proposed project (see
Chapter 2.11, “Transportation”). Traffic speed data, existing vehicle distribution, and lane
configuration for the future without and with the proposed project were employed in the respective
air quality modeling scenarios. For CO, traffic conditions for the each of the peak periods (weekday
morning [7:45 AM to 8:45 AM], midday [2:30 PM to 3:30 PM], and evening [4:45 PM to 5:45 PM] were
used for the analysis.
For PM (PM10 and PM2.5), traffic conditions for the same peak periods were used to describe traffic
conditions for both the daily and weekly time scales.
Dispersion Model and Meteorology for Microscale Analyses
Mobile source dispersion models are the basic analytical tools used to estimate pollutant concentrations
from the emissions generated by motor vehicles as expected under given conditions of traffic, roadway
geometry, and meteorology. CAL3QHC Version 2 is a line‐source dispersion model that predicts
pollutant concentrations near congested intersections and heavily traveled roadways. CAL3QHC input
variables include free flow and calculated idle emission factors, roadway geometries, traffic volumes,
site characteristics, background pollutant concentrations, signal timing, and meteorological conditions.
CAL3QHC predicts inert pollutant concentrations, averaged over a one‐hour period near roadways.
This model was used to predict concentrations at the intersections.
2 EPA, Motor Vehicle Emission Simulator (MOVES), User Guide for MOVES2014a, November 2015. 3 EPA, Age Distribution Projection Tool for MOVES2014.
https://www3.epa.gov/otaq/models/moves/documents/age‐distribution‐projection‐tool‐moves2014.xlsm

125 Edgewater Street - CEQR No. 17DCP069R Environmental Assessment Statement
Page 2.12-10
CAL3QHC predicts peak one‐hour pollutant concentrations using assumed meteorology and peak‐
period traffic conditions. Different emission rates occur when vehicles are stopped (idling),
accelerating, decelerating, and moving at different average speeds. CAL3QHC simplifies these
different emission rates into the following two components:
• Emissions when vehicles are stopped (idling) during the red phase of a signalized
intersection.
• Emissions when vehicles are in motion during the green phase of a signalized intersection.
The analyses followed the EPA’s Intersection Modeling Guidelines (EPA‐454/R‐92‐005) for CO
modeling methodology and receptor placement. All major roadway segments (links) within
approximately 1,000 feet from each analysis site (i.e., congested intersection) were considered.
The CAL3QHC model has been updated with an extended module, CAL3QHCR, which allows for the
incorporation of the latest 5 years of hourly meteorological data into the modeling, instead of worst‐
case assumptions regarding meteorological parameters. This refined version of the model,
CAL3QHCR, is employed if maximum predicted future CO concentrations are greater than the
applicable ambient air quality standards or when de minimis thresholds are exceeded using the first
level of CAL3QHC modeling.
The CAL3QHCR model offers two approaches with varying degrees of detail in terms of traffic data
utilization: (i) Tier I approach – one hour of vehicular emissions, traffic volumes and signalization data
are entered into CAL3QHCR as a screening level model that is most appropriate for short‐term
averaging periods where peak hour traffic conditions are suitable; and (ii) Tier II approach ‐ vehicular
emissions, traffic volumes and signalization data are more detailed and entered into the CAL3QHCR
model for each hour of a week. The weekly traffic conditions are assumed to be the same for each week
throughout the modeled period.
To determine motor vehicle generated PM (PM10 and PM2.5) concentrations adjacent to streets within
the traffic study area, the CAL3QHCR dispersion model was applied.
Tier I CO Analysis ‐ CAL3QHC
In applying the CAL3QHC model, the wind angle was varied to determine the wind direction resulting
in the maximum concentrations at each receptor.
Following the EPA guidelines4, CAL3QHC computations were performed using a wind speed of one
meter per second, and the neutral stability class D. The 8‐hour average CO concentrations were
estimated by multiplying the predicted 1‐hour average CO concentrations by a factor of 0.7 to account
for persistence of meteorological conditions and fluctuations in traffic volumes. A surface roughness
of 3.21 meters was chosen. At each receptor location, concentrations were calculated for all wind
directions, and the highest predicted concentration was reported, regardless of frequency of
occurrence. These assumptions ensured that reasonable worst‐case meteorology was used to estimate
impacts.
4 Guidelines for Modeling Carbon Monoxide from Roadway Intersections, EPA Office of Air Quality Planning and Standards,
Publication EPA‐454/R‐92‐005.

125 Edgewater Street - CEQR No. 17DCP069R Environmental Assessment Statement
Page 2.12-11
Tier I PM Analysis—CAL3QHCR
A Tier I PM (PM10 and PM2.5) analysis performed with the CAL3QHCR model includes the five years
of monitored hourly meteorological data. One hour of vehicular emissions and traffic volumes were
also entered into the model as the worst‐case 1‐hour peak conditions for conservative purposes. The
CAL3QHCR module allows for the incorporation of hourly meteorological data into the modeling,
instead of one hour of worst‐case assumptions regarding meteorological parameters and is therefore
more appropriate for calculating 24‐hour and annual average concentrations.
All analyses were conducted using the latest five consecutive years of meteorological data (2011‐2015).
Surface data was obtained from La Guardia Airport and upper air data was obtained from Brookhaven
station, New York. Data will be processed using the current EPA AERMET version 15181 and the EPA
procedure. The meteorological data provides hour‐by‐hour wind speeds and directions, stability states,
and temperature inversion elevations over the five‐year period.
Analysis Year
The microscale analyses were performed for the 2019 analysis year, the year by which the proposed
project is likely to be completed. The future analyses were performed for both without the proposed
project (the No‐Action condition) and with the proposed project (the With‐Action condition).
Background Concentrations
Background concentrations are those pollutant concentrations originating from distant sources that are
not directly included in the modeling analysis, which accounts for vehicular emissions on the streets
within 1,000 feet and within view of the analysis site. Appropriate background concentrations are
added to modeling results to obtain total pollutant concentrations at an analysis site.
The background concentrations that were used for the microscale analysis are presented in Table 2.12‐
3. These background concentrations were obtained from the nearest monitored location, representing
the second‐highest value from the latest available five years (2011–2015) of monitored data for 1‐hour
and 8‐hour CO concentrations, the second highest value from the three most recent years (2013‐2015)
of data available for PM10, and the maximum 98th percentile concentration averaged over three years
(2013‐2015) of data for 24‐hour PM2.5 concentration.
The 24‐hour PM2.5 average background concentration of 20.3 μg/m3 was used to establish the de minimis
value, consistent with the guidelines provided in the CEQR Technical Manual. The annual PM2.5
background concentration is not presented in Table 2.12‐3 because the PM2.5 annual average impacts
were assessed on an incremental basis and compared with the PM2.5 de minimis criteria threshold of 0.3
μg/m3, without considering the annual background.

125 Edgewater Street - CEQR No. 17DCP069R Environmental Assessment Statement
Page 2.12-12
Table 2.12-3: Background Concentrations for Intersection Analysis Pollutant Averaging Time Monitoring Location Background Concentration
Carbon Monoxide (CO) 1-Hour1 CCNY, Manhattan 2.3 ppm 8-Hour1 CCNY, Manhattan 1.5 ppm
Particulate Matter (PM10) 24-Hour2 Division Street, Manhattan 44 µg/m3 Particulate Matter (PM2.5) 24-Hour3 Port Richmond, Staten Island 20.3 µg/m3
Source: NYSDEC Ambient Air Quality Report, 2015, http://www.dec.ny.gov/chemical/29310.html Notes: 1 1-hour CO and 8-hour CO background concentrations are based on the highest second max value from the latest five years of available monitoring
data from NYSDEC (2011-2015). 2 24-hour PM10 is based on the highest second max value from the latest three years of available monitoring data from NYSDEC (2013-2015). 3 24-hour PM2.5 background concentration is based on maximum 98th percentile concentration averaged over three years of data from NYSDEC
(2013-2015).
Receptor Placement
Multiple receptors (i.e., precise locations at which concentrations are predicted) were modeled at the
selected site; receptors were placed along the approach and departure links at spaced intervals per
CEQR Technical Manual guidelines. Ground level receptors were placed at sidewalk or roadside
locations near intersections with continuous public access, at a pedestrian height of 1.8 meters.
For the annual PM2.5 modeling, receptors will be placed at a distance of 15 meters from the nearest
moving lane at each analysis location.
Marine Terminal Analysis
The proposed development site is located approximately 600 feet from the Sandy Hook Pilots
Association (SHPA) base station at 201 Edgewater Street. SHPA provides pilotage (ship guidance)
services to vessels entering or departing the Port of New York/New Jersey, the Hudson River, the East
River, Atlantic City, Jamaica Bay, and Long Island Sound (See Figure 1 in Appendix D). Operations are
on a 24‐hour basis, 365 days of the year in all weather conditions and port circumstances. The SHPA
pilot boat fleet at the station includes more than a dozen modern vessels. There are two station boats,
the New York and New Jersey (See Figure 2 and 3 in Appendix D), which are used to perform the daily
responsibilities of the pilots on station. There are also four America class boats (America, Wanderer,
Phantom, and Yankee) and Sandy Hook class boats, which are used for pilot boarding and transporting
pilots to and from pilot station (see Figure 4 in Appendix D).
The main services of the Sandy Hook station include piloting to and from destination of any location
within the port of NY/NJ to sea and transporting any vessel from one location to another within the
port. The Pilot boats make more than 12,500 transits a year on numerous and diverse types of vessels
flow through the harbor. Near SHPA, closer to the proposed development, there is also a maintenance
and repair boat yard (at 200 Edgewater Street) where private yachts are stationed during repair service
(See Figure 5 in Appendix D).
Emissions from these ship operations have the potential to impact receptors at the proposed
development. The types and amounts of these emissions depend on boat activities during transit to
and from station as well as docking and idling activities at the station. The potential air quality impacts
from these emissions on the proposed project were evaluated under the With‐Action condition. A
summary of the emissions calculations, modeling parameters results is also provided in Appendix D.

125 Edgewater Street - CEQR No. 17DCP069R Environmental Assessment Statement
Page 2.12-13
Refined Dispersion Modeling
A dispersion modeling analysis of the pilot boat and yacht emissions was conducted using the latest
version of the EPA’s AERMOD dispersion model 7.10 (EPA version 15181). AERMOD is a state‐of‐the‐
art dispersion model, applicable to rural and urban areas, flat and complex terrain, surface and elevated
releases, and multiple sources (including point, area, and volume sources). AERMOD is a steady‐state
plume model that incorporates current concepts about flow and dispersion in complex terrain,
including updated treatments of the boundary layer theory, understanding of turbulence and
dispersion, and includes handling of terrain interactions.
The AERMOD model calculates pollutant concentrations from one or more points (e.g., exhaust stacks)
based on hourly meteorological data, and has the capability to calculate pollutant concentrations at
locations where the plume from the exhaust stack is affected by the aerodynamic wakes and eddies
(downwash) produced by nearby structures. The analyses of potential impacts from exhaust stacks
were made assuming stack tip downwash, urban dispersion and surface roughness length, and
elimination of calms.
Emission Sources and Parameters
Both pilot boats and yachts are considered marine or recreational vessels. Emissions from marine
vessels vary based on operating mode. Three operating modes (transit, maneuvering, and dwelling)
are used to characterize vessel activity: transit (traveling into and out of the station), maneuvering
(maneuvering in and around the station) and dwelling (idling). Marine vessels are equipped with, at
least, two engines—main engine and auxiliary engine. Main engine emissions occur during transit and
maneuvering modes but are shutdown while dwelling at a station. During dwelling, when main
engines are turned off but the boat remains on duty, the auxiliary engine(s) are running to provide
ship‐board electricity for lighting and navigation.
Pilot boats as a type of marine vessels could be operating similar to marine vessels. Specific operating
parameters that are needed to calculate emissions from the marine vessels include type of boats,
number and horsepower (HP) of the primary and auxiliary engine(s), load factors, and the hours of
operation in each mode.
However, with the exception of the general type of ships that comprise the Sandy Hook station fleet
and the approximate number of hours of yearly transit operation, no other specific operational data
(e.g., the number of ships travelling in and out of the station on an hourly or daily basis; the direction
the ships traveling in and out of the Harbor; and the operational time in each mode for each type of
vessel) are available. There is also no data available for the yacht operations.
Therefore, emissions from both the pilot boats and yachts were conservatively estimated using older
(Tier 2) EPA emission standards for NOx and particulate matter (PM) for Category 2 marine engines
(e.g., tugboats, pushboats, supply vessels, fishing vessels, and other commercial vessels) even though
Tier 3 (more stringent) emission standards have already been in place since 2009 and Tier 4 standards
are phasing in between 2014 and 2017.5
The SO2 emission factor is a function of fuel oil sulfur content. For Category 2 marine diesel engines,
federal standards before 2012 limited sulfur content in the fuel to 500 ppm (0.05 percent) but starting
5 Marine Diesel Engines, DieselNet, Table 2 (https:/www.dieselnet.com/standards/us/marine.php).

125 Edgewater Street - CEQR No. 17DCP069R Environmental Assessment Statement
Page 2.12-14
in 2014 sulfur content in fuel oil should not be more than 15 ppm (0.0015 percent). The SO2 emission
factor used in this analysis based on this sulfur content was obtained from the East River Ferry EAS
(13DME009Y).
The basic equation that is used to estimate pilot boat and yacht emissions is shown below (as in the
East River Ferry EAS, 2013). This equation is applicable to all main and auxiliary engines sizes, and
provides the rates per unit of work (i.e. per kW‐hr). In order to obtain emission rates in grams per
hour, it is necessary to multiply the rates per unit of work by the work in kilowatts and the time in
hours, as shown below:
E = EF * Time in Mode * VP * %Load
Where,
E = pollutant specific emissions (grams per hour)
EF = emission factor by operating mode (grams/kW‐hr)
Time in mode = hours
VP = average vessel power by operating mode, kW
Load, % = average engine load by operating mode.
Most of the emissions generated from the non‐oceangoing type of marine vessels occur during transit
to and from the landing station. Dwelling emissions near the landing station are lower because the
boats only operate for short periods under idle conditions, and maneuver to and from the station under
low engine loads (and low emissions). Separate loading factors which were developed for the main
engines in the transit mode (cruise or slow cruise), maneuvering mode, and dwelling (idling) mode
were used in the analysis.
To incorporate all emissions released from the approaching/departing/maneuvering vessels as well as
dwelling (idling) emissions at the station, emissions were simulated as one irregularly‐shaped area
source using area source algorithm of the AERMOD model. The modeling area was extended west
from pilot boat station over the water to the property line approximately 1,300 feet and north over the
water approximately 500 feet. Emissions from pilot boats and yachts were combined and spread over
this modeling area.
Methodology Utilized for Estimating NO2 Concentrations
EPA’s preferred regulatory stationary source dispersion model, AERMOD, is capable of producing
detailed output data that can be analyzed at the hourly level required for the form of the 1‐hour
standards. EPA has also developed guidance to estimate the NO2/NOx conversion ratio, applicable to
heating and hot water systems, as discussed further below.
The 1‐hour NO2 concentration associated with the emissions from both the pilot boats and yachts were
estimated using AERMOD model’s Tier 3 option: Plume Volume Molar Ratio Method (PVMRM). The
PVMRM module accounts for the chemical transformation of NO emitted from the stack to NO2 within
the source plume using hourly ozone background concentrations. Hourly background ozone
concentrations from the Queens College monitoring station were incorporated into the AERMOD
model to estimate the conversion from NOx to NO2. Ozone concentrations were taken from the nearest
ozone monitoring station which has complete latest five years of hourly data available.

125 Edgewater Street - CEQR No. 17DCP069R Environmental Assessment Statement
Page 2.12-15
The 98th percentile daily 1‐hour maximum concentration at each receptor location for each modeled
year was calculated within the AERMOD model; then the 98th percentile concentrations were averaged
over the latest five years. The highest daily 1‐hour NO2 concentration from all receptor locations was
selected as the maximum 1‐hour NO2 concentration. The background concentrations value was added
to the modeling result to get the total concentration for 1‐hour NO2.
Annual NO2 concentrations from heating and hot water sources were estimated using a NO2/NOx
conversion ratio of 0.75, as described in EPA’s Guideline on Air Quality Models at 40 CFR part 51
Appendix W, Section 5.2.4.10.6
Meteorological Data
All analyses were conducted using the latest five consecutive years of meteorological data (2011‐2015).
Surface data was obtained from La Guardia Airport and upper air data was obtained from Brookhaven
station, New York. Data will be processed using the current EPA AERMET version 15181 and the EPA
procedure. The meteorological data provides hour‐by‐hour wind speeds and directions, stability states,
and temperature inversion elevations over the five‐year period.
Receptor Placement
Discrete receptors (i.e., locations at which concentrations are calculated) were modeled along the
building façades of proposed development Building A, B and C (see Figure 1‐1 and Figure 1‐2 for the
site plan) to represent potentially sensitive locations such as operable windows and intake vents. Rows
of receptors at spaced intervals on the modeled buildings were analyzed at multiple elevations.
Background Concentrations
The background concentrations that were used for the marine terminal analysis are presented in Table
2.12‐4. These background concentrations were obtained from the nearest monitored location,
representing the second‐highest value from the latest available five years (2011–2015) of monitored
data for 1‐hour and 8‐hour CO concentrations, the second highest value from the three most recent
years (2013‐2015) of data available for PM10, the maximum 98th percentile concentration averaged over
three years (2013‐2015) of data for 24‐hour PM2.5 concentration, and the maximum 99th percentile
concentration averaged over three years (2013‐2015) of data for 1‐hour SO2 concentration.
The 24‐hour PM2.5 average background concentration of 20.3 μg/m3 was used to establish the de minimis
value, consistent with the guidance provided in the CEQR Technical Manual. The annual PM2.5
background concentration is not presented in Table 2.12‐4 because the PM2.5 annual average impacts
was assessed on an incremental basis and compared with the PM2.5 de minimis criteria threshold of 0.3
μg/m3, without considering the annual background
6 http://www.epa.gov/scram001/guidance/guide/appw_05.pdf

125 Edgewater Street - CEQR No. 17DCP069R Environmental Assessment Statement
Page 2.12-16
Table 2.12-4: Background Concentrations for Marine Terminal Analysis Pollutant Averaging Time Monitoring Location Background Concentration
Carbon Monoxide (CO) 1-Hour1 CCNY, Manhattan 2.3 ppm 8-Hour1 CCNY, Manhattan 1.5 ppm
Nitrogen Dioxide (NO2) 1-Hour2 Queens College, Queens 113.2 µg/m3 Annual3 Queens College, Queens 34 µg/m3
Particulate Matter (PM10) 24-Hour4 Division Street, Manhattan 44 µg/m3 Particulate Matter (PM2.5) 24-Hour5 Port Richmond, Staten Island 20.3 µg/m3
Sulfur Dioxide (SO2) 1-Hour6 Queens College, Queens 29.1 µg/m3 Source: NYSDEC Ambient Air Quality Report, 2015, http://www.dec.ny.gov/chemical/29310.html. Notes: 1 1-hour CO and 8-hour CO background concentrations are based on the highest second max value from the latest five years of available monitoring
data from NYSDEC (2011-2015). 2 1-hour NO2 background concentration is based on three-year average (2013-2015) of the 98th percentile of daily maximum 1-hour concentrations
from available monitoring data from NYSDEC. 3 Annual NO2 background concentration is based on the maximum annual average from the latest five years of available monitoring data from
NYSDEC (2011-2015). 4 24-hour PM10 is based on the highest second max value from the latest three years of available monitoring data from NYSDEC (2013-2015). 5 The 24-hour PM2.5 background concentration is based on maximum 98th percentile concentration averaged over three years of data from
NYSDEC (2013-2015). 6 1-hour SO2 background concentration is based on maximum 99th percentile concentration averaged over the latest three years (2013-2015) of
available monitoring data from NYSDEC.
Stationary Sources
Stationary source analyses were conducted following the methodologies presented in the CEQR
Technical Manual to evaluate potential future pollutant concentrations with the proposed action,
including:
Potential impacts from the HVAC emissions of the proposed buildings to significantly impact
other proposed development sites (project‐on‐project impact) or existing land uses (project‐
on‐existing impact);
Potential impacts from air toxics emissions from existing nearby industrial facilities on
proposed development sites; and
Potential effects from existing “large” and “major” sources of emissions in the study area on
the proposed development sites.
Individual HVAC Systems
A stationary source analysis was conducted to evaluate potential impacts from the proposed project’s
HVAC systems on sensitive uses from existing buildings (project‐on‐existing impact) and other
proposed buildings (project‐on‐project impact) with heights similar or greater than the proposed
building.

125 Edgewater Street - CEQR No. 17DCP069R Environmental Assessment Statement
Page 2.12-17
Screening Analysis
A screening analysis was performed to assess air quality impacts from emissions associated with the
HVAC systems of proposed buildings. The methodology described in the CEQR Technical Manual was
used for the analysis to determine the potential impacts from the proposed project’s HVAC systems.
The methodology determines the minimum required distance from the source to the nearest receptor
of similar or greater height, beyond which the action would not have a significant adverse impact. The
screening procedures utilize information regarding the type of fuel to be used, the maximum
development size, and the HVAC systems exhaust stack height to evaluate whether a significant
adverse impact may occur.
Based on the maximum development size, if the distance from the development site to the nearest
building of similar or greater height is less than the minimum required distance determined in the
CEQR Technical Manual, there is the potential for significant air quality impacts, and a refined
dispersion modeling analysis would be required. Otherwise, if the source passes the screening analysis,
then no further analysis is required.
Project‐on‐Project Analysis
According to the RWCDS, the proposed development would consist of three residential buildings –
Building A, which would be 13 stories (130 feet) tall; Building B, which would be 12 stories (120 feet)
tall; and Building C, which would be 6 stories (62 feet) tall. It was assumed that each building would
have a separate boiler installation with the exhaust stack located on the tallest portion of the building
roof. Therefore, a stationary HVAC analysis is warranted to determine the project‐on‐project (Building
B‐on‐Building A and Building C‐on‐Building B) potential impacts. Building C could also potentially
impact Building A, however, since Building C is closer to Building B than Building A. If Building C’s
HVAC analysis would not cause significant adverse impacts at Building B, no impacts would occur at
sensitive receptors on Building A, which is located further from Building C.
It’s assumed that all proposed buildings would use natural gas for their HVAC systems based on the
proposed developer’s commitment. For the determination of project‐on‐project air quality impacts, a
screening analysis was initially performed assuming natural gas as the fuel type. If the screening results
fails, more refined analysis would be conducted using EPA’s AERSCREEN and/or AERMOD model.
Project‐on‐Existing Analysis
A survey of existing building heights within a 400‐foot radius of the development site identified one
potential receptor building of similar or greater height: the 7‐story (87 feet) office building on Block
2820, Lot 95, which could potentially be impacted by Building C.
A screening analysis was initially performed assuming natural gas as the fuel type following the
methodology described in the CEQR Technical Manual. If the screening results fails, more refined
analysis would be conducted using EPA’s AERSCREEN and/or AERMOD model.
Cumulative Impacts from HVAC Systems of Proposed Development
In addition to the individual HVAC analysis, cumulative impacts from multiple sources with similar
stack heights were analyzed. Given similar heights and close proximity to each other, Building A (130
feet) and Building B (120 feet) were considered as a cluster to determine the potential impacts from the
combined HVAC emissions onto existing buildings of similar or greater height.

125 Edgewater Street - CEQR No. 17DCP069R Environmental Assessment Statement
Page 2.12-18
Screening Analysis
A screening analysis was performed to assess a cumulative air quality impacts associated with the
HVAC systems of Building A and Building B. Similar to individual HVAC analysis, the methodology
described in the CEQR Technical Manual was used for the analysis with a combined development size.
If the screening results fails, more refined analysis would be conducted using EPA’s AERSCREEN
and/or AERMOD model.
Industrial Sources Analysis
According to the CEQR Technical Manual, an air quality assessment is required to evaluate the potential
impacts of emissions from ventilation exhaust systems of manufacturing or processing facilities when
a project would result in new sensitive uses (particularly schools, hospitals, parks, and residences)
within a 400‐foot radius.
Land use maps were reviewed to identify potential sources of emissions from manufacturing/industrial
operations. A preliminary survey was conducted using the New York City Department of
Environmental Protection’s Clean Air Tracking System (DEP CATS) to determine if there are any DEP‐
issued industrial permits for these potential sources of air toxics concerns. No active industrial permits
were found for any existing sites with potential air toxics emissions. Therefore, no analysis would be
needed and no significant impacts on the proposed project are anticipated from industrial source
emissions.
“Large” or “Major” Source Analysis
A comprehensive search was also performed to identify “large” or “major” emission source within a
1000‐foot radius of the development site. “Major” sources are identified as those sources located at Title
V facilities that require Prevention of Significant Deterioration permits. “Large” sources are identified
as sources located at facilities that require a State Facility Permit.
After reviewing the NYSDEC Title V and State Facility Permit websites and available aerial photos
provided by Google and Bing, a potential facility with a Title V permit (Permit No. 2‐6402‐00295, see
Appendix D) was found at 130 Edgewater Street— the New York Power Authority’s (NYPA) Pouch
Terminal facility, which is approximately 110 feet away from the nearest proposed receptor site:
Building A.7 The potential air quality impacts from the Pouch Terminal facility on the sensitive
receptors on Building A were analyzed using EPA’s AERMOD model. A brief technical memorandum
of the Pouch Terminal analysis is provided in Appendix D.
Refined Dispersion Modeling
The potential air quality impacts from the Pouch Terminal facility were analyzed using EPA’s
AERMOD dispersion model. AERMOD is a state‐of‐the‐art dispersion model, applicable to rural and
urban areas, flat and complex terrain, surface and elevated releases, and multiple sources (including
point, area, and volume sources). AERMOD is a steady‐state plume model that incorporates current
concepts about flow and dispersion in complex terrain, including updated treatments of the boundary
layer theory, understanding of turbulence and dispersion, and includes handling of terrain
interactions.
7 “Issued Title V Permits: All.” NYSDEC Bureau of Stationary Sources, http://www.dec.ny.gov/dardata/boss/afs/issued_atv.html;
“Issued State Facility Permits: All.” NYSDEC Bureau of Stationary Sources, http://www.dec.ny.gov/dardata/boss/afs/issued_asf.html.

125 Edgewater Street - CEQR No. 17DCP069R Environmental Assessment Statement
Page 2.12-19
The AERMOD model calculates pollutant concentrations from one or more points (e.g., exhaust stacks)
based on hourly meteorological data, and has the capability to calculate pollutant concentrations at
locations where the plume from the exhaust stack is affected by the aerodynamic wakes and eddies
(downwash) produced by nearby structures. The analyses of potential impacts from exhaust stacks
were made assuming stack tip downwash, urban dispersion and surface roughness length, and
elimination of calms. AERMOD can be run with and without building downwash (the downwash
option accounts for the effects on plume dispersion created by the structure the stack is located on, and
other nearby structures). Therefore, the analysis was performed using the AERMOD model for both
options to assess the worst‐case impact from these sources.
Emission Rate and Stack Parameters
The refined dispersion modeling analysis was performed for NO2, PM2.5, and PM10. The emission rates
used for the analysis were calculated based on the emission factors directly from the permit or from
EPA’s AP‐428. Some assumptions (i.e., the long term permissible capacity) were made based on a
similar facility which was analyzed for the Domino Sugar Rezoning (07DCP094K) EIS project. The
Stack parameters—such as stack diameter, stack height, stack exhaust temperature and exhaust
velocity—came directly from the permit or the actual operation data obtained from the facility.
Methodology Utilized for Estimating NO2 Concentrations
EPA’s preferred regulatory stationary source dispersion model, AERMOD, is capable of producing
detailed output data that can be analyzed at the hourly level required for the form of the 1‐hour
standards. EPA has also developed guidance to estimate the NO2/NOx conversion ratio, applicable to
heating and hot water systems, as discussed further below.
The 1‐hour NO2 concentration associated with the emissions from the Pouch Terminal facility’s boilers
and engines were estimated using the AERMOD model’s Tier 1 option, the most conservative
approach, which assumes a full (100%) conversion of NOx to NO2.
The 98th percentile daily 1‐hour maximum concentration at each receptor location for each modeled
year was calculated within the AERMOD model; then the 98th percentile concentrations were averaged
over the latest five years. The highest daily 1‐hour NO2 concentration from all receptor locations was
selected as the maximum 1‐hour NO2 concentration. The background concentrations value was added
to the modeling results to get the total concentrations for 1‐hour NO2.
Annual NO2 concentrations from heating and hot water sources were estimated using a NO2/NOx
conversion ratio of 0.75, as described in EPA’s Guideline on Air Quality Models at 40 CFR part 51
Appendix W, Section 5.2.4.10.9
Meteorological Data
All analyses were conducted using five consecutive years of meteorological data (2010‐2014).10 Surface
data was obtained from La Guardia Airport and upper air data was obtained from Brookhaven station,
New York. Data will be processed using the current EPA AERMET version 15181 and the EPA
8 https://www3.epa.gov/ttn/chief/ap42/ch03/index.html 9 http://www.epa.gov/scram001/guidance/guide/appw_05.pdf. 10 The latest 2015 meteorological data was not available when the analyses were conducted and reviewed by DCP/DEP.

125 Edgewater Street - CEQR No. 17DCP069R Environmental Assessment Statement
Page 2.12-20
procedure. The meteorological data provides hour‐by‐hour wind speeds and directions, stability states,
and temperature inversion elevations over the five‐year period.
Receptor Placement
Discrete receptors were modeled along the building façades of the three proposed buildings to
represent potentially sensitive locations such as operable windows and intake vents. Rows of receptors
at spaced intervals on the modeled buildings were analyzed at multiple elevations.
Background Concentrations
Appropriate background concentrations values (see Table 2.12‐5) were added to modeling results to
get the total concentrations for 1‐hour and annual NO2. Predicted values were compared with the
NAAQS. To develop background levels, concentration measured at the nearest NYSDEC ambient
monitoring station over the latest available three‐year period (2012‐2014)11 were used for the 1‐hour
NO2, and the latest five‐year period (2012‐2014) were used for the annual average NO2.
The 24‐hour PM2.5 average background concentration of 19.4 μg/m3 was used to establish the de minimis
value, consistent with the guidance provided in the CEQR Technical Manual. The annual average PM2.5
impacts will be assessed on an incremental basis and compared with the PM2.5 de minimis criteria
threshold of 0.3 μg/m3, without considering the annual background.
Table 2.12-5: Background Concentrations for Pouch Terminal Facility Analysis Pollutant Averaging Time Monitoring Location Background Concentration
Nitrogen Dioxide (NO2) 1-hour1 Queens College, Queens 108.9 µg/m3 Annual2 IS 52, Bronx 40.6 µg/m3
Particulate Matter (PM2.5) 24-Hour3 Port Richmond, Staten Island 19.4 µg/m3 Source: NYSDEC Ambient Air Quality Report, 2014, http://www.dec.ny.gov/chemical/29310.html Notes: 1 1-hour NO2 background concentration is based on three-year average (2012-2014) of the 98th percentile of daily maximum 1-hour
concentrations from available monitoring data from NYSDEC. 2 Annual NO2 background concentration is based on the maximum annual average from the latest five years of available monitoring data from
NYSDEC (2010-2014). 3 The 24-hour PM2.5 background concentration is based on maximum 98th percentile concentration averaged over three years of data from
NYSDEC (2012-2014).
2.12.5 Assessment
Existing Conditions
Appropriate ambient background concentrations values were added to modeling results to get the total
concentration experienced at receptors. Background concentrations are ambient pollution levels
associated with existing stationary, mobile, and other area emission sources. NYSDEC maintains an air
11 The latest 2015 background concentrations were not available when the analyses were conducted and reviewed by DCP/DEP. To
be consistent with the meteorological data, background concentrations from 2010‐2014 were used.

125 Edgewater Street - CEQR No. 17DCP069R Environmental Assessment Statement
Page 2.12-21
quality monitoring network and produces annual air quality reports that include monitoring data for
CO, NO2, PM10, PM2.5, and SO2. To develop background levels, the latest available pollutant
concentrations from monitoring sites located closest to the development site were used. If the pollutant
concentration from the nearest monitoring station is not available or the data is not for background
concentrations determination (e.g., data collected from Tapered Element Oscillating Microbalance
[TEOM] sampler), the next closest monitoring station would be selected, and so forth. Table 2.12‐6
summarizes the background concentrations used for each of the pollutants.
Annual PM2.5 impacts are assessed on an incremental basis and compared with the PM2.5 de minimis
criteria of 0.3 μg/m3, without considering the annual background. Therefore the annual PM2.5
background is not presented in the table.
Table 2.12-6: Ambient Background Concentrations Pollutant Averaging Time Monitoring Location Background Concentration
Carbon Monoxide (CO) 1-Hour1 CCNY, Manhattan 2.3 ppm 8-Hour1 CCNY, Manhattan 1.5 ppm
Nitrogen Dioxide (NO2) 1-Hour2 Queens College, Queens 113.2 µg/m3 Annual3 Queens College, Queens 34 µg/m3
Particulate Matter (PM10) 24-Hour4 Division Street, Manhattan 44 µg/m3 Particulate Matter (PM2.5) 24-Hour5 Port Richmond, Staten Island 20.3 µg/m3
Sulfur Dioxide (SO2) 1-Hour6 Queens College, Queens 29.1 µg/m3 Source: NYSDEC Ambient Air Quality Report, 2015, http://www.dec.ny.gov/chemical/29310.html. Notes: 1 1-hour CO and 8-hour CO background concentrations are based on the highest second max value from the latest five years of available monitoring
data from NYSDEC (2011-2015). 2 1-hour NO2 background concentration is based on three-year average (2013-2015) of the 98th percentile of daily maximum 1-hour concentrations
from available monitoring data from NYSDEC. 3 Annual NO2 background concentration is based on the maximum annual average from the latest five years of available monitoring data from
NYSDEC (2011-2015). 4 24-hour PM10 is based on the highest second max value from the latest three years of available monitoring data from NYSDEC (2013-2015). 5 The 24-hour PM2.5 background concentration is based on maximum 98th percentile concentration averaged over three years of data from
NYSDEC (2013-2015). 6 1-hour SO2 background concentration is based on maximum 99th percentile concentration averaged over the latest three years (2013-2015) of
available monitoring data from NYSDEC.
Future No-Action Condition
Mobile Sources
Intersection Analysis
CO concentrations in the No‐Action condition were determined for the 2019 analysis year using the
methodology previously described. Table 2.12‐7 shows future maximum predicted 8‐hour average CO
concentrations, including background concentrations, at the analyzed intersection under the No‐
Action condition. The values shown are the highest predicted concentrations for the receptor locations
for any of the time periods analyzed.
As shown in Table 2.12‐7, No‐Action condition values are predicted to be well below the 1‐hour
standard of 35 ppm and the 8‐hour CO standard of nine ppm.

125 Edgewater Street - CEQR No. 17DCP069R Environmental Assessment Statement
Page 2.12-22
Table 2.12-7: No-Action Maximum Predicted CO Concentrations (ppm) from Intersection Analysis
Analysis Site Location Time Period 1-Hour
Concentration NAAQS 8-Hour
Concentration NAAQS
1 Edgewater Street and Lynhurst Avenue
Weekday AM 2.379 35
1.555 9 Weekday MD 2.374 1.552
Weekday PM 2.471 1.620 Notes: 1 1-hour Concentration includes a background concentration of 2.3 ppm (see Table 2.12-3). 2 8-hour Concentration includes a background concentration of 1.5 ppm (see Table 2.12-3).
PM10 concentrations for the No‐Action condition were determined using the methodology described
above. Predicted future 24‐hour PM10 concentrations, including background concentrations, at the
analyzed intersection in the No‐Action condition are presented in Table 2.12‐8. As shown in Table 2.12‐
8, the 24‐hr PM10 concentration is well below the NAAQS. The values shown is the highest predicted
concentrations from all receptor locations.
PM2.5 concentrations for the No‐Action condition are not present, since impacts are assessed on an
incremental basis.
Table 2.12-8: No-Action Maximum Predicted 24-hour PM10 Concentrations (µg/m3) from Intersection Analysis
Analysis Site Location Modeled 24-Hour
ConcentrationBackground
Concentration Total
Concentration NAAQS
1 Edgewater Street and Lynhurst Avenue 5.10 44 49.10 150
Future With-Action Condition
Mobile Sources
Intersection Analysis
CO concentrations in the With‐Action condition were determined for the 2019 analysis year using the
methodology previously described. Table 2.12‐8 shows future maximum predicted 8‐hour average CO
concentrations, including background concentrations, at the analyzed intersection under the With‐
Action condition. The values shown are the highest predicted concentrations for the receptor locations
for any of the time periods analyzed.
As shown in Table 2.12‐8, With‐Action condition values are predicted to be well below the 1‐hour
standard of 35 ppm and the 8‐hour CO standard of nine ppm. Additionally, the incremental 8‐hour CO
concentration is very small, and consequently would not result in a violation of the CEQR de minimis
CO criteria. Therefore, CO emissions from intersection analysis with the proposed project would not
result in a significant adverse air quality impact.

125 Edgewater Street - CEQR No. 17DCP069R Environmental Assessment Statement
Page 2.12-23
Table 2.12-8: With-Action Maximum Predicted CO Concentrations (ppm) from Intersection Analysis
Analysis Site Location Time Period
With-Action 1-Hour
Concentration 1-Hour NAAQS
No-Action 8-Hour
Concentration
With-Action 8-Hour
Concentration 8-Hour
Increment De
Minimis
1 Edgewater Street
and Lynhurst Avenue
Weekday AM 2.388 35
1.555 1.562 0.006 3.72 Weekday MD 2.380 1.552 1.556 0.004 3.72 Weekday PM 2.475 1.620 1.623 0.003 3.69
Notes: 1 1-hour Concentration includes a background concentration of 2.3 ppm (see Table 2.12-3). 2 8-hour Concentration includes a background concentration of 1.5 ppm (see Table 2.12-3). 3 The NAAQS for 1-hour and 8-hour CO concentrations are 35 ppm and nine ppm respectively.
PM10 concentrations for the With‐Action condition were determined using the methodology described
above. Predicted future 24‐hour PM10 concentrations, including background concentrations, at the
analyzed intersection in the With‐Action condition are presented in Table 2.12‐9. As shown in Table
2.12‐9, the 24‐hr PM10 concentration is well below the NAAQS. The values shown is the highest
predicted concentrations from all receptor locations.
Table 2.12-9: No-Action Maximum Predicted 24-hour PM10 Concentrations (µg/m3) from Intersection Analysis
Analysis Site Location Modeled 24-Hour
ConcentrationBackground
Concentration Total
Concentration NAAQS
1 Edgewater Street and Lynhurst Avenue 5.98 44 49.98 150
Using the methodology previously described, maximum predicted 24‐hour and annual average PM2.5
concentration increments were calculated so that they could be compared with the de minimis criteria.
Based on this analysis, the maximum predicted localized 24‐hour average and neighborhood‐scale
annual average incremental PM2.5 concentrations are presented in Tables 2.12‐10. The results show that
the 24‐hr PM2.5 and annual PM2.5 concentrations would not result in a violation of the de minimis criteria.
Therefore, pollutants emissions from intersection analysis with the proposed project would not result
in a significant adverse air quality impact.
Table 2.12-10: Maximum Predicted PM2.5 Incremental Concentrations (µg/m3) from Intersection Analysis Analysis
Site Location Averaging Time No-Action With-Action Increment De Minimis1 1 Edgewater Street and
Lynhurst Avenue 24-Hour PM2.5 1.29 1.51 0.28 7.35 Annual PM2.5 0.029 0.034 0.005 0.1
Notes: 1 The PM2.5 de minimis criteria threshold for annual (neighborhood scale) is 0.1 µg/m3 without considering background concentration.
Marine Terminal Analysis
Potential cumulative impacts on the three proposed buildings from the pilot boats and yachts
emissions were determined using EPA’s AERMOD dispersion model using the methodology
previously described.
In the analysis of ferry emissions in East River Ferry EAS, the number of vessels approaching and
departing the stations was estimated based on ferry schedules as transportation vehicles to provide

125 Edgewater Street - CEQR No. 17DCP069R Environmental Assessment Statement
Page 2.12-24
necessary service to the public on a daily basis (e.g., 3 ferries in each direction to and from the station).
However, the pilot boats at Sandy Hook are not operating on a specified hourly or daily basis but only
on demand (i.e., when pilot service is requested). As such, the number of scheduled trips on a timely
basis cannot be determined. However, for the conservative purposes of this analysis, a worst‐case
scenario was developed, based on annual activity rates, which assumes that three pilot boats and one
yacht (a total of four vessels) would be operating near the station during a reasonable worst‐case hour.
The worst‐case scenario also includes the following conservative assumptions:
The pilot boats would each have two 1,100 HP main engines and one 125 HP auxiliary
engine;
The yachts would each have one 110 HP main engine;
The transit/maneuvering time of each vessel would be two minutes; and
The idling (docking) time of each vessel would be ten (10) minutes.
In addition, it was conservatively assumed that none of the vessels would have emission controls for
either NO2 or particulate matter (to approximate Tier 2 marine engines).
Table 2.12‐11 presents the engine parameters and emission factors used to calculate the emission rates
of the pilot boats and yachts. Table 2.12‐12 presents the estimated emission rates (gram per second) of
the pilot boats and yachts, as well as the combined emission rates (gram per square meter) by
considering all emission sources as an area source.
CO, NO2, PM10, PM2.5 and SO2 concentrations in the With‐Action condition were determined using the
methodology previously described. Table 2.12‐13 shows future maximum predicted pollutants
concentrations at all receptor locations from the vessel emissions for 1‐hour and 8‐hour CO
concentrations, 24‐hour PM10 concentrations, and 1‐hour SO2 concentrations, and includes ambient
background concentrations. The 24‐hour PM2.5 and annual PM2.5 concentrations are compared to the de
minimis criteria without considering background concentrations.
As shown in Table 2.12‐13, the 1‐hour and 8‐hour CO concentrations, the 24‐hour PM10 concentrations
and the 1‐hour SO2 concentrations are well below the NAAQS. Additionally, the 24‐hr PM2.5 and annual
PM2.5 concentrations would not result in a violation of the de minimis criteria. Therefore, pollutants
emissions from the analyzed vessel emissions would not result in a significant adverse impact on the
new sensitive receptors introduced by the proposed project.

125 Edgewater Street - CEQR No. 17DCP069R Environmental Assessment Statement
Page 2.12-25
Table 2.12-11: Engine Parameters and Pollutant Emission Factors for Marine Terminal Analysis
Emissions by Mode
Engines Parameters Pollutant Emission Factors2
Power Output
Time in Mode Load Factor
Transit MNV Docking Transit MNV1 Docking
NOx PM10 PM2.5 SO2 CO hp kW hrs hrs Hrs g/kW-hr g/kW-hr g/kW-hr g/kW-hr g/kW-hr
Pilot Boats Main Engine 2,200 1,640 0.033 0.033 --- 0.40 0.20 --- 8.7 0.50 0.46 0.87 5.0
Auxiliary Engine 125 93 --- --- 0.167 --- --- 0.8 8.7 0.50 0.46 0.81 5.0 Yachts Main Engine 110 82 0.033 0.033 0.17 0.40 0.20 0.80 7.2 0.20 0.18 0.87 5.0 Notes:
1 MNV = Maneuvering Mode 2 Pollutant emission factors are based on Tier 2 EPA Emission Standards or the East River Ferry EAS (13DME009Y) as discussed in the methodology section.
Table 2.12-12: Emission Rates for Marine Terminal Analysis 1-Hour NOx Annual NOx 24-Hour PM10 24-Hour PM2.5 Annual PM2.5 1-Hour SO2 1-Hour CO2 Pilot Boats Emission Rates (g/s) Transit Emissions 0.1586 0.1086 0.0091 0.0084 0.0057 0.0159 0.0911 Maneuvering Emissions 0.0793 0.0543 0.0046 0.0042 0.0029 0.0079 0.0456 Dock Emissions 0.0901 0.0617 0.0052 0.0048 0.0033 0.0084 0.0518 Total Trip Emissions 0.3279 0.2246 0.0188 0.0173 0.0119 0.0322 0.1885 Yachts Emission Rates (g/s) Transit Emissions 0.0022 0.0015 0.00006 0.00006 0.00004 0.00026 0.0015 Maneuvering Emissions 0.0011 0.0007 0.00006 0.00003 0.00002 0.00013 0.0008 Dock Emissions 0.0219 0.0150 0.00061 0.00061 0.00042 0.00264 0.0152 Total Trip Emissions 0.0252 0.0172 0.00073 0.00070 0.00048 0.00304 0.0175 Total Emission Rates1 (g/s-m2) 3.93E-06 2.69E-06 2.18E-07 2.01E-07 1.38E-07 3.92E-07 2.29E-06
Notes: 1 Total emission rates were calculated based on an area of 89,751 m2 for the modeled area source. 2 8-hour CO concentrations were also modeled using the same emission rate for 1-hour CO.

125 Edgewater Street - CEQR No. 17DCP069R Environmental Assessment Statement
Page 2.12-26
Table 2.12-13: With-Action Maximum Predicted Concentrations (µg/m3) from Marine Terminal Analysis
Pollutant Averaging Time Maximum Modeled
Concentration Background
Concentration Total
Concentration NAAQS/
De Minimis
CO 1-Hour1 51 2634 2685 40075 8-Hour1 21 1718 1739 10305
NO2 1-Hour2 153.68 --- 153.68 188 Annual3 2.18 34 36.18 100
PM10 24-Hour 0.98 44 44.98 150 PM2.5 24-Hour 0.75 20.3 0.75 7.35 PM2.5 Annual3 0.149 --- 0.149 0.3 SO2 1-Hour 8.01 29.1 37.00 196
Notes: 1 The 1-hour and 8-hour CO background concentrations were converted from ppm to µg/m3 multiplying by 1,145. 2 Seasonal-hourly background concentrations were added to the modeled 1-hour NO2 concentrations to predict the maximum total concentration. 3 Annual NO2 impacts were estimated using a NO2/NOx conversion ratio of 0.75 as per EPA guidance. 4 The PM2.5 de minimis criteria threshold for annual (neighborhood scale) is 0.3 µg/m3.
Stationary Sources
Individual HVAC Systems
Screening Analysis
Screening analyses were performed to assess both project‐on‐project and project‐on‐existing air quality
impacts from emissions associated with the HVAC systems of the proposed buildings, using the
methodology previously described.
Project‐on‐Project Analysis
Building B on Building A
Building B (120 feet) could have a potential impact on taller Building A (130 feet). Building B consists
of a total floor area of 228,800 gross square feet (gsf), and the distance between these two buildings at
roof level is approximately 120 feet. The screening analysis result (see Figure 2.12‐1) shows that the
minimum required distance to pass the screening analysis would be approximately 109 feet, which is
less than the distance between Building B and Building A. Therefore, there would be no significant
adverse impacts from Building B’s HVAC systems onto Building A and no further analysis is needed.
However, an E) designation (E‐401) with restrictions on boiler fuel type and stack location, to be placed
on the development site, are necessary to avoid impacts. The language specifying (E) designation and
the appropriate HVAC restrictions is provided at the end of HVAC analysis section.
Building C on Building B
Building C (62 feet) could have a potential impact on taller Building B (120 feet). Building C consists of
a total floor area of 36,930 gsf, and the distance between these two buildings is approximately 92 feet.
The screening analyses was conducted using No. 2 fuel oil for HVAC systems for conservative
purposes, although the proposed developer is anticipating the use of natural gas. The screening
analysis result (see Figure 2.12‐2) shows that the minimum required distance to pass the screening

FIGURE 17-7NO2 BOILER SCREEN
RESIDENTIAL DEVELOPMENT - NATURAL GAS
1,000
10,000
100,000
1,000,000
10,000,000
0 25 50 75 100 125 150 175 200 225 250 275 300 325 350 375 400
Distance to nearest building (ft)
Max
imum
Dev
elop
men
t Siz
e(ft
2 )
30 ft100 ft165 ft
WARNING: These printed materials may be out of date. Please ensure you have the current version that can be found on www.nyc.gov/oec.
187,688 gsf
120 ft
Minimum required distance : 103 ft
PASS
10/26/16
Figure
2.12-1 HVAC Screen (Building B on Building A)125 Edgewater StreetStaten Island, New York
limingliu
Rectangle
limingliu
Line
limingliu
Rectangle
limingliu
Line
limingliu
Rectangle
limingliu
Rectangle

FIGURE 17-7NO2 BOILER SCREEN
RESIDENTIAL DEVELOPMENT - NATURAL GAS
1,000
10,000
100,000
1,000,000
10,000,000
0 25 50 75 100 125 150 175 200 225 250 275 300 325 350 375 400
Distance to nearest building (ft)
Max
imum
Dev
elop
men
t Siz
e(ft
2 )
30 ft100 ft165 ft
WARNING: These printed materials may be out of date. Please ensure you have the current version that can be found on www.nyc.gov/oec.
30,810 gsf
92 ft
Minimum required distance : 41 ft
PASS
10/26/16
Figure
2.12-2 HVAC Screen (Building C on Building B)125 Edgewater StreetStaten Island, New York
limingliu
Rectangle
limingliu
Line
limingliu
Rectangle
limingliu
Line
limingliu
Rectangle
limingliu
Rectangle

125 Edgewater Street - CEQR No. 17DCP069R Environmental Assessment Statement
Page 2.12-27
analysis would be approximately 61 feet, which is less than the distance between Building C and
Building B. Therefore, there would be no significant adverse impacts from Building C’s HVAC systems
onto Building B and no further analysis is needed.
Project‐on‐Existing Analysis
A survey of existing building heights within a 400‐foot radius of the development site identified one
potential receptor building of similar or greater height: the 7‐story (87 feet) office building on Block
2820, Lot 95, which could potentially be impacted by Building C (62 feet).
Building C consists of a total floor area of 36,930 gsf, and the distance between these two buildings is
approximately 102 feet. Similarly, a screening analysis was conducted assuming No.2 fuel oil as the
fuel type for Building C’s HAVC system. The screening analysis result (see Figure 2.12‐3) shows that
the minimum required distance to pass the screening analysis would be approximately 61 feet, which
is less than the distance between Building C and the existing office building. Therefore, there would
be no significant adverse impacts from Building C’s HVAC systems onto existing buildings and no
further analysis is needed.
Cumulative Impacts from HVAC Systems
Screening Analysis
In addition to the individual HVAC analysis, cumulative impacts from Building A (130 feet) and
Building B (120 feet) were assessed to determine the potential impacts from the combined HVAC
emissions onto existing buildings of similar or greater height.
A survey of existing building heights within a 400‐foot radius of the cluster identified that all existing
buildings are shorter than the cluster. According to the CEQR Technical Manual, as there are no
buildings of similar or greater height within 400 feet of the cluster, a distance of 400 feet will be used
for screening purposes.
For cumulative HVAC impact analysis, a combined development size (441,764 gsf) will be used for the
screening analysis. For conservative purposes, a screening analysis was conducted assuming No.2 fuel
oil as the fuel type for their HAVC systems. Based on the screening analysis result (see Figure 2.12‐4),
the minimum required distance to pass the screening analysis would be approximately 239 feet, which
is less than the distance between cluster and the existing office building. Therefore, there would be no
significant adverse impacts from the combined HVAC systems of Building A and Building B onto
existing buildings and no further analysis is needed.
(E) Designation Requirements
To ensure that there are no significant adverse impacts from HVAC systems of the proposed buildings,
certain restrictions would be required though the mapping of an (E) designation (E‐401) for air quality
regarding fuel type and stack location.
In addition, to avoid any potential significant adverse air quality impacts from existing “large” or
“major” sources onto Building A, certain (E) designation related to air quality would be required to
ensure that no operable windows or air intakes are located above a height of 128 feet above grade on
Building A, as described below under “Large” or “Major” Source Analysis section.
The text of the (E) designation would be as follows:

FIGURE 17-7NO2 BOILER SCREEN
RESIDENTIAL DEVELOPMENT - NATURAL GAS
1,000
10,000
100,000
1,000,000
10,000,000
0 25 50 75 100 125 150 175 200 225 250 275 300 325 350 375 400
Distance to nearest building (ft)
Max
imum
Dev
elop
men
t Siz
e(ft
2 )
30 ft100 ft165 ft
WARNING: These printed materials may be out of date. Please ensure you have the current version that can be found on www.nyc.gov/oec.
30,810 gsf
102 ft
Minimum required distance : 41 ft
PASS
10/26/16
Figure
2.12-3 HVAC Screen (Building C on Existing Building)125 Edgewater StreetStaten Island, New York
limingliu
Rectangle
limingliu
Line
limingliu
Rectangle
limingliu
Line
limingliu
Rectangle
limingliu
Rectangle

FIGURE 17-7NO2 BOILER SCREEN
RESIDENTIAL DEVELOPMENT - NATURAL GAS
1,000
10,000
100,000
1,000,000
10,000,000
0 25 50 75 100 125 150 175 200 225 250 275 300 325 350 375 400
Distance to nearest building (ft)
Max
imum
Dev
elop
men
t Siz
e(ft
2 )
30 ft100 ft165 ft
WARNING: These printed materials may be out of date. Please ensure you have the current version that can be found on www.nyc.gov/oec.
344,930 gsf
400 ft
Minimum required distance : 135 ft
PASS
10/26/16
Figure
2.12-4 HVAC Screen (Cumulative Impacts on Existing Building)125 Edgewater StreetStaten Island, New York
limingliu
Rectangle
limingliu
Line
limingliu
Rectangle
limingliu
Line
limingliu
Rectangle
limingliu
Rectangle

125 Edgewater Street - CEQR No. 17DCP069R Environmental Assessment Statement
Page 2.12-28
Building A (Block 2820, Lot 90): Any new residential and/or commercial development on the
above referenced property must ensure that no operable windows or air intakes are located
above a height of 128 feet above grade and that the HVAC stack is located at least 133 feet
above grade to avoid any potential significant adverse air quality impacts.
Building B (Block 2820, Lot 90): Any new residential and/or commercial development on the
above reference properties must exclusively use natural gas as the type of fuel for heating,
ventilating and air conditioning (HVAC) systems, and ensure that the HVAC stack(s) is
located at least 200 feet from northern lot line of Lot 110.
Building C (Block 2820, Lot 90): Any new residential and/or commercial development on the
above reference properties must ensure that the HVAC stack is located at least 582 feet from
northern lot line of Lot 110.”
See Figure 2.12‐5 for illustrative depictions of (E) designation distance restrictions.
Industrial Sources Analysis
To assess air quality impacts on the proposed project associated with air toxics emissions from
industrial permits from existing land uses, an investigation of existing land uses within a 400‐foot
radius of the development site was conducted. Initially, land use maps were reviewed to identify
surrounding land uses that potentially have DEP‐issued industrial permits, such as Commercial/Office
Buildings, Industrial/Manufacturing, Transportation/Utility, Public Facilities/Institutions, and Parking
Facilities. Table 2.12‐14 shows the list of all existing land uses that were identified to have potentials to
cause air quality impact within a 400‐foot radius of the development site.

EDGEWATER STREET
Lot 110
582’
200’
582’ Distance to Lot 110
Date: 12/5/2016
Tax Lot
Figure
2.12-5Air QualityE-Designation
0 150 300Feet
125 Edgewater StreetStaten Island, New York

125 Edgewater Street - CEQR No. 17DCP069R Environmental Assessment Statement
Page 2.12-29
Table 2.12-14: Potential Industrial Sources within 400 Feet of the Proposed Project Block Lot Address Land Use Category Owner Name DEP CATS 2820 95 1 Edgewater Street Commercial/Office Buildings Edgewater Plaza Loft No Industrial Permit 2820 119 145 Edgewater Street Transportation/Utility Jr Sea Knights-Amer I No Record Found 2820 110 181 Edgewater Street Industrial/Manufacturing 181 Edgewater LLC No Record Found 2822 21 Bay Street Parking Facilities Pouch Terminal Inc. No Record Found 2822 23 Bay Street Parking Facilities Sovereign Realty Assoc. No Record Found 2822 26 Bay Street Parking Facilities Sovereign Realty Assoc. No Record Found 2822 20 Bay Street Parking Facilities Pouch Terminal Inc. No Record Found 2822 1 951 Bay Street Transportation/Utility Merit Oil Of NY Inc. No Industrial Permit 2822 22 Bay Street Parking Facilities Sovereign Realty Assoc. No Record Found 2822 24 Bay Street Parking Facilities Sovereign Realty Assoc. No Record Found 2823 17 4 Willow Avenue Commercial/Office Buildings Immitti, Jr., Salvato No Record Found 2823 8 981 Bay Street Commercial/Office Buildings JCS Properties Inc. No Record Found 2823 25 Edgewater Street Parking Facilities NYCTA No Record Found 2823 1 987 Bay Street Commercial/Office Buildings Steeple Bay Holdings, No Record Found 2823 31 100 Edgewater Street Industrial/Manufacturing Edgewater Plaza Loft No Record Found 2823 30 94 Edgewater Street Commercial/Office Buildings 94 Edgewater Development No Record Found 2823 29 Edgewater Street Parking Facilities NYCTA No Record Found 2823 26 Edgewater Street Parking Facilities NYCTA No Record Found 2825 4 110 Edgewater Street Industrial/Manufacturing Bay Street Partners LLC No Record Found 2825 8 1071 Bay Street Commercial/Office Buildings 1071 Bay Street LLC No Record Found 2825 16 Bay Street Transportation/Utility New York Telephone Co No Industrial Permit 2825 19 1025 Bay Street Transportation/Utility Rando Enterprises Inc. No Record Found 2825 10 1065 Bay Street Commercial/Office Buildings 1071 Bay Street LLC No Record Found 2825 1 1077 Bay Street Commercial/Office Buildings 10-77 Bay Street B LLC No Record Found
Source: NYCDEP’s Clean Air Tracking System (CATS). https://a826-web01.nyc.gov/DEP.BoilerInformationExt/
“Large” or “Major” Source Analysis
Potential stationary source impacts on the three proposed buildings from the NYPA Pouch Terminal
Facility at 130 Edgewater Street were determined using EPA’s AERMOD dispersion model. As noted
above, the methodology used in the analysis is consistent with what was done for a similar NYPA
facility, the Domino Sugar Rezoning (07DCP094K) EIS project. The two critical pollutants for the
analysis are NO2 and PM2.5.
The Title V permit indicated that the Pouch Terminal Facility contains a combustion turbine (GE
LM6000) with a design capacity of 420 million British thermal unit (Btu) per hour, a boiler with a design
capacity of 7.4 million Btu per hour, and a diesel backup generator with a design capacity of 746
horsepower. In consultation with NYPA and DCP/DEP, the backup generator was eliminated from the
analysis because it would only be used for emergency purpose. The Title V permit provided the exact
location of the combustion turbine and the boiler within the plant and the emission factors for NO2 but
not for PM2.5. However, as both the Pouch Terminal Facility and North First Street NYPA Facility used
the same type of combustion turbine (GE LM6000), the PM2.5 emission factor assumed for the analysis
is consistent with the North First Street NYPA Facility.

125 Edgewater Street - CEQR No. 17DCP069R Environmental Assessment Statement
Page 2.12-30
The actual five years (2010‐2014) of operation data obtained from the Pouch Terminal Facility showed
that the facility operates at an actual maximum of 115 percent of the rated capacity in the short term
basis and at approximately 23 percent of rated capacity in the long term basis (See Attachment D). In
consultation with DEP, the long term permissible capacity was adjusted to 97 percent to be consistent
with the Domino Sugar Rezoning EIS project. As a result, the emission rates calculated based on the
permit information were adjusted by applying a multiplier of 1.15 (115 percent) for the 1‐hour NO2 and
24‐hour PM2.5, and a multiplier of 0.97 (97 percent) for the annual NO2 and PM2.5. Table 2.12‐15 presents
the stack parameters and emission rates used in the analysis.
Table 2.12-15: Emission Rates & Stack Parameters for the Pouch Terminal Facility Emission Sources Combustion Turbine Boiler
Emission Rates (g/s) 1-hour NO2 0.7244 0.0339 Annual NO2 0.6306 0.0329
24-Hour PM2.5 0.216 0.0071 Annual PM2.5 0.1822 0.0069
Stack Parameters Stack Height (m) 32.46 3.66
Stack Diameter (m) 3.66 0.51 Exhaust Velocity (m/s) 31.32 5.34
Exhaust Temperature (˚F) 672 589
The background concentrations were added to the maximum estimated modeling concentrations for
1‐hour and annual NO2 to estimate total concentrations, while 24‐hour and annual PM2.5 concentrations
were compared with the PM2.5 de minimis criteria without considering background concentration. The
results of the detailed AERMOD analysis are presented in Table 2.12‐16.
As shown in Table 2.12‐16, the maximum 1‐hour and annual NO2 are below their respective NAAQS
values. The maximum 24‐hour PM2.5 concentration is below the de minimis criteria threshold of 7.8
μg/m3, and the annual PM2.5 concentration is below the de minimis criteria threshold of 0.3 μg/m3.
Therefore, there would be no significant adverse stationary source impacts on the proposed project
from existing “large” or “major” sources.
Table 2.12-16: Maximum Predicted Concentration (µg/m3) from the Pouch Terminal Facility
Pollutant Averaging
Period Maximum Modeled Concentration Background
Concentration Total
Concentration1 NAAQS /
De Minimis No Downwash Downwash
NO2 1-Hour 16.65 13.91 108.9 125.55 188 Annual 0.49 0.39 43 43.49 100
PM2.5 24-Hour 3.73 1.94 19.4 3.73 7.8 Annual 0.09 0.07 -- 0.09 0.3
Notes: 1 Total concentration represents the higher pollutant level predicted from "No Downwash" and "Downwash".
As described in the introduction of this Revised EAS, a supplemental air quality analysis was
undertaken using EPA’s AERMOD dispersion model at an additional receptor height of 128 feet above

125 Edgewater Street - CEQR No. 17DCP069R Environmental Assessment Statement
Page 2.12-31
grade on Building A with a 15‐foot setback required by zoning to ascertain if any significant adverse
air quality impacts would result from the existing NYPA Pouch Terminal facility onto Building A. The
supplemental analysis was performed utilizing the same emission rates and stack parameters as stated
in Table 2.12‐15, with the same AERMOD modeling algorithms. Additional information for this
supplemental air quality analysis is provided in Appendix D.
The AERMOD results of the supplemental air quality analysis are presented in Table 2.12‐17. As shown
in Table 2.12‐17, the maximum 1‐hour and annual NO2 are below their respective NAAQS values. The
maximum 24‐hour PM2.5 concentration is below the de minimis criteria threshold of 7.8 μg/m3, and the
annual PM2.5 concentration is below the de minimis criteria threshold of 0.3 μg/m3. Therefore, there
would be no significant adverse stationary source impacts on Building A at a height of no taller than
128 feet above grade from existing “large” or “major” sources.
Table 2.12-17: Maximum Predicted Concentration (µg/m3) on Building A from the Pouch Terminal Facility
Pollutant Averaging
Period Maximum Modeled Concentration Background
Concentration Total
Concentration1 NAAQS /
De Minimis No Downwash Downwash
NO2 1-Hour 23.35 23.35 108.9 132.2 188 Annual 0.98 0.94 43 44 100
PM2.5 24-Hour 5.1 4.5 19.4 5.1 7.8 Annual 0.21 0.20 -- 0.21 0.3
Notes: 2 Total concentration represents the higher pollutant level predicted from "No Downwash" and "Downwash".
(E) Designation Requirements
To avoid any potential significant adverse air quality impacts from existing “large” or “major” sources
onto Building A, certain (E) designation related to air quality would be required to ensure that no
operable windows or air intakes are located above a height of 128 feet above grade on Building A.
Please refer to the HVAC analysis section above for the E‐Designation text for Building A.
2.12.6 Conclusion
The analyses conclude that the proposed project would not result in any significant adverse air quality
impacts on sensitive uses in the surrounding community, and the proposed project under the RWCDS
would not be adversely affected by existing sources of air emissions in the rezoning area. A summary
of the general findings is presented below:
The mobile source analyses determined that vehicular emissions due to project‐generated traffic at the
analyzed intersection would not result in any violations of NAAQS or the City’s de minimis criteria. In
addition, emissions from the vessel operations at the SHPA and nearby Yacht Club were determined
to not result in any significant adverse impacts on the development site.
The stationary source analyses determined that there would be no potential significant adverse air
quality impacts from the HVAC systems at the projected development site. An (E) designation would
be mapped on the development site as part of the proposed project to ensure the development site’s
HVAC systems emissions would not significantly impact either other proposed buildings (project‐on‐
project impacts) or existing land uses (project‐on‐existing impacts).

125 Edgewater Street - CEQR No. 17DCP069R Environmental Assessment Statement
Page 2.12-32
Additionally, no industrial sources associated with air toxics emissions were identified in a 400‐foot
radius of the project site. “Large” and “major” emissions sources within 1,000 feet of the development
site were also analyzed and the results indicated that the potential impacts from these emission sources
on sensitive receptors on the proposed buildings are not expected to be significant.

125 Edgewater Street - CEQR No. 17DCP069R Environmental Assessment Statement
Page 2.13-1
Chapter 2.13: Noise
2.13.1 Introduction
This chapter assesses the potential for the proposed project to result in significant adverse noiseimpacts. Since the proposed project would introduce new noise sensitive receptors into the project site,ambient noise monitoring was conducted to determine whether receptors would be introduced into anarea with high ambient noise conditions. The ambient noise levels at the proposed development havebeen evaluated according to CEQR Noise Exposure Guidelines to determine if there is a need forbuilding sound attenuation requirements in order to maintain acceptable interior noise conditions. Thepotential increase in mobile source noise due to the traffic that would be generated by the proposedproject has been evaluated for evaluating potential impact to existing noise sensitive receptors in thestudy area.
Subject Site
The subject property is located at Tax Block 2820, Lot 90. Edgewater Street is a two way street with onemoving lane in each direction. The area in which the subject property is located is developed primarilywith parking lots and storage yards, commercial buildings, and residences.
The proposed action would allow for redevelopment of a vacant lot in the Rosebank neighborhood ofStaten Island. The subject site is located on the north side of Edgewater Street and has frontage on theUpper New York Bay. Vehicular traffic on Edgewater Street, train movements on the Staten Island RailRoad, and an electrical generating station located across Edgewater Street from the subject site are thepredominant sources of noise. The proposed development would not introduce significant stationarynoise sources but would generate a modest number of vehicle trips as described in Section 2.11“Transportation”.
2.13.2 Methodology
Framework of Noise Analysis
Noise is defined as any unwanted sound, and sound is defined as any pressure variation that thehuman ear can detect. Humans can detect a large range of sound pressures, from 20 to 20 millionmicropascals, but only those air pressure variations occurring within a particular set of frequencies areexperienced as sound. Air pressure changes that occur between 20 and 20,000 times a second, stated asunits of Hertz (Hz), are registered as sound.
Because the human ear can detect such a wide range of sound pressures, sound pressure is convertedto sound pressure level (SPL), which is measured in units called decibels (dB). The decibel is a relativemeasure of the sound pressure with respect to a standardized reference quantity. Because the dB scale

125 Edgewater Street - CEQR No. 17DCP069R Environmental Assessment Statement
Page 2.13-2
is logarithmic, a relative increase of 10 dB represents a sound pressure that is 10 times higher. However,humans do not perceive a 10 dB increase as 10 times louder. Instead, they perceive it as twice as loud.
The human ear does not perceive sound levels at each frequency equally loud. To compensate for thisphenomenon in perception, a frequency filter known as A weighting (dB(A)) is used to evaluateenvironmental noise levels. Table 2.13 1 lists some noise levels for typical daily activities.
Table 2.13-1: Noise Levels of Common Sources Sound Source SPL (dBA)
Air Raid Siren at 50 feet 120Maximum Levels at Rock Concerts (Rear Seats) 110On Platform by Passing Subway Train 100On Sidewalk by Passing Heavy Truck or Bus 90 On Sidewalk by Typical Highway 80 On Sidewalk by Passing Automobiles with Mufflers 70 Typical Urban Area 60 70 Typical Suburban Area 50 60Quiet Suburban Area at Night 40 50Typical Rural Area at Night 30 40Isolated Broadcast Studio 20Audiometric (Hearing Testing) Booth 10 Threshold of Hearing 0 Source: 2014 CEQR Technical ManualNotes:A change in 3 dB(A) is a noticeable change in SPL. A change in 10 dB(A) is perceived as a doubling or halving in SPL.
Sound is often measured and described in terms of its overall energy, taking all frequencies intoaccount. However, the human hearing process is not the same at all frequencies. Humans are lesssensitive to low frequencies (less than 250 Hz) than mid frequencies (500 Hz to 1,000 Hz) and are mostsensitive to frequencies in the 1,000 to 5,000 Hz range. Therefore, noise measurements are oftenadjusted, or weighted, as a function of frequency to account for human perception and sensitivities.The most common weighting networks used are the A and C weighting networks. These weight scaleswere developed to allow sound level meters, which use filter networks to approximate thecharacteristic of the human hearing mechanism, to simulate the frequency sensitivity of humanhearing. The A weighted network is the most commonly used, and sound levels measured using thisweighting are denoted as dB(A). The letter “A” indicates that the sound has been filtered to reduce thestrength of very low and very high frequency sounds, much as the human ear does. C weighting givesnearly equal emphasis to sounds of most frequencies. Mid range frequencies approximate the actual(unweighted) sound level, while the very low and very high frequency bands are significantly affectedby C weighting.
The following is typical of human response to relative changes in noise level:
3 dB(A) change is the threshold of change detectable by the human ear;
5 dB(A) change is readily noticeable; and
10 dB(A) change is perceived as a doubling or halving of the noise level.

125 Edgewater Street - CEQR No. 17DCP069R Environmental Assessment Statement
Page 2.13-3
The SPL that humans experience typically varies from moment to moment. Therefore, variousdescriptors are used to evaluate noise levels over time. The sound level exceeded during a givenpercentage of a measurement period is the percentile exceeded sound level (LX). Examples includeL10, L50, and L90.
Some typical descriptors are defined below.
L10 is the sound level which is exceeded for 10 percent of the time during a given time period.Therefore, it represents the higher end of the range of sound levels. The unit is used in the 2014CEQR Technical Manual to evaluate acceptable thresholds for noise exposure for new receptorsthat would be introduced by a proposed action.
Leq is the continuous equivalent sound level. The sound energy from the fluctuating SPLs isaveraged over time to create a single number to describe the mean energy, or intensity, level.High noise levels during a measurement period will have a greater effect on the Leq than lownoise levels. Leq has an advantage over other descriptors because Leq values from variousnoise sources can be added and subtracted to determine cumulative noise levels.
Leq (24) is the continuous equivalent sound level over a 24 hour time period.
The decrease in sound level caused by the distance from any single noise source normally follows theinverse square law (i.e., the SPL changes in inverse proportion to the square of the distance from thesound source). In a large open area with no obstructive or reflective surfaces, it is a general rule that atdistances greater than 50 feet, the SPL from a point source of noise drops off at a rate of 6 dB with eachdoubling of distance away from the source. For “line” sources, such as vehicles on a street, the SPLdrops off at a rate of 3 dB(A) with each doubling of the distance from the source. Sound energy isabsorbed in the air as a function of temperature, humidity, and the frequency of the sound. The dropoff rate also will vary with both terrain conditions and the presence of obstructions in the soundpropagation path.
Measurement Location and Equipment
Because the predominant noise sources in the area of the proposed project are vehicular and train trafficas well as an electrical generating facility, noise monitoring was conducted during peak vehiculartravel periods, 8:00 9:00 AM, 12:00 1:00 PM, and 5:00 6:00 PM for locations affected by vehicular andtrain traffic, as well as over a 24 hour period for the electrical generating facility. Pursuant to CEQRTechnical Manualmethodology, readings were conducted for 24 hours at the intersection of EdgewaterStreet and Lynhurst Avenue (N1 location) to document noise from the electrical generating facility, forone hour periods at the intersection of Edgewater Street and Willow Avenue (N2 location) to documenttrain noise, and for 20 minute periods at the Upper New York Harbor frontage (N3 location). Figure2.13 1 shows the three locations selected for noise monitoring.
Noise monitoring at the N2 (one hour) and N3 (20 minute) locations was conducted using a Type 2Larson Davis LxT2 sound meter, and for the 24 hour location using a Casella CEL 633C meter, bothwith wind screens. The monitors were placed on a tripod at a height of approximately three feet abovethe ground, away from any other surfaces. The monitors were calibrated prior to and following eachmonitoring session. Heavy commercial vehicular traffic on Edgewater Street constitutes a worst casecondition for noise at the project site.
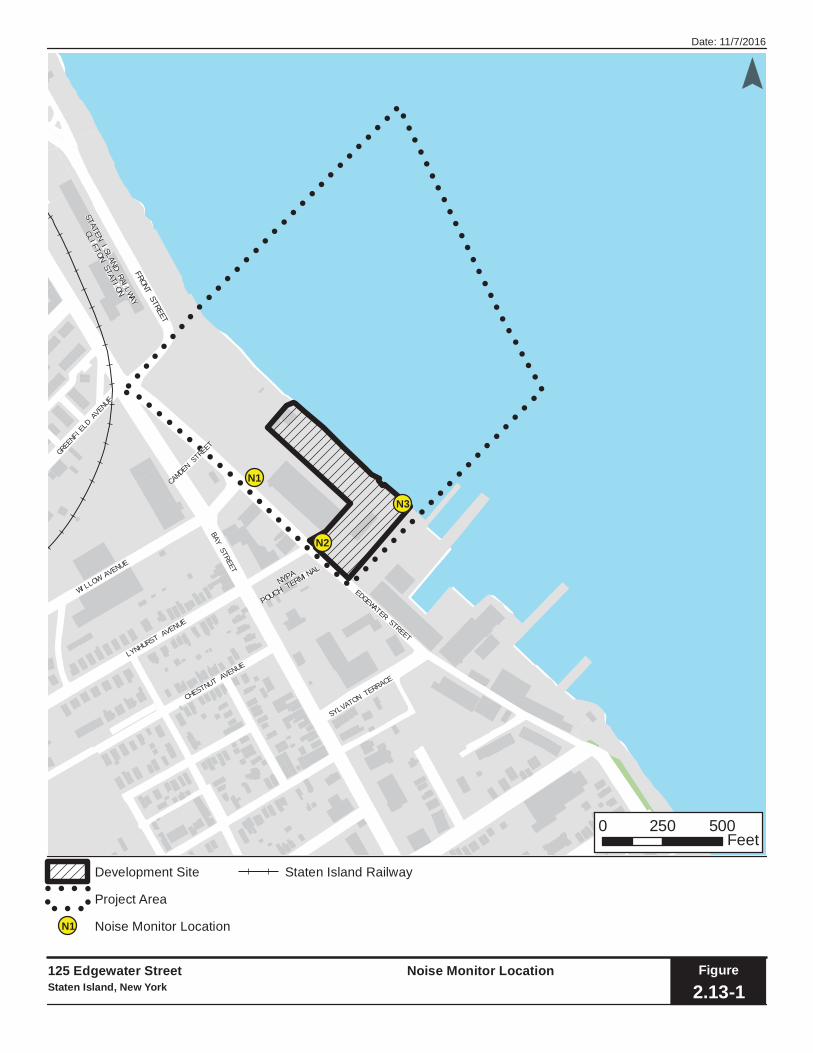
!
!
!
!
!
!
!
!
!
!
!
!
!
!
!
!
!
!
!
!
!
!
!
!
!
!
!
!
!
!!!
!!
!!
!!
!!
!!
!!
!!
!!
!!
!!
!!!
!
!
!
!
!
!
!
!
!
!
!
!
!
!
!
!
!
!
!
!
!
!
!
!
!
!
!
!
!
!
!
!
!
!
!
!
!
!
!
!
!!
STATEN ISLAND RAILWAY
CLIFTON STATION
FRONTSTREET
NYPA
POUCH TERMINAL
BAY STREET
EDGEWATER STREET
LYNHURST AVENUE
WILLOW AVENUE
GREENFIELD AVENUE
CHESTNUT AVENUE
SYLVATON TERRACE
CAMDEN STREET
N3
N2
N1
Date: 11/7/2016
Development Site
!
! ! !
!!
!!! Project Area
Noise Monitor Location
Staten Island Railway
Figure
2.13-1Noise Monitor Location125 Edgewater Street
Staten Island, New York
0 250 500Feet
N1
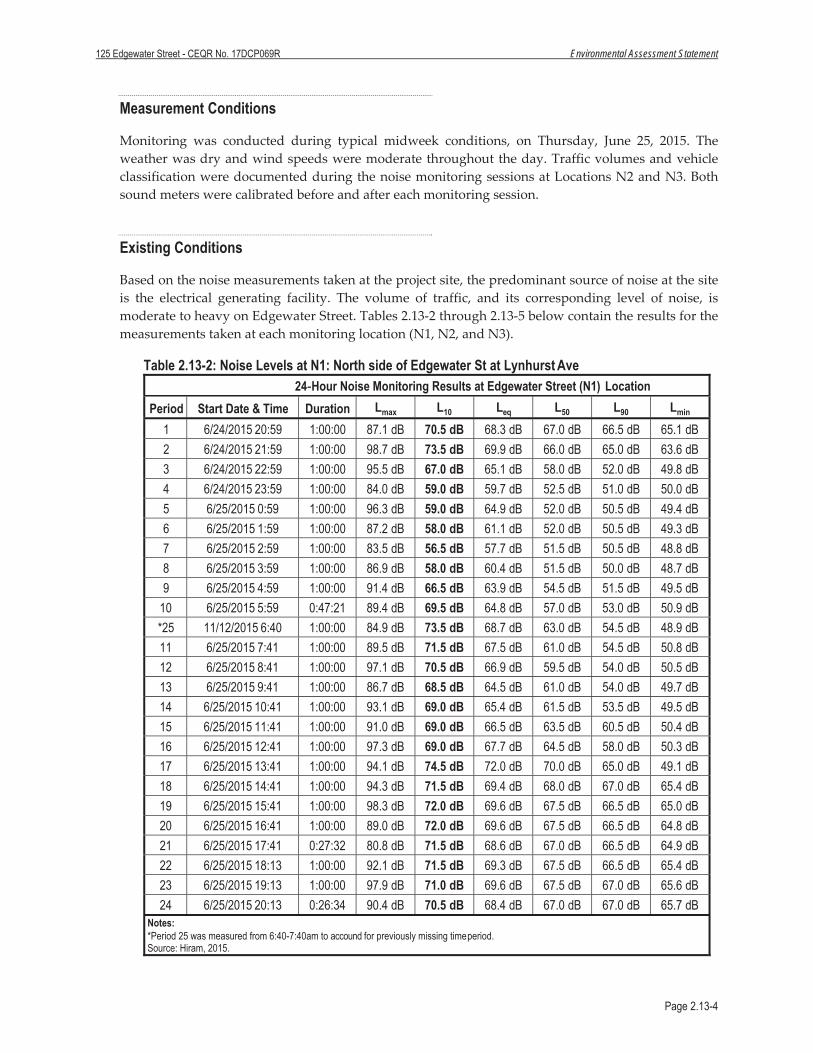
125 Edgewater Street - CEQR No. 17DCP069R Environmental Assessment Statement
Page 2.13-4
Measurement Conditions
Monitoring was conducted during typical midweek conditions, on Thursday, June 25, 2015. Theweather was dry and wind speeds were moderate throughout the day. Traffic volumes and vehicleclassification were documented during the noise monitoring sessions at Locations N2 and N3. Bothsound meters were calibrated before and after each monitoring session.
Existing Conditions
Based on the noise measurements taken at the project site, the predominant source of noise at the siteis the electrical generating facility. The volume of traffic, and its corresponding level of noise, ismoderate to heavy on Edgewater Street. Tables 2.13 2 through 2.13 5 below contain the results for themeasurements taken at each monitoring location (N1, N2, and N3).
Table 2.13-2: Noise Levels at N1: North side of Edgewater St at Lynhurst Ave 24 Hour Noise Monitoring Results at Edgewater Street (N1) Location
Period Start Date & Time Duration Lmax L10 Leq L50 L90 Lmin
1 6/24/2015 20:59 1:00:00 87.1 dB 70.5 dB 68.3 dB 67.0 dB 66.5 dB 65.1 dB 2 6/24/2015 21:59 1:00:00 98.7 dB 73.5 dB 69.9 dB 66.0 dB 65.0 dB 63.6 dB 3 6/24/2015 22:59 1:00:00 95.5 dB 67.0 dB 65.1 dB 58.0 dB 52.0 dB 49.8 dB 4 6/24/2015 23:59 1:00:00 84.0 dB 59.0 dB 59.7 dB 52.5 dB 51.0 dB 50.0 dB 5 6/25/2015 0:59 1:00:00 96.3 dB 59.0 dB 64.9 dB 52.0 dB 50.5 dB 49.4 dB 6 6/25/2015 1:59 1:00:00 87.2 dB 58.0 dB 61.1 dB 52.0 dB 50.5 dB 49.3 dB 7 6/25/2015 2:59 1:00:00 83.5 dB 56.5 dB 57.7 dB 51.5 dB 50.5 dB 48.8 dB 8 6/25/2015 3:59 1:00:00 86.9 dB 58.0 dB 60.4 dB 51.5 dB 50.0 dB 48.7 dB 9 6/25/2015 4:59 1:00:00 91.4 dB 66.5 dB 63.9 dB 54.5 dB 51.5 dB 49.5 dB
10 6/25/2015 5:59 0:47:21 89.4 dB 69.5 dB 64.8 dB 57.0 dB 53.0 dB 50.9 dB *25 11/12/2015 6:40 1:00:00 84.9 dB 73.5 dB 68.7 dB 63.0 dB 54.5 dB 48.9 dB 11 6/25/2015 7:41 1:00:00 89.5 dB 71.5 dB 67.5 dB 61.0 dB 54.5 dB 50.8 dB 12 6/25/2015 8:41 1:00:00 97.1 dB 70.5 dB 66.9 dB 59.5 dB 54.0 dB 50.5 dB 13 6/25/2015 9:41 1:00:00 86.7 dB 68.5 dB 64.5 dB 61.0 dB 54.0 dB 49.7 dB 14 6/25/2015 10:41 1:00:00 93.1 dB 69.0 dB 65.4 dB 61.5 dB 53.5 dB 49.5 dB 15 6/25/2015 11:41 1:00:00 91.0 dB 69.0 dB 66.5 dB 63.5 dB 60.5 dB 50.4 dB 16 6/25/2015 12:41 1:00:00 97.3 dB 69.0 dB 67.7 dB 64.5 dB 58.0 dB 50.3 dB 17 6/25/2015 13:41 1:00:00 94.1 dB 74.5 dB 72.0 dB 70.0 dB 65.0 dB 49.1 dB 18 6/25/2015 14:41 1:00:00 94.3 dB 71.5 dB 69.4 dB 68.0 dB 67.0 dB 65.4 dB 19 6/25/2015 15:41 1:00:00 98.3 dB 72.0 dB 69.6 dB 67.5 dB 66.5 dB 65.0 dB 20 6/25/2015 16:41 1:00:00 89.0 dB 72.0 dB 69.6 dB 67.5 dB 66.5 dB 64.8 dB 21 6/25/2015 17:41 0:27:32 80.8 dB 71.5 dB 68.6 dB 67.0 dB 66.5 dB 64.9 dB 22 6/25/2015 18:13 1:00:00 92.1 dB 71.5 dB 69.3 dB 67.5 dB 66.5 dB 65.4 dB 23 6/25/2015 19:13 1:00:00 97.9 dB 71.0 dB 69.6 dB 67.5 dB 67.0 dB 65.6 dB 24 6/25/2015 20:13 0:26:34 90.4 dB 70.5 dB 68.4 dB 67.0 dB 67.0 dB 65.7 dB
Notes:*Period 25 was measured from 6:40-7:40am to accound for previously missing time period. Source: Hiram, 2015.

125 Edgewater Street - CEQR No. 17DCP069R Environmental Assessment Statement
Page 2.13-5
Table 2.13-3: Noise Levels at N2: Intersection of Edgewater St and Willow Ave Thursday, June 25, 2015
8:09 – 9:09 am 12:09 – 1:12 pm 5:01 – 6:03 pm Lmax 96.8 93.0 95.8
L5 69.9 70.2 70.0 L10 67.3 67.1 67.6Leq 68.0 66.6 67.9 L50 59.6 59.1 61.2 L90 54.9 54.6 56.5 Lmin 48.4 50.1 53.4
Source: Hiram, 2015.
Table 2.13-4: Noise Levels at N3: Upper NY Harbor frontage Thursday, June 25, 2015
7:44 – 8:04 am 11:45 – 12:05 pm 4:35 – 4:56 pm Lmax 66.4 65.0 70.6
L5 61.2 55.7 60.4 L10 59.6 53.6 59.3Leq 56.6 50.9 58.4 L50 54.7 48.6 57.9 L90 53.0 46.9 57.0 Lmin 51.9 45.1 56.3
Source: Hiram, 2015.
Table 2.13-5: Traffic Volumes and Vehicle Classifications on Edgewater Street (20-minute counts for duration of each monitoring session)
6/25/2015 AM Midday PM Car / Taxi 172 131 203 Van / Light Truck / SUV 122 105 137 Heavy Truck 8 9 4 Bus 0 0 0 Mini-Bus 1 1 2 Motorcycle 2 3 5
Source: Hiram, 2015.
A summary of the noise measurement results at the subject property are described as follow:
Site N1 at Edgewater Street and Lynhurst Avenue the highest daytime L10 noise level was 74.5from 13:41 to 14:41 and the highest nighttime noise level was 73.5 during the 21:59 to 22:59 pmperiod.

125 Edgewater Street - CEQR No. 17DCP069R Environmental Assessment Statement
Page 2.13-6
Site N2 at Edgewater Street and Willow Avenue, which is closer to the electrical generatingfacility and traffic on Edgewater Street, the highest L10 noise level was 67.6 during the peakevening period.
Site N3 adjacent to the Upper NY Harbor, which is near the Upper NY Harbor, was 59.6 duringthe morning peak period.
2.13.3 Noise Assessment
Mobile Source Noise Assessment
The potential increase between future No Action and With Action condition noise levels werecalculated with a proportional modeling technique used as a tool to estimate changes in noise levelsaccording to the CEQR Technical Manual. The noise analysis examined No Action and With actiontraffic conditions for the weekday morning, mid day and afternoon peak periods. The selected timeperiods are when development facilitated by the proposed project would be expected to produce themaximum traffic generation (based on the traffic studies presented in Section 2.11 “Transportation”)and therefore result in the maximum potential for significant noise level increases. The methodologiesused for the noise analyses are described below.
Proportional Modeling
Proportional modeling determines the potential for significant adverse noise impact at existingreceptors due to the proposed project. Vehicular traffic volumes are converted into Noise PassengerCar Equivalent (Noise PCE) values where each medium duty truck (gross weight between 9,900 and26,400 pounds) is assumed to generate the noise equivalent of 13 cars, and each heavy truck (grossweight of more than 26,400 pounds) is assumed to generate the noise equivalent of 47 cars, and eachbus (vehicles designed to carry more than nine passengers) is assumed to generate the noise equivalentof 18 cars. Future No Action and With Action condition noise levels are calculated using the followingequation:
With Action L10 = No Action L10 + 10 * log (With Action PCE / No Action PCE)
Because traffic noise levels are directly related to PCE volumes, if PCEs increase 100% (double) thennoise levels would increase 3 dB(A) and there could be significant adverse noise impact depending onabsolute level. If PCEs do not increase 100 percent, then noise levels would not increase 3 dB(A) andthere would not be significant adverse noise impact regardless of absolute noise level.
PCE Analysis
The PCE analysis was conducted using a vehicle classification breakdown based on turning movementcounts conducted at the Edgewater Street / Willow Avenue and Bay Street / Lynhurst Avenueintersections. The majority of vehicles in these counts were passenger autos or light trucks—rangingfrom 92 percent to 99 percent depending on the time period. Across the time periods Medium Trucksranged from 1 percent to 4 percent, Heavy Trucks ranged from 0 percent to 1 percent, and Buses rangedfrom 0 percent to 3 percent. To be conservative, project generated trips were assumed to follow the

125 Edgewater Street - CEQR No. 17DCP069R Environmental Assessment Statement
Page 2.13-7
same classification scheme, although project generated trips are anticipated to primarily be passengerautos.
The analysis was conducted for traffic conditions at the two closest intersections to the proposed projectwhere ambient noise monitoring was conducted, Edgewater Street / Willow Avenue and EdgewaterStreet / Lynhurst Avenue. PCEs were evaluated for weekday morning, midday, and evening peakperiod traffic conditions. The analysis indicates the proposed project would result in a maximumincrease in PCEs of 37 percent for the afternoon peak period at the Edgewater and Lynhurst Avenueintersection which would correspond to an increase of 1.4 dB. At the Edgewater Street and WillowAvenue intersection, the maximum increase in PCEs would be 20% which would correspond to anincrease of 0.8 dB. Table 2.13 6 summarizes the PCE analysis. These increases are far below thescreening criteria of a 100 percent increase, which indicates that the increase in vehicular traffic wouldresult in less than a 3 dB(A) increase in sound levels at the neighborhood around the project site. Asdiscussed above, a change in sound levels of 3 dB(A) or less cannot typically be perceived by humans.Therefore, no discernible difference in sound levels would be recognized by the public and there wouldbe no significant adverse noise impact and no further mobile source noise analysis is required.
Table 2.13-6: Mobile Source Screening Analysis (Noise PCEs)
Edgewater and Willow Edgewater and Lynhurst
AM No-Action 1,347 1,039
With-Action 1,613 1,340 Project Increase 19.7% 29.0%
MDNo-Action 835 670
With-Action 964 875 Project Increase 15.4% 30.7%
PMNo-Action 969 769
With-Action 1,126 1,051 Project Increase 16.2% 36.6%
Noise Assessment for New Receptors
The 2014 CEQR Technical Manual provides noise exposure guidelines for assessing With Actionambient noise conditions at new residential and institutional receptors, as shown in Table 2.13 7. Theexisting measurement results have been adjusted according to the PCE Analysis, which accounts forthe vehicle trip generation due to proposed actions, to determine the With Action noise conditions. TheWith Action noise conditions have been assessed according to these guidelines, as shown in Table 2.138

125 Edgewater Street - CEQR No. 17DCP069R Environmental Assessment Statement
Page 2.13-8
Table 2.13-7: Noise Exposure Guidelines for Use in City Environmental Impact Review
ReceptorType
TimePeriod
Acceptable External
Exposure
MarginallyAcceptable
External Exposure
MarginallyUnacceptable External
Exposure
ClearlyUnacceptable
External Exposure
Residence,hotel, or motel
7 AM to 10 PM L10 65 dB(A) 65 L10 70 dB(A) 70 L10 80 dB(A) L10 > 80 dB(A)
10 PM to 7 AM L10 55 dB(A) 55 L10 70 dB(A) 70 L10 80 dB(A) L10 > 80 dB(A)
Commercialor office Same as Residential
Source: Table 19-2, 2014 CEQR Technical Manual.
Table 2.13-8: Sound Level Acceptability
Measurement Site Time Existing L10
Sound Level
With-Action Sound Level
Increase(PCE Analysis)
With-Action L10Sound Level Impact
Site N1: North side of
Edgewater St at Lynhurst Ave
Morning 71.5 0.8 72.3 MarginallyUnacceptable
Midday 69.0 0.6 69.6 MarginallyAcceptable
Evening 72.0 0.7 72.7 MarginallyUnacceptable
HighestDaytime 74.5 None* 74.5 Marginally
Unacceptable Highest
Nighttime 73.5 None* 73.5 MarginallyUnacceptable
Site N2: Intersection of Edgewater St
and Willow Ave
Morning 67.3 1.1 68.4 MarginallyAcceptable
Midday 67.1 1.2 68.3 MarginallyAcceptable
Evening 67.6 1.4 69.0 MarginallyAcceptable
Site N3: Upper NY Harbor
Morning 59.6 None* 59.6 Acceptable Midday 53.6 None* 53.6 Acceptable Evening 59.3 None* 59.3 Acceptable
*Noise levels due to general ambient sources and/or electrical generating facility and would not be affected by vehicle trip generation.
Source: VHB, 2016.
At Site N1, the with action ambient L10 noise conditions up to 74.5 dB(A) are considered MarginallyUnacceptable during both the daytime and nighttime periods according the CEQR Noise ExposureGuidelines. At Site N2, the ambient noise conditions up to 69.0 dB(A) are considered MarginallyAcceptable. At Site N3, the ambient L10 noise conditions up to 59.6 dB(A) are considered Acceptableduring all peak periods. Based on this evaluation, the With Action noise conditions would beMarginally Unacceptable at the proposed development. Therefore, interior sound levels would exceed45 dB(A) and there is a need to consider designing and specifying the buildings for specific outdoorto indoor sound attenuation.

125 Edgewater Street - CEQR No. 17DCP069R Environmental Assessment Statement
Page 2.13-9
The CEQR Technical Manual defines attenuation requirements for buildings based on exterior noiselevel (see Table 2.13 9), should levels be considered marginally unacceptable or clearly unacceptable.Recommended noise attenuation values for buildings are designed to maintain interior L10 noise levelsof 45 dB(A) or lower for residential uses and interior noise levels of 50 dB(A) or lower forcommercial/office uses.
Table 2.13-9: Required Attenuation Values to Achieve Acceptable Interior Noise Levels Marginally Unacceptable Clearly Unacceptable
Noise Level with Proposed Project 70 < L10 73 73 < L10 76 76 < L10 78 78 < L10 80 80 < L10
Attenuation A (I)28 dB(A)
(II)31 dB(A)
(III)33 dB(A)
(IIV)35 dB(A) 36 + (L10-80)B dB(A)
Source: New York City Department of Environmental ProtectionNotes:A The above composite window-wall attenuation values are for residential dwellings and community facility development. Commercial office spaces and meeting rooms would be 5 dB(A) less in each category. All of the above categories require a closed window situation and hence an alternate means of ventilation.
B Required attenuation values increase by 1 dB(A) increments for L10 values greater than 80 dB(A).
Based on Table 2.13 9, window wall noise attenuation of 31 dB(A) will be required. The compositeoutdoor to indoor transmission classification (OITC) value of the composite window wall structure isused to determine the necessary sound attenuation. Sound attenuation measures would be achievedthrough construction materials and techniques with sufficient OITC rated windows and walls.
To preclude the potential for significant adverse impacts related to noise, an (E) designation would beincorporated into the proposed project. The text for the (E) designation (E 401) is as follows:
Block 2820, Lot 90
The following (E) designation noise text would apply to the proposed development:
“In order to ensure an acceptable interior noise environment, future residential uses mustprovide a closed window condition with a minimum window/wall sound attenuation of 31dB(A) for all facades of the proposed buildings to maintain interior noise levels of 45 dB(A)or less for residential uses and 50 dB(A) or less for commercial uses. In order to maintain aclosed window condition, an alternate means of ventilation must also be provided.Alternate means of ventilation includes, but is not limited to, air conditioning.”
With the implementation of the (E) designation (E 401), no significant adverse impacts related to noisewould occur.
2.13.4 Conclusions
The noise analysis concludes that the proposed project would not generate traffic that wouldsubstantially increase ambient noise conditions and cause a significant adverse noise impact (i.e., itwould not result in a doubling of noise passenger car equivalents [Noise PCEs], which would benecessary to cause a 3 dB(A) increase in noise levels). Therefore, no discernible difference in soundlevels would be recognized existing receptors in the study area and there would be no significantadverse noise impact.

125 Edgewater Street - CEQR No. 17DCP069R Environmental Assessment Statement
Page 2.13-10
Ambient noise monitoring was conducted at three locations within the project site that arerepresentative of locations where the proposed building façades would be. The measurement resultswere adjusted for the increase in noise due to vehicular trip generation due to the proposed action todetermine the With Action noise conditions. According to CEQR Noise Exposure Guidelines, theWith Action noise conditions would be Marginally Unacceptable at the proposed development.Therefore, interior sound levels would exceed 45 dB(A) and there is a need to consider designing andspecifying the buildings for specific outdoor to indoor sound attenuation.
According to the required attenuation values to achieve acceptable interior noise levels in the CEQRTechnical Manual, a minimum window wall noise attenuation of 31 dB(A) will be required. Topreclude the potential for significant adverse impacts related to noise, an (E) designation would beincorporated into the proposed project as described in Section 2.13.3. With the implementation of the(E) designation, no significant adverse impacts related to noise would occur.

125 Edgewater Street - CEQR No. 17DCP069R Environmental Assessment Statement
Page 2.14-1
Chapter 2.14: Neighborhood Character
2.14.1 Introduction
This analysis of neighborhood character follows the guidelines set forth in the 2014 CEQR TechnicalManual. As defined within the manual, neighborhood character is an amalgam of various elements thatgive neighborhoods a distinct “personality,” including land use, urban design and visual resources,historic resources, socioeconomic conditions, transportation, and noise (all of which are separatetechnical areas of analysis within the EAS). According to the CEQR Technical Manual, neighborhoodcharacter impacts are rare and only occur under unusual circumstances.
A neighborhood character assessment is generally needed, per the CEQR Technical Manual, when aproposed project is projected to generate significant adverse impacts to one or more of the contributingelements of neighborhood character. In the absence of an impact on any of the relevant technical areas,a combination of moderate effects to the neighborhood could result in an impact to neighborhoodcharacter. Moreover, a significant impact identified in one of the technical areas that contribute to aneighborhood’s character is not necessarily equivalent to a significant impact on neighborhoodcharacter. Therefore, an assessment of neighborhood character is generally appropriate if a proposedproject has the potential to result in any significant adverse impacts in the following technical areas:
Land Use, Zoning, and Public Policy
Socioeconomic Conditions
Open Space
Historic and Cultural Resources
Urban Design and Visual Resources
Shadows
Transportation
Noise
Preliminary analyses were undertaken for land use, zoning, and public policy; socioeconomicconditions; open space; urban design and visual resources; shadows; and noise pursuant to CEQRTechnical Manualmethodology. A preliminary screening analysis was conducted for all transportationcomponents and a detailed analysis was performed for pedestrian elements and traffic. A detailedanalysis was also performed for shadows. Therefore, a preliminary neighborhood character assessmentwas performed.
2.14.2 Methodology
This preliminary assessment describes the defining features of the neighborhood and then assesses thepotential for the proposed project to affect these defining features, either by having a significantadverse impact on a defining feature or through a combination of moderate effects. As recommended

125 Edgewater Street - CEQR No. 17DCP069R Environmental Assessment Statement
Page 2.14-2
in the CEQR Technical Manual, the study area for the neighborhood character analysis is consistent withthe study areas in the relevant technical areas assessed under CEQR that contribute to the definingelements of the neighborhood.
2.14.3 Preliminary Assessment
Existing Conditions
The technical areas that comprise neighborhood character are each briefly summarized in turn belowwithin the context of the neighborhood’s defining features. However, it should be noted that none ofthese analysis areas have the potential for significant adverse impacts. The defining features of thesurrounding area’s neighborhood character are principally: the separation of the waterfront fromneighborhoods to the west by Bay Street and Edgewater Street and the land uses which correspondwith this separation, the waterfront as a visual and open space resource, proximity to the Rosebankand Clifton downtown areas and to Clifton Station as a transportation nexus.
Land Use
Within the 400 foot land use study area are a range of land uses and building types which generallycorrespond with a delineation by Edgewater Street, and to a lesser extent, Bay Street. The waterfront,located east of Edgewater Street, is generally developed with commercial, industrial/manufacturing,and transportation/utility uses in large industrial, office, and warehouse structures. These land usesare generally found on large lots. The area bounded by Edgewater Street and Bay Street is developedprimarily as an industrial and utility corridor with a large area of off street parking where it fronts onEdgewater Street opposite the waterfront; and as a commercial corridor with local services on eitherside of Bay Street. South and East of Bay Street are suburban residential neighborhoods. To thenorthwest of the project area is the Staten Island Railway Clifton Station and associated lots developedwith railway tracks.
Socioeconomics
Residential uses within the socioeconomic study area are generally found west of Bay Street north ofClifton Avenue (where the project area is located) and on either side of Bay Street south of CliftonAvenue. The socioeconomic character of the neighborhood and surrounding census tracts is classifiedas low income relative to Staten Island; income levels are considered average as compared to New YorkCity as a whole. Income distribution within the socioeconomic study area mirrors that of the City as awhole.
Open Space
The open space study area is characterized by a residential open space ratio which exceeds the citywide average at the DCP benchmark open space ratio. As such, the study area is considered well servedby open space. Notable open resources within the open space study area include Alice Austen Park

125 Edgewater Street - CEQR No. 17DCP069R Environmental Assessment Statement
Page 2.14-3
near the project area and Von Briesen Park; both open space resources are located along the waterfrontand are developed with historic landmarks.
Shadows
The only sunlight sensitive resource within the study area is the New York Harbor. As such sunlightsensitive resources are not considered to be a defining neighborhood feature within the study area.
Historic and Cultural Resources
There are no historic or cultural resources located within 400 feet of the project area.
Urban Design and Visual Resources
The urban design study are does not have one cohesive character. As described above, the land usesfound within the study area are substantially delineated by the presence of Bay Street and EdgewaterStreet, which are the two main roadways within the study area. Edgewater Street extends from thebeginning of Front Street to the north to Hylan Boulevard to the south and is largely developed withlow rise industrial and utility use buildings along the waterfront in addition to the seven storycommercial Pouch Terminal building. Many of these buildings are built at the street line; the lots uponwhich they are developed are built with parking areas, unpaved siting areas, or pierheads. Buildingsare built at FARs between 0 1.0 due to the large size of the zoning lots which include underwater areas.The waterfront is visible from many locations along Edgewater Street and is a visual resource. Theopposite side of Edgewater Street and either side of Bay Street, another major corridor within the studyarea, are developed with low rise commercial uses in addition to parking facilities and the PouchTerminal generating plant. Buildings within this area are generally low rise and many of the buildingsare developed with entrances and storefronts fronting on Bay Street. West of Bay Street is a residentialsuburban neighborhood which is developed along a grid system. Buildings are generally developedon small lots, rise two stories and are semi attached or detached.
Transportation
The transportation character of the study area is defined by personal vehicular and bus use of BayStreet. There are few pedestrian trips along Bay Street to Clifton Station. Edgewater Street is a relativelyun trafficked area by vehicles, pedestrian, and transit. There are a large number of parking lots withinthe study area; particularly, for the Pouch Terminal building and otherwise located in the area boundedby Bay Street and Edgewater Street.
Noise
Measured noise levels at the project site are considered to be marginally unacceptable. Major noisesources include the Pouch Terminal Power Generation Building located opposite the site betweenEdgewater and Bay Streets and vehicular traffic along Edgewater Street.

125 Edgewater Street - CEQR No. 17DCP069R Environmental Assessment Statement
Page 2.14-4
Future No-Action Scenario
As described in Chapter 1.0, “Project Description,” under the future No Action scenario thedevelopment site would remain vacant and zoned M2 1. No as of right development would occur onthe development site.
Phase I of the Stapleton Waterfront Development Plan, described further in Section 2.7, “Urban Designand Visual Resources,” is located approximately 0.5 miles north of the project area along the StapletonWaterfront. The development would result in the redevelopment of the under utilizing manufacturingwaterfront with new mixed use buildings with ground retail along Bay Street and with a new uplandconnection to the Stapleton Community, visual corridor, and waterfront esplanade. Additionally, newpublicly accessible open space areas would also be created as part of Phase I of the development. Thedevelopment would enliven Bay Street and the waterfront. Phase II and Phase III would result inadditional development subsequent to the proposed project. These background developments areexpected to substantially affect the character of the Stapleton neighborhood and to a lesser extentClifton, just north of the project area.
The neighborhood character of the proposed project’s study area is not expected to be substantiallyaffected by background development along the Stapleton waterfront.
Future With-Action Scenario
The proposed project would redevelop the currently vacant site primarily for residential purposes withaccessory retail space and accessory parking to serve project residents and other persons in thesurrounding community. As compared to the future No Action scenario, both RWCDS 1 and RWCDS2 would result in a substantial increase in residential units (including affordable housing), parkingspaces, and publicly accessible open space. RWCDS 1 would result in mixed use buildings withcommercial uses on the second floor of each building while RWCDS 2 would result in entirelyresidential buildings with a slightly greater number of units as compared to RWCDS 1.
Both RWCDS 1 and RWCDS 2 would be consistent with the mixed use character of the surroundingstudy area and planned development as part of the Stapleton Waterfront Development Plan. BothRWCDS 1 and 2 would connect upland neighborhoods with the waterfront. RWCDS 1 would activateEdgewater Street and the waterfront with new retail uses. The medium density residential usesassociated with the proposed project would be compatible with the study area (which is developedwith a large amount of open space proximate to the development site) and would contribute to thedevelopment of Bay Street and Edgewater Street as a vibrant mixed use corridor and the StapletonWaterfront as an active and attractive open space.
The proposed project does not have the potential to affect the defining features of the area’sneighborhood character. The proposed project would revitalize the waterfront and Edgewater Streetwhile respecting the residential neighborhoods to its south and west; would reinforce the urban designcharacter of the waterfront and Edgewater Street; and would have little measurable impact ontransportation level of service and noise levels. The proposed project would not result in a significantadverse impact in any of the technical areas which contribute to neighborhood character.

125 Edgewater Street - CEQR No. 17DCP069R Environmental Assessment Statement
Page 2.14-5
Consideration of Moderate Effects
The CEQR Technical Manual states that even if a project does not have the potential to result in asignificant adverse impact to neighborhood character in a certain technical area, the project may resultin a combination of moderate effects to several elements that may cumulatively affect an area’sneighborhood character. A moderate effect is generally defined as an effect considered reasonably closeto a significant adverse impact threshold for a particular technical area. The proposed actions wouldnot result in adverse effects that are reasonably close to significant adverse impacts in any of the abovetechnical areas. Even when considered together the moderate effects of the proposed project would notresult in a significant adverse impact to neighborhood character.
2.14.4 Conclusion
This preliminary assessment identified no potential significant adverse impacts to the study area’sneighborhood character resulting from the proposed actions. Therefore, a detailed neighborhoodcharacter analysis is not necessary. Overall, the proposed project would be consistent with the currentshifts in the area’s neighborhood character characterized by a movement from underutilized industrialuses or vacant lots to active residential and mixed uses along the waterfront.

125 Edgewater Street - CEQR No. 17DCP069R Environmental Assessment Statement
Page 2.15-1
Chapter 2.15: Construction
2.15.1 Introduction
Construction activities, although temporary in nature, can sometimes result in significant adverseenvironmental impacts. Consideration of several factors, including the location and setting of theproject in relation to other uses, and the intensity and duration of the construction activities, mayindicate that a project’s construction activities warrant analysis.
The proposed action would result in the construction of three mixed use buildings at the developmentsite (Buildings A, B, and C) with a total of 371 dwelling units, 24,173 gsf of commercial space, and 346parking spaces. In addition, the proposed project would create approximately one acre of new openspace (a shore public walkway and an upland connection/visual corridor).
Construction activity associated with the proposed project would be approximately 2¼ years. Apreliminary assessment of potential construction impacts was prepared in accordance with theguidelines of the 2014 CEQR Technical Manual, and is presented below.
2.15.2 Construction Regulations and General Practices
Construction Oversight
Governmental oversight of construction in New York City is extensive and involves a number of City,State, and Federal agencies, each with specific areas of responsibility, as follows.
The New York City Department of Buildings (DOB) has primary oversight of construction.DOB oversees compliance with the New York City Building Code to ensure that buildings arestructurally, electrically, and mechanically safe. In addition, DOB enforces safety regulationsto protect both workers and the general public during construction. Areas of oversight includeinstallation and operation of equipment such as cranes and lifts, sidewalk sheds, safety netting,and scaffolding.
The New York City Department of Environmental Protection (DEP) enforces the New YorkCity Noise Code, reviews and approves any needed Remedial Action Plans (RAPs) andassociated Construction Health and Safety Plans (CHASPs) as well as the removal of fuel tanksand abatement of hazardous materials. DEP also regulates water disposal into the sewersystem and reviews and approves any rerouting of wastewater flow.
The New York City Fire Department (FDNY) has primary oversight of compliance with theNew York City Fire Code and the installation of tanks containing flammable materials.
The New York City Department of Transportation Office of Construction Mitigation andCoordination (DOT OCMC) reviews and approves any traffic lane and sidewalk closures.

125 Edgewater Street - CEQR No. 17DCP069R Environmental Assessment Statement
Page 2.15-2
New York City Transit (NYCT) is responsible for bus stop relocations and subsurfaceconstruction within 200 feet of a subway, if needed.
The New York City Landmarks Preservation Commission approves studies and testing toprevent loss of archaeological resources and to prevent damage to architectural resources.
The New York State Department of Environmental Conservation (NYSDEC) regulates disposalof hazardous materials, and construction, operation, and removal of bulk petroleum andchemical storage tanks. NYSDEC also regulates discharge of water into rivers and streams.
The New York State Department of Labor (DOL) licenses asbestos workers.
The New York State Department of Transportation (NYSDOT) reviews and approves anytraffic lane closures on its roadways, should any be necessary.
The U.S. Environmental Protection Agency (EPA) has wide ranging authority overenvironmental matters, including air emissions, noise, hazardous materials, and the use ofpoisons, however, much of its responsibility is delegated to the state level.
The Occupational Safety and Health Administration (OSHA) sets standards for work sitesafety and construction equipment.
Construction Hours
New York City regulates the hours of construction work through the New York City Noise ControlCode, as amended in December 2005 and effective July 1, 2007. Construction is limited to weekdaysbetween the hours of 7:00 AM and 6:00 PM, and noise limits are set for certain specific pieces ofconstruction equipment. The City may permit work outside of these hours to accommodate: (1)emergency conditions; (2) public safety; (3) construction projects by or on behalf of City agencies; (4)construction activities with minimal noise impacts; and (5) undue hardship resulting from unique sitecharacteristics, unforeseen conditions, scheduling conflicts, and/or financial considerations. The NewYork City Department of Buildings issues these work permits, and in some instances, approval of anoise mitigation plan from DEP under the City’s Noise Code is also required.
In New York City, construction work typically occurs on weekdays and begins at 7:00 AM, with mostworkers arriving between 6:00 AM and 7:00 AM. Work typically ends at 4:00 PM, with some exceptionswhen certain critical tasks (e.g., finishing a concrete pour for a floor deck, completing the drilling ofpiles, or completing the bolting of a steel frame erected that day) require that the workday be extendedbeyond normal work hours. Any extended workdays generally last until approximately 5:30 PM or6:00 PM and do not include all construction workers on site, but only those involved in the specifictask requiring additional work time. For work outside of normal construction hours, work permits areobtained from DOB prior to such work commencing. The numbers of workers and pieces of equipmentin operation for work outside normal hours is generally limited to those needed to complete theparticular authorized task. Overall, the level of activity for any work outside of normal constructionhours is less than a normal workday.

125 Edgewater Street - CEQR No. 17DCP069R Environmental Assessment Statement
Page 2.15-3
Construction Practices
Access, Deliveries and Staging Areas
Access to construction sites is controlled. Work areas are fenced off, and limited access points forworkers and construction related trucks are provided. Typically, worker vehicles are not allowed intothe construction area, and workers or trucks without a need to be on the site are not allowed entry.After work hours, the gates are closed and locked. Security guards may patrol the construction siteafter work hours and over weekends to prevent unauthorized access.
Material deliveries to the site are controlled and scheduled. To aid in adhering to the deliveryschedules, as is normal for building construction in New York City, flaggers are employed at each ofthe construction site’s access points. Flaggers are typically supplied by either the subcontractor on siteat the time or by the construction manager. The flaggers control trucks entering and exiting the site sothat they would not interfere with one another. In addition, they provide an additional traffic aid astrucks enter and exit the on street traffic streams.
For the proposed project, the primary access point for trucks delivering materials would be atEdgewater Street at the site’s existing driveway.
Material deliveries to the site would be controlled and scheduled as discussed above.
Lane and Walkway Closures
Temporary curb lane and sidewalk closures are typical for construction projects in New York City. Tomanage such closures, a Maintenance and Protection of Traffic (MPT) plan is developed consistent withDOT requirements. DOT OCMC reviews and approves MPT plans, and the implementation of theclosures is also coordinated with DOT OCMC. In general, construction managers for major projects onadjacent sites also coordinate their activities to avoid delays and inefficiencies.
Construction activities would be staged primarily within the project site, and are not expected torequire closing or narrowing of travel and parking lanes or pedestrian facilities.
Public Safety
A variety of measures are employed to ensure public safety during construction at sites within NewYork City. Examples include the use of sidewalk bridges to provide overhead protection forpedestrians passing by the construction site and the employment of flaggers to control trucks enteringand exiting the construction site, to provide guidance to pedestrians, and/or to alert or slow down thetraffic. Other safety measures include following DOB requirements during the installation andoperation of tower cranes to ensure safe operation of the equipment and the installation of safetynettings on the sides of the project as the superstructure advances upward to prevent debris fromfalling to the ground.
As at other New York City construction sites, the proposed project would follow all DOB safetyrequirements to ensure that construction of the project is conducted with care so as to minimize thedisruption to the community.

125 Edgewater Street - CEQR No. 17DCP069R Environmental Assessment Statement
Page 2.15-4
Rodent Control
Construction projects in New York City typically include provisions for a rodent (i.e., mouse and rat)control program with provisions for this formalized in construction contracts for the development.Rodent control programs are typically carried out throughout construction, beginning with surveyingand baiting appropriate areas prior to construction and providing for proper site sanitation andmaintenance during construction. Signage would be posted, and coordination would be conductedwith appropriate public agencies. Only EPA and NYSDEC registered rodenticides would bepermitted, and the contractor would be required to implement the rodent control program in a mannerthat is not hazardous to the general public, domestic animals, and non target wildlife.
2.15.3 Construction Schedule and Activities
Construction Schedule
General Overview
Construction of mid rise or large scale buildings in New York City typically follows a general pattern.The first task is construction startup, which involves the siting of work trailers, installation oftemporary power and communication lines, and the erection of site perimeter fencing. Then, if there isan existing building on the site, any potential hazardous materials (such as asbestos) are abated, andthe building is then demolished with some of the materials recycled and debris taken to a licenseddisposal facility. For sites requiring new or upgraded public utility connections, these activities areundertaken next (e.g., electrical connection, installation of new water or sewer lines and hook ups, etc.).Excavation and removal and/or addition and re grading of the soils is the next step, followed byconstruction of the foundations. When the below grade construction is completed, construction of thecore and shell of the new building begins. The core is the central part of the building and is the mainpart of the structural system. It contains the elevators and the mechanical systems for heating,ventilation, and air conditioning (HVAC). The shell is the outside of the building. As the core and floordecks of the building are being erected, installation of the mechanical and electrical internal networkswould start. As the building progresses upward, the exterior cladding is placed, and the interior fit outbegins. During the busiest time of building construction, the upper core and structure are built whilethe mechanical/electrical connections, exterior cladding, and interior finishing progress on lower floors.Finally, site work, including landscaping and other site work associated with a particular building site,like completing or resurfacing new access roadway and sidewalks (or open space) is undertaken, andsite access and protection measures required during construction are removed.
125 Edgewater Street Construction Schedule
The anticipated construction schedule is presented in Table 2.15 1 and reflects a reasonable assumptionfor construction activities at the site. Construction would begin in the third quarter of 2017. It isassumed that development across the site would occur in phases and, based on a feasible developmenttimeline, the full build out on the project area would be completed by the end of 2019. Altogether, it isprojected that construction activities would occur on the site over a period of two and a quarter years.

125 Edgewater Street - CEQR No. 17DCP069R Environmental Assessment Statement
Page 2.15-5
Table 2.15 1 Anticipated Construction Schedule
As shown in the schedule, construction would begin in mid 2017 with demolition, excavation, andfoundation work in the area of Building A. Construction of Building A would continue withsuperstructure work beginning in the first quarter of 2018. Building A superstructure work wouldcontinue through mid 2018, with the enclosure of the building starting in the second quarter of 2018and overlapping with the completion of the superstructure construction. Enclosure of the buildingwould continue into the fourth quarter of 2018. Interior buildout would start in mid 2018 and wouldcontinue into the second quarter of 2019. Overall, construction of Building A, and the shore publicwalkway in this portion of the site, would take 20 months.
Construction of Buildings B and C would follow the same pattern as Building A. Building B wouldtake the longest to construct (21 months). Building C would take 12 months to complete.
Construction of all three buildings would overlap for approximately 7 months between the start of thefourth quarter of 2018 and the end of the third quarter of 2019.
Construction Activities
Construction of the proposed project would be subject to the government regulations and oversightdetailed in Section 1.2 and would employ the general construction practices described above.
Demolition, Site Preparation, Excavation and Foundation
Construction at the development site would begin with a number of activities to prepare the site forconstruction work. Early activities would involve the installation of public safety measures, such asfencing and Jersey barriers. Trailers for the construction engineers and managers would be hauled tothe site and installed. Also, portable toilets, dumpsters for trash, and water and fuel tankers would be
Q3S O N D J F M A M J J A S O N D J F M A M J J A S O N D1 2 3 4 5 6 7 8 9 10 11 12 13 14 15 16 17 18 19 20 21 22 23 24 25 26 27 28
Demolition/Excavation/FoundationSuperstructureExterior ClosureInterior BuildoutSite Work
Demolition/Excavation/FoundationSuperstructureExterior ClosureInterior BuildoutSite Work
Demolition/Excavation/FoundationSuperstructureExterior ClosureInterior BuildoutSite Work
Building B
Building C
* Site work includes esplanade construction
Construction Phase
Q1 Q2 Q32017 2018
Q1 Q2 Q42019
Q3 Q4Q4
Building A

125 Edgewater Street - CEQR No. 17DCP069R Environmental Assessment Statement
Page 2.15-6
brought to the site and installed. Temporary utilities would be connected to the construction trailers.Interior access roads and turnarounds would be established.
The existing 1 story steel shed on the site would be removed from the site.
Foundation and excavation work would include the drilling of piles that would support the proposedbuildings. Site utilities (electric, water, and sewer lines) would also be installed. Equipment usedduring this period of construction would include excavators, front end loaders, dump trucks, and piledrivers. Concrete trucks would also be used for the slab on grade.
Any soil to be removed from the project site would be loaded onto dump trucks for transport to alicensed disposal facility or for reuse elsewhere on the project site or on another construction site thatneeds fill. To reduce the potential for public exposure to contaminants during excavation activities,construction activities would be performed in accordance with all applicable regulatory requirementsas discussed in Chapter 2.9, “Hazardous Materials.”
For the proposed project, excavation and foundation work is anticipated to occur over a total of 16months for all three buildings; however, this work would be undertaken at different locationsthroughout the site for different periods: for Building A, 6 months, for Building B, 7 months, and forBuilding C, 5 months.
Superstructure and Exterior Closure
Construction of the core and shell involves construction of the building’s framework, core, and exterior.The superstructure is the building’s framework (beams and columns) and floor decks. Construction ofthe core, or interior structure, includes construction of the building’s elevator shafts; vertical risers formechanical, electrical, and plumbing systems; electrical and mechanical equipment rooms; core stairs;and restroom areas. Construction of the exterior involves the installation of the façade (exterior walls,windows, and cladding and the roof).
Equipment during this phase typically includes air compressors, cranes, delivery and concrete trucks,concrete pumps, concrete trowels, welding equipment, and a variety of handheld tools. Temporaryconstruction elevators (hoists) are also typically constructed for the delivery of materials and verticalmovement of workers when necessary. Tower cranes are used to lift structural components and otherlarge materials. Superstructure activities also require the use of mobile cranes, welders, impactwrenches, and a variety of trucks. Tower cranes are typically on site for both the superstructure andexterior façade stages of construction. Concrete trucks and trucks delivering rebar are active duringthis stage of construction.
For the proposed project, superstructure and exterior closure work is anticipated to take approximately18 months at the site, with 9 months at Building A, 12 months at Building B, and 5 months at BuildingC. There would be some overlap of these phases at the site, with superstructure and exterior closurework beginning at Building B as this work is being completed at Building A. Superstructure andexterior closure work at Building C would overlap entirely with the same phase of work at Building B.
Interior Fit-out and Site Work
Interior fit out activities include the construction of interior partitions, installation of lighting fixturesand interior finishes (i.e., flooring, painting, etc.); mechanical and electrical work, such as theinstallation of elevators; and lobby finishes. In addition, final cleanup and touchup of the proposed

125 Edgewater Street - CEQR No. 17DCP069R Environmental Assessment Statement
Page 2.15-7
buildings and final building systems (i.e., electrical system, fire alarm, plumbing, etc.) testing andinspections would be part of this stage of construction.
Equipment used during interior construction typically includes exterior hoists, compressors, deliverytrucks, and a variety of small hand held tools. This stage of construction is typically the quietest anddoes not generate fugitive dust since this work occurs within the buildings with the façadessubstantially complete.
This stage of construction would also include the final finishing of the building and grounds, includinglandscaping activities and other site work related to the esplanade. This is also when the constructionprotection measures (fencing, sidewalk enclosures, bridges, remaining scaffolding, etc.) around theconstruction site would be removed.
For the proposed project, this work would begin on the lower floors of each of the towers as thesuperstructure and exterior closure work for each tower is being completed (i.e., the various tasks forthis effort would overlap). At Building A, interior buildout and site work would be completed over 10months, at Building B, over 12 months, and at Building C, over 6 months. Interior buildout at BuildingsA, B, and C would generally overlap, as in the superstructure and exterior closure phase ofconstruction.
2.15.4 Assessment of Project Construction
In accordance with the guidelines of the CEQR Technical Manual, this preliminary assessment evaluatesthe effects associated with the proposed action’s construction related activities includingtransportation, air quality, and noise. Hazardous materials are discussed in Chapter 2.9.
As discussed in more detail in Chapter 2.1, Land Use, Zoning, and Public Policy, the area surroundingthe development site consists of a mixture of commercial, light industrial, and transportation andutility uses, parking, and vacant land as well as the waters of Upper New York Bay. The nearestresidential use is approximately 370 feet from the development site. The nearest existing open spaceuse is approximately 1,040 feet from the development site; in the future No Action condition, new openspace will be developed, and the nearest open space will be 520 feet from the development site. Thenearest active use to the development site is the seven story, 256,000 square foot office building locatedadjacent to the development site within the rezoning area.
Transportation
Traffic
Construction of the project would generate trips from construction workers traveling to and from thesite as well as from the delivery of materials and equipment, and the removal of debris. The number oftrips generated during construction were based on the construction sequencing discussed above;projections of worker and delivery trucks are shown in Table 2.15 2. Construction activities wouldoccur between 2017 and 2019.

125 Edgewater Street - CEQR No. 17DCP069R Environmental Assessment Statement
Page 2.15-8
Table 2.15-2: Average Number of Daily Construction Vehicle by Quarter 2017 2018 2019
1Q 2Q 3Q 4Q 1Q 2Q 3Q 4Q 1Q 2Q 3Q 4Q
Workers 0 0 14 20 28 64 114 137 199 154 146 68
Autos 0 0 9 12 18 40 72 87 126 97 92 43
Trucks 0 0 0 13 19 10 19 25 16 21 6 9
Vehicles 0 0 9 25 37 50 91 112 142 118 98 52
PCEs 0 0 9 38 56 60 110 137 158 139 104 61
As shown in the Table 2.15 2, it is projected that the highest number of construction trips would begenerated during the first quarter of 2019. During this period, construction activities would generateon average 199 workers a day and 16 trucks a day. Based on the 2000 Census reverse journey to workdata for the Construction industry, it is anticipated that approximately 74 percent1 of constructionworkers would drive to and from the project site. The average vehicle occupancy is 1.17 workers pervehicle. For the peak construction period, the average number of auto and trucks would beapproximately 142 vehicles per day (158 passenger car equivalents [PCEs] per day2).
Construction activities would be expected to occur for a construction shift of 7 AM to 3:30 PM. Forconstruction workers, typical arrival patterns show that most arrivals (approximately 80 percent) occurduring the hour of 6 to 7 AM (the hour before the beginning of a regular day shift), and the samepercentage of departure trips occurs during the hour of 3:30 PM to 4:30 PM (at the end of the shift). Fortrucks, deliveries are usually spread throughout the day but the peak activity (approximately 25percent) would occur during the 6 to 7 AM hour. Construction activities are expected to generate 101auto trips and eight truck trips (a total of 117 PCEs) during the 6 AM to 7 AM peak hour, and 101 autotrips and two truck trips (a total of 105 PCEs) during the 3:30 PM to 4:30 PM peak hour. Table 2.15 3shows the hourly construction vehicle trip projections.
1 The census data shows that approximately 70 percent of Construction industry worker trips would travel by auto and six percentwould travel by ferry, ferry trips were distributed between other modes (auto, rail, bus) to reach the project site2 Per the 2014 CEQR Technical Manual, the peak quarter for construction traffic is assessed based on PCEs and it is assumed that onetruck is equivalent to two passenger cars

125 Edgewater Street - CEQR No. 17DCP069R Environmental Assessment Statement
Page 2.15-9
Table 2.15-3: Projected Construction Vehicle Trips
TimeAuto Trips Truck Trips Total Total (PCEs)
In Out In Out In Out In Out6 AM to 7 AM 101 0 4 4 105 4 109 87 AM to 8 AM 25 0 2 2 27 2 29 48 AM to 9 AM 0 0 2 2 2 2 4 49 AM to 10 AM 0 0 2 2 2 2 4 410 AM to 11 AM 0 0 1 1 1 1 2 211 AM to Noon 0 0 1 1 1 1 2 2Noon to 1 PM 0 0 1 1 1 1 2 21 PM to 2 PM 0 0 1 1 1 1 2 22 PM to 3 PM 0 6 1 1 1 7 2 83 PM to 4 PM 0 101 1 1 1 102 2 1034 PM to 5 PM 0 19 0 0 0 19 0 195 PM to 6 PM 0 0 0 0 0 0 0 06 PM to 7 PM 0 0 0 0 0 0 0 0
The number of vehicle trips expected to be generated during the peak construction period wascompared to number of trips expected to be generated by proposed project, and is presented in Table2.15 4 below. The number of vehicle trips generated during the AM construction peak hour would beless than the number of vehicles trips generated by the project during the AM peak hour. Similarly, thePM construction peak hour would generate less vehicle trips when compared to the midday and PMpeak hours. It should also be noted that the background traffic for the construction peak hour are lowerthan peak hours analyzed for the project. Therefore, it would be expected that with the improvementsidentified in Chapter 2.11, “Transportation,” in place, significant traffic impacts would not result fromconstruction activities.
Table 2.15-4: Comparison of Construction and Proposed Project Traffic Increment
Parking
As shown in Table 2.15 3, the projected number of construction auto trips during the peak constructionperiod would be approximately 126 vehicles per day. During most periods of construction, it isexpected that all construction worker parking would be accommodated on site in areas that have yetto undergo construction or within completely parking garages. However, during the peak constructionperiod when all areas would be under construction, vehicles would be expected to park at availableon and off street parking facilities within a ¼ mile radius of the development site. It is not expectedfor the construction activities to result in significant parking impacts.
Transit and Pedestrians
Based on the 2000 Census reverse journey to work data for the Construction industry, it is anticipatedthat approximately 14.5 percent of constructions workers would commute to the project site via bus
Construction Peak Period Vehicle Trips Project Generated Vehicle Trips6 AM 7 AM
Peak Hour3:30 PM 4:30 PM
Peak Hour7:45 AM 8:45 AM
Peak Hour2:30 PM 3:30 PM
Peak Hour4:45 PM 5:45 PM
Peak HourAuto 101 101 178 149 240Trucks 8 2 4 0 0Vehicles 109 103 182 149 240PCEs 117 105 186 149 240

125 Edgewater Street - CEQR No. 17DCP069R Environmental Assessment Statement
Page 2.15-10
and 11.5 percent would commute the project site via the Staten Island Railway (SIR). It is not expectedthat construction workers would walk to the project site.
It is expected that the vast majority of workers (80 percent) would arrival between 6 AM and 7 AM,and depart between 3:30 PM and 4:30 PM. Construction activities would be expected to generate 23bus trips and 18 SIR trips during the peak hours. Since the number of transit and pedestrian tripsgenerated would be below the 2014 CEQR Technical Manual threshold of 200 transit or walk trips,construction activities are not expected to result in transit and pedestrian impacts.
Air Quality
Construction impacts on air quality may occur because of particulate matter (fugitive dust) created bydemolition, excavation, earth moving operations, etc., and increased truck traffic to and from theconstruction site on local roadways or because of temporary road closings.
For stationary source emissions, the most intense construction activities in terms of air pollutantemissions are typically the demolition, excavation, and foundation stages since it is during these stagesthat the largest number of large non road diesel engines would be employed, resulting in the highestlevels of air emissions. The other stages of construction, including superstructure, exterior façades,interior finishes and site work, typically result in much lower air emissions since they require fewerpieces of heavy duty diesel equipment. Equipment used in the latter stages of construction generallyhave small engines and are dispersed vertically throughout the building, resulting in very lowconcentration increments in adjacent areas. Additionally, the latter stages of construction do notinvolve soil disturbance activities and therefore would result in significantly lower dust emissions.Interior finishes activities are better shielded from nearby sensitive receptors by the proposedstructures themselves.
For the proposed project, while the proposed project would have an overall construction period longerthan two years (i.e., 2¼ years), the most intense construction activities in terms of air pollutantemissions would occur for only 20 months and would be phased. In addition, there would be a onemonth break between excavation and foundation work at Building A and Building B. Together, thiswould minimize the potential impact. The development site is currently predominantly vacant, andtherefore, demolition activities on the site would be very limited and are not anticipated to result inintense or long exposure to air pollutants for any potential sensitive receptors. In addition, theserelatively intense construction activities would be phased to minimize the impact—excavation andfoundation on Building A from the third quarter of 2017 through the first quarter of 2018; excavationand foundation on Building B from the second quarter of 2018 into the fourth quarter of that year, andexcavation and foundation on Building C from fourth quarter 2018 to the middle of the first quarter of2019. Because of the site layout, any heavy equipment associated with the construction of the threebuildings (such as a tower crane) would operate from different locations within the site duringconstruction. Then, as is typical for construction projects, air emissions would be lower in the otherstages of construction, particularly as activities would be dispersed throughout the development site.Therefore, it is not anticipated that project construction would result in any significant adverse airquality impacts to nearby sensitive receptors, including the nearest occupied building at 1 EdgewaterStreet, an office building that is located approximately 100 feet from the center of the development site.
With regard to sensitive residential receptors, there is the potential for the creation of on site receptorsat Building A before the final build out of Buildings B and C. However, at the time that Building A is

125 Edgewater Street - CEQR No. 17DCP069R Environmental Assessment Statement
Page 2.15-11
completed and potentially occupied, there would not be any heavy construction work (e.g., excavation,demolition, or foundation work) underway at Buildings B and C. Instead, Buildings B and C would bein interior fit out stage, which would result in much lower air emissions than the demolition,excavation, and foundation stages. Therefore, it is not anticipated that project construction would resultin any significant adverse air quality impacts to on site sensitive receptors.
Mobile source emissions typically result from the operation of construction equipment, trucksdelivering materials and removing debris, workers’ private vehicles, or occasional disruptions in trafficnear the construction site. As described in above in Transportation section, the vehicular trip generationfrom construction would be below the threshold for a detailed mobile source analysis. Therefore, amore detailed assessment of construction related air quality analysis is not warranted.
In addition, to address pollutant emissions during construction, the project will adhere to theapplicable laws, regulations, and building codes in place that focus on clean fuel, dust suppressionmeasures, and idling restrictions for on road vehicles:
Clean Fuel. Ultra low sulfur diesel (ULSD) would be used for diesel engines throughout theconstruction site.3
Dust Control. Fugitive dust control plans would be required as part of contract specifications.For example, stabilized truck exit areas would be established for washing off the wheels of alltrucks that exit the construction site. Truck routes within the site would be watered as neededto avoid the re suspension of dust. All trucks hauling loose material would be equipped withtight fitting tailgates and their loads securely covered prior to leaving the site. In addition toregular cleaning by the City, streets adjacent to the site would be cleaned as frequently asneeded by the construction contractor. Water sprays would be used for all transfer of spoils toensure that materials are dampened as necessary to avoid the suspension of dust into the air.All measures required by the portion of the New York City Air Pollution Control Code regulatingconstruction related dust emissions would be implemented.
Restrictions on Vehicle Idling. In addition to adhering to the local law restricting unnecessaryidling on roadways, on site vehicle idle time would also be restricted to three minutes for allequipment and vehicles that are not using their engines to operate a loading, unloading, orprocessing device (e.g., concrete mixing trucks) or otherwise required for the proper operationof the engine.
In addition to adhering to the required laws and regulations, the proposed project will also implementthe following emissions reductions measures to further reduce the effects of construction activities onair quality:
Diesel Equipment Reduction. Construction of the proposed project would minimize the use ofdiesel engines and use electric engines, to the extent practicable. This would reduce the needfor on site generators, and require the use of electric engines in lieu of diesel where practicable.
Best Available Tailpipe Reduction Technologies. Nonroad diesel engines with a power ratingof 50 horsepower (hp) or greater would utilize the best available tailpipe (BAT) technology forreducing DPM emissions. Diesel particle filters (DPF) have been identified as being the tailpipe
3 The Environmental Protection Agency (EPA) required a major reduction in the sulfur content of diesel fuel intended for use inlocomotive, marine, and non road engines and equipment, including construction equipment. As of 2015, the diesel fuel producedby all large refiners, small refiners, and importers must be ULSD fuel. Sulfur levels in non road diesel fuel are limited to a maximumof 15 parts per million.

125 Edgewater Street - CEQR No. 17DCP069R Environmental Assessment Statement
Page 2.15-12
technology currently proven to have the highest reduction capability. Construction contractswould specify that all diesel nonroad engines rated at 50 hp or greater would utilize DPFs,either installed on the engine by the original equipment manufacturer (OEM) or retrofit witha DPF verified by EPA or the California Air Resources Board, and may include active DPFs ifnecessary; or other technology proven to reduce DPM by at least 90 percent.
Utilization of Newer Equipment. EPA’s Tier 1 through 4 standards for nonroad enginesregulate the emission of criteria pollutants from new engines, including PM, CO, NOx, andhydrocarbons (HC). All nonroad construction equipment in the project would meet at least theTier 2 emissions standard, and construction equipment meeting Tier 3 with diesel particulatefilters and/or Tier 4 emissions standards would be used where conforming equipment iswidely available, and the use of such equipment is practicable.
Source Location. In order to reduce the resulting concentration increments at sensitivereceptors, large emissions sources and activities such as concrete trucks and pumps would belocated away from the sensitive receptors to the extent practicable. This would reduce potentialconcentration increments from on site sources at such locations by increasing the distancebetween the emission sources and the sensitive locations, resulting in enhanced dispersion ofpollutants.
Overall, these air emission control commitments are expected to significantly reduce diesel particulatematter (DPM) emissions by a similar reduction level that would be achieved by applying the currentlydefined best available control technologies under New York City Local Law 77 of 2003, which arerequired only for publically funded City capital projects.
Therefore, due to the factors described above and with the implementation of an emissions controlprogram, the proposed project would not result in any significant adverse impacts on air quality.
Noise
Construction activities have the potential to affect the noise conditions of existing receptors near thedevelopment site and new receptors that may be introduced during the phased development.Construction noise can vary widely depending on the phase of construction (e.g., demolition, landclearing and excavations, foundation, steel and concrete erection, mechanical and interior fit out) andthe specific task equipment and methods being used. The most significant construction noise sourcesat a construction site are generally the movement of trucks to and from a project site, back up alarmsand equipment such as excavators, hoe rams, drill rigs, pile driving rigs, and cranes.
Noise from construction activities and some construction equipment is regulated by the New York CityNoise Control Code and by the EPA. The New York City Noise Control Code limits constructionactivities to weekdays between the hours of 7:00 AM and 6:00 PM, requires that a Construction NoiseMitigation Plan be implemented, and sets noise limits for specific pieces of construction equipment.Noise control measures would be described in the Construction Noise Mitigation Plan and couldinclude a variety of source and path controls.
The following controls to reduce noise at the source will be implemented to the extent feasible, practicaland safe as required by the New York City Noise Code:
The responsible party would self certify that all construction tools and equipment have beenmaintained to not generate excessive or unnecessary noise and that the noise emissions would

125 Edgewater Street - CEQR No. 17DCP069R Environmental Assessment Statement
Page 2.15-13
not exceed the levels specified in the Federal Highway Administration’s RoadwayConstruction Noise Model User’s Guide, January, 2006.
All construction equipment would be equipped with necessary noise reduction equipmentincluding mufflers. All equipment with internal combustion engines would be operated withthe doors closed including noise insulating materials and at the lowest engine speed allowable.
Where feasible, practical and safe, the use of back up alarms would be minimized and/orquieter back up alarms would be installed in accordance with OSHA standards.
Vehicles would not be allowed to idle more than three minutes in accordance with New YorkCity Administrative Code §24 163.
The contractor shall utilize a training program to inform workers on methods that canminimize construction noise.
For impact equipment such as pile drivers and jackhammers, the quietest equipment shall beselected taking into consideration the structural and geotechnical conditions.
The use of hoe rams shall include the use of acoustic shrouds or acoustic curtains to minimizenoise.
The following path noise controls will be implemented to the extent feasible, practical and safe asrequired by the New York City Noise Code:
When the DOB regulations require a perimeter barrier or “construction fence” and the site iswithin 200 feet of a receptor, the barrier shall be constructed in a specific manner (as describedin the New York City Noise Code) to provide sufficient sound attenuation. Section 3307.7 ofthe New York City Building Code requires a solid 8 foot wall made out of wood or othersuitable material be constructed where a new building is being constructed or a building isbeing demolished to grade.
Should noise complaints occur during construction, the contractor shall use path noise controlmeasures such as temporary noise barriers, jersey barriers and/or portable noise enclosures forsmall equipment.
In general, the quietest equipment and methods shall be used for excavators, dump trucks,cranes, auger drills and concrete saws to the extent feasible and practical.
Overall, construction of the proposed project would not involve any unusual or exceptionalconstruction activities or practices for a building in New York City. The noisiest period of constructionwould be during foundation work due primarily to pile driving activities. At the existing officebuilding at 1 Edgewater Street, which is located approximately 100 feet from the center of thedevelopment site, Leq noise levels during pile driving would be approximately 80 dBA at the exteriorof the building prior to the use of acoustic shrouds and/or the perimeter barrier to attenuate sound.The sound attenuation properties of the building at 1 Edgewater Street are not known at this time;however, there is a potential that interior noise levels may exceed 50 dBA L10 during pile drivingactivities, which is generally considered to be the threshold for indoor nuisance levels in office andcommercial properties. Path noise controls such as acoustic shrouds will be implemented as feasible,practical, safe and as required by the New York City Noise Code.

125 Edgewater Street - CEQR No. 17DCP069R Environmental Assessment Statement
Page 2.15-14
Excavation and foundation work is anticipated to occur over a total of 20 months for all three buildings;however, this work would be undertaken at different locations throughout the site for differentperiods. Construction would generally move within the development site, starting near the southernportion of the site where Building A would be constructed and move north to the area of Building Band then Building C. The demolition, excavation, foundation and superstructure work would becompleted at Buildings B and C before the interior buildout of Building A and before residents couldpotentially occupy the building. If residents were to occupy Building A during construction ofBuildings B and C, it would be during the exterior closeout, interior buildout and site work phaseswhich are substantially quieter than the foundation work phase. Construction noise levels at BuildingA during these phases of construction at Buildings B and C would be approximately 70 dBA (exterior)without path noise controls. With implementation of the 31 dBA window/wall sound attenuation atBuilding A, interior sound levels would be below 45 dBA (Leq) which is considered to be the thresholdfor indoor nuisance levels during daytime hours according to the CEQR Technical Manual. With theadherence to existing construction noise regulations and the implementation of a Construction NoiseMitigation Plan, as required by the New York City Noise Code, the proposed project is not anticipatedto result in significant adverse construction noise impacts.

Appendix A Proposed Text Amendments


Edgewater Street Text Amendment (P2012R0355)Draft: 23 November 2016
1
Matter underlined is new, to be added;Matter struck out is to be deleted;Matter within # # is defined in Section 12-10;* * * indicates where unchanged text appears in the Zoning Resolution
Article XISPECIAL PURPOSE DISTRICTS
Chapter 6Special Stapleton Waterfront District
* * *116-01Definitions
For the purposes of this Chapter, matter in italics is defined in Section 12-10 (DEFINITIONS) or in this Section.
Esplanade
The “Esplanade” is a park extending along all portions of the waterfront edges of the #Special Stapleton Waterfront District#. The #Esplanade# is shown in the District Plan, Map 1 (Special Stapleton Waterfront District, Subareas and Public Spaces) in the Appendix to A of this Chapter.
* * *Mandatory front building wall line
“Mandatory front building wall lines” are imaginary lines extending through Subarea B of the #Special Stapleton Waterfront District# which are shown on Map 3 (Mandatory Front Building Wall Lines) in theAppendix to A of this Chapter, and with which #building# walls must generally coincide, as provided in Section 116-232.
Pier Place, the Cove
“Pier Place” and the “Cove” are designated open spaces accessible to the public, located within the #Special Stapleton Waterfront District# as shown in the District Plan, Map 1, in the Appendix to A of this Chapter.
Shore public walkway
A #shore public walkway# is a linear public access area running alongside the shore or water edges of a #platform# on a #waterfront zoning lot#.
Upland connection

Edgewater Street Text Amendment (P2012R0355)Draft: 23 November 2016
2
An “upland connection” is a pedestrian way that which provides a public access route from the #Esplanade# or a #shore public walkway# to a public sidewalk within a public #street#. Required #uplandconnections# are shown in the District Plan, Map 5 (Upland Connections and Visual Corridors), in theAppendix to A of this Chapter.
Visual corridor
A "visual corridor" is a public #street# or tract of land within a #block# that provides a direct and unobstructed view to the water from a vantage point within a public #street#. Required #visual corridors# are shown in the District Plan, Map 5, and Map 6 (Location of Visual Corridor in Subarea E) in the Appendix to A of this Chapter.
116-02General Provisions
In harmony with the general purposes and content of this Resolution and the general purposes of the #Special Stapleton Waterfront District#, the provisions of this Chapter shall apply to all #developments#, #enlargements# and changes of #use# within the #Special Stapleton Waterfront District#. The regulations of all other Chapters of this Resolution are applicable except as modified, supplemented or superseded by the provisions of this Chapter. In the event of a conflict between the provisions of this Chapter and other regulations of this Resolution, the provisions of this Chapter shall control. However, in #flood zones#, in the event of a conflict between the provisions of this Chapter and the provisions of Article VI, Chapter 4 (Special Regulations Applying in Flood Hazard Areas), the provisions of Article VI, Chapter 4, shall control., except in Subarea E of this Chapter.
Within the #Special Stapleton Waterfront District#, the regulations of the underlying R6, C2-2, C4-2Aand M2-1 Districts shall apply, as modified in this Chapter.
116-03District Plan and Maps
The District Plan for the #Special Stapleton Waterfront District# identifies specific areas comprising the Special District in which special zoning regulations are established in order to carry out the general purposes of the #Special Stapleton Waterfront District#.
These areas shall include the #Esplanade#, Subareas A, B1, B2, B3, B4, B5, C, D and E, the #Esplanade#and two designated public open spaces: #Pier Place# and the #Cove#. In addition, Subareas B and E shall include #upland connections# and Subarea E shall include a #shore public walkway#.
The District Plan includes the following maps in the Appendix to A of this Chapter.
Map 1 Special Stapleton Waterfront District, Subareas and Public Spaces Map 2 Ground Floor Use and Frontage Requirements Map 3 Mandatory Front Building Wall Lines Map 4 Restricted Curb Cut and Off-Street Loading Locations Map 5 Upland Connections and Visual CorridorsMap 6 Location of Visual Corridor in Subarea E

Edgewater Street Text Amendment (P2012R0355)Draft: 23 November 2016
3
* * *
116-04Subareas
In order to carry out the purposes and provisions of this Chapter, the following subareas are established within the #Special Stapleton Waterfront District#: Subarea A, Subarea B, comprised of Subareas B1, B2, B3, B4 and B5, Subareas C, D and E, the #Esplanade#, #Pier Place# and the #Cove#. In each of these subareas, special regulations apply that may not apply in other subareas.
116-05Applicability
In Subareas A, B and C, the #Esplanade#, #Pier Place# and the #Cove#, Tthe provisions of Article VI, Chapter 2 (Special Regulations Applying in the Waterfront Area), shall not apply in the #Special Stapleton Waterfront District#, except where specifically stated otherwise in this Chapter. In lieu thereof, the special #use#, #bulk#, #accessory# off-street parking, public access and urban design regulations of Sections 116-10 through 116-50 shall apply.
In Subarea D, the provisions of Article VI, Chapter 2 shall apply pursuant to the underlying M2-1 Districtregulations.
In Subarea E, the underlying provisions of Article VI, Chapter 2 shall apply, except as modified in Section 116-60 (SPECIAL REGULATIONS IN SUBAREA E), inclusive. In addition, the provisions of Article VI, Chapter 4 (Special Regulations Applying in Flood Hazard Areas), shall not apply. In lieu thereof, the provisions of Section 116-623 (Height and setback regulations), shall apply.
#Lower density growth management area# regulations shall not apply in the #Special Stapleton Waterfront District#.
116-10SPECIAL USE REGULATIONS FOR SUBAREAS A, B AND C, THE ESPLANADE, PIER PLACE AND THE COVE
Within the #Special Stapleton Waterfront District# In Subareas A, B and C, the #Esplanade#, #Pier Place# and the #Cove#, the following special #use# regulations shall apply. The #use# regulations of the underlying C4-2A District shall be modified by Sections 116-101 through 116-13, inclusive.
116-101Use Groups 12 and 14
The #uses# listed in Section 32-21 (Use Group 12) shall not be permitted in Subarea C.
The #uses# listed in Section 32-23 (Use Group 14) shall be permitted in the #Special Stapleton Waterfront District# Subareas A, B and C, the #Esplanade#, #Pier Place# and the #Cove#; boat storage, repair or painting, however, shall be allowed without restriction relating to boat length.

Edgewater Street Text Amendment (P2012R0355)Draft: 23 November 2016
4
* * *
116-11Special Sign Regulations
The #sign# regulations of the underlying C4-2 District in Section 32-60 (SIGN REGULATIONS) shall be modified as follows: #flashing signs# shall not be permitted in the #Special Stapleton Waterfront District# Subareas A, B and C, the #Esplanade#, #Pier Place# and the #Cove#.
116-12Mandatory Ground Floor Use and Frontage Requirements
The provisions of Section 32-433 (Ground floor use in C1, C2 and C4 Districts in the Borough of Staten Island) shall not apply in the #Special Stapleton Waterfront District# Subareas A, B and C. However, on designated #streets# and #mandatory front building wall lines# in Subareas B3 and C, as shown on Map 2 in the Appendix to A of this Chapter, the special ground floor #use# and frontage regulations of this Section shall apply to any #building developed# or #enlarged# after October 25, 2006.
#Uses# located on the ground floor level, or within two feet of the as-built level of the adjoining sidewalk, shall be exclusively limited to the permitted non-#residential uses# as modified by the special #use# provisions of this Chapter. Such ground floor #uses# shall extend along the entire width of the#building#, except for lobbies or entrances to #accessory# parking spaces, and shall have a depth provided in accordance with Section 37-32 (Ground Floor Depth Requirements for Certain Uses).
* * *
116-13Transparency Requirements
Within the #Special Stapleton Waterfront District# In Subareas A, B and C, the transparency requirements of Section 37-34 (Minimum Transparency Requirements) shall apply to any #development# or an #enlargement# where the #enlarged# portion of the ground floor of the #building# is within eight feet of the #street line# and where non-#residential uses# are located on the ground floor level or within two feet of the as-built level of the adjoining sidewalk.
116-20SPECIAL BULK REGULATIONS FOR SUBAREAS A, B AND C, THE ESPLANADE, PIER PLACE AND THE COVE
The special #bulk# regulations of this Section shall apply within the #Special Stapleton Waterfront District# to Subareas A, B and C, the #Esplanade#, #Pier Place# and the #Cove#.
* * *

Edgewater Street Text Amendment (P2012R0355)Draft: 23 November 2016
5
116-231Special rooftop regulations
The provisions of Section 33-42 (Permitted Obstructions) shall apply to all #buildings or other structures# in the #Special Stapleton Waterfront District# Subareas A, B and C, except that dormers may penetrate a maximum base height in accordance with the provisions of paragraph (c)(1) of Section 23-621 (Permitted obstructions in certain districts).
116-232 Street wall location
In Subarea A, the underlying #street wall# location regulations shall apply.
In Subareas B and C, the underlying #street wall# location regulations of a C4-2A District or an R6B District, as applicable, shall be modified as set forth in this Section. Map 3 (Mandatory Front Building Wall Lines) in the Appendix to A of this Chapter, specifies locations in Subareas B and C where #mandatory front building wall# requirements apply as follows:
* * *
116-233Maximum building height
Within the #Special Stapleton Waterfront District# In Subareas A, B and C, the maximum height of a #building or other structure# outside of Subarea B2 shall not exceed 50 feet. However, where the ground floor lever of a #building# provides a #qualifying ground floor# in accordance with the supplementalprovisions set forth in paragraph (b) of Section 35-652 (Maximum height of buildings and setback regulations), the maximum height of a #building or other structure# may be increased to 55 feet.
Within Subarea B2, the maximum height of a #building or other structure# shall not exceed 60 feet.
116-30SPECIAL ACCESSORY OFF-STREET PARKING AND LOADING REGULATIONS FOR SUBAREAS A, B AND C
Within the #Special Stapleton Waterfront District# In Subareas A, B and C, the parking and loading regulations of the underlying C4-2A District shall apply, except as modified in this Section.
* * *116-34Location and Width of Curb Cuts
Curb cuts are prohibited in the locations shown on Map 4 (Restricted Curb Cut and Off-Street Loading Locations) in the Appendix to A of this Chapter.

Edgewater Street Text Amendment (P2012R0355)Draft: 23 November 2016
6
In Subarea C, for #zoning lots# with access only to Front Street, only one curb cut shall be permitted along Front Street.
Within the #Special Stapleton Waterfront District# In Subareas A, B and C, the maximum width of curb cuts shall not exceed 25 feet, including splays.
* * *
116-40UPLAND CONNECTIONS AND VISUAL CORRIDORS FOR SUBAREAS A, B AND C
116-41Upland Connections
In the locations shown on Map 5 (Upland Connections and Visual Corridors) in the Appendix to A of this Chapter, #upland connections# shall be provided. An #upland connection# traversing a #zoning lot# in Subareas A, B and C shall consist of a single circulation path bordered continuously along both sides by buffer zones.
* * *
(c) Permitted obstructions
The provisions of Section 62-611 (Permitted obstructions) shall apply to #upland connections# within the #Special Stapleton Waterfront District# Subarea B, the #Esplanade#, #Pier Place# and the #Cove#. The permitted obstructions listed in paragraph (b)(2) of Section 62-611 are further subject to the tree and planting requirements of Section 62-655. Water-Dependent (WD) #uses# referenced in paragraph (a)(6) of Section 62-611 shall be as listed in Section 62-211.
116-42Visual Corridors
#Visual corridors# shall be provided in the locations shown on Map 5 in the Appendix to A of this Chapter. Such #visual corridors# shall be subject to the requirements of Section 116-512 (Design requirements for visual corridors).
116-50SPECIAL URBAN DESIGN REQUIREMENTS FOR SUBAREAS A, B AND C, THE ESPLANADE, PIER PLACE AND THE COVE

Edgewater Street Text Amendment (P2012R0355)Draft: 23 November 2016
7
The special urban design requirements of this Section, inclusive, shall apply to all #developments# and #enlargements# within the #Special Stapleton Waterfront District# Subareas A, B and C, the #Esplanade#, #Pier Place# and the #Cove#.
* * *116-512Design requirements for visual corridors
The requirements of this Section shall apply to all #visual corridors# within Subarea B, the #Esplanade#, #Pier Place# and the #Cove#. When a #visual corridor# coincides with an #upland connection#, the provisions of Section 116-511 (Design requirements for upland connections) shall also apply.
* * *
116-5352Waterfront Public Access Signage
The New York City Waterfront Symbol Plaque shall be used to direct the public to waterfront public access areas including the #Esplanade# and #upland connections# within Subarea B, #Pier Place# and the #Cove#, and to identify the entry points of these areas. Such signage shall be provided in accordance with requirements of Section 62-654.
116-5453Refuse Storage Areas
Refuse shall be stored within a #completely enclosed building#.
116-60SPECIAL REGULATIONS IN SUBAREA E
The special #use#, #bulk#, #visual corridor# and #waterfront public access area# requirements of this Section, inclusive, shall apply to Subarea E.
116-61Special Use Regulations
The #use# regulations of Article VI, Chapter 2 (Special Regulations Applying in the Waterfront Area) shall apply, modified as follows:
(a) The provisions of Section 32-433 (Ground floor use in C1, C2 and C4 Districts in the Borough of Staten Island) shall not apply;
(b) The provisions of Section 62-29 (Special Use Regulations for R6, R7, R8, R9 and R10 Districts) are modified to allow #uses# listed in Section 62-212 (Waterfront-Enhancing (WE) uses) to be located anywhere within a #building# existing prior to [date of adoption] provided that no #commercial floor area# is located above a #dwelling unit#; and

Edgewater Street Text Amendment (P2012R0355)Draft: 23 November 2016
8
(c) #Physical culture or health establishments# shall be permitted as-of-right. The special permit provisions of Section 73-36 shall not apply.
116-62Special Bulk Regulations
The #bulk# regulations of Article VI, Chapter 2 (Special Regulations Applying in the Waterfront Area) shall apply, except as modified in this Section, inclusive.
116-621Floor area
Subarea E of the #Special Stapleton Waterfront District# shall be a #Mandatory Inclusionary Housing area# for the purpose of applying the Inclusionary Housing Program provisions of Section 23-90(INCLUSIONARY HOUSING), inclusive.
The #floor area# regulations of Article VI, Chapter 2, shall not apply. In lieu thereof, the #floor area# regulations of Section 23-154 (Inclusionary Housing), as applicable to #Mandatory Inclusionary Housing areas#, shall apply.
116-622Required yards
The special #yard# provisions of 62-332 (Rear yards and waterfront yards) shall apply, except that the 40foot minimum depth requirement for a #waterfront yard# may be reduced by up to five feet, to a minimum depth of 35 feet, along those portions of the landward edge of the stabilized shore, bulkhead or natural #shoreline# where the depth of the landward portions of the #zoning lot# is less than 150 feet, asmeasured perpendicular and landward from such edge.
116-623Height and setback regulations
The provisions of Section 62-341 (Developments on land and platforms) shall apply, except as modifiedin this Section.
(a) #Initial setback distance#
The provisions of paragraph (a)(2) of Section 62-341 shall be modified for #buildings# located on portions of a #zoning lot# where the distance between the edge of the stabilized shore and a landward #zoning lot line# is less than 150 feet. The depth of such #initial setback distance# from the boundary of a #shore public walkway# may be reduced to five feet, provided that at least 40percent of the width of each #story# required to be set back above the minimum base height is set back no less than ten feet from the boundary of the #shore public walkway#.
(b) Measurement of height

Edgewater Street Text Amendment (P2012R0355)Draft: 23 November 2016
9
The provisions of paragraph (a)(3) of Section 62-341 shall apply, except that for the purpose of this Section, #base plane# shall refer to an elevation of 16.8 feet above Richmond Datum.
(c) Permitted obstructions
The provisions of paragraphs (a)(4)(i) and (ii) of Section 62-341 shall not apply. Dormers and penthouse portions of a #building# shall not be considered permitted obstructions above a maximum base height.
(d) Maximum base height
The maximum base height provisions of paragraph (c)(1) of Section 62-341 shall apply, except that a #building or other structure#, or a portion thereof, located within an #initial setback distance#, shall rise to a height of at least 25 feet or two #stories#, whichever is less, and may notexceed a maximum base height of 55 feet or five #stories#, whichever is less.
(e) Maximum #building# height and tower size
The maximum #residential# tower size provisions of paragraph (c)(4) of Section 62-341 shall not apply. For the purposes of this paragraph (e), any portion of a #building# that exceeds a height of 55 feet or five #stories#, whichever is less, shall be considered a tower. #Buildings# with tower portions fronting on Edgewater Street shall not exceed a height of 120 feet above the #base plane# or 12 #stories#, whichever is less. The height of any other #building# with tower portions shall not exceed a height of 110 feet above the #base plane#, or 11 #stories#, whichever is less. Each #story# within a tower portion of a #building# shall not exceed a gross area of 10,000square feet up to a height of 90 feet or nine #stories#, whichever is less, and each #story# above a height of 90 feet or nine #stories#, whichever is less, shall not exceed a gross area of 8,100 square feet. All #stories# within the tower portions of #buildings# shall be bounded on all sides by open areas on the #zoning lot#. For #zoning lots# with three or more #buildings#, no more than two #buildings# shall contain towers.
(f) #Floor area# distribution
The provisions of paragraph (c)(3) of Section 62-341 shall not apply.
(g) #Street wall# articulation facing #shore public walkways#
The provisions of paragraph (c)(5) of Section 62-341 shall apply. In addition, for portions of #buildings# fronting on a #shore public walkway# with an #aggregate width of street wall# greater than 200 feet, such #street walls# shall provide a recess at least five feet deep and 55 feet wide, unobstructed from the lowest level of the #building# to the sky. In no event shall a #street wall# extend along a #shore public walkway# for a distance greater than 130 feet withoutproviding such a recess. Furthermore, above the height of the second #story#, such #street walls# shall provide at least one additional recess with a minimum depth of five feet and a minimum width or, where applicable, an aggregate width, of at least 40 feet.
(h) Streetscape provisions

Edgewater Street Text Amendment (P2012R0355)Draft: 23 November 2016
10
The streetscape provisions of paragraph (c)(6) of Section 62-341 shall not apply. In lieu thereof, the following provisions shall apply:
(1) Lobbies
A #residential# lobby, extending along at least 30 percent of the #aggregate width of street walls# shall be provided, but need not be wider than 35 feet. Transparent glazing materials shall occupy at least 40 percent of the surface area of the #street wall# of the lobby, measured between a height of two and ten feet above the level of the adjoining grade.
A lobby to a #commercial or community facility use# shall have a minimum width of 20 feet. Transparent glazing materials shall occupy at least 50 percent of the surface area of the #street wall# of the lobby, measured between a height of two feet above the level of the adjoining grade and a height 12 feet above the level of the first finished floor.
In the event of a conflict between the provisions of this paragraph (h)(1) and the construction standards of the Federal government or Appendix G of the New York City Building Code, the requirements of this paragraph shall not apply.
(2) Parking garage wall treatment
For any level within a #building# where #accessory# off-street parking is provided, such parking shall be screened from the #street line# or #waterfront public access area# with a #street wall# that is at least 50 percent opaque. Each one-foot square portion of such #street wall# shall comply individually with this requirement. Such required wall treatment may be interrupted by vehicular or pedestrian entrances. In addition to the wall treatment, the screening requirements of Section 62-655 (Planting and trees) shall apply.
For #buildings# with #street walls# that are more than 50 feet in width and located within 50 feet of a #waterfront public access area# or #street#, at least 70 percent of the width of such #street walls# shall contain #floor area# at the first #story# located completely above the #base plane#.
116-63Requirements for Visual Corridors and Waterfront Public Access Areas
116-631Visual corridors
The provisions of 62-51 (Applicability of Visual Corridor Requirements) shall apply, except as modified in this Section. The minimum width of the required #visual corridor# shall be 60 feet. The location of such #visual corridor# shall be as shown on Map 5 (Upland Connections and Visual Corridors) and Map 6 (Location of Visual Corridor in Subarea E) in Appendix A of this Chapter. Such #visual corridor# shall be located such that the northern boundary of the #visual corridor# shall intersect with the easterly #street line# of Edgewater Street at a point 22 feet south of the following intersection: the easterly prolongation of the northerly #street line# of Lynhurst Avenue and the easterly #street line# of Edgewater Street. Such #visual corridor# shall extend to the pierhead line at an angle of 89.35 degrees, as measured between the northern boundary of such #visual corridor# and the portion of the easterly #street line# of Edgewater Street north of such #visual corridor#.

Edgewater Street Text Amendment (P2012R0355)Draft: 23 November 2016
11
116-632Waterfront Public Access Area
The provisions of 62-52 (Applicability of Waterfront Public Access Area Requirements) shall apply,except that no #supplemental public access area#, as set forth in 62-57 (Requirements for Supplemental Public Access Areas), shall be required. However, a #shore public walkway# and an #upland connection# must be provided as modified in this Section and shown on Maps 1, 5 and 6 in Appendix A of this Chapter.
(a) #Shore public walkway#
The provisions of paragraph (a)(3) of Section 62-53 (Requirements for Shore Public Walkways)shall apply, except that the minimum width of a #shore public walkway# on shallow portions of a #zoning lot# set forth in such Section shall be modified to be no less than 35 feet.
If there is an existing #building or other structure# to remain on the #zoning lot#, the entire area between such existing #building# and the shoreline shall be entirely occupied by the #shore public walkway#, with a required circulation path of at least eight feet.
(b) #Upland connections#
The requirement for a “transition area” within a Type 2 #upland connection# in paragraph (b)(2)of Section 62-561 (Types of upland connections) shall not apply. In addition, the minimum width requirement of ten feet for the #upland connection# abutting such turnaround shall be modified to five feet, provided that the entire area of the vehicular turnaround is paved with the same paving material as the #upland connection#.
116-633Phased development of Waterfront Public Access Area
For the purposes of applying for an authorization for phased #development# of a #waterfront public access area# in paragraph (c)(1) of Section 62-822 (Modification of waterfront public access area and visual corridor requirements), the #lot area# shall be the portion of the #zoning lot# above water.

Edgewater Street Text Amendment (P2012R0355)Draft: 23 November 2016
12
Appendix AStapleton Waterfront District PlanMap 1. Special Stapleton Waterfront District, Subareas and Public Spaces
[EXISTING]

Edgewater Street Text Amendment (P2012R0355)Draft: 23 November 2016
13
[PROPOSED]

Edgewater Street Text Amendment (P2012R0355)Draft: 23 November 2016
14
Map 2. Ground Floor Use and Frontage Requirements
[EXISTING]

Edgewater Street Text Amendment (P2012R0355)Draft: 23 November 2016
15
[PROPOSED]

Edgewater Street Text Amendment (P2012R0355)Draft: 23 November 2016
16
Map 3. Mandatory Front Building Wall Lines
[EXISTING]

Edgewater Street Text Amendment (P2012R0355)Draft: 23 November 2016
17
[PROPOSED]

Edgewater Street Text Amendment (P2012R0355)Draft: 23 November 2016
18
Map 4. Restricted Curb Cut and Off-Street Loading Locations
[EXISTING]

Edgewater Street Text Amendment (P2012R0355)Draft: 23 November 2016
19
[PROPOSED]
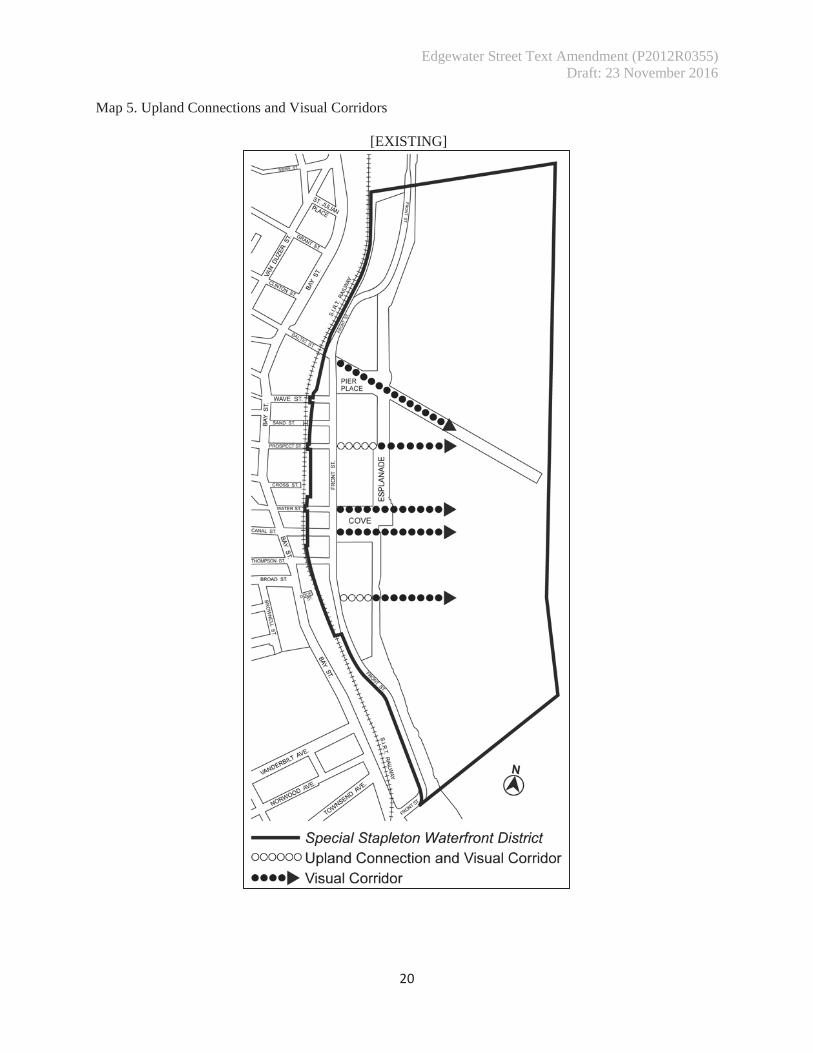
Edgewater Street Text Amendment (P2012R0355)Draft: 23 November 2016
20
Map 5. Upland Connections and Visual Corridors
[EXISTING]

Edgewater Street Text Amendment (P2012R0355)Draft: 23 November 2016
21
[PROPOSED]

Edgewater Street Text Amendment (P2012R0355)Draft: 23 November 2016
22
Map 6. Location of Visual Corridor in Subarea E
[NEW MAP: PROPOSED]

Edgewater Street Text Amendment (P2012R0355)Draft: 23 November 2016
23
* * *
APPENDIX F Inclusionary Housing Designated Areas and Mandatory Inclusionary Housing Areas
* * *
Queens
* * *
Staten Island
Staten Island Community District 1
In Subarea E of the #Special Stapleton Waterfront District# (see Section 116-60) and in the R6 Districtwithin the areas shown on the following Map 1:

Edgewater Street Text Amendment (P2012R0355)Draft: 23 November 2016
24
Map 1. (date of adoption)[NEW MAP: PROPOSED]
Mandatory Inclusionary Housing area see Section 23-154(d)(3)
Area 1 Option 1, Option 2 and Workforce Option
Portion of Community District 1, Staten Island
* * *

Appendix B New York City Waterfront Revitalization Program
Consistency Assessment Form


NYC WRP CONSISTENCY ASSESSMENT FORM – 2016 1
NEW YORK CITY WATERFRONT REVITALIZATION PROGRAM
Consistency Assessment Form
Proposed actions that are subject to CEQR, ULURP or other local, state or federal discretionary review procedures, and that are within New York City’s Coastal Zone, must be reviewed and assessed for their consistency with the New York City Waterfront Revitalization Program (WRP) which has been approved as part of the State’s Coastal Management Program.
This form is intended to assist an applicant in certifying that the proposed activity is consistent with the WRP. It should be completed when the local, state, or federal application is prepared. The completed form and accompanying information will be used by the New York State Department of State, the New York City Department of City Planning, or other city or state agencies in their review of the applicant’s certification of consistency. A. APPLICANT INFORMATION Name of Applicant: Name of Applicant Representative: Address: Telephone: Email: Project site owner (if different than above): B. PROPOSED ACTIVITY If more space is needed, include as an attachment.
1. Brief description of activity
2. Purpose of activity
FOR INTERNAL USE ONLY WRP No. _____________________ Date Received: ___________________ DOS No. _____________________
12-11011/22/2016
Pier 21 Development LLC
Caroline G. Harris
475 Park Avenue South, Suite 2803, New York, NY, 10016
212-835-2651 [email protected]
The applicant, Pier 21 Development LLC, is seeking a series of land use approvals to facilitate a mixed-use development with a waterfrontpublic access area at 125 Edgewater Street in the Rosebank neighborhood in Staten Island, Community District 1.
The proposed actions would facilitate the development of three mixed-use buildings totaling 351,567 gross square feet (gsf) of residentialspace, 24,173 gsf of commercial space, 346 parking space; and a new Waterfront Public Access Area consisting of public open space,upland connection, and visual corridors at 125 Edgewater Street in the Rosebank neighborhood of Staten Island.
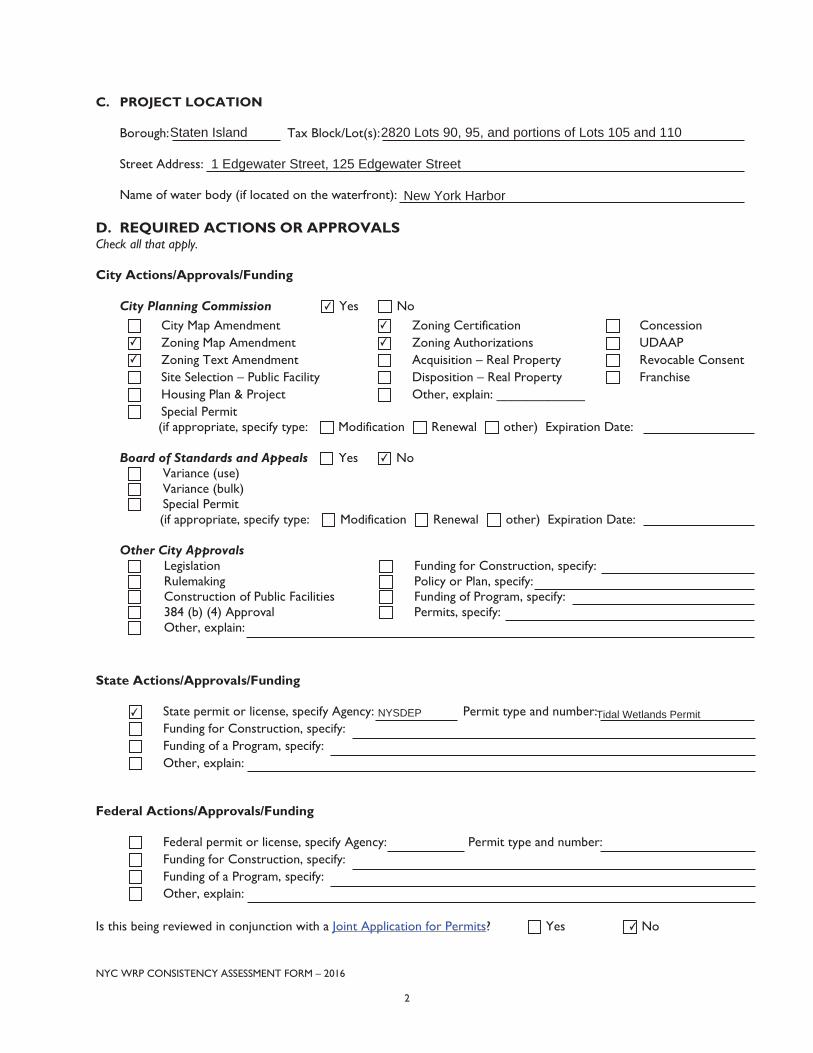
NYC WRP CONSISTENCY ASSESSMENT FORM – 2016 2
C. PROJECT LOCATION Borough: Tax Block/Lot(s):
Street Address: Name of water body (if located on the waterfront):
D. REQUIRED ACTIONS OR APPROVALS Check all that apply. City Actions/Approvals/Funding
City Planning Commission Yes No City Map Amendment Zoning Certification Concession Zoning Map Amendment Zoning Authorizations UDAAP Zoning Text Amendment Acquisition – Real Property Revocable Consent Site Selection – Public Facility Disposition – Real Property Franchise Housing Plan & Project Other, explain: ____________ Special Permit (if appropriate, specify type: Modification Renewal other) Expiration Date:
Board of Standards and Appeals Yes No
Variance (use) Variance (bulk) Special Permit
(if appropriate, specify type: Modification Renewal other) Expiration Date:
Other City Approvals Legislation Funding for Construction, specify: Rulemaking Policy or Plan, specify: Construction of Public Facilities Funding of Program, specify: 384 (b) (4) Approval Permits, specify: Other, explain:
State Actions/Approvals/Funding
State permit or license, specify Agency: Permit type and number: Funding for Construction, specify: Funding of a Program, specify: Other, explain:
Federal Actions/Approvals/Funding
Federal permit or license, specify Agency: Permit type and number: Funding for Construction, specify: Funding of a Program, specify: Other, explain:
Is this being reviewed in conjunction with a Joint Application for Permits? Yes No
Staten Island 2820 Lots 90, 95, and portions of Lots 105 and 110
1 Edgewater Street, 125 Edgewater Street
New York Harbor
✔
✔ ✔
✔
✔ NYSDEP Tidal Wetlands Permit
✔
✔
✔

NYC WRP CONSISTENCY ASSESSMENT FORM – 2016 3
E. LOCATION QUESTIONS
1. Does the project require a waterfront site? Yes No
2. Would the action result in a physical alteration to a waterfront site, including land along the shoreline, land under water or coastal waters? Yes No
3. Is the project located on publicly owned land or receiving public assistance? Yes No
4. Is the project located within a FEMA 1% annual chance floodplain? (6.2) Yes No
5. Is the project located within a FEMA 0.2% annual chance floodplain? (6.2) Yes No
6. Is the project located adjacent to or within a special area designation? See Maps – Part III of the NYC WRP. If so, check appropriate boxes below and evaluate policies noted in parentheses as part of WRP Policy Assessment (Section F).
Yes No
Significant Maritime and Industrial Area (SMIA) (2.1)
Special Natural Waterfront Area (SNWA) (4.1)
Priority Martine Activity Zone (PMAZ) (3.5)
Recognized Ecological Complex (REC) (4.4)
West Shore Ecologically Sensitive Maritime and Industrial Area (ESMIA) (2.2, 4.2)
F. WRP POLICY ASSESSMENT Review the project or action for consistency with the WRP policies. For each policy, check Promote, Hinder or Not Applicable (N/A). For more information about consistency review process and determination, see Part I of the NYC Waterfront Revitalization Program. When assessing each policy, review the full policy language, including all sub-policies, contained within Part II of the WRP. The relevance of each applicable policy may vary depending upon the project type and where it is located (i.e. if it is located within one of the special area designations).
For those policies checked Promote or Hinder, provide a written statement on a separate page that assesses the effects of the proposed activity on the relevant policies or standards. If the project or action promotes a policy, explain how the action would be consistent with the goals of the policy. If it hinders a policy, consideration should be given toward any practical means of altering or modifying the project to eliminate the hindrance. Policies that would be advanced by the project should be balanced against those that would be hindered by the project. If reasonable modifications to eliminate the hindrance are not possible, consideration should be given as to whether the hindrance is of such a degree as to be substantial, and if so, those adverse effects should be mitigated to the extent practicable. Promote Hinder N/A
1 Support and facilitate commercial and residential redevelopment in areas well-suited to such development.
1.1 Encourage commercial and residential redevelopment in appropriate Coastal Zone areas.
1.2 Encourage non-industrial development with uses and design features that enliven the waterfront and attract the public.
1.3 Encourage redevelopment in the Coastal Zone where public facilities and infrastructure are adequate or will be developed.
1.4 In areas adjacent to SMIAs, ensure new residential development maximizes compatibility with existing adjacent maritime and industrial uses.
1.5 Integrate consideration of climate change and sea level rise into the planning and design of waterfront residential and commercial development, pursuant to WRP Policy 6.2.
✔
✔
✔
✔
✔
✔
✔
✔
✔
✔
✔
✔
✔

NYC WRP CONSISTENCY ASSESSMENT FORM – 2016 4
Promote Hinder N/A
2 Support water-dependent and industrial uses in New York City coastal areas that are well-suited to their continued operation.
2.1 Promote water-dependent and industrial uses in Significant Maritime and Industrial Areas.
2.2 Encourage a compatible relationship between working waterfront uses, upland development and natural resources within the Ecologically Sensitive Maritime and Industrial Area.
2.3 Encourage working waterfront uses at appropriate sites outside the Significant Maritime and Industrial Areas or Ecologically Sensitive Maritime Industrial Area.
2.4 Provide infrastructure improvements necessary to support working waterfront uses.
2.5 Incorporate consideration of climate change and sea level rise into the planning and design of waterfront industrial development and infrastructure, pursuant to WRP Policy 6.2.
3 Promote use of New York City's waterways for commercial and recreational boating and water-dependent transportation.
3.1. Support and encourage in-water recreational activities in suitable locations.
3.2 Support and encourage recreational, educational and commercial boating in New York City's maritime centers.
3.3 Minimize conflicts between recreational boating and commercial ship operations.
3.4 Minimize impact of commercial and recreational boating activities on the aquatic environment and surrounding land and water uses.
3.5 In Priority Marine Activity Zones, support the ongoing maintenance of maritime infrastructure for water-dependent uses.
4 Protect and restore the quality and function of ecological systems within the New York City coastal area.
4.1 Protect and restore the ecological quality and component habitats and resources within the Special Natural Waterfront Areas.
4.2 Protect and restore the ecological quality and component habitats and resources within the Ecologically Sensitive Maritime and Industrial Area.
4.3 Protect designated Significant Coastal Fish and Wildlife Habitats.
4.4 Identify, remediate and restore ecological functions within Recognized Ecological Complexes.
4.5 Protect and restore tidal and freshwater wetlands.
4.6
In addition to wetlands, seek opportunities to create a mosaic of habitats with high ecological value and function that provide environmental and societal benefits. Restoration should strive to incorporate multiple habitat characteristics to achieve the greatest ecological benefit at a single location.
4.7 Protect vulnerable plant, fish and wildlife species, and rare ecological communities. Design and develop land and water uses to maximize their integration or compatibility with the identified ecological community.
4.8 Maintain and protect living aquatic resources.
✔
✔
✔
✔
✔
✔
✔
✔
✔
✔
✔
✔
✔
✔
✔
✔
✔
✔
✔
✔
✔

NYC WRP CONSISTENCY ASSESSMENT FORM – 2016 5
Promote Hinder N/A
5 Protect and improve water quality in the New York City coastal area.
5.1 Manage direct or indirect discharges to waterbodies.
5.2 Protect the quality of New York City's waters by managing activities that generate nonpoint source pollution.
5.3 Protect water quality when excavating or placing fill in navigable waters and in or near marshes, estuaries, tidal marshes, and wetlands.
5.4 Protect the quality and quantity of groundwater, streams, and the sources of water for wetlands.
5.5 Protect and improve water quality through cost-effective grey-infrastructure and in-water ecological strategies.
6 Minimize loss of life, structures, infrastructure, and natural resources caused by flooding and erosion, and increase resilience to future conditions created by climate change.
6.1 Minimize losses from flooding and erosion by employing non-structural and structural management measures appropriate to the site, the use of the property to be protected, and the surrounding area.
6.2 Integrate consideration of the latest New York City projections of climate change and sea level rise (as published in New York City Panel on Climate Change 2015 Report, Chapter 2: Sea Level Rise and Coastal Storms) into the planning and design of projects in the city’s Coastal Zone.
6.3 Direct public funding for flood prevention or erosion control measures to those locations where the investment will yield significant public benefit.
6.4 Protect and preserve non-renewable sources of sand for beach nourishment.
7 Minimize environmental degradation and negative impacts on public health from solid waste, toxic pollutants, hazardous materials, and industrial materials that may pose risks to the environment and public health and safety.
7.1 Manage solid waste material, hazardous wastes, toxic pollutants, substances hazardous to the environment, and the unenclosed storage of industrial materials to protect public health, control pollution and prevent degradation of coastal ecosystems.
7.2 Prevent and remediate discharge of petroleum products.
7.3 Transport solid waste and hazardous materials and site solid and hazardous waste facilities in a manner that minimizes potential degradation of coastal resources.
8 Provide public access to, from, and along New York City's coastal waters.
8.1 Preserve, protect, maintain, and enhance physical, visual and recreational access to the waterfront.
8.2 Incorporate public access into new public and private development where compatible with proposed land use and coastal location.
8.3 Provide visual access to the waterfront where physically practical.
8.4 Preserve and develop waterfront open space and recreation on publicly owned land at suitable locations.
✔
✔
✔
✔
✔
✔
✔
✔
✔
✔
✔
✔
✔
✔
✔
✔
✔
✔
✔
✔


NYC WRP CONSISTENCY ASSESSMENT FORM – 2016 7
Submission Requirements For all actions requiring City Planning Commission approval, materials should be submitted to the Department of City Planning.
For local actions not requiring City Planning Commission review, the applicant or agent shall submit materials to the Lead Agency responsible for environmental review. A copy should also be sent to the Department of City Planning.
For State actions or funding, the Lead Agency responsible for environmental review should transmit its WRP consistency assessment to the Department of City Planning.
For Federal direct actions, funding, or permits applications, including Joint Applicants for Permits, the applicant or agent shall also submit a copy of this completed form along with his/her application to the NYS Department of State Office of Planning and Development and other relevant state and federal agencies. A copy of the application should be provided to the NYC Department of City Planning.
The Department of City Planning is also available for consultation and advisement regarding WRP consistency procedural matters.
New York City Department of City Planning Waterfront and Open Space Division 120 Broadway, 31st Floor New York, New York 10271 212-720-3525 [email protected] www.nyc.gov/wrp
New York State Department of State Office of Planning and Development Suite 1010 One Commerce Place, 99 Washington Avenue Albany, New York 12231-0001 (518) 474-6000 www.dos.ny.gov/opd/programs/consistency
Applicant Checklist
Copy of original signed NYC Consistency Assessment Form
Attachment with consistency assessment statements for all relevant policies
For Joint Applications for Permits, one (1) copy of the complete application package
Environmental Review documents
Drawings (plans, sections, elevations), surveys, photographs, maps, or other information or materials which would support the certification of consistency and are not included in other documents submitted. All drawings should be clearly labeled and at a scale that is legible.

Appendix C Agency Correspondence


ENVIRONMENTAL REVIEW
Project number: DEPARTMENT OF CITY PLANNING / 77DCP075R Project: 125 EDGEWATER STREET Date received: 10/19/2016
Properties with no Architectural or Archaeological significance: 1) ADDRESS: 125 EDGEWATER STREET, BBL: 5028200090 2) ADDRESS: BAY STREET, BBL: 5028200001 3) ADDRESS: 1 EDGEWATER STREET, BBL: 5028200095 4) ADDRESS: MURRAY HULBERT AVE, BBL: 5028200105 5) ADDRESS: 181 EDGEWATER STREET, BBL: 5028200110
10/27/2016
SIGNATURE DATE Gina Santucci, Environmental Review Coordinator
File Name: 31364_FSO_DNP_10252016.doc

Appendix D Air Quality

Marine Terminal Analysis
Sandy Hook Pilot Station and Yacht Yard Pilot Boat #1 (The New York)
Pilot Boat #2 (The New Jersey) Pilot Boat of America Class
Marine Terminal Analysis Page 1

Engi
ne P
aram
eter
s and
Pol
luta
nt E
miss
ion
Fact
ors f
or M
arin
e Ter
min
al An
alysis
Emiss
ions
by M
ode
Engi
nes P
aram
eter
s Po
lluta
nt E
miss
ion
Fact
ors2
Powe
r Ou
tput
Tim
e in
Mode
Lo
ad F
acto
r
Tran
sit
MNV
Dock
ing
Tran
sit
MNV1
Dock
ing
NOx
PM10
PM
2.5
SO2
CO
hp
kW
hrs
hrs
Hrs
g/kW
-hr
g/kW
-hr
g/kW
-hr
g/kW
-hr
g/kW
-hr
Pilo
t Boa
ts
Main
Engin
e 2,2
00
1,640
0.0
33
0.033
---
0.4
0 0.2
0 ---
8.7
0.5
0 0.4
6 0.8
7 5.0
Au
xiliar
y Eng
ine
125
93
---
---
0.167
--
- --
- 0.8
8.7
0.5
0 0.4
6 0.8
1 5.0
Ya
chts
Ma
in En
gine
110
82
0.033
0.0
33
0.17
0.40
0.20
0.80
7.2
0.20
0.18
0.87
5.0
Note
s: 1 2MN
V =
Mane
uver
ing M
ode
Pollu
tant e
miss
ion fa
ctors
are b
ased
on T
ier 2
EPA
Emiss
ion S
tanda
rds o
r the
Eas
t Rive
r Fer
ry EA
S (1
3DME
009Y
) as d
iscus
sed i
n the
meth
odolo
gy se
ction
.
Emiss
ion
Rate
s for
Mar
ine T
erm
inal
Analy
sis
1-Ho
ur N
O x
Annu
al NO
x 24
-Hou
r PM 1
0 24
-Hou
r PM 2
.5 An
nual
PM2.5
1-
Hour
SO 2
1-
Hour
CO2
Pilo
t Boa
ts E
miss
ion
Rate
s (g/
s)
Tran
sit E
miss
ions
0.158
6 0.1
086
0.009
1 0.0
084
0.005
7 0.0
159
0.091
1 Ma
neuv
ering
Emi
ssion
s 0.0
793
0.054
3 0.0
046
0.004
2 0.0
029
0.007
9 0.0
456
Dock
Emi
ssion
s 0.0
901
0.061
7 0.0
052
0.004
8 0.0
033
0.008
4 0.0
518
Total
Trip
Emi
ssion
s 0.3
279
0.224
6 0.0
188
0.017
3 0.0
119
0.032
2 0.1
885
Yach
ts E
miss
ion
Rate
s (g/
s)
Tran
sit E
miss
ions
0.002
2 0.0
015
0.000
06
0.000
06
0.000
04
0.000
26
0.001
5 Ma
neuv
ering
Emi
ssion
s 0.0
011
0.000
7 0.0
0006
0.0
0003
0.0
0002
0.0
0013
0.0
008
Dock
Emi
ssion
s 0.0
219
0.015
0 0.0
0061
0.0
0061
0.0
0042
0.0
0264
0.0
152
Total
Trip
Emi
ssion
s 0.0
252
0.017
2 0.0
0073
0.0
0070
0.0
0048
0.0
0304
0.0
175
Tota
l Em
issio
n Ra
tes1 (
g/s-
m2 )
3.93E
-06
2.69E
-06
2.18E
-07
2.01E
-07
1.38E
-07
3.92E
-07
2.29E
-06
Note
s: 1
Total
emiss
ion ra
tes w
ere c
alcula
ted ba
sed o
n an a
rea o
f 89,7
51 m
2 for
the m
odele
d are
a sou
rce.
28-
hour
CO
conc
entra
tions
wer
e also
mod
eled u
sing t
he sa
me em
ission
rate
for 1-
hour
CO.
Mar
ine
Term
inal
Ana
lysi
sP
age
2

Marine Terminal Analysis AERMOD Modeling Parameters
Model AERMOD (EPA Version 15181)Source Type Polygon area sourceDimension of area source 89,751 square meter segment Emission Sources and Receptor Coordinates UTM NAD83 Datum and UTM Zone 18Surface Characteristic Urban Area OptionUrban Surface Roughness Length 1Number of Engines per Vessel 2 main engines, 1 auxiliary for Pilot Boats; 1 main engine for Yachts
Engine Horsepower (at 100% load) 1,100 hp for main (propulsion), 125 hp for auxiliary; 110 hp for yachts
Engine Operation Loads See Tables 2.12-11Emission Factors See Tables 2.12-11Receptor Placement Discrete receptors (1.8 m) on each floor along proposed building façades
Meteorological Data
Preprocessed by the AERMET meteorological preprocessor program by Trinity Consultants, Inc. Yearly meteorological data for 2011-2015 concatenated into single multiyear file for PM2.5 modeling, as EPA recommended
Surface Meteorological Data LaGuardia 2011-2015Profile Meteorological Data Brookhaven Station 2011-2015Pollutant Background Concentrations Queens College monitoring station data for 2011-2015
Maximum Predicted Concentrations (μg/m3) from Marine Terminal Analysis
Pollutant Averaging TimeMaximum Modeled
ConcentrationBackground
ConcentrationTotal
ConcentrationNAAQS/
De Minimis
CO1-Hour1 51 2634 2685 400758-Hour1 21 1718 1739 10305
NO21-Hour2 153.68 --- 153.68 188Annual3 2.18 34 36.18 100
PM10 24-Hour 0.98 44 44.98 150PM2.5 24-Hour 0.75 20.3 0.75 7.35PM2.5 Annual3 0.149 --- 0.149 0.3SO2 1-Hour 8.01 29.1 37.00 196
Notes:1 The 1-hour and 8-hour CO background concentrations were converted from ppm to μg/m3 multiplying by 1,145.2 Seasonal-hourly background concentrations were added to the modeled 1-hour NO2 concentrations to predict the maximum total concentration.3 Annual NO2 impacts were estimated using a NO2/NOx conversion ratio of 0.75 as per EPA guidance.4 The PM2.5 de minimis criteria threshold for annual (neighborhood scale) is 0.3 μg/m3.
Marine Terminal Analysis Page 3

Pouch Terminal Analysis Technical Memorandum
This memo presents the findings for the air quality analysis assessment of the Pouch Terminal NYPA facility located at 143 Edgewater Street Staten Island, NY 10305 onto the proposed 125 Edgewater Street Development. In summary, based on the legal emission limit written on the State issued permit (Title V) and the current threshold for Staten Island, the analysis finds no significant adverse impacts from the NYPA facility to the proposed development from ground level to a height of 126 feet. Significant adverse impacts were identified for the proposed development above 126 feet on Building A.
Scope of Work
The analysis serves to address the following concerns:
1. Conduct the air quality analysis and coordinate with DEP and NYPA to ensure that the analysis is consistent with the one for the Domino Sugar Rezoning (07DCP094K) EIS project
2. Propose setback, if any, required from the NYPA facility for 125 Edgewater Street. 3. The extent of the impact from the Pouch Terminal Facility to its surrounding neighborhood 4. The potential impact two stories above the applicant proposed elevation
Methodology
The methodology used in the analysis is consistent with what was done for a similar NYPA facility on N 1st Street and River Street in Brooklyn NY for the Domino Sugar Rezoning (07DCP094K) EIS project. Emission Sources
The dispersion modeling analysis includes the sources identified in the State Permit (Title V) dated 01/25/2016 with sensitive receptors at the 125 Edgewater Street proposed buildings. The two critical pollutants for the analysis are nitrogen dioxide (NO2) and fine particulate matter (PM2.5). Analysis include the following runs: 1-hr NO2, Annual NO2, 24-hr PM2.5 and Annual PM2.5. The Title V permit indicated that the facility contains a combustion turbine (GE LM6000) with a design capacity of 420 million Btu per hour, a boiler with a design capacity of 7.4 million Btu per hour, and a diesel backup generator with a design capacity of 746 horsepower. In consultation with NYPA and DEP, the backup generator is eliminated from the analysis because it would only be used for emergency purpose. The Title V permit provided the exact location of the combustion turbine and the boiler within the plant and the emission factors for NO2 but not for PM2.5. However, as both Pouch Terminal and N 1st Street NYPA facilities used the same type of combustion turbine (GE LM6000), the PM2.5 emission factor assumed is consistent with the NYPA facility on N 1st Street. The emission factors for all the sources are listed in the table below.
Pouch Terminal Analysis Tech Memo Page 1

Source Name Pollutant Emission Factor Source
1 CombustionTurbine
PM2.5
0.00355lb/MMBtu
Assumption consistent with Dominos EIS and includethe filterable and condensable particles
NO2 5 lb/hour Pouch Terminal Title V permit item 50.2
2 Low NOx (<30
ppm) Heater Boiler
PM2.5 7.6 lb/106 ft3 AP 42 Table 1.4-2
NO2
0.0364lb/MMBtu Pouch Terminal Title V permit item 60.2
3 DieselGenerator
PM2.5
0.0022lb/hp-hr
AP 42 Table 3.3-1 (PM10 emission for uncontrolleddiesel engine, assumes 100% PM10 is PM2.5)
NO2 10.23 lb/hr Pouch Terminal Title V permit item 60.2
Usage
Based on the 5 year combustion turbine usage factors provided by NYPA, a multiplier will be used to account for the emission rates based on the usage provided by NYPA. Per NYPA guidance, the low NOx boiler will only operate when the Combustion Turbine is operating and the temperature is below 50 F. The short term and annual emission rate multiplier will be the 5 year maximum usage rate that satisfy both criteria. NYPA also provided us with five years of operation data from (2010-2014). NYPA data shows that the Pouch Terminal facility operate at an actual maximum of 115% of the rated capacity in the short term basis, which affects the 1 and 24 hour analysis and at approximately 23% of rated capacity in the long term basis, which affects the annual analysis. In consultation with DEP we adjusted the long term permissible capacity to 97 % to be consistent with the Domino analysis. Detail information can be obtained on the “Pouch Terminal Information.xlsx” as attached below.
Analysis Emission RateMultiplier Comments
1-hr NO2 1.15 Based on the peak hour usage (2011,2012)Annual NO2 0.97 Based on the maximum daily usage per data provided by NYPA and in
coordination with DEP using methodology consistent with Dominos analysis forN 1st Street Plant
24-hr PM2.5 1.15 Based on the peak hour usage (2011,2012)Annual PM2.5 0.97 Based on the maximum daily usage per data provided by NYPA and in
coordination with DEP using methodology consistent with Dominos analysis forN 1st Street Plant
Receptors
The dispersion modeling placed receptors on all building façades of the proposed buildings for 125 Edgewater every 10 feet from the ground floor to the 15th floor (146 feet) and every 25 feet in the horizontal direction. The analysis also include a 10’ x 10’ grid receptor pattern surrounding the power plant to determine the extent of the impact near the power plant. Receptors were also placed on the existing building at 1 Edgewater Street (Block 2820 Lot 95). Pouch Terminal Analysis Tech Memo Page 2

Downwash Options
The analysis will analyze both with and without downwash option. Background Concentration
Pollutant Averaging Time Monitoring Location Background Concentration
Nitrogen Dioxide (NO2) 1-hour1 Queens College, Queens 108.9 μg/m3
Annual2 IS 52, Bronx 40.6 μg/m3
Particulate Matter (PM2.5) 24-Hour3 Port Richmond, Staten Island 19.4 μg/m3
Source: NYSDEC Ambient Air Quality Report, 2014, http://www.dec.ny.gov/chemical/29310.html Notes:1 1-hour NO2 background concentration is based on three-year average (2012-2014) of the 98th percentile of daily maximum 1-hour concentrations
from available monitoring data from NYSDEC.2 Annual NO2 background concentration is based on the maximum annual average from the latest five years of available monitoring data from NYSDEC
(2010-2014).3 The 24-hour PM2.5 background concentration is based on maximum 98th percentile concentration averaged over three years of data from NYSDEC
(2012-2014).
Results
The analysis assumed that the Pouch Terminal facility would not operate beyond 115% of its rated capacity in any given hour and would not operate beyond 97% permissible capacity on any year. This analysis finds that there is no significant adverse impact from the Pouch Terminal NYPA facility onto the proposed development on 125 Edgewater Street from ground level to 126 feet. Short Term PM2.5 impact was identified above 126 feet on Building A. The analysis showed that both the combustion turbine and boiler would impact the surrounding area at different elevations. The combustion turbine has a height of 107 feet and the boiler has a height of 13 feet. The highest impact from the combustion turbine is at 136 feet in height and the highest impact from the boiler is located at 26 feet in height. Short term impacts are projected at 16 feet elevation for the existing commercial use south of the Boiler. The results are compiled below and the extent of the impact are illustrated in the attached figure below.
Highest Elevation without Impact (126 feet)
Pollutant Average Time Background (μg/m3) Concentration (μg/m3) Criteria (μg/m3)PM2.5 24-hour 19.4 3.73 7.8
Annual N/A 0.14 0.3NO2 1-hour 118 136.65 188
Annual 43 43.49 100
Table 2: Lowest Elevation with Impact (136 feet)
Pollutant Average Time Background (μg/m3) Concentration (μg/m3) Criteria (μg/m3)PM2.5 24-hour 19.4 10.58* 7.8
Annual N/A 0.31* 0.3NO2 1-hour 118 157.19 188
Annual 43 44.06 100Note:*The number in bold denotes CEQR Criteria exceedances.
Pouch Terminal Analysis Tech Memo Page 3


Pouch Terminal Information.xlsx
1. Is there a site plan for the facility that you can share with us that shows the locations of all three emission sources (Combustion Turbine, Boiler and Generator). This information would allow us to do precise Air Quality modeling.
Notes:
Plant stack is at loacation B2Boiler is just Below B6 (drawings show otherwise) The diesel generator trailer can be moved but is typically near B8The diesel generator is limited to 500 hoursThe air inlet heater (boiler) typically operates only when ambient temperature is below ~50DegF
Page 1

Pouch Terminal Information.xlsx
2. Can you provide us with the following emission parameters: temperature, diameter and velocity for multiple operating loads for all three emission sources (Combustion Turbine, Boiler and Generator).
Temp (DegF) stack diameter Velocity (scfm) Height (ft)
Turbine 750 144" ~300000 106.5
Boiler 600 20" 1133 12
Generator 725 5" 1220 6
3. Can you provide us with the most recent emission factors (LB/MMBTU) for the following pollutants (NOx, SO2, PM10, PM2.5, Ammonia and HAPs).
4. Can you provide us with the most recent hourly heat input (MMBTU) over 5-years period .
Year hours MWhheat input (Mmbtu)
Nox #/mmbtu (Part 75 CEMS)
Nox Tons (Part 75 CEMS)
SO2 Tons (Part 75)
NH3 Tons (Part 60 CEMS) PM10 (AP-42)
2015 1446 66882 647867 0.022 3.5 0.2 3.3 2.12014 1017 45799 426895 0.029 2.4 0.1 1.5 1.42013 2481 114326 1055490 0.020 5.5 0.3 4.0 3.72012 2273 102125 968415 0.023 5.0 0.3 4.1 3.52011 2575 116668 1097503 0.021 5.9 0.3 5.6 3.92010 1997 91980 854611 0.019 4.1 0.3
Note: All data are mass emissions. Nox and NH3 are from CEMS monitors. SO2,PM are derived from emission factors, HAPS are too broadly defined and we would suggest using emission factors such as AP-42 for determining specific HAPS.
CT operations and emissions Data
Page 2

Pouch Terminal Information.xlsx
Temperature Band
Temperature Minimum (F)
Temperature Maximum (F)
5 Years Hours Count
5 Years Hours
Operated
Maximum Daily Operated Hours
Maximu Daily Boiler Usage Operate % Weighted
Average
0 10 56 7 12.5%10 20 516 74 75% 75% 14.3% 38720 30 2594 498 100% 100% 19.2% 259430 40 6759 1279 100% 100% 18.9% 675940 50 7447 1343 100% 0% 18.0% 744750 60 6466 759 100% 0% 11.7% 646660 70 8247 977 88% 0% 11.8% 7216.12570 80 7568 2331 100% 0% 30.8% 756880 90 3608 2576 100% 0% 71.4% 360890 100 553 496 100% 0% 89.7% 553
100 110 10 9 90.0%97%Long-Term Permissible Capacity
Page 3

Pouc
h Te
rmin
al In
form
atio
n.xl
sx
Sum
mar
y of
Hou
rly O
pera
ting
Dat
a
Janu
ary
Febr
uary
Mar
chA
pril
May
June
July
Aug
ust
Sept
embe
rO
ctob
erN
ovem
ber
Dec
embe
rA
NN
UA
Lno
tes
12
34
56
78
910
1112
2010
Janu
ary
Febr
uary
Mar
chA
pril
May
June
July
Aug
ust
Sept
embe
rO
ctob
erN
ovem
ber
Dec
embe
rA
NN
UA
Lno
tes
Max
112%
112%
110%
103%
112%
104%
105%
106%
103%
113%
113%
112%
113%
max
Ave
rage
25%
23%
8%18
%22
%40
%66
%49
%18
%12
%12
%9%
25%
avg
Tota
l No.
of h
ours
744
672
744
720
744
720
744
744
720
744
720
744
8760
sum
Tota
l num
ber o
f ope
ratin
g ho
urs
158.
512
6.0
55.2
121.
914
5.2
270.
846
2.8
338.
511
9.1
72.1
70.2
56.3
1996
sum
Gre
ater
than
25%
load
158.
312
5.9
54.9
120.
814
4.5
269.
746
1.6
336.
911
7.9
72.0
69.8
55.9
1988
sum
Gre
ater
than
50%
load
154.
912
3.7
53.2
118.
914
3.1
267.
645
9.0
333.
411
5.9
69.0
67.3
53.7
1960
sum
Gre
ater
than
75%
load
153.
612
1.3
53.0
118.
414
2.3
267.
345
8.2
332.
711
5.1
67.5
66.5
52.6
1948
sum
Gre
ater
than
or e
qual
to 1
00%
load
148.
911
6.3
48.0
46.0
126.
023
4.6
440.
632
0.0
98.2
65.9
65.0
39.0
1749
sum
Perc
enta
ge o
f tim
e op
erat
ing
21.3
0%18
.74%
7.42
%16
.93%
19.5
2%37
.61%
62.2
0%45
.49%
16.5
4%9.
68%
9.75
%7.
56%
avg
Perc
enta
ge o
f ope
ratin
g tim
e >
25%
Loa
d10
0%10
0%99
%99
%99
%10
0%10
0%10
0%99
%10
0%99
%99
%10
0%ca
lc.
Perc
enta
ge o
f ope
ratin
g tim
e >
50%
Loa
d98
%98
%96
%98
%99
%99
%99
%99
%97
%96
%96
%95
%98
%ca
lc.
Perc
enta
ge o
f ope
ratin
g tim
e >
75%
Loa
d97
%96
%96
%97
%98
%99
%99
%98
%97
%94
%95
%93
%98
%ca
lc.
Perc
enta
ge o
f ope
ratin
g tim
e >=
100%
Loa
d94
%92
%87
%38
%87
%87
%95
%95
%82
%91
%93
%69
%88
%ca
lc.
Tem
pera
ture
32.6
33.5
47.4
57.3
65.6
75.7
82.2
78.1
7259
.949
.234
.9
2011
Janu
ary
Febr
uary
Mar
chA
pril
May
June
July
Aug
ust
Sept
embe
rO
ctob
erN
ovem
ber
Dec
embe
rA
NN
UA
Lno
tes
Max
104%
105%
105%
106%
110%
110%
106%
105%
106%
114%
114%
115%
115%
max
Ave
rage
15%
20%
51%
37%
28%
34%
52%
49%
43%
19%
20%
18%
32%
avg
Tota
l No.
of h
ours
744
672
744
720
744
720
744
744
720
744
720
744
8760
sum
Tota
l num
ber o
f ope
ratin
g ho
urs
100.
812
0.9
356.
824
9.1
184.
222
4.9
357.
434
0.5
286.
612
4.0
119.
211
0.6
2575
sum
Gre
ater
than
25%
load
99.2
119.
335
5.4
247.
818
4.1
224.
935
6.0
339.
328
5.3
122.
911
9.1
110.
525
64su
mG
reat
er th
an 5
0% lo
ad96
.711
6.4
352.
524
3.7
181.
122
2.6
352.
933
5.8
282.
512
0.3
116.
510
7.3
2528
sum
Gre
ater
than
75%
load
94.9
116.
035
0.9
242.
717
9.3
221.
535
1.4
335.
228
2.0
119.
611
5.0
106.
825
15su
mG
reat
er th
an o
r equ
al to
100
% lo
ad74
.993
.031
8.9
163.
017
6.0
195.
734
4.6
313.
026
3.8
104.
011
1.7
100.
422
59su
m
Perc
enta
ge o
f tim
e op
erat
ing
13.5
4%18
.00%
47.9
5%34
.59%
24.7
5%31
.24%
48.0
4%45
.77%
39.8
1%16
.67%
16.5
5%14
.86%
29%
avg
Perc
enta
ge o
f ope
ratin
g tim
e >
25%
Loa
d98
%99
%10
0%99
%10
0%10
0%10
0%10
0%10
0%99
%10
0%10
0%12
8%ca
lc.
Perc
enta
ge o
f ope
ratin
g tim
e >
50%
Loa
d96
%96
%99
%98
%98
%99
%99
%99
%99
%97
%98
%97
%12
7%ca
lc.
Perc
enta
ge o
f ope
ratin
g tim
e >
75%
Loa
d94
%96
%98
%97
%97
%98
%98
%98
%98
%96
%97
%97
%12
6%ca
lc.
Perc
enta
ge o
f ope
ratin
g tim
e >=
100%
Loa
d74
%77
%89
%65
%96
%87
%96
%92
%92
%84
%94
%91
%11
3%ca
lc.
Tem
pera
ture
31.9
3641
.352
62.6
72.2
8075
.369
.958
.151
.943
.5
2012
Janu
ary
Febr
uary
Mar
chA
pril
May
June
July
Aug
ust
Sept
embe
rO
ctob
erN
ovem
ber
Dec
embe
rA
NN
UA
Lno
tes
Max
115%
113%
103%
104%
103%
104%
104%
103%
104%
101%
101%
102%
115%
max
Ave
rage
48%
37%
13%
18%
14%
27%
45%
47%
22%
11%
39%
13%
28%
avg
Tota
l No.
of h
ours
744
672
744
720
744
720
744
744
720
744
720
744
8760
sum
Tota
l num
ber o
f ope
ratin
g ho
urs
301.
422
9.3
88.9
118.
296
.018
2.5
322.
733
9.2
147.
380
.427
5.5
91.6
2273
sum
Gre
ater
than
25%
load
301.
422
7.7
87.7
116.
995
.418
1.6
321.
133
7.2
146.
380
.127
3.9
90.6
2260
sum
Gre
ater
than
50%
load
296.
522
3.0
86.0
114.
394
.517
9.6
319.
133
2.6
144.
979
.727
1.4
89.1
2231
sum
Gre
ater
than
75%
load
294.
822
2.8
85.4
113.
593
.417
9.6
318.
133
1.2
144.
679
.027
0.7
87.8
2221
sum
Gre
ater
than
or e
qual
to 1
00%
load
289.
317
9.0
48.0
67.0
61.1
120.
026
9.3
109.
996
.05.
04.
023
.012
71su
m
Perc
enta
ge o
f tim
e op
erat
ing
40.5
2%34
.12%
11.9
4%16
.41%
12.9
0%25
.35%
43.3
7%45
.59%
20.4
6%10
.80%
38.2
6%12
.31%
26%
avg
Perc
enta
ge o
f ope
ratin
g tim
e >
25%
Loa
d10
0%99
%99
%99
%99
%99
%99
%99
%99
%10
0%99
%99
%11
3%ca
lc.
Perc
enta
ge o
f ope
ratin
g tim
e >
50%
Loa
d98
%97
%97
%97
%98
%98
%99
%98
%98
%99
%99
%97
%11
2%ca
lc.
Perc
enta
ge o
f ope
ratin
g tim
e >
75%
Loa
d98
%97
%96
%96
%97
%98
%99
%98
%98
%98
%98
%96
%11
1%ca
lc.
Perc
enta
ge o
f ope
ratin
g tim
e >=
100%
Loa
d96
%78
%54
%57
%64
%66
%83
%32
%65
%6%
1%25
%64
%ca
lc.
Tem
pera
ture
37.1
41.2
49.9
55.4
65.2
72.3
79.6
78.1
70.1
6044
.842
.4
Pag
e 4

Pouc
h Te
rmin
al In
form
atio
n.xl
sx
Sum
mar
y of
Hou
rly O
pera
ting
Dat
a20
13Ja
nuar
yFe
brua
ryM
arch
Apr
ilM
ayJu
neJu
lyA
ugus
tSe
ptem
ber
Oct
ober
Nov
embe
rD
ecem
ber
AN
NU
AL
note
sM
ax10
2%10
4%10
3%10
3%10
1%10
3%10
3%10
3%10
3%10
1%10
2%10
0%10
4%m
axA
vera
ge33
%47
%28
%8%
13%
41%
86%
44%
24%
13%
5%11
%29
%av
g
Tota
l No.
of h
ours
744
672
744
720
744
720
744
744
720
744
720
744
8760
sum
Tota
l num
ber o
f ope
ratin
g ho
urs
234.
630
3.7
196.
152
.295
.528
3.1
634.
930
8.9
166.
995
.829
.480
.424
82su
m
Gre
ater
than
25%
load
232.
730
2.0
194.
952
.095
.228
2.1
633.
530
7.2
165.
195
.329
.079
.924
69su
mG
reat
er th
an 5
0% lo
ad22
9.0
299.
319
1.6
51.4
93.6
279.
363
1.2
303.
016
2.7
94.3
28.9
79.5
2444
sum
Gre
ater
than
75%
load
228.
829
8.0
191.
651
.493
.627
8.9
630.
330
1.0
161.
893
.428
.077
.924
35su
mG
reat
er th
an o
r equ
al to
100
% lo
ad87
.583
.011
6.0
38.0
21.0
116.
020
5.6
264.
390
.04.
02.
00.
010
27su
m
Perc
enta
ge o
f tim
e op
erat
ing
31.5
4%45
.20%
26.3
6%7.
25%
12.8
4%39
.32%
85.3
4%41
.52%
23.1
8%12
.88%
4.08
%10
.80%
28%
avg
Perc
enta
ge o
f ope
ratin
g tim
e >
25%
Loa
d99
%99
%99
%10
0%10
0%10
0%10
0%99
%99
%99
%99
%99
%12
4%ca
lc.
Perc
enta
ge o
f ope
ratin
g tim
e >
50%
Loa
d98
%99
%98
%98
%98
%99
%99
%98
%98
%98
%98
%99
%12
2%ca
lc.
Perc
enta
ge o
f ope
ratin
g tim
e >
75%
Loa
d98
%98
%98
%98
%98
%99
%99
%97
%97
%97
%95
%97
%12
2%ca
lc.
Perc
enta
ge o
f ope
ratin
g tim
e >=
100%
Loa
d37
%27
%59
%73
%22
%41
%32
%86
%54
%4%
7%0%
51%
calc
.Te
mpe
ratu
re35
.934
.339
.952
62.7
73.2
80.7
7567
.860
.545
.338
.2
2014
Janu
ary
Febr
uary
Mar
chA
pril
May
June
July
Aug
ust
Sept
embe
rO
ctob
erN
ovem
ber
Dec
embe
rA
NN
UA
Lno
tes
Max
100%
102%
99%
100%
104%
105%
105%
104%
105%
103%
101%
101%
105%
max
Ave
rage
8%8%
5%4%
3%17
%36
%17
%16
%20
%9%
4%12
%av
g
Tota
l No.
of h
ours
744
672
744
720
744
720
744
744
720
744
720
744
8760
sum
Tota
l num
ber o
f ope
ratin
g ho
urs
57.9
48.4
37.3
27.4
18.4
114.
325
1.9
118.
510
8.3
145.
459
.230
.210
17su
m
Gre
ater
than
25%
load
57.5
47.3
36.5
27.3
18.2
113.
425
0.4
117.
210
7.5
142.
755
.626
.199
9su
mG
reat
er th
an 5
0% lo
ad56
.445
.835
.926
.616
.011
2.0
247.
711
6.1
106.
214
0.8
53.8
25.0
982
sum
Gre
ater
than
75%
load
56.0
45.0
35.2
26.1
15.6
111.
624
6.7
115.
210
6.2
140.
053
.824
.097
6su
mG
reat
er th
an o
r equ
al to
100
% lo
ad0.
08.
00.
00.
010
.671
.821
7.7
98.8
87.0
91.0
5.0
1.0
591
sum
Perc
enta
ge o
f tim
e op
erat
ing
7.78
%7.
20%
5.01
%3.
80%
2.48
%15
.87%
33.8
5%15
.93%
15.0
4%19
.55%
8.23
%4.
05%
12%
avg
Perc
enta
ge o
f ope
ratin
g tim
e >
25%
Loa
d99
%98
%98
%10
0%98
%99
%99
%99
%99
%98
%94
%86
%50
%ca
lc.
Perc
enta
ge o
f ope
ratin
g tim
e >
50%
Loa
d97
%95
%96
%97
%87
%98
%98
%98
%98
%97
%91
%83
%49
%ca
lc.
Perc
enta
ge o
f ope
ratin
g tim
e >
75%
Loa
d97
%93
%94
%96
%85
%98
%98
%97
%98
%96
%91
%80
%49
%ca
lc.
Perc
enta
ge o
f ope
ratin
g tim
e >=
100%
Loa
d0%
17%
0%0%
58%
63%
86%
83%
80%
63%
8%3%
30%
calc
.Te
mpe
ratu
re28
.631
.336
.950
.363
.171
.876
.374
.570
60.1
45.1
40.2
Pag
e 5

1
Supplemental Pouch Terminal Analysis Technical Memorandum
This technical memorandum presents the methodology and findings for the supplemental air quality
analysis assessment that was undertaken to ascertain if any significant adverse air quality impacts would
result from the existing New York Power Authority’s (NYPA) Pouch Terminal facility onto Building A. The
supplemental analysis was performed up to a receptor height of 128 feet above grade on Building A using
the similar air quality modeling algorithms and parameters from the December 2016 EAS in accordance
with New York City Department of City Planning (DCP). The analysis demonstrated that there would be
no significant adverse air quality impacts on Building A at a height of no taller than 128 feet above grade
from existing NYPA Pouch Terminal facility.
Purpose and Need for Additional Air Quality Analysis
A detailed air quality analysis was performed and incorporated into Chapter 2.12, “Air Quality” and
Appendix D of the December 2016 EAS, to assess the potential impact from the NYPA Pouch Terminal
facility at 130 Edgewater Street to the proposed project, with Building A as the nearest sensitive receptor.
The December 2016 air quality analysis analyzed receptors up to a height of 126 feet on Building A and
demonstrated that there would not be a significant adverse air quality impact on Building A at this height.
However, the analysis also predicted that there would be short-term and annual PM2.5 impacts at
hypothetical heights of 136 feet and 146 feet above grade on the western façade of Building A facing the
Pouch Terminal facility.
As described in the introduction of this Revised EAS, as a result of the change in the base flood elevation
(BFE) assumptions that were made after the December 2016 EAS, Building A now would be considered 127
feet above grade (120 feet as measured from DFE). To address concerns raised by the Community Board
and the City Council regarding the effects of the NYPA Pouch Terminal facility onto Building A, an
additional study of the potential air quality impact of the NYPA facility was undertaken to ascertain if any
air quality impacts would result.
In this supplemental air quality analysis, receptors were modelled at an elevation of 128 feet (above grade)
on Building A. The 128 foot above grade elevation is 1 foot greater than the proposed 127 feet above grade
in order to provide a cushion in the event the BFE increases pursuant to an update of FEMA maps prior to
construction.
Methodology
The supplemental analysis was performed using EPA’s AERMOD dispersion model utilizing the same
emission rates and stack parameters as stated in Table 2.12-15 of the December 2016 EAS, with the same
AERMOD modeling algorithms for the modeled pollutants - 1‐hr NO2, Annual NO2, 24‐hr PM2.5 and
Annual PM2.5.
Emission Sources Parameters
The dispersion modeling analysis includes two emission sources from the NYPA Pouch Terminal facility
specified in December 2016 EAS - a combustion turbine (GE LM6000) with a design capacity of 420 million
Btu per hour, a boiler with a design capacity of 7.4 million Btu per hour. The emission rates and stack
parameters for the two emission sources are listed in Table 1.

2 Supplemental Pouch Terminal Analysis
Table 1: Emission Rates & Stack Parameters for the Pouch Terminal Facility
Emission Sources Combustion Turbine Boiler
Emission Rates (g/s)
1-hour NO2 0.7244 0.0339
Annual NO2 0.6306 0.0329
24-Hour PM2.5 0.216 0.0071
Annual PM2.5 0.1822 0.0069
Stack Parameters
Stack Height (m) 32.46 3.66
Stack Diameter (m) 3.66 0.51
Exhaust Velocity (m/s) 31.32 5.34
Exhaust Temperature (˚F) 672 589
Receptors
As shown in Figure 1-2, the base of Building A would be set back from the Edgewater Street lot line; this is
not required by zoning. For conservative purposes, this supplemental air quality analysis was performed
assuming that the base of Building A will be located at the lot line facing Edgewater Street, with the upper
floors of the building set back 15 feet above the base height of 59 feet (above grade) pursuant to Zoning
Resolution (ZR) Section 62-341(a)(2). This assumption is conservative because Building A receptors are
located in the closest possible location to the emissions sources at the NYPA facility.
Discrete receptors were placed along the building façades on Building A from the ground floor to 128 feet
(above grade) and every 10 feet in the horizontal direction.
Background Concentration
Appropriate background concentrations values (see Table 2) were added to modeling results to get the total
concentrations for 1-hour and annual NO2. Predicted values were compared with the NAAQS. The 24-hour
PM2.5 average background concentration of 19.4 µg/m3 was used to establish the de minimis value, consistent
with the guidance provided in the CEQR Technical Manual. The annual average PM2.5 impacts will be
assessed on an incremental basis and compared with the PM2.5 de minimis criteria threshold of 0.3 µg/m3,
without considering the annual background.
Table 2: Background Concentrations for Pouch Terminal Facility Analysis
Pollutant Averaging Time Monitoring Location Background Concentration
Nitrogen Dioxide (NO2) 1-hour1 Queens College, Queens 108.9 µg/m3
Annual2 IS 52, Bronx 40.6 µg/m3
Particulate Matter (PM2.5) 24-Hour3 Port Richmond, Staten Island 19.4 µg/m3
Source: NYSDEC Ambient Air Quality Report, 2014, http://www.dec.ny.gov/chemical/29310.html Notes: 1 1-hour NO2 background concentration is based on three-year average (2012-2014) of the 98th percentile of daily maximum 1-hour
concentrations from available monitoring data from NYSDEC. 2 Annual NO2 background concentration is based on the maximum annual average from the latest five years of available monitoring data from
NYSDEC (2010-2014). 3 The 24-hour PM2.5 background concentration is based on maximum 98th percentile concentration averaged over three years of data from
NYSDEC (2012-2014).

3 Supplemental Pouch Terminal Analysis
Results
The AERMOD results of the supplemental air quality analysis are presented in Table 3. As shown in Table
3, the maximum 1-hour and annual NO2 are below their respective NAAQS values. The maximum 24-hour
PM2.5 concentration is below the de minimis criteria threshold of 7.8 µg/m3, and the annual PM2.5
concentration is below the de minimis criteria threshold of 0.3 µg/m3. Therefore, there would be no
significant adverse stationary source impacts on Building A at a height of 128 feet (above grade) from the
existing NYPA Pouch Terminal facility at 130 Edgewater Street.
Table 3: Maximum Predicted Concentration (µg/m3) on Building A from the Pouch Terminal Facility
Pollutant Averaging
Period
Maximum Modeled Concentration Background Concentration
Total Concentration1
NAAQS / De Minimis No Downwash Downwash
NO2 1-Hour 23.35 23.35 108.9 132.2 188
Annual 0.98 0.94 43 44 100
PM2.5 24-Hour 5.1 4.5 19.4 5.1 7.8
Annual 0.21 0.20 -- 0.21 0.3
Notes: 1 Total concentration represents the higher pollutant level predicted from "No Downwash" and "Downwash".
To avoid any potential significant adverse air quality impacts from existing NYPA Pouch Terminal
facility onto Building A, an (E) designation related to air quality is required to ensure that no operable
windows or air intakes are located above a height of 128 feet above grade on Building A. The text of the
(E) designation on Building A is provided in Chapter 2.12, “Air Quality” of this revised EAS.

Facility DEC ID: 2640200295
DEC Permit Conditions Renewal 2/FINAL Page 1
PERMITUnder the Environmental Conservation Law (ECL)
IDENTIFICATION INFORMATION
Permit Type: Air Title V FacilityPermit ID: 2-6402-00295/00003
Effective Date: 01/25/2016 Expiration Date: 01/24/2021
Permit Issued To:NEW YORK POWER AUTHORITY 123 MAIN ST WHITE PLAINS, NY 10601
Contact: JOHN KAHABKA NY POWER AUTHORITY 123 MAIN ST WHITE PLAINS, NY 10601 (914) 681-6308
Facility: POUCH TERMINAL 143 EDGEWATER ST|LYNHURST AVE & EDGEWATER ST STATEN ISLAND, NY 10305
Contact: JOHN KAHABKA NY POWER AUTHORITY 123 MAIN ST WHITE PLAINS, NY 10601 (914) 681-6308
Description:This is a Title V Renewal for NYPA's Pouch Terminal. The facility consists ofone simple cycle combustion turbine (GE LM6000) which fires only natural gas.The turbine will employ a spray intercooling system to optimize power output.The unit is equipped with selective catalytic reduction to control emissions ofoxides of nitrogen and catalytic oxidation to control emissions of carbonmonoxide. Other equipment on-site include gas and air compressors, coolingtower lube oil cooling system, water treatment and storage system, ammoniastorage and injection system, raw water storage, and auxilliary electricalsystems. The stack is approximately 107 feet in height and 144 inches indiameter. The facility will generate a maximum 47 megawatts of power. Theturbine will not operate below 50 percent load except during periods of start upor shut down.

Facility DEC ID: 2640200295
DEC Permit Conditions Renewal 2/FINAL Page 2
By acceptance of this permit, the permittee agrees that the permit is contingent upon strictcompliance with the ECL, all applicable regulations, the General Conditions specified and anySpecial Conditions included as part of this permit.
Permit Administrator: STEPHEN A WATTS 47-40 21ST ST LONG ISLAND CITY, NY 11101-5401
Authorized Signature: _________________________________ Date: ___ / ___ / _____

Facility DEC ID: 2640200295
DEC Permit Conditions Renewal 2/FINAL Page 3
Notification of Other State Permittee Obligations
Item A: Permittee Accepts Legal Responsibility and Agrees to Indemnification
The permittee expressly agrees to indemnify and hold harmless the Departmentof Environmental Conservation of the State of New York, its representatives,employees and agents ("DEC") for all claims, suits, actions, and damages, to theextent attributable to the permittee's acts or omissions in connection with thecompliance permittee's undertaking of activities in connection with, or operationand maintenance of, the facility or facilities authorized by the permit whether incompliance or not in any compliance with the terms and conditions of the permit.This indemnification does not extend to any claims, suits, actions, or damages tothe extent attributable to DEC's own negligent or intentional acts or omissions,or to any claims, suits, or actions naming the DEC and arising under article 78of the New York Civil Practice Laws and Rules or any citizen suit or civilrights provision under federal or state laws.
Item B: Permittee's Contractors to Comply with Permit
The permittee is responsible for informing its independent contractors, employees, agents and assigns of their responsibility to comply with this permit,including all special conditions while acting as the permittee's agent with respectto the permitted activities, and such persons shall be subject to the samesanctions for violations of the Environmental Conservation Law as thoseprescribed for the permittee.
Item C: Permittee Responsible for Obtaining Other Required Permits
The permittee is responsible for obtaining any other permits, approvals, lands, easements and rights-of-way that may be required to carry out the activities thatare authorized by this permit.
Item D: No Right to Trespass or Interfere with Riparian Rights
This permit does not convey to the permittee any right to trespass upon the landsor interfere with the riparian rights of others in order to perform the permitted work nor does it authorize the impairment of any rights, title, or interest in realor personal property held or vested in a person not a party to the permit.

Facility DEC ID: 2640200295
DEC Permit Conditions Renewal 2/FINAL Page 4
LIST OF CONDITIONS
DEC GENERAL CONDITIONS General ProvisionsFacility Inspection by the Department
Relationship of this Permit to Other Department Orders and DeterminationsApplications for permit renewals, modifications and transfersPermit modifications, suspensions or revocations by the Department Facility Level
Submission of application for permit modification or renewal - REGION 2 HEADQUARTERS

Facility DEC ID: 2640200295
DEC Permit Conditions Renewal 2/FINAL Page 5
DEC GENERAL CONDITIONS **** General Provisions ****
For the purpose of your Title V permit, the following section contains state-only enforceable terms and conditions.
GENERAL CONDITIONS - Apply to ALL Authorized Permits.
Condition 1: Facility Inspection by the DepartmentApplicable State Requirement: ECL 19-0305
Item 1.1:The permitted site or facility, including relevant records, is subject to inspection at reasonablehours and intervals by an authorized representative of the Department of EnvironmentalConservation (the Department) to determine whether the permittee is complying with this permitand the ECL. Such representative may order the work suspended pursuant to ECL 71-0301 andSAPA 401(3).
Item 1.2:The permittee shall provide a person to accompany the Department's representative during aninspection to the permit area when requested by the Department.
Item 1.3:A copy of this permit, including all referenced maps, drawings and special conditions, must beavailable for inspection by the Department at all times at the project site or facility. Failure toproduce a copy of the permit upon request by a Department representative is a violation of thispermit.
Condition 2: Relationship of this Permit to Other Department Orders and DeterminationsApplicable State Requirement: ECL 3-0301 (2) (m)
Item 2.1:Unless expressly provided for by the Department, issuance of this permit does not modify,supersede or rescind any order or determination previously issued by the Department or any ofthe terms, conditions or requirements contained in such order or determination.
Condition 3: Applications for permit renewals, modifications and transfersApplicable State Requirement: 6 NYCRR 621.11
Item 3.1:The permittee must submit a renewal application at least 180 days before expiration of permitsfor both Title V and State Facility Permits.
Item 3.3:Permits are transferrable with the approval of the department unless specifically prohibited bythe statute, regulation or another permit condition. Applications for permit transfer should besubmitted prior to actual transfer of ownership.
Condition 4: Permit modifications, suspensions or revocations by the DepartmentApplicable State Requirement: 6 NYCRR 621.13
Item 4.1:

Facility DEC ID: 2640200295
DEC Permit Conditions Renewal 2/FINAL Page 6
The Department reserves the right to exercise all available authority to modify, suspend, orrevoke this permit in accordance with 6NYCRR Part 621. The grounds for modification,suspension or revocation include:
a) materially false or inaccurate statements in the permit application or supporting papers;b) failure by the permittee to comply with any terms or conditions of the permit;c) exceeding the scope of the project as described in the permit application;d) newly discovered material information or a material change in environmental conditions,relevant technology or applicable law or regulations since the issuance of the existing permit;e) noncompliance with previously issued permit conditions, orders of the commissioner, anyprovisions of the Environmental Conservation Law or regulations of the Department related tothe permitted activity.
**** Facility Level ****
Condition 5: Submission of application for permit modification or renewal - REGION 2 HEADQUARTERS Applicable State Requirement: 6 NYCRR 621.6 (a)
Item 5.1:Submission of applications for permit modification or renewal are to be submitted to: NYSDEC Regional Permit Administrator Region 2 Headquarters Division of Environmental Permits 1 Hunters Point Plaza, 4740 21st Street Long Island City, NY 11101-5407 (718) 482-4997

Permit ID: 2-6402-00295/00003 Facility DEC ID: 2640200295
Air Pollution Control Permit ConditionsRenewal 2 Page 1 FINAL
Permit Under the Environmental Conservation Law (ECL)
ARTICLE 19: AIR POLLUTION CONTROL - TITLE V PERMIT
IDENTIFICATION INFORMATION
Permit Issued To:NEW YORK POWER AUTHORITY 123 MAIN ST WHITE PLAINS, NY 10601
Facility: POUCH TERMINAL 143 EDGEWATER ST|LYNHURST AVE & EDGEWATER ST STATEN ISLAND, NY 10305
Authorized Activity By Standard Industrial Classification Code: 4911 - ELECTRIC SERVICES
Permit Effective Date: 01/25/2016 Permit Expiration Date: 01/24/2021

Permit ID: 2-6402-00295/00003 Facility DEC ID: 2640200295
Air Pollution Control Permit ConditionsRenewal 2 Page 2 FINAL
LIST OF CONDITIONS
FEDERALLY ENFORCEABLE CONDITIONS
Facility Level 1 6 NYCRR 200.6: Acceptable Ambient Air Quality 2 6 NYCRR 201-6.4 (a) (7): Fees 3 6 NYCRR 201-6.4 (c): Recordkeeping and Reporting of Compliance Monitoring 4 6 NYCRR 201-6.4 (c) (2): Records of Monitoring, Sampling, and Measurement 5 6 NYCRR 201-6.4 (c) (3) (ii): Compliance Certification 6 6 NYCRR 201-6.4 (e): Compliance Certification 7 6 NYCRR 202-2.1: Compliance Certification 8 6 NYCRR 202-2.5: Recordkeeping requirements 9 6 NYCRR 215.2: Open Fires - Prohibitions 10 6 NYCRR 200.7: Maintenance of Equipment 11 6 NYCRR 201-1.7: Recycling and Salvage 12 6 NYCRR 201-1.8: Prohibition of Reintroduction of Collected Contaminants to the air 13 6 NYCRR 201-3.2 (a): Exempt Sources - Proof of Eligibility 14 6 NYCRR 201-3.3 (a): Trivial Sources - Proof of Eligibility 15 6 NYCRR 201-6.4 (a) (4): Requirement to Provide Information 16 6 NYCRR 201-6.4 (a) (8): Right to Inspect 17 6 NYCRR 201-6.4 (f) (6): Off Permit Changes 18 6 NYCRR 202-1.1: Required Emissions Tests 19 40 CFR Part 68: Accidental release provisions. 20 40CFR 82, Subpart F: Recycling and Emissions Reduction 21 6 NYCRR Subpart 201-6: Emission Unit Definition 22 6 NYCRR 201-6.4 (d) (4): Progress Reports Due Semiannually 23 6 NYCRR 211.1: Air pollution prohibited 24 40CFR 60.4, NSPS Subpart A: EPA Region 2 address. 25 40CFR 60.7(a), NSPS Subpart A: Date of construction notification -
If a COM is not used. 26 40CFR 60.7(b), NSPS Subpart A: Recordkeeping requirements. 27 40CFR 60.7(f), NSPS Subpart A: Facility files for subject sources. 28 40CFR 60.12, NSPS Subpart A: Circumvention. 29 40CFR 60.13, NSPS Subpart A: Monitoring requirements. 30 40CFR 60.14, NSPS Subpart A: Modifications. 31 40CFR 60.15, NSPS Subpart A: Reconstruction 32 40CFR 63, Subpart ZZZZ: Compliance and Enforcement 33 40 CFR Part 72: Facility Subject to Title IV Acid Rain Regulations and Permitting 34 40CFR 97.406, Subpart AAAAA: Compliance Certification 35 40CFR 97.506, Subpart BBBBB: Compliance Certification 36 40CFR 97.606, Subpart CCCCC: Compliance Certification Emission Unit Level 37 6 NYCRR Subpart 201-6: Emission Point Definition By Emission Unit 38 6 NYCRR Subpart 201-6: Process Definition By Emission Unit
EU=1-00001

Permit ID: 2-6402-00295/00003 Facility DEC ID: 2640200295
Air Pollution Control Permit ConditionsRenewal 2 Page 3 FINAL
39 40CFR 60.334(h)(4), NSPS Subpart GG: Custom fuel monitoring schedule
EU=1-00001,EP=00001
40 6 NYCRR 227-1.3 (a): Compliance Certification
STATE ONLY ENFORCEABLE CONDITIONS Facility Level 41 ECL 19-0301: Contaminant List 42 6 NYCRR 201-1.4: Malfunctions and start-up/shutdown activities 43 6 NYCRR 201-1.4: Compliance Demonstration 44 6 NYCRR 211.2: Visible Emissions Limited 45 6 NYCRR 242-1.5: Compliance Demonstration 46 6 NYCRR 242-1.5: Compliance Demonstration Emission Unit Level
EU=1-00001 47 6 NYCRR Subpart 201-5: Compliance Demonstration 48 6 NYCRR Subpart 201-5: Compliance Demonstration 49 6 NYCRR Subpart 201-5: Compliance Demonstration 50 6 NYCRR Subpart 201-5: Compliance Demonstration 51 6 NYCRR Subpart 201-5: Compliance Demonstration 52 6 NYCRR Subpart 201-5: Compliance Demonstration 53 6 NYCRR Subpart 201-5: Compliance Demonstration 54 6 NYCRR Subpart 201-5: Compliance Demonstration 55 6 NYCRR Subpart 201-5: Compliance Demonstration 56 6 NYCRR Subpart 201-5: Compliance Demonstration 57 6 NYCRR Subpart 201-5: Compliance Demonstration 58 6 NYCRR Subpart 201-5: Compliance Demonstration 59 6 NYCRR Subpart 201-5: Compliance Demonstration 60 6 NYCRR Subpart 201-5: Compliance Demonstration

Permit ID: 2-6402-00295/00003 Facility DEC ID: 2640200295
Air Pollution Control Permit ConditionsRenewal 2 Page 4 FINAL
FEDERALLY ENFORCEABLE CONDITIONS **** Facility Level ****
NOTIFICATION OF GENERAL PERMITTEE OBLIGATIONS The items listed below are not subject to the annual compliance certification requirements under Title V. Permittees may also have other obligations
under regulations of general applicability.
Item A: Emergency Defense - 6 NYCRR 201-1.5
An emergency, as defined by subpart 201-2, constitutes anaffirmative defense to penalties sought in an enforcement action brought by the Department for noncompliance with emissions limitations or permit conditions for all facilities in New York State.
(a) The affirmative defense of emergency shall be demonstrated through properly signed, contemporaneous operating logs, or other relevant evidence that:
(1) An emergency occurred and that the facility owner or operator can identify the cause(s) of the
emergency; (2) The equipment at the permitted facility causing the emergency was at the time being properly operated and maintained; (3) During the period of the emergency the facility owner or operator took all reasonable steps to minimize levels of emissions that exceeded the emission standards, or other requirements in the permit; and (4) The facility owner or operator notified the Department within two working days after the event occurred. This notice must contain a description of the emergency, any steps taken to mitigate emissions, and corrective actions taken.
(b) In any enforcement proceeding, the facility owner or operator seeking to establish the occurrence of an emergency has the burden of proof.
(c) This provision is in addition to any emergency or upset provision contained in any applicable requirement.
Item B: Public Access to Recordkeeping for Title V Facilities - 6 NYCRR 201-1.10 (b) The Department will make available to the public any
permit application, compliance plan, permit, and monitoring and compliance certification report pursuant toSection 503(e) of the Act, except for information entitledto confidential treatment pursuant to 6 NYCRR Part 616 - Public Access to records and Section 114(c) of the Act.

Permit ID: 2-6402-00295/00003 Facility DEC ID: 2640200295
Air Pollution Control Permit ConditionsRenewal 2 Page 5 FINAL
Item C: Timely Application for the Renewal of Title V Permits - 6 NYCRR 201-6.2 (a) (4) Owners and/or operators of facilities having an issued Title V permit shall submit a complete application at least 180 days, but not more than eighteen months, prior to the date of permit expiration for permit renewal purposes.
Item D: Certification by a Responsible Official - 6 NYCRR 201-6.2 (d) (12) Any application, form, report or compliance certification required to be submitted pursuant to the federally enforceable portions of this permit shall contain a certification of truth, accuracy and completeness by a responsible official. This certification shall state that based on information and belief formed after reasonable inquiry, the statements and information in the document are true, accurate, and complete.
Item E: Requirement to Comply With All Conditions - 6 NYCRR 201-6.4 (a) (2) The permittee must comply with all conditions of the Title V facility permit. Any permit non-compliance constitutes a violation of the Act and is grounds for enforcement action; for permit termination, revocation and reissuance, or modification; or for denial of a permit renewal application.
Item F: Permit Revocation, Modification, Reopening, Reissuance or Termination, and Associated Information Submission Requirements - 6 NYCRR 201-6.4 (a) (3) This permit may be modified, revoked, reopened and reissued, or terminated for cause. The filing of a request by the permittee for a permit modification, revocation and reissuance, or termination, or of a notification of planned changes or anticipated noncompliance does not stay any permit condition.
Item G: Cessation or Reduction of Permitted Activity Not a Defense - 6 NYCRR 201-6.4 (a) (5) It shall not be a defense for a permittee in an enforcement action to claim that a cessation or reduction in the permitted activity would have been necessary in order to maintain compliance with the conditions of this permit.
Item H: Property Rights - 6 NYCRR 201-6.4 (a) (6)
This permit does not convey any property rights of any sort or any exclusive privilege.

Permit ID: 2-6402-00295/00003 Facility DEC ID: 2640200295
Air Pollution Control Permit ConditionsRenewal 2 Page 6 FINAL
Item I: Severability - 6 NYCRR 201-6.4 (a) (9)
If any provisions, parts or conditions of this permit are found to be invalid or are the subject of a challenge, the remainder of this permit shall continue to be valid.
Item J: Permit Shield - 6 NYCRR 201-6.4 (g)
All permittees granted a Title V facility permit shall be covered under the protection of a permit shield, except as provided under 6 NYCRR Subpart 201-6. Compliance with the conditions of the permit shall be deemed compliance with any applicable requirements as of the date of permit issuance, provided that such applicable requirements are included and are specifically identified in the permit, or the Department, in acting on the permit application or revision, determines in writing that other requirements specifically identified are not applicable to the major stationary source, and the permit includes the determination or a concise summary thereof. Nothing herein shall preclude the Department from revising or revoking the permit pursuant to 6 NYCRR Part 621 or from exercising its summary abatement authority. Nothing in this permit shall alter or affect the following:
i. The ability of the Department to seek to bring suit on behalf of the State of New York, or the Administrator to seek to bring suit on behalf of the United States, to immediately restrain any person causing or contributing to pollution presenting an imminent and substantial endangerment to public health, welfare or the environment to stop the emission of air pollutants causing or contributing to such pollution;
ii. The liability of a permittee of the Title V facility for any violation of applicable requirements prior to or at the time of permit issuance;
iii. The applicable requirements of Title IV of the Act;
iv. The ability of the Department or the Administrator to obtain information from the permittee concerning the ability to enter, inspect and monitor the facility.
Item K: Reopening for Cause - 6 NYCRR 201-6.4 (i)
This Title V permit shall be reopened and revised under any of the following circumstances:
i. If additional applicable requirements under the Act become applicable where this permit's remaining term is

Permit ID: 2-6402-00295/00003 Facility DEC ID: 2640200295
Air Pollution Control Permit ConditionsRenewal 2 Page 7 FINAL
three or more years, a reopening shall be completed not later than 18 months after promulgation of the applicable requirement. No such reopening is required if the effective date of the requirement is later than the date on which this permit is due to expire, unless the originalpermit or any of its terms and conditions has been extended by the Department pursuant to the provisions of Part 201-6.7 and Part 621.
ii. The Department or the Administrator determines that the permit contains a material mistake or that inaccurate statements were made in establishing the emissions standards or other terms or conditions of the
permit.
iii. The Department or the Administrator determines that the Title V permit must be revised or reopened to assure compliance with applicable requirements.
iv. If the permitted facility is an "affected source" subject to the requirements of Title IV of the Act, and additional requirements (including excess emissions requirements) become applicable. Upon approval by the Administrator, excess emissions offset plans shall be deemed to be incorporated into the permit.
Proceedings to reopen and issue Title V facility permits shall follow the same procedures as apply to initial permit issuance but shall affect only those parts of the permit for which cause to reopen exists.
Reopenings shall not be initiated before a notice of suchintent is provided to the facility by the Department at least thirty days in advance of the date that the permit is to be reopened, except that the Department may providea shorter time period in the case of an emergency.
Item L: Permit Exclusion - ECL 19-0305 The issuance of this permit by the Department and the
receipt thereof by the Applicant does not and shall not beconstrued as barring, diminishing, adjudicating or in any way affecting any legal, administrative or equitable rights or claims, actions, suits, causes of action or demands whatsoever that the Department may have against the Applicant for violations based on facts and circumstances alleged to have occurred or existed prior tothe effective date of this permit, including, but not limited to, any enforcement action authorized pursuant to the provisions of applicable federal law, the Environmental Conservation Law of the State of New York (ECL) and Chapter III of the Official Compilation of the Codes, Rules and Regulations of the State of New York
Permit ID: 2-6402-00295/00003 Facility DEC ID: 2640200295
Air Pollution Control Permit ConditionsRenewal 2 Page 8 FINAL
(NYCRR). The issuance of this permit also shall not in anyway affect pending or future enforcement actions under theClean Air Act brought by the United States or any person.
Item M: Federally Enforceable Requirements - 40 CFR 70.6 (b) All terms and conditions in this permit required by the
Act or any applicable requirement, including any provisions designed to limit a facility's potential to emit, are enforceable by the Administrator and citizens under the Act. The Department has, in this permit, specifically designated any terms and conditions that are not required under the Act or under any of its applicable requirements as being enforceable under only state
regulations.
MANDATORY FEDERALLY ENFORCEABLE PERMIT CONDITIONS SUBJECT TO ANNUAL CERTIFICATIONS AT ALL TIMES
The following federally enforceable permit conditions are mandatory for all Title V permits and are subject to annual compliance certification requirements at all times.
Condition 1: Acceptable Ambient Air Quality Effective between the dates of 01/25/2016 and 01/24/2021
Applicable Federal Requirement:6 NYCRR 200.6
Item 1.1:Notwithstanding the provisions of 6 NYCRR Chapter III, Subchapter A, no person shall allow orpermit any air contamination source to emit air contaminants in quantities which alone or incombination with emissions from other air contamination sources would contravene anyapplicable ambient air quality standard and/or cause air pollution. In such cases wherecontravention occurs or may occur, the Commissioner shall specify the degree and/or method ofemission control required.
Condition 2: Fees Effective between the dates of 01/25/2016 and 01/24/2021
Applicable Federal Requirement:6 NYCRR 201-6.4 (a) (7)
Item 2.1:The owner and/or operator of a stationary source shall pay fees to the Department consistentwith the fee schedule authorized by ECL 72-0303.
Condition 3: Recordkeeping and Reporting of Compliance Monitoring Effective between the dates of 01/25/2016 and 01/24/2021
Applicable Federal Requirement:6 NYCRR 201-6.4 (c)
Permit ID: 2-6402-00295/00003 Facility DEC ID: 2640200295
Air Pollution Control Permit ConditionsRenewal 2 Page 9 FINAL
Item 3.1:The following information must be included in any required compliance monitoring records andreports:
(i) The date, place, and time of sampling or measurements;
(ii) The date(s) analyses were performed;
(iii)The company or entity that performed the analyses;
(iv) The analytical techniques or methods used including quality assurance and quality controlprocedures if required;
(v) The results of such analyses including quality assurance data where required; and
(vi) The operating conditions as existing at the time of sampling or measurement.
Any deviation from permit requirements must be clearly identified in all records and reports. Reports must be certified by a responsible official, consistent with Section 201-6.2 of Part 201.
Condition 4: Records of Monitoring, Sampling, and Measurement Effective between the dates of 01/25/2016 and 01/24/2021
Applicable Federal Requirement:6 NYCRR 201-6.4 (c) (2)
Item 4.1:Compliance monitoring and recordkeeping shall be conducted according to the terms andconditions contained in this permit and shall follow all quality assurance requirements found inapplicable regulations. Records of all monitoring data and support information must be retainedfor a period of at least 5 years from the date of the monitoring, sampling, measurement, report,or application. Support information includes all calibration and maintenance records and alloriginal strip-chart recordings for continuous monitoring instrumentation, and copies of allreports required by the permit.
Condition 5: Compliance Certification Effective between the dates of 01/25/2016 and 01/24/2021
Applicable Federal Requirement:6 NYCRR 201-6.4 (c) (3) (ii)
Item 5.1:The Compliance Certification activity will be performed for the Facility.
Item 5.2:Compliance Certification shall include the following monitoring:
Monitoring Type: RECORD KEEPING/MAINTENANCE PROCEDURESMonitoring Description: To meet the requirements of this facility permit with respect to reporting, the permittee must:

Permit ID: 2-6402-00295/00003 Facility DEC ID: 2640200295
Air Pollution Control Permit ConditionsRenewal 2 Page 10 FINAL
Submit reports of any required monitoring at a minimum frequency of every 6 months, based on a calendar year reporting schedule. These reports shall be submitted to the Department within 30 days after the end of a reportingperiod. All instances of deviations from permit requirements must be clearly identified in such reports. All required reports must be certified by the responsible official for this facility.
Notify the Department and report permit deviations and incidences of noncompliance stating the probable cause of such deviations, and any corrective actions or preventive measures taken. Where the underlying applicable requirement contains a definition of prompt or otherwise specifies a time frame for reporting deviations, that definition or time frame shall govern. Where the underlying applicable requirement fails to address the time frame for reporting deviations, reports of deviationsshall be submitted to the permitting authority based on
the following schedule:
(1) For emissions of a hazardous air pollutant (as identified in an applicable regulation) that continue for more than an hour in excess of permit requirements, the report must be made within 24 hours of the
occurrence.
(2) For emissions of any regulated air pollutant, excluding those listed in paragraph (1) of this section, that continue for more than two hours in excess of permit requirements, the report must be made within 48
hours.
(3) For all other deviations from permit requirements, the report shall be contained in the 6 month monitoring report required above.
(4) This permit may contain a more stringent reporting requirement than required by paragraphs (1), (2) or (3) above. If more stringent reporting requirements have beenplaced in this permit or exist in applicable requirements that apply to this facility, the more stringent reporting
requirement shall apply.
If above paragraphs (1) or (2) are met, the source must notify the permitting authority by telephone during normalbusiness hours at the Regional Office of jurisdiction for this permit, attention Regional Air Pollution Control Engineer (RAPCE) according to the timetable listed in paragraphs (1) and (2) of this section. For deviations and incidences that must be reported outside of normal business hours, on weekends, or holidays, the DEC Spill

Permit ID: 2-6402-00295/00003 Facility DEC ID: 2640200295
Air Pollution Control Permit ConditionsRenewal 2 Page 11 FINAL
Hotline phone number at 1-800-457-7362 shall be used. A written notice, certified by a responsible official consistent with 6 NYCRR Part 201-6.2(d)(12), must be submitted within 10 working days of an occurrence for deviations reported under (1) and (2). All deviations reported under paragraphs (1) and (2) of this section mustalso be identified in the 6 month monitoring report
required above.
The provisions of 6 NYCRR 201-1.4 shall apply if the permittee seeks to have a violation excused unless otherwise limited by regulation. In order to have a violation of a federal regulation (such as a new source performance standard or national emissions standard for hazardous air pollutants) excused, the specific federal regulation must provide for an affirmative defense during start-up, shutdowns, malfunctions or upsets. Notwithstanding any recordkeeping and reporting requirements in 6 NYCRR 201-1.4, reports of any deviationsshall not be on a less frequent basis than the reporting periods described in paragraphs (1) and (4) above.
In the case of any condition contained in this permit witha reporting requirement of "Upon request by regulatory agency" the permittee shall include in the semiannual report, a statement for each such condition that the monitoring or recordkeeping was performed as required or requested and a listing of all instances of deviations from these requirements.
In the case of any emission testing performed during the previous six month reporting period, either due to a request by the Department, EPA, or a regulatory requirement, the permittee shall include in the semiannualreport a summary of the testing results and shall indicatewhether or not the Department or EPA has approved the
results.
All semiannual reports may be submitted electronically or physically. Electronic reports shall be submitted using the Department’s Air Compliance and Emissions Electronic-Reporting system (ACE). If the facility owner or operator elects to send physical copies instead, two copies shall be sent to the Department (one copy to the regional air pollution control engineer (RAPCE) in the regional office and one copy to the Bureau of Quality Assurance (BQA) in the DEC central office) and one copy shall be sent to the Administrator (or his or her representative). Mailing addresses for the above referenced persons are contained in the monitoring condition for 6 NYCRR Part 201-6.4(e), contained elsewhere
in this permit.

Permit ID: 2-6402-00295/00003 Facility DEC ID: 2640200295
Air Pollution Control Permit ConditionsRenewal 2 Page 12 FINAL
Reporting Requirements: SEMI-ANNUALLY (CALENDAR)Reports due 30 days after the reporting period.The initial report is due 7/30/2016.Subsequent reports are due every 6 calendar month(s).
Condition 6: Compliance Certification Effective between the dates of 01/25/2016 and 01/24/2021
Applicable Federal Requirement:6 NYCRR 201-6.4 (e)
Item 6.1:The Compliance Certification activity will be performed for the Facility.
Item 6.2:Compliance Certification shall include the following monitoring:
Monitoring Type: RECORD KEEPING/MAINTENANCE PROCEDURESMonitoring Description: Requirements for compliance certifications with terms and conditions contained in this facility permit include the following:
i. Compliance certifications shall contain: - the identification of each term or condition of the permit that is the basis of the certification; - the compliance status; - whether compliance was continuous or intermittent; - the method(s) used for determining the compliance status of the facility, currently and over the reporting period consistent with the monitoring and related record keeping and reporting requirements of this permit; - such other facts as the Department may require to determine the compliance status of the facility as specified in any special permit terms or conditions; and - such additional requirements as may be specified elsewhere in this permit related to compliance certification.
ii. The responsible official must include in the annual certification report all terms and conditions contained in this permit which are identified as being subject to certification, including emission limitations, standards, or work practices. That is, the provisions labeled herein as "Compliance Certification" are not the only provisions of this permit for which an annual certification is required.
iii. Compliance certifications shall be submitted annually. Certification reports are due 30 days after the anniversary date of four consecutive calendar quarters.

Permit ID: 2-6402-00295/00003 Facility DEC ID: 2640200295
Air Pollution Control Permit ConditionsRenewal 2 Page 13 FINAL
The first report is due 30 days after the calendar quarterthat occurs just prior to the permit anniversary date, unless another quarter has been acceptable by the
Department.
iv. All annual compliance certifications may be submittedelectronically or physically. Electronic reports shall besubmitted using the Department’s Air Compliance and Emissions Electronic-Reporting system (ACE). If the facility owner or operator elects to send physical copies instead, two copies shall be sent to the Department (one copy to the regional air pollution control engineer (RAPCE) in the regional office and one copy to the Bureau of Quality Assurance (BQA) in the DEC central office) and one copy shall be sent to the Administrator (or his or herrepresentative). The mailing addresses for the above referenced persons are:
Chief – Stationary Source Compliance Section USEPA Region 2 Air Compliance Branch 290 Broadway
New York, NY 10007-1866
The address for the RAPCE is as follows:
Regional Air Pollution Control Engineer Hunters Point Plaza
47-40 21st StreetLong Island City, NY 11101-5407
The address for the BQA is as follows:
NYSDEC Bureau of Quality Assurance
625 Broadway Albany, NY 12233-3258
Monitoring Frequency: ANNUALLYReporting Requirements: ANNUALLY (CALENDAR)Reports due 30 days after the reporting period.The initial report is due 1/30/2017.Subsequent reports are due on the same day each year
Condition 7: Compliance Certification Effective between the dates of 01/25/2016 and 01/24/2021
Applicable Federal Requirement:6 NYCRR 202-2.1
Item 7.1:The Compliance Certification activity will be performed for the Facility.

Permit ID: 2-6402-00295/00003 Facility DEC ID: 2640200295
Air Pollution Control Permit ConditionsRenewal 2 Page 14 FINAL
Item 7.2:Compliance Certification shall include the following monitoring:
Monitoring Type: RECORD KEEPING/MAINTENANCE PROCEDURESMonitoring Description: Emission statements shall be submitted on or before April 15th each year for emissions of the previous calendar year. Statements are to be mailed to: New York State Department of Environmental Conservation, Division of Air Resources, Bureau of Air Quality Planning, 625 Broadway, Albany NY 12233-3251
Monitoring Frequency: ANNUALLYReporting Requirements: ANNUALLY (CALENDAR)Reports due by April 15th for previous calendar year
Condition 8: Recordkeeping requirements Effective between the dates of 01/25/2016 and 01/24/2021
Applicable Federal Requirement:6 NYCRR 202-2.5
Item 8.1:(a) The following records shall be maintained for at least five years:
(1) a copy of each emission statement submitted to the department; and
(2) records indicating how the information submitted in the emissionstatement was determined, including any calculations, data, measurements, and estimates used.
(b) These records shall be made available at the facility to the representatives of thedepartment upon request during normal business hours.
Condition 9: Open Fires - Prohibitions Effective between the dates of 01/25/2016 and 01/24/2021
Applicable Federal Requirement:6 NYCRR 215.2
Item 9.1: Except as allowed by Title 6 NYCRR Section 215.3, no person shall burn, cause, suffer, allowor permit the burning of any materials in an open fire.
Item 9.2Per Section 215.3, burning in an open fire, provided it is not contrary to other law or regulation,will be allowed as follows:(a) On-site burning in any town with a total population less than 20,000 of downed limbs andbranches (including branches with attached leaves or needles) less than six inches in diameterand eight feet in length between May 15th and the following March 15th. For the purposes ofthis subdivision, the total population of a town shall include the population of any village orportion thereof located within the town. However, this subdivision shall not be construed toallow burning within any village.(b) Barbecue grills, maple sugar arches and similar outdoor cooking devices when actually usedfor cooking or processing food.

Permit ID: 2-6402-00295/00003 Facility DEC ID: 2640200295
Air Pollution Control Permit ConditionsRenewal 2 Page 15 FINAL
(c) Small fires used for cooking and camp fires provided that only charcoal or untreated wood isused as fuel and the fire is not left unattended until extinguished.(d) On-site burning of agricultural wastes as part of a valid agricultural operation on contiguousagricultural lands larger than five acres actively devoted to agricultural or horticultural use,provided such waste is actually grown or generated on those lands and such waste is capable ofbeing fully burned within a 24-hour period.(e) The use of liquid petroleum fueled smudge pots to prevent frost damage to crops.(f) Ceremonial or celebratory bonfires where not otherwise prohibited by law, provided that onlyuntreated wood or other agricultural products are used as fuel and the fire is not left unattendeduntil extinguished.(g) Small fires that are used to dispose of a flag or religious item, and small fires or other smokeproducing process where not otherwise prohibited by law that are used in connection with areligious ceremony.(h) Burning on an emergency basis of explosive or other dangerous or contraband materials bypolice or other public safety organization.(i) Prescribed burns performed according to Part 194 of this Title.(j) Fire training, including firefighting, fire rescue, and fire/arson investigation training,performed under applicable rules and guidelines of the New York State Department of State'sOffice of Fire Prevention and Control. For fire training performed on acquired structures, thestructures must be emptied and stripped of any material that is toxic, hazardous or likely to emittoxic smoke (such as asbestos, asphalt shingles and vinyl siding or other vinyl products) prior toburning and must be at least 300 feet from other occupied structures. No more than one structureper lot or within a 300 foot radius (whichever is bigger) may be burned in a training exercise.(k) Individual open fires as approved by the Director of the Division of Air Resources as may berequired in response to an outbreak of a plant or animal disease upon request by thecommissioner of the Department of Agriculture and Markets, or for the destruction of invasiveplant and insect species.(l) Individual open fires that are otherwise authorized under the environmental conservation law,or by rule or regulation of the Department.
MANDATORY FEDERALLY ENFORCEABLE PERMIT CONDITIONS SUBJECT TO ANNUAL CERTIFICATIONS ONLY IF APPLICABLE
The following federally enforceable permit conditions are mandatory for all Title V permits and are subject to annual compliance certification requirements only if effectuated during the reporting period. [NOTE: The corresponding annual compliance certification for those conditions not effectuated during the reporting period shall be specified as "not applicable".]
Condition 10: Maintenance of Equipment Effective between the dates of 01/25/2016 and 01/24/2021
Applicable Federal Requirement:6 NYCRR 200.7
Item 10.1:Any person who owns or operates an air contamination source which is equipped with anemission control device shall operate such device and keep it in a satisfactory state ofmaintenance and repair in accordance with ordinary and necessary practices, standards and

Permit ID: 2-6402-00295/00003 Facility DEC ID: 2640200295
Air Pollution Control Permit ConditionsRenewal 2 Page 16 FINAL
procedures, inclusive of manufacturer's specifications, required to operate such deviceeffectively.
Condition 11: Recycling and Salvage Effective between the dates of 01/25/2016 and 01/24/2021
Applicable Federal Requirement:6 NYCRR 201-1.7
Item 11.1:Where practical, the owner or operator of an air contamination source shall recycle or salvage aircontaminants collected in an air cleaning device according to the requirements of the ECL.
Condition 12: Prohibition of Reintroduction of Collected Contaminants to the air Effective between the dates of 01/25/2016 and 01/24/2021
Applicable Federal Requirement:6 NYCRR 201-1.8
Item 12.1:No person shall unnecessarily remove, handle or cause to be handled, collected air contaminantsfrom an air cleaning device for recycling, salvage or disposal in a manner that would reintroducethem to the outdoor atmosphere.
Condition 13: Exempt Sources - Proof of Eligibility Effective between the dates of 01/25/2016 and 01/24/2021
Applicable Federal Requirement:6 NYCRR 201-3.2 (a)
Item 13.1:The owner or operator of an emission source or activity that is listed as being exempt may berequired to certify that it is operated within the specific criteria described in this Subpart. Theowner or operator of any such emission source or activity must maintain all records necessaryfor demonstrating compliance with this Subpart on-site for a period of five years, and make themavailable to representatives of the department upon request.
Condition 14: Trivial Sources - Proof of Eligibility Effective between the dates of 01/25/2016 and 01/24/2021
Applicable Federal Requirement:6 NYCRR 201-3.3 (a)
Item 14.1:The owner or operator of an emission source or activity that is listed as being trivial in thisSection may be required to certify that it is operated within the specific criteria described in thisSubpart. The owner or operator of any such emission source or activity must maintain allrequired records on-site for a period of five years and make them available to representatives ofthe department upon request.
Condition 15: Requirement to Provide Information Effective between the dates of 01/25/2016 and 01/24/2021
Applicable Federal Requirement:6 NYCRR 201-6.4 (a) (4)

Permit ID: 2-6402-00295/00003 Facility DEC ID: 2640200295
Air Pollution Control Permit ConditionsRenewal 2 Page 17 FINAL
Item 15.1:The owner and/or operator shall furnish to the department, within a reasonable time, anyinformation that the department may request in writing to determine whether cause exists formodifying, revoking and reissuing, or terminating the permit or to determine compliance withthe permit. Upon request, the permittee shall also furnish to the department copies of recordsrequired to be kept by the permit or, for information claimed to be confidential, the permitteemay furnish such records directly to the administrator along with a claim of confidentiality, if theadministrator initiated the request for information or otherwise has need of it.
Condition 16: Right to Inspect Effective between the dates of 01/25/2016 and 01/24/2021
Applicable Federal Requirement:6 NYCRR 201-6.4 (a) (8)
Item 16.1:The department or an authorized representative shall be allowed upon presentation of credentials and other documents as may be required by law to:
(i) enter upon the permittee's premises where a facility subject to the permitting requirements ofthis Subpart is located or emissions-related activity is conducted, or where records must be keptunder the conditions of the permit;
(ii) have access to and copy, at reasonable times, any records that must be kept under theconditions of the permit;
(iii) inspect at reasonable times any emission sources, equipment (including monitoring and airpollution control equipment), practices, and operations regulated or required under the permit;and
(iv) sample or monitor at reasonable times substances or parameters for the purpose of assuringcompliance with the permit or applicable requirements.
Condition 17: Off Permit Changes Effective between the dates of 01/25/2016 and 01/24/2021
Applicable Federal Requirement:6 NYCRR 201-6.4 (f) (6)
Item 17.1:No permit revision will be required for operating changes that contravene an express permitterm, provided that such changes would not violate applicable requirements as defined under thisPart or contravene federally enforceable monitoring (including test methods), recordkeeping,reporting, or compliance certification permit terms and conditions. Such changes may be madewithout requiring a permit revision, if the changes are not modifications under any provision oftitle I of the act and the changes do not exceed the emissions allowable under the permit(whether expressed therein as a rate of emissions or in terms of total emissions) provided that thefacility provides the administrator and the department with written notification as required belowin advance of the proposed changes within a minimum of seven days. The facility owner oroperator, and the department shall attach each such notice to their copy of the relevant permit.

Permit ID: 2-6402-00295/00003 Facility DEC ID: 2640200295
Air Pollution Control Permit ConditionsRenewal 2 Page 18 FINAL
(i) For each such change, the written notification required above shall include a brief descriptionof the change within the permitted facility, the date on which the change will occur, any changein emissions, and any permit term or condition that is no longer applicable as a result of thechange.
(ii) The permit shield described in section 6 NYCRR 201-6.4 shall not apply to any changemade pursuant to this paragraph.
Condition 18: Required Emissions Tests Effective between the dates of 01/25/2016 and 01/24/2021
Applicable Federal Requirement:6 NYCRR 202-1.1
Item 18.1:For the purpose of ascertaining compliance or non-compliance with any air pollution controlcode, rule or regulation, the commissioner may require the person who owns such aircontamination source to submit an acceptable report of measured emissions within a stated time.
Condition 19: Accidental release provisions. Effective between the dates of 01/25/2016 and 01/24/2021
Applicable Federal Requirement:40 CFR Part 68
Item 19.1:If a chemical is listed in Tables 1,2,3 or 4 of 40 CFR §68.130 is present in a process in quantitiesgreater than the threshold quantity listed in Tables 1,2,3 or 4, the following requirements willapply:
a) The owner or operator shall comply with the provisions of 40 CFR Part 68 and;
b) The owner or operator shall submit at the time of permit issuance (if not previouslysubmitted) one of the following, if such quantities are present:
1) A compliance schedule for meeting the requirements of 40 CFR Part 68 by the date providedin 40 CFR §68.10(a) or,
2) A certification statement that the source is in compliance with all requirements of 40 CFRPart 68, including the registration and submission of the Risk Management Plan. Informationshould be submitted to:
Risk Management Plan Reporting CenterC/O CSC8400 Corporate DrCarrollton, Md. 20785
Condition 20: Recycling and Emissions Reduction Effective between the dates of 01/25/2016 and 01/24/2021
Applicable Federal Requirement:40CFR 82, Subpart F

Permit ID: 2-6402-00295/00003 Facility DEC ID: 2640200295
Air Pollution Control Permit ConditionsRenewal 2 Page 19 FINAL
Item 20.1:The permittee shall comply with all applicable provisions of 40 CFR Part 82.
The following conditions are subject to annual compliance certification requirements for Title V permits only.
Condition 21: Emission Unit Definition Effective between the dates of 01/25/2016 and 01/24/2021
Applicable Federal Requirement:6 NYCRR Subpart 201-6
Item 21.1:The facility is authorized to perform regulated processes under this permit for: Emission Unit: 1-00001 Emission Unit Description: This emission unit consists of the following: 1) a combustion turbine, which shall be operated in the simple cycle and fire only natural gas, 2) one Heatec boiler used to heat gas turbine combustion inlet air when ambient temperature and humidity could cause icing at the turbine inlet, and 3) a 746 bhp diesel back-up generator.
Condition 22: Progress Reports Due Semiannually Effective between the dates of 01/25/2016 and 01/24/2021
Applicable Federal Requirement:6 NYCRR 201-6.4 (d) (4)
Item 22.1:Progress reports consistent with an applicable schedule of compliance are to be submitted atleast semiannually, or at a more frequent period if specified in the applicable requirement or bythe department. Such progress reports shall contain the following:
(i) dates for achieving the activities, milestones, or compliance required in the schedule ofcompliance, and dates when such activities, milestones or compliance were achieved; and
(ii) an explanation of why any dates in the schedule of compliance were not or will not be met,and any preventive or corrective measures adopted.
Condition 23: Air pollution prohibited Effective between the dates of 01/25/2016 and 01/24/2021
Applicable Federal Requirement:6 NYCRR 211.1
Item 23.1:

Permit ID: 2-6402-00295/00003 Facility DEC ID: 2640200295
Air Pollution Control Permit ConditionsRenewal 2 Page 20 FINAL
No person shall cause or allow emissions of air contaminants to the outdoor atmosphere of suchquantity, characteristic or duration which are injurious to human, plant or animal life or toproperty, or which unreasonably interfere with the comfortable enjoyment of life or property.Notwithstanding the existence of specific air quality standards or emission limits, thisprohibition applies, but is not limited to, any particulate, fume, gas, mist, odor, smoke, vapor,pollen, toxic or deleterious emission, either alone or in combination with others.
Condition 24: EPA Region 2 address. Effective between the dates of 01/25/2016 and 01/24/2021
Applicable Federal Requirement:40CFR 60.4, NSPS Subpart A
Item 24.1:All requests, reports, applications, submittals, and other communications to the Administratorpursuant to this part shall be submitted in duplicate to the following address:
Director, Division of Enforcement and Compliance Assistance USEPA Region 2 290 Broadway, 21st Floor New York, NY 10007-1886
Copies of all correspondence to the administrator pursuant to this part shall also be submitted tothe NYSDEC Regional Office issuing this permit (see address at the beginning of this permit)and to the following address:
NYSDEC Bureau of Quality Assurance 625 Broadway Albany, NY 12233-3258
Condition 25: Date of construction notification - If a COM is not used. Effective between the dates of 01/25/2016 and 01/24/2021
Applicable Federal Requirement:40CFR 60.7(a), NSPS Subpart A
Item 25.1:Any owner or operator subject to this part shall furnish the Administrator with the followinginformation:
1) a notification of the date construction or reconstruction commenced, post marked no later than30 days after such date;
3) a notification of the actual date of initial start up, post marked within 15 days after such date;
4) a notification of any physical or operational change to an existing facility which may increasethe emission rate of any air pollutant to which a standard applies, unless the change isspecifically exempted under this part. The notice shall be post marked 60 days or as soon aspracticable before the change is commenced and shall include information describing the precise

Permit ID: 2-6402-00295/00003 Facility DEC ID: 2640200295
Air Pollution Control Permit ConditionsRenewal 2 Page 21 FINAL
nature of the change, present and proposed emission control systems, productive capability ofthe facility before and after the change, and the expected completion date of the change. TheAdministrator may request additional information regarding the change;
5) a notification of the date upon which the demonstration of continuous monitoring systemperformance commences, post marked not less than 30 days prior to such date;
6) a notification of the anticipated date for conducting the opacity observations, post marked notless than 30 days prior to such date.
Condition 26: Recordkeeping requirements. Effective between the dates of 01/25/2016 and 01/24/2021
Applicable Federal Requirement:40CFR 60.7(b), NSPS Subpart A
Item 26.1:Affected owners or operators shall maintain records of occurrence and duration of any startup,shutdown, or malfunction in the operation of an affected facility; any malfunction of the airpollution control equipment; or any periods during which a continuous monitoring system ormonitoring device is inoperative.
Condition 27: Facility files for subject sources. Effective between the dates of 01/25/2016 and 01/24/2021
Applicable Federal Requirement:40CFR 60.7(f), NSPS Subpart A
Item 27.1:The following files shall be maintained at the facility for all affected sources: all measurements,including continuous monitoring systems, monitoring device, and performance testingmeasurements; all continuous monitoring system performance evaluations;all continuousmonitoring device calibration checks; adjustments and maintenance performed on these systemsor devices; and all other information required by this part, recorded in permanent form suitablefor inspections. The file shall be maintained for at least two years following the date of suchmeasurements, reports, and records.
Condition 28: Circumvention. Effective between the dates of 01/25/2016 and 01/24/2021
Applicable Federal Requirement:40CFR 60.12, NSPS Subpart A
Item 28.1:No owner or operator subject to the provisions of this part shall build, erect, install, or use anyarticle, machine, equipment or process, the use of which conceals an emission which wouldotherwise constitute a violation of an applicable standard. Such concealment includes, but is notlimited to, the use of gaseous diluents to achieve compliance with an opacity standard or with astandard which is based on the concentration of a pollutant in the gases discharged to theatmosphere.
Condition 29: Monitoring requirements. Effective between the dates of 01/25/2016 and 01/24/2021
Applicable Federal Requirement:40CFR 60.13, NSPS Subpart A

Permit ID: 2-6402-00295/00003 Facility DEC ID: 2640200295
Air Pollution Control Permit ConditionsRenewal 2 Page 22 FINAL
Item 29.1:All continuous monitoring systems and devices shall be installed, calibrated, maintained, andoperated in accordance with the requirements of section 60.13.
Condition 30: Modifications. Effective between the dates of 01/25/2016 and 01/24/2021
Applicable Federal Requirement:40CFR 60.14, NSPS Subpart A
Item 30.1:Within 180 days of the completion of any physical or operational change (as defined in section60.14), compliance with the applicable standards must be achieved.
Condition 31: Reconstruction Effective between the dates of 01/25/2016 and 01/24/2021
Applicable Federal Requirement:40CFR 60.15, NSPS Subpart A
Item 31.1:The following shall be submitted to the Administrator prior to reconstruction (as defined insection 60.15):
1) a notice of intent to reconstruct 60 days prior to the action;
2) name and address of the owner or operator;
3) the location of the existing facility;
4) a brief description of the existing facility and the components to be replaced;
5) a description of the existing air pollution control equipment and the proposed air pollutioncontrol equipment;
6) an estimate of the fixed capital cost of the replacements and of constructing a comparableentirely new facility;
7) the estimated life of the facility after the replacements; and
8) a discussion of any economic or technical limitations the facility may have in complying withthe applicable standards of performance after the proposed replacements.
Condition 32: Compliance and Enforcement Effective between the dates of 01/25/2016 and 01/24/2021
Applicable Federal Requirement:40CFR 63, Subpart ZZZZ
Item 32.1:The Department has not accepted delegation of 40 CFR Part 63 Subpart ZZZZ. Any questionsconcerning compliance and/or enforcement of this regulation should be referred to USEPARegion 2, 290 Broadway, 21st Floor, New York, NY 10007-1866; (212) 637-4080. Should the

Permit ID: 2-6402-00295/00003 Facility DEC ID: 2640200295
Air Pollution Control Permit ConditionsRenewal 2 Page 23 FINAL
Department decide to accept delegation of 40 CFR Part 63 Subpart ZZZZ during the term of thispermit, enforcement of this regulation will revert to the Department as of the effective date ofdelegation.
Condition 33: Facility Subject to Title IV Acid Rain Regulations and Permitting Effective between the dates of 01/25/2016 and 01/24/2021
Applicable Federal Requirement:40 CFR Part 72
Item 33.1: This facility is subject to the Title IV Acid Rain Regulations found in 40 CFRParts 72, 73, 75, 76, 77 and 78. The Acid Rain Permit is an attachment to this permit.
Condition 34: Compliance Certification Effective between the dates of 01/25/2016 and 01/24/2021
Applicable Federal Requirement:40CFR 97.406, Subpart AAAAA
Item 34.1:The Compliance Certification activity will be performed for the Facility.
Regulated Contaminant(s): CAS No: 0NY210-00-0 OXIDES OF NITROGEN
Item 34.2:Compliance Certification shall include the following monitoring:
Monitoring Type: RECORD KEEPING/MAINTENANCE PROCEDURESMonitoring Description: (1) The facility shall comply with the requirement to have a designated representative, and may have an alternate designated representative, in accordance with §§97.413 through 97.418 of Subpart AAAAA. The facility shall notify the Department of this representative (and alternative) with contact information upon issuance of this permit and when any changes are made to the representative (or alternative) or their contact information.
(2) The facility, and the designated representative, of each TR NOX Annual source (facility) and each TR NOx Annual Unit at the facility shall comply with the monitoring, reporting, and recordkeeping requirements of §§97.430 through 97.435 of Subpart AAAAA and subpart H of part 75 of this chapter. This includes but is not limited to: requirements for installation, certification, and data accounting for all required monitoring systems; requirements for recording, reporting, and quality-assurance of the data; and certification of

Permit ID: 2-6402-00295/00003 Facility DEC ID: 2640200295
Air Pollution Control Permit ConditionsRenewal 2 Page 24 FINAL
compliance of such data. Data from continuous emission monitoring equipment are submitted quarterly (calendar year). These reports are generally due 30 days after the end of a calendar quarter. All other monitoring data are submitted to the DEC semiannually (calendar year). These reports are due on January 30th and July 30th of each
year.
(3) The emissions data determined shall be used to calculate allocations of TR NOx Annual allowances and to determine compliance with the TR NOx Annual emissions limitation and assurance provisions. As of the allowance transfer deadline for a control period in a given year, the owners and operators of each TR NOx Annual facility and each TR NOx Annual Unit at the facility shall hold, inthe facilities compliance account, TR NOx Annual allowances available for deduction for such control periodunder §97.424(a) in an amount not less than the tons of total NOx emissions for such control period from all TR NOX Annual Units at the facility.
Monitoring Frequency: AS REQUIRED - SEE PERMIT MONITORING DESCRIPTION
Reporting Requirements: AS REQUIRED - SEE MONITORING DESCRIPTION
Condition 35: Compliance Certification Effective between the dates of 01/25/2016 and 01/24/2021
Applicable Federal Requirement:40CFR 97.506, Subpart BBBBB
Item 35.1:The Compliance Certification activity will be performed for the Facility.
Regulated Contaminant(s):CAS No: 0NY210-00-0 OXIDES OF NITROGEN
Item 35.2:Compliance Certification shall include the following monitoring:
Monitoring Type: RECORD KEEPING/MAINTENANCE PROCEDURESMonitoring Description: (1) The facility shall comply with the requirement to
have a designated representative, and may have an alternate designated representative, in accordance with §§97.513 through 97.518 of Subpart BBBBB. The facility shall notify the Department of this representative (and alternative) with contact information upon issuance of this permit and when any changes are made to the representative (or alternative) or their contact
information.

Permit ID: 2-6402-00295/00003 Facility DEC ID: 2640200295
Air Pollution Control Permit ConditionsRenewal 2 Page 25 FINAL
(2) The facility, and the designated representative, of each TR NOx Ozone Season source (facility) and each TR NOxOzone Season Unit at the facility shall comply with the monitoring, reporting, and recordkeeping requirements of §§97.530 through 97.535 of Subpart BBBBB and subpart H of part 75 of this chapter. This includes but is not limited to: requirements for installation, certification, and dataaccounting for all required monitoring systems; requirements for recording, reporting, and quality-assurance of the data; and certification of compliance of such data. Data from continuous emission monitoring equipment are submitted quarterly (calendar year). These reports are generally due 30 days after the end of a calendar quarter. All other monitoring data are submitted to the DEC semiannually (calendar year). These reports are due on January 30th and July 30th of each
year.
(3) The emissions data determined shall be used to calculate allocations of TR NOx Ozone Season allowances and to determine compliance with the TR NOx Ozone Season emissions limitation and assurance provisions. As of the allowance transfer deadline for a control period in a given year, the owners and operators of each TR NOx Ozone Season facility and each TR NOx Ozone Season Unit at the facility shall hold, in the facilities compliance account,TR NOx Ozone Season allowances available for deduction forsuch control period under §97.524(a) in an amount not lessthan the tons of total NOx emissions for such control period from all TR NOx Ozone Season Units at the
facility.
Monitoring Frequency: AS REQUIRED - SEE PERMIT MONITORING DESCRIPTION
Reporting Requirements: AS REQUIRED - SEE MONITORING DESCRIPTION
Condition 36: Compliance Certification Effective between the dates of 01/25/2016 and 01/24/2021
Applicable Federal Requirement:40CFR 97.606, Subpart CCCCC
Item 36.1:The Compliance Certification activity will be performed for the Facility.
Regulated Contaminant(s):CAS No: 007446-09-5 SULFUR DIOXIDE
Item 36.2:Compliance Certification shall include the following monitoring:
Monitoring Type: RECORD KEEPING/MAINTENANCE PROCEDURES

Permit ID: 2-6402-00295/00003 Facility DEC ID: 2640200295
Air Pollution Control Permit ConditionsRenewal 2 Page 26 FINAL
Monitoring Description: (1) The facility shall comply with the requirement to have a designated representative, and may have an alternate designated representative, in accordance with §§97.613 through 97.618 of Subpart CCCCC. The facility shall notify the Department of this representative (and alternative) with contact information upon issuance of this permit and when any changes are made to the representative (or alternative) or their contact information.
(2) The facility, and the designated representative, of each TR SO2 Group 1 source (facility) and each TR SO2 Group 1 Unit at the facility shall comply with the monitoring, reporting, and recordkeeping requirements of §§97.630 through 97.635 of Subpart CCCCC and subpart H of part 75 of this chapter. This includes but is not limited to: requirements for installation, certification, and data accounting for all required monitoring systems; requirements for recording, reporting, and quality-assurance of the data; and certification of compliance of such data. Data from continuous emission monitoring equipment are submitted quarterly (calendar year). These reports are generally due 30 days after the end of a calendar quarter. All other monitoring data are submitted to the DEC semiannually (calendar year). These reports are due on January 30th and July 30th of each year.
(3) The emissions data determined shall be used to calculate allocations of TR SO2 Group 1 allowances and to determine compliance with the TR SO2 Group 1 emissions limitation and assurance provisions. As of the allowance transfer deadline for a control period in a given year, the owners and operators of each TR SO2 Group 1 facility and each TR SO2 Group 1 Unit at the facility shall hold, in the facilities compliance account, TR SO2 Group 1 allowances available for deduction for such control period under §97.624(a) in an amount not less than the tons of total SO2 emissions for such control period from all TR SO2 Group 1 Units at the facility.
Monitoring Frequency: AS REQUIRED - SEE PERMIT MONITORING DESCRIPTIONReporting Requirements: AS REQUIRED - SEE MONITORING DESCRIPTION
**** Emission Unit Level ****
Condition 37: Emission Point Definition By Emission Unit Effective between the dates of 01/25/2016 and 01/24/2021

Permit ID: 2-6402-00295/00003 Facility DEC ID: 2640200295
Air Pollution Control Permit ConditionsRenewal 2 Page 27 FINAL
Applicable Federal Requirement:6 NYCRR Subpart 201-6
Item 37.1:The following emission points are included in this permit for the cited Emission Unit:
Emission Unit: 1-00001
Emission Point: 00001 Height (ft.): 107 Diameter (in.): 144NYTMN (km.): 4496.822 NYTME (km.): 578.807
Emission Point: 00002 Height (ft.): 15 Diameter (in.): 22NYTMN (km.): 4496.775 NYTME (km.): 578.786
Emission Point: 00003 Height (ft.): 1 Diameter (in.): 5NYTMN (km.): 4496.76 NYTME (km.): 578.776
Condition 38: Process Definition By Emission Unit Effective between the dates of 01/25/2016 and 01/24/2021
Applicable Federal Requirement:6 NYCRR Subpart 201-6
Item 38.1:This permit authorizes the following regulated processes for the cited Emission Unit:
Emission Unit: 1-00001 Process: 001 Source Classification Code: 2-01-002-01 Process Description: One combustion turbine (GE LM6000) firing natural gas.
Emission Source/Control: 00001 - Combustion Design Capacity: 420 million Btu per hour
Emission Source/Control: 00002 - Control Control Type: SELECTIVE CATALYTIC REDUCTION (SCR)
Emission Source/Control: 00003 - Control Control Type: CATALYTIC OXIDATION
Item 38.2:This permit authorizes the following regulated processes for the cited Emission Unit:
Emission Unit: 1-00001 Process: 002 Source Classification Code: 1-02-006-03 Process Description: Natural gas firing in one 7.4 mmBtu/hr boiler.
Emission Source/Control: 00004 - Combustion Design Capacity: 7.4 million Btu per hour

Permit ID: 2-6402-00295/00003 Facility DEC ID: 2640200295
Air Pollution Control Permit ConditionsRenewal 2 Page 28 FINAL
Item 38.3:This permit authorizes the following regulated processes for the cited Emission Unit:
Emission Unit: 1-00001 Process: 003 Source Classification Code: 2-02-001-02 Process Description: one 746 bhp diesel back up generator
Emission Source/Control: 00005 - Combustion Design Capacity: 746 horsepower (mechanical)
Condition 39: Custom fuel monitoring schedule Effective between the dates of 01/25/2016 and 01/24/2021
Applicable Federal Requirement:40CFR 60.334(h)(4), NSPS Subpart GG
Item 39.1:This Condition applies to Emission Unit: 1-00001
Item 39.2:For any turbine that commenced construction, reconstruction or modification after October 3,1977, but before July 8, 2004, and for which a custom fuel monitoring schedule has previouslybeen approved, the owner or operator may, without submitting a special petition to theAdministrator, continue monitoring on this schedule.
Condition 40: Compliance Certification Effective between the dates of 01/25/2016 and 01/24/2021
Applicable Federal Requirement:6 NYCRR 227-1.3 (a)
Item 40.1:The Compliance Certification activity will be performed for:
Emission Unit: 1-00001 Emission Point: 00001
Item 40.2:Compliance Certification shall include the following monitoring:
Monitoring Type: MONITORING OF PROCESS OR CONTROL DEVICE PARAMETERS AS SURROGATEMonitoring Description: No person shall operate a stationary combustion installation which exhibits greater than 20 percent opacity (six minute average), except for one-six-minute period per hour of not more than 27 percent opacity. The Department reserves the right to perform or require the performance of a Method 9 opacity evaluation at any time during facility operation.
The permittee will conduct observations of visible emissions from the emission unit, process, etc. to which this condition applies at the monitoring frequency stated

Permit ID: 2-6402-00295/00003 Facility DEC ID: 2640200295
Air Pollution Control Permit ConditionsRenewal 2 Page 29 FINAL
below while the process is in operation. The permittee will investigate, in a timely manner, any instance where there is cause to believe that visible emissions have the potential to exceed the opacity standard.
The permittee shall investigate the cause, make any necessary corrections, and verify that the excess visible emissions problem has been corrected. If visible emissions with the potential to exceed the standard continue, the permittee will conduct a Method 9 assessmentwithin the next operating day of the sources associated with the potential noncompliance to determine the degree of opacity and will notify the NYSDEC if the method 9 testindicates that the opacity standard is not met.
Records of visible emissions observations (or any follow-up method 9 tests), investigations and corrective actions will be kept on-site. Should the Department determine that permittee's record keeping format is inadequate to demonstrate compliance with this condition, it shall provide written notice to the permittee stating the inadequacies, and permittee shall have 90 days to revise its prospective record keeping format in a manner acceptable to the Department.
Parameter Monitored: OPACITYUpper Permit Limit: 20 percentReference Test Method: EPA Method 9Monitoring Frequency: ONCE DURING THE TERM OF THE PERMITAveraging Method: 6-MINUTE AVERAGE (METHOD 9)Reporting Requirements: ANNUALLY (CALENDAR)Reports due 30 days after the reporting period.The initial report is due 1/30/2017.Subsequent reports are due every 12 calendar month(s).

Permit ID: 2-6402-00295/00003 Facility DEC ID: 2640200295
Air Pollution Control Permit ConditionsRenewal 2 Page 30 FINAL
STATE ONLY ENFORCEABLE CONDITIONS **** Facility Level ****
NOTIFICATION OF GENERAL PERMITTEE OBLIGATIONSThis section contains terms and conditions which are not federally enforceable. Permitteesmay also have other obligations under regulations of general applicability
Item A: General Provisions for State Enforceable Permit Terms andCondition - 6 NYCRR Part 201-5
Any person who owns and/or operates stationary sources shall operate and maintain all emission units and any required emission control devices in compliance with all applicable Parts of this Chapter and existing laws, and shall operate the facility in accordance with all criteria, emission limits, terms, conditions, and standards in this permit. Failure of such person to properly operate and maintain the effectiveness of such emission units and emission control devices may be sufficient reason for the Department to revoke or deny a
permit.
The owner or operator of the permitted facility must maintain all required records on-site for a period of fiveyears and make them available to representatives of the Department upon request. Department representatives must be granted access to any facility regulated by this Subpart, during normal operating hours, for the purpose ofdetermining compliance with this and any other state and federal air pollution control requirements, regulations or
law.
STATE ONLY APPLICABLE REQUIREMENTSThe following conditions are state applicable requirements and are not subject to compliance certification requirements unless otherwise noted or required
under 6 NYCRR Part 201.
Condition 41: Contaminant List Effective between the dates of 01/25/2016 and 01/24/2021
Applicable State Requirement:ECL 19-0301
Item 41.1:Emissions of the following contaminants are subject to contaminant specific requirements in thispermit(emission limits, control requirements or compliance monitoring conditions).
CAS No: 000630-08-0Name: CARBON MONOXIDE

Permit ID: 2-6402-00295/00003 Facility DEC ID: 2640200295
Air Pollution Control Permit ConditionsRenewal 2 Page 31 FINAL
CAS No: 007446-09-5Name: SULFUR DIOXIDE
CAS No: 007664-41-7 Name: AMMONIA
CAS No: 0NY210-00-0Name: OXIDES OF NITROGEN
Condition 42: Malfunctions and start-up/shutdown activities Effective between the dates of 01/25/2016 and 01/24/2021
Applicable State Requirement:6 NYCRR 201-1.4
Item 42.1:(a) The facility owner or operator shall take all necessary and appropriate actions to prevent theemission of air pollutants that result in contravention of any applicable emission standard duringperiods of start-up, shutdown, or malfunction.
(b) The facility owner or operator shall compile and maintain records of all equipmentmalfunctions, maintenance, or start-up/shutdown activities when they can be expected to result inan exceedance of any applicable emission standard, and shall submit a report of such activities tothe department when requested to do so, or when so required by a condition of a permit issuedfor the corresponding air contamination source. Such reports shall state whether any violationsoccurred and, if so, whether they were unavoidable, include the time, frequency and duration ofthe maintenance and/or start-up/shutdown activities, and an estimate of the emission rates of anyair contaminants released. Such records shall be maintained for a period of at least five yearsand made available for review to department representatives upon request. Facility owners oroperators subject to continuous stack monitoring and quarterly reporting requirements need notsubmit additional reports for equipment maintenance or start-up/shutdown activities for thefacility to the department.
(c) In the event that emissions of air contaminants in excess of any emission standard in thisSubchapter occur due to a malfunction, the facility owner or operator shall compile and maintainrecords of the malfunction and notify the department as soon as possible during normal workinghours, but not later than two working days after becoming aware that the malfunction occurred. When requested by the department, the facility owner or operator shall submit a written reportto the department describing the malfunction, the corrective action taken, identification of aircontaminants, and an estimate of the emission rates.
(d) The department may also require the owner or operator to include, in reports describedunder Subdivisions (b) and (c) of this Section, an estimate of the maximum ground levelconcentration of each air contaminant emitted and the effect of such emissions.
(e) A violation of any applicable emission standard resulting from start-up, shutdown, ormalfunction conditions at a permitted or registered facility may not be subject to an enforcementaction by the department and/or penalty if the department determines, in its sole discretion, thatsuch a violation was unavoidable. The actions and recordkeeping and reporting requirementslisted above must be adhered to in such circumstances.

Permit ID: 2-6402-00295/00003 Facility DEC ID: 2640200295
Air Pollution Control Permit ConditionsRenewal 2 Page 32 FINAL
Condition 43: Compliance Demonstration Effective between the dates of 01/25/2016 and 01/24/2021
Applicable State Requirement:6 NYCRR 201-1.4
Item 43.1:The Compliance Demonstration activity will be performed for the Facility.
Item 43.2:Compliance Demonstration shall include the following monitoring:
Monitoring Type: RECORD KEEPING/MAINTENANCE PROCEDURESMonitoring Description: In the event that the permittee claims that an excess emission is the result of an unavoidable malfunction or upset, the permittee shall submit a Report of Malfunction and Abatement to the Department's Regional Air pollution Control Engineer within 30 days from the date that the excess emission occurred. The Report of Malfunction and Abatement shall contain the following information:
1) a description of the possible malfunction or upset;
2) the cause of the excess emission;
3) the reason(s) why it is claimed that the excess emission was the result of an unavoidable malfunction or upset;
4) the date and time of the excess emission;
5) the air contaminant(s) emitted, including the parameters of the permit exceedance;
6) the estimated emission rates of the air contaminant(s) emitted;
7) the corrective action taken to address the excess emission; and
8) any action taken to prevent such an excess emission from reoccurring.
Monitoring Frequency: CONTINUOUSReporting Requirements: AS REQUIRED - SEE MONITORING DESCRIPTION
Condition 44: Visible Emissions Limited Effective between the dates of 01/25/2016 and 01/24/2021
Applicable State Requirement:6 NYCRR 211.2

Permit ID: 2-6402-00295/00003 Facility DEC ID: 2640200295
Air Pollution Control Permit ConditionsRenewal 2 Page 33 FINAL
Item 44.1:Except as permitted by a specific part of this Subchapter and for open fires for which a restrictedburning permit has been issued, no person shall cause or allow any air contamination source toemit any material having an opacity equal to or greater than 20 percent (six minute average)except for one continuous six-minute period per hour of not more than 57 percent opacity.
Condition 45: Compliance Demonstration Effective between the dates of 01/25/2016 and 01/24/2021
Applicable State Requirement:6 NYCRR 242-1.5
Item 45.1:The Compliance Demonstration activity will be performed for the Facility.
Item 45.2:Compliance Demonstration shall include the following monitoring:
Monitoring Type: RECORD KEEPING/MAINTENANCE PROCEDURESMonitoring Description: The owners and operators and, to the extent applicable, the CO2 authorized account representative of each CO2 budget source and each CO2 budget unit at the source shall comply with the monitoring requirements of Subpart 242-8. The emissions measurements recorded and reported in accordance with Subpart 242-8 of this Part shall be used to determine compliance by the unit with the following CO2 requirements:
(1) The owners and operators of each CO2 budget source and each CO2 budget unit at the source shall hold CO2 allowances available for compliance deductions under Section 242-6.5, as of the CO2 allowance transfer deadline, in the source's compliance account in an amount not less than the total CO2 emissions for the control period from all CO2 budget units at the source, as determined in accordance with Subparts 242-6 and 242-8.
(2) Each ton of CO2 emitted in excess of the CO2 budget emissions limitation shall constitute a separate violation of this Part and applicable state law.
(3) A CO2 budget unit shall be subject to the requirements specified in item 1 starting on the later, of January 1, 2009 or the date on which the unit commences operation.
(4) CO2 allowances shall be held in, deducted from, or transferred among CO2 Allowance Tracking System accounts in accordance with Subparts 242-5, 242-6, and 242-7, and Section 242-10.7.

Permit ID: 2-6402-00295/00003 Facility DEC ID: 2640200295
Air Pollution Control Permit ConditionsRenewal 2 Page 34 FINAL
(5) A CO2 allowance shall not be deducted, in order to comply with the requirements specified in item 1, for a control period that ends prior to the allocation year for which the CO2 allowance was allocated. A CO2 offset allowance shall not be deducted, in order to comply with the requirements under item 1, beyond the applicable percent limitations set out in 6NYCRR Part
242-6.5(a)(3).
(6) A CO2 allowance under the CO2 Budget Trading Program is a limited authorization by the Department or a participating state to emit one ton of CO2 in accordance with the CO2 Budget Trading Program. No provision of the CO2 Budget Trading Program, the CO2 budget permit application, or the CO2 budget permit or any provision of law shall be construed to limit the authority of the Department or a participating state to terminate or limit
such authorization.
(7) A CO2 allowance under the CO2 Budget Trading Program does not constitute a property right.
Monitoring Frequency: AS REQUIRED - SEE PERMIT MONITORING DESCRIPTION
Reporting Requirements: SEMI-ANNUALLY (CALENDAR)Reports due 30 days after the reporting period.The initial report is due 7/30/2016.Subsequent reports are due every 6 calendar month(s).
Condition 46: Compliance Demonstration Effective between the dates of 01/25/2016 and 01/24/2021
Applicable State Requirement:6 NYCRR 242-1.5
Item 46.1:The Compliance Demonstration activity will be performed for the Facility.
Item 46.2:Compliance Demonstration shall include the following monitoring:
Monitoring Type: RECORD KEEPING/MAINTENANCE PROCEDURESMonitoring Description: The owners and operators of the CO2 budget source and
each CO2 budget unit at the source shall keep on site at the source each of the following documents for a period of10 years from the date the document is created. This period may be extended for cause, at any time prior to theend of 10 years, in writing by the department.
(i) The account certificate of representation for the CO2 authorized account representative for the source and each CO2 budget unit at the source and all documents that

Permit ID: 2-6402-00295/00003 Facility DEC ID: 2640200295
Air Pollution Control Permit ConditionsRenewal 2 Page 35 FINAL
demonstrate the truth of the statements in the account certificate of representation, in accordance with 6 NYCRR Part 242-2.4, provided that the certificate and documents shall be retained on site at the source beyond such 10-year period until such documents are superseded becauseof the submission of a new account certificate of
representation.
(ii) All emissions monitoring information, in accordance with Subpart 242-8 and 40 CFR 75.57.
(iii) Copies of all reports, compliance certifications, and other submissions and all records made or required under the CO2 Budget Trading Program.
(iv) Copies of all documents used to complete a CO2 budgetpermit application and any other submission under the CO2 Budget Trading Program or to demonstrate compliance with the requirements of the CO2 Budget Trading Program.
The CO2 authorized account representative of a CO2 budget source and each CO2 budget unit at the source shall submitthe reports and compliance certifications required under the CO2 Budget Trading Program, including those under
Subpart 242-4.
Monitoring Frequency: AS REQUIRED - SEE PERMIT MONITORING DESCRIPTION
Reporting Requirements: SEMI-ANNUALLY (CALENDAR)Reports due 30 days after the reporting period.The initial report is due 7/30/2016.Subsequent reports are due every 6 calendar month(s).
**** Emission Unit Level ****
Condition 47: Compliance Demonstration Effective between the dates of 01/25/2016 and 01/24/2021
Applicable State Requirement:6 NYCRR Subpart 201-5
Item 47.1:The Compliance Demonstration activity will be performed for:
Emission Unit: 1-00001
Item 47.2:Compliance Demonstration shall include the following monitoring:
Monitoring Type: MONITORING OF PROCESS OR CONTROL DEVICE PARAMETERS AS SURROGATE

Permit ID: 2-6402-00295/00003 Facility DEC ID: 2640200295
Air Pollution Control Permit ConditionsRenewal 2 Page 36 FINAL
Monitoring Description: Start-up shall be defined as the 30 minute period of time from the point that the gas turbine begins firing fuel. The owner or operator shall record the date and time of each period of start-up. A report consisting of the recorded information shall be submitted to the Department quarterly with the facility's required excess emissions report. All records shall be maintained by the applicant at their Poletti facility for a minimum of five years.
Parameter Monitored: DURATION OF START UPUpper Permit Limit: 30 minutesMonitoring Frequency: CONTINUOUSAveraging Method: MAXIMUM - NOT TO BE EXCEEDED PER OCCURRENCEReporting Requirements: QUARTERLY (CALENDAR)Reports due 30 days after the reporting period.The initial report is due 4/30/2016.Subsequent reports are due every 3 calendar month(s).
Condition 48: Compliance Demonstration Effective between the dates of 01/25/2016 and 01/24/2021
Applicable State Requirement:6 NYCRR Subpart 201-5
Item 48.1:The Compliance Demonstration activity will be performed for:
Emission Unit: 1-00001
Item 48.2:Compliance Demonstration shall include the following monitoring:
Monitoring Type: MONITORING OF PROCESS OR CONTROL DEVICE PARAMETERS AS SURROGATEMonitoring Description: A shutdown shall be defined as the period of time when the stop signal is initiated to when fuel is no longer being combusted in the engine or a subsequent start is initiated, not to exceed 20 minutes per occurrence. The owner or operator shall record each period of shutdown and its duration. A report consisting of the recorded information shall be submitted to the Department quarterly with the facility's required excess emissions report. All records shall be maintained by the applicant at their Poletti facility for a minimum of five years.
Parameter Monitored: DURATION OF SHUTDOWNUpper Permit Limit: 20 minutesMonitoring Frequency: CONTINUOUSAveraging Method: MAXIMUM - NOT TO BE EXCEEDED PER OCCURRENCE

Permit ID: 2-6402-00295/00003 Facility DEC ID: 2640200295
Air Pollution Control Permit ConditionsRenewal 2 Page 37 FINAL
Reporting Requirements: QUARTERLY (CALENDAR)Reports due 30 days after the reporting period.The initial report is due 4/30/2016.Subsequent reports are due every 3 calendar month(s).
Condition 49: Compliance Demonstration Effective between the dates of 01/25/2016 and 01/24/2021
Applicable State Requirement:6 NYCRR Subpart 201-5
Item 49.1:The Compliance Demonstration activity will be performed for:
Emission Unit: 1-00001
Regulated Contaminant(s): CAS No: 0NY210-00-0 OXIDES OF NITROGEN
Item 49.2:Compliance Demonstration shall include the following monitoring:
Monitoring Type: INTERMITTENT EMISSION TESTINGMonitoring Description: The Heatec boiler is limited to 30 ppm of NOx emissions. The owner or operator shall conduct compliance testing once during the term of the permit. The owner or operator shall submit a test protocol for Department approval. Testing shall be scheduled no sooner than 30 days of test protocol approval. The test results shall be submitted to the Department within 60 days of test completion. Test results shall be maintained by the applicant at their Poletti facility for a minimum of five years.
Parameter Monitored: OXIDES OF NITROGENUpper Permit Limit: 30 parts per million by volume (dry, corrected to 3% oxygen)Reference Test Method: 40 CFR 60 Appendix B & FMonitoring Frequency: ONCE DURING THE TERM OF THE PERMITAveraging Method: 1-HOUR AVERAGEReporting Requirements: AS REQUIRED - SEE MONITORING DESCRIPTION
Condition 50: Compliance Demonstration Effective between the dates of 01/25/2016 and 01/24/2021
Applicable State Requirement:6 NYCRR Subpart 201-5
Item 50.1:The Compliance Demonstration activity will be performed for:
Emission Unit: 1-00001
Regulated Contaminant(s):

Permit ID: 2-6402-00295/00003 Facility DEC ID: 2640200295
Air Pollution Control Permit ConditionsRenewal 2 Page 38 FINAL
CAS No: 0NY210-00-0 OXIDES OF NITROGEN
Item 50.2:Compliance Demonstration shall include the following monitoring:
Monitoring Type: CONTINUOUS EMISSION MONITORING (CEM)Monitoring Description: This facility shall install, calibrate, maintain, and
operate a continuous emissions monitor for oxides of nitrogen. The 5.0 pounds per hour limit shall apply during steady state operations where the turbine operates for the full 60 minutes of the hour. The following limits shall apply during steady state partial hours (lessthan the full 60 minutes) of operation:
Time Period (minutes) NOx Mass Limit (pounds)
1 - 15 2.5 16 - 30 3.0 31 - 45 3.75 46 - 59 5.0
Emissions in excess of the steady state limits for full 60minute hours and steady state partial hours shall be reported quarterly through the facility's excess emissionsreport. All records shall be maintained by the applicant at their Poletti facility for a minimum of five years.
Manufacturer Name/Model Number: NOx AnalyzerParameter Monitored: OXIDES OF NITROGENUpper Permit Limit: 5.0 pounds per hourReference Test Method: 40 CFR 75Monitoring Frequency: CONTINUOUSAveraging Method: 1-HOUR AVERAGEReporting Requirements: QUARTERLY (CALENDAR)Reports due 30 days after the reporting period.The initial report is due 4/30/2016.Subsequent reports are due every 3 calendar month(s).
Condition 51: Compliance Demonstration Effective between the dates of 01/25/2016 and 01/24/2021
Applicable State Requirement:6 NYCRR Subpart 201-5
Item 51.1:The Compliance Demonstration activity will be performed for:

Permit ID: 2-6402-00295/00003 Facility DEC ID: 2640200295
Air Pollution Control Permit ConditionsRenewal 2 Page 39 FINAL
Emission Unit: 1-00001
Regulated Contaminant(s): CAS No: 0NY210-00-0 OXIDES OF NITROGEN
Item 51.2:Compliance Demonstration shall include the following monitoring:
Monitoring Type: CONTINUOUS EMISSION MONITORING (CEM)Monitoring Description: This facility shall install, calibrate, maintain, and operate a continuous 40 CFR Part 75 emissions monitor for measuring and recording oxides of nitrogen. The facility shall also install either a continuous monitor for oxygen or carbon dioxide. All records shall be maintained by the applicant at their Poletti facility for a minimum of five years.
The 2.5 ppmvd limit shall be applicable during periods of steady state operation where the facility operates 16 or more minutes consecutively in one clock hour. When a facility operates in steady state less than 16 minutes (consecutively in one clock hour, and excluding startup or shutdown) the 2.5 ppmvd limit does not apply, but a mass emission limit of 2.5 pounds applies. Emissions in excess of either the 2.5 ppmvd limit or the 2.5 pound limit shall be reported quarterly through the facility's excess emissions report.
Manufacturer Name/Model Number: NOx AnalyzerParameter Monitored: OXIDES OF NITROGENUpper Permit Limit: 2.5 parts per million by volume (dry, corrected to 15% O2)Reference Test Method: 40 CFR 75Monitoring Frequency: CONTINUOUSAveraging Method: 1-HOUR AVERAGEReporting Requirements: QUARTERLY (CALENDAR)Reports due 30 days after the reporting period.The initial report is due 4/30/2016.Subsequent reports are due every 3 calendar month(s).
Condition 52: Compliance Demonstration Effective between the dates of 01/25/2016 and 01/24/2021
Applicable State Requirement:6 NYCRR Subpart 201-5
Item 52.1:The Compliance Demonstration activity will be performed for:
Emission Unit: 1-00001

Permit ID: 2-6402-00295/00003 Facility DEC ID: 2640200295
Air Pollution Control Permit ConditionsRenewal 2 Page 40 FINAL
Regulated Contaminant(s): CAS No: 0NY210-00-0 OXIDES OF NITROGEN
Item 52.2:Compliance Demonstration shall include the following monitoring:
Monitoring Type: CONTINUOUS EMISSION MONITORING (CEM)Monitoring Description: This facility shall install, calibrate, maintain and operate a continuous emissions monitor for oxides of nitrogen. This limit shall apply only during periods of start-up (30 minutes per occurrence). Emissions in excess of this limit shall be reported quarterly through the facility's excess emissions report. All records shall be maintained by the applicant at their Poletti facility for a minimum of five years.
Manufacturer Name/Model Number: NOx AnalyzerParameter Monitored: OXIDES OF NITROGENUpper Permit Limit: 15.0 poundsReference Test Method: NoneMonitoring Frequency: CONTINUOUSAveraging Method: MAXIMUM - NOT TO BE EXCEEDED PER OCCURRENCEReporting Requirements: QUARTERLY (CALENDAR)Reports due 30 days after the reporting period.The initial report is due 4/30/2016.Subsequent reports are due every 3 calendar month(s).
Condition 53: Compliance Demonstration Effective between the dates of 01/25/2016 and 01/24/2021
Applicable State Requirement:6 NYCRR Subpart 201-5
Item 53.1:The Compliance Demonstration activity will be performed for:
Emission Unit: 1-00001
Regulated Contaminant(s): CAS No: 0NY210-00-0 OXIDES OF NITROGEN
Item 53.2:Compliance Demonstration shall include the following monitoring:
Monitoring Type: CONTINUOUS EMISSION MONITORING (CEM)Monitoring Description: This facility shall install, calibrate, maintain and operate a continuous emissions monitor for oxides of nitrogen. This limit shall apply only during periods of shutdown, not to exceed 20 minutes per occurrence. Emissions in excess of this limit shall be reported

Permit ID: 2-6402-00295/00003 Facility DEC ID: 2640200295
Air Pollution Control Permit ConditionsRenewal 2 Page 41 FINAL
quarterly through the facility's excess emissions report. All records shall be maintained by the applicant at their Poletti facility for a minimum of five years.
Manufacturer Name/Model Number: NOx AnalyzerParameter Monitored: OXIDES OF NITROGENUpper Permit Limit: 5.0 poundsReference Test Method: NoneMonitoring Frequency: CONTINUOUSAveraging Method: MAXIMUM - NOT TO BE EXCEEDED PER
OCCURRENCEReporting Requirements: QUARTERLY (CALENDAR)Reports due 30 days after the reporting period.The initial report is due 4/30/2016.Subsequent reports are due every 3 calendar month(s).
Condition 54: Compliance Demonstration Effective between the dates of 01/25/2016 and 01/24/2021
Applicable State Requirement:6 NYCRR Subpart 201-5
Item 54.1:The Compliance Demonstration activity will be performed for:
Emission Unit: 1-00001
Regulated Contaminant(s):CAS No: 000630-08-0 CARBON MONOXIDE
Item 54.2:Compliance Demonstration shall include the following monitoring:
Monitoring Type: CONTINUOUS EMISSION MONITORING (CEM)Monitoring Description: This facility shall install, calibrate, maintain and
operate a continuous emissions monitor for carbon monoxide. This limit shall apply during periods of start-up or shutdown. Emissions in excess of this limit shall be reported quarterly through the facility's excess emissions report. All records shall be maintained by the applicant at their Poletti facility for a minimum of five
years.
Manufacturer Name/Model Number: CO AnalyzerParameter Monitored: CARBON MONOXIDEUpper Permit Limit: 8.0 poundsReference Test Method: 40 CFR 60 Appendix FMonitoring Frequency: CONTINUOUSAveraging Method: MAXIMUM - NOT TO BE EXCEEDED PER
OCCURRENCEReporting Requirements: QUARTERLY (CALENDAR)Reports due 30 days after the reporting period.

Permit ID: 2-6402-00295/00003 Facility DEC ID: 2640200295
Air Pollution Control Permit ConditionsRenewal 2 Page 42 FINAL
The initial report is due 4/30/2016.Subsequent reports are due every 3 calendar month(s).
Condition 55: Compliance Demonstration Effective between the dates of 01/25/2016 and 01/24/2021
Applicable State Requirement:6 NYCRR Subpart 201-5
Item 55.1:The Compliance Demonstration activity will be performed for:
Emission Unit: 1-00001
Regulated Contaminant(s): CAS No: 0NY210-00-0 OXIDES OF NITROGEN
Item 55.2:Compliance Demonstration shall include the following monitoring:
Monitoring Type: INTERMITTENT EMISSION TESTINGMonitoring Description: The back-up engine shall meet a limit of 10.23 pounds per hour of NOx emissions. The owner or operator shall conduct compliance testing once during the term of the permit. The owner or operator shall submit a test protocol for Department approval. Testing shall be scheduled no sooner than 30 days of test protocol approval. The test results shall be submitted to the Department within 60 days of test completion. Test results shall be maintained by the applicant at their Poletti facility for a minimum of five years.
Parameter Monitored: OXIDES OF NITROGENUpper Permit Limit: 10.23 pounds per hourReference Test Method: 40 CFR 60 Appendix B & FMonitoring Frequency: ONCE DURING THE TERM OF THE PERMITAveraging Method: 1-HOUR AVERAGEReporting Requirements: AS REQUIRED - SEE MONITORING DESCRIPTION
Condition 56: Compliance Demonstration Effective between the dates of 01/25/2016 and 01/24/2021
Applicable State Requirement:6 NYCRR Subpart 201-5
Item 56.1:The Compliance Demonstration activity will be performed for:
Emission Unit: 1-00001
Regulated Contaminant(s): CAS No: 000630-08-0 CARBON MONOXIDE

Permit ID: 2-6402-00295/00003 Facility DEC ID: 2640200295
Air Pollution Control Permit ConditionsRenewal 2 Page 43 FINAL
Item 56.2:Compliance Demonstration shall include the following monitoring:
Monitoring Type: CONTINUOUS EMISSION MONITORING (CEM)Monitoring Description: This facility shall install, calibrate, maintain and operate a continuous emissions monitor for carbon monoxide. This limit shall apply at all times except during periods of start-up or shutdown. Emissions in excess of this limit shall be reported quarterly through the facility's excess emissions report. All records shall be maintained by the applicant at their Poletti facility for a minimum of five years.
Manufacturer Name/Model Number: CO AnalyzerParameter Monitored: CARBON MONOXIDEUpper Permit Limit: 0.013 pounds per million BtusReference Test Method: 40 CFR 60 Appendix FMonitoring Frequency: CONTINUOUSAveraging Method: 1-HOUR AVERAGEReporting Requirements: QUARTERLY (CALENDAR)Reports due 30 days after the reporting period.The initial report is due 4/30/2016.Subsequent reports are due every 3 calendar month(s).
Condition 57: Compliance Demonstration Effective between the dates of 01/25/2016 and 01/24/2021
Applicable State Requirement:6 NYCRR Subpart 201-5
Item 57.1:The Compliance Demonstration activity will be performed for:
Emission Unit: 1-00001
Regulated Contaminant(s): CAS No: 007664-41-7 AMMONIA
Item 57.2:Compliance Demonstration shall include the following monitoring:
Monitoring Type: CONTINUOUS EMISSION MONITORING (CEM)Monitoring Description: The facility shall install, calibrate, maintain, and operate a continuous emissions monitor for ammonia slip, in accordance with the manufacturer's specifications. This limit shall apply during periods of start-up or shutdown. Emissions in excess of this limit shall be reported quarterly through the facility's excess emissions report. All records shall be maintained by the applicant at their Poletti facility for a minimum of five years.

Permit ID: 2-6402-00295/00003 Facility DEC ID: 2640200295
Air Pollution Control Permit ConditionsRenewal 2 Page 44 FINAL
Manufacturer Name/Model Number: Ammonia AnalyzerParameter Monitored: AMMONIAUpper Permit Limit: 7.4 poundsReference Test Method: 40 CFR 60 Appendix A Conditional Method 203Monitoring Frequency: CONTINUOUSAveraging Method: MAXIMUM - NOT TO BE EXCEEDED PER OCCURRENCEReporting Requirements: QUARTERLY (CALENDAR)Reports due 30 days after the reporting period.The initial report is due 4/30/2016.Subsequent reports are due every 3 calendar month(s).
Condition 58: Compliance Demonstration Effective between the dates of 01/25/2016 and 01/24/2021
Applicable State Requirement:6 NYCRR Subpart 201-5
Item 58.1:The Compliance Demonstration activity will be performed for:
Emission Unit: 1-00001
Regulated Contaminant(s): CAS No: 007664-41-7 AMMONIA
Item 58.2:Compliance Demonstration shall include the following monitoring:
Monitoring Type: CONTINUOUS EMISSION MONITORING (CEM)Monitoring Description: The facility shall install, calibrate, maintain, and operate a continuous emissions monitor for ammonia slip, in accordance with the manufacturer's specifications. This limit shall apply at all times except during periods of start-up or shutdown. Emissions in excess of this limit shall be reported quarterly through the facility's excess emissions report. All records shall be maintained by the applicant at their Poletti facility for a minimum of five years.
Manufacturer Name/Model Number: Ammonia AnalyzerParameter Monitored: AMMONIAUpper Permit Limit: 10.0 parts per million by volume (dry, corrected to 15% O2)Reference Test Method: 40 CFR 60 Appendix A Conditional Method 203Monitoring Frequency: CONTINUOUSAveraging Method: 1-HOUR AVERAGEReporting Requirements: QUARTERLY (CALENDAR)Reports due 30 days after the reporting period.The initial report is due 4/30/2016.Subsequent reports are due every 3 calendar month(s).

Permit ID: 2-6402-00295/00003 Facility DEC ID: 2640200295
Air Pollution Control Permit ConditionsRenewal 2 Page 45 FINAL
Condition 59: Compliance Demonstration Effective between the dates of 01/25/2016 and 01/24/2021
Applicable State Requirement:6 NYCRR Subpart 201-5
Item 59.1:The Compliance Demonstration activity will be performed for:
Emission Unit: 1-00001
Item 59.2:Compliance Demonstration shall include the following monitoring:
Monitoring Type: WORK PRACTICE INVOLVING SPECIFIC OPERATIONSMonitoring Description: The diesel back-up engine shall be limited to 500 hours per year of operation. These engines shall install non resettable hour meters to record their hours of operation. The records for number of hours per year fired shall be maintained by the applicant at their Poletti facility for a minimum of five years.
Work Practice Type: HOURS PER YEAR OPERATIONUpper Permit Limit: 500 hoursMonitoring Frequency: AS REQUIRED - SEE PERMIT MONITORING DESCRIPTIONAveraging Method: ANNUAL MAXIMUM ROLLED MONTHLYReporting Requirements: SEMI-ANNUALLY (CALENDAR)Reports due 30 days after the reporting period.The initial report is due 7/30/2016.Subsequent reports are due every 6 calendar month(s).
Condition 60: Compliance Demonstration Effective between the dates of 01/25/2016 and 01/24/2021
Applicable State Requirement:6 NYCRR Subpart 201-5
Item 60.1:The Compliance Demonstration activity will be performed for:
Emission Unit: 1-00001
Regulated Contaminant(s): CAS No: 0NY210-00-0 OXIDES OF NITROGEN
Item 60.2:Compliance Demonstration shall include the following monitoring:
Monitoring Type: CONTINUOUS EMISSION MONITORING (CEM)Monitoring Description: The facility shall calculate the tons per year of oxides

Permit ID: 2-6402-00295/00003 Facility DEC ID: 2640200295
Air Pollution Control Permit ConditionsRenewal 2 Page 46 FINAL
of nitrogen emissions based on a twelve month rolling average using the following equation:
(GTACT + (0.0364 lbs/mmBtu)(BATHI) + (10.23 lbs/hr)(BETAHO)) / 2000 lbs/ton <= 21.9 tpy
where:
GTACT = gas turbine actual NOx emissions in pounds per year from the CEM reports,BATHI = boiler annual total heat input in mmBtu/yr,
andBETAHO = back-up engine total annual hours of operation
in hr/yr.
All records shall be maintained by the applicant at their Poletti facility for a minimum of five years.
Manufacturer Name/Model Number: NOx AnalyzerParameter Monitored: OXIDES OF NITROGENUpper Permit Limit: 21.90 tons per yearReference Test Method: 40 CFR 75Monitoring Frequency: CONTINUOUSAveraging Method: ANNUAL MAXIMUM ROLLED MONTHLYReporting Requirements: QUARTERLY (CALENDAR)Reports due 30 days after the reporting period.The initial report is due 4/30/2016.Subsequent reports are due every 3 calendar month(s).

Permit ID: 2-6402-00295/00003 Facility DEC ID: 2640200295
Air Pollution Control Permit ConditionsRenewal 2 Page 47 FINAL