Fairfax County VA Final Official Statement - EMMA.MSRB.org.
198
NEW ISSUE – Full Book Entry RATINGS: Fitch: AAA Moody’s: Aaa Standard & Poor’s: AAA (See “RATINGS” herein) In the opinion of Bond Counsel, under existing law and assuming continuing compliance with the provisions of the Internal Revenue Code of 1986, as amended (the “Code”), as described herein, interest on the Bonds will not be includable in the gross income of the owners thereof for federal income tax purposes. Under existing law, the interest on the Bonds is excluded from Virginia taxable income for purposes of the individual income tax and the income taxation of corporations by the Commonwealth of Virginia under Sections 58.1-322 and 58.1-402 of the Code of Virginia of 1950, as amended, to the extent that such interest is excludable from gross income for federal income tax purposes. See “TAX MATTERS” herein for certain provisions of the Code that may affect the tax treatment of interest on the Bonds for certain bondholders. $316,310,000 FAIRFAX COUNTY, VIRGINIA PUBLIC IMPROVEMENT AND REFUNDING BONDS, SERIES 2014A Dated Date of Delivery Due October 1, as shown on the inside cover page Interest on the Bonds will be payable on each April 1 and October 1, commencing October 1, 2014. The Bonds are being issued for the purpose of financing various public improvements and, subject to favorable market conditions, to refund certain outstanding bonds of the County and to pay costs of issuing the Bonds. The Bonds maturing after October 1, 2023, are subject to redemption prior to maturity as a whole or in part at any time on or after October 1, 2023, at a redemption price of par plus accrued interest. The Bonds will be general obligations of Fairfax County, Virginia, for the payment of which the Board of Supervisors of the County is unconditionally obligated to levy and collect an annual ad valorem tax, unlimited as to rate or amount, upon all property in the County subject to local taxation. This page and the inside cover page contain certain information for quick reference only. They are not a summary of this issue. Investors must read the entire Official Statement to obtain information essential to making an informed investment decision. The Bonds are offered for delivery when, as, and if issued, subject to the approving opinion of Sidley Austin LLP, Washington, D.C., Bond Counsel. The Bonds will be available for delivery in New York, New York, through the facilities of DTC on or about February 6, 2014. January 23, 2014
-
Upload
khangminh22 -
Category
Documents
-
view
2 -
download
0
Transcript of Fairfax County VA Final Official Statement - EMMA.MSRB.org.

NEW ISSUE – Full Book Entry RATINGS: Fitch: AAA Moody’s: Aaa Standard & Poor’s: AAA (See “RATINGS” herein)
In the opinion of Bond Counsel, under existing law and assuming continuing compliance with the provisions of the Internal Revenue Code of 1986, as amended (the “Code”), as described herein, interest on the Bonds will not be includable in the gross income of the owners thereof for federal income tax purposes. Under existing law, the interest on the Bonds is excluded from Virginia taxable income for purposes of the individual income tax and the income taxation of corporations by the Commonwealth of Virginia under Sections 58.1-322 and 58.1-402 of the Code of Virginia of 1950, as amended, to the extent that such interest is excludable from gross income for federal income tax purposes. See “TAX MATTERS” herein for certain provisions of the Code that may affect the tax treatment of interest on the Bonds for certain bondholders.
$316,310,000 FAIRFAX COUNTY, VIRGINIA
PUBLIC IMPROVEMENT AND REFUNDING BONDS, SERIES 2014A
Dated Date of Delivery Due October 1, as shown on the inside cover page
Interest on the Bonds will be payable on each April 1 and October 1, commencing October 1, 2014.
The Bonds are being issued for the purpose of financing various public improvements and, subject to favorable market conditions, to refund certain outstanding bonds of the County and to pay costs of issuing the Bonds.
The Bonds maturing after October 1, 2023, are subject to redemption prior to maturity as a whole or in part at any time on or after October 1, 2023, at a redemption price of par plus accrued interest.
The Bonds will be general obligations of Fairfax County, Virginia, for the payment of which the Board of Supervisors of the County is unconditionally obligated to levy and collect an annual ad valorem tax, unlimited as to rate or amount, upon all property in the County subject to local taxation.
This page and the inside cover page contain certain information for quick reference only. They are not a summary of this issue. Investors must read the entire Official Statement to obtain information essential to making an informed investment decision.
The Bonds are offered for delivery when, as, and if issued, subject to the approving opinion of Sidley Austin LLP, Washington, D.C., Bond Counsel. The Bonds will be available for delivery in New York, New York, through the facilities of DTC on or about February 6, 2014. January 23, 2014

FAIRFAX COUNTY, VIRGINIA PUBLIC IMPROVEMENT AND REFUNDING BONDS, SERIES 2014A
MATURITY DATES, PRINCIPAL AMOUNTS, INTEREST RATES AND PRICES/YIELDS
Base CUSIP† Number 30382A $316,310,000 SERIES 2014A BONDS
Maturity Date October 1
Principal Amount
Interest Rate
Price or Yield
CUSIP† Suffix
2014 $15,505,000 3.00% 0.12% AX0 2015 28,380,000 3.00 0.20 AY8 2016 31,060,000 4.00 0.40 AZ5 2017 15,610,000 4.00 0.58 BA9 2018 15,600,000 4.00 0.94 BB7 2019 15,600,000 4.00 1.25 BC5 2020 15,595,000 4.00 1.67 BD3 2021 15,590,000 4.00 2.00 BE1 2022 15,600,000 5.00 2.29 BF8 2023 15,620,000 5.00 2.49 BG6 2024 13,215,000 5.00 2.65(1) BH4 2025 13,215,000 5.00 2.78(1) BJ0 2026 13,215,000 3.00 100 BK7 2027 13,215,000 4.00 3.10(1) BL5 2028 13,215,000 4.00 3.22(1) BM3 2029 13,215,000 4.00 3.32(1) BN1 2030 13,215,000 4.00 3.48(1) BP6 2031 13,215,000 4.00 3.57(1) BQ4 2032 13,215,000 4.00 3.65(1) BR2 2033 13,215,000 4.00 3.72(1) BS0
(1) Yield to first par call on October 1, 2023
† CUSIP® is a registered trademark of the American Bankers Association. The CUSIP numbers listed above are being provided solely for the convenience of bondholders only, and the County does not make any representation with respect to such numbers or undertake any responsibility for their accuracy. The CUSIP numbers are subject to change after the issuance of the Bonds.

Fairfax County, Virginia BOARD OF SUPERVISORS
Sharon Bulova, Chairman Penelope A. Gross, Vice Chairman
John C. Cook John W. Foust
Michael R. Frey Patrick S. Herrity
Catherine M. Hudgins Gerald W. Hyland
Jeff C. McKay Linda Q. Smyth
______________
COUNTY OFFICIALS Edward L. Long Jr., County Executive
Robert A. Stalzer, Deputy County Executive David P. Bobzien, County Attorney
David J. Molchany, Deputy County Executive David M. Rohrer, Deputy County Executive
Patricia D. Harrison, Deputy County Executive Christopher Pietsch, Director, Department of Finance
Susan W. Datta, Chief Financial Officer ________________ PAYING AGENT
Fairfax County Director of Finance 12000 Government Center Parkway, Suite 214
Fairfax, Virginia 22035-0074 (703) 324-3120
_______________ FINANCIAL ADVISOR
Public Financial Management, Inc. 4350 North Fairfax Drive, Suite 580
Arlington, Virginia 22203-1547 (703) 741-0175
_______________ BOND COUNSEL Sidley Austin LLP
1501 K Street, N.W. Washington, D.C. 20005
(202) 736-8350 ________________
For information relating to this Official Statement, please contact: Susan W. Datta, Chief Financial Officer
Fairfax County, Virginia 12000 Government Center Parkway, Suite 561
Fairfax, Virginia 22035-0074 (703) 324-2391

i
No person has been authorized by Fairfax County (the “County”) to give any information or to make any representations with respect to the County or the Bonds other than those contained in this Official Statement, and, if given or made, such other information or representations may not be relied upon as having been authorized by the County. This Official Statement does not constitute an offer to sell or the solicitation of an offer to buy, nor shall there be any sale of the Bonds by any person in any jurisdiction in which it is unlawful for such person to make such offer, solicitation, or sale. The information herein is subject to change without notice, and neither the delivery of this Official Statement nor any sale made hereunder shall, under any circumstances, create any implication that there has been no change in the affairs of the County since the date hereof. This Official Statement is not to be construed as a contract or agreement between the County and the purchasers or owners of any of the Bonds. Any electronic reproduction of this Official Statement may contain computer generated errors or other deviations from the printed Official Statement. In any such case, the printed version controls.
TABLE OF CONTENTS
Page INTRODUCTION ....................................................................................................................................... 1 THE BONDS ............................................................................................................................................... 1
Authorization and Purposes; Refunding Plan ......................................................................................... 1 Description ............................................................................................................................................. 3 Optional Redemption .............................................................................................................................. 3 Selection of Bonds for Redemption ........................................................................................................ 3 Notice of Redemption ............................................................................................................................. 3 Security ................................................................................................................................................... 4 State Aid Intercept .................................................................................................................................. 4 Remedies ................................................................................................................................................ 4 No Litigation Respecting the Bonds ....................................................................................................... 5
FAIRFAX COUNTY .................................................................................................................................. 5 GENERAL DESCRIPTION ...................................................................................................................... 5
Overview ................................................................................................................................................ 5 Population ............................................................................................................................................... 6 Certain County Administrative and Financial Staff Members ............................................................... 7 County Employees .................................................................................................................................. 9
GOVERNMENT SERVICES .................................................................................................................... 9 General Government Administration ..................................................................................................... 9 Public Schools ...................................................................................................................................... 10 Public Works ........................................................................................................................................ 12 Transportation ....................................................................................................................................... 13 Parks, Recreation and Libraries ............................................................................................................ 16 Community Development..................................................................................................................... 17 Health and Welfare ............................................................................................................................... 18 Judicial Administration......................................................................................................................... 18 Public Safety ......................................................................................................................................... 19 Water Supply Service ........................................................................................................................... 19
ECONOMIC FACTORS .......................................................................................................................... 20 Economic Development ....................................................................................................................... 20 Employment ......................................................................................................................................... 22 Construction Activity ........................................................................................................................... 24

ii
Housing................................................................................................................................................. 25 Colleges and Universities ..................................................................................................................... 26 Cultural Amenities ................................................................................................................................ 26
DEBT ADMINISTRATION .................................................................................................................... 27 Statement of Bonded Indebtedness ....................................................................................................... 27 Limits on Indebtedness ......................................................................................................................... 27 Bond Referenda Authorization ............................................................................................................. 27 Other Tax Supported Debt Obligations ................................................................................................ 28 Lease Commitments and Contractual Obligations ............................................................................... 31 Debt Service on Tax Supported Debt Obligations ............................................................................... 32 Sewer Revenue Bonds .......................................................................................................................... 33 Debt Ratios ........................................................................................................................................... 36 Underlying Bonded Indebtedness ......................................................................................................... 38
TAX BASE DATA .................................................................................................................................... 38 FINANCIAL INFORMATION ............................................................................................................... 42
Five Year Summary of Revenues, Expenditures and Fund Balances for General, Special Revenue and Debt Service Funds .................................................................................................. 42
Financial Policies .................................................................................................................................. 43 Certain Financial Procedures ................................................................................................................ 44 Investment Management Policy ........................................................................................................... 45 General Fund Revenues, Expenditures, Transfers and Beginning Fund Balance ................................ 45 General Fund Summary ........................................................................................................................ 45 Revenues ............................................................................................................................................... 46 Expenditures and Transfers .................................................................................................................. 48 FY 2014 Budget ................................................................................................................................... 49 FY 2015 Budget ................................................................................................................................... 49
CAPITAL IMPROVEMENT PROGRAM ............................................................................................ 50 RETIREMENT SYSTEMS ...................................................................................................................... 50
Fairfax County Employees’ Retirement System (ERS) ....................................................................... 51 Fairfax County Police Officers Retirement Systems (PORS) .............................................................. 52 Fairfax County Uniformed Retirement System (URS) ........................................................................ 53 Educational Employees’ Supplementary Retirement System of Fairfax County (ERFC) ................... 55 Virginia Retirement Systems (VRS) .................................................................................................... 56 Fairfax County Retirement Systems - Plan Revisions from the Board of Supervisors ........................ 57 Other Post-Employment Benefits (OPEB) ........................................................................................... 57
CONTINGENT LIABILITIES AND CLAIMS ..................................................................................... 57 APPROVAL OF LEGAL PROCEEDINGS ........................................................................................... 58 TAX MATTERS ....................................................................................................................................... 58
Opinion of Bond Counsel ..................................................................................................................... 58 Original Issue Discount ........................................................................................................................ 58 Bond Premium ...................................................................................................................................... 59 Backup Withholding ............................................................................................................................. 59 Other Tax Consequences ...................................................................................................................... 59 Future Tax Developments .................................................................................................................... 60
FINANCIAL ADVISOR ........................................................................................................................... 60 VERIFICATION OF CERTAIN FINANCIAL COMPUTATIONS ................................................... 61 RATINGS .................................................................................................................................................. 61 SALE AT COMPETITIVE BIDDING ................................................................................................... 61 CERTIFICATE CONCERNING OFFICIAL STATEMENT .............................................................. 61 MISCELLANEOUS .................................................................................................................................. 62

iii
FUTURE FINANCIAL INFORMATION .............................................................................................. 62 APPROVAL OF OFFICIAL STATEMENT ......................................................................................... 62 APPENDICES Organization of Fairfax County Government ............................................................................... Appendix I Locations of Political Jurisdictions ............................................................................................. Appendix II Map of Fairfax County ............................................................................................................... Appendix III Management’s Discussion and Analysis and Basic Financial Statements ................................. Appendix IV Book-Entry Only System ............................................................................................................ Appendix V Proposed Form of Legal Opinion ............................................................................................... Appendix VI Continuing Disclosure Agreement ............................................................................................ Appendix VII

1
OFFICIAL STATEMENT
FAIRFAX COUNTY, VIRGINIA
Regarding
$316,310,000 Public Improvement and Refunding Bonds, Series 2014A
INTRODUCTION
The purpose of this Official Statement, which includes the cover page, the inside cover pages and the appendices hereto, is to furnish information in connection with the sale by Fairfax County, Virginia (the “County”), of its $316,310,000 Public Improvement and Refunding Bonds, Series 2014A (the “Bonds”).
THE BONDS
Authorization and Purposes; Refunding Plan
The Bonds will be issued under a resolution (the “Resolution”) adopted by the Board of Supervisors of Fairfax County (the “Board of Supervisors”) on December 3, 2013, pursuant to Article VII, Section 10(b) of the Constitution of Virginia and the Public Finance Act of 1991, Chapter 26, Title 15.2, Code of Virginia of 1950, as amended (the “Act”).
A portion of the Bonds will be issued to provide funds (including a portion of the net offering premium) in the following amounts for the following purposes (collectively, the “Public Improvements”):
School Improvements .................................................................. $161,000,000 Transportation Improvements and Facilities ............................... 59,500,000 Public Safety Facilities ................................................................ Parks and Park Facilities .............................................................
50,000,000 13,000,000
Public Library Facilities .............................................................. 6,135,000 Total $289,635,000
A portion of the proceeds of the Bonds will be applied to refund for present value debt service
savings and to redeem prior to their respective maturities certain outstanding bonds of the County referred to hereafter as the “2004 A Refunded Bonds,” the “2004 B Refunded Bonds,” and the “2005 A Refunded Bonds,” and collectively as the “Refunded Bonds.”
In order to comply with federal income tax limitations on advance refundings, the County has refunded only portions of certain maturities of its 2004 B Refunded Bonds and 2005 A Refunded Bonds. New CUSIP numbers have been issued for both the partial maturities of bonds that are Refunded Bonds and the partial maturities of the bonds that are not being refunded by the Bonds. These new CUSIP numbers are to be provided to beneficial owners of the Refunded Bonds in the formal notice of the defeasance to be sent by the Escrow Agent (hereinafter mentioned, the “partial maturities”) to DTC. Beneficial owners of partial maturities that are not Refunded Bonds may check with their broker or other financial consultant to learn the new CUSIP number for their Bonds. Set forth below are the Refunded Bonds and their old and new CUSIP numbers (if applicable):

2
2004 A Refunded Bonds
Maturity (April 1)
Principal Amount
Redemption Date
Redemption
Price CUSIP
New CUSIP
2015 $5,435,000 April 1, 2014 100% 30382A AL6 N/A 2016 5,415,000 April 1, 2014 100 303820 4T8 N/A 2017 3,925,000 April 1, 2014 100 303820 4U5 N/A 2018 2,360,000 April 1, 2014 100 303820 4V3 N/A 2019 2,360,000 April 1, 2014 100 303820 7Q1 N/A 2020 2,360,000 April 1, 2014 100 303820 7R9 N/A 2021 2,360,000 April 1, 2014 100 303820 7S7 N/A 2022 2,360,000 April 1, 2014 100 303820 7T5 N/A 2023 2,360,000 April 1, 2014 100 303820 7U2 N/A 2024 2,360,000 April 1, 2014 100 303820 7V0 N/A
2004 B Refunded Bonds
Maturity (October 1)
Principal Amount
Redemption Date
Redemption
Price CUSIP
New CUSIP
2015 $9,335,000 October 1, 2014 100% 303820 N59 30382A BT8
2005 A Refunded Bonds
Maturity (October 1)
Principal Amount
Redemption Date
Redemption
Price CUSIP
New CUSIP
2016 $13,770,000 October 1, 2015 100% 303820 R30 30382A BV3 _____________ † CUSIP® is a registered trademark of the American Bankers Association. The CUSIP numbers listed above are being provided solely for the convenience of bondholders only, and the County does not make any representation with respect to such numbers or undertake any responsibility for their accuracy. The CUSIP numbers are subject to being changed after the issuance of the Bonds.
Upon delivery and issuance of the Bonds by the County, proceeds thereof will be used to provide for the payment and redemption of the Refunded Bonds by depositing with The Bank of New York Mellon Trust Company, N.A., pursuant to an escrow deposit agreement, cash and non-callable, direct obligations of the United States of America the maturing principal of and interest on which, together with such cash, will be sufficient to pay all principal, applicable redemption premiums, and interest on the Refunded Bonds to their respective redemption dates. The arithmetical computations of the sufficiency of the cash and securities deposited with The Bank of New York Mellon Trust Company, N.A., to pay the principal of and interest on the Refunded Bonds will be verified by Robert Thomas CPA, LLC, Shawnee Mission, Kansas.
The sources and uses of the proceeds of the Bonds are summarized below.

3
Sources Par amount of the Bonds................. $316,310,000 Net offering premium ..................... 31,460,719 Total Sources .............................. $347,770,719
Uses
Public Improvements ...................... $289,635,000 Deposit for payment of Refunded Bonds Underwriter’s discount ...................
56,892,852 711,698
Other issuance expenses ................. 531,169 Total Uses ................................... $347,770,719
Description
The Bonds will be dated the date of their delivery, will bear interest from their delivery date, payable on each April 1 and October 1, commencing October 1, 2014, at the rates will mature in amounts on October 1 in each of the years 2014 through 2033, inclusive, as set forth on the inside cover page of this Official Statement. The Bonds will be issued in denominations of $5,000 and integral multiples thereof under the book-entry system of the Depository Trust Company (“DTC”), and principal and interest on the Bonds will be payable in the manner described in Appendix V, “BOOK-ENTRY ONLY SYSTEM.”
Optional Redemption
The Bonds maturing on or before October 1, 2023, are not subject to optional redemption before their maturity. The Bonds maturing after October 1, 2023, are subject to redemption prior to maturity, at the option of the County, from any money available for such purpose on any date not earlier than October 1, 2023, as a whole or in part (in integral multiples of $5,000) at any time, at a redemption price equal to the principal amount thereof, together with the interest accrued to the redemption date on the principal amount to be redeemed.
Selection of Bonds for Redemption
Bonds may be redeemed only in increments of $5,000 or integral multiples thereof. If less than all of the Bonds of a maturity are called for redemption, the Bonds or portions thereof to be redeemed will be selected by the paying agent and bond registrar in such manner as the paying agent and bond registrar in its sole discretion may determine, each $5,000 increment being counted as one Bond for such purpose. If a portion of a Bond is called for redemption, a new Bond in a principal amount equal to the unredeemed portion thereof will be issued to the bondholder upon the surrender thereof.
In the case of redemption of Bonds at the option of the County, the County will select the maturities of the bonds to be redeemed.
Notice of Redemption
Not more than sixty (60) nor less than thirty (30) days before the redemption date of any Bonds to be redeemed, whether such redemption be in whole or in part, the County will cause a notice of such redemption to be filed with the bond registrar and to be mailed, postage prepaid, to the registered owner

4
of each Bond to be redeemed in whole or in part at his address appearing upon the registration books of the County, but failure to mail such notice or any defect therein will not affect the validity of the redemption. Each such notice is to set forth the date designated for redemption, the redemption price to be paid, the maturities of the Bonds to be redeemed and, if less than all of the Bonds of any one maturity then outstanding shall be called for redemption, the distinctive numbers and letters, if any, of such Bonds to be redeemed and, in the case of any Bond to be redeemed in part only, the portion of the principal amount thereof to be redeemed. If any Bond is to be redeemed in part only, the notice of redemption will state also that on or after the redemption date, upon surrender of such Bond, a new Bond or Bonds in principal amount equal to the unredeemed portion of such Bond will be issued.
Any notice of optional redemption of the Bonds may state that it is conditioned upon there being available an amount of money sufficient to pay the redemption price plus interest accrued and unpaid to the redemption date, and any conditional notice so given may be rescinded at any time before the payment of the redemption price if any such condition so specified is not satisfied. If a redemption does not occur after a conditional notice is given due to an insufficient amount of funds on deposit by the County, the corresponding notice of redemption will be deemed to be revoked.
Security
The Bonds are general obligations of the County for which its full faith and credit are irrevocably pledged. The Act requires that the Board of Supervisors shall, in each year while any of the Bonds shall be outstanding, levy and collect an ad valorem tax, unlimited as to rate or amount, upon all property in the County subject to local taxation sufficient to pay the principal of and the interest on the Bonds as the same shall become due, which tax shall be in addition to all other taxes authorized to be levied in the County.
State Aid Intercept
The provisions of Section 15.2-2659 of the Act, in substance, direct the Governor of Virginia, upon satisfactory proof of default by the County in the payment of principal of or interest on the Bonds, immediately to order the Comptroller of Virginia to withhold all further payment to the County of all funds, or any part thereof, appropriated and payable by the Commonwealth of Virginia (the “Commonwealth” or “State”) to the County for any and all purposes until such default is remedied. For as long as the default continues, the law directs the Governor to require the Comptroller to pay to the holders of such Bonds or the paying agent therefor all of the withheld funds or as much as are necessary to cure, or to cure insofar as possible, the default on such Bonds. The Governor shall, as soon as practicable, give notice of such default and of the availability of funds with the paying agent or with the Comptroller by publication one time in a daily newspaper of general circulation in the City of Richmond, Virginia, and by mail to the registered owners of such Bonds. Although the provisions of Section 15.2-2659 have never been tested in a Virginia court, the Attorney General of Virginia has opined that appropriated funds can be withheld pursuant to its provisions.
Remedies
The Bonds do not specifically provide any remedies that would be available to a bondholder if the County defaults in the payment of principal of or interest on the Bonds, nor do they contain a provision for the appointment of a trustee to protect and enforce the interests of the bondholders upon the occurrence of such default. If a bondholder does not receive payment of principal or interest when due, the holder could seek to obtain a writ of mandamus from a court of competent jurisdiction requiring the Board of Supervisors to levy and collect an ad valorem tax, unlimited as to rate or amount, upon all property in the County subject to local taxation sufficient to pay the principal of and the interest on the

5
Bonds as the same shall become due. The mandamus remedy, however, may be impracticable and difficult to enforce. The enforceability of rights or remedies with respect to the Bonds (but not the validity of the Bonds) may be limited by bankruptcy, insolvency, or other Commonwealth or federal laws, heretofore or hereafter enacted, and equitable principles affecting the enforcement of creditors’ rights.
No Litigation Respecting the Bonds
No litigation is pending or, to the best of the County’s knowledge, threatened (a) to restrain or enjoin the issuance, sale, or delivery of any of the Bonds, the application of the proceeds thereof, or the pledge of tax revenues for payment of the Bonds, (b) in any way contesting or affecting any authority for the issuance or validity of the Bonds, (c) in any way contesting the existence or powers of the County or (d) that, if determined adversely against the County, would have a material adverse effect on the County. See “CONTINGENT LIABILITIES AND CLAIMS” for a description of litigation affecting the County.
FAIRFAX COUNTY
GENERAL DESCRIPTION Overview
The County is located in the northeastern corner of the Commonwealth and encompasses an area of 407 square miles. Its current estimated population exceeds one million. The County is part of the Washington, D.C. metropolitan area, which includes jurisdictions in Maryland, the District of Columbia and Northern Virginia.
The Fairfax County government is organized under the Urban County Executive form of government (as defined under Virginia law). The governing body of Fairfax County is the Board of Supervisors, which makes policies for the administration of the County. The Board of Supervisors is comprised of ten members: the Chairman, elected at large for a four year term, and one member from each of nine districts, each elected for a four year term by the voters of the district in which the member resides. The Board of Supervisors appoints a County Executive to act as the administrative head of the County. The County Executive serves at the pleasure of the Board of Supervisors, carries out the policies established by the Board of Supervisors, directs business and administrative procedures, and recommends officers and personnel to be appointed by the Board of Supervisors. (See Appendix I.)
In Virginia, cities and counties are discrete units of government and do not overlap. Fairfax County completely surrounds the City of Fairfax and is adjacent to the City of Falls Church and the City of Alexandria. (See Appendix II.) Property within these cities is not subject to taxation by Fairfax County, and the County generally is not required to provide governmental services to their residents. The County does, however, provide certain services to the residents of certain of these cities pursuant to agreements with such cities.
In Fairfax County there are three incorporated towns, Clifton, Herndon and Vienna, which are underlying units of government within the County, and the ordinances and regulations of the County are, with certain limitations prescribed by Virginia law, generally effective in them. (See Appendix III.) Property in these towns is subject to County taxation, and the County provides certain services to their residents. These towns may incur general obligation bonded indebtedness without the prior approval of the County (more fully discussed in “DEBT ADMINISTRATION – Underlying Bonded Indebtedness”).

6
Population
Fairfax County’s estimated 2012 population was 1,118,602. In 1980, Fairfax County was the third most populous jurisdiction in the Washington, D.C., primary metropolitan statistical area, as defined by the U.S. Bureau of the Census. By 1990, Fairfax County, with 818,584 residents, had become the most populous jurisdiction in the Washington, D.C. area, adding an average of 22,000 people per year in the 1980s. Population growth during the 1990s and 2000s has slowed in Fairfax County; on average, about 11,000 people per year were added to the population during 2000-2012.
Fairfax County Population
Calendar Year Population 1940 40,929 1950 98,557 1960 248,897 1970 454,275 1980 596,901 1990 818,584 2000 969,749
2001 984,366 2002 1,004,435 2003 1,012,090 2004 1,022,298 2005 1,033,646 2006 1,037,311 2007 1,041,507 2008 1,050,315 2009 1,074,227 2010 1,081,726
2011 1,100,692 2012 1,118,602
_____________________ Sources: U.S. Bureau of the Census (1940-2000, 2010) and the Fairfax County Department of Systems Management for Human Services
The following table reflects the population age distribution of County residents, based on the U.S. Census Bureau’s 2010 Decennial Census. The survey estimated the County’s total population in 2010 at 1,081,726.
Household Population Age Distribution Fairfax County
2010 Age Group Number Percent (%) Under 20 years 285,405 26.4 20 – 34 218,781 20.2 35 – 54 339,757 31.4 55 – 64 131,493 12.2 65 and Over 106,290 9.8 Total 1,081,726 100.0
_________________ Sources: U.S. Bureau of the Census, 2010 Decennial Census and Virginia Employment Commission

7
Based on data released by the U.S. Census Bureau, Fairfax County’s median household income in
2012 was $107,096. The estimated median family income in Fairfax County was $124,831 in 2012. Over 32.0% of the County households and 39.8% of families had annual incomes of $150,000 or more. The following table illustrates the 2012 household and family income distribution in the County.
Annual Household and Family Income Distribution (by Percentage) Fairfax County, 20121
Income Level Household Family Under $25,000 7.2% 5.1% $25,000 – 49,999 11.4% 10.2% $50,000 – 74,999 14.2% 11.3% $75,000 – 99,999 13.3% 12.0% $100,000 – 149,999 21.3% 21.6% $150,000 or more 32.6% 39.8% Median Income $107,096 $124,831
____________________________ Sources: Fairfax County Department of Neighborhood and Community Services; Population Division, U.S. Bureau of the Census, 2012 American Community Survey 1 In 2010, the Population-Division, U.S. Bureau of the Census estimated that there were 386,131 households and 260,241 families in Fairfax County. “Families” are defined as those households containing two or more persons related by blood, marriage, or adoption
Certain County Administrative and Financial Staff Members
Edward L. Long Jr., County Executive, joined the County in 1977 as a Budget Analyst. He served as a Senior Budget Analyst from 1980 to 1983 and as Assistant Director from 1983 to 1989. He was appointed Director of the Office of Management and Budget in October 1989 and Deputy County Executive-Chief Financial Officer (“DCE-CFO”) in 1997. Mr. Long retired as DCE-CFO in May, 2011. Mr. Long was appointed County Executive effective April 25, 2012. Mr. Long has a Bachelor’s Degree in Political Science from Emory & Henry College and a Master’s Degree in Urban Studies from the University of Maryland at College Park. He has served on the Fairfax-Falls Church Community Services Board and is active and has held offices in numerous professional organizations in the Northern Virginia region. Mr. Long serves as an adjunct professor at George Mason University and American University. He served on the Government Finance Officers Association (“GFOA”) Standards Committee on Governmental Budgeting and Management. In 1993 Mr. Long was recognized by the Washington Metropolitan GFOA with the Anna Lee Berman Award for Outstanding Leadership in Governmental Finance. In 2006, Mr. Long was awarded the A. Heath Onthank Award, the County’s highest employee award, in recognition of his achievements in advancing and improving public service in Fairfax County. In 2012, Mr. Long received the 2012 Distinguished Local Government Leadership Award from the Association of Government Accountants.
Robert A. Stalzer, Deputy County Executive, joined Fairfax County Government on June 5, 2000. Mr. Stalzer previously served as Town Manager for the Town of Herndon, Virginia from 1988 until June 2000. He was Director of Planning and Zoning for Roanoke County, Virginia from 1983 until 1988. Mr. Stalzer holds a Bachelor of Arts degree from Clark University, a Master of Regional and City Planning degree from the University of Oklahoma, and a Master of Business Administration degree from Syracuse University. Mr. Stalzer is a past president of the Virginia Local Government Management Association and recognized as a credentialed manager by the International City/County Management Association. Mr. Stalzer has served as an adjunct professor at Virginia Polytechnic Institute and State University, Roanoke College, and George Mason University.

8
David P. Bobzien was appointed County Attorney by the Fairfax County Board of Supervisors effective January 1993, after serving as a member of the Fairfax County Planning Commission and as the Chairman of the Fairfax County Goals Advisory Commission. He is a past chair of the Local Government Law Section of the Virginia State Bar, a past president of the Local Government Attorneys of Virginia, a past president of Lawyers Helping Lawyers, the organization that assists lawyers in Virginia suffering from substance abuse or mental illness, and the Immediate Past President of the Virginia Law Foundation. In 2004-2005 he served as the president of the Virginia State Bar. Mr. Bobzien is the current Chairman of the Virginia Continuing Legal Education Committee of the Virginia Law Foundation and a board member of the Fairfax Law Foundation. He also serves as a member of the American Bar Association’s Commission on Domestic and Sexual Violence and as the Fairfax Bar Association’s delegate in the American Bar Association’s House of Delegates. Mr. Bobzien is a fellow of both the Virginia Law Foundation and the American Bar Foundation. Prior to assuming his present County position, he served as an assistant counsel in the Office of Professional Responsibility of the United States Department of Justice. From 1975 to 1979 Mr. Bobzien was an associate in the Fairfax law firm of Fitzgerald and Smith. He served as a captain in the Judge Advocate General’s Corps in the United States Army from 1971 to 1975. Mr. Bobzien is a graduate of Holy Cross College and holds a J.D. from the University of Virginia and an LL.M. in Taxation from George Washington University.
David J. Molchany, Deputy County Executive, joined the County in 1995. In 2003 Mr. Molchany was recognized by Governing magazine as one of the top ten Public Officials of the Year. He is also active in professional organizations at the international, national, state, and local levels of government. Previous employers have included Sallie Mae, American Management Systems, and Electronic Data Systems. Mr. Molchany is a 1983 graduate of Juniata College and holds a Bachelor of Science degree in Marketing and Computer Science.
David M. Rohrer, Deputy County Executive, has worked with the Fairfax County Police Department for almost 32 years and was appointed chief in 2004. In addition, Mr. Rohrer has also served as deputy chief for investigations and operations support; Patrol Bureau commander; Special Operations Division and district commander; SWAT first-line supervisor; and first-line patrol supervisor. Mr. Rohrer has served two terms as chairman of the Metropolitan Washington Council of Governments Police Chiefs’ Committee, and he is a member of numerous organizations, including the International Association of Chiefs of Police; the Major Cities Chiefs’ Association; the Police Executive Research Forum; and the Virginia Association of Chiefs of Police. Mr. Rohrer holds a bachelor’s degree in administration of justice from George Mason University.
Patricia D. Harrison, Deputy County Executive, has worked in the field of human services since her graduation from Slippery Rock University in 1980 where she obtained a Bachelor’s Degree in Therapeutic Recreation. She joined Fairfax County Government in 1986 and directed the creation of inclusive and therapeutic recreation services for people with disabilities. Prior to joining the County Executive’s office, she served as Director for the Department of Community and Recreation Services for ten years. Ms. Harrison also holds a Master’s Degree with a concentration in Therapeutic Recreation Administration from University of Maryland, College Park Campus and obtained a Certificate of Public Management from George Washington University. She maintains her credentials as a Certified Therapeutic Recreation Specialist.
Christopher J. Pietsch was appointed Director of Finance for Fairfax County effective December 30, 2013. From 2003 until his appointment as Director of Finance, Mr. Pietsch served as the Director of the Fairfax County Internal Audit Office. Prior to that, Mr. Pietsch spent 16 years working in bank auditing as well as governmental auditing with the Commonwealth of Virginia. Mr. Pietsch is a graduate of James Madison University, Harrisonburg, Virginia, with a degree in Finance. In addition, he is a Certified Internal Auditor and a Certified Bank Auditor.

9
Susan W. Datta was appointed as the Chief Financial Officer of the County in May 2011. In addition, she is Director of the County Department of Management and Budget. Ms. Datta received her Bachelor’s Degree in American Government from the University of Virginia and a Masters of Public Administration from the University of North Carolina at Chapel Hill. Ms. Datta worked as Assistant to the County Manager in Catawba County, North Carolina, from 1984 to 1987. She joined the Fairfax County Department of Management and Budget in May 1987 as a budget analyst.
County Employees
As of July 2013, there were 36,071 full and part time positions authorized for the County. Of this total, 23,831 were authorized by the School Board, 11,208 were authorized in other activities funded directly or supported by the General Fund of the County, and 1,032 were authorized in activities not supported by the General Fund, principally the County’s Integrated Sewer System (the “Integrated Sewer System”). Fairfax County employees are not represented by unions. Fairfax County public school employees have, however, organized the Fairfax Education Association and the Fairfax County Federation of Teachers to represent the interests of its members at public hearings and meetings before the School Board and the Board of Supervisors. General County employees’ interests are represented at these types of meetings by the Employees Advisory Council and other groups such as police, fire, and sheriff employee organizations. None of these organizations is empowered to serve as negotiating agent for its members for collective bargaining purposes. Collective bargaining by public employees in Virginia is prohibited by law, and such restriction has been upheld by the Supreme Court of Virginia.
GOVERNMENT SERVICES
Reflecting its urban character, Fairfax County provides a comprehensive range of public services characteristic of its form of government under Virginia law and its integral position within the Washington metropolitan area. The following subsections describe principal governmental services and services performed in conjunction with other governmental entities.
General Government Administration The County government center complex is located in the Fairfax Center area and is accessible by
U.S. Routes 50 and 29, near Interstate Highway 66. The 675,000 square foot government center houses core County services and agencies. Two adjacent County office buildings provide an additional 486,000 square feet of space and house primarily human services and community development agencies and departments of the County. The County also occupies a 135,000 square foot governmental center for delivery of County services in the southeast part of the County. Six remote governmental centers, in addition to the central government center complex and the center in the Southeast part of the County, have been established. The centers provide office space for members of the Board of Supervisors, personnel, police, and building inspectors, and provide meeting rooms for community activities.
Between FY 2004 through FY 2012, Fairfax County’s performance measurement efforts have been recognized by the International City/County Management Association (“ICMA”) with its “Certificate of Distinction.” In 2009, ICMA created its third and highest level of recognition, called the “Certificate of Excellence.” Fairfax County has received this newest and highest level of ICMA’s recognition from 2009 and through 2013 for its consistent efforts to incorporate performance data into decision-making, sustain the program through training and process improvement, and by providing a high-level of accountability and transparency while obtaining and sharing community input.
During 2013, Fairfax County’s Comprehensive Annual Financial Report for the fiscal year ended June 30, 2012, received GFOA’s Certificate of Achievement for Excellence in Financial Reporting for the 36th consecutive year. In addition, for the past 29 years, Fairfax County has earned GFOA’s Distinguished Budget Presentation Award. This award represents the highest form of recognition in

10
governmental budgeting and reflects the commitment of the governing body and staff in meeting the highest principles of public budgeting. The Association of Public Treasurers of the United States and Canada (“APT”) has awarded the County certification for its investment policy, confirming that the County meets the high public investment standards set forth by the Association. This award has been received each year since 1998. Written investment policies submitted to the APT received vigorous peer-team review for conformity with principles of sound investment management, careful public stewardship, and adoption of the profession’s best practices.
Public Schools The Fairfax County Public Schools (“FCPS”) is the largest educational system in the
Commonwealth of Virginia and the eleventh largest school system nationwide, ranked by enrollment. The system is directed by a twelve person School Board (the “School Board”) elected by the citizens of the County to serve four-year terms. A student representative with a one-year term participates in the discussions but does not vote. Because the School Board is not empowered to levy taxes or to incur indebtedness, the operating costs of FCPS are provided by transfers to the School Board from the General Fund of the County and the federal and Commonwealth governments (see the “FINANCIAL INFORMATION – General Fund Summary” herein). Capital construction funding for public school facilities is provided primarily by the sale of general obligation bonds of the County.
The FCPS system is a high quality system offering a variety of programs. There is a strong academic program for college-bound students. Almost 96% of FCPS graduates enroll in post-secondary educational programs. In addition to the traditional academic curriculum, the Thomas Jefferson High School for Science and Technology provides a four-year college preparatory program for students who have a strong interest and high aptitude in mathematics, science, computer science, engineering, or related professional fields. The school has been designated as one of the Governor’s magnet schools for science and technology, and students from other Northern Virginia counties are admitted on a tuition-paying basis.
An extensive program for students pursuing opportunities in technical careers has also been developed. Various courses are offered in business, health occupations, industrial technology, marketing, trade and industrial, and family and consumer sciences studies program areas. In addition, there are special programs offered for gifted children and for students with disabilities spanning ages 2 through 21. FCPS also provides an extensive adult education program offering basic education courses and general education, vocational, and enrichment programs. Annually over 40,000 community members have continued their education through more than 4,200 academic, career, and life skill classes offered through the Adult and Community Education program.
As of FY 2014, the School Board operates 189 schools and 7 special education centers:
Fairfax County Public Schools
Type of School Number of Public
Schools Elementary School 139 Middle School 23 High School 22 Secondary Schools1 3 Alternative High Schools 2 Special Education Centers 7 Total 196
_____________ Source: Fairfax County Public Schools 1Grades 7-12.

11
As shown below, the number of students attending Fairfax County Public Schools increased overall between FY 2004 and FY 2013. Enrollment for FY 2013 was 181,259, an increase of 17,064 students over the FY 2004 enrollment, and 3,341 over the FY 2012 enrollment.
Fairfax County Public Schools Enrollment
Fiscal Year
Number of Public
School Students
% Change 2004 164,195 - 2005 164,408 0.13 2006 164,284 (.07) 2007 164,486 0.12 2008 166,307 1.12 2009 169,538 1.94 2010 172,391 1.68 2011 174,933 1.48 2012 177,918 1.71 2013 181,259 1.88
__________________ Source: Fairfax County Public Schools FY 2013 Approved Budget
The average per pupil expenditures based on FY 2013 approved budget operating costs for several Washington metropolitan area jurisdictions are as follows:
Washington Metropolitan Per Pupil Expenditures Jurisdiction
Per Pupil Expenditures
Arlington County $18,675 Alexandria City 17,024 Falls Church City 16,612 Montgomery County (Md.) 14,880 Fairfax County 13,564 Prince George’s County (Md.) 12,296 Manassas City 12,108 Loudoun County 11,595 Manassas Park City 10,619 Prince William County 10,163
____________________ Source: FY 2013 Washington Area Boards of Education Guide
Nearly 72% of the Advanced Placement (AP) tests taken by FCPS students in 2012 rated a score of 3 or above (on a grading scale of 1 to 5). Students who score a 3 or above on at least three AP exams are recognized by the College Board as AP Scholars. The total number of students recognized as AP Scholars rose from 5,176 in 2011 to 5,737 in 2012. In 2012, 35,759 AP tests were given, an increase of 5.2% from 2011. As a result of increasing both student participation and performance, FCPS was one of 388 school districts in the U. S. to be named an Advanced Placement Achievement District by the College Board in 2011. The greatest gains in 2012 from 2011 were made by underrepresented minority students, with Hispanic student AP enrollment increasing by 829% and Black student AP enrollment increasing by 14.6%.

12
2012 Average Scholastic Aptitude Test Scores Critical Reading Writing Math Total
United States 496 488 514 1498 Virginia 510 495 512 1517 Fairfax County 550 542 567 1659
_____________ Source: The College Board
The Virginia Standards of Learning pass rates for FCPS students in 2011 were 93% in English and 92% in mathematics. The achievement gap continued to narrow in reading for Black students and in mathematics for Hispanic students. Public Works
Essential management, professional engineering, design, and construction services in support of the construction of roads, sidewalks, trails, storm drainage, sewers, street lights, bus shelters and public facilities (except schools, housing, and parks) are provided through the Department of Public Works and Environmental Services. The Department is also responsible for the acquisition of land for, and timely construction of, public facilities projects contained in bond referenda questions approved by the voters of Fairfax County. See “DEBT ADMINISTRATION – Bond Referenda Authorization” herein.
Wastewater generated in the County is treated at one County-owned treatment facility, four inter-jurisdictional treatment facilities, and one private treatment facility. The County-owned treatment facility is the Noman M. Cole, Jr., Pollution Control Plant. The four inter-jurisdictional treatment facilities are the District of Columbia Water and Sewer Authority’s Blue Plains Facility, and plants operated by the Upper Occoquan Sewage Authority (“UOSA”), Arlington County, and the Alexandria Renew Enterprises. The private treatment facility is the Harbor View Wastewater Treatment Plant. The County’s treatment capacity in the six facilities totals approximately 157.18 million gallons per day (“mgd”). In addition, the County has purchased 0.1 mgd of capacity from the Prince William County Service Authority for future flow needs in the southern portion of the County.
The Department manages and operates the I-95 Sanitary Landfill located on approximately 500 acres in the southern portion of the County. This facility is operated on a “special fund” basis, which utilizes tipping fees to pay for the operation and capital expenditures of the landfill. Since January 1, 1996, the landfill has been dedicated to the disposal of ash generated primarily by the incineration of municipal solid waste at the Arlington/Alexandria Energy-from-Waste Facility and the Fairfax County I-95 Energy/Resource Recovery Facility (“E/RRF”). On older portions of the landfill, the County has initiated closure activities which involve placing a synthetic or low permeability soil cap over the closed section of the landfill along with installation of landfill gas extraction wells and leachate collection systems. Capping activity has been completed on approximately 260 acres of the site. The closure project is a multi-phase construction project to continue through the remaining life of the facility. The County has established reserves for this purpose and has met the financial assurance requirements established by the Virginia Department of Environmental Quality regarding closure and post-closure care. Additional landfill requirements, whether debris or municipal solid waste, are met through separate contracts.
The E/RRF burns solid waste delivered to the facility from the County as well as portions of the District of Columbia, Prince William County, and Loudoun County. The facility has a dependable electric capacity rating of 63 megawatts for sale to Dominion Virginia Power, although it has the ability to generate for sale over 80 megawatts. Fairfax County and the Fairfax County Solid Waste Authority,

13
which was created by the County, entered into a service contract (the “Covanta Contract”) in August 1987 with Ogden Martin Systems of Fairfax (now Covanta Fairfax, Inc.), under which Covanta Fairfax, Inc. was obligated to design, construct, operate, and maintain a 3,000 ton per day resource recovery facility at the I-95 Landfill Site. The County, under the Covanta Contract, is obligated to deliver certain minimum annual tonnages of solid waste to the E/RRF and to pay Covanta Fairfax, Inc., tipping fees for the disposal of such waste to provide funds sufficient to pay the operating costs of the E/RRF. Covanta Energy Corporation, of which Covanta Fairfax, Inc., is an indirectly wholly-owned subsidiary, has guaranteed the obligations of Covanta Fairfax, Inc., under the Covanta Contract.
During FY 2013, the E/RRF processed over 946,000 tons of material towards the County’s delivery commitment, exceeding the guaranteed requirements by 10,000 tons. Covanta Fairfax, Inc., processed in excess of 975,000 tons of waste in FY 2013. The current Covanta Contract remains in effect through February 1, 2016.
Transportation
General
Fairfax County is served by various highway, rail and air transportation facilities. The Capital Beltway (Interstate Highways 95 and 495), Interstate Highways 395, and 66 and the Dulles Toll Road provide access to all parts of the Washington metropolitan area and major surface transportation corridors along the eastern seaboard. The Washington Metropolitan Area Transit Authority (“WMATA”) Metrorail system provides area residents with one of the largest and most modern regional transit systems in the world.
Two major airports serve the County with daily national and international service. Washington Dulles International Airport (“Dulles Airport”), located along the County’s western boundary, is also the site of a designated Foreign Trade Zone. Ronald Reagan Washington National Airport, located a few miles east of the County, is accessible by Interstate Highways 66 and 395. In 1987, control of these facilities was transferred by a 50-year lease from the federal government to the Metropolitan Washington Airports Authority (“MWAA”), a public authority created by inter-jurisdictional compact between the Commonwealth and the District of Columbia. In June 2003, the lease was extended to 2067.
Ground transportation receives significant attention from the County, primarily in an effort to relieve traffic congestion along the major arterials leading to Washington, D.C. and also to facilitate cross-County movement, connecting established and developing centers of commerce and industry. Recent efforts have included increased local funding for highway improvements, establishment of transportation improvement districts, creation of County transit systems, continued participation in WMATA, and other improvements which encourage increased use of Metrorail, bus services, and carpooling. The County also participates in a regional commuter rail system to expand transportation services available to County residents. In Virginia, the Commonwealth is generally responsible for highway construction and maintenance. However, highway improvement needs in Fairfax County far exceed the highway revenues available from the Commonwealth.
Since 1993, funding for County transportation projects has been received from Commonwealth bond financing, Federal Highway Reimbursement Anticipation Notes, Commonwealth general funds, fuel tax collections, County bond financing, Northern Virginia Transportation Authority tax collections and other revenue sources. A few of the many projects supported by these funding sources have included the Fairfax County Parkway, the County’s share of capital costs for the WMATA’s Metrorail system, the Dulles Toll Road, and improvements to U.S. Route 1, U.S. Route 29, I-66, I-95, I-495, the Fairfax County Parkway, State Route 7 and State Route 28.

14
Metro Transit System
Since 1970, Fairfax County and the other major political subdivisions in the Washington, D.C. metropolitan area have contracted with WMATA to finance, construct and operate a 103-mile Metrorail subway and surface rail transit system. Funding for the construction of the Metrorail system has come from direct Congressional appropriations and by direct local contributions. Five Interim Capital Contributions Agreements between WMATA and the participating political jurisdictions were executed to fully fund and complete the 103-mile adopted regional system.
WMATA’s Board of Directors periodically adopts a Capital Improvement Plan, which prioritizes and maintains the existing capital plant and rolling stock of the Metrobus and Metrorail systems. The regional partners to WMATA periodically agree to updated funding agreements regarding their portion of capital priorities and infrastructure renewal projects. County general obligation bonds are issued as the primary source of the County’s share of WMATA’s CIP.
The County’s operating assistance to WMATA is funded from the General Fund, gasoline tax receipts, and State aid. Fairfax County’s share of the bus and rail operating subsidies for FY 2004-2013 are shown in the following table:
Fairfax County WMATA Operating Subsidies (Millions of Dollars)
Fiscal Year
Bus Operations1,2
Rail Operations1
ADA Para-
transit1
Less State Aid3
Less Gas Tax
Receipts4
Adjust-ments and
Interest Applied
Net General
Fund 2004 $27.060 $18.582 $4.936 $22.112 $11.815 $5.174 $11.477 2005 29.662 17.375 5.945 22.033 14.748 0.000 16.201 2006 31.687 18.849 5.841 19.809 17.971 1.200 17.397 2007 37.368 17.496 5.803 19.406 20.885 1.990 18.386 2008 36.745 19.267 7.088 21.375 22.610 1.287 17.828 2009 45.292 17.665 7.565 39.836 23.490 0.000 7.196 2010 40.204 22.622 9.164 46.003 17.799 0.300 7.888 2011 45.387 15.598 11.347 44.745 21.838 0.300 5.449 2012 47.458 19.481 12.410 46.252 26.163 2.259 4.675 2013 48.829 26.209 12.424 49.734 28.568 0.056 9.104
__________________ Source: Fairfax County Department of Transportation and Department of Management and Budget 1 The amounts shown for operating subsidies represent actual disbursements in those years. Adjustments based on final WMATA annual
audited figures are incorporated in the fiscal year in which the credit for an overpayment was applied or a debited amount was paid rather than the fiscal year in which the credit or debit was earned.
2 Includes other service enhancements. 3 Virginia law permits the use of State aid for transportation to fund transit program operating costs in addition to transit program capital
costs. 4 A 2% retail gasoline tax is to be dedicated to mass transit costs in those Northern Virginia jurisdictions covered by the Northern Virginia
Transportation Commission (“NVTC”). The receipts from this tax are paid to NVTC which then allocates these funds to participating jurisdictions for payment of transit operating, capital and debt service costs.

15
Tax Districts
Transportation improvement districts provide another source of funding for transportation improvements in the County. The County, together with Loudoun County, a neighboring jurisdiction, formed the Route 28 Highway Transportation Improvement District (the “Route 28 District”) in 1987 to accelerate highway improvements proposed by the Commonwealth to State Route 28. State Route 28 runs approximately parallel to the County’s western border and connects State Route 7 in eastern Loudoun County to U.S. Route 50 and Interstate Highway 66 in western Fairfax County. The initial improvements, which consisted of expanding State Route 28 from two to six lanes, with additional turning lanes, are now complete. State Route 28 provides access to Washington Dulles International Airport, as do the Dulles Access Road and the Dulles Toll Road, both of which connect the Capital Beltway to Dulles Airport. Such improvements were financed from proceeds of a special improvements tax (the “Route 28 Special Improvements Tax”) collected from owners of real property zoned for commercial and industrial use in the District and bonds issued by the Fairfax County Economic Development Authority (the “EDA”) secured by the Route 28 Special Improvements Tax collections.
In 2001, the Virginia General Assembly enacted legislation permitting the creation of one or more special transportation taxing districts located between the West Falls Church Metrorail station and the Dulles Airport area to provide a means of financing an extension of rail service in the Dulles Corridor. The structure of any such district is modeled after the existing Route 28 District. In February 2004, pursuant to a petition submitted by landowners representing a majority of the assessed value of property zoned for commercial or industrial use in the Tysons and Reston commercial districts, the Board of Supervisors formed the Phase I Dulles Rail Transportation Improvement District (the “Phase I District”) to provide funds to support the County’s share of Phase I of a proposed expansion of the Metrorail system to Dulles Airport and beyond (“Phase I”). Funds for financing the County’s $400 million share of the Phase I expansion of the Metrorail system are provided from a real estate tax levy on all property zoned for commercial and industrial use in the Phase I District (the “Phase I Special Improvements Tax”). As of December, 2013 the County has provided to MWAA its required $400 million share for the Phase I Project from the proceeds of the Phase I Special Improvements Tax and from bonds issued by the EDA secured by the Phase I Special Improvements Tax collections. The County expects to provide approximately $68 million in additional funds for the completion of the Phase I Project from financing sources other than the Phase I Special Improvements Tax. Phase II of the proposed expansion of the Metrorail system (“Phase II”) will complete the 23-mile line to Dulles Airport and beyond into Loudoun County. In October 2009, the County received a valid petition to form another special tax district comprised of the Reston-Herndon-Dulles commercial districts to provide $330 million toward the County’s portion of the Phase II financing. The Phase II tax district was approved by the Herndon Town Council on November 11, 2009, and by the Fairfax County Board of Supervisors on December 7, 2009.
County Transit Systems
Within the County, the Fairfax Connector System provides feeder bus service to Metrorail Stations. The Fairfax Connector operates 79 routes to ten Metrorail Stations, including the Huntington, Pentagon, West Falls Church–VT/UVA, Van Dorn Street, Vienna/Fairfax-GMU, Dunn Loring-Merrifield, Franconia-Springfield, Pentagon City, Eisenhower Avenue, and King Street Stations. Private contractors operate and maintain the service and have the responsibility to employ and supervise all transit personnel, while the Board of Supervisors maintains control and approves all policies for bus service such as routes and service levels, fare structures, and funding assistance. The Fairfax Connector System is supported from General Fund and fare box revenues. The FY 2014 Adopted Budget Plan also includes support of $19.1 million from State aid. The Fairfax Connector carried approximately 10.4 million passengers in FY 2012. Fairfax Connector System expenditures totaled approximately $84.7

16
million in FY 2013, including capital expenditures. The County runs three permanent maintenance and garage facilities for the Fairfax Connector System, with bus operations management provided by a contractor.
Commuter Rail
Fairfax County is a member of the Northern Virginia Transportation Commission and, in cooperation with the Potomac and Rappahannock Transportation Commission, is a participating jurisdiction in the operation of the Virginia Railway Express commuter rail service. As of December 2013, the service consisted of seven peak period trips from south of the County in the City of Fredericksburg to north of the County in the District of Columbia and six peak trips that run from west of the County in the City of Manassas to north of the County in the District of Columbia. Under a Master Agreement among VRE’s participating jurisdictions, the County is to contribute to capital, operating, and debt service costs of the VRE on a pro rata basis according to its share of ridership. The County’s share of the FY 2014 commuter rail operating and capital budget is $5.3 million.
Parks, Recreation and Libraries
Fairfax County provides a variety of recreational, educational, and cultural activities and services to people who live, work, and study in Fairfax County. In FY 2013, the Fairfax County Public Library (the “Library”) made more than 13.1 million loans and recorded more than 5.2 million visits to its 23 branches, and reported more than 4.6 million user visits to its Web site. The Library offers free events and activities, including puppet shows for toddlers, story time for school-aged children, book discussion groups for teens, live author visits for adults, and English conversation classes for ESOL customers (or new arrivals). The Library also makes library services available and accessible to people who have disabilities or are homebound.
The Department of Community and Recreation Services provides a variety of recreational, community, and human services for County residents. These services include senior adult programs and centers, therapeutic recreation services for individuals with disabilities, a variety of youth programs including recreational activities at youth centers, community-based recreational opportunities, support for Fairfax County’s various volunteer sports councils and leagues, and a variety of volunteer opportunities.
Fairfax County also operates an extensive park system which provides a wide variety of recreational activities and facilities. Under the direction of a Board of Supervisors appointed 12-member Park Authority Board, the Fairfax County Park Authority (“FCPA”) works with constituents, government leaders and appointees to implement Park Authority Board policies, preserve and protect natural and cultural resources, and facilitate the development of park and recreation programs and facilities. FCPA oversees operation and management of a 23,265-acre County park system with 421 parks, nine recreation centers with swimming pools, fitness centers, racquetball courts, program space, eight golf courses, an ice skating rink, skateparks, campgrounds, 203 playgrounds, 668 public gardens, five nature centers, an equestrian center, 731 athletic fields including 31 synthetic turf fields, ten historic sites, two waterparks, a horticultural center, and more than 320 miles of trails. In FY 2013, FCPA welcomed over 16.5 million visitors to parks, groomed fields for 174,000 competitors, and worked to control non-native invasive plants, promote native species and preserve woodlands and green open spaces.
FCPA charges fees for the use of certain park facilities including the recreation and fitness centers and golf courses which are operated on a cost recovery basis. This revenue fund represents approximately 60% of FCPA’s funding. The remaining operating funds are appropriated by the Board of Supervisors from the County’s combined general fund, providing the main operating funds for natural and cultural preservation and protection, administrative tasks, general access parks, planning and

17
development, and park maintenance and operations. User fees do not cover the cost of new development of facilities, land acquisition, or the major renovation of existing facilities. These improvements are funded primarily through revenue bonds and general obligation bonds. General obligation bonds are primarily used for the renovation of existing facilities.
The Northern Virginia Regional Park Authority, an independent entity in which the County participates, operates 21 parks covering approximately 10,000 acres throughout Northern Virginia including the County. NVRPA is continually in the process of completing, acquiring, developing, or expanding its regional park facilities.
Community Development
The Fairfax County Redevelopment and Housing Authority (“FCRHA”) was established in 1966 to meet low and moderate income family housing needs. The FCRHA owns or administers housing developments in Fairfax County with staff and funding provided from County, federal, Commonwealth, and private sources. As of January 2012, the FCRHA owns 75 properties, which are comprised of over 3,600 apartments, townhouses, senior retirement homes, and assisted living facilities, as well as specialized housing such as mobile home pads and beds in group homes. The FCRHA also administers 3,527 federal Housing Choice Vouchers. In FY 2013, 17,450 people were served through the FCRHA’s three major affordable housing programs: Public Housing, the Housing Choice Voucher program, and the Fairfax County Rental Program (FCRP). In FY 2012, the average income of households served in these three programs was approximately $26,387, or 27% of Area Median Income for a family of three (the average size of the households served). This meets the U.S. Department of Housing and Urban Development’s (HUD) definition of “extremely low income.”
FCRHA has provided financing with low-income housing tax credits for privately owned developments that reserve a total of 1,135 units for lower income tenants. Fairfax County’s Workforce Housing policy, adopted by the Board of Supervisors in 2007, is a proffer-based incentive system designed to encourage the voluntary development of new housing affordable to a range of moderate-income workers in Fairfax County’s high-rise/high-density areas. The Comprehensive Plan provides for a density bonus of up to one unit for every workforce unit provided by a developer, with the expectation that at least 12% of units in new developments be affordable or workforce housing.
In April 2004, the Board of Supervisors adopted its Affordable Housing Preservation Initiative to preserve affordable housing units. The centerpiece of the Board of Supervisors’ Preservation Initiative was the creation of the “Penny for Affordable Housing Fund.” Beginning in FY 2006, the County’s budget each year included the equivalent of one penny on the County’s real estate tax rate for the preservation and production of affordable housing in the County. In FY 2010, the Penny Fund was reduced to the equivalent of half of one penny. In FY 2013, this funding equated to $9,975,000 for affordable housing.
Other County services include efforts to increase local employment opportunities by encouraging and retaining business and industrial development through the County’s Economic Development Authority. On July 1, 2007, the County established an Office of Community Revitalization and Reinvestment (“OCRR”). The mission of the OCRR is to facilitate strategic redevelopment and investments within targeted commercial areas of the County that align with the community vision, and improve the economic viability, appearance and function of those areas. Among other initiatives, the OCRR is charged with working with property owners and the community to facilitate interest and participation in commercial development activities, and to develop public/private partnerships that further the County’s revitalization, redevelopment and reinvestment efforts.

18
Health and Welfare
The County provides an extensive array of services designed to protect, promote, and improve the health and welfare of Fairfax County citizens through a decentralized human services program. Based on individual needs, County human service centers define a comprehensive assistance plan that utilizes the services provided by all County departments. The County operates human service centers in locations convenient to residents to provide financial, medical, vocational, and social services. The Fairfax-Falls Church Community Services Board (“CSB”) responsible for planning, organizing, and providing services to individuals who have a mental illness, intellectual disability, or a substance use disorder. The CSB provides state mandated services to assist, improve and maximize the potential of individuals affected by these conditions and strengthen their capacity for living self-determined, productive and valued lives. The CSB is part of the Fairfax County Human Services System. The CSB provides its services at many sites throughout the County, including six community mental health centers, several outpatient sites, a detoxification center, group homes, consumer-operated drop in centers, and several specialized residential treatment sites.
Other programs that the County provides include subsidized day care programs for older adults and children of low-income families, two special needs centers that serve emotionally disturbed or physically challenged children, and group homes for youth with serious emotional disturbances. Residential treatment services are also offered in the areas of substance abuse as well as substance abuse outpatient and specialized day treatment programs. In addition, vocational and residential programs are provided for adults with intellectual disabilities and serious mental illness.
Financial assistance and social services are available to eligible residents. For low-income families and individuals, the Department of Family Services (“DFS”) administers federal, Commonwealth, and local programs, such as public assistance, employment and training, and subsidized child care, as well as programs targeted to at-risk children, such as child abuse prevention, Child Protective Services, Foster Care and Adoption, and services purchased under the Comprehensive Services Act. For older adults, DFS also administers programs that include federal funds granted to localities, Commonwealth funds and additional support from the County. The federal and state governments partially reimburse DFS for the cost of administering the programs based on an annual allocation to Fairfax County as well as program costs. DFS operates the County’s after school child care program in over 130 school-age child centers (located in the public schools and one recreational center) that serve more than 10,000 children during the school year and more than 2,500 children during the summer. Since FY 1986, the County has provided a comprehensive County transportation service, Fastran, for qualified elderly, disabled, and low-income persons. Transportation is provided by bus, van, or cab on a door-to-door basis to County programs, medical care, grocery stores, and other destinations.
Judicial Administration
Fairfax County’s court system is one of the most sophisticated systems in Virginia in its use of advanced case management techniques and rehabilitation programs. The County uses automated systems to support case docketing and record retrieval, electronic filing and imaging in the land recordation process, juror selection, service of notices and subpoenas, and the processing of criminal and traffic warrants and collecting delinquent tax obligations.
The County has undertaken rehabilitation efforts through the Juvenile and Domestic Relations District Court and the Office of the Sheriff. These efforts include work training programs and counseling services for both adult and juvenile offenders. Additionally, residential treatment services are provided for juvenile offenders, and a work release program is provided for offenders confined in the County’s Adult Detention Center.

19
Public Safety
A number of agencies share responsibility for public safety in Fairfax County. The Police Department, which is responsible for law enforcement, had, as of July 1, 2013, an authorized strength of 1,335 police officers, 32 animal control officers, and 351 civilian personnel, with 6 positions supported by grant funding. The agency is accredited by the Virginia Law Enforcement Professional Standards Commission, which signifies the department’s compliance with certain standards that are specific to Virginia law enforcement operations and administration. The commanders of the eight police district stations located throughout the County have considerable latitude to tailor their operations to provide police services in ways most responsive to the needs of their respective communities, including community policing endeavors. The department has specialized units that operate as both standing (staffed full time) and non-standing units (staffed as needed), including the Helicopter Division, which operates two helicopters to provide support to general police operations, traffic monitoring, emergency medical evacuation, and rescue support; the Criminal Intelligence Unit, which provides an effective response to organized criminal activity including terrorist-related, gang, and bias crimes; the Gang Unit, which provides regional leadership directed at combating gang crime through prevention and enforcement initiatives; and the Language Skills Support Unit, which serves to bridge the gap in the diverse cultures in the community by providing language support for the successful resolution of major criminal investigations.
Over the past 10 years, the County has maintained one of the lowest rates of serious crimes among jurisdictions in the Washington, D.C., metropolitan area and among comparable suburban jurisdictions throughout the United States. Additionally, the Police Department has continually attained a clearance rate for violent crimes such as murder, rape, and robbery far above the national averages for such offenses. At the same time, Fairfax County has maintained one of the lowest per capita costs for police services of all the local jurisdictions in the Washington metropolitan area.
Fire and rescue services are provided by 1,346 paid uniformed personnel, 187 paid civilian support personnel, and approximately 200 operational volunteers as of April 2013. The County operates 37 fire and rescue stations. The department operates various specialty units, including paramedic engine companies, a hazardous materials response unit, a technical rescue operations team, an arson canine unit, and a water rescue team whose members are certified in swift water rescue. The department also supports regional, national, and international emergency response operations through maintaining and supporting the Urban Search and Rescue Team (“US&R”). US&R operates under the auspices of the Department of Homeland Security for domestic responses and is sponsored by the United States Agency for International Development/Office of Foreign Disaster Assistance for international deployments. In addition to emergency response, the department provides various non-emergency services.
In May 2004, the Office of Emergency Management was established as a separate agency serving as the County’s focal point for emergency preparedness and internal and external coordination to respond to natural, technological, and terrorist-related emergencies. In FY 2013, thirteen employees provided emergency management services for Fairfax County, including the Towns of Clifton, Herndon and Vienna. The major areas of focus include emergency management planning and policy, the Countywide emergency training and exercise program, public preparedness and education, and enhancement of response and recovery capabilities.
Water Supply Service
Water service is provided to the residents of Fairfax County by Fairfax Water (“FW”), the City of Fairfax, the City of Falls Church, the Town of Herndon, the Town of Vienna, or individual wells. FW, which operates the largest water system in the Commonwealth of Virginia, was established by the Board

20
of Supervisors in 1957 to develop a comprehensive, Countywide water supply system through the acquisition of existing systems and the construction of new facilities. FW is an independent body administered by a ten-member board appointed by the Fairfax County Board of Supervisors. FW finances its capital improvements through the issuance of revenue bonds that are not backed by the full faith and credit of the County but principally repaid by revenues derived from charges for services rendered. FW’s basic retail water charge is currently $2.16 per 1,000 gallons, plus a quarterly service charge (currently $8.35 for most single-family homes and townhouses). To pay for treatment and pumping capacity which is used only during periods of high demand, FW also levies a peak use charge of an additional $3.20 per 1,000 gallons on customers who exceed their winter quarter consumption by 6,000 gallons or 33%, whichever is greater. There also are fees for initial connection to the system and for opening, closing, or transferring an account.
FW utilizes two sources of water supply (Occoquan and Potomac Rivers), operates associated treatment, transmission, storage, and distribution facilities and provides service to approximately 235,000 retail customers in Fairfax County, with an average daily consumption of about 79 million gallons per day (“mgd”). In addition, FW supplies about 66 mgd to other suppliers for resale, principally in the City of Alexandria, Loudoun County, and Prince William County. The average population served by FW is estimated at 1,700,000 persons. The combined maximum daily capacity of the supply and treatment facilities is 345 mgd, which is sufficient to meet current demand.
Under an agreement with the Board of Supervisors, FW annually submits a 10-year capital improvement program which is reviewed and approved by the Board of Supervisors as part of the County’s total capital improvement program. FW’s 10-year Capital Improvement Program adopted in FY 2011 includes projects totaling $638,807,000.
The City of Falls Church, Fairfax Water, and Fairfax County, with the assistance of a federal mediator successfully negotiated terms for the sale of the Falls Church Water Utility to Fairfax Water. The terms were approved by the Falls Church City Council, the Fairfax City Council, the Fairfax Water Board of Directors, and the Fairfax County Board of Supervisors and the sale was completed on January 3, 2014. On such date Fairfax Water added approximately 50,000 customers of the City of Fairfax to the Fairfax Water. The City Council of Fairfax has separately approved an agreement to sell their system and join with Fairfax Water.
ECONOMIC FACTORS
Economic Development
Economic development activities of the County are carried out through the Fairfax County Economic Development Authority (“EDA”), whose seven commissioners are appointed by the Board of Supervisors. EDA promotes Fairfax County as a premier location for business start-up, relocation and expansion, and capital investment. It works with new and existing businesses to help identify their facility and site needs, and assist in resolving County-related issues and provide other business assistance. Pursuant to its enabling legislation, EDA encourages investment in the County with tax-exempt conduit revenue bond financing.
The total inventory of office space in the County was estimated at 115.1 million square feet in the first half of 2013. By year end 2013 there was nearly 1.9 million square feet of space under construction, of which over 500,000 square feet was speculative. During 2013, over 1 million square feet of office space was delivered of which 600,000 square feet was speculative. The direct vacancy rate for the office markets was 14.4% as of June 30, 2013. Including sublet space, the office vacancy rate was 16.9% as of June 30, 2013.

21
The base of technology-oriented companies, particularly in computer software development, computer systems integration, telecommunications, and Internet-related services, has served as a strong magnet for the expansion and attraction of business and professional services. Government contractors, as well as diversified business and financial services, have added to the demand for prime office space in a number of key employment centers throughout the County.
Federal civilian employment in the County only makes up 4.1% of the total jobs in the County, but the federal government’s Base Realignment and Closure Commission (BRAC) project has actually resulted in additional federal jobs in the County. Federal procurement spending in the County has slightly decreased from $26.5 billion in FY 2011 to $26.3 billion in FY 2012. However, due to a diversified business base, the County was able to withstand the reductions of federal procurement spending in fiscal years 1999, 2000, 2007 and 2012. The County’s real estate values, personal property tax receipts, sales tax receipts and Business Professional Occupational license receipts did not decrease during those years. A 10% decrease in federal procurement spending in the County from FY 2012 levels would still leave procurement spending at a rate 40% higher than 2008 levels.
There are 99 hotels (with 75 or more rooms) in the County, totaling 17,670 hotel rooms and over 11 million square feet of space. Hotel development parallels commercial construction in terms of diversity of concept and design with a variety of product and service mixes (all-suites, business meeting facilities, and leisure facilities) in the marketplace.
Improvements to the County’s transportation system including increased service levels at Washington Dulles International Airport has helped serve as a catalyst for corporate activities dependent on immediate access to travel throughout the region, country and world. The Metrorail service extension from the East Falls Church station, through Tysons through Dulles Airport, to Route 772 in Loudoun County will continue to help foster economic growth.
The Board of Supervisors and the County actively support the revitalization and redevelopment throughout the County, particularly in its more mature business areas. Many enhancements have been made to the residential and commercial neighborhoods in Annandale, Bailey Crossroads/Seven Corners, the Lake Anne section of Reston, the Springfield and McLean central business districts, Merrifield, and the Richmond Highway corridor in the southeastern portion of the County. A number of capital improvement projects and other construction in process or already completed have improved the appearance and quality of life of these communities.
The most notable area of redevelopment in the County, Tysons—Fairfax County’s “downtown”—is undergoing a transformative land-use replanning effort. Spurred by the Metrorail project, the County is working to set the stage for Tysons’s evolution into a more urban-scale, pedestrian-friendly environment, with more housing, recreation and open space in addition to more-dense office and retail development. Tysons currently has over 38.7 million square feet of office, retail, and other commercial space and is behind only downtown D.C.’s Central Business District and the East End submarkets in the entire Washington D.C. metro area in total office inventory, and has 11.2 million square feet of residential space. After Phase I of the Metrorail expansion is completed, it is expected that Tysons will continue to have significant growth in population, employment and commercial, retail and residential space over the next several decades. County staff continues to evaluate potential arrangements for financing the public share of Tysons infrastructure improvements and to facilitate co-operative funding agreements with the private sector. County staff, in cooperation with private participants, created a new 501(c)(6) membership organization known as the Tysons Partnership in January 2011. Tysons Partnership will provide a comprehensive approach to tasks that include marketing and branding, transportation, urban design/planning, public facilities and community amenities and finance. On January 8, 2013 the Board of Supervisors by ordinance established a Tysons Transportation Service District No. 1

22
(the “Tysons Service District”) to provide transportation infrastructure and transit services within Tysons. As the governing board of the Tysons Service District, the Board of Supervisors is empowered to levy and collect a tax on any property within Tysons Service District’s boundaries to finance the transportation infrastructure and transit services projects. The tax rate of $0.04 per $100 of assessed value was adopted by the Board of Supervisors as part of the FY 2014 Adopted Budget Plan.
Employment
More than 34,100 payroll business establishments (units) including global, corporate and regional headquarters, technology firms, sales and marketing offices, and business services are located in Fairfax County, employing over 585,000. Local businesses create employment in such diversified areas as computer software development and systems integration, technical services, management consulting, government contracting, Internet-related services, wholesale and retail trade, and financial services. The following table presents data on the average number of payroll establishments and employment by major industry classification in Fairfax County as of first quarter 2013.
Businesses and Employment by Industry Fairfax County, Virginia1
Industrial Classification Number of
Establishments Average Payroll
Employment for Quarter Agriculture/Forestry/Fishing/Hunting
12
34
Mining 9 267 Utilities 26 1,880 Construction 2,264 24,613 Manufacturing 427 6,631 Wholesale Trade 1,216 13,823 Retail Trade 2,596 51,991 Transportation/Warehousing 408 9,774 Information 791 22,417 Finance and Insurance 1,554 23,066 Real Estate/Rental and Leasing 1,488 9,510 Professional/Scientific/Technical Services2 9,712 158,785 Management of Companies and Enterprises 338 21,632 Administrative/Support/Waste Management 1,873 39,219 Educational Services 570 49,846 Health Care and Social Assistance 3,550 53,182 Arts, Entertainment, and Recreation 364 7,241 Accommodation and Food Services 2,049 39,473 Other (except Public Administration) 4,744 20,841 Public Administration 133 31,184 Total 34,124 585,409 ____________________ Source: Virginia Employment Commission, Quarterly Census of Employment and Wages, Fairfax County, first quarter 2013 1 Excludes self-employed business owners. 2 The Services category includes professional and technical services, health care and social assistance, management services, educational services, accommodation and food services, arts, entertainment and recreation, administrative and waste services, and membership organizations and trade associations.
The following is a list of the largest private, base sector (non-retail) employers in Fairfax County as of September 2013. Companies are alphabetized in their size category.

23
Largest Private Employers in Fairfax County
7,000-10,000+ Employees in Fairfax County
Booz Allen Hamilton Professional, Scientific and Technical Services Inova Health System Health Care 4,000-6,999 Employees in Fairfax County
Federal Home Loan Mortgage Corp. (Freddie Mac) Finance and Insurance Lockheed Martin Professional, Scientific and Technical Services Northrop Grumman Professional, Scientific and Technical Services SAIC Professional, Scientific and Technical Services 1,000-3,999 Employees in Fairfax County
Administaff Administrative and Support Services AT&T Information/Telecommunications BAE Systems Professional, Scientific and Tech Services/Transportation Equipment Boeing Professional, Scientific and Technical Services/Manufacturing CACI International Professional, Scientific and Technical Services Capital One Finance and Insurance Catholic Diocese of Arlington Educational Services/Other Services CGI Professional, Scientific and Technical Services Cisco Systems Telecommunications CSC Professional, Scientific and Technical Services Deloitte Professional, Scientific and Technical Services ExxonMobil Wholesale Trade (Petroleum Products) Gannett Information/Newspaper Publishers General Dynamics Professional, Scientific and Technical Services/Manufacturing HP Enterprise Services Information/Data Processing Services IBM Professional, Scientific and Technical Svs./Computers, Peripherals ICF International Professional, Scientific and Technical Services ITT Exelis Professional, Scientific and Technical Services Kaiser Foundation Health (Kaiser Permanente) Health Care L-3 Communications Professional, Scientific and Technical Services ManTech International Corp. Professional, Scientific and Technical Services Navy Federal Credit Union Finance and Insurance Oracle Information/Software PricewaterhouseCoopers Professional, Scientific and Technical Services QinetiQ North America Professional, Scientific and Technical Services Quest Diagnostics Health Care Reston Hospital Center/HCA Virginia Health Care Securitas Security Services USA Administrative and Support Services Sprint Information/Telecommunications SRA International Professional, Scientific and Technical Services TASC Professional, Scientific and Technical Services MITRE Professional, Scientific and Technical Services Triple Canopy Professional, Scientific and Technical Services/Administration and Support Unisys Professional, Scientific and Technical Services United Parcel Service Transportation and Warehousing U.S. Investigations Services Administrative and Support Services Verizon Professional, Scientific and Technical Services/Telecommunications Wells Fargo Finance and Insurance
____________________ Source: Virginia Employment Commission and Fairfax County Economic Development Authority

24
Unemployment in the County has historically been, and continues to be, well below the national average, even in challenging economic times. The unemployment rate in Fairfax County in October, 2013 was 4.3%. Virginia and U.S. unemployment rates during October, 2013 were 5.5% and 7.0%, respectively. Reflecting the global recession that began in late 2007 and escalated a year later, Fairfax County’s average annual unemployment rate had risen to a high of 5.0% in 2010 but has since declined, reflecting an overall leveling out of the economic downturn. The following table shows the average annual unemployment rate in Fairfax County as compared with Virginia and national averages in the past decade as well as the October 2013 unemployment rates:
Average Annual Unemployment Rates Calendar Year
Fairfax County
Virginia
United States
2003 3.1% 4.1% 6.0% 2004 2.7 3.7 5.5 2005 2.5 3.5 5.1 2006 2.2 3.0 4.6 2007 2.2 3.1 4.6 2008 2009 2010
2.9 4.9 5.0
4.0 6.9 7.1
5.8 9.3 9.6
2011 4.5 6.4 8.9 2012 4.2 5.9 8.1 October 2013 4.3 5.5 7.0
__________________________________ Sources: U.S. Bureau of Labor Statistics; Virginia Employment Commission
According to the Virginia Employment Commission, the total number of jobs in the County was 585,409 in the first quarter of 2013. Self-employed persons are not included in these counts. The following table presents total covered employment in recent years:
Covered Employment1
Second Quarter
Covered Employment in Fairfax County % Change As of March
Covered Employment in Fairfax County % Change
2001 542,984 - 2007 585,433 1.8 2002 525,041 (3.3%) 2008 585,727 0.1 2003 532,730 1.5 2009 570,987 (2.5) 2004 544,258 2.2 2010 573,551 0.4 2005 565,720 3.9 2011 581,120 1.3 2006 574,920 1.6 2012 590,490 1.6
________________________________________ Source: Virginia Employment Commission 1 Covered employment means employees covered by state and federal unemployment laws Construction Activity
The following table illustrates trends in residential and commercial construction activity in the County:

25
Building Permits Estimated Housing Units
Started Residential Properties Industrial and
Commercial Properties Fiscal Year Number
Estimated Value (000s) Number
Estimated Value (000s) Number
2004 16,4421 $ 800,358 4,0341 $405,788 6,780 2005 23,2531 1,145,145 4,0131 460,814 4,353 2006 17,1681 918,839 4,4131 450,382 2,784 2007 11,4191 757,848 4,9741 1,297,296 1,599 2008 10,7191 548,759 5,0461 619,613 2,238 2009 8,7801 327,454 4,3611 413,719 1,361 2010 8,977 428,941 3,946 375,126 1,150 2011 9,371 480,268 4,595 397,435 1,797 2012 9,454 538,307 4,308 602,444 3,023 2013 10,610 509,957 3,907 710,488 1,930 _____________________ Sources: Building permits provided by Fairfax County Department of Public Works and Environmental Services and estimated housing units started provided by Weldon Cooper Center, University of Virginia. 1 Includes new and alteration/repair permits issued. Does not include trade permits issued.
The following is a partial list of major new or expanded office projects within the County announced in 2013:
New or Expanded Commercial Projects
Name of Company Nature of Operations
Projected New/Additional
Employment Amazon Web Services Information Technology 500 Blackbag Technologies Software 6 China Unicom Americas Telecommunications 4 comScore Social Media/Internet 75 Dimension Data Information Technology 85 DLT Solutions Information Technology 22 FrontPoint Security Solutions Information Technology/ Security Services 179 Mandiant Corporation Information Technology 80 OBXtek Information Technology 65 Salient Federal Solutions Information Technology 530 TCoombs Associates Information Technology 100 ________________________ Source: Fairfax County Economic Development Authority Housing
In 2012 single-family detached housing units represented 47.7% of the total housing units within Fairfax County. Single-family attached housing accounted for 24.4%, and multi-family housing made up the remaining 27.9%. As of January 2012, the median market value of all owned housing units, including condominiums, in Fairfax County was estimated by the Department of Neighborhood and Community Services to be $430,855.

26
Housing Units by Type of Structure 1980 1990 2000 2012 No. % No. % No. % No. %
Single-Family: Detached1
125,580
59.3
163,029
53.9
181,591
50.6
194,508
47.7
Attached2 30,833 14.6 67,306 22.3 87,171 24.3 99,460 24.4 Multi-Family3 55,333 26.1 72,129 23.8 90,198 25.1 114,151 27.9 Total 211,746 100.0 302,464 100.0 358,960 100.0 408,119 100.0
____________________ Sources: U.S. Bureau of the Census, U.S. Census of Housing (1980) and Fairfax County Department of Neighborhood and Community Services 1 Single-family detached includes all single-family homes and mobile homes. 2 Single-family attached includes duplexes, townhouses, and multiplex units. 3 Multi-family includes condominiums, apartments and other units in structures with a common entryway.
The average sale price of housing units within the County is set forth below:
Average Sale Price Housing Units Type of Structure 2011 2012 % change
All Homes $471,317 $492,480 4.5% Detached Homes 624,355 641,066 2.7 Attached Homes 313,458 332,435 6.1
____________________ Source: Realestate Business Intelligence, an MRIS Company
Colleges and Universities
Sixteen institutions of higher education are located in Fairfax County: Averett University, Central Michigan University, Everest College, George Mason University, ITT Technical Institute, Marymount University, Missouri State University (Department of Defense Studies), Northern Virginia Community College, Potomac College, Sanford-Brown College, Stratford University, University of Phoenix, the Virginia Polytechnic Institute and State University (Virginia Tech), two campuses of the University of Virginia (both Virginia Tech and the Falls Church campus of the University of Virginia are located in the Northern Virginia Graduate Center) and Webster University. George Mason University, with an enrollment of more than 32,000 students, offers over 195 degree programs. The Northern Virginia Community College serves more than 72,000 students in credit courses and non-credit workforce and professional development programs at six campuses and two centers throughout Northern Virginia. American University, George Washington University, Catholic University, and Virginia Commonwealth University also operate programs in the County’s secondary schools and on military installations within the County.
Cultural Amenities
Wolf Trap Farm Park for the Performing Arts, a cultural facility internationally renowned for its ballet, symphony, concert, and opera offerings, and the only national park for the performing arts in the U.S., is located in north-central Fairfax County. Nearly 300 cultural organizations – theater and opera companies, music and dance groups, community arts centers, festivals, and other activities – are based in and around the County. The County also assists in supporting the Fairfax Symphony, an internationally recognized orchestra that provides a variety of musical programs and outreach services to County residents. Other well-known attractions in the County include Mount Vernon, the home of George

27
Washington; Woodlawn Plantation, George Washington’s wedding gift to his nephew; and Gunston Hall, home of George Mason, author of the U.S. Bill of Rights and the first Constitution of Virginia. The region also boasts professional baseball, basketball, football, ice hockey and soccer.
DEBT ADMINISTRATION
Statement of Bonded Indebtedness
Pursuant to the Constitution of Virginia and the Act, a county in Virginia is authorized to issue general obligation bonds secured by a pledge of its full faith and credit. For the payment of such bonds, the Board of Supervisors of the County is required to levy, if necessary, an annual ad valorem tax on all property in the County subject to local taxation.
As of June 30, 2013, the County had outstanding the following amounts of general obligation bonds:
Purpose Total General
Obligation Bonds School $1,310,858,900 General Government 737,981,100 Total General Obligation Bonded Indebtedness1 $2,048,840,000
_______________ Source: Fairfax County Comprehensive Annual Financial Report FY 2013 1 See “Debt Service on Tax Supported Debt Obligations” herein for outstanding general obligation debt service as of January 30, 2013.
The County does not rely upon short-term borrowings to fund operating requirements. The County has never defaulted in the payment of either principal or interest on any general obligation indebtedness.
Limits on Indebtedness
There is no legal limit on the amount of general obligation bonded indebtedness that Fairfax County can at any time incur or have outstanding. However, all such indebtedness must be approved by voter referendum prior to issuance. Since 1975, the Board of Supervisors has established as a financial guideline a self-imposed limit on the average annual amount of bond sales. In May 2006, the Board of Supervisors increased the bond sale target to $1.375 billion over a 5-year period, or an average of $275 million annually, with the flexibility to expand to a maximum of $300 million based on market conditions and/or priority needs in any given year. The actual amount of bond sales will be determined by construction funding requirements and municipal bond market conditions.
The Board of Supervisors also has imposed limits which provide that the County’s long-term debt should not exceed 3% of the total market value of taxable real and personal property in the County. The limits also provide that annual debt service should not exceed 10% of annual General Fund disbursements. These limits may be changed by the Board of Supervisors, and they are not binding on future Boards of Supervisors of the County.
Bond Referenda Authorization
The following chart presents by purpose Fairfax County’s authorized but unissued general obligation bond indebtedness as of December 31, 2013:

28
Authorized Purpose
Amount Authorized but Unissued as of December 31, 2013
School Improvements $692,615,000 Transportation Improvements and Facilities 146,857,000 Parks and Park Facilities 95,173,000 Public Safety Facilities 131,490,000 Library Facilities 31,135,000 Flood Control 30,000,000 Total $1,127,270,000
_____________ Source: Fairfax County Department of Management and Budget
Other Tax Supported Debt Obligations
The Board of Supervisors of the County directly or indirectly appoints all or a portion of the governing body of several legally independent local and regional authorities that provide services to the County and its constituents. Such authorities include those that issue revenue bonds that are not general obligations of the County and issue debt supported directly or contingently by appropriations of tax revenues by the County. The full faith and credit of the County are not pledged to secure such bonds.
In March 1994, the Fairfax County Economic Development Authority (“EDA”) issued $116,965,000 of lease revenue bonds to finance the acquisition for the County of two office buildings occupied by County agencies and departments. In October 2003, EDA issued $85,650,000 of lease revenue refunding bonds, to refund $88,405,000 of the 1994 lease revenue bonds. The County is absolutely and unconditionally obligated by the terms of a lease agreement with EDA to pay amounts equal to debt service on EDA’s bonds. The County’s obligation to make such payments is subject to the annual appropriation by the Board of Supervisors of sufficient funds for such purpose. The coincidental terms of the bonds and the lease agreement extend to November 15, 2018.
Beginning in 1996, the Fairfax County Redevelopment and Housing Authority (“FCRHA”) has issued $42,460,000 of revenue bonds in seven series to finance the construction/renovation of five community center buildings, two adult day health care centers, one Head Start facility and one senior center. The County was obligated by the terms of triple net lease agreements or payment agreements with FCRHA to pay amounts equal to debt service on FCRHA’s bonds. The County’s obligation to make such payments is subject to the annual appropriation by the Board of Supervisors of funds for such purpose. The coincidental terms of the various bonds, lease agreements and payment agreements extend to May 1, 2029. The most recent series was issued on August 22, 2006. On that date, FCRHA issued $8,065,000 of revenue bonds to finance the cost of an adult day health care center and a community center. On March 10, 2010, EDA issued $43,390,000 revenue bonds (Six Public Facilities Projects) (the “2010 Bonds”) and provided a portion of the proceeds of the 2010 Bonds to the County to enable the County pursuant to its lease agreements with FCRHA to purchase five facilities financed from FCRHA bond issuances in 1996, 1998, 1999 and 2004. FCRHA used the funds provided by the County to redeem or defease the four series of bonds that financed the applicable facilities. Two original series issued by FCRHA in 2003, and 2005 financing respectively a head start facility and a senior center.
In July 2000, the Fairfax County Board of Supervisors entered into a Master Development Agreement with a private developer to finance and construct a 135,000 square foot government center in the southeastern region of the County. In November 2000, $29,000,000 of Certificates of Participation (“Certificates” or “COPs”) were issued, secured by a triple net lease on the property between the developer and the County. The County was obligated by the terms of the lease agreement to pay an

29
amount equal to the debt service on the Certificates. The County accepted the government center as substantially complete in February 2002. A portion of the proceeds of EDA’s 2010 Bonds were provided to the County to enable the County to exercise an option to purchase the government center (the “South County Government Center Purchase”). The purchase price provided by the County was used to defease the COPs. The County is obligated by the terms of a contract with the EDA to pay amounts equal to debt service on the EDA’s 2010 Bonds. The County’s obligation to make such payments is subject to the annual appropriation by the Board of Supervisors of sufficient funds for such purpose. The coincidental terms of EDA’s 2010 Bonds and the contract extend to April 2032.
In June 2003, EDA issued $70,830,000 of revenue bonds (Laurel Hill Public Facilities Project), backed by a contract with the County. Approximately $55,300,000 of the bonds were allocable to the financing of a new public secondary school in the southern part of the County and $15,530,000 of the bonds were allocable to the financing of a new 18 hole public golf course in the southern part of the County. The County is obligated by the terms of a contract with EDA to pay amounts equal to debt service on EDA’s bonds. The County’s obligation to make such payments is subject to the annual appropriation by the Board of Supervisors of sufficient funds for such purpose. The coincidental terms of the bonds and the contract extend to June 2033. In April 2012, EDA issued its $47,745,000 Revenue Refunding Bonds (Laurel Hill Public Facilities Projects) to refund a portion of the bonds.
On January 27, 2005, EDA issued $60,690,000 of revenue bonds (School Board Central Administration Building Project Phase I), backed by a contract with the County. The bonds were issued to finance the purchase of certain property, including an existing office building thereon, the purchase of certain land adjacent thereto and the improvement of the existing building for use by the School Board as an administration building. The County is obligated by a contract with EDA to pay amounts equal to debt service on EDA’s bonds. The County’s obligation to make such payments is subject to the annual appropriation by the Board of Supervisors of sufficient funds for such purpose. The coincidental terms of the bonds and the contract extend to April 2035.
On December 27, 2005, the Fairfax County Park Authority issued two promissory notes in the aggregate amount of $12,900,000 for the purpose of providing a portion of the purchase price of a conservation easement for preservation purposes on an approximately 41 acre parcel of land, and options to purchase certain land. This land is known as “Salona,” an historic site within the County. The County is obligated by the terms of a contract with FCPA to pay amounts sufficient to pay the principal and interest installments on the promissory notes when due. The County’s obligation to make such payments is subject to the annual appropriation by the Board of Supervisors of sufficient funds for such purpose. The coincidental terms of the promissory notes and contract extend to December 2025.
On February 16, 2006, FCRHA issued a $40,600,000 Bond Anticipation Note (Affordable Housing Acquisition) Series 2006 (the “Series 2006 Note”). The Series 2006 Note was issued for the purpose of providing a portion of the funds required for the purchase of a multi-family rental housing complex, known as Crescent Apartments, to further FCRHA’s goal of preserving existing affordable housing in Fairfax County. In 2007, 2008, 2011 and 2013 FCRHA issued bond anticipation notes each time to refinance previous bond anticipation notes issued for the financing or refinancing of the Crescent Apartments project that were not paid from County money set aside to promote affordable housing. The currently outstanding Bond Anticipation Notes (Affordable Housing Acquisition) Series 2013A (the “2013A Notes”) were issued in the principal amount of $24,650,000. The final maturity of the Series 2013A Notes is March 1, 2015. The County is obligated by a contract with FCRHA to make payments equal to the debt service on the 2013A Notes. The County’s obligation to make such payments is subject to annual appropriation.

30
On November 28, 2007, FCRHA issued $105,485,000 Bond Anticipation Notes (Affordable Housing Acquisition) Series 2007B (the “Series 2007B Notes”). The Series 2007B Notes were issued for the purpose of providing a portion of the funds required for the purchase of a multi-family rental housing complex located in Annandale, Virginia. In 2008, FCRHA issued bond anticipation notes to refinance the Series 2007B Notes. On August 20, 2009, FCRHA issued its Revenue Bonds (Affordable Housing Acquisition) Series 2009 in the aggregate amount of $94,950,000 (the “Series 2009 Bonds”) to pay a portion of the principal amount of the 2008 outstanding bond anticipation notes. A portion of the principal amount of the 2008 bond anticipation notes, and the interest due on such notes, was paid from money set aside to promote affordable housing. The County is obligated by the terms of a payment agreement with FCRHA, subject to the appropriation of funds for the purpose, to pay amounts equal to the interest on and the principal of the Series 2009 Bonds. The coincidental terms of the Series 2009 Bonds and the related payment agreement extend to October 2039.
In July 2011, EDA issued $99,430,000 of Revenue Bonds (Wiehle Avenue Metrorail Station Parking Project). The bonds were issued to finance a portion of the costs of construction of a public parking facility to serve the Wiehle Avenue Metrorail Station that is being constructed as part of the extension of Washington Metropolitan Area Transit Authority’s Metrorail System in the Dulles Corridor. The County is obligated by contract with EDA to pay amounts equal to debt service on EDA’s bonds. The County’s obligation to make such payments is subject to the annual appropriation by the Board of Supervisors of sufficient funds for such purpose. The coincidental terms of the bonds and the contract extend to August 2034.
In May 2012, EDA issued $65,965,000 of Revenue Bonds (Community Services Facilities Projects) backed by a contract between the County and EDA. The bonds were issued to finance the improvement of certain properties to be used by the County as a mental health facility and as a neighborhood community center. The County is obligated by a contract with EDA to pay amounts equal to debt service on such bonds. The County’s obligation to make such payments is subject to the annual appropriation by the Board of Supervisors of sufficient funds for such purpose. The coincidental terms of the bonds and the contract extend to March 2042.
In November 2013, the County issued a $11,085,000 special subfund revenue bond (the “2013 VRA Bond”) to Virginia Resources Authority (“VRA”). In return for issuing the 2013 VRA Bond, VRA provided the County with a portion of the proceeds realized from its autumn 2013 pooled financing bond transaction. The 2013 VRA Bond was issued to finance renovations to a complex that serves as a senior housing and assisted living facility, a senior center and an adult day health care center in the County. The County is obligated by a contract with VRA to pay amounts equal to the debt service on the 2013 VRA Bond. The County’s obligation to make such payments is subject to the annual appropriation by the Board of Supervisors of sufficient funds for such purpose. The coincidental term of the 2013 VRA Bond and the contract extend to October 2033.
In December 2013, EDA and the County entered into a master credit agreement with Bank of America, N.A., pursuant to which a revolving line of credit in an amount of up to $100,000,000 is made available to the County to provide interim financing for projects within the County’s Capital Improvement Program or other similar projects. On January 14, 2014 the County approved a draw on the revolving line of credit in the amount of $30 million to finance the leasehold acquisition of the Lorton Workhouse Arts Center. See the description herein below under “Lease Commitments and Contractual Obligations.”
In December 2013, EDA and the County entered into a loan agreement with T.D. Bank, N.A., pursuant to which the proceeds of the loan in the amount of $25,000,000 are made available to the County to provide financing for the costs of the planned replacement of County-owned building subsystems such

31
as roofs, electrical systems, HVAC, plumbing systems, carpet replacement, parking lot and garage repairs, fire alarm replacement and emergency generator replacement that have reached the end of their useful life. The County is obligated by a contract with EDA to pay amounts equal to the debt service on the loan. The County’s obligation to make such payments is subject to the annual appropriation by the Board of Supervisors of sufficient funds for such purpose.
Lease Commitments and Contractual Obligations
The County leases certain real estate, equipment, and sewer facilities under various long-term lease agreements. In addition, pursuant to contracts with Arlington County, the Alexandria Sanitation Authority, the District of Columbia, and the Upper Occoquan Sewage Authority, the County is obligated to share the capital costs and associated debt service of certain facilities.
In 1989 and 1990, EDA issued $26,765,000 of parking revenue bonds to finance construction of parking structures near the Vienna Metrorail Station and the Huntington Metrorail Station in Fairfax County. All obligations relating to the construction of such parking structures have now been paid. EDA issued $25.735 million in bonds on November 10, 1999, to finance a second parking structure at the Vienna Metrorail Station. In August 2005, EDA issued $18,695,000 in bonds to refund all of the callable 1999 parking revenue bonds. The parking revenue bonds are payable under a lease with the WMATA from revenues to be derived by WMATA from parking surcharges at these and other parking facilities in Fairfax County. In the event such revenues are not sufficient to pay debt service on the parking revenue bonds and under certain other conditions, the County is, in effect, obligated, subject to annual appropriation by its Board of Supervisors, to make payments to EDA sufficient to pay such debt service.
In February 1990, the Northern Virginia Transportation Commission issued $79.4 million of bonds to finance certain costs associated with the establishment of commuter rail services (the Virginia Railway Express) in the area of Northern Virginia bordering Washington, D.C. Fairfax County has joined with other jurisdictions through a Master Agreement to bear certain costs associated with operating and insuring the rail service as well as servicing the debt issued by NVTC. The Master Agreement requires that the County’s governmental officers charged with preparing its annual budget include an amount equal to its share of the costs of the Virginia Railway Express. Each jurisdiction’s share is determined by a formula set out in the Master Agreement. Fairfax County’s share of this cost was $4.9 million in FY 2011. An additional $23 million in NVTC commuter rail revenue bonds were issued in early 1997 to purchase new rail coaches. Debt service on these bonds is being funded predominantly by Commonwealth and federal funds and VRE revenues.
On October 29, 2003, EDA issued $33,375,000 transportation contract revenue bonds to provide $30,000,000 to the Commonwealth Transportation Board (CTB) for construction of certain interchanges on Route 28 in the Route 28 Highway Transportation District, which is partly in Fairfax County and partly in Loudoun County. EDA on August 26, 2004, issued $57,410,000 transportation contract revenue bonds to provide an additional $60 million for construction of additional interchanges. The bonds issued in 2003 and 2004 financed the construction of six interchanges. In March 2007, EDA issued $41,505,000 transportation contract revenue bonds to finance a portion of constructing an additional four interchanges in the Route 28 Highway Transportation District. In July 2008, EDA issued $51,505,000 transportation contract revenue bonds to finance additional costs of constructing the additional four interchanges on Route 28. See also the discussion of taxes levied by the County in the Route 28 Highway Transportation Improvement District, located partly in the County, to pay debt service on CTB and EDA bonds in “GOVERNMENT SERVICES - Transportation – Tax Districts” herein. In May, 2012, the EDA issued bonds to refund a portion of the bonds issued in 2003 and 2004.
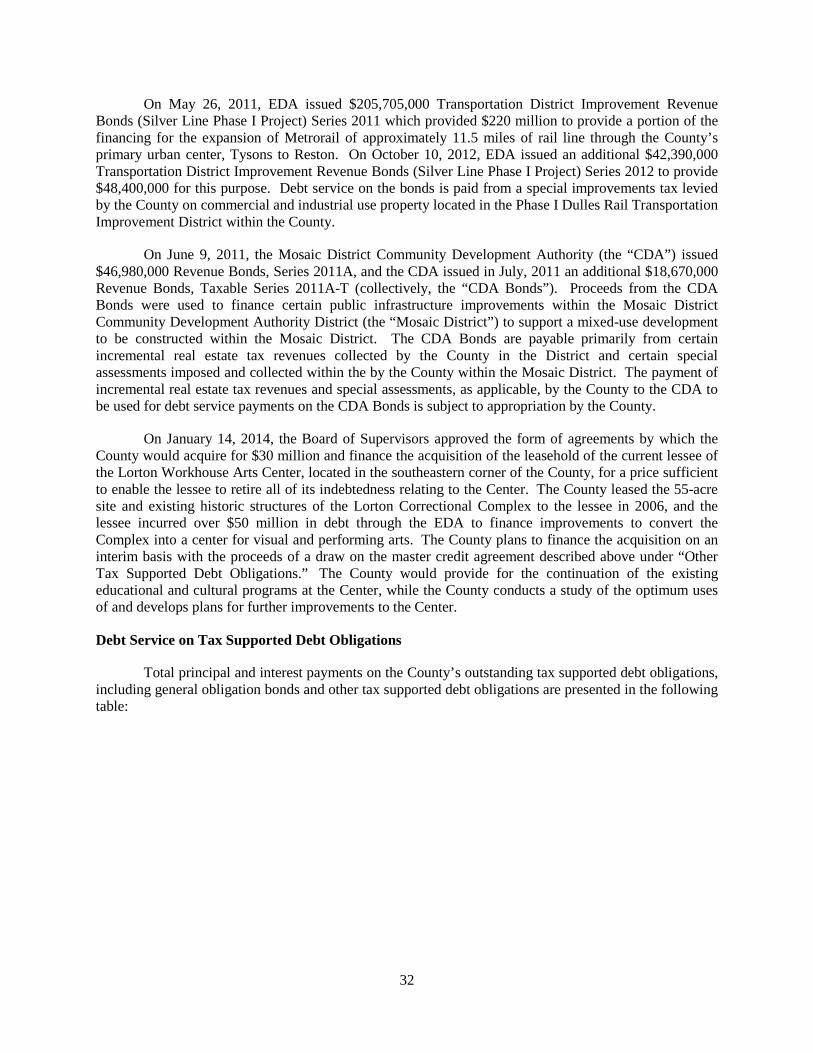
32
On May 26, 2011, EDA issued $205,705,000 Transportation District Improvement Revenue Bonds (Silver Line Phase I Project) Series 2011 which provided $220 million to provide a portion of the financing for the expansion of Metrorail of approximately 11.5 miles of rail line through the County’s primary urban center, Tysons to Reston. On October 10, 2012, EDA issued an additional $42,390,000 Transportation District Improvement Revenue Bonds (Silver Line Phase I Project) Series 2012 to provide $48,400,000 for this purpose. Debt service on the bonds is paid from a special improvements tax levied by the County on commercial and industrial use property located in the Phase I Dulles Rail Transportation Improvement District within the County.
On June 9, 2011, the Mosaic District Community Development Authority (the “CDA”) issued $46,980,000 Revenue Bonds, Series 2011A, and the CDA issued in July, 2011 an additional $18,670,000 Revenue Bonds, Taxable Series 2011A-T (collectively, the “CDA Bonds”). Proceeds from the CDA Bonds were used to finance certain public infrastructure improvements within the Mosaic District Community Development Authority District (the “Mosaic District”) to support a mixed-use development to be constructed within the Mosaic District. The CDA Bonds are payable primarily from certain incremental real estate tax revenues collected by the County in the District and certain special assessments imposed and collected within the by the County within the Mosaic District. The payment of incremental real estate tax revenues and special assessments, as applicable, by the County to the CDA to be used for debt service payments on the CDA Bonds is subject to appropriation by the County.
On January 14, 2014, the Board of Supervisors approved the form of agreements by which the County would acquire for $30 million and finance the acquisition of the leasehold of the current lessee of the Lorton Workhouse Arts Center, located in the southeastern corner of the County, for a price sufficient to enable the lessee to retire all of its indebtedness relating to the Center. The County leased the 55-acre site and existing historic structures of the Lorton Correctional Complex to the lessee in 2006, and the lessee incurred over $50 million in debt through the EDA to finance improvements to convert the Complex into a center for visual and performing arts. The County plans to finance the acquisition on an interim basis with the proceeds of a draw on the master credit agreement described above under “Other Tax Supported Debt Obligations.” The County would provide for the continuation of the existing educational and cultural programs at the Center, while the County conducts a study of the optimum uses of and develops plans for further improvements to the Center.
Debt Service on Tax Supported Debt Obligations
Total principal and interest payments on the County’s outstanding tax supported debt obligations, including general obligation bonds and other tax supported debt obligations are presented in the following table:

33
General Obligation Bonds1 Other Tax
Supported Debt Obligations Fiscal Year
Ending June 30 Principal Interest2 Principal Interest Total4 2014 $176,290,000 $92,086,118 $21,710,067 $19,445,555 $309,531,739 2015 181,790,000 93,816,800 47,129,5023 19,423,023 342,159,325 2016 180,610,000 83,681,764 28,729,094 18,277,194 311,298,051 2017 174,660,000 75,490,094 29,418,849 17,251,268 296,820,211 2018 165,010,000 67,769,104 28,513,773 16,082,207 277,375,084 2019 157,645,000 60,498,234 29,168,872 14,720,850 262,032,955 2020 149,665,000 53,250,375 16,014,151 13,774,611 232,704,137 2021 142,180,000 47,001,449 16,544,618 13,077,023 218,803,089 2022 133,135,000 41,118,159 17,075,278 12,343,880 203,672,317 2023 123,655,000 35,824,431 17,626,139 11,604,116 188,709,687 2024 113,965,000 30,152,474 14,463,724 10,915,835 169,497,034 2025 108,150,000 24,790,280 15,005,000 10,310,059 158,255,339 2026 98,635,000 20,505,763 15,242,500 9,688,523 144,071,786 2027 89,945,000 16,823,390 15,515,000 9,052,403 131,335,793 2028 78,215,000 12,956,488 16,155,000 8,388,391 115,714,878 2029 66,495,000 9,552,630 16,835,000 7,691,228 100,573,858 2030 56,520,000 6,488,375 17,470,000 6,957,581 87,435,956 2031 43,035,000 4,223,475 18,225,000 6,185,266 71,668,741 2032 34,405,000 2,421,375 19,025,000 5,352,463 61,203,838 2033 23,530,000 1,050,775 17,900,000 4,467,178 46,947,953
2034-2042 13,215,000 264,300 83,930,000 14,030,459 111,439,759 Total3 $2,310,750,000 $779,765,850 $501,696,567 $249,039,113 $3,841,251,530
______________________________________________
Source: Fairfax County Department of Management and Budget 1 Includes debt service on the Bonds and excludes debt service on the Refunded Bonds. 2 Does not reflect anticipated payments by the United States Treasury with respect to the County’s Public Improvement Bonds Series 2009E (Federally Taxable - Build America Bonds). 3 Includes the debt service on the Series 2013A Notes relating to the purchase of the Crescent Apartments complex, including the $21,465,000 principal amount of the Series 2013A Notes due on March 1, 2015, which is expected to be refinanced. 4 Totals may not add due to rounding.
Sewer Revenue Bonds
In 1986, the County issued $75 million of an authorized $179 of million sewer revenue bonds pursuant to a General Bond Resolution adopted by the Board of Supervisors (the “General Bond Resolution”). The proceeds were expended to finance the expansion of the wastewater treatment facilities at the Noman M. Cole, Jr., Pollution Control Plant from 36 mgd to 54 mgd and the County’s share of the cost of expanding facilities at the District of Columbia’s Blue Plains Wastewater Treatment Plant. The treatment capacity of the Blue Plains Plant expanded from 309 mgd to 370 mgd, and the County’s share increased from 16.02 mgd to 31.0 mgd. In 1993, the County issued $72.1 million sewer revenue refunding bonds to advance refund for debt service savings a portion of its outstanding sewer revenue bonds. In July 1996, the County issued the remaining authorized but unissued $104 million sewer revenue bonds to finance additional expansion and improvements to its Noman M. Cole, Jr., Pollution Control Plant. On November 15, 2003, the County redeemed from available funds of the Integrated Sewer System the outstanding balance of its 1993 sewer revenue refunding bonds. On October 14, 2004, the County issued its $94.005 million sewer revenue refunding bonds to advance refund for debt service savings all of the callable 1996 sewer revenue bonds. On June 17, 2009, the County issued its $152.255

34
million sewer revenue bonds to finance a portion of the upgrade costs allocable to the County at certain wastewater treatment facilities that are owned by, or that provide service to, the County, the purchase of additional capacity at certain wastewater treatment facilities for the benefit of the County and the costs of certain additions, extensions and improvements to the County’s sewage collection, treatment and disposal systems. On August 8, 2012, the County issued its $90.710 million sewer revenue bonds to finance a portion of capital improvement costs allocable to the County at certain wastewater facilities that are owned by or that provide service to, the County, which are required by the Commonwealth to reduce nitrogen discharge, the purchase of additional capacity at certain wastewater treatment facilities for the benefit of the County and the costs of certain additions, extensions and improvements to the County’s sewage collection, treatment and disposal systems.
Wastewater treatment capacity and services are also provided to the Integrated Sewer System pursuant to contracts with Arlington County, the Alexandria Renew Enterprises (“ARE”), the District of Columbia, and the Upper Occoquan Sewage Authority (“UOSA”), whereby the County is obligated to share the capital costs and associated debt service of certain facilities. The County’s obligations to such entities are payable solely from the revenues of the Integrated Sewer System on a basis, under the General Bond Resolution, subordinate to its sewer revenue bonds, and are not general obligations of the County. Further information concerning these obligations is included in Notes J and K to the Basic Financial Statements shown in Appendix IV.
The County has entered into a service agreement with ARE that obligates the County for 60% of the cost of capacity of the ARE wastewater treatment plant and a joint use system, including debt service on ARE bonds issued for ARE system improvements where the County does not otherwise provide for its share of the capital cost of such improvements. The County’s share of previous upgrades was $200 million. The County’s share of additional upgrades, as estimated by ARE, is approximately $80 million. The County obtained permanent funding from the Virginia Water Facilities Revolving Fund in FY 2001 and again in FY 2002 for a portion of its share of the initial costs from the proceeds of two loans aggregating $90 million. The County issued to the Virginia Water Facilities Revolving Fund the County’s $40 million subordinated sewer revenue bonds which now bear interest at the rate of 2.35% per annum and $50 million subordinated sewer revenue bonds which now bear interest at the rate of 2.35% per annum, in evidence of its obligation to repay the loans. The County expects to provide the balance of its share of the costs of ARE’s improvement project from other borrowings and available Integrated Sewer System funds.
In January 1996, UOSA issued $330.86 million of bonds: $288.60 million to finance the cost of expanding its advanced wastewater treatment plant from 32 mgd to 54 mgd and $42.26 million to refinance certain of its outstanding bonds. In January 2004, UOSA refunded a portion of this debt for debt service savings and accordingly revised the participating member jurisdictions’ debt service schedules. In November 2004, July 2005, and again in February 2007, UOSA refunded additional portions of its outstanding debt. In February of 2007, UOSA issued $90,315,000 of Regional Sewer System Revenue Refunding Bonds to advance refund another portion of the outstanding bonds issued in 1996. In December 2007, UOSA issued $119,715,000 in bonds to finance the expansion and replacement of certain systems within its wastewater treatment plant. In December 2010, UOSA issued $85.18 million in bonds to finance UOSA capital improvements including interceptor and pump delivery systems, nutrient reduction projects and miscellaneous plant and hydraulic improvements. See the table below for the County’s debt service obligations on outstanding UOSA bonds. In 2013 UOSA issued two series of refunding bonds for debt service savings and accordingly reduced the participating member jurisdictions’ debt service payment requirements.
The debt service on the County’s outstanding sewer revenue bonds, its subordinated sewer revenue bonds payable to the Virginia Water Facilities Revolving Fund evidencing loans for a portion of

35
the County’s costs associated with the ARE improvement project, and its subordinated obligations payable for capacity under its contract with UOSA, is reflected in the following table.
Sewer Revenue Bonds Other Sewer Debt Service
Obligations Fiscal Year
Ending June 30 Principal Interest SRF/VRA1 UOSA2 Total3 2014 $7,265,000 $14,624,744 $6,203,277 $20,516,348 $48,609,370 2015 7,615,000 14,289,094 6,203,277 20,604,047 48,711,418 2016 7,995,000 13,921,244 6,203,277 20,728,134 48,847,655 2017 8,420,000 13,518,519 6,203,277 20,726,324 48,868,120 2018 8,860,000 13,086,519 6,203,277 20,718,077 48,867,873
2019 9,330,000 12,631,769 6,203,277 20,704,969 48,870,016 2020 9,820,000 12,174,794 6,203,277 20,695,221 48,893,292 2021 10,295,000 11,707,913 6,203,278 20,336,891 48,543,081 2022 10,810,000 11,206,431 3,412,199 23,310,214 48,738,844 2023 11,355,000 10,676,744 - 20,862,983 42,894,726
2024 11,930,000 10,116,984 - 20,848,373 42,895,357 2025 12,510,000 9,549,213 - 20,889,455 42,948,668 2026 13,100,000 8,973,556 - 28,398,071 50,471,627 2027 13,725,000 8,374,338 - 21,703,416 43,802,753 2028 14,355,000 7,745,413 21,682,488 43,782,901
2028-2044 154,450,000 51,613,313 - 125,721,516 331,784,829
Total $311,835,000 $224,210,584 $53,038,418 $448,446,527 $1,037,530,530
___________________ Source: Fairfax County Department of Public Works and Environmental Services
1 Debt service on the County’s subordinated sewer revenue bonds issued to the Virginia Water Facilities Revolving Fund evidencing the County’s obligation to repay $90 million in loans made to the County by Virginia Resources Authority from the Fund.
2 Based on the County’s share of scheduled UOSA debt service. Does not reflect any anticipated payments by the United States Treasury on outstanding UOSA Build America Bonds.
3 Totals may not add due to rounding.

36
Debt Ratios
The following data are presented to show trends in the relationship of the general obligation bond indebtedness of the County to the estimated market value of taxable property in the County and to its estimated population and the trend of general obligation debt service requirements as a percentage of General Fund disbursements.
Trend of Debt as a Percentage of Estimated Market Value of Taxable Property
Fiscal Year
Ended June 30 Bonded Indebtedness1 Estimated
Market Value2 Percentage 2004 $1,814,517,662 $144,154,864,000 1.26% 2005 1,931,008,940 159,414,044,000 1.21 2006 1,963,217,876 194,028,165,000 1.01 2007 2,057,354,681 235,241,795,000 0.87 2008 2,158,810,512 244,492,998,000 0.84 2009 2,177,230,444 245,145,594,000 0.89 2010 2,361,511,650 222,671,526,000 1.06 2011 2,339,623,998 203,621,876,000 1.15 2012 2,504,402,351 210,685,949,000 1.19 2013 2,514,451,567 217,125,234,000 1.16
___________________ Sources: Fairfax County Department of Tax Administration, Department of Management and Budget and Comprehensive Annual Financial Report FY 2013 Note: Bonded Indebtedness for Fiscal Year 2013 included herein differs from the data shown in Tables 3.1, 3.2 and 3.4 of the Statistical Section of the County’s Fiscal Year 2013 Comprehensive Annual Financial Report based on the treatment of bond premium and discounts. In the Comprehensive Annual Financial Report, Fiscal Year 2013 Bonded Indebtedness represents principal outstanding plus unamortized premium (minus unamortized discount). In the table above, Bonded Indebtedness is based on outstanding principal without adjustment for unamortized premium or discount. 1 Excludes self-supporting debt of the Integrated Sewer System, the HUD Section 108 Loan, all debt listed under “Lease Commitments and
Contractual Obligations” and capital lease debt related to equipment acquisitions, which are not general obligations of Fairfax County. The total includes debt listed under “Other Tax Supported Debt Obligations.”
2 Estimated market value is based on recorded values as of January 1 of the prior fiscal year, and reflects the original book value and does not reflect any adjustments made during the fiscal year.

37
Debt Per Capita
Fiscal Year Ended
June 30 Bonded
Indebtedness1 Estimated
Population2
Bonded Indebtedness Per Capita
Fairfax County Per Capita
Income3
Debt Per Capita as Percentage of
Per Capita Income4
2003 $1,779,461,575 1,012,090 $1,758 $54,117 3.25% 2004 1,814,517,662 1,022,298 1,775 57,547 3.08 2005 1,931,008,940 1,033,646 1,868 61,837 3.02 2006 1,963,217,876 1,037,311 1,893 64,698 2.93 2007 2,057,354,681 1,041,507 1,975 67,691 2.92
2008 2,158,810,512 1,050,315 2,055 70,822 2.90 2009 2,177,230,444 1,074,227 2,027 69,241 2.93 2010 2,361,511,650 1,081,726 2,183 67,094 3.25 2011 2,339,623,998 1,100,692 2,126 64,637 3.29 2012 2,504,402,351
1,118,602 2,239 68,847 3.25
____________ Source: Fairfax County Comprehensive Annual Financial Report FY 2013
Note: Bonded Indebtedness and Bonded Indebtedness Per Capita for Fiscal Year 2013 included herein differ from the data shown in Tables 3.1, 3.2 and 3.4 of the Statistical Section of the County’s Fiscal Year 2013 Comprehensive Annual Financial Report based on the treatment of bond premium and discounts. In the Comprehensive Annual Financial Report, Fiscal Year 2013 Bonded Indebtedness represents principal outstanding plus unamortized premium (minus unamortized discount). In the table above, Bonded Indebtedness is based on outstanding principal, without unamortized premium or discount.
1 The total includes General Obligation Bonds and other tax supported debt payable from the General Fund including the County’s obligation to
make payments with respect to “Other Tax Supported Debt Obligations.” 2 Source: Fairfax County Department of Systems Management for Human Services. 2013 Estimated Population not yet available. 3 Source: Bureau of Economic Analysis (BEA), U.S. Department of Commerce, 2002-2008 and Fairfax County Department of Management
and Budget 2009-2012. In April 2010, BEA completed a comprehensive revision of local area statistics back to 1999. 4 Forecasted amount per Fairfax County Department of Management and Budget.
Debt Service Requirements as a Percentage of General Fund Disbursements
Fiscal Year Ended
June 30
Debt Service
Requirements1 General Fund Disbursements Percentage
2004 $213,027,136 $2,597,650,034 8.20% 2005 224,543,583 2,799,591,368 8.02 2006 239,648,201 3,035,010,293 7.90 2007 254,078,433 3,225,512,678 7.88 2008 268,268,915 3,322,168,721 8.08
2009 279,049,740 3,353,638,093 8.32 2010 280,514,878 3,308,948,661 8.48 2011 290,585,694 3,344,902,997 8.69 2012 290,776,904 3,418,544,048 8.51 2013 292,243,676 3,533,287,183 8.27
_______________________ Source: Fairfax County Department of Management and Budget and Comprehensive Annual Financial Report FY 2013 1 The Debt Service Requirements include total principal and interest payments on the County’s outstanding tax supported debt obligations, including all debt listed under the heading “Other Tax Supported Debt Obligations.”

38
Underlying Bonded Indebtedness
The following table shows the underlying bonded indebtedness of towns within the boundaries of Fairfax County as of June 30, 2013:
Town of Vienna Storm Drainage/Street Improvement/Water and Sewer/Public Buildings
$16,638,379
Town of Herndon Recreational Complex/Water and Sewer/Recreational Facilities
15,459,658
Total Underlying Indebtedness $32,098,037 _______________ Source: Fairfax County Comprehensive Annual Financial Report 2013, Town of Vienna, Town of Herndon
These underlying general obligation bonds are obligations of the respective towns only and are not obligations of Fairfax County.
The bonds, notes and other obligations of Fairfax Water, the Fairfax County Park Authority, the Fairfax County Industrial Development Authority, the Fairfax County Economic Development Authority, the Fairfax County Redevelopment and Housing Authority, the Route 28 Highway Transportation Improvement District, the Phase I Dulles Rail Transportation Improvement District, the Northern Virginia Health Center Commission, the Northern Virginia Transportation Commission, and the Mosaic District Community Development Authority are not obligations of the County.
TAX BASE DATA
Fairfax County annually reassesses approximately 358,489 parcels of real property employing a computer assisted mass reassessment program for both residential and non-residential properties. The County uses a statistic called the coefficient of dispersion (the “Coefficient of Dispersion”) which measures the uniformity of assessment to sale ratios among properties. The lower the coefficient of dispersion, the more uniform the assessment. The overall Coefficient of Dispersion in Fairfax County for tax year 2012 (FY 2013) was 4.9%, and the assessment to sales price ratio was 0.924. A Coefficient of Dispersion of 15% is considered good by professional assessing standards. The County falls into the excellent category, indicating a high degree of assessment uniformity and equity.
The assessed value for FY 2014 of the real estate tax base, as reported for calendar year 2013 assessments in the main tax book for Fairfax County, increased by 3.4% in value from the prior year.
The data in the following five tables are presented to illustrate trends and characteristics of the assessed value of real and personal property which are major sources of County-derived revenue:

39
Assessed Value of All Taxable Property1
Fiscal Year Real Property Personal Property Total 2004 $129,215,116,649 $14,005,217,597 $143,220,334,246 2005 144,643,064,429 13,618,244,620 158,261,309,049 2006 177,877,141,169 14,310,177,208 192,187,318,377 2007 217,461,663,192 14,885,684,962 232,347,348,154 2008 226,344,848,687 14,968,086,737 241,312,935,424 2009 226,983,531,614 15,516,080,309 242,499,611,923 2010 204,047,166,164 14,502,191,112 218,549,357,276 2011 185,755,271,151 14,767,968,334 200,523,239,485 2012 192,062,068,734 15,265,499,862 207,327,568,596 2013 197,593,481,694 15,847,134,170 213,440,615,864 2014 204,733,875,742 15,986,186,051 220,720,061,793
___________________________ Source: Fairfax County Department of Tax Administration. FY 2013 and FY 2014 are estimates. All years included figures for the Public Service Corporation. All Public Service Corporation real property assessments are required under Virginia law to be made at 100% of estimated market value annually by the State Corporation Commission. 1 Figures are net of exonerated assessments and tax relief for the elderly and disabled.
Tax Rates per $100 Assessed Value (Fiscal Year)
2005 2006 2007 2008 2009 2010 2011 2012 2013 2014 Real Estate – Regular and Public Service ....................... $1.13 $1.00 $.89 $.89 $ .92 $1.04 $1.09 $1.07 $1.075 $1.085 Personal Property – Regular . 4.57 4.57 4.57 4.57 4.57 4.57 4.57 4.57 4.57 4.57 Personal Property – Public Service .................................. 1.13 1.00 .89 .89 .92 1.04 1.09 1.07 1.075 1.085 Personal Property – Mining and Manufacturing, Machinery and Tools ............ 4.57 4.57 4.57 4.57 4.57 4.57 4.57 4.57 4.57 4.57 Personal Property – Research and Development .................. 4.57 4.57 4.57 4.57 4.57 4.57 4.57 4.57 4.57 4.57 Personal Property – Mobile Homes ................................... 1.13 1.00 .89 .89 .92 1.04 1.09 1.07 1.075 1.085 Personal Property – Antique Cars ....................................... .01 .01 .01 .01 .01 .01 .01 .01 .01 .01 Personal Property – Special1. .01 .01 .01 .01 .01 .01 .01 .01 .01 .01 ____________________________________________________________________________________ Source: Fairfax County Approved Fiscal Plans, FY 2005-2014 1 Includes vehicles specially equipped for the handicapped, privately owned vans used for van pools, vehicles belonging to volunteer fire and
rescue squad members, vehicles owned by auxiliary police and reserve deputy sheriffs, certain property of homeowners associations, aircraft, including flight simulators, and motor vehicles owned by qualified elderly or disabled individuals, and boats.

40
Commercial-Industrial Percentage of the Total Assessed Value of Real Property1
Fiscal Year2 Percent (%)3 2005 18.20 2006 17.36 2007 17.22 2008 19.23 2009 21.06
2010 22.67 2011 19.70 2012 19.64 2013 20.77 2014 19.96
____________________ Source: Fairfax County Department of Tax Administration 1 Assessed values are reported by State of Virginia Land Use Codes. Vacant land is defined according to zoning classification. 2 Fiscal year property taxes are levied on prior year assessments. 3 Includes the Towns of Vienna, Herndon and Clifton.
The following data show the assessed value of real property of the 25 largest holders of real property in the County (as of January 1, 2013).
[Remainder of Page Left Intentionally Blank]

41
Top 25 Holders of Real Property in Fairfax County As of January 1, 2013
Rank Property Owner Property Type Total Assessment1
1 Tysons Corner Property Holdings LLC Tysons Corner Regional Shopping Mall $1,137,857,650 2 Cesc Skyline LLC Commercial & Industrial 419,290,390 3 Fairfax Company Of Virginia LLC Fair Oaks Mall 379,938,870 4 Federal Home Loan Mortgage Corporation Office and Residential 341,990,170 5 Camden Summit Partnership LP Apartments 326,992,350 6 Sri Seven Fair Lakes LLC Commercial & Industrial 264,259,140 7 Ps Business Parks LP Industrial Parks 256,850,710 8 Washington Gas Light Co Public Utility 252,538,480 9 Reston Town Center Property LLC Commercial & Retail 238,816,470 10 Homart Newco One Inc Commercial & Industrial 224,542,520 11 Patriot Village Owner Apartments 218,783,120 12 Campus Point Realty Corp Office 218,496,010 13 Writ LP Office, Apartments, Industrial, and Shopping Centers 217,958,440 14 South Office Market LLC Office 215,336,470 15 Home Properties Mount Vernon LLC Apartments and Office 213,005,730 16 Aimco Riverside Park LLC Apartments 204,663,040 17 Mobil Fairfax Inc HQ Office and Various Commercial 201,254,670 18 Capital One Bank Office 197,036,980 19 Mitre Corporation Office 193,991,940 20 Gannett Co Inc Office 186,313,630 21 Metropark 2345 LLC Office 181,732,990 22 Fairfax Owner LLC Office 174,917,900 23 Eqr-Skyline Towers LLC Apartments and Office 174,384,600 24 Brandywine Acquisition Partners LP Office 169,575,090 25 Crescent Financing LLC Office 155,236,230
Total $6,765,763,590
___________________ Source: Fairfax County Department of Tax Administration, January 1, 2013, tax rolls 1 As of January 1, 2013, the assessed value of the real property of the 25 largest holders of real property in the County represented 3.53% of the total assessed value of all real property in Fairfax County, excluding tax-exempt properties. January 1, 2013, assessments generate tax revenue in FY 2014.

42
Real and Personal Property Tax Levies and Tax Collections
Fiscal Year Total Levy1
Current Collections2
% of Total Levy
Collected3
Collection of Delinquent
Taxes Total Current &
Delinquent Taxes
% of Total Levy &
Delinquent Taxes
2005 $2,098,851,884 $2,082,670,287 99.23% $29,164,688 $2,111,834,975 100.62% 2006 2,270,001,560 2,253,875,705 99.29% 27,523,583 2,281,399,288 100.50% 2007 2,445,217,224 2,436,800,582 99.66% 25,358,430 2,462,159,012 100.69% 2008 2,526,532,291 2,517,345,644 99.64% 22,348,830 2,539,694,474 100.52% 2009 2,616,413,372 2,597,768,048 99.29% 23,406,200 2,621,174,248 100.18% 2010 2,617,630,834 2,611,825,961 99.78% 21,900,682 2,633,726,643 100.61% 2011 2,529,322,489 2,519,767,097 99.62% 22,696,208 2,542,463,305 100.52% 2012 2,578,579,112 2,563,131,721 99.40% 22,034,282 2,585,166,003 100.26% 2013 2,673,534,218 2,659,075,923 99.46% 18,985,502 2,678,061,4254 100.17% 2014 2,775,758,811 2,761,707,880 99.49% 3,985,502 2,765,693,3824 99.64% __________________ Sources: Fairfax County Department of Management and Budget and Department of Tax Administration 1 The total levy is the levy for General Fund real and personal property taxes and does not include the property tax levy for Special Revenue
Funds, e.g. for refuse collection and community centers. 2 Current collections do not include tax collections for the Special Revenue Funds or payments in lieu of taxes. As a result of revised
accounting procedures, the collection of penalty and interest payments for late payments of current taxes is included in the collection of current taxes rather than under the collection of back taxes.
3 The percentage of levy is not the collection rate since current collections also include penalty and interest payments for late payments of current taxes.
4 Estimated amounts per Fairfax County Department of Management and Budget FY 2013 and FY 2014 Adopted Budget Plans.
Section 58.1-3916 of the Code of Virginia authorizes Fairfax County, pursuant to Section 4-10-1 of the County Code, to impose a penalty of 10% for failure to pay taxes when due, with interest to be due on such taxes and penalty following the day such taxes are due at the rate of 10% per annum the first year and at the greater of 10% per annum and the rate established pursuant to Section 6621 of the Internal Revenue Code for the second and subsequent years of delinquency.
FINANCIAL INFORMATION
Five Year Summary of Revenues, Expenditures and Fund Balances for General, Special Revenue and Debt Service Funds
The financial data shown in the following table represent a summary for the five fiscal years ended June 30, 2013, of the revenues, expenditures, and fund balances accounted for in the County’s General Fund, Special Revenue Funds, and Debt Service Funds, and, in accordance with Statement No. 14 of the Governmental Accounting Standards Board, in the comparable, primary government-appropriated funds of the discretely reported component units. The summaries for the five fiscal years ended June 30, 2013, have been compiled from the financial statements of the County for the respective years and should be read in conjunction with the related financial statements and notes thereto.

43
Fiscal Years Ended June 30, 2009 2010 2011 2012 2013 Revenues: Taxes1 ............................................... $2,843,368,005 $2,889,531,062 $2,848,580,425 $2,898,255,803 $3,026,313,822 Permits, privilege fees, and regulatory licenses ................................ 41,148,793 47,681,442 55,402,463 59,935,796 62,411,104 Fines and forfeitures ......................... 16,507,756 15,065,700 16,645,115 17,230,369 16,842,952 Revenue from the use of money and property ................................................ 61,527,372 38,959,091 37,124,786 35,234,063 36,081,802 Charges for services and recovered costs 485,293,893 411,214,184 428,046,963 441,423,501 449,653,765 Intergovernmental ............................ 1,014,053,353 1,042,227,100 1,106,149,358 1,113,147,729 1,226,117,736 Miscellaneous ................................... 12,010,402 11,687,915 11,248,827 13,780,036 12,797,703 Total revenues .................................. $4,473,909,574 $4,456,366,494 $4,503,197,937 $4,579,007,297 $4,830,218,884 Expenditures and transfers: General governmental administration $ 147,666,875 $ 141,269,734 $ 165,348,601 $ 178,269,343 $ 179,785,573 Judicial administration ..................... 43,241,720 37,838,681 49,781,817 49,461,933 45,919,569 Public safety ..................................... 581,163,408 575,374,119 573,438,199 595,235,346 642,126,633 Public works ..................................... 199,877,925 203,795,365 205,652,599 210,031,358 214,679,613 Health and welfare ........................... 488,089,767 487,497,996 540,186,138 555,316,485 540,103,616 Parks, recreation and cultural ........... 110,841,317 98,359,159 80,116,456 84,076,869 83,966,114 Community development ................. 197,475,489 210,638,852 364,724,482 408,614,331 365,399,785 Education2 ........................................ 2,263,603,776 2,196,207,759 2,213,823,884 2,324,927,087 2,497,492,021 Debt service ...................................... 301,160,663 301,280,384 320,697,058 330,670,748 343,425,315 Net transfers to other funds3 ............. (2,863,061) 22,318,350 23,347,426 69,324,474 39,320,313 Total expenditures and transfers ....... $4,330,257,879 $4,274,580,399 $4,537,116,660 $4,805,927,974 $4,952,218,552 Excess (deficiency) of revenues over expenditures and transfers ............ $143,651,695 $181,786,095 ($33,918,723) (226,920,677) (121,999,668) Other Financing Sources: Revenue bonds issued 266,704,702 107,645,374 48,709,053 Fund balance, beginning of year4 ......... 719,469,009 863,218,017 1,016,824,844 1,257,018,819 1,167,930,245 Adjustment of fund balance, beginning of year ....................................................... - 10,538,045 37,439,914 30,031,918 - Increase (decrease) in reserve for inventories of supplies .......................... 97,313 (1,277,399) - 154,811 (95,516) Fund balance, end of year..................... $ 863,218,017 $1,043,726,713 $1,287,050,737 $1,167,930,245 $1,094,544,114
_____________________ Source: Fairfax County Comprehensive Annual Financial Reports for the fiscal years ended June 30, 2009-2013. 1 Taxes include real estate, personal property, sales, recordation, business, professional, and other licenses and miscellaneous other taxes. 2 Teachers’ salaries accounted for in the School Operating Fund are paid by contract over a twelve-month period ending in August.
Consequently, in order to reflect the total teachers’ salaries in the fiscal year the services are rendered, an accrual is made at the end of each fiscal year for the payroll liability arising from those teachers’ salaries to be paid in the first two months of the succeeding fiscal year.
3 The inter-fund transfers among the funds presented have been eliminated. 4 Fund balance includes amounts reserved for inventories of supplies. Beginning in FY 2011, inventories of supplies were reported as an
increase or decrease in fund balance only if the inventories deemed significant in relation to the total fund balance.
Financial Policies
The Board of Supervisors has been guided by long-standing financial policies and guidelines in the conduct of financial management. The governing statement of financial policy is contained within the Ten Principles of Sound Financial Management (“Ten Principles”). Adopted by the Board of Supervisors in 1975 and amended as needed to address changing economic conditions and management practices, the Ten Principles have been reaffirmed and have guided each succeeding Board of Supervisors to establish strong fiscal management tools and practices. The Ten Principles provide for the integration of land use planning with capital and operating budgets; establish guidelines for the development of annual balanced budgets; stress the importance of maintaining positive cash balances; establish firm not to exceed limits to debt ratios; provide guidance on cash management, internal controls, and performance measurement; provide guidelines restricting the proliferation of underlying debt and use of moral obligation financing; and encourage the development of a diversified economy within the County.

44
Other policies and tools that have been designed to enhance the impact of the Ten Principles include annual adoption of budgetary guidelines, formal establishment of various expenditure, revenue, and special purpose reserves, capital improvement planning guidelines, policies for risk management, guidelines for acceptance of grant awards, and planning for information technology. Various tools in active use by the County include the annual budget, the Capital Improvement Program, revenue and financial forecasts, and management initiatives such as a performance measurement program, a pay-for-performance management system, workforce planning, and various information technology initiatives.
Certain Financial Procedures
Description of Funds
The County’s annual audited financial statements include the funds administered by the Board of Supervisors and the School Board. The accounts of the County are organized on the basis of funds, each of which is considered to be a separate accounting entity. The transactions in each fund are accounted for by providing a separate set of self-balancing accounts which comprise its assets, liabilities, fund balance, revenues, and expenditures.
Annual Financial Statements
The County has no legal authority to borrow in anticipation of future years’ revenues, except by the issuance of bonds or bond anticipation notes.
Prior to the beginning of each fiscal year, the Board of Supervisors adopts a budget plan consisting of contemplated expenditures and estimated revenues for such fiscal year. On the basis of the adopted budget plan, the Board of Supervisors appropriates funds for the expenditures, and establishes tax rates sufficient to produce the revenues, contemplated in the budget plan.
The annual budgeting process for a fiscal year begins in the first quarter of the previous fiscal year with the submission by agency directors of budget requests to the Department of Management and Budget. During the second quarter, budget requests are reviewed and meetings between the County Executive, Deputy County Executives, and agency directors are held to discuss agency requests. Upon receipt of the preliminary budget of the School Board in the third quarter, the County Executive prepares an initial budget for submission to the Board of Supervisors and proposes tax rates sufficient to produce revenues needed to meet expenditures contemplated in the initial budget. After work sessions with the Board of Supervisors and public hearings on the proposed budget, changes are made and the final budget is adopted. Tax rates are established prior to the beginning of the fiscal year for which the budget is prepared.
During the fiscal year, quarterly reviews of revenue and expenditures are undertaken by the County Department of Management and Budget. On the basis of these reviews, the Board of Supervisors revises appropriations as needed or desired.
In 1982, the Board of Supervisors adopted a financial policy requiring maintenance of a “managed reserve” in the General Fund beginning on July 1, 1982, at a level not less than 2% of General Fund disbursements. This reserve has been incorporated in the budget each fiscal year. This reserve was implemented to provide for temporary financing of unforeseen needs of an emergency nature and to permit orderly adjustment to changes resulting from termination of revenue sources through actions of other governmental bodies. In 1985, the Board of Supervisors adopted a policy on appropriations during quarterly budget reviews, which provides that non-recurring revenues should be used for either capital expenditures or other non-recurring expenditures and that quarterly review adjustments are not to exceed

45
2% of the General Fund disbursements. In addition, on September 13, 1999, the Board of Supervisors established a Revenue Stabilization Fund with a goal of reaching 3% of General Fund disbursements. As of the FY 2006 Third Quarter Review, the Revenue Stabilization Fund was fully funded at 3% of General Fund disbursements. This reserve continues to be fully funded and currently totals $102.8 million. This reserve is designed to address ongoing requirements in years of significant economic downturn. Criteria for withdrawals from the Revenue Stabilization Fund include (1) projected revenues must reflect a decrease of greater than 1.5% from the current fiscal year estimate, (2) withdrawals must not exceed one-half of the fund balance in any fiscal year, and (3) withdrawals must be used in combination with spending cuts or other measures.
Investment Management Policy
The County’s Division of Investments and Cash Management operates under the direction of the Investment Committee comprised of the Chief Financial Officer/Director of the Department of Management and Budget, the Director of the Department of Finance, the Director of the Department of Tax Administration, and the Deputy Director of the Department of Finance. Guided by a formal investment policy, the Committee continually reviews the County’s investment policies and strategies and monitors daily investment activity.
During FY 2013, the County’s average portfolio size (which includes investments in the General Fund, Special Revenue Funds, and Enterprise Funds) was approximately $2.85 billion. The funds are invested in U.S. Treasury obligations, obligations of the Federal Home Loan Mortgage Corporation, Federal Home Loan Banks, Federal Farm Credit Bank, and Fannie Mae, bankers’ acceptances, commercial paper (rated A1/P1 or higher), negotiable and non-negotiable and insured certificates of deposit, money market mutual funds limited to government obligations, corporate notes, bank notes, and other investments permitted under Virginia law for these purposes.
The County’s investment policy, which governs the pooled cash, and general obligation bond proceeds, portfolios prohibits investment in instruments generally referred to as derivatives, and the County does not employ leverage in its investments.
The Association of Public Treasurers of the United States and Canada has awarded the County a certification for its investment policy each year since 1998. To achieve certification, an investment policy must establish standards recognized in the profession as fostering prudent management of public funds.
General Fund Revenues, Expenditures, Transfers and Beginning Fund Balance
The General Fund is maintained by the County to account for revenue derived from Countywide ad valorem taxes, other local taxes, licenses, fees, permits, charges for services, certain revenue from federal and State governments, and interest earned on invested cash balances of the General Fund and Capital Project Funds. General Fund expenditures and transfers include the costs of general County government, transfers to the School Operating Fund to pay the local share of operating Fairfax County public schools, and transfers to the Debt Service and Capital Projects Funds to pay debt service on County general obligation bonds and for certain capital improvement projects.
General Fund Summary
Shown below are the County’s revenues, expenditures, transfers, and beginning fund balance of the General Fund for FY 2009 through FY 2013.

46
General Fund Revenues, Transfers, and Beginning Fund Balance (in thousands)
Fiscal Year Ended June 30 2009 2010 2011 2012 2013 General Property Taxes ................................ $2,364,260 $2,412,143 $2,321,809 $2,364,202 $2,477,040 Other Local Taxes ........................................ 460,417 460,147 505,518 517,376 530,960 Permits, Privilege Fees, and Regulatory Licenses .....................................................
24,494
28,666
34,267
36,844
38,201
Fines and Forfeitures .................................... 16,477 14,943 16,563 17,147 16,792 Revenue from the Use of Money and Property .....................................................
42,554
22,641
19,988
19,624
18,555
Charges for Services and Recovered Costs ..........................................................
70,237
68,916
64,103
66,804
76,242
Intergovernmental ......................................... 355,798 343,997 348,640 347,751 339,758 Miscellaneous ............................................... 826 673 13,932 13,497 1,305 Transfers In and Beginning Fund Balance ......................................................
297,758
306,064
396,482
388,970
363,702
Total ................................................ $3,632,821 $3,658,190 $3,721,302 $3,772,215 $3,862,555 _____________ Source: Fairfax County Comprehensive Annual Financial Reports for FY 2009 - FY 2013
General Fund Expenditures and Transfers (in thousands)
Fiscal Year Ended June 30 2009 2010 2011 2012 2013 Transfer to School Operating Fund ................... $1,626,601 $1,626,601 $1,611,590 $1,610,835 $1,683,322 Costs of General County Government .............. 1,354,845 1,304,385 1,372,007 1,444,498 1,474,374 Transfer to Debt Service Funds ........................ 267,801 274,700 281,869 276,520 281,610 Transfer to Capital Project Funds ..................... 21,907 20,895 15,908 19,627 17,055 Transfer to Metro Construction and Operations Fund ............................................
7,510
7,410
7,410
11,298
11,298
Other Transfers ................................................. 74,974 58,744 56,119 55,766 65,628 Total.................................................................. $3,353,638 $3,292,735 $3,344,903 $3,418,544 $3,533,287
____________ Source: Fairfax County Comprehensive Annual Financial Reports for FY 200-FY 2013
Revenues
The following is a discussion of the General Fund revenue structure.
General Property Taxes – An annual ad valorem tax is levied by the County on the assessed value of real and tangible personal property located within the County as of January 1 preceding the fiscal year in which such tax is due. The personal property tax on motor vehicles which acquire situs within the County or have title transferred on or after January 2 is prorated on a monthly basis. Real property and personal property are assessed at 100% of fair market value. Real property taxes are due July 28 and December 5 of the fiscal year in which they are levied. The payment date for personal property taxes is October 5. The penalty for late payment is 10% of the amount due, and interest on delinquent taxes and

47
penalties accrues at a rate of 1% per annum for real estate and 5% per annum for personal property. In cases of property on which delinquent taxes are not paid within three years, the County may sell the property at public auction to pay the amounts due. There is no legal limit at the present time on the property tax rates that may be established by the County. Property taxes (including delinquent payments, penalties, and interest) accounted for 70.8% of total General Fund revenues in FY 2013. However, this percentage does not include the reimbursement from the Commonwealth of Virginia for a portion of the personal property tax. Including the reimbursement reflected in Intergovernmental revenue, the percentage of revenue from property taxes in FY 2013 79.5%. A discussion concerning the Commonwealth’s plan to reduce personal property taxes follows.
During its 1998 Special Session, the General Assembly of Virginia enacted legislation to reduce personal property taxes applicable to individually owned motor vehicles. The reduction, which applies to the first $20,000 in assessed value, was scheduled to be phased in over a five year period. The legislation states that the Commonwealth will reimburse local governments for the revenue lost from the reduction in personal property tax collections. In fiscal years subsequent to the legislation personal property taxes paid by citizens steadily reduced until such reduction equaled 70% in 2002. Due to Commonwealth budget constraints, the 2003 Virginia General Assembly temporarily froze the tax reduction at 70%. The 2005 General Assembly revised this measure further to limit its tax relief payments to all localities to a total of $950 million per tax year beginning with 2006 (fiscal year 2007). The County’s fixed share of the $950 million is $211,313,944, as determined by its share of the total payments made to all localities by the Commonwealth during calendar years 2004 and 2005 for tax year 2004 (fiscal year 2005). The County’s total personal property tax collections for FY 2013 were $564.9 million, comprised of $353.6 million paid by taxpayers and $211.3 million reimbursed by the Commonwealth of Virginia.
Other Local Taxes – The County levies various other local taxes, including a 1% local sales tax (collected by the Commonwealth and remitted to the County), a tax on consumer utility bills based on consumption for gas and electric services and a 5% communications sales tax which is imposed on the charge for or sale of communications services. Also included in this category is a cigarette tax of $0.30 per pack, property recordation taxes, an automobile license tax, and various businesses, professional, and occupational licenses taxes. These taxes accounted for 15.2% of total General Fund revenues in FY 2013.
Permits, Privilege Fees, and Regulatory Licenses – The County requires that licenses or permits be obtained in order to perform certain activities in the County and that fees be paid for services provided by certain County departments. These revenues represented 1.1% of total General Fund revenues for FY 2013.
Fines and Forfeitures – The sources of revenue in this category include court fines and penalties from the Circuit Court and the General District Court and court fines, costs from the Juvenile and Domestic Relations District Court and fines for traffic violations, misdemeanors, and felonies. In addition, the County receives revenues from parking violations as authorized under the County Code. Revenues in this category represented 0.5% of General Fund revenues in FY 2013.
Revenue from the Use of Money and Property – The principal sources of revenue to the General Fund from the use of money and property are interest on General Fund and Capital Project Fund investments and minor amounts of revenue from the sale and lease of County equipment and property. These revenues represented 0.5% of General Fund revenues in FY 2013.
Charges for Services and Recovered Costs – The principal sources of revenue to the General Fund from charges for services are County Clerk fees, school age child care fees, recreation fees, publication sales and various other services for which the County charges a fee. Revenues in this category represented 2.2% of General Fund revenues in FY 2013.

48
Intergovernmental Revenue – Intergovernmental revenue is comprised of revenue from the Commonwealth and revenue from the federal government. Revenues in this category represented 10.3% of General Fund revenues in FY 2013. This percentage includes the revenue that the County receives from the Commonwealth as reimbursement for the County’s personal property tax. Each revenue source within intergovernmental revenue is discussed below.
Revenue from the Commonwealth – The County is reimbursed by the Commonwealth of Virginia for a portion of shared expenses, including certain expenditures for social services, the sheriff’s office, courts, the Office of the Commonwealth Attorney, and other constitutional offices. Additionally, the County receives a share of the net profits from the State Alcoholic Beverage Control Board’s liquor sales and state contributions to assist in meeting law enforcement expenditures. As mentioned in the section concerning General Property Taxes, the Commonwealth also reimburses the County for a portion of its personal property tax on vehicles. Including the reimbursement for the County’s personal property tax, revenues from this category represented 9.7% of total General Fund revenues in the fiscal year ended June 30, 2013. Excluding this reimbursement, revenue from this category represented 3.6% of General Fund revenue in FY 2013. The County receives a significant amount of additional State aid in support of public school operations. These revenues are credited directly to the School Operating and School Lunch Funds, however, and are not reflected in the General Fund.
Revenue from the Federal Government – The principal sources of categorical federal aid to the General Fund are federal grant moneys supporting human service programs such as supplemental nutrition, temporary assistance for needy families, foster care, adoption assistance, and medical assistance for clients of the Department of Family Services. This revenue category represented 0.9% of General Fund revenues in FY 2013.
Miscellaneous Revenues – The sources of revenue in this category include the sale of land and buildings, contract rebates, and other miscellaneous sources. These revenue sources accounted for less than 0.1% of General Fund revenue in FY 2013.
Expenditures and Transfers
The following is a discussion of the major classifications of General Fund expenditures and transfers.
Transfer to School Operating Fund – The County transfers money from the General Fund to the School Operating Fund to pay the County’s share of the costs of operating public schools in Fairfax County. This transfer represented approximately 47.6% of total disbursements from the General Fund in the fiscal year ended June 30, 2013. The transfer to the School Operating Fund was approximately 71.9% of total receipts of the School Operating Fund. Other revenues credited directly to the School Operating and School Lunch Funds include revenue from the Federal Government, the Commonwealth of Virginia, the City of Fairfax (representing tuition of students residing in the City of Fairfax who attend Fairfax County schools), and other revenue derived locally from sale of textbooks, school lunches, etc.
Costs of General County Government – The County pays the costs of general County government from the General Fund. These costs include expenditures for general government administration, judicial administration, public safety, public works, health and welfare, parks, recreational and cultural programs, and community development. This classification was approximately 41.7% of total General Fund disbursements in FY 2013.
Transfer to Debt Service Fund – The County transfers from the General Fund to the Debt Service Fund amounts sufficient to pay principal and interest on outstanding County and School debt including

49
general obligation bonds and EDA and FCRHA revenue bonds. Transfers to the Debt Service Fund represented 8.0% of total General Fund disbursements in FY 2013. Effective FY 2006, Fairfax County Public Schools (FCPS) transfers from its operating fund to the County’s Debt Service Fund an amount sufficient to pay principal and interest on the outstanding EDA Facilities Revenue Bonds Series 2005 A (School Board Central Administration Building Project Phase I).
Transfer to Capital Project Funds – The County transfers money from the General Fund to the Capital Project Funds to pay the cost of certain capital improvements. The General Fund transfer to the Capital Project Funds (except for the General Fund transfer for Fairfax County’s obligations to WMATA, which is discussed below) represented 0.5% of total General Fund disbursements in FY 2013.
Transfer to Metro Construction and Operations Fund – The County is a member jurisdiction of WMATA and as such has agreed to make certain capital contributions in support of the construction by WMATA of a rail transit system to serve the Washington metropolitan area (which includes the County) and to pay a portion of the deficit incurred by WMATA in the operation of its bus system and rail system. The County generally has used bond proceeds to fund its capital contributions to WMATA and has transferred money from the General Fund to pay its share of the bus and rail operating subsidies. The General Fund transfer to the Metro Construction and Operations Fund to pay the County’s share of the system’s operating subsidies represented 0.3% of total General Fund disbursements in FY 2013. See the subsection herein entitled “GOVERNMENT SERVICES - Transportation” for a more complete discussion of the County’s obligations with respect to WMATA.
Other Funds – The County transfers money from the General Fund to other funds for a variety of purposes. The General Fund transfer to other funds includes transfers to the County Transit Systems, Information Technology, Aging Grants and Programs, Community-Based Funding Pool, Housing Programs for the Elderly, Health Benefits Trust, and Equipment Management and Transportation Agency. Transfers to other funds were 1.9% of total General Fund disbursements in FY 2013.
Transfer to Revenue Stabilization Fund – Beginning in FY 2000, the County began setting aside money in the General Fund for a Revenue Stabilization Fund to address significant revenue reductions during severe, prolonged economic downturns. The Revenue Stabilization Fund represented 32.7% of the total fund balance in the General Fund as of June 30, 2013.
FY 2014 Budget
On April 30, 2013, the Fairfax County Board of Supervisors adopted the Fiscal Year 2014 Budget. The FY 2014 budget is based on General Fund Revenue increase of 2.7% over the FY 2013 Revised Budget Plan. General Fund Disbursements total $3.59 billion, a decrease of $7.9 million or 0.22% from the FY 2013 Revised Budget Plan. The budget includes a real estate tax rate of $1.085 per $100 of assessed value, a one cent increase from the rate of $1.075 per $100 of assessed value as part of the FY 2013 Adopted Budget Plan. The total County transfer to support School Operating and Debt Service is $1.89 billion or 52.7% of total County disbursements. Updated budget projections prepared in fall 2013 are consistent with the FY 2014 adopted budget.
FY 2015 Budget
In November 2013, the County Executive presented a financial forecast for FY 2015. This takes into account the following assumptions: compensation increases are provided to all employees, the transfer to Fairfax County Public Schools is increased by 2% and other projected adjustments for disbursements, and revenues to increase approximately 2.9%. The County Executive’s budget is expected to be presented to the Board of Supervisors in February 2014.

50
CAPITAL IMPROVEMENT PROGRAM
In connection with the County’s adopted comprehensive land use plan, the Fairfax County Planning Commission annually prepares and submits to the Board of Supervisors a capital improvement program (“CIP”) for the ensuing five-year period. The CIP is designed to balance the need for public facilities as expressed by the County’s land use plan with the fiscal capability of the County to provide for those needs.
The CIP is an integral element of the County’s budgeting process. The five-year document serves as a general planning guide for the construction of general purpose, school and public utility projects in the County. The CIP is updated and approved by the Board of Supervisors each year. This annual review process prompts careful attention to the development of reliable capital expenditure and revenue estimates and the timely scheduling of bond referenda.
In connection with the CIP process, the Board of Supervisors has adopted certain policy guidelines for the development and financing of the CIP. These guidelines include self-imposed restrictions on the issuance of general obligation bonds designed to keep General Fund supported debt service expenditures less than 10% of total Combined General Fund disbursements, and to maintain the ratio of bonded indebtedness to the market value of taxable property in the County at a level less than 3.0%.
The Board of Supervisors continues to review the County’s debt program in light of current fiscal conditions and capital needs. Currently, new general obligation bond sales are limited to an average of $275 million per year with a maximum limit of $300 million in a single year. The CIP for fiscal years 2014-2018 (along with estimates for fiscal years 2019 to 2023) was approved by the Board of Supervisors on April 30, 2013. The County program includes new construction, renovation and renewal of school facilities, parks, housing development, revitalization, storm water management, public safety and courts, libraries, human services, solid waste, sewers, and transportation. Significant capital construction activity from FY 2014-2023 totaling $6.02 billion is anticipated for the County, in addition to $0.996 billion in regional parks, and water supply projects which are undertaken within the County to benefit County residents, but is not managed or funded directly by the County. The total capital construction activity planned within the County totals $7.013 billion from FY 2014-2023.
RETIREMENT SYSTEMS
Fairfax County administers four separate public employee retirement systems that provide pension benefits for various classes of County employees: Fairfax County Employees’ Retirement System (ERS), Fairfax County Police Officers Retirement System (PORS), Fairfax County Uniformed Retirement System (URS), and the Educational Employees’ Supplemental Retirement System of Fairfax County (ERFC). In addition, professional employees of the Fairfax County Public Schools participate in a plan sponsored and administered by the Virginia Retirement System.
The Fairfax County retirement systems investments are managed by independent professional investment managers. Investments in derivatives are not made for speculative purposes but may be used by investment managers to gain access to markets, to reduce risk, or to reduce transaction costs.
As of July 1, 2012 (December 31, 2012, for the Educational Employees’ Supplemental Retirement System), the date of the latest actuarial valuations, membership in the reporting entity’s plans consisted of the following:

51
Description Primary Government
Component Unit – Public Schools
ERS PORS URS
ERFC Retirees and beneficiaries receiving benefits 6,888 876 1,109
9,788
Terminated employees entitled to, but not yet receiving, benefits 1,542 33 44
3,099
DROP participants 629 73 119
n/a Active employees 14,107 1,276 1,870
21,519
Total number of plan members 23,166 2,258 3,142
34,406 Source: Fairfax County Comprehensive Annual Financial Report for FY 2013 Fairfax County Employees’ Retirement System (ERS)
Plan Description
The Fairfax County Employees’ Retirement System (ERS) is a cost-sharing multiple-employer defined benefit pension plan. The plan covers full-time and certain part-time employees of the reporting entity who are not covered by other plans of the reporting entity or the Virginia Retirement System (VRS).
Benefit provisions are established and may be amended by County ordinances. All benefits vest at five years of creditable service. To be eligible for normal retirement, an individual must meet the following criteria: (a) attain the age of 65 with five years of creditable service, or (b) attain the age of 50 with age plus years of creditable service being greater than or equal to 80. The normal retirement benefit is calculated using average final compensation (i.e., the highest 78 consecutive two week pay periods or the highest 36 consecutive monthly pay periods) and years (or partial years) of creditable service at date of termination. In addition, if normal retirement occurs before Social Security benefits are scheduled to begin, an additional monthly benefit is paid to retirees. The plan provides that unused sick leave credit may be used in the calculation of average final compensation by projecting the final salary during the unused sick leave period. The benefit for early retirement is actuarially reduced and payable at early termination.
Funding Policy
The contribution requirements of ERS members are established and may be amended by County ordinances. Members may elect to join Plan A or Plan B. Plan A requires member contributions of 4.0% of compensation up to the Social Security wage base and 5.33% of compensation in excess of the wage base. Plan B requires member contributions of 5.33% of compensation.
The County is required to contribute at an actuarially determined rate; the rate for the year ended June 30, 2013, was 18.49% of annual covered payroll. The decision was made to commit additional funding and a rate of 19.05% was adopted for fiscal year 2013. In the event the ERS’s funded ratio (the ratio of the actuarial value of assets to the actuarial accrued liability) exceeds 120% or falls below 90%, the contribution rate will be adjusted to bring the funded ratio back within these parameters.

52
Schedule of Fund Progress
Actuarial Valuation
Date
Actuarial Value of Assets
(000) ( a )
Actuarial Accrued Liability (AAL) –
Entry Age (000) ( b )
Unfunded AAL
(UAAL) (Funding Excess)
(000) ( b-a )
Funded Ratio ( a/b )
Covered Payroll (000)
( c )
UAAL (Funding Excess) as a
Percentage of Covered Payroll
( ( b-a ) / c )
7/1/2010 $2,636,052 $3,771,060 $1,135,008 69.90% 629,249 180.38%
7/1/2011 2,841,466 4,018,924 1,177,458 70.70 642,073 183.38
7/1/2012 3,053,412 4,264,175 1,210,763 71.61 642,639 188.40
Source: Fairfax County Comprehensive Annual Financial Report for FY 2013
Administration
There are ten members of the ERS Board of Trustees. Four members are appointed by the County Board of Supervisors. Three members are elected representing the following groups: County employees, Schools employees, and retired employees. The Fairfax County Director of Human Resources and the Director of Finance serve as ex-officio members of the board, along with an appointee from the Schools.
Professional Services
An independent auditor and actuary are hired to provide service to the fund.
Fairfax County Police Officers Retirement Systems (PORS)
Plan Description
The Fairfax County Police Officers Retirement System (PORS) is a legally separate single-employer defined benefit pension plan established under the Code of Virginia. The plan covers County police officers who are not covered by other plans of the reporting entity or the VRS and former Park Police officers who elected to transfer to the PORS from the Uniformed Retirement System effective January 22, 1983.
Benefit provisions are established and may be amended by County ordinances. All benefits vest at five years of creditable service. To be eligible for normal retirement, an individual must meet the following criteria: (a) if employed before July 1, 1981, attain the age of 55 or have completed 20 years of creditable service, or (b) if employed on or after July 1, 1981, attain the age of 55 or have completed 25 years of creditable service. The normal retirement benefit is calculated using average final compensation and years (or partial years) of creditable service at date of termination. The plan provides that unused sick leave credit may be used in the calculation of average final compensation by projecting the final salary during the unused sick leave period. To be eligible for early retirement, the employee must have 20 years of creditable service (does not apply if hired before July 1, 1981). The benefit for early retirement is actuarially reduced and payable at early termination.

53
Funding Policy
The contribution requirements of PORS members are established and may be amended by County ordinances. Member contributions are based on 10.0% of compensation. The County contributes at a fixed rate as determined by an annual actuarial valuation, unless the PORS’s funding ratio falls outside of a pre-determined range. Once outside the range, the rate is either increased or decreased to accelerate or decelerate the funding until the ratio falls back within the range. The range for the PORS is a minimum funding ratio of 90% and a maximum funding ratio of 120%. The actuarial rate for the year ended June 30, 2013, was 32.04% of annual covered payroll. The decision was made to commit additional funding and a rate of 33.15% was adopted for fiscal year 2013.
Schedule of Fund Progress
Actuarial Valuation Date
Actuarial Value of Assets
(000) ( a )
Actuarial Accrued Liability (AAL) –
Entry Age (000) ( b )
Unfunded AAL
(UAAL) (Funding Excess)
(000) ( b-a )
Funded Ratio ( a/b )
Covered Payroll (000) ( c )
UAAL (Funding Excess) as a
Percentage of Covered Payroll
( ( b-a ) / c )
7/1/2010 $899,543 $1,135,015 $235,472 79.25% 100,500 234.30%
7/1/2011 982,154 1,219,609 237,455 80.53 99,070 239.68
7/1/2012 1,035,444 1,286,841 251,397 80.46 101,121 248.61
Source: Fairfax County Comprehensive Annual Financial Report for FY 2013
Administration
There are seven members of the PORS Board of Trustees. Three members are appointed by the County Board of Supervisors. Two members are active employee elected representatives, and one member is a retiree elected representative. The Fairfax County Director of Finance serves as an ex-officio member of the board.
Professional Services
Independent auditor, actuary and investment consultants are hired to provide service to the fund.
Fairfax County Uniformed Retirement System (URS)
Plan Description
The Fairfax County Uniformed Retirement System (URS) is a single-employer defined benefit pension plan. The plan covers uniformed employees including non-clerical employees of the Fire and Rescue Department and Office of Sheriff, Park Police, Helicopter Pilots, Animal Wardens and Game Wardens who are not covered by other plans of the reporting entity or the VRS.
Benefit provisions are established and may be amended by County ordinances. All benefits vest at five years of creditable service. To be eligible for normal retirement an individual must meet the following criteria: (a) attain the age of 55 with six years of creditable service, or (b) complete 25 years of creditable service. The normal retirement benefit is calculated using average final compensation and

54
years (or partial years) of creditable service at date of termination. Annual cost-of-living adjustments are provided to retirees and beneficiaries equal to the lesser of 4.0% and the percentage increase in the Consumer Price Index for the Washington-Baltimore Metropolitan Statistical Area. The plan provides that unused sick leave credit may be used in the calculation of average final compensation by projecting the final salary during the unused sick leave period. To be eligible for early retirement, employees must have 20 years of creditable service. The benefit for early retirement is actuarially reduced and payable at early termination.
Funding Policy
The contribution requirements of URS members are established and may be amended by County ordinances. Plan A members were given the opportunity to enroll in Plan B as of July 1, 1981 and to enroll in Plan C as of April 1, 1997. From July 1, 1981 through March 31, 1997, all new hires were enrolled in Plan B. Plan B members were given the opportunity to enroll in Plan D as of April 1, 1997. From April 1, 1997 forward all new hires are enrolled in Plan D. Plan A requires member contributions of 4.0% of compensation up to the Social Security wage base and 5.75% of compensation in excess of the wage base. Plan B requires member contributions of 7.08% of compensation up to the Social Security wage base and 8.83% of compensation in excess of the wage base. Plan C requires member contributions of 4.0% of compensation. Plan D requires contributions of 7.08% of compensation.
The County contributes at a fixed rate as determined by an annual actuarial valuation, unless the URS’s funding ratio falls outside of a pre-determined range. Once outside the range, the rate is either increased or decreased to accelerate or decelerate the funding until the ratio falls back within the range. The range for the URS is a minimum funding ratio of 90% and a maximum funding ratio of 120%. The County is required to contribute at an actuarially determined rate; the rate for the year ended June 30, 2013, was determined actuarially to be 34.04% of annual covered payroll. The decision was made to commit additional funding and a rate of 35.00% was adopted for fiscal year 2013.
Schedule of Fund Progress
Actuarial Valuation
Date
Actuarial Value of Assets
(000) ( a )
Actuarial Accrued Liability (AAL) –
Entry Age (000) ( b )
Unfunded AAL
(UAAL) (Funding Excess)
(000) ( b-a )
Funded Ratio ( a/b )
Covered Payroll (000)
( c )
UAAL (Funding Excess) as a
Percentage of Covered Payroll
( ( b-a ) / c )
7/1/2010 $1,095,080 $1,427,617 $332,537 76.71% 146,777 226.56%
7/1/2011 1,185,594 1,526,218 340,624 77.68 147,326 231.20
7/1/2012 1,247,526 1,613,654 366,128 77.31 148,236 246.99
Source: Fairfax County Comprehensive Annual Financial Report for FY 2013 Administration
There are eight members of the URS Board of Trustees. Three members are appointed by the County Board of Supervisors. Three members are employee elected representatives comprised of two members from the Fire and Rescue Department, and one member from the Sheriff’s Department. The Fairfax County Director of Finance and Director of Human Resources serve as ex-officio members of the board.

55
Professional Services
An independent auditor and actuary are hired to provide service to the fund.
Educational Employees’ Supplementary Retirement System of Fairfax County (ERFC)
Plan Description
The Educational Employees’ Supplementary Retirement System of Fairfax County (ERFC) is a legally separate single-employer retirement system established under the Code of Virginia. The ERFC covers all full-time educational and civil service employees who are employed by the Fairfax County Public Schools and who are not covered by other plans of the reporting entity. The ERFC contains two plans, ERFC and ERFC 2001. ERFC is the original defined benefit plan effective July 1, 1973, and remains in effect, although closed to new members. Effective July 1, 2001, all new-hire fulltime educational and civil service employees are enrolled in the ERFC 2001 plan.
The ERFC and ERFC 2001 plans provide retirement, disability, and death benefits to plan members and their beneficiaries. Annual post-retirement increases of 3.0% are effective each March 31. All benefits vest after five years of creditable service. Benefit provisions are established and may be amended by the Fairfax County Public School Board. The ERFC plan supplements the Virginia Retirement System plan. The benefit structure is designed to provide a level retirement benefit through a combined ERFC/VRS benefit structure. The ERFC 2001 plan has a stand-alone structure. Member contributions for the ERFC and ERFC 2001 plans are made through an arrangement which results in a deferral of taxes on the contributions.
The ERFC and ERFC 2001 plans provide for a variety of benefit payment types. Minimum eligibility conditions for receipt of full benefits for ERFC members are either attaining the age of 55 with 25 years of creditable service or completing five years of creditable service at age 65. Minimum eligibility conditions for receipt of full benefits for ERFC 2001 members are either completing five years of creditable service prior to age 60 or any age with 30 years of creditable service.
Funding Policy
The contribution requirements for ERFC and ERFC 2001 members are established and may be amended by the ERFC Board of Trustees with the approval of the School Board. All members are required to contribute 4.0% of their covered salaries. The employer is required to contribute at an actuarially determined rate. For fiscal year 2013, Public Schools were required to contribute 5.34% of annual covered payroll for educational employees and civil service employees.

56
Schedule of Fund Progress
Actuarial Valuation
Date
Actuarial Value of Assets
(000) ( a )
Actuarial Accrued Liability (AAL) –
Entry Age (000) ( b )
Unfunded AAL
(UAAL) (Funding Excess)
(000) ( b-a )
Funded Ratio ( a/b )
Covered Payroll (000)
( c )
UAAL (Funding
Excess) as a Percentage of
Covered Payroll ( ( b-a ) / c )
12/31/2010 $1,822,603 $2,384,061 $561,458 76.45 $1,191,290 47.13%
12/31/2011 1,866,952 2,470,964 604,012 75.56 1,246,973 48.44
12/31/2012 1,935,292 2,566,128 630,836 75.42 1,297,537 48.62
Source: Fairfax County Comprehensive Annual Financial Report for FY 2013 Administration
The Board is composed of seven members: three are appointed by the School Board, and three are elected by active ERFC members. The six combined Board members recommend someone who is not affiliated with FCPS for the seventh position, which is subject to approval by the School Board.
Virginia Retirement Systems (VRS)
Plan Description
Fairfax County Public Schools contributes to the Virginia Retirement System (VRS) on behalf of covered professional Public Schools employees. VRS is a cost-sharing multiple-employer public employee defined benefit pension plan administered by the Commonwealth of Virginia for its political subdivisions. All full-time, salaried, permanent employees of participating employers must participate in the VRS. In accordance with the requirements established by State statute, the VRS provides retirement and disability benefits, annual cost-of-living adjustments, and death benefits to plan members and beneficiaries.
Funding Policy
Plan members are required by State statute to contribute 5.0% of their annual covered salary to the VRS. If a plan member leaves covered employment, the accumulated contributions plus interest earned may be refunded. In accordance with State statute, Public Schools is required to contribute at an actuarially determined rate or a rate approved by the General Assembly. In fiscal year 2013, the General Assembly adopted a higher VRS employer contribution rate of 11.66% compared to the prior year rate of 6.33%. In fiscal years 2011 and 2012, the General Assembly approved significantly lower VRS rates in order to mitigate state budget cuts to localities. By doing so, Virginia school districts are essentially deferring a portion of the recommended employer contributions in those years. FCPS will have to repay these deferred contributions beginning in fiscal year 2013. The FCPS Board committed $16.9 million of June 30, 2013, fund balance toward this purpose. In addition, the General Assembly approved an employer rate increase from 0.6% in fiscal year 2012 to 1.11% in fiscal year 2013 for the VRS Retiree Health Insurance Credit. State statute may be amended only by the Commonwealth of Virginia Legislature. FCPS employer and member contributions to VRS, including the Retiree Health Insurance
57
Credit, for the years ended June 30, 2013, 2012, and 2011, were $242,343,488, $146,454,888, and $112,157,560 respectively, equal to the required contributions for each year.
VRS issues publicly available annual reports and financial statements that can be obtained through their website or writing directly to the agency.
Fairfax County Retirement Systems - Plan Revisions from the Board of Supervisors
As directed by the Board of Supervisors, the Fairfax County Department of Human Resources contracted with a benefits consultant to conduct a comprehensive retirement study. Based on the results of this study, the Board of Supervisors, as part of their mark‐up of the FY 2013 Adopted Budget Plan on April 24, 2012, reaffirmed the County’s commitment to a defined benefit plan model for current employees and for new hires. The Board also directed staff to prepare revisions to the Fairfax County Code to incorporate several modifications to the retirement systems, to apply only to new employees who are hired after January 1, 2013. These changes included increasing the minimum retirement age from 50 to 55 in the Employees’ system, increasing the rule of 80 to the rule of 85 in the Employees’ system, removing the pre‐Social Security Supplement from DROP accounts in the Employees’ system and the Uniformed system, and placing a cap on the use of sick leave for retirement purposes at 2,080 hours for all three retirement systems.
Other Post-Employment Benefits (OPEB)
In fiscal year 2008, the County and FCPS implemented the Governmental Accounting Standards Board Statement No. 45, Accounting and Financial Reporting by Employers for Benefits Postemployment Benefits Other Than Pensions. The County provides health care and life insurance benefits to eligible retirees and their spouses. Fairfax County is one of the founding participants in the Virginia Pooled OPEB Trust Fund sponsored by the Virginia Municipal League and the Virginia Association of Counties (VML/VACo). The Virginia Pooled OPEB Trust Fund was established as an investment vehicle for participating employers to accumulate assets to fund Other Public Employment Benefits (OPEB).
At June 30, 2013, the County had actuarial plan assets of $103.3 million and reported a net OPEB asset of $1.5 million, representing that the annual required contributions (ARC) were slightly in excess of actual contributions. As of the July 1, 2012, actuarial valuation, the County had an actuarial accrued liability of $503.8 million and an ARC of $38.9 million.
FCPS also provides health insurance benefits to eligible retirees and their spouses and is a participant in the Virginia Pooled OPEB Trust Fund. At June 30, 2013, FCPS had actuarial plan assets of $53.4 million in the pooled trust fund and reported a net OPEB asset of $13.4 million. As of the July 1, 2012, actuarial valuation, FCPS had an actuarial accrued liability of $448.8 million and an ARC of $31.1 million.
For further information regarding the County’s retirement systems, see “Basic Financial Statements – Notes to Financial Statements – Notes G and H” in Appendix IV.
CONTINGENT LIABILITIES AND CLAIMS
The County is contingently liable with respect to lawsuits and other claims that arise in the ordinary course of its operations. See Note L in the County’s Financial Statements in Appendix IV to this Official Statement for details as of the end of Fiscal Year 2013.

58
APPROVAL OF LEGAL PROCEEDINGS
Legal matters incident to the authorization and issuance of the Bonds are subject to the approval of Sidley Austin LLP, Washington, D.C., Bond Counsel, the proposed form of whose opinion is included herein as Appendix VI.
TAX MATTERS
Opinion of Bond Counsel
In the opinion of Sidley Austin LLP, Bond Counsel, except as provided in the following sentence, interest on the Bonds will not be includable in the gross income of the owners of the Bonds for federal income tax purposes under existing law. Interest on the Bonds will be includable in the gross income of the owners thereof retroactive to the date of issue of the Bonds in the event of a failure by the County or the School Board of the County to comply with applicable requirements of the Internal Revenue Code of 1986, as amended (the “Code”), and their respective covenants regarding use, expenditure, and investment of the proceeds of the Bonds and timely payment of certain investment earnings to the United States Treasury; and no opinion is rendered by Bond Counsel as to the effect on the exclusion from gross income of the interest on the Bonds for federal income tax purposes of any action taken or not taken without the approval of Bond Counsel or upon the advice or approval of counsel other than Bond Counsel.
Interest on the Bonds will not be an item of tax preference for purposes of the federal individual or corporate alternative minimum tax under the Code. Interest on the Bonds will, however, be included in the calculation of alternative minimum tax liability imposed on corporations under the Code. The Code contains other provisions (some of which are noted below) that could result in tax consequences, as to which no opinion will be rendered by Bond Counsel, as a result of (i) ownership of the Bonds or (ii) inclusion in certain computations of interest that is excluded from gross income.
Original Issue Discount
The excess, if any, of the amount payable at maturity of any maturity of the Bonds purchased as part of the initial public offering over the issue price thereof constitutes original issue discount. The amount of original issue discount that has accrued and is properly allocable to an owner of any maturity of the Bonds with original issue discount (a “Discount Bond”) will be excluded from gross income for federal income tax purposes to the same extent as interest on the Bonds. In general, the issue price of a maturity of the Bonds is the first price at which a substantial amount of Bonds of that maturity was sold (excluding sales to bond houses, brokers, or similar persons or organizations acting in the capacity of underwriters, placement agents, or wholesalers) and the amount of original issue discount accrues in accordance with a constant yield method based on the compounding of interest. A purchaser’s adjusted basis in a Discount Bond is to be increased by the amount of such accruing discount for purposes of determining taxable gain or loss on the sale or other disposition of such Discount Bonds for federal income tax purposes.
A portion of the original issue discount that accrues in each year to an owner of a Discount Bond which is a corporation will be included in the calculation of the corporation’s federal alternative minimum tax liability. In addition, original issue discount that accrues in each year to an owner of a Discount Bond is included in the calculation of the distribution requirements of certain regulated investment companies and may result in some of the collateral federal income tax consequences discussed herein. Consequently, an owner of a Discount Bond should be aware that the accrual of original issue discount in each year may result in an alternative minimum tax liability, additional distribution requirements or other
59
collateral federal income tax consequences although the owner of such Discount Bond has not received cash attributable to such original issue discount in such year.
The accrual of original issue discount and its effect on the redemption, sale, or other disposition of a Discount Bond that is not purchased in the initial offering at the first price at which a substantial amount of such Bonds is sold to the public may be determined according to rules that differ from those described above. Owners of a Discount Bond should consult their tax advisors with respect to the determination for federal income tax purposes of the amount of original issue discount with respect to such Discount Bond and with respect to state and local tax consequences of owning and disposing of such Discount Bond.
Bond Premium
The excess, if any, of the tax basis of Bonds purchased as part of the initial public offering to a purchaser (other than a purchaser who holds such Bonds as inventory, stock in trade, or for sale to customers in the ordinary course of business) over the amount payable at maturity is “Bond Premium.” Bond Premium is amortized over the term of such Bonds for federal income tax purposes (or, in the case of a bond with bond premium callable prior to its stated maturity, the amortization period and yield may be required to be determined on the basis of an earlier call date that results in the lowest yield on such bond). Owners of such Bonds are required to decrease their adjusted basis in such Bonds by the amount of amortizable Bond Premium attributable to each taxable year such Bonds are held. The amortizable bond premium on such Bonds attributable to a taxable year is not deductible for federal income tax purposes; however Bond Premium on such Bonds is treated as an offset to qualified stated interest received on such Bonds. Owners of such Bonds should consult their tax advisors with respect to the determination for federal income tax purposes of the treatment of Bond Premium upon sale, redemption or other disposition of such Bonds and with respect to state and local income tax consequences of owning and disposing of such Bonds.
Backup Withholding
Interest paid on the Bonds is subject to information reporting in a manner similar to interest paid on taxable obligations. While this reporting requirement does not by itself, affect the excludability of interest on the Bonds from gross income for federal income tax purposes, the reporting requirement causes the payment of interest on the Bonds to be subject to backup withholding if such interest is paid to beneficial owners who (i) are not “exempt recipients,” and (ii) either fail to provide certain identifying information (such as the beneficial owner’s taxpayer identification number) in the required manner or have been identified by the Internal Revenue Service as having failed to report all interest and dividends required to be shown on their income tax returns. Generally, individuals are not exempt recipients, whereas corporations and certain other entities generally are exempt recipients. Amounts withheld under the backup withholding rules from a payment to a beneficial owner would be allowed as a refund or a credit against such beneficial owner’s federal income tax liability provided the required information is furnished to the Internal Revenue Service.
Other Tax Consequences
Under existing law, the interest on the Bonds is excluded from Virginia taxable income for purposes of the individual income tax and the income taxation of corporations by the Commonwealth of Virginia under Sections 58.1-322 and 58.1-402 of the Code of Virginia of 1950, as amended (the “Virginia Code”), to the extent that such interest is excludable from gross income for federal income tax purposes.

60
The Code and the Virginia Code contain other provisions (some of which are noted below) that could result in tax consequences, upon which Bond Counsel expresses no opinion, as a result of ownership of the Bonds or the inclusion in certain computations of interest on the Bonds that is excluded from gross income for purposes of federal income taxation.
PROSPECTIVE PURCHASERS OF THE BONDS SHOULD CONSULT THEIR TAX ADVISORS AS TO THE APPLICABILITY AND IMPACT OF ANY SUCH COLLATERAL TAX CONSEQUENCES.
Ownership of tax-exempt obligations may result in collateral federal income tax consequences to certain taxpayers, including, without limitation, financial institutions, property and casualty insurance companies, certain foreign corporations doing business in the United States, certain S Corporations with excess passive income, individual recipients of Social Security or Railroad Retirement benefits, taxpayers who may be deemed to have incurred or continued indebtedness to purchase or carry tax-exempt obligations and taxpayers who may be eligible for the earned income tax credit.
Future Tax Developments
Future or pending legislative proposals, if enacted, regulations, rulings or court decisions may cause interest on the Bonds to be subject, directly or indirectly, to federal income taxation or to State or local income taxation, or may otherwise prevent beneficial owners from realizing the full current benefit of the tax status of such interest. Legislation or regulatory actions and future or pending proposals may also affect the economic value of the federal or state tax exemption or the market value of the Bonds. Prospective purchasers of the Bonds should consult their tax advisors regarding any future, pending or proposed federal or State tax legislation, regulations, rulings or litigation as to which Bond Counsel expresses no opinion.
For example, various proposals have been made in Congress and by the President (the “Proposed Legislation”) which, if enacted, would subject interest on bonds that is otherwise excludable from gross income for federal income tax purposes, including interest on the Bonds, to a tax payable by certain bondholders that are individuals, estates or trusts with adjusted gross income in excess of thresholds specified in the Proposed Legislation. It is unclear if the Proposed Legislation will be enacted, whether in its current or an amended form, or if other legislation that would subject interest on the Bonds to a tax or cause interest on the Bonds to be included in the computation of a tax, will be introduced or enacted. Prospective purchasers should consult their tax advisors as to the effect of the Proposed Legislation, if enacted, in its current form or as it may be amended, or such other legislation on their individual situations.
FINANCIAL ADVISOR
The County has retained Public Financial Management, Inc., Arlington, Virginia, as financial advisor (the “Financial Advisor”) in connection with the issuance of the Bonds. Although the Financial Advisor assisted in the preparation and review of this Official Statement, the Financial Advisor is not obligated to undertake, and has not undertaken to make, an independent verification or to assume responsibility for the accuracy, completeness, or fairness of the information contained in this Official Statement. The Financial Advisor is a financial advisory, investment management, and consulting organization and is not engaged in the business of underwriting municipal securities.

61
VERIFICATION OF CERTAIN FINANCIAL COMPUTATIONS
The accuracy of (i) the arithmetical computations of the maturing principal and interest earned on the federal securities in the escrow account established in the escrow agreement relating to the Refunded Bonds to pay when due or at their respective redemption dates, the principal of, premium, if any, and interest on the Refunded Bonds and (ii) the mathematical computations supporting the conclusion that the Bonds are not “arbitrage bonds,” within the meaning of Section 148 of the Code, have been verified by Robert Thomas CPA, LLC, Shawnee Mission, Kansas. Such verification has been based upon information supplied by the Financial Advisor.
RATINGS
The Bonds have been rated “AAA” (stable outlook) by Fitch Ratings (“Fitch”), “Aaa” (negative outlook) by Moody’s Investors Service, Inc. (“Moody’s”), and “AAA” (stable outlook) by Standard & Poor’s Ratings Services, a division of The McGraw-Hill Companies, Inc. (“Standard & Poor’s”). The County requested that the Bonds be rated and furnished certain information to Fitch, Moody’s, and Standard & Poor’s, including certain information that is not included in this Official Statement.
These ratings are not a recommendation to buy, sell, or hold the Bonds. Generally, rating agencies base their ratings on such materials and information provided by the County, as well as investigations, studies, and assumptions of the rating agencies. Such ratings may be changed at any time and no assurance can be given that they will not be revised downward or withdrawn entirely by any or all of such rating agencies, if, in the judgment of any or all, circumstances so warrant. Such circumstances may include, without limitation, change in or unavailability of information relating to the County. Any such downward revision or withdrawal of any of such ratings may have an adverse effect on the market price of the Bonds.
SALE AT COMPETITIVE BIDDING
The Bonds were awarded pursuant to electronic competitive bidding held via Parity on Thursday, January 23, 2014, to Citigroup Global Markets Inc., at a price to the County that results in an aggregate underwriter’s discount of $711,697.50 derived from the yields on the Bonds shown on the inside cover page. The underwriter has supplied the information as to the initial reoffering yields shown on the inside cover page. The underwriter may offer to sell the Bonds to certain dealers and others at prices higher or lower than the prices derived from the yields shown on the inside cover page.
CERTIFICATE CONCERNING OFFICIAL STATEMENT
Concurrently with the delivery of the Bonds, the Chairman of the Board of Supervisors and the County Executive of the County will certify that, to the best of their knowledge, the Official Statement did not as of its date, and does not as of the date of delivery of the Bonds, contain any untrue statement of a material fact or omit to state a material fact that should be included therein for the purpose for which the Official Statement is to be used, or that is necessary in order to make the statements contained therein, in the light of the circumstances under which they were made, not misleading. Such certificate will also state, however, that the Chairman of the Board of Supervisors and the County Executive of the County did not independently verify the information indicated in this Official Statement as having been obtained or derived from sources other than the County and its officers but that they have no reason to believe that such information is not accurate.

62
MISCELLANEOUS
Any statements in this Official Statement involving matters of opinion or estimates, whether or not expressly so stated, are intended as such and not as representations of fact. No representation is made that any of the estimates will be realized.
FUTURE FINANCIAL INFORMATION
The Securities and Exchange Commission has adopted Rule 15c2-12 under the Securities Exchange Act of 1934, as amended (the “Rule”). In general, the Rule prohibits an underwriter from purchasing or selling municipal securities such as the Bonds, unless it has determined that the issuer of such securities and/or other persons deemed to be material “obligated persons” have committed to provide to The Electronic Municipal Market Access (“EMMA”) system administered by the Municipal Securities Rulemaking Board (i) on an annual basis, certain financial information and operating data (“Annual Reports”), and, if available, audited financial statements, and (ii) notice of various events described in the Rule, if material (“Event Notices”).
The County will covenant in the Continuing Disclosure Agreement (the form of which appears in Appendix VII), to be dated the date of delivery of the Bonds, for the benefit of the holders of the Bonds, to provide to EMMA, annually, not later than March 31 of each year, commencing March 31, 2015, Annual Reports with respect to itself, as issuer. Similarly, the County will provide Event Notices with respect to the Bonds to EMMA.
Pursuant to several continuing disclosure undertakings entered into relating to the Fairfax County Economic Development Authority’s Transportation Contract Revenue Bonds (Route 28 Project), the County provided all required information, except that it inadvertently did not include in its annual information required under such undertakings a description of the twenty largest owners of real property by assessed value in the State Route 28 Highway Transportation Improvement District. The County has implemented procedures to ensure the inclusion of such information in future filings. The County is currently in compliance with all of its other previous undertakings with regard to Rule 15c2-12. It should be noted, however, that while the County has timely filed each annual financial report required by its continuing disclosure undertakings, the filings with respect to certain bond issues were not cross-referenced to such bonds. Although such cross-references are not specifically required by the undertakings, the County has implemented procedures to ensure such cross-references in future filings.
APPROVAL OF OFFICIAL STATEMENT
The execution and delivery of this Official Statement have been duly authorized by the Board of Supervisors of the County.
BOARD OF SUPERVISORS OF FAIRFAX COUNTY, VIRGINIA
By: /s/ Sharon Bulova, Chairman

CITI
ZENS
Boar
d of
Supe
rviso
rsCi
rcuit
Cour
t and
Rec
ords
Gene
ral D
istric
t Cou
rtJu
veni
le &
Dom
estic
Rel
atio
ns D
istric
t Cou
rt
Cler
k of t
he Ci
rcuit
Cour
tOf
fi ce o
f the
Com
mon
wea
lth’s
Atto
rney
Offi c
e of t
he Sh
eriff
Fairf
ax Co
unty
Scho
ol B
oard
Supe
rinte
nden
tFa
irfax
Coun
ty P
ublic
Scho
ols
Cler
k to
the
Boar
d of
Supe
rviso
rs
Offi c
e of t
he Fi
nanc
ial
and
Prog
ram
Aud
itor
Offi c
e of t
he In
tern
al A
udito
r
Offi c
e of E
quity
Pro
gram
s
Offi c
e of P
artn
ersh
ips
Gove
rnm
ent R
elat
ions
Depu
ty Co
unty
Exec
utive
****
Fire a
nd R
escu
eDe
partm
ent
Depa
rtmen
t of P
ublic
Wor
ksan
d En
viron
men
tal S
ervic
es
Depa
rtmen
t of
Plan
ning
and
Zoni
ng
Offi c
e of t
he
Coun
ty A
ttorn
ey Coun
ty Ex
ecut
ive
Depu
ty Co
unty
Exec
utive
**
Depa
rtmen
t of
Info
rmat
ion T
echn
olog
y
Depu
ty Co
unty
Exec
utive
***
Depa
rtmen
t of
Man
agem
ent a
nd B
udge
t
Depa
rtmen
t of
Finan
ce
Depa
rtmen
t of
Tax A
dmin
istra
tion
Depa
rtmen
t of P
urch
asin
gan
d Su
pply
Man
agem
ent
Depu
ty Co
unty
Exec
utive
*
Depa
rtmen
t of A
dmin
istra
tion
for H
uman
Serv
ices
Depa
rtmen
t of H
ousin
g an
dCo
mm
unity
Dev
elop
men
t
Juve
nile
& D
omes
tic
Rela
tions
Dist
rict C
ourt
Rede
velo
pmen
t and
Hous
ing
Auth
ority
Resto
nCo
mm
unity
Cent
er
McL
ean
Com
mun
ity Ce
nter
Hum
an R
ight
sCo
mm
issio
nCi
vil Se
rvice
Com
miss
ion
Fairf
ax Co
unty
Publ
ic Lib
rary
Boa
rdRe
tirem
ent
Adm
inist
ratio
n Ag
ency
Econ
omic
Deve
lopm
ent
Auth
ority
Fairf
ax Co
unty
Pa
rk A
utho
rity
Plan
ning
Com
miss
ion
Fairf
ax Co
unty
Wat
er A
utho
rity
Fairf
ax-F
alls
Chur
chCo
mm
unity
Serv
ices B
oard
Fairf
ax-F
alls
Chur
chCo
mm
unity
Serv
ices B
oard
Depa
rtmen
t of
Fam
ily Se
rvice
s
Depa
rtmen
t of C
omm
unity
and
Recre
atio
n Se
rvice
s
Fairf
ax Co
unty
Publ
ic Lib
rary
Depa
rtmen
t of
Cabl
e Com
mun
icatio
nsan
d Co
nsum
er P
rote
ctio
n
Offi c
e of
Publ
ic Af
fairs
Heal
thDe
partm
ent
Depa
rtmen
t of S
yste
ms
Man
agem
ent f
or H
uman
Serv
ices
Offi c
e of H
uman
Rig
hts
Depa
rtmen
t of
Hum
an R
esou
rces
Boar
d of
Zoni
ng A
ppea
lsOf
fi ce o
f Ele
ctio
ns
Depa
rtmen
t of
Tran
spor
tatio
n
Offi c
e of E
mer
genc
yM
anag
emen
t
Depa
rtmen
t of P
ublic
Safe
ty
Com
mun
icatio
ns
Facil
ities
Man
agem
ent
Depa
rtmen
t
Depa
rtmen
t of
Vehi
cle Se
rvice
s
OR
GA
NIZ
AT
ION
OF
FA
IRFA
X C
OU
NT
Y G
OV
ER
NM
EN
T
DO
TT
ED
LIN
ES
IN
DIC
AT
E M
ULT
IPL
E
RE
PO
RT
ING
RE
LA
TIO
NS
HIP
S.
*
Dep
uty
Co
un
ty E
xecu
tive h
as lia
iso
n w
ith
:
-
Co
mm
issio
n f
or
Wo
men
-
Resto
n C
om
mu
nit
y C
en
ter
Go
vern
ing
Bo
ard
-
McL
ean
Co
mm
un
ity C
en
ter
Go
vern
ing
Bo
ard
-
Red
evelo
pm
en
t an
d H
ou
sin
g A
uth
ori
ty
-
Fair
fax-F
alls C
hu
rch
Co
mm
un
ity S
erv
ices B
oard
**
Dep
uty
Co
un
ty E
xecu
tive h
as lia
iso
n w
ith
:
-
Fair
fax C
ou
nty
Lib
rary
Bo
ard
- E
co
no
mic
Develo
pm
en
t A
uth
ori
ty
***
Dep
uty
Co
un
ty E
xecu
tive h
as lia
iso
n w
ith
:
-
Civ
il S
erv
ice C
om
mis
sio
n
-
Reti
rem
en
t A
dm
inis
trati
on
Ag
en
cy
(R
eti
rem
en
t B
oard
)
****
Dep
uty
Co
un
ty E
xecu
tive h
as lia
iso
n w
ith
:
-
Eco
no
mic
Develo
pm
en
t A
uth
ori
ty
-
Wate
r A
uth
ori
ty
-
Park
Au
tho
rity
-
Healt
h:
Fo
r E
nvir
on
men
tal an
d E
merg
en
cy
M
an
ag
em
en
t
-
Ho
usin
g a
nd
Co
mm
un
ity D
evelo
pm
en
t:
F
or
Develo
pm
en
t a
nd
Revit
alizati
on
Polic
eDe
partm
ent
Anim
alSh
elte
r
HIPA
A Co
ordi
nato
r
Envir
onm
enta
lCo
ordi
nato
r
Lang
uage
Acc
ess C
oord
inat
or
Gang
Pre
vent
ion
Coor
dina
tor
Offi c
e of C
omm
unity
Re
vital
izatio
n an
d Re
inve
stm
ent
I-1
Appendix I

#######################
7KLV#SDJH#LQWHQWLRQDOO\#OHIW#EODQN1#

II-1

#######################
7KLV#SDJH#LQWHQWLRQDOO\#OHIW#EODQN1#

III-1

#######################
7KLV#SDJH#LQWHQWLRQDOO\#OHIW#EODQN1#

Independent Auditors’ Report
The Board of Supervisors County of Fairfax, Virginia:
Report on the Financial Statements
We have audited the accompanying financial statements of the governmental activities, the business-type activities, the aggregate discretely presented component units, each major fund, and the aggregate remaining fund information of the County of Fairfax, Virginia, (the County), as of and for the year ended June 30, 2013, and the related notes to the financial statements, which collectively comprise the County’s basic financial statements as listed in the table of contents.
Management’s Responsibility for the Financial Statements
Management is responsible for the preparation and fair presentation of these financial statements in accordance with U.S. generally accepted accounting principles; this includes the design, implementation, and maintenance of internal control relevant to the preparation and fair presentation of financial statements that are free from material misstatement, whether due to fraud or error.
Auditors’ Responsibility
Our responsibility is to express opinions on these financial statements based on our audit. We did not audit the financial statements of the Fairfax County Redevelopment and Housing Authority (FCRHA), a discretely presented component unit of the County, which represent 7%, 4%, and 4%, respectively, of total assets, net assets, and revenues of the aggregate discretely presented component units. Those financial statements were audited by other auditors whose report thereon has been furnished to us, and our opinion on the County’s aggregate discretely presented component units financial statements, insofar as it relates to the amounts included for the FCRHA, is based solely on the report of the other auditors.
We conducted our audit in accordance with auditing standards generally accepted in the United States of America and the standards applicable to financial audits contained in Government Auditing Standards, issued by the Comptroller General of the United States; and the Specifications for Audits of Counties, Cities and Towns, issued by the Auditor of Public Accounts of the Commonwealth of Virginia (Specifications). Those standards require that we plan and perform the audit to obtain reasonable assurance about whether the financial statements are free from material misstatement.
An audit involves performing procedures to obtain audit evidence about the amounts and disclosures in the financial statements. The procedures selected depend on the auditors’ judgment, including the assessment of the risks of material misstatement of the financial statements, whether due to fraud or error. In making those risk assessments, the auditor considers internal control relevant to the entity’s preparation and fair presentation of the financial statements in order to design audit procedures that are appropriate in the circumstances, but not for the purpose of expressing an opinion on the effectiveness of the entity’s internal control. Accordingly, we express no such opinion. An audit also includes evaluating the appropriateness of accounting policies used and the reasonableness of significant accounting estimates made by management, as well as evaluating the overall presentation of the financial statements.
KPMG LLP Suite 12000 1801 K Street, NW Washington, DC 20006
KPMG LLP is a Delaware limited liability partnership, the U.S. member firm of KPMG International Cooperative (“KPMG International”), a Swiss entity.
Appendix IV

The Fairfax County Board of Supervisors November 22, 2013 Page 2 of 2 We believe that the audit evidence we have obtained is sufficient and appropriate to provide a basis for our audit opinions. Opinions In our opinion, the financial statements referred to above present fairly, in all material respects, the respective financial position of the governmental activities, the business-type activities, the aggregate discretely presented component units, each major fund, and the aggregate remaining fund information of the County, as of June 30, 2013, and the respective changes in financial position, and where applicable, cash flows thereof for the year then ended in accordance with U.S. generally accepted accounting principles.
Other Matters
Required Supplementary Information
U.S. generally accepted accounting principles require that the management’s discussion and analysis on pages 3 through 16 and the required supplementary information and the notes to the required supplemental information on pages 105 through 111 be presented to supplement the basic financial statements. Such information, although not a part of the basic financial statements, is required by the Governmental Accounting Standards Board who considers it to be an essential part of financial reporting for placing the basic financial statements in an appropriate operational, economic, or historical context. We have applied certain limited procedures to the required supplementary information in accordance with auditing standards generally accepted in the United States of America, which consisted of inquiries of management about the methods of preparing the information and comparing the information for consistency with management’s responses to our inquiries, the basic financial statements, and other knowledge we obtained during our audit of the basic financial statements. We do not express an opinion or provide any assurance on the information because the limited procedures do not provide us with sufficient evidence to express an opinion or provide any assurance.
Accounting Change
As discussed in Note N to the basic financial statements, the County implemented Governmental Accounting Standards Board (GASB) Statement number 63, Financial Reporting of Deferred Outflows of Resources, Deferred Inflows of Resources, and Net Position and except for the County Retirement System early implemented GASB Statement number 65, Items Previously Reported As Assets and Liabilities. The County has reclassified the deferred amount on refunding previously reported as assets and liabilities as deferred outflows of resources and deferred inflows of resources, respectively. As a result of this implementation, the County adjusted the 2013 opening balance for net position in order to expense bond issuance costs in the period in which they were incurred.
November 22, 2013

Management’s Discussion and Analysis
he Management’s Discussion and Analysis subsection provides a narrative introduction
to and overview and analysis of the basic financial statements. It includes a description of the government-wide and fund financial statements,
T
as well as an analysis of the County of Fairfax’s overall financial position and results of operations.
3Financial Section
ManageMent’S DiScuSSion anD analySiS (UnaUdited)
This section of the County of Fairfax, Virginia’s (the County) Comprehensive Annual Financial Report (CAFR) presents our discussion and analysis of the County’s financial performance during the fiscal year that ended on June 30, 2013. We encourage readers to consider the information presented here in conjunction with additional information that we have furnished in our Letter of Transmittal, located in the Introductory Section of the CAFR.
Financial HigHligHtS
Highlights for Government-wide Financial Statements
The government-wide financial statements report information about the County as a whole using the economic resources measurement focus and accrual basis of accounting, net of special items.
• The County’s assets and deferred outflow of resources exceeded liabilities and deferred inflow of resources by $1,264.5 million on a government-wide basis at June 30, 2013.
• For the fiscal year, taxes and other revenues of the County’s governmental activities amounted to $4,044.2 million. Expenses amounted to $4,093.9 million.
• For the fiscal year, revenues of the County’s business-type activities were $202.5 million, and expenses were $169.2 million.
Highlights for Fund Financial Statements
The fund financial statements provide detailed information about the County’s most significant funds using the current financial resources measurement focus and modified accrual basis of accounting.
• The County’s governmental funds reported a decrease in fund balance of $79.4 million for fiscal year 2013, compared to a decrease of $29.0 million for fiscal year 2012.
• The County’s General Fund reported a fund balance of $329.3 million, a decrease of $24.4 million, or 6.9 percent, from June 30, 2012.
General Financial Highlights
• In September 2012, the Economic Development Authority issued $42.4 million of revenue bonds (Silver Line Phase 1 Project) Series 2012 to finance a portion of the costs of the construction of the first phase of an extension of the Washington Metropolitan Area Transit Authority’s mass transit system in Fairfax County.
• In January 2013, the County issued $206.3 million of Series 2013A General Obligation Public Improvement to finance school, park, road, and other general County improvements. The County also issued $128.0 million of Series 2013B general obligation refunding bonds to advance refund for multiple outstanding Series bonds in order to save $14.0 million in future debt service payments, with a $12.2 million net present value.
• In February 2013, the Fairfax County Redevelopment and Housing Authority issued $24.7 million of bond anticipation notes to current refund the outstanding Series 2011A bond anticipation notes previously issued to refinance a portion of the purchase price of a multi-family rental housing facility.

county oF FairFax, Virginia coMpreHenSiVe annual Financial report4
ManageMent’S DiScuSSion anD analySiS (UnaUdited)
oVerView oF tHe Financial StateMentS
The financial section of this annual report consists of four parts: (1) management’s discussion and analysis (presented here), (2) basic financial statements, (3) required supplementary information, and (4) other supplementary information.
The County’s basic financial statements consist of two kinds of statements, each with a different view of the County’s finances. The government-wide financial statements provide both long- and short-term information about the County’s overall financial status. The fund financial statements focus on major aspects of the County’s operations, reporting those operations in more detail than the government-wide statements. The basic financial statements also include notes to explain information in the financial statements and provide more detailed data.
The statements and notes are followed by required supplementary information that contains the budgetary comparison schedule for the General Fund and trend data pertaining to the retirement systems. In addition to these required elements, the County includes other supplementary information with combining and individual fund statements to provide details about the governmental, internal service, and fiduciary funds; capital assets; and component units.
Government-wide Financial Statements
The government-wide financial statements report information about the County as a whole using accounting methods similar to those used by private-sector businesses. In addition, they report the County’s net position and how they have changed during the fiscal year.
The first government-wide statement—the statement of net position—presents information on all of the County’s assets and deferred outflow of resources less liabilities, and deferred inflow of resources, resulting in the net position. Over time, increases or decreases in net position may serve as a useful indicator of whether the financial health of the County is improving or deteriorating. Additionally, non-financial factors, such as a change in the County’s property tax base or the condition of County facilities, should be considered to assess the overall health of the County.
The second statement—the statement of activities—presents information showing how the County’s net position changed during the fiscal year. All of the current year’s revenues and expenses are accounted for in the statement of activities, regardless of when cash is received or paid.
The government-wide financial statements are divided into three categories:
Governmental Activities – Most of the County’s basic services are reported here, including public safety; public works; judicial administration; health and welfare services; community development; parks, recreation, and cultural programs; education; and general administration. These activities are financed primarily by property taxes, other local taxes, and federal and state grants. Included in the governmental activities are the governmental funds and internal service funds.
Business-type Activities – The County’s only business-type activity, the Integrated Sewer System (Sewer System), is reported here.
Basic Financial
Statements
Government-wide Financial
Statements
Fund Financial
Statements
Notes to the Financial
Statements
Management’s Discussion and
Analysis
Required Supplementary
Information
Components of the Financial Section
Other Supplementary
Information

5Financial Section
ManageMent’S DiScuSSion anD analySiS
Discretely Presented Component Units – The County includes four other entities in its annual financial report: Fairfax County Public Schools (Public Schools), Fairfax County Redevelopment and Housing Authority (FCRHA), Fairfax County Park Authority (Park Authority), and Fairfax County Economic Development Authority (EDA). Although legally separate, these component units are included because the County is financially accountable for them.
The County’s governmental and business-type activities are collectively referred to as the primary government. Together, the primary government and its discretely presented component units are referred to as the reporting entity.
Fund Financial Statements
The fund financial statements provide detailed information about the County’s most significant funds. Funds are accounting devices that the County uses to keep track of specific sources of funding and spending for particular purposes. The County uses fund accounting to ensure and demonstrate compliance with finance-related legal requirements. The County has the following three types of funds:
Governmental Funds – Most of the County’s basic services are included in governmental funds, which focus on (1) how cash and other financial assets that can readily be converted to cash flow in and out and (2) the balances remaining at year-end that are available for spending. The governmental funds financial statements provide a detailed short-term view that helps the reader determine whether there are more or fewer financial resources that can be spent in the near future to finance the County’s programs. Because this information does not encompass the additional long-term focus of the governmental activities in the government-wide financial statements, additional information is provided to explain the relationship (or differences). The General Fund accounts for the main operating activities of the County; it is the largest of the governmental funds. All other governmental funds, that is, include special revenue funds, debt service funds, and capital projects funds, are collectively referred to as nonmajor governmental funds.
Proprietary Funds – Proprietary funds, which consist of enterprise funds and internal service funds, are used to account for operations that are financed and operated in a manner similar to private business enterprises in which costs are recovered primarily through user charges. Proprietary fund financial statements, like the government-wide financial statements, provide both long- and short-term financial information. The County’s only enterprise fund, the Sewer System, is reported as the County’s business-type activity in the government-wide statements. The fund financial statements provide additional information, such as cash flows, for the Sewer System. The internal service funds are used to account for the provision of general liability, malpractice, and workers’ compensation insurance; health benefits for employees and retirees; vehicle services; document services; and technology infrastructure support to County departments on a cost reimbursement basis.
Fiduciary Funds – Fiduciary funds are used to account for resources held for the benefit of parties outside the government. Fiduciary funds are not reflected in the government-wide financial statements because the resources of those funds are not available to support the County’s programs. The County’s fiduciary funds consist of pension trust funds, an OPEB trust fund and agency funds. The pension trust funds are used to account for the assets held in trust by the County for the employees and beneficiaries of its defined benefit pension plans—the Employees’ Retirement System, the Police Officers Retirement System, and the Uniformed Retirement System. The OPEB trust fund is used to account for the assets held in trust by the County for other post employment benefits. The agency funds are used to account for monies received, held, and disbursed on behalf of developers, welfare recipients, the Commonwealth of Virginia, the recipients of certain bond proceeds, and certain other local governments.

county oF FairFax, Virginia coMpreHenSiVe annual Financial report6
ManageMent’S DiScuSSion anD analySiS (UnaUdited)
2013 2012* 2013 2012* 2013 2012*
Assets:Current and other assets 4,329.4$ 4,288.5 291.1$ 210.9 4,620.5$ 4,499.4 Capital assets (net) 2,397.2 2,290.8 1,350.9 1,303.5 3,748.1 3,594.3
Total assets 6,726.6 6,579.3 1,642.0 1,514.4 8,368.6 8,093.7
Deferred outflow of resources: 45.3 45.9 18.0 6.1 63.3 52.0
Liabilities:Current liabilities 641.7 318.7 42.4 36.7 684.1 355.4 Long-term liabilities 3,088.3 3,323.5 645.6 544.9 3,733.9 3,868.4
Total liabilities 3,730.0 3,642.2 688.0 581.6 4,418.0 4,223.8
Deferred inflow of resources: 2,747.5 2,643.1 1.9 2.1 2,749.4 2,645.2
Net position:Net investment in
capital assets 1,736.9 1,695.1 778.8 769.1 2,515.7 2,464.2 Restricted 215.0 226.4 44.1 51.0 259.1 277.4 Unrestricted (deficit) (1,657.5) (1,581.6) 147.2 116.7 (1,510.3) (1,464.9)
Net position 294.4$ 339.9 970.1$ 936.8 1,264.5$ 1,276.7
Summary of Net PositionAs of June 30($ in millions)
GovernmentalActivities
Business-typeActivities
TotalPrimary Government
2013 2012* 2013 2012* 2013 2012 2013 2012*
Assets:Current and other assets 4,620.5$ 4,499.4 723.2$ 882.6 -$ - 5,343.7$ 5,382.0$ Capital assets (net) 3,748.1 3,594.3 2,831.0 2,809.7 - - 6,579.1 6,404.0
Total assets 8,368.6 8,093.7 3,554.2 3,692.3 - - 11,922.8 11,786.0
Deferred outflow of resources: 63.3 52.0 0.5 - - - 63.8 52.0
Liabilities:Current liabilities 684.1 355.4 194.7 259.6 - - 878.8 615.0 Long-term liabilities 3,733.9 3,868.4 218.0 296.8 - - 3,951.9 4,165.2
Total liabilities 4,418.0 4,223.8 412.7 556.4 - - 4,830.7 4,780.2
Deferred inflow of resources: 2,749.4 2,645.2 - - - - 2,749.4 2,645.2
Net position:Net investment in
capital assets 2,515.7 2,464.2 2,657.1 2,631.3 (1,463.4) (1,341.4) 3,709.4 3,754.1 Restricted 259.1 277.4 164.2 31.6 (133.0) (112.0) 290.3 197.0 Unrestricted (deficit) (1,510.3) (1,464.9) 320.7 473.0 1,596.40 1,453.4 406.8 461.5
Net position 1,264.5$ 1,276.7 3,142.0$ 3,135.9 -$ - 4,406.5$ 4,412.6
*Fiscal Year 2012 amounts restated due to the implementation of GASB statement 65. See Note N on p. 103 for more information.**Reclassifciation represents County issued debt for Schools and Parks facilities. See Note A - 12 on p. 51 for more information.
TotalPrimary Government
ComponentUnits
Reclassifications**
TotalReporting Entity
Summary of Net Position- continuedAs of June 30($ in millions)
Financial analySiS oF tHe county aS a wHole
Statement of Net Position
The following tables present a summary of the Statements of Net Position for the reporting entity as of June 30, 2013 and 2012:

7Financial Section
ManageMent’S DiScuSSion anD analySiS
Net investment in capital assets
84.2%
Restricted9.2% Unrestricted
6.6%
Composition of Net Position of the Reporting Entity
As of June 30, 2013
The Commonwealth of Virginia requires that counties, as well as their financially dependent component units, be financed under a single taxing structure. This results in counties issuing general obligation debt to finance capital assets, such as public schools, for their component units. The component units are then responsible to account for and maintain the assets purchased or constructed with the debt proceeds. While Governmental Accounting Standards Board (GASB) No. 14, The Financial Reporting Entity, requires that the primary government and its component units, which make up the total financial reporting entity, be accounted for separately on the face of the basic financial statements, the net position of the total financial reporting entity best represent the entity’s financial position. The reclassification column represents the matching of the primary government’s outstanding debt to the component units’ related capital assets from a financial reporting entity perspective.
As noted earlier, net position may serve over time as a useful indicator of a government’s financial position. For the reporting entity, assets and deferred outflow of resources exceeded liabilities and deferred inflow of resources by $4,406.5 million at the end of fiscal year 2013, representing a decrease of $6.1 million from the net position at June 30, 2012, as shown below.
As shown to the right, the largest portion of net position is the net investment in capital assets (e.g., land, buildings, infrastructure, and equipment, net of depreciation and amortization), less the outstanding debt that was used to acquire those assets. The restricted net position portion represents resources that are subject to external restrictions on how they may be used. Net position of the reporting entity are restricted for various uses, some of which include grant programs ($43.0 million), community centers ($17.3 million), sewer improvements ($29.1 million), and housing ($22.8 million). The balance of net position that are neither related to capital assets nor restricted for specific uses is represented as unrestricted net position.
$0.0
$500.0
$1,000.0
$1,500.0
$2,000.0
$2,500.0
$3,000.0
$3,500.0
$4,000.0
$4,500.0
2013 2012
Amounts in Millions
Composition of Net Positionof the Reporting Entity
As of June 30
Unrestricted
Restricted
Net investment in capital assets

county oF FairFax, Virginia coMpreHenSiVe annual Financial report8
ManageMent’S DiScuSSion anD analySiS (UnaUdited)
Statement of Activities
The following table summarizes the changes in Net Position for the primary government for the fiscal years ended June 30, 2013 and 2012:
2013 2012 2013 2012 2013 2012Revenues:
Program revenues:Charges for services 527.9$ 432.9 194.0$ 188.9 721.9$ 621.8 Operating grants and contributions 239.5 256.1 - - 239.5 256.1 Capital grants and contributions 22.3 29.7 7.1 14.0 29.4 43.7
General revenues:Real property tax 2,123.8 2,057.9 - - 2,123.8 2,057.9 Personal property tax 353.3 317.0 - - 353.3 317.0 Business licenses tax 158.8 155.5 - - 158.8 155.5 Local sales and use tax 265.0 257.8 - - 265.0 257.8 Consumers utility tax 73.5 65.3 - - 73.5 65.3 Other taxes 61.0 59.6 - - 61.0 59.6 Unrestricted grants and contributions 209.3 218.3 - - 209.3 218.3 Revenue from the use of money 9.8 14.8 1.4 0.5 11.2 15.3
Total revenues 4,044.2 3,864.9 202.5 203.4 4,246.7 4,068.3
Expenses:General government administration 201.4 201.4 ** - - 201.4 201.4 **Judicial administration 46.3 54.7 - - 46.3 54.7 Public safety 658.2 621.9 - - 658.2 621.9 Public works 185.3 176.7 169.2 163.9 ** 354.5 340.6 **Health and welfare 542.1 562.2 - - 542.1 562.2 Community development 387.6 393.5 - - 387.6 393.5 Parks, recreation, and cultural 112.1 114.8 - - 112.1 114.8 Education 1,843.6 1,769.7 - - 1,843.6 1,769.7 Interest on long-term debt * 117.3 112.6 - - 117.3 112.6
Total expenses 4,093.9 4,007.5 169.2 163.9 4,263.1 4,171.4
Increase (decrease) in net position before special item (49.7) (142.6) 33.3 39.5 (16.4) (103.1) Special items:
INOVA - Health 4.2 3.5 - - 4.2 3.5 Increase (decrease) in net position (45.5) (139.1) 33.3 39.5 (12.2) (99.6)
Beginning net position 339.9 479.0 936.8 897.3 1,276.7 1,376.3 Ending net position 294.4$ 339.9 ** 970.1$ 936.8 ** 1,264.5$ 1,276.7 *** For business-type activities, interest on long-term debt is included in the functional expense category.**Fiscal Year 2012 expense amounts restated due to the implementation of GASB statement 65. See Note N on p. 103 for more information.
TotalPrimary
Government
Business-typeActivities
GovernmentalActivities
Summary of Changes in Net PositionFor the Fiscal Years Ended June 30
($ in millions)

9Financial Section
ManageMent’S DiScuSSion anD analySiS
Governmental Activities
Revenues for the County’s governmental activities were $4,044.2 million for fiscal year 2013, representing an increase of $179.3 million over fiscal year 2012. Sources of revenues for fiscal years 2013 and 2012 are shown below:
Taxes constitute the largest source of County revenues, amounting to $3,035.4 million for fiscal year 2013, an increase of $122.3 million over fiscal year 2012, primarily due to real property taxes. Real property taxes ($2,123.8 million) represent 70.0 percent of total taxes and over half of all revenues combined. Unrestricted grants and contributions include $211.3 million in revenues from the Commonwealth of Virginia to reimburse Fairfax County as part of the Personal Property Tax Relief Act (see Note C to the financial statements).
$0.0 $400.0 $800.0 $1,200.0 $1,600.0 $2,000.0 $2,400.0
Real property tax
Other taxes
Personal property tax
Program-specific grants and contributions
Charges for services
Unrestricted grants and contributions
Local sales and use tax
Other
Amounts in Millions
Sources of Revenues
Governmental Activities - Revenues by SourceFor the Fiscal Years Ended June 30, 2013 and 2012
2012 2013
$0.0
$300.0
$600.0
$900.0
$1,200.0
$1,500.0
$1,800.0
$2,100.0
Educ
atio
n
Publ
ic s
afet
y
Hea
lth
and
wel
fare
Com
mun
ity
deve
lopm
ent
Publ
ic w
orks
Park
s, r
ecre
atio
n,an
d cu
ltur
al
Gen
eral
gov
ernm
ent
adm
inis
trat
ion
Inte
rest
on
long
-te
rm d
ebt
Judi
cial
adm
inis
trat
ion
Amounts in Millions
Functions
Governmental Activities - Expenses by FunctionFor the Fiscal Years Ended June 30, 2013 and 2012
2013 2012

county oF FairFax, Virginia coMpreHenSiVe annual Financial report10
ManageMent’S DiScuSSion anD analySiS (UnaUdited)
Total cost of all of the County’s governmental activities for fiscal year 2013 was $4,093.9 million, representing an increase of $86.4 million over fiscal year 2012. As the chart below indicates, education continues to be the County’s largest program. Education expenses totaled about $1.84 billion in fiscal year 2013, supporting school operations and to service debt for bond-funded projects to build new schools and renew older facilities. Public safety expenses represent the second largest expense category, totaling $658.2 million in fiscal year 2013. Public safety expenses increased $36.3 million compared with $3.1 million in fiscal year 2012, primarily due market rate adjustments, 2.5 percent performance-based scale and salary increase for non-uniformed merit employees, and the reinstatement of merit and longevity increases for uniformed employees.
The table on the right shows the total cost of each of the County’s six largest programs—education, public safety, health and welfare, community development, public works, and general government administration—and the net cost of each program (total cost less fees generated by the programs and program-specific intergovernmental aid).
Some of the cost of governmental activities was paid by those who directly benefited from the programs, which was $527.9 million. Other governments and organizations that subsidized certain programs with grants and contributions was $261.8 million. Of the $3,304.1 million net cost of services, the amount that taxpayers paid for these programs through County taxes was $3,035.4 million.
Business-type Activities
The Sewer System recovers its costs primarily through user service charges and availability fees. For fiscal year 2013, the Sewer System reported an increase in net position of $33.3 million. Total revenues of the Sewer System decreased $0.9 million over fiscal year 2012. This decrease was primarily the result of decreases in availability charges and contributions from the Commonwealth of Virginia not fully covered by increases in service charges.
Total expenses of the Sewer System for fiscal year 2013 were $169.2 million, increasing by $5.3 million over fiscal year 2012. This increase resulted primarily from increases in the cost for bond interest and personnel services.
Financial analySiS oF tHe county’S FunDS
As noted earlier, the County uses fund accounting to ensure and demonstrate compliance with finance-related legal requirements. The focus of the County’s governmental funds is to provide information on near-term inflows, outflows, and balances of spendable resources. Such information is useful in assessing the County’s financing requirements. Fund balance classifications are reported by purpose within these classifications; nonspendable, restricted, committed, assigned, and unassigned as defined by GASB 54.
As of June 30, 2013, the County’s governmental funds had a combined fund balance of $1,045.1 million, compared with $1,124.5 million at June 30, 2012. Of the fiscal year 2013 fund balance, $34.8 million is assigned in the General Fund, indicating that it is not available for new spending because it has already been committed for items such as existing purchase orders, construction contracts and loan repayments. Approximately 23.3 percent ($76.8 million) of the total 2013 General fund balance is unassigned,
Functions/Programs 2013 2012 2013 2012Education 1,843.6$ 1,769.7 1,843.6$ 1,769.7 Public safety 658.2 621.9 542.1 504.0 Health and welfare 542.1 562.2 338.6 349.4 Community development 387.6 393.5 131.6 216.3 Public works 185.3 176.7 50.3 44.8 General government administration 201.4 201.4 161.8 137.7 Other 275.7 282.1 236.1 247.7
Total 4,093.9$ 4,007.5 3,304.1$ 3,269.6
Net Cost of County's Governmental ActivitiesFor the Fiscal Years Ended June 30
($ in millions)
TotalCost of Services
Net Cost of Services

11Financial Section
ManageMent’S DiScuSSion anD analySiS
Functions/Programs 2013 2012 2013 2012Education 1,843.6$ 1,769.7 1,843.6$ 1,769.7 Public safety 658.2 621.9 542.1 504.0 Health and welfare 542.1 562.2 338.6 349.4 Community development 387.6 393.5 131.6 216.3 Public works 185.3 176.7 50.3 44.8 General government administration 201.4 201.4 161.8 137.7 Other 275.7 282.1 236.1 247.7
Total 4,093.9$ 4,007.5 3,304.1$ 3,269.6
Net Cost of County's Governmental ActivitiesFor the Fiscal Years Ended June 30
($ in millions)
TotalCost of Services
Net Cost of Services
representing resources not associated with a specified purpose. Of the total nonmajor fund balance, 69.7 percent ($728.2 million) has been restricted or committed in the special revenue, capital projects, and debt service funds to meet the program needs. Nonspendable prepaid expenditures are 0.1 percent ($1.5 million) of the total fund balance. At June 30, 2013, $179.4 million of the General Fund’s committed fund balance of $216.9 million is designated for the managed reserve and revenue stabilization fund based on Fiscal Year 2014 projections.
For the fiscal year ended June 30, 2013, fund balances for all governmental funds decreased by $79.4 million, compared with the $29.0 million decrease for fiscal year ended June 30, 2012. Total revenues, other financing sources, and special item were $5,099.7 million, total expenditures and other financing uses were $5,179.1 million, resulting in the decrease to the fund balances.
The General Fund is the main operating fund of the County. At the end of the current fiscal year, the unassigned fund balance was $76.8 million, which represents approximately 2.5 percent of the General Fund’s total expenditures. Revenues of $3,498.9 million, less expenditures of $3,048.1 million and other financing uses of $475.2 million, resulted in a net decrease in fund balance of $24.4 million, primarily to support a 2.18 percent market rate adjustment, a 2.5 percent performance-based increase for non-uniformed employees, and merit and longevity increases for uniformed employees. It should be noted that some utilization of fund balance is generally expected each year as the County uses savings from prior years held in fund balance to offset disbursement requirements.
The County’s enterprise fund provides the same type of information found in the government-wide financial statements, as the basis of accounting is the same. Factors relating to the financial results of the Sewer System have been addressed in the discussion of the County’s business-type activities.
general FunD BuDgetary HigHligHtS
The final amended budget appropriations, which include expenditures and transfers out, were more than the original budget amounts by $54.8 million or 1.5 percent. This increase is due primarily to the carryover of prior-year commitments. The final amended budget revenues and transfers was less than the original budget by $8.0 million or 0.2 percent, primarily due to the decrease in the Child Care Assistance and Referral Program for Intergovernmental Revenue.
Actual revenues exceeded final budget amounts by $31.9 million, while actual expenditures were $62.7 million less than final budget amounts. Highlights of the comparison of final budget to actual figures for the fiscal year ended June 30, 2013, include the following:
• Tax revenues exceeded budgeted amounts by $27.7 million. The increase is primarily due to the result of increases in Real Estate Taxes, Personal Property Tax receipts, and Other Local taxes.
• Permits, privilege fees, and regulatory licenses were $2.5 million more than budgeted amounts primarily due to higher than projected receipts for Building and Inspection Fees.
• Charges for services revenues were $1.7 million more than budgeted amounts primarily due to higher than projected Emergency Medical Services (EMS) Transport and Clerk Fees.
• General government administration expenditures were $8.8 million, or 8.2 percent, less than budgeted amounts as a result of managing position vacancies, overtime and encumbrances carried forward to the next fiscal year.
• Public safety expenditures were $15.8 million, or 3.7 percent, less than budgeted amounts mainly as a result of savings associated with managing position vacancies and overtime, personnel savings resulting from no major emergencies, reducing the size and scope of training classes, as well as the carryforward of encumbrances.

county oF FairFax, Virginia coMpreHenSiVe annual Financial report12
ManageMent’S DiScuSSion anD analySiS (UnaUdited)
• Health and welfare expenditures were $19.8 million, or 6.6 percent, less than budgeted amounts due to lower than anticipated costs in the Comprehensive Services Act (CSA), a delay in one time funding associated with the procurement of a new Electronic Health Record (EHR), which is needed to meet federal health information technology requirements, and encumbered carryover.
• Nondepartmental expenditures were $5.9 million, or 2.1 percent, less than budgeted amounts primarily due to savings in group health insurance and contributions to the three County Retirement Systems.
capital aSSetS anD long-terM DeBt
Capital Assets
The County’s investment in capital assets as of June 30, 2013, amounted to $3.7 billion (net of accumulated depreciation and amortization), which represents an increase of $153.8 million, or 4.3 percent, over last year. Capital assets as of June 30, 2013 and 2012, are summarized below:
The major capital asset activities for fiscal year 2013 included the following:
• The ongoing costs associated with the upgrade of County and Schools legacy mainframe systems were $8.2 million during fiscal year 2013.
• Fairfax County investment in the Metrorail extension with fiscal year 2013 expenditures of $30 million for construction of the Wiehle Avenue Facility.
• Developers’ contributions of sewer lines and manholes totaled $6.0 million.
• Expenditures related to construction of the new stations supporting the Dulles Rail expansion were $48.4 million in fiscal year 2013.
2013 2012 2013 2012 2013 2012Land 418.4$ 417.8 17.4$ 17.4 435.8$ 435.2 Easements 3.6 3.6 0.4 0.4 4.0 4.0 Buildings, improvements, and infrastructure 2,064.3 2,012.7 1,134.8 1,109.7 3,199.1 3,122.4 Software 86.8 70.6 - - 86.8 70.6 Equipment and library collections 472.1 461.3 12.2 11.6 484.3 472.9 Construction in progress 309.9 208.1 115.1 85.7 425.0 293.8 Equipment under construction 12.7 21.3 - - 12.7 21.3 Software in development 3.9 4.4 - - 3.9 4.4 Purchased capacity - - 869.0 823.6 869.0 823.6
Total capital assets 3,371.7 3,199.8 2,148.9 2,048.4 5,520.6 5,248.2
Less: Accumulated depreciation and amortization (974.5) (909.1) (798.0) (744.8) (1,772.5) (1,653.9)
Total capital assets, net 2,397.2$ 2,290.7 1,350.9$ 1,303.6 3,748.1$ 3,594.3
Capital AssetsAs of June 30($ in millions)
GovernmentalActivities
Business-typeActivities
TotalPrimary
Government

13Financial Section
ManageMent’S DiScuSSion anD analySiS
• Improvements to citizen transportation, including bus and rail service, totaled $16.2 million.
• The Sewer System’s share of the upgrade and operating costs of the Arlington County, City of Alexandria, Upper Occoquan Service Authority, and the District of Columbia’s wastewater treatment facilities, which provide service to certain County residents, was $3.1 million, $9.7 million, $4.9 million and $27.7 million, respectively.
Additional information related to the County’s capital assets can be found in Note F to the financial statements on page 70.
Long-term Debt
There is no legal limit on the amount of long-term indebtedness that the County can at any time incur or have outstanding. However, all general obligation bonded indebtedness must be approved by voter referendum prior to issuance. The Board of Supervisors has established the following self-imposed limits with respect to long-term debt:
• A limit of $1.375 billion of general obligation bond sales over a five-year period, for an average of $275 million annually, with a maximum of $300 million in any given year, excluding refunding bonds;
• A limitation that total long-term debt (excluding capital leases for equipment and sewer revenue bonds) not exceed 3 percent of the total market value of taxable real and personal property in the County and that annual debt service payments not exceed 10 percent of annual General Fund expenditures and transfers out. For fiscal year 2013, these percentages were 1.19 percent and 8.20 percent, respectively.
In January 2013, the County issued $206.3 million of Series 2013A General Obligation Public Improvement with a true interest cost of 2.52 percent and a premium of $43.7 million. Proceeds of $206.3 million are being used to fund new facilities and improvements, as follows (in millions):
County facilities: Transportation facilities ....................... $ 7.6 Public safety facilities ......................... 15.2 Other purposes .................................... 25.7Park facilities ............................................... 15.0Transportation facilities ............................... 15.0Public Schools facilities .............................. 127.8Total bonds issued for new projects ............ $206.3
In January 2013, the County also issued $128.0 million of Series 2013B General Obligation Refunding Bonds to advance refund for multiple outstanding Series bonds, thereby taking advantage of lower interest rates to reduce the County’s debt service payments by $14.0 million over the next thirteen years and obtaining an economic gain of $12.2 million.
In September 2012, the Economic Development Authority issued $42.4 million of revenue bonds (Silver Line Phase 1 Project) Series 2012 to finance a portion of the costs of the construction of the first phase of an extension of the Washington Metropolitan Area Transit Authority’s mass transit system in Fairfax County, with a true interest cost of 3.62 percent and a premium of $6.3 million.

county oF FairFax, Virginia coMpreHenSiVe annual Financial report14
ManageMent’S DiScuSSion anD analySiS (UnaUdited)
In February 2013, the Fairfax County Redevelopment and Housing Authority issued $24.7 million of bond anticipation notes to current refund the outstanding Series 2011A bond anticipation notes previously issued to refinance a portion of the purchase price of a multi-family rental housing facility, with a true interest cost of 0.80 percent.
The following is a summary of the County’s gross outstanding long-term debt as of June 30, 2013 and 2012:
Additional information related to the County’s long-term debt can be found in Note J to the financial statements on page 88.
econoMic FactorS anD next year’S BuDget anD rateS
The following economic factors are reflected in the General Fund budget for fiscal year 2014:
• The assessed value of all real property increased by $6.8 billion, or 3.40 percent, over the fiscal year 2013 value. This resulted from a moderate increase in existing residential property values and new construction in the County.
• Equalized residential property assessments rose up to 3.50 percent and non-residential equalization increased .14 percent for fiscal year 2014. Existing residential property values have increased in each of the last three years indicating the continued stabilization of the residential housing market.
• Personal property tax revenue is projected to increase 1.1 percent in fiscal year 2014. The total vehicle volume is forecast to increase .7 percent in fiscal year 2014. There is no longer a lack of vehicle supply and depreciation of vehicles has returned to more normal levels.
• Revenue from investments is expected to increase 11.2 percent, a result of increasing the County’s Core portfolio by $750 million which is anticipated to increase overall yield from 0.50 percent to 0.53 percent.
The fiscal year 2014 Adopted Budget includes revenues of $3.56 billion, or a 2.7 percent increase over the fiscal year 2013 Revised Budget Plan. Real and personal property taxes represent the majority of budgeted revenues, comprising approximately 77.4 percent of the fiscal year 2014 General Fund revenues. Revenue from real property taxes alone makes up 62.0 percent of total revenues, as compared with approximately 60.9 percent in the fiscal year 2013 Adopted Budget.
Budgeted disbursements, which include expenditures and transfers out, are $3.59 billion, a 0.2 percent decrease from the fiscal year 2013 Revised Budget Plan. County funding for Public Schools is $1.89 billion –
2013 2012 2013 2012 2013 2012General obligation bonds issued for:
County facilities 737.4$ 731.4 -$ - 737.4$ 731.4 Public Schools facilities 1,311.5 1,286.0 - - 1,311.5 1,286.0
Revenue bonds 734.4 716.7 - - 734.4 716.7 Sewer revenue bonds - - 642.9 552.2 642.9 552.2 Capital leases and other 34.2 43.4 - - 34.2 43.4
Total County outstanding debt 2,817.5$ 2,777.5 642.9$ 552.2 3,460.4$ 3,329.7
Outstanding Long-term DebtAs of June 30($ in millions)
GovernmentalActivities
Business-typeActivities
Total Primary Government

15Financial Section
ManageMent’S DiScuSSion anD analySiS
approximately 52.7 percent of the County’s total General Fund budget. This funding supports operating costs, school construction, and debt service. Total direct expenditure funding decreased by $22.7 million, or 1.7 percent, over fiscal year 2013.
The following tax rate and fee adjustments were approved for fiscal year 2014:
Real estate tax rate was increased from $1.075 to $1.085 per $100 of assessed value.•
Commercial real estate tax rate for County transportation increased from $0.11 to $0.125 per $100 of • assessed value, levied on commercial and industrial properties.
Special real estate tax rate collected on all properties within Small District 1, Dranesville for the • McLean Community Center remains at $0.022 per $100 of assessed value. The rate collected on all properties within Small District 5, Hunter Mill for the Reston Community Center remains at $0.047 per $100 of assessed value.
• The sewer availability charge for new single-family homes remains at $7,750 per unit. Sewer service rate remains at $6.55 per 1,000 gallons of water consumption.
• Refuse collection rate for County collection sanitation districts remains at $345 per household and the refuse disposal rate remains at $60 per ton.
• The Stormwater Services rate remains at $0.02 per $100 of assessed value.
• A special real estate tax rate collected on all properties within the Tysons Service District is instituted at a rate of $0.04 per $100 of assessed value.
• Special tax rate for the Dulles Rail Phase 1 Transportation Improvement District decreased from $0.22 to $0.21 per $100 of assessed value, levied on commercial and industrial properties in the district.
• Special tax rate for the Dulles Rail Phase 2 Transportation Improvement District increased from $0.15 to $0.20 per $100 of assessed value, levied on commercial and industrial properties in the district.
The Board has maintained the dedication of one-half penny of the real estate tax rate for the preservation of Affordable Housing. Funding adjustments and strategies have been incorporated in the fiscal year 2014 Adopted Budget Plan to continue to address the County’s commitment to achieving the strategic priorities of a strong investment in education; public safety and gang prevention; affordable housing; environmental protection; transportation improvements; and revenue diversification to reduce the burden on the homeowner.
Other potentially significant matters
Legislation passed by the VA General Assembly during the 2012 special session mandated that beginning July 1, 2012, newly hired employees that participate in the Virginia Retirement System (VRS) must fully pay the employee retirement contribution of five percent. For existing employees, school divisions and localities were able to choose to either shift the entire cost to employees beginning July 1, 2012, or phase in the shift over a five year period. To help offset the financial impact of transitioning the cost to employees, the state required employers to increase salaries for existing employees by the same percentage employees were required to contribute effective July 1, 2012. Fairfax County Public Schools (FCPS), a discretely presented component unit of Fairfax County, began implementation of the mandate with a two percent shift in fiscal year 2013. Additional information regarding this or other matters that may impact FCPS may be found in the FCPS Comprehensive Annual Financial Report. Information regarding the relationship of FCPS to the County and how to request component unit reports may be found on page 36. Information regarding participation in VRS may be found beginning on page 78.
county oF FairFax, Virginia coMpreHenSiVe annual Financial report16
ManageMent’S DiScuSSion anD analySiS (UnaUdited)
contacting tHe county’S Financial ManageMent
This financial report is designed to provide our residents, taxpayers, customers, and investors and creditors with a general overview of the County’s finances and to demonstrate the County’s accountability for the money it receives. If you have questions about this report or need additional financial information, contact the County of Fairfax, Virginia, Department of Finance, 12000 Government Center Parkway, Fairfax, Virginia, 22035. This report can also be found on the County’s web site at www.fairfaxcounty.gov.

Basic Financial Statements
he Basic Financial Statements subsection in
which icludes the government-wide statements,
ncorporate governmental and business-type activities of the County of Fairfax and activities of component units in order to provide an overview of
T
the financial position and results of operations for the reporting entity. This subsection also includes the fund financial statements of the County and the accompanying notes to the financial statements.

17Financial Section
BaSic Financial StatementS

county oF FairFax, Virginia comprehenSiVe annual Financial report18
BaSic Financial StatementS
county oF FairFax, VirginiaStatement of Net PositionJune 30, 2013
Governmental Activities
Business-type Activities
1,257,178,997$ 113,392,387 1,370,571,384 - - - - - -
27,196,677 208,793 27,405,470 4,006,412 2,774 4,009,186
20,372,875 - 20,372,875 2,434,206,366 - 2,434,206,366
3,150,507 - 3,150,507 Loans 57,572,425 - 57,572,425
- - - Due from intergovernmental units (net of allowances):
Property tax relief:Property tax relief - not yet due 211,313,944 - 211,313,944 Other 75,114,036 45,520,211 120,634,247
Due from primary government - - - Due from component units 363,342 - 363,342 Loan to component unit 12,832,200 - 12,832,200 Lease to component unit 51,480,000 - 51,480,000 Interfund receivables 270,125 (270,125) -
2,131,637 402,306 2,533,943 1,463,140 - 1,463,140
40,009,597 94,875,160 134,884,757 129,105,144 15,035,893 144,141,037
34,428 - 34,428 - 21,920,400 21,920,400 - - -
Net OPEB Asset 1,515,610 - 1,515,610 Land held for sale - - -
Non-depreciable/non-amortizable:
418,402,250 17,407,323 435,809,573 3,555,058 406,829 3,961,887
309,940,835 115,149,188 425,090,023 Equipment under construction 12,655,371 - 12,655,371 Software in development 3,917,834 - 3,917,834
384,571,807 12,179,421 396,751,228 Software 86,797,615 - 86,797,615
87,485,754 - 87,485,754 Purchased capacity - 869,047,701 869,047,701
1,341,750,545 88,398,832 1,430,149,377 722,637,965 1,046,377,246 1,769,015,211
(967,406,773) (540,574,645) (1,507,981,418) Accumulated amortization (7,072,956) (257,456,512) (264,529,468)
Total assets 6,726,552,767 1,642,023,182 8,368,575,949
Deferred loss on refunding of debt 45,313,702 18,000,552 63,314,254 45,313,702$ 18,000,552 63,314,254
Investments
See accompanying notes to the financial statements.
Not yet due
Accrued interest Property taxes:
Delinquent
Restricted assets: Equity in pooled cash and temporary investments
DEFERRED OUTFLOWS OF RESOURCES
Primary Government Total Primary
Government
Cash with fiscal agents
Investments
Accounts
Inventories of suppliesPrepaid and other assets
Receivables (net of allowances):
Business license taxes - delinquent
Notes
Certificates of deposit - performance bonds
ASSETSEquity in pooled cash and temporary investmentsCash in banks
Equipment
Land
Construction in progress
Depreciable/amortizable:
Total deferred outflows of resources
Accumulated depreciation
Buildings and improvements
Unearned financing fees (net of amortization)
Capital assets:
Easements
Infrastructure
Library collections

19Financial Section
BaSic Financial StatementS
exhiBit a
Reclassifications(See Note A-12)
429,394,826 - 1,799,966,210 12,691,060 - 12,691,060 3,685,186 - 3,685,186
5,037,697 - 32,443,167 560,958 - 4,570,144
- - 20,372,875 - - 2,434,206,366 - - 3,150,507 - - 57,572,425 Loans
26,463,220 - 26,463,220 Due from intergovernmental units (net of allowances):
Property tax relief:- - 211,313,944 Property tax relief - not yet due
63,467,012 - 184,101,259 Other2,547,390 - 2,547,390 Due from primary government
- - 363,342 Due from component units- - 12,832,200 Loan to component unit- - 51,480,000 Lease to component unit- - - Interfund receivables
2,734,210 - 5,268,153 4,839,497 - 6,302,637
134,932,122 - 269,816,879 17,121,396 - 161,262,433 2,195,032 - 2,229,460 2,021,115 - 23,941,515 1,108,177 - 1,108,177
13,392,985 - 14,908,595 Net OPEB Asset1,026,747 - 1,026,747 Land held for sale
433,926,474 - 869,736,047 17,016,009 - 20,977,896
208,617,693 - 633,707,716 - - 12,655,371 Equipment under construction
6,265,521 - 10,183,355 Software in development
283,414,586 - 680,165,814 4,865,424 - 91,663,039 Software
34,769,180 - 122,254,934 - - 869,047,701 Purchased capacity
3,620,005,573 - 5,050,154,950 - - 1,769,015,211
(1,775,385,238) - (3,283,366,656) (2,474,501) - (267,003,969) Accumulated amortization
3,554,239,351 - 11,922,815,300 Total assets
DEFERRED OUTFLOWS OF RESOURCES545,888 - 63,860,142 Deferred loss on refunding of debt545,888 - 63,860,142
continued
Accumulated depreciation
Total deferred outflows of resources
Business license taxes - delinquent
Notes
Certificates of deposit - performance bondsInvestments
Capital assets: Non-depreciable/non-amortizable:
Buildings and improvements
Inventories of suppliesPrepaid and other assetsRestricted assets:
Equity in pooled cash and temporary investmentsCash with fiscal agents
Land
Construction in progressEasements
Depreciable/amortizable:
Unearned financing fees (net of amortization)
Equipment
Library collections
Infrastructure
ASSETS Equity in pooled cash and temporary investmentsCash in banksInvestments
DelinquentNot yet due
Receivables (net of allowances): Accounts Accrued interest Property taxes:
Total Reporting
Entity
TotalComponent
Units

county oF FairFax, Virginia comprehenSiVe annual Financial report20
BaSic Financial StatementS
county oF FairFax, VirginiaStatement of Net PositionJune 30, 2013
Governmental Activities
Business-type Activities
97,039,287$ 1,183,979 98,223,266 Accrued salaries and benefits 43,814,515 671,023 44,485,538
5,940,807 10,271,510 16,212,317 Accrued interest payable 36,375,398 7,241,935 43,617,333
- - - 2,547,390 - 2,547,390
38,761,380 - 38,761,380 87,008,067 - 87,008,067
202,106,457 - 202,106,457 Revenue bonds payable, net 27,052,289 21,800,736 48,853,025 Notes payable, net 3,830,000 - 3,830,000
63,235,119 1,223,124 64,458,243 Landfill closure and postclosure obligation - - - Obligations under capital leases and installment purchases 1,728,922 - 1,728,922 Insurance and benefit claims payable 29,514,308 - 29,514,308 Loan from primary government - - - Unearned Rent - - -
2,708,008 - 2,708,008
2,024,778,529 - 2,024,778,529 Revenue bonds payable, net 742,609,603 644,676,583 1,387,286,186 Notes payable, net 28,882,500 - 28,882,500
44,473,603 964,124 45,437,727 Landfill closure and postclosure obligation 68,181,679 - 68,181,679 Obligations under capital leases and installment purchases 1,749,072 - 1,749,072 Insurance and benefit claims payable 29,165,535 - 29,165,535 Net pension obligation 119,219,051 - 119,219,051 Loan from primary government - - - Unearned Rent - - - Other 29,206,712 - 29,206,712
Total liabilities 3,729,928,231 688,033,014 4,417,961,245
DEFERRED INFLOWS OF RESOURCES - Deferred tax revenue 2,743,662,768 - 2,743,662,768 Unavailable revenue 3,707,409 - 3,707,409 Deferred gain on refunding of debt 134,536 1,931,477 2,066,013
Total deferred inflows of resources 2,747,504,713 1,931,477 2,749,436,190
1,736,906,426 778,825,722 2,515,732,148
42,950,228 - 42,950,228 - 29,078,061 29,078,061
Repair and replacement - - - 17,256,610 - 17,256,610
Housing - - - Transportation 154,743,247 - 154,743,247 Capital projects - - - Debt service - 15,035,893 15,035,893
(1,657,422,986) 147,119,567 (1,510,303,419) 294,433,525$ 970,059,243 1,264,492,768 Net position
Sewer improvements
Community centers
Unrestricted (deficit)
Due to primary government
Net investment in capital assetsRestricted for:
Compensated absences payable
OtherPortion due or payable after one year:
General obligation bonds payable, net
Compensated absences payable
NET POSITION
General obligation bonds payable, net
Due to component units Unearned revenuePerformance and other depositsLong-term liabilities:
Portion due or payable within one year:
Accounts payable and accrued liabilities
Primary Government Total Primary
Government
See accompanying notes to the financial statements.
LIABILITIES
Contract retainages
Grant programs

21Financial Section
BaSic Financial StatementS
exhiBit aconcluded
Reclassifications(See Note A-12)
44,086,390 - 142,309,656 36,804,338 - 81,289,876 Accrued salaries and benefits7,447,673 - 23,659,990 5,461,893 - 49,079,226 Accrued interest payable
363,342 - 363,342 - - 2,547,390
22,147,125 - 60,908,505 3,878,439 - 90,886,506
- - 202,106,457 756,121 - 49,609,146 Revenue bonds payable, net
7,158,762 - 10,988,762 Notes payable, net27,339,593 - 91,797,836
- - - Landfill closure and postclosure obligation14,056,827 - 15,785,749 Obligations under capital leases and installment purchases24,807,564 - 54,321,872 Insurance and benefit claims payable
243,700 - 243,700 Loan from primary government101,339 - 101,339 Unearned Rent
- - 2,708,008
- - 2,024,778,529 30,745,820 - 1,418,032,006 Revenue bonds payable, net60,454,884 - 89,337,384 Notes payable, net13,084,099 - 58,521,826
- - 68,181,679 Landfill closure and postclosure obligation70,891,107 - 72,640,179 Obligations under capital leases and installment purchases28,377,756 - 57,543,291 Insurance and benefit claims payable
- - 119,219,051 Net pension obligation12,588,500 - 12,588,500 Loan from primary government1,853,665 - 1,853,665 Unearned Rent
- - 29,206,712 Other412,648,937 - 4,830,610,182 Total liabilities
DEFERRED INFLOWS OF RESOURCES - - 2,743,662,768 Deferred tax revenue- - 3,707,409 Unavailable revenue- - 2,066,013 Deferred gain on refunding- - 2,749,436,190 Total deferred inflow of resources
2,657,066,914 (1,463,376,942) 3,709,422,120
6,519,094 - 49,469,322 - - 29,078,061
700,000 - 700,000 Repair and replacement- - 17,256,610
22,799,619 - 22,799,619 Housing- - 154,743,247 Transportation
134,232,122 (132,956,341) 1,275,781 Capital projects61,115 - 15,097,008 Debt service
320,757,438 1,596,333,283 406,787,302 3,142,136,302 - 4,406,629,070
Unrestricted (deficit)Net position
NET POSITIONNet investment in capital assetsRestricted for:
Grant programs Sewer improvements
Community centers
General obligation bonds payable, net
Other
Unearned revenuePerformance and other deposits
General obligation bonds payable, net
Compensated absences payable
Compensated absences payable
Portion due or payable after one year:
LIABILITIESAccounts payable and accrued liabilities
Contract retainages
Due to primary governmentDue to component units
Long-term liabilities:Portion due or payable within one year:
Total Component
Units
Total Reporting
Entity

county oF FairFax, Virginia comprehenSiVe annual Financial report22
BaSic Financial StatementS
county oF FairFax, VirginiaStatement of ActivitiesFor the fiscal year ended June 30, 2013
Governmental activities:201,445,282$ 21,358,761 14,001,774 4,290,115 46,336,343 15,991,980 7,375,561 -
658,186,021 58,883,550 56,916,116 296,805 185,250,816 117,037,898 508,644 17,443,759 542,052,102 64,938,672 138,503,508 14,796 387,551,012 235,619,344 20,101,901 266,789 112,057,718 14,043,089 2,129,388 -
1,843,611,090 - - - 117,251,705 - - -
4,093,742,089 527,873,294 239,536,892 22,312,264
169,212,487 194,030,949 - 7,062,744 169,212,487 194,030,949 - 7,062,744
4,262,954,576 721,904,243 239,536,892 29,375,008
2,627,541,127 106,547,191 253,060,520 167,136,265 107,581,009 41,038,920 60,756,011 489,767
Park Authority 89,797,211 43,477,706 - 13,504,787 9,324,466 - - -
2,834,243,813$ 191,063,817 313,816,531 181,130,819
to specific programs
Revenue from primary government
Special items: INOVA Health
Program Revenues
Health and welfare
General government administrationJudicial administrationPublic safety
Primary government:ExpensesFunctions/Programs
Charges for
Services
Operating Grants and
Contributions
Capital Grants and
Contributions
Total component units
Public works
Real property Taxes:
Community development
Public Schools
Economic Development Authority
Redevelopment and Housing Authority
Parks, recreation, and culturalEducation - for Public SchoolsInterest on long-term debt
Component units:
Total governmental activities
Total primary government
Business-type activities:Public works - Sewer
Total business-type activities
Local sales and use Business licenses
General revenues:
Consumers utility
Personal property
See accompanying notes to the financial statements.
Grants and contributions not restricted Occupancy, tobacco, and other Recordation
Other
Revenue from the use of money and property
Net position, June 30, 2013Net position, July 1, 2012 Change in net positionTotal general revenues

23Financial Section
BaSic Financial StatementS
exhiBit a-1
Governmental activities:(161,794,632) - (161,794,632) - (22,968,802) - (22,968,802) -
(542,089,550) - (542,089,550) - (50,260,515) - (50,260,515) -
(338,595,126) - (338,595,126) - (131,562,978) - (131,562,978) - (95,885,241) - (95,885,241) -
(1,843,611,090) - (1,843,611,090) - (117,251,705) - (117,251,705) -
(3,304,019,639) - (3,304,019,639) -
- 31,881,206 31,881,206 - - 31,881,206 31,881,206 -
(3,304,019,639) 31,881,206 (3,272,138,433) -
- - - (2,100,797,151) - - - (5,296,311) - - - (32,814,718) Park Authority- - - (9,324,466) - - - (2,148,232,646)
2,123,759,406 - 2,123,759,406 - 353,275,799 - 353,275,799 - 158,768,484 - 158,768,484 - 265,029,666 - 265,029,666 - 73,450,331 - 73,450,331 - 28,281,179 - 28,281,179 - 32,694,178 - 32,694,178 -
209,291,717 - 209,291,717 420,471,861 to specific programs9,836,372 1,409,377 11,245,749 415,858
- - - 1,732,130,960 Revenue from primary government- - - 1,667,408
Special items:4,200,000 - 4,200,000 - INOVA Health
3,258,587,132 1,409,377 3,259,996,509 2,154,686,087 (45,432,507) 33,290,583 (12,141,924) 6,453,441 339,866,032 936,768,660 1,276,634,692 3,135,682,861 294,433,525$ 970,059,243 1,264,492,768 3,142,136,302
Net (Expense) Revenue and Changes in Net Position
Total Component
Units
Primary Government
Governmental Activities
Business-type Activities
Total Primary Government
Total governmental activities
Business licenses
Redevelopment and Housing Authority
Economic Development AuthorityTotal component units
General revenues:
Component units:Public Schools
Functions/ProgramsPrimary government:
General government administrationJudicial administration
Education - for Public Schools
Public safetyPublic worksHealth and welfareCommunity developmentParks, recreation, and cultural
Total business-type activities
Interest on long-term debt
Grants and contributions not restricted
Business-type activities:Public works - Sewer
Taxes: Real property Personal property
Recordation
Total primary government
Local sales and use Consumers utility
Occupancy, tobacco, and other
Net position, June 30, 2013
Revenue from the use of money and property
Other
Total general revenues Change in net positionNet position, July 1, 2012
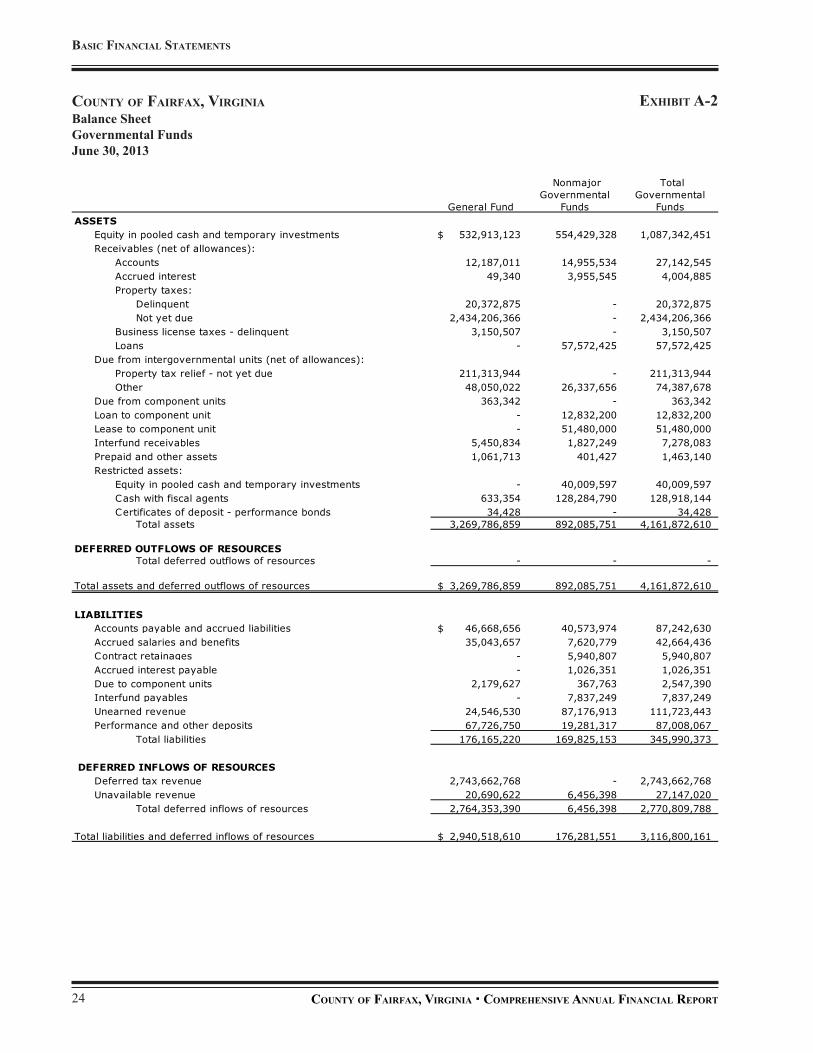
county oF FairFax, Virginia comprehenSiVe annual Financial report24
BaSic Financial StatementS
county oF FairFax, Virginia exhiBit a-2Balance SheetGovernmental FundsJune 30, 2013
General Fund
Nonmajor Governmental
Funds
Total Governmental
Funds
Equity in pooled cash and temporary investments 532,913,123$ 554,429,328 1,087,342,451 Receivables (net of allowances):
Accounts 12,187,011 14,955,534 27,142,545 Accrued interest 49,340 3,955,545 4,004,885 Property taxes:
Delinquent 20,372,875 - 20,372,875 Not yet due 2,434,206,366 - 2,434,206,366
Business license taxes - delinquent 3,150,507 - 3,150,507 Loans - 57,572,425 57,572,425
Due from intergovernmental units (net of allowances):Property tax relief - not yet due 211,313,944 - 211,313,944 Other 48,050,022 26,337,656 74,387,678
Due from component units 363,342 - 363,342 Loan to component unit - 12,832,200 12,832,200 Lease to component unit - 51,480,000 51,480,000 Interfund receivables 5,450,834 1,827,249 7,278,083 Prepaid and other assets 1,061,713 401,427 1,463,140 Restricted assets:
Equity in pooled cash and temporary investments - 40,009,597 40,009,597 Cash with fiscal agents 633,354 128,284,790 128,918,144 Certificates of deposit - performance bonds 34,428 - 34,428
Total assets 3,269,786,859 892,085,751 4,161,872,610
DEFERRED OUTFLOWS OF RESOURCESTotal deferred outflows of resources - - -
3,269,786,859$ 892,085,751 4,161,872,610
LIABILITIES46,668,656$ 40,573,974 87,242,630
Accrued salaries and benefits 35,043,657 7,620,779 42,664,436 - 5,940,807 5,940,807
Accrued interest payable - 1,026,351 1,026,351 Due to component units 2,179,627 367,763 2,547,390
- 7,837,249 7,837,249 24,546,530 87,176,913 111,723,443 67,726,750 19,281,317 87,008,067
Total liabilities 176,165,220 169,825,153 345,990,373
DEFERRED INFLOWS OF RESOURCESDeferred tax revenue 2,743,662,768 - 2,743,662,768 Unavailable revenue 20,690,622 6,456,398 27,147,020
Total deferred inflows of resources 2,764,353,390 6,456,398 2,770,809,788
Total liabilities and deferred inflows of resources 2,940,518,610$ 176,281,551 3,116,800,161
Total assets and deferred outflows of resources
ASSETS
Performance and other depositsUnearned revenue
Accounts payable and accrued liabilities
Contract retainages
Interfund payables

25Financial Section
BaSic Financial StatementS
General Fund
Nonmajor Governmental
Funds
Total Governmental
Funds
Nonspendable:Prepaid amounts 727,441$ 748,799 1,476,240
Total Nonspendable 727,441 748,799 1,476,240 Restricted for:
Public safety, courts, and judicial - 25,515,102 25,515,102 General public works - 110,183,236 110,183,236 Stormwater management - 29,559,119 29,559,119 Transportation - 154,932,897 154,932,897 Social services, health and welfare - 9,467,562 9,467,562 Housing and community development - 29,833,883 29,833,883 Parks, recreation, and cultural - 30,992,500 30,992,500 Debt service - 13,144,740 13,144,740 Capital projects - 156,996,862 156,996,862 Other purposes - 5,189,055 5,189,055
Total Restricted - 565,814,956 565,814,956 Committed to:
Revenue stabilization 107,624,846 - 107,624,846 Managed reserves 71,727,394 - 71,727,394 Public safety, courts, and judicial 1,035,646 4,415,916 5,451,562 Transportation - 46,451,053 46,451,053 Social services, health and welfare 1,376,443 8,409,806 9,786,249 Housing and community development 25,486 14,355,653 14,381,139 Parks, recreation, and cultural 1,623,461 - 1,623,461 Debt service - 19,655,744 19,655,744 Capital projects - 69,060,578 69,060,578 Other purposes 33,465,985 - 33,465,985
Total Committed 216,879,261 162,348,750 379,228,011 Assigned to:
Public safety, courts, and judicial 6,013,982 - 6,013,982 General public works 5,537,668 - 5,537,668 Social services, health and welfare 13,324,618 - 13,324,618 Housing and community development 966,157 - 966,157 Parks, recreation, and cultural 2,979,001 - 2,979,001 Other purposes 6,020,490 - 6,020,490
Total Assigned 34,841,916 - 34,841,916 Unassigned: 76,819,631 (13,108,305) 63,711,326
Total fund balances 329,268,249 715,804,200 1,045,072,449 3,269,786,859$ 892,085,751 4,161,872,610
continued
FUND BALANCES
Total liabilities, deferred inflows of resources, and fund balancesSee accompanying notes to the financial statements.
exhiBit a-2

county oF FairFax, Virginia comprehenSiVe annual Financial report26
BaSic Financial StatementS
county oF FairFax, Virginia
Fund balances - Total governmental funds 1,045,072,449$
Capital assets used in governmental fund activities are not financial resources and, therefore, are not reported in the funds:
Non-depreciable/non-amortizable assets:Land 416,463,562$ Easements 3,555,058 Construction in progress 309,940,835 Equipment under construction 6,794,058 Software in development 3,743,594
Depreciable/amortizable assets:Equipment 257,547,685 Software 84,771,268 Library collections 87,485,754 Buildings and improvements 1,320,117,282 Infrastructure 719,811,145
Total capital assets 3,210,230,241 Less accumulated depreciation/amortization (883,511,575) 2,326,718,666
Some of the County's receivables will not be collected soon enough to pay for the current period's expenditures and, therefore, are reported as unearned revenue in the funds:
Delinquent taxes (net of allowances):Property 17,686,390$ Business license 3,150,507 Other charges for services 645,166
Lease to component unit 51,480,000 72,962,063
When an asset is recorded in governmental fund financial statements, but the revenue is not available, it is reported as deferred inflow of resources in the funds:
Sales and use and other taxes 21,033,470$ EMS transport and other charges for services 2,406,141 23,439,611
For debt refundings resulting in defeasance of debt, the difference between the reacquisition price and the net carrying amount of the old debt should be reported as a deferred outflow of resources or a deferred inflow of resources:
Deferred loss on refunding of debt 45,313,702
Deferred gain on refunding of debt (134,536)
Certain other receivables are accrued only in the government-wide statements 726,358
OPEB costs are recognized as expenditures in the fund statements, but are deferred in the government-wide statements. 1,515,610
Internal service funds are used by management to provide certain goods and services to governmental funds. The assets and liabilities of the internal service funds are included in governmental activities in the statement of net position.
Assets:Current assets 173,040,133$ Capital assets 161,484,793 Less accumulated depreciation/amortization (90,968,154)
Liabilities (74,843,673) 168,713,099
Long-term liabilities related to governmental fund activities are not due and payable in the current period and, therefore, are not reported in the funds:
General obligation bonds payable, net (2,226,884,986)$ Revenue bonds payable, net (769,661,892) Notes payable (32,712,500) Compensated absences payable (104,560,696) Landfill closure and postclosure obligation (68,181,679) Obligations under capital leases and installment purchases (1,408,926) Net pension obligation (119,219,051) Other long-term liabilities (31,914,720) Accrued interest on long-term debt (35,349,047) (3,389,893,497)
Net position of governmental activities 294,433,525$
Amounts reported for governmental activities in the statement of net position (Exhibit A) are different because:
Reconciliation of the Balance Sheet to the Statement of Net PositionGovernmental FundsJune 30, 2013
exhiBit a-2concluded

27Financial Section
BaSic Financial StatementS

county oF FairFax, Virginia comprehenSiVe annual Financial report28
BaSic Financial StatementS
county oF FairFax, VirginiaStatement of Revenues, Expenditures, and Changes in Fund BalancesGovernmental FundsFor the fiscal year ended June 30, 2013
exhiBit a-3
General Fund
NonmajorGovernmental
Funds
Total Governmental
Funds
3,008,000,381$ 28,288,441 3,036,288,822 38,201,352 24,209,752 62,411,104
339,758,071 215,128,856 554,886,927 68,546,107 269,113,954 337,660,061 16,792,348 50,604 16,842,952
10,473 164,869 175,342 18,554,603 15,684,810 34,239,413 7,695,967 6,380,632 14,076,599 1,294,507 867,187 2,161,694
3,498,853,809 559,889,105 4,058,742,914
165,846,296 7,101,565 172,947,861 44,865,364 886,509 45,751,873
581,786,118 57,869,065 639,655,183 79,745,099 118,458,871 198,203,970
349,735,140 193,079,230 542,814,370 49,760,626 142,239,643 192,000,269 37,985,735 16,284,698 54,270,433
Intergovernmental:Community development 9,989,987 168,034,179 178,024,166 Parks, recreation, and cultural 29,591,048 22,903,477 52,494,525 Education - for Public Schools 1,683,462,921 160,148,169 1,843,611,090
Capital outlay:General government administration 9,623,346 960,739 10,584,085 Judicial administration 167,696 - 167,696 Public safety 297,806 2,326,961 2,624,767 Public works 614,691 61,449,220 62,063,911 Health and welfare 628,993 16,504,913 17,133,906 Community development 19,684 76,256,601 76,276,285 Parks, recreation, and cultural 3,564,993 1,143,197 4,708,190
347,692 234,267,724 234,615,416 52,732 127,301,038 127,353,770
3,048,085,967 1,407,215,799 4,455,301,766 450,767,842 (847,326,694) (396,558,852)
10,030,457 515,305,142 525,335,599 (485,201,216) (51,152,920) (536,354,136)
General obligation bonds issued - 206,335,000 206,335,000 Premium on general obligation bonds issued - 43,732,464 43,732,464 Revenue bonds issued - 42,390,000 42,390,000 Premium on revenue bonds issued - 6,319,053 6,319,053
- 128,000,000 128,000,000 Premium on general obligation refunding bonds issued - 18,501,301 18,501,301
- (145,945,515) (145,945,515) Refunding bonds issued 24,650,000 24,650,000
(475,170,759) 788,134,525 312,963,766 SPECIAL ITEMINOVA Health - 4,200,000 4,200,000
(24,402,917) (54,992,169) (79,395,086) 353,671,166 770,796,369 1,124,467,535 329,268,249$ 715,804,200 1,045,072,449
continued
Charges for servicesFines and forfeitures
REVENUESTaxesPermits, privilege fees, and regulatory licenses
Community development
Intergovernmental
Current:General government administration
Parks, recreation, and cultural
Developers' contributionsRevenue from the use of money and propertyRecovered costs
EXPENDITURES
Fund balances, July 1, 2012
Gifts, donations, and contributionsTotal revenues
Judicial administrationPublic safety
Principal retirement
Public works
Debt service:
OTHER FINANCING SOURCES (USES)
Interest and other chargesTotal expenditures
Health and welfare
Transfers out
Excess (deficiency) of revenues over (under) expenditures
Transfers in
General obligation refunding bonds issued
Fund balances, June 30, 2013See accompanying notes to the financial statements.
Total other financing sources (uses)
General obligation payments to refunded bonds escrow agent
Net change in fund balances

29Financial Section
BaSic Financial StatementS
Reconciliation of the Statement of Revenues, Expenditures, and Changes in Fund Balances to the Statement of ActivitiesGovernmental FundsFor the fiscal year ended June 30, 2013
county oF FairFax, Virginia exhiBit a-3concluded
Net change in fund balances - Total governmental funds (79,395,086)$
Amounts reported for governmental activities in the statement of activities (Exhibit A-1) are different because:
Governmental funds report capital outlays as expenditures. However, in the statement of activities, the cost of capital assets is allocated over their estimated useful lives and reported as depreciation/amortization expense.
Capital outlays 173,558,840$ Less depreciation/amortization expense (76,437,540) 97,121,300
In the statement of activities, the gain or loss on the disposition of capital assets is reported. However, in the governmental funds, only the proceeds from sales are reported, which increase fund balance. Thus, the difference is the net book value (i.e., depreciated cost) of the capital asset dispositions. (11,544,639)
Donations of capital assets increase net position in the statement of activities, but do not appear in the governmental funds because they are not financial resources. 18,245,917
Build America Bonds interest subsidy accrual is not recognized as revenue in the fund statements (69,219)
Some of the County's receivables will not be collected soon enough to pay for the current period's expendituresand, therefore, are reported as unearned revenue in the funds:
Delinquent property taxes (4,762)$ Delinquent business license taxes (548,550) Other charges for services 71,606 (481,706)
Some revenues will not be collected for several months after the fiscal year ends, hence, they are not considered "available"revenues and are deferred inflow of resources in the governmental funds:
Sales and use and other taxes (476,467)$ EMS transport and other charges for services 1,078,185 601,718
The receipt of principal payments for the lease to the component unit does not result in a revenue in the statement of activities. (1,360,000)
The issuance of long-term debt, including premiums, is reported as other financing sources in the governmental funds and thus, increases fund balance. In the government-wide statements, however, issuing debt increases long-term liabilities in the statement of net position and does not affect the statement of activities. The following were issued:
Series 2013A General Obligation Bonds (250,067,464)$ Series 2013B General Obligation Refunding Bonds (146,501,301) EDA Series 2012 Transportation Distrisct Improvement Revenue Bonds (48,709,053) FCRHA Bond Anticpation Notes 2013A (24,650,000) (469,927,818)
OPEB costs are recognized as expenditures in the fund statements, but are deferred and amortized in the government-wide statements, resulting in a net difference. (526,000)
Certain other long-term liabilities are recognized only in the government-wide statements,resulting in a net difference. 835,264
The repayment of the principal amounts of long-term debt is reported as an expenditure or as an other financing use whendebt is refunded in governmental funds and thus, reduces fund balance. However, the principal payments reduce theliabilities in the statement of net position and do not result in an expense in the statement of activities.
Principal repayments of matured bonds, notes, and loans 227,067,783$ Payment to escrow agent to refund bonds 145,945,515 Principal payments of capital leases and installment purchases 7,547,634 380,560,932
Interest on long-term debt is reported as an expenditure in the governmental funds when it is due. In the statement of activities, however, interest expense is affected as this interest accrues and as bond-related items are amortized. This difference in interest reporting is as follows:
Accrued interest on bonds, loans, and capital leases (3,292,264)$ Amortization of bond premiums and discounts 25,778,754 Amortization of deferred gains on bond refundings 517,274 Amortization of deferred losses on bond refundings (12,821,995) 10,181,769
Under the modified accrual basis of accounting used in the governmental funds, expenditures for the following are not recognized until they mature. In the statement of activities, however, they are reported as expenses and liabilities as they accrue. The timing differences are as follows:
Landfill closure and postclosure costs (3,832,009)$ Compensated absences (1,747,414) Net pension obligation (16,034,820) Other 6,772,500 (14,841,743)
Internal service funds are used by management to provide certain goods and services to governmental funds. The change in net position is reported with governmental activities. 25,166,804
Change in net position of governmental activities (45,432,507)$

county oF FairFax, Virginia comprehenSiVe annual Financial report30
BaSic Financial StatementS
county oF FairFax, VirginiaStatement of Net PositionProprietary FundsJune 30, 2013
Business-type Activities -
Enterprise Fund Integrated Sewer
System
113,392,387$ 169,836,546 Accounts receivable 208,793 54,132 Accrued interest receivable 2,774 1,527 Due from intergovernmental units (net of allowance) 45,520,211 -
- 829,291 402,306 2,131,637
Total unrestricted current assets 159,526,471 172,853,133
94,875,160 - Cash with fiscal agents 15,035,893 187,000
21,920,400 - Total restricted current assets 131,831,453 187,000
Total current assets 291,357,924 173,040,133 Long-term assets:
Non-depreciable/non-amortizable:Land 17,407,323 1,938,688 Easements 406,829 - Construction in progress 115,149,188 - Equipment under construction - 5,861,313 Software in development - 174,240
Depreciable/amortizable:Equipment 12,179,421 127,024,122 Software - 2,026,347 Purchased capacity 869,047,701 - Buildings and improvements 88,398,832 21,633,263 Infrastructure 1,046,377,246 2,826,820 Accumulated depreciation (540,574,645) (90,084,810) Accumulated amortization (257,456,512) (883,344)
Total capital assets, net 1,350,935,383 70,516,639 Total long-term assets 1,350,935,383 70,516,639
1,642,293,307 243,556,772
DEFERRED OUTFLOWS OF RESOURCESDeferred loss on refunding of debt 18,000,552 -
Total deferred outflows of resources 18,000,552$ - See accompanying notes to the financial statements.
Equity in pooled cash and temporary investments
Inventories of supplies
Restricted assets:
Interfund receivables
Governmental Activities -
Internal Service Funds
ASSETSCurrent assets:
Equity in pooled cash and temporary investments
Capital assets:
Total assets
Investments

31Financial Section
BaSic Financial StatementS
exhiBit a-4
Business-type Activities -
Enterprise Fund Integrated Sewer
System
1,183,979$ 9,796,657 Accrued salaries and benefits 671,023 1,150,079 Contract retainages 10,271,510 -
270,125 - Accrued interest payable 7,241,935 -
21,800,736 - Compensated absences payable 1,223,124 1,715,258 Obligations under capital leases - 1,335,470 Insurance and benefit claims payable - 29,514,308
42,662,432 43,511,772
644,676,583 - Compensated absences payable 964,124 1,432,768 Obligations under capital leases - 733,598 Insurance and benefit claims payable - 29,165,535
645,640,707 31,331,901 688,303,139 74,843,673
DEFERRED INFLOWS OF RESOURCES Deferred gain on refunding of debt 1,931,477 -
Total deferred inflow of resources 1,931,477 -
778,825,722 68,447,572
Sewer improvements 29,078,061 - Debt service 15,035,893 -
147,119,567 100,265,527 970,059,243$ 168,713,099
Current liabilities:Accounts payable and accrued liabilities
Revenue bonds payable, net
Interfund payables
Governmental Activities -
Internal Service Funds
UnrestrictedNet position
Total long-term liabilitiesTotal liabilities
NET POSITIONNet investment in capital assets
Revenue bonds payable, net
Restricted for:
Total current liabilitiesLong-term liabilities:
LIABILITIES

county oF FairFax, Virginia comprehenSiVe annual Financial report32
BaSic Financial StatementS
county oF FairFax, VirginiaStatement of Revenues, Expenses, and Changes in Net PositionProprietary FundsFor the fiscal year ended June 30, 2013
exhiBit a-5
Business-type Activities -
Enterprise Fund Integrated Sewer
System OPERATING REVENUES:
173,553,631$ 283,246,492 - 10,878 - 107,182
173,553,631 283,364,552 OPERATING EXPENSES:
25,607,805 29,017,428 13,238,456 1,942,370
- 57,951,458 - 151,593,453
54,358,299 11,968,320 47,594,864 12,492,863
- 6,271,886 140,799,424 271,237,778 32,754,207 12,126,774
NONOPERATING REVENUES (EXPENSES):20,477,318 -
- 1,234,495 1,409,377 297,493
Interest expense (28,052,165) (79,704) Bond issuance costs (699,561) - Amortization of deferred gain on bond refunding 151,242 -
187,421 340,387 (6,526,368) 1,792,671 26,227,839 13,919,445
Capital contributions 7,062,744 228,823 - 11,018,536
Change in net position 33,290,583 25,166,804 936,768,660 143,546,295 970,059,243$ 168,713,099
See accompanying notes to the financial statements.
Gain before contributions, special item, and transfers
Risk financing and benefit paymentsDepreciation and amortizationProfessional consultant and contractual services
Net position, June 30, 2013
Transfers in
Net position, July 1, 2012
Total nonoperating revenues (expenses)
Operating gain
Insurance recoveries
Gain on disposal of capital assets
Interest revenue
OtherTotal operating expenses
Availability fees
Intergovernmental
Materials and suppliesEquipment operation and maintenance
Personnel services
Sales of servicesCharges for services
OtherTotal operating revenues
Governmental Activities -
Internal Service Funds

33Financial Section
BaSic Financial StatementS
county oF FairFax, VirginiaStatement of Cash FlowsProprietary FundsFor the fiscal year ended June 30, 2013
exhiBit a-6
Business-type Activities -
Enterprise Fund Integrated Sewer
System
173,657,339$ - - 283,711,591
(60,584,089) (68,165,266) (25,571,218) (28,862,770)
- (150,925,161) - (6,396,222)
Intergovernmental revenue received - 10,878 87,502,032 29,373,050
- 11,018,536 - 11,018,536
CASH FLOWS FROM CAPITAL AND RELATED FINANCING ACTIVITIESAvailability fees received 20,477,318 - Capital grants received 1,107,952 -
(17,217,217) - (27,091,441) - 105,867,439 -
(699,561) - Deposit with fiscal agent for legal reserve (5,404,101) -
187,421 459,218 (50,380,282) (13,525,897) (40,650,962) -
Principal payments on obligations under capital leases - (1,113,042) Interest payments on obligations under capital leases - (79,704)
(13,803,434) (14,259,425)
18,170,534 - (22,132,264) -
1,412,216 299,781 (2,549,514) 299,781 71,149,084 26,431,942
Cash and cash equivalents, July 1, 2012 137,118,463 143,591,604 Cash and cash equivalents, June 30, 2013 208,267,547$ 170,023,546
32,754,207$ 12,126,774 Adjustments to reconcile operating income to net cash provided by operating activities:
54,358,299 11,968,320 Insurance recoveries - 1,234,495
- 399,461 103,708 -
- (52,422) 24,638 (42,547)
(54,768) 10,878 279,361 3,573,688 21,644 450,843 14,943 (296,440)
54,747,825 17,246,276 Net cash provided by operating activities 87,502,032$ 29,373,050
5,954,792$ 228,823 Initiation of an obligation under capital lease - 904,893 Net increase in long-term debt resulting from the issuance of loans/revenue bonds by UOSA 4,785,859 -
89,561 -
Payments to employees
Governmental Activities -
Internal Service Funds
CASH FLOWS FROM OPERATING ACTIVITIESReceipts from customers and usersReceipts from interfund services providedPayments to suppliers and contractors
Net cash provided by operating activitiesCASH FLOWS FROM NONCAPITAL FINANCING ACTIVITIES
Transfers from other fundsNet cash provided by noncapital financing activities
Claims and benefits paidPayments for interfund services used
Interest payments on sewer revenue bondsRevenue bonds issued, including premiumPayment of bond issuance costs
Principal payments on sewer revenue bonds
CASH FLOWS FROM INVESTING ACTIVITIESSales of restricted investmentsPurchases of investmentsInterest received
Proceeds from sale of capital assetsPurchase of capital assets, other than purchased capacityAcquisition of purchased capacity
Net cash provided (used) by capital and related financing activities
Decrease in accounts receivable(Increase) decrease in intergovernmental receivables(Increase) in interfund receivables(Increase) decrease in inventories of supplies
Net cash provided by investing activitiesNet decrease in cash and cash equivalents
Depreciation and amortization
Change in assets and liabilities:
Reconciliation of operating income to net cash provided by operating activities:Operating income
(Increase) decrease in other assetsIncrease (decrease) in accounts payable and accrued liabilitiesIncrease in accrued salaries and benefits Increase (decrease) in interfund payables
See accompanying notes to the financial statements.
Total adjustments to operating
Noncash investing, capital, and financing activities:
Increase in fair value of investments not classified as cash and cash equivalents
Capital contributions - sewer lines, manholes, and equipment

county oF FairFax, Virginia comprehenSiVe annual Financial report34
BaSic Financial StatementS
county oF FairFax, VirginiaStatement of Fiduciary Net PositionJune 30, 2013
exhiBit a-7
Pension Trust Funds
OPEB Trust Fund
Agency Funds
8,707,745$ 2,333,265 2,179,172 Cash collateral for securities lending 75,775,624 - -
- - 61,516 Contributions receivable 9,590,951 - -
6,842,099 39,303 - 183,237,686 - -
Equipment 7,251 - -
U.S. Government and agency securities 169,128,018 - - Asset-backed securities 365,341,491 - - Corporate and other bonds 644,401,668 - - Common and preferred stock 1,538,894,502 - - Short-term investments 496,372,993 - - Investment in pooled funds 2,587,279,691 148,542,663 -
Total assets 6,085,579,719 150,915,231 2,240,688$
DEFERRED OUTFLOWS OF RESOURCES Total deferred outflows of resources - -
10,681,056 26,892 - Accrued salaries and benefits 77,396 - -
29,727 - - 223,747,729 - -
75,775,624 - - - - 2,240,688
Total liabilities 310,311,532 26,892 2,240,688$
DEFERRED INFLOWS OF RESOURCES Total deferred inflows of resources - -
5,775,268,187$ 150,888,339 See accompanying notes to the financial statements.
ASSETS
Accounts receivable
Accrued interest and dividends receivable
Accounts payable and accrued liabilities
Equity in pooled cash and temporary investments
Investments, at fair value:
Receivable from sale of investments
LIABILITIES
Held in trust for pension/OPEB benefits NET POSITION
Interfund payablePayable for purchase of pension investmentsLiabilities for collateral received under securities
Liabilities under reimbursement agreementslending agreements

35Financial Section
BaSic Financial StatementS
Statement of Changes in Plan Net PositionTrust FundsFor the fiscal year ended June 30, 2013
exhiBit a-8county oF FairFax, Virginia
Pension Trust Funds
OPEB Trust Fund
215,181,525$ 38,306,234 53,748,642 -
Other - 1,262,891 268,930,167 39,569,125
From investment activities:Net appreciation in fair value of investments 386,515,705 11,348,368 Interest 56,027,281 63,285 Dividends 40,570,434 -
Total income from investment activities 483,113,420 11,411,653 Less investment activities expenses:
Management fees 19,601,922 100,154 Other 1,757,957 500
Total investment activities expenses 21,359,879 100,654 Net income from investment activities 461,753,541 11,310,999 From securities lending activities:
Securities lending income 1,196,192 - Less securities lending expenses:
Management fees 374,434 - Total securities lending activities expenses 374,434 -
Net income from securities lending activities 821,758 - Net investment income 462,575,299 11,310,999
Total additions 731,505,466 50,880,124 DEDUCTIONS
348,410,213 13,531,790 4,068,639 - 2,726,856 153,804
Total deductions 355,205,708 13,685,594 376,299,758 37,194,530
5,398,968,429 113,693,809 5,775,268,187$ 150,888,339
See accompanying notes to the financial statements.
Net position, July 1, 2012
Total contributionsInvestment income:
ADDITIONSContributions:
Employer Plan members
Net position, June 30, 2013
BenefitsRefunds of contributionsAdministrative expenses
Net increase

county oF FairFax, Virginia comprehenSiVe annual Financial report36
BaSic Financial StatementS
county oF FairFax, VirginiaCombining Statement of Net PositionComponent UnitsJune 30, 2013
Public Schools
Redevelopment and Housing
Authority
359,416,873$ 29,286,410 - 12,691,060 - 3,685,186
4,097,440 935,582 172,210 326,480
- 26,463,220 Due from intergovernmental units 63,362,895 - Due from primary government 279,978 -
2,734,210 - 285,276 4,554,221
Equity in pooled cash and temporary investments 125,378,229 - - 17,121,396 - 2,195,032 - 1,960,000
Net OPEB Asset 13,392,985 - Unearned financing fees (net of amortization) - 1,108,177
- 1,026,747
44,869,395 42,096,776 Easements - -
193,374,318 1,833,004 Software in development 6,265,521 -
267,744,446 1,943,111 Software 4,865,424 -
34,769,180 - 3,035,603,055 218,097,802
(1,473,329,850) (119,597,165) Accumulated amortization (2,474,501) -
2,680,807,084 245,727,039
DEFERRED OUTFLOWS OF RESOURCES Deferred amounts from the refunding debt - -
Total deferred outflows of resources -$ - See accompanying notes to the financial statements.
Notes
Inventories of suppliesPrepaid and other assets
Cash with fiscal agents
Restricted assets:
Buildings and improvements
Equipment
ASSETSEquity in pooled cash and temporary investmentsCash in banksInvestments Receivables (net of allowances):
Accounts Accrued interest
Construction in progress
Investments
Property held for saleCapital assets:
Certificates of deposit - performance bonds
Non-depreciable/non-amortizable:Land
Depreciable/amortizable:
Library collections
Accumulated depreciation
Total assets

37Financial Section
BaSic Financial StatementS
exhiBit a-9
Park Authority
Economic Development
Authority
Total Component
Units
40,691,543 - 429,394,826 - - 12,691,060 - - 3,685,186
4,675 - 5,037,697 62,268 - 560,958
- - 26,463,220 104,117 - 63,467,012 Due from intergovernmental units
1,783,018 484,394 2,547,390 Due from primary government - - 2,734,210 - - 4,839,497
9,553,893 - 134,932,122 Equity in pooled cash and temporary investments- - 17,121,396 - - 2,195,032
61,115 - 2,021,115 - - 13,392,985 Net OPEB Asset- - 1,108,177 Unearned financing fees (net of amortization)- - 1,026,747
346,960,303 - 433,926,474 17,016,009 - 17,016,009 Easements13,410,371 - 208,617,693
- - 6,265,521 Software in development
13,688,182 38,847 283,414,586 - - 4,865,424 Software- - 34,769,180
365,536,755 767,961 3,620,005,573 (182,123,372) (334,851) (1,775,385,238)
- - (2,474,501) Accumulated amortization626,748,877 956,351 3,554,239,351
DEFERRED OUTFLOWS OF RESOURCES 545,888 - 545,888 Deferred amounts from the refunding debt 545,888 - 545,888 Total deferred outflows of resources
continued
Restricted assets:
Cash with fiscal agents
Inventories of suppliesPrepaid and other assets
Notes
ASSETSEquity in pooled cash and temporary investmentsCash in banksInvestments Receivables (net of allowances):
Accounts Accrued interest
Depreciable/amortizable:
Certificates of deposit - performance bondsInvestments
Land held for saleCapital assets:
Land
Construction in progress
Non-depreciable/non-amortizable:
Accumulated depreciation
Total assets
Equipment
Library collectionsBuildings and improvements

county oF FairFax, Virginia comprehenSiVe annual Financial report38
BaSic Financial StatementS
county oF FairFax, VirginiaCombining Statement of Net PositionComponent UnitsJune 30, 2013
Public Schools
Redevelopment and Housing
Authority
34,287,206$ 7,343,718 Accrued salaries and benefits 33,900,268 437,863
7,209,628 - Accrued interest payable 895,326 4,548,934 Due to primary government - 128,676
14,889,057 1,931,413 781,524 2,328,621
Revenue bonds payable, net - 697,786 Notes payable - 7,158,762 Compensated absences payable 24,029,318 571,569 Obligations under capital leases and installment purchases 14,056,827 - Insurance and benefit claims payable 24,807,564 - Loan from primary government - - Unearned rent - -
Revenue bonds payable, net - 25,302,420 Notes payable - 60,454,884
10,298,278 648,700 Obligations under capital leases and installment purchases 70,891,107 - Insurance and benefit claims payable 28,377,756 - Loan from primary government - - Unearned rent 965,703 -
Total liabilities 265,389,562 111,553,346
DEFERRED INFLOWS OF RESOURCESTotal deferred inflow of resources - -
2,026,739,054 73,094,587
6,519,094 - - -
Housing - 22,799,619 Capital projects 125,378,229 - Debt service - -
256,781,145 38,279,487 2,415,417,522$ 134,173,693
Long-term liabilities:
NET POSITION
Compensated absences payable
Portion due or payable after one year:
Performance and other deposits
See accompanying notes to the financial statements.
Repair and replacement
Unrestricted (deficit)Net position
Net investment in capital assetsRestricted for:
Grant and education programs
LIABILITIESAccounts payable and accrued liabilities
Unearned revenue
Contract retainages
Portion due or payable within one year:

39Financial Section
BaSic Financial StatementS
exhiBit a-9concluded
Park Authority
Economic Development
Authority
Total Component
Units
2,113,150 342,316 44,086,390 2,324,129 142,078 36,804,338 Accrued salaries and benefits
238,045 - 7,447,673 17,633 - 5,461,893 Accrued interest payable
234,666 - 363,342 Due to primary government5,326,655 - 22,147,125
768,294 - 3,878,439
58,335 - 756,121 Revenue bonds payable, net- - 7,158,762 Notes payable
2,579,399 159,307 27,339,593 - - 14,056,827 Obligations under capital leases and installment purchases- - 24,807,564 Insurance and benefit claims payable
243,700 - 243,700 Loan from primary government- 101,339 101,339 Unearned rent
5,443,400 - 30,745,820 Revenue bonds payable, net- - 60,454,884 Notes payable
2,017,097 120,024 13,084,099 - - 70,891,107 Obligations under capital leases and installment purchases- - 28,377,756 Insurance and benefit claims payable
12,588,500 - 12,588,500 Loan from primary government- 887,962 1,853,665 Unearned rent
33,953,003 1,753,026 412,648,937 Total liabilities
DEFERRED INFLOWS OF RESOURCES- - - Total deferred inflow of resources
556,761,316 471,957 2,657,066,914
- - 6,519,094 700,000 - 700,000
- - 22,799,619 Housing8,853,893 - 134,232,122 Capital projects
61,115 - 61,115 Debt service26,965,438 (1,268,632) 320,757,438
593,341,762 (796,675) 3,142,136,302
Unearned revenuePerformance and other depositsLong-term liabilities:
LIABILITIESAccounts payable and accrued liabilities
Contract retainages
Portion due or payable after one year:
Compensated absences payable
NET POSITION
Portion due or payable within one year:
Compensated absences payable
Net investment in capital assetsRestricted for:
Grant and education programsRepair and replacement
Unrestricted (deficit)Net position

county oF FairFax, Virginia comprehenSiVe annual Financial report40
BaSic Financial StatementS
county oF FairFax, VirginiaCombining Statement of ActivitiesComponent UnitsFor the fiscal year ended June 30, 2013
Public Schools: Education 2,627,541,127$ 106,547,191 253,060,520 167,136,265 Redevelopment and Housing Authority: Community development 107,581,009 41,038,920 60,756,011 489,767 Park Authority:
Parks, recreation, and cultural 89,797,211 43,477,706 - 13,504,787 Economic Development Authority:
Community development 9,324,466 - - - 2,834,243,813$ 191,063,817 313,816,531 181,130,819
General revenues: Grants and contributions not restricted to specific programs Revenue from the use of money Share of Commonwealth's lottery proceeds Revenue from primary government OtherTotal general revenues Change in net positionNet position, July 1, 2012 Net position, June 30, 2013See accompanying notes to the financial statements.
Total component units
Functions/Programs Expenses
Program Revenues
Charges for
Services
Operating Grants and
Contributions
Capital Grants and
Contributions

41Financial Section
BaSic Financial StatementS
exhiBit a-10
(2,100,797,151) - - - (2,100,797,151)
- (5,296,311) - - (5,296,311)
- - (32,814,718) - (32,814,718)
- - - (9,324,466) (9,324,466) (2,100,797,151) (5,296,311) (32,814,718) (9,324,466) (2,148,232,646)
433,102,170 - (12,630,309) - 420,471,861 73,812 222,454 119,592 - 415,858
- - - - - 1,683,322,285 - 39,498,643 9,310,032 1,732,130,960
1,667,408 - - 1,667,408 2,118,165,675 222,454 26,987,926 9,310,032 2,154,686,087
17,368,524 (5,073,857) (5,826,792) (14,434) 6,453,441 2,398,048,998 139,247,550 599,168,554 (782,241) 3,135,682,861 2,415,417,522$ 134,173,693 593,341,762 (796,675) 3,142,136,302
Net (Expense) Revenue and Changes in Net Position
Park Authority
Total Component
Units
Economic Development
Authority
Redevelopment
and Housing Authority
Public Schools
county oF FairFax, Virginia comprehenSiVe annual Financial report42
BaSic Financial StatementS

43Financial Section
county oF FairFax, Virginia
noteS to the Financial StatementS
June 30, 2013
a. Summary oF SigniFicant accounting PolicieS
The County of Fairfax, Virginia, (the County) is organized under the Urban County Executive form of government (as defined under Virginia law). The governing body of the County is the Board of Supervisors (the Board), which makes policies for the administration of the County. The Board is comprised of ten members: the Chairman, elected at large for a four-year term, and one member from each of nine supervisor districts, elected for a four-year term by the voters of the district in which the member resides. The Board appoints a County Executive to act as the administrative head of the County. The County Executive serves at the pleasure of the Board, carries out the policies established by the Board, directs business and administrative procedures, and recommends officers and personnel to be appointed by the Board.
The financial statements of the County have been prepared in conformity with generally accepted accounting principles (GAAP) as applied to government units in the United States of America. The Governmental Accounting Standards Board (GASB) is the accepted primary standard-setting body for establishing governmental accounting and financial reporting principles. The County’s significant accounting policies are described below.
1. Reporting Entity
As required by GAAP, the accompanying financial statements present the financial data of the County (the primary government) and its component units. The financial data of the component units are included in the County’s basic financial statements because of the significance of their operational or financial relationships with the County. The County and its component units are together referred to herein as the reporting entity.
Blended Component Units
Blended component units are entities that are legally separate from the County but that are so closely related to the County that they are, in essence, extensions of the County. The blended component units that are reported as part of the primary government are:
Solid Waste Authority of Fairfax County (SWA) - The SWA is considered a blended component unit because the Board of Supervisors comprises the Board of Directors of the SWA and has the ability to impose its will on the SWA. The SWA is authorized under the Virginia Water and Waste Authorities Act and was created by the Board of Supervisors on June 29, 1987. The SWA has financed the construction of a solid waste to energy facility, which is contractually owned and operated by a commercial entity in accordance with agreements between the County, the SWA, and the commercial entity. The County has assumed the responsibility for the management of the arrangement between the SWA and the commercial entity and for providing sufficient solid waste to result in a financially viable operation; this activity is reported in a special revenue fund of the County, the Energy Resource Recovery Facility Fund. Separate financial statements are not prepared for the SWA.
Small District One - The Board of Supervisors created Small District One, which is located within the Dranesville Magisterial District, in 1970 to provide for the construction of a community center and the operation of its social, cultural, educational, and recreational facilities. This small district is reported as a separate special revenue fund of the County, the

county oF FairFax, Virginia comPrehenSiVe annual Financial rePort44
BaSic Financial StatementS
McLean Community Center Fund, because it is governed by the Board, which has the ability to impose its will on the small district. Separate financial statements are not prepared for Small District One.
Small District Five - The Board of Supervisors created Small District Five, which was located within the Sully, Dranesville and Hunter Mill Magisterial Districts, in 1975 to provide for the construction of a community center and the operation of its social, cultural, educational, and recreational facilities. In March 2006, the Board of Supervisors voted to change the boundaries, placing all boarders within the Hunter Mill Magisterial District. This change became effective January 1, 2007. This small district is reported as a separate special revenue fund of the County, the Reston Community Center Fund, because it is governed by the Board, which has the ability to impose its will on the small district. Separate financial statements are not prepared for Small District Five.
Dulles Rail Phase I Transportation Improvement District - The Board of Supervisors created the Dulles Rail Phase I Transportation Improvement District in 2004 to provide funds for the construction of certain transportation improvements in the district. This district is reported as a separate special revenue fund of the County. The District is governed by the members of the Board of Supervisors representing the property owners within the district. The Board of Supervisors, has the ability to impose its will on the district. Separate financial statements are not prepared for the Dulles Rail Phase I Transportation Improvement District.
Dulles Rail Phase II Transportation Improvement District - The Board of Supervisors created the Dulles Rail Phase II Transportation Improvement District in 2009 to provide funds for the construction of certain transportation improvements in the district. This district is reported as a separate special revenue fund of the County. The District is governed by the members of the Board of Supervisors representing the property owners within the district. The Board of Supervisors, has the ability to impose its will on the district. Separate financial statements are not prepared for the Dulles Rail Phase II Transportation Improvement District.
Mosaic District Community Development Authority (CDA) - The CDA is an independent authority legally authorized by an act of the Virginia General Assembly and was formally created by the Board of Supervisors in April 2009. The CDA’s purpose is to assist in the development of infrastructure improvements within the district. This authority presentation consists of a special revenue, a debt service fund, and a capital projects fund. This authority provides services that exclusively benefit the County and was established with a tax increment financing agreement. Separate financial statements are not prepared for the CDA.
Discretely Presented Component Units
The columns for the component units in the financial statements include the financial data of the County’s other component units. They are presented in separate columns to emphasize that they are legally separate from the County. Separate financial statements of the component units can be obtained by writing to the Financial Reporting Division, Department of Finance, 12000 Government Center Parkway, Suite 214, Fairfax, Virginia 22035. All of the component units have a fiscal year end of June 30. The discretely presented component units are:
Fairfax County Public Schools (Public Schools) - Public Schools is responsible for elementary and secondary education within the County. The School Board is elected by County voters. Public School systems do not have taxing authority under Virginia Code; Public Schools is fiscally dependent on the County. Public Schools operations are funded primarily by the County’s General Fund, and the County issues general obligation debt for Public Schools’ capital projects.

45Financial Section
noteS to the Financial StatementS
Fairfax County Redevelopment and Housing Authority (FCRHA) - FCRHA plans, coordinates, and directs the low income housing programs within the County under the Virginia Housing Authorities Law. FCRHA was approved by a voter referendum in November 1965 and was activated by the Board of Supervisors in February 1966. FCRHA is a political subdivision of and reports to the Commonwealth of Virginia. The Board appoints FCRHA’s Board of Commissioners, and the County provides certain managerial and related financial assistance to FCRHA.
Fairfax County Park Authority (Park Authority) - The Park Authority was created by the Board of Supervisors of the County on December 6, 1950, to maintain and operate the public parks and recreational facilities located in the County. The Board appoints the Park Authority’s governing board, and the County provides funding for the Park Authority’s General Fund and one of its capital projects funds. A memorandum of understanding currently in effect between the County and the Park Authority defines the roles of the County and the Park Authority.
Fairfax County Economic Development Authority (EDA) - The EDA is an independent authority legally authorized by an act of the Virginia General Assembly and was formally created by resolutions of the Board of Supervisors. The EDA’s mission is to attract businesses to Fairfax County and to work with the existing businesses to retain them as they expand and create new jobs. The Board appoints the seven members of the EDA’s commission which appoints the EDA’s executive director. The Board appropriates funds annually to the EDA for operating expenditures incurred in carrying out its mission.
Related Organizations
The Board of Supervisors is also responsible for appointing the members of the boards of Fairfax Water, and the Industrial Development Authority of Fairfax County (IDAFC). The IDAFC does not have a significant operational or financial relationship with the County. Fairfax Water bills and collects for the sales of sewer services on behalf of the County’s sewer system. During fiscal year 2013, Fairfax Water collected approximately $136.0 million on behalf of the County, and as of June 30, 2013, the County has receivables of approximately $32.1 million due from Fairfax Water.
Joint Ventures
The County is a participant in the Upper Occoquan Sewage Authority (UOSA). UOSA is a joint venture created under the provisions of the Virginia Water and Waste Authorities Act to construct, finance, and operate the regional sewage treatment facility in the upper portion of the Occoquan Watershed. UOSA was formed on March 3, 1971, by a concurrent resolution of the governing bodies of Fairfax and Prince William Counties and the Cities of Manassas and Manassas Park. The governing body of UOSA is an eight-member board of directors consisting of two members from each participating jurisdiction appointed to four-year terms. The UOSA Board of Directors adopts an annual operating budget based on projected sewage flows. The County has no explicit and measurable financial interest in UOSA but does have an ongoing financial responsibility for its share of UOSA’s operating costs, construction costs and annual debt service. Complete financial statements of UOSA can be obtained by writing to UOSA, 14631 Compton Road, Centreville, Virginia 20121.
The County is a participant in the Northern Virginia Regional Park Authority (NVRPA). NVRPA is a joint venture created under the Virginia Park Authorities Act of 1959 to protect and preserve Northern Virginia’s rich heritage of woods, meadows, lakes, and streams. The governing body of NVRPA is comprised of two members from each of the 6 member jurisdictions: Fairfax, Arlington, and Loudoun Counties, and the Cities of Alexandria, Falls Church, and Fairfax. Each member jurisdiction provides contributions in direct proportion to its share of the region’s population. The County’s contributions are accounted for in the County Construction capital projects fund. The County has no

county oF FairFax, Virginia comPrehenSiVe annual Financial rePort46
BaSic Financial StatementS
explicit and measurable financial interest in NVRPA. Complete financial statements of NVRPA can be obtained by writing to NVRPA, 5400 Ox Road, Fairfax Station, Virginia 22039.
Jointly Governed Organization
The State Route 28 Highway Transportation Improvement District (District) was created in 1987 under the provisions of the Transportation Improvements District Act by the County and Loudoun County, Virginia, in conjunction with the Commonwealth of Virginia Transportation Board (CVTB), for the purpose of undertaking various improvements to State Route 28. The District is governed by a nine-member Commission comprised of four members from each of the Boards of Supervisors of the County and Loudoun County and the Chairman of the CVTB or his designee. The County has no financial interest in the District. See Note J-8 for additional information related to the District.
2. Basis of Presentation
Government-wide Statements
The statement of net position and the statement of activities display information about the primary government (the County) and its component units. These statements include the financial activities of the overall government, except for fiduciary activities. Eliminations have been made to avoid the double-counting of interfund activities. These statements distinguish between the governmental and business-type activities of the County. Governmental activities generally are financed through taxes, intergovernmental revenues, and other non-exchange transactions. Business-type activities are financed primarily by fees charged to external parties. Likewise, the primary government is reported separately from certain legally separate component units for which the primary government is financially accountable.
The statement of activities presents a comparison between direct expenses and program revenues for each activity of the County. Direct expenses are those that are specifically associated with a program or function and, therefore, are clearly identifiable to a particular activity. Program revenues include: (a) fees, fines, and charges paid by the recipients of goods or services offered by the programs and, (b) grants and contributions that are restricted to meet the operations or capital requirements of a particular program. Revenues that are not classified as program revenues, including all taxes, are presented as general revenues.
Fund Financial Statements
The accounts of the reporting entity are organized on the basis of funds, each of which is considered to be a separate accounting entity. The operations of each fund are accounted for in a separate set of self-balancing accounts comprised of assets, liabilities, fund equity, revenues, and expenditures or expenses, as appropriate. The fund financial statements provide information about the County’s funds, including its fiduciary funds and blended component units. Separate statements for each fund category—governmental, proprietary, and fiduciary—are presented. The emphasis of fund financial statements is on major governmental and enterprise funds, with each displayed in a separate column. All remaining governmental funds are aggregated and reported as nonmajor funds.
The County reports the following major fund types:
General Fund - The General Fund is the County’s primary operating fund, and it is used to account for all revenue sources and expenditures which are not accounted for in other funds.
Enterprise Fund - The Fairfax County Integrated Sewer System (Sewer System) is the only enterprise fund of the County. This fund is used to account for the financing, construction, and operations of the countywide sewer system.

47Financial Section
noteS to the Financial StatementS
The County reports the following nonmajor governmental fund types:
Special Revenue Funds - The special revenue funds are used to account for the proceeds of specific revenue sources (other than debt service and major capital projects) that are legally restricted or committed to expenditure for specified purposes.
Debt Service Fund - The debt service fund is used to account for the accumulation of resources for, and the payment of, the general obligation debt service of the County and for the debt service of the lease revenue bonds and special assessment debt. This includes the general obligation debt the County has issued to fund Public Schools capital projects.
Capital Projects Funds - The capital projects funds are used to account for financial resources used for all general construction projects other than enterprise fund construction.
The County reports the following additional fund types:
Internal Service Funds - These funds are proprietary funds used to account for the provision of general liability, malpractice, and workers’ compensation insurance, health benefits for employees and retirees, vehicle services, document services, and technology infrastructure support that are provided to County departments on a cost reimbursement basis.
Pension and Other Post-Employment Benefits (OPEB) Trust funds – These are fiduciary funds used to account for the assets held in trust by the County for the employees and beneficiaries of its defined benefit pension and OPEB plans – the Employees’ Retirement System, the Police Officers Retirement System, the Uniformed Retirement System, and the Other Post-Employment Benefits (OPEB) Trust Fund.
Agency Funds - These are fiduciary funds used to account for monies received, held, and disbursed on behalf of developers, welfare recipients, the Commonwealth of Virginia, the recipients of certain bond proceeds, and certain other local governments.
3. Measurement Focus and Basis of Accounting
Government-wide, Proprietary, and Fiduciary Fund Statements
The government-wide, proprietary, and trust fund financial statements are reported using the economic resources measurement focus and the accrual basis of accounting. The agency funds also use the accrual basis of accounting to recognize assets and liabilities. Revenues are recorded when earned, and expenses are recorded at the time liabilities are incurred, regardless of when the related cash flows take place. Non-exchange transactions, in which the County gives (or receives) value without directly receiving (or giving) equal value in exchange, include property taxes, grants, and entitlements. On an accrual basis, revenue from property taxes is recognized in the fiscal year for which the taxes are levied. Revenue from grants and entitlements is recognized in the fiscal year in which all eligibility requirements have been satisfied. For the trust funds, member and employer contributions as applicable are recognized in the period in which the contributions are due. Benefits and refunds are recognized when due and payable in accordance with the terms of each plan.
Proprietary funds distinguish operating revenues and expenses from nonoperating items. Operating revenues and expenses generally result from providing services and producing and delivering goods in connection with a proprietary fund’s principal ongoing operations. For the Sewer System, principal operating revenues include sales to existing customers for continuing sewer service. Operating expenses include the cost of sales and services, administrative expenses, and depreciation on capital assets. All revenues and expenses not meeting this definition are reported as nonoperating revenues
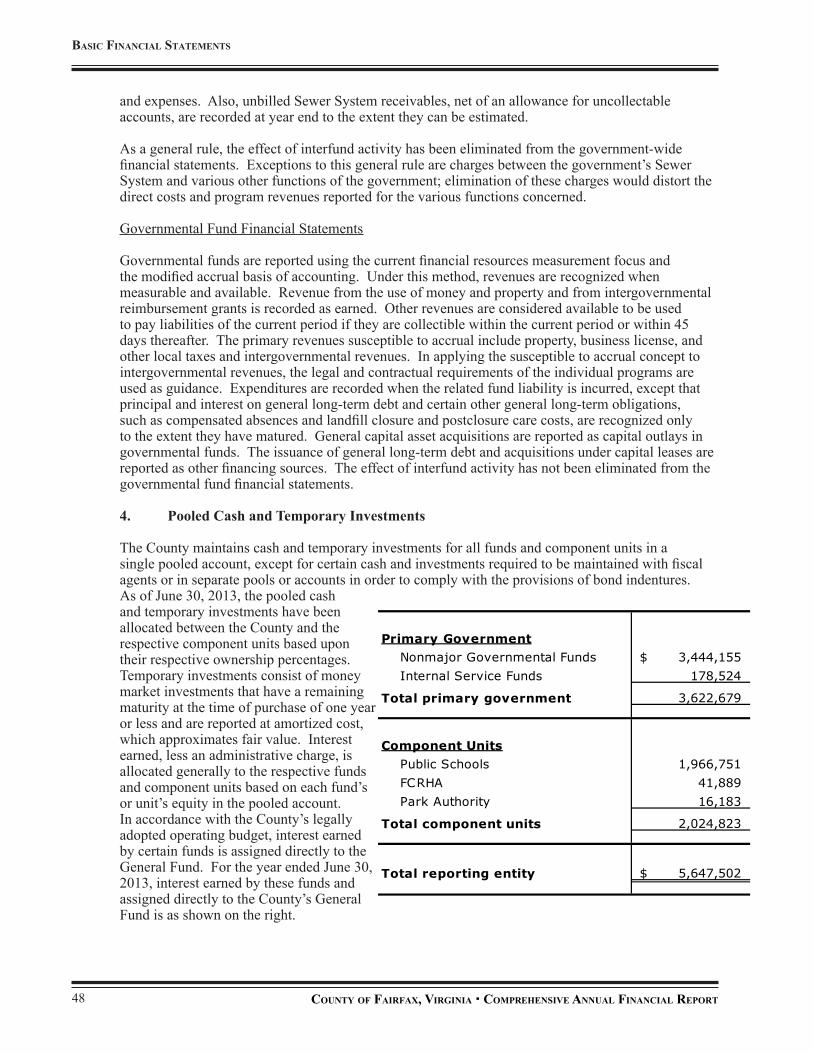
county oF FairFax, Virginia comPrehenSiVe annual Financial rePort48
BaSic Financial StatementS
and expenses. Also, unbilled Sewer System receivables, net of an allowance for uncollectable accounts, are recorded at year end to the extent they can be estimated.
As a general rule, the effect of interfund activity has been eliminated from the government-wide financial statements. Exceptions to this general rule are charges between the government’s Sewer System and various other functions of the government; elimination of these charges would distort the direct costs and program revenues reported for the various functions concerned.
Governmental Fund Financial Statements
Governmental funds are reported using the current financial resources measurement focus and the modified accrual basis of accounting. Under this method, revenues are recognized when measurable and available. Revenue from the use of money and property and from intergovernmental reimbursement grants is recorded as earned. Other revenues are considered available to be used to pay liabilities of the current period if they are collectible within the current period or within 45 days thereafter. The primary revenues susceptible to accrual include property, business license, and other local taxes and intergovernmental revenues. In applying the susceptible to accrual concept to intergovernmental revenues, the legal and contractual requirements of the individual programs are used as guidance. Expenditures are recorded when the related fund liability is incurred, except that principal and interest on general long-term debt and certain other general long-term obligations, such as compensated absences and landfill closure and postclosure care costs, are recognized only to the extent they have matured. General capital asset acquisitions are reported as capital outlays in governmental funds. The issuance of general long-term debt and acquisitions under capital leases are reported as other financing sources. The effect of interfund activity has not been eliminated from the governmental fund financial statements.
4. Pooled Cash and Temporary Investments
The County maintains cash and temporary investments for all funds and component units in a single pooled account, except for certain cash and investments required to be maintained with fiscal agents or in separate pools or accounts in order to comply with the provisions of bond indentures. As of June 30, 2013, the pooled cash and temporary investments have been allocated between the County and the respective component units based upon their respective ownership percentages. Temporary investments consist of money market investments that have a remaining maturity at the time of purchase of one year or less and are reported at amortized cost, which approximates fair value. Interest earned, less an administrative charge, is allocated generally to the respective funds and component units based on each fund’s or unit’s equity in the pooled account. In accordance with the County’s legally adopted operating budget, interest earned by certain funds is assigned directly to the General Fund. For the year ended June 30, 2013, interest earned by these funds and assigned directly to the County’s General Fund is as shown on the right.
Primary GovernmentNonmajor Governmental Funds 3,444,155$ Internal Service Funds 178,524
Total primary government 3,622,679
Component UnitsPublic Schools 1,966,751 FCRHA 41,889 Park Authority 16,183
Total component units 2,024,823
Total reporting entity 5,647,502$

49Financial Section
noteS to the Financial StatementS
5. Cash and Cash Equivalents
For purposes of the statements of cash flows, the amounts reported as cash and cash equivalents for the proprietary fund types represent amounts maintained in the reporting entity’s investment pool, as they are considered to be demand deposits for the purpose of complying with GASB Statement No. 9, “Reporting Cash Flows of Proprietary and Nonexpendable Trust Funds and Governmental Entities that use Proprietary Fund Accounting.”
6. Investments
Money market investments that have a remaining maturity at the time of purchase of one year or less are reported at amortized cost, which approximates fair value. Other investments are reported at fair value. Securities traded on a national or international exchange are valued at the last reported sales price at current exchange rates. Asset-backed securities are valued on the basis of future principal and interest payments and are discounted at prevailing interest rates for similar investments. Investment ownership is recorded as of the trade date. Transactions are finalized and money movement occurs on the settlement date. For the retirement system, cash received as collateral on securities lending transactions and investments made with such cash are reported as assets and as related liabilities for collateral received.
7. Investments in Derivatives
The County Retirement Systems (the Systems), which include the Employees’ (ERS), Police Officers (PORS), and Uniformed (URS) Retirement Systems, as well as the Educational Retirement System (ERFC) of the Public Schools component unit, invest in derivatives as permitted by the Code of Virginia and in accordance with policies set by their respective Board of Trustees. Derivative instruments are financial contracts with valuations dependent on the values of one or more underlying assets, reference rates or financial indices. Detailed information on derivative investments is found in Note B.
8. Inventories
The consumption method of accounting for inventories is used. Under this method, inventories are expensed as they are consumed as operating supplies and spare parts in the period to which they apply.
9. Restricted Assets
Restricted assets are liquid assets which have third-party limitations on their use. When both restricted and unrestricted resources are available for use, it is the government’s policy to use restricted resources first, then unrestricted resources as they are needed.
Unspent amounts from the issuance of general obligation bonds are reported as restricted assets in the County’s capital projects funds. The County also holds certificates of deposit purchased by developers and cash deposits under the terms of performance agreements. The County may require a developer to enter into these agreements in order to ensure that certain structures and improvements are completed according to approved site plans. The certificates, issued by various financial institutions, and cash deposits are released to the developer when the terms of the agreement have been satisfied. If the terms of the agreement are not satisfied, the County uses the cash deposits and proceeds from the certificates to correct or complete the project as necessary. The amount of the certificates and cash deposits held is reported as restricted assets in the General Fund.

county oF FairFax, Virginia comPrehenSiVe annual Financial rePort50
BaSic Financial StatementS
In accordance with the provisions of the 1985 General Bond Resolution as modified through July 2009, certain assets of the Sewer System are restricted for specific future uses, such as repayment of debt obligations, payments on construction projects, and extensions and improvements. Certain assets are restricted to fund the construction of nitrogen removal facilities. As of June 30, 2013, the Sewer System has cash and investments that are restricted for the following uses:
Extensions and improvements 88,671,882$ Nitrogen removal facilities
Long-term debt service requirements 28,123,678 Current debt service requirements 15,035,893
Total restricted assets 131,831,453$
Restricted Assets of the Sewer System
In accordance with requirements of the U. S. Department of Housing and Urban Development and the Virginia Housing Development Authority, the FCRHA is required to maintain certain restricted deposits and funded reserves for repairs and replacements.
The Park Authority has restricted assets representing the amount of the debt service reserve requirement pertaining to its outstanding revenue bonds and unspent amounts from general obligation bonds issued by the County.
10. Capital Assets
Capital assets, including land, permanent easements, buildings, improvements, equipment, library collections, purchased capacity, and infrastructure, that individually cost $5,000 or more and software with a cost of $100,000 or more, with useful lives greater than one year, are reported in the proprietary funds and applicable governmental or business-type activities columns in the government-wide financial statements. The County has capitalized general infrastructure assets, including solid waste disposal facilities, storm water management facilities, public drainage systems, mass transportation facilities, commercial revitalization improvements, and public trails and walkways that were acquired or substantially improved subsequent to July 1, 1980. The County does not capitalize roads and bridges as these belong to the Commonwealth of Virginia.
Purchased capacity consists of payments made by the Sewer System under intermunicipal agreements with the District of Columbia Water and Sewer Authority (Blue Plains), UOSA, Alexandria Sanitation Authority (ASA), Arlington County, Loudoun Water, and Prince William County Service Authority (PWSA) for the Sewer System’s allocated share of improvements to certain specified treatment facilities owned and operated by these jurisdictions.
Purchased capital assets are stated at historical cost or estimated historical cost. Donated capital assets are recorded at their estimated fair market value as of the date of donation. Capital assets are depreciated/amortized over their estimated useful lives using the straight-line method. The estimated useful lives are shown in the table on the right.
Capital Assets Useful Lives
Infrastructure 10 - 50 yearsSewer lines 50 yearsBuildings 20 - 50 yearsPurchased capacity 30 - 99 yearsImprovements 15 - 25 yearsEquipment 5 - 20 yearsLibrary collections 5 yearsSoftware 5 - 20 years

51Financial Section
noteS to the Financial StatementS
No depreciation is taken in the year of acquisition for library collections; depreciation/amortization on other capital assets commences when the assets are purchased or are substantially complete and ready for use. For constructed assets, all associated costs necessary to bring such assets to the condition and location necessary for their intended use, including interest on related debt with respect to the Sewer System, are initially capitalized as construction in progress and are transferred to buildings, improvements, and equipment when the assets are substantially complete and ready for use.
11. Compensated Absences
All reporting entity employees earn annual leave based on a prescribed formula which allows employees with less than ten years of service to accumulate a maximum of 240 hours and employees with ten years or more of service to accumulate a maximum of 320 hours of annual leave as of the end of each year. In addition, employees, except for Public Schools employees, may accrue compensatory leave for hours worked in excess of their scheduled hours. Compensatory leave in excess of 240 hours at the end of the calendar year is forfeited.
The current pay rate, including certain additional employer-related fringe benefits, is used to calculate compensated absences accruals at June 30. The entire liability for compensated absences is reported in the government-wide and proprietary fund statements; whereas, only the matured portion resulting from employee resignations and retirements is reported in the governmental fund statements.
12. Net Position
Net position is comprised of three categories: Net investment in capital assets; Restricted net position; and Unrestricted net position. The first category of net position consists of capital assets, net of accumulated depreciation, reduced by the outstanding balances of bonds that are attributable to these capital assets. Restricted net position is restricted assets reduced by liabilities and deferred inflows of resources related to those assets. As of June 30, 2013, the primary government had $259.1 million restricted net position, of which $172.0 million was restricted by enabling legislation. Net position which is neither restricted nor related to net investment in capital assets, is reported as unrestricted net position.
The County issues debt to finance the construction of school facilities for the Public Schools and park facilities for the Park Authority component units because Public Schools does not have borrowing or taxing authority and the Park Authority does not have taxing authority. The County reports this debt, whereas the Public Schools and Park Authority report the related capital assets and unspent bond proceeds. As a result, in the Statement of Net Position (Exhibit A), the debt reduces unrestricted net position for the primary government, while the capital assets are reported in net investment in capital assets and the unspent bond proceeds are reported in restricted net position for Public Schools and the Park Authority.
Because this debt is related to capital assets and restricted assets of the reporting entity as a whole, the debt amount of $1,596.3 million is reclassified as shown below to present the total reporting entity column of Exhibit A.
Primary Government
Component Units
Public Schools Facilities
Park AuthorityFacilities
Total Reclassifcation of
Debt Issued
Total Reporting
EntityNet Investment in capital assets, net of related debt 2,515,732,148$ 2,657,066,914 (1,292,610,815) (170,766,127) (1,463,376,942) 3,709,422,120 Restricted 259,064,039 164,311,950 (125,610,375) (7,345,966) (132,956,341) 290,419,648 Unrestricted (1,510,303,419) 320,757,438 1,418,221,190 178,112,093 1,596,333,283 406,787,302
Net position 1,264,492,768$ 3,142,136,302 - - - 4,406,629,070
Net Position (summarized)
Reclassification of Debt Issued for:

county oF FairFax, Virginia comPrehenSiVe annual Financial rePort52
BaSic Financial StatementS
13. FundBalanceClassification
The Board of Supervisors, as the highest level of authority within the County, establishes the commitment of fund balance to purposes through the approval of the annual budget plan by resolution, in conjunction with the resolutions associated with the establishment of fee and tax rates, and acceptance or appropriation of funds. All subsequent changes to the budget plan to add, reduce, or redirect resources to other purposes are also accomplished by board resolution. As a result, all unrestricted amounts directed toward a purpose are shown as committed. Balances shown as assigned in the general fund represent encumbrances which would otherwise be unassigned.
The County considers restricted balances to be expended first in cases where both restricted and unrestricted amounts are available. When utilizing unrestricted balances, committed balances are applied first, followed by assigned then unassigned balances.
14. Encumbrances
The County uses encumbrance accounting, under which purchase orders, contracts, and other commitments for the expenditure of funds are recorded to reserve that portion of the applicable appropriation. Encumbrances represent the estimated amount of expenditures ultimately to result if unperformed contracts and open purchase orders are completed. Encumbrances for the capital projects funds do not lapse until the completion of the projects and are reported as reservations of fund balance at year end. Funding for all other encumbrances lapses at year end and requires reappropriation by the Board. Funds with significant encumbrance balances are as follows:
Encumbrance Balance
Primary Government
General Fund
Public safety, courts, and judicial 6,013,982$
General public works 5,537,668
Social services, health and welfare 13,324,618
Housing and community development 966,157
Parks, recreation, and cultural 2,979,001
Other purposes 14,981,485
Total General Fund 43,802,911
Capital Projects Funds
Capital Project 61,246,415$
15. Stabilization and Managed Reserve
In 1983, through resolution the Board of Supervisors established a policy to maintain a managed reserve in the general fund at a level sufficient for temporary financing of unforeseen emergency needs or to permit orderly adjustment to changes resulting from the termination of revenue sources through actions of other governmental bodies. The reserve is maintained at a level of not less than 2.0 percent of total general fund disbursements. The balance is adjusted as a part of the quarterly budget review process.
In 1999, the Board of Supervisors passed a resolution establishing the revenue stabilization fund. The revenue stabilization fund is included in the general fund for reporting purposes. The purpose of the revenue stabilization fund is to provide a mechanism for maintaining a balanced budget without

53Financial Section
noteS to the Financial StatementS
resorting to tax increases and expenditure reductions that aggravate the stresses imposed by the cyclical nature of the economy. Three specific criteria must be met to draw from this fund. Projected revenues must reflect a decrease greater than 1.5% from the current year estimate, withdrawals must not exceed one-half of the fund balance in any fiscal year, and withdrawals must be used in conjunction with spending cuts or other measures.
16. Recovered Costs
Reimbursements from another government, organization, or private company for utilities, tuition fees, vehicle insurance, and services rendered or provided to citizens are recorded as recovered costs in the fund financial statements.
17. Intermunicipal Agreements
The Sewer System has entered into several intermunicipal agreements for the purpose of sharing sewage flow and treatment facility costs (see Note K). The payments made to reimburse operating costs and debt service requirements are recorded as expenses in the year due. Payments made to fund the Sewer System’s portion of facility expansion and upgrade costs are capitalized as purchased capacity (see Note F). The Sewer System amortizes these costs over the period in which benefits are expected to be derived, which is generally 30 years.
The City of Fairfax (the City) makes payments to the County for the City’s share of certain governmental services and debt service costs. Payments for governmental services such as court, jail, custody, health, library, and County agent services are recorded as revenue in the General Fund. Debt service payments represent the City’s share of principal and interest and are recorded as revenue in the County Debt Service Fund. In addition, the City pays the County a share of the local portion of all public assistance payments and services including related administrative costs, which is recorded as revenue in the General Fund. The City of Falls Church makes payments to the County for the full cost of the local portion of public assistance payments (including allocated administrative costs) and for the use of special County health facilities by Falls Church residents. These payments are recorded as revenue in the General Fund.
The County and the cities of Fairfax and Falls Church comprise the Fairfax-Falls Church Community Services Board (CSB), established under State mandate in 1969, to provide mental health, intellectual disability and drug and alcohol abuse treatment services to residents of the three jurisdictions. The CSB uses the County as its fiscal agent. The operations of the CSB, including payments received from these cities for services performed by the County, are reported in a special revenue fund.
18. Deficitfundbalance
The Capital Renewal Construction Fund had a deficit fund balance at June 30, 2013, of $7.3 million. This fund is primarily funded from a transfer from the County General Fund, with additional revenue from the Virginia Department of Transportation and Virginia State Police. The deficit fund balance will be eliminated through a transfers from the County General Fund. Detailed information regarding this fund may be found in Exhibits F and F-1.
19. Use of Estimates
The preparation of financial statements in conformity with GAAP requires management to make estimates and assumptions that affect certain reported amounts and disclosures. Accordingly, actual results could differ from those estimates.

county oF FairFax, Virginia comPrehenSiVe annual Financial rePort54
BaSic Financial StatementS
B. DePoSitS anD inVeStmentS
1. Deposit and Investment Policies
The reporting entity maintains an investment policy, the overall objectives of which are the preservation of capital and the protection of investment principal; maintenance of sufficient liquidity to meet operating requirements; conformance with federal, state, and other legal requirements; diversification to avoid incurring unreasonable risks regarding specific security types or individual financial institutions; and attainment of a market rate of return. Oversight of investment activity is the responsibility of the Investment Committee, which is comprised of the chief financial officer and certain key management and investment staff.
It is the reporting entity’s policy to pool for investing purposes all available funds of the County and its component units that aren’t otherwise required to be kept separate. The investment policy, therefore, applies to the activities of the reporting entity with regard to investing the financial assets of its pooled investment funds.
The primary government’s pension trust funds have adopted investment policies to provide a well-managed investment program to meet the long-term goals of the pension trust funds, provide a high degree of diversification, maintain appropriate asset coverage of fund liabilities, and also optimize investment return without introducing higher volatility to contribution levels. Investment decisions for the funds’ assets are made by the Boards of Trustees or investment managers selected by the Boards of Trustees. While the pension trust funds are not subject to the provisions of the Employee Retirement Income Security Act (ERISA), the Boards of Trustees endeavor to adhere to the spirit of ERISA. The Boards of Trustees believe that risks can be managed, but not eliminated, by establishing constraints on the investment portfolio and by properly monitoring the investment markets, the pension trust funds’ asset allocation, and investment managers. Furthermore, investment portfolios have specific benchmarks and investment guidelines.
The component unit’s pension trust fund’s investment decisions are made by its Board of Trustees or the investment advisors selected by the Board of Trustees. The Board of Trustees manages the fund’s investments under the umbrella of an approved set of investment objectives, guidelines, and performance standards. The objectives are formulated in response to the fund’s anticipated financial needs, risk tolerance, and the need to document and communicate objectives, guidelines, and standards to the fund’s investment managers. The Board of Trustees may grant exceptions to the investment guidelines based on written requests and appropriate justification. All exceptions that are approved are included in an appendix to the written guidelines.
The primary government’s OPEB trust fund and its component unit’s OPEB trust fund are participants in the Virginia Pooled OPEB Trust. Funds of participating jurisdictions are pooled and are invested in the name of the Virginia Pooled OPEB Trust sponsored by the Virginia Municipal League and the Virginia Association of Counties (VML/VACo). The primary government’s and component unit’s respective shares in this pool are reported on the face of the corresponding OPEB trust fund statements as found in the other supplementary information section of the CAFR. The Board of Trustees of the Virginia Pooled OPEB Trust has adopted an investment policy to achieve a compound annualized total rate of return over a market cycle, including current income and capital appreciation, in excess of 5.0 percent after inflation, in a manner consistent with prudent risk-taking. Investment decisions for the funds’ assets are made by the Board of Trustees. The Board of Trustees establishes investment objectives, risk tolerance and asset allocation policies in light of the investment policy, market and economic conditions, and generally prevailing prudent investment practices. The Board of Trustees also monitors the investments to ensure adherence to the adopted policies and guidelines. In addition, the Trustees review, monitor, and evaluate the performance of the investments and its

55Financial Section
noteS to the Financial StatementS
investment advisors in light of available investment opportunities, market conditions, and publicly available indices for the generally accepted evaluation and measurement of such performance. Specific investment information for the Virginia Pooled OPEB Trust can be obtained by writing to VML/VACo Finance Program, 919 East Main Street, Suite 1100, Richmond, Virginia 23219.
The Code of Virginia (Code) authorizes the reporting entity to purchase the following types of investments:
• Commercial paper
• U.S. Treasury and agency securities
• U.S. Treasury strips
• Negotiable certificates of deposits and bank notes
• Money market funds
• Bankers acceptances
• Repurchase agreements
• Medium term corporate notes
• Local government investment pool
• Asset-backed securities
• Hedged debt obligations of sovereign governments
• Securities lending programs
• Obligations of the Asian Development Bank
• Obligations of the African Development Bank
• Obligations of the International Bank for Reconstruction and Development
• Obligations of the Commonwealth of Virginia and its instrumentalities
• Obligations of counties, cities, towns, and other public bodies located within the Commonwealth of Virginia
• Obligations of state and local government units located within other states
• Savings accounts or time deposits in any bank or savings institution within the Commonwealth that complies with the Code
However, the investment policy precludes the investment of pooled funds in derivative securities, reverse repurchase agreements, security lending programs, asset-backed securities, hedged debt, obligations of sovereign governments, obligations of the Commonwealth of Virginia and its instrumentalities, obligations of counties, cities, towns, and other public bodies located within the Commonwealth of Virginia and obligations of state and local government units located within other states.
The Code also authorizes the reporting entity to purchase other investments for its pension trust funds and OPEB trust funds, including common and preferred stocks and corporate bonds that meet the standard of judgment and care set forth in the Code. The pension trust funds’ Boards of Trustees’

county oF FairFax, Virginia comPrehenSiVe annual Financial rePort56
BaSic Financial StatementS
investment policies permit these funds to lend their securities to broker-dealers and other entities (borrowers) for collateral that will be returned for the same securities in the future.
2. Interest Rate Risk
The reporting entity’s policy is to minimize the risk that the market value of securities in its portfolio will fall due to changes in market interest rates. To achieve this minimization of risk, the reporting entity structures the pooled investment portfolio so that sufficient securities mature to meet cash requirements for ongoing operations, thereby avoiding the need to sell securities on the open market prior to maturity. Pooled investments that are purchased to meet liquidity needs shall have a target weighted average maturity of 90 days. All other pooled funds are invested primarily in shorter-term securities, with a maximum maturity of one year. The reporting entity’s pooled investments as of June 30, 2013, are summarized at fair value as shown below:
Investment Type Fair Value
Weighted Average Maturity (Days)
Primary Government - Pooled Investments:Pooled Investments:Agency discount notes 98,357,944$ 2.28Commercial paper 532,336,514 54.82Corporate Notes 3,903,449 0.08Money market funds 74,036,743 0.01Negotiable certificates of deposit 596,280,851 21.12
Total fair value 1,304,915,501$ Portfolio weighted average maturity 78.31
Component Units - Pooled Investments:Agency discount notes 35,742,056$ 2.28Commercial paper 193,444,486 54.82Corporate Notes 1,418,465 0.08Money market funds 26,904,034 0.01Negotiable certificates of deposit 216,681,064 21.12
Total fair value 474,190,105$ Portfolio weighted average maturity 78.31
The primary government’s pension trust funds manage interest rate risk for fixed income accounts by limiting the credit quality of the securities held as well as the duration of the portfolio against the duration of the benchmark. The component unit’s pension trust fund’s fixed income managers utilize the modified duration method to manage interest rate risk. In addition, the fund’s investment policy states that the average effective duration of each manager’s portfolio should be within 30 percent of the portfolio’s benchmark duration.

57Financial Section
noteS to the Financial StatementS
The investments in debt securities of the pension trust funds of the reporting entity as of June 30, 2013, are summarized at fair value as shown below:
Investment Type Fair ValueDuration (Years)
Primary Government - Pension Trust Funds:U.S. Government securities 95,082,751$ 6.0
46,047,990 8.527,997,277 5.9
Corporate and other bonds 493,803,311 3.460,081,461 5.890,516,896 5.2
Asset-backed securities * 208,141,967 3.268,538,931 4.288,660,593 4.2
Short-term investments 323,460,170 0.129,674,338 0.1
143,238,485 0.1
Total fair value 1,675,244,170$
Component Unit - Pension Trust Fund:U.S. Treasuries 101,163,027$ 4.1Agencies 12,808,451 1.7Asset-backed securities * 2,991,078 6.7Cash and Cash equivalents 13,245,154 0.2Corporate bonds 146,515,176 6.0Municipal bonds 8,934,563 4.7Mortgages 109,120,931 2.6Commercial mortgage-backed security 2,589,013 3.2Foreign bonds 48,531,974 2.1Convertible and preferred bonds 12,971,731 7.5Emerging markets 51,102,964 4.7Other 25,618,198 0.8Total fair value 535,592,260$
* The underlying assets of the asset-backed securities are predominantly mortgages.
3. Credit Risk
The reporting entity’s policy is to minimize the risk of loss due to the failure of an issuer or other counterparty to an investment to fulfill its obligations. The reporting entity pre-qualifies financial institutions, broker-dealers, intermediaries, and advisers with which the County does business. In addition, the reporting entity limits its pooled investments to the safest types of securities and diversifies its pooled investment portfolio so that potential losses on individual securities will be minimized. Also, new investments shall not be made in securities that are listed on Moody’s Investors Service, Inc. (Moody’s) Watchlist or Standard & Poor’s, Inc. (S&P) Credit Watch with a negative short term rating. The policy specifies the following acceptable credit ratings for specific types of investments in the pooled portfolio:

county oF FairFax, Virginia comPrehenSiVe annual Financial rePort58
BaSic Financial StatementS
• U.S. government sponsored enterprise instruments shall be rated by both Moody’s and S&P with a minimum rating of Prime 1 and A-1, respectively.
• Prime quality commercial paper shall be rated by at least two of the following: Moody’s, with a rating of P-1; S&P, A-1; Fitch Investor’s Services, Inc. (Fitch), F-1; or by Duff and Phelps, Inc., D-1.
• Mutual funds must have a rating of AAA or better by S&P, Moody’s, or another nationally recognized rating agency.
• Bank deposit notes must have a rating of at least A-1 by S&P and P-1 by Moody’s.
• Banker’s acceptances shall be rated by at least two of the following: Moody’s, with a rating of P-1; S&P, A-1; Fitch Investor’s Services, Inc. (Fitch), F-1; or by Duff and Phelps, Inc., D-1.
• Corporate notes must have a rating of at least Aa by Moody’s and a rating of at least AA by S&P.
While the overall investment guidelines for the primary government’s pension trust funds do not spe-cifically address credit risk, investment managers have specific quality limits appropriate for the type of mandate they are managing and that fit within the total risk tolerance of the fund. The component unit’s pension trust fund’s investment policy states that the average credit quality of a fixed income portfolio must be at least AA. The policy also permits up to 10 percent of the portfolio to be invested in Moody’s or S&P’s quality rating below Baa or BBB, respectively. If a security is downgraded be-low the minimum rating, the investment manager must notify the Board of Trustees and an exception to the guidelines must be granted in order for the security to remain in the portfolio.
As of June 30, 2013, the reporting entity had investments in the following issuers with credit quality ratings as a percent of total investments in debt securities as shown on the opposite page:
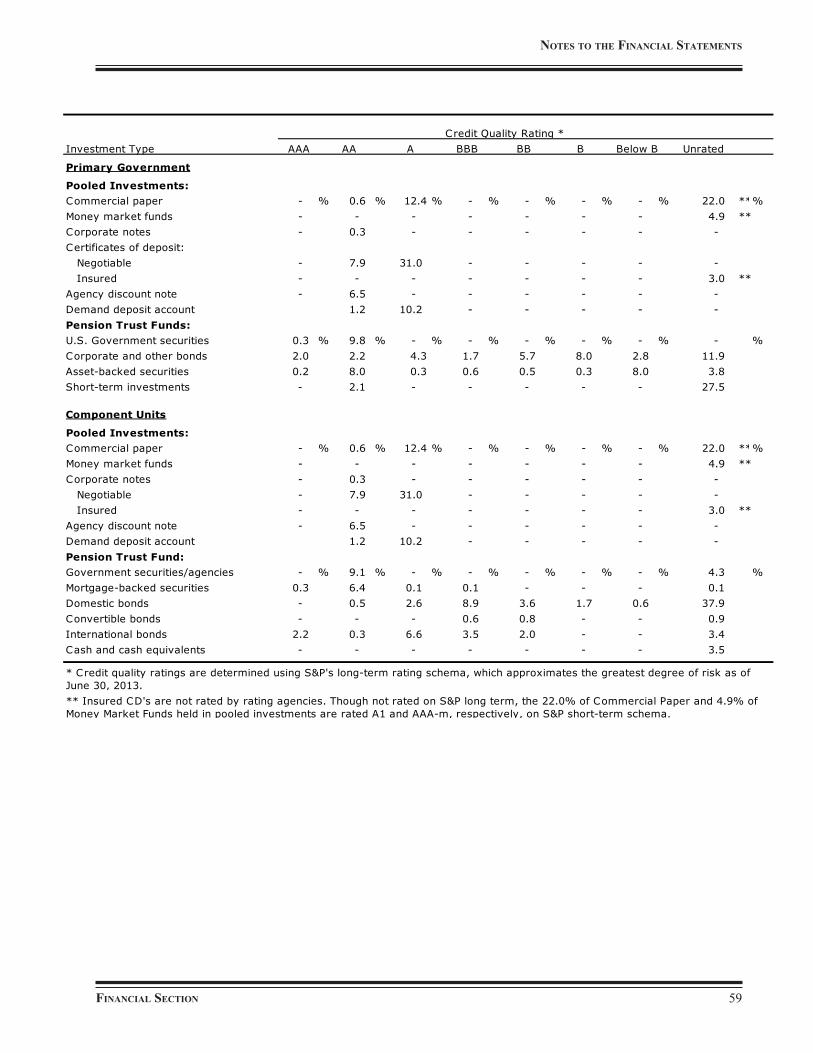
59Financial Section
noteS to the Financial StatementS
Investment Type AAA AA A BBB BB B Below B Unrated
Primary Government
Pooled Investments:Commercial paper - % 0.6 % 12.4 % - % - % - % - % 22.0 **%Money market funds - - - - - - - 4.9 **Corporate notes - 0.3 - - - - - - Certificates of deposit: Negotiable - 7.9 31.0 - - - - - Insured - - - - - - - 3.0 **Agency discount note - 6.5 - - - - - - Demand deposit account 1.2 10.2 - - - - - Pension Trust Funds:U.S. Government securities 0.3 % 9.8 % - % - % - % - % - % - %Corporate and other bonds 2.0 2.2 4.3 1.7 5.7 8.0 2.8 11.9 Asset-backed securities 0.2 8.0 0.3 0.6 0.5 0.3 8.0 3.8 Short-term investments - 2.1 - - - - - 27.5
Component Units
Pooled Investments:Commercial paper - % 0.6 % 12.4 % - % - % - % - % 22.0 **%Money market funds - - - - - - - 4.9 **Corporate notes - 0.3 - - - - - - Negotiable - 7.9 31.0 - - - - - Insured - - - - - - - 3.0 **Agency discount note - 6.5 - - - - - - Demand deposit account 1.2 10.2 - - - - - Pension Trust Fund:Government securities/agencies - % 9.1 % - % - % - % - % - % 4.3 %Mortgage-backed securities 0.3 6.4 0.1 0.1 - - - 0.1 Domestic bonds - 0.5 2.6 8.9 3.6 1.7 0.6 37.9 Convertible bonds - - - 0.6 0.8 - - 0.9 International bonds 2.2 0.3 6.6 3.5 2.0 - - 3.4 Cash and cash equivalents - - - - - - - 3.5
Credit Quality Rating *
* Credit quality ratings are determined using S&P's long-term rating schema, which approximates the greatest degree of risk as of June 30, 2013. ** Insured CD's are not rated by rating agencies. Though not rated on S&P long term, the 22.0% of Commercial Paper and 4.9% of Money Market Funds held in pooled investments are rated A1 and AAA-m, respectively, on S&P short-term schema.

county oF FairFax, Virginia comPrehenSiVe annual Financial rePort60
BaSic Financial StatementS
4. Concentration of Credit Risk
The reporting entity’s investment policy sets the following limits for the types of securities held in its pooled investment portfolio:
In addition, not more than 5 percent of the total pooled funds available for investment at the time of purchase may be invested in any one issuing or guaranteeing corporation for commercial paper, banker’s acceptances, corporate notes, and bank notes. The County shall seek to maintain 5% of the investment portfolio in a combination of mutual funds, demand deposit accounts or open repurchase agreements to meet liquidity requirements.
While the overall investment guidelines for the primary government’s pension trust funds do not specifically address concentration of credit risk, investment managers have specific concentration limits appropriate for the type of mandate they are managing and that fit within the total risk tolerance of the fund. The pension trust funds do not have investments (other than U.S. Government and U.S. Government-guaranteed obligations) in any one organization that represents 5 percent or more of net position available for benefits. The component unit’s pension trust fund’s policy for equity holdings is to limit securities of any one issuer to the greater of 5 percent or the security’s weight in the bench-mark index plus 2 percent of each equity portfolio at market value. For fixed income holdings, the securities of any one issuer with the exception of U.S. Government and its agencies are limited to 10 percent at cost and 15 percent at market of each fixed income portfolio. In addition, the combined allocation to non-U.S. bonds, below investment grade securities, emerging market debt, and convert-ible bonds may not exceed 35 percent of the portfolio. Concerning cash, no more than 10 percent of the cash portfolio shall be invested in certificates of deposit or bankers acceptances issued by any single bank. Up to 35 percent of the cash portfolio may be invested in commercial paper and corpo-rate bonds, with no more than 5 percent invested with any single issuer. Each manager’s portfolio should have no more than 5 percent of its assets allocated to cash. These policies were implemented to ensure diversification of the portfolio.
5. Custodial Credit Risk
For deposits, custodial credit risk is the risk that in the event of a failure of a depository financial institution, the reporting entity may not recover its deposits. In accordance with the Virginia Security for Public Deposits Act (Act), all of the reporting entity’s deposits are covered by federal depository insurance or collateralized in accordance with the Act, which provides for the pooling of collateral pledged by financial institutions with the Treasurer of Virginia to secure public deposits as a class. No specific collateral can be identified as security for one public depositor, and public depositors are prohibited from holding collateral in their name as security for deposits. If any member financial institution fails, the entire collateral pool becomes available to satisfy the claims of governmental entities. If the value of the pool’s collateral is inadequate to cover a loss, additional amounts are assessed on a pro rata basis to the members of the pool. The State Treasury Board is responsible for monitoring compliance with the collateralization and reporting requirements of the Act and for notifying local governments of compliance by participating financial institutions. A multiple financial institution collateral pool that provides for additional assessments is similar to depository insurance,
Repurchase agreements, money market funds and demand deposit accounts 30% maximumBank notes, banker's acceptances and negotiable certificates of deposit 40% maximumCommercial paper 35% maximumCorporate notes 25% maximumUS Treasury and agency securities 100% maximumNon-negotiable certificates of deposit 40% maximum

61Financial Section
noteS to the Financial StatementS
therefore, funds deposited in accordance with the requirements of the Act are considered to be fully insured.
For investments, custodial credit risk is the risk that, in the event of the failure of a counterparty, the reporting entity will not be able to recover the value of its investments or collateral securities that are in the possession of an outside party. Per policy, all of the investments purchased by the reporting entity are insured or registered or are securities held by the reporting entity or its agent in the reporting entity’s name.
The Boards of Trustees of the pension trust funds permit the funds to participate in a securities lending program, which is administered by a custodian. Under this program, certain securities are loaned to approved broker/dealers who borrow the securities and provide collateral in the form of cash, U.S. Treasury or government agency securities, letters of credit, and other securities as specified in the securities lending agreement. The value of the collateral for domestic securities must equal 102 percent of the market value of the security and 105 percent of the market value of the foreign security. The custodian monitors the market value of the collateral on a daily basis. Cash collateral is invested in a fund which is maintained by the custodian or its affiliate. The pension trust funds did not impose any restrictions during the period on the amounts of loans security lending agents made on their behalf, and the agents have agreed to indemnify the pension trust funds by purchasing replacement securities, or returning the cash collateral thereof, in the event a borrower fails to return loaned securities or pay distributions thereon. There were no such failures by any borrower during the fiscal year, nor were there any losses during the period resulting from the default of a borrower or lending agent. At year end, the pension trust funds had no custodial credit risk exposure to borrowers because the amounts the pension trust funds owed the borrower exceeded the amounts the borrowers owed the pension trust funds. Information pertaining to the securities lending transactions as of June 30, 2013, is as follows:
6. Foreign Currency Risk
Per the reporting entity’s policy, pooled investments are limited to U.S. dollar denominated instruments. The pension trust funds are allowed to invest in foreign currency denominated instruments. The component unit’s pension trust fund’s policy allows investment managers to invest
Securities Lent UnderlyingSecurities
Cash CollateralInvestment Value
Securities Collateral
Investment Value Primary Government - Pension Trust Funds:Lent for cash collateral:
U.S. Government securities 3,100,047$ 3,163,945 - Corporate and other bonds 6,059,643 6,214,970 - Common and preferred stock 64,138,611 66,396,709 -
Lent for securities collateral:U.S. Government securities 78,489,762 - 80,670,106 Corporate and other bonds 3,887,792 - 3,967,711 Common and preferred stock 193,181,943 - 212,887,397
Total securities lent 348,857,798$ 75,775,624 297,525,214
Component Unit - Pension Trust Fund:Lent for cash collateral:
U.S. Government and agency securities 1,925,021$ 1,964,661 - Domestic corporate bonds 6,593,923 6,753,205 - Domestic stock 52,324,482 53,587,572 - International stock 3,986,141 4,193,530 -
Total securities lent 64,829,567$ 66,498,968 -

county oF FairFax, Virginia comPrehenSiVe annual Financial rePort62
BaSic Financial StatementS
up to 25 percent of the portfolio in securities issued by non-U.S. guarantors with up to 10 percent in emerging markets. As of June 30, 2013, the fair value in U.S. dollars of the pension trust funds’ foreign currency investments are as follows:
International Securities
Cash and Cash
Equivalents Equity
Convertible and
Fixed Income Total
U.S. DollarsPrimary Government - Pension Trust Funds:Australian dollar 67,968$ 30,036,289 23,189,651 53,293,908 Brazil real 5,166 2,315,655 5,042,963 7,363,784 British pound sterling 291,600 40,100,370 45,766,128 86,158,098 Canadian dollar 161,621 11,116,742 1,363,201 12,641,564 Danish krone - 7,612,093 5,084,792 12,696,885 Euro currency unit 635,826 57,956,102 51,156,127 109,748,055 Hong Kong dollar 47,344 29,247,296 6,568,122 35,862,762 Hungarian forint - 2,940,349 6,013,305 8,953,654 Japanese yen 888,059 58,063,303 49,194,837 108,146,199 Malaysian ringgit - 3,119,762 6,479,736 9,599,498 Mexican new peso 434,942 13,316,103 23,244,220 36,995,265 New Turkish Lira - 1,960,358 4,025,407 5,985,765 New Zealand dollar 2,955 2,232,511 5,389,419 7,624,885 Norwegian krone - - 3,317,374 3,317,374 Philippines peso - 130,675 1,100,149 1,230,824 Polish zloty - 3,049,410 6,272,563 9,321,973 Singapore dollar 6,072 10,837,733 4,721,968 15,565,773 South African comm rand 28,550 5,608,716 4,699,090 10,336,356 South Korean won - 3,166,088 7,999,251 11,165,339 Swedish krona 273,201 8,085,766 5,406,709 13,569,260 Swiss franc 14 15,309,367 7,898,219 23,207,600 Other currencies 72,183 3,266,113 1,797,561 5,135,857
Total fair value 2,915,501$ 309,470,801 275,730,792 587,920,678
Component Unit - Pension Trust Fund:Australian dollar 78,418$ 4,533,115 3,733,573 8,345,106 Brazil real 29,075 1,319,733 12,232,194 13,581,002 Canadian dollar 59,005 11,201,414 6,313,729 17,574,148 Chilean peso 1,481,005 - 671,291 2,152,296 Columbian peso 96,963 - 4,179,923 4,276,886 Czech koruna 2,521 - - 2,521 Danish krone - 1,035,166 - 1,035,166 Euro currency unit 558,184 67,179,721 1,288,276 69,026,181 Hong Kong dollar 420,952 14,761,042 - 15,181,994 Hungarian forint 83 - 2,194,601 2,194,684 Indonesian rupian 9,594 257,649 - 267,243 Israeli Shekel 10,114 - - 10,114 Japanese yen 175,706 46,420,387 - 46,596,093 Malaysian ringgit 105,720 1,418,822 4,315,452 5,839,994 Mexican new peso 5,593 1,297,169 7,941,978 9,244,740 New Taiwan Dollar - 4,618,994 - 4,618,994 New Turkish Lira 10,608 2,204,287 2,566,572 4,781,467 New Zealand dollar 34,735 165,321 7,286,014 7,486,070 Norwegian krone 13,161 4,946,245 2,723,572 7,682,978 Peruvian nuevo sol - - 2,689,845 2,689,845 Philippine peso 85,333 40,561 - 125,894 Polish zloty 98,279 418,355 6,324,943 6,841,577 Pound Sterling 242,872 48,861,069 279,568 49,383,509 Russian rouble - - 3,238,945 3,238,945 South African comm rand 94 1,297,673 4,933,380 6,231,147 Singapore dollar 46,483 6,444,095 4,362,008 10,852,586 South Korean Won 5,645 9,214,948 2,217,393 11,437,986 Swedish krona 99 5,400,984 - 5,401,083 Swiss franc 206,825 17,337,545 - 17,544,370 Thailand baht 574,641 1,743,581 - 2,318,222
Total fair value 4,351,708$ 252,117,876 79,493,257 335,962,841

63Financial Section
noteS to the Financial StatementS
7. Derivatives
In order to enhance investment returns and manage risk exposure, the Primary government’s pension trust funds regularly invest in derivative financial instruments with off-balance-sheet risk. The Systems also entered into derivative transactions to gain exposure to currencies and markets where derivatives are the most cost-effective instrument. During fiscal year 2013, the Systems invested directly in various derivatives including asset-backed securities, collateralized mortgage obligations, exchange-traded futures contracts, forward currency contracts, options, swaps, and floating rate securities. Some traditional on balance sheet securities, such as structured notes, can have derivative-like characteristics where the return may be linked to one or more indices. Asset-backed securities, such as collateralized mortgage obligations (CMOs), are sensitive to changes in interest rates and pre-payments. Futures, forwards, options, and swaps generally are not recorded on the financial statements, whereas floating rate securities, structured notes, and asset-backed securities are recorded. The Systems also have exposure to derivatives indirectly through its ownership interests in certain hedge funds, mutual funds and commingled funds which may use, hold or write derivative financial instruments.
Derivative investments may involve credit and market risk in excess of amounts recognized on the financial statements. The Systems could be exposed to risk if the counterparties to the contracts are unable to meet the terms of the contracts. Holders of futures contracts look to the exchange for performance under the contract and not to the other party holding the offsetting futures position; therefore, the amount at risk due to nonperformance of counterparties to futures contracts is minimal. For counterparties involving over the counter derivatives, the Boards of Trustees of the pension trust funds seek to control such risk through counterparty credit evaluations, counterparty credit limits, and exposure monitoring procedures conducted by investment managers and staff. To address counterparty risk, the Systems instruct the investment managers who use swaps, forwards, and options to only enter into contracts with counterparties rated at investment grade of BBB or better by at least one nationally recognized rating agency.
The Systems held four types of derivative financial instruments with notional values carried off-balance sheet: futures, swaps, currency forwards, and options. Those financial instruments provide the Systems with the opportunity to build passive benchmark positions, manage portfolio duration in relation to various benchmarks, adjust portfolio yield curve exposure, enhance returns, and gain market exposure to various indices in a more efficient way and at lower transaction costs. Risk is inherent to most investments.
Futures contracts are contracts to deliver or receive securities at a specified future date and at a specified price or yield. Futures contracts are traded on organized exchanges (exchange-traded) and typically require an initial margin (collateral) in the form of cash or marketable securities. The net change in the futures contract value is settled daily with the exchanges in cash and the net gains or losses are included in the System’s financial statements. Holders of futures contracts look to the exchange for performance under the contract and not to the entity holding the offsetting futures position. Accordingly, the amount at risk posed by nonperformance of counterparties to futures contracts is minimal. The notional value of the Systems’ investment in futures contracts at June 30, 2013 is shown in the table on the right.
AmountPrimary Government - Pension Trust Funds:Cash & Cash Equivalent Futures:
Long 87,077,523$ Equity Futures:
Long 360,482,220 Fixed Income Futures:
Long 208,892,211 Short (452,657)
Commodity FuturesLong 17,667,058 Short (5,675,425)
Total 667,990,930$
Future Contract Types

county oF FairFax, Virginia comPrehenSiVe annual Financial rePort64
BaSic Financial StatementS
The Systems enter into several types of swap contracts in which two counterparties agree to exchange one stream of payments for another over some agreed to period of time. Swaps are used to manage risk and enhance returns. All counterparties are rated A or better. The Systems’ swap contracts outstanding at June 30, 2013 is summarized as follows:
Option contracts may be exchanged traded or negotiated directly in over the counter transactions between two counterparties. Options holders have the right, but not the obligation, to purchase or sell a financial instrument at a future price and date. The Systems can both purchase and write options. Exchange traded options rely on the exchange for performance and the risk to non-performance of counterparties is minimal. All counterparties for over the counter options are rated A or better. The Systems option contracts at June 30, 2013 are presented as follows:
Currency forwards represent foreign exchange contracts and are used to effect settlements and to protect the base currency value of portfolio assets denominated in foreign currencies against fluctuations in the exchange rates of those currencies or to gain exposure to the change in market value of a specific currency. A forward foreign currency exchange contract is a commitment to purchase or sell a foreign currency at a future date and at a negotiated price. The credit risk of currency contracts that are exchange-traded lies with the clearinghouse of the exchange where the contracts are traded. The credit risk of currency contracts traded over-the counter lies with the counterparty, and exposure usually is equal to the unrealized profit on in-the money contracts. All counterparties are rated A or better. The market risk in foreign currency contracts is
Base Exposure Market ValuePrimary Government - Pension Trust Funds:Equity Swaps:
Total Return Swaps (2,620,881)$ 11,962Variance Swaps 3,130 3,130
Fixed Income Swaps:Credit Default Swaps (29,275) (27,900)Inflation Swaps 51,833 51,833Interest Rate Swaps 522,451 522,248Total Return Swaps (4,248,595) (30,086)
Commodity Swaps:Commodity Swaps 4,896 4,896
Total (6,316,440)$ 536,083
Swap Types
Proceeds Market ValueUnrealized Gain/(loss)
Primary Government - Pension Trust Funds:Cash & cash Equivalent Options:
Put (15,605)$ (1,161) 14,444Commodity Options:
Call (23,202) (516,520) (493,318)Equity Options:
Call (11,440) 17 11,457Put (13,660) (5,384) 8,276
Fixed Income Options:Call (24,499) (12,786) 11,713Put (128,470) (201,441) (72,971)
Total (216,876)$ (737,275) (520,399)

65Financial Section
noteS to the Financial StatementS
related to adverse movements in currency exchange rates. The net unrealized gain on foreign currency spot and forward contract at June 30, 2013 was $1,971,777, and the Systems’ currency forwards contracts are summarized as follows:
Foreign Currency Contracts PurchasedNotional
(Local Currency)
Fair Value of Foreign Currency Contract
Payable in U.S. DollarsPrimary Government - Pension Trust Funds:Australian Dollar (26,075,185) 2,806,857$ Canadian Dollar (1,652,000) 58,605Euro Currency Unit (19,019,039) 177,813Pound Sterling (633,167) 12,436Hong Kong Dollar (640,361) (31)Indian Rupee (42,374,690) 13,964Japanese Yen (188,433,471) 15,269Mexican New Peso (4,232,560) 212New Zealand Dollar (8,500,000) 119,476Philippines Peso (9,223,142) (366)Polish Zloty (989,155) 3,865Russian Rubel (New) (143,800,000) 146,756Swedish Krona (475,149) 392Singapore Dollar (729,425) (524)S African Comm Rand (1,187,098) 11,078South Korean Won (10,852,000,000) 305,716Total Foreign Currency Contracts Purchased 3,671,518$
Foreign Currency Contracts SoldNotional
(Local Currency)
Fair Value of Foreign Currency Contract
Receivable in U.S. DollarsPrimary Government - Pension Trust Funds:Australian Dollar 173,957 (1,685)$ Brazil Real 9,564,515 (458,853)Canadian Dollar 844,000 (26,958)Chilean Peso 3,638,770,000 (141,715)Euro Currency Unit 3,963,204 (88,336)Pound Sterling 9,374,000 (340,708)Indian Rupee 680,380,700 (353,314)Japanese Yen 241,043,650 (77,359)Mexican New Peso 17,011,369 (25,766)Polish Zloty 1,250,720 (14,451)Russian Rubel (New) 143,800,000 (170,905)Singapore Dollar 41,094 105S African Comm Rand 130,500 162South Korean Won 42,551,663 5Thailand Baht 1,166,118 (90)Total Foreign Currency Contracts Sold (1,699,868)$

county oF FairFax, Virginia comPrehenSiVe annual Financial rePort66
BaSic Financial StatementS
As permitted by the Board’s policies, the Systems hold off balance sheet derivatives in a small number of separately managed accounts. Investment managers are prohibited from purchasing securities on margin or using leverage unless specifically permitted within the investment manager’s guidelines. Derivative instruments covered under the scope of GASB 53 are reported at fair value. The changes in fair value of derivative instruments that are used for investment purposes are reported within the investment revenue classification. Gains and losses on derivative securities are determined based upon fair market values as determined by our custodian and recorded in the Statement of Changes in Plan Net Position of the pension trust funds.
During the fiscal year, consistent with standard accounting principle guidelines, the ERFC invested in currency forward derivatives that were not reported on the financial statements as of June 30, 2013. These derivatives are used for hedging non-USD denominated physical instruments back to the base currency. As of June 30, 2013, exposure to the currency forward contracts was $(906,824). In addition, the ERFC had indirect investments in derivatives through its ownership interest in EB DV Large Capital Stock Fund and Emerging Markets Debt Fund, plus with two of the Private Real Estate managers. These portfolios are commingled funds in which ERFC has a percentage ownership. Derivatives in these portfolios consisted of interest rate swaps which reduce the effect of interest rate fluctuations by converting floating rate financing into fixed rate loans for real estate investments. Futures, because they are more liquid than over the counter derivatives, have among the lowest transaction costs available, carry minimal counterparty risk and are de facto currency hedged. Non Deliverable Forward’s (NDF’s) obtain exposure to a currency and its interest rate where the actual purchase of onshore debt is difficult. The interest rate exposure comes through the difference between the spot F/X rate and the forward F/X rate, and through investing the USD cash used as collateral in short dated US bonds. At June 30, 2013, exposure to interest rate swaps was $163,432, exposure to futures contracts was $227,872, exposure to NDF’s was $1,510,081, and exposure to commodity forwards was $179,569.
C. Property Taxes
Real estate is assessed on January 1 each year at the estimated fair market value of all land and improvements. Real estate taxes are due in equal installments, on July 28 and December 5. Unpaid taxes automatically constitute liens on real property which must be satisfied prior to sale or transfer, and after three years, foreclosure proceedings can be initiated.
Personal property taxes on vehicles and business property are based on the estimated fair market value at January 1 each year. The tax on a vehicle may be prorated for the length of time the vehicle has situs in the County. A declaration form is required to be filed, and there is a ten percent penalty for late filing. Personal property taxes are due on October 5, with certain exceptions. Delinquency notices are sent before statutory measures, such as the seizure of property and the placing of liens on bank accounts and/or wages, are initiated.
Real estate and personal property taxes not paid by the due dates are assessed a ten percent late payment penalty on the tax amount. Furthermore, interest accrues from the first day following the due date at an annual rate of ten percent for the first year and thereafter at the rate set by the Internal Revenue Service. The net delinquent taxes receivable, including interest and penalties, as of June 30, 2013, after allowances for uncollectible amounts, is $20,494,032 of which $2,807,642 has been included in tax revenue for fiscal year 2013 because it was collected within 45 days after June 30.
As required by GAAP, the County reports real estate and personal property taxes (net of allowances) assessed for calendar year 2013 as receivables (net of payments totaling $98,142,459 received in advance of the due date) and deferred tax revenue because the County has an enforceable legal claim to these resources at June 30, 2013; however, these resources, which amount to $2,743,662,768, will not be available to the County until fiscal year 2014.

67Financial Section
noteS to the Financial StatementS
The 1998 Virginia General Assembly enacted the Personal Property Tax Relief Act to provide property tax relief on the first $20,000 of value of motor vehicles not used for business purposes. Due to budget constraints, the 2003 Virginia General Assembly froze the tax reduction at 70 percent. The 2005 Virginia General Assembly revised this measure further to limit its tax relief payments to all localities to a total of $950 million per tax year beginning with 2006 (fiscal year 2007). The County’s fixed share of the $950 million is $211,313,944, as determined by its share of the total payments made to all localities by the Commonwealth during calendar years 2004 and 2005 for tax year 2004 (fiscal year 2005). The County’s fixed share from the Commonwealth is reported as intergovernmental revenue in the General Fund.
D. Receivables
Receivables and allowances for uncollectible receivables of the primary government, excluding fiduciary funds, at June 30, 2013, consist of the following:
General Fund
NonmajorGovernmental
FundsEnterprise
Fund
Internal ServiceFunds
Total Primary Government (Exhibit A)
Receivables:Accounts $ 17,568,393 15,225,614 208,793 54,132 33,056,932 Accrued interest 49,340 3,955,545 2,774 1,527 4,009,186 Property taxes:
Delinquent 35,435,391 - - - 35,435,391 Not yet due 2,439,387,004 - - - 2,439,387,004
Business license taxes - delinquent 10,436,078 - - - 10,436,078 Loans - 58,484,315 - - 58,484,315
Total receivables 2,502,876,206 77,665,474 211,567 55,659 2,580,808,906 Allowances for uncollectibles:
Accounts receivable (5,381,382) (270,080) - - (5,651,462)Property taxes:
Delinquent (15,062,516) - - - (15,062,516)Not yet due (5,180,638) - - - (5,180,638)
Business license taxes - delinquent (7,285,571) - - - (7,285,571)Loans - (911,890) - - (911,890)
Total allowances for uncollectibles (32,910,107) (1,181,970) - - (34,092,077)
Total net receivables 2,469,966,099$ 76,483,504 211,567 55,659 2,546,716,829
Receivables of the component units, excluding fiduciary funds, at June 30, 2013, consist of the following:
Public Schools FCRHA
Park Authority
TotalComponent
UnitsReceivables:
Accounts 4,097,440$ 1,050,713 4,675 5,152,828 Accrued interest 172,210 326,480 62,268 560,958 Notes - 28,149,819 - 28,149,819
Total receivables 4,269,650 29,527,012 66,943 33,863,605 Allowances for uncollectibles - (1,801,730) - (1,801,730)
Total net receivables 4,269,650$ 27,725,282 66,943 32,061,875

county oF FairFax, Virginia comPrehenSiVe annual Financial rePort68
BaSic Financial StatementS
Delinquent property taxes receivable from taxpayers in the General Fund as of June 30, 2013, consist of the following:
Amounts due to the primary government and component units from other governmental units at June 30, 2013, include the following:
General Fund
NonmajorGovernmental
FundsEnterprise
FundTotal
(Exhibit A)
Federal government 2,479,866 11,909,047 1,237,620 15,626,533 43,334,449 State government:
Property tax relief:Delinquent - - - - - Allowance for uncollectibles - - - - -
Property tax relief - not yet due 211,313,944 - - 211,313,944 - Allowance for uncollectibles - - - - -
Other 44,286,830 8,148,125 1,300,000 53,734,955 19,610,925 Local governments 1,283,326 6,280,484 42,982,591 50,546,401 417,521
Total intergovernmental units 259,363,966$ 26,337,656 45,520,211 331,221,833 63,362,895
Federal-Build America Bond subsidy 726,358
Total (Exhibit A) 331,948,191
Primary GovernmentComponent
Unit -Public
Schools
e. interFunD BalanceS anD tranSFerS
Payments for fringe benefits are made through the General Fund on behalf of all funds of the County. As a result, interfund payables primarily represent the portion of fringe benefits to be paid by certain other funds to the General Fund. Interfund receivables and payables are also recorded when funds overdraw their share of pooled cash. All amounts are expected to be paid within one year. The composition of interfund balances as of June 30, 2013, is as shown on the right.
Year of LevyReal
EstatePersonal Property Total
2012 7,206,414$ 7,042,757 14,249,171 2011 2,308,825 3,124,609 5,433,434 2010 1,196,799 2,230,045 3,426,844 Prior years 1,977,748 4,573,194 6,550,942
Total delinquent taxes 12,689,786 16,970,605 29,660,391 Penalty and interest 5,896,157 Total delinquent taxes, penalty and interest 35,556,548 Allowances for uncollectibles (15,062,516)
Net delinquent tax receivables 20,494,032$
InterfundReceivables
Interfund Payables
Primary GovernmentGeneral Fund 5,450,834$ - Nonmajor Governmental Funds 1,827,249 7,837,249 Enterprise Fund - 270,125 Internal Service Funds 829,291 -
Total primary government 8,107,374$ 8,107,374
Component UnitPublic Schools:
General Fund 6,746,800$ - Nonmajor Governmental Funds - 5,878,000 Internal Service Funds - 831,100 Fiduciary Funds - 37,700
Total component units 6,746,800$ 6,746,800

69Financial Section
noteS to the Financial StatementS
Due to/from primary government and component units represent amounts paid by one entity on behalf of the other entity. Due to/from primary government and component units as of June 30, 2013, are as follows:
The primary purpose of interfund transfers is to provide funding for operations, including those of the Fairfax-Falls Church Community Services Board, debt service, and capital projects. Interfund transfers for the year ended June 30, 2013, are as follows:
Receivable Entity AmountComponent Units Primary GovernmentPublic Schools General Fund 279,978$
Park Authority General Fund 1,415,255 Park Authority Nonmajor Governmental Fund 367,763
EDA General Fund 484,394
Total 2,547,390$
Primary Government Component UnitGeneral Fund FCRHA 128,676$
General Fund Park Authority 234,666
Total 363,342$
Payable Entity
Transfers In Transfers OutPrimary Government
General Fund 10,030,457$ 485,201,216 Nonmajor Governmental Funds 515,305,143 51,152,920 Internal Service Funds 11,018,536 -
Total primary government 536,354,136$ 536,354,136
Component UnitPublic Schools:
General Fund -$ 30,393,112 Capital Projects Fund 7,616,120 - Nonmajor Governmental Funds 22,776,992 -
Total component units 30,393,112$ 30,393,112
InterfundReceivables
Interfund Payables
Primary GovernmentGeneral Fund 5,450,834$ - Nonmajor Governmental Funds 1,827,249 7,837,249 Enterprise Fund - 270,125 Internal Service Funds 829,291 -
Total primary government 8,107,374$ 8,107,374
Component UnitPublic Schools:
General Fund 6,746,800$ - Nonmajor Governmental Funds - 5,878,000 Internal Service Funds - 831,100 Fiduciary Funds - 37,700
Total component units 6,746,800$ 6,746,800

county oF FairFax, Virginia comPrehenSiVe annual Financial rePort70
BaSic Financial StatementS
F. caPital aSSetS
Capital assets activity for the primary government for the year ended June 30, 2013, is as follows:
Balances July 1, 2012 Increases Decreases
BalancesJune 30, 2013
Primary GovernmentGovernmental activities:
Non-depreciable/non-amortizable:Land 417,792,216$ 816,917 (206,883) 418,402,250 Easements 3,605,076 - (50,018) 3,555,058 Construction in progress 208,056,448 142,121,089 (40,236,702) 309,940,835 Equipment under construction 21,337,570 25,103,378 (33,785,577) 12,655,371 Software in development 4,377,149 1,571,733 (2,031,048) 3,917,834
Total non-depreciable/non-amortizable 655,168,459 169,613,117 (76,310,228) 748,471,348 Depreciable/amortizable:
Equipment 377,402,681 40,080,766 (32,911,640) 384,571,807 Software 70,637,283 16,160,332 - 86,797,615 Library collections 83,928,314 3,557,440 - 87,485,754 Buildings 1,200,022,802 8,352,202 - 1,208,375,004 Improvements 120,360,182 13,051,219 (35,860) 133,375,541 Infrastructure 692,432,866 31,027,817 (822,718) 722,637,965
Total depreciable/amortizable 2,544,784,128 112,229,776 (33,770,218) 2,623,243,686 Less accumulated depreciation/amortization for:
Equipment (211,758,289) (33,684,389) 27,592,925 (217,849,753) Software (1,936,424) (5,136,532) - (7,072,956) Library collections (73,546,886) (3,747,947) - (77,294,833) Buildings (354,613,415) (25,640,520) 50,018 (380,203,917) Improvements (48,846,154) (4,174,212) (4,953,037) (57,973,403) Infrastructure (218,411,154) (16,022,260) 348,547 (234,084,867)
Total accumulated depreciation/amortization (909,112,322) (88,405,860) 23,038,453 (974,479,729) Total capital assets, being depreciated/amortized, net 1,635,671,806 23,823,916 (10,731,765) 1,648,763,957
Total capital assets, net - Governmental activities 2,290,840,265 193,437,033 (87,041,993) 2,397,235,305 Business-type activities:
Non-depreciable/non-amortizable:Land 17,370,540 36,783 - 17,407,323 Easements 371,381 35,448 - 406,829 Construction in progress 85,651,793 48,647,937 (19,150,542) 115,149,188
Total non-depreciable/non-amortizable 103,393,714 48,720,168 (19,150,542) 132,963,340 Depreciable/amortizable:
Equipment 11,617,382 1,889,262 (1,327,223) 12,179,421 Purchased capacity 823,610,880 45,436,821 - 869,047,701 Buildings 88,398,832 - - 88,398,832 Infrastructure 1,021,344,142 25,033,104 - 1,046,377,246
Total depreciable/amortizable 1,944,971,236 72,359,187 (1,327,223) 2,016,003,200 Less accumulated depreciation/amortization for:
Equipment (8,732,243) (813,409) 1,170,306 (8,375,346) Purchased capacity (229,434,178) (28,022,334) - (257,456,512) Buildings (37,020,421) (2,188,049) - (39,208,470) Infrastructure (469,656,322) (23,334,507) - (492,990,829)
Total accumulated depreciation/amortization (744,843,164) (54,358,299) 1,170,306 (798,031,157) Total capital assets, being depreciated/amortized, net 1,200,128,072 18,000,888 (156,917) 1,217,972,043
Total capital assets, net - Business-type activities 1,303,521,786 66,721,056 (19,307,459) 1,350,935,383
Total capital assets, net - Primary government 3,594,362,051$ 260,158,089 (106,349,452) 3,748,170,688

71Financial Section
noteS to the Financial StatementS
Capital assets activity for the component units for the year ended June 30, 2013, is as follows:
BalancesJune 30, 2012 Increases Decreases
BalancesJune 30, 2013
Component Units Public Schools
Non-depreciable/non-amortizable:Land 44,869,395$ - - 44,869,395 Construction in progress 194,676,267 108,003,068 (109,305,017) 193,374,318 Software in development 4,843,645 1,703,127 (281,251) 6,265,521
Total non-depreciable/non-amortizable 244,389,307 109,706,195 (109,586,268) 244,509,234 Depreciable/amortizable:
Equipment 254,773,603 21,194,455 (8,223,612) 267,744,446 Software 4,187,036 678,388 - 4,865,424 Library collections 33,477,414 3,507,141 (2,215,375) 34,769,180 Buildings 1,178,370,955 21,095,241 - 1,199,466,196 Improvements 1,724,134,760 112,002,099 - 1,836,136,859
Total depreciable/amortizable 3,194,943,768 158,477,324 (10,438,987) 3,342,982,105 Less accumulated depreciation/amortization for:
Equipment (168,631,095) (15,936,609) 6,054,995 (178,512,709) Software (1,629,917) (844,584) - (2,474,501) Library collections (24,753,427) (3,721,208) 4,163,796 (24,310,839) Buildings (479,242,319) (30,993,110) - (510,235,429) Improvements (691,700,341) (68,570,532) - (760,270,873)
Total accumulated depreciation/amortization (1,365,957,099) (120,066,043) 10,218,791 (1,475,804,351) Total capital assets, being depreciated/amortized, net 1,828,986,669 38,411,281 (220,196) 1,867,177,754
Total capital assets, net - Public Schools 2,073,375,976 148,117,476 (109,806,464) 2,111,686,988 FCRHA
Non-depreciable/non-amortizable:Land 42,096,776 - - 42,096,776 Construction in progress 885,043 1,994,241 (1,046,280) 1,833,004
Total non-depreciable/non-amortizable 42,981,819 1,994,241 (1,046,280) 43,929,780 Depreciable/amortizable:
Equipment 1,943,111 - - 1,943,111 Buildings and improvements 217,117,252 980,550 - 218,097,802
Total depreciable/amortizable 219,060,363 980,550 - 220,040,913 Less accumulated depreciation/amortization for:
Equipment (5,058,496) (7,390) - (5,065,886) Buildings and improvements (108,289,066) (6,242,213) - (114,531,279)
Total accumulated depreciation/amortization (113,347,562) (6,249,603) - (119,597,165) Total capital assets, being depreciated/amortized, net 105,712,801 (5,269,053) - 100,443,748
Total capital assets, net - FCRHA 148,694,620 (3,274,812) (1,046,280) 144,373,528 Park Authority
Non-depreciable/non-amortizable:Land 364,918,503 1,251,920 (19,210,120) 346,960,303 Easements 17,016,009 - - 17,016,009 Construction in progress 10,391,490 8,896,661 (5,877,780) 13,410,371
Total non-depreciable/non-amortizable 392,326,002 10,148,581 (25,087,900) 377,386,683 Depreciable/amortizable:
Equipment 13,510,516 732,696 (555,030) 13,688,182 Buildings and improvements 353,474,528 12,062,227 - 365,536,755
Total depreciable/amortizable 366,985,044 12,794,923 (555,030) 379,224,937 Less accumulated depreciation/amortization for:
Equipment (11,997,307) (427,711) 565,176 (11,859,842) Buildings and improvements (160,226,880) (10,036,650) - (170,263,530)
Total accumulated depreciation/amortization (172,224,187) (10,464,361) 565,176 (182,123,372) Total capital assets, being depreciated/amortized, net 194,760,857 2,330,562 10,146 197,101,565
Total capital assets, net - Park Authority 587,086,859 12,479,143 (25,077,754) 574,488,248 EDA
Depreciable/amortizable:Equipment 47,193 - (8,346) 38,847 Buildings 767,961 - - 767,961
Total depreciable/amortizable 815,154 - (8,346) 806,808 Less accumulated depreciation/amortization for:
Equipment (43,441) (2,480) 8,346 (37,575) Buildings (222,957) (74,319) - (297,276)
Total accumulated depreciation/amortization (266,398) (76,799) 8,346 (334,851)
Total capital assets, net - EDA 548,756 (76,799) - 471,957
Total capital assets, net - Component units 2,809,706,211$ 157,245,008 (135,930,498) 2,831,020,721

county oF FairFax, Virginia comPrehenSiVe annual Financial rePort72
BaSic Financial StatementS
Depreciation and amortization expense for the year ended June 30, 2013, charged to the functions of the primary government and component units is as follows:
g. retirement PlanS
The reporting entity administers the following four separate public employee retirement systems that provide pension benefits for various classes of employees. In addition, professional employees of Public Schools participate in a plan sponsored and administered by the Virginia Retirement System (VRS).
1. Fairfax County Employees’ Retirement System
Plan Description
The Fairfax County Employees’ Retirement System (ERS) is a cost-sharing multiple-employer defined benefit pension plan which covers only employees of the reporting entity. The plan covers full-time and certain part-time employees of the reporting entity who are not covered by other plans of the reporting entity or the VRS. Information regarding membership in the ERS is disclosed in item 6 of this note.
Benefit provisions are established and may be amended by County ordinances. All benefits vest at five years of creditable service. Members who were hired before January 1, 2013 may elect to join Plan A or Plan B, and members who were hired on or after January 1, 2013 may elect to join Plan C or Plan D. To be eligible for normal retirement, an individual must meet the following criteria: (a) attain the age of 65 with five years of service, (b) for Plans A and B, attain the age of 50 with age plus years of service being greater than or equal to 80, or (c) for Plans C and D, attain the age of 55 with age plus years of service being greater than or equal to 85. The normal retirement benefit is calculated using average final compensation (i.e., the highest 78 consecutive two week pay periods or the highest 36 consecutive monthly pay periods) and years (or partial years) of creditable service at date of termination. In addition, if normal retirement occurs before Social Security benefits are scheduled to begin, an additional monthly benefit is paid to retirees. The plan provides that unused sick leave credit may be used in the calculation of average final compensation by projecting the final salary during the unused sick leave period. The benefit for early retirement is actuarially reduced and payable at early termination.
GovernmentalActivities
Business-typeActivities
ComponentUnits
Primary GovernmentGeneral government administration $20,381,441 - - Judicial administration 979,728 - - Public safety 11,822,984 - - Public works 15,238,162 54,358,299 - Health and welfare 2,676,178 - - Community development 18,271,430 - - Parks, recreation, and cultural 7,067,617 - - In addition, depreciation on capital assets held by the
County's internal service funds is charged to the various functions based on asset usage. 11,968,320 - -
Component UnitsPublic Schools - - 120,066,043 FCRHA - - 6,249,603 Park Authority - - 10,464,361 EDA - - 76,799
Total depreciation and amortization expense 88,405,860$ 54,358,299 136,856,806

73Financial Section
noteS to the Financial StatementS
Effective July 1, 2005, a Deferred Retirement Option Program (DROP) was established for eligible members of the ERS. Members who are eligible for normal service retirement are eligible to participate in this program. DROP provides the ability for an employee to retire for purposes of the pension plan, while continuing to work and receive a salary for a period of three years. During the DROP period, the pension plan accumulates the accrued monthly benefit into an account balance identified as belonging to the member. The account balance is credited with interest in the amount of 5.0 percent per annum, compounded monthly. The monthly benefit is calculated using service and final compensation as of the date of entry in DROP, with increases equal to the annual COLA adjustment provided for retirees.
The ERS issues a publicly available annual financial report that includes financial statements and required supplementary information. That report may be obtained by writing to the Employees’ Retirement System, 10680 Main Street, Suite 280, Fairfax, VA 22030, or by calling (703) 279-8200.
Funding Policy
The contribution requirements of ERS members are established and may be amended by County ordinances. Plan A and Plan C require member contributions of 4.0 percent of compensation up to the maximum Social Security wage base and 5.33 percent of compensation in excess of the wage base. Plan B and Plan D require member contributions of 5.33 percent of compensation.
The County is required to contribute at an actuarially determined rate; the rate for the year ended June 30, 2013, was 18.49 percent of annual covered payroll. The decision was made to commit additional funding and a rate of 19.05 percent was adopted for fiscal year 2013. In the event the ERS’s funded ratio (the ratio of the actuarial value of assets to the actuarial accrued liability) exceeds 120 percent or falls below 90 percent, the contribution rate will be adjusted to bring the funded ratio back within these parameters.
Annual Pension Cost
For the years ended June 30, 2013, 2012, and 2011, the County’s and Public Schools’ annual pension costs and actual contributions are as follows:
2013 2012 2011
County 91,742,368$ 82,844,146 69,637,538 Public Schools 35,705,650 31,838,392 26,969,997
Total 127,448,018$ 114,682,538 96,607,535
Annual Pension Costs and Actual Contributionsfor Years Ended June 30
For the years ended June 30, 2013, 2012, and 2011, the County’s and Public Schools’ annual required contributions (ARC) are as follows:
2013 2012 2011
County $113,847,222 102,784,539 88,254,921 Public Schools 44,308,744 39,501,819 34,180,344
Total $158,155,966 142,286,358 122,435,265
ARC for Years Ended June 30

county oF FairFax, Virginia comPrehenSiVe annual Financial rePort74
BaSic Financial StatementS
The ARC for the year ended June 30, 2013 was determined as part of the July 1, 2012, actuarial valuation using the entry age actuarial cost method. Significant actuarial assumptions used in the valuation include:
a. A rate of return on the investment of present and future assets of 7.5 percent per year compounded annually, including an inflation component of 3.0 percent.
b. Projected annual salary increases of 4.0 to 10.0 percent, including an inflation component of 3.0 percent.
c. Cost of living adjustments increases of 2.75 percent.
The actuarial value of ERS’s assets was determined using techniques that smooth the effects of short-term volatility in the market value of investments over a three-year period. Any excess of these assets over actuarial accrued liability is amortized as a level percentage of projected payroll over an open 15 year period. The remaining amortization period is 15 years.
For fiscal years ended June 30, 2011 through June 30, 2013, the County’s Employees’ Retirement System funding progress is as follows:
Concentrations
The ERS does not have investments (other than U.S. Government and U.S. Government guaranteed obligations) in any one organization that represent 5.0 percent or more of net position held in trust for pension benefits.
2. FairfaxCountyPoliceOfficersRetirementSystem
Plan Description
The Fairfax County Police Officers Retirement System (PORS) is a legally separate single-employer defined benefit pension plan established under the Code of Virginia. The plan covers County police officers who are not covered by other plans of the reporting entity or the VRS and former Park Police officers who elected to transfer to the PORS from the Uniformed Retirement System effective January 22, 1983. Information regarding membership in the PORS is disclosed in item 6 of this note.
Benefit provisions are established and may be amended by County ordinances. All benefits vest at five years of creditable service. To be eligible for normal retirement, an individual must meet the following criteria: (a) if employed before July 1, 1981; attain the age of 55 or have completed 20 years of creditable service, or (b) if employed on or after July 1, 1981; attain the age of 55 or have completed 25 years of creditable service. The normal retirement benefit is calculated using average
Actuarial Value of Assets
Actuarial Accrued
Liability (AAL) - Entry Age
Unfunded AAL (UAAL)
(Funding Excess)
Covered Payroll
(000) ( a ) (000) ( b ) (000) ( b-a ) (000) ( c )
7/1/2010 2,636,052 3,771,060 1,135,008 69.90 629,249 180.387/1/2011 2,841,466 4,018,924 1,177,458 70.70 642,073 183.387/1/2012 3,053,412 4,264,175 1,210,763 71.61 642,639 188.40
Funded Ratio
UAAL (Funding Excess) as a Percentage of
Covered PayrollActuarial Valuation
Date ( a/b ) ( ( b-a ) / c )

75Financial Section
noteS to the Financial StatementS
final compensation and years (or partial years) of creditable service at date of termination. The plan provides that unused sick leave credit may be used in the calculation of average final compensation by projecting the final salary during the unused sick leave period. Those sworn in on or after January 1, 2013, may not use more than 2,080 hours of accrued sick leave toward service credit for retirement or DROP entry. To be eligible for early retirement, the employee must have 20 years of creditable service (does not apply if hired before July 1, 1981). The benefit for early retirement is actuarially reduced and payable at early termination.
Effective October 1, 2003, a DROP was established for eligible members of the PORS. Members who are eligible for normal service retirement are eligible to participate in this program. DROP provides the ability for an employee to retire for purposes of the pension plan, while continuing to work and receive a salary for a period of three years. During the DROP period, the pension plan accumulates the accrued monthly benefit into an account balance identified as belonging to the member. The account balance is credited with interest in the amount of 5.0 percent per annum, compounded monthly. The monthly benefit is calculated using service and final compensation as of the date of entry in DROP, with increases equal to the annual COLA adjustment provided for retirees.
The PORS issues a publicly available annual financial report that includes financial statements and required supplementary information. That report may be obtained by writing to the Police Officers Retirement System, 10680 Main Street, Suite 280, Fairfax, VA 22030, or by calling (703) 279-8200.
Funding Policy
The contribution requirements of PORS members are established and may be amended by County ordinances. Member contributions are based on 10.0 percent of compensation.
The County contributes at a fixed rate as determined by an annual actuarial valuation, unless the PORS’s funding ratio falls outside of a pre-determined range. Once outside the range, the rate is either increased or decreased to accelerate or decelerate the funding until the ratio falls back within the range. The range for the PORS is a minimum funding ratio of 90 percent and a maximum funding ratio of 120 percent. The actuarial rate for the year ended June 30, 2013, was 32.04 percent of annual covered payroll. The decision was made to commit additional funding and a rate of 33.15 percent was adopted for fiscal year 2013.
Annual Pension Cost
Information related to the County’s annual pension cost, ARC, actual contributions, and net pension obligation (NPO) for fiscal years 2013, 2012, and 2011 are as follows:
2013 2012 2011
ARC, for the year ended June 30 43,091,299$ 39,408,110 36,872,751 Interest on NPO from prior year 4,126,101 3,581,943 3,033,289 Actuarial adjustment (4,959,941) (4,033,924) (3,416,039) Annual pension cost 42,257,459 38,956,129 36,490,001 Actual contributions (34,011,347) (31,700,690) (29,174,611) Increase in the NPO, for the year ended June 30 8,246,112 7,255,439 7,315,390 NPO, beginning of year 55,014,678 47,759,239 40,443,849 NPO, end of year 63,260,790$ 55,014,678 47,759,239
Percentage of annual pension cost contributed 80.49% 81.38% 79.95%
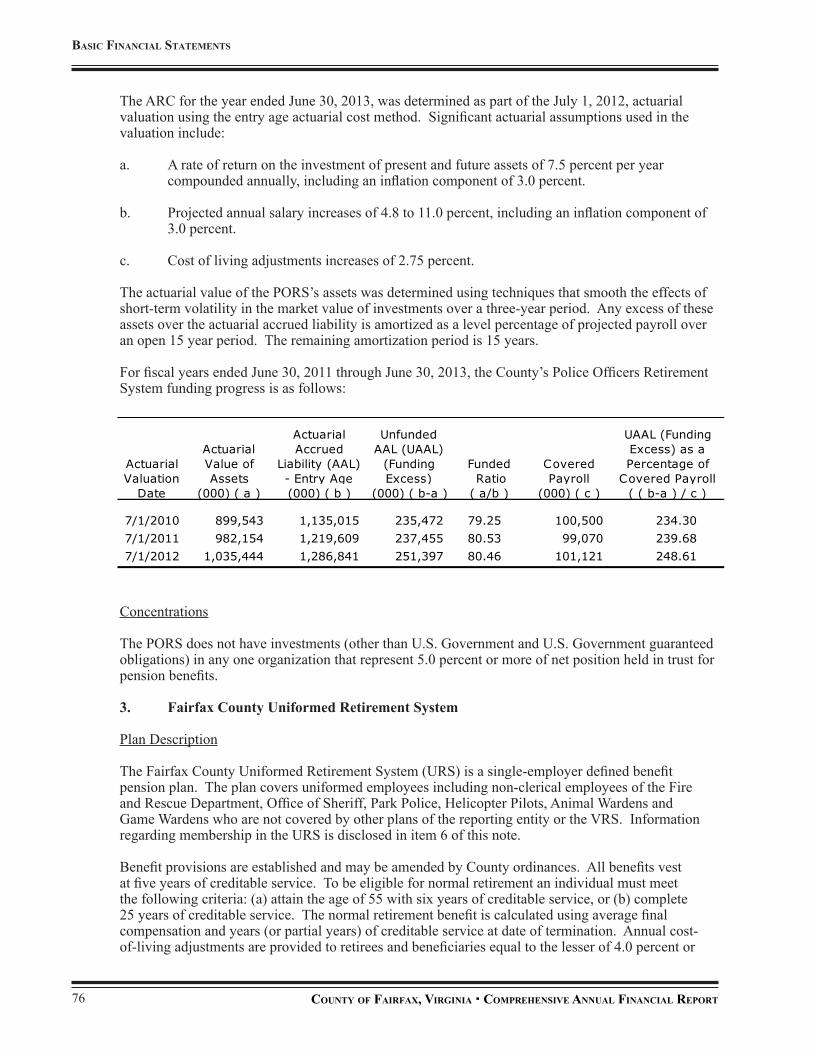
county oF FairFax, Virginia comPrehenSiVe annual Financial rePort76
BaSic Financial StatementS
The ARC for the year ended June 30, 2013, was determined as part of the July 1, 2012, actuarial valuation using the entry age actuarial cost method. Significant actuarial assumptions used in the valuation include:
a. A rate of return on the investment of present and future assets of 7.5 percent per year compounded annually, including an inflation component of 3.0 percent.
b. Projected annual salary increases of 4.8 to 11.0 percent, including an inflation component of 3.0 percent.
c. Cost of living adjustments increases of 2.75 percent.
The actuarial value of the PORS’s assets was determined using techniques that smooth the effects of short-term volatility in the market value of investments over a three-year period. Any excess of these assets over the actuarial accrued liability is amortized as a level percentage of projected payroll over an open 15 year period. The remaining amortization period is 15 years.
For fiscal years ended June 30, 2011 through June 30, 2013, the County’s Police Officers Retirement System funding progress is as follows:
Concentrations
The PORS does not have investments (other than U.S. Government and U.S. Government guaranteed obligations) in any one organization that represent 5.0 percent or more of net position held in trust for pension benefits.
3. Fairfax County Uniformed Retirement System
Plan Description
The Fairfax County Uniformed Retirement System (URS) is a single-employer defined benefit pension plan. The plan covers uniformed employees including non-clerical employees of the Fire and Rescue Department, Office of Sheriff, Park Police, Helicopter Pilots, Animal Wardens and Game Wardens who are not covered by other plans of the reporting entity or the VRS. Information regarding membership in the URS is disclosed in item 6 of this note.
Benefit provisions are established and may be amended by County ordinances. All benefits vest at five years of creditable service. To be eligible for normal retirement an individual must meet the following criteria: (a) attain the age of 55 with six years of creditable service, or (b) complete 25 years of creditable service. The normal retirement benefit is calculated using average final compensation and years (or partial years) of creditable service at date of termination. Annual cost-of-living adjustments are provided to retirees and beneficiaries equal to the lesser of 4.0 percent or
Actuarial Value of Assets
Actuarial Accrued
Liability (AAL) - Entry Age
Unfunded AAL (UAAL)
(Funding Excess)
Covered Payroll
(000) ( a ) (000) ( b ) (000) ( b-a ) (000) ( c )
7/1/2010 899,543 1,135,015 235,472 79.25 100,500 234.307/1/2011 982,154 1,219,609 237,455 80.53 99,070 239.687/1/2012 1,035,444 1,286,841 251,397 80.46 101,121 248.61
Funded Ratio
UAAL (Funding Excess) as a Percentage of
Covered PayrollActuarial Valuation
Date ( a/b ) ( ( b-a ) / c )

77Financial Section
noteS to the Financial StatementS
the percentage increase in the Consumer Price Index for the Washington Consolidated Metropolitan Statistical Area. The plan provides that unused sick leave credit may be used in the calculation of average final compensation by projecting the final salary during the unused sick leave period. Those who commenced employment on or after January 1, 2013, may not use more than 2,080 hours of accrued sick leave toward service credit for retirement or DROP entry. To be eligible for early retirement, employees must have 20 years of creditable service. The benefit for early retirement is actuarially reduced and payable at early termination.
Effective October 1, 2003, a Deferred Retirement Option Program (DROP) was established for eligible members of the URS. Members who are eligible for normal service retirement are eligible to participate in this program. DROP provides the ability for an employee to retire for purposes of the pension plan, while continuing to work and receive a salary for a period of three years. During the DROP period, the pension plan accumulates the accrued monthly benefit into an account balance identified as belonging to the member. The account balance is credited with interest in the amount of 5.0 percent per annum, compounded monthly. The monthly benefit is calculated using service and final compensation as of the date of entry in DROP, with increases equal to the annual COLA adjustment provided for retirees.
The URS issues a publicly available annual financial report that includes financial statements and required supplementary information. That report may be obtained by writing to the Uniformed Retirement System, 10680 Main Street, Suite 280, Fairfax, VA 22030, or by calling (703) 279-8200.
Funding Policy
The contribution requirements of URS members are established and may be amended by County ordinances. Plan A members were given the opportunity to enroll in Plan B as of July 1, 1981 and to enroll in Plan C as of April 1, 1997. From July 1, 1981 through March 31, 1997, all new hires were enrolled in Plan B. Plan B members were given the opportunity to enroll in Plan D as of April 1, 1997. From April 1, 1997 through December 31, 2012, all new hires were enrolled in Plan D. From January 1, 2013 forward all new hires are enrolled in Plan E. Plan A requires member contributions of 4.0 percent of compensation up to the Social Security wage base and 5.75 percent of compensation in excess of the wage base. Plan B requires member contributions of 7.08 percent of compensation up to the Social Security wage base and 8.83 percent of compensation in excess of the wage base. Plan C requires member contributions of 4.0 percent of compensation. Plan D and Plan E require contributions of 7.08 percent of compensation.
The County contributes at a fixed rate as determined by an annual actuarial valuation, unless the URS’s funding ratio falls outside of a pre-determined range. Once outside the range, the rate is either increased or decreased to accelerate or decelerate the funding until the ratio falls back within the range. The range for the URS is a minimum funding ratio of 90 percent and a maximum funding ratio of 120 percent. The County is required to contribute at an actuarially determined rate; the rate for the year ended June 30, 2013, was determined actuarially to be 34.04% of annual covered payroll. The decision was made to commit additional funding and a rate of 35.00% was adopted for fiscal year 2013.
Annual Pension Cost
Information related to the County’s annual pension cost, ARC, actual contributions, and NPO for fiscal years 2013, 2012, and 2011 is presented on the following page:

county oF FairFax, Virginia comPrehenSiVe annual Financial rePort78
BaSic Financial StatementS
The ARC for the year ended June 30, 2013, was determined as part of the July 1, 2012, actuarial valuation using the entry age actuarial cost method. Significant actuarial assumptions used in the valuation include:
a. A rate of return on the investment of present and future assets of 7.5 percent per year compounded annually, including an inflation component of 3.0 percent.
b. Projected annual salary increases of 4.8 to 11.0 percent, including an inflation component of 3.0 percent.
c. Cost of living adjustments increases of 2.75 percent.
The actuarial value of URS’s assets was determined using techniques that smooth the effects of short-term volatility in the market value of investments over a three-year period. URS’s unfunded actuarial accrued liability is amortized as a level percentage of projected payroll over an open 15 year period. The remaining amortization period is 15 years.
For fiscal years ended June 30, 2011 through June 30, 2013, the County’s Uniformed Retirement System funding progress is as follows:
Actuarial Value of Assets
Actuarial Accrued
Liability (AAL) - Entry Age
Unfunded AAL (UAAL)
(Funding Excess)
Covered Payroll
(000) ( a ) (000) ( b ) (000) ( b-a ) (000) ( c )
7/1/2010 1,095,080 1,427,617 332,537 76.71 146,777 226.567/1/2011 1,185,594 1,526,218 340,624 77.68 147,326 231.207/1/2012 1,247,526 1,613,654 366,128 77.31 148,236 246.99
Funded Ratio
UAAL (Funding Excess) as a Percentage of
Covered PayrollActuarial Valuation
Date ( a/b ) ( ( b-a ) / c )
2013 2012 2011
ARC, for the year ended June 30 62,240,960$ 57,663,522 53,208,307 Interest on NPO from prior year 3,612,716 3,093,579 2,563,493 Actuarial adjustment (4,342,808) (3,483,937) (2,886,962) Annual pension cost 61,510,868 57,273,164 52,884,838 Actual contributions (53,722,160) (50,351,335) (45,817,015) Increase in the NPO, for the year ended June 30 7,788,708 6,921,829 7,067,823 NPO, beginning of year 48,169,553 41,247,724 34,179,901 NPO, end of year 55,958,261$ 48,169,553 41,247,724
Percentage of annual pension cost contributed 87.34% 87.91% 86.64%
79Financial Section
noteS to the Financial StatementS
Concentrations
The URS does not have investments (other than U.S. Government and U.S. Government guaranteed obligations) in any one organization that represent 5.0 percent or more of net position held in trust for pension benefits.
4. Educational Employees’ Supplementary Retirement System of Fairfax County
Plan Descriptions
The Educational Employees’ Supplementary Retirement System of Fairfax County (ERFC) is a legally separate single-employer retirement system established under the Code of Virginia. The ERFC covers all full-time educational and civil service employees who are employed by the Public Schools and who are not covered by other plans of the reporting entity. The ERFC contains two plans, ERFC and ERFC 2001. ERFC is the original defined benefit plan effective July 1, 1973, and remains in effect. It is, however, closed to new members. Effective July 1, 2001, all new-hire full-time educational and civil service employees are enrolled in the ERFC 2001 plan. This new defined benefit plan incorporates a streamlined stand-alone retirement benefit structure.
The ERFC and ERFC 2001 plans provide retirement, disability, and death benefits to plan members and their beneficiaries. Annual post-retirement increases of 3.0 percent are effective each March 31. All benefits vest after five years of creditable service. Benefit provisions are established and may be amended by the Fairfax County Public School Board. The ERFC plan supplements the Virginia Retirement System plan. The benefit structure is designed to provide a level retirement benefit through a combined ERFC/VRS benefit structure. The ERFC 2001 plan has a stand-alone structure. Member contributions for the ERFC and ERFC 2001 plans are made through an arrangement which results in a deferral of taxes on the contributions. Further analysis of member contributions may be found in Article III of the ERFC and ERFC 2001 Plan Documents.
The ERFC and ERFC 2001 plans provide for a variety of benefit payment types. Minimum eligibility conditions for receipt of full benefits for ERFC members are either attaining the age of 55 with 25 years of creditable service or completing five years of creditable service at age 65. Minimum eligibility conditions for receipt of full benefits for ERFC 2001 members are either completing five years of creditable service prior to age 60 or any age with 30 years of creditable service. A description of each of the types of benefits payments is contained in the actuarial valuation and the Plan Documents. Total plan membership for the plans is disclosed in item 6 of this note.
The ERFC issues a publicly available financial report that includes financial statements and required supplementary information. That report may be obtained by writing to the Educational Employees’ Supplementary Retirement System, 8001 Forbes Place, Springfield, VA 22151.
Funding Policy
The contribution requirements for ERFC and ERFC 2001 members are established and may be amended by the ERFC Board of Trustees with the approval of the School Board. All members are required to contribute 4.0 percent of their covered salaries. The employer is required to contribute at an actuarially determined rate. For fiscal year 2013, Public Schools is required to contribute 5.34 percent of annual covered payroll for educational employees and civil service employees. Annual Pension Cost For each of the years ended June 30, 2013, 2012, and 2011, the Public Schools’ annual pension cost of $67,734,634; $52,934,245; and $47,118,111, respectively, was equal to its ARC and actual contributions.

county oF FairFax, Virginia comPrehenSiVe annual Financial rePort80
BaSic Financial StatementS
The ARC for the year ended June 30, 2013, was determined as part of the December 31, 2012, actuarial valuation using the entry age actuarial cost method. Significant actuarial assumptions used in the valuation include:
a. A rate of return on the investment of present and future assets of 7.5 percent per year compounded annually, including an inflation component of 3.75 percent.
b. Projected annual salary increases of 3.75 to 9.05 percent, including an inflation component of 3.75 percent.
c. Post-retirement benefit increases of 3.0 percent compounded annually.
The actuarial value of the ERFC’s assets was determined using techniques that smooth the effects of short-term volatility in the market value of investments over a five-year period. Any excess of assets over the actuarial accrued liability is amortized as a level percentage of closed payrolls over a future period, which has never exceeded 30 years. The remaining amortization period, which is closed at December 31, 2012, was 26 years.
For the fiscal years 2011 through 2013, the County’s Educational Employees’ Supplementary Retirement System funding progress is as follows:
Concentrations
ERFC’s investment guidelines limit the securities of any one issue to 10 percent at cost and 15 percent at market of each fixed income portfolio. These guidelines allow an exception for U.S. government securities and its agencies.
5. Virginia Retirement System
Plan Description
Public Schools contributes to the Virginia Retirement System (VRS) on behalf of covered professional Public Schools employees. VRS is a cost-sharing multiple-employer public employee defined benefit pension plan administered by the Commonwealth of Virginia for its political subdivisions. All full-time, salaried, permanent employees of participating employers must participate in the VRS.
In accordance with the requirements established by State statute, the VRS provides retirement and disability benefits, annual cost-of-living adjustments, and death benefits to plan members and beneficiaries. The VRS issues a publicly available annual report that includes financial statements and required supplementary information for the VRS. This report can be obtained by writing to the Virginia Retirement System, P.O. Box 2500, Richmond, VA 23218-2500.
Actuarial Value of Assets
Actuarial Accrued
Liability (AAL) - Entry Age
Unfunded AAL (UAAL)
(Funding Excess)
Covered Payroll
(000) ( a ) (000) ( b ) (000) ( b-a ) (000) ( c )
12/31/2010 1,822,603 2,384,061 561,458 76.45 1,191,290 47.13 12/31/2011 1,866,952 2,470,964 604,012 75.56 1,246,973 48.44 12/31/2012 1,935,292 2,566,128 630,836 75.42 1,297,537 48.62
Funded Ratio
UAAL (Funding Excess) as a Percentage of
Covered PayrollActuarial Valuation
Date ( a/b ) ( ( b-a ) / c )

81Financial Section
noteS to the Financial StatementS
Funding Policy
Plan members are required by State statute to contribute 5.0 percent of their annual covered salary to the VRS. If a plan member leaves covered employment, the accumulated contributions plus interest earned may be refunded. In accordance with State statute, Public Schools is required to contribute at an actuarially determined rate or a rate approved by the General Assembly. In fiscal year 2013, The General Assembly adopted a highter VRS emplyer contribution rate of 11.66 percent compared to the prior year rate of 6.33 percent. In fiscal years 2011 and 2012, the General Assembly approved significantly lower VRS rates in order to mitigate state budget cuts to localities. By doing so, Virginia school districts are essentially deferring a portion of the recommended employer contibutions in those years. FCPS will have to repay these deferred contibutions beginning in fiscal year 2013. The FCPS Board committed $16.9 million of June 30, 2013 fund balance toward this purpose. In addition, the General Assembly approved an employer rate increase from 0.6 percent in fiscal year 2012 to 1.11 percent in fiscal year 2013 for the VRS Retiree Health Insurance Credit. State statute may be amended only by the Commonwealth of Virginia Legislature. The combined FCPS employer and member contributions to VRS, including the Retiree Health Insurance Credit, for the years ended June 30, 2013, 2012, and 2011 were $242,343,488; $146,454,888; and $112,157,560 respectively, equal to the required contributions for each year.
6. Current Plan Membership
At July 1, 2012 (December 31, 2012, for ERFC), the date of the latest actuarial valuations, membership in the reporting entity’s plans consisted of the following:
7. Required Supplementary Information
Pension trend data, including the schedule of funding progress and the schedule of employer contributions, can be found in the required supplementary information section immediately following the notes to the financial statements.
h. other PoSt-emPloyment BeneFitS
The reporting entity administers two separate other post-employment benefits (OPEB) plans and has established trust funds to account for the cost of OPEB.
1. Fairfax County OPEB Plan
Plan Description
The Fairfax County OPEB Trust Fund is a single-employer defined benefit plan administered by Fairfax County. The County provides medical/dental, vision, and life insurance benefits to eligible retirees and their spouses. In order to participate, retirees must have reached the age of 55 or be
Component Unit - Public Schools
ERS PORS URS ERFC
Retirees and beneficiaries receiving benefits 6,888 876 1,109 9,788Terminated employees entitled to, but not yet receiving, benefits 1,542 33 44 3,099DROP participants 629 73 119 n/aActive employees 14,107 1,276 1,870 21,519
Total number of plan members 23,166 2,258 3,142 34,406
Primary Government

county oF FairFax, Virginia comPrehenSiVe annual Financial rePort82
BaSic Financial StatementS
on disability retirement and must have health benefit coverage in a plan provided by the County. Retirees must have five years of service in order to participate in this program. Beginning in fiscal year 2004, the amount of monthly subsidy provided by the County is based on years of service and ranges from $30 per month to $220 per month. Retirees receiving the subsidy prior to fiscal year 2004 are grandfathered at $100 per month unless their years of service entitle them to receive a higher monthly subsidy.
In addition, the Board of Supervisors has established a program to subsidize the continuation of term life insurance, at reduced coverage amounts, for retirees. Retirees generally pay for 50 percent of their coverage amounts at age-banded premium rates, with the County incurring the balance of the cost. Benefit provisions are established and may be amended by the Board of Supervisors.
Funding Policy
The contributions to the OPEB Trust Fund are established and may be amended by the Board of Supervisors. The contributions are typically based on projected pay-as-you-go financing requirements, with an additional amount to prefund benefits. GASB Statement No. 45 requires recognition of the current expense of OPEB based on each governing body’s annual required contribution, but does not require funding of the related liability.
Fairfax County is one of the founding participants in the Virginia Pooled OPEB Trust Fund sponsored by VML/VACo. The Virginia Pooled OPEB Trust Fund is established as an investment vehicle for participating employers to accumulate assets to fund OPEB. Plan assets for purposes of GASB Statement No. 45 are usually in the form of stocks, bonds, and other classes of investments, that have been segregated and restricted in a trust, in which (a) contributions to the plan are irrevocable, (b) assets are dedicated to providing benefits to retirees and their beneficiaries, and (c) assets are legally protected from creditors of the employer or plan administrator, for the payment of benefits in accordance with the terms of the plan. Further information, including financial statements, can be obtained by writing to VML/VACo Finance Program, 919 East Main Street, Suite 1100, Richmond, Virginia 23219.
Annual OPEB Cost
The County’s annual OPEB cost (expense) is calculated based on the annual required contribution of the employer (ARC), an amount actuarially determined in accordance with the parameters of GASB Statement No. 45. The ARC represents a level of funding that, if paid on an ongoing basis, is projected to cover normal cost each year and amortize any unfunded actuarial liabilities (or funding excess) over a period not to exceed thirty years. The County’s annual OPEB cost, the percentage of annual OPEB cost contributed to the plan, and the net OPEB asset for 2013, 2012, and 2011 are as follows:
2013 2012 2011
ARC, for the year ended June 30 38,858,000$ 37,640,000 35,373,000 Interest on net OPEB asset from prior year (153,000) 351,000 (713,000) Actuarial adjustment 127,000 (291,000) 529,000 Annual OPEB cost 38,832,000 37,700,000 35,189,000 Actual contributions (38,306,000) (44,421,000) (21,004,000) (Increase) decrease in net OPEB asset, for the year ended June 30 526,000 (6,721,000) 14,185,000 Net OPEB asset, beginning of year (2,041,610) 4,679,390 (9,505,610) Net OPEB (asset) obligation, end of year (1,515,610)$ (2,041,610) 4,679,390
Percentage of annual OPEB cost contributed 98.65% 117.83% 59.69%

83Financial Section
noteS to the Financial StatementS
Actuarial valuations of an ongoing plan involve estimates of the value of reported amounts and assumptions about the probability of occurrence of events far into the future. Examples include assumptions about future employment, mortality, and the healthcare cost trend. Amounts determined regarding the funded status of the plan and the annual required contributions of the employer are subject to continual revision as actual results are compared with past expectations and new estimates are made about the future. The schedule of funding progress, also presented as required supplementary information following the notes to the financial statements, presents multi-year trend information about whether the actuarial value of plan assets is increasing or decreasing over time relative to the actuarial accrued liabilities for benefits.
For the fiscal years 2011 through 2013, the County’s OPEB funding progress is as follows:
Projections of benefits for financial reporting purposes are based on the substantive plan (the plan as understood by the employer and the plan members) and include the types of benefits provided at the time of each valuation and the historical pattern of sharing of benefit costs between the employer and plan members to that point. The actuarial methods and assumptions used include techniques that are designed to reduce the effects of short-term volatility in actuarial accrued liabilities and the actuarial value of assets, consistent with the long-term perspective of the calculations. The ARC for fiscal year 2013 was determined as part of the July 1, 2012, actuarial valuation using the entry age actuarial cost method. Significant actuarial assumptions used in the valuation include:
a. A rate of return on the investment of present and future assets of 7.5 percent per year compounded annually.
b. Projected annual salary increases of 3.0 percent.
c. An annual healthcare cost trend rate of 7.76 percent initial Pre 65 and 7.47 percent Post 65, reduced by decrements to an ultimate rate of 5.0 percent.
The actuarial value of the OPEB assets was determined using techniques that smooth the effects of short-term volatility in the market value of investments over a five-year period. Any excess of these assets over actuarial accrued liability is amortized as a level percentage of projected payroll over an open 30 year period. The remaining amortization period is 30 years.
The Fairfax County OPEB Trust Fund does not issue a stand-alone financial report and is not included in the report of a public employee retirement system or of another entity.
Actuarial Value of Assets
Actuarial Accrued
Liability (AAL) - Entry Age
Unfunded AAL (UAAL)
(Funding Excess)
Covered Payroll
(000) ( a ) (000) ( b ) (000) ( b-a ) (000) ( c )
7/1/2010 60,473 489,203 428,730 12.36 777,040 55.177/1/2011 80,087 474,229 394,142 16.89 799,500 49.307/1/2012 103,270 503,786 400,516 20.50 824,504 48.58
Funded Ratio
UAAL (Funding Excess) as a Percentage of
Covered PayrollActuarial Valuation
Date ( a/b ) ( ( b-a ) / c )

county oF FairFax, Virginia comPrehenSiVe annual Financial rePort84
BaSic Financial StatementS
Concentrations
The Fairfax County OPEB Trust Fund does not have investments (other than U.S. Government and U.S. Government guaranteed obligations) in any one organization that represent 5.0 percent or more of net position held in trust for OPEB benefits.
2. Public Schools OPEB Plan
Plan Description
The Fairfax County Public Schools OPEB Trust Fund is a single-employer defined benefit plan administered by the Fairfax County Public Schools (Public Schools). Public Schools provides health benefits to eligible retirees and their spouses. In order to participate, retirees must have reached the age of 55 or be on disability retirement and must have health benefit coverage in a plan provided by Public Schools. There is no minimum number of years of service required to participate in this plan. Plan participants may continue medical coverage by paying the appropriate subsidized premiums. The amount of monthly subsidy is based on years of service and ranges from $15 per month to $175 per month. Benefit provisions may be amended by the School Board.
Funding Policy
The contributions to the Public Schools OPEB Trust Fund are established and may be amended by the School Board. The contributions are typically based on projected pay-as-you-go financing requirements, with an additional amount to prefund benefits. The costs of administering the plan are paid for by the Public Schools OPEB Trust Fund through the use of investment income and employer contributions. GASB Statement No. 45 requires recognition of the current expense of the plan based on each annual required contribution, but it does not require funding of the related liability.
Public Schools is a participant in the Virginia Pooled OPEB Trust Fund sponsored by the Virginia Municipal League and the Virginia Association of Counties (VML/VACo). The Virginia Pooled OPEB Trust Fund is established as an investment vehicle for participating employers to accumulate assets to fund OPEB. Plan assets for purposes of GASB Statement No. 45 are usually in the form of stocks, bonds, and other classes of investments, that have been segregated and restricted in a trust, in which (a) contributions to the plan are irrevocable, (b) assets are dedicated to providing benefits to retirees and their beneficiaries, and (c) assets are legally protected from creditors of the employer or plan administrator, for the payment of benefits in accordance with the terms of the plan. Further information, including financial statements, can be obtained by writing to VML/VACo Finance Program, 919 East Main Street, Suite 1100, Richmond, Virginia 23219.
Annual OPEB Cost
Public Schools’ annual OPEB cost (expense) is calculated based on the annual required contribution (ARC), an amount actuarially determined in accordance with the parameters of GASB Statement No. 45. The ARC represents a level of funding that, if paid on an ongoing basis, is projected to cover normal cost each year and amortize any unfunded actuarial liabilities (or funding excess) over an open period not to exceed thirty years.
For the year ended June 30, 2013, 2012, and 2011, Public Schools’ OPEB funding progress is presented on the following page:

85Financial Section
noteS to the Financial StatementS
Actuarial valuations of an ongoing plan involve estimates of the value of reported amounts and assumptions about the probability of occurrence of events far into the future. Examples include assumptions about future employment, mortality, and the healthcare cost trend. Amounts determined regarding the funded status of the plan and the annual required contributions of the employer are subject to continual revision as actual results are compared with past expectations and new estimates are made about the future. The schedule of funding progress, also presented as required supplementary information following the notes to the financial statements, presents multi-year trend information about whether the actuarial value of plan assets is increasing or decreasing over time relative to the actuarial accrued liabilities for benefits.
For the fiscal years 2011 through 2013, Public Schools’ OPEB funding progress is as follows:
Projections of benefits for financial reporting purposes are based on Public Schools’ substantive plan (the plan as understood by Public Schools and the plan members) and include the types of benefits provided at the time of each valuation and the historical pattern of sharing of benefit costs between Public Schools and plan members to that point. The actuarial methods and assumptions used include techniques that are designed to reduce the effects of short-term volatility in actuarial accrued liabilities and the actuarial value of assets, consistent with the long-term perspective of the calculations.
The ARC for fiscal year 2013 was determined as part of the July 1, 2011, actuarial valuation using the entry age actuarial cost method. Significant actuarial assumptions used in the valuation include:
a. A rate of return on the investment of present and future assets of 7.5 percent per year compounded annually, including an inflation component of 4.0 percent.
b. An annual healthcare cost trend rate of 8.0 percent, reduced by decrements of 0.5 percent for the next three years.
The actuarial value of OPEB assets was determined using techniques that smooth the effects of short-term volatility in the market value of investments over a five-year period. Any excess of these assets over actuarial accrued liability is amortized as a level percentage of projected payroll over an open 30 year period. The remaining amortization period is 30 years.
2013 2012 2011
ARC, for the year ended June 30 31,142,000$ 30,630,000 38,163,000 Actuarial adjustment (9,000) 33,000 172,000 Annual OPEB cost 31,133,000 30,663,000 38,335,000 Actual contributions (34,471,108) (42,426,871) (45,492,399) (Increase) decrease in net OPEB asset, for the year ended June 30 (3,338,108) (11,763,871) (7,157,399) Net OPEB obligation (asset), beginning of year (10,054,877) 1,708,994 8,866,393 Net OPEB obligation (asset), end of year (13,392,985)$ (10,054,877) 1,708,994
Percentage of annual OPEB cost contributed 110.72% 138.37% 118.67%
Actuarial Value of Assets
Actuarial Accrued
Liability (AAL) - Entry Age
Unfunded AAL (UAAL)
(Funding Excess)
Covered Payroll
(000) ( a ) (000) ( b ) (000) ( b-a ) (000) ( c )
7/1/2010 19,563 471,617 452,054 4.15 1,432,000 31.577/1/2011 40,051 431,303 391,252 9.29 1,005,000 38.937/1/2012 53,423 448,849 395,426 11.90 1,045,000 37.84
Funded Ratio
UAAL (Funding Excess) as a Percentage of
Covered PayrollActuarial Valuation
Date ( a/b ) ( ( b-a ) / c )

county oF FairFax, Virginia comPrehenSiVe annual Financial rePort86
BaSic Financial StatementS
The Public Schools OPEB Trust Fund does not issue a stand-alone financial report and is not included in the report of a public employee retirement system or of another entity.
Concentrations
The Fairfax County Public Schools OPEB Trust Fund does not have investments (other than U.S. Government and U.S. Government guaranteed obligations) in any one organization that represent 5.0 percent or more of net position held in trust for OPEB benefits.
3. Current Plan Membership
The latest actuarial valuations for Fairfax County and Fairfax County Public Schools were July 1, 2012 and July 1, 2011, respectively. At that time membership in the reporting entity’s plans consisted of the following:
i. riSk management The reporting entity is exposed to various risks of loss related to torts, theft of, damage to, and destruction of assets, errors and omissions, injuries to employees, and natural disasters. The County and Public Schools maintain self-insurance internal service funds for workers’ compensation claims and certain property and casualty risks and for health insurance benefits. The County and Public Schools believe that it is more cost effective to manage certain risks internally rather than purchase commercial insurance. The FCRHA, Park Authority, and EDA participate in the County’s self-insurance program. Participating funds and agencies are charged “premiums” which are computed based on relevant data coupled with actual loss experience applied on a retrospective basis.
Liabilities are reported in the self-insurance funds when it is probable that losses have occurred and the amounts of the losses can be reasonably estimated. Liabilities include an amount for claims that have been incurred but not reported to date. Because actual claims liabilities depend on such complex factors as inflation, changes in governing laws and standards, and court awards, the process used in computing claims liabilities is reevaluated periodically, to include an annual actuarial study, to take into consideration the history, frequency and severity of recent claims and other economic and social factors. These liabilities are computed using a combination of actual claims experience and actuarially determined amounts and include any specific, incremental claim adjustment expenses and estimated recoveries. The liabilities do not include nonincremental claim adjustment expenses. The claims liabilities in the self-insurance funds are discounted at 0.45 percent and 0.60 percent at June 30, 2013 and 2012, respectively, to reflect anticipated investment income. Changes in the balances of claims liabilities during fiscal years 2013 and 2012 are presented on the following page:
Primary Government
Component Unit - Public Schools
OPEB OPEB
Retirees and beneficiaries receiving benefits 4,469 8,636Active employees 12,954 18,396
Total number of plan members 17,423 27,032

87Financial Section
noteS to the Financial StatementS
In addition to the self-insurance program, commercial property insurance is carried for buildings and contents plus certain large and costly items, such as fire apparatus and helicopters. Excess liability and workers’ compensation insurance policies are maintained for exposures above a $1,000,000 self-insured retention. Settled claims have not exceeded any of these commercial coverages in any of the past three fiscal years.
Self-Insurance Health Benefits InsuranceHealth Benefits
TrustLiability balances, June 30, 2011 40,416,658$ 11,697,500 29,894,740 18,378,000 C laims incurred - C laims and changes in estimates 16,175,889 138,462,249 11,245,905 291,142,914 C laims payments (15,098,834) (132,897,788) (9,390,566) (289,860,914)
Liability balances, June 30, 2012 41,493,713 17,261,961 31,750,079 19,660,000
C laims incurred
Claims and changes in estimates 24,850,485 127,037,432 11,831,316 306,977,640
C laims payments (19,187,198) (132,776,550) (9,290,075) (307,743,640)
Liability balances, June 30, 2013 47,157,000$ 11,522,843 34,291,320 18,894,000
Primary Government Component Unit - Public SchoolsInternal Service Funds

county oF FairFax, Virginia comPrehenSiVe annual Financial rePort88
BaSic Financial StatementS
J. long-term oBligationS
The following is a summary of changes in the government-wide long-term obligations of the primary government and component units for the year ended June 30, 2013 (in thousands):
Additions ReductionsPrimary GovernmentGovernmental activities:
General obligation bonds payable:Principal amount of bonds payable 2,017,435$ 334,335 (302,930) 2,048,840 176,290 Premium on bonds payable 142,772 62,233 (26,960) 178,045 25,816
Revenue bonds payable:Principal amount of bonds payable 716,700 42,390 (24,666) 734,424 23,795 Premium on bonds payable 33,234 6,319 (3,492) 36,061 3,303 Discount on bonds payable (870) - 47 (823) (46)
Notes payable, net 8,708 - (645) 8,063 645 Bond anticipation notes:
Principal amount of bonds anticipation notes 26,725 24,650 (26,725) 24,650 3,185 Premium on bond anticipation notes 917 - (917) - -
Compensated absences payable 105,873 64,838 (63,002) 107,709 63,235 Landfill closure and postclosure obligation 64,350 68,182 (64,350) 68,182 - Obligations under capital leases and installment purchases 11,234 904 (8,660) 3,478 1,729 Insurance and benefit claims payable 58,756 151,888 (151,964) 58,680 29,514 Net pension obligation 103,184 119,219 (103,184) 119,219 - Other:
HUD Section 108 loans 12,155 - (662) 11,493 667 Obligations for claims and judgments 7,975 1,203 (7,975) 1,203 1,203 Library Exchange 20,054 - (835) 19,219 838
Total governmental activities 3,329,202 876,161 (786,920) 3,418,443 330,174 Business-type activities:
Sewer revenue bonds payable:Principal amount of bonds payable 552,254 107,850 (17,217) 642,887 20,915 Premium on bonds payable 9,278 15,157 (845) 23,590 886
Compensated absences payable 2,158 1,467 (1,438) 2,187 1,223
Total business-type activities 563,690 124,474 (19,500) 668,664 23,024
Total long-term liabilities - Primary government 3,892,892$ 1,000,635 (806,420) 4,087,107 353,198 Component UnitsPublic Schools
Compensated absences payable 32,804$ 24,487 (22,963) 34,328 24,029 Obligations under capital leases and installment purchases 87,533 10,294 (12,879) 84,948 17,219 Insurance and benefit claims payable 51,410 29,977 (28,202) 53,185 24,808 Unearned rent 1,333 - (367) 966 -
Total Public Schools 173,080 64,758 (64,411) 173,427 66,056 FCRHA
Mortgage revenue bonds payable 26,667 - (667) 26,000 698 Mortgage notes payable 69,701 162 (2,249) 67,614 7,159 Compensated absences payable 1,098 701 (579) 1,220 572
Total FCRHA 97,466 863 (3,495) 94,834 8,429 Park Authority
Revenue bonds payable:Principal amount of bonds payable 7,745 4,800 (7,745) 4,800 - Discount on bonds payable (42) - 42 - - Premium on bonds payable - 701 - 701 58
Loan from primary government 13,042 - (210) 12,832 244 Compensated absences payable 4,560 2,361 (2,325) 4,596 2,579
Total Park Authority 25,305 7,862 (10,238) 22,929 2,881 EDA
Compensated absences payable 260 19 - 279 159 Unearned rent 1,071 - (82) 989 101
Total EDA 1,331 19 (82) 1,268 260
Total long-term liabilities - Component units 297,182$ 73,502 (78,226) 292,458 77,626
Due Within
One YearBalance
June 30, 2012Balance
June 30, 2013

89Financial Section
noteS to the Financial StatementS
Compensated absences payable, obligations under capital leases, obligation to component unit, and obligations for claims and judgments for the primary government are liquidated by the General Fund and other governmental funds. The landfill closure and postclosure obligation will be liquidated by the I-95 Refuse Disposal Fund, a special revenue fund. In addition, the County, FCRHA, Park Authority, and EDA are required to adhere to and be in compliance with the rebate and reporting requirements of the federal regulations pertaining to arbitrage investment earnings on certain bond proceeds.
1. General Obligation Bonds
General obligation bonds are issued to provide funding for long-term capital improvements. In addition, they are issued to refund outstanding general obligation bonds when market conditions enable the County to achieve significant reductions in its debt service payments. Such bonds are direct obligations of the County, and the full faith and credit of the County are pledged as security. The County is required to submit to public referendum for authority to issue general obligation bonds.
At June 30, 2013, the amount of general obligation bonds authorized and unissued is summarized to the right (in thousands). The Commonwealth of Virginia does not impose a legal limit on the amount of general obligation indebtedness that the County can incur or have outstanding. The Board of Supervisors, however, has self-imposed bond limits to provide that the County’s net debt may not exceed three percent of the total market value of taxable real and personal property in the County. In addition, the annual debt service may not exceed ten percent of the annual General Fund disbursements. As a financial guideline, the Board of Supervisors also follows a self-imposed limitation in total general obligation bond sales of $1.375 billion over a five-year period or an average of $275 million annually, with a maximum of $300 million in any given year. All self-imposed bond limits have been complied with at June 30, 2013.
In January 2013, the County issued $206,335,000 of Series 2013A General Obligation Public Improvement and $128,000,000 of Series 2013B refunding bonds with average interest rates of 4.96 percent and 3.58 percent, respectively. The Refunding Bonds, totaling $128,000,000, were issued to advance refund $15,755,000 of outstanding Series 2004A bonds, $9,270,000 of outstanding Series 2004B bonds, $33,185,000 of outstanding Series 2005A bonds, $35,190,000 of outstanding Series 2007A bonds, and $35,160,000 of outstanding Series 2008A bonds. Proceeds of $145,945,515 were used to purchase U.S. Government securities which were deposited in an irrevocable escrow account to provide for the resources to redeem the Series 2004A bonds on April 1, 2014, the Series 2004B bonds on October 1, 2014, the Series 2005A bonds on October 1, 2015, the Series 2007A bonds on April 1, 2015, and the Series 2008A on April 1, 2018. The County refunded these bonds to reduce its total debt service payments over the next twelve years by approximately $14.0 million and to obtain an economic gain of approximately $12.2 million.
Detailed information regarding the general obligation bonds outstanding as of June 30, 2013, is contained in Section 5 of this note.
Bond Purpose Amount
School improvements 442,613$ Transportation improvements 146,858 Parks and park facilities 95,173 Public safety facilities 131,491 Public library facilities 31,135 Flood control 30,000
Total authorized but unissued bonds 877,270$

county oF FairFax, Virginia comPrehenSiVe annual Financial rePort90
BaSic Financial StatementS
2. Revenue Bonds
In March 1994, the EDA issued $116,965,000 of lease revenue bonds (Series 1994) to finance the County’s acquisition of certain land and office buildings adjacent to its main government center. In October 2003, the EDA issued $85,650,000 of lease revenue refunding bonds to advance refund $88,405,000 of outstanding Series 1994 lease revenue bonds. In June 2003, the EDA issued $70,830,000 of revenue bonds to finance the development and construction of a public high school and a public golf course and related structures, facilities, and equipment in the Laurel Hill area of the southern part of the County. In April 2012, the Authority issued $47,745,000 to advance refund a portion of the outstanding Series 2003 Laurel Hill revenue bonds. In January 2005, the EDA issued $60,690,000 of facilities revenue bonds to finance the acquisition of land and an existing office building to enable the Fairfax County Public Schools to consolidate numerous Public Schools administrative offices. In March 2010, the EDA issued $43,390,000 of lease revenue bonds to current refund the FCRHA $3,365,000 of outstanding Series 1996 lease revenue bonds, $2,960,000 of outstanding Series 1998 lease revenue bonds, $835,000 of outstanding Series 1999 lease revenue bonds, and to advance refund the FCRHA $7,245,000 of outstanding Series 2004 lease revenue bonds, and the County’s $25,580,000 of outstanding Series 2000 certificate of participation bonds. In May 2011, the EDA issued $205,705,000 of transportation district improvement revenue bonds (Silver Line Phase 1 Project) Series 2011 and in September 2012, the EDA issued $42,390,000 of transportation district improvement revenue bonds (Silver Line Phase 1 Project) Series 2012 to finance a portion of the costs of the construction of the first phase of an extension of the Washington Metropolitan Area Transit Authority’s mass transit system in Fairfax County. In July 2011, the EDA issued $99,430,000 of revenue bonds Series 2011 to finance a portion of the costs of the construction of a public parking facility on public lands within Fairfax County, Virginia, to serve the Wiehle Avenue Metrorail Station. In May 2012, the EDA issued $65,965,000 of revenue bonds Series 2012 to finance the improvement of certain properties to be used by Fairfax County as mental health facilities and as a neighborhood community center. As the County is responsible, under the related documents and subject to annual appropriation, to make payments to a trustee sufficient to pay principal and interest on these bonds, the related transactions, including the liability for the bonds, have been recorded in the County’s financial statements and not in those of EDA.
In November 2007, the FCRHA issued a $105,485,000 bond anticipation note (Series 2007B) to finance a portion of the purchase price of a multi-family rental housing property as part of the County’s affordable housing initiative. In October 2008, the FCRHA issued a $104,105,000 bond anticipation notes (Series 2008B) to repay the outstanding $105,485,000 bond anticipation notes (Series 2007B). In August 2009, the FCRHA issued a $94,950,000 of revenue bonds to provide funds, together with other funds, sufficient to pay the outstanding $104,105,000 short-term bond anticipation notes (Series 2008B) that matured on October 1, 2009. The bonds bear an average interest rate of 4.53 percent and mature on October 1, 2039. As the County is responsible, under the related documents and subject to annual appropriation, to make payments to a trustee sufficient to pay principal and interest on these bonds, the related transactions, including the liability for these bonds, have been recorded in the County’s financial statements and not in those of the FCRHA.
In June 2011, Community Development Authority (the “Authority”) issued $46,980,000 Revenue Bonds (Mosaic District Project) Series 2011A. In July 2011, the Authority issued $18,670,000 Revenue Bonds (Taxable) Series 2011A-T. The bonds were issued to finance certain public infrastructure improvements within or serving the Authority district. The 2011 Bonds are limited obligations of the Authority, payable solely from and secured by a pledge of certain County Advanced Revenues and certain Special Assessment Revenues.
None of these revenue bonds nor the related payment responsibilities of the County are general obligation debt of the County, and the full faith and credit of the County is not pledged to these bonds for such payment responsibility.

91Financial Section
noteS to the Financial StatementS
Detailed information regarding the revenue bonds outstanding as of June 30, 2013 is contained in Section 5 of this note.
3. Sewer Revenue Bonds
In October 2004, the Sewer System issued $94,005,000 of Series 2004 Sewer Revenue Refunding Bonds with an average interest rate of 4.61 percent to advance refund $91,430,000 of the outstanding Series 1996 Sewer Revenue Bonds with an average interest rate of 5.82 percent. Net proceeds of the Refunding Bond were used mostly to redeem the Series 1996 Bonds on July 15, 2006. The lower interest rate of the Refunding Bond would reduce total debt service payment over future years by approximately $16.8 million. In June 2009, the Sewer System issued $152,255,000 of Series 2009 Sewer Revenue Bonds with an average interest rate of 4.88 percent to fund the System’s portion of upgrade costs at certain wastewater treatment facilities that are owned by, or that provide service to, the County, the purchase of additional capacity, and the costs for other system improvements. In August 2012, the System issued $90,710,000 of Series 2012 Sewer Revenue Bonds with an average interest rate 4.54 percent to fund upgrade costs allocable to the System at certain treatment facilities that are owned by, or that provide service to, the County, the purchase of additional capacity, and the costs for other system improvements. As of June 30, 2013, the outstanding bonds consist of $90,710,000 of Series 2012 Revenue Bonds, $144,890,000 of Series 2009 Revenue Bonds and $76,235,000 of Series 2004 Refunding Bonds.
The aforementioned sewer revenue bonds were issued in accordance with the General Bond Resolution adopted by the Board of Supervisors on July 29, 1985, and are payable from and secured by the net revenue generated through the Sewer System’s operations. Accordingly, the Master Bond Resolution includes a rate covenant under which the Sewer System agreed that it will charge reasonable rates for the use of and services rendered by the Sewer System. Furthermore, the Sewer System will adjust the rates from time to time to generate net revenues sufficient to provide an amount equal to 100 percent of its annual principal and interest requirements and the Sewer System’s annual commitments to fund its proportionate share of other jurisdictions’ debt service requirements. In addition, payment of the principal and interest on all bonds is insured by municipal bond insurance policies.
In January 1995, UOSA, a joint venture, issued $288,600,000 of Regional Sewer System Revenue Bonds to finance the cost of expanding the capacity of its wastewater treatment facilities and $42,260,000 of Regional Sewer System Revenue Refunding Bonds to refund certain outstanding bonds that had been issued to finance a prior expansion. In December 2003, UOSA issued $58,150,000 of Regional Sewer System Revenue Refunding Bonds to advance refund its outstanding Series 1993 bonds. In November 2004, UOSA issued $49,395,000 of Regional Sewer System Revenue Refunding Bonds to advance refund a portion of the outstanding Series 1995 bonds. On July 1, 2005, UOSA issued $82,465,000 of Regional Sewer System Revenue Refunding Bonds, of which the Sewer System’s share is $53,201,198, to advance refund another portion of the outstanding Series 1995 bonds, resulting in a $1,909,604 accounting gain, which is being amortized over the life of the Series 2005 Bonds. In February 2007, UOSA issued $90,315,000 of Regional Sewer System Revenue Refunding bonds, of which the Sewer System’s share is $58,265,521, to advance refund another portion of the outstanding Series 1995 Bonds, resulting in an $83,868 accounting loss, which is amortized over the life of the Series 2007 Bonds. In December 2007, UOSA issued $119,715,000 of Regional Sewer System Revenue Bonds, of which the System’s share is $53,925,458, to finance the cost of expanding its wastewater treatment and conveyance facilities. In December 2010, UOSA issued $85,180,000 of Regional Sewer System Revenue Bonds, of which the System’s share is $34,113,615, to finance the cost of certain capital improvements.

county oF FairFax, Virginia comPrehenSiVe annual Financial rePort92
BaSic Financial StatementS
In July 2011, UOSA entered into VRA loan 2011A for $6,100,000 to fund costs related to the Energy Service (ESCO) project. In December 2011, UOSA entered into VRA loan 2011B for $13,934,552 to fund Phase 1 of the Nutrient Compliance Improvement Project (P1NR). The System’s total share at June 30, 2013, is $8,384,801.
In May 2013, UOSA issued $101,615,000 of Regional Sewer System Revenue Refunding Bonds of which the System’s share is $65,555,566, to refund Series 2005 Bonds. Although the refunding resulted in an accounting loss of $12,354,368 which is being amortized over the life of the Series 2013A Bonds, the System reduced total debt service payments over future years by approximately $4.9 million.
The Sewer System’s share of UOSA’s total outstanding debt at June 30, 2013, is $283,269,711, and it is subordinate to the sewer revenue bonds issued by the Sewer System.
In June 2001 and June 2002, the Sewer System issued 20-year subordinated sewer revenue bonds in the amounts of $40,000,000 and $50,000,000, respectively, to the Virginia Water Facilities Revolving Fund, acting by and through the Virginia Resources Authority. The proceeds have been used to finance a portion of the Sewer System’s share of incurred expansion and upgrade costs of the Alexandria Sanitation Authority’s wastewater treatment facilities, which provide service to certain County residents. In September 2012, the System executed a rate reduction agreement with VRA reducing the interest rates on these bonds from 4.1 percent per annum and 3.75 percent per annum, respectively, to 2.35 percent per annum and the collectively require semi-annual debt service payments from $3,318,536 to $3,101,638. The bonds are subordinated to all outstanding prior bond issues of the Sewer System and payments for operation and maintenance expenses. As of June 30, 2013, the outstanding principal for the 2001 and 2002 subordinated revenue bonds is $20,247,399 and $27,534,588 respectively.
Detailed information regarding the sewer revenue bonds outstanding as of June 30, 2013 is contained in Section 5 of this note.
4. Bond Anticipation Notes
In February 2008, the FCRHA issued a $37,615,000 refunding bond anticipation notes to repay a portion of a 2007 short-term note that matured on February 12, 2008. The original short-term note was issued to partially finance the purchase of a multi-family rental housing complex as part of the County’s affordable housing initiative. In May 2011, the FCRHA issued $28,905,000 of bond an-ticipation notes to current refund $30,215,000 of outstanding Series 2008A bond anticipation notes. In February 2013, the FCRHA issued $24,650,000 of bond anticipations notes to current refund $26,725,000 of outstanding Series 2011 bond anticipation notes. The note matures on March 1, 2015. As the County is responsible, under the related documents and subject to appropriation, to pay timely the principal of and interest on the note, the related transactions, including the liability for the note, have been recorded in the County’s financial statements and not in those of the FCRHA. The note is not a general obligation debt of the County, and the full faith and credit of the County is not pledged to the note.
Detailed information regarding the bond anticipation note outstanding as of June 30, 2013, is con-tained in Section 5 of this note.
5. County Debt and Related Interest to Maturity
The County’s outstanding general obligation bonds, revenue bonds, notes payable, HUD Section 108 loans, Sewer System revenue bonds, and the related interest to maturity as of June 30, 2013, are comprised of the issues presented on the opposite page:

93Financial Section
noteS to the Financial StatementS
Interest Rate(%)
Issue Date
Final Maturity
Date
Annual Principal
Payments (000)
Original Issue (000)
Principal Outstanding
(000)
Interest Payable to Maturity
(000)
Total Principal Outstanding &
Interest Payable to Maturity
(000)Governmental activities:General obligation bonds:
General County:Series 2004A Public Improvement 4.00.5.25 04-14-04 04-01-24 815-3,180 63,530 8,892 2,108 11,000 Series 2004A Refunding 4.50-5.25 04-14-04 04-01-17 1,898-5,580 67,200 11,885 1,262 13,147 Series 2004B Public Improvement 4.50-5.00 10-19-04 10-01-19 28-3,455 69,120 10,820 888 11,708 Series 2004B Refunding 4.50-5.00 10-19-04 10-01-19 825-2,555 30,375 14,335 2,027 16,362 Series 2005A Public Improvement 4.25-5.00 08-16-05 10-01-25 65-4,315 85,655 32,557 8,771 41,328 Series 2005A Refunding 4.25-5.00 08-16-05 10-01-21 3,045-10,155 117,505 73,437 13,176 86,613 Series 2007A Public Improvement 4.00-5.00 02-07-07 04-01-27 5,389 107,780 21,556 4,661 26,217 Series 2008A Public Improvement 4.13-5.00 01-30-08 04-01-28 4,955-4,960 99,155 59,490 20,977 80,467 Series 2009A Public Improvement 3.50-5.00 01-28-09 04-01-29 2,450 49,000 39,200 13,986 53,186 Series 2009 B Refunding 3.00 01-28-09 04-01-14 3,840 31,884 3,840 115 3,955 Series 2009 C Refunding 3.00-5.00 10-28-09 10-01-19 3,019-14,578 48,527 48,527 9,732 58,259 Series 2009 D Public Improvement 5.00 10-28-09 10-01-14 10,739-10,743 53,710 21,482 1,074 22,556 Series 2009 E Public Improvement (BABs) 3.10-5.25 10-28-09 10-01-29 4,247 63,700 63,700 28,768 92,468 Series 2011 A Public Improvement 4.00-5.00 02-10-11 04-01-31 2,400-2,410 47,880 43,215 18,796 62,011 Series 2011 A Refunding 5.00 02-10-11 04-01-15 1,703-1,719 6,912 3,422 256 3,678 Series 2012 A Public Improvement 2.00-5.00 02-02-12 04-01-32 3,855-3,860 77,185 73,330 26,011 99,341 Series 2012 B Refunding 3.00-5.00 02-02-12 04-01-24 2,334-13,142 74,759 74,759 29,400 104,159 Series 2013 A Public Improvement 1.50-5.00 01-24-13 10-01-32 3,925-3,930 78,535 78,535 39,654 118,189 Series 2013 B Refunding 3.00-4.00 01-24-13 10-01-25 1,242-9,255 54,389 54,389 15,082 69,471
Total general obligation bonds - General County 1,226,801 737,371 236,744 974,115 Schools:
Series 2004A Public Improvement 4.00.5.25 04-14-04 04-01-24 1,543-6,005 120,215 16,813 3,985 20,798 Series 2004A Refunding 4.50-5.25 04-14-04 04-01-17 2,027-6,485 78,165 14,955 1,434 16,389 Series 2004B Public Improvement 4.50-5.00 10-19-04 10-01-19 47-5,815 116,280 18,210 1,495 19,705 Series 2004B Refunding 4.50-5.00 10-19-04 10-01-19 2,600-8,070 96,035 45,305 6,408 51,713 Series 2005A Public Improvement 4.25-5.00 08-16-05 10-01-25 80-5,270 104,685 39,803 10,727 50,530 Series 2005A Refunding 4.25-5.00 08-16-05 10-01-21 5,820-20,335 235,740 148,783 26,912 175,695 Series 2007A Public Improvement 4.00-5.00 02-07-07 04-01-27 6,341 126,820 25,364 5,485 30,849 Series 2008A Public Improvement 4.13-5.00 01-30-08 04-01-28 6,765 135,320 81,180 28,633 109,813 Series 2009A Public Improvement 3.50-5.00 01-28-09 04-01-29 7,525 150,510 120,400 42,958 163,358 Series 2009B Refunding 3.00 01-28-09 04-01-14 3,190 26,487 3,190 96 3,286 Series 2009C Refunding 3.00-5.00 10-28-09 10-01-19 5,081-24,052 83,273 83,273 16,212 99,485 Series 2009D Public Improvement 5.00 10-28-09 10-01-14 2,636-2,637 13,185 5,273 264 5,537 Series 2009E Public Improvement (BABs) 3.10-5.25 10-28-09 10-01-29 9,233 138,500 138,500 62,549 201,049 Series 2011 A Public Improvement 4.00-5.00 02-10-11 04-01-31 6,230 123,515 112,140 48,789 160,929 Series 2011 A Refunding 5.00 02-10-11 04-01-15 2,902-2,955 11,783 5,833 437 6,270 Series 2012 A Public Improvement 2.00-5.00 02-02-12 04-01-32 7,020-7,025 140,470 133,445 47,331 180,776 Series 2012 B Refunding 3.00-5.00 02-02-12 04-01-24 4,516-21,057 117,591 117,591 46,189 163,780 Series 2013 A Public Improvement 1.50-5.00 01-24-13 10-01-32 6,390 127,800 127,800 64,549 192,349 Series 2013 B Refunding 3.00-4.00 01-24-13 10-01-25 1,518-14,285 73,611 73,611 20,230 93,841
Total general obligation bonds - Schools 2,019,985 1,311,469 434,683 1,746,152
Total general obligation bonds 3,246,786 2,048,840 671,427 2,720,267
Revenue bonds:EDA revenue bonds:
Series 2003 Refunding 5.00 10-01-03 11-15-18 6,025-7,885 85,650 41,175 7,324 48,499 Series 2005 4.00-5.00 01-27-05 04-01-35 1,415-3,615 60,690 51,480 31,584 83,064 Series 2010 2.00-5.00 03-10-10 04-01-32 1,280-2,785 43,390 35,720 12,530 48,250 Series 2011 Silver Line Phase 1 Project 2.00-5.00 05-26-11 04-01-36 4,935-13,685 205,705 194,675 135,787 330,462 Series 2011 Metrorail Station Parking Project2.00-5.00 07-28-11 08-01-34 3,275-7,225 99,430 99,430 56,578 156,008 Series 2012A Refunding Laurel Hill Project 3.00-5.00 04-17-12 06-01-33 670-4,205 47,745 47,745 14,711 62,456 Series 2012A Facilities Revenue Bonds 4.50-5.00 05-30-12 03-01-42 1,190-3,700 65,965 64,770 51,601 116,371 Series 2012 Silver Line Phase 1 Project 3.00-5.00 10-10-12 04-01-37 980-2,835 42,390 41,200 30,245 71,445
FCRHA lease revenue bonds: Series 2003 3.50 07-22-03 8-01-23 44-176 2,530 1,514 294 1,808 Series 2005 3.50-3.60 06-16-05 06-01-15 810 8,105 1,620 87 1,707 Series 2009 2.5-5.00 08-20-09 10-01-39 1,940-5,610 94,950 89,445 65,854 155,299
CDA revenue bonds: Series 2011A Tax-Exempt 6.25-6.88 06-09-11 03-01-36 465-5,315 46,980 46,980 54,608 101,588 Series 2011A Taxable 7.25 07-06-11 03-01-36 150-2,180 18,670 18,670 23,281 41,951
Total revenue bonds 822,200 734,424 484,484 1,218,908
Notes payable 3.73-4.29 12-27-05 12-31-25 323-645 12,900 8,063 2,173 10,236
HUD Section 108 loan #8 4.97-6.67 07-01-01 08-01-21 115 2,300 1,035 90 1,125
HUD Section 108 loan #11 Variable 06-29-09 08-01-28 196-334 5,040 4,267 1,436 5,703
HUD Section 108 loan #12 Variable 02-14-11 08-01-30 343-344 6,535 6,191 1,564 7,755
Total HUD Section 108 loans 13,875 11,493 3,090 14,583
Bond Anticipation Note Series 2013A-Taxable .04-.66 02-14-13 03-01-15 3,185-21,465 24,650 24,650 303 24,953
Total governmental activities 4,120,411 2,827,470 1,161,477 3,988,947 Business-type activities:Sewer revenue bonds:
UOSA Bonds Subordinated 2.00-6.00 01-12-95 07-01-43 1,760-21,526 277,621 283,270 152,776 436,046 Series 2001 Subordinated 4.10 06-01-01 02-01-21 2,329-2,743 40,000 20,247 2,081 22,328 Series 2002 Subordinated 3.75 09-01-02 03-01-22 2,781-3,353 50,000 27,535 3,175 30,710 Series 2004 Refunding 3.00-5.00 10-14-04 07-15-28 3,155-6,725 94,005 76,235 32,506 108,741 Series 2009 Revenue 2.50-5.00 06-17-09 07-15-40 2,670-9,415 152,255 144,890 115,723 260,613 Series 2012 Revenue 2.00-5.00 08-08-12 07-15-43 1,440-5,435 90,710 90,710 75,982 166,692
Total business-type activities 704,591 642,887 382,243 1,025,130
Total County bond, note, and loan indebtedness 4,825,002$ 3,470,357 1,543,720 5,014,077
Series

county oF FairFax, Virginia comPrehenSiVe annual Financial rePort94
BaSic Financial StatementS
Principal and interest to maturity (in thousands) for the County’s general obligation bonds, revenue bonds, loans, and Sewer System revenue bonds outstanding at June 30, 2013, are as follows:
6. FCRHA Bonds, Notes, and Loans Payable
The FCRHA issues various debt instruments, including bonds, notes and mortgages, to finance the cost of acquisition, construction, and equipping of its workforce, senior, disabled, low income, transient, and homeless affordable housing projects. These debt instruments are usually secured by the properties being financed. Sources of permanent financing include the Federal Department of Housing and Urban Development (HUD), the Virginia Housing Development Authority (VHDA), commercial lenders, and the County. In addition, the FCRHA maintains unsecured $10 million tax-exempt and $5 million taxable lines of credit with a commercial bank to provide interim (bridge) financing.
The table on the facing page, details all FCRHA bonds, notes (including a loan from the County), and loans payable as of June 30, 2013, excluding FCRHA’s component units:
Fiscal Year Principal Interest Principal Interest Principal Interest Principal Interest Principal Interest2014 176,290 93,373 23,795 34,937 4,497 784 20,915 27,415 225,497 156,509 2015 171,720 82,031 25,504 34,054 22,784 735 22,157 26,260 242,165 143,080 2016 166,980 73,983 28,849 32,879 1,326 560 23,210 25,342 220,365 132,764 2017 161,295 65,990 30,404 31,706 1,333 526 24,224 24,350 217,256 122,572 2018 151,760 58,681 29,984 30,282 1,340 486 25,260 23,321 208,344 112,770 2019-2023 640,095 200,206 131,959 131,534 6,706 1,777 133,177 100,441 911,937 433,958 2024-2028 422,790 82,677 135,934 101,809 4,855 640 146,048 75,384 709,627 260,510 2029-2033 157,910 14,486 174,385 64,978 1,365 58 91,649 46,525 425,309 126,047 2034-2038 - - 128,785 20,156 - - 88,978 27,142 217,763 47,298 2039-2043 - - 24,825 2,149 - - 67,269 6,063 92,094 8,212 2044-2048 - - - - - - - - - -
Totals 2,048,840$ 671,427$ 734,424$ 484,484$ 44,206$ 5,566$ 642,887 382,243 3,470,357 1,543,720
Total
Business-Type
General Obligation Bonds
Revenue Bonds
Sewer System Revenue Bonds
Notes and Loans
Governmental Activities
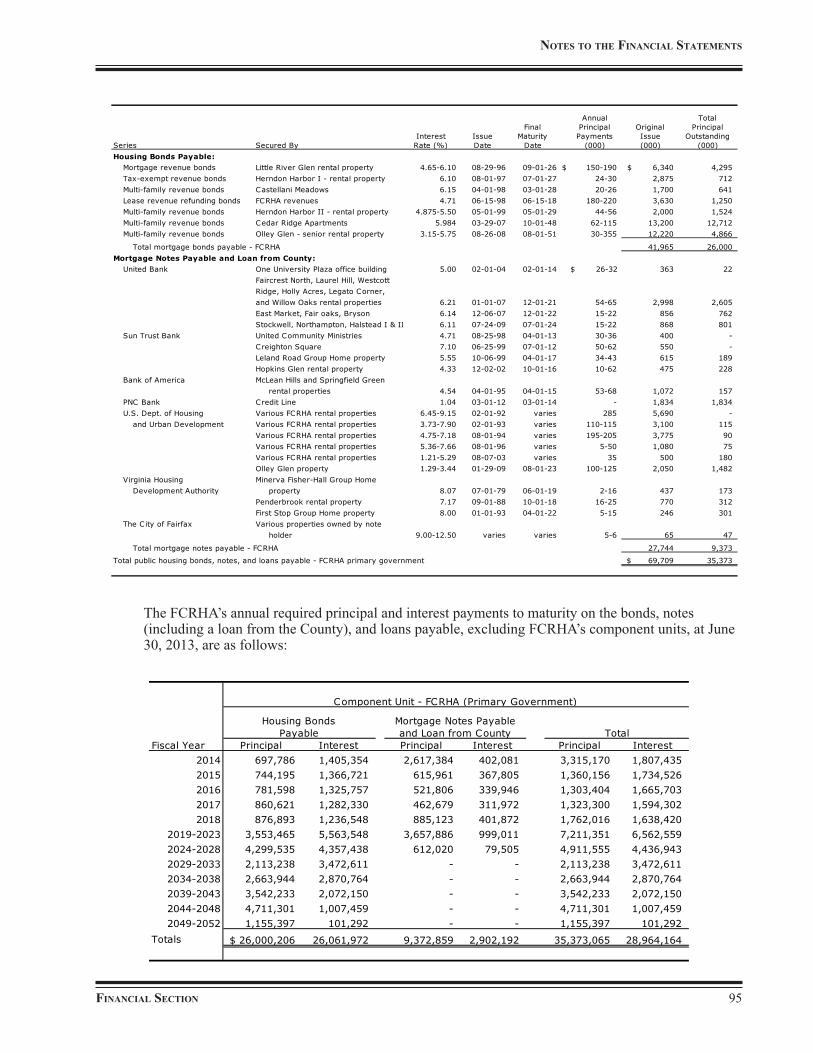
95Financial Section
noteS to the Financial StatementS
The FCRHA’s annual required principal and interest payments to maturity on the bonds, notes (including a loan from the County), and loans payable, excluding FCRHA’s component units, at June 30, 2013, are as follows:
Fiscal Year Principal Interest Principal Interest Principal Interest2014 697,786 1,405,354 2,617,384 402,081 3,315,170 1,807,435 2015 744,195 1,366,721 615,961 367,805 1,360,156 1,734,526 2016 781,598 1,325,757 521,806 339,946 1,303,404 1,665,703 2017 860,621 1,282,330 462,679 311,972 1,323,300 1,594,302 2018 876,893 1,236,548 885,123 401,872 1,762,016 1,638,420
2019-2023 3,553,465 5,563,548 3,657,886 999,011 7,211,351 6,562,559 2024-2028 4,299,535 4,357,438 612,020 79,505 4,911,555 4,436,943 2029-2033 2,113,238 3,472,611 - - 2,113,238 3,472,611 2034-2038 2,663,944 2,870,764 - - 2,663,944 2,870,764 2039-2043 3,542,233 2,072,150 - - 3,542,233 2,072,150 2044-2048 4,711,301 1,007,459 - - 4,711,301 1,007,459 2049-2052 1,155,397 101,292 - - 1,155,397 101,292
Totals 26,000,206$ 26,061,972 9,372,859 2,902,192 35,373,065 28,964,164
Component Unit - FCRHA (Primary Government)
Housing Bonds Payable
Mortgage Notes Payable and Loan from County Total
Secured ByInterest
Rate (%)IssueDate
Final Maturity
Date
AnnualPrincipal
Payments (000)
Original Issue(000)
Total Principal
Outstanding (000)
Housing Bonds Payable:Mortgage revenue bonds Little River Glen rental property 4.65-6.10 08-29-96 09-01-26 $ 150-190 6,340$ 4,295 Tax-exempt revenue bonds Herndon Harbor I - rental property 6.10 08-01-97 07-01-27 24-30 2,875 712 Multi-family revenue bonds Castellani Meadows 6.15 04-01-98 03-01-28 20-26 1,700 641 Lease revenue refunding bonds FCRHA revenues 4.71 06-15-98 06-15-18 180-220 3,630 1,250 Multi-family revenue bonds Herndon Harbor II - rental property 4.875-5.50 05-01-99 05-01-29 44-56 2,000 1,524 Multi-family revenue bonds Cedar Ridge Apartments 5.984 03-29-07 10-01-48 62-115 13,200 12,712 Multi-family revenue bonds Olley Glen - senior rental property 3.15-5.75 08-26-08 08-01-51 30-355 12,220 4,866
Total mortgage bonds payable - FCRHA 41,965 26,000 Mortgage Notes Payable and Loan from County:
United Bank One University Plaza office building 5.00 02-01-04 02-01-14 $ 26-32 363 22 Faircrest North, Laurel Hill, Westcott Ridge, Holly Acres, Legato Corner, and Willow Oaks rental properties 6.21 01-01-07 12-01-21 54-65 2,998 2,605 East Market, Fair oaks, Bryson 6.14 12-06-07 12-01-22 15-22 856 762 Stockwell, Northampton, Halstead I & II 6.11 07-24-09 07-01-24 15-22 868 801
Sun Trust Bank United Community Ministries 4.71 08-25-98 04-01-13 30-36 400 - Creighton Square 7.10 06-25-99 07-01-12 50-62 550 - Leland Road Group Home property 5.55 10-06-99 04-01-17 34-43 615 189 Hopkins Glen rental property 4.33 12-02-02 10-01-16 10-62 475 228
Bank of America McLean Hills and Springfield Green rental properties 4.54 04-01-95 04-01-15 53-68 1,072 157
PNC Bank Credit Line 1.04 03-01-12 03-01-14 - 1,834 1,834 U.S. Dept. of Housing Various FCRHA rental properties 6.45-9.15 02-01-92 varies 285 5,690 -
and Urban Development Various FCRHA rental properties 3.73-7.90 02-01-93 varies 110-115 3,100 115 Various FCRHA rental properties 4.75-7.18 08-01-94 varies 195-205 3,775 90 Various FCRHA rental properties 5.36-7.66 08-01-96 varies 5-50 1,080 75 Various FCRHA rental properties 1.21-5.29 08-07-03 varies 35 500 180 Olley Glen property 1.29-3.44 01-29-09 08-01-23 100-125 2,050 1,482
Virginia Housing Minerva Fisher-Hall Group Home Development Authority property 8.07 07-01-79 06-01-19 2-16 437 173
Penderbrook rental property 7.17 09-01-88 10-01-18 16-25 770 312 First Stop Group Home property 8.00 01-01-93 04-01-22 5-15 246 301
The City of Fairfax Various properties owned by note holder 9.00-12.50 varies varies 5-6 65 47
Total mortgage notes payable - FCRHA 27,744 9,373
Total public housing bonds, notes, and loans payable - FCRHA primary government 69,709$ 35,373
Series

county oF FairFax, Virginia comPrehenSiVe annual Financial rePort96
BaSic Financial StatementS
7. Park Authority Bonds, Loans, and Notes Payable
In February 1995, the Park Authority issued $13,870,000 of Park Facilities Revenue Bonds, Series 1995, to fund the construction of additional golf facilities for County residents and patrons. In September 2001, the Park Authority issued $13,015,000 of Park Facilities Revenue Refunding Bonds, Series 2001 to advance refund $11,670,000 of the outstanding Series 1995 bonds. The outstanding $7.02 million of Revenue Bonds Series 2001 was refunded on June 5, 2013 through the Virginia Resources Authority bond sale of Series 2013, which resulted in a total debt service savings of $1.92 million. The bonds are solely the obligation of the Park Authority and are payable from the Park Revenue Fund’s revenues from operations, earnings on investments, and certain fund balance reserves.
In June 2003, the Park Authority received a $15,530,000 loan from the County to fund the development and construction of a public golf course and related structures, facilities, and equipment to be located in the Laurel Hill area of the southern part of the County. The loan is solely the obligation of the Park Authority and is payable from the Park Revenue Fund’s revenues from operations, earnings on investments, and certain fund balance reserves.
The debt service requirements to maturity for the outstanding bonds and loan at June 30, 2013, are as follows:
8. Conduit Debt Obligations
The FCRHA is empowered by the Commonwealth of Virginia to issue tax-exempt bonds on behalf of qualified businesses to develop or rehabilitate low income housing within the County. Principal and interest on the tax-exempt bonds are paid entirely by the owners of the properties, who have entered into binding contracts to develop or rehabilitate the subject properties. The terms of the tax-exempt bonds stipulate that neither the FCRHA nor the County guarantees the repayment of principal and interest to the bondholders. A bondholder’s sole recourse in the event of default on the tax-exempt bonds is to the subject property and third-party beneficiaries. Accordingly, these bonds are not reported as liabilities in the accompanying financial statements. As of June 30, 2013, approximately $28 million of such tax-exempt bonds that are still outstanding.
The EDA is empowered by the Commonwealth of Virginia to issue Industrial Revenue Bonds (IRBs) on behalf of businesses relocating and/or expanding their operations within the County. Principal and interest on the IRBs are paid entirely by the businesses. The terms of the IRBs stipulate that neither the EDA nor the County guarantees the repayment of principal and interest to the bondholders. Accordingly, these bonds are not reported as liabilities in the accompanying financial statements. As of June 30, 2013, the cumulative amount of all IRBs outstanding was $702,367,561.
In October 2003, August 2004, March 2007, and July 2008, the EDA issued $33,375,000; $57,410,000; $41,505,000 and $51,505,000, respectively, of transportation contract revenue bonds
Principal Interest Principal Interest Principal Interest2014 - - 180,206 5.00 243,700 499,434 243,700 679,640 2015 2.42 615,000 191,541 5.00 283,100 487,249 898,100 678,790 2016 4.40 630,000 171,088 5.00 327,900 473,094 957,900 644,182 2017 4.50 655,000 146,884 5.00 372,600 456,699 1,027,600 603,583 2018 4.82 680,000 119,275 5.00 422,300 438,069 1,102,300 557,344 2019-2023 4.23-4.82 2,220,000 161,850 5.00 2,942,600 1,820,741 5,162,600 1,982,591 2024-2028 - - - 3.00-5.00 3,765,000 1,150,781 3,765,000 1,150,781
2029-2033 - - - 3.00-4.00 4,475,000 484,256 4,475,000 484,256 Totals 4,800,000$ 970,844 12,832,200$ 5,810,323 17,632,200 6,781,167
Int. RateFiscal Year
TotalRevenue BondsInt. Rate
Loan from Primary Government

97Financial Section
noteS to the Financial StatementS
on behalf of the State Route 28 Transportation Improvement District for the purpose of financing a portion of the costs of the construction of certain improvements to State Route 28 in the County. In May 2012, the Authority issued $86,275,000 of transportation contract revenue refunding bonds on behalf of the State Route 28 Transportation Improvement District to advance refund $29,285,000 of outstanding Series 2003 bonds and $52,755,000 of outstanding Series 2004 bonds. The bonds are payable from the collection of special improvements assessments levied by the County and by Loudoun County, Virginia, on property owners in the District. As the County and EDA are not responsible to make payments to pay principal and interest on the bonds, the related transactions, including the liability for the bonds, are not recorded in the County’s or EDA’s financial statements. As of June 30, 2013, the principal amount of transportation contract revenue bonds outstanding was $180,345,000.
In December 2005, the Park Authority issued two notes totaling $12.9 million to finance the acquisition of a permanent conservation easement. As the County is responsible, under the related documents and subject to appropriation, to pay the principal and interest on the notes, the related transactions, including the liability for the notes, have been recorded in the County’s financial statements and not in those of the Park Authority. The notes are not general obligation debt of the County, and the full faith and credit of the County is not pledged to the notes. As of June 30, 2013, $8.1 million of these notes are outstanding.
9. Defeasance of Debt
During the fiscal year, the County has defeased certain outstanding bonds by placing the proceeds of newly issued bonds in an irrevocable escrow fund to provide for all future debt service payments on the old bonds. Accordingly, the escrow fund assets and the liabilities for the defeased bonds are not included in the financial statements. As of June 30, 2013, the outstanding bonds but considered defeased are $386 million in general obligation bonds.
10.SanitaryLandfillClosureandPostclosureObligation
State and federal laws require the County to place a final cover on its I-95 Sanitary Landfill when it stops accepting solid waste and to perform certain maintenance and monitoring functions at the site for 30 years after closure. The existing Municipal Solid Waste unit stopped accepting waste on December 31, 1995 and the placement of the final closure cap was completed during 2008. The ash disposal unit continues to accept incinerator ash from the waste to energy facilities and the Norman Cole Pollution Prevention Plant. Closure expenditures have been incurred for approximately 70 percent of the total area involved. The County holds permits that allow it to continue using the landfill until approximately 2042.
The $68.2 million reported as the landfill closure and post closure obligation at June 30, 2013, represents the total estimated cost remaining to be incurred based on landfill capacity used to date. The actual cost may vary due to inflation, changes in technology, or changes in regulations. It is expected that the landfill closure and post closure care costs will be funded from existing resources in the I-95 Refuse Disposal Fund.
11. Obligations Under Capital Leases and Installment Purchases
The reporting entity has financed the acquisition of certain capital assets, including a satellite government center, buses, computer equipment, copier machines, and trailers, by entering into capital lease and installment purchase agreements. The balance of capital assets, net, and the minimum obligations under these capital lease and installment purchase agreements as of June 30, 2013, are presented on the following page:

county oF FairFax, Virginia comPrehenSiVe annual Financial rePort98
BaSic Financial StatementS
The County is the lessor in a direct financing lease with Public Schools for an administrative office building and related land. The lease is structured so that Public Schools will make annual lease payments over 30 years equal to the County’s required debt service payments on the Series 2005 Facilities Revenue Bonds (see Note J-2). The County will transfer ownership of the building to Public Schools once all the lease obligations are satisfied. The total future minimum lease payments receivable is $51.5 million and unearned revenue in the amount of $51.5 million is reported. Minimum lease payments for each of the five succeeding fiscal years are $1,415,000; $1,470,000; $1,530,000; $1,590,000; and $1,670,000 respectively.
k. long-term commitmentS
1. Washington Metropolitan Area Transit Authority (WMATA)
The County’s commitments to WMATA are comprised of agreements to make capital contributions for the construction of rail lines and for the acquisition, replacement, and renovation of transit equipment and facilities and to provide operating subsidies for its rail, bus, and paratransit systems. The County’s commitments in each of these areas are summarized as follows:
Capital Contributions – Transit Equipment and Facilities
Each fiscal year, the County and other local jurisdictions make contributions for WMATA’s acquisition, replacement, and rehabilitation of transit equipment and facilities and for the debt service on federally guaranteed transit revenue bonds issued by WMATA. The County’s obligation of approximately $26.8 million for fiscal year 2013 was funded with $22.6 million of County general obligation bond proceeds, and $4.2 million of state aid provided through the Northern Virginia Transportation Commission (NVTC). It is anticipated that the County’s obligation for fiscal year 2014 will amount to $30.9 million and be funded with $2.8 million of state aid provided through the NVTC, and $28.1 million of County general obligation bond proceeds.
Asset ClassPrimary Government -
Governmental ActivitiesComponent Unit -
Public Schools
Land -$ 6,000,000 Buildings - 48,158,308 Improvements 3,774,949 - Equipment 14,728,968 67,768,311 Total assets, at cost 18,503,917 121,926,619 Accumulated depreciation (11,686,618) (35,044,975) Total assets, net 6,817,299$ 86,881,644
Fiscal Year Minimum Obligations Minimum Obligations2014 1,854,822$ 17,219,323 2015 599,298 14,571,681 2016 499,631 9,368,297 2017 261,651 8,611,045 2018 261,651 4,409,455 2019-2023 327,360 18,879,912 2024-2028 70,926 18,875,485 2029-2033 - 18,877,550 2034-2038 - 7,550,825
- Total minimum obligations 3,875,339 118,363,573 Portion representing interest (397,345) (33,415,639) Present value of minimum obligations 3,477,994$ 84,947,934

99Financial Section
noteS to the Financial StatementS
Operating Subsidies
The County and other local jurisdictions contribute annually toward WMATA’s deficits resulting from the operation of its rail, bus, and paratransit systems. For fiscal year 2013, the County’s obligation of approximately $87.5 million for operating subsidies was funded with $9.2 million from the County’s Metro Operations and Construction Fund, $78.3 million from state aid and regional gasoline tax receipts provided through the NVTC. It is anticipated that the County’s obligation for fiscal year 2014 will amount to $96.2 million and be funded with $88.6 million of state aid and regional gasoline tax receipts provided through the NVTC and $7.6 million of County funds.
Beginning in fiscal year 2013, the state aid discussed in both Capital Contributions and Operating subsidies is shown passing through the County and Regional Transportation Projects Fund as the result of a change in the language used in the State Budget. Prior to fiscal year 2013, this activity was not reflected as activity on the County financial statements.
2. Virginia Railway Express (VRE)
The County, as a member of the NVTC and in cooperation with the Potomac and Rappahannock Transportation Commission (PRTC), is a participating jurisdiction in the operation of the VRE commuter rail service. The service primarily consists of rush hour trips originating from Manassas, Virginia and from Fredericksburg, Virginia to Union Station in Washington, DC. There are five stations in Fairfax County.
In October 1989, the Board of Supervisors of Fairfax County approved the Commuter Rail Master Agreement and financial plans. These have subsequently been amended to reflect voting criteria for member jurisdictions, new member requirements, and fairness in the subsidy allocation formula which took effect for fiscal year 2008. The Board approved this Amended Master Agreement on September 10, 2007. The Amended Master Agreement requires the County to contribute to capital, operating, and debt service costs of the VRE on a pro rata basis according to its share of ridership. The County’s fiscal year 2013 contribution to the VRE was $4.5 million.
3. Operating Lease Commitments
The County, Public Schools, and the EDA have entered into various long-term lease agreements for real estate and equipment. Certain real estate leases contain provisions which allow for increased rentals based upon increases in real estate taxes and the Consumer Price Index. All lease obligations are contingent upon the Board of Supervisors appropriating funds for each fiscal year’s payments. For fiscal year 2013, the County’s, Public Schools’, and EDA’s total expenditures for these operating leases were $18.5 million, $4.2 million, and $0.7 million, respectively. At June 30, 2013, the minimum long-term lease commitments accounted for as operating leases were as shown below:
Primary Government
Fiscal Year Governmental Activities Public Schools EDA2014 16,643,882 4,014,404 714,493 2015 14,498,705 4,115,582 734,162 2016 13,421,572 3,399,712 754,273 2017 12,874,901 1,538,847 775,047 2018 12,730,192 1,555,739 796,263 2019-2023 19,837,520 959,309 1,098,370 2024-2028 5,889,701 - - 2029-2033 2,710,068 - - 2034-2038 1,369,227 - - 2039-2043 1,034,077 - - Total 101,009,845$ 15,583,593 4,872,608
Component Units

county oF FairFax, Virginia comPrehenSiVe annual Financial rePort100
BaSic Financial StatementS
4. Intermunicipal Agreements
City of Alexandria, Virginia, Renew Enterprises
The Sewer System is obligated under an agreement with the City of Alexandria, Virginia, Renew Enterprises (ARE) to share the construction and operating costs and debt service requirements for its sewage treatment facility. Currently, the Sewer System has a capacity entitlement of 32.4 MGD, which is 60 percent of the facility’s total capacity of 54 MGD. The Sewer System is allowed only one non-voting representative at the meetings of the ARE and has no significant influence in the management of the treatment facility. In addition, the Sewer System has no direct ongoing equity interest in the assets or liabilities of the ARE.
The ARE facility is currently undergoing major improvements to meet new water quality standards. The Sewer System paid ARE $9,757,751 for purchase capacity in fiscal year 2013, to fund its share of construction costs, and it estimates its share of the remaining construction costs to be $153.6 million of which $40.1 million, is expected to be incurred in fiscal year 2014 and the balance over fiscal years 2015 to 2023. In addition, the Sewer System made payments of $12.8 million to the ARE during fiscal year 2013 for its share of the ARE’s operating costs.
District of Columbia Water and Sewer Authority
The Sewer System is obligated under an intermunicipal agreement between the County; the District of Columbia (District); District of Columbia Water and Sewer Authority (DC Water); Montgomery County, Maryland; Prince George’s County, Maryland; and the Washington Suburban Sanitary Commission to share the construction and operating costs of the Blue Plains Wastewater Treatment Plant, which is operated by DC Water. Currently, the Sewer System has a capacity entitlement of 31 MGD, which is approximately 8.4 percent of the Plant’s total capacity of 370 MGD. DC Water has a Board of Directors comprised of six members from the District, two each from Montgomery and Prince George’s Counties, and one from the County. The County has no significant control over plant operations and construction and no ownership interest in the assets of DC Water.
The Blue Plains Plant is currently undergoing a major renovation of its chemical additions and sludge disposal systems. The Sewer System paid DC Water $27.7 million for purchase capacity during fiscal year 2013 to fund its share of construction costs, and it estimates its share of the remaining construction costs to be $136.6 million, of which $26.3 million is expected to be incurred in fiscal year 2014 and the balance over fiscal years 2015 to 2023. In addition, the Sewer System made payments of $13.2 million for contractual services to DC Water during fiscal year 2013 for its share of the Plant’s operating costs.
Upper Occoquan Sewage Authority
As described in Note A, UOSA is a joint venture created under the provisions of the Virginia Water and Waste Authorities Act to be the single regional entity to construct, finance, and operate the regional sewage treatment facility for the upper portion of the Occoquan Watershed. The Sewer System’s allocated share of the UOSA plant’s total capacity of 54.0 MGD is 22.6 MGD, or approximately 42 percent.
UOSA’s current operating expenses, construction costs, and annual debt service payments are funded by each of the participating jurisdictions based on their allocated capacity, with certain modifications. The Sewer System made contractual service payments to UOSA in fiscal year 2013 of $12.6 million to pay its share of UOSA’s operating costs.
Summarized UOSA financial information as of and for the years ended June 30, 2012, and 2011 (the most recent audited financial information available), is shown on the following page:

101Financial Section
noteS to the Financial StatementS
2012 2011
Total assets 633,347,332$ 637,303,357 Total liabilities (533,484,845) (537,851,308)
Total net assets 99,862,487$ 99,452,049
Operating revenues 26,287,967$ 26,552,992 Operating expenses (47,735,959) (46,966,704) Nonoperating revenues, net 11,666,621 5,842,390 Capital contributions 10,191,809 9,736,587
Increase (decrease) in net assets 410,438$ (4,834,735)
Arlington County, Virginia
The Sewer System is obligated under an agreement with Arlington County, Virginia, to share the construction and operating costs of the sewage treatment facility owned and operated by Arlington County. Currently, the Sewer System has a capacity entitlement of 3 MGD, which is 7.5 percent of the facility’s total capacity of 40 MGD. The Sewer System has no significant influence over the management of the treatment facility. In addition, the Sewer System has no direct on-going equity interest in the facility’s assets and liabilities.
The Arlington facility is currently undergoing a major upgrade to meet new water quality standards. The Sewer System paid Arlington $3.1 million in fiscal year 2013 to fund its share of the construction costs, and it estimates its share of the remaining construction costs to be $3.6 million, of which $0.6 million is expected to be incurred in fiscal year 2014 and the balance over fiscal years 2015 to 2023. In addition, the Sewer System made payments of $2.2 million for contractual services to Arlington during fiscal year 2013 for its share of Arlington’s operating costs.
Loudoun County, Virginia
The Sewer System is obligated under an agreement with Loudoun County, Virginia, to share the construction and operating costs and debt service requirements for the sewage treatment facility owned and operated by Loudoun Water. Currently, the Sewer System has a capacity entitlement of 1.0 MGD, which is 9.0 percent of the facility’s total capacity of 11 MGD. The Sewer System has no significant influence over the management of the treatment facility. Furthermore, the Sewer System has no direct on-going equity interest in the facility’s assets and liabilities.
The System did not pay any operating cost to Loudoun Water in fiscal year 2013. The System will incur operating costs once it starts to deliver flows to Loudoun Water’s facilities which is not expected to start in fiscal year 2014.
5. Long-term Contracts
At June 30, 2013, the primary government had contractual commitments of $67,203,245 in the capital projects funds and $47,902,000 in the Sewer System for construction of various sewer projects. At June 30, 2013, the component units had contractual commitments of $144,327,131 and

county oF FairFax, Virginia comPrehenSiVe annual Financial rePort102
BaSic Financial StatementS
$17,009,427 in the capital projects funds of the Public Schools and the Park Authority, respectively, for construction of various projects.
l. contingent liaBilitieS
The County is contingently liable with respect to lawsuits and other claims that arise in the ordinary course of its operations. Although the outcome of these matters is not presently determinable, in the opinion of County management, the resolution of these matters will not have a material adverse effect on the County’s financial condition.
The County receives grant funds, principally from the federal government, for construction and various other programs. Certain expenditures of these funds are subject to audit by the grantor, and the County is contingently liable to refund amounts received in excess of allowable expenditures. In the opinion of County management, no material refunds will be required as a result of expenditures disallowed by the grantors.
m. SPecial itemS
In September 2010, the Board of Supervisors approved a two phase Contract of Sale with Inova Health Systems which included the transfer of approximately 15 acres of land including the Woodburn Mental Health Center and Woodburn Place from the County to Inova. In exchange for this land, Inova provided the County with an approximate 5-acre parcel at Willow Oaks II, a $15 million cash payment, and a 10-year lease of 40,000 square feet within the new Mid County Center building. In fiscal year 2011, the first installment of $7,300,000 was paid. In fiscal year 2012, the second installment of $3,500,000 was paid. For fiscal year 2013, the remaining $4,200,000 resides in an escrow account. This amount will be offset by the costs owed to Inova Health System for infrastructure construction completed. At the end of the project, any residual amounts not used for construction costs will be returned to the County.
n. imPlementation oF new accounting PronouncementS
In Fiscal Year 2013, the County implemented GASB Statement No. 60, “Accounting and Financial Reporting for Service Concession Arrangements”. The implementation of the new standard did not have a material impact on the County’s financial statements for Fiscal Year 2013.
The County implemented GASB Statement No. 61, “The Financial Reporting Entity Omnibus — an amendment of GASB Statements No. 14 and No. 34”. The implementation of the new standard did not have a material impact on the County’s financial statements for Fiscal Year 2013.
The County implemented GASB Statement No. 62, “Codification of Accounting and Financial Reporting Guidance contained in Pre-November 30, 1989 FASB and AICPA”. The implementation of the new standard did not have a material impact on the County’s financial statements for Fiscal Year 2013.
The County implemented GASB Statement No. 63, “Financial Reporting of Deferred Outflows of Resources, Deferred Inflows of Resources and Net Position”. The implementation of the new standard has replaced the statement of net assets with the statement of net position which includes the deferred outflows of resources and deferred inflow of resources.

103Financial Section
noteS to the Financial StatementS
The County, with the exception of the County Retirement Systems, has opted to early implement GASB Statement No. 65, “Items Previously Reported as Assets and Liabilities”. Bond issuance costs, except any portion related to prepaid insurance costs, are recognized as an expense in fiscal year 2013. Prior to the implementation, these items were deferred and amortized over the life of the existing debt. The County has reclassified the deferred amount on refunding previously reported as assets and liabilities as deferred outflows of resources and deferred inflows of resources. The balance of Deferred Bond Issuance Cost in fiscal year 2012 as reported were $19,137,654 for Governmental Activities, $1,037,765 for Business Type Activities, and $1,350,550 for Component Units. The cumulative effect of applying GASB 65 has resulted in an increase to fiscal year 2012 total expenses by $20,400,502. The recalculated expenses and net position for fiscal year 2012, to obtain fiscal year 2013 beginning net position are as follows:
Governmental Activities 359,003,686$ (19,137,654) 339,866,032$
Business-type Activities 937,806,425 (1,037,765) 936,768,660
Total Primary Government 1,296,810,111 (20,175,419) 1,276,634,692
Component Units 3,135,907,944 (225,083) 3,135,682,861
Total Reporting Entity 4,432,718,055$ (20,400,502) 4,412,317,553$
Governmental Activities 3,988,442,783$ 19,137,654 4,007,580,437$
Business-type Activities 162,918,142 1,037,765 163,955,907
Total Primary Government 4,151,360,925 20,175,419 4,171,536,344
Component Units 2,653,124,458 225,083 2,653,349,541
Total Reporting Entity 6,804,485,383$ 20,400,502 6,824,885,885$
Deferred Bond Issuance Costs
Expensed
2012 Total net assets
2012 net position, as adjusted
2012 Total expenditures
Bond Issuance Costs Expense
2012 total expenditures, as adjusted
The County has also opted to early implement GASB Statement No. 66, “Technical Corrections – 2012”. The implementation of the new standard did not have a material impact on the County’s financial statements for Fiscal Year 2013.

county oF FairFax, Virginia comPrehenSiVe annual Financial rePort104
BaSic Financial StatementS

Required Supplementary Information
he Required Supplementary Information subsection includes the budgetary comparison
schedule for the County of Fairfax’s major fund, the General Fund. It also includes trend data, including
T the schedule of funding progress and the schedule of employer contributions, related to the pension trust funds of the County of Fairfax and the Fairfax County Public Schools component unit. The notes to required supplementary information are also included in this subsection.

105Financial Section
RequiRed SupplementaRy inFoRmation
county oF FaiRFax, ViRginiaBudgetary Comparison Schedule - General Fund (Budget Basis)For the fiscal year ended June 30, 2013
Original Final
2,981,818,327$ 2,980,259,769 3,008,000,381 27,740,612 34,902,539 35,747,734 38,201,352 2,453,618
341,525,676 332,199,305 332,278,726 79,421 70,095,102 70,971,358 72,674,073 1,702,715 13,595,913 14,612,835 14,131,523 (481,312) 18,169,566 18,160,015 18,097,468 (62,547) 14,716,245 14,858,461 15,285,540 427,079
3,474,823,368 3,466,809,477 3,498,669,063 31,859,586
General government administration 100,674,663 106,765,325 97,974,104 8,791,221 Judicial administration 33,073,100 33,897,463 33,451,817 445,646 Public safety 421,729,844 432,020,788 416,235,478 15,785,310 Public works 67,736,780 72,930,851 68,389,977 4,540,874 Health and welfare 298,699,875 301,333,216 281,524,289 19,808,927 Community development 44,582,338 48,267,746 42,704,669 5,563,077 Parks, recreation, and cultural 50,128,306 51,376,421 49,448,162 1,928,259 Nondepartmental 287,116,896 285,476,845 279,594,237 5,882,608
1,303,741,802 1,332,068,655 1,269,322,733 62,745,922
Excess of revenues over expenditures 2,171,081,566 2,134,740,822 2,229,346,330 94,605,508
6,770,457 6,770,457 6,770,457 - (550,722,589) (577,171,807) (577,171,807) -
(1,683,322,285) (1,683,322,285) (1,683,322,285) -
(2,227,274,417) (2,253,723,635) (2,253,723,635) -
(56,192,851)$ (118,982,813) (24,377,305) 94,605,508 See accompanying notes to required supplementary information.
Budgeted Amounts
Variance from Final Budget
Positive (Negative)
REVENUES
Actual Amounts (Budget Basis)
Total other financing (uses)
TaxesPermits, privilege fees, and regulatory licensesIntergovernmentalCharges for servicesFines and forfeituresRevenue from the use of money and property
Net change in fund balance
OTHER FINANCING SOURCES (USES)Transfers in from other primary government fundsTransfers out to other primary government fundsTransfers out to component units
Recovered costs
Total revenuesEXPENDITURES
Total expenditures

county oF FaiRFax, ViRginia compRehenSiVe annual Financial RepoRt106
RequiRed SupplementaRy inFoRmation
Schedule of Funding ProgressFor the fiscal year ended June 30, 2013
county oF FaiRFax, ViRginia
Actuarial Value of Assets
Actuarial Accrued
Liability (AAL) - Entry Age
Unfunded AAL (UAAL)
(Funding Excess)
Covered Payroll
(000) ( a ) (000) ( b ) (000) ( b-a ) (000) ( c )Primary GovernmentEmployees' Retirement System:
7/1/2003 1,903,970$ 2,251,187$ 347,217$ 84.58 % 530,216$ 65.49 %7/1/2004 2,030,539 2,411,135 380,596 84.22 552,738 68.867/1/2005 2,202,515 2,676,418 473,903 82.29 565,063 83.877/1/2006 2,363,844 2,881,780 517,936 82.03 574,294 90.197/1/2007 2,596,658 3,139,187 542,529 82.72 579,075 93.697/1/2008 2,752,874 3,328,901 576,027 82.70 610,877 94.307/1/2009 2,603,284 3,535,874 932,590 73.62 628,481 148.397/1/2010 2,636,052 3,771,060 1,135,008 69.90 629,249 180.387/1/2011 2,841,466 4,018,924 1,177,457 70.70 642,073 183.387/1/2012 3,053,412 4,264,175 1,210,763 71.61 642,639 188.40
Police Officers Retirement System:7/1/2003 644,405 703,977 59,572 91.54 71,401 83.437/1/2004 685,495 749,344 63,849 91.48 78,080 81.777/1/2005 732,582 828,702 96,120 88.40 83,939 114.517/1/2006 788,766 897,478 108,712 87.89 89,062 122.067/1/2007 870,975 968,735 97,760 89.91 95,904 101.947/1/2008 908,077 1,031,333 123,256 88.05 99,714 123.617/1/2009 879,543 1,076,039 196,496 81.74 99,647 197.197/1/2010 899,543 1,135,015 235,472 79.25 100,500 234.307/1/2011 982,154 1,219,609 237,455 80.53 99,070 239.687/1/2012 1,035,444 1,286,841 251,397 80.46 101,121 248.61
Uniformed Retirement System:7/1/2003 715,797 795,342 79,545 90.00 100,749 78.957/1/2004 767,357 881,015 113,658 87.10 102,960 110.397/1/2005 830,702 974,106 143,404 85.28 109,067 131.487/1/2006 921,414 1,102,667 181,253 83.56 127,469 142.197/1/2007 1,028,385 1,206,624 178,239 85.23 136,487 130.597/1/2008 1,097,994 1,285,694 187,700 85.40 142,724 131.517/1/2009 1,074,230 1,351,204 276,974 79.50 147,083 188.317/1/2010 1,095,080 1,427,617 332,537 76.71 146,777 226.567/1/2011 1,185,594 1,526,218 340,624 77.68 147,326 231.207/1/2012 1,247,526 1,613,654 366,128 77.31 148,236 246.99
Other Post-Employment Benefits (OPEB):7/1/2007 - 379,856 379,856 - 650,106 58.437/1/2008 48,207 350,709 302,502 13.75 697,253 43.397/1/2009 50,233 441,286 391,053 11.38 761,303 51.377/1/2010 60,473 489,203 428,730 12.36 777,040 55.177/1/2011 80,087 474,229 394,142 16.89 799,500 49.307/1/2012 103,270 503,786 400,516 20.50 824,504 48.58
Component Unit - Public SchoolsEducational Employees' Supplementary Retirement System:
6/30/2003 1,597,459 1,772,418 174,959 90.13 866,502 20.1912/31/2004 1,643,020 1,935,582 292,562 84.89 977,817 29.9212/31/2005 1,718,399 2,022,962 304,563 84.94 1,050,217 29.0012/31/2006 1,818,930 2,105,552 286,622 86.39 1,111,828 25.7812/31/2007 1,924,886 2,186,801 261,915 88.02 1,161,432 22.5512/31/2008 1,733,946 2,255,298 521,352 76.88 1,211,140 43.0512/31/2009 1,769,540 2,314,282 544,742 76.46 1,208,093 45.0912/31/2010 1,822,603 2,384,061 561,458 76.45 1,191,290 47.1312/31/2011 1,866,952 2,470,964 604,012 75.56 1,246,973 48.4412/31/2012 1,935,292 2,566,128 630,836 75.42 1,297,537 48.62Other Post-Employment Benefits (OPEB):
7/1/2007 - 299,668 299,668 - 1,302,665 23.00 7/1/2008 7,996 458,067 450,071 1.75 1,352,321 33.28 7/1/2009 17,520 466,324 448,804 3.76 1,182,922 37.94 7/1/2010 19,563 471,617 452,054 4.15 1,432,000 31.57 7/1/2011 40,051 431,303 391,252 9.29 1,005,000 38.93 7/1/2012 53,423 448,849 395,426 11.90 1,045,000 37.84
See accompanying notes to required supplementary information.
Funded Ratio
UAAL (Funding Excess) as a Percentage of
Covered PayrollActuarial Valuation
Date ( a/b ) ( ( b-a ) / c )

107Financial Section
RequiRed SupplementaRy inFoRmation
Schedule of Employer ContributionsFor the fiscal year ended June 30, 2013
county oF FaiRFax, ViRginia
Annual Required
Contribution
Annual Required
Contribution
Annual Required
Contribution2004 51,992,031$ 66.20 % 17,356,995$ 84.59 % 25,186,003$ 98.56 %2005 67,996,277 69.06 20,744,793 71.83 32,320,929 84.132006 73,734,724 67.05 22,641,707 73.88 37,668,222 85.312007 81,551,794 70.45 26,518,550 72.49 43,009,853 84.832008 89,480,173 70.00 28,198,891 76.06 46,849,354 83.432009 95,052,308 69.00 27,625,460 85.00 47,247,396 86.002010 92,771,532 69.06 30,759,259 77.27 47,289,026 86.222011 122,435,265 78.90 36,872,751 79.12 53,208,307 86.112012 142,286,358 80.60 39,408,110 81.38 57,663,522 87.912013 158,155,966 80.58 43,091,299 80.49 62,240,960 87.34
Annual Required
Contribution
37,331,203$ * 100.00 %32,198,596 * 100.0034,648,918 * 100.0036,644,001 * 100.0038,334,140 * 100.0040,012,480 * 100.0037,868,623 * 100.0047,118,111 * 100.0052,934,245 * 100.0067,734,634 * 100.00
Fiscal Year Ended
June 302008 185.42 % 103.21 %2009 84.89 97.702010 54.59 75.472011 59.38 118.702012 118.02 138.372013 98.58 110.72
* The annual required contribution is equal to the annual pension cost.See accompanying notes to required supplementary information.
35,373,000
Percentage Contributed
Component Unit - Public Schools
2010
Percentage Contributed
Other Post-Employment Benefits (OPEB)
38,163,000
Primary Government
Fiscal Year Ended
June 30
20062007
2011
2005
20092008
2013
Fiscal Year
Ended June 30
Primary Government
Uniformed RetirementPolice Officers RetirementEmployees' Retirement
Percentage Contributed
Percentage Contributed
Educational Employees'Supplementary Retirement
30,630,000
2004
Percentage Contributed
Annual Required
Contribution
Other Post-Employment Benefits (OPEB)
Annual Required
Contribution
Percentage Contributed
31,142,000 38,858,000 37,640,000
2012
37,522,000 35,954,000
31,648,000$ 25,393,000 32,553,000
25,302,000$

county oF FaiRFax, ViRginia compRehenSiVe annual Financial RepoRt108
RequiRed SupplementaRy inFoRmation

109Financial Section
noteS to RequiRed SupplementaRy inFoRmation
county oF FaiRFax, ViRginia
noteS to RequiRed SupplementaRy inFoRmation
June 30, 2013
A. BudgetaRy data
The Board of Supervisors adheres to the following procedures in establishing the budgetary data reflected in the financial statements:
a. By March 1, the County Executive submits to the Board of Supervisors a proposed operating budget for the fiscal year commencing the following July 1. The operating budget includes proposed expenditures and the means of financing them. During April, public hearings are conducted to obtain taxpayer comments. By May 1, the budget is legally enacted through passage of an appropriation resolution.
b. The operating budget includes all County appropriated funds and certain non-appropriated funds. The non-appropriated funds include certain funds of the Park Authority and the FCRHA that are not financed by the County.
c. Budget reviews are held during the fiscal year. Public hearings are held if the recommended increase in the appropriated budget is greater than one percent of expenditures.
d. The budget is controlled at certain legal and administrative levels. The Code of Virginia requires that the County annually adopt a balanced budget. The adopted Fiscal Planning Resolution places legal restrictions on expenditures at the agency (e.g., County organizations in the General Fund) or fund level and identifies administrative controls at the character (i.e., personnel services, operating expenses, recovered costs, and capital equipment) or project level. The County’s Department of Management and Budget is authorized to transfer budgeted amounts between characters or projects within any agency or fund as a management function. Any revisions that alter the total expenditures of any agency or fund must be approved by the Board of Supervisors.
e. Annual operating budgets are adopted for all appropriated governmental funds, except for the capital projects funds in which budgetary control is achieved on a project-by-project basis. The budgets are on a basis consistent with GAAP for the General Fund, except that:
• Revenue from investments is recognized in the governmental funds for budget purposes only if collected within 45 days of year end, instead of as earned.
• Certain purchase order transactions that qualify as current expenditures under GAAP, are not recognized as expenditures in the current budget due to the timing of the receipt of goods or services.
• Offsetting revenues and expenditures related to donated food are not budgeted.
• Capital lease transactions when initiated are not budgeted as offsetting expenditures and other financing sources.
• Certain capital outlays are budgeted as functional expenditures.
• Payments from or to component units are budgeted as transfers rather than functional revenues and expenditures.

county oF FaiRFax, ViRginia compRehenSiVe annual Financial RepoRt110
RequiRed SupplementaRy inFoRmation
• Inventories of supplies are not included in the fund balance for budget purposes.
• Nondepartmental expenditures are reported for budgeting purposes, but are included in functional expenditures for reporting purposes.
• The Gift Fund, which is included in the County’s General Fund for reporting purposes, is treated as an agency fund for budgeting purposes.
• The Information Technolgy Fund, Consolidated Community Funding Pool Fund and the Contributory Fund, which are included in the County’s General Fund for reporting purposes, are treated as special revenue funds for budgeting purposes.
The following schedule reconciles the amounts on the Budgetary Comparison Schedule – General Fund (Budget Basis) to the amounts on the Statement of Revenues, Expenditures, and Changes in Fund Balances (Exhibit A-3):
f. Original and final budgeted amounts are shown on the Budgetary Comparison Schedule; amendments were not significant in relation to the original budget.
g. Appropriations lapse at June 30 unless the Board of Supervisors approves carrying them forward to the next fiscal year.
Primary GovernmentGeneral Fund
Net change in fund balance (Budget basis) (24,377,305)$ Basis difference - Revenue from investments 232,320 Timing difference - Purchase expenditures 55,419 Interfund differences - Fringe benefits (195,824) Perspective differences:
The Gift Fund and NOVARIS are treated as agency funds for budget purposes (52,589) The Consolidated Community Funding Pool Fund is treated as a special revenue fund for budget purposes (31,292) The Contributory Fund is treated as a special revenue fund for budget purposes (58,385) The Information Technology Fund is treated as a special revenue fund for budget purposes 24,739
Net change in fund balance (GAAP basis) (24,402,917)$

111Financial Section
noteS to RequiRed SupplementaRy inFoRmation
B. penSion tRend data
Six-year historical trend information of the retirement systems administered by the reporting entity is presented as required supplementary information. This information is intended to help users assess each system’s funding status on a going concern basis, assess progress made in accumulating assets to pay benefits when due, and make comparisons with other public employee retirement systems.
Analysis of the dollar amounts of plan net position, actuarial accrued liability, and unfunded actuarial accrued liability in isolation can be misleading. Expressing plan net position as a percentage of the actuarial accrued liability provides one indication of each system’s funding status on a going concern basis. Analysis of this percentage over time indicates whether the system is becoming financially stronger or weaker. Generally, the greater this percentage is, the stronger the system. Trends in the unfunded actuarial accrued liability and annual covered payroll are both affected by inflation. Expressing the unfunded actuarial accrued liability as a percentage of annual covered payroll approximately adjusts for the effects of inflation and aids analysis of the system’s progress made in accumulating sufficient assets to pay benefits when due. Generally, the smaller this percentage is, the stronger the system.
Information pertaining to the retirement systems administered by the reporting entity can be found in Note G to the financial statements.
c. otheR poSt-employment BeneFitS (opeB) tRend data
Actuarial valuations of an ongoing plan involve estimates of the value of reported amounts and assumptions about the probability of occurrence of events far into the future. Examples include assumptions about future employment, mortality, and the healthcare cost trend. Amounts determined regarding the funded status of the plan and the annual required contributions of the employer are subject to continual revision as actual results are compared with past expectations and new estimates are made about the future. The schedule of funding progress, presented as required supplementary information following the notes to the financial statements, presents multiyear trend information about whether the actuarial value of plan assets is increasing or decreasing over time relative to the actuarial accrued liabilities for benefits.
Information pertaining to the OPEB plans administered by the reporting entity can be found in Note H to the financial statements.

Appendix V
BOOK-ENTRY ONLY SYSTEM
The Depository Trust Company (“DTC”), New York, New York, will act as securities depository for the Bonds. The Bonds will be issued as fully registered securities registered in the name of Cede & Co. (DTC’s partnership nominee) or such other name as may be requested by an authorized representative of DTC. One fully registered Bond certificate will be issued for each principal amount of Bonds of a Series bearing interest at a specified interest rate, each in the aggregate principal amount of such quantity of Bonds, and will be deposited with DTC.
DTC, the world’s largest depository, is a limited purpose trust company organized under the New York Banking Law, a “banking organization” within the meaning of the New York Banking Law, a member of the Federal Reserve System, a “clearing corporation” within the meaning of the New York Uniform Commercial Code, and a “clearing agency” registered pursuant to the provisions of Section 17A of the Securities Exchange Act of 1934. DTC holds and provides asset servicing for over 3.5 million issues of U.S. and non U.S. equity issues, corporate and municipal debt issues, and money market instruments (from over 100 countries) that DTC’s participants (“Direct Participants”) deposit with DTC. DTC also facilitates the post trade settlement among Direct Participants of sales and other securities transactions in deposited securities, through electronic computerized book entry transfers and pledges between Direct Participants’ accounts. This eliminates the need for physical movement of securities certificates. Direct Participants include both U.S. and non U.S. securities brokers and dealers, banks, trust companies, clearing corporations, and certain other organizations. DTC is a wholly owned subsidiary of The Depository Trust & Clearing Corporation (“DTCC”). DTCC is the holding company for DTC, National Securities Clearing Corporation and Fixed Income Clearing Corporation, all of which are registered clearing agencies. DTCC is owned by the users of its regulated subsidiaries. Access to the DTC system is also available to others such as both U.S. and non U.S. securities brokers and dealers, banks, trust companies, and clearing corporations that clear through or maintain a custodial relationship with a Direct Participant, either directly or indirectly (“Indirect Participants”). The DTC Rules applicable to its Participants are on file with the Securities and Exchange Commission. More information about DTC can be found at www.dtcc.com and www.dtc.org.
Purchases of the Bonds under the DTC system must be made by or through Direct Participants, which will receive a credit for the Bonds on DTC’s records. The ownership interest of each actual purchaser of the Bonds (“Beneficial Owner”) is in turn to be recorded on the Direct and Indirect Participants’ records. Beneficial Owners will not receive written confirmation from DTC of their purchase. Beneficial Owners are, however, expected to receive written confirmations providing details of the transaction, as well as periodic statements of their holdings, from the Direct or Indirect Participant through which the Beneficial Owner entered into the transaction. Transfers of ownership interest in the Bonds are to be accomplished by entries made on the books of Direct and Indirect Participants acting on behalf of Beneficial Owners. Beneficial Owners will not receive bond certificates representing their ownership interests in the Bonds, except in the event that use of the book entry system for the Bonds is discontinued.
To facilitate subsequent transfers, all Bonds deposited by Direct Participants with DTC are registered in the name of DTC’s partnership nominee, Cede & Co., or such other name as may be requested by an authorized representative of DTC. The deposit of the Bonds with DTC and their registration in the name of Cede & Co. or such other DTC nominee do not effect any change in beneficial ownership. DTC has no knowledge of the actual Beneficial Owners of the Bonds; DTC’s records reflect only the identity of the Direct Participants to whose accounts such Bonds are credited, which may or may

V-2
not be the Beneficial Owners. The Direct and Indirect Participants will remain responsible for keeping account of their holdings on behalf of their customers.
Conveyance of notices and other communications by DTC to Direct Participants, by Direct Participants to Indirect Participants, and by Direct Participants and Indirect Participants to Beneficial Owners will be governed by arrangements among them, subject to any statutory or regulatory requirements as may be in effect from time to time. Beneficial Owners of Bonds may wish to take certain steps to augment the transmission to them of notices of significant events with respect to the Bonds, such as redemptions, tenders, defaults, and proposed amendments to the Bond documents. For example, Beneficial Owners of the Bonds may wish to ascertain that the nominee holding the Bonds for their benefit has agreed to obtain and transmit notices to Beneficial Owners. In the alternative, Beneficial Owners may wish to provide their names and addresses to the registrar and request that copies of notices be provided directly to them.
Neither DTC nor Cede & Co. (nor any other DTC nominee) will consent or vote with respect to the Bonds unless authorized by a Direct Participant in accordance with DTC’s Procedures. Under its usual procedures, DTC mails an Omnibus Proxy to the County as soon as possible after the record date. The Omnibus Proxy assigns Cede & Co.’s consenting or voting rights to those Direct Participants to whose accounts the Bonds are credited on the record date (identified in a listing attached to the Omnibus Proxy).
Principal, premium, if any, and interest payments on the Bonds will be made to Cede & Co., or such other nominee as may be requested by an authorized representative of DTC. DTC’s practice is to credit Direct Participants’ accounts upon DTC’s receipt of funds and corresponding detailed information from the County, on a payable date in accordance with their respective holdings shown on DTC’s records. Payments by Participants to Beneficial Owners will be governed by standing instructions and customary practices, as is the case with securities held for the accounts of customers in bearer form or registered in “street name,” and will be the responsibility of such Participant and not of DTC or the County, subject to any statutory or regulatory requirements as may be in effect from time to time. Payment of redemption proceeds, distributions, and dividend payments to Cede & Co. (or such other nominee as may be requested by an authorized representative of DTC is the responsibility of the County, disbursement of such payments to Direct Participants will be the responsibility of DTC, and disbursement of such payments to the Beneficial Owners shall be the responsibility of Direct and Indirect Participants.
DTC may discontinue providing its services as depository with respect to the Bonds at any time by giving reasonable notice to the County. Under such circumstances, in the event that a successor depository is not obtained, certificates for the Bonds are required to be printed and delivered.
The County may decide to discontinue use of the system of book-entry transfers through DTC (or a successor securities depository). In that event, certificates for the Bonds will be printed and delivered.
The information in this section concerning DTC and DTC’s book-entry system has been obtained from sources that the County believes to be reliable, but the County takes no responsibility for the accuracy thereof.

Appendix VI
VI-1
SIDLEY AUSTIN LLP 1501 K STREET, N.W. WASHINGTON, D.C. 20005 (202) 736 8000 (202) 736 8711 FAX
BEIJING BOSTON BRUSSELS CHICAGO DALLAS FRANKFURT GENEVA
HONG KONG HOUSTON LONDON LOS ANGELES NEW YORK PALO ALTO SAN FRANCISCO
SHANGHAI SINGAPORE SYDNEY TOKYO WASHINGTON, D.C.
FOUNDED 1866
February _, 2014
Board of Supervisors of Fairfax County, Virginia Fairfax, Virginia
As bond counsel to Fairfax County, Virginia (the “County”), we have examined certified copies of the legal proceedings, including the election proceedings and other proofs submitted, relative to the issuance and sale of
$316,310,000 Fairfax County, Virginia
Public Improvement and Refunding Bonds, Series 2014A (the “Bonds”)
The Bonds are dated the date of their delivery, mature in annual installments on October 1 in each of the years 2014 to 2033, inclusive, and bear interest, payable on the 1st days of April and October in each year, commencing October 1, 2014. The Bonds are subject to redemption prior to their respective maturities in the manner and upon the terms and conditions set forth in the resolution authorizing the issuance of the Bonds adopted by the Board of Supervisors of Fairfax County on December 3, 2013.
From such examination, we are of the opinion that:
(1) Such proceedings and proofs show lawful authority for the issuance and sale of the Bonds pursuant to the Constitution and laws of Virginia, and the Bonds constitute valid and binding general obligations of the County, for the payment of which the full faith and credit of the County are pledged, and all taxable property in the County is subject to the levy of an ad valorem tax, without limitation as to rate or amount, for the payment of the Bonds and the interest thereon, which tax shall be in addition to all other taxes authorized to be levied in the County to the extent other funds of the County are not lawfully available and appropriated for such purpose.
(2) Except as provided in the following sentence, interest on the Bonds is not includable in the gross income of the owners thereof for purposes of federal income taxation based on existing law. Interest on the Bonds will be includable in the gross income of the owners thereof retroactive to the date of issue of the Bonds in the event of a failure by the County or the school board of the County to comply with applicable requirements of the Internal Revenue Code of 1986, as amended (the “Code”), with respect to the Bonds, and their respective covenants regarding use, expenditure, and investment of the proceeds of the Bonds and the timely payment of certain investment earnings to the United States Treasury, and we render no opinion as to the effect on the exclusion from gross income of the interest on the Bonds for federal income tax purposes of any action taken or not taken without our approval or upon the advice or approval of counsel other than us.

VI-2
(3) Interest on the Bonds is not an item of tax preference for purposes of the federal individual or corporate alternative minimum tax.
The Code contains other provisions that could result in tax consequences, as to which we render no opinion, as a result of ownership of the Bonds or the inclusion in certain computations (including without limitation those related to the corporate alternative minimum tax) of interest that is excluded from gross income.
Respectfully submitted,

VII-1
Appendix VII
CONTINUING DISCLOSURE AGREEMENT
This Continuing Disclosure Agreement (the “Disclosure Agreement”) is executed and delivered by Fairfax County, Virginia (the “County”), in connection with the issuance by the County of $316,310,000 aggregate principal amount of its Public Improvement and Refunding Bonds, Series 2014A (the “Bonds”) pursuant to the provisions of a resolution (the “Resolution”) adopted on December 3, 2013, by the Board of Supervisors of the County. The proceeds of the Bonds are being used by the County to finance and refinance various public improvements in the County. The County hereby covenants and agrees as follows:
SECTION 1. Purpose of the Disclosure Agreement. This Disclosure Agreement is being executed and delivered by the County for the benefit of the holders of the Bonds and in order to assist the Participating Underwriters (defined below) in complying with the Rule (defined below). The County acknowledges that it is undertaking primary responsibility for any reports, notices, or disclosures that may be required under this Agreement.
SECTION 2. Definitions. In addition to the definitions set forth in the Resolution, which apply to any capitalized term used in this Disclosure Agreement unless otherwise defined in this Section, the following capitalized terms shall have the following meanings:
“Annual Report” shall mean any Annual Report provided by the County pursuant to, and as described in, Sections 3 and 4 of this Disclosure Agreement.
“Dissemination Agent” shall mean the County, acting in its capacity as Dissemination Agent hereunder, or any successor Dissemination Agent designated in writing by the County and which has filed with the County a written acceptance of such designation.
“Filing Date” shall have the meaning given to such term in Section 3(a) hereof.
“Fiscal Year” shall mean the twelve month period at the end of which financial position and results of operations are determined. Currently, the County’s Fiscal Year begins July 1 and continues through June 30 of the next calendar year.
“Holder” or “holder” shall mean, for purposes of this Disclosure Agreement, any person who is a record owner or beneficial owner of a Bond.
“Listed Events” shall mean any of the events listed in subsection (b)(5)(i)(C) of the Rule, which are as follows:
principal and interest payment delinquencies;
non-payment related defaults; if material;
unscheduled draws on debt service reserves reflecting financial difficulties;
unscheduled draws on credit enhancements reflecting financial difficulties;
substitution of credit or liquidity providers, or their failure to perform;

VII-2
adverse tax opinions, the issuance by the Internal Revenue Service of proposed or final determinations of taxability, Notices of Proposed Issue (IRS Form 570-TEB) or other material notices or determinations with respect to or events affecting the tax-exempt status of the Bonds;
modifications to rights of holders, if material;
bond calls, if material, and tender offers;
defeasances;
release, substitution, or sale of property securing repayment of the Bonds, if material;
rating changes;
bankruptcy, insolvency, receivership or similar event of the County; which event is considered to occur when any of the following occur: the appointment of a receiver, fiscal agent or similar officer for the County in a proceeding under the U.S. Bankruptcy Code or in any other proceeding under state or federal law in which a court or governmental authority has assumed jurisdiction over substantially all of the assets of business of the County, or if such jurisdiction has been assumed by leaving the existing governing body and officials or officers in possession but subject to the supervision and orders of a court of governmental authority, or the entry of an order confirming a plan of reorganization, arrangement or liquidation by a court or governmental authority having supervision or jurisdiction over substantially all of the assets or business of the County;
the consummation of a merger, consolidation, or acquisition involving the County or the sale of all or substantially all of the assets of the County, other than in the ordinary course of business, the entry into a definitive agreement to undertake such an action or the termination of a definitive agreement relating any such actions, other than pursuant to its terms, if material; and
appointment of a successor or additional paying agent or the change of name of a paying agent, if material.
“Participating Underwriter” shall mean any of the original underwriters of the County’s Bonds required to comply with the Rule in connection with the offering of such Bonds.
“Repository” shall mean The Electronic Municipal Market Access (“EMMA”) system administered by the Municipal Securities Rulemaking Board. EMMA is recognized as a National Repository for purposes of the Rule.
“Rule” shall mean Rule 15c2-12 adopted by the Securities and Exchange Commission under the Securities Exchange Act of 1934, as the same may be amended from time to time.
SECTION 3. Provision of Annual Reports.
A. The County shall, or shall cause the Dissemination Agent to, provide to each Repository an Annual Report which is consistent with the requirements of Section 4 of this Disclosure Agreement. Such Annual Report shall be filed on a date (the “Filing Date”) that is not later than March 31 after the end of any Fiscal Year (commencing with its Fiscal Year ended June 30, 2014). Not later than ten (10) days prior to the Filing Date, the County shall provide the Annual Report to the Dissemination Agent (if applicable). In such case, the Annual Report (i) may be submitted as a single document or as separate documents comprising a package, (ii) may cross-reference other information as provided in Section 4 of

VII-3
this Disclosure Agreement, and (iii) shall include the County’s audited financial statements or, if audited financial statements are not available, such unaudited financial statements as may be required by the Rule. In any event, audited financial statements of the County must be submitted, if and when available, together with or separately from the Annual Report.
B. The annual financial statements of the County shall be prepared on the basis of generally accepted accounting principles and will be audited. Copies of the audited annual financial statements, which may be filed separately from the Annual Report, will be filed with the Repositories when they become publicly available.
C. If the County fails to provide an Annual Report to the Repository by the date required in subsection (A) hereto or to file its audited annual financial statements with the Repository when they become publicly available, the County shall send a notice to the Repository in substantially the form attached hereto as Exhibit B.
SECTION 4. Content of Annual Reports. Except as otherwise agreed, any Annual Report required to be filed hereunder shall contain or incorporate by reference, at a minimum, annual financial information relating to the County, including operating data, updating such information relating to the County as described in Exhibit A, all with a view toward assisting Participating Underwriters in complying with the Rule.
Any or all of such information may be incorporated by reference from other documents, including official statements of securities issues with respect to which the County is an “obligated person” (within the meaning of the Rule), which have been filed with the Repository or the Securities and Exchange Commission. If the document incorporated by reference is a final official statement, it must be available from the Municipal Securities Rulemaking Board. The County shall clearly identify each such other document so incorporated by reference.
SECTION 5. Reporting of Listed Events. The County will provide within 10 business days to the Repository notice of any of the Listed Events.
SECTION 6. Termination of Reporting Obligation. The County’s obligations under this Disclosure Agreement shall terminate upon the earlier to occur of the legal defeasance or final retirement of all the Bonds.
SECTION 7. Dissemination Agent. The County may, from time to time, appoint or engage a Dissemination Agent to assist it in carrying out its obligations under this Disclosure Agreement and may discharge any such Agent, with or without appointing a successor Dissemination Agent. If at any time there is not any other designated Dissemination Agent, the County shall be the Dissemination Agent.
SECTION 8. Amendment. Notwithstanding any other provision of this Disclosure Agreement, the County may amend this Disclosure Agreement, if such amendment is supported by an opinion of independent counsel with expertise in federal securities laws, to the effect that such amendment is permitted or required by the Rule.
SECTION 9. Additional Information. Nothing in this Disclosure Agreement shall be deemed to prevent the County from disseminating any other information, using the means of dissemination set forth in this Disclosure Agreement or any other means of communication, or including any other information in any Annual Report or notice of occurrence of a Listed Event, in addition to that which is required by this Disclosure Agreement. If the County chooses to include any information in any Annual Report or notice of occurrence of a Listed Event, in addition to that which is specifically required by this

VII-4
Disclosure Agreement, the County shall have no obligation under this Agreement to update such information or include it in any future Annual Report or notice of occurrence of a Listed Event.
SECTION 10. Default. Any person referred to in Section 11 (other than the County) may take such action as may be necessary and appropriate, including seeking mandate or specific performance by court order, to cause the County to file its Annual Report or to give notice of a Listed Event. The holders of not less than a majority in aggregate principal amount of Bonds outstanding may take such actions as may be necessary and appropriate, including seeking mandate or specific performance by court order, to challenge the adequacy of any information provided pursuant to this Disclosure Agreement, or to enforce any other obligation of the County hereunder. A default under this Disclosure Agreement shall not be deemed an event of default under the Resolution or the Bonds of the County, and the sole remedy under this Disclosure Agreement in the event of any failure of the County to comply herewith shall be an action to compel performance. Nothing in this provision shall be deemed to restrict the rights or remedies of any holder pursuant to the Securities Exchange Act of 1934, the rules and regulations promulgated thereunder, or other applicable laws.
SECTION 11. Beneficiaries. This Disclosure Agreement shall inure solely to the benefit of the County, the Participating Underwriters, and holders from time to time of the County’s Bonds, and shall create no rights in any other person or entity.
Date: February __, 2014
FAIRFAX COUNTY, VIRGINIA
By: _________________________________ Susan W. Datta Chief Financial Officer

VII-5
EXHIBIT A
CONTENT OF ANNUAL REPORT
(a) Financial Information. Updated information concerning General Fund revenues, expenditures, categories of expenditures, fund balances, assessed value of taxable property, tax rates, major taxpayers, and tax levies and collections.
(b) Debt Information. Updated information concerning general obligation bonds indebtedness, including bonds authorized and unissued, bonds outstanding, the ratios of debt to the market value of taxable property, debt per capita, and debt service as a percentage of General Fund disbursements.
(c) Demographic Information. Updated demographic information respecting the County such as its population, public school enrollment, and per pupil expenditure.
(d) Economic Information. Updated economic information respecting the County such as income, employment, unemployment, building permits, and taxable sales data.
(e) Retirement Plans. Updated information respecting pension and retirement plans for County employees, including a summary of membership, revenues, expenses, and actuarial valuation(s) of such plans.
(f) Contingent Liabilities. A summary of material litigation and other material contingent liabilities pending against the County.
In general, the foregoing will include information as of the end of the most recent fiscal year or as of the most recent practicable date. Where information for the fiscal year just ended is provided, it may be preliminary and unaudited. Where information has historically been provided for more than a single period, comparable information will in general be provided for the same number of periods where valid and available. Where comparative demographic or economic information for the County and the United States as a whole is contemporaneously available and, in the judgment of the County, informative, such information may be included. Where, in the judgment of the County, an accompanying narrative is required to make data presented not misleading, such narrative will be provided.

VII-6
EXHIBIT B
NOTICE OF FAILURE TO FILE ANNUAL REPORT [AUDITED ANNUAL FINANCIAL STATEMENTS]
Re: FAIRFAX COUNTY VIRGINIA PUBLIC IMPROVEMENT AND REFUNDING BONDS,
SERIES 2014A
CUSIP NOS.:
Dated: _____________ __, 20__
NOTICE IS HEREBY GIVEN that Fairfax County, Virginia has not provided an Annual Report [Audited Annual Financial Statements] as required by Section 3 of the Continuing Disclosure Agreement, which was entered into in connection with the above-named bonds issued pursuant to that certain Resolution adopted on December 3, 2013, by the Board of Supervisors of the County, the proceeds of which were used to finance and refinance various public improvements in the County. [The County anticipates that the Annual Report [Audited Annual Financial Statements] will be filed by ___________.]
Dated: ________________
FAIRFAX COUNTY, VIRGINIA By