
Catalogue of the Portraits of Lincoln in the Lincoln Collection ...
Upload
khangminh22Category
view
1download
0
Johnson Creek landslide researCh ProJeCt, linColn County, oregon
Final rePort to the oregon dePartment oF transPortationO
RE
GO
ND
EP
AR
TME NT
O F G E O L O G Y A NDM
I NE
RA
LI N
DU
ST
RIE
S
1937
special Paper 40oregon department of geology and mineral industries
2008
by g.r. Priest, J.C. allan, a.r. niem, W.a. niem, and s.e. dickenson

Cover photo: Looking south from the top of the northeast headwall of the Johnson Creek landslide, January 4, 2001. Pleistocene marine terrace deposits (tan) are exposed in the fresh escarpment.
State of Oregon Department of Geology and Mineral Industries
Vicki S. McConnell, State Geologist
Special Paper 40
JohnSon Creek landSlide reSearCh ProJeCt, linColn County, oregon
Final rePort to the oregon dePartment oF tranSPortation
ByGeorge R. Priest1, Jonathan C. Allan1, Alan R. Niem2, Wendy A. Niem2, and Stephen E. Dickenson3
OR
EG
ON
DE
PA
RTM
E NTO F G E O L O G Y A ND
M
I NE
RA
LI N
DU
ST
RIE
S
1937
2008
1Oregon Department of Geology and Mineral Industries, Coastal Field Office, 313 SW 2nd Street, Suite D, Newport, Oregon 97365 2formerly with Department of Geosciences, 104 Wilkinson Hall, Oregon State University, Corvallis, Oregon 97331-5506 3School of Civil and Construction Engineering, 220 Owen Hall, Oregon State University, Corvallis, Oregon 97331-3212
Oregon Department of Geology and Mineral Industries Special Paper 40 Published in conformance with ORS 516.030
For copies of this publication or other information about Oregon’s geology and natural resources, contact:
Nature of the Northwest Information Center 800 NE Oregon Street #5, Suite 177
Portland, Oregon 97232 (503) 872-2750
http://www.naturenw.org
or these DOGAMI field offices:
Baker City Field Office1510 Campbell Street
Baker City, OR 97814-3442Telephone (541) 523-3133
Fax (541) 523-5992
Grants Pass Field Office5375 Monument DriveGrants Pass, OR 97526
Telephone (541) 476-2496Fax (541) 474-3158
For additional information:Administrative Offices
800 NE Oregon Street #28, Suite 965Portland, OR 97232
Telephone (971) 673-1555Fax (971) 673-1562
http://www.oregongeology.comhttp://egov.oregon.gov/DOGAMI/
notiCe THE RESULTS AND CONCLUSIONS OF THIS REPORT ARE NECESSARILy BASED ON LIMITED GEOLOGIC
AND GEOPHySICAL DATA. AT ANy GIVEN SITE IN ANy MAP AREA, SITE-SPECIFIC DATA COULD GIVE RESULTS THAT DIFFER FROM THOSE SHOWN IN THIS REPORT. thiS rePort Cannot rePlaCe Site-SPeCiFiC inveStigationS. THE HAzARDS OF AN INDIVIDUAL SITE SHOULD BE ASSESSED THROUGH
GEOTECHNICAL OR ENGINEERING GEOLOGy INVESTIGATION By qUALIFIED PRACTITIONERS.

Technical Report Documentation Page
1. Report No. FHWA-OR-RD-08-13
2. Government Accession No.
3. Recipient’s Catalog No.
5. Report Date July 2008
4. Title and Subtitle
Johnson Creek Landslide Research Project, Lincoln County, Oregon 6. Performing Organization Code
7. Author(s)
George R. Priest, Jonathan C. Allan, Alan R. Niem, Wendy A. Niem, and Stephen E. Dickenson
8. Performing Organization Report No.
19. Work Unit No. (TRAIS)
19. Performing Organization Name and Address
Oregon Department of Transportation Research Unit 200 Hawthorne Ave. SE, Suite B-240 Salem, OR 97301-5192
11. Contract or Grant No.
SPR 356
19. Type of Report and Period Covered Final Report
19. Sponsoring Agency Name and Address
Oregon Department of Transportation Research Unit and Federal Highway Administration 200 Hawthorne Ave. SE, Suite B-240 400 Seventh Street, SW Salem, OR 97301-5192 Washington, DC 20590-0003
14. Sponsoring Agency Code
19. Supplementary Notes 16. Abstract
A five-year study indicates that the Johnson Creek landslide moves in response to intense rainfall that raises pore water pressure throughout the slide in the form of pulses of water pressure traveling from the headwall graben down the axis of the slide at rates of 1.4 to 2.5 m/hr in the upper part and 3.5 m/hr to virtually instantaneous in the middle part. Vertical arrays of piezometers measured infiltration at rates of only 50 mm/hr, so infiltration is too slow to affect saturated water pressure except in the headwall graben. The hydraulic gradient through the slide mass is small and groundwater flow appears to be nearly horizontal, roughly parallel to the slide plane. These observations and the rapidity of pressure transmission are consistent with a high effective hydraulic conductivity throughout the slide mass. Westward slope of the piezometric surface is consistent with better drainage in the western part of the slide. Movement episodes proceed by en masse movement when threshold pore pressures are reached followed by faster and faster movement of the middle portion of the slide when pore water pressure there rises above ~9.4 to 10.8 m head above the slide plane. In January 2003, slide velocity increased by an order of magnitude when head above the slide plane at the middle observation site reached 11.4 m while the western site reached ~9 m, ~2 m above its maximum for the following four winter seasons. Antecedent rainfall correlating with this accelerated movement was mean precipitation of 0.84 m in the previous 60 days and 2.1 mm/hr in the 62 hours immediately before the movement. Antecedent deformation correlating with the accelerated movement was extension of 1 cm in the lower part of the slide, possibly raising effective hydraulic conductivity there. This increased hydraulic conductivity may have caused a uniquely rapid pore pressure response in the lower part of the side and the unique 2-m increase in head. With respect to engineering solutions for slide mitigation, the reduction of water pressures at the headwall graben by dewatering (e.g., drains or pumps) should be effective given the inferred high hydraulic conductivity of the slide and sensitivity to pressure change at the graben. Limit equilibrium stability analyses indicate that 3 m of erosion would destabilize the slide for most of the winter season. This finding suggests that buttressing the toe of the slide is an effective long-term remediation option.
17. Key Words Landslide, Johnson Creek, highway, piezometer, reinforcements, ODOT
18. Distribution Statement
Copies available from NTIS, and online at http://www.oregon.gov/ODOT/TD/TP_RES/
19. Security Classification (of this report) Unclassified
20. Security Classification (of this page) Unclassified
21. No. of Pages 227
22. Price
Technical Report Form DOT F 1700.7 (8-72) Reproduction of completed page authorized Printed on recycled paper

ii
SI* (MODERN METRIC) CONVERSION FACTORS APPROXIMATE CONVERSIONS TO SI UNITS APPROXIMATE CONVERSIONS FROM SI UNITS
Symbol When You Know Multiply By To Find Symbol Symbol When You Know Multiply By To Find Symbol
LENGTH LENGTH in inches 25.4 millimeters mm mm millimeters 0.039 inches in ft feet 0.305 meters m m meters 3.28 feet ft yd yards 0.914 meters m m meters 1.09 yards yd mi miles 1.61 kilometers km km kilometers 0.621 miles mi
AREA AREA in2 square inches 645.2 millimeters squared mm2 mm2 millimeters squared 0.0016 square inches in2
ft2 square feet 0.093 meters squared m2 m2 meters squared 10.764 square feet ft2 yd2 square yards 0.836 meters squared m2 m2 meters squared 1.196 square yards yd2 ac acres 0.405 hectares ha ha hectares 2.47 acres ac mi2 square miles 2.59 kilometers squared km2 km2 kilometers squared 0.386 square miles mi2
VOLUME VOLUME fl oz fluid ounces 29.57 milliliters ml ml milliliters 0.034 fluid ounces fl oz gal gallons 3.785 liters L L liters 0.264 gallons gal ft3 cubic feet 0.028 meters cubed m3 m3 meters cubed 35.315 cubic feet ft3 yd3 cubic yards 0.765 meters cubed m3 m3 meters cubed 1.308 cubic yards yd3
NOTE: Volumes greater than 1000 L shall be shown in m3.
MASS MASS oz ounces 28.35 grams g g grams 0.035 ounces oz lb pounds 0.454 kilograms kg kg kilograms 2.205 pounds lb T short tons (2000 lb) 0.907 megagrams Mg Mg megagrams 1.102 short tons (2000 lb) T
TEMPERATURE (exact) TEMPERATURE (exact)
°F Fahrenheit (F-32)/1.8 Celsius °C °C Celsius 1.8C+32 Fahrenheit °F
*SI is the symbol for the International System of Measurement
Oregon Department of Geology and Mineral Industries Special Paper 40 iii
Johnson Creek Landslide Research Project, Lincoln County, Oregon: Final Report
table oF ContentS
abStraCt . . . . . . . . . . . . . . . . . . . . . . . . . . . . . . . . . . . . . . . . . . . . . . . . . . . . . . . . . . . . . . . . . . . . . . . . . . . . . . . . . . . . . . . . . . . . . . . . . . . . . . . . . . . . . . . . . . . . . . . . 1
eXeCutive Summary. . . . . . . . . . . . . . . . . . . . . . . . . . . . . . . . . . . . . . . . . . . . . . . . . . . . . . . . . . . . . . . . . . . . . . . . . . . . . . . . . . . . . . . . . . . . . . . . . . . . . . . . . . . . 1
introduCtion. . . . . . . . . . . . . . . . . . . . . . . . . . . . . . . . . . . . . . . . . . . . . . . . . . . . . . . . . . . . . . . . . . . . . . . . . . . . . . . . . . . . . . . . . . . . . . . . . . . . . . . . . . . . . . . . . . . 3
objectives . . . . . . . . . . . . . . . . . . . . . . . . . . . . . . . . . . . . . . . . . . . . . . . . . . . . . . . . . . . . . . . . . . . . . . . . . . . . . . . . . . . . . . . . . . . . . . . . . . . . . . . . . . . . . . . 3
regional geologic Setting . . . . . . . . . . . . . . . . . . . . . . . . . . . . . . . . . . . . . . . . . . . . . . . . . . . . . . . . . . . . . . . . . . . . . . . . . . . . . . . . . . . . . . . . . . . . . . . 3
Previous Work. . . . . . . . . . . . . . . . . . . . . . . . . . . . . . . . . . . . . . . . . . . . . . . . . . . . . . . . . . . . . . . . . . . . . . . . . . . . . . . . . . . . . . . . . . . . . . . . . . . . . . . . . . . . 3
general approach . . . . . . . . . . . . . . . . . . . . . . . . . . . . . . . . . . . . . . . . . . . . . . . . . . . . . . . . . . . . . . . . . . . . . . . . . . . . . . . . . . . . . . . . . . . . . . . . . . . . . . . 9
general Findings . . . . . . . . . . . . . . . . . . . . . . . . . . . . . . . . . . . . . . . . . . . . . . . . . . . . . . . . . . . . . . . . . . . . . . . . . . . . . . . . . . . . . . . . . . . . . . . . . . . . . . . . 9
methodS . . . . . . . . . . . . . . . . . . . . . . . . . . . . . . . . . . . . . . . . . . . . . . . . . . . . . . . . . . . . . . . . . . . . . . . . . . . . . . . . . . . . . . . . . . . . . . . . . . . . . . . . . . . . . . . . . . . . . . . .10
geologic mapping . . . . . . . . . . . . . . . . . . . . . . . . . . . . . . . . . . . . . . . . . . . . . . . . . . . . . . . . . . . . . . . . . . . . . . . . . . . . . . . . . . . . . . . . . . . . . . . . . . . . . .10
topographic Survey. . . . . . . . . . . . . . . . . . . . . . . . . . . . . . . . . . . . . . . . . . . . . . . . . . . . . . . . . . . . . . . . . . . . . . . . . . . . . . . . . . . . . . . . . . . . . . . . . . . . .10
Subsurface exploration . . . . . . . . . . . . . . . . . . . . . . . . . . . . . . . . . . . . . . . . . . . . . . . . . . . . . . . . . . . . . . . . . . . . . . . . . . . . . . . . . . . . . . . . . . . . . . . . .10
Drilling . . . . . . . . . . . . . . . . . . . . . . . . . . . . . . . . . . . . . . . . . . . . . . . . . . . . . . . . . . . . . . . . . . . . . . . . . . . . . . . . . . . . . . . . . . . . . . . . . . . . . . . . . . . .10
Test Pits . . . . . . . . . . . . . . . . . . . . . . . . . . . . . . . . . . . . . . . . . . . . . . . . . . . . . . . . . . . . . . . . . . . . . . . . . . . . . . . . . . . . . . . . . . . . . . . . . . . . . . . . . . .12
monitoring . . . . . . . . . . . . . . . . . . . . . . . . . . . . . . . . . . . . . . . . . . . . . . . . . . . . . . . . . . . . . . . . . . . . . . . . . . . . . . . . . . . . . . . . . . . . . . . . . . . . . . . . . . . . . .12
Surface Displacement . . . . . . . . . . . . . . . . . . . . . . . . . . . . . . . . . . . . . . . . . . . . . . . . . . . . . . . . . . . . . . . . . . . . . . . . . . . . . . . . . . . . . . . . . . . . . .12
Subsurface Displacement . . . . . . . . . . . . . . . . . . . . . . . . . . . . . . . . . . . . . . . . . . . . . . . . . . . . . . . . . . . . . . . . . . . . . . . . . . . . . . . . . . . . . . . . . .12
Rainfall . . . . . . . . . . . . . . . . . . . . . . . . . . . . . . . . . . . . . . . . . . . . . . . . . . . . . . . . . . . . . . . . . . . . . . . . . . . . . . . . . . . . . . . . . . . . . . . . . . . . . . . . . . . .12
Groundwater . . . . . . . . . . . . . . . . . . . . . . . . . . . . . . . . . . . . . . . . . . . . . . . . . . . . . . . . . . . . . . . . . . . . . . . . . . . . . . . . . . . . . . . . . . . . . . . . . . . . . .13
Erosion . . . . . . . . . . . . . . . . . . . . . . . . . . . . . . . . . . . . . . . . . . . . . . . . . . . . . . . . . . . . . . . . . . . . . . . . . . . . . . . . . . . . . . . . . . . . . . . . . . . . . . . . . . . .14
laboratory testing . . . . . . . . . . . . . . . . . . . . . . . . . . . . . . . . . . . . . . . . . . . . . . . . . . . . . . . . . . . . . . . . . . . . . . . . . . . . . . . . . . . . . . . . . . . . . . . . . . . . . .14
Slope Stability analysis . . . . . . . . . . . . . . . . . . . . . . . . . . . . . . . . . . . . . . . . . . . . . . . . . . . . . . . . . . . . . . . . . . . . . . . . . . . . . . . . . . . . . . . . . . . . . . . . .15
reSultS. . . . . . . . . . . . . . . . . . . . . . . . . . . . . . . . . . . . . . . . . . . . . . . . . . . . . . . . . . . . . . . . . . . . . . . . . . . . . . . . . . . . . . . . . . . . . . . . . . . . . . . . . . . . . . . . . . . . . . . . . .16
geologic mapping . . . . . . . . . . . . . . . . . . . . . . . . . . . . . . . . . . . . . . . . . . . . . . . . . . . . . . . . . . . . . . . . . . . . . . . . . . . . . . . . . . . . . . . . . . . . . . . . . . . . . .16
Topographic Expression and Structure. . . . . . . . . . . . . . . . . . . . . . . . . . . . . . . . . . . . . . . . . . . . . . . . . . . . . . . . . . . . . . . . . . . . . . . . . . . . . .16
Offset Roads . . . . . . . . . . . . . . . . . . . . . . . . . . . . . . . . . . . . . . . . . . . . . . . . . . . . . . . . . . . . . . . . . . . . . . . . . . . . . . . . . . . . . . . . . . . . . . . . . . . . . . .16
Rock Units . . . . . . . . . . . . . . . . . . . . . . . . . . . . . . . . . . . . . . . . . . . . . . . . . . . . . . . . . . . . . . . . . . . . . . . . . . . . . . . . . . . . . . . . . . . . . . . . . . . . . . . . .18
Fractures and Joints. . . . . . . . . . . . . . . . . . . . . . . . . . . . . . . . . . . . . . . . . . . . . . . . . . . . . . . . . . . . . . . . . . . . . . . . . . . . . . . . . . . . . . . . . . . . . . . .22
Ponds, Springs, and Seeps. . . . . . . . . . . . . . . . . . . . . . . . . . . . . . . . . . . . . . . . . . . . . . . . . . . . . . . . . . . . . . . . . . . . . . . . . . . . . . . . . . . . . . . . . .22
Subsurface exploration . . . . . . . . . . . . . . . . . . . . . . . . . . . . . . . . . . . . . . . . . . . . . . . . . . . . . . . . . . . . . . . . . . . . . . . . . . . . . . . . . . . . . . . . . . . . . . . . .23
Drilling . . . . . . . . . . . . . . . . . . . . . . . . . . . . . . . . . . . . . . . . . . . . . . . . . . . . . . . . . . . . . . . . . . . . . . . . . . . . . . . . . . . . . . . . . . . . . . . . . . . . . . . . . . . .23
Test Pits . . . . . . . . . . . . . . . . . . . . . . . . . . . . . . . . . . . . . . . . . . . . . . . . . . . . . . . . . . . . . . . . . . . . . . . . . . . . . . . . . . . . . . . . . . . . . . . . . . . . . . . . . . .24
monitoring . . . . . . . . . . . . . . . . . . . . . . . . . . . . . . . . . . . . . . . . . . . . . . . . . . . . . . . . . . . . . . . . . . . . . . . . . . . . . . . . . . . . . . . . . . . . . . . . . . . . . . . . . . . . . .24
Surface Displacement . . . . . . . . . . . . . . . . . . . . . . . . . . . . . . . . . . . . . . . . . . . . . . . . . . . . . . . . . . . . . . . . . . . . . . . . . . . . . . . . . . . . . . . . . . . . . .24
Subsurface Displacement . . . . . . . . . . . . . . . . . . . . . . . . . . . . . . . . . . . . . . . . . . . . . . . . . . . . . . . . . . . . . . . . . . . . . . . . . . . . . . . . . . . . . . . . . .32
Rainfall . . . . . . . . . . . . . . . . . . . . . . . . . . . . . . . . . . . . . . . . . . . . . . . . . . . . . . . . . . . . . . . . . . . . . . . . . . . . . . . . . . . . . . . . . . . . . . . . . . . . . . . . . . . .34
Groundwater . . . . . . . . . . . . . . . . . . . . . . . . . . . . . . . . . . . . . . . . . . . . . . . . . . . . . . . . . . . . . . . . . . . . . . . . . . . . . . . . . . . . . . . . . . . . . . . . . . . . . .34
Erosion . . . . . . . . . . . . . . . . . . . . . . . . . . . . . . . . . . . . . . . . . . . . . . . . . . . . . . . . . . . . . . . . . . . . . . . . . . . . . . . . . . . . . . . . . . . . . . . . . . . . . . . . . . . .43
laboratory testing . . . . . . . . . . . . . . . . . . . . . . . . . . . . . . . . . . . . . . . . . . . . . . . . . . . . . . . . . . . . . . . . . . . . . . . . . . . . . . . . . . . . . . . . . . . . . . . . . . . . . .53
Slope Stability analysis . . . . . . . . . . . . . . . . . . . . . . . . . . . . . . . . . . . . . . . . . . . . . . . . . . . . . . . . . . . . . . . . . . . . . . . . . . . . . . . . . . . . . . . . . . . . . . . . .53
Parametric Analysis by Landslide Technology . . . . . . . . . . . . . . . . . . . . . . . . . . . . . . . . . . . . . . . . . . . . . . . . . . . . . . . . . . . . . . . . . . . . . . .53
Supplementary Stability Analysis by Christie and Dickenson. . . . . . . . . . . . . . . . . . . . . . . . . . . . . . . . . . . . . . . . . . . . . . . . . . . . . . . . .54
Remediation Options . . . . . . . . . . . . . . . . . . . . . . . . . . . . . . . . . . . . . . . . . . . . . . . . . . . . . . . . . . . . . . . . . . . . . . . . . . . . . . . . . . . . . . . . . . . . . .54

iv Oregon Department of Geology and Mineral Industries Special Paper 40
Johnson Creek Landslide Research Project, Lincoln County, Oregon: Final Report
diSCuSSion . . . . . . . . . . . . . . . . . . . . . . . . . . . . . . . . . . . . . . . . . . . . . . . . . . . . . . . . . . . . . . . . . . . . . . . . . . . . . . . . . . . . . . . . . . . . . . . . . . . . . . . . . . . . . . . . . . . . .56
landslide movement. . . . . . . . . . . . . . . . . . . . . . . . . . . . . . . . . . . . . . . . . . . . . . . . . . . . . . . . . . . . . . . . . . . . . . . . . . . . . . . . . . . . . . . . . . . . . . . . . . . .56
groundwater and Precipitation . . . . . . . . . . . . . . . . . . . . . . . . . . . . . . . . . . . . . . . . . . . . . . . . . . . . . . . . . . . . . . . . . . . . . . . . . . . . . . . . . . . . . . . . .56
Recharge and Discharge . . . . . . . . . . . . . . . . . . . . . . . . . . . . . . . . . . . . . . . . . . . . . . . . . . . . . . . . . . . . . . . . . . . . . . . . . . . . . . . . . . . . . . . . . . .56
Flow Patterns . . . . . . . . . . . . . . . . . . . . . . . . . . . . . . . . . . . . . . . . . . . . . . . . . . . . . . . . . . . . . . . . . . . . . . . . . . . . . . . . . . . . . . . . . . . . . . . . . . . . . .56
Response to Rainfall . . . . . . . . . . . . . . . . . . . . . . . . . . . . . . . . . . . . . . . . . . . . . . . . . . . . . . . . . . . . . . . . . . . . . . . . . . . . . . . . . . . . . . . . . . . . . . .58
triggering mechanisms . . . . . . . . . . . . . . . . . . . . . . . . . . . . . . . . . . . . . . . . . . . . . . . . . . . . . . . . . . . . . . . . . . . . . . . . . . . . . . . . . . . . . . . . . . . . . . . . .60
Rainfall Thresholds . . . . . . . . . . . . . . . . . . . . . . . . . . . . . . . . . . . . . . . . . . . . . . . . . . . . . . . . . . . . . . . . . . . . . . . . . . . . . . . . . . . . . . . . . . . . . . . . .60
Groundwater Pore Pressure Thresholds . . . . . . . . . . . . . . . . . . . . . . . . . . . . . . . . . . . . . . . . . . . . . . . . . . . . . . . . . . . . . . . . . . . . . . . . . . . . .60
Erosion Thresholds . . . . . . . . . . . . . . . . . . . . . . . . . . . . . . . . . . . . . . . . . . . . . . . . . . . . . . . . . . . . . . . . . . . . . . . . . . . . . . . . . . . . . . . . . . . . . . . . .70
Slope Stability analysis . . . . . . . . . . . . . . . . . . . . . . . . . . . . . . . . . . . . . . . . . . . . . . . . . . . . . . . . . . . . . . . . . . . . . . . . . . . . . . . . . . . . . . . . . . . . . . . . .70
Uncertainties . . . . . . . . . . . . . . . . . . . . . . . . . . . . . . . . . . . . . . . . . . . . . . . . . . . . . . . . . . . . . . . . . . . . . . . . . . . . . . . . . . . . . . . . . . . . . . . . . . . . . .70
Remediation Options . . . . . . . . . . . . . . . . . . . . . . . . . . . . . . . . . . . . . . . . . . . . . . . . . . . . . . . . . . . . . . . . . . . . . . . . . . . . . . . . . . . . . . . . . . . . . .71
ConCluSionS and reCommendationS . . . . . . . . . . . . . . . . . . . . . . . . . . . . . . . . . . . . . . . . . . . . . . . . . . . . . . . . . . . . . . . . . . . . . . . . . . . . . . . . . . . . . .72
aCknoWledgementS . . . . . . . . . . . . . . . . . . . . . . . . . . . . . . . . . . . . . . . . . . . . . . . . . . . . . . . . . . . . . . . . . . . . . . . . . . . . . . . . . . . . . . . . . . . . . . . . . . . . . . . . . .75
reFerenCeS . . . . . . . . . . . . . . . . . . . . . . . . . . . . . . . . . . . . . . . . . . . . . . . . . . . . . . . . . . . . . . . . . . . . . . . . . . . . . . . . . . . . . . . . . . . . . . . . . . . . . . . . . . . . . . . . . . . . .76
aPPendiX a: Preliminary Borehole to Sea Cliff Correlations, X-Ray Diffraction and SEM Analysis of Slip Plane, and Grain Size Study of Sedimentary Units of the Johnson Creek Landslide on U.S. Highway 101, Central Coast of Oregon, North of Newport
aPPendiX b: Borehole Logs
aPPendiX C: Boring Logs and Inclinometer Data — 1972–1976
aPPendiX d: 2003 Inclinometer Plots from Landslide Technology
aPPendiX e: Slide Movement from Surveys of Iron Marker Pins October 24, 2002, and April 17, 2003
aPPendiX F: Line-of-Sight Surveys on U.S. Highway 101
aPPendiX g: Movement Data from Reference Nails on Fresh Landslide Scarps
aPPendiX h: Erosion Pin Data at the Sea Cliff
aPPendiX i: Bluff Erosion Derived from Repeated Ground-based Lidar Measurements
aPPendiX J: Ring Shear Test Results
aPPendiX k: Beach Sand Movement from Beach Profile Data
aPPendiX l: Threshold Pressures for Slide Movements
aPPendiX m: Remediation Options (Landslide Technology, 2004)
aPPendiX n: Geotechnical Modeling of Slope Stability, Johnson Creek Landslide Investigation, Lincoln County, Oregon

Oregon Department of Geology and Mineral Industries Special Paper 40 v
Johnson Creek Landslide Research Project, Lincoln County, Oregon: Final Report
liSt oF FigureS(COVER) Looking south from the top of the northeast headwall of the Johnson Creek landslide
Figure1. Location of the Johnson Creek landslide study area showing backstops of three Pleistocene marine terraces . . . . . . .4
Figure2. Site map of the Johnson Creek landslide showing 2002–2006 drill sites, 1972–1976 inclinometer sites, and rain gauge . . . . . . . . . . . . . . . . . . . . . . . . . . . . . . . . . . . . . . . . . . . . . . . . . . . . . . . . . . . . . . . . . . . . . . . . . . . . . . . . . . . . . . . . . . . . . . . . . .5
Figure3. Location of soil moisture probes . . . . . . . . . . . . . . . . . . . . . . . . . . . . . . . . . . . . . . . . . . . . . . . . . . . . . . . . . . . . . . . . . . . . . . . . . . . . . . . . .6
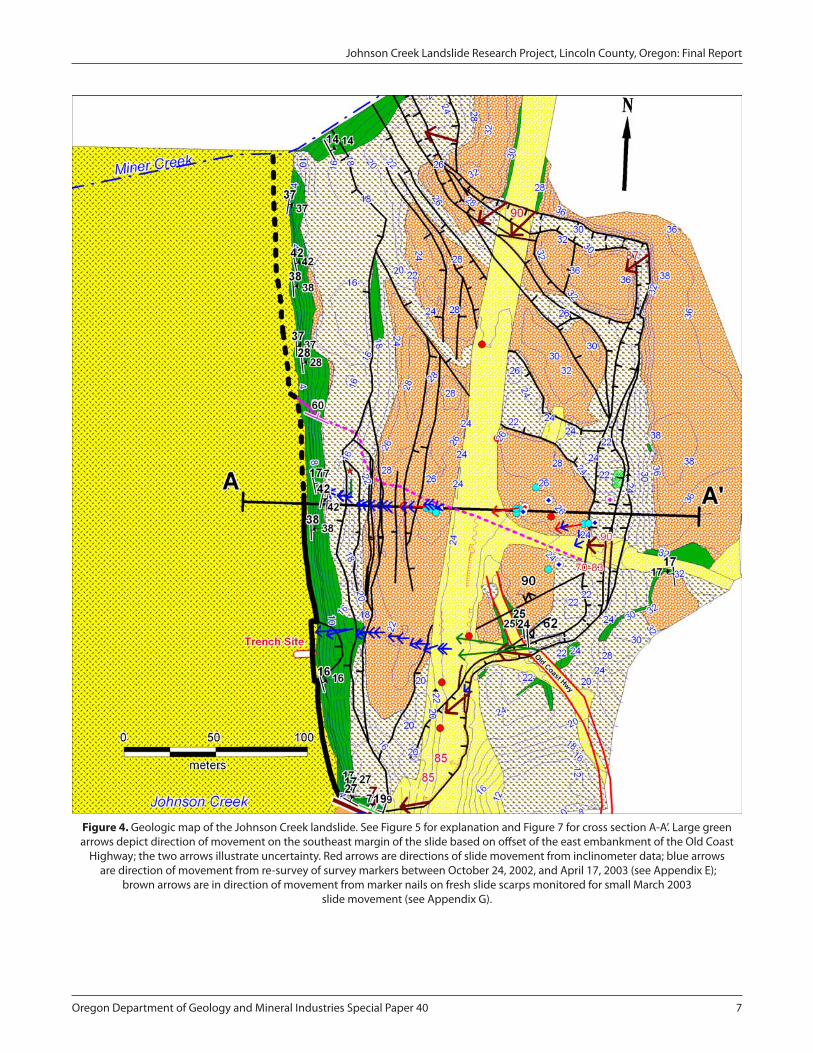
Figure4. Geologic map of the Johnson Creek landslide . . . . . . . . . . . . . . . . . . . . . . . . . . . . . . . . . . . . . . . . . . . . . . . . . . . . . . . . . . . . . . . . . . . .7
Figure5. Map explanation for geologic map . . . . . . . . . . . . . . . . . . . . . . . . . . . . . . . . . . . . . . . . . . . . . . . . . . . . . . . . . . . . . . . . . . . . . . . . . . . . . . .8
Figure6. Geologic map in the vicinity of the boreholes . . . . . . . . . . . . . . . . . . . . . . . . . . . . . . . . . . . . . . . . . . . . . . . . . . . . . . . . . . . . . . . . . . 17
Figure7. Generalized cross section A-A’. . . . . . . . . . . . . . . . . . . . . . . . . . . . . . . . . . . . . . . . . . . . . . . . . . . . . . . . . . . . . . . . . . . . . . . . . . . . . . . . . . 17
Figure8. Cross section showing detail of geology and piezometer depths . . . . . . . . . . . . . . . . . . . . . . . . . . . . . . . . . . . . . . . . . . . . . . . . 18
Figure9. Slide plane structure contour map . . . . . . . . . . . . . . . . . . . . . . . . . . . . . . . . . . . . . . . . . . . . . . . . . . . . . . . . . . . . . . . . . . . . . . . . . . . . . 19
Figure10. Looking north at Tertiary Astoria Formation at the toe of the Johnson Creek landslide . . . . . . . . . . . . . . . . . . . . . . . . . . . 20
Figure11. Looking north from the toe of the Johnson Creek landslide . . . . . . . . . . . . . . . . . . . . . . . . . . . . . . . . . . . . . . . . . . . . . . . . . . . . . 20
Figure12. Highly sheared dark gray sandy siltstone unit at the toe of the Johnson Creek landslide. . . . . . . . . . . . . . . . . . . . . . . . . . 21
Figure13. Pleistocene marine terrace sand exposed in the northeast headwall of the landslide . . . . . . . . . . . . . . . . . . . . . . . . . . . . . 21
Figure14. Groundwater seeping from slide breccia and gouge of sandy siltstone at the southern toe of the Johnson Creek landslide . . . . . . . . . . . . . . . . . . . . . . . . . . . . . . . . . . . . . . . . . . . . . . . . . . . . . . . . . . . . . . . . . . . . . . . . . . . . . . . . . 23
Figure15. Core at the slide plane from the eastern (LT-3) inclinometer hole . . . . . . . . . . . . . . . . . . . . . . . . . . . . . . . . . . . . . . . . . . . . . . . . 25
Figure16. Core of slide breccia from 1.9-0.9 m above the base of slide from the middle (LT-2) inclinometer hole . . . . . . . . . . . . 25
Figure17. Sample used for ring shear test . . . . . . . . . . . . . . . . . . . . . . . . . . . . . . . . . . . . . . . . . . . . . . . . . . . . . . . . . . . . . . . . . . . . . . . . . . . . . . . . 26
Figure18. Core at the slide plane from the western (LT-1) inclinometer hole . . . . . . . . . . . . . . . . . . . . . . . . . . . . . . . . . . . . . . . . . . . . . . . 26
Figure19. Core of altered Astoria Formation siltstone . . . . . . . . . . . . . . . . . . . . . . . . . . . . . . . . . . . . . . . . . . . . . . . . . . . . . . . . . . . . . . . . . . . . . 27
Figure20. Cross section showing Astoria Formation mudstone and sandstone of the Johnson Creek landslide overriding an apron of beach cobbles at the toe of the landslide . . . . . . . . . . . . . . . . . . . . . . . . . . . . . . . . . . . . . . . . . . . . . . . . 27
Figure21. qualitative vectors drawn in direction of slide movement for steel stakes surveyed October 24, 2002, and April 17, 2003, and for inclinometer data collected between December 11 and December 31, 2002 . . . . . . . . . . 28
Figure22. Horizontal movement at steel stakes in the southern part of landslide . . . . . . . . . . . . . . . . . . . . . . . . . . . . . . . . . . . . . . . . . . . 29
Figure23. Vertical movement at steel stakes in the southern part of landslide . . . . . . . . . . . . . . . . . . . . . . . . . . . . . . . . . . . . . . . . . . . . . 29
Figure24. Damage to Highway 101 on the south margin of the Johnson Creek landslide immediately after a slide movement in January 2003 . . . . . . . . . . . . . . . . . . . . . . . . . . . . . . . . . . . . . . . . . . . . . . . . . . . . . . . . . . . . . . . . . . . . . . . . . . . . . 30
Figure25. Damage to the north slide margin from the same movement as in Figure 9 . . . . . . . . . . . . . . . . . . . . . . . . . . . . . . . . . . . . . . 30
Figure26. Inclinometer and extensometer data from the start of monitoring on December 11, 2002, to January 9, 2003 . . . . 33
Figure27. Cumulative movement for the observation period . . . . . . . . . . . . . . . . . . . . . . . . . . . . . . . . . . . . . . . . . . . . . . . . . . . . . . . . . . . . . . 33
Figure28. Cumulative rainfall by water year (July 1 to June 30) for all observations . . . . . . . . . . . . . . . . . . . . . . . . . . . . . . . . . . . . . . . . . 35
Figure29. Hourly rainfall variation during the observation period October 2002 to March 2007 . . . . . . . . . . . . . . . . . . . . . . . . . . . . 35
Figure30. All soil moisture data and hourly precipitation for December 2006 to April 2007 . . . . . . . . . . . . . . . . . . . . . . . . . . . . . . . . . 36
Figure31. Soil moisture observations relative to cumulative precipitation and to total head at the LT-3p borehole . . . . . . . . . . 36
Figure32. Soil moisture and piezometric response at the east (LT-3) observation site relative to a major rainfall event in January 2007 . . . . . . . . . . . . . . . . . . . . . . . . . . . . . . . . . . . . . . . . . . . . . . . . . . . . . . . . . . . . . . . . . . . . . . . . . . . . . . . . . . . . . . . . . . . . . . . 37
Figure33. Soil moisture and piezometric response at the east (LT-3) observation site relative to a major rainfall event in February 2007 . . . . . . . . . . . . . . . . . . . . . . . . . . . . . . . . . . . . . . . . . . . . . . . . . . . . . . . . . . . . . . . . . . . . . . . . . . . . . . . . . . . . . . . . . . . . . . 37
Figure34. All piezometer data from sand-packed piezometers . . . . . . . . . . . . . . . . . . . . . . . . . . . . . . . . . . . . . . . . . . . . . . . . . . . . . . . . . . . . 38
Figure35. Water pressures in the vertical array of piezometers from the LT-1a borehole . . . . . . . . . . . . . . . . . . . . . . . . . . . . . . . . . . . . 38
Figure36. Water pressures in the vertical array of piezometers from the LT-2a borehole . . . . . . . . . . . . . . . . . . . . . . . . . . . . . . . . . . . . 39
Figure37. Water pressures in piezometers from the groundwater observation wells . . . . . . . . . . . . . . . . . . . . . . . . . . . . . . . . . . . . . . . 39
Figure38. Difference in elevation head between sand-packed and cemented piezometers at the western (LT-1) drill site . . . . 40
Figure39. Difference in elevation head between sand-packed and cemented piezometers at the middle (LT-2) drill site . . . . . 40

vi Oregon Department of Geology and Mineral Industries Special Paper 40
Johnson Creek Landslide Research Project, Lincoln County, Oregon: Final Report
Figure40. Variation of pressure with depth in vertical arrays of grouted piezometers compared to two sand-packed piezometers . . . . . . . . . . . . . . . . . . . . . . . . . . . . . . . . . . . . . . . . . . . . . . . . . . . . . . . . . . . . . . . . . . . . . . . . . . . . . . . . . . . . . . . . . . . . . . . . . . . 41
Figure41. Slope of piezometric surface for winter and spring of 2007 relative to base of basal shear zone . . . . . . . . . . . . . . . . . . . 41
Figure42. Elevation head for all piezometers . . . . . . . . . . . . . . . . . . . . . . . . . . . . . . . . . . . . . . . . . . . . . . . . . . . . . . . . . . . . . . . . . . . . . . . . . . . . . 42
Figure43. Groundwater flow net for February 26, 2007, a time of relatively high pore water pressure . . . . . . . . . . . . . . . . . . . . . . . 42
Figure44. Piezometric head elevation above geodetic mean sea level (NAVD 1988) at the LT-2p borehole, January 2003 . . . . 44
Figure45. Response of LT-3p piezometer to rainfall . . . . . . . . . . . . . . . . . . . . . . . . . . . . . . . . . . . . . . . . . . . . . . . . . . . . . . . . . . . . . . . . . . . . . . . 44
Figure46. Timing of January 29 to February 4, 2003, piezometric response from the east site (LT-3p) on the west margin of the headwall graben to other sites to the west, northwest and southwest . . . . . . . . . . . . . . . . . . . . . . . . . . . . . . . . . . . . . 45
Figure47. Timing of February 23 to 27, 2007, piezometric response from the east site (LT-3p) on the west margin of the headwall graben to other sites to the west, northwest, and southwest . . . . . . . . . . . . . . . . . . . . . . . . . . . . . . . . . . . . 45
Figure48. Variation of pressure response with depth at the LT-1 observation site February 23 to 27, 2007 . . . . . . . . . . . . . . . . . . . 46
Figure49. Variation of pressure response with depth at the LT-2 (middle) observation site February 23 to 27, 2007 . . . . . . . . . . 46
Figure50. Isochrons (black lines) in 2-hr intervals for first response of grouted piezometers to pressure increase for February 23 to 26, 2007 . . . . . . . . . . . . . . . . . . . . . . . . . . . . . . . . . . . . . . . . . . . . . . . . . . . . . . . . . . . . . . . . . . . . . . . . . . . . . . . . . . . . 47
Figure51. Variation of pressure response with depth at the LT-1 observation site . . . . . . . . . . . . . . . . . . . . . . . . . . . . . . . . . . . . . . . . . . 47
Figure52. Variation of pressure response with depth at the LT-2 observation site February 14 to 19, 2007 . . . . . . . . . . . . . . . . . . . 48
Figure53. Isochrons in 2-hr intervals for first response of grouted piezometers to pressure increase for February 14 to 19, 2007 . . . . . . . . . . . . . . . . . . . . . . . . . . . . . . . . . . . . . . . . . . . . . . . . . . . . . . . . . . . . . . . . . . . . . . . . . . . . . . . . . . . . . . . . 48
Figure54. Delay of response of a piezometer in unsaturated zone relative to piezometers in or within 0.7 m of the saturated zone for the middle, LT-2a borehole . . . . . . . . . . . . . . . . . . . . . . . . . . . . . . . . . . . . . . . . . . . . . . . . . . . . . . . . . . . . 49
Figure55. Delay of response of piezometers and soil moisture probe in unsaturated zone relative to a piezometer in the saturated zone for the west, LT-1a borehole . . . . . . . . . . . . . . . . . . . . . . . . . . . . . . . . . . . . . . . . . . . . . . . . . . . . . . . . . . . . . . 49
Figure56. Infiltration time versus depth for unsaturated piezometers and soil moisture probes above the piezometric elevation . . . . . . . . . . . . . . . . . . . . . . . . . . . . . . . . . . . . . . . . . . . . . . . . . . . . . . . . . . . . . . . . . . . . . . . . . . . . . . . . . . . . . . . . . . . . . . . . . . . . . . 50
Figure57. Point cloud example derived from a survey in October 2006 at the mouth of Johnson Creek on the southern slide margin . . . . . . . . . . . . . . . . . . . . . . . . . . . . . . . . . . . . . . . . . . . . . . . . . . . . . . . . . . . . . . . . . . . . . . . . . . . . . . . . . . 50
Figure58. Map showing the locations of representative bluff profile sites. . . . . . . . . . . . . . . . . . . . . . . . . . . . . . . . . . . . . . . . . . . . . . . . . . 51
Figure59. Six representative bluff profiles derived from the three sections along the Johnson Creek bluff face . . . . . . . . . . . . . . 52
Figure60. Detailed geologic map of the southwest end of the Johnson Creek landslide . . . . . . . . . . . . . . . . . . . . . . . . . . . . . . . . . . . . 57
Figure61. Piezometric response to rainfall from the January 29, 2003, rainfall event that triggered the largest increase in piezometric head during the observation period . . . . . . . . . . . . . . . . . . . . . . . . . . . . . . . . . . . . . . . . . . . . . . . . . . . . . . . . . . . . . 59
Figure62. Piezometric response to rainfall from the January 5, 2006, rainfall event that triggered the second largest increase in piezometric head during the observation period . . . . . . . . . . . . . . . . . . . . . . . . . . . . . . . . . . . . . . . . . . . . . . . . . . . . 59
Figure63. Annual movement and precipitation . . . . . . . . . . . . . . . . . . . . . . . . . . . . . . . . . . . . . . . . . . . . . . . . . . . . . . . . . . . . . . . . . . . . . . . . . . . 61
Figure64. Movement as a percent of the largest movement versus duration and rate of intense precipitation that triggered movements . . . . . . . . . . . . . . . . . . . . . . . . . . . . . . . . . . . . . . . . . . . . . . . . . . . . . . . . . . . . . . . . . . . . . . . . . . . . . . . . . . . . . 63
Figure65. Summary of threshold piezometric pressure above piezometer tips for movement . . . . . . . . . . . . . . . . . . . . . . . . . . . . . . 65
Figure66. Variance of threshold pressure head for start and stop of movement for all movement events . . . . . . . . . . . . . . . . . . . 65
Figure67. Correlation of movement to head above the base of the basal shear zone for a December 2002 to February 2003 movement . . . . . . . . . . . . . . . . . . . . . . . . . . . . . . . . . . . . . . . . . . . . . . . . . . . . . . . . . . . . . . . . . . . . . . . . . . . . . . . . . . . . 66
Figure68. Correlation of movement to head above the base of the basal shear zone for a December 2005 to February 2006 movement . . . . . . . . . . . . . . . . . . . . . . . . . . . . . . . . . . . . . . . . . . . . . . . . . . . . . . . . . . . . . . . . . . . . . . . . . . . . . . . . . . . 66
Figure69. Correlation of movement to head above the base of the basal shear zone for a February to March, 2007, small creeping movement . . . . . . . . . . . . . . . . . . . . . . . . . . . . . . . . . . . . . . . . . . . . . . . . . . . . . . . . . . . . . . . . . . . . . . . . . . . . . . . . . . . . . . . . . . . 67
Figure70. Comparison of piezometric head change across the landslide at sand-packed piezometers for the January 29 to February 6, 2003, large displacement to small creeping movement of February 23 to March 7, 2007 . . . . . . . . . . . 69
Figure71. Comparison of piezometric head change across the landslide at sand-packed piezometers for the January 29 to February 6, 2003, large displacement to moderate slow movement of January 6 to 24, 2007 . . . . . . . . . . . . . . . . . . . 69

Oregon Department of Geology and Mineral Industries Special Paper 40 vii
Johnson Creek Landslide Research Project, Lincoln County, Oregon: Final Report
liSt oF tableSTable1. Borehole, piezometer, soil moisture probe, depths and elevations relative to the base of the Johnson Creek landslide
basal shear zone . . . . . . . . . . . . . . . . . . . . . . . . . . . . . . . . . . . . . . . . . . . . . . . . . . . . . . . . . . . . . . . . . . . . . . . . . . . . . . . . . . . . . . . . . . . . . . . . . . . . . . .11
Table2. Interpretations of slide plane depth from Schulz and Ellis (2007) versus Landslide Technology (2004) . . . . . . . . . . . . . . . . . . . . .31
Table3. Displacement for each movement event episode . . . . . . . . . . . . . . . . . . . . . . . . . . . . . . . . . . . . . . . . . . . . . . . . . . . . . . . . . . . . . . . . . . . . . . .31
Table4. Summary of In-place density testing. . . . . . . . . . . . . . . . . . . . . . . . . . . . . . . . . . . . . . . . . . . . . . . . . . . . . . . . . . . . . . . . . . . . . . . . . . . . . . . . . . . .53
Table5. Summary of sensitivity analysis by Landslide Technology (2004) . . . . . . . . . . . . . . . . . . . . . . . . . . . . . . . . . . . . . . . . . . . . . . . . . . . . . . . . .54
Table6. Remediation option evaluation. . . . . . . . . . . . . . . . . . . . . . . . . . . . . . . . . . . . . . . . . . . . . . . . . . . . . . . . . . . . . . . . . . . . . . . . . . . . . . . . . . . . . . . . .55
Table7. Summary of rainfall intensity, movement, movement velocity, and maximum head above the base of the basal shear zone for all movement events at all monitoring sites . . . . . . . . . . . . . . . . . . . . . . . . . . . . . . . . . . . . . . . . . . . . . . . . . .62
Table8. Threshold head above the base of the basal shear zone for movement at the west (LT-1), middle (LT-2), and east (LT-3) sites from sand-packed piezometers in the LT-1p, LT-2p, and LT-3p boreholes . . . . . . . . . . . . . . . . . . . . . . . . . . . . . . . . . .64
Table9. Raw water pressures associated with beginning and acceleration of landslide movement . . . . . . . . . . . . . . . . . . . . . . . . . . . . . . . .74
liSt oF PlateSPlateAI. Preliminary lithologic correlation of boreholes LT-1, LT-2, and LT-3 with outcrop at west toe of Johnson Creek
landslide . . . . . . . . . . . . . . . . . . . . . . . . . . . . . . . . . . . . . . . . . . . . . . . . . . . . . . . . . . . . . . . . . . . . . . . . . . . . . . . . . . . . . . . . . . . . . . . . . . . . A-19

Oregon Department of Geology and Mineral Industries Special Paper 40 1
Johnson Creek Landslide Research Project, Lincoln County, Oregon: Final Report
abStraCt
A five-year study indicates that the Johnson Creek land-slide moves in response to intense rainfall that raises pore water pressure throughout the slide in the form of pulses of water pressure traveling from the headwall graben down the axis of the slide at rates of 1.4 to 2.5 m/hr in the upper part and 3.5 m/hr to virtually instan-taneous in the middle part. Vertical arrays of piezom-eters measured infiltration at rates of only 50 mm/hr, so infiltration is too slow to affect saturated water pres-sure except in the headwall graben. The hydraulic gra-dient through the slide mass is small and groundwater flow appears to be nearly horizontal, roughly parallel to the slide plane. These observations and the rapidity of pressure transmission are consistent with a high effec-tive hydraulic conductivity throughout the slide mass. Westward slope of the piezometric surface is consistent with better drainage in the western part of the slide. Movement episodes proceed by en masse movement when threshold pore pressures are reached followed by faster and faster movement of the middle portion of the slide when pore water pressure there rises above ~9.4 to 10.8 m head above the slide plane. In January 2003, slide velocity increased by an order of magnitude
when head above the slide plane at the middle observa-tion site reached 11.4 m while the western site reached ~9 m, ~2 m above its maximum for the following four winter seasons. Antecedent rainfall correlating with this accelerated movement was mean precipitation of 0.84 m in the previous 60 days and 2.1 mm/hr in the 62 hours immediately before the movement. Antecedent deformation correlating with the accelerated movement was extension of 1 cm in the lower part of the slide, possibly raising effective hydraulic conductivity there. This increased hydraulic conductivity may have caused a uniquely rapid pore pressure response in the lower part of the side and the unique 2-m increase in head. With respect to engineering solutions for slide mitiga-tion, the reduction of water pressures at the headwall graben by dewatering (e.g., drains or pumps) should be effective given the inferred high hydraulic conduc-tivity of the slide and sensitivity to pressure change at the graben. Limit equilibrium stability analyses indi-cate that 3 m of erosion would destabilize the slide for most of the winter season. This finding suggests that buttressing the toe of the slide is an effective long-term remediation option.
eXeCutive Summary
This report presents and interprets data acquired during a five-year study by the Oregon Department of Geology and Mineral Industries (DOGAMI) and the Oregon Department of Transportation (ODOT).
The Johnson Creek landslide moves in response to prolonged, intense rainfall that raises water pressure throughout the slide over a period of 30 to 50 hours. The sequence of events that leads to movement starts with vertical infiltration through the unsaturated zone at ~50 mm/hr (~1.5 to 3.0 m depth in 30 to 50 hours). Infiltration rapidly raises pore water pressure in the headwall graben. Pressure is then transmitted down the axis of the slide at speeds of 1.4 to 2.5 m/hr in the upper part and 3.5 m/hr to virtually instantaneous in the middle part of the slide. Arrival time of this trans-lating pulse, or “wave,” of pressure is similar at different levels in the saturated zone in the middle of the slide mass, producing about the same total head at each level monitored; therefore the vertical hydraulic gradi-
ent is small. Seepage analyses from recorded piezom-eter data demonstrated nearly horizontal flow roughly parallel to the slide plane. These observations and the rapidity of pressure transmission are consistent with a high effective hydraulic conductivity throughout the slide. The lower piezometric elevation in the western part of the slide is probably indicative of better drain-age there. A structure of unknown strike but with 2 m of down-to-the-east displacement lies in the middle of the slide where piezometric gradient changes and may be a groundwater barrier.
The slide begins to move en masse when threshold pore pressures are reached, the middle portion of the slide moving more rapidly than those portions to the east and west when pore water pressure there rises above ~9.4 to 10.8 m head above the slide plane. Head above the slide plane is persistently higher at the middle monitoring site than east and west of it at all times of the year, perhaps in response to the groundwater barri-

2 Oregon Department of Geology and Mineral Industries Special Paper 40
Johnson Creek Landslide Research Project, Lincoln County, Oregon: Final Report
er. For most of the small creeping movements observed during the four winters, the middle site appeared to control movement for the slide as a whole. Slide veloc-ity in January 2003 reached a minimum of 3-6 mm/hr in the middle of the slide when head above the slide plane at the middle site reached 11.4 m while the west-ern site reached ~9 m, ~2 m above its maximum head over the following four winter seasons. The eastern site lagged behind at a steady rate of ~0.3 mm/hr during this event. These were the highest rates of movement during the five winter seasons. The conditions for accel-erated movement were 0.84 m of rainfall in the previ-ous 60 days and 62 hours of rain at a mean rate of 2.1 mm/hr. Other instances of rain at these intensities for 33 and 15 hours did not trigger the unique response at the western site, although in January of 2006 head rose as high as 10.9 m at the middle site, resulting in creeping movements averaging 0.24–0.27 mm/hr. Pore water pressure increase at the western site occurred 5 hours before the middle site in January 2003 but 28 hours after the middle site in January 2006. Anteced-ent movement in December 2002 of the western site 1 cm farther than the middle site created extension between the two and possibly raised effective hydrau-lic conductivity. Increased hydraulic conductivity may have caused the early pressure response and the unique increase in head at the western site. Understanding the complex groundwater hydraulics within and below the slide mass will be facilitated by continued monitoring of the slide with the newly installed vertical arrays of piezometers. Additional vertical arrays of piezometers installed in other parts of the slide would be beneficial. It is recommended that if these arrays are installed, they be grouted. Grouted piezometers installed at the
same depth as the adjacent sand-packed piezometers recorded water pressures 1-2 m higher. Pressures from sand-packed piezometers were lower than the hydro-static gradient.
Erosion at the toe of the slide along the beach due to wave action was also found to impact significantly the margin of stability of the slide. Limit equilibrium stabil-ity analyses found that factor of safety (FOS) declines 2.3 percent for every meter of erosion from the passive wedge formed by the back-tilted toe of the slide. The same analysis found that 1 m rise in head at the middle monitoring site caused a 2 percent decline in FOS, and that the slide reaches instability when head rise at the middle site rises 1.1 m above normal winter levels. Removal of 3 m from the toe could thus destabilize the slide during most of the winter season.
Remediation of the water pressures at the headwall graben by drainage through French drains or other means (vertical wells, surface collection, and drainage of rainwater) would be a valuable demonstration proj-ect. The high hydraulic conductivity of the slide mass inferred from rapid pore pressure transmission should make dewatering schemes particularly effective. But-tressing the toe of the slide is an effective long-term remediation option, as it eliminates erosion that can trigger movement regardless of pore water pressures. The chief environmental costs for hard revetments are loss of dry sand beach from rising sea level and creat-ing an unnatural shoreline feature. Both of these can be mitigated by buttressing only the southern part of the slide where the most damaging movement has occurred. Understanding whether a partial buttress could stabilize other parts of the slide is an important objective for further research.

Oregon Department of Geology and Mineral Industries Special Paper 40 �
Johnson Creek Landslide Research Project, Lincoln County, Oregon: Final Report
This is the final report for a five-year investigation of the Johnson Creek landslide, Lincoln County, Oregon, by Oregon Department of Geology and Mineral Indus-tries (DOGAMI) and Oregon Department of Trans-portation (ODOT) (Figure 1). The ODOT Research Program sponsored the project in cooperation with the Federal Highway Administration in order to gain a better understanding of the mechanics of large transla-tional landslides affecting Tertiary sedimentary rocks along the U.S. west coast. The U.S. Geological Survey (USGS) Landslide Hazards Program became a partner in the project in 2005 with similar aims. The slide is less than 0.5 km (¼ mile) south of Otter Rock, Oregon, and impacts U.S. Highway 101, two private structures, and local utilities. It is clearly visible on 1939 aerial photos and causes a westward deflection of Highway 101. ODOT installed six inclinometers between 1972 and 1976 (Figure 2). In this investigation ten bore-holes, three soil moisture probes, and a rain gauge were installed to monitor rainfall, movement, and water pressure (Figures 2 and 3).
Objectives
The objectives of the investigation are to determine: Relative importance of groundwater pressure and coastal erosion as driving forces for translational landslides.Thresholds of water pressure and erosion that trigger movement.Potential effectiveness of remediation alterna-tives.Costs of remediation alternatives in terms of money and effect on beach sand supply.Application of the information to other coastal translational landslides.
RegiOnal geOlOgic setting
The Johnson Creek landslide is one of several similar translational slides on coastal bluffs of Lincoln County that cut through seaward dipping Tertiary sedimenta-ry rocks. Where these bluffs form sea cliffs 20 to 60 m high, translational slides are common with single block failures up to ~100 m wide (Priest and Allan, 2004). The bluff at Johnson Creek has all of these characteris-
•
•
•
•
•
tics: It is ~30 m high, is composed of seaward dipping sedimentary rocks of the Astoria Formation, and is affected by a large translational landslide ~200 m wide (Figure 2). Like many of the sedimentary rock bluffs on the Pacific coast, a flight of Pleistocene marine terraces creates a steplike landscape with a veneer of beach and dune sand (Figures 1 and 4). The landslide cuts through the second terrace in this sequence (Figure 1).
PReviOus WORk
The geotechnical engineering firm Landslide Technol-ogy installed inclinometers and piezometers in winter 2002-2003, analyzed movement and water pressure data, and produced a summary report (Landslide Tech-nology, 2004). The summary report documented obser-vations from December 2002 to March 2003:
There were three movement events: December 13 to 16, 2002; January 31 to February 3, 2003; and March 20 to 24, 2003. The second event had 24-cm movement in the central part of the slide; the movement sheared off all inclinometers and one piezometer cable installed below the slide plane. The other two movements were ≤ 4 cm.Resurvey of marker pins on the slide surface revealed that the southern part of the slide moved faster than the central and northern part during this period.Piezometric level measured in a sand pack 3–6 m below the central part of the slide plane was lower than in the slide mass, but shearing of the piezom-eter cable by the January 27 to February 3, 2003, movement limited data collection to 24 days. Landslide Technology concluded that groundwa-ter levels in the slide mass are primarily influenced by surface water, with less influence from a deeper groundwater source. A minimum level of approximately 10 m of head above the slide plane in the central part of the slide was reached before ground movement was triggered.Factor of safety declined 2.3 percent for every 1 m of erosion of the slide toe.
Landslide Technology (2004) recommended sev-eral remediation options (Appendix M) based on a limit equilibrium analysis of stability that identified
•
•
•
•
•
intRODuctiOn

4 Oregon Department of Geology and Mineral Industries Special Paper 40
Johnson Creek Landslide Research Project, Lincoln County, Oregon: Final Report
12
3
Figure 1. Location of the study area showing the backstops (eastern reach of coastal retreat) of three Pleistocene marine terraces numbered from youngest (1) to oldest (3). The remnant of a fourth terrace is preserved east of the third backstop at the ridge top
between Spencer Creek and Johnson Creek. The Johnson Creek landslide displaces the second youngest terrace. Figure is modified from Landslide Technology (2004).

Oregon Department of Geology and Mineral Industries Special Paper 40 5
Johnson Creek Landslide Research Project, Lincoln County, Oregon: Final Report
909090909090909090
626262626262626262Tre nch S iteTre nch S iteTre nch S iteTre nch S iteTre nch S iteTre nch S iteTre nch S iteTre nch S iteTre nch S ite
808080808080808080
363636363636363636
Figure 13Figure 13
Fre sh Scarps(C ov e r Photo)
Gra
be
n
He
ad
sc
ar p
O ldCoast Hwy 000000000 404040404040404040
metersmetersmetersmetersmetersmetersmetersmetersmetersB
ac
k- T
i l t ed
To
eB
l oc
k
T r a n s l a t i o n a lB l o c k
Hw
y10
1
Johnson Cr.
Figure 14Figure 14
Figure 57Figure 57
Figure 11Figure 11
Figure 12Figure 12
M iner Cr.
Figure 10Figure 10
Rain GaugeRain GaugeRain GaugeRain GaugeRain GaugeRain GaugeRain GaugeRain GaugeRain GaugeLT-1LT-1LT-1LT-1LT-1LT-1LT-1LT-1LT-1
LT-2LT-2LT-2LT-2LT-2LT-2LT-2LT-2LT-2
B -5B -5B -5B -5B -5B -5B -5B -5B -5
B -4B -4B -4B -4B -4B -4B -4B -4B -4
LT-1aLT-1aLT-1aLT-1aLT-1aLT-1aLT-1aLT-1aLT-1aLT-1pLT-1pLT-1pLT-1pLT-1pLT-1pLT-1pLT-1pLT-1p
LT-2-pLT-2-pLT-2-pLT-2-pLT-2-pLT-2-pLT-2-pLT-2-pLT-2-p
LT-2aLT-2aLT-2aLT-2aLT-2aLT-2aLT-2aLT-2aLT-2a
LT-3LT-3LT-3LT-3LT-3LT-3LT-3LT-3LT-3LT-3pLT-3pLT-3pLT-3pLT-3pLT-3pLT-3pLT-3pLT-3p
383838383838383838
303030303030303030
282828282828282828
262626262626262626
242424242424242424
222222222222222222
202020202020202020
181818181818181818
141414141414141414
121212121212121212
363636363636363636
323232323232323232
161616161616161616
101010101010101010666 66 6666
444 44 4444
343434343434343434
222222222
76-476-476-476-476-476-476-476-476-4
76-376-376-376-376-376-376-376-376-3
76-176-176-176-176-176-176-176-176-1
76-276-276-276-276-276-276-276-276-2
72-172-172-172-172-172-172-172-172-1
73-173-173-173-173-173-173-173-173-1
Figure 2. Site map of the Johnson Creek landslide showing 2002–2006 drill sites (blue dots), 1972–1976 Oregon Department of Transportation inclinometer sites (red dots), and the rain gauge. Blue dots with black circle and cross have soil moisture probes
installed. Borehole labels in black are piezometer holes; purple labels indicate inclinometers; brown labels indicate groundwater observation wells. Base map is a 2005 U.S. Geological Survey digital orthophoto quadrangle (DOq). Blue lines are topographic contours
at 2-m intervals; black lines are major slide block boundaries. Black teeth on slide boundaries point toward the down thrown side; dashed purple line is highly speculative structure connecting an exposed fault or internal scarp at the toe to a similar structure located
somewhere between boreholes LT-1 and LT-2. White dotted ellipses mark localities of detailed fracture and joint observations.

6 Oregon Department of Geology and Mineral Industries Special Paper 40
Johnson Creek Landslide Research Project, Lincoln County, Oregon: Final Report
Figure 3. Location of soil moisture probes. Probe locations are labeled WC-1S, WC-1D, WC-3S, and WC-3D; probe depths are 1.5 m, 2.4 m, 1.6 m, and 3.1 m, respectively. Other labels are as in Figure 2.
Figure is from Schulz and Ellis (2007).
Oregon Department of Geology and Mineral Industries Special Paper 40 7
Johnson Creek Landslide Research Project, Lincoln County, Oregon: Final Report
Figure 4. Geologic map of the Johnson Creek landslide. See Figure 5 for explanation and Figure 7 for cross section A-A’. Large green arrows depict direction of movement on the southeast margin of the slide based on offset of the east embankment of the Old Coast
Highway; the two arrows illustrate uncertainty. Red arrows are directions of slide movement from inclinometer data; blue arrows are direction of movement from re-survey of survey markers between October 24, 2002, and April 17, 2003 (see Appendix E);
brown arrows are in direction of movement from marker nails on fresh slide scarps monitored for small March 2003 slide movement (see Appendix G).

8 Oregon Department of Geology and Mineral Industries Special Paper 40
Johnson Creek Landslide Research Project, Lincoln County, Oregon: Final Report
groundwater pressure as the primary cause of move-ment, aided by erosion of the slide toe. Additional slope stability analyses performed by Dickenson and Chris-tie of Oregon State University (Priest and others, 2006; Appendix N) supplemented the limit equilibrium anal-yses of Landslide Technology (2004) with additional parametric evaluations of the influence of groundwater conditions, toe erosion, and geotechnical parameters on the computed margins of stability. Landslide Tech-nology concluded that a buttress at the toe of the slide would be the most cost-effective remediation option.
An interim report by Priest and others (2006) sum-marized previous work plus additional data available through November 20, 2004. They concluded that
Small movements of a few centimeters appeared to affect the entire slide equally and nearly simul-taneously. Differential movement between internal slide blocks occurred between January 27 and February 3, 2003, when the central part of the slide moved 24 cm.Head above the slide plane was largest in the cen-tral part of the slide where the largest movement occurred. The Astoria Formation below the basal shear zone is much less permeable than the fractured materi-als in and above the shear zone.
•
•
•
•
East-to-west migration of pore water pressure increases accompanying rainfall events might be caused by (a) pressure transmission and flow from infiltration of water at the head of the slide or (b) vertical infiltration throughout the slide. East-to-west lag of pressure increases in the latter case would be from greater depth of the water table in the western part of the slide. The highly fractured slide probably has relatively high effective hydraulic conductivity. Buttressing the southern, fastest moving part of the slide may be a cost-effective remediation option relative to buttressing the entire slide. Dewatering with vertical, pumped wells may slow movement significantly.
In December 2005 the U.S. Geological Survey (USGS) Landslide Hazards Program upgraded instrumentation for hourly (or shorter) collection of movement, water pore pressure, and rainfall data. Ellis and others (2007a) summarized December 2005 to January 2006 observa-tions, concluding that:
Rapid response of pore pressures near the basal slip plane to rainfall events suggests either rela-tively high hydraulic conductivity along the slide plane or rapid infiltration of rainfall through frac-tures from the ground surface in the upper part of the slide.
•
•
•
•
•
Figure 5. Map explanation for geologic map (Figure 4).

Oregon Department of Geology and Mineral Industries Special Paper 40 9
Johnson Creek Landslide Research Project, Lincoln County, Oregon: Final Report
Reduction in pore pressure thresholds from pre-vious movement episodes indicates that rainfall or pore-pressure thresholds may not be entirely reliable or precise indicators of potential landslide movement.
In 2006 USGS installed soil moisture probes and ver-tical arrays of piezometers (Schulz and Ellis, 2007) in part to test the hypothesis of Priest and others (2006) that vertical infiltration of meteoric water may have a role in east-to-west migration of water pressure increases. Ellis and others (2007b) concluded from observation of water pressures during small (≤ 4 cm) movements between December 12, 2006, and April 1, 2007, that:
The primary source of groundwater pressure increases throughout the slide is from infiltra-tion of water near the head of the slide where the water table is shallow and from lateral groundwa-ter flow.When the basal shear-zone groundwater pressure near the center of the slide reaches an approxi-mate threshold value, the slide begins to creep almost uniformly.Groundwater flow within the slide is approxi-mately parallel to the slide base.There is a very weak vertical hydraulic gradient, even across the basal shear zone, and relative-ly high hydraulic conductivity throughout the slide mass. Ellis and others (2007b) emphasized that this conclusion contradicts the conclusion of Landslide Technology (2004) that there is a hydraulic gradient to lower total head below the basal shear zone.
Schulz (2007, p. 362) similarly concluded that “vibrating-wire-piezometer nests show nearly horizon-tal groundwater pressure transmission from the head of the landslide toward the toe, and suggest that the landslide basal rupture surface has no effect on ground-water flow.” The inferences by Ellis and others (2007b) and Schulz (2007) were from observation of piezomet-ric pressures from grouted piezometers at depths up to 0.5 m below the base of the basal shear zone. The infer-ences of Landslide Technology (2004) were from piezo-metric pressures observed in a sand pack 3-6 m below the base of the basal shear zone, so the observational database is not exactly equivalent.
•
•
•
•
•
general aPProaCh
We examine hydrologic, geologic, and slide movement data from November 23, 2002, to April 1, 2007, to gain insight into how the hydrologic regime triggers slide movement. Although still preliminary, ground-based light detection and ranging (lidar) surveys of wave ero-sion of the landslide toe provide additional insight into the potential importance of erosion in triggering move-ment. We use slope stability analyses to understand the how much erosion and water pressure is required to cause slide movement. We briefly summarize general conclusions from slope stability analyses of Landslide Technology (2004) and Priest and others (2006); also see Appendices M and N.
general FindingS
We verify previous findings that intense rainfall events cause all observed movements. Water infiltrates rap-idly into the shallow water table at the head of the slide, transmitting pore water pressure through the saturat-ed zone to the rest of the slide. Except at the headwall graben, wetting fronts from these rainfall events reach the water table after pore water pressure rises from lateral pressure transmission and flow. The key role of pore water pressure in triggering movement and the high hydraulic conductivity of the slide inferred from pore water pressure transmission suggests that dewa-tering may be an effective remediation option in these kinds of slides. The upper part of the slide with highest water table and highest head above the slide plane is the most critical target for dewatering. Erosion of the slide toe can trigger movement regardless of water pressure, if it proceeds far enough, so long-term remediation of coastal slides of this type will require some means of stopping erosion. An erosion resistant buttress would be the most effective means of stopping both move-ment and erosion.

10 Oregon Department of Geology and Mineral Industries Special Paper 40
Johnson Creek Landslide Research Project, Lincoln County, Oregon: Final Report
geologiC maPPing
Geologic mapping was conducted by George Priest with assistance from Alan Niem. Dense vegetation and deep soil hindered bedrock mapping. A 1-m steel split tube punch coring device was used to penetrate the soils where bedrock was poorly exposed. Some areas had such dense brushy vegetation that they were virtu-ally inaccessible. The most accurate geologic data were gathered at the sea cliff, the two bounding drainages, and in the northeast quadrant of the landslide where a recent movement created many fresh exposures (see cover photo). Johnson Creek exposed bedrock below the slide during winter 2002-2003. General spacing, width, and orientation of fractures were carefully mea-sured at representative sites in all of these exposures and in road cuts (Figure 2). The Old Coast Highway and Highway 101 were convenient markers for measure-ment of lateral and vertical offset by the slide. Surface water, seeps, and springs were also mapped.
toPograPhiC Survey
Dennison Surveying of Newport, Oregon, performed a survey of topography in fall 2002 and a resurvey of selected points (steel rods) in spring 2003. Survey con-trol outside the landslide area was established by tying the survey to at least four ODOT Global Positioning System (GPS) control points including ODOT points 9303-1, 9303-2, 9303-3 and 9303-4. Coordinates and elevations were established by static GPS methods and were verified (GPS site calibration procedures) against Lincoln County Geodetic control points and National Geodetic Survey High Accuracy Reference Network (HARN) control monuments. The vertical datum for all topographic data was the North American Vertical Datum of 1988 (NAVD 1988). The horizontal datum was originally a local reference system used by ODOT but was transformed to Oregon State Plane 3601 North Zone, North American Datum of 1983 (NAD 1983) meters.
The survey was expressed in topographic contours at 0.5-m intervals that generally yielded an excellent rep-resentation of the morphology of the landslide. A few areas of particularly dense vegetation prevented access in the western part of the slide.
SubSurFaCe eXPloration
drillingExploratory drilling program began with six bor-
ings completed between November 18 and December 5, 2002 (first phase) and January 6 to January 10, 2003 (second phase). Borings completed as part of phase one are designated, from west to east (lower to upper part of the slide), LT-1, LT-2, and LT- 3 (Figure 2). Compan-ion borings drilled in the second-phase installation of piezometers are designated LT-1p, LT-2p, and LT-3p (Figure 2; Table 1).
Geo-Tech Explorations, Inc. of Tualatin, Oregon, per-formed the exploratory drilling using a track-mounted CME 850 drill rig. A combination of 15-cm (57/8-in) outer diameter (O.D.) tricone mud-rotary, casing instal-lation through overburden, and PQ3-wireline diamond core drilling techniques were used to drill the slope inclinometer borings to final depth. Hollow-stem auger techniques were used to drill the piezometer borings to final depth. Soil samples in the inclinometer borings (LT-1, LT-2, and LT-3) were obtained at approximately 0.76- or 1.52-m (2.5- or 5-ft) intervals using a 7.6-cm (3-in) O.D. split-spoon sample barrel driven by a 63.5-kg (140-lb) auto-trip hammer. The underlying bedrock was sampled by obtaining rock cores using 1.52-m (5-ft) long, triple barrel coring techniques. The quality of the bedrock was recorded using Rock Quality Desig-nation (RQD) and core recovery indices. Samples were also collected in the piezometer borings in the zones of measured slide movement, using 7.6-cm (3-in) diam-eter thin-walled Shelby tubes. In addition, select soil samples were obtained in Boring LT-3p using Standard Penetration Test (SPT) procedures.
Four boreholes were drilled in November 2006 in order to install additional piezometers (Table 1; Figure 2): One (LT-1a) at the west site, one (LT-2a) at the middle site, and two between the middle and east sites (B-4 and B-5). William H. Schulz of the USGS super-vised drilling and described cores from the B-4 and B-5 boreholes (Schulz and Ellis, 2007). No samples were described from the LT-1a or LT-2a boreholes, which were rapidly drilled utilizing a rotary bit. Boreholes for the water-content sensors were made by driving a 0.6-m-long, 5.1-cm-diameter, cylindrical steel sampler using a 22-kg electric breaker hammer to depths of 1.5
methodS

Oregon Department of Geology and Mineral Industries Special Paper 40 11
Johnson Creek Landslide Research Project, Lincoln County, Oregon: Final Report
table 1. Borehole, piezometer, soil moisture probe, depths and elevations relative to the base of the Johnson Creek landslide basal shear zone (“slide plane” in the table).
Hole
BoreholeElevation
(m)Total
Depth(m)
DepthtoProbeTip
(m)
ProbeElevation
(m)SlidePlaneDepth(m)
SlidePlaneElevation(m)
SandPack
DepthInterval
(m)
LT-1p piezometer @ 23.80 m 25.179 26.8 24.80 0.38 26.2 −1.1 23.8–26.8
LT-1 inclinometer 25.048 33.8 26.5 −1.5 -
LT-2p piezometer @ 16.70 m 24.698 25.0 16.70 8.00 18.4 6.3 15.2–18.2
LT-2p piezometer @ 24.70 m 24.698 25.0 24.70 0.00 18.4 6.3 21.8–25.0
LT-2 inclinometer 25.028 34.7 18.6 6.4 -
LT-3p piezometer @ 5.5 m 24.472 7.0 5.50 18.97 5.8 18.7 3.9–7.0
LT-3 inclinometer 24.746 28.7 7.0 17.7 -
LT-1a piezometer hole @ 3.35 m 25.201 26.5 3.35 21.85 25.9 -0.7 cement
LT-1a piezometer hole @ 9.14 m 25.201 26.5 9.14 16.06 25.9 -0.7 cement
LT-1a piezometer @ 15.24 m 25.201 26.5 15.24 9.96 25.9 -0.7 cement
LT-1a piezometer @ 21.34 m 25.201 26.5 21.34 3.86 25.9 -0.7 cement
LT-1a piezometer @ 24.08 m 25.201 26.5 24.08 1.12 25.9 -0.7 cement
LT-1a piezometer @ 26.21 m 25.201 26.5 26.21 −1.01 25.9 -0.7 cement
LT-2a piezometer @ 3.05 m 24.792 19.4 3.05 21.74 18.8 6.0 cement
LT-2a piezometer @ 6.10 m 24.792 19.4 6.10 18.69 18.8 6.0 cement
LT-2a piezometer @ 10.67 m 24.792 19.4 10.67 14.12 18.8 6.0 cement
LT-2a piezometer @ 13.72 m 24.792 19.4 13.72 11.07 18.8 6.0 cement
LT-2a piezometer @ 16.76 m 24.792 19.4 16.76 8.03 18.8 6.0 cement
LT-2a piezometer @ 19.29 m 24.792 19.4 19.29 5.50 18.8 6.0 cement
B-4 piezometer hole 20.12 m 26.736 20.6 20.12 6.62 18.2 8.5 cement
B-5 piezometer hole @ 10.67 m 23.199 12.0 10.67 12.53 9.8 13.4 cement
LT-1 soil moisture probe @ 1.5 m 25.048 1.50 1.50 23.55 26.5 −1.5 -
LT-1 soil moisture probe @ 3.0 m 25.048 2.40 2.40 22.65 26.5 −1.5 -
LT-3 soil moisture probe @ 1.50 m 24.396 1.60 1.60 22.80 7.0 17.4 -
LT-3 soil moisture probe @ 3.0 m 24.396 3.10 3.10 21.30 7.0 17.4 -
72-1 (1972 ODOT inclinometer) 23.50 21.3 - - 9.1 14.4 -
73-1 (1973 ODOT inclinometer 23.50 29.0 - - 16.8 6.7 -
76-1 (1976 ODOT inclinometer) 25.66 21.3 - - 14.6 11.0 -
76-1 (1976 ODOT inclinometer) 25.00 21.3 - - 14.6 10.4 -
76-2 (1976 ODOT inclinometer) 24.00 21.3 - - 20.1 3.9 -
76-3 (1976 ODOT inclinometer) 25.50 26.2 - - 24.4 1.1 -
76-4 (1976 ODOT inclinometer) 25.50 25.9 - - 26.8 −1.3 -
Slide plane depths and elevations from Oregon Department of Transportation (ODOT) inclinometers installed in the 1970s are highly uncertain; see text for explanation. @ = at depth of; all elevations are relative to the North American Vertical Datum of 1988 (NAVD 1988).

12 Oregon Department of Geology and Mineral Industries Special Paper 40
Johnson Creek Landslide Research Project, Lincoln County, Oregon: Final Report
to 3.1 m, two at the western (LT-1) and two at the east-ern (LT-3) site (Figure 3; Schulz and Ellis [2007]). Table 1 summarizes borehole depths and collar elevations.
test PitsOn March 24, 2003, two exploratory test pits were
excavated in an east-west line through the slide toe to examine the geometry and composition of the slide plane. The backhoe reached ~1.5 m depth in each pit. Pit locations are shown in Figure 2 as the trench site.
monitoring
Surface displacementMovement of the slide surface between October
2002 and April 2003 was determined by resurveying survey pins along a line-of-sight parallel to Highway 101 (Appendix F), resurveying steel stakes in three east-west lines through the slide (Appendix E), and detailed mea-surements across the heads of marker nails installed on both sides of well defined scarps (Appendix G). Move-ment at survey pins for the line-of-site survey and the steel stakes was determined by comparison to stable survey points outside the slide. Vertical and horizon-tal separation of marker nails installed with nail heads touching allowed precise measurement of direction and amount of movement at individual fresh scarps. Vulnerability of marker nails to burial or removal by mass wasting limited measurement to one movement episode in March 2003.
Subsurface displacement Inclinometers and extensometers provided slide
movement data at three sites (LT-1, LT-2, and LT-3; Figure 2). Borehole depths are listed in Table 1.
Slope inclinometer casings were installed in bor-ings LT-1, LT-2, and LT-3. The inclinometers consist of 3.048-m (10-ft) lengths of Slope Indicator Com-pany 7.0-cm (2.75-in) O.D. acrylonitrile-butadiene-styrene (ABS) casings with quick-connect couplings. The annular space between the casings and boring sidewalls was backfilled with cement bentonite grout, and each inclinometer was capped with a protective surface monument and concrete. Details of the incli-nometer installations are included on the summary boring logs, Appendix B. Coaxial cable was attached to the downslope exterior of the slope indicator cas-ings. The RG59U coaxial cable is commonly used for
home electronics. The cable can allow the use of time domain reflectometry (TDR) technology for measure-ment of additional information on slide movement at depth after the casing has been sheared, but no TDR logging device was available for that experiment before the cables were sheared by the large slide movement in 2003. Coaxial cables were installed in 2006 on casings of groundwater monitoring wells B-4 and B-5 (Figure 2), so these data may be collected at those sites some time in the future.
Manual boring extensometers were installed within the slope inclinometer casings after the inclinometer probe was unable to pass the shear zone. The extensom-eters allow for continued slide monitoring, although at a reduced accuracy and with no directional informa-tion as compared to the inclinometer. The extensom-eter consisted in the original installation of a braided steel rope anchored with an attached chain in a 3-m (10-ft) long concrete and sand plug at the bottom of the casing. A 0.6- to 0.9-m (2- to 3-ft) section of steel rope extended from the top of the casing with a crimped ferrule attached near the end of the rope. The distance between the top of the casing and the bottom of the ferrule became the gauge length of the extensometer during the first two years of observations.
In November 20, 2004, the USGS installed new data acquisition systems to monitor existing instrumenta-tion at the site, and new instrumentation was added that allowed simultaneous recording of precipita-tion, groundwater pressure and landslide movement. PsiTronix extension transducers (80-in range) were attached with a pulley and reel assembly to the braided wire in each of the three extensometer holes (Figure 2). USGS replaced the three GEOKON dataloggers with two Campbell Scientific CR10X dataloggers, one at the LT-1 site and one at the LT-3 site.
Measurement error varied with the method. Incli-nometers have a high precision (0.25 mm) compared to that of the extensometers (1 cm) used prior to instal-lation of the cable and pulley system. Cable extension of 0.05 cm can be resolved with the cable and pulley system (Schulz and Ellis, 2007).
rainfallA rain gauge was installed above the headscarp at the location shown in Figure 2 about 80 m northeast of the LT-3 site. The instrument is a Global Water, Inc., RG200 tipping bucket rain gauge initially connected to a Global

Oregon Department of Geology and Mineral Industries Special Paper 40 13
Johnson Creek Landslide Research Project, Lincoln County, Oregon: Final Report
Water model GL400-1-1 pulse type datalogger. As of November 20, 2004, the new Scientific CR10X logger at the LT-3 site also receives data through a wire from the rain gauge. Both current and former dataloggers were originally programmed to record rainfall amounts every hour; however, since March 9, 2006, data from the rain gauge, extensometers, and piezometers has been recorded every 15 minutes. On January 7, 2003, a wind shield was installed on the rain gauge. Prior to that high winds created some false readings.
Estimates of precipitation for periods of time when local rain gauge data were lacking were compiled from the Hatfield Marine Science Center archives (http://hmsc.oregonstate.edu/weather/archives/guinlib/). The rain gauge for these data is located ~12 km south of the landslide.
groundwaterGroundwater pore pressures were monitored by
vibrating wire piezometers, and soil moisture was monitored by soil moisture probes. Table 1 summa-rizes borehole depths and elevations of all piezometers and probes. Piezometers and moisture probes were installed in phases.
In December 2002, four vibrating wire pressure transducers, manufactured by Slope Indicator Com-pany, were installed next to the LT-1, LT-2, and LT-3 inclinometer holes; these boreholes are labeled LT-1p, LT-2p, and LT-3p in Figure 2. In each boring, the pres-sure transducers were installed within 2 m above the slide plane identified from inclinometer data. The sand pack around the transducer penetrated the slide plane. An additional pressure transducer was installed 5.1 m below the basal shear zone at the middle drill site (LT-2p) in a sand pack 3–6 m below the slide plane. This transducer lost communication with the datalogger due to slide movement on February 1, 2003.
Between November 7 and November 14, 2006, the USGS Landslide Hazards Program supervised installa-tion of 12 vibrating wire piezometers in two boreholes, consisting of two vertical arrays of six piezometers (boreholes LT-1a and LT-2a, Figure 2; Table 1). All were grouted with a bentonite-cement mixture (see Schulz and Ellis, 2007, for further details).
Also installed November 2006 were two single piezometers inside slotted casing near the bottom of two groundwater monitoring wells (boreholes B-4 and B-5, Figure 1; Table 1). The groundwater monitoring
wells consisted of Johnson Screens 1.25-in (3.15-cm) diameter, schedule 80 PVC pipe with 10-slot screened sections. Coaxial cable was taped to the outside of the B-4 and B-5 well casings and extends to the bottom of each borehole. The cable permits possible identifica-tion of the depth of shearing in the two wells (Kane and Beck, 1996). The annular space around each well casing was backfilled with 10/20 Colorado silica sand and Volclay coarse bentonite chips. Bentonite chips were placed in the bottom of borehole B-5 below the sand backfill and above the sand backfill in both boreholes to 0.3 m below ground surface. Steel, flush-mount well covers were set in concrete from 0.3 m below ground surface to the ground surface (see Schulz and Ellis, 2007, for further details).
B-4 and B-5 pore pressure data are not equivalent to data from the other piezometers because both are water-table observation wells and provide only water table elevation. The other piezometers are Casagrande piezometers that provide discrete measurements of groundwater pressure at a point.
In November 2006 the USGS also installed four soil moisture probes (Table 1; Figure 3). These are Decagon Devices, Inc., ECH2O model EC-5 dielectric sensors. The sensors produce an output voltage that depends on the dielectric constant of the medium surround-ing the sensors. The EC-5 has a claimed resolution of 0.001 m3/m3 and accuracy of at least 0.003 m3/m3 in all soils with salinity below 8 decisiemens per meter (Schulz and Ellis, 2007). Schulz and Ellis (2007) noted that the deeper probe at the LT-1 site (WC-1D, Figure 3) appears to measure very subtle changes in water content at times when large changes are measured by the other sensors but does not appear to provide accu-rate absolute measurements or to detect moderate and small changes in water content.
Between December 2002 and November 2004, piezometer data were collected by two single-channel GEOKON dataloggers, one at the eastern (LT-3p) site and one at the western (LT-1p) site. Data from LT-2p and LT-3p installations were collected at the LT-3p site; data from the LT-1p piezometer flowed to the LT-1p site. Data were downloaded periodically with a laptop computer. In November 2004, the USGS Landslide Hazards Program installed new dataloggers at these two sites. Both loggers are powered by rechargeable gel cell batteries recharged by solar panels. In early 2006 the USGS incorporated cellular modems into the

14 Oregon Department of Geology and Mineral Industries Special Paper 40
Johnson Creek Landslide Research Project, Lincoln County, Oregon: Final Report
data acquisition systems so that data could be accessed remotely and more frequently. Pore-water pressures were recorded every hour between January 2003 and March 8, 2006. From March 9, 2006, to April 1, 2007, data were collected every 15 minutes. See Schulz and Ellis (2007) for further details on the USGS upgrade.
erosionPins. An attempt was made to measure the rate of
erosion at the slide toe using survey pins installed in the face of the bluff. Thirty-five, 298-mm (117/8 in) long pins were inserted in six profiles up the face of the bluff on December 9, 2002. The amount of pin sticking out was measured at installation and again on April 10, 2003 (Appendix H). Because many of the pins were lost to erosion in the first season, steel stakes 77 cm (30 in) long were driven into the base of the sea cliff in spring 2004 to obtain additional data. Extensive loss of the 77 cm pins to erosion and talus cover caused this experi-ment to be abandoned.
Lidar. Owing to failure of survey pins to yield accu-rate erosion rates, ground-based light detection and ranging (lidar) surveys (GBL) were initially undertaken as a pilot effort to obtain estimates of mass loss along three segments of the sea cliff (south, middle, and north) and encompassed the region between the toe of the landslide and the top of the bluff face (Appendix I). The GBL point density is high enough that individual trees located at the top of the sea cliff can be tracked, providing an independent means of measuring slide movement at the toe of the slide where slide movement data are lacking. Furthermore, removing the effects of differential slide movement from the GBL data will be crucial for determining the extent of bluff erosion in response to wave runup erosion and subaerial weather-ing processes. Processing of the data is still at an early stage, so slide movement has not yet been estimated. The initial survey of the bluff was carried out May 14, 2004, and provided a baseline for future measure-ments. Following the initial GBL survey, two surveys were undertaken by staff from ODOT’s Geometronics group. These latter surveys were carried out respective-ly on October 3-4, 2006, almost 2.5 years after the first survey in 2004, and again on April 3-4, 2007. However, in contrast to the initial survey in 2004, the latter two surveys encompassed the entire length of the toe of the Johnson Creek landslide.
Airborne lidar surveys by USGS in 1997, 1998, and 2002 were examined for erosion information, but once the data were gridded and reduced to elevation con-tours, errors of 1.2–2.4 m (bluff accretion or exagger-ated erosion) became apparent. These errors appear to be from smoothing of relatively sparse data on steep bluff slopes, so the data were not useful.
Beach erosion. Erosion and deposition of beach and dune sand can affect slide stability owing to the but-tressing effect and erosion protection afforded by thick sand accumulations. Measurements of beach sand levels were obtained using lidar and topographic sur-veying (Appendix K). Field surveying of topographic profiles to determine beach sand volume was suspend-ed after spring 2003. Observations since that time are qualitative from frequent visits to the beach.
laboratory teSting
Laboratory testing was performed to determine soil index properties for correlation with engineering parameters and to aid with classification. All testing was performed at the Landslide Technology soil labo-ratory in Portland, Oregon. Tests were performed on selected samples collected during field explorations to verify field classifications and to determine the follow-ing properties:
soil classificationnatural moisture contentin-place densityresidual shear strength
Soil and rock core samples obtained from the field exploration program were visually re-examined in the laboratory to confirm field classifications using Ameri-can Society for Testing and Materials Document 2488 (ASTM D 2488). Together with the results of additional laboratory testing, final soil descriptions were prepared in general accordance with ASTM D 2487. Soil classi-fications and descriptions are presented on the boring logs of Appendix B.
Moisture contents were determined on all samples retrieved from the field explorations in general accor-dance with ASTM D 2216.
In-place density tests were performed on selected core samples obtained during field explorations. The tests were performed in general accordance with ASTM D 2937.
••••

Oregon Department of Geology and Mineral Industries Special Paper 40 15
Johnson Creek Landslide Research Project, Lincoln County, Oregon: Final Report
Residual shear strength tests were performed on shear zone material obtained from a drill core sample. The specimen was obtained in boring LT-2 at a depth of 18.1 m (59 ft). The zone of slide movement measured in inclinometer LT-2 is from depths of 17.4 to 18.6 m (57 to 61 ft). The tested soil is soft, slightly clayey, sandy silt; no sand- or gravel-sized fragments were in the sample.
The sample was remolded by hand and placed in the ring-shear apparatus. The ring shear sample is 0.20 in thick and has a surface area of 6.2 in2. After the sample was placed in the ring shear apparatus, it was consoli-dated in a water bath for each load increment prior to shearing. The sample was tested at 490, 245, and 123 KPa (5.1, 2.6, and 1.3 tons per square foot, tsf ) confin-ing pressure to simulate the range of in-situ effective confining stress along the shear zone. In-situ confining pressures at the shear zone within LT-1, LT-2, and LT-3 were estimated to be 380, 290, and 120 KPa (4.0, 3.0, and 1.3 tsf ), respectively, using groundwater levels obtained from the vibrating wire piezometers. Following consol-idation of the samples, shearing was commenced at a rate of 0.024 degrees per minute until reaching residual strength. The test was repeated for each of the three loads detailed above (Appendix J).
SloPe Stability analySiS
Two independent suites of limit equilibrium, slope sta-bility analyses were completed to evaluate the influence of groundwater conditions, geotechnical parameters, and toe erosion on the slide movement. Although the stability modeling was performed using conventional 2-D slope stability procedures, the analyses were per-formed for several cross sections of the slide; thus, the results are useful for elucidating the 3-D kinematics of the slide mass. Landslide Technology (2004) executed the first suite of analyses (Appendix M), and Christie and Dickenson in the Department of Civil, Construc-tion, and Environmental Engineering at Oregon State University carried out the second suite (Priest and others, 2006; Appendix N). Project support was insuf-ficient to update these analyses for data collected after spring 2003.
Both Landslide Technology and Oregon State Univer-sity used the method of Spencer (1967) in the computer program XSTABL by Interactive Software Designs, Inc.
(http://www.xstabl.com/). XSTABL employs rigid body mechanics in the solution of circular and wedge slip surfaces. The program searches for the critical surface exhibiting the lowest margin of stability (expressed as the factor of safety against sliding). This approach does not account for the cumulative effect of multiple water-filled tension cracks or interaction between blocks within the overall slide mass. Spencer’s method is a force and moment equilibrium method that assumes the resultant slide force inclination is the same for every slice. A box search method is used for the stability anal-ysis at the toe of the slope. The force and moment equi-librium approach generates random points within the user specified search box.
The Landslide Technology (2004) analyses were performed by back-calculating the required strength (angle of shearing resistance, φ′) along the shear zone at the drilling transect to infer incipient failure conditions (i.e., for a factor of safety equal to 1.0). The improve-ments to the factor of safety (FOS) were then checked for various treatment options using the back-calculat-ed φr′. Landslide Technology used standard engineer-ing calculations to construct site-specific remediation options (Appendix M).
Christie and Dickenson (Priest and others, 2006; Appendix N) evaluated the influence of the following parameters on overall slide mass stability: (a) drained shear strength parameters, (b) piezometric surface and threshold pore pressure required for slope movement, (c) influence of water-filled tension cracks on toe stabil-ity, and (d) evaluation of the impact of translating pore pressure pulses, or waves, on overall stability. Their approach was similar to that of Landslide Technology but used two additional cross sections, one north and one south of the drilling transect (see Appendix N).

16 Oregon Department of Geology and Mineral Industries Special Paper 40
Johnson Creek Landslide Research Project, Lincoln County, Oregon: Final Report
geologiC maPPing
The geologic map, cross sections, and structure con-tour map shown in Figures 4–9 summarize surface and subsurface interpretations of the landslide structure. Figure 4 depicts all interpretations of slide movement direction from inclinometer logs, resurveys, marker nail monitoring, and offset roads.
topographic expression and StructureJohnson Creek landslide has a maximum width of
200 m from headscarp to toe. East of Highway 101, the slide extends 240 m north-south, but west of Highway 101 the slide extends ~400 m north-south (Figures 2 and 4). Steep-sided ravines bound the slide at John-son Creek on the south and Miner Creek on the north (Figure 2). Johnson Creek cuts through the slide mass to underlying undisturbed bedrock but Miner Creek appears to lie in slide material that extends northward out of the project area.
Surface features within the slide include a 6- to 15-m headscarp, a 7- to 23-m-wide graben, a 100- to 120-m-wide translational block, and back-rotated toe block (Figures 2 and 7). The headwall graben is only 7 to 12 m wide around most of the slide (Figure 2). Internal slide scarps trend northwest in the northern part of the slide and east-west to northeast in the southern part (Fig-ures 2 and 7).
The back-tilted toe block is 4 to 30 m wide and forms a 17-m-high bench that lies at the base of scarps sepa-rating it from the main translational blocks to the east (Figures 2 and 7). These scarps have about 10 m of relief and change northward from multiple scarps to one scarp. The width of the toe block increases by a factor of 2 where the scarps fuse into one. Bedding in Tertiary Astoria Formation exposed at the toe dips between 15° and 45° to the east, rotated from original west dip on the order of ~17° (Figures 4 and 10). This “back-rotation” is likely due to upward movement of slide blocks. If the basal slide zone of a translational slide rises to the sur-face at its toe, a passive wedge is formed where material can rotate relative to the main slide mass. Local slumps can also result in back-rotation of slide blocks, but this block is relatively coherent, as demonstrated by conti-nuity of single marker beds (Figure 11). These marker beds are offset ~2 m down to the northeast on a fault
or internal shear plane striking N 66˚ W and dipping 60° NE (solid part of the purple line in Figure 2). This structure occurs where the toe block changes width and multiple scarps behind it change to a single scarp (Figures 2 and 4).
The large translational blocks east of the toe block are generally higher in elevation in the northern half and highest in the northeast quadrant where movement over approximately the past 10 years created a near ver-tical headscarp (Figures 2 and 4). East of Highway 101 the translational blocks are at an elevation of 27–33 m in the northern half and 23–26 m in the southern half of the slide. West of Highway 101 the southern half of these blocks lies at an elevation of 20–23 m while the northern half lies at 25- to 31-m elevation. The sur-face expression of the slide is therefore suggestive of increasing displacement west and south of the north-east corner (Landslide Technology, 2004).
offset roadsAt the southern margin of the slide on the Old Coast
Highway, offset since highway abandonment in about 1943 (Len Saltekoff, ODOT, personal communication 2005; Figure 2) is ~ 3.35 ± 0.6 m left lateral and ~0.91 ± 0.05 m vertical. These vertical and horizontal com-ponents of movement imply a slide plane dip of ~15° ± 2° west. Mean rate of movement over the 62 years was ~5.4 ± 1 cm/yr horizontal and ~1.5 ± 0.08 cm/yr vertical. These values are based on displacement of the original gravel surface at the east highway embankment inside and outside of the slide. Only a few centimeters of gravel are present, so it is likely that the road was graveled only once or twice before abandonment and has not been largely disturbed (i.e., re-graded or exca-vated) since then. The trend of the road embankments would seem to offer another datum for estimation of lat-eral offset, but there was apparently continual realign-ment of the road as the slide moved, creating a curving embankment now disrupted at the slide margin. Lateral offset since initial construction of the Old Coast High-way can be crudely estimated by assuming the road was originally straight, trending about N 27° W (north part in the slide) to N 38° W (south part outside the slide). Left-lateral offset determined in this fashion is ~6.4 ± 1.2 m. Vertical offset since initial construction cannot be determined easily, as it is likely that the road
reSultS

Oregon Department of Geology and Mineral Industries Special Paper 40 17
Johnson Creek Landslide Research Project, Lincoln County, Oregon: Final Report
Figure 6. Geologic map in the vicinity of the boreholes (blue dots) for this project. Symbols as in Figures 4 and 5. Cross section A-A’ is shown in Figure 7.
Figure 7. Generalized cross section A-A’. Strike and dip of tectonic faults (red dashed lines) are inferred faults that cannot be located more accurately than the spacing of the boreholes, so are not depicted on the geologic map. Purple dashed line is an internal slide
structure with dip and offset best fitting borehole stratigraphy; lateral position between boreholes LT-1 and LT-2 is unknown. Dashed black line is the slide plane inferred from estimated depth of slide plane at inclinometer hole 76-1, but elevation
and depth data for the slide plane at this hole have higher uncertainty than for inclinometer holes LT-1, LT-2, and LT-3 (solid black line labeled slide plane). Horizontal lines are isolines of elevation with labels in meters above
geodetic mean sea level (NAVD 88). See Figure 5 for explanation of geologic units; vertical scale = horizontal scale.

18 Oregon Department of Geology and Mineral Industries Special Paper 40
Johnson Creek Landslide Research Project, Lincoln County, Oregon: Final Report
was continuously graded as the slide moved. The age of the Old Coast Highway is not known, but construc-tion activity was widespread in 1927–1932 (Len Salt-ekoff, ODOT, 2005 personal communication). Using this time frame, the average rate of lateral movement is ~8.5 ± 1.6 cm/yr, about 57 percent higher than the rate calculated from highway abandonment in 1943. There is more uncertainty in the 1927–1932 age of construc-tion than the 1943 age of abandonment, so the ~5.4 ± 1 cm/yr horizontal and ~1.5 ± 0.08 cm/yr vertical rates are probably better estimates.
rock unitsThe Johnson Creek landslide is within the Miocene
Astoria Formation (Figures 4–9; see Appendix A for detailed description). The Astoria Formation is the dominant rock exposed at the slide toe where it con-sists of 66 percent sandy or clayey siltstone, 27 percent moderately indurated silty fine- to medium-grained sandstone, 6 percent tuffaceous claystone or siltstone, and 1 percent calcareous claystone. The basal slip plane gouge exposed at the toe is predominantly clayey silt-stone or sandy clayey siltstone overlain by ~3 m of brec-ciated siltstone (Figure 12; Appendix A).
The dominant surface unit in the rest of the land-slide is Pleistocene marine terrace deposits that lie on a nearly flat-lying Pleistocene wavecut terrace (Figures 4 and 7). These deposits are 3 to 6 m thick and are com-
posed of well-sorted fine- to medium-grained quartzo-feldspathic sand underlain by a basal cobble layer. In some places post-depositional (Pleistocene?) erosion has removed or redistributed the original deposits. The deposits have much higher permeability than the finer grained, cemented and poorly sorted sedimentary rock of the underlying Astoria Formation (see size analyses in Appendix A). The Pleistocene sand is weakly cement-ed by thin films of poorly crystalline goethite (Johnson, 2003) and/or allophane with some larger voids locally filled with gibbsite (Grathoff and others, 2001; Grathoff, 2005; Johnson, 2003), but overall porosity is still quite high. As allophane dehydrates and shrinks, it loses its cementing qualities, causing the terrace sand to become friable where exposed (Grathoff, 2005); hence, most exposures of the terrace sand quickly become covered in talus. The best exposures are at the recently exposed portion of the northeast headscarp (cover page picture and Figure 13) and at the top of the sea cliff. The lower contact of the Pleistocene sand deposit is at an eleva-tion of ~29 m in the northern half of the headscarp and at ~32 m in the southern half of the headscarp. The lower contact on the north appears to be a wave-cut platform with lag gravel, whereas the one on the south is irregular with colluvial material at the contact con-sistent with reworking of the original deposit in a sub-aerial environment, probably during Pleistocene time, as the deposit is still well consolidated.
Figure 8. Cross section showing detail of geology and piezometer depths (blue triangles). See Figures 5 and 7 for explanation; vertical scale = horizontal scale.
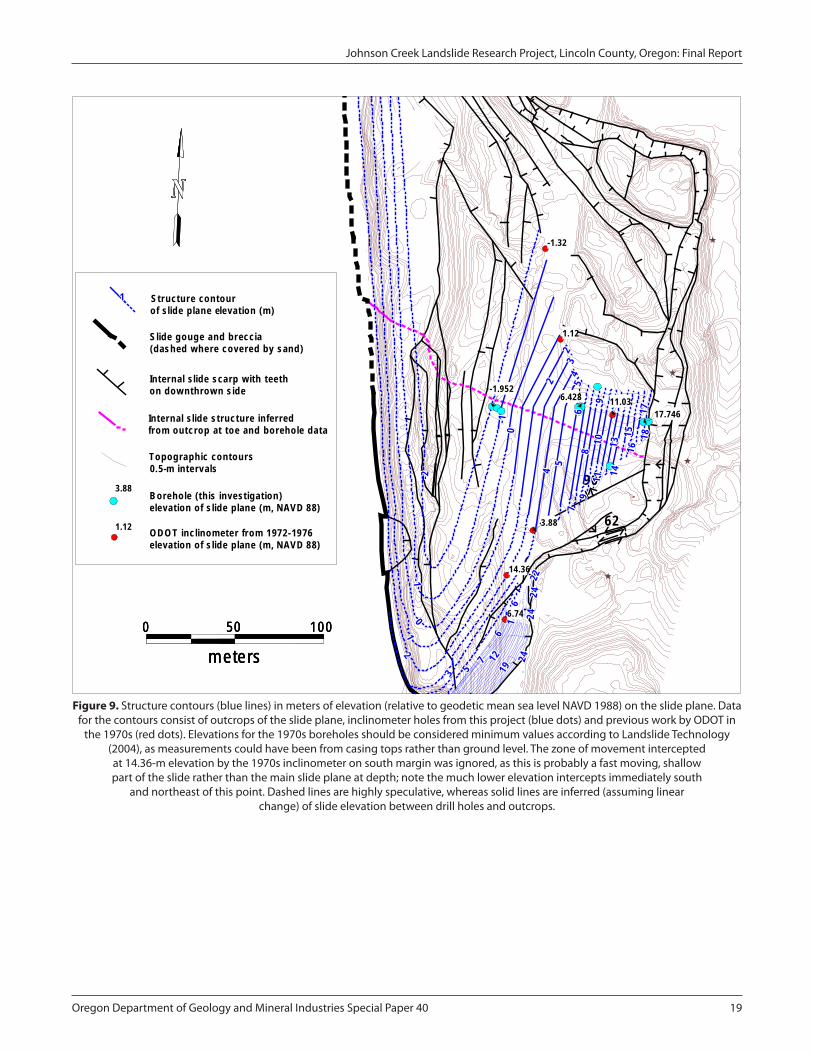
Oregon Department of Geology and Mineral Industries Special Paper 40 19
Johnson Creek Landslide Research Project, Lincoln County, Oregon: Final Report
909090909090909090
626262626262626262
50 100
m eters0
Internal slide scarp w ith teethon dow nthrow n side
Internal slide structure infer redfrom outcrop at toe and borehole data
Structure contourof slide plane elevation (m)
ODO T inclinometer from 1972-1976elevation of slide plane (m, NAVD 88)
Borehole (this investigation)elevation of slide plane (m, NAVD 88)
100
Slide gouge and breccia(dashed where covered by sand)
111111111
Topographic contours0.5-m intervals
3.88
1.12
50
m eters0 50 100
m eters0
11.03
3.88
-1.952
17.746
6.428
-1-1-1-1-1-1-1-1-1
222222222
000000000
666 66 6666
555555555444444444
888888888101010101010101010
101010101010101010242424242424242424
191919191919191919121212121212121212777777777
131313131313131313151515151515151515
222222222111111111
000000000-1-1-1-1-1-1-1-1-1
333333333444444444
555555555
999999999
181818181818181818161616161616161616
141414141414141414111111111111111111999999999
777 77 7777
666666666242424242424242424
666666666
242424242424242424222222222222222222
222222222
-2-2-2 -2-2 -2-2-2-2
555555555333333333
171717171717171717
-1.32
1.12
14.36
6.74
Figure 9. Structure contours (blue lines) in meters of elevation (relative to geodetic mean sea level NAVD 1988) on the slide plane. Data for the contours consist of outcrops of the slide plane, inclinometer holes from this project (blue dots) and previous work by ODOT in
the 1970s (red dots). Elevations for the 1970s boreholes should be considered minimum values according to Landslide Technology (2004), as measurements could have been from casing tops rather than ground level. The zone of movement intercepted at 14.36-m elevation by the 1970s inclinometer on south margin was ignored, as this is probably a fast moving, shallow part of the slide rather than the main slide plane at depth; note the much lower elevation intercepts immediately south
and northeast of this point. Dashed lines are highly speculative, whereas solid lines are inferred (assuming linear change) of slide elevation between drill holes and outcrops.

20 Oregon Department of Geology and Mineral Industries Special Paper 40
Johnson Creek Landslide Research Project, Lincoln County, Oregon: Final Report
Figure 10. Looking north at Tertiary Astoria Formation at the toe of the Johnson Creek landslide. The smooth light tan unit is sandstone; sandy siltstone is the overlying dark orange gray unit. Black 0.8-m-long back pack is
shown for scale. These units had an original dip of ~17˚ E, whereas in this exposure they dip 28˚–37˚ E from back rotation. See Figure 2 for location.
Figure 11. Looking north from the toe of the Johnson Creek landslide. Note light-colored marker beds that can be traced easily over the entire length of the slide toe.

Oregon Department of Geology and Mineral Industries Special Paper 40 21
Johnson Creek Landslide Research Project, Lincoln County, Oregon: Final Report
Figure 12. Highly sheared dark gray sandy siltstone unit at the toe of the Johnson Creek landslide. This unit underlies the tan sandstone in Figure 3. Chuck Dennison of Dennison Surveying is pointing at the unit.
Slightly reworked talus from the slide partially covers the basal shear zone.
Figure 13. Pleistocene marine terrace sand exposed in the northeast headwall of the landslide. Jonathan Allan of DOGAMI is measuring the thickness of the unit. Note the nearly flat surface of the sand sheet.
The contact with underlying Tertiary Astoria Formation is ~1 m below the base of the ladder.

22 Oregon Department of Geology and Mineral Industries Special Paper 40
Johnson Creek Landslide Research Project, Lincoln County, Oregon: Final Report
Colluvium of Astoria Formation and marine terrace sand covers many parts of the slide. This material is thickest at the base of slide scarps and is thicker where scarps are higher. Thickness in the headwall graben exceeded the 1-m length of a punch core.
Fractures and JointsErosion and road construction exposed fractures
and joints in only a few places: The sea cliff and adja-cent outcrops in Minor Creek and Johnson Creek, a road cut through the headscarp, and fresh scarps in the northeast part of the slide (see cover photo). Fractures within the landslide are much more closely spaced than outside the slide. Figure 2 shows localities of detailed observations.
Outside of the landslide, joints are essentially absent in the Pleistocene marine terrace deposits but common in the underlying Astoria Formation where there are generally two sets trending northwest and northeast. Within 100 m east of the landslide headscarp are two joint systems striking N 10°–30° W, dipping 62°–88° W crossing a less numerous set striking N 70° E to N 88° W and dipping 63°–73° N. A few vertical fractures strik-ing N 45°–52° E occur locally in the same area. Johnson Creek exposes a set below the landslide striking N 17°–60° W and dipping within about 13°–17° of vertical. This set is crossed by a vertical set striking N 54°–57° E. Spacing of tectonic joints below the side plane at the toe and east of the headscarp tends to be irregular with some areas nearly devoid of joints over distances of a few meters next to areas with sets of joints spaced at a few tenths of a meter.
Joints and fractures within the landslide strike sub-parallel to adjacent slide block boundaries and to north-west or northeast trending tectonic joints. On the face of the sea cliff extensional high-angle fractures parallel to the cliff face have normal listric-slip of a few to sev-eral meters (Appendix A). An exposure at the sea cliff on the north side of Johnson Creek (Figure 2) has frac-ture systems spaced at an average of 12 cm with many only a few centimeters apart. The fractures are in three major sets, N 47° E, dipping 88° N; 32°–42° W, dipping 72°–78° E; and roughly parallel to the slide toe at N 7°–17° E, dipping within 17° of vertical. At the north end of the toe block at Miner Creek nearly vertical fractures trend roughly parallel to the block. One of these frac-tures near the back (east side) of the toe block is a ~1 cm fissure narrowing downward. East-facing scarps of
Quaternary marine terrace sand freshly exposed in the northeast graben have fractures and sheared surfaces at N 7°–55° W, dipping 78°–90° W. The strike of most of these fractures is roughly parallel to the trend of the north-trending headwall graben. Fresh sheared surfac-es at the base of the north-south headscarp in the same area strike north-south and dip 87° W (Figure 4). Other freshly sheared surfaces cutting roads at the northern, eastern, and southern edges of the landslide also strike parallel to the boundary and have inclinations toward the slide of 70°–90° (Figure 4).
Ponds, Springs, and SeepsSurface water on the landslide locally ponds in the
headwall graben, forming marshy areas. Creeks on the north and south margins of the slide flow all year long from drainage basins east of the slide. Prominent wet-land features are not readily evident over most of the landslide except at the headwall graben, where a small sag pond occurs (unit Hsp, Figure 4).
Intermittent groundwater seeps were observed in the uppermost part of the sea cliff in the past five win-ters. These seeps issued from a perched aquifer in basal Pleistocene marine terrace sand where these deposits lie on less permeable Astoria Formation. More promi-nent seeps occur at the terrace contact outside the landslide where landslide fractures do not interrupt groundwater flow.
Modest seeps and a few springs of groundwater emerge from fractured Astoria Formation along the base of the landslide at the sea cliff. The toe of the slide was searched for springs and seeps on January 8, 2005, after an intense rainfall event. One spring with field-estimated flow at ~27 liters per minute (lpm) (~7 gal-lons per minute, gpm) issued from fractured Astoria Formation in the sea cliff 10 m south of north edge of the slide. Wave erosion of beach sand observed on April 28, 2007, exposed pervasive groundwater seeps at the slide plane (Figure 14).

Oregon Department of Geology and Mineral Industries Special Paper 40 23
Johnson Creek Landslide Research Project, Lincoln County, Oregon: Final Report
Figure 14. Groundwater seeping from slide breccia and gouge of sandy siltstone at the southern toe of the Johnson Creek landslide. The mouth of Johnson Creek is in the upper right where driftwood is piled up.
Note that beach sand is stripped off. Wave erosion is more efficient in this part of the slide owing to a persistent rip cell embayment that carries sand offshore. Photo was taken April 28, 2007.
SubSurFaCe eXPloration
drillingExploratory borings encountered materials that are
separated into three geotechnical engineering units identified as Pleistocene terrace sand overlying a thin layer of decomposed Astoria Formation, fractured Astoria Formation slide debris, and bedrock of Astoria Formation below the slide. Detailed descriptions of the subsurface materials are included in Appendices A and B. Correlation of rock units between boreholes is illus-trated in the cross section of Figure 7 and in Appendix A.
Pleistocene marine terrace sand and decomposed Astoria Formation were encountered to depths of 5.0 to 6.9 m. Pleistocene terrace deposits consist of loose to medium dense, silty sand. Decomposed Astoria Forma-tion lies immediately below the sand and is 1 to 2 m (3 to 6 ft) of medium stiff, silty orange clay.
The Pleistocene terrace contact with underlying Astoria Formation is 2 m lower in boreholes LT-2 and LT-3 than in LT-1 on the west side of the slide (Figure 7). The 2-m offset of the Pleistocene terrace can be explained by either a Quaternary fault or by internal deformation within the slide. Landslide Technology (2004) and Priest and others (2006) used a tectonic fault to match offset of Astoria marker beds, but the authors do not show the fault offsetting the marine ter-race; Appendix A shows a cross section with this inter-pretation. Lacking evidence of a Quaternary fault in the area, the geologic cross section depicts an internal slide structure between LT-1 and LT-2 with apparent dip of 58˚ E, derived from a best fit for offset of both the Pleistocene terrace and the Astoria Formation. Actual strike, dip, and location of this structure are unknown. The structure was placed at a small change in direction of slide movement between LT-1 and LT-2 interpreted from the resurvey data, assuming it accommodates this

24 Oregon Department of Geology and Mineral Industries Special Paper 40
Johnson Creek Landslide Research Project, Lincoln County, Oregon: Final Report
change in direction (Figure 6). In order to depict the structure on the map, it is arbitrarily connected along lineaments from this point to a structure at the slide toe with the same vertical displacement (dashed purple line in Figure 6). The structure at the slide toe strikes N 66˚ W, dips 60˚ NE, and displaces Astoria Formation 2 m down to the northeast (Figure 6). There may be no connection between the two, as simple extrapola-tion of this strike and dip yields a 37˚ apparent dip in the cross section and a crossing point 20 m east of the one shown.
Astoria Formation encountered in drill core consists of moderately to highly fractured sandstone, siltstone, and tuffaceous mudstone. This fractured rock is typi-cally very soft rock (classification R1 [Sara, 2003]) with lesser soft rock (R2). In-place Astoria Formation is typ-ically a soft rock (R2). Due to drill and sample specifi-cations for the drilling investigation, standard penetra-tion tests (SPT) were not taken in the drill holes except to isolate the base of the terrace sand in boring LT-3p.
Slickensides and apparent gouge zones were also encountered in the slide debris and in the rock underly-ing the zone of shearing recorded by the inclinometers (Figures 15–19). Slickenside orientations were typically near vertical. Vertical slickensides were also encoun-tered on fracture surfaces in the in-place rock, which suggests that other tectonically induced strain (faults) may be present in the slide area.
Gouge material encountered in the borings is clas-sified as very soft, slightly clayey to clayey, sandy silt. Brecciated siltstone and sandstone were commonly encountered in the slide debris but were not encoun-tered in the rock below the slide except for a 0.15-m layer of wet, highly sheared siltstone dipping about 2° at 15.4 m depth in borehole LT-3. The gouge layer at 15.4 m depth is not described by Landslide Technology (2004) (Appendix B) but was observed by us when the core was taken.
test PitsThe two exploratory test pits through the slide toe
revealed gouge of the basal shear zone overriding beach sand and an underlying berm of rounded to subround-ed cobbles and pebbles (Figure 20). Cobble and pebble lithologies appeared similar to siltstone and sandstone in the sea cliff. Location of the test pits was at the foot of a small slump block (Figure 2).
monitoring
Automated collection of data established by the USGS in 2005 continues at the writing of this report. Data are periodically downloaded by USGS via a cell phone connection. Data may be viewed at the USGS web site, http://landslides.usgs.gov/monitoring/johnson_creek/.
Surface displacementResurveys. Survey points were established on the
ground surface at three east-west sections across the slide (Figure 21; Appendix E). Two sets of readings were taken, one on October 24, 2002, and one on April 17, 2003. The general trend of increasing movement to the south and southwest in the slide mass is depicted quali-tatively in Figure 21 by the varying length of the blue arrows and quantitatively in Figures 22 and 23. From readings taken upslope of the headwall graben in stable ground, the survey repeatability error is large, about 11 cm to 15 cm horizontal and 1 to 130 cm vertical. The one point with 130 cm vertical error was probably a result of disturbance of the steel stake or calculation/transcription error.
Even with the relatively high error in the survey data, general trends emerged that were helpful in under-standing the overall differences in ground movement across the slide during the large movement event that occurred at the end of January 2003. This event in com-bination with the December 2002 and March 2003 movements had enough displacement in the central and southern part of the slide to be detectable in spite of the measurement error. The error was too large to detect movement in the northern transect, so those data are not shown (see Appendix E). At the drilling transect, horizontal surface displacement was 22 to 33 cm to the west or southwest and 4–9 cm vertical. Larg-est movement was in the southern survey line where the slide moved 21–130 cm horizontally and 6–70 cm vertically.
The general trend of increasing displacement from the northern to the southern margin of the landslide is reflected in observations of damage immediately after the December 2002 movements. The northern margin at Highway 101 had only ~1-2 cm of vertical offset, while the highway on the southern margin had 18 cm of vertical displacement and 5-cm-wide fissures (Figures 24 and 25). As explained below, the slide at the drill-ing transect only had ~5 cm of movement during this

Oregon Department of Geology and Mineral Industries Special Paper 40 25
Johnson Creek Landslide Research Project, Lincoln County, Oregon: Final Report
Slide plane at LT-3 inclinometer hole
Figure 15. Core at the slide plane from the eastern (LT-3) inclinometer hole.
Figure 16. Core of slide breccia from 1.9 to 0.9 m above the base of slide from the middle (LT-2) inclinometer hole. Inclinometer data show shearing at 18.6-m (61 ft) depth. Photo of the slide plane is not available.

26 Oregon Department of Geology and Mineral Industries Special Paper 40
Johnson Creek Landslide Research Project, Lincoln County, Oregon: Final Report
59.4 ft depth Sample for Ring Shear Test
Figure 17. Sample used for ring shear test at a depth of ~18 m (59 ft) in borehole LT-2. Inclinometer data show shearing at 18.6 m (61 ft).
Slide Plane at 26.5 m (87 ft)depth in borehole LT-1.
Figure 18. Core at the slide plane from the western (LT-1) inclinometer hole. Numerous sheared fractures occur just above the slide plane.

Oregon Department of Geology and Mineral Industries Special Paper 40 27
Johnson Creek Landslide Research Project, Lincoln County, Oregon: Final Report
Figure 19. Core of altered Astoria Formation siltstone (orange) at 4.6- to 5.2-m depth immediately below the Pleistocene marine terrace sand contact at ~4.3 m (14 ft) depth in borehole LT-3. Dark gray material
below 5.2-m (17 ft) depth is unaltered siltstone.
Figure 20. Cross section showing Astoria Formation mudstone and sandstone of the Johnson Creek landslide overriding an apron of beach cobbles at the toe of the landslide. Slanted line pattern
indicates west-dipping, undisturbed Astoria Formation below the landslide. See Figures 2 and 6 for location and Plate A1 for cross section units.

28 Oregon Department of Geology and Mineral Industries Special Paper 40
Johnson Creek Landslide Research Project, Lincoln County, Oregon: Final Report
Figure 21. qualitative vectors (blue arrows) drawn in direction of slide movement for steel stakes surveyed October 24, 2002, and April 17, 2003, and for inclinometer data (red arrows) collected between December 11 and December 31, 2002.
Relative lengths of arrows correspond roughly to relative amount of movement. Red crosses without arrows are points where slide movement between surveys was less than the error in the measurement.
Green arrows illustrate possible movement direction from offset of the Old Coast Highway; brown arrow illustrates general movement direction inferred from scarp trends
and offset of marker nails in the northeastern part of the slide.

Oregon Department of Geology and Mineral Industries Special Paper 40 29
Johnson Creek Landslide Research Project, Lincoln County, Oregon: Final Report
Figure 22. Horizontal movement (cm) at steel stakes (blue crosses) in the southern part of landslide from resurvey of steel survey stakes October 24, 2002, and April 17, 2003. Key boreholes are also shown (circles with diamonds
and blue labels). Movement east of the headwall of –10.85 cm (eastward movement) is survey error, so this is the approximate error of the data.
Figure 23. Vertical movement (cm) at steel stakes (blue crosses) in the southern part of landslide. Movement east of the headwall of +0.29 to +2.91 cm (upward) is typical survey error. There are two survey stakes east of the headwall
with displacements of –129.88 cm and -22.1 cm, but these are probably local anomalies caused by displacement of steel stakes by causes other than slide movement (falling tree debris, survey notation errors, tampering, etc.).

30 Oregon Department of Geology and Mineral Industries Special Paper 40
Johnson Creek Landslide Research Project, Lincoln County, Oregon: Final Report
Figure 24. Damage to Highway 101 on the south margin of the Johnson Creek landslide immediately after a slide movement in January 2003. Maximum vertical offset is 17.8 cm down to the northwest;
fissures are as wide as 5 cm. This part of the slide is south of the resurvey lines and confirms the general trend of increasing offset to the south. Roger Hart is in the background.
Figure 25. Damage to the north slide margin on Highway 101 from the same movement as in Figure 24. Note that vertical offset is only 1-2 cm.

Oregon Department of Geology and Mineral Industries Special Paper 40 31
Johnson Creek Landslide Research Project, Lincoln County, Oregon: Final Report
time. The largest slide movement during the resurvey observation interval was at the end of January 2003 and was about 24 cm at in the central part of the slide, so movement on the southern margin was probably much larger than that; unfortunately, it did so much damage to the highway that it was repaired before a measure-ment could be made.
The line-of-sight survey readings taken in January and February 2003 (Appendix F) also show that the south-ern area of the slide has moved faster than the northern area. The general trend of west-directed movement in the western part of the slide and southwest-directed movement in the northeast portion inferred from scarp trends is also reflected in the resurvey data (Figures 21 and 22).
Marker nails. On March 12, 2003, marker nails were placed across fresh scarps created from the February 2003 slide movement and then measured March 24 and April 11, 2003. A slide movement measured at ~2 cm at extensometers in March 21–28, 2003, displaced all of the nails around the slide perimeter ~2 cm (Appen-dix G). Direction of motion determined from the nails
matched other observations, west at the headwall graben, right lateral at the north margin, and left lateral at the southern margin (brown arrows, Figure 4). Nails placed across an older, sharply defined bedrock scarp in the interior of the slide showed no movement (east-northeast trending scarp with 90˚ dip in southeast part of slide, Figure 4). The results are consistent with en masse movement of 2 cm with insignificant internal deformation.
table 2. Interpretations of slide plane depth from Schulz and Ellis (2007) versus Landslide Technology (2004).
BoreholeMaximumDepth(m)
MinimumDepth(m)
ProbableDepth(m)
LandslideTechnology
(2004)Depth(m)
LT-1 26.52 25.30 25.81 26.5LT-1a 25.76 24.54 25.05 —LT-2 18.59 17.37 17.77 18.6LT-2a 18.62 17.34 17.74 —LT-3 6.46 5.79 6.13 7.0
table 3. Displacement for each movement event episode.
Episode
WestSite(LT-1) MiddleSite(LT-2) EastSite(LT-3)
Inclin.(cm)
Extens.(cm)
Inferred(cm)
Inclin.(cm)
Extens.(cm)
Inferred(cm)
Inclin.(cm)
Extens.(cm)
Inferred(cm)
December 13–31, 2002 2.3 1 5 2.8 1 4 3.2 3.2
January 31–February 3, 2003 — 14 14 — 24 24 — 5 5
March 21–28, 2003 — 2 2 — 2 2 — 2 2
November 15–March 4, 2004 — 4 4 — 2 2 — 3 3
November 11–18, 2004 — 0 0 — 0 0 — 2 2
December 27–January 4, 2006 — 1.4 1.4 — 1.4 1.4 — 1.0 1.0
January 6–24, 2006 — 3.3 3.3 — 3.5 3.5 — 1.8 1.8
January 27–February 10, 2006 — 3.4 3.4 — 4.0 4.0 — 3.2 3.2
November 6–15, 2006 — 0.6 0.6 — 1.1 1.1 — 0.6 0.6
December 24–28, 2006 — 0.3 0.3 — 0.2 0.2 — 0.3 0.3
January 2–11, 2007 — 1.1 1.1 — 1.0 1.0 — 0.9 0.9
February 15–16, 2007 — 0.0 0.0 — 0.0 0.0 — 0.2 0.2
February 25–March 9, 2007 — 2.2 2.2 — 2.2 2.2 — 2.2 2.2
March 12–15, 2007 — 0.0 0.0 — 0.0 0.0 — 0.1 0.1
Total displacement 2.3 33 37 2.8 42 45 3.2 22 25
Inclin. = inclinometer; Extens. = extensometer. Differences of 1-2 cm in total inferred movement between this table and summary charts are caused by accumulated rounding errors in extensometer data collected before November 20, 2005; those data have mea-surement errors of 1 cm.

32 Oregon Department of Geology and Mineral Industries Special Paper 40
Johnson Creek Landslide Research Project, Lincoln County, Oregon: Final Report
Subsurface displacementData. All subsurface displacement data collected in
this investigation are in the digital file Piezometer+Soil Mois+Movement_DATA.xls on the publication CD. Estimated depths to the basal shear zone at all boreholes are listed in Table 1. Table 2 lists alternative slide plane depths from Schulz and Ellis (2007). Table 3 summariz-es all slide movements during the observation period. Note that some elevations and depths to the slide plane differ slightly from those reported by Schulz and Ellis (2007). These differences are from small differences in interpretation of geological and geotechnical data. For example, we used basal shear zone depths from interpretations of Landslide Technology (2004) that placed the slide plane near the bottom of the shear zone deflection in inclinometer data. Schulz and Ellis (2007) place the slide plane near the center of the deflection, ~0.3–0.8 m above our slide plane (Table 2). Appendix D summarizes all inclinometer displacement plots. Inclinometer displacement plots for ODOT boreholes drilled in 1972–1976 are in Appendix C. Figures 26 and 27 depict all slide movement data.
Data gaps. Site vandalism caused loss of data in two instances. The data gap between July 9, 2005, and Sep-tember 22, 2005, is from loss of a solar panel power-ing the datalogger. The LT-2 extensometer wire and pulley system experienced two sudden changes over less than the 1-hr sampling interval. A decrease of 3.2 cm occurred between 13:00 and 14:00 hours on June 30, 2005, an increase of 3.4 cm occurred between 14:00 and 15:00 hours October 11, 2005 (Figure 27). The October change was from reseating the wire into the pulley from apparent vandalism on June 30, so data col-lected between these dates are unreliable.
Observations. Inclinometer readings began on December 11, 2002. Shear movement was first detect-ed in the casings on December 16, 2002. Inclinometers measured 2.3 to 3.2 cm of displacement before the probe could not pass distorted casing at the slide zone. Each inclinometer was converted to an extensometer when this happened. Inclinometer readings ceased progressively from the western to the eastern incli-nometers: December 23, 2002 for LT-1, December 26 for LT-2, and January 3, 2003, for LT-3. Figure 26 shows displacements for the inclinometers and extensometers during this time. Dashed lines in Figure 26 depict how extensometer data were merged with inclinometer data to determine total movement since the start of moni-
toring. Figure 27 shows all displacement using this merged data.
Shear movements were detected at depths of 26.5 m, 18.6 m, and 7.0 m below ground surface for LT-1, LT-2, and LT-3, respectively (Appendix D; Landslide Technology, 2004). Schulz and Ellis (2007, p. 9) noted that “all shear displacement of the inclinometer cas-ings occurred within a 1.2-m-thick zone, indicating that the landslide basal shear zone at these locations is less than 1.2 m thick. About 64 percent and 83 percent of the shear displacement of the inclinometer casing at boreholes LT-1 and LT-2, respectively, occurred within a zone 0.6 m thick, strongly suggesting that the basal shear zone at these locations is less than 0.6 m thick and probably less than 0.3 m thick.”
Inclinometers LT-1, LT-2, and LT-3 measured shear zone movement vectors in the directions 273, 258, and 247 degrees azimuth (red arrows in Figure 21), respec-tively. From analysis of inclinometer data by Landslide Technology (2004), apparent shear movement near the bottom of inclinometer hole LT-2 (Appendix D) is likely due to systematic error.
Six inclinometers installed by ODOT in the 1970s (Figure 2; Appendix C) provide some constraints on slide plane depth, but the data are highly uncertain. According to Landslide Technology (2004), the vertical datum and horizontal datum are not known, and the surface measurement point for the “slope meter tubes” is unknown. Depths could be from the ground surface or from casing protruding above the ground. The plots for three borings (76-2, 76-3, and 76-4) have similar appearances, which can be attributed to the depth of movement somewhat deeper than the casing (Land-slide Technology, 2004).
Total displacement over the four years and four months of observation was approximately 37 cm, 45 cm, and 25 cm at the west (LT-1), middle (LT-2), and east (LT-3) sites, respectively (Table 3). Small differ-ences in total displacement shown Table 3 and Figure 27 are from some spurious raw data from previously explained tampering with instruments and rounding errors for the less precise data collected from hand measurements prior to November 2005. All movement occurred during the five winter rainy seasons. The 24-cm displacement at LT-2 between January 31 and Feb-ruary 3, 2003, created 10 cm of compression between LT-1 and LT-2 and 19 cm of extension between LT-3 and LT-2 (Table 3). Twelve smaller movements over

Oregon Department of Geology and Mineral Industries Special Paper 40 33
Johnson Creek Landslide Research Project, Lincoln County, Oregon: Final Report
Inc linom eter and Extensom eter Data fo r the Decem ber 11 , 2002 to January 9 , 2003
-3
-2
-1
0
1
2
3
4
5
6
12 /10 12 /12 12 /14 12 /16 12 /18 12 /20 12 /22 12 /24 12 /26 12 /28 12 /30 1 /1 1 /3 1 /5 1 /7 1 /9
Dis
plac
emen
t(cm
)LT -1-in fe rred (cm ) LT -2 -in fe rred (cm ) LT -3 -in fe rred (cm ) LT -1 extens. (cm ) LT -2 extens. (cm )LT -3 extens. (cm ) LT -1 inc linom . (cm ) LT -2 inc linom . (cm ) LT -3 inc linom . (cm )
Figure 26. Inclinometer and extensometer data (solid lines) from the start of monitoring on December 11, 2002, to January 9, 2003. Dashed lines depict slide movement inferred from combined extensometer and
inclinometer data; error bars on extensometer data are 1 cm; precision on inclinometer data is 0.25 mm.
0
5
10
15
20
25
30
35
40
45
Oct
-02
Jan-
03Ap
r-03
Jul -0
3O
ct-0
3Ja
n-04
Apr-0
4
Jul-0
4O
ct-0
4Ja
n-05
Apr-0
5
Jul -0
5O
ct-0
5Ja
n-06
Apr-0
6
Jul -0
6Se
p-06
Dec-
06M
ar-0
7
Cum
ulat
ive
Mov
emen
t(cm
)
LT-1 (West)
LT-3 (East)
LT-2 (Middle)
Feb. 1
Vandalism
Figure 27. Cumulative movement for the observation period November 23, 2002, to April 1, 2007. Note that cumulative totals are the raw data unadjusted for error introduced by vandalism or other causes.

34 Oregon Department of Geology and Mineral Industries Special Paper 40
Johnson Creek Landslide Research Project, Lincoln County, Oregon: Final Report
the subsequent four years left the 10 cm of compres-sion unchanged and increased the 19 cm of extension to 20 cm at the head of the slide (Table 3). Given that measurement error for half of the data was 1 cm, this change in extension is not significant. Note that the terms extension and compression are used here to explain relative movement, not the stress regime of the slide; the stress regime in unknown.
rainfall Data. All rainfall data are in the digital file
Piezometer+Soil Mois+Movement_DATA.xls on the publication CD. Data are from a recently clear-cut area above the headwall of the landslide (Figure 2).
Data gaps. Data were not recorded during two inter-vals in summer 2005 and 2006. The data gap between July 10, 2005, and September 21, 2005, is from vandal-ism. Zero rainfall recorded between July 28, 2006, and September 25, 2006, is partly due to clogging of the rain gauge with leaves. Removal of leaves on Septem-ber 25 caused a spurious reading. The rain gauge 14 km south at the Hatfield Marine Science Center (HMSC) recorded a trace of rain (0.25 mm in 15 minutes) on July 31, August 9, 11, 28, 29, and 31, but the first sig-nificant precipitation missed by the rain gauge was on September 15 when the HMSC gauge recorded 2.9 mm over 3.5 hr. A larger event was missed on September 18 when HMSC recorded 10.9 mm in 6.5 hr. Therefore, the gauge was not able to collect data at least between September 15 and 25, 2006.
Observations. Most rainfall occurred between the middle of September and May in each of the five winters; the most intense precipitation was between November and February each year (Figures 28 and 29). Total rain-fall was highest in 2005-2006, followed by 2002-2003, 2003-2004, 2006-2007, and 2004-2005. Cumulative rainfall to February 1 of each year is marked in Figure 28 for comparison of rainfall intensity at the point of largest slide movement in 2003. December to February 1 intensity was highest in 2002-2003, followed by 2005-2006, 2003-2004, 2006-2007, and 2004-2005 (Figure 28). Higher intensity is a steeper slope on the cumula-tive rainfall curve. Intensity was seldom over 10 mm/hr (Figure 29).
groundwater Data files. All pore pressure and soil moisture data
are in the digital file Piezometer+Soil Mois+Movement_DATA.xls on the publication CD. Estimated depths of piezometers and soil moisture probes are listed in Table 1.
Soil moisture data. All but one of the soil mois-ture probes showed measurable variation in moisture during the December 2006 to April 2007 observation interval (Figure 30). The soil moisture probe at 2.4 m depth at the western (LT-1) site (probe WC-1d) showed little response and apparently malfunctioned (Schulz and Ellis, 2007). The probe at 1.6 m depth at the east site (probe WC-3s) had less pronounced and slower response to wetting events than the one at the 1.5 m depth at the west site (probe WC-1s) (Figure 30).
The soil moisture probe at 3.1 m depth at the east (LT-3) site responds to major rainfall events before the probe at 1.6 m depth (Figures 31–33). The probe at 3.1 m depth responds at variable times after rainfall event but always when total piezometric head at the site reaches 1 m above the probe elevation (Figures 31–33).
Piezometer data. All piezometer data are illustrated in Figure 34 for sand-packed piezometers, in Figures 35 and 36 for grouted piezometers, and in Figure 37 for piezometers in two groundwater monitoring wells. Drilling effects and data losses are noted in the illustra-tions. The anomalous rise in pore pressure from drill-ing fluids did not persist more than about three days at each site.
Grouted versus sand-packed piezometers. Sand-packed piezometer data did not match data from grouted piezometers at the same depths. Mikkelsen and Green (2003) verified the high accuracy of pore water pressures from grouted piezometers and recom-mended abandoning sand-packed installations. Water pressure in sand-packed piezometers near the slide plane in the LT-1p and LT-2p boreholes is consistently lower than pressure in grouted piezometers LT-1a and LT-2a at about the same depth (Figures 38 and 39). Dif-ferences are 1.7–2.0 m lower at LT-1p and 0.9–2.0 m lower at LT-2p. During peak head events, head at LT-1p is 0.9 m lower than at LT-1a, while at LT-2p it is lower by 0.9–1.4 m than LT-2a (Figures 38 and 39). Figure 40 illustrates that cemented piezometers in the vertical arrays from the LT-1a and LT-2a boreholes plot on a hydrostatic line, whereas contemporaneous water pres-sure from the sand-packed piezometers fall off the line.

Oregon Department of Geology and Mineral Industries Special Paper 40 35
Johnson Creek Landslide Research Project, Lincoln County, Oregon: Final Report
Annual Cumulative Precipitation
0
2
4
6
8
10
12
14
16
18
Jun-
02Au
g-02
Oct
-02
Nov-
02Ja
n-03
Mar
-03
May
-03
Jul -0
3Se
p-03
Nov-
03Ja
n-04
Mar
-04
May
-04
Jul-0
4Se
p-04
Nov-
04Ja
n-05
Mar
-05
May
-05
Jul-0
5Se
p-05
Nov-
05Ja
n-06
Mar
-06
May
-06
Jul -0
6Se
p-06
Nov-
06Ja
n-07
Mar
-07
May
-07
Jul-0
7
Cum
ulat
ive
Rai
nfal
l(de
cim
eter
s)
Feb. 1 Feb. 1Feb. 1 Feb. 1Feb. 1
LargestMovement
Figure 28. Cumulative rainfall by water year (July 1 to June 30) for all observations. Cumulative rainfall associated with the largest slide movement on February 1, 2002 is shown as the dashed reference line;
vertical lines mark the same date in each water year. Red = data from the Hatfield Marine Science Center 12 km south of the study area. The data gap in 2005 is from vandalism.
0
2
4
6
8
10
12
14
16
18
20
Oct-0
2Ja
n-03
Apr-0
3Ju
l-03
Oct-0
3Ja
n-04
Apr-0
4Ju
l-04
Oct-0
4Ja
n-05
Apr-0
5Ju
l-05
Oct-0
5Ja
n-06
Apr-0
6Ju
l-06
Sep-
06De
c-06
Mar
-07
Prec
ipita
tion
(mm
/hr)
Figure 29. Hourly rainfall variation during the observation period October 2002 to March 2007.

36 Oregon Department of Geology and Mineral Industries Special Paper 40
Johnson Creek Landslide Research Project, Lincoln County, Oregon: Final Report
Soil M o is ture Data
0.000
0.050
0.100
0.150
0.200
0.250
0.300
0.350
0.400
0.450
0.500
12 /10 12 /20 12 /30 1 /9 1 /19 1 /29 2 /8 2 /18 2 /28 3 /10 3 /20 3 /30
Soil
Moi
stur
e(V
ol.%
H2 O
/100
)
0
2
4
6
8
10
12
Rai
nfal
l(m
m/h
r)
W C-3s water conten t, 1 .6m depth (vo l % /100) W C -3d water conten t, 3 .1m depth (vo l % /100)W C -1s water conten t, 1 .5m depth (vo l % /100) W C -1d water conten t, 2 .4m depth (vo l % /100)P rec ip (m m /hr)
Figure 30. All soil moisture data and hourly precipitation for December 2006 to April 2007.
Soil M o is ture Data versus Tota l Head at LT-3p - Decem ber 2006 to April 2007
0 .00
0 .05
0 .10
0 .15
0 .20
0 .25
0 .30
0 .35
0 .40
0 .45
0 .50
12 /10 12 /20 12 /30 1 /9 1 /19 1 /29 2 /8 2 /18 2 /28 3 /10 3 /20 3 /30
Soil
Moi
stur
e(V
ol.%
H2 O
/100
),pp
tn(5
m)
2 0 .5
21
21 .5
22
22 .5
23
23 .5
LT-3
pTo
talh
ead
(m)
W C-3s water conten t, 1 .6m depth (vo l % /100) W C -3d water conten t, 3 .1m depth (vo l % /100)W C -1s water conten t, 1 .5m depth (vo l % /100) W C -1d water conten t, 2 .4m depth (vo l % /100)Cum ula tive P rec ip (5 m ) LT -3p 5.5m Tota l Head (m )
W C-3d Probe E levation
W C-3s Probe E levation
Figure 31. Soil moisture observations for the period December 2006 to April 2007 relative to cumulative precipitation and to total head at the LT-3p borehole. Note that the deeper moisture probe at the LT-3 site, WC-3d, lies below the total piezometric head at that site in some intervals.
Cumulative precipitation (pptn) is in units of 5 m in order to plot on the graph.

Oregon Department of Geology and Mineral Industries Special Paper 40 37
Johnson Creek Landslide Research Project, Lincoln County, Oregon: Final Report
Soil M o is ture and P iezom etric Response at the East (LT-3 ) S ite - January 2-5 , 2007
0 .25
0 .30
0 .35
0 .40
1 /2 /070:00
1 /2 /078:00
1 /2 /0716:00
1 /3 /070:00
1 /3 /078:00
1 /3 /0716:00
1 /4 /070:00
1 /4 /078:00
1 /4 /0716:00
1 /5 /070:00
Wat
erC
onte
nt(V
ol.%
H2 O
/100
),C
um.P
ptn
(m)
2 1 .0
21 .5
22 .0
22 .5
23 .0
23 .5
LT-3
pTo
talH
ead
(m)
W C-3s water conten t, 1 .6m depth (vo l % /100) W C -3d water conten t, 3 .1m depth (vo l % /100)Cum ula tive P rec ip (m ) LT -3p 5.5m Tota l Head (m )
Elev. o f probe at 3 .1 m depth = 21.65 m
27 hrs
15 hrs
E levation of probe at 1 .6 mdepth
0 hrs
1 .5 hrs
4 .5 hrs
P iezom . elev. w hen probe at 3 .1 m responds = 22.6 m
Figure 32. Soil moisture and piezometric response at the east (LT-3) observation site relative to a major rainfall event in January 2007.
Soil M o is ture and P iezom etric Response at the East (LT-3 ) S ite - February 13-17 , 2007
0 .00
0 .05
0 .10
0 .15
0 .20
0 .25
0 .30
0 .35
0 .40
2 /13 /07 0:00 2 /13 /07 16:00 2 /14 /07 8:00 2 /15 /07 0:00 2 /15 /07 16:00 2 /16 /07 8:00 2 /17 /07 0:00
Wat
erC
onte
nt(V
ol.%
H2 O
/100
),C
um.P
ptn
(m)
2 0 .5
21 .0
21 .5
22 .0
22 .5
23 .0
23 .5
LT-3
pTo
talH
ead
(m)
W C-3s water conten t, 1 .6m depth (vo l % /100) W C -3d water conten t, 3 .1m depth (vo l % /100)Cum ula tive P rec ip (2 m ) LT -3p 5.5m Tota l Head (m )
Elev. o f probe at 3 .1 m depth = 21.65 m
Piezom . elev. w hen probe at 3 .1 m responds = 22.6 m
36 hrs
E levation of probe at 1 .6 mdepth
0 hrs
1 .5 hrs
34 hrs
Figure 33. Soil moisture and piezometric response at the east (LT-3) observation site relative to a major rainfall event in February 2007.
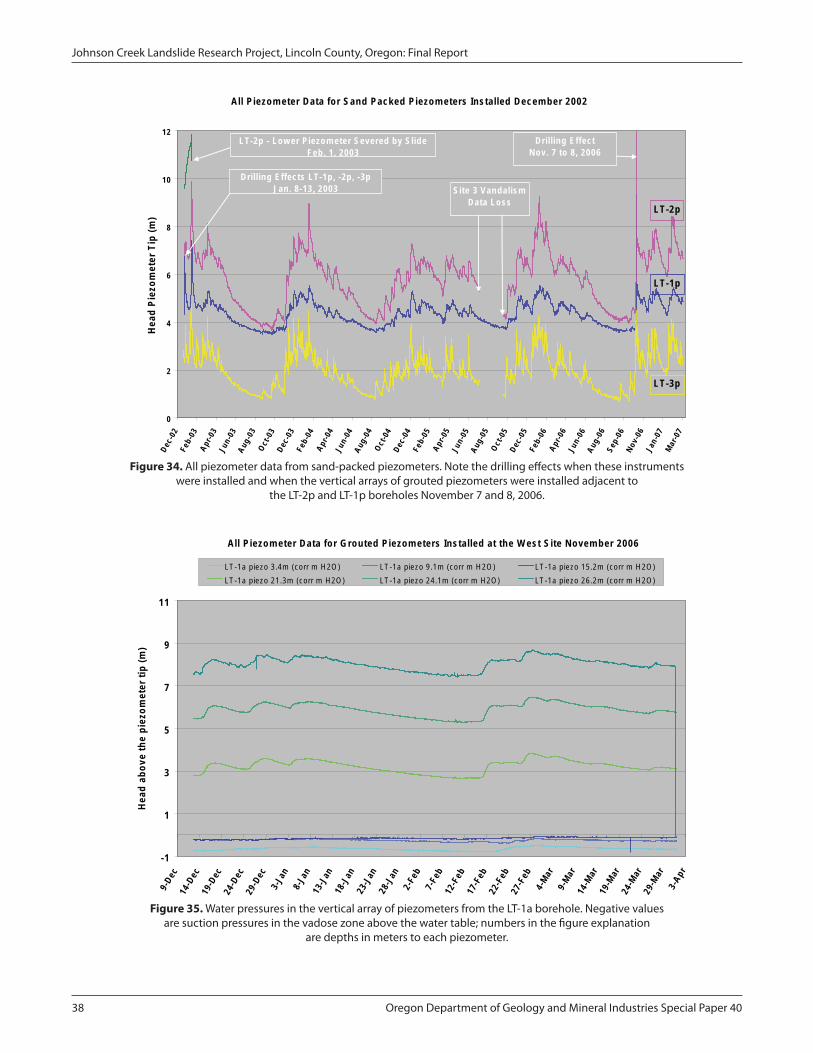
38 Oregon Department of Geology and Mineral Industries Special Paper 40
Johnson Creek Landslide Research Project, Lincoln County, Oregon: Final Report
All P iezom eter Data for Sand Packed P iezom eters Insta lled Decem ber 2002
0
2
4
6
8
10
12
Dec-
02Fe
b-03
Apr-0
3Ju
n-03
Aug-
03Oc
t-03
Dec-
03Fe
b-04
Apr-0
4Ju
n-04
Aug-
04Oc
t-04
Dec-
04Fe
b-05
Apr-0
5Ju
n-05
Aug-
05Oc
t-05
Dec-
05Fe
b-06
Apr-0
6Ju
n-06
Aug-
06Se
p -06
Nov-
06Ja
n -07
Mar
-07
Hea
dPi
ezom
eter
Tip
(m)
LT-2p - Low er P iezom eter Severed by S lideFeb . 1 , 2003
Drilling E ffectNov. 7 to 8, 2006
S ite 3 VandalismData Loss
Drilling E ffects LT-1p , -2p , -3pJan . 8-13, 2003
LT-2p
LT-1p
LT-3p
Figure 34. All piezometer data from sand-packed piezometers. Note the drilling effects when these instruments were installed and when the vertical arrays of grouted piezometers were installed adjacent to
the LT-2p and LT-1p boreholes November 7 and 8, 2006.
All P iezom eter Data for G routed P iezom eters Insta lled at the W est S ite Novem ber 2006
-1
1
3
5
7
9
11
9-De
c14
-Dec
19-D
ec24
-Dec
29-D
ec3-
Jan
8-Ja
n13
-Jan
18-J
an23
-Jan
28-J
an2-
Feb
7-Fe
b12
-Feb
17-F
eb22
-Feb
27-F
eb4-
Mar9-
Mar14
-Mar
19-M
ar24
-Mar
29-M
ar3-
Apr
Hea
dab
ove
the
piez
omet
ertip
(m)
LT -1a p iezo 3.4m (corr m H2O ) LT -1a p iezo 9.1m (corr m H2O ) LT -1a p iezo 15.2m (corr m H2O )LT -1a p iezo 21.3m (corr m H2O ) LT -1a p iezo 24.1m (corr m H2O ) LT -1a p iezo 26.2m (corr m H2O )
Figure 35. Water pressures in the vertical array of piezometers from the LT-1a borehole. Negative values are suction pressures in the vadose zone above the water table; numbers in the figure explanation
are depths in meters to each piezometer.

Oregon Department of Geology and Mineral Industries Special Paper 40 39
Johnson Creek Landslide Research Project, Lincoln County, Oregon: Final Report
All P iezom eter Data From G routed P iezom eters Insta lled at the M idd le S ite Novem ber 2006
-1
1
3
5
7
9
11
9-De
c14
-Dec
19-D
ec24
-Dec
29-D
ec3-
Jan
8-Ja
n13
-Jan
18-J
an23
-Jan
28-J
an2-
Feb
7-Fe
b12
-Feb
17-F
eb22
-Feb
27-F
eb4-
Mar
9-M
ar14
-Mar
19-M
ar24
-Mar
29-M
ar3-
Apr
Hea
dA
bove
the
Piez
omet
erTi
p(m
)LT -2a p iezo 3.0m (corr m H2O ) LT -2a p iezo 6.1m (corr m H2O _) LT -2a p iezo 10.7m (corr m H2O )LT -2a p iezo 13.7m (corr m H2O ) LT -2a p iezo 16.8m (corr m H2O ) LT -2a p iezo 19.2m (corr m H2O )
Figure 36. Water pressures (head above the piezometer tip) in the vertical array of piezometers from the LT-2a borehole; depth labels refer to depth of the piezometer tip. Negative values are suction pressures in the
vadose zone above the water table; numbers in the figure explanation are depths in meters to each piezometer.
All P iezom eter Data from G roundw ater O bservation W ells Insta lled Novem ber 2006
0
2
4
6
8
10
12
9-De
c14
-Dec
19-D
ec24
-Dec
29-D
ec3-
Jan
8-Ja
n13
-Jan
18-J
an23
-Jan
28-J
an2-
Feb
7-Fe
b12
-Feb
17-F
eb22
-Feb
27-F
eb4-
Mar9-
Mar14
-Mar
19-M
ar24
-Mar
29-M
ar3-
Apr
Hea
dab
ove
the
piez
omet
ertip
(m)
B-4 p iezo 20.2m (corr m H2O ) B -5 p iezo 10.67m (corr m H2O )
Figure 37. Water pressures (head above the piezometer tip) in piezometers from the groundwater observation wells; numbers in the figure explanation are depths in meters to each piezometer.

40 Oregon Department of Geology and Mineral Industries Special Paper 40
Johnson Creek Landslide Research Project, Lincoln County, Oregon: Final Report
LT-1p versus LT-1a Tota l Head D ifference
0
1
2
3
4
5
6
7
8
9
11/19/06 12/9 /06 12/29/06 1/18/07 2/7 /07 2/27 /07 3/19/07 4/8 /07
Hea
d(m
)LT -1p Tota l Head 24.8m (m ) LT -1a Tota l Head 24.1m (m ) LT -1 Tota l Head D iff.1a @ 24.1 m (m )
SandPacked(LT-1p)
Cem ented(LT-1a)
D ifference1 .9 m
Figure 38. Difference in elevation head between sand-packed and cemented piezometers at the western (LT-1) drill site.
LT-2a versus LT-2p Tota l Head D ifference
0
1
2
3
4
5
6
7
8
9
10
11
12
13
14
15
16
17
18
11/19/06 12/9 /06 12/29/06 1/18/07 2/7 /07 2/27 /07 3/19/07 4/8 /07
Hea
d(m
)
LT -2p 16.7m Tota l Head (m ) LT -2a 16.8m Tota l Head (m ) LT -2 Tota l Head D iff. 2a @ 16.8 m (m )
SandPacked(LT-2p)
Cem ented(LT-2a)
D ifference0 .9 -1 .4 m
Figure 39. Difference in elevation head between sand-packed and cemented piezometers at the middle (LT-2) drill site. Difference in head during peak head events (white arrows) is between 0.9 and 1.4 m.

Oregon Department of Geology and Mineral Industries Special Paper 40 41
Johnson Creek Landslide Research Project, Lincoln County, Oregon: Final Report
-2
0
2
4
6
8
10
12
-30-25-20-15-10-50Depth (m )
Wat
erPr
essu
reA
bove
Piez
o(m
H2O
)
LT -1a Bar. Corr. P ressure (m H2O above p iezo) LT -2a Bar. Corr. P ressure (m H2O above p iezo)LT -1p Bar. Corr. P ressure (m H2O above p iezo) LT -2p Bar. Corr. P ressure (m H2O above p iezo)
P iezom etric Pore W ater P ressure Corre lation w ith Depth(February 18, 2007 11:00 AM , barom etrica lly corrected pressures)
Sand Packed(LT -1p)
Hydrosta tic L ine (1 :1 s lope)
Unsatu ra ted Zone
Sand Packed(LT -2p)
Satu ra ted Zone
Figure 40. Variation of pressure with depth in vertical arrays of grouted piezometers (colored lines connecting small squares and diamonds) compared to two sand-packed piezometers in adjacent boreholes (larger square and diamond).
Dashed lines depict ideal increase in water pressure with depth predicted by the weight of the water column in the saturated zone at each borehole. Sand packed data do not plot on the hydrostatic line.
S lope of P iezom etric Surface for Low and H igh Head Conditions February 2007
-5
0
5
10
15
20
25
0 10 20 30 40 50 60 70 80 90D istance East o f LT-1a (m )
Elev
atio
n(m
NA
VD88
)
2 -11-07 Tota l Head (m ) 2-26-07 Tota l Head (m ) S lide P lane E lev (m )
W est East
LT-1a
LT-3p
LT-2a
LargestHead aboveS lide P lane
Figure 41. Slope of piezometric surface for winter and spring of 2007 relative to base of basal shear zone. Piezometric data from two grouted piezometers, LT-1a and LT-2a, are used in preference to data from
sand-packed piezometers (LT-1p and LT-2p), so head elevations are not underestimated. All piezometers are installed above the base of the basal shear zone; horizontal scale = vertical scale.

42 Oregon Department of Geology and Mineral Industries Special Paper 40
Johnson Creek Landslide Research Project, Lincoln County, Oregon: Final Report
E levation Head - All P iezom eters: Decem ber 2006 to April 2007
0
5
10
15
20
25
Nov-06 Dec-06 Dec-06 Jan-07 Feb-07 Feb-07 M ar-07 Apr-07
Hea
d(m
)LT -2p 16.7m E lev. Head (m )
LT -2a-10.7m E lev. Head (m )
LT -2a 13.7m E lev. Head (m )
LT -2a 16.8m E lev. Head (m )
LT -2a 19.2m E lev. Head (m )
LT -3p 5.5m E lev. Head (m )
LT -4 20.2m E lev. Head (m )
LT -5 10.67m E lev. Head (m )
LT -1p EL Head 24.8m (m H2O )
LT -1a EL Head 21.3m (m H2O )
LT -1a EL Head 24.1m (m H2O )
LT -1a EL Head 26.2m (m H2O )
prec ip (m m )
W est(LT -1a, LT -1p )
East(LT -3p )
M idd le(LT -2a, LT -2p
LT -4 , LT -5)
Sand Packed
Sand Packed
Sand Packed
Figure 42. Elevation head for all piezometers. Vertically descending lines in the piezometer data are errors in the data most likely caused by data logger frequency mismatch to frequency of the signal from the
vibrating wire piezometers (Erik Mikkelsen, 2007, personal communication).
-4
0
4
8
12
16
20
24
28
0 10 20 30 40 50 60 70 80 90 100D istance East o f LT-1 Inc linom eter (m )
Elev
.(m
NA
VD88
)
E lev . P iezo T ip E lev . Base o f Basal Shear Zone P iez. E lev . 2-26-07 Surface E lev .(Sha llowest P iezo.)
FLOW NET CROSS SECTIONFebruary 26 , 2007 P iezom eter Data
LT -1a LT -2a LT -3pW est East
Equipo ten tia l L ines
LT -2pLT -1p
Tota l Head (m )
7.64
17.35
17.5417.1017.197.73
7.55
22.62
Figure 43. Groundwater flow net for February 26, 2007, a time of relatively high pore water pressure. Numbers are total head at each piezometer; dashed black lines are equipotential isolines; blue lines are estimated groundwater flow paths.
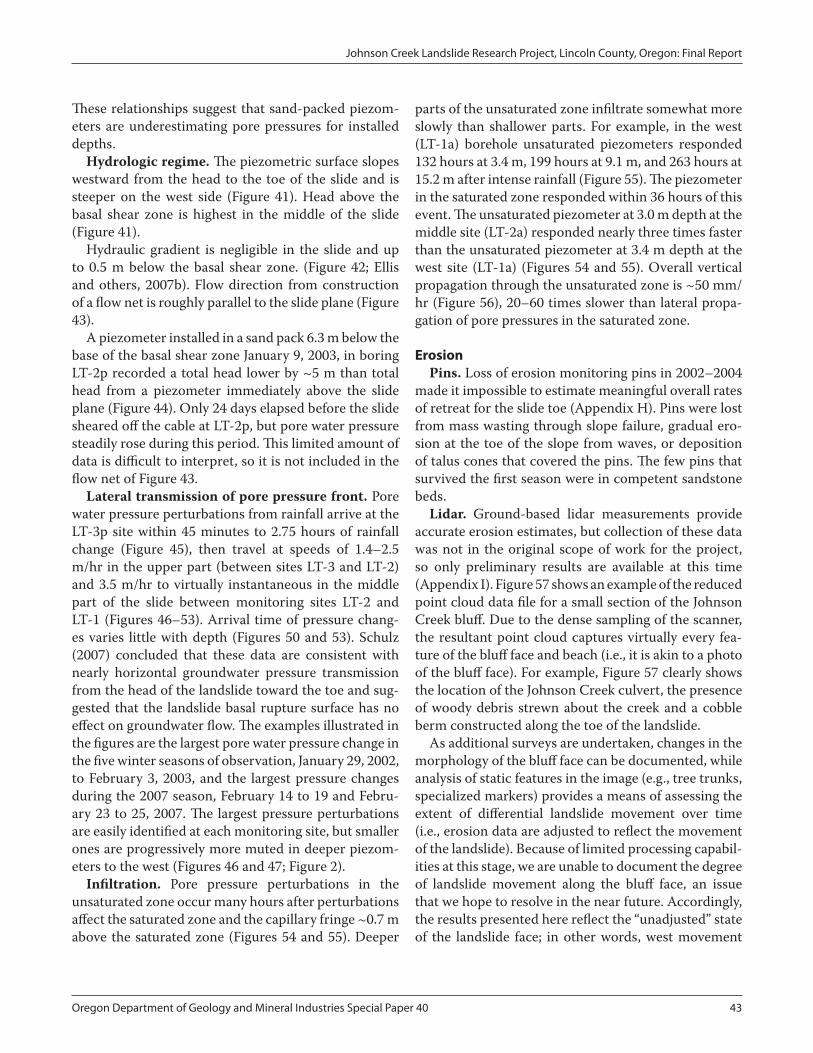
Oregon Department of Geology and Mineral Industries Special Paper 40 43
Johnson Creek Landslide Research Project, Lincoln County, Oregon: Final Report
These relationships suggest that sand-packed piezom-eters are underestimating pore pressures for installed depths.
Hydrologic regime. The piezometric surface slopes westward from the head to the toe of the slide and is steeper on the west side (Figure 41). Head above the basal shear zone is highest in the middle of the slide (Figure 41).
Hydraulic gradient is negligible in the slide and up to 0.5 m below the basal shear zone. (Figure 42; Ellis and others, 2007b). Flow direction from construction of a flow net is roughly parallel to the slide plane (Figure 43).
A piezometer installed in a sand pack 6.3 m below the base of the basal shear zone January 9, 2003, in boring LT-2p recorded a total head lower by ~5 m than total head from a piezometer immediately above the slide plane (Figure 44). Only 24 days elapsed before the slide sheared off the cable at LT-2p, but pore water pressure steadily rose during this period. This limited amount of data is difficult to interpret, so it is not included in the flow net of Figure 43.
Lateral transmission of pore pressure front. Pore water pressure perturbations from rainfall arrive at the LT-3p site within 45 minutes to 2.75 hours of rainfall change (Figure 45), then travel at speeds of 1.4–2.5 m/hr in the upper part (between sites LT-3 and LT-2) and 3.5 m/hr to virtually instantaneous in the middle part of the slide between monitoring sites LT-2 and LT-1 (Figures 46–53). Arrival time of pressure chang-es varies little with depth (Figures 50 and 53). Schulz (2007) concluded that these data are consistent with nearly horizontal groundwater pressure transmission from the head of the landslide toward the toe and sug-gested that the landslide basal rupture surface has no effect on groundwater flow. The examples illustrated in the figures are the largest pore water pressure change in the five winter seasons of observation, January 29, 2002, to February 3, 2003, and the largest pressure changes during the 2007 season, February 14 to 19 and Febru-ary 23 to 25, 2007. The largest pressure perturbations are easily identified at each monitoring site, but smaller ones are progressively more muted in deeper piezom-eters to the west (Figures 46 and 47; Figure 2).
Infiltration. Pore pressure perturbations in the unsaturated zone occur many hours after perturbations affect the saturated zone and the capillary fringe ~0.7 m above the saturated zone (Figures 54 and 55). Deeper
parts of the unsaturated zone infiltrate somewhat more slowly than shallower parts. For example, in the west (LT-1a) borehole unsaturated piezometers responded 132 hours at 3.4 m, 199 hours at 9.1 m, and 263 hours at 15.2 m after intense rainfall (Figure 55). The piezometer in the saturated zone responded within 36 hours of this event. The unsaturated piezometer at 3.0 m depth at the middle site (LT-2a) responded nearly three times faster than the unsaturated piezometer at 3.4 m depth at the west site (LT-1a) (Figures 54 and 55). Overall vertical propagation through the unsaturated zone is ~50 mm/hr (Figure 56), 20–60 times slower than lateral propa-gation of pore pressures in the saturated zone.
erosionPins. Loss of erosion monitoring pins in 2002–2004
made it impossible to estimate meaningful overall rates of retreat for the slide toe (Appendix H). Pins were lost from mass wasting through slope failure, gradual ero-sion at the toe of the slope from waves, or deposition of talus cones that covered the pins. The few pins that survived the first season were in competent sandstone beds.
Lidar. Ground-based lidar measurements provide accurate erosion estimates, but collection of these data was not in the original scope of work for the project, so only preliminary results are available at this time (Appendix I). Figure 57 shows an example of the reduced point cloud data file for a small section of the Johnson Creek bluff. Due to the dense sampling of the scanner, the resultant point cloud captures virtually every fea-ture of the bluff face and beach (i.e., it is akin to a photo of the bluff face). For example, Figure 57 clearly shows the location of the Johnson Creek culvert, the presence of woody debris strewn about the creek and a cobble berm constructed along the toe of the landslide.
As additional surveys are undertaken, changes in the morphology of the bluff face can be documented, while analysis of static features in the image (e.g., tree trunks, specialized markers) provides a means of assessing the extent of differential landslide movement over time (i.e., erosion data are adjusted to reflect the movement of the landslide). Because of limited processing capabil-ities at this stage, we are unable to document the degree of landslide movement along the bluff face, an issue that we hope to resolve in the near future. Accordingly, the results presented here reflect the “unadjusted” state of the landslide face; in other words, west movement

44 Oregon Department of Geology and Mineral Industries Special Paper 40
Johnson Creek Landslide Research Project, Lincoln County, Oregon: Final Report
LT-2p E levation Head vs Rain fa ll
0 .00
2 .00
4 .00
6 .00
8 .00
10 .00
12 .00
14 .00
16 .00
18 .00
20 .00
04-Jan-03 09-Jan-03 14-Jan-03 19-Jan-03 24-Jan-03 29-Jan-03 03-Feb-03 08-Feb-03
Elev
.Hea
d(m
)/Rai
nfal
l(m
m/h
r)/C
um.R
ain
(mm
/20)
LT-2p upper (m )LT-2p Lower (m )Cum Rain (m m /20)Ra in fa ll (m m /hr)
Be low S lide P lane
Above S lide P lane
Figure 44. Piezometric head elevation above geodetic mean sea level (NAVD 1988) at the LT-2p borehole, January 2003. Data for the piezometer below the slide plane end when the piezometer cable was severed by slide movement
at 9:00 PM on February 1, 2003. Cum. Rain = cumulative rainfall from January 9, 2003, to February 2003.
2 .0
2 .2
2 .4
0:00
2:00
4:00
6:00
8:00
10:0
0
12:0
0
14:0
0
16:0
0
18:0
0
20:0
0
22:0
0
0:00
Hea
d(m
),Pp
tn(m
m/h
r)
0
1
2
3
4
5
Pptn
(mm
/15
min
)
LT -3p p iez 5.5 m (m H2O ) prec ip (m m /15 m in) prec ip (m m /hr)
2.75 hrs
1.75 hrs0.75 hrs
1.5 hrs
Figure 45. Response of LT-3p piezometer to rainfall; piezometer is at the western margin of the headwall graben. Water pressure response is generally within ~2 hours of a rainfall event and can be used as a proxy
for pressure responses to rainfall at graben.

Oregon Department of Geology and Mineral Industries Special Paper 40 45
Johnson Creek Landslide Research Project, Lincoln County, Oregon: Final Report
January 29 to February 4 , 2003 P iezom etric Response Rela tive to Response at LT-3p
2
3
4
5
6
7
8
9
10
11
12
1 /29 /03 0:00 1 /30 /03 0:00 1 /31 /03 0:00 2 /1 /03 0:00 2 /2 /03 0:00 2 /3 /03 0:00
Hea
d(m
)
p iez LT -1p 24.8 m (m H2O ) p iez LT -2p 16.7m (m H2O ) p iez LT -3p 5.5 m (m H2O )
LT-3p
LT-2p start = 13 hrs
LT-1p start = 8 hrs
START
38.4-12 = 26.4 hrs
60-12 = 48 hrs
12 hrs
Figure 46. Timing of January 29 to February 4, 2003, piezometric response from the east site (LT-3p) on the west margin of the headwall graben to other sites to the west, northwest, and southwest (see Figure 2 location map). Data are from piezometers
near the basal shear zone. Distances west refer to distance from the west margin of the headwall graben. Blue numbers are first response times after response at the LT-3p site. Black numbers are the times when pressure reached half the
amplitude of the perturbation; vertical lines are in increments of 2 hrs.
Pore Pressure Response at the Basal Shear Zone- February 23-27, 2007Response Rela tive to Response at the LT-3p (East) S ite
2
3
4
5
6
7
8
9
10
11
12
2/23/07 12:00 2/24/07 0:00 2/24/07 12:00 2/25/07 0:00 2/25/07 12:00 2/26/07 0:00 2/26/07 12:00 2/27/07 0:00
Hea
d(m
)
LT -3p
B-4 @ 32 m w est = 23 hrs
LT-2p @ 40 m w est = 15 hrs
LT-1a @ 83 m w est = 30 hrs
B -5 @ 20 m w est = 20 hrs
LT-2a @ 40 m w est = 21 hrs
LT-1p @ 86 m w est = 41 hrs
START
B-5 = 33hrs
42 hrs
45.5 hrs
LT-1p = 51.5hrs
44 hrs
38.4 hrs
8
Figure 47. Timing of February 23 to 27, 2007, piezometric response from the east site (LT-3p) on the west margin of the headwall graben to other sites to the west, northwest, and southwest (see Figure 2 location map). Data are from piezometers near the basal
shear zone. Distances west refer to distance from the west margin of the headwall graben. Blue numbers are first response times after response at the LT-3p site. Black numbers are the times when pressure reached half the amplitude of the perturbation. LT-2p is installed
in a sand pack; B-4 and B-5 are groundwater monitoring wells; all others are grouted. Vertical lines are in increments of 2 hrs.
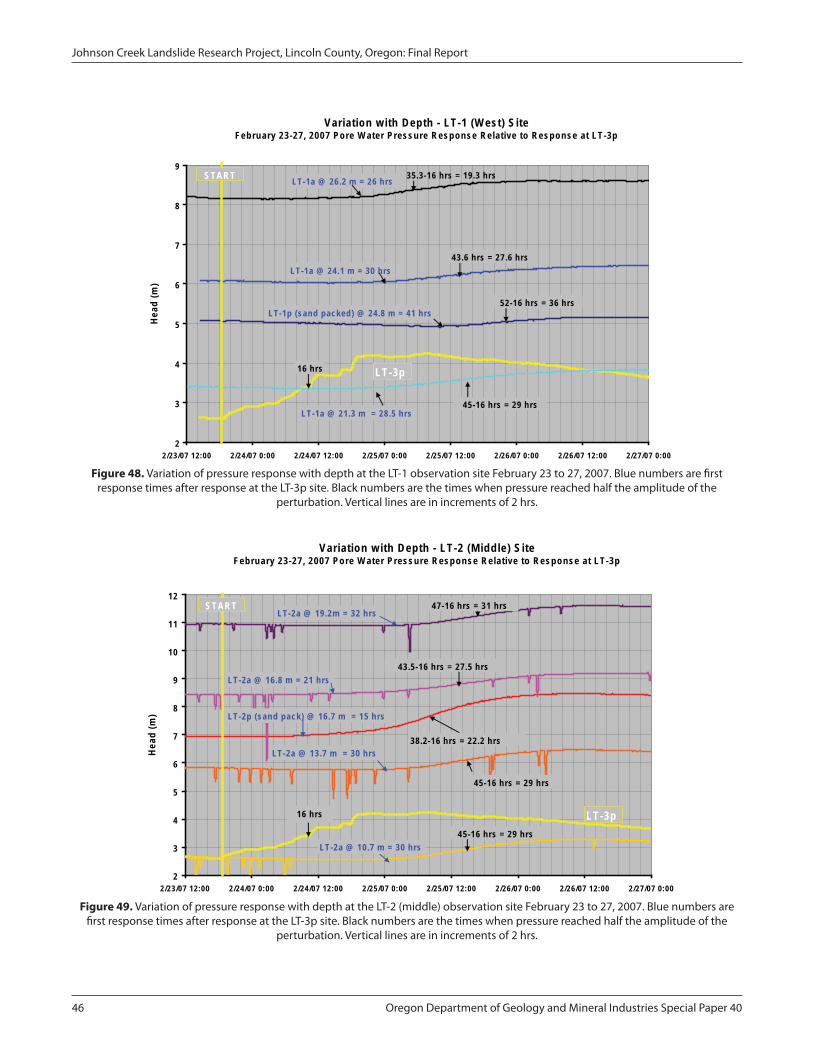
46 Oregon Department of Geology and Mineral Industries Special Paper 40
Johnson Creek Landslide Research Project, Lincoln County, Oregon: Final Report
Variation w ith Depth - LT-1 (W est) S iteFebruary 23-27 , 2007 Pore W ater P ressure Response Rela tive to Response at LT-3p
2
3
4
5
6
7
8
9
2/23/07 12:00 2/24/07 0:00 2/24/07 12:00 2/25/07 0:00 2/25/07 12:00 2/26/07 0:00 2/26/07 12:00 2/27/07 0:00
Hea
d(m
)
LT -3p
LT-1a @ 24.1 m = 30 hrs
LT-1a @ 21.3 m = 28.5 hrs
LT-1a @ 26.2 m = 26 hrs
LT-1p (sand packed) @ 24.8 m = 41 hrs
START
45-16 hrs = 29 hrs
35.3-16 hrs = 19.3 hrs
43.6 hrs = 27.6 hrs
52-16 hrs = 36 hrs
16 hrs
Figure 48. Variation of pressure response with depth at the LT-1 observation site February 23 to 27, 2007. Blue numbers are first response times after response at the LT-3p site. Black numbers are the times when pressure reached half the amplitude of the
perturbation. Vertical lines are in increments of 2 hrs.
Variation w ith Depth - LT-2 (M idd le) S iteFebruary 23-27 , 2007 Pore W ater P ressure Response Rela tive to Response at LT-3p
2
3
4
5
6
7
8
9
10
11
12
2/23/07 12:00 2/24/07 0:00 2/24/07 12:00 2/25/07 0:00 2/25/07 12:00 2/26/07 0:00 2/26/07 12:00 2/27/07 0:00
Hea
d(m
)
LT -3p
LT-2a @ 19.2m = 32 hrs
LT-2p (sand pack) @ 16.7 m = 15 hrs
LT-2a @ 13.7 m = 30 hrs
LT-2a @ 10.7 m = 30 hrs
LT-2a @ 16.8 m = 21 hrs
START 47-16 hrs = 31 hrs
43.5-16 hrs = 27.5 hrs
38.2-16 hrs = 22.2 hrs
45-16 hrs = 29 hrs
16 hrs
45-16 hrs = 29 hrs
Figure 49. Variation of pressure response with depth at the LT-2 (middle) observation site February 23 to 27, 2007. Blue numbers are first response times after response at the LT-3p site. Black numbers are the times when pressure reached half the amplitude of the
perturbation. Vertical lines are in increments of 2 hrs.

Oregon Department of Geology and Mineral Industries Special Paper 40 47
Johnson Creek Landslide Research Project, Lincoln County, Oregon: Final Report
-5
0
5
10
15
20
25
30
0 10 20 30 40 50 60 70 80 90 100D istance East o f LT -1 (m )
Elev
.(m
)
E lev. P iez. (m NAVD88) E lev. Base of Basa l Shear Zone Surface E lev. Tota l Head (m ) @ 2-26-07 19:00
B -4 B -5 LT -3pLT -2aLT -1a
0
41/36
LT -1p
W est East
1816
18 141620
LT -2p(p ro jec ted) (pro jec ted)
February 23-26 , 2007
28
20
1214
12 10
3024
26 2428
22
26/ 19.3 hrs
21/ 27.5 hrs
30/ 27.6 hrs
32/ 31 hrs
30/ 29 hrs
30/ 29 hrs
28.5 / 29 hrs
1.4-2 .1 m /hr
5 .0- (i) m /h r
15/22.2
30 hrs15 hrs
Figure 50. Isochrons (black lines) in 2-hr intervals for first response of grouted piezometers to pressure increase for February 23 to 26, 2007. Baseline is the time when the increase occurred at the LT-3p site. Blue numbers are the first response time; black numbers
separated by a back slash are response time for half of the total response; red numbers are the same data for sand-packed piezometers. Blue boxes list travel velocity of pressure response; (i) = virtually instantaneous response between the two monitoring sites. Green
dotted lines are isochrons for downward infiltration of groundwater, assuming a mean rate of 50 mm/hr. Vertical exaggeration is 1.6.
Variation w ith Depth - LT-1 (W est) S iteFebruary 14-19 , 2007 Pore W ater P ressure Response Rela tive to Response at LT-3p
1
2
3
4
5
6
7
8
9
2/13/07 12:00 2/14/07 12:00 2/15/07 12:00 2/16/07 12:00 2/17/07 12:00 2/18/07 12:00 2/19/07 12:00
Hea
d(m
)
LT -3p
LT -1a @ 24.1 m = 29 hrs
LT -1a @ 21.3 m = 34.8 hrs
LT -1a @ 27.5 m = 26 hrs
LT -1p (sand packed ) @ 24.8 m = 12 hrs
START48-16 = 32 hrs
54.5-16 = 38.5 hrs
62.5-16 = 46.5 hrs
16 hrs
54.5-16 = 38.5 hrs
Figure 51. Variation of pressure response with depth at the LT-1 observation site for February 14 to 19, 2007. Blue numbers are first response times after response at the LT-3p site. Black numbers are the times when
pressure reached half the amplitude of the perturbation; vertical lines are in increments of 2 hrs.

48 Oregon Department of Geology and Mineral Industries Special Paper 40
Johnson Creek Landslide Research Project, Lincoln County, Oregon: Final Report
Variation w ith Depth - LT-2 (M idd le) S iteFebruary 14-19 , 2007 Pore W ater P ressure Response Rela tive to Response at LT-3p
1
3
5
7
9
11
2/13/07 12:00 2/14/07 12:00 2/15/07 12:00 2/16/07 12:00 2/17/07 12:00 2/18/07 12:00 2/19/07 12:00
Hea
d(m
)
LT -3p
LT -2a @ 19.2m = 18 hrs
LT -2p (sand pack)@ 16.7 m = 12 hrs
LT -2a @ 13.7 m = 22 hrs
LT -2a @ 10.7 m = 20 hrs
LT -2a @ 16.8 m = 24.4 hrs
START
45 hrs - 16 hrs = 29 hrs
51-16 hrs = 35 hrs
52.4 hrs - 16 hrs = 36.4 hrs
42-16 hrs= 26 hrs
45-16 hrs = 29 hrs
16 hrs
Figure 52. Variation of pressure response with depth at the LT-2 (middle) observation site February 14 to 19, 2007. Blue numbers are first response times after response at the LT-3p site. Black numbers are the times when
pressure reached half the amplitude of the perturbation; vertical lines are in increments of 2 hrs.
-5
0
5
10
15
20
25
30
0 10 20 30 40 50 60 70 80 90 100D istance East o f LT -1 (m )
Elev
.(m
)
E lev. P iez. (m NAVD88) E lev. Base of Basa l Shear Zone Surface E lev. Tota l Head (m ) @ 2-26-07 19:00
B -4 B -5 LT -3pLT -2aLT -1a
0
LT -1p
W est East
1012
14
1620 18
LT -2p(p ro jec ted) (pro jec ted)
2224
26
February 14-19 , 2007
2830
3234
26/ 32 hrs
12/2624.4 / 36 .4 hrs
29/ 38.5 hrs
18/ 35 hrs
22/ 29hrs
20/ 29hrs
34.8 / 38 .5hrs
1.8-2 .5 m /hr
3 .5- 9 .7m /hr
30 hrs15 hrs
12/46.5
Figure 53. Isochrons (black lines) in 2-hr intervals for first response of grouted piezometers to pressure increase for February 14 to 19, 2007. Baseline is the time when the increase occurred at the LT-3p site. Blue numbers are
the first response time; black numbers separated by a back slash are response time for half of the total response; red numbers are the same data for sand-packed piezometers. Blue boxes list travel velocity of pressure
response; (i) = virtually instantaneous response between the two monitoring sites. Green dotted lines are isochrons for downward infiltration of groundwater assuming a mean rate of 50 mm/hr. Vertical exaggeration is 1.6.

Oregon Department of Geology and Mineral Industries Special Paper 40 49
Johnson Creek Landslide Research Project, Lincoln County, Oregon: Final Report
-1 .0
-0 .5
0 .0
0 .5
2 /10 /07 2 /12 /07 2 /14 /07 2 /16 /07 2 /18 /07 2 /20 /07 2 /22 /07 2 /24 /07 2 /26 /07
Wat
erC
onte
nt(v
ol%
/100
),U
nsat
.Hea
d(m
)
0
1
2
3
4
5
6
7
8
Sat.
Hea
d(m
),Pp
tn(d
m)
2 0 hrs
24 hrs
50 hrs
Soil M oisture at 1 .5 m depth (w est o f s ite )
Unsaturated at 6 .1 m depth , 18.7 m elev.
Unsaturated at 3 .0 m depth , 21.7 e lev.
Saturated at 10.7 m depth , 14.1 m elev.
36 hrsSoil M oisture at 1 .5 m depth (east o f s ite )
Cum ulative Precip ita tion(dm )
0 hrsSaturation Po in t (head = 18.7 m elev .)
Figure 54. Delay of response of a piezometer in unsaturated zone relative to piezometers in or within 0.7 m of the saturated zone for the middle (LT-2a) borehole. Note that the piezometer at 6.1-m depth becomes saturated after
February 25, 2007. The soil moisture data are from the LT-1 observation site to the west.
-1 .0
-0 .5
0 .0
0 .5
1 .0
1 .5
2 .0
2 /10 /07 2 /12 /07 2 /14 /07 2 /16 /07 2 /18 /07 2 /20 /07 2 /22 /07 2 /24 /07 2 /26 /07
Wat
erC
onte
nt(v
ol%
/100
),U
nsat
.Hea
d(m
)
0
1
2
3
4
5
6
7
8
Sat.
Hea
d(m
),Pp
tn(d
m)
W C-1s water conten t, 1 .5m depth (vo l % /100) LT -1a p iezo 3.4m (corr m H2O )LT -1a p iezo 9.1m (corr m H2O ) LT -1a p iezo 15.2m (corr m H2O )Cum ula tive P rec ip (dm ) LT -1a Tota l Head 21.3m (corr m H2O )
20 hrs
36 hrs
132 hrs
199 hrs
263 hrs
1 .5 m depth
15 .2 m depth
9 .1 m depth
3 .4 m depth
Saturated
Cum ulative P rec ip ita tion (dm )
0 hrs
So il M o is ture
Unsaturated
Usaturated
Unsaturated
21 .3 m depth
Figure 55. Delay of response of piezometers and soil moisture probe in unsaturated zone relative to a piezometer in the saturated zone for the west (LT-1a) borehole. Depths are to piezometer or soil moisture probes tips.
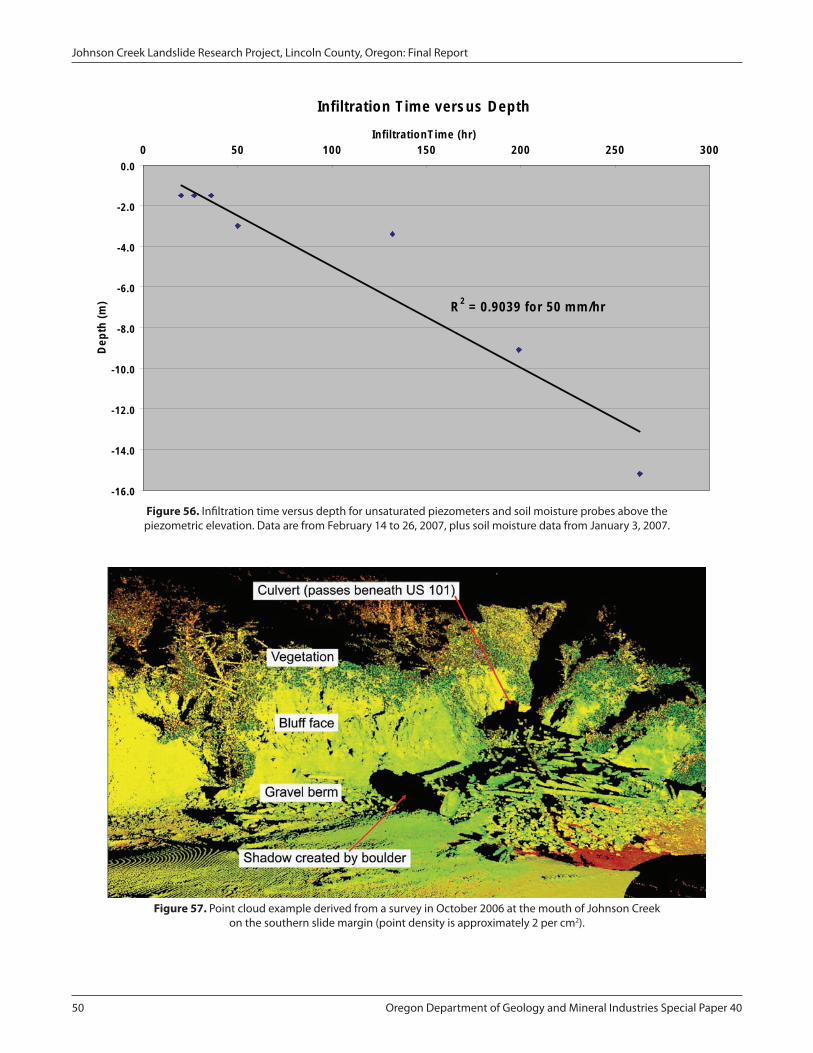
50 Oregon Department of Geology and Mineral Industries Special Paper 40
Johnson Creek Landslide Research Project, Lincoln County, Oregon: Final Report
In filtra tion T im e versus Depth
R 2 = 0.9039 for 50 m m /hr
-16.0
-14.0
-12 .0
-10 .0
-8 .0
-6 .0
-4 .0
-2 .0
0 .00 50 100 150 200 250 300
In filtra tionT im e (hr)
Dep
th(m
)
Figure 56. Infiltration time versus depth for unsaturated piezometers and soil moisture probes above the piezometric elevation. Data are from February 14 to 26, 2007, plus soil moisture data from January 3, 2007.
Figure 57. Point cloud example derived from a survey in October 2006 at the mouth of Johnson Creek on the southern slide margin (point density is approximately 2 per cm2).

Oregon Department of Geology and Mineral Industries Special Paper 40 51
Johnson Creek Landslide Research Project, Lincoln County, Oregon: Final Report
Figure 58. Map showing locations of representative bluff profile sites.
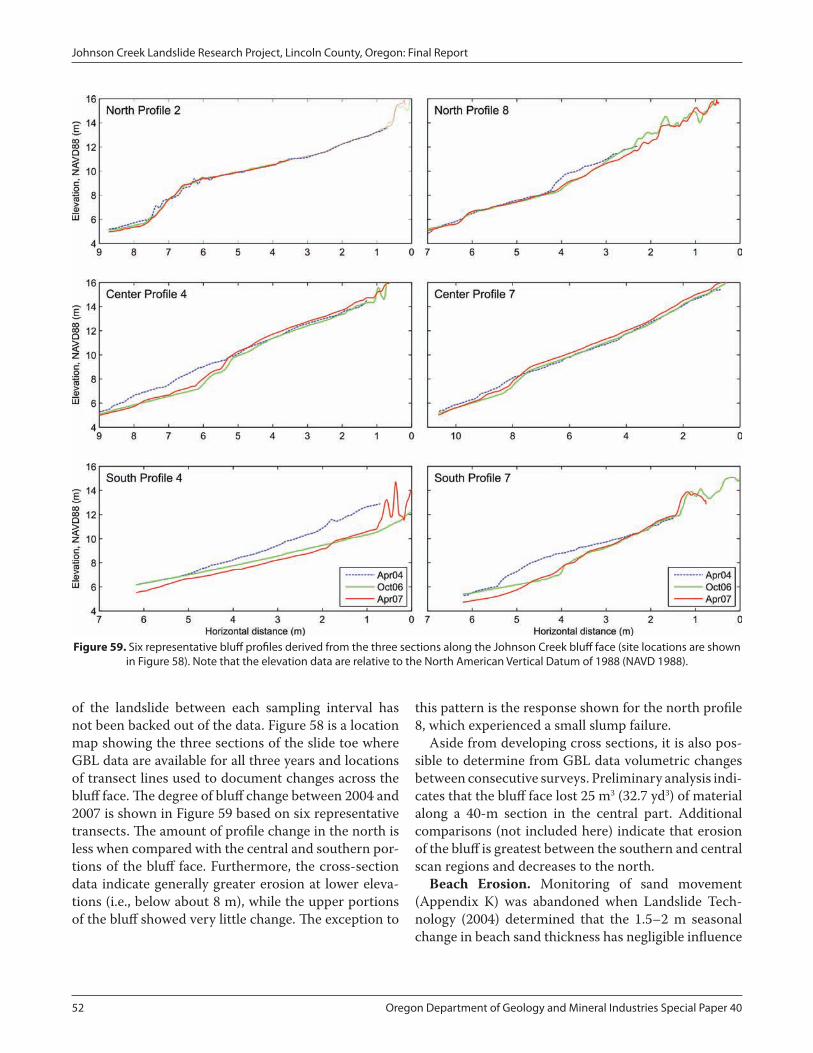
52 Oregon Department of Geology and Mineral Industries Special Paper 40
Johnson Creek Landslide Research Project, Lincoln County, Oregon: Final Report
Figure 59. Six representative bluff profiles derived from the three sections along the Johnson Creek bluff face (site locations are shown in Figure 58). Note that the elevation data are relative to the North American Vertical Datum of 1988 (NAVD 1988).
of the landslide between each sampling interval has not been backed out of the data. Figure 58 is a location map showing the three sections of the slide toe where GBL data are available for all three years and locations of transect lines used to document changes across the bluff face. The degree of bluff change between 2004 and 2007 is shown in Figure 59 based on six representative transects. The amount of profile change in the north is less when compared with the central and southern por-tions of the bluff face. Furthermore, the cross-section data indicate generally greater erosion at lower eleva-tions (i.e., below about 8 m), while the upper portions of the bluff showed very little change. The exception to
this pattern is the response shown for the north profile 8, which experienced a small slump failure.
Aside from developing cross sections, it is also pos-sible to determine from GBL data volumetric changes between consecutive surveys. Preliminary analysis indi-cates that the bluff face lost 25 m3 (32.7 yd3) of material along a 40-m section in the central part. Additional comparisons (not included here) indicate that erosion of the bluff is greatest between the southern and central scan regions and decreases to the north.
Beach Erosion. Monitoring of sand movement (Appendix K) was abandoned when Landslide Tech-nology (2004) determined that the 1.5–2 m seasonal change in beach sand thickness has negligible influence

Oregon Department of Geology and Mineral Industries Special Paper 40 53
Johnson Creek Landslide Research Project, Lincoln County, Oregon: Final Report
on slide stability. The 2003 survey did reveal that the central part of the slide toe is exposed to a lower beach and higher wave strike (Appendix K). Johnson Creek generally lowers the beach profile during the winter allowing free access of winter waves to the slide toe on its southern margin.
laboratory teSting
Laboratory testing results of Landslide Technology (2004) are compiled here for convenience. Results of in-place density tests are summarized in Table 4. Moisture contents are listed on the borehole logs of Appendix B. Results of the ring shear test are given in Appendix J. The phi angle of the Mohr stress envelope was 13.1˚ for ring shear testing of the slide gouge.
SloPe Stability analySiS
Parametric analysis by landslide technologyLandslide Technology (2004) did a parametric inves-
tigation to evaluate the sensitivity of landslide stability to the precipitation, groundwater levels, erosion and beach sand level. The analysis and recommendations are summarized in Appendix M. They first back-calculated the residual strength (φr′) value for the slip surface ana-lyzed in cross section A-A’ (Figure 7), finding a value of 6.5˚ for initiation of movement at threshold pore water pressures (10 m above the slide plane at the middle, LT-2, site). This single-digit value is comparable with similar slides in the Astoria Formation and other large translational landslides in tuffaceous sediments and decomposed volcanic rocks in the region, all of which have been investigated by Landslide Technology utiliz-ing similar procedures. The back-calculated φr′ value is an average for the model. The difference between the back analyzed φ′ value and the value obtained from the
ring shear testing (13.1 degrees) may be attributed to the fact that (1) the sample tested may not be represen-tative of the entire failure surface, and (2) systematic underestimation of water pressure by the sand-packed piezometers at the LT-1p and LT-2p boreholes, as pre-viously explained.
Using the back-calculated φr′ of 6.5˚, Landslide Tech-nology performed a parametric analysis to evaluate sensitivity of the slide to three parameters: (1) precipita-tion and groundwater, (2) erosion, and (3) the seasonal deposition and removal of beach sand. For each param-eter, incremental changes were made to determine the resulting percent change in factor of safety (FOS). A summary of the analyses is provided in Table 5.
Landslide Technology (2004) demonstrated that at the latitude of the cross section A-A’ (Figures 6 and 7) the greatest reductions in FOS occur from high pore water pressure from severe storms and loss of toe sup-port. Shifting beach sand was an insignificant factor (Table 5). They determined that the landslide is at the stability limit when head above the slide plane is 7.0 m at the west (LT-1) site, 10 m at the middle (LT-2) site, and 6.3 m at the east (LT-3) site. Factor of safety is 2 percent above the stability limit during average winter conditions when head above the slide plane is 6.6 m at the west (LT-1) site, 8.9 m at the middle (LT-2) site, and 4.4 m at the east (LT-3) site. Factor of safety was 7.2 percent below the stability limit when simulated head above the slide plane was 10.6 m, 13.3 m, and 7.1 m at the west, middle, and east sites, respectively. The latter was the “severe storm” scenario when piezometric head at the basal shear zone was assumed to be 1.5 m above the highs recorded during the 2002-2003 season. Any higher uniform increase in head would place the piezo-metric surface above the surface at the shallowest part of the slide at site LT-3p. Highs in piezometric head during 2002-2003 are still the largest observed in five
table 4. Summary of in-place density testing.
BoringNo. SampleNo. Depth,m(ft) SoilDescription
MoistUnitWeightkN/m3
(pcf)MoistureContent
DryUnitWeightkN/m3
(pcf)
LT-1 R-410.5–10.8
(34.4–35.4) soft (R2), gray, silty, fine sandstone 21.3 (135.5) 21% 17.5 (111.8)
LT-2 R-1018.8–19.0
(61.7–62.3) very soft (R1), gray, fine silty sandstone 21.5 (137.1) 18% 18.3 (116.5)
R2 and R1 refer to rock hardness in the classification scheme of Sera (2003).

54 Oregon Department of Geology and Mineral Industries Special Paper 40
Johnson Creek Landslide Research Project, Lincoln County, Oregon: Final Report
winter seasons of observation, so this is an extremely conservative assumption.
FOS decreases by 2 percent for every meter of head rise at the middle (LT-2p) site, on the basis of extrapola-tion of the three data points listed by Landslide Tech-nology (2004). FOS decreases by 2.3 percent for every meter of erosion of the toe, on the basis of on a similar extrapolation of their data. A meter of change in depth of sand at the toe of the slide changed FOS by only 0.3 percent.
Supplementary Stability analysis by Christie and dickenson
The stability analyses performed by Christie and Dickenson of Oregon State University are given by Priest and others (2006) and are reproduced in Appendix N. Christie and Dickenson verified the results of Landslide Technology (2004), examined the effect on stability of water filled cracks in the slide mass, and further evalu-ated the influence of parameters such as groundwater conditions and geotechnical strength parameters for three sections through the slide mass. Their analysis resulted in a residual friction angle of φ′ = 5.9° for a sim-ilar cross section to the one used by Landslide Technol-ogy (i.e., at the drilling transect). They also constructed cross sections in the northern and southern parts of the slide, finding maximum residual friction angles of 9° to 11° for a southern section, and 5.7° and 8.3° for a north-ern cross section. These residual friction angle data are for slide geometries that most closely matched 1970s
inclinometer data from ODOT (Appendix C). Their findings demonstrate that a higher assumed residual friction angle is needed in the southern part of the slide to maintain stability when that area is subjected to threshold pore pressures for instability of the northern and central parts of the slide. In other words, the south-ern part is inherently less stable. This observation fits with the resurvey data and observed greater movement in the southern part of the slide (Figures 22–25).
Christie and Dickenson evaluated the influence of the phreatic surface on stability (i.e., factor of safety against sliding) in order to determine the contribution to FOS of each portion of the slide in the drilling transect, using the “severe storm” case of Landslide Technology (2004). This scenario results in a 9 percent decrease in factor of safety from “normal winter” groundwater conditions. The analysis shows that 50 percent of the decrease occurs over the eastern (upslope) 25 percent of the slide plane. These findings underscore the criti-cal importance to slide stability of pore water pressure between the LT-3 and LT-2 monitoring sites in the upper part of the slide.
The analysis of a water-filled crack near the slide toe found that water-filled cracks penetrating deeper than ~8 m can destabilize the toe. Failure of the toe in front of the crack is the source of instability to the rest of the slide.
remediation optionsLandslide Technology (2004) examined the follow-
ing remediation options based on the stability analysis (see Appendix M for details):
Unloading the upper part of the slide by excava-tion.Buttressing the slide toe with a revetment at the beach:Installing horizontal drains at the slide toe.Installing a tied-back shear pile wall within the slide.Maintaining the highway affected by the slide through periodic repaving.
Table 6 summarizes the pros and cons of each option. Landslide Technology (2004) recommended buttress-ing as the best long-term option. Dewatering by hori-zontal drains was thought impractical because drains would be severed by the back-rotated toe block.
1.
2.
3.4.
5.
table 5. Summary of sensitivity analysis by Landslide Technology (2004).
Parameter
ChangeinFactorofSafetyfromBack-
Analysis(−Decrease/+Increase)
Groundwater
“Normal” 2003 winter level +2.0 %
“Severe Storm” −7.2 %
Erosion of Cliff Face
0.5 m (1 ft) of Erosion −0.8 %
1.5 m (5 ft) of Erosion −3.6 %
3.0 m (10 ft) of Erosion −6.8 %
Seasonal Deposition/Removal of Sand
1.0 m (3 ft) Removal −0.3 %
1.0 m(3 ft) Deposition +0.3 %

Oregon Department of Geology and Mineral Industries Special Paper 40 55
Johnson Creek Landslide Research Project, Lincoln County, Oregon: Final Report
D. Andrew Vessely of Landslide Technology (e-mail communication, April 26, 2005) detailed the reasons that dewatering is generally less effective than buttress-ing for this slide:
“Horizontal drains would have limited benefit in improving the stability of Johnson Creek landslide due to (i) relatively low existing groundwater levels, and (ii) the low residual shear strength at the failure zone. For our evaluation of conceptual treatment options, we assumed that horizontal drains would be drilled from the beach to obtain a suitable angle into the slide mass. Given the landslide geometry and constructability limi-tations, the drains could only dewater the upper portion of the slide mass (the drains would not intercept ground-water in the lower portion).
Keep in mind that our sensitivity analyses indicated that seasonal groundwater level increases of 3 to 6 feet (across the entire slide mass) would decrease the stabil-ity by approximately 2 percent.” . . .“One would expect that a drop of 3 to 6 feet over the entire slide mass would improve stability only 2 percent. Even if the horizontal drains were successful in lowering the upper groundwa-ter levels, say 5 to 10 feet, they would not act over the entire slide mass - hence the 1 percent improvement as indicated in our report.
Also, when dealing with a translational slide with a low residual friction angle of 6.5 degrees, increasing the effective stress (for example by dewatering) would have limited benefit since the available shear strength is a function of σ ′n(tan ø′).
As far as using well points or even deep dewatering wells, it has been our experience that any type of dewater-ing in a heterogeneous slide mass involves a high degree of uncertainty. Horizontal drains are relatively cheap and can often be tried on an experimental basis, but as discussed in this E-mail and in our report, horizontal drains are not well suited for this landslide. Dewatering wells can be significantly more expensive than horizontal drains, and therefore should be considered with caution as a treatment for this slide. Given the relatively shallow depth of sliding in the graben area (i.e. limited potential for significant draw downs) and the low residual friction angle, I am not an advocate of dewatering for this slide. Furthermore, and perhaps more importantly, it is my opinion that bluff erosion would over time, negate any stability improvements obtained from dewatering. Our analyses indicated that 1 foot of bluff erosion decreases the stability of the slide mass by 1 percent. As you know, this amount of bluff erosion can occur over a fairly short timeframe.”
table 6. Remediation option comparison (Landslide Technology, 2004)
RemediationOption
1Unload
UpperSlide
2Toe
Buttress
3Horizontal
Drains
4Tied-Back
ShearPileWall
5Road
Maintainance
Effectiveness moderate high low high low
Constructibility good good moderate difficult not applicable
Engineering simple moderate moderate difficult simple
Environmental long-term impact low high low low low
Maintenance long-term low low moderate low high
Construction costs ($ million) 0.9 1.1 0.5 11–14 0.4 (20 yrs)
56 Oregon Department of Geology and Mineral Industries Special Paper 40
Johnson Creek Landslide Research Project, Lincoln County, Oregon: Final Report
landSlide movement
The landslide moves in a more or less coherent block during small (≤2 cm), continuous movements but has increasing internal deformation among blocks as single-event displacement exceeds 2 cm. The largest movement occurred between January 31 and Febru-ary 10, 2006, and produced net extension in the east-ern part of the slide and compression in the western part as the middle part moved ~24 cm (Figure 27; Table 3). This movement was preceded by a 4-5 cm move-ment in December of 2002 that involved the western part of the slide moving ~1 cm more than the middle of the slide. Marker nails were placed across fresh scarps from this and the December 2002 episode and then measured after a March 21–28, 2003, movement. All nails around the slide perimeter were displaced ~2 cm (Appendix G), matching extensometer displacement (Table 3). Nails across an interior scarp had no relative movement (Appendix G), so the slide moved en masse during the March event.
Resurveying in April 2003 of steel stakes placed on the slide in fall 2002 (Appendix E) revealed that the northern part of the slide moved less than the survey measurement error. Surface displacements in the cen-tral part matched the December 2002 to March 2003 cumulative totals of 10–28 cm for the extensometers (Table 1), but 21–130 cm horizontal and 6–70 cm verti-cal displacement occurred in the southwestern part of the slide. Survey error was as high as 11 cm to 15 cm horizontal and 1 to 130 cm vertical, so no firm conclu-sions can be drawn. Nevertheless, the general finding of more movement to the south matched the greater highway damage there (Figure 24).
All displacements after the big 2003 storm event were ≤ 4 cm and produced only small differential move-ment between the extensometers (Table 3). Movements between 2 and 4 cm appear to have the same general pattern as large 2003 movement, the middle borehole, LT-2, moving somewhat faster than the other two, the west borehole moving faster than the east one (Table 3).
Movement direction estimated from the resurvey data, marker nails, and inclinometers is generally down the axis of the slide away from headscarps. Directions were southwest in the northeast part of the slide, west
in the central part, and west-northwest in the southeast corner of the slide (Figure 4).
The slide plane in the drilling transect appears to follow siltstone beds in the Astoria Formation, cross-ing the bedding dip at low angles but staying above competent sandstone beds (Figure 7). The slide must curve upward to meet its outcrop at the beach and flat-ten somewhat at the mouth of Johnson Creek where it has a near-zero measured dip (Figure 60). Back rota-tion on the toe block is further evidence of upward curving geometry. Astoria Formation in the headwall of the slide dips ~17˚ W, but the same rocks in the toe block dip at angles of 16˚–42˚ E, hence rotation was 33–59˚. Numerous small listric displacements occur in the outer part of the toe block, so rotation proba-bly decreases rapidly toward the back (east side) of the block. Johnson Creek creates a cross section exposure at the south end of the block revealing rapid change of dip from east inclination to west over distance of only 20 m (Figure 60). The structure contour map (Figure 9) summarizes the probable geometry of the slide based on available inclinometer and outcrop data.
groundWater and PreCiPitation
recharge and dischargeWater enters the slide mainly from rainfall. Ground-
water is discharged as subsurface flow into beach sedi-ment or as seeps and springs observed at the surface during the wet season.
There are perennial creeks on the northern and southern margins of the slide but only the northern creek, Minor Creek, flows in significant slide material (Figure 2). Groundwater may be exchanged with Minor Creek in or out of the slide, depending on local hydrau-lic gradients. Johnson Creek on the south margin flows through a concrete conduit where it intersects the head of the slide. The mouth of the creek flows on bedrock underlying the slide, although large discharge events may make intermittent contact with the toe of the slide.
Flow PatternsThe vertical piezometer arrays at the middle and west
observation sites provided detailed measurements of hydraulic gradient. A flow net cross section illustrates
diSCuSSion

Oregon Department of Geology and Mineral Industries Special Paper 40 57
Johnson Creek Landslide Research Project, Lincoln County, Oregon: Final Report
Figure 60. Detailed geologic map of the southwest end of the Johnson Creek landslide. Blue numbers are elevations in meters above geodetic mean sea level (NAVD 1988); black numbers are bedding dip in Astoria Formation. Black lines are slide scarps.
Note the prominent sandstone marker bed (light green unit).
the west sloping piezometric surface, low hydraulic gradient, and flow directions roughly parallel to the slide plane (Figure 43; Ellis and others, 2007b). The low hydraulic gradient is consistent with high effective hydraulic conductivity within the slide mass (Ellis and others, 2007b). The steeper slope of the piezometric surface toward the toe of the slide could be from better drainage of the lower part. Astoria Formation and the Pleistocene marine terrace are offset ~2 m down to the east between the west and middle observation sites (Figure 7), so this structure may create a barrier to lateral flow or pressure transmission. West inclina-tion of the piezometric surface between the LT-3 and LT-2 sites is lower than the west dip of the basal shear zone, so head above the slide plane rises rapidly from
the LT-3 to the LT-2 site (Figure 43). Head above the slide plane is highest at LT-2 at all times of the year, contributing the main driving force for the landslide (Landslide Technology, 2004; Ellis and others, 2007a, 2007b).
Total head measured 6.3 m below the base of the basal shear zone in Astoria Formation was ~5 m lower than total head immediately above the slide plane (Figure 44) and may indicate some limited downward flow below the slide. Data could be gathered from the piezometer below the slide for only 24 days before it was severed by the December 2002 slide movement, so it is difficult to draw firm conclusions. It may be possible that with greater elapsed time after a major, prolonged period of rainfall that the pore pressures beneath the

58 Oregon Department of Geology and Mineral Industries Special Paper 40
Johnson Creek Landslide Research Project, Lincoln County, Oregon: Final Report
slide increase due to the lag in rise of phreatic surface beneath the slide plane. This could be in response to deeper recharge and change in the local hydraulic gra-dient following the storms. There was no significant hydraulic gradient between the slide and piezometers installed in 2006 below the base of the basal shear zone (Ellis and others, 2007b; Figure 42), but these were only 0.35 m below the base of the shear zone at the west-ern (LT-1a) borehole and 0.52 m below at the middle (LT-2a) borehole (Table 1). According to well records from the Oregon Department of Water Resources, two wells within the landslide at its northern end yielded ~ 45–64 lpm (12–17 gpm) below a static water level of ~9 m (28–30 ft) depth (in Astoria Formation), while a well ~200 m south of the landslide in Astoria Forma-tion bedrock yielded of 2 lpm (0.5 gpm) below the static water level of 14.6 m (48 ft) depth. These data and pre-viously discussed lower fracture density below the slide are suggestive of lower hydraulic conductivity and per-meability, but there is not enough quantitative infor-mation to draw firm conclusions.
response to rainfallCorrelation of pressure rise to small rainfall events is
progressively more difficult from piezometers further down the axis of the slide. Whereas every fluctuation in rainfall is obvious in the pressure data at the LT-3 site (Figure 45), the response is more muted at the LT-2 site and even more subdued at the LT-1 site (Figures 46 and 47).
The rapid rise in head at the headwall graben in response to rainfall events is transmitted laterally down the slide axis at varying speeds in different rain-fall events (Ellis and others, 2007a). Ellis and others (2007a) gave two examples: A September 2005 rainfall event caused pressure rise at the LT-3 site 16 hours after start of rain, at the LT-2 site after 84 hours, and at the LT-1 site after 90 hours. A mid-December storm produced pressure rise at LT-3 three hours after rain began, after 31 hours at LT-2, and after 79 hours at the LT-1 site. Two additional examples are the beginning of two of the largest rainfall events in the observation period, January 29, 2003, and January 5, 2006. Pressure rose 1 hour after rainfall in both of the January events at LT-3p, but response in the LT-2p and LT-1p sites was completely different. In January 2003 the western (LT-1p) site responded in only 10 hours while the middle (LT-2p) site responded 15 hours after rainfall (Figure
61). In 2006, the western site responded 37 after the rain while the middle site responded after 9 hours (Figure 62). The January 2003 rainfall caused the larg-est rise in head recorded during the investigation and was the only time that the rise in pressure at the LT-1p site rivaled response of the LT-2p site (Figure 34). Ellis and others (2007a) concluded that, “The reason for this variability in pore pressure response is not clear, but could be related in part to possible increases in hydrau-lic conductivity with increased ground saturation in the winter months. Landslide movements could also alter the pore pressure response by causing changes in hydraulic conductivity along the basal slip plane and/or in fractures from the surface. Such changes in timing of pore pressure increases could have implications for the use of rainfall thresholds as predictors of possible movement on such landslides because they suggest that antecedent conditions can significantly affect the timing of pore-pressure response.” We agree with this assessment. Extended dry periods appear to correlate with slower pore pressure response at the head of the slide.
For the February 2007 rainfall events the vertical arrays of piezometers in grouted boreholes allowed detailed calculation of the vertical infiltration and rate of lateral translation of the “front” of pore pressure rise from the headscarp to the toe of the slide mass. The front of pore pressure rise moved laterally at a rate of 1.4–2.5 m/hr in the upper part of the slide (between sites LT-3 and LT-2), and varied from 3.5 m/hr to a very high rate (i.e., pore pressure increases measured almost instanta-neously) in the middle part of the slide between moni-toring sites LT-2 and LT-1. Because vertical infiltration is 50 mm/hr (Figure 56), water takes ~40–360 hours to infiltrate to the saturated zone ~2–18 m below the three monitoring sites (Figure 53). Pressure pulses take 1.5–50 hours to travel the 2–90 m from the headwall graben to the three sites (Figures 50–53); hence, pres-sure pulses always arrive at the monitoring sites before water can infiltrate through the unsaturated zone. The initial rise in pore water pressure from a rainfall event is transmitted somewhat more quickly down the basal shear zone but by the time half of the peak response has occurred, pressure arrives at about the same time at all depths in the saturated zone (Figures 50 and 53). The higher speed of transmission between LT-2 and LT-1 relative to LT-2 and LT-3 may be caused by higher effective hydraulic conductivity in the western part of

Oregon Department of Geology and Mineral Industries Special Paper 40 59
Johnson Creek Landslide Research Project, Lincoln County, Oregon: Final Report
January 29 , 2003 P iezom etric Response To Rain fa ll
3
4
5
6
7
8
0:00 5:00 10:00 15:00 20:00
Hea
dA
bove
Piez
omet
er(m
)
7 2
73
74
75
76
77
78
79
80
81
82
Cum
.Ppt
n.(d
m)
p iez LT -1p 24.8 m (m H2O ) p iez LT -2p 16.7m (m H2O ) p iez LT -3p 5.5 m (m H2O ) Cum ula tive P rec ip (dm )
LT-3p
10 hrs
15 hrs
0 hrs 2 hrs
LT -2p
LT-1p
Figure 61. Piezometric response to rainfall from the January 29, 2003, rainfall event that triggered the largest increase in piezometric head during the observation period; vertical lines are 1-hr intervals.
January 5-6 , 2006 P iezom etric Response to Rain fa ll
2 .5
3 .0
3 .5
4 .0
4 .5
5 .0
5 .5
6 .0
6 .5
7 .0
7 .5
8 .0
8 .5
0:00 5:00 10:00 15:00 20:00 1:00 6:00 11:00 16:00 21:00 2:00 7:00 12:00 17:00 22:00
Hea
dA
bove
Piez
omet
er(m
)
7 .8
7 .9
8
8 .1
8 .2
8 .3
8 .4
Cum
.Ppt
n.(d
m)
LT -2p p iez 16.7m (corr m H2O ) LT -3p p iez 5.5 m (corr m H2O ) p iez LT -1 24.8m (m H2O ) Cum ula tive P rec ip (dm )
0 hrs
1 hr
9 hrs
37 hrs
LT -3p
LT-2p
LT-1p
Figure 62. Piezometric response to rainfall from the January 5, 2006, rainfall event that triggered the second largest increase in piezometric head during the observation period; vertical lines are 1-hr intervals.

60 Oregon Department of Geology and Mineral Industries Special Paper 40
Johnson Creek Landslide Research Project, Lincoln County, Oregon: Final Report
the slide. Perhaps better groundwater drainage through a more highly fractured rock in the western part of the slide keeps the piezometric surface lower there as well.
triggering meChaniSmS
rainfall thresholdsThere is general correlation between slide movement,
annual precipitation, antecedent precipitation before each event, and rainfall intensity (Figure 63; Table 7). The largest movement on January 31, 2002, to Febru-ary 3, 2003, was preceded by 62 hours of precipitation at 2.1 mm/hr after antecedent rain since July 1 of 0.927 m; 0.84 m of this rain was concentrated in the previous two months (Figure 63). None of the later movement events were more than 17 percent of this large move-ment even though intensities and durations of associ-ated rain events were in many cases similar (Figure 64). The maximum 60-day cumulative rainfall for all other slide movements was 0.64 m; this rainfall occurred prior to the second largest displacement, January 27, 2006 (Figure 64). Variation in 60-day cumulative rain prior to each movement event resembles variation in total movement per event, but there are many differ-ences (Figure 64). Both large amounts of antecedent rain and a burst of intense rainfall appear to be neces-sary to trigger movements that can displace the slide tens of centimeters in less than three days.
groundwater Pore Pressure thresholdsThresholds for the entire data set. Threshold head
above the slide plane for start and stop of movement are compiled in Table 8; only data from LT-1p, LT-2p, and LT-3p piezometers are used (1) because they were installed for the entire observation period and (2) to eliminate any previously discussed differences between data from grouted and sand-packed instruments. Head is referenced to the base of the basal shear zone. Appendix L contains all of the charts used to compile Table 8. Figures 65 and 66 illustrate the correlation of head above the piezometers with movement during the five winters of observation. For eight small movements recorded after detailed, hourly movement data became available, threshold head above the slide plane for start and stop of movement at the LT-1p, LT-2p, and LT-3p were ~ 6.4 ± 0.2 m, 9.1 ± 0.6 m, and 3.4 ± 0.5 m, respec-tively, equivalent to 5.0 m, 7.4 m, and 3.2 m head above piezometer tips (Table 8; Figure 65). Standard deviation
from mean values increases from the west to the east site, ~4 percent for LT-1p data, ~8 percent for LT-2p data, and ~16 percent for LT-3p data (Figure 46; Table 8). This variance is probably related to antecedent con-ditions such as degree of saturation of the slide mass from rainfall events and forces within the slide created by differential movement of neighboring blocks (Ellis and others, 2007a, 2007b).
Detailed observations of three movement events. Three examples demonstrate the complex behavior of the slide; Table 7 summarizes key attributes of all movement events, including these three. The base of the basal shear zone is the reference for hydraulic head in the following descriptions.
December 2002 to February 2003 (Figure 67). This movement occurred in two episodes (December 13 to 31, 2002, and January 31 to February 3, 2003; Table 7) and was in response to the largest displacement and head rise during the observation period. Rain fell at a mean rate of 1.6 mm/hr for 46 hours between December 14 and 16, 2002. Movement started sometime between the December 13 and 16 measurements, reaching by December 23, 5 cm at the west site, 4 cm at the middle site and 3 cm at the east site. The larger displacement at the west site relative to the middle and east sites was the pattern in inclinometer data before conversion to the less precise extensometers (Figure 26), so it is not simply a function of the ±1 cm error in extensometer measurement. This movement created relative exten-sion between the middle and western boreholes. Mean rates of movement were 0.15 mm/hr, 0.12 mm/hr, and 0.1 mm/hr at the west, middle and east sites, respec-tively. Shear zone depths determined from this move-ment informed installation of piezometers at each site. Rain continued at a mean rate of 0.9 mm/hr through January 4, 2003. Rain was intermittent over the next several days, then no rain fell from 9:00 AM January 26 to 5:00 AM, January 29. Intense rain started at 6:00 AM and by 7:00 AM, January 29, pressure at the LT-3p piezometer began to rise sharply (Figure 61). Total rainfall over the next 62 hours was 0.13 m (2.1 mm/hr). This intense rain coupled with the previous rain event caused a unique response in pore water pressure not repeated since. Head began to rise at the western bore-hole 5 hours before it did in the middle borehole. Peak head reached 2.7 m over starting pressures in the middle and west piezometers, while the east site increased 2 m. Head above the base of the basal shear zone reached

Oregon Department of Geology and Mineral Industries Special Paper 40 61
Johnson Creek Landslide Research Project, Lincoln County, Oregon: Final Report
Annual Cum ulative M ovem ent and Prec ip ita tion - Ju ly to June
0123456789
101112131415161718
Jun-
02Au
g-02
Oct-0
2No
v-02
Jan-
03M
ar-0
3M
ay-0
3Ju
l-03
Sep-
03No
v-03
Jan-
04M
ar-0
4M
ay-0
4Ju
l-04
Sep-
04No
v-04
Jan-
05M
ar-0
5M
ay-0
5Ju
l-05
Sep-
05No
v-05
Jan-
06M
ar-0
6M
ay-0
6Ju
l-06
Sep-
06No
v-06
Jan-
07M
ar-0
7M
ay-0
7Ju
l-07
Cum
.Jul
y-J
une
Pptn
.(dm
)
-202468101214161820222426283032
Cum
.Jul
y-J
une
Mov
emen
t(cm
)
LT -2M ovem ent
LT-3M ovem ent
LT-1M ovem ent
Vanda lism
Figure 63. Annual movement and precipitation. Vertical white lines illustrate cumulative rain at December 1 and February 1 each year. Note that only in the first year is there ~1 m of rain in this interval.
the highest values recorded, 8.8, 11.4, and 4.8 m at the west, middle, and east sites, respectively. All rainfall events after this caused the west piezometer to rise no more than one third of the response at the middle site, and head generally rose in the middle borehole before the western one (Figure 65). An extensometer reading January 31 registered negligible movement but by the next reading, February 3, the middle site had moved 21 cm, the west site 13 cm, and the east site 1 cm. Over the following four days the west site moved 2 cm, the middle 3 cm, and the east 2 cm. The rate of movement at the east site extrapolated through these four days of readings projects linearly to the reading on January 31, 0.3 mm/hr. Rate of movement at the middle and west sites between the January 31 and February 3 readings was at least 6 mm/hr and 3 mm/hr, respectively. Move-ment was thus relatively rapid and nonlinear at the
middle and west sites but constant and of an order of magnitude slower at the east site.
December 2005 to February 2006 (Figure 68). This movement occurred in three episodes and was the second largest slide movement and pore pressure rise during the five winter seasons. The second epi-sode, January 6 to 24, 2006, had peak head values at the middle site approaching the 2003 event. The pore pressure increase was triggered by 2 days of rain at an average rate of 1.6 mm/hr. Pore water pressure increase started 1 hour after start of rain at the eastern borehole, 9 hours later at the middle borehole, and 37 hours later at the western site (Figure 62). Head reached a maxi-mum of 7.0, 10.9, and 4.5 m at the west, middle, and east sites, respectively. Total movement occurred in three episodes over ~40 days and was 8, 9, and 6 cm at the west, middle, and east sites, respectively. The

62 Oregon Department of Geology and Mineral Industries Special Paper 40
Johnson Creek Landslide Research Project, Lincoln County, Oregon: Final Report
table 7. Summary of rainfall intensity, movement, movement velocity, and maximum head above the base of the basal shear zone for all movement events at all monitoring sites.
Episode
Dec.13–31,2002
Jan.31-Feb.3,2003
Mar.21–28,2003
Nov.15-Mar.4,2004
Nov.11–18,2004
Dec.27-Jan.4,2006
Jan.6–24,2006
Jan.27-Feb.10,
2006
Nov.6–15,2006
Dec.24–28,2006
Jan.2–11-2007
Feb.15–16,2007
Feb.25-Mar.9,2007
Mar.12–15,2007
Pptn. prior 60 days (dm) 3.2 6.4 2.3 5.7 -1.7 3.4 4.3 4.0 3.2 6.4 2.3 5.7 -1.7 3.4
Start cum. pptn. (mm) 342.00 927.00 1342.00 188.70 376.60 700.00 887 1108.00 70.60 644.00 713.00 905.00 1031.30 1222.5
Stop cum. pptn. (mm) 490.00 1057.40 1414.00 1092.00 394.00 732.00 963 1231.39 301.75 669 764 973.00 1104.00 1235.0
Pptn. (mm) 74.44 130.40 72.00 903.30 17.40 32.00 76.00 123.39 231.15 25.00 51.00 68.00 72.70 12.5
Date and time start 12/14/ 2002 3:00
1/29/ 2003 15:00
3/21/ 2003 3:00
11/15/ 2003 6:00
11/12/ 2004 20:00
12/27/ 2005 20:00
1/9/ 2006 4:00
1/26/ 2006 0:00
11/1/ 2006 20:45
12/24/ 2006 17:30
1/2/ 2007 16:00
2/14/ 2007 19:45
2/24/ 2007 0:30
3/12/ 2007 4:45
Date and time stop 12/16/ 2002 1:00
2/1/ 2003 5:00
3/22/ 2003 12:00
1/30/ 2004 1:00
11/16/ 2004 10:00
12/28/ 2005 11:00
1/10/ 2006 23:00
2/1/ 2006 7:00
11/7/ 2006 20:30
12/25/ 2006 11:00
1/3/ 2007 21:15
2/16/ 2007 16:45
2/25/ 2007 17:30
3/12/ 2007 15:00
Duration (hrs) 46.0 62.0 33.0 1819.0 86.0 15.0 43.0 151.0 143.7 17.5 29.3 45.0 41.0 10.3
Intensity (mm/hr) 1.6 2.1 2.2 0.5 0.2 2.1 1.8 0.8 1.6 1.4 1.7 1.5 1.8 1.2
Max. head LT-1p (m) nd 8.805 6.73 6.961 5.767 6.7 7 6.7 nd 6.69 6.8 6.0 6.9 6.5
Max. head LT-1a (m) nd nd nd nd nd nd nd nd nd nd 7.14 7.1 8.2 7.8
Max. head LT-2p (m) nd 11.4163 9.8 10.5769 7.1 9.6 10.933 9.88 10.19 9.4 9.57 8.5 10.1 8.9
Max. head LT-2a (m) nd nd nd nd nd nd nd nd nd nd 10.56 10.0 11.2 10.5
Max. head LT-3p (m) nd 4.8 4.4 4.7 2.1 4.0 4.4 4.1 4.7 3.9 3.939 4.2 4.3 3.5
LT-1 movement (mm) 49.6 138.2 20 40 0 14 33 33.9 6 2.54 10.57 0 22 0
Date and time start 12/16/ 2002 12:00
1/31/ 2003 12:00
3/22/ 2003 8:00
12/14/ 2003 7:00
— 12/27/ 2005 23:00
1/6/ 2006 1:00
1/29/ 2006 4:00
11/8/ 2006 8:45
12/24/ 2006 0:00
1/3/ 2007 1:15
— 2/25/ 2007 4:15
—
Date and time stop 12/23/ 2002 12:00
2/3/ 2003 12:00
3/29/ 2003 3:00
2/4/ 2004 17:00
— 1/4/ 2006 16:00
1/15/ 2006 23:00
2/6/ 2006 19:00
11/15/ 2006 15:30
12/29/ 2006 18:45
1/10/ 2007 16:00
— 3/5/ 2007 17:00
—
Duration (hrs) 168.0 117.0 163.0 1258.0 — 185.0 238.0 207.0 174.8 138.8 182.7 — 204.8 —
Slide velocity @ 90% movement (mm/hr)
0.27 1.06 0.11 0.03 — 0.07 0.12 0.15 0.03 0.02 0.05 — 0.10 —
LT-2 movement (mm) 39.4 241.4 20 20 0 14 35.46 39.88 11 1.75 9.94 0 22 0
Date and time start 12/16/ 2002 12:00
1/31/ 2003 12:00
3/22/ 2003 8:00
12/14/ 2003 7:00
— 12/27/ 2005 23:00
1/6/ 2006 1:00
1/29/ 2006 4:00
11/7/ 2006 8:15
12/24/ 2006 0:00
1/3/ 2007 1:15
— 2/26/ 2007 3:45
—
Date and time stop 12/23/ 2002 12:00
2/3/ 2003 12:00
3/29/ 2003 3:00
2/4/ 2004 17:00
— 1/4/ 2006 16:00
1/15/ 2006 23:00
2/6/ 2006 19:00
11/14/ 2006 11:45
12/28/ 2006 22:30
1/10/ 2007 16:00
— 3/5/ 2007 17:00
—
Duration (hrs) 168 72 163 1258 — 185 238 207 172 119 183 — 181 —
Slide velocity @ 90% movement (mm/hr)
0.21 3.02 0.11 0.01 — 0.07 0.13 0.17 0.06 0.01 0.05 — 0.11 —
LT-3 movement (mm) 32.3 46.1 20.0 30.0 16.0 10.0 18.3 31.9 6.0 3.3 8.9 2.0 22.0 1.0
Date and time start 12/16/ 2002 12:00
1/31/ 2003 12:00
3/22/ 2003 8:00
12/14/ 2003 7:00
11/11/ 2004 13:00
12/27/ 2005 23:00
1/6/ 2006 1:00
1/29/ 2006 4:00
11/4/ 2006 21:00
12/24/ 2006 0:00
1/3/ 2007 1:15
2/14/ 2007 14:15
2/24/ 2007 14:00
3/12/ 2007 10:00
Date and time stop 12/23/ 2002 12:00
2/5/ 2003 9:00
3/29/ 2003 3:00
2/4/ 2004 17:00
11/17/ 2004 18:00
1/4/ 2006 16:00
1/15/ 2006 23:00
2/6/ 2006 19:00
11/14/ 2006 11:45
12/27/ 2006 10:00
1/10/ 2007 16:00
2/16/ 2007 13:15
3/5/ 2007 17:00
3/14/ 2007 12:00
Duration (hrs) 168 117 163 1258 149 185 238 207 231 82 183 47 219 50
Slide velocity @ 90% movement (mm/hr)
0.17 0.35 0.11 0.02 0.10 0.05 0.07 0.14 0.02 0.04 0.04 0.04 0.09 0.02
Pptn. is precipitation; cum. is cumulative; max. is maximum; nd is no data (no sensor recording); dash means no (0 mm) movement. LT-1, LT-2, and LT-3 are boreholes.
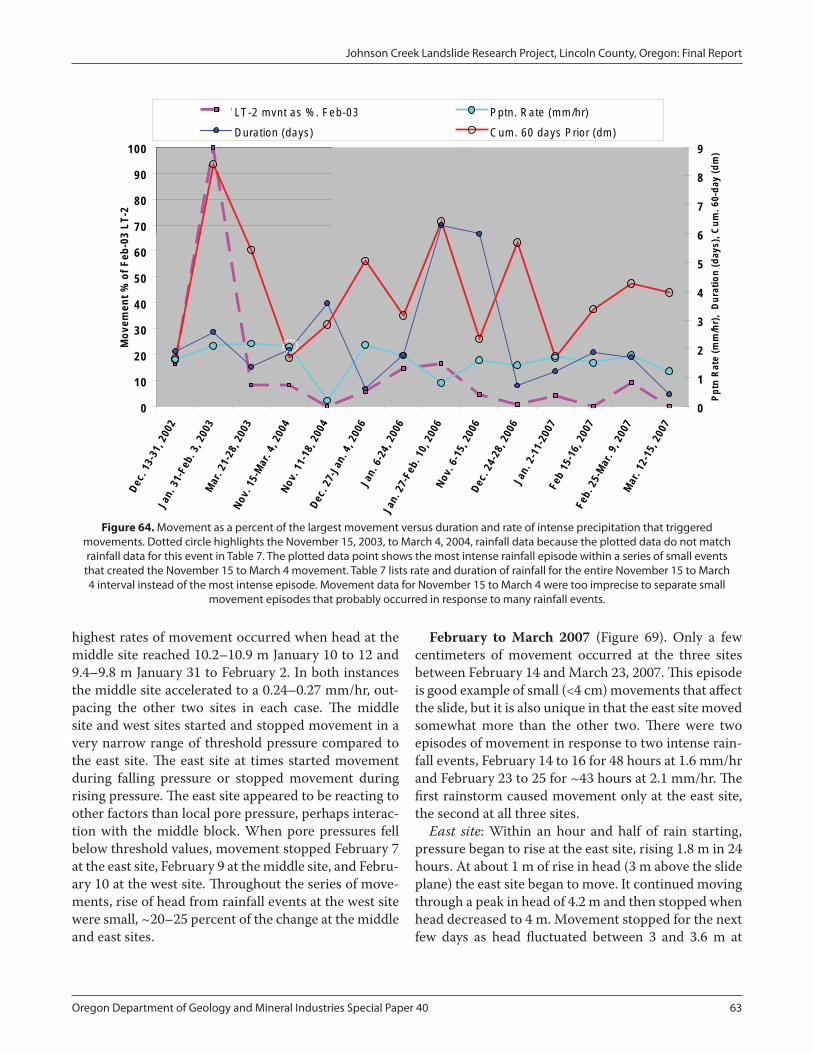
Oregon Department of Geology and Mineral Industries Special Paper 40 63
Johnson Creek Landslide Research Project, Lincoln County, Oregon: Final Report
0
10
20
30
40
50
60
70
80
90
100De
c.13
-31,
2002
Jan .
31-F
eb. 3
, 200
3M
ar. 2
1-28
, 200
3No
v.15
-Mar
. 4, 2
004
Nov.
11-1
8,20
04De
c.27
-Jan
. 4, 2
006
Jan .
6-24
, 200
6Ja
n .27
-Feb
. 10,
2006
Nov.
6-15
, 200
6De
c.24
-28,
2006
Jan .
2-11
-200
7Fe
b15
-16,
2007
Feb .
25-M
ar. 9
, 200
7M
ar. 1
2-15
, 200
7
Mov
emen
t%of
Feb-
03LT
-2
0
1
2
3
4
5
6
7
8
9
Pptn
Rat
e(m
m/h
r),
Dur
atio
n(d
ays)
,Cum
.60-
day
(dm
)
LT -2 m vnt as % . Feb-03 Pptn . Ra te (m m /hr)Dura tion (days) Cum . 60 days P rio r (dm )
Figure 64. Movement as a percent of the largest movement versus duration and rate of intense precipitation that triggered movements. Dotted circle highlights the November 15, 2003, to March 4, 2004, rainfall data because the plotted data do not match rainfall data for this event in Table 7. The plotted data point shows the most intense rainfall episode within a series of small events that created the November 15 to March 4 movement. Table 7 lists rate and duration of rainfall for the entire November 15 to March 4 interval instead of the most intense episode. Movement data for November 15 to March 4 were too imprecise to separate small
movement episodes that probably occurred in response to many rainfall events.
highest rates of movement occurred when head at the middle site reached 10.2–10.9 m January 10 to 12 and 9.4–9.8 m January 31 to February 2. In both instances the middle site accelerated to a 0.24–0.27 mm/hr, out-pacing the other two sites in each case. The middle site and west sites started and stopped movement in a very narrow range of threshold pressure compared to the east site. The east site at times started movement during falling pressure or stopped movement during rising pressure. The east site appeared to be reacting to other factors than local pore pressure, perhaps interac-tion with the middle block. When pore pressures fell below threshold values, movement stopped February 7 at the east site, February 9 at the middle site, and Febru-ary 10 at the west site. Throughout the series of move-ments, rise of head from rainfall events at the west site were small, ~20–25 percent of the change at the middle and east sites.
February to March 2007 (Figure 69). Only a few centimeters of movement occurred at the three sites between February 14 and March 23, 2007. This episode is good example of small (<4 cm) movements that affect the slide, but it is also unique in that the east site moved somewhat more than the other two. There were two episodes of movement in response to two intense rain-fall events, February 14 to 16 for 48 hours at 1.6 mm/hr and February 23 to 25 for ~43 hours at 2.1 mm/hr. The first rainstorm caused movement only at the east site, the second at all three sites.
East site: Within an hour and half of rain starting, pressure began to rise at the east site, rising 1.8 m in 24 hours. At about 1 m of rise in head (3 m above the slide plane) the east site began to move. It continued moving through a peak in head of 4.2 m and then stopped when head decreased to 4 m. Movement stopped for the next few days as head fluctuated between 3 and 3.6 m at

64 Oregon Department of Geology and Mineral Industries Special Paper 40
Johnson Creek Landslide Research Project, Lincoln County, Oregon: Final Report
table 8. Threshold head above the base of the basal shear zone for movement at the west (LT-1), middle (LT-2), and east (LT-3) sites from sand-packed piezometers in the LT-1p, LT-2p, and LT-3p boreholes.
LT-1p LT-2p LT-3p
EpisodeStartPressure
Head(m)StopPressure
Head(m)StartPressure
Head(m)StopPressure
Head(m)StartPressure
Head(m)StopPressure
Head(m)
December 2002 no data no data no data no data no data no data
January to February 2003 >5.7; <6.8 >6.1; <6.4 >10.1; <11 >8.5; <9.2 >4.8; <5.0 >3.2; <3.4
March 2003 >6.0; <6.4 6.4 >8.2; <9.4 >8.7; <9.4 >2.9 ; <4.4 >3.3: <4.4
November 2003 to March 2004 >5.2; <6.3 >6.9; <7.1 >6.8; <8.7 >9.5; <10.6 >2.8; <3.7 >3.9; <4.5
November 2004 no data no data no data no data >1.9; <2.1 2.1
December 2005 6.1 6.3 8.1 9.0 3.9 3.3
January 2006 6.3 6.5 9.0 8.7 3.3 3.9
February 2006 6.1 6.1 8.6 8.5 3.4 2.9
November 2006 5.9 6.2 8.1 8.6 3.1 3.1
January 2007 5.9 6.3 9.0 8.6 3.6 2.9
February 2007 2007 no data no data no data no data 3.5 4.1
March 2007 6.1 6.35 9.5 8.6 3.9 3
March 2007 creep no data no data no data no data 3.5 3
Mean hourly data 6.1 6.3 8.7 8.7 3.5 3.3
Standard deviation hourly data 0.2 0.1 0.6 0.2 0.3 0.5
Mean start and stop 6.2 8.7 3.4
Range 0.4 0.4 1.4 0.5 0.8 1.2
Bold numbers are from hourly movement data; other numbers are from movement data collected by hand at intervals of one or more days.
the east site, but movement started again when head reached 3.7 m. The east site stopped movement when head was at 3.3 m but moved immediately before that when head was only 3 m. The east site had one more small movement when head rose to 3.5 m. Total move-ment was 2.6 cm. Maximum velocity of movement was 0.15 mm/hr, but velocity varied little.
West and middle sites: Peak head above the slide plane was below threshold for movement at the middle and west sites during the first movement at the east site, remaining at or below 8.8 m and 6.5 m, respectively. A day after the east site started its second episode of movement, the west site began moving, followed within a few hours by the middle site. The middle site did not start movement until head was at nearly the peak for the entire episode, 10 m above the basal shear zone. Movement continued at the middle site until pres-sure fell to 9 m. Movement at the west site occurred between ~6.6 and 7 m head above the slide. The west site started movement when the sand-packed piezom-eter was experiencing falling pressure, but the grouted
piezometer at the same elevation registered rising pres-sure. It was earlier noted that pressure changes arrive at different times at the two types of installations, so this may be evidence that the grouted piezometers are registering more reliable pressure changes. The sand-packed piezometer registered 6.4 m when movement started and 6.7 m when it stopped; the grouted piezom-eter at the west site registered ~7.9 m at both the start and stop. The narrower range of threshold values for the grouted piezometer also suggests better quality data. The middle site moved 2 cm and the west site 2.2 cm at the end of this event. Maximum velocity at both sites was ~0.4 mm/hr and was reached when the middle site had head above the slide of 9.8–10.1 m; the west site, 6.3–6.8 m. Below these pressures, the two sites moved at similar speed to the east site.
Head response comparisons. Figures 70 and 71 illustrate how the head response in 2006 and 2007 com-pares to the 2003 event temporally and spatially across the landslide. Head response is calculated by subtract-ing the starting (background) total head at each site at

Oregon Department of Geology and Mineral Industries Special Paper 40 65
Johnson Creek Landslide Research Project, Lincoln County, Oregon: Final Report
0123456789
1011121314151617181920
Oct
-02
Jan-
03Ap
r-03
Jul -0
3O
ct-0
3Ja
n-04
Apr-
04Ju
l -04
Oct
-04
Jan-
05Ap
r-05
Jul-0
5O
ct-0
5Ja
n-06
Apr-
06Ju
l -06
Sep-
06De
c-06
Mar
-07
Hea
dab
ove
piez
omte
r(m
)
-40
-30
-20
-10
0
10
20
30
40
Cum
ulat
ive
Mov
emen
t(cm
)
LT-2 Cum. Movement( )
LT-1 Cum. Movement( )
LT-3 Cum. Movement (cm)
LT-2p = 7.4 m
LT-1p = 5 m
LT-3p = 3.2 m
Figure 65. Summary of threshold piezometric pressure above piezometer tips for movement. Vertical white lines mark movement episodes.
Thresho ld Head Above S lide P lane for M ovem ent LT-1 , LT-2 , and LT-3 S ites(2003 -2007 Data)
R 2 = 0.01
R 2 = 0.04
R 2 = 0.01
R 2 = 0.01
R 2 = 0.08
R 2 = 0.02
0
1
2
3
4
5
6
7
8
9
10
11
12
Dec-02
Jan -Feb
03
Mar-03
Nov-03-M
ar-04
Nov-04
Dec-05
Jan -06
Feb-06
Nov-06
Jan -07
Feb-07
M ar-07
M ar-07
creep
Thre
shol
dhe
adab
ove
slid
epl
ane
(m)
LT -1p S tart Head (m )LT -1p S top Head (m )LT -2p S tart Head (m )LT -2p S top Head (m )LT -3p S tart Head (m )LT -3p S top Head (m )L inear (LT -3p S tart Head (m ))L inear (LT -3p S top Head (m ))L inear (LT -1p S top Head (m ))L inear (LT -1p S tart Head (m ))L inear (LT -2p S top Head (m ))L inear (LT -2p S tart Head (m ))
East S ite (LT-3p)
W est S ite (LT-1p)
M idd le S ite (LT-2p)
Figure 66. Variance of threshold pressure head for start and stop of movement for all movement events. Arrows indicate uncertainty introduced because of large (1–4 day) sampling intervals and ±1 cm precision of extensometer data before automated recording of movement was available. Sizes of symbols without
arrows are roughly proportional to uncertainty.

66 Oregon Department of Geology and Mineral Industries Special Paper 40
Johnson Creek Landslide Research Project, Lincoln County, Oregon: Final Report
Decem ber 2002 to February 2003 M ovem ent Events
-2
0
2
4
6
8
10
12
12 /5 12 /10 12 /15 12 /20 12 /25 12 /30 1 /4 1 /9 1 /14 1 /19 1 /24 1 /29 2 /3 2 /8 2 /13 2 /18
Hea
d(m
),C
um.P
ptn.
(dm
)
0
5
10
15
20
25
30
Cum
.Mov
emen
t(cm
)
LT -1p Head above s lide @ 24.8 m (m ) LT -2p Head above s lide @ 16.7 (m H20)LT -3p Head above s lide @ 5.5 m (m H20) Cum ula tive P rec ip (dm )Cum ula tive LT -1 (cm ) Cum ula tive LT -2 (cm )Cum ula tive LT -3 (cm )
East S ite
M idd le S ite
W est S ite
D rillingE ffec ts
on W aterP ressure
?
?
Figure 67. Correlation of movement to head above the base of the basal shear zone for a December 2002 to February 2003 movement. The February event was the largest single movement during the five years of observation. Colored arrows and lines mark head at
stop or start of movement: Green arrow = start; red arrow = stop; white lines = range of threshold pressure. Data are for sand-packed piezometers in the basal shear zone. Only manually measured extensometer data were available during these observations.
Decem ber 2005 to February 2006 M ovem ent Events
0
1
2
3
4
5
6
7
8
9
10
11
12
12/17 12/21 12/25 12/29 1/2 1/6 1 /10 1/14 1/18 1/22 1/26 1/30 2/3 2/7 2 /11 2/15 2/19 2/23
Hea
d(m
),C
um.P
ptn.
(dm
)
0
1
2
3
4
5
6
7
8
9
10
Cum
ulat
ive
Mov
emen
t(cm
)
LT -1p Head above s lide @ 24.8 m (m ) LT -2p Head above s lide 16.7 (m H20) LT -3p Head above s lide 5.5 m (m H20)Cum ula tive P rec ip (dm ) M ovem ent LT -1 (cm ) M ovem ent LT -2 (cm )M ovem ent LT -3 (cm )
East S ite
M idd le S ite
W est S ite
Figure 68. Correlation of movement to head above the base of the basal shear zone for a December 2005 to February 2006 movement. Colored arrows and lines mark head at stop or start of movement: Green arrow = start; red arrow = stop;
white lines = range of threshold pressure. Data are for sand-packed piezometers in the basal shear zone. Extensometer data from automated data retrieval were available during these observations.

Oregon Department of Geology and Mineral Industries Special Paper 40 67
Johnson Creek Landslide Research Project, Lincoln County, Oregon: Final Report
February-M arch 2007 M ovem ent Events
0
1
2
3
4
5
6
7
8
9
10
11
12
2/9 2/11 2/13 2/15 2/17 2/19 2/21 2/23 2/25 2/27 3/1 3/3 3 /5 3 /7 3 /9 3 /11 3/13 3/15 3/17 3/19 3/21 3/23 3/25 3/27
Hea
d(m
),C
um.P
ptn.
(dm
)
0
0 .5
1
1 .5
2
2 .5
3
Cum
ulat
ive
Mov
emen
t(cm
)
LT -1p Head above s lide (m ) LT -2p Head above s lide (m )LT -3p Head above s lide (m ) LT -1a 24.1m head above s lide (m H2O )LT -2a 16.8m -head above s lide (corr m ) Cum ula tive P rec ip (dm )LT -1 M ovem ent (cm ) LT -2 M ovem ent (cm )LT -3 M ovem ent (cm )
East S ite
M idd le S ite
W est S ite
Figure 69. Correlation of movement to head above the base of the basal shear zone for a February to March, 2007, small creeping movement. Colored arrows and lines mark head at stop or start of movement: Green arrow = start; red arrow = stop;
white lines = range of threshold pressure for sand-packed piezometers (angled red and green arrows point to equivalent data from grouted piezometers). Data are for sand-packed (LT-1p, LT-2p, and LT-3p) and grouted
(LT-1a and LT-2a) piezometers in the basal shear zone. Extensometer data from automated data retrieval were available during these observations; the small vertical scale reveals the 0.05-cm oscillations in the data.
the start of the January 2007 movement, the minimum value for all of the comparative data. This effectively takes out the westward slope of the piezometric sur-face. For the 2006 sequence of three movements, only the second episode (January 6 to 24, 2006) is plotted, as it has the highest head values and shows an accelera-tion of the middle site (Figure 68). The 2003 event is unique in several ways but also shows some similarities to later events:
Peak head in 2003 far exceeded the two later events.In 2003 movement began to slow when head at the middle site decreased 0.5 m from its peak, even though the west site had just reached its peak value for the observation period (orange line on the figures). Hence, pore water pressure at the west site was apparently not as important in
•
•
controlling the end of movement as at the middle site. In contrast to large variation in head at the west site in 2003, head at the west site in 2006 and 2007 stayed within a narrower range. This is true in general for the entire observation period after 2003 (Figure 65).In 2006, larger movement at the middle site rela-tive to the west site appears to be from increased speed of the middle site in response to the large head increase rather than decreased speed at the west site. In 2003, the speed of movement was faster at the middle site relative to the western site even though head increase was about the same at both.
•
•

68 Oregon Department of Geology and Mineral Industries Special Paper 40
Johnson Creek Landslide Research Project, Lincoln County, Oregon: Final Report
Starting (background) head was higher for the 2003 event than for the small creeping event in 2007 but similar to the moderate 2006 event.In January 2003 head rose earlier at the west site than the middle site; head rose first at the middle site in the 2006 and 2007 events.Head at cessation of movement was higher in the 2003 event at the west and middle sites but lower at the east site compared to the 2006 event. By 2007, the east site ceased moving at a lower head than in 2003.Threshold head at start and cessation of move-ment was larger at the middle site in 2007 than in 2006; the opposite is true for the west siteAt the east and middle sites, threshold for start of movement in 2003 was substantially higher than needed to start movement in the two later events (brown line in Figures 70 and 71). In 2003, the west site showed a small amount of movement at a head higher than the two later events (brown line in figures), but the previous reading showed no movement and ~1 m lower head, so the threshold could be similar to the two later events within this large uncertainty. In all three events, the middle site started moving at a higher threshold head than it stopped.In all three events, the west site started at a lower threshold head than it stopped.In the 2006 and 2007 events, the east site started moving at a lower threshold head than it stopped; the opposite occurred in 2003.
Conclusions from the three events. These obser-vations appear consistent with the middle (LT-2) site being a controlling factor in slide movement (Landslide Technology, 2004; Ellis and others, 2007b). Head above the slide plane is always highest there, and the slide mass at the middle site tends to move faster than at other sites, especially the east site which seems to move at a more or less constant velocity, even when the middle site accelerates. It appears that the east site reaches some threshold rate of movement ≤ 0.3 mm/hr and is essentially “left behind” by the middle site. When the east site moved on its own in February 2007, it did not trigger movement at the sites to the west. The middle site accelerated relative to the other two when head rose above 9.4 m in one instance and 10.2 m in another, but once the site started moving it generally stopped at a lower head than it started. The west site had the
•
•
•
•
•
•
•
•
opposite behavior, suggesting that the middle site was pushing the west site as each pulse of pressure affected the middle site sooner. On two occasions this pattern did not hold. In the December 16 to 23, 2003, episode, 62 hours of rain at 2.1 mm/hr preceded movement at the west site. During the February 2007 movement, the west site started moving before the middle site. In fact, the threshold head for movement and accelera-tion of movement varied at all three sites from move-ment to movement even though the middle site had a somewhat more consistent pattern than the others. One caveat to this observation is the apparent lack of precision of the sand-packed piezometers relative to the grouted piezometers in specifying both timing and magnitude of head response at the base of the slide. Data for grouted piezometers are available only for the 2007 movement and appear to show much less varia-tion in threshold head for start and stop of movement at all sites (Figure 69). As more of these data become available, some of the apparent lack of consistency of movement with head changes may go away.
There appears to be a general tendency for move-ment to start and stop at decreasing threshold head from 2003 to 2007, but the decrease is only ~0.7-0.8 m of head at the key middle (LT-2p) site. Precision of the 2003 movement data is ±1 cm, whereas precision of 2006 and 2007 data is ±0.05 cm. The 2006 and 2007 observations demonstrate that large changes in head can occur within a ±1 cm range of movement, so while the observations are worth noting, the data do not sup-port any firm conclusion about a trend of decreasing head.
A remaining question is why on February 2, 2003, the west site experienced the same large rise in head as the middle site. This unique response and the atten-dant large movement occurred as a result of 2.6 days of rain at 2.1 mm/hr but was absent in the later move-ment events that responded to rain at about this inten-sity for two-day periods. The response did not occur when the middle site maintained a head of 10.9 m for 8 hours in 2006 but did occur when head at the middle site reached 10.9–11.4 m above the slide plane for two days. Possibilities for raising pore water pressure in the lower part of the slide are:
Breaching of a groundwater barrier such as the fault or internal structure that offsets the geologic section down 2 m to the east.
•

Oregon Department of Geology and Mineral Industries Special Paper 40 69
Johnson Creek Landslide Research Project, Lincoln County, Oregon: Final Report
February 2007 vs February 2003 Response
0.0
0.5
1 .0
1 .5
2 .0
2 .5
3 .0
3 .5
4 .0
0 20 40 60 80D istance East o f LT-1 Boreho le (m )
Nor
mal
ized
Hea
dR
espo
nse
(m)
F eb -07 @ 0 hrs (LT -3p 1st p iez . resp .)
Feb -07 @ 16.3 hrs (LT -3 M vm nt.)
Feb -07 @ 51.5 hrs
Feb-07 @ 64.7 hrs (LT -1&2 1stM vm nt.)
M ar-07 @ 136 hrs (creep )
M ar-07 @ 184 hrs (creep )
M ar-07 @ 282 hrs (m vm nt S tops)
Feb -03 @ 0 hrs (LT -3p 1st p iez . resp .)
Feb -03 @ 10 hrs (LT -1 m vm nt)
Feb -03 @ 65 hrs (LT -2+3 lg m vm t?)
Feb-03 @ 80 hrs (LT -2&3 lg m vm t?)
Feb-03 @ 96 hrs (m vm nt s low s)
Feb-03 @ 185 hrs (m vm nt stops)
LT -1p LT-2p LT-3p
W est East
Figure 70. Comparison of piezometric head change across the landslide at sand-packed piezometers for the January 29 to February 6, 2003, large displacement to small creeping movement of February 23 to March 7, 2007. Diagram shows quantitative differences between head in the two events by normalizing to the mean piezometric
gradient across the slide at the start of the two movements minus 1 meter [((starting total head 2003 + starting total head 2007)/2) − 1 meter]. Hrs = hours after first piezometric response at the LT-3p piezometer at the headwall graben;
Mvmnt. = slide displacement measured at extensometers; piez. resp. = piezometric response.
January 2006 vs February 2003 Head Response
0.0
0.5
1 .0
1 .5
2 .0
2 .5
3 .0
3 .5
4 .0
0 20 40 60 80D istance East o f LT-1 (m )
Nor
mal
ized
Hea
dR
espo
nse
(m)
Jan -06 LT -3 1st resp+M vm t
Jan -06 @ 28hr (LT -1&2 m ove)
Jan -06 @ 104 hr (LT -3p pk)
Jan -06 @ 133 hr (accel LT -2)
Jan -06 @ 151 hr (LT -1p pk)
Jan -06 @ 228 hr (LT -3 slow s)
Jan -06 @ 237 hr (LT -1+2 slow )
Jan -06 @ 349 hr (LT -3 stop )
Jan -06 @ 364 hr (LT -1 stop )
Jan -06 @ 454 hr (LT -2 stop )
Feb -03 @ 0 hrs (LT -3p 1st p iez .resp .)Feb -03 @ 10 hrs (LT -1 m vm nt)
Feb -03 @ 65 hrs (LT -2+3 lg m vm t? )
Feb -03 @ 80 hrs (LT -2&3 lg m vm t? )
Feb -03 @ 96 hrs (M vm nt S low s)
Feb -03 @ 185 hrs (M vm nt S tops)
W est East
LT-1p LT-2p LT-3p
Figure 71. Comparison of piezometric head change across the landslide at sand-packed piezometers for the January 29 to February 6, 2003, large displacement to moderate slow movement of January 6 to 24, 2006. Diagram shows quantitative differences between head in the two events by normalizing to the mean piezometric gradient across the slide at the start
of the two movements minus 1 meter [((starting total head 2003 + starting total head 2006)/2) − 1 meter]. Hrs = hours after first piezometric response at the LT-3p piezometer at the headwall graben; Mvmnt. = slide displacement
measured at extensometers; piez. resp. = piezometric response; pk = peak piezometric head.

70 Oregon Department of Geology and Mineral Industries Special Paper 40
Johnson Creek Landslide Research Project, Lincoln County, Oregon: Final Report
Opening hydraulic conduits such as fracture sys-tems in response to slide movement. Compressing the fracture system from movement at the middle site “ramming” the west site. Combined effect of infiltration and lateral pres-sure transmission. For example, the saturated zone lies ~18 m below the surface at the west site, so after 15 days of continuous rain at infiltration of 0.05 m/hr, the entire unsaturated zone is full of infiltrating water. What effect does this have on pressure response? Does continuous intense rainfall reach the saturated zone more and more quickly as time goes on?
Perhaps the 1 cm of extension created by the Decem-ber 2002 movement opened up fractures, causing better pressure transmission and flow of water both vertically and horizontally between the west and middle sites. Unusually high hydraulic conductivity between the middle and west sites immediately prior to the January 2003 movement is consistent with arrival of pressure response at the western site 5 hours before the middle site.
erosion thresholdsStability analysis by Landslide Technology (2004)
clearly demonstrated that erosion of the slide toe could trigger movement regardless of pore water pressures. Continued wave erosion will decrease the factor of safety, so a decrease in threshold pore pressures would be expected. The slight negative slopes of the threshold data in Figure 66 are suggestive of this trend, but the uncertainty in these data is much too large to draw any conclusions. The detailed analysis of the three events above is also suggestive that erosion may be decreasing threshold pore pressures relative to the large February 2003 event, but, again, uncertainty in the data is too large to make any firm interpretation.
Preliminary erosion estimates from the ground-based lidar experiment at the Johnson Creek landslide are over too short of an interval to offer definitive esti-mates of erosion, but the data clearly demonstrate that both wave erosion at the base of the sea cliff and mass wasting at the top are occurring at significant rates. Ero-sion estimates by Priest and others (2004) for coastal bluffs in the Astoria Formation are 15–24 cm per year for the beaches around Johnson Creek and 6.1 cm for other beaches in this county. The Jumpoff Joe landslide at Nye Beach 11 km south of the study area is geologi-cally similar to the Johnson Creek slide: It is a trans-
•
•
•
lational slide in seaward dipping Tertiary siltstone. In the 1940s at Jumpoff Joe, erosion through a competent sandstone buttress caused failure of a block penetrating 100 m into the coastal bluff (Priest and others, 2004). The block then eroded at ~90 cm/yr over the next 54 years (Priest and others, 2004). Assuming that (1) the range 6.1–90 cm/yr brackets possible erosion rates at the Johnson Creek slide blocks, (2) factor of safety decreases by 2.3 percent for each meter of bluff retreat (Landslide Technology, 2004), and (3) pore water pres-sure in the stable slide at “normal winter” pore pressure keeps the factor of safety at 2 percent above the thresh-old for movement (Landslide Technology, 2004), then 1–15 years of erosion at 90–6.1 cm/yr (0.9 m, 2 percent decrease of factor of safety) would bring the slide to its stability threshold for most of the winter season. Ero-sion for 4 to 150 years (3.9 m) would reduce the factor of safety by 9 percent, creating severe instability during the winter season (“severe storm” scenario of Landslide Technology [2004]). According to the stability analy-sis of Landslide Technology (2004), the latter scenario would be equivalent to an increase in head at the moni-toring sites of 3.6 m for the west (LT-1p) piezometer, 3.3 m at the middle piezometer (LT-2p), and 0.8 m at the east piezometer (LT-3p). The slide currently appears to have stability similar to when the observations started within the uncertainty of the data, so is seems unlikely that the worst-case erosion scenarios have occurred during the observation period.
SloPe Stability analySiS
uncertaintiesLimit equilibrium slope stability analyses demon-
strated that pore water pressures and erosion of the toe control stability and that either can trigger move-ment. The limit equilibrium back analysis of Landslide Technology (2004) assumed threshold pressures above the slide plane of 7.0 m at the west (LT-1p) piezometer, 10 m at the middle (LT-2p) piezometer, and 6.3 m at the east (LT-3p) piezometer. As previously explained, observed thresholds from five winters of observation are, 6.4 ± 0.2 m, 9.1 ± 0.6 m, and 3.4 ± 0.5 m, for LT-1p, LT-2p, and LT-3p, respectively. The modeled head is within the uncertainty of observational data for all but the eastern (LT-3p) site, which is 46 percent higher than observed. The reason for this is that the Land-slide Technology (2004) site map had the piezometer site mislabeled as the inclinometer site, leading them

Oregon Department of Geology and Mineral Industries Special Paper 40 71
Johnson Creek Landslide Research Project, Lincoln County, Oregon: Final Report
to assume that the piezometer was down the slide dip from the inclinometer instead of up dip. Because the inclinometer and piezometer are within a few meters of each another and the piezometric surface has a gentle inclination in the eastern part of the slide (Figure 53), the total head at the modeled position (and thus head above the slide plane) is probably very close to the value assumed. There is probably no significant error in the model from this source.
Another potential problem with the analysis is use of data from sand-packed piezometers. As previously discussed, the sand-packed piezometric head is lower and apparently less accurate than head measured from grouted piezometers. The difference is 0.9 m at LT-1p site and 0.9–1.4 m at LT-2p; these values are for peak head events like those used in the stability analysis. Observed thresholds are based on sand-packed piezom-eter data, so equivalent grouted data for the LT-1p site should be approximately 7.3± 0.2 m and 10–10.5 ± 0.6 for LT-2p. These values are essentially identical to those used by Landslide Technology, so there is no significant error.
remediation optionsThe stability analyses, calibrated with field monitor-
ing and observational data, are useful tools for evaluat-ing the effectiveness of various remedial options for this slide. The input parameters in the numerical models have been refined with the observational data to pro-vide results that are consistent with control of slide movement by pore water pressures in the upper part. The stability analysis found that factor of safety (FOS) decreased more in the upper part of the slide than in the lower part for a given rise in pore pressure (Appen-dix N). The percent decrease in FOS cumulatively for each monitoring site was 21 percent from the head of the slide to piezometer LT-3p, 52 percent to piezometer LT-2p, and 73 percent to piezometer LT-1p (Appendix N). Monitoring of surface movement by resurveying
and observation of highway damage found much larger movement and instability in the southern part of the slide. Using threshold head determined at the drill-ing transect, the southern part of the slide required a higher back-calculated residual shear angle to remain stable (Appendix N).
The stability analysis of Landslide Technology (2004) underscored the importance of erosion in trigger-ing movement, a finding not obvious from any of the observational data. A 2.3 percent decrease in FOS from erosion of 1 m at the toe is a major component in choosing remediation options for any coastal land-slide of this type. The same analysis found that a 1-m rise in head at the middle monitoring site caused a 2 percent decline in FOS and that the slide reaches insta-bility when head rise at the middle site reaches 1.1 m above normal winter levels. Removal of 3 m from the toe could thus destabilize the slide during most of the winter season. In general, buttressing all or part of the toe is the most effective option, as it achieves slope sta-bility while eliminating erosion and mass wasting. The first priority for a buttress of this landslide is the south-ern, least stable part where most highway damage has been concentrated and where resurvey data indicate highest deformation. Mitigating the large increases in pore water pressure in the critical upper 25 percent of the slide could be considered but would be less effective than buttressing. Trenched drainage systems or vertical wells pumped during winter rainfall events may slow or stop slide movement in the short term. Large diameter vertical wells would maximize the number of fractures intercepted. Because threshold pore water pressures have remained fairly constant over the last five years of observation, erosion rates may be relatively low,; thus a drainage system may provide significant remediation before erosion causes movement. Installation of such a system could be justified from a research perspective in order to gain an understanding of the effectiveness of alternative dewatering schemes.

72 Oregon Department of Geology and Mineral Industries Special Paper 40
Johnson Creek Landslide Research Project, Lincoln County, Oregon: Final Report
Monitoring movement and pore water pressures at the Johnson Creek landslide continues to provide a unique opportunity to examine factors controlling movement of large translational landslides in sedimentary rock. The slide moves in response to intense rainfall that raises water pressure throughout the side over a period of 30–50 hours. The sequence of events that leads to movement starts with vertical infiltration through the unsaturated zone at ~50 mm/hr (~1.5–3.0 m depth in 30–50 hrs). The piezometric elevation slopes down the axis of the slide but the slide surface is nearly horizon-tal, so in this period of time infiltrating water can reach the water table only at the headwall graben. Infiltration rapidly raises pore water pressure in the graben; pres-sure is then transmitted down the axis of the slide at speeds of 1.4–2.5 m/hr in the upper part (between sites LT-3 and LT-2) and 3.5 m/hr to virtually instantaneous in the middle part of the slide between monitoring sites LT-2 and LT-1. Arrival time of this “wave” of pressure is similar at different levels in the saturated zone at both the middle and west monitoring sites. It arrives at the east site next to the graben ~1–3 hours after the start of most rainfall events. There is also little vertical hydraulic gradient at the middle and west sites. A flow net showed nearly horizontal flow roughly parallel to the slide plane. These observations and the rapidity of pressure transmission are consistent with a high effec-tive hydraulic conductivity throughout the slide mass (Ellis and others, 2007a, 2007b). The lower piezometric head in the western part of the slide is probably indica-tive of better drainage there than to the east, possibly in response to a fault or internal slide structure that causes 2 m of down-the-east displacement between boreholes LT-1 and LT-2 (Landslide Technology, 2004; Ellis and others, 2007b).
Pore water pressure changes at the middle of the slide appeared to be a key control of movement. The middle monitoring site has head above the slide plane persistently higher than at sites to the east and west. Total movement there was a factor of 1.8 times that of the east site and a factor of 1.4 times that of the west site (Table 3). The slide begins to move en masse when threshold pressures are reached, the middle site out-pacing the ones east and west when pore water pres-sure there rises above ~9.4–10.8 m head above the slide plane. Pore water pressure thresholds for movement
at the site near the headwall graben varied much more widely than at the other two sites, consistent with pas-sive response to movements in the middle. Stability analysis found that pore water pressure change from the middle observation site to the head of the slide accounted for 52 percent in change in factor of safety compared to 21 percent to the east site.
The lower part of the slide also plays an important role in stability. Pore water pressure at the western monitoring site, 62 percent of the way down the slide axis, appears to be a key control on slide movement. The largest, fastest displacement occurred January 31 to February 2, 2003, when pore water pressure at the west site rose as much as at the middle site. In all sub-sequent movement events, pressure changes at the west site have been no more than about one third of the responses at the middle site. Slide velocity during the 2003 event increased by an order of magnitude relative to all later events. The dramatic effect on stability of this unique rise in head at the west site was confirmed by the stability analysis finding that the slide from this site east accounts for 73 percent of the decrease in factor of safety for a given rise in pore water pressure (Appen-dix N). The conditions for accelerated movement were 0.84 m of rainfall in the previous 60 days and 62 hours of antecedent rain at a mean rate of 2.1 mm/hr. Other instances of rain at these intensities for 33 and 15 hours did not trigger the unique response at the west site, although in January of 2006 head rose as high as 10.9 m at the middle site. Antecedent movement in December 2002 of the west site 1 cm further than the middle site created extension between the two and possibly raised effective hydraulic conductivity. Increased hydraulic conductivity may have caused the unique early pres-sure response and increase in head at the west site. The large movement in January 2003 increased compres-sion between the middle and west sites for the remain-der of the observation period. This compression may have decreased the effective hydraulic conductivity in the western part of the slide and contributed to the lack of large movement events in subsequent years (Table 3).
Acquiring observational data to test these hypotheses should be a priority for further investigation. Monitor-ing one of the large movements with the vertical arrays of piezometers now installed will be vital. Measure-
ConCluSionS and reCommendationS

Oregon Department of Geology and Mineral Industries Special Paper 40 73
Johnson Creek Landslide Research Project, Lincoln County, Oregon: Final Report
ment of porosity and permeability of rocks and instal-lation of additional inclinometers and piezometers, including innovative wireless piezometers below the slide plane, would greatly improve data quality. Instal-lation should be aimed at other parts of the slide along strike and down the axis. Any new piezometers should be installed using the grouting procedure as opposed to sand-packed boreholes. Pore water pressure data from grouted piezometers are a more accurate mea-surement of pressure at the installed depth than mea-surements from piezometers installed in standard sand packs. Grouted piezometers installed at the same depth as adjacent sand-packed piezometers recorded water pressures 1-2 m higher. Sand-packed pressures were lower than the predicted by hydrostatic gradient at the installed depth.
Remediation of water pressures at the headwall graben by drainage through French drains or other means (e.g., vertical wells, sealing the surface) could be implemented on an experimental basis to evaluate alternative approaches. The high hydraulic conductiv-ity of the slide mass should make dewatering schemes effective. Large-diameter vertical wells might be an effi-cient means of draining the networks of fractures that transmit pressure and water through the slide. Costs could be kept down by pumping only at a threshold of pore pressure or rainfall intensity.
Limit equilibrium stability analysis found that factor of safety (FOS) declines 2.3 percent for every meter of erosion from the passive wedge formed by the back-tilted toe of the slide (Landslide Technology, 2004). The same analysis found that a 1-m rise in head at the middle monitoring site caused a 2 percent decline in FOS and that the slide reaches instability when head rise at the middle site reaches 1.1 m above normal winter levels. Removal of 3 m from the toe could thus destabilize the slide during most of the winter season. Erosion would also be expected to destabilize the toe and possibly create extension in the lower part of the slide with attendant increase in hydraulic conductiv-ity. Buttressing the slide with a revetment is therefore the most effective long-term remediation option. But-tressing eliminates erosion while stopping slide move-ment. The main environmental impacts of a buttress are (1) creating an unnatural feature at the shoreline, (2) causing loss of dry sand beach from scour and by fixing the shoreline in the face of rising sea level, and (3) cutting off sand supply from bluff erosion. There is
little sand content in the current sea cliff (Appendix A), so loss of sand supply would be minimal. The other two impacts can only be mitigated by making the revetment as small as possible. The most cost-effective and envi-ronmentally benign option would be to buttress only the southern 30 percent of the slide where the largest, most damaging movement has occurred and where stability analysis indicates the least resistance to slid-ing (Appendix N). It is possible that buttressing this portion of the slide might improve stability of the rest of the slide. Determining this is an important research objective.
It may be that innovative erosion-control such as a dynamic revetment composed of hard rock cobbles can offer a significant increase in the factor of safety at reasonable cost and with low environmental impact. Dynamic revetments adjust in height in response to wave conditions, rising higher during large wave events. The mass of such a revetment would also help buttress the landslide, possibly increasing the factor of safety significantly. Further study of this option, perhaps with a demonstration project, would be worthy of consider-ation.
The analysis in this report is incomplete without a more accurate measure of wave erosion at the toe of the slide. Ground-based lidar surveys like those per-formed May 14, 2004, October 3-4, 2006, and April 3-4, 2007, should be completed annually or semiannually to accurately track erosion so this variable can be properly evaluated against theoretical predictions. Monitoring wave activity from offshore buoy data will allow empiri-cal relationships to be established between erosion and wave strike that may allow erosion prediction in the future from the buoy data alone.
Until remediation is implemented, the current data stream of hourly rain gauge, piezometer, and extensom-eter data should be used to warn ODOT of impending slide movement. This type of system has been imple-mented along Interstate Highway 84 in the Columbia River Gorge. This system would require maintaining the current instrumentation and telecommunications links to the two dataloggers. Costs to the State of Oregon will be minimal for the next few years while USGS partners maintain the instrumentation. Table 9 lists possible threshold water pressures for such a system, but all that is needed is monitoring of the water pres-sure and movement at the key LT-2 site. The observed variability of thresholds for movement makes such a

74 Oregon Department of Geology and Mineral Industries Special Paper 40
Johnson Creek Landslide Research Project, Lincoln County, Oregon: Final Report
system unreliable for warning of small creeping move-ments, but still useful for the large movements like the one in 2003. Intense precipitation of ~2 mm/hr for ~60 hours and antecedent rain of ~0.8 m over 60 days were the key factors in triggering the largest slide displace-ment. When these thresholds are approached, the slide is capable of severe damage to the highway in less than 3 days.
ODOT should keep in mind that any warnings would be experimental at best and that such warnings should not be relied upon without other types of observations. A warning system based on this data collection system might give false alarms, or movement could still occur unexpectedly as a result of evolving internal slide forces, particularly wave erosion. Instrument failures, commu-nications failures, or other factors could also cause the system to fail.
table 9. Raw water pressures associated with beginning and acceleration of landslide movement.
PiezometerRawPressure(m)-StartofMovement
RawPressure(m)-AcceleratedMovement
LT-1p (24.8-m depth) 4.6 7.4
LT-1a (24.08-m depth) 5.9 8.6
LT-2p (16.7-m depth) 6.8 9.8
LT-2a (16.76-m depth) 7.9 10.8
LT-3p (5.5-m depth) 3.0 4.8
These thresholds could be incorporated into a landslide warning system. Pressures are in meters of water above the piezometer tips as recorded by the dataloggers. Threshold values for start of movement are therefore different from those of Table 8. Pressures for start of movement are based on the mean values for start and stop of movement minus one standard deviation. Pressures for accelerated movement are based on peak pressures reached during the January 31 to February 3, 2003, event; as LT-1a and LT-2a piezometers were not installed at that time, values for those piezometers are estimated from values at LT-1p and LT-2p by adjusting for depth differences and then adding 1.85 m to the LT-1p value (for LT-1a) and 0.9 m to the LT-2p value (for LT-2a).

Oregon Department of Geology and Mineral Industries Special Paper 40 75
Johnson Creek Landslide Research Project, Lincoln County, Oregon: Final Report
This project was funded by ODOT Miscellaneous Con-tract and Agreement, Project Name: Detailed Geo-technical Analysis of Large Translational Landslides in Seaward-Dipping Sedimentary Rocks. State Planning and Research Project 356. Funding for the project was provided to ODOT by the Federal Highway Adminis-tration.
In 2005 the essential labor and material support was provided by the U.S. Geological Survey (USGS) Land-slide Hazards Program. William L. Ellis of the USGS, Denver, Colorado, office, supervised all telecommu-nications and instrumental upgrades to allow hourly collection of movement data that proved vital to the project. He made numerous trips from Denver to solve telecommunications issues. William H. Schulz of the USGS supervised drilling and installation of the 2006 piezometers. Rex Baum led the USGS team and made key recommendations that greatly improved the proj-ect plan. Thanks are owed to all the USGS partners for their valuable reviews and discussion of data. Special thanks are owed to William Schulz for his instruc-tion in the interpretation of piezometer data from the unsaturated zone. Without this help, the paper could not have been written.
In addition to providing overall technical guidance to the project, ODOT loaned GeoKon LC-1 dataloggers and a Slope Indicator inclinometer cable, probe, and Datamate to the project. Len Saltekoff of ODOT pro-vided estimates of the age of the Old Coast Highway. Jerry Stokes of ODOT provided estimates of average annual maintenance costs where the slide cuts High-way 101. ODOT supervised the drilling contractor for the 2006 boreholes and provided flaggers for highway crossings. Lincoln County also assisted by loaning roadside warning signs during the 2006 drilling.
Technical advisory committee (TAC) reviewers at various stages of the investigation were Michael T. Long, Steve Narkiewicz, Bernie Kleutsch, and Mat-thew Mabey of ODOT, and Yumei Wang and William J. Burns of DOGAMI. Numerous discussions with the TAC in meetings, by phone, and through e-mail were
invaluable. Mike Long also encouraged us at the pro-posal stage and kindly arranged for acquisition of a 2004 scan of the slide toe using ground-based lidar. The 2004 scan was completed by David Wellman of D. Well-man Surveying L.L.C., Eugene, Oregon. Ranvir Singh of ODOT Geometronics supervised the 2006 and 2007 lidar scans of the slide toe using supplemental funding from ODOT Research.
Marshall Gannet of the USGS provided an invaluable review of initial hydrologic interpretations in the inter-im report. His discussions about the difference between lateral flow and lateral transmission of hydraulic pres-sure in causing head change were particularly useful.
Landslide Technology’s team of geotechnical engi-neers and engineering geologists on the project includ-ed Charles M. Hammond, CEG; Andrew Vessely, CEG, PE; Jonathan Harris, PE; Erica Meyer, EIT; and Darren Beckstrand, GIT. Mr. Hammond was the geotechni-cal study project manager. Mr. Vessely provided senior oversight, managed the engineering analyses, reviewed the interim report, and provided key interpretations and advice. Mr. Harris managed the instrumentation and data analysis, installed dataloggers and the rain gauge, and assisted with the engineering analyses. Ms. Meyer performed the engineering analyses. Mr. Beck-strand performed the field inspection and assisted with initial data analysis in 2003.
Geo-Tech Explorations, Inc., of Tualatin, Oregon, performed the 2002-2003 geotechnical drilling and installed slope inclinometer casing and vibrating-wire piezometers under the direction of Landslide Tech-nology. Slope Inclinometer Company supplied slope inclinometer casing and vibrating wire piezometers for the 2002-2003 work. The company also put us in touch with Erik Mikkelsen, who contributed an invaluable analysis of error in the water pressure data from the sand-packed piezometers.
Dennison Surveying Inc., of Newport, Oregon, was retained under DOGAMI contract 41120-080401 to survey the landslide topography and to establish per-manent survey hubs for long-term monitoring.
aCknoWledgementS

76 OregonDepartmentofGeologyandMineralIndustriesSpecialPaper40
JohnsonCreekLandslideResearchProject,LincolnCounty,Oregon:FinalReport
Collins, B. D., and Kayen, R., 2006, Land-based LIDAR mapping — a new surveying technique to shed light on rapid topographic change. U.S. Geological Survey Fact Sheet 2006-3111, 4 p.
Ellis, W. L., Priest, G. R., and Schulz, W. H., 2007a, Precipitation, pore pressure, and landslide move-ment — detailed observations at the Johnson Creek landslide, coastal Oregon: First North American Landslide Conference Landslides and Society: Integrated Science, Engineering, Management, and Mitigation, Vail, Colorado June 3–8, 2007a, Conference Proceedings.
Ellis, W. L., Schulz, W. H., Baum, R., and Priest, G. R., 2007b, Hydrogeologic investigations of the John-son Creek landslide — recent data, results and future plans: 2007 Landslide Symposium: New Tools and Techniques for Developing Regional Hazard Maps and Future Risk Management Prac-tices, Portland, Oreg., April 26–28, 2007.
Grathoff, G. H., 2005, Weathering mineralogy in dunal soils near Newport, Oregon: Oregon Society of Soil Scientists Annual Meeting, oral presentation.
Grathoff, G. H., Peterson, C. D., Beckstrand, D. L., 2001, Coastal dune soils in Oregon, USA, form-ing allophane and gibbsite: 12th International Clay Minerals conference, Bahía Blanca, Argentina, July 22–28, 2001.
Johnson, C. M., 2003, Iron mineralogy in the Newport dune sheet, Oregon coast: Portland State Univer-sity M.S. thesis, 38 p. Web link: http://web.pdx.edu/~grathog/StudentWork/Catrina%20Johnson%20UG%20honors%20thesis%20SP03.pdf.
Kane, W. F., and Beck, T. J., 1996, Rapid slope monitor-ing: Civil Engineering, v. 66, no. 6, p. 56–58.
Landslide Technology, 2004, Geotechnical investiga-tion, Johnson Creek landslide, Lincoln County, Oregon: Oregon Department of Geology and Min-eral Industries Open-File Report O-04-05, 115 p.
Mikkelsen, P. E., and Green, G. E., 2003, Piezometers in fully grouted boreholes, Symposium on Field Measurements in Geomechanics, FMGM, Oslo, Norway, 10 p. Web link: http://www.slopeindica-tor.com/pdf/papers/piezometers-in-fully-grout-ed-boreholes.pdf .
Priest, G. R., and Allan, J. C., 2004, Evaluation of coastal erosion hazard zones along dune and bluff backed shorelines in Lincoln County, Oregon: Cascade Head to Seal Rock: Oregon Department of Geol-ogy and Mineral Industries Open-File Report O-04-09, 188 p.
Priest, G. R., Allen, J. C., Niem, A., Christie, S. R., and Dickenson, S. E., 2006, Interim report: Johnson Creek landslide project, Lincoln County, Oregon:Oregon Department of Geology and Mineral Industries Open-File Report O-06-02, 184 p.
Schulz, W. H., 2007, Hydrologic controls on translation-al bedrock landslides, coastal Oregon: Geological Society of America Abstracts with Programs, v. 39, no. 6, p. 362.
Schulz, W. H., and Ellis, W. L., 2007, Preliminary results of subsurface exploration and monitoring at the Johnson Creek landslide, Lincoln County, Oregon: U.S. Geological Survey Open-File Report 2007-1127, 11 p., 1 appendix. Web link: http://pubs.usgs.gov/of/2007/1127/.
Sera, M. N., 2003, Site assessment and remediation: CRC Press, Boca Ration, Fla., 1176 p.
Spencer, E., 1967, A method of analysis of the stabil-ity of embankments assuming parallel interslice forces: Geotechnique, v. 17, no. 1, p. 11–26.
REFERENCES

Oregon Department of Geology and Mineral Industries Special Paper 40 Appendix A | 1
Johnson Creek Landslide Research Project, Lincoln County, Oregon: Final Report
eXeCutive Summary and reCommendationS
Dr. Alan Niem was contracted by DOGAMI to provide information to DOGAMI, ODOT, and Landslide Tech-nology on the geologic nature and controls of the John-son Creek landslide on the central Oregon coast north of Newport (Figure A1). This preliminary report con-sists of (1) a detailed discussion of east-west lithologic correlation of boreholes LT-1, LT-2, and LT-3 to a sea cliff section at the toe of the landslide, (2) x-ray diffrac-tion (XRD) study of the mineralogical and microscopic (e.g., scanning electron microscope [SEM]) causes of slope failure, and (3) statistical grain size and thin sec-tion analysis of the stratigraphic section with emphasis on the lower and middle Miocene Astoria Formation exposed in the sea cliff at the toe of the landslide to determine the potential of these strata to contribute to the modern littoral sand budget.
reSultS
1. borehole and Sea Cliff Correlation
The Pleistocene terrace deposit in the upper part of the three boreholes consists of densely packed, well-sorted, reddish yellow iron oxide-stained, friable, fine to medium sand, 11 to 20 ft thick, a local paleosol (in LT-1), and a rounded siltstone cobble at the base of the deposit (in LT-2) (Plate AI correlation diagram). Some sediment in the base of the terrace deposit is com-positionally and texturally similar to the paleo-surge channel-fill quartzo-feldspathic-lithic (mainly Astoria
mudstone clasts) terrace sand and gravel that overlie the angular unconformity on the Astoria Formation exposed a short distance east of the headscarp on the Boise Cascade logging road. Pleistocene terrace beach sands in the sea cliffs and headscarp consist of locally case-hardened, well-sorted, fine and some medium beach sand (mainly subrounded grains of quartz, feld-spar, and lithics [volcanic]) and a fluvial sandy gravel channel fill with framework-supported, rounded, white gibbsite, quartz, and Columbia River Basalt pebbles. These gravel lenses are overlain by a gray paleosol with gley or E-horizon and a dark, organic-rich A horizon. The Pleistocene deposits and the Miocene Astoria For-mation are locally overlain and partly covered by thin to thick, surficial, Holocene landslide toe colluvium com-posed of mostly poorly sorted angular clasts of Astoria Formation siltstone in a reworked Pleistocene terrace sand matrix (see middle sea cliff section on Plate AI). The maximum vertical displacement by landsliding of the angular unconformity between the Quaternary ter-race deposit and the underlying lower and middle Mio-cene Astoria Formation is calculated to be 70 feet on a 1:1 scale cross section between its position just east of the headscarp through the three boreholes to its posi-tion in the sea cliffs at the toe of the landslide (Plate AI, cross section B).
Composite thickness of the Astoria Formation cor-related in the three boreholes and exposed in the sea cliff is 140 ft. These 140 ft of strata include four strati-graphic sequences of shallow-marine (inner to middle shelf ), fossil mollusk-bearing, very fine- to fine-grained, bioturbated sandstone (informally called sandstone sequences A, B, C, and D; see correlation diagram, Plate
aPPendiX a: Preliminary borehole to Sea CliFF CorrelationS, X-ray diFFraCtion and Sem analySiS oF SliP Plane, and grain Size Study oF Sedimentary unitS
oF the JohnSon Creek landSlide on u.S. highWay 101, Central CoaSt oF oregon, north oF neWPort
by Alan R. NiemProfessor Emeritus of GeologyOregon State UniversityOregon Registered Geologist #G659
submitted to DOGAMI on April 9, 2003revised June 25, 2003

2 | Appendix A Oregon Department of Geology and Mineral Industries Special Paper 40
Johnson Creek Landslide Research Project, Lincoln County, Oregon: Final Report
AI). The sandstone sequences range from 5 ft to 31 ft thick. Sandstone sequences A, B, C, and D are separat-ed by four units of massive, finely micaceous, medium gray siltstone (informally called units 1 through 4 from base to top; Plate AI). In thin sections, the very fine- to fine-grained quartzo-feldspathic-lithic (volcanic) mica-bearing Astoria sandstones are moderately well indurat-ed due to extensive sparry calcite and clay rim cement and some detrital clay. In contrast, the darker gray deeper marine (outer shelf and upper slope?), foram-bearing, micro-micaceous siltstone units are composed of expandable iron-rich smectite clay (see XRD analy-sis section, Figures A3a, A3b, and A3c) and silt-sized angular quartz, plagioclase feldspar, pyrite, carbonized wood, and mica and are relatively less indurated (less strong). Siltstone unit 2 contains the active basal slip plane (based on inclinometer data) in boreholes LT-1, LT-2, and LT-3, suggesting some stratigraphic control on the landslide (Plate AI).
Sandstone sequences A, B, C, and D and siltstone units 1, 2, and 3 are correlated on a 3.63:1 scale cor-relation diagram (Plate AI) between the boreholes by stratigraphic position, regional strike and westward dip, similar fossils, internal stratigraphy, distinctive fragments of calcite-replaced pumice in a fine-grained bioturbated sandstone sequence, and adjacent altered glass shard-bearing tuff marker beds. In addition, the yellowish brown, 10- to 11-ft-thick very fine- to fine-grained, shallow-marine, calcite-cemented sandstone D with large fossil scallops (Patinopecten) at the base of the sea cliff sections can be traced laterally and mapped (e.g., G. Priest, Figure A2) north-south along the John-son Creek landslide sea cliff. This sandstone sequence occurs with blocky jointed, thin tuffs at the top and base and an underlying distinctive, thin, buff, concre-tionary, foram-rich rib-forming bed in the underlying siltstone unit 3 (Plate AI middle sea cliff section). Sand-stone sequence D, the underlying Dentalium- (tusk
Figure a1. Index map of study area, showing line of cross section (Plate AI).

Oregon Department of Geology and Mineral Industries Special Paper 40 Appendix A | 3
Johnson Creek Landslide Research Project, Lincoln County, Oregon: Final Report
shell) bearing siltstone unit 3, and the overlying thick massive siltstone (unit 4) with horizons of calcareous concretions overlain by Pleistocene terrace/Holocene sand colluvium are in separate, back-rotated eastward dipping landslide blocks as shown in an east-west cross section (Plate AI). These borehole and outcrop data were used in reconstructing two small east-west cross sections (A and B) of the Johnson Creek translational slide (before sliding, A; and after sliding, B).
In cross section B on Plate AI (no vertical exaggera-tion), correlation lines connecting Astoria sandstone sequence C and siltstone units 2 and 3 dip 17° west-ward above the active basal slip plane. Correlated sand-stone sequences A and B and siltstone unit 1 (a more confident correlation between boreholes) also dip 17 to 20° west below the active slip plane. The dip of these
correlation lines and calculated dips closely match the regional dips measured with a Brunton compass in an Astoria Formation wave-cut bench 150 ft west of the Johnson Creek landslide sea cliff by Alan Niem and just east of the headscarp mapped by George Priest (Figure A2) range from 17° to 20° west. Dips measured on rare bedding in the cores of the three boreholes during drilling (measured by Beckstrand, Niem, and Priest) average 17° but range from 10° to 20° (Plate AI). The lower dip amounts measured below the slip plane could be explained by (a) drag or displacement of different blocks of Astoria Formation by three postulated normal or oblique-slip faults (drawn to make a balanced cross section) or (b) inaccuracy of correlation or drafting or variation (plus or minus a few degrees) of measuring field and core attitudes (i.e., strikes and dips).
Figure a2. Geologic map of the Johnson Creek landslide study area (from G. Priest; updated January 3, 2004, by A. R. Niem and W. A. Niem).

4 | Appendix A Oregon Department of Geology and Mineral Industries Special Paper 40
Johnson Creek Landslide Research Project, Lincoln County, Oregon: Final Report
Figure a3a. Comparison of the X-ray diffraction patterns of clay-sized fraction (<2 microns) of four samples: Mg-saturated glycolated host rock in sea cliff (GR03-1), gouge in basal slip plane at the sea cliff (GR03-00, siltstone
unit 3), core sample of host rock clayey siltstone (siltstone unit 2) at 54 ft (N03-XX), and clay-silt gouge in basal slip plane at 58.1 ft (borehole LT-2p). All four samples contain mainly expandable Fe-smectite clay matrix (large peak
labeled 1) with minor (smaller peaks) detrital illite, Fe-chlorite, possible kaolinite, quartz, anorthite, and diagenetic pyrite. The similarity of peaks suggests the host rock siltstone is the parent rock for the slip plane gouge.
Figure a3b. X-ray diffraction patterns of the silt-sized fraction (>2 microns) of the clay-silt gouge of the basal slip plane show that the gouge contains detrital quartz, calcic plagioclase (i.e.,
anorthite Na, Ca), pyrite, muscovite, chlorite, nontronite (Fe-smectite), and calcite.

Oregon Department of Geology and Mineral Industries Special Paper 40 Appendix A | 5
Johnson Creek Landslide Research Project, Lincoln County, Oregon: Final Report
2. X-ray diffraction Study of the mineralogical and microscopic (i.e., Sem) Causes of Slope Failure
The active basal slip plane in the boreholes consists of a thin sheared gouge of wet, soft, medium gray, sheared clayey siltstone. This wet sticky gouge could be easily rolled and molded into long threads between the thumb and index finger, suggesting a moderate clay content. Due to the soft wet nature of the slide plane gouge, recovery was usually poor. A Shelby tube sample of the slide plane gouge (from LT-2P at 59-60 ft) from Landslide Technology underwent XRD analysis but not hydrometer or sieve size analysis. However, a sample of the nearby host clayey siltstone (core sample N03-XX at 54 ft in LT-2) has the same mineralogy (see later XRD discussion) and contains 24.5% clay, 74.6% silt, and 0.9% sand (Table A1).
Based upon inclinometer depths to the basal slip plane and construction of a 1:1 cross section (on Plate AI), the slip plane dips 17° westward between boreholes LT-3 and LT-2 and flattens to 8° westward between LT-
Figure a3c. X-ray diffraction pattern of the clay-sized fraction (<2 microns) of the host rock siltstone (siltstone unit 3) that contains the active slip plane at the base of the sea cliff outcrop. Note the shift to lower 2-theta value of the
smectite peak upon glycolation. Other clay-sized components include detrital Fe-chlorite, illite, quartz, and calcite.
table a1. Size statistics data.
SampleNo.Percent
SandPercent
SiltPercent
Clay
GR03-00 0.6 93.1 6.3
GR03-1 12.8 74.5 12.7
GR03-5 0.3 79.4 20.3
GR03-6 13 66 21
GR03-7 37.5 55.8 6.7
GR03-8 71 24.6 4.4
GR03-9 5.6 87.7 6.7
GR03-10 5.7 76.9 17.4
GR03-13 31 57 12
N03-32 67.1 32.4 0.5
N03-53 79 20.5 0.5
N03-XX (LT-2 @ 54 ft) 0.9 74.6 24.5
Pin03-2 76 17.5 6.5
Pin03-4a 51.7 32.6 15.7
Shaded cells indicate siltstone samples, including slip plane gouge sample (GR03-00) at base of southern sea cliff section. Other samples are sandstone.

6 | Appendix A Oregon Department of Geology and Mineral Industries Special Paper 40
Johnson Creek Landslide Research Project, Lincoln County, Oregon: Final Report
2 and LT-1 (cross section B, Plate AI). The slip plane is just below sea level (NAVD 1983) and then curves up to the surface at the beach, cutting across sand-stone sequences C and D and siltstone units 3 and 4 and forming a low bench that is seasonally covered by beach sand. A backhoe excavation of the slip plane near where it emerges on the beach (supervised by George Priest) and winter field observations of the low wave-cut bench that contains the slip plane at the base of the sea cliff suggest the slip plane is nearly horizontal at the surface and then dips 35° eastward thrusted out over 3 to 4.5 ft of modern winter beach heavy mineral sand, sandstone boulder talus, and a basal shelly basalt gravel and underlying intact siltstone unit 4 (bedrock). The basal slip plane gouge, which was temporarily
exposed in February 2003 on the wave-cut platform below the southern sea cliff measured section, was sampled (sample GR03-00) and underwent XRD and hydrometer/sieve size analysis. It consists of 6.3 wt % clay size grains, 93.1 wt % silt, and 0.6 wt % sand (Table A1; Figure A4). It was surprising that the wet, plastic (i.e., moderate plasticity) siltstone gouge sample did not have more clay than indicated by the hydrometer grain size analysis because it felt sticky and easily rolled into a ball and thread (see further discussion in section on grain size analysis of siltstones).
Overlying the thin basal slip plane shear gouge (soft, micro-slickensided wet clayey silt) are 10 or more feet of landslide toe breccia, consisting of very poorly sorted, angular broken blocks of Dentalium-bearing
Figure a4. Grain size classification of disaggregated lower and middle Miocene Astoria Formation sandstones and siltstones from sea cliffs at the toe of the Johnson Creek landslide and from cored boreholes LT-1, LT-2, and LT-3.
Grain sizes from sieve and hydrometer analysis Triangular classification diagram of sediments by Folk (1974).

Oregon Department of Geology and Mineral Industries Special Paper 40 Appendix A | 7
Johnson Creek Landslide Research Project, Lincoln County, Oregon: Final Report
siltstone unit 3 (the host rock) in a sheared clayey(?) silt matrix. The breccia is locally overlain by intact (nearly unfractured) siltstone unit 3 that occurs just below sandstone sequence D in the southern sea cliff mea-sured section. The sample of host rock siltstone unit 3 (sample GR03-1) consists of 12.7% clay, 74.5% silt, and 12.89% sand (Table A1). Landslide breccia also appears as a 16-ft-thick section of subhorizontal landslide brec-cia zones (composed of angular mudstone clasts and chips in clayey silty gouge) and intervening intact silt-stone unit 2 in the lower part of borehole LT-1 (Plate AI). The active basal slip plane in LT-1, based upon inclinometer data, lies in the middle of this brecciated zone and includes many overlying and underlying high-angle, slickensided, open (or clay or iron oxide filled) planar extensional fractures that could act as perme-able avenues for groundwater flow. Similar extensional high-angle fractures with normal listric slip of a few to several meters occur above the basal slip plane gouge and landslide breccia zone in the sea cliffs at the toe of the landslide (i.e., west end of cross section B).
XRD analysis of the clay mineralogy of the basal slip plane clay-silt gouge in LT-2 (sample LT-2P Shelby tube at 59-60 ft, siltstone unit 2, in Figure A3a) and in the sea cliff outcrop (siltstone unit 3; sample GR03-00) shows that the clay-sized fraction (<2 microns) in this gouge is composed mainly of expandable iron-rich smectite (clay mineral) with minor amounts of detrital illite (mus-covite), chlorite (altered biotite?), and perhaps some kaolinite (kaolin) clay minerals (see XRD pattern Figure A3a). Similarly, XRD analysis reveals that the silt-sized fraction (>2 microns) of the gouge contains detrital quartz, calcic plagioclase (i.e., anorthite Na, Ca), pyrite, muscovite, chlorite (clinochlore; altered biotite?), non-tronite (Fe-smectite), and calcite (see XRD pattern Figure A3b). X-ray diffraction and thin section study show that these clay mineral types and other minerals are identical to the minerals in samples (e.g., outcrop sample GR03-1 and core sample N03-XX from 54 ft in LT-2) of the adjacent foram-bearing host rock siltstone (units 3 and 2) (see XRD pattern of host rock sample GR03-1 and N03-XX; Figures A3a and A3b). SEM photomicrographs of the sheared gouge show that the expandable iron-rich smectite clay (nontronite?) has been crudely aligned parallel to the slip planes and con-tains micro-slickensides and sheared and broken foram microfossil tests as a result of this slippage (Figures A5a, A5b, and A5c) suggesting a preferred zone or plane of
Figure a5a. SEM photomicrograph of sheared contact (sample GR03-02) shows the contact of the undeformed host siltstone (labeled S) with broken fragmented clay-silt gouge (note angular broken siltstone fragments labeled G). The dark crack (labeled C) is the sharp 2-mm-thick contact. Note 1-mm bar scale in bottom margin of photo.
Figure a5b. SEM photomicrograph at low magnification (12.5×) shows a sharp smooth shear plane (labeled Fr) that appears to step across the specimen. The specimen was mounted upside-down, which places the shear gouge (g) in the upper NW half of the photograph and the unsheared siltstone (s) in the lower SE half of the photograph. The sheared gouge appears as a jumbled mass of largely subparallel (imbricated) smectite clay particles or packets. In the gouge, multiple fractures (dark lines), along which slippage has occurred, are subparallel the main shear boundary.

8 | Appendix A Oregon Department of Geology and Mineral Industries Special Paper 40
Johnson Creek Landslide Research Project, Lincoln County, Oregon: Final Report
weakness and residual strength. Thin section and SEM photomicrographs also show that many intersecting microdehydration cracks can develop in the expand-able smectite-rich gouge as a result of sample prepara-tion (drying and dehydration; Figure A6). It is suggested that these microfractures could also form naturally and could represent avenues for groundwater flow which could further weather the gouge and weaken the cohe-sion and residual strength by chemical reactions (e.g., dehydration and rehydration of expandable smectite clay in the gouge zone due to seasonal fluctuations of the groundwater table related to rainfall). Groundwater access to such confined microfracture porosity in the slip plane could reduce frictional resistance force and increase the upward normal pressure on the overlying less permeable intact host clayey siltstone in the slide block overlying the basal slip plane.
3. grain Size analysis of Sedimentary units in Johnson Creek landslide and their Potential Contribution to the modern littoral budget
Sieve and hydrometer grain size analysis was conduct-ed on 12 Astoria Formation sandstone and siltstone samples (Tables A1 and A2). Most samples are from the southern sea cliff measured section at the toe of the Johnson Creek landslide (i.e., sandstone sequence D and siltstone units 2, 3, and 4), but some came from the
borehole cores, including siltstone unit 2 (Figures A1 and A2). Three samples of modern (Holocene) beach and dune sands also were sieved (Table A2). Compari-son of the grain size distribution and size statistics of these samples (modern sands and bedrock) allowed preliminary conclusions about how much sand from the Astoria Formation strata in the Johnson Creek sea cliffs contributes to the modern littoral sand budget (task 3 of the contract). The slip plane siltstone gouge and siltstone unit samples1 plot on a triangular sediment classification diagram (Figure A4) as siltstone or sandy siltstone (% clay ranges from 6.3% to 24.5%, averaging 14.3%), but we believe these rocks may contain more clay and less silt by weight than shown by the hydrom-eter settling tube analysis, perhaps due to incomplete disaggregation or some flocculation of clay-size grains as silt-sized flocs even though a deflocculating agent (sodium phosphate) was used. Initial visual thin section
�. Civil engineers and engineering geologists generally use the ASTM classification of sediments (e.g., used by ODOT; Bernie Kleutsch, 2003, personal communication) in which mud (i.e., mudstone) includes both silt-sized (siltstone) and clay-sized (claystone) sediment grains for geotechnical purposes. Muds (mudstones) are further differentiated in the Wentworth (1922) and National Research Council classifications used by many geologists. Figure A9 is a comparison of these scales used by engineers and geologists. We prefer to use the term siltstone in this preliminary report to agree with our hydrometer grain size analysis, with the sediment classification of Folk (Figure A4), and with the definition of the Astoria Formation by Snavely and others (1976, 1964) as sandstone, siltstone, and tuff on their regional geologic maps and reports in the Newport area.
Figure a5c. SEM photomicrograph of bent and broken test (shell) of benthonic foraminer (f ) along a fracture (Fr). Flake of biotite (mica) is labeled b.
Figure a6. Photomicrograph of dessication microfractures in siltstone sample N03-XX (borehole LT-2 at 54 ft). Microfractures were created as the sample was dried and heated in the process of preparing the thin section. Blue-dyed epoxy fills the microfractures (3.5×, plane-polarized light).
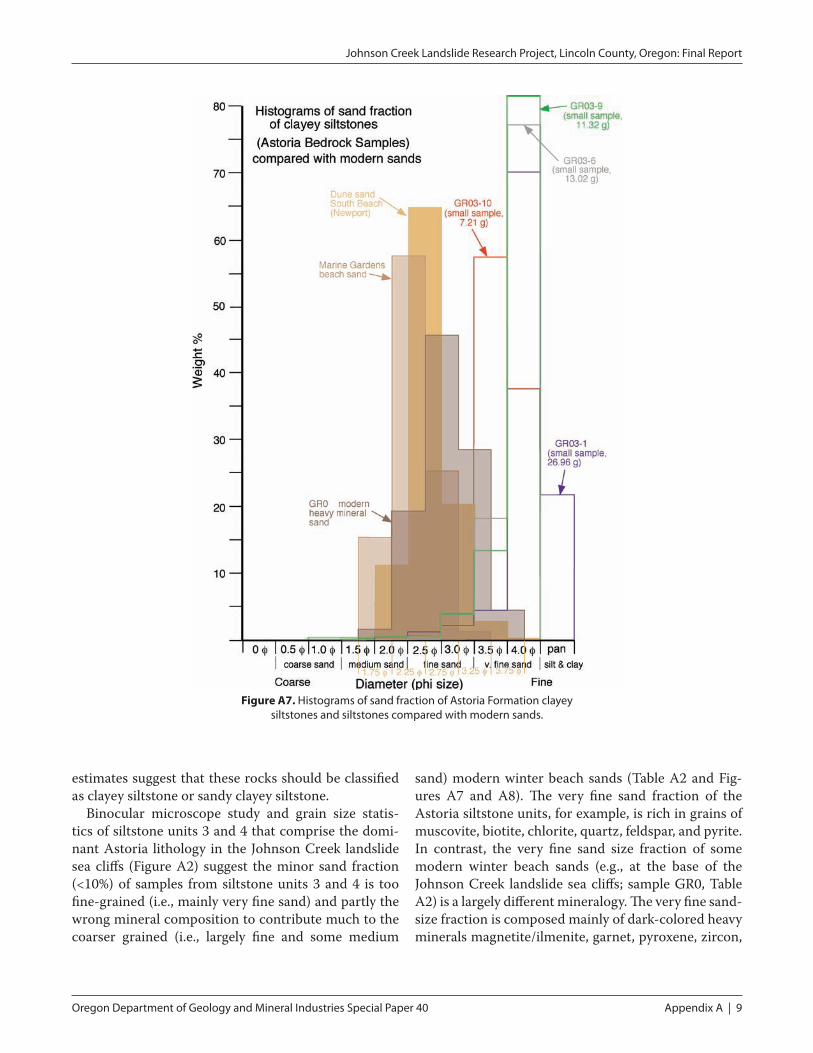
Oregon Department of Geology and Mineral Industries Special Paper 40 Appendix A | 9
Johnson Creek Landslide Research Project, Lincoln County, Oregon: Final Report
estimates suggest that these rocks should be classified as clayey siltstone or sandy clayey siltstone.
Binocular microscope study and grain size statis-tics of siltstone units 3 and 4 that comprise the domi-nant Astoria lithology in the Johnson Creek landslide sea cliffs (Figure A2) suggest the minor sand fraction (<10%) of samples from siltstone units 3 and 4 is too fine-grained (i.e., mainly very fine sand) and partly the wrong mineral composition to contribute much to the coarser grained (i.e., largely fine and some medium
sand) modern winter beach sands (Table A2 and Fig-ures A7 and A8). The very fine sand fraction of the Astoria siltstone units, for example, is rich in grains of muscovite, biotite, chlorite, quartz, feldspar, and pyrite. In contrast, the very fine sand size fraction of some modern winter beach sands (e.g., at the base of the Johnson Creek landslide sea cliffs; sample GR0, Table A2) is a largely different mineralogy. The very fine sand-size fraction is composed mainly of dark-colored heavy minerals magnetite/ilmenite, garnet, pyroxene, zircon,
Figure a7. Histograms of sand fraction of Astoria Formation clayey siltstones and siltstones compared with modern sands.

10 | Appendix A Oregon Department of Geology and Mineral Industries Special Paper 40
Johnson Creek Landslide Research Project, Lincoln County, Oregon: Final Report
tourmaline, hypersthene and other heavies and some very fine sand-sized grains of quartz and feldspar.
Some very fine- to fine-grained poorly sorted, bio-turbated, shallow-marine Astoria silty sandstones, such as the 10- to 11-ft-thick sandstone sequence D in the lower sea cliff at the toe of the landslide, could contribute 60 to 70% of its weight and volume (visually estimated in thin section) as compositionally similar fine2 sand-sized grains to the fine sand fraction of the quartz- and feldspar-rich modern beach sand. Howev-
2. Note: the ASTM engineer’s verbal and quantitative limits for sieved sand sizes are slightly different than the geologist’s Wentworth (1922) scale and National Research Council scale. In this report, we use the Wentworth’s scale, National Research Council scale, and phi scale (see Figure A9 for comparison).
er, a large proportion (estimated 30 to 40 wt. %) of the sieved Astoria sandstone samples, in statistical plots of mean size, standard deviation (a measure of sorting), and median size, is generally finer grained and more poorly sorted than the modern beach sands (Figures A10, A11, A12, and A13). Modern beach and Astoria sandstone bedrock and core samples generally overlap in skewness (a measure of the asymmetry of the grain size distribution). Quartz and feldspar grains in the Astoria Formation also are more angular than in the modern sand. A modern beach sand sample from near Otter Rock also contains, in addition to fine sand-sized quartz, feldspar, and very fine sand-sized dark-colored heavy minerals, well-rounded very coarse to medium
Figure a8. Binary plot of mean size versus standard deviation compares grain sizes of modern beach sands
with grain sizes of bedrock. After Friedman (1962).
Figure a9. Comparison of grain size scales used by geologists and by engineers.

Oregon Department of Geology and Mineral Industries Special Paper 40 Appendix A | 11
Johnson Creek Landslide Research Project, Lincoln County, Oregon: Final Report
Figure a10. Comparison of histograms for sand fraction of Astoria Formation sandstone bedrock and core samples (gray) with modern beach sands and dune sands. The modern sands are distinctly coarser grained than the sand fraction in the bedrock.

12 | Appendix A Oregon Department of Geology and Mineral Industries Special Paper 40
Johnson Creek Landslide Research Project, Lincoln County, Oregon: Final Report
sand-sized fragments of middle Miocene Columbia River Basalt derived from nearby basalt headlands and sea stacks (such as Cape Foulweather). This younger basalt unit overlies and invasively intruded (as dikes and sills) the older Astoria Formation. In contrast, the Miocene Astoria strata in thin section contain fine- and
some medium sand-sized fragments of andesite/basalt lava derived from the western Cascades volcanic arc and texturally distinct basalt clasts eroded from older Coast Range Eocene basalts, very coarse sand-sized grains of calcite-replaced pumice, metamorphic rock fragments, micas, green hornblende, pyrite, and carbonized wood
Figure a11. Nomogram with ranges of mean and median grain sizes of Astoria Formation (bedrock) samples and modern beach samples.
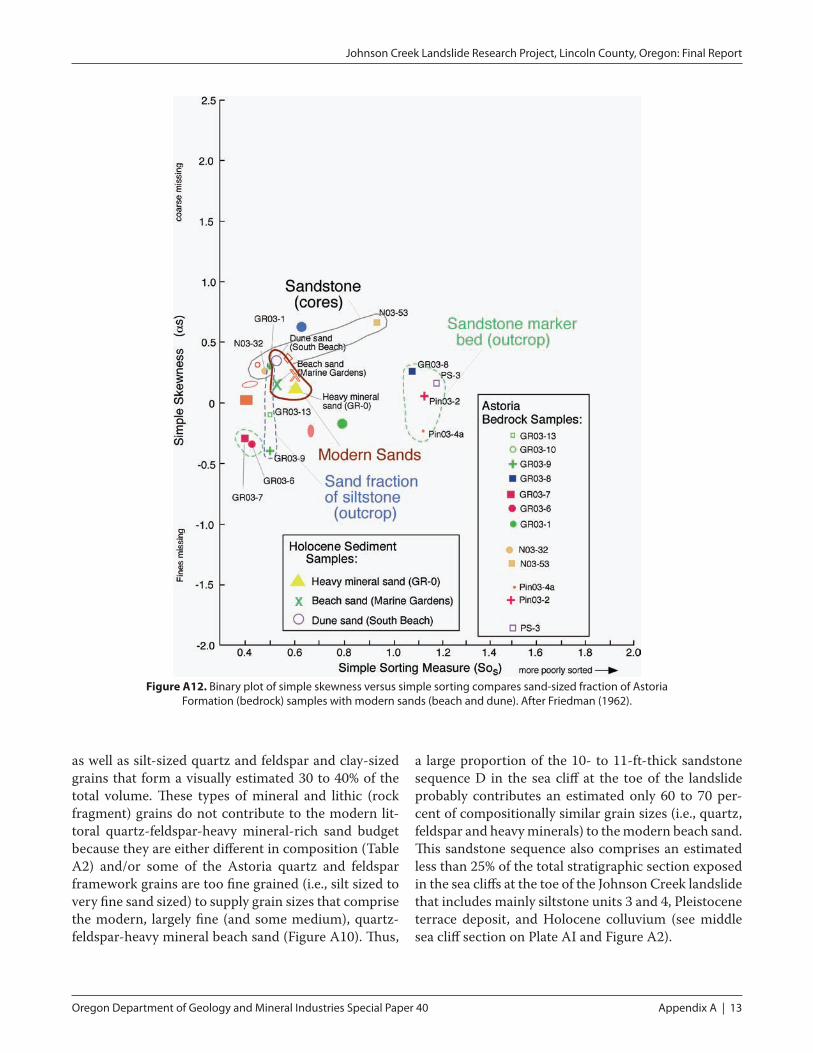
Oregon Department of Geology and Mineral Industries Special Paper 40 Appendix A | 13
Johnson Creek Landslide Research Project, Lincoln County, Oregon: Final Report
as well as silt-sized quartz and feldspar and clay-sized grains that form a visually estimated 30 to 40% of the total volume. These types of mineral and lithic (rock fragment) grains do not contribute to the modern lit-toral quartz-feldspar-heavy mineral-rich sand budget because they are either different in composition (Table A2) and/or some of the Astoria quartz and feldspar framework grains are too fine grained (i.e., silt sized to very fine sand sized) to supply grain sizes that comprise the modern, largely fine (and some medium), quartz-feldspar-heavy mineral beach sand (Figure A10). Thus,
a large proportion of the 10- to 11-ft-thick sandstone sequence D in the sea cliff at the toe of the landslide probably contributes an estimated only 60 to 70 per-cent of compositionally similar grain sizes (i.e., quartz, feldspar and heavy minerals) to the modern beach sand. This sandstone sequence also comprises an estimated less than 25% of the total stratigraphic section exposed in the sea cliffs at the toe of the Johnson Creek landslide that includes mainly siltstone units 3 and 4, Pleistocene terrace deposit, and Holocene colluvium (see middle sea cliff section on Plate AI and Figure A2).
Figure a12. Binary plot of simple skewness versus simple sorting compares sand-sized fraction of Astoria Formation (bedrock) samples with modern sands (beach and dune). After Friedman (1962).
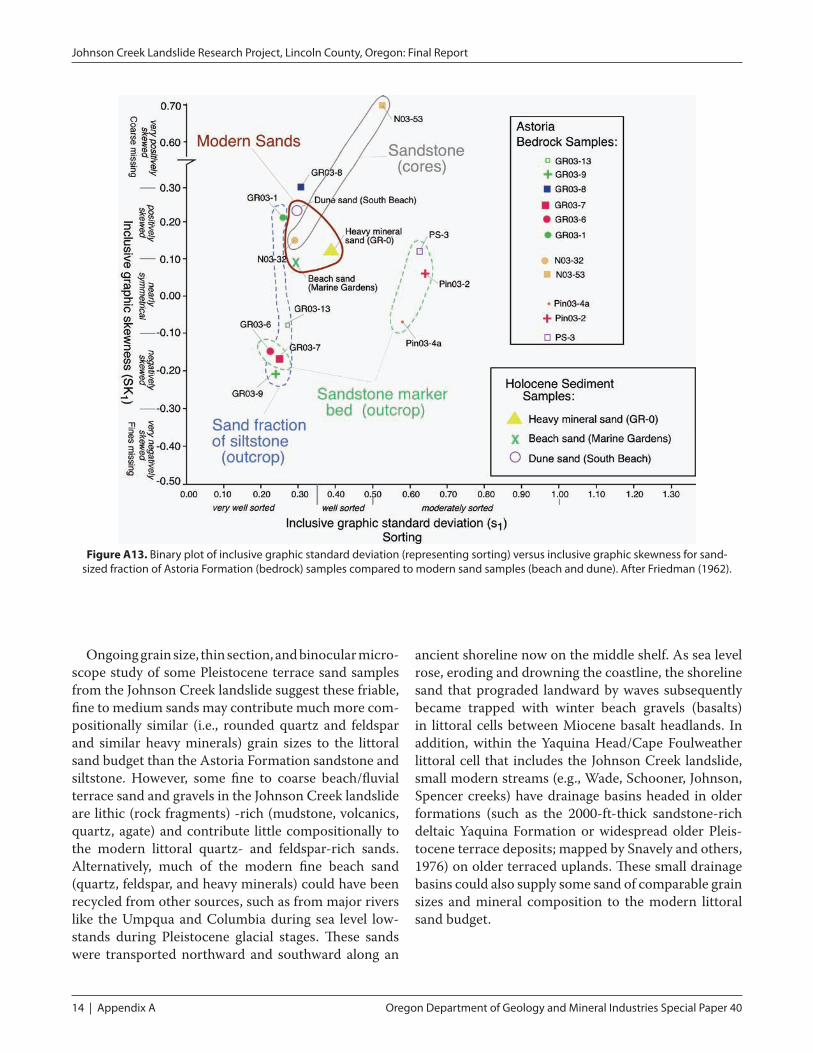
14 | Appendix A Oregon Department of Geology and Mineral Industries Special Paper 40
Johnson Creek Landslide Research Project, Lincoln County, Oregon: Final Report
Figure a13. Binary plot of inclusive graphic standard deviation (representing sorting) versus inclusive graphic skewness for sand-sized fraction of Astoria Formation (bedrock) samples compared to modern sand samples (beach and dune). After Friedman (1962).
Ongoing grain size, thin section, and binocular micro-scope study of some Pleistocene terrace sand samples from the Johnson Creek landslide suggest these friable, fine to medium sands may contribute much more com-positionally similar (i.e., rounded quartz and feldspar and similar heavy minerals) grain sizes to the littoral sand budget than the Astoria Formation sandstone and siltstone. However, some fine to coarse beach/fluvial terrace sand and gravels in the Johnson Creek landslide are lithic (rock fragments) -rich (mudstone, volcanics, quartz, agate) and contribute little compositionally to the modern littoral quartz- and feldspar-rich sands. Alternatively, much of the modern fine beach sand (quartz, feldspar, and heavy minerals) could have been recycled from other sources, such as from major rivers like the Umpqua and Columbia during sea level low-stands during Pleistocene glacial stages. These sands were transported northward and southward along an
ancient shoreline now on the middle shelf. As sea level rose, eroding and drowning the coastline, the shoreline sand that prograded landward by waves subsequently became trapped with winter beach gravels (basalts) in littoral cells between Miocene basalt headlands. In addition, within the Yaquina Head/Cape Foulweather littoral cell that includes the Johnson Creek landslide, small modern streams (e.g., Wade, Schooner, Johnson, Spencer creeks) have drainage basins headed in older formations (such as the 2000-ft-thick sandstone-rich deltaic Yaquina Formation or widespread older Pleis-tocene terrace deposits; mapped by Snavely and others, 1976) on older terraced uplands. These small drainage basins could also supply some sand of comparable grain sizes and mineral composition to the modern littoral sand budget.

Oregon Department of Geology and Mineral Industries Special Paper 40 Appendix A | 15
Johnson Creek Landslide Research Project, Lincoln County, Oregon: Final Report
reCommendationS
Some additional hydrometer grain size, XRD, thin section, and SEM study of the basal slip plane and Astoria siltstone units in outcrop and core would help define better the mineralogical and micro-textural causes (e.g., percent clay versus silt) of this landslide, which should then be fur-ther related to geotechnical engineering proper-ties. A rapid sediment analyzer (sedigraph) could be used to obtain quantitatively more meaning-ful grain size analysis of percent clay and silt than obtained with a hydrometer. Point counts of percent silt and sand versus clay in thin section would give better quantitative volumetric results than visual estimation.In order to draw a better balanced east-west cross section, a section of the westward-dipping Asto-ria strata along the Boise Cascade Johnson Creek logging road a short distance east of the head-scarp should be measured, described, and pro-jected (i.e., correlate sandstone, tuff and siltstone units) into the east-west correlation diagram to borehole LT-3 (Plate AI, Figures A1 and A2). This east-of-the-headscarp section, unaffected by the Johnson Creek landslide, would help to show the relative movement that has occurred since the slide was initiated. (Time and funds prevent this from being done in this preliminary report.) Additional sieving, pebble counts of gravels, mea-suring sections at the headscarp and augering the Pleistocene terrace deposit exposed in the heads-carp should be conducted to define the geometry of this deposit, the topographic relief on the Pleis-tocene/Astoria unconformity (e.g., incised paleo-valley fill? or wave-cut bench? with surge chan-nels or older landslide or faults). Some additional measured sections along the north-south sea cliff could be measured. Fracture analysis of joints and slip planes in those sections could be done to measure quantitatively the percentage of ver-tical porosity and permeability. Two north-south geologic cross sections across the Johnson Creek landslide could then be constructed and units correlated to augment the east-west cross section — one section at the headscarp at the eastern end of the Johnson Creek landslide and the other sec-tion along the beach sea cliffs. A three-dimen-sional fence diagram could then be constructed.
1.
2.
3.
The contribution of sand-sized sediment from modern streams draining the Astoria and Yaquina formations and Pleistocene terrace and other sea cliff exposures of Astoria sandstones in the Yaqui-na Head-Cape Foulweather littoral cell should be studied by sieving, thin section (i.e., point count-ing), and field examination in order to determine the potential of these units to contribute similar size sediment to the littoral sand budget and to calculate the volume of sediment shed from these units. Such studies would provide better quantita-tive information with the sea cliff erosion studies being conducted by Jon Allan. The Astoria For-mation samples from the Johnson Creek landslide study represent only 140 ft of the entire 1,000-ft plus Astoria section; this small sampling may not be representative of the potential grain size con-tribution of the entire sea cliff section in this cell.
reFerenCeS
Folk, R. L., 1974, Petrology of sedimentary rocks: Hemphill, Austin, Tex., 182 p.
Friedman, G. M., 1962, Comparison of moment mea-sures for sieving and thin section data in sedimen-tary and petrological studies: Journal of Sedimen-tary Petrology, v. 32, p. 15–25.
Snavely, P. D., Jr., Rau, W. W., and Wagner, H. C., 1964, Miocene stratigraphy of the Yaquina Bay area, Newport, Oregon: The Ore Bin, v. 26, no. 8, p. 133–151.
Snavely, P. D., Jr., MacLeod, N. S., Wagner, H. C., and Rau, W. W., 1976, Geologic map of the Cape Foulweather and Euchre Mountain quadrangles, Lincoln County, Oregon: U.S. Geological Survey Misc. Inv. Series Map I-868, scale 1:62,500.
Wentworth, C. K., 1922, A scale of grade and class terms for clastic sediments: Journal of Geology, v. 30, p. 377–392.
4.


Oregon Department of Geology and Mineral Industries Special Paper 40 Appendix A | 17
Johnson Creek Landslide Research Project, Lincoln County, Oregon: Final Report
Table A2. Percentage sand, silt, and clay in samples.
Easting Northing
Elevation (m) relative
to NAVD 1983
Sample No. *
Location Description
Lithology or Sediment Classification Principal Minerals
Sample Wt. (g)
Mean (numerical)
(φ) Mean
(verbal)
Median (numerical)
(φ)Median (verbal)
Standard Deviation
(s1) (φ)
Simple Sorting
(numerical) (φ)
Sorting (verbal)
Skewness (numerical)
(Sk1) ** (φ)
Skewness (verbal)
Simple skewness (alpha s)
Kurtosis (numerical)
Kurtosis (verbal) ***
2,218,352.78 125,494.11 5.55 Pin03-4a northern sea cliff section
friable fine to medium grained sandstone
quartz (70–80%), feldspar (5–10%), mica (muscovite) (<3%), heavy minerals (green pyroxenes and opaques) (<6%)
110.09 2.9 fine sand
2.75 fine sand
0.5784 1.13 moderately sorted
-0.07 nearly symmetrical
-0.25 1.84 very leptokurtic
2,218.367.4 125,277.24 2.35 GR03-00 southern sea cliff section
basal gouge quartz, white and black micas, forams, quartz, translucent heavy minerals
2.74 4.18 coarse silt
4.21 coarse silt
0.3773 0.75 well sorted -0.55 very negatively skewed
1.81 very leptokurtic
2,218.367.4 125,277.24 3.1 GR03-1 southern sea cliff section
Dentalium (fossil scaphopod) -bearing clayey siltstone at base of section
quartz (50%), feldspar (15%), biotite/chlorite (20%), muscovite (10%), opaque heavy minerals (5%), forams (5%)
26.96 (without forams
and shell fragments)
3.93 very fine sand
3.85 very fine sand
0.264 0.5 very well sorted
0.21 positively skewed
0.3 4.1 extremely leptokurtic
2,218.367.4 125,277.24 3.7 GR03-5 southern sea cliff section
tuffaceous claystone
quartz, white and black micas, feldspar
1 4.07 coarse silt
4.17 coarse silt
0.3442 0.58 very well sorted
-0.37 very negatively skewed
1.57 very leptokurtic
2,218.367.4 125,277.24 3.85 GR03-6 southern sea cliff section
fine-grained calcite-cemented sandstone
13.02 3.65 very fine sand
3.65 very fine sand
0.2288 0.43 very well sorted
-0.15 slightly negatively
skewed
–0.35 1.39 leptokurtic
2,218.367.4 125,277.24 4.6 GR03-7 southern sea cliff section
Patinopecten sandstone
quartz (50%) feldspar (40%), white mica + biotite/chlorite (<2%), translucent heavy minerals (<2%), opaque heavy minerals (ilmenite/magnetite) (<3%), carbonized wood (3%)
57.3 3.53 very fine sand
3.6 very fine sand
0.2462 0.4 very well sorted
-0.17 slightly negatively
skewed
–0.3 1.09 mesokurtic
2,218.367.4 125,277.24 5.25 GR03-8 southern sea cliff section
shallow marine fine-grained sandstone
quartz (70%), lithics (24%), feldspars (5%)
128.03 2.3 fine sand
2.65 fine sand
0.3133 1.075 very well sorted
0.3 positively skewed
0.25 1.47 leptokurtic
2,218.367.4 125,277.24 6.75 GR03-9 southern sea cliff section
clayey sandy siltstone - 8” above 10-11 ft yellow sandstone marker bed
quartz (60%), feldspar (10–15%), biotite (5%), white mica (15%), opaque heavy minerals (5%)
11.32 3.63 very fine sand
3.65 very fine sand
0.239 0.5 very well sorted
-0.21 negatively skewed
–0.4 2.05 very leptokurtic
2,218.367.4 125,277.24 8.28 GR03-10 southern sea cliff section
clayey sandy siltstone 3 to 5 ft below top of sea cliff
quartz (50%), feldspar (20%), mica (10%), opaques (5%), shell fragments (<3%)
7.21 3.5 very fine sand
3.5 very fine sand
0.2538 0.43 very well sorted
-0.06 nearly symmetrical
1.16 leptokurtic
(table continued on next page)* All samples for size analysis, thin section, SEM, and XRD from the middle and northern sea cliff sections were rock fall collected on the public beach (sand) and correlated to the adjacent sea cliff sections. These sections were measured from the public beach by visually estimating thickness of units using a 3-m pole tilted perpendicular to the angle of dip of the strata in the sea cliff.
Samples from the southern sea cliff section, which was described and measured with a Jacobs staff and Abney level, were collected directly from the coastal sea cliff which is on State of Oregon land.
** Positive skewness = coarse fraction missing. Negative skewness = fine fraction missing.
*** Leptokurtic = very tall peak. Mesokurtic = close to normal curve. Platykurtic = flat curve

18 | Appendix A Oregon Department of Geology and Mineral Industries Special Paper 40
Johnson Creek Landslide Research Project, Lincoln County, Oregon: Final Report
Easting Northing
Elevation (m) relative
to NAVD 1983
Sample No. *
Location Description
Lithology or Sediment Classification Principal Minerals
Sample Wt. (g)
Mean (numerical)
(φ) Mean
(verbal)
Median (numerical)
(φ)Median (verbal)
Standard Deviation
(s1) (φ)
Simple Sorting
(numerical) (φ)
Sorting (verbal)
Skewness (numerical)
(Sk1) ** (φ)
Skewness (verbal)
Simple skewness (alpha s)
Kurtosis (numerical)
Kurtosis (verbal) ***
2,218.367.4 125,277.24 14.83 GR03-13 southern sea cliff section
weathered clayey sandy siltstone at 8 ft below top of section
quartz (60%), feldspar (30%), micas (5%), opaque heavy minerals (3%), translucent heavy minerals (2%)
41.65 3.6 very fine sand
3.65 very fine sand
0.264 0.5 very well sorted
-0.08 nearly symmetrical
–0.1 1.37 leptokurtic
2,218,430.39 125,383.68 3.7 N03-32 LT-3 @ 68.4 ft pumice-bearing fine- to medium-grained fossiliferous sandstone
54.53 3.23 very fine sand
3.2 very fine sand
0.2939 0.48 very well sorted
0.15 slightly positively skewed
0.25 0.87 platykurtic
2,218,515.77 125,374.33 6.3 N03-53 LT-1 @ 58.8 ft medium-grained sandstone
quartz (75%), lithics (25%)
92.78 2.57 fine sand
2.5 fine sand
0.5303 0.93 moderately sorted
0.7 very positively skewed
0.65 1.26 leptokurtic
2,218,480.36 125,383.12 8.1 N03-XX LT-2 @ 54 ft clayey siltstone
quartz, feldspar, white mica, black mica, pyrite, forams
2.94 3.38 very fine sand
3.64 very fine sand
0.6563 1.09 moderately sorted
-1.38 very negatively skewed
0.95 mesokurtic
2,218,352.78 125,494.11 4.35 Pin03-2 northern sea cliff section
calcite-cemented fine- to medium-grained silty sandstone
quartz (70%), feldspar (20%), green translucent lithic (5%), opaque heavy minerals (2%), mica (<1%)
103.6 2.6 fine sand
2.6 fine sand
0.6409 1.125 moderately sorted
0.06 nearly symmetrical
0.05 1.42 leptokurtic
2,218,357.08 125,392.03 4.86 PS-3 middle sea cliff section
calcite-cemented fine- to medium-grained sandstone
quartz (70%),lithics (30%)
195.88 2.47 fine sand
2.5 fine sand
0.63 1.175 moderately sorted
0.12 slightly positively skewed
0.15 1.48 leptokurtic
6(?) Holocene dune
South Beach State Park (Newport)
dune sand quartz (55%), feldspar (30%), translucent heavy minerals (pyroxene, garnet, hornblende, and others) (8%), opaque heavy minerals (7%)
202.48 2.35 fine sand
2.3 fine sand
0.2966 0.525 very well sorted
0.23 positively skewed
0.35 1.43 leptokurtic
2(?) Marine Gardens
beach sand
Marine Gardens, Otter Rock
winter beach sand
173.11 2.07 fine sand
2.05 fine sand
0.2966 0.525 very well sorted
0.09 nearly symmetrical
0.15 1.08 mesokurtic
2,218,364 125,277 2.2 GR0 heavy
mineral beach sand
modern beach, southern sea cliff section
winter beach sand
181.6 2.6 fine sand
2.55 fine sand
0.3943 0.6 well sorted 0.12 positively skewed
0.1 0.89 platykurtic
* All samples for size analysis, thin section, SEM, and XRD from the middle and northern sea cliff sections were rock fall collected on the public beach (sand) and correlated to the adjacent sea cliff sections. These sections were measured from the public beach by visually estimating thickness of units using a 3-m pole tilted perpendicular to the angle of dip of the strata in the sea cliff.
Samples from the southern sea cliff section, which was described and measured with a Jacobs staff and Abney level, were collected directly from the coastal sea cliff which is on State of Oregon land.
** Positive skewness = coarse fraction missing. Negative skewness = fine fraction missing.
*** Leptokurtic = very tall peak. Mesokurtic = close to normal curve. Platykurtic = flat curve.
Table A2. continued.

Oregon Department of Geology and Mineral Industries Special Paper 40Johnson Creek Landslide Research Project, Lincoln County, Oregon: Final Report
by G. R. Priest, J. C. Allan, A. R. Niem, W. A. Niem, and S. E. DickensonAppendix A

Oregon Department of Geology and Mineral Industries Special Paper 40 Appendix B | 1
Johnson Creek Landslide Research Project, Lincoln County, Oregon: Final Report
aPPendiX b: borehole logS
The following logs (Figures B1–B8) are reproduced here for the convenience of the reader.
2002-2003 logs (Figures b1–b6) (landslide technology, 2004)
Figure b1. Summary boring log LT-1.

2 | Appendix B Oregon Department of Geology and Mineral Industries Special Paper 40
Johnson Creek Landslide Research Project, Lincoln County, Oregon: Final Report
Figure b1. continued.

Oregon Department of Geology and Mineral Industries Special Paper 40 Appendix B | 3
Johnson Creek Landslide Research Project, Lincoln County, Oregon: Final Report
Figure b2. Summary boring log LT-1P.

4 | Appendix B Oregon Department of Geology and Mineral Industries Special Paper 40
Johnson Creek Landslide Research Project, Lincoln County, Oregon: Final Report
Figure b2. continued.

Oregon Department of Geology and Mineral Industries Special Paper 40 Appendix B | 5
Johnson Creek Landslide Research Project, Lincoln County, Oregon: Final Report
Figure b3. Summary boring log LT-2.

6 | Appendix B Oregon Department of Geology and Mineral Industries Special Paper 40
Johnson Creek Landslide Research Project, Lincoln County, Oregon: Final Report
Figure b3. continued.

Oregon Department of Geology and Mineral Industries Special Paper 40 Appendix B | 7
Johnson Creek Landslide Research Project, Lincoln County, Oregon: Final Report
Figure b4. Summary boring log LT-2P.

8 | Appendix B Oregon Department of Geology and Mineral Industries Special Paper 40
Johnson Creek Landslide Research Project, Lincoln County, Oregon: Final Report
Figure b4. continued.

Oregon Department of Geology and Mineral Industries Special Paper 40 Appendix B | 9
Johnson Creek Landslide Research Project, Lincoln County, Oregon: Final Report
Figure b5. Summary boring log LT-3.

10 | Appendix B Oregon Department of Geology and Mineral Industries Special Paper 40
Johnson Creek Landslide Research Project, Lincoln County, Oregon: Final Report
Figure b5. continued.

Oregon Department of Geology and Mineral Industries Special Paper 40 Appendix B | 11
Johnson Creek Landslide Research Project, Lincoln County, Oregon: Final Report
Figure b6. Summary boring log LT-3P.

12 | Appendix B Oregon Department of Geology and Mineral Industries Special Paper 40
Johnson Creek Landslide Research Project, Lincoln County, Oregon: Final Report
2006 borehole logs (Figures b7–b8) (William Schulz, u.S. geological Survey)
Figure b7. Subsurface exploration log B-4.

Oregon Department of Geology and Mineral Industries Special Paper 40 Appendix B | 13
Johnson Creek Landslide Research Project, Lincoln County, Oregon: Final Report
Figure b8. Subsurface exploration log B-5.

14 | Appendix B Oregon Department of Geology and Mineral Industries Special Paper 40
Johnson Creek Landslide Research Project, Lincoln County, Oregon: Final Report
Figure b8. continued.
reference: Landslide Technology, 2004, Geotechnical investigation Johnson Creek landslide, Lincoln County, Oregon: Oregon Department of Geology and Mineral Industries Open-File Report O-04-05, 115 p.

Oregon Department of Geology and Mineral Industries Special Paper 40 Appendix C | �
Johnson Creek Landslide Research Project, Lincoln County, Oregon: Final Report
APPENDIX C: BorINg Logs AND INCLINomEtEr DAtA — 1972–1976
Figure C1. Oregon State Highway Division January 9, �979, memorandum regarding Johnson Creek slide slope meter tubes.

� | Appendix C Oregon Department of Geology and Mineral Industries Special Paper 40
Johnson Creek Landslide Research Project, Lincoln County, Oregon: Final Report
Figure C2. Oregon State Highway Division soils and geological exploration log 7�-�.

Oregon Department of Geology and Mineral Industries Special Paper 40 Appendix C | �
Johnson Creek Landslide Research Project, Lincoln County, Oregon: Final Report
Figure C2. continued.

4 | Appendix C Oregon Department of Geology and Mineral Industries Special Paper 40
Johnson Creek Landslide Research Project, Lincoln County, Oregon: Final Report
Figure C3. Oregon State Highway Division soils and geological exploration log 7�-�.

Oregon Department of Geology and Mineral Industries Special Paper 40 Appendix C | �
Johnson Creek Landslide Research Project, Lincoln County, Oregon: Final Report
Figure C4. Oregon State Highway Division soils and geological exploration log 76-�.

6 | Appendix C Oregon Department of Geology and Mineral Industries Special Paper 40
Johnson Creek Landslide Research Project, Lincoln County, Oregon: Final Report
Figure C4. continued.

Oregon Department of Geology and Mineral Industries Special Paper 40 Appendix C | 7
Johnson Creek Landslide Research Project, Lincoln County, Oregon: Final Report
Figure C4. continued.

� | Appendix C Oregon Department of Geology and Mineral Industries Special Paper 40
Johnson Creek Landslide Research Project, Lincoln County, Oregon: Final Report
Figure C5. Oregon State Highway Division soils and geological exploration log 76-�.

Oregon Department of Geology and Mineral Industries Special Paper 40 Appendix C | 9
Johnson Creek Landslide Research Project, Lincoln County, Oregon: Final Report
Figure C5. continued.

�0 | Appendix C Oregon Department of Geology and Mineral Industries Special Paper 40
Johnson Creek Landslide Research Project, Lincoln County, Oregon: Final Report
Figure C6. Oregon State Highway Division soils and geological exploration log 76-�.

Oregon Department of Geology and Mineral Industries Special Paper 40 Appendix C | ��
Johnson Creek Landslide Research Project, Lincoln County, Oregon: Final Report
Figure C6. continued.

�� | Appendix C Oregon Department of Geology and Mineral Industries Special Paper 40
Johnson Creek Landslide Research Project, Lincoln County, Oregon: Final Report
Figure C7. Oregon State Highway Division soils and geological exploration log 76-4.

Oregon Department of Geology and Mineral Industries Special Paper 40 Appendix C | ��
Johnson Creek Landslide Research Project, Lincoln County, Oregon: Final Report
Figure C7. continued.

Oregon Department of Geology and Mineral Industries Special Paper 40 Appendix D | �
Johnson Creek Landslide Research Project, Lincoln County, Oregon: Final Report
APPENDIX D: 2003 INCLINomEtEr PLots From LANDsLIDE tEChNoLogy
Figure D1. Inclinometer LT-� deflection plot.

� | Appendix D Oregon Department of Geology and Mineral Industries Special Paper 40
Johnson Creek Landslide Research Project, Lincoln County, Oregon: Final Report
Figure D2. Inclinometer LT-� deflection plot.

Oregon Department of Geology and Mineral Industries Special Paper 40 Appendix D | �
Johnson Creek Landslide Research Project, Lincoln County, Oregon: Final Report
Figure D3. Inclinometer LT-� deflection plot.

Oregon Department of Geology and Mineral Industries Special Paper 40 Appendix E | �
Johnson Creek Landslide Research Project, Lincoln County, Oregon: Final Report
Survey points were established on the ground sur-face at three east-west sections across the slide (Figure E1). Two sets of readings were taken, one in October 2002 and one in April 2003. Based on readings taken in stable ground (Figures E1 and E2), the survey repeat-ability error appears to be relatively large, about 11 cm to 15 cm horizontal and 1 to 130 cm vertical (Table E1). Only one point had an error of 130 cm vertical, prob-ably from disturbance of the steel stake or calculation/transcription error; points east of the slide are in rec-reational use and subject to disturbance. Mean vertical error without this point is 2.9 cm (Table E2).
Differences and vector directions between points are depicted in Table E1 and Figures E3–E8. Arctangents of the vertical over the horizontal movements (Table E2) generally agree with approximate dips of the basal shear zone estimated from inclinometer data, although
the large survey errors make any such agreement some-what fortuitous.
Ground movements within the landslide are gen-erally faster toward the west and the south. Highway damage was largest on the south margin of the slide relative to the north (Figures E9 and E1), confirming the general trend of the resurvey data. Figure E10 docu-ments 18 cm of vertical offset south of the southern-most survey line from December 2002 cumulative slide movement. Movement in the center of the slide at this time was ~5 cm horizontal, based on extensometer data. A much larger movement occurred January 29, 2003, that caused ~24 cm horizontal displacement at the center of the slide and heavy damage to this part of the highway. The damage was repaired before a photo could be taken.
Appendix e: Slide MoveMent froM SurveyS of iron MArker pinS october 24, 2002, And April 17, 2003

� | Appendix E Oregon Department of Geology and Mineral Industries Special Paper 40
Johnson Creek Landslide Research Project, Lincoln County, Oregon: Final Report
figure e1. Horizontal error in centimeters for relocation of survey points on stable ground outside the landslide. See Figure � of the main text for explanation of slide block boundaries (black and purple lines).
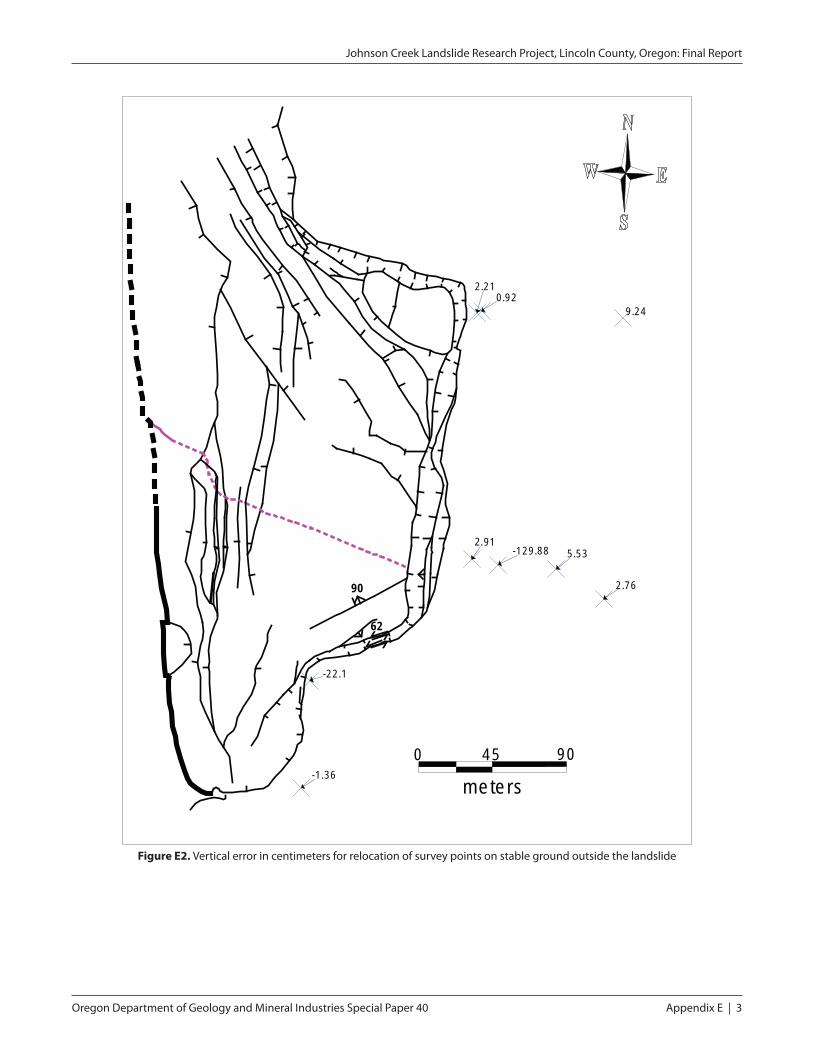
Oregon Department of Geology and Mineral Industries Special Paper 40 Appendix E | �
Johnson Creek Landslide Research Project, Lincoln County, Oregon: Final Report
909090909090909090
626262626262626262
0 45 90
me te rs
2 .210 .92
-129 .88 5 .532.91
2 .76
-22 .1
-1 .36
9 .24
figure e2. Vertical error in centimeters for relocation of survey points on stable ground outside the landslide

4 | Appendix E Oregon Department of Geology and Mineral Industries Special Paper 40
Johnson Creek Landslide Research Project, Lincoln County, Oregon: Final Report
table e1. Re-survey of steel stake markers at the headwall for error analysis.
Distance (m) East of Headscarp
Horizontal Error (cm)
Vertical Error (cm) Area
�.� 0.0 �.� northeast headwall
6.0 �0.9 0.9 northeast headwall
9�.0 �0.9 9.� northeast headwall
�.6 0.0 0.� central headwall
4.4 0.0 �.� central headwall
��.0 �0.9 �.9 central headwall
�7.5 �0.9 ��9.9* central headwall
7�.8 �5.4 5.5 central headwall
�0�.6 �0.9 �.8 central headwall
�8.5 0.0 �.4 southeast headwall
Mean 7.0 �5.6 all headwall sites
Standard deviation 6.� 40.� all headwall sites
Mean without ��9.9-cm vertical error 6.5 �.9 all headwall sites but one
Standard deviation without ��9.9-cm vertical error 6.4 �.8 all headwall sites but one
Mean without ��9.9-cm vertical error plus � standard deviation �� 6 all headwall sites but one
All horizontal and vertical values should be zero at these selected points outside of the landslide. *The vertical error of ��9.9 cm is probably a local anomaly caused by tampering with the steel stake.
table e2. Slide movement between October �00� and April �00� from re-survey of steel stakes.
SiteHorizontal (cm West)
Vertical (cm) (−) = Down to the West
Estimated Slide Dip from Resurvey (Arctangent of
Vertical/Horizontal)
Estimated Slide Dip from Boreholes +
Outcrops (−) = East
North survey hubs < ± �� < ± 6 — —
Middle survey hubs near LT-� borehole (east of Highway �0�)
�0 ± �� − 8 ± 6 ��° ± ��° ��–��°
Middle survey hubs near LT-� borehole (west of Highway �0�)
�� ± �� − 6 ± 6 �5° ± ��° ~�0.5°
Middle survey hubs on back-tilted block at top of sea cliff
�4 ± �� − 6 ± 6 �4° ± ��° ~ − �0°
South survey hubs east of Highway �0� �5 ± �� − �� ± 6 56° ± ��° no data
South survey hubs west of Highway �0� �� ± �� − 9 ± 6 �5° ± ��° no data
South survey hubs on back-tilted block at top of sea cliff
��� ± �� − 70 ± 6 �8° ± ��° no data
Error estimates are from Table E� using the mean error (without the ��9.9-cm outlier) plus one standard deviation. Slide dips are estimated from geologic cross sections between drill holes and surface outcrop of the slide plane. Middle survey hubs are at the same latitude as the LT-�, LT-�, and LT-� boreholes; no hubs were near the LT-� borehole.

Oregon Department of Geology and Mineral Industries Special Paper 40 Appendix E | 5
Johnson Creek Landslide Research Project, Lincoln County, Oregon: Final Report
figure e3. Qualitative vectors drawn in direction of slide movement for steel stakes surveyed October �4, �00�, and April �7, �00� (blue arrows) and for inclinometer data (red arrows) collected between December ��
and December ��, �00�. Relative lengths of arrows correspond roughly to relative amounts of movement. Red crosses without arrows are points where slide movement between surveys was less than the error in the measurement. Blue dots are boreholes. Boreholes with red arrows are inclinometer holes with
direction of movement from inclinometer surveys. Green arrows illustrate possible movement direction from offset of the Old Coast Highway; brown arrow illustrates general movement direction inferred
from scarp trends and offset of marker nails in the northeastern part of the slide. See Figure � of the main text for explanation of slide block boundaries (black and purple lines).

6 | Appendix E Oregon Department of Geology and Mineral Industries Special Paper 40
Johnson Creek Landslide Research Project, Lincoln County, Oregon: Final Report
figure e4. Detailed view of vector directions of slide movement in the southern part of the Johnson Creek landslide. Arrow length is qualitatively drawn to correlate with amount of horizontal movement; symbols as in Figure E�.

Oregon Department of Geology and Mineral Industries Special Paper 40 Appendix E | 7
Johnson Creek Landslide Research Project, Lincoln County, Oregon: Final Report
figure e5. Horizontal movement (cm; negative is east) at steel stakes (blue crosses) in northern part of landslide between October �4, �00�, and April �7, �00�. Note that most movement is equal to or less than the survey
error of ±�0.85 cm ( except for one anomalous negative value at the headwall of the slide). Note that one control point east of the figure area was left off for to enlarge scale. Data for this point are listed in Table E�.

8 | Appendix E Oregon Department of Geology and Mineral Industries Special Paper 40
Johnson Creek Landslide Research Project, Lincoln County, Oregon: Final Report
figure e6. Horizontal movement (cm; negative is east) at steel stakes (×s) in the southern part of the landslide. Boreholes for this project are blue dots. Movement east of the headwall of –�0.85 cm
(eastward movement) is survey error, so this is the approximate error of the data.

Oregon Department of Geology and Mineral Industries Special Paper 40 Appendix E | 9
Johnson Creek Landslide Research Project, Lincoln County, Oregon: Final Report
figure e7. Vertical movement in the northeastern part of the landslide (negative is down).
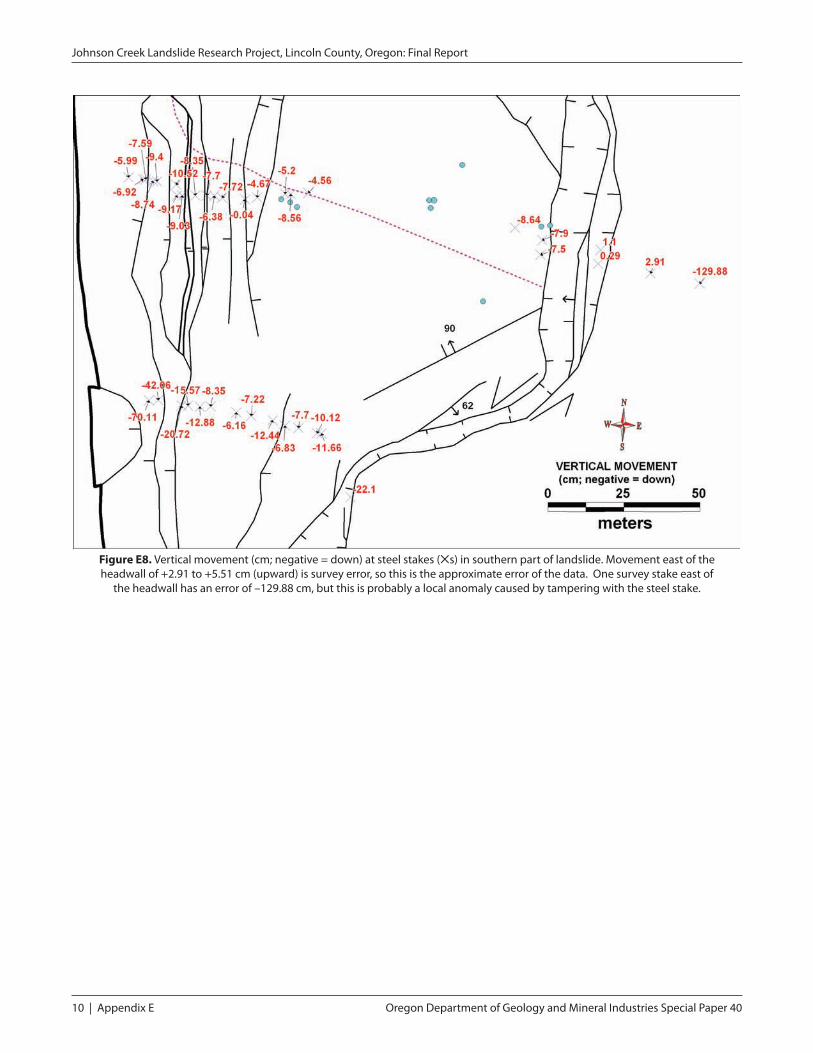
�0 | Appendix E Oregon Department of Geology and Mineral Industries Special Paper 40
Johnson Creek Landslide Research Project, Lincoln County, Oregon: Final Report
figure e8. Vertical movement (cm; negative = down) at steel stakes (×s) in southern part of landslide. Movement east of the headwall of +�.9� to +5.5� cm (upward) is survey error, so this is the approximate error of the data. One survey stake east of
the headwall has an error of –��9.88 cm, but this is probably a local anomaly caused by tampering with the steel stake.

Oregon Department of Geology and Mineral Industries Special Paper 40 Appendix E | ��
Johnson Creek Landslide Research Project, Lincoln County, Oregon: Final Report
figure e9. (top) Damage to Highway �0� on the south margin of the Johnson Creek landslide immediately after a slide movement in January �00�. (bottom) Maximum vertical offset is �7.8 cm down to the northwest;
fissures are as wide as 5 cm. This part of the slide is south of the resurvey lines and confirms the general trend of increasing offset to the south. Roger Hart is in the background.

�� | Appendix E Oregon Department of Geology and Mineral Industries Special Paper 40
Johnson Creek Landslide Research Project, Lincoln County, Oregon: Final Report
figure e10. Damage to the north slide margin from the same movement as in Figure E9. Note that offset is only �-� cm vertical.

Oregon Department of Geology and Mineral Industries Special Paper 40 Appendix F | �
Johnson Creek Landslide Research Project, Lincoln County, Oregon: Final Report
APPENDIX F: LINE-oF-sIght survEys oN u.s. hIghwAy 101
Figure F1. Location of line-of-sight survey pins. All surveys were done with a total station to subcentimeter accuracies. Black lines are mapped slide block boundaries. Solid purple line is internal slide structure or fault; dotted purple line is speculative extension of this structure across the slide to match a similar structure inferred from borehole logs. Red numbers are dips on
fresh scarps (red hachured lines) where nails were installed in �00�. Blue lines are topographic contours at �-m intervals.

� | Appendix F Oregon Department of Geology and Mineral Industries Special Paper 40
Johnson Creek Landslide Research Project, Lincoln County, Oregon: Final Report
M e as u r e d ho r iz on tal change (s ou th to no r th along Highw ay 101)
-0 .020
0.000
0.020
0.040
0.060
0.080
0.100
0.120
0.140
0 50 100 150 200 250 300 350 400
Dis tance (m )
Hor
izon
talc
hang
e(m
)
No rthS outh
Roads c arp
Otter Roc k7
1221
Mag nail 4
Mag nail 3
Mag nail 2
Mag nail 8Mag nail 5
Mag nail 6 Mag nail 1
Figure F2. Horizontal change along U.S. Highway �0� January �6, �00�, to February 4, �00�; (+) = westward movement; (-) = eastward movement.
M e as u r e d ve r t ical change (s ou th to no r th along Highw ay 101)
-0.250
-0.200
-0.150
-0.100
-0.050
0.000
0.050
0.100
0 50 100 150 200 250 300 350 400
Dis tance (m )
Elev
atio
nch
ange
(m)
Error Ellips e
No r thSo u th
Road scarp
Otter Roc k
1221
Mag nail 1
Mag nail 2
Mag nail 3
Mag nail 4
Mag nail 5
Mag nail 67
Mag nail 8
Figure F3. Vertical change along U.S. Highway �0� January �6, �00�, to February 4, �00�; (-) = down; (+) = up.
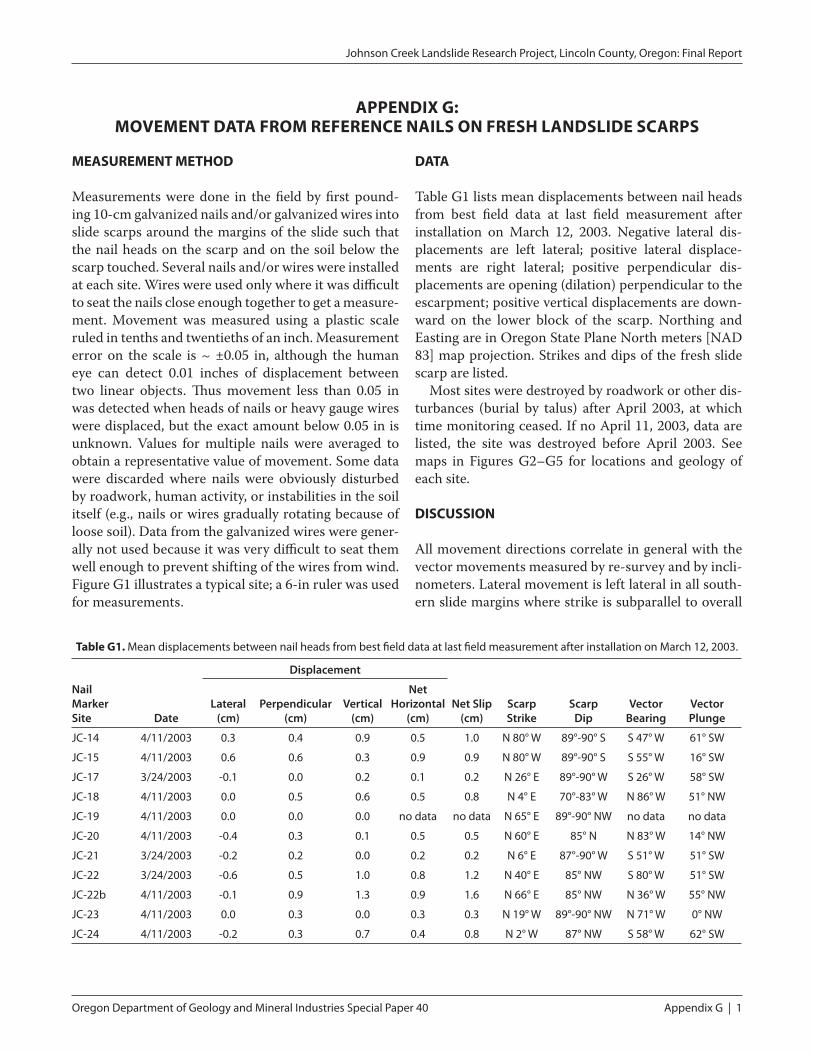
Oregon Department of Geology and Mineral Industries Special Paper 40 Appendix G | �
Johnson Creek Landslide Research Project, Lincoln County, Oregon: Final Report
mEAsurEmENt mEthoD
Measurements were done in the field by first pound-ing 10-cm galvanized nails and/or galvanized wires into slide scarps around the margins of the slide such that the nail heads on the scarp and on the soil below the scarp touched. Several nails and/or wires were installed at each site. Wires were used only where it was difficult to seat the nails close enough together to get a measure-ment. Movement was measured using a plastic scale ruled in tenths and twentieths of an inch. Measurement error on the scale is ~ ±0.05 in, although the human eye can detect 0.01 inches of displacement between two linear objects. Thus movement less than 0.05 in was detected when heads of nails or heavy gauge wires were displaced, but the exact amount below 0.05 in is unknown. Values for multiple nails were averaged to obtain a representative value of movement. Some data were discarded where nails were obviously disturbed by roadwork, human activity, or instabilities in the soil itself (e.g., nails or wires gradually rotating because of loose soil). Data from the galvanized wires were gener-ally not used because it was very difficult to seat them well enough to prevent shifting of the wires from wind. Figure G1 illustrates a typical site; a 6-in ruler was used for measurements.
DAtA
Table G1 lists mean displacements between nail heads from best field data at last field measurement after installation on March 12, 2003. Negative lateral dis-placements are left lateral; positive lateral displace-ments are right lateral; positive perpendicular dis-placements are opening (dilation) perpendicular to the escarpment; positive vertical displacements are down-ward on the lower block of the scarp. Northing and Easting are in Oregon State Plane North meters [NAD 83] map projection. Strikes and dips of the fresh slide scarp are listed.
Most sites were destroyed by roadwork or other dis-turbances (burial by talus) after April 2003, at which time monitoring ceased. If no April 11, 2003, data are listed, the site was destroyed before April 2003. See maps in Figures G2–G5 for locations and geology of each site.
DIsCussIoN
All movement directions correlate in general with the vector movements measured by re-survey and by incli-nometers. Lateral movement is left lateral in all south-ern slide margins where strike is subparallel to overall
table g1. Mean displacements between nail heads from best field data at last field measurement after installation on March ��, �00�.
Nail Marker Site Date
Displacement
Net Slip (cm)
Scarp Strike
Scarp Dip
Vector Bearing
Vector Plunge
Lateral (cm)
Perpendicular (cm)
Vertical (cm)
Net Horizontal
(cm)
JC-�4 4/��/�00� 0.� 0.4 0.9 0.� �.0 N �0° W �9°-90° S S 47° W 6�° SW
JC-�� 4/��/�00� 0.6 0.6 0.� 0.9 0.9 N �0° W �9°-90° S S ��° W �6° SW
JC-�7 �/�4/�00� -0.� 0.0 0.� 0.� 0.� N �6° E �9°-90° W S �6° W ��° SW
JC-�� 4/��/�00� 0.0 0.� 0.6 0.� 0.� N 4° E 70°-��° W N �6° W ��° NW
JC-�9 4/��/�00� 0.0 0.0 0.0 no data no data N 6�° E �9°-90° NW no data no data
JC-�0 4/��/�00� -0.4 0.� 0.� 0.� 0.� N 60° E ��° N N ��° W �4° NW
JC-�� �/�4/�00� -0.� 0.� 0.0 0.� 0.� N 6° E �7°-90° W S ��° W ��° SW
JC-�� �/�4/�00� -0.6 0.� �.0 0.� �.� N 40° E ��° NW S �0° W ��° SW
JC-��b 4/��/�00� -0.� 0.9 �.� 0.9 �.6 N 66° E ��° NW N �6° W ��° NW
JC-�� 4/��/�00� 0.0 0.� 0.0 0.� 0.� N �9° W �9°-90° NW N 7�° W 0° NW
JC-�4 4/��/�00� -0.� 0.� 0.7 0.4 0.� N �° W �7° NW S ��° W 6�° SW
APPENDIX g: movEmENt DAtA From rEFErENCE NAILs oN FrEsh LANDsLIDE sCArPs

� | Appendix G Oregon Department of Geology and Mineral Industries Special Paper 40
Johnson Creek Landslide Research Project, Lincoln County, Oregon: Final Report
slide movement direction and right lateral in equivalent areas on the north margin. Measurements at the heads-carps show extension and downward displacement but no significant lateral movement.
Site JC-17 had barely discernible movement, much less than movement on the adjacent headscarp to the west, site JC-18. Movement on JC-18 preceded the beginning of movement on the scarp at site JC-17, so it appears that downward displacement at site JC-18 destabilized the area to the east and triggered move-ment there.
Site JC-19 had no detectable movement during the observation period even though significant movement occurred during the same period at the slide plane (extensometer data) and the slide margins. The site JC-19 slide scarp has ~40 cm of down-to-the-north displacement over a period of ~64 years since the Old Coast Highway was abandoned, so significant move-ment has occurred in the past. A check of this shel-tered site in November of 2004 revealed no movement had occurred to that time, so apparently no significant internal deformation in the landslide is occurring along this northeast-trending slide scarp.
Movement at the extensometer in borehole LT-3 during the March 20–26, 2003, movement event is ~0.5 ± 0.3 cm. This is the same amount as the opening (dilation) measured on the fissure at site JC-18 between March 12 and April 11, 2003 (0.5 ± 0.1 cm). We infer that this opening probably coincided with the March 20–26 movement at site LT-3, which lies only 18 m to the northwest of site JC-18.
The nails at the northern margin at U.S. Highway 101 recorded right-lateral movement of 0.3–0.6 ± 0.1 cm (sites JC-14 and JC-15). Nails at the northeast head-scarp (site JC-24) recorded 0.3 ± 0.1 cm of dilation per-pendicular to the scarp. Nails at the southern margin at the Old Coast Highway (site JC-20) recorded left-lateral movement of –0.4 ± 0.1 cm, while nails in the southernmost margin (sites JC-22 and JC-23) had left-lateral movements of 0 to –0.6 ± 0.1 cm. We conclude
that movement in the northern, central, and southern part of the slide at and east of U.S. Highway 101 was similar during the March 20–26 movement event. This movement was not translated to the northernmost site west of U.S. Highway 101 (site JC-23).
Net horizontal movement at site JC-20 on the south-ern margin of the slide where it cuts the Old Coast Highway is 0.4 cm left lateral and 0.3 cm perpendicular to the scarp striking N60˚E. This corresponds to a net horizontal slip of 0.5 cm toward N83˚W. This is prob-ably a reasonably good estimate of the net horizontal slip vector for this part of the Johnson Creek landslide, as it matches well with net direction of slip estimated independently from horizontal offset of the Old Coast Highway (see discussion in main text). Because most of the slip is subparallel to the slide margin, a narrow graben would be expected. This is one of the narrowest graben at the slide margin.
Net horizontal movement at sites JC-14 and JC-15 is 0.3 to 0.6 cm right lateral and 0.4 to 0.6 cm perpen-dicular to the scarp striking N80˚W on the northern margin of the slide where it cuts the Highway 101. This corresponds to a net horizontal slip of 0.5–0.8 cm toward S47–55˚W, 67–75˚ southwest of the scarp strike. Because a large part of the slip is perpendicu-lar to the slide margin, a significant graben would be expected, and such is the case. The graben at sites JC-14 and JC-15 is 0.8–13 m wide, narrower than the 17–20 m graben at the central headwall, where all movement is perpendicular to the margin, but wider than the 4–6 m graben at the southern margin (site JC-20) where most movement is subparallel to the margin.
sItE Photos
Photos of individual monitoring sites are given in Fig-ures G6–G17.

Oregon Department of Geology and Mineral Industries Special Paper 40 Appendix G | �
Johnson Creek Landslide Research Project, Lincoln County, Oregon: Final Report
Figure g1. A typical marker nail site (JC-�� ); 6-in ruler used for measurements.

4 | Appendix G Oregon Department of Geology and Mineral Industries Special Paper 40
Johnson Creek Landslide Research Project, Lincoln County, Oregon: Final Report
Figure g2. Overview of locations (black labels) where marker nails were monitored for movement on fresh slide scarps. Brown arrows are direction of movement inferred from the marker nails with base of arrow at locality. Black lines are mapped slide block
boundaries. Solid purple line is an internal slide structure or fault; dotted purple line is speculative extension of this structure across the slide to match a similar structure inferred from borehole logs. Red numbers are dips on fresh scarps (red
hachured lines) where nails were installed in �00�. Blue lines are topographic contours at �-m intervals.

Oregon Department of Geology and Mineral Industries Special Paper 40 Appendix G | �
Johnson Creek Landslide Research Project, Lincoln County, Oregon: Final Report
Figure g3. Marker nail locations in north part of slide. Orange unit is Pleistocene marine terrace sand; green striped unit is Astoria Formation; brown unit is colluvium; yellow unit is highway fill.
Small red arrow indicates direction of dip of recently active slide scarp (red line with teeth in direction of scarp inclination); red number is dip in degrees.
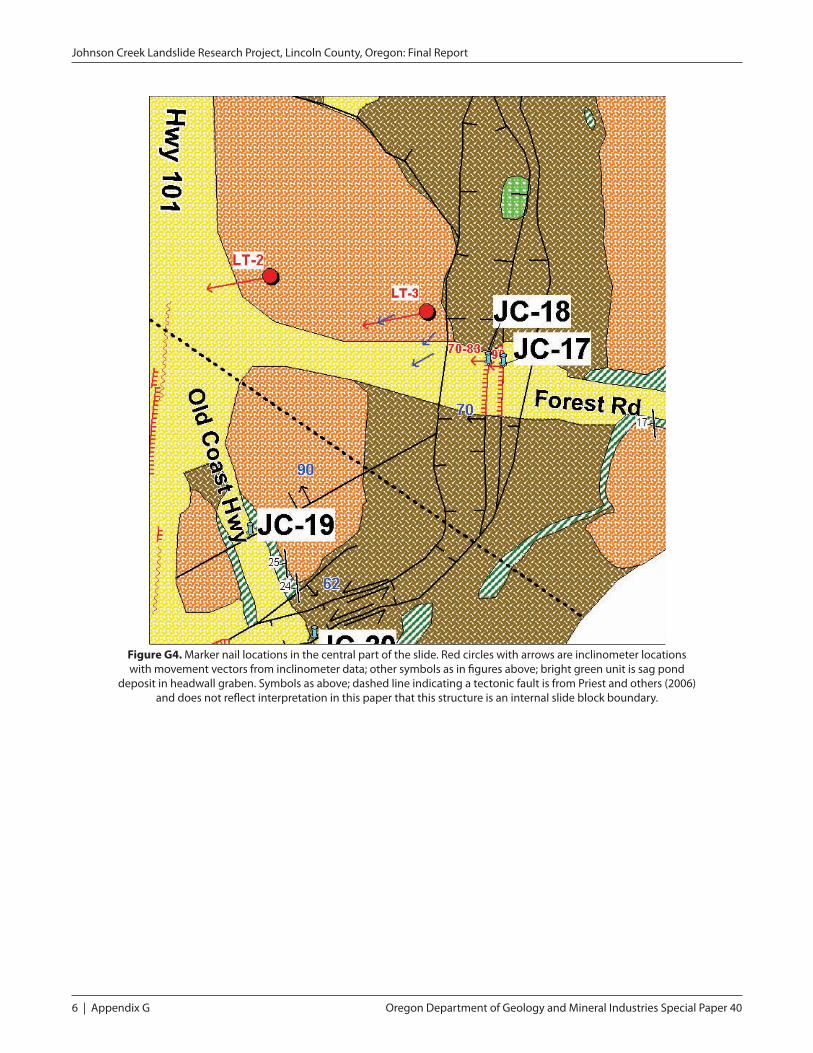
6 | Appendix G Oregon Department of Geology and Mineral Industries Special Paper 40
Johnson Creek Landslide Research Project, Lincoln County, Oregon: Final Report
Figure g4. Marker nail locations in the central part of the slide. Red circles with arrows are inclinometer locations with movement vectors from inclinometer data; other symbols as in figures above; bright green unit is sag pond
deposit in headwall graben. Symbols as above; dashed line indicating a tectonic fault is from Priest and others (�006) and does not reflect interpretation in this paper that this structure is an internal slide block boundary.
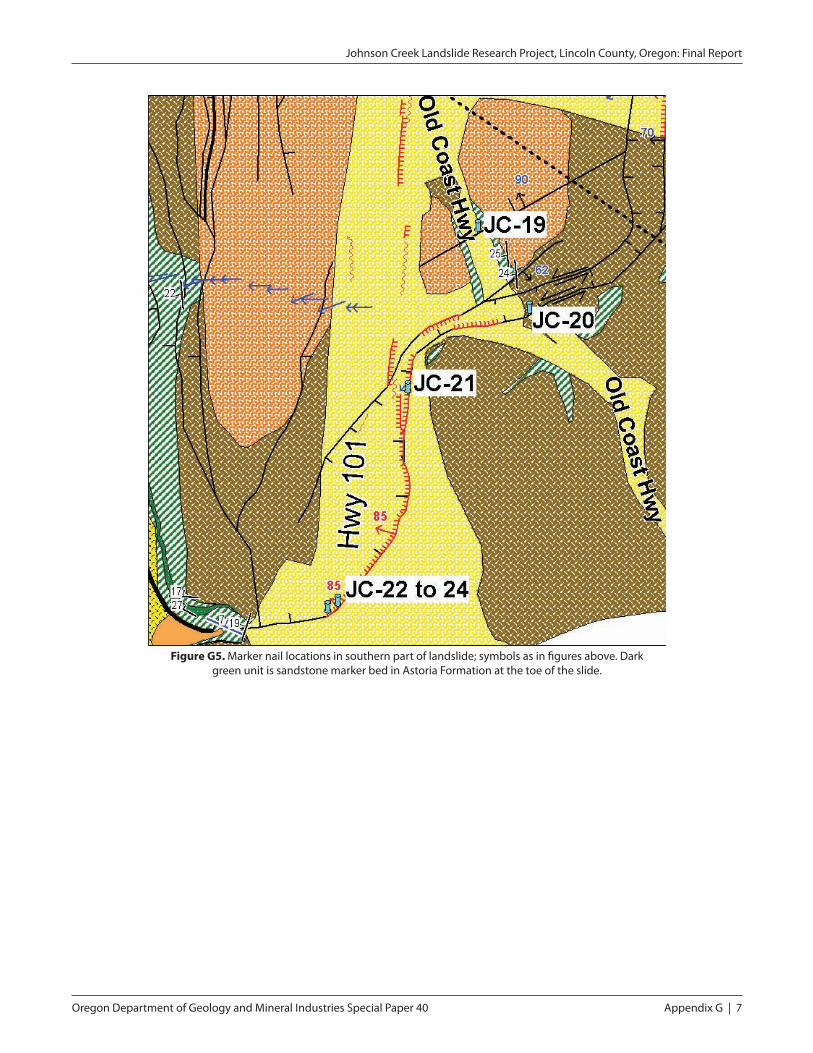
Oregon Department of Geology and Mineral Industries Special Paper 40 Appendix G | 7
Johnson Creek Landslide Research Project, Lincoln County, Oregon: Final Report
Figure g5. Marker nail locations in southern part of landslide; symbols as in figures above. Dark green unit is sandstone marker bed in Astoria Formation at the toe of the slide.
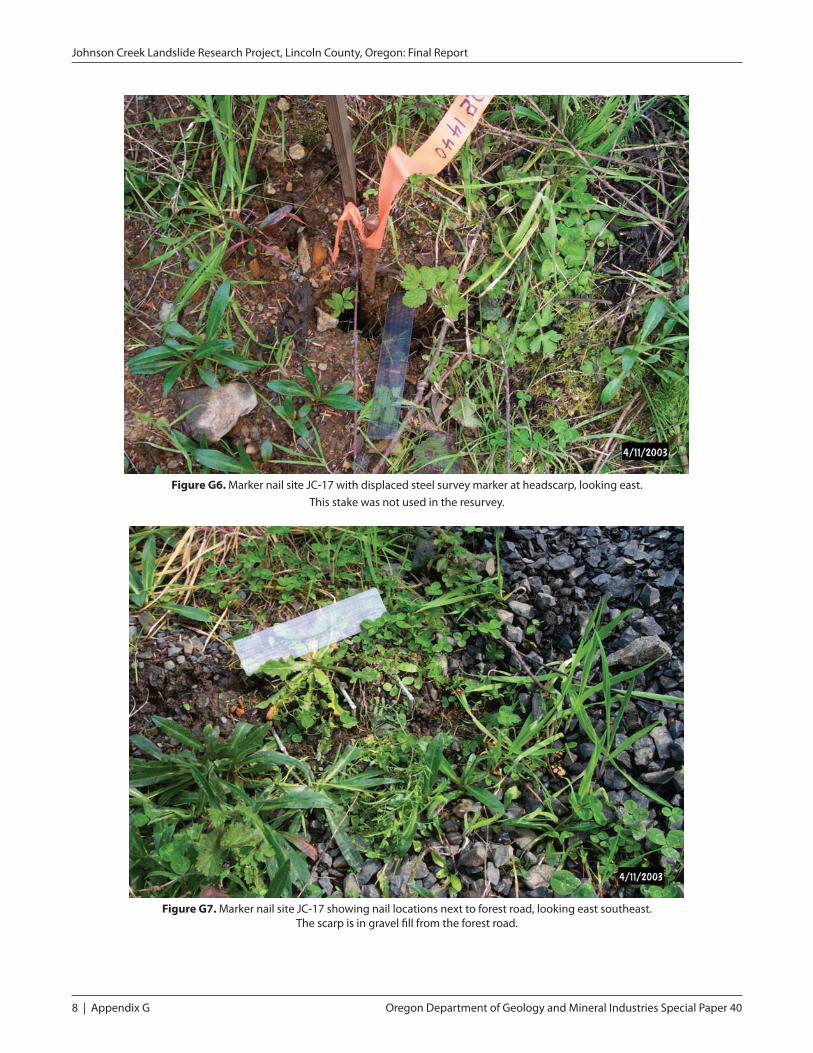
� | Appendix G Oregon Department of Geology and Mineral Industries Special Paper 40
Johnson Creek Landslide Research Project, Lincoln County, Oregon: Final Report
Figure g6. Marker nail site JC-�7 with displaced steel survey marker at headscarp, looking east. This stake was not used in the resurvey.
Figure g7. Marker nail site JC-�7 showing nail locations next to forest road, looking east southeast. The scarp is in gravel fill from the forest road.

Oregon Department of Geology and Mineral Industries Special Paper 40 Appendix G | 9
Johnson Creek Landslide Research Project, Lincoln County, Oregon: Final Report
Figure g8. Marker nail site JC-��, looking southeast. The scarp is in gravel fill from the forest road. Exposed portions of the two vertical nails on the right are ~�.� cm long. Note that fresh gravel dumped on the road
has disturbed the nails on the right, so that measurement was not used.
Figure g9. Marker nail site JC-�9 looking south. Yellow field book is ~�9 cm long. Note that all nail heads are still touching in this April �00� photograph, so no significant movement occurred. Scarp is in relatively fresh Astoria
Formation siltstone and sandstone with a thin covering of gravel from the Old Coast Highway.
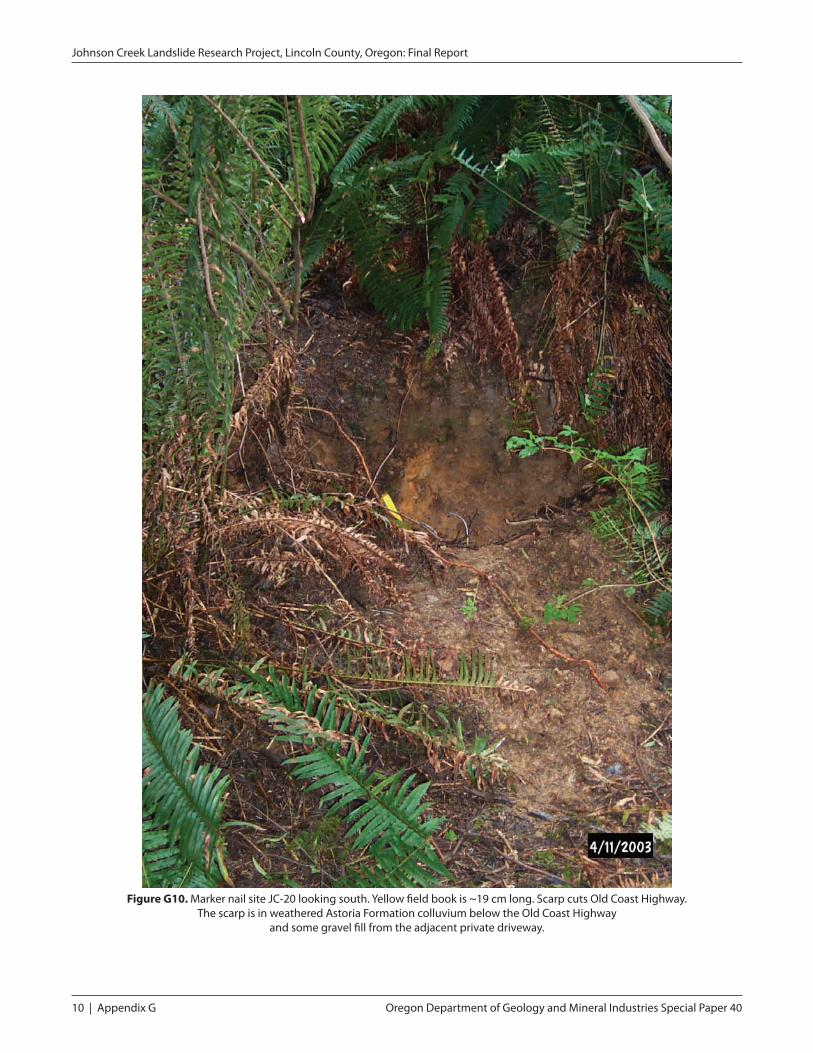
�0 | Appendix G Oregon Department of Geology and Mineral Industries Special Paper 40
Johnson Creek Landslide Research Project, Lincoln County, Oregon: Final Report
Figure g10. Marker nail site JC-�0 looking south. Yellow field book is ~�9 cm long. Scarp cuts Old Coast Highway. The scarp is in weathered Astoria Formation colluvium below the Old Coast Highway
and some gravel fill from the adjacent private driveway.
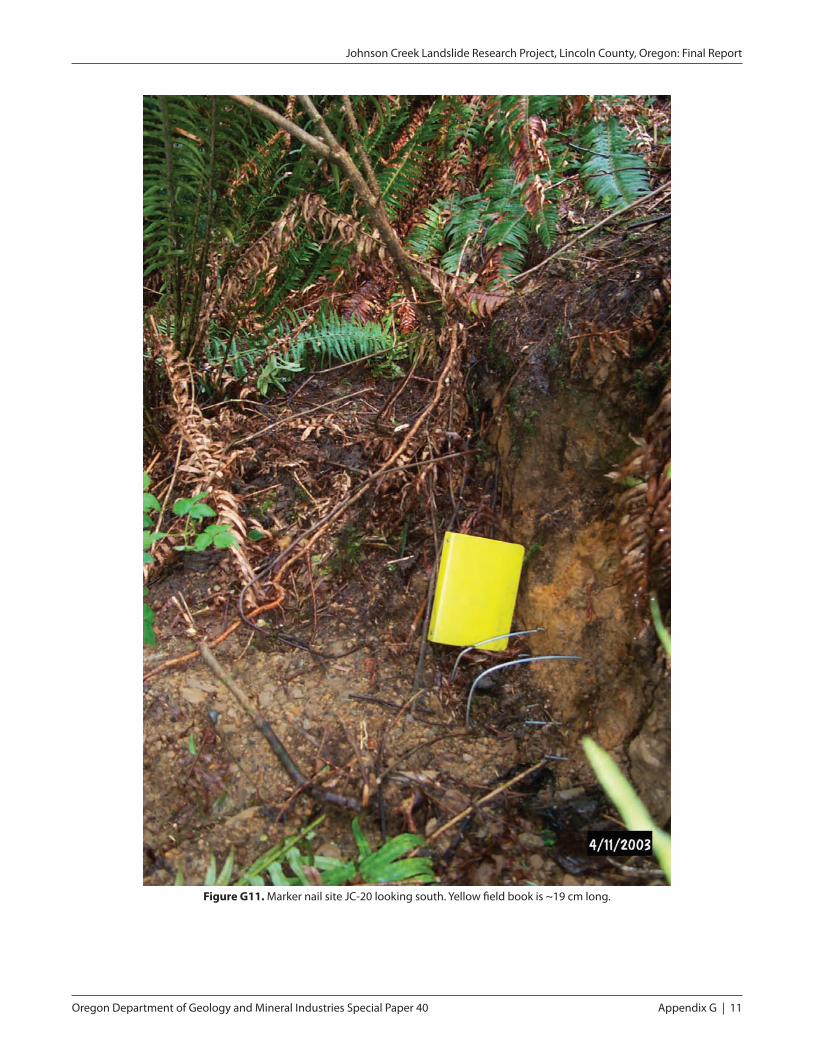
Oregon Department of Geology and Mineral Industries Special Paper 40 Appendix G | ��
Johnson Creek Landslide Research Project, Lincoln County, Oregon: Final Report
Figure g11. Marker nail site JC-�0 looking south. Yellow field book is ~�9 cm long.

�� | Appendix G Oregon Department of Geology and Mineral Industries Special Paper 40
Johnson Creek Landslide Research Project, Lincoln County, Oregon: Final Report
Figure g12. Marker nail site JC-�� looking southeast. Yellow field book is ~�9 cm long. The scarp is in gravel fill from the Highway �0�.
Figure g13. Marker nail sites JC-�� (near red highway cone at top of highway embankment) to JC-�4 (to the right of the yellow field book) looking northeast parallel to the strike of the fresh headscarp (red orange fill of excavated
Astoria Formation). Yellow field book is ~�9 cm long. The near-vertical portion of scarp is ~�.� m high.

Oregon Department of Geology and Mineral Industries Special Paper 40 Appendix G | ��
Johnson Creek Landslide Research Project, Lincoln County, Oregon: Final Report
Figure g14. Marker nail site JC-�� looking southeast on west side of U.S. Highway �0�. Scarp is asphalt and gravel.

�4 | Appendix G Oregon Department of Geology and Mineral Industries Special Paper 40
Johnson Creek Landslide Research Project, Lincoln County, Oregon: Final Report
Figure g15. Marker nail site JC-�� with both wires and nails, looking south southeast. Scarp is in red orange fill of excavated Astoria Formation overlain by gravel and asphalt. Near vertical portion of scarp is ~�.� m high.

Oregon Department of Geology and Mineral Industries Special Paper 40 Appendix G | ��
Johnson Creek Landslide Research Project, Lincoln County, Oregon: Final Report
Figure g16. Marker nail site JC-�� on north margin of the landslide looking east southeast. Yellow field book is ~�9 cm long.
Figure g17. Marker nail site JC-�4 looking southeast. This is the northeast headwall of the landslide. The tan unit in the near vertical escarpment is Pleistocene marine terrace sand. Talus lies along the base of the slope.

Oregon Department of Geology and Mineral Industries Special Paper 40 Appendix H | �
Johnson Creek Landslide Research Project, Lincoln County, Oregon: Final Report
APPENDIX h: ErosIoN PIN DAtA At thE sEA CLIFF
Figure h1. Location of erosion monitoring pins at the toe of the Johnson Creek landslide. Black lines are mapped slide block boundaries. Solid purple line is internal slide structure or fault; dotted purple line is speculative extension of this
structure across the slide to match a similar structure inferred from borehole logs. Red numbers are dips on fresh scarps (red hachured lines) where nails were installed in �00�. Blue lines are topographic contours at �-m intervals.

� | Appendix H Oregon Department of Geology and Mineral Industries Special Paper 40
Johnson Creek Landslide Research Project, Lincoln County, Oregon: Final Report
Figure h2. Bluff erosion data for December 9, �00�, to April �0, �00�. Note that there is no obvious correlation of erosion and bluff height or position north-south. The maximum length of pins was �0 cm (��.9 inches), so no larger erosion value could be measured;
consequently, there are a number of points at �0 cm (��.9) on the graphs. Pin loss was generally caused by falling blocks of rock similar in size or larger than the pin. To overcome this problem, sharpened
steel rods ~76 cm (�0 in) long were driven into the bluff in �004. However, no data have been gathered, owing to low wave conditions prior to compilation of this report.

Oregon Department of Geology and Mineral Industries Special Paper 40 Appendix I | �
Johnson Creek Landslide Research Project, Lincoln County, Oregon: Final Report
Analysis by Jonathan C. Allan Coastal Field Office, Oregon Department of Geology and Mineral Industries
Ground-based three-dimensional (3-D) laser (GBL) scanning technology has been successfully used by Department of Transportation offices throughout the United States to undertake bridge and rockface surveys (e.g., PennDOT), and by researchers for monitoring mass wasting on the central California coast (Collins and Kayen, 2006). The major advantage of GBL over other techniques is that the laser scanner is capable of generating a detailed topographic map of the entire
bluff face (data spacing of 2.5 cm2 with an accuracy of ±0.5 cm (1 in2 at an accuracy of 0.2 in) providing an unprecedented level of detail of bluff change. Subse-quent resurveys of the bluff face using the 3-D laser scanner can thus provide a unique insight into the spa-tial and temporal variability of bluff erosion that may help resolve the relative importance of coastal erosion and groundwater in triggering landslide movement at places like Johnson Creek and elsewhere on the Oregon coast.
DOGAMI and ODOT staff have trialed GBL on three occasions at the Johnson Creek landslide: a preliminary test was undertaken in May 2004 at three discrete loca-
Figure I1. Location map showing those areas repeatedly scanned using ground-based lidar. Note that the �006 and �007 surveys covered the entire bluff face, whereas the �004 pilot survey covered three discrete
locations on the bluff face. Slide block boundaries (black lines) are from Priest and others (�006).
APPENDIX I: BLuFF ErosIoN DErIvED From rEPEAtED grouND-BAsED LIDAr mEAsurEmENts

� | Appendix I Oregon Department of Geology and Mineral Industries Special Paper 40
Johnson Creek Landslide Research Project, Lincoln County, Oregon: Final Report
tions on the bluff face (south, middle, and north end), while follow-up surveys were carried out in October 2006 and again in April 2007 of the entire 300 m (1000 ft) long bluff face (Figure I1). Precise survey control was provided by various “stable” survey monuments located outside the landslide area, enabling the scans to be precisely georeferenced to the same coordinate and elevation datums during each setup. Figure I2 shows an example of the reduced point cloud data file for a small section of the Johnson Creek bluff near its south-ern end. Due to the dense sampling of the scanner, the resultant point cloud captures virtually every feature of the bluff face and beach (i.e., it is akin to a photo of the bluff face). For example, Figure I2 clearly shows the location of the Johnson Creek culvert, the presence of woody debris strewn about the creek, and a cobble berm constructed along the toe of the landslide.
As additional GBL lidar surveys are undertaken, changes in the morphology of the bluff face can be documented, while analyses of static features in the image (e.g., tree trunks) provide a means of assessing the extent of differential landslide movement over time (i.e., the data are subsequently adjusted to reflect the movement of the landslide). However, because of lim-ited processing capabilities at this stage, we are unable to document the degree of landslide movement along
the Johnson Creek bluff face, an issue that we hope to resolve in the near future. Accordingly, the results pre-sented here reflect the “unadjusted” state of the land-slide face, whereby movement of the landslide between each sampling interval has not been backed out of the original data set. Figure I3 is a location map showing the three sections of the bluff where GBL data are avail-able for all three years and the locations of the tran-sect lines used to document changes across the bluff face. The degree of bluff change between 2004 and 2007 based on six representative transects is shown in Figure I4. As can be seen in Figure I4, in general the amount of profile change in the north is comparatively less than in the central and southern portions of the bluff face. This pattern is consistent with analyses of erosion as measured by the erosion pins described in Appendix H. Furthermore, analyses of the response of the bluff over time indicate generally greater erosion at lower eleva-tions (i.e., above the 4.5-m elevation and below about 8 to 10 m), while the upper portions of the bluff face show much less change. There are of course exceptions to this, such as the responses shown for the north pro-file 8 and south profile 4 sites, which indicate signifi-cant erosion at higher elevations. At both these sites, the erosion probably reflects a slump failure.
Figure I2. Point cloud example derived from a survey in October �006 at Johnson Creek (point density is approximately � cm�).
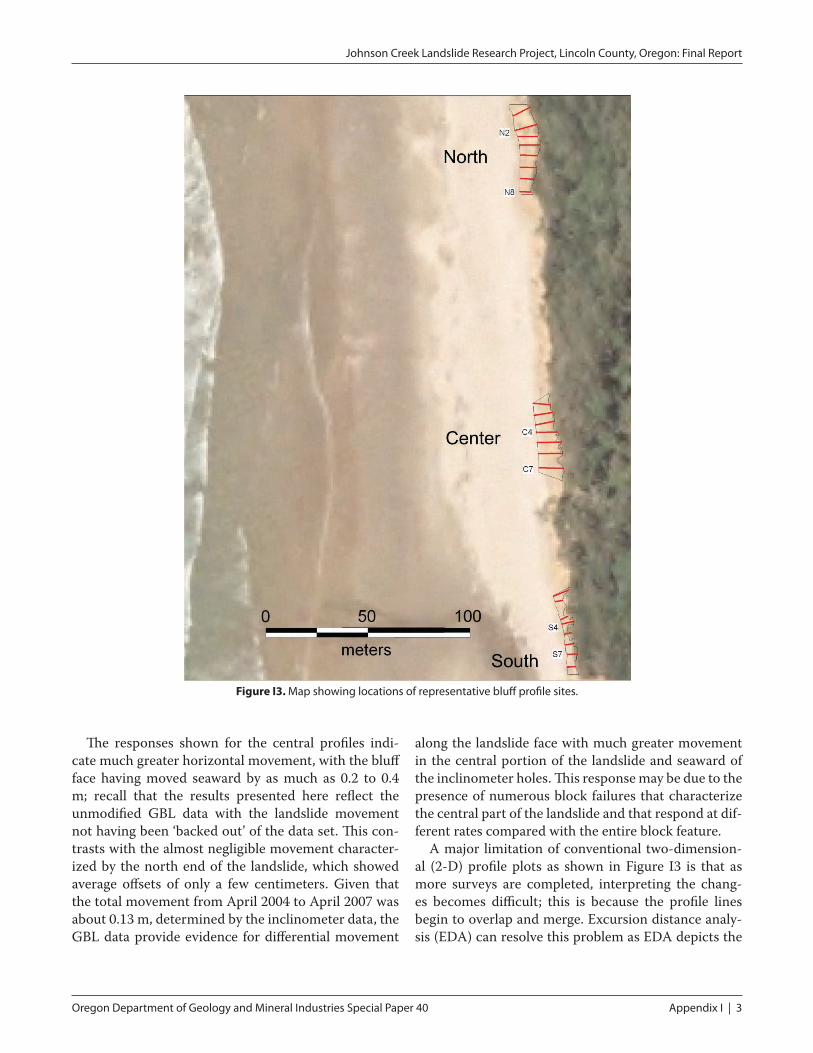
Oregon Department of Geology and Mineral Industries Special Paper 40 Appendix I | �
Johnson Creek Landslide Research Project, Lincoln County, Oregon: Final Report
Figure I3. Map showing locations of representative bluff profile sites.
The responses shown for the central profiles indi-cate much greater horizontal movement, with the bluff face having moved seaward by as much as 0.2 to 0.4 m; recall that the results presented here reflect the unmodified GBL data with the landslide movement not having been ‘backed out’ of the data set. This con-trasts with the almost negligible movement character-ized by the north end of the landslide, which showed average offsets of only a few centimeters. Given that the total movement from April 2004 to April 2007 was about 0.13 m, determined by the inclinometer data, the GBL data provide evidence for differential movement
along the landslide face with much greater movement in the central portion of the landslide and seaward of the inclinometer holes. This response may be due to the presence of numerous block failures that characterize the central part of the landslide and that respond at dif-ferent rates compared with the entire block feature.
A major limitation of conventional two-dimension-al (2-D) profile plots as shown in Figure I3 is that as more surveys are completed, interpreting the chang-es becomes difficult; this is because the profile lines begin to overlap and merge. Excursion distance analy-sis (EDA) can resolve this problem as EDA depicts the

4 | Appendix I Oregon Department of Geology and Mineral Industries Special Paper 40
Johnson Creek Landslide Research Project, Lincoln County, Oregon: Final Report
Figure I4. Six representative bluff profiles derived from the three sections along the Johnson Creek bluff face (the locations of these sites are provided in Figure I�). Note that the elevation data are relative to the North American Vertical Datum of �9�� (NAVD ��).
change in position of the bluff face (i.e., its excursions) for different contour elevations against time. In this respect, EDA is analogous to a “time stack” of how the beach is responding to variations in the incident wave energy, currents, and the sediment budget. One can take such an approach one step further and plot the response of the excursions along a feature of interest, such as the Johnson Creek bluff face, to better appreci-ate the alongshore variability in bluff response (erosion and accretion). Here we have used the 2004 GBL data set as the baseline from which the 2006 and 2007 scans have been related. Figure I5 presents the results of such analyses for the period 2004 to 2006 and from 2004 to 2007 for two contour elevations, the 7-m and 11-m ele-
vations. Respectively, these two elevations character-ize the response of the lower and upper bluff face. The alongshore position (x axis) of the excursions is plot-ted in northings (meters) and reflects the approximate position of the bluff profile sites from south to north. As can be seen in Figure I5, the lower bluff face is char-acterized predominantly by erosion, with the great-est degree of erosion, −1.8 m, occurring in the south between 2004 and 2006. Significant erosion also char-acterizes the central part of the landslide, while ero-sion in the north is considerably lower. At the higher 11-m elevation, the response is generally more uniform in the central and northern portions of the landslide, while the southern end shows more variable responses;

Oregon Department of Geology and Mineral Industries Special Paper 40 Appendix I | �
Johnson Creek Landslide Research Project, Lincoln County, Oregon: Final Report
Figure I5. Alongshore response of the 7-m (lower bluff face) and ��-m (upper bluff face) contour elevations. Note that negative values indicate erosion while positive values indicate accretion or progradation of the bluff face.
in the south the bluff elevation is lower and transects at some locations did not extend above 11 m — hence the missing data points. Finally, here, Figure I5 shows that for the most part the 2007 survey places the bluff face seaward of the 2006 survey, indicating that the entire landslide has moved.
Aside from developing cross sections, it is possible to determine volumetric changes between consecutive surveys. Figure I6 is a 3-D digital terrain model (DTM) generated for the southern end of the landslide and is
the product of subtracting the 2004 data set from the 2007 scan. To eliminate erroneous data associated with trees and bushes along the bluff top, a contour plot was initially developed and a boundary line was designated, above which the data were “blanked” and ignored. As can be seen in Figure I6, the southern end of the land-slide is dominated by significant erosion with some areas having seen as much as 2 m of bluff retreat, while the bulk of the landslide has eroded landward by approxi-mately −0.25 m to −0.5 m. The total volume change for
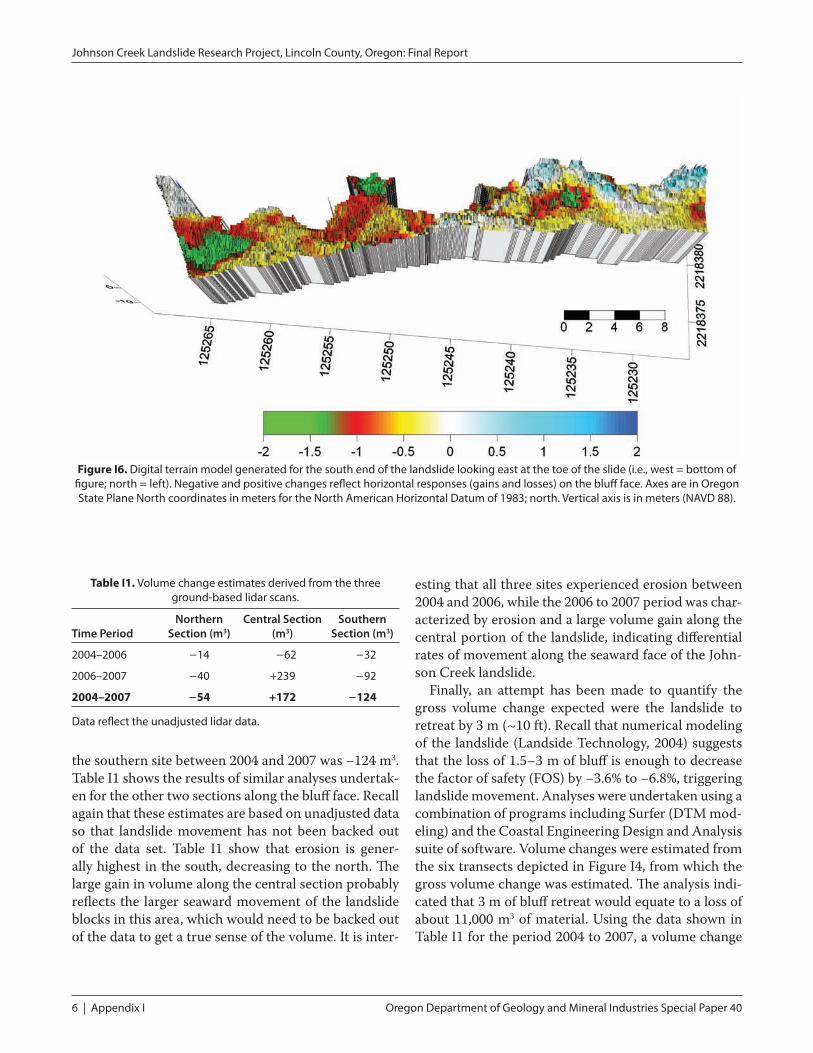
6 | Appendix I Oregon Department of Geology and Mineral Industries Special Paper 40
Johnson Creek Landslide Research Project, Lincoln County, Oregon: Final Report
Figure I6. Digital terrain model generated for the south end of the landslide looking east at the toe of the slide (i.e., west = bottom of figure; north = left). Negative and positive changes reflect horizontal responses (gains and losses) on the bluff face. Axes are in Oregon State Plane North coordinates in meters for the North American Horizontal Datum of �9��; north. Vertical axis is in meters (NAVD ��).
the southern site between 2004 and 2007 was −124 m3. Table I1 shows the results of similar analyses undertak-en for the other two sections along the bluff face. Recall again that these estimates are based on unadjusted data so that landslide movement has not been backed out of the data set. Table I1 show that erosion is gener-ally highest in the south, decreasing to the north. The large gain in volume along the central section probably reflects the larger seaward movement of the landslide blocks in this area, which would need to be backed out of the data to get a true sense of the volume. It is inter-
esting that all three sites experienced erosion between 2004 and 2006, while the 2006 to 2007 period was char-acterized by erosion and a large volume gain along the central portion of the landslide, indicating differential rates of movement along the seaward face of the John-son Creek landslide.
Finally, an attempt has been made to quantify the gross volume change expected were the landslide to retreat by 3 m (~10 ft). Recall that numerical modeling of the landslide (Landside Technology, 2004) suggests that the loss of 1.5–3 m of bluff is enough to decrease the factor of safety (FOS) by −3.6% to −6.8%, triggering landslide movement. Analyses were undertaken using a combination of programs including Surfer (DTM mod-eling) and the Coastal Engineering Design and Analysis suite of software. Volume changes were estimated from the six transects depicted in Figure I4, from which the gross volume change was estimated. The analysis indi-cated that 3 m of bluff retreat would equate to a loss of about 11,000 m3 of material. Using the data shown in Table I1 for the period 2004 to 2007, a volume change
table I1. Volume change estimates derived from the three ground-based lidar scans.
Time PeriodNorthern
Section (m3)Central Section
(m3)Southern
Section (m3)
�004–�006 −�4 −6� −��
�006–�007 −40 +��9 −9�
2004–2007 −54 +172 −124
Data reflect the unadjusted lidar data.

Oregon Department of Geology and Mineral Industries Special Paper 40 Appendix I | 7
Johnson Creek Landslide Research Project, Lincoln County, Oregon: Final Report
based around the three discrete sections was estimated for the full length of the landslide. Furthermore, because the landslide has moved so significantly in the central part of the block, the rate of erosion was assumed to be comparable to the south end. Assuming this is cor-rect, the amount of bluff erosion over the 2004 to 2007 period is conservatively estimated to be about 900 m3. This would imply that it would take something on the order of 30+ years to achieve a volume of erosion significant enough to trigger a landslide failure move-ment comparable to the December 2002 event. Thus, it would appear that the degree of erosion occurring along the Johnson Creek bluff face is indeed significant enough to enhance landslide movement when coupled with heavy precipitation events and may help account for the episodic nature of major movement events.
rEFErENCEs
Collins, B. D., and Kayen, R., 2006, Land-based lidar mapping — a new surveying technique to shed light on rapid topographic change: U.S. Geological Survey Fact Sheet 2006-3111, 4 p.
Landslide Technology, 2004, Geotechnical investiga-tion, Johnson Creek landslide, Lincoln County, Oregon: Oregon Department of Geology and Min-eral Industries Open-File Report O-04-05, 115 p.
Priest, G. R., Allen, J. C., Niem, A., Christie, S. R., and Dickenson, S. E., 2006, Interim report: Johnson Creek landslide project, Lincoln County, Oregon:Oregon Department of Geology and Mineral Industries Open-File Report O-06-02, 184 p.

Oregon Department of Geology and Mineral Industries Special Paper 40 Appendix J | �
Johnson Creek Landslide Research Project, Lincoln County, Oregon: Final Report
APPENDIX J: rINg shEAr tEst rEsuLts
Figure J1. Shear stress versus displacement.

� | Appendix J Oregon Department of Geology and Mineral Industries Special Paper 40
Johnson Creek Landslide Research Project, Lincoln County, Oregon: Final Report
Figure J2. Results of ring shear test on sample from �7.9 m (�9 ft) depth in borehole LT-�.

Oregon Department of Geology and Mineral Industries Special Paper 40 Appendix K | �
Johnson Creek Landslide Research Project, Lincoln County, Oregon: Final Report
Beach profile information have been derived from analyses of light detection and ranging (lidar) data measured by the U.S. Geological Survey, and from top-ographic surveys undertaken at the end of the winter season (April 2003). Some beach surveys were also car-ried out during the winter. However, storms between December 2002 and January 2003 eroded the bench-marks. As a result, we have been unable to reoccupy the study sites.
Figure K1 presents a location map that identifies the position of the beach profile sites studied. Figure K2 presents a three-dimensional image of the beach, while
Figure 3 presents profile cross-section information. It is worth noting that at the time of the lidar flight in Sep-tember 2002, a large rip embayment had become estab-lished in front of the landslide. The rip embayment has remained throughout the winter months and has prob-ably contributed to localized erosion along the central portion of the bluff face over the winter months.
Total volumetric change in the amount of sand in front of the landslide is estimated to be 47,700 m3 of sand (i.e., erosion of this amount over the duration of the winter, September 2002 to April 2003).
APPENDIX k: BEACh sAND movEmENt From BEACh ProFILE DAtA

� | Appendix K Oregon Department of Geology and Mineral Industries Special Paper 40
Johnson Creek Landslide Research Project, Lincoln County, Oregon: Final Report
Figure k1. Location map of beach profiles.

Oregon Department of Geology and Mineral Industries Special Paper 40 Appendix K | �
Johnson Creek Landslide Research Project, Lincoln County, Oregon: Final Report
Figure k2. Three-dimensional perspective overlooking the beach in front of the Johnson Creek landslide. View is toward the south-east. Contour elevations are 0.�� m, with �.0-m contours delineated by green lines. The red line denotes the approximate location of the mudstone-beach contact in April �00�. The beach experienced a vertical drop of �–� m over the �00�-�00� winter storm season.

4 | Appendix K Oregon Department of Geology and Mineral Industries Special Paper 40
Johnson Creek Landslide Research Project, Lincoln County, Oregon: Final Report
Figure k3. Beach profile surveys for profiles � and � derived from lidar data and from the April �00� topographic survey.

Oregon Department of Geology and Mineral Industries Special Paper 40 Appendix K | �
Johnson Creek Landslide Research Project, Lincoln County, Oregon: Final Report
Figure k3, continued. Beach profile surveys for profiles � and 4 derived from lidar data and from the April �00� topographic survey.

6 | Appendix K Oregon Department of Geology and Mineral Industries Special Paper 40
Johnson Creek Landslide Research Project, Lincoln County, Oregon: Final Report
Figure k3, continued. Beach profile surveys for profiles � and 6 derived from lidar data and from the April �00� topographic survey.

Oregon Department of Geology and Mineral Industries Special Paper 40 Appendix K | 7
Johnson Creek Landslide Research Project, Lincoln County, Oregon: Final Report
Figure k3, continued. Beach profile surveys for profiles 9 and �0 derived from lidar data and from the April �00� topographic survey.

� | Appendix K Oregon Department of Geology and Mineral Industries Special Paper 40
Johnson Creek Landslide Research Project, Lincoln County, Oregon: Final Report
Figure k3, continued. Beach profile surveys for profiles �� and �� derived from lidar data and from the April �00� topographic survey.

Oregon Department of Geology and Mineral Industries Special Paper 40 Appendix K | 9
Johnson Creek Landslide Research Project, Lincoln County, Oregon: Final Report
Figure k3, continued. Beach profile surveys for profiles �� and �4 derived from lidar data and from the April �00� topographic survey.

Oregon Department of Geology and Mineral Industries Special Paper 40 Appendix L | �
Johnson Creek Landslide Research Project, Lincoln County, Oregon: Final Report
APPENDIX L: ThrEshoLD PrEssurEs for sLIDE MovEMENTs
Figures L1–L11 illustrate threshold pressure above the slide plane for start, stop, and slowing of slide movement during each movement epi-sode. The figures contain notes made while compiling Table 7 of the main text. Also shown is cumulative precipitation from the start of each water year on July 1. In a few cases, detailed charts at large vertical scales are given to illustrate the uncertainty in picking exact time that movement begins or ends. Numbers in colored boxes are all in head (meters H2O) above the base of the basal shear zone.

� | Appendix L Oregon Department of Geology and Mineral Industries Special Paper 40
Johnson Creek Landslide Research Project, Lincoln County, Oregon: Final Report
Decem ber 2002 to February 2003 M ovem ent Events
-1
1
3
5
7
9
11
13
15
17
19
21
23
25
27
29
5-Dec 10-Dec 15-Dec 20-Dec 25-Dec 30-Dec 4-Jan 9-Jan 14-Jan 19-Jan 24-Jan 29-Jan 3-Feb 8-Feb 13-Feb 18-Feb
Mov
emen
t(cm
),H
ead
(m),
Cum
.Ppt
n(d
m)
Cum . M ovem ent LT -1 (cm ) Cum . M ovem ent LT -2 (cm )Cum . M ovem ent LT -3 (cm ) LT -1p Head above s lide @ 24.8 m (m )LT -2p Head above s lide @ 16.7 (m H20) LT -3p Head above s lide @ 5.5 m (m H20)Cum Pptn (dm )
D rillingE ffec ts onW aterP ressure
LT -2 >10.5; <11.5 m
LT -1 >5.7; <6.8 mLT -3 >4.8; <5.0 m
LT -2 >8.5; <9.2 m
LT -1 >6.1; <6.4 mLT -3 >3.2; <3.4m
Second M ovem entS tart S top
2nd StartS top
1st S tart
S top
figure L1. Threshold pressure above the slide plane for December �00� to February �003 movement events.

Oregon Department of Geology and Mineral Industries Special Paper 40 Appendix L | 3
Johnson Creek Landslide Research Project, Lincoln County, Oregon: Final Report
M arch 2003 M ovem ent
0
1
2
3
4
5
6
7
8
9
10
11
7-M ar 9-M ar 11-M ar 13-M ar 15-M ar 17-M ar 19-M ar 21-M ar 23-M ar 25-M ar 27-M ar 29-M ar 31-M ar 2-Apr 4-Apr
Mov
emen
t(cm
),H
ead
(m))
0
2
4
6
8
10
12
14
16
18
Cum . M ovem ent LT -1 (cm ) Cum . M ovem ent LT -2 (cm )Cum . M ovem ent LT -3 (cm ) LT -1p Head above s lide @ 24.8 m (m )LT -2p Head above s lide @ 16.7 (m H20) LT -3p Head above s lide @ 5.5 m (m H20)Cum Pptn (dm )
LT -2 >8.5; <9.8 mLT -1 >6.3; <6.7 m
LT -3 >2.9 ; <4.4 m
>8.7; <9.1 m~6.7 m
>3.3: <4.4 m
Start
S top
Start M ovem ent S top
figure L2. Threshold pressure above the slide plane for March �003 movement.

4 | Appendix L Oregon Department of Geology and Mineral Industries Special Paper 40
Johnson Creek Landslide Research Project, Lincoln County, Oregon: Final Report
Novem ber 2003 to M arch 2004 M ovem ents
0
1
2
3
4
5
6
7
8
9
10
11
12
10/6 10/16 10/26 11/5 11/15 11/25 12/5 12/15 12/25 1/4 1/14 1/24 2/3 2/13 2/23 3/4 3/14 3/24
Mov
emen
t(cm
),H
ead
(m)
0
2
4
6
8
10
12
14
16
18
Cum
.Ppt
n.(d
m)
Cum . M ovem ent LT -1 (cm ) Cum . M ovem ent LT -2 (cm ) Cum . M ovem ent LT -3 (cm )LT -1p Head above s lide @ 24.8 m (m ) LT -2p Head above s lide @ 16.7 (m H20) LT -3p Head above s lide @ 5.5 m (m H20)Cum Pptn (dm )
LT -2 >7.2; <9.1 m
LT -1 >5.5; <6.6 mLT -3 >2.8; <3.7 m
>9.2; <10.1 m
6.8 m
>3.9m ; <4.5
Start M ovem ent S topM ovem ent
Start M ovem ent
S top
figure L3. Threshold pressure above the slide plane for November �003 to March �004 movements.

Oregon Department of Geology and Mineral Industries Special Paper 40 Appendix L | �
Johnson Creek Landslide Research Project, Lincoln County, Oregon: Final Report
O ctober 2004 to January 2005 M ovem ent
0
1
2
3
4
5
6
7
8
9
10-Sep
15-Sep
20-Sep
25-Sep
30-Sep
5-O ct
10-O ct
15-O ct
20-O ct
25-O ct
30-O ct
4-Nov
9-Nov
14-Nov
19-Nov
24-Nov
29-Nov
4-Dec
9-Dec
14-Dec
19-Dec
24-Dec
29-Dec
3-Jan
8-Jan
Mov
emen
t(cm
),H
ead
(m)
0
1
2
3
4
5
6
7
8
Cum
.Ppt
n.(d
m)
Cum . M ovem ent LT -1 (cm ) Cum . M ovem ent LT -2 (cm ) Cum . M ovem ent LT -3 (cm )LT -1p Head above s lide @ 24.8 m (m ) LT -2p Head above s lide @ 16.7 (m H20) LT -3p Head above s lide @ 5.5 m (m H20)Cum Pptn (dm ) Cum Pptn (dm )
Head1.9<LT -3< 2.1 m
HeadLT -3 ~2.1 m
Start M ovem ent S top m ovem ent
East S ite (LT -3)M ovem ent
figure L4. Threshold pressure above the slide plane for October �004 to January �00� movement.

� | Appendix L Oregon Department of Geology and Mineral Industries Special Paper 40
Johnson Creek Landslide Research Project, Lincoln County, Oregon: Final Report
Decem ber 2005 to February 2006 M ovem ent vs P ressure Head
0
1
2
3
4
5
6
7
8
9
10
11
12
17-Dec
20-Dec
23-Dec
26-Dec
29-Dec
1-Jan
4-Jan
7-Jan
10-Jan
13-Jan
16-Jan
19-Jan
22-Jan
25-Jan
28-Jan
31-Jan
3-Feb
6-Feb
9-Feb
12-Feb
15-Feb
18-Feb
21-Feb
24-Feb
Mov
emen
t(cm
),H
ead
(m)
5
6
7
8
9
10
11
12
13
14
Cum
.Ppt
n.(d
m)
Cum . M ovem ent LT -1 (cm ) Cum . M ovem ent LT -2 (cm )Cum . M ovem ent LT -3 (cm ) LT -1p Head above s lide @ 24.8 m (m )LT -2p Head above s lide 16.7 (m H20) LT -3p Head above s lide 5.5 m (m H20)Cum Pptn (dm )
Start LT -2Possib le: 12 /25
8.4mDefin ite : 12 /27
8.7 m
Start LT -1M ovem ent12/28 2:00 6.4
Possib . 12 /22 16:003.9 m
Defin ite : 12 /27 23:00 3.7 m
LT -2 2/9 16:00 8.9 m
LT -1 2/10 11:00 6.4 m
LT -3 2/7 18:00 2.9 m
Stop
LT -1 S tab le below 6.8-6 .4 m
LT -2 S tab le below 9.1-9 m
LT -3 S tab le 3.9-2 .9-3 .4 m
LT -3 stops below 3.3 m
LT -1 S tops at 6 .6-6 .7 mStarts above 6.6 m
LT -2 S tab lebelow 9.4 m
figure L5. Movement versus pressure head for December �00� to February �00�.

Oregon Department of Geology and Mineral Industries Special Paper 40 Appendix L | �
Johnson Creek Landslide Research Project, Lincoln County, Oregon: Final Report
Start o f o f Decem ber 2005 M ovem ent Event
0
0.2
0.4
0 .6
0 .8
1
1.2
1.4
1 .6
20-Dec
21-Dec
22-Dec
23-Dec
24-Dec
25-Dec
26-Dec
27-Dec
28-Dec
29-Dec
30-Dec
31-Dec
1-Jan 2-Jan 3-Jan 4-Jan 5-Jan 6-Jan 7-Jan
Mov
emen
t(cm
)
5
6
7
8
9
Cum
.Ppt
n.(d
m)
12-28-05 Event LT -1 (cm ) M ovem ent LT -2 (cm ) M ovem ent LT -3 (cm ) Series4
LT -3 (east s ite ) possib le start as early as 12/22/05 17:00; large even t starts at 12/27 /05 23:00LT -2 (m idd le site ) possib le start as early as 12/25/05 0:00; large even t starts at 12/27 /05 23:00LT -1 (w est s ite ) starts m ovem ent at 12/28 /05 0:00
Possib leLT -3S tart
LT -1S tart
Possib leLT -2S tart
LT -2 + 3Start
figure L6. Uncertainty in slide movement data for the December �00� event.

� | Appendix L Oregon Department of Geology and Mineral Industries Special Paper 40
Johnson Creek Landslide Research Project, Lincoln County, Oregon: Final Report
January 2006 M ovem ent Event
0
0
0
0
0
0
1
1
1
1
1
1
1
1
1
1
2
2
25-Jan 26-Jan 27-Jan 28-Jan 29-Jan 30-Jan 31-Jan 1-Feb 2-Feb 3-Feb
Mov
emen
t(cm
)d isp LT -1 (cm ) d isp LT -2 (cm ) d isp LT -3 (cm )
LT -3 (east s ite ) possib le start as early as 1/26/06 23:00; defin ite start at 1 /28 /06 13:00LT -2 (m idd le site ) possib le start as early as 1/28/06 1:00; defin ite start at 1 /29 /06 5:00LT -1 (w est s ite ) possib le m ovem ent at 1 /28 /06 1:00; defin ite start at 1 /28 /06 23:00
Possib leLT -3S tart
Possib leLT -1 and 2
S tart
LT -3S tart
LT -1S tart
LT -2S tart
figure L7. Uncertainty in slide movement data for the January �00� event.

Oregon Department of Geology and Mineral Industries Special Paper 40 Appendix L | �
Johnson Creek Landslide Research Project, Lincoln County, Oregon: Final Report
End of January 2006 M ovem ent
1
2
2
3
3
4
4
5
1-Feb 2-Feb 3-Feb 4-Feb 5-Feb 6-Feb 7-Feb 8-Feb 9-Feb 10-Feb 11-Feb 12-Feb 13-Feb
Mov
emen
t(cm
)
Cum . M ovem ent LT -1 (cm ) Cum . M ovem ent LT -2 (cm ) Cum . M ovem ent LT -3 (cm )
figure L8. Uncertainty in slide movement data for the December �00� event.

�0 | Appendix L Oregon Department of Geology and Mineral Industries Special Paper 40
Johnson Creek Landslide Research Project, Lincoln County, Oregon: Final Report
Novem ber 2006 M ovem ent vs P ressure Head
0
1
2
3
4
5
6
7
8
9
10
11
12
13
14
15
30-O ct 1-Nov 3-Nov 5-Nov 7-Nov 9-Nov 11-Nov 13-Nov 15-Nov 17-Nov 19-Nov 21-Nov
Hea
d(m
)
0
0 .5
1
1.5
2
2.5
3
3.5
4
4.5
Cum
.Mov
emen
t(cm
),Pp
tn.(
dm)
LT -1p Head above s lide @ 24.8 m (m ) LT -2p Head above s lide 16.7 (m H20) LT -3p Head above s lide 5.5 m (m H20)Cum . M ovem ent LT -1 (cm ) Cum . M ovem ent LT -2 (cm ) Cum . M ovem ent LT -3 (cm )Cum Pptn (dm )
D rilling E ffec t
Defin ite S tartLT -3 = 3.9 m11/6 18:45
S tart M oveLT -2 = 8.5 m
11/7 8:15
S tart M oveLT -1 = 6.2 m
11/8 8:45
S topLT -3 = 3.1 m11/14 11:45
S top M oveLT -2 = 9.0 m11/14 11:45
S top M oveLT -1 = 6.5 m11/15 15:30
Probab le S tartLT -3 = 3.1 m11/4 21:00
figure L9. Movement versus pressure head for November �00�.
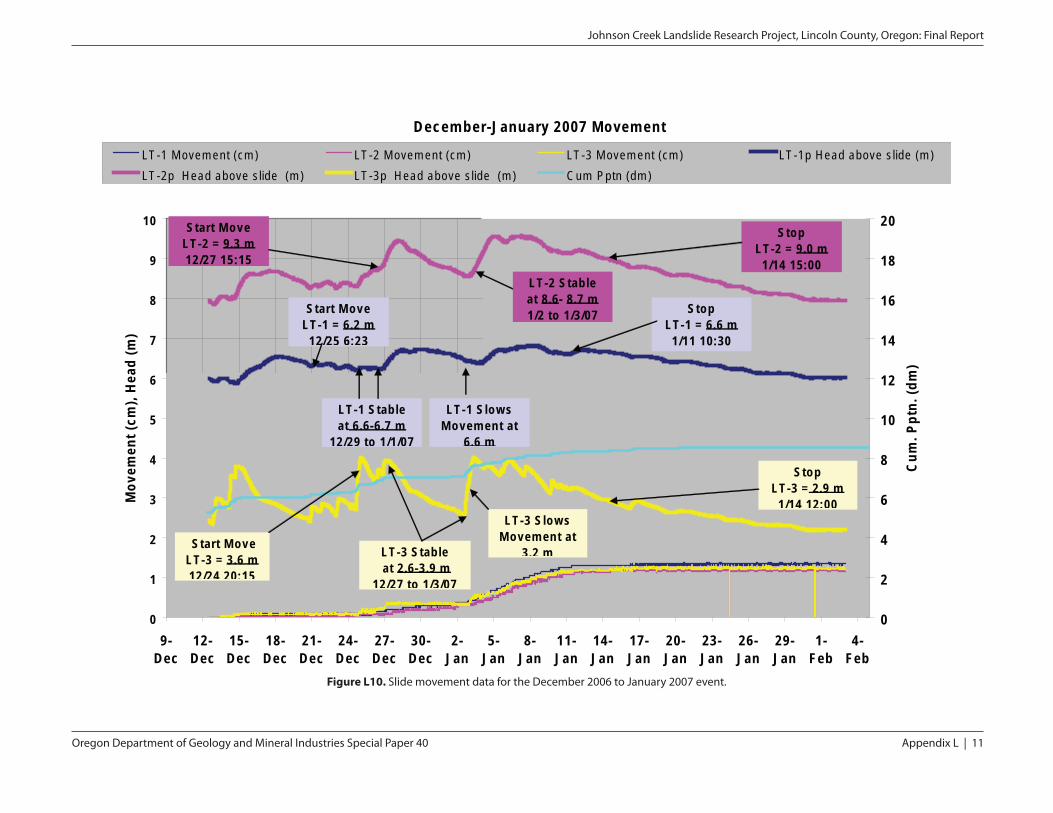
Oregon Department of Geology and Mineral Industries Special Paper 40 Appendix L | ��
Johnson Creek Landslide Research Project, Lincoln County, Oregon: Final Report
Decem ber-January 2007 M ovem ent
0
1
2
3
4
5
6
7
8
9
10
9-Dec
12-Dec
15-Dec
18-Dec
21-Dec
24-Dec
27-Dec
30-Dec
2-Jan
5-Jan
8-Jan
11-Jan
14-Jan
17-Jan
20-Jan
23-Jan
26-Jan
29-Jan
1-Feb
4-Feb
Mov
emen
t(cm
),H
ead
(m)
0
2
4
6
8
10
12
14
16
18
20
Cum
.Ppt
n.(d
m)
LT -1 M ovem ent (cm ) LT -2 M ovem ent (cm ) LT -3 M ovem ent (cm ) LT -1p Head above s lide (m )LT -2p Head above s lide (m ) LT -3p Head above s lide (m ) Cum Pptn (dm )
Start M oveLT -2 = 9.3 m12/27 15:15
S tart M oveLT -1 = 6.2 m12/25 6:23
S topLT -3 = 2.9 m1/14 12:00
S topLT -2 = 9.0 m1/14 15:00
S topLT -1 = 6.6 m1/11 10:30
S tart M oveLT -3 = 3.6 m12/24 20:15
LT -2 S tab leat 8 .6- 8 .7 m1/2 to 1/3 /07
LT -1 S tab leat 6 .6-6 .7 m
12/29 to 1/1 /07
LT -3 S tab leat 2 .6-3 .9 m
12/27 to 1/3 /07
LT -3 S low sM ovem ent at
3 .2 m
LT -1 S low sM ovem ent at
6 .6 m
figure L10. Slide movement data for the December �00� to January �00� event.

�� | Appendix L Oregon Department of Geology and Mineral Industries Special Paper 40
Johnson Creek Landslide Research Project, Lincoln County, Oregon: Final Report
February-M arch 2007 M ovem ent
0
1
2
3
4
5
6
7
8
9
10
11
9-Feb
11-Feb
13-Feb
15-Feb
17-Feb
19-Feb
21-Feb
23-Feb
25-Feb
27-Feb
1-M ar
3-M ar
5-M ar
7-M ar
9-M ar
11-M ar
13-M ar
15-M ar
17-M ar
19-M ar
21-M ar
23-M ar
25-M ar
27-M ar
Mov
emen
t(cm
),H
ead
(m)
0
2
4
6
8
10
12
14
Cum
.Ppt
n.(d
m)
LT -1 M ovem ent (cm ) LT -2 M ovem ent (cm ) LT -3 M ovem ent (cm )LT -1p Head above s lide (m ) LT -2p Head above s lide (m ) LT -3p Head above s lide (m )Cum Pptn (dm )
E . S ite (LT -3)S tart Feb. 15
3.45-3 .5 m
East S ite (LT -3)S tart M ove 3.9 m
W est S tart 6 .4 m
M idd le S ite (LT -2)S tart M ove 9.9 m
M idd le S ite (LT -2)S top C reep at 9 .0 m
East S ite (LT -3)S tart C reep 3.5 m ;
S top C reep at 3 .0 m
W est S ite (LT -1)S top C reep at 6 .7 m
E. S ite (LT -3)S top Feb. 16
4.1 m
M idd le S ite (LT -2)S lows M ovem ent a t 9 .7 m
W est S ite (LT -1)S lows M ovem ent a t 6 .7 m
East S ite (LT -3)S lows 3.1m
East S ite (LT -3)S top at 3 .2 m
figure L11. Side movement data for the February to March �00� event.

Oregon Department of Geology and Mineral Industries Special Paper 40 Appendix M | �
Johnson Creek Landslide Research Project, Lincoln County, Oregon: Final Report
LANDsLIDE stABILIty EvALuAtIoN
A slope stability evaluation of the landslide at the drill-ing transect for boreholes LT-1, LT-2, and LT-3 was performed by Landslide Technology (Landslide Tech-nology, 2004) using data available in 2002 and spring of 2003, including (1) borehole data, (2) depth of sliding and groundwater data from instrumentation, (3) geo-logic reconnaissance of the site, and (4) topographic map. The results of the stability analysis were used in evaluating potential slide treatment options, which are discussed in the section below entitled Remediation Option Analysis. Samuel R. Christie and Dr. Stephen E. Dickenson of Oregon State University reexamined the stability analysis of Landslide Technology (2004); their results are summarized in Appendix N and gener-ally agree with the Landslide Technology analysis for
the cross section through the boreholes. They obtained similar results for cross sections north and south of the boreholes.
The stability and remediation analyses from Land-slide Technology (2004) are for convenience of the reader reproduced below unchanged from the origi-nal report, except for a quotation from an unpublished letter from Landslide Technology in response to review comments. The quotation is in regard to the effect on slide stability of water-filled fissures or cracks in the landslide.
Back AnalysisThe stability analyses (Landslide Technology, 2004)
were performed on cross section A-A’, Figure M1. This section was selected because it is nearly parallel to the direction of slide movement and passes through the
APPENDIX m: rEmEDIAtIoN oPtIoNs (LANDsLIDE tEChNoLogy, 2004)
Figure m1. Generalized cross section used by Landslide Technology (�004) for stability analysis. Note that the locations of LT-� and LT-�p are reversed from actual locations. This minor error should not materially affect
the analysis. Location of the cross section is essentially the same as A-A’ in Figure 6 of the main text.

� | Appendix M Oregon Department of Geology and Mineral Industries Special Paper 40
Johnson Creek Landslide Research Project, Lincoln County, Oregon: Final Report
three sets of instrumented borings. Analyses were per-formed using Spencer’s method in the computer pro-gram XSTABL. Soil parameters used for this study are discussed in more detail in the following sections.
The analyses were performed by back-calculating the required strength (angle of shearing resistance, φ′) along the shear zone for incipient failure conditions (i.e., for a factor of safety equal to 1.0). The improvements to the factor of safety (FOS) were then checked for various treatment options using the back-calculated φr′.
Shear zone. The location of the shear zone is esti-mated based on the known depth of movement in incli-nometers LT-1, LT-2, and LT-3, the location of cracks observed upslope from the instrumentation, inter-preted topography, and observations from the test pit at the slide toe. The analyzed slip surface is shown in Figure M1.
Groundwater levels. Groundwater levels used in the back analysis stability evaluation are based on piezom-eter measurements when a threshold level of 10.0 m (32.8 ft) of head on the slide plane was reached in LT-2p. The depth of the groundwater measured below the ground surface at this time for LT-1p, LT-2p, and LT-3p was 19.2 m (elev. 5.4 m), 8.6 m (elev. 15.7 m) and 0.7 m (elev. 23.3 m), respectively. This groundwater level was kept constant throughout the back analysis and is shown in Figure M1.
Material parameters. Strength and density param-eters of the soil and rock used in the analyses were estimated based on moisture content, material clas-sification, and our experience with similar materials. Residual ring shear testing of the Astoria Formation material found in the shear zone resulted in an effective residual friction angle of φr′ = 13.1 degrees. The strength and density parameters of the soil and rock used in the analysis are summarized in Table M1.
Analysis results. The back-calculated residual strength (φr′) value for the slip surface analyzed in cross section A-A’ (Figure M1) was determined to be 6.5 degrees. This single digit value is comparable with similar slides in the Astoria Formation and other large translational landslides in tuffaceous sediments and decomposed volcanic rocks, all of which have been investigated by Landslide Technology. The difference between the back analyzed φ′ value and the value obtained from the ring shear testing (13.1 degrees) may be attributed to the fact that the sample tested may not be representative of the entire failure surface. The back-calculated φr′ value is an average value for the model.
sensitivity AnalysisA parametric investigation was performed to evalu-
ate the sensitivity of landslide stability to the following parameters: precipitation, groundwater levels, erosion, and beach sand level. Specific parameters were varied as discussed in the following sections.
Precipitation and groundwater. An evaluation of the sensitivity of slide movement to precipitation and groundwater level was performed. As discussed in sec-tion 5.3 [of Landslide Technology (2004)], a rainfall event which measures 55 to 60 mm of rainfall in a 24-hr period is likely to trigger landslide movement. Peak rainfall events cause groundwater to rise above thresh-old levels, further destabilizing the landslide. With the available piezometer data, groundwater levels for a “severe storm” were modeled by raising the highest mea-sured levels in piezometers LT-1p, LT-2p, and LT-3p by 1.5 m (but not above the ground surface). Groundwater levels used for the theoretical “severe storm” analysis are elevation 9.0 m, 19.0 m, and 24.1 m at piezometer locations LT-1p, LT-2p, and LT-3p, respectively. The results indicate that a rise in groundwater level of 1.5 m above the back-analyzed level would decrease the FOS of the slide mass by seven percent.
During the winter months groundwater levels appear to stay at reasonably stable levels, except during mod-erate to severe rainfall events. These “normal winter” levels were measured at average elevations of 5.0 m, 14.6 m, and 21.4 m in piezometers LT-1p, LT-2p, and LT-3p, respectively. By varying only the groundwater level in the slide the results of the analysis indicate that decreasing the groundwater level to the theoretical “normal winter” results in an increase in the FOS of the slide on the order of two percent higher than the back analysis.
table m1. Summary of material strength and density parameters.
MaterialUnit Weight kN/m3 (pcf)
Cohesion Intercept, c’
Pa (psf)
Angle of Shearing
Resistance, φ′ (degrees)
Terrace sand and decomposed Astoria Formation ��.� (���) 0 ��
Astoria Formation ��.� (���) 0 6.�*
Rock fill ��.� (���) 0 4�
*Back calculated value from the geologic cross section shown in Figure M�.

Oregon Department of Geology and Mineral Industries Special Paper 40 Appendix M | �
Johnson Creek Landslide Research Project, Lincoln County, Oregon: Final Report
Water-filled cracks. Landslide Technology (2004) did not discuss the effect of water-filled cracks, but reviewers of the 2004 report did ask about this issue. Here is the response from Landslide Technology in their September 4, 2003, unpublished letter:
“Regarding the potential effect of water-filled ten-sion cracks, Boring LT-3 is located near the head of the slide and any cracks downhill from LT-3, with or without water, would be modeled as an internal force in the stability analyses of the overall landslide and would have very minor effect on the friction angle (only the added weight of water in the tension crack). A water-filled crack uphill from LT-3 might have an effect on the back-calculated friction angle, and we tested this to see any difference. We placed an 18-ft high water filled crack east of LT-3, and the factor of safety against slid-ing increased slightly, and the resulting phi residual dropped from 6.5 to 6.45 degrees. We interpret that this difference is due to the removal of a small portion of the landslide’s driving wedge.”
Erosion and beach sand movement. To evaluate the effect of ocean surf on the stability of the slide, both erosion of the cliff face at the toe of the slide and the seasonal deposition and removal of sand due to surf action were analyzed.
To evaluate the sensitivity of the slide to erosion of the bluff at the beach, stability analyses were performed and compared to the back-analysis results. The models were developed by offsetting the entire face of the bluff (up to
an approximate elevation of 14.6 m) 0.3 m (1 ft), 1.5 m (5 ft), and 3.0 m (10 ft) to the east, respectively (Figure M2). To isolate the effect of the erosion, the geometry of the shear zone at the toe remained unchanged from the back analysis. To keep the groundwater conditions constant through the analyses, groundwater levels for the 3.0-m erosion study were used. The only differ-ence between this groundwater level and that used in the back analysis is a slight lowering of the water level west of LT-1P due to a change in the inflection point of the groundwater surface at the beach as a result of the changing location of the cliff face.
An additional study was performed to isolate and evaluate the effect of seasonal deposition and removal of sand from the beach relative to the stability of the slide. The model for this analysis consisted of adding approximately one meter of sand to the beach area, which isolated the effect of the sand by limiting vari-ations to the model (i.e., the failure surface). For this analysis the groundwater level remained unchanged from the back analysis model. The geometry of the shear zone was modified only by extending the toe out-ward to the new ground surface.
Summary of sensitivity analysis. A parametric study has been performed to evaluate the sensitivity of the slide to three major parameters: (1) precipita-tion and groundwater, (2) erosion, and (3) the seasonal deposition and removal of sand on the beach. The back analysis model was used as the reference, and for each
Figure m2. Site map. Slide block boundaries (black lines) are from Landslide Technology (�004).
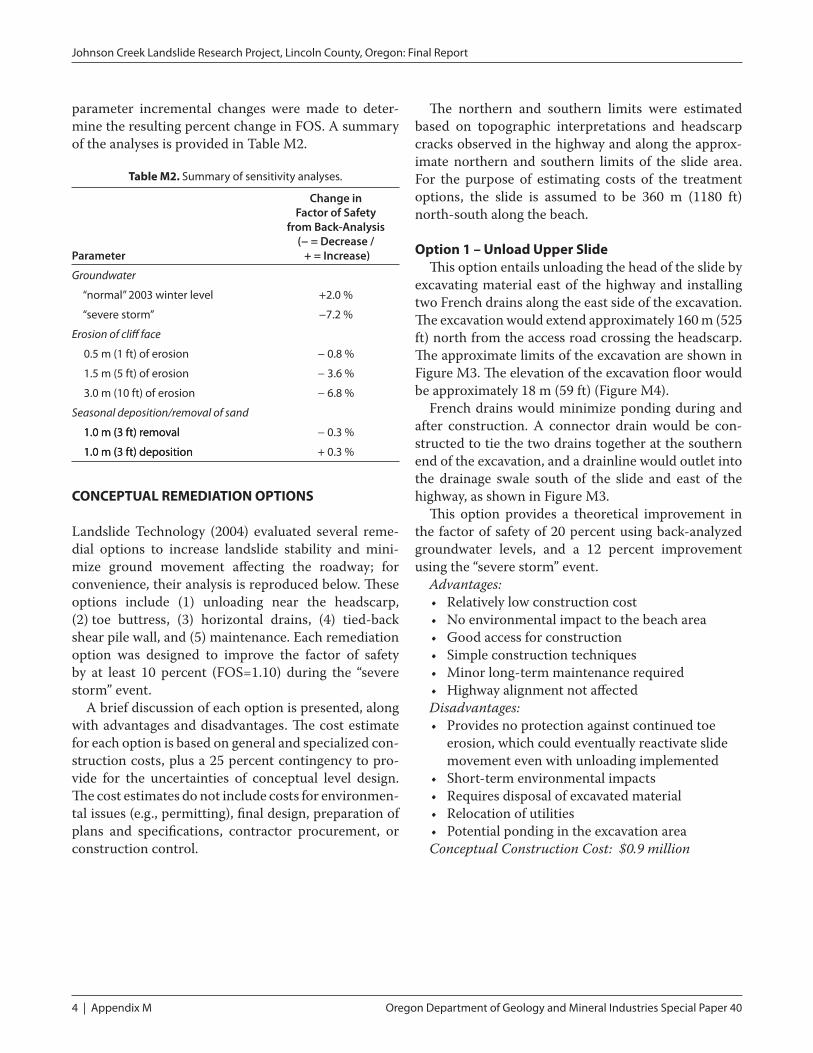
4 | Appendix M Oregon Department of Geology and Mineral Industries Special Paper 40
Johnson Creek Landslide Research Project, Lincoln County, Oregon: Final Report
parameter incremental changes were made to deter-mine the resulting percent change in FOS. A summary of the analyses is provided in Table M2.
table m2. Summary of sensitivity analyses.
Parameter
Change in Factor of Safety
from Back-Analysis (− = Decrease / + = Increase)
Groundwater
“normal” �00� winter level +�.0 %
“severe storm” −7.� %
Erosion of cliff face
0.� m (� ft) of erosion − 0.� %
�.� m (� ft) of erosion − �.6 %
�.0 m (�0 ft) of erosion − 6.� %
Seasonal deposition/removal of sand
�.0 m (� ft) removal�.0 m (� ft) removal − 0.� %
�.0 m (� ft) deposition�.0 m (� ft) deposition + 0.� %
CoNCEPtuAL rEmEDIAtIoN oPtIoNs
Landslide Technology (2004) evaluated several reme-dial options to increase landslide stability and mini-mize ground movement affecting the roadway; for convenience, their analysis is reproduced below. These options include (1) unloading near the headscarp, (2) toe buttress, (3) horizontal drains, (4) tied-back shear pile wall, and (5) maintenance. Each remediation option was designed to improve the factor of safety by at least 10 percent (FOS=1.10) during the “severe storm” event.
A brief discussion of each option is presented, along with advantages and disadvantages. The cost estimate for each option is based on general and specialized con-struction costs, plus a 25 percent contingency to pro-vide for the uncertainties of conceptual level design. The cost estimates do not include costs for environmen-tal issues (e.g., permitting), final design, preparation of plans and specifications, contractor procurement, or construction control.
The northern and southern limits were estimated based on topographic interpretations and headscarp cracks observed in the highway and along the approx-imate northern and southern limits of the slide area. For the purpose of estimating costs of the treatment options, the slide is assumed to be 360 m (1180 ft) north-south along the beach.
option 1 – unload upper slideThis option entails unloading the head of the slide by
excavating material east of the highway and installing two French drains along the east side of the excavation. The excavation would extend approximately 160 m (525 ft) north from the access road crossing the headscarp. The approximate limits of the excavation are shown in Figure M3. The elevation of the excavation floor would be approximately 18 m (59 ft) (Figure M4).
French drains would minimize ponding during and after construction. A connector drain would be con-structed to tie the two drains together at the southern end of the excavation, and a drainline would outlet into the drainage swale south of the slide and east of the highway, as shown in Figure M3.
This option provides a theoretical improvement in the factor of safety of 20 percent using back-analyzed groundwater levels, and a 12 percent improvement using the “severe storm” event.
Advantages:Relatively low construction costNo environmental impact to the beach areaGood access for constructionSimple construction techniquesMinor long-term maintenance requiredHighway alignment not affected
Disadvantages:Provides no protection against continued toe erosion, which could eventually reactivate slide movement even with unloading implemented Short-term environmental impactsRequires disposal of excavated materialRelocation of utilitiesPotential ponding in the excavation area
Conceptual Construction Cost: $0.9 million
••••••
•
••••

Oregon Department of Geology and Mineral Industries Special Paper 40 Appendix M | �
Johnson Creek Landslide Research Project, Lincoln County, Oregon: Final Report
Figure m3. All remediation alternatives summarized by Landslide Technology (�004).
Figure m4. Remediation by unloading the head of the slide and buttressing the slide (taken from Landslide Technology, �004).

6 | Appendix M Oregon Department of Geology and Mineral Industries Special Paper 40
Johnson Creek Landslide Research Project, Lincoln County, Oregon: Final Report
option 2 – toe ButtressThis option would involve building a buttress on the
beach along the toe of the slide as shown in Figures M3 and M4. The buttress would consist of rockfill with a key extending approximately 2 m (6 ft) below the beach, and riprap facing for erosion protection. The buttress would be 11 m high (36 ft), extend approximately 8 m (26 ft) onto the beach from the bluff, and have a 1V:1.5H slope face with the level top extending approximately 2 m (6 ft) out from the existing slope face.
Construction would consist of excavating the key trench in sections, placing a geotextile fabric and then rockfill materials in lifts. The construction of the key trench would occur in 15-m (50-ft) sections to prevent slide instability during construction. Once the length of key was fully constructed, rockfill and riprap would be placed in lifts along the length of the slide to the fin-ished height.
This option provides a theoretical improvement in the factor of safety of 19 percent using back-analyzed groundwater levels, and a 12 percent improvement using the “severe storm” event.
Advantages:High degree of confidence in stability improve-mentRelatively low construction cost Limits rate of bluff erosionSimple construction techniquesMinimal long-term maintenance requiredHighway alignment not affected
Disadvantages:High environmental impact (construction on beach)Limited access to site
Conceptual Construction Cost: $1.1 million
•
•••••
•
•
option 3 – horizontal DrainsThis option would consist of installing horizontal
drains through the slide mass from the toe of the slope (Figures M3 and M5). The drains would consist of slot-ted PVC pipe installed laterally into the slope face with a specialized drill rig. The horizontal drains would attempt to reduce the groundwater level during normal conditions and prevent the buildup of groundwater pressure during extreme rainstorm events.
Based on the stability analyses, improvement in the FOS from horizontal drains is about 1% during the “severe storm” event. Also, the rotational failures at the toe of the larger slide are likely to shear the horizon-tal drains rendering them less effective or inoperable, which could also worsen the stability of the rotational failures.
Other options would be necessary to provide addi-tional stability to the overall slide, such as a toe but-tress. A riprap toe buttress could minimize erosion of the bluff and could provide stability to the rotational toe failures.
Based on the 1% improvement in FOS during the “severe storm” and the potential for rotational failures at the slide toe, this option is not recommended for the Johnson Creek landslide. Nevertheless, to provide com-parison to other options, a conceptual design might include two drain arrays as shown in Figure M3. The cost estimate includes a total of 36 horizontal drains in two arrays for a total constructed length of 4,270 m (14,000 ft).
Advantages:Relatively low construction costSimple construction techniquesHighway alignment not affectedLow long-term environmental impactMinor long-term maintenance
Disadvantages:Stability improvement is low Limited design life of the drains with erosion and slide movementLimited access to site
Conceptual Construction Cost: $0.5 million
•••••
••
•

Oregon Department of Geology and Mineral Industries Special Paper 40 Appendix M | 7
Johnson Creek Landslide Research Project, Lincoln County, Oregon: Final Report
option 4 – tied-Back shear Pile wallThis option consists of constructing a row of large
diameter, heavily reinforced concrete piles with tieback anchors to resist slide movement, installed just west of the highway as shown in Figures M3 and M5. Concep-tual design consists of a 342-m-long (1122 ft) wall of 1.4-m (4 ft) diameter and 36 m (120 ft) deep piles with a spacing of 3.0 m (10 ft). A continuous, structural cap-ping beam would be constructed at the top of the shear piles. Two rows of tiebacks would be installed through the capping beam (Figure M5). The tiebacks would decrease pile deflection and movements and would result in less passive contact pressures in the sandstone below the shear zone. The wall and anchors could be covered and the site restored to a natural condition. This conceptual design provides a factor of safety of 1.3 during the “severe storm” event.
Advantages:High degree of confidence in stability improve-mentLow environmental impact (no construction on beach)Minimal long-term maintenanceHighway alignment not affected
Disadvantages:ExpensiveSpecialized construction technique Construction could impact highway trafficLower slide area may continue to move due to continued bluff erosion
Conceptual Construction Cost: $11 to 14 million
•
•
••
••••
Figure m5. Remediation by horizontal drains and shear pile wall with tiebacks (taken from Landslide Technology, �004).

� | Appendix M Oregon Department of Geology and Mineral Industries Special Paper 40
Johnson Creek Landslide Research Project, Lincoln County, Oregon: Final Report
option 5 – road maintenanceThis option would consist of continued maintenance
of the road. This option requires that the slide area continue to be inspected on a weekly basis and on a daily basis during large storm events, and then quickly repaired when significant movements occur. ODOT records indicate that yearly costs for maintenance have been approximately $15,000 per year prior to the late 1970s, and $20,000 per year more recently.
Advantages:InexpensiveLow environmental impact
DisadvantagesNo effective stabilizationLandslide will continue to moveContinued risk to property and life safetyRequires continual inspection and emergency repair as necessary
Cost: $20,000 a year for basic maintenance (~$400,000 for 20 years)
••
••••
summary of remediation optionsRemediation options that were evaluated for John-
son Creek landslide include unloading, buttressing, draining, a tied-back shear pile wall, and maintenance. A summary of the construction options is provided in Table M3.
Unloading, buttressing, and a tied-back shear pile wall are effective methods to remediate this landslide. Considering the large size of this landslide, unloading and buttressing are relatively low cost options. With stabilization and cost consideration, buttressing would be a preferential option; however, it has a significant environmental impact. A shear pile wall is extremely expensive primarily due to the depth of sliding. Drain-ing groundwater from the landslide through horizontal drains would be ineffective. Groundwater levels within the slide mass are relatively low, and high groundwa-ter levels following precipitation events rapidly drop or naturally drain from the fractured slide mass. Based on the conceptual costs for the construction of these remediation options, annual maintenance becomes a reasonable option.
table m3. Remediation option comparison.
Remediation Option
1 Unload
Upper Slide
2 Toe
Buttress
3 Horizontal
Drains
4 Tied-Back
Shear Pile Wall
5 Road
Maintainance
Effectiveness moderate high low high low
Constructibility good good moderate difficult not applicable
Engineering simple moderate moderate difficult simple
Environmental long-term impact low high low low low
Maintenance long-term low low moderate low high
Construction costs ($ million) 0.9 �.� 0.� ��–�4 0.4 (�0 yrs)
rEFErENCE
Landslide Technology, 2004, Geotechnical investiga-tion, Johnson Creek landslide, Lincoln County, Oregon: Oregon Department of Geology and Mineral Industries Open-File Report O-04-05, 115 p.

Oregon Department of Geology and Mineral Industries Special Paper 40 Appendix N | i
Johnson Creek Landslide Research Project, Lincoln County, Oregon: Final Report
APPENDIX N
GEOTECHNICAL MODELING OF SLOPE STABILITY JOHNSON CREEK LANDSLIDE INVESTIGATION
LINCOLN COUNTY, OREGON
Prepared for DOGAMI by
Samuel R. Christie, Graduate Researcher Dr. Stephen E. Dickenson, Associate Professor
Geotechnical Engineering Group Department of Civil, Construction and Environmental Engineering
Oregon State University
June 3, 2005

ii | Appendix N Oregon Department of Geology and Mineral Industries Special Paper 40
Johnson Creek Landslide Research Project, Lincoln County, Oregon: Final Report
ABSTRACT
The Johnson Creek Landslide has become the focus of an extensive, multi-agency investigation, with the goal of identifying internal and external controls on the rate of slide movement. It is anticipated that continued monitoring of this active Coast Range landslide will reveal patterns in slope movement related to factors such as rainfall, groundwater conditions, and toe erosion. As more is learned about the characteristics of the slide more effective methods of remediation can be developed and implemented. The mechanics of the Johnson Creek slide are complicated by the existence of highly weathered and fractured marine sedimentary rocks, complex groundwater hydrology adjacent to the shear zone, highly heterogeneous geotechnical properties, and failure kinematics that involves the interaction of several blocks within the slide mass. Prior geotechnical investigation and stability analyses have focused on one fairly well defined failure surface located near the center of the slide mass. In order to highlight the influence of geotechnical uncertainty on the computed stability of the slide a small project was initiated to supplement the geotechnical stability analyses performed for DOGAMI by Landslide Technology (2004).Additional analyses using standard of practice, limit equilibrium methods for assessing slope stability have been conducted in order to evaluate the influence of the following parameters on overall slide mass stability: (a) drained shear strength parameters, (b) piezometric surface and threshold pore pressure required for slope movement, (c) influence of water-filled tension cracks on toe stability, and (d) evaluation of the impact of translating pore pressure pulses, or waves, on overall stability. The results of these analyses are discussed and compared to those performed by Landslide Technology, where applicable. Additionally, the results are discussed in terms of the inherent limitations, applicability, and overall relevance to the investigation. Recommendations are provided for additional analyses, field investigations, and instrumentation.

Oregon Department of Geology and Mineral Industries Special Paper 40 Appendix N | iii
Johnson Creek Landslide Research Project, Lincoln County, Oregon: Final Report
TABLE OF CONTENTS
Page
1.0 INTRODUCTION ...............................................................................................................1
2.0 MODELING EFFORTS ......................................................................................................3 2.1 Model Set Up...................................................................................................................3
2.1.1 Cross Sections .....................................................................................................3 2.1.2 Slope Stability Software......................................................................................5
2.2 Parametric Studies...........................................................................................................62.2.1 φ' & c'...................................................................................................................6 2.2.2 Piezometric Surface.............................................................................................9 2.2.3 Toe Failure & Tension Cracks ..........................................................................10 2.2.4 Pressure Wave Analysis ....................................................................................11
3.0 CONCLUSIONS................................................................................................................14
4.0 RECOMMENDATIONS FOR FUTURE WORK ............................................................15 4.1 Field Investigation and Monitoring...............................................................................15 4.2 Laboratory Investigations..............................................................................................15 4.3 Modeling .......................................................................................................................16
ACKNOWLEDGEMENTS...........................................................................................................16
REFERENCES ..............................................................................................................................17
LIST OF FIGURES
Figure No.
1 Site Plan 2 Cross Section A-A' & Cross Section B-B' 3 Cross Section C-C' 4 Parametric Study c'-φ' A-A' 5 Parametric Study c'-φ' B-B' 6 Parametric Study c'-φ' C-C' 7 Parametric Study Tension Cracks 8 Head Rise Time Lag 9 Factor of Safety vs. Piezometric Increase
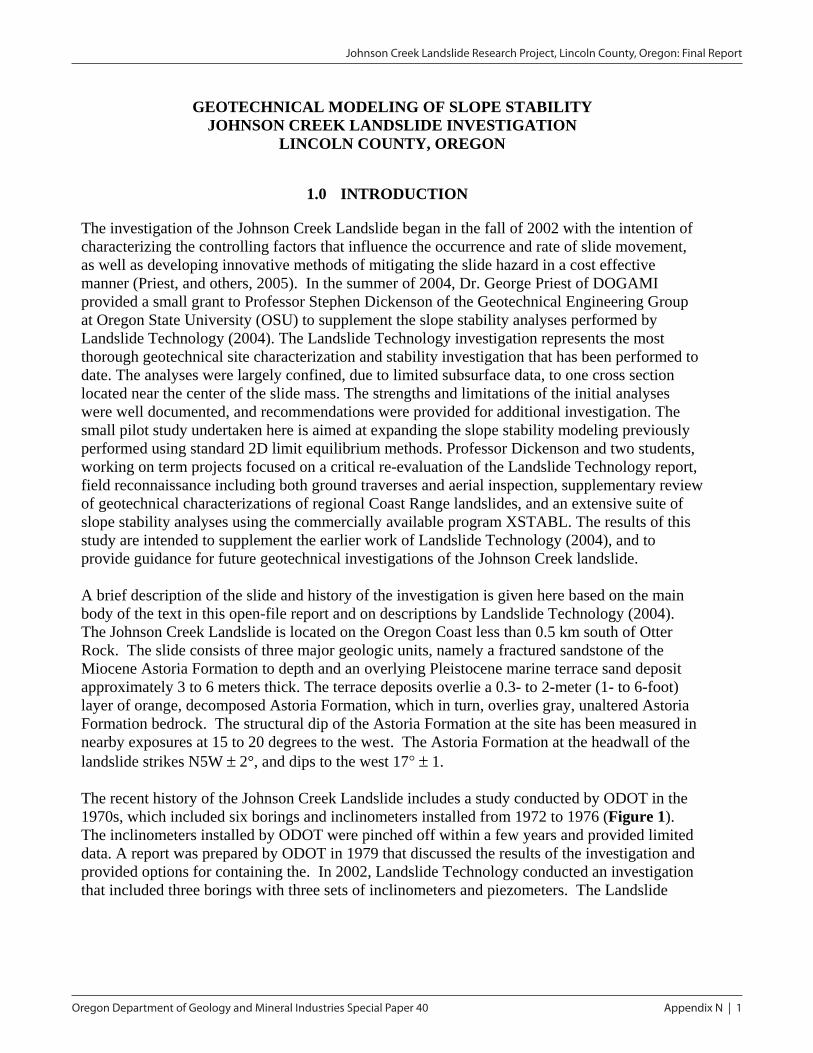
Oregon Department of Geology and Mineral Industries Special Paper 40 Appendix N | �
Johnson Creek Landslide Research Project, Lincoln County, Oregon: Final Report
GEOTECHNICAL MODELING OF SLOPE STABILITY JOHNSON CREEK LANDSLIDE INVESTIGATION
LINCOLN COUNTY, OREGON
1.0 INTRODUCTION
The investigation of the Johnson Creek Landslide began in the fall of 2002 with the intention of characterizing the controlling factors that influence the occurrence and rate of slide movement, as well as developing innovative methods of mitigating the slide hazard in a cost effective manner (Priest, and others, 2005). In the summer of 2004, Dr. George Priest of DOGAMI provided a small grant to Professor Stephen Dickenson of the Geotechnical Engineering Group at Oregon State University (OSU) to supplement the slope stability analyses performed by Landslide Technology (2004). The Landslide Technology investigation represents the most thorough geotechnical site characterization and stability investigation that has been performed to date. The analyses were largely confined, due to limited subsurface data, to one cross section located near the center of the slide mass. The strengths and limitations of the initial analyses were well documented, and recommendations were provided for additional investigation. The small pilot study undertaken here is aimed at expanding the slope stability modeling previously performed using standard 2D limit equilibrium methods. Professor Dickenson and two students, working on term projects focused on a critical re-evaluation of the Landslide Technology report, field reconnaissance including both ground traverses and aerial inspection, supplementary review of geotechnical characterizations of regional Coast Range landslides, and an extensive suite of slope stability analyses using the commercially available program XSTABL. The results of this study are intended to supplement the earlier work of Landslide Technology (2004), and to provide guidance for future geotechnical investigations of the Johnson Creek landslide.
A brief description of the slide and history of the investigation is given here based on the main body of the text in this open-file report and on descriptions by Landslide Technology (2004).The Johnson Creek Landslide is located on the Oregon Coast less than 0.5 km south of Otter Rock. The slide consists of three major geologic units, namely a fractured sandstone of the Miocene Astoria Formation to depth and an overlying Pleistocene marine terrace sand deposit approximately 3 to 6 meters thick. The terrace deposits overlie a 0.3- to 2-meter (1- to 6-foot) layer of orange, decomposed Astoria Formation, which in turn, overlies gray, unaltered Astoria Formation bedrock. The structural dip of the Astoria Formation at the site has been measured in nearby exposures at 15 to 20 degrees to the west. The Astoria Formation at the headwall of the landslide strikes N5W ± 2°, and dips to the west 17° ± 1.
The recent history of the Johnson Creek Landslide includes a study conducted by ODOT in the 1970s, which included six borings and inclinometers installed from 1972 to 1976 (Figure 1).The inclinometers installed by ODOT were pinched off within a few years and provided limited data. A report was prepared by ODOT in 1979 that discussed the results of the investigation and provided options for containing the. In 2002, Landslide Technology conducted an investigation that included three borings with three sets of inclinometers and piezometers. The Landslide

� | Appendix N Oregon Department of Geology and Mineral Industries Special Paper 40
Johnson Creek Landslide Research Project, Lincoln County, Oregon: Final Report
Technology report documented three slide events consisting of two slow events and one fast event, which in January 2003 sheared off all three of the inclinometers. Since January 2003 there have been three minor periods of slide movement, all three of which occurred in the winter of 2003-2004.
Figure 1. Site plan showing locations of cross sections used for analysis. Slide block boundaries (thin green lines are from Landslide Technology (2004).
The investigations to date have identified the key controls on slide initiation and rate of movement, provided estimates of average soil strength parameters across the shear zone, as well as estimates of the threshold pore pressures required for "fast" and "slow" movement. Sensitivity studies by Landslide Technology (2004) have shown that the greatest reduction in factor of safety occurs from severe storm events (-9%) and the loss of toe support (-7%); loss of toe support can be from cliff erosion, sliding at the toe, removal of beach sand due to seasonal wave climate and more long term littoral cell migration. In addition to the analyses mentioned above, insights into the mechanics of the slide have been raised. There is substantial evidence that the slide may be moving as three blocks as opposed to a coherent slide mass. If indeed the slide is moving as separate blocks, the 2D modeling approaches employed thus far are limited in the ability to effectively model the kinematics of the slide. The significance of this is discussed in the Conclusions section of this report.
The DOGAMI investigation has included data collection and monitoring of the slide for a 5-year period. The scope of the extensive investigation:
• Project management, including contracting, reporting and convening periodic meetings of a technical steering committee consisting of ODOT and DOGAMI personnel.
• Field data collection (geologic mapping, logging and stratigraphic interpretation of drill hole samples, collection of piezometer, rainfall, extensometer, and inclinometer data.)
• Geological and geotechnical interpretation of data.

Oregon Department of Geology and Mineral Industries Special Paper 40 Appendix N | �
Johnson Creek Landslide Research Project, Lincoln County, Oregon: Final Report
• Publication of three reports, the LT report (Landslide Technology, 2004), an interim report after about two years (Priest and others 2005), and a final report that will be prepared in 2007 at the end of five years of data collection.
This small study contributes to the comprehensive DOGAMI investigation by confirming the back-calculated residual strength parameters from the 2004 Landslide Technology report, providing additional stability analyses of other sections of the slide as well as examination of different piezometric surfaces, and by providing recommendations for future geotechnical studies of this landslide.
2.0 MODELING EFFORTS
2.1 Model Set Up
2.1.1 Cross Sections
To evaluate the portions of the slide that may be moving differentially, three different cross sections were used in our analyses. Cross sections A-A', B-B', and C-C' are intended to represent the slide blocks of the entire slide mass (Figures 2 and 3). A brief discussion of the development of each slide follows:
Figure 2. Cross Sections A-A' and B-B'.
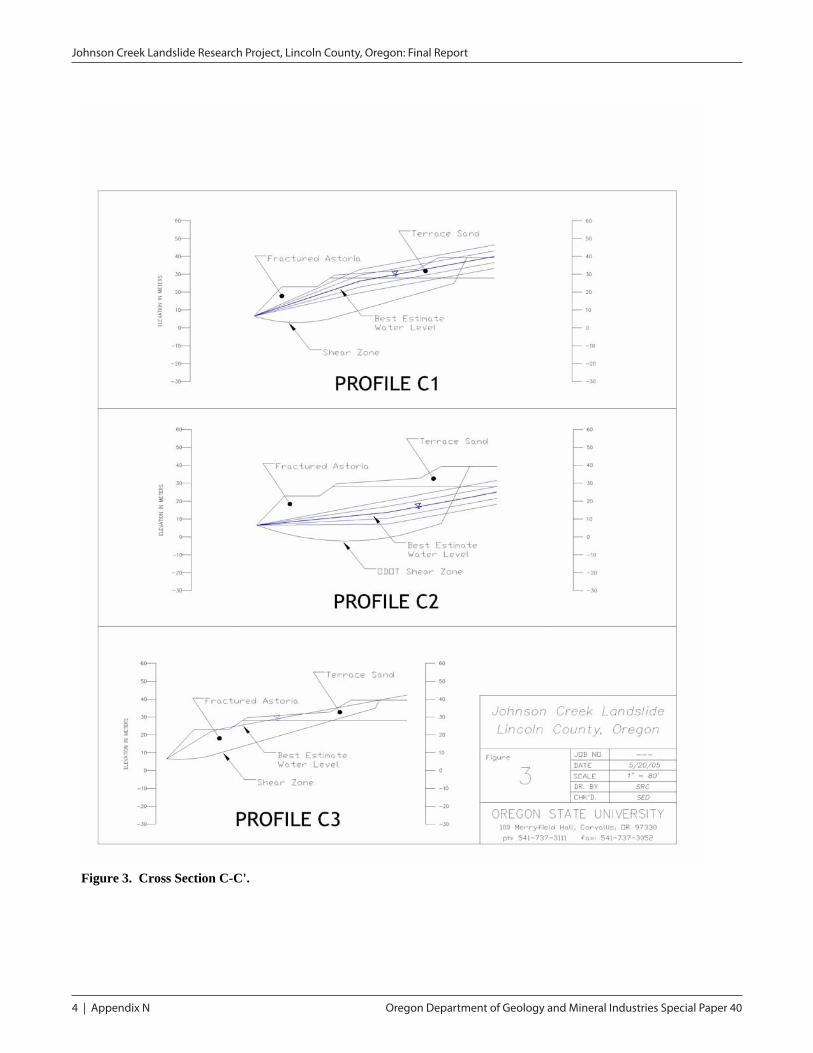
4 | Appendix N Oregon Department of Geology and Mineral Industries Special Paper 40
Johnson Creek Landslide Research Project, Lincoln County, Oregon: Final Report
Figure 3. Cross Section C-C'.

Oregon Department of Geology and Mineral Industries Special Paper 40 Appendix N | �
Johnson Creek Landslide Research Project, Lincoln County, Oregon: Final Report
Cross Section A-A'
Representing the centermost portion of the slide, cross section A-A' (Figure 1) was developed from the Landslide Technology (2004) exploration data. The configuration of the slide plane was established by Landslide Technology and adopted for this study after additional review of available instrumentation data.
Cross Section B-B'
Representing the northernmost portion of the slide, cross section B-B' (Figure 1) was developed to evaluate this area’s overall stability and sensitivity to piezometric head increase. The slide geometry is oriented in the direction of the predominant movement of the slope. There is a small bend (approximately 20 degrees) in the section, which follows the movement vectors and the steepest slope gradient obtained from the topographical survey. Although the incorporation of the bend in section is not strictly correct for 2D limit equilibrium analyses, this is considered to impart only a very minor error in the computed margin of safety.
The shear zone associated with this slide plane was extrapolated from the data of Landslide Technology (2004) used in cross section A-A' and an ODOT exploration point (76-4) from a 1976 borehole that produced a boring log and an inclinometer data point. Naturally when data is extrapolated, as is the case here with shear zone and piezometric surfaces, there is some level of uncertainty as to the accuracy of the extrapolated data. However, based on the relative differences observed in the data both could vary by approximately +/-5 feet.
Cross Section C-C'
This cross section was developed to analyze the southernmost "block" of the slide and intersected a small toe failure. Three different shear zones were analyzed and are designated C1, C2, and C3; all have a common feature of a steeply dipping slide plane at the head scarp. Shear zone C1 was extrapolated using the exploration and inclinometer data from the Landslide Technology report, and is similar in shape to the shear zone used in cross section A-A'. Shear zone C2 was developed using nearby ODOT exploration and inclinometer data points 73-1 and 72-1; this failure surface is more deep seated than C1 and C3. Shear zone C3 represents a shallow failure that is nearly linear along the length of the block.
2.1.2 Slope Stability Software
This study focused on the application of limit equilibrium procedures for evaluating the stability of the Johnson Creek Landslide. Analyses were performed using the commercially available program XSTABL that is the same slope stability program employed by Landslide Technology (2004). XSTABL is a program that employs rigid body mechanics in the solution of circular and wedge slip surfaces. The program searches for the critical surface exhibiting the lowest margin of stability (expressed as the factor of safety against sliding). This approach does not account for the cumulative effect of multiple water-filled tension cracks or interaction between blocks within the overall slide mass.

6 | Appendix N Oregon Department of Geology and Mineral Industries Special Paper 40
Johnson Creek Landslide Research Project, Lincoln County, Oregon: Final Report
Spencer's method (1967) was used to evaluate slope stability in our residual strength parameter and piezometric surface parametric study. Spencer's method, in short, is a force and moment equilibrium method that assumes the resultant slide force inclination is the same for every slice. A box search method was used for the stability analysis at the toe of the slope. This is a force and moment equilibrium approach that generates random points within the user specified search box. Details on the XSTABL program can be found at the following website: http://forest.moscowfsl.wsu.edu/4702/xstabl0.html.
2.2 Parametric Studies
In order to evaluate the influence of various parameters and slope configurations on the stability of the slide mass a series of sensitivity analyses were performed. The parameters that were evaluated included:
1. Drained strength parameters ( ' and c'). 2. Location of the piezometric surface and pore pressures along the failure plane. 3. Influence of water-filled tension cracks on toe stability. 4. Influence of translating pore pressure waves on the stability of the slide.
These evaluations highlighted the relative contributions of the various parameters on overall stability. This work supplements the Landslide Technology's analyses by confirming their back-calculated residual strength parameters, providing analysis of additional cross sections, bounding the residual strength parameters, and evaluating slide toe stability.
2.2.1 φ' & c'
The purpose of the parametric study was to bound the "average" Mohr-Coulomb residual strength parameters associated with the shear zone. Analysis was performed using Spencer's method in the computer program XSTABL (Section 3.1.2). Residual strength parameters c' and φ' were back calculated for fixed factor of safety (FOS) value equal to 1 along the three cross sections (Figures 2 and 3) used in this study. Residual strength parameters were determined by performing the stability analysis for piezometric surfaces corresponding to the best estimate threshold level and variations of this level from +2 meters to -2 meters.
In order to obtain the representative strength parameters (c' and φ') for stability analyses the soils in the shear zone should be sampled and tested. While theoretically advantageous, the variability of the soils along the slide plane, combined with the difficulty and cost associated with obtaining samples, requires that the strength parameters be estimated from back-calculation using the best estimate configuration of the slide plane and 2D limit equilibrium methods. Since unique values of both c' and φ' cannot be determined for a given slide geometry, one approach is to select a value of one and solve for the other in an analysis of the slope stability for marginally stable equilibrium (FOS = 1.0). This method has been employed in this study. The combinations of c' and φ' that yield FOS = 1 are shown in Figures 4 to 6. It should be noted that the representative

Oregon Department of Geology and Mineral Industries Special Paper 40 Appendix N | 7
Johnson Creek Landslide Research Project, Lincoln County, Oregon: Final Report
values of c' for residual strength along slide planes in materials commonly found in the Oregon Coast Range are very small (commonly less than 50 psf). If this value is assumed, as a maximum upper bound, then appropriate values of φ' are in the range of approximately 5.5° to 6.0°. The parametric analyses for c' values greater than 100 psf were only performed to establish the representative trends in c' and φ'.
The residual strength parameters determined in this study are consistent with those determined by Landslide Technology (2004) along cross section A-A'. The residual strength parameters provided in the Landslide Technology report of c'=0 and φ'=6.5° represent an average across the entire shear zone. For comparison, the case of c' = 0 in this study yielded φ' = 5.9° at the threshold piezometric surface. Thus, the average friction angle estimate from Landslide Technology and this study are for all intents and purposes equivalent. The small difference in the values is more than likely due to the slight geometric variations in the two respective slope stability models.
The residual strength parameters determined for the shear zone along cross section B-B' are very similar to cross section A-A'. The similarity is not surprising considering that the geometry of cross section B-B' is similar to cross section A-A' and that the shear zone was extrapolated from the Landslide Technology data located along section A-A'. For piezometric surfaces at -4m and +4m of the best estimate level, residual friction angles of 5.7° and 8.3° were calculated (Figure5). The best estimate residual friction angle of 6.9° is consistent with the previous results associated with cross section A-A'.
The residual strength parameters are highly dependent on geometry of the slip surface used in the analysis. Shear zone C1 yields maximum residual friction angles of 14° to 23° (see Figure 6)for the extreme water levels of -4m and +4m, respectively. By examining the extrapolated head values used in the stability analysis (Figure 3), it is clear that the piezometric surface provides a significant pressure head increase and corresponding reduction in the effective normal stress with each step change in the piezometric surface. As a result, the residual friction angle must be increased to maintain the factor of safety of 1, thereby contributing to the variability of residual strength with these runs. Shear zone C2 was developed from ODOT data and has the deepest shear zone out of the three piezometric surfaces. This, however, tends to reduce the sensitivity of the back calculated strength parameters to increases in the piezometric head due to the large normal stresses over the shear zone. The maximum residual friction angles ranged from 9° to 11° for -4m and +4m fluctuations of the best-estimated piezometric surface, respectively. Shear zone C3 is the shallowest (with respect to the ground surface) of the three cases and subsequently has the largest residual friction angle out of the three cases. Additionally, the piezometric surface approximately follows the surface geometry; this further decreases the normal stress and requires a significant increase in the residual strength to maintain a factor of safety of 1. Generally speaking, the trends associated with the three shear zones are consistent with the model and analysis method.

� | Appendix N Oregon Department of Geology and Mineral Industries Special Paper 40
Johnson Creek Landslide Research Project, Lincoln County, Oregon: Final Report
Residual Strength Parameters Johnson Creek Landslide, Section A-A'
0
1
2
3
4
5
6
7
0 100 200 300 400 500 600 700 800
c' (psf)
φ' (d
egre
es)
Threshold
Threshold + 1m
Threshold + 2m
Threshold - 1m
Threshold - 2m
Figure 4. Cross Section A-A' Parametric Study
Residual Strength Parameters Johnson Creek Landslide, Section B-B'
0
1
2
3
4
5
6
7
8
9
0 100 200 300 400 500 600 700 800 900 1000 1100
c' (psf)
φ' (d
egre
es)
Best Estimate
Best Estimate + 2m
Best Estimate + 4m
Best Estimate - 2m
Best Estimate - 4m
Figure 5 Cross Section B-B' Parametric Study

Oregon Department of Geology and Mineral Industries Special Paper 40 Appendix N | 9
Johnson Creek Landslide Research Project, Lincoln County, Oregon: Final Report
Residual Strength Parameters Johnson Creek Landslide, Section C-C'
0
5
10
15
20
25
30
0 100 200 300 400 500 600 700 800 900 1000
c' (psf)
φ' (d
egre
es)
Best Estimate
Best Estimate + 2m
Best Estimate + 4m
Best Estimate - 2m
Best Estimate - 4m
Case 3
Case 2
Case 1
Figure 6. Cross Section C-C' Parametric Study
2.2.2 Piezometric Surface
The fractured and interbedded nature of the weathered sedimentary rocks at the site, combined with near-vertical tensional cracks and internal slide planes greatly complicates the groundwater regime in and adjacent to the slide mass. Optimally, an extensive vertical and lateral array of piezometers would be employed to obtain data that could be used to generate real-time, 3-D plots of the pressure heads within the slide mass and immediately beneath the slide plane. As it currently exists there are only three piezometers at the site. The relatively small number of instruments poses significant limitations in the groundwater characterization required for slope stability analyses. The three existing instruments are recording pore pressures above the slide plane. As a result, the pore pressures used in the slope stability calculations may not be truly representative of the conditions across the shear zone. This is particularly important when considering the response of the piezometric surface during storm events may not be representative of what is occurring at the depth of interest.
The piezometric surfaces vary greatly across the shear zone and little data beneath the slip plane exists. It appears that above the slide plane the pore pressures are controlled by infiltration of water through cracks and fissures from above, while below the slide plane the pore pressure is governed by seepage from deeper geologic units. The occurrence of the pore pressure peaks is

�0 | Appendix N Oregon Department of Geology and Mineral Industries Special Paper 40
Johnson Creek Landslide Research Project, Lincoln County, Oregon: Final Report
not coincident. In fact, the peak pore pressures beneath the slide plane may lag rainfall peaks by weeks or months.
Unfortunately, piezometric data does not exist through cross sections B-B' and C-C'. By necessity we estimated the location of the piezometric surfaces at these two locations. To address the considerable uncertainty associated with the piezometric surface estimates, we performed a sensitivity study to evaluate the influence of the piezometric surface elevation on the stability of the slide mass. The piezometric surface was varied form the best estimate value by +- 4m. As previously discussed in 2.2.1, the influence on stability of the piezometric surface was most pronounced at Section C-C' and less pronounced at Section B-B' due to the respective geometries of these sections.
2.2.3 Toe Failure & Tension Cracks
To evaluate the influence of tension cracks in the slide mass slope stability analyses were performed at the toe of cross-sections A-A' and B-B' for varying tension crack depths completely filled with water. The search routine employed in the limit equilibrium model locates all critical surfaces through the tension crack therefore the interaction effects of multiple tension cracks could not be determined from this analysis. However, this analysis did examine the influence of slope stability versus the depth of the tension crack filled with water provided some insight to the threshold tension crack depth.
The results of our analyses indicate there is a bilinear relationship in the percent change FOS for tension crack depths up to 10 feet in cross section A-A' and 15 feet in cross section B-B' (Figure 7). Past these respective "threshold" tension crack depths there is an increase in the slope of this curve indicating a relatively rapid loss in stability.
The significance of these results is that the depth of tension crack filled with water at the toe of the slide may be influencing the stability of the larger slide mass. An additional analysis was performed with the critical toe section removed from the previously stated analysis performed on cross section A-A' with best estimate threshold water levels. The factor of safety prior to removing the failed toe section was 1.0. After removing the critical toe section, a stability analysis was performed and the factor of safety against sliding dropped to 0.87. This represents a 13 percent decrease in the factor of safety and implies the performance of the toe has a significant influence on the stability of the slide mass.

Oregon Department of Geology and Mineral Industries Special Paper 40 Appendix N | ��
Johnson Creek Landslide Research Project, Lincoln County, Oregon: Final Report
Toe Stability vs. Tension Crack Depth Filled with Water
0.90
0.95
1.00
1.05
1.10
1.15
1.20
1.25
1.30
1.35
1.40
0 5 10 15 20 25 30 35
Tension Crack Depth Filled with Water (feet)
Fact
or o
f Saf
ety
0
5
10
15
20
25
30
35
Perc
ent C
hang
e in
Fac
tor o
f Sa
fety
A-A' FOS B-B' FOS A-A' Percent Change in FOS B-B' Percent Change in FOS
Figure 7. Analysis of Toe Stability with Varying Tension Crack Depth Filled with Water
2.2.4 Pressure Wave Analysis
In depth evaluation of the piezometer data demonstrates that the pore pressures rise first at the top of the slope and progressively increase with distance down slope (see the main body of this open-file report). The rise and fall of pore pressure adjacent to the shear zone moves down slope in the form of a long-period wave. This pulse, or pressure wave, influences the stability of the slide mass by reducing the effective normal stress and shear strength of the section of the slide where this pulse is present.
Based on the analysis of progressive piezometric head increase, a suite of slope stability analyses were performed on cross section A-A' with step increases in the piezometric surface (Figure 8).The base model for this analysis was developed from the information provided in Table 1 for the fast movement case. The initial head values for the analysis were taken from the initial values provided in Table 1. All head values used were referenced to the failure plane to ensure consistency throughout the analysis. To model the pressure wave, the piezometric head was increased from normal to "fast movement levels" in increments approximately equal to 1/5 of the total shear zone length. The increases were cumulative and by the end of the analysis the results matched the factor of safety estimates from Landslide Technology (2004) for the extreme storm case. The results of the slope stability analyses are shown in Figure 9.
The overall percent change in slope stability from normal winter values to severe storm values is 9 percent, this compares very well to the Landslide Technology estimate of 9.2 percent. The

�� | Appendix N Oregon Department of Geology and Mineral Industries Special Paper 40
Johnson Creek Landslide Research Project, Lincoln County, Oregon: Final Report
analysis shows that 50 percent of the 9 percent change in factor of safety occurs over the eastern (upslope) 25 percent of the slide plane. As shown in the Figure 9, there is a non-linear decrease in factor of safety that transitions to a relatively linear change over the remaining 75 percent of the slide plane. The non-linear decrease in factor of safety is not thought to be a physical phenomenon but rather a manifestation of the computer program's analysis technique with high water pressure levels and low normal stresses. Examining the trend of factor of safety versus incremental pressure increase suggests a linear relationship could be extrapolated back through the point associated with LT-3P to a FOS value equal to 1.0.
Given the relatively high change in factor of safety associated with the head increase associated with the sever storm level, investigating options to maintain the head levels at their normal winter levels appears to be warranted. Although the FOS increase with horizontal drains is 1 percent (Landslide Technology, 2004), this dewatering scheme proposes lowering the normal winter water table by approximately 3 feet. From a limit equilibrium stand point lowering the water table does not improve the FOS significantly, however, if severe water levels could be mitigated or water level could be maintained at "normal" winter levels this option would, in effect, provide an increase in FOS of the 9 percent; the difference associated between normal winter levels and the severe storm levels.
Table 1. Threshold values of initial pressure head, pressure head at movement, and depth to elevation head (water table) for slow and fast slide movement. Pressure head is in meters above the slide plane (taken from the main body of this open-file report).
Drill
InitialHead (m)
.
InitialHead (m)
.Pressure Head
(m)Pressure Head
(m)
Depth to Elevation Head (m)
Depth to Elevation Head (m)
SiteSlowMvmt
FastMvmt Slow Movement Fast Movement Slow Movement Fast Movement
LT-1 6.5 6.9 7 ~9.0-9.7 19.3 ~16.6-17.3LT-2 9.2 9.4 9.4 ~12 8.6 ~6LT-3 4.5 4.6 ~5.0 ~6.5 ~1.6 ~0.1

Oregon Department of Geology and Mineral Industries Special Paper 40 Appendix N | ��
Johnson Creek Landslide Research Project, Lincoln County, Oregon: Final Report
Figure 8. Schematic illustration of progressive rise in piezometric head from east-to-west after a typical rainfall event (Priest and others, 2006).
Factor of Safety vs. Piezometric Increase along Section A-A'
0.92
0.93
0.94
0.95
0.96
0.97
0.98
0.99
1.00
1.01
1.02
0.000.250.500.751.00
Fraction of Slide Plane with Piezo Increase (Left = East)
Fact
or o
f Saf
ety
Aga
inst
Slid
ing
0
1
2
3
4
5
6
7
8
9
10
Perc
ent C
hang
e in
Fac
tor o
f Saf
ety
FOS against sliding Percent change in FOS
LT-3pLT-2pLT-1p
Figure 9. Factor of Safety versus Piezometric Increase along Shear Zone A-A'. (Note that left is actually west in this diagram).

�4 | Appendix N Oregon Department of Geology and Mineral Industries Special Paper 40
Johnson Creek Landslide Research Project, Lincoln County, Oregon: Final Report
3.0 CONCLUSIONS
On the basis of independent slope stability and parametric analyses the average residual strength parameters provided in the 2004 Landslide Technology report are reasonable for the Johnson Creek Landslide. Furthermore, analysis of a severe storm event yielded the same factor of safety percentage decrease as Landslide Technology's. The residual strength parameter variation for c' = 0 gives φ' values do not appear to be extremely sensitive to changes in the piezometric surface. Thus, potential errors in the analytical results based on the range of likely strength parameters are probably small. The sensitivity of the overall decrease in factor of safety associated with an increasing piezometric surface, however, was found to be significant. This observation is consistent with the Landslide Technology's slope stability analysis report and the correlation of movement events with piezometric spikes outlined in the main body of this open-file report.
Tension cracks appear to affect the stability of the toe when cracks are within the 10-foot to 15-foot range and are completely filled with water. Slope stability analysis shows that there is a 13 percent decrease in factor of safety associated with the removal of the critical toe surface obtained in the tension crack portion of the analysis. Based on the contribution that the toe has on the global stability, the use of a buttress system as recommended in the Landslide Technology report and the in the main body of this open-file report certainly warrants serious consideration.
Given the relative importance of the piezometric surface and toe stability on the overall stability of the slide mass, addressing both of these issues will be critical to successful remediation. Rather than focusing on the modest improvement (1% per Landslide Technology, 2004) lowering the piezometric surface provides, one approach should consider maintaining the "normal winter" levels which ultimately provides a net factor of safety increase of approximately 9 percent over the piezometric surface representing a significant rainfall event. Toe stability, too, should be addressed since there is a significant decrease in the factor of safety associated with the failure/erosion of the toe section. Even if dewatering measures were successfully implemented, the slope would likely become unstable and move regardless of the piezometric water levels.
Although these analysis were performed using standard of practice limit equilibrium methods, there are significant shortcomings associated with these models. For instance, in the case of this landslide there are many factors that influence the stability of the mass concurrently. These variables include the kinematics influence of individual blocks, time dependent increase in the piezometric surface, seepage effects, multiple tension cracks, and the accumulative effects associated with all of these occurring with in a given time frame. In addition to modeling limitations, there is a very limited base of geotechnical data for this landslide. Despite the shortcomings of the limit equilibrium analysis methods, they provide a powerful tool in illustrating the relative influence that hydrologic and geotechnical parameters have on the stability of the slide. In our opinion, these methods are appropriate given the limited data available, and they provide insight into the problem and facilitate the evaluation of potential remediation strategies.

Oregon Department of Geology and Mineral Industries Special Paper 40 Appendix N | ��
Johnson Creek Landslide Research Project, Lincoln County, Oregon: Final Report
4.0 RECOMMENDATIONS FOR FUTURE WORK
4.1 Field Investigation and Monitoring
In our opinion, there exists the need for additional fieldwork and in situ exploration if the mechanics and causative factors of the slide are to be more completely understood. Given the area of the slide mass, the variable subsurface conditions (e.g. fracturing, soil strengths, stress state, etc.), the complexity of the slide movement, and complex piezometric conditions, there is a need to further investigate these unknowns since they are ultimately influencing the behavior of the slide. Clearly the resources available to this project will dictate the degree to which the various hydrologic and geotechnical controls are characterized. A prioritization strategy is needed.
It appears that a research and monitoring emphasis on the groundwater regime would yield tremendous insights on the initiation and rate of slope movement. A program of extensive instrumentation is highly recommended. As an example, one approach to addressing these unknowns would be to install approximately 10 piezometers and inclinometer tubes throughout the slide. Cross sections B-B' and C-C' would be ideal candidates for 4 piezometer and inclinometer sets. The two remaining piezometer and inclinometer sets would then be placed along cross section A-A', particularly near the toe where conditions are not well defined to this point in the investigation. Optimally, the piezometers should be placed immediately above and below the shear zone. The assertion that this material may be imposing a confined aquifer type of condition would be of great importance in evaluating the net pressure effect on the slide plane after a storm event.
The long-term survival of the piezometers is a key consideration. This is especially true for instrumentation located below the shear zone. It is recommended that a system of wireless piezometers be used below the slide plane. A wireless system could be used to transmit data across the slide plane even after the slope has moved enough to damage the borehole casing (i.e., slope inclinometer tubing). Data would be transmitted from the piezometer located beneath the slide plane to a receiver suspended in the borehole immediately above the shear zone. Wireless systems such as this have been developed for use in physical model testing using the geotechnical centrifuge. They have been show to be rugged and reliable for these applications. The Geotechnical Engineering Group at Oregon State University is pursuing field applications for this technology and it appears that the Johnson Creek landslide could be a test bed for evaluating the applicability of this wireless instrumentation.
4.2 Laboratory Investigations
The benefits of additional laboratory testing are judged to be minimal. The heterogeneity of the slide mass materials (lithology, weathering, and pattern of discontinuities) precludes extensive characterization by laboratory tests alone. It appears that a more significant contribution would

�6 | Appendix N Oregon Department of Geology and Mineral Industries Special Paper 40
Johnson Creek Landslide Research Project, Lincoln County, Oregon: Final Report
be made by focusing on drilling and field logging of the materials in order to characterize the locations of the shear zone and piezometric surface, as well as the nature of the soil and rock adjacent to the slide plane. These efforts would be pursued during the placement of the in situ instrumentation.
One aspect of laboratory testing that may be worthwhile would be additional characterization of the porosity and permeability of intact specimens of the weathered rock located near the slide plane. These data would be useful in subsequent hydrologic modeling; however, these properties would have to be modified to account for the rock mass characteristics (i.e. discontinuities, variability in the degree of weathering, etc).
4.3 Modeling
The use of more sophisticated models at this point in the study would not likely provide a better understanding of the behavior of this slide. A 3-D FEM/FDM model could be created based on the surface surveys and subsurface conditions as they are currently understood; however, uncertainties associated with the morphology of the slip surface, the hydrologic regime, geologic structure within the slide mass, and the kinematics of the various blocks within the overall slide mass would significantly limit confidence in the modeling results. If more advanced modeling is pursued, it is recommended that simple models be prepared and validated prior to applications involving all of the relevant parameters that can be reasonably modeled. The application of simple models, along with appropriate simplifications using informed judgment, may yield insights on the kinematic aspects of the slide that are not well defined using the 2-D limit equilibrium models. The ultimate goal of performing coupled hydrologic-geotechnical stability modeling is considered extremely worthwhile.
ACKNOWLEDGEMENTS
The authors wish to acknowledge the tremendous contributions made to the project by several individuals. Mr. Jason Locke (U.S. Navy, and 2005 graduate of the Department of Construction, Civil, Construction and Environmental Engineering at Oregon State University. In addition to collecting references from DOGAMI, ODOT, and NOAA at the outset of the project, he contributed a great deal to the site reconnaissance by participating in the ground mapping. He also secured the use of an airplane and served as pilot for our aerial reconnaissance. The equipment and services were provided at no cost the project. The authors are grateful to Mr. Locke for his generosity and great interest in the project. Mr. Locke has also provided a collection of his aerial photographs for the DOGAMI archives.
The authors are also grateful to Mr. Andrew Vessely (Cornforth Consultants, Inc.) for sharing his insights on the Johnson Creek Landslide, as well as other Coast Range landslides in the region. His perspectives on the investigations performed to date and the mechanics of the slide were extremely useful.
We also wish to thank Mr. Michael Vail (formerly Graduate Researcher, Geotechnical Engineering Group, OSU) for his preliminary slope stability modeling and figure preparation.

Oregon Department of Geology and Mineral Industries Special Paper 40 Appendix N | �7
Johnson Creek Landslide Research Project, Lincoln County, Oregon: Final Report
His contributions were very useful for highlighting variations in computed stability using different slope stability programs.
REFERENCES
Landslide Technology, 2004, Geotechnical investigation Johnson Creek Landslide, Lincoln County, Oregon: Oregon Department of Geology and Mineral Industries Open-File Report O-04-05, 115 p, published on CD.
Priest, G.R., Allan, J.C., Niem, A., 2006, Interim Report: Johnson Creek Landslide Project, Lincoln County, Oregon: Oregon Department of Geology and Mineral Industries Open-File Report, 04-05, .
Copyright © 2022 FDOKUMEN