Hydrological control of stream water chemistry in a glacial catchment (Damma Glacier, Switzerland)
16
Hydrological control of stream water chemistry in a glacial catchment (Damma Glacier, Switzerland) Ruth S. Hindshaw a,b, ⁎, Edward T. Tipper c , Ben C. Reynolds a , Emmanuel Lemarchand a,b , Jan G. Wiederhold a,b , Jan Magnusson d , Stefano M. Bernasconi e , Ruben Kretzschmar b , Bernard Bourdon a,1 a Institute of Geochemistry and Petrology, ETH Zurich, Clausiusstrasse 25, 8092 Zurich, Switzerland b Institute of Biogeochemistry and Pollutant Dynamics, ETH Zurich, CHN, Universitätstrasse 16, 8092 Zurich, Switzerland c Department of Earth Sciences, University of Cambridge, Downing Street, Cambridge, CB2 3EQ, United Kingdom d WSL Institute for Snow and Avalanche Research SLF, Flüelastrasse 11, 7260 Davos Dorf, Switzerland e Geological Institute, ETH Zurich, Sonneggstrasse 5, 8092 Zurich, Switzerland abstract article info Article history: Received 15 February 2011 Received in revised form 4 April 2011 Accepted 16 April 2011 Available online xxxx Editor: J.D. Blum Keywords: Glacial weathering Hydrogeochemistry Damma glacier Strontium isotopes Oxygen isotopes Granite weathering The temporal and spatial controls of stream water chemistry in a small, granitic, glacial catchment were investigated in conjunction with high-resolution hydrological and meteorological measurements. Significant systematic seasonal and diurnal variations were observed in the stream water chemistry, which were not caused by the mixing of water draining different lithologies. A hydrological model (ALPINE3D, Lehning et al., 2006) was used to calculate the relative contributions of the principal water sources, snow melt and ice melt, throughout the period of this study. Pronounced seasonal minima in δ 18 O and 87 Sr/ 86 Sr were attributed to spring snow melt. Clear changes in X/Si ratios (X = Ca, Mg, K, Na, Sr) between summer and winter were observed. These changes are interpreted to reflect seasonal changes in the average residence time of water in the sub-glacial drainage network with short residence times in summer, when the discharge was greatest, leading to high X/Si ratios, and long residence times in winter, when the discharge was lowest, resulting in low X/Si ratios. This study shows that the time dependent stoichiometry of cation to Si ratios in glacial stream water (and likely all catchments) strongly depends on the hydrological state of the catchment at the time of sampling. Annual fluxes based on spot samples varied by a factor of six depending on the time of year in which the sample was collected, highlighting the importance of long-term catchment monitoring. An improved understanding of the spatial and temporal controls acting on stream water chemistry will allow silicate weathering processes to be more precisely quantified. © 2011 Elsevier B.V. All rights reserved. 1. Introduction Globally, the chemical composition of river water varies widely (Meybeck, 2003). Although much of this variation can be attributed to different lithologies (Reeder et al., 1972; Gaillardet et al., 1999), there is considerable variation between rivers draining similar lithologies (Gíslason et al., 1996; White et al., 1999; Oliva et al., 2003). The relative importance of the different extrinsic weathering factors such as climate, runoff, tectonics and vegetation on runoff composition is still debated (Bluth and Kump, 1994; White and Blum, 1995; Oliva et al., 2003; Riebe et al., 2004; West et al., 2005) and disentangling these factors is difficult since they are not independent variables, e.g. temperature affects runoff and local vegetation. The majority of studies that have derived estimates of CO 2 consumption by silicate weathering, based on river chemistry, have assumed that the chemical composition of a single river derived from spot sampling is invariant. However, an increasing number of studies of large rivers indicate significant seasonal variations in chemical composition (Cameron et al., 1995; Yang et al., 1996; Shiller, 1997; Galy and France-Lanord, 1999; France-Lanord et al., 2003; Zakharova et al., 2005; Tipper et al., 2006; Ollivier et al., 2010) and long term studies highlight the inter-annual variability of annual weathering fluxes (Likens et al., 1998; Gupta et al., 2011). Time series data are vital in order to obtain accurate annual chemical weathering fluxes but also offer an unrivalled opportunity to understand the underlying mineral weathering processes. This is because lithology, the major control of stream water chemistry, is constant whilst external variables such as climate and hydrology vary, permitting an assessment of these variables on chemical weathering processes. High frequency sampling studies of rivers to investigate temporal variability have tended to focus on alpine catchments which are either glaciated (Fairchild et al., 1999; Hodson et al., 2000; Mitchell et al., 2001; Hosein et al., 2004) or snow covered (e.g. Marsh and Pomeroy, Chemical Geology xxx (2011) xxx–xxx ⁎ Corresponding author. E-mail address: [email protected] (R.S. Hindshaw). 1 Laboratoire des Sciences des la Terre, ENS Lyon, 46 Allée d'Italie, F-69364 Lyon. CHEMGE-16218; No of Pages 16 0009-2541/$ – see front matter © 2011 Elsevier B.V. All rights reserved. doi:10.1016/j.chemgeo.2011.04.012 Contents lists available at ScienceDirect Chemical Geology journal homepage: www.elsevier.com/locate/chemgeo Please cite this article as: Hindshaw, R.S., et al., Hydrological control of stream water chemistry in a glacial catchment (Damma Glacier, Switzerland), Chem. Geol. (2011), doi:10.1016/j.chemgeo.2011.04.012
Transcript of Hydrological control of stream water chemistry in a glacial catchment (Damma Glacier, Switzerland)

Hydrological control of stream water chemistry in a glacial catchment(Damma Glacier, Switzerland)
Ruth S. Hindshaw a,b,⁎, Edward T. Tipper c, Ben C. Reynolds a, Emmanuel Lemarchand a,b,Jan G. Wiederhold a,b, Jan Magnusson d, Stefano M. Bernasconi e, Ruben Kretzschmar b, Bernard Bourdon a,1
a Institute of Geochemistry and Petrology, ETH Zurich, Clausiusstrasse 25, 8092 Zurich, Switzerlandb Institute of Biogeochemistry and Pollutant Dynamics, ETH Zurich, CHN, Universitätstrasse 16, 8092 Zurich, Switzerlandc Department of Earth Sciences, University of Cambridge, Downing Street, Cambridge, CB2 3EQ, United Kingdomd WSL Institute for Snow and Avalanche Research SLF, Flüelastrasse 11, 7260 Davos Dorf, Switzerlande Geological Institute, ETH Zurich, Sonneggstrasse 5, 8092 Zurich, Switzerland
a b s t r a c ta r t i c l e i n f o
Article history:Received 15 February 2011Received in revised form 4 April 2011Accepted 16 April 2011Available online xxxx
Editor: J.D. Blum
Keywords:Glacial weatheringHydrogeochemistryDamma glacierStrontium isotopesOxygen isotopesGranite weathering
The temporal and spatial controls of stream water chemistry in a small, granitic, glacial catchment wereinvestigated in conjunction with high-resolution hydrological and meteorological measurements. Significantsystematic seasonal and diurnal variations were observed in the stream water chemistry, which were notcaused by the mixing of water draining different lithologies. A hydrological model (ALPINE3D, Lehning et al.,2006) was used to calculate the relative contributions of the principal water sources, snow melt and ice melt,throughout the period of this study. Pronounced seasonal minima in δ18O and 87Sr/86Sr were attributed tospring snow melt. Clear changes in X/Si ratios (X=Ca, Mg, K, Na, Sr) between summer and winter wereobserved. These changes are interpreted to reflect seasonal changes in the average residence time of water inthe sub-glacial drainage network with short residence times in summer, when the discharge was greatest,leading to high X/Si ratios, and long residence times in winter, when the discharge was lowest, resulting inlow X/Si ratios. This study shows that the time dependent stoichiometry of cation to Si ratios in glacial streamwater (and likely all catchments) strongly depends on the hydrological state of the catchment at the time ofsampling. Annual fluxes based on spot samples varied by a factor of six depending on the time of year in whichthe sample was collected, highlighting the importance of long-term catchment monitoring. An improvedunderstanding of the spatial and temporal controls acting on stream water chemistry will allow silicateweathering processes to be more precisely quantified.
© 2011 Elsevier B.V. All rights reserved.
1. Introduction
Globally, the chemical composition of river water varies widely(Meybeck, 2003). Althoughmuch of this variation can be attributed todifferent lithologies (Reeder et al., 1972; Gaillardet et al., 1999), thereis considerable variation between rivers draining similar lithologies(Gíslason et al., 1996; White et al., 1999; Oliva et al., 2003). Therelative importance of the different extrinsic weathering factors suchas climate, runoff, tectonics and vegetation on runoff composition isstill debated (Bluth and Kump, 1994; White and Blum, 1995; Oliva etal., 2003; Riebe et al., 2004; West et al., 2005) and disentangling thesefactors is difficult since they are not independent variables, e.g.temperature affects runoff and local vegetation. The majority ofstudies that have derived estimates of CO2 consumption by silicate
weathering, based on river chemistry, have assumed that thechemical composition of a single river derived from spot sampling isinvariant. However, an increasing number of studies of large riversindicate significant seasonal variations in chemical composition(Cameron et al., 1995; Yang et al., 1996; Shiller, 1997; Galy andFrance-Lanord, 1999; France-Lanord et al., 2003; Zakharova et al.,2005; Tipper et al., 2006; Ollivier et al., 2010) and long term studieshighlight the inter-annual variability of annual weathering fluxes(Likens et al., 1998; Gupta et al., 2011). Time series data are vital inorder to obtain accurate annual chemical weathering fluxes but alsooffer an unrivalled opportunity to understand the underlying mineralweathering processes. This is because lithology, the major control ofstream water chemistry, is constant whilst external variables such asclimate and hydrology vary, permitting an assessment of thesevariables on chemical weathering processes.
High frequency sampling studies of rivers to investigate temporalvariability have tended to focus on alpine catchments which are eitherglaciated (Fairchild et al., 1999; Hodson et al., 2000; Mitchell et al.,2001; Hosein et al., 2004) or snow covered (e.g. Marsh and Pomeroy,
Chemical Geology xxx (2011) xxx–xxx
⁎ Corresponding author.E-mail address: [email protected] (R.S. Hindshaw).
1 Laboratoire des Sciences des la Terre, ENS Lyon, 46 Allée d'Italie, F-69364 Lyon.
CHEMGE-16218; No of Pages 16
0009-2541/$ – see front matter © 2011 Elsevier B.V. All rights reserved.doi:10.1016/j.chemgeo.2011.04.012
Contents lists available at ScienceDirect
Chemical Geology
j ourna l homepage: www.e lsev ie r.com/ locate /chemgeo
Please cite this article as: Hindshaw, R.S., et al., Hydrological control of stream water chemistry in a glacial catchment (Damma Glacier,Switzerland), Chem. Geol. (2011), doi:10.1016/j.chemgeo.2011.04.012

1999). The bias towards alpine catchments results from thesecatchments' importance in hydroelectric power and summer watersupply (Viviroli and Weingartner, 2004). Consequently, the focus ofmany of these studies has been to ascertain where the water comesfrom and not where the solutes originated (Malard et al., 1999). As aresult, the hydrology of glacial catchments tends to be very wellunderstood making them an ideal choice for gaining a betterunderstanding of chemical weathering processes.
Combining the hydrological approaches (e.g. hydrograph separa-tion Buttle, 1994) with the chemical approaches (e.g. mass balanceGarrels and Mackenzie, 1967) offers a unique opportunity to improveour understanding of the processes which control stream waterchemistry. A number of studies have used such a combination, mostnotably that of Clow and Drever (1996) who artificially enhanceddischarge and studied the resultant effects, proving that discharge hasan important control over solute acquisition. Other studies have foundthe role of discharge to be less important, invoking chemostaticbehaviour (Godsey et al., 2009; Clow and Mast, 2010). These studiesstrongly indicate that although the weathering of primary mineralsprovides solutes, it is the secondary processes such as adsorption(Berner et al., 1998) and secondary mineral formation which actuallycontrol the resultant chemical composition of the stream. Theseprocesses are not constant over the year (Clow and Mast, 2010) andare very difficult to constrain. More data is needed to assess theirrelative importance.
Glacial catchments are ideal for exploring and further constrainingthe controls on stream water chemistry. Due to the large fluctuationsin discharge over diurnal and seasonal timescales, the role ofdischarge in changing stream water chemical compositions can beevaluated. In addition, the changes in glacier hydrology over theseason and the development of glacial drainage systems are relativelywell documented (e.g. Brown, 2002). Glacial studies are typically onlyconducted during the melt season, consequently, potential chemicalchanges from summer to winter are not well known. Additionally, therole of glaciers in enhancing or suppressing chemical weathering ratesis still contested (Sharp et al., 1995; Anderson et al., 1997).
Studies which use the dissolved load composition in order tounderstand weathering reactions often have weak links to catchmenthydrology. In this study, we investigate whether hydrological sourceinformation can be used to explain the observed daily and seasonalchanges occurring in glacial stream water chemistry in a small,granitic, alpine catchment by utilising major element, 87Sr/86Sr andδ18O data. Identifying the main controls of solute acquisition willimprove the quantification of weathering rates in catchments wheredischarge data is available but frequent chemical sampling is notpossible.
2. Study area
The study area was the Damma glacier forefield: a small(10.7 km2), granitic catchment situated in the central Swiss Alps,which is currently being studied as part of the BigLink project(Bernasconi et al., 2008). The glacier covers 40% of the catchment andhas been retreating since ~1850 (VAW, 2005). Due to a sharp changein gradient a small piece (~0.14 km2) of glacier has become detachedfrom the main glacier during retreat and is referred to as ‘dead ice’.Large side moraines are present dating from approximately 1850 (theend of the Little Ice Age) and two terminal moraine bands dating from1927 and 1992 mark the end of two short periods of re-advance(VAW, 2005). The elevation of the catchment ranges from 1800 m to3300 m and the entire catchment is snow covered for approximately6 months of the year. The average annual temperature is 2.2 °C,annual precipitation is ~2300 mm and annual runoff is ~2700 mm.Evapotranspiration was estimated to be 70 mm in 2008 (Kormann,2009). The positive water balance is due to the negative mass balanceof the glacier.
The valley floor is a braided stream system, and the streams areephemeral. Themain stream, the Dammareuss, passes underneath thedead ice whilst the side stream cuts through the western side moraine(Fig. 1). A gauging station has been installed downstream of theconfluence between the side and the main stream and at theconfluence the side stream contributes approximately one third ofthe discharge.
The catchment is underlain by the central Aar granite which has anintrusion age of 298 Ma (Schaltegger, 1994), though further meta-morphic resetting took place around 50 Ma (Dempster, 1986). Theaverage mineralogy is: quartz (32%), plagioclase (32%, An0.1),microcline (23%), muscovite (6%), biotite (4%), epidote (3%) togetherwith trace amounts of apatite. Biotite was extensively altered tochlorite during Alpine orogeny (Dempster, 1986). Negligible levels ofcarbonate (91±83 mg/kg, 1σSD) were detected by coulometrictitration in the rock samples which have been analysed so far (deSouza et al., 2010). The soils in the glacier forefield are thin, weaklydeveloped and often contain large rock fragments.
3. Sampling and analytical methods
Water sampling was conducted at fortnightly intervals during thesummer of 2008, from 13th May to 28th October. In addition, twowinter samples were collected on 16th January and on 8th April 2009.Three locations were sampled in order to assess spatial variability. Thefollowing provides a brief description of the sampling sites: Site E wasthe stream exiting from under the dead ice, Site B was the side streamwhere it incised the western side moraine and Site A was by thegauging station (Fig. 1), by which point above-ground braiding had
Site B
Site E
Site A
dead icedead ice
Zurich
Bern
Aar Massif
Dammareuss
100 m
N
Meteorology Station
Fig. 1. Map of the sampling locations. Stars mark the stream water sampling locationsand the meteorology station. Sites A and E lie on the main stream and Site B is on theside stream. The gauging station is situated at Site A. The side moraines, which datefrom 1850, are marked with dashed lines but the two most recent terminal morainesare not shown. Numbers indicate the height of the contour lines. The star in the insetshows the location of the Damma glacier in relation to the rest of Switzerland.
2 R.S. Hindshaw et al. / Chemical Geology xxx (2011) xxx–xxx
Please cite this article as: Hindshaw, R.S., et al., Hydrological control of stream water chemistry in a glacial catchment (Damma Glacier,Switzerland), Chem. Geol. (2011), doi:10.1016/j.chemgeo.2011.04.012

ceased. Two 24-hour sampling campaigns with hourly sampling wereconducted on 24th–25th August 2008 and 2nd–3rd June 2009 at SiteA. The gauging station recorded water discharge and conductivityevery 10 min beginning early in the 2008melt season (Fig. 2). The firsttwo water samples were taken before the station was operational; forthese samples the discharge was estimated. In addition to the gaugingstation, a meteorology station was erected in the middle of theforefield which recorded data every 30 min. Rainfall and temperatureduring the sampling period are shown in Fig. 2.
Rain water samples were collected using a 1.5 m high plasticcylinder located near the meteorology station. The cylinder had aplastic funnel at the top feeding into a 2 L plastic bottle and the top ofthe funnel was protected by a finemesh to prevent insects from flyingin. This bottle was emptied every two weeks. Although this methodpredominantly collected wet precipitation, a small amount of drydeposition may also have been collected if it was wind-blown into thefunnel and subsequently dissolved. Snow samples were packed intopre-cleaned HDPE bottles wearing sterile gloves after removal of thetop few centimetres of the snow pack and were allowed to meltnaturally. Porewater samples were collected from suction cupsinstalled at depths of 5–25 cm and groundwater samples werecollected from tube wells which reached the water table.
All water samples were filtered in the field (snow samples werefiltered oncemelted) using 0.2 μmnylon filters into pre-cleaned HDPEbottles. Bottles for cation analysis were cleaned using 2% HNO3 andthose for anion analysis were cleaned using MQ (Millipore) water.After filtration, samples for cation analysis were acidified to pH 2 withdistilled HNO3. A filtered water sample was titrated with 1.1 mM HCland alkalinity was calculated from the titration curve using the Granmethod (Stumm and Morgan, 1996).
Temperature and pH were recorded in situ (Hanna HI 98160 pHmeter).Major cations (Ca2+,Mg2+, Na+, K+) and Siweremeasured byinductively-coupled plasma optical emission spectrometry (ICP-OES,Vista-MPX, Varian Inc., USA) and anions (Cl−, F−, NO3
−, PO43− SO4
2−)were measured using ion chromatography (IC, 761 Compact IC,Metrohm AG, Switzerland). Phosphate in stream water samples wasalways below the detection limit of the IC (b50 ppb). Measured cationconcentrations of the water standard SLRS-4 (National ResearchCouncil Canada) were within 10% of the certified values. Averagerelative standard deviations of repeatmeasurements of sampleswere:Na+ 12%, F− 11%, K+ 9%, Ca2+ 8%, Si 7%, Cl− 6%, Mg2+ and SO4
2− 4%,and NO3
− 3%. Calculated charge balance errors (CBE) were less than
2.5%, indicating the accuracy of the anion and cation measurements.Some higher charge balance errors were caused in winter samples bymeasuring the alkalinity back in the laboratory over 12 h after samplecollection due to adverse weather conditions in the field. This could bedue to oversaturationwith respect to CO2: degassing occurred, alteringthe carbonate equilibrium in the water sample, leading to anoverestimation of [HCO3
−] in the sample. This effect was also notedby Yde et al. (2005) and highlights the importance of immediatemeasurement in the field.
The oxygen isotopic composition was measured using the CO2
equilibration method: 200 μL samples of water were pipetted into12 mL septum-capped vials which were subsequently filled with amixture of 0.3% CO2 and He. After equilibration at 25 °C for at least18 h the CO2/He mixture was measured using a Gas Bench II (ThermoScientific) connected to an isotope ratio mass spectrometer (Delta Vplus, Thermo Scientific). Measurements were calibrated with theinternational standards SMOW, SLAP and GISP. The results arereported in the conventional delta notation with respect to VSMOWand sample standard deviation (2σSD) was less than 0.1‰.
Samples for strontium isotope analysis were first purified, based onmethods by Deniel and Pin (2001) and de Souza et al. (2010), to removematrix ions. The 87Sr/86Sr ratio was measured, for the majority ofsamples, on a multicollector ICP-MS (Nu Plasma, Nu Instruments, UK).Solutions (50 ppb) were introduced to the mass spectrometer using aPFA microconcentric nebuliser with an uptake rate of ~50 μL/min andthe aerosol was dried using a desolvator (either Aridus II, Apex Q orApexHFdepending on the session). This gave aminimum88Sr ion beamintensity of 5×10⁻¹¹ A. Krypton and Rb interferences were correctedusing anon-peak zero and an iterative correction for any residual Kr andRb above background (de Souza et al., 2010). The mass bias calculatedfor Sr was assumed to be valid for Rb and Kr. This is valid since themagnitude of this correction was small compared to the externalreproducibility. SampleswerebracketedbyNBS987andall samples andstandards were normalised to 86Sr/88Sr=0.1194. Due to a clear drift inthe standard values a secondary correction to give NBS 987 87Sr/86Srratios of 0.710250 was used. Each sample was measured at least twice.Reproducibility (2σSD) of standards over the course of this study were0.709182±66 and 0.708665±59 for seawater and an in-housestandard respectively. Sample standard deviation (2σSD) was less than80 ppm. Samples not measured by ICP-MS were measured by thermalionisation mass spectrometry (TIMS) (Triton, Thermo Fischer Scientif-ic). Approximately 250 ng of Sr was loaded in nitric form together with
Fig. 2. Main parameters recorded at the gauging station and at the meteorology station during 2008. Conductivity is inversely related to discharge but does not react strongly torainfall events which cause large, short-lived spikes in discharge. No data was recorded by the meteorology station from 7th–10th July and 14th–19th August due to technicalproblems.
3R.S. Hindshaw et al. / Chemical Geology xxx (2011) xxx–xxx
Please cite this article as: Hindshaw, R.S., et al., Hydrological control of stream water chemistry in a glacial catchment (Damma Glacier,Switzerland), Chem. Geol. (2011), doi:10.1016/j.chemgeo.2011.04.012

1 μL of tantalum phosphate activator solution onto degassed singlerhenium filaments. Data acquisition was comprised of 200 measure-ments with a 4 s integration time in static mode. The exponential lawwas applied to correct for instrument mass fractionation and all 87Sr/86Sr ratios were normalised to 86Sr/88Sr=0.1194. 85Rb was monitoredto correct for rubidium interferences on 87Sr. At least two differentstandards (of NBS 987, seawater and an in-house standard) wereanalysed in each session tomonitor machine drift and each sample wasmeasured four times. Similar to ICP-MS, a secondary correction wasapplied to all data. Reproducibility (2σSD) of standards over the course ofthis study were 0.709181±25 and 0.708669±18 for seawater and thein-house standard respectively. Sample standard deviation (2σSD) wasless than 40 ppm. Sample 20080624A was measured by both methodsand yielded identical results of 0.720637±36 (MC-ICP-MS) and0.720636±25 (TIMS).
4. Hydrology and water chemistry
4.1. Catchment meteorology and hydrology
Air temperature, conductivity, rainfall and discharge all showedsignificant temporal variability during 2008 (Fig. 2). As expected for aglacial catchment, discharge exhibited a strong seasonal trend withmaximum discharge during the summer months and an abruptcessation of flow coinciding with the first snow in autumn. Heavy rainevents in the summer caused rapid increases in discharge with flowsreaching in excess of 6000 L s−1. Superimposed on the seasonal
discharge trendwere strong diurnal cycles linked to themelting of theglacier during the day. Conductivity was inversely related to dischargeand exhibited diurnal and seasonal variations. The conductivity ofthe stream water was not strongly correlated with heavy rainfallevents.
Pronounced seasonal and diurnal variations were observed in δ18Owhich were similar in magnitude at all three sites (Fig. 3). Streamwater sampled at the start of the melt season was depleted in 18O(δ18O~−17‰) and as melting progressed the δ18O value measured inthe stream rapidly increased. From July onwards δ18O continued toincrease, but at a slower rate, until thewintermonthswhen no furtherincrease in δ18O was observed. The highest δ18O values reached werearound −14‰. Similar seasonal trends in δ18O have been previouslyrecorded in snow affected catchments (Bottomley et al., 1986; Tayloret al., 2001; Unnikrishna et al., 2002; Liu et al., 2004).
The diurnal amplitudes of δ18O variation were 0.3‰ and 0.6‰ inJune and August respectively, which were less than the seasonalamplitude of 3‰ (Tables 1 and 2). In June, δ18O was inversely relatedto discharge but there was a significant phase shift with the minimumδ18O value reached seven hours aftermaximumdischarge. The diurnalminimum can be explained by increased melting in response toincreased solar radiation during the day. The first half of the Augustδ18O diurnal cycle was also inversely related to discharge, but theminimum δ18O value was observed two hours before maximumdischarge. In August a second minimum occurred during the nightand this could have been caused by icemelt contributions at night dueto high night-time air temperatures (Jobard and Dzikowski, 2006).
Fig. 3. Left column: Seasonal changes in discharge, cation concentrations (represented by Ca2+), anion concentrations (represented by F−) and δ18O. Red symbols are data from SiteA, green symbols are for Site B and blue symbols are for Site E. Precipitation corrected values are indicated by orange, light green and light blue for Sites A, B and E respectively and arejoined by a dashed line. For most data points the correction is too small to observe. Centre and right columns: Diurnal data for discharge, cation concentrations, anion concentrationsand δ18O, from site A during August and June respectively. The vertical dashed lines indicate times of maximum discharge. (For interpretation of the references to colour in this figurelegend, the reader is referred to the web version of this article.)
4 R.S. Hindshaw et al. / Chemical Geology xxx (2011) xxx–xxx
Please cite this article as: Hindshaw, R.S., et al., Hydrological control of stream water chemistry in a glacial catchment (Damma Glacier,Switzerland), Chem. Geol. (2011), doi:10.1016/j.chemgeo.2011.04.012

4.2. Precipitation
There are three sources of precipitation inputs to the catchment toconsider: rain, snow and indirectly ice, each of which has a differentchemical and isotopic composition (Table 1, Tresch, 2007).
The δ18O values for rain decreased from −7‰ in spring to −14‰in late September. The decrease in δ18O throughout the season iscaused by changes in the precipitation source characteristics and airtemperature (Gat, 1996; Unnikrishna et al., 2002). The chemicalcomposition of the rain was variable and was dominated by Ca2+ andNO3
−. The average 87Sr/86Sr of two composite rain samples was0.70941 which is similar to the 87Sr/86Sr of rain recorded in a
neighbouring catchment (Arn et al., 2003) and is considerably lowerthan the ratios measured in the stream waters (0.71570 to 0.73248,see Section 4.4).
The δ18O values in snow were lower than for rain and werevariable with time, depth and altitude2, reflecting a heterogeneoussnowpack (Unnikrishna et al., 2002). Snow samples were more dilutethan rain samples and the dominant cation and anion was K+ or Ca2+
and Cl− respectively. Si and F− concentrations were negligiblecompared to those measured in the stream. A previous study in the
2 The full δ18O database can be found at http://www.cces.ethz.ch/projects/clench/BigLink.
Table 1Major species, 87Sr/86Sr, and δ18O data for seasonal sampling. R=rain and S=snow. Measurement reproducibility is described in the text.
Site Date Time Runoff pH T Ca2+ Mg2+ Na+ K+ Si F− Cl− NO3− SO4
2− HCO3− Sr2+ δ18O 87Sr/86Sr
(YMD) (CET) (L s−1) (°C) (μmol L−1) (nmol L−1) (‰)
A 20080513 07:35 250 5.61 0.8 27.5 5.0 13.2 14.5 26.2 7.5 5.2 34.0 8.9 63.1 36.6 −16.47 0.72680A 20080527 15:20 800 6.55 0.4 19.5 3.1 9.8 10.2 15.8 6.6 4.1 22.2 6.8 27.8 −16.36 0.72458A 20080610 15:30 2528 6.34 4.7 18.7 3.3 8.9 9.5 14.6 5.1 3.6 15.8 5.9 26.2 28.3 −15.37 0.72070A 20080624 15:30 4502 6.42 5.5 11.8 2.0 7.1 7.6 7.7 3.7 3.6 9.4 3.9 18.1 17.8 −14.78 0.72064A 20080708 14:40 2886 6.23 6.3 11.8 2.1 6.3 7.9 9.9 4.1 3.0 9.1 4.0 16.6 18.1 −14.33 0.72194A 20080722 15:30 1908 6.24 5.4 12.2 2.4 6.7 8.1 12.2 4.2 2.4 8.5 4.3 32.8 19.2 −14.50 0.72268A 20080805 14:35 3595 6.51 10.5 7.9 1.5 4.3 5.5 6.4 2.3 1.9 5.2 2.5 13.9 12.3 −14.47 0.72310A 20080819 15:35 4110 6.52 6.9 8.5 1.5 5.8 6.2 7.3 3.1 2.9 4.7 2.7 16.1 12.7 −14.19 0.72440A 20080902 13:55 4221 6.15 5.9 7.9 1.4 3.3 4.7 6.1 2.5 1.9 4.8 2.6 13.4 11.7 −13.78 0.72486A 20080916 15:30 916 5.84 4.9 19.9 4.1 13.9 16.1 30.0 6.7 3.2 14.5 9.1 40.6 36.1 −13.63 0.72278A 20080930 17:00 236 5.75 4.2 19.1 4.5 15.5 16.1 37.6 7.6 2.5 12.7 7.9 49.6 34.0 −14.14 0.72319A 20081014 14:30 420 5.55 4.2 18.6 3.6 12.4 13.2 24.1 6.8 2.5 16.6 7.9 33.6 34.7 −13.83 0.72320A 20081028 09:50 84 5.75 2.6 24.3 5.5 24.3 20.3 54.3 9.5 3.0 14.7 10.3 97.5 42.7 −13.76 0.72489A 20090116 20 6.30 2.2 33.9 7.8 29.8 24.0 71.1 10.8 2.6 15.7 80.4 48.2 −13.83 0.72370A 20090408 08:05 20 6.05 2.5 42.3 11.1 35.7 24.9 70.6 9.7 3.3 40.9 14.3 72.6 73.7 −14.20 0.72445B 20080527 13:50 6.37 −0.2 16.0 2.2 7.3 6.8 9.7 6.7 4.7 20.2 6.0 17.1 −16.43 0.73228B 20080610 12:50 6.15 3.8 15.7 2.1 6.8 6.8 5.0 4.6 5.0 15.6 4.5 7.8 18.0 −15.99 0.72582B 20080624 12:45 5.34 7.0 11.0 1.5 3.8 3.8 3.3 3.6 2.6 10.4 3.9 9.9 13.4 −15.10 0.72648B 20080708 12:40 5.95 8.6 11.3 1.5 4.8 5.3 3.3 2.6 4.0 12.2 3.9 6.7 14.4 −14.60 0.72663B 20080722 11:00 421 5.28 8.2 11.0 1.6 4.5 4.8 4.5 3.7 4.1 10.6 4.0 20.7 13.7 −14.69 0.72902B 20080805 12:25 2092 6.43 8.4 6.5 0.9 1.7 2.4 2.0 1.7 1.0 4.4 1.8 5.8 7.7 −14.55 0.72975B 20080819 13:00 2045 5.50 10.5 6.6 0.9 2.2 3.3 2.5 2.8 1.4 3.8 1.8 7.8 7.6 −14.40 0.73166B 20080902 11:40 2078 5.97 7.4 6.7 0.9 2.2 3.6 2.6 1.9 1.7 4.7 2.0 6.0 7.8 −13.87 0.73248B 20080916 13:10 175 5.88 6.7 12.9 1.7 4.7 4.9 7.3 4.2 3.0 14.5 5.8 16.6 17.6 −14.54 0.73140B 20080930 12:15 5.90 4.5 12.0 1.6 4.7 5.5 12.3 5.1 1.7 19.6 3.8 12.8 15.1 −15.01 0.73095B 20081014 12:10 4.90 6.1 13.4 1.8 6.0 6.4 11.2 5.8 2.2 19.0 6.0 12.0 19.0 −14.25 0.73083B 20081028 10:20 7.30 3.5 19.0 3.0 16.0 11.0 39.3 10.1 2.8 15.9 6.6 69.8 24.3 −13.48 0.73018E 20080527 09:30 5.83 0.2 20.0 2.9 8.9 10.0 9.4 4.5 6.5 28.9 8.4 38.6 −17.34 0.71875E 20080610 09:30 6.40 1.3 19.7 3.7 9.3 11.3 10.3 3.6 5.4 17.8 6.8 30.6 37.7 −15.72 0.71570E 20080624 09:15 7.19 2.5 11.0 2.1 6.6 8.6 6.4 2.7 3.6 10.7 3.9 17.1 20.3 −15.05 0.71712E 20080708 09:10 7.15 2.0 13.4 2.7 7.1 9.3 10.3 3.1 3.4 12.0 5.0 22.1 24.1 −14.22 0.71761E 20080722 14:00 892 6.10 2.0 10.3 2.2 6.9 8.2 7.9 2.7 4.1 7.8 3.8 28.1 20.1 −14.58 0.71820E 20080805 09:00 1866 6.10 3.2 7.4 2.1 4.6 7.1 5.7 1.3 4.3 4.9 2.2 5.3 13.1 −14.42 0.71835E 20080819 09:30 1083 6.20 3.1 10.3 2.1 5.7 − 8.9 2.2 2.6 6.1 3.9 20.4 19.5 −14.25 0.71889E 20080902 08:40 723 5.98 2.5 11.0 2.2 5.3 7.8 8.1 2.5 2.4 7.5 4.5 17.1 22.6 −13.62 0.71892E 20080916 09:45 230 6.58 1.1 21.9 5.3 13.9 17.9 26.9 5.1 2.7 17.1 12.2 50.8 50.9 −13.32 0.71831E 20080930 09:30 50 6.16 1.2 19.7 4.9 14.0 17.7 31.9 6.4 2.9 17.3 8.9 46.4 40.9 −14.29 0.71946E 20081014 09:00 6.45 1.5 21.0 3.8 10.9 14.4 19.3 5.3 2.2 20.8 9.0 37.8 45.7 −13.67 0.71938E 20081028 12:40 5.85 1.3 20.7 5.4 16.2 19.6 35.2 7.5 2.2 20.5 10.8 54.7 45.2 −13.79 0.71990R 20080624 4.6 0.5 2.3 2.0 2.4 0.0 4.9 22.4 5.4 2.8 −8.57R 20080708 12.7 1.4 2.7 2.3 1.6 0.0 4.7 20.8 6.9 13.5 −6.41R 20080726 5.2 0.6 2.5 2.2 1.6 0.0 3.0 12.4 3.8 3.7 −10.09R 20080805 7.8 1.2 4.2 2.5 0.1 0.0 5.8 23.2 8.0 10.3 −7.08 0.70933a
R 20080819 7.1 0.8 2.3 1.7 2.3 0.0 3.2 11.9 4.4 6.0 −8.55R 20080902 5.6 0.6 1.1 0.8 1.8 0.0 2.3 17.5 6.5 4.7 −7.40R 20080916 16.5 1.3 3.7 4.9 0.9 0.0 3.0 11.5 5.5 18.9 −10.54R 20080930 19.2 4.9 6.0 7.5 11.9 0.0 8.1 16.8 5.5 18.8 −13.96 0.70950b
S 20080513 2.2 0.1 1.7 0.7 0.05 0.0 6.4 4.9 1.0 1.7 −16.38S 20081028 6.2 0.4 4.0 1.8 0.00 0.0 21.0 15.5 3.2 2.9 −10.85S 20090116 3.8 0.2 1.4 8.8 0.00 0.0 20.4 8.8 3.2 1.8 −14.90S 20090116 1.8 0.2 2.0 2.3 0.01 0.0 6.7 6.9 1.7 1.6 −18.29S 20090116 2.7 0.4 3.8 3.3 0.00 0.0 7.4 2.9 −16.76S 20090406 4.9 0.8 26.6 7.6 0.11 0.4 29.9 9.8 2.2 6.4 −15.37S 20090407 2.5 0.2 0.9 1.6 0.13 0.0 9.3 1.1 −14.12S 20090407 0.6 0.1 0.4 0.6 0.09 0.0 4.0 6.1 0.6 0.5 −15.10
PO43− was measured but was below the detection limit.
a Average rain, first 4 samples of the season.b Average rain, last 4 samples of the season.
5R.S. Hindshaw et al. / Chemical Geology xxx (2011) xxx–xxx
Please cite this article as: Hindshaw, R.S., et al., Hydrological control of stream water chemistry in a glacial catchment (Damma Glacier,Switzerland), Chem. Geol. (2011), doi:10.1016/j.chemgeo.2011.04.012
same area reported a 87Sr/86Sr value of 0.70985 for snow (de Souza etal., 2010), which is similar to rain.
Ice is directly derived from snow and is also a ‘precipitation’ sourceof ions when it melts. The average δ18O ratio of melted ice from thedead ice was−16.66±0.47‰. No 87Sr/86Sr value was obtained for ice.During ice formation, solutes are excluded resulting in very low soluteconcentrations (Fountain, 1996).
4.3. Correction for precipitation inputs
The water chemistry in the Damma catchment is characterised byvery dilute meltwaters (sum of positive charge b100 meq L−1),typical of waters draining granitic lithologies (White and Blum,1995). The dissolved load is a mixture of precipitation andweatheringproducts, and these dilute streamwaters could potentially be stronglyinfluenced by precipitation (including glacial melt).
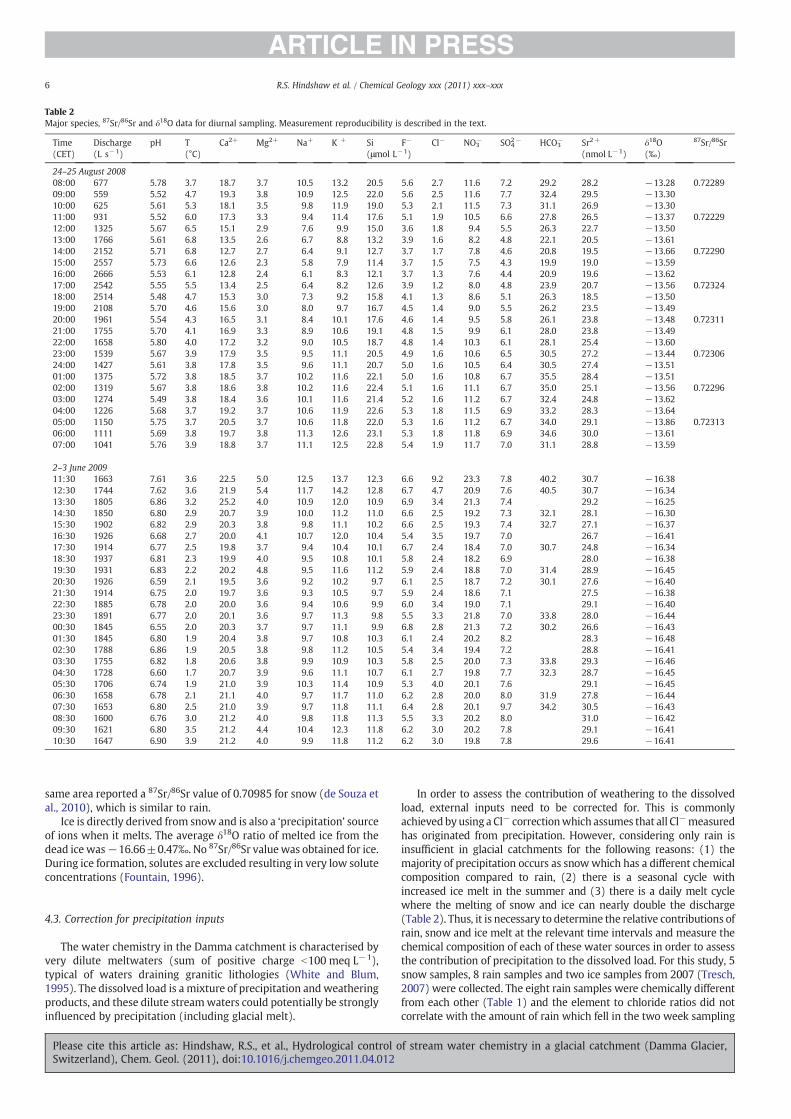
In order to assess the contribution of weathering to the dissolvedload, external inputs need to be corrected for. This is commonlyachievedbyusing a Cl− correctionwhich assumes that all Cl−measuredhas originated from precipitation. However, considering only rain isinsufficient in glacial catchments for the following reasons: (1) themajority of precipitation occurs as snowwhich has a different chemicalcomposition compared to rain, (2) there is a seasonal cycle withincreased ice melt in the summer and (3) there is a daily melt cyclewhere the melting of snow and ice can nearly double the discharge(Table 2). Thus, it is necessary to determine the relative contributions ofrain, snow and ice melt at the relevant time intervals and measure thechemical composition of each of these water sources in order to assessthe contribution of precipitation to the dissolved load. For this study, 5snow samples, 8 rain samples and two ice samples from 2007 (Tresch,2007) were collected. The eight rain samples were chemically differentfrom each other (Table 1) and the element to chloride ratios did notcorrelate with the amount of rain which fell in the two week sampling
Table 2Major species, 87Sr/86Sr and δ18O data for diurnal sampling. Measurement reproducibility is described in the text.
Time Discharge pH T Ca2+ Mg2+ Na+ K + Si F− Cl− NO3− SO4
2− HCO3− Sr2+ δ18O 87Sr/86Sr
(CET) (L s−1) (°C) (μmol L−1) (nmol L−1) (‰)
24–25 August 200808:00 677 5.78 3.7 18.7 3.7 10.5 13.2 20.5 5.6 2.7 11.6 7.2 29.2 28.2 −13.28 0.7228909:00 559 5.52 4.7 19.3 3.8 10.9 12.5 22.0 5.6 2.5 11.6 7.7 32.4 29.5 −13.3010:00 625 5.61 5.3 18.1 3.5 9.8 11.9 19.0 5.3 2.1 11.5 7.3 31.1 26.9 −13.3011:00 931 5.52 6.0 17.3 3.3 9.4 11.4 17.6 5.1 1.9 10.5 6.6 27.8 26.5 −13.37 0.7222912:00 1325 5.67 6.5 15.1 2.9 7.6 9.9 15.0 3.6 1.8 9.4 5.5 26.3 22.7 −13.5013:00 1766 5.61 6.8 13.5 2.6 6.7 8.8 13.2 3.9 1.6 8.2 4.8 22.1 20.5 −13.6114:00 2152 5.71 6.8 12.7 2.7 6.4 9.1 12.7 3.7 1.7 7.8 4.6 20.8 19.5 −13.66 0.7229015:00 2557 5.73 6.6 12.6 2.3 5.8 7.9 11.4 3.7 1.5 7.5 4.3 19.9 19.0 −13.5916:00 2666 5.53 6.1 12.8 2.4 6.1 8.3 12.1 3.7 1.3 7.6 4.4 20.9 19.6 −13.6217:00 2542 5.55 5.5 13.4 2.5 6.4 8.2 12.6 3.9 1.2 8.0 4.8 23.9 20.7 −13.56 0.7232418:00 2514 5.48 4.7 15.3 3.0 7.3 9.2 15.8 4.1 1.3 8.6 5.1 26.3 18.5 −13.5019:00 2108 5.70 4.6 15.6 3.0 8.0 9.7 16.7 4.5 1.4 9.0 5.5 26.2 23.5 −13.4920:00 1961 5.54 4.3 16.5 3.1 8.4 10.1 17.6 4.6 1.4 9.5 5.8 26.1 23.8 −13.48 0.7231121:00 1755 5.70 4.1 16.9 3.3 8.9 10.6 19.1 4.8 1.5 9.9 6.1 28.0 23.8 −13.4922:00 1658 5.80 4.0 17.2 3.2 9.0 10.5 18.7 4.8 1.4 10.3 6.1 28.1 25.4 −13.6023:00 1539 5.67 3.9 17.9 3.5 9.5 11.1 20.5 4.9 1.6 10.6 6.5 30.5 27.2 −13.44 0.7230624:00 1427 5.61 3.8 17.8 3.5 9.6 11.1 20.7 5.0 1.6 10.5 6.4 30.5 27.4 −13.5101:00 1375 5.72 3.8 18.5 3.7 10.2 11.6 22.1 5.0 1.6 10.8 6.7 35.5 28.4 −13.5102:00 1319 5.67 3.8 18.6 3.8 10.2 11.6 22.4 5.1 1.6 11.1 6.7 35.0 25.1 −13.56 0.7229603:00 1274 5.49 3.8 18.4 3.6 10.1 11.6 21.4 5.2 1.6 11.2 6.7 32.4 24.8 −13.6204:00 1226 5.68 3.7 19.2 3.7 10.6 11.9 22.6 5.3 1.8 11.5 6.9 33.2 28.3 −13.6405:00 1150 5.75 3.7 20.5 3.7 10.6 11.8 22.0 5.3 1.6 11.2 6.7 34.0 29.1 −13.86 0.7231306:00 1111 5.69 3.8 19.7 3.8 11.3 12.6 23.1 5.3 1.8 11.8 6.9 34.6 30.0 −13.6107:00 1041 5.76 3.9 18.8 3.7 11.1 12.5 22.8 5.4 1.9 11.7 7.0 31.1 28.8 −13.59
2–3 June 200911:30 1663 7.61 3.6 22.5 5.0 12.5 13.7 12.3 6.6 9.2 23.3 7.8 40.2 30.7 −16.3812:30 1744 7.62 3.6 21.9 5.4 11.7 14.2 12.8 6.7 4.7 20.9 7.6 40.5 30.7 −16.3413:30 1805 6.86 3.2 25.2 4.0 10.9 12.0 10.9 6.9 3.4 21.3 7.4 29.2 −16.2514:30 1850 6.80 2.9 20.7 3.9 10.0 11.2 11.0 6.6 2.5 19.2 7.3 32.1 28.1 −16.3015:30 1902 6.82 2.9 20.3 3.8 9.8 11.1 10.2 6.6 2.5 19.3 7.4 32.7 27.1 −16.3716:30 1926 6.68 2.7 20.0 4.1 10.7 12.0 10.4 5.4 3.5 19.7 7.0 26.7 −16.4117:30 1914 6.77 2.5 19.8 3.7 9.4 10.4 10.1 6.7 2.4 18.4 7.0 30.7 24.8 −16.3418:30 1937 6.81 2.3 19.9 4.0 9.5 10.8 10.1 5.8 2.4 18.2 6.9 28.0 −16.3819:30 1931 6.83 2.2 20.2 4.8 9.5 11.6 11.2 5.9 2.4 18.8 7.0 31.4 28.9 −16.4520:30 1926 6.59 2.1 19.5 3.6 9.2 10.2 9.7 6.1 2.5 18.7 7.2 30.1 27.6 −16.4021:30 1914 6.75 2.0 19.7 3.6 9.3 10.5 9.7 5.9 2.4 18.6 7.1 27.5 −16.3822:30 1885 6.78 2.0 20.0 3.6 9.4 10.6 9.9 6.0 3.4 19.0 7.1 29.1 −16.4023:30 1891 6.77 2.0 20.1 3.6 9.7 11.3 9.8 5.5 3.3 21.8 7.0 33.8 28.0 −16.4400:30 1845 6.55 2.0 20.3 3.7 9.7 11.1 9.9 6.8 2.8 21.3 7.2 30.2 26.6 −16.4301:30 1845 6.80 1.9 20.4 3.8 9.7 10.8 10.3 6.1 2.4 20.2 8.2 28.3 −16.4802:30 1788 6.86 1.9 20.5 3.8 9.8 11.2 10.5 5.4 3.4 19.4 7.2 28.8 −16.4103:30 1755 6.82 1.8 20.6 3.8 9.9 10.9 10.3 5.8 2.5 20.0 7.3 33.8 29.3 −16.4604:30 1728 6.60 1.7 20.7 3.9 9.6 11.1 10.7 6.1 2.7 19.8 7.7 32.3 28.7 −16.4505:30 1706 6.74 1.9 21.0 3.9 10.3 11.4 10.9 5.3 4.0 20.1 7.6 29.1 −16.4506:30 1658 6.78 2.1 21.1 4.0 9.7 11.7 11.0 6.2 2.8 20.0 8.0 31.9 27.8 −16.4407:30 1653 6.80 2.5 21.0 3.9 9.7 11.8 11.1 6.4 2.8 20.1 9.7 34.2 30.5 −16.4308:30 1600 6.76 3.0 21.2 4.0 9.8 11.8 11.3 5.5 3.3 20.2 8.0 31.0 −16.4209:30 1621 6.80 3.5 21.2 4.4 10.4 12.3 11.8 6.2 3.0 20.2 7.8 29.1 −16.4110:30 1647 6.90 3.9 21.2 4.0 9.9 11.8 11.2 6.2 3.0 19.8 7.8 29.6 −16.41
6 R.S. Hindshaw et al. / Chemical Geology xxx (2011) xxx–xxx
Please cite this article as: Hindshaw, R.S., et al., Hydrological control of stream water chemistry in a glacial catchment (Damma Glacier,Switzerland), Chem. Geol. (2011), doi:10.1016/j.chemgeo.2011.04.012

period. The average rain composition was used rather than the raincomposition weighted with respect to precipitation volumes due to thefrequent overflowing of the bottle collecting the rain. The chemicalcomposition of snow varies during snow melt due to preferentialleaching and fractionation of ions (Johannessen and Henriksen, 1978;Tsiouris et al., 1985; Williams and Melack, 1991; Marsh and Pomeroy,1999) and this will result in a non-constant X/Cl ratio during the snowmelt period. Preferential leaching effects are strong for nitrate andsulphate relative to chloride (Williams and Melack, 1991; Marsh andPomeroy, 1999), thus the precipitation corrections for these two anionsmay introduce a seasonal bias. Preferential elution of cations relative tochloride ismuch less pronounced (Marsh and Pomeroy, 1999), thus theprecipitation correction for cations will be less affected than nitrate andsulphate by this leaching process. Due to the lack of samples collectedduring the snowmelt periodwe could not quantify this process further.
The percentage contributions of each of the water sources (rain,snow melt and ice melt) to the total discharge were obtained usingthe ALPINE3D distributed model for the 2008 hydrological year(Lehning et al. (2006) and applied to the Damma glacier catchment byMagnusson et al. (2011)). ALPINE3D is an energy-balance modelwhich can be used to model high-resolution discharge dynamics inglacio-nival watersheds. The model takes into account the observedevolution of the snow pack during the ablation season (Farinotti et al.,2010) and local meteorological parameters. Snowmelt dominated thefirst half of the summer and ice melt dominated at the end of thesummer (Fig. 4a). With the modelled contribution of sources knownfor each sampling day, a weighted X/Cl ratio was calculated and theprecipitation correction applied as is usual. The X/Cl ratios for each ofthe precipitation sources were assumed to be constant throughout theyear. For Ca, the average percentage of the total annual dissolved fluxderived from precipitation was 10% with a range of 2% (January) to25% (end of summer). Since the three sites were sampled at differenttimes of day, and a diurnal melt cycle exists, an additional correctionshould also be applied to take into account the diurnal change in X/Clratios in order that data from the different sites are directly comparable.However, the data could not be corrected to take into account the timeof sampling due to incomplete discharge data from Sites E and B.
A second precipitation input correction was calculated by usingthe meteorology station data, which recorded the volume ofprecipitation reaching the forefield (Fig. 2). The precipitation volumeover two weeks was multiplied by the composition of the relevantrain or snow sample (ice melt was not included in this calculation).These were then added up to give an annual input flux fromprecipitation, which was subtracted from annual discharge fluxesobtained from the raw data and compared with annual fluxesobtained from the chloride corrected data (Table 4). These two valuesshow very good agreement with each other, indicating that theprecipitation correction is robust. The correction is quite small becausedilute snow is the dominant precipitation source to this catchment.Theprecipitation correctiondecreased absolute concentrations (Fig. 3)but did not affect overall trends in chemical ratios (Fig. 5).
4.4. Stream water chemistry
The cation abundances were typical for glacial meltwaters drainingalpine glaciers (Anderson et al., 1997), with Ca2+NK+≈Na+NMg2+.Anion abundances were HCO3
−NNO3−NSO4
2−F−≈Cl− (Table 1). Al-though the stream waters were dilute, significant spatial, seasonal anddiurnal trends were observed in both precipitation corrected anduncorrected data (Figs. 3 and 5).
Although the three sampling sites lie within 1 km of each otherand drain a common lithology, spatial differences were observed. Themost pronounced spatial differences were observed in 87Sr/86Sr(Fig. 6): Site B was the most radiogenic with an average 87Sr/86Sr of0.73024 and Site E was the least radiogenic with an average 87Sr/86Srof 0.71838. The side stream (Site B) had more dilute major element
concentrations than the main stream (Sites A and E) for the majorityof samples (Fig. 3, Table 1). Spatial variation was also observed inelement ratios (Fig. 5). Due to diurnal variability, part of the observeddifferences between sites could have been caused by sampling thesites at different times of the day (Table 1).
The concentrations of the major elements exhibited markedseasonal and diurnal variations in response to changes in discharge(illustrated by Ca2+ and F− in Fig. 3). In general, the diurnal variation ofthe analysed parameters was ~20% of the seasonal variation. Maximumand minimum seasonal concentrations were observed in winter and atthe end of August respectively. Over a single day, maximumconcentrations were observed at night and minimum concentrationswere observed during mid-afternoon. Discharge varied by a factor ofover 200 over the year, whereas themaximumelemental concentrationvariation, observed for Si, was only a factor of 10. A similar mutedresponse of concentration variations to discharge variations wasobserved at the diurnal timescale and demonstrates that the variabilityin solute concentrations is not only controlled by dilution. Theattenuated response of solutes to changes in discharge has been termed‘chemostatic’ in the hydrological literature (Godsey et al., 2009; Clow
Fig. 4. (a) Proportion of snow melt and ice melt contributing to discharge on thedifferent sampling days as modelled by ALPINE3D (Magnusson et al., 2011). (b)Comparison of modelled δ18O compared to the measured values. The model is based onRayleigh fractionation of remaining snow as the snow pack melts mixing with ice of aconstant isotopic composition as described in the text. (c) The difference betweenmodelled and measured δ18O. The grey area indicates the combined uncertainty of 20%in the estimation of snow and ice proportions, 10% in the estimation of catchment snowcover and 1‰ in the δ18O value of ice.
7R.S. Hindshaw et al. / Chemical Geology xxx (2011) xxx–xxx
Please cite this article as: Hindshaw, R.S., et al., Hydrological control of stream water chemistry in a glacial catchment (Damma Glacier,Switzerland), Chem. Geol. (2011), doi:10.1016/j.chemgeo.2011.04.012
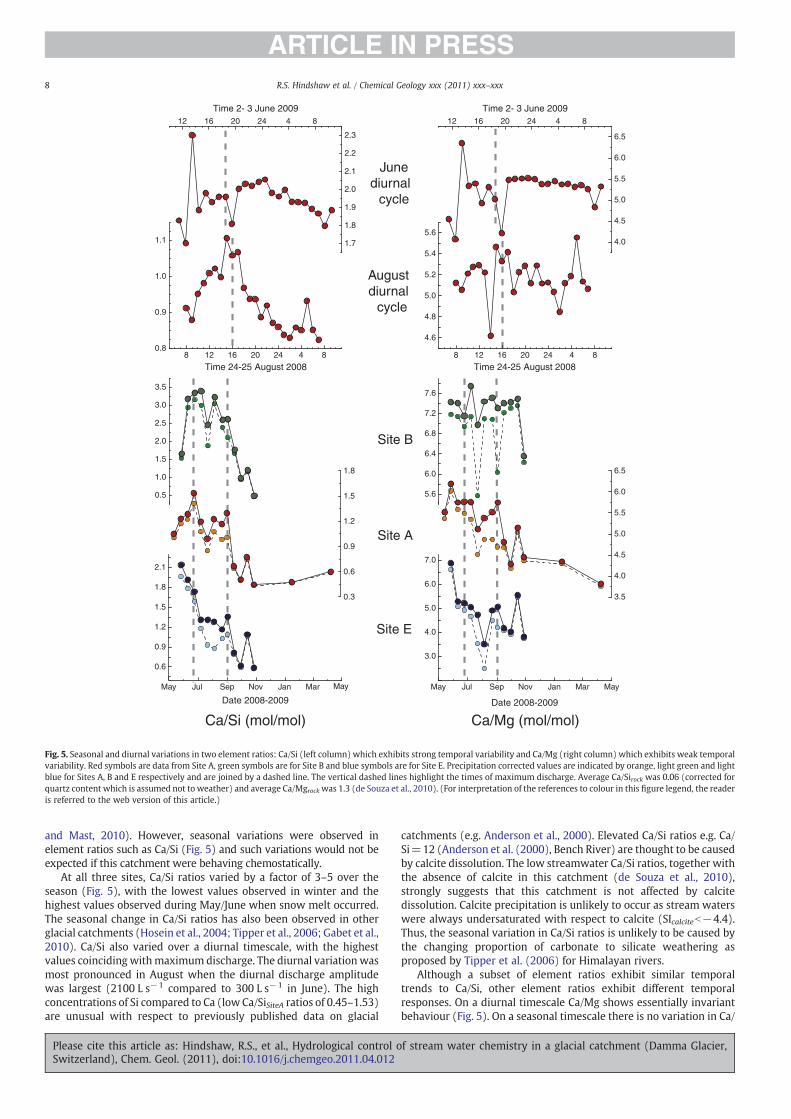
and Mast, 2010). However, seasonal variations were observed inelement ratios such as Ca/Si (Fig. 5) and such variations would not beexpected if this catchment were behaving chemostatically.
At all three sites, Ca/Si ratios varied by a factor of 3–5 over theseason (Fig. 5), with the lowest values observed in winter and thehighest values observed during May/June when snow melt occurred.The seasonal change in Ca/Si ratios has also been observed in otherglacial catchments (Hosein et al., 2004; Tipper et al., 2006; Gabet et al.,2010). Ca/Si also varied over a diurnal timescale, with the highestvalues coinciding withmaximum discharge. The diurnal variation wasmost pronounced in August when the diurnal discharge amplitudewas largest (2100 L s−1 compared to 300 L s−1 in June). The highconcentrations of Si compared to Ca (low Ca/SiSiteA ratios of 0.45–1.53)are unusual with respect to previously published data on glacial
catchments (e.g. Anderson et al., 2000). Elevated Ca/Si ratios e.g. Ca/Si=12 (Anderson et al. (2000), Bench River) are thought to be causedby calcite dissolution. The low streamwater Ca/Si ratios, together withthe absence of calcite in this catchment (de Souza et al., 2010),strongly suggests that this catchment is not affected by calcitedissolution. Calcite precipitation is unlikely to occur as stream waterswere always undersaturated with respect to calcite (SIcalciteb−4.4).Thus, the seasonal variation in Ca/Si ratios is unlikely to be caused bythe changing proportion of carbonate to silicate weathering asproposed by Tipper et al. (2006) for Himalayan rivers.
Although a subset of element ratios exhibit similar temporaltrends to Ca/Si, other element ratios exhibit different temporalresponses. On a diurnal timescale Ca/Mg shows essentially invariantbehaviour (Fig. 5). On a seasonal timescale there is no variation in Ca/
Fig. 5. Seasonal and diurnal variations in two element ratios: Ca/Si (left column) which exhibits strong temporal variability and Ca/Mg (right column) which exhibits weak temporalvariability. Red symbols are data from Site A, green symbols are for Site B and blue symbols are for Site E. Precipitation corrected values are indicated by orange, light green and lightblue for Sites A, B and E respectively and are joined by a dashed line. The vertical dashed lines highlight the times of maximum discharge. Average Ca/Sirock was 0.06 (corrected forquartz content which is assumed not to weather) and average Ca/Mgrockwas 1.3 (de Souza et al., 2010). (For interpretation of the references to colour in this figure legend, the readeris referred to the web version of this article.)
8 R.S. Hindshaw et al. / Chemical Geology xxx (2011) xxx–xxx
Please cite this article as: Hindshaw, R.S., et al., Hydrological control of stream water chemistry in a glacial catchment (Damma Glacier,Switzerland), Chem. Geol. (2011), doi:10.1016/j.chemgeo.2011.04.012

Mg at Site B but at Site A similar variation to Ca/Si is observed. Thecomplex and varied temporal responses of element ratios are due todifferent sources (e.g. preferential mineral dissolution) and processes(e.g. ion exchange, formation of secondary phases) which act on eachelement. In addition, element ratio variations observed at Site A couldalso be affected by differing relative inputs from Sites B and E.
Significant temporal variation was also observed in strontiumisotopes (Fig. 6). At all three sites there was a seasonal variation in87Sr/86Sr of 0.006, with an increase from unradiogenic values at thestart of June to more radiogenic values at the end of August. After 2ndSeptember 87Sr/86Sr at Site B decreased whereas at Site E it continuedto increase. Site A reflects values which are a mixture of the isotopicfluxes at Sites B and E (discussed further in Section 5.2.1). Diurnalvariation in 87Sr/86Sr in August was 0.001 with an increase in valuesfrommid-morning to mid-afternoon. The temporal trends in 87Sr/86Srwere not related to variations in discharge or element ratios but theydo appear related to the temporal trends observed for δ18O (compareFigs. 3 and 6).
5. Discussion:water sources, solute sources andweathering processes
In the following discussion we will refer to water sources andchemical sources. We define water sources based on hydrology andδ18O, and chemical sources based on major element chemistry and
87Sr/86Sr. The chemical composition of each water source can bemeasured at its origin, but along its flowpath its chemical compositioncan change and it can mix with other water sources, complicatingsource apportionment.
5.1. Identifying water sources
Identifying the sources of water and their flowpaths is crucial tounderstanding how rivers acquire their solutes (Malard et al., 1999;Brown et al., 2006), but is often neglected in many studies of chemicalweathering. The ALPINE3D hydrological model (Magnusson et al.,2011) showed that snow and ice melt were the principal watercomponents of this catchment, with the first half of the summerdominated by snow melt and the second half dominated by ice melt(Fig. 4a). Evapotranspiration and sub-surface components are minorcontributors to the water budget of this catchment and can thus beneglected. Evapotranspiration contributed less than 3% of the waterbudget for this catchment (Kormann, 2009) and an additional sub-surface component was not required to accurately model the annualhydrograph. Variation in δ18O reflects the changing hydrologicalproperties of the catchment and the increase in δ18O over the season,observed at all three sites, is typical for snow covered catchments (e.g.Bottomley et al., 1986; Unnikrishna et al., 2002;Welp et al., 2005). Theδ18O values of the water inputs to the catchment can be used toprovide information on the temporal changes of the water sourcecontributions to the stream and aid in the interpretation of theobserved chemical changes.
The validity of the source apportionment derived from theALPINE3D hydrological model was tested by using it to predict theδ18O value of the river water, and comparing these values to theobserved values. Since the response of the catchment to rain events isvery rapid (cf Fig. 2) and it did not rain on any of the sampling days,rain was neglected as a water source, reducing the problem to snowand ice inputs. A snow pack is initially composed of isotopicallydistinct layers reflecting different precipitation events, but over timeisotopic redistribution processes serve to vertically homogenisesnowpack δ18O values (Raben and Theakstone, 1998; Taylor et al.,2001; Unnikrishna et al., 2002). These processes occur during snowcrystal metamorphism as a result of melting, freezing and vapourtransport of water within the snowpack. The observation thatmeltwaters are isotopically lighter than the snowpack is understoodto occur as a result of the fractionation of oxygen isotopes duringmelting, with 18O preferentially retained in the ice phase (Taylor et al.,2001; Unnikrishna et al., 2002).
To estimate the δ18O composition of water derived from the partialmelting of snow, it is necessary to take into account the isotopicfractionation between the solid phase (snow/ice) and water. Thisprocess can be represented by a Rayleigh fractionation process, wherethe δ18O of the meltwater at time t (δ18Ot) is a function of the fractionof snow remaining (f).
δ18 Ot = δ18 O0 + 1000� �
fαwater−ice−1−1000 ð1Þ
The equilibrium fractionation factor between water and ice(αwater− ice) was taken to be 0.9965 at 0 °C (Gat, 1996). The fractionof snow remaining in the catchment (f) was modelled by Farinotti etal. (2010) based on daily photographs of the catchment. It isassumed that on 13th May, f is 1 and thus δ18O0 is taken to be−16.47‰ (Table 1). Variations in δ18O can occur with altitude, withlower δ18O values at higher elevations (Gat, 1996), but as nosystematic variations with altitude were observed, we assumed ahomogeneous snow-pack.
The isotopic composition of snow melt will be further modified bymixing with ice melt. Since the fraction of ice removed compared tothe total glacial ice volume is negligible, a constant δ18O for ice of
Fig. 6. Seasonal and diurnal variation in 87Sr/86Sr. The dashed lines highlight the timesof maximum discharge. 87Sr/86Sr decreases in response to the snow melt peak indischarge at the start of the season but does not decrease in response to high dischargelater in the year. Similar variation is observed on the diurnal timescale but with asmaller magnitude. The temporal trends in 87Sr/86Sr are similar to those observed inδ18O (Fig. 3).
9R.S. Hindshaw et al. / Chemical Geology xxx (2011) xxx–xxx
Please cite this article as: Hindshaw, R.S., et al., Hydrological control of stream water chemistry in a glacial catchment (Damma Glacier,Switzerland), Chem. Geol. (2011), doi:10.1016/j.chemgeo.2011.04.012

−16.66‰, based on sevenmelted ice samples from the dead ice block,was assumed. The estimated δ18O values of snow melt and ice meltwere combined according to the proportions derived from theALPINE3D model (Magnusson et al., 2011) to estimate the bulk δ18Oof the river water.
δ18Oriver = δ18Oice⋅Fice + δ18Osnow⋅Fsnow ð2Þ
where F is the fractional contribution to discharge and Fice+Fsnow=1.
The modelled seasonal variation of δ18O in the river was comparedto the measured values up to 2nd September. The predicted andobserved δ18O values agree remarkably well for such a simple model,with less than 1‰ discrepancy (Fig. 4b and c). This implies that thesystematic increase in δ18O over the season can be adequatelyexplained by inputs from snow melt, controlled by fractional melting,mixing with ice melt. Discrepancies with the observed data couldarise for a number of reasons. Firstly, there was an estimated error of20% in the proportions of snow to ice melt from the ALPINE3D model.Secondly, the δ18O value of glacier ice was not well constrained.Thirdly, rain inputs were neglected. Although it did not rain on any ofthe sampling days, water from previous rain events could still bepercolating through the forefield. Fourthly, the Rayleigh approxima-tion assumes the snow pack is a well-mixed, uniform reservoir; a statewhich is unlikely to be maintained throughout the melt season.Fifthly, during the percolation of meltwater through the snowpackand underlying ice, further isotopic exchange can occur (Taylor et al.,2001; Lee et al., 2010).
Although the retreat of the snow pack is important for the balanceof snow to ice melt, it is also important to consider glacial drainage(though this will not change δ18O) as this will determine the contacttime between water and sub-glacial sediments, potentially affectingthe chemical composition of the water. The form of the hydrographcan help to infer glacial drainage. With its lower albedo, ice meltsmuch more rapidly than snow and accentuates the daily dischargeamplitude (Fountain, 1996), whereas snow cover attenuates dailydischarge amplitude. The rapid melting of ice contributes to thedevelopment of a channelised (short water residence time) sub-glacial drainage system which also serves to accentuate the dailydischarge amplitude (Nienow et al., 1996). Thus, the differencebetween the maximum and the minimum discharge (daily dischargeamplitude) each day reflects the amount of snow cover on the glacierand the nature of the subglacial drainage system. In 2008 the dailydischarge amplitude increased up to mid-September reflecting theretreat of the snow-line and thereafter abruptly decreased in responseto new snow. At the start of the melt season the drainage capacity ofthe glacier is low due to contracted channels and the glacier cannotdrainwater at the same rate as it is supplied from the glacier. Drainagecapacity increases as the season progresses asmelt watermelts the icecausing channel expansion (Schuler et al., 2004). This change indrainage can be inferred from the time difference between maximumsolar insolation and maximum discharge (Fountain, 1996) and thistime difference reached its minimum value at the end of August(Kormann, 2009), implying that this waswhen the subglacial networkwas draining most efficiently. These two parameters together point toan expanding channel network and decreased snow cover up until thebeginning of September. Thereafter, the combination of a reducingchannel network and new snow fall in mid-September caused thedrainage efficiency and resulting discharge (Fig. 2) to sharplydecrease. Thus, although δ18O did not exhibit large variation duringSeptember (the sources remained the same), the way the waterdrained had changed. This sudden ‘shutdown’ of the glacial drainagesystem induced noticeable changes in the streamwater chemistry, asdiscussed below.
5.2. Identifying chemical sources of solutes
Whilst δ18O and the ALPINE3D model show that the main watersources in this catchment are snow and ice melt, there could beadditional water sources such as porewater and groundwater whichare concentrated in solutes but are negligible for the total waterbalance. Even with only two water sources, variation in flow pathlength could create a number of different chemical sources throughchanges in the elemental composition as a result of processes such asdissolution, secondary mineral precipitation, exchange and biologicalcycling.
5.2.1. Sources of 87Sr/86SrThe 87Sr/86Sr ratio of the stream reflects themixing of sources with
different 87Sr/86Sr ratios, for example, different minerals or externaldust inputs. However, 87Sr/86Sr should be insensitive to secondaryprocess such as the precipitation of secondary phases. The δ18O ratiosof groundwater samples are similar to those of the river (Table 3)suggesting connectivity between the stream and shallow groundwa-ter (Malard et al., 1999; Magnusson et al., submitted for publication),which could influence 87Sr/86Sr. If there are no Sr inputs from theforefield areas and Sr is conservative over short timescales then Site Ashould fall on a mixing line between Sites E and B in 87Sr/86Sr vs 1/[Sr]space for each sample (Langmuir et al., 1978). The minimumdeviation between the mixing line and Site A data points can becalculated as the perpendicular distance from the mixing line. Thecalculated deviation from conservative mixing is small (b1 fmol L−1
Sr and an average 87Sr/86Sr deviation of 0.00135‰) and shows noseasonal trend (not shown). Much of the difference can be attributedto difference in sample collection times: 87Sr/86Sr at Site A had adiurnal variation of ~0.001.
Ground and porewaters could contribute to the water mixture atSite A. However, porewaters have extremely heterogeneous chemicalcompositions (Table 3) and do not plot on the mixing line betweensites E and B in Fig. 7. The δ18O of the porewaters varied between rainvalues and river values suggesting that some of the porewaters wereisolated with no connectivity to the stream. The groundwater samplewere neither chemically nor isotopically distinct from the streamwater samples (Fig. 7) and, as the volume contribution to totaldischarge was minor (Section 5.1), will consequently have animperceptible effect on the stream water chemistry observed at SiteA. Althoughwe cannot completely exclude a contribution fromgroundand porewaters, it is likely that the forefield soils between Sites E andAhave a negligible impact on the dissolved flux of Sr and this should betrue for other elements which have similar chemical behaviour to Sr.Thus, for Sr, Site A can be explained as a simplemixture of waters fromSites E and B.
Previous measurements of 87Sr/86Sr inmineral separates and rocksfrom the catchment indicated a large degree of heterogeneity (deSouza et al., 2010). It is thus likely that differences in the degree ofmetamorphic resetting of radiogenic Sr are controlling the spatialdifference in 87Sr/86Sr between Sites E and B rather than differentweathering conditions in each of the sub-catchments. For example, interms of 87Sr/86Sr ratios (Fig. 7), Site E appears to drain a lithologymore akin to the gneissic rock sample R04 (0.71613) and themylonitic rock sample R05 (0.75577) is more representative of SiteB (Fig. 7, de Souza et al., 2010). Due to the large heterogeneity of 87Sr/86Sr in the mineral separates measured by de Souza et al. (2010) wecannot ascribe the streamwater chemistry to a specific composition ofminerals weathering.
Significant dust deposition, principally from Saharan dust storms(De Angelis and Gaudichet, 1991; Thevenon et al., 2009), occurs alongthe Alpine chain. Saharan dust contains 20–50% carbonate (Goudieand Middleton, 2001) which is dissolved during transport byatmospheric aerosols (De Angelis and Gaudichet, 1991). The additionof dissolved carbonates could impact stream water chemistry at
10 R.S. Hindshaw et al. / Chemical Geology xxx (2011) xxx–xxx
Please cite this article as: Hindshaw, R.S., et al., Hydrological control of stream water chemistry in a glacial catchment (Damma Glacier,Switzerland), Chem. Geol. (2011), doi:10.1016/j.chemgeo.2011.04.012

Damma. However, the comparatively low Ca/Si ratios observedsuggest that carbonate dust deposition does not strongly influencethe stream water chemistry of this catchment.
Seasonal trends in 87Sr/86Sr have been observed in other catchments(Krishnaswami et al., 1992; Aubert et al., 2002; Tipper et al., 2006;Bélanger and Holmden, 2010), and these have been linked to dischargecontrol of weathering sources. It was proposed that discharge controlswhich chemically distinct areas of a catchment (Aubert et al., 2002) andwhichminerals (Bullen et al., 1996; Tipper et al., 2006) contribute to thedissolved load. In this fieldsite, the lowest flows have the mostradiogenic 87Sr/86Sr ratios, which is broadly consistent with previousstudies (Bullen et al., 1996; Tipper et al., 2006). However, a simpledischarge control cannot explain the 87Sr/86Sr data since discharge is notcorrelated with 87Sr/86Sr (R2SiteA=0.17).
The seasonal variation in 87Sr/86Sr at Damma is identical in form tothat which would be predicted by the rapid addition and subsequentdepletion of an unradiogenic source (Nezat et al., 2010). Wedemonstrated in the previous section that δ18O can be explained bythe relative degree of snow and ice melt from the forefield and theglacier surface. If the 27th May sample is excluded then there is alinear relationship between δ18O and 87Sr/86Sr for all sites (e.g. Site E,R2=0.62). The correlation of 87Sr/86Sr with δ18O suggests that thevariations in 87Sr/86Sr can similarly be explained by snow melt. Totaldischarge is composed of snow melt and ice melt. We can considerthat a fraction of this flow (f⁎) comes into contact with sub-glacialsediment where it acquires solutes and 87Sr/86Sr ratios derived fromdissolution, hereafter termed sub-glacial flow. Although two maintypes of subglacial drainage system exist (channelised and distribut-ed, Nienow et al., 1996), we assume that the isotopic composition ofstrontium released from weathered sediments is unaffected by thenature of the sub-glacial drainage system. The rest of the discharge isen-glacial (within the glacier) or supra-glacial (on the glacier surface)flow where there is negligible solute acquisition. We term these lasttwo components surface melt. As explained above, we assume that the
groundwater and porewater inputs are negligible. The following massbalance equation can be written for Sr isotopes:
ϕt Sr½ �tRt = f ⁎ ϕice Sr½ �⁎iceR⁎ice + ϕsnow Sr½ �⁎snowR⁎snow� �
+ 1−f ⁎� �
ϕice Sr½ �iceRice + ϕsnow Sr½ �snowRsnow
� � ð3Þ
Table 3Major species, 87Sr/86Sr and δ18O data for groundwater (GW) and porewater (PW) samples. Measurement reproducibility is described in the text.
Samplename
Ca2+ Mg2+ Na+ K+ Si F− Cl− NO3− PO4
3− SO42− HCO3
− Sr2+ δ18O 87Sr/86Sr(μmol L−1) (nmol L−1) (‰)
GW1a 23.2 4.8 20.2 17.4 59.1 12.1 5.3 12.1 – 7.8 62.7 34.6 −13.11 0.72959GW1b 59.0 5.1 17.2 15.5 39.7 15.3 94.7 7.5 – 7.7 36.2 52.1 −14.17GW1c 34.8 5.4 16.4 15.6 42.6 36.9 0.72831GW2a 49.9 16.8 21.7 41.3 45.2 3.6 12.9 27.2 – 5.8 100.1 −13.96GW2b 41.2 9.4 22.7 23.2 53.1 9.6 1.6 4.6 – 11.4 127.8 53.5 −14.09GW2c 47.5 10.3 24.1 25.2 54.9 9.4 21.7 11.0 – 12.5 106.8 63.9 −14.08GW3a 120.5 23.7 22.4 42.6 78.1 6.3 809.4 – – 3.6 144.8 −13.10GW3b 51.2 20.9 20.5 38.0 74.7 4.4 33.1 – – 2.3 204.5 80.1 −13.27GW3c 42.4 19.2 18.4 38.6 62.2 75.5 0.71553GW4b 13.7 3.0 3.9 13.0 4.3 2.4 2.3 5.4 – 3.4 29.6 21.8 −14.23GW5b 13.6 2.4 3.7 12.6 5.4 2.6 1.4 6.9 – 4.2 27.4 21.9 −14.12GW6b 14.7 5.9 9.1 19.6 25.8 8.5 1.4 6.8 – 4.2 55.4 18.1 −14.78PW1a 152.0 14.2 27.6 44.5 15.7 0.0 468.5 10.6 – 2.5 45.6 −18.18PW1b 149.3 49.6 18.8 17.6 17.2 1.7 223.4 – – 2.1 119.3 −10.29PW1c 22.3 8.6 23.1 32.3 61.9 3.4 19.0 1.4 8.7 – 30.6 −12.10 0.71691PW1d 19.7 8.5 22.4 30.2 61.5 3.3 10.2 1.7 9.0 – 30.0 −12.24PW1e 33.1 13.1 22.8 27.7 42.9 3.5 10.2 – – 7.6 117.9 46.2 −13.60PW2a 2760.8 59.9 19.5 139.5 52.4 1114.0 0.70840PW2b 75.3 5.8 15.8 44.2 14.9 3.3 250.2 6.5 1.9 1.7 23.2 −14.12PW2c 268.5 149.4 184.0 196.8 15.0 9.3 677.0 836.6 4.6 293.5 272.8 −8.72 0.71577PW3a 37.0 6.8 1.7 15.7 26.2 4.3 96.9 0.4 – 0.8 27.2 0.71570PW3b 59.2 15.5 18.6 29.4 9.0 59.8 0.71652PW4 550.4 95.5 47.5 138.5 93.9 15.6 1135.8 – – 3.3 579.3 493.6 −14.04 0.72276PW5 591.7 8.2 51.8 26.5 20.5 0.0 3568.1 – 38.5 0.0 40.1 −19.29PW6 78.0 10.7 18.7 8.4 34.7 0.9 159.9 – – 1.7 22.0 −6.42PW8 57.7 1.1 352.9 11.0 2.7 2.5 125.5 2.7 – 2.2 23.7 −14.21PW11 428.2 66.6 47.4 374.3 89.0 12.5 1304.3 11.1 – 24.9 570.8 279.8 −13.03 0.71447PW13 3974.5 37.6 33.6 53.9 108.1 21.4 – 24.4 42.0 6.2 2753.8 −9.05PW21 339.7 45.0 34.8 102.5 50.3 331.2 0.71237
− Indicates species was below the detection limit.Blank space indicates species was not measured.
Fig. 7. Mixing plot of 87Sr/86Sr against [Ca]/[Sr]. Site E can be explained as a mixturebetween average rock and a surface melt component. The surface melt end-memberhas a Ca/Sr ratio which is an average of snow samples and a 87Sr/86Sr ratio which is theaverage of the rain samples (Table 1). We assume 87Sr/86Srsnow=87Sr/86Srrain. Similarly,Site B can be explained by mixing of the surface melt component with the mostradiogenic rock sampled (R05). Site A is a mixture between Sites B and E. The numberson the mixing lines refer to the fractional contribution from rock. Rock data are from deSouza et al. (2010). Porewaters (PW) have distinct compositions and have negligibleinfluence on the stream water composition at Site A. Groundwater samples (GW) haveidentical compositions to the stream water indicating connectivity between the two(Magnusson et al., submitted for publication), though theywill not influence the streamwater composition at Site A.
11R.S. Hindshaw et al. / Chemical Geology xxx (2011) xxx–xxx
Please cite this article as: Hindshaw, R.S., et al., Hydrological control of stream water chemistry in a glacial catchment (Damma Glacier,Switzerland), Chem. Geol. (2011), doi:10.1016/j.chemgeo.2011.04.012

where ϕ is the discharge, the subscript t is for ‘total’ and the asteriskindicates concentrations ([Sr]) and isotope ratios (R) modified byinteraction with sub-glacial sediments. We assume ice has the sameisotopic composition and Sr concentration as snow and the combinedterm is given the subscript g for ‘glacial’.
ϕt Sr½ �tRt = f ⁎ϕt Sr½ �⁎g R⁎g + 1−f ⁎� �
ϕt Sr½ �gRg ð4Þ
If the concentrations and isotopic compositions of the two mixingcomponents are assumed to be constant throughout the season thenthe value of f⁎ can be determined by fitting Eq. (4) with the values ofRt, ϕt and [Sr]t observed at Site A. The physical plausibility of thecalculated values of f⁎ can then be assessed. The values of [Sr]g and Rg
are assumed to be constant with values of 2.35 nmol L−1 (averagesnow [Sr], Table 1) and 0.70971 (snow 87Sr/86Sr, from de Souza et al.(2010)) respectively. The choice of these values is supported by thefact that stream water data for Sites B and E lie on mixing linesbetween the surface melt end-member and rock compositions in 87Sr/86Sr vs Ca/Sr space (Fig. 7). During winter, the contribution of surfacemelt is expected to be negligible and these winter samples shouldrepresent the sub-glacial component. Thus, 74 nmol L−1 for [Sr]g⁎ and0.73248 for Rg⁎were chosen as these were the highest values observedin the stream water during winter. The calculated amounts of sub-glacial and surface meltwater compared to the total discharge areillustrated in Fig. 8.
An independent approximation of the proportion of sub-glacialwater can be obtained from the shape of the diurnal hydrograph.Diurnal discharge variations are driven by day-time melting of the
glacier surface. It is assumed that the difference between thedischarge at the time of sampling and the night-time minimumrepresents addition of surface melt which does not weathersediments (1− f⁎). Although some of this water will inevitablyreach the bed of the glacier, its effect, on a diurnal timescale, is toenlarge existing channels (Schuler et al., 2004), thus increased water–sediment contact will be minimal. Minimal melting of the glaciersurface is expected to occur at night, therefore we assume that thediurnal minimum represents sub-glacial flow only (f⁎). These valuesof f⁎ agree with the fitted values in the latter half of the season butunderestimate the proportion of surface melt water at the start of themelt season (Fig. 8). During this part of the year, snow melt from theglacier surface dominates andmaintains high flow rates even at night,due to the long time lag (N7 h) between maximum runoff andmaximum solar insolation. Snow melt at night leads to an over-estimation of the amount of sub-glacial water at this time of the year.
Although further data would be needed to verify the assumptionsmade, to a first approximation, the fitted amounts of surface and sub-glacial meltwater are plausible based on current understanding ofglacier hydrology and the strontium isotopic composition of thestream water can be explained by a two-component mixture ofsurface melt and subglacial water, whose composition is controlled bylocal lithology (Fig. 7). The relative proportions of these two solutesources are controlled by the evolution of the glacial drainage systemover the melt season.
5.2.2. Elemental sourcesElemental ratios did not correlate with Sr isotopes, which only
trace chemical sources. This implies that processes (e.g. adsorption)play an important role in modulating stream water chemistry inaddition to chemical sources. The diurnal changes in stream waterchemistry are very similar to those observed seasonally. We thus inferthat the underlying controls on stream water chemistry are the sameat both the diurnal and the seasonal timescales.
There are at least three processes which could alter elementalratios within a water body: biological cycling, weathering and ionexchange.
Biological cycling could affect elemental ratios on diurnal andseasonal timescales in response to changing nutrient requirements.However the effect of biology on stream water chemistry in thiscatchment is expected to be negligible due to the sparse vegetationcover and the limited influence of porewaters on stream waterchemistry (Section 5.2.1). Further, stable isotope analyses of Sr and Cahave shown that the effect of biological cycling on river Sr and Ca isnegligible (de Souza et al., 2010; Hindshaw et al., 2011). Weatheringprocesses can affect element ratios by altering the ratio of ionsreleased into solution during dissolution or through precipitationprocesses selectively removing ions from solution. Silicate dissolutionrates vary with temperature and pH and the stream watertemperature exhibited clear diurnal variation (Table 2). White et al.(1999) reported the effect of temperature on individual elementalrelease rates from laboratory experiments. Using the temperature–elemental release rate relationships for Ca and Si derived for the mostcompositionally similar granite to Damma (weathered Loch Valegranite), we can calculate that an 8 °C variation in temperature wouldbe required to explain the observed diurnal variation in Ca/Si ratios inAugust. This change in temperature is much larger than the 3 °Cchange observed. There was no clear diurnal variation in streamwaterpH, therefore the influence of pH on Ca/Si ratios is expected to beminimal. Thus, changing silicate dissolution rates are unlikely to causediurnal variations of element ratios. Ion exchange and sorptionprocesses have rapid kinetics (Stumm and Morgan, 1996) and areknown to cause the release of base cations during flushing with dilutewater i.e. snowmelt (e.g. Clow and Mast, 2010). The effect of flushingwith dilute water on element ratios such as Ca/Na appears to becatchment specific (Malard et al., 1999; Tranter et al., 2002; Clow and
Fig. 8. The calculated amount of surface meltwater (a) and the amount of sub-glacialmeltwater (b) with respect to the observed total discharge. In both figures line 1(dotted) represents values obtained by fitting Eq. (4) to observed values, assumingfixed chemical and isotopic compositions of the two components (see text). In (a) thevalues of line 2 (dash-dot) are the difference between the minimum diurnal dischargeand the discharge at the time of sampling, assumed to represent surface glacial meltonly. The values of line 2 in (b) are the minimum discharge values observed on thesampling day, assumed to represent sub-glacial meltwater only. The discrepancybetween the two sets of values at the start of themelt season is likely to be due to snow-melt causing elevated diurnal discharge minima, leading to an overestimation of theamount of water which has interacted with sub-glacial sediments.
12 R.S. Hindshaw et al. / Chemical Geology xxx (2011) xxx–xxx
Please cite this article as: Hindshaw, R.S., et al., Hydrological control of stream water chemistry in a glacial catchment (Damma Glacier,Switzerland), Chem. Geol. (2011), doi:10.1016/j.chemgeo.2011.04.012

Mast, 2010). Ion exchange is undoubtedly important in thiscatchment but this process was unable to be quantified further.
Rather than the chemical composition of a single water bodychanging, the seasonal and diurnal variations could be caused bymixing different water bodies which have different chemicalcompositions (Malard et al., 2000). Previous work on glacial drainagesystems using dye tracers has identified two major componentsnamely a ‘distributed’ component which is characterised by longerresidence times and a ‘channelised’ component which is characterisedby shorter residence times (Nienow et al., 1996; Brown, 2002). Thedrainage system of the Damma glacier presumably behaves in asimilar way.
Waters with different residence times have the potential toacquire different solute compositions. Laboratory experiments haveshown that the initial stages of weathering are incongruent, resultingin the preferential release of Ca, Mg, K and Sr relative to Si and, to acertain extent, Na (Acker and Bricker, 1992; Brantley et al., 1998;
White et al., 1999). Under high discharge conditions (short residencetime), the stream water chemistry is likely to reflect incongruentweathering processes, whereas water with a longer residence time isexpected reflect more congruent weathering. This prediction is inagreement with other fieldsites where high cation/Si ratios are oftenobserved in water with short residence times compared to water withlong residence times (Brown et al., 2006; Tipper et al., 2006; Gabet etal., 2010). It is therefore plausible that the diurnal and seasonalvariations are caused by the variable mixing of water with differentresidence times and chemical compositions. For elemental ratiosEq. (4) would become:
ϕtXt = af⁎⁎ϕtX⁎ch
g + 1−að Þf ⁎⁎ϕtX⁎dis
g + 1−f ⁎⁎� �
ϕtXg ð5Þ
where Xg⁎ch and Xg⁎dis are the chemical ratios of the channelised(short residence time, more incongruent weathering) and distributed
Fig.9. Conceptual model of how the glacier hydrology controls stream water chemistry represented by three different times during the season. Figure based on Brown (2002). Bluearrows represent chemical contributions from snow and ice melt and red and green arrows represent chemical contributions from distributed and channelised sub-glacial flowpathsrespectively. (a) At the beginning of the season snow still covered the glacier, but significant snow melt was occurring from the surface. This water mixed with concentrated waterfrom the base of the glacier (distributed flow). (b) By August all snow in the ablation zone of the glacier had melted and crevasses had opened up which allowed icemelt to reach thebed of the glacier expanding sub-glacial channels and creating the fast channelised component which dominated the river chemistry. (c) In September, new snow fall which was notsubject to strong melting due to cold temperatures, effectively sealed the crevasses (which gradually froze up) blocking transfer of melt water through crevasses. This resulted in areturn to distributed flow conditions which persisted throughout the winter. During winter baseflow is maintained through pressure melting.
13R.S. Hindshaw et al. / Chemical Geology xxx (2011) xxx–xxx
Please cite this article as: Hindshaw, R.S., et al., Hydrological control of stream water chemistry in a glacial catchment (Damma Glacier,Switzerland), Chem. Geol. (2011), doi:10.1016/j.chemgeo.2011.04.012
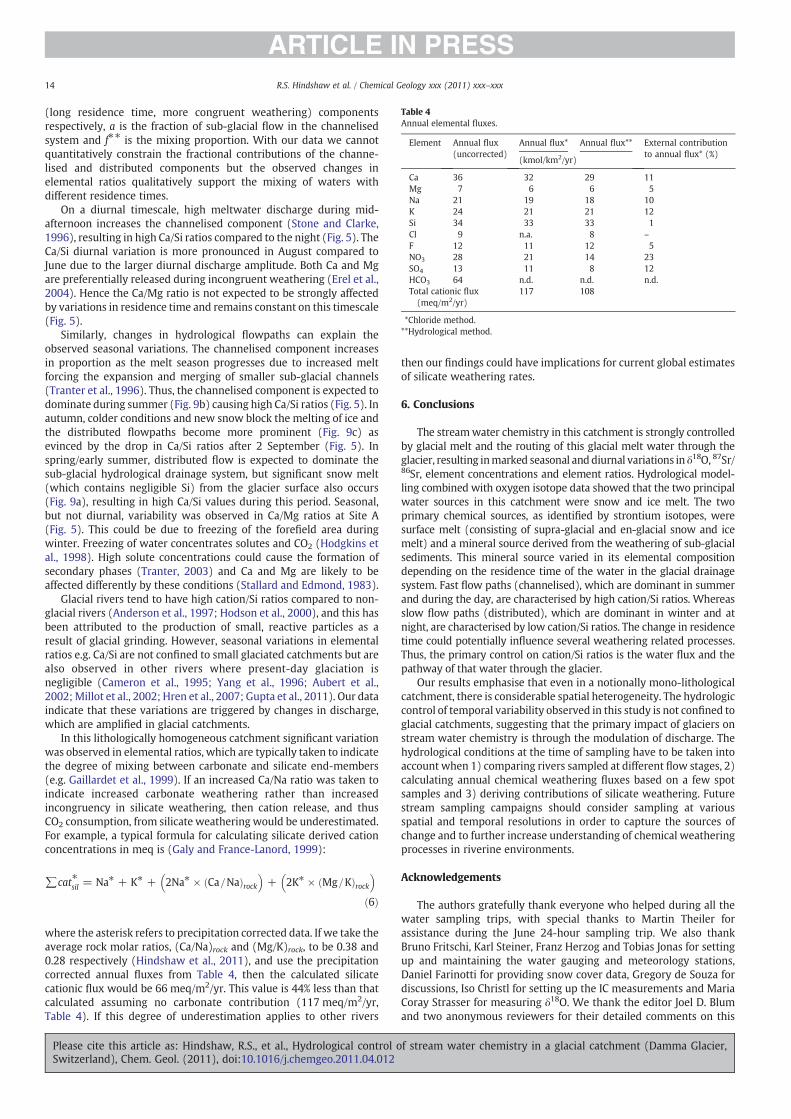
(long residence time, more congruent weathering) componentsrespectively, a is the fraction of sub-glacial flow in the channelisedsystem and f⁎⁎ is the mixing proportion. With our data we cannotquantitatively constrain the fractional contributions of the channe-lised and distributed components but the observed changes inelemental ratios qualitatively support the mixing of waters withdifferent residence times.
On a diurnal timescale, high meltwater discharge during mid-afternoon increases the channelised component (Stone and Clarke,1996), resulting in high Ca/Si ratios compared to the night (Fig. 5). TheCa/Si diurnal variation is more pronounced in August compared toJune due to the larger diurnal discharge amplitude. Both Ca and Mgare preferentially released during incongruent weathering (Erel et al.,2004). Hence the Ca/Mg ratio is not expected to be strongly affectedby variations in residence time and remains constant on this timescale(Fig. 5).
Similarly, changes in hydrological flowpaths can explain theobserved seasonal variations. The channelised component increasesin proportion as the melt season progresses due to increased meltforcing the expansion and merging of smaller sub-glacial channels(Tranter et al., 1996). Thus, the channelised component is expected todominate during summer (Fig. 9b) causing high Ca/Si ratios (Fig. 5). Inautumn, colder conditions and new snow block the melting of ice andthe distributed flowpaths become more prominent (Fig. 9c) asevinced by the drop in Ca/Si ratios after 2 September (Fig. 5). Inspring/early summer, distributed flow is expected to dominate thesub-glacial hydrological drainage system, but significant snow melt(which contains negligible Si) from the glacier surface also occurs(Fig. 9a), resulting in high Ca/Si values during this period. Seasonal,but not diurnal, variability was observed in Ca/Mg ratios at Site A(Fig. 5). This could be due to freezing of the forefield area duringwinter. Freezing of water concentrates solutes and CO2 (Hodgkins etal., 1998). High solute concentrations could cause the formation ofsecondary phases (Tranter, 2003) and Ca and Mg are likely to beaffected differently by these conditions (Stallard and Edmond, 1983).
Glacial rivers tend to have high cation/Si ratios compared to non-glacial rivers (Anderson et al., 1997; Hodson et al., 2000), and this hasbeen attributed to the production of small, reactive particles as aresult of glacial grinding. However, seasonal variations in elementalratios e.g. Ca/Si are not confined to small glaciated catchments but arealso observed in other rivers where present-day glaciation isnegligible (Cameron et al., 1995; Yang et al., 1996; Aubert et al.,2002;Millot et al., 2002; Hren et al., 2007; Gupta et al., 2011). Our dataindicate that these variations are triggered by changes in discharge,which are amplified in glacial catchments.
In this lithologically homogeneous catchment significant variationwas observed in elemental ratios, which are typically taken to indicatethe degree of mixing between carbonate and silicate end-members(e.g. Gaillardet et al., 1999). If an increased Ca/Na ratio was taken toindicate increased carbonate weathering rather than increasedincongruency in silicate weathering, then cation release, and thusCO2 consumption, from silicate weathering would be underestimated.For example, a typical formula for calculating silicate derived cationconcentrations in meq is (Galy and France-Lanord, 1999):
∑cat⁎sil = Na⁎ + K⁎ + 2Na⁎ × Ca=Nað Þrock� �
+ 2K⁎ × Mg=Kð Þrock� �
ð6Þ
where the asterisk refers to precipitation corrected data. If we take theaverage rock molar ratios, (Ca/Na)rock and (Mg/K)rock, to be 0.38 and0.28 respectively (Hindshaw et al., 2011), and use the precipitationcorrected annual fluxes from Table 4, then the calculated silicatecationic flux would be 66 meq/m2/yr. This value is 44% less than thatcalculated assuming no carbonate contribution (117 meq/m2/yr,Table 4). If this degree of underestimation applies to other rivers
then our findings could have implications for current global estimatesof silicate weathering rates.
6. Conclusions
The streamwater chemistry in this catchment is strongly controlledby glacial melt and the routing of this glacial melt water through theglacier, resulting inmarked seasonal anddiurnal variations in δ18O, 87Sr/86Sr, element concentrations and element ratios. Hydrological model-ling combined with oxygen isotope data showed that the two principalwater sources in this catchment were snow and ice melt. The twoprimary chemical sources, as identified by strontium isotopes, weresurface melt (consisting of supra-glacial and en-glacial snow and icemelt) and a mineral source derived from the weathering of sub-glacialsediments. This mineral source varied in its elemental compositiondepending on the residence time of the water in the glacial drainagesystem. Fast flow paths (channelised), which are dominant in summerand during the day, are characterised by high cation/Si ratios. Whereasslow flow paths (distributed), which are dominant in winter and atnight, are characterised by low cation/Si ratios. The change in residencetime could potentially influence several weathering related processes.Thus, the primary control on cation/Si ratios is the water flux and thepathway of that water through the glacier.
Our results emphasise that even in a notionally mono-lithologicalcatchment, there is considerable spatial heterogeneity. The hydrologiccontrol of temporal variability observed in this study is not confined toglacial catchments, suggesting that the primary impact of glaciers onstream water chemistry is through the modulation of discharge. Thehydrological conditions at the time of sampling have to be taken intoaccount when 1) comparing rivers sampled at different flow stages, 2)calculating annual chemical weathering fluxes based on a few spotsamples and 3) deriving contributions of silicate weathering. Futurestream sampling campaigns should consider sampling at variousspatial and temporal resolutions in order to capture the sources ofchange and to further increase understanding of chemical weatheringprocesses in riverine environments.
Acknowledgements
The authors gratefully thank everyone who helped during all thewater sampling trips, with special thanks to Martin Theiler forassistance during the June 24-hour sampling trip. We also thankBruno Fritschi, Karl Steiner, Franz Herzog and Tobias Jonas for settingup and maintaining the water gauging and meteorology stations,Daniel Farinotti for providing snow cover data, Gregory de Souza fordiscussions, Iso Christl for setting up the IC measurements and MariaCoray Strasser for measuring δ18O. We thank the editor Joel D. Blumand two anonymous reviewers for their detailed comments on this
Table 4Annual elemental fluxes.
Element Annual flux(uncorrected)
Annual flux* Annual flux** External contributionto annual flux* (%)
(kmol/km2/yr)
Ca 36 32 29 11Mg 7 6 6 5Na 21 19 18 10K 24 21 21 12Si 34 33 33 1Cl 9 n.a. 8 –
F 12 11 12 5NO3 28 21 14 23SO4 13 11 8 12HCO3 64 n.d. n.d. n.d.Total cationic flux(meq/m2/yr)
117 108
*Chloride method.**Hydrological method.
14 R.S. Hindshaw et al. / Chemical Geology xxx (2011) xxx–xxx
Please cite this article as: Hindshaw, R.S., et al., Hydrological control of stream water chemistry in a glacial catchment (Damma Glacier,Switzerland), Chem. Geol. (2011), doi:10.1016/j.chemgeo.2011.04.012

manuscript. This work was funded by the BigLink project of the ETHCompetence Center Environment and Sustainability of the ETHDomain (CCES) and by ETH Research Grant No. 04/06-3.
References
Acker, J.G., Bricker, O.P., 1992. The influence of pH on biotite dissolution and alterationkinetics at low temperature. Geochim. Cosmochim. Acta 56, 3073–3092.
Anderson, S.P., Drever, J.I., Humphrey, N.F., 1997. Chemical weathering in glacialenvironments. Geology 25, 399–402.
Anderson, S.P., Drever, J.I., Frost, C.D., Holden, P., 2000. Chemical weathering in theforeland of a retreating glacier. Geochim. Cosmochim. Acta 64, 1173–1189.
Arn, K., Hosein, R., Föllmi, K.B., Steinmann, P., Aubert, A., Kramers, J., 2003. Strontiumisotope systematics in two glaciated crystalline catchments: Rhone and Oberaarglaciers (Swiss Alps). Schweiz. Mineral. Petrogr. Mitt. 83, 273–283.
Aubert, D., Probst, A., Stille, P., Viville, D., 2002. Evidence of hydrological control of Srbehavior in streamwater (Strengbach catchment, Vosgesmountains, France). Appl.Geochem. 17, 285–300.
Bélanger, N., Holmden, C., 2010. Influence of landscape on the apportionment of Canutrition in a Boreal Shield forest of Saskatchewan (Canada) using 87Sr/86Sr as atracer. Can. J. Soil Sci. 90, 267–288.
Bernasconi, S.M., Christl, I., Hajdas, I., Zimmermann, S., Hagedorn, F., Smittenberg, R.,Furrer, G., Zeyer, J., Brunner, I., Frey, B., Plötze, M., Lapanje, A., Edwards, P., OldeVenterink, H., Göransson, H., Frossard, E., Bünemann, E., Jansa, J., Tamburini, F.,Welc, M., Mitchell, E., Bourdon, B., Kretzschmar, R., Reynolds, B., Lemarchand, E.,Wiederhold, J., Tipper, E., Kiczka, M., Hindshaw, R., Stähli, M., Jonas, T., Magnusson,J., Bauder, A., Farinotti, D., Huss, M., Wacker, L., Abbaspour, K., 2008. Weathering,soil formation and initial ecosystem evolution on a glacier forefield: a case studyfrom the Damma Glacier, Switzerland. Miner. Mag. 72, 19–22.
Berner, R.A., Rao, J.-L., Chang, S., O'Brien, R., Keller, C.K., 1998. Seasonal variability ofadsorption and exchange equilibria in soil waters. Aquat. Geochem. 4, 273–290.
Bullen, T.D., Krabbenhoft, D.P., Kendall, C., 1996. Kinetic andmineralogic controls on theevolution of groundwater chemistry and 87Sr/86Sr in a sandy silicate aquifer,northern Wisconsin, USA. Geochim. Cosmochim. Acta 60, 1807–1821.
Bluth, G.J.S., Kump, L.R., 1994. Lithologic and climatologic controls of river chemistry.Geochim. Cosmochim. Acta 58, 2341–2359.
Bottomley, D.J., Craig, D., Johnston, L.M., 1986. Oxygen-18 studies of snowmelt runoff ina small precambrian shield watershed: implications for streamwater acidificationin acid-sensitive terrain. J. Hydrol. 88, 213–234.
Brantley, S.L., Chesley, J.T., Stillings, L.L., 1998. Isotopic ratios and release rates of strontiummeasured from weathering feldspars. Geochim. Cosmochim. Acta 62, 1493–1500.
Brown, G.H., 2002. Glacier meltwater hydrochemistry. Appl. Geochem. 17, 855–883.Brown, L.E., Hannah, D.M., Milner, A.M., Soulsby, C., Hodson, A.J., Brewer, M.J., 2006.
Water source dynamics in a glacierized alpine river basin (Taillon-Gabiétous,French Pyrénées). Water Resour. Res. 42, W08404.
Buttle, J.M., 1994. Isotope hydrograph separations and rapid delivery of pre-eventwater from drainage basins. Prog. Phys. Geog. 18, 16–41.
Cameron, E.M., Hall, G.E.M., Veizer, J., Krouse, H.R., 1995. Isotopic and elementalhydrogeochemistry of a major river system: Fraser River, British Columbia, Canada.Chem. Geol. 122, 149–169.
Clow, D.W., Drever, J.I., 1996. Weathering rates as a function of flow through an alpinesoil. Chem. Geol. 132, 131–141.
Clow, D.W., Mast, M.A., 2010. Mechanisms for chemostatic behavior in catchments:implications for CO2 consumption by mineral weathering. Chem. Geol. 269, 40–51.
De Angelis, M., Gaudichet, A., 1991. Saharan dust deposition over Mont Blanc (FrenchAlps) during the last 30 years. Tellus 43B, 61–75.
de Souza, G.F., Reynolds, B.C., Kiczka, M., Bourdon, B., 2010. Evidence for mass-dependent isotopic fractionation of strontium in a glaciated granitic watershed.Geochim. Cosmochim. Acta 74, 2596–2614.
Dempster, T.J., 1986. Isotope systematics in minerals: biotite rejuvenation andexchange during Alpine metamorphism. Earth Planet. Sci. Lett. 78, 355–367.
Deniel, C., Pin, C., 2001. Single-stage method for the simultaneous isolation of lead andstrontium from silicate samples for isotopic measurements. Anal. Chim. Acta 426,95–103.
Erel, Y., Blum, J.D., Roueff, E., Ganor, J., 2004. Lead and strontium isotopes as monitors ofexperimental granitoid mineral dissolution. Geochim. Cosmochim. Acta 68,4649–4663.
Fairchild, I.J., Killawee, J.A., Sharp, M.J., Spiro, B., Hubbard, B., Lorrain, R.D., Tison, J.-L.,1999. Solute generation and transfer from a chemically reactive alpine glacial-proglacial system. Earth Surf. Process. Landforms 24, 1189–1211.
Farinotti, D., Magnusson, J., Huss, M., Bauder, A., 2010. Snow accumulation distributioninferred from time-lapse photography and simple modelling. Hydrol. Process. 24,2087–2097.
Fountain, A.G., 1996. Effect of snow and firn hydrology on the physical and chemicalcharacteristics of glaical runoff. Hydrol. Process. 10, 509–521.
France-Lanord, C., Evans, M., Hurtrez, J.-E., Riotte, J., 2003. Annual dissolved fluxes fromCentral Nepal rivers: budget of chemical erosion in the Himalayas. C. R. Geosci. 335,1131–1140.
Gabet, E.J., Wolff-Boenisch, D., Langner, H., Burbank, D., Putkonen, J., 2010. Geomorphicand climatic controls on chemical weathing in the High Himalayas of Nepal.Geomorphology 122, 205–210.
Gaillardet, J., Dupré, B., Louvat, P., Allègre, C.J., 1999. Gobal silicate weathering and CO2
consumption rates deduced from the chemistry of large rivers. Chem. Geol. 159,3–30.
Galy, A., France-Lanord, C., 1999. Weathering processes in the Ganges-Brahmaputrabasin and the riverine alkalinity budget. Chem. Geol. 159, 31–60.
Garrels, R.M., Mackenzie, F.T., 1967. Origin of the chemical compositions of somesprings and lakes. In: Gould, R.F. (Ed.), Equilibrium Concepts in Natural WaterSystems. : Advances in Chemistry Series, vol. 67. American Chemical Society,Washington DC, pp. 222–242.
Gat, J.R., 1996. Oxygen and hydrogen isotopes in the hydrologic cycle. Annu. Rev. EarthPlanet. Sci. 24, 225–262.
Gíslason, S.R., Arnórsson, S., Ármannsson, H., 1996. Chemical weathering of basalt insouthwest Iceland: effects of runoff, age of rocks and vegetative/glacial cover. Am. J.Sci. 296, 837–907.
Godsey, S.E., Kirchner, J.W., Clow, D.W., 2009. Concentration-discharge relationshipsreflect chemostatic characteristics of US catchments. Hydrol. Process. 23, 1844–1864.
Goudie, A.S., Middleton, N.J., 2001. Saharan dust storms: nature and consequences.Earth Sci. Rev. 56, 179–204.
Gupta, H., Chakrapani, G.J., Selvaraj, K., Kao, S.-J., 2011. The fluvial geochemistry,contributions of silicate, carbonate and saline-alkaline components to chemicalweathering flux and controlling parameters: Narmada River (Deccan Traps), India.Geochim. Cosmochim. Acta 75, 800–824.
Hindshaw, R.S., Reynolds, B.C., Wiederhold, J.G., Kretzschmar, R., Bourdon, B., 2011.Calcium isotopes in a proglacial weathering environment: Damma glacier,Switzerland. Geochim. Cosmochim. Acta 75, 106–118.
Hodgkins, R., Tranter, M., Dowdeswell, J.A., 1998. The hydrochemistry of runoff from a‘cold-based’ glacier in the High Arctic (Scott Turnerbreen, Svalbard). Hydrol. Process.12, 87–103.
Hodson, A., Tranter, M., Vatne, G., 2000. Contemporary rates of chemical denudationand atmospheric CO2 sequestration in glacier basins: an Arctic perspective. EarthSurf. Process. Landforms 25, 1447–1471.
Hosein, R., Arn, K., Steinmann, P., Adatte, T., Föllmi, K.B., 2004. Carbonate and silicateweathering in two presently glaciated, crystalline catchments in the Swiss Alps.Geochim. Cosmochim. Acta 68, 1021–1033.
Hren, M.T., Chamberlain, C.P., Hilley, G.E., Blisniuk, P.M., Bookhagen, B., 2007. Major ionchemistry of the Yarlung Tsangpo-Brahmaputra river: Chemical weathering,erosion, and CO2 consumption in the southern Tibetan plateau and easternsyntaxis of the Himalaya. Geochim. Cosmochim. Acta 71, 2907–2935.
Jobard, S., Dzikowski, M., 2006. Evolution of glacial flow and drainage during theablation season. J. Hydrol. 330, 663–671.
Johannessen, M., Henriksen, A., 1978. Chemistry of snow meltwater: changes inconcentration during melting. Water Resour. Res. 14, 615–619.
Kormann, C., 2009. Untersuchungen des Wasserhaushaltes und der Abflussdynamikeines Gletschervorfeldes. Master's thesis, TU Dresden.
Krishnaswami, S., Trivedi, J.R., Sarin, M.M., Ramesh, R., Sharma, K.K., 1992. Strontiumisotopes and rubidium in the Ganga - Brahmaputra river system:Weathering in theHimalaya, fluxes to the Bay of Bengal and contributions to the evolution of oceanic87Sr/86Sr. Earth Planet. Sci. Lett. 109, 243–253.
Langmuir, C.H., Vocke, R.D., Hanson, G.N., Hart, S.R., 1978. A general mixing equationwith applications to Icelandic basalts. Earth Planet. Sci. Lett. 37, 380–392.
Lee, J., Feng, X., Faiia, A.M., Posmentier, E.S., Kirchner, J.W., Osterhuber, R., Taylor, S.,2010. Isotopic evolution of a seasonal snowcover and its melt by isotopic exchangebetween liquid water and ice. Chem. Geol. 270, 126–134.
Lehning, M., Völksch, I., Gustafsson, D., Nguyen, T.A., Stähli, M., Zappa, M., 2006.ALPINE3D: a detailed model of mountain surface processes and its application tosnow hydrology. Hydrol. Process. 20, 2111–2128.
Likens, G.E., Driscoll, C.T., Buso, D.C., Siccama, T.G., Johnson, C.E., Lovett, G.M., Fahey, T.J.,Reiners, W.A., Ryan, D.F., Martin, C.W., Bailey, S.W., 1998. The biogeochemistry ofcalcium at Hubbard Brook. Biogeochemistry 41, 89–173.
Liu, F., Williams, M.W., Caine, N., 2004. Source waters and flow paths in an alpinecatchment, Colorado Front Range, United States. Water Resour. Res. 40, W09401.
Magnusson, J., Farinotti, D., Jonas, T., Bavay, M., 2011. Quantitative evaluation ofdifferent hydrological modelling approaches in a partly glacierized Swisswatershed. Hydrol. Process. doi:10.1002/hyp.7958.
Magnusson, J., Kobierska, F., Huxol, S., Jonas, T., Kirchner, J.W., submitted forpublication. Melt water driven stream and groundwater stage fluctuations on aglacier forefield (Damma gletscher, Switzerland). Hydrol. Process.
Malard, F., Tockner, K., Ward, J.V., 1999. Shifting dominance of subcatchment watersources and flow paths in a glacial floodplain, Val Roseg, Switzerland. Arct. Antarct.Alp. Res. 31, 135–150.
Malard, F., Tockner, K., Ward, J.V., 2000. Physico-chemical heterogeneity in a glacialriverscape. Landscape Ecol. 15, 679–695.
Marsh, P., Pomeroy, J.W., 1999. Spatial and temporal variations in snowmelt runoffchemistry, Northwest Territories, Canada. Water Resour. Res. 35, 1559–1567.
Meybeck, M., 2003. Global occurrence of major elements in rivers. In: Holland, H.D.,Turekian, K.K. (Eds.), Treatise on Geochemistry. : Surface and ground water,weathering and soils, vol. 5. Elsevier.
Millot, R., Gaillardet, J., Dupré, B., Allègre, C.J., 2002. The global control of silicateweathering rates and the coupling with physical erosion: new insights from riversof the Canadian Shield. Earth Planet. Sci. Lett. 196, 83–98.
Mitchell, A.C., Brown, G.H., Fuge, R., 2001. Minor and trace element export from aglacierized Alpine headwater catchment (Haut Glacier d'Arolla, Switzerland).Hydrol. Process. 15, 3499–3524.
Nezat, C.A., Blum, J.D., Driscoll, C.T., 2010. Patterns of Ca/Sr and 87Sr/86Sr variationbefore and after a whole watershed CaSiO3 addition at the Hubbard BrookExperimental Forest, USA. Geochim. Cosmochim. Acta 74, 3129–3142.
Nienow, P.W., Sharp, M., Willis, I.C., 1996. Velocity-discharge relationships derivedfrom dye tracer experiments in glacial meltwaters: implications for subglacial flowconditions. Hydrol. Process. 10, 1411–1426.
15R.S. Hindshaw et al. / Chemical Geology xxx (2011) xxx–xxx
Please cite this article as: Hindshaw, R.S., et al., Hydrological control of stream water chemistry in a glacial catchment (Damma Glacier,Switzerland), Chem. Geol. (2011), doi:10.1016/j.chemgeo.2011.04.012
Oliva, P., Viers, J., Dupré, B., 2003. Chemical weathering in granitic environments. Chem.Geol. 202, 225–256.
Ollivier, P., Hamelin, B., Radakovitch, O., 2010. Seasonal variations of physical andchemical erosion: a three-year survey of the Rhone River, (France). Geochim.Cosmochim. Acta 74, 907–927.
Raben, P., Theakstone, W.H., 1998. Changes in ionic and oxygen isotopic composition ofthe snowpack at the glacier Austre Okstindbreen, Norway, 1995. Nord. Hydrol. 29,1–20.
Reeder, S.W., Hitchon, B., Levinson, A.A., 1972. Hydrogeochemistry of the surface watersof the Mackenzie River drainage basin, Canada — I. factors controlling inorganiccomposition. Geochim. Cosmochim. Acta 36, 825–865.
Riebe, C.S., Kirchner, J.W., Finkel, R.C., 2004. Erosional and climatic effects on long-termchemical weathering rates in granitic landscapes spanning diverse climate regimes.Earth Planet. Sci. Lett. 224, 547–562.
Schaltegger, U., 1994. Unravelling the pre-Mesozoic history of Aar and Gotthard massifs(Central Alps) by isotopic dating — a review. Schweiz. Miner. Petrog. Mitt. 74,41–51.
Schuler, T., Fischer, U.H., Gudmundsson, G.H., 2004. Diurnal variability of subglacialdrainage conditions as revealed by tracer experiments. J. Geophys. Res. 109,F02008.
Sharp, M., Tranter, M., Brown, G.H., Skidmore, M., 1995. Rates of chemical denudationand CO2 drawdown in a glacier-covered alpine catchment. Geology 23, 61–64.
Shiller, A.M., 1997. Dissolved trace elements in the Mississippi River: seasonal,interannual, and decadal variability. Geochim. Cosmochim. Acta 61, 4321–4330.
Stallard, R.F., Edmond, J.M., 1983. Geochemistry of the Amazon 2. The influence ofgeology and weathering environment on the dissolved load. J. Geophys. Res. 88,9671–9688.
Stone, D.B., Clarke, G.K.C., 1996. In situ measurements of basal water quality andpressure as an indicator of the character of subglacial drainage systems. Hydrol.Process. 10, 615–628.
Stumm, W., Morgan, J.J., 1996. Aquatic Chemistry: Chemical Equilibria and Rates inNatural Waters, 3rd ed. Wiley.
Taylor, S., Feng, X., Kirchner, J.W., Osterhuber, R., Klaue, B., Renshaw, C.E., 2001. Isotopicevolution of a seasonal snowpack and its melt. Water Resour. Res. 37, 759–769.
Thevenon, F., Anselmetti, F.S., Bernasconi, S.M., Schwikowski, M., 2009. Mineral dustand elemental black carbon records from an Alpine ice core (Colle Gnifetti glacier)over the last millennium. J. Geophys. Res. 114, D17102.
Tipper, E.T., Bickle, M.J., Galy, A., West, A.J., Pomiès, C., Chapman, H.J., 2006. The shortterm climatic sensitivity of carbonate and silicate weathering fluxes: insight fromseasonal variations in river chemistry. Geochim. Cosmochim. Acta 70, 2737–2754.
Tranter, M., 2003. Geochemical weathering in glacial and proglacial environments. In:Holland, H.D., Turekian, K.K. (Eds.), Treatise on Geochemistry. : Surface and groundwater, weathering and soils, vol. 5. Elsevier.
Tranter, M., Brown, G.H., Hodson, A.J., Gurnell, A.M., 1996. Hydrochemistry as anindicator of subglacial drainage system structure: a comparison of alpine and sub-polar environments. Hydrol. Process. 10, 541–556.
Tranter, M., Sharp, M.J., Lamb, H.R., Brown, G.H., Hubbard, B.P., Willis, I.C., 2002.Geochemical weathering at the bed of Haut Glacier d'Arolla, Switzerland — a newmodel. Hydrol. Process. 16, 959–993.
Tresch, E., 2007. Hydrochemistry of the Damma glacier forefield— temporal and spatialvariability. Master's thesis, ETH Zurich. http://e-collection.ethbib.ethz.ch/view/eth:30215.
Tsiouris, S., Vincent, C.E., Davies, T.D., Brimblecombe, P., 1985. The elution of ionsthrough field and laboratory snowpacks. Ann. Glaciol. 7, 196–201.
Unnikrishna, P.V., McDonnell, J.J., Kendall, C., 2002. Isotope variations in a Sierra Nevadasnowpack and their relation to meltwater. J. Hydrol. 260, 38–57.
VAW, 2005. Gletscherberichte (1881–2002) ‘Die Gletscher der Schweizer Alpen’,Jahrbücher der Glaziologischen Kommission der Schweizerischen Akademie derNaturwissenschaften (SANW) Versuchsanstalt für Wasserbau, Hydrologie undGlaziologie (VAW) No. 1–122. http://glaciology.ethz.ch/swiss-glaciers. ETH Zürich.
Viviroli, D., Weingartner, R., 2004. The hydrological significance of mountains: fromregional to global scale. Hydrol. Earth Syst. Sci. 8, 1016–1029.
Welp, L.R., Randerson, J.T., Finlay, J.C., Davydov, S.P., Zimova, G.M., Davydova, A.I.,Zimov, S.A., 2005. A high-resolution time series of oxygen isotopes from theKolyma River: implications for the seasonal dynamics of discharge and basin-scalewater use. Geophys. Res. Lett. 32, L14401.
West, A.J., Galy, A., Bickle, M., 2005. Tectonic and climatic controls on silicateweathering. Earth Planet. Sci. Lett. 235, 211–228.
White, A.F., Blum, A.E., 1995. Effects of climate on chemical weathering in watersheds.Geochim. Cosmochim. Acta 59, 1729–1747.
White, A.F., Blum, A.E., Bullen, T.D., Vivit, D.V., Schulz, M., Fitzpatrick, J., 1999. The effectof temperature on experimental and natural chemical weathering rates of granitoidrocks. Geochim. Cosmochim. Acta 63, 3277–3291.
Williams, M.W., Melack, J.M., 1991. Solute chemistry of snowmelt and runoff in analpine basin, Sierra Nevada. Water Resour. Res. 27, 1575–1588.
Yang, C., Telmer, K., Veizer, J., 1996. Chemical dynamics of the “St. Lawrence” riverinesystem: δDH2O, δ18OH2O, δ13CDIC, δ34Ssulfate, and dissolved 87Sr/86Sr. Geochim.Cosmochim. Acta 60, 851–866.
Yde, J.C., Knudsen, N.T., Nielsen, O.B., 2005. Glacier hydrochemistry, solute provenance,and chemical denudation at a surge-type glacier in Kuannersuit Kuussuat, DiskoIsland, West Greenland. J. Hydrol. 300, 172–187.
Zakharova, E.A., Pokrovsky, O.S., Dupré, B., Zaslavskaya, M.B., 2005. Chemical weath-ering of silicate rocks in Aldan Shield and Baikal Uplift: insights from long-termseasonal measurements of solute fluxes in rivers. Chem. Geol. 214, 223–248.
16 R.S. Hindshaw et al. / Chemical Geology xxx (2011) xxx–xxx
Please cite this article as: Hindshaw, R.S., et al., Hydrological control of stream water chemistry in a glacial catchment (Damma Glacier,Switzerland), Chem. Geol. (2011), doi:10.1016/j.chemgeo.2011.04.012