Social Mobility in 20th Century Switzerland
328
Faculté des sciences sociales et politiques (SSP) Institut des Sciences Sociales (ISS) Social mobility in 20 th Century Switzerland THÈSE DE DOCTORAT Présentée à la Faculté des sciences sociales et politique de l'Université de Lausanne pour l'obtention du grade de Docteure ès sciences sociales par Julie Falcon Directeur de thèse M. Dominique Joye, Professeur, Université de Lausanne Jury Mme Monica Budowski, Professeure, Université de Fribourg M. Paul de Graaf, Professeur, Université de Tilburg M. Daniel Oesch, Professeur, Université de Lausanne Lausanne Novembre 2013
Transcript of Social Mobility in 20th Century Switzerland
Faculté des sciences sociales et politiques (SSP)
Institut des Sciences Sociales (ISS)
Social mobility in 20th CenturySwitzerland
THÈSE DE DOCTORAT
Présentée à la
Faculté des sciences sociales et politique de l'Université de Lausanne
pour l'obtention du grade de Docteure ès sciences sociales
par
Julie Falcon
Directeur de thèse
M. Dominique Joye, Professeur, Université de Lausanne
Jury
Mme Monica Budowski, Professeure, Université de FribourgM. Paul de Graaf, Professeur, Université de Tilburg
M. Daniel Oesch, Professeur, Université de Lausanne
LausanneNovembre 2013

Summary
The study of social mobility enables us to assess the extent to which a given society is “open”.
Addressing this issue is particularly crucial in our democratic societies, where it is expected that the
place of individuals in society should no longer be determined at birth, but rather by individual
quality. The present inquiry investigates this issue in the context of Switzerland, a country
characterised by specific institutional settings, notably through the close association its educational
system shares with the labour market.
Through a detailed empirical analysis based on robust statistical analyses carried out from a unique
tailor-made dataset, I demonstrate that Swiss society has not become more open throughout the
twentieth century. Although some barriers have lost some salience, Swiss society has overall
remained extremely rigid. In particular, because it channels individuals into highly segmented
tracks very early on, the Swiss educational system does not attenuate social background differences.
Thus, Switzerland is found in a particular configuration where an individual's place in society is
highly determined not only by his or her educational attainment, but also by his or her social
background. In other words, Switzerland constitutes a sort of “non-meritocratic meritocracy”.
Résumé
L'étude de la mobilité sociale permet d'évaluer dans quelle mesure une société donnée est
« ouverte ». S'intéresser à cette question est particulièrement crucial dans nos sociétés
démocratiques, où il est attendu que la place des individus ne soit plus déterminée à la naissance,
mais plutôt par les qualités individuelles. La présente étude examine cette question dans le cadre de
la Suisse, un pays aux caractéristiques institutionnelles spécifiques, particulièrement de part le lien
étroit que son système éducatif entretien avec le marché du travail.
A travers une analyse empirique détaillée fondée sur des analyses statistiques robustes menées à
partir d'un jeu de données unique construit sur-mesure, je démontre que la société suisse n'est pas
devenue plus ouverte au cours du 20ème siècle. Même si certaines barrières ont perdu de
l'importance, dans son ensemble, la société suisse est restée extrêmement rigide. En particulier,
parce qu’il oriente très tôt les individus dans des filières fortement segmentées, le système éducatif
suisse n'atténue pas les différences entre milieux sociaux. Ainsi, la Suisse se trouve dans une
configuration particulière où, d'une part, la place d'un individu dans la société est hautement
déterminée par son niveau d'étude et, d'autre part, par son origine sociale. En d’autres termes, la
Suisse apparaît comme une sorte de « méritocratie non-méritocratique ».


“Pessimism is intellectually easy, perhaps even intellectually lazy. It often reflects a
simple extrapolation of past experience into the future”. Erik Olin Wright (2013:21)


Forewords
I have realised this PhD thesis during my five years of assistantship at the University of Lausanne.
My time in Lausanne has been one of the most enriching experiences of my life so far, therefore I
would like to seize the opportunity to thank these people who, being far or close, in Lausanne or
elsewhere, have taken part in this wonderful adventure in some respects.
First of all, this whole adventure would certainly never have happened without Julien Chevillard
who, as a former student of the Master Ingénierie de l'Enquête en Science Sociales of Lille 1
University, advertised the positions opening in Lausanne to other graduates of this Master and was
keen enough to answer my questions and send me feedback on my application. I feel very indebted
to you, Julien. Along similar lines, I would like to thank Camélia Louacheni and Katia Choppin,
who encouraged me to apply, but also Lesley Versprille and Philippa Gitlin, whom I met shortly
before I decided to apply for this PhD position in Lausanne and who have been highly inspiring
persons at that time.
I am obviously extremely grateful to Dominique Joye, my PhD supervisor, who, with colleagues
from MISC and FORS, offered me this outstanding opportunity to undertake a PhD thesis as a
graduate assistant at the University of Lausanne. After five years of intense research, the main
conclusion I can come up with without a shade of a doubt is that having Dominique Joye as a PhD
supervisor is indeed a real joy! Not only have I learnt a lot from you, Dominique, but I have really
enjoyed our meetings and discussions. In particular, I have really liked the fact that every time I had
a question, you never had a straightforward answer – the famous oui et non answer! While such an
answer at first sight could look disconcerting, I actually found it extremely stimulating in the end,
enabling me to broaden my vision of sociology and methodology.
In addition to Dominique, Daniel Oesch has been a extremely inspiring peer for the completion of
my PhD thesis. From the moment he was hired during my second year, Daniel's expertise has
proven very valuable, for me but also for the whole research team. One of Daniel's multiple
qualities indeed stems from the – usually three! – sharp and clever remarks he points out in order to
improve one's research. I have really benefited from your many more than three remarks, Daniel,
either while I presented at internal meetings, or, more importantly, for the assessment of my PhD
7

thesis.
I would similarly like to thank Monica Budowski from the University of Fribourg and Paul De
Graaf from the University of Tilburg who kindly agreed to assess my PhD thesis. The feedback you
respectively gave me during the colloque was extremely helpful and led me to improve the final
version of the manuscript of my thesis.
Besides this, I should also underline that the specific PhD-friendly research atmosphere within the
big MISC-PAVIE-LINES-LIVES family has clearly constituted one of the key ingredients for the
successful completion of this PhD thesis. I would like to thank all those who have taken part to this
dynamic throughout the realisation of my PhD, notably Matteo Antonini, Pedro Araujo, Mouna
Bakouri, Ana Barbeiro, Pierre Bataille, Isabel Baumann, Robert Baur, André Berchtold, Laura
Bernardi, Vanessa Brandalesi, Karen Brändle, Felix Bühlmann, Raul Burgos, Marlène Carvalhosa
Barbosa, Sandra Constantin, Nora Dasoki, Véronique Eicher, Guy Elcheroth, Anne Etienne,
Delphine Fagot, Nicole Fasel, Rachel Fasel, Farinaz Fassa, Alexis Gabadinho, Laura Galhano,
Jacques-Antoine Gauthier, Lavinia Gianettoni, Nadia Girardin, Francesco Giudici, Eva Green,
Dinah Gross, Doris Hanappi, Claire Johnston, Hannah Klass, Maïlys Korber, Jean-Marie Le Goff,
Frédérique Leresche, Emmanuelle Marendaz Colle, Ignacio Madero Cabib, Christian Maggiori,
Davide Morselli, Sandra Penic, Emmanuel Rousseaux, Caroline Roberts, Pierre-Alain Roch,
Florence Rossignon, Oriane Sarrasin, Manuela Schicka, Dario Spini, Matthias Studer, Zhivko
Taushanov, Nicolas Turtschi, Isabel Valarino, Anna Von Ow and Isabelle Zinn.
Moreover, I owe particular thanks to Jakob Eberhard, who has been a truly supportive friend,
Francesco Laganà, for being a fantastic colleague to work with for the seminar Stratégie de
Recherche en Sciences Sociales, Cédric Jacot from the University of Neuchâtel, for the interesting
discussions we had on social mobility, Emily Murphy, for always happily answering my questions
on English language issues, Carolina Carvalho Arruda and Gaëlle Aeby, for having been the best
office mates I could have ever dreamt of, and Stephanie Glaeser and Andrès Guarin, for just being
incredibly joyful and faithful friends.
In addition, I appreciate the FORS team whom I was always able to count on for their excellent
counsel, in particular Denise Bloch, Michèle Ernst Staehli, Eliane Ferrez, Florence Lebert, Oliver
Lipps, François Lorétan, Alexandre Pollien, Jan Rosset, Valérie-Anne Ryser, Marlène Sapin, Flurina
Schmid, Robin Tillmann, Marieke Voorpostel and Boris Wernli.
I should not forget to mention Jean-PieRRe MülleR who opened my mind to the wondeRful woRld
of R and the open source philosophy, and also the “IMAture” team: Mélanie Glasson, Thomas
8

Müller, Jorge Peña, Yannick Rochat and Arnaud Thevenet.
I also had the chance during these five years to mix with the elite – at least with the elite research
team – notably Andrea Pilotti, Steven Piguet and Stéphanie Ginalski.
But whether the elite or any researcher, we would certainly be nothing without these people who
render our life easier, the administrative staff. Specifically, Christelle Burri, Anne-Sophie Chappuis,
Annick Despont and Tatiana Lazzaro, who have earned being put under the spotlight.
One further important aspect for the completion of my PhD thesis has been the financial support I
received at several occasions, being from the Swiss National Science Foundation, the Fondation du
450ème Anniversaire, the Académie Suisse des Sciences Humaines et Sociales, and the University
of Lausanne itself. In particular, I would like to acclaim Nicky Le Feuvre for her generous funding
policy supporting graduate assistants at the Institut des Sciences Sociales. This diverse financial
support clearly contributed to the successful completion of my PhD thesis, notably by enabling me
to attend academic meetings such as conferences and summer/spring schools.
Indeed, I benefited at these occasions from feedback and discussions with my peers in my highly
technical research field. I would like in this respect to particularly thank Louis-André Vallet from
Sciences Po Paris who on many occasions was keen enough to give me some of his time to discuss
log-linear models issues, but also Ruud Luijkx from the University of Tilburg for showing me some
specific log-linear models to assess the quality of my data. Moreover, Reinhard Pollak for having
kindly invited me to come to the Social Science Research Center Berlin for my post-doc research
fellowship and also for sending me the paper he wrote with Walter Müller for the RC28 conference
in Trento – I replicated some of the models presented in this paper on my data in this PhD thesis.
And finally, John Goldthorpe from the University of Oxford for sending me his encouragement,
notably on the paper I presented at the aforementioned conference.
Last but not least, financial support also enabled me to get my whole PhD thesis proofread. I wish
to thank my friend Mario Cacciottolo for having accepted to do the work.
I should also underline that this PhD adventure has not only been self-introspective, but also a true
human adventure! The Linh family has been the most generous family I have ever met. When I
arrived in Switzerland, they opened their door to me, offered me a place to stay, and treated me like
a true family member without even knowing me. Merci Geneviève, Chinh, Sophie, Samuel et tout
particulièrement Noémie, ainsi que Victor Coval, pour votre générosité et votre joie de vivre!
I also would like to thank José Campo. I really enjoyed the weekly recreational pottery workshops,
and creating “strombolique” ceramics. Muchas gracias José!
9

Manuel Tettamanti has also been a very special person during the realisation of this PhD thesis.
Although our ways have taken us along different paths, your company has clearly been a source of
stability and fulfilment for me. Merci d'avoir été un précieux compagnon!
Finally, I would like to dedicate this PhD thesis to my family. Particularly to Florent Falcon, my
brother, Sandrine Cosset, his companion, and Stella, their adorable daughter, for their down-to-earth
attitude. J'aime beaucoup ce que vous êtes et ce que vous avez construit! But also to Noëlle Magnin,
my grand mother, for being such a role model. J'espère être aussi en forme et active quand j'aurais
ton âge! And finally to my parents, Yves Falcon and Brigitte Magnin. Merci de m'avoir toujours,
chacun à votre manière, chacun de votre coté, encouragé, fait confiance et laissé libre de faire et
d'aller où bon me semble.
Lausanne, November 2013
10

Contents
Forewords............................................................................................................................................. 7Contents.............................................................................................................................................. 11List of Figures.....................................................................................................................................15List of Tables...................................................................................................................................... 17
1 .The coming of meritocracy? Intergenerational social mobility in the Swiss social stratificationmountain............................................................................................................................................. 21
1.1 .Democracy, meritocracy and social mobility.........................................................................21 1.2 .From ladders to mountains: consequences of changes in the social stratification on socialmobility opportunities....................................................................................................................24 1.3 .The Swiss social stratification mountain as subject of enquiry............................................. 26
Part I: Research background and study design...................................................................................29
2 .How can social mobility increase (or not)? Theories of social mobility and current challenges..31 2.1 .Social mobility and the achievement of meritocracy.............................................................32
2.1.1 .The American Dream and the “from rag to riches” myths.............................................32 2.1.2 .When theory meets the American ideology: the liberal theory of industrialism............33 2.1.3 .The common confusions between social mobility, equality of opportunity, andeconomic development..............................................................................................................37
2.2 .Basically cross-national invariance in social mobility..........................................................38 2.2.1 .Methodological innovations: one small step for sociologists, one giant leap for socialmobility research.......................................................................................................................38 2.2.2 .The CASMIN project and the finding of cross-national invariance in social mobility. 41 2.2.3 .The incomplete picture of cross-national invariance in social mobility........................44
2.3 .Non-persistent inequality and new challenges.......................................................................46 2.3.1 .The complete picture of actually non-persistent inequality........................................... 46 2.3.2 .Rational Action Theory: the emerging new paradigm of social mobility research........47 2.3.3 .Non-persistent inequality or offset inequality ? Actual challenges posed by macro-structural changes......................................................................................................................53
2.4 .Macro-structural changes, social stratification and the emergence of new social inequalitydynamics........................................................................................................................................ 54
2.4.1 .The unique post-WWII economic boom context under the historical lens and the recentstrengthening of social inequalities...........................................................................................55 2.4.2 .Educational expansion, increasing educational differentiation and decreasing labourmarket rewards.......................................................................................................................... 58 2.4.3 .Tertiarisation and increasing heterogeneity in the service class....................................60 2.4.4 .Feminisation and the erosion of the male breadwinner model......................................63
3 .Social mobility in Switzerland: still a rigid society?.....................................................................69 3.1 .Stability, prosperity, attractivity: Switzerland, a European Eldorado....................................69 3.2 .The German deviation and the Swiss proximity : social mobility and vocational education72 3.3 .Feminisation in Switzerland : the persistence of high gender inequality .............................75
11
3.4 .Previous social mobility studies in Switzerland: a society as rigid as its mountains are high....................................................................................................................................................... 77 3.5 .Which social mobility dynamics should be expected in Switzerland across the twentiethcentury?..........................................................................................................................................81
3.5.1 .Hypotheses on trends in social mobility over time........................................................ 81 3.5.2 .Hypotheses on the mediating effect of education on social mobility trends..................83 3.5.3 .Hypotheses on the Swiss pattern of social mobility.......................................................85 3.5.4 .Transversal hypotheses on social mobility dynamics according to gender andcitizenship................................................................................................................................. 87
4 .A unique study design to analyse social mobility dynamics in Switzerland: methodologicalconsiderations..................................................................................................................................... 89
4.1 .Twelve surveys for a birth-cohort analysis : detail of data and population...........................90 4.1.1 .Data used : the crucial importance of progress in data collection..................................90 4.1.2 .Defining the population..................................................................................................92 4.1.3 .Sample size, distribution of the population and justification of approach.....................95
4.2 .Choice of indicators............................................................................................................. 101 4.2.1 .The ESeC class schema rather than the EGP class schema.........................................102 4.2.2 .Grusky's, Güveli's and Oesch's class scheme : introducing, discussing and choosingdisaggregated measures of social class for the analysis of social mobility.............................105 4.2.3 .The BHJM educational grid as a simplified Swiss CASMIN version.........................111
4.3 .Operationalisation of indicators........................................................................................... 113 4.3.1 .Coding the ESeC classification.................................................................................... 113 4.3.2 .Coding the Oesch classification................................................................................... 116 4.3.3 .Coding the BHJM educational grid..............................................................................117 4.3.4 .Comparing the ESeC and the Oesch class schemas.....................................................119
4.4 .The measurement of social mobility: introducing mobility tables and log-linear models. .120 4.4.1 .Absolute and relative social mobility: distinguishing the two fundamental measures ofsocial mobility.........................................................................................................................121 4.4.2 .Log-linear models: the tailor-made statistical method to model mobility tables.........123 4.4.3 .Details of log-linear models used.................................................................................126 4.4.4 .Final practical statistical considerations : discussing model selection criteria androbustness assessment............................................................................................................. 130
Part II: Empirical analysis................................................................................................................ 133
5 .From origin to destination: analysing trends in social mobility in Switzerland..........................135 5.1 .Introduction..........................................................................................................................135 5.2 .How has the Swiss class structure evolved over time according to gender?.......................136 5.3 .Did social mobility increase over time in Switzerland?...................................................... 142
5.3.1 .Absolute trends in social mobility................................................................................142 5.3.2 .Relative trends in social mobility.................................................................................147
5.4 .Discussion and conclusion...................................................................................................152
6 .When education reproduces social inequalities: explaining how education mediates constantsocial mobility in Switzerland.......................................................................................................... 157
6.1 .Introduction..........................................................................................................................157 6.2 .How has the Swiss educational system expanded over time?.............................................158 6.3 .Have educational opportunities equalised over time in Switzerland?.................................164
6.3.1 .Absolute trends in educational inequality.................................................................... 164
12

6.3.2 .Relative trends in educational inequality..................................................................... 168 6.4 .Has return to education changed over time in Switzerland?...............................................174
6.4.1 .Absolute trends in return to education......................................................................... 174 6.4.2 .Relative trends in return to education.......................................................................... 179
6.5 .Is the direct origin-destination association weaker in higher levels of education?.............183 6.6 .Does the origin-destination association remain constant when effects of education arecontrolled?................................................................................................................................... 185 6.7 .Discussion and conclusion...................................................................................................187
7 .Barriers to social mobility in Switzerland: finding the Swiss pattern of social mobility anddisaggregating the big service class in social mobility analysis.......................................................195
7.1 .Introduction..........................................................................................................................195 7.2 .Finding the pattern of social fluidity in Switzerland........................................................... 196
7.2.1 .Trends in class distribution following the “core social fluidity approach”..................196 7.2.2 .General pattern of absolute reproduction and recruitment within the equivalent “coremodel” classes.........................................................................................................................198 7.2.3 .The role of education on the pattern of class attainment.............................................200 7.2.4 .Fitting and adjusting the core model of social fluidity to Switzerland........................201
7.3 .Adjusting the pattern of social fluidity to the different fractions of the service class.........207 7.3.1 .Disaggregating the service class: trends in class distribution with the Oesch classschema.....................................................................................................................................207 7.3.2 .General pattern of absolute reproduction and recruitment within the disaggregatedservice class.............................................................................................................................209 7.3.3 .The role of education on the pattern of attainment to the different fractions of theservice class.............................................................................................................................211 7.3.4 .Fitting and adjusting the core model of social fluidity to the disaggregated service classin Switzerland..........................................................................................................................212
7.4 .Two visions of the Swiss pattern of social mobility............................................................ 216 7.5 .Discussion and conclusion...................................................................................................217
8 .Meritocracy did not come. Concluding remarks on intergenerational social mobility in the Swisssocial stratification mountain............................................................................................................223
8.1 .Too little meritocracy and social mobility in the Swiss democracy: the persistent importanceof social origin in the Swiss social stratification mountain......................................................... 223 8.2 .Switzerland, the “non-meritocratic meritocracy”: implications of our findings.................229 8.3 .Limitations and future research prospects........................................................................... 232
A.Appendix A................................................................................................................................. 237 B.Appendix B................................................................................................................................. 251 C.Appendix C................................................................................................................................. 267 D.Appendix D.................................................................................................................................279 E.Appendix E.................................................................................................................................. 291 F.Appendix F................................................................................................................................... 295
References........................................................................................................................................ 313
13

14

List of Figures
Figure 2.1: Changing relations over time among class origins, educational attainment, and classdestinations as expected under the liberal theory of industrialism.....................................................34Figure 2.2: Simplified path diagram of how destination depends on social origins and education. . 36Figure 3.1: Evolution of the share of foreign population permanently established in Switzerland.. .70Figure 4.1: Detail of the population in Switzerland with foreign background in the 2000 censusdata..................................................................................................................................................... 93Figure 4.2: Distribution of sample according to birth year................................................................ 96Figure 4.3: Boxplots of age distribution according to birth-cohorts variables...................................98Figure 4.4: Difficulty of monitoring, specificity of human asset and the EseC classes...................103Figure 4.5: The Oesch class schema................................................................................................. 111Figure 5.1: Marginal distributions of class destination by gender over birth-cohorts in percentages.......................................................................................................................................................... 137Figure 5.2: Marginal distributions of father's social position over birth-cohorts in percentages.....138Figure 5.3: Marginal distributions of class destination by social origin over birth-cohorts inpercentages....................................................................................................................................... 140Figure 5.4: Absolute social mobility for men and women aged 30–64 by birth-cohort in percentages.......................................................................................................................................................... 143Figure 5.5: Ratio between (1) Vertical mobility (TV) and Non-Vertical mobility (TNV) and (2)Upward mobility (TU) and Downward mobility (TD) for men and women according to citizenshipover birth-cohorts............................................................................................................................. 146Figure 5.6: Plots of parameters of the different Unidiff models fitted on men and women mobilitytables, divided into eight cohorts and five cohorts........................................................................... 151Figure 6.1: Trends over birth-cohorts in educational expansion by gender.....................................159Figure 6.2: Trends over birth-cohorts in educational distribution by gender...................................160Figure 6.3: Trends in gender ratio distribution by level of education (measured in odds-ratio). ....161Figure 6.4: Trends over birth-cohorts in educational expansion by social origin............................165Figure 6.5: Trends over birth-cohorts in educational distribution by social origin..........................166Figure 6.6: Plots of parameters of the different Unidiff models fitted on men and womeneducational mobility tables, divided into eight cohorts and five cohorts......................................... 173Figure 6.7: Trends over birth-cohorts in educational expansion by social class destination............175Figure 6.8: Trends over birth-cohorts in educational distribution by social class destination.........177Figure 6.9: Plots of parameters of the different Unidiff models fitted on men and women return toeducation tables, divided into eight cohorts and five cohorts...........................................................182Figure 6.10: Plots of parameters of the Unidiff models fitted on men and women to test thecompositional effect hypothesis (OD according to E) on all the population and only Swiss citizens........................................................................................................................................................... 185Figure 6.11: Unidiff parameters of the origin-destination association for models controlling effectsof education fitted on men and women mobility tables, divided into five cohorts..........................186Figure 6.12: Ratio between share of salariat class destination and share of tertiary-educated overbirth-cohort in Switzerland...............................................................................................................190Figure 7.1: Marginal distributions of class origin (father) and class destination by gender over birth-cohorts in percentages following the core social fluidity approach.................................................197Figure 7.2: Marginal distributions of class origin (father) and class destination by gender over birth-
15

cohorts in percentages with the Oesch classes................................................................................. 208Figure B.1: Unidiff parameters for survey/period effect on ED for men and women......................254Figure B.2: Unidiff parameters for survey/period effect on OD and OE for women.......................255Figure B.3: Unidiff parameters for birth cohorts for each set of association with different controls.......................................................................................................................................................... 263Figure C.1: Marginal distributions of class destination by gender over birth-cohorts in percentagesfor Swiss citizens only......................................................................................................................268Figure C.2: Marginal distributions of class destination by gender over birth-cohorts in percentagesfor foreign residents only..................................................................................................................269Figure C.3: Marginal distributions of father's social position over birth-cohorts in percentages forSwiss citizens only........................................................................................................................... 270Figure C.4: Marginal distributions of father's social position over birth-cohorts in percentages forforeign residents only....................................................................................................................... 271Figure C.5: Marginal distributions of class destination by social origin over birth-cohorts inpercentages for Swiss citizens only.................................................................................................. 272Figure C.6: Marginal distributions of class destination by social origin over birth-cohorts inpercentages for foreign residents only..............................................................................................273Figure C.7: Absolute social mobility for men and women aged 30–64 by birth-cohort in percentagesfor Swiss citizens only......................................................................................................................274Figure C.8: Absolute social mobility for men and women aged 30–64 by birth-cohort in percentagesfor foreign residents only..................................................................................................................275Figure C.9: Plots of parameters of the different Unidiff models fitted on men and women mobilitytables, divided into eight cohorts and five cohorts, on the total population and only on Swisscitizens.............................................................................................................................................. 276Figure D.1: Trends over birth-cohorts in educational distribution by gender and citizenship.........280Figure D.2: Trends over birth-cohorts in educational distribution by social origin and by citizenship.......................................................................................................................................................... 281Figure D.3: Plots of parameters of the different Unidiff models fitted on men and womeneducational mobility tables, divided into eight cohorts and five cohorts, on the total population andonly on Swiss citizens...................................................................................................................... 282Figure D.4: Trends over birth-cohorts in educational distribution by social class destination and bycitizenship.........................................................................................................................................284Figure D.5: Plots of parameters of the different Unidiff models fitted on men and women return toeducation tables, divided into eight cohorts and five cohorts on the total population and only onSwiss citizens....................................................................................................................................287
16

List of Tables
Table 3.1: Parameters of models of core social fluidity for industrial nations and Germany fromErikson and Goldthorpe (1992b) and Switzerland from Jacot (2013)................................................80Table 4.1: List of surveys used in this research..................................................................................91Table 4.2: Sample detail: surveys by 8 birth-cohort...........................................................................99Table 4.3: Sample detail: surveys by 5 birth-cohort.........................................................................100Table 4.4: The ESeC and EGP class schemas compared..................................................................102Table 4.5: Comparison of the BHJM and the CASMIN educational grids......................................112Table 4.6: Collapsability of the EseC class schema......................................................................... 115Table 4.7: Collapsability of the Oesch class schema........................................................................ 117Table 4.8: Conversion between the MOSAiCH 2007 and the BHJM educational grids..................118Table 4.9: EGP, ESeC and Oesch class schemas correspondence grid applied to fit the core model ofsocial fluidity.................................................................................................................................... 120Table 4.10: Example of possible combinations of log-linear models on a three-way contingencytable.................................................................................................................................................. 127Table 5.1: Comparison between Switzerland and Europe of average absolute mobility for men andwomen, controlling for classification effects with the Swiss Household Panel 1999 data..............144Table 5.2: Results of fitting the log-linear models to men's mobility tables according to their father'ssocial position, divided into eight cohorts and five cohorts............................................................. 148Table 5.3: Results of fitting the log-linear models to women mobility tables according to theirfather's social position, divided into eight cohorts and five cohorts.................................................149Table 6.1: Results of fitting the log-linear models to men educational mobility tables according totheir father's social position, divided into eight cohorts and five cohorts (men aged 30–64 ).........170Table 6.2: Results of fitting the log-linear models to women educational mobility tables accordingto their father's social position, divided into eight cohorts and five cohorts (women aged 30–64 ) 171Table 6.3: Results of fitting the log-linear models to men return to education tables, divided intoeight cohorts and five cohorts (men aged 30–64).............................................................................180Table 6.4: Results of fitting the log-linear models to women return to education tables, divided intoeight cohorts and five cohorts (women aged 30–64)........................................................................181Table 6.5: Results of fitting the log-linear models to test the compositional effect hypothesis onmen's mobility table (men aged 30–64 )...........................................................................................184Table 6.6: Results of fitting the log-linear models to test the compositional effect hypothesis onwomen's mobility table (women aged 30–64 ).................................................................................184Table 7.1: Distribution of outflow and inflow percentages between class of origin and classdestination by gender following the equivalent core social fluidity classes.....................................199Table 7.2: Distribution of outflow and inflow percentages between educational attainment and classdestination by gender following the equivalent core social fluidity classes.....................................201Table 7.3: Results of fitting the core log-linear model of social fluidity and some adjustments tomen's mobility tables according to their father's social position, controlling for birth-cohorts (menaged 30–64, ESeC class schema)..................................................................................................... 203Table 7.4: Results of fitting the core log-linear model of social fluidity and some adjustments towomen's mobility tables according to their father's social position, controlling for birth-cohorts(women aged 30–64, ESeC class schema)....................................................................................... 205Table 7.5: Distribution of outflow and inflow percentages between class of origin and class
17
destination by gender with Oesch classes.........................................................................................210Table 7.6: Distribution of outflow and inflow percentages between educational attainment and classdestination by gender with Oesch classes.........................................................................................212Table 7.7: Results of fitting the core log-linear model of social fluidity and some adjustments tomen's mobility tables according to their father's social position, controlling for birth-cohorts (menaged 30–64, Oesch class schema).....................................................................................................214Table 7.8: Results of fitting the core log-linear model of social fluidity and some adjustments tomen's mobility tables according to their father's social position, controlling for birth-cohorts(women aged 30–64, Oesch class schema)...................................................................................... 215Table 7.9: Men's mobility pattern according to the final model of core social fluidity for each ESeCand Oesch class schema....................................................................................................................218Table 7.10: Women's mobility pattern according to the final model of core social fluidity for eachESeC and Oesch class schema..........................................................................................................218Table A.1: Detail of data production and quality for each survey used............................................238Table A.2: Sample detail: surveys by 8 birth-cohort, complete cases only (OED)..........................239Table A.3: Sample detail: surveys by 5 birth-cohort, complete cases only (OED)..........................240Table A.4: Detail of information available within each survey for the coding of respondent's fathersocial position................................................................................................................................... 241Table A.5: Detail of information available within each survey for the coding of respondent's socialposition............................................................................................................................................. 242Table A.6: Distribution of the father's social position measured with the ESeC class schemaaccording to surveys......................................................................................................................... 243Table A.7: Distribution of the respondent's social position measured with the ESeC class schemaaccording to surveys......................................................................................................................... 244Table A.8: Distribution of the father's social position measured with the Oesch class schemaaccording to surveys......................................................................................................................... 245Table A.9: Distribution of the respondent's social position measured with the Oesch class schemaaccording to surveys......................................................................................................................... 246Table A.10: Detail of information available within each survey for the coding of respondent'seducation...........................................................................................................................................247Table A.11: Distribution of the respondent's education measured with the BHJM grid according tosurveys.............................................................................................................................................. 249Table A.12: Cross-tabulation of ESeC and Oesch class schemas.....................................................250Table B.1: Summary of our substantive conclusions....................................................................... 253Table B.2: Log-linear models tested on the SCAOD table to assess whether OD display age and/orsurvey/period effect, fitted on men and women mobility tables......................................................260Table B.3: Log-linear models tested on the SCAOE table to assess whether OE display age and/orsurvey/period effect, fitted on men and women mobility tables......................................................261Table B.4: Log-linear models tested on the SCAED table to assess whether ED display age and/orsurvey/period effect, fitted on men and women mobility tables......................................................262Table B.5: Test of homogeneity within cohorts with the ESeC class schema.................................. 264Table B.6: Test of homogeneity within cohorts with the Oesch class schema.................................265Table B.7: Goodness of fit of model of constant association across surveys within birth cohorts fortables constructed with the ESeC class schema................................................................................266Table B.8: Goodness of fit of model of constant association across surveys within birth cohorts fortables constructed with the Oesch class schema...............................................................................266Table C.1: Parameters detail of best log-linear models fitted expressed in exp beta scale. ............277Table D.1: Parameters detail of best log-linear models fitted for the educational mobility tablesexpressed in exp beta scale. .............................................................................................................283Table D.2: Results of fitting the log-linear models to men return to education tables, divided into
18

eight cohorts and five cohorts (men aged 30–64 ), excluding self-employed and small employers(i.e. ESeC = 4).................................................................................................................................. 285Table D.3: Results of fitting the log-linear models to women return to education tables, divided intoeight cohorts and five cohorts (women aged 30–64 ), excluding self-employed and small employers(i.e. ESeC = 4).................................................................................................................................. 286Table D.4: Parameters detail of best log-linear models fitted for the return to education tablesexpressed in exp beta scale. .............................................................................................................288Table D.5: Log-linear models tested on the COED table, fitted on men and women mobility tables........................................................................................................................................................... 289Table F.1: Recap of all effects tested for each models of Tables 7.3 and 7.4...................................296Table F.2: Recap of all effects tested for each models of Tables 7.7 and 7.8...................................296Table F.3: Detail and meaning of effects for models fitted on tables 7.3 and 7.4............................297Table F.4: Detail and meaning of effects for models fitted on tables 7.7 and 7.8............................299Table F.5: Matrices of topological log-linear models.......................................................................300
19

La vie est belle, le destin s´en écarte. Life is beautiful, destiny moves away from it.Personne ne joue avec les mêmes cartes. No one plays with the same cards.Le berceau lève le voile, The cradle lift the veil,multiples sont les routes qu´il dévoile. multiples are the roads it unveils.Tant pis, on n'est pas nés sous la même étoile. Too bad, we weren't born under the same star.IAM, Nés sous la même étoile.
20
1 . The coming of meritocracy? Intergenerationalsocial mobility in the Swiss social stratificationmountain
1.1 . Democracy, meritocracy and social mobilityFor centuries, individuals' place in society was determined at birth and quasi-impossible to reverse.
Those born sous une bonne étoile1 enjoyed a life of wealth and privilege whereas the others – the
vast majority – experienced a life of hard work and deprivation. Children of nobles became noble,
children of peasants remained peasants. This is basically how the social stratification was defined: a
minority of “blessed” on the one side and a majority of “damned” on the other. However, with the
burgeoning of the Lumières2, this feudal hierarchical order tottered.
The eighteenth century indeed marked a turning point in humanity's history. The emergence of
intellectual thought based on rationality and knowledge, as opposed to tradition and religion,
provided justification to overthrow this old hierarchical order. This transformation began following
the American Revolutionary War and the French Revolution, notably through the formalisation of
the very first founding texts defining human rights as a core universalistic principle: the United
States Declaration of Independence and the Declaration of the Rights of Man and of the Citizen.
This was translated by the settlement of democracy as a political regime. Since then, democracy has
become the leading governance model in the world.
Democracy, by stating that each citizen is eligible for political representation and has the right to
participate to the political life, implies that “all human beings are born free and equal in dignity and
rights”, as it was put by the Universal Declaration of Human Rights adopted in 1948 by the United
Nations. Principles of liberty and equality indeed form the cornerstone of democracy. Under
democracy, individuals' destinies no longer depend on a bonne fée's3 mood but rather the ability an
individual has to take control of his or her life. Because in democracy, everyone is given such
ability, including the unconditional access to education, everyone has a chance to succeed in life.
From this standpoint, it is commonly believed that with the emergence of democracy, the impact of
social origin on a person's social position gradually erases in favour of achieved characteristics such
1 Understand: Under a good star2 Understand: Enlightenment3 Understand: good fairy
21

as education, and intergenerational social mobility4 as well as equality of opportunity increase,
leading to the coming of meritocracy.
In a meritocracy, it is expected that one's social position does not depend on social background but
results from a fair competition based on the sole criteria of talent and merit. What counts and is
rewarded is achievement, not longer ascription, as was the case in feudal times. As a result, since
each individual is offered equal opportunity to demonstrate his or her talent and succeed in society,
meritocracy defines (1) that individuals are only responsible for their own destiny and worth,
occupying the place they hold in the social stratification, whether it be an elite position or an under-
class position, and (2) that social mobility chances are high, being upwardly or downwardly. Thus,
with this rationale, social mobility constitutes a straightforward indicator of equality of opportunity.
Indeed, “it is widely held that if there were greater equality of opportunity there would be more
social mobility and, conversely, that more social mobility indicates greater equality of opportunity”
(Breen 2010b:414). However, this vision is misleading insofar as these are fundamentally two
different concepts: equality of opportunity is first and foremost an ideological concept, whereas
social mobility describes a very concrete situation.
The metaphor of the lottery adjusts quite well to the idea of equality of opportunity: in a lottery each
participant receives the identical probability of winning. In the same vein, according to meritocratic
statements, each individual in a democratic society gets the same chance in life to succeed and
potentially reach the most prestigious occupations of the social hierarchy. Equality of opportunity in
this sense combines two fundamental tenets of democracy which are liberty and equality that are
crucial for a functioning democracy. Therefore, the concept of equality of opportunity defines avant
toute chose5 a model of social justice. It provides grounds with respect to what is fair and what is
unfair. While a person succeeding for ascribed reasons – for instance, because of his or her social
background, gender and/or national origin – would be considered unfair and would not fit with
democratic tenets, a person who reached a high social position owing only to achieved
characteristics – such as talent and merit – would. Achievement is not only legitimate and
rewarding, but desirable.
However, as a matter of fact, equality of opportunity is not a natural reality: some people are born
into rich families and other into poor ones; some grow up during periods of deprivation and war,
while others come of age during economic prosperity. As a consequence, it is democracy's
responsibility to ensure that opportunities are as equally distributed as democratic requirements
4 From here onwards the term “social mobility” will be referring to intergenerational social mobility if not otherwisespecified.
5 Understand : before everything
22
demand. The implementation of diverse policies promoting equality of opportunity undoubtedly
serve to achieve this. However, as there exists no magical potion to fulfil these requirements, the
implementation of equality of opportunity can take different forms over time and place.
For instance, as it is usually assumed that the educational system serves to make equality of
opportunity an operative institution,Western societies implemented reforms of their educational
systems during the post-WWII years in the form of educational expansion. The rationale for this
endeavour at that time was primarily to invest in human capital to identify talents that were needed
to enhance the economic development characteristic of this period. The main concern was to not
waste talents that would have certainly been lost if access to education had not been expanded, and
correspondingly, which would have constituted a loss for society (Kahn 2011). In other words,
equality of opportunity at that time was considered a democratisation of selection – everyone
should have the same chances to be selected to reach elite positions. Nonetheless, since the
emergence of economic crises, equality of opportunity has been conceived as a democratisation of
success – everybody should have an equal chance to earn a degree and enjoy the corresponding
professional integration (Kahn 2011). Thus, the concept of equality of opportunity and the way it is
envisaged is highly dependent on the economic, social, political and historical context in which a
society is embedded. Clearly, it reflects societies' orientations and what they perceive as unequal
opportunities, which in turn political intervention can transform into more equally distributed
opportunities. In this sense, social mobility can only be seen as one measure of equality of
opportunity, that based on social background.
Social mobility, in fact, describes a very precise situation: that of a change in a person's social
position. This change can be observed either intergenerationally, meaning compared to family
background, or intragenerationally, meaning over a person's life course. The former is usually
thought of as a measure of equality of opportunity. Even theoretical developments on
intergenerational social mobility testify to the close link the two concepts entertain together. The
liberal theory of industrialism maintains that social mobility in industrial societies will increase and
therefore logically result in more meritocracy. Our research will nevertheless demonstrate that even
when expectations of this theory are met, no greater meritocracy can be uncovered.
To demonstrate this, we will concentrate the present research on the study of intergenerational
social mobility. Specifically, we will investigate how social background and education condition
individuals' life chances – Lebenschancen (Weber 1978) – and their social mobility opportunities.
We will particularly pay attention to the influence of the recent macro-structural changes that should
have led to greater social mobility opportunities, and in turn, the coming of meritocracy. In fact,
23

throughout the twentieth century, in Switzerland as in other Western countries, the educational
structure changed significantly as a consequence of educational expansion, as well as the
occupational structure with the coming of industrial and post-industrial societies (Oesch 2006b,
2013).
1.2 . From ladders to mountains: consequences of changes inthe social stratification on social mobility opportunities
Over the past century, Western societies have witnessed considerable macro-structural changes.
Opportunities to reach a higher educational level have increased globally, as have opportunities to
reach the highest fractions of the structure of occupations. As a consequence, some scholars,
notably post-modern ones (Beck 1992), argued that social class inequalities were no longer relevant
and that social classes were dead. In fact, since a growing share of the population continues to attain
higher class fractions, no more ascribed obstacle seems to hinder such progression. As a
consequence, post-modern theorists state that inequalities have become individualised, essentially
stemming from differences in achievement, and that our societies have become fluid and open –
classless societies, so to speak. These statements would seem to find some support from recent
empirical research that concluded that educational inequality decreased (Breen et al. 2009, 2010)
and that social fluidity increased (Breen and Luijkx 2004a). Conclusions of these empirical studies
are, however, more subtle and should be understood in light of the historical, economic and societal
context in which they took place. Therefore, what we would like to underline here is that the
expectations of post-modern theorists are quite simplistic. Their vision is misleading insofar as they
interpret the social structure from a unidimensional stance, as common thinking usually implies.
In everyday language, we often use the expression to climb the social ladder as a metaphor of
intergenerational social mobility. However, this metaphor is often found problematic, since it
imposes several theoretically dubious assumptions. First, viewing the social structure as a ladder
implies that the social structure is ordered on a sole unidimensional hierarchical axe according to
attributes such as education and income. This vision is mistaken, as it completely ignores potential
conflicts that different groups might have. In fact, with a ladder, the distance between each rung is
exactly the same, while in reality some groups of occupations are close to each other, others further.
A second problem of the ladder is that it implies that there is only one way to climb (being up or
down). Thirdly, it imposes a fixed vision of the social stratification. The ladder does not account for
social changes in the hierarchical structure.
That being said, consequential social changes happened over a rather short period of time in
24

Western societies. First, educational expansion considerably transformed educational opportunities
for all. Second, the feminisation process enabled women to gain access to education and the labour
market, areas from which they used to be excluded. Third, the tertiarisation of the labour force
resulted in a growing share of the population reaching higher rank social positions. As a
consequence, it has been argued that social class inequality transformed, and even in some respects
increased, rather than totally disappeared, as post-modern theorists argue. We indeed agree that
there has been a form of a “new deal” in the distribution of inequality, resulting from the
transformation of the social stratification. While old hierarchies faded away, new ones emerged,
implying that old forms of inequality disappeared, while new ones are being uncovered. This is an
extremely important point, since this argumentation provides a completely different interpretation to
the observation that many people were able to reach the highest social class fractions. It might be
the case, for instance, that new division lines are currently emerging in the highest social class, as
recent research suggests (see Güveli, Luijkx, and Ganzeboom 2012; Güveli 2006), implying that
new cleavages are appearing within some social classes. The same point could be made in regard to
educational attainment: when more and more people attain a higher educational level, it might be
the case that differentiation criteria between different tracks within the same educational level could
arise (see Ichou and Vallet 2011).
Therefore, to correctly understand what these social changes imply for social mobility
opportunities, a new metaphor can be put forward: instead of comparing the social mobility process
to the climb of a ladder, we would prefer to envisage it in terms of a mountain climbing. Mountains
indeed display interesting features that are of importance for the understanding of the social
stratification. First, mountains have the advantage of being irregular and multidimensional. In the
climbing of a mountain, there are usually several stages located at different distances and altitudes
from each other. Sometimes barriers arise that make the climbing more difficult. In this sense, the
mountain metaphor adjusts well to the theoretical vision of social classes. Second, infrastructures
such as the development of a path, the construction of a cable car, or of railway line can be
developed to facilitated the climbing of the mountain. Third, the mountain metaphor resolves the
old criticism raised by Marxist sociologists about the term stratification. Stratification, similarly to
ladders, was seen as anti-Marxist “since it places emphasis on the vertical ranking of classes rather
than the exploitative relations between them” (Grusky and Ku 2008:26 see note 1). In fact, on the
same mountain, you can find different villages and environments that offer different opportunities,
even on the same level: for instance, more sun on one side of the mountain and more green grass on
the other side. In other words, the mountain metaphor displays the advantage of emphasising the
25

multidimensionality of the social stratification by allowing us to acknowledge its vertical and
horizontal dimensions. Indeed, within the same hierarchical level, different groups can have access
to different resources. To arbitrate which dimension is the most salient, one can observe the shape of
the mountain: the larger the mountain is, the more horizontal differentiation exists; the thinner it is,
more vertical distinctions can be assessed. Last but not least, mountains have the ability to change
with the passage of time. They can rise as a consequence of the succession of earthquakes; they can
erode with the force of the atmospheric conditions and landslides. This is one of the main strengths
of the mountain metaphor: not only do mountains take different shapes, but they can turn into new
ones. Their shape does indeed evolve – slowly but surely – depicting new dynamics. Of course,
most of the time, it takes thousands of years for mountains to change, but this metaphor still
provides interesting insights for the understanding of social change, since social change is also a
long process6.
Altogether, we can envisage macro-structural changes that modified the structure of opportunities in
our Western societies since the last century, similarly to erosion and earthquakes. In fact, the
tertiarisation process resulted in some erosion of the former industrial mountain, implying that the
mountain has become larger at its top. With educational expansion, the climbing path has been
enlarged and new infrastructures have been constructed so that an increasing share of the people can
get a chance to reach the peak. Finally, with the feminisation process, an increasing share of women
are allowed to climb the mountain. Thus, more opportunities to climb the mountain exist today.
However, it could be the case that different climbing paths actually lead to different outcomes.
From this standpoint, we can wonder whether the ascension of the social stratification mountain in
Switzerland has become more common. In other words, have social mobility opportunities
increased? Subsequently, did increasing meritocracy and equality of opportunity arise? Switzerland
is indeed an interesting case to study. With its specific institutional features, it might add new
insights to the comparative study of social mobility.
1.3 . The Swiss social stratification mountain as subject ofenquiry
Switzerland is a little Eldorado in the middle of Europe. Extremely stable, this country has built one
of the most prosperous economies in the world and has been only marginally affected by the recent
economic crises. The massive demand for a foreign labour force constitutes one indicator of the
continuous prosperity of the Swiss economy, since today more than 20% of the population comes
6 When sudden changes do occasionally happen such as revolutions or economic crisis, they could be referred to asearthquakes, avalanches or volcanic eruptions.
26
from a foreign country. Only Luxembourg displays a larger share of foreign population in Europe.
Additionally, Switzerland, like Germany, is a country with an important vocational education
tradition. It has been often claimed that this specific type of educational system shapes social
mobility chances differently, since Germany has often been pointed out as a rather special case in
this respect when compared to other European countries. Switzerland, from this standpoint, will
prove to be an interesting case to study. Significant similarities between these two countries in
regard to their social mobility regime could indeed be expected.
A further characteristic of the Swiss social stratification mountain pertains to the persistence of
considerable gender inequality. Switzerland indeed remains a rather traditional country in several
respects. Therefore, in Switzerland, significant social mobility opportunities differences should exist
according to gender, despite the feminisation process.
Altogether, all these Swiss specific institutional settings should be of relevant importance for the
comparative study of social mobility. However, social mobility research in Switzerland remains
scarce and, to some extent, outdated. In fact, the Swiss social mobility regime has only been
marginally investigated. Furthermore, no studies systematically addressed issues of social change,
gender differences and the influence of the foreign population on social mobility opportunities in
this country. We thus hope to fill a considerable gap, not only from a comparative perspective, but
also at the national level.
Our contribution to this field of research is thus threefold: (1) we aim to address how recent changes
in the social stratification impacted on the structure of opportunities; (2) we wish to thoroughly
examine social mobility dynamics in Switzerland, being in terms of trends or pattern; (3) we intend
to systematically analyse gender differences on these issues and also assess how social mobility
opportunities differ between the Swiss citizen population and the foreign population living in
Switzerland.
In Chapter 2, we will introduce research on social mobility and how the issue of macro-structural
changes might impact the dynamics of social inequality, and in turn, social mobility opportunities.
We will argue that changes documented by recent research stating that inequalities are non-
persistent do not necessarily imply that social inequalities considerably weakened. In contrast, we
will maintain that inequalities may have taken new forms and adapted to the new social
stratification order as a consequence of macro-structural changes including educational expansion,
tertiarisation and feminisation. Next, we will introduce the Swiss context more thoroughly in
Chapter 3. The unique situation of Switzerland in Europe, having never been affected by World
27

Wars within its borders, unlike its neighbours, and having enjoyed high levels of economic
prosperity, therefore attracting foreign workers, makes it a interesting case to study. Furthermore,
Switzerland displays quite significant institutional affinities with Germany, most notably through its
dual educational system. Finally, investigating social mobility in Switzerland will also provide to be
instructional with respect to gender differences, as it remains a highly gender-traditional country.
In Chapter 4, we will discuss our methodological design. With the construction of a unique dataset
based on twelve surveys collected between 1975 and 2009 and divided into birth-cohorts, we will
be able to capture temporal change in intergenerational social mobility. We will discuss the choice
and construction of our indicators, then assess the quality of our data. With the use of robust
methodological tools, we will be able to thoroughly analyse dynamics in the intergenerational social
mobility process in the Swiss Confederation, something we will do in our empirical chapters.
Our empirical analysis is distributed into three chapters: we will first address how the direct effect
of social origin on social destination changed over time. In other words, we will show to what
extent intergenerational social mobility increased over time in Switzerland, both in absolute and
relative terms. Next, we will analyse the extent to which education mediates social mobility in
Switzerland. This will consist of analysing the extent to which educational inequalities decreased
and return to education increased and whether this has in turn generated more meritocracy and
equality of opportunity. Our last empirical analysis will be concerned with the shape of the social
mobility pattern in Switzerland. We will fit a model to our Swiss data that depicts the social
mobility pattern of industrial countries to see how this model describes the Swiss social mobility
pattern, and we will propose some adaptations. We will furthermore address the issue of whether
heterogeneous social mobility dynamics can be observed in some specific class fractions of the
service class. Finally, in Chapter 8, we will underline the main conclusions of our research and what
they imply. We will explain why we find that meritocracy did not increase in Switzerland despite
consequential changes to the social stratification mountain.
28

Part I:
Research background and study design
29

30
2 . How can social mobility increase (or not)?Theories of social mobility and current challenges
The core research question with which social mobility scholars have been fascinated by concerns to
which extent social mobility can increase. This question has given rise to much empirical analysis,
since this field of research has been one of the most – if not the most – prolific and active of all
sociological areas. Very technical, these empirical analysis have been particularly concerned with
measurement issues. As we will underline, measuring social mobility is far from straightforward, as
it can be measured in two ways. First, in absolute terms. In this case, the absolute measure of social
mobility refers to observed mobility. Second, in relative terms, a measure which provides an
indication of the extent of openness in a society. Also often called social fluidity, this latter measure
has attracted much attention in empirical assessments of social mobility. Yet in spite of these
empirical analyses, the question of increasing social mobility still remains highly debated today. on
the one hand, some scholars argue that social mobility remained quite constant and that small
variations observed should be interpreted as trendless fluctuations. On the other hand, recent
research suggests that it increased and that inequalities are non-persistent.
This fascination with the empirical assessment of trends in social mobility in turn has often been
criticised for hindering theoretical developments on social mobility. In fact, besides the liberal
theory of industrialism, theoretical contributions to the field have been rather scarce and usually
extrapolated from empirical observations without paying much attention to the actual mechanism in
progress. However, since the new millennium, new prospects in social mobility theory have arisen
under the common framework of rational action theory. While these developments were first of all
designed to explain the persistence of inequality, more recent attempts have been made to actually
account for these latest empirical assessments demonstrating changes in social mobility dynamics.
In this chapter, we propose to present a general state of the evolution of empirical reflections
concerning social mobility research and to discuss recent findings of non-persistent inequality in
light of important macro-structural changes that Western societies went through since the last
century. This outline of the research context will in turn enable us to highlight the Swiss specificity
as compared to international research in the next chapter.
31

2.1 . Social mobility and the achievement of meritocracyWhile the development of empirical research on social mobility started to emerge in the post-WWII
years in the American context, the concept of social mobility is actually rooted in the nineteenth
century. Social mobility was then envisaged as a way to serve the democratic ideology. Through the
promotion of an ideology of equality of opportunity, it was expected that democratic societies
would logically exhibit the rise of meritocracy. This ideology has been significant in the United
States, since at the time of the first sociological developments in the field, the belief in the
American dream, personified through the self-made man character, influenced early theoretical
developments regarding social mobility. According to some scholars, social mobility was the key
instrument to achieving meritocracy in modern societies characterised with industrial and economic
development. Yet while the association between social mobility, meritocracy, and economic growth
can look rather straightforward from the outside, such claims actually look overly simplistic and
optimistic, very much in line with the American ideology.
2.1.1 . The American Dream and the “from rag to riches” mythsAs underlined by Cuin (1993), the concept of social mobility emerged during the nineteenth century
in the context of the United States of America, then the utmost example of modern democracy
(Tocqueville 1850). At that time, social mobility was perceived as an ideological instrument to fulfil
democratic ideals of liberty and equality. In fact, social mobility became a common sense belief that
anyone could achieve, through the elaboration of an American Dream ideology, notably diffused
under the form of from rags to riches myths by authors such as Horatio Alger (see Wohl 1953, cited
in Cuin 1993:42).
The emergence of this formative belief relied on three fundamental notions, namely those of a
classless society, equality of opportunity, and social achievement (Cuin 1993). The concept of a
classless society constitutes the first condition to believe in social mobility. It assumes that society
is open and that individuals can circulate freely within the social structure without facing barriers.
In other words, in the American ideology, no structural determinism can retain individuals in
pursuing their goal; individuals are all equal. While the concept of a classless society defines the
freedom of movement within the society, the equality of opportunity can be seen as an instrument to
legitimise existing inequalities within the social structure. The rationale is the following: as there
exists no structural barrier to hinder individuals to fulfil their goals, individuals have all the same
chances to succeed in life. Finally, the concept of social achievement is the consequence of both
previous notions. Individuals owe their social achievement only to their own talents. From this
32
liberal stance, every individual is seen responsible for their own social condition and social mobility
is perceived as a “natural” phenomenon.
This supposed “natural” character of social mobility was not questioned until the middle of the
twentieth century, as social mobility had hardly ever been a subject of enquiry by social scientists
before – though Sorokin's (1927) pioneering work in the 1920s, which will be presented later on, is
a notable exception. Yet the very first studies undertaken of social mobility in the United States of
America were still permeated with the American ideology. These studies had the ambition to
demonstrate the cultural exceptionalism of the United States, a country which was expected to have
particularly high levels of social mobility. This culturalist intuition was especially guided by
expectations that “the absence of an inherited aristocracy in the American history” (Hout and
DiPrete 2006:4), “the rejection of deference in interpersonal relations, the generalization of
ambition, and the pervasive influence of the American Dream of material success” (Erikson and
Goldthorpe 1992b:14) would generate higher levels of social mobility in this country as compared
to older European nations.
Such claims provided some theoretical foundations to the liberal theory of industrialism. Integrated
with the influential Functionalism paradigm of the post-WWII years, this theory contended that
meritocracy and social mobility would increase logically with the development of industrial
societies. While we will point out that this theoretical approach accounts a certain number of
weaknesses, we should not undermine the fact that the liberal theory of industrialism still
constitutes one of the most serious theoretical formulations about social mobility carried out
hitherto, as it provides quite systematic insights in regard to the mechanism in place.
2.1.2 . When theory meets the American ideology: the liberaltheory of industrialism
Developed in the 1960s, the liberal theory of industrialism – also known as the industrialisation
thesis – contends that industrial societies, compared to pre-industrial ones, would be characterised
by increasing social mobility rates and equality of opportunity (Blau and Duncan 1967; Kerr et al.
1960; Parsons 1960; Treiman 1970). Directly inspired by Functionalism, this theoretical approach
states that in industrial societies, (1) rates of social mobility will be higher and upward mobility will
predominate over downward mobility, and that (2) individuals will compete on a more equal basis
to attain a particular social position, resulting in an increase in the equality of opportunity and in the
achievement of meritocracy.
From this standpoint, achieved characteristics are expected to succeed to ascriptive ones in the
33

attainment process. Working-class children have equal chances to reach an upper-class social
position as upper-class children, if the former prove to be as talented and as deserving as the latter.
Indeed, while with the development of industrialism, allocation into the social structure increasingly
operates on the basis of individual talent and effort, regardless of ascriptive characteristics such as
social origin, sex, race, or national origin, it is implied that individuals own their social position
owing only to personal merit and talent (or non-merit/non-talent). In other words, under this
perspective, inequality essentially stems from differences in merit and talent between individuals
(Bihr and Pfefferkorn 2008:19).
Proponents of the liberal theory of industrialism formally explained how achievement would
dominate over ascription by introducing the notion of the OED triangle. This triangle, as
represented in Figure 2.1, depicts how the relationship between social origin (O), educational
attainment (E) and class destination (D) is expected to change in industrial societies. With the
coming of industrialism, the association between social origin and educational attainment as well as
that between social origin and class destination weakens. Conversely, the association between
educational attainment and class destination strengthens. In other words, under industrialism, the
individual's social position increasingly depends only on the individual's talent and “the chances of
'success' are steadily improved for all.” (Erikson and Goldthorpe 1992b:6).
The mechanisms through which increased social mobility occur are threefold. First, the increase in
social mobility rates and equality of opportunity are driven by changes in the social structure. In
fact, the rapid change in the structure of the social division of labour generates increasingly
differentiated occupations. Further, the shifts from the agriculture sector to the manufacturing sector
34
Figure 2.1: Changing relations over time among class origins, educational attainment, and classdestinations as expected under the liberal theory of industrialismNote: Figure replicated from Godthorpe (2007b:159).
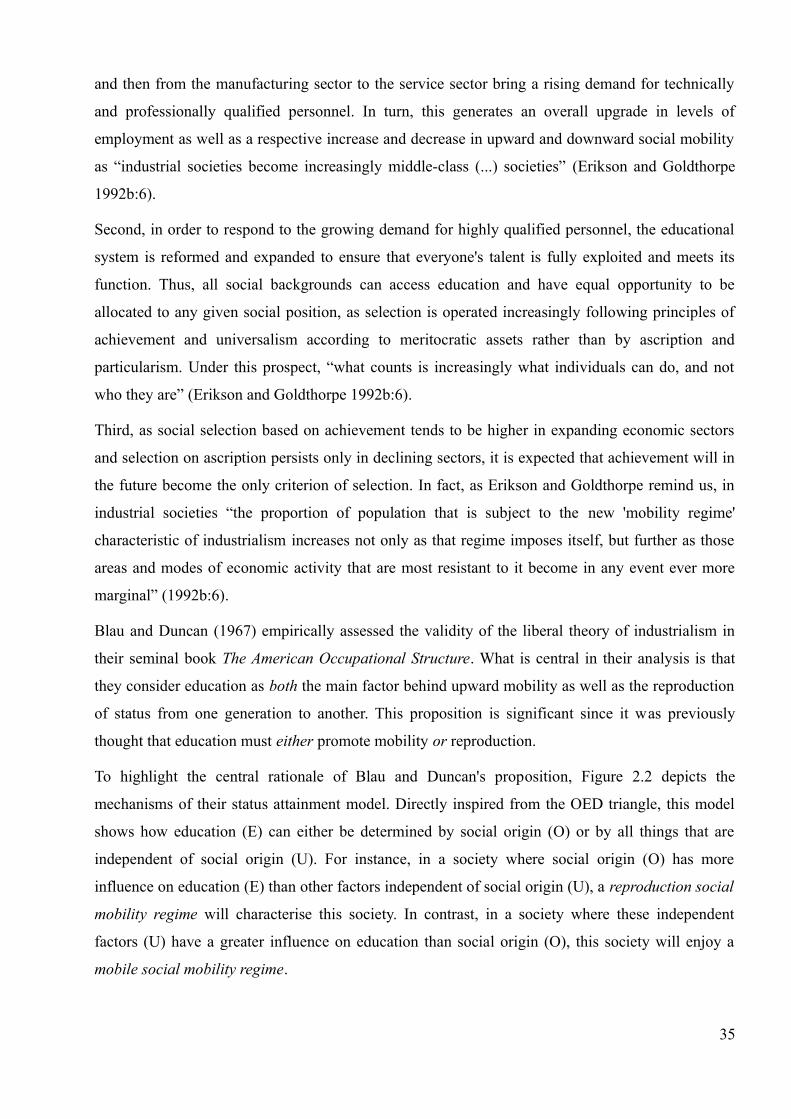
and then from the manufacturing sector to the service sector bring a rising demand for technically
and professionally qualified personnel. In turn, this generates an overall upgrade in levels of
employment as well as a respective increase and decrease in upward and downward social mobility
as “industrial societies become increasingly middle-class (...) societies” (Erikson and Goldthorpe
1992b:6).
Second, in order to respond to the growing demand for highly qualified personnel, the educational
system is reformed and expanded to ensure that everyone's talent is fully exploited and meets its
function. Thus, all social backgrounds can access education and have equal opportunity to be
allocated to any given social position, as selection is operated increasingly following principles of
achievement and universalism according to meritocratic assets rather than by ascription and
particularism. Under this prospect, “what counts is increasingly what individuals can do, and not
who they are” (Erikson and Goldthorpe 1992b:6).
Third, as social selection based on achievement tends to be higher in expanding economic sectors
and selection on ascription persists only in declining sectors, it is expected that achievement will in
the future become the only criterion of selection. In fact, as Erikson and Goldthorpe remind us, in
industrial societies “the proportion of population that is subject to the new 'mobility regime'
characteristic of industrialism increases not only as that regime imposes itself, but further as those
areas and modes of economic activity that are most resistant to it become in any event ever more
marginal” (1992b:6).
Blau and Duncan (1967) empirically assessed the validity of the liberal theory of industrialism in
their seminal book The American Occupational Structure. What is central in their analysis is that
they consider education as both the main factor behind upward mobility as well as the reproduction
of status from one generation to another. This proposition is significant since it was previously
thought that education must either promote mobility or reproduction.
To highlight the central rationale of Blau and Duncan's proposition, Figure 2.2 depicts the
mechanisms of their status attainment model. Directly inspired from the OED triangle, this model
shows how education (E) can either be determined by social origin (O) or by all things that are
independent of social origin (U). For instance, in a society where social origin (O) has more
influence on education (E) than other factors independent of social origin (U), a reproduction social
mobility regime will characterise this society. In contrast, in a society where these independent
factors (U) have a greater influence on education than social origin (O), this society will enjoy a
mobile social mobility regime.
35

They tested this assertion empirically using path models to determine which social mobility regime
characterised the American society at that time. They first investigated whether the indirect effect of
social origin via education (ac) was greater than the direct effect of social origin (b) on social
destination (D). Secondly, they investigated whether the indirect effect of factors independent of
social origin via education (Uc) was greater than the indirect effect of social origin (ac) on social
destination (D). They found that both relations were important in status attainment. Thus, status
attainment was not only determined by social origin but also by independent factors. Blau and
Duncan concluded that an important share of social mobility was mediated by education and as a
consequence that achievement was more important than ascription in determining occupational
status in mid-twentieth century United States of America, consistent with the liberal theory of
industrialism.
However, in spite of the fact that the liberal theory remains a serious and influential theorisation of
social mobility today, it met an amount of criticism. Noted for being slightly too optimistic in regard
to increasing social mobility and equality of opportunity chances, it was qualified as Functionalism
rose7 (Erikson and Goldthorpe 1992b). Overall, the main weaknesses of this theoretical approach
stem from the confusion made between social mobility, equality of opportunity and industrialism.
7 Understand: pink. As opposed to Functionalism noir – understand: dark – referring to the Marxist tradition (seeBraverman 1974)
36
Figure 2.2: Simplified path diagram of how destination depends on social origins and education. Note: Figure replicated from Hout and DiPrete (2006:6)

2.1.3 . The common confusions between social mobility, equalityof opportunity, and economic development
Conventional wisdom dictates that economic development increases social mobility and greater
social mobility means more equality of opportunity. Yet these are actually very strong assumptions,
as there exists no straightforward relationship between economic development and social mobility
as well as between equality of opportunity and social mobility.
It is indeed tempting to view economic development as a vector of increasing social mobility. Some
studies carried out during the liberal theory of industrialism years did, in fact, find a positive
relationship between indicators of economic development and indicators of social mobility
(Cutright 1968; Hazelrigg 1974); however, others did not (Hardy and Hazelrigg 1978; Hazelrigg
and Garnier 1976).
Therefore, it must be emphasised that no systematic link exists between economic growth and
increasing social mobility (Breen 1997a). Furthermore, when this link does exist, social mobility
does not necessarily increase gradually. For instance, it was found that in Brazil, a country that
exhibited rapid industrialisation, the increase in social fluidity was not monotonic (Torche and
Ribeiro 2010) Conclusively, while it is not totally unfounded that economic development could be
one possible explanation of increasing social mobility, it cannot be automatic at any time.
Regarding the association between social mobility and equality of opportunity, the confusion is
even more fixed in one's mentality. It should be reiterated that equality of opportunity is very much
an ideological concept, stating that individuals should be allocated in the social structure according
to achieved criteria. However, to disentangle confusion between social mobility and equality of
opportunity, three points can be made, in line with Breen (2010b).
Firstly, it remains important to note that opportunities are not distributed equally. It is indeed one of
the most well documented empirical findings that those located in the lowest social positions tend to
come from a low social background, while those holding the highest social positions originate from
a similar position. Secondly, while it may be the case that increasing social mobility does actually
correspond with increasing class-based equality of opportunity, this does not imply that all
opportunities are equally distributed. We can certainly say, for example, that in one generation
educational inequality decreased and return to education increased, however, we cannot say whether
these opportunities have been more equally distributed within the population. It might be the case,
for instance, that opportunities increased for, say, only white females with an intermediate class
background. Would this mean that equality of opportunity increased? Certainly not, say, from a
37
black working-class male point of view. Finally, even though it was the case that opportunities
would have been more equally distributed, this would not necessarily generate more absolute social
mobility, as the social structure is shaped by external changes like economic context and industrial
development, and therefore are independent of changes in equality of opportunity. Therefore, for all
these reasons, we will try to avoid speaking of equality of opportunity when referring to social
mobility. Yet in cases when we should employ this expression, it should clearly be understood as
referring to class-based inequality of opportunity.
All in all, for all these reasons, the liberal theory of industrialism accounted major weaknesses. It is
from this standpoint that a new current of social mobility research emerged, having the express goal
of empirically invalidating this theory.
2.2 . Basically cross-national invariance in social mobilityAlternative views to the liberal theory of industrialism and to the idea of an education-based
meritocracy arose from the 1970s onwards, primarily on the other side of the Atlantic Ocean in
Europe. After a rigorous empirical analysis of social mobility, Erikson and Goldthorpe (1992b)
concluded that social mobility was basically characterised by cross-national and cross-temporal
invariance. They were able to arrive at such an outcome thanks to important methodological
innovations and the undertaking of rigorous data collection under a common framework.
2.2.1 . Methodological innovations: one small step forsociologists, one giant leap for social mobility research
The achievement of a total renewal in social mobility research was pushed forward in the mid-
1970s by two important methodological innovations: (1) the introduction of a social class schema
and (2) the implementation of new statistical models.
Firstly, the development of a social class schema jointly by Erikson, Goldthorpe and Portocarero
(1979 henceforth the EGP class schema) constituted a major advancement in social mobility
research. While from the outside, the introduction of a social class schema in social mobility
research can look rather anecdotic, it has actually imposed a completely different vision of social
mobility. Indeed, most previous social mobility research, and in particular that emanating from the
liberal theory of industrialism, used to measure social position through various socio-economic
status indexes. Yet such scales, based on the ranking of occupations according to prestige, income
and education, depict a unidimensional hierarchical order. From a class theorist point of view, such
practice poses a problem as it ignores class conflict and multiple relational dimensions between
classes that are characteristic of capitalist industrial societies. A reasoning in terms of social class is
38

indeed able to envisage the structure of social positions interdependently, a vision that cannot be
captured with continuous measure as proposed in socio-economic scales. Therefore, introducing a
social class perspective to the study of social mobility, allows social mobility to be thought of from
a multidimensional stance. This shift from a unidimensional to a multidimensional vision
constitutes a considerable difference, which actually injected much creativity into social mobility
analysis.
In addition to the fact that the introduction of a social class perspective opens de nouveaux horizons
des possibles8 to social mobility analysis, it also has the noteworthy particularity to be seriously
theoretically rooted in the Weberian tradition of class analysis, which states that individuals share
common life chances – Lebenschancen (Weber 1978). The neo-Weberian EGP class schema based
its construction logic under the two core concepts of employment relationship and employment
regulation. In regard to employment relationship, it distinguishes between (1) the employers, (2) the
self-employed without employees, and (3) the employees; as for the employment regulation, it
discriminates within employees between (1) those with a service relationship regulation, (2) those
with a labour contract regulation, and (3) those with an intermediate form of regulation (Lemel
2004:51).
While the first division line is quite straightforward, the second requires some detailed explanation.
A service relationship employment regulation defines situations where employees enjoy incremental
advancement, employment security, and the possibility of exchanging commitment to the job
against a high level of trust on the part of employers. The service relationship regulation
characterises the service class, also called the salariat. The labour contract employment regulation in
contrast describes employees who have closely regulated payment arrangements and who are
subject to routine and greater supervision. Stated differently, “service-class employees are
controlled by the “carrot” of long-term benefits, and workers by the “stick” of close regulation and
the labor contract” (Evans 1996:214; quoted in Oesch 2006b:21). In regard to the definition of the
intermediate employment regulation, it is somewhere in between and also more blurred.
Notwithstanding these theoretical considerations, it must also be said that the EGP class schema has
a pragmatic primary goal. Erikson and Goldthorpe indeed underline that it should be considered
“essentially as an instrument de travail” (1992b:46) to serve analytical purposes. Still, the creation
of a class schema for social mobility analysis happened to be significant for the second
methodological innovation: the implementation of log-linear models.
To correctly understand the importance of this second methodological innovation, it may certainly
8 Understand : New possible prospects.
39

be informative to briefly travel into past empirical social mobility analysis undertaken in the 1950s.
At that time, a first set of comparative social mobility analysis had already been undertaken, notably
in countries such as the United States (Kahl 1957; Rogoff 1953; Warner and Abegglen 1955), Great
Britain (Glass 1954), the Federal Republic of Germany (Bolte 1959; Janowitz 1958), Sweden
(Carlsson 1958), and Denmark (Svalastoga 1959). While this first generation (Ganzeboom,
Treiman, and Ultee 1991) of comparative research resulted in the creation of the Research
Committee on Social Stratification and Social Mobility (RC28) of the International Sociological
Association, empirical assessments were rather crude given the small possibilities of statistical tools
then available to researchers. Thus, at that time, the analysis of social mobility was usually limited
to the inspection of inflow and outflow percentages of mobility from manual to non-manual
occupations. However, some problems arose in this method of measuring social mobility as soon as
some scholars realised that it was problematic to compare cross-nationally and cross-temporally
different social structure to correctly measure social mobility. Indeed, as Crompton reminds us in
regard to cross-temporal differences, “given long-term changes in the occupational structure, a
certain amount of “upward” mobility is “built in” or “forced”, given the under-supply of non-
manual sons” (1998:211). The same argument equally applies for cross-national comparison: to
what extent are social mobility rates between different countries comparable if these countries have
a different marginal distribution of manual and non-manual occupations?
Aware of such problems, several scholars made attempts to overcome it, such as with the
development of the mobility ratio (see Hout 1983:16). However, it turned out to be inadequate. It
was only in the 1970s that such statistical limitation was surpassed through the introduction of log-
linear models for the analysis of categorical variables (Featherman, Jones, and Hauser 1975;
Goodman 1965, 1969). These models have the advantage of disentangling structural effects from
net effects in a mobility table that cross-classifies – in the case of social mobility – social origin and
social destination. In other words, these models enable researchers to disentangle the effects implied
by the marginal distribution of categories in table, as well as the effects related to the intrinsic
association between variables within the cells of the table with the odds-ratio statistic.
This considerable innovation generated a massive reorientation in the concrete analysis of social
mobility by allowing it to be measured in two different ways. First, in absolute terms with a
description of flows between social origin and social destination; second, in relative terms with a
measure of the association between social origin and social destination – often referred to as social
fluidity. A further interesting feature of log-linear models is that, when specified in a topological
form (Hauser 1978), they are very powerful to inspect specific relations within certain cells in a
40
table. In that, “such models make it possible to treat a bivariate association as a multidimensional
pattern and, in particular, to model the diagonal (which represents class immobility) separately from
the off-diagonal cells” (Ganzeboom et al. 1991:287). This latter specification of log-linear models
happened to be highly crucial for Erikson and Goldthorpe's (1992b) finding of cross-national
invariance in social mobility.
2.2.2 . The CASMIN project and the finding of cross-nationalinvariance in social mobility
These two methodological innovations constituted a perfect match to achieve advancement in social
mobility research, especially as social mobility scholars at the time had the express goal of
undertaking comparative analysis of social mobility to challenge the industrialisation thesis. The
availability of these new standardised tools indeed happened to provide the condition of success for
the undertaking of the first large-scale comparative social mobility data collection project, latter
known as the CASMIN project (Comparative Analysis of Social Mobility in Industrial Nations).
Launched in the 1970s, preliminary analysis of social mobility in Australia and in the United States
of America had already been undertaken by the mid-1970s by Featherman, Jones, and Hauser
(1975). Interestingly, their findings were at odds with statements of the liberal theory of
industrialism. In their two-country comparison, scholars reported substantial cross-national
differences in terms of absolute mobility rates due to the different patterns in the farming,
manufacturing and service sectors. However, they found that both countries shared common
relative rates of mobility. In other words, when applying log-linear models to the mobility table,
they noticed that the association between social origin and social destination was the same in both
countries. Such observation led the authors to conclude that patterns of mobility are expected to be
“basically the same” in industrial societies with a market economy and a nuclear family system
(Featherman et al. 1975:340). This theoretical statement, which came to be known as the FJH
hypothesis, constituted a first step towards the empirical invalidation of liberal theory of
industrialism.
It is worth noting that in the late 1950s, Lipset and Zetterberg's analysis pointed in the direction of
cross-national similarities in social mobility between both the United States of America and
European nations, as they had found that in the countries they studied, rates of mobility were high
and not substantially different. Thus, they concluded that “the overall pattern of social mobility
appears to be much the same in the industrial societies of various Western countries”(1959:13).
However, this observation that came to be known as the LZ hypothesis held only for absolute levels
41
of social mobility, unlike the FJH hypothesis which holds essentially in relative terms.
These first empirical assessments fostered the development of social mobility data collection. This
endeavour was formalised between 1983 and 1988 through the undertaking of the CASMIN project
conducted notably by Müller and Goldthorpe initially and latter on with Erikson (Erikson et al.
1988). It resulted in the publication in the early 1990s of The Constant Flux, by Erikson and
Goldthorpe (1992b). They demonstrated the large-scale empirical invalidation of the
industrialisation thesis through a detailed and innovative comparative analysis of social mobility in
twelve industrialised countries, namely Australia, England and Wales, France, the Federal Republic
of Germany, Hungary, the Irish Republic, Japan, Northern Ireland, Poland, Scotland, Sweden, and
the United States. What is noteworthy from their empirical analysis is that they applied in line with
the aforementioned methodological innovations' “new standards in comparative analysis by the
rigorous recoding of occupational information in nationally representative data sets” (Breen and
Jonsson 2005:230) in addition to log-linear modelling techniques.
To challenge the industrialisation thesis, Erikson and Goldthorpe's contribution was twofold: (1)
assessing the extent of cross-national variation in social mobility pattern, and (2) determining the
degree of change over time in relative social mobility.
To assess the extent of cross-national variation in social mobility pattern, they built a sophisticated
topological log-linear model which they later called the model of core social fluidity. This model
presents the advantage of partitioning a mobility table into different levels of (net) association
between social origin and social destination in order to find a general pattern of social mobility.
While some regions of the table are expected to have positive association, others should depict
negative association. Erikson and Goldthorpe theoretically define four main dimensions of the
social (im-)mobility process according to the relative desirability, advantages and barriers that
characterise each cells of the mobility table. These dimensions take the form of effects: (1)
inheritance effects, (2) hierarchical effects, (3) sectoral effects, and (4) (dis)affinity effects9.
They found firstly that inheritance effects and sectoral effects were more important than hierarchical
ones in explaining relative mobility patterns. This directly challenges the assumptions made by the
liberal theory of industrialism. Secondly, and more importantly, they were able to corroborate
findings of Featherman, Jones and Hauser as all twelve countries that were compared to the model
of core social fluidity showed little variation in the general pattern of social fluidity. They thus
concluded that, since the model of core social fluidity adequately describes the social mobility
9 These effects that take the form of matrices are depicted in Table F.5 in Appendix F. In Appendix E we provide anoverview of the rationale for the core model of social fluidity.
42
pattern of all countries in the study, industrial nations share a common multidimensional pattern of
intergenerational social mobility, and the small observed differences between nations only account
for countries' idiosyncratic historical and political circumstances.
The second contribution of Erikson and Goldthorpe aimed at determining the degree of change over
time in relative social mobility. They were able to test this by introducing a new log-linear model:
the Unidiff, Uniform Difference model (Erikson and Goldthorpe 1992b; see also Xie 1992 who
proposed simultaneously the same model under the name “log-multiplicative layer effect model”).
This model, which allows the relative strength of the association between social origin and social
destination to vary by a specific cohort, is able to detect a uniform change towards either greater or
lesser social fluidity. In other words, this model enabled Erikson and Goldthorpe to test whether the
amount of relative social mobility had increased over time. In their analysis they observed small
differences between nations in their degree of social fluidity, as the strength of the association
between social origin and social position remained the same between cohorts in most countries.
Nonetheless, in Sweden – a nation with a long-term social-democratic tradition – and in the United
States – until recently the most economically advanced country – they did find that relative mobility
had slightly increased over birth-cohorts. Yet overall, Erikson and Goldthorpe concluded that
“although there may have been an increase in absolute rates of social mobility, the class differences
in relative mobility rates persists, that is, that there is “constant social fluidity” across different
societies” (Crompton 1998:69).
These findings actually echoed Shavit and Blossfeld's (1993) conclusions on educational inequality
published the subsequent year. This comparative study on changes in educational inequality
undertaken in thirteen industrialised countries revealed that in most industrialised countries,
inequality in educational opportunity had remained remarkably stable over the twentieth century.
Only gender educational inequality narrowed and equalised in all thirteen countries, but not those
based on social origin. Yet two exceptions to the observation of persistent education inequality were
found in the cases of Sweden and the Netherlands, given that these two countries exhibited a
reduction in inequality in educational attainment. According to Shavit and Blossfeld, such
improvements could be attributed to sharp social welfare policies that equalised living conditions
and overall life opportunities in the two countries. However, with only two countries out of thirteen
depicting increasing educational equality, overall educational inequality proved to be significantly
persistent.
By the 1990s, Erikson and Goldthorpe, as well as Shavit and Blossfeld, were able to empirically
invalidate claims of the liberal theory of industrialism. Rather than demonstrating a general trend
43

towards increasing equality, both sets of research documented the persistence of inequality in spite
of economic development. In this sense, these findings lent general support to the FJH hypothesis of
cross-national invariance in social mobility.
Interestingly, such conclusions remind us to some extent of Sorokin's (1927) early observations on
social mobility. From his pioneer analysis of numerous data sources with rudimentary statistics,
Sorokin sustained that no society is actually characterised by either an increase or a decrease in
social mobility but instead by alternating waves of increasing and decreasing social mobility, taking
the form of trendless fluctuations (Sorokin 1927). He put forth two main reasons to account for such
observations. Firstly, that social mobility decreases with endogenous factors, and increases with
exogenous factors. For instance, “periods of relative social stability in which the inherent tendency
for stratification to become more rigid is unimpeded are punctuated by bursts of increased mobility
and openness occurring in times of social uncertainty and dislocation.” ((Erikson and Goldthorpe
1992b:20) Secondly, that “while certain barriers to mobility have been largely removed – for
example, juridical and religious ones – it is important to recognize that other barriers have become
more severe or have been newly introduced – for example, those represented by systems of
educational selection and occupational qualification” (Sorokin 1927; cited by Erikson and
Goldthorpe 1992b:20).
Yet this grand bond en avant10 in social mobility research primarily achieved by Erikson and
Goldthorpe encompassed some weaknesses, particularly in regard to the way the temporal
dimensions of social mobility and women's social mobility were treated.
2.2.3 . The incomplete picture of cross-national invariance insocial mobility
In fact, the two main weaknesses addressed to Erikson and Goldthorpe's Constant Flux thesis
stemmed from the rather static and imbalanced picture they provided of cross-national invariance in
social mobility.
Firstly, it was static in that the reliability of trends in relative social mobility they drew over time
were highly questionable. Indeed, some scholars argued that the conclusion of no increase in social
fluidity across cohorts was “suspect, since they have data for only one point in time and hence must
rely on the dubious assumption that there are no age effects on mobility and hence that age
differences may be interpreted as cohort effects” (Treiman and Ganzeboom 2000:125). This came to
be the most striking criticism.
10 Understand : Great Leap Forward
44

Secondly, it was imbalanced in that women's social mobility was addressed only in one chapter and
not from a systematic stance. Such a criticism was not new in social mobility research, as for a long
time social mobility scholars simply ignored women's social mobility. Thus, the mere fact that
Erikson and Goldthorpe dedicated one chapter to analyse women's social mobility constituted a
considerable improvement. However, notwithstanding this advancement, Erikson and Goldthorpe
were mainly interested in analysing men's social mobility, only analysing women's social mobility
to demonstrate “how little women's experience of class mobility differs from that of men”
(1992b:275). However, the measurement approach they adopted to derive such observation was
problematic, as they still considered the family to be the unit of class analysis, not the individual.
Indeed, such observation was derived respectively from the conventional approach and the
dominance approach (Erikson 1984b). While the former describes marital mobility, derived from
women's husband's social position, the latter attributes the class position of the spouse who holds
the dominant position in the labour force. In practice, it often consists of inferring the married
woman’s social position according to that of her husband. Although the latter position constitutes an
improvement, it still does not acknowledge fully women's employment situation. In fact, when
Erikson and Goldthorpe applied the individual approach to women by measuring only women’s
employment situations, they arrived at slightly different results. They found that women display
greater downward mobility than men in absolute terms, even though no gender differences would
have been observed in relative terms.
Thus, it seems that Erikson and Goldthorpe's research failed to adequately capture temporal
dynamics, and in turn address societal changes that resulted from them, such as women's new role
in Western societies. This is partly due to reasons of data availability, but also to the historical
context that preceded the publication of The Constant Flux. In fact, not only was the phenomenon
of women's increased labour force participation ongoing at the time they undertook their analysis,
but also the data they used for it had been collected in the 1970s. In spite of these criticisms, the
publication of The Constant Flux marked a turning point in social mobility research, but also to a
wider extent in social stratification research. Not only did Erikson and Goldthorpe succeed in
setting rigorous methodological standards in comparative research, but they further inspired a new
generation of sociologists to walk in their footsteps and undertake large scale comparative research
projects. This is how more recent research was able to address remaining empirical criticism and
filling major gaps.
45
2.3 . Non-persistent inequality and new challenges
2.3.1 . The complete picture of actually non-persistent inequalitySince the publication of Erikson and Goldthorpe's study, further comparative research has more
systematically analysed temporal trends in intergenerational social mobility, as well as women's
social mobility, and came to more qualified conclusions. These new studies in fact found some
evidence of non-persistent inequality regarding both (1) social mobility and (2) educational
inequality.
Breen's (2004a) edited Social Mobility In Europe collective book constituted the logical
continuation of Erikson and Goldthorpe's analysis. This comparative research provided a detailed
analysis of temporal trends and cross-national variation in social mobility in eleven European
countries between 1970 and 2000. This time, in contrast to Erikson and Goldthorpe (1992b),
authors were able to make real period comparison through the use of several surveys for each
country. Furthermore, they analysed women's social mobility systematically, applying the individual
approach.
What is noteworthy about this new comparative research is that in several respects, “the main
findings (...), which held true for both sexes, were at odds with those of The Constant Flux” (Breen
and Jonsson 2005:230). Firstly, authors observed that from the 1970s to the 1990s, rates of absolute
social mobility had become more similar. The Lipset-Zetterberg hypothesis states “overall pattern of
social mobility appears to be much the same in the industrial societies of various Western countries”
(Lipset and Zetterberg 1959:13). Although wrong in a strict sense, this hypothesis has become
closer to the truth than it used to be. Secondly, this research brought out a general tendency towards
increasing social fluidity, even though this trend was not statistically significant in every case
(Breen and Luijkx 2004a:389). Thirdly, considerable differences in the strength of fluidity between
some countries and within some countries over time was proven (Breen and Luijkx 2004a:400).
Finally, this analysis further underlined that social fluidity was greater in state socialist (Poland and
Hungary) and social democratic (Norway and Sweden) countries, but also in Israel (and the United
States, for which data was made available to authors by Michael Hout).
In a similar vein, recent comparative research analysing long-term trends in educational inequality
in eight European countries (Breen et al. 2009, 2010) contradicted Shavit and Blossfeld's previous
conclusions on persistent inequality in educational attainment. Using more recent data and a larger
sample size as well as different modelling techniques, Breen, Luijkx, Müller and Pollak (henceforth
BLMP) reassessed empirical evidence concerning persistent inequality in educational attainment
46
and found a marked decline in inequality in educational attainment over time for both men and
women. This trend particularly holds for children from farming and working-class origins.
Thus, from this recent research it appears that The Constant Flux thesis was rejected on empirical
grounds. Indeed, as underlined by Beller and Hout, “once in doubt, the consensus view now is that
differences are substantial” (2006:353) in relative mobility rates. While such contradictory findings
between previous research and the most recent research may look bewildering to some scholars,
others argue that a large part of differentials in outcomes would be mainly imputable to technical
reasons (Breen and Jonsson 2005, 2007). The data used in more recent research involves longer
observation time periods because more cross-sectional data is available and accounts for a larger
sample size. All this allows for more robustness in the models estimated. Scholars have also made
an increasing use of dynamic modelling techniques designed to test change (Breen and Jonsson
2005:236). Furthermore, while older research focused on assessing change by adopting a period
approach, some recent research suggests that change is more likely to be driven by a process of
cohort replacement rather than through period change, which would explain why former research
failed to detect change (Breen and Jonsson 2007:1805). Lastly, the majority of data collected now
includes women, whereas previous survey samples were often confined to men (Breen and Jonsson
2005:235).
This reversal trend in findings on educational inequality and social mobility in less than two
decades raises a certain number of questions. First, what could explain such a non-persistent
inequality trend? Second, to what extent does this trend result from macro-structural changes?
Third, will this trend last or come to a halt at some point in time? While we will address the latter
two issues later on, for now we would like to present the emerging theoretical model of Rational
Action Theory, which was originally formulated to explain persistent educational inequality.
2.3.2 . Rational Action Theory: the emerging new paradigm ofsocial mobility research
Since the rejection of the liberal theory of industrialism, theoretical developments in the field had
been rather weak. It was only at the eve of the new millennium that new developments based on the
Rational Action Theory (henceforth RAT) emerged (Breen and Goldthorpe 1997). This theoretical
framework was first constructed to explain educational inequality. However, more recently, some
attempts have been undertaken to generalise it to social mobility.
Breen and Goldthorpe developed a model of educational choice to uncover mechanisms driving
persistent educational inequality (1997; see also: Goldthorpe 2000 chap. 9, and 2007b chap. 3).
47
Taking the form of micro-level explanation, this theoretical model aims at explaining how
individuals from different class origins make different educational choices. They sustain that
individuals' differences in subjective rationality according to social origin cause the perpetuation of
inequality of outcome.
To assess the mechanism through which educational inequalities persist, they directly draw some
inspiration from Boudon's theory of inequality of opportunity (1985). Boudon proposed to
decompose the allocation process into the educational structure between the primary and secondary
effect. The primary effect simply encompasses cultural heritage – in other words, the academic
ability of children, which differs with social background. The secondary effect, however, is much
more central in Boudon's theory. It is at this level that individual action is acknowledged in the
allocation process into the educational structure. It describes the process of individuals' educational
choices made during the educational career in order to maximise the social utility of a given
educational level. Yet as the social utility of a given educational level is met when the expected
benefice of education is higher than its cost, and as the social utility of education differs by social
origins, it is likely that equally talented individuals from different social origins will make different
rational choices in their educational career. Indeed, the social utility of a high educational level is
much higher for individuals from upper social classes than for individuals from lower social classes.
In other words, from Boudon's point of view, “educational inequalities are thus essentially due to
the exponentials effects of social position conditioned expectations and, to a much more limited
extent, to a cultural inequalities effect” (1985:177 own translation)11.
In this sense, Boudon's theory constitutes a significant criticism of Bourdieu and Passeron's cultural
reproduction theory (Bourdieu and Passeron 1964, 1970) which contends that educational and
social inequalities are created and reproduced within the educational system because children of
different social backgrounds are endowed with different habitus and cultural capital. In short, the
habitus defines a set of dispositions, orientations, and modes of conduct that a child acquires and
adopts during his or her socialisation and whose influence remains pervasive throughout the life
course. The habitus is shaped and transmitted through cultural capital, corresponding to cultural
resources possessed by families. According to the cultural reproduction theory, since the educational
system imposes a pedagogy that relies on the dominant class habitus, children of the dominant class
background will be better rewarded by the educational system than children of a working-class
background, because the former have the appropriate habitus and cultural capital – the main idea
11 Original quote : Les “inégalités devant l'enseignement sont donc essentiellement dues aux effets exponentiels du conditionnement des attentes par la position sociale et, dans une mesure beaucoup plus limitée, à l'effet des inégalités culturelles”
48
being that the dominant class preserves its dominant position and legitimises existing inequality
through educational institutions. In the authors' own words: “Today the School succeeds, with the
ideology of natural “endowments” and of innate “tastes”, to legitimise the circular reproduction of
social hierarchies and of educational hierarchies”12 (Bourdieu and Passeron 1970:250 own
translation; see for similar theoretical developments conflict theory Collins 1971; cited in Graaf
1986). However, this theory has been heavily criticised, particularly in regard to its extreme
determinism and its difficult empirical demonstration, since the definition of cultural capital
remains quite blurred (Goldthorpe 2007a).
In their RAT model, Breen and Goldthorpe integrate both primary and secondary effects under the
common label of likelihood of success, one of the three main factors that shape educational choices.
In line with Boudon, the primary effect is referred to as ability and the secondary effect is referred
to as expectation of success. The difference in expectations of success is shaped by pupils' own
knowledge of their ability and the subjective probability they attach to being successful in the next
stage of education.
The two other factors that shape pupils' educational choices are (1) the cost of remaining at school,
which includes the direct cost of education as well as forgone earnings, and (2) the value or utility
that children and their family attach to the three possible different educational outcomes: pass,
failure, or leave a given education level. Yet Breen and Goldthorpe argue that as families are
concerned that their children acquire a class position at least as advantageous as that from which
they come in order to avoid downward social mobility, the value or utility attached to a given
educational outcome will vary by social class. This third factor, also known as the relative risk
aversion, is argued as being the most important.
Thus, middle class children can more easily bear the costs of higher education, they further believe
to expect higher rates of success in education, and they are more inclined to continue to higher
education than working-class children because by doing so they are more likely to avoid the risk of
downward mobility. All these reasons explain why educational inequality remains persistent. Yet
with the recent new deal in empirical research, theoretical explanation of non-persistent educational
inequality was articulated with the original RAT model.
BLMP argue that the non-persistent educational inequality trend observed came through both the
decline of primary and secondary class effects. The primary effect declined first through the general
improvement of the standard of living driven by both economic growth and welfare-state protection
12 Original sentence : “l'Ecole parvient aujourd'hui, avec l'idéologie des “dons” naturels et des “goût” innées, àlégitimer la reproduction circulaire des hiérarchies sociales et des hiérarches scolaires”
49
since the end of WWII (Erikson and Jonsson 1996b:81). In particular, this should have benefited
children of working-class and farmer-class families. Furthermore, “this should have been reinforced
by changes within educational institutions, such as the growth in public provision of early child care
and preschool education; the development of full-day rather than part-time schooling; increased
school support to counteract performance gaps of pupils; and differences in the timing, extent, and
manner of tracking, all of which may reduce class differences in school performance” (Breen et al.
2009:1479). At the secondary effect level, they point in the direction of the decreased cost of
education. Not only has the direct cost of education become smaller as school fees have been
largely abolished, but simultaneously the average disposable family income has increased, making
education costs easier for families to bear.
These observations are in line with Goldthorpe and Breen's claims in the latest version of their RAT
model (see Goldthorpe 2007b chap. 3). They suggest two ways through which educational class
differentials can be reduced, located essentially at the cost level of their original theoretical model.
Either (1) through the subsidisation of young people according to their class of origin, or (2)
through the general reduction in inequality of condition between classes. In other words, class
differentials in educational attainment are expected to decrease when class differentials in resources
also decrease.
The issue of class differences in resources is crucial to explaining trends in social mobility.
Goldthorpe draws an outline theory of social mobility in his essay On Sociology (2007b chap. 7).
He builds his theory on the central notions of mobility strategies and differentials in resources and
goals to explain why, overall, social mobility should remain constant. He highlights how different
social classes face different constraints according to their employment relations (employer, self-
employed and employee) and more importantly, given the predominance of employees in modern
societies, according to their employment regulations. Significant differences indeed exist among
employees, from salariat to the working class. The former enjoys long-term contract, a salary with
regular increments and career opportunities, whereas the latter “are typically engaged by their
employer or employing organization through a contract that implies a short-term and specific
exchange of discrete amounts of labor in return for wages calculated on a piece or time basic”
(Goldthorpe 2007b:164).
Such differences significantly impact resources available within the different social classes. Not
only do individuals in the salariat class have higher average earnings than other classes, but they
also enjoy (1) “greater economic security through their better protection against the risk of job loss
and subsequent unemployment”; (2) “greater economic stability in that their incomes from
50

employment will show less short-term fluctuation in relation to amount of work performed and will
be less subject to interruption as a result of sickness or accident”; and (3) “more favorable economic
prospects in that their incomes will tend to follow a rising curve until a much later stage in the
course of their working lives, peaking in their fifties rather than in their late twenties or thirties”
(Goldthorpe 2007b:165). Therefore, the availability of resources is differentially constrained by
social classes and thus this will in turn shape individuals' social mobility strategies differently.
In line with the concept of relative risk aversion presented above, individuals' goals for their social
mobility strategy will primarily be directed towards maintaining “a class position that is no less
desirable than that of their parents or, in other words, to avoid downward mobility” (Goldthorpe
2007b:167). Thus the achievement of upward social mobility will only be of a secondary concern.
To ensure social class maintenance, each class develops their own social mobility strategies, which
Goldthorpe calls the strategies “from below” pursed from less advantaged class origins and
strategies “from above” for more advantaged class origins. The strategy from below implies that
individuals of working-class background will opt for vocational training rather than remaining in
mainstream education in order to ensure that they attain a skilled position rather than an unskilled
one. This choice will be the safest indeed, as continuing in mainstream education would constitute a
higher risk in terms of qualification gained as well as in terms of cost. Furthermore, “such a strategy
could also give chances of short-range upward mobility into intermediate-class, especially manual
supervisory or lower technical, positions” (Goldthorpe 2007b:170). The strategy from above, in
contrast, involves children of salariat class continuing in mainstream education. This will be the
safest option, as the priority is the intergenerational maintenance of class position. Furthermore,
children of salariat background may benefit at some point from their social connection to find
relevant employment, regardless of their educational qualifications. In particular, for some specific
positions, such as personal services and sales sectors, employers seem to attach higher importance
to social skills and various personal or lifestyle characteristics such as “appearance, self-
presentation, savoir faire, manners and accent” (Goldthorpe 2007b:175) than to formal
qualification.
Ultimately, insofar as each social class pursues different social mobility strategies because of the
different constraints they face, social fluidity should not exhibit higher levels. Yet the possibility of
increasing social fluidity can actually come if a change in resources happens: “fluidity will be
greater, the more the class-linked inequalities in resources, or the immediate outcomes of such
inequalities, are in some way modified” (Goldthorpe 2007b:180). Breen also advances similar
arguments in several publications, but in more general terms (1997a; see also Breen and Luijkx
51
2004a; and Breen and Jonsson 2007). He states that changes in social fluidity can come through two
fundamental mechanisms: through change in class returns to assets and/or in transmissibility of
assets. For instance, in the case of the educational asset, he argues that class return can decrease if
education becomes less important in the labour market, while class transmissibility can decrease
when education depends less on social origin (for example, after it undergoes school reforms).
Two specific effects were identified to explain how social fluidity can increase through education
(Breen and Jonsson 2007; Breen 2010a). First, the equalisation effect describes the declining
association between individuals' social origin and their educational attainment. Besides the
aforementioned studies undertaken by BLMP, preceding research had already pointed towards such
equalisation effect in the context of France (Thélot and Vallet 2000), Germany (Erikson and Jonsson
1996a), Italy (Shavit and Westerbeek 1998), the Netherlands (Sieben, Huinink, and De Graaf 2001),
and Sweden (Jonsson and Erikson 2000). Second, the compositional effect stems from the
observation that the effect of social origin on social destination tends to be weaker at higher levels
of education (Hout 1984, 1988). Breen speaks of a differential association to refer to this
observation (Breen 2010a:368). As a consequence, with the expansion of the educational system, an
increasing number of people reach higher levels of education, so the association between social
origin and social destination correspondingly declines. In other words, “if class origins are less
important in shaping destinations among highly educated people then, as more people come to
acquire higher levels of education, the overall association between origins and destinations will
decline.” (Breen 2010b:419). This compositional mechanism was corroborated empirically in the
case of France (Vallet 2004a), Germany (Breen and Jonsson 2007) and Sweden (Erikson and
Jonsson 1998). Finally, Breen (2010a) underlines that both effects can happen together. While he
finds that only the compositional effect explains increasing social fluidity in the United Kingdom,
he finds that the equalisation effect dominates the compositional effect in Sweden, whereas in
Germany the compositional effect dominates the equalisation effect. Breen further concludes that
educational expansion constitutes a way to increase social fluidity, even when there has been no
equalisation effect (Breen 2010a:382). However, other research finds that social fluidity in Brazil
increased while neither the equalisation effect nor the compositional effect happened (Torche and
Ribeiro 2010). Thus, these mechanisms do not systematically explain increased social fluidity.
Altogether, it must be recognised that scholars have attempted to formalise more systematic
processes driving both persistent and non-persistent inequality. While these theoretical
developments are serious and indeed provide interesting insights for the understanding of the social
mobility process, we wonder to which extent the recent macro-structural changes that our Western
52
societies have undergone challenge these developments. For instance, how have educational
expansion, tertiarisation, and feminisation, coupled with the general equalisation of living
standards, affected the relative importance of primary and secondary effects in the allocation
process? In particular, it has been argued that women's new role in the educational and social
structures stems from “shifts in the perception of educational returns that have been prompted by
changes in women's labor market participation” (Goldthorpe 2007b:66) rather than from changes in
costs of education or in resources among families, suggesting that more complex mechanisms to the
basic tenets of RAT actually take place. From this standpoint, discussing how to account and
integrate macro-structural changes in the analysis of social mobility constitutes the greatest
challenge of our research field.
2.3.3 . Non-persistent inequality or offset inequality ? Actualchallenges posed by macro-structural changes
While research undertaken within the auspices of what we could call the non-persistent inequality
thesis constitutes a major advancement in the study of social mobility, it poses major challenges to
social stratification research – in particular, regarding the question of educational and social class
boundaries. The most straightforward explanation of non-persistent inequality would be that class
boundaries declined over time and that today's societies have indeed become more open and more
equal in certain respects. However, it remains unclear as to which extent class boundaries actually
declined. Several points of observation indeed qualify the non-persistent inequality statements.
First of all, when distinguishing finer boundaries within educational categories, equalisation and
compositional effects lose some relevance (see for instance Ichou and Vallet 2011; Torche 2011). In
the meantime, as educational opportunities equalised, return to education decreased (see for
instance Breen and Goldthorpe 2001; Goldthorpe and Mills 2004; Vallet 2004a). In other words, the
occupational advantage afforded by educational titles weakened, implying an educational
downgrading. Furthermore, other studies underlined the persistence of non-meritocratic assets in the
occupational attainment process (Goldthorpe and Jackson 2008; Jackson, Goldthorpe, and Mills
2005). Last but not least, it must also be underlined that the social structure has been considerably
modified over the time frame considered. BLMP in this respect highlights that the classes that
enjoyed the most educational equalisation are also those who shrank the most, namely the farmer
class and the working class.
Therefore, some scholars have acknowledged some skepticism towards the lasting duration of the
non-persistent inequality trend. Goldthorpe (2007b) as a supporter of Sorokin's (1927) trendless
53
fluctuation thesis, notably wonders to which extent Western societies will undergo a reversing trend
in social mobility – like decreasing social fluidity – given the overall increase of inequalities in
recent years. He underlines that the general trend towards increasing social fluidity observed in
industrialised countries was exhibited in particular in the postwar decades, in a context where
inequalities of incomes decreased, unemployment was very low, and social welfare policies were
implemented. Considering that since the mid-1970s income inequalities have trended to increase,
unemployment rates reached significantly higher levels and welfare policy became less class
redistributive, there are good reasons to expect that a decline in social fluidity will characterise birth
cohorts that entered the labour market since the 1980s. Some research already suggests this reversal
trend has taken place. In the United States, a turndown in social fluidity occurred among men born
in the 1970s (Beller and Hout 2005) and in the United Kingdom, men and women who entered the
labour market in the 1980s experienced a decline in intergenerational income mobility (Blanden et
al. 2004).
Thus, it may be the case that non-persistent inequality that we observe today is actually
characteristic of past societies. There is an amount of suspicion that in a context of massive macro-
societal changes, inequalities were offset rather than vanquished.
2.4 . Macro-structural changes, social stratification and theemergence of new social inequality dynamics
During the past century, Western societies, as well as the whole world, have undergone massive
macro-structural changes. Unprecedented changes in humanity's history have indeed been witnessed
and have had enormous repercussions on human lives. At the historical level, the twentieth century
has been affected by totalitarian regimes and, more dramatically, by two World Wars. At the
economic level, economic fluctuations were as diverse as the Great Depression of the 1930s and the
“Thirty Glorious Years” long boom economic growth of the post-WWII years, followed by the
development of the globalised economy. Fluctuations at the societal level included the emergence of
global emancipatory processes amongst different groups of the population throughout the century,
from the suffragette movement in the early 1900s to the Civil Rights Movement, the decolonisation
process, and the sexual revolution from the 1960s onwards. Altogether, these changes turned the
face and the fate of humanity upside down. As a consequence, today's societies are hardly
comparable to those that existed one century ago.
In turn, these changes impacted, at the macro-level, on the social stratification structure and, at the
micro-level, on the opportunities and constraints faced by individuals in regard to their social
54
mobility chances. The central question which we wish to address here concerns the extent to which
these changes resulted in decreasing inequality, or rather, in the reorganisation of the structure of
social inequality, after a short adjustment period to the new stratification order. In order to correctly
understand how macro-structural changes modified the social structure and impacted on individuals'
life chances, we shall underline how important these changes have been, describe them and discuss
what they imply for social mobility research. We shall achieve this by first outlining briefly the
unique context of the post-WWII years that characterised Western societies.
2.4.1 . The unique post-WWII economic boom context under thehistorical lens and the recent strengthening of social inequalities
The end of WWII marked a turning point in twentieth century history. In the context of the
reconstruction, the Western world and Europe in particular went through an unprecedented
economic boom in human history. The demand for labour force was so high that full employment
was the norm and mass immigration was needed to fill vacancies. In this context, new labour
market entrants were ascertained to enjoy enviable employment prospects and a lifelong career.
Even the population from the lowest social strata enjoyed the benefits of economic growth, as the
expression “the affluent worker” testifies (Goldthorpe et al. 1968), since the overall population got
wealthier. It is also during this time period that educational systems were expended, primarily to
meet demand for qualified workers, thus offering new opportunities to the general population. From
this standpoint, in this specific context, climbing the “social ladder” and enjoying upward mobility
no longer looked unrealistic.
The contrast with the previous socio-economic period and the situation of older generations is
enormous. Indeed, generations who were born or lived in the period prior to 1945 were marked with
extreme ideologies, totalitarian regimes, the Great Depression, and more dramatically, two World
Wars (Sapin, Spini, and Widmer 2007). They were confronted with harsh socio-economic
conditions, war injuries and severe sanitary issues through the spreading of epidemic disease
(Chauvel 1998:6–7). In this context of global deprivation, social mobility, if any, was more likely to
be of a downgrading kind. From this standpoint, the overall increase in upward social mobility in
the post-WWII years, rendered possible with the gradual upgrading of the social structure, was at
odds with what could actually have been achieved a few decades before. As a consequence, social
class boundaries were gradually eroding and that anything could be achieved, in particular in the
context of the “wind of freedom” characteristic of the post-WWII years. However, as the expression
“Thirty Glorious Years”, coined by French economist Fourastié (1979), translates, this unique
period of economic prosperity came to an halt at the edge of the 1970s.
55

From the mid-1970s onwards, the economic situation worsened as Western societies experienced an
economic downturn caused by the first oil shock in 1973. Given the recurrence of economic crisis
since then, younger generations have not been able to find as good labour market entry conditions
as the post-WWII baby boom generations to catch up with their senior counterparts. In contrast,
they have endured increasing uncertainty in many respects, fostered by the consequences of the
development of globalisation.
First, these younger generations have suffered massively from the risk of unemployment. More
importantly, given the harsh conditions of the labour market, they have been subject to long-lasting
unemployment leading potentially to social exclusion, given the scarring effect of such unsuccessful
transition to adulthood. Second, with economic fluctuations, weak economic growth and increasing
unemployment rate, younger generations' professional integration has become increasingly chaotic.
Even the highly educated do not seem to be protected from these fluctuations. Third, with the
liberalisation of the labour market, younger generations have been increasingly subject to
precarious and flexible forms of employment, such as irregular working hours, short-term contracts,
and hired labour. Fourth, with the growing share of industrial firms' delocalisation, bankruptcy, and
mass redundancy, transition to unemployment can be sudden and affect large categories of the
population. In other words, over the recent decades, the post-WWII model of a career for life and of
sizeable upward social mobility chances has eroded, since individuals' employment careers have
become less predictable and more uncertain.
Nevertheless, authors such as Beck (1992) and Giddens (1990) argue that this new context leads to
a decrease in social inequalities. They maintain that as uncertainty encourages individuals to act
responsibly and to manage their own way, modern societies have shifted from being a “class
society” to an individualised society exhibiting increasing risk in terms of employment career
through increasing flexibility, but that affects all individuals the same. This is the so-called risk
society thesis. In fact, traditional factors of inequality, such as social origin and education, are
expected to weaken and be replaced by new forms of life trajectories and risks. This trend should
further be reinforced with the decreasing salience of gender, race and national-origin inequalities
fostered by the development of different emancipatory movements since the 1960s, such as
feminism and civil rights movements. For all these reasons, inequality should be expected to
become increasingly individualised and social mobility chances could actually be enhanced – being
both upwardly and downwardly.
Alternative claims, however, have been made. Notably, Breen (1997b) asserts that recent changes
experienced in Western societies, specifically with the development of globalisation, are likely to
56
trigger the strengthening of existing social inequality. He maintains that increasing uncertainties and
risks, notably provoked by the flexibility of the labour market, primarily affect individuals already
in disadvantaged social positions, whereas those in qualified salariat positions should be rather well
protected from such changes. As a result, not only is social class inequality expected to remain an
important factor in shaping inequalities, but social inequalities are amplifying, given the
asymmetrical uncertainty and risk that the different social class groups face.
A large scale comparative research study supports such claims (see the GLOBALIFE project
coordinated by Blossfeld Blossfeld, Buchholz, and Hofäcker 2006; Blossfeld and Hofmeister 2006;
Blossfeld, Mills, and Bernardi 2006; Blossfeld et al. 2005). While men in mid-career, especially
among those who are well-established in the labour market, keep on enjoying stable and enviable
labour market prospects, their female counterparts depict a trend toward marginalisation on the
labour market, since their labour market integration is often precarious and since they gravitate
significantly towards flexible forms of employment. Moreover, among women themselves,
inequalities polarise those who have resources and those who do not. In particular, educational
resources are of crucial importance for women, since the (non-) investment in individual resources
constitutes an important (dis-) advantage that is cumulative: “well-educated young women in
modern, knowledge-based business fields possess the greatest chances of avoiding unemployment
and advancing their careers. In contrast, the disadvantaged (...) are women with few qualifications,
little work experience and earlier childrearing breaks in employment along with those who have
more frequent and longer phases of unemployment. They face a particularly high risk of having to
work in insecure and precarious jobs or of becoming (repeatedly) unemployed” (Buchholz et al.
2009:62). Young people do not enjoy better situations than mid-career women, either. Far more
educated than older cohorts, young people paradoxically face higher uncertainties with an “increase
in precarious, atypical forms of employment (e.g. short-term jobs, part-time jobs, precarious forms
of self-employment, and, compared with older cohorts, lower income)” (Buchholz et al. 2009:57).
Those who are poorly qualified face even worse labour market entry conditions “because individual
(human capital) resources gain in importance through the growing relevance of the market and
individual competition” (Buchholz et al. 2009:57).
Overall, these empirical observations echo with Chauvel's work on France (1998). He demonstrated
that the post-WWII “baby boom” generations born between the late 1940s and the early 1960s were
clearly the winners of this unprecedented economic upturn in several domains of life chances. Many
people indeed reached top level positions, whereas generations who entered the labour market a few
years later, though being better educated thanks to the educational expansion over this period, faced
57

less enviable employment prospects.
Altogether. the upward mobility opportunities that arose during the Thirty Glorious Years have
decreased, or at least levelled, within the most recent decades. In other words, this most likely
indicates that only those who entered the labour market during the unique historical context of the
post-WWII economic boom – a limited part of the population – have been significantly more likely
to enjoy favourable fate and life chances as compared to other generations born throughout the
twentieth century. This observation certainly results from a form of adaptation to the new social
stratification order that has been modified as a consequence of structural changes with the
expansion of educational systems and, notably, the tertiarisation of the labour market. Yet it must be
underlined that the post-WWII economic boom benefited primarily, if not essentially, to men, since
this epoch displayed the culmination of the male-breadwinner model. While the feminisation
process that started in the 1970s certainly contributed to equalising inequality between men and
women, it remains unclear whether this gender equalisation came at the price of increasing social
class inequality.
We will now address the consequences of the considerable transformations in social structure that
our Western society went through since the 1970s with regard to the dynamics of social inequality.
Three major labour market trends can be underlined in this respect: (1) educational expansion, (2)
tertiarisation, and (3) feminisation (Oesch 2006b chap. 2). We will discuss what these three trends
imply for social mobility research today. We are particularly interested in discussing the extent to
which the salience of social class still remains relevant in today's societies. It seems to be the case
that rather than a gradual disappearance of social class inequality, when we use a different lens, we
observe new dynamics of social inequalities within our societies.
2.4.2 . Educational expansion, increasing educationaldifferentiation and decreasing labour market rewards
Since the demonstration of non-persistent educational inequality (Breen et al. 2009, 2010), scholars
have been interested in understanding how educational expansion modified educational inequality
and, to a wider extent, the social stratification process. One core of explanation for the reducing
educational inequality trend can be found in the Maximally Maintained Inequality hypothesis
asserted by Raftery and Hout (1993). This hypothesis states that privileged groups take advantage
of the existence of class differentials in educational attainment and try to maximally maintain
educational inequality with their counterparts of lower social classes. Yet with educational
expansion, they argue it is very much likely that the attainment of a given educational level will
58

become universal among children of higher social classes and will in turn generate a decreasing
association between social origin and educational attainment.
This hypothesis, however, was later readapted by Lucas (2001) into the Effectively Maintained
Inequality hypothesis to reveal how tracking actually maintains educational inequalities. In contrast
to Raftery and Hout, Lucas argues that when a given educational level becomes almost universal,
higher social class children will enrol in the most prestigious tracks of this educational level. In
other words, when quantitative inequalities in attaining a certain level have declined, class
inequalities are primarily expressed through qualitative differences between academically and
socially stratified tracks. As a consequence, educational inequalities will persist at the horizontal
level as privileged families develop new strategies for their children by replacing the quantitative
advantage with qualitative advantage in order to maintain and secure their social rank. Interestingly,
as early as the 1970s, Boudon (1985:196–197) anticipated consequences of tracking and streaming
on educational hierarchies in his theory on inequality of opportunity.
Much research does indeed bring support to the educational differentiation hypothesis and qualify
the observations of equalisation and compositional effects in some countries. For instance, Ichou
and Vallet (2011) points out in the case of France that while access to the Baccalauréat13 degree
actually increased quite significantly over time, inequality had actually persisted between different
tracks within this educational level. In particular, inequality remained strong when the most
prestigious tracks of the Baccalauréat, such as general scientific, were isolated. Thus, the
democratisation of the attainment of this educational level is highly debatable, as access to the most
prestigious tracks of the Baccalauréat did not increase substantially.
Along similar lines in the United States, Torche (2011) reveals evidence of a U-shaped
compositional effect pattern when distinguishing between different levels of higher education: while
within the bachelor's degree holder she observes a very small effect of social origin on social
position attained, among those with an advanced degree, she points out that social origin actually
plays a comparable role as it does with those with low levels of education. Furthermore, she also
underlines that horizontal stratification within educational tracks is quite pronounced. These new
findings thus suggest that different social reproduction strategies exist and inequality should not be
treated in a strictly quantitative form.
Nevertheless, other studies did not find evidence of this horizontal differentiation (Jackson et al.
2008; Reimer and Pollak 2010). A reason for this may stem from the operationalisation procedure,
rather than the substantial irrelevance of horizontal tracks in the educational inequality process. In
13 French equivalent of British A-level
59

fact, finer divisions between both measures of field of study and social class would certainly have
displayed other outcomes. The recent research from van de Werfhorst and Luijkx (2010) indeed
shows that one's educational field of study actually hampers intergenerational social mobility when
using disaggregated measures of social origin and education.
Similar interpretation as for educational inequality could certainly be made concerning return to
education. Indeed, as educational inequality decreased, return to education also decreased in many
European countries (Breen and Goldthorpe 2001; Ganzeboom and Luijkx 2004; Goldthorpe and
Mills 2004; Vallet 2004a; Werfhorst 2007). This decreasing return to education is often attributed to
educational expansion. As Boudon (1985) highlights, such educational downgrading results from
the non-congruence between the new educational structure and the actual social structure. While the
shape of the former is free of structural constraints and can be modified by individual will through
political action, for instance, the latter is largely determined by economic and technological factors.
As a consequence, since the social structure evolved less rapidly than the educational structure did,
an incompatibility between educational supply and demand took place and in turn educational
attainment has provided a less reliable signal to employers.
Decreasing return to education may furthermore have been fostered by a compositional effect in the
service class. Some scholars argue that employers attach increasing importance to non-meritocratic
traits in the recruitment process (Breen and Goldthorpe 2001). In particular, for some specific
positions such as personal services and sales sectors, employers to attach higher importance to
social skills and various personal or lifestyle characteristics such as “appearance, self-presentation,
savoir faire, manners and accent” (Jackson et al. 2005) than to formal qualification. Yet as the
service sector and these occupations expanded significantly over the last decades, it may be the case
that decreasing return to education is driven by a change in the composition of the social structure.
Some research, in fact, points out that professionals are more significantly recruited on formal
qualification bases than the managers (Jackson et al. 2005). A similar explanation was put forward
by Klein (2011) in the context of Germany, where he attributes the slight decrease in return to
education observed in the country to the development of jobs in administrative and management
positions that happen to depend less on education than professional occupation. All these
observations thus suggest that the service class has become an increasing heterogeneous group.
2.4.3 . Tertiarisation and increasing heterogeneity in the serviceclass
If one remembers the conclusions of the non-persistent educational inequality finding (Breen et al.
2009, 2010), BLMP underlines that inequality has particularly decreased amongst the children from
farming and working-class origins. Yet these two classes shrank significantly within the time-frame
considered, whereas in the meantime, with the tertiarisation process, the service class expanded.
60
Thus, it would seem that while some division lines in the social stratification gradually disappeared,
new ones may have emerged.
It is an obvious matter of fact that the social stratification of Western countries has been
considerably transformed over the recent decades. It indeed underwent an overall upward shift with
the development of the tertiary economy through the emergence of the welfare and service
economies, which were fostered by the globalisation process. Such massive changes directly impact
employment opportunities. The share of people occupying positions in the service class has
considerably increased in all Western countries.
As a consequence, new boundaries in the social stratification, which most research fails to measure,
may have emerged. The measurement tool used to measure social class is of central concern here.
We could indeed expect that some categories that used to be homogenous and thus discriminating
have become big blocks which do not necessarily properly reflect the reality of today's Western
societies. We highlighted in the preceding section that horizontal division in the educational
structure gains increasing importance in the educational attainment and social position processes. It
may also prove to be tangible that new division lines have emerged in some social class categories,
as much research suggests.
Collaborative research led by Güveli (Güveli and Graaf 2007; Güveli et al. 2012; Güveli 2006) in
the Netherlands shows that heterogenous social mobility and social reproduction logics exist within
different fractions of Goldthorpe's service class, namely the “technocrats” and “the social and
cultural specialists”, as proposed by Kriesi (1989). In particular, the research she published with
Luijkx and Ganzeboom points out that there is more upward mobility towards the technocrats
category and more reproduction within the social and cultural specialists. In fact, children from the
lower social classes are more likely to attain the class of technocrats than the social and cultural
specialists class, whereas the social and cultural specialists are more successful in preventing their
children from downward mobility than the technocrats. Furthermore, this research emphasises that
the technocrats/social and cultural specialist boundary is a more salient distinction than the high
salariat/low salariat boundary. They could not, however, confirm whether immobility within the
new class fractions has reinforced over time – one possible explanation for that may stem from the
fact that social fluidity increased in overall in the Netherlands. Yet overall, this research clearly
suggests that the service class depicts heterogenous social mobility patterns.
These findings echo with previous research from Western and Wright (1994; Western 1994a, 1994b;
Wright 1997), who analysed social mobility using Wright's conception of class analysis, which
notably isolates the managers, the professionals and the self-employed (1989, 1997). Main
61
outcomes demonstrated that the authority boundary was the most permeable, while the property
boundary was the least permeable and the expertise boundary was somewhere in between14.
Furthermore, Savage, Barlow, Dickens and Fielding (1992) came to similar conclusions: they found
that the professional class was much more cohesively formed than the group of managers, the latter
being composed of a wide variety of social backgrounds and offering less secured intergenerational
social mobility prospects than the former. More recently, Bühlmann's (2010) analysis of the
occupational careers of the different fractions of the service class – the managers, the professionals,
and the associate professionals – corroborated this trend in the United Kingdom. He found that “on
average the managers enjoy a significantly shorter period of education and traverse a significantly
longer period in feeder occupations than both associate professionals and professionals” (2010:203).
Theoretical explanations for such heterogenous mobility chances within these different fractions of
the service class draw inspiration from Bourdieu and Passeron's theory of social reproduction
(1964, 1970) by referring to the concepts of capital and resources. For instance, Savage, Barlow,
Dickens and Fielding (1992) identify three types of assets that are each associated with different
fractions of the service class: (1) Property assets. They offer the most robust bases for class
formation, since they allow other people's labour to be readily exploited, and could also be readily
stored as capital; (2) Organisation assets. They allow super-ordinates to control and exploit the
labour of subordinates but cannot be stored easily, as these accumulate over the career; and (3)
Cultural assets. They can be stored and transmitted more readily, through the “habitus”, but,
according to the authors, must be translated into other contexts to actually produce material
rewards. Along similar lines, Güveli, Luijkx and Ganzeboom (2012) argue that the new pointed
division lines within the middle class can be explained through differences in resources. In
particular, they underline two reasons why social reproduction should be higher within the social
and cultural specialists: (1) they assert that cultural resources are more easy to store in families than
economic resources because of internalised dispositions (habitus); and (2) they maintain that the
social and cultural specialists positions tend to require a high level of education. In turn, as social
reproduction is often said to be mediated by education, the social and cultural specialists should
exhibit higher social reproduction than the technocrats.
All this said, Savage, Barlow, Dickens and Fielding still recognise that being from any service class
background remains an advantage to reach any of the service class fractions. In this respect, it
echoes to a certain extent with Goldthorpe's claims that mobility between these different fractions of
the service class – to which he refers as horizontal “situses” – is quite frequent (1982). This is the
14 In Wright's class schema, the authority boundary reflects the managers, the property boundary the self-employed andin particular employers, and the expertise boundary, the professionals.
62
reason why, according to Goldthorpe, dividing the service class into horizontal “situses” is not of
too much relevance. For him, the original theoretical definition of the service class remains highly
valid: the service class forms a single social class as (1) people with this kind of position share
overall high and secured incomes that are likely to rise over a lifetime and (2) have the same
employment relationship.
To summarise, although the different fractions of service class may still share rather similar life
chances, it appears that social mobility dynamics in this group are not as homogenous as one might
be tempted to say at first sight. Yet with the continuous development of tertiary economy over the
past decades, the heterogeneity within the service class is likely to increase. Additionally, looking
into disaggregated fractions of the service class might also provide interesting grounds in the better
understanding of women's specific social mobility pattern, since the service sector expansion
particularly facilitated women's growth labour participation over the same period.
2.4.4 . Feminisation and the erosion of the male breadwinnermodel
Since the weakening of the Fordist model of the industrial society and the development of the
service economy from the 1970s onwards, women's labour force participation constantly increased.
While in the early 1970s women's labour force participation rate averaged around 50% in Western
societies, by the 2000s more than two thirds of women were participating actively in the labour
market (Oesch 2006b). Such a massive shift has mainly been fostered by the development of
employment in the tertiary sector, since more than 80% of women work in services. Thus, the
coming of the post-industrial society corresponds with the integration of women into the
professional sphere and the reorganisation of gender relations. As a consequence, the traditional
male breadwinner model has progressively eroded in Western societies and now the dual-earner
family model is emerging.
While the study of women's social mobility had long been neglected prior to the 1980s, early
studies carried out on women's social mobility generated cutting debates about how to measure
women's social position. The main issue concerned what would the appropriate unit of women's
class analysis be. As in classical class analysis, the family is considered the key unit of class
analysis; before the 1980s, a woman's social position was usually inferred from that of her husband
and thus their individual social mobility was not at all measured in early social mobility research.
However, in the context of feminist movements and women's increasing labour force participation,
this practice was increasingly called into question, in particular after Acker's (1973) striking
63

accusation of social mobility scholars for their so-called “intellectual sexism”.
After these attacks, the early 1980s witnessed intense debates about the measurement of women's
social position (Erikson 1984b; see lively debates in the journal “Sociology”: Goldthorpe 1983,
1984; Heath and Britten 1984; Stanworth 1984) These debates can be summarised into three
competing theoretical positions.
The conventional approach was mainly defended by Goldthorpe (1983; see also: Erikson and
Goldthorpe 1992b) and supported the classical class approach, which assesses women's social
position according to that of their husband. In other words, under the conventional approach,
women's social mobility is defined essentially in terms of marriage mobility. This approach sustains
that individuals' life chances are not simply determined by their position in the labour market, but
primarily by their membership to a family or a household. From this standpoint, families and
households constitute the only adequate unit of class analysis as it is within this unit that resources,
lifestyles, social networks and values are shared (Breen 2004c:8; Kurz and Müller 1987:428) This
measure of women's social mobility is relevant in a context where women hardly participate in the
labour force and remain in the personal sphere. However, in a changing context characterised with
feminisation, this classical measure becomes more problematic.
Thus, Erikson (1984a, 1984b) proposed an adaptation of the latter approach to account for the
feminisation process in social mobility research. The dominant approach consists of attributing the
class position of the spouse who holds the dominant position in the labour force to the household. In
order to arbitrate which spouse holds the dominant position, a set of dominance rules were defined.
This includes, in order of importance, (1) who is the partner who works full-time rather than part-
time and (2) who is the partner who occupies the more advantaged class position. However,
although this approach theoretically takes situations into account where women hold the dominant
social position within a family or a household, given the gradual decline of male primacy and the
persistence of essentialism15 in the occupational structure, in practice this approach often consists of
inferring a married women's social position according to that of her husband.
However, given that the two preceding approaches provided too few answers to the changing role of
women in Western societies, the individual approach came to be preferred after the 1980s, as
defended by Heath and Britten (1984). This approach sustains that women's social position, and in
turn their social mobility, should be measured according to their own social position, regardless of
that of their husband, if any. Vallet (1986) provided some empirical grounds in favour of this
approach. He demonstrated that in France between 1962 and 1982, (1) women's labour force
15 We will introduce these two concepts very shortly
64

participation had increased, (2) women's professional careers had became increasingly continuous,
(3) homogamy among dual earner couples had decreased, and (4) male's profession superiority over
female had also decreased. As a consequence, since these empirical observations clearly weakened
both previous approaches, the individual approach became the favoured one to measure women's
social mobility.
This decision was important, as women's social mobility findings are heavily dependent on the
measurement approach adopted. For instance, in the chapter they dedicated to women in The
Constant Flux, Erikson and Goldthorpe found “evidence of how little women’s experience of class
mobility differs from that of men” (1992b:275) when measuring women's social position with the
conventional approach. However, women displayed greater downward mobility than men when
women's own social position was taken to measure their social position, the so-called individual
approach. The individual approach indeed shows the interdependency of men and women's social
stratification opportunities, something that the conventional and dominant approach would not
allow us to observe. In fact, to correctly understand men's social mobility opportunities, they must
be related to women's. Men's absolute social mobility chances are dependent of women's, since men
are more likely to attain higher social positions because women actually predominantly occupy the
lowest social positions (Cautrès 1992:478). From that point forward, women’s social mobility has
been more systematically analysed, and international research has demonstrated that women display
more social fluidity than men (Breen and Jonsson 2005:236).
This latter observation, however, must be related to women's persisting specific role in Western
societies. While important advances have been achieved, many features of everyday life remind us
that gender equality is still far from being completely reached.
Indeed, these advances in social mobility should not overshadow persisting gender inequality. One
of the major limits of gender equality can notably be observed in the persistent asymmetrical nature
of the division of work between men and women within the personal sphere (Blossfeld and Drobnič
2001; Drobnič and Blossfeld 2004). In fact, within households, women still overwhelmingly hold
primary responsibility of unpaid work such as housework and childcare. Blossfeld underlines that
“gender role change has been generally asymmetric, with a greater movement of women into the
traditional male sphere than vice versa” (Blossfeld 2007:284). Thus, while there has been
considerably increased symmetry between men and women in terms of educational and
employment opportunities, the persistent asymmetrical nature of gender role division in the
personal sphere hampers the complete achievement of gender equality.
Yet such persistent inequality in the personal sphere has concrete consequences on women's
65
integration in the professional sphere. Firstly, women overwhelmingly hold part-time jobs, which
are famously known for constituting a major disadvantage in terms of career progression. Anyone
employed in a part-time job is likely to have lower advancement opportunities or simply to hold a
job that offers no advancement opportunity at all. Furthermore, service sector and part-time jobs are
usually coupled with more precarious and variable work contract terms and conditions. As a
consequence, women are often disadvantaged in respect to social security and income (Handl and
Steinmetz 2007:246–247). Secondly, the mere fact that women continue to be thought of as the
main provider in the personal sphere results in men and women investing different segments of
occupations within the labour market following a “gendered-type” criterion. Women tend indeed to
be more likely to occupy “female typed” employment such as hairdressers, secretaries or
schoolteachers, and men tend to be more likely to occupy “male typed” ones, such as carpenters,
engineers or business executives. This phenomenon is usually referred to as occupational sex-
segregation (Hakim 1979, 1992). This channeling in gender-typified occupations does not only
originate from the structure of the labour market, but also from the educational structure (Charles
and Bradley 2002, 2009). In spite of gender convergence in terms of educational levels, men and
women still choose sex-specific trainings. Yet educational segregation by gender has a lasting
influence on men’s and women’s chances in the labour market (Gundert and Mayer 2012; Smyth
and Steinmetz 2008). In other words, the increased gender symmetry in terms of labour force
participation hides persisting gender differences in regard to the different nature of employment
held by men and women.
Charles and Grusky (2005:332–333) explain these persisting gender inequalities through two
mechanisms that shape sex-segregation. Firstly, at the horizontal level, they argue that essentialism
shapes gender stereotypes. It implies that women are presumed to excel in personal service,
nurturance, and interpersonal interaction (i.e. non-manual sectors), and men in interaction with
things (rather than people) and in strenuous or physical labour (i.e. manual sectors). Secondly, male
primacy at the vertical level. Male primacy stems from the long-standing belief that men are more
status-worthy than women and accordingly better suited for positions of high pay or authority.
While male primacy declined following the 1970s feminist movements in Western societies
(Weeden 1998), this gender revolution did not break down essentialist gender stereotypes.
Such incomplete gender revolution (Esping-Andersen 2009) has consequences on women's social
mobility prospects. Overall, research documents that predominantly male occupations offer higher
advancement opportunities, thus men have higher upward mobility chances than women do (Reskin
and Bielby 2005; Rosenfeld 1992). Additionally, Williams (1992) found that men in predominantly
66
female jobs advance more quickly than their female co-workers. This phenomenon, which she calls
the “glass escalator” as opposed to the “glass ceiling”, stems from the fact that men's supervisors
are uncomfortable with men doing customarily female jobs, she explains. However, despite this
general male premium in occupational career chances, further research underlines that women
involved in full-time jobs are more likely to access “male” and “gender-mixed” occupations (Hakim
1998). Further research demonstrates that “full-time jobs are particularly important in breaking
down sex-stereotypes and cultural barriers to women at all occupational levels” (Drobnič and
Blossfeld 2004:148). Furthermore, “gender-mixed” occupations – which are likely to be located in
the service class positions – increasingly become the best jobs in terms of earnings, status and
prestige (Hakim 1998). Thus, all in all, full-time employment and “male” or “gender-mixed”
occupations are likely to be the labour market fractions which offer the highest social mobility
opportunities for women. In contrast, women who occupy part-time employment are likely to hold a
“female” occupation and have very limited career mobility prospects (Blossfeld and Hakim 1997).
Consequently, feminisation has considerably reorganised gender relations in Western societies.
Overall, women gained more independence and greater access to resources from which they used to
be excluded. The decreased educational gender gap and the increased participation of women in the
labour market in turn fostered women's upward social mobility chances.
Altogether, all of the changes we described above have considerably modified the social structure.
Old hierarchies have decreased while others seem to be emerging. In light of these macro-structural
changes, we shall now introduce the specificities of the Swiss society, a society that has often been
depicted as a rigid one.
67

68
3 . Social mobility in Switzerland: still a rigidsociety?
Little is known about social mobility in Switzerland. According to the few studies carried out, the
Swiss social mobility regime would be considered particularly rigid. This specific feature of the
Swiss society would pertain to the high development of vocational education, as is the case in
Germany. This affinity with the German educational system thus makes Switzerland an interesting
case to study, since Germany has often been depicted as a special case in comparative research. It
might indeed prove interesting to study whether Germany's deviation relates to its idiosyncratic
institutional settings or to a set of shared common characteristics with countries from, say, the
Germanic constellation. We could, in fact, expect both countries to depict similar social mobility
dynamics. However, it might also be the case that, given its specific history and socio-economic
development, Switzerland's social mobility regime displays its own features. Therefore, we shall
introduce Switzerland's specific context here by highlighting the unique socio-economic
characteristics of this European Eldorado.
3.1 . Stability, prosperity, attractivity: Switzerland, aEuropean Eldorado
From outside its borders, Switzerland is usually depicted as some kind of Eldorado in the middle of
Europe. While some could argue that this enviable situation stems from Switzerland's resistance to
enter the European Union, there is actually another set of reasons. Indeed, if Switzerland should
have a motto, as France has the motto Liberté, Egalité, Fraternité, a good guess for the Swiss
context could certainly be Stability, Prosperity, Attractivity.
In fact, Switzerland is first and foremost a very stable country. As a fervent partisan of neutrality,
Switzerland was never officially involved in either of the World Wars16. However, the country
suffered from the instability and restrictions characteristic of these times, as did all other European
countries. In fact, despite its neutral orientation, Switzerland was never far from the Nazi invasion
during WWII, and Swiss troops spent the duration of the war on the lookout. That said, Switzerland
was never invaded or bombed. As a consequence, Switzerland was found to be in a very enviable
16 It must be emphasised that the extent to which Switzerland was actually unofficially involved in WWII still remainshighly disputed today.
69
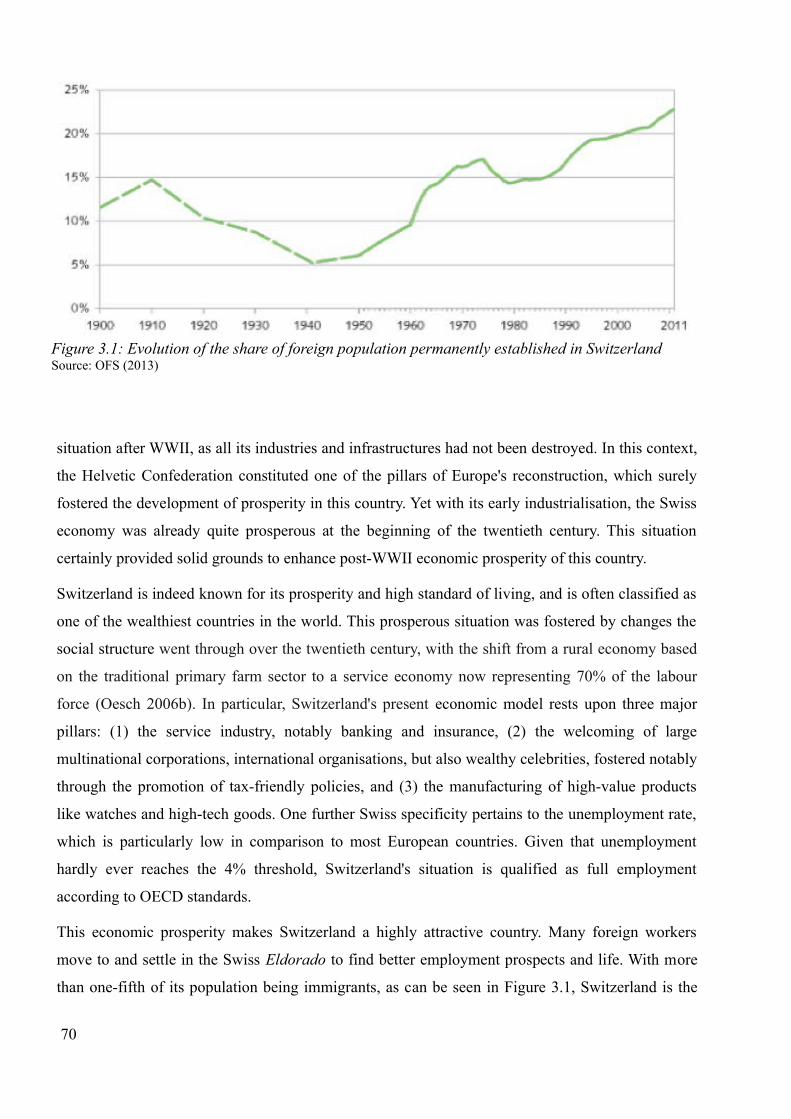
situation after WWII, as all its industries and infrastructures had not been destroyed. In this context,
the Helvetic Confederation constituted one of the pillars of Europe's reconstruction, which surely
fostered the development of prosperity in this country. Yet with its early industrialisation, the Swiss
economy was already quite prosperous at the beginning of the twentieth century. This situation
certainly provided solid grounds to enhance post-WWII economic prosperity of this country.
Switzerland is indeed known for its prosperity and high standard of living, and is often classified as
one of the wealthiest countries in the world. This prosperous situation was fostered by changes the
social structure went through over the twentieth century, with the shift from a rural economy based
on the traditional primary farm sector to a service economy now representing 70% of the labour
force (Oesch 2006b). In particular, Switzerland's present economic model rests upon three major
pillars: (1) the service industry, notably banking and insurance, (2) the welcoming of large
multinational corporations, international organisations, but also wealthy celebrities, fostered notably
through the promotion of tax-friendly policies, and (3) the manufacturing of high-value products
like watches and high-tech goods. One further Swiss specificity pertains to the unemployment rate,
which is particularly low in comparison to most European countries. Given that unemployment
hardly ever reaches the 4% threshold, Switzerland's situation is qualified as full employment
according to OECD standards.
This economic prosperity makes Switzerland a highly attractive country. Many foreign workers
move to and settle in the Swiss Eldorado to find better employment prospects and life. With more
than one-fifth of its population being immigrants, as can be seen in Figure 3.1, Switzerland is the
70
Figure 3.1: Evolution of the share of foreign population permanently established in SwitzerlandSource: OFS (2013)
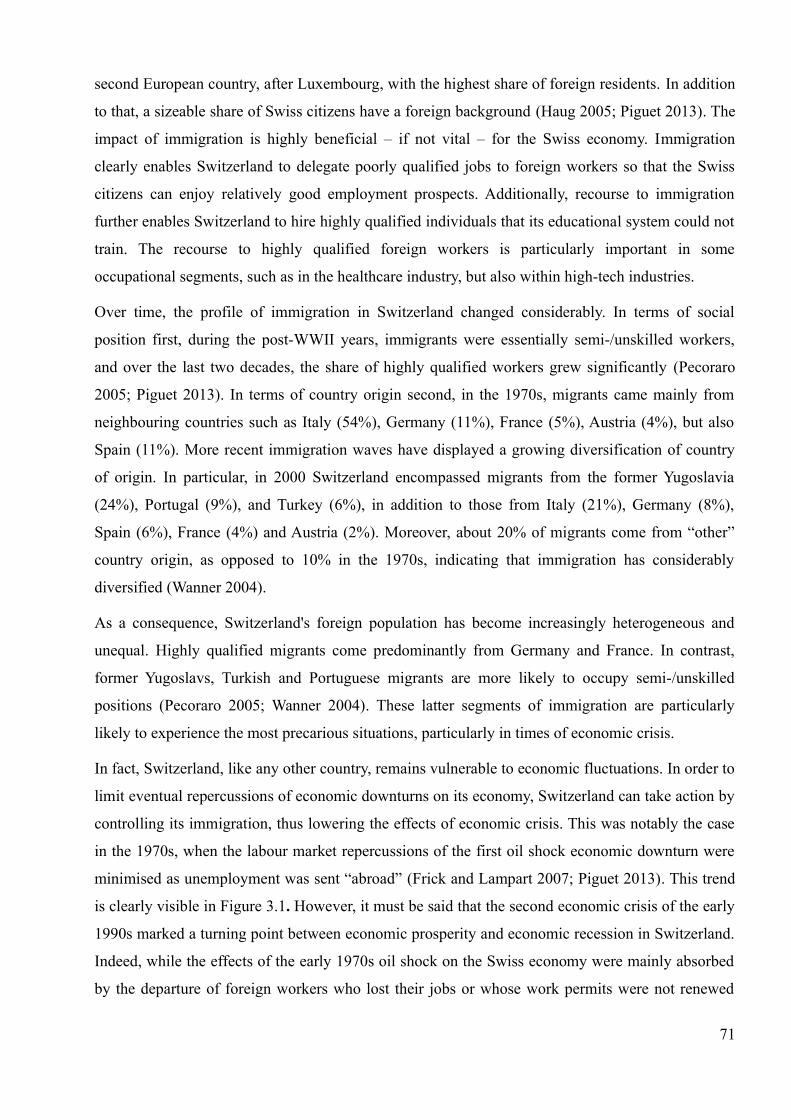
second European country, after Luxembourg, with the highest share of foreign residents. In addition
to that, a sizeable share of Swiss citizens have a foreign background (Haug 2005; Piguet 2013). The
impact of immigration is highly beneficial – if not vital – for the Swiss economy. Immigration
clearly enables Switzerland to delegate poorly qualified jobs to foreign workers so that the Swiss
citizens can enjoy relatively good employment prospects. Additionally, recourse to immigration
further enables Switzerland to hire highly qualified individuals that its educational system could not
train. The recourse to highly qualified foreign workers is particularly important in some
occupational segments, such as in the healthcare industry, but also within high-tech industries.
Over time, the profile of immigration in Switzerland changed considerably. In terms of social
position first, during the post-WWII years, immigrants were essentially semi-/unskilled workers,
and over the last two decades, the share of highly qualified workers grew significantly (Pecoraro
2005; Piguet 2013). In terms of country origin second, in the 1970s, migrants came mainly from
neighbouring countries such as Italy (54%), Germany (11%), France (5%), Austria (4%), but also
Spain (11%). More recent immigration waves have displayed a growing diversification of country
of origin. In particular, in 2000 Switzerland encompassed migrants from the former Yugoslavia
(24%), Portugal (9%), and Turkey (6%), in addition to those from Italy (21%), Germany (8%),
Spain (6%), France (4%) and Austria (2%). Moreover, about 20% of migrants come from “other”
country origin, as opposed to 10% in the 1970s, indicating that immigration has considerably
diversified (Wanner 2004).
As a consequence, Switzerland's foreign population has become increasingly heterogeneous and
unequal. Highly qualified migrants come predominantly from Germany and France. In contrast,
former Yugoslavs, Turkish and Portuguese migrants are more likely to occupy semi-/unskilled
positions (Pecoraro 2005; Wanner 2004). These latter segments of immigration are particularly
likely to experience the most precarious situations, particularly in times of economic crisis.
In fact, Switzerland, like any other country, remains vulnerable to economic fluctuations. In order to
limit eventual repercussions of economic downturns on its economy, Switzerland can take action by
controlling its immigration, thus lowering the effects of economic crisis. This was notably the case
in the 1970s, when the labour market repercussions of the first oil shock economic downturn were
minimised as unemployment was sent “abroad” (Frick and Lampart 2007; Piguet 2013). This trend
is clearly visible in Figure 3.1. However, it must be said that the second economic crisis of the early
1990s marked a turning point between economic prosperity and economic recession in Switzerland.
Indeed, while the effects of the early 1970s oil shock on the Swiss economy were mainly absorbed
by the departure of foreign workers who lost their jobs or whose work permits were not renewed
71

(Buchmann, Kriesi, and Sacchi 2009:571), the effects of the crisis of the early 1990s were much
more marked because of changes in immigration policy and in employers’ and workers’ behaviour
(Flückiger 1998:392). Not only did Switzerland experience an economic recession of exceptional
length, but the rate of unemployment also reached unprecedented levels with a significantly higher
increase than in any other European countries, though Switzerland’s unemployment rate remained
one of the lowest among all OECD countries (Flückiger 1998:369).
Thus, even the most stable countries can be significantly affected by external forces such as
economic crisis. However, it appears that direct consequences of these fluctuations can be
modulated to a certain extent by political action, such as the regulation of immigration. In addition
to that, Switzerland's specific educational system certainly constitutes one of the factors of this
country's economic success. In fact, the high development of vocational education results in a
labour force trained in highly specialised domains that closely align with labour market
requirements. Moreover, vocational education has repeatedly been acknowledged to prevent
unemployment risk at the crucial moment of the transition from school to work (Müller 2009).
From this standpoint, Switzerland's educational system constitutes one of its main specificity
compared to other European countries. In this respect, Switzerland's parallels with Germany, one
core European country with a similar educational system, might provide interesting insights in
regard to the specific influence of vocational educational systems on social mobility dynamics.
3.2 . The German deviation and the Swiss proximity : socialmobility and vocational education
Germany is often described as the European country that deviates the most from general trends and
patterns in social mobility. In terms of social mobility trends first, Germany substantially differs
from other European countries in regard to the trend in return to education. While other European
countries share a common decrease in return to education over time, Germany, by contrast, shows
little or no change in return to education over time (Klein 2011; Müller and Pollak 2004). In regard
to social mobility pattern second, in The Constant Flux, Erikson and Goldthorpe (1992b) observed
that Germany constituted the country with the highest deviation from the model of core social
fluidity. Thus, Erikson and Goldthorpe proposed a German variant of their model of core social
fluidity to more adequately adjust to the German specificity. They argued that Germany displayed
greater inequality in class mobility chances as they observed that in this country (1) there were high
inheritance barriers in all classes but the salariat, and also important hierarchical barriers; (2)
mobility was more pronounced between the salariat class and the intermediate classes, such as the
routine non-manual and the petty bourgeoisie, implying the existence of a marked distinction
72
between manual and non-manual employment in terms of mobility chances; and (3) mobility
barriers were lower between agriculture and other sectors, as the sector effect was weak.
In order to explain this particularity of Germany in comparison to other European countries, two
reasons were invoked. First, some features of the German class structure explain why the divide
between manual and non-manual class is so marked in Germany. Without going into detail, since
the Bismarckian era, non-manual employees in this country have enjoyed similar employment
regulation in terms of pension, health insurance, job security and unemployment benefits, which
would explain why mobility is quite common within non-manual classes. In contrast, as working-
class employees do not benefit from such generous employment regulation, the social distance
between the manual and the non-manual classes remains quite marked in Germany (see Kocka
1981). The second specificity of Germany stems from its educational system, which acts as a
reinforcer of class inequality in the social mobility process. Indeed, “the institutionalised character
of the class structure in Germany is enhanced by the system of vocational training which makes the
boundary between unskilled and skilled work more impermeable than in other countries” (Müller
and Pollak 2004:78). Germany's educational system is indeed vocationally oriented, with the so-
called “dual system” of vocational education and training (VET). This system, it has been argued,
certainly hampers upward social mobility chances of children of non-skilled workers, particularly
when compared to those of the skilled workers (Erikson and Goldthorpe 1992b:149–150).
Along similar lines, Germany's specific educational system would explain why return to education
did not decrease. According to Allmendinger (1989), in countries where both standardisation and
stratification are high, such as in Germany, the association between education and occupation is
high. This link was corroborated by Shavit and Müller's (1998) comparative research on school-to-
work transitions. By studying how the occupational attainment process varies in different countries
according to different education systems, they found that in countries where vocational training is
occupationally specific and where there are arrangements between employers and schools,
vocational education yields higher returns to education.
Given that the Swiss educational system is also highly vocationally oriented, Germany and
Switzerland share important affinities in their educational system. In both countries, educational
selection into rigid tracks happens at a relatively early age, and educational expansion at tertiary
educational levels has been more moderate than in other European countries. Furthermore, both
countries are among those with the lowest amount of intergenerational educational mobility (Pfeffer
2008). Moreover, over the last two decades, both countries established the so-called “Universities of
73

Applied Sciences17” to enhance educational expansion. Because selection into these educational
paths is less selective than that of traditional universities, the development of these specific
universities is likely to increase access to tertiary education for lower social class children and
consequently reduce educational inequality. This trend is likely to be marked in Switzerland since,
according to OECD (2013), the Swiss educational system expanded significantly over the last ten
years. Most notably, Switzerland would have “reported a growth in tertiary attainment rates of more
than 10 percentage points between 2000 and 2011” (OECD 2013:30). However, we express some
skepticism regarding the magnitude of this expansion over the last decade. While it is true that the
Swiss educational system continues to expand, it would seem that a sizeable share of this expansion
accounts for international students (OECD 2013:290). Consequently, it is not very clear whether
this expansion benefits the Swiss population. Moreover, the grouping procedure of educational
levels may not adequately capture and reflect the specific institutional settings of the Swiss
educational system. Therefore, the measurement of the amplitude of educational expansion in
Switzerland over the last decade remains highly debatable to us.
Finally, it must be mentioned that Switzerland does not depict one single unified educational
system: there are twenty-six educational systems in Switzerland, one in each canton. Cantonal
differences in the educational system are not insignificant, significant variations exist between these
regional units, such as term of age at tracking, maximum class size threshold, and number of hours
taught at school, which in turn create different degrees of educational inequality (Stadelmann-
Steffen 2012).
From this standpoint, vocationally oriented educational systems, such as those developed in
Germany and Switzerland, seem to actually inhibit the reduction of social inequality and result in
specific patterns of social inequality. However, some research tends to demonstrate that this
specificity is actually reducing, since the two core and long-lasting features of Germany's social
mobility regime seem to be eroding. This suggests that we might arrive at the end of a special case.
For instance, it has been underlined that the German deviation from the core model of social fluidity
has decreased within younger generations (Müller and Pollak 2004). Along similar lines, return to
education might have decreased in Germany in recent years (Pollak and Müller 2013).
In spite of these recent new findings that question the extent to which vocational education
reproduces social inequality, one remaining core feature of vocational education is that it hampers
gender equalisation by channelling pupils early in their educational career into gender-typified
educational tracks. This might be one source of explanation to the persisting high extent of gender
17 Respectively in German and French: Fachhochschule and Haute Ecole Spécialisée (HES)
74

inequality in Switzerland. In fact, despite the considerable feminisation of the labour market,
Switzerland is often depicted as an highly gender-traditional country.
3.3 . Feminisation in Switzerland : the persistence of highgender inequality
Like in all Western societies, feminisation has considerably reorganised gender relations in
Switzerland. Women have overall gained more independence and more access to resources from
which they used to be excluded. In many respects, gender inequality has indeed decreased, since
women in Switzerland today have similar educational chances as men and actively participate in the
labour force. However, in spite of these important evolutions, gender inequality in Switzerland
remains significant, and is actually more salient than in most other Western countries.
What is first and foremost noteworthy in Switzerland in regard to gender relations is that Swiss
women only gained the legal right to vote in 1971, which is relatively late when compared to other
Western countries18. Of course, this Swiss specificity must be understood in light of its direct
democracy political system, since it implied that Swiss men had to vote and decide whether Swiss
women could gain political rights19 – which was never the case in any other country in the world.
Yet since then, in order to reabsorb this lag behind in regard to women's place in society, the Swiss
Federal State has put some efforts forward to promote gender equality over the last thirty years
(Coradi Vellacott and Wolter 2005).
We can indeed say that there has been a non-negligible gender equalisation in educational
attainment over the last few decades in Switzerland. However, this trend has not been as marked as
in other countries. While the gender gap in accessing education reabsorbed significantly, men are
still more likely to gain higher education than women. This trend is particularly noteworthy since at
the international level, the gender inequality trend reversed in terms of educational attainment, since
women now do better in school than men in an increasing share of Western countries (Buchmann,
DiPrete, and McDaniel 2008; Buchmann and DiPrete 2006). However, this reversing trend must be
understood at the vertical level, since it appears that men and women overall remain predominantly
oriented into gender-typified educational tracks.
In Switzerland's professional sphere, the labour force feminised significantly, as over recent years
about 60% of active women held a job, a percentage averaging increasingly towards the men's rate
18 For instance, in Germany women gained the legal right to vote in 1919, in the United Kingdom in 1928, in France in1944, and in Italy in 1945.
19 The documentary from Stéphane Goël “De la cuisine au parlement / Kinder, Küche, Politik” released in 2012 in thisrespect clearly highlights how the Swiss political system hindered women to gain political rights earlier.
75
(about 75%) (Suter et al. 2009:40). However, important inequalities remain. First, because of the
low development of childcare facilities and other infrastructures to enhance the conciliation of
work-family balance in Switzerland, many women interrupt their professional career or reduce their
working time after giving birth to their first child. The consequences of these decisions on future
career prospects are significant, since advancement opportunities are thus considerably hindered.
Furthermore, women become more financially dependent on their husband and are rapidly
reallocated into the traditional role of female caretaker. Research, in fact, documents that
transitioning to parenthood creates increasing gender inequality. While a couple may have
egalitarian values, the birth of their first child actually results in unequal practices in the division of
labour within couples – and this trend happens to be particularly marked in Switzerland (Bühlmann,
Elcheroth, and Tettamanti 2010). Second, even when women are active in the labour market, they
suffer from considerable income inequality in comparison to men: on average, women with the
same occupation and qualification as men earn about one quarter less (Levy 2010:43). This gap is
considerable, since it ranks as one of the greatest in international comparison. Last but not least, in
case of the occurrence of a divorce or a separation, women face high poverty-risk (Falter 2009). All
this, from an economical and sociological perspective, results in a considerable loss for society,
since women's investment in human capital is not rewarded as it should be.
The most straightforward explanation for the persistence of such significant gender differences in
Switzerland can be found in gender stereotypes amplified by its specific educational system. In fact,
through vocational education, men and women are channelled very early into sex-typified
educational tracks which in turn results in them occupying sex-segregated occupational segments.
Switzerland, in this respect, is particularly famous for its high level of sex-segregation in the labour
market from a comparative perspective (Charles and Buchmann 1994; Charles and Grusky 2005;
Flückiger 1998; Kriesi, Buchmann, and Sacchi 2010). Therefore, women's and men's fate in
Switzerland is determined very early through its specific institutional settings into highly gendered-
traditional roles.
Altogether, the Swiss context provides unusual and unique characteristics that are likely to add new
knowledge to the comparative study of social mobility. According to previous social mobility
research, Swiss society would be particularly rigid. We will now outline previous research
undertaken on social mobility in Switzerland.
76
3.4 . Previous social mobility studies in Switzerland: asociety as rigid as its mountains are high
Besides Girod's pioneering work on social mobility located in Geneva's area (1971, 1977), and
research by Weiss (1979, 1986), only three research studies had been carried out on social mobility
in Switzerland until fairly recently (Bergman, Joye, and Fux 2002; Joye, Bergman, and Lambert
2003; Levy, Joye, and Kaufmann 1997; Levy, Joye, Guye, et al. 1997). Nonetheless, these last few
years have witnessed a revival of interest in the sociological study of social mobility in Switzerland,
particularly in a temporal perspective (Falcon 2012a, 2012b; Jacot 2013; Jann and Combet 2012).
Overall, these studies underline the strong persistence of social origin on the determination of a
person's social position.
Most studies on social mobility in Switzerland indeed reveal that both absolute and relative rates of
social mobility have remained stable over time (Bergman et al. 2002; Falcon 2012b; Levy, Joye,
and Kaufmann 1997; Levy, Joye, Guye, et al. 1997). However, the study of Joye, Bergman and
Lambert (2003) provides slightly more contrasting findings. The authors observe a trend towards
increasing social fluidity in Switzerland when measuring social class with the ISCO-88 typology on
one digit, whereas when measuring social class with the EGP class schema they find no increasing
social fluidity. This finding underlines the central role of indicators in social mobility measurement.
As for the recent analysis of Jann and Combet (2012), it shows with an unconventional modelling
technique – proportional reduction of error – that the effect of social origin on social position has
decreased for women, but not for men in Switzerland. Finally, in a recent article Jacot (2013)
underlined the considerable role of education in the reproduction of social inequalities in
Switzerland. As for the study of women's social mobility in Switzerland, it has hardly ever been
studied. The Tous Egaux? study was the first to observe women's situation. It found that women are
on average more disadvantaged than men in terms of education and social position gained, and that
they are more likely to experience downward social mobility (Levy, Joye, and Kaufmann 1997;
Levy, Joye, Guye, et al. 1997). This research, however, did not look at trends in women's social
fluidity. Aside from this research, only the recent studies undertaken by Jann and Combet (2012)
and myself (Falcon 2012b) started to systematically document women's social mobility
opportunities in Switzerland.
From a comparative perspective, even though Switzerland seems to be very often excluded from
comparative research, the recent research from Pfeffer (2008) on educational inequality constitutes,
from our point of view, a notable exception to this unfortunate habit. In this research, Pfeffer shows
how educational inequalities in Switzerland are among the greatest in all the nineteen countries
77
studied. This bad ranking of Switzerland in terms of educational mobility can be related to its
educational system specificities, which are notably characterised by early tracking in highly
segmented tracks, making Switzerland one of the most selective educational systems in Western
societies (Meyer 2009). Much research indeed demonstrates that the importance of social origin is
particularly pronounced at the beginning of the educational career rather than later (Maurin 2007;
Shavit and Blossfeld 1993). In other words, the earlier the selection happens, the lower the chances
of equalisation the educational system would have to harmonise pupils' social origin differences.
This observation echoes with research carried out at the national level. The study from Buchmann
and Charles (1993) was one of the first to demonstrate, through the analysis of two Swiss-German
cohorts born in 1950 and 1960, that despite educational expansion, the effect of social origin on
educational attainment had not substantially decreased. In addition to other findings, the authors
found that transition to university education was marked by a strong effect of social origin. This
observation can also be explained by the relatively small expansion of tertiary education in
Switzerland, as compared to other Western countries. Further research also pointed to the
persistence of a strong effect of social origin at specific levels. This is the case during the transition
from the primary education level to the secondary education level (Meyer 2009), but also at the
transition to upper secondary levels (Hupka-Brunner, Sacchi, and Stalder 2010). At tertiary levels,
Buchmann, Sacchi, Lamprecht and Stamm (2007) found that the effect of social background at both
tertiary-level vocational training and university level remained stable between the 1950 and 1960
cohorts. Additionally, the authors found a tendency towards educational reproduction in the two
types of tertiary education: “children from families with educational background in vocational
schooling are much more likely to follow vocational tracks, whereas children with parental
background in general education are more likely to pursue academic education.” (Buchmann et al.
2007:347). Altogether, the authors speak of an intergenerational transmission of the rigid separation
of vocational and academic tracks at the tertiary level. However, while educational equalisation
looks rather limited in Switzerland, Jacot's recent research (2013) found some light evidence of
compositional effect among men. Yet he further insists on the fact that the importance of education
in the social mobility process is often overstated, by observing how social origin has a non-
negligible impact on social position when controlling for educational attainment.
In addition to studies on the development of social mobility in Switzerland, two studies have
addressed the issue of the pattern of social mobility in this country: the research from Levy, Joye,
Guye and Kaufmann (1997) and the recent one from Jacot (2013)
The first study particularly underlines the specific fate of children of the self-employed. They
78

indeed found that social reproduction had decreased over time among the self-employed and
although their social destination was quite diverse, it usually corresponded with a downward move
towards low-status occupations involving routine tasks. This downgrading effect was particularly
high among women, as family businesses are more often transmitted from fathers to sons. They
furthermore pointed to the existence of mobility between skilled white-collar and manual workers
first, and skilled white-collar workers and intermediate class workers second20. Finally, after having
fitted topological log-linear models following Western and Wright's (1994) framework, they were
able to demonstrate first the existence of a strong impermeability between the working class and
other classes, and second the importance of education as the main resource to reach the highest
social positions. Additionally, they highlighted that for women, the property dimension was less
important than for men, whereas the expertise one was crucial. In other words, education seems
more important for women than for men in the social mobility process.
Jacot's recent publication (2013) also addressed the issue of the pattern of social fluidity in
Switzerland. However, his goal did not primarily consist of finding and eventually adapting a
pattern of social fluidity in the context of Switzerland, but rather showing the remaining importance
of inheritance, sector and affinity effects after controlling for education. Yet Jacot's research remains
highly interesting in that he proposes an adaptation to Switzerland of the model of core social
fluidity21 in a theoretically informed way. Specifically, he mostly adapts negative and positive
affinity matrices. In his endeavour, he pays particular attention to the social mobility of children of
the self-employed petite bourgeoisie, as this category underwent important variations over time in
Switzerland (Arvanitis and Marmet 2001; Buchmann et al. 2009; Tillmann and Budowski 2007).
Indeed, while it decreased in the 1970s and 1980s, it increased again in the 1990s up until the early
2000s, corresponding to a reversal trend. This U-shaped curve in the development of self-
employment in Switzerland seems to lead to heterogenous dynamics in the pattern of social
mobility in this social class category. Indeed, it is expected that the decrease in the self-employed
category in the 1970s and 1980s resulted in the social downgrading of children of the self-employed
into skilled and unskilled manual positions, whereas it is argued that the increase witnessed in the
1990s actually corresponded to a strategy of avoidance of downward mobility among children from
the salariat class in the context of the economic crisis and high unemployment rate increase
(Flückiger 1998). These consequential changes correspond to a compositional change in the profile
of the self-employed category, from farmers and independent artisans in earlier times to more
20 This research uses the Swiss Socio-Professional Categories (CSP-CH) class schema (See Joye and Schuler 1995).Skilled white-collars correspond to “employés qualifiés”, manual workers to “ouvriers” and intermediate classworkers to “catégories intermédiares”.
21 He labels this adapted model the « core S », S standing for Suisse/Switzerland.
79
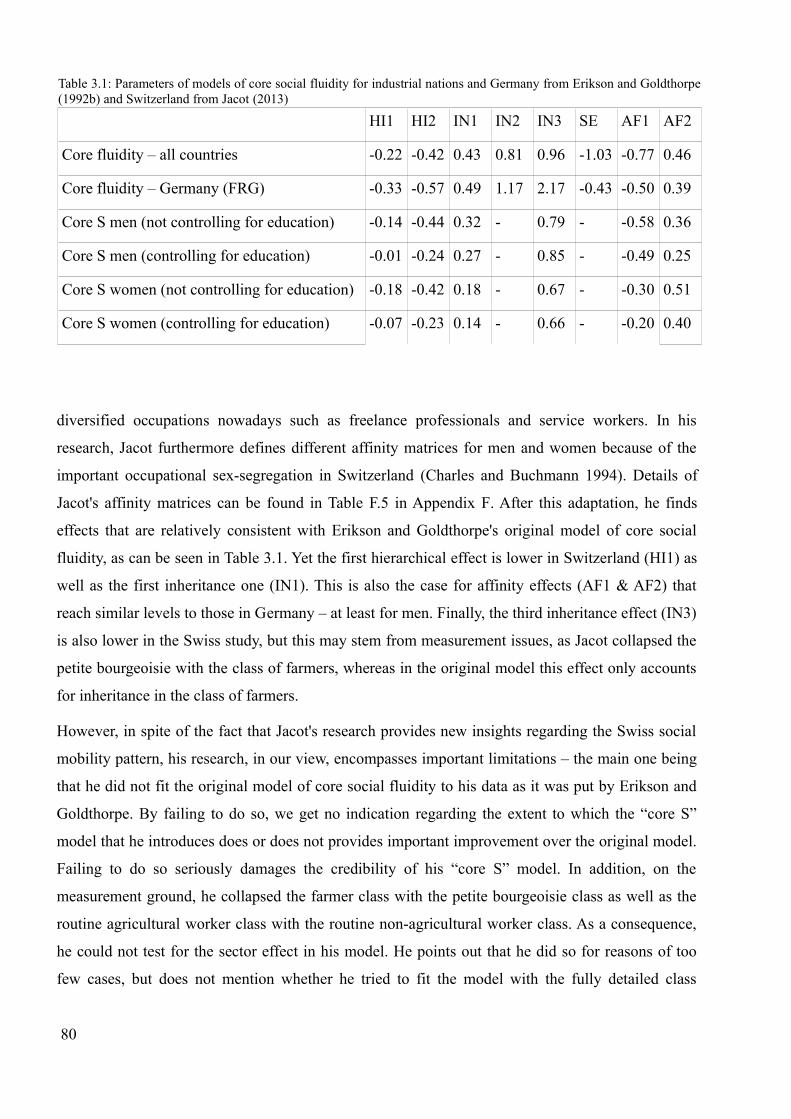
diversified occupations nowadays such as freelance professionals and service workers. In his
research, Jacot furthermore defines different affinity matrices for men and women because of the
important occupational sex-segregation in Switzerland (Charles and Buchmann 1994). Details of
Jacot's affinity matrices can be found in Table F.5 in Appendix F. After this adaptation, he finds
effects that are relatively consistent with Erikson and Goldthorpe's original model of core social
fluidity, as can be seen in Table 3.1. Yet the first hierarchical effect is lower in Switzerland (HI1) as
well as the first inheritance one (IN1). This is also the case for affinity effects (AF1 & AF2) that
reach similar levels to those in Germany – at least for men. Finally, the third inheritance effect (IN3)
is also lower in the Swiss study, but this may stem from measurement issues, as Jacot collapsed the
petite bourgeoisie with the class of farmers, whereas in the original model this effect only accounts
for inheritance in the class of farmers.
However, in spite of the fact that Jacot's research provides new insights regarding the Swiss social
mobility pattern, his research, in our view, encompasses important limitations – the main one being
that he did not fit the original model of core social fluidity to his data as it was put by Erikson and
Goldthorpe. By failing to do so, we get no indication regarding the extent to which the “core S”
model that he introduces does or does not provides important improvement over the original model.
Failing to do so seriously damages the credibility of his “core S” model. In addition, on the
measurement ground, he collapsed the farmer class with the petite bourgeoisie class as well as the
routine agricultural worker class with the routine non-agricultural worker class. As a consequence,
he could not test for the sector effect in his model. He points out that he did so for reasons of too
few cases, but does not mention whether he tried to fit the model with the fully detailed class
80
Table 3.1: Parameters of models of core social fluidity for industrial nations and Germany from Erikson and Goldthorpe(1992b) and Switzerland from Jacot (2013)
HI1 HI2 IN1 IN2 IN3 SE AF1 AF2
Core fluidity – all countries -0.22 -0.42 0.43 0.81 0.96 -1.03 -0.77 0.46
Core fluidity – Germany (FRG) -0.33 -0.57 0.49 1.17 2.17 -0.43 -0.50 0.39
Core S men (not controlling for education) -0.14 -0.44 0.32 - 0.79 - -0.58 0.36
Core S men (controlling for education) -0.01 -0.24 0.27 - 0.85 - -0.49 0.25
Core S women (not controlling for education) -0.18 -0.42 0.18 - 0.67 - -0.30 0.51
Core S women (controlling for education) -0.07 -0.23 0.14 - 0.66 - -0.20 0.40

schema version. Furthermore, while Jacot argues – à juste titre22 – that we should pay particular
attention to the social mobility of children of the self-employed, he does not question the
measurement of this heterogenous category. This category indeed displays high heterogeneity,
especially between the large employers, the liberal professions and the petite bourgeoisie in terms of
economic, cultural and social resources. Of course, Jacot's failure to address the heterogeneity of the
self-employed stems essentially from the instrument de travail that he uses, namely the EGP class
schema, which does not isolate the large employers and the liberal professions from the salariat
class.
To summarise, existing research on social mobility in Switzerland underlines that Swiss society
seems to be characterised by a strong degree of rigidity. This rigidity is often attributed to its
specific vocational educational system, which is characterised by early selection into highly
stratified tracks and leaves very little leeway to recover from a poor initial placement. However,
most of these studies focus on a limited time frame, which renders it difficult to really capture social
change in social mobility dynamics over time. Furthermore, statistical estimates returned are likely
to lack robustness, as the studies use small sample sizes in their data. Finally, very little research
exists on the issue of gender differences and the influence of immigration in the social mobility
process. This present research thus aims to overcome these weaknesses in previous research studies.
3.5 . Which social mobility dynamics should be expected inSwitzerland across the twentieth century?
The general research question addressed in this research could be stated as follows: what are the
characteristics of social mobility dynamics in twentieth century Switzerland in the light of its
specific institutional context? To answer this question, we will divide our research endeavour into
three steps: (1) by looking at the evolution of trends in social mobility over time; (2) by
investigating whether the mediating effect of education on social mobility changed, and if so, how
and why; (3) by looking more thoroughly at the pattern of social mobility. We will more thoroughly
discuss here what could be expected, or at least hypothesised, in the Swiss context in light of its
particularity.
3.5.1 . Hypotheses on trends in social mobility over timeThe main issue that we want to address here concerns to what extent social mobility trends changed
over time in Switzerland. Has social mobility increased as it has been the case in other Western
countries when measured in relative terms? Or have social mobility trends displayed Swiss-specific
22 Understand: purposefully
81

characteristics, in particular given the vocational educational system and the large foreign
population in Switzerland?
We could hypothesise that social mobility has increased over time in Switzerland. According to the
liberal theory of industrialism, at least absolute social mobility should have increased over time.
The considerable shift from the industry to the service sector in the Swiss social structure during the
twentieth century would seem to favour such a change. Furthermore, according to recent empirical
findings, relative social mobility should also have increased. In fact, in line with RAT statements,
with the expansion of the educational system in Switzerland, resources available to different class
backgrounds should have changed and consequently, class returns and/or transmissibility of assets
may have decreased, generating greater social fluidity in turn. Nevertheless, although a decreasing
proportion of young people leave school after compulsory education, and an increasing share attend
higher education (Levy 2010:34), educational expansion has remained quite moderate in
Switzerland, as compared to other Western countries. Therefore, it is also possible to expect that,
following the constant flux thesis but also in line with most research on the inequality of
opportunity in Switzerland, social mobility might have remained rather constant in Switzerland
when measured in relative terms.
Furthermore, specific variations in social mobility could be expected according to the historical
context, notably economic fluctuations. The liberal theory of industrialism predicts that the increase
in social mobility should have been more marked in periods of economic growth than in periods of
economic recession, at least in absolute terms. Along similar lines, following statements of RAT, the
degree of class return to assets is likely to evolve with the economic context. While educational
assets might be less important on the labour market during periods of economic growth, it may
become more important in periods of economic recession due to differentials in job opportunities.
As a consequence, relative social mobility could increase in the former context, and decrease in the
latter. Some Swiss studies demonstrate the effects of such contextual variations. In the case of
transitions from school to work, when the labour force expands, the occupational prestige of one’s
first job is significantly higher (Buchmann and Sacchi 1998:434). In the case of job opportunity,
opportunities improve during times of economic growth, whereas they deteriorate during recessions
(Kriesi et al. 2010:319). As we highlighted previously, the 1990s constitute a turning point between
economic prosperity and economic recession in Switzerland, since unemployment was not “sent
abroad” as it was in the 1970s. As a consequence, Switzerland's unemployment rate grew
significantly – although the unemployment rate rarely reached the 4% threshold.
As a result, we formalise two main hypotheses regarding the development of trends in social
82
mobility in Switzerland:
– H1a: Social mobility increased in Switzerland in the twentieth century: youngest generations
should display higher levels social mobility than oldest generations.
– H1b: Social mobility fluctuated according to economic fluctuations: generations who entered
the labour market during the long-boom period enjoyed more upward mobility chances
whereas those who started to entered the labour market from the 1970s, and particularly in
the 1990s, experienced a reduction in opportunities.
We can now turn to our hypotheses on the mediating effect of education on social mobility trends.
3.5.2 . Hypotheses on the mediating effect of education on socialmobility trends
We are here interested to address whether the role of education in the social mobility process
changed in Switzerland, and if so, how. Do we observe, as has been shown in other countries,
equalisation and/or compositional effects in the Swiss context that could foster social mobility, and
if so, what does this imply in terms of intergenerational social mobility? Finally, has the value of
education changed in Switzerland over time?
Like in other Western countries, Switzerland expanded its educational system during the second
half of the twentieth century. As a consequence, we should reasonably expect that an increasing
share of the population should have gained access to educational levels from which they used to be
excluded, since resources should have been more equally distributed. This equalisation effect
should also have been more marked among generations that entered higher education from the
1990s onwards. In fact, we expect that the recent development of Universities of Applied Sciences23
should have offered even more opportunities for children from lower social backgrounds to reach
higher education. Yet given the moderate expansion of the Swiss educational system as compared to
other European countries, and given the persistence of a high share of vocational education,
educational equalisation should not have been as important as in other Western countries. Therefore,
two hypotheses can be stated:
– H2a: Educational inequalities decreased in Switzerland: younger generations should display
more equally distributed chances of access to education than was the case in oldest
generations.
– H2b: This decrease was enhanced from the 1990s onwards following the development of
23 Respectively in German and French: Fachhochschule and Haute Ecole Spécialisée (HES)
83
Universities of Applied Sciences: the reduction of educational inequalities should
particularly have been pronounced within younger generations as a consequence of the
educational expansion in Switzerland of the late 1990s .
Following this educational expansion, it was found in many European countries that return to
education had actually decreased. In other words, the occupational advantage afforded by education
decreased, as some educational titles lost value on the labour market. This observation is at odds
with expectations of the liberal theory of industrialism, which expects that selection will
increasingly be operated according to achieved characteristics such as educational attainment.
However, one notable exception to this trend has been put forward: Germany. The German context
has proven to depict little, if any, decrease in return to education. Since Switzerland's educational
system displays high affinities with the German one, it is very much likely that a similar specific
trend could be uncovered in this country. However, the recent development of Universities of
Applied Sciences may have affected the stability of return to education in Switzerland. They could
in fact have created a certain downgrading of educational titles. As a consequence, we phrase two
hypotheses:
– H3a: Return to education remained relatively stable in Switzerland: the value of educational
title should have remained at a similar level over time, being for oldest or youngest
generations.
– H3b: The development of Universities of Applied Sciences altered the stability of return to
education: the stability of return to education should have come at a halt and met a decrease
within the youngest generations.
Education also mediates social mobility in the form of a compositional effect. This effect states that
the association between social origin and social destination weakens within higher educational
levels. Coupled with educational expansion, the compositional effect is likely to increase social
mobility. We underline that the recent research from Jacot found evidence of a compositional effect
in Switzerland, but only among men. This effect stemmed primarily from those with general
education and was particularly pronounced at the tertiary level. However, no such compositional
effect was displayed among women, particularly as parameters indicated that among women with
tertiary education, the association between social origin and social destination was actually stronger
than those with only compulsory education. In spite of these mixed findings, it would be reasonable
to expect that those with low social background who attain tertiary education should have similar
employment prospects than their counterparts from other social backgrounds. Yet given the
relatively limited expansion of tertiary education in Switzerland, this effect is likely to have
84

moderate impact on the trend of social fluidity. From this standpoint we formalise the following
hypothesis:
– H4: The association between social origin and social destination is weaker within higher
educational levels: graduate from higher education are likely to be selected on meritocratic
assets and those from lower levels of education on non-meritocratic ones.
We have now outlined how we expect education to mediate social mobility trends. We should now
focus on the hypotheses regarding the pattern of social mobility in Switzerland.
3.5.3 . Hypotheses on the Swiss pattern of social mobilityWe are concerned with two issues here: to what extent does the Swiss pattern of social fluidity
converge or diverge from Erikson and Goldthorpe's model of core social fluidity? To what extent
can subtler social mobility dynamics be uncovered when finer division lines are drawn in the
service class?
Regarding the Swiss pattern of social fluidity, we should expect this pattern to be rather convergent
with that of other European countries. In fact, Erikson and Goldthorpe's findings of core pattern of
social fluidity which support the FJH hypothesis of basic cross-national invariance in social fluidity
pattern still remains today the most eminent finding of the RC28 (Hout and DiPrete 2006). We see
no reason why Switzerland should display vastly different patterns in its social mobility regime.
That said, we could expect Switzerland to display some deviations as compared to the original core
model. This intuition is guided by the high deviation of Germany to the core model of social
fluidity. Thus, given the high institutional similarities between Germany and Switzerland, the Swiss
pattern of social fluidity could deviate quite significantly from the overall pattern and exhibit
similarities with the German one. Previous research would seem to lend support to this intuition
since it was pointed out that education is the main resource to reach the highest social positions and
that high barriers exist between the working class and other classes (Levy, Joye, Guye, et al. 1997).
Yet overall, social inheritance is expected to be stronger within the categories at the extremes of the
social stratification, namely the salariat and unskilled workers; but also within self-employed
categories due to the familial transmission of business.
In addition to that, the category of self-employment is likely to display specific social mobility
dynamics. Previous research in Switzerland indeed underlines the particular downward mobility
fate of the children of self-employed – at least some categories of it, notably the farmers. Given the
notable changes exhibited by the self-employed category over time, we expect to find positive and
negative affinities between these occupational segments and the other social classes.
85

– H5a: Switzerland's pattern of social fluidity deviates from the core model of social fluidity:
the Swiss pattern should display higher affinities with the German variant of the core model
of social fluidity than with the original core model of social fluidity.
– H5b: Self-employed categories exhibit a specific social mobility pattern: children of the self-
employed should be more downwardly mobile in Switzerland than in other industrialised
countries (i.e. as compared to the core model).
In parallel to this, we address whether social mobility dynamics in the service class are as
homogeneous as the core model of social fluidity expects. When measuring the service class in a
more disaggregated fashion, we might indeed uncover subtler social mobility dynamics. In fact,
over the recent years, new issues have arisen in social mobility research that may undermine such
claims of a common pattern in social fluidity, to a certain extent. New studies have addressed the
issue of whether structural changes that Western societies went through over the recent decades may
have modified social mobility dynamics. These considerations are indeed important in that the
social structure of Western societies shifted from industrial to post-industrial with the development
of a large salariat class. Yet as the full title24 of The Constant Flux book reminds us, in addition to
the structure of the EGP class schema, Erikson and Goldthorpe's research was designed in the
context of industrial societies. While this industrial vision of the societies under study was certainly
highly relevant at the time the authors carried out their inquiry, especially as they based their
analysis on data that clearly reflected such stratification, this may be less relevant in today's
societies.
It may be the case, as international research suggests (Güveli et al. 2012; Güveli 2006), that new
boundaries may have emerged in the social stratification that classic measurement tools fail to
capture. We could indeed expect that some categories that used to be homogenous and thus
discriminating have become big blocks which do not necessarily properly reflect the reality of
today's Western societies. This is an important aspect, as social mobility dynamics might differ
within different fractions of the service class. For instance, it is argued that these different fractions
have access to different resources. Thus, some fractions of the service-class could be expected to
depict high social reproduction, while others could be expected to be more mobile, both within and
outside the service class. Furthermore, the heterogeneity of the self-employed category within the
service class should be addressed. It is expected that this particular segment of the service class
should display different social mobility patterns. From this standpoint, structural changes in the
social stratification have become a crucial point to be addressed in contemporary social mobility
24 The full title of the book is: “The Constant Flux. A study of class mobility in industrial societies”.
86
research. We formalise these issues in the two following hypotheses:
– H6a: Social mobility dynamics display heterogeneity within the service class: some fractions
of the service class should depict more mobility, whereas others should be less mobile.
– H6b: The self-employed categories within the service class show a specific social mobility
pattern: social immobility should be stronger in these categories than in other service class
categories.
We have finished phrasing all of our substantive research hypotheses. One remaining set of
hypotheses, however, must be addressed: the transversal one, according to gender and citizenship.
3.5.4 . Transversal hypotheses on social mobility dynamicsaccording to gender and citizenship
We expect to find differences in social mobility according to gender and citizenship. In fact, women
and non-Swiss citizens should be more disadvantaged in regard to their social mobility chances than
men and Swiss citizens, respectively.
Gender differences in social mobility in Switzerland are expected to be relatively marked,
particularly given the high degree of occupational sex segregation on the Swiss labour market
(Charles and Buchmann 1994; Flückiger 1998; Kriesi et al. 2010). However, we expect to uncover a
general decrease in gender inequality. In fact, as women’s labour force participation grew
considerably over time, “increasing its share from little more than a third in 1980 to almost half of
total workforce in 2000” (Oesch 2003:245), gender inequality in regard to labour force participation
should have been modified in some respects. In the meantime, Western societies have undergone a
considerable gender equalisation in educational attainment over the last few decades (Shavit and
Blossfeld 1993). It is particularly noteworthy that gender inequality in this domain has decreased so
significantly that it is now actually reversing in some Western countries, at least in terms of vertical
educational inequalities, since the share of women in higher education exceeds that of men
(Buchmann et al. 2008; Buchmann and DiPrete 2006).
As a result, it is reasonable to expect, in accordance with statements of the liberal theory of
industrialism, that women’s social mobility chances will increasingly converge with those of men,
given the rationale of a shift from ascriptive to achievement selection. However, following RAT one
can argue that through the promotion of policies of equal opportunity between men and women by
the Swiss Federal State over the last thirty years (Coradi Vellacott and Wolter 2005), the
transmissibility and the class returns to assets may have increased. Indeed, the reduction of gender
inequality in educational attainment and on the labour market may have generated a perverse effect
87

of a shift from gender inequality to social origin inequality. In this case, women’s situation may
converge with that of men, but the overall weight of social origin on social opportunities may
increase. From this standpoint, our gender-specific hypothesis can be put this way:
– H7: Social mobility opportunities between men and women have converged: gender
differences in social mobility chances should have been higher in the oldest generations than
in the youngest ones.
Finally, social mobility dynamics should differ according to citizenship and migration background.
Little is known about the impact of immigration and the migration status on social mobility, being
in Switzerland or in other countries. Consequences of immigration on career development can be
quite diverse. As Haug and Wanner underline (2005), migration can have a positive or a negative
impact on professional opportunities. For instance, migration can be positive in the sense that it can
provide more and better employment opportunities than in the country of origin. Nevertheless,
migration can reveal more harmful for career development, especially for women, when it results
from a form of “sacrifice” to follow a partner.
However, in Switzerland, long-term settled migrants would seem to enjoy better prospects than
natives. Bauer and Riphahn (2007) indeed suggest that second generation immigrants display higher
levels of intergenerational mobility than natives. Yet they further underline that, being for migrants
or natives, disadvantaged children have very few chances to catch up educationally. Nevertheless,
the overall problem we face when focusing on the migrant population to try to predict citizenship-
specific social mobility dynamics pertains to the fact that non-Swiss citizens are an extremely
heterogeneous group. We can nonetheless hypothesise that on average, Swiss citizens should have
access to more resources than non-Swiss citizens and thus enjoy better social mobility opportunities
than the population with a foreign background. Therefore, our last hypothesis can be stated:
– H8: Social mobility perspective differs according to citizenship: Swiss citizens enjoy better
social mobility chances than non-Swiss citizens.
Altogether, our research on social mobility in Switzerland is likely to bring new insights to the
comparative study of social mobility. We shall now present and explain our methodological
framework applied for the undertaking of this research.
88

4 . A unique study design to analyse social mobilitydynamics in Switzerland: methodologicalconsiderations
In order to assess the extent to which Switzerland's social mobility dynamics converge with those of
other European countries, and provide some answers to our research questions and hypotheses, we
decided to follow methodological framework similar to current international research on social
mobility (Notably: Breen 2004a; Breen et al. 2009). Scholars were able to achieve substantial
empirical advances in the field through the use of several data sources, which enabled them in turn
to have a rather significant time window and large sample size. With the increasing availability of
multiple cross-sectional data, current research is not only able to monitor the development of trends
in social mobility, but also to return more robust statistical estimates. Therefore, the current study
will follow in the footsteps of current mainstream comparative research in our field to assess the
extent of commonality and variation of social mobility dynamics in Switzerland as compared to
other Western countries.
However, our approach will slightly deviate from this research framework in that we will use new
and different indicators to measure social class. In particular, in addition to the ESeC classification,
the use of the Oesch class schema that depicts the social structure of post-industrial societies should
enable us to address the issue of social change in the social structure and its potential consequences
on social mobility dynamics, since it more adequately reflects the social structure of post-industrial
societies. In turn, we will confront outcomes returned with the new measure with the classic
measure of social class in social mobility analysis.
The present chapter will be structured as follows: we will first present the data we used, then
discuss the indicators we chose and the validity of their operationalisation. Finally, the modelling
technique we applied will be presented.
89
4.1 . Twelve surveys for a birth-cohort analysis : detail ofdata and population
4.1.1 . Data used : the crucial importance of progress in datacollection
As Breen and Jonsson correctly emphasised, “our knowledge about the world is never better than
the data on which it is based” (2005:235). With the major progress in data collection, quality and
coding, particularly since the 1990s in Western countries, researchers have been increasingly able to
document and understand peculiarities of our present-day societies and how they evolve.
Switzerland has not been an exception to this trend.
It must be noted, however, that progress in data collection in Switzerland has clearly been favoured
by political will, with the implementation of the government-funded Swiss Priority Program
“Switzerland: Towards the Future” between 1996 and 2004 to promote research in social sciences.
This program has indeed constituted a major turning point in data collection in Switzerland – first,
with the creation of the Swiss Household Panel in 1999, and second, with the now regular
participation of Switzerland in comparative surveys frameworks such as the European Social
Survey (ESS) and the International Social Survey Program (ISSP). We shall here acknowledge our
gratitude to these people who have been involved and promoted all these projects, making credible
social sciences research in Switzerland no longer just an eventual future, but a reality.
This PhD thesis would have been markedly different without the availability of these data sources.
In fact, in order to answer to our research questions regarding the evolution of trends in social
mobility in Switzerland, we constructed a uniquely compiled dataset by using a collection of twelve
Swiss national population representative sample surveys gathered between 1975 and 2009. As can
be seen in Table 4.1, which lists the detail of these surveys, nine out of twelve of them directly
result from the collective endeavour taken under the Swiss Priority Program “Switzerland: Towards
the Future”. Furthermore, the data sources that were provided by the data archive service of the
Swiss Centre of Expertise in the Social Sciences (FORS) have the advantage of containing detailed
information on occupation, education and social origin of respondents, information that is of central
concern to our present research.
But before discussing operationalisation issues more thoroughly, we must discuss what the use of
multiple survey data implies for the quality of our analysis. Indeed, as the data is never free from
errors, and does not necessarily use the same sampling methods or collection mode, we must be
aware of the potential bias that the use of multiple cross-sections may induce. In Table A.1 in
90

Appendix A, which outlines the detail of data production and quality for each survey we used, we
observe differences and similarities between surveys. In terms of targeted population, only one
survey out of twelve excludes foreigners (AP75). Regarding sampling procedure, only the sample
of the CH91 survey is drawn from quotas. All other surveys are based on stratified random samples,
according to municipalities for oldest surveys and according to regions for more recent ones. Data
91
Table 4.1: List of surveys used in this research
Year Short name Survey name Responsible for survey production
1975 AP75 Attitudes politiques 1975 Kerr Henry, Handley David, Roig Charles, and SidjanskiDusan, Université de Genève, Département de sciencepolitique.
1987 ISSP87 International Social Survey Programme 1987: Social Inequality I (ISSP 1987)
Guido Hischier, and Heinrich Zwicky, Soziologisches Institutder Universitàt Zürich.
1991 CH91 Les Suisses et leur société : positionnements et images
René Levy, Dominique Joye, Michel Bassand, OlivierGuye, and Vincent Kaufmann, Université de Lausanne,Institut d'anthropologie et de sociologie - IAS; EPFLLausanne, Institut de recherches sur l'environnementconstruit - IREC.
1999 SHP99 Swiss Household Panel Robin Tillmann (Resp.), Swiss Centre of Expertise in the Social Sciences (FORS).
2002 ESS02 European Social Survey in Switzerland - 2002
Dominique Joye, Nicole Schöbi, and Nanette Wälti, SwissInformation and Data Archive Service for the Social Sciences(SIDOS).
2004 SHP04 Swiss Household Panel (second sample)
Robin Tillmann (Resp.), Swiss Centre of Expertise in the Social Sciences (FORS).
2004 ESS04 European Social Survey in Switzerland - 2004
Dominique Joye, Nicole Schöbi, and Nanette Wälti. SwissInformation and Data Archive Service for the Social Sciences(SIDOS)
2005 MCH05 MOSAiCH 2005 Dominique Joye, Nicole Schöbi, and Céline Kaenel,Swiss Information and Data Archive Service for theSocial Sciences (SIDOS).
2006 ESS06 European Social Survey in Switzerland - 2006
Dominique Joye, Nicole Schöbi, Alexandre Pollien, andCéline Kaenel, Swiss Information and Data Archive Servicefor the Social Sciences (SIDOS)
2007 MCH07 MOSAiCH 2007 Dominique Joye, Nicole Schöbi, Sylvie Leuenberger,and Alexandre Pollien, Swiss Information and DataArchive Service for the Social Sciences (SIDOS)
2008 ESS08 European Social Survey in Switzerland - 2008
Dominique Joye, Sylvie Leuenberger-Zanetta, AlexandrePollien, Marlène Sapin, and Nicole Schöbi. Swiss Centre ofExpertise in the Social Sciences (FORS).
2009 MCH09 MOSAiCH 2009 Dominique Joye, Nicole Schöbi, Sylvie Leuenberger-Zanetta, Alexandre Pollien, and Marlène Sapin. SwissCentre of Expertise in the Social Sciences (FORS).
Note: MOSAiCH surveys stand for “Measure of Sociological Observation of Attitudes in Switzerland” and includeISSP.

collection was usually collected face-to-face, with the CAPI procedure for most recent surveys.
However, for the ISSP87 survey, data was collected in the form of a paper questionnaire with an
incentive of 50 CHF offered for the returned questionnaire, whereas SHP99 and SHP04 data was
collected by telephone, using the CATI procedure. Response rates varied quite significantly: AP75
as well as SHP99 and SHP04 surveys display high response rates (between 64% and 82%) while the
first wave of the ESS (2002) displays a particularly low response rate (33%). All other surveys
depict a relatively normal response rates, located around the 50% threshold. Therefore, in spite of a
certain number of similarities between the different data sources we used, it remains indeed possible
that differences in their reliability and validity may induce spurious temporal change (Breen and
Luijkx 2004b:40–41). In addition, the representation of the most disadvantaged population groups is
often badly documented in surveys in Switzerland, mainly because these groups are likely to have a
foreign background and thus be difficult to reach. In order to minimise potential survey effect and
the weakness in the representation of the total Swiss population, one strategy is to apply weighting25
in order to ensure that the surveys we use are as representative of the Swiss population as possible.
All in all, our assessment of data quality, which we display in Appendix B, demonstrates no
substantial survey effect that would distort our substantive conclusions. Therefore, our approach is
reliable. In particular, we would like to underline that the use of multiple cross-sections certainly
provides better and less biased estimates as compared to the use of one single data source. For
instance, for the analysis of trends in educational inequality from a birth-cohort perspective, it has
been argued that “given survey-specific sources of error, multiple observations of the same cohorts
over several surveys should lead to greater reliability of measurement” (Breen et al. 2009:1515).
Thus, we envisage such methodological framework as a strength rather than a weakness. We can
now further specify the population on which our study focuses.
4.1.2 . Defining the populationIn regard to the population definition of our research, we include in our analysis both Swiss citizens
and foreign residents, since the latter account for an important share of the total population of
Switzerland: about one-fifth today. Although the inclusion or exclusion of foreign residents in our
analysis could give rise to discussions, as this population is likely to have attained a different
educational system than in Switzerland, it is important to include them as they are, by definition,
part of the social structure. Omitting them would be similar to omitting women in the analysis of
social mobility, a practice that is no longer acceptable in societies in which women actively
participate in the labour force. Furthermore, as men's and women's social positions are
25 Except for the AP75 and ISSP87 surveys, where no weighting variable was available. Note that if not otherwisespecified, all analysis presented includes weightings.
92

interdependent of each other, Swiss national citizens' social position must be understood as a system
of mutual dependence with that of foreign residents.
Moreover, it is unclear whether citizenship would actually be correct criteria of exclusion. Indeed,
as can be seen in Figure 4.1, which was replicated from Wanner (2012), in the year 2000, more than
6% of Swiss citizens were born abroad and gained Swiss citizenship by naturalisation. In contrast,
almost 5% of foreign residents were actually born in Switzerland. Thus, while it may be true that a
sizeable share of foreign residents grew up and were socialised in a different environment than
Switzerland, this is not systematically the case. There are indeed many foreigners who spent most
of their lives, if not all their lives, in Switzerland, but were not naturalised due to the difficulty of
attaining Swiss citizenship. Furthermore, for those who were actually born abroad, we have no
indication of the timing of migration in their life course since this kind of information is usually
poorly documented in surveys. However, migrating to Switzerland during childhood versus
migrating during adulthood must have extremely different consequences in terms of life chances. It
may also have different implications according to country of origin. Last but not least, it was
actually underlined in previous research that the lack of inclusion of foreign residents in social
93
Total populationin 2000 census(7'288'010)
⎞⎥⎥⎥⎥⎬⎥⎥⎥⎥⎥⎠
Foreigner(20.5%)
⎞⎬⎠
Born in CH(4.8%)
⎞⎥⎬⎥⎠
Lived in CHfor more than 5years (16.8%)
⎞⎥⎥⎥⎥⎥⎥⎥⎬⎥⎥⎥⎥⎥⎥⎥⎥⎠
People withforeignbackground(27.9%)
⎞⎥⎥⎬⎥⎥⎥⎠
Born abroad(15.7%)
⎞⎥⎥⎬⎥⎥⎠
Lived in CHfor less than 5years (3.7%)
⎞⎥⎥⎬⎥⎥⎥⎠
Swiss citizens(79.5%)
⎞⎬⎠
Born abroad(6.6%)
⎞⎥⎬⎥⎠
Swiss bynaturalisation(7.4%)⎞
⎥⎬⎥⎠
Born in CH(72.9%)
⎞⎬⎠
Swiss by birth(72.1%)
100% 100% 100% 100% 100%
Citizenship Place of birth Place of livingin 1995
Naturalisationstatus
Citizenship atbirth
Figure 4.1: Detail of the population in Switzerland with foreign background in the 2000 censusdata.Note: Figure replicated and translated from Wanner (2012:25).
mobility research constitutes an important limitation. This is the case of research on Germany
where data used only includes German citizens, despite the fact that the share of foreign residents
grew to nine percent of the total population in the early 2000s (Müller and Pollak 2004:111). For all
these reasons, the inclusion of foreign residents is extremely relevant, especially in the Swiss
context.
However, as a form of a control for immigration effect and to outline tentatively whether the
structure of opportunities and constraints differs among the migrant population, we have tried also
to draw general trends separately on the two groups of population that compose the Swiss society,
divided according to citizenship criteria: the Swiss citizens versus the foreign residents. Of course,
because the group of non-Swiss citizens is extremely heterogeneous and because the citizenship
criteria does not say anything about timing of migration, trends we will draw will remain rather
crude. However, this attempt is better than nothing and will certainly provide some general and
interesting insights on the group of non-Swiss citizens and also how they relate to Swiss citizens.
A further criterion to define our population stems from age boundaries, as we limited our population
to people aged between 30 and 64 years old at the time of the survey. These age limits were chosen
first to prevent differential mortality between social classes, as people from lower social classes are
more likely to die younger than those from upper social classes (Breen et al. 2009:1481). Second,
we defined the 30 years old threshold to ensure that everyone had enough time to integrate in the
labour market in order to disentangle the potential effects of intragenerational social mobility and
career mobility. In fact, social mobility research usually assumes that after a certain age, it is
relatively rare that people change in social position (Erikson and Goldthorpe 1992b:72). More
precisely, it is expected that after reaching the age of 30, “individuals reach a stage in their careers
after which occupational changes conductive to significant upward or downward mobility become
relatively uncommon. In other words, it is suggested that there exists an initial stage that is ‘critical’
for career promotion (or demotion). After this stage, job mobility is still possible but should mostly
involve horizontal moves that are not much consequential for individuals’ locations in the
occupational hierarchy” (Barone and Schizzerotto 2011:336). The stage where no further significant
change in occupation occurs is referred to as occupational maturity (Goldthorpe 1987:52). Yet it
must be said that this remains a strong assumption, as the validity of the threshold gives rise to
some debates, in particular in the context of increasing employment uncertainty of our present-day
societies. For instance, Bühlmann (2010) documented that occupational maturity happens around
the age of 35 in the UK. Along similar lines, a collaborative research project undertaken within the
Equalsoc Network of Excellence as part of the 6th Framework Programme of the European Union
94
found significant variations over time and place in occupational maturity (See contributions of the
special issue of European Societies, in particular: Härkönen and Bihagen 2011; Hillmert 2011;
Wolbers, Luijkx, and Ultee 2011). Notwithstanding these discussions, we kept the threshold of age
30 for our analysis, it must be said, for statistical reasons, in order to increase the robustness of our
models. Nonetheless, earlier analysis restricted to people aged at least 35 did provide comparable
outcomes to those presented in this thesis. Furthermore, our data quality assessments displayed in
Appendix B indicate that our substantive conclusions do not suffer from age effect. In other words,
we do not seem to suffer from potential biases imposed by the rather strong assumption of
occupational maturity at the age of 30.
Lastly, our research, like most of today's comparative research, includes women. While this
observation seems quite obvious for us today, it was actually not that straightforward in previous
times, as social mobility data collected was often confined to men (Breen and Jonsson 2005:235).
We envisage the inclusion of women in our research as a major advancement, given that at this time
very little research has investigated women's social mobility and systematically addressed gender
differences in social mobility in Switzerland.
Having defined our population, we can now turn to considerations regarding how we might best
gain insights of the unique dataset we constructed for the analysis of social mobility in Switzerland.
4.1.3 . Sample size, distribution of the population andjustification of approach
With the use of these twelve data sources and the definition of the population we chose, we are able
to reach a total sample size of 19,186 individuals. However, this sample size drops to 13,216 cases
when we consider only valid cases on our three variables of interest, namely social origin,
educational attainment and social destination (see Tables A.2 and A.3 in Appendix A). This gap
mainly pertains to the vast amount of missing information on social origin and social position in the
original sample size (respectively 25% and 20%), whereas missing information on educational
attainment is hardly existent (less than 1%). Missing information on social origin and social
position stems notably from people who never had an occupation. It is particularly marked among
women. However, it also encompasses true missing. As a consequence, because we exclude missing
cases and because they are likely to not happen at random, it might be the case that our findings
depict some bias. This is a major issue that has not been addressed in social mobility research.
However, because the design of an imputation procedure for missing information on social origin
and social position would constitute a tremendous amount of work and be somewhat controversial,
95

we simply omit missing information.
Having discussed the issue of missing cases, we can now decide which approach is best to capture
temporal trends with our data. on the one hand, we could assess temporal dynamics in social
mobility in a period perspective – for instance, according to year of survey or decades. On the other
hand, we could look at differences in social mobility opportunities from a birth-cohort perspective,
by dividing our sample according to the year of birth of respondents.
Two main reasons lead us to suspect that the best approach for the present research should be the
latter. First, as some recent research suggests, change is more likely to be driven by a process of
cohort replacement rather than through period change (Breen and Jonsson 2007:1805; see also:
Müller and Pollak 2004). Second, most of the surveys we use were collected from the late 1990s
onwards. Thus, by definition, we have little leeway to truly capture period dynamics with our data,
particularly since we have only one survey for the 1970s and one for the 1980s and these surveys
both have small sample sizes and demonstrate some weaknesses for the construction of indicators,
as we will underline in Point 4.3. Therefore, in the end we decided to opt for the birth-cohort
approach.
96
Figure 4.2: Distribution of sample according to birth year
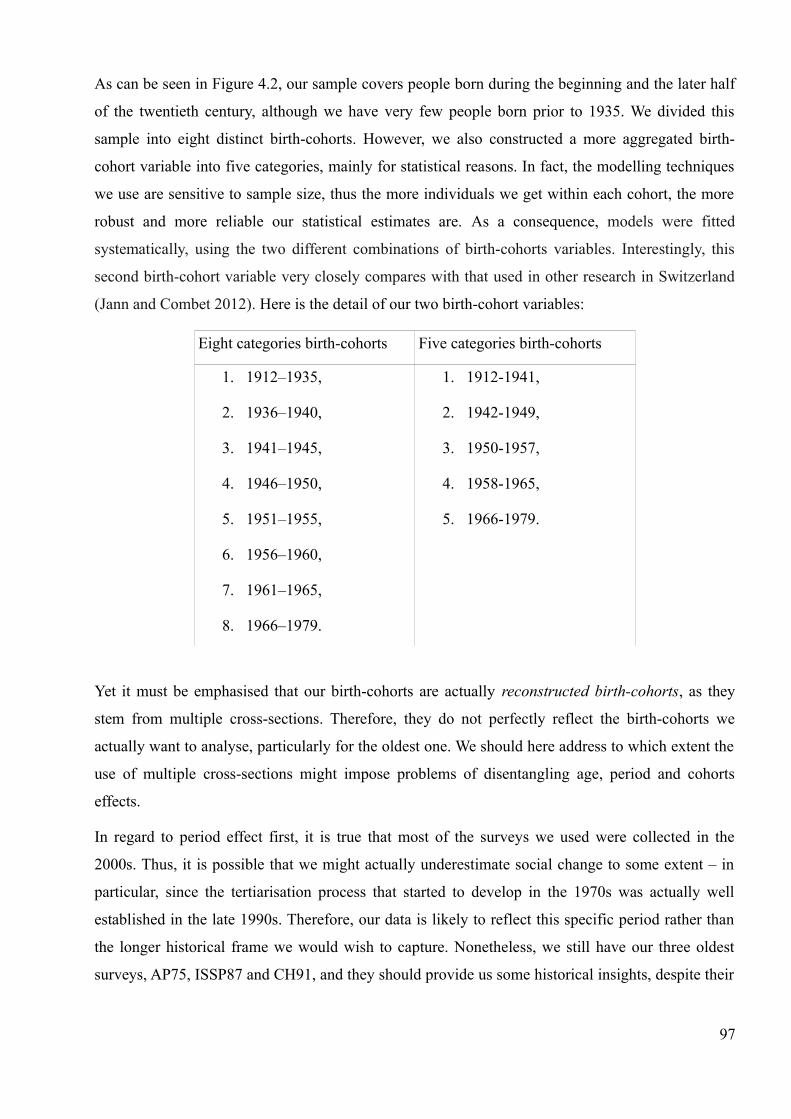
As can be seen in Figure 4.2, our sample covers people born during the beginning and the later half
of the twentieth century, although we have very few people born prior to 1935. We divided this
sample into eight distinct birth-cohorts. However, we also constructed a more aggregated birth-
cohort variable into five categories, mainly for statistical reasons. In fact, the modelling techniques
we use are sensitive to sample size, thus the more individuals we get within each cohort, the more
robust and more reliable our statistical estimates are. As a consequence, models were fitted
systematically, using the two different combinations of birth-cohorts variables. Interestingly, this
second birth-cohort variable very closely compares with that used in other research in Switzerland
(Jann and Combet 2012). Here is the detail of our two birth-cohort variables:
Eight categories birth-cohorts Five categories birth-cohorts
1. 1912–1935,
2. 1936–1940,
3. 1941–1945,
4. 1946–1950,
5. 1951–1955,
6. 1956–1960,
7. 1961–1965,
8. 1966–1979.
1. 1912-1941,
2. 1942-1949,
3. 1950-1957,
4. 1958-1965,
5. 1966-1979.
Yet it must be emphasised that our birth-cohorts are actually reconstructed birth-cohorts, as they
stem from multiple cross-sections. Therefore, they do not perfectly reflect the birth-cohorts we
actually want to analyse, particularly for the oldest one. We should here address to which extent the
use of multiple cross-sections might impose problems of disentangling age, period and cohorts
effects.
In regard to period effect first, it is true that most of the surveys we used were collected in the
2000s. Thus, it is possible that we might actually underestimate social change to some extent – in
particular, since the tertiarisation process that started to develop in the 1970s was actually well
established in the late 1990s. Therefore, our data is likely to reflect this specific period rather than
the longer historical frame we would wish to capture. Nonetheless, we still have our three oldest
surveys, AP75, ISSP87 and CH91, and they should provide us some historical insights, despite their
97
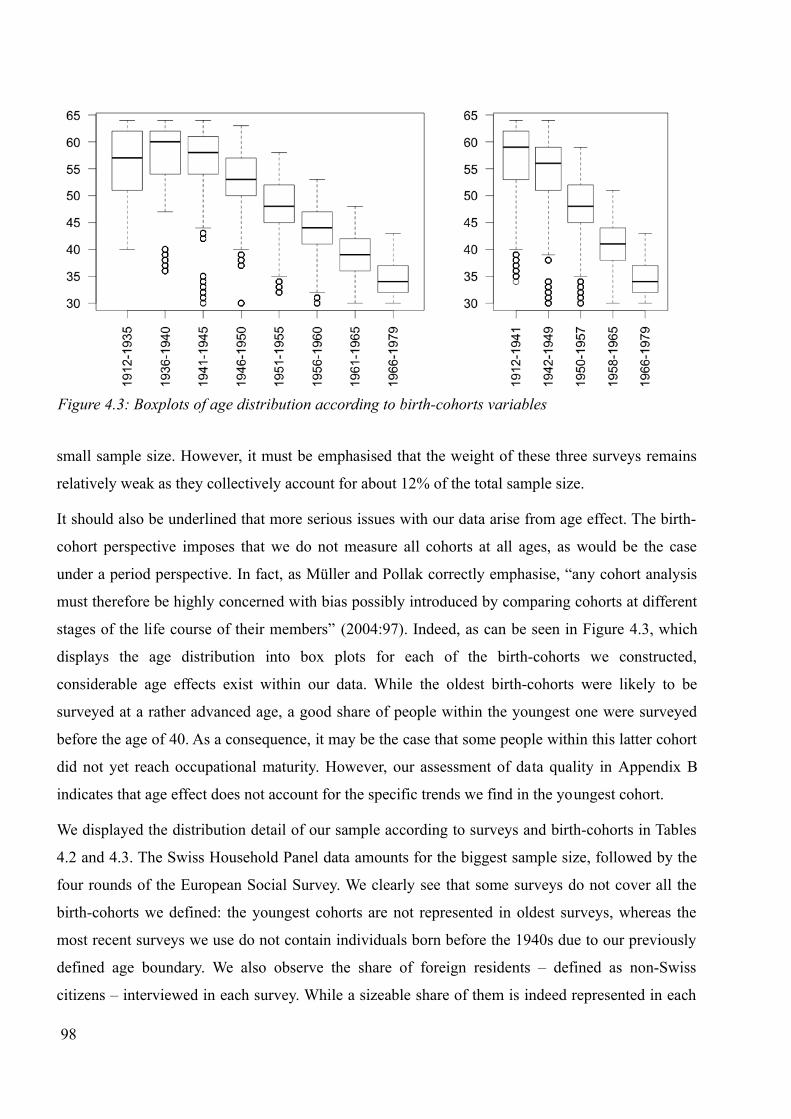
small sample size. However, it must be emphasised that the weight of these three surveys remains
relatively weak as they collectively account for about 12% of the total sample size.
It should also be underlined that more serious issues with our data arise from age effect. The birth-
cohort perspective imposes that we do not measure all cohorts at all ages, as would be the case
under a period perspective. In fact, as Müller and Pollak correctly emphasise, “any cohort analysis
must therefore be highly concerned with bias possibly introduced by comparing cohorts at different
stages of the life course of their members” (2004:97). Indeed, as can be seen in Figure 4.3, which
displays the age distribution into box plots for each of the birth-cohorts we constructed,
considerable age effects exist within our data. While the oldest birth-cohorts were likely to be
surveyed at a rather advanced age, a good share of people within the youngest one were surveyed
before the age of 40. As a consequence, it may be the case that some people within this latter cohort
did not yet reach occupational maturity. However, our assessment of data quality in Appendix B
indicates that age effect does not account for the specific trends we find in the youngest cohort.
We displayed the distribution detail of our sample according to surveys and birth-cohorts in Tables
4.2 and 4.3. The Swiss Household Panel data amounts for the biggest sample size, followed by the
four rounds of the European Social Survey. We clearly see that some surveys do not cover all the
birth-cohorts we defined: the youngest cohorts are not represented in oldest surveys, whereas the
most recent surveys we use do not contain individuals born before the 1940s due to our previously
defined age boundary. We also observe the share of foreign residents – defined as non-Swiss
citizens – interviewed in each survey. While a sizeable share of them is indeed represented in each
98
Figure 4.3: Boxplots of age distribution according to birth-cohorts variables
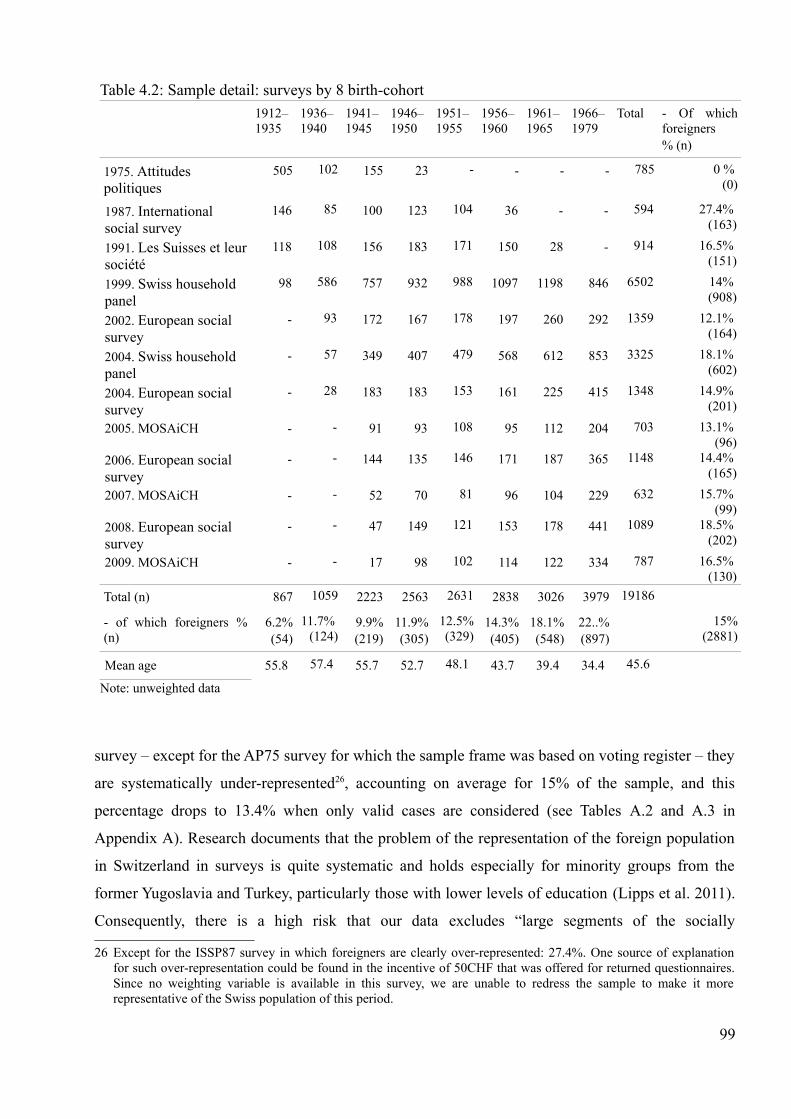
survey – except for the AP75 survey for which the sample frame was based on voting register – they
are systematically under-represented26, accounting on average for 15% of the sample, and this
percentage drops to 13.4% when only valid cases are considered (see Tables A.2 and A.3 in
Appendix A). Research documents that the problem of the representation of the foreign population
in Switzerland in surveys is quite systematic and holds especially for minority groups from the
former Yugoslavia and Turkey, particularly those with lower levels of education (Lipps et al. 2011).
Consequently, there is a high risk that our data excludes “large segments of the socially
26 Except for the ISSP87 survey in which foreigners are clearly over-represented: 27.4%. One source of explanationfor such over-representation could be found in the incentive of 50CHF that was offered for returned questionnaires.Since no weighting variable is available in this survey, we are unable to redress the sample to make it morerepresentative of the Swiss population of this period.
99
Table 4.2: Sample detail: surveys by 8 birth-cohort
1912–1935
1936–1940
1941–1945
1946–1950
1951–1955
1956–1960
1961–1965
1966–1979
Total - Of whichforeigners% (n)
1975. Attitudes politiques
505 102 155 23 - - - - 785 0 % (0)
1987. International social survey
146 85 100 123 104 36 - - 594 27.4% (163)
1991. Les Suisses et leur société
118 108 156 183 171 150 28 - 914 16.5% (151)
1999. Swiss household panel
98 586 757 932 988 1097 1198 846 6502 14% (908)
2002. European social survey
- 93 172 167 178 197 260 292 1359 12.1% (164)
2004. Swiss household panel
- 57 349 407 479 568 612 853 3325 18.1% (602)
2004. European social survey
- 28 183 183 153 161 225 415 1348 14.9% (201)
2005. MOSAiCH - - 91 93 108 95 112 204 703 13.1% (96)
2006. European social survey
- - 144 135 146 171 187 365 1148 14.4% (165)
2007. MOSAiCH - - 52 70 81 96 104 229 632 15.7% (99)
2008. European social survey
- - 47 149 121 153 178 441 1089 18.5% (202)
2009. MOSAiCH - - 17 98 102 114 122 334 787 16.5% (130)
Total (n) 867 1059 2223 2563 2631 2838 3026 3979 19186
- of which foreigners %(n)
6.2%(54)
11.7% (124)
9.9%(219)
11.9%(305)
12.5%(329)
14.3%(405)
18.1%(548)
22..%(897)
15%(2881)
Mean age 55.8 57.4 55.7 52.7 48.1 43.7 39.4 34.4 45.6
Note: unweighted data

disadvantaged population of non-western European origin” (Laganà et al. 2013:1289). In other
words, our data is not likely reflect the social reality, as it does not capture the most vulnerable
groups of the population. One way to deal with this issue is to redress the under-represented groups
through the implementation of weightings. This procedure indeed clearly enables us to give more
weight to the foreign population: when we apply weightings, their representation grows to 22.7%
and 21.6% respectively for the whole sample, and for valid cases only. Therefore, applying
weightings to our sample clearly improves the quality of our data.
Notwithstanding these improvements, it is important to underline that weightings tend to over-
represent the most advantaged segments of the foreign population, whereas the most disadvantaged
100
Table 4.3: Sample detail: surveys by 5 birth-cohort
1912–1941
1942-1949
1950-1957
1958-1965
1966-1979
Total - Of whichforeigners% (n)
1975. Attitudes politiques 638 147 - - - 785 0 % (0)
1987. International social survey
249 180 165 - - 594 27.4% (163)
1991. Les Suisses et leur société
248 287 267 112 - 914 16.5% (151)
1999. Swiss household panel 825 1344 1625 1862 846 6502 14% (908)
2002. European social survey
128 261 294 384 292 1359 12.1% (164)
2004. Swiss household panel 119 600 789 964 853 3325 18.1% (602)
2004. European social survey
62 296 242 333 415 1348 14.9% (201)
2005. MOSAiCH 18 149 161 171 204 703 13.1% (96)
2006. European social survey
- 248 236 299 365 1148 14.4% (165)
2007. MOSAiCH - 106 137 160 229 632 15.7% (99)
2008. European social survey
- 160 222 266 441 1089 18.5% (202)
2009. MOSAiCH - 96 169 188 334 787 16.5% (130)
Total (n) 2287 3874 4307 4739 3979 19186
- of which foreigners % (n)
9.7% (221)
10.5%(405)
13.2%(567)
16.7%(791)
22.5%(897)
15% (2881)
Mean age 56.7 54.2 47.6 40.7 34.4 45.6Note: unweighted data

ones remain largely under-represented. As a result, returned statistical estimates are certainly biased
in a conservative way. In the end, the most efficient method to adequately represent foreigners in
surveys would seem to be the overcoming of the language barrier (see Laganà et al. 2013).
Yet in spite of these limitations, our data will enable us to gain some interesting insights on the
specificities of social mobility in Switzerland. Indeed, the data we use and the birth-cohort approach
we chose are quite unique since they clearly enable us to capture as much historical change as
possible in social mobility in Switzerland. This approach is even more original since most previous
Swiss studies did not systematically assess trends in social mobility with such a wide time-scale.
Furthermore, the important sample size we get with the aggregation of multiple surveys might allow
us to draw rather serious outcomes in regard to both absolute trends as well as relative trends in
social mobility. In fact, this point is crucial, as statistical models we use are sensitive to sample size.
Therefore, in addition to providing us with a large time frame, our data, with such a large sample
size, “allows for more robustness in the models estimated” (Breen and Jonsson 2005:236).
Altogether, our research design provides serious bases for the analysis of social mobility dynamics
in Switzerland and should enable us to draw new insights in this respect. We shall now discuss the
measurement tools we use for our analysis.
4.2 . Choice of indicatorsAs we have seen in the introduction of this thesis, any measurement tool imposes a certain vision of
the world. We underlined that social positions, when measured in terms of socio-economic index,
convey a unidimensional view of hierarchies usually reflected in the form of ladders. However,
when considered in terms of social classes, social positions mirror hierarchies in a multidimensional
stance, since they more adequately describe relations between different classes. We clearly see the
latter representation as the most theoretically correct for the study of social mobility. We will thus
take this approach as our starting point. We further suggested that mountains provide an interesting
metaphor of social stratification and class structure, since mountains can take different forms and,
more importantly, change over time. Therefore, we will implement two different class schema to
our data in order to address this social change issue in the social stratification map.
In line with previous research, we understand indicators we use as instruments de travail. This
implies that we will distinguish as many categories “as it proves empirically useful to distinguish
for the analytical purposes in hand” (Erikson and Goldthorpe 1992b:46). We will now detail and
justify the indicators we chose with the use of two different class schema and of a specific
educational grid.
101

4.2.1 . The ESeC class schema rather than the EGP class schemaThe first class schema we chose to implement to our data is the European Socio-economic Class
schema (Rose and Harrison 2010b henceforth ESeC). This new class schema was commissioned by
Eurostat to serve as a comparative measure of social class in Europe. This classification constitutes
a good instrument to measure social stratification in Europe, despite often being criticised for its
supposed British bias.
The ESeC class schema indeed takes its roots from the British context, as it was elaborated
following the revision of the United Kingdom's social class nomenclature in the early 2000s for this
country's Office for National Statistics (Brousse 2008, 2012). This British classification, namely the
National Statistics Socio-economic Classification (NS-SEC), stems from the EGP class schema, the
class schema that was created by Erikson, Goldthorpe and Portocarero (1979) for the analysis of
social mobility.
Therefore, affinities between ESeC and the classic EGP class schema are important, as it can be
seen in Table 4.4. Indeed, from this standpoint it seems that ESeC is actually no different from EGP.
Yet we will clarify shortly why ESeC is better than EGP and why it should now be preferred to
EGP. We should nonetheless first share the particular theoretical rationale that ESeC and EGP share
102
Table 4.4: The ESeC and EGP class schemas compared
ESEC EGPEmploymentrelationship
1 Higher salariat I Higher service classService relationship
2 Lower salariat II Lower service class
3 Higher-grade white-collar workers IIIaHigher-grade routine non-manual employees
Mixed 6 Higher-grade blue-collar workers V
Lower-grade technicians and manual supervisory
4 Petite bourgeoisie or independents IVab Non-farm petty bourgeoisieNot applicable
5 Farmers IVc Farmers
7 Lower-grade white-collar workers IIIbLower-grade routine non-manual employees
Labour contract
8 Skilled workers VI Skilled manual workers
9 Semi- and non-skilled workers
VIIaSemi- / unskilled manual worker not in agriculture
VIIbSemi- / unskilled manual worker in agriculture

in common. This is indeed a very important point, as most other Socio-economic Classifications
were constructed following national representations, such as the French Professions et Catégories
Socioprofessionnelles (PCS).
As we mentioned earlier (cf. Section 2.2.1), the EGP class schema is based on the twofold
conceptual distinction between employment relationships and employment regulation. The former
discriminates between (1) the employers, (2) the self-employed without employees, and (3) the
employees, whereas the latter denotes divisions between employees that have (1) a service
relationship regulation, (2) a labour contract regulation, and (3) an intermediate form of regulation.
The concept of employment regulation amongst the employees can easily be summarised in a two-
axis map, as can be seen in Figure 4.4, with the horizontal axis displaying the extent of difficulty of
monitoring and the vertical axis displaying the extent of specificity of human assets. The
corresponding ESeC classes are reported accordingly on the axes of the map.
Thus, for these strong theoretical similarities, ESeC and EGP are expected to be very comparable
and we therefore expect that the overall conclusions of the present research carried out with ESeC
will be substantially comparable to the conclusions of other international research that was drawn
with the EGP schema. Indeed, research comparing the two class schema found that “on average
103
Figure 4.4: Difficulty of monitoring, specificity of human asset and the EseC classesNote: Figure replicated from Rose, Harrison, and Pevalin (2010:12)

about 70 per cent are allocated to corresponding classes by the two class schema” (Davis and Elias
2010:97).
Yet differences between the two classifications arise in several respects. As compared to the original
EGP class schema, the ESeC classification clearly makes a distinction between higher-grade white-
collar workers that have a mixed employment regulation (ESeC 3) and lower-grade white-collar
workers that are characterised with a labour contract (ESeC 7) (Brousse 2008). In the original
version of the EGP classes, both were allocated into the class III of routine non-manual, which has a
mixed employment regulation. Bihagen, Nermo and Erikson (2010) also highlighted that the share
of the higher salariat in ESeC (EseC 1) is smaller than its corresponding EGP class (EGP I). They
explain that ESeC discriminates the higher salariat class better and reallocates some occupations
originally classified in EGP I into the lower salariat class (ESeC 2). They further underline that the
share of higher-grade blue-collar workers (ESeC 6 and EGP V) is considerably larger with ESeC
than with EGP. This category seems the most troublesome since in EGP more than 30% of ESeC 6
is allocated into EGP II and 20% into EGP VII. Nevertheless, Bihagen, Nermo and Erikson argue
that the ESeC version of higher-grade blue-collar workers is actually more in line with theoretical
expectations and thus should be a more reliable measure. Ultimately, ESeC provides a reliably
adapted and improved classification in comparison to the original EGP class schema.
Notwithstanding these improvements, the ESeC classification – and logically its EGP ancestor –
met a certain amount of criticism. Maloutas (2007) in particular asserted that this European
nomenclature would have several weaknesses. According to him, (1) the employment relationship
divide (employee – self-employed) should be more significant than the employment regulation one;
(2) the concept of employment regulation would not be relevant in national contexts where the
public sector is highly developed; (3) the isolation of a class of farmers would be not theoretically
grounded; and (4) the schema would be British-biased and would not adequately describe southern
European societies where, notably, self-employment is significantly developed.
However, while it might be true that ESeC – as well as EGP – does fail to capture all European
societies' specificities, much research indicates that ESeC is not heavily Bristish-biased (see Davis
and Elias 2010 for a comparative research; see Wirth et al. 2010 for an application of ESeC in the
German context). Interestingly, analysis undertaken by Barone, Schizzerotto and Barone (2010)
demonstrates that ESeC actually performs better than EGP for the analysis of educational inequality
in Italy. This latter point seems indeed to be the strength of ESeC as compared to EGP, as the former
is expected to have a better discriminatory power.
A further strength of ESeC stems from its documentation, and particularly in regard to its
104

operationalisation, which is not only highly transparent but also makes it possible to impute social
class position in cases of missing information on employment relationship or supervisory status
(Davis and Elias 2010:104–105). In contrast, the operationalisation of the EGP class schema is not
that straightforward; Goldthorpe argues that it should be adapted to each national context by local
experts, as the same occupation might be associated with different employment relations in different
countries. While we understand Goldthorpe's point, there seems to be no clear-cut harmonised
criterion for such an endeavour, which is a major problem – as local experts might have different
interpretations of employment regulation. Furthermore, researchers very often use existing
algorithms that do not adapt for national peculiarities, such as those proposed by Ganzeboom and
Treiman (2003). Yet while it provides a harmonised base for the construction of the EGP class
schema, it seems that the proposed operationalisation is not without its problems (for a detailed
discussion, see Appendix B in Rose and Harrison 2010a:294).
For all the reasons discussed above, ESeC has the merit to provide a comprehensive and
harmonised socio-economic classification to measure social classes in Europe and we expect that it
should provide a more reliable measure than EGP, while still remaining highly comparable with it
as well as with previous comparative research in our field.
Yet in recent years, it has been increasingly suggested that we should also look at more
disaggregated social classes in order to counter the death of class thesis. This is set to be one of the
prospects of the ESeC consortium (see Rose and Harrison 2010a). However, Grusky has already set
a research agenda for a new class analysis from a decomposed micro-class occupation-based
perspective rather than from a big-class-based one, the so-called “decomposition without death”
approach (Grusky and Weeden 2001). Other scholars, such as Güveli, have proposed a trade-off
perspective by disaggregating EGP's big service classes into two different fractions (see notably
Güveli et al. 2012). We shall discuss these new approaches in the next section, in particular in the
light of societal changes Western societies have undergone over the last few decades, since as
Boeda underlines, “classifications age because reality changes. classifications need to be revised
periodically” (2009:3).
4.2.2 . Grusky's, Güveli's and Oesch's class scheme : introducing,discussing and choosing disaggregated measures of social classfor the analysis of social mobility
Very recently, two research studies have proposed a new way to look at social mobility. First, the
research by Jonsson, Grusky, Di Carlo, Pollak and Brinton (2009) has analysed social mobility in an
extremely disaggregated fashion. Second, the research by Güveli, Luijkx and Ganzeboom (2012)
105
has suggested that new social mobility dynamics were emerging within EGP's service class. While
both research studies take very different perspectives, they both share our view to question the long-
term validity of the EGP class schema for social mobility analysis. It was indeed argued that the
EGP class schema is very well suited to describe industrial societies like those that of Western
societies exhibited in the 1970s when it was created, but that it no longer adequately captures social
divisions in today's societies (Oesch 2006a, 2006b). This criticism, it must be underlined, was
developed in reaction to the development of the supposed death of class thesis which stated that
social classes were no longer relevant in our globalised economies (Clark and Lipset 1991; Pakulski
and Waters 1996). With the recent findings of non-persistent inequality in educational attainment
and increasing social fluidity, some post-modern scholars could be tempted to conclude that social
class indeed lost its salience. Yet Weeden and Grusky insisted on the fact that “these results are
misleading insofar as they are driven by a weakening of the signal that is captured by the
measurement tool. (...) such weakening may simply be an artefact of applying a measurement tool
that is conveying ever less information about the inequality space” (2012:1756). In this context, we
will introduce and discuss new disaggregated measures of social class, notably Grusky's micro-class
approach, Güveli's adaptation of the EGP class schema, and finally Oesch's proposition of
redrawing of the class map.
The micro-class theory was developed notably by Grusky and Weeden (2001; see also Weeden and
Grusky 2005). According to them, class action takes place at the occupational level rather than at a
big-class level. Therefore, they envisage the social structure as decomposing – at a ratcheting-down
level within occupations. Recent comparative empirical research (see Jonsson et al. 2009) has in
fact proven that when applying the micro-class perspective to social mobility analysis, there is
actually a large share of social immobility that is driven at the micro-class level rather than at the
big-classes one. In other words, social reproduction is particularly likely to happen not necessarily
within big-classes, but within occupational groups: for instance, a son of carpenter is more likely to
become a carpenter and a son of a medical doctor, himself a medical doctor.
The micro-class analysis of social mobility, however, received a certain number of critics (see
notably Erikson, Goldthorpe, and Hällsten 2012). In particular, criticisms were addressed regarding
the theoretical reasons to expect reproduction at the occupational level. Yet Jonsson, Grusky, Di
Carlo, Pollak and Brinton actually do provide general theoretical arguments in that respect, based
on the distinction of four types of resources: (1) human capital, (2) cultural capital, (3) social
network/social capital, and (4) economic resources. According to them, these resources shall be
envisaged as occupationally specific resources. They argue that “because the social, cultural and
106

economic resources conveyed to children depend so fundamentally on the occupations of their
parents, one might expect occupations to play a featured role in intergenerational reproduction.”
(Jonsson et al. 2009:978). A further point of criticism stems from the extremely deterministic vision
of society that this analysis imposes to us. These authors are indeed very much concerned with
explaining social immobility and they say nothing regarding eventual social mobility affinities that
might exist between different occupations.
As far as we are concerned, we think that while it may be true that for some occupational segments
– especially those at the extremes of the social structure, those that require higher education and
those that are characterised by a self-employment employment relationship – social reproduction
might be more marked and even eventually increasing, the micro-class approach still poses the issue
of how our Western societies have evolved since Middle Ages, a time when occupations were
clearly passed down from father to son. In fact, in a context where educational and occupational
supply are increasingly large and diversified, this finding initially seems counterintuitive to us. Yet
this approach has merit to be provocative enough to question the extent of openness in today's so-
called free societies since “intergenerational choice remains very circumscribed and that residues of
caste-like reproduction persist to a greater extent than most of us had probably imagined.” (Jonsson
et al. 2007:37). However, it still remains unclear to us as to how the micro-class approach envisages
social change. For instance, we could wonder to which extent we could expect occupational
reproduction to be more important today than yesterday, and why. Similarly, we could wonder how
compositional changes in the social structure could be accounted for, since with the development of
technology, new occupations emerge and others disappear.
Therefore, since we are very much concerned with the issue of social change, the approach
proposed by Güveli (see Güveli and Graaf 2007; Güveli et al. 2012; Güveli, Need, and Graaf 2007)
seems quite interesting to us. Clearly, the starting point of Güveli's approach is to question the
extent to which change in the social structure modifies social mobility dynamics. In the research she
published with Luijkx and Ganzeboom (2012), she shows in the context of the Netherlands that
heterogenous social mobility and social reproduction dynamics exist within different fractions of
Goldthorpe's service class. Addressing the heterogeneity issue is particularly relevant in this
particular country, since the service class accounts for about 50% of the total labour force. To
demonstrate so, she outlines new division lines within the service class by distinguishing “the
technocrats” on the one hand and “the social and cultural specialists” on the other, a typology
inspired from Kriesi (1989), within EGP's classes I and II (higher and lower salariat). Allocation to
one of the service class fractions was defined as follows: “occupations are to be classified as social
107

and cultural specialists if the tasks are relatively difficult to monitor by employers and if the basic
tasks consist of social services and/or are based on specialized knowledge in social and cultural
issues; occupations are to be allocated into the fraction of technocrats, if their tasks are relatively
easy to monitor by their employer or if the basic tasks in these occupations consist of controlling
employees.” (Güveli et al. 2012:228). In the end, the new disaggregated service class is detailed as
follows:
– Ia. the old class of high-grade technocrats (Managers of large firms, governmental and non-
governmental administrators, physical scientists, etc.)
– Ib. the new class of high-grade social and cultural specialists (Medical doctors, dentists,
university teachers, social scientists, high church officers etc.)
– IIa. the old class of low-grade technocrats (Managers of small firms, engineers, computer
programmers, accountants, etc.)
– IIb. the new class of low-grade social and cultural specialists (Medical assistants,
professional nurses, teachers, journalists, artists, etc.)
This research pointed out that there is more upward mobility towards the technocrats category and
more reproduction within the social and cultural specialists. In other words, heterogeneous social
mobility dynamics were found when disaggregating EGP's big service class. Authors explain that
the new pointed division lines stem from differences in available resources within these two
fractions of the service class. In line with Bourdieu and Passeron's (1964, 1970) cultural
reproduction theory, they argue that social immobility is higher within the social and cultural
specialists than in the technocrats, since the former are often more educated and have more cultural
resources, which are easier to store in families than economic resources. In other research, Güveli
had already demonstrated that this new class conception makes sense with respect to political
preference, lifestyle, and life course developments (Güveli and Graaf 2007; Güveli et al. 2007). Yet
it must be said that they were not able to demonstrate that inheritance within these class fractions
had increased over time. One reason for that might pertain to the general increasing social fluidity
pattern that characterises the Netherlands (see Ganzeboom and Luijkx 2004).
Notwithstanding the lack of support for increasing differentiation over time into the service class
fractions in the Netherlands, we consider Güveli, Luijkx and Ganzeboom's analysis as a serious and
constructive attempt to address issues of the changing social structure from an industrial to a post-
industrial one. We consider it critical to test whether when looking at more disaggregated measures
of social class, alternative social (im-)mobility dynamics could be uncovered. Yet rather than using
108
Güveli's adaptation of the EGP class schema, we propose the present analysis to use the Oesch class
schema (2006a, 2006b). While this class schema has similar theoretical roots as Güveli's (Erikson et
al. 1979; Kriesi 1989), it actually has the advantage of offering finer distinctions of different
fractions within the service class. Furthermore, this class schema was operationalised in a
comparative context, in which Switzerland was included.
The Oesch class schema was clearly created to provide some answers to the changing social
structure. This class schema should arguably reflect macro-structural changes that characterise our
present-day post-industrial societies and that can be summarised under these three interdependent
general phenomenons: educational expansion, feminisation, and tertiarisation. As a consequence of
these macro-structural changes, Oesch sustains that (1) the manual – non-manual worker divide is
no longer relevant and (2) the service class has become too big a class. Therefore, he proposes a
new conceptual map of social classes.
Oesch constructed his class schema on the twofold distinction between marketable skills and work
logics. While the former describes the vertical level which constitutes, according to him, “a concept
that is more easily operationalised than the somewhat blurry concept of employment relationship”
(Oesch 2006b:67), the latter defines differences at the horizontal level. We see the horizontal level
as the major strength of the Oesch class schema. Indeed, such explicit horizontal divisions aligned
at similar hierarchical levels provide a largely different vision of the social structure. Not only does
this horizontal distinction enable researchers to view the service class as composed of different
fractions, but also to envisage the distance between manual and non-manual worker classes at a
similar horizontal level, rather than a vertical one. These horizontal divides, conceptualised as work
logics, are inspired from Wright's (1989, 1997) class schema. Yet in contrast to Wright, who relies
on assets to define these horizontal differences, Oesch insists “instead on the differences in the daily
work experience as determining different interests and loyalties with the middle class” (2006b:61).
Four work logics are identified:
– The independent work logic. It is specific of employers and the self-employed.
– The organisational work logic. It defines work involving coordination, authority and control
where orientation is towards the organisation. It is usually characterised of manager-type
occupation and should be associated with a clear command structure that corresponds to a
career sequence.
– The technical work logic. It consists of the development and use of technical expertise and
the orientation is towards a scientific community or trade rather than towards the employing
109
organisation.
– The interpersonal service work logic. These occupations involve face-to-face services and
depend primarily on social skills. Unlike the organisational work logic, which involves a
direct line of command and loyalty towards the organisation, the interpersonal service work
logic is primarily oriented towards clients, patients or petitioners and relies mainly on
education, thus offering less occupational mobility perspectives.
Interestingly, Güveli also built on a similar idea of Oesch's concept of work logic to distinguish
between the service class fraction she identifies, since she mentioned that “managers seek to
prevent the interest and the viability of the organisation they work for while specialists try to
prevent the interest of their clients, patients or students and/or their field of specialisation.”(Güveli
and Graaf 2007:187).
In the end, Oesch distinguishes 17 social classes within his class schema, as can be seen in Figure
4.5. In our view, the Oesch class schema not only has the ability to capture peculiarities of post-
industrial societies, including the phenomenon of occupational gender segregation and the
clustering of employment in the welfare state, it also further encompasses all fractions of “old” and
“new” middle classes, which is not the case of Güveli's adaptation of the EGP class schema. Indeed,
Güveli's approach distinguishes only what she calls the old middle class, the technocrats, and the
new middle class, the social and cultural specialists. Yet she totally ignores the “genuine” old
middle class, which is composed of large employers and self-employed professionals. Of course, it
would be unfair to criticise Güveli's approach without mentioning the “EGP bias”. In fact, her class
schema proposition is more of an adaptation of EGP's class schema than a truly new class schema,
and the failure to isolate a category of large employers and self-employed professionals does
actually constitute a long-lasting criticism to the EGP class schema. Breen in particular underlines
that “placing them in class I (rather than, say, in a new sub-class in class IV) does lead to an
inconsistency between the theoretical postulates of the schema and its implementation” (2005:42).
Goldthorpe himself recognises this problem, since he underlines that “this procedure is faute de
mieux and means introducing some, though in all probability only a quite small, degree of error”
(1995:314).
For all these reasons, the Oesch class schema is better suited than both Grusky's micro-class and
Güveli's disaggregated service classes to assess the extent of possible finer division lines within
different fractions of the Swiss social structure. We see this choice of indicator even more exciting
since, as far as we know, the Oesch class schema has not yet been applied to other social mobility
110

analysis.
We have so far detailed and justified the choice of our two measures of social class. We can now
turn to our choice of an education grid.
4.2.3 . The BHJM educational grid as a simplified SwissCASMIN version
In contrast to the choice of social class indicators, we will be more concise in justifying the choice
of our educational grid. It must be said that the reason why we chose to code our educational
variable following the grid proposed by Bergman, Hupka, Joye and Meyer (2009 henceforth
BHJM) was a very practical one: this grid actually proposed a harmonised codification procedure
for all the surveys we use.
When elaborating this grid, the authors were concerned with taking into account both the
specificities of the Swiss educational system and the evolution it went through, especially during
the last two decades with the introduction of the professional maturity degree and the development
of Universities of Applied Sciences. Therefore, this grid was clearly developed to fit with the Swiss
context – though it actually does closely compare with the actual CASMIN classification (Müller et
111
Self-employed Employees
Independent work logic
Technicalwork logic
Organisational work logic
Interpersonal service work logic
Marketableskills:
1. Largeemployers (>9)Firm ownersHotel ownersSalesmen
2. Self-employedprofessionalsLawyersAccountantsMedical doctors
5. Technical expertsMechanical engineersComputing professionalsArchitects
10. Higher-grade managersBusiness administratorsFinancial managersPublic administrators
14. Socio-culturalprofessionalsUniversity teachersMedical doctorsJournalists
Professional /Managerial
3. Small proprietors, artisans,with employees (<9)Restaurant ownersFarmersGarage owners
6. TechniciansElectrical techniciansComputer equipmentoperatorsSafety inspectors
11. Associate managersManagers in small firmsTax officialsBookkeepers
15. Socio-cultural semi-professionalsPrimary school teachersPhysiotherapistsSocial workers
Associateprofessional /managerial
4. Small proprietors, artisans,without employeesShopkeepersHairdressersLorry drivers
7. Skilled craftsMachinery mechanicsCarpentersElectricians
12. Skilled officeSecretariesBank tellersStock clerks
16. Skilled serviceChildren's nursesCooksBeauticians
Generally /vocationallyskilled
8. RoutineoperativesAssemblersMachinistsFreighthandlers
9. RoutineagricultureFarm handsLoggersGardeners
13. Routine officeMail sorting clerksCall centre employeesMessengers
17. Routine serviceShop assistantsHome helpersWaiters
Low / un-skilled
Figure 4.5: The Oesch class schemaNote: Figure replicated from Oesch (2006b:68)

al. 1989), the educational grid that is usually used in comparative social mobility research.
Indeed, as can be seen in Table 4.5, both grids share a lot of affinities and the same general
structure. However, some differences arise. First, it can be seen that the BHJM grid insists more on
the categorical nature of the Swiss educational system, whereas the CASMIN grid, while
acknowledging some horizontal divisions, is clearly more structured in a hierarchical way. This
specificity of the Swiss grid can be found in the numbering of educational levels it uses, since the
secondary professional educational level is actually numbered in fourth position, while its CASMIN
equivalent would be second. While this numbering from the outside can look anecdotic, it clearly
acknowledges the importance of the development of vocational education through the
apprenticeship system in the context of Switzerland. Second, the BHJM grid does not provide the
detail of the different categories corresponding to different extents of compulsory education.
Similarly, the BHJM grid does not distinguish within the secondary general educational level
112
Table 4.5: Comparison of the BHJM and the CASMIN educational grids
The Bergman, Hupka, Joye and Meyer grid The CASMIN grid
1 Compulsory education 1a Inadequately completed elementaryeducation
1b Completed (compulsory) elementaryeducation
1c (Compulsory) elementary educationand basic vocational qualification
4 Secondary professional education(including elementary vocationaltraining)
2a Secondary intermediate vocationalqualification or intermediate generalqualification and vocationalqualification
2 Secondary general education withoutmaturity
2bSecondary intermediate generalqualification
3 Secondary general education withmaturity (including vocational maturityand “école normales” for oldestsurveys)
2c_gen Full general maturity certificates
2c_voc Full vocational maturity certificate orgeneral maturity certificate andvocational qualification
5 Post-secondary and lower tertiaryvocational education (includingUniversities of Applied Sciences HES /HEP)
3a Lower tertiary education
6 University education (withoutdistinction between short and longtraining)
3b Higher tertiary education

between the general maturity and the vocational maturity.
Differences between both grids could further be discussed. In the same vein, we could also have
discussed the extent to which this grid relates to the International Standard Classification of
Education (ISCED-7) (see Schneider 2008). However, while it is true that a thorough discussion of
these issues is required for the Swiss case, it goes beyond the scope of this PhD thesis, especially
since there are 26 educational systems in Switzerland, one within each canton.
Since we have now presented all the measures we wish to use for our research, we can now discuss
their operationalisation.
4.3 . Operationalisation of indicatorsThe twelve datasets we use contain the best available data in Switzerland that is representative of
the national population and contains social origin indicators. These should thus enable us to
correctly measure the three main variables of interest for the present research: social origin
(measured through the respondent’s father’s occupation around the age of 15), social position, and
educational attainment. In order to render these datasets comparable and thus ensure the coherence
of our finding, a long re-codification process was undertaken. We will detail this recoding process
and its limitations in this section, for each classification we use: the ESeC class schema, the Oesch
class schema, and the BHJM educational grid.
4.3.1 . Coding the ESeC classificationTo code the ESeC class schema, the following informations are required (see Davis and Elias 2010):
– A variable reporting respondent's occupation, measured – ideally – in ISCO-88 codes.
– A variable distinguishing between (1) employers, (2) the self-employed, and (3) employees,
referring to the theoretical rationale of the concept of employment relationship of this
classification.
– For employers, the number of employees they employ: “the distinction here is between
employers who delegate at least some managerial tasks (“large”) and those who tend to
undertake such tasks themselves (“small”).” (Davis and Elias 2010:62). The threshold
between the two is having 10 or more employees versus less than 10.
– For employees, a variable measuring whether they exercise some authority and supervision
tasks.
Most of the surveys we use contain this information. We reported in Tables A.4 and A.5 in
113
Appendix A how in each survey they were coded for the father's social position and the
respondent's. Yet in some cases, the coding of the ESeC variable could not be operationalised in its
full version27, but only with some approximations or even sometimes using the simplified syntax28,
which allows to code ESeC when only the ISCO-88 variable is available in the data.
We used the simplified syntax notably to code the father's social position for both AP75 and ISSP87
surveys, since no employment status information was available for them. Additionally, in some
surveys we were only able to derive employment status with some approximation. In the ISSP87
survey, there was no information available on the number of employees for the employers. By
default, we allocated them into the category of small employers. We suffered from similar missing
information in the three MOSAiCH surveys for father's social position. We thus followed the same
procedure as mentioned above. Furthermore, in the latter surveys, no information was provided on
the father's supervisory tasks. As a consequence, all employees were classified by default in the no
supervisory category. Finally and interestingly, again for father's social position, the ESS surveys
only distinguish for the employers between those who have more or less than 25 employees. This
threshold is different from the one that the ESeC codification requires, which is 10. Last but not
least, for the 1975 and 1987 surveys, we had to recode ISCO codes originally coded following the
ISCO-68 grid on three digits into its equivalent in the ISCO-88 version. It must be noted that as no
simple correspondence table between ISCO-68 and ISCO-88 exists, there might be some
approximations in the recoding of classifications. It must furthermore be stated that while for some
surveys we had ISCO-88 codes coded on four digits, thus more detailed information on occupation,
we truncated these variables on three digits to suit the actually proposed ESeC syntax and
comparability standard between surveys. Still, some research underlined that there is a “clear loss of
validity when moving from the four-digit to the three-digit level” (Wirth et al. 2010:136).
Other research further highlighted some coding issues on supervisory status. Since we got only
missing information for father's supervisory status in MOSAiCH surveys in addition to the two
oldest surveys, we thus expect relatively little bias in this respect. However, it was pointed out that
measurement of supervisory tasks in surveys is not as accurate as it should be. Research from
Pollak, Bauer, Müller, Weiss and Wirth found “that different procedures to assess supervisory status
may lead to quite substantial variation in class distributions within the ESeC schema” (2010:138).
In particular, they concluded that the way supervisory responsibility in ESS surveys is defined is too
broad and may lead to allocate many employees as supervisors. As a consequence, we might gain
27 The full ESeC syntax can be found here : https://www.iser.essex.ac.uk/files/esec/guide/docs/Appendix6.sps28 The simplified ESeC syntaxe can be found here : https://www.iser.essex.ac.uk/files/esec/nsi/matrices/Euroesec
%20Simple.SPS
114

some measurement inconsistencies from the ESS surveys we use too.
However, this does not seem to be the case too often, since we do not observe a systematic pattern
into this direction, as can be seen in Tables A.6 and A.7 in Appendix A, which depict the
distribution of the ESeC variable according to surveys respectively for the father's and respondent's
social position. While we do observe some variations, they do not appear to stem from the same
core of surveys (being ESS, MCH or SHP data). In contrast, we systematically observe some
variations for the two oldest surveys we use. For the measurement of father's social position first,
both AP75 and ISSP87 depict a lower share of higher salariat, petite bourgeois and higher-grade
blue collar than should be expected. Similarly, amongst respondent's social position, the ISSP87
survey reports a lower share of petit bourgeois and lower-grade white-collar, and an extremely
important share of lower-grade salariat. Thus, while it seems that we have some inconsistencies
within our data, they do not seem to be of any systematic kind. The recoding procedure of the ESeC
variable we applied looks rather robust to us.
In the end, we use the ESeC schema collapsed on seven and three levels for the purpose of our
analysis, as indicated in Table 4.6. Furthermore, we use a second collapsed version of ESeC on six
levels to fit the analysis of core social fluidity as undertaken in our last empirical chapter. The
collapse is as follows (corresponding class number are indicated between brackets):
1. Salariat (1 and 2)
2. Intermediate employees (3, 6 and 7)
115
Table 4.6: Collapsability of the EseC class schema.
9 levels 7 levels 3 levels
1. Higher salariat 1. Higher salariat1. Service class
2. Lower salariat 2. Lower salariat
3. Higher-grade white collar3. Intermediate employees
2. Intermediate class6. Higher-grade blue collar
4. Petite bourgeois 4. Small employers and self-employed5. Small farmers
7. Lower white-collar 5. Lower white-collar
3. Working class8. Skilled manual 6. Skilled manual
9. Semi-/un skilled 7. Semi-/un skilled

3. Petite bourgeois (4)
4. Farmers (5)
5. Skilled manual (8)
6. Semi-/ un skilled (9)
We will now detail the coding procedure of the Oesch class schema.
4.3.2 . Coding the Oesch classificationThe operationalisation of the Oesch class schema is quite straightforward since it only requires
information on the employment relationship (whether self-employed or not) and for employers, the
number of employees they employ with the same number threshold as for ESeC (i.e. 10 employees),
in addition to the ISCO-88 code29. Therefore, the coding of the Oesch class schema is actually
simpler than that for ESeC. Yet unlike for ESeC, the coding of the Oesch classification is based on
ISCO-88 codes on four digits. We have this detailed information in all but two surveys, notably our
two oldest ones, AP75 and ISSP87, so we do not expect too much bias from this side.
One problem of the Oesch classification as compared to ESeC is that the coding procedure does not
propose adjustments in case of missing information. As a consequence, as can be seen in Tables A.8
and A.9, which display the distribution of the Oesch class schema for each survey for the father's
and respondent's class position, within a certain number of surveys we were unable to code social
positions with an independent work logic (for social origin with AP75 and MOSAiCH surveys and
for both social origin and respondent's social position with ISSP87 data). Yet we were able in some
cases to allocate some people into the class of “small proprietors, artisans, without employees”,
since we defined, when no employment relation information was available, to classify by default all
ISCO-88 codes corresponding to 6210 – subsistence agricultural and fishery workers, namely
farmers – into this class, while the original procedure allocates them into routine agriculture
positions if employed and into the class of small proprietors, artisans, without employees when self-
employed. The adjustment renders the classification more reliable, especially for our oldest surveys.
One further problem that arises from the coding of the Oesch class schema is that we get very few,
if any, people in the categories of routine agriculture and routine office. While it might be true that
few people occupy a routine agriculture position in Switzerland, we may have gained slightly more
observations within the routine office class if we would have adjusted the classification with
29 Oesch further proposes to adjust the coding according to educational level (see Oesch 2006b:79). We do not followthis adjustment procedure since we are also interested here to see how educational levels are distributed within theOesch class schema.
116

educational titles. Yet as we underlined in note 29, we did not follow this procedure, since we are
also interested in analysing the distribution of Oesch classes according to education. Adjusting the
coding of the class schema according to education and then analysing the educational distribution
according to this class schema would be tautological. In the end, the final codification process
displays some variations, as we observed earlier with ESeC, but we cannot find any systematic
survey effect besides those mentioned above.
Analysis using the Oesch classification will only be undertaken on a collapsed version of the
schema, notably on nine levels, as can be seen in Table 4.7. We followed Oesch's suggestion to
collapse the classes into eight categories, but further isolated the classes of routine operative and
routine agriculture from the skilled crafts, in order to find some common correspondence with
ESeC and EGP classifications.
117
Table 4.7: Collapsability of the Oesch class schema.
17 levels 9 levels
1. Large employers (>9)1. Traditional bourgeoisie
2. Self-employed professionals
3. Small proprietors, artisans, with employees (<9)7. Petite bourgeoisie
4. Small proprietors, artisans, without employees
5. Technical experts2. Technical specialists
6. Technicians
7. Skilled crafts 8. Skilled crafts
8. Routine operatives9. Routine technical
9. Routine agriculture
10. Higher-grade managers3. Managers
11. Associate managers
12. Skilled office4. Office clerks
13. Routine office
14. Socio-cultural professionals5. Socio-cultural specialists
15. Socio-cultural semi-professionals
16. Skilled service6. service workers
17. Routine service

4.3.3 . Coding the BHJM educational gridTo code education variables in surveys using a common educational grid, Bergman, Hupka, Joye
and Meyer (2009) proceeded in two steps. First, they coded all educational titles into a detailed
educational grid with thirteen modalities, following those available in the MOSAiCH 2007 survey.
Next, they allocated all educational levels into an aggregated educational variable coded into six
categories, as can be observed in Table 4.8.
Details of the coding process and the final distribution of the variable can be found in Tables A.10
and A.11 in Appendix A. Overall, we can say that biggest sources of bias arise from the oldest
surveys, namely AP75, ISSP87 but also CH91, since it seems that the number of individuals with
secondary vocational education is largely underestimated. Even worse, in the ISSP87 survey, no
such category is actually available. Besides these, we do not observe significant variations in the
distribution of education in each survey.
Yet since very few people in Switzerland leave school with a secondary educational level without
118
Table 4.8: Conversion between the MOSAiCH 2007 and the BHJM educational grids
MOSAiCH 2007 educational grid BHJM educational grid
1. Incomplete primary school
1. Compulsory education2. Primary school
3. Secondary education, first stage
6. General training school (3 years)2. Secondary general education withoutmaturity
7. School preparing for university, vocationalbaccalaureate 3. Secondary general education with
maturity (including vocational maturity and“école normales” for oldest surveys)9. School for university for adults and baccalaureate
after vocational training
4. Initial vocational training (1-2 years) 4. Secondary professional education(including elementary vocational training)5. Apprenticeship (vocational training, dual system)
8. Vocational training (second) 5. Post-secondary and lower tertiaryvocational education (including Universitiesof Applied Sciences HES / HEP)
10. Higher vocational training
11. Pedagogical and applied university
12. University diploma and post-graduate (includingtechnical) 6. University education (without distinction
between short and long training)13. University doctorate
14. Other 7. Other

maturity (on average 2.4%), for our analysis we merged this category with its corresponding
category with maturity. Therefore, in the end, our education variable is distributed into the
following five levels:
1. Compulsory education
2. Secondary general education with or without maturity
3. Secondary professional education (vocational training)
4. Lower tertiary education / professional training after secondary education
5. Higher tertiary education (university & polytechnic school)
Furthermore, to measure trends in educational expansion more generally, we also constructed two
dichotomous variables distinguishing between the following:
1. Having attained at least secondary education (1 versus 2,3,4,5)
2. Having attained at least tertiary education (1,2,3 versus 4,5).
We have now presented thoroughly how we operationalise our main indicators. In the following
point, we would like to shortly present how much the two class schema we use are comparable with
each other.
4.3.4 . Comparing the ESeC and the Oesch class schemasAs stated in our last empirical analysis (see Chapter 7), we are interested in assessing to which
extent we can observe finer social (im-)mobility dynamics when using a more disaggregated
measure of social class than ESeC, namely with the Oesch class schema. Since we start with the
core model of social fluidity as introduced by Erikson and Goldthorpe (1992b), we use the ESeC
class schema into six levels, as defined above.
To check whether the two class schemas are comparable, we report the cross-tabulation of both
class schema in Table A.12 in Appendix A. We observe that both class schema display important
affinities. In most cases, more than 70% of individuals are allocated to the corresponding class.
However, some categories of the Oesch class schema depict some important comparability
weaknesses. This is notably the case of routine service occupations, which are classified at 85% in
the ESeC classification in the semi-/unskilled class. There is also an inadequacy between the Oesch
skilled service and routine service classes and the ESeC classes of white-collar class, since a
significant share of these Oesch classes is classified as ESeC skilled manual and semi-/unskilled
classes. Important divergence can also be found in the Oesch class of associate managers, of which
119

more than 40% are to be allocated into ESeC white collar classes, while they should be in the
salariat under Oesch's class schema. Finally, some of Oesch's large employers class are actually
allocated into white-collar, skilled manual and – even more surprisingly – in the semi-/unskilled
class within the ESeC classification.
We thus find some inconsistencies and as a consequence, we cannot say that both class schema are
strictly comparable. Yet since we use a collapsed version of the Oesch class schema into nine levels
for our analysis, these comparability limits should still remain relatively weak. At last, in Table 4.9,
we display the correspondence grid we apply to compare EGP, ESeC and Oesch class schema.
We can now turn to the measurement of social mobility per se, notably in the form of mobility
tables and log-linear models.
120
Table 4.9: EGP, ESeC and Oesch class schemas correspondence grid applied to fit the core model ofsocial fluidity
EGP « core model » version Corresponding ESeC classes Corresponding Oesch classes
I+II. Service class 1+2. Salariat
1. Large employers
2. Self-employed professionals
5. Technical experts
6. Technicians
10. Higher-grade managers
11. Associate managers
14. Socio-cultural professionals
15. Socio-cultural semi-professionals
III. Routine non-manual workers 3+7. White collar
12. Skilled office
13. Routine office
16. Skilled service
17. Routine service
IVab. Petty bourgeoisie : smallproprietors and artisans etc. With orwithout employees
4. Petite bourgeoisie 3+4. Small proprietors, artisans withor without employees
IVc. Farmers 5. Small farmers
V + VI. Skilled workers 6+8. Skilled manual 7. Skilled crafts
VIIa. Non-skilled workers9. Semi-/ unskilled
8. Routine operatives
VIIb. Agricultural labourers 9. Routine agriculture

4.4 . The measurement of social mobility: introducingmobility tables and log-linear models
As we underlined in Section 2.2.1, the introduction of two important methodological innovations in
the 1970s constituted, as we put it, “one small step for sociologists, one giant leap for social
mobility research”. One of these innovations was the shift in the measurement of social position:
from a unidimensional measure in the form of socio-economic index, we moved to a
multidimensional measure taking the form of social class. The other innovation was the
implementation of new statistical models: log-linear models (Goodman 1965). The introduction of
log-linear models for the analysis of social mobility has indeed been a major methodological
advancement, since this statistical technique allows the association between categorical variables in
a contingency table to be modelled in a flexible way. The consequence of such a découverte30
resulted in a re-orientation in social mobility measurement, formalising the distinction between
absolute and relative social mobility.
4.4.1 . Absolute and relative social mobility: distinguishing thetwo fundamental measures of social mobility
The study of intergenerational social mobility consists of the comparison of a person's social
position with that of his or her family background, usually measured through his or her father's
social position. In order to assess how much social mobility takes place in a given society,
sociologists usually create a table that cross-classifies a person's social background with his or her
social position, the so-called mobility table. From this single mobility table, two types of measures
of social mobility can be returned: an absolute measure and a relative measure.
Absolute social mobility is a measure of observed mobility, as it refers to mobility that can be
calculated directly from a mobility table. Mobility tables are indeed extremely straightforward tools
to analyse social mobility. They consist of the cross-tabulation of a person's social origin with his or
her social position attainment during adulthood. As both variables are usually distributed with the
same number of categories, the diagonal cells of the mobility table indicate the extent of social
reproduction, whereas cells outside the main diagonal report the extent of social mobility.
Elementary social mobility analysis usually consists of the inspection of inflow and outflow
percentages, corresponding respectively to column and row percentages. Outflow percentages
indicate the distribution of social destiny within each category of origin; in other words, they
provide information on the social position reached by children of a given class origin. Inflow
percentages, in contrast, report for each type of social destination from which social origin they
30 Understand: discovery
121
were recruited. It tells us, for instance, the extent to which a certain class position auto-recruits from
the same class origin.
Yet this way of analysing social mobility poses some problems, as Hout illustrates: “While they
[inflow and outflow percentages] provide some information about the process of social
stratification, other processes related to the relative supply and demand of labor power from
different strata also influence the inflow and outflow patterns. For example, the high fertility of
farmers coupled with a decrease in the proportion of the U.S. labor force in farming contributes to
the unbalanced inflow/outflow pattern for farm occupations. While only 39.4 percent of farmers'
sons follow their fathers into farming, 80.9 percent of farmers in 1973 have farm origins”
(1983:12). This illustration clearly summarises the main challenge social mobility scholars faced in
the 1970s, since we are unable to say to how much social reproduction was exhibited in the class of
farmers in this example.
This problem stems from the different marginal distribution of each social class within a mobility
table: in Hout's example, in the father's generation, 23% of fathers were farmers, whereas in the
son's generation, this rate had dropped to 11%. In other words, as the social structure is not fixed, it
is very difficult to assess how much social reproduction exists. So the measurement of absolute
social mobility is highly dependent on the available structure of opportunity. For instance, if a given
society is composed of 40% manual workers and only 10% higher salariat positions, then the
likelihood of reaching a manual worker position rather than a higher salariat position will be higher
for everyone, simply because the structure of opportunities available in this society imposes so. Yet
we would not be able to assess the extent to which the likelihood of social reproduction within these
two classes is the same or not. It might indeed be the case that the propensity of social reproduction
is actually stronger within the higher salariat class, even though we would not be able to observe so,
strictly from the observed percentages distribution in the mobility table.
This issue can be extended to cross-national and cross-temporal comparison: since the distribution
of social classes varies over time and place, comparing social mobility cross-nationally and cross-
temporally is basically impossible. The analysis of inflow and outflow percentages of social
mobility thus must be understood in a strictly descriptive manner, but cannot in any case clearly
capture the extent of rigidity or fluidity that a given society displays and how it situates over time
and place insofar as it does not measure the direct association between categories of the mobility
table. The relative measure of social mobility overcomes this issue.
In fact, relative social mobility, in contrast to absolute social mobility, provides a measure of a
given society’s degree of openness. Often also called social fluidity, relative social mobility
122
measures one person’s chances of access to a given social position in comparison to people from
different social positions. In other words, “it tells us something about the advantages and
disadvantages associated with being born into one class rather than another” (Breen 2004b:20). To
measure relative social mobility, sociologists use tailor-made modelling techniques called log-linear
models.
Breen provides a clear-cut illustration to understand the distinction between absolute and relative
measures of social mobility and the importance of making such a distinction:
“Suppose that my father was a clerk and that I am a manager: then, in absolute terms I
have been upwardly mobile. But suppose that, in my father’s generation, being a clerk
gave him a class position that was better than half of the population, whereas, in my
generation, being a manager puts me in a position which is better than, say, 40 per cent
of the population. Then, in relative terms I have been downwardly mobile because my
rank is worse than my father’s: half of the population were in a better position than him
whereas 60 per cent are in a better class position than me, and this is so even though I
have an objectively better class position than he had. This discrepancy between absolute
and relative mobility might seem far-fetched, but it is actually quite the opposite. When
there has been a large upward shift in the distribution of class positions such a
discrepancy will be common” (2010b:417–418).
From this standpoint, it appears that the distinction between absolute and relative measures of social
mobility is indeed central to the analysis of social mobility. This is even more crucial in the context
of the considerable changes in the composition of social structure that our Western societies have
undergone since the last century. Since we have defined the two fundamental measures of social
mobility, we can now more thoroughly explain how relative social mobility is exactly measured, by
introducing log-linear models.
4.4.2 . Log-linear models: the tailor-made statistical method tomodel mobility tables
The basic idea of log-linear models is to measure the association between different categorical
variables that are in a contingency table (for a thorough introduction to log-linear models, see Hout
1983; Knoke and Burke 1980; Sloane and Morgan 1996; Vallet 2004b, 2005). In this sense, this
special case of generalised linear models does not consist of explaining one phenomenon (with a
dependent variable, like in our case social position attained) according to a set of factors (with
independent variables, such as social origin and educational attainment), as is the case with logistic
123
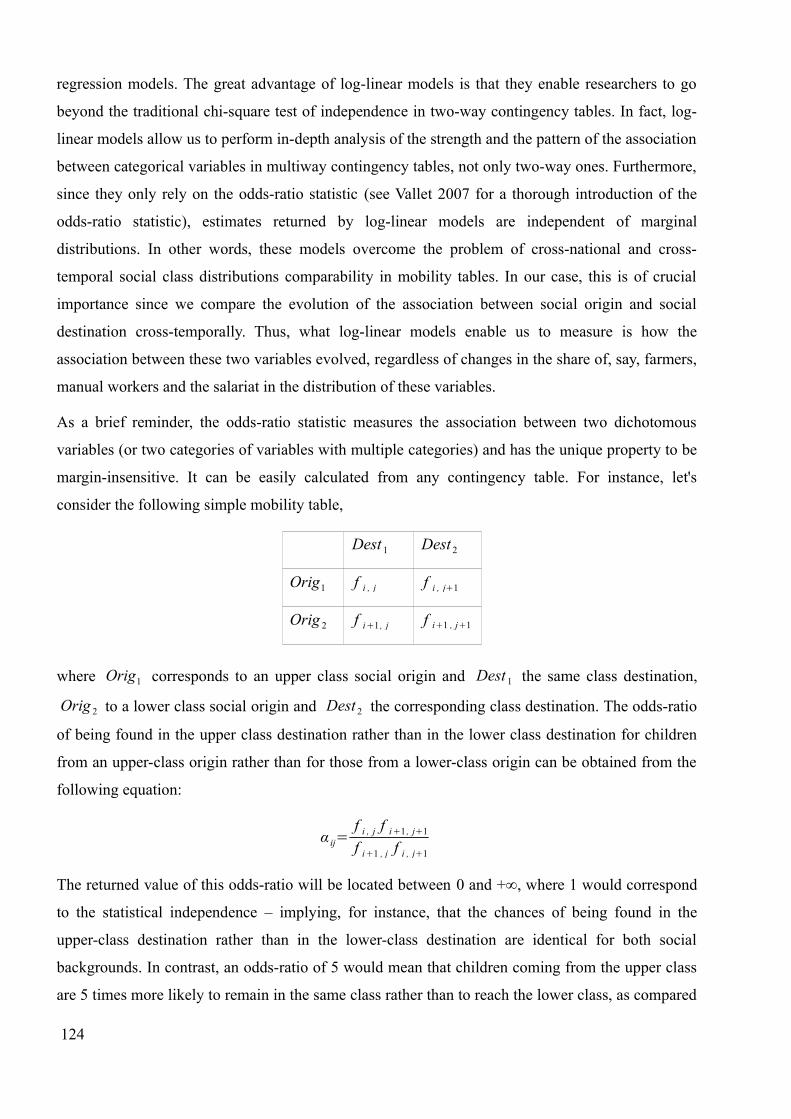
regression models. The great advantage of log-linear models is that they enable researchers to go
beyond the traditional chi-square test of independence in two-way contingency tables. In fact, log-
linear models allow us to perform in-depth analysis of the strength and the pattern of the association
between categorical variables in multiway contingency tables, not only two-way ones. Furthermore,
since they only rely on the odds-ratio statistic (see Vallet 2007 for a thorough introduction of the
odds-ratio statistic), estimates returned by log-linear models are independent of marginal
distributions. In other words, these models overcome the problem of cross-national and cross-
temporal social class distributions comparability in mobility tables. In our case, this is of crucial
importance since we compare the evolution of the association between social origin and social
destination cross-temporally. Thus, what log-linear models enable us to measure is how the
association between these two variables evolved, regardless of changes in the share of, say, farmers,
manual workers and the salariat in the distribution of these variables.
As a brief reminder, the odds-ratio statistic measures the association between two dichotomous
variables (or two categories of variables with multiple categories) and has the unique property to be
margin-insensitive. It can be easily calculated from any contingency table. For instance, let's
consider the following simple mobility table,
Dest 1 Dest 2
Orig1 f i , j f i , j+1
Orig 2 f i+1 , j f i+1 , j+1
where Orig1 corresponds to an upper class social origin and Dest 1 the same class destination,
Orig 2 to a lower class social origin and Dest 2 the corresponding class destination. The odds-ratio
of being found in the upper class destination rather than in the lower class destination for children
from an upper-class origin rather than for those from a lower-class origin can be obtained from the
following equation:
α ij=f i , j f i+1 , j+1
f i+1 , j f i , j+1
The returned value of this odds-ratio will be located between 0 and +∞, where 1 would correspond
to the statistical independence – implying, for instance, that the chances of being found in the
upper-class destination rather than in the lower-class destination are identical for both social
backgrounds. In contrast, an odds-ratio of 5 would mean that children coming from the upper class
are 5 times more likely to remain in the same class rather than to reach the lower class, as compared
124

to children of the lower class. In this sense, the odds-ratio statistic “measures the association at the
heart of the contingency table31” (Vallet 2007:61 own translation, emphasis in original).
The log-linear modelling technique does nothing else than generalise this procedure by
systematically computing odds-ratios within contingency tables: in the case of a simple two-way
mobility table with dichotomous variables, only one single odds-ratio needs to be computed to
describe the association, but in bigger tables, multiple odds-ratios are computed.
Formally, multiple ways exists to model contingency tables with log-linear models. As an example,
let us take the case of a two-way contingency table to introduce basic log-linear models and the
logic behind them.
➢ The saturated model (the model which reproduces the data):
log (mij)=λ+λiA+λ j
B+λijAB , which could also be written as {AB} (1)
where log (mij) is the log of the expected cell frequency of the cases for cell ij in the contingency
table, λ is the overall mean of the natural log of the expected frequencies, λiA the main effect for
variable A, λ jB the main effect for variable B, and λ ij
AB the interaction effect for variables A and B,
for instance between social origin and social destination. By definition, this model is called the
saturated model since it reproduces the exact observed frequencies. In other words, this model is not
of any relevance as it does not tell us anything about our data. Therefore, a simpler model can be
specified, assuming that A and B, for instance social origin and social destination, are independent.
➢ The independence model (the model with no association between variables A and B):
log (mij)=λ+λiA+λ j
B , which could also be written as {A,B} (2)
In this model, since we have removed the interaction effect between variables A and B –
corresponding to the λijAB term – these variables are assumed to be independent. In this sense, this
model is similar to the chi-square test of independence. This model is usually taken as a baseline
model.
Typically, log-linear models consist of testing a combination of models situated between the
independence model and the saturated model. This is a very important feature of log-linear model,
which is referred to as the hierarchical approach. This means that models are hierarchically
ordered, from the simplest to the most sophisticated model.
A more sophisticated model, as compared to the independence model, could be a model which
31 Original quote “mesure l’association au cœur du tableau croisé”.
125
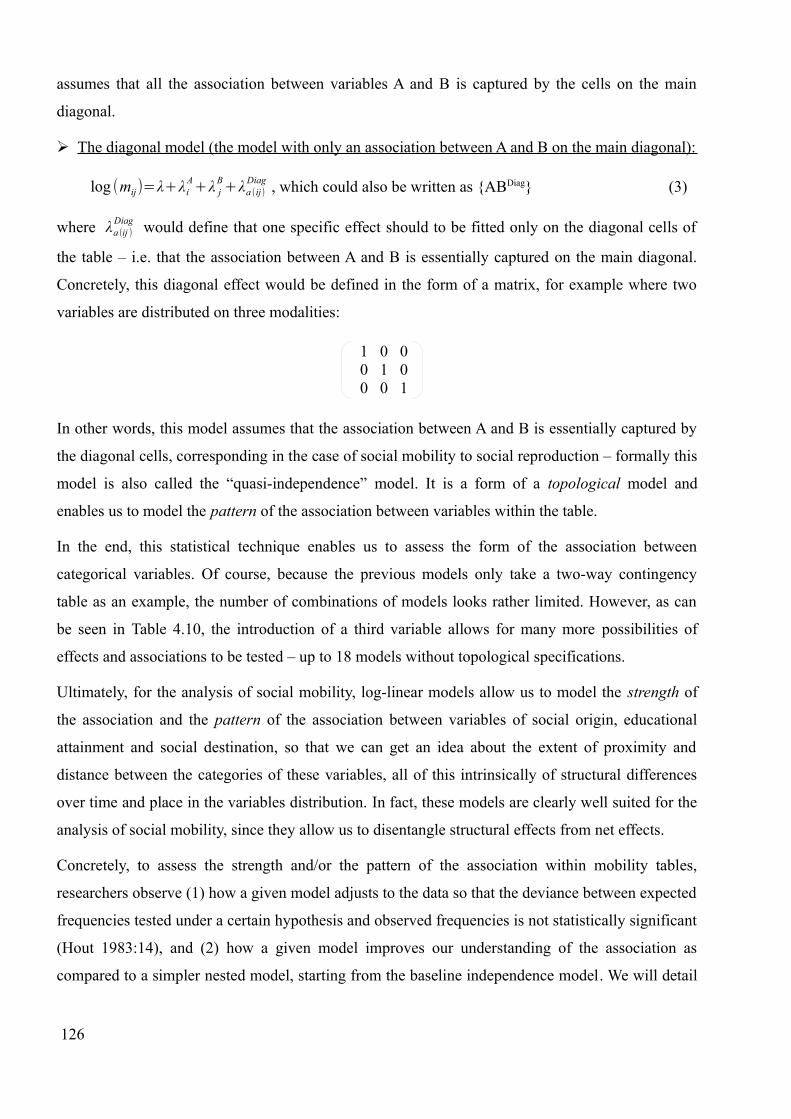
assumes that all the association between variables A and B is captured by the cells on the main
diagonal.
➢ The diagonal model (the model with only an association between A and B on the main diagonal):
log (mij)=λ+λiA+λ j
B+λa (ij)Diag , which could also be written as {ABDiag} (3)
where λa (ij )Diag would define that one specific effect should to be fitted only on the diagonal cells of
the table – i.e. that the association between A and B is essentially captured on the main diagonal.
Concretely, this diagonal effect would be defined in the form of a matrix, for example where two
variables are distributed on three modalities:
1 0 0 0 1 0 0 0 1
In other words, this model assumes that the association between A and B is essentially captured by
the diagonal cells, corresponding in the case of social mobility to social reproduction – formally this
model is also called the “quasi-independence” model. It is a form of a topological model and
enables us to model the pattern of the association between variables within the table.
In the end, this statistical technique enables us to assess the form of the association between
categorical variables. Of course, because the previous models only take a two-way contingency
table as an example, the number of combinations of models looks rather limited. However, as can
be seen in Table 4.10, the introduction of a third variable allows for many more possibilities of
effects and associations to be tested – up to 18 models without topological specifications.
Ultimately, for the analysis of social mobility, log-linear models allow us to model the strength of
the association and the pattern of the association between variables of social origin, educational
attainment and social destination, so that we can get an idea about the extent of proximity and
distance between the categories of these variables, all of this intrinsically of structural differences
over time and place in the variables distribution. In fact, these models are clearly well suited for the
analysis of social mobility, since they allow us to disentangle structural effects from net effects.
Concretely, to assess the strength and/or the pattern of the association within mobility tables,
researchers observe (1) how a given model adjusts to the data so that the deviance between expected
frequencies tested under a certain hypothesis and observed frequencies is not statistically significant
(Hout 1983:14), and (2) how a given model improves our understanding of the association as
compared to a simpler nested model, starting from the baseline independence model. We will detail
126
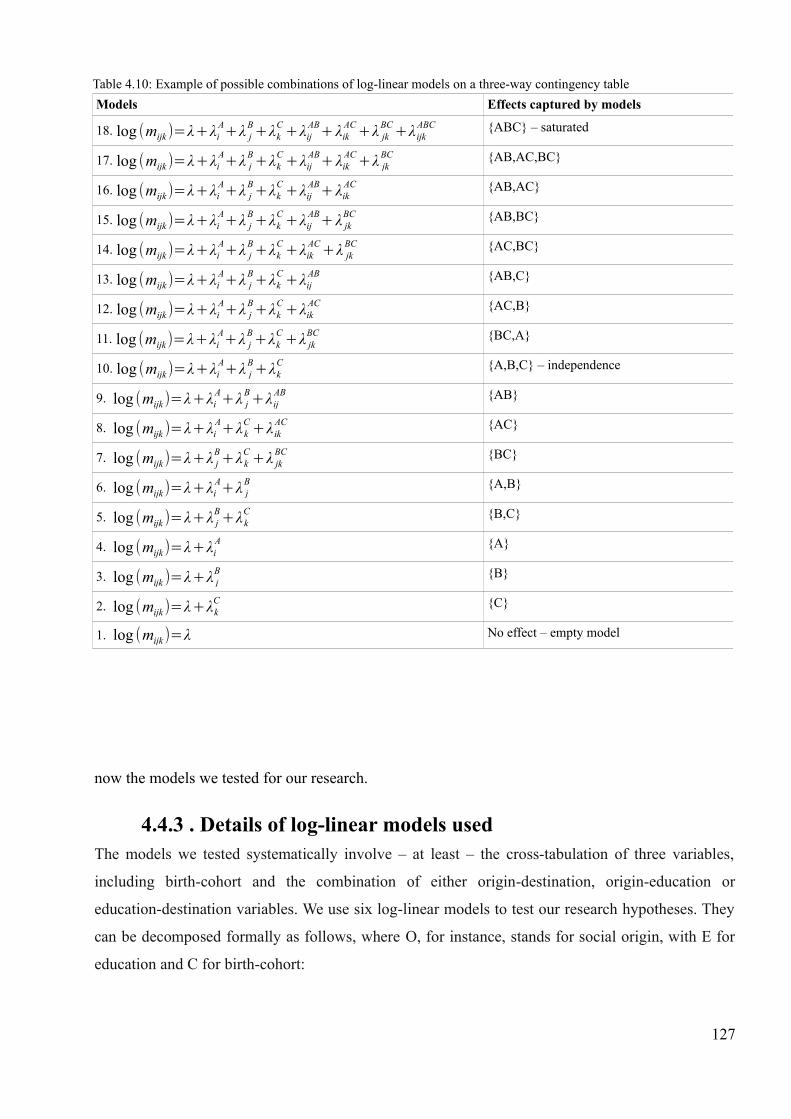
now the models we tested for our research.
4.4.3 . Details of log-linear models usedThe models we tested systematically involve – at least – the cross-tabulation of three variables,
including birth-cohort and the combination of either origin-destination, origin-education or
education-destination variables. We use six log-linear models to test our research hypotheses. They
can be decomposed formally as follows, where O, for instance, stands for social origin, with E for
education and C for birth-cohort:
127
Table 4.10: Example of possible combinations of log-linear models on a three-way contingency table
Models Effects captured by models
18. log (mijk )=λ+λiA+λ j
B+λkC+λij
AB+ λikAC+λ jk
BC+λijkABC {ABC} – saturated
17. log (mijk)=λ+λiA+λ j
B+λkC+λij
AB+ λikAC+λ jk
BC {AB,AC,BC}
16. log (mijk )=λ+λiA+λ j
B+λkC+λij
AB+ λikAC {AB,AC}
15. log (mijk )=λ+λiA+λ j
B+λkC+λij
AB+ λ jkBC {AB,BC}
14. log (mijk )=λ+λiA+λ j
B+λkC+λik
AC+λ jkBC {AC,BC}
13. log (mijk )=λ+λiA+λ j
B+λkC+λij
AB {AB,C}
12. log (mijk )=λ+λiA+λ j
B+λkC+λik
AC {AC,B}
11. log (mijk )=λ+λiA+λ j
B+λkC+λ jk
BC {BC,A}
10. log (mijk )=λ+λiA+λ j
B+λkC {A,B,C} – independence
9. log (mijk )=λ+λiA+λ j
B+λijAB {AB}
8. log (mijk )=λ+λiA+λk
C+λikAC {AC}
7. log (mijk )=λ+λ jB+λ k
C+λ jkBC {BC}
6. log (mijk )=λ+λiA+λ j
B {A,B}
5. log (mijk )=λ+λ jB+λk
C {B,C}
4. log (mijk )=λ+λiA {A}
3. log (mijk )=λ+λ jB {B}
2. log (mijk )=λ+λkC {C}
1. log (mijk )=λ No effect – empty model
➢ The conditional independence model (the baseline model):
log (mijk)=λ+λ iO+λ j
E+λkC+λ ik
OC+λ jkEC , (1)
which could also be written as {OC, EC}
This first model, as shown in equation 1, is called the conditional independence model and
constitutes the baseline model. It makes the assumption that social origin and education are
independent – in other words, that educational equality over birth-cohorts stands in Swiss society.
➢ The constant association model (the model that assumes a given association to be constant):
log (mijk)=λ+λ iO+λ j
E+λkG +λ ik
OG+λ jkEG+λ ij
OE , (2)
which could also be written as {OC, EC, OE}
Conversely, the second model applied (equation 2) is called the constant association model (CnSF)
and assumes that the association between social origin and education has remained constant across
birth-cohorts. This model assumes that educational inequality did not change substantially. If, as we
hypothesised, return to education remained relatively stable, this is the model that best reflects the
reality.
➢ The Uniform Difference model (the model assuming that a given association changed):
log (mijk)=λ+λ iO+λ j
E+λkC+λ ik
OC+λ jkEC+β k ψij , (3)
which could also be written as {OC, EC, βcOE}
This third model, known as either the Uniform Difference model (Unidiff) or the log-multiplicative
layer effect model (Erikson and Goldthorpe 1992b; Xie 1992), assumes that the origin-education
association takes the same pattern over birth-cohorts, but that the strength of the OE association
varies log-multiplicatively, in a uniform manner, over birth-cohorts (indicated by the term βk ψ ij ).
In other words, this model tests for substantial change in the strength of the association between
origin and education over cohorts, and is very powerful to detect a dominant trend in the data. If this
model fits, it accounts for a change over birth-cohorts. The sense of this change is displayed in
Unidiff parameters, which are returned on a scale of log odds-ratio. The first parameter is always set
to 1, to serve as the reference category, then if parameters are bigger than 1, this implies that the
association between the two-variables increased – for instance, that educational inequalities
increased – whereas a parameter below 1 indicates that the association decreased – in other words,
that educational inequality decreased. In other words, should the model prove to better describe our
data than the preceding constant association model, then this will support our research hypotheses
128

which states that social fluidity and educational equality increased.
In addition to these three models, two further models were fitted at some occasion in order to check
the robustness of trends displayed.
➢ The Uniform Difference model with a linear trend (the model assuming that the change in a
given association has been linear):
log (mijk)=λ+λ iO+λ j
E+λkC+λ ik
OC+λ jkEC+(1+ β lin year )ψ ij , (4)
which could also be written as {OC, EC, βc(lin)OE}
The Unidiff linear trend model, as displayed in equation 4, is very useful to arbitrate between a
linear and a non-linear change over time in the OE association, for instance. It assumes that the
Unidiff trend is linear. For instance, this model could prove useful in outlining the extent to which
the hypothesised increasing social fluidity and educational equality trend would have developed at
the same pace across birth-cohorts. As this model is parsimonious with only a loss of one degree of
freedom as compared to the constant association model, it provides a serious alternative to the
“classic” Unidiff model.
➢ The Constrained Uniform Difference model (the model assuming that the change in a given
association has reached similar level in some categories):
log (mijk)=λ+λ iO+λ j
E+λkC+λ ik
OC+λ jkEC+β k constrained ψ ij , (5)
which could also be written as {OC, EC, βc(constrained)OE}
The constrained Unidiff model (equation 5) constitutes a simpler version of the Unidiff model and
specifies equality constraints to be imposed on the β parameters. Stated differently, this model
assumes that the origin-education association is the same between different categories of the birth-
cohort variable (the β parameters ). For instance, we could expect that social fluidity increased only
within the oldest birth-cohorts and then slowed down, as we hypothesised. By testing equality
constraint in the Unidiff parameters of the youngest birth-cohorts, we could test whether the degree
of social fluidity has reached similar levels for these birth-cohorts. This model is not only useful to
test whether a difference in the origin-education association observed between, say, two birth-
cohorts is significant, but also because it is by definition more parsimonious than the classic Unidiff
model. Equality constraints are defined according to the β Unidiff parameters returned by the
Unidiff model. Combinations of constrained Unidiff were usually tested in cases where the Unidiff
model did not provide significant improvement over the constant association model in order to
validate (or invalidate) the robustness of the constant association trend.
129

Finally, in our last empirical chapter, we fitted and adapted Erikson and Goldthorpe's (1992b) model
of core social fluidity.
➢ The core model of social fluidity (the model that specifies the pattern of the association between
social origin and social destination).
log (mij)=λ+λiO+λ j
D+λa(ij)HI1 +λb(ij)
HI2 +λc (ij )IN1 +λd (ij)
IN2 + λe (ij )IN3 +λ f (ij)
SE +λg (ij )AF1+λh (ij)
AF2 , (6)
which could also be written as {ODHI1 + HI2 + IN1 + IN2 + IN3 + SE + AF1 + AF2}
This model, which is a sophisticated specification of topological log-linear models, proposes to
decompose the structure of the mobility table into different sets of (net) associations. To do so,
matrices defining the association that should be captured are fitted to the data. In their model,
Erikson and Goldthorpe constructed up to eight matrices, each measuring a special effect relating to
hierarchy, inheritance, sector and affinity32. Each of these matrices can in turn be modified to test
whether a further effect provides additional information as regard to the pattern of social mobility.
Having presented the models we will fit to our data, we can now turn to final practical
considerations.
4.4.4 . Final practical statistical considerations : discussing modelselection criteria and robustness assessment
For model selection, we primarily rely on the classic frequentist approach, consisting of model
comparison based on the conventional deviance statistic (G2).This method simply consists in
comparing how the gain in G2 of a given model, as compared to a simpler model, more adequately
describes the data in light of the number of degree of freedom lost. This choice can look rather
unusual in the context where the Bayesian approach has gained increasing importance with the
diffusion of the BIC statistic as the device for model selection (Raftery 1986, 1995). However, BIC
has often been criticised for rejecting more complicated models. Furthermore, one must keep in
mind that our sample size, while not inconsiderable, still remains relatively small as compared to
other social mobility research, especially when we consider only complete cases. Yet as can be seen
from the BIC equation reported here:
BIC=G2−df ×log (N i , j)
by subtracting to the G2 statistic the number of degrees of freedom multiplied by the log of the
sample size, BIC by definition imposes greater penalty on models fitted with a smaller sample size.
32 These effects are presented in more detail in Appendix E and corresponding matrices are displayed in Table F.5 inAppendix F
130
Thus, while the BIC statistic will be systematically reported in tables presented in our analysis, as
BIC quasi-systematically favours the constant association model, we will not use it nor underline it
for model selection. The more negative the BIC value, the more it is said the model should be
preferred.
Furthermore, models were systematically fitted using two different combinations of birth-cohorts
variables. Indeed, models were first fitted using the following eight birth-cohort distinction: 1912–
1935, 1936–1940, 1941–1945, 1946–1950, 1951–1955, 1956–1960, 1961–1965, 1966–1979;
secondly, using a more aggregated construction of birth cohorts distributed as follow in five
categories: 1912–1941, 1942–1949, 1950–1957, 1958–1965 and 1966–1979. Not only does this
second version of birth-cohort division closely compare with that used in other research in
Switzerland (Jann and Combet 2012), it further provides more reliable model estimation as log-
linear models are famously acknowledged for being sensitive to sample size. Thus, while
estimations using the eight birth-cohort version may provide a more detailed picture of trends in
relative social mobility, those using the five birth-cohort version will prove more robust. For this
reason, final outcomes will be drawn from this latter version, although systematically they will be
confronted with the more detailed version – with which they do coincide.
Last but not least, analyses presented below were computed using the R (R Development Core
Team 2010) and LEM (Vermunt 1997) softwares.
We have now thoroughly presented all the methodological design that we used to construct our
analysis. Since this methodological framework is quite complex, we discussed in detail the quality
and validity of our data and indicators. While it is clear that our final data is not perfect and displays
some weaknesses in many respects, it still has the advantage of providing serious grounds for the
assessment of social mobility trends in Switzerland. Our endeavour has particularly been concerned
with rendering the different indicators we use as comparable as possible between surveys.
In the end, the construction of a unique dataset clearly ensures to return robust estimations. The log-
linear modelling technique will prove particularly efficient in assessing the extent to which the
association between intergenerational social mobility, educational inequality and return to education
changed, net of structural changes in the social structure. From this standpoint, we are now ready to
start our substantial analysis.
131

132

Part II:
Empirical analysis
133

134
5 . From origin to destination: analysing trends insocial mobility in Switzerland33
5.1 . IntroductionPrevious research on social mobility in Switzerland concludes that Switzerland is characterised by a
strong degree of rigidity. In particular, Joye, Bergman and Lambert underline that the
“intergenerational inheritance of advantage remains powerfully intact in Switzerland” (Joye et al.
2003:287). However, these conclusions display some limitations, notably since they were drawn
only on men and on a relatively limited time scale. In this context, our goal in this first chapter is to
reassess to which extent these conclusions still hold when a robust research process is undertaken,
such as is the case in the present inquiry. We are particularly concerned with determining how social
mobility trends evolved across birth-cohorts, in absolute and in relative terms. In accordance with
our research hypotheses, we expect that:
– social mobility increased in Switzerland in the twentieth century (H1a),
– social mobility fluctuated according to economic fluctuations (H1b).
– men and women's social mobility opportunities have converged (H7) and,
– Swiss-citizens and foreign residents display different social mobility opportunities (H8).
We test this by exploring the degree to which social origin influences the social position achieved in
Switzerland. In particular, by focusing on analysing whether the influence of social origin on life
chances has changed over time in Switzerland or if it has remained constant, our analysis shall
provide an interesting contribution to the comparative study of intergenerational social mobility. In
light of particular institutional settings that exist in Switzerland, we wonder whether Switzerland
converges with the recent empirical studies that concluded to non-persistent inequality, or whether it
remains a special case.
Our analysis will consist of the description of changes in the composition of the Swiss class
structure, and in the inspection of absolute and relative social mobility.
33 An earlier version of this chapter was published in the Swiss Journal of Sociology in 2012 under the title: TemporalTrends in Intergenerational Social Mobility in Switzerland: A Cohort Study of Men and Women Born between 1912and 1974
135

5.2 . How has the Swiss class structure evolved over timeaccording to gender?
To understand to which extent changes in the economic context transformed the structure of
opportunities in Switzerland, we begin our analysis with a depiction of changes in the class
structure across birth-cohorts, first by gender and then by social origin.
First of all, from Figure 5.1 we observe that the Swiss social structure displays changes that are
characteristic of twentieth-century Western countries: mainly a decline in the small employers and
the self-employed, skilled manual and semi-/unskilled occupations, and a rise in the higher salariat,
lower salariat, and intermediate employee occupations. The higher salariat is certainly the class that
exhibited the highest increase (more than 10%) as well as major changes in regard to gender
differences. The gender gap indeed weakened over cohorts, with the stagnation of the number of
men in this class from the 1941–45 to the 1961–65 birth-cohorts, and a shift from less than 5% to
more than 10% across birth-cohorts among women. This demonstrates that most of the global
increase in the higher salariat class can be explained by women’s higher opportunities in this class.
Yet this class is still the most sex-segregated of all, with a difference of more than 10% between
men and women within each cohort. Therefore, the highest social class still remains profoundly
male-dominated. Furthermore, the percentage of men in the higher salariat increases 3% among
those born after 1965 while it only increases 1.6% among women. So it remains to be seen whether
the weakening gender difference trend will continue, or whether this difference is an age effect. One
further noticeable fact within the higher salariat class pertains to the significant difference between
the pre-1936 birth-cohort and that of 1936–40 for men (with an increase from 12% to 24%).
Although it is possible to suspect that this particularly marked increase accounts for measurement
effect, as the reliability of the oldest cohort is slightly lower than others,34 it is nevertheless also
possible that this trend accounts for higher opportunities in this class for the 1936–40 birth-cohort.
The latter indeed entered the labour market at the beginning of the long boom period following
WWII. Furthermore, this change was not as sudden as it appears on the graph. When looking more
deeply into the data, one will find that 6% of men born between 1912 and 1920 held a higher
salariat position, around 10% for those born in the 1920s, and 18% for those born between 1931 and
1935. In contrast to the higher salariat, the sex-segregation within the lower salariat is at its lowest
level, since rates for both men and women are similar. It should nevertheless be pointed out that
while men were on average more numerous in this class than women until the 1940–45 birth-cohort,
34 As we mentioned in Chapter 4, the oldest birth-cohort was indeed constructed mainly from the two oldest surveyswhich exhibit several measurement issues, such as approximations in the recoding from ISCO-68 to ISCO-88 andthe computation of the ESeC class schema in its simple version for reasons of lack of information (except forrespondents in the 1975 survey).
136

this trend reversed by the 1946–50 birth-cohort, with the noticeable exception of the 1955–60 birth-
cohort, which exhibits comparable percentages. The female-dominated intermediate employee class
increased moderately across cohorts (2%), whereas the small employers and self-employed class
decreased almost 10%. This important change in the small employers and self-employed class has
been more marked for women than for men: they were respectively 15% and 14% in this class in
the oldest cohort and only 8% of men and 4% of women were in this class in the post-1965 birth-
cohort. Changes also occurred in the lower white collar and skilled manual classes, which are
female- and male-dominated, respectively. In the former, the percentage of women steadily
decreased (except for the oldest birth-cohort) and men’s number remained relatively constant at a
very low level (around 4%), whereas in the latter, the percentage of men declined moderately and
the percentage of women stayed at the same level, around 3%. Women in the semi-/unskilled class
likely exhibit the most significant change with a collapse from 26% to 12% across birth-cohorts. As
a consequence, the gender gap clearly declined in the semi-/unskilled class, demonstrating that
women were no longer more likely than men to have a job in the semi-/unskilled class.
137
Figure 5.1: Marginal distributions of class destination by gender over birth-cohorts in percentages
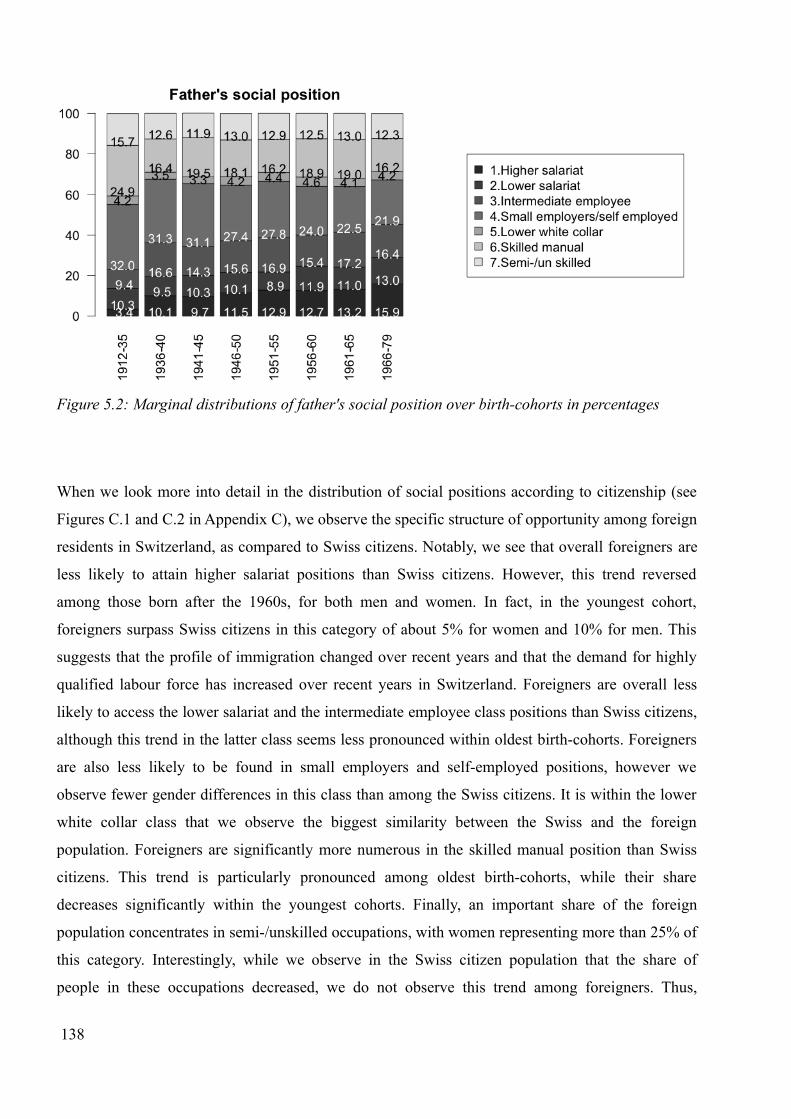
When we look more into detail in the distribution of social positions according to citizenship (see
Figures C.1 and C.2 in Appendix C), we observe the specific structure of opportunity among foreign
residents in Switzerland, as compared to Swiss citizens. Notably, we see that overall foreigners are
less likely to attain higher salariat positions than Swiss citizens. However, this trend reversed
among those born after the 1960s, for both men and women. In fact, in the youngest cohort,
foreigners surpass Swiss citizens in this category of about 5% for women and 10% for men. This
suggests that the profile of immigration changed over recent years and that the demand for highly
qualified labour force has increased over recent years in Switzerland. Foreigners are overall less
likely to access the lower salariat and the intermediate employee class positions than Swiss citizens,
although this trend in the latter class seems less pronounced within oldest birth-cohorts. Foreigners
are also less likely to be found in small employers and self-employed positions, however we
observe fewer gender differences in this class than among the Swiss citizens. It is within the lower
white collar class that we observe the biggest similarity between the Swiss and the foreign
population. Foreigners are significantly more numerous in the skilled manual position than Swiss
citizens. This trend is particularly pronounced among oldest birth-cohorts, while their share
decreases significantly within the youngest cohorts. Finally, an important share of the foreign
population concentrates in semi-/unskilled occupations, with women representing more than 25% of
this category. Interestingly, while we observe in the Swiss citizen population that the share of
people in these occupations decreased, we do not observe this trend among foreigners. Thus,
138
Figure 5.2: Marginal distributions of father's social position over birth-cohorts in percentages
foreigners congregate at the extremes of the Swiss social stratification, since they are more
numerous in the lowest social classes than the Swiss population, and also in top occupations,
although this phenomenon seems to be extremely recent.
We now shift our attention to changes in the class structure by social origin. For reasons of
simplicity, social origin was recoded into three main classes: salariat origin (higher salariat and
lower salariat); intermediate origin (intermediate employees, small employers and self-employed);
and working-class origin (lower white collar, skilled manual and semi-/unskilled). But before
depicting changes in the class structure according to social background, we can observe how the
composition of the father's social position changed over birth-cohorts (see Figure 5.2, and also
Figure C.3 and Figure C.4 in Appendix C for the difference between Swiss citizens and foreign
residents). The main trend is consistent with changes depicted earlier: the small employers and self-
employed category decreased 10%, while the higher and lower salariat as well as intermediate
employees increased quite significantly. As for the lower white collar, skilled manual and
semi-/unskilled classes, they remained relatively stables. As compared to the Swiss citizen
population, foreign residents depict two major trends in the composition of their social background,
which most likely reflect different immigration waves: of those born between the early 1940s and
mid-1950s, about one-third were to come from a small employers/self-employed class; these are
certainly people whose father was a farmer. In the subsequent cohorts, the social background
composition of foreigners changed in favour of skilled manual and semi/-unskilled classes.
Knowing these overall evolutions in the composition of social backgrounds, we can now analyse
whether the attainment of any given social class is differently conditioned according to the father's
class position.
The first look at outcomes (see Figure 5.3 and Figures C.5 and C.6 in Appendix C for differences
between Swiss citizens and foreign residents) suggests that social origin is an important determinant
of social position and social reproduction. For instance, the social origin of the higher salariat and
the lower salariat is predominantly salariat, while that of the skilled manual and semi/-unskilled is
predominantly intermediate and working-class origins. Within the higher salariat class, the share of
those from salariat origin has remained constant among Swiss citizens (about 25%) while it has
increased continuously over time for foreign residents, and surpassed the level of their Swiss citizen
counterparts, particularly since it increased significantly in the youngest cohort to the point of
reaching the 50% threshold. As a consequence, the recent new waves of immigration in Switzerland
could actually reinforce social inequality in some ways. It is nevertheless important to notice that,
regardless of citizenship, the proportion of those from an intermediate and working-class origin who
139
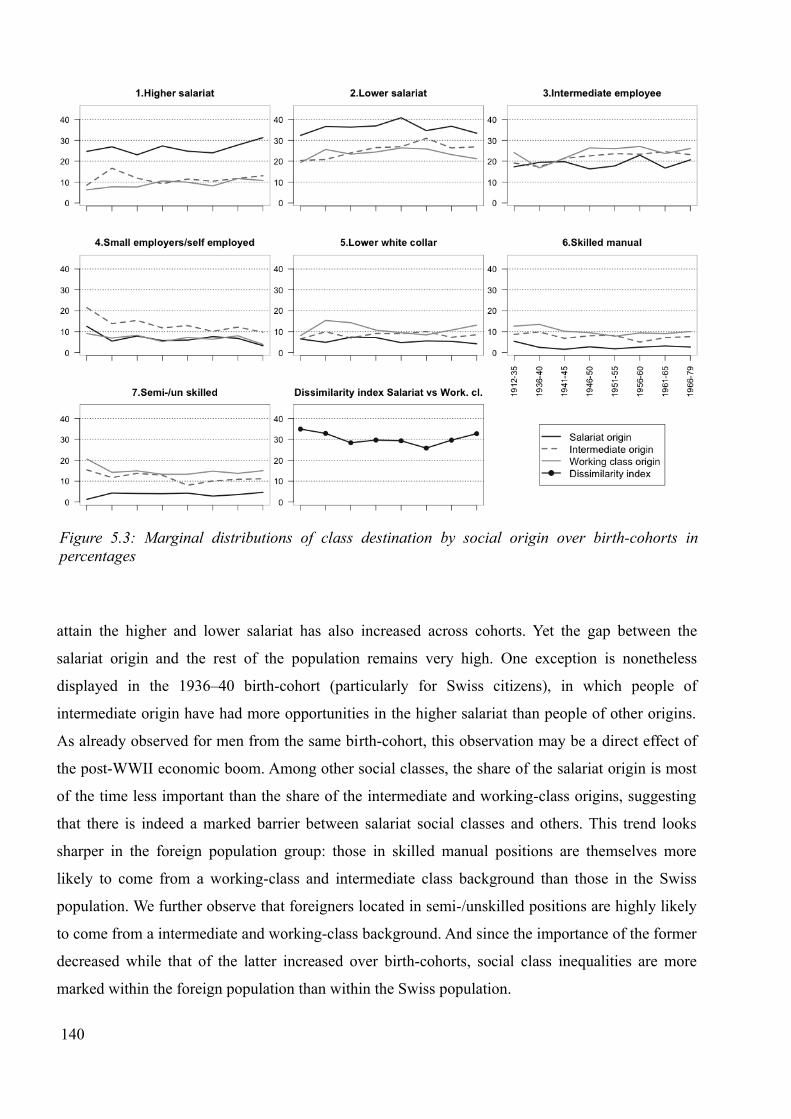
attain the higher and lower salariat has also increased across cohorts. Yet the gap between the
salariat origin and the rest of the population remains very high. One exception is nonetheless
displayed in the 1936–40 birth-cohort (particularly for Swiss citizens), in which people of
intermediate origin have had more opportunities in the higher salariat than people of other origins.
As already observed for men from the same birth-cohort, this observation may be a direct effect of
the post-WWII economic boom. Among other social classes, the share of the salariat origin is most
of the time less important than the share of the intermediate and working-class origins, suggesting
that there is indeed a marked barrier between salariat social classes and others. This trend looks
sharper in the foreign population group: those in skilled manual positions are themselves more
likely to come from a working-class and intermediate class background than those in the Swiss
population. We further observe that foreigners located in semi-/unskilled positions are highly likely
to come from a intermediate and working-class background. And since the importance of the former
decreased while that of the latter increased over birth-cohorts, social class inequalities are more
marked within the foreign population than within the Swiss population.
140
Figure 5.3: Marginal distributions of class destination by social origin over birth-cohorts inpercentages

To summarise the broad changes that occurred in the Swiss social structure over cohorts, we
computed indexes of dissimilarity between men and women and between salariat and working-class
origins. This measure reveals how many women (or working-class origin) would have to change
their social position in order for women and men (or working-class and salariat origin) to have the
same social position distribution. From the oldest birth-cohorts to the 1941–45 birth-cohort,
differences in the class distribution between men and women were reinforced 10%, mainly because
men of these birth-cohorts enjoyed better opportunities in the higher salariat. In contrast, the trend
reversed in the subsequent cohorts. Constantly decreasing across the cohorts, the index of
dissimilarity shows that women’s situation globally improved over time. Despite this converging
trend, there still remains more than 20% dissimilarity between men's and women’s social position
distribution, which they would have to bridge before reaching gender equality in social positions. It
is worth noting that social class gender segregation is slightly higher within the foreign population.
It is particularly notable that while the dissimilarity had decreased significantly between those born
before and after 1940, and again among those born after 1955, it has increased again in the youngest
cohort. This trend counters the Swiss citizen population, in which the dissimilarity index has kept
on decreasing continuously following the cohorts born after 1940.
The picture grows even less encouraging when it comes to differences between the salariat and the
working-class origin. While there seems to have been a diminution of differences between the
1936–40 and 1941–45 birth-cohorts, no real change happened in the following birth-cohorts, with
an index of dissimilarity stabilising at around 28%.
Two points, however, must be underlined:
– The dissimilarity index is less than 26% in the 1956-1960 birth-cohort, suggesting that this
cohort witnesses the lowest level of social background inequality,
– The index increases to 33% in the 1966-1979 birth-cohort, reaching a similar level to the
1936-1940 birth-cohort. Thus, inequalities based on social background seem to have
reinforced in the youngest birth-cohort.
While the former observation holds only for Swiss citizens, as among foreign residents, it is in the
1941-1945 birth-cohorts that social background inequality have been the lowest; the latter
observation holds particularly true for non-Swiss citizens. Moreover, the dissimilarity index
confirms the idea that social background inequality is more polarised in the group of foreigners than
in the Swiss population. Yet, in the two cases, these inequalities remain substantial. From this
standpoint, we can wonder to which extent these changes observed in the class structure have
141
influenced social mobility chances.
5.3 . Did social mobility increase over time in Switzerland?As mentioned earlier in this thesis, two measures of social mobility exist: first, a measure of
absolute social mobility, and second, a measure of relative social mobility. Both measures enable
researchers to provide a complementary vision regarding trends in social mobility. Therefore, the
following section is dedicated to the analysis of both absolute and relative social mobility in
Switzerland.
5.3.1 . Absolute trends in social mobilityFigure 5.4 shows how mobility rates have changed across birth-cohorts for men and women aged
30–64 (in Appendix C this analysis is replicated in Figures C.7 and C.8 separately for Swiss and
non-Swiss citizens). These rates were calculated following Erikson and Goldthorpe’s (1992b:195)
framework to ensure as much comparability as possible with international research. The total
mobility rate is the percentage of cases that do not fall on the main diagonal of the mobility table.
This rate is the proportion of people located in a class different than that of their father. Of course,
this measure is sensitive to the number of classes identified, but with a seven-class schema like
CASMIN, this rate usually ranges between 60 and 70 percent of individuals (Breen 2004b:17) in
industrialised countries. This rate can be decomposed into further rates.35 The vertical mobility rate
is a measure of long-range mobility, whereas non-vertical mobility is a measure of short-range
mobility. Upward and downward rates are themselves a deconstruction of vertical mobility; they
respectively designate mobility movements up and down the main diagonal, corresponding to
ascending and descending mobility.
First of all, Figure 5.4 shows the noteworthy trend that most rates prove to be quite stable over
cohorts, suggesting that the level of social mobility in Switzerland remained quite constant over
time, at least in absolute terms. Gender differences in total mobility are small, although women
demonstrate a slightly higher level of mobility than men, a difference that can primarily be
attributed to gender differentials in the social structure between fathers and daughters. Further
gender contrasts exist between vertical and non-vertical rates. The latter exhibit a higher gender gap
than the former, indicating that the higher level of total mobility rate observed for women results
35 Following Erikson and Goldthorpe’s framework (Erikson and Goldthorpe 1992b:45; see also Breen 2004b:17–18),these rates were computed using a collapsed version of the ESeC class schema. This grouping into three-levels is asfollows. For comparison with the authors’ original frameworks that use the CASMIN class schema, we show itsequivalent between brackets: 1. Classes 1 and 2 (I + II); 2. Classes 3, 4, 5 and 6 (III, IVab, IVc and V+VI); 3. Class 7(VIIa and VIIb). Vertical mobility designates cases that do not fall on the main diagonal of the collapsed classschema version, whereas non-vertical mobility accounts for the difference between total mobility and verticalmobility.
142
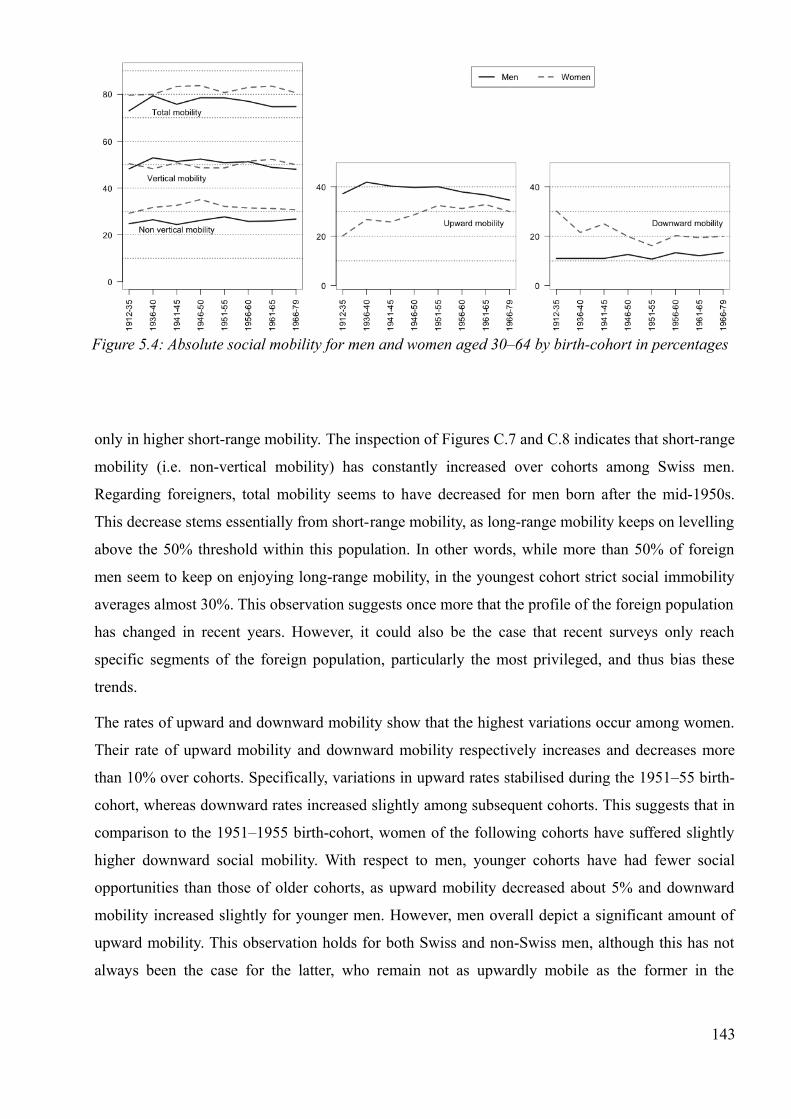
only in higher short-range mobility. The inspection of Figures C.7 and C.8 indicates that short-range
mobility (i.e. non-vertical mobility) has constantly increased over cohorts among Swiss men.
Regarding foreigners, total mobility seems to have decreased for men born after the mid-1950s.
This decrease stems essentially from short-range mobility, as long-range mobility keeps on levelling
above the 50% threshold within this population. In other words, while more than 50% of foreign
men seem to keep on enjoying long-range mobility, in the youngest cohort strict social immobility
averages almost 30%. This observation suggests once more that the profile of the foreign population
has changed in recent years. However, it could also be the case that recent surveys only reach
specific segments of the foreign population, particularly the most privileged, and thus bias these
trends.
The rates of upward and downward mobility show that the highest variations occur among women.
Their rate of upward mobility and downward mobility respectively increases and decreases more
than 10% over cohorts. Specifically, variations in upward rates stabilised during the 1951–55 birth-
cohort, whereas downward rates increased slightly among subsequent cohorts. This suggests that in
comparison to the 1951–1955 birth-cohort, women of the following cohorts have suffered slightly
higher downward social mobility. With respect to men, younger cohorts have had fewer social
opportunities than those of older cohorts, as upward mobility decreased about 5% and downward
mobility increased slightly for younger men. However, men overall depict a significant amount of
upward mobility. This observation holds for both Swiss and non-Swiss men, although this has not
always been the case for the latter, who remain not as upwardly mobile as the former in the
143
Figure 5.4: Absolute social mobility for men and women aged 30–64 by birth-cohort in percentages

youngest cohorts. In regard to foreign women, while they used to be much less upwardly mobile
than Swiss women, they almost catch up in the youngest cohorts. But in spite of the increasing
convergence of upward mobility opportunities between Swiss and non-Swiss citizens, the latter still
remain more downwardly mobility than the former. In particular, foreign men born between 1936
and 1950 seem to have suffered significantly from social downgrading. Nevertheless, irrespective of
citizenship, it is noticeable that men's and women’s opportunities in terms of upward and downward
social mobility tend to converge from the 1951–55 birth-cohort onward, although men are still more
upwardly mobile than women and women more downwardly mobile than men.
One striking fact regarding absolute rates of social mobility presented in Figure 5.4 is that total
mobility rates are on average higher than those traditionally found in social mobility research for
both men and women. Indeed, they range here from around 76% to 82%, whereas they usually lie
between 60% and 70% within the CASMIN schema, as mentioned above. In order to assess to
which extent this difference is significant, rather than merely a class schema measurement effect,
we compared the mean for each rate of the present outcomes with that of the data of the Swiss
Household Panel 1999 (the biggest sample size dataset) that we computed with the ESeC schema
and with the CASMIN schema. Furthermore, we calculated the mean rates for Europe in order to
outline a comparative dimension of Switzerland’s absolute social mobility.
The outcomes displayed in Table 5.1 indeed reveal some classification effects. Rates computed with
the ESeC class schema actually tend to underestimate the degree of total mobility for both men and
144
Table 5.1: Comparison between Switzerland and Europe of average absolute mobility for men and women, controllingfor classification effects with the Swiss Household Panel 1999 data.
Men Women
Switzerland Europe Switzerland Europe
ESEC ESEC EGP EGP ESEC ESEC EGP EGP
12DS shp99 shp99 12DS shp99 shp99
all CH Fgn all all all CH Fgn all all
Total mobility 76.4 76.4 80.9 76.2 81.1 67.0 81.8 81.8 79.1 79.3 87.6 74.3
Vertical mobility 50.5 50.3 47.8 52.4 53.7 48.4 50.0 49.4 54.2 46.5 54.3 50.5
Non-vertical mobility 26.0 26.1 33.2 23.7 27.4 18.5 31.8 32.4 25.0 32.8 33.4 23.8
Upward mobility 38.6 39.8 29.2 40.1 41.5 31.3 28.5 29.1 23.9 24.4 31.8 31.3
Downward mobility 11.8 10.5 18.6 12.4 12.2 17.1 21.5 20.3 30.3 22.2 22.5 19.2Note: 12DS=all 12 datasets; Shp99=Swiss Household Panel 1999 data; all=total population of Switzerland; CH=Swisscitizens population; Fgn=Foreign resident population in Switzerland; Rates for Europe were computed from tables 3.6and 3.17 shown in Breen and Luijkx (2004b:48, 66) and correspond to average rates for the period between 1970s and1990s. Countries covered are Britain, France, Germany (West-), Hungary, Ireland, Israel, Italy, the Netherlands,Norway, Poland and Sweden.
women: about 76% and 80% with the ESeC schema respectively for men and women versus 81%
and 88% with the CASMIN schema (EGP) on SHP99 data. For men, this difference mostly stems
from non-vertical mobility, whereas for women this is accounted for by upward mobility within
vertical mobility, at least for Swiss women. In fact, Swiss women are not on average less upwardly
mobile than European women. Additionally, they do not seem much more downwardly mobile than
their European counterparts when we isolate foreign women. Finally, the considerable difference in
total mobility rates between Swiss women and European women stems from the enormous amount
of non-vertical mobility in the former group: women in Switzerland are about 10% more likely to
exhibit short-range mobility than European women. The same can be said in regard to men. In
addition to that, men experience more vertical mobility in Switzerland than in the rest of Europe:
interestingly, this trend transposes in more upward mobility (about 10% more) and less downward
mobility (about 5% less) among men living in Switzerland than other European countries. Thus, in
absolute terms, men in Switzerland have many more chances to climb the social ladder than in the
rest of Europe – at least on average. Ultimately, Switzerland seems to depict quite idiosyncratic
absolute mobility rates, although it must be underlined that these observations are based on means
that are nowhere near adequate enough to describe real trends. Furthermore, we could wonder to
which extent the comparative tools we use satisfactorily capture the reality and specificity of the
Swiss social structure. In fact, both ESeC and EGP class schema were constructed using standard
algorithms that may not be best to describe Swiss society. Therefore, more research is needed on the
construction and the operationalisation of comparative tools measuring class schema in the Swiss
context. Yet, in spite of these measurement questions, outcomes depicted point towards interesting
insights.
What is furthermore interesting is to look more thoroughly at differences in average absolute
mobility between Swiss and non-Swiss citizens. Foreign men display higher non-vertical mobility
than Swiss men and Swiss men display higher vertical mobility than foreign men. These higher
vertical mobility chances for Swiss men translate into higher upward mobility and lower downward
mobility chances in comparison to foreign men. In contrast, while foreign women also display even
higher vertical mobility than both Swiss men and women, they are significantly likely to exhibit
downward mobility (on average 30%). This observation shows that the experience of migration for
women tends to come at the price of lost social position.
Finally, in Figure 5.5, we computed ratios between vertical and non-vertical mobility and between
upward and downward mobility over birth-cohorts to assess the extent of change or stability in the
distribution of absolute mobility. While we observe that overall, there is always more long-range
145

mobility than short-range mobility as well as more upward than downward mobility in Switzerland
– with the exception of foreign women on this latter point – Swiss men's upward mobility
advantage is decreasing over time, whereas foreign women's upward mobility disadvantage has
almost disappeared in youngest cohorts. Yet in spite of these trends, the ratio still privileges Swiss
men, whereas the ratio for foreign women still remains extremely close to 1, which implies they
have only a few more upward mobility chances than downward mobility ones. In other words, in
simplistic terms we could say that the winners of the social mobility “lottery” are Swiss men,
whereas the losers are foreign women.
But these observations only hold in absolute terms. We can now wonder how much these variations
146
Figure 5.5: Ratio between (1) Vertical mobility (TV) and Non-Vertical mobility (TNV) and (2)Upward mobility (TU) and Downward mobility (TD) for men and women according to citizenshipover birth-cohorts.

result from intrinsic change rather than pure structural change. The analysis of relative rates of
mobility will help us to disentangle the structural effects from the net effects.
5.3.2 . Relative trends in social mobilityIn contrast to absolute social mobility, relative social mobility shows a given society’s degree of
openness. Relative social mobility measures one person’s chances of access to a given social
position in comparison to people from different social positions. In other words, “it tells us
something about the advantages and disadvantages associated with being born into one class rather
than another” (Breen 2004b:20). Concretely, through the use of the odds ratio, a statistic that has the
property of being independent of the marginal distribution, the measure of relative social mobility
has the ambition of capturing intrinsic changes in social mobility, supposedly net of structural
changes.
We measured relative social mobility by applying the classical log-linear models approach to the
men's and women’s mobility table. More specifically, the three basic log-linear models that were
presented in the methodological chapter were fitted to the data in order to find whether or not we
could observe a trend towards increasing social fluidity in Switzerland. Additionally, when the
Unidiff model did not prove significant enough as compared to the CnSF model, more
parsimonious models were run to check on which ground we had accepted (or rejected) the CnSF
model. To assess the robustness of trends depicted, models were furthermore fitted on two different
birth-cohorts versions: one with detailed birth-cohorts in eight categories and one with synthesised
birth-cohorts in five categories. However, trends will be mainly interpreted from the latter birth-
cohort version, as it proves to provide the most robust estimates because it encompasses greater
sample size for each cohort. The results of models fitted are displayed in Tables 5.2 and 5.3
respectively for men and women.
For men, with the detailed birth-cohort version, the Unidiff model does not provide significant
improvement and thus must be rejected. However, more parsimonious models were tested. The
Unidiff model with a linear trend does not pass the significance threshold with a gain in the G2 of
only 1.4 with a loss of one degree of freedom (df). Unidiff models run with a constraint on Unidiff
parameters prove yet to be more successful. A first model (M4) constraining Unidiff parameters of
birth-cohorts 1936-1940 to 1966-1974 to be equal provides a significant improvement over the
CnSF model. Similarly, a second model (M5), imposing Unidiff parameters to be equal between
1936-1940 and 1951-1960 birth-cohorts, as compared to the previous model, also does. However, as
can be seen from Unidiff parameters plotted in Figure 5.6, these two constrained models indicate
147

148
Table 5.2: Results of fitting the log-linear models to men's mobility tables according to their father's social position,divided into eight cohorts and five cohorts
Models F / D G2 Df P DI %G2 BIC
* Men, 8 cohorts mobility table N=6984
M0. Cond. Ind. 1350.1 288 0.000 16.9 - -1199.1
M1. CnSF 304.4 252 0.013 7.11 77.45 -1926.1
M2. Unidiff 294.8 245 0.016 6.96 78.16 -1873.8Parameters M2 c1 = 1; c2 = 0.61; c3 = 0.74; c4 = 0.71; c5 = 0.64; c6 = 0.66; c7 = 0.70; c8 = 0.72
M3. Unidiff Linear trend 303.0 251 0.014 7.12 77.56 -1918.7Parameters M3 -0.0029
M4. Unidiff constrained 297.1 251 0.024 7.01 77.99 -1924.6Parameters M4 c1 = 1; c2, c3, c4, c5, c6, c7 & c8 = 0.69
M5. Unidiff constrained 295.2 250 0.026 6.95 78.14 -1917.6Parameters M5 c1 = 1; c2, c5 & c6 = 0.65; c3, c4, c7 & c8 =0.71
Model comparison
M0 - M1 1045.7 36 0.000
M1 - M2 9.6 7 0.212
M1 - M3 1.4 1 0.237
M1 - M4 7.3 1 0.007
M1 - M5 9.2 2 0.010
M4 - M5 1.9 1 0.168
* Men, 5 cohorts mobility table N=6984
M0. Cond. Ind. 1235.5 180 0.000 16.33 - -357.7
M1. CnSF 179.4 144 0.024 5.46 85.48 -1095.2
M2. Unidiff 172.6 140 0.032 5.29 86.03 -1066.6Parameters M2 c1 = 1; c2 = 0.96; c3 = 0.77; c4 = 0.86; c5 = 0.89
M3. Unidiff Linear trend 178.0 143 0.025 5.47 85.59 -1087.8Parameters M3 -0.0027
M4. Unidiff constrained 177.3 143 0.027 5.47 85.65 -1088.7Parameters M4 c1 = 1; c2, c3, c4 & c5 = 0.8658
M5. Unidiff constrained 174.0 142 0.035 5.32 85.92 -1082.9Parameters M5 c1 = 1; c2, c4 & c5 = 0.8991; c3 = 0.7716
M6. Unidiff constrained 172.8 141 0.036 5.29 86.02 -1075.3Parameters M6 c1 = 1; c2 = 0.9587; c3 = 0.7697; c4 & c5 = 0.8718
Model comparison
M0 - M1 1056.1 36 0.000
M1 - M2 6.8 4 0.147
M1 - M3 1.4 1 0.237
M1 - M4 2.1 1 0.147
M1 - M5 5.4 2 0.067
M1 - M6 6.6 3 0.086
Notes: Cond Ind=conditional independence model; CnSF=constant social fluidity model (the model which assumes theOD association to be constant); Unidiff=uniform difference model (the model which assumes the OD associationchanged). G2=deviance, Df=degree of freedom, P=p-value, DI=dissimilarity index, %G2=proportion of reduction ofdeviance, BIC=Bayesian information criterion. On the parameters lines, c1 to c5/c8 refer to corresponding birth-cohorts. To be significant, each new effect added into a model is compared to previous nested model and should exhibita p-value below 0.05 (see models comparison panels)

149
Table 5.3: Results of fitting the log-linear models to women mobility tables according to their father's social position,divided into eight cohorts and five cohorts
Models F / D G2 Df P DI %G2 BIC
* Women, 8 cohorts mobility table N=6381
M0. Cond. Ind. 904.6 288 0.000 13.42 - -1618.6
M1. CnSF 329.9 252 0.001 6.93 63.53 -1877.9
M2. Unidiff 324.5 245 0.000 6.9 64.13 -1822Parameters M2 c1 = 1; c2 = 1.08; c3 = 0.95; c4 = 0.91; c5 = 0.90; c6 = 0.79; c7 = 0.74; c8 = 0.97
M3. Unidiff Linear trend 329.8 251 0.001 6.92 63.54 -1870Parameters M3 -0.0013
M4. Unidiff constrained 325.0 250 0.001 6.87 64.07 -1865.3Parameters M4 c1 & c2 = 1; c3, c4, c5 & c8 = 0.90; c6 & c7 = 0.73
M5. Unidiff constrained 324.9 249 0.001 6.87 64.08 -1856.6Parameters M5 c1 = 1; c2: 1.08; c3, c4, c5 & c8 = 0.94; c6 & c7 = 0.76
Model comparison
M0 - M1 574.7 36 0.000
M1 - M2 5.4 7 0.611
M1 - M3 0.1 1 0.752
M1 - M4 4.9 2 0.086
M1 - M5 5 3 0.172
* Women, 5 cohorts mobility table N=6381
M0. Cond. Ind. 748.9 180 0.000 12.39 - -828.1
M1. CnSF 170.6 144 0.065 5.14 77.22 -1091
M2. Unidiff 163.8 140 0.082 5.05 78.12 -1062.7Parameters M2 c1 = 1; c2 = 0.83; c3 = 0.79; c4 = 0.67; c5 = 0.87
M3. Unidiff Linear trend 170.0 143 0.061 5.1 77.3 -1082.8Parameters M3 -0.0024
M4. Unidiff constrained 168.3 143 0.073 5.1 77.53 -1084.6Parameters M4 c1 = 1; c2, c3, c4 & c5 = 0.78
M5. Unidiff constrained 164.5 142 0.096 5.03 78.04 -1079.6Parameters M5 c1 = 1; c2, c3 & c5 = 0.83; c4 = 0.67
M6. Unidiff constrained 163.9 141 0.091 5.06 78.11 -1071.4Parameters M6 c1 = 1; c2, c3 = 0.80; c4 = 0.67; c5 = 0.87
Model comparison
M0 - M1 578.3 36 0.000
M1 - M2 6.8 4 0.147
M1 - M3 0.6 1 0.439
M1 - M4 2.3 1 0.129
M1 - M5 6.1 2 0.047
M1 - M6 6.7 3 0.082
M5 - M2 0.7 2 0.705
Notes: Cond Ind=conditional independence model; CnSF=constant social fluidity model (the model which assumes theOD association to be constant); Unidiff=uniform difference model (the model which assumes the OD associationchanged). G2=deviance, Df=degree of freedom, P=p-value, DI=dissimilarity index, %G2=proportion of reduction ofdeviance, BIC=Bayesian information criterion. On the parameters lines, c1 to c5/c8 refer to corresponding birth-cohorts. To be significant, each new effect added into a model is compared to previous nested model and should exhibita p-value below 0.05 (see models comparison panels)

some rather limited variations in social fluidity rather than a clear increasing trend over time.
Overall, Unidiff parameters point to some unexpected variation between the oldest cohort and other
cohorts. While parameters indicate that social fluidity remained relatively stable from the 1941–45
birth-cohort to the 1966–74 cohort, between the 1912–35 and the 1936–40 cohorts, the parameters
display a very strong increase in social fluidity, with a fall from 1 to 0.61. Although this increase in
social fluidity is consistent with the trend of increasing opportunities within the higher salariat from
the pre-1936 birth-cohort to the 1936–40 one, this impressive difference may account for
measurement effect to some extent. We have indeed already noted in the analysis of changes in the
class structure that the measurement quality of the oldest birth-cohort should be slightly less reliable
than others. More than 70% of it was indeed constructed from the two oldest datasets (AP75 and
ISSP87) for which the recoding from ISCO-68 to ISCO-88 was approximated and the ESeC class
schema was computed in its simple version for reasons of lack of information (except for
respondents in the AP75 survey). The ISCO recodification should not be the main issue, as this
effect has never been underlined in comparative research. The simple computation of ESeC
probably accounts for this difference to some extent. But one must also bear in mind that the oldest
birth-cohort is very heterogeneous and includes people born between 1912 and 1935, so this change
may have been eventually substantial, but not as sudden as it looks. Unfortunately, the too-small
sample size within the oldest cohort does not allow us to test this hypothesis any further with log-
linear models. Thus, this first set of analysis suggests that we do not observe in Switzerland a
general increasing social fluidity trend for men. Does a similar picture arise when the synthesised
and more robust birth-cohort version is used?
The answer is yes. Not only does the Unidiff model not provide significantly more information than
the CnSF model, neither do any of the four simpler models tested. Only the second Unidiff model
with constrained parameters (M5) seems to come nearer the significance threshold of 5%. Yet with
a p-value of 0.067, this model remains unacceptable and must be rejected. Thus, while there must
have been variations in social fluidity in Switzerland for men, these variations do not seem to have
been substantial but rather sparse and do not point in the direction of a general trend towards
increasing social fluidity. In fact, as can be seen in plots in Figure 5.6, the 1950-1957 birth-cohort
may have experienced slightly more social fluidity that other cohorts. However, among the
subsequent birth-cohort, the Unidiff parameters clearly indicate that this trend reversed in the sense
of decreasing social fluidity. In other words, these fluctuations provide an overall constant picture of
social fluidity in Switzerland, at least for men. Can the same be said in regard to women?
Indeed, results for women paint a similar picture. Whether the detailed birth-cohort version or the
150
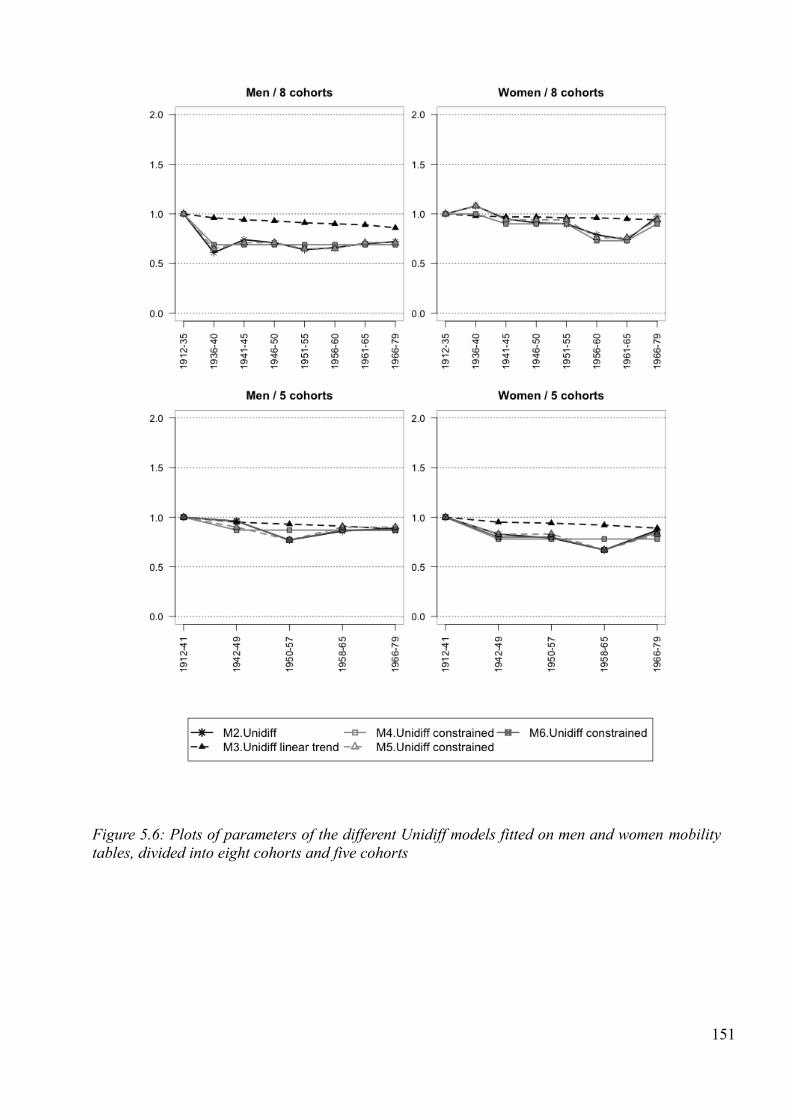
151
Figure 5.6: Plots of parameters of the different Unidiff models fitted on men and women mobilitytables, divided into eight cohorts and five cohorts

synthesised birth-cohort version, the full Unidiff model must be rejected. Furthermore, no simpler
model proves to fit the data significantly enough to discern any trend with the detailed birth-cohort
version. Yet one simpler model (M5) fitted with the synthesised birth-cohort version provides a
slight but significant improvement over the basic CnSF model. However, this model scarcely
reaches the significance threshold of 5% with a p-value of 0.047. Furthermore, by constraining
Unidiff parameters to be equal between 1942-1957 and 1966-1979 birth-cohorts, the model implies
that variations have been rather limited as can be seen in plots displayed in Figure 5.6. It seems,
however, that women born between 1958 and 1965 may have enjoyed higher levels of social
fluidity than any other cohort.
In other words, among the cohorts considered, the strength of the association between social origin
and social destination has remained rather constant; while some variations in social fluidity may
have occurred, they do not seem to have been important enough to substantially modify the
structure of opportunities of individuals' chance of successfully achieving a given social position
relative to another, for both men and women. Furthermore, no general trend pointing in the
direction of increasing social fluidity can be observed in any case, not even a non-significant one.
Finally, it is important to stress that these conclusions still hold when we control for citizenship and
age, being for men or women (see Figure C.9).
Ultimately, in order to show how much life chances are conditioned by social origin, we report in
Table C.1 in appendix C the parameter details of best log-linear models fitted for both men and
women. Parameters indicate, for instance, that the chances of accessing a social position in the
higher salariat rather than one in the semi-/unskilled class are 26.4 times higher for men and 91.4
higher for women who have a father from the higher salariat rather than from the semi-/unskilled
class. In other words, barriers in class position attainment are particularly strong in Switzerland.
5.4 . Discussion and conclusionTo sum it up, the present findings do not lend support to the liberal theory of industrialism, which
predicts an increase in social mobility over birth-cohorts, as hypothesised (H1a). Although the
Swiss social structure underwent an upward shift with a decrease of the proportion of people in the
lowest social classes and an increase of those in higher rank positions, both measures of absolute
and relative social mobility support the trend of no significant change, in line with the constant flux
thesis. In fact, not only do the rates of absolute social mobility remain steady over time, but the log-
linear model estimates also clearly favour the model of constant social fluidity. Therefore, in
Switzerland, both upward directed changes in the social structure and the overall expansion of the
152
educational system did not result in a substantial increase in social mobility opportunities.
Additionally, only little evidence was found regarding the impact of economic variations on social
mobility, lending little support to our hypothesis (cf. H1b). It is likely that, the most noticeable
findings in this respect pertain to men's upward mobility advantage, which eroded in youngest
cohorts. In addition to that, the period of the long boom indeed offered greater opportunities in the
higher salariat class for men and for the intermediate class born between 1936 and 1945. Besides
this, no further important contextual effect was observed in subsequent cohorts, particularly in
relative terms. In fact, the parameters of the Unidiff model corroborate the idea of overall stability
of inequality of opportunity over time for men.
Globally, the greatest changes occurred among women, corroborating our hypothesis of a gender
convergence amongst youngest cohorts (H7). In spite of the fact that the Swiss social structure is
still highly sex-segregated, women’s situation has improved over time. Women from recent birth-
cohorts indeed enjoyed greater upward social mobility and lower downward social mobility than
women of older birth-cohorts, resulting in an increasing convergence with men’s situation in terms
of absolute social mobility chances. Yet in relative terms, changes we observe have not been
substantial enough to reveal a decreasing trend in inequality of opportunity in Switzerland, in spite
of some variations pointing in the direction of increasing social fluidity, especially for women born
between 1958 and 1965. Of course, these observations apply only to working women. In this
respect, there are good reasons to suspect some selection bias in the social composition of the oldest
birth-cohorts of women, as for these women, being a housewife was the social norm. As a
consequence, working women were more likely to be found in low-qualified occupations, while
men held highest social positions. We should also emphasise that outcomes for women would
certainly have been different if we could have distinguished between full-time and part-time
employment. It is, in fact, probable that women in full-time employment would have enjoyed
greater upward social mobility whereas those in part-time employment would have been more
likely to experience downward mobility as some research suggests (see Blossfeld and Drobnič
2001).
This first analysis also tentatively highlights differences in social mobility (1) between Swiss
citizens and the foreign population, and (2) between Switzerland and other European countries.
Globally, trends drawn on the foreign population demonstrate primarily the heterogeneity of this
group: they are over-represented at the extremes of the social structure and depict marked social
class inequality. We furthermore observe a trend towards the polarisation of social mobility
opportunities within the foreign population, particularly within the youngest cohorts. This trend
153

would seem to reflect the diversification of the foreign population witnessed in recent immigration
waves, in particular with the growing share of highly qualified migrants who have arrived in
Switzerland (Pecoraro 2005; Piguet 2013). Secondly, we observe that the profile of the foreign
population in Switzerland has changed over time: for instance, in the youngest cohort, the share of
immigrants in the higher salariat grew substantially. We also outlined that overall, women who
immigrated to Switzerland tend to have experienced much more downward mobility than Swiss
women. Therefore, for women, the experience of migrating to Switzerland seems to come at the
price of a loss of social position. In contrast, Swiss men enjoy substantially more upward social
mobility than any other segments of the population. This observation is also true from a
comparative perspective. In fact, Swiss men are on average 10% more upwardly mobile than
European men. Yet, this advantage for Swiss men seems to decrease – at least slightly – in the
youngest cohorts. From this standpoint, although we clearly find some support for our hypothesis
on social mobility differences according to citizenship (H8), the Swiss premium over foreigners
seem to be less marked today than it was in oldest cohorts. This trend is furthermore weakened by
the increasing share of highly qualified migrants in the youngest cohorts, who enjoy higher
opportunities in the salariat class than the Swiss citizens. Yet in spite of this huge share of absolute
upward social mobility, in relative terms men's structure of opportunity did not change significantly.
Therefore, this huge amount of absolute mobility accounts essentially for structural mobility, driven
by the changing social structure.
From this standpoint, the non-changing trend observed in social fluidity in Switzerland is
inconsistent with the argument stating that research using longer observation time periods, larger
sample size, and adopting a cohort perspective is more likely to detect change. Indeed, the present
research demonstrates the clear-cut result of non-substantial change in social fluidity in Switzerland,
despite a robust research design.
Finally, the results of the present research are consistent with previous studies on social mobility in
Switzerland that focused on a smaller time frame. They coincide particularly with those of Levy,
Joye, Guye and Kaufmann (1997) and Bergman, Joye and Fux (2002), who had found no effects of
contextual changes on social mobility. In this respect, we can now maintain on the basis of the
present research that substantive change was not overshadowed by the limited time frame that the
authors used. Instead, there seems to be no significant substantial change in social mobility in
Switzerland. Furthermore, the present outcomes also converge partially with those from the analysis
of Joye, Bergman and Lambert (2003) on Swiss men’s social fluidity, at least with the findings they
have drawn with the CASMIN class schema.
154

That being said, the constant flux thesis provides a good description of the evolution of social
mobility in Switzerland. Yet it remains to be seen to which extent this particularly strong persistence
of inequality of opportunity in Switzerland stems from institutional settings characteristic of this
country. In this respect, the dual nature of the Swiss educational system might be one source of
explanation. Therefore, in the next chapter we will investigate the mediating effect of education on
intergenerational social mobility.
155

156

6 . When education reproduces social inequalities:explaining how education mediates constantsocial mobility in Switzerland
6.1 . IntroductionAnalysis undertaken in the previous chapter demonstrates the clear-cut findings of the persistent
importance of social origin on social position opportunities in Switzerland over time. While it
seems that there have been some weak variations in social fluidity, and even probably increasing
social fluidity for some birth-cohorts, overall Swiss society seems to be characterised by a rather
strong degree of rigidity. To explain this peculiar finding, as compared to other Western countries,
in this second chapter we investigate the mediating effect of educational attainment in the social
mobility process. We can indeed wonder what role education plays in light of the constant social
fluidity trend we outlined, particularly when given the educational expansion that took place in
Switzerland over the last century. It could be the case that educational expansion in the Swiss
context did not actually generate more social mobility, in contrast to other empirical research in the
field.
Indeed, education has traditionally been considered the main driver of meritocracy in the social
mobility literature, a feature that should characterise democratic and industrial societies. Since the
1960s, intergenerational social mobility scholars have addressed this meritocratic issue through the
investigation of the mediating effect of education under the conceptual framework of the so-called
OED triangle – which proposes to model the association between social origin, education and social
destination. While changes in the OED association have been analysed in many countries, so far no
research has analysed systematically temporal trends in the three-way OED interaction in
Switzerland. This analysis may thus help us to understand the effect of the specific Swiss
educational system on social mobility dynamics.
The analysis will consist of assessing (1) the extent of change in educational inequality
(equalisation effect), (2) the extent of change in the occupational advantage afforded by education
(return to education), and (3) the extent of variation in the origin-destination association according
to educational levels (compositional effect).
157

In line with our hypotheses:
– educational inequalities should have decreased overall (H2a),
– and more markedly within the youngest birth-cohorts given Switzerland's late educational
expansion (H2b).
– returns to education should have remained relatively stable (H3a),
– although it should have decreased within youngest cohorts (H3b).
– the association between social origin and social destination should be weaker within higher
educational levels – compositional effect (H4).
– these outcomes should display differences according to gender (H7),
– and to citizenship (H8).
In order to assess the extent of validity of these hypotheses, both absolute and relative trends will be
described. We will start this endeavour by observing how the Swiss educational system expanded
over time.
6.2 . How has the Swiss educational system expanded overtime?
Figure 6.1 depicts trends over birth-cohorts in educational expansion in Switzerland by gender,
measured according to (1) having attained at least secondary education and to (2) having attained at
least tertiary education.
As for having attained at least secondary education, while within the oldest cohort, only 50% had
attained at least secondary education, about 90% attained this educational level in the youngest
cohort. Thus, the structure of the Swiss educational system underwent a massive upward shift. What
is furthermore noteworthy is the fact that gender differences decreased considerably up to the 1951-
1955 birth-cohort. Indeed, while women used to be much less likely than men to attain at least
secondary education in the oldest birth-cohorts, this gender gap considerably weakened and actually
almost disappeared within the youngest birth-cohorts. Yet men are still slightly more likely than
women to reach at least secondary education, suggesting that gender equality has not completely
been achieved in Switzerland in spite of the general gender equalisation trend observed.
This persistent gender inequality picture is much more obvious when we turn to the second graph of
Figure 6.1, which shows the share of the Swiss population that attained at least tertiary education.
158
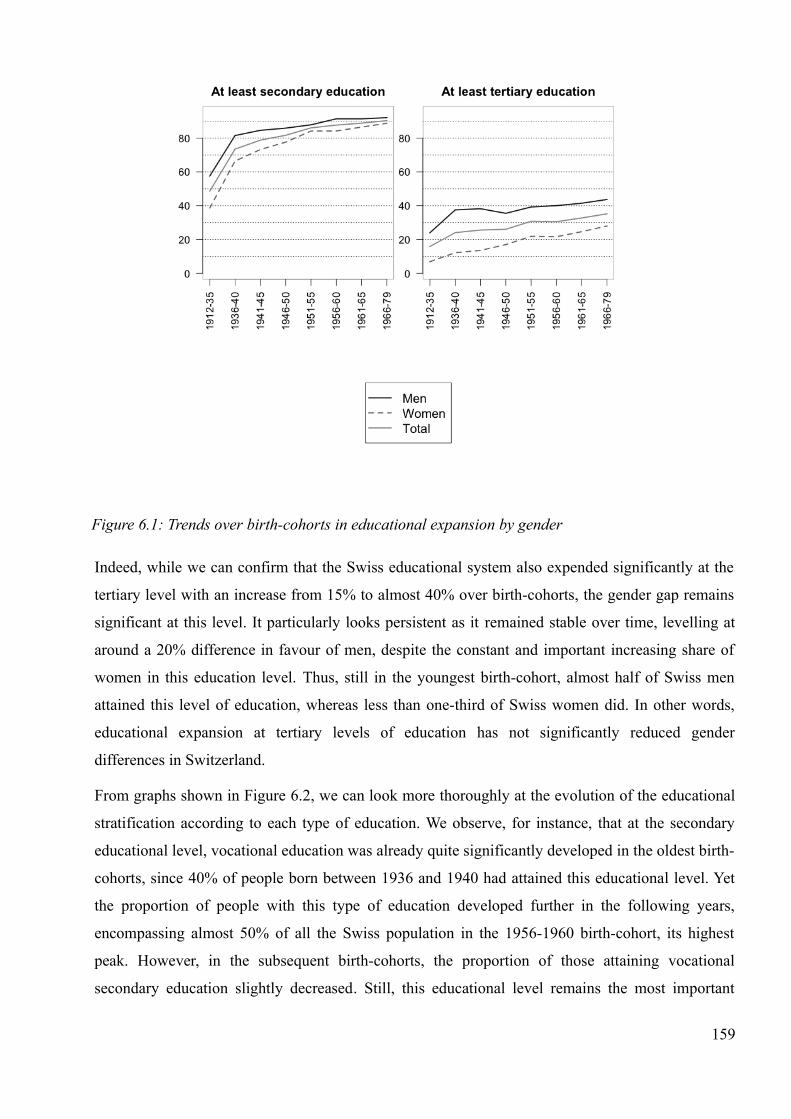
Indeed, while we can confirm that the Swiss educational system also expended significantly at the
tertiary level with an increase from 15% to almost 40% over birth-cohorts, the gender gap remains
significant at this level. It particularly looks persistent as it remained stable over time, levelling at
around a 20% difference in favour of men, despite the constant and important increasing share of
women in this education level. Thus, still in the youngest birth-cohort, almost half of Swiss men
attained this level of education, whereas less than one-third of Swiss women did. In other words,
educational expansion at tertiary levels of education has not significantly reduced gender
differences in Switzerland.
From graphs shown in Figure 6.2, we can look more thoroughly at the evolution of the educational
stratification according to each type of education. We observe, for instance, that at the secondary
educational level, vocational education was already quite significantly developed in the oldest birth-
cohorts, since 40% of people born between 1936 and 1940 had attained this educational level. Yet
the proportion of people with this type of education developed further in the following years,
encompassing almost 50% of all the Swiss population in the 1956-1960 birth-cohort, its highest
peak. However, in the subsequent birth-cohorts, the proportion of those attaining vocational
secondary education slightly decreased. Still, this educational level remains the most important
159
Figure 6.1: Trends over birth-cohorts in educational expansion by gender

educational category of all in Switzerland. What is noteworthy is that there are 10% more women
than men in this educational level and that gender inequality does actually tend to increase in the
youngest birth-cohort, as the share of men decreases by a few points. This is not the case within the
secondary general education level, where gender inequality is the lowest and remains constant,
160
Figure 6.2: Trends over birth-cohorts in educational distribution by gender
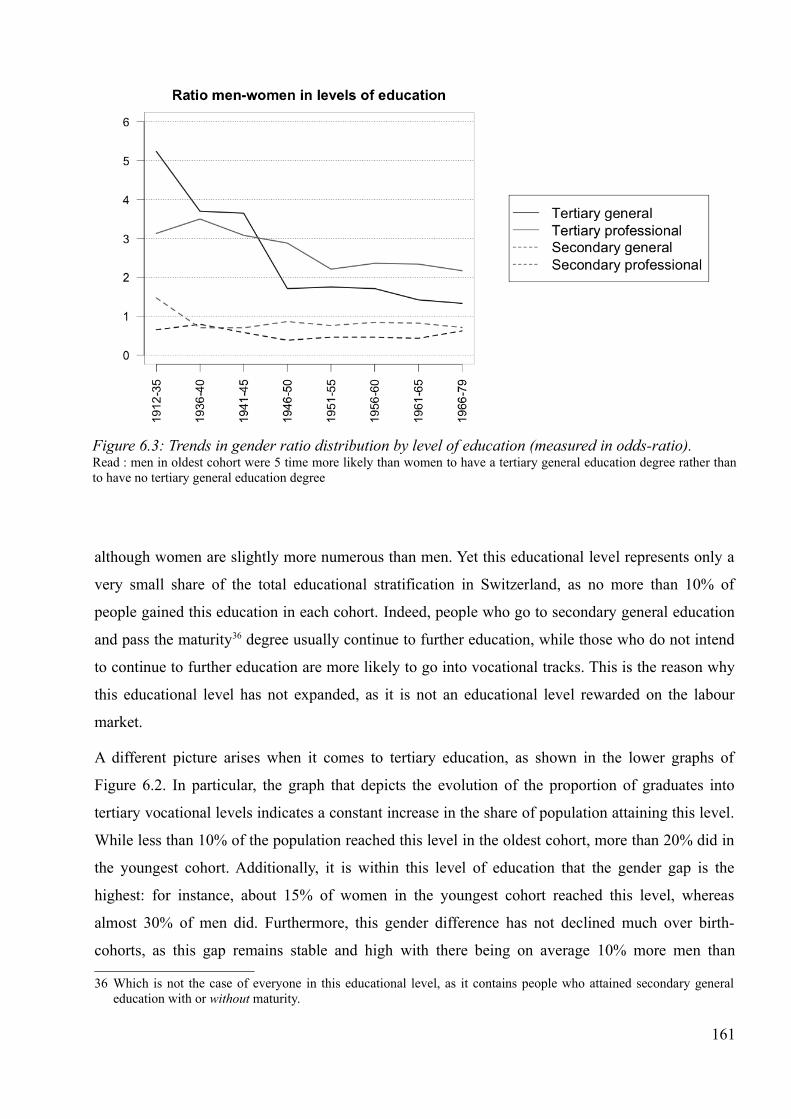
although women are slightly more numerous than men. Yet this educational level represents only a
very small share of the total educational stratification in Switzerland, as no more than 10% of
people gained this education in each cohort. Indeed, people who go to secondary general education
and pass the maturity36 degree usually continue to further education, while those who do not intend
to continue to further education are more likely to go into vocational tracks. This is the reason why
this educational level has not expanded, as it is not an educational level rewarded on the labour
market.
A different picture arises when it comes to tertiary education, as shown in the lower graphs of
Figure 6.2. In particular, the graph that depicts the evolution of the proportion of graduates into
tertiary vocational levels indicates a constant increase in the share of population attaining this level.
While less than 10% of the population reached this level in the oldest cohort, more than 20% did in
the youngest cohort. Additionally, it is within this level of education that the gender gap is the
highest: for instance, about 15% of women in the youngest cohort reached this level, whereas
almost 30% of men did. Furthermore, this gender difference has not declined much over birth-
cohorts, as this gap remains stable and high with there being on average 10% more men than
36 Which is not the case of everyone in this educational level, as it contains people who attained secondary generaleducation with or without maturity.
161
Figure 6.3: Trends in gender ratio distribution by level of education (measured in odds-ratio). Read : men in oldest cohort were 5 time more likely than women to have a tertiary general education degree rather thanto have no tertiary general education degree

women in this educational level. Such high and persisting gender difference must account for the
specialisation of this type of education. In fact, tertiary vocational education encompasses schools
that mostly prepare students for male-dominated jobs. Yet since the late 1990s introduction of
Universities of Applied Sciences that focus on preparation for female-dominated jobs, this gender
gap should have declined. It remains to be seen whether our sample limitation hinders us to see this
evolution or whether there indeed has been no strong impact of the development of these applied
Universities on gender inequalities at the tertiary vocational educational level.
In contrast, gender inequality at the tertiary general education level has declined over time quite
significantly. While this level of education also underwent an upward shift between the oldest and
youngest cohorts, the gender gap clearly decreased, especially from the 1946-1950 birth-cohort
onwards. Although more men than women attain this level of education in the youngest cohort,
there are only less than 5% more men than women. Despite this gender equalisation, it remains
noteworthy that in the youngest cohort, less than 20% of the total population of Switzerland reaches
tertiary general education, such as University or polytechnic schools, indicating that educational
expansion in Switzerland, although not insignificant, still remains relatively moderate in
comparison to other Western countries. Yet according to latest OECD's report “education at a
glance” (2013), the attainment of tertiary education in Switzerland expanded more importantly that
what we observe here. In 2011, 35% of the Swiss population had a tertiary education degree. So it
might be the case that our study fails to capture latest developments in the expansion of the Swiss
educational system. Nevertheless, it is also possible that OECD's figures overestimate this
expansion, through the groupings of educational titles it uses. This measurement effect in the OECD
report can be suspected through the distribution of the two types of tertiary education tracks, with
the overrepresentation – as compared to our findings – of tertiary graduates from general education
(25%), and the underestimation of those who graduated from vocational tracks (11%). In addition to
potential measurement effects, one further explanation of the potential overestimation of the
expansion of the Swiss educational system could stem from the growing share of highly qualified
migrants that Switzerland has welcomed over recent years. Thus, OECD's figures require higher
scrutiny and qualifications.
A closer look at the educational distribution according to the citizenship criteria indeed proves
instructive. As can be seen from Figure D.1 in Appendix D, the share of the foreign population that
has not attained at least secondary education is much higher than in the group of Swiss citizens,
regardless of gender. Still in the youngest cohort, more than 20% of foreigners had only completed
compulsory education, indicating that a sizeable share of the foreign population in Switzerland
162
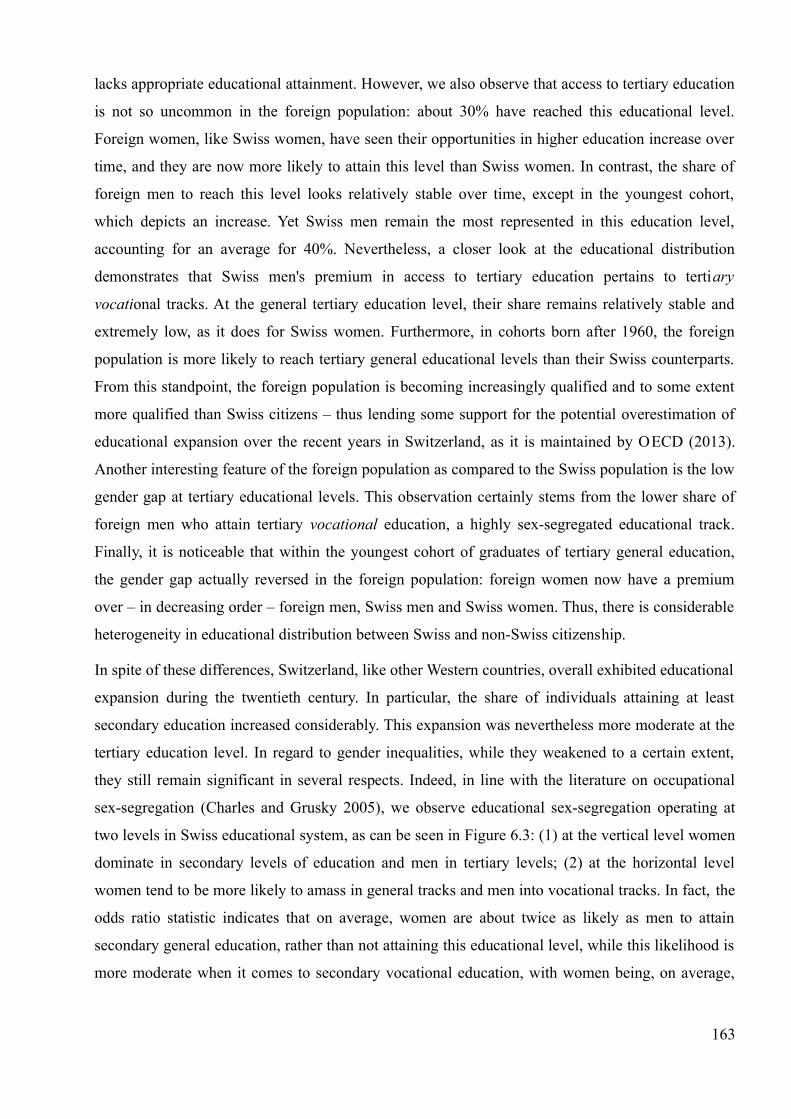
lacks appropriate educational attainment. However, we also observe that access to tertiary education
is not so uncommon in the foreign population: about 30% have reached this educational level.
Foreign women, like Swiss women, have seen their opportunities in higher education increase over
time, and they are now more likely to attain this level than Swiss women. In contrast, the share of
foreign men to reach this level looks relatively stable over time, except in the youngest cohort,
which depicts an increase. Yet Swiss men remain the most represented in this education level,
accounting for an average for 40%. Nevertheless, a closer look at the educational distribution
demonstrates that Swiss men's premium in access to tertiary education pertains to tertiary
vocational tracks. At the general tertiary education level, their share remains relatively stable and
extremely low, as it does for Swiss women. Furthermore, in cohorts born after 1960, the foreign
population is more likely to reach tertiary general educational levels than their Swiss counterparts.
From this standpoint, the foreign population is becoming increasingly qualified and to some extent
more qualified than Swiss citizens – thus lending some support for the potential overestimation of
educational expansion over the recent years in Switzerland, as it is maintained by OECD (2013).
Another interesting feature of the foreign population as compared to the Swiss population is the low
gender gap at tertiary educational levels. This observation certainly stems from the lower share of
foreign men who attain tertiary vocational education, a highly sex-segregated educational track.
Finally, it is noticeable that within the youngest cohort of graduates of tertiary general education,
the gender gap actually reversed in the foreign population: foreign women now have a premium
over – in decreasing order – foreign men, Swiss men and Swiss women. Thus, there is considerable
heterogeneity in educational distribution between Swiss and non-Swiss citizenship.
In spite of these differences, Switzerland, like other Western countries, overall exhibited educational
expansion during the twentieth century. In particular, the share of individuals attaining at least
secondary education increased considerably. This expansion was nevertheless more moderate at the
tertiary education level. In regard to gender inequalities, while they weakened to a certain extent,
they still remain significant in several respects. Indeed, in line with the literature on occupational
sex-segregation (Charles and Grusky 2005), we observe educational sex-segregation operating at
two levels in Swiss educational system, as can be seen in Figure 6.3: (1) at the vertical level women
dominate in secondary levels of education and men in tertiary levels; (2) at the horizontal level
women tend to be more likely to amass in general tracks and men into vocational tracks. In fact, the
odds ratio statistic indicates that on average, women are about twice as likely as men to attain
secondary general education, rather than not attaining this educational level, while this likelihood is
more moderate when it comes to secondary vocational education, with women being, on average,
163

only 1.3 time more likely than men to reach this educational level. At the tertiary level, although
men are still more numerous than women, as we have already mentioned, the feminisation is much
more pronounced in general tracks than in vocational ones. While men were 5.2 times more
numerous in tertiary general education levels and 3.1 times in tertiary vocational ones in the oldest
birth-cohort, they dropped respectively to 1.3 times and 2.2 times in the youngest cohort. This
gender segregation trend is particularly pronounced within the Swiss citizen population, certainly
because of its higher attainment within vocational tracks that are more gender-segregated. Thus,
having presented overall trends in educational expansion by gender in Switzerland, we can now
wonder how these transformations have impacted the role of education in the social mobility
process. We will first look at trends in educational equalisation.
6.3 . Have educational opportunities equalised over time inSwitzerland?
In order to assess trends in the effect of social origin on educational attainment and thus analysing
whether there has been an equalisation effect in Switzerland, two sets of analysis are presented here:
(1) an analysis of absolute trends of educational inequality and (2) an analysis of relative trends of
educational inequality using the log-linear modelling technique.
6.3.1 . Absolute trends in educational inequalityAbsolute trends of educational inequality are measured by looking at the distribution of education
according to each category of class origin – outflow percentages. However, for the sake of clarity,
the distributions will only be depicted according to two antagonistic class origins using the ESeC
typology collapsed into three categories, namely the salariat class versus the working class.
Furthermore, gender differences according to class background will also be underlined, though plots
will not be depicted for reasons of space limitation. They are, however, available on request.
From the first graph on the left side of Figure 6.4, we observe that the increase in the proportion of
the Swiss population attaining at least secondary education benefited mainly to those with a
working social class background. Indeed, while in the oldest cohort less than 50% of those with
working-class origins had reached at least this educational level, this increased to almost 90% in the
youngest cohorts. In contrast, among those with a salariat origin, 80% of them had reached this
educational level in the oldest birth-cohort. Therefore, it is clear that educational expansion in
Switzerland reduced social origin inequality in access to at least secondary education. While
children from the salariat class were 35% more likely to reach at least secondary education than
those from a working-class background in the oldest cohort, the gap has dropped to 10% in the
164

youngest cohorts. This decline constitutes a considerable change in terms of educational equality.
However, this decreasing trend of the effect of social origin on education is not further corroborated
when it comes to attaining at least tertiary education. Indeed, as shown in the second graph of
Figure 6.4, although the share of people who reached this level of education increased for both
salariat and working-class social backgrounds, this increase looks more moderate within the latter
and sharper within the former. Thus, while we observe an equalisation trend in regard to having
attained at least secondary education, at the tertiary level we observe a trend towards increasing
inequality between social backgrounds. It must be underlined that this latter trend holds particularly
for women, while among men, there seems to be a slight decline in differences between social
backgrounds. This difference must be understood in that so few women in the oldest birth-cohort
reached tertiary education that social origin was not the main discriminating criterion at that time.
Looking at more specific educational levels enables us to see how the access to and the composition
of each educational level changed over time. From graphs in Figure 6.5 we observe that secondary
vocational education has increasingly become a working-class educational level over time. Indeed,
while those from a salariat origin in this educational level were slightly underrepresented in the
oldest birth-cohorts, their share has decreased, whereas in the meantime this educational level
expanded. In other words, expansion of secondary vocational education benefited mostly working-
165
Figure 6.4: Trends over birth-cohorts in educational expansion by social origin
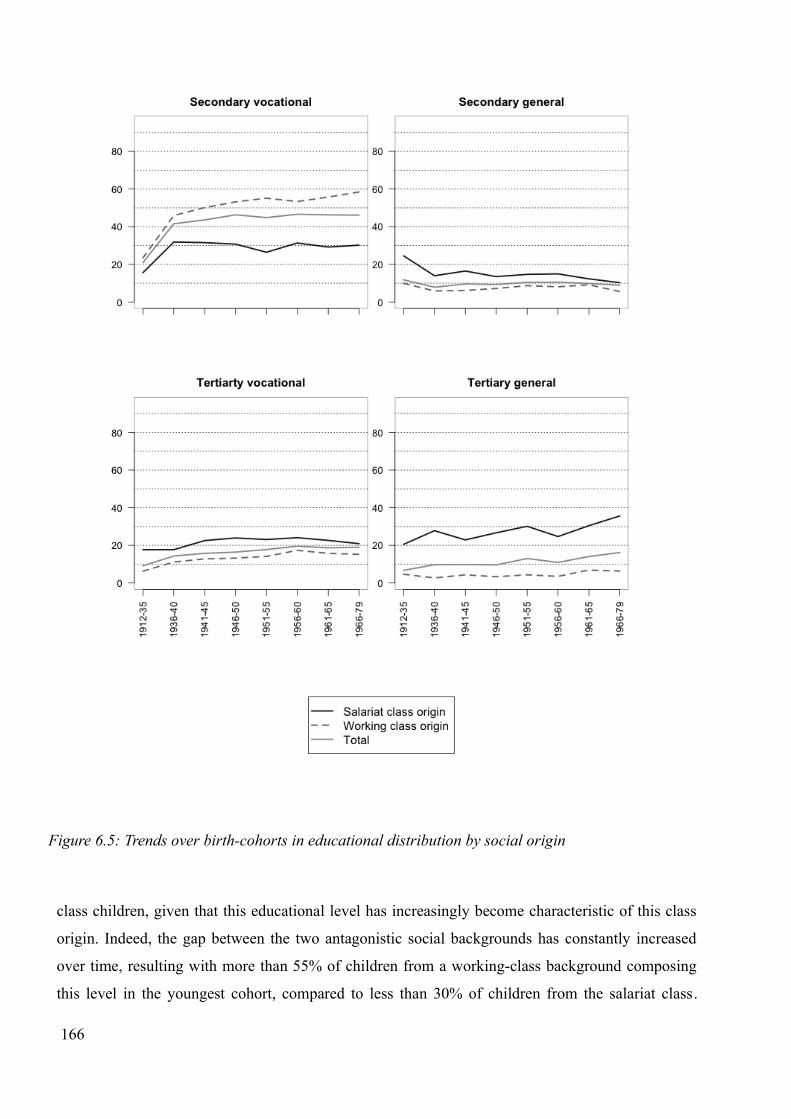
class children, given that this educational level has increasingly become characteristic of this class
origin. Indeed, the gap between the two antagonistic social backgrounds has constantly increased
over time, resulting with more than 55% of children from a working-class background composing
this level in the youngest cohort, compared to less than 30% of children from the salariat class.
166
Figure 6.5: Trends over birth-cohorts in educational distribution by social origin
Although this increase holds for both men and women, it is more marked among women.
In contrast, the difference in social composition of those who attained secondary general education
with or without maturity has decreased over time. While this educational level represents only a
small share of the total distribution of education, differences by social background declined, as
indicated by the graph in the upper right side of Figure 6.5. Further investigation indicates that this
decreasing difference between social background is mainly driven by women, whereas this decline
is very limited among men.
At tertiary educational levels, the effect of social origin goes in diverging trends according to the
track considered. When looking at tertiary vocational education, social background differences are
rather small and decrease over time, as the gap between both salariat and working class
backgrounds weakens over birth-cohorts. However, such decreasing difference between social
origin, while being very marked among men with a drop in social origin gap of more than 10 points
over birth-cohorts, the same does not hold for women. Although women are underrepresented in
this level of education, as we noted above, women who attain this level are more likely to come
from a salariat background. Furthermore, this salariat background advantage for women tends to
increase over time, at least until the 1951-1955 birth-cohort. Thus, class background inequality in
access to tertiary vocational education seems to have decreased only for men over time, while it
tended to rather increase among women.
Regarding social background differences in reference to tertiary general education, they increased
over time. The number of individuals from a working-class origin remained relatively stable over
birth-cohorts, whereas those from a salariat origin increased significantly: from 20% in the oldest
cohort to more than 35% in the youngest. The gap between social backgrounds thus increased more
than 10 points during this time frame. It is noteworthy that this increase has been much more sharp
amongst women than amongst men: while the social background gap oscillated between around
25% to around 32% for the latter, resulting in a gap of less than 10 points among the latter, it
increased about 25 points for the former.
Further differences arise according to citizenship criteria (see Figure D.2 in Appendix D). We
observe that foreigners from a working-class background are much less likely to have attained at
least secondary education, although their share increased at the same time the educational system
expanded. In contrast, their salariat class counterparts do not display disadvantages, especially in
the youngest cohorts. Indeed, foreigners with a salariat class origin are actually more likely than
Swiss citizens from the same social background to attain at least tertiary education, and particularly
tertiary general education. And this trend has increased in the youngest birth-cohorts, indicating that
167

educational inequalities are exacerbating in the foreign population. Yet being from a salariat class
background, regardless of citizenship, still remains the most salient dimension in accessing tertiary
education. However, Swiss citizens with a working-class background have a slight premium over
foreigners with the same background to attain tertiary education. This small premium essentially
happens within tertiary vocational tracks, as working-class children are nearly nonexistent within
tertiary general educational levels.
To summarise, educational expansion increased overall educational opportunities, particularly for
children of a working-class background, since educational expansion happened mainly at the
secondary vocational level and to a lower extent at the tertiary vocational level, but not into general
education tracks. Furthermore, it seems that the gender equalisation effect observed in the overall
distribution of educational levels in the previous section has mainly been driven by women from a
salariat social background. Indeed, women who attained tertiary educational levels were much more
likely than men to come from a salariat social background. However, this trend must be interpreted
under the historical lens, as women from older birth-cohorts exhibited completely different
situations in terms of educational chances, as compared to their male counterparts. Thus, while
figures seem to indicate more marked increasing inequality according to social background for
women, they could be interpreted more as an adjustment to men's situation rather than an increasing
inequality trend. In fact, while women used to be massively excluded from access to at least
secondary education within oldest cohorts, this gender disadvantage progressively faded away with
educational expansion and development, and social background differences became more salient,
while this was already the case among men. We furthermore observe that foreigners with a salariat
class origin are considerably over-represented in tertiary educational levels. However, the trends
observed are not net of structural changes. Indeed, over the period considered, the salariat class
grew significantly while the working class decreased. Therefore, an investigation of relative trends
in educational inequality must be undertaken to assess whether we observe a substantial
equalisation effect in Switzerland.
6.3.2 . Relative trends in educational inequalityTo assess whether the association between social origin and educational attainment changed over
time in Switzerland, we fitted the three basic log-linear models as presented in the methodological
chapter. As we mentioned earlier, in cases where the Unidiff model did not provide a significant
improvement over the CnSF model, different combinations of simpler models were fitted to the
data, such as a Unidiff model with linear trend and Unidiff models constrained. Furthermore,
systematically, models were fitted by using two different birth-cohort variables: the most detailed
168
version divides birth-cohorts into eight categories, whereas the most synthesised version
encompasses five birth-cohort categories. As log-linear models tend to be sensitive to sample size,
we assume that models constructed with the five birth-cohort version provide the best measure of
trends in educational equalisation. Results of the models fitted are displayed in Tables 6.1 and 6.2
respectively for men and women. So what do fitted models tell us in regard to the evolution of
educational inequality in Switzerland?
As we can see for men, when using the most detailed version of birth-cohorts, we observe that the
Unidiff model fails to provide a significant improvement over the CnSF. Thus, simpler models were
fitted. The Unidiff model with a linear trend must also be rejected. However, when fitting a Unidiff
model by constraining Unidiff parameters of birth-cohorts 1912-1935, 1936-1940 and 1946-1950 to
be equal as well as those from birth-cohorts 1941-1945, and 1951 onwards to be equal (M4), we
observe a significant improvement over the CnSF model. Furthermore, in model M5, we test
whether Unidiff parameters for birth-cohorts 1956-1965 differ from the 1941-1945 and other post
1951 birth-cohorts. This model also provides a significant improvement over the CnSF model.
Thus, these constrained models indicate that there has been a change in the association between
social origin and educational attainment (OE) over birth-cohorts in Switzerland, at least among
men. However, it is not very clear whether this trend can be summarised more adequately with two
or three parameters. In fact, while the model M5 does not provide a significant improvement over
the model M4, strictly speaking, this model is still very close to the acceptable threshold with a p-
value of 0.06. Thus, as can be seen in Figure 6.6, which plots Unidiff parameters of the different
models fitted, this first set of analysis suggests that educational inequality decreased between the
pre-1940s and the post-1950s birth-cohorts overall. It also seems that for people born between 1956
and 1965, the decrease reached its highest level, although this trend does not reach the significance
threshold of 5%. When using the synthesised version of birth-cohorts, this trend is corroborated. In
fact, the Unidiff model describes the data more adequately than the CnSF model. As can be seen in
Figure 6.6, the Unidiff parameters indicate that educational inequality decreased for men in
Switzerland up to the 1965 birth-cohort. Subsequently, inequality reinforced in the following birth-
cohort. Regarding the Unidiff linear trend model (M3), while providing more information than the
CnSF model, it must be rejected for the full Unidiff model (M2), as this latter model provides
slightly more information than the former. In other words, the reinforced trend in the OE association
observed within the youngest cohort as compared to previous ones is a significant effect. Can
similar trend be observed within women?
Models fitted in Table 6.2 indicate that the Unidiff model (M3) does not provide a significant
169
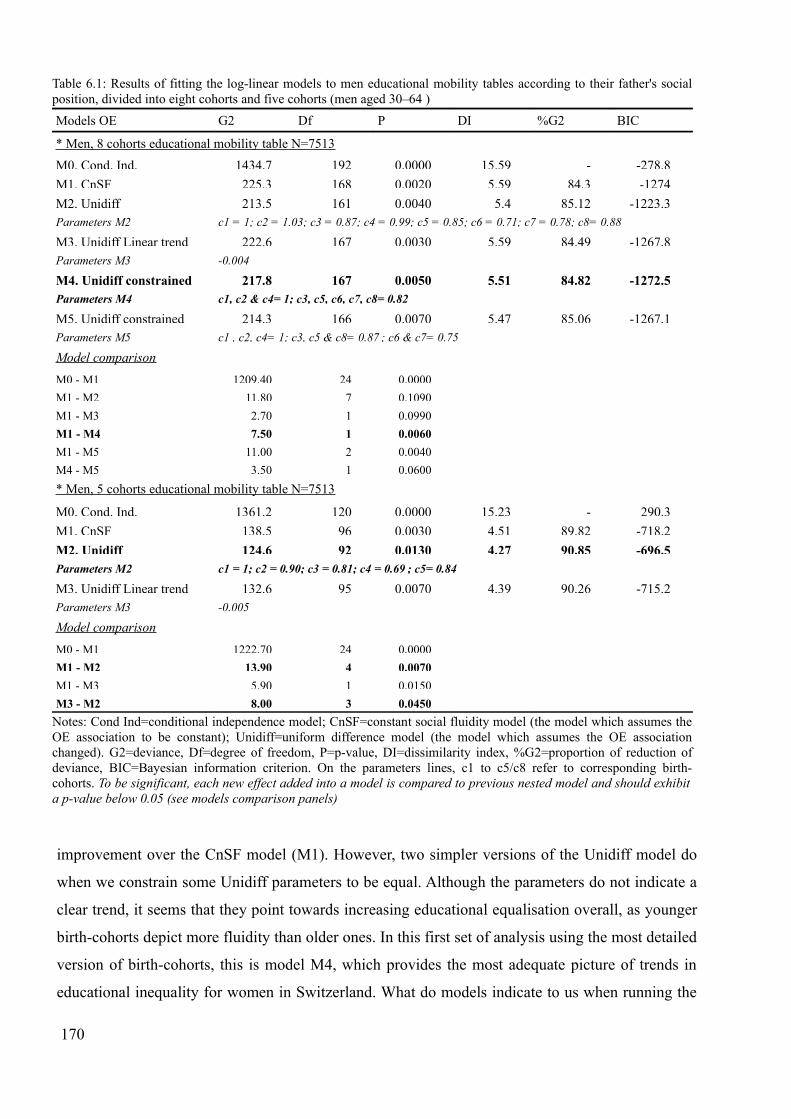
improvement over the CnSF model (M1). However, two simpler versions of the Unidiff model do
when we constrain some Unidiff parameters to be equal. Although the parameters do not indicate a
clear trend, it seems that they point towards increasing educational equalisation overall, as younger
birth-cohorts depict more fluidity than older ones. In this first set of analysis using the most detailed
version of birth-cohorts, this is model M4, which provides the most adequate picture of trends in
educational inequality for women in Switzerland. What do models indicate to us when running the
170
Table 6.1: Results of fitting the log-linear models to men educational mobility tables according to their father's socialposition, divided into eight cohorts and five cohorts (men aged 30–64 )
Models OE G2 Df P DI %G2 BIC
* Men, 8 cohorts educational mobility table N=7513
M0. Cond. Ind. 1434.7 192 0.0000 15.59 - -278.8
M1. CnSF 225.3 168 0.0020 5.59 84.3 -1274
M2. Unidiff 213.5 161 0.0040 5.4 85.12 -1223.3Parameters M2 c1 = 1; c2 = 1.03; c3 = 0.87; c4 = 0.99; c5 = 0.85; c6 = 0.71; c7 = 0.78; c8= 0.88
M3. Unidiff Linear trend 222.6 167 0.0030 5.59 84.49 -1267.8Parameters M3 -0.004
M4. Unidiff constrained 217.8 167 0.0050 5.51 84.82 -1272.5Parameters M4 c1, c2 & c4= 1; c3, c5, c6, c7, c8= 0.82
M5. Unidiff constrained 214.3 166 0.0070 5.47 85.06 -1267.1Parameters M5 c1 , c2, c4= 1; c3, c5 & c8= 0.87 ; c6 & c7= 0.75
Model comparison
M0 - M1 1209.40 24 0.0000
M1 - M2 11.80 7 0.1090
M1 - M3 2.70 1 0.0990
M1 - M4 7.50 1 0.0060
M1 - M5 11.00 2 0.0040
M4 - M5 3.50 1 0.0600
* Men, 5 cohorts educational mobility table N=7513
M0. Cond. Ind. 1361.2 120 0.0000 15.23 - 290.3
M1. CnSF 138.5 96 0.0030 4.51 89.82 -718.2
M2. Unidiff 124.6 92 0.0130 4.27 90.85 -696.5Parameters M2 c1 = 1; c2 = 0.90; c3 = 0.81; c4 = 0.69 ; c5= 0.84
M3. Unidiff Linear trend 132.6 95 0.0070 4.39 90.26 -715.2Parameters M3 -0.005
Model comparison
M0 - M1 1222.70 24 0.0000
M1 - M2 13.90 4 0.0070
M1 - M3 5.90 1 0.0150
M3 - M2 8.00 3 0.0450
Notes: Cond Ind=conditional independence model; CnSF=constant social fluidity model (the model which assumes theOE association to be constant); Unidiff=uniform difference model (the model which assumes the OE associationchanged). G2=deviance, Df=degree of freedom, P=p-value, DI=dissimilarity index, %G2=proportion of reduction ofdeviance, BIC=Bayesian information criterion. On the parameters lines, c1 to c5/c8 refer to corresponding birth-cohorts. To be significant, each new effect added into a model is compared to previous nested model and should exhibita p-value below 0.05 (see models comparison panels)

same set of analysis while using the more synthesised and robust birth-cohort version? First of all,
the Unidiff model does not provide more information than the CnSF model. Therefore, further
171
Table 6.2: Results of fitting the log-linear models to women educational mobility tables according to their father's socialposition, divided into eight cohorts and five cohorts (women aged 30–64 )
Models OE G2 Df P DI %G2 BIC
* Women, 8 cohorts educational mobility table N=7994
M0. Cond. Ind. 1187.6 192 0.000 13.6 - -537.8
M1. CnSF 167.6 168 0.494 4.37 85.89 -1342.1
M2. Unidiff 158.6 161 0.534 4.29 86.65 -1288.2Parameters M2 c1 = 1; c2 = 1; c3 = 0.93; c4 = 1.03; c5 = 0.84; c6 = 0.97; c7 = 0.73; c8= 0.90
M3. Unidiff Linear trend 165.9 167 0.509 4.35 86.03 -1334.8Parameters M3 -0.0032
M4. Unidiff constrained 162.7 167 0.580 4.39 86.3 -1338Parameters M4 c1, c2, c4 & c6=1; c3, c5, c7 & c8=0.85
M5. Unidiff constrained 159.8 166 0.621 4.29 86.54 -1332Parameters M5 c1 , c2, c4 & c6= 1; c3 & c8= 0.91 ; c5 & c7= 0.78
Model comparison
M0 - M1 1020.00 24 0.000
M1 - M2 9.00 7 0.251
M1 - M3 1.70 1 0.197
M1 - M4 4.90 1 0.027
M1 - M5 7.80 2 0.020
M4 - M5 2.90 1 0.089
* Women, 5 cohorts educational mobility table N=7994
M0. Cond. Ind. 1136.3 120 0.000 13.65 - 57.9
M1. CnSF 107.2 96 0.205 3.78 90.57 -755.5
M2. Unidiff 101.1 92 0.243 3.68 91.11 -725.7Parameters M2 c1 = 1; c2 = 1.08; c3 = 0.97; c4 = 0.83; c5= 0.95
M3. Unidiff Linear trend 105.8 95 0.211 3.76 90.69 -747.9Parameters M3 -0.0027
M4. Unidiff constrained 101.2 94 0.287 3.68 91.09 -743.5Parameters M4 c1, c3 & c5= 1; c2 = 1.11; c4= 0.86
M5. Unidiff constrained 101.1 93 0.266 3.68 91.1 -734.6Parameters M5 c1= 1; c2 = 1.08; c3 & c5=0.96; c4= 0.83
Model comparison
M0 - M1 1029.10 24 0.000
M1 - M2 6.10 4 0.193
M1 - M3 1.40 1 0.243
M1 - M4 6.00 2 0.051
M1 - M5 6.10 3 0.109
M4 - M2 0.10 2 0.859
Notes: Cond Ind=conditional independence model; CnSF=constant social fluidity model (the model which assumes theOE association to be constant); Unidiff=uniform difference model (the model which assumes the OE associationchanged). G2=deviance, Df=degree of freedom, P=p-value, DI=dissimilarity index, %G2=proportion of reduction ofdeviance, BIC=Bayesian information criterion. On the parameters lines, c1 to c5/c8 refer to corresponding birth-cohorts. To be significant, each new effect added into a model is compared to previous nested model and should exhibita p-value below 0.05 (see models comparison panels)
simpler models were run, but none of them provide a significant improvement over the CnSF,
strictly speaking. However, Model M4, which is a Unidiff constrained model, actually provides
quite a bit more information than the CnSF model, with a p-value of 0.051. Stated differently,
although we cannot accept this model, it should not be rejected on the grounds of statistical
significance. Parameters of this model indeed indicate a rather stable situation over time in terms of
educational inequality. Nonetheless, they further indicate that for women born between 1942 and
1949, educational inequality reinforced, while for those born between 1958 and 1965, it decreased.
For all other cohorts, the level of inequality seems to have remained relatively stable. In other
words, we observe within women, as for men, a reinforced OE inequality trend within the youngest
birth-cohort. We should add that similar trends are displayed when controlling for citizenship (see
Figure D.3 in Appendix D), amongst both men and women, although educational inequality seem to
have less importantly reinforced in the youngest cohort within Swiss women. In other words, it
would seem that foreign women account for a non-negligible weight in this trend.
In Table D.1, we report parameter details of best log-linear models fitted in order to provide some
bases in regard to how much educational opportunities depend on social origin, for both men and
women. For instance, we can see that men who have a father in the higher salariat class rather than
one in the semi-/unskilled manual class are about 155 times more likely to attain tertiary general
education rather than only completing compulsory education. Although this odds-ratio drops to 54
times and 21 times for men from the lower salariat and the intermediate employee class origin
respectively, they still indicate that access to tertiary general education in Switzerland significantly
depends on social background, despite the general equalisation trend observed for men, at least for
those born prior to the mid-1960s. A similar trend can be observed among women. Although this
odds-ratio is to a certain extent more moderate than that observed for men, it remains quite
significant: women with a higher salariat, lower salariat or intermediate employee class origin rather
than a semi-/unskilled one are respectively 67 times, 33 times and 11 times more likely to reach
tertiary general education rather compulsory education.
Thus, this analysis of relative trends in educational inequality in Switzerland indicates that
educational equalisation has increased at least for people born prior to 1965. While this increase is
particularly obvious for men, this is much less the case for women. In fact, their situation does not
seem to have changed substantially over time. Another noticeable fact about Switzerland that holds
for both men and women is the general reinforced trend in educational inequality witnessed within
the youngest birth-cohort (1966 to 1979). All in all, educational inequality in Switzerland (1)
decreased to a certain extent but not linearly, (2) appears to have been much more moderate for
172
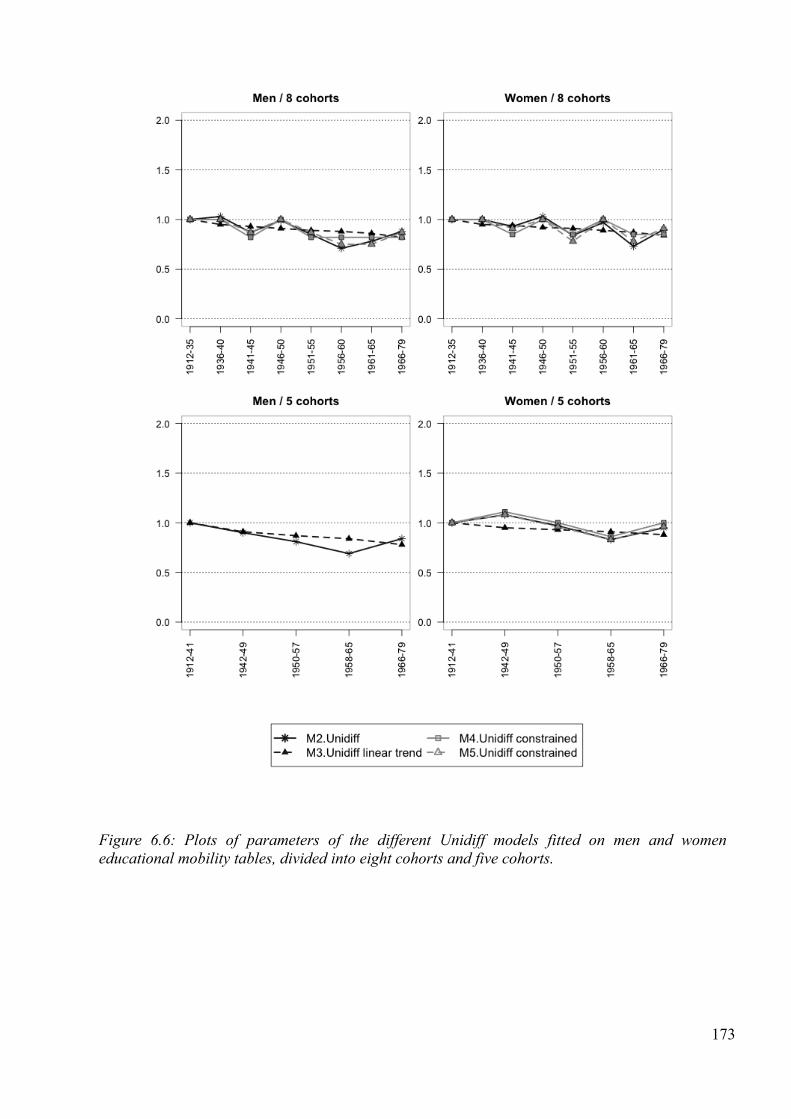
173
Figure 6.6: Plots of parameters of the different Unidiff models fitted on men and womeneducational mobility tables, divided into eight cohorts and five cohorts.
women, and (3) reinforced in the youngest birth-cohort. In turn, we can wonder to which extent
these trends in educational inequality have impacted the way education is rewarded on the labour
market.
6.4 . Has return to education changed over time inSwitzerland?
To answer this question, equivalent analytical framework has been undertaken, as it was on
educational inequality. Thus, we will begin by depicting (1) trends in absolute return to education
and (2) trends in relative return to education. We should further underline for the sake of clarity that
by return to education, we understand the occupational advantage afforded by education. In that,
here return to education is not defined in terms of income, as is usually the case in the economic
literature, but in terms of social position.
6.4.1 . Absolute trends in return to educationUnlike the measure of absolute trends of educational inequality, we measure absolute trends in
return to education by looking at inflow percentages, the distribution of education within each
social position category. Nonetheless, we here again focus only on the two antagonistic class
destinations of the social structure, which are the salariat class versus the working class, in order to
draw main trends. Similarly, gender differences will be pointed out accordingly when needed, while
findings are not displayed here but are available on request.
The first graph on the left of Figure 6.7 shows the overall evolution of return to education for those
who attained at least secondary education over time. In this respect, we can first of all say that
having attained at least secondary education has almost always ensured reaching a social position in
the salariat class, for even in the oldest birth-cohort, about 80% of those in a salariat occupation had
gained such education, and in the youngest cohort, this rate borders the 100% threshold. In other
words, education is highly important factor to reach salariat occupations. However, while chances
of attaining the salariat class for people with at least secondary education increased together with
educational expansion, chances to reach a working-class position with this type of education also
increased. Indeed, while only 30% of those who attained at least secondary education ended up in
working-class occupations in the oldest cohort, the rate is about 70% within the younger cohorts.
Thus, educational expansion has considerably changed the occupational prospects reachable
according to educational attainment: in fact, while it was quite clear among older cohorts that
having attained at least secondary education would enable one to attain a salariat position and
having not attained such would lead one into a working-class position, this picture is much less
174

obvious today. The gap between the salariat and the working-class levels was around 30% for the
youngest cohorts whereas it averaged around 45% for the oldest. Thus, from this standpoint,
educational expansion seems to have devalued education and weakened social class polarisation.
In the foreign population, however (see Figure D.4 in Appendix D), a considerable gap remains
between those who have attained at least secondary education and those who have not, in terms of
employment prospects: those without at least a secondary educational level are far more likely to be
found in a working-class position than their Swiss citizen counterparts. This again suggests that
education is a more salient variable in the foreign population than among Swiss citizens. Yet the
downgrading trend observed in the whole population is also visible in this group, although it
remains much more moderate.
However, as the second graph in Figure 6.7 indicates, when we look at the evolution of chances to
attain salariat class among those who reached at least tertiary education, we observe an alternative
picture with respect to the dynamics of inequality. The picture provided shows that at tertiary level
the importance of education on social position attained actually increased quite considerably.
Indeed, while the number of people with this educational level who attained the working class
175
Figure 6.7: Trends over birth-cohorts in educational expansion by social class destination
remained low and stable under the 10% line over birth-cohorts, the share of their counterparts who
reached the salariat class constantly increased. This trend showing the increasing importance of
tertiary education for the attainment of salariat positions is further corroborated when we look at the
increasing gap between salariat and working-class destination, which broadens from 40% to 60%.
Thus, in contrast to previous statements showing that the polarisation between social classes
decreased when considering at least secondary education levels, the polarisation actually increased
when we look at only tertiary levels of education. These two observations hold for both men and
women, although this trend is more marked for women than for men. Furthermore, the percentage
of women reaching a salariat class position has become increasingly composed of tertiary-educated
women over time. This is in line with the general trend observed earlier in regard to women's
increasing opportunities in tertiary educational levels. But do these trends differ within each level in
terms of type of education?
A more thorough investigation of secondary education levels provides us the key of this diverging
outcome in terms of return to education. As is visible in the upper left graph in Figure 6.8, the share
of those with secondary vocational education who ended up in the working class constantly
increased over time. In contrast, the share of those with the same education who reached the salariat
class increased less markedly and then started to decrease from the 1946-1950 birth-cohort
onwards. As a consequence, this type of education has increasingly become a level that secures
oneself into working-class social positions. The gap between the salariat and the working class has
indeed considerably increased over time, with a growth of more than 25%. Interestingly, this trend
is more marked among men than women. It may be induced by the higher propensity for women to
attain intermediate or salariat positions, as working-class occupations tend to be more male-
dominated due to their high manual component. In other words, having a secondary vocational
educational level seems to be much less of an obstacle for women to reach a salariat position than it
is for men. However, since the number of women in a salariat position with this type of education
has met a moderate decrease since the 1946-1950 birth-cohort, this female advantage over men may
very well be disappearing in youngest cohorts. Nonetheless, not only has secondary vocational
education become increasingly an educational level for a pupil from a working-class background, as
shown in the previous section, but attaining this level of education has increasingly led to attaining
a working-class position.
In regard to secondary general education, as can be seen in the upper right graph in Figure 6.8 while
this level of education represents a small share of the total educational structure, the inequality ratio
in composition of salariat versus working-class positions decreased, especially since the post-1950
176

birth-cohorts. Stated differently, while there were more people with a salariat position who had
gained this educational level than those with a working-class position, this distinction has
disappeared among the youngest cohorts. This education level no longer constitutes a good bet for
social distinction strategy.
177
Figure 6.8: Trends over birth-cohorts in educational distribution by social class destination

This weakening inequality is actually mostly attributable to women: indeed, among men this
distinction is nearly nonexistent, whereas among women this educational level was more
characteristic of a salariat class position than a working-class one within oldest birth-cohorts, while
this is less the case in younger ones. In other words, this educational level has witnessed a certain
downgrading over time, particularly for women. Nevertheless, this special case does not enable us
to speak about a general downgrading, as this educational level encompasses only a minority of the
whole educational structure.
In contrast to secondary general education, both tertiary vocational and tertiary general educational
levels over time have exhibited an overall increasing polarisation between chances of accessing the
salariat class versus the working class. As can be seen in graphs in the lower part of Figure 6.8, not
only are these levels of education mostly characteristic of people who attained a salariat position,
but also, as people with this social position are about 30% more than those with a working-class
position to hold this educational level, this social position security is likely to remain over time.
Notably, this trend holds for both men and women, although it is less sharp in regard to the tertiary
vocational educational level among women. In contrast, for women this trend is much more marked
within the tertiary general education level from the 1960s birth-cohorts onwards. This observation
coincides with the increasing share of women in this educational level over time.
We also observe differences according to citizenship (see Figure D.4 in Appendix D). Although
those who are found in the salariat class are very much likely to have graduated from any type of
tertiary education, the share with this educational level is more significant in the foreign population
than in the Swiss citizen population. Interestingly, the increasing trend of the share of graduates
with tertiary general education in the salariat stems mostly from the foreign population, whereas
this trend is quite stable among Swiss citizens: between birth-cohort 1956-1960 and the youngest
one, the share of graduates with tertiary general education found in the salariat class grew from
about 35% to 55% in the foreign population while it remained stable and below the 30% threshold
in the Swiss citizen population.
Thus, tertiary education has increasingly become important over time, particularly for birth-cohorts
who entered the labour market in the post-1960s years. This trend coincides, of course, with the
tertiarisation process that Western societies have gone through since the last third of the twentieth
century. In this context of changing social structures, looking at relative trends in return to
education should enable us to assess the extent of significance of this increasing absolute return to
education trend.
178

6.4.2 . Relative trends in return to educationHere again, we followed the same framework as previously in order to capture the evolution in the
association between educational attainment and social position attained over birth-cohorts. Models
fitted are displayed in Tables 6.3 and 6.4 for men and women respectively.
In regard to men's return to education table, the Unidiff model does provide a significant
improvement over the CnSF model for both birth-cohort variable configurations. Unidiff parameters
in both cases indicate a non-linear increasing trend, as can be seen in Figure 6.9: while men born
around the 1940s have seen their level of return to education decrease, in subsequent cohorts, return
to education remained rather stable and increased significantly within the youngest one.
Surprisingly, however, in the eight birth-cohort version, the Unidiff model with a linear trend more
adequately describes the data than the complete Unidiff model. Yet as this trend is not corroborated
with the five birth-cohort version, we assume that variations depicted by Unidiff parameters are
substantial and thus that return to education actually varied non-linearly for men over birth-cohorts
in Switzerland. Thus, overall return to education for men in Switzerland did not decrease, except for
those born in the 1940s. In contrast, return to education maintained and even increased for those
born after the mid-1960s.
In contrast, women's return to education clearly increased, and more importantly, it increased
linearly. Indeed, as can be seen in Table 6.4, the Unidiff model first of all does provide a significant
improvement over the CnSF for both birth-cohort configurations. Second, Unidiff parameters
clearly indicate a rather linear and important increase in return to education, as can be seen in
Figure 6.9. Third, when fitting a Unidiff model with a linear trend, not only does the model provide
a significant improvement over the CnSF model, but it must also be preferred over the complete
Unidiff model on the grounds of model comparison. Last but not least, the parameters of the Unidiff
linear trend model clearly adjust quite well with those of the complete Unidiff model, indicating in
fact that the Unidiff linear trend model constitutes a robust outcome. In other words, in spite of
some weak variations over birth-cohorts in the level of return to education for women in
Switzerland, their occupational advantage afforded by education overall increased both linearly and
significantly. Indeed, with an increase in parameters up to 1.35 in the youngest cohort, women's
return to education increased substantially.
For both men and women, these trends are corroborated when excluding self-employed and small
employers (ESeC category 4) from the table, as this category has a higher propensity to rely on
inheritance and other non-meritocratic assets rather than on educational credentials in order to attain
this social position. Results of models fitted without this category are displayed in Tables D.2 and
179

D.3 respectively for men and women, in appendix D.
In addition to that, similar trends in Unidiff parameters are returned when models are run only on
the Swiss citizen population (see Figure D.5). We nonetheless observe within the youngest cohort
that (1) for men, return to education increased slightly more on the whole population than only on
Swiss citizens, and that (2) for women, return to education looks more marked within the Swiss
population than the whole population. In other words, these crude trends suggest that foreign men
enjoy higher returns to education than Swiss men, and Swiss women higher returns than their
foreign counterparts.
Finally, in Table D.4 in the same appendix, parameters of best models fitted for men and women are
displayed. These parameters indicate how much education conditions social position attained. We
180
Table 6.3: Results of fitting the log-linear models to men return to education tables, divided into eight cohorts and fivecohorts (men aged 30–64)
Models ED G2 Df P DI %G2 BIC
* Men, 8 cohorts return to education table N=7529
M0. Cond. Ind. 3345.2 192 0.0000 26.35 - 1631.3
M1. CnSF 248.3 168 0.0000 5.27 92.58 -1251.3
M2. Unidiff 228.0 161 0.0000 4.99 93.19 -1209.2Parameters M2 c1 = 1; c2 = 1.03; c3 = 0.91; c4 = 0.92; c5 = 1.09; c6 = 1.04; c7 = 1.06; c8= 1.24
M3. Unidiff Linear trend 236.8 167 0.0000 5.09 92.92 -1253.9Parameters M3 0.007
Model comparison
M0 - M1 3096.90 24 0.0000
M1 - M2 20.30 7 0.0180
M1 - M3 11.50 1 0.0010
M3 - M2 8.80 6 0.1830
* Men, 5 cohorts return to education table N=7529
M0. Cond. Ind. 3268.6 120 0.0000 26.11 - 2197.4
M1. CnSF 159.8 96 0.0000 4.46 95.11 -697.2
M2. Unidiff 141.1 92 0.0010 4.11 95.68 -680.1Parameters M2 c1 = 1; c2 = 0.90; c3 = 1.01; c4 = 1.04 ; c5= 1.21
M3. Unidiff Linear trend 150.4 95 0.0000 4.26 95.4 -697.6Parameters M3 0.006
Model comparison
M0 - M1 3108.80 24 0.0000
M1 - M2 18.70 4 0.0050
M1 - M3 9.40 1 0.0060
M3 - M2 9.3 3 0.0250
Notes: Cond Ind=conditional independence model; CnSF=constant social fluidity model (the model which assumes theED association to be constant); Unidiff=uniform difference model (the model which assumes the ED associationchanged). G2=deviance, Df=degree of freedom, P=p-value, DI=dissimilarity index, %G2=proportion of reduction ofdeviance, BIC=Bayesian information criterion. On the parameters lines, c1 to c5/c8 refer to corresponding birth-cohorts. To be significant, each new effect added into a model is compared to previous nested model and should exhibita p-value below 0.05 (see models comparison panels)
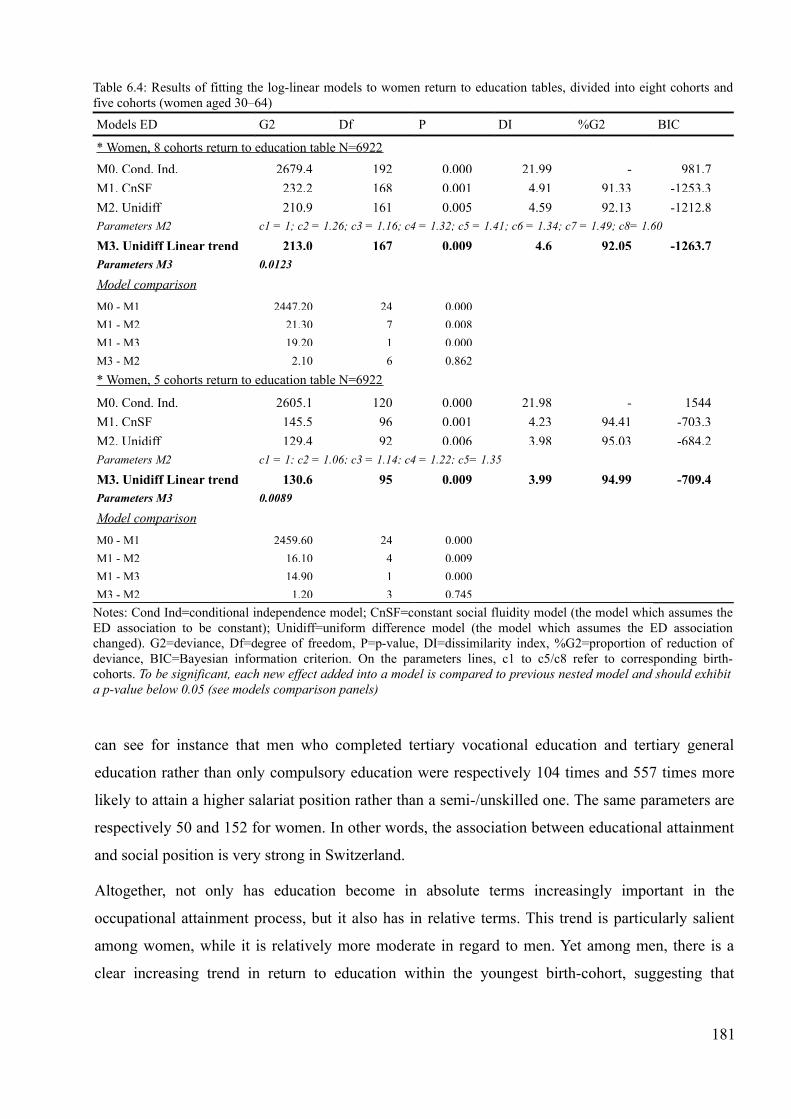
can see for instance that men who completed tertiary vocational education and tertiary general
education rather than only compulsory education were respectively 104 times and 557 times more
likely to attain a higher salariat position rather than a semi-/unskilled one. The same parameters are
respectively 50 and 152 for women. In other words, the association between educational attainment
and social position is very strong in Switzerland.
Altogether, not only has education become in absolute terms increasingly important in the
occupational attainment process, but it also has in relative terms. This trend is particularly salient
among women, while it is relatively more moderate in regard to men. Yet among men, there is a
clear increasing trend in return to education within the youngest birth-cohort, suggesting that
181
Table 6.4: Results of fitting the log-linear models to women return to education tables, divided into eight cohorts andfive cohorts (women aged 30–64)
Models ED G2 Df P DI %G2 BIC
* Women, 8 cohorts return to education table N=6922
M0. Cond. Ind. 2679.4 192 0.000 21.99 - 981.7
M1. CnSF 232.2 168 0.001 4.91 91.33 -1253.3
M2. Unidiff 210.9 161 0.005 4.59 92.13 -1212.8Parameters M2 c1 = 1; c2 = 1.26; c3 = 1.16; c4 = 1.32; c5 = 1.41; c6 = 1.34; c7 = 1.49; c8= 1.60
M3. Unidiff Linear trend 213.0 167 0.009 4.6 92.05 -1263.7Parameters M3 0.0123
Model comparison
M0 - M1 2447.20 24 0.000
M1 - M2 21.30 7 0.008
M1 - M3 19.20 1 0.000
M3 - M2 2.10 6 0.862
* Women, 5 cohorts return to education table N=6922
M0. Cond. Ind. 2605.1 120 0.000 21.98 - 1544
M1. CnSF 145.5 96 0.001 4.23 94.41 -703.3
M2. Unidiff 129.4 92 0.006 3.98 95.03 -684.2Parameters M2 c1 = 1; c2 = 1.06; c3 = 1.14; c4 = 1.22; c5= 1.35
M3. Unidiff Linear trend 130.6 95 0.009 3.99 94.99 -709.4Parameters M3 0.0089
Model comparison
M0 - M1 2459.60 24 0.000
M1 - M2 16.10 4 0.009
M1 - M3 14.90 1 0.000
M3 - M2 1.20 3 0.745
Notes: Cond Ind=conditional independence model; CnSF=constant social fluidity model (the model which assumes theED association to be constant); Unidiff=uniform difference model (the model which assumes the ED associationchanged). G2=deviance, Df=degree of freedom, P=p-value, DI=dissimilarity index, %G2=proportion of reduction ofdeviance, BIC=Bayesian information criterion. On the parameters lines, c1 to c5/c8 refer to corresponding birth-cohorts. To be significant, each new effect added into a model is compared to previous nested model and should exhibita p-value below 0.05 (see models comparison panels)

182
Figure 6.9: Plots of parameters of the different Unidiff models fitted on men and women return toeducation tables, divided into eight cohorts and five cohorts.

education in Switzerland is becoming increasingly important. However, while education gains
importance on the labour market, we can wonder whether the direct effect of social origin on social
destination varies according to levels of education, in line with the compositional effect claims.
6.5 . Is the direct origin-destination association weaker inhigher levels of education?
From the previous chapter in which we modelled the association between social origin and social
destination in Switzerland, we observed some minor variations in social fluidity, pointing in no
consistent direction. It is important to stress that this trend (1) is not statistically significant, and (2)
is not linear, as social fluidity actually decreases within younger cohorts. Thus, change in social
fluidity in Switzerland is rather limited, if at all present. However, we can wonder whether this
relatively minor change could have been driven by a compositional effect. Indeed, compositional
effect has been described as being one possible way to increase social fluidity. A compositional
effect results from the observation that the association between social origin and social destination
decreases within higher levels of education, meaning that social selection among the highly
educated depends primarily on their educational assets rather than their ascriptive assets. In turn,
this effect, coupled with educational expansion, is likely to increase social fluidity as more and
more people reach a social position according to meritocratic assets.
To test this effect, we modelled the three-way interaction table between social origin, educational
attainment and social destination and looked whether the origin-destination association varied
significantly by levels of education with a Unidiff model. Results displayed in Tables 6.5 and 6.6
respectively for men and women do indicate that a compositional effect in Switzerland exists, as the
Unidiff model clearly provides a better fit than the CnSF model.
Unidiff parameters depicted in Figure 6.10. indicate that for both men and women this is indeed
within the highest level of education – tertiary general education – that the origin-destination
association is the lowest. This effect is particularly strong among women with a parameter of 0.18.
There are, however, gender differences regarding the level of education which displays the highest
level of origin-destination association, besides the first categories of the education variable that
refers to compulsory education. For women, it is among the level of tertiary vocational education
that the OD association is the strongest (0.80), whereas among men this is within the secondary
vocational education category (0.66).
Interestingly, when we replicate models only on the Swiss citizens population, we observe that the
Unidiff model is no more significant than the constant association model (models not displayed but
183
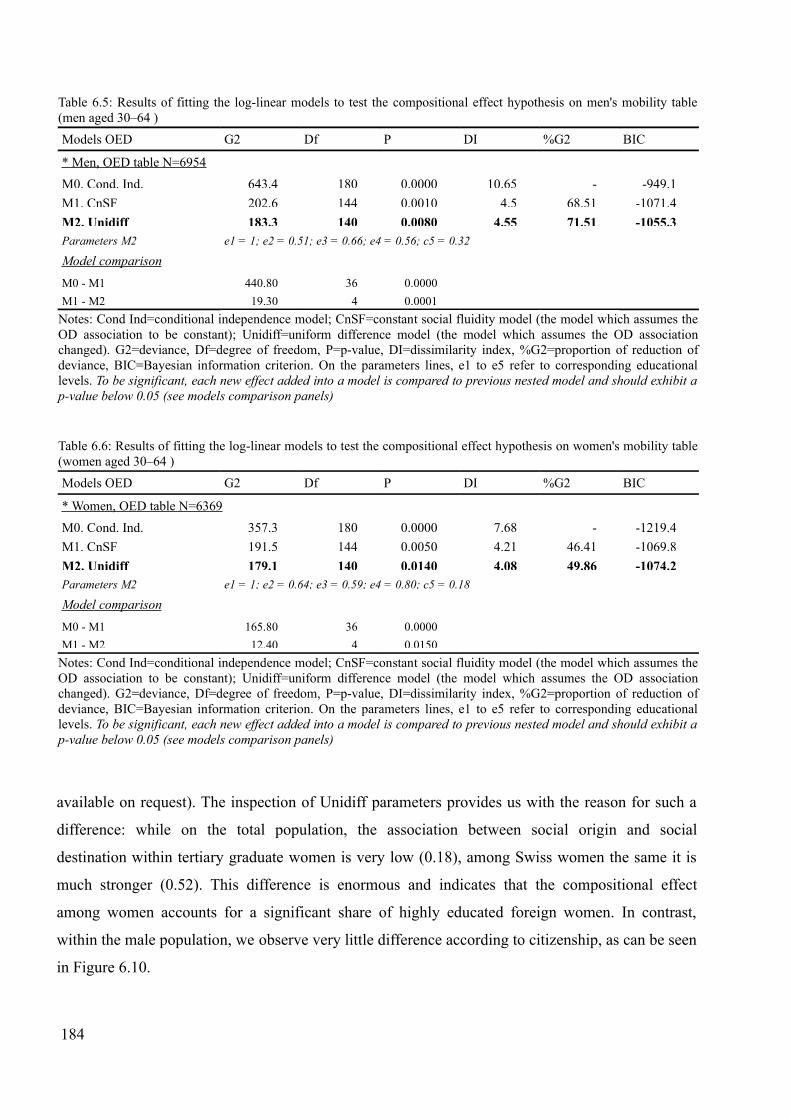
available on request). The inspection of Unidiff parameters provides us with the reason for such a
difference: while on the total population, the association between social origin and social
destination within tertiary graduate women is very low (0.18), among Swiss women the same it is
much stronger (0.52). This difference is enormous and indicates that the compositional effect
among women accounts for a significant share of highly educated foreign women. In contrast,
within the male population, we observe very little difference according to citizenship, as can be seen
in Figure 6.10.
184
Table 6.5: Results of fitting the log-linear models to test the compositional effect hypothesis on men's mobility table(men aged 30–64 )
Models OED G2 Df P DI %G2 BIC
* Men, OED table N=6954
M0. Cond. Ind. 643.4 180 0.0000 10.65 - -949.1
M1. CnSF 202.6 144 0.0010 4.5 68.51 -1071.4
M2. Unidiff 183.3 140 0.0080 4.55 71.51 -1055.3Parameters M2 e1 = 1; e2 = 0.51; e3 = 0.66; e4 = 0.56; c5 = 0.32
Model comparison
M0 - M1 440.80 36 0.0000
M1 - M2 19.30 4 0.0001
Notes: Cond Ind=conditional independence model; CnSF=constant social fluidity model (the model which assumes theOD association to be constant); Unidiff=uniform difference model (the model which assumes the OD associationchanged). G2=deviance, Df=degree of freedom, P=p-value, DI=dissimilarity index, %G2=proportion of reduction ofdeviance, BIC=Bayesian information criterion. On the parameters lines, e1 to e5 refer to corresponding educationallevels. To be significant, each new effect added into a model is compared to previous nested model and should exhibit ap-value below 0.05 (see models comparison panels)
Table 6.6: Results of fitting the log-linear models to test the compositional effect hypothesis on women's mobility table(women aged 30–64 )
Models OED G2 Df P DI %G2 BIC
* Women, OED table N=6369
M0. Cond. Ind. 357.3 180 0.0000 7.68 - -1219.4
M1. CnSF 191.5 144 0.0050 4.21 46.41 -1069.8
M2. Unidiff 179.1 140 0.0140 4.08 49.86 -1074.2Parameters M2 e1 = 1; e2 = 0.64; e3 = 0.59; e4 = 0.80; c5 = 0.18
Model comparison
M0 - M1 165.80 36 0.0000
M1 - M2 12.40 4 0.0150
Notes: Cond Ind=conditional independence model; CnSF=constant social fluidity model (the model which assumes theOD association to be constant); Unidiff=uniform difference model (the model which assumes the OD associationchanged). G2=deviance, Df=degree of freedom, P=p-value, DI=dissimilarity index, %G2=proportion of reduction ofdeviance, BIC=Bayesian information criterion. On the parameters lines, e1 to e5 refer to corresponding educationallevels. To be significant, each new effect added into a model is compared to previous nested model and should exhibit ap-value below 0.05 (see models comparison panels)

Thus, the association between social origin and social destination decreases significantly by levels
of education, at least for men. For women, this effect is mostly driven by foreigners. However, it
appears that this effect has had scarce effect on the overall structure of social fluidity in
Switzerland, given the near-constant – or at least trendless – social fluidity trend pointed out in the
previous chapter. This effect, while substantial, most likely had only a very limited impact on social
fluidity, as it has not been coupled with significant educational expansion. We verify this assertion
in the next section.
6.6 . Does the origin-destination association remain constantwhen effects of education are controlled?
In order to ascertain the trends on the mediating effect of education on intergenerational social
mobility, we ran a last set of models to our data on a four-way mobility table containing variables
185
Figure 6.10: Plots of parameters of the Unidiff models fitted on men and women to test thecompositional effect hypothesis (OD according to E) on all the population and only Swiss citizens.

for birth-cohort, social origin, educational attainment, and social position attained. In fact, it could
be the case that another trend in the origin-destination association arises when the educational
variable is introduced in our models. Therefore, to test the extent to which our conclusions still hold
when we put all variables together in one single model set, we replicated models presented in Pollak
and Müller (2013). Models fitted are displayed in Table D.5.
Models M2 and M3 indicate that respectively adding the origin-destination and the education-
destination associations to the baseline model (M1) improves the fit of the model to the data for
men and women. When we put these two terms together in M4, the model fit further improves.
Then in models M4a-c, we test whether adding diverse Unidiff effects separately improves the fit.
For both men and women, adding a Unidiff effect on the OD association over birth-cohort does not
provide a significantly better adjustment of the model to the data (M4a). In other words, variations
in the OD association remain too small to conclude a substantial OD change, even when controlling
186
Figure 6.11: Unidiff parameters of the origin-destination association for models controllingeffects of education fitted on men and women mobility tables, divided into five cohorts

for education. In regard to return to education (M4b) and compositional effect (M4c), both effects
remain significant, at least when they are taken separately, being for men or women. A further set of
models tests whether both effects combined together add to the model fit as well. As can be seen
from model comparison between M4b/M4c to M5b, both effects still remain significant when they
are put together. Finally, the comparison of model M5b and model M6 once again confirms that no
significant change in the OD association can be uncovered, even when accounting for the previous
significant effects. These observations hold for both men and women.
In other words, our main conclusions remain unchanged when controlling for direct effects of each
combination of models we fitted in previous sections. In particular, from Figure 6.11 we observe
that the trend in the association between social origin and social destination across birth-cohorts
depicts the same trendless fluctuation pattern as found in the previous chapter, even when
controlling for the effect of education, whether being return to education or educational expansion.
From this standpoint, since we have asserted the robustness of our substantial conclusions, we can
now turn to a thorough discussion of our findings.
6.7 . Discussion and conclusionOur goal in the chapter was to assess in the context of Switzerland (1) the extent of change on
educational inequality (equalisation effect), (2) the extent of change in the occupational advantage
afforded by education (return to education), and (3) the extent of difference in the association
between social origin and social destination according to level of education (compositional effect).
We further assessed overall trends in educational expansion in Switzerland and systematically
pointed out gender differences in respect to our research questions. We hypothesised that
educational equality increased in Switzerland over time (H2a), particularly within the youngest
cohorts (H2b); that return to education had remained stable (H3a), but decreased in the youngest
cohort (H3b); and that the association between social origin and social destination would be weaker
in higher levels of education (H4). We further expected some gender convergence over time and
some differences between men and women (H7), and between Swiss citizens and foreign residents
(H8).
Our results indicate that the share of the population attaining at least secondary education
considerably increased over birth-cohorts in Switzerland. Yet Switzerland remains a country
characterised by strong development of secondary vocational education, with about 40% of the total
population attaining this type of education, and with the limited expansion of higher education, as
less than 20% of people from the youngest birth-cohort gained tertiary general education. Thus, first
187
of all, educational expansion in Switzerland remains relatively moderate in comparison to other
Western countries. We also observed that amongst youngest cohorts, the foreign population
outnumbered Swiss citizens in tertiary general educational tracks, congruently with the changing
profile of migration in Switzerland, due to the recruitment of highly qualified migrants over recent
years (Pecoraro 2005; Piguet 2013).
Regarding gender inequality, it decreased quite considerably, lending support to our hypothesis
(H7). Indeed, women used to be far less likely than men to attain at least secondary education in the
oldest birth-cohorts, whereas this difference almost faded away within the youngest birth-cohort.
However, at tertiary educational levels, gender inequality did not completely disappear. Indeed,
gender differences remain rather significant, particularly within the tertiary vocational level, as men
who gain any type of tertiary education outnumber women by a margin of 15%. Thus, while
educational opportunities did equalise between men and women, this trend is not as sharp as what
has been observed in most other Western countries. However, gender inequality in educational
attainment is lower within the foreign population, particularly at tertiary education levels. In
particular, within the youngest cohort, foreign women actually outperform men, being foreigner or
Swiss, within tertiary general tracks. Thus, contrary to our hypothesis (H8), the foreign population
does not systematically lag behind the Swiss citizen population. In contrast, some segments of the
foreign population look particularly advantaged. Overall, this lower propensity for gender
segregation in the foreign population stems from its lower representation in vocational tracks, as
compared to Swiss citizens.
Educational expansion in Switzerland benefited mainly those with a working class background.
However, at tertiary education levels, children of working-class origin still lag behind salariat class
origin one. This trend is particularly pronounced within the tertiary general educational level. Thus,
while we observe an equalisation trend in regard to having attained at least secondary education, at
the tertiary level we observe a trend towards increasing inequality between social backgrounds.
More thorough investigation reveals that women who attained tertiary education were much more
likely than men to come from a salariat social background. In addition to that, within the foreign
population, those who graduated from tertiary education were considerably more likely than Swiss
citizens to come from a salariat class background. Since this trend is extremely pronounced within
the youngest cohorts, social reproduction is increasing in the foreign population.
Yet in relative terms, educational inequality decreased to a certain extent, but not linearly. Indeed,
for men and women, the Unidiff parameters indicate that while educational inequality declined up
to birth-cohorts born in the mid-1960s, in the subsequent cohort they reinforced. This latter trend is
188

consistent with previous research in Switzerland (Jann and Combet 2012), and among women
accounts to a certain extent for foreign women in particular. Furthermore, this overall decreasing
trend appears to be much less marked for women than for men. In other words, while women from
younger cohorts gained better access to education than before, these women were more likely than
men to be positively selected on a higher social class background. Yet overall these observations
corroborate one of our hypotheses (H2a), though not the second one (H2b). Indeed, the trend
towards increasing educational equality has come to an halt, and even reversed, in the youngest
cohort, suggesting that the development of Universities of Applied Sciences since the 1990s in
Switzerland may have not favoured greater equality of educational opportunity, but rather the
contrary. This observation, however, would require more scrutiny to assert the effect of these new
educational tracks on the total structure of educational opportunity.
In the meantime, as educational equality increased in Switzerland, return to education did as well.
In fact, educational attainment became increasingly important in order to reach a salariat position.
In particular, for birth-cohorts who started to enter the labour market in the post-1960s years, a
tertiary general educational degree became more important over time. This trend also holds in
relative terms net of structural changes for both men and women. It is particularly salient among
women, while it is more moderate in regard to men. Thus, in contrast to other European countries,
return to education in Switzerland did not decrease but rather increased. This observation is at odds
with our hypotheses. We predicted that return to education would have remained relatively stable
rather than increase (H3a), but also that it would have decreased in youngest cohorts (H3b). One
simple explanation of such counter-intuitive trends could stem from the non-congruence between
the educational and the social structures, with the limited and late expansion of tertiary education in
Switzerland, as well as the considerable supply of occupations in salariat occupations. In particular,
it could be the case that since the social structure expanded more rapidly and earlier than the
educational structure, oldest cohorts with only, say, secondary vocational education, could still
reach high social positions. In contrast, for younger cohorts who entered the labour market
following educational expansion, education might have become more crucial in attaining the same
social position.
Finally, we observe a compositional effect for both men and women in Switzerland, in line with our
expectations (H4). Parameters indeed reveal that the association between social origin and social
destination is almost independent within the tertiary general educational level. Into other
educational levels, this association is weaker as compared to compulsory education, but displays
gender differences in levels of association between social origin and social destination. Nonetheless,
189

after excluding foreign residents, the compositional effect is no more significant among women.
Parameters indicate that among Swiss women who graduated from tertiary general education, social
origin still remains important. This observation suggests that foreign women who attain the highest
educational level in contrast to Swiss women are recruited only on their merit, rather than on their
social origin. Overall, while a compositional effect takes place in Switzerland, at least among men,
it remains unclear as to whether this effect actually fostered social fluidity, given the relatively
constant level of social fluidity that was pointed out in the previous chapter. Most likely, this effect,
while substantial, had only a limited impact on social fluidity in Switzerland, as it has not been
complemented with significant educational expansion.
All in all, the configuration of trends in intergenerational social mobility in Switzerland is quite
unusual. Overall trends point in the direction of an equalisation effect and a compositional effect.
Furthermore, there is clear evidence that return to education not only maintained but increased – at
least within the youngest cohorts – in Switzerland, unlike other European countries. All these
observations support our research hypotheses, and even go beyond when it comes to returns to
190
Figure 6.12: Ratio between share of salariat class destination and share of tertiary-educated overbirth-cohort in Switzerland
education. Thus, from this standpoint, we could reach the simple conclusion that Switzerland is a
rather meritocratic country, as the effect of social origin on social destination seems to have
decreased when this effect is mediated by education. Yet asserting such conclusions would be
misleading since the direct effect of social origin on social destination has remained rather constant
over birth-cohorts in Switzerland. In fact, the constant social fluidity trend that we pointed out in the
previous chapter still holds when we control for the different mediating effects of education on this
association. In other words, Switzerland provides an interesting example of a configuration where
all mechanisms that can increase social fluidity take place without having substantially increased
social fluidity. These observations are mostly in line with Jacot's (2013) recent publication, in which
he underlined that in Switzerland, social origin still had a significant influence on social destination
when controlling for education. This outcome must be interpreted, of course, in light of
Switzerland's institutional context, which is characterised by a low expansion of tertiary education,
especially at general levels, and a highly tertiarised labour force.
Finally, on the substantial ground, this analysis leaves us with three remaining remarks. First, our
analysis clearly demonstrates that theoretical assumptions of the liberal theory of industrialism are,
in fact, wrong. While this theoretical framework expected that social fluidity would increase
logically if educational inequality decreased and return to education increased, what we actually
observe here is an offset. It seems indeed that social origin has become less important to reach
secondary educational levels but not tertiary ones. Thus, social origin remains an important
predictor of the attainment of tertiary education. Yet in the meantime, the value of education on the
labour market maintained and even increased – for women especially. Stated differently, changes in
educational opportunities and return to education do not systematically imply changes in social
fluidity and greater meritocracy. As some scholars underline (Goldthorpe and Jackson 2008), the
idea of an education-based meritocracy in modern societies should not overshadow the persisting
direct effect of social origin on social destination. Switzerland, in this respect, does provide an
interesting example of what we could provocatively call a “non-meritocratic meritocracy”.
Second, all our analysis indicates that inequalities might actually have reinforced within youngest
birth-cohorts. In fact, for both men and women, educational inequalities increase within cohorts
born after the mid-1960s. Furthermore, return to education increased among men within the same
birth-cohort, while it was quite constant in older ones, and among women it kept on increasing
linearly. One possible explanation for that could be found in the consequences of the 1990s
economic crisis in Switzerland, which was marked with a significant increase in unemployment
(Flückiger 1998). It remains unclear whether the development of Universities of Applied Sciences
191

since the late 1990s accounts for this polarisation effect. It would seems to us that, since the
polarisation appears to be located mainly between secondary vocational and tertiary general levels,
these Applied Universities should be likely to reduce class inequalities – or at least not reinforce
them. However, a non-negligible share of this reinforced inequality trend could also stem from the
growing heterogeneity in the profile of the foreign population. Indeed, over recent years,
Switzerland has increasingly recruited highly qualified migrants. We clearly observe this trend in
our data, since within the youngest cohorts foreigners who are found within a salariat position are
more likely than Swiss citizens to have graduated from tertiary general education. In the meantime,
a noticeable share of the foreign population has remained poorly educated, particularly those
originating from countries outside the EU. Yet on the theoretical ground, these observations clearly
lend some support to the trendless fluctuations thesis, originally phrased by Sorokin (1927) and
later championed by Erikson and Goldthorpe (1992b), which states that no society is actually
characterised by either an increase or a decrease in social mobility, but instead by alternation of
waves of increase and waves of decrease.
Third, the finding of a constant and even increasing level of return to education in Switzerland
constitutes a notable exception in Europe. Indeed, while in most European countries it was found
that return to education actually decreased (Breen and Luijkx 2004a), we have found the contrary in
the Swiss context. One possible explanation for this might pertain to the specificities of Swiss social
stratification, with the moderate development of tertiary education and the significant development
of the salariat, which accounts for about 50% of the social structure within youngest cohorts in the
male population. The lack of enough qualified labour force would actually constitute the most
straightforward explanation for such a trend. Yet over recent years, education might have become
more determinant on the labour market because of educational expansion. Notably, this effect must
have been reinforced by the increasing share of highly qualified foreign workers that arrived in
Switzerland over recent years. These two trends clearly adjust to the Swiss labour market, whose
core feature is a high demand for highly qualified individuals.
In fact, as can be seen in Figure 6.12, there have always been more opportunities in the salariat than
individuals educated at the tertiary educational level in Switzerland. In fact, the ratio never drops
below the 1.5 threshold. A similar trend was observed in Germany by Klein (2011) to explain the
rather constant level of return to education in this country. Klein further analysed how the slight
reduction in university return to education in Germany stems from a compositional effect. While
decreasing return to education is often attributed to educational expansion (Ganzeboom and Luijkx
2004), an alternative explanation is that of a compositional shift in the structure of occupations.
192
Klein indeed highlights that the slight decrease in return to education observed in Germany stems
from the higher development of jobs in administrative and management positions than those in the
professional social services over recent decades, since these former occupations are less dependent
on education. In this context, we could wonder along similar lines to which extent the increasing
return to education trend observed in Switzerland stems from some form of compositional effect in
the occupational structure and if we observe heterogeneous social mobility dynamics in the big
service class. This will be our endeavour in the next and final empirical chapter of this thesis. In
order to analyse whether this is the case, we shall assess first the extent of specificity of the Swiss
pattern of social mobility to clearly point out where overall barriers to social mobility are located,
then we will look more thoroughly into the social mobility pattern to see whether we can observe
finer social mobility dynamics with a different class schema than what we have used so far.
193

194

7 . Barriers to social mobility in Switzerland:finding the Swiss pattern of social mobility anddisaggregating the big service class in socialmobility analysis
7.1 . IntroductionIn the two preceding chapters, we found that the impact of social origin on the social position
attained remained constant over birth-cohorts in Switzerland, but that educational inequality had
decreased and return to education maintained and even increased. This latter observation is peculiar
enough as return to education actually decreased in many European countries. Therefore, in this
context, we can wonder whether this trend in return to education could stem from a compositional
effect in the employment structure, particularly within the salariat. Indeed, while in Switzerland and
other Western countries, the tertiarisation process considerably increased the share of occupations in
the salariat, this trend has been particularly marked in Switzerland since almost 50% of men and
40% of women are located in the class within the youngest birth-cohort.
As a consequence, we propose in the present chapter to thoroughly analyse the social mobility
pattern to understand social mobility dynamics in Switzerland, particularly by disaggregating the
salariat class. To do so, we will fit Erikson and Goldthorpe's model of core social fluidity (1992b),
first following the classic core approach, in order to situate Switzerland in a comparative
perspective, and second, using a disaggregated framework to assess heterogeneity in the social
mobility dynamic within the service class. Therefore, not only should we fit the classical core
model of social fluidity to our data, but we should also question whether new dynamics can be
observed in this changing context by readapting the core model of social fluidity.
In line with our hypotheses:
– the Swiss pattern of social fluidity should deviate from the core model of social fluidity
(H5a), as this has been observed for Germany, and,
– particularly the children from the self-employed should be more downwardly mobile than it
is assumed under the core model (H5b).
195
– the service class should display heterogeneous social mobility dynamics (H6a) and,
– high social immobility should be found in the self-employed service class (H6b).
Our analysis is divided into two parts. In the first part, we will aim to find the Swiss pattern of
social fluidity. To do so, we will replicate Erikson and Goldthorpe's core model of social fluidity
and adjust it to our data. In the second part, we will address the issue of whether subtler social
mobility dynamics can be observed within the service class when we apply the Oesch class schema
to our data. In both parts, we will systematically draw trends in class distribution evolution as well
as inflow and outflow distributions according to social origin and educational attainment.
7.2 . Finding the pattern of social fluidity in Switzerland
7.2.1 . Trends in class distribution following the “core socialfluidity approach”
Figure 7.1 displays trends in the distribution of each social class in the version that will be used to
undertake analysis of core social fluidity in Switzerland for men, women and father. This plot will
certainly help us to correctly understand the commonalities and the specificities of Switzerland in
terms of social fluidity. Although similar plots were presented in the first empirical chapter of this
thesis, this one is different in that some social class categories are more aggregated (the service
class, the white collar) and other are disaggregated (petite bourgeoisie and farmers). Furthermore,
we plotted the father's social position.
Major trends indicate that almost half of men in Switzerland occupy a position in the service class.
This share remains rather stable over birth-cohorts. In contrast, the share of women in this class
considerably increases over the same interval of time. While about 25% of women entered this class
in the oldest cohort, about 40% of women born in the post-1940s entered this class. Looking at the
distribution of fathers in this class also indicates that the service class developed significantly over
the twentieth century. The white collar class is dominated by women, with more than 30% of them
in this class, while only about 10% of men and fathers have this class position. The petite
bourgeoisie displays a decreasing trend for both men and women over time, although this trend is
more pronounced within women. Interestingly, we do not observe a reversal trend in the youngest
cohort in this category, as the literature suggests (Arvanitis and Marmet 2001; Buchmann et al.
2009; Tillmann and Budowski 2007). There can be two possible explanations for this: either our
sample does not really capture this phenomenon for reasons of time frame or operationalisation; or
the reversal trend actually happened within other segments of self-employment that are not captured
196

through this classification. Regarding fathers, about 10% of them remain in the petite bourgeoisie
over birth-cohorts. The class of farmers is, for the first time, isolated here. We observe that this class
was quite significantly developed among fathers of the oldest birth-cohorts. However, with
197
Figure 7.1: Marginal distributions of class origin (father) and class destination by gender overbirth-cohorts in percentages following the core social fluidity approach
industrialisation, it significantly decreased, accounting for about 10% of all social origins within the
youngest birth-cohort. Regarding men and women, less than 5% of them actually occupied a farmer
position across all birth-cohorts. It is noteworthy that the share of skilled workers tends to have
slightly increased over time for men. Finally, we observe that the share of women within the
semi-/unskilled class decreased up to the post-1940s birth-cohort. At that point, it stabilised around
the 10% level, as it did for their male and father counterparts.
Altogether, the farmers as a class origin decreased significantly, the petite bourgeoisie class
decreased moderately, and the service class became the biggest social class over time for both men
and women. From this standpoint, we can wonder which form the social mobility pattern in
Switzerland takes. But before fitting and eventually adjusting the core model of social fluidity to
Switzerland, a general inspection of outflow and inflow percentages in the mobility tables of men
and women will certainly provide us interesting information regarding reproduction and recruitment
within each of the aforementioned classes as well as according to education.
7.2.2 . General pattern of absolute reproduction and recruitmentwithin the equivalent “core model” classes
Table 7.1 shows the outflow and inflow percentages distribution between class of origin and class
destination by gender.
Looking at the distribution of outflow percentages first, we observe that social reproduction is the
highest within the salariat class for both men and women: more than 70% of sons of the salariat
class remain in this class themselves and almost 55% of daughters do. In contrast, sons of white
collar workers are much more likely to attain the salariat class (55%) than to remain in their father's
class. Nonetheless, about 20% of them experience downward social mobility within the skilled
worker class. Daughters of white collar workers are equally likely to remain in their father's class
position or to move upwardly in the salariat class. Interestingly, social reproduction is not very high
among sons and daughters of the petite bourgeoisie (respectively 15% and 7%). Almost half of
petite bourgeoisie sons actually experience upward mobility within the salariat class, while 20% of
them do exhibit social downgrading within the skilled worker class. Thus, this class doesn't appear
highly cohesive. Three quarters of women with a petite bourgeoisie class background end up in
salariat and white collar positions. A similar pattern can be observed within the farmer class: first,
only 20% of men and 7% of women actually remain in the farmer class; second, 24% of sons of
farmers attain salariat positions and 28% skilled workers positions; third, about 50% of daughters of
farmers gain a salariat or white collar position. Yet almost 40% of the latter end up either in a
198
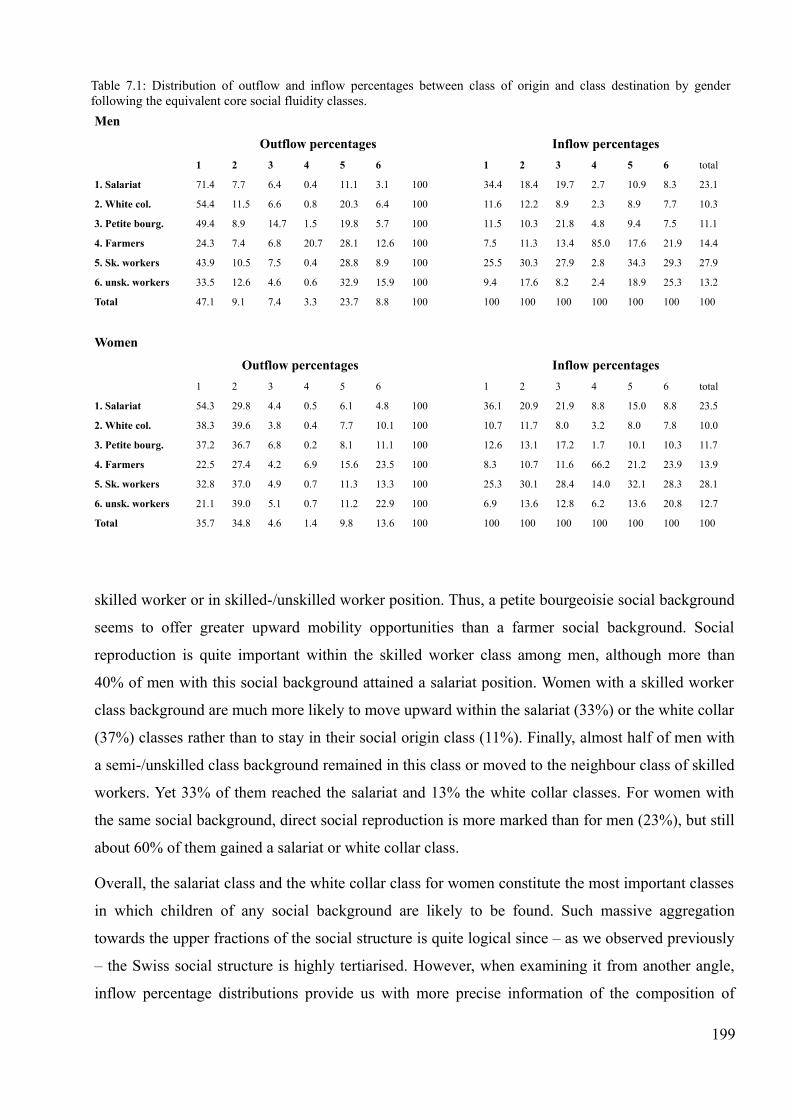
skilled worker or in skilled-/unskilled worker position. Thus, a petite bourgeoisie social background
seems to offer greater upward mobility opportunities than a farmer social background. Social
reproduction is quite important within the skilled worker class among men, although more than
40% of men with this social background attained a salariat position. Women with a skilled worker
class background are much more likely to move upward within the salariat (33%) or the white collar
(37%) classes rather than to stay in their social origin class (11%). Finally, almost half of men with
a semi-/unskilled class background remained in this class or moved to the neighbour class of skilled
workers. Yet 33% of them reached the salariat and 13% the white collar classes. For women with
the same social background, direct social reproduction is more marked than for men (23%), but still
about 60% of them gained a salariat or white collar class.
Overall, the salariat class and the white collar class for women constitute the most important classes
in which children of any social background are likely to be found. Such massive aggregation
towards the upper fractions of the social structure is quite logical since – as we observed previously
– the Swiss social structure is highly tertiarised. However, when examining it from another angle,
inflow percentage distributions provide us with more precise information of the composition of
199
Table 7.1: Distribution of outflow and inflow percentages between class of origin and class destination by genderfollowing the equivalent core social fluidity classes.
Men
Outflow percentages Inflow percentages
1 2 3 4 5 6 1 2 3 4 5 6 total
1. Salariat 71.4 7.7 6.4 0.4 11.1 3.1 100 34.4 18.4 19.7 2.7 10.9 8.3 23.1
2. White col. 54.4 11.5 6.6 0.8 20.3 6.4 100 11.6 12.2 8.9 2.3 8.9 7.7 10.3
3. Petite bourg. 49.4 8.9 14.7 1.5 19.8 5.7 100 11.5 10.3 21.8 4.8 9.4 7.5 11.1
4. Farmers 24.3 7.4 6.8 20.7 28.1 12.6 100 7.5 11.3 13.4 85.0 17.6 21.9 14.4
5. Sk. workers 43.9 10.5 7.5 0.4 28.8 8.9 100 25.5 30.3 27.9 2.8 34.3 29.3 27.9
6. unsk. workers 33.5 12.6 4.6 0.6 32.9 15.9 100 9.4 17.6 8.2 2.4 18.9 25.3 13.2
Total 47.1 9.1 7.4 3.3 23.7 8.8 100 100 100 100 100 100 100 100
Women
Outflow percentages Inflow percentages
1 2 3 4 5 6 1 2 3 4 5 6 total
1. Salariat 54.3 29.8 4.4 0.5 6.1 4.8 100 36.1 20.9 21.9 8.8 15.0 8.8 23.5
2. White col. 38.3 39.6 3.8 0.4 7.7 10.1 100 10.7 11.7 8.0 3.2 8.0 7.8 10.0
3. Petite bourg. 37.2 36.7 6.8 0.2 8.1 11.1 100 12.6 13.1 17.2 1.7 10.1 10.3 11.7
4. Farmers 22.5 27.4 4.2 6.9 15.6 23.5 100 8.3 10.7 11.6 66.2 21.2 23.9 13.9
5. Sk. workers 32.8 37.0 4.9 0.7 11.3 13.3 100 25.3 30.1 28.4 14.0 32.1 28.3 28.1
6. unsk. workers 21.1 39.0 5.1 0.7 11.2 22.9 100 6.9 13.6 12.8 6.2 13.6 20.8 12.7
Total 35.7 34.8 4.6 1.4 9.8 13.6 100 100 100 100 100 100 100 100

each class destination according to social background, as inflow percentages indicate which social
background each class recruits.
From inflow percentages in Table 7.2, we observe that the salariat class recruits significantly from
the salariat class (34% for men and 36% for women of self-recruitment) and the skilled worker class
(25%). white collar and petite bourgeoisie origins account together for another 20% of the
composition of the salariat class. The skilled workers background also constitutes an important
share of the white collar class (30%). Furthermore, this class depicts the smallest level of self-
recruitment, with only 12% of men and women in this class coming from the white collar
background. Interestingly, about 20% of men and women in the white collar class come from the
salariat. The petite bourgeoisie class recruits predominantly from the skilled worker class (28%) and
from the salariat (about 20%), suggesting that this class provides both upward and downward
mobility opportunities. It is noteworthy that self-recruitment in this class is actually lower in the
petite bourgeoisie than in the salariat (22% and 17% respectively for men and women). We would
have expected a higher share of self-recruitment in this class, given the importance of family
business transmission. It is within the class of farmers that self-recruitment is the highest: 85% for
men and 66% for women. The skilled worker class recruits not only from its own class (around
33%) but also from the farmer class (18% for men and 21% for women). Thus, children of farmers
do move downwardly into the skilled worker class but also into the semi-/unskilled class.
Furthermore, the semi-/unskilled class recruits predominantly from the skilled workers and the
semi-/unskilled classes. We can now observe how education conditions the attainment of social
position.
7.2.3 . The role of education on the pattern of class attainmentWe demonstrated in the previous chapter that education plays an important role on class attainment
in Switzerland. A brief look at outflow and inflow percentages between educational attainment and
class destination as depicted in Table 7.2 will certainly provide us with more insights in this respect.
From the outflow table first, we observe that very few people who attained only compulsory
education actually reached salariat position: 14% for men and 9% for women. These people are
likely to end up in skilled worker and semi-/unskilled worker positions. In contrast, both men and
women with secondary general education were more likely to attain the salariat and white collar
classes than any other class. Regarding people who graduated with secondary vocational education,
they ended up mostly in the skilled worker class for men and the white collar class for women. For
both men and women, secondary vocational education seems to hinder chances to reach the salariat
class while at least 60% of those who graduated with any type of tertiary education reached the
200

salariat class. This share even reaches the 80% threshold in regard to tertiary general education,
while a small share of men with tertiary vocational education gained skilled worker positions and a
moderate share of women with the same education attained the white collar class.
The inspection of inflow percentages corroborates the trends we depicted: the salariat class recruits
predominantly people educated at tertiary levels, while the farmers, skilled manual and
semi-/unskilled worker classes recruit primarily people with only compulsory education.
Furthermore, those with secondary vocational education are mainly recruited in white collar and
skilled manual classes.
So far, we have seen how reproduction varies between social classes and how each class recruits
according to social background and education. Now we will fit the core model of social fluidity to
Switzerland and see whether it requires some adjustments.
7.2.4 . Fitting and adjusting the core model of social fluidity toSwitzerland
To fit and adjust the core model of social fluidity to Switzerland, we first converted matrices of all
eight effects of this model into the ESeC class schema. The original model indeed relied on the EGP
201
Table 7.2: Distribution of outflow and inflow percentages between educational attainment and class destination bygender following the equivalent core social fluidity classes
Men
Outflow percentages Inflow percentages
1 2 3 4 5 6 1 2 3 4 5 6 Total
1. Compulsory 14.4 10.0 5.8 6.9 36.9 25.9 100 3.8 13.0 9.8 26.0 19.5 36.8 13.0
2. General sec. 51.5 16.9 8.3 1.4 13.8 8.1 100 7.6 12.2 7.7 2.9 4.0 6.4 6.9
3. Vocational sec. 26.6 12.6 10.0 4.2 35.6 10.9 100 23.2 53.8 55.2 52.1 61.8 50.6 41.1
4. Vocational ter. 69.0 6.0 7.1 2.5 13.5 1.8 100 35.4 15.2 23.0 18.4 13.8 5.1 23.8
5. General ter. 92.3 3.5 2.1 0.0 1.3 0.6 100 30.0 5.7 4.3 0.6 0.9 1.1 15.2
Total 47.1 9.7 7.4 3.3 23.7 8.8 100 100 100 100 100 100 100 100
Women
Outflow percentages Inflow percentages
1 2 3 4 5 6 1 2 3 4 5 6 Total
1. Compulsory 9.5 29.0 4.8 2.4 13.8 40.5 100 4.6 14.2 17.8 29.5 24.2 51.1 19.9
2. General sec. 42.6 41.6 3.0 0.6 7.6 4.6 100 14.7 14.7 8.0 5.2 9.5 4.2 12.3
3. Vocational sec. 26.3 43.5 5.4 1.8 11.3 11.7 100 35.2 59.5 56.1 60.7 55.2 41.1 47.1
4. Vocational ter. 60.9 24.8 4.3 0.5 7.1 2.5 100 21.7 9.1 11.8 4.6 9.2 2.3 11.3
5. General ter. 84.6 8.8 2.9 0.0 1.8 1.8 100 23.8 2.5 6.3 0.0 1.9 1.3 9.4
Total 35.7 34.8 4.6 1.4 9.8 13.6 100 100 100 100 100 100 100 100

class schema. Yet as we discussed in the methodological chapter, these two class schema stem from
the same theoretical foundations and are thus expected to be highly comparable. However, the
ESeC class schema entails one minor difference with respect to the original EGP framework: they
do not enable to distinguish within routine occupations between the agricultural routine workers and
non-agricultural routine workers. They are just collapsed together under the label “semi-/unskilled
class”. As a consequence, the conversion of the core model of social fluidity is problematic for two
reasons. First, for the sector effect (SE), we could not arbitrate whether this class was in primary
production or not. Therefore, no sector effect was specified at all within this category. By doing
this, we neither favoured agricultural nor non-agricultural workers. Nonetheless, this practice may
lower the overall sector effect to a certain extent. Second, for the positive affinity effect (AF2), the
original core model of social fluidity specifies positive affinity between non-agricultural unskilled
workers and skilled manual workers as well as a higher propensity for children of farmers to attain
the non-agricultural unskilled worker position. In this case as well, no positive affinity was
specified for the categories of unskilled worker to avoid confusion. However, besides these two
minor adjustments, models displayed should be comparable with the original core model of social
fluidity. A detail of matrices converted are displayed in appendix F in table F.5. In addition, in
Tables F.1 we provide an overview of all effects that are tested in each models, and in Tables F.3,
the detail and meaning of each of these effect.
Models presented below are systematically adjusted for both men and women. However, as the core
model of social fluidity was first designed on the men's mobility table, our prime strategy consists
of fitting and adjusting the model to men's situation. For the sake of comparison, the same models
will be adjusted to the women's mobility table. By doing so, we can assess the extent to which
women's pattern of social fluidity converges or diverges with that of men. Furthermore, this strategy
is important, as the core model of social fluidity has hardly ever been investigated in Switzerland. In
this context, the prime goal here is to find a baseline pattern that describes social fluidity in
Switzerland in order to provide a point of reference. Improvement of models will be assessed
mostly through the decrease in G2, although other indicators should be used. The lower the G2, the
more estimated frequencies adjust to the data.
Models fitted are displayed in Tables 7.3 and 7.4 for men and women. As can be seen, the core
model (M2a) provides a satisfactory fit for both men and women, as compared to the constant
association model (M1), since it misclassifies 5.71% of the data for men and 4.9% for women (the
original dissimilarity index for the constant association model being respectively 4.69% and
3.97%). Furthermore, this model captures a decrease of 86.20% for men and 78.26% for women of
202

the G2 of the original conditional independence model. Finally, parameters provide overall
consistent effects with the original core model of social fluidity, in particular among women. Yet
some actually return quite unusual or even problematic values, especially for men. First, the first
inheritance effect (IN1), of the main diagonal, which captures immobility in all cases, is very low:
203
Table 7.3: Results of fitting the core log-linear model of social fluidity and some adjustments to men's mobility tablesaccording to their father's social position, controlling for birth-cohorts (men aged 30–64, ESeC class schema)
Models OD G2 Df P DI %G2 BIC
* Men, 5 cohorts origin-destination mobility table N=6984
M0. Cond. Ind. 1586.1 125 0.000 16.54 - 479.6
M1. CnSF 145.2 100 0.002 4.69 90.85 -739.8
M2a. Core classic 218.9 117 0.000 5.71 86.2 -816.7
M2b. AF1_G 217.7 117 0.000 5.76 86.27 -817.9
M2c. AF2_G 224,2 117 0.000 5.67 85.87 -811.4
M2d. AF1_G+AF2_G 223.8 117 0.000 5.68 85.89 -811.9
M2e. AF1_S 237.2 117 0.000 5.77 85.04 -798.4
M2f. AF2_S 256.0 117 0.000 6.13 83.86 -779.6
M2g. AF1_S+AF2_S 260.7 117 0.000 6.27 83.56 -774.9
M3a. M2b + AF1 Ga 215.1 117 0.000 5.73 86.44 -820.5
M3b. M2b + AF1 Gb 207.6 117 0.000 5.6 86.91 -828
M3c. M2b + AF1 Gc 215.1 117 0.000 5.74 86.44 -820.5
M3d. M2b + AF1 Gd 190.1 117 0.000 5.21 88.01 -845.5
M3e. M2b + AF1 Ge 192.2 117 0.000 5.22 87.88 -843.4
M3f. M2d + AF2a 180.3 117 0.000 5.04 88.63 -855.3
M3g. M2d + AF2b 183.5 117 0.000 5.03 88.43 -852.1
Corresponding parameters HI1 HI2 IN2 IN2 IN3 SE AF1 AF2
Core classic -0.22 -0.42 0.43 0.81 0.96 -1.03 -0.77 0.46
M2a. Core classic -0.17 -0.61 0.08 0.88 2.38 -0.15 0.09 0.44
M2b. AF1_G -0.15 -0.49 0.08 0.90 2.24 -0.22 -0.11 0.44
M2c. AF2_G -0.11 -0.62 0.13 0.90 2.14 -0.20 0.10 0.42
M2d. AF1_G+AF2_G -0.09 -0.05 0.13 0.92 2.06 -0.26 -0.09 0.42
M2e. AF1_S -0.14 -0.67 0.16 0.69 2.36 -0.22 0.05 0.39
M2f. AF2_S -0.11 -0.89 0.29 0.40 2.83 0.05 0.30 0.24
M2g. AF1_S+AF2_S -0.09 -0.68 0.30 0.38 2.69 -0.04 -0.11 0.20
M3a. M2b + AF1 Ga -0.13 -0.47 0.09 0.91 2.23 -0.22 -0.15 0.42
M3b. M2b + AF1 Gb -0.08 -0.45 0.12 0.82 2.19 -0.28 -0.22 0.35
M3c. M2b + AF1 Gc -0.08 -0.57 0.12 0.77 2.23 -0.27 -0.13 0.31
M3d. M2b + AF1 Gd 0.01 -0.31 0.18 0.71 2.19 -0.23 -0.35 0.23
M3e. M2b + AF1 Ge -0.01 -0.32 0.18 0.70 2.13 -0.22 -0.34 0.24
M3f. M2d + AF2a -0.06 -0.30 0.18 0.72 2.16 -0.33 -0.28 0.29
M3g. M2d + AF2b -0.04 -0.30 0.20 0.69 2.22 -0.34 -0.30 0.26Notes: Cond Ind=conditional independence model; CnSF=constant social fluidity model; Core classic=core model ofsocial fluidity. G2=deviance, Df=degree of freedom, P=p-value, DI=dissimilarity index, %G2=proportion of reductionof deviance, BIC=Bayesian information criterion. The smaller the G2, the better the model fit.

0.08 for men and 0.13 for women, whereas the original core model indicates a first inheritance
effect of 0.43. Yet in his article, Jacot documents the same effect of value of 0.18 and 0.14 for men
and women respectively. Thus, this effect might substantially be weaker in Switzerland than in
other countries. Second, the third inheritance effect (IN3), which measures reproduction within the
class of farmers, is very high: 2.38, while Erikson and Goldthorpe (1992) report a value of 0.96.
However, they report for Germany a value of 2.17, thus high inheritance within the class of farmers
might be a feature of “Germanic countries”. Third, the sector effect (SE) seems to be much weaker
in Switzerland than in the original core model: -0.15 versus -1.03. Yet to some extent this might be
due to weaknesses met in the operationalisation of this effect implied by the ESeC class schema.
Fourth and more importantly, the negative affinity effect (AF1) is much lower than expected and
actually returned a positive value among men: 0.09. This latter point is highly problematic. These
awkward parameters thus suggest that the core model of social fluidity as fitted here does not
appropriately describe the Swiss pattern of social fluidity, and as a consequence, requires some
adaptations.
In order to find a better adjustment of the core model of social fluidity to the Swiss data, we first
fitted deviated versions of the core model of social fluidity that exist in the literature before seeking
adaptations based on the data. First, we fitted the two affinity matrices that were proposed for
Germany in Erikson and Goldthorpe's Constant Flux study (1992), as Germany is a country with a
high level of institutional proximity with Switzerland. Second, we fitted the two affinity matrices
that were proposed by Jacot for Switzerland (2013). These models are displayed in Tables 7.3 and
7.4 under the names M2b to M2g. On all models fitted, only the model with the German negative
affinity matrix (AF1) provides a slight improvement over the classic core model. For women, it is
the German positive affinity matrix (AF2) that seems to provide better ground to describe the Swiss
social mobility pattern. Yet we will for now carry on focusing on modelling men's social mobility
pattern and thus start from the German negative affinity matrix. This model indeed provides more
consistent parameters for men, as now the negative affinity parameter returns a negative value (-
0.11). It must, however, be underlined that we are quite surprised that the “core S” model
introduced by Jacot (2013) to describe the Swiss pattern of social fluidity adjusted to the data so
poorly in comparison to the classic core model of social fluidity.
As we have seen, by specifying a negative upward mobility affinity from semi-/unskilled workers to
the white collar and petite bourgeoisie classes such as that specified for Germany in the constant
flux, we arrived at a slightly more satisfactory core model. This model thus happens to be a good
baseline model in our endeavour to model the Swiss pattern of social fluidity. Therefore, we ran
204

another set of models (M3a to M3g). In the first model (M3a) we tested whether the disaffinity from
semi-/unskilled workers to the white collar and petite bourgeoisie classes is symmetrical: whether
white collar and petite bourgeoisie children are less likely to reach a semi-/unskilled workers
position. This symmetry proves to slightly improve the model, thus we continued our endeavour.
We further tested whether a negative affinity for children of the salariat in the attainment of skilled
205
Table 7.4: Results of fitting the core log-linear model of social fluidity and some adjustments to women's mobilitytables according to their father's social position, controlling for birth-cohorts (women aged 30–64, ESeC class schema)
Models OD G2 Df P DI %G2 BIC
* Women, 5 cohorts origin-destination mobility table N=6382
M0. Cond. Ind. 788.8 125 0.000 12.26 - -306.3
M1. CnSF 111.2 100 0.208 3.97 85.9 -764.9
M2a. Core classic 171.5 117 0.001 4.9 78.26 -853.5
M2b. AF1_G 176.8 117 0.000 5.09 77.58 -848.2
M2c. AF2_G 169.4 117 0.000 4.87 78.52 -855.6
M2d. AF1_G+AF2_G 174.9 117 0.000 5.06 77.83 -850.2
M2e. AF1_S 176.8 117 0.000 5.08 77.59 -848.3
M2f. AF2_S 186.3 117 0.000 5.31 76.39 -838.8
M2g. AF1_S+AF2_S 188.7 117 0.000 5.37 76.08 -836.1
M3a. M2b + AF1 Ga 175.9 117 0.000 5.07 77.7 -849.1
M3b. M2b + AF1 Gb 173.6 117 0.000 5.05 77.99 -851.5
M3c. M2b + AF1 Gc 171.1 117 0.000 4.96 78.31 -853.9
M3d. M2b + AF1 Gd 160.1 117 0.000 4.85 79.7 -864.9
M3e. M2b + AF1 Ge 160.9 117 0.000 4.86 79.6 -864.2
M3f. M2d + AF2a 150.1 117 0.000 4.68 80.97 -874.9
M3g. M2d + AF2b 149.3 117 0.000 4.68 81.08 -875.8
Corresponding parameters HI1 HI2 IN2 IN2 IN3 SE AF1 AF2
Core classic (men only) -0.22 -0.42 0.43 0.81 0.96 -1.03 -0.77 0.46
M2a. Core classic -0.22 -0.46 0.12 0.34 1.62 -0.28 -0.28 0.22
M2b. AF1_G -0.22 -0.61 0.13 0.34 1.62 -0.25 -0.06 0.22
M2c. AF2_G -0.16 -0.45 0.17 0.39 1.40 -0.33 -0.28 0.24
M2d. AF1_G+AF2_G -0.16 -0.60 0.17 0.39 1.41 -0.30 -0.06 0.24
M2e. AF1_S -0.25 -0.65 0.11 0.30 1.74 -0.22 -0.04 0.21
M2f. AF2_S -0.20 -0.56 0.14 0.13 1.80 -0.27 -0.28 0.04
M2g. AF1_S+AF2_S -0.23 -0.74 0.12 0.10 1.95 -0.20 -0.10 0.04
M3a. M2b + AF1 Ga -0.20 -0.60 0.12 0.36 1.61 -0.26 -0.09 0.20
M3b. M2b + AF1 Gb -0.18 -0.59 0.11 0.35 1.60 -0.28 -0.13 0.17
M3c. M2b + AF1 Gc -0.12 -0.67 0.14 0.20 1.58 -0.35 -0.17 0.05
M3d. M2b + AF1 Gd -0.11 -0.51 0.12 0.35 1.60 -0.18 -0.26 0.08
M3e. M2b + AF1 Ge -0.11 -0.52 0.12 0.34 0.15 -0.17 -0.26 0.08
M3g. M2d + AF2b -0.17 -0.51 0.13 0.41 1.61 -0.23 -0.15 0.23Notes: Cond Ind=conditional independence model; CnSF=constant social fluidity model; Core classic=core model ofsocial fluidity. G2=deviance, Df=degree of freedom, P=p-value, DI=dissimilarity index, %G2=proportion of reductionof deviance, BIC=Bayesian information criterion. The smaller the G2, the better the model fit.
workers (M3b) existed, and whether this effect is symmetric (M3c). This effect proves to be indeed
significant, but not symmetrical. We thus reject model M3c and carried on from model M3b. From
there, we further specified a negative affinity effect for children of farmers to attain the salariat and
the white collar classes (M3d). This effect is very important, since the deviance (G2) decreases
more than 15 points. However, this effect is not symmetrical (M3e). Finally, we tested whether
there was a positive affinity for children of the farmer class to attain the skilled worker class (M3f).
This effect is also quite important, as the G2 drops 10 points. In a final model, we tested whether
this last effect was symmetrical (M3g), but we must actually reject this hypothesis. Thus,
Switzerland depicts more negative and positive affinities than other European countries. These
effects, however, stem mainly from the farmer and semi-/unskilled class. In other words, this
suggests that barrier to attain and leave these classes are quite important.
Parameters of our best model indicate that the first hierarchy effect (HI1) is very low in Switzerland
(-0.06 versus -0.22 in the core model). Furthermore, the first inheritance (IN1) effect is also smaller
(0.18 versus 0.43) but the third inheritance (IN3) effect is much stronger (2.16 versus 0.96). Finally,
both negative (AF1) and positive (AF2) effect are rather moderate (AF1: -0.38 versus -0.77; AF2:
0.29 versus 0.46). For women, the different improvement made in the model for men also proved to
be important, and parameters of the final model provide consistent findings. However, to adequately
model women's pattern of social fluidity, a more thorough investigation should certainly be
undertaken. Indeed, in many respects women's social mobility pattern may differ from that of men
and it would be better to evaluate it separately, given the important extent of occupational sex-
segregation in Switzerland. This is what Jacot (2013) did by proposing different affinity matrices
for men and women. However, while the “core-CH” model of social fluidity found here may not be
perfect, it still provides consistent outcomes for women, as parameters return reliables values.
Thus, we overall arrive at a satisfactory adaptation of the core model of social fluidity to the Swiss
context. This adaptation, however, came at the price of a certain number of adjustments, which in
our view qualify to some respect the idea of basic cross-national invariance in social mobility
pattern, as phrased by the FJH hypothesis. We shall in the remaining section of this chapter address
now to which extent we can observe finer social mobility dynamics in the service class when
applying the Oesch class schema to our data.
206

7.3 . Adjusting the pattern of social fluidity to the differentfractions of the service class
7.3.1 . Disaggregating the service class: trends in classdistribution with the Oesch class schema
As we mentioned in the methodological chapter, comparability between the ESeC class schema and
the Oesch class schema is not perfect, strictly speaking. Furthermore, the operationalisation of this
class schema was problematic for some surveys because of a lack of information on self-
employment status. However, the ESeC and the Oesch class schema overall remain relatively
comparable. We thus expect a significant convergence with the two class schema.
As a brief reminder, the Oesch class schema is based on the core concept of work-logic. With this
concept, Oesch is able to identify four different fractions within the service class: (1) the traditional
bourgeoisie; (2) the technical specialists; (3) the managers; and (4) the socio-cultural specialists. He
furthermore distinguishes between white collar workers, office clerks and service workers, which
would correspond in the recent version of the Goldthorpe class schema to classes IIIa and IIIb
respectively. However, in comparison to our previous analysis, we are unable to isolate a class of
farmers within this class schema. By default, we expect them to be found in the petite bourgeoisie.
Yet overall, this class schema is highly interesting in that it enables disaggregation within different
fractions of the service class: (1) the traditional bourgeoisie, (2) the technical specialists, (3) the
managers, (4) the socio-cultural specialists.
We can see in Figure 7.2 that the share of people in the traditional bourgeoisie remains relatively
stable over birth-cohorts for both men and fathers: it accounts for almost 5% of the total social
structure for fathers and about 8% for men. Yet we observe some variations in the youngest cohorts,
with a decline in the 1958-1965 birth-cohort and a very slight increase in the post-mid-1960s birth-
cohorts. For women, while they lagged behind within oldest birth-cohorts, they also levelled around
the 5% threshold since the post-1940s birth-cohorts. The technical specialists fraction of the service
class developed quite significantly over time. Indeed, it accounted for men and for fathers for 10%
and less than 5% respectively within the oldest birth-cohort, while in the youngest, these
proportions increased to 15% and 10%. It is also noteworthy that the share of women in this class
also increased over birth-cohorts, although more moderately. The manager class represented around
20% of the social structure for men, 10% for women, and slightly more for fathers. These
proportions remain stable over time and increase for women in the youngest cohorts. Finally, the
last fraction of the service class, the socio-cultural specialists, is highly feminised and developed
207

importantly for women born until the early 1950s, when it represented more than 25% of the social
structure for women. However, within the youngest birth-cohort, the share of women in this class
decreased about 5%. Eventually, the decrease could stem from an age effect, since this birth-cohort
208
Figure 7.2: Marginal distributions of class origin (father) and class destination by gender overbirth-cohorts in percentages with the Oesch classes
is particularly younger than other ones. Thus, we could wonder to which extent this is an
occupational maturity effect or, alternatively, a career interruption effect stemming from maternity
leave. Yet this class remains one of the leading female classes. Indeed, about 10% of men are
located in this class and less than 5% among fathers. Thus, we observe different dynamics within
the different fractions of the service class in terms of development and gender.
The Oesch class schema furthermore disaggregates the white collar class by isolating first the office
clerks class and then the service workers class. They are not, however, strictly comparable with the
ESeC white collar class, as Oesch integrates some unskilled service occupations into this class,
which in ESeC are classified in the semi-/unskilled category. This explains why almost 50% of
women in the oldest cohort are classified in either an office clerk position or a service worker one.
In contrast, they hardly represent 5% of the routine class. Overall, these two white collar classes are
female-dominated, particularly within the service worker class. However, the gender gap is less
marked within the office clerks class than in the service workers ones. Yet in the latter class, the
share of men increases over birth-cohorts, whereas in the former class, it decreases.
Trends in the three remaining classes are rather consistent with previous observations. However, as
compared to the ESeC class schema, in the Oesch class schema the number of men and fathers
found in routine/unskilled occupations is lower, because some of them are actually allocated into
service worker occupations within the class schema. Yet overall, major trends in the Swiss social
stratification look rather consistent with those depicted with the ESeC classification. We can now
turn to the analysis of inflow and outflow percentages according to first, social origin, and second,
educational attainment.
7.3.2 . General pattern of absolute reproduction and recruitmentwithin the disaggregated service class
We first turn to the analysis of outflow and inflow percentages between class of origin and class
destination with the Oesch class schema. As can be seen in the outflow percentages in Table 7.5, we
observe that social reproduction in the traditional bourgeoisie class is among the highest, as 37% of
sons with this social background remain in this class. When they are not intergenerationally
immobile, sons of the traditional bourgeoisie end up in socio-cultural specialist positions. Regarding
sons of technical specialists, they are equally likely to remain in their father's class or to reach
manager position and socio-cultural specialist position. Furthermore, around 12% reach the
traditional bourgeoisie class. 35% of sons of managers follow in their father's footsteps. Those who
do not do so go into professional positions, either in the technical work-logic or in the interpersonal
209

service one. Finally, 26% of sons of socio-cultural specialists reach a similar position to their father.
However, others moved into the manager and technical specialist segments of the service class.
Thus, although social reproduction is higher in each fraction of the service class, they still exhibit
quite a bit of positive affinity between each other. And it is true that being from any service class
background usually hinders downward social mobility moves.
The inspection of the inflow mobility table corroborates these trends. It further reveals that a
notable share of technical specialists have a manager class background. This is also the fraction that
has the highest share of men with a skilled crafts social background: nearly 30%. Furthermore, a
non-negligible share of the socio-cultural specialists come from the traditional bourgeoisie but also
from manager backgrounds.
210
Table 7.5: Distribution of outflow and inflow percentages between class of origin and class destination by gender withOesch classes.
Men
Outflow percentages Inflow percentages
1 2 3 4 5 6 7 8 9 1 2 3 4 5 6 7 8 9
1. Tradi. bourg. 37.0 10.3 12.7 16.3 2.0 3.2 11.4 5.8 1.2 100 22.5 3.8 3.1 8.5 1.5 2.7 3.9 1.7 1.3 4.9
2. Technical spe. 11.7 19.7 27.0 14.4 3.6 3.5 7.3 10.9 1.8 100 9.5 9.7 8.8 10.0 3.8 3.9 3.3 4.1 2.6 6.6
3. Managers 8.9 15.1 34.9 14.2 5.0 4.8 8.6 7.5 1.0 100 14.2 14.6 22.3 19.4 10.4 10.6 7.8 5.6 2.8 13.1
4. Socio-cult. spe. 7.5 16.1 23.6 26.4 2.5 3.4 10.3 7.0 3.1 100 4.2 5.5 5.3 12.7 1.8 2.7 3.3 1.8 3.0 4.5
5. Office clerks 6.5 13.2 24.9 8.4 10.7 5.5 12.4 13.7 4.7 100 5.5 6.7 8.4 6.0 11.6 6.5 5.9 5.4 6.7 6.9
6. Service workers 5.0 17.4 22.2 6.6 10.2 10.3 8.2 15.5 4.6 100 1.7 3.6 3.0 1.9 4.5 4.8 1.6 2.5 2.7 2.8
7. Petite bourg. 6.2 11.1 14.8 6.7 4.6 5.3 29.2 17.8 4.4 100 17.0 18.4 16.2 15.6 16.2 20.0 44.9 22.8 20.6 22.1
8. Skilled crafts 5.4 13.1 17.1 6.4 7.6 7.1 12.1 25.4 5.8 100 20.2 29.7 25.7 20.4 36.9 37.0 25.5 44.7 37.5 30.7
9. Routine 4.9 12.4 17.3 6.0 9.7 8.0 6.5 22.8 12.4 100 5.2 8.0 7.4 5.4 13.3 11.8 3.9 11.4 22.8 8.5
Total 8.0 13.3 20.1 9.5 6.4 6.0 13.8 18.0 4.9 100 100 100 100 100 100 100 100 100 100 100
Women
Outflow percentages Inflow percentages
1 2 3 4 5 6 7 8 9 1 2 3 4 5 6 7 8 9
1. Tradi. bourg. 13.9 5.9 17.1 25.2 15.8 6.7 11.5 3.3 0.6 100 15.5 9.0 7.6 5.5 4.9 1.3 5.9 3.4 1.1 4.8
2. Technical spe. 7.0 6.3 12.4 31.7 15.0 16.5 6.7 2.4 2.0 100 11.7 14.3 8.2 10.2 6.9 4.9 5.1 3.7 5.2 6.9
3. Managers 4.6 5.1 15.5 31.1 17.0 14.1 8.1 3.3 1.2 100 13.4 20.3 18.0 17.7 13.8 7.3 10.8 8.8 5.5 12.8
4. Socio-cult. spe. 6.4 5.0 10.8 47.6 11.0 11.7 4.5 2.0 1.2 100 7.5 7.9 5.0 10.8 3.5 2.4 2.4 2.1 2.1 4.8
5. Office clerks 3.7 1.9 13.2 22.6 22.0 24.1 6.8 3.5 2.2 100 5.3 3.7 7.5 6.3 8.7 6.1 4.4 4.6 4.9 6.4
6. Service workers 3.4 3.1 10.8 18.5 19.7 26.7 8.0 3.6 6.3 100 2.7 3.4 3.4 2.9 4.3 3.8 2.9 2.6 7.9 3.3
7. Petite bourg. 3.8 1.8 9.2 19.5 13.2 28.9 14.2 6.2 3.2 100 18.1 11.7 17.1 17.8 17.1 24.1 30.4 26.5 23.6 21.4
8. Skilled crafts 2.6 2.8 10.4 17.4 16.2 31.0 9.8 6.5 3.3 100 18.8 11.7 17.1 17.8 17.1 24.1 30.4 26.5 23.6 31.7
9. Routine 4.2 1.0 6.1 14.4 19.9 36.9 8.6 4.0 4.9 100 7.0 2.2 4.0 4.7 9.1 10.9 6.5 6.1 12.7 7.9
Total 4.3 3.2 11.3 22.3 15.9 25.6 9.6 4.8 3.0 100 100 100 100 100 100 100 100 100 100 100

Women's opportunities are slightly different, given the gendered nature of the social structure.
Daughters of any fractions of the service class concentrate into socio-cultural specialist positions.
Furthermore, this is the class where social reproduction is the highest. Yet 17% of women with a
traditional bourgeoisie background reach manager positions. Furthermore, being from a technical
specialist or a socio-cultural specialist background is positively associated with a traditional
bourgeoisie position. Now, do we also observe differences within each service class fractions in
terms of educational attainment?
7.3.3 . The role of education on the pattern of attainment to thedifferent fractions of the service class
Table 7.6 indicates outflow and inflow percentage distributions of class destination with the Oesch
class schema by educational attainment. From the outflow table, we observe that the tertiary-
educated concentrate into manager (for men) and socio-cultural specialist positions (almost 30% of
all tertiary-educated for each). Yet the other two fractions of the service class still depict high levels
of tertiary education graduates. Tertiary vocational education characterises primarily managers and,
to a lower extent, technical specialists for men. It furthermore seems that secondary vocational
education constitutes a disadvantage to reach any fraction of the service class. However, 14% of
graduates with this educational level are found in the manager class. Finally, about 45% of those
with secondary general education end up divided equally within manager or socio-cultural specialist
positions.
The inspection of inflow percentages reveals that it is among the socio-cultural specialists that we
find the highest number of people with tertiary general education. In fact, almost half of this class is
composed of highly educated individuals. Furthermore, this class has the highest number of people
with secondary general education (17%). The highest number of individuals with tertiary vocational
education is found in the technical specialists fraction (42%) whereas the manager class depicts the
highest number of individuals with secondary vocational education of all service class fractions
(30%). Overall, similar trends are exhibited among women – though the gender bias applies and
implies that almost half of tertiary-educated women at the general level attain socio-cultural
specialist positions.
The description of outflow and inflow percentages provides us with some insights regarding the
heterogeneity of profiles of the different fractions of the service class according to social origin and
educational attainment. However, these percentages are not net of margin effect and thus do not
adequately reflect the pattern of social mobility. We now propose to turn to more thoroughly model
211
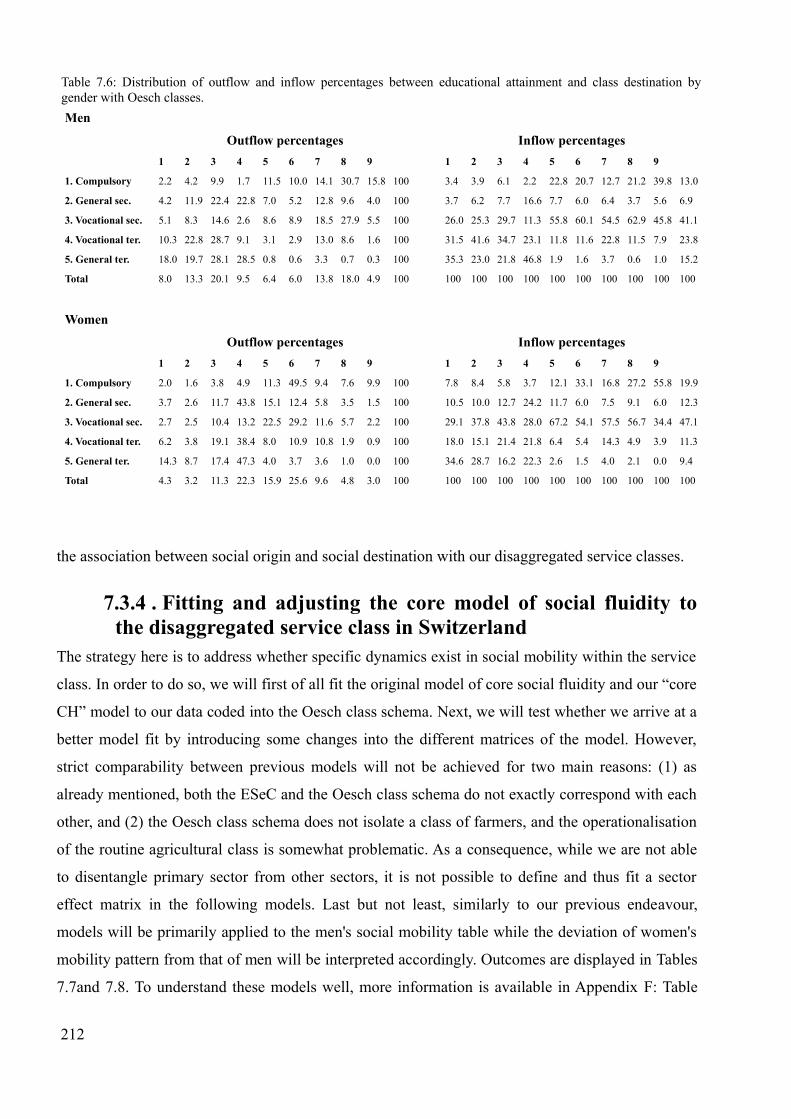
the association between social origin and social destination with our disaggregated service classes.
7.3.4 . Fitting and adjusting the core model of social fluidity tothe disaggregated service class in Switzerland
The strategy here is to address whether specific dynamics exist in social mobility within the service
class. In order to do so, we will first of all fit the original model of core social fluidity and our “core
CH” model to our data coded into the Oesch class schema. Next, we will test whether we arrive at a
better model fit by introducing some changes into the different matrices of the model. However,
strict comparability between previous models will not be achieved for two main reasons: (1) as
already mentioned, both the ESeC and the Oesch class schema do not exactly correspond with each
other, and (2) the Oesch class schema does not isolate a class of farmers, and the operationalisation
of the routine agricultural class is somewhat problematic. As a consequence, while we are not able
to disentangle primary sector from other sectors, it is not possible to define and thus fit a sector
effect matrix in the following models. Last but not least, similarly to our previous endeavour,
models will be primarily applied to the men's social mobility table while the deviation of women's
mobility pattern from that of men will be interpreted accordingly. Outcomes are displayed in Tables
7.7and 7.8. To understand these models well, more information is available in Appendix F: Table
212
Table 7.6: Distribution of outflow and inflow percentages between educational attainment and class destination bygender with Oesch classes.
Men
Outflow percentages Inflow percentages
1 2 3 4 5 6 7 8 9 1 2 3 4 5 6 7 8 9
1. Compulsory 2.2 4.2 9.9 1.7 11.5 10.0 14.1 30.7 15.8 100 3.4 3.9 6.1 2.2 22.8 20.7 12.7 21.2 39.8 13.0
2. General sec. 4.2 11.9 22.4 22.8 7.0 5.2 12.8 9.6 4.0 100 3.7 6.2 7.7 16.6 7.7 6.0 6.4 3.7 5.6 6.9
3. Vocational sec. 5.1 8.3 14.6 2.6 8.6 8.9 18.5 27.9 5.5 100 26.0 25.3 29.7 11.3 55.8 60.1 54.5 62.9 45.8 41.1
4. Vocational ter. 10.3 22.8 28.7 9.1 3.1 2.9 13.0 8.6 1.6 100 31.5 41.6 34.7 23.1 11.8 11.6 22.8 11.5 7.9 23.8
5. General ter. 18.0 19.7 28.1 28.5 0.8 0.6 3.3 0.7 0.3 100 35.3 23.0 21.8 46.8 1.9 1.6 3.7 0.6 1.0 15.2
Total 8.0 13.3 20.1 9.5 6.4 6.0 13.8 18.0 4.9 100 100 100 100 100 100 100 100 100 100 100
Women
Outflow percentages Inflow percentages
1 2 3 4 5 6 7 8 9 1 2 3 4 5 6 7 8 9
1. Compulsory 2.0 1.6 3.8 4.9 11.3 49.5 9.4 7.6 9.9 100 7.8 8.4 5.8 3.7 12.1 33.1 16.8 27.2 55.8 19.9
2. General sec. 3.7 2.6 11.7 43.8 15.1 12.4 5.8 3.5 1.5 100 10.5 10.0 12.7 24.2 11.7 6.0 7.5 9.1 6.0 12.3
3. Vocational sec. 2.7 2.5 10.4 13.2 22.5 29.2 11.6 5.7 2.2 100 29.1 37.8 43.8 28.0 67.2 54.1 57.5 56.7 34.4 47.1
4. Vocational ter. 6.2 3.8 19.1 38.4 8.0 10.9 10.8 1.9 0.9 100 18.0 15.1 21.4 21.8 6.4 5.4 14.3 4.9 3.9 11.3
5. General ter. 14.3 8.7 17.4 47.3 4.0 3.7 3.6 1.0 0.0 100 34.6 28.7 16.2 22.3 2.6 1.5 4.0 2.1 0.0 9.4
Total 4.3 3.2 11.3 22.3 15.9 25.6 9.6 4.8 3.0 100 100 100 100 100 100 100 100 100 100 100

F.2 summarises all effects that were tested in each model, Table F.4 details the meaning of each
effect and Table F.5 provides details of matrices fitted to our data.
The first models fitted show that for men, the “core CH” model fits the data slightly better than the
classic core model of social fluidity. This slight improvement nonetheless has significant impact on
the parameters of the model: while with the original classic core model of social fluidity we had
inconsistent parameters, they are now all consistent, except for one effect. Indeed, only the third
inheritance effect (IN3) indicates an almost null reproduction effect in the petite bourgeoisie class.
For women, however, the “core CH” model hardly makes any difference from the “classical core”
model. What is furthermore problematic among women is that three parameters over seven return
inconsistent values: both hierarchy effects (HI1 and HI2) and the third inheritance effect (IN3). In
spite of these problems, we will carry on modelling the Swiss pattern of social fluidity starting from
the “core CH” model.
First of all, we addressed issues of inheritance. We did so by adapting the first inheritance effect
(IN1) to our new class schema: inheritance here is defined as only happening in all cells of the main
diagonal. This model (M4a) significantly reduces the value of the G2. In other words, inheritance is
more marked within each fraction of the service class than between different ones. In a second
model (M4b), we tested whether a similar outcome can be observed when the second inheritance
effect (IN2) is translated only on the main diagonal for all fractions of the service class and the
petite bourgeoisie. This model, however, must be rejected. Nonetheless, when inheritance within the
technical specialists and managers is removed from the latter matrix, significant reduction in G2
happens (M4c). Thus,t reproduction is particularly strong within the traditional bourgeoisie and the
socio-cultural specialists, and not within the two other fractions of the service class. Finally, in
another model (M4d) we tested whether the traditional bourgeoisie displays particularly high social
reproduction within the third inheritance effect (IN3). This specification must be rejected on the
statistical ground. However, it must be noted the third inheritance effect displays unstable and
inconsistent parameters in the models fitted so far.
Next, we carried on our investigation by readapting the original sector effect to the Oesch class
schema. As underlined, the Oesch class schema does not enable us to distinguish between the
primary sector and other sector – yet it isolates a category of self-employment work-logic: the
traditional bourgeoise, such as employers or liberal professions, and the petite bourgeoisie. Like
sector effects, self-employment constitutes an important dimension to social reproduction. Model 4e
does suggest so. Thus, a higher propensity for any category of self-employment to not mix with
other classes seems to exist.
213

We then turned to the definition of positive affinities (AF2). We first tested whether there was a
higher propensity for children of the non-salariat class (except the routine class) to reach any of the
214
Table 7.7: Results of fitting the core log-linear model of social fluidity and some adjustments to men's mobility tablesaccording to their father's social position, controlling for birth-cohorts (men aged 30–64, Oesch class schema)
Models OD G2 Df P DI %G2 BIC
* Men, 5 cohorts origin-destination mobility table N=6296
M0. Cond. Ind. 1503.3 320 0.000 18.33 0.00 -1296.0
M1. CnSF 339.5 256 0.000 7.58 78.59 -1899.9
M2. Core classic 700.5 313 0.000 10.88 55.84 -2037.6
M3. Core CH 689.3 313 0.000 10.68 56.54 -2048.0
M4a. M3+IN1oe 599.0 313 0.000 10.17 62.23 -2139.0
M4b. M4a+IN2oe1 626.5 313 0.000 10.31 60.50 -2211.5
M4c. M4a+IN2oe2. 552.3 313 0.000 9.50 65.18 -2185.7
M4d. M4c+IN3oe 554.0 313 0.000 9.55 65.07 -2184.0
M4e. M4c+SEoe 537.5 312 0.000 9.33 66.11 -2191.8
M4f. M4e+AF2oe1 526.1 312 0.000 9.39 66.83 -2203.2
M4g. M4e+AF2oe2 520.9 312 0.000 9.44 67.16 -2208.4
M4h. M4e+AF2oe3 517.4 312 0.000 9.44 67.38 -2211.9
M4i. M4e+AF2oe4 508.6 312 0.000 9.43 67.93 -2220.7
M4j. M4i+AF1oe1 496.2 312 0.000 9.25 68.71 -2233.1
M4k. M4i+AF1oe2 492.9 312 0.000 9.23 68.93 -2236.4
M4l. M4i+AF1oe3 493.9 312 0.000 9.24 68.86 -2235.4
Corresponding parameters HI1 HI2 IN2 IN2 IN3 SE AF1 AF2
Core classic -0.22 -0.42 0.43 0.81 0.96 -1.03 -0.77 0.46
Core CH -0.06 -0.30 0.18 0.72 2.16 -0.33 -0.28 0.29
M2. Core classic -0.16 0.20 0.23 1.02 -0.05 - -0.65 0.39
M3. Core CH -0.09 -0.38 0.26 0.87 0.01 - -0.23 0.26
M4a. M3+IN1oe 0.03 -0.39 0.47 1.02 -0.43 - -0.27 0.13
M4b. M4a+IN2oe1 -0.41 -0.57 0.23 0.40 0.44 - -0.35 0.12
M4c. M4a+IN2oe2. -0.41 -0.43 0.26 1.08 -0.28 - -0.37 0.10
M4d. M4c+IN3oe -0.44 -0.45 0.24 0.72 0.29 - -0.35 0.15
M4e. M4c+SEoe -0.42 -0.32 0.24 0.96 -0.50 -0.20 -0.37 0.07
M4f. M4e+AF2oe1 -0.46 -0.37 0.28 0.77 -0.46 -0.23 -0.35 0.26
M4g. M4e+AF2oe2 -0.38 -0.35 0.35 0.79 -0.53 -0.22 -0.34 0.21
M4h. M4e+AF2oe3 -0.39 -0.36 0.35 0.84 -0.51 -0.20 -0.33 0.21
M4i. M4e+AF2oe4 -0.39 -0.34 0.36 0.87 -0.57 -0.21 -0.32 0.24
M4j. M4i+AF1oe1 -0.38 -0.37 0.33 0.81 -0.39 -0.16 -0.38 0.19
M4k. M4i+AF1oe2 -0.37 -0.37 0.34 0.79 -0.37 -0.16 -0.40 0.19
M4l. M4i+AF1oe3 -0.35 -0.48 0.34 0.75 -0.23 -0.12 -0.36 0.14Notes: Cond Ind=conditional independence model; CnSF=constant social fluidity model; Core classic=core model ofsocial fluidity. G2=deviance, Df=degree of freedom, P=p-value, DI=dissimilarity index, %G2=proportion of reductionof deviance, BIC=Bayesian information criterion. The smaller the G2, the better the model fit.

technical specialist and manager fractions of the service class. This effect improves the quality of
the adjustment of our model to our data (M4f). In a second model (M4g), we additionally specified
215
Table 7.8: Results of fitting the core log-linear model of social fluidity and some adjustments to men's mobility tablesaccording to their father's social position, controlling for birth-cohorts (women aged 30–64, Oesch class schema)
Models OD G2 Df P DI %G2 BIC
* Women, 5 cohorts origin-destination mobility table N=5604
M0. Cond. Ind. 875.7 320 0.000 14.62 - -1886.3
M1. CnSF 291.4 256 0.064 7.27 63.06 -1918.2
M2. Core classic 516.6 313 0.000 10.23 34.51 -2184.9
M3. Core CH 516.6 313 0.000 10.22 34.51 -2185.0
M4a. M3+IN1oe 490.5 313 0.000 10.08 37.82 -2211.1
M4b. M4a+IN2oe1 567.1 313 0.000 10.99 28.12 -2134.5
M4c. M4a+IN2oe2. 539.2 313 0.000 10.65 31.65 -2162.4
M4d. M4c+IN3oe 546.2 313 0.000 10.68 30.76 -2155.4
M4e. M4c+SEoe 531.6 312 0.000 10.57 32.61 -2161.4
M4f. M4e+AF2oe1 528.7 312 0.000 10.51 32.98 -2164.3
M4g. M4e+AF2oe2 525.5 312 0.000 10.49 33.38 -2167.4
M4h. M4e+AF2oe3 524.9 312 0.000 10.49 33.46 -2168.0
M4i. M4e+AF2oe4 523.4 312 0.000 10.44 33.64 -2169.5
M4j. M4i+AF1oe1 523.9 312 0.000 10.45 33.59 -2169.1
M4k. M4i+AF1oe2 523.5 312 0.000 10.45 33.63 -2169.4
M4l. M4i+AF1oe3 520.3 312 0.000 10.29 34.04 -2172.6
Corresponding parameters HI1 HI2 IN2 IN2 IN3 SE AF1 AF2
Core classic (men only) -0.22 -0.42 0.43 0.81 0.96 -1.03 -0.77 0.46
Core CH -0.17 -0.51 0.13 0.41 1.55 -0.23 -0.15 0.22
M2. Core classic 0.22 0.53 0.16 1.60 -1.31 - -0.36 0.26
M3. Core CH 0.22 0.17 0.16 1.60 -1.31 - -0.02 0.26
M4a. M3+IN1oe 0.25 0.16 0.30 1.71 -1.56 - 0.03 0.23
M4b. M4a+IN2oe1 -0.46 -0.33 0.12 0.34 -0.06 - -0.02 0.10
M4c. M4a+IN2oe2. -0.46 -0.28 0.11 0.76 -0.48 - -0.03 0.10
M4d. M4c+IN3oe -0.47 -0.32 0.11 0.71 -0.30 - -0.02 0.12
M4e. M4c+SEoe -0.46 -0.19 0.10 0.69 -0.73 -0.18 -0.04 0.08
M4f. M4e+AF2oe1 -0.43 -0.19 0.13 0.59 -0.72 0.20 -0.07 0.19
M4g. M4e+AF2oe2 -0.38 -0.18 0.17 0.63 -0.78 -0.19 -0.06 0.15
M4h. M4e+AF2oe3 -0.38 -0.19 0.17 0.66 -0.75 -0.16 -0.06 0.15
M4i. M4e+AF2oe4 -0.37 -0.16 0.17 0.69 -0.80 -0.18 -0.06 0.16
M4j. M4i+AF1oe1 -0.37 -0.18 0.18 0.68 -0.80 -0.17 -0.02 0.16
M4k. M4i+AF1oe2 -0.37 -0.18 0.18 0.67 -0.77 -0.17 -0.05 0.15
M4l. M4i+AF1oe3 -0.35 -0.20 0.17 0.63 -0.68 -0.15 -0.11 0.12Notes: Cond Ind=conditional independence model; CnSF=constant social fluidity model; Core classic=core model ofsocial fluidity. G2=deviance, Df=degree of freedom, P=p-value, DI=dissimilarity index, %G2=proportion of reductionof deviance, BIC=Bayesian information criterion. The smaller the G2, the better the model fit.
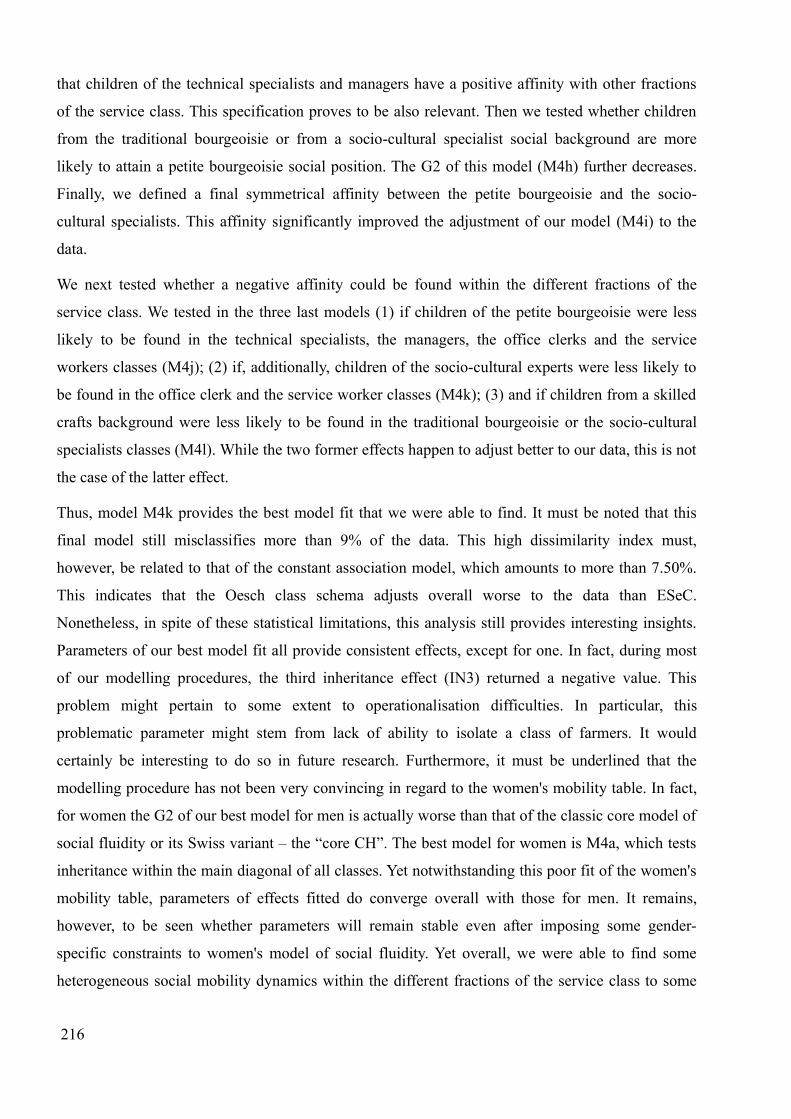
that children of the technical specialists and managers have a positive affinity with other fractions
of the service class. This specification proves to be also relevant. Then we tested whether children
from the traditional bourgeoisie or from a socio-cultural specialist social background are more
likely to attain a petite bourgeoisie social position. The G2 of this model (M4h) further decreases.
Finally, we defined a final symmetrical affinity between the petite bourgeoisie and the socio-
cultural specialists. This affinity significantly improved the adjustment of our model (M4i) to the
data.
We next tested whether a negative affinity could be found within the different fractions of the
service class. We tested in the three last models (1) if children of the petite bourgeoisie were less
likely to be found in the technical specialists, the managers, the office clerks and the service
workers classes (M4j); (2) if, additionally, children of the socio-cultural experts were less likely to
be found in the office clerk and the service worker classes (M4k); (3) and if children from a skilled
crafts background were less likely to be found in the traditional bourgeoisie or the socio-cultural
specialists classes (M4l). While the two former effects happen to adjust better to our data, this is not
the case of the latter effect.
Thus, model M4k provides the best model fit that we were able to find. It must be noted that this
final model still misclassifies more than 9% of the data. This high dissimilarity index must,
however, be related to that of the constant association model, which amounts to more than 7.50%.
This indicates that the Oesch class schema adjusts overall worse to the data than ESeC.
Nonetheless, in spite of these statistical limitations, this analysis still provides interesting insights.
Parameters of our best model fit all provide consistent effects, except for one. In fact, during most
of our modelling procedures, the third inheritance effect (IN3) returned a negative value. This
problem might pertain to some extent to operationalisation difficulties. In particular, this
problematic parameter might stem from lack of ability to isolate a class of farmers. It would
certainly be interesting to do so in future research. Furthermore, it must be underlined that the
modelling procedure has not been very convincing in regard to the women's mobility table. In fact,
for women the G2 of our best model for men is actually worse than that of the classic core model of
social fluidity or its Swiss variant – the “core CH”. The best model for women is M4a, which tests
inheritance within the main diagonal of all classes. Yet notwithstanding this poor fit of the women's
mobility table, parameters of effects fitted do converge overall with those for men. It remains,
however, to be seen whether parameters will remain stable even after imposing some gender-
specific constraints to women's model of social fluidity. Yet overall, we were able to find some
heterogeneous social mobility dynamics within the different fractions of the service class to some
216

extent. This actually leaves us with two visions of the Swiss pattern of social mobility.
7.4 . Two visions of the Swiss pattern of social mobilityIn this last section, we would like to address how far both final models of core social fluidity in
Switzerland fitted with both the ESeC and the Oesch class schema do converge or diverge.
Parameters of each effect in the mobility tables of men and women are displayed in Tables 7.9 and
7.10. Overall, quite notable differences do exist between each class schema approach. However, the
patterns are very similar with both cases having a high propensity of immobility on the main
diagonal. The disaggregated approach of the service class, however, indicates some heterogeneity in
the dynamics of social immobility within its different fractions. Those with assets that can be stored
and transmitted, such as property assets and cultural assets, have a higher propensity of social
reproduction than the other fraction (Savage et al. 1992). This is the case of the traditional
bourgeoisie and the socio-cultural specialists. We could have expected that the technical specialists
fraction would depict this trend as well. However, this service class fraction seems to dispose from
fewer assets than the socio-cultural specialists, as overall they come from lower social backgrounds
and have a more vocational type of education. We observe that this latter fraction, as well as the
manager fraction, displays less immobility and more mobility with the other fractions of the service
class. However, despite these heterogenous social (im)mobility dynamics within the service class, it
remains very clear that being from any service class background is still an advantage in avoiding
downward social mobility.
Thus, although the service class is not as unified as it may have appear, it still remains relatively
homogenous to some extent. Being from any of the service class fractions might indeed offer better
life chances on average, as compared to non-salariat classes. Yet it remains to be seen whether we
could observe either an increasing or a decreasing heterogeneity by analysing dynamics from a
temporal stance. We could probably expect some fractions, especially those with the highest cultural
resources, such as the socio-cultural specialists, to become increasingly rigid over time, while the
manager class could eventually remain the class that offers the highest chances of upward – but also
downward – social mobility. We can now turn to an overall discussion of our findings.
7.5 . Discussion and conclusionThe objectives in this chapter were twofold: (1) to find the Swiss pattern of social mobility and (2)
to address whether we could observe some heterogeneous social mobility dynamics in the service
class. This latter endeavour was guided by the idea of finding clues to explain the constant and even
217
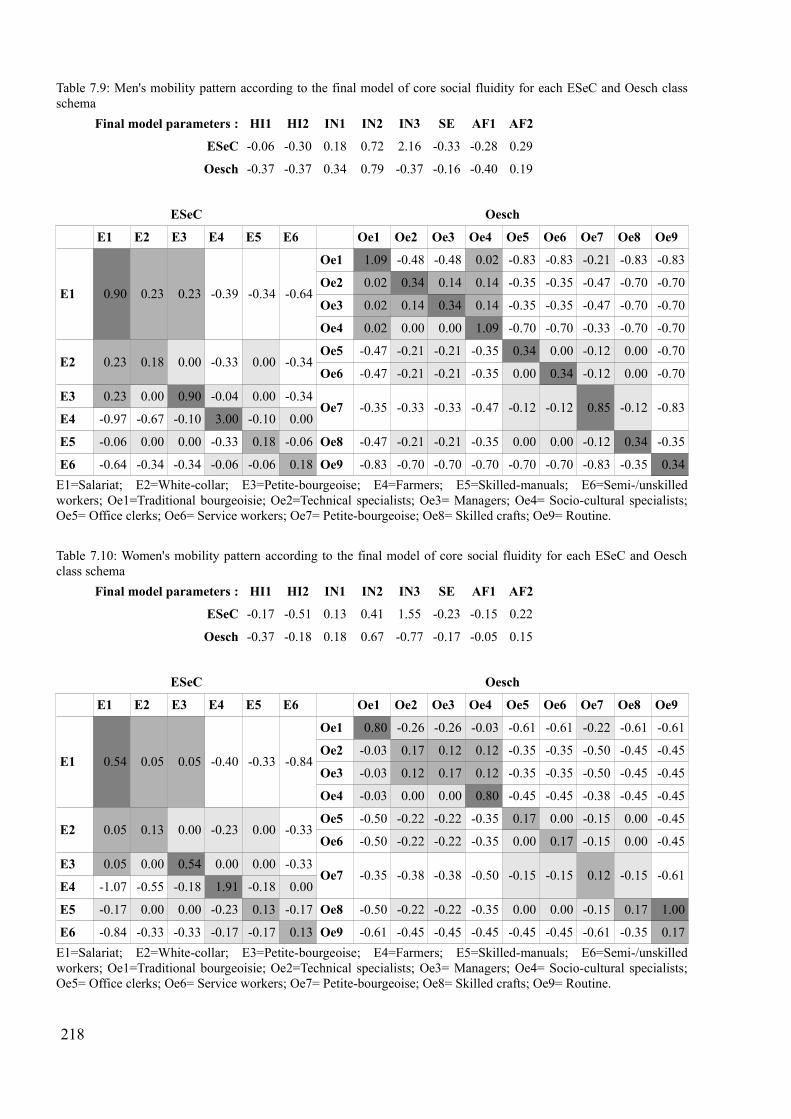
218
Table 7.9: Men's mobility pattern according to the final model of core social fluidity for each ESeC and Oesch classschema
Final model parameters : HI1 HI2 IN1 IN2 IN3 SE AF1 AF2
ESeC -0.06 -0.30 0.18 0.72 2.16 -0.33 -0.28 0.29
Oesch -0.37 -0.37 0.34 0.79 -0.37 -0.16 -0.40 0.19
ESeC Oesch
E1 E2 E3 E4 E5 E6 Oe1 Oe2 Oe3 Oe4 Oe5 Oe6 Oe7 Oe8 Oe9
E1 0.90 0.23 0.23 -0.39 -0.34 -0.64
Oe1 1.09 -0.48 -0.48 0.02 -0.83 -0.83 -0.21 -0.83 -0.83
Oe2 0.02 0.34 0.14 0.14 -0.35 -0.35 -0.47 -0.70 -0.70
Oe3 0.02 0.14 0.34 0.14 -0.35 -0.35 -0.47 -0.70 -0.70
Oe4 0.02 0.00 0.00 1.09 -0.70 -0.70 -0.33 -0.70 -0.70
E2 0.23 0.18 0.00 -0.33 0.00 -0.34Oe5 -0.47 -0.21 -0.21 -0.35 0.34 0.00 -0.12 0.00 -0.70
Oe6 -0.47 -0.21 -0.21 -0.35 0.00 0.34 -0.12 0.00 -0.70
E3 0.23 0.00 0.90 -0.04 0.00 -0.34Oe7 -0.35 -0.33 -0.33 -0.47 -0.12 -0.12 0.85 -0.12 -0.83
E4 -0.97 -0.67 -0.10 3.00 -0.10 0.00
E5 -0.06 0.00 0.00 -0.33 0.18 -0.06 Oe8 -0.47 -0.21 -0.21 -0.35 0.00 0.00 -0.12 0.34 -0.35
E6 -0.64 -0.34 -0.34 -0.06 -0.06 0.18 Oe9 -0.83 -0.70 -0.70 -0.70 -0.70 -0.70 -0.83 -0.35 0.34
E1=Salariat; E2=White-collar; E3=Petite-bourgeoise; E4=Farmers; E5=Skilled-manuals; E6=Semi-/unskilledworkers; Oe1=Traditional bourgeoisie; Oe2=Technical specialists; Oe3= Managers; Oe4= Socio-cultural specialists;Oe5= Office clerks; Oe6= Service workers; Oe7= Petite-bourgeoise; Oe8= Skilled crafts; Oe9= Routine.
Table 7.10: Women's mobility pattern according to the final model of core social fluidity for each ESeC and Oeschclass schema
Final model parameters : HI1 HI2 IN1 IN2 IN3 SE AF1 AF2
ESeC -0.17 -0.51 0.13 0.41 1.55 -0.23 -0.15 0.22
Oesch -0.37 -0.18 0.18 0.67 -0.77 -0.17 -0.05 0.15
ESeC Oesch
E1 E2 E3 E4 E5 E6 Oe1 Oe2 Oe3 Oe4 Oe5 Oe6 Oe7 Oe8 Oe9
E1 0.54 0.05 0.05 -0.40 -0.33 -0.84
Oe1 0.80 -0.26 -0.26 -0.03 -0.61 -0.61 -0.22 -0.61 -0.61
Oe2 -0.03 0.17 0.12 0.12 -0.35 -0.35 -0.50 -0.45 -0.45
Oe3 -0.03 0.12 0.17 0.12 -0.35 -0.35 -0.50 -0.45 -0.45
Oe4 -0.03 0.00 0.00 0.80 -0.45 -0.45 -0.38 -0.45 -0.45
E2 0.05 0.13 0.00 -0.23 0.00 -0.33Oe5 -0.50 -0.22 -0.22 -0.35 0.17 0.00 -0.15 0.00 -0.45
Oe6 -0.50 -0.22 -0.22 -0.35 0.00 0.17 -0.15 0.00 -0.45
E3 0.05 0.00 0.54 0.00 0.00 -0.33Oe7 -0.35 -0.38 -0.38 -0.50 -0.15 -0.15 0.12 -0.15 -0.61
E4 -1.07 -0.55 -0.18 1.91 -0.18 0.00
E5 -0.17 0.00 0.00 -0.23 0.13 -0.17 Oe8 -0.50 -0.22 -0.22 -0.35 0.00 0.00 -0.15 0.17 1.00
E6 -0.84 -0.33 -0.33 -0.17 -0.17 0.13 Oe9 -0.61 -0.45 -0.45 -0.45 -0.45 -0.45 -0.61 -0.35 0.17
E1=Salariat; E2=White-collar; E3=Petite-bourgeoise; E4=Farmers; E5=Skilled-manuals; E6=Semi-/unskilledworkers; Oe1=Traditional bourgeoisie; Oe2=Technical specialists; Oe3= Managers; Oe4= Socio-cultural specialists;Oe5= Office clerks; Oe6= Service workers; Oe7= Petite-bourgeoise; Oe8= Skilled crafts; Oe9= Routine.
increasing return to education trend that we found in the preceding chapter, since it could have been
driven by a compositional shift in the occupational structure.
Our first main concern was to assess the extent of commonality and variation of the Swiss pattern of
social mobility with the original model of core social fluidity as proposed by Erikson and
Goldthorpe. We hypothesised that the Swiss case would deviate from this model and display
affinities with the German variant of the model (H5a). Although findings indicate that the Swiss
pattern of social fluidity displays a high degree of commonality with the original model, a certain
number of adjustments were necessary to improve the quality of our model. In line with our
hypothesis, some of these adjustments stem from the refinements proposed by Erikson and
Goldthorpe for the case of Germany. Our starting point for the adjustment of the core model of
social fluidity was the German negative affinity matrix (AF1), which specifies that children of the
semi-/unskilled worker class have a lower likelihood to move into white collar and petite
bourgeoisie positions. Subsequently, further refinements were undertaken, mostly in the form of
negative affinity: (1) we specified that the German effect is symmetric, so that white collar and
petite bourgeoisie children have a lower propensity to move into the semi-/unskilled class; (2)
children of the salariat in Switzerland are less likely to attain skilled worker position; and (3)
children of farmers, similarly to children of semi-/unskilled workers, are very unlikely to reach the
salariat or the white collar class. In contrast, we found that children of farmers have a positive
affinity (AF2) with the skilled worker class. This is the only adaptation of the positive affinity
matrix that we specified and it lent some support to our second hypothesis stating that self-
employed children should exhibit more downward mobility in Switzerland (H5b). However, it
seems to hold true for children of farm origin, while those from the petite bourgeoise have more
resources and are protected from moving into semi-/unskilled occupations.
Altogether, these adaptations seem rather consistent with the explanations pointed out for Germany
in The Constant Flux (Erikson and Goldthorpe 1992b:149–150). The authors suggested that there
was an important division within the working class between its skilled and non-skilled components,
stemming from the dual educational system. In fact, holding an apprenticeship in Germany certainly
improves occupational life-chances, as compared to having attained no particular level of education.
The same seems to apply in Switzerland and actually expends to the children of farmers.
Furthermore, children of the highest fractions of the Swiss social stratification – namely the salariat,
the white collar and the petite bourgeoisie – are particularly protected from downward social
mobility moves. Thus, the Swiss social mobility pattern looks particularly rigid, as it depicts
important barriers between the manual and non-manual classes.
219

All these adaptations suggest that Switzerland deviates quite significantly from the original model
of core social fluidity, particular since Germany has been considered the country with the highest
level of deviation from the original model. In fact, we found that the Swiss pattern deviates from the
core model of social fluidity even more than Germany. Furthermore, these observations were found
to hold for Swiss men essentially, as when fitting the same model to women, we observed that
women's pattern of social mobility deviates significantly from that of men. While we decided not to
continue the investigation of women's own pattern of social mobility in Switzerland, since we think
it should be addressed thoroughly and properly in further research, this deviation of women's
pattern as compared to men's in itself constitutes an outcome. This point is at odds with our
hypothesis of gender convergence in social mobility dynamics (H7).
We wonder in this respect whether the original core model of social fluidity as proposed by Erikson
and Goldthorpe displays a male-bias. In fact, the core model of social fluidity was originally
constructed to describe social mobility in 1970s industrial societies, which by definition were still
highly characterised with the male breadwinner family model. Since then, women's position in
society has considerably changed, as they now actively take part in the labour market. In the
meantime, the social structure of Western societies underwent an upward shift with the coming of
tertiarisation and educational expansion. As a consequence, the social stratification of Western
societies has been considerably transformed and the service class has become a big – one might say
too big – class. In this context, we are led to wonder whether we can observe heterogeneous social
mobility dynamics in different fractions of the service class. We were able to disaggregate the big
service class into four main fractions as proposed by Oesch (2006a, 2006b): (1) the traditional
bourgeoisie, (2) the technical specialists, (3) the managers, and (4) the socio-cultural specialists.
This was our second objective in this last empirical chapter.
In the second part of our analysis, we addressed this issue of the changing social structure and its
consequences on social mobility dynamics. Indeed, the significant expansion of the service class
over the time frame considered implies that almost 50% of the Swiss population is found in this
class. Yet by disaggregating the service class into four different fractions, we have tried to find
subtler social mobility dynamics. We were indeed able to show some heterogeneity in the social
mobility dynamics of the different fractions of the service class we isolated. Starting with the Swiss
adaptation of the core model of social fluidity – the so-called core-CH – we proposed several sets of
adaptations that proved to adjust significantly better to our data. Additionally, we were able to show
that social inheritance is more important on the main diagonal into each salariat class than into the
sole large salariat class. We also found differential affinities with other classes for each fraction of
220

the salariat classes. Notably, the traditional bourgeoisie and the socio-cultural specialists have
overall fewer affinities with other classes but display positive affinity together. In contrast, the
technical specialists and the managers have more positive affinity with each other, but also with
other non-salariat classes.
These findings clearly corroborate our hypothesis (H6a). Social mobility dynamics are indeed
heterogeneous within the service class. Specifically, the salariat could be divided into two broad
main categories with, on the one hand, the technical specialists and the managers who display the
highest extent of mobility since they rely on lower cultural resources. Indeed, on average they gain
vocation-oriented education at the tertiary level for the former and the secondary level for the latter.
On the other hand, the traditional bourgeoisie and the socio-cultural specialists who are the most
immobile. This observation supports our hypothesis H6b stating that the self-employed category in
the service class displays more immobility. However, this category does not hold the monopoly of
high social immobility propensity, since socio-cultural specialists hold a similar level of immobility.
Thus, property assets (characteristics of the traditional bourgeoisie) and cultural assets
(characteristics of the socio-cultural specialists) play a similar sizeable role in social reproduction.
These findings altogether provide us with some clues in regard to our original endeavour to explain
the specific stable and increasing return to education trend that we found in the preceding chapter.
For men, the stable trend in return to education certainly stems from the stable share of the manager
position over time in the Swiss social structure. If their share had increased, return to education
could eventually have decreased, since these occupations rely less on higher education. In contrast,
as the technical specialist fractions increased continuously over time, and since this service class
fraction on average requires tertiary vocational education, the general level of return to education
remained stable for men. As regard to women, the linear increase of return to education over time
clearly stems from the development of occupations in the socio-cultural specialist service class
fraction. Indeed, the share of women within this fraction increased significantly over time. Thus, we
find some indication of a compositional effect in the social structure to explain the specificity of the
trend of return to education in the Swiss context.
Yet while the disaggregated analysis of the service class provides us with some interesting insights
in regard to social mobility dynamics, it must be underlined that the service class overall seems to
remain a rather unified group. In fact, coming from any service class background seems to
significantly hinder chances of downward mobility overall. In other words, to be able to conclude
that each fraction of the service class we identified is actually different, further research would be
required in order to more thoroughly address to extent to which they display different life chances.
221

They certainly do, to some extent, and they certainly differentiate with each other in terms of
cultural habits, for instance.
Additionally, further research undertaken with the Oesch class schema should also try to improve
the coding procedure of this class schema for cases where we lack information on self-employment
and by isolating the farmers from the rest of the petite bourgeoisie in the class schema. We are well
aware of operationalisation weaknesses that this class schema displays, especially with our data in
which information on self-employment is sometimes scarce or lacking, but its theoretical rationale
is interesting enough to encourage scholars to use this class schema for the analysis of social
mobility in post-industrial societies – particularly since we wonder to which extent our research
findings happen to stem from the Swiss specificity or whether they could be corroborated in cross-
national contexts. We could, in turn, wonder whether we could find evidence of a new
“disaggregated core model of social fluidity”. All of these final remarks lay the groundwork for
future research. But for now, we must turn to the overall discussion of findings uncovered in this
thesis.
222
8 . Meritocracy did not come. Concluding remarkson intergenerational social mobility in the Swisssocial stratification mountain
8.1 . Too little meritocracy and social mobility in the Swissdemocracy: the persistent importance of social origin inthe Swiss social stratification mountain
In Switzerland, as in many other countries in the world, principles of liberty and equality constitute
the cornerstone of democracy. They define that everyone is born sous la même étoile37 and equally
gifted to succeed in life and become a responsible citizen. The influence of social background on
life chances in democratic societies should thus only be of marginal importance, acting as a relic of
old hierarchical orders dating from feudal times, when individuals' fates were determined at birth.
Indeed, the sole criteria that should count to select and allocate individuals in a democratic society
will be talent and merit. Consequently, these societies are expected to be highly meritocratic, since
they give to each individual equal opportunity to make his or her place in the society. From this
standpoint, by looking at how much social background influences individuals' social position in
society, the study of intergenerational social mobility can provide a measure of equality of
opportunity to test how true this meritocratic assumption actually is. It is commonly expected that if
class-based educational inequality is erased and if education becomes the main determinant of a
person's social position, then an education-based meritocracy is in place. In other words, the study
of social mobility enables us to outline how open democratic societies are. If social mobility
increases, it is assumed that these societies tend more and more towards democratic requirements,
whereas if it decreases, they might be in danger because these requirements become fewer and
fewer.
We assessed these issues in the context of Switzerland, an extremely prosperous country where
education plays a major role in the allocation process. We wondered to which extent social mobility
has increased since the beginning of the last century in this country, and if in turn it had become
more meritocratic. We were able to empirically investigate these issues through the construction of
a unique tailor-made dataset based on the aggregation of twelve surveys collected between 1975
37 Understand : Under the same star
223

and 2009. This study design allowed us to gain a large sample size representative of the Swiss
population born between the early 1910s and the late 1970s, which we divided into several birth-
cohorts to undertake our analysis in order to correctly assess the extent of change in the Swiss social
mobility regime. Through the thorough recoding of each dataset into comparative measures and the
use of adequate statistical models in addition to systematic robustness checks, our study is unique in
Switzerland. It constitutes serious grounds for the description of substantial social mobility
dynamics in Switzerland.
Our research was particularly concerned with the impact of the changing social stratification
structure on social mobility opportunities. This is the reason why we argued that rather than seeing
the social mobility process as climbing a ladder, it could be envisaged as climbing a mountain. In
fact, between other things, mountains display the unique feature of being capable of taking a new
shape over time. The mountain metaphor can therefore account for social changes in the social
stratification that Swiss society, like other Western societies, has undergone since the last century,
unlike the ladder metaphor. In fact, with processes of educational expansion and tertiarisation, the
social stratification structure has been considerably modified in these societies. Therefore, these
changes are likely to have impacted social mobility chances, and in turn, equality of opportunity
and meritocracy.
With the data we constructed, we were indeed able to observe changes in the Swiss social
stratification mountain. First, the educational structure expanded, and as a result, almost everybody
today attains at least secondary education in Switzerland. Furthermore, an increasing share of the
Swiss population has also attained a tertiary educational level. Yet the Swiss educational system did
not expand as much as in other European countries, since educational expansion has been relatively
moderate. Switzerland indeed remains one of the core countries in Europe whose educational
system is vocationally oriented: about 40% of the total population attains secondary vocational
education, whereas only 20% of the population in the youngest generations attains tertiary general
education. In addition to educational expansion, the Swiss social stratification mountain has
tertiarised as a consequence of the development of the service economy. The structure of
occupations underwent an upward shift as the semi-/unskilled and farmer classes shrank
significantly, whereas the salariat and intermediate employee classes grew. Finally, in both the
educational and occupational structures, the Swiss social stratification mountain feminised
considerably. While gender inequality is still significant in Switzerland in many respects, it
decreased significantly in terms of access to education and the labour market. As a consequence, we
would have expected that all these structural changes would have considerably modified social
224

mobility opportunities in Switzerland in the sense of greater social mobility. However, our empirical
analysis leads us to reject such claims. While we do find some changes in the structure of
opportunity, they did not create more intergenerational social mobility.
We do indeed observe that changes in the social stratification structure had some consequences
affecting the dynamic of inequality, particularly since we find that the role of education in the social
mobility process changed. As in other European countries, educational inequalities reduced in
Switzerland over time. Thus, educational opportunities have equalised to a certain extent. This trend
is particularly more pronounced among men and holds essentially for people born prior to 1965.
Nonetheless, in the youngest birth-cohort, educational inequalities tend to have reinforced, being for
men or women. In other words, while there has been some educational equalisation over time in
Switzerland, which was certainly fostered by educational expansion, this trend seems to have
reversed in recent years. In other words, non-persistent educational inequality does not persist over
time in Switzerland.
In the meantime, we observe that the value of education did not decrease, unlike in other European
countries. Education in Switzerland remained as rewarded on the labour market as it used to be, if
not more. For men, the level of return to education stayed mostly the same over birth-cohorts and
even increased considerably within the youngest one. As for women, return to education increased
during the whole period and, interestingly, increased linearly. Thus, in Switzerland the occupational
advantage afforded by education for women constantly increased. This Swiss idiosyncrasy in this
trend in return to education could be attributed to the gap between the educational and occupational
structure – in other words, between processes of educational expansion and tertiarisation. Since the
former developed later than the latter, education has become increasingly determinant over time in
allocating individuals into social positions, while it was probably not as crucial in earlier times.
This trend towards increasing return to education has certainly been intensified over recent years by
the changing profile of the foreign population, which accounts for more than one-fifth of the total
population in Switzerland. Indeed, while the migrant population traditionally concentrated on
poorly qualified occupational segments of the Swiss labour market, thus enabling Swiss citizens to
enjoy good occupational prospects even with only low qualifications, recently Switzerland has
witnessed the emergence of highly qualified migrants. As a consequence, within the youngest
cohort we observe that foreigners today are more likely to hold a tertiary general educational level
and occupy a higher salariat class than Swiss citizens.
Altogether, it is noteworthy that these two findings, respectively decreasing educational inequality
while stabilizing and even increasing return to education, are in line with expectations of an
225
education-based meritocracy, as they were put notably by the liberal theory of industrialism. It is
indeed very often acknowledged that progress towards an education-based meritocracy requires
three main processes of change (Goldthorpe and Jackson 2008): (1) that the association between
social origin and educational attainment decreases, implying that educational opportunities equalise;
(2) that the association between educational attainment and social destination increases, so that
education becomes the main determinant of individuals' social position; and (3) that the association
between social origin and social destination is weaker in the highest levels of education, suggesting
that highly educated people are likely to be selected only according to achieved characteristics,
rather than ascribed ones. Yet as with educational expansion, an increasing share of people attain
higher education, it is likely that more and more people will become selected on meritocratic assets.
This is what is called a compositional effect.
Since we also find evidence of this latter effect for both men and women in Switzerland, we are
very much tempted to conclude that an education-based meritocracy is actually present in this
country: (1) education has become less dependent on social origin, (2) social position attained is
importantly conditioned on education, and (3) highly educated people are selected primarily
according to their educational attainment. However, one very important piece of the puzzle is
missing. Logically, if an education-based meritocracy did hold in Switzerland, we should observe
that the direct association between social origin and social destination would have also decreased,
but we do not observe this trend in this country. Both measures of relative and absolute social
mobility indicate that social mobility has remained constant over time in Switzerland. While we
observe some variations in relative social mobility opportunities, they are not substantial enough
and do not point in any consistent direction towards increasing social fluidity for men or women.
Therefore, rather than naively concluding that Switzerland is an education-based meritocracy, we
would prefer to underline that the Swiss configuration is rather peculiar: while educational
inequality overall declined and return to education tended to increase, social mobility remained
constant. In other words, Switzerland provides a unique example of what we could term a “non-
meritocratic meritocracy”.
To understand this unique configuration of the Swiss social mobility regime, more pieces of the
puzzle are required. We were able to identify five main reasons to explain this Swiss idiosyncrasy.
First, in regard to educational equalisation, we notice that equalisation happened mostly at
secondary vocational educational levels, and to a lower extent, tertiary vocational tracks as well.
Children of the working class have increasingly attained these educational levels. Yet important
barriers persist in the attainment of general education for children of lower class backgrounds. In
226

fact, educational equality in access to general education tracks, and importantly, at the tertiary
general level, did not increase.
Second, the lowest educational equalisation effect that we found among women stems from the fact
that these are women from the salariat class background who were more likely to enjoy the benefits
of educational expansion. Women who attained tertiary education were indeed more likely to come
from this social background than men were. Thus, while an increasing share of women attained
higher education and saw their educational opportunities converging with those of men overall,
those who primarily enjoyed change were most likely to be positively selected on a higher social
class background.
Third, we notice that education has become increasingly important to the occupational process
allocation. While tertiary education and, particularly, tertiary general education, significantly
prevents one from attaining any position outside the salariat class, secondary vocational education
has increasingly become a working-class educational level. Indeed, while some people with
secondary vocational education used to succeed in reaching the salariat class, this opportunity
decreased over birth-cohorts, whereas in the meantime, the number of opportunities in the salariat
class increased. From this standpoint, social class inequalities seem to have polarised. on the one
hand, while working-class children have become more likely to attain secondary vocational
education, those who reached a working-class position during their adulthood have become more
likely to be graduates of this educational level. On the other hand, an increasing share of salariat
class children reached tertiary general education and later occupied a salariat class position. Thus,
the effect we observe is very much an offset, rather than a trend towards increasing meritocracy.
This observation brings us to our fourth point: barriers in social mobility in Switzerland are high. In
our last empirical chapter, we were concerned with assessing the extent of commonality and
variation of the Swiss pattern of social mobility by fitting the core model of social fluidity, a model
designed by Erikson and Goldthorpe (1992b) that describes the mobility pattern of industrial
societies. While our analysis reveals many commonalities with the general core pattern, we were
able to identify a certain number of deviations from it. In the end, the final representation at which
we arrived at deviates more than what was found for Germany, the country that deviated the most
from other countries in the original analysis of Erikson and Goldthorpe. Deviation essentially stems
from the barriers faced by children from the semi-/unskilled workers and farmer classes to move
upwardly to other classes, and by children of the salariat and white-collar classes (also the petite-
bourgeoisie to some extent) to move downwardly to the lowest social classes. Thus, important
obstacles remain between the well-off and less privileged in the Swiss society, which from this
227

perspective looks extremely rigid.
Our fifth and last point regards the evolution of the Swiss social structure in the salariat class. The
constant and even increasing return to education trend that we observed in the Swiss context could
be attributed to some compositional effect in the social structure, since the occupational segments
which developed the most over time in the salariat class are those of a professional kind, which rely
more on educational credentials. Yet since the Swiss educational system trains fewer people than the
social structure requires, the value of education in Switzerland did not lose its significance. This
observation is particularly true for women whose occupational opportunities developed more
rapidly than their educational opportunities. We further observed that different service class
fractions depict heterogeneous social mobility dynamics to some extent. Some segments display
more intergenerational social mobility, whereas others, more immobility: on the one hand, the
traditional bourgeoisie and the socio-cultural specialists are more immobile, whereas on the other
hand the technical specialists and the managers are more mobile. Thus, depending on which
occupational segment develops the most in the service class, social mobility might either decrease
or increase.
To summarise, it appears that the social stratification mountain in Switzerland is in fact too big to
climb – either up or down. While the shape of this mountain changed with both the educational and
occupational structures rising up, changes that we observed did not result in the substantial
reduction of class-based inequality of opportunity. It is true that educational inequalities have been
reduced when compared to older birth-cohorts. It is also true that the value of education has not
been altered and even increased to some respect. It is further true that those who reached tertiary
education were recruited according to their individual talent and merit, regardless of their social
origin. But concluding that Switzerland is an education-based meritocracy would prove totally
misleading, since social origin has remained an important predictor of social position throughout all
birth-cohorts. To describe this peculiar configuration, we provocatively qualified Switzerland as a
“non-meritocratic meritocracy”. Indeed, changes observed in the social structure in the end did not
modify social mobility chances overall, nor equality of opportunity. In this sense, our findings
corroborate Jacot's (2013) claims that social origin remains an important predictor of social position
in Switzerland and that the mediating effect of education in the social mobility process should not
be too overstated. While education can certainly be a way to open new opportunities to individuals,
it can also hinder their prospects with selection into highly segmented and oriented tracks. We shall
now discuss the implications of our findings.
228
8.2 . Switzerland, the “non-meritocratic meritocracy”:implications of our findings
Our findings of a “non-meritocratic meritocracy” in Switzerland have implications at different
levels, notably at the theoretical level and at the political level.
At the theoretical level, these findings demonstrate that theoretical statements of the liberal theory
of industrialism are clearly misleading. The structure of inequalities does not evolve as logically as
a basic mathematic calculation would suggest. The Swiss configuration enlightens us to the fact that
changes in the social mobility process are much more subtle than classical theoretical formulations
in the field would have expected. If we would follow the theoretical expectations of the liberal
theory of industrialism, we could have reached the naïve interpretation that Switzerland is an
extremely meritocratic country, which would have been a rather unique situation in Europe. Yet
when looking into greater detail on what our findings of a decreasing educational inequality trend
and of an increasing return to education trend actually mean, we arrive at opposing conclusions.
This thus suggests that we should be extremely careful in interpreting any decreasing inequality
trend that any empirical research documents. We should question what this finding means and
implies. While it is indeed important to underline that the social world in which we live changes and
that new opportunities might arise for some people, these trends should be more systematically
contextualised according to the macro-structural circumstances under which they occurred. In fact,
the non-persistent educational inequality trend documented recently by Breen, Luijkx, Müller and
Pollak (2009, 2010 henceforth BLMP) has been received as a rather important finding. Not only
was this a rather important revolution into the field of social stratification research since it rejected
the old claims of the persistent educational inequality thesis (Shavit and Blossfeld 1993), but also at
a more substantial level, it lent support to the idea that our present-day Western societies are finally
not as unequal as they used to be. While it is certainly true that we enjoy more equality today in
many respects as compared to, say, one hundred years ago, this decreasing inequality trend must be
understood in the specific context in which it happened. As BLMP accurately underline, the trend
that they documented actually happened mostly at the secondary educational level, while the
attainment of tertiary education remained hardly unchanged. Furthermore, these increasing
educational opportunities primarily benefited children from working-class and farmer backgrounds,
two class positions that happened to shrink over time. Last but not least, this trend actually
happened during a relatively short period of time, between 1950 and 1975.
In other words, what we would like to highlight here through the findings of the present research, as
well as through the example of the non-persistent educational inequality trend, is that scholars
229

should more systematically underscore the context in which such findings happen to occur.
Understanding and documenting the context in which social change happens is, in fact, crucial,
since it would be extremely damaging to social stratification research that some post-modern
theorists understand the non-persistent educational inequality trend as evidence of the weakening
salience of social inequalities. Significant social inequality persists in our present-day society in
many respects, since the social stratification has not been turned upside down. Empirical research
even documents that in countries where social stratification has been quite considerably modified
over a short period of time, notably in Hungary, social inequalities did not disappear, but rather
adapted and transformed according to the new social order (Róbert and Bukodi 2004). Therefore,
we see our findings supporting the trendless fluctuations hypothesis, in line with Sorokin (1927)
and more recently with Erikson and Goldthorpe (1992b). In fact, our finding of a “non-meritocratic
meritocracy” constitutes a brilliant demonstration of how inequality actually transforms and only
very little decreases. We can now discuss the political implications of these findings.
To correctly understand what our findings imply at the political level, we would like to more
thoroughly emphasise women's particular fate over time in regard to their social mobility
opportunities. At first sight, we could be very much tempted to conclude that women have been the
great winners of macro-structural changes in terms of life chances, since they experienced a high
increase in terms of access to highest levels of education and in terms of upward mobility chances.
Furthermore, gender differences in the structure of occupation decreased constantly and still do
within the youngest birth-cohort. Yet when we look more thoroughly into the specific profile of
these women whose situation has improved, we actually observe that they were more likely than
men to be positively selected from a higher social class background. In fact, one of the main reasons
why we do not find clear decreasing educational inequality among women in Switzerland pertains
to the fact that these women who reached higher education happened to come predominantly from
the salariat class. In other words, we observe to some extent a perverse effect of gender equality:
while gender inequality faded to a certain degree, social background inequalities seem to have
become more crucial.
Our point here, however, is not to undermine the importance of gender equality, since a lot still
needs to be done in Switzerland in this respect. Gender equality policies are indeed important since
Switzerland still remains a highly gender-traditional country. Women in Switzerland are indeed
significantly likely to be employed part-time in female-typed occupations offering few and limited
career prospects. Furthermore, at the moment of transition to parenthood, they face important
constraints, since very often classical gender roles arise again (if this was not the case before) and
230
the division of labour within the household becomes extremely gendered. Thus, political efforts to
promote gender equality constitute a central pillar for the improvement of equality of opportunities
in Switzerland.
But thinking of equality of opportunity in Switzerland only under the gender lens is problematic. To
provide a simple and grotesque illustration of this issue, we could argue that if what changed is that
gender does not count anymore for children of Kings38 to pretend to the Throne, the only pretenders
to the Throne would still remain children of Kings. Thus, Kings' daughters might get the chance to
sit on the Throne, but they would have had this opportunity only because their father was a King.
Therefore, if political efforts to increase equality of opportunity between men and women actually
increase class-based inequality in the end, we could wonder how opportunities would have been
more equally distributed in Switzerland. Our analysis suggests to us that this trend is indeed taking
place, since the difference in the distribution of the occupational structure between the working-
class origin and the salariat class origin increased from the 1956 birth-cohort onwards, whereas
between men and women, it decreased.
In other words, it is not enough to put political emphasis only on gender equality, as has mostly
been the case up until now. We would like to urge Swiss politicians to think of issues of equality of
opportunities also from a social background perspective. Indeed, if they are actually concerned with
the issue of equality of opportunity as a whole, they should also address the issue of class-based
inequality, not only gender inequality issues. If not, the only promotion of gender equality could
actually increase class-based inequality, which in the long run would be counterproductive since it
would invalidate the idea of the promotion of equality of opportunity as a whole.
There could be several ways through which Switzerland could reduce class-based inequalities. First,
by postponing selection into highly stratified educational tracks, working-class children could
actually get more leeway to potentially reach the best and most rewarding educational tracks
(Maurin 2007). In fact, the school system would have eventually had more of a possibility to
harmonise social class differences in educational success. Additionally, there should be more
options to cross the boundaries of each educational track. While such opportunities already exist to
some extent, their development and promotion could certainly foster class-based equality of
opportunity. Furthermore, the development of quality and accessible childcare facilities and
kindergarten schools would contribute to the equalisation of social background differences between
children at the crucial moment of child development.
38 When referring to children of Kings, we understand that these could equally be children of Queens, in the case aQueen rather than a King is ruling.
231
Still, probably the single most effective way to reduce class-based inequality would consist of
reducing overall social inequalities in Switzerland through the implementation of more
redistributive policies. This political action would not only promote more equality of outcome, but
logically increase equality of opportunity overall. Indeed, if inequality of outcome is reduced, then
it will become easier to move between different social classes, since the social stratification
mountain would be lower, but the possibility to climb or descend it would be higher, so to speak
(Dubet 2010). A further reason why increasing equality of outcome would benefit society as a
whole would be that greater equality of outcome is good for individual autonomy and social
cohesion in that individuals are not always competing, but rather seeking a good quality of life.
Although we are aware that this political action is not on the Swiss political agenda, we invite Swiss
politicians to think of how to decrease class-based inequalities in Switzerland.
Before that, an extremely straightforward action that both politicians and scholars could very easily
implement would consist of systematically reporting social origin indicators in surveys. In fact, as
Coradi Vellacott and Wolter (2005:90) correctly underline, information on social background in
Switzerland is often missing in surveys and when it exists, it is very often not adequately measured.
We noticed in some of the data we used that social origin was measured with some approximations,
since we lacked some information. While we understand that this information was not too much of
a concern in the oldest surveys we use, we do not understand why in recent datasets, notably the
MOSAiCH surveys, some information is still missing for correctly measuring social origin. Similar
criticism could also be addressed to the TREE and the COCOON data. These two longitudinal
surveys are extremely valuable in many respects and we are certain that they will reveal important
findings on the dynamics of social inequality in Switzerland. However, to accurately capture and
understand these dynamics, it is absolutely crucial that these surveys correctly measure social
origin, since socio-economic index measures available in this data provide a simplified vision of the
structure of inequalities. Altogether, we would like to stress that such a central variable as social
origin on life chances must not only be measured, but be adequately measured. It is with this last
point that we wish to finalise the main implications of our findings. Finally, in the last section, we
will point out the limitations of our research as well as lay the groundwork for future research.
8.3 . Limitations and future research prospectsOne of the main limitations that we identify in our research concerns the way we measured
women's social mobility. In several respects, the measurement of women's social position remains
problematic. In our data, we did not isolate women who were currently employed at the time of the
survey from those who were not. It might be the case that for some women, the social position we
232

measured was one that they had occupied several years before. But more importantly, among active
women, we did not distinguish between those employed in full-time and part-time work. We suspect
that this might be an explanation of why the core pattern of social fluidity of Swiss women deviates
so significantly from Swiss men. Possibly, when replicating the same analysis exclusively to
women employed full-time, we might be able to get a better adjustment of the model. Future
research must address these issues, not only in the context of Switzerland but also cross-nationally.
We could indeed expect the social mobility opportunities and pattern of women employed full-time
to differ substantially from those employed part-time. While women employed full-time might have
a social mobility pattern similar to men's core model of social fluidity, it could be the case that the
pattern of social mobility of women employed part-time is extremely specific. Overall, these
observations lead us to wonder whether Erikson and Goldthorpe's original core model of social
fluidity does not display a male-bias. Yet it could also be true that Swiss women depict a
substantially different pattern of social fluidity as compared to other countries. Thus, while our
findings question the cross-national and cross-temporal validity of the core model of social fluidity,
it would be important to more thoroughly address these questions in future research, and if possible,
in a comparative framework.
Furthermore, to correctly address issues of women's social mobility, we should consider how to
integrate occupational career information to our models. While this would also prove interesting to
understand men's social mobility pattern, it would be extremely relevant to the understanding of
women's social mobility. In fact, with career interruptions and heterogeneous working-time
employment, we could gain new insights regarding which occupational segments offer more or less
social mobility and why. We could even consider enlarging the perspective to other life course
domains that are likely to impact the occupational career, notably on cohabitation history and family
formation issues.
Three further points must be addressed regarding consequences of feminisation in social mobility
research. The first point regards the way social origin is measured. In fact, over recent years, the
consensual measure of social origin through father's social position has eroded. In particular, some
scholars have emphasised the importance of mother resources in the mobility process and thus
argued that mothers should be included in the measurement of social origin. For instance, Beller
demonstrated that “fathers' class is an increasingly poor proxy for family social class background in
the United States, and [that] research conclusions can be distorted when it is used as such”
(2009:508). The second point concerns the extent to which educational homogamy increased. Some
research, for instance, found that it increased (Blossfeld and Timm 2003). As a consequence, it is
233

expected that inequalities between households might increase social inequalities overall. The third
point regards the role of the partner in the social mobility process. Some research actually argues
that the resources of the partner can foster social mobility opportunities (Vallet 1986). Thus, overall,
women's new role in society opens the door to many research questions regarding the study of
social stratification and inequality of opportunity.
A second, more minor limitation of our research pertains to how we have tried to address the issue
of the changing structure of occupations within the salariat class. We were able to demonstrate the
existence of heterogeneous social mobility dynamics in the different fractions of the service class
that we identified as defined by the Oesch class schema. Furthermore, this approach provided us
some clues to explain the increasing return to education trend that we observe in Switzerland. Thus,
overall we judge our approach relevant and constructive. However, we must also admit that we
were a bit frustrated to not be able to arrive at a more satisfactory model fit. This problem might
arise to a considerable extent from the problems we met in operationalising the Oesch class schema
to some of our data, in particular when we lacked information on employment relationship.
Certainly, a coding procedure accounting for this kind of lacking information could be developed.
Moreover, in the context of the present enquiry, we face a major limitation with this class schema
since it does not isolate a class of farmers. This pertains to the fact that this class schema was
operationalised to describe post-industrial societies, not industrial ones – yet our data covers a very
large time frame. Therefore, the absence of a class of farmers is problematic within the oldest birth-
cohorts, since this class displays specific resources and has been one of the most important drivers
of social change in class inequality over the last century. That is the reason why it should be
isolated. This endeavour could be easily adjusted to this class schema, especially since it provides
an interesting tool for the analysis of social mobility. These overall improvements in its
implementation would, in turn, certainly serve us to more specifically test how social reproduction
evolved over time within each of the different service class fractions it isolates. Additionally, it
would provide good grounds for the undertaking of the cross-national analysis of social mobility in
a more disaggregated manner and would enable us to address to what extent the disaggregated
pattern of social mobility that we observe in Switzerland displays some commonalities and
variations with other countries. It could be the case indeed that, like the core model of social fluidity
found by Erikson and Goldthorpe in the context of industrial societies, a disaggregated core model
of social fluidity could be uncovered within post-industrial societies.
In addition to that, one point of discussion of our research stems from the way we addressed
differences in social mobility opportunities between Swiss citizens and the foreign resident
234

population. We have tried throughout this research to underline differences in social mobility
opportunities between these two populations when possible. This approach proved instructive since
we were able to observe, notably, that (1) foreign women are the losers of the social mobility
“lottery” in Switzerland while Swiss men are the winners, (2) the foreign population displays lower
gender inequality in access to education than the Swiss citizens, (3) the profile of the foreign
population over recent years has become more diversified through the emergence of highly
qualified migrants in the Swiss territory, (4) foreign women in the youngest cohort are more
educated in tertiary general education that the Swiss citizens, (5) highly qualified foreign women
are more likely to be selected on the labour market according to their educational background, in
contrast to highly qualified Swiss women whose labour market outcome still remains considerably
influenced by their social background. Thus, overall we were able to reach interesting substantial
insights regarding the specific structure of opportunities that the foreign population faces,
particularly since as far as we know, no social mobility study has tried to address these issues in a
systematic way, in Switzerland or elsewhere.
However, because the data we use lacks precise information documenting the timing of migration to
Switzerland, we were unable to correctly explain why this population displays these specific
outcomes. This is problematic, as totally diverging explanations could be put forward. For instance,
to explain the lower gender educational inequality and the outnumbering of foreign women
graduating with tertiary general education, it could be the case that the foreign population
experienced a different educational system abroad that may have offered them better opportunities
than the Swiss system. But it could also be the case that the foreign population actually faces
different opportunities in the Swiss educational system than Swiss citizens, perhaps because their
parents have a different vision of education as parents of Swiss citizens. These could be two very
different explanations of the same outcome. on the one hand, foreign educational systems would
offer better opportunities than the Swiss educational system; on the other hand, it would offer better
opportunities to non-Swiss citizens than Swiss citizens.
Therefore, being able to identify which one of these explanations is correct could have considerable
implications with respect to the integration of the foreign population in Switzerland. Since a
significant share of non-Swiss residents have lived almost all of their lives – if not all – in
Switzerland, this would imply that they integrate quite well to the country. Of course, we could
expect to observe differences in this respect in regard to country of origin. Therefore, future
research should address the questions of how migration impacts social mobility chances, and of
how the presence of foreign nationals can interfere with Swiss institutions and/or benefit the
235

cohesion of the Swiss society. This point looks particularly crucial. Possibly, other social
stratification mountains interfere with the Swiss social stratification mountain. This could indeed
constitute at least one explanation of the overall reinforced inequality trend that we observe within
the youngest cohort. A further explanation of such reinforced inequality trend could also stem from
the recent economic crises. Although Switzerland has only been marginally affected by the
turbulent economic fluctuations so far, this aspect is likely to be a major issue in countries where
consequences of the economic downturn have been more dramatic. In these countries, it is indeed
likely that inequality will increase.
All in all, our research on social mobility in Switzerland has demonstrated that inequality based on
social background can remain persistent even when classical expectations defining an education-
based meritocracy are in place. This suggest that meritocracy in itself is not desirable if significant
barriers persist. From this standpoint, if the objective of democracies is to ensure that everyone is
born sous la même étoile39, then the principle of equality should be put on equal footing with the
principle of liberty.
39 Understand : Under the same star.
236

A. Appendix A.
Complementary information on Chapter 4 .:A unique study design to analyse social mobility dynamics in Switzerland: methodological considerations
237

Table A.1: Detail of data production and quality for each survey used
Survey Targeted population Sampling procedure Data collection modeResponse
rate
Finalvalid
samplesize (N)
AP75 Swiss citizens aged 16 or morespeaking German, French or Italian
Stratified random sample according to municipalitiesNB: Two groups were originally oversampled:(1) the French speaking population(2) the young population (16-19 years old) A random sample of these oversampled populations was a posterioridrawn to ensure representativity in the final archived data (OriginalN=1917).
face-to-face 82.1% 1392
ISSP87 Switzerland's resident populationaged 16 or more speaking German,French or Italian
Stratified random sample according to municipalitiesMail survey with anincentive of 50 CHF
51.3% 987
CH91 Switzerland's resident populationaged 20 or more speaking German,French, Italian, Portuguese or Serbo-Croatian
Stratified quotas sample according to municipalities. NB: Two groups were oversampled: (1) 100 seasonal workers selected according to nationality (Portugueseand Serbo-Croatian) and industry sector (building or catering).(2) 100 privileged people selected according to income (>80'000 CHF).
face-to-face - 2030
SHP99 Switzerland's resident populationaged 14 or more speaking German,French or Italian and living in aprivate household
Stratified random sample according to regions CATI
64.0% 7799
SHP04 65.0% 3654
ESS02 Switzerland's resident populationaged 15 or more speaking German,French or Italian
Stratified random sample according to regions
CAPI
33.5% 2040
ESS04 Stratified random sample according to regions 46.9% 2141
ESS06 Stratified random sample according to regions 51.5% 1804
ESS08 Non-stratified random sample 50.4% 1819
MCH05 Switzerland's resident populationaged 18 or more speaking German,French or Italian
Stratified random sample according to regions
CAPI
50.1% 1078
MCH07 Stratified random sample according to regions 46.3% 1003
MCH09 Stratified random sample according to regions 47.8% 1229

239
Table A.2: Sample detail: surveys by 8 birth-cohort, complete cases only (OED)
1912–1935
1936–1940
1941–1945
1946–1950
1951–1955
1956–1960
1961–1965
1966–1979
Total - Of whichforeigners% (n)
1975. Attitudes politiques
328 67 97 12 - - - - 504 0 % (0)
1987. International social survey
119 67 82 111 85 32 - - 496 26.4% (131)
1991. Les Suisses et leur société
82 84 104 145 133 111 22 - 681 16.6% (113)
1999. Swiss household panel
20 198 406 543 594 672 689 487 3609 12.0% (433)
2002. European social survey
- 70 124 125 137 145 207 228 1036 11.1% (115)
2004. Swiss household panel
- 17 144 192 255 333 357 494 1792 12.7% (228)
2004. European social survey
- 24 161 168 144 138 208 373 1216 14.1% (172)
2005. MOSAiCH - - 72 91 96 86 103 191 639 13.6% (87)
2006. European social survey
- - 127 126 133 157 167 330 1040 13.4% (139)
2007. MOSAiCH - - 45 60 74 87 87 202 555 14.6% (81)
2008. European social survey
- - 41 136 103 140 154 382 956 16.9% (162)
2009. MOSAiCH - - 13 90 93 104 105 287 692 15.3% (106)
Total (n) 549 527 1416 1799 1847 2005 2099 2974 13216
- of which foreigners %(n)
6.9%(38)
11.0% (58)
8.6%(122)
10.6%(191)
9.7%(179)
12.0%(240)
15.8%(332)
20.4%(607)
13.4%(1767)
Mean age 55.0 55.7 55.8 52.9 48.3 44.0 39.9 34.6 45.2
Note: unweighted data

240
1912–1941
1942-1949
1950-1957
1958-1965
1966-1979
Total - Of whichforeigners% (n)
1975. Attitudes politiques
414 90 - - - 504 0 % (0)
1987. International social survey
201 158 137 - - 496 26.4% (131)
1991. Les Suisses et leur société
185 207 203 86 - 681 16.6% (113)
1999. Swiss household panel
292 749 983 1098 487 3609 12.0% (433)
2002. European social survey
96 195 218 299 228 1036 11.1% (115)
2004. Swiss household panel
33 275 419 571 494 1792 12.7% (228)
2004. European social survey
53 268 222 300 373 1216 14.1% (172)
2005. MOSAiCH 14 132 146 156 191 639 13.6% (87)
2006. European social survey
- 222 219 269 330 1040 13.4% (139)
2007. MOSAiCH - 89 126 138 202 555 14.6% (81)
2008. European social survey
- 146 193 235 382 956 16.9% (162)
2009. MOSAiCH - 84 156 165 287 692 15.3% (106)
Total (n) 1288 2615 3022 3317 2974 13216
- of which foreigners % (n)
9.2%(119)
9.4%(246)
10.4%(314)
14.5%(481)
20.4%(607)
13.4% (1767)
Mean age 55.5 54.4 47.9 41.1 34.6 45.2
Note: unweighted data

Table A.4: Detail of information available within each survey for the coding of respondent's father social position
Survey
Occupation (ISCO) Employment relationship (self-employed) Number of employeesfor self-employed
Supervisory tasks for employees
variable coding variable coding variable coding variable coding
AP75 v209 ISCO68 3 digits NA NA NA NA NA NA
ISSP87 v104 ISCO68 3 digits NA NA NA NA NA NA
CH91 V29 (v23=1) Occupation list (conversion gridwith ISCO88 in thedocumentation of the survey)
v28 2. indépendant v29 1. zéro2. 1 à 43. 5 à 94. 10 à 245. 25 à 496. 50 à 997. 100 et plus
v32 1. fonction dirigeante2. fonction d'encadrement(enseignant)
SHP99SHP04
Is4faj.. ISCO88 4 digits p..013 3. self-employed p..o14 1. zéro2. 1 à 43. 5 à 94. 10 à 245. 25 à 496. 50 à 997. 100 et plus
p..o16 1. management position2. training position / teacher
ESS02ESS04ESS06ESS08
iscocof ISCO88 4 digits emprf14 2. self-employed emplnof 1. aucun2. de 1 à 243. 25 ou plus
jbspvf 1. oui
MCH05MCH07
D1eiscoisco4_per
ISCO88 4 digits d1d 2. self-employed NA NA NA NA
MCH09 si15br ISCO88 4 digits si15a 4. indépendant ou propreentreprise
NA NA NA NA

Table A.5: Detail of information available within each survey for the coding of respondent's social position
Survey
Occupation (ISCO) Employment relationship (self-employed) Number of employeesfor self-employed
Supervisory tasks for employees
variable coding variable coding variable coding variable coding
AP75 v361 ISCO68 3 digits v368 2. à mon compte v369 continuous v370 1. oui
ISSP87 v75 ISCO68 3 digits v77 1. self-employed2. self employed with (paid)employees)3. workrs self-employed atsomeone's other account
NA NA v78 1. supervises others at work
CH91 isco-88 ISCO88 4 digits v147 2. indépendant v148 1. zéro2. 1 à 43. 5 à 94. 10 à 245. 25 à 496. 50 à 997. 100 et plus
v151a 1. fonction dirigeante2.fonction d'encadrement(enseignant)
SHP99SHP04
Is4maj99is4maj04
ISCO88 4 digits P99w29p04w29a
1. self-employed P99w31p04w31
1. zéro2. 1 à 43. 5 à 94. 10 à 245. 25 à 496. 50 à 997. 100 et plus
P99w34p04w34a
1. management position2. training position
ESS02ESS04ESS06ESS08
iscoco ISCO88 4 digits emplrel 2. seelf-employed emplno continuous jbspv 1. oui
MCH05MCH07
d24aisco &d21bisco
ISCO88 4 digits d22a 3. indépendant d23 continuous d26 1. oui
MCH09 d21abr ISCO88 4 digits si19a 4. indépendant ou propreentreprise
d23 continuous d26 1. oui

Table A.6: Distribution of the father's social position measured with the ESeC class schema according to surveys.
EseC Father AP75 ISSP87 CH91 SHP99 ESS02 SHP04 ESS04 MCH05 ESS06 MCH07 ESS08 MCH09 Total
1. Higher salariat 2.0 7.7 13.4 13.1 16.1 15.7 10.7 10.5 11.3 11.2 11.8 11.9 12.4
15 42 104 605 171 408 131 66 118 61 119 91 1932
2. Lower salariat 10.1 13.8 12.8 11.8 10.8 9.9 12.1 9.2 10.8 8.1 10.7 7.3 10.9
76 75 99 546 115 258 148 58 113 44 108 56 1696
3. Higher white collar 3.4 8.1 7.1 5.2 5.3 6.5 3.9 8.1 5.3 9.0 6.7 9.0 6.0
26 44 55 241 56 170 48 51 55 49 67 69 932
4. Petite bourgeois 8.1 6.1 12.1 10.7 12.6 10.7 11.6 15.4 12.0 17.1 13.9 11.0 11.4
61 33 94 494 134 279 142 97 125 93 140 84 1776
5. Small farmers 24.3 16.4 14.7 12.0 14.7 11.2 16.9 16.8 14.9 14.0 13.2 17.4 14.1
184 89 114 556 156 291 206 106 156 76 133 133 2200
6. Higher-grade blue collar 2.1 1.7 8.5 13.8 12.1 7.8 14.4 1.3 13.4 1.7 12.4 2.0 9.8
16 9 66 637 129 202 176 8 140 9 125 15 1532
7. Lower white-collar 3.8 6.6 4.0 3.7 3.9 4.2 4.8 7.1 3.6 6.6 2.3 3.8 4.2
29 36 31 173 41 110 59 45 38 36 23 29 650
8. Skilled manual 27.0 21.2 18.5 16.6 14.6 20.1 14.8 19.5 15.9 21.1 17.4 20.9 18.2
204 115 143 766 155 523 181 123 166 115 175 160 2826
9. Semi-/un skilled 19.2 18.3 8.9 12.9 10.1 13.7 10.7 12.2 12.7 11.2 11.6 16.7 13.0
145 99 69 597 107 355 131 77 133 61 117 128 2021
Total 100.0 100.0 100.0 100.0 100.0 100.0 100.0 100.0 100.0 100.0 100.0 100.0 100.0
756 542 775 4615 1064 2596 1222 631 1044 544 1007 765 15561

Table A.7: Distribution of the respondent's social position measured with the ESeC class schema according to surveys.
EseC Respondent AP75 ISSP87 CH91 SHP99 ESS02 SHP04 ESS04 MCH05 ESS06 MCH07 ESS08 MCH09 Total
1. Higher salariat 7.3 15.5 13.8 15.7 15.6 17.4 12.7 12.0 12.0 14.2 13.7 11.9 14.4
39 84 103 569 199 393 166 80 134 86 146 90 2089
2. Lower salariat 22.7 33.8 22.5 28.8 27.3 25.8 26.4 28.9 27.6 26.5 29.3 25.2 27.3
122 183 168 1044 348 585 344 192 308 160 312 191 3957
3. Higher white collar 5.2 12.8 13.7 12.5 13.9 12.3 12.7 14.0 14.4 16.9 13.4 12.9 12.9
28 69 102 455 177 279 165 93 161 102 143 98 1872
4. Petite bourgeois 11.9 2.4 5.9 6.9 6.8 5.8 7.3 1.2 7.8 1.0 7.5 2.4 6.1
64 13 44 252 87 131 95 8 87 6 80 18 885
5. Small farmers 5.8 3.1 0.8 1.7 2.4 2.2 3.1 2.7 2.7 2.3 1.7 4.4 2.4
31 17 6 61 31 50 40 18 30 14 18 33 349
6. Higher-grade blue collar 12.8 11.1 7.0 7.7 11.4 8.4 12.4 14.3 9.3 8.9 9.8 15.6 9.9
69 60 52 279 145 190 162 95 104 54 104 118 1432
7. Lower white-collar 7.1 5.0 10.5 9.5 8.4 8.1 9.5 9.0 8.2 11.6 7.5 9.5 8.8
38 27 78 346 107 183 124 60 91 70 80 72 1276
8. Skilled manual 12.7 6.8 10.7 6.9 6.4 9.0 5.7 7.1 4.5 7.1 5.2 6.1 7.1
68 37 80 249 81 204 74 47 50 43 55 46 1034
9. Semi-/un skilled 14.5 9.4 15.1 10.3 7.8 11.0 10.3 10.7 13.5 11.4 11.9 12.1 11.1
78 51 113 374 99 250 134 71 151 69 127 92 1609
Total 100.0 100.0 100.0 100.0 100.0 100.0 100.0 100.0 100.0 100.0 100.0 100.0 100.0
537 541 746 3629 1274 2265 1304 664 1116 604 1065 758 14503
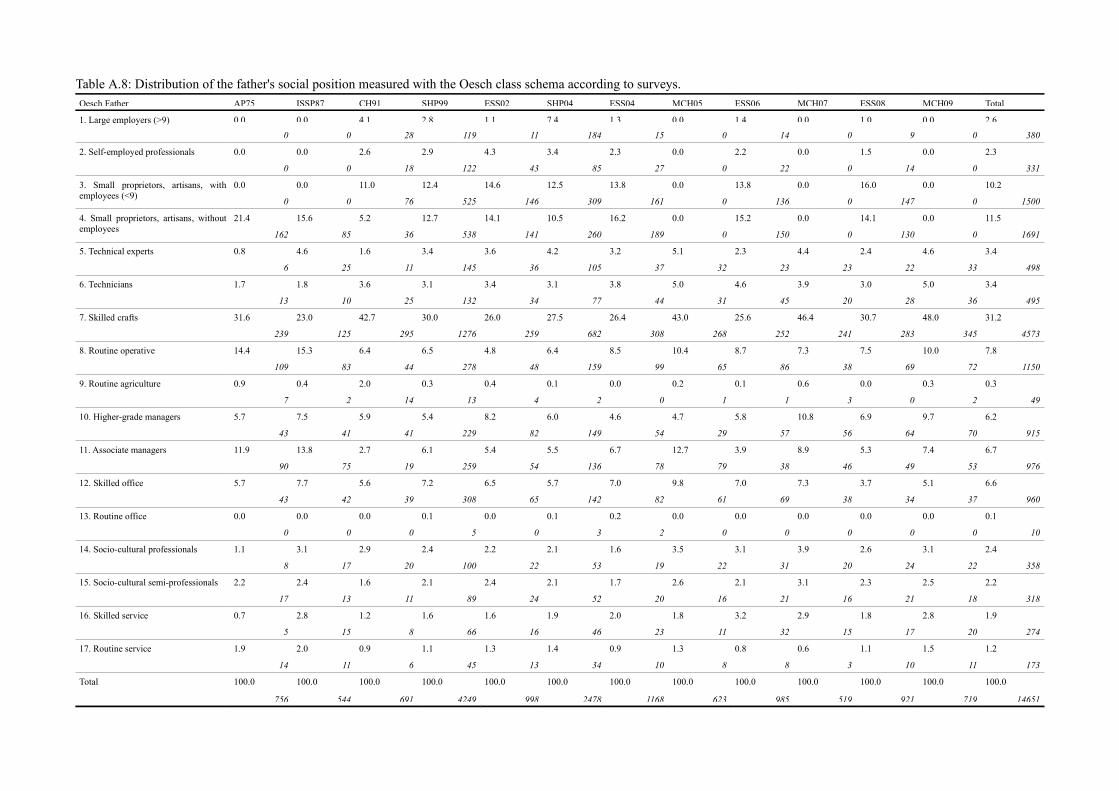
Table A.8: Distribution of the father's social position measured with the Oesch class schema according to surveys.Oesch Father AP75 ISSP87 CH91 SHP99 ESS02 SHP04 ESS04 MCH05 ESS06 MCH07 ESS08 MCH09 Total
1. Large employers (>9) 0.0 0.0 4.1 2.8 1.1 7.4 1.3 0.0 1.4 0.0 1.0 0.0 2.6
0 0 28 119 11 184 15 0 14 0 9 0 380
2. Self-employed professionals 0.0 0.0 2.6 2.9 4.3 3.4 2.3 0.0 2.2 0.0 1.5 0.0 2.3
0 0 18 122 43 85 27 0 22 0 14 0 331
3. Small proprietors, artisans, withemployees (<9)
0.0 0.0 11.0 12.4 14.6 12.5 13.8 0.0 13.8 0.0 16.0 0.0 10.2
0 0 76 525 146 309 161 0 136 0 147 0 1500
4. Small proprietors, artisans, withoutemployees
21.4 15.6 5.2 12.7 14.1 10.5 16.2 0.0 15.2 0.0 14.1 0.0 11.5
162 85 36 538 141 260 189 0 150 0 130 0 1691
5. Technical experts 0.8 4.6 1.6 3.4 3.6 4.2 3.2 5.1 2.3 4.4 2.4 4.6 3.4
6 25 11 145 36 105 37 32 23 23 22 33 498
6. Technicians 1.7 1.8 3.6 3.1 3.4 3.1 3.8 5.0 4.6 3.9 3.0 5.0 3.4
13 10 25 132 34 77 44 31 45 20 28 36 495
7. Skilled crafts 31.6 23.0 42.7 30.0 26.0 27.5 26.4 43.0 25.6 46.4 30.7 48.0 31.2
239 125 295 1276 259 682 308 268 252 241 283 345 4573
8. Routine operative 14.4 15.3 6.4 6.5 4.8 6.4 8.5 10.4 8.7 7.3 7.5 10.0 7.8
109 83 44 278 48 159 99 65 86 38 69 72 1150
9. Routine agriculture 0.9 0.4 2.0 0.3 0.4 0.1 0.0 0.2 0.1 0.6 0.0 0.3 0.3
7 2 14 13 4 2 0 1 1 3 0 2 49
10. Higher-grade managers 5.7 7.5 5.9 5.4 8.2 6.0 4.6 4.7 5.8 10.8 6.9 9.7 6.2
43 41 41 229 82 149 54 29 57 56 64 70 915
11. Associate managers 11.9 13.8 2.7 6.1 5.4 5.5 6.7 12.7 3.9 8.9 5.3 7.4 6.7
90 75 19 259 54 136 78 79 38 46 49 53 976
12. Skilled office 5.7 7.7 5.6 7.2 6.5 5.7 7.0 9.8 7.0 7.3 3.7 5.1 6.6
43 42 39 308 65 142 82 61 69 38 34 37 960
13. Routine office 0.0 0.0 0.0 0.1 0.0 0.1 0.2 0.0 0.0 0.0 0.0 0.0 0.1
0 0 0 5 0 3 2 0 0 0 0 0 10
14. Socio-cultural professionals 1.1 3.1 2.9 2.4 2.2 2.1 1.6 3.5 3.1 3.9 2.6 3.1 2.4
8 17 20 100 22 53 19 22 31 20 24 22 358
15. Socio-cultural semi-professionals 2.2 2.4 1.6 2.1 2.4 2.1 1.7 2.6 2.1 3.1 2.3 2.5 2.2
17 13 11 89 24 52 20 16 21 16 21 18 318
16. Skilled service 0.7 2.8 1.2 1.6 1.6 1.9 2.0 1.8 3.2 2.9 1.8 2.8 1.9
5 15 8 66 16 46 23 11 32 15 17 20 274
17. Routine service 1.9 2.0 0.9 1.1 1.3 1.4 0.9 1.3 0.8 0.6 1.1 1.5 1.2
14 11 6 45 13 34 10 8 8 3 10 11 173
Total 100.0 100.0 100.0 100.0 100.0 100.0 100.0 100.0 100.0 100.0 100.0 100.0 100.0
756 544 691 4249 998 2478 1168 623 985 519 921 719 14651
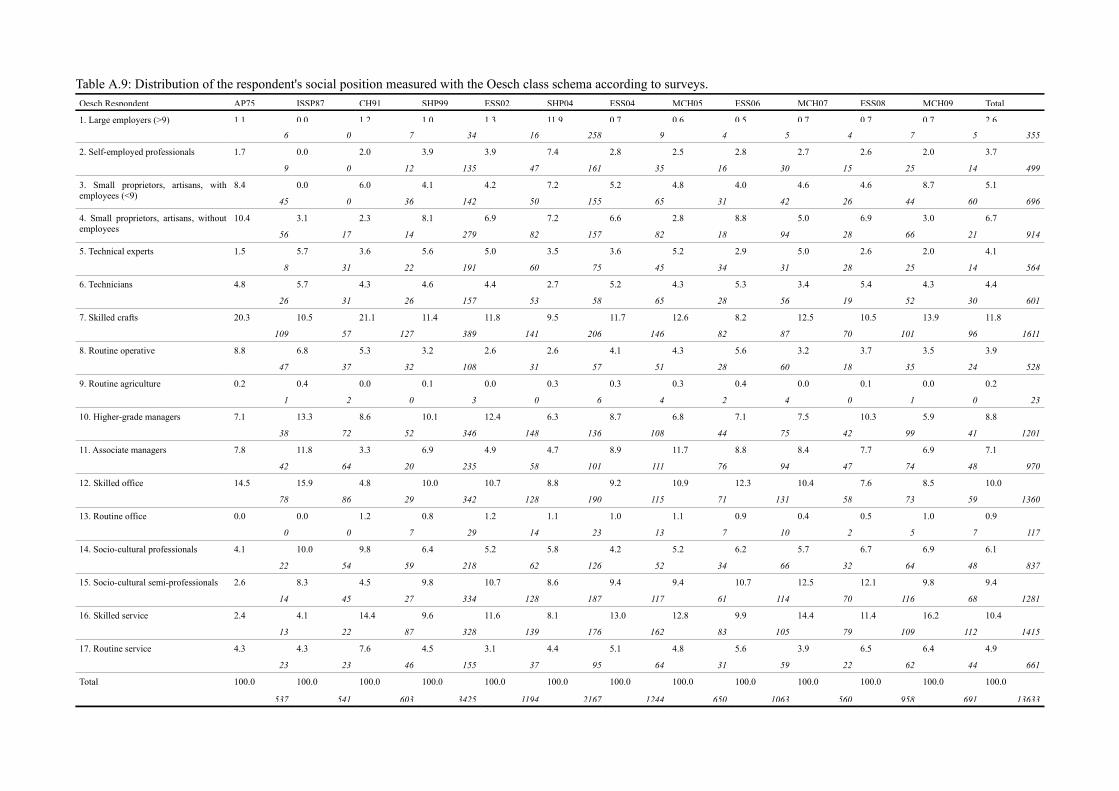
Table A.9: Distribution of the respondent's social position measured with the Oesch class schema according to surveys.Oesch Respondent AP75 ISSP87 CH91 SHP99 ESS02 SHP04 ESS04 MCH05 ESS06 MCH07 ESS08 MCH09 Total
1. Large employers (>9) 1.1 0.0 1.2 1.0 1.3 11.9 0.7 0.6 0.5 0.7 0.7 0.7 2.6
6 0 7 34 16 258 9 4 5 4 7 5 355
2. Self-employed professionals 1.7 0.0 2.0 3.9 3.9 7.4 2.8 2.5 2.8 2.7 2.6 2.0 3.7
9 0 12 135 47 161 35 16 30 15 25 14 499
3. Small proprietors, artisans, withemployees (<9)
8.4 0.0 6.0 4.1 4.2 7.2 5.2 4.8 4.0 4.6 4.6 8.7 5.1
45 0 36 142 50 155 65 31 42 26 44 60 696
4. Small proprietors, artisans, withoutemployees
10.4 3.1 2.3 8.1 6.9 7.2 6.6 2.8 8.8 5.0 6.9 3.0 6.7
56 17 14 279 82 157 82 18 94 28 66 21 914
5. Technical experts 1.5 5.7 3.6 5.6 5.0 3.5 3.6 5.2 2.9 5.0 2.6 2.0 4.1
8 31 22 191 60 75 45 34 31 28 25 14 564
6. Technicians 4.8 5.7 4.3 4.6 4.4 2.7 5.2 4.3 5.3 3.4 5.4 4.3 4.4
26 31 26 157 53 58 65 28 56 19 52 30 601
7. Skilled crafts 20.3 10.5 21.1 11.4 11.8 9.5 11.7 12.6 8.2 12.5 10.5 13.9 11.8
109 57 127 389 141 206 146 82 87 70 101 96 1611
8. Routine operative 8.8 6.8 5.3 3.2 2.6 2.6 4.1 4.3 5.6 3.2 3.7 3.5 3.9
47 37 32 108 31 57 51 28 60 18 35 24 528
9. Routine agriculture 0.2 0.4 0.0 0.1 0.0 0.3 0.3 0.3 0.4 0.0 0.1 0.0 0.2
1 2 0 3 0 6 4 2 4 0 1 0 23
10. Higher-grade managers 7.1 13.3 8.6 10.1 12.4 6.3 8.7 6.8 7.1 7.5 10.3 5.9 8.8
38 72 52 346 148 136 108 44 75 42 99 41 1201
11. Associate managers 7.8 11.8 3.3 6.9 4.9 4.7 8.9 11.7 8.8 8.4 7.7 6.9 7.1
42 64 20 235 58 101 111 76 94 47 74 48 970
12. Skilled office 14.5 15.9 4.8 10.0 10.7 8.8 9.2 10.9 12.3 10.4 7.6 8.5 10.0
78 86 29 342 128 190 115 71 131 58 73 59 1360
13. Routine office 0.0 0.0 1.2 0.8 1.2 1.1 1.0 1.1 0.9 0.4 0.5 1.0 0.9
0 0 7 29 14 23 13 7 10 2 5 7 117
14. Socio-cultural professionals 4.1 10.0 9.8 6.4 5.2 5.8 4.2 5.2 6.2 5.7 6.7 6.9 6.1
22 54 59 218 62 126 52 34 66 32 64 48 837
15. Socio-cultural semi-professionals 2.6 8.3 4.5 9.8 10.7 8.6 9.4 9.4 10.7 12.5 12.1 9.8 9.4
14 45 27 334 128 187 117 61 114 70 116 68 1281
16. Skilled service 2.4 4.1 14.4 9.6 11.6 8.1 13.0 12.8 9.9 14.4 11.4 16.2 10.4
13 22 87 328 139 176 162 83 105 79 109 112 1415
17. Routine service 4.3 4.3 7.6 4.5 3.1 4.4 5.1 4.8 5.6 3.9 6.5 6.4 4.9
23 23 46 155 37 95 64 31 59 22 62 44 661
Total 100.0 100.0 100.0 100.0 100.0 100.0 100.0 100.0 100.0 100.0 100.0 100.0 100.0
537 541 603 3425 1194 2167 1244 650 1063 560 958 691 13633

Table A.10: Detail of information available within each survey for the coding of respondent's education
Survey Variable Education 1:Compulsory education
Education 2:Secondary generalwithout maturity
Education 3:Secondary general
with maturity
Education 4:Secondary
professional
Education 5:Post- secondary &tertiary vocational
Education 6:Tertiary general
(University)
AP75 v292 2. école primaire non terminée3. école primaire terminée5. école secondaire inférieure
6. école secondaire sans maturité
8. école secondaire avec maturité9. école normale
4. études pendant apprentissage
7. école technique 10. université ou polytechnique fédérale (sans licence)11. université ou polytechnique fédérale (avec licence)
ISSP87 v88 1. None. still at school2. Primary school3. Secondary school
4. Incomplete middle school
6. Complete middle school7. Teachers training
5. Technical qualification. higher Fachschule
8. Incomplete university9. Complete university
CH91 v18 1. école primaire2. école secondaire, collège cycle
5. gymnase (école secondaire supérieure)
3. apprentissage 4. école professionnelle supérieure6. technicum
7. universités, hautes écoles
SHP99SHP04
edcat99edcat04
0. incomplete compulsory school1. compulsory school2. elementary vocational training
4. general training school 7. vocational maturity8. teacher training college9. bachelor/maturity (high school)
3. domestic science course, 1 year school of commerce5. apprenticeship (CFC, EFZ)6. full-time vocational school
10. vocational high school with master certificate, federal certificate11. technical or vocational school12. vocational high school ETS, HTL etc.13. university of teacher education HEP, PH14. university of applied sciences HES, FH
15. university, academic high school, EPF, ETH16. PhD
ESS02ESS04
edlvchedlvach
1. Incomplete compulsory school2. Compulsory school6. 1 year: school of commerce/domestic science school
8. 2 to 3 years: general training school
4. Secondary school (Maturity)5. Graduation diploma school (Maturity professional)
3. Elementary vocational training (enterprise + school)7. Apprenticeship9. 2 to 3 years: full time vocational school
10. Vocational higher education (with special degree)11. Technical or vocational school (2 yrs full/ 3 yrs part time)12. Technical or vocational high school (specialized)
13. University (3years, short bachelor's degree)14. University (4years and more, bachelor's degree)15. University (masters, post-grade)
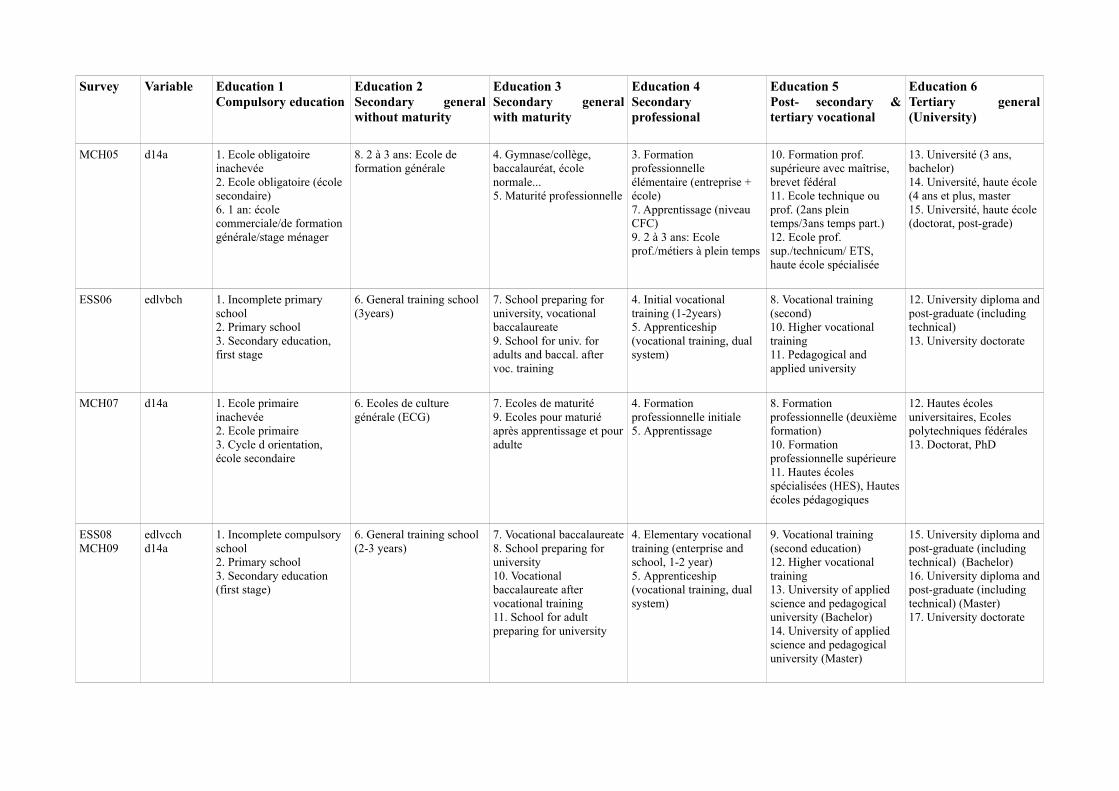
Survey Variable Education 1Compulsory education
Education 2Secondary generalwithout maturity
Education 3Secondary generalwith maturity
Education 4Secondaryprofessional
Education 5Post- secondary &tertiary vocational
Education 6Tertiary general(University)
MCH05 d14a 1. Ecole obligatoire inachevée2. Ecole obligatoire (école secondaire) 6. 1 an: école commerciale/de formation générale/stage ménager
8. 2 à 3 ans: Ecole de formation générale
4. Gymnase/collège, baccalauréat, école normale...5. Maturité professionnelle
3. Formation professionnelle élémentaire (entreprise + école)7. Apprentissage (niveau CFC)9. 2 à 3 ans: Ecole prof./métiers à plein temps
10. Formation prof. supérieure avec maîtrise, brevet fédéral11. Ecole technique ou prof. (2ans plein temps/3ans temps part.)12. Ecole prof. sup./technicum/ ETS, haute école spécialisée
13. Université (3 ans, bachelor)14. Université, haute école (4 ans et plus, master15. Université, haute école (doctorat, post-grade)
ESS06 edlvbch 1. Incomplete primary school2. Primary school3. Secondary education, first stage
6. General training school (3years)
7. School preparing for university, vocational baccalaureate9. School for univ. for adults and baccal. after voc. training
4. Initial vocational training (1-2years)5. Apprenticeship (vocational training, dual system)
8. Vocational training (second)10. Higher vocational training11. Pedagogical and applied university
12. University diploma and post-graduate (including technical)13. University doctorate
MCH07 d14a 1. Ecole primaire inachevée2. Ecole primaire3. Cycle d orientation, école secondaire
6. Ecoles de culture générale (ECG)
7. Ecoles de maturité9. Ecoles pour maturié après apprentissage et pour adulte
4. Formation professionnelle initiale5. Apprentissage
8. Formation professionnelle (deuxième formation)10. Formation professionnelle supérieure11. Hautes écoles spécialisées (HES), Hautes écoles pédagogiques
12. Hautes écoles universitaires, Ecoles polytechniques fédérales13. Doctorat, PhD
ESS08MCH09
edlvcchd14a
1. Incomplete compulsory school2. Primary school3. Secondary education (first stage)
6. General training school (2-3 years)
7. Vocational baccalaureate8. School preparing for university10. Vocational baccalaureate after vocational training11. School for adult preparing for university
4. Elementary vocational training (enterprise and school, 1-2 year)5. Apprenticeship (vocational training, dual system)
9. Vocational training (second education)12. Higher vocational training13. University of applied science and pedagogical university (Bachelor)14. University of applied science and pedagogical university (Master)
15. University diploma and post-graduate (including technical) (Bachelor)16. University diploma and post-graduate (including technical) (Master)17. University doctorate
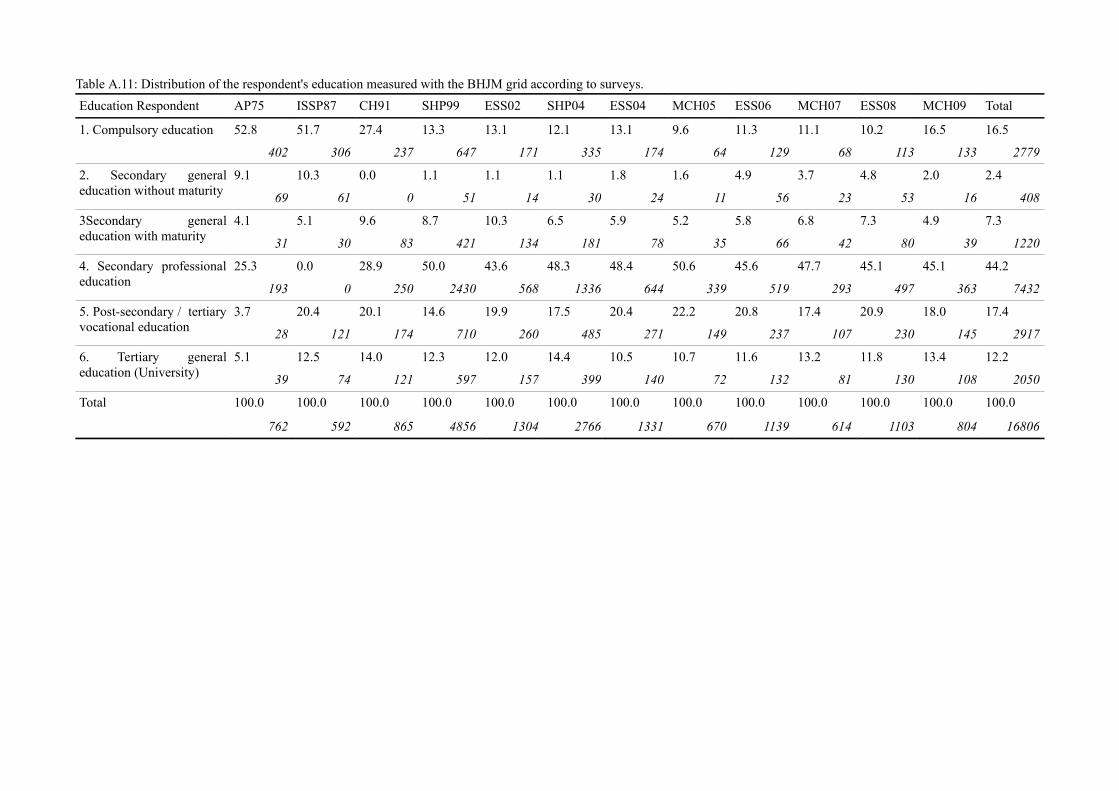
Table A.11: Distribution of the respondent's education measured with the BHJM grid according to surveys.
Education Respondent AP75 ISSP87 CH91 SHP99 ESS02 SHP04 ESS04 MCH05 ESS06 MCH07 ESS08 MCH09 Total
1. Compulsory education 52.8 51.7 27.4 13.3 13.1 12.1 13.1 9.6 11.3 11.1 10.2 16.5 16.5
402 306 237 647 171 335 174 64 129 68 113 133 2779
2. Secondary generaleducation without maturity
9.1 10.3 0.0 1.1 1.1 1.1 1.8 1.6 4.9 3.7 4.8 2.0 2.4
69 61 0 51 14 30 24 11 56 23 53 16 408
3Secondary generaleducation with maturity
4.1 5.1 9.6 8.7 10.3 6.5 5.9 5.2 5.8 6.8 7.3 4.9 7.3
31 30 83 421 134 181 78 35 66 42 80 39 1220
4. Secondary professionaleducation
25.3 0.0 28.9 50.0 43.6 48.3 48.4 50.6 45.6 47.7 45.1 45.1 44.2
193 0 250 2430 568 1336 644 339 519 293 497 363 7432
5. Post-secondary / tertiaryvocational education
3.7 20.4 20.1 14.6 19.9 17.5 20.4 22.2 20.8 17.4 20.9 18.0 17.4
28 121 174 710 260 485 271 149 237 107 230 145 2917
6. Tertiary generaleducation (University)
5.1 12.5 14.0 12.3 12.0 14.4 10.5 10.7 11.6 13.2 11.8 13.4 12.2
39 74 121 597 157 399 140 72 132 81 130 108 2050
Total 100.0 100.0 100.0 100.0 100.0 100.0 100.0 100.0 100.0 100.0 100.0 100.0 100.0
762 592 865 4856 1304 2766 1331 670 1139 614 1103 804 16806
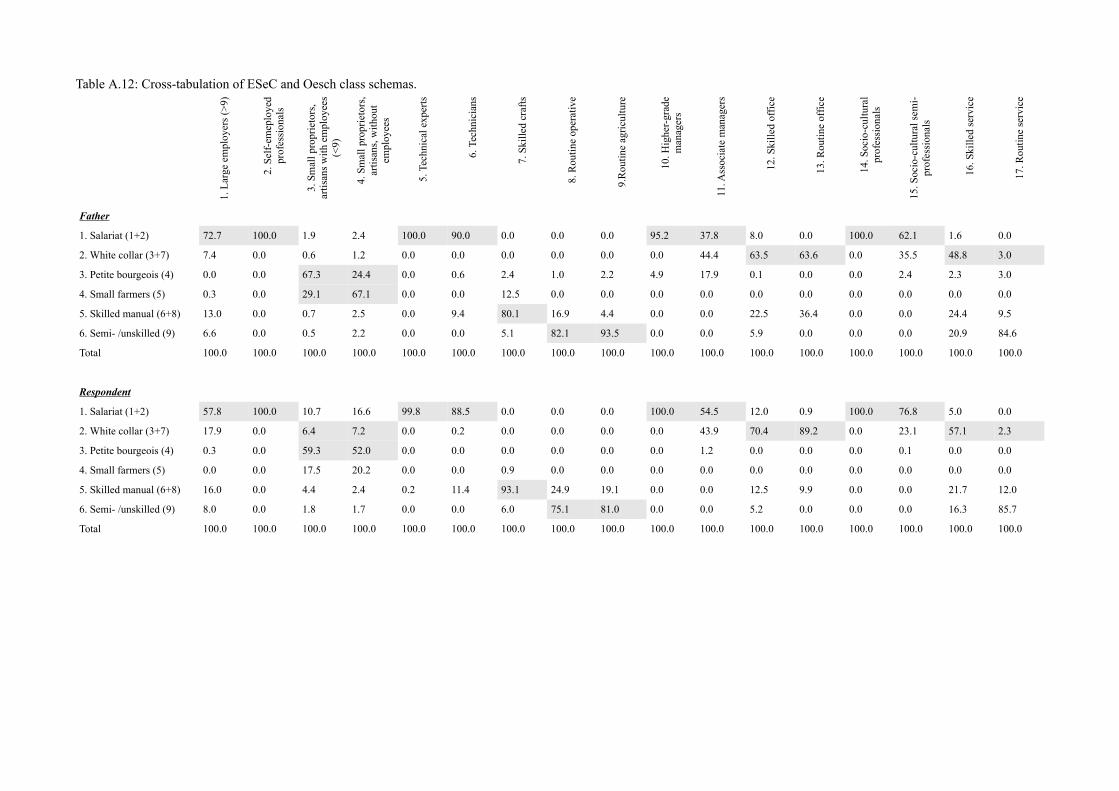
Table A.12: Cross-tabulation of ESeC and Oesch class schemas.
1. L
arge
em
ploy
ers
(>9)
2. S
elf-
emep
loye
dpr
ofes
sion
als
3. S
mal
l pro
prie
tors
,ar
tisa
ns w
ith
empl
oyee
s(<
9)
4. S
mal
l pro
prie
tors
,ar
tisa
ns, w
itho
utem
ploy
ees
5. T
echn
ical
exp
erts
6. T
echn
icia
ns
7. S
kille
d cr
afts
8. R
outi
ne o
pera
tive
9.R
outi
ne a
gric
ultu
re
10. H
ighe
r-gr
ade
man
ager
s
11. A
ssoc
iate
man
ager
s
12. S
kille
d of
fice
13. R
outi
ne o
ffic
e
14. S
ocio
-cul
tura
lpr
ofes
sion
als
15. S
ocio
-cul
tura
l sem
i-pr
ofes
sion
als
16. S
kille
d se
rvic
e
17. R
outi
ne s
ervi
ce
Father
1. Salariat (1+2) 72.7 100.0 1.9 2.4 100.0 90.0 0.0 0.0 0.0 95.2 37.8 8.0 0.0 100.0 62.1 1.6 0.0
2. White collar (3+7) 7.4 0.0 0.6 1.2 0.0 0.0 0.0 0.0 0.0 0.0 44.4 63.5 63.6 0.0 35.5 48.8 3.0
3. Petite bourgeois (4) 0.0 0.0 67.3 24.4 0.0 0.6 2.4 1.0 2.2 4.9 17.9 0.1 0.0 0.0 2.4 2.3 3.0
4. Small farmers (5) 0.3 0.0 29.1 67.1 0.0 0.0 12.5 0.0 0.0 0.0 0.0 0.0 0.0 0.0 0.0 0.0 0.0
5. Skilled manual (6+8) 13.0 0.0 0.7 2.5 0.0 9.4 80.1 16.9 4.4 0.0 0.0 22.5 36.4 0.0 0.0 24.4 9.5
6. Semi- /unskilled (9) 6.6 0.0 0.5 2.2 0.0 0.0 5.1 82.1 93.5 0.0 0.0 5.9 0.0 0.0 0.0 20.9 84.6
Total 100.0 100.0 100.0 100.0 100.0 100.0 100.0 100.0 100.0 100.0 100.0 100.0 100.0 100.0 100.0 100.0 100.0
Respondent
1. Salariat (1+2) 57.8 100.0 10.7 16.6 99.8 88.5 0.0 0.0 0.0 100.0 54.5 12.0 0.9 100.0 76.8 5.0 0.0
2. White collar (3+7) 17.9 0.0 6.4 7.2 0.0 0.2 0.0 0.0 0.0 0.0 43.9 70.4 89.2 0.0 23.1 57.1 2.3
3. Petite bourgeois (4) 0.3 0.0 59.3 52.0 0.0 0.0 0.0 0.0 0.0 0.0 1.2 0.0 0.0 0.0 0.1 0.0 0.0
4. Small farmers (5) 0.0 0.0 17.5 20.2 0.0 0.0 0.9 0.0 0.0 0.0 0.0 0.0 0.0 0.0 0.0 0.0 0.0
5. Skilled manual (6+8) 16.0 0.0 4.4 2.4 0.2 11.4 93.1 24.9 19.1 0.0 0.0 12.5 9.9 0.0 0.0 21.7 12.0
6. Semi- /unskilled (9) 8.0 0.0 1.8 1.7 0.0 0.0 6.0 75.1 81.0 0.0 0.0 5.2 0.0 0.0 0.0 16.3 85.7
Total 100.0 100.0 100.0 100.0 100.0 100.0 100.0 100.0 100.0 100.0 100.0 100.0 100.0 100.0 100.0 100.0 100.0

B. Appendix B.
Data quality assessment: disentangling age and survey effects from cohort effects
251

What is at stake?Our research is based on a birth-cohort analysis constructed from twelve data sources collected at
different points in time. While this analytical design substantially constitutes a strength rather than a
weakness for the analysis of social mobility, it relies per se on two strong assumptions: that social
mobility is exempt of age and survey/period effects. The first assumption, age effect, pertains to the
fact that our birth-cohorts are not distributed evenly according to age. It is possible that youngest
cohorts will display different social mobility trends because they are on average much younger than
the oldest cohorts and might still have not yet reached their occupational maturity – in other words,
that their career mobility process might still be ongoing. The second assumption, survey/period
effect, stems from the use of multiple cross-sections. It might be the case that some of the surveys
we use provide different measures of social mobility because of the lack of information for the
construction of some indicators, or because of the way the data was collected, or simply due to
some sampling frame vagaries. In this case, we would acknowledge a survey effect. In contrast, a
substantial cohort trend could also mask a period effect. In this case, we would not observe random
fluctuations between surveys but a general trend across the time at which data was collected.
Therefore, if we do not control for these two strong assumptions, our substantial conclusions might
be biased. By applying two sets of analysis, we test the extent to which our birth-cohort analysis is
systematically distorted by age and/or survey/period effects on the three main associations which
are of great concern in this PhD thesis: (1) the association between social origin and social
destination; (2) that between social origin and educational attainment; and finally, (3) that between
educational attainment and social destination. Our tests address (1) whether birth-cohort effects
observed in our substantial analysis still hold when both age and survey/period effects are
controlled and, (2) whether each survey provides the same measure of our variables within each
birth-cohort.
Are our substantive conclusions on birth-cohortsdistorted by age and/or survey/period effects?
As can be seen in Table B.1, our substantive analysis on birth-cohorts points out that for men and
women, the association between social origin and social position attained remained relatively stable,
that educational inequalities (OE) decreased for men but remained quite stable for women, and that
return to education (ED) increased for both men and women. If these effects are not concealed by
age and/or survey/period effects, then these conclusions should still hold true. However, how could
our conclusions be biased by one or both of these effects?
252

Regarding age effect, it is most likely to happen on social position attained (D) because of career
mobility effect, whereas educational attainment (E) and even more social origin (O) are more
unlikely to change with age. Thus, no significant age effect should be expected on the OE
association, while some age effect might exist on OD and ED. In particular, we could expect
consequential age effect on ED, since research highlights that the association between education
and employment is particularly pronounced during the early career stage (Pollak and Müller 2013),
whereas during later employment stage, factors other than education gain importance, such as
experience or performance in preceding jobs (Müller 2009). As a consequence, the ED association
might be stronger among younger cohorts because of age effect. Conversely, on the OD association,
we should expect an increase in this association with age when we do not control for cohort,
because of the potential influence of counter mobility people might experience during their early
occupational career – i.e. the fact to move back to one's original class origin after some time during
one's career in other class positions.
As far as survey effects are concerned, while we have put much effort to render the twelve surveys
we use highly comparable – at least as much as possible – it still remains possible that our surveys
might play a role in our birth-cohort estimates. If we detect true survey effects, it is likely to happen
at random according to survey specificity (construction of indicators, sample design etc.), or
according to survey group (SHP, ESS and MCH). Alternatively, since controlling for survey effect
implies that we control for period effect, we might as well detect some period effects, when survey
variations happen systematically in a specific period of time. If this is the case, this should be less
problematic for our substantive conclusions since cohorts are embedded in periods and as a
consequence a specific period context will logically influence cohorts as it reflects the conditions in
which the cohorts live their life.
To test for such age and survey/period effects, we fitted different sets of log-linear models on three
five-way tables with OD, OE and ED variables respectively40. Additionally, each of these tables
contain survey, age and cohort variables. Here age is defined in three categories (30-39; 40-49; 50-
40 Given that this five-way table is extremely large, we only test age and survey effects here using the ESeC classschema. Repeating the same models with the Oesch class schema would certainly return very similar estimates, butwould be problematic as it is distributed on more categories than ESeC – precisely, it uses two more categories forthe collapsed version we use – which in the case of such a large table is likely to make a difference in term asignificance threshold, given the sample size of our data.
253
Table B.1: Summary of our substantive conclusions
Association: Men Women
OD Stable Stable
OE Decrease Stable
ED Increase Increase

64) and cohort using our synthesised variable in five categories, because such a large five-way table
imposes so.
The modelling procedure implemented is very straightforward. It consists of starting with the
constant association model, controlling for survey and age effect (M1), then testing whether a
Unidiff effect on survey (M2), on age (M3) or on cohort (M4) describes the data more adequately. A
further set of model tests whether the association, for instance between OD, varies log-
multiplicatively according to two effects, either by cohort and age (M5), by survey and age (M6), or
by survey and cohort (M7). Finally, in a last model, we test whether a Unidiff effect can be found
simultaneously on survey, cohort and age (M8). Our main interest will consist of analysing for
associations in which we find a Unidiff trend whether it accounts for additional variation across
survey/period and/or across age (i.e. M5, M7 and M8, compared to M4). For associations where
constant social fluidity is found, we will be interested in assessing the extent to which this
association varies by age and/or by survey (i.e. M2, M3 and M6, compared to M1).
Models fitted on the OD association are displayed in Table B.2. For men, on all the models fitted,
none of them provides a significant improvement over the constant association model (M1). This
suggests that OD is constant not only across cohorts but also across survey/period and age groups.
For women, we find some evidence of survey/period variation in the OD association but no age
254
Figure B.1: Unidiff parameters for survey/period effect on ED for men and women

effect. From parameters plotted in Figure B.2, we are tempted to conclude that two surveys depict
strong but random fluctuations in the OD association (namely surveys CH91 and MCH09).
However, between the ESS04 and ESS08 surveys, the OD association reached a higher level.
Therefore, it seems to be the case that this survey effect in OD actually reflects some period effect.
This reinforced trend in OD in recent years is visible in Unidiff parameters of the youngest cohort,
being with or without control for survey and age effects (see Figure B.3). Therefore, this survey
effect does not distort our substantive conclusions significantly. It just seems that for women, the
OD association strengthened in recent years, which from a cohort perspective leads us to conclude
an overall stable trend.
Concerning the OE association (Table B.3), for men we observe that model M3, allowing OE to
vary across age groups, and model M4, across cohorts, should be preferred over the constant
association model (M1). However, variation across age groups erases when this effect is put
together with variation across cohorts (see M4-M5). Therefore, our substantive conclusions on OE
are not distorted by age and survey effect for men. For women, we find a significant survey/period
effect once again. The inspection of Unidiff parameters in Figure B.2 again indicates a trend toward
period effect rather than survey effect. In fact, the OE association is particularly strong within the
four more recent surveys that we use. This period effect certainly explains why we do not find a
255
Figure B.2: Unidiff parameters for survey/period effect on OD and OE for women

clear decreasing OE trend across birth-cohorts in our data, as in recent years, the OE association
reinforced, which can be seen as well in the youngest birth-cohort (see Figure B.3).
Finally, we were particularly concerned with potential age effects imposed on the ED association as
we use a rather large age boundary threshold (30 years old). Models displayed in Table B.4 enable
us to reject this age effect on ED for both men or women. However, while cohort variation remains
significant, we also find a considerable survey/period effect for both men and women (see M4-M7).
Interestingly, Unidiff parameters for survey effects (see Figure B.1) point here again in the direction
of period effect rather than random survey variations. It does seem that the ED association
strengthened significantly from the mid-2000s onwards. Yet even when controlling for survey
variations, parameters for birth-cohorts, while depicting a flatter trend, still remain on the increasing
slope (see Figure B.3). This confirms the Swiss idiosyncrasy of no decrease in return to education.
Altogether, our substantive conclusions are not significantly distorted by age and survey effects.If
any distortion can be identified, it essentially stems from period effect. In fact, in recent years some
of the associations we analyse tended to reinforce. This is particularly true among women, as we
observe a period effect on the three associations of interest, whereas for men this essentially holds
with respect to return to education. Yet since these period effects are systematically reflected in the
youngest birth-cohorts in the form of reinforced association in the Unidiff parameters, these effects
are de facto integrated in our substantive conclusions.
We can now turn to the second set of tests on our data by assessing how and to which extent our
measures of social origin, educational attainment and social position attained vary across birth-
cohorts.
Does each survey provide the same measure withineach birth-cohort?
In order to go even further in the assessment of the quality of our data, we now address whether
each survey measures the same way our main variables of interest within each birth-cohort. In other
words, we are concerned by the fact that the same cohort might display some measurement
heterogeneity through survey effect. Therefore, we imposed a second set of tests on our data.
We follow the same procedure as proposed by Breen, Luijkx, Müller and Pollak (2009). The basic
idea is to control whether the marginal distribution and the association between social origin and
educational attainment – in the case of their research – do not vary too significantly between
surveys within the same birth-cohorts. To do so, they fit log-linear models in order “to check (a)
whether the marginal distributions of education and class origins remain constant, within the limits
256
of sampling variability; and (more important from [their] point of view) (b) whether the association
between these variables is also constant” (2009:1488).
They precisely specified four log-linear models on a four-way table cross-classifying social origin
(O), educational attainment (E), cohort (C) and survey period (S). These models “allow the origin –
education association to vary over cohorts (they all include the COE term) and also allow the
distribution of cohorts to vary over surveys (the CS term). [Their] interest is in whether the CO, CE,
and OE relationships vary over surveys. In model 1 none of them does; in model 2 the distribution
of class origins in each cohort, CO, is allowed to differ over surveys, yielding the term CSO; in
model 3, so is the distribution of education (CE), giving CSE; and in model 4 [they] allow the
association between origins and education (OE) to vary over surveys (SOE).” (2009:1488).
Like them, we assess the goodness of fit using the likelihood ratio test as measured by the deviance
(G2). Yet since these models involve the cross-tabulation of four variables, and because our sample
size, though large, is not so big, some of the models estimated returned some empty estimated cells.
Therefore, we had to readjust the number of degrees of freedom into our models to account for
these estimation problems. Following the procedure proposed by Bishop, Fienberg and Holland
(1975:115), we adjusted the number of degrees of freedom of our models with the formula:
V '=V −z e+z v
where V corresponds to the initial number of degrees of freedom calculated from the model, ze to
the number of elementary cells with zero estimates (empty estimated cells), and z v to the number
of log-linear parameters that could not be estimated. By subtracting the original number of degrees
of freedom, the number of zero estimated cells, and the number of non-estimated log-linear
parameters, we get our adjusted number of degrees of freedom V ' .
Finally, unlike BLMP, we did not only fit these models specifically for the association between
social origin and educational attainment, but also for the the two other associations existing in the
OED triangle, namely origin-destination and education-destination. Furthermore, we systematically
fitted these models on our two-birth cohorts variables and our two social class classifications, ESeC
and Oesch for robustness check assessments.
As can be easily observed in Tables B.5 and B.6, which display models fitted for all the
combinations we tested, systematically, this is the fourth model that must be accepted, since it
provides a significant improvement over the previous ones. In other words, this means that we do
have some survey effects within birth-cohorts to some extent, as in the case of the origin-education
table, “the marginal distributions of both class origin and education, and also the origin-education
257

association, are not constant over surveys within cohorts” (Breen et al. 2009:190). Eventually, these
survey effects could stem from the fact that the samples of the surveys we use are not drawn from
the same population. BLMP (2009, see particularly footnote 8) highlighted two possible
explanations for this survey effect in sampling frame design that might be of relevance in the
context of the present enquiry. First, since we use data from different survey series, we have a high
risk that each survey does not sample the population in the same way; second, since over the time
frame of the surveys we use, the share of the immigrant population in the total population in
Switzerland increased roughly 10 percentage points, accounting today for about 23%, it is fairly
likely that each survey did not draw its sample from the same population. Thus, these survey effects
we observe could actually stem not only from each survey's idiosyncratic sampling frame, but also
from substantial change in the composition of the Swiss population.
Yet in order to fully assess the quality of our data and identify whether our data displays systematic
measurement issues, we carried on our data quality assessment by further following BLMP's second
step procedure, which consists of looking within each cohort to see whether the constant association
model (CnSF) across surveys fits the data. In other words, if the model adjusts well enough to the
data, this implies that survey variations within each birth-cohorts are insignificant.
These models are reported in Tables B.7 and B.8. We observe that our data overall adjusts quite well
to the constant association model, if we take as significance threshold for model adjustment a p-
value bigger than 0.001. Some cohorts exhibit important survey effects, but we do not observe these
effects systematically for each set of analysis being on the origin-destination, origin-education and
education-destination tables or on the two social class classifications and birth-cohorts variables we
use.
ConclusionOur data quality assessment leads us to conclude that (1) our substantial conclusions are not
distorted by age and survey/period effects, and that (2) each birth-cohort displays some limited non-
systematic measurement heterogeneity, according to survey. Stated differently, while the quality of
our data is not perfect, these weaknesses do not undermine our substantial conclusions. We would
like one more time to underscore that eventually we envisage the use of multiple cross-sections as a
strength rather than a weakness, as even though our data does not enable us to measure the exact
reality we would like to measure, we would have probably had a greater source of error if we had
only used one cross-section. Indeed, measuring the same phenomenon with multiple sources of data
might actually increase the reliability of our findings, in addition to the robustness of statistical
258

estimations. Last but not least, in line with Erikson and Goldthorpe we would like to reiterate that
we do not want to take the risk of “throwing out the sociological baby with the statistical bath-
water”.(1992a:292). Therefore, we judge the quality of our data to be good enough to undertake a
serious analysis of the dynamics of social mobility in Switzerland.
259

260
Table B.2: Log-linear models tested on the SCAOD table to assess whether OD display age and/or survey/period effect,fitted on men and women mobility tables.
ModelMen (N=6983) Women (N=6380)
DF L2 P BIC DF L2 P BIC
M1.CSAO CSAD OD 2171 2043.6 0.9751 -6301.79 2171 2060.7 0.9547 -6199.55
M2.CSAO CSAD βsOD 2160 2030.9 0.9770 -6172.27 2160 2039.0 0.9690 -6179.41
M3.CSAO CSAD βaOD 2169 2041.8 0.9750 -6295.96 2169 2060.5 0.9520 -6192.11
M4.CSAO CSAD βcOD 2167 2038.6 0.9761 -6291.42 2167 2052.9 0.9603 -6192.12
M5.CSAO CSAD βcβaOD 2165 2038.1 0.9748 -6284.25 2165 2051.5 0.9596 -6185.95
M6.CSAO CSAD βsβaOD 2158 2029.0 0.9769 -6266.46 2158 2038.7 0.9671 -6172.09
M7.CSAO CSAD βsβcOD 2156 2026.3 0.9776 -6261.44 2156 2032.0 0.9722 -6171.15
M8.CSAO CSAD βsβaβcOD 2154 2024.9 0.9771 -6255.18 2154 2026.8 0.9754 -6168.76
Models comparison
M1-M2 11 12.7 0.3094 11 21.7 0.0267
M1-M3 2 1.8 0.3962 2 0.2 0.9187
M1-M4 4 5.0 0.2873 4 7.8 0.0996
M2-M6 2 1.9 0.3902 2 0.3 0.8626
M2-M7 4 4.6 0.3371 4 7.0 0.1379
M3-M5 4 3.7 0.4525 4 9.0 0.0597
M3-M6 11 12.8 0.3073 11 21.8 0.0256
M4-M5 2 0.5 0.7705 2 1.4 0.4869
M4-M7 11 12.3 0.3412 11 20.9 0.0346
M5-M8 11 13.2 0.2795 11 24.7 0.0102
M6-M8 4 4.1 0.3932 4 11.9 0.0182
M7-M8 2 1.4 0.4888 2 5.2 0.0736
Parameters
βsOD M2 M6 M7 M8 M2 M6 M7 M8
AP75 1.00 1.00 1.00 1.00 1.00 1.00 1.00 1.00
ISSP87 0.70 0.71 0.67 0.65 1.14 1.13 1.33 1.42
CH91 0.69 0.70 0.65 0.61 2.00 1.97 2.20 2.11
SHP99 0.59 0.60 0.55 0.46 1.07 1.07 1.42 1.72
ESS02 0.57 0.58 0.52 0.44 1.12 1.11 1.42 1.78
SHP04 0.61 0.62 0.54 0.45 0.96 0.95 1.27 1.72
ESS04 0.67 0.68 0.59 0.51 1.34 1.32 1.66 2.01
MCH05 0.72 0.72 0.67 0.56 1.16 1.15 1.48 1.92
ESS06 0.67 0.68 0.61 0.50 1.40 1.38 1.73 2.14
MCH07 0.64 0.64 0.59 0.47 1.48 1.46 1.79 2.20
ESS08 0.58 0.59 0.52 0.41 1.41 1.38 1.70 2.15
MCH09 0.78 0.77 0.72 0.61 1.98 1.93 2.29 2.60
βaOD M3 M5 M6 M8 M3 M5 M6 M8
35-44 1.00 1.00 1.00 1.00 1.00 1.00 1.00 1.00
45-54 0.92 0.92 0.94 0.98 0.96 1.12 0.94 0.92
55-64 1.03 0.95 1.01 1.09 0.99 0.98 0.93 0.41
βcOD M4 M5 M7 M8 M4 M5 M7 M8
1912-1941 1.00 1.00 1.00 1.00 1.00 1.00 1.00 1.00
1942-1949 0.99 0.99 1.12 1.16 0.85 0.85 0.66 0.59
1950-1957 0.79 0.81 0.98 1.08 0.85 0.78 0.65 0.25
1958-1965 0.92 0.92 1.08 1.21 0.69 0.61 0.46 -0.10
1966-1979 0.91 0.87 1.07 1.19 0.98 0.97 0.84 0.09
Notes: CSAO CSAD OD= constant association model; each model with a β indicates a Unidiff effect (i.e. a change inthe concerned association). G2=deviance, Df=degree of freedom, P=p-value, BIC=Bayesian information criterion. Tobe significant, each new effect added into a model is compared to previous nested model and should exhibit a p-valuebelow 0.05 (see models comparison panels)

261
Table B.3: Log-linear models tested on the SCAOE table to assess whether OE display age and/or survey/period effect,fitted on men and women mobility tables.
ModelMen (N=7512) Women (N=7996)
DF L2 P BIC DF L2 P BIC
M1.CSAO CSAE OE 1393 1511.4 0.0141 -3887.50 1393 1466.3 0.0841 -3970.38
M2.CSAO CSAE βsOE 1382 1498.6 0.0150 -3857.71 1382 1442.4 0.1260 -3951.35
M3.CSAO CSAE βaOE 1391 1500.9 0.0205 -3890.27 1391 1460.9 0.0941 -3968.02
M4.CSAO CSAE βcOE 1389 1501.3 0.0183 -3882.08 1389 1461.7 0.0856 -3959.39
M5.CSAO CSAE βcβaOE 1387 1498.2 0.0193 -3877.50 1387 1457.9 0.0906 -3955.36
M6.CSAO CSAE βsβaOE 1380 1487.3 0.0226 -3861.28 1380 1439.3 0.1300 -3946.62
M7.CSAO CSAE βsβcOE 1378 1486.7 0.0212 -3854.14 1378 1436.1 0.1349 -3942.08
M8.CSAO CSAE βsβaβcOE 1376 1481.5 0.0242 -3851.59 1376 11.28.5 1.0000 -4241.85
Models comparison
M1-M2 11 12.8 0.3032 11 23.9 0.0131
M1-M3 2 10.5 0.0052 2 5.4 0.0655
M1-M4 4 10.1 0.0391 4 4.6 0.3274
M2-M6 2 11.3 0.0035 2 3.1 0.2153
M2-M7 4 11.9 0.0179 4 6.3 0.1749
M3-M5 4 2.7 0.6029 4 3.0 0.5667
M3-M6 11 13.6 0.2530 11 21.6 0.0283
M4-M5 2 3.1 0.2042 2 3.8 0.1518
M4-M7 11 14.6 0.1969 11 25.6 0.0074
M5-M8 11 16.7 0.1164 11 1457.9 0.0000
M6-M8 4 5.8 0.2140 4 1439.3 0.0000
M7-M8 2 5.2 0.0742 2 1436.1 0.0000
Parameters
βsOE M2 M6 M7 M8 M2 M6 M7 M8
AP75 1.00 1.00 1.00 1.00 1.00 1.00 1.00 1.00
ISSP87 0.82 0.89 0.94 0.93 0.96 1.02 0.98 0.77
CH91 0.87 0.92 0.98 1.00 1.24 1.29 1.26 1.14
SHP99 0.77 0.79 0.98 1.01 1.28 1.32 1.40 0.94
ESS02 0.89 0.93 1.11 1.15 0.92 0.94 1.04 1.17
SHP04 0.84 0.89 1.10 1.18 0.94 0.99 1.11 1.00
ESS04 1.00 1.09 1.27 1.34 1.19 1.26 1.35 1.12
MCH05 0.90 0.95 1.17 1.25 1.36 1.42 1.51 1.43
ESS06 0.87 0.89 1.12 1.21 1.59 1.68 1.75 1.62
MCH07 0.49 0.49 0.76 0.90 1.53 1.62 1.70 1.56
ESS08 0.95 0.97 1.20 1.27 1.56 1.67 1.74 1.58
MCH09 1.03 1.09 1.31 1.37 1.42 1.51 1.61 1.48
βaOE M3 M5 M6 M8 M3 M5 M6 M8
35-44 1.00 1.00 1.00 1.00 1.00 1.00 1.00 1.00
45-54 0.90 0.92 0.91 0.79 1.12 1.28 1.12 0.82
55-64 1.18 1.10 1.17 0.82 1.23 1.41 1.22 0.78
βcOE M4 M5 M7 M8 M4 M5 M7 M8
1912-1941 1.00 1.00 1.00 1.00 1.00 1.00 1.00 1.00
1942-1949 0.91 0.92 0.86 0.86 1.13 1.16 1.03 0.92
1950-1957 0.84 0.93 0.80 0.79 1.02 1.12 0.83 0.91
1958-1965 0.71 0.81 0.63 0.57 0.89 1.07 0.70 0.90
1966-1979 0.85 0.92 0.72 0.51 0.96 1.32 0.82 0.80
Notes: CSAO CSAE OE= constant association model; each model with a β indicates a Unidiff effect (i.e. a change inthe concerned association). G2=deviance, Df=degree of freedom, P=p-value, BIC=Bayesian information criterion. Tobe significant, each new effect added into a model is compared to previous nested model and should exhibit a p-valuebelow 0.05 (see models comparison panels)

262
Table B.4: Log-linear models tested on the SCAED table to assess whether ED display age and/or survey/period effect,fitted on men and women mobility tables.
ModelMen (N=7528) Women (N=6921)
DF L2 P BIC DF L2 P BIC
M1.CSAE CSAD ED 1393 1706.0 0.0000 -3694.19 1393 1235.1 0.9990 -4114.30
M2.CSAE CSAD βsED 1382 1348.8 0.7337 -4008.77 1382 1135.7 1.0000 -4171.44
M3.CSAE CSAD βaED 1391 1414.4 0.3251 -3978.08 1391 1230.0 0.9992 -4111.65
M4.CSAE CSAD βcED 1389 1401.4 0.4024 -3983.31 1389 1220.3 0.9996 -4113.69
M5.CSAE CSAD βcβaED 1387 1386.3 0.5002 -3990.65 1387 1211.1 0.9997 -4115.26
M6.CSAE CSAD βsβaED 1380 1348.1 0.7252 -4001.68 1380 1129.8 1.0000 -4169.60
M7.CSAE CSAD βsβcED 1378 1340.7 0.7591 -4001.32 1378 1131.9 1.0000 -4159.88
M8.CSAE CSAD βsβaβcED 1376 1340.3 0.7500 -3994.04 1376 1128.5 1.0000 -4155.57
Models comparison
M1-M2 11 357.2 0.0000 11 99.4 0.0000
M1-M3 2 291.6 0.0000 2 5.1 0.0806
M1-M4 4 304.6 0.0000 4 14.8 0.0052
M2-M6 2 0.7 0.7189 2 5.9 0.0539
M2-M7 4 8.1 0.0898 4 3.8 0.4343
M3-M5 4 28.1 0.0000 4 18.9 0.0008
M3-M6 11 66.3 0.0000 11 100.2 0.0000
M4-M5 2 15.1 0.0005 2 9.2 0.0098
M4-M7 11 60.7 0.0000 11 88.4 0.0000
M5-M8 11 46.0 0.0000 11 82.6 0.0000
M6-M8 4 7.8 0.0965 4 1.3 0.8572
M7-M8 2 0.4 0.7875 2 3.4 0.1853
Parameters
βsED M2 M6 M7 M8 M2 M6 M7 M8
AP75 1.00 1.00 1.00 1.00 1.00 1.00 1.00 1.00
ISSP87 0.71 0.71 0.82 0.84 0.72 0.72 0.73 0.77
CH91 0.95 0.95 1.08 1.09 1.11 1.10 1.14 1.14
SHP99 0.88 0.88 1.03 1.08 0.84 0.86 0.84 0.94
ESS02 0.95 0.94 1.07 1.11 1.12 1.09 1.10 0.83
SHP04 '.964 0.96 1.09 1.14 0.90 0.88 0.84 1.00
ESS04 0.93 0.92 1.06 1.10 1.05 1.02 1.00 1.12
MCH05 1.21 1.19 1.34 1.39 1.39 1.34 1.35 1.43
ESS06 1.38 1.36 1.52 1.56 1.61 1.54 1.58 1.62
MCH07 1.62 1.60 1.75 1.80 1.54 1.48 1.50 1.56
ESS08 1.36 1.34 1.50 1.54 1.57 1.50 1.53 1.58
MCH09 1.39 1.38 1.53 1.58 1.45 1.39 1.40 1.48
βaED M3 M5 M6 M8 M3 M5 M6 M8
35-44 1.00 1.00 1.00 1.00 1.00 1.00 1.00 1.00
45-54 0.96 1.30 0.96 1.00 0.88 1.08 0.88 0.82
55-64 0.99 1.57 0.95 0.93 0.90 1.49 0.86 0.78
βcED M4 M5 M7 M8 M4 M5 M7 M8
1912-1941 1.00 1.00 1.00 1.00 1.00 1.00 1.00 1.00
1942-1949 0.89 0.83 0.78 0.77 1.07 1.09 0.96 0.92
1950-1957 0.99 1.16 0.84 0.79 1.15 1.43 1.00 0.91
1958-1965 1.00 1.35 0.84 0.76 1.23 1.70 1.08 0.90
1966-1979 1.18 1.79 0.96 0.88 1.35 1.92 1.12 0.80
Notes: CSAE CSAD ED= constant association model; each model with a β indicates a Unidiff effect (i.e. a change inthe concerned association). G2=deviance, Df=degree of freedom, P=p-value, BIC=Bayesian information criterion. Tobe significant, each new effect added into a model is compared to previous nested model and should exhibit a p-valuebelow 0.05 (see models comparison panels)

263
Figure B.3: Unidiff parameters for birth cohorts for each set of association with different controls

264
Table B.5: Test of homogeneity within cohorts with the ESeC class schema.
G2 df P DI Models G2 df P
8 birth-cohorts
Origin - Destination
M1. COD CS SO SD 3809.3 3132 0.000 17.46
M2. COD CSO SD 3428.9 2790 0.000 16.39 M1-M2 380.3 342 0.075
M3. COD CSO CSD 2987.4 2448 0.000 14.98 M2-M3 441.6 342 0.000
M4. COD CSO CSD SOD 2439.7 2052 0.000 13.22 M3-M4 547.6 395 0.000
Origin - Education
M1. COE CS SO SE 2647.2 2202 0.000 12.93
M2. COE CSO SE 2262.8 1860 0.000 11.39 M1-M2 384.4 342 0.057
M3. COE CSO CSE 1973.5 1632 0.000 10.37 M2-M3 289.4 228 0.004
M4. COE CSO CSE SOE 1625.4 1368 0.000 9.24 M3-M4 348.0 264 0.000
Education - Destination
M1. CED CS SE SD 2577.8 2202 0.000 13.27
M2. CED CSE SD 2290.5 1974 0.000 12.19 M1-M2 287.3 228 0.005
M3. CED CSE CSD 1847.8 1632 0.000 10.28 M2-M3 442.7 342 0.000
M4. CED CSE CSD SED 1279.0 1368 0.958 8.10 M3-M4 568.9 264 0.000
5 birth-cohorts
Origin - Destination
M1. COD CS SO SD 2627.7 2028 0.000 14.57
M2. COD CSO SD 2402.1 1824 0.000 13.73 M1-M2 225.6 204 0.143
M3. COD CSO CSD 2113.0 1620 0.000 12.56 M2-M3 289.1 204 0.000
M4. COD CSO CSD SOD 1548.2 1224 0.000 10.36 M3-M4 564.7 396 0.000
Origin - Education
M1. COE CS SO SE 1817.6 1420 0.000 10.65
M2. COE CSO SE 1615.2 1216 0.000 9.59 M1-M2 202.5 204 0.517
M3. COE CSO CSE 1402.6 1080 0.000 8.82 M2-M3 212.5 136 0.000
M4. COE CSO CSE SOE 1050.6 816 0.000 7.32 M3-M4 352.1 264 0.000
Education - Destination
M1. CED CS SE SD 1896.9 1420 0.000 11.16
M2. CED CSE SD 1678.8 1284 0.000 10.42 M1-M2 218.1 136 0.000
M3. CED CSE CSD 1399.2 1080 0.000 8.92 M2-M3 279.7 204 0.000
M4. CED CSE CSD SED 829.1 816 0.367 6.22 M3-M4 570.0 264 0.000
Notes: G2=deviance, Df=degree of freedom, P=p-value, DI=dissimilarity index.

265
Table B.6: Test of homogeneity within cohorts with the Oesch class schema.
G2 df P DI Models G2 df P
8 birth-cohorts
Origin - Destination
M1. COD CS SO SD 5160.3 5264 0.844 21.35
M2. COD CSO SD 4642.3 4808 0.956 19.90 M1-M2 517.9 456 0.024
M3. COD CSO CSD 4045.7 4352 1.000 18.12 M2-M3 596.7 456 0.000
M4. COD CSO CSD SOD 3163.9 3648 1.000 15.39 M3-M4 881.7 704 0.000
Origin - Education
M1. COE CS SO SE 3086.4 2860 0.002 14.09
M2. COE CSO SE 2624.1 2404 0.001 12.48 M1-M2 462.3 456 0.409
M3. COE CSO CSE 2323.7 2176 0.014 11.24 M2-M3 300.4 228 0.001
M4. COE CSO CSE SOE 1869.3 1824 0.225 9.96 M3-M4 454.4 352 0.000
Education - Destination
M1. CED CS SE SD 3390.6 2860 0.000 15.78
M2. CED CSE SD 3088.3 2632 0.000 14.68 M1-M2 302.3 228 0.001
M3. CED CSE CSD 2502.7 2176 0.000 12.73 M2-M3 585.6 456 0.000
M4. CED CSE CSD SED 1759.6 1824 0.857 9.92 M3-M4 743.1 352 0.000
5 birth-cohorts
Origin - Destination
M1. COD CS SO SD 3674.6 3424 0.002 17.92
M2. COD CSO SD 3398.3 3152 0.001 16.97 M1-M2 276.3 272 0.416
M3. COD CSO CSD 3005.2 2880 0.051 15.46 M2-M3 393.1 272 0.000
M4. COD CSO CSD SOD 2110.2 2176 0.841 12.26 M3-M4 895.1 704 0.000
Origin - Education
M1. COE CS SO SE 2038.4 1848 0.001 11.19
M2. COE CSO SE 1781.6 1576 0.000 10.13 M1-M2 256.9 272 0.736
M3. COE CSO CSE 1566.7 1440 0.011 9.16 M2-M3 214.9 136 0.000
M4. COE CSO CSE SOE 1116.6 1088 0.267 7.45 M3-M4 450.1 352 0.000
Education - Destination
M1. CED CS SE SD 2467.3 1848 0.000 13.62
M2. CED CSE SD 2249.0 1712 0.000 12.63 M1-M2 218.3 136 0.000
M3. CED CSE CSD 1895.1 1440 0.000 10.97 M2-M3 353.8 272 0.001
M4. CED CSE CSD SED 1153.7 1088 0.081 7.82 M3-M4 741.4 352 0.000
Notes: G2=deviance, Df=degree of freedom, P=p-value, DI=dissimilarity index.

266
Table B.7: Goodness of fit of model of constant association across surveys within birth cohorts for tables constructedwith the ESeC class schema
Origin-Destination Origin-Education Education-Destination
G2 df P G2 df P G2 df P
8 birth-cohorts
1912-1935 126.8 102 0.049 85.5 66 0.053 61.4 66 0.636
1936-1940 188.0 188 0.486 167.9 138 0.042 125.3 113 0.601
1941-1945 435.2 374 0.016 297.6 250 0.021 283.4 254 0.099
1946-1950 413.2 385 0.266 328.7 254 0.001 284.9 250 0.266
1951-1955 506.3 360 0.000 272.5 234 0.043 266.0 234 0.074
1956-1960 499.3 360 0.000 295.8 234 0.004 298.7 234 0.003
1961-1965 429.9 318 0.000 295.7 212 0.000 227.2 216 0.287
1966-1979 388.6 288 0.000 229.7 192 0.033 301.0 192 0.000
5 birth-cohorts
1912-1941 270.9 235 0.054 216.9 162 0.003 187.0 154 0.036
1942-1949 465.0 396 0.010 352.6 258 0.000 311.3 258 0.013
1950-1957 500.6 360 0.000 319.4 234 0.000 326.0 234 0.000
1958-1965 487.8 324 0.000 284.1 216 0.001 273.8 216 0.005
1966-1979 388.6 288 0.000 229.7 192 0.033 301.0 192 0.000
Note: Problematic models emphasised (P > 0.001)
Table B.8: Goodness of fit of model of constant association across surveys within birth cohorts for tables constructedwith the Oesch class schema
Origin-Destinaton Origin-Education Education-Destination
G2 df P G2 df P G2 df P
8 birth-cohorts
1912-1935 132.0 133 0.508 71.0 77 0.671 83.3 77 0.291
1936-1940 278.0 282 0.556 196.2 157 0.018 165.4 165 0.477
1941-1945 598.9 546 0.058 353.3 289 0.006 388.2 318 0.004
1946-1950 552.4 494 0.035 403.9 309 0.000 400.5 333 0.007
1951-1955 688.6 556 0.000 355.4 285 0.003 415.7 309 0.000
1956-1960 587.5 554 0.157 336.3 281 0.013 381.0 306 0.002
1961-1965 617.7 599 0.290 337.7 252 0.000 330.6 284 0.030
1966-1979 590.5 464 0.000 269.9 232 0.044 337.2 256 0.001
5 birth-cohorts
1912-1941 430.7 373 0.021 215.9 189 0.087 257.4 205 0.008
1942-1949 688.4 625 0.040 389.2 313 0.002 447.9 341 0.000
1950-1957 677.0 569 0.001 372.2 285 0.000 469.1 309 0.000
1958-1965 618.6 520 0.002 319.5 264 0.011 383.4 288 0.000
1966-1979 590.5 464 0.000 269.9 232 0.044 337.2 256 0.001
Note: Problematic models emphasised (P > 0.001)

C. Appendix C.
Complementary information on Chapter 5 .:From origin to destination: analysing trends in social mobility in Switzerland
267

268
Figure C.1: Marginal distributions of class destination by gender over birth-cohorts in percentagesfor Swiss citizens only

269
Figure C.2: Marginal distributions of class destination by gender over birth-cohorts inpercentages for foreign residents only

270
Figure C.3: Marginal distributions of father's social position over birth-cohorts in percentages forSwiss citizens only
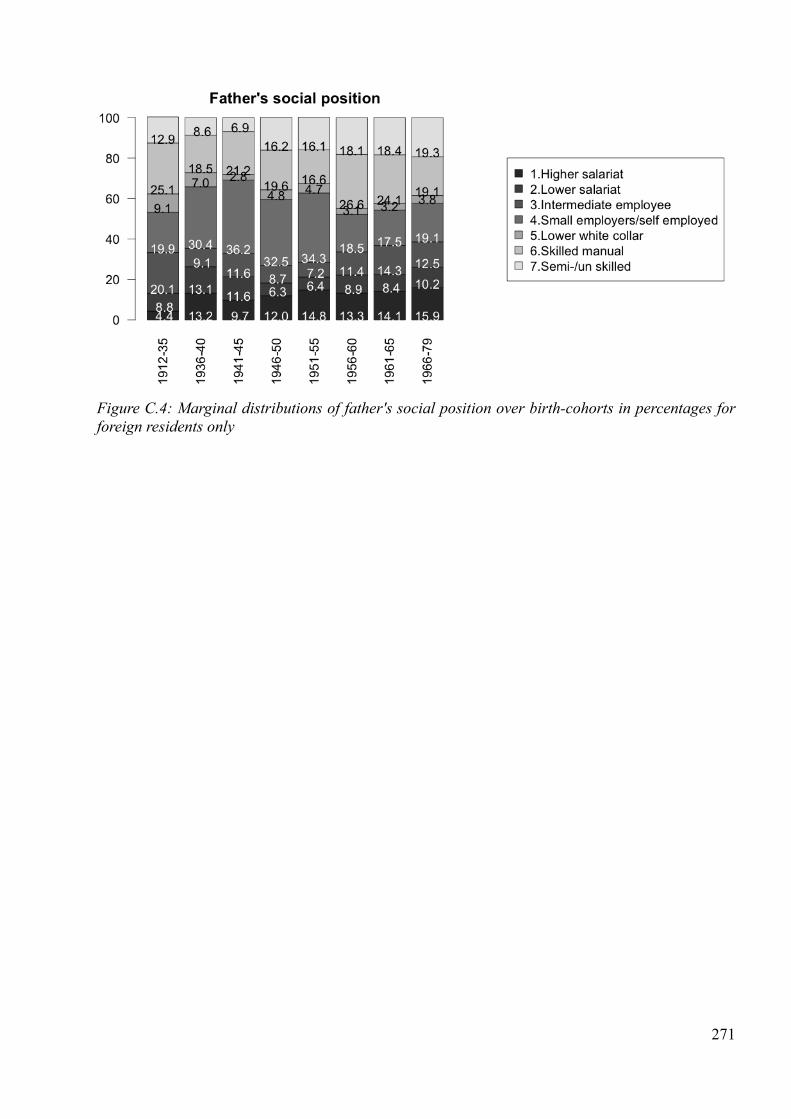
271
Figure C.4: Marginal distributions of father's social position over birth-cohorts in percentages forforeign residents only

272
Figure C.5: Marginal distributions of class destination by social origin over birth-cohorts inpercentages for Swiss citizens only

273
Figure C.6: Marginal distributions of class destination by social origin over birth-cohorts inpercentages for foreign residents only
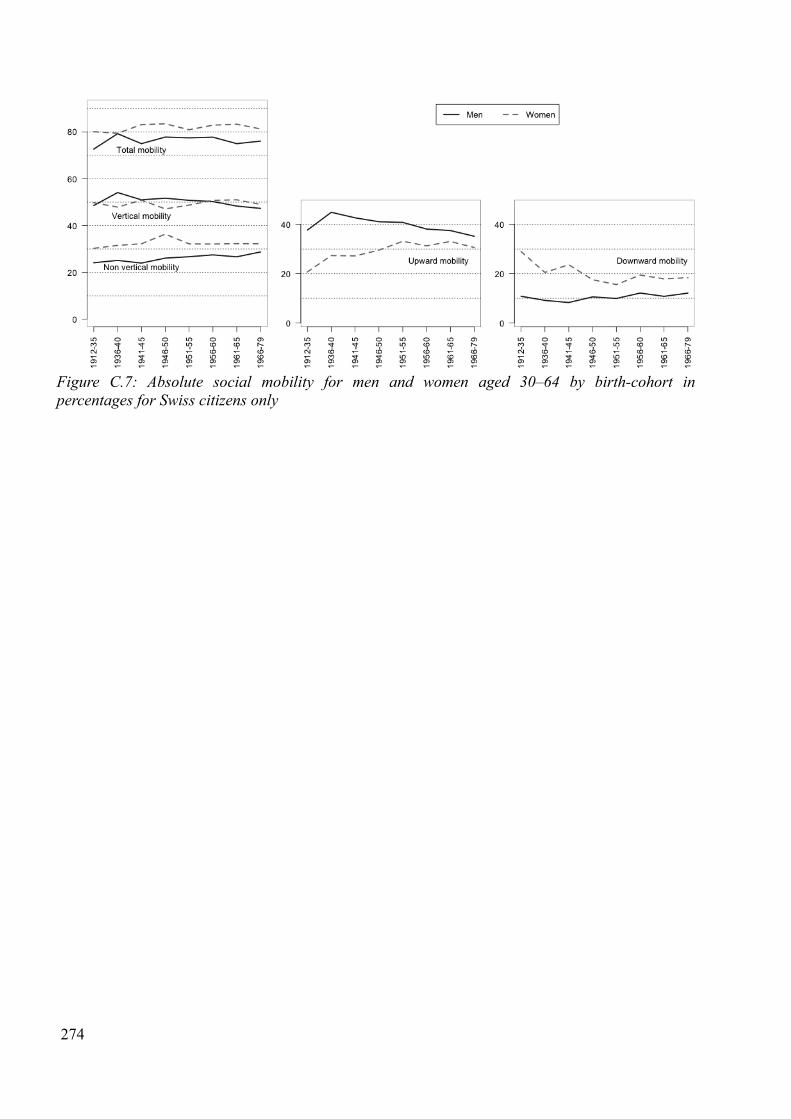
274
Figure C.7: Absolute social mobility for men and women aged 30–64 by birth-cohort inpercentages for Swiss citizens only

275
Figure C.8: Absolute social mobility for men and women aged 30–64 by birth-cohort inpercentages for foreign residents only
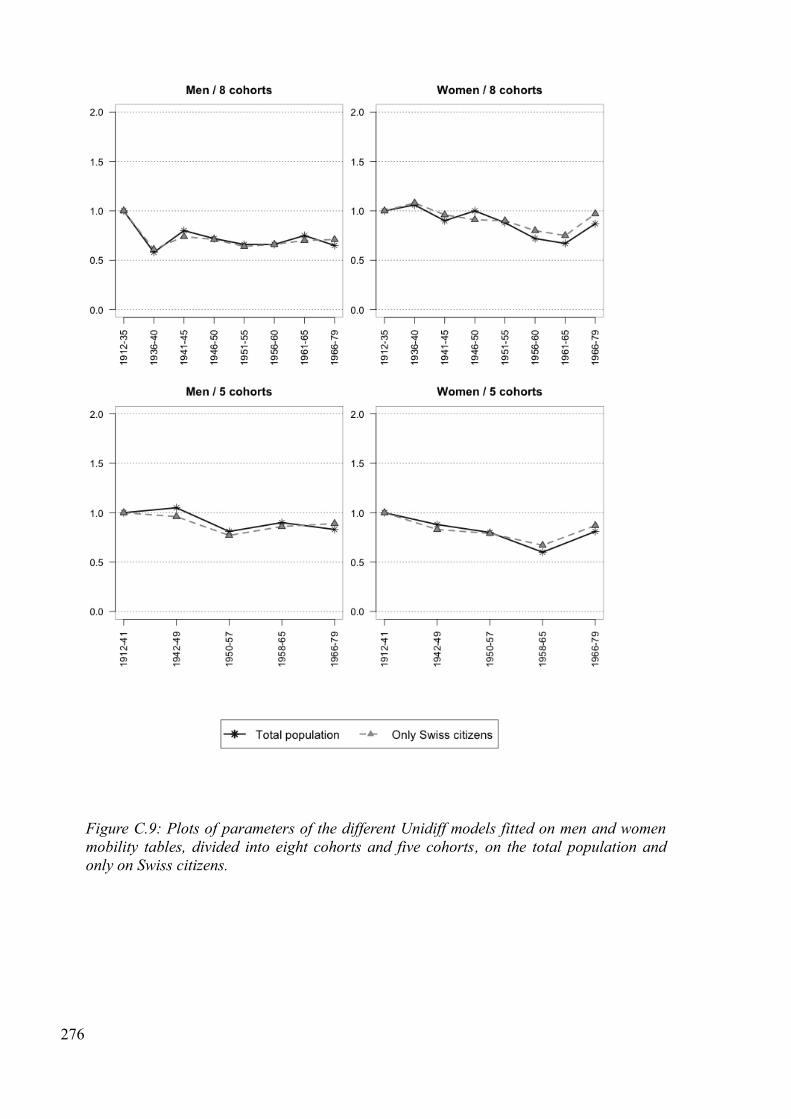
276
Figure C.9: Plots of parameters of the different Unidiff models fitted on men and womenmobility tables, divided into eight cohorts and five cohorts, on the total population andonly on Swiss citizens.
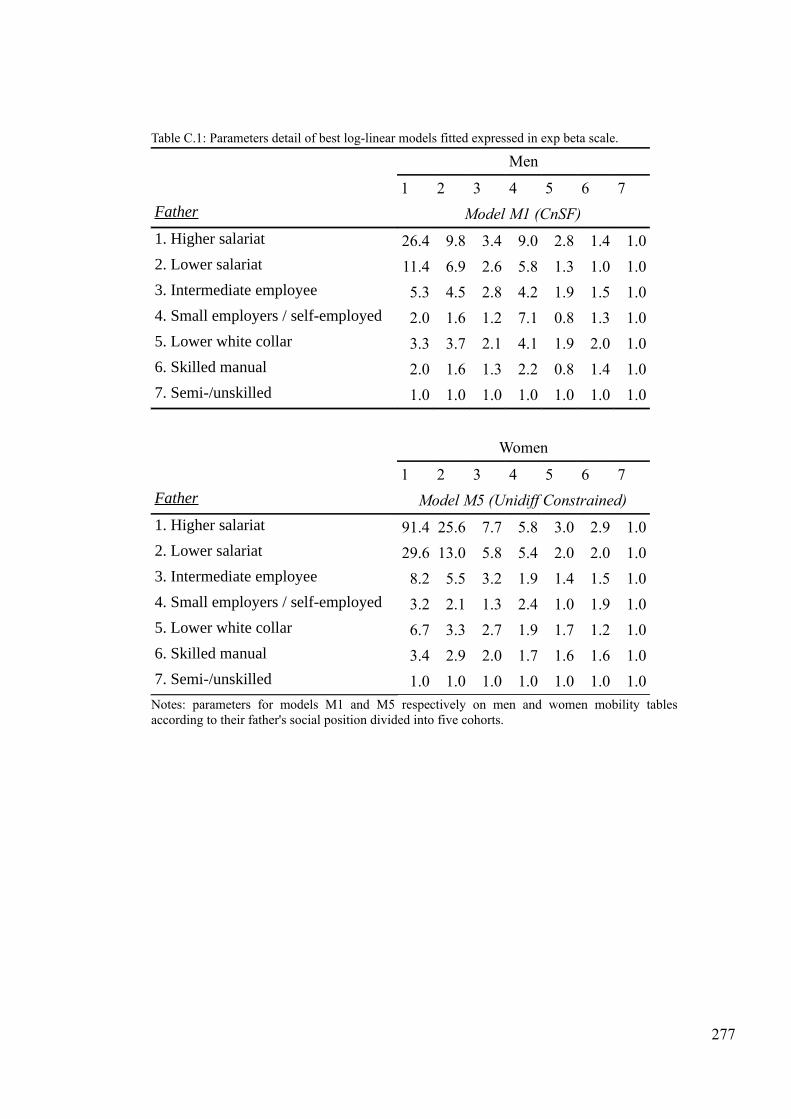
277
Table C.1: Parameters detail of best log-linear models fitted expressed in exp beta scale.
Men
1 2 3 4 5 6 7
Father Model M1 (CnSF)
1. Higher salariat 26.4 9.8 3.4 9.0 2.8 1.4 1.0
2. Lower salariat 11.4 6.9 2.6 5.8 1.3 1.0 1.0
3. Intermediate employee 5.3 4.5 2.8 4.2 1.9 1.5 1.0
4. Small employers / self-employed 2.0 1.6 1.2 7.1 0.8 1.3 1.0
5. Lower white collar 3.3 3.7 2.1 4.1 1.9 2.0 1.0
6. Skilled manual 2.0 1.6 1.3 2.2 0.8 1.4 1.0
7. Semi-/unskilled 1.0 1.0 1.0 1.0 1.0 1.0 1.0
Women
1 2 3 4 5 6 7
Father Model M5 (Unidiff Constrained)
1. Higher salariat 91.4 25.6 7.7 5.8 3.0 2.9 1.0
2. Lower salariat 29.6 13.0 5.8 5.4 2.0 2.0 1.0
3. Intermediate employee 8.2 5.5 3.2 1.9 1.4 1.5 1.0
4. Small employers / self-employed 3.2 2.1 1.3 2.4 1.0 1.9 1.0
5. Lower white collar 6.7 3.3 2.7 1.9 1.7 1.2 1.0
6. Skilled manual 3.4 2.9 2.0 1.7 1.6 1.6 1.0
7. Semi-/unskilled 1.0 1.0 1.0 1.0 1.0 1.0 1.0
Notes: parameters for models M1 and M5 respectively on men and women mobility tablesaccording to their father's social position divided into five cohorts.

278

D. Appendix D.
Complementary information on Chapter 6 .:When education reproduces social inequalities: explaining how education mediates constant social mobility in Switzerland
279

280
Figure D.1: Trends over birth-cohorts in educational distribution by gender and citizenship

281
Figure D.2: Trends over birth-cohorts in educational distribution by social origin and bycitizenship
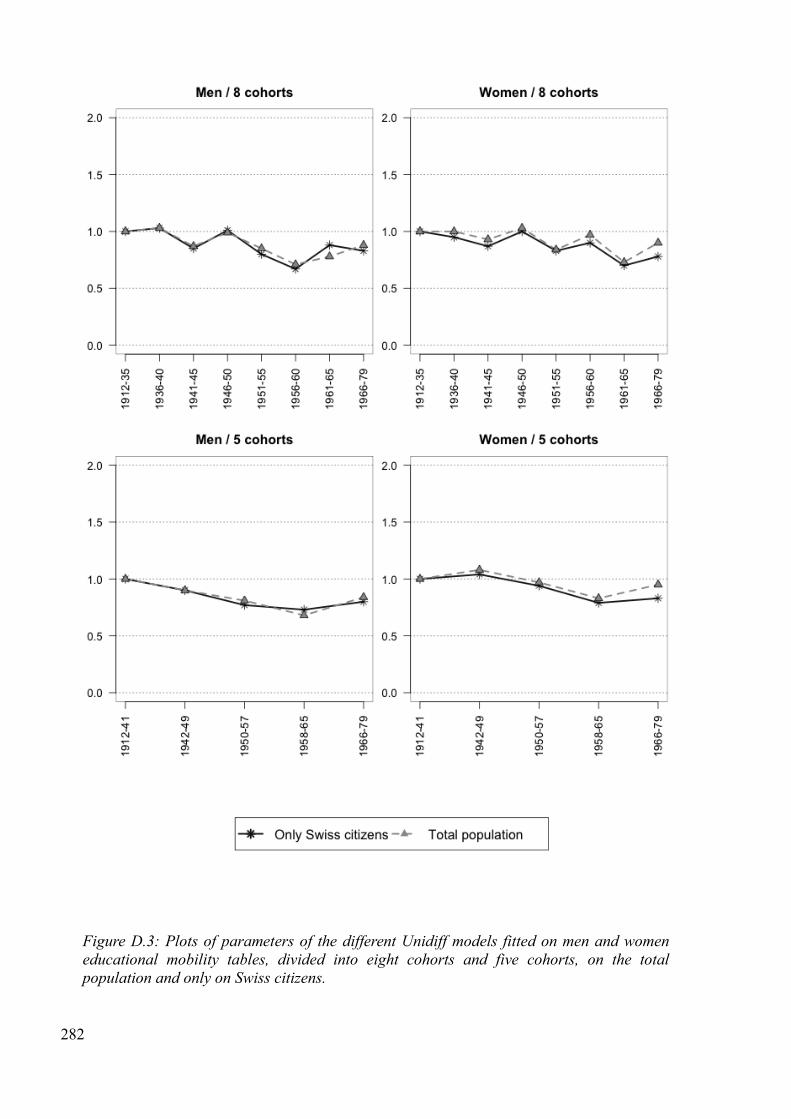
282
Figure D.3: Plots of parameters of the different Unidiff models fitted on men and womeneducational mobility tables, divided into eight cohorts and five cohorts, on the totalpopulation and only on Swiss citizens.

283
Table D.1: Parameters detail of best log-linear models fitted for the educational mobility tables expressed in exp betascale.
Men Women
E1 E2 E3 E4 E5 E1 E2 E3 E4 E5
Father Model M2 (Unidiff) Model M1 (CnSF)
1. Higher salariat 1.0 12.6 2.6 15.8 155.3 1.0 14.7 3.5 13.6 66.7
2. Lower salariat 1.0 7.7 2.6 12.7 54.2 1.0 11.2 2.9 9.0 33.4
3. Intermediate employee 1.0 5.3 3.5 7.4 21.2 1.0 6.4 2.8 4.6 10.7
4. Small employers / self-employed 1.0 1.1 1.0 1.7 2.7 1.0 2.2 1.2 2.4 4.1
5. Lower white collar 1.0 1.8 1.2 2.3 4.1 1.0 3.8 2.1 2.7 5.9
6. Skilled manual 1.0 1.3 1.5 2.2 2.9 1.0 2.1 1.7 2.0 2.3
7. Semi-/unskilled 1.0 1.0 1.0 1.0 1.0 1.0 1.0 1.0 1.0 1.0
Notes: E1=compulsory education; E2=secondary general education; E3=secondary professional education; E4=tertiaryvocational education; E5=tertiary general education

284
Figure D.4: Trends over birth-cohorts in educational distribution by social class destinationand by citizenship
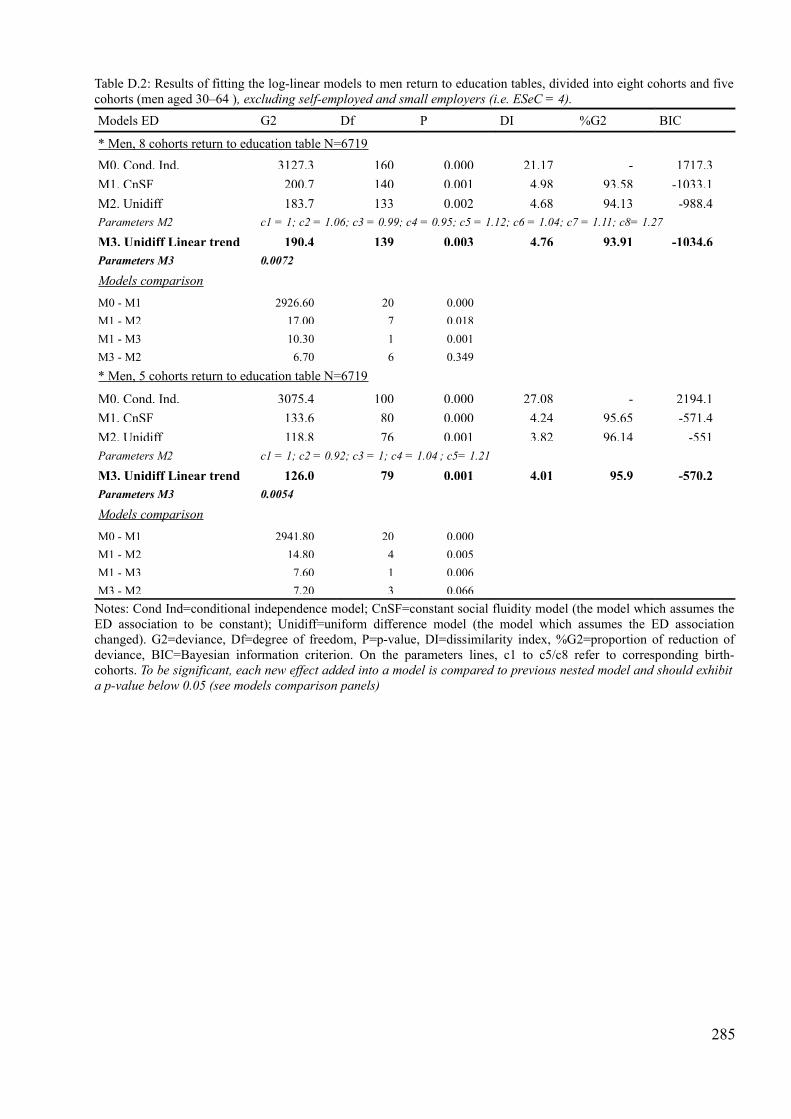
Table D.2: Results of fitting the log-linear models to men return to education tables, divided into eight cohorts and fivecohorts (men aged 30–64 ), excluding self-employed and small employers (i.e. ESeC = 4).
Models ED G2 Df P DI %G2 BIC
* Men, 8 cohorts return to education table N=6719
M0. Cond. Ind. 3127.3 160 0.000 21.17 - 1717.3
M1. CnSF 200.7 140 0.001 4.98 93.58 -1033.1
M2. Unidiff 183.7 133 0.002 4.68 94.13 -988.4Parameters M2 c1 = 1; c2 = 1.06; c3 = 0.99; c4 = 0.95; c5 = 1.12; c6 = 1.04; c7 = 1.11; c8= 1.27
M3. Unidiff Linear trend 190.4 139 0.003 4.76 93.91 -1034.6Parameters M3 0.0072
Models comparison
M0 - M1 2926.60 20 0.000
M1 - M2 17.00 7 0.018
M1 - M3 10.30 1 0.001
M3 - M2 6.70 6 0.349
* Men, 5 cohorts return to education table N=6719
M0. Cond. Ind. 3075.4 100 0.000 27.08 - 2194.1
M1. CnSF 133.6 80 0.000 4.24 95.65 -571.4
M2. Unidiff 118.8 76 0.001 3.82 96.14 -551Parameters M2 c1 = 1; c2 = 0.92; c3 = 1; c4 = 1.04 ; c5= 1.21
M3. Unidiff Linear trend 126.0 79 0.001 4.01 95.9 -570.2Parameters M3 0.0054
Models comparison
M0 - M1 2941.80 20 0.000
M1 - M2 14.80 4 0.005
M1 - M3 7.60 1 0.006
M3 - M2 7.20 3 0.066
Notes: Cond Ind=conditional independence model; CnSF=constant social fluidity model (the model which assumes theED association to be constant); Unidiff=uniform difference model (the model which assumes the ED associationchanged). G2=deviance, Df=degree of freedom, P=p-value, DI=dissimilarity index, %G2=proportion of reduction ofdeviance, BIC=Bayesian information criterion. On the parameters lines, c1 to c5/c8 refer to corresponding birth-cohorts. To be significant, each new effect added into a model is compared to previous nested model and should exhibita p-value below 0.05 (see models comparison panels)
285
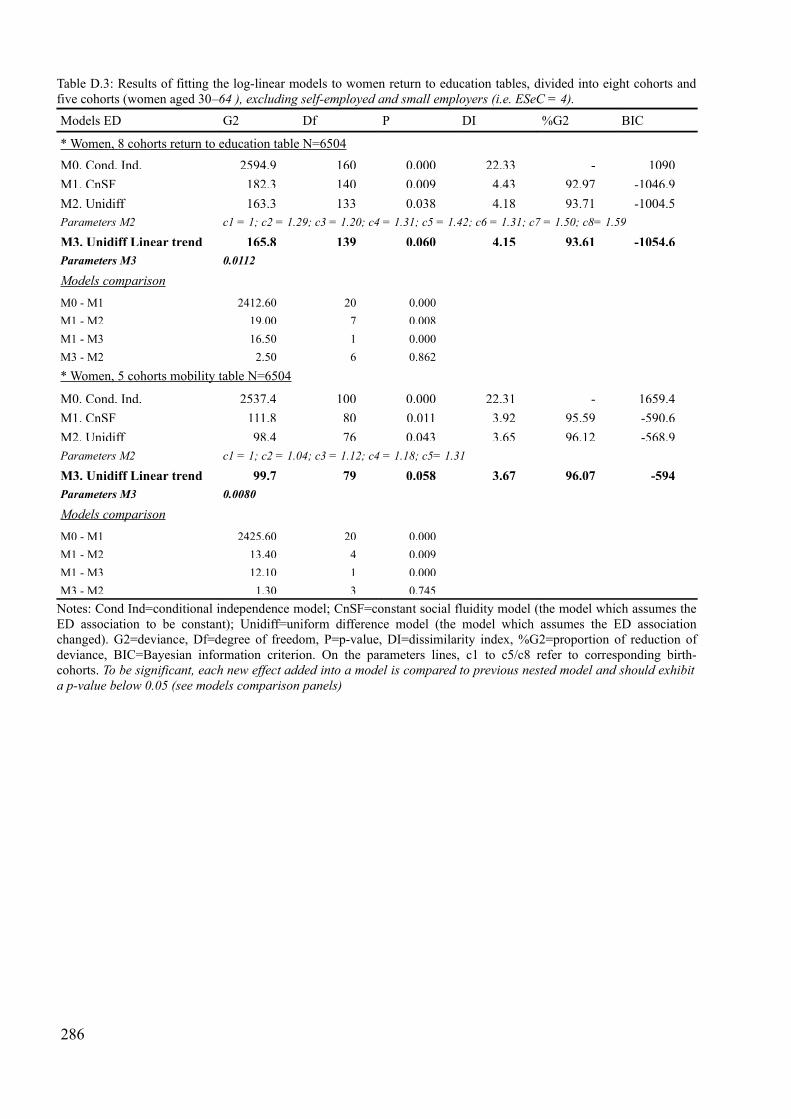
Table D.3: Results of fitting the log-linear models to women return to education tables, divided into eight cohorts andfive cohorts (women aged 30–64 ), excluding self-employed and small employers (i.e. ESeC = 4).
Models ED G2 Df P DI %G2 BIC
* Women, 8 cohorts return to education table N=6504
M0. Cond. Ind. 2594.9 160 0.000 22.33 - 1090
M1. CnSF 182.3 140 0.009 4.43 92.97 -1046.9
M2. Unidiff 163.3 133 0.038 4.18 93.71 -1004.5Parameters M2 c1 = 1; c2 = 1.29; c3 = 1.20; c4 = 1.31; c5 = 1.42; c6 = 1.31; c7 = 1.50; c8= 1.59
M3. Unidiff Linear trend 165.8 139 0.060 4.15 93.61 -1054.6Parameters M3 0.0112
Models comparison
M0 - M1 2412.60 20 0.000
M1 - M2 19.00 7 0.008
M1 - M3 16.50 1 0.000
M3 - M2 2.50 6 0.862
* Women, 5 cohorts mobility table N=6504
M0. Cond. Ind. 2537.4 100 0.000 22.31 - 1659.4
M1. CnSF 111.8 80 0.011 3.92 95.59 -590.6
M2. Unidiff 98.4 76 0.043 3.65 96.12 -568.9Parameters M2 c1 = 1; c2 = 1.04; c3 = 1.12; c4 = 1.18; c5= 1.31
M3. Unidiff Linear trend 99.7 79 0.058 3.67 96.07 -594Parameters M3 0.0080
Models comparison
M0 - M1 2425.60 20 0.000
M1 - M2 13.40 4 0.009
M1 - M3 12.10 1 0.000
M3 - M2 1.30 3 0.745
Notes: Cond Ind=conditional independence model; CnSF=constant social fluidity model (the model which assumes theED association to be constant); Unidiff=uniform difference model (the model which assumes the ED associationchanged). G2=deviance, Df=degree of freedom, P=p-value, DI=dissimilarity index, %G2=proportion of reduction ofdeviance, BIC=Bayesian information criterion. On the parameters lines, c1 to c5/c8 refer to corresponding birth-cohorts. To be significant, each new effect added into a model is compared to previous nested model and should exhibita p-value below 0.05 (see models comparison panels)
286
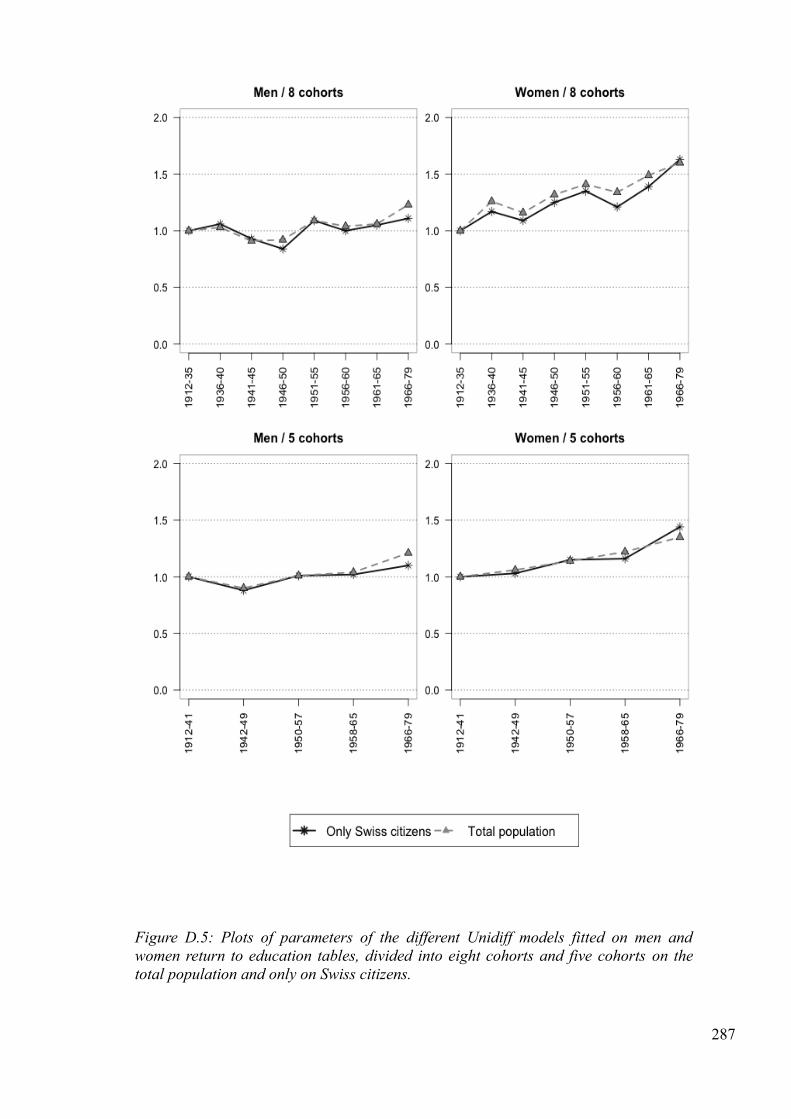
287
Figure D.5: Plots of parameters of the different Unidiff models fitted on men andwomen return to education tables, divided into eight cohorts and five cohorts on thetotal population and only on Swiss citizens.
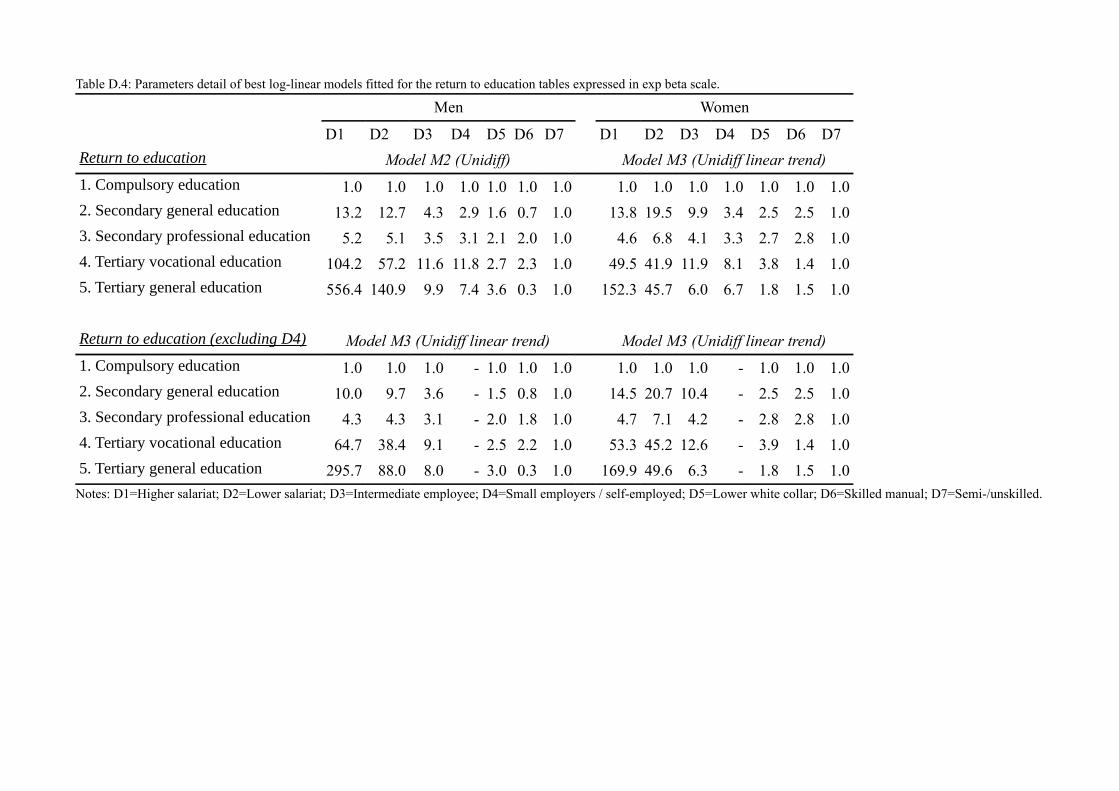
Table D.4: Parameters detail of best log-linear models fitted for the return to education tables expressed in exp beta scale.
Men Women
D1 D2 D3 D4 D5 D6 D7 D1 D2 D3 D4 D5 D6 D7
Return to education Model M2 (Unidiff) Model M3 (Unidiff linear trend)
1. Compulsory education 1.0 1.0 1.0 1.0 1.0 1.0 1.0 1.0 1.0 1.0 1.0 1.0 1.0 1.0
2. Secondary general education 13.2 12.7 4.3 2.9 1.6 0.7 1.0 13.8 19.5 9.9 3.4 2.5 2.5 1.0
3. Secondary professional education 5.2 5.1 3.5 3.1 2.1 2.0 1.0 4.6 6.8 4.1 3.3 2.7 2.8 1.0
4. Tertiary vocational education 104.2 57.2 11.6 11.8 2.7 2.3 1.0 49.5 41.9 11.9 8.1 3.8 1.4 1.0
5. Tertiary general education 556.4 140.9 9.9 7.4 3.6 0.3 1.0 152.3 45.7 6.0 6.7 1.8 1.5 1.0
Return to education (excluding D4) Model M3 (Unidiff linear trend) Model M3 (Unidiff linear trend)
1. Compulsory education 1.0 1.0 1.0 - 1.0 1.0 1.0 1.0 1.0 1.0 - 1.0 1.0 1.0
2. Secondary general education 10.0 9.7 3.6 - 1.5 0.8 1.0 14.5 20.7 10.4 - 2.5 2.5 1.0
3. Secondary professional education 4.3 4.3 3.1 - 2.0 1.8 1.0 4.7 7.1 4.2 - 2.8 2.8 1.0
4. Tertiary vocational education 64.7 38.4 9.1 - 2.5 2.2 1.0 53.3 45.2 12.6 - 3.9 1.4 1.0
5. Tertiary general education 295.7 88.0 8.0 - 3.0 0.3 1.0 169.9 49.6 6.3 - 1.8 1.5 1.0
Notes: D1=Higher salariat; D2=Lower salariat; D3=Intermediate employee; D4=Small employers / self-employed; D5=Lower white collar; D6=Skilled manual; D7=Semi-/unskilled.
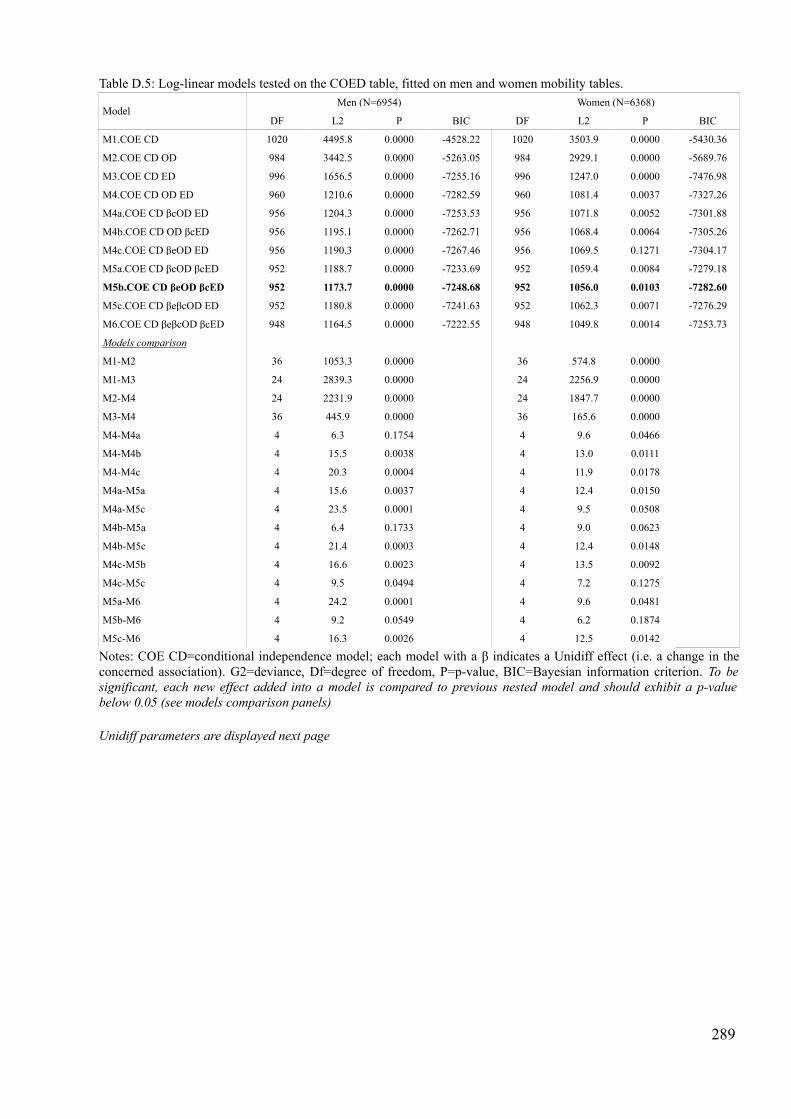
289
Table D.5: Log-linear models tested on the COED table, fitted on men and women mobility tables.
ModelMen (N=6954) Women (N=6368)
DF L2 P BIC DF L2 P BIC
M1.COE CD 1020 4495.8 0.0000 -4528.22 1020 3503.9 0.0000 -5430.36
M2.COE CD OD 984 3442.5 0.0000 -5263.05 984 2929.1 0.0000 -5689.76
M3.COE CD ED 996 1656.5 0.0000 -7255.16 996 1247.0 0.0000 -7476.98
M4.COE CD OD ED 960 1210.6 0.0000 -7282.59 960 1081.4 0.0037 -7327.26
M4a.COE CD βcOD ED 956 1204.3 0.0000 -7253.53 956 1071.8 0.0052 -7301.88
M4b.COE CD OD βcED 956 1195.1 0.0000 -7262.71 956 1068.4 0.0064 -7305.26
M4c.COE CD βeOD ED 956 1190.3 0.0000 -7267.46 956 1069.5 0.1271 -7304.17
M5a.COE CD βcOD βcED 952 1188.7 0.0000 -7233.69 952 1059.4 0.0084 -7279.18
M5b.COE CD βeOD βcED 952 1173.7 0.0000 -7248.68 952 1056.0 0.0103 -7282.60
M5c.COE CD βeβcOD ED 952 1180.8 0.0000 -7241.63 952 1062.3 0.0071 -7276.29
M6.COE CD βeβcOD βcED 948 1164.5 0.0000 -7222.55 948 1049.8 0.0014 -7253.73
Models comparison
M1-M2 36 1053.3 0.0000 36 574.8 0.0000
M1-M3 24 2839.3 0.0000 24 2256.9 0.0000
M2-M4 24 2231.9 0.0000 24 1847.7 0.0000
M3-M4 36 445.9 0.0000 36 165.6 0.0000
M4-M4a 4 6.3 0.1754 4 9.6 0.0466
M4-M4b 4 15.5 0.0038 4 13.0 0.0111
M4-M4c 4 20.3 0.0004 4 11.9 0.0178
M4a-M5a 4 15.6 0.0037 4 12.4 0.0150
M4a-M5c 4 23.5 0.0001 4 9.5 0.0508
M4b-M5a 4 6.4 0.1733 4 9.0 0.0623
M4b-M5c 4 21.4 0.0003 4 12.4 0.0148
M4c-M5b 4 16.6 0.0023 4 13.5 0.0092
M4c-M5c 4 9.5 0.0494 4 7.2 0.1275
M5a-M6 4 24.2 0.0001 4 9.6 0.0481
M5b-M6 4 9.2 0.0549 4 6.2 0.1874
M5c-M6 4 16.3 0.0026 4 12.5 0.0142
Notes: COE CD=conditional independence model; each model with a β indicates a Unidiff effect (i.e. a change in theconcerned association). G2=deviance, Df=degree of freedom, P=p-value, BIC=Bayesian information criterion. To besignificant, each new effect added into a model is compared to previous nested model and should exhibit a p-valuebelow 0.05 (see models comparison panels)
Unidiff parameters are displayed next page
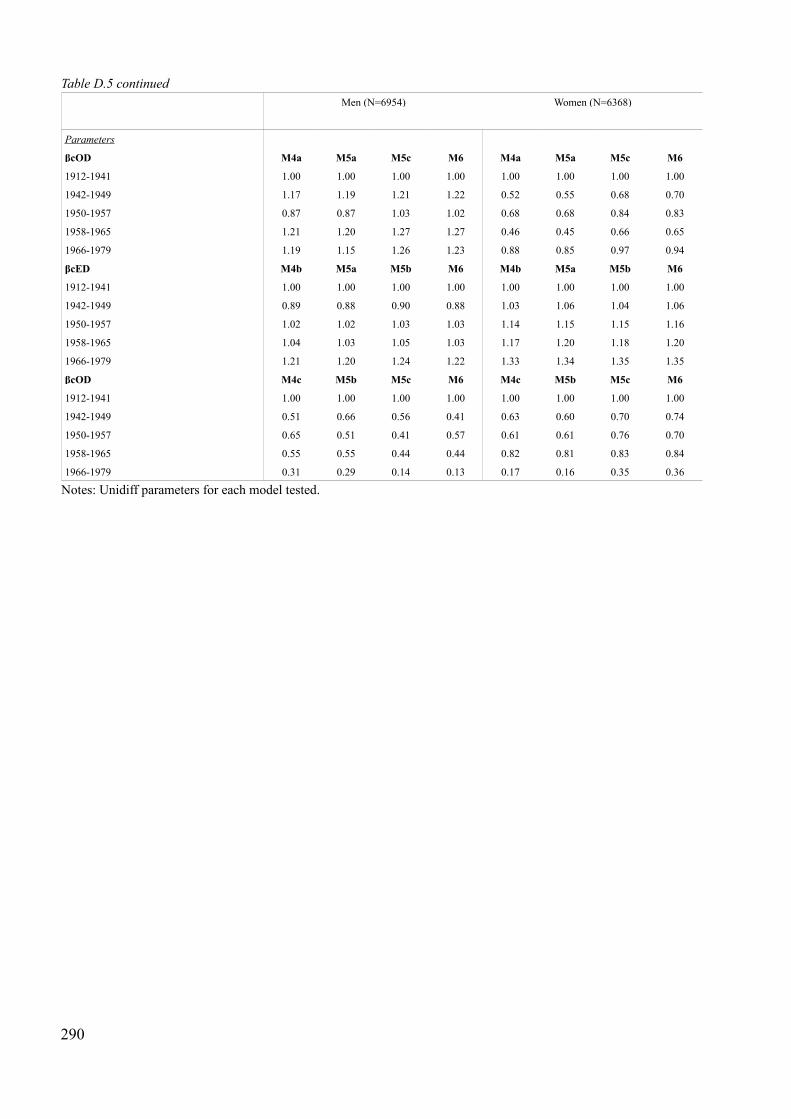
290
Table D.5 continuedMen (N=6954) Women (N=6368)
Parameters
βcOD M4a M5a M5c M6 M4a M5a M5c M6
1912-1941 1.00 1.00 1.00 1.00 1.00 1.00 1.00 1.00
1942-1949 1.17 1.19 1.21 1.22 0.52 0.55 0.68 0.70
1950-1957 0.87 0.87 1.03 1.02 0.68 0.68 0.84 0.83
1958-1965 1.21 1.20 1.27 1.27 0.46 0.45 0.66 0.65
1966-1979 1.19 1.15 1.26 1.23 0.88 0.85 0.97 0.94
βcED M4b M5a M5b M6 M4b M5a M5b M6
1912-1941 1.00 1.00 1.00 1.00 1.00 1.00 1.00 1.00
1942-1949 0.89 0.88 0.90 0.88 1.03 1.06 1.04 1.06
1950-1957 1.02 1.02 1.03 1.03 1.14 1.15 1.15 1.16
1958-1965 1.04 1.03 1.05 1.03 1.17 1.20 1.18 1.20
1966-1979 1.21 1.20 1.24 1.22 1.33 1.34 1.35 1.35
βcOD M4c M5b M5c M6 M4c M5b M5c M6
1912-1941 1.00 1.00 1.00 1.00 1.00 1.00 1.00 1.00
1942-1949 0.51 0.66 0.56 0.41 0.63 0.60 0.70 0.74
1950-1957 0.65 0.51 0.41 0.57 0.61 0.61 0.76 0.70
1958-1965 0.55 0.55 0.44 0.44 0.82 0.81 0.83 0.84
1966-1979 0.31 0.29 0.14 0.13 0.17 0.16 0.35 0.36
Notes: Unidiff parameters for each model tested.

E. Appendix E
The core model of social fluidity : An overview
291
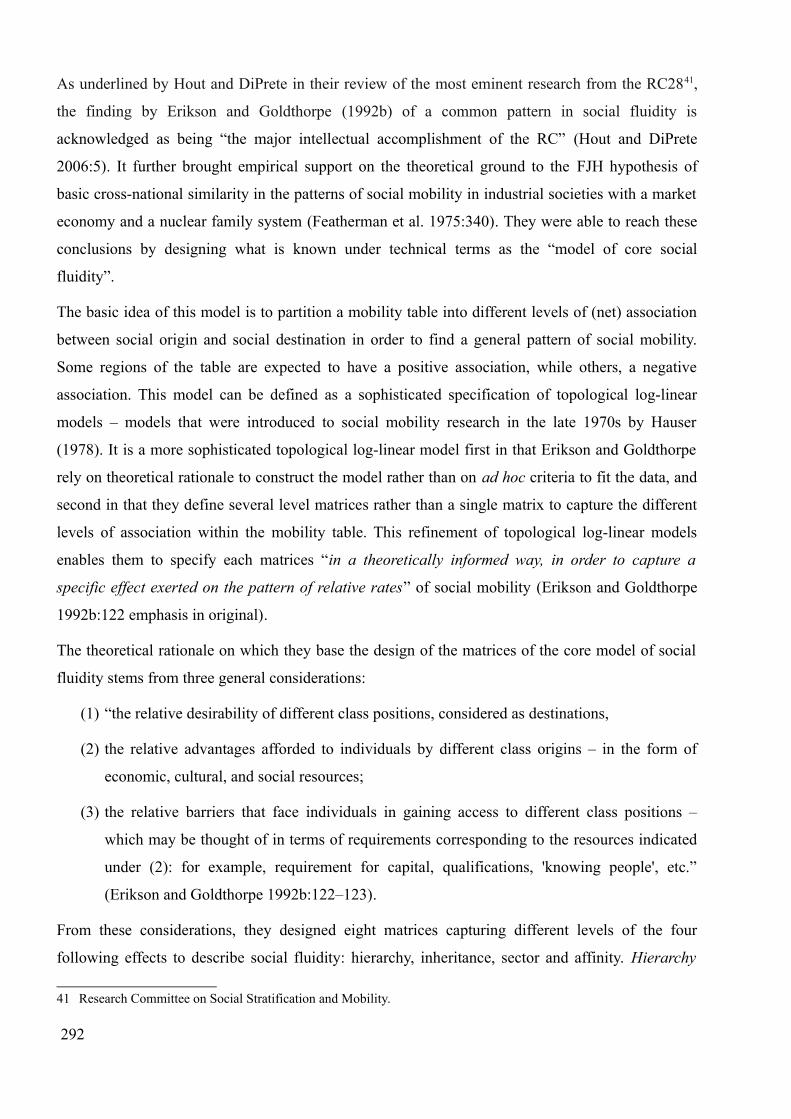
As underlined by Hout and DiPrete in their review of the most eminent research from the RC2841,
the finding by Erikson and Goldthorpe (1992b) of a common pattern in social fluidity is
acknowledged as being “the major intellectual accomplishment of the RC” (Hout and DiPrete
2006:5). It further brought empirical support on the theoretical ground to the FJH hypothesis of
basic cross-national similarity in the patterns of social mobility in industrial societies with a market
economy and a nuclear family system (Featherman et al. 1975:340). They were able to reach these
conclusions by designing what is known under technical terms as the “model of core social
fluidity”.
The basic idea of this model is to partition a mobility table into different levels of (net) association
between social origin and social destination in order to find a general pattern of social mobility.
Some regions of the table are expected to have a positive association, while others, a negative
association. This model can be defined as a sophisticated specification of topological log-linear
models – models that were introduced to social mobility research in the late 1970s by Hauser
(1978). It is a more sophisticated topological log-linear model first in that Erikson and Goldthorpe
rely on theoretical rationale to construct the model rather than on ad hoc criteria to fit the data, and
second in that they define several level matrices rather than a single matrix to capture the different
levels of association within the mobility table. This refinement of topological log-linear models
enables them to specify each matrices “in a theoretically informed way, in order to capture a
specific effect exerted on the pattern of relative rates” of social mobility (Erikson and Goldthorpe
1992b:122 emphasis in original).
The theoretical rationale on which they base the design of the matrices of the core model of social
fluidity stems from three general considerations:
(1) “the relative desirability of different class positions, considered as destinations,
(2) the relative advantages afforded to individuals by different class origins – in the form of
economic, cultural, and social resources;
(3) the relative barriers that face individuals in gaining access to different class positions –
which may be thought of in terms of requirements corresponding to the resources indicated
under (2): for example, requirement for capital, qualifications, 'knowing people', etc.”
(Erikson and Goldthorpe 1992b:122–123).
From these considerations, they designed eight matrices capturing different levels of the four
following effects to describe social fluidity: hierarchy, inheritance, sector and affinity. Hierarchy
41 Research Committee on Social Stratification and Mobility.
292
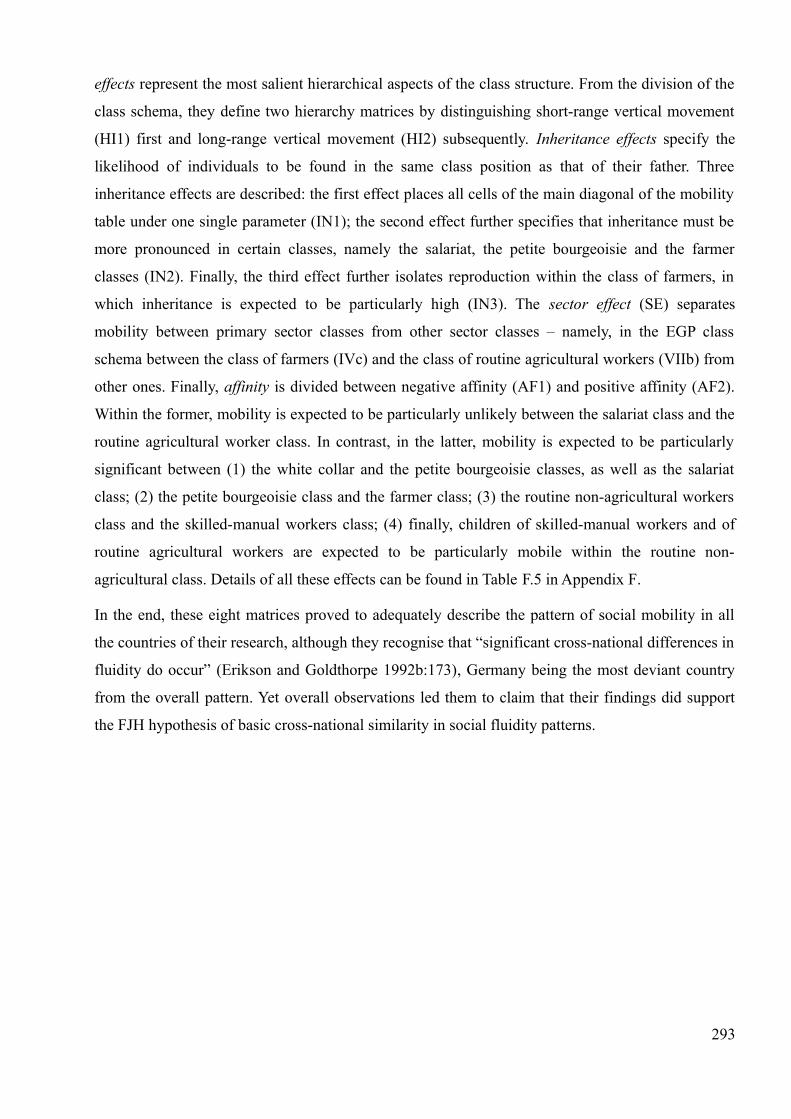
effects represent the most salient hierarchical aspects of the class structure. From the division of the
class schema, they define two hierarchy matrices by distinguishing short-range vertical movement
(HI1) first and long-range vertical movement (HI2) subsequently. Inheritance effects specify the
likelihood of individuals to be found in the same class position as that of their father. Three
inheritance effects are described: the first effect places all cells of the main diagonal of the mobility
table under one single parameter (IN1); the second effect further specifies that inheritance must be
more pronounced in certain classes, namely the salariat, the petite bourgeoisie and the farmer
classes (IN2). Finally, the third effect further isolates reproduction within the class of farmers, in
which inheritance is expected to be particularly high (IN3). The sector effect (SE) separates
mobility between primary sector classes from other sector classes – namely, in the EGP class
schema between the class of farmers (IVc) and the class of routine agricultural workers (VIIb) from
other ones. Finally, affinity is divided between negative affinity (AF1) and positive affinity (AF2).
Within the former, mobility is expected to be particularly unlikely between the salariat class and the
routine agricultural worker class. In contrast, in the latter, mobility is expected to be particularly
significant between (1) the white collar and the petite bourgeoisie classes, as well as the salariat
class; (2) the petite bourgeoisie class and the farmer class; (3) the routine non-agricultural workers
class and the skilled-manual workers class; (4) finally, children of skilled-manual workers and of
routine agricultural workers are expected to be particularly mobile within the routine non-
agricultural class. Details of all these effects can be found in Table F.5 in Appendix F.
In the end, these eight matrices proved to adequately describe the pattern of social mobility in all
the countries of their research, although they recognise that “significant cross-national differences in
fluidity do occur” (Erikson and Goldthorpe 1992b:173), Germany being the most deviant country
from the overall pattern. Yet overall observations led them to claim that their findings did support
the FJH hypothesis of basic cross-national similarity in social fluidity patterns.
293

294

F. Appendix F
Complementary information on Chapter 7 .:Barriers to social mobility in Switzerland: finding the Swiss pattern of social mobility and disaggregating the big service class in social mobility analysis
295

Table F.1: Recap of all effects tested for each models of Tables 7.3 and 7.4
model effects
M2a HI1 + HI2 + IN1 + IN2 + IN3 + SE + AF1 + AF2
M2b HI1 + HI2 + IN1 + IN2 + IN3 + SE + AF1 G + AF2
M2c HI1 + HI2 + IN1 + IN2 + IN3 + SE + AF1 + AF2 G
M2d HI1 + HI2 + IN1 + IN2 + IN3 + SE + AF1 G + AF2 G
M2e HI1 + HI2 + IN1 + IN2 + IN3 + SE + AF1 S + AF2
M2f HI1 + HI2 + IN1 + IN2 + IN3 + SE + AF1 + AF2 S
M2g HI1 + HI2 + IN1 + IN2 + IN3 + SE + AF1 S + AF2 S
M3a HI1 + HI2 + IN1 + IN2 + IN3 + SE + AF1 Ga + AF2
M3b HI1 + HI2 + IN1 + IN2 + IN3 + SE + AF1 Gb + AF2
M3c HI1 + HI2 + IN1 + IN2 + IN3 + SE + AF1 Gc + AF2
M3d HI1 + HI2 + IN1 + IN2 + IN3 + SE + AF1 Gd + AF2
M3e HI1 + HI2 + IN1 + IN2 + IN3 + SE + AF1 Ge + AF2
M3f HI1 + HI2 + IN1 + IN2 + IN3 + SE + AF1 Gd + AF2a
M3g HI1 + HI2 + IN1 + IN2 + IN3 + SE + AF1 Gd + AF2b
Table F.2: Recap of all effects tested for each models of Tables 7.7 and 7.8
model effects
M2 HI1 + HI2 + IN1 + IN2 + IN3 + AF1 + AF2
M3 HI1 + HI2 + IN1 + IN2 + IN3 + AF1 Gd + AF2a
M4a HI1 + HI2 + IN1oe + IN2 + IN3 + AF1 Gd + AF2a
M4b HI1 + HI2 + IN1oe + IN2oe1 + IN3 + AF1 Gd + AF2a
M4c HI1 + HI2 + IN1oe + IN2oe2 + IN3 + AF1 Gd + AF2a
M4d HI1 + HI2 + IN1oe + IN2oe2 + IN3oe + AF1 Gd + AF2a
M4e HI1 + HI2 + IN1oe + IN2oe2 + IN3 + SEoe + AF1 Gd + AF2a
M4f HI1 + HI2 + IN1oe + IN2oe2 + IN3 + SEoe + AF1 Gd + AF2oe1
M4g HI1 + HI2 + IN1oe + IN2oe2 + IN3 + SEoe + AF1 Gd + AF2oe2
M4h HI1 + HI2 + IN1oe + IN2oe2 + IN3 + SEoe + AF1 Gd + AF2oe3
M4i HI1 + HI2 + IN1oe + IN2oe2 + IN3 + SEoe + AF1 Gd + AF2oe4
M4j HI1 + HI2 + IN1oe + IN2oe2 + IN3 + SEoe + AF1oe1 + AF2oe4
M4k HI1 + HI2 + IN1oe + IN2oe2 + IN3 + SEoe + AF1oe2 + AF2oe4
M4l HI1 + HI2 + IN1oe + IN2oe2 + IN3 + SEoe + AF1oe3 + AF2oe4
296

Table F.3: Detail and meaning of effects for models fitted on tables 7.3 and 7.4
Effect name Meaning of effect
HI1 – hierarchy 1 Unlikely short range mobility between [the service class] and [the routine non-manual workers + petty bourgeoisie + skilled workers] and
[farmers + the non-skilled workers + agricultural labourers]
HI2 – hierarchy 2 Unlikely long range mobility between [the service class] and [farmers + the non-skilled workers + agricultural labourers]
IN1 – inheritance 1 Immobility in all cases of the main diagonal
IN2 – inheritance 2 Immobility in service class, petty bourgeoisie and farmers
IN2 G – inheritance 2 Germany Immobility in petty bourgeoisie and farmers
IN3 – inheritance 3 Immobility in farmers
SE – sector Lower propensity for classes from primary sector (farmers and agricultural labourers) to move into other sectors
AF1 – negative affinity Unlikely mobility between agricultural labourers and the service class (symmetric effect)
AF1 G – negative affinity Germany Unlikely mobility (i) for children of [skilled workers sons + agricultural labourers] into [the service class + the routine non-manual workersclass + the petty bourgeoisie]; (ii) for children of [the service class] to move downwardly into [the agricultural labourers class].
AF1 S – negative affinity Switzerlandmen (Jacot 2013)
Unlikely mobility (i) for sons of [petty bourgeoisie + farmers] into [the service class]; (ii) for sons of [non-skilled workers + agriculturallabourers] into [petty bourgeoisie + farmers]; (iii) for sons of [service class] into [the skilled workers + non-skilled workers + agriculturallabourers]
AF1 S – negative affinity Switzerlandwomen (Jacot 2013)
Unlikely mobility (i) for daughters of [skilled workers] into [the service class]; (ii) for daughters of [non-skilled workers + agriculturallabourers] into [petty bourgeoisie + farmers]; (iii) for daughters of [service class] into [the skilled workers + non-skilled workers +agricultural labourers]
AF2 – positive affinity Likely mobility (i) between [routine non-manual workers + petty bourgeoisie] and [the service class] (symmetric effect); (ii) between [pettybourgeoisie] and [farmers] (symmetric effect); (iii) between [skilled workers] and [non-skilled workers] (symmetric effect); (iv) for sons of[farmers + agricultural labourers] into the [non-skilled workers].
AF2 G – positive affinity Germany Likely mobility in addition to effects specified in AF2 between [petty bourgeoisie] and [routine non-manual workers] (symmetric effect).
AF2 S – positive affinity Switzerlandmen (Jacot 2013)
Likely mobility (i) for sons of [service class] into [the petty bourgeoisie + farmers], (ii) for sons of [petty bourgeoisie + farmers] into [thenon-skilled workers + agricultural labourers]; (iii) for sons of [non-skilled workers + agricultural labourers] into [the skilled workers].
AF2 S – positive affinity Switzerlandwomen (Jacot 2013)
Likely mobility (i) for daughters of [service class] into [the routine non-manual workers]; (ii) daughters of [routine non-manual workers]into [the petty bourgeoisie + farmers]; (iii) daughters of [petty bourgeoisie + farmers] into [the non-skilled workers + agricultural labourers]
Table continued next page
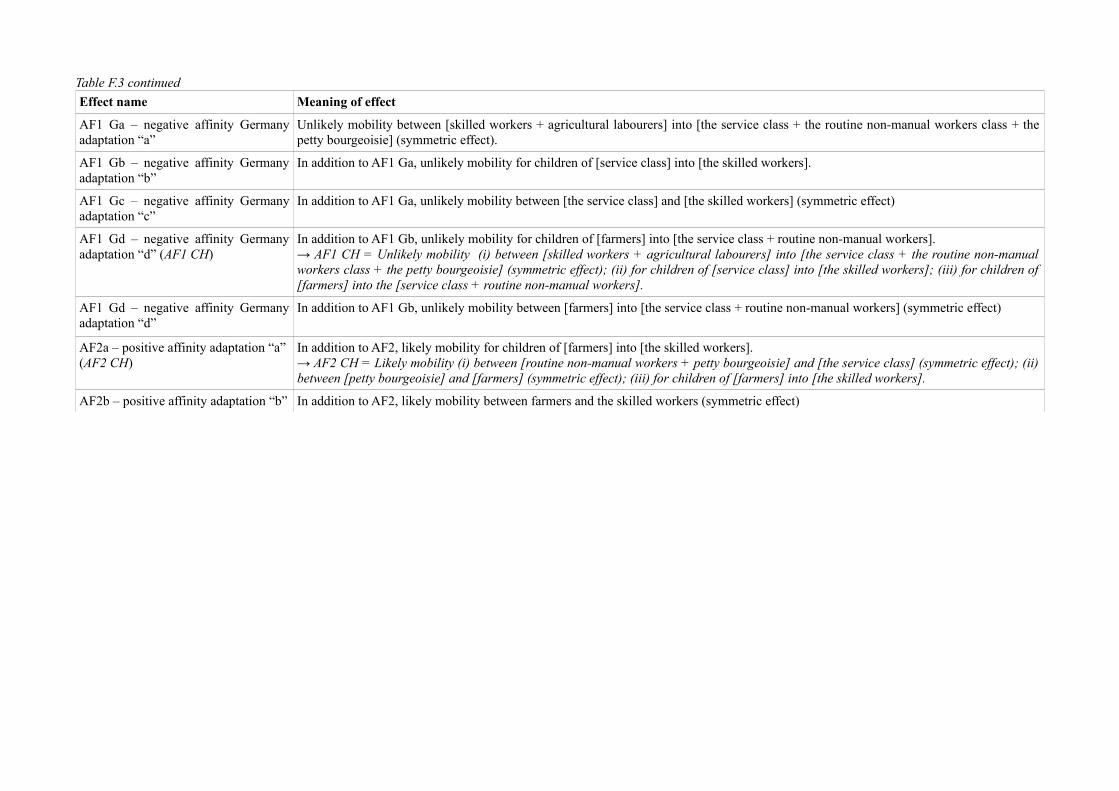
Table F.3 continued
Effect name Meaning of effect
AF1 Ga – negative affinity Germanyadaptation “a”
Unlikely mobility between [skilled workers + agricultural labourers] into [the service class + the routine non-manual workers class + thepetty bourgeoisie] (symmetric effect).
AF1 Gb – negative affinity Germanyadaptation “b”
In addition to AF1 Ga, unlikely mobility for children of [service class] into [the skilled workers].
AF1 Gc – negative affinity Germanyadaptation “c”
In addition to AF1 Ga, unlikely mobility between [the service class] and [the skilled workers] (symmetric effect)
AF1 Gd – negative affinity Germanyadaptation “d” (AF1 CH)
In addition to AF1 Gb, unlikely mobility for children of [farmers] into [the service class + routine non-manual workers].→ AF1 CH = Unlikely mobility (i) between [skilled workers + agricultural labourers] into [the service class + the routine non-manualworkers class + the petty bourgeoisie] (symmetric effect); (ii) for children of [service class] into [the skilled workers]; (iii) for children of[farmers] into the [service class + routine non-manual workers].
AF1 Gd – negative affinity Germanyadaptation “d”
In addition to AF1 Gb, unlikely mobility between [farmers] into [the service class + routine non-manual workers] (symmetric effect)
AF2a – positive affinity adaptation “a”(AF2 CH)
In addition to AF2, likely mobility for children of [farmers] into [the skilled workers].→ AF2 CH = Likely mobility (i) between [routine non-manual workers + petty bourgeoisie] and [the service class] (symmetric effect); (ii)between [petty bourgeoisie] and [farmers] (symmetric effect); (iii) for children of [farmers] into [the skilled workers].
AF2b – positive affinity adaptation “b” In addition to AF2, likely mobility between farmers and the skilled workers (symmetric effect)
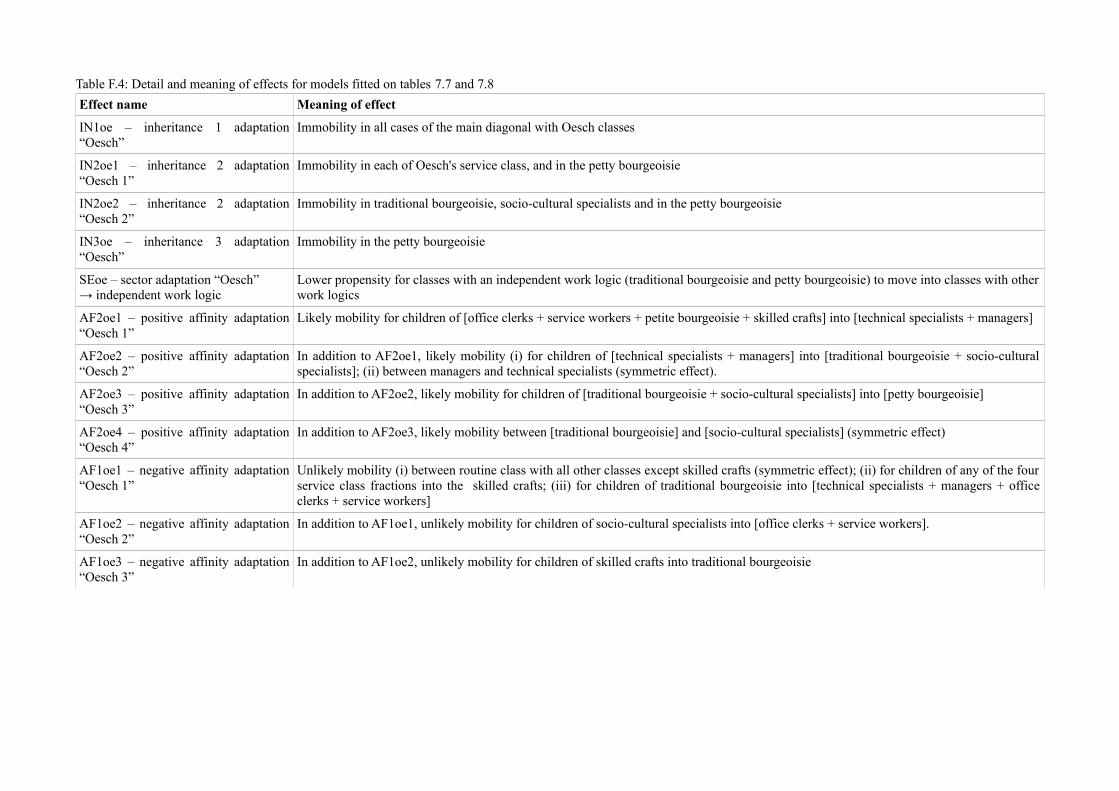
Table F.4: Detail and meaning of effects for models fitted on tables 7.7 and 7.8
Effect name Meaning of effect
IN1oe – inheritance 1 adaptation“Oesch”
Immobility in all cases of the main diagonal with Oesch classes
IN2oe1 – inheritance 2 adaptation“Oesch 1”
Immobility in each of Oesch's service class, and in the petty bourgeoisie
IN2oe2 – inheritance 2 adaptation“Oesch 2”
Immobility in traditional bourgeoisie, socio-cultural specialists and in the petty bourgeoisie
IN3oe – inheritance 3 adaptation“Oesch”
Immobility in the petty bourgeoisie
SEoe – sector adaptation “Oesch” → independent work logic
Lower propensity for classes with an independent work logic (traditional bourgeoisie and petty bourgeoisie) to move into classes with otherwork logics
AF2oe1 – positive affinity adaptation“Oesch 1”
Likely mobility for children of [office clerks + service workers + petite bourgeoisie + skilled crafts] into [technical specialists + managers]
AF2oe2 – positive affinity adaptation“Oesch 2”
In addition to AF2oe1, likely mobility (i) for children of [technical specialists + managers] into [traditional bourgeoisie + socio-culturalspecialists]; (ii) between managers and technical specialists (symmetric effect).
AF2oe3 – positive affinity adaptation“Oesch 3”
In addition to AF2oe2, likely mobility for children of [traditional bourgeoisie + socio-cultural specialists] into [petty bourgeoisie]
AF2oe4 – positive affinity adaptation“Oesch 4”
In addition to AF2oe3, likely mobility between [traditional bourgeoisie] and [socio-cultural specialists] (symmetric effect)
AF1oe1 – negative affinity adaptation“Oesch 1”
Unlikely mobility (i) between routine class with all other classes except skilled crafts (symmetric effect); (ii) for children of any of the fourservice class fractions into the skilled crafts; (iii) for children of traditional bourgeoisie into [technical specialists + managers + officeclerks + service workers]
AF1oe2 – negative affinity adaptation“Oesch 2”
In addition to AF1oe1, unlikely mobility for children of socio-cultural specialists into [office clerks + service workers].
AF1oe3 – negative affinity adaptation“Oesch 3”
In addition to AF1oe2, unlikely mobility for children of skilled crafts into traditional bourgeoisie

Table F.5: Matrices of topological log-linear models
HI1 effect (Hierarchy 1)
EGP classes ESeC classes Oesch classes
G1 G2 G3 G4 G5 G6 G7 E1 E2 E3 E4 E5 E6 Oe1 Oe2 Oe3 Oe4 Oe5 Oe6 Oe7 Oe8 Oe9
G1 0 1 1 1 1 1 1 E1 0 1 1 1 1 1 Oe1 0 0 0 0 1 1 1 1 1
G2 1 0 0 0 0 1 1 E2 1 0 0 0 0 1 Oe2 0 0 0 0 1 1 1 1 1
G3 1 0 0 0 0 1 1 E3 1 0 0 0 0 1 Oe3 0 0 0 0 1 1 1 1 1
G4 1 1 1 1 1 0 0 E4 1 1 1 1 1 0 Oe4 0 0 0 0 1 1 1 1 1
G5 1 0 0 0 0 1 1 E5 1 0 0 0 0 1 Oe5 1 1 1 1 0 0 0 0 1
G6 1 1 1 1 1 0 0 E6 1 1 1 1 1 0 Oe6 1 1 1 1 0 0 0 0 1
G7 1 1 1 1 1 0 0 Oe7 1 1 1 1 0 0 0 0 1
Oe8 1 1 1 1 0 0 0 0 1
Oe9 1 1 1 1 1 1 1 1 0
HI2 effect (Hierarchy 2)
EGP classes ESeC classes Oesch classes
G1 G2 G3 G4 G5 G6 G7 E1 E2 E3 E4 E5 E6 Oe1 Oe2 Oe3 Oe4 Oe5 Oe6 Oe7 Oe8 Oe9
G1 0 0 0 0 0 1 1 E1 0 0 0 0 0 1 Oe1 0 0 0 0 0 0 0 0 1
G2 0 0 0 0 0 0 0 E2 0 0 0 0 0 0 Oe2 0 0 0 0 0 0 0 0 0
G3 0 0 0 0 0 0 0 E3 0 0 0 0 0 0 Oe3 0 0 0 0 0 0 0 0 0
G4 1 0 0 0 0 0 0 E4 1 0 0 0 0 0 Oe4 0 0 0 0 0 0 0 0 0
G5 0 0 0 0 0 0 0 E5 0 0 0 0 0 0 Oe5 0 0 0 0 0 0 0 0 0
G6 1 0 0 0 0 0 0 E6 1 0 0 0 0 0 Oe6 0 0 0 0 0 0 0 0 0
G7 1 0 0 0 0 0 0 Oe7 0 0 0 0 0 0 0 0 0
Oe8 0 0 0 0 0 0 0 0 0
Oe9 1 0 0 0 0 0 0 0 0
Note: EGP classes: G1= I+II. Service class; G2= III. Routine non-manual workers; G3= IVab. Petty bourgeoisie; G4=IVc. Farmers; G5=V+VI. Skilled workers; G6= VIIa. Non-skilled workers; G7=VIIb. Agricultural labourers; ESeC classes: E1=1.Salariat; E2=2.White-collar; E3=3.Petite bourgeoisie; E4=4.Farmers; E5=5.Skilled workers;E6=6.Semi-/unskilled; Oesch classes: Oe1=1.Traditional bourgeoisie; Oe2= 2.Technical specialists; Oe3= 3.Managers; Oe4= 4.Socio-cultural specialists; Oe5= 5.Office clerks;Oe6= 6.Service worker; Oe7= 7.Petite bourgeoisie; Oe8= 8.Skilled crafts; Oe9= 9.Routine.

IN1 effect (Inheritance 1)
EGP classes ESeC classes Oesch classes
G1 G2 G3 G4 G5 G6 G7 E1 E2 E3 E4 E5 E6 Oe1 Oe2 Oe3 Oe4 Oe5 Oe6 Oe7 Oe8 Oe9
G1 1 0 0 0 0 0 0 E1 1 0 0 0 0 0 Oe1 1 1 1 1 0 0 0 0 0
G2 0 1 0 0 0 0 0 E2 0 1 0 0 0 0 Oe2 1 1 1 1 0 0 0 0 0
G3 0 0 1 0 0 0 0 E3 0 0 1 0 0 0 Oe3 1 1 1 1 0 0 0 0 0
G4 0 0 0 1 0 0 0 E4 0 0 0 1 0 0 Oe4 1 1 1 1 0 0 0 0 0
G5 0 0 0 0 1 0 0 E5 0 0 0 0 1 0 Oe5 0 0 0 0 1 1 0 0 0
G6 0 0 0 0 0 1 0 E6 0 0 0 0 0 1 Oe6 0 0 0 0 1 1 0 0 0
G7 0 0 0 0 0 0 1 Oe7 0 0 0 0 0 0 1 0 0
Oe8 0 0 0 0 0 0 0 1 0
Oe9 0 0 0 0 0 0 0 0 1
IN2 effect (Inheritance 2)
EGP classes ESeC classes Oesch classes
G1 G2 G3 G4 G5 G6 G7 E1 E2 E3 E4 E5 E6 Oe1 Oe2 Oe3 Oe4 Oe5 Oe6 Oe7 Oe8 Oe9
G1 1 0 0 0 0 0 0 E1 1 0 0 0 0 0 Oe1 1 1 1 1 0 0 0 0 0
G2 0 0 0 0 0 0 0 E2 0 0 0 0 0 0 Oe2 1 1 1 1 0 0 0 0 0
G3 0 0 1 0 0 0 0 E3 0 0 1 0 0 0 Oe3 1 1 1 1 0 0 0 0 0
G4 0 0 0 1 0 0 0 E4 0 0 0 1 0 0 Oe4 1 1 1 1 0 0 0 0 0
G5 0 0 0 0 0 0 0 E5 0 0 0 0 0 0 Oe5 0 0 0 0 0 0 0 0 0
G6 0 0 0 0 0 0 0 E6 0 0 0 0 0 0 Oe6 0 0 0 0 0 0 0 0 0
G7 0 0 0 0 0 0 0 Oe7 0 0 0 0 0 0 1 0 0
Oe8 0 0 0 0 0 0 0 0 0
Oe9 0 0 0 0 0 0 0 0 0
Note: EGP classes: G1= I+II. Service class; G2= III. Routine non-manual workers; G3= IVab. Petty bourgeoisie; G4=IVc. Farmers; G5=V+VI. Skilled workers; G6= VIIa. Non-skilled workers; G7=VIIb. Agricultural labourers; ESeC classes: E1=1.Salariat; E2=2.White-collar; E3=3.Petite bourgeoisie; E4=4.Farmers; E5=5.Skilled workers;E6=6.Semi-/unskilled; Oesch classes: Oe1=1.Traditional bourgeoisie; Oe2= 2.Technical specialists; Oe3= 3.Managers; Oe4= 4.Socio-cultural specialists; Oe5= 5.Office clerks;Oe6= 6.Service worker; Oe7= 7.Petite bourgeoisie; Oe8= 8.Skilled crafts; Oe9= 9.Routine.

IN2 G effect (Inheritance 2 Germany)
EGP classes ESeC classes
G1 G2 G3 G4 G5 G6 G7 E1 E2 E3 E4 E5 E6
G1 0 0 0 0 0 0 0 E1 0 0 0 0 0 0
G2 0 0 0 0 0 0 0 E2 0 0 0 0 0 0
G3 0 0 1 0 0 0 0 E3 0 0 1 0 0 0
G4 0 0 0 1 0 0 0 E4 0 0 0 1 0 0
G5 0 0 0 0 0 0 0 E5 0 0 0 0 0 0
G6 0 0 0 0 0 0 0 E6 0 0 0 0 0 0
G7 0 0 0 0 0 0 0
IN3 effect (Inheritance 3)
EGP classes ESeC classes Oesch classes
G1 G2 G3 G4 G5 G6 G7 E1 E2 E3 E4 E5 E6 Oe1 Oe2 Oe3 Oe4 Oe5 Oe6 Oe7 Oe8 Oe9
G1 0 0 0 0 0 0 0 E1 0 0 0 0 0 0 Oe1 0 0 0 0 0 0 0 0 0
G2 0 0 0 0 0 0 0 E2 0 0 0 0 0 0 Oe2 0 0 0 0 0 0 0 0 0
G3 0 0 0 0 0 0 0 E3 0 0 1 0 0 0 Oe3 0 0 0 0 0 0 0 0 0
G4 0 0 0 1 0 0 0 E4 0 0 0 0 0 0 Oe4 0 0 0 0 0 0 0 0 0
G5 0 0 0 0 0 0 0 E5 0 0 0 0 0 0 Oe5 0 0 0 0 0 0 0 0 0
G6 0 0 0 0 0 0 0 E6 0 0 0 0 0 0 Oe6 0 0 0 0 0 0 0 0 0
G7 0 0 0 0 0 0 0 Oe7 0 0 0 0 0 0 1 0 0
Oe8 0 0 0 0 0 0 0 0 0
Oe9 0 0 0 0 0 0 0 0 0
Note: EGP classes: G1= I+II. Service class; G2= III. Routine non-manual workers; G3= IVab. Petty bourgeoisie; G4=IVc. Farmers; G5=V+VI. Skilled workers; G6= VIIa. Non-skilled workers; G7=VIIb. Agricultural labourers; ESeC classes: E1=1.Salariat; E2=2.White-collar; E3=3.Petite bourgeoisie; E4=4.Farmers; E5=5.Skilled workers;E6=6.Semi-/unskilled; Oesch classes: Oe1=1.Traditional bourgeoisie; Oe2= 2.Technical specialists; Oe3= 3.Managers; Oe4= 4.Socio-cultural specialists; Oe5= 5.Office clerks;Oe6= 6.Service worker; Oe7= 7.Petite bourgeoisie; Oe8= 8.Skilled crafts; Oe9= 9.Routine.

SE effect (Sector)
EGP classes ESeC classes
G1 G2 G3 G4 G5 G6 G7 E1 E2 E3 E4 E5 E6
G1 0 0 0 1 0 0 1 E1 0 0 0 1 0 0
G2 0 0 0 1 0 0 1 E2 0 0 0 1 0 0
G3 0 0 0 1 0 0 1 E3 0 0 0 1 0 0
G4 1 1 1 0 1 1 0 E4 1 1 1 0 1 0
G5 0 0 0 1 0 0 1 E5 0 0 0 1 0 0
G6 0 0 0 1 0 0 1 E6 0 0 0 0 0 0
G7 1 1 1 0 1 1 0 Note: here sector effect is only specified forfarmers (E4) while no effect is specifiedwithin the semi-/unskilled class (E6).
AF1 effect (Affinity 1)
EGP classes ESeC classes Oesch classes
G1 G2 G3 G4 G5 G6 G7 E1 E2 E3 E4 E5 E6 Oe1 Oe2 Oe3 Oe4 Oe5 Oe6 Oe7 Oe8 Oe9
G1 0 0 0 0 0 0 1 E1 0 0 0 0 0 1 Oe1 0 0 0 0 0 0 0 0 1
G2 0 0 0 0 0 0 0 E2 0 0 0 0 0 0 Oe2 0 0 0 0 0 0 0 0 0
G3 0 0 0 0 0 0 0 E3 0 0 0 0 0 0 Oe3 0 0 0 0 0 0 0 0 0
G4 0 0 0 0 0 0 0 E4 0 0 0 0 0 0 Oe4 0 0 0 0 0 0 0 0 0
G5 0 0 0 0 0 0 0 E5 0 0 0 0 0 0 Oe5 0 0 0 0 0 0 0 0 0
G6 0 0 0 0 0 0 0 E6 1 0 0 0 0 0 Oe6 0 0 0 0 0 0 0 0 0
G7 1 0 0 0 0 0 0 Oe7 0 0 0 0 0 0 0 0 0
Oe8 0 0 0 0 0 0 0 0 0
Oe9 1 0 0 0 0 0 0 0 0
Note: EGP classes: G1= I+II. Service class; G2= III. Routine non-manual workers; G3= IVab. Petty bourgeoisie; G4=IVc. Farmers; G5=V+VI. Skilled workers; G6= VIIa. Non-skilled workers; G7=VIIb. Agricultural labourers; ESeC classes: E1=1.Salariat; E2=2.White-collar; E3=3.Petite bourgeoisie; E4=4.Farmers; E5=5.Skilled workers;E6=6.Semi-/unskilled; Oesch classes: Oe1=1.Traditional bourgeoisie; Oe2= 2.Technical specialists; Oe3= 3.Managers; Oe4= 4.Socio-cultural specialists; Oe5= 5.Office clerks;Oe6= 6.Service worker; Oe7= 7.Petite bourgeoisie; Oe8= 8.Skilled crafts; Oe9= 9.Routine.
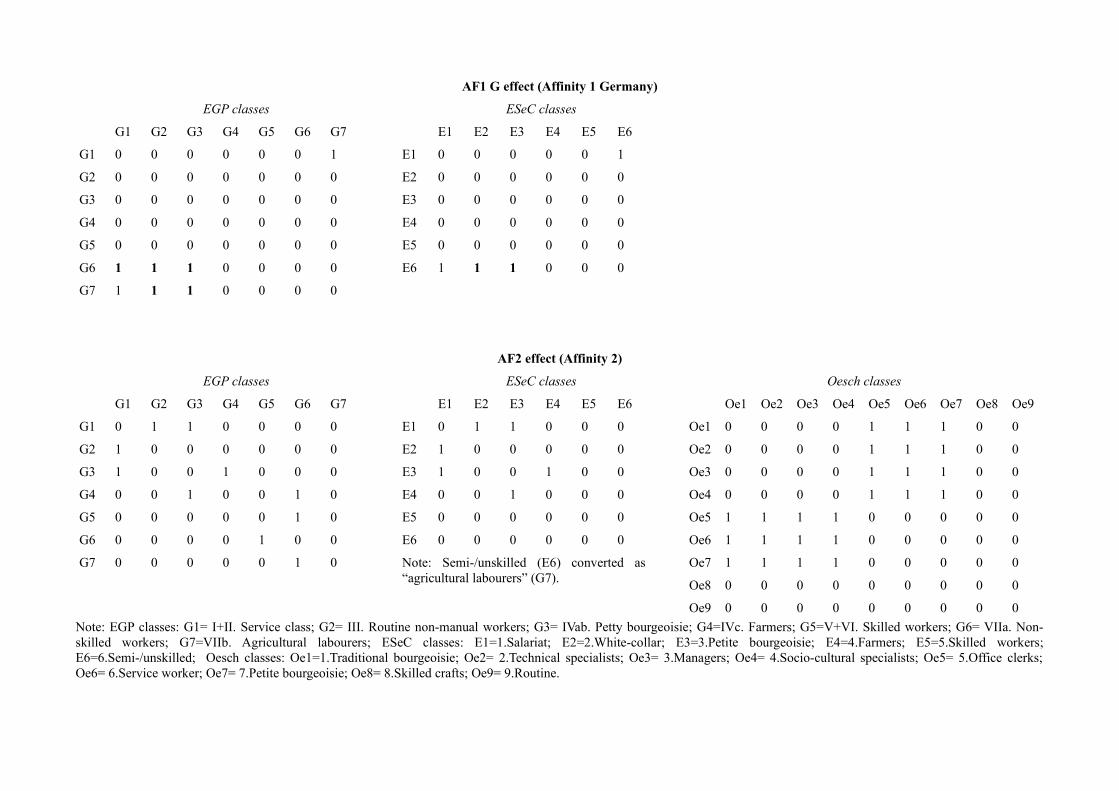
AF1 G effect (Affinity 1 Germany)
EGP classes ESeC classes
G1 G2 G3 G4 G5 G6 G7 E1 E2 E3 E4 E5 E6
G1 0 0 0 0 0 0 1 E1 0 0 0 0 0 1
G2 0 0 0 0 0 0 0 E2 0 0 0 0 0 0
G3 0 0 0 0 0 0 0 E3 0 0 0 0 0 0
G4 0 0 0 0 0 0 0 E4 0 0 0 0 0 0
G5 0 0 0 0 0 0 0 E5 0 0 0 0 0 0
G6 1 1 1 0 0 0 0 E6 1 1 1 0 0 0
G7 1 1 1 0 0 0 0
AF2 effect (Affinity 2)
EGP classes ESeC classes Oesch classes
G1 G2 G3 G4 G5 G6 G7 E1 E2 E3 E4 E5 E6 Oe1 Oe2 Oe3 Oe4 Oe5 Oe6 Oe7 Oe8 Oe9
G1 0 1 1 0 0 0 0 E1 0 1 1 0 0 0 Oe1 0 0 0 0 1 1 1 0 0
G2 1 0 0 0 0 0 0 E2 1 0 0 0 0 0 Oe2 0 0 0 0 1 1 1 0 0
G3 1 0 0 1 0 0 0 E3 1 0 0 1 0 0 Oe3 0 0 0 0 1 1 1 0 0
G4 0 0 1 0 0 1 0 E4 0 0 1 0 0 0 Oe4 0 0 0 0 1 1 1 0 0
G5 0 0 0 0 0 1 0 E5 0 0 0 0 0 0 Oe5 1 1 1 1 0 0 0 0 0
G6 0 0 0 0 1 0 0 E6 0 0 0 0 0 0 Oe6 1 1 1 1 0 0 0 0 0
G7 0 0 0 0 0 1 0 Note: Semi-/unskilled (E6) converted as“agricultural labourers” (G7).
Oe7 1 1 1 1 0 0 0 0 0
Oe8 0 0 0 0 0 0 0 0 0
Oe9 0 0 0 0 0 0 0 0 0
Note: EGP classes: G1= I+II. Service class; G2= III. Routine non-manual workers; G3= IVab. Petty bourgeoisie; G4=IVc. Farmers; G5=V+VI. Skilled workers; G6= VIIa. Non-skilled workers; G7=VIIb. Agricultural labourers; ESeC classes: E1=1.Salariat; E2=2.White-collar; E3=3.Petite bourgeoisie; E4=4.Farmers; E5=5.Skilled workers;E6=6.Semi-/unskilled; Oesch classes: Oe1=1.Traditional bourgeoisie; Oe2= 2.Technical specialists; Oe3= 3.Managers; Oe4= 4.Socio-cultural specialists; Oe5= 5.Office clerks;Oe6= 6.Service worker; Oe7= 7.Petite bourgeoisie; Oe8= 8.Skilled crafts; Oe9= 9.Routine.

AF2 G effect (Affinity 2 Germany)
EGP classes ESeC classes
G1 G2 G3 G4 G5 G6 G7 E1 E2 E3 E4 E5 E6
G1 0 1 1 0 0 0 0 E1 0 1 1 0 0 0
G2 1 0 1 0 0 0 0 E2 1 0 1 0 0 0
G3 1 1 0 1 0 0 0 E3 1 1 0 1 0 0
G4 0 0 1 0 0 1 0 E4 0 0 1 0 0 0
G5 0 0 0 0 0 1 0 E5 0 0 0 0 0 0
G6 0 0 0 0 1 0 0 E6 0 0 0 0 0 0
G7 0 0 0 0 0 1 0 Note: Semi-/unskilled (E6) converted as“agricultural labourers” (G7).
AF1 S effect (Affinity 1 Switzerland - men)
EGP classes ESeC classes
G1 G2 G3 G4 G5 G6 G7 E1 E2 E3 E4 E5 E6
G1 0 0 0 0 1 1 1 E1 0 0 0 0 1 1
G2 0 0 0 0 0 0 0 E2 0 0 0 0 0 0
G3 1 0 0 0 0 0 0 E3 1 0 0 0 0 0
G4 1 0 0 0 0 0 0 E4 1 0 0 0 0 0
G5 0 0 0 0 0 0 0 E5 0 0 0 0 0 0
G6 0 0 1 1 0 0 0 E6 0 0 1 1 0 0
G7 0 0 1 1 0 0 0
Note: in the original core S model the Petty bourgeoisie and the farmers categories were merged (G3 &G4). We disaggregated them here for sake of comparability.
Note: EGP classes: G1= I+II. Service class; G2= III. Routine non-manual workers; G3= IVab. Petty bourgeoisie; G4=IVc. Farmers; G5=V+VI. Skilled workers; G6= VIIa. Non-skilled workers; G7=VIIb. Agricultural labourers; ESeC classes: E1=1.Salariat; E2=2.White-collar; E3=3.Petite bourgeoisie; E4=4.Farmers; E5=5.Skilled workers;E6=6.Semi-/unskilled; Oesch classes: Oe1=1.Traditional bourgeoisie; Oe2= 2.Technical specialists; Oe3= 3.Managers; Oe4= 4.Socio-cultural specialists; Oe5= 5.Office clerks;Oe6= 6.Service worker; Oe7= 7.Petite bourgeoisie; Oe8= 8.Skilled crafts; Oe9= 9.Routine.
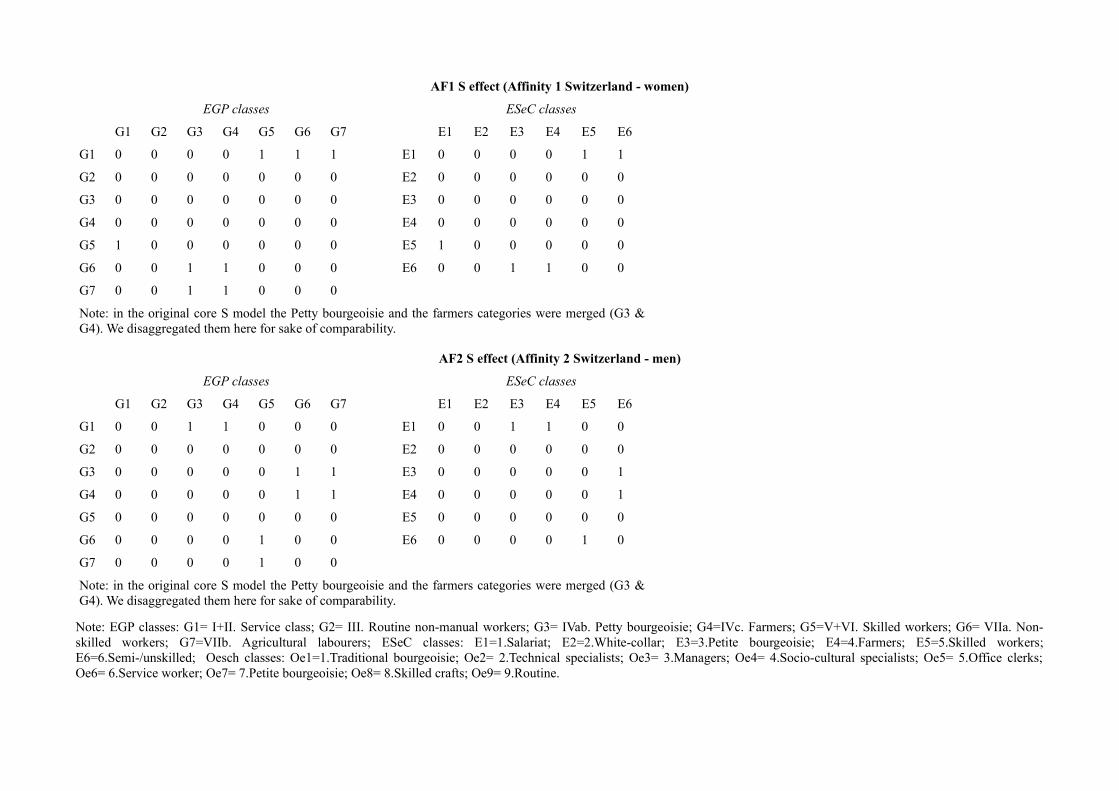
AF1 S effect (Affinity 1 Switzerland - women)
EGP classes ESeC classes
G1 G2 G3 G4 G5 G6 G7 E1 E2 E3 E4 E5 E6
G1 0 0 0 0 1 1 1 E1 0 0 0 0 1 1
G2 0 0 0 0 0 0 0 E2 0 0 0 0 0 0
G3 0 0 0 0 0 0 0 E3 0 0 0 0 0 0
G4 0 0 0 0 0 0 0 E4 0 0 0 0 0 0
G5 1 0 0 0 0 0 0 E5 1 0 0 0 0 0
G6 0 0 1 1 0 0 0 E6 0 0 1 1 0 0
G7 0 0 1 1 0 0 0
Note: in the original core S model the Petty bourgeoisie and the farmers categories were merged (G3 &G4). We disaggregated them here for sake of comparability.
AF2 S effect (Affinity 2 Switzerland - men)
EGP classes ESeC classes
G1 G2 G3 G4 G5 G6 G7 E1 E2 E3 E4 E5 E6
G1 0 0 1 1 0 0 0 E1 0 0 1 1 0 0
G2 0 0 0 0 0 0 0 E2 0 0 0 0 0 0
G3 0 0 0 0 0 1 1 E3 0 0 0 0 0 1
G4 0 0 0 0 0 1 1 E4 0 0 0 0 0 1
G5 0 0 0 0 0 0 0 E5 0 0 0 0 0 0
G6 0 0 0 0 1 0 0 E6 0 0 0 0 1 0
G7 0 0 0 0 1 0 0
Note: in the original core S model the Petty bourgeoisie and the farmers categories were merged (G3 &G4). We disaggregated them here for sake of comparability.
Note: EGP classes: G1= I+II. Service class; G2= III. Routine non-manual workers; G3= IVab. Petty bourgeoisie; G4=IVc. Farmers; G5=V+VI. Skilled workers; G6= VIIa. Non-skilled workers; G7=VIIb. Agricultural labourers; ESeC classes: E1=1.Salariat; E2=2.White-collar; E3=3.Petite bourgeoisie; E4=4.Farmers; E5=5.Skilled workers;E6=6.Semi-/unskilled; Oesch classes: Oe1=1.Traditional bourgeoisie; Oe2= 2.Technical specialists; Oe3= 3.Managers; Oe4= 4.Socio-cultural specialists; Oe5= 5.Office clerks;Oe6= 6.Service worker; Oe7= 7.Petite bourgeoisie; Oe8= 8.Skilled crafts; Oe9= 9.Routine.

AF2 S effect (Affinity 2 Switzerland - women)
EGP classes ESeC classes
G1 G2 G3 G4 G5 G6 G7 E1 E2 E3 E4 E5 E6
G1 0 1 0 0 0 0 0 E1 0 1 0 0 0 0
G2 0 0 1 1 0 0 0 E2 0 0 1 1 0 0
G3 0 0 0 0 0 1 1 E3 0 0 0 0 0 1
G4 0 0 0 0 0 1 1 E4 0 0 0 0 0 1
G5 0 0 0 0 0 0 0 E5 0 0 0 0 0 0
G6 0 0 0 0 0 0 0 E6 0 0 0 0 0 0
G7 0 0 0 0 0 0 0
Note: in the original core S model the Petty bourgeoisie and the farmers categories were merged (G3 &G4). We disaggregated them here for sake of comparability.
AF1 CH effect (affinity 1 Switzerland – corresponding to AF1 Gd in models)
ESeC classes Oesch classes
E1 E2 E3 E4 E5 E6 Oe1 Oe2 Oe3 Oe4 Oe5 Oe6 Oe7 Oe8 Oe9
E1 0 0 0 0 1 1 Oe1 0 0 0 0 0 0 0 1 1
E2 0 0 0 0 0 1 Oe2 0 0 0 0 0 0 0 1 1
E3 0 0 0 0 0 1 Oe3 0 0 0 0 0 0 0 1 1
E4 1 1 0 0 0 0 Oe4 0 0 0 0 0 0 0 1 1
E5 0 0 0 0 0 0 Oe5 0 0 0 0 0 0 0 0 1
E6 1 1 1 0 0 0 Oe6 0 0 0 0 0 0 0 0 1
Oe7 0 0 0 0 0 0 0 0 1
Oe8 0 0 0 0 0 0 0 0 0
Oe9 1 1 1 1 1 1 1 0 0
Note: EGP classes: G1= I+II. Service class; G2= III. Routine non-manual workers; G3= IVab. Petty bourgeoisie; G4=IVc. Farmers; G5=V+VI. Skilled workers; G6= VIIa. Non-skilled workers; G7=VIIb. Agricultural labourers; ESeC classes: E1=1.Salariat; E2=2.White-collar; E3=3.Petite bourgeoisie; E4=4.Farmers; E5=5.Skilled workers;E6=6.Semi-/unskilled; Oesch classes: Oe1=1.Traditional bourgeoisie; Oe2= 2.Technical specialists; Oe3= 3.Managers; Oe4= 4.Socio-cultural specialists; Oe5= 5.Office clerks;Oe6= 6.Service worker; Oe7= 7.Petite bourgeoisie; Oe8= 8.Skilled crafts; Oe9= 9.Routine.
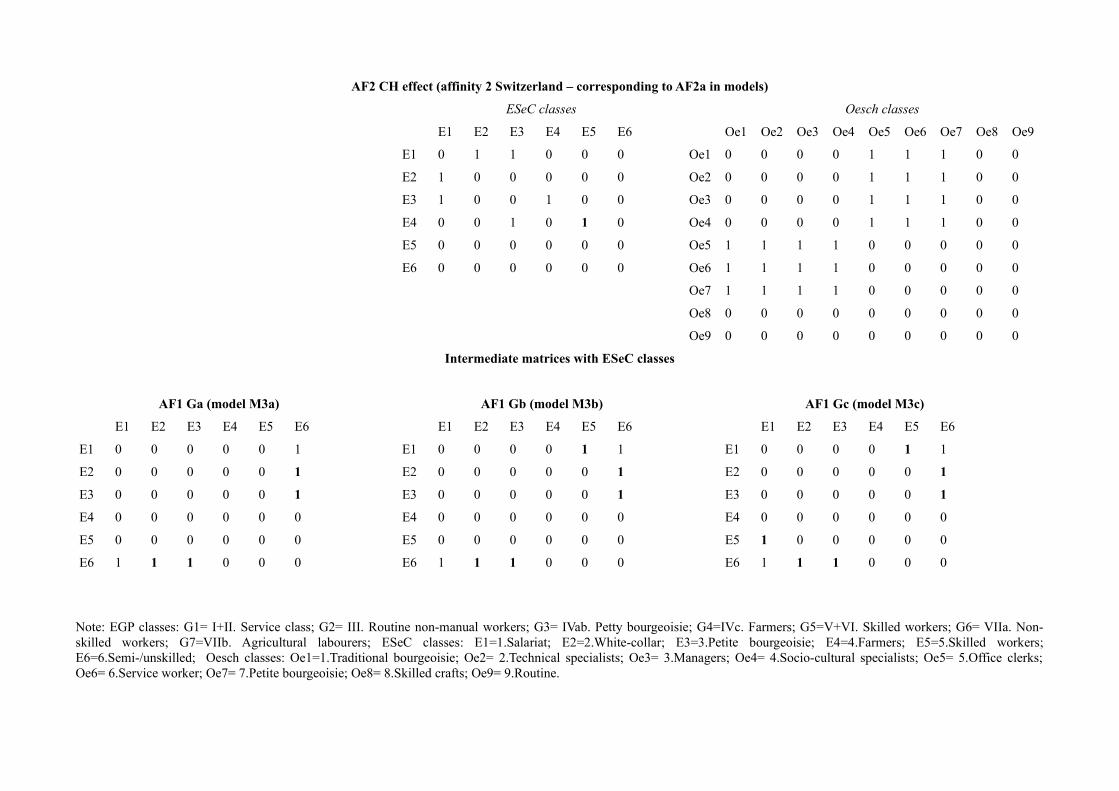
AF2 CH effect (affinity 2 Switzerland – corresponding to AF2a in models)
ESeC classes Oesch classes
E1 E2 E3 E4 E5 E6 Oe1 Oe2 Oe3 Oe4 Oe5 Oe6 Oe7 Oe8 Oe9
E1 0 1 1 0 0 0 Oe1 0 0 0 0 1 1 1 0 0
E2 1 0 0 0 0 0 Oe2 0 0 0 0 1 1 1 0 0
E3 1 0 0 1 0 0 Oe3 0 0 0 0 1 1 1 0 0
E4 0 0 1 0 1 0 Oe4 0 0 0 0 1 1 1 0 0
E5 0 0 0 0 0 0 Oe5 1 1 1 1 0 0 0 0 0
E6 0 0 0 0 0 0 Oe6 1 1 1 1 0 0 0 0 0
Oe7 1 1 1 1 0 0 0 0 0
Oe8 0 0 0 0 0 0 0 0 0
Oe9 0 0 0 0 0 0 0 0 0
Intermediate matrices with ESeC classes
AF1 Ga (model M3a) AF1 Gb (model M3b) AF1 Gc (model M3c)
E1 E2 E3 E4 E5 E6 E1 E2 E3 E4 E5 E6 E1 E2 E3 E4 E5 E6
E1 0 0 0 0 0 1 E1 0 0 0 0 1 1 E1 0 0 0 0 1 1
E2 0 0 0 0 0 1 E2 0 0 0 0 0 1 E2 0 0 0 0 0 1
E3 0 0 0 0 0 1 E3 0 0 0 0 0 1 E3 0 0 0 0 0 1
E4 0 0 0 0 0 0 E4 0 0 0 0 0 0 E4 0 0 0 0 0 0
E5 0 0 0 0 0 0 E5 0 0 0 0 0 0 E5 1 0 0 0 0 0
E6 1 1 1 0 0 0 E6 1 1 1 0 0 0 E6 1 1 1 0 0 0
Note: EGP classes: G1= I+II. Service class; G2= III. Routine non-manual workers; G3= IVab. Petty bourgeoisie; G4=IVc. Farmers; G5=V+VI. Skilled workers; G6= VIIa. Non-skilled workers; G7=VIIb. Agricultural labourers; ESeC classes: E1=1.Salariat; E2=2.White-collar; E3=3.Petite bourgeoisie; E4=4.Farmers; E5=5.Skilled workers;E6=6.Semi-/unskilled; Oesch classes: Oe1=1.Traditional bourgeoisie; Oe2= 2.Technical specialists; Oe3= 3.Managers; Oe4= 4.Socio-cultural specialists; Oe5= 5.Office clerks;Oe6= 6.Service worker; Oe7= 7.Petite bourgeoisie; Oe8= 8.Skilled crafts; Oe9= 9.Routine.
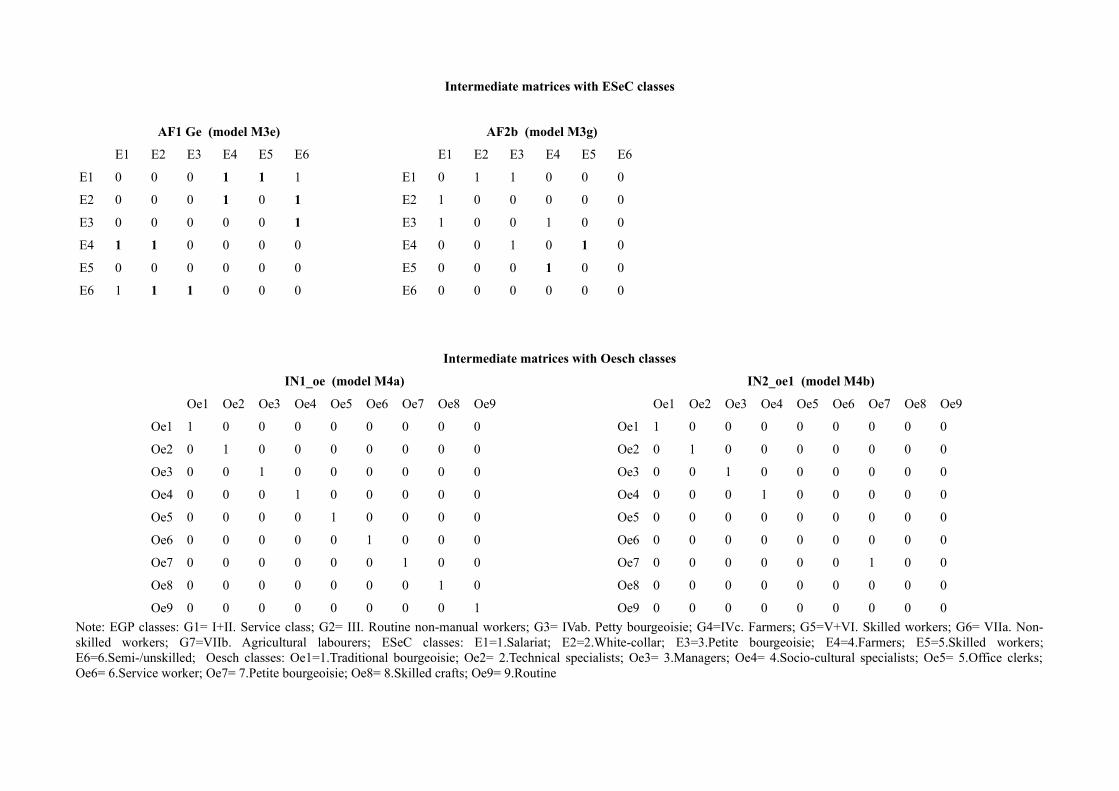
Intermediate matrices with ESeC classes
AF1 Ge (model M3e) AF2b (model M3g)
E1 E2 E3 E4 E5 E6 E1 E2 E3 E4 E5 E6
E1 0 0 0 1 1 1 E1 0 1 1 0 0 0
E2 0 0 0 1 0 1 E2 1 0 0 0 0 0
E3 0 0 0 0 0 1 E3 1 0 0 1 0 0
E4 1 1 0 0 0 0 E4 0 0 1 0 1 0
E5 0 0 0 0 0 0 E5 0 0 0 1 0 0
E6 1 1 1 0 0 0 E6 0 0 0 0 0 0
Intermediate matrices with Oesch classes
IN1_oe (model M4a) IN2_oe1 (model M4b)
Oe1 Oe2 Oe3 Oe4 Oe5 Oe6 Oe7 Oe8 Oe9 Oe1 Oe2 Oe3 Oe4 Oe5 Oe6 Oe7 Oe8 Oe9
Oe1 1 0 0 0 0 0 0 0 0 Oe1 1 0 0 0 0 0 0 0 0
Oe2 0 1 0 0 0 0 0 0 0 Oe2 0 1 0 0 0 0 0 0 0
Oe3 0 0 1 0 0 0 0 0 0 Oe3 0 0 1 0 0 0 0 0 0
Oe4 0 0 0 1 0 0 0 0 0 Oe4 0 0 0 1 0 0 0 0 0
Oe5 0 0 0 0 1 0 0 0 0 Oe5 0 0 0 0 0 0 0 0 0
Oe6 0 0 0 0 0 1 0 0 0 Oe6 0 0 0 0 0 0 0 0 0
Oe7 0 0 0 0 0 0 1 0 0 Oe7 0 0 0 0 0 0 1 0 0
Oe8 0 0 0 0 0 0 0 1 0 Oe8 0 0 0 0 0 0 0 0 0
Oe9 0 0 0 0 0 0 0 0 1 Oe9 0 0 0 0 0 0 0 0 0
Note: EGP classes: G1= I+II. Service class; G2= III. Routine non-manual workers; G3= IVab. Petty bourgeoisie; G4=IVc. Farmers; G5=V+VI. Skilled workers; G6= VIIa. Non-skilled workers; G7=VIIb. Agricultural labourers; ESeC classes: E1=1.Salariat; E2=2.White-collar; E3=3.Petite bourgeoisie; E4=4.Farmers; E5=5.Skilled workers;E6=6.Semi-/unskilled; Oesch classes: Oe1=1.Traditional bourgeoisie; Oe2= 2.Technical specialists; Oe3= 3.Managers; Oe4= 4.Socio-cultural specialists; Oe5= 5.Office clerks;Oe6= 6.Service worker; Oe7= 7.Petite bourgeoisie; Oe8= 8.Skilled crafts; Oe9= 9.Routine

Intermediate matrices with Oesch classes
IN2_oe2 (model M4c) IN3_oe (model M4d)
Oe1 Oe2 Oe3 Oe4 Oe5 Oe6 Oe7 Oe8 Oe9 Oe1 Oe2 Oe3 Oe4 Oe5 Oe6 Oe7 Oe8 Oe9
Oe1 1 0 0 0 0 0 0 0 0 Oe1 1 0 0 0 0 0 0 0 0
Oe2 0 0 0 0 0 0 0 0 0 Oe2 0 0 0 0 0 0 0 0 0
Oe3 0 0 0 0 0 0 0 0 0 Oe3 0 0 0 0 0 0 0 0 0
Oe4 0 0 0 1 0 0 0 0 0 Oe4 0 0 0 0 0 0 0 0 0
Oe5 0 0 0 0 0 0 0 0 0 Oe5 0 0 0 0 0 0 0 0 0
Oe6 0 0 0 0 0 0 0 0 0 Oe6 0 0 0 0 0 0 0 0 0
Oe7 0 0 0 0 0 0 1 0 0 Oe7 0 0 0 0 0 0 1 0 0
Oe8 0 0 0 0 0 0 0 0 0 Oe8 0 0 0 0 0 0 0 0 0
Oe9 0 0 0 0 0 0 0 0 0 Oe9 0 0 0 0 0 0 0 0 0
Intermediate matrices with Oesch classes
SE_oe (model M4e) AF2_oe1 (model M4f)
Oe1 Oe2 Oe3 Oe4 Oe5 Oe6 Oe7 Oe8 Oe9 Oe1 Oe2 Oe3 Oe4 Oe5 Oe6 Oe7 Oe8 Oe9
Oe1 0 1 1 1 1 1 0 1 1 Oe1 0 0 0 0 0 0 0 0 0
Oe2 1 0 0 0 0 0 1 0 0 Oe2 0 0 0 0 0 0 0 0 0
Oe3 1 0 0 0 0 0 1 0 0 Oe3 0 0 0 0 0 0 0 0 0
Oe4 1 0 0 0 0 0 1 0 0 Oe4 0 0 0 0 0 0 0 0 0
Oe5 1 0 0 0 0 0 1 0 0 Oe5 0 1 1 0 0 0 0 0 0
Oe6 1 0 0 0 0 0 0 0 0 Oe6 0 1 1 0 0 0 0 0 0
Oe7 0 1 1 1 1 1 0 1 1 Oe7 0 1 1 0 0 0 0 0 0
Oe8 1 0 0 0 0 0 1 0 0 Oe8 0 1 1 0 0 0 0 0 0
Oe9 1 0 0 0 0 0 1 0 0 Oe9 0 0 0 0 0 0 0 0 0
Note: EGP classes: G1= I+II. Service class; G2= III. Routine non-manual workers; G3= IVab. Petty bourgeoisie; G4=IVc. Farmers; G5=V+VI. Skilled workers; G6= VIIa. Non-skilled workers; G7=VIIb. Agricultural labourers; ESeC classes: E1=1.Salariat; E2=2.White-collar; E3=3.Petite bourgeoisie; E4=4.Farmers; E5=5.Skilled workers;E6=6.Semi-/unskilled; Oesch classes: Oe1=1.Traditional bourgeoisie; Oe2= 2.Technical specialists; Oe3= 3.Managers; Oe4= 4.Socio-cultural specialists; Oe5= 5.Office clerks;Oe6= 6.Service worker; Oe7= 7.Petite bourgeoisie; Oe8= 8.Skilled crafts; Oe9= 9.Routine

Intermediate matrices with Oesch classes
AF2_oe2 (model M4g) AF2_oe3 (model M4h)
Oe1 Oe2 Oe3 Oe4 Oe5 Oe6 Oe7 Oe8 Oe9 Oe1 Oe2 Oe3 Oe4 Oe5 Oe6 Oe7 Oe8 Oe9
Oe1 0 0 0 0 0 0 0 0 0 Oe1 0 0 0 0 0 0 1 0 0
Oe2 1 0 1 1 0 0 0 0 0 Oe2 1 0 1 1 0 0 0 0 0
Oe3 1 1 0 1 0 0 0 0 0 Oe3 1 1 0 1 0 0 0 0 0
Oe4 0 0 0 0 0 0 0 0 0 Oe4 0 0 0 0 0 0 1 0 0
Oe5 0 1 1 0 0 0 0 0 0 Oe5 0 1 1 0 0 0 0 0 0
Oe6 0 1 1 0 0 0 0 0 0 Oe6 0 1 1 0 0 0 0 0 0
Oe7 0 1 1 0 0 0 0 0 0 Oe7 0 1 1 0 0 0 0 0 0
Oe8 0 1 1 0 0 0 0 0 0 Oe8 0 1 1 0 0 0 0 0 0
Oe9 0 0 0 0 0 0 0 0 0 Oe9 0 0 0 0 0 0 0 0 0
Intermediate matrices with Oesch classes
AF2_oe4 (model M4i) AF1_oe1 (model M4j)
Oe1 Oe2 Oe3 Oe4 Oe5 Oe6 Oe7 Oe8 Oe9 Oe1 Oe2 Oe3 Oe4 Oe5 Oe6 Oe7 Oe8 Oe9
Oe1 0 0 0 1 0 0 1 0 0 Oe1 0 1 1 0 1 1 0 1 1
Oe2 1 0 1 1 0 0 0 0 0 Oe2 0 0 0 0 0 0 0 1 1
Oe3 1 1 0 1 0 0 0 0 0 Oe3 0 0 0 0 0 0 0 1 1
Oe4 1 0 0 0 0 0 1 0 0 Oe4 0 0 0 0 0 0 0 1 1
Oe5 0 1 1 0 0 0 0 0 0 Oe5 0 0 0 0 0 0 0 0 1
Oe6 0 1 1 0 0 0 0 0 0 Oe6 0 0 0 0 0 0 0 0 1
Oe7 0 1 1 0 0 0 0 0 0 Oe7 0 0 0 0 0 0 0 0 1
Oe8 0 1 1 0 0 0 0 0 0 Oe8 0 0 0 0 0 0 0 0 0
Oe9 0 0 0 0 0 0 0 0 0 Oe9 1 1 1 1 1 1 1 0 0
Note: EGP classes: G1= I+II. Service class; G2= III. Routine non-manual workers; G3= IVab. Petty bourgeoisie; G4=IVc. Farmers; G5=V+VI. Skilled workers; G6= VIIa. Non-skilled workers; G7=VIIb. Agricultural labourers; ESeC classes: E1=1.Salariat; E2=2.White-collar; E3=3.Petite bourgeoisie; E4=4.Farmers; E5=5.Skilled workers;E6=6.Semi-/unskilled; Oesch classes: Oe1=1.Traditional bourgeoisie; Oe2= 2.Technical specialists; Oe3= 3.Managers; Oe4= 4.Socio-cultural specialists; Oe5= 5.Office clerks;Oe6= 6.Service worker; Oe7= 7.Petite bourgeoisie; Oe8= 8.Skilled crafts; Oe9= 9.Routine

Intermediate matrices with Oesch classes
AF1_oe2 (model M4k) AF1_oe3 (model M4l)
Oe1 Oe2 Oe3 Oe4 Oe5 Oe6 Oe7 Oe8 Oe9 Oe1 Oe2 Oe3 Oe4 Oe5 Oe6 Oe7 Oe8 Oe9
Oe1 0 1 1 0 1 1 0 1 1 Oe1 0 1 1 0 1 1 0 1 1
Oe2 0 0 0 0 0 0 0 1 1 Oe2 0 0 0 0 0 0 0 1 1
Oe3 0 0 0 0 0 0 0 1 1 Oe3 0 0 0 0 0 0 0 1 1
Oe4 0 0 0 0 1 1 0 1 1 Oe4 0 0 0 0 1 1 0 1 1
Oe5 0 0 0 0 0 0 0 0 1 Oe5 0 0 0 0 0 0 0 0 1
Oe6 0 0 0 0 0 0 0 0 1 Oe6 0 0 0 0 0 0 0 0 1
Oe7 0 0 0 0 0 0 0 0 1 Oe7 0 0 0 0 0 0 0 0 1
Oe8 0 0 0 0 0 0 0 0 0 Oe8 1 0 0 0 0 0 0 0 0
Oe9 1 1 1 1 1 1 1 0 0 Oe9 1 1 1 1 1 1 1 0 0
Note: EGP classes: G1= I+II. Service class; G2= III. Routine non-manual workers; G3= IVab. Petty bourgeoisie; G4=IVc. Farmers; G5=V+VI. Skilled workers; G6= VIIa. Non-skilled workers; G7=VIIb. Agricultural labourers; ESeC classes: E1=1.Salariat; E2=2.White-collar; E3=3.Petite bourgeoisie; E4=4.Farmers; E5=5.Skilled workers;E6=6.Semi-/unskilled; Oesch classes: Oe1=1.Traditional bourgeoisie; Oe2= 2.Technical specialists; Oe3= 3.Managers; Oe4= 4.Socio-cultural specialists; Oe5= 5.Office clerks;Oe6= 6.Service worker; Oe7= 7.Petite bourgeoisie; Oe8= 8.Skilled crafts; Oe9= 9.Routine

References
Acker, Joan. 1973. “Women and Social Stratification: A Case of Intellectual Sexism.” AmericanJournal of Sociology 78(4):936–45.
Allmendinger, Jutta. 1989. “Educational Systems and Labor Market Outcomes.” EuropeanSociological Review 5(3):231–50.
Arvanitis, Spyridon, and David Marmet. 2001. Unternehmensgründungen in Der SchweizerischenWirtschaft. Bern: SECO.
Barone, Carlo, and Antonio Schizzerotto. 2011. “Introduction.” European Societies 13(3):331–45.
Barone, Carlo, Antonio Schizzerotto, and Roberta Barone. 2010. “Class of Origin and EducationalInequalities in Contemporary Italy. A Validation Analysis of the ESeC.” Pp. 245–63 inSocial class in Europe. An introduction to the European socio-economic classification,edited by David Rose and Eric Harrison. New York: Routledge.
Bauer, Philipp, and Regina T. Riphahn. 2007. “Heterogeneity in the Intergenerational Transmissionof Educational Attainment: Evidence from Switzerland on Natives and Second-generationImmigrants.” Journal of Population Economics 20(1):121–48.
Beck, Ulrich. 1992. Risk Society: Towards a New Modernity. London: Sage Publications Ltd.
Beller, Emily. 2009. “Bringing Intergenerational Social Mobility Research into the Twenty-firstCentury: Why Mothers Matter.” American Sociological Review 74(4):507–28.
Beller, Emily, and Michael Hout. 2005. “Inequality and Intergenerational Mobility: Change AcrossCohorts’. Department of Sociology.” University of California, Berkeley.
Beller, Emily, and Michael Hout. 2006. “Welfare States and Social Mobility: How Educational andSocial Policy May Affect Cross-national Differences in the Association BetweenOccupational Origins and Destinations.” Research in Social Stratification and Mobility24(4):353–65.
Bergman, Manfred Max, Sandra Hupka, Dominique Joye, and Thomas Meyer. 2009.“Recodification de La Formation Dans Les Enquêtes.” Unpublished working paper.
Bergman, Manfred Max, Dominique Joye, and Beat Fux. 2002. “Social Change, Mobility andInequality in Switzerland in the 1990s.” Swiss Journal of Sociology 28(2):261–95.
Bihr, Alain, and Roland Pfefferkorn. 2008. Le Système Des Inégalités. Paris: La Découverte.
Bishop, Yvonne, Stephen Fienberg, and Paul Holland. 1975. Discrete Multivariate Analysis: Theoryand Applications. Cambridge (MA): MIT Press.
Blanden, J., A. Goodman, P. Gregg, and S. Machin. 2004. “Changes in Intergenerational Mobility in
313

Britain.” Pp. 122–46 in Generational income mobility in North America and Europe, editedby M. Corak. Cambridge: Cambridge University Press.
Blau, Peter, and Otis Duncan. 1967. The American Occupational Structure. New York: Wiley.
Blossfeld, Hans-Peter. 2007. “Linked Lives in Modern Societies. The Impact on Social Inequalityof Increasing Educational Homogamy and the Shift Towards Dual-earner Couples.” Pp.275–91 in From Origin to Destination. Trends and Mechanisms in Social StratificationResearch, edited by Stefani Scherer, Reinhard Pollak, Gunnar Otte, and Markus Gangl.Chicago: The University of Chicago Press.
Blossfeld, Hans-Peter, Sandra Buchholz, and Dirk Hofäcker. 2006. Globalization, Uncertainty andLate Careers in Society. London and New York: Routledge.
Blossfeld, Hans-Peter, and Sonja Drobnič. 2001. Careers of Couples in Contemporary Societies:From Male Breadwinner to Dual Earner Families. Oxford University Press.
Blossfeld, Hans-Peter, and Catherine Hakim. 1997. Between Equalization and Marginalization:Women Working Part-time in Europe. Oxford University Press.
Blossfeld, Hans-Peter, and Heather Hofmeister. 2006. Globalization, Uncertainty and Women’sCareers: An International Comparison. Cheltenham: Edward Elgar Publishing.
Blossfeld, Hans-Peter, Eric Klijzing, Melinda Mills, and Karin Kurz. 2005. Globalization,Uncertainty and Youth in Society. London and New York: Routledge.
Blossfeld, Hans-Peter, Melinda Mills, and Fabrizio Bernardi. 2006. Globalization, Uncertainty andMen’s Careers: An International Comparison. Cheltenham: Edward Elgar Publishing.
Blossfeld, Hans-Peter, and Andreas Timm. 2003. Who Marries Whom?: Educational Systems asMarriage Markets in Modern Societies. Dordrecht: Kluwer academic publishers.
Boeda, Michel. 2009. “The How and Why of Statistical Classifications.” Courrier des statistiques,English series (15):3–9.
Bolte, K. M. 1959. Sozialer Aufstieg Und Abstieg: Eine Untersuchung Über Berufsprestige UndBerufsmobilität. Stuttgart: F. Enke Verlag.
Boudon, Raymond. 1985. L’inégalité Des Chances: La Mobilité Sociale Dans Les SociétésIndustrielles. 3rd ed. Paris: Armand Colin.
Bourdieu, Pierre, and Jean-Claude Passeron. 1964. Les Héritiers: Les Étudiants et La Culture.Paris: Minuit.
Bourdieu, Pierre, and Jean-Claude Passeron. 1970. La Reproduction: Éléments Pour Une ThéorieDu Système D’enseignement. Paris: Minuit.
Braverman, H. 1974. Labor and Monopoly Capital: The Degradation of Work in the TwentiethCentury. New York: Monthly Review Press.
Breen, Richard. 1997a. “Inequality, Economic Growth and Social Mobility.” The British journal ofsociology 48(3):429–49.
314

Breen, Richard. 1997b. “Risk, Recommodification and Stratification.” Sociology 31(3):473–89.
Breen, Richard. 2004a. Social Mobility in Europe. Oxford: Oxford University Press.
Breen, Richard. 2004b. “Statistical Methods of Mobility Research.” Pp. 17–35 in Social Mobility inEurope, edited by Richard Breen. Oxford: Oxford University Press.
Breen, Richard. 2004c. “The Comparative Study of Social Mobility.” Pp. 1–16 in Social Mobility inEurope, edited by Richard Breen. Oxford: Oxford University Press.
Breen, Richard. 2005. “Foundations of a neo-Weberian Class Analysis.” Pp. 31–50 in Approachesto Class Analysis, edited by Erik Olin Wright.
Breen, Richard. 2010a. “Educational Expansion and Social Mobility in the 20th Century.” SocialForces 89(2):365–88.
Breen, Richard. 2010b. “Social Mobility and Equality of Opportunity. Geary Lecture Spring 2010.”The Economic and Social Review 41(4):413–28.
Breen, Richard, and John H. Goldthorpe. 1997. “Explaining Educational Differentials. Towards aFormal Rational Action Theory.” Rationality and Society 9(3):275 –305.
Breen, Richard, and John H. Goldthorpe. 2001. “Class, Mobility and Merit The Experience of TwoBritish Birth Cohorts.” European Sociological Review 17(2):81–101.
Breen, Richard, and Jan O. Jonsson. 2005. “Inequality of Opportunity in Comparative Perspective:Recent Research on Educational Attainment and Social Mobility.” Annual Review ofSociology 31(1):223–43.
Breen, Richard, and Jan O. Jonsson. 2007. “Explaining Change in Social Fluidity: EducationalEqualization and Educational Expansion in Twentieth-Century Sweden.” The AmericanJournal of Sociology 112(6):1775–1810.
Breen, Richard, and Ruud Luijkx. 2004a. “Conclusions.” Pp. 383–410 in Social Mobility in Europe,edited by Richard Breen. Oxford: Oxford University Press.
Breen, Richard, and Ruud Luijkx. 2004b. “Social Mobility in Europe Between 1970 and 2000.” Pp.37–75 in Social Mobility in Europe, edited by Richard Breen. Oxford: Oxford UniversityPress.
Breen, Richard, Ruud Luijkx, Walter Müller, and Reinhard Pollak. 2009. “Nonpersistent Inequalityin Educational Attainment: Evidence from Eight European Countries.” American Journal ofSociology 114(5):1475–1521.
Breen, Richard, Ruud Luijkx, Walter Müller, and Reinhard Pollak. 2010. “Long-term Trends inEducational Inequality in Europe: Class Inequalities and Gender Differences.” EuropeanSociological Review 26(1):31–48.
Brousse, Cécile. 2008. “ESeC, Projet Européen de Classification Socio-économique.” Courrier desstatistiques 125:27–36.
Brousse, Cécile. 2012. “Réflexions sur la Nomenclature Socio-économique Européenne en
315

Gestation.” Revue Française de Socio-Économie n° 10(2):241–50.
Buchholz, Sandra et al. 2009. “Life Courses in the Globalization Process: The Development ofSocial Inequalities in Modern Societies.” European sociological review 25(1):53–71.
Buchmann, Claudia, and Thomas A. DiPrete. 2006. “The Growing Female Advantage in CollegeCompletion: The Role of Family Background and Academic Achievement.” AmericanSociological Review 71(4):515–41.
Buchmann, Claudia, Thomas A. DiPrete, and Anne McDaniel. 2008. “Gender Inequalities inEducation.” Annual Review of Sociology 34(1):319–37.
Buchmann, Marlis, and Maria Charles. 1993. “The Lifelong Shadow: Social Origins and Educa-tional Opportunities in Switzerland.” Pp. 177–92 in Persistent Inequalities. ChangingEducational Stratification in Thirteen Countries, edited by Yossi Shavit and Hans-PeterBlossfeld. Boulder, Colorado: Westview Press.
Buchmann, Marlis, Irene Kriesi, and Stefan Sacchi. 2009. “Labour Market, Job Opportunities, andTransitions to Self-employment: Evidence from Switzerland from the Mid 1960s to the Late1980s.” European Sociological Review 25(5):569–83.
Buchmann, Marlis, and Stefan Sacchi. 1998. “The Transition from School to Work in Switzerland.Do Characteristics of the Educational System and Class Barriers Matter?” Pp. 407–42 inFrom School to Work. A Comparative Study of Educational Qualifications and OccupationDestinations, edited by Yossi Shavit and Walter Müller. Oxford: Clarendon Press.
Buchmann, Marlis, Stefan Sacchi, Markus Lamprecht, and Hanspeter Stamm. 2007. “Switzerland:Tertiary Education Expansion and Social Inequality.” Pp. 321–48 in Stratification in HigherEducation: a Comparative Study, edited by Yossi Shavit, Richard Arum, and AdamGamoran. Stanford: Stanford Univ. Press.
Bühlmann, Felix. 2010. “Routes into the British Service Class Feeder Logics According to Genderand Occupational Groups.” Sociology 44(2):195–212.
Bühlmann, Felix, Guy Elcheroth, and Manuel Tettamanti. 2010. “The Division of Labour AmongEuropean Couples: The Effects of Life Course and Welfare Policy on Value–practiceConfigurations.” European Sociological Review 26(1):49–66.
Carlsson, G. 1958. Social Mobility and Class Structure. Lund: Gleerup.
Cautrès, Bruno. 1992. “Recherches Récentes Sur La Mobilité Sociale.” Revue Française de SciencePolitique 42(3):441–79.
Charles, Maria, and Karen Bradley. 2002. “Equal but Separate? A Cross-National Study of SexSegregation in Higher Education.” American Sociological Review 67(4):573–99.
Charles, Maria, and Karen Bradley. 2009. “Indulging Our Gendered Selves? Sex Segregation byField of Study in 44 Countries.” American Journal of Sociology 114(4):924–76.
Charles, Maria, and Marlis Buchmann. 1994. “Assessing Micro-level Explanations of OccupationalSex Segregation: Human-capital Development and Labor Market Opportunities inSwitzerland.” Swiss Journal of Sociology 20(3):595–620.
316

Charles, Maria, and David Grusky. 2005. Occupational Ghettos: The Worldwide Segregation ofWomen And Men. Stanford: Stanford University Press.
Chauvel, Louis. 1998. Le Destin Des Générations: Structure Sociale Et Cohortes En France AuXXe Siècle. Paris: Presses Univ. de France.
Clark, Terry Nichols, and Seymour Martin Lipset. 1991. “Are Social Classes Dying?” InternationalSociology 6(4):397–410.
Collins, Randall. 1971. “Functional and Conflict Theories of Educational Stratification.” AmericanSociological Review 36(6):1002–19.
Coradi Vellacott, Maja, and Stefan Wolter. 2005. L’égalité Des Chances Dans Le Système ÉducatifSuisse. Aarau: Centre suisse de coordination pour la recherche en éducation.
Crompton, Rosemary. 1998. Class and Stratification: An Introduction to Current Debates. 2nd ed.Cambridge: Polity Press.
Cuin, Charles-Henry. 1993. Les Sociologues Et La Mobilité Sociale. Paris: Presses universitaires deFrance.
Cutright, P. 1968. “Occupational Inheritance: a Cross-national Analysis.” American Journal ofSociology 73:400–416.
Davis, Rhys, and Peter Elias. 2010. “The Application of ESeC to Three Sources of ComparativeEuropean Data.” Pp. 61–86 in Social Class in Europe. An Introduction to the EuropeanSocio-economic Classification, edited by David Rose and Eric Harrison. New York:Routledge.
Drobnič, Sonja, and Hans-Peter Blossfeld. 2004. “Career Patterns over the Life Course: Gender,Class, and Linked Lives.” Research in Social Stratification and Mobility 21:139–64.
Dubet, François. 2010. Les Places et Les Chances: Repenser La Justice Sociale. Paris: Seuil.
Erikson, Robert. 1984a. “Changes in Social Mobility in Industrial Nations: The Case of Sweden.”Research in Social Stratification and Mobility 2:165–95.
Erikson, Robert. 1984b. “Social Class of Men, Women and Families.” Sociology 18(4):500–514.
Erikson, Robert, and John H. Goldthorpe. 1992a. “The CASMIN Project and the American Dream.”European Sociological Review 8(3):283–305.
Erikson, Robert, and John H. Goldthorpe. 1992b. The Constant Flux: A Study of Class Mobility inIndustrial Societies. Oxford: Clarendon Press.
Erikson, Robert, John H. Goldthorpe, and Martin Hällsten. 2012. “No Way Back up fromRatcheting down? A Critique of the ‘microclass’ Approach to the Analysis of SocialMobility.” Acta Sociologica 55(3):211–29.
Erikson, Robert, John H. Goldthorpe, Wolfgang König, Paul Lüttinger, and Walter Müller. 1988.“CASMIN International Mobility Superfile: Documentation.”
317

Erikson, Robert, John H. Goldthorpe, and Lucienne Portocarero. 1979. “Intergenerational ClassMobility in Three Western European Societies.” Bristish journal of sociolgy (33).
Erikson, Robert, and Jan O. Jonsson. 1996a. Can Education Be Equalized? The Swedish Case inComparative Perspective. Boulder, Colorado: Westview Press.
Erikson, Robert, and Jan O. Jonsson. 1996b. “The Swedish Context: Educational Reform and Long-Term Change in Educational Inequality.” in Can Education Be Equalized? The SwedishCase in Comparative Perspective, edited by Robert Erikson and Jan O. Jonsson. Boulder,Colorado: Westview Press.
Erikson, Robert, and Jan O. Jonsson. 1998. “Qualifications and the Allocation Process of YoungMen and Women in the Swedish Labour Market.” Pp. 369–406 in From School to Work. AComparative Study of Educational Qualifications and Occupation Destinations, edited byYossi Shavit and Walter Müller. Oxford: Clarendon Press.
Esping-Andersen, Gosta. 2009. Incomplete Revolution: Adapting Welfare States to Women’s NewRoles. Cambridge: Polity.
Evans, Geoffrey. 1996. “Putting Men and Women into Classes: An Assessment of the Cross-SexValidity of the Goldthorpe Class Schema.” Sociology 30(2):209–34.
Falcon, Julie. 2012a. “Existe-t-il Un Affaiblissement de L’inégalité Des Chances En Suisse.” LIVESWorking Paper 2012(12):1:16.
Falcon, Julie. 2012b. “Temporal Trends in Intergenerational Social Mobility in Switzerland: ACohort Study of Men and Women Born Between 1912 and 1974.” Swiss Journal ofSociology 38(2):153–75.
Falter, Jean-Marc. 2009. “Le Divorce, Facteur de Pauvreté Féminine.” Pp. 297–315 in Transitionsdans le Parcours de Vie et Construction des Inégalités, edited by Michel Oris et al.Lausanne: Presses polytechniques et universitaires romandes.
Featherman, David. L., F. Lancaster Jones, and Robert M. Hauser. 1975. “Assumptions of SocialMobility Research in the United States.” Social Science Research 4(4):329–60.
Flückiger, Yves. 1998. “The Labour Market in Switzerland: The End of a Special Case?”International Journal of Manpower 19(6):369–95.
Fourastié, Jean. 1979. Les Trente Glorieuses: Ou La Révolution Invisible de 1946 à 1975. Paris:Hachette.
Frick, A., and D. Lampart. 2007. Entwicklung Auf Dem Schweizerischen Arbeitsmarkt Seit 1980.Zürich: Swiss Economic Institute: Swiss Federal Institute of Technology.
Ganzeboom, Harry, and Ruud Luijkx. 2004. “Recent Trends in Intergenerational Occupational ClassReproduction in the Netherlands 1970-99.” Pp. 345–81 in Social Mobility in Europe, editedby Richard Breen. Oxford: Oxford University Press.
Ganzeboom, Harry, and Donald Treiman. 2003. “Three Internationlly Standardied Measures forComparative Research on Occupational Status.” Pp. 159–93 in Advances in Cross-nationalComparison. A European Working Book for Demographic and Socio-economic Variables,
318

edited by J Hoffmeyer-Zlotnik and C Wolf. New York: Plenum/Kluwer Academic Press.
Ganzeboom, Harry, Donald Treiman, and Wout Ultee. 1991. “Comparative IntergenerationalStratification Research: Three Generations and Beyond.” Annual Review of Sociology 277–302.
Giddens, Anthony. 1990. The Consequences of Modernity. Cambridge: Polity Press.
Girod, Roger. 1971. Mobilité Sociale : Faits Établis et Problèmes Ouverts. Genève: Droz.
Girod, Roger. 1977. Inégalité, Inégalités: Analyse de La Mobilité Sociale. Paris: Pressesuniversitaires de France.
Glass, David. 1954. Social Mobility in Britain. London: Routledge and Kegan Paul.
Goldthorpe, John H. 1982. “On the Service Class, Its Formation and Future.” Pp. 162–85 in SocialClass and the Division of Labour, edited by Anthony Giddens and Gavin Mackenzie.Cambridge: Cambridge University Press.
Goldthorpe, John H. 1983. “Women and Class Analysis: In Defence of the Conventional View.”Sociology 17(4):465–88.
Goldthorpe, John H. 1984. “Women and Class Analysis: A Reply to the Replies.” Sociology18(4):491–99.
Goldthorpe, John H. 1987. Social Mobility and Class Structure in Modern Britain. Oxford:Clarendon Press.
Goldthorpe, John H. 1995. “The Service Class Revisited.” Pp. 313–29 in Social Change and theMiddle Classes, edited by Tim Butler and Mike Savage. London: Routledge.
Goldthorpe, John H. 2000. On Sociology: Numbers, Narratives, and the Integration of Researchand Theory. Oxford: Oxford University Press.
Goldthorpe, John H. 2007a. “‘Cultural Capital’: Some Critical Observations.”Pp. 78–101 in FromOrigin to Destination. Trends and Mechanisms in Social Stratification Research, edited byStefani Scherer, Reinhard Pollak, Gunnar Otte, and Markus Gangl. Chicago: The Universityof Chicago press.
Goldthorpe, John H. 2007b. On Sociology Second Edition Volume Two: Illustration and Retrospect.Stanford: Stanford Univ Press.
Goldthorpe, John H., and Michelle Jackson. 2008. “Education-based Meritocracy: The Barriers toIts Realization.” Pp. 93–117 in Social Class: How Does it Work?, edited by Annette Lareauand Dalton Conley. New York: Russell Sage Foundation.
Goldthorpe, John H., David Lockwood, Frank Bechhofer, and Jennifer Platt. 1968. The AffluentWorker: Political Attitudes and Behaviour. Cambridge: Cambridge University Press.
Goldthorpe, John H., and Colin Mills. 2004. “Trends in Intergenerational Class Mobility in Britainin the Late Twentieth Century.” Pp. 196–224 in Social mobility in Europe, edited by RichardBreen. Oxford: Oxford University Press.
319

Goodman, Leo A. 1965. “On the Statistical Analysis of Mobility Tables.” American Journal ofSociology 70(5):564–85.
Goodman, Leo A. 1969. “On the Measurement of Social Mobility: An Index of Status Persistence.”American Sociological Review 34(6):831.
Graaf, Paul M. De. 1986. “The Impact of Financial and Cultural Resources on EducationalAttainment in the Netherlands.” Sociology of Education 59(4):237–46.
Grusky, David B., and Kim A. Weeden. 2001. “Decomposition Without Death: A Research Agendafor a New Class Analysis.” Acta Sociologica 44(3):203–18.
Grusky, David, and Manwai Ku. 2008. “Gloom, Doom, and Inequality.” Pp. 2–28 in SocialStratification: Class, Race, and Gender in Sociological Perspective, edited by DavidGrusky. Boulder, Colorado: Westview Press.
Gundert, Stephanie, and Karl Ulrich Mayer. 2012. “Gender Segregation in Training and SocialMobility of Women in West Germany.” European Sociological Review 28(1):59–81.
Güveli, Ayşe. 2006. New Social Classes Within the Service Class in the Netherlands and Britain.Adjusting the AGP Class Schema for the Technocrats and the Social and CulturalSpecialists’. Nijmegen: ICS-dissertation series.
Güveli, Ayşe, and Nan Dirk De Graaf. 2007. “Career Class (Im)mobility of the Social-CulturalSpecialists and the Technocrats in the Netherlands.” European Sociological Review23(2):185–201.
Güveli, Ayşe, Ruud Luijkx, and Harry Ganzeboom. 2012. “Patterns of Intergenerational Mobility ofthe Old and New Middle Classes in a Post-industrial Society: Netherlands 1970–2006.”Social Science Research 41(2):224–41.
Güveli, Ayşe, Ariana Need, and Nan Dirk de Graaf. 2007. “The Rise of ‘New’ Social Classes Withinthe Service Class in the Netherlands: Political Orientation of Social and Cultural Specialistsand Technocrats Between 1970 and 2003.” Acta Sociologica 50(2):129–46.
Hakim, Catherine. 1979. Occupational Segregation: a Comparative Study of the Degree andPattern of the Differentiation Between Men and Women’s Work in Britain, the United Statesand Other Countries. Department of Employment.
Hakim, Catherine. 1992. “Explaining Trends in Occupational Segregation: The Measurement,Causes, and Consequences of the Sexual Division of Labour.” European SociologicalReview 8(2):127–52.
Hakim, Catherine. 1998. Social Change and Innovation in the Labor Market. Oxford: OxfordUniversity press.
Handl, Johannes, and Stephanie Steinmetz. 2007. “Lessons from Social Mobility Research: Couldthe Index Discussion in Occupational Sex Segregation Benefit?” Pp. 246–74 in From Originto Destination: Trends and Mechanisms in Social Stratification Research, edited by StefaniScherer, R. Pollak, Gunnar Otte, and Markus Gangl. Frankfurt/Main: Campus Verlag.
Hardy, M. A., and L. E. Hazelrigg. 1978. “Industrialization and the Circulatory Rate of
320
Occupational Mobility: Further Tests of Some Cross-Sectional Hypotheses.” SociologicalFocus 1–10.
Härkönen, Juho, and Erik Bihagen. 2011. “Occupational Attainment and Career Progression inSweden.” European Societies 13(3):451–79.
Haug, Werner. 2005. “First and Second Generation Migrants in the Labour Market.” Pp. 5–15 inMigrants et Marché du Travail. Compétences et Insertion Professionnelle des PersonnesD’origine Etrangère en Suisse, Statistique de la Suisse, edited by Werner Haug and PhilippeWanner. Neuchâtel: Office fédéral de la statistique.
Haug, Werner, and Philippe Wanner. 2005. Migrants et Marché Du Travail. Compétences etInsertion Professionnelle Des Personnes D’origine Étrangère En Suisse. Neuchâtel: OfficeFédérale de la Statistique.
Hauser, Robert M. 1978. “A Structural Model of the Mobility Table.” Social Forces 56(3):919–53.
Hazelrigg, L. E. 1974. “Cross-national Comparisons of Father-to-son Occupational Mobility.” Pp.469–93 in Social Stratification, edited by J. Lopreato and L. S. Lewis. New York: Harperand Row.
Hazelrigg, L. E., and M. A. Garnier. 1976. “Occupational Mobility in Industrial Societies: aComparative Analysis of Differential Access to Occupational Ranks in SeventeenCountries.” American Sociological Review 498–511.
Heath, Anthony, and Nicky Britten. 1984. “Women’s Jobs Do Make a Difference: A Reply toGoldthorpe.” Sociology 18(4):475–90.
Hillmert, Steffen. 2011. “Occupational Mobility and Developments of Inequality Along the LifeCourse.” European Societies 13(3):401–23.
Hout, Michael. 1983. Mobility Tables. Newbury Park: Sage.
Hout, Michael. 1984. “Status, Autonomy, and Training in Occupational Mobility.” AmericanJournal of Sociology 1379–1409.
Hout, Michael. 1988. “More Universalism, Less Structural Mobility: The American OccupationalStructure in the 1980s.” American Journal of Sociology 93(6):1358–1400.
Hout, Michael, and Thomas A. DiPrete. 2006. “What We Have Learned: RC28’s Contributions toKnowledge About Social Stratification.” Research in Social Stratification and Mobility24(1):1–20.
Hupka-Brunner, Sandra, Stefan Sacchi, and Barbara Stalder. 2010. “Social Origin and Access toUpper Secondary Education in Switzerland: A Comparison of Company-basedApprenticeship and Exclusively Schoolbased Programmes.” Swiss Journal of Sociology36(1):11–31.
Ichou, Mathieu, and Louis‐André Vallet. 2011. “Do All Roads Lead to Inequality? Trends inFrench Upper Secondary School Analysed with Four Longitudinal Surveys.” Oxford Reviewof Education 37(2):167–94.
321

Jackson, Michelle, John H. Goldthorpe, and Colin Mills. 2005. “Education, Employers and ClassMobility.” Research in Social Stratification and Mobility 23:3–33.
Jackson, Michelle, Ruud Luijkx, Reinhard Pollak, Louis-André Vallet, and Herman G. van deWerfhorst. 2008. “Educational Fields of Study and the Intergenerational Mobility Process inComparative Perspective.” International Journal of Comparative Sociology 49(4-5):369–88.
Jacot, Cédric. 2013. “Le Rôle de La Classe Sociale D’origine Dans La Détermination Des Positionsde Classe à Niveau de Formation Équivalent.” Swiss Journal of Sociology 39(1):81–102.
Jann, Ben, and Benita Combet. 2012. “Zur Entwicklung Der Intergenerationalen Mobilität in DerSchweiz.” Swiss Journal of Sociology 38(2):177–99.
Janowitz, M. 1958. “Social Stratification and Mobility in West Germany.” American Journal ofSociology 64(1):6–24.
Jonsson, Jan O., and Robert Erikson. 2000. “Understanding Educational Inequality. The SwedishExperience.” L’Année sociologique (50):345–82.
Jonsson, Jan O., David Grusky, Matthew Di Carlo, Reinhard Pollak, and Mary C. Brinton. 2007.“Microclass Mobility: Social Reproduction in Four Countries.” Arbeitspapiere -Mannheimer Zentrum für Europäische Sozialforschung (100):1–47.
Jonsson, Jan O., David Grusky, Matthew Di Carlo, Reinhard Pollak, and Mary. C. Brinton. 2009.“Microclass Mobility: Social Reproduction in Four Countries.” American Journal ofSociology 114(4):977–1036.
Joye, Dominique, Manfred Max Bergman, and Paul Lambert. 2003. “Intergenerational Educationaland Social Mobility in Switzerland.” Swiss Journal of Sociology 29(2):263–91.
Joye, Dominique, and Martin Schuler. 1995. Stratification Sociale En Suisse: Catégories Socio-professionnelle. Berne: Office fédérale de la statistique.
Kahl, J. A. 1957. The American Class Structure. New York: Rinehart.
Kahn, Pierre. 2011. “La Démocratisation de L’enseignement Sous La Ve République: De L’égalitéDes Chances à L’égalité Des Réussites.” Pp. 37–45 in Pour en finir avec l’égalité deschances, edited by Didier Desponds. Neuilly: Atlande.
Kerr, Clark, John Dunlop, Frederick Harbison, and Charles Myers. 1960. Industrialism andIndustrial Man. Cambridge: Harvard University Press.
Klein, Markus. 2011. “Trends in the Association Between Educational Attainment and ClassDestinations in West Germany: Looking Inside the Service Class.” Research in SocialStratification and Mobility 29(4):427–44.
Knoke, David, and Peter Burke. 1980. Log-linear Models. London: Sage Publications Ltd.
Kocka, J. 1981. “Class Formation, Interest Articulation and Public Policy: The Origins of theGerman White-collar Class in the Late 19th and Early 20th Centuries’.” Pp. 63–81 inOrganizing interest in Western Europe: Pluralism Corporatism and the Traansformation ofPolitics, edited by S. Berger, A. Hirschmann, and C. Maier. Cambridge: Cambridge
322
University Press.
Kriesi, Hanspeter. 1989. “New Social Movements and the New Class in the Netherlands.”American Journal of Sociology 94(5):1078–1116.
Kriesi, Irene, Marlis Buchmann, and Stefan Sacchi. 2010. “Variation in Job Opportunities for Menand Women in the Swiss Labor Market 1962–1989.” Research in Social Stratification andMobility 28(3):309–23.
Kurz, Karin, and Walter Müller. 1987. “Class Mobility in the Industrial World.” Annual Review ofSociology 13:417–42.
Laganà, Francesco, Guy Elcheroth, Sandra Penic, Brian Kleiner, and Nicole Fasel. 2013. “NationalMinorities and Their Representation in Social Surveys: Which Practices Make aDifference?” Quality & Quantity 47(3):1287–1314.
Lemel, Yannick. 2004. Les Classes Sociales. Paris: Presses universitaires de France.
Levy, René. 2010. La Structure Social de La Suisse. Lausanne: Presses polytechniques etuniversitaires romandes.
Levy, René, Dominique Joye, Olivier Guye, and Vincent Kaufmann. 1997. Tous Égaux ?: De LaStratification Aux Représentations. Zürich: Seismo.
Levy, René, Dominique Joye, and Vincent Kaufmann. 1997. “Changement Structurel et MobilitéSociale En Suisse.” Swiss Journal of Sociology 23(3):463–90.
Lipps, Oliver, Francesco Laganà, Alexandre Pollien, and Lavinia Gianettoni. 2011. “NationalMinorities and Their Representation in Swiss Surveys (I): Providing Evidence andAnalyzing Causes for Their Under-representation.” FORS Working Paper Series 2011(2).
Lipset, S. M., and H. Zetterberg. 1959. “Social Mobility in Industrial Society.” in Social Mobility inIndustrial Societies, edited by S. M. Lipset and R. Bendix. Berckley: University ofCalifornia Press.
Lucas, Samuel R. 2001. “Effectively Maintained Inequality: Education Transitions, Track Mobility,and Social Background Effects.” American Journal of Sociology 106(6):1642–90.
Maloutas, Thomas. 2007. “Socio-Economic Classification Models and Contextual Difference: The‘European Socio-economic Classes’ (ESeC) from a South European Angle.” SouthEuropean Society and Politics 12(4):443–60.
Maurin, Éric. 2007. La Nouvelle Question Scolaire: Les Bénéfices de la Démocratisation. Paris:Éditions du Seuil.
Meyer, Thomas. 2009. “On Ne Prête Qu’aux Riches : L’inégalité Des Chances Devant Le Systèmede Formation En Suisse.” Pp. 60–81 in Rapport Social 2008. La Suisse Mesurée etComparée, edited by Christian Suter et al. Zürich: Seismo.
Müller, Walter. 2009. “Benefits and Costs of Vocational Education and Training.” Pp. 123–48 inRaymond Boudon, A Life in Sociology, edited by Mohamed Cherkaoui and Peter Hamilton.Paris: Bardwell Press.
323
Müller, Walter, Paul Lüttinger, Wolfgang König, and Wolfgang Karle. 1989. “Class and Educationin Industrial Nations.” International Journal of Sociology 19(3):3–39.
Müller, Walter, and Reinhard Pollak. 2004. “Social Mobility in West Germany. the Long Arms ofHistory Discovered?” Pp. 77–113 in Social mobility in Europe, edited by Richard Breen.Oxford: Oxford University Press.
OECD. 2013. “Education at a Glance 2013: OECD Indicators.”
Oesch, Daniel. 2003. “Labour Market Trends and the Goldthorpe Class Schema: a ConceptualReassessment.” Swiss Journal of Sociology 29(2):241–62.
Oesch, Daniel. 2006a. “Coming to Grips with a Changing Class Structure.” International Sociology21(2):263–88.
Oesch, Daniel. 2006b. Redrawing the Class Map: Stratification and Institutions in Britain,Germany, Sweden and Switzerland. Basingstoke: Palgrave Macmillan.
Oesch, Daniel. 2013. Occupational Change in Europe. How Technology and Education Transformthe Job Structure. Oxford: Oxford University Press.
Office fédéral de la statistique. 2013. “Population Résidante Permanente Étrangère Selon LaNationalité.” Retrieved July 16, 2013(http://www.bfs.admin.ch/bfs/portal/fr/index/themen/01/07/blank/key/01/01.html).
Pakulski, Jan, and Malcolm Waters. 1996. The Death of Class. London: Sage.
Parsons, Talcott. 1960. Structure and Process in Modern Societies. Glencoe: Free press.
Pecoraro, Marco. 2005. “Les Migrants Hautement Qualifiés.” Pp. 71–109 in Migrants et Marché duTravail. Compétences et Insertion Professionnelle des Personnes D’origine Etrangère enSuisse, Statistique de la Suisse, edited by Werner Haug and Philippe Wanner. Neuchâtel:Office fédéral de la statistique.
Pfeffer, Fabian T. 2008. “Persistent Inequality in Educational Attainment and Its InstitutionalContext.” European Sociological Review 24(5):543.
Piguet, Etienne. 2013. L’immigration En Suisse. Soixante Ans D’entrouverture. 3rd edition.Lausanne: Presses polytechniques et universitaires romandes.
Pollak, Reinhard, Gerrit Bauer, Walter Müller, Felix Weiss, and Heike Wirth. 2010. “TheComparative Measurement of Supervisory Status.” Pp. 138–57 in Social Class in Europe.An Introduction to the European Socio-economic Classification, edited by David Rose andEric Harrison. New York: Routledge.
Pollak, Reinhard, and Walter Müller. 2013. “The Mobility Triangle Revisited – Changes inEducational Inequality, Educational Returns and Social Mobility over Periods and Cohortsin Germany.” Presented at the RC28 Spring Meeting conference, in Trento University.
R Development Core Team. 2010. R: A Language and Environment for Statistical Computing.Vienna, Austria. Retrieved (http://www.R-project.org).
324
Raftery, Adrian E. 1986. “Choosing Models for Cross-Classifications.” American SociologicalReview 51(1):145–46.
Raftery, Adrian E. 1995. “Bayesian Model Selection in Social Research.” SociologicalMethodology 25:111–63.
Raftery, Adrian E., and Michael Hout. 1993. “Maximally Maintained Inequality: Expansion,Reform, and Opportunity in Irish Education, 1921-75.” Sociology of Education 41–62.
Reimer, David, and Reinhard Pollak. 2010. “Educational Expansion and Its Consequences forVertical and Horizontal Inequalities in Access to Higher Education in West Germany.”European Sociological Review 26(4):415–30.
Reskin, Barbara F., and Denise D. Bielby. 2005. “A Sociological Perspective on Gender and CareerOutcomes.” The Journal of Economic Perspectives 19(1):71–86.
Róbert, Péter, and Erzsébet Bukodi. 2004. “Changes in Intergenerational Class Mobility inHungary, 1973-2000.” Pp. 287–314 in Social mobility in Europe, edited by Richard Breen.Oxford: Oxford University Press.
Rogoff, N. 1953. Recent Trends in Occupational Mobility. Glencoe: The Free Press.
Rose, David, and Eric Harrison. 2010a. “ESeC in Retrospect and Prospect. An Epilogue.” Pp. 267–98 in Social Class in Europe. An Introduction to the European Socio-economicClassification, edited by David Rose and Eric Harrison. New York: Routledge.
Rose, David, and Eric Harrison. 2010b. Social Class in Europe: An Introduction to the EuropeanSocio-economic Classification. New York: Routledge.
Rose, David, Eric Harrison, and David Pevalin. 2010. “The European Socio-economicClassification. A Prolegomenon.” Pp. 3–38 in Social Class in Europe. An Introduction to theEuropean Socio-economic Classification, edited by David Rose and Eric Harrison. NewYork: Routledge.
Rosenfeld, Rachel A. 1992. “Job Mobility and Career Processes.” Annual Review of Sociology18:39–61.
Sapin, Marlène, Dario Spini, and Eric Widmer. 2007. Les Parcours De Vie: De L’adolescence AuGrand Âge. Lausanne: Presses polytechniques et universitaires romandes.
Savage, Mike, James Barlow, Peter Dickens, and Tony Fielding. 1992. Property, Bureaucracy andCulture: Middle Class Formation in Contemporary Britain. Routledge.
Schneider, Silke L. 2008. The International Standard Classificaion of Education (ISCED-97). AnEvaluation of Content and Criterion Validity for 15 European Countries. MannheimerZentrum Für Europäische Sozialforschung. Mannheim: Universität Mannheim.
Shavit, Yossi, and Hans-Peter Blossfeld. 1993. Persistent Inequality: Changing EducationalAttainment in Thirteen Countries. Boulder, Colorado: Westview Press.
Shavit, Yossi, and Walter Müller. 1998. From School to Work. Oxford: Clarendon Press.
325

Shavit, Yossi, and Karin Westerbeek. 1998. “Educational Stratification in Italy: Reforms,Expansion, and Equality of Opportunity.” European Sociological Review 14(1):33.47.
Sieben, Inge, Johannes Huinink, and Paul M. De Graaf. 2001. “Family Background and SiblingResemblance in Education Attainment: Trends in the Former FRG, the Former GDR, andthe Netherlands.” European Sociological Review 17(4):401–30.
Sloane, Douglas, and S. Philip Morgan. 1996. “An Introduction to Categorical Data Analysis.”Annual Review of Sociology 22:351–75.
Smyth, E., and S. Steinmetz. 2008. “Field of Study and Gender Segregation in European LabourMarkets.” International Journal of Comparative Sociology 49(4-5):257–81.
Sorokin, Pitirim. 1927. Social Mobility. New York: Harper & Brothers.
Stadelmann-Steffen, Isabelle. 2012. “Education Policy and Educational Inequality—Evidence fromthe Swiss Laboratory.” European Sociological Review 28(3):379–93.
Stanworth, Michelle. 1984. “Women and Class Analysis: A Reply to John Goldthorpe.” Sociology18(2):159–70.
Suter, Christian et al. 2009. Rapport Social 2008: La Suisse Mesurée et Comparée. Zürich: Seismo.
Svalastoga, Kaare. 1959. Prestige, Class and Society. Copenhagen: Gyldendal.
Thélot, Claude, and Louis-André Vallet. 2000. “La Réduction Des Inégalités Sociales DevantL’école Depuis Le Début Du Siècle.” Economie et statistique 334(1):3–32.
Tillmann, Robin, and Monica Budowski. 2007. “Inégalités et Classes Sociales En Suisse : QuelleConfiguration ?” Swiss Journal of Sociology 33(2):193–212.
Tocqueville, Alexis. 1850. De La Démocratie En Amérique. Paris: Flammarion.
Torche, Florencia. 2011. “Is a College Degree Still the Great Equalizer? Intergenerational MobilityAcross Levels of Schooling in the United States.” American Journal of Sociology117(3):763–807.
Torche, Florencia, and Carlos Costa Ribeiro. 2010. “Pathways of Change in Social Mobility:Industrialization, Education and Growing Fluidity in Brazil.” Research in SocialStratification and Mobility 28(3):291–307.
Treiman, Donald. 1970. “Industrialization and Social Stratification.” Sociological Inquiry40(2):207–34.
Treiman, Donald, and Harry Ganzeboom. 2000. “The Fourth Generation of ComparativeStratification Research.” The international handbook of sociology 123–50.
Vallet, Louis-André. 1986. “Activité Professionnelle de La Femme Mariée et Détermination de LaPosition Sociale de La Famille: Un Test Empirique: La France Entre 1962 et 1982.” Revuefrançaise de sociologie 655–96.
Vallet, Louis-André. 2004a. “Change in Intergenerational Class Mobility in France from the 1970s
326

to the 1990s and Its Explanation: An Analysis Following the CASMIN Approach.” Pp. 115–48 in Social mobility in Europe, edited by Richard Breen. Oxford: Oxford University Press.
Vallet, Louis-André. 2004b. “Modélisation Log-linéaire et Log-multiplicative Des Tableaux deContingence. Éléments de Cours.”
Vallet, Louis-André. 2005. “Utiliser Le Modèle Log-linéaire Pour Mettre Au Jour La Structure DuLien Entre Les Deux Variables D’un Tableau de Contingence: Un Exemple D’application àLa Mobilité Sociale.” Actes des journées de méthodologie statistique 21.
Vallet, Louis-André. 2007. “Sur L’origine, Les Bonnes Raisons de L’usage, et La Fécondité deL’odds Ratio.” Courrier des statistiques (121-122):59–65.
Vermunt, Jeroen K. 1997. LEM 1.0: A General Program for the Analysis of Categorical Data.Tillburg: Tillburg University.
Wanner, Philippe. 2004. Migration et Intégration. Populations Étrangères En Suisse. Neuchâtel:Office Fédérale de la Statistique.
Wanner, Philippe. 2012. “Données et Méthodes.” Pp. 24–33 in La démographie des étrangers enSuisse, edited by Philippe Wanner. Zürich: Seismo.
Warner, W. L., and J. C. Abegglen. 1955. Occupational Mobility in American Business andIndustry, 1928-1952. Minneapolis: University of the Minnesota Press.
Weber, Max. 1978. Economy and Society: An Outline of Interpretative Sociology. University ofCalifornia Press.
Weeden, Kim A. 1998. “Revisiting Occupational Sex Segregation in the United States, 1910–1990:Results from a Log-linear Approach.” Demography 35(4):475–87.
Weeden, Kim A., and David B. Grusky. 2005. “The Case for a New Class Map.” American Journalof Sociology 111(1):141–212.
Weeden, Kim A., and David B. Grusky. 2012. “The Three Worlds of Inequality.” American Journalof Sociology 117(6):1723–85.
Weiss, Pierre. 1979. “De La Détermination de L’influence de La Mobilité Sociale Sur Les AttitudesPolitiques.” Swiss Journal of Sociology 5(1):53–78.
Weiss, Pierre. 1986. La Mobilité Sociale. Paris: Presses universitaires de France.
Werfhorst, Herman G. van de. 2007. “Scarcity and Abundance: Reconciling Trends in the Effects ofEducation on Social Class and Earnings in Great Britain 1972–2003.” EuropeanSociological Review 23(2):239–61.
Werfhorst, Herman G. van de, and Ruud Luijkx. 2010. “Educational Field of Study and SocialMobility: Disaggregating Social Origin and Education.” Sociology 44(4):695–715.
Western, Mark. 1994a. “Class Structure and Intergenerational Class Mobility: A ComparativeAnalysis of Nation and Gender.” Social Forces 73(1):101–34.
327
Western, Mark. 1994b. “Intergenerational Class Mobility Among Women and Men.” Journal ofSociology 30(3):303–21.
Western, Mark, and Erik Olin Wright. 1994. “The Permeability of Class Boundaries toIntergenerational Mobility Among Men in the United States, Canada, Norway and Sweden.”American Sociological Review 59(4):606–29.
Williams, C. L. 1992. “The Glass Escalator: Hidden Advantages for Men in the‘ Female’Professions.” Social Problems 253–67.
Wirth, Heike, Cornelia Gresch, Walter Müller, Reinhard Pollak, and Felix Weiss. 2010. “MeasuringSocial Class. The Case of Germany.” Pp. 114–37 in Social Class in Europe. An Introductionto the European Socio-economic Classification, edited by David Rose and Eric Harrison.New York: Routledge.
Wohl, R. Richard. 1953. “The’rags to Riches Story’: An Episode of Secular Idealism.” Pp. 388–95in Class, Status, and Power: Social Stratificaiton in Comparative Perspective, edited by R.Bendix and Seymour Martin Lipset.
Wolbers, Maarten H. J., Ruud Luijkx, and Wout Ultee. 2011. “Educational Attainment,Occupational Achievements, Career Peaks.” European Societies 13(3):425–50.
Wright, Erik Olin. 1989. Classes. London: Verso.
Wright, Erik Olin. 1997. Class Counts: Comparative Studies in Class Analysis. Cambridge:Cambridge University Press.
Wright, Erik Olin. 2013. “Transforming Capitalism through Real Utopias.” American SociologicalReview 78(1):1–25.
Xie, Yu. 1992. “The Log-Multiplicative Layer Effect Model for Comparing Mobility Tables.”American Sociological Review 57(3):380–95.
328