Landslides in the Polish Carpathians as the Potential Educational Geosites

146 Environmental Geology 35 (2–3) August 1998 7 Q Springer-Verlag
Received: 20 November 1996 7 Accepted: 25 June 1997
P. Reichenbach (Y) 7 M. Cardinali 7 P. De VitaF. GuzzettiCNR - IRPI, via Madonna Alta 126, I-06100 Perugia, Italy
Regional hydrological thresholdsfor landslides and floods in theTiber River Basin (central Italy)P. Reichenbach 7 M. Cardinali 7 P. De Vita 7 F. Guzzetti
Abstract The definition of landslide warningthresholds, based on the analysis of hydrologicaldata, is proposed. In the Tiber River Basin of cen-tral Italy historical information on landslides andfloods, for the period 1918–1990, was availablefrom a nationwide bibliographical and archive in-ventory on geohydrological catastrophes. Hydrolog-ical data were obtained from mean daily dischargerecords at various gauging stations within the ba-sin. Several hundred hydrological events, broadlydefined as a series of consecutive days having meandaily discharge exceeding a predefined value, wereidentified. Hydrological parameters obtained fromthe discharge records were used to rank the eventsaccording to their probability to trigger mass mov-ements or inundations and to define regionalthresholds for the occurrence of landslides andfloods. The proposed approach, not lacking limita-tions, has conceptual and operational advantages,among which is the possibility of using historicalinformation on geohydrological catastrophes.
Key words Landslide 7 Flood 7 Regional warningthreshold 7 Hazard assessment
Introduction
In many countries landslides and floods generate a yearlyloss of property larger than that from any other naturaldisaster. Casualties due to slope failures and inundationsare larger in the developing countries and economiclosses are more severe in the industrialized world. In Ita-ly, a nation-wide project aimed at collecting informationon landslides and floods for the period 1918–1990 inven-toried about 11,000 landslides and 5000 inundations(Guzzetti and others 1994). In the 5-year interval between1991 and 1995, 44 (out of the 92) Italian provinces wereaffected by mass movements or inundations, with more
than 100 casualties (Guzzetti and others 1996a). Estimatesfor 1996, a particularly wet year, indicate that 30 prov-inces experienced flooding or landsliding, with more than20 casualties. Direct and indirect damage was not ascer-tained, but it can be provisionally estimated in the orderof several billion dollars.The analysis of the temporal recurrence of natural catas-trophes shows that damaging events occur with a fre-quency higher than the social and economical ability torecover from previous events. Due to the high cost ofground protection, industrialized societies and developingcountries are increasingly less eager to invest in structur-al measures to reduce natural risks. Hence, the new issueis the development of warning systems and land utiliza-tion regulations aimed at minimizing the loss of lives andproperty damage without investing in long-term, costlyprojects of ground protection (International Decade forNatural Hazards Reduction 1987; United Nation DisastersRelief Organization 1991).Within this framework, the identification of regionalthresholds for the initiation of slope movements or wide-spread flooding may play a renewed role in helping tomitigate the risk. When a storm is expected or while it ispassing over a territory, the monitoring of meteorologi-cal, hydrological or geotechnical parameters, such asrainfall intensity/duration, river discharge or groundwaterpore pressure, coupled with initiation thresholds definedin statistical, deterministic or heuristic fashion, may allowfor the identification of potentially hazardous conditionsand the issuing of warning or alarm messages to civilprotection authorities and the population. Indeed, thereare only a few places in the world where rainfall thresh-olds are part of operational landslide warning systems,such as in the San Francisco Bay region (Keefer and oth-ers 1987; Wilson and others 1993; Wilson and Wieczorek1995), in Hong Kong (Brand 1981; Brand and others1984; Premchitt and others 1994), and in Japan (Onoderaand others 1974).
ThresholdsA threshold is defined as the minimum or maximum lev-el of some quantity needed for a process to take place ora state to change (White and others 1996). A minimumthreshold defines the lowest level below which a processdoes not occur. A maximum threshold represents the lev-

Environmental Geology 35 (2–3) August 1998 7 Q Springer-Verlag 147
el above which a process always occur, i.e., there is a100% chance of occurrence whenever the threshold is ex-ceeded (Crozier 1996). For rainfall-induced slope failuresa threshold may represent the minimum intensity or du-ration of rain, the minimum level of porewater pressure,the slope angle, the reduction of shear strength or thedisplacement required for a landslide to take place.Thresholds can also be defined for parameters controllingthe occurrence of landslides, such as the antecedent hy-drogeological conditions or the (minimum or maximum)soil depth required for failures to take place.
Rainfall thresholdsRainfall-induced shallow landslides, mostly soil slips anddebris flows (Ellen and Wieczorek 1988), are initiated bya transient loss of shear strength, resulting from the in-crease in porewater pressure, caused by intense rainfallonto loose surficial soil overlying firmer, less permeablebedrock (Campbell 1975; Wilson 1989). Ideally, theknowledge of the spatial distribution and variability ofsoil thickness and its properties, coupled with detailedmeasurements of rainfall, would allow for the temporaland spatial prediction of slope instability conditions dur-ing a storm. Unfortunately, knowledge on soil thickness,soil hydraulic and geotechnical properties, subsurfacegeometry and bedrock interaction is limited, and re-stricted to a few sites. The physical process controllinghow and to what extent rainfall contributes to the in-crease in porewater pressure (i.e., infiltration) remainspoorly understood, particularly on sloping ground. Addi-tionally, antecedent conditions (hydrological and shearstrength), locally important in determining where andwhen a slope will fail, are difficult to ascertain. Despitethe promising approaches of deriving information on soilcharacteristics from topography (Moore and others 1993)and of coupling hydrological and slope stability modelsto forecast sites of potential instability (Montgomery andDietrich 1994; Dietrich and others 1995), it remains diffi-cult to define soil characteristics and to identify instabili-ty conditions over a territory whose extent is of interestfor hazard evaluation and civil protection policy making.An alternative approach to the evaluation of the hazardinduced by rainfall-induced shallow landslides consists ofthe definition of rainfall thresholds based on the statisti-cal analysis of the relationship between rainfall and theoccurrence of mass movements. The approach requiresaccurate rainfall data and detailed information on the oc-currence of slope failures. Landslide occurrence is ascer-tained by compiling an inventory of slope failures. Theinventory, completed immediately after the event to min-imize information loss, records the location and time ofoccurrence of failures. The former can be obtainedthrough field mapping and the interpretation of aerialphotographs; the latter is determined mostly through in-terviews. Rainfall data should be collected from a careful-ly designed and sufficiently dense network of recordingrain gauges, of probably no less than 1 gauge for abouteach 50 km2. This value may be underestimated inmountainous regions, where topographic effects on rain-
fall are difficult to ascertain. Additionally, the temporalresolution of rainfall measurements must be adequate.Daily precipitation records do not capture peak rainfallintensity, a fundamental measure where convective preci-pitations of short duration and high intensity trigger dif-fused mass movements, and are inadequate for the defi-nition of accurate, site-specific rainfall thresholds. Use ofdaily precipitation records is restricted to the definitionof regional thresholds, where more accurate data are notavailable (Glade 1998).Where information on landslides and rainfall is available,plots can be prepared and threshold curves can be fittedas lower bounds for the occurrence of slope failures. Themost commonly investigated rainfall parameters are: total(“cumulative”) rainfall; antecedent (“pre-event”) rainfall;rainfall intensity and duration. Various combinations ofthese parameters have been attempted. Thresholds weredefined for: rainfall intensity (Brand and others 1984);the duration/intensity ratio (Caine 1980; Cancelli andNova 1985); the duration above a predefined intensitylevel (Wieczorek and Sarmiento 1983); the cumulativerainfall in a given time (Govi and others 1985; Page andothers 1993); the antecedent rainfall/daily rainfall ratio(Kim and others 1991); the event rainfall/yearly averagerainfall ratio (Govi and Sorzana 1980); and the daily rain-fall/antecedent excess rainfall ratio (Crozier 1986). Mostof the proposed thresholds perform well in the regionwhere they were developed but can not be exported toneighboring areas. Also, their temporal accuracy remainslargely untested (Crozier 1996).Possibly, the best known rainfall threshold is that pro-posed by Caine (1980), who collected a worldwide set ofrainfall and landslide data and proposed a function relat-ing rainfall intensity and duration. Similar thresholdshave been proposed for the San Francisco Bay region(Cannon and Ellen 1985; Wieczorek 1987), for Carinthia(Moser and Hohensim 1983), for the Southern Alps (Can-celli and Nova 1985; Ceriani and others 1992; Guzzettiand others 1992; Polloni and others 1992; Crosta 1990,Crosta 1994), for the pre-Alpine regions of northern Italy(Crosta 1994) and for the Piedmont region (Polloni andothers 1996). Caine’s approach, not considering the ante-cedent conditions, is not suited for deep-seated landslidesor failures triggered by low-intensity rainfall events, andwhere complex, leaky aquifers are present within theslope.The main operational advantage of rainfall thresholds,that justify their definition and application in warningsystems, refers to the fact that rainfall is relatively simpleand inexpensive to measure over large areas. Indeed, inplaces rainfall is being forecast with increasing accuracy.If rainfall data (measured or forecasted) are sufficientlydense in space, thresholds may allow for a good (fine)spatial resolution. Additionally, where data on soil prop-erties and porewater pressure at shallow depth are availa-ble, rainfall thresholds can be linked to site-specific geo-technical models, largely improving the temporal predic-tion of shallow landslides (Keefer and others 1987).Drawbacks of rainfall thresholds are both conceptual and

148 Environmental Geology 35 (2–3) August 1998 7 Q Springer-Verlag
operational. Conceptually, rainfall is not the primarycause of slope failures. Landslides are caused by the buil-dup of high porewater pressure into the ground (Camp-bell 1975; Wilson 1989). Groundwater conditions respon-sible for slope failures are related to rainfall through in-filtration, soil characteristics, antecedent moisture con-tent, and rainfall history. These environmental variables(“preparatory factors”) are poorly known over large areasand exhibit considerable spatial and temporal variability.The assumption that the higher the rainfall intensity, thelarger is the probability of failures is simplistic and notalways acceptable. During the July 1987 storm in Valtelli-na (southern Italian Alps), an event with 50–100-year re-turn period, soil slips and debris flows were more abun-dant on the southern side of the valley, which receivedone-third more rain than the northern one, but did notoccur in the area where the highest intensity and cumula-tive precipitation were recorded. Due to the local geologi-cal setting, soil cover was absent and shallow failures didnot develop where rainfall was more intense (Crosta andothers 1990; Guzzetti and others 1992). In general, for theinitiation of failures, the geological and morphologicalsetting as well as the antecedent hydrological conditionsplay an important role until a regional (“maximum”)threshold of rainfall intensity is exceeded, and diffusedlandsliding occur independently of the antecedent condi-tions (Brand 1981). The maximum regional thresholdmay vary seasonally (Govi and Sorzana 1980; Govi andothers 1985) as well as in response to changes in the en-vironmental conditions (soil cover, land use).Operational limitations for the definition of rainfallthresholds refer mostly to the availability of data of ade-quate quality, resolution and recording length. During anevent, a dense network of recording rain gauges is re-quired, and immediately after the event a detailed inven-tory of landslides must be compiled. At least one eventmust be investigated in detail. Indeed, a single event maybe so intense (“extreme” i.e., with a return period ex-ceeding 100 years) as not to be representative of the localinstability conditions. Thresholds based on extremeevents can underestimate the probability of failures.Hence, a long record of rainfall measurements and manyevents resulting from different meteorological conditions,should be analyzed to define reliable rainfall thresholds.Unfortunatelly, information on an adequate number ofevents is seldom available. In Italy, as in many othercountries, detailed rainfall data, from dense networks ofcontinuously recording stations, are available only locallyand for the last few years (20–30 years at most). Addi-tionally, accurate landslide inventories are preparedmostly for major events. This largely limits the possibilityof using historical data in defining accurate (site-specific)rainfall thresholds. Daily records of rainfall measure-ments are available for longer periods (up to 120 years inItaly), allowing for the evaluation of regional thresholds.
Hydrological thresholdsAn alternative approach to the definition of thresholdsfor the (temporal) occurrence of landslides is based on
the analysis of river discharge measurements. Runoff isthe result of a complex interaction between rainfall, infil-tration, percolation to the groundwater table, overlandflow and channel flow occurring along the drainage net-work and on the slopes (Freeze and Cherry 1979). Al-though not lacking uncertainties, particularly duringflooding events, runoff measures the temporal and spatialresponse of a catchment to a meteorological event (a“rainstorm”) as well as the catchment hydrological ante-cedent conditions.In many areas, intense or prolonged rainfall can triggerdiffused landsliding and cause extensive inundation.Hence, it should be possible to relate the variation in wa-ter levels at a gauging station in a river basin to the oc-currence of landsliding and flooding in the catchment.Water levels, or the corresponding discharge measure-ments, can be used to define hydrological thresholds forthe occurrence of geohydrological catastrophes. Require-ments for such analysis are basic, namely: an inventoryof landslides and inundations; and a record of runoffmeasurements. The latter, although not as common asrainfall measurements, are available at several localitieswith the required accuracy (i.e., average daily measure-ments) and for a long period of time (more than few de-cades). Historical information on past catastrophic eventscan be compared with historical discharge measurementsto define statistical thresholds. This represents a majoradvantage over the definition of rainfall thresholds. Addi-tionally, runoff is a better measure than daily rainfall toestimate regional thresholds for the occurrence of land-slides.The approach does not lack limitations due mostly to thequality and representativeness of the runoff record. Hy-drological thresholds can be defined only for catchmentswhere runoff reflects the short-term hydrological behav-ior of the basin, particularly during extreme events.Hence, the approach can not be applied 1) to ephemeralstreams, where discharge is episodic and peak water lev-els are difficult to measure; 2) where highly permeablerocks (i.e., limestone) crop out, altering the short-termhydrological response of the basin; and 3) where riversare regulated or where the natural water flow is artificial-ly controlled. Other limitations refer to the assumptionthat all environmental variables controlling river dis-charge remain constant during the time frame of theanalysis. Modification in land-use practice (i.e., clear-cut-ting, reforestation, etc.) or the build up of levees and res-ervoirs change the runoff regime, limiting (and locallypreventing) the use of discharge measurements for thedefinition of hydrological thresholds for landslide occur-rence.Despite these limitations, the definition of regional hy-drological thresholds for the occurrence of mass move-ments and inundations was attempted in the Tiber RiverBasin of central Italy. In the following, we present the re-sults of such an evaluation, discussing advantages anddrawbacks.

Environmental Geology 35 (2–3) August 1998 7 Q Springer-Verlag 149
Fig. 1Tiber River Basin location map of 1495 landslides (gray square)and 1051 inundations (black dot) inventoried by the AVIproject for the period 1918–1990 (Guzzetti and others 1996a).Landslides occurred at 936 sites. Inundations affected 388localities. For 560 landslides and 1005 inundations the date ofoccurrence is known
The Tiber River project
The Tiber River basin extends for 17,169 square kilomet-ers in central Italy and represents the second largest riverbasin in Italy (Fig. 1). The area has a long history of hy-drological catastrophes. Reports on landslides and inun-dations go back to Etruscan and Roman periods. Thefirst documented information on slope movements in thehillsides of Todi and Orvieto dates back to the fourteenthcentury (Guzzetti and others 1996b). The oldest reportedflood occurred in Rome in 381 B.C. Since then tens of ca-tastrophic events were reported.
Historical information on landslides and floodsIn the early 1990s, a nation-wide project aimed at collect-ing information on landslides and floods for the period
1918–1990 (the AVI Project), produced a catalogue of his-torical landslides and inundations in Italy (Guzzetti andothers 1994). The inventory was completed through thesystematic review of newspapers, the interview of expertwitnesses, and the inspection of technical and scientificreports and papers. For 22 provinces in cental Italy, 3521landslides and 2365 inundations were inventoried andprovisionally mapped at the 1 : 100,000 scale. About one-half of the events (1495 landslides and 1051 floods) werelocated within the Tiber River Basin (Fig. 1). The 1495landslides occurred at 936 sites, and the 1051 inundationsaffected 388 different localities (Guzzetti and others1996a). There are 22 sites that were inundated more than10 times in 72 years (1918–1990).In the Tiber River Basin the spatial recurrence of floodsis twice that of landslides. This reflects both the morpho-logical setting and a recording problem. Inundations oc-cur along the drainage network and are (spatially) lessvariable than landslides that can occur on any slope, al-beit with different probabilities. The historical catalogueis affected by recording problems related to the humanperception of hydrological catastrophes. Floods are gener-ally perceived as more catastrophic events than land-slides. Landslides may occur days or even weeks after theonset of a meteorological event. Slope failures may not beperceived as directly related to the triggering event andare locally underestimated in number. For these reasonsthe historical record reflects only the minimum numberof events that actually occurred. Of the 786 municipalitieswhose territory lie within the Tiber River basin, 251 wereaffected at least once by landslides and 148 by inunda-tions. On average, each municipality experienced 6 land-slides and 7 inundations. Townships more frequently af-fected by landslides were: Rome (150), Orvieto (88), Peru-gia (64), and Todi (41). Inundations were recurrent inRome (180), Deruta (66), Torgiano (40), and Orte (38).The considerably high density of events in large munici-palities (i.e., Rome, Perugia, Orvieto, etc.) reflects aknown bias in the historical catalogue toward denselypopulated areas (Guzzetti and others 1994).For about one-third of all landslides (560) and 95% of allinundations (1005) the date of the event is known, mak-ing the information suitable for the definition of hydro-logical thresholds. A preliminary analysis of all datedevents revealed a predictable seasonality. Inundations andlandslides are more frequent in the winter season(Fig. 2A). Inundations are abundant in December, whenprecipitation is higher. Landslides are frequent in Januaryand February, when rainstorms last longer and the ante-cedent conditions are heavier, increasing soil moisture.The frequency of catastrophic events exhibits a correla-tion with the general climatic trend (Fig. 2B). Landslidesand inundations were found to be rare during WorldWar II and the post-war period, reflecting the incomplet-ness of the catalogue rather than a peculiar climatologicalcondition (a dry period).The reliability of archive catalogues is difficult to ascer-tain, and depends largely on the quality, availability,completeness, and redundancy of the historical sources

150 Environmental Geology 35 (2–3) August 1998 7 Q Springer-Verlag
Fig. 2A, BTiber River Basin frequency plots of landslides and inundationsinventoried by the AVI project for the period 1921–1990,compared with the regional climatic trend, expressed by meandaily discharge at the Ripetta gauging station, Rome (heavythick line). A Average, monthly frequency of landslides (white)and inundations (black). Dashed line is rainfall expressed asmean daily discharge equivalent. B Frequency of hydrologicalevents with information on landslides (white) and inundations(black) in 3-year intervals
Table 1Hydrological and lithological characteristics of 7 gauging stations in the Tiber River Basin that exhibit the longest record ofmeasurement. The P.te Nuovo and Ripetta gauging stations (bold) were selected to define regional hydrological thresholds
Gauging station Basin Recordlength
Catchmentarea
Permeable Daily discharge Largestevent
(years) (km2) (%) mean(m3 sP1)
max(m3 sP1)
(date)
a S. Lucia Tevere 37 934 16 14 432 14/12/34b P.te Felcino Tevere 37 2033 4 27 697 25/12/59c P.te Bettona Topino 39 1220 56 11 323 15/12/37d Torgiano Chiascio 46 1956 32 23 708 15/12/37e P.te Nuovo Tevere 55 4147 16 48 1011 15/12/37f Macchiagrossa Nera 26 4020 85 84 354 15/12/37g Ripetta Tevere 64 16 545 32 231 2730 17/12/37
(Ibsen and Brunsden 1996). The drawback to any histori-cal analysis is the lack of spatial completeness, resolutionand precision, and an undefined overestimation of eventswhich caused damage to man-made structures as op-posed to an underestimation of events, even large ones,which took place in unpopulated areas (Casale and others1994; Guzzetti and others 1994; Ibsen and Brunsden1996).In the Tiber River Basin, due to the physiographical set-ting, sites affected by inundations are easily (and moreprecisely) localized than those affected by mass move-ments. Newspapers and chronicles most commonly re-port information on “widespread” or “diffused” landslid-ing (i.e., numerous landslides) without any detail on theexact location of failures. Hence, a landslide, unless it in-volved a town or a major facility, was difficult to locatewith accuracy. Regardless of this limitation, if the date ofoccurrence was known, the landslide was used to definethe threshold. An attempt was made to test the spatialreliability of the AVI inventory by comparing the distri-bution of recorded historical landslides with the spatialdistribution of more than 20,000 slope failures mappedby photo-interpretation in the Umbria and Marche re-gions of central Italy (Guzzetti and Cardinali 1990; An-tonini and others 1993). The test showed that the densityof recorded historical events falling directly on landslidedeposits, or within a distance of 500 meters, is twice thedensity of the events that lay at a greater distance. Inother words, 70% of all recorded historical landslides inthe Umbria and Marche regions lay on, or within a dis-tance of 500 m to the nearest mapped landslide body.This is probably the best that one can expect from inven-tories completed with different techniques.
Hydrological recordsMean daily discharge measurements for 85 gauging sta-tions in central Italy are available, in table format, fromthe Servizio Idrografico Nazionale. Data were digitized bythe University of Perugia and stored into a computer da-tabase available on the Internet (http://wwwdb.gndci.pg.cnz.it). Of these gauging stations, 27 are located withinthe Tiber River Basin. Table 1 lists the Santa Lucia, Bet-

Environmental Geology 35 (2–3) August 1998 7 Q Springer-Verlag 151
Fig. 3Tiber River Basin lithological map with the location of 7 waterdischarge gauging stations: a Santa Lucia, b Ponte Felcino, cBettona, d Torgiano, e Ponte Nuovo, f Macchiagrossa, and gRipetta. See Table 1 for station characteristics. Thin lines aremajor rivers, heavy lines are major drainage divides. Legend: 1recent alluvial deposits, 2 volcanic rocks, 3 limestone and marl,4 flysch deposits
tona, Ponte Felcino, Torgiano, Ponte Nuovo, Macchia-grossa and Ripetta gauging stations that exhibit the long-est record of measurements (626 years; Fig. 3). Succes-sively, the Ponte Nuovo and Ripetta gauging stationswere selected to define regional hydrological thresholdsbecause of their particularly long record (655 years) andthe availability of information on historical catastrophicevents.For each of the 7 gauging stations listed in Table 1, thefrequency distributions of mean daily discharge and dailydischarge volume were computed (Fig. 4). No attemptwas made to consider different rating curves. Inspectionof the cumulative curves revealed that, at each gaugingstation, about half of the total discharge occurred duringapproximately 80% of the entire measurement period,
corresponding to days of low water flow. The remaining50% of the total discharge occurred on a limited numberof days (about 20%), characterized by sustained, or highflow. Hence, hydrological events possibly associated withthe occurrence of landslides and inundations are limitedto 20% of the record of daily discharge measurements.Where predominately permeable rocks crop out (mostlylimestone) the hydrological behavior is different. Due tothe infiltration capacity and the storage effect of limes-tone, about half of the total discharge occurred on 35%of the days, characterized by sustained water flow (cf.Macchiagrossa Fig. 4).
Hydrological eventsTo establish hydrological thresholds based on historicaldata, “hydrological events” were defined as a series ofconsecutive days having a mean daily discharge exceed-ing a predefined value, set equal to 80% of the cumula-tive frequency distribution of mean daily discharge ateach gauging station. This cut-off value corresponds toabout half of the total volume of water discharged by theTiber River. Table 2 lists the cut-off values and the num-ber of events that were identified at each gauging station.Hydrological events were identified by means of a com-puter program that searched the record of daily runoff,selected a cut-off value, and systematically recognized theevents. Events lasting for more than 7 days were visuallyinspected to check for the presence of relative maximawithin the sequence, i.e., for the occurrence of multipleevents. For each event a set of hydrological parameterswere automatically measured or estimated by the com-puter program, namely:1. The highest value (“maximum”) of mean daily dis-charge (in m3sec–1);2. The cumulative (total) flood volume (in millions cubicmeters), estimated as the sum of the daily flood volumecomputed by multiplying the mean daily discharge by thenumber of seconds in the day;3. The event duration (in days); and4. The event intensity (in m3sec–1km–2), computed, ateach gauging station, dividing the average value of theevent daily discharge by the catchment area.The selected hydrological parameters reveal different as-pects of each hydrological event. The maximum meandaily discharge (a measure of peak water flow) and theestimated flood volume (a measure of the total amountof water) allow for ranking the events according to theirmagnitude. The duration and intensity provide informa-tion on the geographical extent of the event, i.e., it beinglocalized or spead over the entire basin. Hydrological pa-rameters, being derived from the empirical analysis ofthe same data set, are all positively correlated. In general,severe events lasted for several days, extended over theentire basin, and were characterized by large flood vol-umes and moderate to high daily runoff.The average values of the (measured or estimated) hy-drological parameters at each gauging station exhibit arelationship with catchment area. The correlation is posi-tive and linear for flood volume, positive and nonlinear

152 Environmental Geology 35 (2–3) August 1998 7 Q Springer-Verlag
Fig. 4Tiber River Basin cumulative frequency distribution plots ofmean daily discharge (solid line) and of daily discharge volume(dashed line) for 4 gauging stations. The Ponte Felcino andMacchiagrossa gauging stations represent mostly impermeable(flysch terrain) and mostly permeable (limestone) catchments,respectively (see Fig. 3). The Ponte Nuovo and Ripetta gaugingstations were selected to define regional hydrological thresholds
for maximum mean daily discharge, and negative andnonlinear for the event intensity (Fig. 5). Estimated floodvolume is not influenced by catchment lithology, justify-ing the selection of cut-off values based on the percent-age of total flood volume. On the other hand, both maxi-mum mean daily discharge and the event intensity varywith basin lithology and morphology. For the latter, twosets of curves, for mostly permeable (limestone) andmostly impermeable (flysch) basins can be identified(Fig. 5C). Differences in the hydraulic parameters for theRipetta gauging station are due to the catchment area(much larger than that of its subbasins), the lithologicalsetting (the basin encompasses permeable and impermea-ble rocks), and the presence of dams.The majority of the events that were identified at eachgauging station was limited to a portion of the basin.Only a limited number of events (177) were identified inall gauging stations and affected the whole basin at the
same time. These regional events exhibit peculiar hydro-logical characteristics. At the Ripetta gauging station theylast for 7 days or more, mean daily discharge exceeds800 m3 sec–1, flood volume is greater than 300!106 m3,and intensity exceeds 0.031 m3 s–1 km–2.For each hydrological event, the number and location ofall landslides and inundations known to have occurredwere counted, and a set of “event maps” were prepared(Fig. 6). Catastrophic events (for which landslides and in-undations are reported) exhibit larger hydrological pa-rameters (maximum mean daily discharge, flood volume,event duration and intensity) than the events for whichnothing is reported in the historical catalogue. In general,long-lasting and severe hydrological events were asso-ciated with a greater occurrence of landslides or inunda-tions (Fig. 7). Landslides are relatively more frequentthan inundations when the event intensity is low, that is,for long-lasting events characterized by a constant, re-gionally distributed rainfall.Inspection of the cumulative frequency distributions ofcatastrophic events reveals that, albeit with low frequency(^20–30%), landslides and inundations occurred alsowhen the hydrological conditions in the catchment werenot severe. Indeed, landslides and inundations were re-ported when maximum mean daily discharge, estimatedflood volume and event intensity had low (or very low)values. This stresses the role of (short- and long-term)

Environmental Geology 35 (2–3) August 1998 7 Q Springer-Verlag 153
Tabl
e 2
Cha
ract
eris
tics
of
hydr
olog
ical
eve
nts
inve
ntor
ied
at t
he 7
gau
ging
sta
tion
s in
the
Tib
er R
iver
Bas
in
Gau
ging
Stat
ion
Cut
-off
valu
eT
otal
even
tsEv
ents
wit
hT
otal
flo
od v
olum
eM
axim
um d
aily
dis
char
geE
vent
int
ensi
ty
(m3
sP1)
info
r-m
atio
nm
ax(1
06m
3)
mea
n(1
06m
3)
min
(106
m3)
cv (%)
max
(m3
sP1)
mea
n(m
3sP
1)
min
(m3
sP1)
cv (%)
max
(m3
sP1
kmP
1)
mea
n(m
3sP
1km
P2)
min
(m3
sP1
kmP
2)
cv (%)
aS.
Luc
ia30
453
1812
319
310
343
299
3075
0.38
50.
070
0.03
252
bP.
Fel
cino
6050
131
187
375
9469
719
060
700.
175
0.06
00.
030
45c
Bet
tona
2536
332
9412
211
032
358
2566
0.12
00.
035
0.02
038
dT
orgi
ano
5042
445
226
264
106
708
130
5077
0.13
50.
046
0.02
644
eP
. Nuo
vo10
064
284
548
619
106
1011
270
100
680.
171
0.04
30.
024
40f
Mac
chia
gros
sa12
025
236
700
5710
133
354
154
120
260.
057
0.03
50.
029
16g
Rip
etta
300
800
214
2174
237
2610
327
3061
030
054
0.08
30.
027
0.01
831
Fig. 5A–CTiber River Basin plot of the correlation between average eventparameters and catchment area: A estimated flood volume; Bmaximum mean daily discharge; C event intensity. Diamondsrepresent largely impermeable and circles mostly permeablecatchments. Open symbols indicate events for which noinformation is reported in the historical catalogue. Closesymbols indicate events for which information on landslides orinundations is reported. Thick lines fit close symbols and thinlines fit open symbols
antecedent conditions, but it also suggests a degree ofunpredictability of hydrological catastrophes. Additional-ly, the historical database shows that, when hydrologicalconditions are not severe, landslides are more frequentthan inundations, confirming that the spatial variabilityof local environmental factors that trigger mass move-ments cannot be fully captured by measuring daily ru-noff.At the Ponte Nuovo gauging station (e on Fig. 3) for the65 years between 1925 and 1990 (with gaps between 1943and 1945, due to World War II, and between 1981 and
154 Environmental Geology 35 (2–3) August 1998 7 Q Springer-Verlag
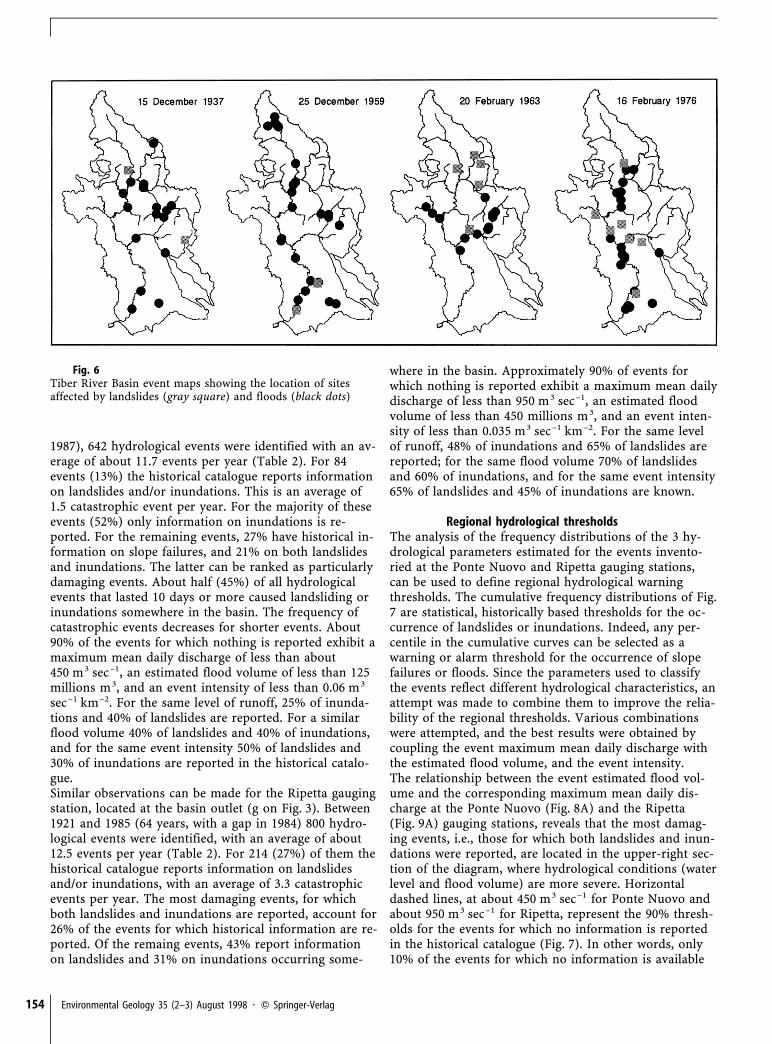
Fig. 6Tiber River Basin event maps showing the location of sitesaffected by landslides (gray square) and floods (black dots)
1987), 642 hydrological events were identified with an av-erage of about 11.7 events per year (Table 2). For 84events (13%) the historical catalogue reports informationon landslides and/or inundations. This is an average of1.5 catastrophic event per year. For the majority of theseevents (52%) only information on inundations is re-ported. For the remaining events, 27% have historical in-formation on slope failures, and 21% on both landslidesand inundations. The latter can be ranked as particularlydamaging events. About half (45%) of all hydrologicalevents that lasted 10 days or more caused landsliding orinundations somewhere in the basin. The frequency ofcatastrophic events decreases for shorter events. About90% of the events for which nothing is reported exhibit amaximum mean daily discharge of less than about450 m3 sec–1, an estimated flood volume of less than 125millions m3, and an event intensity of less than 0.06 m3
sec–1 km–2. For the same level of runoff, 25% of inunda-tions and 40% of landslides are reported. For a similarflood volume 40% of landslides and 40% of inundations,and for the same event intensity 50% of landslides and30% of inundations are reported in the historical catalo-gue.Similar observations can be made for the Ripetta gaugingstation, located at the basin outlet (g on Fig. 3). Between1921 and 1985 (64 years, with a gap in 1984) 800 hydro-logical events were identified, with an average of about12.5 events per year (Table 2). For 214 (27%) of them thehistorical catalogue reports information on landslidesand/or inundations, with an average of 3.3 catastrophicevents per year. The most damaging events, for whichboth landslides and inundations are reported, account for26% of the events for which historical information are re-ported. Of the remaing events, 43% report informationon landslides and 31% on inundations occurring some-
where in the basin. Approximately 90% of events forwhich nothing is reported exhibit a maximum mean dailydischarge of less than 950 m3 sec–1, an estimated floodvolume of less than 450 millions m3, and an event inten-sity of less than 0.035 m3 sec–1 km–2. For the same levelof runoff, 48% of inundations and 65% of landslides arereported; for the same flood volume 70% of landslidesand 60% of inundations, and for the same event intensity65% of landslides and 45% of inundations are known.
Regional hydrological thresholdsThe analysis of the frequency distributions of the 3 hy-drological parameters estimated for the events invento-ried at the Ponte Nuovo and Ripetta gauging stations,can be used to define regional hydrological warningthresholds. The cumulative frequency distributions of Fig.7 are statistical, historically based thresholds for the oc-currence of landslides or inundations. Indeed, any per-centile in the cumulative curves can be selected as awarning or alarm threshold for the occurrence of slopefailures or floods. Since the parameters used to classifythe events reflect different hydrological characteristics, anattempt was made to combine them to improve the relia-bility of the regional thresholds. Various combinationswere attempted, and the best results were obtained bycoupling the event maximum mean daily discharge withthe estimated flood volume, and the event intensity.The relationship between the event estimated flood vol-ume and the corresponding maximum mean daily dis-charge at the Ponte Nuovo (Fig. 8A) and the Ripetta(Fig. 9A) gauging stations, reveals that the most damag-ing events, i.e., those for which both landslides and inun-dations were reported, are located in the upper-right sec-tion of the diagram, where hydrological conditions (waterlevel and flood volume) are more severe. Horizontaldashed lines, at about 450 m3 sec–1 for Ponte Nuovo andabout 950 m3 sec–1 for Ripetta, represent the 90% thresh-olds for the events for which no information is reportedin the historical catalogue (Fig. 7). In other words, only10% of the events for which no information is available

Environmental Geology 35 (2–3) August 1998 7 Q Springer-Verlag 155
Fig. 7Tiber River Basin frequency distributions plots of the eventshydrological parameters for the Ponte Nuovo and Ripettagauging stations. Solid dark lines represent the events for whichno information on landslides or inundations is reported in thehistorical catalogue. Dashed lines represent the events for whichlandslides are known to have occurred. Dashed dotted linesrepresent the events for which inundations are known to haveoccurred
exceeds the threshold. Likewise, the vertical dashed linesrepresent the 90% thresholds for the event estimatedflood volume. In this case, only 10% of the events thatexceeded the given thresholds did not generate landslidesor inundations. Similar considerations can be made forthe relationship between the event maximum mean dailydischarge and the corresponding intensity (Figs. 8B and9B). Vertical dashed lines, at about 0.06 m3sec–1 km–2 forPonte Nuovo and about 0.035 m3 sec–1 km–2 for Ripettarepresent the 90% thresholds for the events with no re-ported historical information.

156 Environmental Geology 35 (2–3) August 1998 7 Q Springer-Verlag
Fig. 8A, BTiber River Basin regional hydrological thresholds for the PonteNuovo gauging station: A relationship between maximum meandaily disharge and total estimated flood volume; B relationshipbetween maximum mean daily discharge and the eventintensity. Filled squares indicate that both landslides andinundations are reported. Filled triangles when landslides onlyare reported, and filled circles when inundations only arereported. Open symbols indicate events for which noinformation on landslides or inundations is reported in thehistorical catalogue. Dashed lines are 90% thresholds for totalestimated flood volume and maximum mean daily disharge (seeFig. 7). Thick and thin solid lines are “upper” and “lower”regional hydrological thresholds, respectively
Fig. 9A, BTiber River Basin regional hydrological thresholds for theRipetta gauging station: A relationship between maximummean daily disharge and total estimated flood volume; Brelationship between maximum mean daily disharge and theevent intensity. Filled squares indicate that both landslides andinundations are reported. Filled triangles when landslides arereported and filled circles when inundations are reported. Opensymbols are events for which no information on landslides orinundations is reported in the historical catalogue. Dashed linesare 90% thresholds for total estimated flood volume andmaximum mean daily disharge (see Fig. 7). Thick and thin solidlines are “upper” and “lower” regional hydrological thresholds,respectively
The solid lines in Figs. 8 and 9 are regional warningthresholds. They separate hydrological conditions that,from the historical record, are more (or less) prone tothe occurrence of landslides or inundations. The “upper”thresholds (thick lines) correspond to regional “maxi-mum” thresholds, whereas the “lower” thresholds (thinlines) are higher than the “minimum” regional thresh-olds. Although drawn heuristically, the thresholds fit apreliminary subdivision of hydrological events based on amultivariate regression model prepared using as predic-tor variables, the events hydrological parameters; and asthe dependent variable, the occurrence of landslides orinundations.At Ponte Nuovo (Fig. 8) the most damaging events (blacksquares) are all located in the higher probability zone(above the “upper” threshold), where water level is high-er and flood volume is larger. A few open dots are alsopresent in the same area. They represent events for which
no information on landslides or inundations is reported.A detailed review showed that these events occurred inthe decade 1940–1950 when, due to World War II and thepost-war reconstruction, the historical catalogue is poor.These events can be considered as possible “false nega-tives.” An attempt was made to test the efficency of thePonte Nuovo discharge/volume thresholds (Fig. 8A). Theregional thresholds, defined considering catastrophicevents which occurred upstream from the Ponte Nuovogauge, were compared with the historical data on land-slides and inundations available for the entire Tiber RiverBasin (symbols of Fig. 9A). As expected some of the mostdamaging events fell below the warning threshold, butthe overall fit of the regional threshold remained satisfac-tory.At the Ripetta gauging station the most damaging events(black squares) exhibit a large scatter and hydrologicalthresholds are somewhat less well defined (Fig. 9A and

Environmental Geology 35 (2–3) August 1998 7 Q Springer-Verlag 157
9B). In addition to possible inconsistencies in the histori-cal catalogue, the loose constraint and the larger scattermay be explained by the large extent of the catchmentand the corresponding large lagtime, the lithological andmorphological complexity of the basin, and a lower spa-tial resolution of the hydrological threshold in the lower-most part of the basin. Despite these limitations thresh-olds for the Ripetta gauging station are still acceptablefor regional warnings.As previously discussed, landslides and inundations werereported also when hydrological conditions were not se-vere. The combination of maximum mean daily dischargewith estimated flood volume and the event intensity con-firms that the probability of occurrence of landslides orinundations in such circumstances (i.e., in the lower-leftpart of the diagrams, below the lower threshold) is low,though greater than zero.
Conclusions
The evaluation carried out in the Tiber River Basinproved that hydrological conditions prone to the occur-rence of landslides and inundations can be ascertainedthrough the analysis of runoff measurements coupledwith historical information on catastrophic events. Exam-ination of runoff records at several gauging stations al-lowed for the identification of hydrological events thatwere ranked according to a set of hydrological paramet-ers: 1) maximum mean daily discharge, 2) estimatedflood volume, and 3) event intensity. These parameters,expressing different hydrological characteristics, allowedfor the statistical definition of regional thresholds for theoccurrence of landslides and inundations. Such thresh-olds can be used to issue regional warnings and may behelpful in planning civil protection policies.Benefits and drawbacks of the approach have been dis-cussed. The definition of hydrological thresholds has con-ceptual and operational advantages over other types ofthresholds. Ideally, they better conform to the rathercomplex physical processes involved in the occurrence ofinundations and rainfall-induced slope failures. Opera-tionally, they maximize the information content of histor-ical data on natural catastrophes, and they prove effectivewhere meteorological (rainfall) and geotechnical data arenot available with the adequate spatial or temporal reso-lution. Limitations are due to the availability, quality andaccuracy of the historical records, as well as to geomor-phological and physiographical constraints. Being definedthrough the analysis of the frequency distribution of ru-noff measurements, hydrological thresholds endure con-ceptual and operational limitations typical of statisticalmodelling. They cannot be exported to neighboring areasand they suffer, in an unknown way, from the inadequa-cy of the basic data, whose reliability, accuracy and com-pleteness are largely untested. The approach works onlyfor catchments where the drainage network reflects thehydrological behavior of the territory. It cannot be ap-
plied where runoff is episodic and peak water levels aredifficult to measure, where catchment are underlain byhighly permeable rocks, or where the natural water flowis artificially controlled.Further limitations involve to the assumption that all en-vironmental variables controlling runoff remain constant.Significant changes in runoff due to the buildup of reser-voirs, the change in land-use practice (clear-cutting, re-forestation, etc.), or intense urbanization may limit (orprevent) the definition and reliability of hydrologicalthresholds. In the Tiber River Basin dams are present(Corbara Lake) or are under construction. In the period1930–1960 reforestation was performed at several sites; inthe last 30 years uncultivated and abandoned areas haveincreased over cultivated land and built-up areas have ex-panded. The contrasting effects of these changes on ru-noff, although largely unknown, do not appear to be suf-ficient to undermine the reliability of the proposedthresholds.The spatial resolution of hydrological thresholds is lower(or much lower) than that of warning thresholds basedon the analysis of rainfall data, the monitoring of pie-zometric levels or the measurement of ground displace-ments. A better catalogue of historical information onlandslides and inundations will certainly improve thespatial resolution and reliability of hydrological thresh-olds. In the Tiber River Basin, the Ponte Nuovo gaugingstation represents the best compromise between basinsize and the volume of available information. For smallersubbasins the available historical information is insuffi-cient to define thresholds. For larger areas (cf. Ripetta)the basin is probably too large and complex to allow forthe definition of reliable thresholds.A substantial improvement of the historical cataloguewould require a large research effort, in order to increasethe number of events inventoried and to refine the loca-tion of landslides and inundations. Unfortunately, collec-tion and validation of historical information on hydrolog-ical catastrophes is time consuming, expensive, errorprone and subject to large uncertainties. The historicalcatalogue could be extended back further into the past,but this will not improve the definition of thresholdswhich are constrained by the availability of runoff meas-urements that cannot be extended in the past.For alert or alarm purposes and civil protection policymaking, regional hydrological thresholds cannot substi-tute for other warning thresholds. Rather they comple-ment the other approaches where appropriate informa-tion is not available. It would be desirable to comparethe effectiveness and reliability of thresholds based ondifferent approaches. For the Tiber River Basin an at-tempt was made to correlate hydrological thresholds withrainfall. Detailed rainfall data for the basin were notavailable to us, and rainfall characterstics were estimatedfrom daily records. Inspection of rainstorms that trig-gered regional events revealed that landslides and inun-dations are more frequent when the runoff coefficent(i.e., the percentage of rainfall transformed into runoff)exceeds 0.5. Larger runoff coefficents produced wide-

158 Environmental Geology 35 (2–3) August 1998 7 Q Springer-Verlag
spread inundation and diffused landsliding. The largesthydrological event recorded in the basin during this cen-tury occurred on 15 December 1937 and produced inun-dations and landslides (Fig. 6). At the Ponte Nuovo andRipetta gauging stations mean daily discharge exceeded1000 and 2700 m3 sec–1, respectively (Table 1). Duringthis catastrophic event the runoff coefficent (at PonteNuovo) reached 0.6, accounting for the widespred flood-ing and the mass movements that, most probably, weremore abundant than what was reported in the historicalcatalogue.In central Italy slope failures occur more frequently inlandslide prone areas (Guzzetti and others 1996b). Wherethe territory is classified as unstable, landslides occur inresponse to hydrological conditions (rainfall intensity andduration, soil saturation, infiltration, overland flow, etc.)that are probably less severe than those needed to triggerlandslides in stable areas. As a consequence, regional hy-drological thresholds may over- or underestimate the lo-cal instability conditions. Ideally different thresholdsshould be prepared for different lithological and geomor-phological environments. At present the information con-tained in the historical catalogue does not allow for sucha detailed analysis, but research is under way to test thefeasibility of the approach.Lastly, it should be pointed out that the (statistical andoperational) performance of the proposed (“lower” and“upper”) thresholds is different. The “upper” (90% prob-ability) threshold is close to the regional “maximum”threshold and can be used to issue alarms and for takingcivil protection actions. The “lower” threshold requires amore complex interpretation. There is a 50% probabilitythat a catastrophic event will occur when the threshold isexceeded. This is a rather poor statistical performance.Yet, since a community may not be willing to accept a50% chance of being inundated or affected by a landslide,the threshold may prove valuable in a regional warningsystem. Indeed, the effectiveness of the “lower” thresholdfor civil protection actions can be improved by preparinghazard maps, i.e., by zoning the territory into areas thatare prone to landslides or inundations.
Acknowledgements We are indebted to the people who carriedout the strenuous work of collecting historical information onlandslides and floods in Central Italy, and to Prof. Manciola(University of Perugia) who made available the database of dai-ly discharge measurements. The reviewers comments greatlyimproved the paper. The research was supported by CNR-IRPIand CNR-GNDCI grants. The paper is CNR-GNDCI report no1640.
ReferencesAntonini G, Cardinali M, Guzzetti F, Reichenbach P,
Sorrentino A (1993) Carta Inventario dei Fenomeni Franosidella Regione Marche ed Aree Limitrofe. Publication no. 580,2 sheets, scale 1 : 100,000. Consiglio Nazionale delle Ricerche(CNR) Gruppo Nazionale per la Difesa dalle Catastrofi Idro-geologiche (GNDCI), Rome
Brand EW (1981) Some thoughts on rain-induced slope fail-ures. In: Proceedings of 10th International Conference on SoilMechanics and Foundation Engineering, Stockholm. Balkema,Rotterdam, 3 : 373–376
Brand EW, Premchitt J, Phillipson HB (1984) Relationshipbetween rainfall and landslides in Hong Kong. In: Proceed-ings of the 4th International Symposium on Landslides, Tor-onto, Canada. 1 : 377–384
Caine N (1980) The rainfall intensity-duration control of shal-low landslides and debris flows. Geogr Ann 62A:23–27
Campbell R H (1975) Soil slips, debris flows, and rainstormsin the Santa Monica Mountains and vicinity, southern Cali-fornia. US Geological Survey Professional Paper 851, U.S.Government Printing Office, Washington DC
Cancelli A, Nova R (1985) Landslides in soil debris covertriggered by rainstorms in Valtellina (central Alps - Italy). In:Proceedings of 4th International Conference and Field Work-shop on Landslides, Tokyo. The Japan Geological Society, To-kyo, pp 267–272
Cannon SH, Ellen SD (1985) Rainfall conditions for abundantdebris avalanches, San Francisco Bay region, California. CalifGeol 38 : 267–272
Casale R, Fantechi R, Flageollet JC (eds) (1994). Temporaloccurrence and forecasting of landslides in the EuropeanCommunity. Final report. European Community, ProgrammeEPOCH (Ct 90 0025), Printéclair
Ceriani M, Lauzi S, and Padovan N (1992) Rainfall and land-slides in the Alpine area of Lombardia Region, central Alps,Italy. In: Interpraevent 1992, Bern. 2 : 9–20
Crosta G (1990) A study of slope movements caused by heavyrainfall in Valtellina (Italy - July 1987). In: Cancelli A (ed)ALPS 90, Proceedings of 6th International Conference andField Workshop on Landslides, Milan, Ricerca Scientifica edEducazione Permanente, Suppl. 79b, Milano, pp 247–258
Crosta G (1994) Rainfall thresholds applied to soil slips in al-pine and prealpine areas. In: Proceedings of 1st InternationalSymposium on Protection and Development of the Environ-ment in Mountains Areas, Ponte di Legno, 20–24 June. Mon-tana S.r.L., Milano, pp 141–153
Crosta G, Guzzetti F, Marchetti G, Reichenbach P (1990)Morphological classification of debris-flow processes insouth-central Alps (Italy). In: Price DG (ed) Proceedings ofthe 6th International Congress IAEG, Amsterdam, The Ne-therlands, 6–10 August. Balkema, Rotterdam, pp 1565–1572
Crozier M (1986) Landslides: causes, consequences and envi-ronment. Croom Helm, London
Crozier M (1996) The climate-landslide couple: a SouthernHemisphere perspective. Paleoclimate Res 19 ESF, Special Is-sue 12, pp 329–350
Dietrich EW, Reiss R, Hsu M-L, Montgomery DR (1995) Aprocess-based model for colluvial soil depth and shallowlandsliding using digital elevation data. Hydrol Process9 : 383–400
Ellen SD, Wieczorek GF (eds) (1988) Landslides, floods, andmarine effects of the storm of January 3–5, 1982, in the SanFrancisco Bay region, California. US Geological Suvey Profes-sional Paper 1434, U.S. government Printing Office, Washing-ton DC
Freeze RA, Cherry JA (1979) Groundwater. Prentice-Hall,London
Glade T (1998) Establishing the frequency and magnitude oflandslide-triggering rainstorm events in New Zealand. Envi-ron Geol
Govi M, Sorzana PF (1980) Landslide suceptibility as a func-tion of critical rainfall amount in piedmont basin (north-western Italy). Stud Geomorphol Carpatho-Balcanica Krakow14 : 43–61

Environmental Geology 35 (2–3) August 1998 7 Q Springer-Verlag 159
Govi M, Mortara G, Sorzana P (1985) Eventi idrologici efrane. Geol Appl Ing Bari 20 : 359–375
Guzzetti F, Cardinali M (1990) Landslide inventory map ofthe Umbria region, central Italy. In: Cancelli A (ed), ALPS 90,Proceedings of 6th International Conference and Field Work-shop on Landslides, Milan, Ricerca Scientifica ed EducazionePermanente, Suppl. 79b, Milano, pp 273–284
Guzzetti F, Crosta G, Marchetti M, and Reichenbach P
(1992) Debris flows triggered by the July, 17–19, 1987 stormin the Valtellina area (northern Italy). In: Interpraevent 1992,Bern. 2 : 193–204
Guzzetti F, Cardinali M, and Reichenbach P (1994) TheAVI project: a bibliographical and archive inventory of land-slides and floods in Italy. Environ Manage 18 : 623–633
Guzzetti F, Cardinali M, Reichenbach P (1996a) Map ofsites affected by landslides or floods - the AVI project. Publi-cation no. 1346, map at 1 : 1,200,000 scale. CNR-GNDCI, Rome
Guzzetti F, Cardinali M, Reichenbach P (1996b) The in-fluence of structual setting and lithology on landslide typeand pattern. Environ Eng Geol 4 : 531–555
Ibsen ML, Brunsden D (1996) The nature, use and problemsof historical archives for the temporal occurrence of land-slides, with specific reference to the south coast of Britain,Ventnor, Isle of Wight. Geomorphology 15 : 241–258
IDNHR, Advisory Commitee (1987) Confronting Natural Disas-ters. An International Decade for Natural Hazard Reduction.National Academy Press, Washington, 0DC
Keefer DK, Wilson RC, Mark RK, Brabb EE, Brown WM
III, Ellen SD, Harp EL, Wieczorek GF, Alger CS, Zatkin
RS (1987) Real-time landslide warning during heavy rainfall.Science 238 : 921–925
Kim SK, Hong WP, and Kim YM (1991) Prediction of rainfall-triggered landslides in Korea. In: Bell DH (ed) Landslides.Balkema, Rotterdam, pp 989–994
Montgomery DR, Dietrich WE (1994) A physically basedmodel for the topographic control of shallow landsliding. Wa-ter Resour Res 30 : 1153–1171
Moore ID, Gessler PE, Nielsen GA, Peterson GA (1993)Soil attribute prediction using terrain analysis. Soil Sci SocAm J 57 : 443–452
Moser M, Hohensim F (1983) Geotechnical aspects of soil slipsin Alpine regions. Eng Geol 19 : 185–211
Onodera T, Yoshinaka R, Kazama H (1974) Slope failurescaused by heavy rainfall in Japan. In: Proceedings of 2nd In-ternational Congress International Association of EngineeringGeology, San Paulo. Grafica Editora Hamburg LTDA, SaoPaulo, Brasil, 11 : 1–10
Page MJ, Trustrum NA, DeRose RC (1993) A high resolutionrecord of storm-induced erosion from lake sediments, NewZealand. J Paleoclimatol 11 : 333–348
Polloni G, Ceriani M, Lauzi S, Padovan N, Crosta G
(1992) Rainfall and soil slipping events in Valtellina. In: BellH (ed) Landslides. Proceedings of 6th International Sympo-sium on Landslides, 10–14 February 1992, Christchurch, NewZealand. Balkema, Rotterdam, pp 183–188
Polloni G, Aleotti P, Baldelli P, Nosetto A, Casavec-
chia K (1996) Heavy rain triggered landslides in the Albaarea during November 1994 flooding event in the Piemonteregion (Italy). In: Senneset K (ed) Landslides. Proceedings of7th International Symposium on Landslides, Trondheim, Nor-way, June 1996. Balkema, Rotterdam, pp 1955–1960
Premchitt J, Brand EW, Chen PYM (1994) Rain-inducedlandslides in Hong Kong, 1972–1992. Asia Eng June: 43–51
UNDRO (1991) Mitigating Natural Disasters. Phenomena, Ef-fects and Options. United Nations, New York
White ID, Mottershead DN, Harrison JJ (1996) Environ-mental systems, 2nd edn. Chapman & Hall, London
Wieczorek GF (1987) Effects of rainfall intensity and durationon debris flows in central Santa Cruz Mountains, California.In: Costa JE, Wieczorek GF (eds) Debris flows/avalanches:process, recognition and mitigation. Reviews in EngineeringGeology vol 7, Geological Society of America, Boulder, Colo.,pp 93–104
Wieczorek GF, Sarmiento J (1983) Significance of storm in-tensity-duration for triggering debris flows near La Honda,California (abstract). Geological Society of America, Abstractswith Programs, 15(5):289
Wilson RC (1989) Rainstorms, pore pressures, and debrisflows: a theoretical framework. In: Sadler PM, Morton DM(eds) Landslides in a semi-arid environment. Publications ofthe Inland Geological Society, Riverside, Calif., 2 : 101–117
Wilson RC, Wieczorek GF (1995) Rainfall thresholds for ini-tiation of debris flows at La Honda, California. Environ EngGeosci 1 : 11–27
Wilson RC, Mark RK, Barbato G (1993) Operation of a real-time warning system for debris flows in the San FranciscoBay area, California. In: Shen HW, Su ST, Wen F (eds) Hy-draulic Engineering ’93, Proceedings of the 1993 Conference.Hydraulics Division, American Society of Civil Engineers,New York, 2 : 1908–1913
Copyright © 2022 FDOKUMEN