Landslides, ice quakes, earthquakes: A thermodynamic approach to surface instabilities
Upload
independentCategory
view
2download
0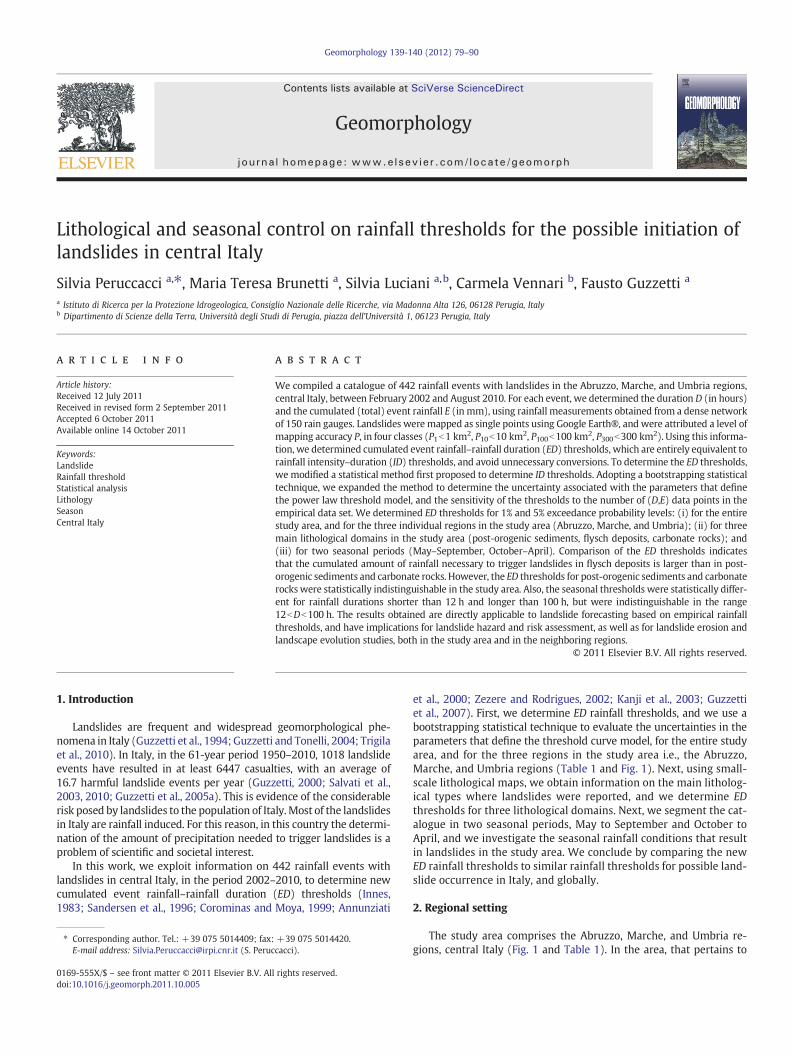
Geomorphology 139-140 (2012) 79–90
Contents lists available at SciVerse ScienceDirect
Geomorphology
j ourna l homepage: www.e lsev ie r .com/ locate /geomorph
Lithological and seasonal control on rainfall thresholds for the possible initiation oflandslides in central Italy
Silvia Peruccacci a,⁎, Maria Teresa Brunetti a, Silvia Luciani a,b, Carmela Vennari b, Fausto Guzzetti a
a Istituto di Ricerca per la Protezione Idrogeologica, Consiglio Nazionale delle Ricerche, via Madonna Alta 126, 06128 Perugia, Italyb Dipartimento di Scienze della Terra, Università degli Studi di Perugia, piazza dell'Università 1, 06123 Perugia, Italy
⁎ Corresponding author. Tel.: +39 075 5014409; fax:E-mail address: [email protected] (S. Peruc
0169-555X/$ – see front matter © 2011 Elsevier B.V. Aldoi:10.1016/j.geomorph.2011.10.005
a b s t r a c t
a r t i c l e i n f oArticle history:Received 12 July 2011Received in revised form 2 September 2011Accepted 6 October 2011Available online 14 October 2011
Keywords:LandslideRainfall thresholdStatistical analysisLithologySeasonCentral Italy
We compiled a catalogue of 442 rainfall events with landslides in the Abruzzo, Marche, and Umbria regions,central Italy, between February 2002 and August 2010. For each event, we determined the duration D (in hours)and the cumulated (total) event rainfall E (in mm), using rainfall measurements obtained from a dense networkof 150 rain gauges. Landslides were mapped as single points using Google Earth®, and were attributed a level ofmapping accuracy P, in four classes (P1b1 km2, P10b10 km2, P100b100 km2, P300b300 km2). Using this informa-tion, we determined cumulated event rainfall–rainfall duration (ED) thresholds, which are entirely equivalent torainfall intensity–duration (ID) thresholds, and avoid unnecessary conversions. To determine the ED thresholds,we modified a statistical method first proposed to determine ID thresholds. Adopting a bootstrapping statisticaltechnique, we expanded the method to determine the uncertainty associated with the parameters that definethe power law threshold model, and the sensitivity of the thresholds to the number of (D,E) data points in theempirical data set. We determined ED thresholds for 1% and 5% exceedance probability levels: (i) for the entirestudy area, and for the three individual regions in the study area (Abruzzo, Marche, and Umbria); (ii) for threemain lithological domains in the study area (post-orogenic sediments, flysch deposits, carbonate rocks); and(iii) for two seasonal periods (May–September, October–April). Comparison of the ED thresholds indicatesthat the cumulated amount of rainfall necessary to trigger landslides in flysch deposits is larger than in post-orogenic sediments and carbonate rocks. However, the ED thresholds for post-orogenic sediments and carbonaterocks were statistically indistinguishable in the study area. Also, the seasonal thresholds were statistically differ-ent for rainfall durations shorter than 12 h and longer than 100 h, but were indistinguishable in the range12bDb100 h. The results obtained are directly applicable to landslide forecasting based on empirical rainfallthresholds, and have implications for landslide hazard and risk assessment, as well as for landslide erosion andlandscape evolution studies, both in the study area and in the neighboring regions.
© 2011 Elsevier B.V. All rights reserved.
1. Introduction
Landslides are frequent and widespread geomorphological phe-nomena in Italy (Guzzetti et al., 1994; Guzzetti and Tonelli, 2004; Trigilaet al., 2010). In Italy, in the 61-year period 1950–2010, 1018 landslideevents have resulted in at least 6447 casualties, with an average of16.7 harmful landslide events per year (Guzzetti, 2000; Salvati et al.,2003, 2010; Guzzetti et al., 2005a). This is evidence of the considerablerisk posed by landslides to the population of Italy. Most of the landslidesin Italy are rainfall induced. For this reason, in this country the determi-nation of the amount of precipitation needed to trigger landslides is aproblem of scientific and societal interest.
In this work, we exploit information on 442 rainfall events withlandslides in central Italy, in the period 2002–2010, to determine newcumulated event rainfall–rainfall duration (ED) thresholds (Innes,1983; Sandersen et al., 1996; Corominas and Moya, 1999; Annunziati
+39 075 5014420.cacci).
l rights reserved.
et al., 2000; Zezere and Rodrigues, 2002; Kanji et al., 2003; Guzzettiet al., 2007). First, we determine ED rainfall thresholds, and we use abootstrapping statistical technique to evaluate the uncertainties in theparameters that define the threshold curve model, for the entire studyarea, and for the three regions in the study area i.e., the Abruzzo,Marche, and Umbria regions (Table 1 and Fig. 1). Next, using small-scale lithological maps, we obtain information on the main litholog-ical types where landslides were reported, and we determine EDthresholds for three lithological domains. Next, we segment the cat-alogue in two seasonal periods, May to September and October toApril, and we investigate the seasonal rainfall conditions that resultin landslides in the study area. We conclude by comparing the newED rainfall thresholds to similar rainfall thresholds for possible land-slide occurrence in Italy, and globally.
2. Regional setting
The study area comprises the Abruzzo, Marche, and Umbria re-gions, central Italy (Fig. 1 and Table 1). In the area, that pertains to
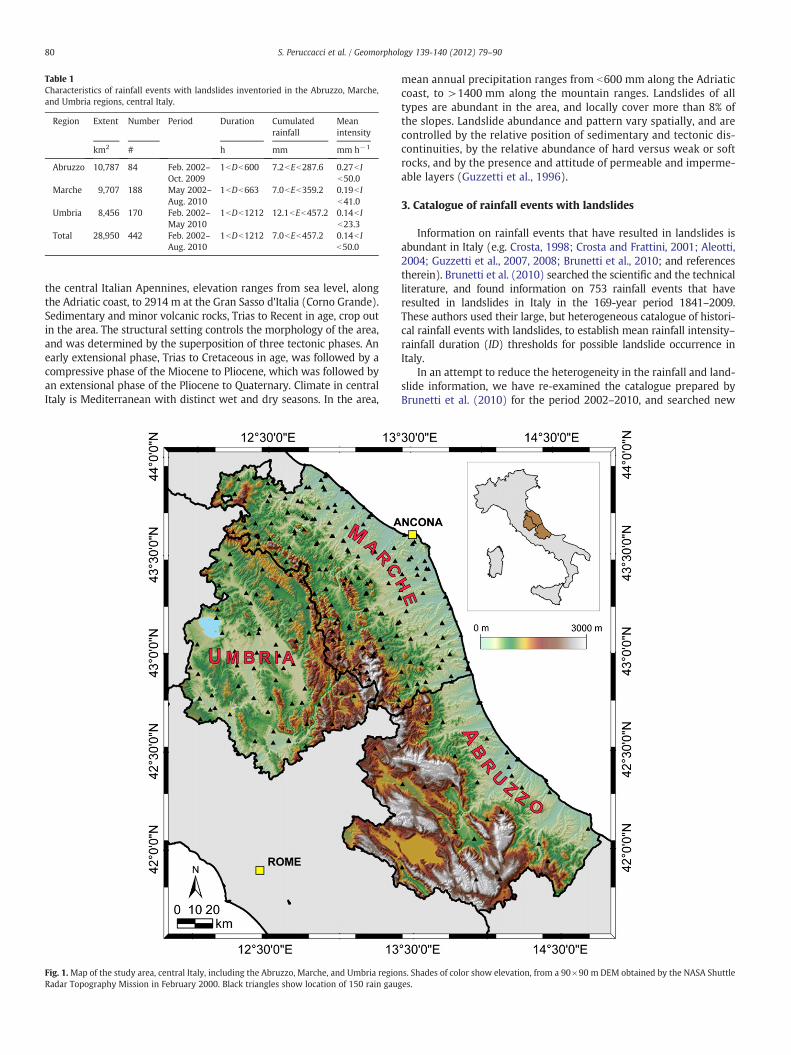
Table 1Characteristics of rainfall events with landslides inventoried in the Abruzzo, Marche,and Umbria regions, central Italy.
Region Extent Number Period Duration Cumulatedrainfall
Meanintensity
km2 # h mm mm h−1
Abruzzo 10,787 84 Feb. 2002–Oct. 2009
1bDb600 7.2bEb287.6 0.27b Ib50.0
Marche 9,707 188 May 2002–Aug. 2010
1bDb663 7.0bEb359.2 0.19b Ib41.0
Umbria 8,456 170 Feb. 2002–May 2010
1bDb1212 12.1bEb457.2 0.14b Ib23.3
Total 28,950 442 Feb. 2002–Aug. 2010
1bDb1212 7.0bEb457.2 0.14b Ib50.0
80 S. Peruccacci et al. / Geomorphology 139-140 (2012) 79–90
the central Italian Apennines, elevation ranges from sea level, alongthe Adriatic coast, to 2914 m at the Gran Sasso d'Italia (Corno Grande).Sedimentary and minor volcanic rocks, Trias to Recent in age, crop outin the area. The structural setting controls the morphology of the area,and was determined by the superposition of three tectonic phases. Anearly extensional phase, Trias to Cretaceous in age, was followed by acompressive phase of the Miocene to Pliocene, which was followed byan extensional phase of the Pliocene to Quaternary. Climate in centralItaly is Mediterranean with distinct wet and dry seasons. In the area,
Fig. 1.Map of the study area, central Italy, including the Abruzzo, Marche, and Umbria regioRadar Topography Mission in February 2000. Black triangles show location of 150 rain gau
mean annual precipitation ranges from b600 mm along the Adriaticcoast, to >1400 mm along the mountain ranges. Landslides of alltypes are abundant in the area, and locally cover more than 8% ofthe slopes. Landslide abundance and pattern vary spatially, and arecontrolled by the relative position of sedimentary and tectonic dis-continuities, by the relative abundance of hard versus weak or softrocks, and by the presence and attitude of permeable and imperme-able layers (Guzzetti et al., 1996).
3. Catalogue of rainfall events with landslides
Information on rainfall events that have resulted in landslides isabundant in Italy (e.g. Crosta, 1998; Crosta and Frattini, 2001; Aleotti,2004; Guzzetti et al., 2007, 2008; Brunetti et al., 2010; and referencestherein). Brunetti et al. (2010) searched the scientific and the technicalliterature, and found information on 753 rainfall events that haveresulted in landslides in Italy in the 169-year period 1841–2009.These authors used their large, but heterogeneous catalogue of histori-cal rainfall events with landslides, to establish mean rainfall intensity–rainfall duration (ID) thresholds for possible landslide occurrence inItaly.
In an attempt to reduce the heterogeneity in the rainfall and land-slide information, we have re-examined the catalogue prepared byBrunetti et al. (2010) for the period 2002–2010, and searched new
ns. Shades of color show elevation, from a 90×90 m DEM obtained by the NASA Shuttleges.
81S. Peruccacci et al. / Geomorphology 139-140 (2012) 79–90
information in the same period, to obtain a new catalogue of rainfallevents with landslides in the Abruzzo, Marche, and Umbria regions,central Italy (Fig. 1). The period covered by the new catalogue(8.5 years between February 2002 and August 2010) was decidedbased on the availability of rainfall information (see below). Thenew catalogue lists 84 rainfall events in the Abruzzo region, 188events in the Marche region, and 170 events in the Umbria region,for a total of 442 rainfall events with landslides in the 28,950 km2
study area (Table 1).The new landslide information was obtained through the analysis
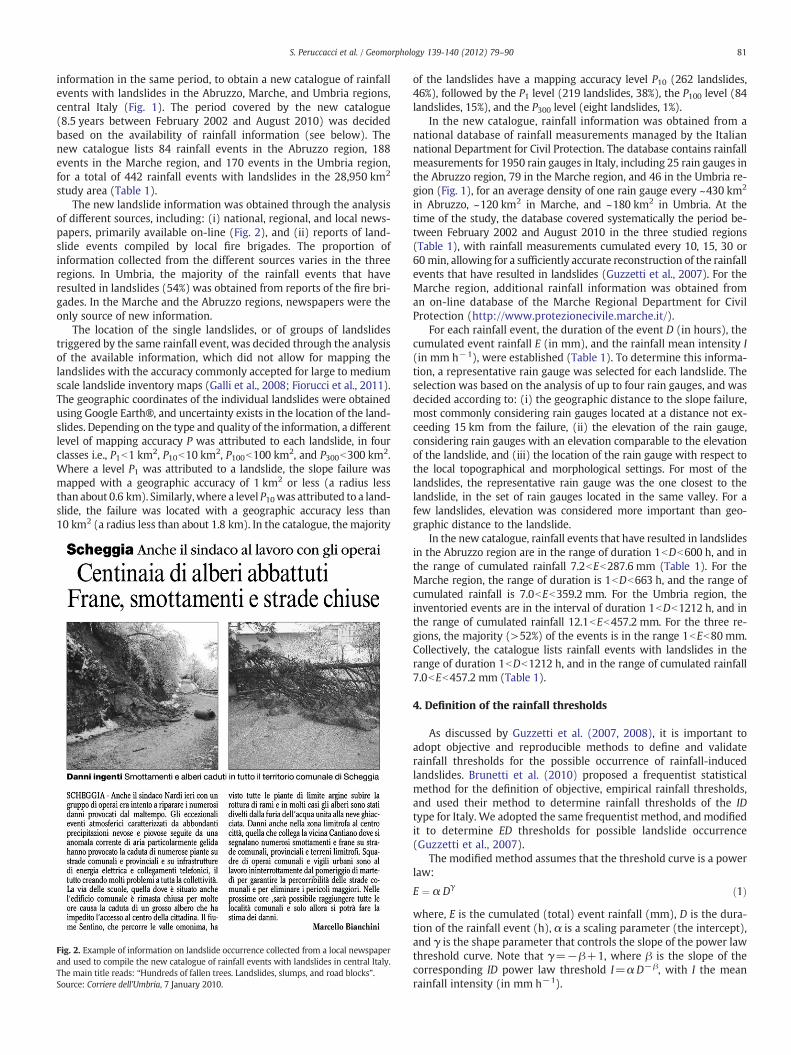
of different sources, including: (i) national, regional, and local news-papers, primarily available on-line (Fig. 2), and (ii) reports of land-slide events compiled by local fire brigades. The proportion ofinformation collected from the different sources varies in the threeregions. In Umbria, the majority of the rainfall events that haveresulted in landslides (54%) was obtained from reports of the fire bri-gades. In the Marche and the Abruzzo regions, newspapers were theonly source of new information.
The location of the single landslides, or of groups of landslidestriggered by the same rainfall event, was decided through the analysisof the available information, which did not allow for mapping thelandslides with the accuracy commonly accepted for large to mediumscale landslide inventory maps (Galli et al., 2008; Fiorucci et al., 2011).The geographic coordinates of the individual landslides were obtainedusing Google Earth®, and uncertainty exists in the location of the land-slides. Depending on the type and quality of the information, a differentlevel of mapping accuracy P was attributed to each landslide, in fourclasses i.e., P1b1 km2, P10b10 km2, P100b100 km2, and P300b300 km2.Where a level P1 was attributed to a landslide, the slope failure wasmapped with a geographic accuracy of 1 km2 or less (a radius lessthan about 0.6 km). Similarly,where a level P10was attributed to a land-slide, the failure was located with a geographic accuracy less than10 km2 (a radius less than about 1.8 km). In the catalogue, the majority
Fig. 2. Example of information on landslide occurrence collected from a local newspaperand used to compile the new catalogue of rainfall events with landslides in central Italy.The main title reads: “Hundreds of fallen trees. Landslides, slumps, and road blocks”.Source: Corriere dell'Umbria, 7 January 2010.
of the landslides have a mapping accuracy level P10 (262 landslides,46%), followed by the P1 level (219 landslides, 38%), the P100 level (84landslides, 15%), and the P300 level (eight landslides, 1%).
In the new catalogue, rainfall information was obtained from anational database of rainfall measurements managed by the Italiannational Department for Civil Protection. The database contains rainfallmeasurements for 1950 rain gauges in Italy, including 25 rain gauges inthe Abruzzo region, 79 in the Marche region, and 46 in the Umbria re-gion (Fig. 1), for an average density of one rain gauge every ~430 km2
in Abruzzo, ~120 km2 in Marche, and ~180 km2 in Umbria. At thetime of the study, the database covered systematically the period be-tween February 2002 and August 2010 in the three studied regions(Table 1), with rainfall measurements cumulated every 10, 15, 30 or60 min, allowing for a sufficiently accurate reconstruction of the rainfallevents that have resulted in landslides (Guzzetti et al., 2007). For theMarche region, additional rainfall information was obtained froman on-line database of the Marche Regional Department for CivilProtection (http://www.protezionecivile.marche.it/).
For each rainfall event, the duration of the event D (in hours), thecumulated event rainfall E (in mm), and the rainfall mean intensity I(in mm h−1), were established (Table 1). To determine this informa-tion, a representative rain gauge was selected for each landslide. Theselection was based on the analysis of up to four rain gauges, and wasdecided according to: (i) the geographic distance to the slope failure,most commonly considering rain gauges located at a distance not ex-ceeding 15 km from the failure, (ii) the elevation of the rain gauge,considering rain gauges with an elevation comparable to the elevationof the landslide, and (iii) the location of the rain gauge with respect tothe local topographical and morphological settings. For most of thelandslides, the representative rain gauge was the one closest to thelandslide, in the set of rain gauges located in the same valley. For afew landslides, elevation was considered more important than geo-graphic distance to the landslide.
In the new catalogue, rainfall events that have resulted in landslidesin the Abruzzo region are in the range of duration 1bDb600 h, and inthe range of cumulated rainfall 7.2bEb287.6 mm (Table 1). For theMarche region, the range of duration is 1bDb663 h, and the range ofcumulated rainfall is 7.0bEb359.2 mm. For the Umbria region, theinventoried events are in the interval of duration 1bDb1212 h, and inthe range of cumulated rainfall 12.1bEb457.2 mm. For the three re-gions, the majority (>52%) of the events is in the range 1bEb80 mm.Collectively, the catalogue lists rainfall events with landslides in therange of duration 1bDb1212 h, and in the range of cumulated rainfall7.0bEb457.2 mm (Table 1).
4. Definition of the rainfall thresholds
As discussed by Guzzetti et al. (2007, 2008), it is important toadopt objective and reproducible methods to define and validaterainfall thresholds for the possible occurrence of rainfall-inducedlandslides. Brunetti et al. (2010) proposed a frequentist statisticalmethod for the definition of objective, empirical rainfall thresholds,and used their method to determine rainfall thresholds of the IDtype for Italy. We adopted the same frequentist method, andmodifiedit to determine ED thresholds for possible landslide occurrence(Guzzetti et al., 2007).
The modified method assumes that the threshold curve is a powerlaw:
E ¼ α Dγ ð1Þwhere, E is the cumulated (total) event rainfall (mm), D is the dura-tion of the rainfall event (h), α is a scaling parameter (the intercept),and γ is the shape parameter that controls the slope of the power lawthreshold curve. Note that γ=−β+1, where β is the slope of thecorresponding ID power law threshold I=α D−β, with I the meanrainfall intensity (in mm h−1).
82 S. Peruccacci et al. / Geomorphology 139-140 (2012) 79–90
The intercept α and the slope γ in Eq. (1) are determined througha frequency analysis of the empirical rainfall conditions that haveresulted in known landslides (Brunetti et al., 2010). The set of (D,E)data points is fitted (in logarithmic coordinates) with a power lawcurve (Eq. 1). For each (D,E) data point, the difference (distance) be-tween E and the fit is calculated. Kernel density estimation (KDE), anon-parametric technique for estimating the probability density func-tion of a random variable (Silverman, 1986; Scott, 1992; Venables andRipley, 2002), is then used to determine the probability density of thedifferences. Next, the probability density of the differences is modeledusing a Gaussian function, and thresholds corresponding to differentexceedance probabilities are defined. Assuming the set of rainfall events,i.e. the (D,E) data points, is sufficiently complete and representative ofthe conditions that led to slope failures in a study area, we can statethat in the same study area the probability of experiencing landslidestriggered by rainfall above the ED threshold is less than the corre-sponding exceedance probability (Brunetti et al., 2010). In this study,calculation of the ED rainfall thresholds using the frequentist methodwas performed at the 1% and the 5% exceedance probability levels.
A limit with the definition of rainfall thresholds based on thestatistical analysis of empirical data is that the inferred thresholdsdepend entirely on the data set used to determine the thresholds i.e.,the (D,E) empirical data points (Brunetti et al., 2010). The quality ofthe thresholds depends also on the abundance and the distribution ofthe empirical data points. Better results are obtainedwhen the frequen-tist method is applied to a large data set, covering evenly the entirerange of the examined rainfall duration D. When new rainfall eventswith landslides occur and are recorded in a study area, the data setchanges and the thresholds should be recalculated. The new curvesmay differ from the previous thresholds, especially for data sets with alimited number of events. The extent and significance of the differencecan be evaluated, providing information on the uncertainty associatedwith the parameters αand γ that define the power law threshold equa-tion (Eq. 1). The values of the differences in the intercept α, Δα, and inthe scaling exponent γ, Δγ, can also be used to decide if two or morethresholds are statistically different, or not.
The mean values of α (intercept) and γ (slope), and the associateduncertainties Δα and Δγ, were estimated adopting a “bootstrap” sta-tistical technique. Bootstrapping is a non-parametric technique forassessing the mean sample distribution of a population from an em-pirical data set (Efron, 1979; Efron and Tibshirani, 1994). The tech-nique generates k series of m randomly selected events from anempirical data set of n events. Analysis of the synthetic k series allowscalculating the mean value and the uncertainty associated with a pa-rameter, including the standard deviation σ. In order to determinethe mean values of α and γ (at the 1% and 5% exceedance probabilitylevels), and their respective uncertainties (Δα, Δγ), we set n=442 forthe entire study area, n=84 for Abruzzo, n=188 for Marche, andn=170 for Umbria, k=5000, and m=n. A rainfall threshold isthen defined using the mean values of the parameters α and γ. Themeasures of the uncertainty Δα and Δγ, taken individually, identifytwo minimum and two maximum curves around the 1% and the 5%thresholds. In particular, the two minimum curves are:
Emin;Δα ¼ α−Δαð ÞDγ ð2Þ
Emin;Δγ ¼ αD γ−Δγð Þ ð3Þ
and the two maximum curves are:
Emax;Δα ¼ α þ Δαð ÞDγ ð4Þ
Emax;Δγ ¼ αD γþΔγð Þ ð5Þ
The curves defined by Eqs. (2)–(5) vary with rainfall duration. Toevaluate the combined effect of the uncertainty associated with the
intercept α and the scaling exponent γ, for each given rainfall durationD, we take the lowest (highest) value of the twominimum (maximum)curves, i.e.
Emin ¼ min Emin;Δα ; Emin;Δγ
h i
Emax ¼ max Emax;Δα ; Emax;Δγ
h i8<: ð6Þ
In the D–E space, the system of Eq. (6) defines the region of uncer-tainty associated with the ED threshold curve, given Eqs. (2)–(5), Δα,and Δγ. Generally Δα affects the cumulated rainfall for short dura-tions. For longer durations, E is more sensitive to Δγ, because γ isthe exponent of the power law model curve (Eq. (1)).
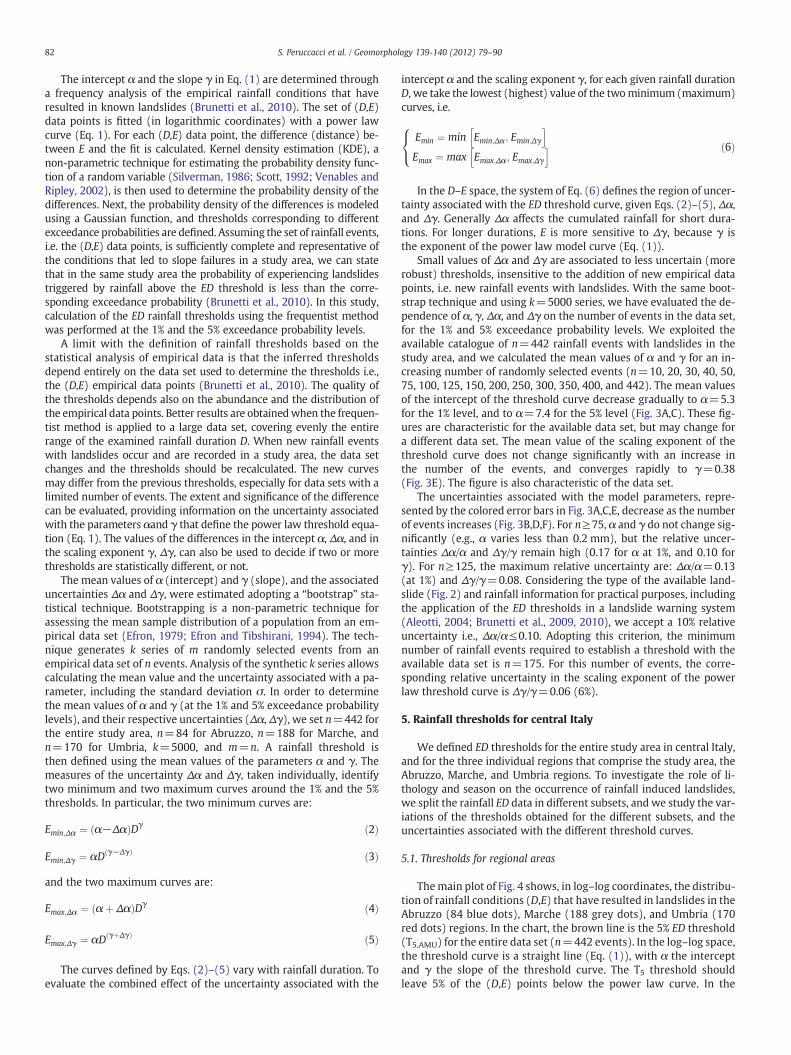
Small values of Δα and Δγ are associated to less uncertain (morerobust) thresholds, insensitive to the addition of new empirical datapoints, i.e. new rainfall events with landslides. With the same boot-strap technique and using k=5000 series, we have evaluated the de-pendence of α, γ, Δα, and Δγ on the number of events in the data set,for the 1% and 5% exceedance probability levels. We exploited theavailable catalogue of n=442 rainfall events with landslides in thestudy area, and we calculated the mean values of α and γ for an in-creasing number of randomly selected events (n=10, 20, 30, 40, 50,75, 100, 125, 150, 200, 250, 300, 350, 400, and 442). The mean valuesof the intercept of the threshold curve decrease gradually to α=5.3for the 1% level, and to α=7.4 for the 5% level (Fig. 3A,C). These fig-ures are characteristic for the available data set, but may change fora different data set. The mean value of the scaling exponent of thethreshold curve does not change significantly with an increase inthe number of the events, and converges rapidly to γ=0.38(Fig. 3E). The figure is also characteristic of the data set.
The uncertainties associated with the model parameters, repre-sented by the colored error bars in Fig. 3A,C,E, decrease as the numberof events increases (Fig. 3B,D,F). For n≥75, α and γ do not change sig-nificantly (e.g., α varies less than 0.2 mm), but the relative uncer-tainties Δα/α and Δγ/γ remain high (0.17 for α at 1%, and 0.10 forγ). For n≥125, the maximum relative uncertainty are: Δα/α=0.13(at 1%) and Δγ/γ=0.08. Considering the type of the available land-slide (Fig. 2) and rainfall information for practical purposes, includingthe application of the ED thresholds in a landslide warning system(Aleotti, 2004; Brunetti et al., 2009, 2010), we accept a 10% relativeuncertainty i.e., Δα/α≤0.10. Adopting this criterion, the minimumnumber of rainfall events required to establish a threshold with theavailable data set is n=175. For this number of events, the corre-sponding relative uncertainty in the scaling exponent of the powerlaw threshold curve is Δγ/γ=0.06 (6%).
5. Rainfall thresholds for central Italy
We defined ED thresholds for the entire study area in central Italy,and for the three individual regions that comprise the study area, theAbruzzo, Marche, and Umbria regions. To investigate the role of li-thology and season on the occurrence of rainfall induced landslides,we split the rainfall ED data in different subsets, and we study the var-iations of the thresholds obtained for the different subsets, and theuncertainties associated with the different threshold curves.
5.1. Thresholds for regional areas
Themain plot of Fig. 4 shows, in log–log coordinates, the distribu-tion of rainfall conditions (D,E) that have resulted in landslides in theAbruzzo (84 blue dots), Marche (188 grey dots), and Umbria (170red dots) regions. In the chart, the brown line is the 5% ED threshold(T5,AMU) for the entire data set (n=442 events). In the log–log space,the threshold curve is a straight line (Eq. (1)), with α the interceptand γ the slope of the threshold curve. The T5 threshold shouldleave 5% of the (D,E) points below the power law curve. In the
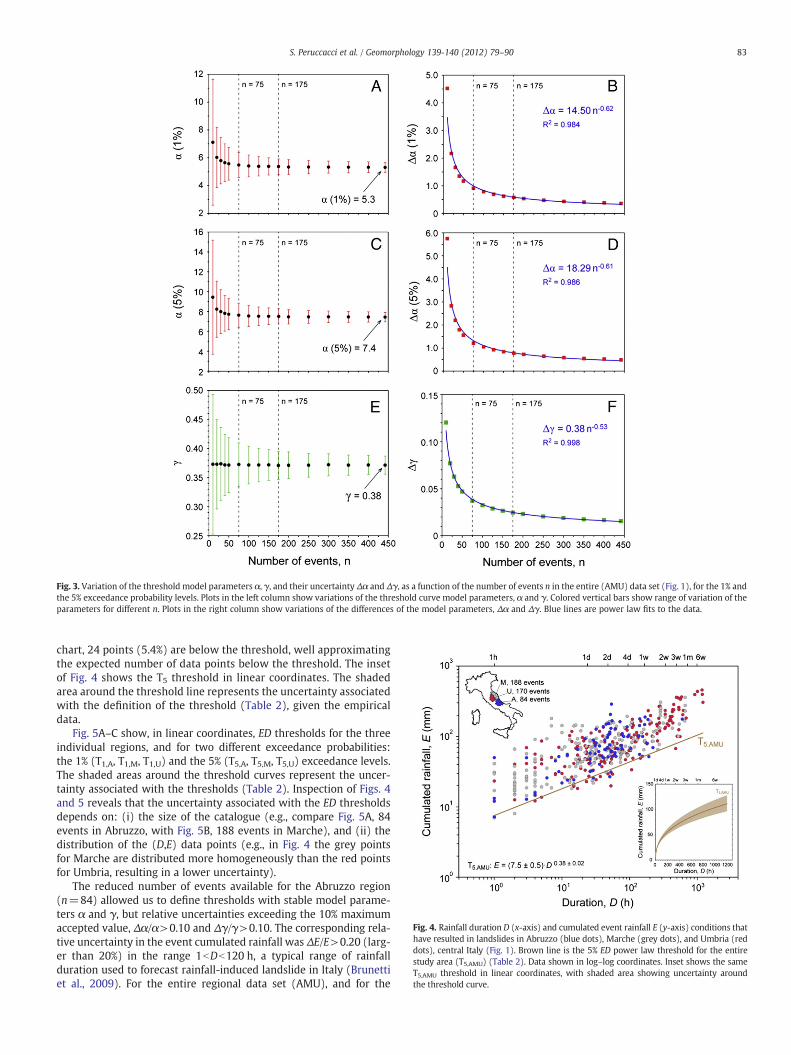
Fig. 3. Variation of the threshold model parameters α, γ, and their uncertainty Δα and Δγ, as a function of the number of events n in the entire (AMU) data set (Fig. 1), for the 1% andthe 5% exceedance probability levels. Plots in the left column show variations of the threshold curve model parameters, α and γ. Colored vertical bars show range of variation of theparameters for different n. Plots in the right column show variations of the differences of the model parameters, Δα and Δγ. Blue lines are power law fits to the data.
Fig. 4. Rainfall duration D (x-axis) and cumulated event rainfall E (y-axis) conditions thathave resulted in landslides in Abruzzo (blue dots), Marche (grey dots), and Umbria (reddots), central Italy (Fig. 1). Brown line is the 5% ED power law threshold for the entirestudy area (T5,AMU) (Table 2). Data shown in log–log coordinates. Inset shows the sameT5,AMU threshold in linear coordinates, with shaded area showing uncertainty aroundthe threshold curve.
83S. Peruccacci et al. / Geomorphology 139-140 (2012) 79–90
chart, 24 points (5.4%) are below the threshold, well approximatingthe expected number of data points below the threshold. The insetof Fig. 4 shows the T5 threshold in linear coordinates. The shadedarea around the threshold line represents the uncertainty associatedwith the definition of the threshold (Table 2), given the empiricaldata.
Fig. 5A–C show, in linear coordinates, ED thresholds for the threeindividual regions, and for two different exceedance probabilities:the 1% (T1,A, T1,M, T1,U) and the 5% (T5,A, T5,M, T5,U) exceedance levels.The shaded areas around the threshold curves represent the uncer-tainty associated with the thresholds (Table 2). Inspection of Figs. 4and 5 reveals that the uncertainty associated with the ED thresholdsdepends on: (i) the size of the catalogue (e.g., compare Fig. 5A, 84events in Abruzzo, with Fig. 5B, 188 events in Marche), and (ii) thedistribution of the (D,E) data points (e.g., in Fig. 4 the grey pointsfor Marche are distributed more homogeneously than the red pointsfor Umbria, resulting in a lower uncertainty).
The reduced number of events available for the Abruzzo region(n=84) allowed us to define thresholds with stable model parame-ters α and γ, but relative uncertainties exceeding the 10% maximumaccepted value, Δα/α>0.10 and Δγ/γ>0.10. The corresponding rela-tive uncertainty in the event cumulated rainfall was ΔE/E>0.20 (larg-er than 20%) in the range 1bDb120 h, a typical range of rainfallduration used to forecast rainfall-induced landslide in Italy (Brunettiet al., 2009). For the entire regional data set (AMU), and for the
84 S. Peruccacci et al. / Geomorphology 139-140 (2012) 79–90
Marche (M) and Umbria (U) subsets, values of the relative uncertain-ty in the cumulated rainfall were ΔE/Eb0.10, in the same range ofrainfall duration. We conclude that the ED thresholds for the Abruzzo,Marche, and Umbria regions are substantially equivalent and statisti-cally indistinguishable, at the 1% and 5% exceedance probability levels(Fig. 5D and Table 2).
5.2. Thresholds for different lithological types
The ED rainfall thresholds shown in Figs. 4 and 5 were determinedfor administrative subdivisions that do not have any relationship withthe regional morphological (Fig. 1) or lithological (Fig. 6) settings. Toinvestigate the relationships between lithology and rainfall thresh-olds, we attributed each landslide in the catalogue to a lithology type,in five classes. For the purpose, we used a 1:500,000 scale lithologicalmap, andwe adopted the same grouping of rock types used by Guzzetti
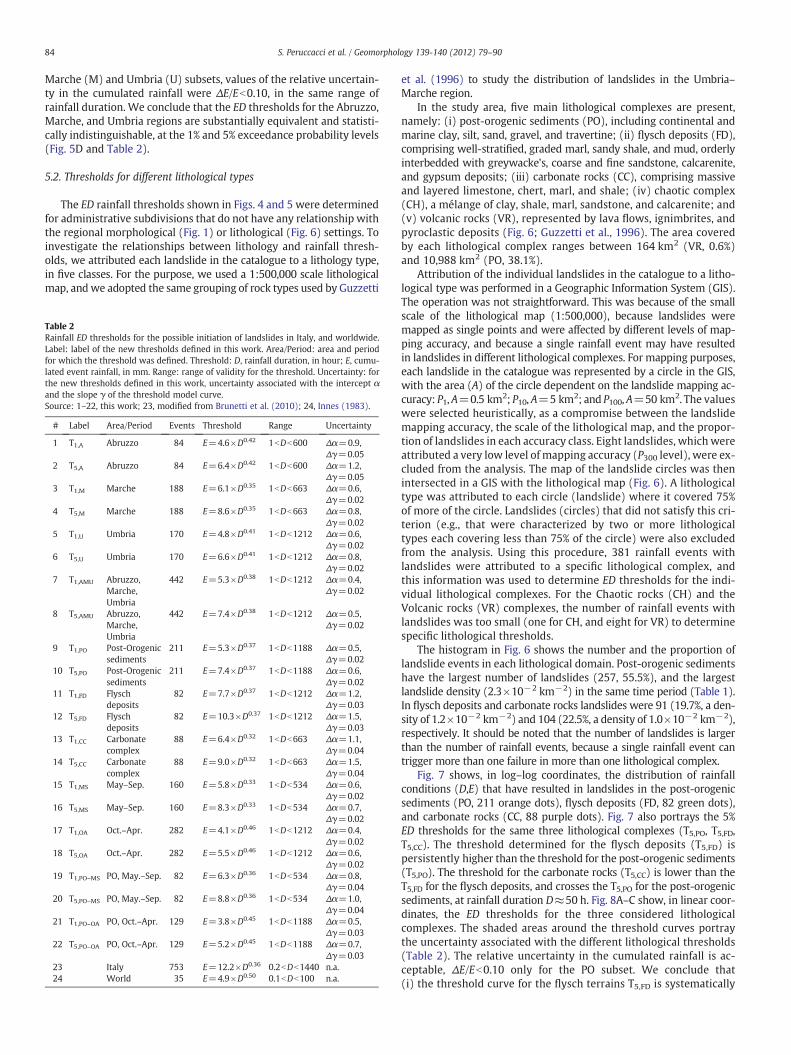
Table 2Rainfall ED thresholds for the possible initiation of landslides in Italy, and worldwide.Label: label of the new thresholds defined in this work. Area/Period: area and periodfor which the threshold was defined. Threshold: D, rainfall duration, in hour; E, cumu-lated event rainfall, in mm. Range: range of validity for the threshold. Uncertainty: forthe new thresholds defined in this work, uncertainty associated with the intercept αand the slope γ of the threshold model curve.Source: 1–22, this work; 23, modified from Brunetti et al. (2010); 24, Innes (1983).
# Label Area/Period Events Threshold Range Uncertainty
1 T1,A Abruzzo 84 E=4.6×D0.42 1bDb600 Δα=0.9,Δγ=0.05
2 T5,A Abruzzo 84 E=6.4×D0.42 1bDb600 Δα=1.2,Δγ=0.05
3 T1,M Marche 188 E=6.1×D0.35 1bDb663 Δα=0.6,Δγ=0.02
4 T5,M Marche 188 E=8.6×D0.35 1bDb663 Δα=0.8,Δγ=0.02
5 T1,U Umbria 170 E=4.8×D0.41 1bDb1212 Δα=0.6,Δγ=0.02
6 T5,U Umbria 170 E=6.6×D0.41 1bDb1212 Δα=0.8,Δγ=0.02
7 T1,AMU Abruzzo,Marche,Umbria
442 E=5.3×D0.38 1bDb1212 Δα=0.4,Δγ=0.02
8 T5,AMU Abruzzo,Marche,Umbria
442 E=7.4×D0.38 1bDb1212 Δα=0.5,Δγ=0.02
9 T1,PO Post-Orogenicsediments
211 E=5.3×D0.37 1bDb1188 Δα=0.5,Δγ=0.02
10 T5,PO Post-Orogenicsediments
211 E=7.4×D0.37 1bDb1188 Δα=0.6,Δγ=0.02
11 T1,FD Flyschdeposits
82 E=7.7×D0.37 1bDb1212 Δα=1.2,Δγ=0.03
12 T5,FD Flyschdeposits
82 E=10.3×D0.37 1bDb1212 Δα=1.5,Δγ=0.03
13 T1,CC Carbonatecomplex
88 E=6.4×D0.32 1bDb663 Δα=1.1,Δγ=0.04
14 T5,CC Carbonatecomplex
88 E=9.0×D0.32 1bDb663 Δα=1.5,Δγ=0.04
15 T1,MS May–Sep. 160 E=5.8×D0.33 1bDb534 Δα=0.6,Δγ=0.02
16 T5,MS May–Sep. 160 E=8.3×D0.33 1bDb534 Δα=0.7,Δγ=0.02
17 T1,OA Oct.–Apr. 282 E=4.1×D0.46 1bDb1212 Δα=0.4,Δγ=0.02
18 T5,OA Oct.–Apr. 282 E=5.5×D0.46 1bDb1212 Δα=0.6,Δγ=0.02
19 T1,PO–MS PO, May.–Sep. 82 E=6.3×D0.36 1bDb534 Δα=0.8,Δγ=0.04
20 T5,PO–MS PO, May.–Sep. 82 E=8.8×D0.36 1bDb534 Δα=1.0,Δγ=0.04
21 T1,PO–OA PO, Oct.–Apr. 129 E=3.8×D0.45 1bDb1188 Δα=0.5,Δγ=0.03
22 T5,PO–OA PO, Oct.–Apr. 129 E=5.2×D0.45 1bDb1188 Δα=0.7,Δγ=0.03
23 Italy 753 E=12.2×D0.36 0.2bDb1440 n.a.24 World 35 E=4.9×D0.50 0.1bDb100 n.a.
et al. (1996) to study the distribution of landslides in the Umbria–Marche region.
In the study area, five main lithological complexes are present,namely: (i) post-orogenic sediments (PO), including continental andmarine clay, silt, sand, gravel, and travertine; (ii) flysch deposits (FD),comprising well-stratified, graded marl, sandy shale, and mud, orderlyinterbedded with greywacke's, coarse and fine sandstone, calcarenite,and gypsum deposits; (iii) carbonate rocks (CC), comprising massiveand layered limestone, chert, marl, and shale; (iv) chaotic complex(CH), a mélange of clay, shale, marl, sandstone, and calcarenite; and(v) volcanic rocks (VR), represented by lava flows, ignimbrites, andpyroclastic deposits (Fig. 6; Guzzetti et al., 1996). The area coveredby each lithological complex ranges between 164 km2 (VR, 0.6%)and 10,988 km2 (PO, 38.1%).
Attribution of the individual landslides in the catalogue to a litho-logical type was performed in a Geographic Information System (GIS).The operation was not straightforward. This was because of the smallscale of the lithological map (1:500,000), because landslides weremapped as single points and were affected by different levels of map-ping accuracy, and because a single rainfall event may have resultedin landslides in different lithological complexes. For mapping purposes,each landslide in the catalogue was represented by a circle in the GIS,with the area (A) of the circle dependent on the landslide mapping ac-curacy: P1,A=0.5 km2; P10, A=5 km2; and P100,A=50 km2. The valueswere selected heuristically, as a compromise between the landslidemapping accuracy, the scale of the lithological map, and the propor-tion of landslides in each accuracy class. Eight landslides, which wereattributed a very low level of mapping accuracy (P300 level), were ex-cluded from the analysis. The map of the landslide circles was thenintersected in a GIS with the lithological map (Fig. 6). A lithologicaltype was attributed to each circle (landslide) where it covered 75%of more of the circle. Landslides (circles) that did not satisfy this cri-terion (e.g., that were characterized by two or more lithologicaltypes each covering less than 75% of the circle) were also excludedfrom the analysis. Using this procedure, 381 rainfall events withlandslides were attributed to a specific lithological complex, andthis information was used to determine ED thresholds for the indi-vidual lithological complexes. For the Chaotic rocks (CH) and theVolcanic rocks (VR) complexes, the number of rainfall events withlandslides was too small (one for CH, and eight for VR) to determinespecific lithological thresholds.
The histogram in Fig. 6 shows the number and the proportion oflandslide events in each lithological domain. Post-orogenic sedimentshave the largest number of landslides (257, 55.5%), and the largestlandslide density (2.3×10⁻² km−2) in the same time period (Table 1).In flysch deposits and carbonate rocks landslides were 91 (19.7%, a den-sity of 1.2×10⁻² km−2) and 104 (22.5%, a density of 1.0×10⁻² km−2),respectively. It should be noted that the number of landslides is largerthan the number of rainfall events, because a single rainfall event cantrigger more than one failure in more than one lithological complex.
Fig. 7 shows, in log–log coordinates, the distribution of rainfallconditions (D,E) that have resulted in landslides in the post-orogenicsediments (PO, 211 orange dots), flysch deposits (FD, 82 green dots),and carbonate rocks (CC, 88 purple dots). Fig. 7 also portrays the 5%ED thresholds for the same three lithological complexes (T5,PO, T5,FD,T5,CC). The threshold determined for the flysch deposits (T5,FD) ispersistently higher than the threshold for the post-orogenic sediments(T5,PO). The threshold for the carbonate rocks (T5,CC) is lower than theT5,FD for the flysch deposits, and crosses the T5,PO for the post-orogenicsediments, at rainfall duration D≈50 h. Fig. 8A–C show, in linear coor-dinates, the ED thresholds for the three considered lithologicalcomplexes. The shaded areas around the threshold curves portraythe uncertainty associated with the different lithological thresholds(Table 2). The relative uncertainty in the cumulated rainfall is ac-ceptable, ΔE/Eb0.10 only for the PO subset. We conclude that(i) the threshold curve for the flysch terrains T5,FD is systematically
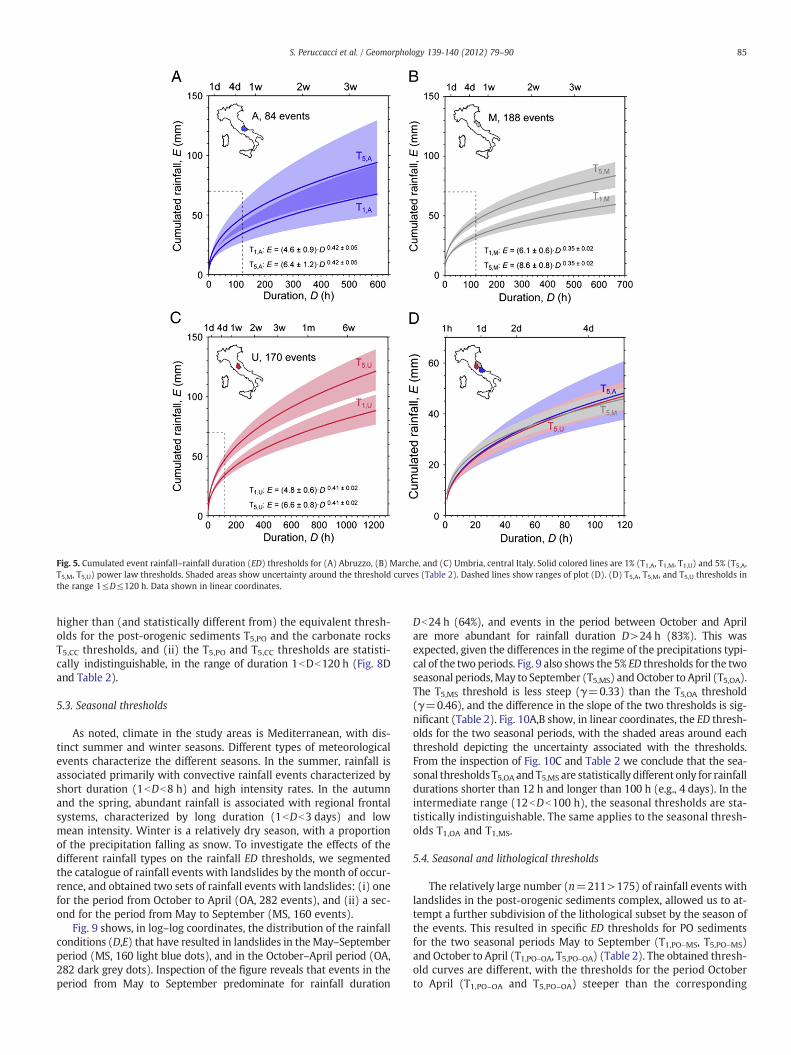
Fig. 5. Cumulated event rainfall–rainfall duration (ED) thresholds for (A) Abruzzo, (B) Marche, and (C) Umbria, central Italy. Solid colored lines are 1% (T1,A, T1,M, T1,U) and 5% (T5,A,T5,M, T5,U) power law thresholds. Shaded areas show uncertainty around the threshold curves (Table 2). Dashed lines show ranges of plot (D). (D) T5,A, T5,M, and T5,U thresholds inthe range 1≤D≤120 h. Data shown in linear coordinates.
85S. Peruccacci et al. / Geomorphology 139-140 (2012) 79–90
higher than (and statistically different from) the equivalent thresh-olds for the post-orogenic sediments T5,PO and the carbonate rocksT5,CC thresholds, and (ii) the T5,PO and T5,CC thresholds are statisti-cally indistinguishable, in the range of duration 1bDb120 h (Fig. 8Dand Table 2).
5.3. Seasonal thresholds
As noted, climate in the study areas is Mediterranean, with dis-tinct summer and winter seasons. Different types of meteorologicalevents characterize the different seasons. In the summer, rainfall isassociated primarily with convective rainfall events characterized byshort duration (1bDb8 h) and high intensity rates. In the autumnand the spring, abundant rainfall is associated with regional frontalsystems, characterized by long duration (1bDb3 days) and lowmean intensity. Winter is a relatively dry season, with a proportionof the precipitation falling as snow. To investigate the effects of thedifferent rainfall types on the rainfall ED thresholds, we segmentedthe catalogue of rainfall events with landslides by the month of occur-rence, and obtained two sets of rainfall events with landslides: (i) onefor the period from October to April (OA, 282 events), and (ii) a sec-ond for the period from May to September (MS, 160 events).
Fig. 9 shows, in log–log coordinates, the distribution of the rainfallconditions (D,E) that have resulted in landslides in theMay–Septemberperiod (MS, 160 light blue dots), and in the October–April period (OA,282 dark grey dots). Inspection of the figure reveals that events in theperiod from May to September predominate for rainfall duration
Db24 h (64%), and events in the period between October and Aprilare more abundant for rainfall duration D>24 h (83%). This wasexpected, given the differences in the regime of the precipitations typi-cal of the two periods. Fig. 9 also shows the 5% ED thresholds for the twoseasonal periods,May to September (T5,MS) andOctober to April (T5,OA).The T5,MS threshold is less steep (γ=0.33) than the T5,OA threshold(γ=0.46), and the difference in the slope of the two thresholds is sig-nificant (Table 2). Fig. 10A,B show, in linear coordinates, the ED thresh-olds for the two seasonal periods, with the shaded areas around eachthreshold depicting the uncertainty associated with the thresholds.From the inspection of Fig. 10C and Table 2 we conclude that the sea-sonal thresholds T5,OA and T5,MS are statistically different only for rainfalldurations shorter than 12 h and longer than 100 h (e.g., 4 days). In theintermediate range (12bDb100 h), the seasonal thresholds are sta-tistically indistinguishable. The same applies to the seasonal thresh-olds T1,OA and T1,MS.
5.4. Seasonal and lithological thresholds
The relatively large number (n=211>175) of rainfall events withlandslides in the post-orogenic sediments complex, allowed us to at-tempt a further subdivision of the lithological subset by the season ofthe events. This resulted in specific ED thresholds for PO sedimentsfor the two seasonal periods May to September (T1,PO–MS, T5,PO–MS)and October to April (T1,PO–OA, T5,PO–OA) (Table 2). The obtained thresh-old curves are different, with the thresholds for the period Octoberto April (T1,PO–OA and T5,PO–OA) steeper than the corresponding

Fig. 6. Simplified lithological map of the study area. PO, post-orogenic sediments complex; FD, flysch deposits complex; CC, carbonate rocks complex; CH, Chaotic deposits; VR, Vol-canic rocks complex. Yellow dots show location of rainfall-induced landslides. Black circles show uncertainty in the location of the landslides, in three classes. Pie chart shows extentand percentage of the lithological complexes. Histogram shows the number and proportion of landslides in each lithological complex.
Fig. 7. Rainfall duration D (x-axis) and cumulated event rainfall E (y-axis) conditionsthat have resulted in landslides in the post-orogenic sediments (PO, orange dots),flysch deposits (FD, green dots), and carbonate rocks (CC, purple dots), in the studyarea. Colored lines are 5% (T5,PO, T5,FD, T5,CC) power law thresholds. Data shown inlog–log coordinates. Inset shows distribution of lithological complexes (Fig. 6).
86 S. Peruccacci et al. / Geomorphology 139-140 (2012) 79–90
thresholds for the period May to September (T1,PO–MS, T5,PO–MS). In-spection of the uncertainty associated with the parameters thatcontrol the thresholds reveals that the differences between thethresholds are statistically significant (Table 2).
6. Discussion
In the literature, the majority of the rainfall thresholds for possiblelandslide occurrence, including local, regional, national, and globalthresholds, are of the (mean) intensity–duration (ID) type (Guzzettiet al., 2007, 2008, and references therein). This is probably becauseof the pioneering work of Caine (1980), who was first to determinea global ID rainfall threshold for possible landslide occurrence. Consid-ering the amount of rainfall required to trigger a landslide, intensity–duration (ID) and cumulated rainfall–duration (ED) thresholds areentirely equivalent. Indeed, the rainfall mean intensity is obtainedby dividing the cumulated rainfall measured at rain gauges by theduration of the event, I=E/D (Guzzetti et al., 2007).
When determining a functional dependency between two vari-ables, it is assumed that the variables express or measure indepen-dent quantities. When searching a statistical relationship betweenthe rainfall duration D and the rainfall mean intensity I, the assump-tion is violated because the rainfall mean intensity depends on therainfall duration, through the cumulated rainfall. Thus, it is more ap-propriate to search for a statistical dependency of the cumulatedrainfall E to the rainfall duration D. For this reason, in this work
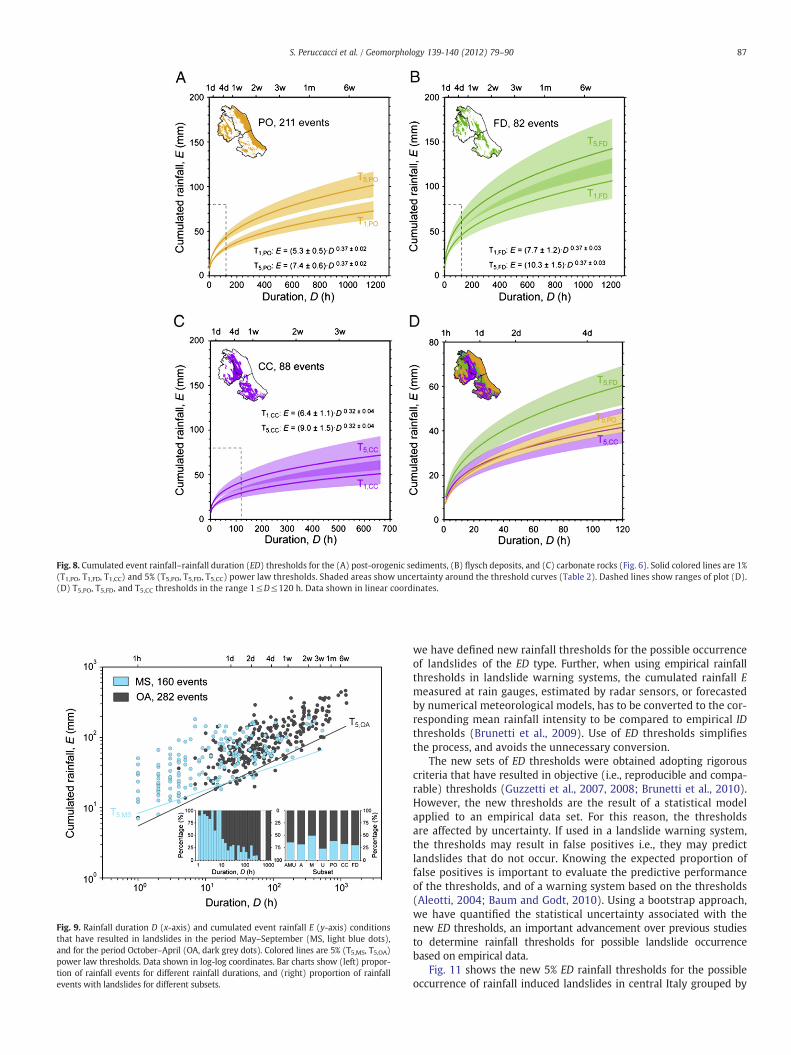
Fig. 8. Cumulated event rainfall–rainfall duration (ED) thresholds for the (A) post-orogenic sediments, (B) flysch deposits, and (C) carbonate rocks (Fig. 6). Solid colored lines are 1%(T1,PO, T1,FD, T1,CC) and 5% (T5,PO, T5,FD, T5,CC) power law thresholds. Shaded areas show uncertainty around the threshold curves (Table 2). Dashed lines show ranges of plot (D).(D) T5,PO, T5,FD, and T5,CC thresholds in the range 1≤D≤120 h. Data shown in linear coordinates.
Fig. 9. Rainfall duration D (x-axis) and cumulated event rainfall E (y-axis) conditionsthat have resulted in landslides in the period May–September (MS, light blue dots),and for the period October–April (OA, dark grey dots). Colored lines are 5% (T5,MS, T5,OA)power law thresholds. Data shown in log-log coordinates. Bar charts show (left) propor-tion of rainfall events for different rainfall durations, and (right) proportion of rainfallevents with landslides for different subsets.
87S. Peruccacci et al. / Geomorphology 139-140 (2012) 79–90
we have defined new rainfall thresholds for the possible occurrenceof landslides of the ED type. Further, when using empirical rainfallthresholds in landslide warning systems, the cumulated rainfall Emeasured at rain gauges, estimated by radar sensors, or forecastedby numerical meteorological models, has to be converted to the cor-responding mean rainfall intensity to be compared to empirical IDthresholds (Brunetti et al., 2009). Use of ED thresholds simplifiesthe process, and avoids the unnecessary conversion.
The new sets of ED thresholds were obtained adopting rigorouscriteria that have resulted in objective (i.e., reproducible and compa-rable) thresholds (Guzzetti et al., 2007, 2008; Brunetti et al., 2010).However, the new thresholds are the result of a statistical modelapplied to an empirical data set. For this reason, the thresholdsare affected by uncertainty. If used in a landslide warning system,the thresholds may result in false positives i.e., they may predictlandslides that do not occur. Knowing the expected proportion offalse positives is important to evaluate the predictive performanceof the thresholds, and of a warning system based on the thresholds(Aleotti, 2004; Baum and Godt, 2010). Using a bootstrap approach,we have quantified the statistical uncertainty associated with thenew ED thresholds, an important advancement over previous studiesto determine rainfall thresholds for possible landslide occurrencebased on empirical data.
Fig. 11 shows the new 5% ED rainfall thresholds for the possibleoccurrence of rainfall induced landslides in central Italy grouped by
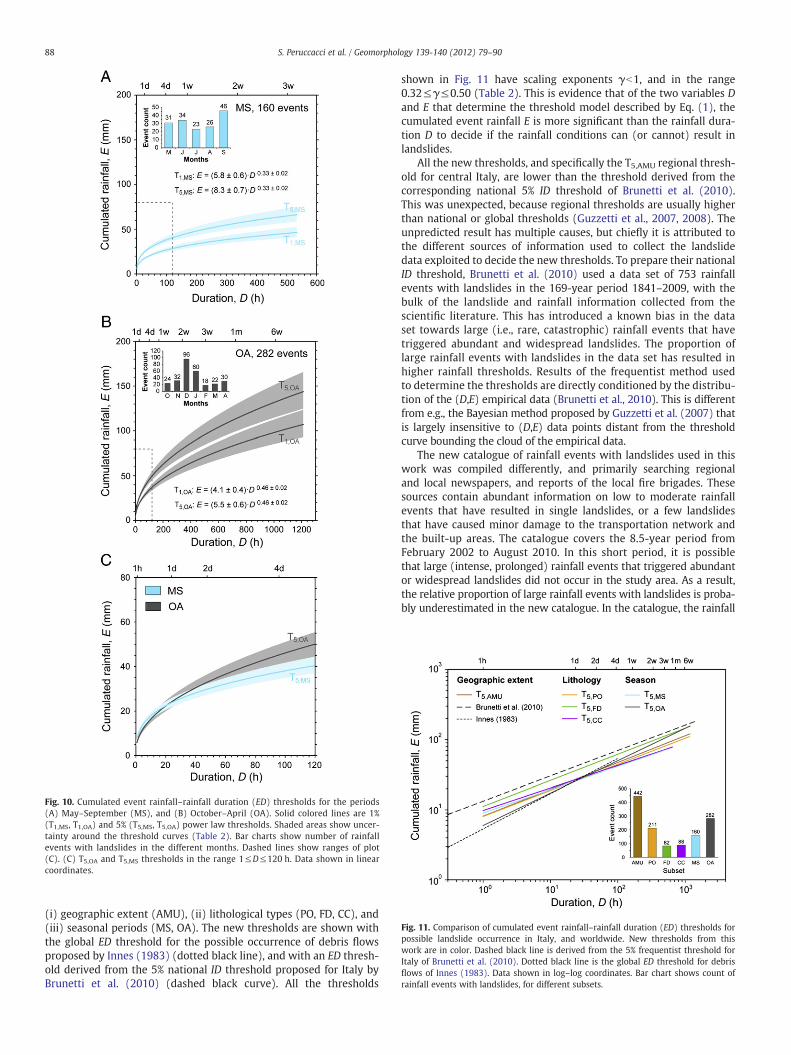
Fig. 10. Cumulated event rainfall–rainfall duration (ED) thresholds for the periods(A) May–September (MS), and (B) October–April (OA). Solid colored lines are 1%(T1,MS, T1,OA) and 5% (T5,MS, T5,OA) power law thresholds. Shaded areas show uncer-tainty around the threshold curves (Table 2). Bar charts show number of rainfallevents with landslides in the different months. Dashed lines show ranges of plot(C). (C) T5,OA and T5,MS thresholds in the range 1≤D≤120 h. Data shown in linearcoordinates.
Fig. 11. Comparison of cumulated event rainfall–rainfall duration (ED) thresholds forpossible landslide occurrence in Italy, and worldwide. New thresholds from thiswork are in color. Dashed black line is derived from the 5% frequentist threshold forItaly of Brunetti et al. (2010). Dotted black line is the global ED threshold for debrisflows of Innes (1983). Data shown in log–log coordinates. Bar chart shows count ofrainfall events with landslides, for different subsets.
88 S. Peruccacci et al. / Geomorphology 139-140 (2012) 79–90
(i) geographic extent (AMU), (ii) lithological types (PO, FD, CC), and(iii) seasonal periods (MS, OA). The new thresholds are shown withthe global ED threshold for the possible occurrence of debris flowsproposed by Innes (1983) (dotted black line), and with an ED thresh-old derived from the 5% national ID threshold proposed for Italy byBrunetti et al. (2010) (dashed black curve). All the thresholds
shown in Fig. 11 have scaling exponents γb1, and in the range0.32≤γ≤0.50 (Table 2). This is evidence that of the two variables Dand E that determine the threshold model described by Eq. (1), thecumulated event rainfall E is more significant than the rainfall dura-tion D to decide if the rainfall conditions can (or cannot) result inlandslides.
All the new thresholds, and specifically the T5,AMU regional thresh-old for central Italy, are lower than the threshold derived from thecorresponding national 5% ID threshold of Brunetti et al. (2010).This was unexpected, because regional thresholds are usually higherthan national or global thresholds (Guzzetti et al., 2007, 2008). Theunpredicted result has multiple causes, but chiefly it is attributed tothe different sources of information used to collect the landslidedata exploited to decide the new thresholds. To prepare their nationalID threshold, Brunetti et al. (2010) used a data set of 753 rainfallevents with landslides in the 169-year period 1841–2009, with thebulk of the landslide and rainfall information collected from thescientific literature. This has introduced a known bias in the dataset towards large (i.e., rare, catastrophic) rainfall events that havetriggered abundant and widespread landslides. The proportion oflarge rainfall events with landslides in the data set has resulted inhigher rainfall thresholds. Results of the frequentist method usedto determine the thresholds are directly conditioned by the distribu-tion of the (D,E) empirical data (Brunetti et al., 2010). This is differentfrom e.g., the Bayesian method proposed by Guzzetti et al. (2007) thatis largely insensitive to (D,E) data points distant from the thresholdcurve bounding the cloud of the empirical data.
The new catalogue of rainfall events with landslides used in thiswork was compiled differently, and primarily searching regionaland local newspapers, and reports of the local fire brigades. Thesesources contain abundant information on low to moderate rainfallevents that have resulted in single landslides, or a few landslidesthat have caused minor damage to the transportation network andthe built-up areas. The catalogue covers the 8.5-year period fromFebruary 2002 to August 2010. In this short period, it is possiblethat large (intense, prolonged) rainfall events that triggered abundantor widespread landslides did not occur in the study area. As a result,the relative proportion of large rainfall events with landslides is proba-bly underestimated in the new catalogue. In the catalogue, the rainfall

89S. Peruccacci et al. / Geomorphology 139-140 (2012) 79–90
information was obtained from a national network of rain gauges. Thishas limited the uncertainty in the rainfall information associated withrain gauges of different type, technology, and age that inevitably affectscatalogues covering very long periods, including the catalogue used byBrunetti et al. (2010). Moreover, the short period covered by the newcatalogue has also served to limit the uncertainty associated with thechanging climate, and to changes in land use and land cover that areknown to affect landslide occurrence, resulting in a more consistentdata set. Finally, the new catalogue indicates that slope failures in thestudy area were triggered by less severe rainfall conditions thanexpected (Brunetti et al., 2010). This is important for landslide hazardand risk assessment, and for studies of the evolution of landscapes con-trolled by mass wasting processes.
The new catalogue of the (D,E) empirical rainfall data was seg-mented by lithology and season. The lithological thresholds for thepost-orogenic sediments and the carbonate rocks are statistically in-distinguishable in the range 1bDb120 h, whereas the thresholdsestablished for the flysch deposits are persistently higher and statisti-cally different from the other corresponding lithological thresholds,for all rainfall durations (Fig. 8). Inspection of Fig. 11 and Table 2 fur-ther indicates that the seasonal thresholds have a significant differ-ence in the slope γ, and are statistically different for Db12 h, andfor D>100 h. In particular, for short rainfall periods (Db12 h) thecumulated rainfall required to initiate landslides is higher in thesummer period (i.e., from May to September) than between Octoberand April. This was expected, because in the later period the antecedentrainfall conditions, and the resulting increased moisture in the soil,contribute to reduce the amount of event rainfall required to initiatinglandslides.
Overall, the analysis of the segmented catalogue (Fig. 11 andTable 2) has revealed that the differences between the lithologicaland the seasonal thresholds exists but are not large, and for some ofthe thresholds are not statistically significant (e.g., T5,PO, T5,CC, T5,OA,and T5,MS in the range 12bDb100 h). This indicates that the amountand the duration of the rainfall that can result in landslides in thestudy area, and more generally in central Italy, are somewhat inde-pendent of the lithological type (except for flysch deposits) and ofthe seasonal period (in the range 12bDb100 h). This is an importantresult, with implications for landslide forecasting (Aleotti, 2004;Brunetti et al., 2009; Baum and Godt, 2010). We attribute the resultto the fact that the landslides listed in the new catalogue used todefine the ED thresholds were primarily shallow slope failures. Shallowlandslides involve chiefly the soil cover and theweathered bedrock. Thegeotechnical and hydrological properties of the soils in the study areamay not be appreciably different to result in statistically differentthresholds. We expect that this will facilitate the determination of therainfall thresholds and their extrapolation to neighboring and distantareas characterized by similar morphological, lithological, and climaticsettings (Crosta, 1998). The finding may also affect the construction ofprobabilistic landslide hazard models, for which the determination ofthe temporal frequency of landslides is important (Guzzetti et al.,2005b, 2006; Jaiswal et al., 2010; Witt et al., 2010).
Although the size of the data set used in this study was significant(442 rainfall events with landslides in a 8.5-year period), we ac-knowledge that it may not be sufficient to detect (subtle) differencesin the cumulated amount or duration of rainfall required to causeslope instability due to different lithological types, or seasonal pe-riods. Environmental factors not explicitly considered in this study(e.g. land use, land cover types, burned areas, and human inducedchanges) may also affect the amount of rain necessary to initiatelandslides locally. We further acknowledge that the adopted boot-strapping technique may result in optimistic estimates of the varia-tions (uncertainties) in the threshold model parameters α and γ(Efron and Tibshirani, 1994; Davison and Hinkley, 1997). For this rea-son, care must be taken when considering differences between thevarious thresholds.
7. Conclusions
We compiled a new catalogue of 442 rainfall events that haveresulted in landslides in central Italy, in the period February 2002 toAugust 2010. The 8.5-year period was too short to detect possiblechanges in local climate, typical meteorological conditions, land use,and land cover that may influence landslide occurrence in the studyarea. The consistency of the new catalogue was an advantage for thedefinition of reliable rainfall thresholds for possible landslide occur-rence, contributing to reduce the uncertainty associated with the de-termination of rainfall thresholds from empirical data sets.
To determine new cumulated event rainfall–rainfall duration (ED)thresholds for central Italy, we modified the frequentist approach pro-posed by Brunetti et al. (2010) to define intensity–duration thresholds(ID).We improved themethods by adopting a bootstrapping techniqueto evaluate the statistical uncertainty associated with the two parame-ters that determine the thresholds i.e., the scaling exponent γ, and theintercept α. Further, we studied the robustness of the thresholds tothe size of the empirical data set, and found that to limit the relativeuncertainty below 10%, the number of rainfall events must be n>175.This figure may change for a different data set.
The new ED thresholds for central Italy obtained in this work indi-cate that shallow landslides in the study area are triggered by less se-vere rainfall conditions than previously recognized (Brunetti et al.,2010). This has consequences for landslide forecasting (Aleotti, 2004;Brunetti et al., 2009, 2010; Baum and Godt, 2010), hazard and risk as-sessment using probabilistic models (Guzzetti et al., 2005b, 2006),and for landscape evolution studies (Fiorucci et al., 2011), in the studyarea and in the neighboring regions. We segmented the empirical (D,E) data set by region (Abruzzo, Marche, and Umbria), main lithologicaltype (carbonate rocks, flysch deposits, and post-orogenic sediments),and season of the event (October to April and May to September), andfound that not all of the obtained thresholds were different. Regionalthresholdswere not distinguishable statistically. For lithological thresh-olds, the curves obtained for flysch terrains were persistently higherthan the corresponding curves obtained for the other rock types,which could not be separated. Short, convective rainfall events triggerlandslides in the period between May and September, and long rainfallperiods associated with frontal systems (D>1 day) result in landslidesfrom October to April.
We expect the method tested in this work to establish the new EDrainfall thresholds, and to determine the uncertainty and the robust-ness of the thresholds, can be applicable to other areas. We furtherexpect the new ED rainfall thresholds established in this work cancontribute to forecast the occurrence of rainfall-induced landslidesin central Italy, and in similar physiographic and climatic regions(Aleotti, 2004; Brunetti et al., 2009, 2010; Baum and Godt, 2010).
Acknowledgments
SP, MTB, and SL are supported by DPC grants. The Italian nationalDepartment for Civil Protection (DPC) provided access to the nationalrainfall database used in the study. Additional rainfall informationwas made available by the Marche Regional Department for Civil Pro-tection. We thank G. Tonelli and M. Rossi for working on the rainfalldatabase, and D. Calcaterra and D. Kirschbaum for the constructive re-views. We thank the "Corriere Adriatico" and the "Corriere dell'Um-bria" editorial staffs for providing access to their news databases.
References
Aleotti, P., 2004. A warning system for rainfall-induced shallow failures. EngineeringGeology 73, 247–265.
Annunziati, A., Focardi, A., Focardi, P., Martello, S., Vannocci, P., 2000. Analysis of therainfall thresholds that induced debris flows in the area of Apuan Alps – Tuscany,Italy (19 June 1996 storm). Proc. EGS Plinius Conf. on Mediterranean Storms. Ed.Bios, Cosenza, Italy, pp. 485–493.
90 S. Peruccacci et al. / Geomorphology 139-140 (2012) 79–90
Baum, R.L., Godt, J.W., 2010. Early warning of rainfall-induced shallow landslides anddebris flows in the USA. Landslides 7, 259–272.
Brunetti,M.T., Peruccacci, S., Rossi,M., Guzzetti, F., Reichenbach, P., Ardizzone, F., Cardinali,M., Mondini, A., Salvati, P., Tonelli, G., Valigi, D., Luciani, S., 2009. A prototype systemto forecast rainfall induced landslides in Italy. Proc. of the 1st Italian Workshop onLandslides, Rainfall-Induced Landslides: Mechanisms, Monitoring Techniquesand Now-casting Models for Early Warning Systems: Doppiavoce Edizioni, Naples,1, pp. 157–161.
Brunetti, M.T., Peruccacci, S., Rossi, M., Luciani, S., Valigi, D., Guzzetti, F., 2010. Rainfallthresholds for the possible occurrence of landslides in Italy. Natural Hazards andEarth System Sciences 10, 447–458.
Caine, N., 1980. The rainfall intensity–duration control of shallow landslides and debrisflow. Geografiska Annaler A 62, 23–27.
Corominas, J., Moya, J., 1999. Historical landslides in the Eastern Pyrenees and their re-lation to rainy events. In: Chacon, J., Irigaray, C., Fernandez, T. (Eds.), landslides.A.A. Balkema, Rotterdam, pp. 125–132.
Crosta, G.B., 1998. Regionalization of rainfall thresholds: an aid to landslide hazardevaluation. Environmental Geology 35, 131–145.
Crosta, G.B., Frattini, P., 2001. Rainfall thresholds for triggering soil slips and debrisflow. Proc. of the 2nd EGS Plinius Conference on Mediterranean Storms: Publica-tion CNR GNDCI, 2547, pp. 463–487.
Davison, A.C., Hinkley, D.V., 1997. Bootstrap Methods and their Application. CambridgeSeries in Statistical and Probabilistic Mathematics. Cambridge University Press,Cambridge.
Efron, B., 1979. Bootstrap methods: another look at jackknife. The Annals of Statistics 7,1–26.
Efron, B., Tibshirani, R.J., 1994. An Introduction to the Bootstrap. Chapman and Hall,New York.
Fiorucci, F., Cardinali, M., Carlà, R., Rossi, M., Mondini, A.C., Santurri, F., Ardizzone, F.,Guzzetti, F., 2011. Seasonal landslide mapping and estimation of landslide mobili-zation rates using aerial and satellite images. Geomorphology 129, 59–70.
Galli, M., Ardizzone, F., Cardinali, M., Guzzetti, F., Reichenbach, P., 2008. Comparison oflandslide inventory maps. Geomorphology 94, 268–289.
Guzzetti, F., 2000. Landslide fatalities and evaluation of landslide risk in Italy. EngineeringGeology 58, 89–107.
Guzzetti, F., Tonelli, G., 2004. Information system on hydrological and geomorphologicalcatastrophes in Italy (SICI): a tool for managing landslide and flood hazards. NaturalHazards and Earth System Sciences 4, 213–232.
Guzzetti, F., Cardinali, M., Reichenbach, P., 1994. The AVI Project: a bibliographical andarchive inventory of landslides and floods in Italy. Environmental Management 18,623–633.
Guzzetti, F., Cardinali, M., Reichenbach, P., 1996. The influence of structural setting andlithology on landslide type andpattern. Environmental and EngineeringGeoscience 2,531–555.
Guzzetti, F., Stark, C.P., Salvati, P., 2005a. Evaluation of flood and landslide risk to thepopulation of Italy. Environmental Management 36, 15–36.
Guzzetti, F., Reichenbach, P., Cardinali, M., Galli, M., Ardizzone, F., 2005b. Probabilisticlandslide hazard assessment at the basin scale. Geomorphology 72, 272–299.
Guzzetti, F., Galli, M., Reichenbach, P., Ardizzone, F., Cardinali, M., 2006. Landslidehazard assessment in the Collazzone area, Umbria, central Italy. Natural Hazardsand Earth System Sciences 6, 115–131.
Guzzetti, F., Peruccacci, S., Rossi, M., Stark, C.P., 2007. Rainfall thresholds for the initiationof landslides in central and southern Europe. Meteorology and Atmospheric Physics98, 239–267.
Guzzetti, F., Peruccacci, S., Rossi, M., Stark, C.P., 2008. The rainfall intensity–durationcontrol of shallow landslides and debris flows: an update. Landslides 5, 3–17.
Innes, J.L., 1983. Debris flows. Progress in Physical Geography 7, 469–501.Jaiswal, P., van Westen, C.J., Jetten, V., 2010. Quantitative landslide hazard assessment
along a transportation corridor in southern India. Engineering Geology 116, 236–250.Kanji, M.A., Massad, F., Cruz, P.T., 2003. Debris flows in areas of residual soils: occur-
rence and characteristics. International Workshop on Occurrence and Mechanismsof Flows in Natural Slopes and Earthfills: Iw-Flows2003, Associazione GeotecnicaItaliana, 2, pp. 1–11.
Salvati, P., Guzzetti, F., Reichenbach, P., Cardinali, M., Stark, C.P., 2003. Map of landslidesand floods with human consequences in Italy. Publication CNR GNDCI n. 2822,Scale 1:1,200,000.
Salvati, P., Bianchi, C., Rossi, M., Guzzetti, F., 2010. Societal landslide and flood risk inItaly. Natural Hazards and Earth System Sciences 10, 465–483.
Sandersen, F., Bakkehøi, S., Hestnes, E., Lied, K., 1996. The influence of meteorologicalfactors on the initiation of debris flows, rockfalls, rockslides and rockmass stability.In: Senneset, K. (Ed.), Landslides. A.A, Balkema, Rotterdam, pp. 97–114.
Scott, D.W., 1992. Multivariate Density Estimation. Theory, Practice and Visualization.Wiley, New York.
Silverman, B.W., 1986. Density Estimation. Chapman and Hall, London.Trigila, A., Iadanza, C., Spizzichino, D., 2010. Quality assessment of the Italian Landslide
Inventory using GIS processing. Landslides 7, 455–470.Venables, W.N., Ripley, B.D., 2002. Modern Applied Statistics with S. Springer, New York.Witt, A., Malamud, B.D., Rossi, M., Guzzetti, F., Peruccacci, S., 2010. Temporal correlation
and clustering of landslides. Earth Surface Processes and Landforms 35, 1138–1156.Zezere, J.L., Rodrigues, M.L., 2002. Rainfall thresholds for landsliding in Lisbon Area
(Portugal). In: Rybar, J., Stemberk, J., Wagner, P. (Eds.), Landslides. A.A, Balkema,Lisse, pp. 333–338.
Copyright © 2022 FDOKUMEN