Photo-lithological map of the southern flank of the Tindouf Basin (Western Sahara)
13
This article was downloaded by: [Universita Degli Studi di Firenze], [Andrea Ciampalini] On: 25 August 2014, At: 03:27 Publisher: Taylor & Francis Informa Ltd Registered in England and Wales Registered Number: 1072954 Registered office: Mortimer House, 37-41 Mortimer Street, London W1T 3JH, UK Journal of Maps Publication details, including instructions for authors and subscription information: http://www.tandfonline.com/loi/tjom20 Photo-lithological map of the southern flank of the Tindouf Basin (Western Sahara) Andrea Ciampalini a , Francesca Garfagnoli a , Benedetta Antonielli a , Chiara Del Ventisette a & Sandro Moretti a a Department of Earth Sciences , University of Firenze , Firenze , Italy Published online: 26 Nov 2012. To cite this article: Andrea Ciampalini , Francesca Garfagnoli , Benedetta Antonielli , Chiara Del Ventisette & Sandro Moretti (2012) Photo-lithological map of the southern flank of the Tindouf Basin (Western Sahara), Journal of Maps, 8:4, 453-464, DOI: 10.1080/17445647.2012.746947 To link to this article: http://dx.doi.org/10.1080/17445647.2012.746947 PLEASE SCROLL DOWN FOR ARTICLE Taylor & Francis makes every effort to ensure the accuracy of all the information (the “Content”) contained in the publications on our platform. However, Taylor & Francis, our agents, and our licensors make no representations or warranties whatsoever as to the accuracy, completeness, or suitability for any purpose of the Content. Any opinions and views expressed in this publication are the opinions and views of the authors, and are not the views of or endorsed by Taylor & Francis. The accuracy of the Content should not be relied upon and should be independently verified with primary sources of information. Taylor and Francis shall not be liable for any losses, actions, claims, proceedings, demands, costs, expenses, damages, and other liabilities whatsoever or howsoever caused arising directly or indirectly in connection with, in relation to or arising out of the use of the Content. This article may be used for research, teaching, and private study purposes. Any substantial or systematic reproduction, redistribution, reselling, loan, sub-licensing, systematic supply, or distribution in any form to anyone is expressly forbidden. Terms & Conditions of access and use can be found at http:// www.tandfonline.com/page/terms-and-conditions
-
Upload
independent -
Category
Documents
-
view
0 -
download
0
Transcript of Photo-lithological map of the southern flank of the Tindouf Basin (Western Sahara)

This article was downloaded by: [Universita Degli Studi di Firenze], [Andrea Ciampalini]On: 25 August 2014, At: 03:27Publisher: Taylor & FrancisInforma Ltd Registered in England and Wales Registered Number: 1072954 Registered office: MortimerHouse, 37-41 Mortimer Street, London W1T 3JH, UK
Journal of MapsPublication details, including instructions for authors and subscription information:http://www.tandfonline.com/loi/tjom20
Photo-lithological map of the southern flank of theTindouf Basin (Western Sahara)Andrea Ciampalini a , Francesca Garfagnoli a , Benedetta Antonielli a , Chiara DelVentisette a & Sandro Moretti aa Department of Earth Sciences , University of Firenze , Firenze , ItalyPublished online: 26 Nov 2012.
To cite this article: Andrea Ciampalini , Francesca Garfagnoli , Benedetta Antonielli , Chiara Del Ventisette & SandroMoretti (2012) Photo-lithological map of the southern flank of the Tindouf Basin (Western Sahara), Journal of Maps, 8:4,453-464, DOI: 10.1080/17445647.2012.746947
To link to this article: http://dx.doi.org/10.1080/17445647.2012.746947
PLEASE SCROLL DOWN FOR ARTICLE
Taylor & Francis makes every effort to ensure the accuracy of all the information (the “Content”) containedin the publications on our platform. However, Taylor & Francis, our agents, and our licensors make norepresentations or warranties whatsoever as to the accuracy, completeness, or suitability for any purpose ofthe Content. Any opinions and views expressed in this publication are the opinions and views of the authors,and are not the views of or endorsed by Taylor & Francis. The accuracy of the Content should not be reliedupon and should be independently verified with primary sources of information. Taylor and Francis shallnot be liable for any losses, actions, claims, proceedings, demands, costs, expenses, damages, and otherliabilities whatsoever or howsoever caused arising directly or indirectly in connection with, in relation to orarising out of the use of the Content.
This article may be used for research, teaching, and private study purposes. Any substantial or systematicreproduction, redistribution, reselling, loan, sub-licensing, systematic supply, or distribution in anyform to anyone is expressly forbidden. Terms & Conditions of access and use can be found at http://www.tandfonline.com/page/terms-and-conditions
SCIENCE
Photo-lithological map of the southern flank of the Tindouf Basin (Western Sahara)
Andrea Ciampalini∗, Francesca Garfagnoli, Benedetta Antonielli, Chiara Del Ventisette and Sandro Moretti
Department of Earth Sciences, University of Firenze, Firenze, Italy
(Received 30 May 2012; Resubmitted 30 October 2012; Accepted 2 November 2012)
This paper examines the potential to map surface geology by applying specific enhancement techniques to Landsat7 ETM+ imagery, resulting in false color composite images, which were interpreted and then validated during afield campaign. The study area is located on the southern flank of the Tindouf Basin (Western Sahara), and it isnoted that there is a general lack of bibliographic data due both to the region’s remote location and to its difficultpolitical situation. A number of photo-lithological units were mapped within the Proterozoic basement and thesedimentary succession of the Tindouf Basin incisively contributing to the knowledge of the geological settingof this area.
Keywords: Landsat ETM +; enhancement techniques; photo-interpretation; geological mapping; Tindouf Basin;Western Sahara
1. Introduction
Landsat images have proved to be an inexpensive and useful tool in the discrimination of lithologies, characterizedby different spectral properties (Deller, 2006; Gupta, 2003; Wulder et al., 2008; Zumsprekel & Prinz, 2000). Theyare an effective, time and cost-saving method for geological mapping of large areas, and it is especially useful inareas difficult to reach to carry out traditional geological surveys. A suitable analysis of satellite optical images,such as Landsat 7 ETM +, substantially helps in lithological investigation of poorly understood areas. This is par-ticularly true in arid environments, where the lack of both vegetation cover and thick soils allows a clear obser-vation of the outcropping rock sequences (Baghdadi, Grandjean, Lahondere, Paillou, & Lasne 2005; Dawelbait& Morari, 2011; Gad & Kusky, 2006). In this study, Landsat 7 ETM+ images were analyzed using specificenhancement techniques, such as band ratios, color composites and principal component analysis (PCA)(Dehnavi et al., 2010; Dogan, 2008, 2009; Kaufmann 1988; Madani, 2009; Rajesh, 2008; Sabins, 1999;Shalaby, Bishta, Roz, & Zalaky, 2010). Using enhancement techniques, different photo-lithologic units on thesouthern flank of the Tindouf Basin (Western Sahara) were mapped through visual interpretation, validated withground-truth data, and compiled using a geographic information system (GIS). The study area is located in theSADR (Saharawi Arab Democratic Republic) territory, which is bounded to the south and east by the Mauritaniaborder and to the north and west by the Moroccan wall (Figure 1). Few studies concerning the southern flank of theTindouf Basin have been published (Guerrak, 1988a, 1988b, Guerrak, 1991; Villeneuve, 2005). This lack of geo-logical data could be explained by the remote location and to the recent political situation. Photo-interpretation ofLandsat 7 ETM+ images was performed for a test area of about 9400 km2. This paper contributes to the knowledgeof the geological setting of an area that has not been mapped in detail yet, and substantiates the use of remotesensing methods as a proxy geologic mapping technique. The information about the geology of another part ofthe Tindouf basin (Djebilet, Algeria), characterized by the same sedimentary sequence and rocks, combined tothe remote sensing techniques were used to extend the geological interpretation to the study area. The obtainedphoto-lithological map was validated through a field investigation where the lithologies were verified.
ISSN 1744-5647 online# 2012 Andrea Ciampalini, Francesca Garfagnoli, Benedetta Antonielli, Chiara Del Ventisette and Sandro Moretti
http://dx.doi.org/10.1080/17445647.2012.746947
http://www.tandfonline.com
∗Corresponding author. Email: [email protected]
Journal of MapsVol. 8, No. 4, December 2012, 453–464
Dow
nloa
ded
by [
Uni
vers
ita D
egli
Stud
i di F
iren
ze],
[A
ndre
a C
iam
palin
i] a
t 03:
27 2
5 A
ugus
t 201
4
2. Geological setting
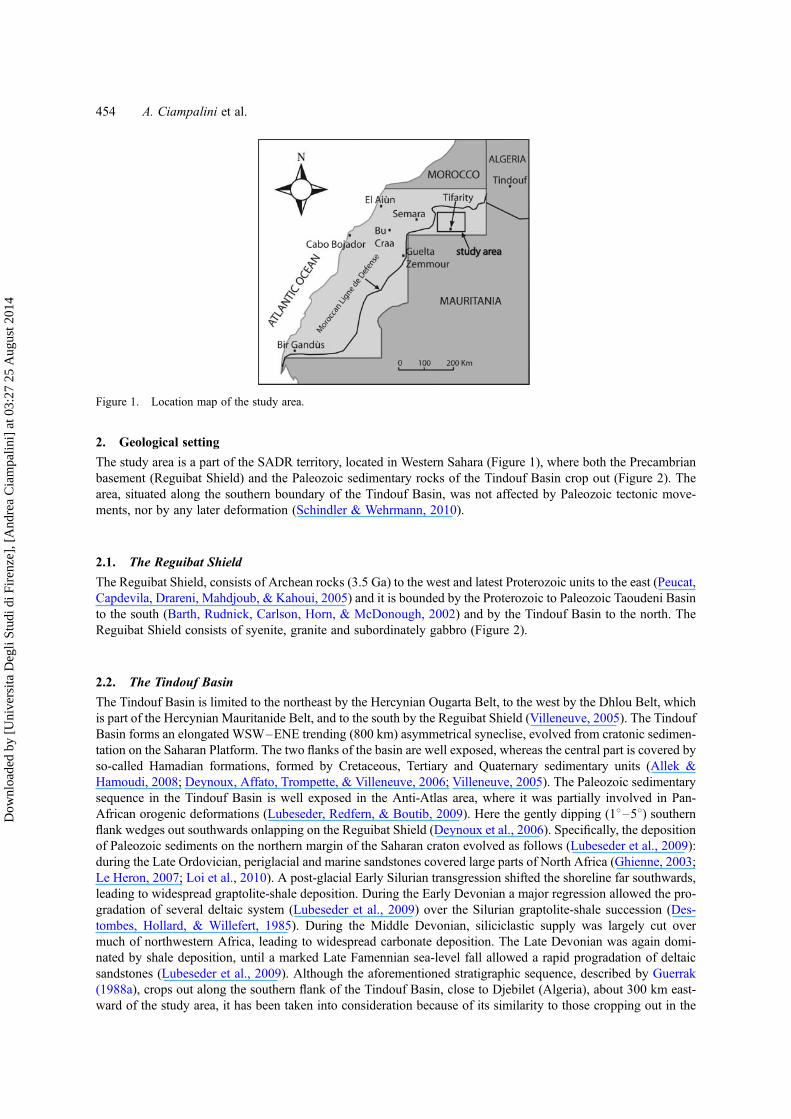
The study area is a part of the SADR territory, located in Western Sahara (Figure 1), where both the Precambrianbasement (Reguibat Shield) and the Paleozoic sedimentary rocks of the Tindouf Basin crop out (Figure 2). Thearea, situated along the southern boundary of the Tindouf Basin, was not affected by Paleozoic tectonic move-ments, nor by any later deformation (Schindler & Wehrmann, 2010).
2.1. The Reguibat Shield
The Reguibat Shield, consists of Archean rocks (3.5 Ga) to the west and latest Proterozoic units to the east (Peucat,Capdevila, Drareni, Mahdjoub, & Kahoui, 2005) and it is bounded by the Proterozoic to Paleozoic Taoudeni Basinto the south (Barth, Rudnick, Carlson, Horn, & McDonough, 2002) and by the Tindouf Basin to the north. TheReguibat Shield consists of syenite, granite and subordinately gabbro (Figure 2).
2.2. The Tindouf Basin
The Tindouf Basin is limited to the northeast by the Hercynian Ougarta Belt, to the west by the Dhlou Belt, whichis part of the Hercynian Mauritanide Belt, and to the south by the Reguibat Shield (Villeneuve, 2005). The TindoufBasin forms an elongated WSW–ENE trending (800 km) asymmetrical syneclise, evolved from cratonic sedimen-tation on the Saharan Platform. The two flanks of the basin are well exposed, whereas the central part is covered byso-called Hamadian formations, formed by Cretaceous, Tertiary and Quaternary sedimentary units (Allek &Hamoudi, 2008; Deynoux, Affato, Trompette, & Villeneuve, 2006; Villeneuve, 2005). The Paleozoic sedimentarysequence in the Tindouf Basin is well exposed in the Anti-Atlas area, where it was partially involved in Pan-African orogenic deformations (Lubeseder, Redfern, & Boutib, 2009). Here the gently dipping (18–58) southernflank wedges out southwards onlapping on the Reguibat Shield (Deynoux et al., 2006). Specifically, the depositionof Paleozoic sediments on the northern margin of the Saharan craton evolved as follows (Lubeseder et al., 2009):during the Late Ordovician, periglacial and marine sandstones covered large parts of North Africa (Ghienne, 2003;Le Heron, 2007; Loi et al., 2010). A post-glacial Early Silurian transgression shifted the shoreline far southwards,leading to widespread graptolite-shale deposition. During the Early Devonian a major regression allowed the pro-gradation of several deltaic system (Lubeseder et al., 2009) over the Silurian graptolite-shale succession (Des-tombes, Hollard, & Willefert, 1985). During the Middle Devonian, siliciclastic supply was largely cut overmuch of northwestern Africa, leading to widespread carbonate deposition. The Late Devonian was again domi-nated by shale deposition, until a marked Late Famennian sea-level fall allowed a rapid progradation of deltaicsandstones (Lubeseder et al., 2009). Although the aforementioned stratigraphic sequence, described by Guerrak(1988a), crops out along the southern flank of the Tindouf Basin, close to Djebilet (Algeria), about 300 km east-ward of the study area, it has been taken into consideration because of its similarity to those cropping out in the
Figure 1. Location map of the study area.
454 A. Ciampalini et al.
Dow
nloa
ded
by [
Uni
vers
ita D
egli
Stud
i di F
iren
ze],
[A
ndre
a C
iam
palin
i] a
t 03:
27 2
5 A
ugus
t 201
4
study area, located in Western Sahara. This similarity has been confirmed by the geological survey though theidentification of the same lithologies cropping out close to Djebilet.
3. Material and methods: satellite data acquisition and analysis
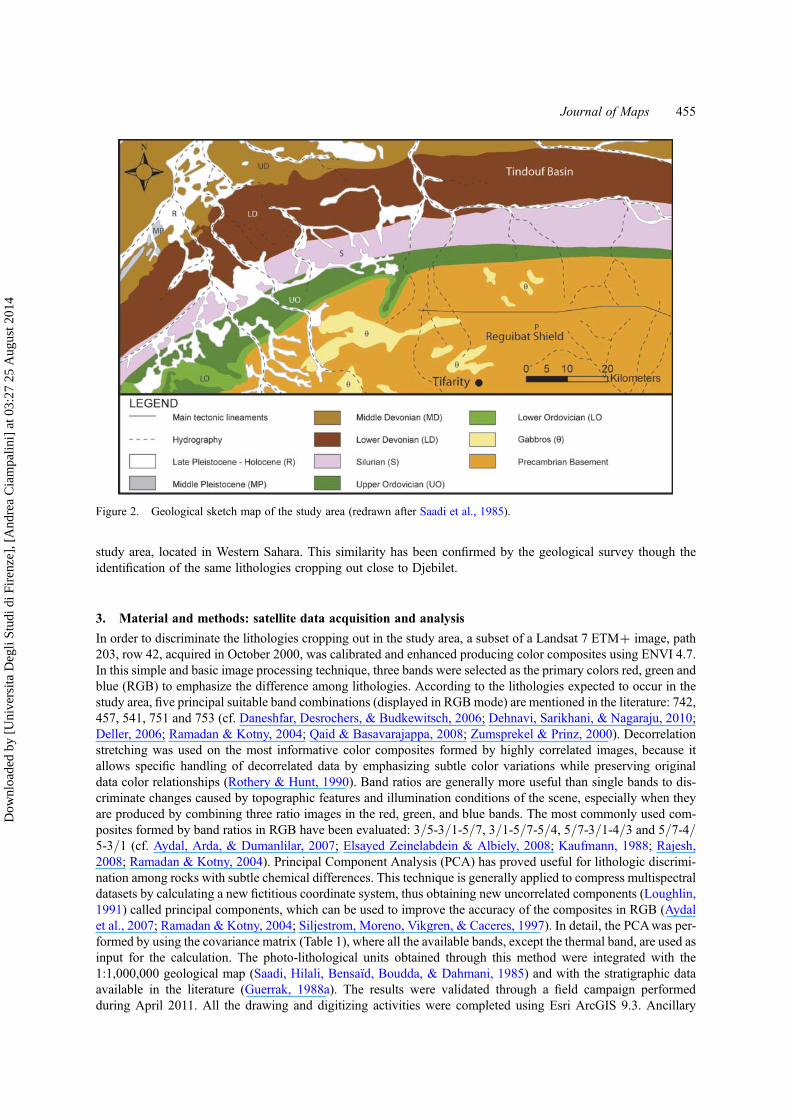
In order to discriminate the lithologies cropping out in the study area, a subset of a Landsat 7 ETM+ image, path203, row 42, acquired in October 2000, was calibrated and enhanced producing color composites using ENVI 4.7.In this simple and basic image processing technique, three bands were selected as the primary colors red, green andblue (RGB) to emphasize the difference among lithologies. According to the lithologies expected to occur in thestudy area, five principal suitable band combinations (displayed in RGB mode) are mentioned in the literature: 742,457, 541, 751 and 753 (cf. Daneshfar, Desrochers, & Budkewitsch, 2006; Dehnavi, Sarikhani, & Nagaraju, 2010;Deller, 2006; Ramadan & Kotny, 2004; Qaid & Basavarajappa, 2008; Zumsprekel & Prinz, 2000). Decorrelationstretching was used on the most informative color composites formed by highly correlated images, because itallows specific handling of decorrelated data by emphasizing subtle color variations while preserving originaldata color relationships (Rothery & Hunt, 1990). Band ratios are generally more useful than single bands to dis-criminate changes caused by topographic features and illumination conditions of the scene, especially when theyare produced by combining three ratio images in the red, green, and blue bands. The most commonly used com-posites formed by band ratios in RGB have been evaluated: 3/5-3/1-5/7, 3/1-5/7-5/4, 5/7-3/1-4/3 and 5/7-4/5-3/1 (cf. Aydal, Arda, & Dumanlilar, 2007; Elsayed Zeinelabdein & Albiely, 2008; Kaufmann, 1988; Rajesh,2008; Ramadan & Kotny, 2004). Principal Component Analysis (PCA) has proved useful for lithologic discrimi-nation among rocks with subtle chemical differences. This technique is generally applied to compress multispectraldatasets by calculating a new fictitious coordinate system, thus obtaining new uncorrelated components (Loughlin,1991) called principal components, which can be used to improve the accuracy of the composites in RGB (Aydalet al., 2007; Ramadan & Kotny, 2004; Siljestrom, Moreno, Vikgren, & Caceres, 1997). In detail, the PCA was per-formed by using the covariance matrix (Table 1), where all the available bands, except the thermal band, are used asinput for the calculation. The photo-lithological units obtained through this method were integrated with the1:1,000,000 geological map (Saadi, Hilali, Bensaıd, Boudda, & Dahmani, 1985) and with the stratigraphic dataavailable in the literature (Guerrak, 1988a). The results were validated through a field campaign performedduring April 2011. All the drawing and digitizing activities were completed using Esri ArcGIS 9.3. Ancillary
Figure 2. Geological sketch map of the study area (redrawn after Saadi et al., 1985).
Journal of Maps 455
Dow
nloa
ded
by [
Uni
vers
ita D
egli
Stud
i di F
iren
ze],
[A
ndre
a C
iam
palin
i] a
t 03:
27 2
5 A
ugus
t 201
4
field data (GPS coordinates, samples, photos) collected during the field survey were also included to establish somereference points.
4. Results and discussion
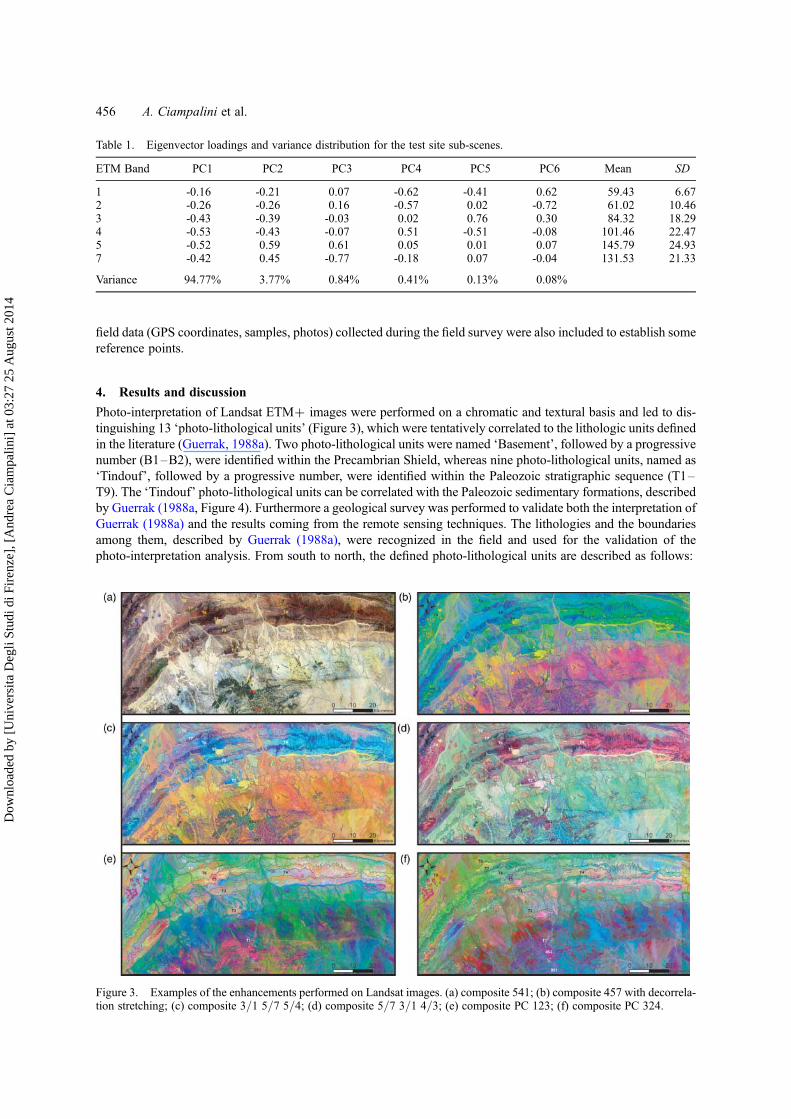
Photo-interpretation of Landsat ETM+ images were performed on a chromatic and textural basis and led to dis-tinguishing 13 ‘photo-lithological units’ (Figure 3), which were tentatively correlated to the lithologic units definedin the literature (Guerrak, 1988a). Two photo-lithological units were named ‘Basement’, followed by a progressivenumber (B1–B2), were identified within the Precambrian Shield, whereas nine photo-lithological units, named as‘Tindouf’, followed by a progressive number, were identified within the Paleozoic stratigraphic sequence (T1–T9). The ‘Tindouf’ photo-lithological units can be correlated with the Paleozoic sedimentary formations, describedby Guerrak (1988a, Figure 4). Furthermore a geological survey was performed to validate both the interpretation ofGuerrak (1988a) and the results coming from the remote sensing techniques. The lithologies and the boundariesamong them, described by Guerrak (1988a), were recognized in the field and used for the validation of thephoto-interpretation analysis. From south to north, the defined photo-lithological units are described as follows:
Figure 3. Examples of the enhancements performed on Landsat images. (a) composite 541; (b) composite 457 with decorrela-tion stretching; (c) composite 3/1 5/7 5/4; (d) composite 5/7 3/1 4/3; (e) composite PC 123; (f) composite PC 324.
Table 1. Eigenvector loadings and variance distribution for the test site sub-scenes.
ETM Band PC1 PC2 PC3 PC4 PC5 PC6 Mean SD
1 -0.16 -0.21 0.07 -0.62 -0.41 0.62 59.43 6.672 -0.26 -0.26 0.16 -0.57 0.02 -0.72 61.02 10.463 -0.43 -0.39 -0.03 0.02 0.76 0.30 84.32 18.294 -0.53 -0.43 -0.07 0.51 -0.51 -0.08 101.46 22.475 -0.52 0.59 0.61 0.05 0.01 0.07 145.79 24.937 -0.42 0.45 -0.77 -0.18 0.07 -0.04 131.53 21.33
Variance 94.77% 3.77% 0.84% 0.41% 0.13% 0.08%
456 A. Ciampalini et al.
Dow
nloa
ded
by [
Uni
vers
ita D
egli
Stud
i di F
iren
ze],
[A
ndre
a C
iam
palin
i] a
t 03:
27 2
5 A
ugus
t 201
4
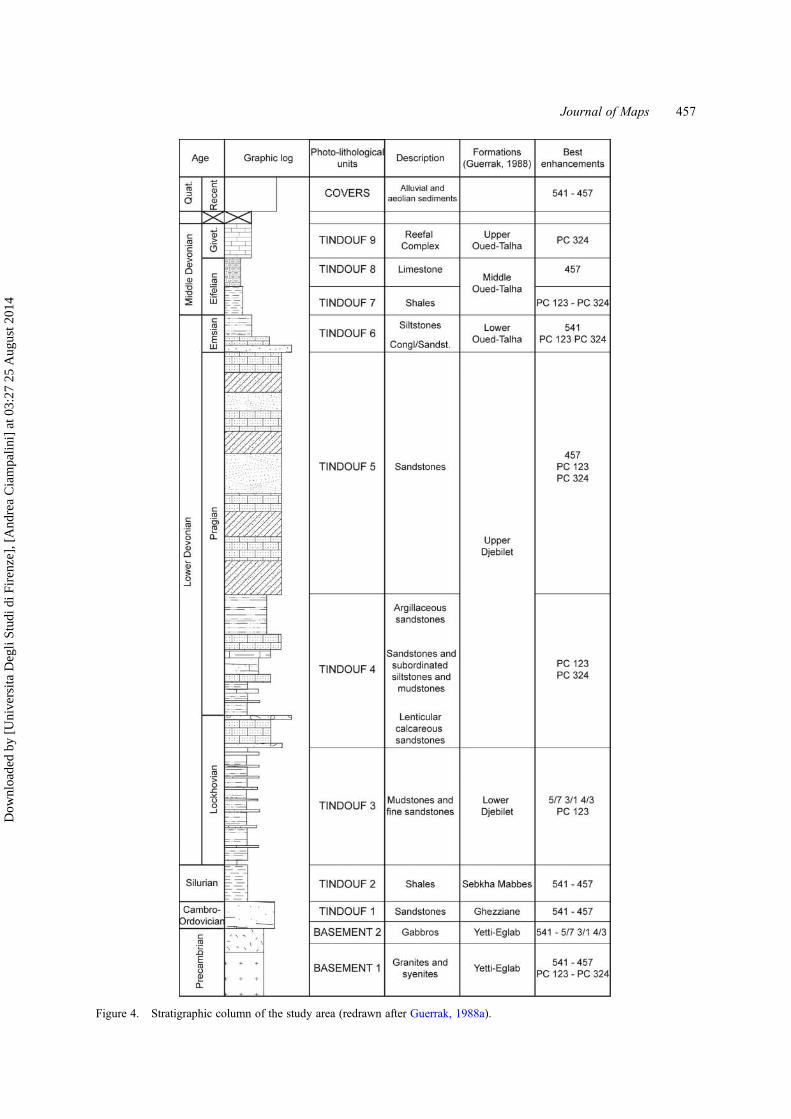
Figure 4. Stratigraphic column of the study area (redrawn after Guerrak, 1988a).
Journal of Maps 457
Dow
nloa
ded
by [
Uni
vers
ita D
egli
Stud
i di F
iren
ze],
[A
ndre
a C
iam
palin
i] a
t 03:
27 2
5 A
ugus
t 201
4
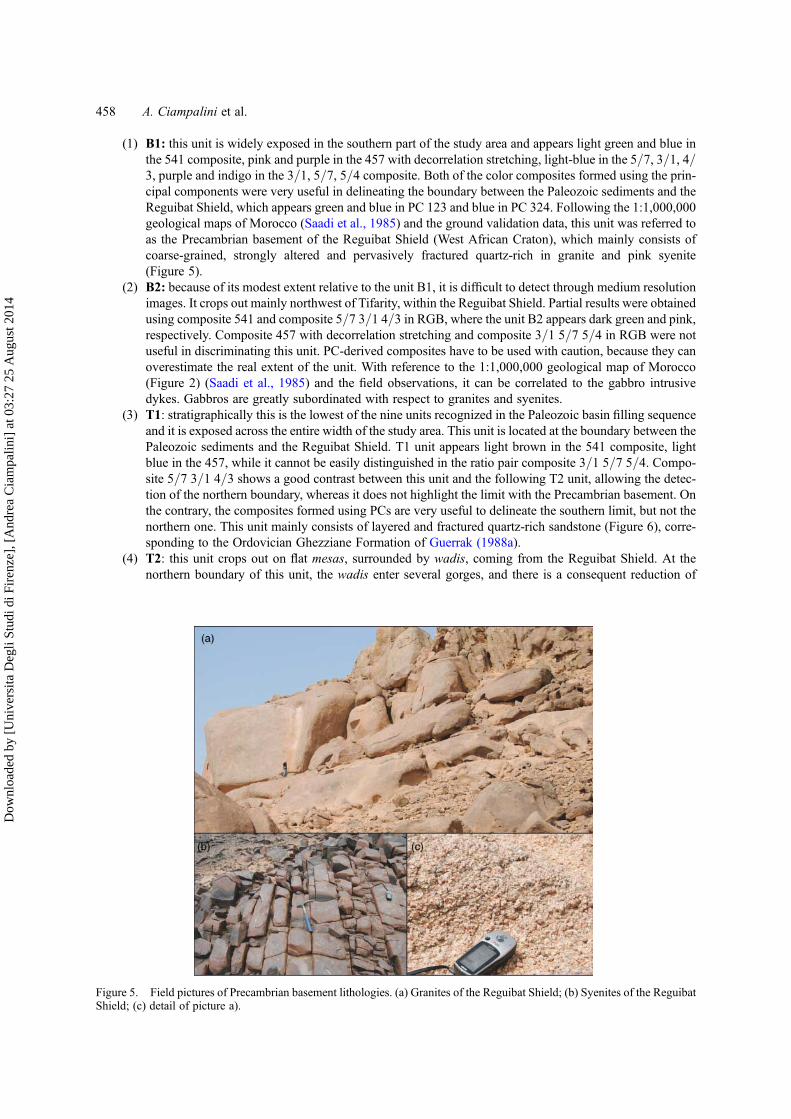
(1) B1: this unit is widely exposed in the southern part of the study area and appears light green and blue inthe 541 composite, pink and purple in the 457 with decorrelation stretching, light-blue in the 5/7, 3/1, 4/3, purple and indigo in the 3/1, 5/7, 5/4 composite. Both of the color composites formed using the prin-cipal components were very useful in delineating the boundary between the Paleozoic sediments and theReguibat Shield, which appears green and blue in PC 123 and blue in PC 324. Following the 1:1,000,000geological maps of Morocco (Saadi et al., 1985) and the ground validation data, this unit was referred toas the Precambrian basement of the Reguibat Shield (West African Craton), which mainly consists ofcoarse-grained, strongly altered and pervasively fractured quartz-rich in granite and pink syenite(Figure 5).
(2) B2: because of its modest extent relative to the unit B1, it is difficult to detect through medium resolutionimages. It crops out mainly northwest of Tifarity, within the Reguibat Shield. Partial results were obtainedusing composite 541 and composite 5/7 3/1 4/3 in RGB, where the unit B2 appears dark green and pink,respectively. Composite 457 with decorrelation stretching and composite 3/1 5/7 5/4 in RGB were notuseful in discriminating this unit. PC-derived composites have to be used with caution, because they canoverestimate the real extent of the unit. With reference to the 1:1,000,000 geological map of Morocco(Figure 2) (Saadi et al., 1985) and the field observations, it can be correlated to the gabbro intrusivedykes. Gabbros are greatly subordinated with respect to granites and syenites.
(3) T1: stratigraphically this is the lowest of the nine units recognized in the Paleozoic basin filling sequenceand it is exposed across the entire width of the study area. This unit is located at the boundary between thePaleozoic sediments and the Reguibat Shield. T1 unit appears light brown in the 541 composite, lightblue in the 457, while it cannot be easily distinguished in the ratio pair composite 3/1 5/7 5/4. Compo-site 5/7 3/1 4/3 shows a good contrast between this unit and the following T2 unit, allowing the detec-tion of the northern boundary, whereas it does not highlight the limit with the Precambrian basement. Onthe contrary, the composites formed using PCs are very useful to delineate the southern limit, but not thenorthern one. This unit mainly consists of layered and fractured quartz-rich sandstone (Figure 6), corre-sponding to the Ordovician Ghezziane Formation of Guerrak (1988a).
(4) T2: this unit crops out on flat mesas, surrounded by wadis, coming from the Reguibat Shield. At thenorthern boundary of this unit, the wadis enter several gorges, and there is a consequent reduction of
Figure 5. Field pictures of Precambrian basement lithologies. (a) Granites of the Reguibat Shield; (b) Syenites of the ReguibatShield; (c) detail of picture a).
458 A. Ciampalini et al.
Dow
nloa
ded
by [
Uni
vers
ita D
egli
Stud
i di F
iren
ze],
[A
ndre
a C
iam
palin
i] a
t 03:
27 2
5 A
ugus
t 201
4

the channel width. This geomorphological framework allows the deposition of fluvial and aeolian sedi-ments on the surface of the mesa, shielding the original lithology and causing interference in its reflec-tance characteristics. Where the recent cover is absent, the unit T2 appears dark brown or purple in the541 composite. In the 457, it is portrayed in dark blue in the central and eastern part of the study area andin purple in the western part. This divergence could be related to the different orientation of the geologicalstructure, which trends northeast in the western portion of the map area and trends eastward in the easternhalf of the map. The composite formed by ratios 3/1 5/7 5/4 does not highlight this unit with a singlecolor, but it is useful in delineating its boundary due to the high contrast with the neighboring units.Ratios 5/7 3/1 4/3 as RGB correlate with the fluvial cover and aeolian sediments, but, where theyare missing, T2 is represented in purple. Results from composites obtained through PCs were inconclu-sive. The T2 unit likely corresponds to the Silurian shales (Guerrak, 1988a).
(5) T3: the lithologies making up this unit to the top of the sequence are spectrally very similar because theyconsist mainly of interlayered mudstone, limestone, sandstone and siltstone. Most simple image enhance-ments, such as the 541 color composite, use highly correlated spectral bands, which are not very useful todelineate differences between lithologies having similar physical or spectral features. Regardless, thisunit appears as several shades of brown in the 541 composite, similar to T4 to the north. Thus, the541 composite is not useful to delineate the northern boundary of T3, but it can be used for the southernboundary because of the contrast in the RGB image between the lithologies at the base of T3 and theSilurian shale at the top of T2. Specifically, the basal level of limestone is highlighted in red in the541 composite and it is observed throughout the study area. The 457 composite shows better resultsthan the 451 composite in delineating the extent of T3, which appears in blue with the exception ofthe limestone level which is colored green. This is probably caused by increased decorrelationbetween spectral bands. Among the band ratios composites, the 5/7 3/1 4/3 was the most useful,because it was able to delineate both the upper and lower boundaries of T3. The best enhancement forthis unit is represented by the PC 123 as a RGB image, where the unit T3 is orange and characterizedby a high contrast relative to T2 and T4. T3 probably corresponds to the Lochkovian limestone(Figure 7) and the interlayered mudstone and fine-grained sandstone of the Djebilet Formation asdefined by Guerrak (1988a).
Figure 6. Field pictures of the Ordovician sedimentary succession. (a) Ordovician sandstones; (b) and (c) details of picture a).
Journal of Maps 459
Dow
nloa
ded
by [
Uni
vers
ita D
egli
Stud
i di F
iren
ze],
[A
ndre
a C
iam
palin
i] a
t 03:
27 2
5 A
ugus
t 201
4
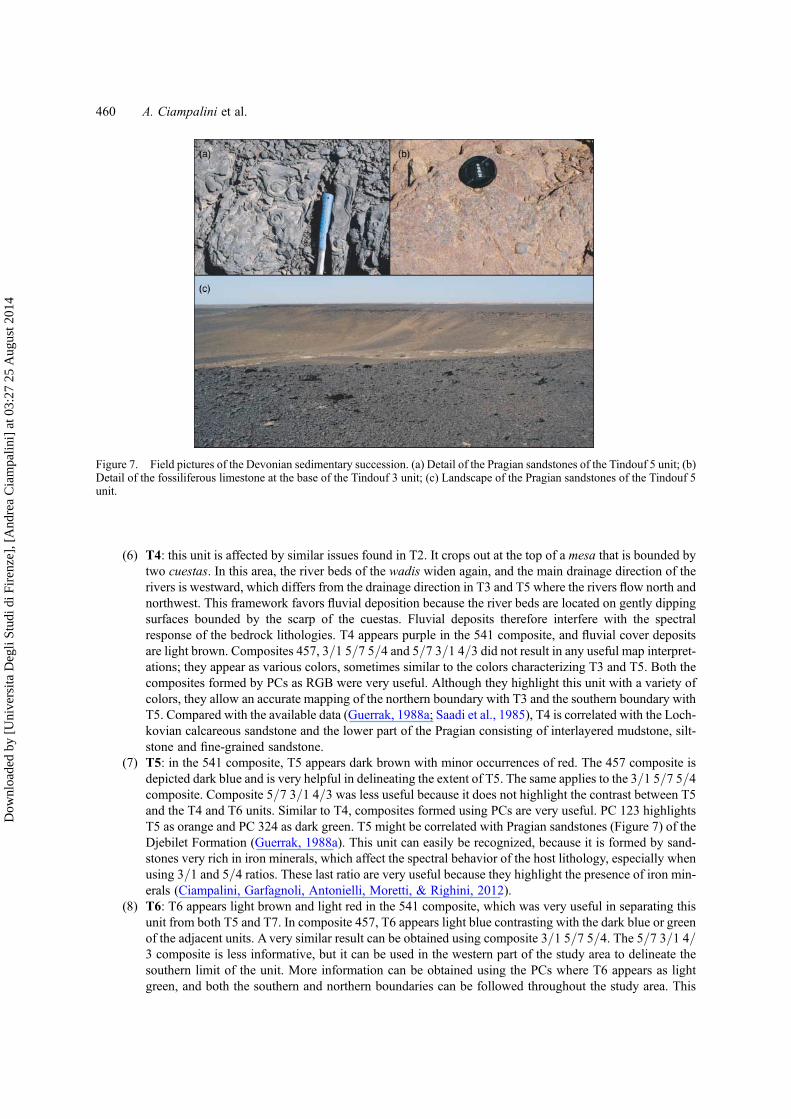
(6) T4: this unit is affected by similar issues found in T2. It crops out at the top of a mesa that is bounded bytwo cuestas. In this area, the river beds of the wadis widen again, and the main drainage direction of therivers is westward, which differs from the drainage direction in T3 and T5 where the rivers flow north andnorthwest. This framework favors fluvial deposition because the river beds are located on gently dippingsurfaces bounded by the scarp of the cuestas. Fluvial deposits therefore interfere with the spectralresponse of the bedrock lithologies. T4 appears purple in the 541 composite, and fluvial cover depositsare light brown. Composites 457, 3/1 5/7 5/4 and 5/7 3/1 4/3 did not result in any useful map interpret-ations; they appear as various colors, sometimes similar to the colors characterizing T3 and T5. Both thecomposites formed by PCs as RGB were very useful. Although they highlight this unit with a variety ofcolors, they allow an accurate mapping of the northern boundary with T3 and the southern boundary withT5. Compared with the available data (Guerrak, 1988a; Saadi et al., 1985), T4 is correlated with the Loch-kovian calcareous sandstone and the lower part of the Pragian consisting of interlayered mudstone, silt-stone and fine-grained sandstone.
(7) T5: in the 541 composite, T5 appears dark brown with minor occurrences of red. The 457 composite isdepicted dark blue and is very helpful in delineating the extent of T5. The same applies to the 3/1 5/7 5/4composite. Composite 5/7 3/1 4/3 was less useful because it does not highlight the contrast between T5and the T4 and T6 units. Similar to T4, composites formed using PCs are very useful. PC 123 highlightsT5 as orange and PC 324 as dark green. T5 might be correlated with Pragian sandstones (Figure 7) of theDjebilet Formation (Guerrak, 1988a). This unit can easily be recognized, because it is formed by sand-stones very rich in iron minerals, which affect the spectral behavior of the host lithology, especially whenusing 3/1 and 5/4 ratios. These last ratio are very useful because they highlight the presence of iron min-erals (Ciampalini, Garfagnoli, Antonielli, Moretti, & Righini, 2012).
(8) T6: T6 appears light brown and light red in the 541 composite, which was very useful in separating thisunit from both T5 and T7. In composite 457, T6 appears light blue contrasting with the dark blue or greenof the adjacent units. A very similar result can be obtained using composite 3/1 5/7 5/4. The 5/7 3/1 4/3 composite is less informative, but it can be used in the western part of the study area to delineate thesouthern limit of the unit. More information can be obtained using the PCs where T6 appears as lightgreen, and both the southern and northern boundaries can be followed throughout the study area. This
Figure 7. Field pictures of the Devonian sedimentary succession. (a) Detail of the Pragian sandstones of the Tindouf 5 unit; (b)Detail of the fossiliferous limestone at the base of the Tindouf 3 unit; (c) Landscape of the Pragian sandstones of the Tindouf 5unit.
460 A. Ciampalini et al.
Dow
nloa
ded
by [
Uni
vers
ita D
egli
Stud
i di F
iren
ze],
[A
ndre
a C
iam
palin
i] a
t 03:
27 2
5 A
ugus
t 201
4
unit was interpreted as the Lower Oued Talha Formation (Emsian) composed of conglomerate, sandstoneand subordinately siltstone.
(9) T7: in the 541 composite T7 appears as different shades of brown and it is easily delineable in the easternpart of the study area; however, in the southwestern part of the map it can be indistinguishable from theneighboring photo-lithological units, probably because of the presence of widespread aeolian deposits,fluvial cover or both. Unit T7 is observed as dark blue using the 457 composite and the 3/1 5/7 5/4image. The 5/7 3/1 4/3 composite can be used only in the eastern part for delineating the southernboundary. More accurate information can be obtained from the composites formed using PCs. In particu-lar, PC 324 highlights this unit in orange contrasting with the green of T6 and T8. From the publishedmaps and literature (Guerrak, 1988a), this unit is correlated with the middle Oued Talha Formation(Emisian-Givetian), predominantly consisting of shale.
(10) T8: this unit is mostly characterized by being covered by the deposits of the largest wadi in the map area.Its lower contact was defined using enhanced images, whereas the upper boundary was interpretedbecause the reef mounds (Givetian) outcropping nearby pertain to the T9 unit. It appears light brownin the 541 composite, green and blue in the 457, light blue in the 3/1 5/7 5/4, and as assorted colorsin the 5/7 3/1 4/3 composites, but these enhancements do not show consistent differences from T7.Both the composites formed using the principal components were not informative. The T8 unit is con-sidered part of the middle Oued Talha Formation (Eifelian; Guerrak, 1988a) and consists of limestone.
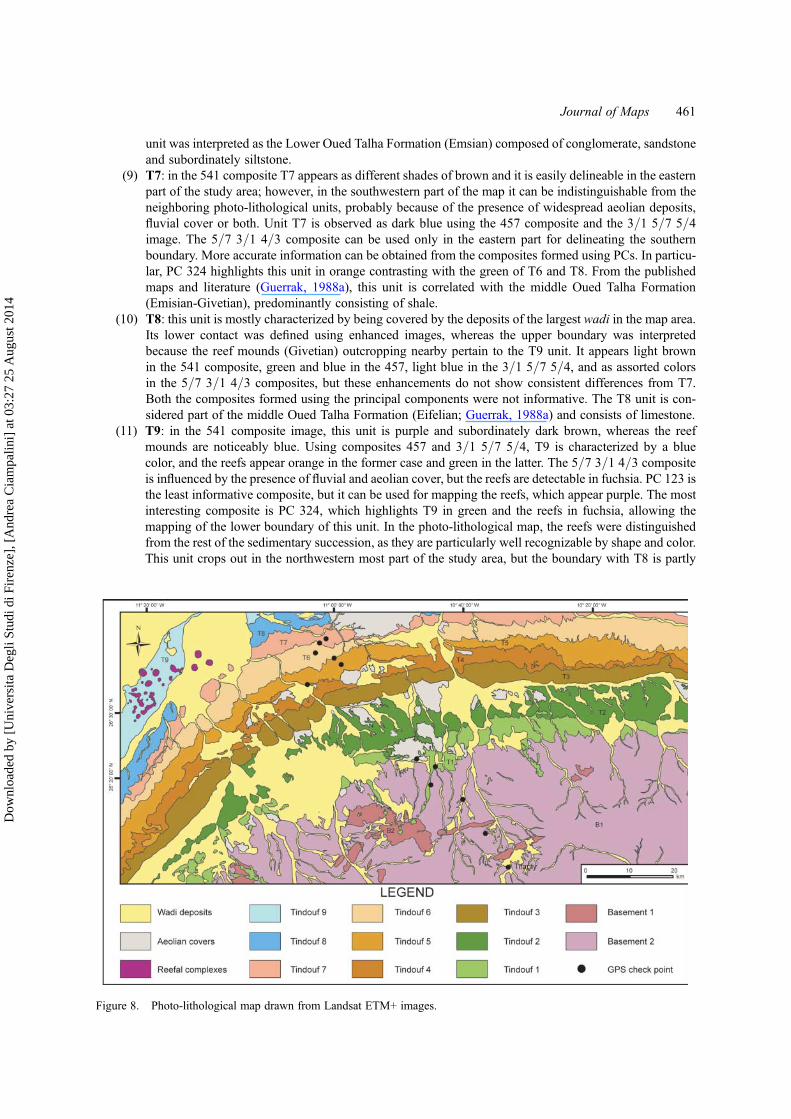
(11) T9: in the 541 composite image, this unit is purple and subordinately dark brown, whereas the reefmounds are noticeably blue. Using composites 457 and 3/1 5/7 5/4, T9 is characterized by a bluecolor, and the reefs appear orange in the former case and green in the latter. The 5/7 3/1 4/3 compositeis influenced by the presence of fluvial and aeolian cover, but the reefs are detectable in fuchsia. PC 123 isthe least informative composite, but it can be used for mapping the reefs, which appear purple. The mostinteresting composite is PC 324, which highlights T9 in green and the reefs in fuchsia, allowing themapping of the lower boundary of this unit. In the photo-lithological map, the reefs were distinguishedfrom the rest of the sedimentary succession, as they are particularly well recognizable by shape and color.This unit crops out in the northwestern most part of the study area, but the boundary with T8 is partly
Figure 8. Photo-lithological map drawn from Landsat ETM+ images.
Journal of Maps 461
Dow
nloa
ded
by [
Uni
vers
ita D
egli
Stud
i di F
iren
ze],
[A
ndre
a C
iam
palin
i] a
t 03:
27 2
5 A
ugus
t 201
4
covered by fluvial deposits. T9 is stratigraphically the highest unit of the nine distinguished in the Paleo-zoic Tindouf Basin. It includes Givetian (in age) reef complexes of various sizes and is made up of sand-stones and siltstones (Schindler & Wehrmann, 2010). It is correlated with the Oued Talha Formation ofGuerrak (1988a). T9 is correlated with the upper Oued Talha Formation (Givetian), consisting of silici-clastic siltstone and sandstone and carbonates at the top of the mounds (Guerrak, 1988a; Schindler &Wehrmann, 2010).
(12) Cover: this unit is white in the 541 composite, yellow in composite 457 with decorrelation stretching,light blue and yellow in the 3/1, 5/7, 5/4, and fuchsia and yellow in the 5/7, 5/4, 3/1 composite. Com-posites formed using PCs were unusable, because they highlight cover with several different colors. Thisunit is formed by recent slope or Cenozoic aeolian deposits, predominantly consisting of sand derivedfrom the weathering and disintegration of the granitic Precambrian basement.
(13) Wadi: this unit corresponds to fluvial and alluvial deposits within completely dry riverbeds, occasionallyhosting rainwater flow. They mostly consist of loose sandy and silty sediments. The identification of thewadi riverbeds and of the related sediments can be easily performed using single bands or a simple ratioin gray scale. In the study area, the calibrated ETM+ band 3 and the band 3/band 1 ratio were very effec-tive at delineating the hydrographic network and its sediments, which appear white or light grey, in con-trast with the dark grey and black of bedrock outcrops. More elaborated enhancements can be stronglyaffected by mineralogical changes in the composition of the river sediments, particularly at the confluenceof two or more wadis and highlighted by a color change in deposits along the same wadi.
The 13 recognized ‘photo-lithological units’ (Figure 8) using the described image processing techniques wereused to draw a photo-lithological map of the study area.
5. Conclusions
In areas difficult to reach and subject to socio-political and logistical constraints, such as Western Sahara, geologicalmapping raises a number of issues regarding cost, feasibility and security. In such cases, the use of Landsat 7 ETM+can provide a particularly effective and low-cost tool for rapid mapping, thanks to the synoptic view and to the capa-bility to distinguish the different lithologies based on their spectral features. In this paper, some enhancement tech-niques were applied to a Landsat 7 ETM+ subset of the Tindouf basin (Western Sahara), in order to discriminate andmap the lithologies. False color composite images, color composites derived from band ratioing or principal com-ponent analysis have been particularly effective for the identification of a number of photo-lithological unitswithin the study area, using simple visual recognition. Even though visual interpretation is subjective, it hasproved highly valuable for geological mapping, making it possible to map lithologic units with much more detail,with respect to the existing literature (Guerrak, 1988a; Saadi et al., 1985). The integration of pre-existing geologicaldata and data collected during the field survey performed in April 2011, with the analyzed satellite images in a GISenvironment, allowed the reliable linking of the photo-lithological units with the available litho-stratigraphic scheme(Guerrak, 1988a) and existing maps (Saadi et al., 1985) for the study area. In particular, the Proterozoic granitic base-ment and the sedimentary succession of the Tindouf Basin were mapped as 13 photo-lithological units, includingalluvial and aeolian deposits. This study demonstrates that, if properly post-processed, minimally expensiveoptical satellite imagery can represent a valuable tool for rapid and reliable geologic mapping at a regional scale.This method is particularly useful in arid environments due to the absence of widespread vegetation cover. Thephoto-interpreted maps will be useful guides to ground surveys for a more detailed characterization of themapped units and of their structural relationships, or to serve as a starting point for mineral resources investigations.
AcknowledgementsThis research was financed by Autostrade per L’Italia S.p.a. The authors gratefully acknowledge the staff of the NGO Ban SloutLarbi and in particular Fiorella Bendoni, as well as the Government of the SADR, particularly of Abdullahi Mohamed Salem,for their invaluable support during the field work. The authors would like to thank to Stuart Gill and an anonymous reviewer fortheir helpful suggestions which improved the manuscript.
ReferencesAllek, K., & Hamoudi, M. (2008). Regional-scale aeromagnetic survey of the south-west of Algeria: A tool for area selection for
diamond exploration. Journal of African Earth Sciences, 50, 6778.
462 A. Ciampalini et al.
Dow
nloa
ded
by [
Uni
vers
ita D
egli
Stud
i di F
iren
ze],
[A
ndre
a C
iam
palin
i] a
t 03:
27 2
5 A
ugus
t 201
4
Aydal, D., Arda, E., & Dumanlilar, O. (2007). Application of the Crosta technique for alteration mapping of granitoidic rocksusing ETM+ data: Case study from eastern Tauride belt (SE Turkey). International Journal of Remote Sensing, 28,3895–3913.
Baghdadi, N., Grandjean, G., Lahondere, D., Paillou, P., & Lasne, Y. (2005). Apport de l’imagerie satellitaire radar pourl’exploration geologique en zones arides. The contribution of radar satellite imagery to geological exploration in aridareas. C.R. Geoscience, 337, 719–728.
Barth, M.G., Rudnick, R.L, Carlson, R.W., Horn, I., & McDonough, W.F. (2002). Re_/Os and U_/Pb geochronological con-straints on the eclogite/tonalite connection in the Archean Man Shield, West Africa. Precambrian Research, 118, 267–283.
Ciampalini, A., Garfagnoli, F., Antonielli, B., Moretti, S., & Righini, G. (2012). Remote sensing techniques using LandsatETM+ applied to the detection of iron ore deposits in Western Africa. Arabian Journal of Geosciences, doi: 10.1007/s12517-012-0725-0.
Daneshfar, B., Desrochers, A., & Budkewitsch, P. (2006). Mineral-potential mapping for MVT deposits with limited data setsusing Landsat data and geological evidence in the Borden Basin, Northern Baffin Island, Nunavut, Canada. NaturalResources Research, 15, 129–149.
Dawelbait, M., & Morari, F. (2011). Limits and potentialities of studying dryland vegetation using the optical remote sensing.Italian Journal of Agronomy, 3, 97–106.
Dehnavi, A.G., Sarikhani, R., & Nagaraju, D. (2010). Image processing and analysis of mapping alteration zones in environ-mental research, East of Kurdistan, Iran. World Applied Sciences Journal, 11, 278–283.
Deller, M.E. (2006). Facies discrimination in laterites using Landsat Thematic Mapper, ASTER and ALI data - examples fromEritrea and Arabia. International Journal of Remote Sensing, 27, 2389–2409.
Destombes, J., Hollard, H., & Willefert, S. (1985). Lower Palaeozoic rocks of Morocco. In C.H. Holland (Ed.), LowerPalaeozoic of North-western and West Central Africa (pp. 91–336). New York: John Wiley.
Deynoux, M., Affato, P., Trompette, R., & Villeneuve, M. (2006). Pan-African tectonic evolution and glacial events registeredin Neoproterozoic to Cambrian cratonic and foreland basins of West Africa. Journal of African Earth Sciences, 46,397–426.
Dogan, H.M. (2008). Applications of remote sensing and Geographic Information Systems to assess ferrous minerals and ironoxide of Tokat province in Turkey. International Journal of Remote Sensing, 29, 221–233.
Dogan, H.M. (2009). Mineral composite assessment of Kelkit River Basin in Turkey by means of remote sensing. Journal ofEarth System Science, 118, 701–710.
Elsayed Zeinelabdein, K.A., & Albiely, A.I. (2008). Ratio image processing techniques: A prospecting tool for mineral deposits,Red Sea Hills, NE Sudan. The International Archives of the Photogrammetry, Remote Sensing and Spatial InformationSciences, 37(B8), 1295–1297.
Gad, S., & Kusky, T.M. (2006). Lithological mapping in the Eastern Desert of Egypt, the Barramiya area, using Landsat the-matic mapper (TM). Journal of African Earth Sciences, 44, 196–202.
Ghienne, J.F. (2003). Late Ordovician sedimentary environments, glacial cycles, and post-glacial transgression in the TaoudeniBasin, West Africa. Palaeogeography, Palaeoclimatology, Palaeoecology, 189, 117–145.
Guerrak, S. (1988a). Geology of Early Devonian oolitic iron-ore of the Gara Djebilet field, Sahara Platform, Algeria. OreGeology Reviews, 3, 333–358.
Guerrak, S. (1988b). Ordovician ironstone sedimentation in Ougarta Ranges: North Western Sahara (Algeria). Journal ofAfrican Earth Sciences, 7, 657–678.
Guerrak, S. (1991). Paleozoic patterns of oolitic ironstone sedimentation in the Sahara. Journal of African Earth Sciences, 12,31–39.
Gupta, R.P. (2003). Remote sensing geology. Berlin: Springer.Kaufmann, H. (1988). Mineral exploration along the Aqaba-Levant Structure by use of TM-data: Concepts, processing and
results. International Journal of Remote Sensing, 9, 1639–1658.Le Heron, D.P. (2007). Late Ordovician glacial record of the Anti-Atlas, Morocco. Sedimentary Geology, 201, 93–110.Loi, A., Ghienne, J.F., Dabard, M.P., Paris, F., Botquelen, A., Christ, N., & . . . Destombes, J. (2010). The Late Ordovician
glacio-eustatic record from a high-latitude storm-dominated shelf succession: The Bou Ingarf section (Anti-Atlas,Southern Morocco). Palaeogeography, Palaeoclimatology, Palaeoecology, 296, 332–358.
Loughlin, W.P. (1991). Principal component analysis for alteration mapping. Photogrammetric Engineering & Remote Sensing,57, 1163–1169.
Lubeseder, S., Redfern, J., & Boutib, L. (2009). Mixed siliciclastic-carbonate shelf sedimentation-Lower Devonian sequencesof the SW Anti-Atlas, Morocco. Sedimentary Geology, 215, 13–32.
Madani, A.A. (2009). Utilization of Landsat ETM+ data for mapping gossans and iron rich zones exposed at Bahrah area,Western Arabian Shield, Saudi Arabia. Journal of King Abdulaziz University: Earth Sciences, 20, 25–49.
Peucat, J.J., Capdevila, R., Drareni, A., Mahdjoub, Y., & Kahoui, M. (2005). The Eglab massif in the West African Craton(Algeria), an original segment of the Eburnean orogenic belt: Petrology, geochemistry and geochronology. PrecambrianResearch, 136, 309–352.
Qaid, A.M., & Basavarajappa, H.T. (2008). Application of optimum index factor technique to Landsat-7 data for geologicalmapping of North East of Hajjah, Yemen. American-Eurasian Journal of Scientific Research, 3, 84–91.
Rajesh, H.M. (2008). Mapping proterozoic unconformity-related uranium deposits in the Rockhole area, Northern Territory,Australia using Landsat ETM+. Ore Geology Reviews, 33, 382–396.
Ramadan, T.M., & Kotny, A. (2004). Mineralogical and structural characterization of alteration zones detected by orbital remotesensing at Shalatein District, SE Desert, Egypt. Journal of African Earth Sciences, 40, 89–99.
Journal of Maps 463
Dow
nloa
ded
by [
Uni
vers
ita D
egli
Stud
i di F
iren
ze],
[A
ndre
a C
iam
palin
i] a
t 03:
27 2
5 A
ugus
t 201
4
Rothery, D.A., & Hunt, G.A. (1990). A simple way to perform decorrelation stretching and related techniques on menu-drivenimage processing systems. International Journal of Remote Sensing, 11, 133–137.
Saadi, M., Hilali, E.A., Bensaıd, M., Boudda, A., & Dahmani, M. (1985). Carte Geologique du Maroc, echelle 1/1000000.Geological map of Morocco, scale 1:1000000. Edition du Service Geologique du Maroc, Notes et Memoires n8 260.
Sabins, F. (1999). Remote sensing for mineral exploration. Ore Geology Reviews, 14, 157–183.Schindler, E., & Wehrmann, A. (2010). Genesis and internal architecture of the Middle to Upper Devonian Gwirat Al Hyssan
reef-mound (Western Sahara). Palaeogeography, Palaeoclimatology, Palaeoecology, 304, 184–193.Shalaby, M.H., Bishta, A.Z., Roz, M.E., & Zalaky, M.A. (2010). Integration of geologic and remote sensing studies for the
discovery of uranium mineralization in some granite plutons, Eastern Desert, Egypt. Journal of King AbdulazizUniversity: Earth Sciences, 21, 1–25.
Siljestrom, P.A., Moreno, A., Vikgren, K., & Caceres, L.M. (1997). Technical note: The application of selective principal com-ponent analysis (SPCA) to Thematic Mapper (TM) image for the recognition of geomorphologic features configuration.International Journal of Remote Sensing, 18, 3843–3852.
Villeneuve, M. (2005). Paleozoic basins in West Africa and the Mauritanide thrust belt. Journal of African Earth Sciences, 43,166–195.
Wulder, M.A., White, J.C., Goward, S.N., Masek, J.G., Irons, J.R., Herold, M., & . . . Woodcock, C.E. (2008). Landsat conti-nuity: Issues and opportunities for land cover monitoring. Remote Sensing of Environment, 112, 955–969.
Zumsprekel, H., & Prinz, T. (2000). Computer-enhanced multispectral remote sensing data: A useful tool for the geologicalmapping of Archean terrains in (semi)arid environments. Computer & Geosciences, 26, 87–100.
464 A. Ciampalini et al.
Dow
nloa
ded
by [
Uni
vers
ita D
egli
Stud
i di F
iren
ze],
[A
ndre
a C
iam
palin
i] a
t 03:
27 2
5 A
ugus
t 201
4