Predicting Acute Ischaemic Stroke Outcome Using Clinical and Temporal Thresholds
9
International Scholarly Research Network ISRN Neurology Volume 2011, Article ID 354642, 9 pages doi:10.5402/2011/354642 Research Article Predicting Acute Ischaemic Stroke Outcome Using Clinical and Temporal Thresholds Denis Sablot, 1 Faouzi Belahsen, 2, 3 Fabrice Vuillier, 3 Jean-Franc ¸ois Cassarini, 1 Pierre Decavel, 3 Laurent Tatu, 3 Thierry Moulin, 3 and Elisabeth Medeiros de Bustos 3 1 Department of Neurology, Saint Jean Hospital, 20 Avenue du Languedoc, 66046 Perpignan Cedex, France 2 Department of Neurology, CHU Hassan II, Dhar Mehraz, Fes 30000, Morocco 3 Department of Neurology, CHU Besancon, 3 Boulevard Fleming, 25030 Besancon Cedex, France Correspondence should be addressed to Thierry Moulin, [email protected] Received 11 April 2011; Accepted 14 May 2011 Academic Editor: G. de Courten-Myers Copyright © 2011 Denis Sablot et al. This is an open access article distributed under the Creative Commons Attribution License, which permits unrestricted use, distribution, and reproduction in any medium, provided the original work is properly cited. Background. Few studies have analysed the natural course of cerebral ischaemia for predicting outcome. We aimed to determine the early clinical findings and the thresholds for deficit severity and symptom duration that make it possible to stratify outcome. Methods. We included 154 patients with transient ischaemic attack or ischaemic stroke. Stroke profiles and neurological status were assessed from onset to 24 hrs, on admission, at 48 hrs, and at discharge. Outcomes were evaluated using the modified Rankin Scale. Positive and negative predictive values were calculated for the different thresholds. The model was subsequently evaluated on a new prospective cohort of 157 patients. Results. Initial National Institute of Health Stroke Scale (NIHSS) score <5 and symptoms regressing within 135 min were predictive of good outcome. Initial NIHSS score >22 and symptom stability after 1,230 min were predictive of physical dependency or death. Conclusions. Low and high NIHSS cut-off points are effective positive predictive values for good and poor outcomes. Thresholds for symptom duration are less conclusive. 1. Introduction The majority of studies on the prehospitalisation phase of cerebral ischaemia (ischaemic stroke [IS] and transient ischaemic attack [TIA]) have largely been conducted by emergency medical personnel [1–3] and have primarily focused on technical considerations, general practitioners’ (GP) knowledge of cerebrovascular events, the time lapses before medical care is sought, and the measures needed to shorten these delays. However, the dynamic nature of cerebral ischaemia has been emphasised [4], and the process—in terms of time and space—involved in the transition from reversible ischaemia to irreversible infarction is not a uniform one. This may explain the extremely variable outcomes for any given trunk occlusion, including the “spectacular shrinking deficit” described by Kraemer et al. [5]. Evidence suggests that management of IS patients is not always adapted to individual pathophysiological states and that the natural course of IS needs to be assessed with an array of simple and available tests. Rapid assessment is all the more crucial given that thrombolytic treatment is highly time dependent (<3 hours after symptom onset). Although the management of cerebral ischaemia is considerably helped by neuroimaging techniques such as diffusion-perfusion MR imaging (DWI- PWI), these techniques cannot replace clinical findings such as symptom intensity and duration. Identifying the initial course and thresholds may constitute a predictive diagnostic tool and lead to better acute management of stroke. Indeed placebo group analyses from pivot studies have demon- strated a good reliability between baseline National Institutes of Health Stroke Scale (NIHSS) scores on admission and functional outcome or hospital disposition after stroke [6– 8]. To our knowledge, only one recent study has specifically analysed the natural course of cerebral ischaemia to predict outcome [9]. The aims of this study were firstly to determine the early clinical findings that are predictive of outcome in acute stoke, and secondly, to establish the thresholds for deficit severity and symptom duration that make it possible to stratify outcome.
-
Upload
independent -
Category
Documents
-
view
0 -
download
0
Transcript of Predicting Acute Ischaemic Stroke Outcome Using Clinical and Temporal Thresholds
International Scholarly Research NetworkISRN NeurologyVolume 2011, Article ID 354642, 9 pagesdoi:10.5402/2011/354642
Research Article
Predicting Acute Ischaemic Stroke Outcome Using Clinical andTemporal Thresholds
Denis Sablot,1 Faouzi Belahsen,2, 3 Fabrice Vuillier,3 Jean-Francois Cassarini,1
Pierre Decavel,3 Laurent Tatu,3 Thierry Moulin,3 and Elisabeth Medeiros de Bustos3
1 Department of Neurology, Saint Jean Hospital, 20 Avenue du Languedoc, 66046 Perpignan Cedex, France2 Department of Neurology, CHU Hassan II, Dhar Mehraz, Fes 30000, Morocco3 Department of Neurology, CHU Besancon, 3 Boulevard Fleming, 25030 Besancon Cedex, France
Correspondence should be addressed to Thierry Moulin, [email protected]
Received 11 April 2011; Accepted 14 May 2011
Academic Editor: G. de Courten-Myers
Copyright © 2011 Denis Sablot et al. This is an open access article distributed under the Creative Commons Attribution License,which permits unrestricted use, distribution, and reproduction in any medium, provided the original work is properly cited.
Background. Few studies have analysed the natural course of cerebral ischaemia for predicting outcome. We aimed to determinethe early clinical findings and the thresholds for deficit severity and symptom duration that make it possible to stratify outcome.Methods. We included 154 patients with transient ischaemic attack or ischaemic stroke. Stroke profiles and neurological statuswere assessed from onset to 24 hrs, on admission, at 48 hrs, and at discharge. Outcomes were evaluated using the modified RankinScale. Positive and negative predictive values were calculated for the different thresholds. The model was subsequently evaluated ona new prospective cohort of 157 patients. Results. Initial National Institute of Health Stroke Scale (NIHSS) score <5 and symptomsregressing within 135 min were predictive of good outcome. Initial NIHSS score >22 and symptom stability after 1,230 min werepredictive of physical dependency or death. Conclusions. Low and high NIHSS cut-off points are effective positive predictive valuesfor good and poor outcomes. Thresholds for symptom duration are less conclusive.
1. Introduction
The majority of studies on the prehospitalisation phaseof cerebral ischaemia (ischaemic stroke [IS] and transientischaemic attack [TIA]) have largely been conducted byemergency medical personnel [1–3] and have primarilyfocused on technical considerations, general practitioners’(GP) knowledge of cerebrovascular events, the time lapsesbefore medical care is sought, and the measures needed toshorten these delays.
However, the dynamic nature of cerebral ischaemiahas been emphasised [4], and the process—in terms oftime and space—involved in the transition from reversibleischaemia to irreversible infarction is not a uniform one.This may explain the extremely variable outcomes for anygiven trunk occlusion, including the “spectacular shrinkingdeficit” described by Kraemer et al. [5]. Evidence suggeststhat management of IS patients is not always adapted toindividual pathophysiological states and that the naturalcourse of IS needs to be assessed with an array of simple andavailable tests. Rapid assessment is all the more crucial given
that thrombolytic treatment is highly time dependent (<3hours after symptom onset). Although the management ofcerebral ischaemia is considerably helped by neuroimagingtechniques such as diffusion-perfusion MR imaging (DWI-PWI), these techniques cannot replace clinical findings suchas symptom intensity and duration. Identifying the initialcourse and thresholds may constitute a predictive diagnostictool and lead to better acute management of stroke. Indeedplacebo group analyses from pivot studies have demon-strated a good reliability between baseline National Institutesof Health Stroke Scale (NIHSS) scores on admission andfunctional outcome or hospital disposition after stroke [6–8]. To our knowledge, only one recent study has specificallyanalysed the natural course of cerebral ischaemia to predictoutcome [9].
The aims of this study were firstly to determine the earlyclinical findings that are predictive of outcome in acute stoke,and secondly, to establish the thresholds for deficit severityand symptom duration that make it possible to stratifyoutcome.
2 ISRN Neurology
2. Patients and Methods
2.1. Study Population. The study had a prospective, observa-tional cohort design. From September 2000 to March 2001,patients admitted to Besancon University Hospital within24 hours of symptom onset with clinical and neuroimagingpatterns of IS or TIA were screened for inclusion in thestudy (n = 361). We selected arterial ischaemia and excludedcerebral venous thrombosis and intracerebral haematoma orpatients who had previously had a stroke and were dependent(corresponding to a modified Rankin Scale (mRS) scoreof 3). Patients were excluded as follows: 98 were admittedwithout consulting a GP, 27 had intraparenchymatoushaematoma, 4 had cerebral venous thrombosis, 24 IS patientswere admitted >24 hours after symptom onset and two werereceiving thrombolytic therapy. Among the 206 IS patientsadmitted within <24 hours, 52 were excluded when theprecise course of their symptoms could not be obtained(n = 32), because the GP could not be contacted or couldnot establish relevant and detailed clinical patterns (n = 18),or when the patient showed symptoms of events similarto IS (epilepsy, migraine) which could cast doubt on theirdiagnosis (2 cases). The remaining 154 eligible patients wereassessed according to the Besancon Stroke Registry criteria,reported in greater detail elsewhere [10]. TIA was definedaccording to a symptom duration of <24 hours (pre-2004definition) [11]. For the purposes of this study, posterior andanterior circulation strokes were not differentiated, and sideof deficit was not specified.
2.2. Scoring and Questionnaire. Two scores were used toassess prehospitalisation clinical status. The first, termedthe “Neurological Dysfunction Score” (NDS), reflected thepatient’s and/or his/her family’s evaluation of the symp-toms and their variation prior to assessment on admission(Table 3). This initial NDS, termed “NDS-0,” defined theinitial onset time of the symptoms. The second score wasthe NIHSS retrospectively estimated by the GP, termed“NIHSS-GP.” For patients who had been referred by a GP,NIHSS-GP was performed as soon as possible (up to 12hours) after admission by a phone interview with the GPusing a standard procedure. Upon admission, the in-hospitalclinical examination was carried out to establish a new NDS(NDS-1) and an admission NIHSS (NIHSS-1). In order tomonitor stroke course and to estimate the maximal durationof symptoms within 24 hours, a further examination tookplace every 8 hours during the first day of hospitalisation(NIHSS-1a, NIHSS-1b), 24 hours after admission (NIHSS-2), and finally at discharge (NIHSS-3). The latter score wasassociated with the mRS. These neurological examinationswere all performed by neurologists with NIHSS certification.
The NDS was used to assess the variation of the deficitbefore admission, to identify the degree of variance in thecourse of IS, and to ensure relevance and agreement inscore evolution (NIHSS and NDS). Several NIHSS itemswere unknown or insufficiently assessed by the GP. Thiswas most frequent for the following items: dysarthria (21patients), neglect (11 patients), visual loss (9 patients), andataxia (8 patients). For these items, the NIHSS-GP item
was considered to have the same value as the correspondingNIHSS-1 item if the NDS was stable during the same period.This score was disregarded if the NDS was unstable duringthe same period.
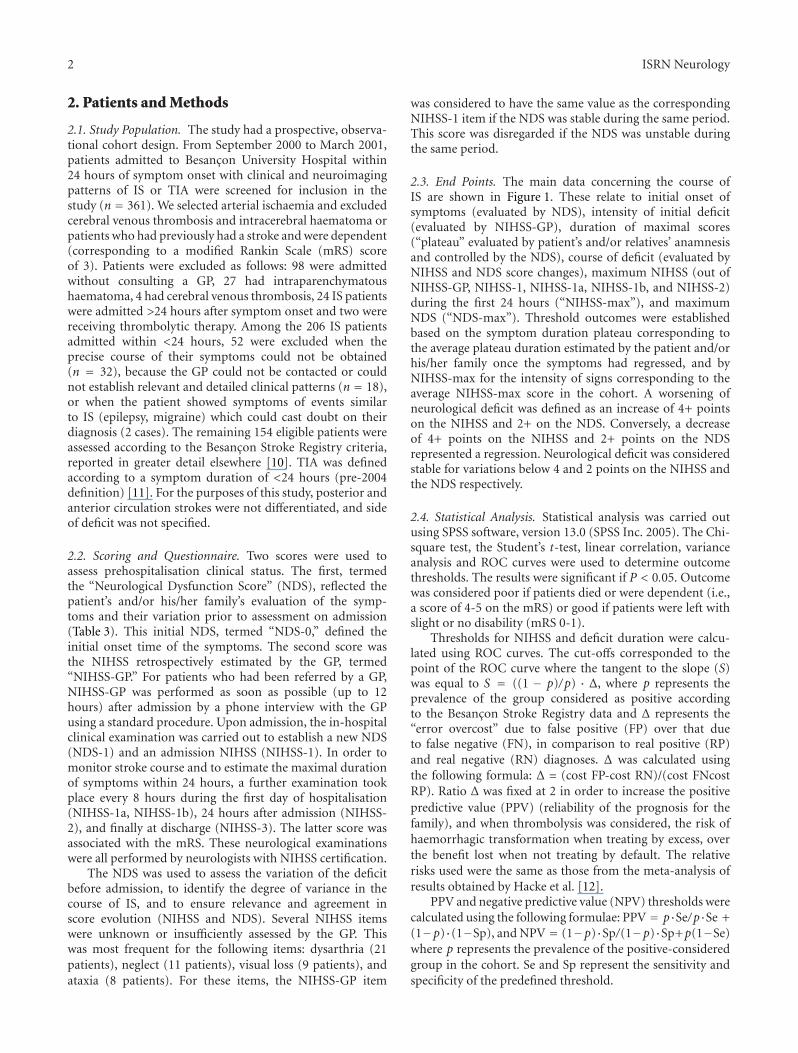
2.3. End Points. The main data concerning the course ofIS are shown in Figure 1. These relate to initial onset ofsymptoms (evaluated by NDS), intensity of initial deficit(evaluated by NIHSS-GP), duration of maximal scores(“plateau” evaluated by patient’s and/or relatives’ anamnesisand controlled by the NDS), course of deficit (evaluated byNIHSS and NDS score changes), maximum NIHSS (out ofNIHSS-GP, NIHSS-1, NIHSS-1a, NIHSS-1b, and NIHSS-2)during the first 24 hours (“NIHSS-max”), and maximumNDS (“NDS-max”). Threshold outcomes were establishedbased on the symptom duration plateau corresponding tothe average plateau duration estimated by the patient and/orhis/her family once the symptoms had regressed, and byNIHSS-max for the intensity of signs corresponding to theaverage NIHSS-max score in the cohort. A worsening ofneurological deficit was defined as an increase of 4+ pointson the NIHSS and 2+ on the NDS. Conversely, a decreaseof 4+ points on the NIHSS and 2+ points on the NDSrepresented a regression. Neurological deficit was consideredstable for variations below 4 and 2 points on the NIHSS andthe NDS respectively.
2.4. Statistical Analysis. Statistical analysis was carried outusing SPSS software, version 13.0 (SPSS Inc. 2005). The Chi-square test, the Student’s t-test, linear correlation, varianceanalysis and ROC curves were used to determine outcomethresholds. The results were significant if P < 0.05. Outcomewas considered poor if patients died or were dependent (i.e.,a score of 4-5 on the mRS) or good if patients were left withslight or no disability (mRS 0-1).
Thresholds for NIHSS and deficit duration were calcu-lated using ROC curves. The cut-offs corresponded to thepoint of the ROC curve where the tangent to the slope (S)was equal to S = ((1 − p)/p) · Δ, where p represents theprevalence of the group considered as positive accordingto the Besancon Stroke Registry data and Δ represents the“error overcost” due to false positive (FP) over that dueto false negative (FN), in comparison to real positive (RP)and real negative (RN) diagnoses. Δ was calculated usingthe following formula: Δ = (cost FP-cost RN)/(cost FNcostRP). Ratio Δ was fixed at 2 in order to increase the positivepredictive value (PPV) (reliability of the prognosis for thefamily), and when thrombolysis was considered, the risk ofhaemorrhagic transformation when treating by excess, overthe benefit lost when not treating by default. The relativerisks used were the same as those from the meta-analysis ofresults obtained by Hacke et al. [12].
PPV and negative predictive value (NPV) thresholds werecalculated using the following formulae: PPV = p·Se/p·Se +(1−p)·(1−Sp), and NPV = (1−p)·Sp/(1−p)·Sp+p(1−Se)where p represents the prevalence of the positive-consideredgroup in the cohort. Se and Sp represent the sensitivity andspecificity of the predefined threshold.
ISRN Neurology 3
Intensity ofinitialdeficit(NIHSSmaximum)
“Plateau” duration of maximum scores
Time (minutes)
Quality ofcourse of
deficit
Initialsymptomonset
NIHSS-1NDS-1
NIHSS-2NDS-2
NIHSSNDS
Hospitalisation Discharge
NIHSS-3mRankin score
0
NIHSS-GPNDS-0
Prehospitalisation
Figure 1: Analysis of IS course data.
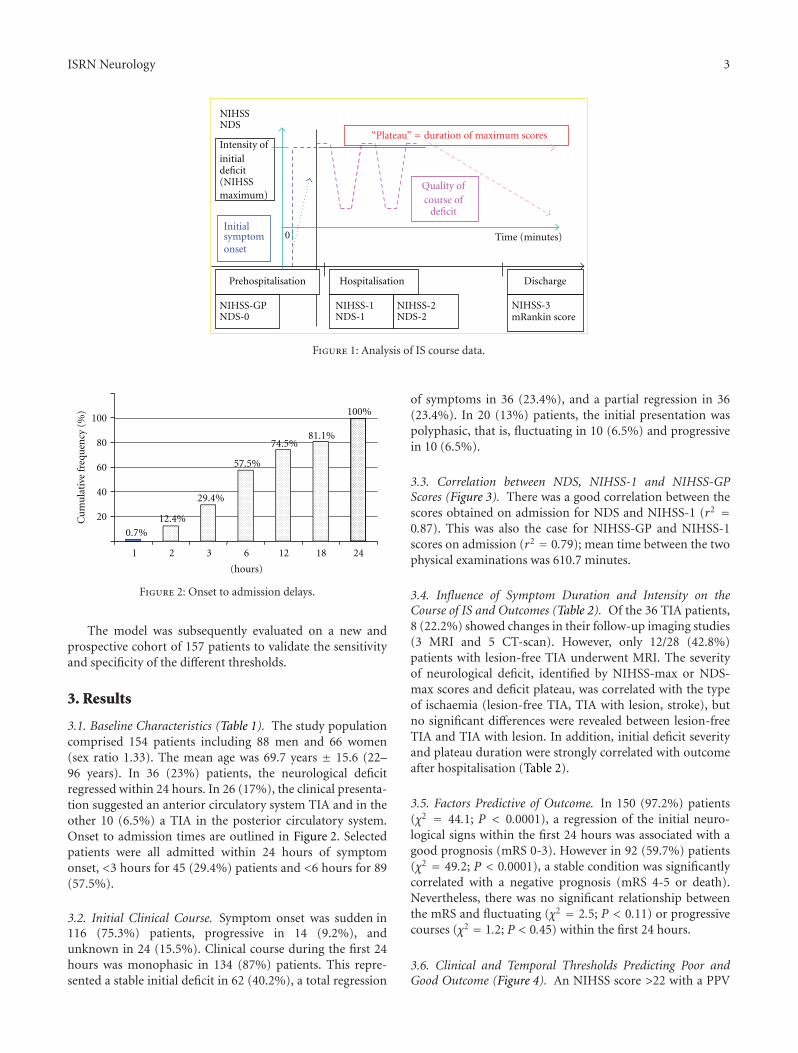
0.7%12.4%
29.4%
57.5%
74.5%81.1%
20
40
60
80
100
1 2 3 6 12 18 24
(hours)
100%
Cu
mu
lati
vefr
equ
ency
(%)
Figure 2: Onset to admission delays.
The model was subsequently evaluated on a new andprospective cohort of 157 patients to validate the sensitivityand specificity of the different thresholds.
3. Results
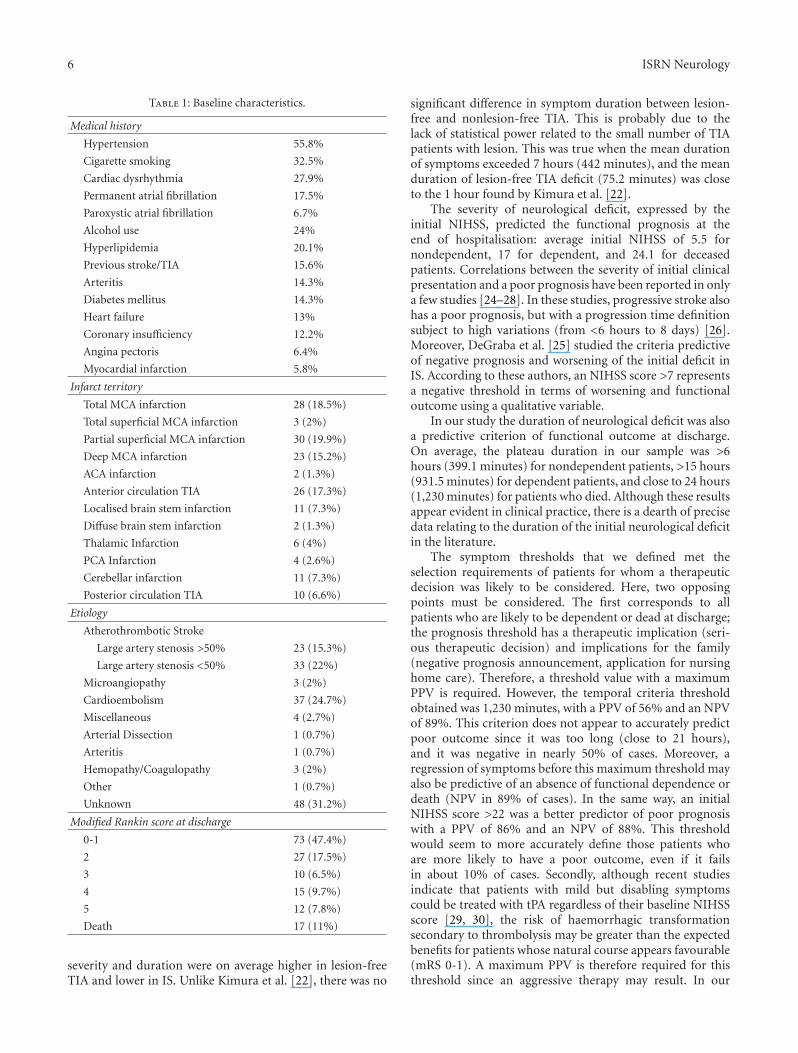
3.1. Baseline Characteristics (Table 1). The study populationcomprised 154 patients including 88 men and 66 women(sex ratio 1.33). The mean age was 69.7 years ± 15.6 (22–96 years). In 36 (23%) patients, the neurological deficitregressed within 24 hours. In 26 (17%), the clinical presenta-tion suggested an anterior circulatory system TIA and in theother 10 (6.5%) a TIA in the posterior circulatory system.Onset to admission times are outlined in Figure 2. Selectedpatients were all admitted within 24 hours of symptomonset, <3 hours for 45 (29.4%) patients and <6 hours for 89(57.5%).
3.2. Initial Clinical Course. Symptom onset was sudden in116 (75.3%) patients, progressive in 14 (9.2%), andunknown in 24 (15.5%). Clinical course during the first 24hours was monophasic in 134 (87%) patients. This repre-sented a stable initial deficit in 62 (40.2%), a total regression
of symptoms in 36 (23.4%), and a partial regression in 36(23.4%). In 20 (13%) patients, the initial presentation waspolyphasic, that is, fluctuating in 10 (6.5%) and progressivein 10 (6.5%).
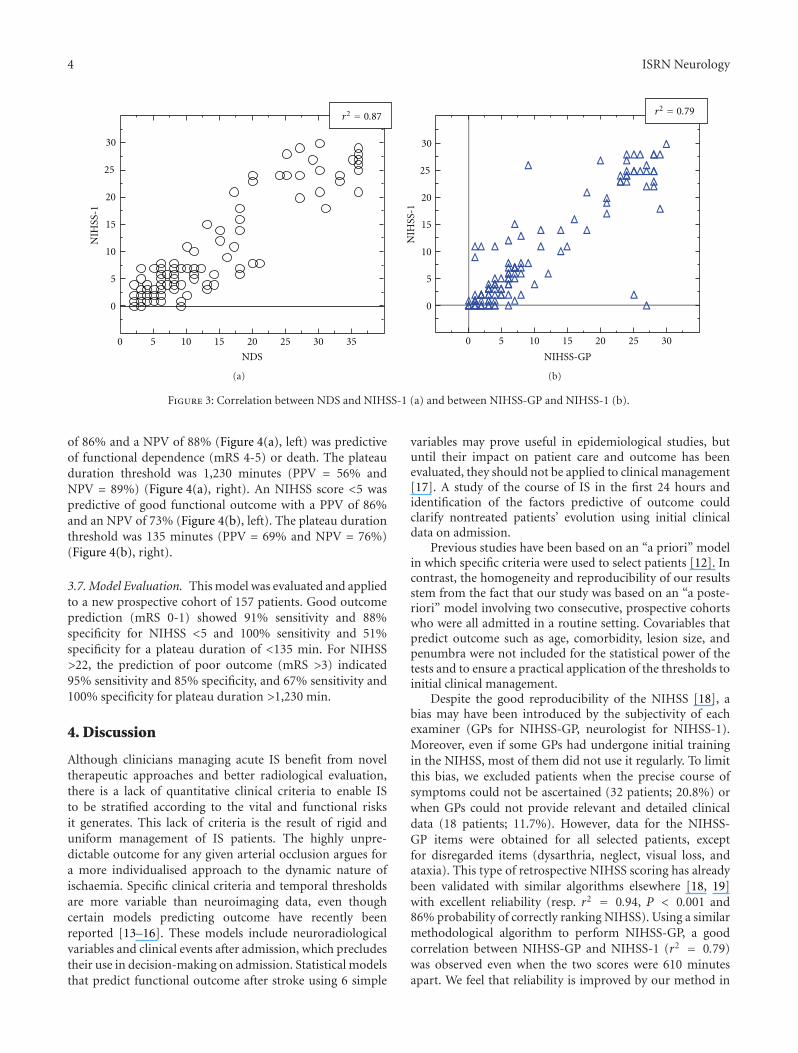
3.3. Correlation between NDS, NIHSS-1 and NIHSS-GPScores (Figure 3). There was a good correlation between thescores obtained on admission for NDS and NIHSS-1 (r2 =0.87). This was also the case for NIHSS-GP and NIHSS-1scores on admission (r2 = 0.79); mean time between the twophysical examinations was 610.7 minutes.
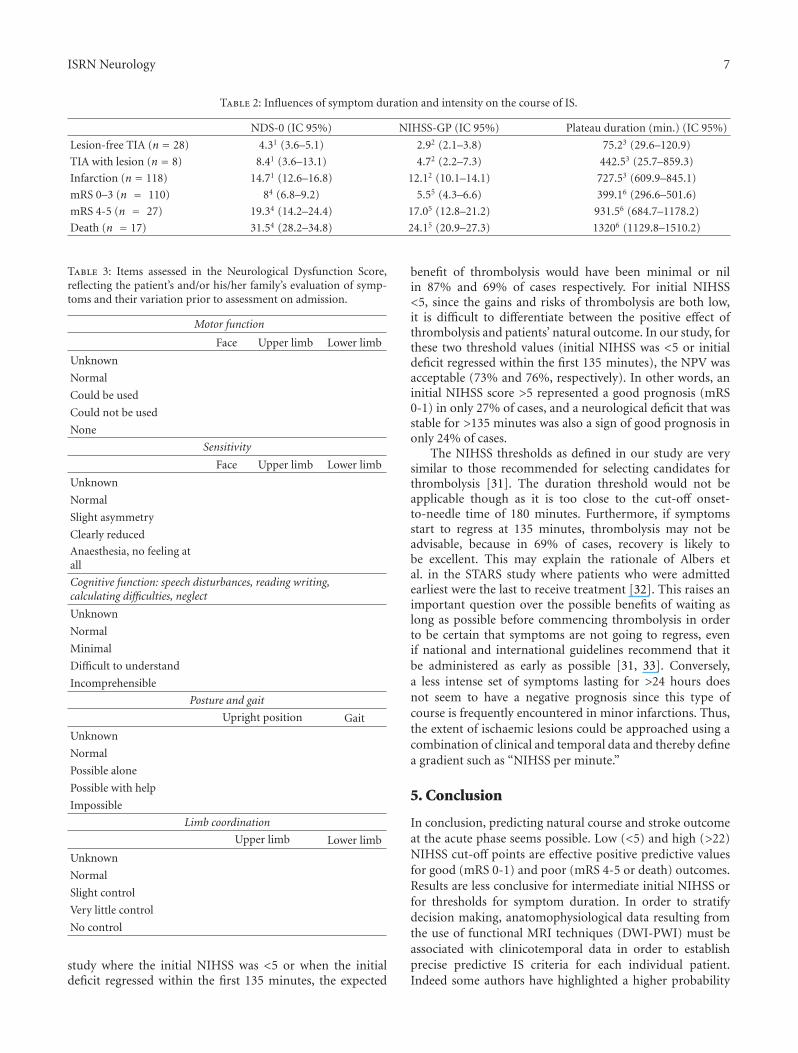
3.4. Influence of Symptom Duration and Intensity on theCourse of IS and Outcomes (Table 2). Of the 36 TIA patients,8 (22.2%) showed changes in their follow-up imaging studies(3 MRI and 5 CT-scan). However, only 12/28 (42.8%)patients with lesion-free TIA underwent MRI. The severityof neurological deficit, identified by NIHSS-max or NDS-max scores and deficit plateau, was correlated with the typeof ischaemia (lesion-free TIA, TIA with lesion, stroke), butno significant differences were revealed between lesion-freeTIA and TIA with lesion. In addition, initial deficit severityand plateau duration were strongly correlated with outcomeafter hospitalisation (Table 2).
3.5. Factors Predictive of Outcome. In 150 (97.2%) patients(χ2 = 44.1; P < 0.0001), a regression of the initial neuro-logical signs within the first 24 hours was associated with agood prognosis (mRS 0-3). However in 92 (59.7%) patients(χ2 = 49.2; P < 0.0001), a stable condition was significantlycorrelated with a negative prognosis (mRS 4-5 or death).Nevertheless, there was no significant relationship betweenthe mRS and fluctuating (χ2 = 2.5; P < 0.11) or progressivecourses (χ2 = 1.2; P < 0.45) within the first 24 hours.
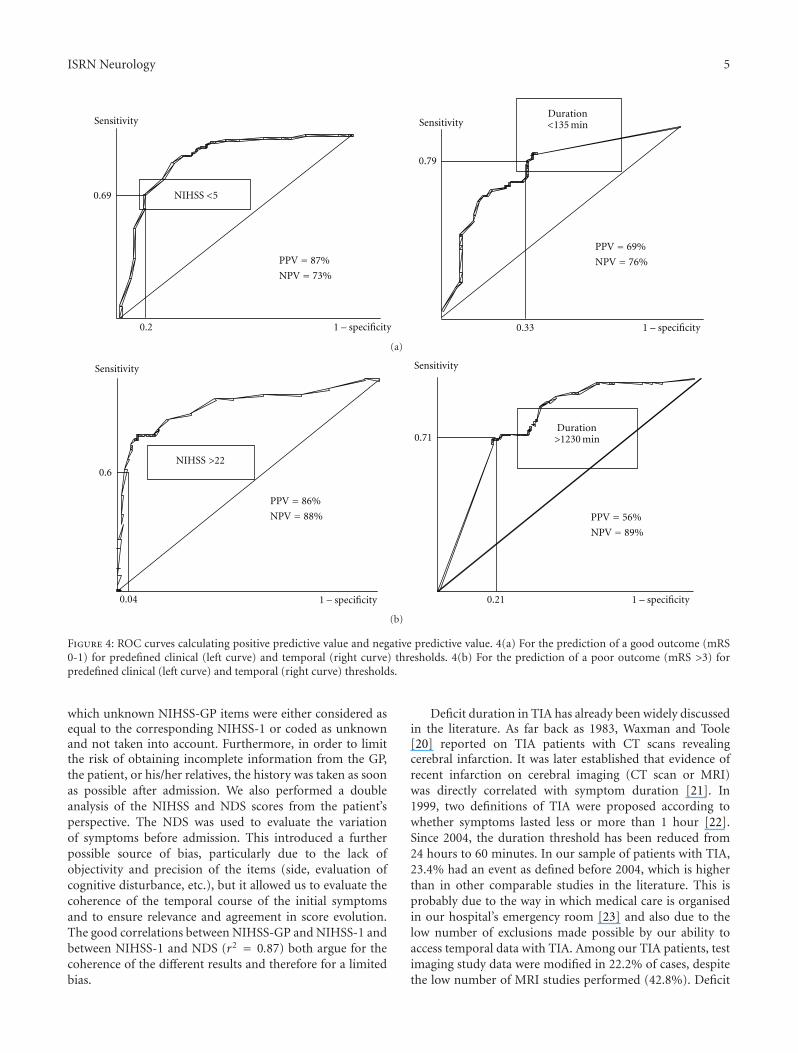
3.6. Clinical and Temporal Thresholds Predicting Poor andGood Outcome (Figure 4). An NIHSS score >22 with a PPV
4 ISRN Neurology
0 5 10 15 20 25 30 35
0
5
10
15
20
25
30
r2 0.87
NDS
NIH
SS-1
(a)
NIHSS-GP
0 5 10 15 20 25 30
0
5
10
15
20
25
30
r2 0.79
NIH
SS-1
(b)
Figure 3: Correlation between NDS and NIHSS-1 (a) and between NIHSS-GP and NIHSS-1 (b).
of 86% and a NPV of 88% (Figure 4(a), left) was predictiveof functional dependence (mRS 4-5) or death. The plateauduration threshold was 1,230 minutes (PPV = 56% andNPV = 89%) (Figure 4(a), right). An NIHSS score <5 waspredictive of good functional outcome with a PPV of 86%and an NPV of 73% (Figure 4(b), left). The plateau durationthreshold was 135 minutes (PPV = 69% and NPV = 76%)(Figure 4(b), right).
3.7. Model Evaluation. This model was evaluated and appliedto a new prospective cohort of 157 patients. Good outcomeprediction (mRS 0-1) showed 91% sensitivity and 88%specificity for NIHSS <5 and 100% sensitivity and 51%specificity for a plateau duration of <135 min. For NIHSS>22, the prediction of poor outcome (mRS >3) indicated95% sensitivity and 85% specificity, and 67% sensitivity and100% specificity for plateau duration >1,230 min.
4. Discussion
Although clinicians managing acute IS benefit from noveltherapeutic approaches and better radiological evaluation,there is a lack of quantitative clinical criteria to enable ISto be stratified according to the vital and functional risksit generates. This lack of criteria is the result of rigid anduniform management of IS patients. The highly unpre-dictable outcome for any given arterial occlusion argues fora more individualised approach to the dynamic nature ofischaemia. Specific clinical criteria and temporal thresholdsare more variable than neuroimaging data, even thoughcertain models predicting outcome have recently beenreported [13–16]. These models include neuroradiologicalvariables and clinical events after admission, which precludestheir use in decision-making on admission. Statistical modelsthat predict functional outcome after stroke using 6 simple
variables may prove useful in epidemiological studies, butuntil their impact on patient care and outcome has beenevaluated, they should not be applied to clinical management[17]. A study of the course of IS in the first 24 hours andidentification of the factors predictive of outcome couldclarify nontreated patients’ evolution using initial clinicaldata on admission.
Previous studies have been based on an “a priori” modelin which specific criteria were used to select patients [12]. Incontrast, the homogeneity and reproducibility of our resultsstem from the fact that our study was based on an “a poste-riori” model involving two consecutive, prospective cohortswho were all admitted in a routine setting. Covariables thatpredict outcome such as age, comorbidity, lesion size, andpenumbra were not included for the statistical power of thetests and to ensure a practical application of the thresholds toinitial clinical management.
Despite the good reproducibility of the NIHSS [18], abias may have been introduced by the subjectivity of eachexaminer (GPs for NIHSS-GP, neurologist for NIHSS-1).Moreover, even if some GPs had undergone initial trainingin the NIHSS, most of them did not use it regularly. To limitthis bias, we excluded patients when the precise course ofsymptoms could not be ascertained (32 patients; 20.8%) orwhen GPs could not provide relevant and detailed clinicaldata (18 patients; 11.7%). However, data for the NIHSS-GP items were obtained for all selected patients, exceptfor disregarded items (dysarthria, neglect, visual loss, andataxia). This type of retrospective NIHSS scoring has alreadybeen validated with similar algorithms elsewhere [18, 19]with excellent reliability (resp. r2 = 0.94, P < 0.001 and86% probability of correctly ranking NIHSS). Using a similarmethodological algorithm to perform NIHSS-GP, a goodcorrelation between NIHSS-GP and NIHSS-1 (r2 = 0.79)was observed even when the two scores were 610 minutesapart. We feel that reliability is improved by our method in
ISRN Neurology 5
Sensitivity
0.2
0.69
PPV 87%
NPV 73%
NIHSS <5
1 – specificity
Sensitivity
0.33
0.79
PPV 69%
NPV 76%
Duration<135 min
1 – specificity
(a)
0.6
0.04
PPV 86%
NPV 88%
Sensitivity
NIHSS >22
1 – specificity 0.21
0.71
PPV 56%
NPV 89%
Sensitivity
Duration>1230 min
1 – specificity
(b)
Figure 4: ROC curves calculating positive predictive value and negative predictive value. 4(a) For the prediction of a good outcome (mRS0-1) for predefined clinical (left curve) and temporal (right curve) thresholds. 4(b) For the prediction of a poor outcome (mRS >3) forpredefined clinical (left curve) and temporal (right curve) thresholds.
which unknown NIHSS-GP items were either considered asequal to the corresponding NIHSS-1 or coded as unknownand not taken into account. Furthermore, in order to limitthe risk of obtaining incomplete information from the GP,the patient, or his/her relatives, the history was taken as soonas possible after admission. We also performed a doubleanalysis of the NIHSS and NDS scores from the patient’sperspective. The NDS was used to evaluate the variationof symptoms before admission. This introduced a furtherpossible source of bias, particularly due to the lack ofobjectivity and precision of the items (side, evaluation ofcognitive disturbance, etc.), but it allowed us to evaluate thecoherence of the temporal course of the initial symptomsand to ensure relevance and agreement in score evolution.The good correlations between NIHSS-GP and NIHSS-1 andbetween NIHSS-1 and NDS (r2 = 0.87) both argue for thecoherence of the different results and therefore for a limitedbias.
Deficit duration in TIA has already been widely discussedin the literature. As far back as 1983, Waxman and Toole[20] reported on TIA patients with CT scans revealingcerebral infarction. It was later established that evidence ofrecent infarction on cerebral imaging (CT scan or MRI)was directly correlated with symptom duration [21]. In1999, two definitions of TIA were proposed according towhether symptoms lasted less or more than 1 hour [22].Since 2004, the duration threshold has been reduced from24 hours to 60 minutes. In our sample of patients with TIA,23.4% had an event as defined before 2004, which is higherthan in other comparable studies in the literature. This isprobably due to the way in which medical care is organisedin our hospital’s emergency room [23] and also due to thelow number of exclusions made possible by our ability toaccess temporal data with TIA. Among our TIA patients, testimaging study data were modified in 22.2% of cases, despitethe low number of MRI studies performed (42.8%). Deficit
6 ISRN Neurology
Table 1: Baseline characteristics.
Medical history
Hypertension 55.8%
Cigarette smoking 32.5%
Cardiac dysrhythmia 27.9%
Permanent atrial fibrillation 17.5%
Paroxystic atrial fibrillation 6.7%
Alcohol use 24%
Hyperlipidemia 20.1%
Previous stroke/TIA 15.6%
Arteritis 14.3%
Diabetes mellitus 14.3%
Heart failure 13%
Coronary insufficiency 12.2%
Angina pectoris 6.4%
Myocardial infarction 5.8%
Infarct territory
Total MCA infarction 28 (18.5%)
Total superficial MCA infarction 3 (2%)
Partial superficial MCA infarction 30 (19.9%)
Deep MCA infarction 23 (15.2%)
ACA infarction 2 (1.3%)
Anterior circulation TIA 26 (17.3%)
Localised brain stem infarction 11 (7.3%)
Diffuse brain stem infarction 2 (1.3%)
Thalamic Infarction 6 (4%)
PCA Infarction 4 (2.6%)
Cerebellar infarction 11 (7.3%)
Posterior circulation TIA 10 (6.6%)
Etiology
Atherothrombotic Stroke
Large artery stenosis >50% 23 (15.3%)
Large artery stenosis <50% 33 (22%)
Microangiopathy 3 (2%)
Cardioembolism 37 (24.7%)
Miscellaneous 4 (2.7%)
Arterial Dissection 1 (0.7%)
Arteritis 1 (0.7%)
Hemopathy/Coagulopathy 3 (2%)
Other 1 (0.7%)
Unknown 48 (31.2%)
Modified Rankin score at discharge
0-1 73 (47.4%)
2 27 (17.5%)
3 10 (6.5%)
4 15 (9.7%)
5 12 (7.8%)
Death 17 (11%)
severity and duration were on average higher in lesion-freeTIA and lower in IS. Unlike Kimura et al. [22], there was no
significant difference in symptom duration between lesion-free and nonlesion-free TIA. This is probably due to thelack of statistical power related to the small number of TIApatients with lesion. This was true when the mean durationof symptoms exceeded 7 hours (442 minutes), and the meanduration of lesion-free TIA deficit (75.2 minutes) was closeto the 1 hour found by Kimura et al. [22].
The severity of neurological deficit, expressed by theinitial NIHSS, predicted the functional prognosis at theend of hospitalisation: average initial NIHSS of 5.5 fornondependent, 17 for dependent, and 24.1 for deceasedpatients. Correlations between the severity of initial clinicalpresentation and a poor prognosis have been reported in onlya few studies [24–28]. In these studies, progressive stroke alsohas a poor prognosis, but with a progression time definitionsubject to high variations (from <6 hours to 8 days) [26].Moreover, DeGraba et al. [25] studied the criteria predictiveof negative prognosis and worsening of the initial deficit inIS. According to these authors, an NIHSS score >7 representsa negative threshold in terms of worsening and functionaloutcome using a qualitative variable.
In our study the duration of neurological deficit was alsoa predictive criterion of functional outcome at discharge.On average, the plateau duration in our sample was >6hours (399.1 minutes) for nondependent patients, >15 hours(931.5 minutes) for dependent patients, and close to 24 hours(1,230 minutes) for patients who died. Although these resultsappear evident in clinical practice, there is a dearth of precisedata relating to the duration of the initial neurological deficitin the literature.
The symptom thresholds that we defined met theselection requirements of patients for whom a therapeuticdecision was likely to be considered. Here, two opposingpoints must be considered. The first corresponds to allpatients who are likely to be dependent or dead at discharge;the prognosis threshold has a therapeutic implication (seri-ous therapeutic decision) and implications for the family(negative prognosis announcement, application for nursinghome care). Therefore, a threshold value with a maximumPPV is required. However, the temporal criteria thresholdobtained was 1,230 minutes, with a PPV of 56% and an NPVof 89%. This criterion does not appear to accurately predictpoor outcome since it was too long (close to 21 hours),and it was negative in nearly 50% of cases. Moreover, aregression of symptoms before this maximum threshold mayalso be predictive of an absence of functional dependence ordeath (NPV in 89% of cases). In the same way, an initialNIHSS score >22 was a better predictor of poor prognosiswith a PPV of 86% and an NPV of 88%. This thresholdwould seem to more accurately define those patients whoare more likely to have a poor outcome, even if it failsin about 10% of cases. Secondly, although recent studiesindicate that patients with mild but disabling symptomscould be treated with tPA regardless of their baseline NIHSSscore [29, 30], the risk of haemorrhagic transformationsecondary to thrombolysis may be greater than the expectedbenefits for patients whose natural course appears favourable(mRS 0-1). A maximum PPV is therefore required for thisthreshold since an aggressive therapy may result. In our
ISRN Neurology 7
Table 2: Influences of symptom duration and intensity on the course of IS.
NDS-0 (IC 95%) NIHSS-GP (IC 95%) Plateau duration (min.) (IC 95%)
Lesion-free TIA (n = 28) 4.31 (3.6–5.1) 2.92 (2.1–3.8) 75.23 (29.6–120.9)
TIA with lesion (n = 8) 8.41 (3.6–13.1) 4.72 (2.2–7.3) 442.53 (25.7–859.3)
Infarction (n = 118) 14.71 (12.6–16.8) 12.12 (10.1–14.1) 727.53 (609.9–845.1)
mRS 0–3 (n = 110) 84 (6.8–9.2) 5.55 (4.3–6.6) 399.16 (296.6–501.6)
mRS 4-5 (n = 27) 19.34 (14.2–24.4) 17.05 (12.8–21.2) 931.56 (684.7–1178.2)
Death (n = 17) 31.54 (28.2–34.8) 24.15 (20.9–27.3) 13206 (1129.8–1510.2)
Table 3: Items assessed in the Neurological Dysfunction Score,reflecting the patient’s and/or his/her family’s evaluation of symp-toms and their variation prior to assessment on admission.
Motor function
Face Upper limb Lower limb
Unknown
Normal
Could be used
Could not be used
None
Sensitivity
Face Upper limb Lower limb
Unknown
Normal
Slight asymmetry
Clearly reduced
Anaesthesia, no feeling atall
Cognitive function: speech disturbances, reading writing,calculating difficulties, neglect
Unknown
Normal
Minimal
Difficult to understand
Incomprehensible
Posture and gait
Upright position Gait
Unknown
Normal
Possible alone
Possible with help
Impossible
Limb coordination
Upper limb Lower limb
Unknown
Normal
Slight control
Very little control
No control
study where the initial NIHSS was <5 or when the initialdeficit regressed within the first 135 minutes, the expected
benefit of thrombolysis would have been minimal or nilin 87% and 69% of cases respectively. For initial NIHSS<5, since the gains and risks of thrombolysis are both low,it is difficult to differentiate between the positive effect ofthrombolysis and patients’ natural outcome. In our study, forthese two threshold values (initial NIHSS was <5 or initialdeficit regressed within the first 135 minutes), the NPV wasacceptable (73% and 76%, respectively). In other words, aninitial NIHSS score >5 represented a good prognosis (mRS0-1) in only 27% of cases, and a neurological deficit that wasstable for >135 minutes was also a sign of good prognosis inonly 24% of cases.
The NIHSS thresholds as defined in our study are verysimilar to those recommended for selecting candidates forthrombolysis [31]. The duration threshold would not beapplicable though as it is too close to the cut-off onset-to-needle time of 180 minutes. Furthermore, if symptomsstart to regress at 135 minutes, thrombolysis may not beadvisable, because in 69% of cases, recovery is likely tobe excellent. This may explain the rationale of Albers etal. in the STARS study where patients who were admittedearliest were the last to receive treatment [32]. This raises animportant question over the possible benefits of waiting aslong as possible before commencing thrombolysis in orderto be certain that symptoms are not going to regress, evenif national and international guidelines recommend that itbe administered as early as possible [31, 33]. Conversely,a less intense set of symptoms lasting for >24 hours doesnot seem to have a negative prognosis since this type ofcourse is frequently encountered in minor infarctions. Thus,the extent of ischaemic lesions could be approached using acombination of clinical and temporal data and thereby definea gradient such as “NIHSS per minute.”
5. Conclusion
In conclusion, predicting natural course and stroke outcomeat the acute phase seems possible. Low (<5) and high (>22)NIHSS cut-off points are effective positive predictive valuesfor good (mRS 0-1) and poor (mRS 4-5 or death) outcomes.Results are less conclusive for intermediate initial NIHSS orfor thresholds for symptom duration. In order to stratifydecision making, anatomophysiological data resulting fromthe use of functional MRI techniques (DWI-PWI) must beassociated with clinicotemporal data in order to establishprecise predictive IS criteria for each individual patient.Indeed some authors have highlighted a higher probability
8 ISRN Neurology
of infarction growth and early neurological deteriorationwhen a mismatch between clinical data and DWI is observed[34, 35]. However, it seems that these data alone cannotidentify independent predictors of outcome at 3 months[36, 37]. In order to stratify decision making, clinical andtemporal variables should be integrated into the equationalongside neuroimaging data in order to determine naturaloutcome, and thus the best course of treatment.
References
[1] T. J. Crocco, R. U. Kothari, M. R. Sayre, and T. Liu, “Anationwide prehospital stroke survey,” Prehospital EmergencyCare, vol. 3, no. 3, pp. 201–206, 1999.
[2] R. Kothari, E. Jauch, J. Broderick et al., “Acute stroke: delays topresentation and emergency department evaluation,” Annalsof Emergency Medicine, vol. 33, no. 1, pp. 3–8, 1999.
[3] C. S. Lin, J. Tsai, P. Woo, and H. Chang, “Prehospital delayand emergency department management of ischemic strokepatients in Taiwan, R.O.C,” Prehospital Emergency Care, vol. 3,no. 3, pp. 194–200, 1999.
[4] J. C. Baron, R. von Kummer, and G. J. del Zoppo, “Treatmentof acute ischemic stroke: challenging the concept of a rigid anduniversal time window,” Stroke, vol. 26, no. 12, pp. 2219–2221,1995.
[5] N. Kraemer, G. Thomalla, J. Soennichsen et al., “Magneticresonance imaging and clinical patterns of patients with‘spectacular shrinking deficit’ after acute middle cerebralartery stroke,” Cerebrovascular Diseases, vol. 20, no. 5, pp. 285–290, 2005.
[6] D. Schlegel, S. J. Kolb, J. M. Luciano et al., “Utility of the NIHstroke scale as a predictor of hospital disposition,” Stroke, vol.34, no. 1, pp. 134–137, 2003.
[7] H. P. Adams Jr., P. H. Davis, E. C. Leira et al., “BaselineNIH stroke scale score strongly predicts outcome after stroke:a report of the trial of org 10172 in acute stroke treatment(TOAST),” Neurology, vol. 53, no. 1, pp. 126–131, 1999.
[8] M. R. Frankel, L. B. Morgenstern, T. Kwiatkowski et al.,“Predicting prognosis after stroke: a placebo group analysisfrom the national institute of neurological disorders andstroke rt-PA stroke trial,” Neurology, vol. 55, no. 7, pp. 952–959, 2000.
[9] S. Sato, K. Toyoda, T. Uehara et al., “Baseline NIH stroke scalescore predicting outcome in anterior and posterior circulationstrokes,” Neurology, vol. 70, no. 24, pp. 2371–2377, 2008.
[10] T. Moulin, L. Tatu, T. Crepin-Leblond, D. Chavot, S. Berges,and L. Rumbach, “The Besancon stroke registry: an acutestroke registry of 2500 consecutive patients,” European Neu-rology, vol. 38, no. 1, pp. 10–20, 1997.
[11] J. D. Easton, “Redefining TIA,” Neurology, vol. 62, no. 8, pp.S1–S2, 2004.
[12] W. Hacke, G. Donnan, C. Fieschi et al., “Association ofoutcome with early stroke treatment: pooled analysis ofATLANTIS, ECASS, and NINDS rt-PA stroke trials,” TheLancet, vol. 363, no. 9411, pp. 768–774, 2004.
[13] A. E. Baird, J. Dambrosia, S. J. Janket et al., “A three-item scalefor the early prediction of stroke recovery,” The Lancet, vol.357, no. 9274, pp. 2095–2099, 2001.
[14] K. C. Johnston, A. F. Connors Jr., D. P. Wagner, and E. C. HaleyJr., “Predicting outcome in ischemic stroke: external validationof predictive risk models,” Stroke, vol. 34, no. 1, pp. 200–202,2003.
[15] C. Weimar, I. R. Konig, K. Kraywinkel, A. Ziegler, and H. C.Diener, “Age and national institutes of health stroke scale scorewithin 6 hours after onset are accurate predictors of outcomeafter cerebral ischemia: development and external validationof prognostic models,” Stroke, vol. 35, no. 1, pp. 158–162, 2004.
[16] C. Weimar, “Predicting outcome after acute ischemic stroke:an external validation of prognostic models,” Neurology, vol.62, no. 4, pp. 581–585, 2004.
[17] C. Counsell, M. Dennis, and M. McDowall, “Predictingfunctional outcome in acute stroke: comparison of a simplesix variable model with other predictive systems and informalclinical prediction,” Journal of Neurology, Neurosurgery andPsychiatry, vol. 75, no. 3, pp. 401–405, 2004.
[18] L. S. Williams, E. Y. Yilmaz, and A. M. Lopez-Yunez,“Retrospective assessment of initial stroke severity with theNIH stroke scale,” Stroke, vol. 31, no. 4, pp. 858–862, 2000.
[19] S. E. Kasner, B. L. Cucchiara, M. L. McGarvey, J. M. Luciano,D. S. Liebeskind, and J. A. Chalela, “Modified nationalinstitutes of health stroke scale can be estimated from medicalrecords,” Stroke, vol. 34, no. 2, pp. 568–570, 2003.
[20] S. G. Waxman and J. F. Toole, “Temporal profile resemblingTIA in the setting of cerebral infarction,” Stroke, vol. 14, no. 3,pp. 433–437, 1983.
[21] F. Fazekas, G. Fazekas, R. Schmidt, P. Kapeller, and H. Offen-bacher, “Magnetic resonance imaging correlates of transientcerebral ischemic attacks,” Stroke, vol. 27, no. 4, pp. 607–611,1996.
[22] K. Kimura, K. Minematsu, M. Yasaka, K. Wada, and T.Yamaguchi, “The duration of symptoms in transient ischemicattack,” Neurology, vol. 52, no. 5, pp. 976–980, 1999.
[23] T. Moulin, D. Sablot, E. Vidry et al., “Impact of emergencyroom neurologists on patient management and outcome,”European Neurology, vol. 50, no. 4, pp. 207–214, 2003.
[24] W. Hacke, S. Schwab, M. Horn, M. Spranger, M. De Georgia,and R. Von Kummer, “’Malignant’ middle cerebral arteryterritory infarction: clinical course and prognostic signs,”Archives of Neurology, vol. 53, no. 4, pp. 309–315, 1996.
[25] T. J. DeGraba, J. M. Hallenbeck, K. D. Pettigrew, A. J. Dutka,and B. J. Kelly, “Progression in acute stroke: value of the initialNIH stroke scale score on patient stratification in future trials,”Stroke, vol. 30, no. 6, pp. 1208–1212, 1999.
[26] D. Toni, M. Fiorelli, M. Gentile et al., “Progressing neuro-logical deficit secondary to acute ischemic stroke: a studyon predictability, pathogenesis, and prognosis,” Archives ofNeurology, vol. 52, no. 7, pp. 670–675, 1995.
[27] S. Terai, “Clinical course of acute deep infarcts in carotidsystem—pathogenesis of progressing stroke,” Japanese Journalof Geriatrics, vol. 36, no. 11, pp. 811–816, 1999.
[28] H. Itoh, H. I. M. Shioi, N. Oshida, and N. Nagai, “Progressivestroke during the acute state of cerebral infarction in theterritory of the internal carotid artery,” Brain and Nerve, vol.49, no. 2, pp. 138–144, 1996.
[29] M. Kohrmann, T. Nowe, H. B. Huttner et al., “Safety andoutcome after thrombolysis in stroke patients with mild symp-toms,” Cerebrovascular Diseases, vol. 27, no. 2, pp. 160–166,2009.
[30] E. E. Smith, A. R. Abdullah, I. Petkovska, E. Rosenthal, W. J.Koroshetz, and L. H. Schwamm, “Poor outcomes in patientswho do not receive intravenous tissue plasminogen activatorbecause of mild or improving ischemic stroke,” Stroke, vol. 36,no. 11, pp. 2497–2499, 2005.
[31] H. P. Adams, T. G. Brott, A. J. Furlan et al., “Guidelines forthrombolytic therapy for acute stroke: a supplement to the
ISRN Neurology 9
guidelines for the management of patients with acute ischemicstroke,” Stroke, vol. 27, no. 9, pp. 1711–1718, 1996.
[32] G. W. Albers, V. E. Bates, W. M. Clark, R. Bell, P. Verro,and S. A. Hamilton, “Intravenous tissue-type plasminogenactivator for treatment of acute stroke: the standard treatmentwith alteplase to reverse stroke (STARS) study,” Journal of theAmerican Medical Association, vol. 283, no. 9, pp. 1145–1150,2000.
[33] W. M. Clark, G. W. Albers, K. P. Madden, and S. Hamilton,“The rtPA (Alteplase) 0- to 6-hour acute stroke trial, partA (A0276g): results of a double-blind, placebo-controlled,multicenter study. Thromblytic therapy in acute ischemicstroke study investigators,” Stroke, vol. 31, no. 4, pp. 811–816,2000.
[34] A. Davalos, M. Blanco, S. Pedraza et al., “The clinical-DWImismatch: a new diagnostic approach to the brain tissue at riskof infarction,” Neurology, vol. 62, no. 12, pp. 2187–2192, 2004.
[35] J. Prosser, K. Butcher, L. Allport et al., “Clinical-diffusion mis-match predicts the putative penumbra with high specificity,”Stroke, vol. 36, no. 8, pp. 1700–1704, 2005.
[36] P. J. Hand, J. M. Wardlaw, C. S. Rivers et al., “MR diffusion-weighted imaging and outcome prediction after ischemicstroke,” Neurology, vol. 66, no. 8, pp. 1159–1163, 2006.
[37] P. A. Barber and W. Powers, “MR DWI does not substitutefor stroke severity scores in predicting stroke outcome,”Neurology, vol. 66, no. 8, pp. 1138–1139, 2006.