Clinical outcome following acute ischaemic stroke relates to both activation and autoregulatory...
12
BioMed Central Page 1 of 12 (page number not for citation purposes) BMC Neurology Open Access Research article Clinical outcome following acute ischaemic stroke relates to both activation and autoregulatory inhibition of cytokine production Hedley CA Emsley* 1 , Craig J Smith 2 , Carole M Gavin 3 , Rachel F Georgiou 2 , Andy Vail 4 , Elisa M Barberan 5 , Karen Illingworth 6 , Sylvia Scarth 6 , Vijitha Wickramasinghe 7 , Margaret E Hoadley 6 , Nancy J Rothwell 7 , Pippa J Tyrrell 2 and Stephen J Hopkins 6 Address: 1 Division of Neuroscience, The University of Liverpool, The Walton Centre for Neurology & Neurosurgery, Lower Lane, Liverpool L9 7LJ, UK, 2 Division of Medicine and Neuroscience, The University of Manchester, Hope Hospital, Salford, UK, 3 Department of Emergency Medicine, Hope Hospital, Salford, UK, 4 Biostatistics Group, The University of Manchester, Hope Hospital, Salford, UK, 5 Stroke Medicine (Neurosciences), Hope Hospital, Salford, UK, 6 Injury Research, Hope Hospital, Salford, UK and 7 Faculty of Life Sciences, The University of Manchester, UK Email: Hedley CA Emsley* - [email protected]; Craig J Smith - [email protected]; Carole M Gavin - [email protected]; Rachel F Georgiou - [email protected]; Andy Vail - [email protected]; Elisa M Barberan - [email protected]; Karen Illingworth - [email protected]; Sylvia Scarth - [email protected]; Vijitha Wickramasinghe - [email protected]; Margaret E Hoadley - [email protected]; Nancy J Rothwell - [email protected]; Pippa J Tyrrell - [email protected]; Stephen J Hopkins - [email protected] * Corresponding author Abstract Background: As critical mediators of local and systemic inflammatory responses, cytokines are produced in the brain following ischaemic stroke. Some have been detected in the circulation of stroke patients, but their role and source is unclear. Focusing primarily on interleukin(IL)-1-related mechanisms, we serially measured plasma inflammatory markers, and the production of cytokines by whole blood, from 36 patients recruited within 12 h and followed up to 1 year after acute ischaemic stroke (AIS). Results: Admission plasma IL-1 receptor antagonist (IL-1ra) concentration was elevated, relative to age- , sex-, and atherosclerosis-matched controls. IL-1β, soluble IL-1 receptor type II, tumour necrosis factor (TNF)-α, TNF-RII, IL-10 and leptin concentrations did not significantly differ from controls, but peak soluble TNF receptor type I (sTNF-RI) in the first week correlated strongly with computed tomography infarct volume at 5–7 days, mRS and BI at 3 and 12 months. Neopterin was raised in patients at 5–7 d, relative to controls, and in subjects with significant atherosclerosis. Spontaneous IL-1β, TNF-α and IL-6 gene and protein expression by blood cells was minimal, and induction of these cytokines by lipopolysaccharide (LPS) was significantly lower in patients than in controls during the first week. Minimum LPS-induced cytokine production correlated strongly with mRS and BI, and also with plasma cortisol. Conclusion: Absence of spontaneous whole blood gene activation or cytokine production suggests that peripheral blood cells are not the source of cytokines measured in plasma after AIS. Increased plasma IL- 1ra within 12 h of AIS onset, the relationship between sTNF-RI and stroke severity, and suppressed cytokine induction suggests early activation of endogenous immunosuppressive mechanisms after AIS. Published: 28 February 2007 BMC Neurology 2007, 7:5 doi:10.1186/1471-2377-7-5 Received: 11 August 2006 Accepted: 28 February 2007 This article is available from: http://www.biomedcentral.com/1471-2377/7/5 © 2007 Emsley et al; licensee BioMed Central Ltd. This is an Open Access article distributed under the terms of the Creative Commons Attribution License (http://creativecommons.org/licenses/by/2.0 ), which permits unrestricted use, distribution, and reproduction in any medium, provided the original work is properly cited.
-
Upload
independent -
Category
Documents
-
view
1 -
download
0
Transcript of Clinical outcome following acute ischaemic stroke relates to both activation and autoregulatory...

BioMed CentralBMC Neurology
ss
Open AcceResearch articleClinical outcome following acute ischaemic stroke relates to both activation and autoregulatory inhibition of cytokine productionHedley CA Emsley*1, Craig J Smith2, Carole M Gavin3, Rachel F Georgiou2, Andy Vail4, Elisa M Barberan5, Karen Illingworth6, Sylvia Scarth6, Vijitha Wickramasinghe7, Margaret E Hoadley6, Nancy J Rothwell7, Pippa J Tyrrell2 and Stephen J Hopkins6Address: 1Division of Neuroscience, The University of Liverpool, The Walton Centre for Neurology & Neurosurgery, Lower Lane, Liverpool L9 7LJ, UK, 2Division of Medicine and Neuroscience, The University of Manchester, Hope Hospital, Salford, UK, 3Department of Emergency Medicine, Hope Hospital, Salford, UK, 4Biostatistics Group, The University of Manchester, Hope Hospital, Salford, UK, 5Stroke Medicine (Neurosciences), Hope Hospital, Salford, UK, 6Injury Research, Hope Hospital, Salford, UK and 7Faculty of Life Sciences, The University of Manchester, UK
Email: Hedley CA Emsley* - [email protected]; Craig J Smith - [email protected]; Carole M Gavin - [email protected]; Rachel F Georgiou - [email protected]; Andy Vail - [email protected]; Elisa M Barberan - [email protected]; Karen Illingworth - [email protected]; Sylvia Scarth - [email protected]; Vijitha Wickramasinghe - [email protected]; Margaret E Hoadley - [email protected]; Nancy J Rothwell - [email protected]; Pippa J Tyrrell - [email protected]; Stephen J Hopkins - [email protected]
* Corresponding author
AbstractBackground: As critical mediators of local and systemic inflammatory responses, cytokines are producedin the brain following ischaemic stroke. Some have been detected in the circulation of stroke patients, buttheir role and source is unclear. Focusing primarily on interleukin(IL)-1-related mechanisms, we seriallymeasured plasma inflammatory markers, and the production of cytokines by whole blood, from 36 patientsrecruited within 12 h and followed up to 1 year after acute ischaemic stroke (AIS).
Results: Admission plasma IL-1 receptor antagonist (IL-1ra) concentration was elevated, relative to age-, sex-, and atherosclerosis-matched controls. IL-1β, soluble IL-1 receptor type II, tumour necrosis factor(TNF)-α, TNF-RII, IL-10 and leptin concentrations did not significantly differ from controls, but peaksoluble TNF receptor type I (sTNF-RI) in the first week correlated strongly with computed tomographyinfarct volume at 5–7 days, mRS and BI at 3 and 12 months. Neopterin was raised in patients at 5–7 d,relative to controls, and in subjects with significant atherosclerosis. Spontaneous IL-1β, TNF-α and IL-6gene and protein expression by blood cells was minimal, and induction of these cytokines bylipopolysaccharide (LPS) was significantly lower in patients than in controls during the first week. MinimumLPS-induced cytokine production correlated strongly with mRS and BI, and also with plasma cortisol.
Conclusion: Absence of spontaneous whole blood gene activation or cytokine production suggests thatperipheral blood cells are not the source of cytokines measured in plasma after AIS. Increased plasma IL-1ra within 12 h of AIS onset, the relationship between sTNF-RI and stroke severity, and suppressedcytokine induction suggests early activation of endogenous immunosuppressive mechanisms after AIS.
Published: 28 February 2007
BMC Neurology 2007, 7:5 doi:10.1186/1471-2377-7-5
Received: 11 August 2006Accepted: 28 February 2007
This article is available from: http://www.biomedcentral.com/1471-2377/7/5
© 2007 Emsley et al; licensee BioMed Central Ltd. This is an Open Access article distributed under the terms of the Creative Commons Attribution License (http://creativecommons.org/licenses/by/2.0), which permits unrestricted use, distribution, and reproduction in any medium, provided the original work is properly cited.
Page 1 of 12(page number not for citation purposes)

BMC Neurology 2007, 7:5 http://www.biomedcentral.com/1471-2377/7/5
BackgroundAccumulating evidence supports a role for inflammationin the development of, and responses to, cerebral ischae-mia. Cytokines such as interleukin(IL)-1, tumour necrosisfactor-α (TNF-α) and IL-6 appear to be crucial mediatorsof such responses [1,2], yet much remains unknownabout their complex interactions in the setting of clinicalstroke.
Although cytokines are detected in the brain and cerebro-spinal fluid (CSF) of patients with acute ischaemic stroke(AIS) [3-5], the relevance of measurements in the periph-eral circulation is uncertain. In a recent prospective studyof ischaemic stroke patients, recruited early (within 12 h)after onset of symptoms, we reported early induction ofestablished markers of inflammation, including inter-leukin-6 (IL-6), and strong relationships between theseand both stroke severity and outcome [6,7]. Despite evi-dence that IL-1 is an important mediator in stroke, it hasgenerally not been detected [3,8], other than in one smallstudy where a very modest elevation was noted in compar-ison to healthy subjects [9]. However, elevated inter-leukin-1 receptor antagonist (IL-1ra) concentration hasbeen reported [10,11], and elevations have been observedin circulating TNF-α [12-14] and IL-10 [15,16].
It seems reasonable to propose that the increased plasmacytokines, detected following AIS, originate from inflam-matory tissue in the central nervous system (CNS), butthis is difficult to prove formally, and it is possible thatthey originate peripherally, perhaps from leukocytes thatare activated to enter the circulation in increased num-bers. Increased IL-1β messenger ribonucleic acid (mRNA)expression in blood cells, following AIS has been corre-lated moderately with the degree of neurological impair-ment [17], although other studies suggest IL-1β proteinproduction by peripheral blood cells is no different fromcontrols [18]. There is also evidence that release of TNF-α,IL-6 and IL-8 by blood cells in response to lipopolysaccha-ride (LPS) may be increased in patients following AIS, rel-ative to controls [18,19], suggesting that leukocytes ofpatients with AIS may be primed to release cytokines inresponse to a secondary stimulus.
In view of these issues we sought to further determine therelationship between inflammation and AIS, as well as toidentify whether blood leukocytes might be the source ofplasma cytokines. We therefore set out primarily to exam-ine (a) whether circulating IL-1ra is elevated and related tostroke severity or outcome, and (b) whether peripheralblood IL-1β production by peripheral blood leukocytes isinduced or primed, early after AIS. We additionally reportdata for related cytokines and inflammatory mediators, inthe same context.
MethodsPatients, control subjects, radiology and assessment of atherosclerosisThe study was approved by the Local Research EthicsCommittee and methodology for clinical evaluation wasas described previously [6]. Briefly, patients over 18 yearspresenting at Hope Hospital, Salford, within 12 h ofsymptom onset of AIS, were eligible. Patients wereexcluded if there was any improvement in symptomssince onset, the time of onset of symptoms could not bereliably determined, or there was evidence of active malig-nancy. Control subjects with no history of stroke or tran-sient ischaemic attack, without clinically evident infectionnecessitating medical treatment, and without a history ofcognitive impairment sufficient to interfere with daily lifewere matched for age (± 5 years), sex and degree of athero-sclerosis. Written informed consent (or assent from a rel-ative) was obtained for all patients and control subjects.
Computed tomography (CT) brain scans were performedon an IGE CT Pace Plus 3rd generation CT scanner within24 h of admission, in order to exclude patients with pri-mary intracerebral haemorrhage or stroke mimic from fur-ther analysis. Ischaemic stroke patients underwent asecond CT brain scan at 5 to 7 days for determination ofcerebral infarct volume, using a semi-automated tech-nique [20]. Ankle brachial pressure index (ABPI) was usedto classify degree of atherosclerosis where carotid duplexdata were unavailable. Patients and control subjects weredivided into two groups, one without significant athero-sclerosis (< 50% carotid artery stenosis bilaterally, or low-est ABPI ≥ 0.92), and one with significant atherosclerosis(≥ 50% carotid artery stenosis on at least one side, or low-est ABPI < 0.92).
Blood and urine samplesVenous blood samples were taken from patients at base-line, the next 09:00 time point where admission wasbefore 07:00 or after 11:00, and 24 hours after admission,plus 5 to 7 days, 3 months and 12 months at 09:00. Bloodwas also drawn from resting control subjects at 09:00 andat a time matched to the patient's time of admission if thiswas before 07:00 or after 11:00. Blood was collected intotubes containing pyrogen-free heparin, and wrapped incool-gel packs. At 1 hour after collection, blood was cen-trifuged at 2000 g for 30 minutes, at 4°C. Plasma was sep-arated, frozen and stored at -70°C until analysis. Cellpellets from 10 ml of centrifuged blood were resuspendedin 5 ml saline and 1 ml volumes were centrifuged at12000 g prior to removing the supernatant and freezing at-70°C for analysis of cytokine mRNA. Urine was collectedat the same time points into foil-wrapped sterile contain-ers, wrapped in cool-gel packs, frozen and stored at -70°Cuntil analysis.
Page 2 of 12(page number not for citation purposes)

BMC Neurology 2007, 7:5 http://www.biomedcentral.com/1471-2377/7/5
Whole blood stimulationLipopolysaccharide (LPS) stimulation of whole blood wasperformed to assess the potential of peripheral blood leu-kocytes to produce cytokines after stroke. A separate por-tion of whole blood was mixed with an equal volume ofRoswell Park Memorial Institute medium (RPMI; Invitro-gen, Paisley, UK) or RPMI containing LPS (from E. Coliserotype 0128:B12, Sigma, Gillingham, UK) at 200 ng/mland incubated in triplicate 1 ml volumes in 12-well multi-dishes (Nalge Nunc Int. Roskilde, Denmark). After 24hours at 37°C in a 5% CO2 atmosphere the contents ofeach well were transferred to microcentrifuge tubes andcentrifuged at 12000 g for 10 mins. The supernatant wasseparated, frozen and stored at -70°C until analysis.
Enzyme-linked immunosorbent assaysPlasma (or blood culture supernatant) IL-1β, sIL-1-RII,TNF-α, sTNF-RI, sTNF-RII, IL-10 and leptin were meas-ured using sandwich enzyme-linked immunosorbentassays (ELISAs). Analytes were captured on 96-well micro-plates (Costar, Cambridge, MA) with analyte-specificmonoclonal antibodies (IL-1β : cat no. MAB601, R&DSystems Europe Ltd., Abingdon, UK, sIL-1-RII: cat no.MAB663; R&D Systems, TNF-α : supplied by S. Poole,NIBSC, sTNF-RI: cat no. MAB625; R&D Systems, sTNF-RII:cat no. 58.177.08; Biosource, Nivelles, Belgium, leptin:cat no. MAB398; R&D Systems, IL-10: cat no. 58.132.08;Biosource). IL-1β was secondarily bound with a goat anti-human antibody (cat no. AF201NA; R&D Systems) fol-lowed by HRP-conjugated donkey anti-goat antibody(code number 705-035-147; Jackson ImmunoResearchLaboratories Inc., PA, USA), prior to development withorthophenylene-diamine (OPD; Sigma, Poole, UK).Other analytes were secondarily bound with biotinylatedantibodies (sIL-1-RII: cat no. BAF263; R&D Systems, TNF-α : supplied by S. Poole (NIBSC, South Mimms, UK);sTNF-RI: cat no. BAF225, R&D Systems, sTNF-RII: cat no.58.177.02; Biosource, leptin: cat no. BAM398; R&D Sys-tems, IL-10: cat no. 58.132.02; Biosource) followed bystreptavidin-HRP (cat no. 43–4323; Zymed LaboratoriesInc., CA, USA, or cat no. 41.000.04; Biosource for the IL-10 and sTNF-RII assays) and developed with OPD. Work-ing standards for IL-1β (R&D Systems, cat. no. 2010LB,TNF-α (supplied by S. Poole, NIBSC), IL-10 (Biosource,cat no. SD909) were calibrated against WHO interna-tional standards. Cortisol, IL-6 and IL-1ra were measuredas described previously [6,21]. Other analytes were cali-brated using commercially available materials: sIL-1-RII:cat no. 263-2R; R&D Systems; sTNF-RI: cat no. 225-B1;R&D Systems; sTNF-RII: cat no. 58.177.10; Biosource; lep-tin: cat no. 398-LP, R&D Systems.
Minimum assay sensitivities, allowing for sample dilution(1:10 for sIL-RII, sTNF-RI, sTNF-RII and leptin, and 1:5 forIL-1ra), were 6.5 pg/ml (IL-1β), 352 pg/ml (IL-1ra), 860
pg/ml (sIL-1-RII), 7 pg/ml (TNF-α), 200 pg/ml (sTNF-RI),1000 pg/ml (sTNF-RII), < 500 pg/ml(leptin), 0.6 pg/ml(IL-10). Inter-assay coefficients of variation (CVs) forquality control samples were 15% at 83.5 pg/ml to 26% at51.5 pg/ml for IL-1β, 11% at 2.48 ng/ml to 19% at 680pg/ml for IL-1ra, 12% at 1.2 ng/ml to 20% at 145 pg/mlfor sIL-1-RII, 11% at 42 pg/ml to 10 pg/ml for TNF-α), 7%at 200 pg/ml to 36% at 23 pg/ml for sTNF-RI, 7% at 850pg/ml to 9% at 300 pg/ml for sTNF-RII), 22% at 67.5 ng/ml to 28% at 5.4 ng/mlfor leptin, 4% at 235.1 pg/ml to6% at 8.2 pg/ml for IL-10. For measurements of superna-tants from unstimulated samples, minimum sensitivitieswere 6.7 pg/ml (IL-1β), 3.4 pg/ml (TNF-α) and 7 pg/ml(IL-6) and interassay CVs were 7% at 56.3 pg/ml to 30%at 5.9 pg/ml for IL-1β, 11% at 99.5 pg/ml to 19% at 14.5pg/ml for TNF-α, and 11% at 45 pg/ml, 23% to 45% at 5.3pg/ml for IL-6. For measurements of supernatants fromLPS-stimulated samples, minimum sensitivities were 7%for IL-1β, 8.5 pg/ml for TNF-α, 7 pg/ml for IL-6, and 1.6pg/ml for IL-10. Interassay CVs were 6% at 911 pg/ml to12% at 19 pg/ml for IL-1β, 10% at 4.6 ng/ml to 19% at 14pg/ml for TNF-α, 7% at 1.3 ng/ml to 23% at 16.9 pg/mlfor IL-6, and 10% at 261 pg/ml to 16% at 12 pg/ml for IL-10. Cytokine production was corrected for monocytecounts obtained at each time point, and adjusted for the1:1 dilution with RPMI.
Neopterin and creatinine measurementThe urinary neopterin/creatinine ratio was determined byreverse-phase high performance liquid chromatography(Spectroflow 400 isocratic pump; Applied Biosystems,Warrington, UK) at ambient temperature using a 4.6 ×100 mm analytical column packed with 3 µm particles ofSpherisorb ODS2 (Waters, Milford, MA), preceded by a4.6 × 10 mm guard cartridge packed with a generic C18material. Elution was with a gradient of 15 mmol/l potas-sium phosphate buffer, pH 6.4, at 0.8 ml/min for 6 minfollowed by the addition of 6% acetonitrile at 0.8 ml/minfor a further 3 minutes. Neopterin was measured fluori-metrically (excitation 353 nm, emission 438 nm: LS-5luminescence spectrophotometer; Perkin-Elmer, Beacons-field, UK) and the ratio was calculated relative to creati-nine determined by ultraviolet absorbance at 235 nm(Spectroflow 757 absorbance detector; Applied Biosys-tems). Urine samples were diluted 1/10 in 15 mmol/lpotassium phosphate buffer, pH 6.4, containing 0.2% dis-odium EDTA, prior to injection of 20 µl on to the column.Urinary neopterin was expressed as a ratio with creatinineto account for variation in urine volumes. Inter-assay coef-ficients of variation for urinary neopterin/creatinine were11.5% at a ratio of 259, 23.4% at 178 and 19.8% at 101.
Measurement of cytokine mRNA in whole bloodRNA was isolated from the frozen blood cell pellets of 20sequentially admitted patients, and their matched con-
Page 3 of 12(page number not for citation purposes)

BMC Neurology 2007, 7:5 http://www.biomedcentral.com/1471-2377/7/5
trols, using TrizolLS RNA isolation solution (InvitrogenLtd., Paisley, UK). The RNA concentration was deter-mined spectrophotometrically at 260 nm. All RNA sam-ples for IL-1β mRNA measurements were routinely treatedwith 0.5 units RQ1 DNase (Promega, UK) per 50 ng totalRNA at 37°C for 30 mins. The IL-1β, IL-6 and TNF-αmRNA in these samples were measured using an immu-nometric, reverse transcriptase, polymerase chain reac-tion, as previously described [22]. Where IL-6 and TNF-αmRNA values were high, these were also DNase treated to,although in no case were results substantially reduced bythis treatment. Cytokine mRNA was expressed as mole-cules of mRNA/monocyte, assuming total RNA recoveryfrom blood was 100%.
Statistical AnalysisThe pre-specified, primary outcome measures were peakplasma IL-1ra and maximum IL-1β production by wholeblood during the first week after ischaemic stroke com-pared with CT cerebral infarct volume at 5 to 7 days andmodified Rankin Scale (mRS) at 3 months. Post-hoc eval-uation of the data resulted in a change in the IL-1β param-eter to minimum production. Correlations were assessedusing the Spearman Rank correlation coefficient. Paired t-tests or logistic regression analysis of log-transformedcytokine, cytokine receptor, leptin, urinary neopterin, orcytokine production data were used for group compari-sons where appropriate. The sample size of 36 patient-control subject pairs had 80% power at the 5% signifi-cance level to detect a difference of 0.67 standard devia-tion (SD) in primary analyses between control subjectsand patients. All calculations were performed using SPSSfor Windows (SPSS Inc., Chicago, IL). Secondary analyseswere plasma IL-1β, sIL-1RII, TNFα, sTNF-RI, sTNF-RII, IL-10, leptin and urinary neopterin, and IL-1β, IL-6 and TNF-α production (a) at all time points compared with con-trols, (b) peak in the first week versus CT infarct volumeat 5 to 7 days and clinical outcome at 3 and 12 months.Secondary analyses are descriptive, to be used for the pur-pose of hypothesis generation.
ResultsForty-three patients were recruited between April 2000and January 2001. Six patients with primary intracerebralhaemorrhage and one patient for whom no matched con-trol could be found, were excluded. The thirty-six remain-ing patients included in the analysis were recruited at amedian interval of 4.75 h (range 1.5 h to 11.75 h) fromonset of symptoms of AIS. Fourteen patients died by 12months: certified causes of death were index stroke (8),recurrent stroke (1), pulmonary embolism (1), left ven-tricular failure secondary to myocardial infarction (1) andsepsis (3). Infections and other events associated with aninflammatory response occurring in the 6-week periodprior to each assessment were as described previously [6].
Participant characteristics are summarised in table 1. Nopatients received treatment with intravenous thromboly-sis.
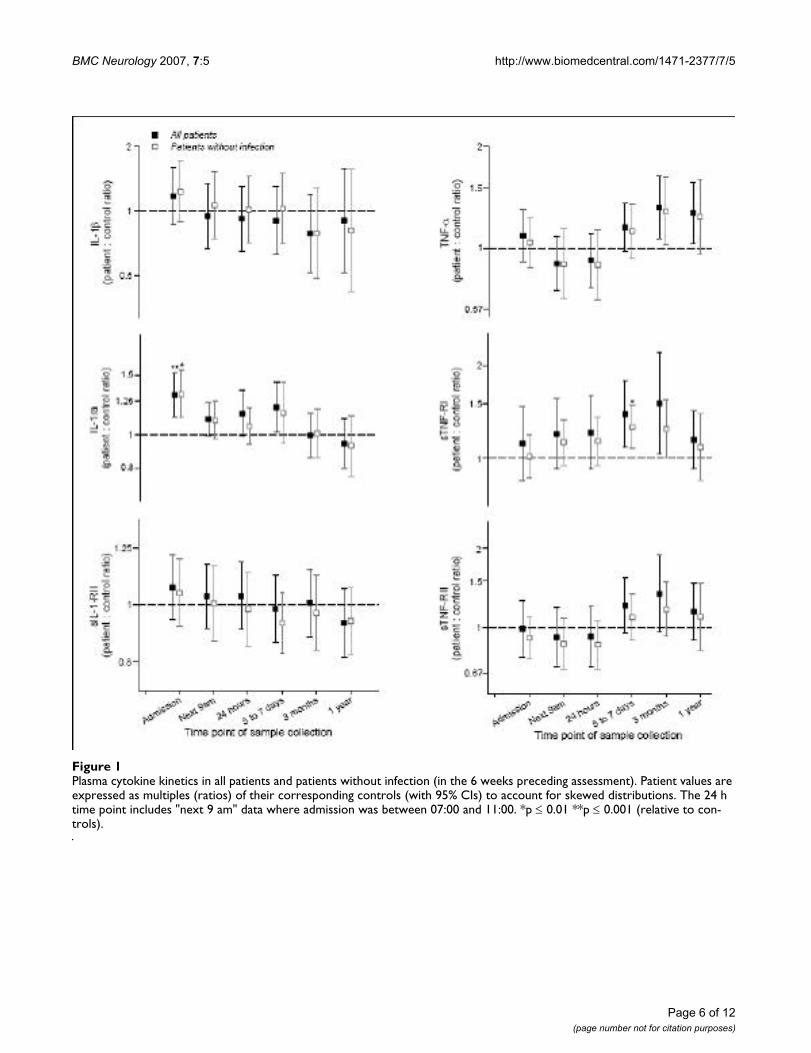
Plasma cytokines and soluble receptorsThe median plasma IL-1ra concentration was significantlyelevated relative to controls at admission (p < 0.001), andremained elevated until 5–7 days (fig 1). Peak IL-1ra con-centration in the first week showed modest correlationwith infarct volume (r = 0.45, p = 0.02), but did not cor-relate significantly with modified Rankin Scale (mRS) at 3months, or show meaningful correlations with any otheroutcome measures. Plasma IL-1β and sIL-1-RII concentra-tions were similar to controls at all time points (fig 1) andalso did not exhibit meaningful correlations with out-come. Peak IL-1ra, IL-1β and sIL-1-RII concentrations didnot exhibit any correlations with each other. PlasmasTNF-RI concentration was elevated at 5–7 days, inpatients without evidence of infection (fig 1). Peakplasma sTNF-RI concentration in the first week correlatedstrongly with infarct volume (r = 0.62, p = 0.001), mRS at3 months (r = 0.59, p < 0.001) and 1 year (r = 0.57, p =0.001), and Barthel Index (BI) at 3 months (r = -0.58, p =0.001) and 1 year (r = -0.61, p < 0.001). Plasma TNF-αand sTNF-RII concentrations followed a similar but lessmarked pattern to sTNF-RI (fig 1), and peak plasma TNF-α, sTNF-RI and sTNF-RII concentrations all showed strongcorrelations with each other (TNF-α :sTNF-RI, r = 0.64, p< 0.001; TNF-α : sTNF-RII, r = 0.77, p < 0.001; sTNF-RI:sTNF-RII, r = 0.83, p < 0.001). Plasma IL-10 and leptinconcentrations were similar to controls at all time points(not shown).
Peripheral blood cytokine production and gene expressionFollowing activation with LPS, the cytokines IL-1β, IL-6and TNF-α were all strongly induced in whole blood. An850-fold increase was seen in IL-6 production at admis-sion compared with blood incubated in medium. How-ever, IL-1β production in blood from patients wassignificantly reduced relative to controls between admis-sion and 5–7 days, and a similar pattern was apparent forTNF-α and IL-6 (fig 2). This pattern was seen in bloodfrom all patients, although it was less evident in thosewithout infection. IL-10 production, measured at admis-sion and 24 hours after admission, exhibited a similar pat-tern to IL-1β, TNF-α and IL-6 production at thesetimepoints (not shown). Minimum in vitro IL-1β produc-tion in the first week correlated significantly with mRS at3 months (table 2). A similar correlation was apparentbetween IL-6 production and mRS, although the correla-tion between TNF production and mRS was less strong(table 2). Minimum in vitro IL-1β production was lower innon-survivors than in survivors at 12 months (p = 0.004)(figure 3), and the same was apparent for IL-6 (p = 0.002)(figure 3) and TNF-α (p = 0.014) (figure 3). Plasma corti-
Page 4 of 12(page number not for citation purposes)

BMC Neurology 2007, 7:5 http://www.biomedcentral.com/1471-2377/7/5
sol concentration showed strong inverse correlations withLPS-stimulated IL-1β, IL-6 and TNF-α productionbetween admission and 5–7 days (table 3). In the absenceof LPS, blood incubated in medium for 24 h producedminimal amounts of IL-1β (Interquartile range (IQR) forall time points of 22 to 47 pg/106 monocytes (controls),19 to 66 pg/106 monocytes (patients)), IL-6 (IQR for alltime points 28 to 55 pg/106 monocytes (controls), 28 to102 pg/106 monocytes (patients)) or TNF-α (IQR for alltime points 39 to 82 pg/106 monocytes (controls), 35 to90 pg/106 monocytes (patients)). Minimal spontaneousactivation of peripheral blood cells was confirmed by theabsence of cytokine mRNA expression in a group of 20consecutive patients examined either at admission or 24 hlater (data not shown).
Urinary neopterinUrinary neopterin was raised in patients at 5–7 days(median 354 µmol/mol creatinine) compared to controls(median 254 µmol/mol creatinine) (p = 0.002), but not atany other time point and a similar elevation was apparentin patients with evidence of infection excluded. Peak uri-nary neopterin correlated strongly with peak TNF-α con-centration (r = 0.6, p < 0.001), but less with sTNF-RI (r =0.4, p = 0.05) and sTNF-RII (r = 0.4, p = 0.01), andappeared unrelated to other plasma cytokines, solublereceptors or in vitro cytokine production.
AtherosclerosisSeventeen patients and control subjects were classified ashaving significant atherosclerosis. A higher urinary neop-
Table 1: Control subject and patient characteristics
Baseline characteristics Controls Patients
Mean age ± S.D. (years) 68.7 ± 12.6 69.6 ± 13.0Male 24 (67%) 24 (67%) Stroke characteristics
Caucasian 36 (100%) 36 (100%) Oxfordshire Community Stroke Project (OCSP) classificationSystolic blood pressure* 142 (100, 200) 151 (60, 232) Total anterior circulation syndrome 16 (46%)Diastolic blood pressure* 79 (60, 120) 82 (40, 146) Partial anterior circulation syndrome 12 (34%)Body mass index* (kg/m2) 26 (17, 36) 26 (18,41) Lacunar syndrome 5 (14%)'Significant' atherosclerosis 17 (47%) 17 (47%) Posterior circulation syndrome 2 (6%)
Current or former smoker 23 (64%) 25 (69%) National Institutes of Health Stroke Scale (NIHSS) score*Smoking history unknown 0 (0%) 1 (3%) Admission 14 (3, 24)Hypertension 11 (31%) 23 (64%) 5–7 days 11 (1, 42)
Atrial fibrillation 2 (6%) 8 (22%) Modified Rankin Scale*Diabetes mellitus 6 (17%) 3 (8%) Pre-stroke 0 (0, 4)
Ischaemic heart disease 7 (19%) 8 (22%) Barthel Index*Prevalence of selected drugs** Pre-stroke 100 (20, 100)
Paracetamol Not known 20 (56%)Statins 11 (31%) 20 (56%)Antiplatelet agents 14 (39%) 33 (92%) Infections/other events associated with an inflammatory response||
Warfarin 2 (6%) 4 (11%) Pre-stroke 3 (8%)¶ACEIs† or A-IIR‡ antagonists 5 (14%) 10 (28%) Pre-stroke or 1st week after stroke 11 (33%)¶NSAIDs§ 4 (11%) 7 (19%)Beta-blockers 7 (19%) 15 (42%) Pre-3 months 5 (21%)¶Inhaled corticosteroids 2 (6%) 6 (17%) Pre-1 year 3 (17%)¶Azathioprine 1 (3%) 0 (0%)
* data shown as median (min, max)** at recruitment for control subjects; during study period for patients† angiotensin-converting enzyme inhibitors‡ angiotensin-II receptor§non-steroidal anti-inflammatory drugs|| in 6 weeks prior to assessment¶number of patients (% of survivors) with infection at each time point
Page 5 of 12(page number not for citation purposes)
BMC Neurology 2007, 7:5 http://www.biomedcentral.com/1471-2377/7/5
Page 6 of 12(page number not for citation purposes)
Plasma cytokine kinetics in all patients and patients without infection (in the 6 weeks preceding assessment)Figure 1Plasma cytokine kinetics in all patients and patients without infection (in the 6 weeks preceding assessment). Patient values are expressed as multiples (ratios) of their corresponding controls (with 95% CIs) to account for skewed distributions. The 24 h time point includes "next 9 am" data where admission was between 07:00 and 11:00. *p ≤ 0.01 **p ≤ 0.001 (relative to con-trols).

BMC Neurology 2007, 7:5 http://www.biomedcentral.com/1471-2377/7/5
terin concentration was seen in control subjects with sig-nificant atherosclerosis (median 309 µmol/molcreatinine) than those without (median 244 µmol/molcreatinine) (p < 0.01). IL-10 concentration was lower incontrol subjects with significant atherosclerosis (median0.60 pg/ml) than those without (median 1.00 pg/ml) (p= 0.05). No notable differences in other plasma cytokines,soluble receptors or in vitro cytokine production were seenbetween those individuals (including patients and con-trols) with or without significant atherosclerosis at anytime-point.
DiscussionCytokines such as IL-1, TNF and IL-6 are key regulators ofinflammation at sites of infection or tissue damage. Fol-lowing AIS, it seems reasonable to hypothesise thatcytokines measured in the plasma arise from cells associ-ated with inflammatory activity in the brain, but this isnot certain. Therefore, in addition to evaluating the rela-tionships between plasma cytokines and the clinicalimpact of stroke, we have attempted to identify the possi-ble contribution of peripheral blood leukocytes to theplasma cytokine pool. We also wanted to know whetherleukocyte activation, apparent in terms of increased num-bers in the circulation [6], was associated with anincreased potential to produce cytokines. In this study ourprimary focus has been the IL-1 system, but we also exam-ined other cytokines, their receptors, and neopterin, asmolecules that have previously been associated withinflammatory cell activation.
In accord with its localised role, and with previous studies[3,8], there was no evidence of an increase in plasma IL-1β concentration. We also found no change in plasma sIL-1-RII concentration. However, the elevation in plasma IL-1ra concentration, at a much earlier stage after strokeonset than previously reported [10], suggests early activa-tion of anti-inflammatory components directed at regulat-ing IL-1. Leptin was evaluated because it appears in some
cases to mediate neuroimmune responses dependent onIL-1 [23] and, although high leptin levels were recentlyfound to be associated with stroke [24], the present datasupport neither a clear change in leptin concentration fol-lowing stroke, nor any relationship with outcome.
Our findings with respect to TNF-α are consistent withone previous study [8], but differ from those showing thatplasma or serum TNF-α concentrations after stroke areincreased and correlate with cerebral infarct volume [12-14]. The role of TNF-α in stroke remains controversial,and indeed a potentially beneficial role in ischaemic tol-erance has been suggested [25]. However, we found sTNF-RI was increased at 5–7 d and the peak concentration inthe first week correlated with infarct volume and outcome(mRS and BI) at 3 months and 1 year. This is consistentwith earlier observations of elevated sTNF-RI concentra-tion in stroke patients with nosocomial infection [26]. Amore robust relationship between sTNF-RI and strokeseverity or outcome may reflect a longer half-life of recep-tors compared to TNF-α. The possibility that TNF-α andits receptors are activated in concert is supported by thestrong correlations between their peak concentrations andsuggests their release is proportionate to each other. Thefact that we used controls matched for atherosclerosis,and that elevated serum sTNF-RI and sTNF-RII concentra-tions are increased in carotid atherosclerosis [27] mayexplain why our data are not as clearly differentiated inrespect of TNF-α as those where healthy controls wereused.
Atherosclerosis may also be a confounding factor with IL-10 analysis, since patient plasma IL-10 concentrationswere similar to those of controls and reduced concentra-tions of plasma IL-10 have been noted in studies whereplasma of patients with stroke has been compared to thatof healthy controls [15]. In support of this explanation,higher plasma concentrations of IL-10 have been detectedin plasma of patients with stable, versus unstable coro-
Table 2: Correlation matrix of cytokine production versus stroke severity and outcome
Minimum cytokine production in first week
IL-1β IL-6 TNF-α
r p r p r p
Admission NIHSS -0.45 0.008 -0.48 0.003 -0.36 0.045–7 day NIHSS -0.34 0.05 -0.30 0.08 -0.27 0.1Infarct volume -0.43 0.03 -0.37 0.06 -0.31 0.13 month mRS -0.63 < 0.001 -0.58 < 0.001 -0.48 0.0051 year mRS -0.65 < 0.001 -0.65 < 0.001 -0.55 0.0023 month BI 0.59 < 0.001 0.57 < 0.001 0.47 0.0081 year BI 0.62 < 0.001 0.65 < 0.001 0.55 0.002
r values are Rank Spearman correlation coefficients
Page 7 of 12(page number not for citation purposes)

BMC Neurology 2007, 7:5 http://www.biomedcentral.com/1471-2377/7/5
Page 8 of 12(page number not for citation purposes)
Lipopolysaccharide-stimulated cytokine production kinetics in all patients and patients without infection (in the 6 weeks pre-ceding assessment)Figure 2Lipopolysaccharide-stimulated cytokine production kinetics in all patients and patients without infection (in the 6 weeks pre-ceding assessment). Box plots show medians, 10th and 90th percentiles and outliers. The 24 hour timepoint includes "next 9 am" data where admission was between 07:00 and 11:00. *p ≤ 0.01 **p ≤ 0.001 (relative to controls).

BMC Neurology 2007, 7:5 http://www.biomedcentral.com/1471-2377/7/5
Page 9 of 12(page number not for citation purposes)
Minimum LPS-stimulated cytokine production in first week in survivors and non-survivors to 12 monthsFigure 3Minimum LPS-stimulated cytokine production in first week in survivors and non-survivors to 12 months. P values generated from analysis of log-transformed data (logistic regression for comparison of survivors and non-survivors, paired t-test for com-parisons with controls).
Table 3: Correlation matrix of plasma cortisol concentration versus LPS-stimulated whole blood in vitro cytokine production
IL-1β production IL-6 production TNF production
r p r p r p
Control subjects 09:00 -0.09 0.6 -0.001 1.0 -0.39 0.02Admission matched† 0.18 0.3 -0.02 0.9 -0.06 0.7
Patients Admission -0.57 < 0.001 -0.59 < 0.001 -0.72 < 0.00124 hours -0.65 < 0.001 -0.64 < 0.001 -0.67 < 0.0015–7 days -0.58 0.001 -0.48 0.006 -0.68 < 0.0013 months -0.05 0.8 -0.13 0.5 -0.10 0.612 months -0.35 0.2 -0.09 0.7 -0.17 0.5
r values are Rank Spearman correlation coefficients†admission matched data includes 09:00 values if admission was between 07:00 and 11:00

BMC Neurology 2007, 7:5 http://www.biomedcentral.com/1471-2377/7/5
nary syndromes [28] and, experimentally, IL-10 defi-ciency results in increased atherosclerosis inapolipoprotein E-deficient mice [29].
Activation of cells of monocytoid lineage is associatedwith increased production of neopterin in plasma orurine. Although we found urinary neopterin to beincreased following stroke, and this is consistent with aprevious report that found neopterin to be increased dur-ing the first week after stroke [30] we also found it to behigher in control subjects with significant atherosclerosis.The association with atherosclerosis has been reportedpreviously [31] and it is possible that this influences thestrength of the apparent association. Consistent with thisinterpretation, another study reported neopterin as beinghigher one year after stroke than at the acute stage, and tobe correlated with age [32].
CSF is arguably more relevant than plasma to eventsoccurring in the brain. However, lumbar puncture poses arisk of cerebral herniation and it is difficult to obtain CSFat repeated time points. Plasma, or serum markers there-fore have potentially greater practical value and have beenevaluated in most studies. It may be that plasma cytokinesdo reflect brain cytokines, particularly after an acute cere-bral event, but the validity of this has not been well estab-lished, and blood monocytes in particular are potentialsources of plasma cytokines. This is particularly the casewhere serum, rather than plasma, has been collected andthere is potential for monocytes to release cytokines dur-ing clotting, particularly if endotoxin is present in collec-tion tubes [33,34]. The ability of blood cells to producecytokines is potentially relevant, not only because theymay be responsible for producing the cytokines while inthe circulation but because these cells have the potentialto enter the CNS after stroke and their activation state mayreflect systemic responsiveness of the immune systemafter stroke. Our determination of cytokine gene activa-tion in the blood of patients, and of spontaneous, wholeblood cytokine induction, indicates peripheral blood cellsare not the source of cytokines after ischaemic stroke. Thissupports the hypothesis that cytokine production isupregulated within the brain, possibly by microglia, inresponse to cerebral ischaemia, and these cytokines enterthe peripheral circulation via reabsorption from the CSF,or via afferent lymphatics. While cells in other peripheraltissues, such as those associated with concomitant periph-eral atherosclerosis, might also be expected to be contrib-utors to a pre-existing inflammatory state, it seemsunlikely that they would be more readily activated thanblood cells following a stroke.
In contrast to the increased plasma cytokines, presumedto originate from the brain, we report, for the first time,reduction of cytokine production by endotoxin-stimu-
lated whole blood from patients relative to controls. Thiswas seen within hours of ischaemic stroke and persistedduring the first week. These data differ from a previousreport, where LPS-induced more IL-6 and TNF in bloodfrom patients with stroke, compared to controls [19].However, they are consistent with a number of studiesexamining cytokine production by whole blood fromtrauma patients [35,36]. Reasons for conflict with the ear-lier study [19] are not clear, although in that study: (1)cytokines were induced for only 4 h by LPS, which mightbe relevant if downregulation is relatively delayed; (2)data were not corrected for monocyte count; (3) non-nor-mally distributed data were analysed with parametric sta-tistical tests and (4) controls were not matched for degreeof atherosclerosis. Suppression of endotoxin-stimulatedcytokine production, and the inverse relationships withstroke severity and outcome, may relate to the extent ofCNS inflammation and a physiological attempt to down-regulate cytokine activation, although it should be notedthat the correlation with infarct volume was relativelyweak. The mechanisms are therefore unclear although,following trauma, a suppressive factor has been shown tobe present in serum and this was apparently not trans-forming growth factor (TGF)-β, IL-4 or IL-10 [36]. IL-10seems unlikely to have contributed to the relative reduc-tion in cytokine production observed in the present studybecause its production pattern was similar to those of IL-1β, IL-6 and TNF-α. It seems unlikely that reduced capac-ity to produce cytokines is due to depletion in vivo, sincethere was no evidence for increased IL-1β or TNF-α in theplasma, and mRNA for all three cytokines had not beeninduced at baseline.
We have previously reported elevation in plasma cortisolconcentration within 12 hours of ischaemic stroke [6] andthe correlation between plasma cortisol and suppressionof cytokine production, suggests this might be a potentialexplanation. These observations are consistent with exper-imental data describing a systemic anti-inflammatoryresponse, including reduced endotoxin stimulated wholeblood TNF-α and increased IL-10 production, after infu-sion of IL-1β into the brain, through stimulation of thehypothalamo-pituitary-adrenal axis and the sympatheticnervous system [37]. However, evidence from experimen-tal ischaemia suggests that activation of the sympatheticnervous system, but not corticosteroid receptors, is moreimportant in suppression of whole blood TNF production[38]. Both catecholamines and corticosteroids suppressendotoxin-induced cytokine production by whole bloodfrom healthy volunteers [39,40]. Such regulatoryresponses, and increases in inhibitory cytokines such asIL-1ra, may be responsible for increased vulnerability ofstroke patients to infections [38,41,42]. This might con-tribute toward the increased mortality in patients withgreatest inhibition of systemic cytokine induction.
Page 10 of 12(page number not for citation purposes)

BMC Neurology 2007, 7:5 http://www.biomedcentral.com/1471-2377/7/5
Particular strengths of the present study are the very earlyrecruitment of patients after onset of symptoms of AIS(median < 5 h), and further assessments within the first24 h of admission. In studies where later sampling timepoints have been used it is difficult to distinguish theeffects of the stroke itself from subsequent infections orother events. We also recognise that cytokine responsesseen at 3 months and 1 year reflect the fact that manypatients with the most severe strokes did not survive tolater time points. Control subjects were individuallymatched for degree of atherosclerosis, in addition to ageand sex, because each of these variables are known toinfluence peripheral inflammatory markers, including IL-6 and neopterin [43]. The rationale for carotid artery ste-nosis and ABPI thresholds for 'significant atherosclerosis'used in the present study was guided by the available evi-dence, as discussed previously [6]. Possible criticisms ofthe present study might include our relatively small sam-ple size and multiple statistical testing. We may havemissed some associations through the former, and mayhave identified spurious associations through the latter.However, we clearly stated the primary questions at thestudy outset and believe that we are reporting data thatshould provide an important stimulus for further study.
ConclusionThe present data confirm the association between periph-eral inflammatory markers and stroke and also drawattention to the potential confounding issue of the associ-ation between stroke and atherosclerosis. Peripheralblood cells appear to make no major contribution to theplasma cytokine concentration after stroke and, comparedto age-, sex-, and atherosclerosis-matched control sub-jects, are relatively resistant to activation by LPS. Thisreduced production of cytokines is significantly correlatedwith worse outcome and mortality, and highlights thepotential of identifying vulnerable subjects for treatment.
Competing interestsThe author(s) declare that they have no competing inter-ests.
Authors' contributionsHCAE conducted the study and analysed the data, carriedout assays and drafted the manuscript. CJS, CMG, RFGand EMB all participated in the conduct of the studyincluding patient recruitment, follow-up assessments andsample preparation. KI, SS, VW and MEH carried outassays and cytokine mRNA measurements. AV advised onstudy design and statistical analysis. NJR, PJT and SJH con-ceived of the study, secured funding, and participated inits design and coordination. All authors read andapproved the final manuscript.
AcknowledgementsWe would like to thank Gregory J del Zoppo and John M Hallenbeck for their helpful discussions during this work. We would like to acknowledge Professor MG Walker, Manchester Royal Infirmary, who kindly helped with the assessment of carotid artery disease. We would also like to thank Miss Paula Beech and Mr Noel Kelso for their assistance during this work, and Mr Paul Reed for his help with setting up the HPLC assay.
This study was funded by a grant from Research into Ageing, provided by the UK Community Fund, and supported by Salford Royal Hospitals National Health Service (NHS) Trust Research and Development Directo-rate. HCAE is funded by the University of Liverpool. CJS is funded by the Stroke Association. EMB, CMG, MH and SJH are funded by Salford Royal Hospitals' NHS Trust. NJR is supported by the Medical Research Council. AV, KI, SS RFG and PJT are funded by the University of Manchester.
References1. Hallenbeck JM: The many faces of tumour necrosis factor in
stroke. Nat Med 2002, 8(12):1363-1368.2. Allan SM, Tyrrell PJ, Rothwell NJ: Interleukin-1 and neuronal
injury. Nat Rev Immunol 2005, 5:629-640.3. Tarkowski E, Rosengren L, Blomstrand C, Wikkelsö C, Jensen C,
Ekholm S, Tarkowski A: Early intrathecal production of inter-leukin-6 predicts the size of brain lesion in stroke. Stroke 1995,26:1393-1398.
4. Tomimoto H, Akiguchi I, Wakita H, Kinoshita A, Ikemoto A, Naka-mura S, Kimura J: Glial expression of cytokines in the brains ofcerebrovascular disease patients. Acta Neuropathol 1996,92:281-7.
5. Sairanen T, Carpen O, Karjalainen-Lindsberg ML, Paetau A, TurpeinenU, Kaste M, Lindsberg PJ: Evolution of cerebral tumor necrosisfactor-alpha production during human ischemic stroke.Stroke 2001, 32(8):1750-1758.
6. Emsley HCA, Smith CJ, Gavin CM, Georgiou RF, Vail A, Barberan EM,Hallenbeck JM, del Zoppo GJ, Rothwell NJ, Tyrrell PJ, Hopkins SJ: Anearly and sustained peripheral inflammatory response inacute ischaemic stroke: relationships with infection andatherosclerosis. J Neuroimmunol 2003, 139:93-101.
7. Smith CJ, Emsley HCA, Gavin CM, Georgiou RF, Vail A, Barberan EM,del Zoppo GJ, Hallenbeck JM, Rothwell NJ, Hopkins SJ, Tyrrell PJ:Peak plasma interleukin-6 and other peripheral markers ofinflammation in the first week of ischaemic stroke correlatewith brain infarct volume, stroke severity and long-term out-come. BMC Neurol 2004, 4:2.
8. Fassbender K, Rossol S, Kammer T, Daffertshofer M, Wirth S, Doll-man M, Hennerici M: Proinflammatory cytokines in serum ofpatients with acute cerebral ischemia: kinetics of secretionand relation to the extent of brain damage and outcome ofdisease. J Neurol Sci 1994, 122:135-139.
9. Mazzotta G, Sarchielli P, Caso V, Paciaroni M, Floridi A, Floridi A, Gal-lai V: Different cytokine levels in thrombolysis patients aspredictors for clinical outcome. Eur J Neurol 2004, 11:377-81.
10. Beamer NB, Coull BM, Clark WM, Hazel JS, Silberger JR: Inter-leukin-6 and interleukin-1 receptor antagonist in acutestroke. Ann Neurol 1995, 37:800-804.
11. Beamer NB, Coull BM, Clark WM, Briley DP, Wynn M, Sexton G:Persistent inflammatory response in stroke survivors. Neurol-ogy 1998, 50:1722-1728.
12. Carlstedt F, Lind L, Lindahl B: Proinflammatory cytokines, meas-ured in a mixed population on arrival in the emergencydepartment, are related to mortality and severity of disease.J Intern Med 1997, 242:351-365.
13. Vila N, Castillo J, Dávalos A, Chamorro A: Proinflammatorycytokines and early neurological worsening in ischemicstroke. Stroke 2000, 31(10):2325-2329.
14. Zaremba J, Skrobanski P, Losy J: Tumour necrosis factor-alpha isincreased in the cerebrospinal fluid and serum of ischaemicstroke patients and correlates with the volume of evolvingbrain infarct. BioMed Pharmacother 2001, 55(5):258-263.
15. Perini F, Morra M, Alecci M, Galloni E, Marchi M, Toso V: Temporalprofile of serum anti-inflammatory and pro-inflammatory
Page 11 of 12(page number not for citation purposes)
http://www.ncbi.nlm.nih.gov/entrez/query.fcgi?cmd=Retrieve&db=PubMed&dopt=Abstract&list_uids=7631343
http://www.ncbi.nlm.nih.gov/entrez/query.fcgi?cmd=Retrieve&db=PubMed&dopt=Abstract&list_uids=7631343
http://www.ncbi.nlm.nih.gov/entrez/query.fcgi?cmd=Retrieve&db=PubMed&dopt=Abstract&list_uids=8870830
http://www.ncbi.nlm.nih.gov/entrez/query.fcgi?cmd=Retrieve&db=PubMed&dopt=Abstract&list_uids=8870830
http://www.ncbi.nlm.nih.gov/entrez/query.fcgi?cmd=Retrieve&db=PubMed&dopt=Abstract&list_uids=8021695
http://www.ncbi.nlm.nih.gov/entrez/query.fcgi?cmd=Retrieve&db=PubMed&dopt=Abstract&list_uids=8021695
http://www.ncbi.nlm.nih.gov/entrez/query.fcgi?cmd=Retrieve&db=PubMed&dopt=Abstract&list_uids=8021695
http://www.ncbi.nlm.nih.gov/entrez/query.fcgi?cmd=Retrieve&db=PubMed&dopt=Abstract&list_uids=7778854
http://www.ncbi.nlm.nih.gov/entrez/query.fcgi?cmd=Retrieve&db=PubMed&dopt=Abstract&list_uids=7778854
http://www.ncbi.nlm.nih.gov/entrez/query.fcgi?cmd=Retrieve&db=PubMed&dopt=Abstract&list_uids=7778854
http://www.ncbi.nlm.nih.gov/entrez/query.fcgi?cmd=Retrieve&db=PubMed&dopt=Abstract&list_uids=9633717

BMC Neurology 2007, 7:5 http://www.biomedcentral.com/1471-2377/7/5
Publish with BioMed Central and every scientist can read your work free of charge
"BioMed Central will be the most significant development for disseminating the results of biomedical research in our lifetime."
Sir Paul Nurse, Cancer Research UK
Your research papers will be:
available free of charge to the entire biomedical community
peer reviewed and published immediately upon acceptance
cited in PubMed and archived on PubMed Central
yours — you keep the copyright
Submit your manuscript here:http://www.biomedcentral.com/info/publishing_adv.asp
BioMedcentral
interleukins in acute ischemic stroke patients. Neurol Sci 2001,22:289-296.
16. Vila N, Castillo J, Dávalos A, Esteve A, Planas AM, Chamorro A: Lev-els of anti-inflammatory cytokines and neurological worsen-ing in acute ischemic stroke. Stroke 2003, 34:671-675.
17. Kostulas N, Pelidou SH, Kivisakk P, Kostulas V, Link H: Increased IL-1beta, IL-8, and IL-17 mRNA expression in blood mononu-clear cells observed in a prospective ischemic stroke study.Stroke 1999, 30:2174-9.
18. Grau AJ, Aulmann M, Lichy C, Meiser H, Buggle F, Brandt T, Grond-Ginsbach C: Increased cytokine release by leucocytes in survi-vors of stroke at young age. Eur J Clin Invest 2001, 31:999-1006.
19. Ferrarese C, Mascarucci P, Zoia C, Cavarretta R, Frigo M, Begni B,Sarinella F, Frattola L, De Simoni MG: Increased cytokine releasefrom peripheral blood cells after acute stroke. J Cereb BloodFlow Metab 1999, 19(9):1004-1009.
20. Gavin CM, Smith CJ, Emsley HCA, Hughes DG, Turnbull IW, Vail A,Tyrrell PJ: Reliability of a semi-automated technique of cere-bral infarct volume measurement with CT. Cerebrovasc Dis2004, 18(3):220-6.
21. Emsley HCA, Smith CJ, Georgiou RF, Vail A, Hopkins SJ, Rothwell NJ,Tyrrell PJ, for the IL-1ra in Acute Stroke Investigators: A ran-domised phase II study of interleukin-1 receptor antagonistin acute stroke patients. J Neurol Neurosurg Psychiatry 2005,76:1366-72.
22. Hoadley ME, Hopkins SJ: Simple, quantitative measurement ofcytokine gene expression using an immunometric reversetranscriptase-polymerase chain reaction. J Immunol Methods2003, 282:135-145.
23. Luheshi GN, Gardner JD, Rushforth DA, Loudon AS, Rothwell NJ:Leptin actions on food intake and body temperature aremediated by IL-1. Proc Natl Acad Sci USA 1999, 96:7047-7052.
24. Söderberg S, Stegmayr B, Ahlbeck-Glader C, Slunga-Birgander L,Ahrén B, Olsson T: High leptin levels are associated withstroke. Cerebrovasc Dis 2003, 15:63-69.
25. Castillo J, Angeles Moro M, Blanco M, Leira R, Serena J, Lizasoain I,Davalos A: The release of tumor necrosis factor-α is associ-ated with ischemic tolerance in human stroke. Ann Neurol2003, 54:811-819.
26. Fassbender K, Dempfle C-E, Mielke O, Rossol S, Schneider S, DollmanM, Hennerici M: Proinflammatory cytokines: indicators ofinfection in high-risk patients. J Lab Clin Med 1997, 130:535-539.
27. Elkind MS, Cheng J, Boden-Albala B, Rundek T, Thomas J, Chen H,Rabbani LE, Sacco RL, Thrift AG: Tumor necrosis factor receptorlevels are associated with carotid atherosclerosis. Stroke2002, 33:31-38.
28. Smith DA, Irving SD, Sheldon J, Cole D, Kaski JC: Serum levels ofthe antiinflammatory cytokine interleukin-10 are decreasedin patients with unstable angina. Circulation 2001, 104:746-749.
29. Caligiuri G, Rudling M, Ollivier V, Jacob MP, Michel JB, Hansson GK,Nicoletti A: Interleukin-10 deficiency increases atherosclero-sis, thrombosis, and low-density lipoproteins in apolipopro-tein E knockout mice. Mol Med 2003, 9:10-17.
30. Grau AJ, Reis A, Buggle F, Al-Khalaf A, Werle E, Valois N, Bertram M,Becher H, Grond-Ginsbach C: Monocyte function and plasmalevels of interleukin-8 in acute ischemic stroke. J Neurol Sci2001, 192:41-47.
31. Tatzber F, Rabl H, Koriska K, Erhart U, Puhl H, Waeg G, Krebs A,Esterbauer H: Elevated serum neopterin levels in atheroscle-rosis. Atherosclerosis 1991, 89:203-208.
32. Anwaar I, Gottsäter A, Lindgärde F, Mattiasson I: Increasing plasmaneopterin and persistent plasma endothelin during follow-upafter acute cerebral ischemia. Angiology 1999, 50:1-8.
33. Freeman R, Wheeler J, Robertson H, Paes ML, Laidler J: In-vitroproduction of TNF-alpha in blood samples. Lancet 1990,336:312-313.
34. Murch S, MacDonald T, Goldin RD, Hunt NCA, Riches PG, GoodingR: In-vitro production of cytokines in serum. Lancet 1990,336:687-688.
35. Keel M, Schregenberger N, Steckholzer U, Ungethum U, Kenney J,Trentz O, Ertel W: Endotoxin tolerance after severe injury andits regulatory mechanisms. J Trauma 1996, 41:430-437.
36. Majetschak M, Borgermann J, Waydhas C, Obertacke U, Nast-KolbD, Schade FU: Whole blood tumor necrosis factor-alpha pro-duction and its relation to systemic concentrations of inter-leukin 4, interleukin 10, and transforming growth factor-
beta1 in multiply injured blunt trauma victims. Crit Care Med2000, 28:1847-1853.
37. Woiciechowsky C, Schoning B, Daberkow N, Asche K, StoltenburgG, Lanksch WR, Volk HD: Brain IL-1beta induces local inflam-mation but systemic anti-inflammatory response throughstimulation of both hypothalamic-pituitary-adrenal axis andsympathetic nervous system. Brain Res 1999, 816:563-71.
38. Prass K, Meisel C, Hoflich C, Braun J, Halle E, Wolf T, Ruscher K,Victorov IV, Priller J, Dirnagl U, Volk HD, Meisel A: Stroke-inducedimmunodeficiency promotes spontaneous bacterial infec-tions and is mediated by sympathetic activation reversal bypoststroke T helper cell type 1-like immunostimulation. JExp Med 2003, 198:725-36.
39. DeRijk R, Michelson D, Karp B, Petrides J, Galliven E, Deuster P, Paci-otti G, Gold PW, Sternberg EM: Exercise and circadian rhythm-induced variations in plasma cortisol differentially regulateinterleukin-1 beta (IL-1 beta), IL-6, and tumor necrosis fac-tor-alpha (TNF alpha) production in humans: high sensitivityof TNF alpha and resistance of IL-6. J Clin Endocrinol Metab 1997,82:2182-91.
40. Bergmann M, Gornikiewicz A, Sautner T, Waldmann E, Weber T, Mit-tlbock M, Roth E, Fugger R: Attenuation of catecholamine-induced immunosuppression in whole blood from patientswith sepsis. Shock 1999, 12:421-7.
41. Langhorne P, Stott DJ, Robertson L, MacDonald J, Jones L, McAlpineC, Dick F, Taylor GS, Murray G: Medical complications afterstroke: a multicenter study. Stroke 2000, 31:1223-1229.
42. Meisel C, Prass K, Braun J, Victorov I, Wolf T, Megow D, Halle E, VolkHD, Dirnagl U, Meisel A: Preventive antibacterial treatmentimproves the general medical and neurological outcome in amouse model of stroke. Stroke 2004, 35:2-6.
43. Erren M, Reinecke H, Junker R, Fobker M, Schulte H, Schurek JO,Kropf J, Kerber S, Breithardt G, Assmann G, Cullen P: Systemicinflammatory parameters in patients with atherosclerosis ofthe coronary and peripheral arteries. Arterioscler Thromb VascBiol 1999, 19:2355-2363.
Pre-publication historyThe pre-publication history for this paper can be accessedhere:
http://www.biomedcentral.com/1471-2377/7/5/prepub
Page 12 of 12(page number not for citation purposes)
http://www.ncbi.nlm.nih.gov/entrez/query.fcgi?cmd=Retrieve&db=PubMed&dopt=Abstract&list_uids=9390642
http://www.ncbi.nlm.nih.gov/entrez/query.fcgi?cmd=Retrieve&db=PubMed&dopt=Abstract&list_uids=9390642
http://www.ncbi.nlm.nih.gov/entrez/query.fcgi?cmd=Retrieve&db=PubMed&dopt=Abstract&list_uids=1793448
http://www.ncbi.nlm.nih.gov/entrez/query.fcgi?cmd=Retrieve&db=PubMed&dopt=Abstract&list_uids=1793448
http://www.ncbi.nlm.nih.gov/entrez/query.fcgi?cmd=Retrieve&db=PubMed&dopt=Abstract&list_uids=9924883
http://www.ncbi.nlm.nih.gov/entrez/query.fcgi?cmd=Retrieve&db=PubMed&dopt=Abstract&list_uids=9924883
http://www.ncbi.nlm.nih.gov/entrez/query.fcgi?cmd=Retrieve&db=PubMed&dopt=Abstract&list_uids=9924883
http://www.ncbi.nlm.nih.gov/entrez/query.fcgi?cmd=Retrieve&db=PubMed&dopt=Abstract&list_uids=1973999
http://www.ncbi.nlm.nih.gov/entrez/query.fcgi?cmd=Retrieve&db=PubMed&dopt=Abstract&list_uids=1973999
http://www.ncbi.nlm.nih.gov/entrez/query.fcgi?cmd=Retrieve&db=PubMed&dopt=Abstract&list_uids=8810959
http://www.ncbi.nlm.nih.gov/entrez/query.fcgi?cmd=Retrieve&db=PubMed&dopt=Abstract&list_uids=8810959
http://www.ncbi.nlm.nih.gov/entrez/query.fcgi?cmd=Retrieve&db=PubMed&dopt=Abstract&list_uids=9878881
http://www.ncbi.nlm.nih.gov/entrez/query.fcgi?cmd=Retrieve&db=PubMed&dopt=Abstract&list_uids=9878881
http://www.ncbi.nlm.nih.gov/entrez/query.fcgi?cmd=Retrieve&db=PubMed&dopt=Abstract&list_uids=9878881
http://www.ncbi.nlm.nih.gov/entrez/query.fcgi?cmd=Retrieve&db=PubMed&dopt=Abstract&list_uids=9215292
http://www.ncbi.nlm.nih.gov/entrez/query.fcgi?cmd=Retrieve&db=PubMed&dopt=Abstract&list_uids=9215292