Binocular rivalry with peripheral prisms used for hemianopia rehabilitation
Upload
uni-marburgCategory
view
1download
0
Binocular rivalry – frontal activity relates to introspection and 1
action, but not to perception 2
3
Stefan Frässle*1,2
, Jens Sommer2, Andreas Jansen
2, Marnix Naber
1,3-5 & 4
Wolfgang Einhäuser1,6
5
6 1Department of Neurophysics, Philipps-University, 35032 Marburg, Germany 7
2Section BrainImaging, Department of Psychiatry and Psychotherapy, Philipps-University, 8
35037 Marburg, Germany 9 3Vision Sciences Laboratory, Harvard University, 02138 MA, Cambridge, USA 10
4Cognitive Psychology Unit, Leiden University, 2333AK, Leiden, The Netherlands 11
5Leiden Institute for Brain and Cognition, Leiden, 2300RC, Leiden, The Netherlands 12
6Center for Interdisciplinary Research (ZiF), 33615 Bielefeld, Germany 13
14
Address for Correspondence 15 Stefan Frässle 16
Philipps-University Marburg 17
Section BrainImaging, Department of Psychiatry and Psychotherapy 18
Rudolf-Bultmann-Straße 8 19
35037 Marburg, Germany 20
Phone: +49 6421 5865076 21
23
24
Abbreviated title 25 Neural correlates of binocular rivalry 26
27
28
Number of pages: 36 29
Number of figures: 3 30
Number of tables: 2 31
Number of multimedia: 0 32
Number of 3D models: 0 33
34
Number of words (abstract): 247 words 35
Number of words (introduction): 499 words 36
Number of words (discussion): 1498 words 37
38
39
Conflict of interest 40 The authors declare no competing financial interests. 41
42
Acknowledgements 43 This work was supported by the von Behring Röntgen Stiftung grant 57-0032 (to J.S.), the 44
Else Kröner-Fresenius Stiftung grant 2012_A219 (to A.J.), the Dutch NWO Rubicon 446-11-45
013 and the Marie Curie Cofund Action (to M.N.), and the German Research Foundation 46
(DFG) grant no. EI 852-3 (to W.E.). We thank Alexander Platzner for technical support as 47
well as Sören Krach and Frieder Paulus for fruitful discussions. 48
49
Major changes and additions are highlighted in blue font. 50

Page 2 of 36
Abstract 1
When two dissimilar stimuli are presented to the eyes, perception alternates between multiple 2
interpretations, a phenomenon dubbed binocular rivalry. Numerous recent imaging studies 3
have attempted to unveil neural substrates underlying multi-stable perception. However, these 4
studies had a conceptual constraint: access to observers’ perceptual state relied on their 5
introspection and active report. Here we investigate to what extent neural correlates of 6
binocular rivalry in healthy humans are confounded by this subjective measure and by action. 7
We use the optokinetic nystagmus (OKN) and pupil size to objectively and continuously map 8
perceptual alternations for binocular-rivalry stimuli. Combining these two measures with 9
functional magnetic resonance imaging (fMRI) allows us to assess the neural correlates of 10
binocular rivalry time-locked to the perceptual alternations in the absence of active report. 11
When observers are asked to actively report their percept, our objective measures matched the 12
report. In this active condition, objective measures and subjective report identify occipital, 13
parietal and frontal areas to underlie the processing of binocular rivalry, replicating earlier 14
findings. Furthermore, objective measures provide additional statistical power due to their 15
continuous nature. Importantly, when observers passively experience rivalry without 16
reporting perceptual alternations, a different picture emerges: differential neural activity in 17
frontal areas is absent, whereas activation in occipital and parietal regions persists. Our results 18
question the popular view of a driving role of frontal areas in the initiation of perceptual 19
alternations during binocular rivalry. Instead we conclude that frontal areas are associated 20
with active report and introspection rather than with rivalry per se. 21

Page 3 of 36
Introduction 1
Our brain continuously infers a unique perception from ambiguous information. Rivalry 2
makes this ambiguity explicit, with awareness alternating between multiple interpretations of 3
a constant stimulus (Dutour, 1760; Necker, 1832). Specifically, “binocular rivalry” occurs 4
when dissimilar images are presented to the eyes (Wheatstone, 1838). 5
A pioneering study on neural foundations of binocular rivalry tagged one stimulus by having 6
it flicker at a fixed frequency (Lansing, 1964). Whenever this stimulus dominated perception, 7
the flicker frequency was seen prominently in the electroencephalogram (EEG). EEG activity 8
signaling a preceding reversal first occurs at occipital electrodes (120 ms after stimulus onset) 9
and later at parietal (250 ms) and frontal (410 ms) sites (Kornmeier and Bach, 2005). 10
Using functional magnetic resonance imaging (fMRI), rivalry-related activity was located 11
throughout the visual hierarchy: in the lateral geniculate nucleus (LGN) (Haynes et al., 2005; 12
Wunderlich et al., 2005), striate cortex (V1) (Polonsky et al., 2000; Tong, 2003; Lee et al., 13
2005; Meng et al., 2005) and higher regions (e.g., Tong et al., 1998). Pattern recognition 14
techniques allow decoding the perceptual state from V1 and early extra-striate (V2, V3) 15
activity (Haynes and Rees, 2005). With the exception of LGN (Lehky and Maunsell, 1996), 16
the ubiquity of rivalry representations also holds in non-human primates: neurons responsive 17
to the dominant percept (rather than to the stimulus) are found throughout the visual hierarchy 18
(Logothetis and Schall, 1989; Leopold and Logothetis, 1996), with increasing numbers 19
towards higher areas (Sheinberg and Logothetis, 1997). 20
While visual areas represent physical and rivalry switches, BOLD activity in human parietal 21
and frontal regions seems exclusive to rivalry switches (Lumer et al., 1998), and further 22
evidence has been mounting that fronto-parietal networks play a causal role in triggering 23
perceptual switches (Leopold and Logothetis, 1999; Sterzer and Kleinschmidt, 2007; Sterzer 24
et al., 2009). Knapen et al. (2011) have recently challenged this notion: they found that in 25
fronto-parietal regions perceptual switches only elicited a different neural activity from abrupt 26

Page 4 of 36
physical stimulus changes. If instead transitions mimicked the wave-like pattern of actual 1
rivalry transitions, activity for rivalry and physical switches was indistinguishable. As 2
possible explanations, the authors suggested that fronto-parietal networks react to changes in 3
perceptual experience, attentional load or task demands associated therewith. Here we extend 4
this suggestion. We note that the report of one’s perception modulates rivalry (Beets et al., 5
2010) and – besides the pure motor act – requires continuous self-monitoring of one’s own 6
perceptual state. Such self-monitoring is typically attributed to frontal areas, as evidenced by 7
lesion (Lezak, 1983) and imaging data (Gusnard et al., 2001). Hence we hypothesize that the 8
frontal activation typically seen in rivalry is attributable to increased self-monitoring around 9
perceptual switches. Under this hypothesis, frontal activation should be largely reduced when 10
no active report is required. To continuously link neural activity to an observers' perceptual 11
state in the absence of report, we adapted a recent paradigm (Naber et al., 2011) for fMRI. 12
Contrasting BOLD activity for passive experience to active report allows for the first time 13
dissociating effects of rivalry per se from self-monitoring perceptual changes. 14

Page 5 of 36
Materials and Methods 1
Observers 2
Twenty observers (9 male, 11 female, age: 19-30 years) participated in the experiment. All 3
were healthy and had no history of neurological or psychiatric diseases. Further inclusion 4
criteria were right-handedness with an index exceeding +70 according to the Edinburgh 5
Inventory of Handedness (Oldfield, 1971), a visual acuity index higher than 0.9 without visual 6
aids according to the Freiburg Visual Acuity & Contrast Test (FrACT; Bach, 1996), and 7
normal color vision according to the Farnsworth Test (Farnsworth, 1943). Except for one 8
(author SF), all observers were naïve to the purpose of the experiment. They gave informed 9
written consent before the study. The study conformed to the Declaration of Helsinki and was 10
approved by the local ethics committee of the Medical faculty of the Philipps-University 11
Marburg. 12
Stimuli 13
We adapted a previously developed paradigm that allows decoding the observers’ perception 14
in binocular rivalry without relying on their active report (Naber et al., 2011) for the use in 15
fMRI. The paradigm exploits the optokinetic nystagmus (OKN) and the pupil reflex as 16
objective measures of the currently dominant percept. These "reflexes" follow the perceived 17
rather than the physical stimulus (perceived motion direction and luminance, respectively) 18
and have widely been used in human (Enoksson, 1963; Lorber et al., 1965; Brenner et al., 19
1969; Fox et al., 1975; Fahle et al., 2011; Naber et al., 2011) and animal studies (Logothetis 20
and Schall, 1990; Fries et al., 1997) of rivalry, though not in the context of human imaging. 21
We used two types of binocular-rivalry stimuli, static and dynamic gratings as detailed below. 22
For the dynamic stimulus, the currently dominant percept was decoded from the direction of 23
the OKN slow-phase; for the static stimulus, the currently dominant percept was decoded 24
Page 6 of 36
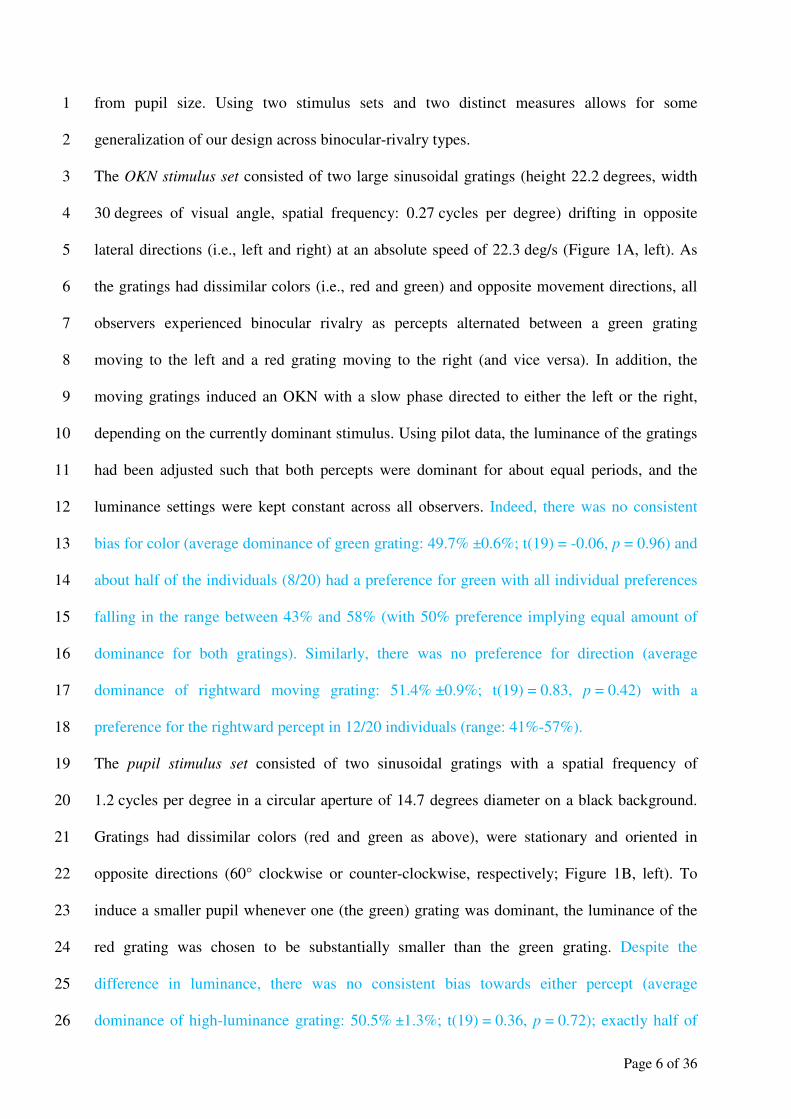
from pupil size. Using two stimulus sets and two distinct measures allows for some 1
generalization of our design across binocular-rivalry types. 2
The OKN stimulus set consisted of two large sinusoidal gratings (height 22.2 degrees, width 3
30 degrees of visual angle, spatial frequency: 0.27 cycles per degree) drifting in opposite 4
lateral directions (i.e., left and right) at an absolute speed of 22.3 deg/s (Figure 1A, left). As 5
the gratings had dissimilar colors (i.e., red and green) and opposite movement directions, all 6
observers experienced binocular rivalry as percepts alternated between a green grating 7
moving to the left and a red grating moving to the right (and vice versa). In addition, the 8
moving gratings induced an OKN with a slow phase directed to either the left or the right, 9
depending on the currently dominant stimulus. Using pilot data, the luminance of the gratings 10
had been adjusted such that both percepts were dominant for about equal periods, and the 11
luminance settings were kept constant across all observers. Indeed, there was no consistent 12
bias for color (average dominance of green grating: 49.7% ±0.6%; t(19) = -0.06, p = 0.96) and 13
about half of the individuals (8/20) had a preference for green with all individual preferences 14
falling in the range between 43% and 58% (with 50% preference implying equal amount of 15
dominance for both gratings). Similarly, there was no preference for direction (average 16
dominance of rightward moving grating: 51.4% ±0.9%; t(19) = 0.83, p = 0.42) with a 17
preference for the rightward percept in 12/20 individuals (range: 41%-57%). 18
The pupil stimulus set consisted of two sinusoidal gratings with a spatial frequency of 19
1.2 cycles per degree in a circular aperture of 14.7 degrees diameter on a black background. 20
Gratings had dissimilar colors (red and green as above), were stationary and oriented in 21
opposite directions (60° clockwise or counter-clockwise, respectively; Figure 1B, left). To 22
induce a smaller pupil whenever one (the green) grating was dominant, the luminance of the 23
red grating was chosen to be substantially smaller than the green grating. Despite the 24
difference in luminance, there was no consistent bias towards either percept (average 25
dominance of high-luminance grating: 50.5% ±1.3%; t(19) = 0.36, p = 0.72); exactly half of 26

Page 7 of 36
the observers (10/20) had slight preference for the high-luminance grating, the other half for 1
the low-luminance grating, with individual preferences ranging between 43% and 63% for the 2
high-luminance percept. 3
All stimuli were presented via MRI-compatible goggles (VisualSystem, NordicNeuroLab, 4
Milwaukee, WI, USA) attached to the MR head coil using a custom made mounting system. 5
Experimental Design 6
The experiment consisted of 32 trials, lasting 60.9 s each (corresponding to 42 functional 7
whole brain scans). To avoid fatigue, the experiment was split into two sessions of 16 trials. 8
Sessions were interleaved with a 15-minutes break during which structural scans were 9
acquired. Each session used one rivalry type (OKN/pupil). For each rivalry type, there were 4 10
conditions as described in detail below: a rivalry stimulus (rivalry trials) or a matched 11
physically changing stimulus (replay trials), and observers either actively reported visual 12
perception (active-report trials) or just passively experienced ongoing rivalry dynamics 13
(passive-viewing trials). Together with the two rivalry types, the experimental design 14
therefore was a three-way repeated measures within-subjects design. Each of the 3 factors had 15
two levels (TYPE: OKN/pupil; RIVAL: rivalry/replay; REPORT: active report/passive 16
viewing) resulting in a total of 8 different conditions; each condition was performed four 17
times during the experiment. 18
In rivalry trials, we presented different stimuli to each eye. In replay trials, we presented the 19
same stimuli to both eyes but simulated rivalry by physically changing both gratings. The 20
temporal dynamics of these physical alternations were based on observers’ button presses of 21
the preceding rivalry trial with active report. This way, we mimicked the time course of 22
binocular rivalry without actually exposing the observer to an ambiguous situation. 23
In active-report trials, observers had to indicate perceptual dominance of one or the other 24
percept by holding down the right-hand index or middle finger on a MRI-compatible response 25
box (i.e., perceptual alternations were characterized by switching from one to the other 26

Page 8 of 36
button). Observers were explicitly instructed to always indicate one percept as dominant (i.e., 1
most dominant), even when both percepts were partially visible (piecemeal rivalry). In 2
passive-viewing trials, observers just passively experienced perceptual alternations without 3
reporting their percept. 4
In the present study, the button presses served two functions: a) to verify the validity and 5
robustness of the objective measures and b) to ensure observers need to self-monitor their 6
own perceptual state more for active-report trials than for passive-viewing trials. Hence we 7
decided to use a straightforward instruction that all observers could readily comply with 8
inside the fMRI setting. As a consequence, our button-press data only contains information 9
about the dominant percept, but not about any degree of piecemeal rivalry, which is likely to 10
occur to some degree given the size of stimuli (O'Shea et al., 1997). While in debriefing most 11
observers indeed mentioned periods of piecemeal rivalry, each observer reported a unique 12
percept (by holding exactly one button) at least 95% of the time. This indicates that all 13
observers were able to comply with the instruction. Importantly, all main comparisons 14
(between passive viewing and active report) were based on the objective measures 15
(OKN/pupil). Since in both cases rivalry-replay contrasts were considered (see below), any 16
effect of piecemeal rivalry would affect both conditions (active-report / passive-viewing) 17
alike. It seems unlikely that the objective measures themselves, being continuous measures of 18
rivalry dynamics, are affected by the exact instruction regarding button presses. 19
To allow matching the temporal statistics of the simulated switches in replay trials closely to 20
the endogenous switches in awareness in rivalry trials, the trial sequence was: active report 21
rivalry, active report replay, passive viewing rivalry, passive viewing replay. This sequence 22
was repeated four times for each rivalry type. Both replay conditions simulated switches 23
based on the timing of the button presses in the preceding active-report rivalry trial. The order 24
of rivalry types (OKN/pupil) was balanced across observers. 25

Page 9 of 36
OKN velocity and pupil size as objective measures of perceptual state 1
To obtain OKN or pupil size as objective measures of perceptual alternations for the 2
respective rivalry type, videos of observers’ right eye were recorded at a rate of 60 Hz using 3
the camera integrated into the goggles. Videos had a resolution of 640x480 pixels, with 1 4
pixel corresponding to about 0.04 degrees of visual angle (since absolute position information 5
was not needed in the present experiment, we refrained from performing a calibration of the 6
eye-tracker to display coordinates per individual). Pupil size and location was extracted using 7
an open-source implementation of the starburst algorithm (Li and Parkhurst, 2005) in Matlab 8
R2009b (Mathworks, Natick, MA). 9
OKN 10
Since the head was fixed relative to the camera, and only eye velocity rather than absolute 11
position was of interest in the present context, the position of the pupil provided a sufficiently 12
robust estimate of gaze direction to analyze the horizontal component of the OKN. Analysis 13
focused on the OKN’s slow phase (the OKN component in the direction of the motion 14
direction of the stimulus), while the OKN’s fast phase (the component quickly reorienting the 15
eye opposite to the stimulus direction) was removed. Fast phases were detected as phases in 16
which the horizontal speed changed by more than 300 pix/s in 500 ms or the acceleration 17
exceeded 2500 pix/s2 and verified by visual inspection, as were blink onsets. After removal of 18
blinks and fast phases, the resulting signal was interpolated linearly and high-frequency noise 19
was suppressed by averaging with a 500 ms wide sliding average. 20
As the OKN changed direction according to the dominant percept, the OKN slow-phase 21
velocity moved back and forth from positive (rightwards movement) to negative (leftwards 22
movement) velocities (Figure 1A, right). The time points when horizontal eye velocity 23
crossed zero were defined times of perceptual alternations, provided the preceding maximum 24
(minimum) was larger (smaller) than 12 pix/s (-12 pix/s) and the temporally adjacent zero-25
crossing was at least 400 ms in temporal distance. 26

Page 10 of 36
Pupil size 1
To make data commensurate across observers, pupil size (area) in each trial was normalized 2
to z-score (zero mean and unit variance). Blinks were detected as above and pupil size was 3
interpolated linearly across blinks. High-frequency noise was suppressed by averaging with a 4
167 ms (10 samples) wide sliding average. From this low-pass filtered signal, the low-5
frequency trend, computed as sliding average over 4.167 s (250 samples), was subtracted. 6
Zero-crossing points of these z-normalized and detrended pupil traces that were preceded by a 7
sufficiently high maximum/minimum (±0.3 s.d.) and at least 400 ms apart from each other 8
were detected as timings of observers’ perceptual alternations during binocular rivalry. 9
MR image acquisition 10
Time courses of the observers’ brain activity were acquired using a 3-Tesla MR scanner 11
(Siemens Trio, Erlangen, Germany) with a 12 channel head matrix receive coil at the 12
Department of Psychiatry and Psychotherapy, Philipps-University Marburg. A T2*-weighted 13
gradient-echo echo-planar-imaging sequence (EPI) was used to provide functional images 14
sensitive to the Blood Oxygen Level Dependent (BOLD) contrast (parallel imaging factor of 15
2 (GRAPPA), 30 slices, TR = 1450 ms, TE = 25 ms, matrix size 64×64 voxels, voxel size 16
3×3×4 mm, gap size = 0.6 mm, flip angle 90°). Slices of the functional whole brain scans 17
were acquired in descending order and tilted relative to the intercommissural (AC-PC) plane 18
by 20° to reduce EPI-artifacts (Weiskopf et al., 2006; Weiskopf et al., 2007). A high-19
resolution anatomical image was acquired using a T1-weighted magnetization-prepared rapid 20
gradient-echo (3d MP-RAGE) sequence in sagittal plane (176 slices, TR = 1900 ms, 21
TE = 2.26 ms, matrix size 256×256 voxels, voxel size 1×1×1 mm, flip angle 9°) to allow for 22
subsequent coregistration with the functional images. During the experiment, the observers’ 23
head was placed in a helmet made of foam within the MR head coil to minimize scanner noise 24
and head movements. 25

Page 11 of 36
Processing of functional MR imaging data 1
Functional image preprocessing and analysis were conducted using the SPM8 software 2
package (Statistical Parametric Mapping, Wellcome Trust Center for Neuroimaging, London, 3
UK; http://www.fil.ion.ucl.ac.uk) and Matlab R2009b. The first four scans were discarded 4
from the analysis. Functional images were realigned to the mean image of each individual to 5
control for small head movements during the experiment. Using slice timing correction, we 6
further controlled for within-volume acquisition time differences. The corrected functional 7
images were coregistered with the high-resolution anatomical image and then spatially 8
normalized into the Montreal Neurological Institute (MNI) standard space using the unified 9
segmentation-normalization approach (Ashburner and Friston, 2005). Finally, normalized 10
functional images were spatially smoothed with an isotropic Gaussian smoothing kernel at a 11
full-width at half maximum of 6 mm. 12
Neural activity in each voxel of every observer was identified by means of a General Linear 13
Model (GLM; Friston et al., 1995; Worsley and Friston, 1995). We used an event-related 14
approach to define the timings of perceptual alternations during binocular rivalry. 15
Statistical power of continuous measures 16
As OKN speed and pupil size do not only serve as objective measures of perceptual switches 17
but also provide information on a continuous scale, we were first interested to what extent 18
such continuous measures may enhance the statistical power of a GLM. We therefore defined 19
three GLMs incorporating distinct information from the subjective or objective measures 20
during active-report trials as regressors in the design matrix (see details below). Additionally 21
the six motion parameters of both sessions, obtained during realignment of the functional 22
scans, were entered into each GLM as nuisance regressors to control for movement-related 23
artifacts. A high-pass filter with a cutoff period at 512 s was used to remove low-frequency 24
noise while the experimental variability remained unaffected. 25

Page 12 of 36
For the first GLM (“discrete subjective” analysis), the time points when observers pressed a 1
button were used as discrete onsets in our model. In the second GLM (“discrete objective” 2
analysis), discrete onsets were defined by the time points for which OKN or pupil size 3
indicated a shift from one percept to the other as defined above. In the third GLM 4
("continuous objective" analysis), the whole information of OKN slow phase velocity or pupil 5
size traces were used to form continuous regressors. For this purpose, traces were sub-6
sampled to match the repetition time of the functional scans (TR = 1.45 s). To image neural 7
activity as a function of alternations in awareness, only the absolute values of the traces were 8
used and absolute traces were then flipped (subtraction of the maximum and subsequent 9
multiplication with -1). This yielded traces where former zero-crossing points (i.e., timings of 10
perceptual alternations) appeared as regressor peaks in the data curves regardless of the 11
direction of the switch (similar to onsets in an event-related design). In order to use the 12
continuous regressors in the GLM, flipped traces were convolved with SPM’s canonical 13
hemodynamic response function (HRF). Fitting all three GLMs to the same functional data 14
allowed us to investigate how well subjective and objective measures explained the neural 15
mechanisms which underlie binocular rivalry in the brain. To do so, we ran linear contrast of 16
brain activation associated with the perception of a rivalry stimulus compared with a replay 17
stimulus (i.e., rivalry > replay) for each of the three GLMs in every observer. The individual 18
contrast images then entered three distinct random-effects group analyses (one-sample t-tests) 19
to assess the rivalry-related neural pattern for each analysis separately. To directly address 20
benefits of the continuous measures, we additionally ran post-hoc paired t-tests to reveal 21
whether differences between the subjective discrete and objective discrete analysis, as well as 22
between the subjective discrete and objective continuous analysis were statistically 23
significant. 24

Page 13 of 36
Comparing active report to passive viewing 1
In a subsequent analysis, we then investigated the effects of active report and introspection as 2
compared to passive viewing. By applying the continuous objective analysis based on OKN 3
speed or pupil size traces of passive-viewing trials, we addressed brain activity when 4
observers passively experience rivalry. To reveal effects of active report on the neural pattern, 5
we compared rivalry-related activation during active-report trials to passive-viewing trials for 6
each voxel. To do so, we defined a GLM for each observer based on the continuous objective 7
analysis for active-report and passive-viewing trials. Similar to the previous GLMs, the six 8
motion parameters of each session were entered as nuisance regressors and a high-pass filter 9
(cutoff period at 512 s) was used. From this GLM, we calculated linear contrasts revealing the 10
neural regions of rivalry-related activation during active-report and passive-viewing trials 11
separately. These contrasts were calculated for each rivalry type individually (i.e., restricted to 12
either OKN or pupil trials). This yielded 4 contrast images for each observer which then 13
entered a random-effects group analysis (2-way within-subject ANOVA). For each rivalry 14
type separately, we defined a linear contrast on the group level that revealed neural regions 15
where rivalry-related activation was higher during active-report compared with passive-16
viewing trials (“active report rivalry > active report replay” > “passive viewing rivalry > 17
passive viewing replay”). To pinpoint the neural loci that show higher rivalry-related 18
activation for active report than for passive viewing, a global null conjunction analysis was 19
conducted on the resultant two activation patterns (OKN ∩ pupil size). Using the conjunction 20
analysis we tested whether the obtained results were independent of the exact rivalry type. 21
For all group-level analyses, anatomical localization and characterization of the neural loci 22
was achieved using the Anatomical Automatic Labeling toolbox (AAL) within SPM8 23
(Tzourio-Mazoyer et al., 2002). 24

Page 14 of 36
Results 1
We robustly induced binocular rivalry inside the MR scanner by presenting two gratings with 2
distinct motion directions (Figure 1A, left) or luminance (Figure 1B, left). Since we were 3
interested in the effects of active report on neural activity patterns, we used two objective, 4
continuous measures (OKN and pupil size) of the dominant percept. We first verified 5
behaviorally that these measures were reliable indicators of the perceptual state and tested 6
how report and introspection influenced switching behavior; second, we replicated earlier 7
fMRI results based on active report alone; third, we tested the statistical power of using OKN 8
or pupil size as regressors in GLMs for fMRI analysis; forth, we tested whether passive 9
viewing yielded different neural activation patterns as compared to active report. 10
OKN and pupil size are reliable measures of subjective perception 11
First, we tested for the trials in which observers actively reported their perception whether 12
OKN and pupil-size measures were consistent with subjective report. We found that the speed 13
of the OKN's slow phase (Figure 1A, right) and pupil size (Figure 1B, right) changed as a 14
function of the perceptual state: OKN's slow phase was directed to the left when observers 15
reported a leftward moving percept to be dominant, and to the right, when the rightward 16
moving percept was dominant (Figure 1C). Differences in OKN direction were significant 17
between the two percepts (p < 0.05, t-test, FDR corrected, black line in Figure 1C) at each 18
time point from -2167 ms to -583 ms prior to the report of the transition, and from -317 ms 19
prior to 750 ms after. The cross-over point for OKN is seen at -450 ms before the report. This 20
indicates that OKN is consistent with button press data, but may respond somewhat quicker to 21
the perceptual switch than the manual response (see below for details). A similar pattern was 22
found not only in the average data on the group level, but also for each individual. Similarly, 23
for the stationary gratings differing in luminance, differences in pupil size were significant at 24

Page 15 of 36
each time point from -1767 ms to -767 ms prior to, and from -200 ms to 817 ms around the 1
report (Figure 1D), and again this pattern was consistently observed in each individual. 2
Besides testing for significant differences of the average traces, we measured how well OKN 3
and pupil size matched each observer's report. Provided the transition times defined by zero-4
crossings, OKN and pupil make a prediction of the observer's current perceptual state at any 5
point in time. As straightforward measure for the quality of this prediction, we determined the 6
fraction of time for which the prediction was correct with respect to the button-press data. By 7
testing a range of possible latencies between the objective measure and the button press from 8
0s to 2s and using the optimal latency for each individual, we found correct predictions for 9
82% ±2% of the time for OKN and 59% ±1% for pupil size. These numbers increased to 88% ±2% 10
and 83% ±1% in replay trials, possibly indicating a better time-locking due to the sharper transition in 11
replay as compared to more piecemealed transitions in rivalry. All these numbers were significantly 12
different (all p < 0.001, all t ≥ 7.78) from chance (50%). This verifies that OKN and pupil size are 13
reliable indicators of subjective perceptual experience. 14
Based on the optimal latencies, we can estimate the lag between objective indicators and manual 15
response to a perceptual transition during genuine rivalry. The transitions in the objective measures 16
preceded the report by about 400-500 ms (OKN: 0.52 ±0.07 s; pupil: 0.42 ±0.12 s). For rivalry, the 17
precise timing of the perceptual switch is obviously unknown. However, the replay conditions allow 18
an estimate of the typical latencies between physical switch and either measure. The lag between the 19
actual physical switch and the transition in the objective measure (OKN: 0.46 ±0.03 s, pupil: 20
0.30 ±0.11 s) is shorter than the lag between physical switch and report (OKN: 0.60 ±0.02 s, pupil: 21
0.61 ±0.10s). The smaller lag between objective measures and button presses in replay as compared to 22
rivalry is possibly a consequence of the sharper transition in replay, where piecemealing is not 23
simulated. However, even if piecemeal rivalry yields an additional delay, the inter-individual 24
variability is on the order of 0.1 s and thus substantially smaller than the latency between transition 25
and report. While this does not exclude that longer periods of piecemeal rivalry are subjectively 26
experienced, it indicates consistency as to how the observers comply with instructions. In any case, the 27

Page 16 of 36
objective measures are insensitive against the exact instruction and mode of report and thus against 1
putative effects of piecemeal rivalry. Even if piecemeal rivalry had a substantial effect it would affect 2
active-report and passive-viewing alike, and thus would not confound any of the comparisons between 3
these two conditions. 4
Active report speeds up rivalry 5
As next step we tested whether active report had an effect on the dynamics of perceptual 6
switching on a behavioral level. When comparing median dominance durations inferred from 7
active report (button presses) to those obtained from the objective measures, we already found 8
longer dominance durations in active-report trials when using button-press information 9
(button press in OKN trials: 1.78 ±0.16 s; OKN: 1.57 ±0.14 s; Z = -3.14, p = 0.002, Wilcoxon 10
test; button press in pupil trials: 1.74 ±0.15 s; pupil size: 1.48 ±0.04 s; Z = -2.39, p = 0.017; 11
Figure 1E), in line with earlier findings (Fahle et al., 2011; Naber et al., 2011). This difference 12
probably reflects that very short periods of dominance may affect the objective measures, 13
even if they do not last long enough to reach the threshold for report. This interpretation is 14
supported by shorter latencies for objective measures as compared to the button presses, as 15
computed above. Importantly, when comparing median dominance durations revealed by 16
objective measures for active report to those for passive viewing, rivalry slowed down for 17
passive-viewing trials (OKN: 1.58 ±0.17 s, pupil: 1.57 ±0.05 s). While this effect failed to 18
reach significance for the OKN stimulus set (Z = -0.26, p = 0.79) it was significant for the 19
pupil stimulus set (Z = -2.91, p = 0.004). This shows that the mere act of actively reporting 20
one's subjective perception influences rivalry dynamics, at least for the stationary gratings. 21
Neural activity during active report: replication of previous findings 22
When using only the button-press information, our active-report trials closely mimicked 23
previous paradigms of binocular rivalry in fMRI. Hence, we first tested whether our data 24
replicated previous findings on fronto-parietal networks in rivalry (e.g., Lumer et al., 1998). 25
The random-effects group analysis (one-sample t-test) on the linear contrast between rivalry 26

Page 17 of 36
and replay transitions during active report revealed a large network of cortical and subcortical 1
regions to underlie the processing of ambiguous visual input (Figure 2A). This rivalry-related 2
activation pattern was strongly lateralized to the right hemisphere and consisted primarily of 3
occipital, parietal and frontal brain regions (Table 1). We found this pattern consistently 4
across individuals. The patterns were qualitatively similar for both rivalry types, and indeed 5
for the same statistical threshold as above (cluster-extent threshold of p < 0.01, FWE 6
corrected, voxel level threshold of p < 0.001, uncorrected), we found no significant 7
differences between the neural patterns when restricting the analysis to either OKN or pupil 8
trials only. Using a more liberal cluster-extent threshold of p < 0.05 (uncorrected), we did find 9
differences, but only in occipital regions (V1). This difference is not surprising, given that for 10
the different rivalry types, different low-level features (orientation, motion direction) are 11
involved in the rivalry competition. Hence, our active-report trials replicate previous findings: 12
independent of rivalry type, rivalry seems to be mediated by occipital, parietal and frontal 13
regions predominantly in the right hemisphere of the brain. 14
OKN and pupil size as valid and powerful indicators of binocular rivalry’s neural 15
mechanisms during active report 16
As next step, we still restricted our analysis to the active-report trials, but compared the neural 17
patterns obtained by the button-press data with those obtained from the objective measures. 18
This allowed us to test the applicability of the objective measures to identify the neural 19
correlates of switches in perception. Unlike button presses, OKN speed and pupil size do not 20
only provide the discrete events of switch times, but their continuous value at any point in 21
time may also relate to strength of the dominance of the current percept. We therefore also 22
exploited this continuous nature of the objective measures, in addition to defining discrete 23
transition points (zero-crossings of OKN speed or pupil size). This results in 3 possible 24
analyses, which we refer to as "discrete subjective" (button presses), "discrete objective" 25
(zero-crossings of the objective measures) and "continuous objective" (time course of the 26

Page 18 of 36
continuous values of the objective measures), respectively. We tested if either the discrete 1
objective analysis or the continuous objective analysis increased the statistical power of the 2
GLM as compared to the discrete subjective analysis. 3
All three analyses revealed significant neural activity associated with perceptual alternations 4
during rivalry in occipital, parietal and frontal regions in the right hemisphere (Figure 2A-C). 5
Hence, using information from the objective measures yielded qualitatively similar results 6
compared with the discrete subjective analysis. Specifically, activation patterns revealed no 7
significant differences between the discrete subjective and discrete objective analysis given a 8
cluster-extent threshold of p < 0.01, FWE corrected (voxel level threshold p < 0.001, 9
uncorrected). This suggests that both discrete analyses were equally sensitive in mapping the 10
neural network underlying binocular rivalry. Remarkably, the continuous objective analysis 11
reached higher statistical power in the GLM than the discrete subjective analysis. These 12
benefits were significant given a cluster-extent threshold of p < 0.01, FWE corrected (voxel 13
level threshold p < 0.001, uncorrected). Importantly, this higher statistical power was not an 14
artifact of the continuous analysis having more data points, as all regressors had the same 15
length (continuous data were sub-sampled to the TR of the MR scanner). Neural loci showing 16
higher power for the continuous objective analysis were most prominently located in superior 17
occipital, superior parietal and middle frontal brain areas (Figure 2D). Noteworthy, this 18
benefit in statistical power was specifically restricted to the rivalry-related sites as we found 19
significant increase of t-values only for regions within the relevant network. Hence, the 20
increase of t-values was not caused by a global gain unrelated to rivalry but by the more 21
sensitive nature of the continuous measures in mapping the neural mechanism underlying 22
binocular rivalry. 23

Page 19 of 36
Report and introspection partially cause the typically observed neural-activation 1
patterns 2
So far we have shown that OKN and pupil size are valid and sensitive measures of the neural 3
mechanisms underlying binocular rivalry when active report was required. Extending beyond 4
this confirmation of earlier findings, these measures, however, also allowed us to measure the 5
neural correlates of rivalry when no active report was required, and thus to dissociate the 6
effects of rivalry switching per se from the effects of active report. 7
Comparing rivalry-related neural loci (i.e., rivalry > replay) for active-report and 8
passive-viewing trials based on the continuous objective analysis, at first glance revealed 9
qualitatively similar activation patterns (Figure 3A-B). Similar to the active-report condition, 10
the neural network revealed by the rivalry-versus-replay contrast was strongly lateralized to 11
the right hemisphere during passive-viewing trials. Activation within this network was 12
primarily located in the inferior occipital gyrus and the parietal lobe, as well as in the right 13
inferior orbitofrontal lobe. However, despite the similarities, there were also clear differences 14
in the activation patterns. The intensity of the rivalry-related neural network was reduced 15
when observers passively experienced binocular rivalry as compared to when they reported 16
perceptual alternations. Specifically, neural activation in the middle frontal gyrus was not 17
only diminished but completely vanished during passive-viewing trials. This pattern was 18
consistent for OKN and pupil trials separately: for the same statistical threshold as above 19
(cluster-extent threshold of p < 0.01, FWE corrected; voxel level threshold of p < 0.001, 20
uncorrected), we found significant differences between the rivalry types only in occipital 21
regions. Specifically, either V1 or V4 showed higher rivalry-related activation when the 22
analysis was restricted to OKN or pupil trials, respectively. Again, this is in line with early 23
visual areas' involvement in rivalry being related to the specific features of the stimuli used. In 24
contrast, the absence of differential frontal activation generalizes across the rivalry types 25
tested. 26

Page 20 of 36
To test whether the absence of activity in middle frontal regions during passive-viewing trials 1
is an effect of the chosen significance threshold, we explicitly tested significance for each 2
voxel individually. We calculated linear contrast images that reveal neural regions of rivalry-3
related activation for each report and indicator condition separately. These 4 contrast images 4
were then entered into a random-effects group analysis (2-way within-subject ANOVA). On 5
the group level, we conducted a global null conjunction analysis to pinpoint the neural loci 6
where rivalry-related activation was higher when observers reported their perception as 7
compared to when they passively experienced rivalry, regardless of the rivalry type. The 8
conjunction analysis revealed that neural loci showing significantly higher rivalry-related 9
activation during active-report trials (p < 0.001, uncorrected) were most prominently located 10
bilaterally in the middle frontal gyrus, where clusters were most extended (Figure 3C, Table 11
2). Furthermore, regions bilaterally within the supplementary motor areas, the insula and the 12
middle occipital lobe were more activated when observers reported their perception. The 13
conjunction analysis additionally revealed increased rivalry-related activity in the superior 14
and inferior parietal lobule in the left hemisphere due to report. This shows that the difference 15
in neural activation between active-report and passive-viewing trials is specific to certain, 16
predominantly frontal, regions and not due to a general up-regulation of the rivalry-related 17
network when active report is required. Hence, part of the neural activation pattern typically 18
observed for rivalry is a consequence of active report and possibly the associated requirement 19
for introspection about one's own perception. 20

Page 21 of 36
Discussion 1
We investigated the neural loci underlying perceptual alternations during binocular rivalry. 2
While previous brain-imaging studies relied on button presses and thus introspection as 3
measures of perceptual alternations, we adapted an objective approach for fMRI. Using 4
continuous and objective measures of perceptual alternations we dissociated activity related to 5
rivalry alternations from those merely related to active report or introspection. 6
Percept-related action modulates rivalry (Wohlschlager, 2000; Maruya et al., 2007; Beets et 7
al., 2010). Specifically, similar to the speed-up by attention (Paffen et al., 2006; Alais et al., 8
2010), report can accelerate rivalry. One possible cause for this report-related speed-up is 9
therefore increased attention when introspection is required for report. Several studies on the 10
relation of attention and awareness circumvented report of the perceptual state: Lee et al. 11
(2007) related the travelling-wave dynamics of transitions to cortical activity, while Watanabe 12
et al. (2011) and Yuval-Greenberg & Heeger (2013) used binocular-suppression paradigms. 13
Unlike our study, however, they induced perceptual transitions exogenously or used stimuli of 14
vastly different dominance. No rivalry imaging study has yet addressed the effect of report as 15
such. 16
We confirmed OKN and pupil as reliable indicators of rivalry dynamics. Their continuous 17
nature also increases the statistical power of the rivalry-replay contrast in the GLM, providing 18
a more sensitive way to map rivalry's neural processes than conventional analyses based on 19
button presses. Our large stimulus size makes it likely that the continuous measures capture 20
the transition process through periods of piecemeal rivalry - possibly reflecting neural 21
adaptation and reciprocal inhibition between percepts (van Loon et al., 2013), while button 22
presses do not. Importantly, however, regardless of whether button presses or reflexes were 23
used, all analyses for active-report trials revealed similar activation patterns. These patterns 24
were largely consistent with earlier fMRI studies (e.g., Lumer et al., 1998): the neural 25

Page 22 of 36
network underlying perceptual switches that are actively reported is strongly lateralized to the 1
right hemisphere and mainly consists of frontal, parietal and occipital regions. 2
To verify generalization, we compared pupil and OKN data. All imaging results were 3
indistinguishable between both types, except in occipital regions. These differences likely 4
result from distinct stimulus features, consistent with data on rivalry across areas when very 5
dissimilar stimuli compete (Tong et al., 1998). 6
Our objective measures allow fMRI analyses time-locked to perceptual transitions without 7
report. Already the standard approach (rivalry-replay contrasts) appears to discount effects of 8
action by mimicking the motor act in replay. However, whenever report is required, different 9
effects of attention to the stimulus in replay as compared to rivalry, different requirements for 10
performing the task (Knapen et al., 2011) or for self-monitoring, and the direct feedback of 11
action on perceptual representations (Wohlschlager, 2000; Beets et al., 2010) cannot be 12
dissociated from the endogenously triggered perceptual switch. Indeed, we find clear 13
differences between active-report and passive-viewing: rivalry-related activity is reduced or 14
absent when no report is required. Importantly, we find differences between the rivalry-replay 15
contrasts of the two report conditions, which excludes a pure motor-related effect (within each 16
report condition, motor requirements for rivalry and replay are identical). Direct comparison 17
shows that differences between active-report and passive-viewing condition are not a matter 18
of significance threshold. 19
The reduced BOLD signal for passive-viewing as compared to active-report condition is most 20
pronounced bilaterally in the middle frontal gyrus. This casts doubt on a driving role of 21
frontal areas in initiating perceptual alternations (Lumer et al., 1998; Leopold and Logothetis, 22
1999; Sterzer and Kleinschmidt, 2007; Sterzer et al., 2009). Instead, activity in frontal areas is 23
associated with active report and thus introspection rather than with rivalry per se. This 24
interpretation accords with a key role of those regions in introspection and self-monitoring 25
(Lezak, 1983; Gusnard et al., 2001; Goldberg et al., 2006). Hence, frontal areas are unlikely 26

Page 23 of 36
to induce changes in perceptual awareness; instead, they serve a monitoring role required for 1
reporting the change. 2
Additional regions show reduced rivalry-related activity during passive viewing: 1) bilaterally 3
in the supplementary motor area, which is involved in initiating hand movements (Grefkes et 4
al., 2008) such as button presses; 2) bilateral insula, involved in consciousness, self-awareness 5
and cognitive functions linked to emotions, including perception and motor-control (Craig, 6
2009); 3) neural loci within the inferior parietal lobule, responsible for the organization and 7
interpretation of motor action (Rozzi et al., 2008), and 4) the superior parietal lobule, involved 8
in sensorimotor integration by maintaining an internal representation of one's own state 9
(Wolpert et al., 1998). Together these data suggest that neural patterns typically observed 10
when rivalry is measured through the observers’ active report, in particular in frontal regions, 11
have a substantial relation to introspection, self-related processing and action. 12
Analogous to our study, a recent MEG study questioned the notion of a widespread network 13
underlying binocular rivalry (Kamphuisen et al., 2008): in contrast to earlier EEG/MEG 14
studies (Tononi et al., 1998; Srinivasan et al., 1999; Cosmelli et al., 2004), the increase in 15
neural activity associated with perceptual dominance of a tagged stimulus does not necessitate 16
a pan-cortical network for rivalry, but can be modeled by a limited set of occipital sources. 17
Two studies specifically challenged the causal role of frontal areas: De Graaf et al. (2011) 18
showed that transcranial magnetic stimulation to frontal areas modulates the rate of perceptual 19
switches under volitional control, but not of spontaneous switches; thus frontal areas are 20
responsible for voluntary top-down modulation, but not for initiating transitions. Knapen et al. 21
(2011) showed that rivalry transitions and exogenous changes during replay elicit 22
indistinguishable BOLD activity in fronto-parietal cortex, when replay simulates the spatio-23
temporal pattern of rivalry transitions faithfully. They suggested four hypotheses for the role 24
of frontal areas: 1) changes in visual experience differ in salience between rivalry and abrupt 25
physical changes, 2) task demands increase more for rivalry than for abrupt physical changes, 26

Page 24 of 36
3) continuous reorienting of spatial attention when following the wave-like transitions in 1
rivalry, and 4) task-switching between monitoring the end of a dominance period and 2
awaiting the next. 3
Our data selectively narrows down these possibilities to hypotheses 2 and 4. Unless salience 4
or re-orienting are assumed to be task-modulated, our data argue against hypothesis 1 and 3: 5
frontal activity is absent for passive-viewing, although rivalry and replay still differ in 6
salience and re-orienting demands. In our view, reporting triggers highest demands around the 7
transitions, which are – in line with hypothesis 2 – larger for rivalry transitions. Whether this 8
increase is generic or a specific switch between monitoring modes (hypothesis 4) may be 9
addressed in future research by combining Knapen et al's with our approach. Taken together, 10
there is strong evidence against frontal regions causing perceptual transitions. Instead, frontal 11
regions subserve a monitoring role that is modulated by the task at hand. 12
Using dynamic causal modelling (Friston et al., 2003), Weilnhammer et al. (2013) found 13
modulations of top-down connectivity from frontal regions to visual cortex while viewing a 14
bi-stable figure. Contrary to our conclusions, this argues for a driving role of the fronto-15
parietal network. However, the authors did not study binocular rivalry and relied on report. 16
Investigating effective connectivity in our paradigm remains an issue for future research. 17
Two other fMRI studies addressed rivalry-related activation without report. Lumer and Rees 18
(1999) measured functional correlations between cortical regions when observers passively 19
experienced rivalry. Activity in extrastriate visual areas, but not in V1, was correlated with 20
other extrastriate areas, and with parietal and frontal regions. This seemed to suggest frontal 21
and parietal areas as essential loci for rivalry and conscious vision. However, Lumer & Rees 22
could not relate activity to events of perceptual switches. Despite viewing passively, it is 23
likely that participants up- and down-regulated the degree to which they monitored their own 24
perceptual state. Periods of increased self-monitoring would then be associated with increased 25
fronto-parietal activity. Such endogenous up-regulation of self-monitoring would also 26

Page 25 of 36
enhance activity in visual areas. This simultaneous modulation, even if unrelated to 1
perceptual-transition events, could yield the observed correlations. This interpretation is 2
supported by the role of early visual areas in representing ambiguous stimuli (Polonsky et al., 3
2000; Tong, 2003; Lee et al., 2005; Meng et al., 2005), which suggests that activity related to 4
rivalry transitions should then also correlate with V1, contrary to Lumer and Rees’ 5
observations. Wilcke et al. (2009) had observers passively watch rivalry stimuli and used 6
binocular fusion (rather than permanent suppression) as control, excluding task-difficulty 7
differences between replay and rivalry (O'Shea and Corballis, 2005). They identified frontal, 8
parietal, occipital and limbic areas for the processing of ambiguous stimuli without report, 9
consistent with a separate active-report experiment. However, their design precluded time-10
locked analysis of switching for passive viewing, rendering any conclusion about a driving 11
(versus monitoring) role of frontal regions impossible. 12
Concluding, we, for the first time, use a design that combines an analysis time-locked (i.e., 13
event-related) to the perceptual switch with passive viewing in the same condition in fMRI. 14
While we cannot fully exclude that – for some forms of rivalry - frontal areas do play a role in 15
rivalry switching, based on the present data, their role in monitoring changes in awareness is 16
at least substantially larger than in inducing such changes. 17

Page 26 of 36
References 1
Alais D, van Boxtel J, Parker A, van Ee R (2010) Attending to auditory signals slows visual 2
alternations in binocular rivalry. Vision Res 50:929-935. 3
Ashburner J, Friston K (2005) Unified segmentation. Neuroimage 26:839-851. 4
Bach M (1996) The Freiburg Visual Acuity test--automatic measurement of visual acuity. 5
Optom Vis Sci 73:49-53. 6
Beets I, 't Hart B, Rosler F, Henriques D, Einhäuser W, Fiehler K (2010) Online action-to-7
perception transfer: Only percept-dependent action affects perception. Vision 8
Research 50:2633-2641. 9
Benjamini Y, Hochberg Y (1995) Controlling the false discovery rate - A practical and 10
powerful approach to multiple testing. Journal of the Royal Statistical Society Series 11
B-Methodological 57:289-300. 12
Brenner RL, Charles ST, Flynn JT (1969) Pupillary responses in rivalry and amblyopia. Arch 13
Ophthalmol 82:23-29. 14
Cosmelli D, David O, Lachaux JP, Martinerie J, Garnero L, Renault B, Varela F (2004) 15
Waves of consciousness: ongoing cortical patterns during binocular rivalry. 16
Neuroimage 23:128-140. 17
Craig A (2009) How do you feel - now? The anterior insula and human awareness. Nature 18
Reviews Neuroscience 10:59-70. 19
de Graaf TA, de Jong MC, Goebel R, van Ee R, Sack AT (2011) On the functional relevance 20
of frontal cortex for passive and voluntarily controlled bistable vision. Cereb Cortex 21
21:2322-2331. 22
Dutour E-F (1760) Discussion d'une question d'optique. In, pp 514-530. 23
Enoksson P (1963) Binocular Rivalry and Monocular Dominance studied with Optokinetic 24
Nystagmus. Acta Ophthalmol (Copenh) 41:544-563. 25

Page 27 of 36
Fahle MW, Stemmler T, Spang KM (2011) How Much of the "Unconscious" is Just Pre - 1
Threshold? Front Hum Neurosci 5:120. 2
Farnsworth D (1943) The Farnsworth-Munsell 100-hue and dichotomous tests for color 3
vision. Journal of the Optical Society of America 33:568-578. 4
Fox R, Todd S, Bettinger LA (1975) Optokinetic nystagmus as an objective indicator of 5
binocular rivalry. Vision Res 15:849-853. 6
Fries P, Roelfsema P, Engel A, Konig P, Singer W (1997) Synchronization of oscillatory 7
responses in visual cortex correlates with perception in interocular rivalry. 8
Proceedings of the National Academy of Sciences of the United States of America 9
94:12699-12704. 10
Friston KJ, Harrison L, Penny W (2003) Dynamic causal modelling. Neuroimage 19:1273-11
1302. 12
Friston KJ, Holmes AP, Poline JB, Grasby PJ, Williams SCR, Frackowiak RSJ, Turner R 13
(1995) Analysis of fMRI Time-Series Revisited. Neuroimage 2:45-53. 14
Goldberg II, Harel M, Malach R (2006) When the brain loses its self: prefrontal inactivation 15
during sensorimotor processing. Neuron 50:329-339. 16
Grefkes C, Eickhoff S, Nowak D, Dafotakis M, Fink G (2008) Dynamic intra- and 17
interhemispheric interactions during unilateral and bilateral hand movements assessed 18
with fMRI and DCM. Neuroimage 41:1382-1394. 19
Gusnard DA, Akbudak E, Shulman GL, Raichle ME (2001) Medial prefrontal cortex and self-20
referential mental activity: relation to a default mode of brain function. Proc Natl Acad 21
Sci U S A 98:4259-4264. 22
Haynes J, Rees G (2005) Predicting the stream of consciousness from activity in human 23
visual cortex. Curr Biol 15:1301-1307. 24
Haynes JD, Deichmann R, Rees GCP (2005) Eye-specific effects of binocular rivalry in the 25
human lateral geniculate nucleus. Nature 438:496-499. 26

Page 28 of 36
Kamphuisen A, Bauer M, van Ee R (2008) No evidence for widespread synchronized 1
networks in binocular rivalry: MEG frequency tagging entrains primarily early visual 2
cortex. J Vis 8:4.1-8. 3
Knapen T, Brascamp J, Pearson J, van Ee R, Blake R (2011) The role of frontal and parietal 4
brain areas in bistable perception. J Neurosci 31:10293-10301. 5
Kornmeier J, Bach M (2005) The Necker cube - an ambiguous figure disambiguated in early 6
visual processing. Vision Research 45:955-960. 7
Lansing RW (1964) Electroencephalographic Correlates of Binocular Rivalry in Man. 8
Science 146:1325-1327. 9
Lee SH, Blake R, Heeger DJCP (2005) Traveling waves of activity in primary visual cortex 10
during binocular rivalry. Nat Neurosci 8:22-23. 11
Lee SH, Blake R, Heeger DJ (2007) Hierarchy of cortical responses underlying binocular 12
rivalry. Nat Neurosci 10:1048-1054. 13
Lehky SR, Maunsell JH (1996) No binocular rivalry in the LGN of alert macaque monkeys. 14
Vision Res 36:1225-1234. 15
Leopold D, Logothetis N (1996) Activity changes in early visual cortex reflect monkeys' 16
percepts during binocular rivalry. Nature 379:549-553. 17
Leopold DA, Logothetis NK (1999) Multistable phenomena: changing views in perception. 18
Trends Cogn Sci 3:254-264. 19
Lezak MD (1983) Neurophsychological Assessment. New York: Oxford University Press. 20
Li D, Parkhurst DJ (2005) Starburst: A robust algorithm for video-based eye tracking. In: 21
Iowa State University. 22
Logothetis NK, Schall JD (1989) Neuronal correlates of subjective visual perception. Science 23
245:761-763. 24
Logothetis NK, Schall JD (1990) Binocular motion rivalry in macaque monkeys: eye 25
dominance and tracking eye movements. Vision Res 30:1409-1419. 26

Page 29 of 36
Lorber M, Zuber BL, Stark L (1965) Supression of Pupillary Light Reflex in Binocular 1
Rivalry and Saccadic Suppression. Nature 208:558-&. 2
Lumer ED, Rees G (1999) Covariation of activity in visual and prefrontal cortex associated 3
with subjective visual perception. Proc Natl Acad Sci U S A 96:1669-1673. 4
Lumer ED, Friston KJ, Rees G (1998) Neural correlates of perceptual rivalry in the human 5
brain. Science 280:1930-1934. 6
Maruya K, Yang E, Blake R (2007) Voluntary action influences visual competition. 7
Psychological Science 18:1090-1098. 8
Meng M, Remus DA, Tong F (2005) Filling-in of visual phantoms in the human brain. Nat 9
Neurosci 8:1248-1254. 10
Naber M, Frässle S, Einhäuser W (2011) Perceptual rivalry: reflexes reveal the gradual nature 11
of visual awareness. PLoS One 6:e20910. 12
Necker LA (1832) Observations on some remarkable optical phaenomena seen in 13
Switzerland; and on an optical phaenomenon which occurs on viewing a figure of a 14
crystal or geometrical solid. London and Edinburgh Philosophical Magazine and 15
Journal of Science 1:329–337. 16
O'Shea R, Corballis P (2005) Visual grouping on binocular rivalry in a split-brain observer. 17
Vision Research 45:247-261. 18
O'Shea RP, Sims AJ, Govan DG (1997) The effect of spatial frequency and field size on the 19
spread of exclusive visibility in binocular rivalry. Vision Res 37:175-183. 20
Oldfield RC (1971) The assessment and analysis of handedness: the Edinburgh inventory. 21
Neuropsychologia 9:97-113. 22
Paffen CL, Alais D, Verstraten FA (2006) Attention speeds binocular rivalry. Psychol Sci 23
17:752-756. 24
Polonsky A, Blake R, Braun J, Heeger DJ (2000) Neuronal activity in human primary visual 25
cortex correlates with perception during binocular rivalry. Nat Neurosci 3:1153-1159. 26

Page 30 of 36
Rozzi S, Ferrari P, Bonini L, Rizzolatti G, Fogassi L (2008) Functional organization of 1
inferior parietal lobule convexity in the macaque monkey: electrophysiological 2
characterization of motor, sensory and mirror responses and their correlation with 3
cytoarchitectonic areas. European Journal of Neuroscience 28:1569-1588. 4
Sheinberg D, Logothetis N (1997) The role of temporal cortical areas in perceptual 5
organization. Proceedings of the National Academy of Sciences of the United States 6
of America 94:3408-3413. 7
Srinivasan R, Russell DP, Edelman GM, Tononi G (1999) Increased synchronization of 8
neuromagnetic responses during conscious perception. J Neurosci 19:5435-5448. 9
Sterzer P, Kleinschmidt A (2007) A neural basis for inference in perceptual ambiguity. Proc 10
Natl Acad Sci U S A 104:323-328. 11
Sterzer P, Kleinschmidt A, Rees G (2009) The neural bases of multistable perception. Trends 12
Cogn Sci 13:310-318. 13
Tong F (2003) Primary visual cortex and visual awareness. Nat Rev Neurosci 4:219-229. 14
Tong F, Nakayama K, Vaughan J, Kanwisher N (1998) Binocular rivalry and visual 15
awareness in human extrastriate cortex. Neuron 21:753-759. 16
Tononi G, Srinivasan R, Russell DP, Edelman GM (1998) Investigating neural correlates of 17
conscious perception by frequency-tagged neuromagnetic responses. Proc Natl Acad 18
Sci U S A 95:3198-3203. 19
Tzourio-Mazoyer N, Landeau B, Papathanassiou D, Crivello F, Etard O, Delcroix N, Mazoyer 20
B, Joliot M (2002) Automated anatomical labeling of activations in SPM using a 21
macroscopic anatomical parcellation of the MNI MRI single-subject brain. 22
Neuroimage 15:273-289. 23
van Loon AM, Knapen T, Scholte HS, St John-Saaltink E, Donner TH, Lamme VA (2013) 24
GABA shapes the dynamics of bistable perception. Curr Biol 23:823-827. 25

Page 31 of 36
Watanabe M, Cheng K, Murayama Y, Ueno K, Asamizuya T, Tanaka K, Logothetis N (2011) 1
Attention but not awareness modulates the BOLD signal in the human V1 during 2
binocular suppression. Science 334:829-831. 3
Weilnhammer VA, Ludwig K, Hesselmann G, Sterzer P (2013) Frontoparietal cortex 4
mediates perceptual transitions in bistable perception. J Neurosci 33:16009-16015. 5
Weiskopf N, Hutton C, Josephs O, Deichmann R (2006) Optimal EPI parameters for 6
reduction of susceptibility-induced BOLD sensitivity losses: a whole-brain analysis at 7
3 T and 1.5 T. Neuroimage 33:493-504. 8
Weiskopf N, Hutton C, Josephs O, Turner R, Deichmann RCP (2007) Optimized EPI for 9
fMRI studies of the orbitofrontal cortex: compensation of susceptibility-induced 10
gradients in the readout direction. MAGMA 20:39-49. 11
Wheatstone C (1838) Contributions to the physiology of vision. Part the first: On some 12
remarkable, and hitherto unobserved, phaenomena of binocular vision. In, pp 371–13
394. Philos. Trans. R. Soc. Lond. 14
Wilcke JC, O'Shea RP, Watts R (2009) Frontoparietal activity and its structural connectivity 15
in binocular rivalry. Brain Res 1305:96-107. 16
Wohlschlager A (2000) Visual motion priming by invisible actions. Vision Research 40:925-17
930. 18
Wolpert D, Goodbody S, Husain M (1998) Maintaining internal representations the role of the 19
human superior parietal lobe. Nature Neuroscience 1:529-533. 20
Worsley KJ, Friston KJ (1995) Analysis of fMRI Time-Series Revisited - Again. Neuroimage 21
2:173-181. 22
Wunderlich K, Schneider KA, Kastner S (2005) Neural correlates of binocular rivalry in the 23
human lateral geniculate nucleus. Nat Neurosci 8:1595-1602. 24
Yuval-Greenberg S, Heeger DJ (2013) Continuous flash suppression modulates cortical 25
activity in early visual cortex. J Neurosci 33:9635-9643. 26

Page 32 of 36
Legends 1
Figure 1: Binocular rivalry and its objective measures. (A) Top-left: OKN stimulus set 2
consisting of two distinctly colored (red/green) sinusoidal gratings that drifted in opposite 3
lateral directions (i.e., left/right); bottom-left: idealized expected OKN patterns: direction of 4
slow phase follows the perceived direction of motion; right: raw horizontal gaze speed (gray), 5
smoothed OKN slow phase speed (black) and button presses (purple vertical lines) during a 6
typical active report rivalry OKN trial. (B) Top-left: Pupil stimulus set consisting of two 7
stationary sinusoidal gratings that differed in orientation (i.e., ±60°), color (red/green) and 8
luminance; bottom-left: example images from eye-tracking video with pupil detection, pupil 9
size adapts to the perceived luminance; right: detrended pupil size (black) and button presses 10
(purple vertical lines) during an exemplary active report rivalry pupil trial. (C) Average OKN 11
speed (mean and s.e.m. over observer median traces) and (D) average pupil size across 12
observers temporally aligned to the report of a perceptual transition. The horizontal black bars 13
indicate time periods during which traces representing a perceptual switch from percept A to 14
percept B differed significantly from traces representing a perceptual switch from percept B to 15
percept A. The significance criterion was adjusted to an expected false discovery rate of 0.05 16
(Benjamini and Hochberg, 1995) to correct for multiple comparisons. (E) Median dominance 17
durations (i.e., the time period a single percept was visible until alternated for the competing 18
percept) for OKN and pupil trials, and for the different report conditions separately (sb - w = 19
subjective - with active report; ob - w = objective - with active report; ob - wo = objective –20
with passive viewing). Dominance durations indicated by both objective indicators were 21
shorter than those indicated by subjective report. Additionally, switch rate tended to be 22
increased, when observers had to report perceptual alternations. 23
24

Page 33 of 36
Figure 2: Binocular rivalry versus replay for active report trials. (A) “Discrete subjective”: 1
activation pattern shows neural loci that were more activated time-locked to the moment of a 2
subjective report (i.e., button press) during rivalry trials as compared with replay trials 3
(R = right hemisphere, L = left hemisphere). (B) “Discrete objective”: rivalry-related 4
activation pattern (rivalry > replay) time-locked to the moment of an objective alternation 5
(i.e., zero-crossing of OKN or pupil size traces). (C) “Continuous objective”: activation 6
pattern indicates neural loci as revealed by the complete OKN and pupil-size traces. (D) 7
Pattern indicates neural loci where statistical power was significantly increased when using 8
the “continuous objective” analysis as compared to the “discrete subjective” analysis. Results 9
in (A)-(D) are thresholded at a conservative cluster-extent threshold of p < 0.01, FWE 10
corrected (voxel level threshold p < 0.001, uncorrected). All active report trials are included 11
in the analyses, regardless of whether OKN or pupil stimulus set was presented. Activation 12
patterns were rendered onto the surface of a standard anatomical template image. 13
14
Figure 3: Influence of active report on the neural network underlying binocular rivalry. (A) 15
Activation patterns (based on the continuous objective analysis) show neural loci that were 16
identified to be more activated time-locked to a perceptual transition during rivalry as 17
compared with replay when observers actively reported their percept or (B) when observers 18
just passively experienced rivalry dynamics. Results in (A)-(B) are thresholded at a cluster-19
extent threshold of p < 0.01, FWE corrected (voxel level threshold p < 0.001, uncorrected). 20
(C) Pattern indicates neural loci where rivalry-related activation (i.e., rivalry > replay) was 21
significantly higher during active report trials as compared with passive viewing trials, 22
regardless of the objective measure OKN speed or pupil size (i.e., global null conjunction 23
analysis). Results in (C) are thresholded at p < 0.001, uncorrected. 24

Page 34 of 36
Table 1: Shown are loci where activation is greater during rivalry compared with replay. 1
Only the most significant peaks within each area of activation are reported. All results are 2
thresholded at a conservative cluster-extent threshold of p < 0.01, FWE corrected (voxel level 3
threshold p < 0.001, uncorrected). 4
5
Table 2: Loci were identified in terms of a global null conjunction analysis to control for any 6
indicator-related artifacts. Therefore, the linear contrast “rivalry > replay” was calculated for 7
each report and indicator condition in every observer separately. Those contrast images 8
entered a random-effects group analysis where the neural loci were assessed that had higher 9
rivalry-related activation during active report as compared with passive viewing trials 10
regardless of rivalry type. Only the most significant peaks within each area of activation are 11
reported and only clusters exceeding 20 voxels in size are reported. All results are thresholded 12
at p < 0.001, uncorrected. 13

Illustrations and Tables
Table 1: Coordinates and Z scores for transient rivalry-related activations (rivalry > replay)
time-locked to observers’ button presses.
Montreal Neurological Institute (MNI) coordinates Cortical region
x y z
Z score
Rivalry > Replay (button presses)
Right superior parietal 24 -66 46 6.03
Right superior occipital 26 -66 34 5.74
Right middle occipital 40 -82 14 5.72
Right superior frontal 28 -2 52 5.66
Right inf. oper. frontal 46 8 16 5.27
Right precentral 38 -2 50 5.23
Left middle occipital -38 -86 16 5.41
Left inferior occipital -52 -68 -8 4.83
Left cerebellum -26 -70 -24 5.05
Right inferior frontal 40 42 -4 4.47
Right middle frontal 38 36 32 4.32

Page 36 of 36
Table 2: Coordinates and Z scores show neural loci for which the continuous objective
analysis revealed higher rivalry-related activations (rivalry > replay) when observers actively
reported their perception as compared to when they passively experienced rivalry.
Montreal Neurological Institute (MNI) coordinates Cortical region
x y z
Z score
Active > Passive (continuous objective analysis)
Left superior frontal -20 4 60 4.31
Left suppl. motor area -6 12 50 3.74
Left middle occipital -20 -60 36 4.24
Left superior parietal -16 -58 48 3.98
Left middle frontal -36 32 24 4.24
Right insula 30 24 10 4.09
Left insula -28 22 12 4.06
Left middle temporal -44 -60 8 3.99
Right middle frontal 40 40 34 3.98
Right inferior frontal (tris.) 40 36 26 3.71
Right superior frontal 30 44 32 3.41
Left inferior parietal -52 -42 38 3.93
Right sup. medial frontal 8 24 48 3.91
Right middle occipital 32 -74 12 3.74
Right suppl. motor area 10 10 56 3.71
Right precuneus 8 -54 66 3.68
Left calcarine -26 -60 16 3.30
Copyright © 2022 FDOKUMEN