Strength of default mode resting-state connectivity relates to white matter integrity in children
24
Strength of default mode resting state connectivity relates to white matter integrity in children Evan M. Gordon 1 , Philip S. Lee 2 , Jose M. Maisog 3 , Jennifer Foss-Feig 2 , Michael E. Billington 2 , John VanMeter 4 , and Chandan J. Vaidya 2,5 1 Interdisciplinary Program in Neuroscience, Georgetown University Medical Center, Washington, DC 2 Department of Psychology, Georgetown University, Washington, DC 3 Department of Pediatrics, Georgetown University Medical Center, Washington, DC 4 Department of Neurology, Georgetown University Medical Center, Washington, DC 5 Children’s Research Institute, Children’s National Medical Center, Washington, DC Abstract A default mode network of brain regions is known to demonstrate coordinated activity during the resting state. While the default mode network is well characterized in adults, few investigations have focused upon its development. We scanned 9–13 year old children with diffusion tensor imaging and resting-state functional magnetic resonance imaging. We identified resting state networks using Independent Component Analysis and tested whether the functional connectivity between the medial prefrontal cortex (mPFC) and posterior cingulate cortex (PCC) depends upon the maturation of the underlying cingulum white matter tract. To determine the generalizability of this relationship, we also tested whether functional connectivity depends on white matter maturity between bilateral lateral prefrontal cortex (lateral PFC) within the executive control network. We found a positive relationship between mPFC-PCC connectivity and fractional anisotropy of the cingulum bundle; this positive relationship was moderated by the age of the subjects such that it was stronger in older children. By contrast, no such structure-function relationship emerged between right and left lateral PFC. However, functional and structural connectivity of this tract related positively with cognitive speed, fluency, and set-switching neuropsychological measures. Keywords Brain networks; cognition; development; DTI; fMRI Introduction Investigations of the intrinsic functional connectivity of the human brain have demonstrated that the brain is organized into multiple networks (termed “resting-state” networks because they were first identified during rest) whose regions are temporally correlated at low- frequencies, reflecting spontaneous neural activity rather than physiological noise (Birn et al., 2006; De Luca et al., 2006). One resting-state network comprising anterior-posterior midline regions of medial prefrontal cortex (mPFC), posterior cingulate cortex and adjacent precuneus and retrosplenial cortex (referred to hereafter as the PCC), bilateral angular gyrus, Address correspondence to: Chandan J. Vaidya, Ph.D., Department of Psychology, 306 White-Gravenor Hall, Georgetown University, Washington, DC 20057, Ph: (202) 687-4274, Fax: (202) 687-6050, [email protected]. NIH Public Access Author Manuscript Dev Sci. Author manuscript; available in PMC 2012 July 1. Published in final edited form as: Dev Sci. 2011 July ; 14(4): 738–751. doi:10.1111/j.1467-7687.2010.01020.x. NIH-PA Author Manuscript NIH-PA Author Manuscript NIH-PA Author Manuscript
-
Upload
independent -
Category
Documents
-
view
2 -
download
0
Transcript of Strength of default mode resting-state connectivity relates to white matter integrity in children

Strength of default mode resting state connectivity relates towhite matter integrity in children
Evan M. Gordon1, Philip S. Lee2, Jose M. Maisog3, Jennifer Foss-Feig2, Michael E.Billington2, John VanMeter4, and Chandan J. Vaidya2,5
1 Interdisciplinary Program in Neuroscience, Georgetown University Medical Center, Washington,DC2 Department of Psychology, Georgetown University, Washington, DC3 Department of Pediatrics, Georgetown University Medical Center, Washington, DC4 Department of Neurology, Georgetown University Medical Center, Washington, DC5 Children’s Research Institute, Children’s National Medical Center, Washington, DC
AbstractA default mode network of brain regions is known to demonstrate coordinated activity during theresting state. While the default mode network is well characterized in adults, few investigationshave focused upon its development. We scanned 9–13 year old children with diffusion tensorimaging and resting-state functional magnetic resonance imaging. We identified resting statenetworks using Independent Component Analysis and tested whether the functional connectivitybetween the medial prefrontal cortex (mPFC) and posterior cingulate cortex (PCC) depends uponthe maturation of the underlying cingulum white matter tract. To determine the generalizability ofthis relationship, we also tested whether functional connectivity depends on white matter maturitybetween bilateral lateral prefrontal cortex (lateral PFC) within the executive control network. Wefound a positive relationship between mPFC-PCC connectivity and fractional anisotropy of thecingulum bundle; this positive relationship was moderated by the age of the subjects such that itwas stronger in older children. By contrast, no such structure-function relationship emergedbetween right and left lateral PFC. However, functional and structural connectivity of this tractrelated positively with cognitive speed, fluency, and set-switching neuropsychological measures.
KeywordsBrain networks; cognition; development; DTI; fMRI
IntroductionInvestigations of the intrinsic functional connectivity of the human brain have demonstratedthat the brain is organized into multiple networks (termed “resting-state” networks becausethey were first identified during rest) whose regions are temporally correlated at low-frequencies, reflecting spontaneous neural activity rather than physiological noise (Birn etal., 2006; De Luca et al., 2006). One resting-state network comprising anterior-posteriormidline regions of medial prefrontal cortex (mPFC), posterior cingulate cortex and adjacentprecuneus and retrosplenial cortex (referred to hereafter as the PCC), bilateral angular gyrus,
Address correspondence to: Chandan J. Vaidya, Ph.D., Department of Psychology, 306 White-Gravenor Hall, Georgetown University,Washington, DC 20057, Ph: (202) 687-4274, Fax: (202) 687-6050, [email protected].
NIH Public AccessAuthor ManuscriptDev Sci. Author manuscript; available in PMC 2012 July 1.
Published in final edited form as:Dev Sci. 2011 July ; 14(4): 738–751. doi:10.1111/j.1467-7687.2010.01020.x.
NIH
-PA Author Manuscript
NIH
-PA Author Manuscript
NIH
-PA Author Manuscript

and bilateral medial temporal lobe, has been termed the “default mode” network (DMN)because it is active during task-free states and attenuated during most task-directed cognitiveactivity [reviewed in (Buckner et al., 2008)]. Cohesive intrinsic neural activity betweenmPFC and PCC has been identified in infants (Gao et al., 2009) and in children as young as7 years (Fair et al., 2008; Thomason et al., 2008), indicating the early presence of the DMNduring development.
The relevance of DMN functional connectivity to cognitive development is not fully known.DMN brain regions are nominally involved in self-referential cognition, and DMN activityhas been argued to reflect spontaneous internally generated thoughts (Gusnard et al., 2001;Mason et al., 2007; Andrews-Hanna et al., 2010). Nevertheless, there is no generalagreement about how the developing properties of the DMN in particular, and resting-statenetworks in general, may serve cognition (Buckner & Vincent, 2007; Raichle & Snyder,2007). Findings from life-span developmental studies suggest that cognitive change relatesto the integrity of resting-state functional connectivity. First, DMN functional connectivity isdisrupted in disorders of both aging [e.g., Alzhiemer’s, (Greicius et al., 2004), Mildcognitive impairment (Rombouts et al., 2005)] and early development [e.g., Autism(Kennedy et al., 2006); Attention-Deficit/Hyperactivity Disorder (Tian et al., 2006;Castellanos et al., 2008)] that involve cognitive impairment. Second, changes in DMNfunctional connectivity through the lifespan parallel normal cognitive development anddecline such that strength of network connectivity is weak in school-age children (Fair et al.,2008), increases through adolescence into adulthood (Kelly et al., 2009; Fair et al., 2009),and weakens during normal aging (Andrews-Hanna et al., 2007). More specific relationshipswith cognitive function have been noted in normal aging: weaker DMN functionalconnectivity is associated with lower performance in working memory (Sambataro et al.,2010), processing speed, episodic memory, and executive function (Andrews-Hanna et al.,2007). Whether maturational gains in cognition relate to increasing strength of DMNfunctional connectivity in childhood is not known.
The cingulum bundle, a white matter tract connecting mPFC and PCC (Mufson and Pandya,1984), may be important for DMN functional connectivity. The cingulum comprises threecomponents: 1) Efferent fibers from cingulate cortex extending dorsally to premotor andprefrontal cortex and caudoventrally to presubiculum and parahippocampal gyrus; 2)Efferent fibers from the thalamus extending through the cingulate gyrus, rostrally to frontalcortex and caudally to retrosplenial cortex; and 3) Association fibers from prefrontal cortexextending to retrosplenial cortex and from posterior parietal cortex to parahippocampalgyrus and presubiculum regions and rostrally to prefrontal cortex. Thus, the cingulumbundle bridges anterior, posterior, and medial association cortices, thereby supportingcommunication between the nodes of the DMN, both via direct (anterior-posterior cortico-cortical) and indirect (thalamo-cortical) communication pathways. The cingulum isamenable to diffusion tensor imaging (DTI) using fiber tracking methods at birth (Hermoyeet al., 2006), in infancy (Dubois et al., 2008) and in adulthood (Greicius et al., 2009).Consistent with delayed maturation of association cortices compared to primary sensory ormotor cortices, the cingulum bundle matures later than other white matter tracts such as thefornix and the cortico-spinal tracts (Dubois et al., 2008). A direct relationship betweenfunction and structure has been observed in adults, where individual variability in cingulummicrostructural integrity correlated positively with the strength of DMN functionalconnectivity (Andrews-Hanna et al., 2007; van den Heuval et al., 2008; Skudlarski et al.,2008; Supekar et al., 2010; Teipel et al., 2010). However, a recent study failed to find thisstructure-function relationship in 7–9 year-old children (Supekar et al., 2010), suggestingthat this relationship must emerge after this period in childhood development.
Gordon et al. Page 2
Dev Sci. Author manuscript; available in PMC 2012 July 1.
NIH
-PA Author Manuscript
NIH
-PA Author Manuscript
NIH
-PA Author Manuscript
We examined whether the strength of resting-state functional connectivity relates to themicrostructural integrity of the underlying white matter fiber tract and to cognitive functionin 9–13 year-old children. Our central hypothesis focused upon the DMN because it isdetectable by functional magnetic resonance imaging (fMRI) during the preadolescent years.We limited our investigation to the relationship between the mPFC and PCC, the two nodesof the DMN that have been most thoroughly investigated in past studies with adults. Wehypothesized that the strength of functional connectivity between mPFC and PCC wouldrelate positively to the microstructural integrity of the cingulum bundle. Because thisstructure-function relationship likely emerges after age 9 but before adulthood, we furtherhypothesized that this relationship would be stronger in older children. A second goal of thepresent study was to determine whether our hypothesized structure-function relationship isspecific to the DMN, or whether it may generalize to another resting-state network that isboth important for cognition and sensitive to development, but which is very different fromthe DMN in its anatomical axis and task engagement. Thus, we selected a bilateral (ratherthan anterior-posterior) network that activates (rather than de-activates) in response toexternally-oriented tasks. One such bilateral, task-active network is the executive controlnetwork (Seeley et al., 2007). Its primary nodes, within left and right lateral prefrontalcortex (PFC), are connected anatomically by fibers that cross the superior longitudinalfasciculus and course laterally through the corpus callosum (Schmahmann and Pandya,2006). PFC is critical for goal-directed behavior and matures during childhood (Tsujimoto,2008). We hypothesized that functional connectivity between left and right lateral PFCwould be positively correlated with FA of the tract running through the corpus callosum thatconnects these regions. However, as corpus callosum matures relatively early indevelopment (Dubois et al., 2008), we expected that this structure-function relationshipwould not vary with age. Finally, we probed whether connectivity within these two restingstate networks related to cognitive function by examining children’s performance on aneuropsychological battery assessing motor and cognitive processing speed, as well as twoexecutive functions, fluency and set-switching. Based upon past work on normal aging(Andrews-Hanna et al., 2007), we expected connectivity in the DMN to be sensitive toindividual differences in cognitive but not motor performance. Based upon the criticalimportance of lateral PFC to executive function, we further expected connectivity in theexecutive control network to be sensitive selectively to fluency and set-switchingperformance.
MethodsSubjects
Eighteen boys aged 9–13 years (M = 11.10, SD = 1.38) with average or greater IQ (M =122.16, SD = 10.18; Range = 101 to 139) were recruited through advertisements; fouradditional children participated but were excluded due to greater than 1 voxel of headmotion during either DTI or fMRI scanning. Written parental consent was obtainedfollowing explanation of experimental procedures to parents and children. All subjects werepaid for their participation. Exclusion criteria included: (a) Full Scale IQ below 85 asmeasured by the Wechsler Abbreviated Intelligence Scale (WASI: Wechsler, 1999); (b)Reading disorder as measured by Woodcock-Johnson Letter Word ID or Word Attack(Woodcock et al., 2001) standard scores below 85; and (c) Evidence of neurologic (e.g.,epilepsy) or psychiatric (e.g., mood/anxiety) disorders as screened by parent report and theMini-International Neuropsychiatric Interview (Sheehan et al., 1998).
Neuropsychological BatteryChildren were administered the Trail-making, Design Fluency, and Verbal Fluency subtestsfrom the Delis-Kaplan Executive Function System [D–KEFS, (Delis et al., 2001)]. Raw sub-
Gordon et al. Page 3
Dev Sci. Author manuscript; available in PMC 2012 July 1.
NIH
-PA Author Manuscript
NIH
-PA Author Manuscript
NIH
-PA Author Manuscript
scores from the three tests were grouped to create four indices of information processing,two involving non-executive processing and two involving executive processing (Table I):1) Motor Processing Speed, consisting of speed on the Motor component of the Trail-making test (the time required for subjects to trace a path between several targets); 2)Cognitive Processing Speed, a composite of the Letter Sequence and Number SequenceSpeed subscores of the Trail-making test (the time required for subjects to trace a pathbetween targets in alphabetical or numeric order); 3) Fluency, a composite score of thenumber of unique items produced in the Category and Letter subtests of the Verbal Fluencytests and in the non-switching component of the Design Fluency test; and 4) Switching,defined by set-switching demands, consisting of subjects’ speed on the Switchingcomponent of the Trail-making test (the time required for subjects to trace a line betweentargets, switching between numeric and alphabetic targets) and the number of itemsproduced in the Switching components of the Verbal and Design Fluency tests (in whichsubjects must alternate item production between two types of items or connect dots ofalternating colors). To combine scores across different tests, each subject’s raw (uncorrectedfor age) subtest score was converted into a Z-score relative to the scores of the other subjectson that test. Z-score means were then taken across subtests to create the four category scoresfor each child. Results from the D-KEFS were not available for one child. Letter sequenceTrail-making scores (and subsequent Cognitive Processing Speed composite scores) wereexcluded for another child due to a score more than three standard deviations below themean score.
Imaging ProcedureDuring the resting scan, subjects were instructed to lie in the darkened scanner with theireyes closed but to remain awake. All subjects reported that they had remained awakethroughout the entire scan. During the diffusion-tensor scan, subjects watched television viaa magnet compatible projector. Head movement was minimized by small foam cushionsplaced on the sides of the subject’s head.
A high-resolution sagittal T1-weighted structural scan was acquired on a Siemens Trio 3TMRI scanner (Erlangen, Germany) using a 3D MPRAGE sequence for a scan time of7:23min with the following parameters: TR = 2300ms, TE = 2.94ms, 256×256mm FOV,160 slabs with 1mm thick slices, 256×256×160 matrix (effective resolution of 1.0mm3), 1excitation, and a 90 degree flip angle. Functional images were acquired on the sameequipment using a T2*-sensitive gradient echo pulse sequence for a scan time of 5:00 minwith the following parameters: TR = 2000ms, TE = 30ms, 192×192mm FOV, 64×64acquisition matrix, and a 90 degree flip angle. Forty-three 2.5mm thick interleaved sliceswere acquired ascending in the transverse plane (width = 2.5mm, gap width = 0.5mm,effective width = 3mm) for an effective resolution of 3.0mm3. One hundred fifty time pointswere collected; the first two TRs were included for signal stabilization and were discardedfrom analysis. Diffusion-tensor images were acquired on the same equipment using adiffusion weighted echo planar sequence with a scan time of 4:39min using gradient valuesof b=0 and b=1000s/mm2 applied in 35 orthogonal directions with the following parameters:TR = 7700ms, TE = 100ms, 240×240mm FOV, 64×64 acquisition matrix. Fifty-five 2.5mmthick interleaved slices were acquired ascending in the transverse plane (width = 2.5mm, nogap) for an effective resolution of 2.5mm3.
Functional Data AnalysisThe functional data was processed using SPM5 (Wellcome Department of CognitiveNeurology, London, UK) implemented in MATLAB (Version 7.1, SP3, Mathworks, Inc.,Sherborn, MA). The 3D volumes were corrected for slice acquisition timing and registeredto the first volume using an affine transformation. Realigned images were normalized to
Gordon et al. Page 4
Dev Sci. Author manuscript; available in PMC 2012 July 1.
NIH
-PA Author Manuscript
NIH
-PA Author Manuscript
NIH
-PA Author Manuscript
standard space via registration to the SPM5 EPI template image and interpolated to2×2×2mm cubic voxels. Normalized image volumes were spatially smoothed using an 8mmfull width at half-maximum Gaussian kernel.
Analysis of motion indicated that two of the included subjects exhibited large (> 3mm),transient motion in the Z dimension lasting one timepoint and nine timepoints, respectively.These timepoints were removed from further analysis. After this adjustment, none of theincluded subjects had greater than 3 mm of translational motion in the x, y, or z dimensionsat any point during their functional scan. In each subject, we calculated the maximaltranslational motion (farthest distance from zero) in each dimension, which measures motionspikes below 3mm translation. The average maximal motion across subjects was small ineach dimension (X Translation: M = .27mm, SD = 0.22mm, range = .05mm to .80mm; YTranslation: M = .58mm, SD = .47mm, range = .12mm to 2.2mm; Z Translation: M = .73mm, SD = .42mm, range = .27mm to 1.6mm). Subject age did not correlate with maximalmotion in any dimension (all ps > .05). As a further measurement of total motion across thescan, for each subject we calculated the average absolute distance from zero (the square rootof the X translation squared plus the Y translation squared plus the Z translation squared,calculated at each timepoint, and then averaged across the scan). This measure of totalmotion was also small across subjects (M = .25mm, SD = .13mm, range = .049mm to .56mm).
To identify DMN and executive control networks, an independent components analysis(ICA) was performed using the MELODIC toolbox (Beckmann and Smith, 2004) withinFSL (Centre for Functional Magnetic Resonance Imaging of the Brain, University ofOxford, London, UK). The smoothed data from all subjects was temporally concatenated tocreate a single timecourse, and a probabilistic independent components analysis wasperformed on this timecourse using the MELODIC toolbox, allowing the program to selectthe optimal number of components to generate. Within each component, MELODICgenerated significance values for each voxel using a mixture model combining a “noise”Gaussian function with two gamma functions modeling “active” voxels; the probability of agiven voxel’s intensity fitting the gamma functions rather than the background noiseGaussian function was calculated (Beckmann & Smith, 2004). Components werethresholded at P>.999, reflecting a high probability of each “active” voxel truly being a partof that network and not reflecting noise (i.e. stringently excluding false positives). Theresulting components were visually inspected for similarities to published accounts of thedefault network’s spatial extent, as well as for similarities to the executive control network.Within these identified components, we used Marsbar (Brett et al., 2003) to create ROIsbased on contiguous clusters of voxels above the threshold of P>.999 within PCC and mPFC(in the default mode component) and within right and left lateral PFC (in the executivecontrol components). These four ROIs subsequently were used as seeds for both theanatomic and functional connectivity analyses, with analyses conducted in pairs accordingto network membership (DMN or executive control network).
In order to assess functional connectivity, we examined temporal correlations between meantimecourses of ROIs comprising the default mode (PCC and mPFC) and executive control(right lateral PFC and left lateral PFC) networks. In order to minimize the effect ofphysiological factors (such as respiration or heart rate) common to both regions’timecourses, we regressed out the signal timecourse from non-neuronal sources such aswhite matter and CSF (Van Dijk et al., 2010). In order to perform this regression, we firstsegmented each subject’s MPRAGE into grey matter, white matter, and CSF probabilityimages. White matter and CSF ROIs were then created containing all voxels in the brainwith a segmentation value of 1.0 (i.e., no chance of other tissue types being included in thevoxel). Mean timecourses during the rest scan were extracted from within white matter and
Gordon et al. Page 5
Dev Sci. Author manuscript; available in PMC 2012 July 1.
NIH
-PA Author Manuscript
NIH
-PA Author Manuscript
NIH
-PA Author Manuscript

CSF ROIs. These white matter and CSF timecourses were regressed against each voxelwithin the mPFC, PCC, and lateral PFC timecourses, and the residual timecourse from thisregression was obtained for each voxel. This residual timecourse represents the activitywithin that voxel that is not similar to white matter and CSF timecourses. For each ROI, theresidual timecourses for each voxel were averaged, and the mean residual timecourseswithin the two seed ROIs for each network were then correlated against each other to assessfunctional connectivity. This procedure generated a correlation value (Pearson’s r) reflectingthe strength of functional connectivity within each network for each subject. The resulting rvalues were converted to normally-distributed Z-scores using Fisher’s transformation inorder to allow further analysis of correlation strengths.
Anatomic Data AnalysisThe diffusion-weighted scans were processed using the FDT toolbox (Behrens et al., 2003)implemented within FSL (Centre for Functional Magnetic Resonance Imaging of the Brain,University of Oxford, London, UK). The scans were corrected for eddy currents and motionusing affine registration to the first b=0 reference volume using the FLIRT toolbox withinFSL (Jenkinson & Smith, 2001; Jenkinson et al., 2002). Diffusion tensors were fit to the dataand probability distributions on fiber direction at each voxel were calculated usingBEDPOSTX (Behrens et al., 2003). This procedure also generated a whole-brain FractionalAnisotropy (FA) map for each subject. FA is a measure of the integrity of white matterbased on the diffusivity of water at a given voxel. FA is a positive function ranging betweenzero and 1, with zero indicating isotropic and 1 indicating perfectly linear diffusion (Basser& Pierpaoli, 1996).
Using ProbtrackX, probabilistic tractography was conducted for each subject to estimate thedistributions of white matter connections between seed regions. The seed regions consistedof the four ROIs constructed from the group ICA results, which were transformed intoindividual subject space using FLIRT. 5,000 streamline samples were initiated from allvoxels within each seed region, traveling along the probability distribution functions of localvoxels (step length=0.5 mm, curvature threshold=0.2), until they terminated in voxels withinthe other seed region. For default mode network (with PCC and mPFC seeds), a cingulatecortex ROI was constructed using the Wake Forest Pickatlas (Lancaster et al., 1997, 2000;Maldjian et al., 2003) and was inflated by 6mm to include surrounding white matter (such asthe cingulum); this ROI was used as a waypoint through which individual subject PCC-to-mPFC tracts were required to pass. For executive control network, a corpus callosum ROIfrom the Wake Forest Pickatlas was constructed and inflated by 6mm; this ROI was used asa waypoint through which individual subject right lateral PFC to left lateral PFC tracts wererequired to pass. To eliminate unlikely white matter paths generated by the algorithm, allobtained tracts were thresholded by 5% of the maximum connectivity value of the tract(following Bennett et al., 2010). The resulting tracts were binarized and applied as masks tothe subject’s whole-brain FA map. These steps produced images for each subject thatcontained only the FA values along the tracts between each of the two pairs of ROIs. Themean FA value of all voxels within each white matter tract was computed for each subject.
The processing steps above yielded indices of anatomic (i.e., mean FA within white mattertracts) and functional connectivity (i.e., temporal correlations) between the ROI pairs, foreach subject. First, we examined whether FA or functional correlations for the two networkscorrelated with age. All correlations were below .3 (range: −.21 to .29) and did not reachsignificance (ps > .24). Second, we examined the relationship between white matter integrityand functional connectivity by computing the correlation between FA and temporalcorrelation values (Fisher’s Z) for default mode (mPFC-PCC) and executive control (rightlateral PFC-left lateral PFC) networks. Third, as previous work has shown an absence of astructure-function relationship in younger children (Supekar et al., 2010), we examined
Gordon et al. Page 6
Dev Sci. Author manuscript; available in PMC 2012 July 1.
NIH
-PA Author Manuscript
NIH
-PA Author Manuscript
NIH
-PA Author Manuscript

whether the relationship depended on age by conducting partial correlations of FA withfunctional connectivity within each network using age as a covariate. Fourth, to examine therelationship between white matter integrity/functional connectivity and behavior, wespecified a multiple regression model for each behavioral composite measure testing foreffects of DMN FA, DMN temporal correlation, executive control FA, and executive controltemporal correlation on the behavioral score. Thus, four multiple regressions wereconducted, each determining which of the neural measures significantly impacted thebehavioral measure, while accounting for effects of the other neural measures. We followedup the statistically significant models with partial correlations to determine the direction,magnitude, and statistical significance of each neural-behavior relationship within thatmodel.
ResultsFunctional Connectivity
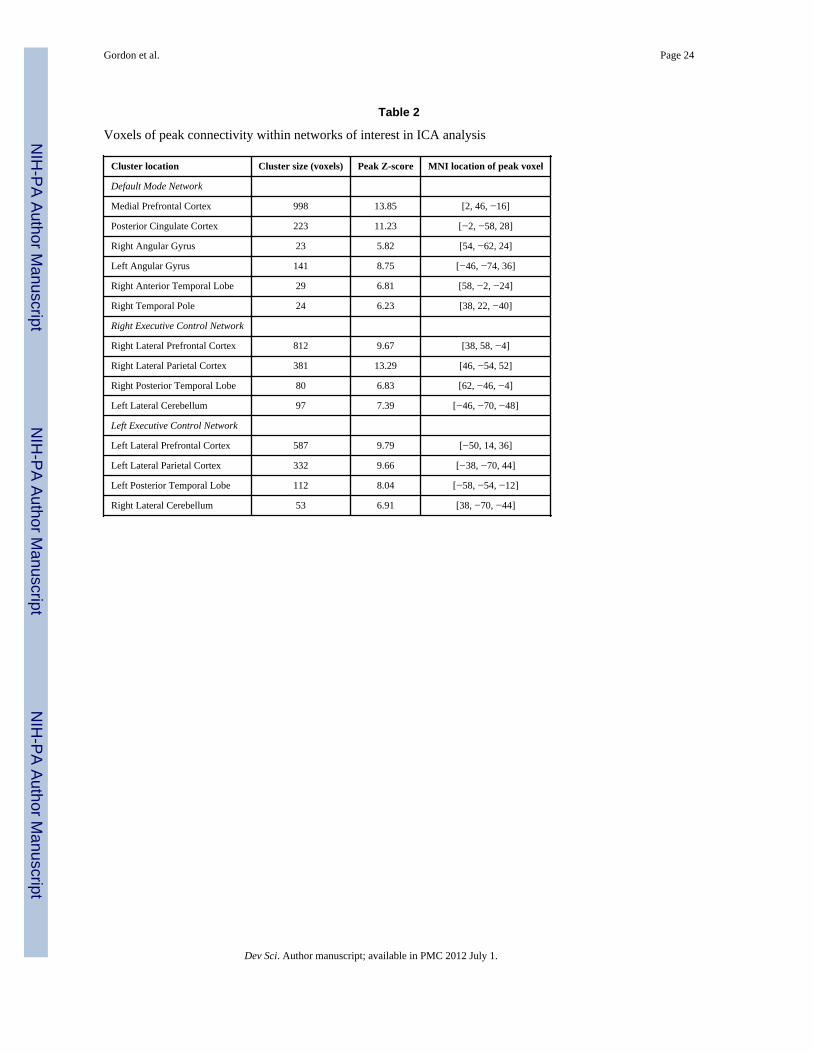
Results of the ICA analysis are shown in Figure 1. Inspection of the ICA results revealedexactly one component matching the canonical DMN, which included clusters in posteriorcingulate cortex, ventral and dorsal medial prefrontal cortex (shown in Figure 1A), bilateralangular gyrus, and bilateral lateral temporal lobe (cannot be seen in Figure 1A). Theexecutive control network was well described by two separate lateralized components: aright executive control component including right dorsolateral prefrontal cortex extendinginto inferior lateral prefrontal cortex, right lateral parietal cortex, and left lateral cerebellum;and a left executive control component, including all of the contralateral homologue regionsof the right executive control component (Figure 1A). See Table 2 for voxels of peakconnectivity within these networks. Other components delineated by the ICA procedurewere tentatively identified as follows (Figure 1B): a language network with clusters inbilateral ventrolateral prefrontal/orbital cortex, angular gyrus, posterior middle temporalgyrus, and temporal pole; a dorsal attention network including clusters in bilateral inferiorparietal cortex; a salience network consisting of clusters in dorsal anterior cingulate cortex,bilateral anterior insula, and bilateral middle frontal gyrus; a primary visual networkconsisting of one large cluster in occipital cortex; an auditory network consisting of clustersin bilateral auditory cortex extending into inferior postecentral gyrus and in medialsupplementary motor area; a visual orienting network consisting of clusters in bilateralprecuneus, middle occipital cortex, supramarginal gyrus, and posterior superior frontal gyrus(possibly in frontal eye fields); a visualmotor network consisting of clusters in bilateralmiddle occipital, superior occipital, and lateral premotor cortex; and a posterior cingulatenetwork consisting of a large posterior cingulate cluster extending into precuneus andbilateral angular gyrus (but, notably, no cluster in medial prefrontal cortex).
Direct assessment of functional connectivity using temporal correlational analyses betweenthe clusters in our networks of interest revealed that the mean connectivity (Z-transformedcorrelation coefficients) within the DMN was .64 (SD = .37) across subjects, while the meanconnectivity within the executive control network was .57 (SD = .22). A post-hoc paired t-test comparing these Z-transformed correlation coefficients indicated that functionalconnectivity of the two networks did not differ significantly (p = .51).
Structural ConnectivityDTI tractography identified the cingulum tract between mPFC and PCC ROIs (fiverepresentative subjects shown in Figure 2). In 12 of 18 subjects, this tract was found inbilateral cingulum, while in the remaining 6 subjects the tract was only detected in thecingulum in one hemisphere. Post-hoc t-tests revealed no differences between subjects withbilateral or unilateral tracts in age, IQ, functional connectivity within the default mode,
Gordon et al. Page 7
Dev Sci. Author manuscript; available in PMC 2012 July 1.
NIH
-PA Author Manuscript
NIH
-PA Author Manuscript
NIH
-PA Author Manuscript

mean FA within the cingulum, or any composite behavioral measure (ps >.2). The tractsbetween bilateral lateral PFC ROIs coursed through the body of the corpus callosum andcrossed the superior corona radiata and superior longitudinal fasciculus (five representativesubjects shown in Figure 3). These tracts were quite variable in appearance, with someextending primarily dorsally to the superior frontal gyrus, some extending directly laterallyto posterior middle frontal gyrus, and others extending caudally to anterior middle frontalgyrus. As large portions of these interhemispheric tracts extruded into prefrontal whitematter, in which FA is likely to be low due to crossing fibers from the anterior-posteriororiented superior longitudinal fasciculus (Mori et al., 2005), we restricted further analysis ofthese tracts to the portion of each tract within the corpus callosum by masking the tract withthe corpus callosum ROI used previously as a waypoint. For further analyses, FA was thusaveraged only within the corpus callosum portion of this tract (Figure 3, in blue).
Across subjects, the average FA value within the mean cingulum tract connecting nodes ofthe DMN was .39 (SD = .03), while the average value within the corpus callosum portion ofthe tract connecting executive control network nodes was .60 (SD = .03). A post-hoc pairedt-test comparing these values indicated that mean structural integrity was higher for thecolossal portion of the executive control network tract than for the cingulum bundle withinthe DMN, t (17) = 18.71, p < .001.
Correlation between Structural and Functional ConnectivityThere was a significant positive correlation between functional connectivity and mean FA inthe DMN, r (17) = .48, p = .045 (Figure 4A), indicating that greater functional connectivitywas associated with higher white matter microstructural integrity. There was no equivalentrelationship between FA and functional connectivity in the executive control network (r (17)= −.08; Figure 5)1.
Effect of age on structure-function relationshipWe found that when a partial correlation was conducted accounting for effects of age, therelationship between DMN functional connectivity and mean FA became stronger (r (15) = .57, p=.016), suggesting that this relationship differs by age. To examine this effect in moredetail, we divided the group into a younger (n=9, age range = 9.1 to 11.0) and older group(n=9, age range = 11.4 to 12.9) based on a median split for age. Examination of the twogroups separately showed that the correlation between DMN functional connectivity and FAwas weak and statistically nonsignificant in the younger group (r (8) = .48, p = .19; Figure4B), but stronger and statistically significant in the older group (r (8) = .73, p = .027; Figure4C). Thus, it appears that this structure-function relationship emerges robustly later inchildhood. This result was not due to differential motion in the two groups, as maximalmotion did not differ between the age groups in any of the three dimensions (ts < 1.7, ps > .1). By contrast, age did not moderate the relationship between functional and structuralconnectivity in the executive control network, which remained weak when age was includedas a covariate (r (15) = −.17).
Relationship with neuropsychological batteryResults of the multiple regression testing for effects of FA and functional connectivity inboth networks on each behavioral measure were as follows: 1) Motor Speed. The effect of
1These results did not change substantially if FA was averaged within the entire tract connecting executive control network nodesrather than just within the portion in the corpus callosum. Within the entire tract, mean FA was .46 (SD = .03), which was significantlylower than the mean FA within the corpus callosum portion of the tract (t (17) = −17.99, p < .001), but still significantly higher thanthe mean FA within the cingulum (t (17) = −7.87, p < .001). FA within this entire tract still did not correlate with functionalconnectivity in the executive control network (r (17) = .08).
Gordon et al. Page 8
Dev Sci. Author manuscript; available in PMC 2012 July 1.
NIH
-PA Author Manuscript
NIH
-PA Author Manuscript
NIH
-PA Author Manuscript

the neural measures on motor speed was not significant (p = .15). 2) Cognitive Speed. Theeffect of the neural measures on cognitive speed was significant (F (4,11) = 4.97, p = .016).Post-hoc partial correlations showed that faster cognitive speed correlated with highercorpus callosum FA (r = .75, p=.003), as well as with higher executive control functionalconnectivity (r = .57, p = .042). 3) Fluency. The effect of the neural measures on fluencywas significant (F (4,12) = 10.59, p = .001). Post-hoc partial correlations showed thatsuperior fluency correlated with higher corpus callosum FA (r = .85, p<.001), and correlatedat trend level with higher executive control functional connectivity (r = .52, p = .056). 4)Switching. The effect of the neural measures on switching ability was significant (F (4,12) =5.59, p = .009). Post-hoc partial correlations showed that superior switching scorescorrelated with higher corpus callosum FA (r = .69, p=.006), as well as with higherexecutive control functional connectivity (r = .73, p = .003). DMN functional and structuralconnectivity did not influence any behavioral measure significantly (ps > .10). Further, noneof these results changed when age was included as a covariate, suggesting that the reportedrelationships did not differ by age.
DiscussionWe examined the relationships between the strength of intrinsic neural activity during restand microstructural integrity of the underlying white matter tracts in the DMN (mPFC-PCC)and executive control network (bilateral lateral PFC) in 9–13 year old typically developingchildren. Consistent with our hypothesis, the strength of functional connectivity of the DMNwas positively related to the integrity of the underlying cingulum bundle. However, thisrelationship was moderated by age such that it was stronger and statistically significant inolder but not younger children. In contrast, interhemispheric frontal lobe functionalconnectivity was not associated with underlying white matter microstructure, and thisrelationship was not influenced by age. Regarding relationships with behavior, functionaland structural connectivity of the executive control network predicted cognitive speed,fluency, and set-switching measures but not motor speed. In contrast, neither structural norfunctional DMN connectivity related to any behavioral measure. Together, these resultsshow that the functional relationship within medial nodes of the DMN depended upon theunderlying structural connection, more strongly for older than younger children, but thatthese measures did not predict behavioral performance. In contrast, the functionalrelationship within the bilateral frontal nodes of the executive control network did not relatereliably to the underlying structural connection, but did predict indices of cognitiveperformance.
Our study is the first to use DTI to measure the integrity of white-matter microstructure intwo white matter tracts that underlie functional networks in late childhood. DTI measuresthe directional coherence of water diffusion in white matter tracts, with higher FA valuesreflecting tracts with thicker, more myelinated, and more consistently organized fibers(Basser, 1995; Pierpaoli & Basser, 1996). As the tract connecting bilateral lateral PFCcourses through the corpus callosum, the largest and most consistently organized whitematter fiber bundle in the brain, FA within this tract is likely to be higher than that of thecingulum bundle within the cingulate gyrus. Indeed, the FA within the corpus callosumpotion of this tract was much higher than the FA within the entire tract, and was also higherthan FA within the cingulum bundle. As Figure 3 shows, paths of this tract differed widelyacross individuals. The lack of consistency in tract definition likely results from immaturityof frontal cortex in late childhood, as well as from methodological constraints oftractography in lateral frontal regions that include multiple crossing fibers such as the lateralfibers radiating out of the corpus collosum and the anterior-posterior fibers within thesuperior longitudinal fasciculus (Mori et al., 2005).
Gordon et al. Page 9
Dev Sci. Author manuscript; available in PMC 2012 July 1.
NIH
-PA Author Manuscript
NIH
-PA Author Manuscript
NIH
-PA Author Manuscript

Our results showed that the more organized the cingulum fiber bundle is (i.e., higher FA),the more efficient the communication (i.e., higher functional connectivity) between itsinterconnected regions. During development, higher FA is an index of white mattermaturation (van der Knaap et al., 1991; Klingberg et al., 1999; Barnea-Goraly et al., 2005;Hermoye et al., 2006), while increased DMN functional connectivity is an index of strongerfunctional organization (Fair et al., 2007, 2008; Thomason et al., 2008). Thus, theassociation of higher FA with higher DMN functional connectivity in the present studyindicates that the increased maturation of the cingulum bundle is related to more efficientcommunication between mPFC and PCC. Our findings extend the positive correlationbetween DMN and cingulum FA observed in young adulthood (van den Heuval et al., 2008)and in normal aging (Andrews-Hanna et al., 2007) to an earlier period of development. Ourcorrelation coefficient was higher (r = .48) than those in the adult studies (r = .29 in youngadults and r = .33 in older adults, controlled for age), perhaps due to a greater range offunctional and structural connectivity in children resulting from variable maturation rates,particularly of fiber tracts connecting association cortices. This greater range may haveserved to increase the strength of the linear relationship between structure and function.
Our results provide some insight into developmental differences in the maturation of theDMN and its association with the integrity of the cingulum bundle. While age did notcorrelate with either FA or functional connectivity, it moderated the strength of thestructure-function relationship, such that this relationship was stronger in 11–13 year-oldchildren than in 9–11 year-old children. These results extend those of Supekar et al. (2010),who reported a weak, nonsignificant relationship between structure and function of theDMN in 7–9 year old children. The present finding suggests that this relationship emergesafter age 9 but is more reliable as children enter the preadolescent years. Interestingly, DMNfunctional connectivity was not lower in younger than in older children, despite theweakness of the structure-function relationship. Similarly, previous studies havedemonstrated that while functional connectivity within the DMN is lower duringdevelopment than in adulthood, it is still relatively robust (Fair et al., 2008; Kelly et al.,2009; Supekar et al., 2010), even at young ages when the cingulum is quite undeveloped(Dubois et al., 2008). This converging evidence suggests that in early childhood, while thecingulum is relatively immature, DMN functional connectivity may be supported by otherstructural connections besides the cingulum. One possibility is that communication may bemediated by structural connections through the medial temporal lobe, a component of theDMN. The hippocampal formation matures early, with volume increasing rapidly until age 2years and slowly thereafter (Utsunomiya et al., 1999), and it is structurally connected to boththe anterior and posterior nodes of the DMN. In macaques, direct monosynaptic connectionsexist between the posterior cingulate and retrosplenial cortex and the medial temporal lobe(Suzuki & Amaral, 1994; Morris et al., 1999; Lavenex et al., 2002; Kobayashi & Amaral,2003), while the uncinate fasciculus is known to connect the medial temporal lobes to theventral medial prefrontal cortex (Carmichael & Price, 1995; Petrides & Pandya, 2007).Future work with younger children ought to investigate whether communication betweenPCC and mPFC may depend on the medial temporal lobe.
The executive control network in the present study was identified as two separate lateralizedcomponents, consistent with past ICA studies (Beckmann et al., 2005; Habas et al., 2009;Kiviniemi et al., 2009; Smith et al., 2009; Stevens et al., 2009). In contrast with the DMN,functional connectivity between the lateral prefrontal nodes of the executive control networkhad no relationship with FA within the corpus callosum. It is possible that this relationshipdid not emerge because of the highly variable paths of the tracts connecting these nodes.Unlike the cingulum within the DMN, there is no single large, coherent tract connectinglateral prefrontal cortex to its contralateral homologue; thus, the connecting tracts detectedusing probabilistic tractography are more likely to vary across subjects. Thus, we restricted
Gordon et al. Page 10
Dev Sci. Author manuscript; available in PMC 2012 July 1.
NIH
-PA Author Manuscript
NIH
-PA Author Manuscript
NIH
-PA Author Manuscript

FA measurement to the corpus callosum portion of the tract in order to increase theconsistency of the tract’s anatomical location across subjects. Still, this portion within thecorpus callosum was not uniform across subjects, which might increase the noise in ourmeasured FA values and thus reduce our ability to detect a structure-function relationship.Alternately, it is possible that the corpus callosum might not be the only pathway forcommunication between lateral prefrontal nodes of the executive control network.Interhemispheric resting state functional connectivity in bilateral networks is not eliminatedin cases of corpus callosum agenesis (Quigley et al., 2003) or even completecommisurotomy (Uddin et al., 2008), suggesting that subcortical structures might alsomediate interhemispheric communication (Uddin et al., 2008). Such an indirectcommunication pathway obviates the strict dependence of bilateral functional connectivityon direct callosal structural connections, which in this study would reduce our ability toobserve correlations between functional and structural connectivity.
Functional connectivity within the DMN was not associated with processing speed in thepresent study. This association has been observed in healthy adults (Hampson et al., 2006)and in normal aging (Andrews-Hanna et al., 2007; Sambataro et al., 2010). Perhaps this lackof a relationship in the present study resulted from our not using a simple reaction timemeasure of cognitive speed. Our measure, time taken for trail-making with letter or numbersequences, required maintenance of the alphabetic/numeric sequences within workingmemory and constant monitoring of the position within those sequences—functionscommonly associated with executive control processes. Indeed, post-hoc cross-correlationsof the cognitive measures revealed that the cognitive speed, fluency, and switching measureswere all inter-correlated (all rs > .68; all ps < .01), but that no behavioral measure correlatedwith motor speed (ps > .1). Thus, the cognitive processing speed measure may not have been“process-pure”, but rather may have required some executive functions, which helps explainboth its association with connectivity within the executive control network and its lack ofassociation with functional connectivity within the DMN.
As hypothesized, we observed that functional connectivity between lateral frontal cortex andthe structural integrity of the corpus callosum connecting them was associated with twomeasures of executive function, fluency and set-switching. Furthermore, these connectivitymeasures also correlated with cognitive speed but not motor speed. The strong inter-correlations between the cognitive speed, fluency, and switching measures suggests thesebehavioral measures likely all tapped into a single non-motor aspect of cognition whichdepends on structural and functional connections within the executive control network, butnot the DMN. These findings are consistent with others showing that colossal volumecorrelated with functions supporting higher order interhemispheric functions (e.g., language,inhibition) but not interhemispheric sensory integration (Clarke & Zaidel, 1994). Higherorder interhemispheric integration is thought to depend upon interconnection of homologousassociation cortices, such as the bilateral prefrontal regions investigated in the present study.It is important to note that while both colossal structural integrity and functionalconnectivity of homologous lateral frontal cortices correlated with the three measures ofcognitive function, the interhemispheric functional connectivity did not depend upon thestructural integrity of the connecting corpus callosum. Thus, our findings suggest that theconcerted functioning of bilateral frontal cortices, which is important for cognitivefunctioning, can be supported by sources other than a direct bilateral structural connection.
In summary, the present study provides the first evidence for a relationship betweenfunctional connectivity within resting-state networks and the maturity of the structural tractsconnecting those networks in late childhood. However, our sample size was somewhatsmall, especially to evaluate age differences. In addition, our sample had relatively high IQscores, which may limit the generalizability of our findings. Finally, ROIs were based upon
Gordon et al. Page 11
Dev Sci. Author manuscript; available in PMC 2012 July 1.
NIH
-PA Author Manuscript
NIH
-PA Author Manuscript
NIH
-PA Author Manuscript
group ICA results in order to have a common starting point for structural and functionalconnectivity analysis across all subjects. In past studies, ROIs for DMN have been basedupon loci reported in the literature (e.g., Fair et al., 2008) or task-evoked group average ofde-activation (e.g., Hampson et al., 2006). Thus, it will be important to replicate our findingof a stronger structure-function association within the DMN with increasing age with largerand more intellectually heterogeneous samples, as well as with other ROI selection methods.Our findings indicate that the structural maturity of the cingulum bundle is important for theefficiency of communication between the midline nodes of the DMN, particularly aschildren enter preadolescent years. In contrast, communication between nodes of thebilateral frontal network does not appear to be supported by the structural integrity of thecorpus callosum, although integrity of both the functional and structural connections isimportant for cognitive functioning. Future research should not only extend these findings indifferent developmental age ranges, but should also examine how these observedrelationships might be disrupted in developmental disorders such as ADHD and Autism.
AcknowledgmentsFunding
This work was supported by the National Institute of Mental Health (MH65395) and by a training grant from theNational Institute of Neurological Disorders and Stroke (3T32NS041231-03S1).
We would like to thank Rusan Chen for statistical guidance and Devon Shook and Stephanie Bean for assistancewith subject recruitment, neuropsychological testing, and MRI data acquisition.
ReferencesAndrews-Hanna JR, Reidler JS, Huang C, Buckner RL. Evidence for the Default Network’s Role in
Spontaneous Cognition. J Neurophysiol. 2010; 104(1):322–335. [PubMed: 20463201]Andrews-Hanna JR, Snyder AZ, Vincent JL, Lustig C, Head D, Raichle ME, Buckner RL. Disruption
of Large-Scale Brain Systems in Advanced Aging. Neuron. 2007; 56(5):924–935. [PubMed:18054866]
Barnea-Goraly N, Menon V, Eckert M, Tamm L, Bammer R, Karchemskiy A, Dant CC, Reiss AL.White matter development during childhood and adolescence: a cross-sectional diffusion tensorimaging study. Cereb Cortex. 2005; 15(12):1848–54. [PubMed: 15758200]
Basser PJ, Pierpaoli C. Microstructural and physiological features of tissues elucidated by quantitative-diffusion-tensor MRI. J Magn Reson B. 1996; 111(3):209–19. [PubMed: 8661285]
Basser PJ. Inferring Microstructural Features and the Physiological State of Tissues from Diffusion-Weighted Images. NMR in Biomedicine. 1995; 8:333–344. [PubMed: 8739270]
Beckmann CF, DeLuca M, Devlin JT, Smith SM. Investigations into resting-state connectivity usingindependent component analysis. Philos Trans R Soc Lond B Biol Sci. 2005; 360(1457):1001–13.[PubMed: 16087444]
Beckmann CF, Smith SM. Probabilistic independent component analysis for functional magneticresonance imaging. IEEE Trans Med Imaging. 2004; 23(2):137–52. [PubMed: 14964560]
Behrens TE, Woolrich MW, Jenkinson M, Johansen-Berg H, Nunes RG, Clare S, Matthews PM,Brady JM, Smith SM. Characterization and propagation of uncertainty in diffusion-weighted MRimaging. Magn Reson Med. 2003; 50(5):1077–88. [PubMed: 14587019]
Bennett IJ, Madden DJ, Vaidya CJ, Howard JH Jr, Howard DV. White matter integrity correlates ofimplicit sequence learning in healthy aging. Neurobiology of Aging. 201010.1016/j.neurobiolaging.2010.03.017
Birn RM, Diamond JB, Smith MA, Bandettini PA. Separating respiratory-variation-related fluctuationsfrom neuronal-activity-related fluctuations in fMRI. NeuroImage. 2006; 31(4):1536–48. [PubMed:16632379]
Brett M, Anton J, Valabregue R, Poline J. Region of interest analysis using an SPM toolbox (abstract).NeuroImage. 2003; 16(Supplemental) (CD-ROM).
Gordon et al. Page 12
Dev Sci. Author manuscript; available in PMC 2012 July 1.
NIH
-PA Author Manuscript
NIH
-PA Author Manuscript
NIH
-PA Author Manuscript

Buckner RL, Andrews-Hanna JR, Schacter DL. The Brain’s Default Network: Anatomy, Function, andRelevance to Disease. Annals of the New York Academy of Sciences. 2008; 1124:1–38. [PubMed:18400922]
Buckner RL, Vincent JL. Unrest at rest: Default activity and spontaneous network correlations.NeuroImage. 2007; 37(4):1091–1096. [PubMed: 17368915]
Carmichael ST, Price JL. Limbic connections of the orbital and medial prefrontal cortex in macaquemonkeys. The Journal of Comparative Neurology. 1995; 363(4):615–641. [PubMed: 8847421]
Castellanos FX, Margulies DS, Kelly A, Uddin LQ, Ghaffari M, Kirsch A, Shaw D, Shehzad Z, DiMartino A, Biswal BB, Sonuga-Barke EJ, Rotrosen J, Adler LA, Milham MP. Cingulate-Precuneus Interactions: A New Locus of Dysfunction in Adult Attention-Deficit/HyperactivityDisorder. Biological psychiatry. 2008; 63(3):332–337. [PubMed: 17888409]
Clarke JM, Zaidel E. Anatomical-behavioral relationships: Corpus callosum morphometry andhemispheric specialization. Behavioural Brain Research. 1994; 64(1–2):185–202. [PubMed:7840886]
De Luca M, Beckmann CF, De Stefano N, Matthews P, Smith S. fMRI resting state networks definedistinct modes of long-distance interactions in the human brain. NeuroImage. 2006; 29(4):1359–1367. [PubMed: 16260155]
Delis, D.; Kaplan, E.; Kramer, J. Delis Kaplan Executive Function System technical manual. SanAntonio, TX: The Psychological Corporation; 2001.
Dubois J, Dehaene-Lambertz G, Perrin M, Mangin JF, Cointepas Y, Duchesnay E, Le Bihan D, Hertz-Pannier L. Asynchrony of the early maturation of white matter bundles in healthy infants:quantitative landmarks revealed noninvasively by diffusion tensor imaging. Hum Brain Mapp.2008; 29(1):14–27. [PubMed: 17318834]
Fair DA, Cohen AL, Dosenbach NUF, Church JA, Miezin FM, Barch DM, Raichle ME, Petersen SE,Schlaggar BL. The maturing architecture of the brain’s default network. Proceedings of theNational Academy of Sciences of the United States of America. 2008; 105(10):4028–32.[PubMed: 18322013]
Fair DA, Cohen AL, Power JD, Dosenbach NUF, Church JA, Miezin FM, Schlaggar BL, Petersen SE.Functional Brain Networks Develop from a “Local to Distributed” Organization. PLoSComputational Biology. 2009; 5(5):e1000381. [PubMed: 19412534]
Fair DA, Dosenbach NUF, Church JA, Cohen AL, Brahmbhatt S, Miezin FM, Barch DM, RaichleME, Petersen SE, Schlaggar BL. Development of distinct control networks through segregationand integration. Proceedings of the National Academy of Sciences of the United States ofAmerica. 2007; 104(33):13507–13512. [PubMed: 17679691]
Gao W, Zhu H, Giovanello KS, Smith JK, Shen D, Gilmore JH, Lin W. Evidence on the emergence ofthe brain’s default network from 2-week-old to 2-year-old healthy pediatric subjects. Proceedingsof the National Academy of Sciences. 2009; 106(16):6790–6795.
Greicius MD, Srivastava G, Reiss AL, Menon V. Default-mode network activity distinguishesAlzheimer’s disease from healthy aging: evidence from functional MRI. Proc Natl Acad Sci U SA. 2004; 101(13):4637–42. [PubMed: 15070770]
Greicius MD, Supekar K, Menon V, Dougherty RF. Resting-State Functional Connectivity ReflectsStructural Connectivity in the Default Mode Network. Cereb Cortex. 2009; 19(1):72–78.[PubMed: 18403396]
Gusnard DA, Akbudak E, Shulman GL, Raichle ME. Medial prefrontal cortex and self-referentialmental activity: Relation to a default mode of brain function. Proceedings of the NationalAcademy of Sciences of the United States of America. 2001; 98(7):4259–4264. [PubMed:11259662]
Habas C, Kamdar N, Nguyen D, Prater K, Beckmann CF, Menon V, Greicius MD. Distinct CerebellarContributions to Intrinsic Connectivity Networks. J Neurosci. 2009; 29(26):8586–8594. [PubMed:19571149]
Hampson M, Driesen NR, Skudlarski P, Gore JC, Constable RT. Brain Connectivity Related toWorking Memory Performance. J Neurosci. 2006; 26(51):13338–13343. [PubMed: 17182784]
Hermoye L, Saint-Martin C, Cosnard G, Lee SK, Kim J, Nassogne MC, Menten R, Clapuyt P,Donohue PK, Hua K, Wakana S, Jiang H, van Zijl PC, Mori S. Pediatric diffusion tensor imaging:
Gordon et al. Page 13
Dev Sci. Author manuscript; available in PMC 2012 July 1.
NIH
-PA Author Manuscript
NIH
-PA Author Manuscript
NIH
-PA Author Manuscript
normal database and observation of the white matter maturation in early childhood. NeuroImage.2006; 29(2):493–504. [PubMed: 16194615]
van den Heuval M, Mandl R, Luigjes J, Pol H. Microstructural Organization of the Cingulum Tractand the Level of Default Mode Functional Connectivity. J Neurosci. 2008; 43(28):10844–10851.
Jenkinson M, Bannister P, Brady M, Smith S. Improved optimization for the robust and accurate linearregistration and motion correction of brain images. NeuroImage. 2002; 17(2):825–41. [PubMed:12377157]
Jenkinson M, Smith S. A global optimisation method for robust affine registration of brain images.Medical Image Analysis. 2001; 5(2):143–156. [PubMed: 11516708]
Kelly A, Di Martino A, Uddin LQ, Shehzad Z, Gee DG, Reiss PT, Margulies DS, Castellanos FX,Milham MP. Development of Anterior Cingulate Functional Connectivity from Late Childhood toEarly Adulthood. Cereb Cortex. 2009; 19(3):640–657. [PubMed: 18653667]
Kennedy DP, Redcay E, Courchesne E. Failing to deactivate: Resting functional abnormalities inautism. Proc Natl Acad Sci U S A. 2006; 103(21):8275–80. [PubMed: 16702548]
Kiviniemi V, Starck T, Remes J, Long X, Nikkinen J, Haapea M, Veijola J, Moilanen I, Isohanni M,Zang Y, Tervonen O. Functional segmentation of the brain cortex using high model order groupPICA. Human Brain Mapping. 2009; 30(12):3865–3886. [PubMed: 19507160]
Klingberg T, Vaidya CJ, Gabrieli JDE, Moseley ME, Hedehus M. Myelination and organization of thefrontal white matter in children: a diffusion tensor MRI study. Neuroreport. 1999; 10(13):2817–2821. [PubMed: 10511446]
van der Knaap MS, Valk J, Bakker CJ, Schooneveld M, Faber JA, Willemse J, Gooskens RH.Myelination as an expression of the functional maturity of the brain. Developmental Medicine andChild Neurology. 1991; 33(10):849–57. [PubMed: 1743407]
Kobayashi Y, Amaral DG. Macaque monkey retrosplenial cortex: II. Cortical afferents. The Journal ofComparative Neurology. 2003; 466(1):48–79. [PubMed: 14515240]
Lancaster JL, Woldorff MG, Parsons LM, Liotti M, Freitas CS, Rainey L, Kochunov PV, NickersonD, Mikiten SA, Fox PT. Automated Talairach atlas labels for functional brain mapping. HumanBrain Mapping. 2000; 10(3):120–131. [PubMed: 10912591]
Lancaster JL, Summerlin JL, Rainey L, Freitas CS, Fox PT. The Talairach daemon, a database serverfor Talairach atlas labels. Neuroimage. 1997; 5(4):S633.
Lavenex P, Suzuki WA, Amaral DG. Perirhinal and parahippocampal cortices of the macaquemonkey: Projections to the neocortex. The Journal of Comparative Neurology. 2002; 447(4):394–420. [PubMed: 11992524]
Maldjian JA, Laurienti PJ, Kraft RA, Burdette JH. An automated method for neuroanatomic andcytoarchitectonic atlas-based interrogation of fMRI data sets. NeuroImage. 2003; 19(3):1233–1239. [PubMed: 12880848]
Mason MF, Norton MI, Van Horn JD, Wegner DM, Grafton ST, Macrae CN. Wandering Minds: TheDefault Network and Stimulus-Independent Thought. Science. 2007; 315(5810):393–395.[PubMed: 17234951]
Mori, S.; Wakana, S.; Zijl, PCMV. MRI atlas of human white matter. Elsevier Science Ltd; 2005.Morris R, Petrides M, Pandya DN. Architecture and connections of retrosplenial area 30 in the rhesus
monkey (macaca mulatta). European Journal of Neuroscience. 1999; 11(7):2506–2518. [PubMed:10383640]
Mufson EJ, Pandya DN. Some observations on the course and composition of the cingulum bundle inthe rhesus monkey. The Journal of Comparative Neurology. 1984; 225(1):31–43. [PubMed:6725639]
Petrides M, Pandya DN. Efferent Association Pathways from the Rostral Prefrontal Cortex in theMacaque Monkey. J Neurosci. 2007; 27(43):11573–11586. [PubMed: 17959800]
Pierpaoli C, Basser PJ. Toward a quantitative assessment of diffusion anisotropy. Magnetic Resonancein Medicine. 1996; 36(6):893–906. [PubMed: 8946355]
Quigley M, Cordes D, Turski P, Moritz C, Haughton V, Seth R, Meyerand ME. Role of the corpuscallosum in functional connectivity. AJNR Am J Neuroradiol. 2003; 24(2):208–12. [PubMed:12591635]
Gordon et al. Page 14
Dev Sci. Author manuscript; available in PMC 2012 July 1.
NIH
-PA Author Manuscript
NIH
-PA Author Manuscript
NIH
-PA Author Manuscript
Raichle ME, Snyder AZ. A default mode of brain function: A brief history of an evolving idea.NeuroImage. 2007; 37(4):1083–1090. [PubMed: 17719799]
Rombouts SA, Barkhof F, Goekoop R, Stam CJ, Scheltens P. Altered resting state networks in mildcognitive impairment and mild Alzheimer’s disease: An fMRI study. Human Brain Mapping.2005; 26(4):231–239. [PubMed: 15954139]
Sambataro F, Murty VP, Callicott JH, Tan H, Das S, Weinberger DR, Mattay VS. Age-relatedalterations in default mode network: Impact on working memory performance. Neurobiology ofAging. 2010; 31(5):839–52. [PubMed: 18674847]
Schmahmann, JD.; Pandya, DN. Fiber Pathways of the Brain. New York, NY: Oxford UniversityPress; 2006.
Seeley WW, Menon V, Schatzberg AF, Keller J, Glover GH, Kenna H, Reiss AL, Greicius MD.Dissociable intrinsic connectivity networks for salience processing and executive control. TheJournal of Neuroscience: The Official Journal of the Society for Neuroscience. 2007; 27(9):2349–56. [PubMed: 17329432]
Sheehan DV, Lecrubier Y, Sheehan KH, Amorim P, Janavs J, Weiller E, Hergueta T, Baker R, DunbarGC. The Mini-International Neuropsychiatric Interview (M.I.N.I.): the development and validationof a structured diagnostic psychiatric interview for DSM-IV and ICD-10. J Clin Psychiatry. 1998;59(Suppl 20):22–33. quiz 34–57. [PubMed: 9881538]
Skudlarski P, Jagannathan K, Calhoun VD, Hampson M, Skudlarska BA, Pearlson G. Measuring brainconnectivity: Diffusion tensor imaging validates resting state temporal correlations. NeuroImage.2008; 43(3):554–561. [PubMed: 18771736]
Smith SM, Fox PT, Miller KL, Glahn DC, Fox PM, Mackay CE, Filippini N, Watkins KE, Toro R,Laird AR, Beckmann CF. Correspondence of the brain’s functional architecture during activationand rest. Proceedings of the National Academy of Sciences. 2009; 106(31):13040–13045.
Stevens MC, Pearlson GD, Calhoun VD. Changes in the interaction of resting-state neural networksfrom adolescence to adulthood. Human Brain Mapping. 2009; 30(8):2356–2366. [PubMed:19172655]
Supekar K, Uddin LQ, Prater K, Amin H, Greicius MD, Menon V. Development of functional andstructural connectivity within the default mode network in young children. NeuroImage. 2010;52(1):290–301. [PubMed: 20385244]
Suzuki WL, Amaral DG. Perirhinal and parahippocampal cortices of the macaque monkey: Corticalafferents. The Journal of Comparative Neurology. 1994; 350(4):497–533. [PubMed: 7890828]
Teipel SJ, Bokde AL, Meindl T, Amaro E Jr, Soldner J, Reiser MF, Herpertz SC, Möller H, HampelH. White matter microstructure underlying default mode network connectivity in the human brain.NeuroImage. 2010; 49(3):2021–2032. [PubMed: 19878723]
Thomason ME, Chang CE, Glover GH, Gabrieli JD, Greicius MD, Gotlib IH. Default-mode functionand task-induced deactivation have overlapping brain substrates in children. NeuroImage. 2008;41(4):1493–1503. [PubMed: 18482851]
Tian L, Jiang T, Wang Y, Zang Y, He Y, Liang M, Sui M, Cao Q, Hu S, Peng M, Zhuo Y. Alteredresting-state functional connectivity patterns of anterior cingulate cortex in adolescents withattention deficit hyperactivity disorder. Neuroscience letters. 2006; 400(1–2):39–43. [PubMed:16510242]
Tsujimoto S. The Prefrontal Cortex: Functional Neural Development During Early Childhood. TheNeuroscientist. 2008; 14(4):345–358. [PubMed: 18467667]
Uddin LQ, Mooshagian E, Zaidel E, Scheres A, Margulies DS, Kelly A, Shehzad Z, Adelstein JS,Castellanos FX, Biswal BB, Milham MP. Residual functional connectivity in the split-brainrevealed with resting-state functional MRI. Neuroreport. 2008; 19(7):703–9. [PubMed: 18418243]
Utsunomiya H, Takano K, Okazaki M, Mitsudome A. Development of the Temporal Lobe in Infantsand Children: Analysis by MR-Based Volumetry. AJNR Am J Neuroradiol. 1999; 20(4):717–723.[PubMed: 10319988]
Van Dijk KRA, Hedden T, Venkataraman A, Evans KC, Lazar SW, Buckner RL. Intrinsic FunctionalConnectivity As a Tool For Human Connectomics: Theory, Properties, and Optimization. JNeurophysiol. 2010; 103(1):297–321. [PubMed: 19889849]
Gordon et al. Page 15
Dev Sci. Author manuscript; available in PMC 2012 July 1.
NIH
-PA Author Manuscript
NIH
-PA Author Manuscript
NIH
-PA Author Manuscript
Wechsler, D. The Wechsler Abbreviated Scale of Intelligence (WASI). New York: PsychologicalCorporation; 1999.
Woodcock, R.; McGrew, K.; Mather, N. Woodcock-Johnson III tests of cognitive abilities. Itasca, IL:Riverside Publishing; 2001.
Gordon et al. Page 16
Dev Sci. Author manuscript; available in PMC 2012 July 1.
NIH
-PA Author Manuscript
NIH
-PA Author Manuscript
NIH
-PA Author Manuscript

Figure 1.ICA results. (A) Networks of interest: DMN and executive control networks. Networks arethresholded at voxelwise probability of inclusion in the network > .999. Seeds forconnectivity analysis were constructed on the activity clusters circled in green. (B) Othernetworks detected by the ICA analysis.
Gordon et al. Page 17
Dev Sci. Author manuscript; available in PMC 2012 July 1.
NIH
-PA Author Manuscript
NIH
-PA Author Manuscript
NIH
-PA Author Manuscript

Figure 2.Cingulum tracts traced by the probabilistic tractography procedure in five representativesubjects. Tracts are displayed on subjects’ anatomical images.
Gordon et al. Page 18
Dev Sci. Author manuscript; available in PMC 2012 July 1.
NIH
-PA Author Manuscript
NIH
-PA Author Manuscript
NIH
-PA Author Manuscript
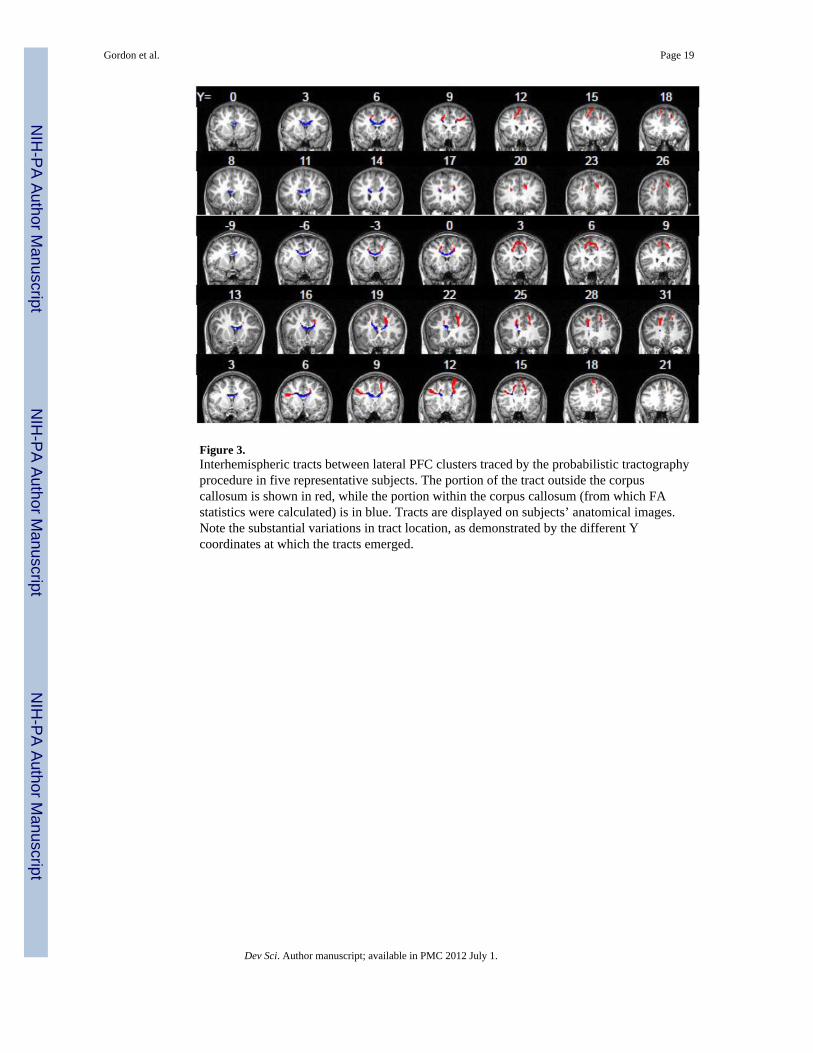
Figure 3.Interhemispheric tracts between lateral PFC clusters traced by the probabilistic tractographyprocedure in five representative subjects. The portion of the tract outside the corpuscallosum is shown in red, while the portion within the corpus callosum (from which FAstatistics were calculated) is in blue. Tracts are displayed on subjects’ anatomical images.Note the substantial variations in tract location, as demonstrated by the different Ycoordinates at which the tracts emerged.
Gordon et al. Page 19
Dev Sci. Author manuscript; available in PMC 2012 July 1.
NIH
-PA Author Manuscript
NIH
-PA Author Manuscript
NIH
-PA Author Manuscript

Figure 4.(A) Correlation between functional connectivity observed within DMN and mean FA withinthe cingulum tracts connecting PCC and mPFC. (B) Weak correlation between DMNfunctional connectivity and cingulum FA in younger children aged 9.1 to 11 years (C)Stronger correlation between DMN functional connectivity and cingulum FA in olderchildren aged 11.4 to 12.9 years
Gordon et al. Page 20
Dev Sci. Author manuscript; available in PMC 2012 July 1.
NIH
-PA Author Manuscript
NIH
-PA Author Manuscript
NIH
-PA Author Manuscript

Figure 5.Correlation between functional connectivity within the executive control network and meanFA within the corpus callosum portion of the tracts connecting left and right lateralprefrontal cortex.
Gordon et al. Page 21
Dev Sci. Author manuscript; available in PMC 2012 July 1.
NIH
-PA Author Manuscript
NIH
-PA Author Manuscript
NIH
-PA Author Manuscript

Figure 6.Partial correlation plots between connectivity measures and behavioral composite measures.Each column of plots represents a multiple regression testing for effects of the four neuralmeasures on that behavioral composite. Each plot shows a partial correlation of the neuralmeasure with the behavioral measure, with the other three neural measures accounted for ascovariates. † = p<.10; * = p<.05; ** = p<.01; *** = p<.001.
Gordon et al. Page 22
Dev Sci. Author manuscript; available in PMC 2012 July 1.
NIH
-PA Author Manuscript
NIH
-PA Author Manuscript
NIH
-PA Author Manuscript

NIH
-PA Author Manuscript
NIH
-PA Author Manuscript
NIH
-PA Author Manuscript
Gordon et al. Page 23
Table 1
Behavioral Measures and Scores
Subtest Raw Scores ± SD Composite Measure
Trail-Making Test: Motor Speed 28.2 ± 10.0 sec Motor Processing Speed
Trail-Making Test: Letter Sequence 34.4 ± 8.8 secCognitive Processing Speed
Trail-Making Test: Number Sequence 38.5 ± 11.6 sec
Verbal Fluency Test: Letter Fluency Total Correct 30.7 ± 10.2 items
FluencyVerbal Fluency Test: Category Fluency Total Correct 35.6 ± 9.8 items
Design Fluency: Filled Dots Total Correct 8.9 ± 3.5 designs
Trail-Making Test: Number-Letter Switching 100.2 ± 48.5 sec
SwitchingVerbal Fluency Test: Category Switching Total Correct 12.0 ± 3.0 items
Design Fluency: Switching Total Correct 5.9 ± 3.1 designs
Dev Sci. Author manuscript; available in PMC 2012 July 1.
NIH
-PA Author Manuscript
NIH
-PA Author Manuscript
NIH
-PA Author Manuscript
Gordon et al. Page 24
Table 2
Voxels of peak connectivity within networks of interest in ICA analysis
Cluster location Cluster size (voxels) Peak Z-score MNI location of peak voxel
Default Mode Network
Medial Prefrontal Cortex 998 13.85 [2, 46, −16]
Posterior Cingulate Cortex 223 11.23 [−2, −58, 28]
Right Angular Gyrus 23 5.82 [54, −62, 24]
Left Angular Gyrus 141 8.75 [−46, −74, 36]
Right Anterior Temporal Lobe 29 6.81 [58, −2, −24]
Right Temporal Pole 24 6.23 [38, 22, −40]
Right Executive Control Network
Right Lateral Prefrontal Cortex 812 9.67 [38, 58, −4]
Right Lateral Parietal Cortex 381 13.29 [46, −54, 52]
Right Posterior Temporal Lobe 80 6.83 [62, −46, −4]
Left Lateral Cerebellum 97 7.39 [−46, −70, −48]
Left Executive Control Network
Left Lateral Prefrontal Cortex 587 9.79 [−50, 14, 36]
Left Lateral Parietal Cortex 332 9.66 [−38, −70, 44]
Left Posterior Temporal Lobe 112 8.04 [−58, −54, −12]
Right Lateral Cerebellum 53 6.91 [38, −70, −44]
Dev Sci. Author manuscript; available in PMC 2012 July 1.