A Pooled Analysis of Advanced Colorectal Neoplasia Diagnoses After Colonoscopic Polypectomy
Upload
independentCategory
view
1download
0
Gene expression in colorectal neoplasia: modificationsinduced by tissue ischaemic time and tissue handling protocol
Susan E Bray, Fiona E M Paulin, Siew Chinn Fong, Lee Baker, Frank A Carey,1
David A Levison,1 Robert J C Steele & Neil M Kernohan1
Department of Surgery & Molecular Oncology, and 1Department of Pathology & Neuroscience, University of Dundee,
Ninewells Hospital & Medical School, Dundee, UK
Date of submission 15 January 2009Accepted for publication 27 May 2009
Bray S E, Paulin F E M, Fong S C, Baker L, Carey F A, Levison D A, Steele R J C & Kernohan N M
(2010) Histopathology 56, 240–250
Gene expression in colorectal neoplasia: modifications induced by tissue ischaemic time andtissue handling protocol
Aims: The heterogeneity within individual distinct can-cer types in terms of behaviour, response to therapy andprognosis is well recognized. A major goal of transla-tional research projects has therefore been to defineclinically significant subgroups of individual tumourtypes by analysis of mRNA as well as protein expression.An essential premise of such investigations is thatexpression of these key molecules is a true reflection ofconditions present within the neoplastic cells in vivo.The aim was to investigate the effect of methods of tissuehandling and storage on expression of mRNA.Methods and results: mRNA expression in 60 biopsysamples obtained from 10 patients with colorectal
tumours was examined. The mRNA expression profileand the level of expression of specific mRNA specieswere significantly affected by the procedures used forcollection and storage of tissue samples. Significantvariation in the level of expression (both increased anddecreased) of transcripts was detectable after 15 min,and by 120 min there was a fourfold increase in thenumber of genes with a more than twofold change inthe level of expression.Conclusions: Reliable interpretation of results of geneexpression at the mRNA level requires standardizedprotocols for tissue procurement.
Keywords: colorectal cancer, gene expression profiling, RNA integrity, RNA isolation, tissue handling
Abbreviations: 2t, two-sample t-test; CI, confidence interval; HCA, hierarchical clustering analysis;MW, Mann–Whitney U-test; PCA, principal components analysis; RIN, RNA integrity number; RT-PCR, reversetranscriptase-polymerase chain reaction
Introduction
Regulated expression of the genome confers phenotypicfeatures on cells that result in morphological differen-tiation and expression of specific functional properties.These features may then either characterize the normalcondition or give rise to manifestations of diseaseprocesses. Technical advances in the field of molecular
biology allow the profiles of genes expressed in normaland diseased states to be compared.1 RNA-basedstudies are particularly important as they reflect theexpression of specific genes and, by implication, theability to generate proteins that support cellularbiochemical functions. Assessment of gene expressionprofiles within diseased tissue therefore enables agenome-wide screen to identify molecular geneticevents that are important in the development ofcancer.2–13 These molecular events determine theproperties of the tumour cells that define their biolog-ical behaviour, resistance to therapy and, ultimately,
Address for correspondence: N M Kernohan, Department of Pathol-
ogy & Neuroscience, University of Dundee, Ninewells Hospital &
Medical School, Dundee, UK. e-mail: [email protected]
� 2010 The Authors. Journal compilation � 2010 Blackwell Publishing Limited.
Histopathology 2010, 56, 240–250. DOI: 10.1111/j.1365-2559.2009.03470.x

prognosis. The level of expression of individual genesthat determine these features may be investigated atthe mRNA level or at the level of protein expression. Inthis study we examined the potential for methods oftissue storage to affect the detected level of expressionof genes at the mRNA level.
The net abundance of an mRNA transcript will bedetermined by its rate ⁄ level of transcription andmodified by the extent it is then degraded, with thehalf-life of mRNAs ranging from 6 to 24 h.14–16 Thestability of mRNA can be influenced by its structure,binding to other cellular proteins, and the presence ofspecific nucleotide sequences such as adenyl-uridyl-rich elements that may determine susceptibility toenzymatic digestion by ribonucleases.15,17–20 Thisdegradation may be enhanced by stripping proteinsfrom RNA during biochemical purification.15 RNasesare ubiquitous enzymes that are particularly abun-dant in some tissues, such as pancreas, and thereforethe propensity for RNA degradation to occur may beto some extent tissue dependent.16,21 Scrupulousmeasures are required to protect mRNA transcriptsfrom enzymatic degradation when tissues are devi-talized or subjected to lysis for molecular studies. Thisis of particular concern for gene expression arraytechnologies, as RNA with structural features asso-ciated with enhanced susceptibility to degradationcould be disproportionately depleted from the pool ofmRNA transcripts. In particular, mRNA transcriptsthat encode proteins that mediate mitogenic signal-ling are often unstable and expressed at low levels;thus their study may present technical challengeswithin the laboratory.22,23
Current translational research initiatives encouragestudies of gene expression on clinical material.24
Clinical specimens are affected by variable and con-founding issues that are difficult to control. Ribonuc-leases degrade RNA, and under conditions of cellularstress associated with surgery, biopsy, neo-adjuvantchemotherapy or radiotherapy, rapid active alterationsin the expression of specific genes may occur. However,the effect of postoperative ischaemic time, potentiallythe most variable factor, is rarely considered.25 In orderthat valid comparisons between test and controlmaterial can be drawn, each tissue should have beenexposed to the same degree (time) of ischaemic stress;otherwise degradation and the capacity for stressresponses to modify gene expression may generatemisleading results. To investigate these issues westudied mRNA expression and integrity in preciselydocumented biopsy samples of colorectal tumours tocompare the effects of method of tissue storage and arange of ischaemic times.
Methods
patients/sample collection
Biopsy specimens were taken from 10 large rectal anddistal sigmoid tumours immediately prior to surgicalresection of the lesion. The diagnosis had been estab-lished preoperatively and approval for the project wasobtained from the Local Research Ethics Committee(REC reference number 04 ⁄S1401 ⁄71). The patientdemographics and a summary of histological andclinical staging are given in Table 1. The protocol forprocessing individual biopsy specimens is given inFigure 1.
rna isolation
Biopsy specimens were homogenized for 10 min at20 Hz on a TissueLyser (Qiagen, Crawley, UK) in amicrocentrifuge tube containing 750 ll QIAzol LysisReagent and a 5-mm steel ball. Chloroform (150 ll)was added before centrifugation at 12 000 g for15 min at 4�C. The upper aqueous phase was trans-ferred to a clean tube and placed in an EZ1 BioRobot(Qiagen); the RNA was purified using an EZ1 RNAUniversal Tissue kit (Qiagen).
rna analysis
RNA integrity and derivation of an RNA integrity scorewas determined by microfluidic capillary electrophore-sis according to the manufacturer’s instructions(Agilent Technologies, South Queensferry, UK). AnRNA integrity number (RIN) was generated by asoftware algorithm that analyses the electrophoretictrace (see Figure 2).
microarray hybridization and gene
expression profil ing
Target RNA was prepared by converting 7.5 lg of RNAinto double-stranded cDNA with a T7-(dT)24 primerincorporating a T7 RNA polymerase promoter. Biotin-labelled cRNA was synthesized from cDNA using anIVT labelling kit (Affymetrix, Santa Clara, CA, USA).RNA fragments (15 lg) were hybridized to a HumanGenome U133 Plus 2.0 array (Affymetrix). Arrayswere scanned and the results quantified using Gene-Chip Operating Software (GCOS v1.2). Signal intensityvalues presented were obtained after backgroundadjustment and normalization using gcRMA algorithmin GeneSpring GX3.7 (Agilent Technologies). A seriesof gene filterings was then carried out (GeneSpring
Gene expression in colorectal tumours 241
� 2010 The Authors. Journal compilation � 2010 Blackwell Publishing Ltd, Histopathology, 56, 240–250.
GX3.7) to obtain a list of probesets that displayed atleast a twofold variation in expression level (‡2 and£0.5). Principal components analysis (PCA) and hier-archical clustering analysis (HCA) were then performedon the data. PCA, an unsupervised decompositionmethod, reduces multidimensional data (such as gene
expression data) into three dimensions, each a principalcomponent with a certain percentage of variance. PCAis a valuable tool for visualization and summarizingcomplex data.26 HCA is a statistical method to groupsamples in distinct clusters that can be presented as ahierarchical tree to show relationships between differ-ent data groupings.27
cdna synthesis
RNA was treated with RQ1 DNase (Promega, South-ampton, UK) prior to reverse transcriptase-polymerasechain reaction (RT-PCR). Total RNA (200 ng) wasreverse-transcribed using M-MLV Reverse Transcrip-tase and Random Hexamer Primer (Invitrogen, Paisley,UK).
quantitative rt-pcr
Quantitative analysis of gene expression was performedby quantitative RT-PCR using an ABI prism 7700sequence detector (Applied Biosystems, Warrington,UK) according to the manufacturer’s protocol. ThisPCR method is less sensitive to the integrity of the RNAtemplate and thus the results are likely to reflect thetrue level of expression of specific transcripts.28 All
Colon tumourbiopsy tissue RNAlater
LN2
0 min 15 min 30 min 60 min 120 min
LN2 LN2 LN2 LN2
4°C overnight –80°C Freezer
–80°C Freezer
Figure 1. Protocol for sample collection in theatre. Biopsy specimens
were taken endoscopically and processed according to the study
protocol. Specimens were either placed immediately in RNAlater�(Catalogue no. 76106; Qiagen, Crawley, UK) or immediately snap
frozen in liquid nitrogen (LN2); thereafter, further samples were snap
frozen at 15-, 30-, 60- and 120-min time intervals. All samples were
then stored at )80�C, with the samples stored in RNAlater� first
remaining at 4�C overnight. An H&E-stained section was taken from
a shaving of the tissue fragments to confirm that the tissue samples
included neoplastic tissue.
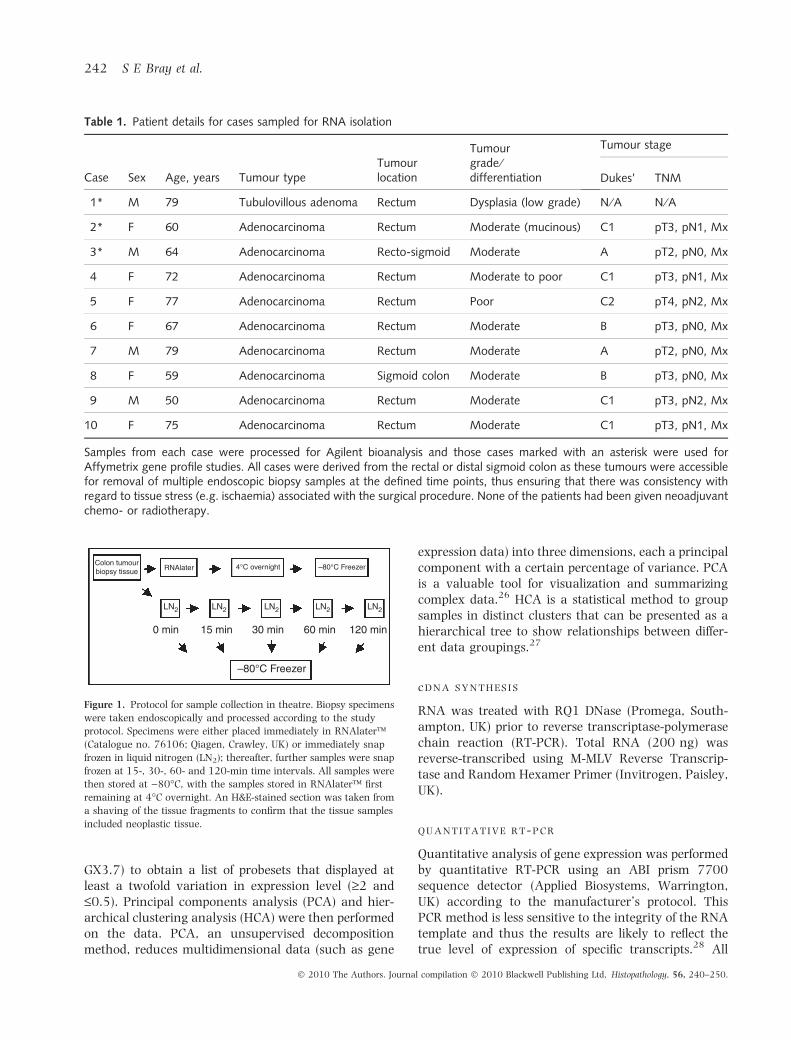
Table 1. Patient details for cases sampled for RNA isolation
Case Sex Age, years Tumour typeTumourlocation
Tumourgrade ⁄differentiation
Tumour stage
Dukes’ TNM
1* M 79 Tubulovillous adenoma Rectum Dysplasia (low grade) N ⁄A N ⁄A
2* F 60 Adenocarcinoma Rectum Moderate (mucinous) C1 pT3, pN1, Mx
3* M 64 Adenocarcinoma Recto-sigmoid Moderate A pT2, pN0, Mx
4 F 72 Adenocarcinoma Rectum Moderate to poor C1 pT3, pN1, Mx
5 F 77 Adenocarcinoma Rectum Poor C2 pT4, pN2, Mx
6 F 67 Adenocarcinoma Rectum Moderate B pT3, pN0, Mx
7 M 79 Adenocarcinoma Rectum Moderate A pT2, pN0, Mx
8 F 59 Adenocarcinoma Sigmoid colon Moderate B pT3, pN0, Mx
9 M 50 Adenocarcinoma Rectum Moderate C1 pT3, pN2, Mx
10 F 75 Adenocarcinoma Rectum Moderate C1 pT3, pN1, Mx
Samples from each case were processed for Agilent bioanalysis and those cases marked with an asterisk were used forAffymetrix gene profile studies. All cases were derived from the rectal or distal sigmoid colon as these tumours were accessiblefor removal of multiple endoscopic biopsy samples at the defined time points, thus ensuring that there was consistency withregard to tissue stress (e.g. ischaemia) associated with the surgical procedure. None of the patients had been given neoadjuvantchemo- or radiotherapy.
242 S E Bray et al.
� 2010 The Authors. Journal compilation � 2010 Blackwell Publishing Ltd, Histopathology, 56, 240–250.

assays were performed in triplicate and results werenormalized against 18S rRNA. Primer and probesets for PCR amplifications were designed using
Primer Express software (Applied Biosystems). Thegenes, corresponding primers and probes are listed inTable 2.
RNA L † = 0
† = 30† = 15
† = 120† = 60
10
A B
C D
E
G
F[Fu]
25
20
15
10
5
0
[Fu]
20
15
10
5
0
[Fu]
100
80
60
40
20
0
20 25 30 35 40 45 50 55 60 65 [s] 20 25 30 35 40 45 50 55 60 65 [s]
20 25 30 35 40 45 50 55 60 65 [s] 20 25 30 35 40 45 50 55 60 65 [s]
20 25 30 35 40 45 50 55 60 65 [s] 20 25 30 35 40 45 50 55 60 65 [s]
[Fu]
70
60
50
40
30
10
20
0
[Fu]
25
30
20
15
10
5
0
[Fu]
15
10
5
0
9
8
7
6
5
4
3
2
1
0RNAL 0 15 30
Time (min)60 120 Path
RN
A in
tegr
ity n
umbe
r
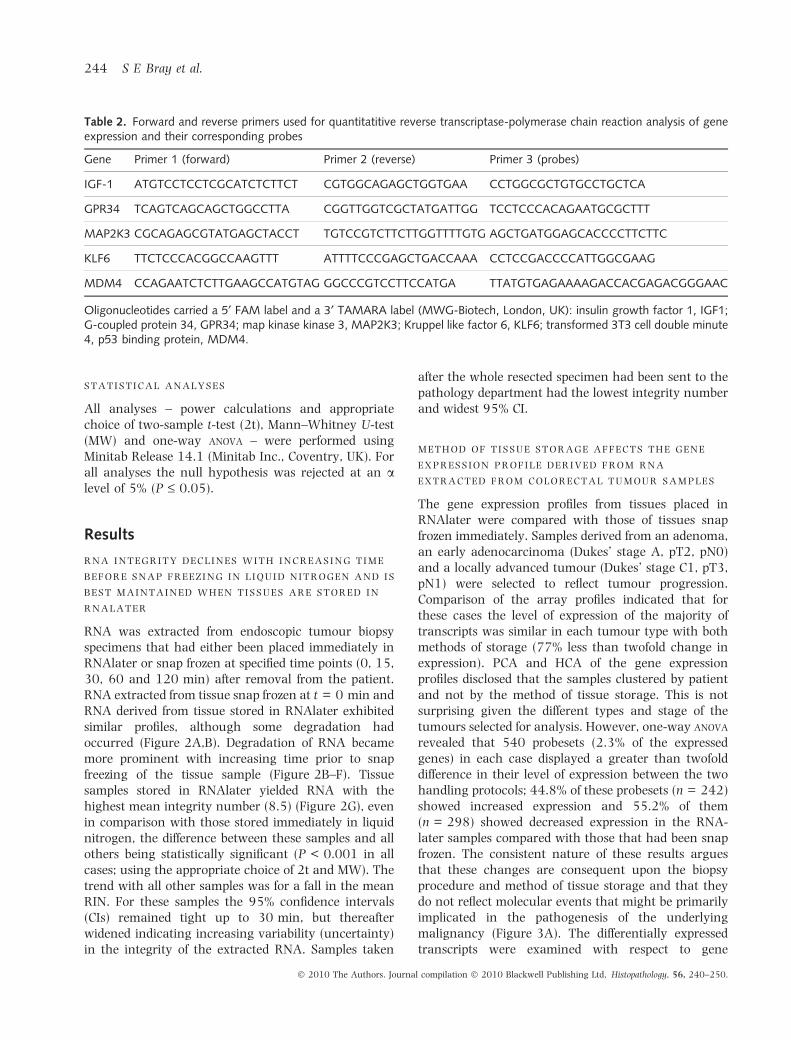
Figure 2. RNA integrity is affected by protocol for tissue storage. Microfluidic capillary electrophoretic tracings obtained from purified RNA
samples (A–F, showing an example of profiles from one study patient) reveal that RNA derived from tissues stored initially in RNAlater is
well preserved with minimal evidence of degradation (A). Immediate snap freezing of tissues also yields high-quality RNA, but there is a
suggestion of some RNA degradation that becomes progressively more prominent with increasing time before snap freezing of the tissue
samples (B–F, t = 0, 15, 30, 60 and 120 min before snap freezing, respectively). Calculation of the mean RNA integrity number (RIN) for
all 10 patients for each time point and storage condition reflects these observations (G), a RIN number of 10 indicating the highest quality,
intact RNA, whereas a RIN score of 0 represents the most degraded RNA. Use of RNAlater yields the highest mean integrity number, the
difference between this sample and all others being statistically significant (P < 0.001 in all cases, using appropriate choice of 2t and MW;
power = 1.00 for all tests). Although statistical significance is not achieved between all other time points and sampling conditions, the 95%
confidence intervals (CIs) remain tight up to the 30-min time point, indicating a high level of confidence in ability of the results to reflect
the true mean. Thereafter confidence decreases as the width of the 95% CIs increases, with the widest CIs being seen for the sample
obtained after specimen preparation by the pathologist (Path).
Gene expression in colorectal tumours 243
� 2010 The Authors. Journal compilation � 2010 Blackwell Publishing Ltd, Histopathology, 56, 240–250.
statistical analyses
All analyses – power calculations and appropriatechoice of two-sample t-test (2t), Mann–Whitney U-test(MW) and one-way anova – were performed usingMinitab Release 14.1 (Minitab Inc., Coventry, UK). Forall analyses the null hypothesis was rejected at an alevel of 5% (P £ 0.05).
Results
rna integrity declines with increasing time
before snap freez ing in liquid nitrogen and is
best maintained when tissues are stored in
rnalater
RNA was extracted from endoscopic tumour biopsyspecimens that had either been placed immediately inRNAlater or snap frozen at specified time points (0, 15,30, 60 and 120 min) after removal from the patient.RNA extracted from tissue snap frozen at t = 0 min andRNA derived from tissue stored in RNAlater exhibitedsimilar profiles, although some degradation hadoccurred (Figure 2A,B). Degradation of RNA becamemore prominent with increasing time prior to snapfreezing of the tissue sample (Figure 2B–F). Tissuesamples stored in RNAlater yielded RNA with thehighest mean integrity number (8.5) (Figure 2G), evenin comparison with those stored immediately in liquidnitrogen, the difference between these samples and allothers being statistically significant (P < 0.001 in allcases; using the appropriate choice of 2t and MW). Thetrend with all other samples was for a fall in the meanRIN. For these samples the 95% confidence intervals(CIs) remained tight up to 30 min, but thereafterwidened indicating increasing variability (uncertainty)in the integrity of the extracted RNA. Samples taken
after the whole resected specimen had been sent to thepathology department had the lowest integrity numberand widest 95% CI.
method of tissue storage affects the gene
express ion profile derived from rna
extracted from colorectal tumour samples
The gene expression profiles from tissues placed inRNAlater were compared with those of tissues snapfrozen immediately. Samples derived from an adenoma,an early adenocarcinoma (Dukes’ stage A, pT2, pN0)and a locally advanced tumour (Dukes’ stage C1, pT3,pN1) were selected to reflect tumour progression.Comparison of the array profiles indicated that forthese cases the level of expression of the majority oftranscripts was similar in each tumour type with bothmethods of storage (77% less than twofold change inexpression). PCA and HCA of the gene expressionprofiles disclosed that the samples clustered by patientand not by the method of tissue storage. This is notsurprising given the different types and stage of thetumours selected for analysis. However, one-way anova
revealed that 540 probesets (2.3% of the expressedgenes) in each case displayed a greater than twofolddifference in their level of expression between the twohandling protocols; 44.8% of these probesets (n = 242)showed increased expression and 55.2% of them(n = 298) showed decreased expression in the RNA-later samples compared with those that had been snapfrozen. The consistent nature of these results arguesthat these changes are consequent upon the biopsyprocedure and method of tissue storage and that theydo not reflect molecular events that might be primarilyimplicated in the pathogenesis of the underlyingmalignancy (Figure 3A). The differentially expressedtranscripts were examined with respect to gene
Table 2. Forward and reverse primers used for quantitatitive reverse transcriptase-polymerase chain reaction analysis of geneexpression and their corresponding probes
Gene Primer 1 (forward) Primer 2 (reverse) Primer 3 (probes)
IGF-1 ATGTCCTCCTCGCATCTCTTCT CGTGGCAGAGCTGGTGAA CCTGGCGCTGTGCCTGCTCA
GPR34 TCAGTCAGCAGCTGGCCTTA CGGTTGGTCGCTATGATTGG TCCTCCCACAGAATGCGCTTT
MAP2K3 CGCAGAGCGTATGAGCTACCT TGTCCGTCTTCTTGGTTTTGTG AGCTGATGGAGCACCCCTTCTTC
KLF6 TTCTCCCACGGCCAAGTTT ATTTTCCCGAGCTGACCAAA CCTCCGACCCCATTGGCGAAG
MDM4 CCAGAATCTCTTGAAGCCATGTAG GGCCCGTCCTTCCATGA TTATGTGAGAAAAGACCACGAGACGGGAAC
Oligonucleotides carried a 5¢ FAM label and a 3¢ TAMARA label (MWG-Biotech, London, UK): insulin growth factor 1, IGF1;G-coupled protein 34, GPR34; map kinase kinase 3, MAP2K3; Kruppel like factor 6, KLF6; transformed 3T3 cell double minute4, p53 binding protein, MDM4.
244 S E Bray et al.
� 2010 The Authors. Journal compilation � 2010 Blackwell Publishing Ltd, Histopathology, 56, 240–250.
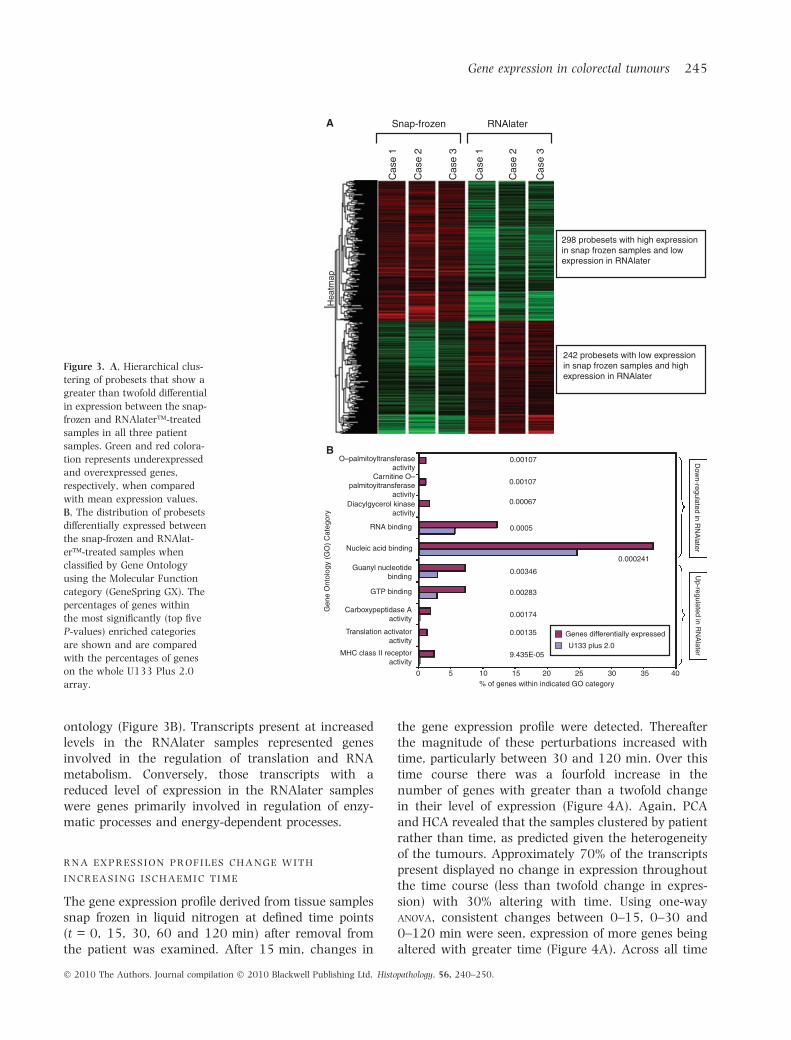
ontology (Figure 3B). Transcripts present at increasedlevels in the RNAlater samples represented genesinvolved in the regulation of translation and RNAmetabolism. Conversely, those transcripts with areduced level of expression in the RNAlater sampleswere genes primarily involved in regulation of enzy-matic processes and energy-dependent processes.
rna express ion profiles change with
increasing ischaemic time
The gene expression profile derived from tissue samplessnap frozen in liquid nitrogen at defined time points(t = 0, 15, 30, 60 and 120 min) after removal fromthe patient was examined. After 15 min, changes in
the gene expression profile were detected. Thereafterthe magnitude of these perturbations increased withtime, particularly between 30 and 120 min. Over thistime course there was a fourfold increase in thenumber of genes with greater than a twofold changein their level of expression (Figure 4A). Again, PCAand HCA revealed that the samples clustered by patientrather than time, as predicted given the heterogeneityof the tumours. Approximately 70% of the transcriptspresent displayed no change in expression throughoutthe time course (less than twofold change in expres-sion) with 30% altering with time. Using one-wayanova, consistent changes between 0–15, 0–30 and0–120 min were seen, expression of more genes beingaltered with greater time (Figure 4A). Across all time
Snap-frozenA
B
Cas
e 1
Hea
tmap
Cas
e 2
Cas
e 1
Cas
e 2
Cas
e 3
Cas
e 3
RNAlater
298 probesets with high expressionin snap frozen samples and lowexpression in RNAlater
242 probesets with low expressionin snap frozen samples and highexpression in RNAlater
O–palmitoyltransferaseactivity
Carnitine O–palmitoyitransferase
activityDiacylgycerol kinase
activity
RNA binding
Nucleic acid binding
Gen
e O
ntol
ogy
(GO
) C
ateg
ory
Guanyl nucleotidebinding
GTP binding
Carboxypeptidase Aactivity
Translation activatoractivity
MHC class II receptoractivity
0 5 10 15 20% of genes within indicated GO category
25 30 35 40
0.00346
Dow
n-regulated in RN
Alater
Up-regulated in R
NA
later
Genes differentially expressed
U133 plus 2.0
0.0005
0.000241
0.00067
0.00107
0.00107
0.00283
0.00174
0.00135
9.435E-05
Figure 3. A, Hierarchical clus-
tering of probesets that show a
greater than twofold differential
in expression between the snap-
frozen and RNAlater�-treated
samples in all three patient
samples. Green and red colora-
tion represents underexpressed
and overexpressed genes,
respectively, when compared
with mean expression values.
B, The distribution of probesets
differentially expressed between
the snap-frozen and RNAlat-
er�-treated samples when
classified by Gene Ontology
using the Molecular Function
category (GeneSpring GX). The
percentages of genes within
the most significantly (top five
P-values) enriched categories
are shown and are compared
with the percentages of genes
on the whole U133 Plus 2.0
array.
Gene expression in colorectal tumours 245
� 2010 The Authors. Journal compilation � 2010 Blackwell Publishing Ltd, Histopathology, 56, 240–250.
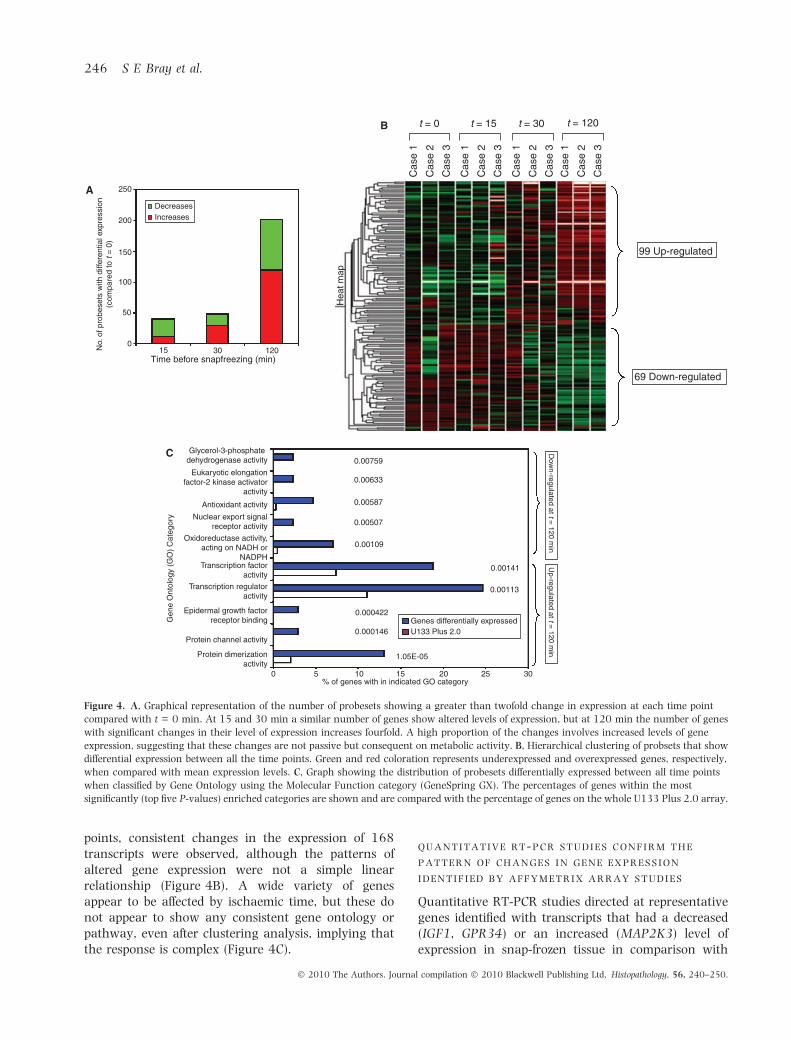
points, consistent changes in the expression of 168transcripts were observed, although the patterns ofaltered gene expression were not a simple linearrelationship (Figure 4B). A wide variety of genesappear to be affected by ischaemic time, but these donot appear to show any consistent gene ontology orpathway, even after clustering analysis, implying thatthe response is complex (Figure 4C).
quantitative rt-pcr studies confirm the
pattern of changes in gene express ion
identif ied by affymetrix array studies
Quantitative RT-PCR studies directed at representativegenes identified with transcripts that had a decreased(IGF1, GPR34) or an increased (MAP2K3) level ofexpression in snap-frozen tissue in comparison with
250A
200
No.
of p
robe
sets
with
diff
eren
tial e
xpre
ssio
n(c
ompa
red
to t
= 0
)
100
150
50
015 30
Time before snapfreezing (min)120
DecreasesIncreases
B t = 0 t = 15 t = 30 t = 120
99 Up-regulated
69 Down-regulated
Cas
e 1
Hea
t map
Cas
e 2
Cas
e 3
Cas
e 1
Cas
e 2
Cas
e 3
Cas
e 1
Cas
e 2
Cas
e 3
Cas
e 1
Cas
e 2
Cas
e 3
C Dow
n-regulated at t = 120 m
inU
p-regulated at t = 120 m
in
Glycerol-3-phosphatedehydrogenase activity
Eukaryotic elongationfactor-2 kinase activator
activity
Antioxidant activity
Nuclear export signalreceptor activity
Oxidoreductase activity,acting on NADH or
NADPH
Epidermal growth factorreceptor binding
Protein channel activity
Protein dimerizationactivity
Transcription regulatoractivity
Transcription factoractivity
0.00633
0.00759
0.00587
0.00507
0.00109
0.00141
0.00113
0.000422
0.000146
0 5 10 15 20 25 30
1.05E-05
% of genes with in indicated GO category
Gen
e O
ntol
ogy
(GO
) C
ateg
ory
Genes differentially expressedU133 Plus 2.0
Figure 4. A, Graphical representation of the number of probesets showing a greater than twofold change in expression at each time point
compared with t = 0 min. At 15 and 30 min a similar number of genes show altered levels of expression, but at 120 min the number of genes
with significant changes in their level of expression increases fourfold. A high proportion of the changes involves increased levels of gene
expression, suggesting that these changes are not passive but consequent on metabolic activity. B, Hierarchical clustering of probsets that show
differential expression between all the time points. Green and red coloration represents underexpressed and overexpressed genes, respectively,
when compared with mean expression levels. C, Graph showing the distribution of probesets differentially expressed between all time points
when classified by Gene Ontology using the Molecular Function category (GeneSpring GX). The percentages of genes within the most
significantly (top five P-values) enriched categories are shown and are compared with the percentage of genes on the whole U133 Plus 2.0 array.
246 S E Bray et al.
� 2010 The Authors. Journal compilation � 2010 Blackwell Publishing Ltd, Histopathology, 56, 240–250.
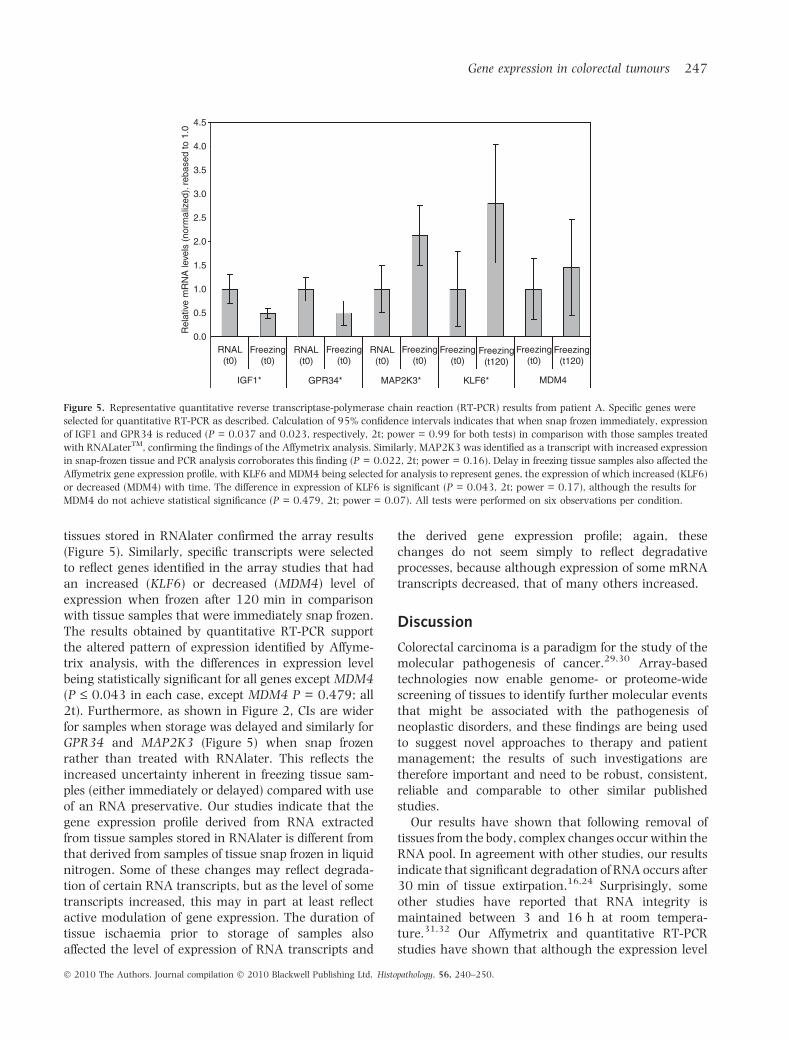
tissues stored in RNAlater confirmed the array results(Figure 5). Similarly, specific transcripts were selectedto reflect genes identified in the array studies that hadan increased (KLF6) or decreased (MDM4) level ofexpression when frozen after 120 min in comparisonwith tissue samples that were immediately snap frozen.The results obtained by quantitative RT-PCR supportthe altered pattern of expression identified by Affyme-trix analysis, with the differences in expression levelbeing statistically significant for all genes except MDM4(P £ 0.043 in each case, except MDM4 P = 0.479; all2t). Furthermore, as shown in Figure 2, CIs are widerfor samples when storage was delayed and similarly forGPR34 and MAP2K3 (Figure 5) when snap frozenrather than treated with RNAlater. This reflects theincreased uncertainty inherent in freezing tissue sam-ples (either immediately or delayed) compared with useof an RNA preservative. Our studies indicate that thegene expression profile derived from RNA extractedfrom tissue samples stored in RNAlater is different fromthat derived from samples of tissue snap frozen in liquidnitrogen. Some of these changes may reflect degrada-tion of certain RNA transcripts, but as the level of sometranscripts increased, this may in part at least reflectactive modulation of gene expression. The duration oftissue ischaemia prior to storage of samples alsoaffected the level of expression of RNA transcripts and
the derived gene expression profile; again, thesechanges do not seem simply to reflect degradativeprocesses, because although expression of some mRNAtranscripts decreased, that of many others increased.
Discussion
Colorectal carcinoma is a paradigm for the study of themolecular pathogenesis of cancer.29,30 Array-basedtechnologies now enable genome- or proteome-widescreening of tissues to identify further molecular eventsthat might be associated with the pathogenesis ofneoplastic disorders, and these findings are being usedto suggest novel approaches to therapy and patientmanagement; the results of such investigations aretherefore important and need to be robust, consistent,reliable and comparable to other similar publishedstudies.
Our results have shown that following removal oftissues from the body, complex changes occur within theRNA pool. In agreement with other studies, our resultsindicate that significant degradation of RNA occurs after30 min of tissue extirpation.16,24 Surprisingly, someother studies have reported that RNA integrity ismaintained between 3 and 16 h at room tempera-ture.31,32 Our Affymetrix and quantitative RT-PCRstudies have shown that although the expression level
4.5
4.0
3.5
3.0R
elat
ive
mR
NA
leve
ls (
norm
aliz
ed).
reba
sed
to 1
.0
2.5
2.0
1.5
1.0
0.5
0.0RNAL
(t0)
IGF1* GPR34* MAP2K3* KLF6* MDM4
RNAL(t0)
RNAL(t0)
Freezing(t0)
Freezing(t0)
Freezing(t0)
Freezing(t0)
Freezing(t0)
Freezing(t120)
Freezing(t120)
Figure 5. Representative quantitative reverse transcriptase-polymerase chain reaction (RT-PCR) results from patient A. Specific genes were
selected for quantitative RT-PCR as described. Calculation of 95% confidence intervals indicates that when snap frozen immediately, expression
of IGF1 and GPR34 is reduced (P = 0.037 and 0.023, respectively, 2t; power = 0.99 for both tests) in comparison with those samples treated
with RNALaterTM, confirming the findings of the Affymetrix analysis. Similarly, MAP2K3 was identified as a transcript with increased expression
in snap-frozen tissue and PCR analysis corroborates this finding (P = 0.022, 2t; power = 0.16). Delay in freezing tissue samples also affected the
Affymetrix gene expression profile, with KLF6 and MDM4 being selected for analysis to represent genes, the expression of which increased (KLF6)
or decreased (MDM4) with time. The difference in expression of KLF6 is significant (P = 0.043, 2t; power = 0.17), although the results for
MDM4 do not achieve statistical significance (P = 0.479, 2t; power = 0.07). All tests were performed on six observations per condition.
Gene expression in colorectal tumours 247
� 2010 The Authors. Journal compilation � 2010 Blackwell Publishing Ltd, Histopathology, 56, 240–250.
of some RNA transcripts falls, as might be expected in anenvironment in which RNA integrity is compromised,that of others increases. Therefore our results reinforcethe notion that, in addition to degradative processes,active regulated modulation of gene expression (pre-sumably in the context of a stress response to ischaemia,temperature and ⁄ or drugs ⁄ chemicals) contributes to theapparent expression level of individual transcripts.33,34
As evidence emerges that implicates altered expression ofspecific genes in the pathogenesis of disease, it is clearthat unless detailed tissue-handling protocols are inplace, misleading results may be obtained. For example,it is suggested that reduced expression of KLF6 may beimplicated in the early stages of the molecular patho-genesis of approximately one-third of colorectal carci-noma cases:35 our study has shown that expression ofKLF6 mRNA is significantly increased by delay in samplefreezing. As the number and magnitude of changes in thelevel of RNA transcripts dramatically increased after30 min, the most consistent results will be obtained fromtissues stored within 30 min of retrieval. The logisticsassociated with tissue collection may mean that it is notpossible to achieve this suggested time frame, but ifdocumentation of the ischaemic time for the tissuesamples (time from clamping of vascular supply orremoval of an endoscopic sample) is adopted intostandard protocols, reliable comparisons between tissuesamples may still be drawn.
We have also shown that gene expression profiles intissue samples can be significantly affected by the methodof tissue storage. RNA ‘friendly’ storage solutions such asRNAlater precipitate out RNA-degrading enzymes into asulphate salt solution, thereby maintaining intactRNA.36 Although some reports have indicated thatthese solutions are not ideal for preserving tissuemorphology for histological diagnosis, it has been shownthat RNAlater preserves RNA integrity and optimizesRNA extraction from tissue samples.37–39 Whereas somestudies have reported similar findings whether tissuesare placed in liquid nitrogen or RNAlater,40,41 otherssuggest that snap freezing yields best results,42,43 and inone Trizol was preferred.44 Our results indicate that RNAextracted from RNAlater-treated tissues consistently hasthe highest RIN in comparison with snap-frozen tissues(P < 0.001), although it is important to recognize thattreatment of tissue samples with RNAlater generates adifferent gene expression profile.
The panel of RNA transcripts that was affected withtime and by method of storage was consistent. There-fore it is likely that most of these changes do not drivethe progression from adenoma to malignancy or thedevelopment of locally advanced disease with associ-ated node metastases. It is impossible to know the true
level of expression of specific genes in vivo, as this maybe affected by circumstances associated with surgicalintervention.25 However, our study has clearly dem-onstrated that in order to obtain consistent results fromRNA-based studies, the impact of tissue procurementand handling procedures on the potential for RNAdegradation and changes in the level of transcription ofspecific genes, needs to be carefully considered.24
Protection of mRNA from enzymatic degradation byRNases is a fundamental issue for experimental designand laboratory practice;45 if neglected, those tran-scripts that are expressed at very low levels or possessstructural properties that render them susceptible tothe activity of these enzymes will be disproportionatelyaffected. Furthermore, following tissue hypoxiaassociated with devitalization at surgery, the cells willinitially engage appropriate stress response pathwaysto protect critical cell functions. It is withinthis background that the potential for additionalchanges in the level of expression of mRNA transcriptsexists.
This investigation’s findings have established theprinciple that studies of gene expression demand aconsistent approach to tissue procurement and han-dling. Although restricted to mRNA, in principalsimilar considerations need to be given to proteomicor immunohistochemical studies, particularly thosethat examine post-translationally modified forms ofprotein (e.g. by phosphorylation). Factors such as tissueischaemia can profoundly influence the results of theseinvestigations and should be recorded as a priority bybiorespositories. Although the quality of samples oftissue lodged in a biobank is dependent on up-streamfactors that are difficult to control, we conclude that itis only through careful and consistent management oftissue procurement that: (i) spurious changes in thelevel of RNA expression related to factors other thanthe underlying disease can be discounted; (ii) theresults from different studies can be assimilated to forma body of evidence that can properly inform thedirection of future research and its translation toclinical developments.
Acknowledgements
This study was supported by Tenovus (Scotland). S.E.B.is a research scientist in the Tayside Tissue Banksupported by Cancer Research UK. S.C.F. and L.B. aresupported by Breast Cancer Research Scotland. Theauthors gratefully acknowledge the technical supportof Ms Kate MacLean and Ms Mary O’Neill, and Ms SallyChalmers for clinical administration associated withthe study.
248 S E Bray et al.
� 2010 The Authors. Journal compilation � 2010 Blackwell Publishing Ltd, Histopathology, 56, 240–250.

Competing interests
None to declare.
References
1. Duggan DJ, Bittner M, Chen Y, Meltzer P, Trent JM. Expression
profiling using cDNA microarrays. Nat. Genet. 1999; 21(1
Suppl.); 10–14.
2. Boyer J, Allen WL, McLean EG et al. Pharmacogenomic identi-
fication of novel determinants of response to chemotherapy in
colon cancer. Cancer Res. 2006; 66; 2765–2777.
3. De Lange R, Burtscher H, Jarsch M, Weidle UH. Identification of
metastasis-associated genes by transcriptional profiling of meta-
static versus non-metastatic colon cancer cell lines. Anticancer
Res. 2001; 21; 2329–2339.
4. Del Rio M, Molina F, Bascoul-Mollevi C et al. Gene expression
signature in advanced colorectal cancer patients select drugs and
response for the use of leucovorin, fluorouracil, and irinotecan.
J. Clin. Oncol. 2007; 25; 773–780.
5. Fujiwara K, Ochiai M, Ubagai T et al. Differential gene expression
profiles in colon epithelium of two rat strains with distinct
susceptibility to colon carcinogenesis after exposure to PhIP in
combination with dietary high fat. Cancer Sci. 2003; 94; 672–678.
6. Li M, Lin YM, Hasegawa S et al. Genes associated with liver
metastasis of colon cancer, identified by genome-wide cDNA
microarray. Int. J. Oncol. 2004; 24; 305–312.
7. Mariadason JM, Arango D, Shi Q et al. Gene expression profiling-
based prediction of response of colon carcinoma cells to
5-fluorouracil and camptothecin. Cancer Res. 2003; 63; 8791–
8812.
8. Notterman DA, Alon U, Sierk AJ, Levine AJ. Transcriptional gene
expression profiles of colorectal adenoma, adenocarcinoma, and
normal tissue examined by oligonucleotide arrays. Cancer Res.
2001; 61; 3124–3130.
9. Paoni NF, Feldman MW, Gutierrez LS, Ploplis VA, Castellino FJ.
Transcriptional profiling of the transition from normal intestinal
epithelia to adenomas and carcinomas in the APCMin ⁄ + mouse.
Physiol. Genomics 2003; 15; 228–235.
10. Park MH, Cho SA, Yoo KH et al. Gene expression profile related to
prognosis of acute myeloid leukemia. Oncol. Rep. 2007; 18;
1395–1402.
11. Schmidt WM, Kalipciyan M, Dornstauder E et al. Dissecting
progressive stages of 5-fluorouracil resistance in vitro using RNA
expression profiling. Int. J. Cancer 2004; 112; 200–212.
12. Wang Y, Jatkoe T, Zhang Y et al. Gene expression profiles and
molecular markers to predict recurrence of Dukes’ B colon
cancer. J. Clin. Oncol. 2004; 22; 1564–1571.
13. Zou TT, Selaru FM, Xu Y et al. Application of cDNA microarrays to
generate a molecular taxonomy capable of distinguishing between
colon cancer and normal colon. Oncogene 2002; 21; 4855–4862.
14. Binder R, Horowitz JA, Basilion JP, Koeller DM, Klausner RD,
Harford JB. Evidence that the pathway of transferrin receptor
mRNA degradation involves an endonucleolytic cleavage within
the 3¢ UTR and does not involve poly(A) tail shortening. EMBO J.
1994; 13; 1969–1980.
15. Shyu AB, Wilkinson MF, van Hoof A. Messenger RNA regulation:
to translate or to degrade. EMBO J. 2008; 27; 471–481.
16. Von Euler H, Khoshnoud R, He Q et al. Time-dependent RNA
degradation affecting cDNA array quality in spontaneous canine
tumours sampled using standard surgical procedures. Int. J. Mol.
Med. 2005; 16; 979–985.
17. Akashi M, Shaw G, Hachiya M, Elstner E, Suzuki G, Koeffler P.
Number and location of AUUUA motifs: role in regulating
transiently expressed RNAs. Blood 1994; 83; 3182–3187.
18. Saida F, Odaert B. RNA recognition and cleavage by
sequencespecific endoribonucleases. Protein Pept. Lett. 2007; 14;
103–111.
19. Wennborg A, Sohlberg B, Angerer D, Klein G, von Gabain A. A
human RNase E-like activity that cleaves RNA sequences
involved in mRNA stability control. Proc. Natl Acad. Sci. USA
1995; 92; 7322–7326.
20. Wreschner DH, Rechavi G. Differential mRNA stability to
reticulocyte ribonucleases correlates with 3¢ non-coding (U)nA
sequences. Eur. J. Biochem. 1988; 172; 333–340.
21. Chirgwin JM, Przybyla AE, MacDonald RJ, Rutter WJ. Isolation of
biologically active ribonucleic acid from sources enriched in
ribonuclease. Biochemistry 1979; 18; 5294–5299.
22. Benjamin D, Moroni C. mRNA stability and cancer: an emerging
link? Expert Opin. Biol. Ther. 2007; 7; 1515–1529.
23. Hanahan D, Weinberg RA. The hallmarks of cancer. Cell 2000;
100; 57–70.
24. Florell SR, Coffin CM, Holden JA et al. Preservation of RNA for
functional genomic studies: a multidisciplinary tumor bank
protocol. Mod. Pathol. 2001; 14; 116–128.
25. Schlomm T, Nakel E, Lubke A et al. Marked gene transcript level
alterations occur early during radical prostatectomy. Eur. Urol.
2008; 53; 333–344.
26. Holter NS, Mitra M, Maritan A, Cieplak M, Banavar JR, Fedoroff
NV. Fundamental patterns underlying gene expression profiles:
simplicity from complexity. Proc. Natl Acad. Sci. USA 2000; 97;
8409–8414.
27. Eisen MB, Spellman PT, Brown PO, Botstein D. Cluster analysis
and display of genome-wide expression patterns. Proc. Natl Acad.
Sci. USA 1998; 95; 14863–14868.
28. Fleige S, Pfaffl MW. RNA integrity and the effect on the
real-time qRT-PCR performance. Mol. Aspects Med. 2006; 27;
126–139.
29. Fearon ER, Vogelstein B. A genetic model for colorectal tumor-
igenesis. Cell 1990; 61; 759–767.
30. Smith G, Carey FA, Beattie J et al. Mutations in APC, Kirsten-ras,
and p53 – alternative genetic pathways to colorectal cancer.
Proc. Natl Acad. Sci. USA 2002; 99; 9433–9438.
31. Micke P, Ohshima M, Tahmasebpoor S et al. Biobanking of fresh
frozen tissue: RNA is stable in nonfixed surgical specimens. Lab.
Invest. 2006; 86; 202–211.
32. Ohashi Y, Creek KE, Pirisi L, Kalus R, Young SR. RNA
degradation in human breast tissue after surgical removal: a
time-course study. Exp. Mol. Pathol. 2004; 77; 98–103.
33. Huang J, Qi R, Quackenbush J, Dauway E, Lazaridis E, Yeatman
T. Effects of ischemia on gene expression. J. Surg. Res. 2001; 99;
222–227.
34. Spruessel A, Steimann G, Jung M et al. Tissue ischemia time affects
gene and protein expression patterns within minutes following
surgical tumor excision. BioTechniques 2004; 36; 1030–1037.
35. Cho YG, Choi BJ, Song JW et al. Aberrant expression of krUppel-
like factor 6 protein in colorectal cancers. World J. Gastroenterol.
2006; 12; 2250–2253.
36. Medeiros F, Rigl CT, Anderson GG, Becker SH, Halling KC. Tissue
handling for genome-wide expression analysis: a review of the
issues, evidence, and opportunities. Arch. Pathol. Lab. Med. 2007;
131; 1805–1816.
37. Paska C, Bogi K, Szilak L et al. Effect of formalin, acetone, and
RNAlater fixatives on tissue preservation and different size
Gene expression in colorectal tumours 249
� 2010 The Authors. Journal compilation � 2010 Blackwell Publishing Ltd, Histopathology, 56, 240–250.
amplicons by real-time PCR from paraffin-embedded tissue.
Diagn. Mol. Pathol. 2004; 13; 234–240.
38. Chowdary D, Lathrop J, Skelton J et al. Prognostic gene expres-
sion signatures can be measured in tissues collected in RNAlater
preservative. J. Mol. Diagn. 2006; 8; 31–39.
39. Roos-van Groningen MC, Eikmans M, Baelde HJ, de Heer E,
Bruijn JA. Improvement of extraction and processing of RNA
from renal biopsies. Kidney Int. 2004; 65; 97–105.
40. Grotzer MA, Patti R, Geoerger B, Eggert A, Chou TT, Phillips PC.
Biological stability of RNA isolated from RNAlater-treated brain
tumor and neuroblastoma xenografts. Med. Pediatr. Oncol. 2000;
34; 438–442.
41. Mutter GL, Zahrieh D, Liu C et al. Comparison of frozen and
RNALater solid tissue storage methods for use in RNA expression
microarrays. BMC Genomics 2004; 5; 88.
42. Olsvik PA, Lie KK, Hevroy EM. Do anesthetics and sampling
strategies affect transcription analysis of fish tissues? BMC Mol.
Biol. 2007; 8; 48.
43. Wang SS, Sherman ME, Rader JS, Carreon J, Schiffman M, Baker
CC. Cervical tissue collection methods for RNA preservation:
comparison of snap-frozen, ethanol-fixed, and RNAlater-fixation.
Diagn. Mol. Pathol. 2006; 15; 144–148.
44. Morrison C, Palatini J, Riggenbach J, Radmacher M, Porcu P.
Fine-needle aspiration biopsy of non-Hodgkin lymphoma for
use in expression microarray analysis. Cancer 2006; 108; 311–
318.
45. Sambrook J, Fritsch EF, Maniatis T. Extraction, purification and
analysis of messenger RNA from eukaryotic cells. In Nolan C ed.
Molecular cloning: a laboratory manual, 2nd edn. New York: Cold
Spring Harbor Laboratory Press, 1989; 7.1–7.87.
250 S E Bray et al.
� 2010 The Authors. Journal compilation � 2010 Blackwell Publishing Ltd, Histopathology, 56, 240–250.
Copyright © 2022 FDOKUMEN