STREAM ECOLOGY - HJ Andrews Experimental Forest
57
STREAM ECOLOGY Application and Testing of General Ecological Theory Edited by JAMES R. BARNES Brigham Young Lntversto Provo, Lich and G. WAY NE MINSHALL Idaho Stare Lntverstri Poca:ello, Idaho PUMA PRESS • NEli YORK OD LOMION
-
Upload
khangminh22 -
Category
Documents
-
view
1 -
download
0
Transcript of STREAM ECOLOGY - HJ Andrews Experimental Forest
STREAM ECOLOGYApplication and Testing ofGeneral Ecological Theory
Edited by
JAMES R. BARNESBrigham Young LntverstoProvo, Lich
and
G. WAY NE MINSHALLIdaho Stare LntverstriPoca:ello, Idaho
PUMA PRESS • NEli YORK OD LOMION
ORGANIC MATTER BUDGETS FOR STREAM ECOSYSTEMS:
PROBLEMS IN THEIR EVALUATION
K.W. Cummins1 , J.R. Sedell
2, F.J. Swanson
2, G.W. Minshall
3,
S.G. Fisher4, C.E. Cushing
5, R.C. Petersen
6, and
R.L. Vannote'
1. Dept. of Fisheries and Wildlife, Oregon State Univ.,Corvallis, Oregon 97331; 2. U.S. Forest Service, Corvallis,Oregon 97331; 3. Dept. of Biology, Idaho State Univ.,Pocatello, Idaho 83209; 4. Dept. of Zoology, Arizona StateUniv., Tempe, Arizona 85281; 5. Ecosystem Dept., BattellePacific N.W. Lab., Richland, Washington 99352; 6. Dept. ofLimnology, Univ. Lund, Lund 3-220003, Sweden; 7. StroudWater Research Center, Avondale, Pennsylvania 19311
•
INTRODUCTION
Since the pioneering work at Hubbard Brook (Fisher andLikens, 1972, 1973; Bormann et al., 1969, 1974; Bormann andLikens, 1979), there has been ever increasing interest inwatershed budgets, both for total organic matter, usuallyexpressed as carbon (Wetzel et al., 1972), and various ions(Fisher and Likens, 1973; Johnson and Swank, 1973; Swank andDouglass, 1975; Fisher, 1977; Webster and Patten, 1979; Fahey,1979; Mulholland and Kuenzler, 1979; Gurtz et al., 1980;Mulholand, 1981). The primary interest in stream dynamics witLina budget context has been in the rate of loss of organic matterfrom the land as well as storage and biological conversion oforganic matter in the stream. Impetus for most studies has comefrom the realization that energetics of small streams (generallyorders 1 to 3 (Strahler, 19571) are heavily dependent on organicnutritional resources of terrestrial origin (Ross, 1963; Hynes,1963; Cummins, 1974; Hynes, 1975). New insights into thestructure and function of running water ecosystems andterrestrial-aquatic linkages (Waring, 1980) are based on thechanging terrestrial dependence with increasing channel size(Cummins, 1975, 1977; Vannote et al., 1980; Minshall et al.,
299
300 K. W. CUMMINS ET AL.
1983), varying stream-side vegetation (Minshall, 1978), and thedynamics of input, storage or processing, and output of organicmatter (Vannote et al., 1980; Minshall et al., 1983; Elwood etal., 1982; Newbold et al., 1982a,b).
The role of organic matter in running waters has beendocumented and discussed to the point that streams and rivers areno longer viewed primarily as open export systems of terrestrialproducts, but rather as sites of production and processing oforganic material (Hynes, 1970; Whitton, 1975). This new imagehas come largely from annual energy budget estimates for streams,(e.g., Odum, 1957a; Teal, 1957; Nelson and Scott, 1962; Tilly,1968; Hall, 1972; Fisher and Likens, 1973; Sedell et al., 1974;Mann, 1975). Stream systems, from small headwaters to largerivers, import, produce, process, and store organic matter(Vannote et al., 1980). The processing and resultant partialrelease of organic and inorganic nutrients from one stream reachto the next has been characterized as processing along acontinuum (Vannote et al., 1980) or spiraling (Webster et al.,1975; O'Neill et al., 1975; Webster and Patten, 1979; Newbold etal., 1982). Only part of this material is exported downstream tothe next order or laterally to the upper bank or flood plainwithout significant alteration. Complex, highly specializedbiological communities reside in running waters and not onlyalter the quantities but also the quality of organic material andinorganic nutrients exported or stored relative to that imported.An example is the alteration of the size distribution ofparticulate organic matter (POM i.e., detritus defined here asall particles >0.45 m plus microbial biomass; Cummins, 1974),by aggregation and disaggregation, that is exported from a reachrelative to that imported. Fisher and Likens (1973) provided theinitial conceptual basis for examining differer: lotic ecosystemsusing the classical two-dimensional P/R plot (Pnotosynthesis/Respiration [Odum, 1957a, b]) with a:third axis representing thesystem's import-export balance. All ecosystems, whether theyaccumulate materials, have net export, or are at steady state,can be located in this three dimensional space. In this mode asteady state system has its import equal to export and P/R = 1.To maintain a steady state when gross photosynthesis (P) andcommunity respiration (R) are not equal, the system must eitherimport or export energy. The mode also allows that P may equal Rin non-steady state systems.
To evaluate such a model, all inputs (detritus andphotosynthesis) outputs (transport and respiration), and changesin storage must be measured independently. Because this is sucha laborious task, one or more parameters are routinely obtainedby difference, and in no case has detrital storage beenadequately examined, especially over greater than annual time
ORGANIC MATTER BUDGETS FOR STREAM ECOSYSTEMS 301
periods. By assuming a steady state (i.e., inputs equal outputsand storage pools experience no net change), the annual energybudget can be balanced by attributing the difference betweentotal energy input and output of organic matter to a singlemeasured parameter or flux. By definition, in steady statesystems, inputs which are not exported from storage compartmentsmust be utilized or transformed. Because nutrient (e.g. organicmatter) storage and turnover are considered key characteristicsof stream ecosystems, an important ecological question is whethertheir assumed steady state is meaningful on an annual basis forthe purpose of constructing such material balance budgets.Certainly none of the parameters are time invariant. Lake andterrestrial ecologists usually can place these systems within anhistorical perspective and view the present state of the systemas a result of the past. For example, sediments in lakes andannual rings in trees provide a record of past events. Streamecosystem history is not recorded as neatly, therefore, thehistory of past events has not been adequately considered inshort term studies. Stream ecosystem structure and function arevery much dependent on recent flood history, long term variationin runoff, and dynamics of riparian vegetation. The storage andexport values commonly measured reflect past and present annualrune f, flood size and frequency patterns, vegetation, anderosional conditions in the watershed as influenced by bothnatural and man-induced variation. If stream organic budgets arenot placed in their historical context, their usefulness forcomparison with other sites and ecosystem types, as well as thesignificance of relationships among photosynthesis, respiration,and input/export ratio is subject to serious question.
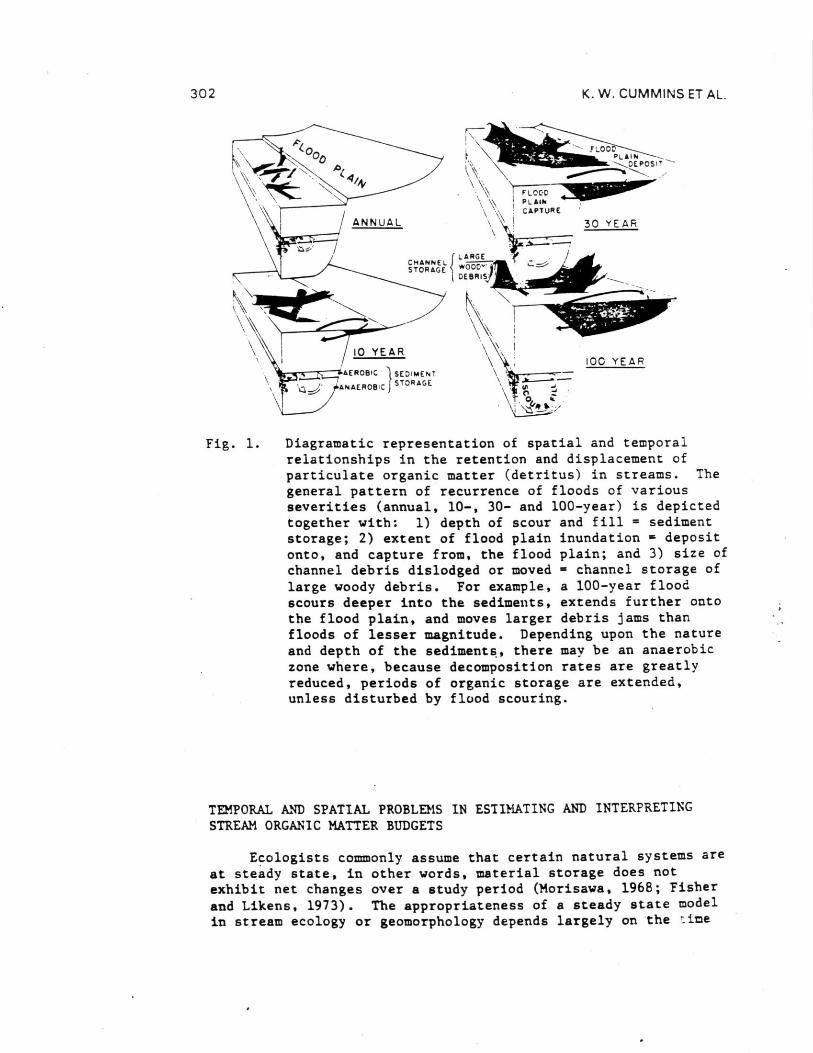
In preparing and evaluating material budgets for runningwater ecosystems, it is essential to consider patterns ofmovement, processing, and storage in both space and time (Fig.1). Typically, annual budget estimates have been based onsampled input and output from a stream segment or small watershed(e.g., Hall, 1972; Fisher and Likens, 1973; Sedell et al., 1974;Minshall, 1978). There are fundamental differences betweensegment and watershed budgets and the validity of comparisonsmust be carefully examined. Regardless of budget type, it isnecessary to recognize the importance of episodic events, such asfloods (channel), and fire (watershed) of greater than annualfrequency of recurrence. In addition, if the emphasis of aninvestigation is biological (e.g., processing efficiency, i.e.,fraction of organic inputs annually coverted to CO
2), the
biological response time must be carefully evaluated relative tothe period of inputs and their availability, and the source ofmaterial collected at output (Meyer and Likens, 1979).
'17//ttlANNUAL 30 YEAR
FLOODPLAIN
--
CHANNELSTORAGE
LARGEwOOD''DEBRIS!'
10 YEAR IOC YEAR
AEROBIC SEDIMENTANAEROBIC STORAGE
--115111.11.111."'\\ ; PLAIN
. CAPTURE
302 K. W. CUMMINS ET AL.
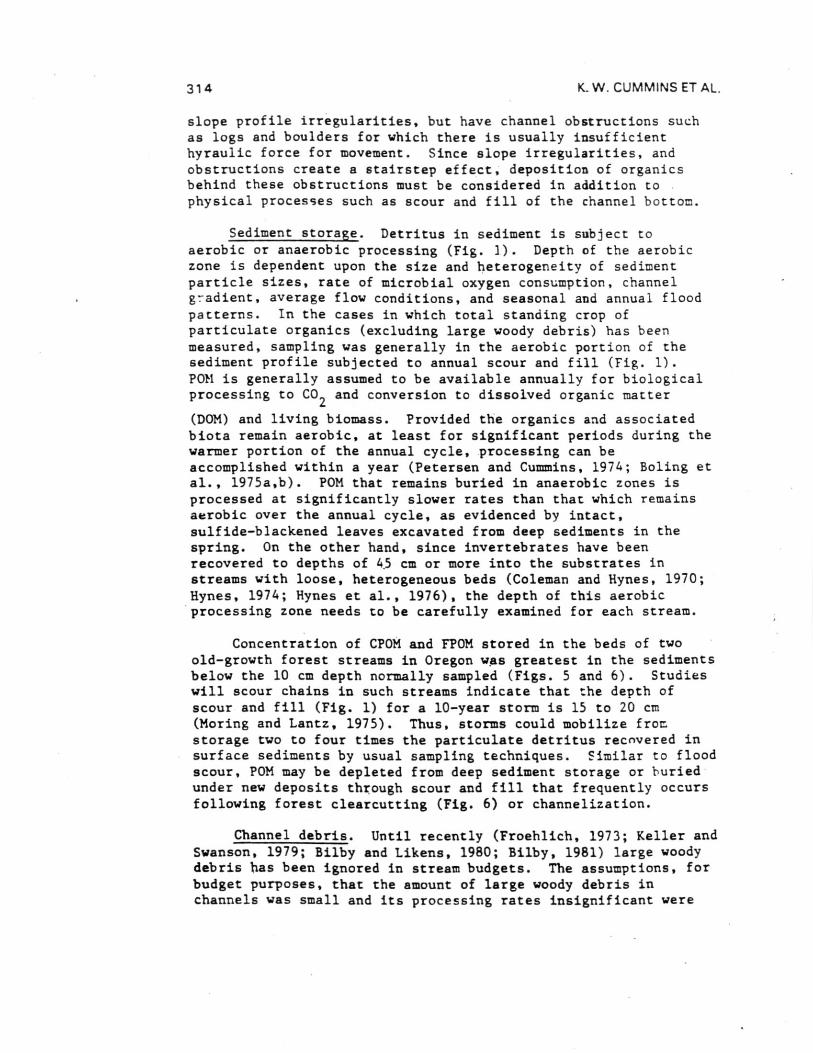
Fig. 1. Diagramatic representation of spatial and temporalrelationships in the retention and displacement ofparticulate organic matter (detritus) in streams. Thegeneral pattern of recurrence of floods of variousseverities (annual, 10-, 30- and 100-year) is depictedtogether with: 1) depth of scour and fill = sedimentstorage; 2) extent of flood plain inundation = depositonto, and capture from, the flood plain; and 3) size ofchannel debris dislodged or moved = channel storage oflarge woody debris. For example, a 100-year floodscours deeper into the sediments, extends further ontothe flood plain, and moves larger debris jams thanfloods of lesser magnitude. Depending upon the natureand depth of the sediments, there may be an anaerobiczone where, because decomposition rates are greatlyreduced, periods of organic storage are extended,unless disturbed by flood scouring.
TEMPORAL AND SPATIAL PROBLEMS IN ESTIMATING AND INTERPRETINGSTREAM ORGANIC MATTER BUDGETS
Ecologists commonly assume that certain natural systems areat steady state, in other words, material storage does notexhibit net changes over a study period (Morisawa, 1968; Fisherand Likens, 1973). The appropriateness of a steady state modelin stream ecology or geomorphology depends largely on the :ime
ORGANIC MATTER BUDGETS FOR STREAM ECOSYSTEMS 303
span and the area considered (Schumm and Lichty, 1965).Generally, the smaller the stream area and shorter the timeperiod, the more applicable should be the steady stateassumption. Some geomorphologists (Trimble, 1975; Schumm et al.,1975; Maddock, 1976) argue that a drainage basin can not beconsidered as being at steady state at any particular point inits history. Leopold and Maddock (1953) proposed that a tendencytoward steady state existed for certain physical properties ofstreams, and that adjustments between changing streamflowvariables could be defined by power function equations. Theyconsidered stream channel morphology to be in "quasi-equilibrium"because the substantial scatter about regressed relationshipsmade it uncertain as to whether steady state had been attained.To these geomorphologists, the dynamic equilibrium of a streamchannel involves adjustments to the history of water and sedimentdischarge (Megahan and Nolan, 1976) over the previous 5-10 yearsor more and does not represent a steady state condition at anyone particular year of water discharge. Because channel andstreamflow conditions are constantly changing, the equilibrium isdescribed in a statistical rather than absolute sense (Maddock1976).
However, organic matter budgets are commonly viewed asabsolute, not statistical, although during any given year inwhich a budget is developed, steady state is probably not a validassumption (e.g., Welton, 1980). During any single year,increase or decrease in storage dominates a budget depending onwater discharge and POM input.
The assumption of steady state of organic matter storage ina stream is further complicated by variation in storagecharacteristics over a greater than annual time scale (e.g.,Welton, 1980). Major storms may alter the volume of material instorage to such an extent that return td pre-storm channelcharacteristics occurs only over a period of years to decades.Furthermore, channel storage capacity of forest streams may varyover the history of the adjacent forest, because periods of treemortality leading to inputs of large woody debris increase boththe total standing crop and the channel capacity for storage offine organic detritus. Therefore, even if a stream experiencesno net change in storage for a year, that year may not be"typical" of long-term conditions which are constantly changingin response to previous storms and the history of the riparianzone.
Discharge History of Streams
The importance of flooding to stream organic matter budgetstudies over annual and longer cycles has been largely ignored.For example, the recurrence interval of peak flows for the study
304 K. W. CUMMINS ET AL.
period is not standard information in stream ecology researchpapers. As much as 80% of the particulate organic matter (POM =0.5 ',Ira) exported by a stream over a year can be discharged duringone or two storms (Hobbie and Likens, 1973; Bormann and Likens,1979; Crisp and Robson, 19 - ;. Because the origin of thismaterial, whether it be wd .in sediments, channel bed or banks,or the flood plain, and it. residence time in the stream systemare unknown, the biological significance of such events to thecommunity has yet to be determined. High water capture of aboardwalk placed in the riparian zone along a reach of AugustaCreek, Michigan provides a specific example. Exclusion from anorganic budget of the lumber which collected at the downstreamwelr during the storm seems logical, but what about the manyotter pieces of organic matter with similar histories from thesame location? Clearly, both the source of the inputs and timescale in which they enter the channel and are transported areimportant if the emphasis is on stream biology.
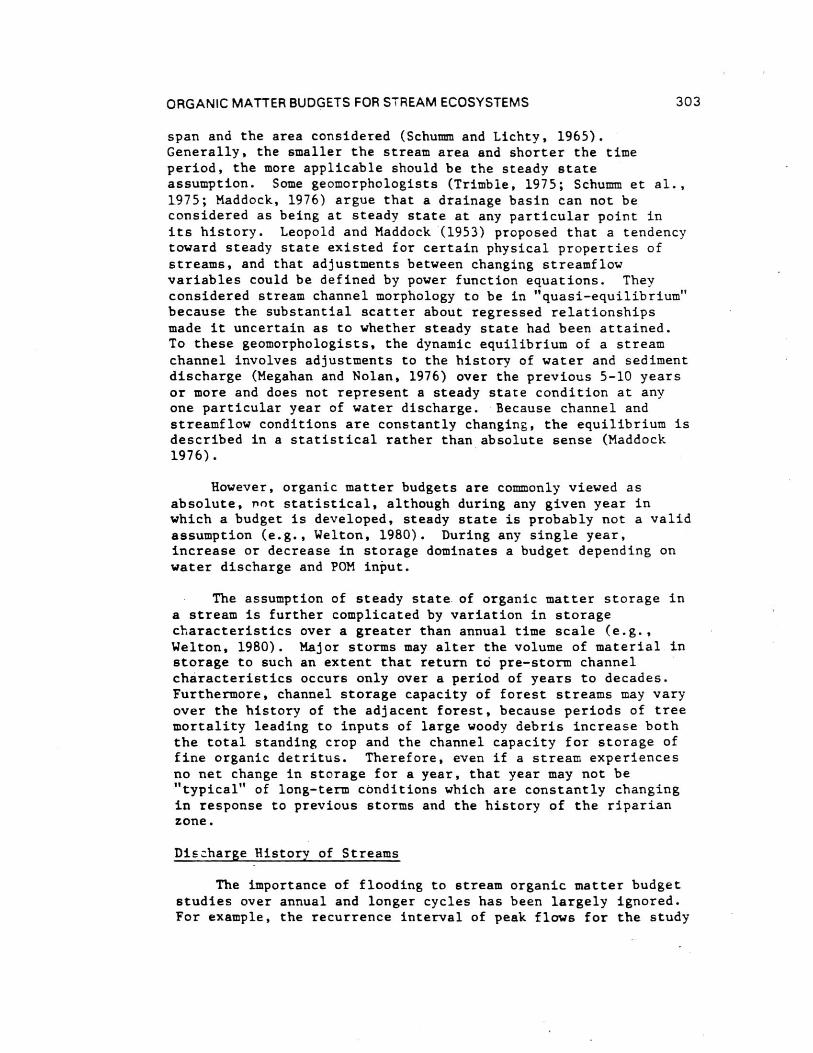
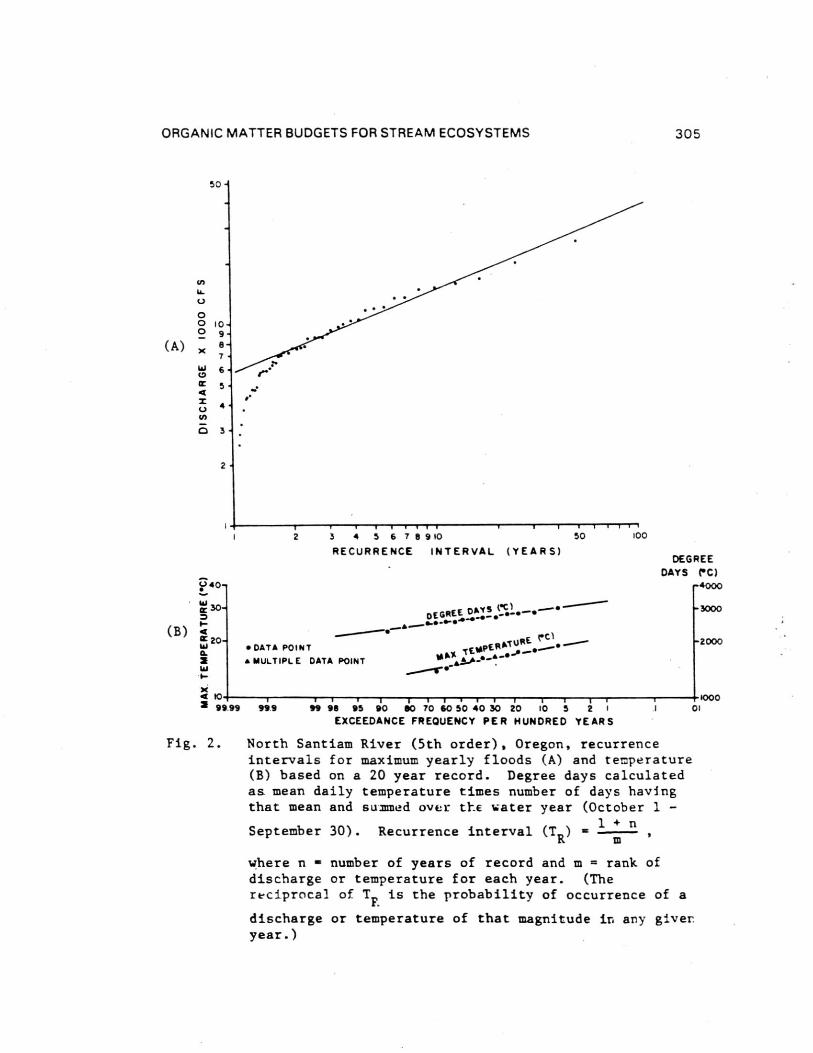
Few published studies (e.g. Dawson, 1980) have placed thefield sampling period in the context of either the annual floodcycle or longer term discharge patterns. It is clearly importantto know the relationship of the study period to major flood ordrought events. At a minimum, material or energy budgetmeasurements should be placed in general perspective of floodreturn frequencies of the study year and several preceding years.Figures 2A and B present recurrence frequencies (Leopold et al.,1968; Morisawa, 1968) of peak discharge, maximum temperature, andannual degree days for the North Santiam River, near Detroit,Oregon. Such long term flow-temperature perspectives allowcomparison of a study year to overall averages and conditionsprior to sampling. This issue is further complicated because thehistory of sediment movement into and through mountain streamsystems has probably been in large part keyed to major storms.In forested areas of the H. J. Andrews Experimental Forest,Oregon, for example, significant debris avalanches, a majorsupplier of sediment to channels, and debris torrents which flushsteep channels, have been triggered by storms with a 5 year andgreater return period (Swanson and Dyrness, 1975). For example,many of the mass movement events occurring over a 30 year samplerecord were triggered by a December 3964 storm that took placewithin the period but had a return interval greater than 100years.
The preceding discussion points up the difficulty inaccounting for infrequent episodic events that strongly influencesediment transport and channel morphology. When a major eventhaving a return period greater than the sample period occursduring a study, it dominates the record. If such an event doesnot occur within the time of the study, a major part of thelong-term system behavior is missed. Further, the
ORGANIC MATTER BUDGETS FOR STREAM ECOSYSTEMS 305
50 -
0
010
0
(A) 7,
-
8
W 6a0
Cr 5.4
4U)
El 3
2
DEGREEDAYS PC)
040— —4000
cr 30-
DATA POINTMULTIPLE DATA POINT
7 T ITITITT i 1 1TITIC
2 3 4 5 6 7 8 9 10 50 *0
RECURRENCE INTERVAL (YEARS)
DEGREE•
MAX TEMPERATURE •
►3000
2000
4 10 2 99 99
1000TT T T T T T T TI T T -T T T999 99 98 95 90 80 70 60 50 40 30 20 10 5 2 I 01
EXCEEDANCE FREQUENCY PER HUNDRED YEARS
Fig. 2. North Santiam River (5th order), Oregon, recurrenceintervals for maximum yearly floods (A) and temperature(B) based on a 20 year record. Degree days calculatedas mean daily temperature times number of days havingthat mean and summed over the water year (October 1 -
1 + nSeptember 30). Recurrence interval (T R ) =
where n = number of years of record and m = rank ofdischarge or temperature for each year. (Thereciprocal of T
F. is the probability of occurrence of a
discharge or temperature of that magnitude in any giver.year.)
306 K. W. CUMMINS ET AL.
interdependence of material transfer during successive peak flowevents poses problems in framing a particular study period withina longer term perspective. Return periods of stream flow arecalculated assuming independence of successive events. However,the amount of organic and inorganic material carried by a givendischarge depends on a variety of factors, such as magnitudes andtiming of preceding events (Paustian and Bestcha, 1981; Bilby andLikens, 1981). Consequently, return periods calculates for asequence of peak flows do not necessarily reflect the relativemagnitude of those events in terms of organic matter transport.
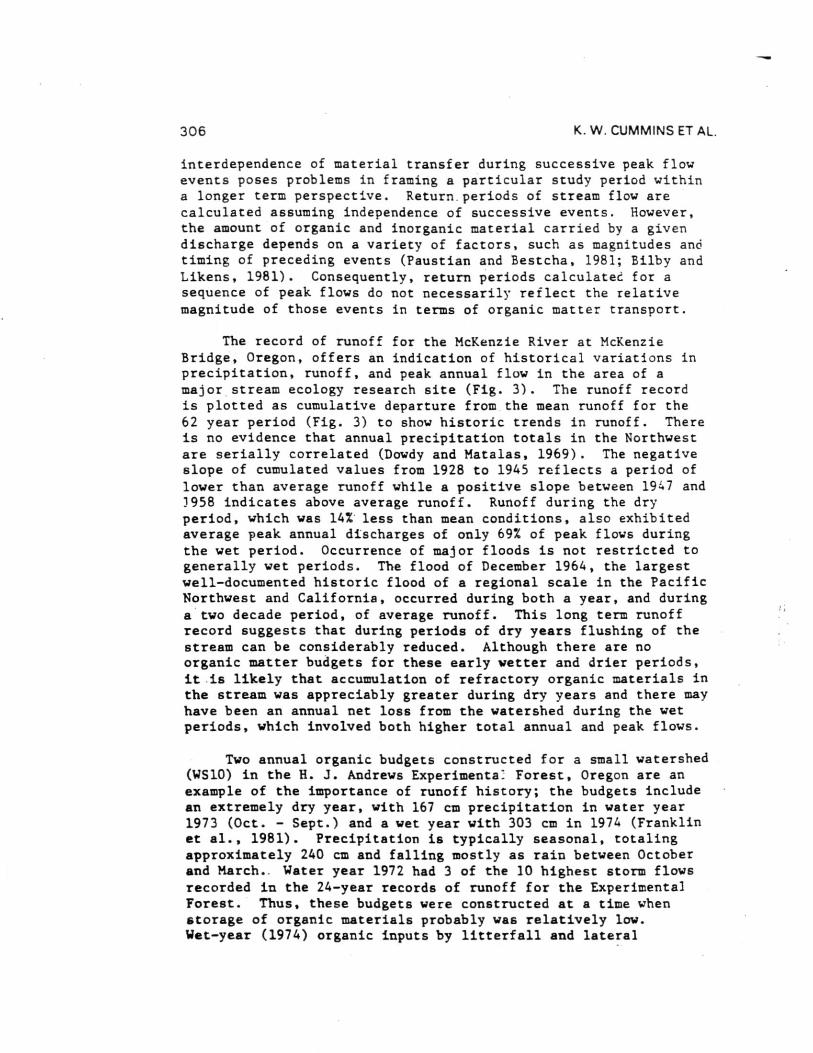
The record of runoff for the McKenzie River at McKenzieBridge, Oregon, offers an indication of historical variations inprecipitation, runoff, and peak annual flow in the area of amajor stream ecology research site (Fig. 3). The runoff recordis plotted as cumulative departure from the mean runoff for the62 year period (Fig. 3) to show historic trends in runoff. Thereis no evidence that annual precipitation totals in the Northwestare serially correlated (Dowdy and Matalas, 1969). The negativeslope of cumulated values from 1928 to 1945 reflects a period oflower than average runoff while a positive slope between 1947 and3958 indicates above average runoff. Runoff during the dryperiod, which was 14% less than mean conditions, also exhibitedaverage peak annual discharges of only 69% of peak flows duringthe wet period. Occurrence of major floods is not restricted togenerally wet periods. The flood of December 1964, the largestwell-documented historic flood of a regional scale in the PacificNorthwest and California, occurred during both a year, and duringa two decade period, of average runoff. This long term runoffrecord suggests that during periods of dry years flushing of thestream can be considerably reduced. Although there are noorganic matter budgets for these early wetter and drier periods,it .is likely that accumulation of refractory organic materials inthe stream was appreciably greater during dry years and there mayhave been an annual net loss from the watershed during the wetperiods, which involved both higher total annual and peak flows.
Two annual organic budgets constructed for a small watershed(WS10) in the H. 3. Andrews Experimenta: Forest, Oregon are anexample of the importance of runoff history; the budgets includean extremely dry year, with 167 cm precipitation in water year1973 (Oct. - Sept.) and a wet year with 303 cm in 1974 (Franklinet al., 1981). Precipitation is typically seasonal, totalingapproximately 240 cm and falling mostly as rain between Octoberand March.. Water year 1972 had 3 of the 10 highest storm flowsrecorded in the 24-year records of runoff for the ExperimentalForest. Thus, these budgets were constructed at a time whenstorage of organic materials probably was relatively low.Wet-year (1974) organic inputs by litterfall and lateral
ORGANIC MATTER BUDGETS FOR STREAM ECOSYSTEMS 307
20,000-
10,000-
0
2000 -
1000-
PEAK DISCHARGE (CFS)
McKENZIE RIVER ANNUAL RUNOFF
MEAN ANNUAL DISCHARGE (CFS)20-
0
20-
-40 -
-60-
so-
-100-
-140
.r1910 1920
1930
1940 1950 1960 1970
1980
Fig. 3. Runoff history of the McKenzie River, Oregon, showing
peak discharge, mean annual discharge, and cumulative
departure from the mean (Dalrymple, 1965) of the entire62 year round record. (That is, the record for each
year is subtracted from the mean, keeping track of
sign, and these differences cumulated and plottedthrough time.)
(surface) movement exceeded dry-year (1973) inputs by 5% and 65%
respectively. Clearly, inputs change significantly with runoff.The dissolved organic matter (DOM< 0.45 1.1m) loss was 246% higher
in 1974 because solution loss is related to runoff. Even though
the annual runoff for 1974 was the second highest in the 63-year
record for the upper McKenzie drainage, the peak discharge had a
308 K. W. CUMMINS ET AL.
one year return period, and on that basis, POM export could beconsidered average or below. Therefore, the various elements ofan organic budget for streams are extremely responsive to themagnitude and frequency of storm events. Although inputs (exceptlandslides) may be relatively less variable, storage, export, andbiological processes must all be evaluated in relation to runoffand return frequency if valid comparisons within and betweenrunning water systems are to be made. The discussion above hasemphasized the effects of peak flows, but it is also important toconsider the role of other episodic events, such as high windswithout appreciable precipitation, which can result in majorpulses of POM input without significant export.
Organic Export Rating Curves
Although rating curves (suspended load vs discharge) forinorganic particulate losses from a watershed have proven usefulfor calculating sediment transport, relationships between streamdischarge and organic matter concentration are approximations atbest (Fisher and Likens, 1973; Bormann et al., 1974; Brinson,1976; Bilby and Likens, 1979; Bormann and Likens, 1979;Schlesinger and Melack, 1981). Even the best regressions ofparticulate organic concentration vs water discharge explain onlyabout 50% of the POM concentration from discharge data (Bormannet al., 1974). When corrections for differences in the percentorganic matter relative to total particulates at various flowrates are included, errors in calculating POM losses from awatershed are even greater. Studies of inorganic and organiccomponents of transport have revealed different patterns for eachof the rising and falling limbs of a peak flow hydrograph(Paustian and Bestcha, 1981).
Rating curves for coarse particulate organic matter(CPOM, > lmm) are particularly poor. Fisher and Likens (1973)
obtained an R2 of 0.05 for their rating curve and rejected its
use on that basis. Sedell and co-workers (Oregon StateUniversity, unpublished data) obtained a CPOM rating curve for a
first order Oregon stream (WS10) with an R2 = 0.14, based on
samples collected over a full year by passing the entiredischarge through an 80 ml net. These results indicate the highdegree of uncertainty in using rating curves for calculating CPOMexport.
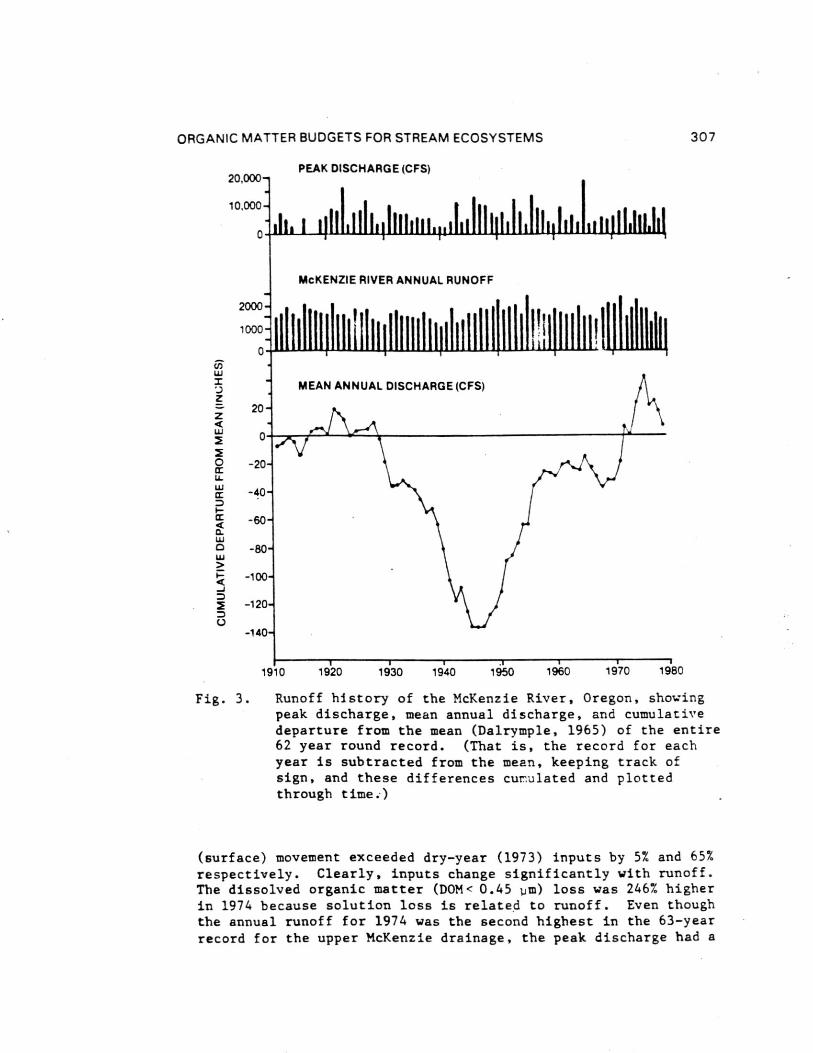
A rating curve for fine particulate organic material(FPOM, <lmm >0.45 um) also was developed for the Oregon streamWatershed 10 (Fig. 4). High FPOM export at moderate flows of18-23 L/s (Fig. 4) represents the first storm in the fall,indicating the importance of timing as well as magnitude ofdischarge. Various curve forms produce poor fits to the data in
ORGANIC MATTER BUDGETS FOR STREAM ECOSYSTEMS 309
lo°
0a.
LA.0Z017:
I-
Uz0o
WATER YEAR 1973
WATER YEAR 1974
•• •
0•
• •• • • 0
ee
ck,4c.
00 0
o 0 000
° a% Ors°OV.c.
••
••
W 20 30 40 50 60 70
80DISCHARGE (I/sec)
Fig. 4. Fine particulate organic matter (FPOM) vs dischargerelationship for Watershed 10, Oregon, over two wateryears. The high value of FPOM at low discharge levelsrepresent the first storm of the fall-winter rainyseason.
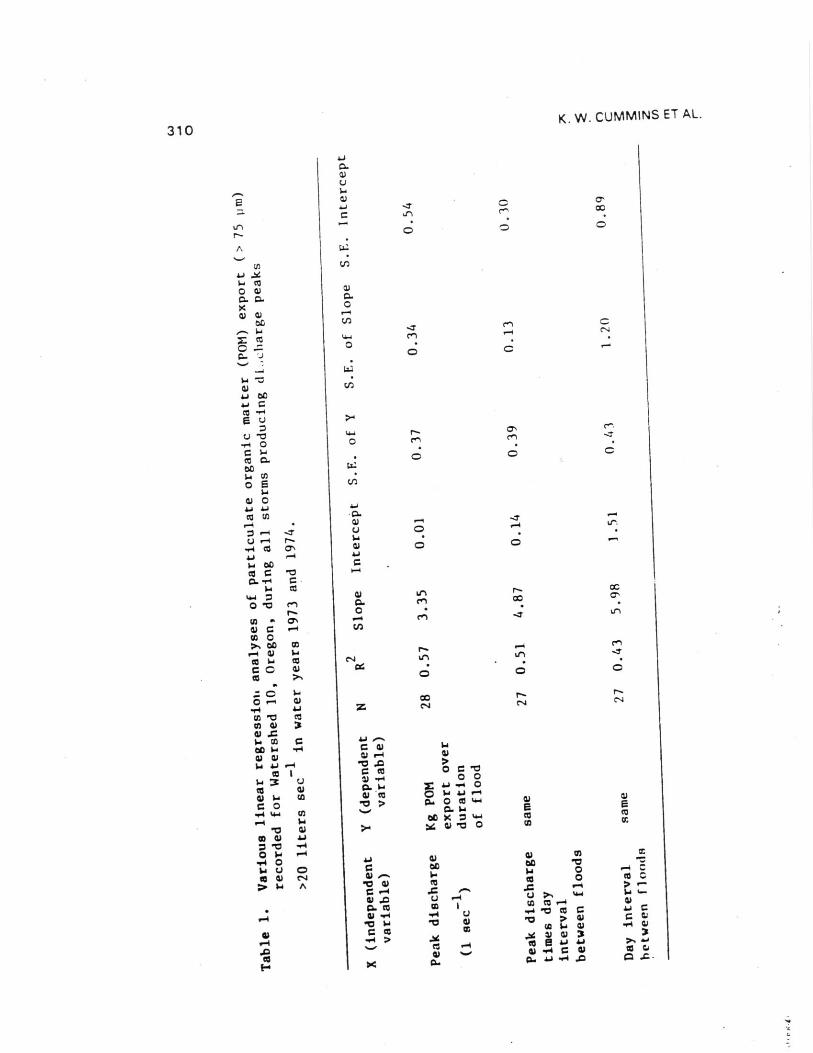
Figure 4, particularly at high flows when the greatest percentageof annual POM transport occurs. Thus, peak discharge, theinterval between storms, and storm sequence are all importantfactors in determining the total export of organic matter from awatershed during a storm event and a myriad of other factors suchas time of year, amount of litterfall, decomposition rates ofPOM, etc.
In an effort to obtain a better fit of peak discharge tototal organic export, 30 storms creating discharges >20 L/s inWatershed 10 were examined (Table 1). Linear regressions oftotal export against peak discharge, interval between storms, andinterval between storms times peak discharge were calculated.All yielded similar results for this area of variableprecipitation, but in mesic areas with fairly even precipitationregimes, the combination of interval between storms, magnitude of
...7...7 (--1(--1
cn r-icn r-i. .. .
C 0C 0
r--
C
4.J
0 COa. a.
a) a)ac
C(1- "J
L.
1r Ga.) oc
u
o1-+
ctat)
c.t)E
CU 0
c0
K. W. CUMMINS ET AL.310
A
0■••■4
Ls)
0■••■4
Ls)
CCc'e
▪
t CO C'
%.r1
CC
c'et CO C'
%.r1
r•-■ rrr in Ln -../
. . .
0 0 C
c0 r- r-CV C■I CNI
Ch0 GCr-1 CU $.4CO I-4 03 I CNI
c C cu c4
co
:". c w,--, cu
,-4 4..4(15 •.c) CS:
th CUCU ..0L.. CI) = 4.1 ■•••.
00 L , •r4 G CU $.4CI) 0) CJ ..-1 a)
$.4 4.) r--4 1:1 .CO >
GCO I C 0 I:,
1.4 U1) •-4 0 0
CO 0) .1..)
...4 0 4.) a) a) a70 i. v-.4
1.4 U 0 G 00 00 1:7
CO (1) c-4 CU ,--. L. L 0.4 p..1..
> L4 A 1::) CD re, cI30 co c.
r-4
CI) .r: U f...i U ›N ‘4.4 6i 6-
Cl• Cti CO I GO CZ .--4 a)
.-I 0) -,-4 ,-4 C.) -.4 "0 CO G .i.) C
C1 LA '4:, 01 '0 a C 0)
tu Z as cn ta ).4 a) .,-■ 0)
.--4 ...-4 > ..%4 .. 0) CL) 3 3
.C1CO CO ...., 6) ,4 G CI) CO C.,
E-4 X Cl. Q.. 4.4 ,-4 XI = .0 -
X a) -t7) 0 co cr.
ORGANIC MATTER BUDGETS FOR STREAM ECOSYSTEMS
311
the previous storm, and peak discharge may be useful forestimation of total POM transport as well as inputs to a reach.
In general, then, the relationship between discharge and theexport of organic matter from small stream watersheds isnon-linear, time dependent, and site specific (i.e., dependent onretention characteristics). Such serial correlationrelationships are likely to be represented best by hysteresiscurves (Faustian and Bestcha, 1979; Whitfield and Schreier, 1981)and sampling needs to be continuous rather than by conventionalgrab-samples (Dawson, 1980; Whitfield and Schreier, 1981).
Relationship Between Organic Matter Export and Decomposition
Loss of organic material from a stream bed can result fromboth export (downstream and to the upper bank or flood plain) anddecomposition. Decomposition rates for assumed steady statesystems have been calculated by Fisher and Likens (1973) andBJrman et al. (1974) from a modified equation by Olson (1963):
X r. I/ (k+K1') where,
X = size of organic pool in the stream bed at steady state,in kg
I = input rate in kg of organic matter yr-1
k = fractional loss rate of X due to decomposition yr-1
k1 = fractional loss rate of X due to export yr
-1
For a forested watershed (WS6) in the Hubbard BrookExperimental Forest (New Hampshire) a dynamic equilibrium wasassumed and five years of export data.were averaged to derive amean decomposition value (k) of 0.43 per year (Bormann et al.,1974). An energy budget can be calculated for 1965-1966 usingexport and storage data from Bormann et al. (1974), litter inputdata from Gosz et al. (1972), and blow-in data from Fisher andLikens (1973), k = 0.46 and k
1 = 0.021. For year the 1966-1967,
which included several large storms, k = 0.40 and k 1 = 0.088.
These calculations of k and k1 values over the five year period
show that even in a year with a large storm only 8.8% of theestimated particulate inputs is exported as POM and in the yearof smallest discharge events it is only 2.1%. Assuming no netchange in storage, the resultant POM decomposition ranged from 82to 96% of inputs. These calculations portray stream ecosystemsas: 1) retentive and affording ample opportunity for biologicalprocessing of detrital inputs and 2) highly variable annualtransport systems, with export varying more than 400% whiledecomposition rates varied only 14% over the 5 year period of
312 K. W. CUMMINS ET AL.
study. Therefore, it is probable that in a wet year with nolarge storms, the DOM fraction would be emphasized; in a yearhaving a 10-20 year storm, POM losses would dominate a budget.
In the modified Olson (1963) equation, decomposition ofdetritus is independent of temperature and dependent upon thesize of the storage pool. Decomposition of detritus in streams,however, has been shown to be strongly related to temperature(e.g., Bolling et al., 1975a; Suberkropp et al., 1975) and,therefore, k is a function of temperature. For example, 90-95%decomposition of leaf litter, composed of species which areprocessed at medium to fast rates, takes about 1000 degree days(Petersen and Cummins, 1974). The annual accumulation of degreedays, and variations between years are extremely important indetermining annual losses due to microbial respiration. Amaximum year-to-year variation of approximately 1000 degree dayswas observed over a 20 year period in the North Santiam River(Fig. 2B). This represents a potential annual fluctuation of 30to 40% in decomposition losses attributable to temperature alone,which would influence the time of depletion of higher qualityinputs as well as conditioning and use of lower quality litter.Therefore, even if storage were adequately measured and relatedto storm events within a given annual cycle and between years,this budget approach cannot be used independent of temperature.
Sampling schemes used to determine parameter values X, I,and k
1 in Olson's equation must deal with scales in time
(turnover frequency) and space (storage pool dimensions)appropriate to characterize each parameter. Failure to do sowill lead to spurious decomposition rate (k) estimates. Forexample, Olson's equation is dependent on definition of storagepool size under circumstances commonly encountered in budgetcalculations. That is, for two streams with identical I and ki,
but with twice as much POM storage (X) in one, apparentfractional loss from storage due to decomposition (k) would be57% lower in the stream with lower standing crop (using data forI, k
1 , and X from Bormann et al., 1974). Therefore, for a given
stream, k will vary with the definition of X. If the storageterm is considered to include logs, deep sediment, and bankstorage, then input and export terms must take into accountevents which alter these components. Ideally each storagecompartment should be characterized in terms of its particular X,I, k, and k
1 values, so that decomposition rate is more
realistically a function of temperature, substrate quality, andoxygen environment and not obtained by difference. Thus,although the Olson (1963) model is a starting point, it must besignificantly modified, and conditions carefully specified inorder to be appropriate.
ORGANIC MATTER BUDGETS FOR STREAM ECOSYSTEMS 313
Detrital (POM) Storage
As stated previously, the assumptions of annual steady statein stream budget work has been perpetuated by failure toadequately measure storage and the input-output balance ismisleading and primarily a function of physical retention orrelease rather than biological activity. In addition, theimportance of, and interaction between, POM storage pools changewith increasing stream size, from headwater tributaries to largerivers. For example, channel woody debris is particularlysignificant in small streams lacking sufficient hydraulic forceto move large jams while flood plain deposition of POM is moresignificant for large rivers.
Storage in and associated with stream channels isapportioned among several sites (compartments) which areidentifiable spatially and on the basis of turnover rates (Fig.1). Although the compartments intergrade, three are sufficientlydiscrete to make their distinction useful: 1) in the channelsediments; 2) in the channel on or above the sediments -primarily in pools and in coarse woody debris jams; and, 3) onthe flood plain or upper bank (Fig. 1). Rates of POM processingare controlled by such factors as dissolved oxygen concentration;size and degradability (quality) of the organic matter;temperature; and extent, frequency, and persistence of wetting(Merritt and Lawson, 1979). The major detritus processing sitesare the aerobic sediment layer and exposed portions of POMaccumulations in debris jams. The processing rates are muchslower in the deeper, anaerobic sediment layers, and large woodydebris accumulations . have processing times much greater than anannual cycle. On the flood plain (upper bank), processing isslower during cold or dry periods than in the stream (Fig. 1).Large wood is processed more rapidly out Of the stream channelduring warm periods because of significantly higher fungal andinvertebrate activity.
The organic storage of Bear Brook (Fisher and Likens, 1973)was assumed to be at steady state, with a detritus reservoir ofabout 80% of the annual input or output of energy. A standingcrop less than the annual organic flux supports the assumption ofsteady state. However, detrital storage would be particularlyimportant in budget calculations when it is large in relation tothe other terms of the material balance equations. The storagecomponent can be large when 1) channel conditions are conduciveto retaining a large amount of organic material, and/or 2) a highproportion of the total sediment yield consists of bedloadincluding organics. The potential for greater channel sedimentstorage increases with decreasing stream order, particularly inforested streams of mountainous areas. These streams arecharacterized by high erosion and litter production rates, and
314 K. W. CUMMINS ET AL.
slope profile irregularities, but have channel obstructions suchas logs and boulders for which there is usually insufficienthyraulic force for movement. Since slope irregularities, andobstructions create a stairstep effect, deposition of organicsbehind these obstructions must be considered in addition tophysical processes such as scour and fill of the channel bottom.
Sediment storage. Detritus in sediment is subject toaerobic or anaerobic processing (Fig. 1). Depth of the aerobiczone is dependent upon the size and heterogeneity of sedimentparticle sizes, rate of microbial oxygen consumption, channelgradient, average flow conditions, and seasonal and annual floodpatterns. In the cases in which total standing crop ofparticulate organics (excluding large woody debris) has beenmeasured, sampling was generally in the aerobic portion of thesediment profile subjected to annual scour and fill (Fig. 1).POM is generally assumed to be available annually for biologicalprocessing to CO
2 and conversion to dissolved organic matter
(DOM) and living biomass. Provided the organics and associatedbiota remain aerobic, at least for significant periods during thewarmer portion of the annual cycle, processing can beaccomplished within a year (Petersen and Cummins, 1974; Boling etal., 1975a,b). POM that remains buried in anaerobic zones isprocessed at significantly slower rates than that which remainsaerobic over the annual cycle, as evidenced by intact,sulfide-blackened leaves excavated from deep sediments in thespring. On the other hand, since invertebrates have beenrecovered to depths of 4 .5 cm or more into the substrates instreams with loose, heterogeneous beds (Coleman and Hynes, 1970;Hynes, 1974; Hynes et al., 1976), the depth of this aerobicprocessing zone needs to be carefully examined for each stream.
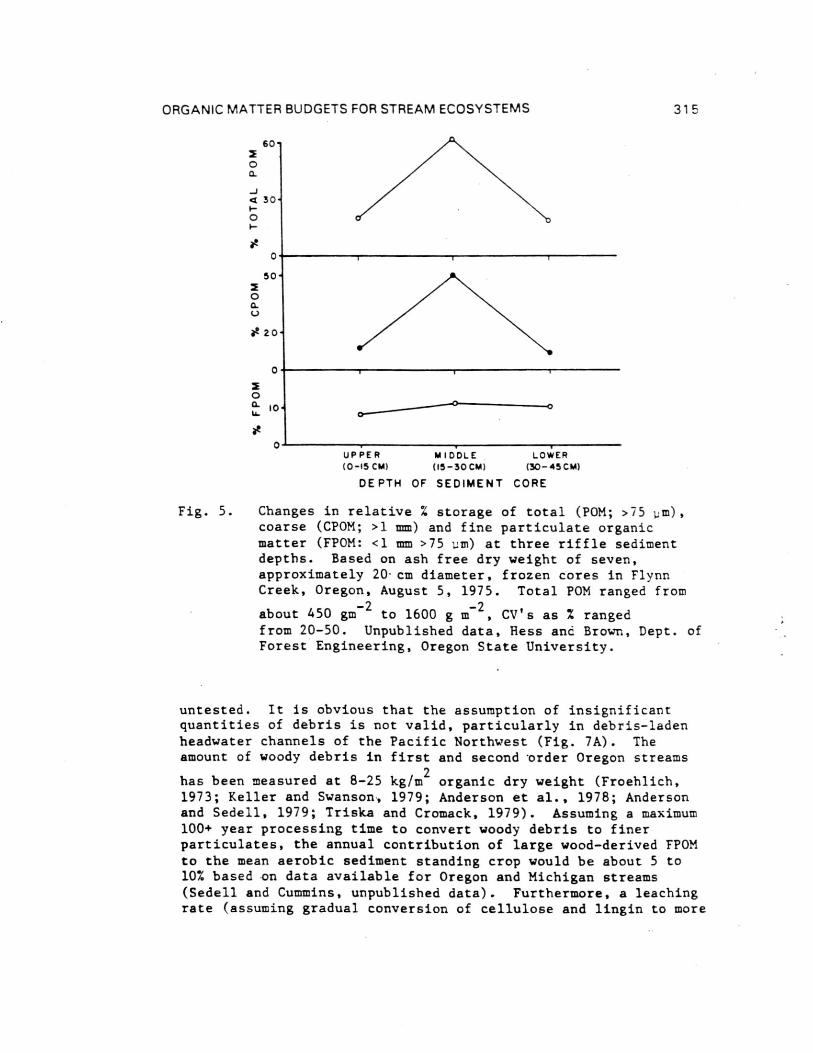
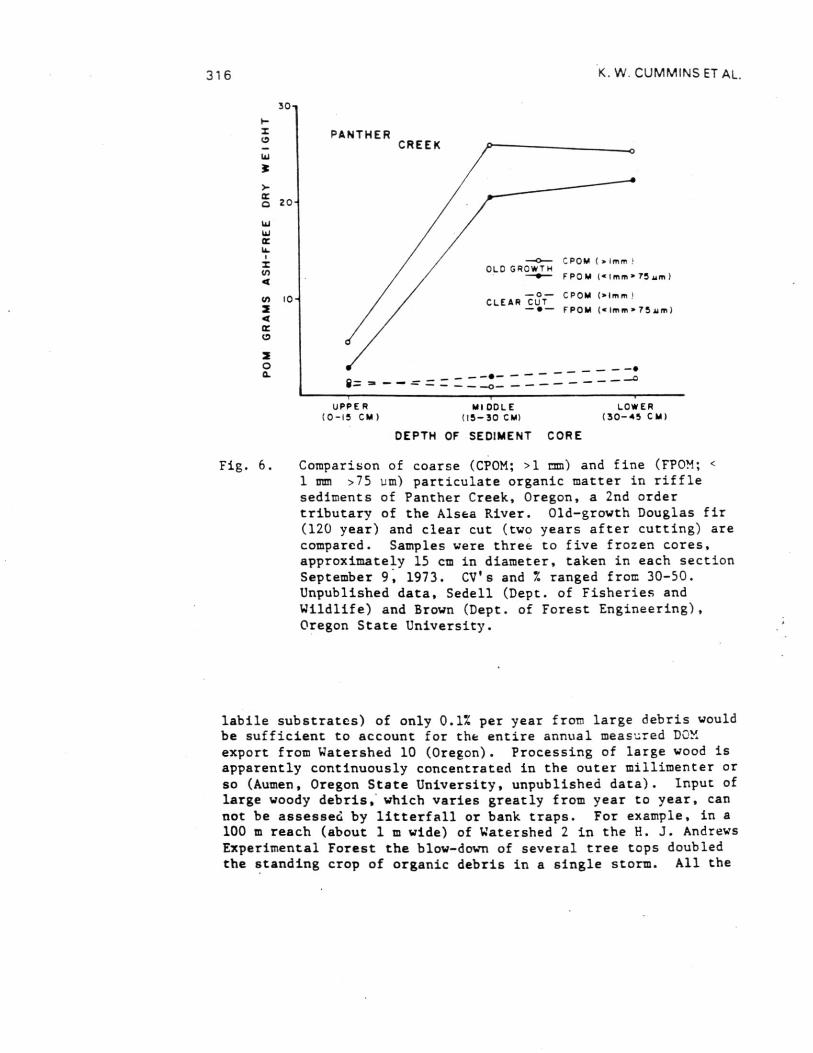
Concentration of CPOM and FPOM stored in the beds of twoold-growth forest streams in Oregon was greatest in the sedimentsbelow the 10 cm depth normally sampled (Figs. 5 and 6). Studieswill scour chains in such streams indicate that the depth ofscour and fill (Fig. 1) for a 10-year storm is 15 to 20 cm(Moring and Lantz, 1975). Thus, storms could mobilize fromstorage two to four times the particulate detritus recovered insurface sediments by usual sampling techniques. Similar to floodscour, POM may be depleted from deep sediment storage or buriedunder new deposits through scour and fill that frequently occursfollowing forest clearcutting (Fig. 6) or channelization.
Channel debris. Until recently (Froehlich, 1973; Keller andSwanson, 1979; Bilby and Likens, 1980; Bilby, 1981) large woodydebris has been ignored in stream budgets. The assumptions, forbudget purposes, that the amount of large woody debris inchannels was small and its processing rates insignificant were
ORGANIC MATTER BUDGETS FOR STREAM ECOSYSTEMS 315
60-
0a_
_Jci 30,
OI-
0
504
O
U
0 20,
0
O10.
0UPPER MIDDLE LOWER(0-15 CM) (15-30 CM) (30-45CM)
DEPTH OF SEDIMENT CORE
Fig. 5. Changes in relative % storage of total (POM; >75 m),coarse (CPOM; >1 mm) and fine particulate organicmatter (FPOM: <1 mm >75 inn) at three riffle sedimentdepths. Based on ash free dry weight of seven,approximately 20-cm diameter, frozen cores in FlynnCreek, Oregon, August 5, 1975. Total POM ranged from
about 450 gm-2 to 1600 g m
-2, CV's as % ranged
from 20-50. Unpublished data, Hess and Brown, Dept. ofForest Engineering, Oregon State University.
untested. It is obvious that the assumption of insignificantquantities of debris is not valid, particularly in debris-ladenheadwater channels of the Pacific Northwest (Fig. 7A). Theamount of woody debris in first and second 'order Oregon streams
has been measured at 8-25 kg/m2 organic dry weight (Froehlich,
1973; Keller and Swanson, 1979; Anderson et al., 1978; Andersonand Sedell, 1979; Triska and Cromack, 1979). Assuming a maximum100+ year processing time to convert woody debris to finerparticulates, the annual contribution of large wood-derived FPOMto the mean aerobic sediment standing crop would be about 5 to10% based on data available for Oregon and Michigan streams(Sedell and Cummins, unpublished data). Furthermore, a leachingrate (assuming gradual conversion of cellulose and lingin to more
U,2
0a.
316 K. W. CUMMINS ET AL.
30,
20.
PANTHERCREEK
—0-- CPOM (OLD GROWTH
imrin
FPOM (41mm.754,m)
10. —0—CLEAR CUT
CPOM (.1mrn
FPOM (.1mm>75am)
• ..... -
UPPER
MIDDLE
LOWER(0-15 CM)
(15-30 CM)
(50-45 CM)
DEPTH OF SEDIMENT CORE
Fig. 6. Comparison of coarse (CPOM; >1 mm) and fine (FPOM; <1 mm >75 um) particulate organic matter in rifflesediments of Panther Creek, Oregon, a 2nd ordertributary of the Alsea River. Old-growth Douglas fir(120 year) and clear cut (two years after cutting) arecompared. Samples were three to five frozen cores,approximately 15 cm in diameter, taken in each sectionSeptember 9, 1973. CV's and % ranged from 30-50.Unpublished data, Sedell (Dept. of Fisheries andWildlife) and Brown (Dept. of Forest Engineering),Oregon State University.
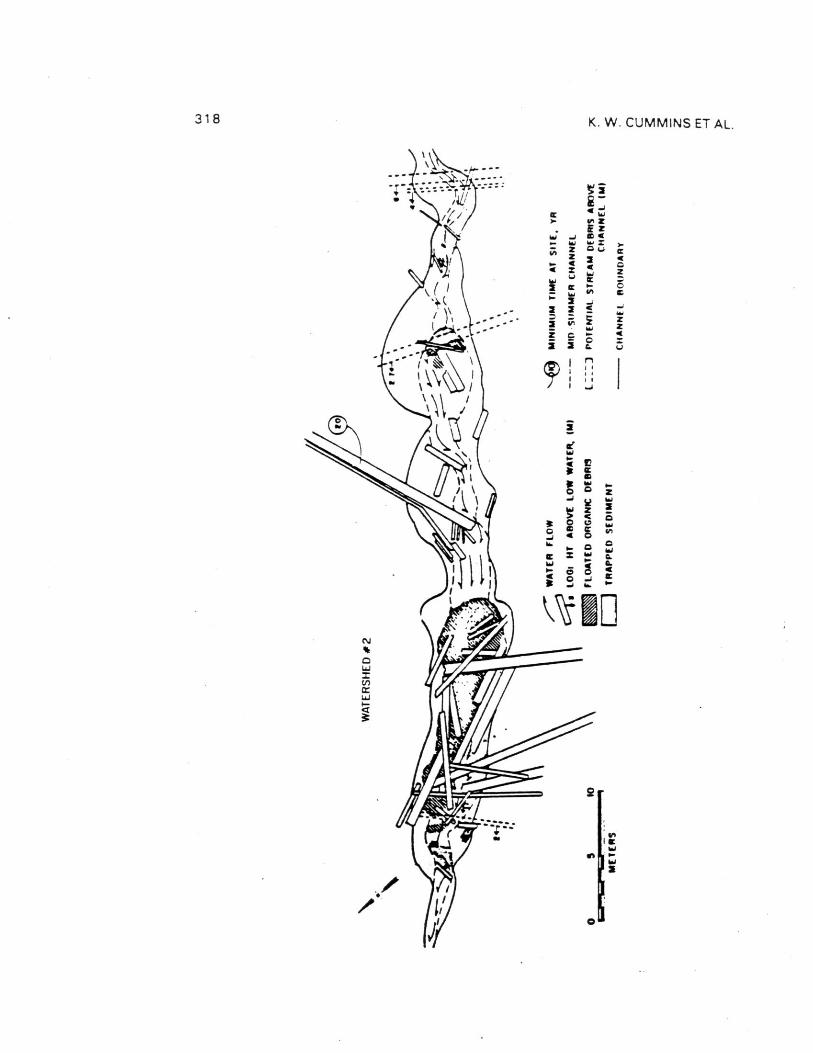
labile substrates) of only 0.1% per year from large debris wouldbe sufficient to account for the entire annual measured DCMexport from Watershed 10 (Oregon). Processing of large wood isapparently continuously concentrated in the outer millimenter orso (Aumen, Oregon State University, unpublished data). Input oflarge woody debris, which varies greatly from year to year, cannot be assessed by litterfall or bank traps. For example, in a100 m reach (about 1 m wide) of Watershed 2 in the H. J. AndrewsExperimental Forest the blow-down of several tree tops doubledthe standing crop of organic debris in a single storm. All the
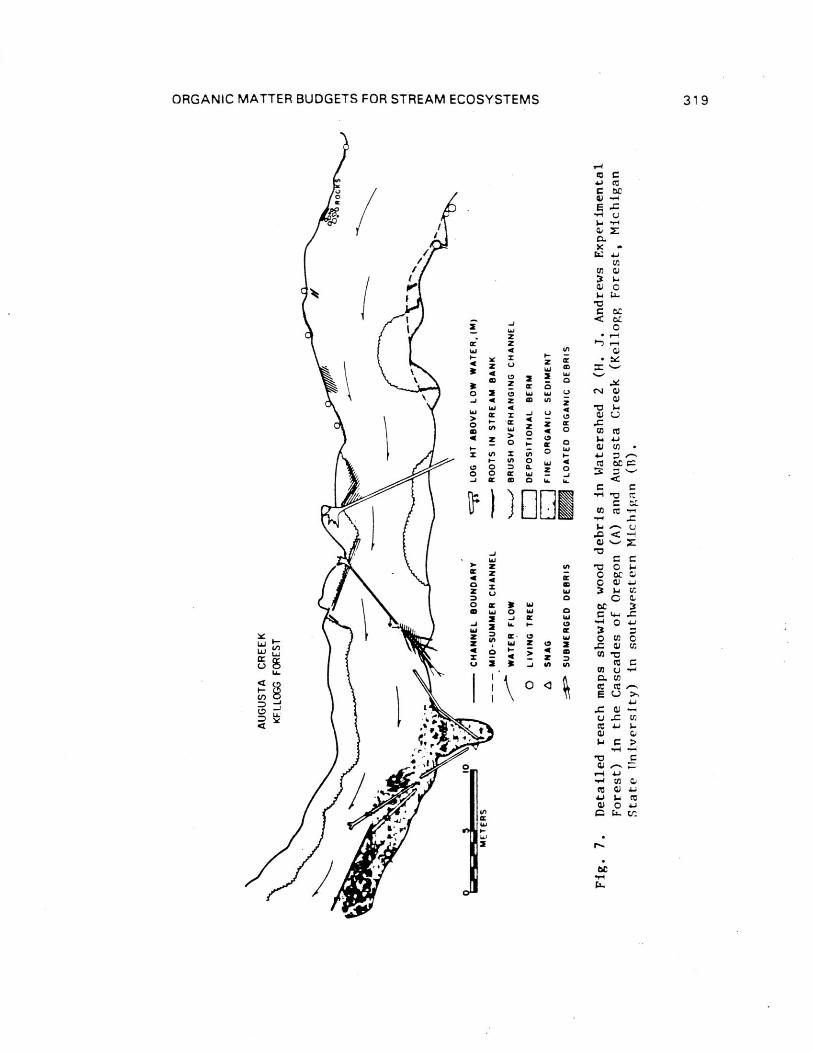
ORGANIC MATTER BUDGETS FOR STREAM ECOSYSTEMS 317
large (> 10 cm diameter) woody debris was measured in a 260 mreach of a third-order section of Augusta Creek, Michigan, whichappeared to have a low concentration of wood (Fig. 7B). Even inthis stream, the measured loading of woody debris--approximately
1.2 kg/m2 organic dry weight, was about 15 times the mean annual
detrius standing crop of the aerobic sediments, excluding thelarge wood measured by conventional traps. Assuming a 30 yearprocessing time for large wood (hardwoods are processed morerapidly than wood of conifers; data from experimental streamsyield estimates of 10 years for medium [approximately 10 cm] andsmaller wood) the breakdown of this CPOM would yield theequivalent of about 14% of the FPOM standing crop annually.Because the amount of large woody debris in the particular studyreach was probably below the average for streams in the area dueto land use practices, and processing rate is probably greater,this estimate is conservative.
Another important feature of large woody debris is its rolein retention of finer CPOM and FPOM and DOM (Bilby and Likens,1980). Retention of FPOM in debris jams and associated sedimentsmay result in its storage for periods of more than a year and theFPOM may require several years for processing. Whether thechannel is in a period of loading of large debris, and whetherlarge woody debris is retaining or releasing finer particulates,are critical assessments in compiling a budget.
Flood plain. Food plains are areas of river valley bottominundated when bankfull channel capacity is periodically exceeded(Maddock, 1976). During overbank flow the flood plain or upperbank can serve as both a source and a sink for POM (Fig. 1). Theorganic content of flood plain and upperbank deposits has notbeen considered in budget determinations for lotic systems, norhas the movement of organic matter from the flood plain back intothe channel. the rates of rise and fall of water level, peakdischarge, channel and flood plain geometry, and flood plainvegetation all interact to determine the POM dynamics of a floodplain during overbank flow. Exposed and buried living and deadvegetation can be used to evaluate the balance between depositionand erosion on the flood plain, as well as the extent ofinundation from floods of various magnitudes. Sigafoos (1964)reconstructed the depositional history of about 75 cm of sedimentin the flood plain of the Potomac River which resulted from a mixof deposition and erosion over a 30-year period - the net effectbeing deposition.
Detritus exchange between the channel and flood plain islikely to involve important qualitative changes with respect to
31 8 K. W. CUMMINS ET AL.
ORGANIC MATTER BUDGETS FOR STREAM ECOSYSTEMS 31 9
X
cr.4
Z
cc2
-.1 4 Z
•
CDLa 4
I —1CC CC
irJ
(.24
0
O
.10••■••
Uz
ccO
z
Qap
0
U
t."Cr0
0
4
0—1IA-
(—
cr) Lr)
o— (f) 0O.
0 crJ CC CO 0
It
4.) CC6C
1-4
04.)
(I) 0)
CL, 0
Cat0ri
fr") 1.
Ca.)•
••■•
0,)01
1:3
ct
CU V,' •.i.JCZ 16C
7.,*
••-4C.r.
Ci)0,4
<(1)
0
.3GC c,CO •,,,J
•
•
•■0
0 11
U C
CO CI:(/)
CC CGO (.10.Ct
UE 1..0 CI)
C.) .0 V.CtC1J3.4
1:3(1.7
(f)
CC CeJ
).4 Ct
0) O Aa
320 K. W. CUMMINS ET AL.
particle size, biochemistry, microbiology, and degree ofconditioning in the terrestrial s y stem (Merritt and Lawson, 1979;Triska and Cromack, 1979). Furthermore, as stated above, whentemperatures are lower on the flood plain than in the streamand/or conditions are dry, biological processing of particulatedetritus can be slower than in aerobic zones of the stream(Merritt and Lawson, 1979). Consequently, leaf liter depositedon the flood plain in the autumn and captured during spring highwater, enters the stream in a less processed condition thanlitter that remained in the aerobic stream sediments over thesame period.
Quantitative and qualitative data are required on the exportfrom and import to the channel to and from the flood plain overannual and longer periods. However, typical litterfall andground surface movement trap techniques are not adequate tocharacterize flood plain dynamics and other methods (e.;., somesort of mark and recapture procedure) would be required forassessment of organic matter input and output from flood plains.
Changes in POM storage along river continua. Input,storage, biological processing, and export of organic matter varythrough a drainage basin from headwater streams to larger rivers.In the River Continuum concept described by Vannote et al.(1980), it was suggested that the size distribution of POMchanges with increasing stream order such that both transport andsurface sediment storage are generally characterized bydecreasing amounts of CPOM as the influence of the riparianvegetation decreases with increasing channel width. This trendof decreasing CPOM to FPOM ratio in transport and storage (Sedellet al., 1978; Neiman and Sedell, 1979a, 1979b; Cummins et al.,1982), which more adequately characterizes the latter, ismodified by tributaries and the CPOM generated from macro-algae(Minshall et al., 1983; Wallace et al., 1982). The changes inrelative importance of certain size classes, which reflectdifferent input, physical retention, and biological processingalong the river continuum, necessitate modifications in thesampling methods applied to organic budget studies in streams andrivers of various size. For example, channel storage in debrisjams would be most significant in first through about third orderheadwater streams, while upper bank, off channel pools, alongbanks and on point bars, and flood plain sites become moresignificant with increasing river size. The importance of deepsediment storage in organic budget calculations in a particularwater year and the action of scour and fill along the ravercontinuum are presently unknown. The problem of comparison amongstreams of different sizes is compounded because budgets forheadwater streams typically approached on a watershed basis,differ significantly from analysis of individual reaches which is
more feasible for larger rivers.
ORGANIC MATTER BUDGETS FOR STREAM ECOSYSTEMS 321
COMPARISON OF WATERSHED AND REACH (SEGMENT) DERIVED ORGANICBUDGETS
Theoretical Considerations
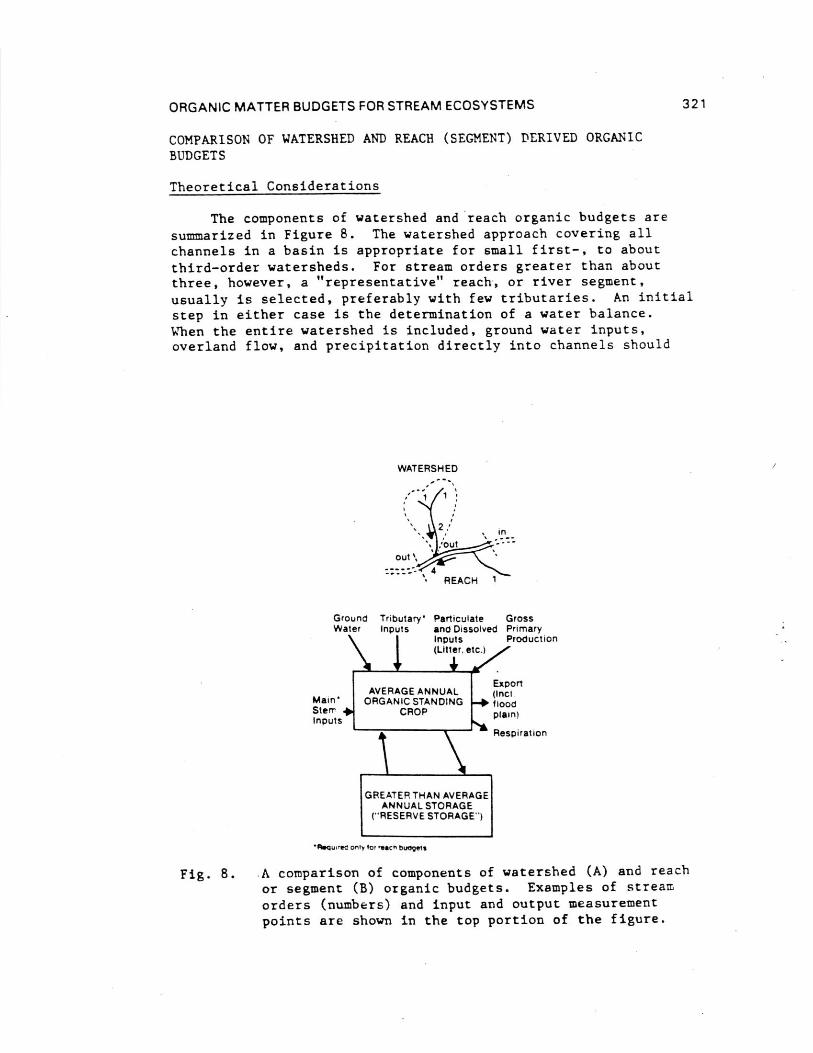
The components of watershed and reach organic budgets aresummarized in Figure 8. The watershed approach covering allchannels in a basin is appropriate for small first-, to aboutthird-order watersheds. For stream orders greater than aboutthree, however, a "representative" reach, or river segment,usually is selected, preferably with few tributaries. An initialstep in either case is the determination of a water balance.When the entire watershed is included, ground water inputs,overland flow, and precipitation directly into channels should
WATERSHED
Ground Tributary' Particulate GrossWater Inputs and Dissolved Primary
\ (Litter. etc.)Inputs Production
AVERAGE ANNUALMain' ORGANIC STANDINGStern CROPInputs
GREATER THAN AVERAGEANNUAL STORAGE
("RESERVE STORAGE")
\-- Respiration
Export(Inc!
♦ floodplain)
■A
• Reclu,', only for reac t, buOvets
Fig. 8. A comparison of components of watershed (A) and reachor segment (B) organic budgets. Examples of streamorders (numbers) and input and output measurementpoints are shown in the top portion of the figure.
322 K. W. 0 I MMINS ET AL.
equal mainstem output plus evaporation and channel relatedtranspiration. The usual method to determine POM and DOM fluxeshas been based on relationships between organic matterconcentrations in grab samples of input and out put at differentrates of water discharge. Total organic fluxes are thencalculated on the basis of transport rating and flow durationcurves (e.g., Fisher and Likens, 1973). Storage is frequentlythe most poorly docume: , ted element of budgets (Fig. 8), becauseboth spatial and temporal sampling problems may lead tosignificant over- or underestimates of this parameter for a givenannual budget.
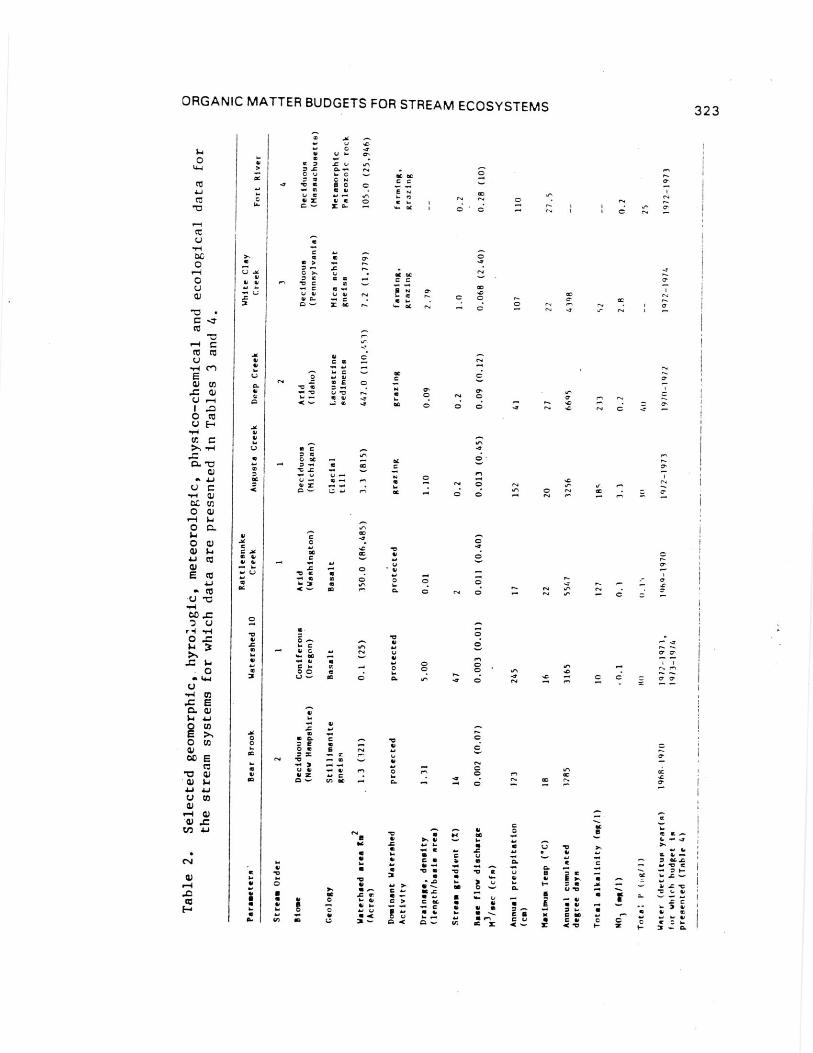
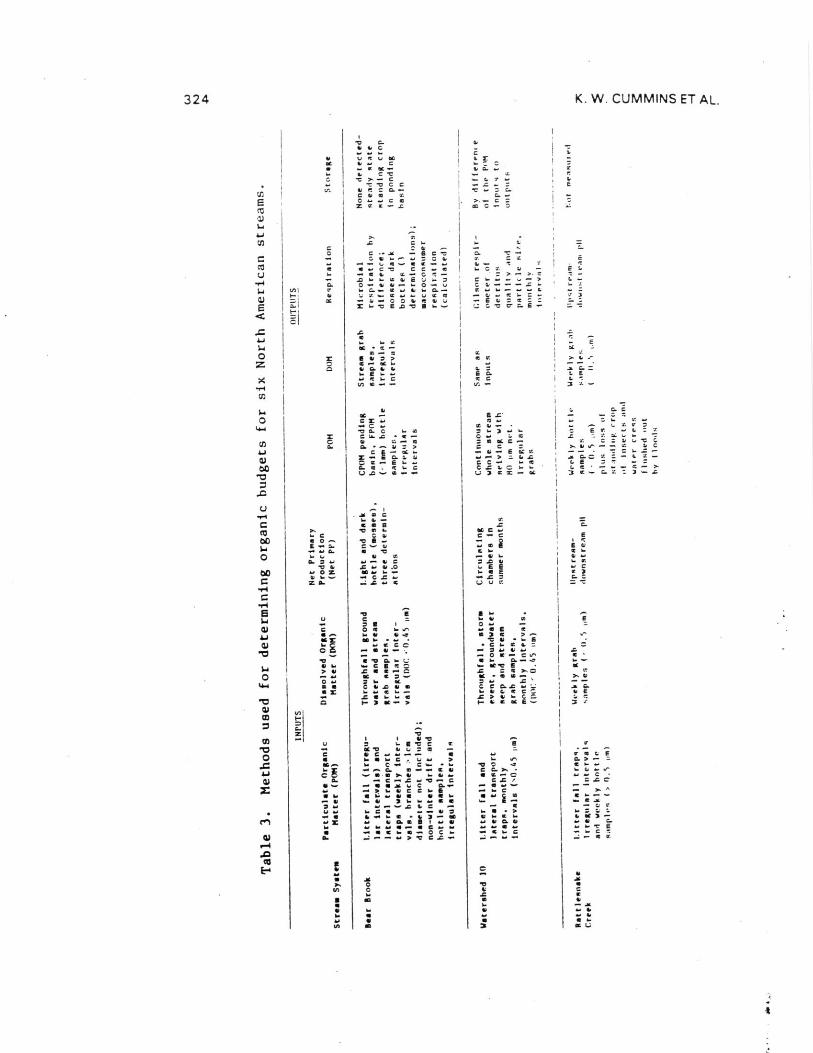
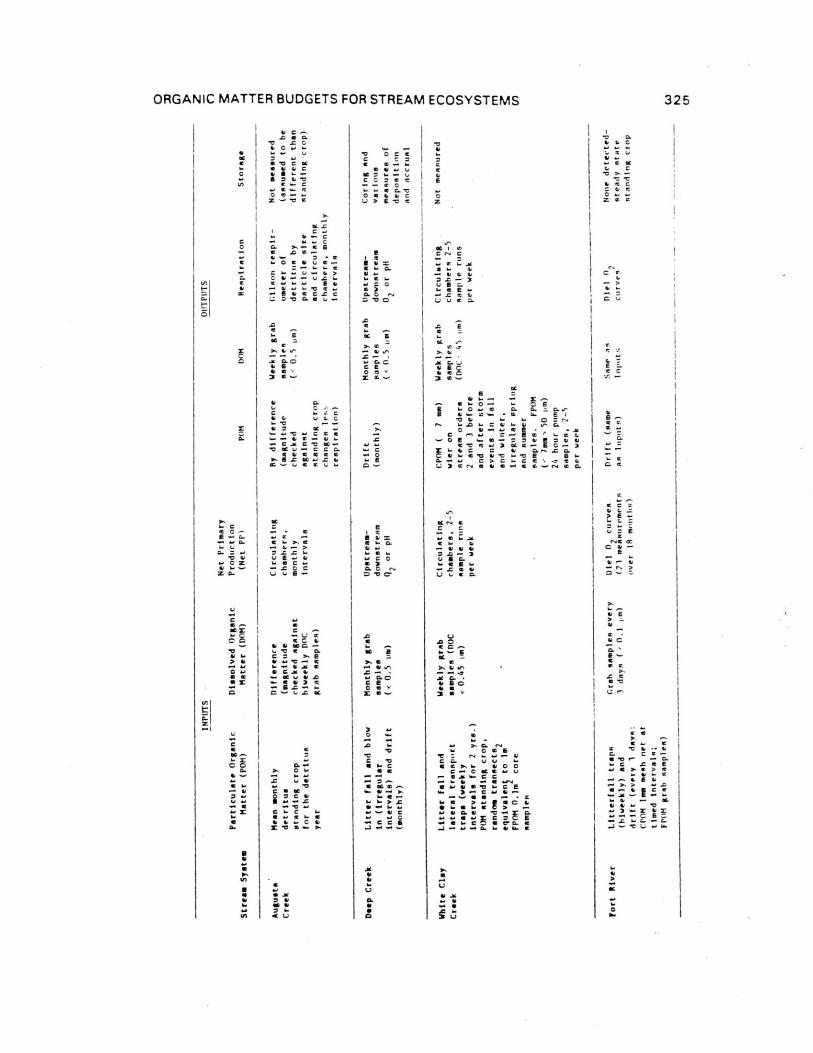
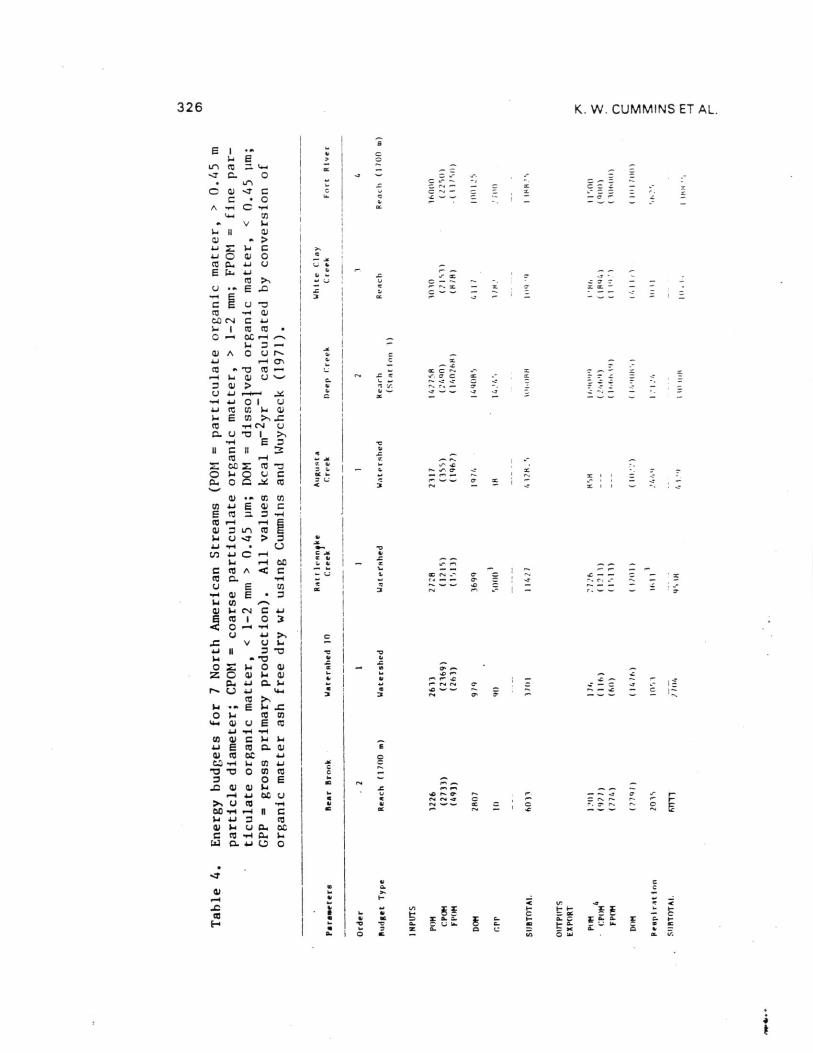
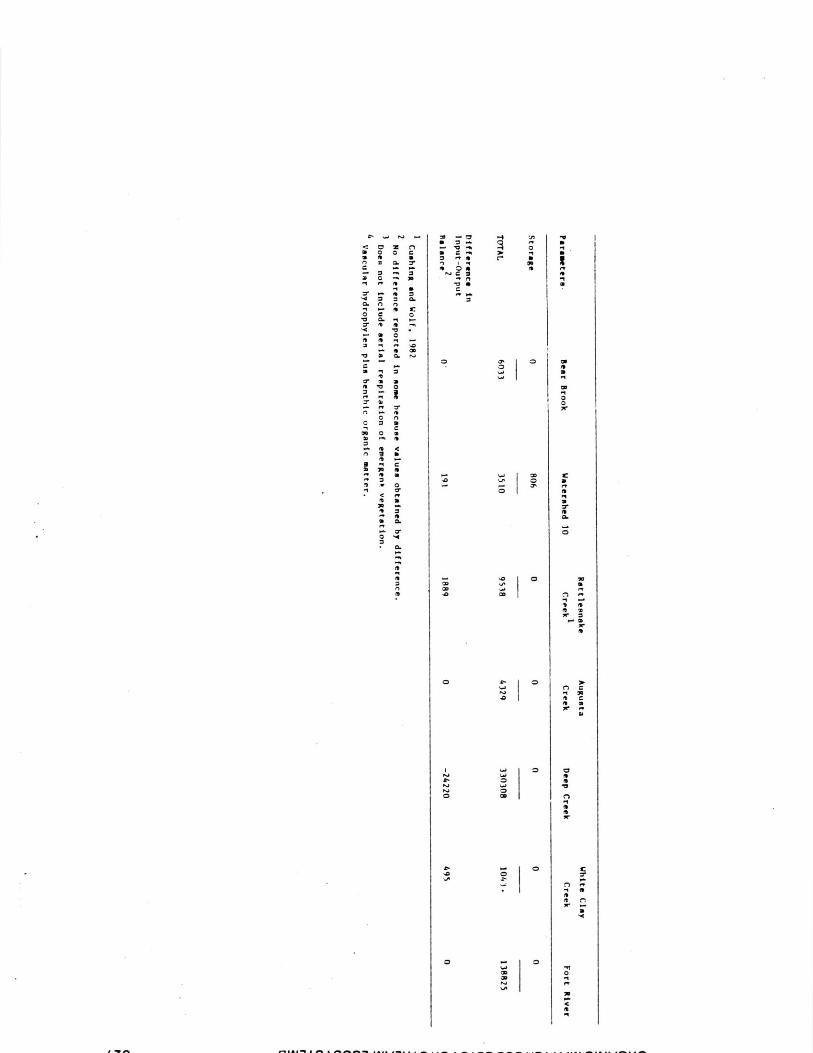
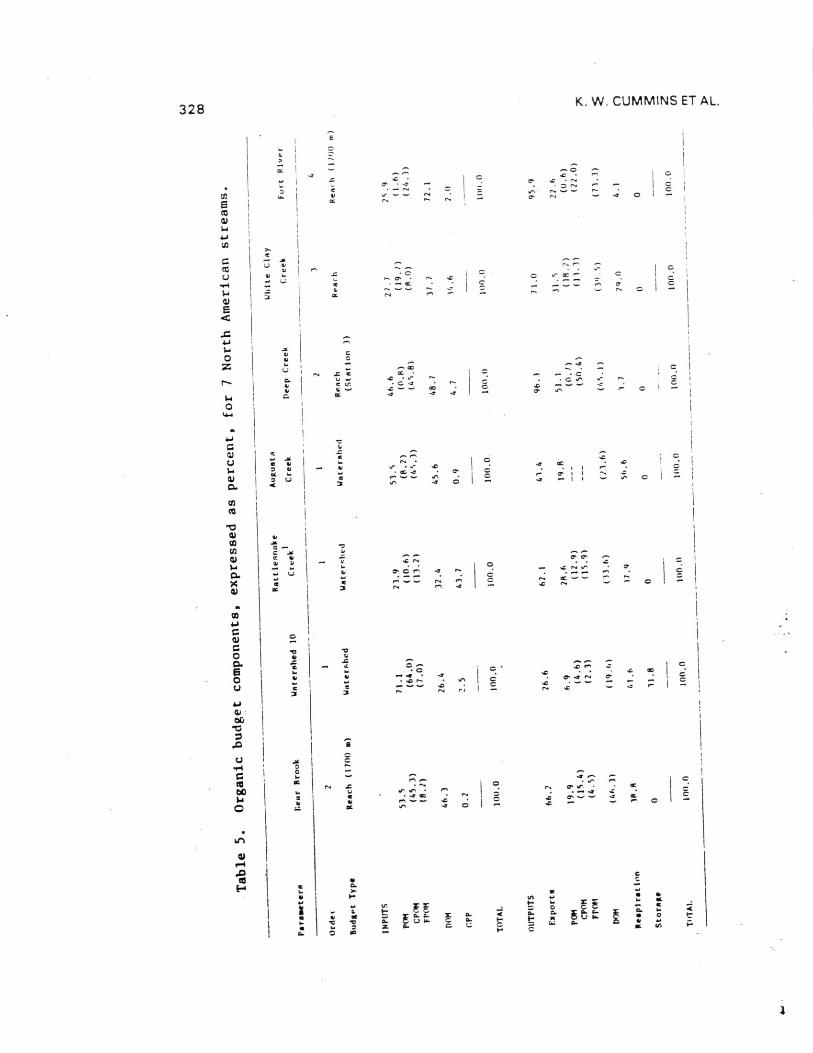
Budget comparisons. Data from seven study sites across theUnited States provide examples of broad trends and problems incomparing organic matter budgets for different streams (Tables2-5). Tables 2 and 3 summarize background information on thestudy streams and methods used to estimate the organic budgets.The sites differ significantly in watershed area, stream slope,and other geomorphic characteristics. Differences in riparianvegetation represent important sources of variation among streamsof a given order in different basins. For example, first-orderstreams in arid regions are bordered by sparse vegetation, soparticulate inputs from surrounding areas are lower thanin-stream primary production (Table 4). In Deep Creek, POMgenerated from aquatic macrophyte breakdown is the majorcomponent of the fraction. In contrast, a coastal coniferousforest stream may flow through a 70 meter high forest and receivelow light inputs and abundant litterfall from canopy andunderstory vegetation of riparian plants (Campbell and Franklin,1979). This variation in the degree of coupling betweenterrestrial and aquatic components varies predictabilty along theriver continuum, even within a Particular vegetation biome(Vannote et al., 1980).
Although obvious differences exist among the organic budgetsof the lotic ecosystems compared (Tables 4 and 5), POMconstituted a major component (25 to 71%) of the total organicmatter input. Except for Deep Creek and Fort River, the amountsof POM imported, expressed on an areal basis, are similar. Of
the approximately 2300 to 3200 kcal m-2
yr-1
POM delivered toWS10, Augusta Creek, and Bear Brook, 7 to 37% was exported, theremainder being converted to DOM, biomass, respired to CO 2 and
stored. POM exports significantly exceeded imports only in DeepCreek and White Clay Creek. Values of gross primary productionfor the systems cluster into two groups at approximately 10 to 90
kcal m-2
yr-1
(0.2 to 2.5% of total inputs of their respectivebudgets). As expected, the small, heavily shaded streams had lowprimary production. In all but Deep Creek and Fort River,
1.40
kr..‘
-•
OC
G.
CC, V 40.■
01. .0CC
4 1.4.c
15-at
1).-, iv .0IV .....0 . • GOC 0., tiCDO 4 14 4 vC V C C< • 0 1-- X" C 1.• ■I- 3 C.
ORGANIC MATTER BUDGETS FOR STREAM ECOSYSTEMS 323
••-■
V C.,
it .4
0 = CI, •••• -0 Q I. C .......- 0C OC 0
., 31 C . C C •-•C C 6 0 C.....7
... CY/ CO IL E N CO
L.,CC 4 .4 I.. m hi eNIV X fl., t 0 it 1... I ..•. r... I
C. •-• X .... - DC i O. C r• cv I
•C
C o ■.7C
>.0D..
Z GC GCen C
CO
■-■ C c0CV C. 0.4 N ac
c C O C C cC■•••• OC. h 1.^X et r N ■.r hC
V CC CC T.
4 0 tt,
0 aa 00 Ccv .0 co E C ...c •-• o.1 Cli,4
c17 C/ .0 r C
/.... r- tO OJ , ilfN
< •••••• ..= C0 , fIC C 0
stn
O
......OD C 4..0 tO C. DC •-• r. DC. 0 T. c = c..c ..c .... ....... -..,• C., C.... •-■ .4C., ••-, cc - en ccL ..-. -••• 1...a - u . rn CC
O
enc .... .c,-.4 o c., ,.,. v ....^ c <-• cc... o c -. ,.. ‘--. - ...,
C C
... ■•••■ 4.7t,
= •••• O - ILO ....
.0 CC C 4.) ... -. ,..■CC GO 0
. 7t ce . 0 0 J •.... ..-• -
..0 •-•• CC CI. 0 cv 0 •-• ry ^•• .-. C =r... esi a, (NI
it C
..-,
4 00 ....
V- CC 0. Q. Gin .7 C..7
..4 (14 C 4.) I I
0 ,
4 C uei 4V C 4 4.,
C I.. 0'. ..-1 N ,
0 C C . r- 0 ■.n..0 P.. ....
N C.+ Cr C.110 ,0 CC 0 in ....
eq ..04 4 0 C,..
.' C
......
Coc
4•J
•1...
-.. •
..0 •-,
CO T.
SD C. C ..... .0
- E C li
6 . E ,..., ..,
C = ..-, Gr r••• ,N -V ^• ..... li■•4 , 9. ....1 S. .■■U IV •••• e f•• 0 e,
I) X A... C • ■-• .4
0 .-, V) CC .... C. .4 ...
C(-A
a..e
a, 4 ir, ac .....
b, V I.. 4
11, .0 4 4 • •C .4 C 4 .04 • C C.,.1
• 0 CC it CO Cl.
4 4.■ Ili ...-, ...■ .... ....... ....■
110 C .0 fa .0 .0 C (-)3 • 0 ...... v
.0 •• 4. . 3 ■ 1., ,-,CM 4 >, V -... CC 0 ....... C.".. • .4 c •-• cc L .0 Cr • - • .,_. a ... (.., •6, o 4 4, C> C CC • V •g
4.0
Vi... 4. 4 C4.V {I ID C ..........+ u E ,... 5 . s.. co ---. C Ili... ii, • < c c., 6.. .-. ,... is en c uaz L.: 3c •-• (::i ..0 A C. tf. GC X git 4-
cr)
C-Z
C•Se X
8E
>-• •.■0 eLe0 0
X
C
C
8E
•
7u•
u
•
C•
r.
E
; to C EC. >
.0 C
ACr. C
- .
7T E
*.•
Cs- C
K. W. CUMMINS ET AL.
C-V W C
4.0
41
et Olt
OCC
C 1.G. 7
C C••
C 4J CO../ C T
C.C
Z P. cc .c CC C
.0 C 4.7
C= 0J
E-•
C M.••• =-• C •••••
4.4,C•••• C u.0 1.4
7 C C.•••• Ce E.. - 7 C
C,> >.
I. L■••4.■ 1. 0
GC u u 1.C C
Z0 0E 17 8
COJr•-•
...E C"
Ir. 3
•ecc • cc
v-
Eoc
EC ecc• >• e v
- •4,c C. 0.■••• E
(f) CO
W
C4.•
E
tr.C-•
Ec
, -
et .=C. C
C X 4.4C 4, • P
T C. C ■•• E ?„."L
-• C = C v. - v t C.•-• C
E P. -• • '7. 0 4.Y C
cau
"C.. .Ecti-PC
4.0
C-• >
.= 6. C3 cc
.06• et E =
CO C••••
C'V OL C
c1:3
c ••-• C
GO g E
E
••
cr.00 .0 E E C
- C1-
•••E
.0P. 7c.
L.) U
324
C7
ot• li• •a, • C
■•••• r•••
C E RC.0 e • C
•••OC
.0, O1
= e 1.• r 11:3 It
cicE z C
CIE 'V Y C = 05C C., 1•••
I., e r C u u >C0.
>.8
C .0 ■-■ C--. 18 U Y 1. C
1. • C C r ErC C
) C CC. C •••
.4. 7
Aa u 0. CC E 1 •
- a •••• e C• b. C
O
CO.
C0
Eor LI.
1. 4a11.
'C.4, O Z
za
I0 SOC L O.
C
C N
.0
CE
.0
00 6
.17 ^,-• •
ba O.C E0 a v
ORGANIC MATTER BUDGETS FOR STREAM ECOSYSTEMS 325
117 CJD • CI.C
G. ^7 0
C OC0 v i C
G-6 7 16 -0
c c6.4 C
C C ••••
-oe C
4.•
Z L.^
.Goo CC OC
Go C>o,
11. fC C= CIC *.oZ.
tt
0
V)
-cC C 7C
C Y 0 Lao
C M CL. o Ca
00,40C> E c
O.
C -
c c - CC
e
6.0 fY C>
C.- C u •E
0 z r o c- L C
Z C.. L., L. 6
C••••C COC c.c 0-
C E*a •C
k CO C Y O.
Loa OC V Y .0*CV) M„a
OC
>. 0 6,.7.. 0 00.
C o tICC 7 CIIw .0
CCC C L C
CX t C
OC I W)C N C
V 1: .0II 0 V-,VC0CLo7 .0Lo • C-1.• a E
(.*
Ec
-it C. G.>6
eLC
oefi
00C G. p-a
0.-C d la
‘-4o E W m-
c ceLX ceCu r CO. .0 ^
irNsec
OC N CC
c L u- V v.7. -)cd 6 0-w e 6 w
CC
Ca,toL. E
0 C7 =
-_-. e 4, 4,- )
O. .0 C.E E 0C a v ,c cr. te C.
G.
CI,8
v.CC
^
v.
CG. V
E
*-• CN.C 0
0 0E
•
ECC-
L..
>C.
20 0 (14 Cc G
OC o EC>. w"
o••.0 Ca •e 6
.0V3
W
4.1 T C.0
0 N rCG.,OZZ00
C C OC
Nc 6u-L.* 0BOOc
C--o
C ^
C
e-
-E
0.0.
C1, 40 C .0IL C
4.1,1r C6./ •-• e-
> .o
.00
-• 0.• ••>
••-■ • Z■-■
C6
G e•r C
tr
CC G
1.6cc
)
`..."
XCo
11.••••
VOI
V)
C6.
O
C
x
C
C00 •.L-c o
c r-
-•7 0
.1
LL
c-7
, -
sr
1
4-J 0 CI1 003E
U • • E .=
C E UC.)
0.13 CNI C 4.)1. I CC Oa •0
CI) A 0 C.)cr%
C.0 wr-4 I. a) C.)
>
•••J 01 U4-1 Y.
CC C.0 C i
CV. J •••••
CC
C
C
C
OO
E ripcoC. U
0,1IE
—
II C II V
4-, Jig
Z P. 0,•S.o 61 0
0C et
•••••
CI) • •• CJ3C/3 E (1.$E
L EQ.)$.4 U 4.■
4.J TI • (..) -•
7,-
F
C
cr) .1•J C •""4-4
C cindcct
W E •
C) C■1 C 1.7E i 0 3
cc4.•J
V C.)
I
r)0 1: )-■ 0 C)Z C)
Or $•4..1
0 w cr)cDuEct,
.I ••-4U) C) C 1.4"a E ro ta• 0)ad 03 CIIC '-
v o rn0 E
.0 ad 0) $4
J./ hC U
U cT1n
.4 4-)C) $-■ U a. aC
c=.3 a 4-+ o
.41N ••••. ••■•• CC
.7 ii, ....,1.-b-- 4. x xc
"-..". 5 E , F._, ,_ .L . .17 :," a-. "" a,.. ,.73 5 ;.J
—
J =
1
EI
in C
•
E
a
C:..--.
C. O ....7 — 'I' z7-, • d-•
C Q.C
L.)
•CC
c..:--
7 ,.c ——_
S.
A ,4 C
V La
326 K. W. CUMMINS ET AL.
<Ca 0 3 Car, x a.
•••••3 30n a
.1 •3rio3 O.
0. n na C
0 C 0-qI
*
a11 .3 7.6.•
I co
a .1I
S a a3 •,0 0
S
■-•0 nC 3 aC
73 0 a3
<g •
-•3 Ca a et
0r.1
0ti < CT
3 at
7. 3
03(0.
a
3a
3, -. CY 4 VI3
— V.....
n0
a C.3 n
n.a
a•r'
,■", i,11 0
,,.., C-1IS3
7,I
3
0
- • w 734:7
e;
ODOD
rI4:3
•-• 0
0
••••■ "11•111 1 /...k 1 AAA 1 AA" • •.• • . . . •
C■••■
C •Cr.•
••••••■..r. •••- ••—•
CC • c`..
••••••
▪
••••C
Cr•
328K. W. CUMMINS ET AL.
. , ---4., .-7....... - -
, 1 cy„ .. .. . ;_-... , = ..." C i
cr• • — — . , 1, .s_ , ., „ _ 7 — --- —
1 ii
1 1 1c
c •.i — -.7 --0 , .. Z
— c. - c i, = —
0. 1 — ... • .,- •C
. c , • c -.3 f--
. —• - c
../ •••••••
Ih CT. or •
^• •-* •••••=CC
C
c ct, .4 CCI 16.0 I .•••• •••• ••••• C
_., °c. •.. i . I ,— ., C. I I
''I •>• -.■ C...3 •-• I I 1
..•C
V0(
•V- • V' Icc , C
•=••
oes
C et -.7
rt-t et,
.41 •
.0 v a•••
r••••
••■■ /..., I
C. ,,...0 Z C.
1■C I s. V. 0.
Clm,
..., 7.. S 1 E 1Z I...
1
1
1
1
C •
C ICC
C C I7c, -•
U
$.4a)
0
01
a)U
U)
4-4
ca
7:3a)coct)
Ca.
a)
a)
a)
4-+
0Gt.6OU
4.4a)oo
U
coootvo
cCA
v.
-
E■-• E0
x zt— E O
Z. 0.• = L.;Z.
■-••
ORGANIC MATTER BUDGETS FOR STREAM ECOSYSTEMS 329
community respiration was a significant portion (29 to 56.6%) ofthe organic budget output.
Many of the differences in budget characteristics areartifacts of system delimitation, thus in reaches of largerstreams such as Deep Creek and Fort River, fluvial import oforganic matter assumes greater importance relative to inputsmeasured on an area basis such as litterfall. Respiration, perunit area exhibits a twelve-fold range in the various systems
when reported on a kcal/m2 basis, and an eleven-fold range on the
basis of percent of total output which is not areally based. Theheavy macrophytic producing streams (Fort River and Deep Creek)have the highest absolute rates of community respiration yet thelowest percent output h; respiration. The remaining output is byfluvial export which is naturally high in these rivers.
The hydrologic data shown in Table 2 should be interpretedin the context of the long term patterns in each watershed.Because the U.S.G.S. water year covers the period of October 1through September 30, stream discharge records correspond wellwith the "detritus year", conveniently defined in the temperatezone as extending from one period of leaf fall to the next. Peak24-hour flows for the budget years compared (Tables 4 and 5) arein the range of 1 to 5-year flood recurrence intervals of annualmaximum daily discharge, based on 8-24 year records. Althoughsimilar flood years allow for more legitimate comparisons, theabsolute organic budget values given for each site are notnecessarily representative of . the long term.
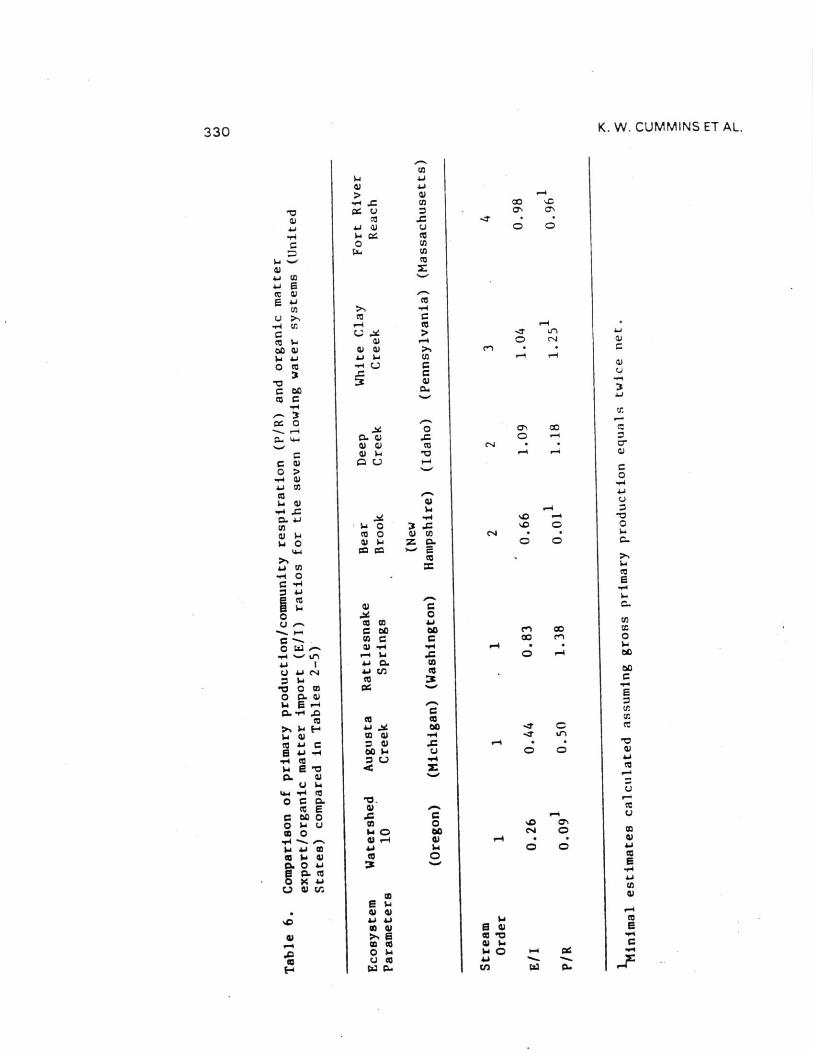
The ratio of export to import (E/I) and primary productionto community respiration (P/R) for the seven streams are comparedin Table 6. First-order streams (except Rattlesnake Springs) andsecond-order Bear Brook had P/R ratios less than one. Watershed10, Augusta Creek, and Bear Brook are all heavily shaded systemswith significant allochthonous inputs, and measured organicmatter export was two-thirds or less of imports in these streams.In Rattlesnake Springs, Deep Creek, and Fort River systems withP/R >1, and E/I near to or >1, the majority of POM particulateexport was derived from extensive beds of aquatic macrophytes.The seven study streams' relationships shown in Table 6 followthe prediction of Fisher and Likens (1973) that in systemshaving P/R < 1 (heterotrophic) imports exceed exports, when P/R > 1exports exceed imports, and they balance when P/R = 1 (see FortRiver, Table 4). However, the ratios given in Table 6 are onlyapproximate, because of problems in accurately measuring detritalexport and derivation of major budget items by difference, whichessentially makes them a function of export.
cnAm+ Ecc cuE 4-3
rl U)
al I-,0.0 CD
0 CO
G 0003 G
r4
CZ 0
P.., 4-1
CUO >
Ir W■••4
Joi
0) 1414 0
4.4
4.J tn
$.40.1
C2
4-Jc4
0
>",
C.;(1)
CV CD4.1
acCa.
C) 14G0 C-2
$-413
c2:3 cc
00
0G
0U 03 c0
C
$.4.I.•J
U 4J CV Jo) (i)CI3
0 CO CG0 G6 (1.1
ECh.
cdE-4 4•J
Ir CJ to 0)ct 4-e
4..)
"..700
ta.
03
t4-4U 1.4
cc0 G
ti E'V.
CZ 0 .00 $.4 u03 0 14 0
0)$.4 4.) 00 4.103 $.4 a)CI.aio
0 4-1a. 01
4-4
coE0) 41
■JJ 4.)03 41
Er-4 03
O03).4
CO U 03E-4 4244
cn
U,
tn
z./•■•
(1)Car
e•-■
00 s..OO'NCrN
OLn
t-4
.-4
1-4
C■1•
4_4
3
0 CCYN CO
t--4
CNI •
f-4 rmi
O
/•••• 4.J
1.1
.0to (NJ
0 C.4-
cp
G.
i.
cnCO
O
oCO
•v•-•1
1.4
U,00r•4 Lf1
•
zO C
000 cv
■CsCN
4))■••■ 0 0
3a)Z
00
00
U)cr;
r-••
E
r••■
C
330
K. W. CUMMINS ET AL.
ORGANIC MATTER BUDGETS FOR STREAM ECOSYSTEMS 331
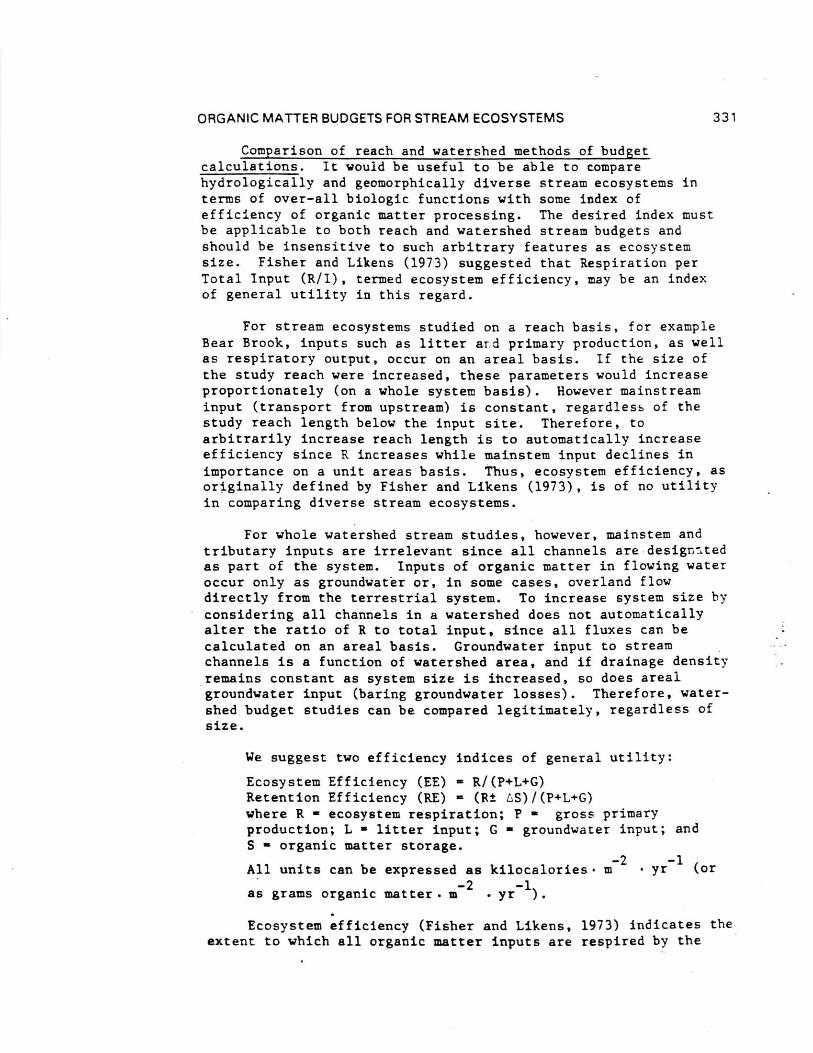
Comparison of reach and watershed methods of budget calculations. It would be useful to be able to comparehydrologically and geomorphically diverse stream ecosystems interms of over-all biologic functions with some index ofefficiency of organic matter processing. The desired index mustbe applicable to both reach and watershed stream budgets andshould be insensitive to such arbitrary features as ecosystemsize. Fisher and Likens (1973) suggested that Respiration perTotal Input (R/I), termed ecosystem efficiency, may be an indexof general utility in this regard.
For stream ecosystems studied on a reach basis, for exampleBear Brook, inputs such as litter ard primary production, as wellas respiratory output, occur on an areal basis. If the size ofthe study reach were increased, these parameters would increaseproportionately (on a whole system basis). However mainstreaminput (transport from upstream) is constant, regardless of thestudy reach length below the input site. Therefore, toarbitrarily increase reach length is to automatically increaseefficiency since R increases while mainstem input declines inimportance on a unit areas basis. Thus, ecosystem efficiency, asoriginally defined by Fisher and Likens (1973), is of no utilityin comparing diverse stream ecosystems.
For whole watershed stream studies, however, mainstem andtributary inputs are irrelevant since all channels are design-_Itedas part of the system. Inputs of organic matter in flowing wateroccur only as groundwater or, in some cases, overland flowdirectly from the terrestrial system. To increase system size byconsidering all channels in a watershed does not automaticallyalter the ratio of R to total input, since all fluxes can becalculated on an areal basis. Groundwater input to streamchannels is a function of watershed area, and if drainage densityremains constant as system size is increased, so does arealgroundwater input (baring groundwater losses). Therefore, water-shed budget studies can be compared legitimately, regardless ofsize.
We suggest two efficiency indices of general utility:
Ecosystem Efficiency (EE) = R/(P+L+G)Retention Efficiency (RE) = (R± LS)/(P+L+G)where R = ecosystem respiration; P = gross primaryproduction; L = litter input; G = groundwater input; andS = organic matter storage.
All units can be expressed as kilocalories.
as grams organic matter. m-2
yr-1
).
Ecosystem efficiency (Fisher and Likens, 1973) indicates theextent to which all organic matter inputs are respired by the
-2 -1 ,km • yr (or
332
K. W. CUMMINS ET AL.
system per unit time (e.g., annually). Retention efficiencyindicates the extent to which all inputs are either respired orstored and is the preferred general expression for handling nonsteady-state systems. At steady state, the expressions areequivalent, although the difference between fast processing andlow retention needs to be carefully distinguished.
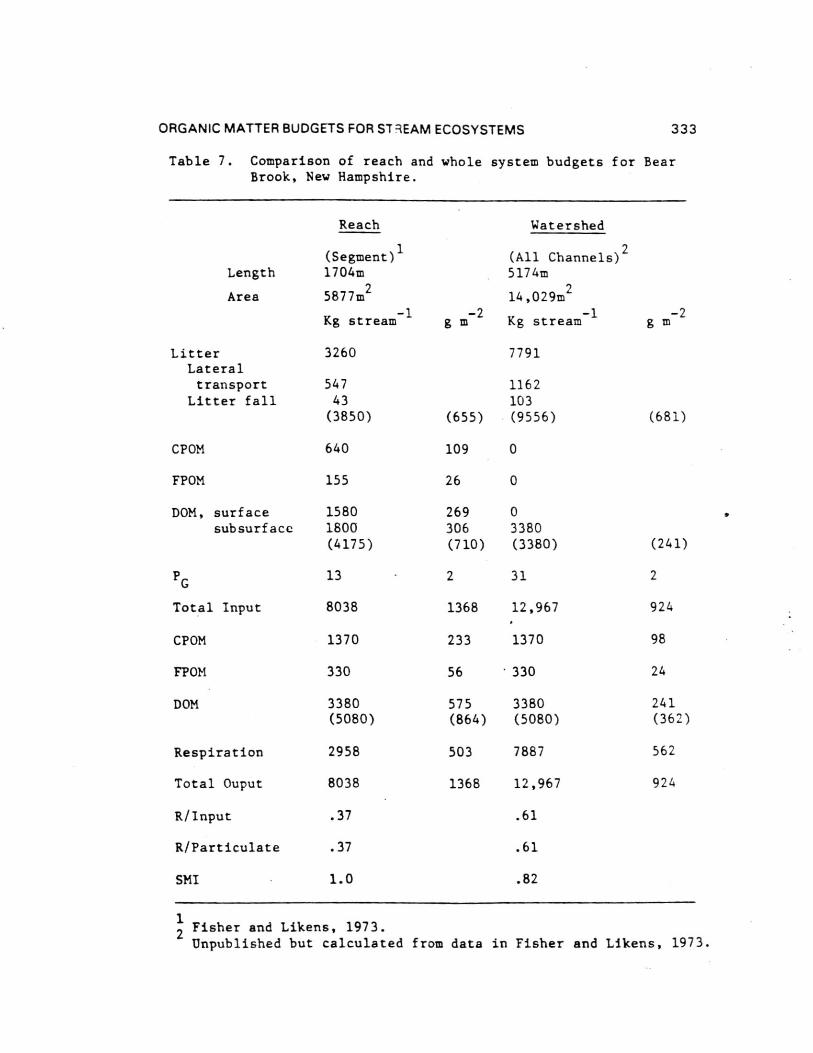
Bear Brook data can be converted to a watershed basis andcompared to Bear Brook reach data (Table 7). Since all channelsare now included, ecosystem area increases 2.4 fold as do allareal fluxes. Tributary and mainstem inputs become zero and DOM
input declines per m-2
. Ecosystem efficiency (EE) for Bear Brookas a watershed is then 0.61 as compared to 0.37 for Bear Brook asa reach ecosystem. The latter value is unique to the arbitrarilydefined reach studied and has no general applicability.
Ecosystem efficiency for the other apparently steady-statewatershed stream, Augusta Creek,. is 0.56. Rattlesnake Creek andWatershed 10 are not at steady state and must be described withRetention Efficiencies. RE's for these two systems are 0.22 and0.49 respectively compared to 0.56 and 0.61 for Augusta Creek andBear Brook.
These data suggest that for a variety of watershed streams(except Rattlesnake Creek), more than half of all inputs are
retained and/or processed to CO2 on an annual basis. If we
extend the model unaltered to the watersheds of large rivers, wewould predict that less than half of all organic matter inputs tostreams enter oceans. Realized retention efficiencies of largerivers may in fact be greater than those of small watershedstreams. For example, litter inputs decline per unit of channelarea in wider streams and primary production may not increasecompensatorily. Large rivers and small to mid-sized streams withhigh drainage density are quite difficult to treat directly aswatershed streams and have consequently been studied as streamreach ecosystems (e.g., Deep Creek, White Clay Creek, FortRiver). As previously stated, budget data for reaches cannot beused to compute EE and RE due to the problem of system size. Howthen might stream reaches be compared? Stream metabolism index(SMI; Fisher, 1977) can be used to compare stream reaches and isdefined as:
SMI (R t AS)/(P+L+T+M+G) - (Qf)(M)
Where T = organic matter input via tributaries; M = OrganicMatter input at mainstem upstream site; Q f = discharge at
mainstem output site/discharge at mainstem input site. Othervariables are as previously defined.
ORGANIC MATTER BUDGETS FOR STREAM ECOSYSTEMS 333
Table 7. Comparison of reach and whole system budgets for BearBrook, New Hampshire.
Reach Watershed
(Segment)1
(All Channels)2
Length 1704m 5174m
Area 5877m2
14,029m'2
Kg stream g m-2
Kg stream-1g m
-2
Litter 3260 7791Lateraltransport 547 1162
Litter fall 43 103(3850) (655) (9556) (681)
CPOM 640 109 0
FPOM 155 26 0
DOM, surface 1580 269 0subsurface 1800 306 3380
(4175) (710) (3380) (241)
PG
13 2 31 2
Total Input 8038 1368 12,967 924
CPOM 1370 233 1370 98
FPOM 330 56 330 24
DOM 3380 575 3380 241
(5080) (864) (5080) (362)
Respiration 2958 503 7887 562
Total Ouput 8038 1368 12,967 924
R/Input .37 .61
R/Particulate .37 .61
SMI 1.0 .82
2Unpublished but calculated from data in Fisher and Likens, 1973.
1Fisher and Likens, 1973.
334 K. W. CUMMINS ET AL.
As with EE and RE, SMI measures the efficiency ofrespiration or storage of some organic input. The denominator ofthe expression represents all inputs that enter the reach fromall sources less mainstem input (fluvial transport) corrected foraccrual of water through the reach. That is R t LS is judgedrelative to excess inputs which would otherwise cause organicmatter concentration to increase across the system. An increasein organic matter concentration in transport across the system istermed loading in this context, thus if SMI = 1.0, output waterwould have the same organic matter concentration as mainsteminput water, and the system would not load. If SMI <1.0, organicmatter concentration would increase across the system and if SMI >1.0, concentration would decline. The specified performancecriterion used here (zero loading) is admittedly arbitrary - thesystem may merely "hold its own" and prevent concentrationincreases linearly.
For watershed stream systems, SMI reduces as follows:
SMI = (R t LS) / P+L+0+0+G - (Qf)(M)
and, since M is analogous to G;SMI = (R t LS) / P+L+G) - (1.0)(G)SMI = (R LS) / P+L
Thus any watershed stream which respires or stores organicmatter equivalent to primary production and litter inputs willhave SMI = 1.0 and will export water with an organic matterconcentration equivalent to the DOM in groundwater. If SMI = 1.0all the way to the sea, organic matter concentration in waterentering estuaries will be equivalent to that in groundwaterentering headwater streams. In fact, SMI may vary widely fromheadwater to estuaries, being >1.0 in some regions (e.g., belowsites of organic enrichment) and <1.0 in others.
Reach SMI's were computed for Bear Brook and Fort Riversystems (Table 7). Bear Brook had an SMI of 1.0 while Fort RiverSMI = 0.66. If Fort River is assumed to be a steady-statesystem, respiration is only 66% of that required to preventloading. As estimated, Bear Brook does not load berAuse all"excess" inputs are respired.
Watershed stream SMI's for WS10 and Bear Brook are 0.62 and0.82 respectively, although WS10 exhibits an almost two-foldrange in two consecutive years (Table 7). Both systems load, in
that SMI <1.0. Loading in watershed streams occurs asgroundwater containing only DOM rapidly picks up more DOM (Kaplanet al., 1980) and POM via litter inputs. Thus, we might expectthat loading is the general rule in headwater systems as aconsequence of the SMI as defined.
ORGANIC MATTER BUDGETS FOR STREAM ECOSYSTEMS 335
While all three efficiencies described here are legitimateindices for comparing different streams on a watershed basis, allare sensitive to discharge and accompanying fluvial transport oforganic matter. In the two years' of budget data availa5le forWS10 in Oregon, inputs were low in the relatively dry water year1973, ,1S was high, anc RE was 0.73 (Table 7). In wet water year1974, input was higher, yet respiration remained constant and REdropped to 0.34. Retention efficiency was thus generally aninverse function of discharge which in turn increased total inputand LS was negative. Yet in both years, was positive. Duringyears with unusually high discharges we can envisage a negative!IS that exceeds respiration. Under those conditions, RE would benegative. In steady-state systems increased discharge lowers REsimply by increasing organic matter input at (presumably)constant R. SMI behaves similarly in both watershed and reachsystems even though the absolute values are different. Atrelatively constant R, increased discharge lowers SMI, thus thesystem loads to a greater extent during wet than during dryyears. For WS10, SMI's for dry and wet years are 0.84 and 0.46,respectively.
In summary, we see that while the efficiency indicesproposed here are conceptually sound and can be applied to allwatershed stream ecosystems, only SMI can be applied to reachsystems. To date, no satisfactory analogue of RE suitable foruse on reach systems, has been devised, and thus reach andwatershed stream systems cannot be compared in this regard. Moreimportantly perhaps, all efficiency indices are highly sensitiveto fluctuations in discharge and decomposition rate of organicmatter. Because we have shown that discharge exhibits great yearto year variation, efficiency values of whatever type, are oflittle utility when based on data from a single year. Not onlyis discharge a critical variable shaping ' seasonal and even dielpatterns in efficiency, but several other factors also greatlyinfluence efficiency on a short-term basis. Temperature,cumulative degree days, insolation, litter input, primaryproduction, and the heterotrophic-autotrophic status ofcommunities, among other variables, shown much greater variationof diel or seasonal periods than from year to year. Allinfluence efficiency. Thus the annual organic budget at bestrepresents a temporal compromise which is too short for revealingstream function on the time scale of geomorphic change and toolong for elucidating biologic control of critical processes.
Whole Basin Budgets by Stream Order
As discussed above, quantification of organic budgets hasmost frequently involved inputs and outputs from entire small(first order) watersheds (e.g., Fisher and Likens, 1973; Sedellet al., 1974) and occasionally from discrete reaches (e.g.,
336 K. W. CUMMINS ET AL.
Fisher, 1977). The River Continuum Concept visualizes thestream-river as a continuum of nutrient turnover processes andpopulation assemblages which are predictably adapted to the mostprobable physical state of a river system along its drainagenetwork (Vannote et al., 1980).
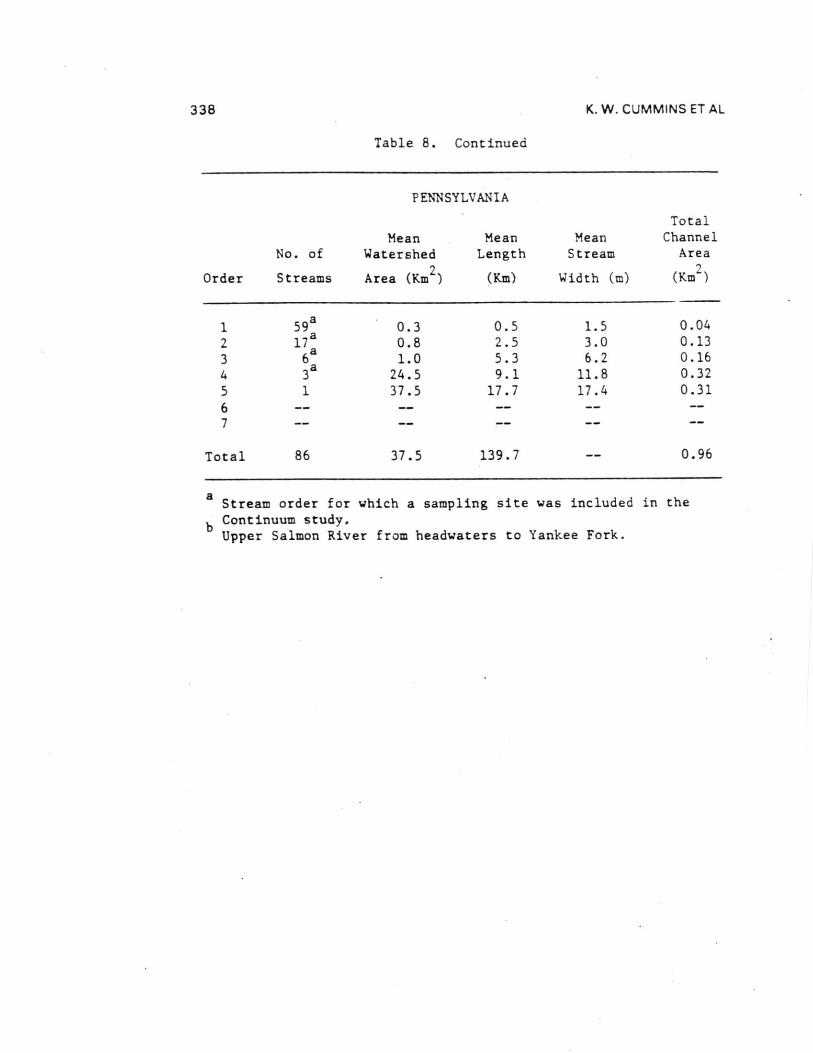
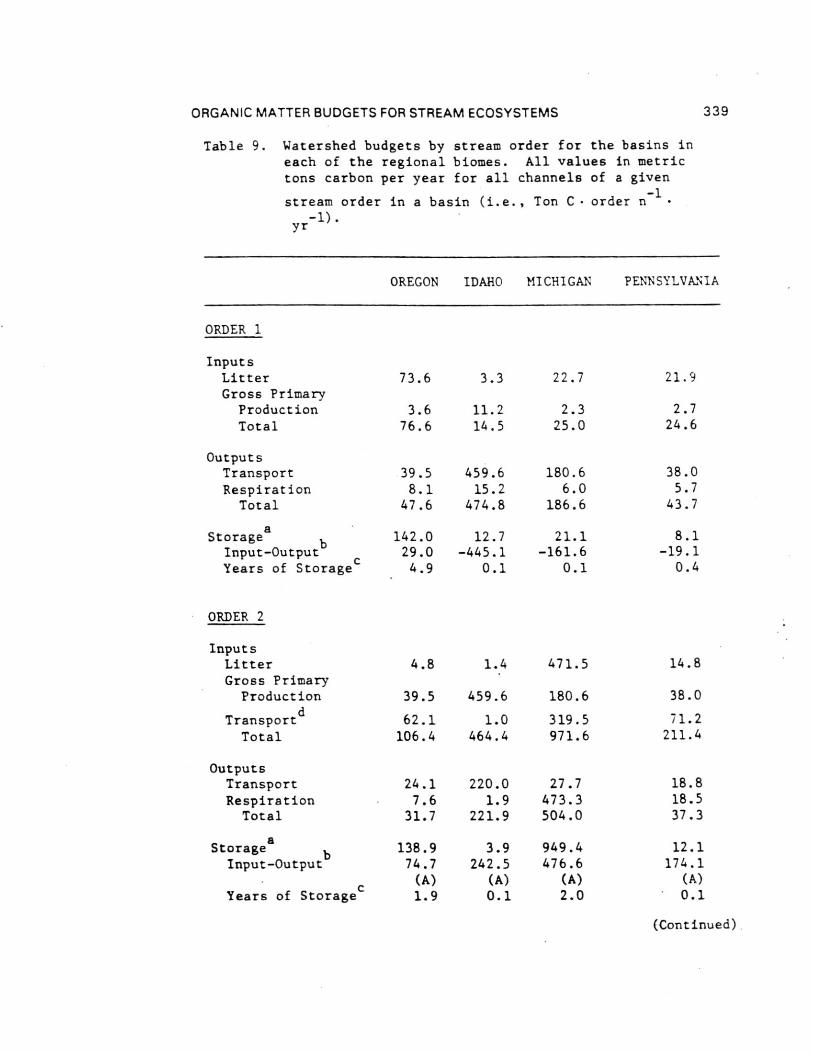
Comparisons of the four different biome stream-river systemsstudied by the River Continuum Group were made by estimatingannual organic carbon budgets. Seasonal terrestrial input,primary production, respiration, storage, and transport data fromthe 16 sample sites were calculated by stream order using basingeomorphic and hydrologic characteristics (Table 8 and 9). Theannual carbon budget gives a first approximation of absolutecarbon fluxes for all channels of a given order in each basin.By comparing the inputs (litter, gross primary production, and[non-flood event] transport to order n from n-1) to outputs(respiration and transport) and the difference between them toPOM storage (except large wood), each basin was evaluated withrespect to changes in carbon storage as to general aggrading(storing organic carbon) or degrading (exporting) condition.Storage divided by the excess of inputs or outputs provides anestimate of the number of years of storage for the given outputrate (Table 9) - that is, given the current loss/accumulationrate, the number of years required to remove/accumulate thepresent storage pool. About 60% of the 23 (by order) systemsshowed a pattern of aggradation with outputs less than inputs.
Headwater Oregon-streams (orders 1 and 2) and all Michiganstreams (except first-order) were characterized by large amountsof storage (Table 9). All other stream orders in all four biomesappeared to be quite active - either rapidly degrading oraggrading with estimated periods for accrual or loss of existingstorage of less than two years ( < 0.1 to 1.7). Only one of the23 order-systems (Oregon fifth order) was evaluated as beingclose to equilibrium (inputs-outputs = 5.6 Ton C). In all butone case (Idaho second order), the difference between inputs andoutputs was about an order of magnitude (11 cases) or less (11cases) than storage. At the basin level, all systems exceptOregon (due to large sixth and seventh order export) appear to beaggrading. Storage in Michigan streams larger than order 1 wasdominated by massive amounts of FPOM, representing between about2 and 13 years accrual at measured input-output rates.
Inclusion of large wood (generally >10 cm diameters) in thewhole basin estimates changes the input-output balanceconsiderably. Excluding wood-dominated Oregon streams, allbasins were estimated to be aggrading with enough storage toaccount for between 1 and 14 years of accrual at existinginput-output rates. By contrast, about 60 years would berequired to remove coarse wood in the Oregon basin.
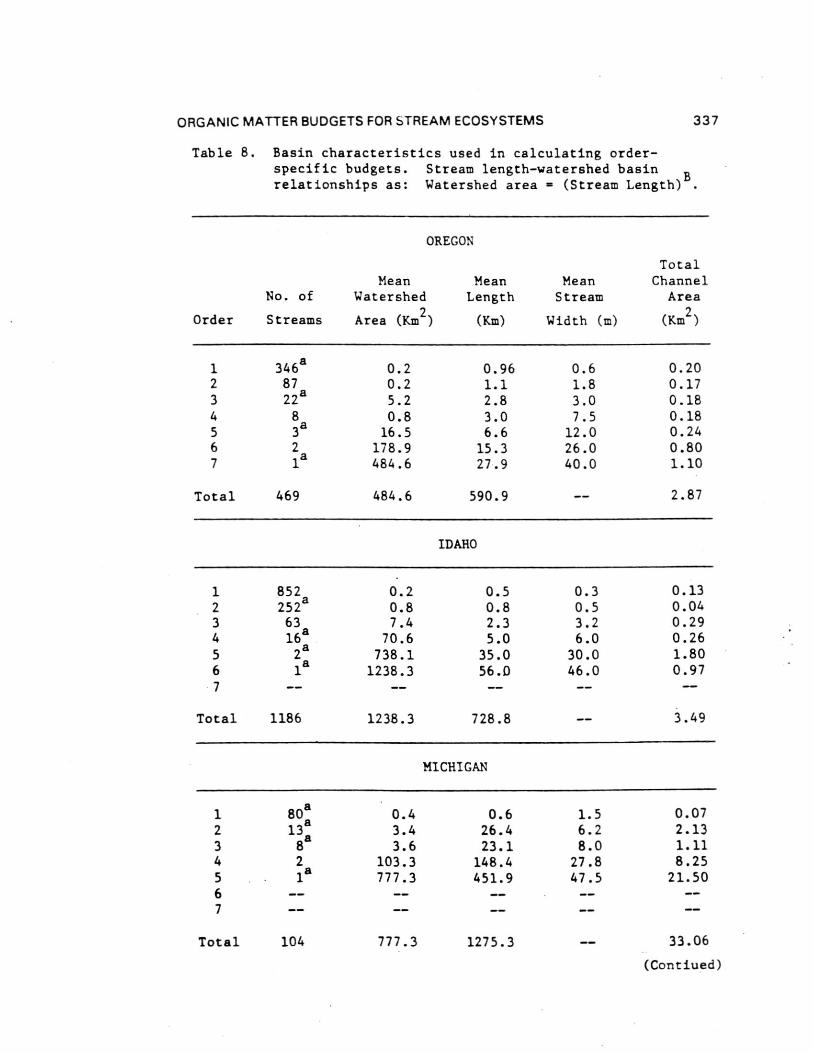
ORGANIC MATTER BUDGETS FOR STREAM ECOSYSTEMS 337
Table 8. Basin characteristics used in calculating order-specific budgets. Stream length-watershed basin Brelationships as: Watershed area = (Stream Length) B.
OREGON
Order
No. of
Streams
Mean MeanWatershed Length
Area (Km2
) (Km)
MeanStream
Width (m)
TotalChannel
Area
(Km2
)
1234567
346a8722a83a
2la
0.2 0.96
0.2 1.1
5.2 2.8
0.8 3.0
16.5 6.6
178.9 15.3
484.6 27.9
0.61.83.07.5
12.026.040.0
0.200.170.180.180.240.801.10
Total 469 484.6 590.9 2.87
IDAHO
1 852 0.2 0.5 0.3 0.132 252a 0.8 0.8 0.5 0.043 63 7.4 2.3 3.2 0.294 16a 70.6 5.0 6.0 0.265
a2 738.1 35.0 30.0 1.80
6 1a
1238.3 56.0 46.0 0.977
Total 1186 1238.3 728.8 3.49
MICHIGAN
1 808 0.4 0.6 1.5 0.072 13
a3.4 26.4 6.2 2.13
3 8 8 3.6 23.1 8.0 1.114 2 103.3 148.4 27.8 8.255 1
a777.3 451.9 47.5 21.50
67
Total 104 777.3 1275.3 33.06
(Contiued)
338 K. W. CUMMINS ET AL
Table 8. Continued
PENNSYLVANIA
TotalMean Mean Mean Channel
No. of Watershed Length Stream Area
Order Streams Area (Km2
) (Km) Width (m) (Km2
)
159a
0.3 0.5 1.5 0.04
2 17a 0.8 2.5 3.0 0.13
34
6aa
31.0
24.55.39.1
6.211.8
0.160.32
5 1 37.5 17.7 17.4 0.31
67
Total 86 37.5 139.7 0.96
aStream order for which a sampling site was included in the
b Continuum study.Upper Salmon River from headwaters to Yankee Fork.
ORGANIC MATTER BUDGETS FOR STREAM ECOSYSTEMS 339
Table 9. Watershed budgets by stream order for the basins ineach of the regional biomes. All values in metrictons carbon per year for all channels of a given
stream order in a basin (i.e., Ton C- order n-1
•-1).
yr
OREGON IDAHO MICHIGAN PENNSYLVANIA
ORDER 1
InputsLitter 73.6 3.3 22.7 21.9Gross Primary
Production 3.6 11.2 2.3 2.7Total 76.6 14.5 25.0 24.6
OutputsTransport 39.5 459.6 180.6 38.0Respiration 8.1 15.2 6.0 5.7
Total 47.6 474.8 186.6 43.7
Storagea
142.0 12.7 21.1 8.1Input-Output
b29.0 -445.1 -161.6 -19.1
Years of Storage 4.9 0.1 0.1 0.4
ORDER 2
InputsLitter 4.8 1.4 471.5 14.8Gross Primary
Production 39.5 459.6 180.6 38.0
Transportd
62.1 1.0 319.5 71.2Total 106.4 464.4 971.6 211.4
OutputsTransport 24.1 220.0 27.7 18.8Respiration 7.6 1.9 473.3 18.5
Total 31.7 221.9 504.0 37.3
Storagea
bInput-Output
138.974.7
3.9242.5
949.4476.6
12.1174.1
(A) (A) (A) (A)Years of Storagec 1.9 0.1 2.0 0.1
(Continued)
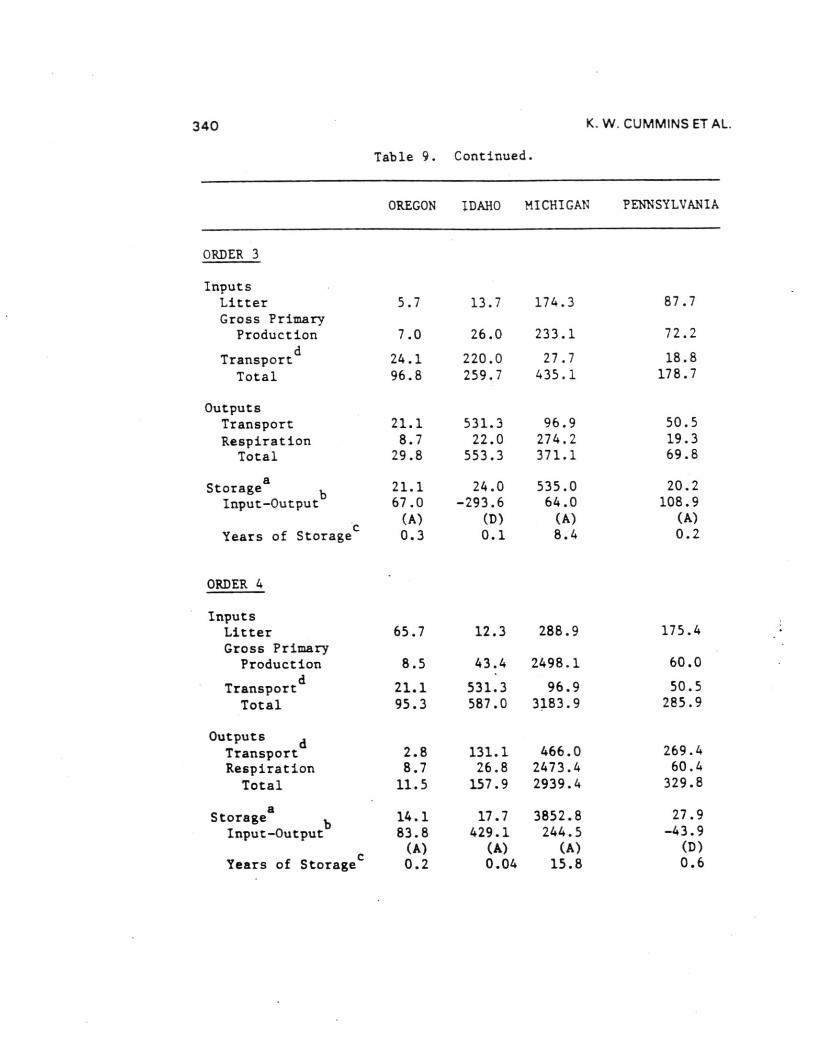
340 K. W. CUMMINS ET AL.
Table 9. Continued.
OREGON IDAHO MICHIGAN PENNSYLVANIA
ORDER 3
InputsLitter 5.7 13.7 174.3 87.7Gross Primary
Production 7.0 26.0 233.1 72.2
Transportd
24.1 220.0 27.7 18.8
Total 96.8 259.7 435.1 178.7
OutputsTransport 21.1 531.3 96.9 50.5
Respiration 8.7 22.0 274.2 19.3Total 29.8 553.3 371.1 69.8
Storage s bInput-Output
21.167.0
24.0-293.6
535.064.0
20.2108.9
(A) (D) (A) (A)
Years of Storage s 0.3 0.1 8.4 0.2
ORDER 4
InputsLitter 65.7 12.3 288.9 175.4
Gross PrimaryProduction 8.5 43.4 2498.1 60.0
Transportd
21.1 531.3 96.9 50.5
Total 95.3 587.0 3183.9 285.9
OutputsTransport
d2.8 131.1 466.0 269.4
Respiration 8.7 26.8 2473.4 60.4
Total 11.5 157.9 2939.4 329.8
Storagea
bInput-Output
14.183.8
17.7429.1
3852.8244.5
27.9-43.9
(A) (A) (A) (D)Years of Storage s 0.2 0.04 15.8 0.6
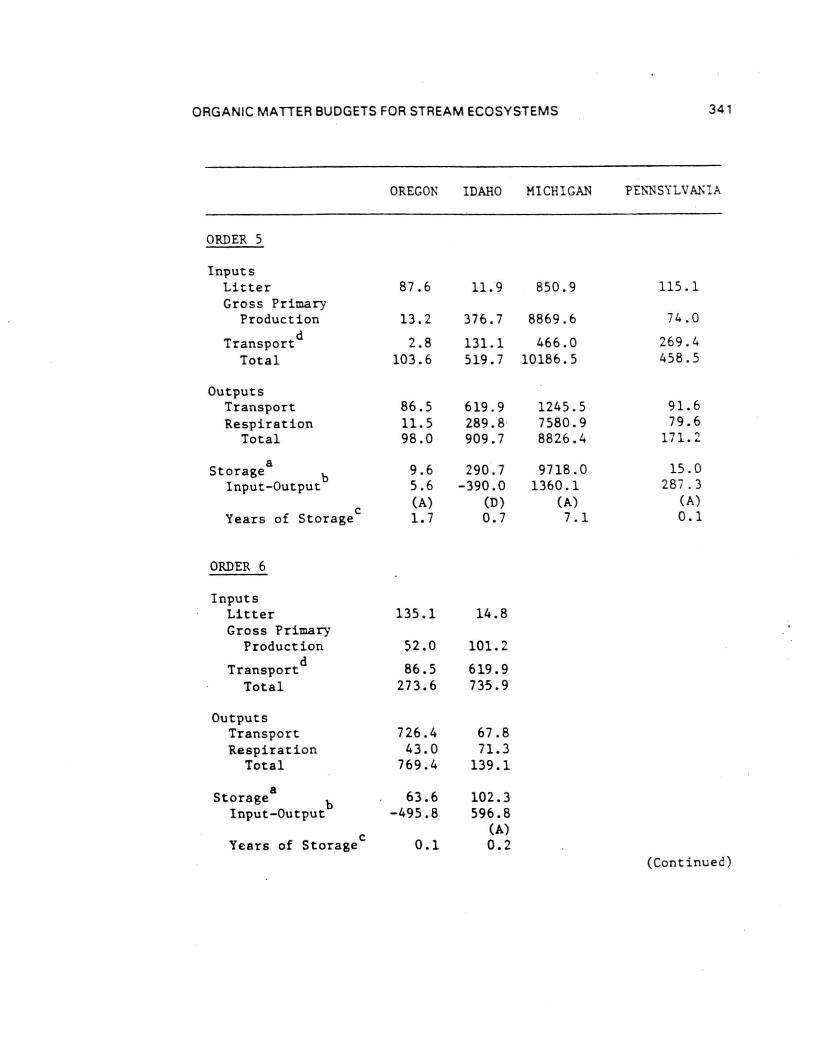
ORGANIC MATTER BUDGETS FOR STREAM ECOSYSTEMS 341
OREGON IDAHO MICHIGAN PENNSYLVANIA
ORDER 5
InputsLitter 87.6 11.9 850.9 115.1Gross Primary
Production 13.2 376.7 8869.6 74.0
Transportd
2.8 131.1 466.0 269.4
Total 103.6 519.7 10186.5 458.5
OutputsTransport 86.5 619.9 1245.5 91.6Respiration 11.5 289.8 7580.9 79.6
Total 98.0 909.7 8826.4 171.2
Storage bInput-Output
9.65.6
290.7-390.0
9718.01360.1
15.0287.3
(A) (D) (A) (A)Years of Storage
c1.7 0.7 7.1 0.1
ORDER 6
InputsLitter 135.1 14.8Gross Primary
Production 52.0 101.2
Transportd 86.5 619.9Total 273.6 735.9
OutputsTransport 726.4 67.8Respiration 43.0 71.3
Total 769.4 139.1
Storageb
Input-Output63.6
-495.8102.3596.8
(A)Years of Storagec 0.1 0.2
(Continued)
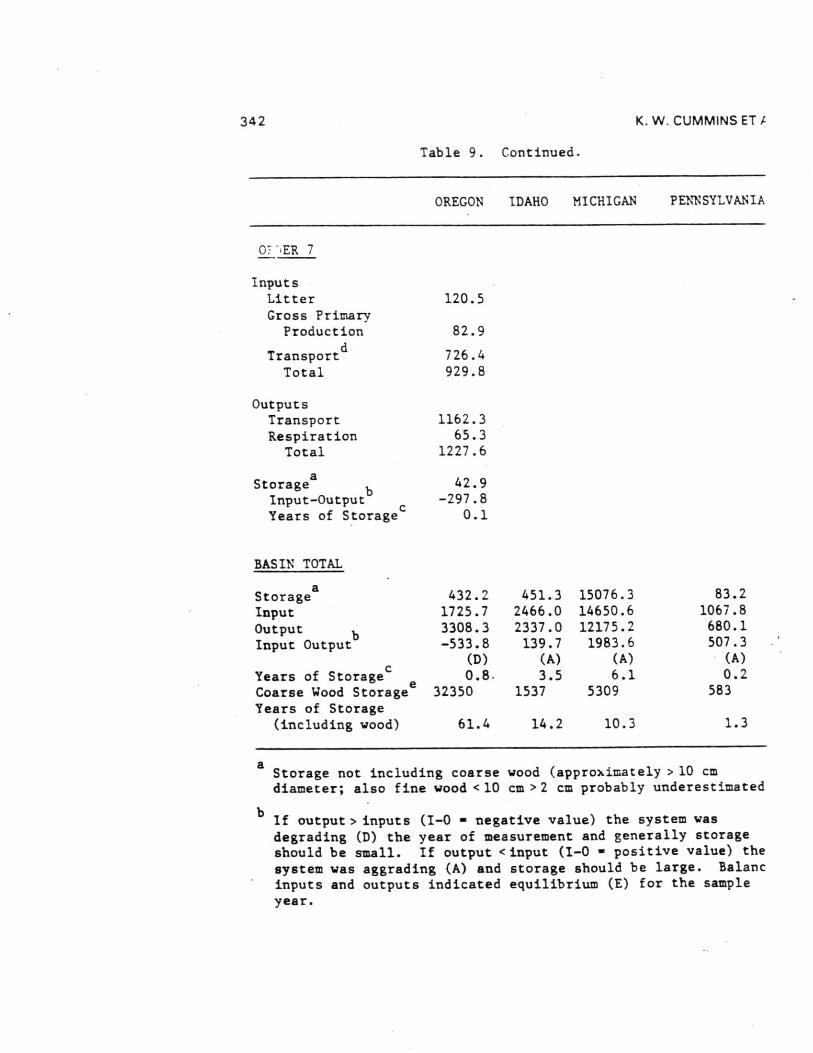
342 K. W. CUMMINS ET
Table 9. Continued.
OREGON IDAHO MICHIGAN PENNSYLVANIA
07 -, ER 7
InputsLitter 120.5Gross Primary
Production 82.9
Transportd
726.4Total 929.8
OutputsTransport 1162.3Respiration 65.3
Total 1227.6
Storagea
b42.9
Input-Output -297.8Years of Storage c0.1
BASIN TOTAL
Storagea
432.2 451.3 15076.3 83.2
Input 1725.7 2466.0 14650.6 1067.8
Output b3308.3 2337.0 12175.2 680.1
Input Output -533.8 139.7 1983.6 507.3(D) (A) (A) (A)
Years of Storagec
0.8. 3.5 6.1 0.2
Coarse Wood Storagee
32350 1537 5309 583
Years of Storage(including wood) 61.4 14.2 10.3 1.3
aStorage not including coarse wood (approximately > 10 cmdiameter; also fine wood <10 cm >2 cm probably underestimated
b If output> inputs (I-0 = negative value) the system wasdegrading (D) the year of measurement and generally storageshould be small. If output <input (I-0 = positive value) thesystem was aggrading (A) and storage should be large. Balancinputs and outputs indicated equilibrium (E) for the sampleyear.
ORGANIC MATTER BUDGETS FOR STREAM ECOSYSTEMS 343
When inputs (I) exceed outputs (0) (1-0) = positive) the yearsof storage entry indicates length of time that would berequired to accumulate the observed storage at the calculatedaggradation rate. When outputs exceed inputs (I-0) =negative) the years of storage entry indicates length oftime that would be required to remove observed storage at thecalculated degradation rate.
d This assumes that all transport measured in stream order n-1is input for stream order n.
e Coarse wood approximately >10 cm volumes estimated byseparate inventories. Annual coarse wood export from basinassumed = O.
ECOSYSTEM COMPARISONS
Despite the problems in calculating stream budget-derivedefficiencies, lotic researchers (e.g., Fisher and Likens, 1973;Bormann et al., 1974; Bormann and Likens, 1979) have joinedsystem ecologists in making efficiency calculations (Reichle,1975; Reichle et al., 1975; Webster et al., 1975; O'Neill et al.,1975). The importance of allochthonous inputs and theunidirectional flow of running waters make comparisons of streamswith terrestrial and lentic systems difficult, although steepsloping terrestrial systems also exhibit unidirectional "flow".Streams are not mere conduits which export terrestrial productsfrom watersheds, but, as with other systems, are physicallyretentive and biologically active. Organic matter and inorganicnutrients are partially cycled within a given reach of stream orriver with some portion being released to the reach below orretained in storage (Elwood et al., 1982; Minshall et al., 1983;Newbold et al., 1982). If the terrestrial community throughwhich a stream flows accumulates organic matter over long periodsof time, the stream should behave in a generally similar fashion,although specific processing rates and storage capacities woulddiffer.
If comparisons of lotic with terrestrial ecosystems are madeon the basis of net ecosystem production (NEP; Reichle, 1975;Reichle et al., 1975), particulate and dissolved organic matterinputs (I) must be included in the stream calculations. Thecomparative relationships would be (Batzli, 1974):
Terrestrial NEP = GPP - RE
Stream (aquatic) NEP [GPP + - [RE + El =
344 K. W. CUMMINS ET AL.
where GPP = gross primary production, RE = ecosystem respiration,
E s organic matter exports, and AS change in storage poolsBased on measurements made on WS10, net ecosystem production canbe calculated as:
NEP = (90 + 3612) - (1053 + 1651) = 988 Kcal m-2
yr-1
(mean of actual measurement of AS II 806 Kcal m-2 yr-1)
If ecosystem productivity is calculated as NEP divided by GPP + I(Reichle, 1975; Reichle et al., 1975), the value is 0.27 forWS10, higher than for various terrestrial communities (0.05 -0.24 [Reichle et al., 1975]) and in the range for lakes (0.30 -0.53, calculated from Wissmar, unpublished data, University ofWashington). However, given the uncertainties of budgetmeasurements in streams, particularly temporal and spatialvariations in storage, the calculation of such ecosystemparameters will require very extensive data sets. Also, therange of values through the drainage net (Vannote et al., 1980)would predictably cover at least as wide a range as terrestrialsystems, particularly since stream system differences arecompounded by varying degrees of terrestrial (riparian)influence. Nevertheless, when adequate data permit it, withinand between ecosystem comparisons of material balance budgetsshould provide useful insights into system function.
DISCUSSION
As pointed out initially, a primary objective of streamorganic budget assessments has been the determination ofecosystem functional properties, which would allow comparisonswithin and between biomes. Because of the temporal and spatialproblems inherent in material balance budgets for organic matterin streams, the results can be ambiguous and misleading. Forexample, budgets constructed primarily from export data are morea feature of physical retention characteristics than biologicalfunction. Therefore, present budget-derived perceptions ofstream ecosystem efficiency are dependent on storage and exportphenomena which tend to obscure the significance of biologicalprocesses. Since organic matter budgets for streams have beenused in the calculation in efficiencies employed in ecosystemcomparisons, the conclusions resulting from such comparisons mustbe evaluated carefully.
The basic problem with existing organic budgets is that thesteady state, or dynamic equilibrium, that is the range overwhich the parameters fluctuate, is not time invariant (Botkin andSobel, 1975) for running water systems. Depending upon the timeframe of reference, flood events of different magnitude can be
ORGANIC MATTER BUDGETS FOR STREAM ECOSYSTEMS 345
variously considered as perturbations that displace streams fromstable trajectories or as fundamental ecos y stem features and,therefore, within the boundary conditions (i.e., variance) of thetrajectory. Major components of lotic ecosystems, such asorganic storage, are largely dependent on the timing andmagnitude of discharge events, and periodic adjustments in thesize of the organic storage pool are features of the system, notperturbations (e.g., Dawson, 1980). Since any definition of asteady state or dynamic equilibrium condition for streamecosystems is highly time dependent, so are the boundaryconditions for "normal stability." Therefore, the concepts of asystem's resistance to, and resilience after, a change (Websteret al., 1975, this volume), for example in storage, must be sonarrowly defined for a given running water system that theirgeneral usefulness may be significantly reduced.
As we have shown, existing material balance budgets forstreams reflect physical transport and storage characteristics toa much greater extent than the metabolic properties of the streamecosystem. The large majority of materials are exported duringflows which occur for less than ten percent of the time. Sinceflows vary from year to year, time dependent budgets are notuseful unless they have been constructed over a long period(possibly ten years or more). While organic budgets have beenuseful in showing the retentive capacity of streams to be fairlyefficient, the separation of the metabolic properties of theecosystem from the physical hydraulic ones has yet to be done.Flood transported organic-particulate matter is seldom quantifiednor is the rate of decomposition of the material estimated. Forexample, the origin of major exports from a watershed (or basin)may be from outside the channel or in other deep storage poolsthat are characterized by minimal biological activity. Also, thepassage of the material may be so rapid as to precludesignificant biological response.
A flow—dependent analysis is available (e.g., Sedell et al.,1978) which might prove useful in characterizing organictransport between reaches and allow for the interpretation of thevariability between geomorphic setting and hydrologic regime. Anadditional advantage is that one runoff season would besufficient if representative flows are monitored. Since thesediment and water moving through a stream channel are theprimary independent variables influencing channel morphology,quantitative relations have been established between water andsediment and all aspects of channel morphology such as dimension,shape, gradient, and pattern have been related to streamdischarge. The ability of water to do work, or stream energy,combined with a measure of reach retention might serve as asuitable common denominator for comparing differences in organic
346 K. W. CUMMINS ET AL.
transport and storage characteristics between streams (Minshallet al., 1983).
Geomorphologists and hydrologists (Leopold et al., 1968;Pfankuch, 1975) have shown a relationship between stream energyand the size of suspended and bedload inorganic materialtransported by streams. Stream power, defined in terms ofdischarge, percent channel slope, and density (or mass) of waterper unit channel width (Leopold and Langbein, 1962; Langbein andLeopold, 1964; Leopold et al., 1968), seems to be a logical unitfor comparing streams of different sizes. However, the powerexpression needs to be scaled with a roughness term to accountfor a stream's retention characteristics prior to plottingagainst biological parameters (e.g., primary production). Someempirically derived scaling system for retention is badly needed(see Minshall et al., 1983 for possible approaches).
Further evaluation of ecosystem properties will come withimproved understanding of storage dynamics. Input-outputdynamics of the storage pools in aquatic ecosystems need to beexamined in terms of 1) the frequency and magnitude of eventswhich reset the quantity and composition of material in storage,2) the relationship between the source of exported material, itsmovement through a system and the stream biological response time(for example, if material that was rarely or ever in the channelis moved through and out of a watershed at a rate that does notallow for significant biological activity (Meyer and Likens,1979), its inclusion in biologically oriented budget calculationsis not warranted and 3) the more continuous, low level leakage inand out of a storage compartment between major turnover events,and the internal processing dynamics of each storage pool shouldbe evaluated in relation to temperature, substrate quality,conditioning (microbial colonization and metabolism of theorganic substrates), and oxygen environment.
CONCLUSIONS
Many of the problems with organic matter budgets discussedin this paper suggest that the field of stream ecology will notbenefit from the development of budgets for numerous systemsbased on short-term (1-2 yr) records and in which some keyparameters are determined by difference. Small-scale researchprograms should focus on comparisons of selected processesbetween diverse stream ecosystems rather than attempt todetermine whole system budgets. What is needed is thedetermination of total stream ecosystem budgets at a few selectedsites where existing long-term data sets can be continued andaugmented by improved monitoring of storage dynamics.
ORGANIC MATTER BUDGETS FOR STREAM ECOSYSTEMS 347
These studies should view the system on scales appropriateto system behavior. For example, log dynamics must be viewed onthe time-scale of decades and centuries, but this does not meanthat the studies themselves must be of this duration. Usingdendrochronologic and mapping methods, it is possible toreconstruct histories of debris inputs to, and catastrophicexport from, streams for periods up to more than a centruy(Sigafoos, 1964; Swanson et al., 1976). Improved understandingof storage dynamics will arise from other types of studies notcommonly a part of budget development. Such studies includelong-term monitoring of decomposition by repeated sampling ofmarked organic materials placed on the stream bed and in thesediment. There is also a particular need for study of theeffects of flood on the storage and biota in streams. Streamecologists need to be opportunistic and prepared to respond toinfrequent episodic events.
Floods, large debris in streams, and major changes instorage are elements of fluvial geomorphology. It is geomorphicprocesses and features which establish the physical template onwhich stream biology is developed and maintained. Futureprogress in stream ecosystem analysis will be dependent in largemeasure on the ability of stream ecologists to incorporateunderstanding of physical and historical processes into models oflotic ecosystem behavior and functioning.
ACKNOWLEDGMENTS
This paper was first written in 1976. Most of the ideaswere not new at that time and certainly stemmed from eachauthor's interactions with other groups and projects as well astheir own research. Since then, the paper has gone through manyversions and revisions and was widely circulated. Others raveintegrated their concepts with ours and presented elsewhere someaspects of the problems treated here. However, we believe now,as we did in 1976, that the paper integrates a variety ofperspectives addressing problem areas in stream ecosystem energybudget work and constitutes a useful contribution.
Original data collection and concept development reported inthis paper were supported by the following research grants:River Continuum Project (NSF BMS-75-07333 and DEB-7811671); U.S.Department of Energy contracts DE AT06-79-EV1004 andAT(45-1)-1830; Coniferous Biome (NSF 7602656); Desert Biome (NSFGB-15886). River Continuum Contribution No. 22; Technical PaperNo. 0000 Oregon Agricultural Experiment Station.
We wish to thank S. V. Gregory, J. Van Sickle, J. L. Meyer,L. Kaplan, J. D. Hall and R. J. Neiman for their reviews of themanuscript.
348 K. W. CUMMINS ET AL.
REFERENCES
Anderson, N.H., J.R. Sedell, L.M. Roberts and F.J. Triska. 1978.The role of aquatic invertebrates in processing wood debrisin coniferous forest streams. Am. Midl. Nat. 100:64-82.
Anderson, N.H. and J.R. Sedell. 1979. Detritus processing bymacroinvertebrates in stream ecosystems. Ann. Rev. Ent.24:351-357.
Batzli, G.O. 1974. Production, assimilation and accumulation oforganic matter in ecosystems. J. Theor. Biol. 45:205-4:17.
Bilby, R.E. 1981. Role of organic debris dams in regulating theexport of dissolved and particulate matter from a forestedwatershed. Ecology 62:1234-1243.
Bilby, R.E. and G.E. likens. 1979. Effects of hydrologicfluctuations on the transport of fine particulate organiccarbon in a small stream. Limnol. Oceanogr. 24:69-75.
Bilby, R.E. and G.E. Likens. 1980. Importance of organic debrisdams in the structure and function of stream ecosystems.Ecology 61:1107-1113.
Boling, R.H., E.D. Goodman, J.0. Zimmer, K.W. Cummins, R.C.Petersen, J.A. Van Sickle, and S.R. Reice. 1975a. Toward amodel of detritus processing in a woodland stream. Ecology.56:141-151.
Boling, R.H., R.C. Petersen, and K.W. Cummins. 1975b. Ecosystemmodeling for small woodland streams, pp. 183-204. In: B.C.Patten (ed.), Systems analysis and simulation in ecology.Vol. 3 Academic Press, NY. 601 pp.
Bormann, F.H., G.E. Likens, and J.S. Eaton. 1969. Bioticregulation of particulate and solution losses from a forestecosystem. BioScience 19:600-610.
Bormann, F.H., G.E. Likens, T.G. Siccama, R.S. Pierce, and J.S.Eaton. 1974. The export of nutrients and recovery ofstable conditions following deforestation at Hubbard Brook.Ecol. Monogr. 44:255-277.
Bormann, F.H. and G.E. Likens. 1979. Pattern and process in aterrestrial ecosystem. Springer-Verlag, N.Y. 253 pp.
Botkin, D.B. and M.J. Sobel. 1975. Stability in time-varyingecosystems. Amer. Nat. 109:625-646.
Brinson, M.M. 1976. Organic matter losses from four watershedsin the humid tropics. Limnol. Oceanogr. 21:572-582.
Campbell, A.G. and J.F. Franklin. 1979. Riparian vegetation inOregon's western Cascade Mountains: composition, biomassand autumn phenology. U.S. Int. Biol. Prog. Conif. ForestBiome. Bull. 14, 90 pp.
Coleman, M.J. and H.B.N. Hynes. 1970. The vertical distributionof the invertebrate fauna in the bed of a stream. Limnol.Oceanogr. 15:31-40.
Crisp, D.T. and S. Robson. 1979. Some effects of discharge onthe transport of animals and peat in a north Pennineheadstream. J. Appl. Ecol. 16:721-736.
ORGANIC MATTER BUDGETS FOR STREAM ECOSYSTEMS 349
Cummins, K.W. 1974. Stream ecosystem structure and function.BioScience 24:631-641.
Cummins, K.W. 1975. The ecology of running waters; theory andpractice. Proc. Sandusky River Basin Symp. Int. JointCommission on Great Lakes, p. 277-293.
Cummins, K.W. 1977. From headwater streams to rivers. Am.Biol. Teacher 39:305-312.
Cummins, K.W. and J.C. Wuycheck. 1971. Caloric equivalents forinvestigations in ecological energetics. Mitt. Int. Verein.Limnol. 18:1-158.
Cummins, K.W., M.J. Klug, G.M. Ward, G.L. Spengler, R.W. Speaker,R.W. Ovink, D.C. Mahan and R.C. Petersen. 1981. Trends inparticulate organic matter fluxes, community processes andmacroinvertebrate functional groups along a Great Lakes drainagebasin river continuum. Verh. Int. Verein. Limnol.21:841-849.
Cushing, C.E. and E.G. Wolf. 1962. Organic energy budget ofRattlesnake Springs, Washington. Amer. Midl. Nat.107:404-407.
Dawson, F.H. 1980. The origin, composition, and downstreamtransport of plant material in a small chalk stream.Freshwat. Biol. 10:419-435.
Dowdy, D.R. and N.C. Matalas. 1969. Analysis of variance,covariance, and time series, pp. 8-78 - 8-90. In: V.T.Chow (ed.), Handbook of applied hydrology. McGraw-Hill Co.,New York.
Elwood, J.W., J.D. Newbold, R.V. O'Neill and W. Van Winkle.1983. Resource spiraling: an operational paradigm foranalyzing lotic ecosystems. In: T.D. Fontaine and S.M.Bartell (eds.), The dynamics of lotic ecosystems. Ann ArborScience, Ann Arbor, Michigan (in press).
Fahey, T.J. 1979. Changes in nutrient content of snow waterduring outflow from a Rocky Mountain coniferous forest.Oikos 32:422-428.
Fisher, S.G. 1977. Organic matter processing by astream-segment ecosystem: Fort River, Massachusetts, U.S.A.Int. Rev. ges. Hydrobiol. 62:701-727.
Fisher, S.G. and G.E. Likens. 1972. Stream ecosystem: organicenergy budget. Bioscience 22:33-35.
Fisher, S.G. and G.E. Likens. 1973. Energy flow in Bear Brook,New Hampshire: an integrative approach to stream ecosystemmetabolism. Ecol. Monogr. 43:421-439:
Froehlich, H.A. 1973. Natural and man-caused slash in headwaterstreams. Loggers Handbook. 638 pp.
Gosz, J.R., G.E. Likens, and F.H. Bormann. 1972. Nutrientcontent of litter-fall on the Hubbard Brook ExperimentalForest, New Hampshire. Ecology. 53:769-784.
350 K. W. CUM
Gurtz, M.E., J.R. Webster, and J.B. Wallace. 1980. Sestcdynamics in southern Appalachian streams: effects o:clearcutting. Can. J. Fish. Aquat. Sci. 37:624-631.
Hall, C.A.S. 1972. Migration and metabolism in a temper.stream ecosystem. Ecology 53:585-604.
Hobbie, J.E. and G.E. Likens. 1973. The output of phospdissolved organic carbon, and fine particulate carboHubbard Brook watersheds. Limnol. Oceanogr. 18:734-
Hynes, H.B.N. 1963. Imported organic matter and secondaproductivity in streams. Proc. 14 Int. Congr. Zool.3:324-329.
Hynes, H.B.N. 1970. The ecology of running waters. UniToronto Press. 555 pp.
Hynes, H.B.N. 1974. Further studies on the distributionstream animals in the substratum. Limnol. Oceanogr.19:92-99.
Hynes, H.B.N. 1975. The stream and its valley. Verh.Verein. Limnol. 19:1-15.
Hynes, H.B.N., D.D. Williams, and N.E. Williams. 1976.Distribution of the benthos within the substratum ofmountain stream. Oikos 27:307-310.
Johnson, P.L. and W.T. Swank. 1973. Studies of cation tin the southern Appalachians on four experimentalwith contrasting vegetation. Ecology 54:70-80.
Keller, E.A. and F.J. Swanson. 1979. Effects of large c
material on channel form and fluvial processes. Ea:Surface Processes 4:361-380.
Langbein, W-.B. and L.B. Leopold. 1964. Quasi-equilibriain channel morphology. Am. J. Sci. 262:782-794.
Leopold, L.B., M.G. Wolman, and J.R. Miller. 1968. Flu-processes in geomorphology. W.H. Freeman, San Fran622 pp.
Leopold, L.B. and T. Maddock, Jr. 1953. The hydraulicof stream channels and some physiographic implicatiU.S. Geol. Surv. Prof. Paper 252. 57 pp.
Leopold, L.B. and W.B. Langbein. 1962. The concept ofin landscape evolution. U.S. Geol. Surv. Prof. Pap20 pp.
Maddock, T., Jr. 1976. A primer on flood plain dynamicSoil Wat. Cons. 31:44-47.
Mann, K.H. 1975. Patterns of energy flow, pp. 248-263.B.A. Whitton (ed.), River ecology. Blackwell Sci.Oxford. 694 pp.
Megahan, W.F. and R.A. Nowlin. 1976. Sediment storagechannels draining small forested watersheds in theof central Idaho, pp. 4-115 - 4-126. In: Proc. TFFederal Inter-Agency Sedimentation Conference. Der.Colorado. PB-245.
ORGANIC MATTER BUDGETS FOR STREAM ECOSYSTEMS 351
Merritt, R.W. and D.L. Lawson. 1979. Leaf litter processing inflood plain and stream communities, pp. 93-105. In:R.R. Johnson and F.J. McCormick (eds.), Strategies forprotection and management of flood plain wetlands and otherriparian ecosystems. Proc. Symp. Forest Serv. U.S.D.A. Gen.Techn. Rept. WO-12.
Meyer, J.L. and G.E. Likens. 1979. Transport and transformationof phosphorous in a forest stream ecosystem. Ecology60:1255-1269.
Minshall, G.W. 1978. Autotrophy in stream ecosystems.BioScience 28:767-771.
Minshall, G.W., R.C. Petersen, K.W. Cummins, T.L. Bott, J.R.Sedell, C.E. Cushing, and R.L. Vannote. 1983. Interbiomecomparisons of stream ecosystem dynamics. Ecol. Monogr.53:1-25.
Moring, J.R. and R.L. Lantz. 1975. The Alsea Watershed Study:Effects of logging on the aquatic resources of threeheadwater streams of the Alsea River, Oregon. FisheryResearch Report No. 9, Oregon Dept. of Fish and Wildlife,Corvallis, Oregon.
Morisawa, M. 1968. Streams: their dynamics and morphology.McGraw-Hill, N.Y. 175 p.
Mulholland, P.R. 1981. Organic carbon flow in a swamp-streamecosystem. Ecol. Monogr. 51:307-322.
Mulholland, P.R. and E.J. Kuenzler. 1979. Organic carbon exportfrom upland and forested wetland watersheds. Limnol.Oceanogr. 24:960-966.
Naiman, R.J. and J.R. Sedell. 1979a. Characterization ofparticulate organic matter transported by some CascadeMountain streams. J. Fish. Res. Bd, Can. 36:17-31.
Naiman, R.J. and J.R. Sedell. 1979b. Benthic organic matter asa function of stream order in Oregon. Arch. Hydrobiol.87:404-422.
Nelson, D.J. and D.C. Scott. 1962. Role of detritus in theproductivity of a rock outcrop community of a Piedmontstream. Limnol. Oceanogr. 7:396-413.
Newbold, J.D., P.I. Mulholland, J.W. Elwood, and R.V. O'Neill.1982a. Organic carbon spiralling in stream ecosystems.Oikos 38:266-272.
Newbold, J.D., R.V. O'Neill, J.W. Elwood, and W.1982b. Nutrient spiralling in streams: implicationsnutrient limitation and invertebrate120:628-652.
Odum, H.T. 1957a. Trophic structure and productivity of SilverSprings, Florida. Ecol. Monogr. 27:55-112.
Odum, H.T. 1957b. Primary production measurements in elevenFlorida springs and a marine turtle-grass community.Limnol. Oceanogr. 2:85-97.
Olson, J.S. 1963. Energy storage and the balance
Van Winkle.for
activity. Amer. Natur.
of producersand decomposers in ecological systems. Ecology 44:322-331.
352 K. W. CUMMINS ET AL.
O'Neill, R.V., W.F. Harris, B.S. Ausmus, and D.E. ReIchle. 1975.A theoretical basis for ecosystem analysis with partcularreference to element cycling, pp. 28-40. In: F.G. Howell,H.B. Gentry, and M.H. Smith (eds.), Mineral cycling insouthwestern ecosystems. E.R.D.A. Symposium Series,Washington, D.C. (Conf. 74-0531).
Paustian, S.J. and R.L. Bestcha. 1979. The suspended sedimentregime of an Oregon Coast Range stream. Wat. Res. Bull.15:144-154.
Petersen, R.C. and K.W. Cummins. 1974. Leaf processing in awoodland stream. Freshwat. Biol. 4:343-368.
Pfankuch, D.J. 1975. Stream reach inventory and channelstability evaluation. Publ. U.S. Dept. of AgricSer., Northern Region (RI-75-002). 26 pp.
Reichle, D.E. 1975. Advances in ecosystem analysis.25:257-264.
Reichle, D.E., R.V. O'Neill, and W.F. Harris. 1975.
. Forest
BioScience
Principlesof energy and material exchange in ecosystems, pp. 27-43.In: W.H. van Dobben and R.H. Lowe-Connell (eds.), Unifyingconcepts in ecology. Dr. W. Junk, The Hague. 320 pp.
Ross, H.H. 1963. Stream communities and terrestrial biomes.Arch. Hydrobiol. 59:235-242.
Schlesinger, W.H. and J.M. Melack. 1981. Transport of organiccarbon in the world's rivers. Tellus 33:172-187.
Schumm, S.A. and R.W. Lichty. 1965. Time, space, and causalityin geomorphology. Am. J. Sci. 263:110-119.
Schumm, S.A., M.P. Mosley, and G.L. Zimpfer. 1975. Unsteadystate denudation. Science 191:871.
Sedell, J.R., F.J. Triska, J.D. Hall, and N.H. Anderson. 1974.Sources and fates of organic inputs in coniferous foreststreams, pp. 57-69. In: R.H. Waring and R.L. Edmonds(eds.), Integrated Research in the Coniferous Forest Biome,Bull. 5. Coniferous Forest Biome, U.S. I.B.P. 78 pp.
Sedell, J.R., R.J. Naiman, K.W. CUmmins, G.W. Minshall, and R.L.Vannote. 1978. Transport of particulate organic matter instreams as a function of physical processes. Verh. Int.Verein. 20:1366-1375.
Sigafoos, R.S. 1964. Botanical evidence of floods andflood-plain deposition. U.S. Geol. Surv. Prof. Paper 485(a):1-35.
Strahler, A.N. 1957. Quantitative analysis of watershedgeomorphology. Am. Geophys. Union. Trans. 38:913-920.
Suberkropp, K.F., M.J. Klug, and K.W. Cummins. 1975. Communityprocessing of leaf litter in woodland streams. Verh. Int.Verein. Limnol. 19:1653-1658.
Swank, W.T. and J.E. Douglas. 1975. Nutrient flux inundisturbed and manipulated forest ecosystems in thesouthern Appalachian mountains. Publ. Assoc. Internat. Sci.Hydrol. Symp. Tokyo (Dec. 1975) 177:445-456.
ORGANIC MATTER BUDGETS FOR STREAM ECOSYSTEMS 353
Swanson, F.J. and C.T. Dyrness. 1975. Impact of clearcuttingand road construction on soil erosion by landslides in thewestern Cascade Range, Oregon. Geology 3:393-396.
Swanson, F.J. and G.W. Lienkaemper. 1978. Physical consequencesof large organic debris in Pacific Northwest streams. USDAForest Seri;. Gen. Techn. Rept. PNW-69. 12 pp.
Teal, J.M. 1957. Community metabolism in a temperate coldspring. Ecol. Mongr. 27:283-302.
Tilly, L.J. 1968. Structure and dynamics of Cone Spring. Ecol.Monogr. 38:169-197.
Trimble, S.W. 1975. Denudation studies: Can we assume streamsteady state? Science 188:1207-1208.
Triska, F.J. and K. Cromack. 1979. The role of wood debris inforests and streams, pp. 171-198. In: R.H. Waring (ed.),Forests: fresh perspectives from ecosystem analysis.Oregon State Univ. Press, Corvallis. 198 pp.
Vannote, R.L., G.W. Minshall, K.W. Cummins, J.R. Sedell and C.E.Cushing. 1980. The river continuum concept. Can. J. Fish.Aquat. Sci. 37:130-137.
Wallace, J.B., D.H. Ross, and J.L. Meyer. 1982. Seston anddissolved organic matter dynamics in a southern Appalachianstream. Ecology 62:824-838.
Waring, R.H. (ed.). 1980. Forests: fresh perspectives formecosystem analysis. Oregon State Univ. Press. 198 pp.
Webster, J.R. and B.C. Patten. 1979. Effects of watershedperturbation on stream potassium and calcium dynamics.Ecol. Monogr. 19:51-72.
Webster, J.R., J.B. Waide, B.C. Patten. 1975. Nutrientrecycling and the stability of ecosystems, pp. 1-27. In:F.G. Howell, J.B. Gentry, and M.H. Smith (eds.), Mineralcycling in southeastern ecosystems. E.R.D.A. SymposiumSeries, Washington, D.C. (Conf. 74-9531).
Welton, J.S. 1980. Dynamics of sediment and organic detritus ina small chalk stream. Arch. Hydrobiol. 90:162-181.
Wetzel, R.G., P.H. Rich, M.G. Miller, and H.L. Allen. 1972.Metabolism of dissolved and particulate detrital carbon in atemperate hardwater lake. Mem. Ist. Ital. Idrobiol. 29(Suppl.):185-243.
Whitfield, P.H. and H. Schreier. 1981. Hysteresis inrelationships between discharge and water chemistry in theFraser River basin, British Columbia. Limnol. Oceanogr.26:1179-1182.
Whitton, B.A. (ed.). 1975. River ecology. Blackwell Sci.Publ., Oxford. 694 pp.
Wolman, M..G. and J.P. Miller. 1960. Magnitude and frequency offorces in geomorphic processes. J. Geol. 68:54-74.
Library of Congress Cataloging in Publication Data
Plenary Symposium on the Testing of General Ecolo g ical Theory in Lotic Ecosystems(198): Provo, Utah)Stream ecology.
"Based on the proceedings of the Plenary Symposium on the Testing of GeneralEcological Theory in Lotic Ecosystems held in conjunction with the 29th annualmeeting of the North American Benthological Society, April 28, 1981, Provo, Utah."
Includes index.Bibliography: p.1. Stream ecology—Congresses. I. Barnes, James R. II. Minshall, G. Wayne. III.
North American Benthological Society. IV. Title.QH541.5.S7P55 1981 574.5'26323 83-11145ISBN 0-306-41460-0
Based on the proceedings of the Plenary Symposium on the Testing of GeneralEcological Theory in Lotic Ecosystems held in conjunction with the 29th annualmeeting of the North American Benthological Society, April 28, 1981, Provo, Ltar.
1983 Plenum Press, New YorkA Division of Plenum Publishing Corporation233 Spring Street, New York, N.Y. 10013
All rights reserved
No part of this book may be reproduced, stored in a retrieval system, or transmittedin any form or by any means, electronic, mechanical. photocopying, microfilming,recording, or otherwise, without written permission from the Publisher
Printed in the United States of America