Individual variations in habitat use and morphology in brook charr

Sustainability of Water Quality and Ecology xxx (2013) xxx–xxx
Contents lists available at ScienceDirect
Sustainability of Water Quality and Ecology
journal homepage: www.elsevier .com/locate /swaqe
A Mid Atlantic brook trout (Salvelinus fontinalis) stream sustainabilitystatistic for rating non-tidal streams
Albert K. Smith a,⇑, Dann Sklarew b,1
a Landscapes and Aquatics, 10714 Pine Street, Fairfax, VA 22030, United Statesb David King Hall, Room 3050, George Mason University, 4400 University Dr., MSN 5F2, Fairfax, VA 22030-4444, United States
a r t i c l e i n f o
Article history:Received 21 January 2013Received in revised form 24 July 2013Accepted 6 August 2013Available online xxxx
Keywords:Environmental assessmentSalvelinus fontinalisSmith–Sklarew equationsSustainability statistic (S)Sustainable populationsBKTI
2212-6139/$ - see front matter � 2013 Elsevier B.Vhttp://dx.doi.org/10.1016/j.swaqe.2013.08.001
⇑ Corresponding author. Tel.: +1 571 228 7247; faE-mail addresses: [email protected] (A
1 Tel.: +1 703 993 2012; fax: +1 703 993 1066.
Please cite this article in press as: Smith, A.K., Srating non-tidal streams. Sustain. Water Qual
a b s t r a c t
Due to the decline of Mid Atlantic brook trout populations coupled with diminishing bud-gets of relevant natural resource agencies who monitor the populations, a quick and costeffective assessment of brook trout streams or potential brook trout streams in the Mid-Atlantic United States is warranted. Using five core metrics – two watershed metrics (per-cent land use in agriculture and distance to the nearest road from the survey site) and threein-stream metrics (riffle/run quality, dissolved oxygen content and water temperature), aclassification model has been developed, useful as preliminary indication as to a stream’ssuitability to sustain brook trout populations. Developed via discriminant analysis usingMaryland Department of Natural Resources’ historical stream data, two classification equa-tions (Smith–Sklarew equations) can be simplified into one equation, which produces asustainability statistic (S). Should the five field measurements from the metrics producea positive ‘‘S’’ value at a given site, then the stream reach most likely favors conditions suit-able for sustainable brook trout populations. Conversely, negative ‘‘S’’ values indicate lessthan adequate conditions for sustainable brook trout populations.
� 2013 Elsevier B.V. All rights reserved.
1. Introduction
Native eastern brook trout (Salvelinus fontinalis) populations are declining in their native range in the Eastern UnitedStates (EBTJV, 2007). The species is the only indigenous trout within the region. Sensitive to degrading environmental con-ditions or rapidly altering habitat, brook trout appear to be ideal bioindicators of headwater biodiversity in coolwater water-sheds of the Eastern United States (Stranko et al., 2008). Meyer et al. (2007) reveal the deep importance of headwaters inprotection of biodiversity. This is where the terrestrial/aquatic interface is most active. Headwaters act as great buffers be-tween land and water while also providing critical habitat for a variety of biota, both plant and animal.
Brook trout are endemic to the eastern portion of the United States and Canada. The natural range for brook trout consistsof the cool and cold water rivers and streams of the eastern portions of North America. Fig. 1 shows the historical range ofbrook trout, including a 50 km buffer around the range. Today, many of the historic populations are threatened by environ-mental degradation, mostly of anthropogenic origin (Hudy et al., 2008). Only 5% of the original brook trout populations in theUnited States, all of which are in Maine, remain at or near their historic numbers. Upon examination of Fig. 2, it appears theremay be a relation between threatened brook trout populations and latitude with the southern latitudes showing the mostthreatened populations. Fig. 2 also reveals the severity of fragmentation between populations compared to the historicalrange of the species. Increased human activity (e.g., farming, timber harvesting, residential development) in the Eastern
. All rights reserved.
x: +1 703 993 1066..K. Smith), [email protected] (D. Sklarew).
klarew, D. A Mid Atlantic brook trout (Salvelinus fontinalis) stream sustainability statistic for. Ecol (2013), http://dx.doi.org/10.1016/j.swaqe.2013.08.001

Fig. 1. Historical US range of brook trout (Hudy et al., 2008).
2 A.K. Smith, D. Sklarew / Sustainability of Water Quality and Ecology xxx (2013) xxx–xxx
United States provides for various and numerous stressors to brook trout populations. Data from the US Census Bureau indi-cate an increase of approximately 90 million people from 1800 to 1900 (Census Bureau, 2002) within the historic range ofthe brook trout. Unlike the 20th century, most of the population expansion during the 19th century was in rural and outlyingareas where forests were cut and farming developed (Dale et al., 2000). The very presence of brook trout in the streamsserves as an indicator of a healthy stream system while declining populations may indicate declining health of the streamecosystem (EBTJV, 2007). Evidence for such measures of sensitivity is revealed in Fig. 2 which shows intact populations ofbrook trout are largely in sparsely populated rural areas or on federal lands, both which incur relatively little impact fromhuman activity. Declining brook trout populations have been attributed to several anthropogenic origins. Hartman andHakala (2006) suggest fine sediment loading from logging practices could be the main detriment to brook trout recruitment.Fine sediments (<0.063 mm) decrease stream biodiversity by smothering eggs and larval brook trout thereby depriving themof oxygen. It is also suggested these fine sediments alter stream biodiversity by covering the habitat necessary for manymacroinvertebrate species. Hartman and Hakala (2006) conclude sediment loading may be the most important factor deter-mining stream health. Furthermore, Utz and Hartman (2007) indicate brook trout survival is largely dependent on terrestrialinsect abundance. Baldigo et al. (2005) report high mortality rates of brook trout in streams where poor timber harvestmethods practiced near riparian zones result in increased siltation and surface water temperatures.
Healthy brook trout trophy fisheries exist in Maine and Canada where brook trout can attain large size and survive formany years (EBTJV, 2007). For various reasons, brook trout are often forced out of their natural range in most of the EasternUnited States and resort to survival in headwater streams with limited nutrient resources (EBTJV, 2007). Brook trout 51 cmlong were caught in Western Maryland streams in the 1800s (Maryland, 2006). The loss of growth potential can be attributedto inability to access food sources in second order and higher streams due to the presence of non-indigenous species, such assmallmouth bass, which may prey on brook trout and non-indigenous trout which outcompete brook trout for forage andspawning locations (EBTJV, 2007). Consequently, brook trout are forced into the headwaters where they are isolated fromother populations of brook trout. The pockets of isolation contribute to fragmented gene pools within the species. The inabil-ity to maintain genetic diversity within a species has been reported as one of the first stages of extinction (Wilcox and Mur-phy, 1985).
Please cite this article in press as: Smith, A.K., Sklarew, D. A Mid Atlantic brook trout (Salvelinus fontinalis) stream sustainability statistic forrating non-tidal streams. Sustain. Water Qual. Ecol (2013), http://dx.doi.org/10.1016/j.swaqe.2013.08.001

Fig. 2. Distribution of brook trout status classifications in subwatersheds throughout the species’ Eastern US range (EBTJV, 2007).
A.K. Smith, D. Sklarew / Sustainability of Water Quality and Ecology xxx (2013) xxx–xxx 3
1.1. Analysis of factors affecting brook trout biodiversity
Habera and Moore (2005) described the severity of brook trout fragmentation in its southern range. Their findings indi-cate brook trout have been forced into the headwaters of most rivers and streams due to competition from exotic species,primarily rainbow trout (Oncorhynchus mykiss) and brown trout (Salmo trutta) and for need of cooler water found at higheraltitudes. The geographical isolation of the trout decreases genetic diversity within the overall trout population, a significantcomplication in species preservation (Lande, 1995). Isolated populations may later be subjected to an extreme environmen-tal condition (e.g. drought, heat wave, landslide) and have no exit potential and would have no remote replacement popu-lation in which they could recruit more fish.
Although exotic species may outcompete brook trout, many agree poor land management is the primary threat to healthybrook trout populations (EBTJV, 2007; Stranko et al., 2008; Hudy et al., 2008). Primarily, improper land use by agriculture hasa compounding effect on sustainable brook trout populations. The Mid-Atlantic region (MD, VA and WV) and the southernrange of the brook trout appear to be most affected by poor agriculture practices while northeast brook trout are largely sub-jected to sedimentation and temperature elevation, both from poor land management (EBTJV, 2007). Unabated livestock useof streams and rivers has a compounding deleterious impact on brook trout habitat. Grazing on the stream banks can lead to
Please cite this article in press as: Smith, A.K., Sklarew, D. A Mid Atlantic brook trout (Salvelinus fontinalis) stream sustainability statistic forrating non-tidal streams. Sustain. Water Qual. Ecol (2013), http://dx.doi.org/10.1016/j.swaqe.2013.08.001

4 A.K. Smith, D. Sklarew / Sustainability of Water Quality and Ecology xxx (2013) xxx–xxx
erosion and sediment loading. Livestock grazing will also prevent or impair the growth of riparian vegetation. Overhangingvegetation decreases solar radiation from heating up the water while also providing terrestrial insects as a food source fortrout (Utz et al., 2010). Additionally, livestock wading in streams alters substrate, potentially displacing aquatic insects anddamaging spawning beds. The overall impact of agriculture on brook trout populations is apparent in a study by Hudy et al.(2008).
While rainbow trout and brown trout are relatively tolerant to perturbations in water quality, (browns and rainbowscompeting in the Mid-Atlantic are not really an issue in brook trout conservation), sustainable brook trout populations re-quire excellent water quality, especially low water temperatures. Higher water temperatures appear to increase metabolism.Trout restricted to smaller headwater tributaries, with limited food sources, are largely malnourished, especially in warmerwater environments (Utz and Hartman, 2007).
1.2. Methods for assessing brook trout habitat
A trout stream assessment tool that has been utilized for over three decades was first developed by Binns and Eiserman(1979) for the Wyoming Game and Fish Department. Binns and Eiserman’s model effectively combines habitat characteris-tics in one overall management assessment tool. The Binns and Eiserman model was later refined and evolved into the Wyo-ming Habitat Assessment Methodology (WHAM) (Quist et al., 2006). WHAM incorporates 11 different water quality andhabitat metrics in a multilinear regression model. The model was specifically designed to aid resource managers in their at-tempts to predict trout standing crop in Wyoming streams. The model was gradually modified through the years to include athree prong approach, including separate assessments. Level I of the assessment focuses on watershed characteristics. LevelII focuses on in-stream water quality and habitat parameters at the stream reach and channel-unit scales. Finally, Level IIIprovides a mechanism where managers can incorporate consideration for site-specific parameters into the decision makingprocess. Such unusual considerations may include bridges, dams, Native American land, waterfalls, etc. (Quist et al., 2006).
WHAM’s effectiveness as an assessment tool is evident due to it enduring nature–still in use for over three decades. A toolsimilar to WHAM may enhance brook trout resource management in the Eastern United States in efforts to conserve thespecies.
In developing WHAM, Binns and Eiserman (1979) chose 22 field attributes to sample, all which characterized fluvial hab-itat for trout. Of the 22, only 11 were significantly correlated with trout standing crop (correlation coefficients greater than0.20). Table 1 outlines, in part, the 11 habitat criteria and minimum rating characteristics for each. In the Mid-Atlantic region,the Maryland Department of Natural Resources lists flow fluctuation, maximum water temperature, bank erosion and ripar-ian cover as apparent habitat attributes impacting brook trout populations (Maryland, 2006, 2009).
In 1982, Raleigh (Raleigh, 1982) developed a brook trout stream index for the US Fish and Wildlife Service. The modelincorporates various in-stream water quality measurements as indicators for the model. The model lacks statisticaljustification for many of the chosen metrics; however, its simplicity provides for a user-friendly field tool. Conversely, theConservation Success Index (CSI) developed by Williams et al. (2007) for the Eastern Brook Trout Joint Venture (EBTJV) is
Table 1Stream habitat attributes used in the Habitat Quality Index. ‘‘R’’ values are from multiple regression analyses in relation to trout standing crop (Binns andEiserman, 1979).
Attribute Symbol R Rating characteristics
0 (worst) 1
Late summer stream flow X1 0.36 Inadequate to support trout(CPF < 10% ADF)
Very limited: potential for trout support is sporadic (CPF10–15% ADF)
Annual stream flow variation X2 0.80 Intermittent stream Extreme fluctuation, but seldom dry; base flow verylimited
Maximum summer streamtemperature (C)
X3 0.28 <6 or >26.4 6–8 or 24.2–26.3
Nitrate nitrogen (mg/l) X4 0.69 <0.01 or >2.0 0.01–0.04 or 0.91–2.0Fish food abundance (number/0.1
m2)X5 0.57 <25 26–99
Fish food diversity (Dg)a X6 0.57 <0.80 0.80–1.19Cover (%)b X7 0.55 < 10 10–25Eroding banks (%)c X8 0.45 75–100 50–74Substrate X9 0.44 SAV lacking Little SAVWater velocity (m3/s)d X10 0.38 <8 or >122 8–15.4 or 106.6–122Stream width (m) X11 0.38 <0.6 or >46 0.6–2.0 or 23–46
a For the purpose of the Habitat Quality Index, Diversity Score (Dg) is defined as follows: Dg = antilog10 D, where D is calculated for each taxon from theformula: D = Pilog10Pi. When Pi is defined as 1/N and N is the number of organisms, then the formula reduces to D = log10N. D is the mean of all D values forthe sample.
b %Cover = total amount of cover (m2)/total area in study section (m2).c %Eroding banks = total length (m) of eroding stream banks (both sides) in section/total length (m) (one side) of study section.d Time-of-travel water velocity, determined with fluorescent dye. Velocity = thalweg length/time required for dye to traverse section.
Please cite this article in press as: Smith, A.K., Sklarew, D. A Mid Atlantic brook trout (Salvelinus fontinalis) stream sustainability statistic forrating non-tidal streams. Sustain. Water Qual. Ecol (2013), http://dx.doi.org/10.1016/j.swaqe.2013.08.001

A.K. Smith, D. Sklarew / Sustainability of Water Quality and Ecology xxx (2013) xxx–xxx 5
quite extensive, time consuming, costly and not very user-friendly. A positive attribute of the model is its incorporation ofwatershed characteristics into the scoring (rating) system within the index.
An index similar to the CSI was recently developed to specifically focus on brook trout population sustainability (Smithand Sklarew, 2012). The index’s rating (BKTI) provides resource managers with a systematic method to evaluate all potentialsubwatersheds and not just those presently harboring trout. Such a tool is especially useful for volunteer and citizen actiongroups who lack the necessary scientific expertise to gauge a stream’s ability to sustain brook trout populations. The index isalso useful in targeting specific problems in a given watershed thereby providing direction for restoration efforts. Althoughspecific to brook trout, the same methods in developing the index could easily be modified to target other species, both floraand fauna. The initial step in developing the BKTI focused on identifying a few key environmental metrics effective in mea-suring the quality of potential brook trout habitat. Multivariate discriminant analysis provided a method where environmen-tal metrics were utilized in a classification model derived from two separate classification linear regression equations, oneequation for each environmental condition in question (Fisher, 1936). The classification model simply provided a rapid indi-cation whether or not any particular stream reach possessed favorable qualities for sustainable brook trout populations.Although detailed steps in developing the BKTI were provided, Smith and Sklarew (2012) did not disclose methods or de-tailed procedures for producing a useable classification model. The classification model, in itself, may be considered an en-tirely separate measurement tool with potential applications in other scenarios.
Utilizing results produced by Smith and Sklarew (2012) as a case example, findings within the present study establish theapproach undertaken in determining favorable conditions for sustainable brook trout populations and, ultimately, a useableclassification model. Readers are encouraged to envision the potential of the described methodology in management appli-cations for other species.
2. Material and methods
The geographic area of concern for selecting streams in the Mid-Atlantic encompassed the state of Maryland and thenorthwest part of Virginia (Figs. 3 and 4). In order to develop a discriminant analysis tool, historical data from various federaland state agencies in the region were obtained and reviewed for suitability. After an extensive search, it was determinedMaryland Department of Natural Resources (MDNR) possessed the most comprehensive database where watershed, in-stream and fish population parameters were collected at the same time or at least tabulated in a fashion where correlationscould readily be derived through data manipulation.
MDNR provides annual data through a public website, http://www.dnr.state.md.us/streams/publications.asp whereviewing access is provided. Before using any of the data, steps were taken to ensure proper protocols for quality assuranceand quality control were adhered to. MDNR implements a Quality Assurance/Quality Control Plan (Maryland, 2009) described
Fig. 3. Map of Maryland’s physiographic provinces. Historical native brook trout range is considered to be west of the fall line, the red separating PiedmontPlateau Province from the Western Shore (Maryland, 2006).
Please cite this article in press as: Smith, A.K., Sklarew, D. A Mid Atlantic brook trout (Salvelinus fontinalis) stream sustainability statistic forrating non-tidal streams. Sustain. Water Qual. Ecol (2013), http://dx.doi.org/10.1016/j.swaqe.2013.08.001

Fig. 4. Map of Virginia showing approximate geographic coverage included in the validation analysis here – i.e., parts of Virginia west and north of the redline. (Original image from Maps.com.)
6 A.K. Smith, D. Sklarew / Sustainability of Water Quality and Ecology xxx (2013) xxx–xxx
in its 106 Ambient Water Quality Monitoring project as requested by the US Environmental Protection Agency. The processwas originally initiated in 1972 and first implemented in 1974. MDNR lists 151 streams with viable brook trout populations.Various data on the conditions of these streams and the brook trout populations therein have been compiled and analyzedfor management purposes (Maryland, 2006). Virginia stream data specific to brook trout populations is limited. Virginia’sDepartment of Environmental Quality’s Probabilistic Monitoring program provided the only stream water quality databasegenerated through random sampling (probabilistic modeling) of surface waters throughout the state. Unfortunately, very fewsites within the program contained brook trout. Therefore, Maryland appears to be the best source for data to build a Mid-Atlantic model.
2.1. Developing a model
Utilizing the combined data on Maryland’s 151 brook trout streams, 120 a priori reference stream reaches (Appendix A)were chosen. Efforts to include representative streams from each of the four provinces, which harbor native brook trout pop-ulations (Fig. 3), were enhanced by utilizing stratified random sampling with proportional allocation. Independent samplingevents on the same stream or watershed were entered as separate data entries.
2.2. Site classification strata
Watershed characteristics were evaluated at the reference site locations with particular emphasis on a set of corevariables (e.g., percent forest cover, percent agriculture, percent urban, distance to the nearest road) described by Hudyet al. (2008) and available data for watersheds largely depended upon United States 2000 census (Census Bureau, 2002).In order to maximize correlations between in-stream habitat measurements and watershed use, most model reference datawere from 2000 to 2004. Metrics were chosen based on available reference site watershed characteristics which correlatewith brook trout populations as documented in scientific findings (Maryland, 2006; Williams et al., 2007; Hudy et al.,2008; Stranko et al., 2008; Thielin, 2006). Several in-stream habitat quality metrics have been utilized in numerous statisticalmodels and indices and have been well documented in the literature (Stranko et al., 2008; Hudy et al., 2008; Baldigo et al.,2005; Binns and Eiserman, 1979; Raleigh, 1982; Thielin, 2006; Kozel et al., 1989; Beauchamp et al., 1992; Larscheid andHubert, 1992; Schmitt et al., 1993; Hawkins et al., 1993; Binns, 1994; Astin, 2007; Whittier et al., 2007). Consequently, inthe present study, documented metrics evaluated for brook trout in-stream habitat quality were based on significanthistorical correlations (e.g. dissolved oxygen and water temperature) and availability as determined by compiled data on
Please cite this article in press as: Smith, A.K., Sklarew, D. A Mid Atlantic brook trout (Salvelinus fontinalis) stream sustainability statistic forrating non-tidal streams. Sustain. Water Qual. Ecol (2013), http://dx.doi.org/10.1016/j.swaqe.2013.08.001

A.K. Smith, D. Sklarew / Sustainability of Water Quality and Ecology xxx (2013) xxx–xxx 7
84 Maryland reference sites (each site consists of a 75 m long reach) using 45 different parameters (Appendix B). All metricswere measured during the spring sampling season of March and April.
2.3. Quality evaluation and final selection of metrics
Each metric was evaluated for its effectiveness for discriminant analysis, first by reviewing Pearson correlation coeffi-cients and identifying metrics that correlated with brook trout populations with R values greater than 0.20 and p 6 0.05(Binns and Eiserman, 1979).
A first quality check of the selected metrics subjected them to cluster analysis, using an average linkage dendrogram(Gauch, 1982), in order to determine if any given metric may bias results. At this stage, a small group of metrics was iden-tified as possible indicators of brook trout populations. To further evaluate the metrics for suitability, the selected subset ofmetrics were evaluated for collinearity in order to eliminate metrics that appear to be statistically similar to each other(R > 0.69), potentially indicative of a model that could inaccurately weigh the predictive value of certain characteristics inthe watershed or stream (Burton and Gerritsen, 2003). Examination of principal component eigenvector metric loadings pro-vided a third and final quality check. Metrics that may have been collinear, as determined by the Pearson correlation coef-ficients, were further evaluated by the graphical proximity of their corresponding eigenvectors. A high R value (R > 0.69) andless than 20� separation within a principal component analysis (PCA) loading graphic provide substantial evidence forcollinearity.
2.4. Discriminant analysis model and cross validation
As a result of the metric quality review detailed in Section 2.3, an even smaller subset of metrics were chosen for devel-oping a discriminant analysis model to determine whether or not given Mid-Atlantic streams, within the original range ofeastern brook trout, have potential to sustain brook trout populations. Eighty-four of the original 120 reference streamshad sufficient data for the selected key metrics. This small subset of metrics was evaluated for effectiveness in discriminatingbetween reference sites with brook trout and those sites devoid of fish. A post hoc multivariate discriminant analysis modelwas developed on MINITAB 16 statistical software utilizing chosen metrics (Hall et al., 2002) with the 84 reference streams.Since metric values were derived from the same 84 reference streams, results were cross-validated within the same modeldevelopment.
To investigate the potential for expanding the geographic range of the model, additional validation using a priori datafrom six Virginia stream reaches was conducted. These reaches were selected from the list of randomly selected referencesites within Virginia’s Department of Environmental Quality’s Probabilistic Monitoring Program (Virginia, 2006). Utilizingthe list of reference sites, a stratified random sample of the reference sites was generated from all the brook trout containingstreams (three identified) in the northwest portion of the state. Other nearby reference sites devoid of brook trout were uti-lized for comparison.
3. Results
Upon examination of Appendix B, very few parameters met or exceeded the benchmark R = 0.20 or greater. Table 2 is a listof 11 metrics chosen based on analysis of Pearson correlations as described in Binns and Eiserman (1979) and also based onfield knowledge. Although macroinvertebrate data were examined, no correlations between macroinvertebrate populationsand brook trout populations met the R = 0.20/p 6 0.05 threshold at the family taxonomic level or lower. An initial, simplevisual review of the tabulated data indicated there might have been some correlation between the genus Ephemerella andbrook trout populations. Unfortunately, the Pearson correlation (R = �0.121) suggests no such correlation exists. Except
Table 2Potential discriminating metrics in Mid-Atlantic upland streams.
Potential discriminating environmental metrics. N = 120 for in-streamparameters; N = 84 for land-use parameters
Pearson correlations with # of brook trout at site locations; pvalues in parentheses; CI = 95%
Distance (m) from sample site to the nearest road (DIST_RD) (data logtransformed)
0.319 (0.000)
%Forest land cover in the watershed (%forest) 0.301 (0.004)%Agriculture land cover in the watershed (%Ag) �0.298 (0.004)Water temperature (�C) (TEMP_FLD) �0.291 (0.002)Riffle quality (0–20) (RIFFQUAL) 0.290 (0.002)In-stream habitat (0–20) (INSTRHAB) 0.275 (0.003)Epifaunal substrate (0–20) (EPI_SUB) 0.258 (0.005)Riparian wideness (m) (RIP_WID) 0.232 (0.020)Aesthetic value (0–20) (AESTHET) 0.202 (0.027)Dissolved oxygen (mg/L) (DO_FLD) 0.189 (0.043)# of Ephemerella sampled at site (Ephemerella) �0.121 (0.186)
Please cite this article in press as: Smith, A.K., Sklarew, D. A Mid Atlantic brook trout (Salvelinus fontinalis) stream sustainability statistic forrating non-tidal streams. Sustain. Water Qual. Ecol (2013), http://dx.doi.org/10.1016/j.swaqe.2013.08.001

8 A.K. Smith, D. Sklarew / Sustainability of Water Quality and Ecology xxx (2013) xxx–xxx
for dissolved oxygen (R = 0.189), Pearson correlation values (R) for all other metrics in Table 2 have a magnitude of R = 0.20 orgreater.
Cluster analysis results in Fig. 5 below indicate small but insignificant overall model bias among the 11 metrics with re-spect to year sampled, stream order or province location of stream reach site. There does appear to be some bias for provincewith respect to %forest cover in the watersheds. Such bias appears logical since the eastern part of Maryland is more urbanthan the western part of the state. Interestingly, the bias does not exist for %agriculture in a province. There appears to bevery little significant bias for year sampled.
The loading plot of the principal components derived from the described 11 metrics was examined (Fig. 6) for metricquality. The graphic reveals possible collinearity between riffle/run quality, in-stream habitat and epifaunal substrate qualityand dissolved oxygen due to their close proximity. Upon checking for collinearity, re-examination of Pearson correlation datareveals p values nearing 0.70 for all three in-stream habitat metrics but not with dissolved oxygen. Fig. 6 also revealsRIP_WID, AESTHET, DIST_RD and %forest may have some collinearity features. However, since DIST_RD has a much higherPearson correlation with the number of brook trout at test sites, it was selected as the best metric within the group.
Fig. 5. Cluster analysis of 11 diagnostic metrics and three model constraints.
Fig. 6. Loading plot of eigenvector spatial significance for 11 potential discriminating metrics.
Please cite this article in press as: Smith, A.K., Sklarew, D. A Mid Atlantic brook trout (Salvelinus fontinalis) stream sustainability statistic forrating non-tidal streams. Sustain. Water Qual. Ecol (2013), http://dx.doi.org/10.1016/j.swaqe.2013.08.001

A.K. Smith, D. Sklarew / Sustainability of Water Quality and Ecology xxx (2013) xxx–xxx 9
A final subgroup of metrics was selected based on thorough examination of Pearson correlations, principal componentanalysis and Eigenvector loading and multiple trials using MINITAB discriminant analysis. Key metrics selected for discrim-inant analysis of 84 Maryland stream reaches, 42 with brook trout populations and 42 without, include: %agriculture landuse in the watershed (%Ag), riffle/run quality (0–20) at the survey site (RIFFQUAL), the log transformed distance (m) tothe nearest road from the survey site (LOG_RD), water temperature (�C) at the survey site (TEMP_FLD) and dissolved oxygen(mg/L) content at the survey site (DO_FLD). As is often the case with discontinuous variables, the lack of correlation betweenmacroinvertebrate biota and brook trout populations may have more to do with the lack of sample sites in the present ap-proach. Final model metrics and the principal component analysis (PCA) are revealed in Table 3.
Results of the analysis along with cross-validation results are presented in Fig. 7. The classification equations derivedfrom the discriminant analysis and corresponding sustainability statistic (S) are provided in Table 4. MDNR and Virginia’sDepartment of Environmental Quality (VDEQ or DEQ) have both utilized data collected from their water quality and biolog-ical monitoring programs to produce biological indices for lotic systems within their states (Stranko et al., 2008; Virginia,2006; Roth et al., 1998; Southerland et al., 2007). The models are useful over a broad geographic range within their respec-tive states. However, the models are not specific to any particular species and, as presented, are models which ultimatelyassess water quality. Taking the exact opposite approach, results from the present study produce a model, which uses waterquality and watershed information to predict the suitability of lotic systems for a particular species, the eastern brook troutwith 76% accuracy.
Appendix B displays the results of correlation analysis of brook trout abundance with 45 stream and watershed param-eters. Correlations between brook trout abundance and 11 metrics are revealed in Table 2. Riffle/Run quality (R = 0.29), in-stream habitat quality (R = 0.28), distance to the nearest road (R = 0.32) and water temperature (R = �0.29) had the highestPearson correlations with brook trout abundance. There was fairly significant collinearity (0.669) between riffle/run qualityand in-stream habitat quality. Further evidence of collinearity between the two metrics is demonstrated by their close prox-imity in Fig. 6. After further examination of the sampling criteria, riffle/run quality was selected over in-stream habitat qual-ity because most of the on-site measurements for riffle/run quality are quantitative in nature whereas, in comparison, manyof the criteria for in-stream habitat were subjective (Maryland, 2009).
Examination of PCA (Table 3) for the five key metrics highlights TEMP_FLD as the feature metric in the first componentfollowed by DIST_RD in the second component and %Ag in the third. Review of PCA results of all 11 preliminary metrics fea-tured %Ag in the fourth PCA indicating an influential component within the watershed (Appendix C).
Fig. 7 suggests measurements of five key metrics within selected stream reach survey sites in the described Mid-Atlanticregion would allow resource managers to predict, with 79% accuracy, the viability of that stream to sustain brook trout pop-ulations. However, results from a post hoc model should legitimately be based on the cross-validation percentage, in this case76%.
Since Pearson correlations are based on two dimensional linear relationships, such models appear to be useful as initialinformation when searching for environmental indicators but, in the present case, lack precision provided via a multivariatethree dimensional discriminant analysis approach. A multi-dimensional analytical approach, such as principal componentanalysis (Table 3), aid in explaining why some Pearson correlations with less favorable R values could possibly result in bet-ter model metrics. Such is the case between DO_FLD (R = 0.19) and DOC_LAB (R = �0.24) where both produced identical pre-dictability results of 76% when used with the other 4 metrics. Since dissolved oxygen is readily attainable in the field andrelatively easy to maintain quality control, dissolved organic carbon was not considered as a possible field metric.
Further exploration of PCA results reveals a loading plot displaying a radiant eigenvector arrangement within the samplepopulation (Fig. 8). The significance of the encompassing ‘‘spider-web’’ loading graphic suggests the model’s ability toencompass a multidimensional space while the biplot displays basic trends along the first two principal components in atwo dimensional space (Fig. 9). The first two principal components account for 66% of the sample population environmentalvariability (Table 3).
Utilizing results summarized in Fig. 7, two classification equations were established (Table 4) to aid resource managers intheir management efforts. Such information coupled with other on-site knowledge (e.g. sedimentation, summertime tem-perature spikes, exotic competitors, etc.) empowers resource managers in their management decision making process.
Table 3Final key metrics with corresponding principal component analysis (Smith and Sklarew, 2012).
Eigen analysis of the correlation matrix84 Cases used, 36 cases contain missing valuesEigenvalue 2.2339 1.0504 0.7414 0.5517 0.4226Proportion 0.447 0.210 0.148 0.110 0.085Cumulative 0.447 0.657 0.805 0.915 1.000Variable PC1 PC2 PC3 PC4 PC5
%Ag �0.447 0.317 �0.621 0.476 �0.295RIFFQUAL 0.473 0.192 0.572 0.589 0.256TEMP_FLD �0.537 �0.054 �0.293 �0.448 0.650DO_FLD 0.533 0.154 �0.264 0.454 0.646LOG_RD 0.065 �0.915 �0.362 0.144 �0.085
Please cite this article in press as: Smith, A.K., Sklarew, D. A Mid Atlantic brook trout (Salvelinus fontinalis) stream sustainability statistic forrating non-tidal streams. Sustain. Water Qual. Ecol (2013), http://dx.doi.org/10.1016/j.swaqe.2013.08.001
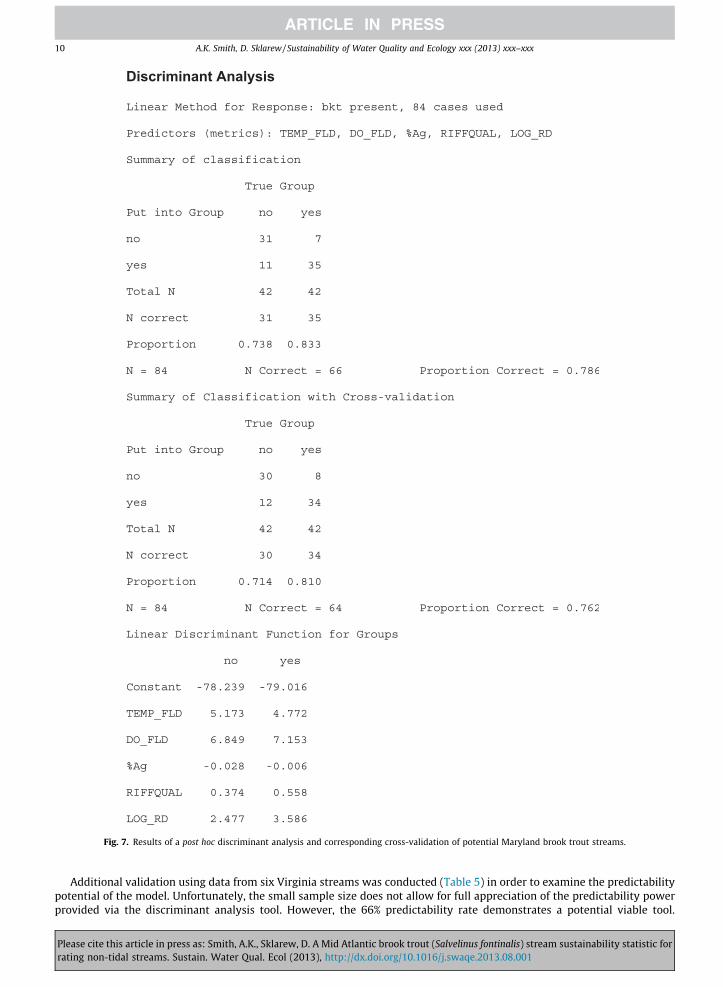
Fig. 7. Results of a post hoc discriminant analysis and corresponding cross-validation of potential Maryland brook trout streams.
10 A.K. Smith, D. Sklarew / Sustainability of Water Quality and Ecology xxx (2013) xxx–xxx
Additional validation using data from six Virginia streams was conducted (Table 5) in order to examine the predictabilitypotential of the model. Unfortunately, the small sample size does not allow for full appreciation of the predictability powerprovided via the discriminant analysis tool. However, the 66% predictability rate demonstrates a potential viable tool.
Please cite this article in press as: Smith, A.K., Sklarew, D. A Mid Atlantic brook trout (Salvelinus fontinalis) stream sustainability statistic forrating non-tidal streams. Sustain. Water Qual. Ecol (2013), http://dx.doi.org/10.1016/j.swaqe.2013.08.001

Table 4Smith–Sklarew classification equations and corresponding sustainability statistic (S) for determining brook trout habitat suitability (Smith and Sklarew, 2012).
S(bkt_sp) = �79.02 + 4.77 (TEMP_FLD) + 7.15 (DO_FLD) + 0.56 (RIFFQUAL) + �0.01 (%Ag) + 3.59 (LOG_RD)S(no_bkt_sp) = �78.24 + 5.17 (TEMP_FLD) + 6.85 (DO_FLD) + 0.37 (RIFFQUAL) + �0.03 (%Ag) + 2.48 (LOG_RD)Combining the two equations we derive an equation for the sustainability statistic (S)S = S(bkt_sp) � S(no_bkt_sp)S = �0.78 + �0.4 (TEMP_FLD) + 0.3 (DO_FLD) + 0.19 (RIFFQUAL) + 0.02 (%Ag) + 1.11 (LOG_RD)Parentheses represent field measurements in units as described in Table 2If S > 0 then stream exhibits characteristics suitable for sustaining brook troutIf S < 0 then stream most likely lacks conditions for sustainable brook trout populations
Fig. 8. Loading plot of 5 key watershed/in-stream metrics.
Fig. 9. Biplot representation of principal component analysis of 5 key watershed/in-stream metrics.
A.K. Smith, D. Sklarew / Sustainability of Water Quality and Ecology xxx (2013) xxx–xxx 11
Looking at summary of classification results in both Fig. 7 and Table 4, it appears predictability of the model is more success-ful for favorable brook trout streams (81% in Maryland, 100% in Virginia). One possibility for the slight skew toward favorable
Please cite this article in press as: Smith, A.K., Sklarew, D. A Mid Atlantic brook trout (Salvelinus fontinalis) stream sustainability statistic forrating non-tidal streams. Sustain. Water Qual. Ecol (2013), http://dx.doi.org/10.1016/j.swaqe.2013.08.001

Table 5Validation of the model using 6 Virginia stream reaches with two groups – ‘‘yes’’ group with brook trout observed, ‘‘no’’ group without – across three streamorders each. Sites selected from Virginia Department of Environmental Quality Probabilistic Monitoring Sites (Virginia, 2006).
Observation StationID StreamName Order Basin # bkt %Ag LOG_RD DO_FLD TEMP_FLD RIFFQUAL S
1 1BNTH046.56 North River 2 Shenandoah 3 0 2.74273 11.9 6.6 19 6.802 2-PRS003.23 SF Piney River 1 James 112 0 0.47712 11.1 8.3 19 3.373 2-STV000.48 Shawvers Run 3 James 4 1 3.22427 11.1 6.8 20 7.224 2-BCC001.90 Back Creek 1 James 0 20 3.23401 12.9 12.9 19 5.185 1BSMT009.08 Smith Creek 3 Shenandoah 0 57 2.92324 8 20.2 10 -0.186 2-BFL011.64 Taylor Creek 2 James 0 4.47 0.00000 11.6 13.7 18 0.73
Prediction for test observationsSquared
Observation Pred. Group From group Distance Probability Actual group
1 Yes YesNo 32.838 0.001Yes 19.370 0.999
2 Yes YesNo 21.578 0.036Yes 14.986 0.964
3 Yes YesNo 35.035 0.001Yes 20.735 0.999
4 Yes NoNo 22.032 0.004Yes 11.056 0.996
5 No NoNo 3.206 0.533Yes 3.468 0.467
6 Yes NoNo 12.878 0.340Yes 11.549 0.660
12 A.K. Smith, D. Sklarew / Sustainability of Water Quality and Ecology xxx (2013) xxx–xxx
streams could be explained by the model indicating brook trout could thrive in a given stream; they just are not there orwere not found during the survey. Such indications should be considered a positive attribute of the model. It is possible manyof the streams that presently do not harbor sustainable brook trout populations could indeed harbor them in their presentstate. In other words, brook trout populations could potentially be established in these streams without any stream reme-diation or restoration. Therefore, based on results from the cross-validation trial and validation using data from selected Vir-ginia streams, the predictability of the model should strictly be viewed as an indication of a stream’s potential to harborsustainable brook trout populations.
4. Discussion
Brook trout populations, especially in the southern half of the species’ range, are diminishing and becoming increasinglyfragmented as shown in Fig. 2 (Hudy et al., 2008). Efforts to restore or remediate brook trout streams may be enhanced withan analytical method to gauge any stream’s potential to harbor sustainable brook trout populations. Classification equations(Table 4), produced through a discriminant analysis model presented herein, provide such a tool for resource efforts in theMid-Atlantic region of the United States. The five key metrics, %agriculture land use in the watershed (%Ag), riffle/run qualityat the survey site (RIFFQUAL), the log transformed distance to the nearest road from the survey site (LOG_RD), water tem-perature at the survey site (TEMP_FLD) and dissolved oxygen content at the survey site (DO_FLD) are useful as predictors ofstream quality. With very little evidence of substantial model bias, applications of the classification equations may be broadreaching. Additionally, the key metrics in the present case can easily be measured with professionally trained volunteers atminimal costs. Although the model may be most useful employed within the State of Maryland, validation results using Vir-ginia stream data suggest the same classification equations may be applicable in certain Virginia geographic regions. Furtherexploration into model applications within Virginia and possibly northeast West Virginia and southwest Pennsylvaniastreams is warranted. Using Virginia stream data, in Table 5 the sustainability statistic ‘‘S’’ (previously denoting a ‘‘suitabil-ity’’ statistic (Smith and Sklarew, 2012) suggests some streams (e.g. Back Creek) may not presently harbor brook trout butmay be suitable in their present state to do so. Therefore, the more positive the S value, the more likely a given stream’s hab-itat is compatible with brook trout sustainability. Conversely, streams that do not score well should not be discarded imme-diately. Taylor Creek (Table 5) did not score well (S = 0.73) but only displayed one poor metric measurement–the distance tothe nearest road. Resource managers should review each individual metric measurement along with S values in order to forman initial just assessment of a particular stream reach or sub-watershed.
Obvious limitations of the model are revealed in the metrics themselves. It is likely there are degraded streams in urbanand suburban areas yet these areas may have little or no agriculture within the watershed. Also, suburban watersheds may
Please cite this article in press as: Smith, A.K., Sklarew, D. A Mid Atlantic brook trout (Salvelinus fontinalis) stream sustainability statistic forrating non-tidal streams. Sustain. Water Qual. Ecol (2013), http://dx.doi.org/10.1016/j.swaqe.2013.08.001

A.K. Smith, D. Sklarew / Sustainability of Water Quality and Ecology xxx (2013) xxx–xxx 13
produce low water temperatures and high dissolved oxygen content in the spring when sampling occurs but summer watertemperatures may be limiting along with low dissolved oxygen concentrations (Raleigh, 1982). The classification equationspresented may be applied over the four geographic provinces within Maryland and possibly similar geographic terrain with-in Virginia but better classification equations might be developed specific to each province or perhaps, more specifically,each ecoregion. Since the main goal of the present study was to identify key metrics useful for discriminating conditionsthroughout the Mid-Atlantic region, no effort was taken to create a tool specific to any given province across the entire Mary-land geographic range. Without prior knowledge of any given watershed or stream or possible instantaneous thresholds,which may be detrimental to brook trout sustainability, the sustainability statistic (S) should be viewed as a screeningindicator.
While traditional environmental indices are largely based on results of two dimensional linear regression as expressed inPearson correlation (R) values Binns and Eiserman, 1979; Raleigh, 1982; Burton and Gerritsen, 2003; Whitman et al., 2004, itappears a multidimensional approach using correlations as a screening tool first followed by multivariate discriminatingtechniques (e.g., PCA, cluster analysis and predictive discriminant analysis) as described in the present study, may producea product with broader application and utility (Hall et al., 2002; Wagner and Fernandez-Gimenez, 2009). By extending theapproach taken by Hall et al. (2002) in which Maryland streams were classified based on their physical habitat features, it ispossible to further refine the classification to identify conditions suitable for brook trout.
5. Conclusion
With severe budgetary cutbacks for natural resource management on the horizon, government agencies are increasinglyfaced with managing conservation efforts with fewer financial resources. Employing the use of screening tools, such as thesustainability statistic (S), while also partnering with NGOs and other agencies, may provide a segue into a new paradigm ofnatural resource management. The era of long, costly studies with narrow focus may be behind us. To reduce strain on finan-cial resources, scientists, resource managers, NGOs and community leaders should attempt to exhaust the usefulness ofexisting data if pertinent data exist for geographic regions of concern. The method described herein could easily be modifiedfor broad application throughout many geographic regions. Using a unique set of metrics specific to a given geographicallocation or species, resource managers would be capable of screening or monitoring landscapes according to managementneeds, goals and objectives.
Acknowledgement
The authors are very grateful for the data and assistance provided by the Maryland State Department of Natural Resourcesand associated state agencies.
Appendix A. Supplementary data
Supplementary data associated with this article can be found, in the online version, at http://dx.doi.org/10.1016/j.swaqe.2013.08.001.
References
Astin, L.A.E., 2007. Developing biological indicators from diverse data: the Potomac Basin-wide index of benthic integrity (B-IBI). Ecological Indicators 7 (4),895–908.
Baldigo, B.P., Murdoch, P.S., Burns, D.A., 2005. Stream acidification and mortality of brook trout (Salvelinus fontinalis) in response to timber harvest in threesmall watersheds of the Catskill Mountains, New York, USA. Canadian Journal of Fisheries and Aquatic Sciences 62, 1168–1183.
Beauchamp, J.J., Christensen, S.W., Smith, E.P., 1992. Selection of factors affecting the presence of brook trout (Salvelinus fontinalis) in Adirondack lakes: acase study. Canadian Journal of Fisheries and Aquatic Sciences 49 (3), 597–608.
Binns, N.A., 1994. Long-term responses of trout and macrohabitats to habitat management in a Wyoming headwater stream. North American Journal ofFisheries Management 14 (1), 87–98.
Binns, N.A., Eiserman, F.M., 1979. Quantification of fluvial trout habitat in Wyoming. Transactions of the American Fisheries Society 108 (3), 215–228.Census Bureau. Statistical Abstract of the United States, 2002.Burton, J., Gerritsen, J., 2003. A stream condition index for Virginia non-coastal streams. Virginia Department of Environmental Quality, Richmond, Virginia,
USA.Dale, V.H., Brown, S., Haeuber, R.A., et al, 2000. Ecological principles and guidelines for managing the use of land 1. Ecological Applications 10 (3), 639–670.EBTJV. Conserving the Eastern Brook Trout: Strategies for Action, Eastern Brook Trout Joint Venture, Conservation Strategy/Habitat Work Group, working
draft, 7, 2007.Fisher, R.A., 1936. The use of multiple measurements in taxonomic problems. Annals of Human Genetics 7 (2), 179–188.Gauch, H.G., 1982. Multivariate Analysis in Community Ecology. Cambridge University Press.Habera, Moore, 2005. Managing southern Appalachian brook trout. Fisheries 30 (7), 10–20.Hall, Morgan, Perry, Waltz, 2002. Development of a provisional physical habitat index for Maryland freshwater streams. Environmental Monitoring and
Assessment 77 (3), 265–291.Hartman, K.J., Hakala, J.P., 2006. Relationships between fine sediment and brook trout recruitment in forested headwater streams. Journal of Freshwater
Ecology 21 (2), 215–230.Hawkins, Kershner, Bisson, et al, 1993. A hierarchical approach to classifying stream habitat features. Fisheries 18 (6), 3–12.Hudy, Thieling, Gillespie, Smith, 2008. Distribution, status, and land use characteristics of subwatersheds within the native range of brook trout in the
eastern United States. North American Journal of Fisheries Management 28 (4), 1069–1085.
Please cite this article in press as: Smith, A.K., Sklarew, D. A Mid Atlantic brook trout (Salvelinus fontinalis) stream sustainability statistic forrating non-tidal streams. Sustain. Water Qual. Ecol (2013), http://dx.doi.org/10.1016/j.swaqe.2013.08.001

14 A.K. Smith, D. Sklarew / Sustainability of Water Quality and Ecology xxx (2013) xxx–xxx
Hudy, M., Thieling, T.M., Gillespie, N., Smith, E.P., 2008. Distribution, status, and land use characteristics of subwatersheds within the native range of brooktrout in the eastern United States. North American Journal of Fisheries Management 28 (4), 1069–1085.
Kozel, S.J., Hubert, W.A., Parsons, M.G., 1989. Habitat features and trout abundance relative to gradient in some Wyoming streams. Northwest Science 63 (4),175–182.
Lande, R., 1995. Mutation and conservation. Conservation Biology 9 (4), 782–791.Larscheid, J.G., Hubert, W.A., 1992. Factors influencing the size structure of brook trout and brown trout in southeastern Wyoming mountain streams. North
American Journal of Fisheries Management 12 (1), 109–117.Maryland, 2006. Maryland Brook Trout Fisheries Management Plan.Maryland DNR. Maryland Department of Natural Resources, Section 106, Ambient Water Quality Monitoring (Core/Trend Monitoring), Quality Assurance
Project Plan [Internet]. Available from: <http://www.google.com/url?sa=t&source=web&cd=1&sqi=2&ved=0CBYQFjAA&url=http%3A%2F%2Fwww.dnr.state.md.us%2Firc%2Fdocs%2F00014550.pdf&rct=j&q=MD%20Section%20106%20Quality&ei=D1dlTp7sNIOFsgKZ3OzHCg&usg=AFQjCNGHr-lYx4cxjUdE6dWSfTLyMh9KDw&cad=rja>.
Meyer, J.L., Kaplan, L.A., Newbold, D., et al., 2007. Where rivers are born: the scientific imperative for defending small streams and wetlands. Small StreamReport, Sierra Club, Washington, DC, Available from: <http://www.sierraclub.org/WhereRiversAreBorn>.
Quist, M.C., Hubert, W.A., Fowden, M., Wolff, S.W., Bower, M.R., 2006. FEATURE–FISH HABITAT–The Wyoming Habitat Assessment Methodology (WHAM): asystematic approach to evaluating watershed conditions and stream habitat. Fisheries 31 (2), 75–81.
Raleigh, 1982. Habitat Suitability Index Models: Brook Trout. U.S. Department of the Interior, Fish and Wildlife Service, Report Number FWS/OBS-82/10.24.Roth, N., Southerland, M., Chaillou, J., et al, 1998. Maryland biological stream survey: development of a fish index of biotic integrity. Environmental
Monitoring and Assessment 51 (1), 89–106.Schmitt, Lemly, Winger, 1993. Habitat Suitability Index Model for Brook Trout in Streams of the Southern Blue Ridge Province: Surrogate Variables, Model
Evaluation, and Suggested Improvements. U. S. Department of the Interior, Fish and Wildlife Service, Washington, D.C. Book (43p) LC Number: QL638.S2S28 1993.
Smith, A.K., Sklarew, D., 2012. A stream suitability index for brook trout (Savelinus fontinalis) in the Mid-Atlantic United States of America. EcologicalIndicators 23, 242–249.
Southerland, M.T., Rogers, G.M., Kline, M.J., et al, 2007. Improving biological indicators to better assess the condition of streams. Ecological Indicators 7 (4),751–767.
Stranko, S.A., Hilderbrand, R.H., Morgan II, R.P., 2008. Brook trout declines with land cover and temperature changes in Maryland. North American Journal ofFisheries Management 28 (4), 1223–1232.
Stranko, Hilderbrand, Morgan, et al, 2008. Brook trout declines with land cover and temperature changes in Maryland. North American Journal of FisheriesManagement 28 (4), 1223–1232.
Thieling, 2006. Assessment and Predictive Model for Brook Trout (Salvelinus fontinalis) Population Status in the Eastern United States. Master’s Thesis. JamesMadison University, Harrisonburg, Virginia.
Utz, R.M., Hartman, K.J., 2007. Identification of critical prey items to Appalachian brook trout (Salvelinus fontinalis) with emphasis on terrestrial organisms.Hydrobiologia 575 (1), 259–270.
Utz, R.M., Hilderbrand, R.H., Raesly, R.L., 2010. Regional differences in patterns of fish species loss with changing land use. Biological Conservation.Virginia DEQ, 2006. Using Probabilistic Monitoring Data to Validate the Non-Coastal Virginia Stream Condition Index. Virginia Department of
Environmental Quality. Report number WQA/2006-001.Wagner, C.L., Fernandez-Gimenez, M.E., 2009. Effects of community-based collaborative group characteristics on social capital. Environmental Management
44 (4), 632–645.Whitman, R.L., Nevers, M.B., Goodrich, M.L., Murphy, P.C., Davis, B.M., 2004. Characterization of Lake Michigan coastal lakes using zooplankton assemblages.
Ecological Indicators 4 (4), 277–286.Whittier, T.R., Hughes, R.M., Stoddard, J.L., Lomnicky, G.A., Peck, D.V., Herlihy, A.T., 2007. A structured approach for developing indices of biotic integrity:
three examples from streams and rivers in the western USA. Transactions of the American Fisheries Society 136, 718–735.Wilcox, B.A., Murphy, D.D., 1985. Conservation strategy: the effects of fragmentation on extinction. The American Naturalist 125 (6), 879–887.Williams, Haak, Gillespie, Colyer, 2007. The conservation success index: synthesizing and communicating salmonid condition and management needs.
Fisheries 32 (10), 477–493.
Please cite this article in press as: Smith, A.K., Sklarew, D. A Mid Atlantic brook trout (Salvelinus fontinalis) stream sustainability statistic forrating non-tidal streams. Sustain. Water Qual. Ecol (2013), http://dx.doi.org/10.1016/j.swaqe.2013.08.001
Copyright © 2022 FDOKUMEN