Water Resources of India - National Hydrology Project
52
Water Resources of India Problems & Perspectives Sudhir Kumar Scientist G National Institute of Hydrology, Roorkee Email: [email protected] [email protected]
-
Upload
khangminh22 -
Category
Documents
-
view
0 -
download
0
Transcript of Water Resources of India - National Hydrology Project

Water Resources of India Problems & Perspectives
Sudhir Kumar
Scientist G
National Institute of Hydrology,
Roorkee


GLOBAL WATER DISTRIBUTION
2.6%
0.1%
Total estimatedwater on earth is~1.39*1018 M3
Humans consumeonly ~0.003 % (i.e.~4*1013 M3 )

Ocean Storage1,370,000,000 km3
Global Hydrological Cycle
Evaporation
320,000 km3
Precipitation
285,000 km3
Evaporation60,000 km3
Precipitation95,000 km3
Run-off
35,000 km3

FRESH WATER RESOURCESItem Area
106 km2
Volume
Km3
% of total
water
% of fresh
water
Oceans 361.3 1,338,000,000 96.5 -
Groundwater:
Fresh
Saline
134.8
134.8
10,530,000
12,870,000
0.76
0.93
30.1
-
Soil moisture 82.0 16,500 0.0012 0.05
Polar ice 16.0 24,023,500 1.7 68.6
Other ice & snow 0.3 340,600 0.025 1.0
Lakes:
Fresh
Saline
1.2
0.8
91,000
85,400
0.007
0.006
0.26
-
Marshes 2.7 11,470 0.0008 0.03
Rivers 148.8 2,120 0.0002 0.006
Biological water 510.0 1,120 0.0001 0.003
Atmospheric water 510.0 12,900 0.001 0.04
Total water 510.0 1,385,984,610 100 -
Fresh water 148.8 35,029,210 2.5 100
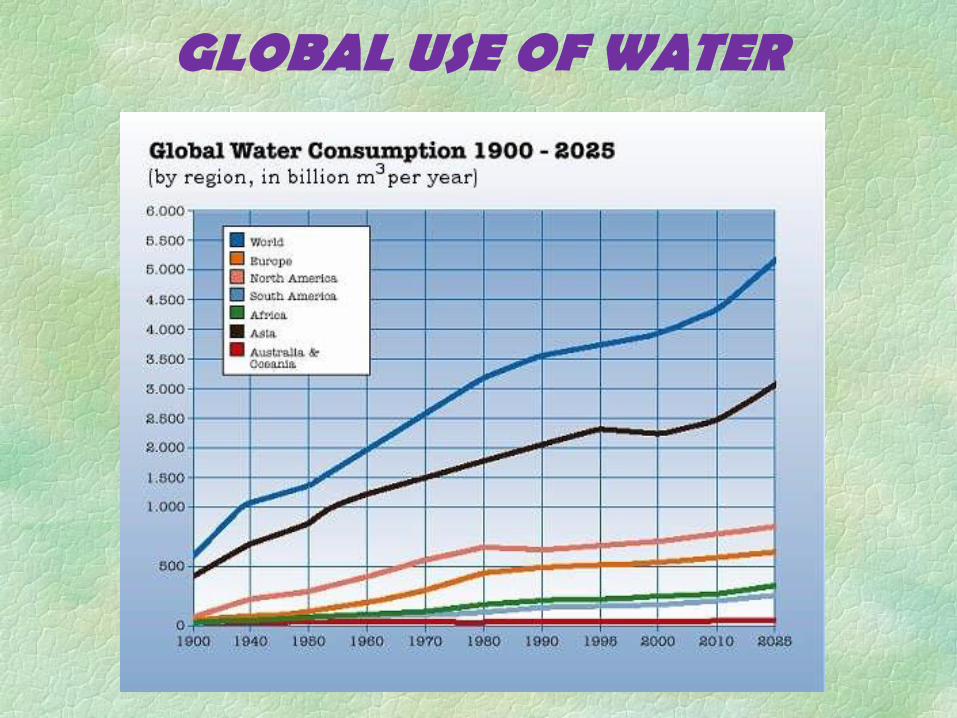
GLOBAL USE OF WATER

GLOBAL USE OF WATER

22%
8%
70%
0
10
20
30
40
50
60
70
80
Agriculture Domestic Industry
Water uses
% o
f to
tal
wate
r u
sed

Farming (41%)
Public
(10%)
Industry
(11%)Power-
Plant (38%)
Farming (85%)
Public (6%)
Industry
(7%)
Power-
Plant (2%)
U.S.A. INDIA
Source: Worldwatch Institute
this comparison of U.S. and India shows how economic growth necessitates increased use of
water for nonagricultural purposes.

MUNICIPAL WATER USE

• Water StressedPer Capita Availability < 1700 Cubic Meter per
year
• Water ScarcePer Capita Availability < 1000 Cubic Meter per
year


Water is a basic natural resource which nurtures life.
• 2 Billion people have no access to clean drinking
water and 2.9 billion have no access to sanitation
• By 2025, 40% of the World’s population, or about 3
billion people will live in countries where it is
difficult or impossible to get enough water to
satisfy basic needs
• 80% of all illness and death in developing world
due to contaminated water
• A child dies every 8 seconds from drinking
contaminated water

Geographical Area 329 mha
Non-cultivated AreaBarren/Waste Land
7%23%
Forested Area 23%
Cultivated Area (CA) 47%
Irrigated Area (produces 55%) 37% of CA
Rainfed Area (produces 45%) 63% of CA
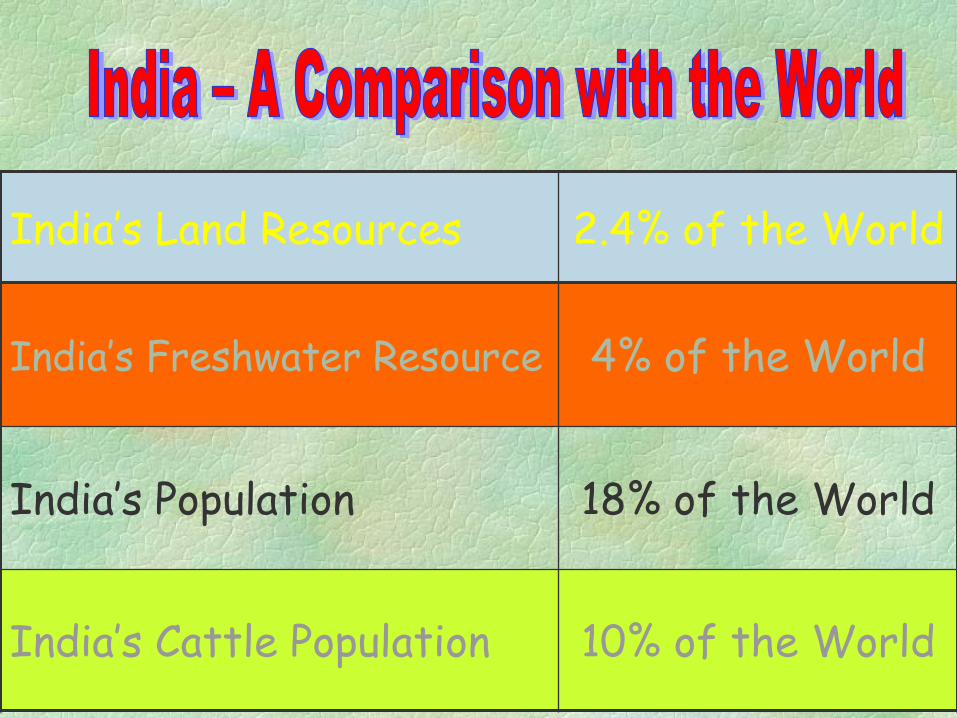
India’s Land Resources 2.4% of the World
India’s Freshwater Resource 4% of the World
India’s Population 18% of the World
India’s Cattle Population 10% of the World

Average Annual Rainfall
– 116 cm

Long-term average annual rainfall is 1160 mm.
Highly Variable in space (about 11,690 mm at Mousinram near Cherrapunji in Meghalaya and 150 mm at Jaisalmer)
Highly Variable in time ( Three-quarters of the rain in less than 120 days during June to September)
Average number of rainy days in a year is 40
RAINFALL PATTERNS IN INDIA
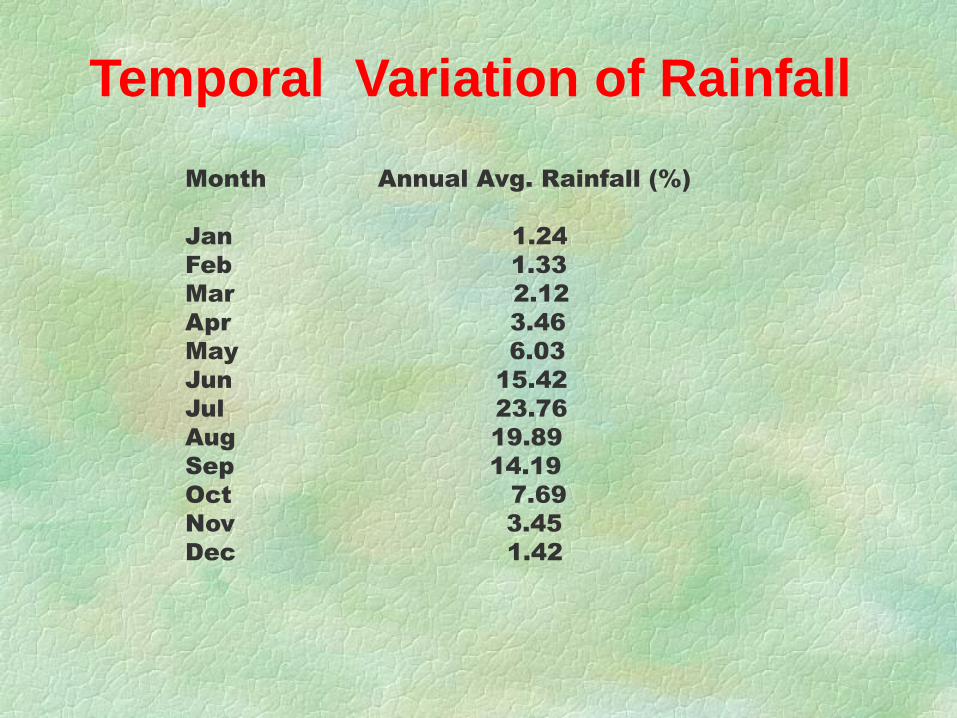
Temporal Variation of Rainfall
Month Annual Avg. Rainfall (%)
Jan 1.24
Feb 1.33
Mar 2.12
Apr 3.46
May 6.03
Jun 15.42
Jul 23.76
Aug 19.89
Sep 14.19
Oct 7.69
Nov 3.45
Dec 1.42

Approximate Annual Water Resources
of India in 2000 and 2025 AD (km3)TOTAL PRECIPITATION
4000
INFILTRATION
2150
SURFACE WATER
1150
INFLOW FROM OUTSIDE INDIA
+200
TO GROUNDWATER
(INFLUENT SEEPAGE
-80 (-100)
FROM GROUNDWATER
(EFFLUENT SEEPAGE)
+450
FROM IRRIGATED AREA
+110 (+150)
TOTAL SURFACE FLOW
1830 (1850)
IMMEDIATE
EVAPORATION
700
SOIL MOISTURE
1650
FROM
IRRIGATION
110 (150)
TOTAL SOIL
MOISTURE
1760 (1800)
TO GROUNDWATER
500
FROM STREAMS
80 (100)
FROM IRRIGATION
180 (250)
TOTAL GROUNDWATER
760 (850)
EVAPORATION
580 (550)EVAP0TRANSPIRATION
1180 (1250)
EVAPORATION FROM
WATER TABLE
60 (50)
EXTRACTION FOR
USE
250 (350)
REGENERATION IN
STREAMS
450
UTILISATION
500 (700)
EVAPORATION
70 (100)
TO SEA AND OUT OF INDIA
1260 1050)
TOTAL UTILIZATION
750 (1050)

Total precipitation 4000 BCM
Annual water availability
(after accounting for losses in the form
evaporation etc.)
1869 BCM
Utilizable water
(the available water cannot be fully utilized due to
topographical and hydrological constraints and the
need for allowing certain amount of water to flow
in the river for maintaining the river regime.)
1123 BCM
- Surface water
- Ground water
690 BCM
433 BCM

BASIN MAP OF INDIA N
BHUTAN
NEPAL
PAKISTAN
CHINA
SRILANKA
BANGLADESH
MYANMAR
BAY
OF
BENGAL
ARABIAN
SEA
INDIAN OCEAN
LAKSHADWEEP
(INDIA)80
160
240
320
320
880800720
960880800720 E
N
240
160
80
CENTRAL WATER COMMISSION
PLATE No. CWC/NBO/Map not to Scale
Projection: Lambert Conical Orthomorphic
For International / State boundaries and Coast - Line refer to Survey of India maps.
B18
B3
B4
B5 B17
B17
B9
B15
B16
B16
B16
B14
B13 B8
B12
B6
B19 B2aB2b
B20
B1
Narmada
B10
B11
Godavari
Krishna
Pennar
Cauvery
Mahanadi
B20
Tapi
Mahi
Sabarm
ati
Yamuna
Ganga
Brahamaputra
B2c
Sutlej
Indus
Ganga
Bara
k
Tsangpo
Indus
Chambal
Betw
a
Sone
Padma
Meghna
MUMBAI
N.DELHI
BHOPAL
SRINAGAR
PANAJI
THIRUANATHAPURAM
PONDICHERRY
CHENNAI
GANDHINAGAR
SILVASSA
BANGALORE
BUBHANESHWAR
COIMBATORE
JAIPUR
LUCKNOW
PATNA
ITANAGAR
KAVARATI
Tadri
DIU
PUNE
NAGPUR
HYDERABAD
CALCUTTA
SHILIGURI
GANGATOK
IMPHAL
KOHIMADISPUR
AIZWALAGARTALA
CHANDIGARHSHIMLA
VADODARA
SHILLONG
(IND
IA)
B7
PORT BLAIR
RANN OF KACHCHH
B1- INDUS BASIN, C.E., CHANDIGARH
B2a - GANGA BASIN, C.E.,LUCKNOW, PATNA & N.DELHI
B2b - BRAHMAPUTRA BASIN, C.E., SHILLONG, SILIGURI
B2c - BARAK BASIN, C.E., SHILLONG
B3 - GODAVARI BASIN, C.E., HYDERABAD.
B4 - KRISHNA BASIN, C.E., HYDERABAD
B5 - CAUVERY BASIN, C.E., COIMBATORE
B6 - SUBERNAREKHA BASIN, C.E., BUBHANESHWAR
B7 - BRAHMANI & BAITARNI BASIN, C.E., BUBHANESHWAR
B8 - MAHANADI BASIN, C.E., BUBHANESHWAR
B9 - PENNAR BASIN, C.E., COIMBATORE
B10 - MAHI BASIN, C.E., VADODARA
B11 - SABARMATI BASIN, C.E., VADODARA
B12 - NARMADA BASIN, C.E., BHOPAL
B13 - TAPI BASIN, C.E., VADODARA
B14 - WEST FLOWING (TAPI TO TADRI), C.E., VADODARA, COIMBATORE
B15 - WEST FLOWING (TADRI TO KANYAKUMARI), C.E., COIMBATORE
B16 - EAST FLOWING BETWEEN MAHANADI AND
PENNAR, C.E., BUBHANESHWAR
B17 - EAST FLOWING BETWEEN PENNAR AND
KANYAKUMARI, C.E., COIMBATORE
B18 - WEST FLOWING OF KUTCH AND SAURASHTRA INCLUDING LUNI,
C.E., VADODARA
B19 - AREA OF INLAND DRAINAGE
B20 - MINOR RIVERS DRAINAGE INTO MYANMAR AND BANGLADESH
LEGEND
HEAD OFFICE
REGIONAL OFFICE
Brahmani

S. No. River BasinAverage Annual
Water Availability (BCM)
1. Indus 73.31
2. Ganga-Brahmaputra-Barak
a. Ganga sub-basin 525.02
b. Brahmaputra & Barak sub-basin 585.60
3. Godavari 110.54
4. Krishna 78.12
5. Cauvery 21.36
6. Pennar 6.32
7. East Flowing Rivers between Mahanadi and Pennar 22.52
8. East Flowing Rivers between Pennar and Kanyakumari 16.46
9. Mahanadi 66.88
10. Brahmani and Baitarni 28.48
11. Subarnrekha 12.37
12. Sabarmati 3.81
13. Mahi 11.02
14. West Flowing Rivers of Kutchh, Saurashtra including Luni 15.10
15. Narmada 45.64
16. Tapi 14.88
17. West Flowing Rivers from Tapi to Tadri 87.41
18. West Flowing Rivers from Tadri to Kanyakumari 113.53
19. Area of Inland Drainage in Rajasthan Desert Negligible
20. Minor River Basins Draining into Bangladesh and Myanmar 31.00


Ground Water Resources
Annual potential natural ground water recharge from rainfall is about 342.43 BCM, which is 8.56% of annual rainfall.
Annual potential ground water recharge augmentation from canal irrigation system is about 90.00 BCM.
Total replenishable groundwater resource is assessed as 433 BCM.

Major Aquifer Provinces in IndiaPROVINCE AQUIFER MATERIAL (TYPE) PARAMETERS
Indo-Gangetic
alluvium
Alluvium with beds of sand, silt and clay with occasional beds of
gravel (Shallow aquifers - unconfined, deeper ones confined or of
leaky type)
T = 1000-5000
Sy = 10-4-10-3
YP = 0.04-0.11
Cenozoic sedimentary
basins
Unconsolidated to semi- Consolidated sandstone, shale and
limestone (Deeper aquifers under confined condition; at places
flowing wells)
T= 500-5000
Sy = 10-5-10-3
YP = 0.01-0.04
Deccan Traps
Basaltic lava flows, generally flat lying, maximum thickness about
1,500 m in the western coast (Main source of groundwater are -
Weathered and fractured horizon, Interflow spaces, Inter-trappeans,
and Vesicular horizons)
T = 10 – 700
Sy = 10-3-10-1
YP = 0.001 - 0.03
Gondwana ProvinceSemi- consolidated sandstone and shale with coal seams (Shallow
aquifers unconfined, deeper ones confined)
T = 50-500
Sy = 10-3-10-1
YP = 0.01-0.10
Precambrian
sedimentary basins
Consolidated sandstone, shale and limestone (Intergranular
porosity low; fractures are the main source of water in sandstone
and shale; solution cavities in limestone)
T = 5-500
Sy = 10-3-10-2
YP = 0.01-0.04
Precambrian
crystalline province
Crystalline rocks, viz, granite, gneiss and schist (Weathered mantle
is the main source of water supply, fractures and lineaments also
facilitate groundwater movement)
T = 5 – 50
Sy = 10-3-10-2
YP = 0.001-0.005
T = Transmissivity ((m2d-1)
Sy = Specific Yield
YP = Yield potential (m3s-1)


0 1000 2000 3000 4000 5000 6000 7000 8000 9000 10000 11000 12000 13000 14000 15000
Indus
Ganga
Brahamputra …
Mahanadi
Brahmani & …
Godavari
Krishna
Cauvery
Pennar
Narmada
Tapi
Mahi
Sabarmati
Per capita per year (cubic m)
Basinwise Per Capita Water Availability
2025 (Projected) 2000
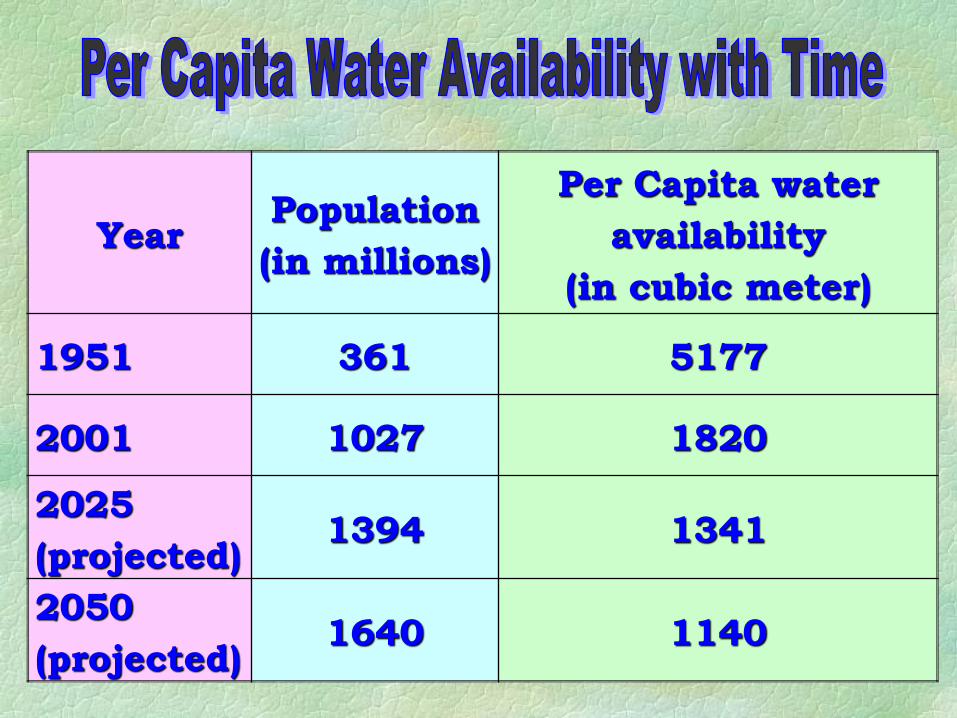
Year Population
(in millions)
Per Capita water
availability
(in cubic meter)
1951 361 5177
2001 1027 1820
2025
(projected)1394 1341
2050
(projected)1640 1140

DescriptionMajor &
Medium
Minor
TotalSurface
water
Ground
water
Ultimate irrigation
potential (Mha)58.47 17.38 64.05 139.90
Potential created up to
March 2008 (Mha)43.08 14.60 46.79 104.47
Balance potential (Mha) 15.39 2.78 17.26 35.43

Storage already created 225 BCM
Storage in Projects under
construction64 BCM
Estimated storages through projects
under consideration108 BCM

Use
Year 2010 Year 2025 Year 2050
Water
Demand
(BCM)
% of
total
demand
Projected
Demand
(BCM)
% of
total
demand
Projected
Demand
(BCM)
% of
total
demand
Irrigation 557 78% 611 72% 807 69%
Domestic 43 6% 62 7% 111 9%
Industries 37 5% 67 8% 81 7%
Environment 5 1% 10 1% 20 2%
Others 68 10% 93 12% 161 13%
Total 710 100% 843 100% 1180 100%

The Indian situation
• Groundwater [Depleted]• Surface water [Polluted]• Rainfall [Wasted]
• Population [ ]• Demand [ ]• Consumption [ ]
SCARCITY
• Agriculture [ ]• Health & Environment[ ]• Future [ ? ]
• Industrial Growth [ ]• Economy-Industry [ ]• Water Business[ ]

STRATEGIES FOR MANAGEMENT
OF WATER RESOURCES
Strengthening of Hydrological & Hydro-metereological network
Establishment of additional sites
Automation of Instruments
Hydrological Information system (Temporal and Spatial data)
O & M of water resources projects
Equitable water distribution and water charges

Automatic Weather Stations
Max. & min. temperature
Humidity
Wind speed & direction
Sunshine & solar radiation
Rainfall and snowfall
Surface albedo
Atmospheric pressure
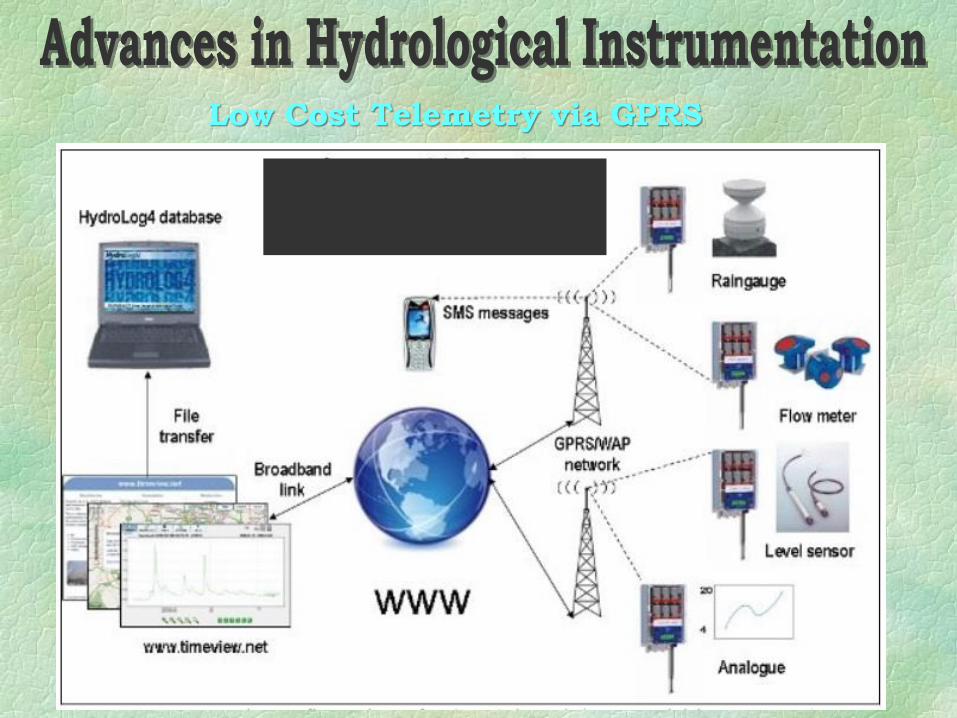
Low Cost Telemetry via GPRS

Radar water level recorder Digital velocity meters
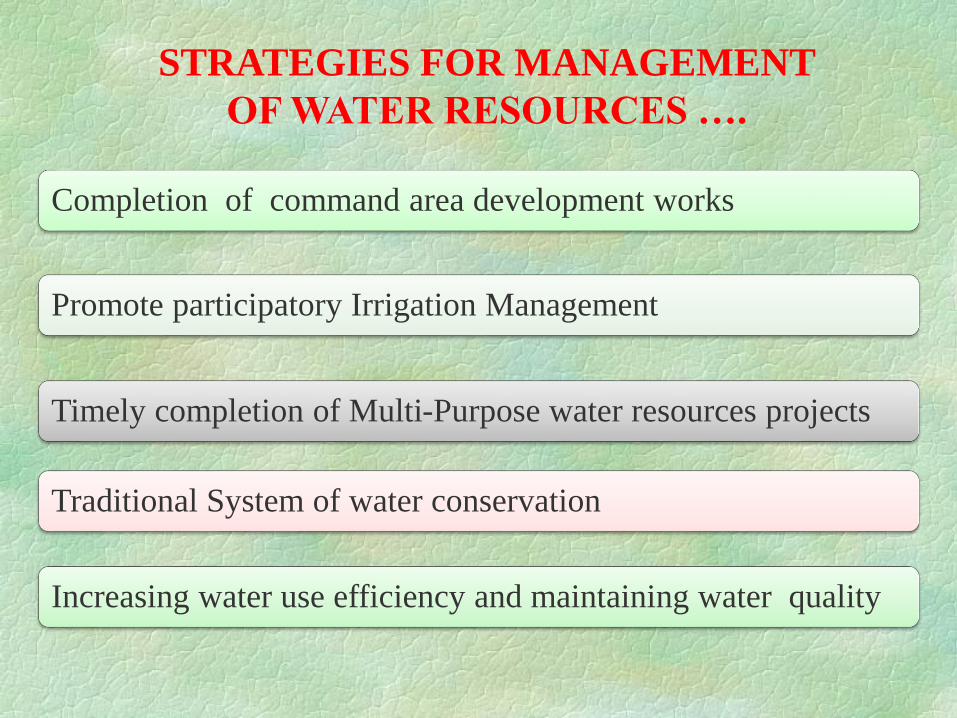
STRATEGIES FOR MANAGEMENT
OF WATER RESOURCES ….
Completion of command area development works
Promote participatory Irrigation Management
Timely completion of Multi-Purpose water resources projects
Traditional System of water conservation
Increasing water use efficiency and maintaining water quality

STRATEGIES FOR MANAGEMENT
OF WATER RESOURCES ….
R&D for increasing water use efficiency and maintaining quality
Incentive for encouraging efficient irrigation practices
Mandatory water auditing
Integrated Water Resources planning, development and management
Ground water Management to avoid over exploitation

STRATEGIES FOR MANAGEMENT
OF WATER RESOURCES ….
Sustainable development of water resources
Systemic Approach for managing the flood & Drought
Recycle and Reuse of water
Rainwater Harvesting and Artificial Recharge
Conjunctive use of surface water and ground water
Watershed Management

STRATEGIES FOR MANAGEMENT
OF WATER RESOURCES….
Inter basin transfer
Water Quality Monitoring
Water Quality Conservation and Environment Restoration
Vulnerability to Climate Change and adaptation strategies
Water rights, ownership and pricing
Desalination of water

Water Quality Issues
41
Common issues of Water Quality• Pathogenic (Bacteriological) Pollution
• Salinity
• Toxicity (micro-pollutants and other industrial pollutants)
Surface Water• Eutrophication
• Oxygen depletion
• Ecological health
Ground Water• Fluoride
• Nitrate
• Arsenic
• Iron
• Sea water intrusion

Impact of Climate Change
Temperature increase
Change in Monsoon Pattern
Increase in Rain Fall Intensity
Decrease in No. of
Rainy Days
Decrease in Snow Fall
Increase in Evaporation
rate
Increase in Glacier retreat
Change in Runoff Pattern
Change in Ground water
Recharge
Increase in Extreme Events
Sea Level Rise

STRATEGIES FOR MANAGEMENT
OF WATER RESOURCES….
Legal restrictions on water use
Decision support Systems in water resources
Virtual Water Transfer
People Participation and capacity Building
Extensive R&D on all water related issues & challenges

Computer based model together with their interactive interfaces are typically called decision support systems (DSSs)
Computer-based systems integrating tools and databases that assist a decision-maker in making informed decisions and analyse consequences

Major Initiatives in Water Resources
Planning and Management
Development of Water Resources Information System
Hydrology Project
Ground water Management and regulation
Investigation of Water resources Development Schemes
Dam safety studies and planning
Flood management and flood Forecasting
Repair, Renovation and Restoration of water bodies
Research & Development

Major Initiatives in Water Resources
Planning and Management
Command Area development and water Management
Technology Transfer Activities and training
Information, Education and Communication

The uneven spatial and temporal distribution of the precipitation in India leads to floods and drought affecting vast areas of the country.
Suitable models for forecasting the monsoon rainfall accurately.
The decision makers and farmers to adopt appropriate strategies for water resources management.
Adequate emphasis should be laid on management of floods and droughts.
CONCLUDING REMARKS

Management of existing storages and creation of additional storages considering the economical, environmental and social aspects.
The movement of pollutants in the rivers, lakes and ground water aquifers needs to be regulated.
A regular monitoring programme needs to be initiated for identifying the areas likely to be affected because of the water quality problems.
For maintaining the quality of freshwater, sustainable water quality management strategies are required to be evolved and implemented.
Desalination as well as recycle and reuse of waste water should be encouraged.
CONCLUDING REMARKS…

Integrated and coordinated development of surface water and ground water resources and their conjunctive use should be envisaged right from the project planning stage and should form an integral part of the project implementation plan.
A comprehensive, reliable and easily accessible Information System for water resources data is a pre-requisite. Initiative of India-WRIS project with the aim of dissemination of data in public domain constitute the most important aspects of the water resources management.
Optimal Reservoir Operation Policies should be evolved considering the Integrated System of Reservoirs for flood management and conservation purposes.
CONCLUDING REMARKS…

Decision Support Systems are required to be developed for integrated planning, development and management of the water resources projects.
Development of DSS (Planning) for Integrated Water Resources Development and Management and DSS for Real Time Operation of Reservoir would be very useful for Water Resources Planning, Development and Management.
CONCLUDING REMARKS…

Studies are required to be taken up for assessment of water resources under changing climatic scenarios.
The concept of virtual water transfer requires to be introduced at policy level for food trade, agriculture and water management.
As most of the major rivers covering about 83% of geographical area in India are inter-state in nature; hence, there is a need for greater inter-state cooperation for integrated development and management of water resources.
The capacity building and awareness programmes should be organised for the users and public for encouraging their effective participation in water management practices and developing ethical concepts for making efficient use of water resources.
CONCLUDING REMARKS…

T
H
A
N
K
S


![International Symposium on Hydrology Water Resources and Environment Development and Management [Pengelolaan Sumberdaya Air dan Lingkungan]](https://static.fdokumen.com/doc/165x107/631afe74bb40f9952b02412c/international-symposium-on-hydrology-water-resources-and-environment-development.jpg)


![[5253] - 501 T.E. (Civil) (End Sem.) HYDROLOGY & WATER ...](https://static.fdokumen.com/doc/165x107/6334fa163108fad7760fc1ec/5253-501-te-civil-end-sem-hydrology-water-.jpg)