A Handbook for Integrated Water Resources Management in Basins
Upload
independentCategory
view
0download
0
Hydrol. Earth Syst. Sci., 12, 1027–1037, 2008www.hydrol-earth-syst-sci.net/12/1027/2008/© Author(s) 2008. This work is distributed underthe Creative Commons Attribution 3.0 License.
Hydrology andEarth System
Sciences
An integrated model for the assessment of global water resources –Part 2: Applications and assessments
N. Hanasaki1, S. Kanae2, T. Oki2, K. Masuda3, K. Motoya4, N. Shirakawa5, Y. Shen6, and K. Tanaka7
1National Institute for Environmental Studies, Japan2Institute of Industrial Science, University of Tokyo, Japan3Frontier Research Center for Global Change, Japan4Faculty of Education and Human Studies, Akita University, Japan5Graduate School of Systems and Information Engineering, University of Tsukuba, Japan6Center for Agricultural Resources Research, The Chinese Academy of Sciences, China7Disaster Prevention Research Institute, Kyoto University, Japan
Received: 17 September 2007 – Published in Hydrol. Earth Syst. Sci. Discuss.: 2 October 2007Revised: 7 May 2008 – Accepted: 30 June 2008 – Published: 29 July 2008
Abstract. To assess global water resources from the per-spective of subannual variation in water availability and wa-ter use, an integrated water resources model was developed.In a companion report, we presented the global meteoro-logical forcing input used to drive the model and six mod-ules, namely, the land surface hydrology module, the riverrouting module, the crop growth module, the reservoir op-eration module, the environmental flow requirement mod-ule, and the anthropogenic withdrawal module. Here, wepresent the results of the model application and global waterresources assessments. First, the timing and volume of sim-ulated agriculture water use were examined because agricul-tural use composes approximately 85% of total consumptivewater withdrawal in the world. The estimated crop calen-dar showed good agreement with earlier reports for wheat,maize, and rice in major countries of production. In ma-jor countries, the error in the planting date was±1 mo, butthere were some exceptional cases. The estimated irrigationwater withdrawal also showed fair agreement with countrystatistics, but tended to be underestimated in countries in theAsian monsoon region. The results indicate the validity ofthe model and the input meteorological forcing because site-specific parameter tuning was not used in the series of sim-ulations. Finally, global water resources were assessed on asubannual basis using a newly devised index. This index lo-cated water-stressed regions that were undetected in earlierstudies. These regions, which are indicated by a gap in the
Correspondence to:N. Hanasaki([email protected])
subannual distribution of water availability and water use,include the Sahel, the Asian monsoon region, and southernAfrica. The simulation results show that the reservoir opera-tions of major reservoirs (>1 km3) and the allocation of en-vironmental flow requirements can alter the population underhigh water stress by approximately−11% to +5% globally.The integrated model is applicable to assessments of variousglobal environmental projections such as climate change.
1 Introduction
Previous assessments of global water resources have pro-jected current and future global water stress, focusing mainlyon the spatial, rather than temporal, distribution of wateravailability and water use. A typical approach is to displaythe global distribution of per capita annual water availability(Arnell, 1999; Arnell, 2004) or the withdrawal to availabilityratio on an annual basis (Vorosmarty et al., 2000; Oki et al.,2001; Alcamo et al., 2003a; Alcamo et al., 2003b). However,seasonality in both water availability and water use occurs insome parts of the world. Therefore, subannual variabilitymust be taken into account. In this two-part report, we intro-duce an integrated global water resources model and assessglobal water resources through the application of the modelfrom the perspective of subannual variation. Here, we ad-dressed the following key question: Given that earlier globalwater resources assessments were on annual basis, does theassessment of water resources on a subannual basis revealany water-stressed regions that were previously overlookedby annual assessments?
Published by Copernicus Publications on behalf of the European Geosciences Union.

1028 N. Hanasaki et al.: An integrated global water resources model – Part 2S
hortw
ave
radi
atio
nA
ir te
mpe
ratu
re
Evap. Pot evap.
Crop growth module
Agr. water demand
Ind. water demand(from AQUASTAT)
Dom. water demand(from AQUASTAT)
River mouth
Withdrawal module
Streamflow
Reservoir module
Streamflow
Runoff
River routing module Env. flow req. module
Land surface hydrology module
Meteorological forcing
Soil moisture ofirrigated cropland
Env. flow req.Reservoir Storage
Agr. water withdrawal
Ind. water withdrawal
Dom. water withdrawal
Removed from
the system
Fig. 1. Schematic diagram of(a) water flow among the modulesand(b) the simulation.
We developed an integrated global water resources modelwith six modules: land surface hydrology, river routing,crop growth, reservoir operation, environmental flow re-quirements, and anthropogenic water withdrawal. The modelsimulates both natural and anthropogenic water flow globally(excluding Antarctica) at a spatial resolution of 1◦
×1◦ (lon-gitude and latitude). The companion report (Hanasaki et al.,2008) presents the integrated model and the global meteoro-logical forcing inputs that drive the model. Here, we presentmodel applications and discuss the results of global water re-sources assessments using the integrated model. The inputdata and simulation design are described (Sect. 2). Some keyestimations of water use are then validated (Sect. 3). Finally,the results of the global water resources assessment are pre-sented (Sect. 4) and discussed (Sect. 5).
Table 1. List of input global geographical data.The spatial resolution is 1◦×1◦ (latitude and longitude).
Variable Note/Reference
Albedo Hall et al., 2006 (ISLSP2)Cropland area Ramankutty and Foley, 1998Irrigated area Doll and Siebert, 2000Crop type Leff et al., 2004River network Oki and Sud, 1998 (TRIP)Vegetation Globally uniform
(bulk transfer coefficient: 0.003)Soil type Globally uniform (depth: 1 m,
field capacity: 0.30 m3/m3,wilting point: 0.15 m3/m3)
2 Simulation
2.1 Input data
To drive the integrated model, we used the meteorologicalforcing input F-GSWP2-B1, which is described in detail inthe companion paper (Hanasaki et al., 2008). It consistsof seven variables: air temperature, specific humidity, windspeed, air pressure, downward shortwave radiation, down-ward longwave radiation, and precipitation. All variables arethree-hourly from 1 January 1986 to 31 December 1995 at aspatial resolution of 1◦×1◦. The meteorological forcing in-put is a hybrid product of ground observation-based monthlygridded data and temporally high-resolution reanalysis data.In addition to the meteorological forcing input, we used var-ious geographical data (Table 1). The use of these data in thesix modules is described in Part 1 (Hanasaki et al., 2008).
2.2 Integration of simulations
To run the fully coupled global water resources model, a se-ries of simulations is required (Fig. 1a). First, the land sur-face hydrology module and the river routing module werecoupled, and a global natural hydrological simulation wasconducted for 10 years from 1986 to 1995 (hereafter “NATsimulation”, short for natural hydrological cycle simulation).The purpose of this simulation was to obtain mean hydrolog-ical variables. These items included mean annual streamflowfor the reservoir operation module, mean monthly runoff forthe environmental flow requirement module, and mean dailyevaporation and potential evaporation to estimate the cropcalendar.
Second, a global cropping calendar was estimated by con-ducting a special simulation using the crop growth mod-ule (hereafter “CAL simulation,” short for crop calendarestimation simulation). In this simulation, four hydrom-eteorological inputs were used: mean daily air tempera-ture, shortwave radiation, evapotranspiration, and potential
Hydrol. Earth Syst. Sci., 12, 1027–1037, 2008 www.hydrol-earth-syst-sci.net/12/1027/2008/
N. Hanasaki et al.: An integrated global water resources model – Part 2 1029
evapotranspiration. The latter two variables were obtainedfrom the NAT simulation. After this, 365 sets of crop yieldwere calculated for each grid by shifting the starting date ofcropping from 1 January to 31 December, and the croppingdate that produced the largest yield in a year was determined.The crop yield was estimated by the crop growth modulebased on concepts of heat unit theory, potential biomass, anda harvest index (e.g., temperature, shortwave radiation, andwater during a cropping period determine crop yield). If thetemperature in the cropping period fell below the base tem-perature (see Sect. 3.3 and Appendix D of Hanasaki et al.,2008), the crop died and the crop yield was zero, except forwinter crops. The cropping calendar for double crops wasalso estimated for the remaining noncropping period so asnot to overlap the planting to harvesting period of the firstcrop. The minimum interval between two cropping periodswas set at 15 days. This simulation was conducted for all 19types of crops (18 specific crop types and one generic cropparameter).
Third, a simulation was conducted to estimate irrigationwater demand. The land surface hydrology and crop growthmodules were coupled, and a global hydrological simulationwas conducted for 10 years from 1986 to 1995 (hereafter“IRG simulation”, short for ideally irrigated simulation). Theirrigation water requirement was calculated from the deficitof soil moisture in irrigated fields during the cropping period(see Sect. 3.3 of Hanasaki et al., 2008). In this simulation,the irrigation water requirement was fully applied during thecropping period from an imaginary source of water. Thisamount of water corresponded to the consumptive irrigationwater demand. Finally, all six modules were coupled, andglobal water resources were simulated from 1986 to 1995(hereafter “FUL simulation,” short for fully coupled simula-tion).
The six modules are coupled as follows (Fig. 1b). First,the land surface hydrology module is used to calculate en-ergy and water balances on land surfaces. Next, the cropgrowth model is activated. The input shortwave radiation andair temperature are identical to those of the land surface hy-drology module, and evaporation and potential evaporationare the simulated results of the land surface hydrology mod-ule. Consumptive agricultural water demand is estimatedduring the cropping period. Runoff is routed by the riverrouting model, and streamflow is calculated. This calcula-tion is conducted from upper stream grids to lower streamgrids; if reservoirs are geo-referenced in the calculated gridcells, the reservoir operation module calculates release, stor-age, and altered streamflow. The environmental flow mod-ule simulates the monthly environmental flow requirementfrom the monthly runoff. Finally, the anthropogenic waterwithdrawal module links water demand and streamflow. Thismodule withdraws domestic, industrial, and agricultural wa-ter from streamflow in that order. Withdrawal is controlled toremain at or above the environmental flow requirement. Theagricultural water that is withdrawn is added to the soil mois-
ture of irrigated lands, and the domestic and industrial waterthat is withdrawn is removed from the integrated model sys-tem (i.e., it disappears without the closure of water and en-ergy balances on the land surface). In reality, some portionof withdrawn water evaporates (water consumption) and theremaining portion returns to rivers or aquifers (return flow).For simplicity, the model takes only consumptive water useinto account, and only the consumptive portion is withdrawnfrom the water source.
For all simulations, the meteorological input for the firstyear of the simulation period was iteratively given to the cou-pled model until soil moisture, river channel water storage,and reservoir storage reached equilibrium. A 10-year simu-lation was then conducted.
3 Validation
We validated the estimated crop calendar, irrigation waterwithdrawal, and environmental flow requirement and com-pared our results with those from earlier studies. The es-timation of the timing and amount of the agricultural wa-ter requirement is critical in water resources assessment be-cause agricultural water makes up 66% of the total waterwithdrawal and 85% of the total water consumption (Shik-lomanov, 2000). The validation of the timing and volumeof simulated water availability (i.e., runoff and streamflow)is described in Part I of this report (Hanasaki et al., 2008).The validation of the reservoir operation module is omittedbecause it has already been described elsewhere (Hanasaki etal., 2006). The withdrawal module is also omitted because itcouples with the water fluxes of the five modules, but doesnot generate any new independent variables.
3.1 Crop calendar
The estimated crop calendar was compared with that reportedby the World Agricultural Outlook Board of the US Depart-ment of Agriculture (1994; hereafter WAOB94), which pro-vides the planting and harvesting dates of major crops formajor countries of the world. We compiled planting datesand harvesting dates of three major grains, namely, wheat,maize, and rice, for 10 countries with the highest produc-tion in the world in 2000 (Food and Agriculture Organiza-tion, 2007a; Fig. 2). WAOB94 normally provides one gen-eral cropping calendar for a country, and both planting dateand harvesting date have a wide range of up to four months.
Wheat is the most widely planted crop in the world (Ishiiet al., 1999). Cropping can be roughly divided into two pat-terns: spring wheat, which is planted in spring and harvestedin autumn; and winter wheat, which is planted in autumn andharvested in early summer (Fig. 2a). For spring wheat, boththe simulated planting dates and harvesting dates in the USA,Canada, and Russia generally agreed with those of WAOB94.In China, both the planting date and the harvesting date were
www.hydrol-earth-syst-sci.net/12/1027/2008/ Hydrol. Earth Syst. Sci., 12, 1027–1037, 2008
1030 N. Hanasaki et al.: An integrated global water resources model – Part 2
0 30 60 90 120 150 180 210 240 270 300 330 360
DOY
0 30 60 90 120 150 180 210 240 270 300 330 360
DOY
GBR
0 30 60 90 120 150 180 210 240 270 300 330 360
DOY
0 30 60 90 120 150 180 210 240 270 300 330 360
DOY
0 30 60 90 120 150 180 210 240 270 300 330 360
DOY
0 30 60 90 120 150 180 210 240 270 300 330 360
DOY
0 30 60 90 120 150 180 210 240 270 300 330 360
DOY
0 30 60 90 120 150 180 210 240 270 300 330 360
DOY
0 30 60 90 120 150 180 210 240 270 300 330 360
DOY
0 30 60 90 120 150 180 210 240 270 300 330 360
DOY
0 30 60 90 120 150 180 210 240 270 300 330 360
DOY
0 30 60 90 120 150 180 210 240 270 300 330 360
DOY
PAK
0 30 60 90 120 150 180 210 240 270 300 330 360
DOY
0 30 60 90 120 150 180 210 240 270 300 330 360
DOY
0 30 60 90 120 150 180 210 240 270 300 330 360
DOY
0 30 60 90 120 150 180 210 240 270 300 330 360
DOY
0 30 60 90 120 150 180 210 240 270 300 330 360
DOY
0 30 60 90 120 150 180 210 240 270 300 330 360
DOY
0 30 60 90 120 150 180 210 240 270 300 330 360
DOY
0 30 60 90 120 150 180 210 240 270 300 330 360
DOY
0 30 60 90 120 150 180 210 240 270 300 330 360
DOY
0 30 60 90 120 150 180 210 240 270 300 330 360
DOY
GER
0 30 60 90 120 150 180 210 240 270 300 330 360
DOY
0 30 60 90 120 150 180 210 240 270 300 330 360
DOY
0 30 60 90 120 150 180 210 240 270 300 330 360
DOY
0 30 60 90 120 150 180 210 240 270 300 330 360
DOY
0 30 60 90 120 150 180 210 240 270 300 330 360
DOY
0 30 60 90 120 150 180 210 240 270 300 330 360
DOY
0 30 60 90 120 150 180 210 240 270 300 330 360
DOY
0 30 60 90 120 150 180 210 240 270 300 330 360
DOY
0 30 60 90 120 150 180 210 240 270 300 330 360
DOY
0 30 60 90 120 150 180 210 240 270 300 330 360
DOY
AUS
0 30 60 90 120 150 180 210 240 270 300 330 360
DOY
0 30 60 90 120 150 180 210 240 270 300 330 360
DOY
0 30 60 90 120 150 180 210 240 270 300 330 360
DOY
0 30 60 90 120 150 180 210 240 270 300 330 360
DOY
0 30 60 90 120 150 180 210 240 270 300 330 360
DOY
0 30 60 90 120 150 180 210 240 270 300 330 360
DOY
0 30 60 90 120 150 180 210 240 270 300 330 360
DOY
0 30 60 90 120 150 180 210 240 270 300 330 360
DOY
0 30 60 90 120 150 180 210 240 270 300 330 360
DOY
0 30 60 90 120 150 180 210 240 270 300 330 360
DOY
CAN
0 30 60 90 120 150 180 210 240 270 300 330 360
DOY
0 30 60 90 120 150 180 210 240 270 300 330 360
DOY
0 30 60 90 120 150 180 210 240 270 300 330 360
DOY
0 30 60 90 120 150 180 210 240 270 300 330 360
DOY
0 30 60 90 120 150 180 210 240 270 300 330 360
DOY
0 30 60 90 120 150 180 210 240 270 300 330 360
DOY
0 30 60 90 120 150 180 210 240 270 300 330 360
DOY
0 30 60 90 120 150 180 210 240 270 300 330 360
DOY
0 30 60 90 120 150 180 210 240 270 300 330 360
DOY
0 30 60 90 120 150 180 210 240 270 300 330 360
DOY
RUS(S)
0 30 60 90 120 150 180 210 240 270 300 330 360
DOY
0 30 60 90 120 150 180 210 240 270 300 330 360
DOY
0 30 60 90 120 150 180 210 240 270 300 330 360
DOY
0 30 60 90 120 150 180 210 240 270 300 330 360
DOY
0 30 60 90 120 150 180 210 240 270 300 330 360
DOY
0 30 60 90 120 150 180 210 240 270 300 330 360
DOY
0 30 60 90 120 150 180 210 240 270 300 330 360
DOY
0 30 60 90 120 150 180 210 240 270 300 330 360
DOY
0 30 60 90 120 150 180 210 240 270 300 330 360
DOY
0 30 60 90 120 150 180 210 240 270 300 330 360
DOY
RUS(W)
0 30 60 90 120 150 180 210 240 270 300 330 360
DOY
0 30 60 90 120 150 180 210 240 270 300 330 360
DOY
0 30 60 90 120 150 180 210 240 270 300 330 360
DOY
0 30 60 90 120 150 180 210 240 270 300 330 360
DOY
0 30 60 90 120 150 180 210 240 270 300 330 360
DOY
0 30 60 90 120 150 180 210 240 270 300 330 360
DOY
0 30 60 90 120 150 180 210 240 270 300 330 360
DOY
0 30 60 90 120 150 180 210 240 270 300 330 360
DOY
0 30 60 90 120 150 180 210 240 270 300 330 360
DOY
0 30 60 90 120 150 180 210 240 270 300 330 360
DOY
FRA
0 30 60 90 120 150 180 210 240 270 300 330 360
DOY
0 30 60 90 120 150 180 210 240 270 300 330 360
DOY
0 30 60 90 120 150 180 210 240 270 300 330 360
DOY
0 30 60 90 120 150 180 210 240 270 300 330 360
DOY
0 30 60 90 120 150 180 210 240 270 300 330 360
DOY
0 30 60 90 120 150 180 210 240 270 300 330 360
DOY
0 30 60 90 120 150 180 210 240 270 300 330 360
DOY
0 30 60 90 120 150 180 210 240 270 300 330 360
DOY
0 30 60 90 120 150 180 210 240 270 300 330 360
DOY
0 30 60 90 120 150 180 210 240 270 300 330 360
DOY
USA(S)
0 30 60 90 120 150 180 210 240 270 300 330 360
DOY
0 30 60 90 120 150 180 210 240 270 300 330 360
DOY
0 30 60 90 120 150 180 210 240 270 300 330 360
DOY
0 30 60 90 120 150 180 210 240 270 300 330 360
DOY
0 30 60 90 120 150 180 210 240 270 300 330 360
DOY
0 30 60 90 120 150 180 210 240 270 300 330 360
DOY
0 30 60 90 120 150 180 210 240 270 300 330 360
DOY
0 30 60 90 120 150 180 210 240 270 300 330 360
DOY
0 30 60 90 120 150 180 210 240 270 300 330 360
DOY
0 30 60 90 120 150 180 210 240 270 300 330 360
DOY
USA(W)
0 30 60 90 120 150 180 210 240 270 300 330 360
DOY
0 30 60 90 120 150 180 210 240 270 300 330 360
DOY
0 30 60 90 120 150 180 210 240 270 300 330 360
DOY
0 30 60 90 120 150 180 210 240 270 300 330 360
DOY
0 30 60 90 120 150 180 210 240 270 300 330 360
DOY
0 30 60 90 120 150 180 210 240 270 300 330 360
DOY
0 30 60 90 120 150 180 210 240 270 300 330 360
DOY
0 30 60 90 120 150 180 210 240 270 300 330 360
DOY
0 30 60 90 120 150 180 210 240 270 300 330 360
DOY
0 30 60 90 120 150 180 210 240 270 300 330 360
DOY
IND
0 30 60 90 120 150 180 210 240 270 300 330 360
DOY
0 30 60 90 120 150 180 210 240 270 300 330 360
DOY
0 30 60 90 120 150 180 210 240 270 300 330 360
DOY
0 30 60 90 120 150 180 210 240 270 300 330 360
DOY
0 30 60 90 120 150 180 210 240 270 300 330 360
DOY
0 30 60 90 120 150 180 210 240 270 300 330 360
DOY
0 30 60 90 120 150 180 210 240 270 300 330 360
DOY
0 30 60 90 120 150 180 210 240 270 300 330 360
DOY
0 30 60 90 120 150 180 210 240 270 300 330 360
DOY
0 30 60 90 120 150 180 210 240 270 300 330 360
DOY
CHN(S)
0 30 60 90 120 150 180 210 240 270 300 330 360
DOY
0 30 60 90 120 150 180 210 240 270 300 330 360
DOY
0 30 60 90 120 150 180 210 240 270 300 330 360
DOY
0 30 60 90 120 150 180 210 240 270 300 330 360
DOY
0 30 60 90 120 150 180 210 240 270 300 330 360
DOY
0 30 60 90 120 150 180 210 240 270 300 330 360
DOY
0 30 60 90 120 150 180 210 240 270 300 330 360
DOY
0 30 60 90 120 150 180 210 240 270 300 330 360
DOY
0 30 60 90 120 150 180 210 240 270 300 330 360
DOY
0 30 60 90 120 150 180 210 240 270 300 330 360
DOY
CHN(W)
0 30 60 90 120 150 180 210 240 270 300 330 360
DOY
0 30 60 90 120 150 180 210 240 270 300 330 360
DOY
0 30 60 90 120 150 180 210 240 270 300 330 360
DOY
0 30 60 90 120 150 180 210 240 270 300 330 360
DOY
0 30 60 90 120 150 180 210 240 270 300 330 360
DOY
0 30 60 90 120 150 180 210 240 270 300 330 360
DOY
0 30 60 90 120 150 180 210 240 270 300 330 360
DOY
0 30 60 90 120 150 180 210 240 270 300 330 360
DOY
Wheat
0 30 60 90 120 150 180 210 240 270 300 330 360
DOY
0 30 60 90 120 150 180 210 240 270 300 330 360
DOY
IDN
0 30 60 90 120 150 180 210 240 270 300 330 360
DOY
0 30 60 90 120 150 180 210 240 270 300 330 360
DOY
0 30 60 90 120 150 180 210 240 270 300 330 360
DOY
0 30 60 90 120 150 180 210 240 270 300 330 360
DOY
0 30 60 90 120 150 180 210 240 270 300 330 360
DOY
0 30 60 90 120 150 180 210 240 270 300 330 360
DOY
0 30 60 90 120 150 180 210 240 270 300 330 360
DOY
0 30 60 90 120 150 180 210 240 270 300 330 360
DOY
0 30 60 90 120 150 180 210 240 270 300 330 360
DOY
0 30 60 90 120 150 180 210 240 270 300 330 360
DOY
ITA
0 30 60 90 120 150 180 210 240 270 300 330 360
DOY
0 30 60 90 120 150 180 210 240 270 300 330 360
DOY
0 30 60 90 120 150 180 210 240 270 300 330 360
DOY
0 30 60 90 120 150 180 210 240 270 300 330 360
DOY
0 30 60 90 120 150 180 210 240 270 300 330 360
DOY
0 30 60 90 120 150 180 210 240 270 300 330 360
DOY
0 30 60 90 120 150 180 210 240 270 300 330 360
DOY
0 30 60 90 120 150 180 210 240 270 300 330 360
DOY
0 30 60 90 120 150 180 210 240 270 300 330 360
DOY
0 30 60 90 120 150 180 210 240 270 300 330 360
DOY
RSA
0 30 60 90 120 150 180 210 240 270 300 330 360
DOY
0 30 60 90 120 150 180 210 240 270 300 330 360
DOY
0 30 60 90 120 150 180 210 240 270 300 330 360
DOY
0 30 60 90 120 150 180 210 240 270 300 330 360
DOY
0 30 60 90 120 150 180 210 240 270 300 330 360
DOY
0 30 60 90 120 150 180 210 240 270 300 330 360
DOY
0 30 60 90 120 150 180 210 240 270 300 330 360
DOY
0 30 60 90 120 150 180 210 240 270 300 330 360
DOY
0 30 60 90 120 150 180 210 240 270 300 330 360
DOY
0 30 60 90 120 150 180 210 240 270 300 330 360
DOY
IND
0 30 60 90 120 150 180 210 240 270 300 330 360
DOY
0 30 60 90 120 150 180 210 240 270 300 330 360
DOY
0 30 60 90 120 150 180 210 240 270 300 330 360
DOY
0 30 60 90 120 150 180 210 240 270 300 330 360
DOY
0 30 60 90 120 150 180 210 240 270 300 330 360
DOY
0 30 60 90 120 150 180 210 240 270 300 330 360
DOY
0 30 60 90 120 150 180 210 240 270 300 330 360
DOY
0 30 60 90 120 150 180 210 240 270 300 330 360
DOY
0 30 60 90 120 150 180 210 240 270 300 330 360
DOY
0 30 60 90 120 150 180 210 240 270 300 330 360
DOY
0 30 60 90 120 150 180 210 240 270 300 330 360
DOY
0 30 60 90 120 150 180 210 240 270 300 330 360
DOY
0 30 60 90 120 150 180 210 240 270 300 330 360
DOY
0 30 60 90 120 150 180 210 240 270 300 330 360
DOY
FRA
0 30 60 90 120 150 180 210 240 270 300 330 360
DOY
0 30 60 90 120 150 180 210 240 270 300 330 360
DOY
0 30 60 90 120 150 180 210 240 270 300 330 360
DOY
0 30 60 90 120 150 180 210 240 270 300 330 360
DOY
0 30 60 90 120 150 180 210 240 270 300 330 360
DOY
0 30 60 90 120 150 180 210 240 270 300 330 360
DOY
0 30 60 90 120 150 180 210 240 270 300 330 360
DOY
0 30 60 90 120 150 180 210 240 270 300 330 360
DOY
0 30 60 90 120 150 180 210 240 270 300 330 360
DOY
0 30 60 90 120 150 180 210 240 270 300 330 360
DOY
ARG
0 30 60 90 120 150 180 210 240 270 300 330 360
DOY
0 30 60 90 120 150 180 210 240 270 300 330 360
DOY
0 30 60 90 120 150 180 210 240 270 300 330 360
DOY
0 30 60 90 120 150 180 210 240 270 300 330 360
DOY
0 30 60 90 120 150 180 210 240 270 300 330 360
DOY
0 30 60 90 120 150 180 210 240 270 300 330 360
DOY
0 30 60 90 120 150 180 210 240 270 300 330 360
DOY
0 30 60 90 120 150 180 210 240 270 300 330 360
DOY
0 30 60 90 120 150 180 210 240 270 300 330 360
DOY
0 30 60 90 120 150 180 210 240 270 300 330 360
DOY
MEX
0 30 60 90 120 150 180 210 240 270 300 330 360
DOY
0 30 60 90 120 150 180 210 240 270 300 330 360
DOY
0 30 60 90 120 150 180 210 240 270 300 330 360
DOY
0 30 60 90 120 150 180 210 240 270 300 330 360
DOY
0 30 60 90 120 150 180 210 240 270 300 330 360
DOY
0 30 60 90 120 150 180 210 240 270 300 330 360
DOY
0 30 60 90 120 150 180 210 240 270 300 330 360
DOY
0 30 60 90 120 150 180 210 240 270 300 330 360
DOY
0 30 60 90 120 150 180 210 240 270 300 330 360
DOY
0 30 60 90 120 150 180 210 240 270 300 330 360
DOY
BRA
0 30 60 90 120 150 180 210 240 270 300 330 360
DOY
0 30 60 90 120 150 180 210 240 270 300 330 360
DOY
0 30 60 90 120 150 180 210 240 270 300 330 360
DOY
0 30 60 90 120 150 180 210 240 270 300 330 360
DOY
0 30 60 90 120 150 180 210 240 270 300 330 360
DOY
0 30 60 90 120 150 180 210 240 270 300 330 360
DOY
0 30 60 90 120 150 180 210 240 270 300 330 360
DOY
0 30 60 90 120 150 180 210 240 270 300 330 360
DOY
0 30 60 90 120 150 180 210 240 270 300 330 360
DOY
0 30 60 90 120 150 180 210 240 270 300 330 360
DOY
CHN
0 30 60 90 120 150 180 210 240 270 300 330 360
DOY
0 30 60 90 120 150 180 210 240 270 300 330 360
DOY
0 30 60 90 120 150 180 210 240 270 300 330 360
DOY
0 30 60 90 120 150 180 210 240 270 300 330 360
DOY
0 30 60 90 120 150 180 210 240 270 300 330 360
DOY
0 30 60 90 120 150 180 210 240 270 300 330 360
DOY
0 30 60 90 120 150 180 210 240 270 300 330 360
DOY
0 30 60 90 120 150 180 210 240 270 300 330 360
DOY
0 30 60 90 120 150 180 210 240 270 300 330 360
DOY
0 30 60 90 120 150 180 210 240 270 300 330 360
DOY
USA
0 30 60 90 120 150 180 210 240 270 300 330 360
DOY
0 30 60 90 120 150 180 210 240 270 300 330 360
DOY
0 30 60 90 120 150 180 210 240 270 300 330 360
DOY
0 30 60 90 120 150 180 210 240 270 300 330 360
DOY
0 30 60 90 120 150 180 210 240 270 300 330 360
DOY
0 30 60 90 120 150 180 210 240 270 300 330 360
DOY
0 30 60 90 120 150 180 210 240 270 300 330 360
DOY
0 30 60 90 120 150 180 210 240 270 300 330 360
DOY
Maize
0 30 60 90 120 150 180 210 240 270 300 330 360
DOY
0 30 60 90 120 150 180 210 240 270 300 330 360
DOY
PAK
0 30 60 90 120 150 180 210 240 270 300 330 360
DOY
0 30 60 90 120 150 180 210 240 270 300 330 360
DOY
0 30 60 90 120 150 180 210 240 270 300 330 360
DOY
0 30 60 90 120 150 180 210 240 270 300 330 360
DOY
0 30 60 90 120 150 180 210 240 270 300 330 360
DOY
0 30 60 90 120 150 180 210 240 270 300 330 360
DOY
0 30 60 90 120 150 180 210 240 270 300 330 360
DOY
0 30 60 90 120 150 180 210 240 270 300 330 360
DOY
0 30 60 90 120 150 180 210 240 270 300 330 360
DOY
0 30 60 90 120 150 180 210 240 270 300 330 360
DOY
USA
0 30 60 90 120 150 180 210 240 270 300 330 360
DOY
0 30 60 90 120 150 180 210 240 270 300 330 360
DOY
0 30 60 90 120 150 180 210 240 270 300 330 360
DOY
0 30 60 90 120 150 180 210 240 270 300 330 360
DOY
0 30 60 90 120 150 180 210 240 270 300 330 360
DOY
0 30 60 90 120 150 180 210 240 270 300 330 360
DOY
0 30 60 90 120 150 180 210 240 270 300 330 360
DOY
0 30 60 90 120 150 180 210 240 270 300 330 360
DOY
0 30 60 90 120 150 180 210 240 270 300 330 360
DOY
0 30 60 90 120 150 180 210 240 270 300 330 360
DOY
BRA
0 30 60 90 120 150 180 210 240 270 300 330 360
DOY
0 30 60 90 120 150 180 210 240 270 300 330 360
DOY
0 30 60 90 120 150 180 210 240 270 300 330 360
DOY
0 30 60 90 120 150 180 210 240 270 300 330 360
DOY
0 30 60 90 120 150 180 210 240 270 300 330 360
DOY
0 30 60 90 120 150 180 210 240 270 300 330 360
DOY
0 30 60 90 120 150 180 210 240 270 300 330 360
DOY
0 30 60 90 120 150 180 210 240 270 300 330 360
DOY
0 30 60 90 120 150 180 210 240 270 300 330 360
DOY
0 30 60 90 120 150 180 210 240 270 300 330 360
DOY
JPN
0 30 60 90 120 150 180 210 240 270 300 330 360
DOY
0 30 60 90 120 150 180 210 240 270 300 330 360
DOY
0 30 60 90 120 150 180 210 240 270 300 330 360
DOY
0 30 60 90 120 150 180 210 240 270 300 330 360
DOY
0 30 60 90 120 150 180 210 240 270 300 330 360
DOY
0 30 60 90 120 150 180 210 240 270 300 330 360
DOY
0 30 60 90 120 150 180 210 240 270 300 330 360
DOY
0 30 60 90 120 150 180 210 240 270 300 330 360
DOY
0 30 60 90 120 150 180 210 240 270 300 330 360
DOY
0 30 60 90 120 150 180 210 240 270 300 330 360
DOY
MMR
0 30 60 90 120 150 180 210 240 270 300 330 360
DOY
0 30 60 90 120 150 180 210 240 270 300 330 360
DOY
0 30 60 90 120 150 180 210 240 270 300 330 360
DOY
0 30 60 90 120 150 180 210 240 270 300 330 360
DOY
0 30 60 90 120 150 180 210 240 270 300 330 360
DOY
0 30 60 90 120 150 180 210 240 270 300 330 360
DOY
0 30 60 90 120 150 180 210 240 270 300 330 360
DOY
0 30 60 90 120 150 180 210 240 270 300 330 360
DOY
0 30 60 90 120 150 180 210 240 270 300 330 360
DOY
0 30 60 90 120 150 180 210 240 270 300 330 360
DOY
THA
0 30 60 90 120 150 180 210 240 270 300 330 360
DOY
0 30 60 90 120 150 180 210 240 270 300 330 360
DOY
0 30 60 90 120 150 180 210 240 270 300 330 360
DOY
0 30 60 90 120 150 180 210 240 270 300 330 360
DOY
0 30 60 90 120 150 180 210 240 270 300 330 360
DOY
0 30 60 90 120 150 180 210 240 270 300 330 360
DOY
0 30 60 90 120 150 180 210 240 270 300 330 360
DOY
0 30 60 90 120 150 180 210 240 270 300 330 360
DOY
0 30 60 90 120 150 180 210 240 270 300 330 360
DOY
0 30 60 90 120 150 180 210 240 270 300 330 360
DOY
BGD
0 30 60 90 120 150 180 210 240 270 300 330 360
DOY
0 30 60 90 120 150 180 210 240 270 300 330 360
DOY
0 30 60 90 120 150 180 210 240 270 300 330 360
DOY
0 30 60 90 120 150 180 210 240 270 300 330 360
DOY
0 30 60 90 120 150 180 210 240 270 300 330 360
DOY
0 30 60 90 120 150 180 210 240 270 300 330 360
DOY
0 30 60 90 120 150 180 210 240 270 300 330 360
DOY
0 30 60 90 120 150 180 210 240 270 300 330 360
DOY
0 30 60 90 120 150 180 210 240 270 300 330 360
DOY
0 30 60 90 120 150 180 210 240 270 300 330 360
DOY
IDN
0 30 60 90 120 150 180 210 240 270 300 330 360
DOY
0 30 60 90 120 150 180 210 240 270 300 330 360
DOY
0 30 60 90 120 150 180 210 240 270 300 330 360
DOY
0 30 60 90 120 150 180 210 240 270 300 330 360
DOY
0 30 60 90 120 150 180 210 240 270 300 330 360
DOY
0 30 60 90 120 150 180 210 240 270 300 330 360
DOY
0 30 60 90 120 150 180 210 240 270 300 330 360
DOY
0 30 60 90 120 150 180 210 240 270 300 330 360
DOY
0 30 60 90 120 150 180 210 240 270 300 330 360
DOY
0 30 60 90 120 150 180 210 240 270 300 330 360
DOY
0 30 60 90 120 150 180 210 240 270 300 330 360
DOY
0 30 60 90 120 150 180 210 240 270 300 330 360
DOY
0 30 60 90 120 150 180 210 240 270 300 330 360
DOY
0 30 60 90 120 150 180 210 240 270 300 330 360
DOY
IND
0 30 60 90 120 150 180 210 240 270 300 330 360
DOY
0 30 60 90 120 150 180 210 240 270 300 330 360
DOY
0 30 60 90 120 150 180 210 240 270 300 330 360
DOY
0 30 60 90 120 150 180 210 240 270 300 330 360
DOY
0 30 60 90 120 150 180 210 240 270 300 330 360
DOY
0 30 60 90 120 150 180 210 240 270 300 330 360
DOY
0 30 60 90 120 150 180 210 240 270 300 330 360
DOY
0 30 60 90 120 150 180 210 240 270 300 330 360
DOY
0 30 60 90 120 150 180 210 240 270 300 330 360
DOY
0 30 60 90 120 150 180 210 240 270 300 330 360
DOY
0 30 60 90 120 150 180 210 240 270 300 330 360
DOY
0 30 60 90 120 150 180 210 240 270 300 330 360
DOY
0 30 60 90 120 150 180 210 240 270 300 330 360
DOY
0 30 60 90 120 150 180 210 240 270 300 330 360
DOY
CHN
0 30 60 90 120 150 180 210 240 270 300 330 360
DOY
0 30 60 90 120 150 180 210 240 270 300 330 360
DOY
0 30 60 90 120 150 180 210 240 270 300 330 360
DOY
0 30 60 90 120 150 180 210 240 270 300 330 360
DOY
0 30 60 90 120 150 180 210 240 270 300 330 360
DOY
0 30 60 90 120 150 180 210 240 270 300 330 360
DOY
0 30 60 90 120 150 180 210 240 270 300 330 360
DOY
0 30 60 90 120 150 180 210 240 270 300 330 360
DOY
Rice
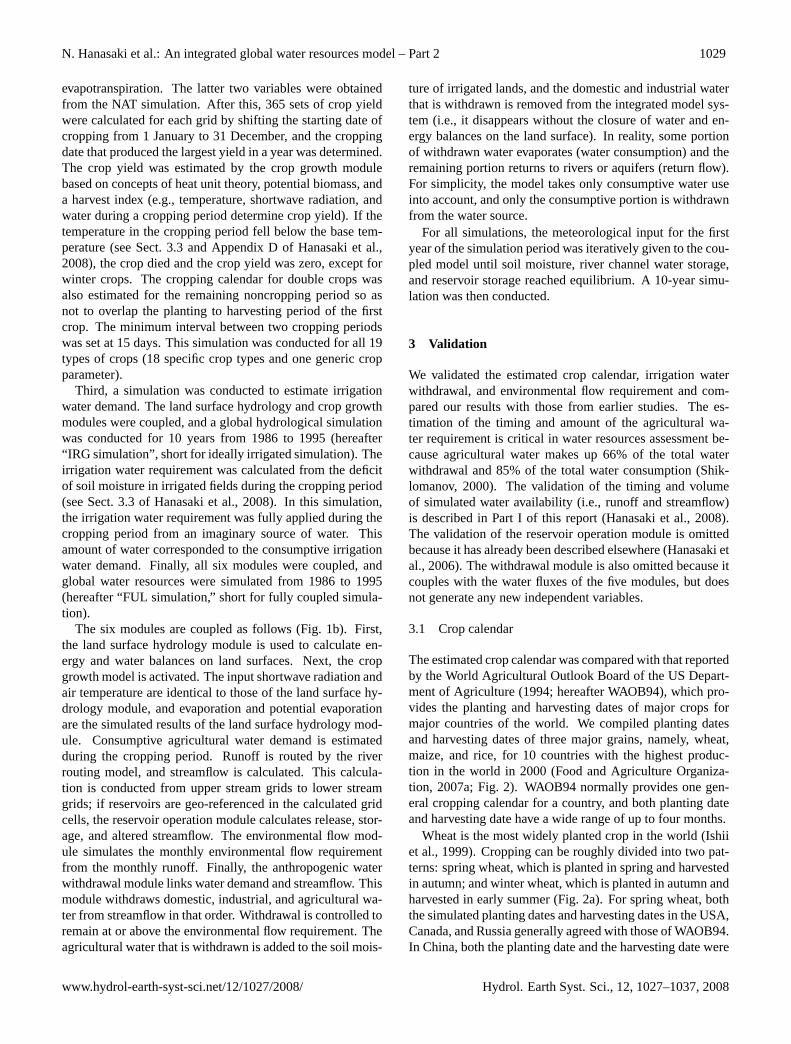
Fig. 2. Simulated planting and harvesting dates for(a) wheat,(b)maize, and(c) rice. The cropping calendars of 10 countries areshown for each crop with the largest production. Green plots showthe simulated planting date for each grid; red plots show the har-vesting date. Grids with>100 km2 of cropland with>3% of thecropland occupied by the species were selected. Green boxes showthe observed planting period; red boxes show the harvesting period(World Agricultural Outlook Board US Department of Agriculture,1994). In Fig. 2a, (W) denotes winter wheat, and (S) denotes springwheat.
approximately 1 month later than those of the WAOB94. Forwinter wheat, the simulated planting dates were reproducedfairly well, except for China and India, whereas the sim-ulated harvesting dates were sometimes 1 month (Russia,Britain) to 2 months (France, Germany) earlier than thoseof the WAOB94.
The planting dates of winter wheat in China and India weresplit into two groups: one resembled winter wheat and theother resembled spring wheat. This variation reflected dif-ferences in regional performance. In India, the simulatedplanting date of northwestern India agreed well with theobservations, but in north central to northeastern India, thesimulated planting date was 2–3 months earlier than in theWAOB94 and the harvesting date was before the arrival ofwinter. In China, the simulated planting date of the south-ern North China Plain was well simulated, but the remain-ing areas such as the Sichuan Basin and central North ChinaPlain had a simulated crop calendar that resembled springwheat; however, in reality, winter wheat was expected. Theseerroneous simulated planting periods were caused by waterstress during the cropping period. In both China and India,low precipitation in winter restricted the crop yield of winterwheat to levels below those of spring wheat. We estimatedthe planting date under ideal water conditions (i.e., no waterstress during the cropping period). In this case, the plantingdate was well reproduced (not shown). In these regions, thecropping calendar could be improved by irrigation. However,because the WAOB94 did not separate the crop calendar intoirrigated and nonirrigated, we used the estimation with noirrigation. For maize, the planting dates in major croppingcountries, namely, the USA, China, Brazil, and Mexico werewell reproduced (Fig. 2b). Harvesting dates were also wellreproduced in China and Brazil, but they were approximately1 month earlier in the USA and Mexico.
More than 90% of rice is produced in the Asian monsoonregion (Ishii et al., 1999). The simulated planting dates andharvesting dates were fairly captured in the 10 selected coun-tries (Fig. 2c). In the top three countries, i.e., China, India,and Indonesia, both the planting date and harvesting dateagreed with observations in most of these areas. There wereexceptional grids with large differences from observations,but most of them were attributed to the vast climate region ofthese countries because they were at the margins of the ma-jor cropping areas. In Thailand and Myanmar, the plantingdate was estimated to be 1–2 months earlier and the crop-ping period was shorter than in WAOB94. In these countries,floodwater inundates paddy fields, but this process was notincorporated in our system.
In general, the planting dates and harvesting dates of ma-jor crops in major cultivation areas agreed with the WAOB94dates. The error in simulated crop planting dates was lessthan ±1 mo in major countries. Exceptions were winterwheat in China and India and rice in Thailand. Therewas a tendency toward the early estimation of harvest-ing dates, and the cropping periods were shorter than in
Hydrol. Earth Syst. Sci., 12, 1027–1037, 2008 www.hydrol-earth-syst-sci.net/12/1027/2008/

N. Hanasaki et al.: An integrated global water resources model – Part 2 1031
Table 2. Comparison of continental irrigation water withdrawal. Unit: km3 yr−1.
Area This study Doll and Siebert, FAO, Shiklomanov,(year) (1995) 20021 (1995) 2007 (2001) 2000 (1995)
Asia 2140 1880 1940 1790Europe 160 120 130 170Africa 140 140 180 140North America 240 190 200 200South America 120 100 190 180Oceania 20 30 20 20
Globe 2810 2450 2660 2500
1: Used in the global water resources assessment by Alcamo et al. (2003b).
0
10
20
30
40
50
60
70
80
90
100
SIM
[km
3 /yr
]
0 10 20 30 40 50 60 70 80 90 100
OBS[km3/yr]
0
10
20
30
40
50
60
70
80
90
100
SIM
[km
3 /yr
]
0 10 20 30 40 50 60 70 80 90 100
OBS[km3/yr]
0
10
20
30
40
50
60
70
80
90
100
SIM
[km
3 /yr
]
0 10 20 30 40 50 60 70 80 90 100
OBS[km3/yr]
0
10
20
30
40
50
60
70
80
90
100
SIM
[km
3 /yr
]
0 10 20 30 40 50 60 70 80 90 100
OBS[km3/yr]
0
10
20
30
40
50
60
70
80
90
100
SIM
[km
3 /yr
]
0 10 20 30 40 50 60 70 80 90 100
OBS[km3/yr]
0
10
20
30
40
50
60
70
80
90
100
SIM
[km
3 /yr
]
0 10 20 30 40 50 60 70 80 90 100
OBS[km3/yr]
0
10
20
30
40
50
60
70
80
90
100
SIM
[km
3 /yr
]
0 10 20 30 40 50 60 70 80 90 100
OBS[km3/yr]
0
10
20
30
40
50
60
70
80
90
100
SIM
[km
3 /yr
]
0 10 20 30 40 50 60 70 80 90 100
OBS[km3/yr]
Bangladesh
0
10
20
30
40
50
60
70
80
90
100
SIM
[km
3 /yr
]
0 10 20 30 40 50 60 70 80 90 100
OBS[km3/yr]
0
10
20
30
40
50
60
70
80
90
100
SIM
[km
3 /yr
]
0 10 20 30 40 50 60 70 80 90 100
OBS[km3/yr]
0
10
20
30
40
50
60
70
80
90
100
SIM
[km
3 /yr
]
0 10 20 30 40 50 60 70 80 90 100
OBS[km3/yr]
0
10
20
30
40
50
60
70
80
90
100
SIM
[km
3 /yr
]
0 10 20 30 40 50 60 70 80 90 100
OBS[km3/yr]
0
10
20
30
40
50
60
70
80
90
100
SIM
[km
3 /yr
]
0 10 20 30 40 50 60 70 80 90 100
OBS[km3/yr]
Brazil
0
10
20
30
40
50
60
70
80
90
100
SIM
[km
3 /yr
]
0 10 20 30 40 50 60 70 80 90 100
OBS[km3/yr]
0
10
20
30
40
50
60
70
80
90
100
SIM
[km
3 /yr
]
0 10 20 30 40 50 60 70 80 90 100
OBS[km3/yr]
0
10
20
30
40
50
60
70
80
90
100
SIM
[km
3 /yr
]
0 10 20 30 40 50 60 70 80 90 100
OBS[km3/yr]
Myanmar
0
10
20
30
40
50
60
70
80
90
100
SIM
[km
3 /yr
]
0 10 20 30 40 50 60 70 80 90 100
OBS[km3/yr]
0
10
20
30
40
50
60
70
80
90
100
SIM
[km
3 /yr
]
0 10 20 30 40 50 60 70 80 90 100
OBS[km3/yr]
0
10
20
30
40
50
60
70
80
90
100
SIM
[km
3 /yr
]
0 10 20 30 40 50 60 70 80 90 100
OBS[km3/yr]
0
10
20
30
40
50
60
70
80
90
100
SIM
[km
3 /yr
]
0 10 20 30 40 50 60 70 80 90 100
OBS[km3/yr]
0
10
20
30
40
50
60
70
80
90
100
SIM
[km
3 /yr
]
0 10 20 30 40 50 60 70 80 90 100
OBS[km3/yr]
0
10
20
30
40
50
60
70
80
90
100
SIM
[km
3 /yr
]
0 10 20 30 40 50 60 70 80 90 100
OBS[km3/yr]
0
10
20
30
40
50
60
70
80
90
100
SIM
[km
3 /yr
]
0 10 20 30 40 50 60 70 80 90 100
OBS[km3/yr]
0
10
20
30
40
50
60
70
80
90
100
SIM
[km
3 /yr
]
0 10 20 30 40 50 60 70 80 90 100
OBS[km3/yr]
0
10
20
30
40
50
60
70
80
90
100
SIM
[km
3 /yr
]
0 10 20 30 40 50 60 70 80 90 100
OBS[km3/yr]
0
10
20
30
40
50
60
70
80
90
100
SIM
[km
3 /yr
]
0 10 20 30 40 50 60 70 80 90 100
OBS[km3/yr]
0
10
20
30
40
50
60
70
80
90
100
SIM
[km
3 /yr
]
0 10 20 30 40 50 60 70 80 90 100
OBS[km3/yr]
0
10
20
30
40
50
60
70
80
90
100
SIM
[km
3 /yr
]
0 10 20 30 40 50 60 70 80 90 100
OBS[km3/yr]
0
10
20
30
40
50
60
70
80
90
100
SIM
[km
3 /yr
]
0 10 20 30 40 50 60 70 80 90 100
OBS[km3/yr]
0
10
20
30
40
50
60
70
80
90
100
SIM
[km
3 /yr
]
0 10 20 30 40 50 60 70 80 90 100
OBS[km3/yr]
0
10
20
30
40
50
60
70
80
90
100
SIM
[km
3 /yr
]
0 10 20 30 40 50 60 70 80 90 100
OBS[km3/yr]
0
10
20
30
40
50
60
70
80
90
100
SIM
[km
3 /yr
]
0 10 20 30 40 50 60 70 80 90 100
OBS[km3/yr]
0
10
20
30
40
50
60
70
80
90
100
SIM
[km
3 /yr
]
0 10 20 30 40 50 60 70 80 90 100
OBS[km3/yr]
0
10
20
30
40
50
60
70
80
90
100
SIM
[km
3 /yr
]
0 10 20 30 40 50 60 70 80 90 100
OBS[km3/yr]
0
10
20
30
40
50
60
70
80
90
100
SIM
[km
3 /yr
]
0 10 20 30 40 50 60 70 80 90 100
OBS[km3/yr]
0
10
20
30
40
50
60
70
80
90
100
SIM
[km
3 /yr
]
0 10 20 30 40 50 60 70 80 90 100
OBS[km3/yr]
0
10
20
30
40
50
60
70
80
90
100
SIM
[km
3 /yr
]
0 10 20 30 40 50 60 70 80 90 100
OBS[km3/yr]
0
10
20
30
40
50
60
70
80
90
100
SIM
[km
3 /yr
]
0 10 20 30 40 50 60 70 80 90 100
OBS[km3/yr]
0
10
20
30
40
50
60
70
80
90
100
SIM
[km
3 /yr
]
0 10 20 30 40 50 60 70 80 90 100
OBS[km3/yr]
0
10
20
30
40
50
60
70
80
90
100
SIM
[km
3 /yr
]
0 10 20 30 40 50 60 70 80 90 100
OBS[km3/yr]
0
10
20
30
40
50
60
70
80
90
100
SIM
[km
3 /yr
]
0 10 20 30 40 50 60 70 80 90 100
OBS[km3/yr]
0
10
20
30
40
50
60
70
80
90
100
SIM
[km
3 /yr
]
0 10 20 30 40 50 60 70 80 90 100
OBS[km3/yr]
0
10
20
30
40
50
60
70
80
90
100
SIM
[km
3 /yr
]
0 10 20 30 40 50 60 70 80 90 100
OBS[km3/yr]
0
10
20
30
40
50
60
70
80
90
100
SIM
[km
3 /yr
]
0 10 20 30 40 50 60 70 80 90 100
OBS[km3/yr]
0
10
20
30
40
50
60
70
80
90
100
SIM
[km
3 /yr
]
0 10 20 30 40 50 60 70 80 90 100
OBS[km3/yr]
0
10
20
30
40
50
60
70
80
90
100
SIM
[km
3 /yr
]
0 10 20 30 40 50 60 70 80 90 100
OBS[km3/yr]
0
10
20
30
40
50
60
70
80
90
100
SIM
[km
3 /yr
]
0 10 20 30 40 50 60 70 80 90 100
OBS[km3/yr]
0
10
20
30
40
50
60
70
80
90
100
SIM
[km
3 /yr
]
0 10 20 30 40 50 60 70 80 90 100
OBS[km3/yr]
0
10
20
30
40
50
60
70
80
90
100
SIM
[km
3 /yr
]
0 10 20 30 40 50 60 70 80 90 100
OBS[km3/yr]
Indonesia
0
10
20
30
40
50
60
70
80
90
100
SIM
[km
3 /yr
]
0 10 20 30 40 50 60 70 80 90 100
OBS[km3/yr]
Iran
0
10
20
30
40
50
60
70
80
90
100
SIM
[km
3 /yr
]
0 10 20 30 40 50 60 70 80 90 100
OBS[km3/yr]
Iraq
0
10
20
30
40
50
60
70
80
90
100
SIM
[km
3 /yr
]
0 10 20 30 40 50 60 70 80 90 100
OBS[km3/yr]
0
10
20
30
40
50
60
70
80
90
100
SIM
[km
3 /yr
]
0 10 20 30 40 50 60 70 80 90 100
OBS[km3/yr]
0
10
20
30
40
50
60
70
80
90
100
SIM
[km
3 /yr
]
0 10 20 30 40 50 60 70 80 90 100
OBS[km3/yr]
0
10
20
30
40
50
60
70
80
90
100
SIM
[km
3 /yr
]
0 10 20 30 40 50 60 70 80 90 100
OBS[km3/yr]
Japan
0
10
20
30
40
50
60
70
80
90
100
SIM
[km
3 /yr
]
0 10 20 30 40 50 60 70 80 90 100
OBS[km3/yr]
0
10
20
30
40
50
60
70
80
90
100
SIM
[km
3 /yr
]
0 10 20 30 40 50 60 70 80 90 100
OBS[km3/yr]
0
10
20
30
40
50
60
70
80
90
100
SIM
[km
3 /yr
]
0 10 20 30 40 50 60 70 80 90 100
OBS[km3/yr]
0
10
20
30
40
50
60
70
80
90
100
SIM
[km
3 /yr
]
0 10 20 30 40 50 60 70 80 90 100
OBS[km3/yr]
0
10
20
30
40
50
60
70
80
90
100
SIM
[km
3 /yr
]
0 10 20 30 40 50 60 70 80 90 100
OBS[km3/yr]
0
10
20
30
40
50
60
70
80
90
100
SIM
[km
3 /yr
]
0 10 20 30 40 50 60 70 80 90 100
OBS[km3/yr]
0
10
20
30
40
50
60
70
80
90
100
SIM
[km
3 /yr
]
0 10 20 30 40 50 60 70 80 90 100
OBS[km3/yr]
0
10
20
30
40
50
60
70
80
90
100
SIM
[km
3 /yr
]
0 10 20 30 40 50 60 70 80 90 100
OBS[km3/yr]
0
10
20
30
40
50
60
70
80
90
100
SIM
[km
3 /yr
]
0 10 20 30 40 50 60 70 80 90 100
OBS[km3/yr]
0
10
20
30
40
50
60
70
80
90
100
SIM
[km
3 /yr
]
0 10 20 30 40 50 60 70 80 90 100
OBS[km3/yr]
0
10
20
30
40
50
60
70
80
90
100
SIM
[km
3 /yr
]
0 10 20 30 40 50 60 70 80 90 100
OBS[km3/yr]
0
10
20
30
40
50
60
70
80
90
100
SIM
[km
3 /yr
]
0 10 20 30 40 50 60 70 80 90 100
OBS[km3/yr]
0
10
20
30
40
50
60
70
80
90
100
SIM
[km
3 /yr
]
0 10 20 30 40 50 60 70 80 90 100
OBS[km3/yr]
0
10
20
30
40
50
60
70
80
90
100
SIM
[km
3 /yr
]
0 10 20 30 40 50 60 70 80 90 100
OBS[km3/yr]
0
10
20
30
40
50
60
70
80
90
100
SIM
[km
3 /yr
]
0 10 20 30 40 50 60 70 80 90 100
OBS[km3/yr]
0
10
20
30
40
50
60
70
80
90
100
SIM
[km
3 /yr
]
0 10 20 30 40 50 60 70 80 90 100
OBS[km3/yr]
Mexico
0
10
20
30
40
50
60
70
80
90
100
SIM
[km
3 /yr
]
0 10 20 30 40 50 60 70 80 90 100
OBS[km3/yr]
0
10
20
30
40
50
60
70
80
90
100
SIM
[km
3 /yr
]
0 10 20 30 40 50 60 70 80 90 100
OBS[km3/yr]
0
10
20
30
40
50
60
70
80
90
100
SIM
[km
3 /yr
]
0 10 20 30 40 50 60 70 80 90 100
OBS[km3/yr]
0
10
20
30
40
50
60
70
80
90
100
SIM
[km
3 /yr
]
0 10 20 30 40 50 60 70 80 90 100
OBS[km3/yr]
0
10
20
30
40
50
60
70
80
90
100
SIM
[km
3 /yr
]
0 10 20 30 40 50 60 70 80 90 100
OBS[km3/yr]
0
10
20
30
40
50
60
70
80
90
100
SIM
[km
3 /yr
]
0 10 20 30 40 50 60 70 80 90 100
OBS[km3/yr]
0
10
20
30
40
50
60
70
80
90
100
SIM
[km
3 /yr
]
0 10 20 30 40 50 60 70 80 90 100
OBS[km3/yr]
0
10
20
30
40
50
60
70
80
90
100
SIM
[km
3 /yr
]
0 10 20 30 40 50 60 70 80 90 100
OBS[km3/yr]
0
10
20
30
40
50
60
70
80
90
100
SIM
[km
3 /yr
]
0 10 20 30 40 50 60 70 80 90 100
OBS[km3/yr]
0
10
20
30
40
50
60
70
80
90
100
SIM
[km
3 /yr
]
0 10 20 30 40 50 60 70 80 90 100
OBS[km3/yr]
0
10
20
30
40
50
60
70
80
90
100
SIM
[km
3 /yr
]
0 10 20 30 40 50 60 70 80 90 100
OBS[km3/yr]
0
10
20
30
40
50
60
70
80
90
100
SIM
[km
3 /yr
]
0 10 20 30 40 50 60 70 80 90 100
OBS[km3/yr]
0
10
20
30
40
50
60
70
80
90
100
SIM
[km
3 /yr
]
0 10 20 30 40 50 60 70 80 90 100
OBS[km3/yr]
0
10
20
30
40
50
60
70
80
90
100
SIM
[km
3 /yr
]
0 10 20 30 40 50 60 70 80 90 100
OBS[km3/yr]
0
10
20
30
40
50
60
70
80
90
100
SIM
[km
3 /yr
]
0 10 20 30 40 50 60 70 80 90 100
OBS[km3/yr]
0
10
20
30
40
50
60
70
80
90
100
SIM
[km
3 /yr
]
0 10 20 30 40 50 60 70 80 90 100
OBS[km3/yr]
0
10
20
30
40
50
60
70
80
90
100
SIM
[km
3 /yr
]
0 10 20 30 40 50 60 70 80 90 100
OBS[km3/yr]
0
10
20
30
40
50
60
70
80
90
100
SIM
[km
3 /yr
]
0 10 20 30 40 50 60 70 80 90 100
OBS[km3/yr]
0
10
20
30
40
50
60
70
80
90
100
SIM
[km
3 /yr
]
0 10 20 30 40 50 60 70 80 90 100
OBS[km3/yr]
0
10
20
30
40
50
60
70
80
90
100
SIM
[km
3 /yr
]
0 10 20 30 40 50 60 70 80 90 100
OBS[km3/yr]
0
10
20
30
40
50
60
70
80
90
100
SIM
[km
3 /yr
]
0 10 20 30 40 50 60 70 80 90 100
OBS[km3/yr]
0
10
20
30
40
50
60
70
80
90
100
SIM
[km
3 /yr
]
0 10 20 30 40 50 60 70 80 90 100
OBS[km3/yr]
0
10
20
30
40
50
60
70
80
90
100
SIM
[km
3 /yr
]
0 10 20 30 40 50 60 70 80 90 100
OBS[km3/yr]
0
10
20
30
40
50
60
70
80
90
100
SIM
[km
3 /yr
]
0 10 20 30 40 50 60 70 80 90 100
OBS[km3/yr]
0
10
20
30
40
50
60
70
80
90
100
SIM
[km
3 /yr
]
0 10 20 30 40 50 60 70 80 90 100
OBS[km3/yr]
0
10
20
30
40
50
60
70
80
90
100
SIM
[km
3 /yr
]
0 10 20 30 40 50 60 70 80 90 100
OBS[km3/yr]
0
10
20
30
40
50
60
70
80
90
100
SIM
[km
3 /yr
]
0 10 20 30 40 50 60 70 80 90 100
OBS[km3/yr]
Vietnam
0
10
20
30
40
50
60
70
80
90
100
SIM
[km
3 /yr
]
0 10 20 30 40 50 60 70 80 90 100
OBS[km3/yr]
0
10
20
30
40
50
60
70
80
90
100
SIM
[km
3 /yr
]
0 10 20 30 40 50 60 70 80 90 100
OBS[km3/yr]
0
10
20
30
40
50
60
70
80
90
100
SIM
[km
3 /yr
]
0 10 20 30 40 50 60 70 80 90 100
OBS[km3/yr]
0
10
20
30
40
50
60
70
80
90
100
SIM
[km
3 /yr
]
0 10 20 30 40 50 60 70 80 90 100
OBS[km3/yr]
0
10
20
30
40
50
60
70
80
90
100
SIM
[km
3 /yr
]
0 10 20 30 40 50 60 70 80 90 100
OBS[km3/yr]
Sudan
0
10
20
30
40
50
60
70
80
90
100
SIM
[km
3 /yr
]
0 10 20 30 40 50 60 70 80 90 100
OBS[km3/yr]
0
10
20
30
40
50
60
70
80
90
100
SIM
[km
3 /yr
]
0 10 20 30 40 50 60 70 80 90 100
OBS[km3/yr]
0
10
20
30
40
50
60
70
80
90
100
SIM
[km
3 /yr
]
0 10 20 30 40 50 60 70 80 90 100
OBS[km3/yr]
0
10
20
30
40
50
60
70
80
90
100
SIM
[km
3 /yr
]
0 10 20 30 40 50 60 70 80 90 100
OBS[km3/yr]
0
10
20
30
40
50
60
70
80
90
100
SIM
[km
3 /yr
]
0 10 20 30 40 50 60 70 80 90 100
OBS[km3/yr]
0
10
20
30
40
50
60
70
80
90
100
SIM
[km
3 /yr
]
0 10 20 30 40 50 60 70 80 90 100
OBS[km3/yr]
0
10
20
30
40
50
60
70
80
90
100
SIM
[km
3 /yr
]
0 10 20 30 40 50 60 70 80 90 100
OBS[km3/yr]
Thailand
0
10
20
30
40
50
60
70
80
90
100
SIM
[km
3 /yr
]
0 10 20 30 40 50 60 70 80 90 100
OBS[km3/yr]
0
10
20
30
40
50
60
70
80
90
100
SIM
[km
3 /yr
]
0 10 20 30 40 50 60 70 80 90 100
OBS[km3/yr]
0
10
20
30
40
50
60
70
80
90
100
SIM
[km
3 /yr
]
0 10 20 30 40 50 60 70 80 90 100
OBS[km3/yr]
0
10
20
30
40
50
60
70
80
90
100
SIM
[km
3 /yr
]
0 10 20 30 40 50 60 70 80 90 100
OBS[km3/yr]
0
10
20
30
40
50
60
70
80
90
100
SIM
[km
3 /yr
]
0 10 20 30 40 50 60 70 80 90 100
OBS[km3/yr]
0
10
20
30
40
50
60
70
80
90
100
SIM
[km
3 /yr
]
0 10 20 30 40 50 60 70 80 90 100
OBS[km3/yr]
0
10
20
30
40
50
60
70
80
90
100
SIM
[km
3 /yr
]
0 10 20 30 40 50 60 70 80 90 100
OBS[km3/yr]
0
10
20
30
40
50
60
70
80
90
100
SIM
[km
3 /yr
]
0 10 20 30 40 50 60 70 80 90 100
OBS[km3/yr]
Egypt
0
10
20
30
40
50
60
70
80
90
100
SIM
[km
3 /yr
]
0 10 20 30 40 50 60 70 80 90 100
OBS[km3/yr]
0
10
20
30
40
50
60
70
80
90
100
SIM
[km
3 /yr
]
0 10 20 30 40 50 60 70 80 90 100
OBS[km3/yr]
0
10
20
30
40
50
60
70
80
90
100
SIM
[km
3 /yr
]
0 10 20 30 40 50 60 70 80 90 100
OBS[km3/yr]
0
10
20
30
40
50
60
70
80
90
100
SIM
[km
3 /yr
]
0 10 20 30 40 50 60 70 80 90 100
OBS[km3/yr]
0
10
20
30
40
50
60
70
80
90
100
SIM
[km
3 /yr
]
0 10 20 30 40 50 60 70 80 90 100
OBS[km3/yr]
0
10
20
30
40
50
60
70
80
90
100
SIM
[km
3 /yr
]
0 10 20 30 40 50 60 70 80 90 100
OBS[km3/yr]
Uzbekistan_Rep
0
10
20
30
40
50
60
70
80
90
100
SIM
[km
3 /yr
]
0 10 20 30 40 50 60 70 80 90 100
OBS[km3/yr]
0
10
20
30
40
50
60
70
80
90
100
SIM
[km
3 /yr
]
0 10 20 30 40 50 60 70 80 90 100
OBS[km3/yr]
0
10
20
30
40
50
60
70
80
90
100
SIM
[km
3 /yr
]
0 10 20 30 40 50 60 70 80 90 100
OBS[km3/yr]
0
100
200
300
400
500
600
700
800
SIM
[km
3 /yr
]
0 100 200 300 400 500 600 700 800
OBS[km3/yr]
0
100
200
300
400
500
600
700
800
SIM
[km
3 /yr
]
0 100 200 300 400 500 600 700 800
OBS[km3/yr]
0
100
200
300
400
500
600
700
800
SIM
[km
3 /yr
]
0 100 200 300 400 500 600 700 800
OBS[km3/yr]
0
100
200
300
400
500
600
700
800
SIM
[km
3 /yr
]
0 100 200 300 400 500 600 700 800
OBS[km3/yr]
0
100
200
300
400
500
600
700
800
SIM
[km
3 /yr
]
0 100 200 300 400 500 600 700 800
OBS[km3/yr]
0
100
200
300
400
500
600
700
800
SIM
[km
3 /yr
]
0 100 200 300 400 500 600 700 800
OBS[km3/yr]
0
100
200
300
400
500
600
700
800
SIM
[km
3 /yr
]
0 100 200 300 400 500 600 700 800
OBS[km3/yr]
0
100
200
300
400
500
600
700
800
SIM
[km
3 /yr
]
0 100 200 300 400 500 600 700 800
OBS[km3/yr]
0
100
200
300
400
500
600
700
800
SIM
[km
3 /yr
]
0 100 200 300 400 500 600 700 800
OBS[km3/yr]
0
100
200
300
400
500
600
700
800
SIM
[km
3 /yr
]
0 100 200 300 400 500 600 700 800
OBS[km3/yr]
0
100
200
300
400
500
600
700
800
SIM
[km
3 /yr
]
0 100 200 300 400 500 600 700 800
OBS[km3/yr]
0
100
200
300
400
500
600
700
800
SIM
[km
3 /yr
]
0 100 200 300 400 500 600 700 800
OBS[km3/yr]
0
100
200
300
400
500
600
700
800
SIM
[km
3 /yr
]
0 100 200 300 400 500 600 700 800
OBS[km3/yr]
0
100
200
300
400
500
600
700
800
SIM
[km
3 /yr
]
0 100 200 300 400 500 600 700 800
OBS[km3/yr]
0
100
200
300
400
500
600
700
800
SIM
[km
3 /yr
]
0 100 200 300 400 500 600 700 800
OBS[km3/yr]
0
100
200
300
400
500
600
700
800
SIM
[km
3 /yr
]
0 100 200 300 400 500 600 700 800
OBS[km3/yr]
0
100
200
300
400
500
600
700
800
SIM
[km
3 /yr
]
0 100 200 300 400 500 600 700 800
OBS[km3/yr]
0
100
200
300
400
500
600
700
800
SIM
[km
3 /yr
]
0 100 200 300 400 500 600 700 800
OBS[km3/yr]
0
100
200
300
400
500
600
700
800
SIM
[km
3 /yr
]
0 100 200 300 400 500 600 700 800
OBS[km3/yr]
0
100
200
300
400
500
600
700
800
SIM
[km
3 /yr
]
0 100 200 300 400 500 600 700 800
OBS[km3/yr]
0
100
200
300
400
500
600
700
800
SIM
[km
3 /yr
]
0 100 200 300 400 500 600 700 800
OBS[km3/yr]
0
100
200
300
400
500
600
700
800
SIM
[km
3 /yr
]
0 100 200 300 400 500 600 700 800
OBS[km3/yr]
0
100
200
300
400
500
600
700
800
SIM
[km
3 /yr
]
0 100 200 300 400 500 600 700 800
OBS[km3/yr]
0
100
200
300
400
500
600
700
800
SIM
[km
3 /yr
]
0 100 200 300 400 500 600 700 800
OBS[km3/yr]
0
100
200
300
400
500
600
700
800
SIM
[km
3 /yr
]
0 100 200 300 400 500 600 700 800
OBS[km3/yr]
China
0
100
200
300
400
500
600
700
800
SIM
[km
3 /yr
]
0 100 200 300 400 500 600 700 800
OBS[km3/yr]
0
100
200
300
400
500
600
700
800
SIM
[km
3 /yr
]
0 100 200 300 400 500 600 700 800
OBS[km3/yr]
0
100
200
300
400
500
600
700
800
SIM
[km
3 /yr
]
0 100 200 300 400 500 600 700 800
OBS[km3/yr]
0
100
200
300
400
500
600
700
800
SIM
[km
3 /yr
]
0 100 200 300 400 500 600 700 800
OBS[km3/yr]
0
100
200
300
400
500
600
700
800
SIM
[km
3 /yr
]
0 100 200 300 400 500 600 700 800
OBS[km3/yr]
0
100
200
300
400
500
600
700
800
SIM
[km
3 /yr
]
0 100 200 300 400 500 600 700 800
OBS[km3/yr]
0
100
200
300
400
500
600
700
800
SIM
[km
3 /yr
]
0 100 200 300 400 500 600 700 800
OBS[km3/yr]
0
100
200
300
400
500
600
700
800
SIM
[km
3 /yr
]
0 100 200 300 400 500 600 700 800
OBS[km3/yr]
0
100
200
300
400
500
600
700
800
SIM
[km
3 /yr
]
0 100 200 300 400 500 600 700 800
OBS[km3/yr]
0
100
200
300
400
500
600
700
800
SIM
[km
3 /yr
]
0 100 200 300 400 500 600 700 800
OBS[km3/yr]
0
100
200
300
400
500
600
700
800
SIM
[km
3 /yr
]
0 100 200 300 400 500 600 700 800
OBS[km3/yr]
0
100
200
300
400
500
600
700
800
SIM
[km
3 /yr
]
0 100 200 300 400 500 600 700 800
OBS[km3/yr]
0
100
200
300
400
500
600
700
800
SIM
[km
3 /yr
]
0 100 200 300 400 500 600 700 800
OBS[km3/yr]
0
100
200
300
400
500
600
700
800
SIM
[km
3 /yr
]
0 100 200 300 400 500 600 700 800
OBS[km3/yr]
0
100
200
300
400
500
600
700
800
SIM
[km
3 /yr
]
0 100 200 300 400 500 600 700 800
OBS[km3/yr]
0
100
200
300
400
500
600
700
800
SIM
[km
3 /yr
]
0 100 200 300 400 500 600 700 800
OBS[km3/yr]
0
100
200
300
400
500
600
700
800
SIM
[km
3 /yr
]
0 100 200 300 400 500 600 700 800
OBS[km3/yr]
0
100
200
300
400
500
600
700
800
SIM
[km
3 /yr
]
0 100 200 300 400 500 600 700 800
OBS[km3/yr]
0
100
200
300
400
500
600
700
800
SIM
[km
3 /yr
]
0 100 200 300 400 500 600 700 800
OBS[km3/yr]
0
100
200
300
400
500
600
700
800
SIM
[km
3 /yr
]
0 100 200 300 400 500 600 700 800
OBS[km3/yr]
0
100
200
300
400
500
600
700
800
SIM
[km
3 /yr
]
0 100 200 300 400 500 600 700 800
OBS[km3/yr]
0
100
200
300
400
500
600
700
800
SIM
[km
3 /yr
]
0 100 200 300 400 500 600 700 800
OBS[km3/yr]
0
100
200
300
400
500
600
700
800
SIM
[km
3 /yr
]
0 100 200 300 400 500 600 700 800
OBS[km3/yr]
India
0
100
200
300
400
500
600
700
800
SIM
[km
3 /yr
]
0 100 200 300 400 500 600 700 800
OBS[km3/yr]
0
100
200
300
400
500
600
700
800
SIM
[km
3 /yr
]
0 100 200 300 400 500 600 700 800
OBS[km3/yr]
0
100
200
300
400
500
600
700
800
SIM
[km
3 /yr
]
0 100 200 300 400 500 600 700 800
OBS[km3/yr]
0
100
200
300
400
500
600
700
800
SIM
[km
3 /yr
]
0 100 200 300 400 500 600 700 800
OBS[km3/yr]
0
100
200
300
400
500
600
700
800
SIM
[km
3 /yr
]
0 100 200 300 400 500 600 700 800
OBS[km3/yr]
0
100
200
300
400
500
600
700
800
SIM
[km
3 /yr
]
0 100 200 300 400 500 600 700 800
OBS[km3/yr]
0
100
200
300
400
500
600
700
800
SIM
[km
3 /yr
]
0 100 200 300 400 500 600 700 800
OBS[km3/yr]
0
100
200
300
400
500
600
700
800
SIM
[km
3 /yr
]
0 100 200 300 400 500 600 700 800
OBS[km3/yr]
0
100
200
300
400
500
600
700
800
SIM
[km
3 /yr
]
0 100 200 300 400 500 600 700 800
OBS[km3/yr]
0
100
200
300
400
500
600
700
800
SIM
[km
3 /yr
]
0 100 200 300 400 500 600 700 800
OBS[km3/yr]
0
100
200
300
400
500
600
700
800
SIM
[km
3 /yr
]
0 100 200 300 400 500 600 700 800
OBS[km3/yr]
0
100
200
300
400
500
600
700
800
SIM
[km
3 /yr
]
0 100 200 300 400 500 600 700 800
OBS[km3/yr]
0
100
200
300
400
500
600
700
800
SIM
[km
3 /yr
]
0 100 200 300 400 500 600 700 800
OBS[km3/yr]
0
100
200
300
400
500
600
700
800
SIM
[km
3 /yr
]
0 100 200 300 400 500 600 700 800
OBS[km3/yr]
0
100
200
300
400
500
600
700
800
SIM
[km
3 /yr
]
0 100 200 300 400 500 600 700 800
OBS[km3/yr]
0
100
200
300
400
500
600
700
800
SIM
[km
3 /yr
]
0 100 200 300 400 500 600 700 800
OBS[km3/yr]
0
100
200
300
400
500
600
700
800
SIM
[km
3 /yr
]
0 100 200 300 400 500 600 700 800
OBS[km3/yr]
0
100
200
300
400
500
600
700
800
SIM
[km
3 /yr
]
0 100 200 300 400 500 600 700 800
OBS[km3/yr]
0
100
200
300
400
500
600
700
800
SIM
[km
3 /yr
]
0 100 200 300 400 500 600 700 800
OBS[km3/yr]
0
100
200
300
400
500
600
700
800
SIM
[km
3 /yr
]
0 100 200 300 400 500 600 700 800
OBS[km3/yr]
0
100
200
300
400
500
600
700
800
SIM
[km
3 /yr
]
0 100 200 300 400 500 600 700 800
OBS[km3/yr]
0
100
200
300
400
500
600
700
800
SIM
[km
3 /yr
]
0 100 200 300 400 500 600 700 800
OBS[km3/yr]
0
100
200
300
400
500
600
700
800
SIM
[km
3 /yr
]
0 100 200 300 400 500 600 700 800
OBS[km3/yr]
0
100
200
300
400
500
600
700
800
SIM
[km
3 /yr
]
0 100 200 300 400 500 600 700 800
OBS[km3/yr]
0
100
200
300
400
500
600
700
800
SIM
[km
3 /yr
]
0 100 200 300 400 500 600 700 800
OBS[km3/yr]
0
100
200
300
400
500
600
700
800
SIM
[km
3 /yr
]
0 100 200 300 400 500 600 700 800
OBS[km3/yr]
0
100
200
300
400
500
600
700
800
SIM
[km
3 /yr
]
0 100 200 300 400 500 600 700 800
OBS[km3/yr]
0
100
200
300
400
500
600
700
800
SIM
[km
3 /yr
]
0 100 200 300 400 500 600 700 800
OBS[km3/yr]
0
100
200
300
400
500
600
700
800
SIM
[km
3 /yr
]
0 100 200 300 400 500 600 700 800
OBS[km3/yr]
0
100
200
300
400
500
600
700
800
SIM
[km
3 /yr
]
0 100 200 300 400 500 600 700 800
OBS[km3/yr]
0
100
200
300
400
500
600
700
800
SIM
[km
3 /yr
]
0 100 200 300 400 500 600 700 800
OBS[km3/yr]
0
100
200
300
400
500
600
700
800
SIM
[km
3 /yr
]
0 100 200 300 400 500 600 700 800
OBS[km3/yr]
0
100
200
300
400
500
600
700
800
SIM
[km
3 /yr
]
0 100 200 300 400 500 600 700 800
OBS[km3/yr]
0
100
200
300
400
500
600
700
800
SIM
[km
3 /yr
]
0 100 200 300 400 500 600 700 800
OBS[km3/yr]
0
100
200
300
400
500
600
700
800
SIM
[km
3 /yr
]
0 100 200 300 400 500 600 700 800
OBS[km3/yr]
Pakistan
0
100
200
300
400
500
600
700
800
SIM
[km
3 /yr
]
0 100 200 300 400 500 600 700 800
OBS[km3/yr]
0
100
200
300
400
500
600
700
800
SIM
[km
3 /yr
]
0 100 200 300 400 500 600 700 800
OBS[km3/yr]
0
100
200
300
400
500
600
700
800
SIM
[km
3 /yr
]
0 100 200 300 400 500 600 700 800
OBS[km3/yr]
0
100
200
300
400
500
600
700
800
SIM
[km
3 /yr
]
0 100 200 300 400 500 600 700 800
OBS[km3/yr]
0
100
200
300
400
500
600
700
800
SIM
[km
3 /yr
]
0 100 200 300 400 500 600 700 800
OBS[km3/yr]
0
100
200
300
400
500
600
700
800
SIM
[km
3 /yr
]
0 100 200 300 400 500 600 700 800
OBS[km3/yr]
0
100
200
300
400
500
600
700
800
SIM
[km
3 /yr
]
0 100 200 300 400 500 600 700 800
OBS[km3/yr]
0
100
200
300
400
500
600
700
800
SIM
[km
3 /yr
]
0 100 200 300 400 500 600 700 800
OBS[km3/yr]
0
100
200
300
400
500
600
700
800
SIM
[km
3 /yr
]
0 100 200 300 400 500 600 700 800
OBS[km3/yr]
0
100
200
300
400
500
600
700
800
SIM
[km
3 /yr
]
0 100 200 300 400 500 600 700 800
OBS[km3/yr]
0
100
200
300
400
500
600
700
800
SIM
[km
3 /yr
]
0 100 200 300 400 500 600 700 800
OBS[km3/yr]
0
100
200
300
400
500
600
700
800
SIM
[km
3 /yr
]
0 100 200 300 400 500 600 700 800
OBS[km3/yr]
0
100
200
300
400
500
600
700
800
SIM
[km
3 /yr
]
0 100 200 300 400 500 600 700 800
OBS[km3/yr]
0
100
200
300
400
500
600
700
800
SIM
[km
3 /yr
]
0 100 200 300 400 500 600 700 800
OBS[km3/yr]
0
100
200
300
400
500
600
700
800
SIM
[km
3 /yr
]
0 100 200 300 400 500 600 700 800
OBS[km3/yr]
0
100
200
300
400
500
600
700
800
SIM
[km
3 /yr
]
0 100 200 300 400 500 600 700 800
OBS[km3/yr]
0
100
200
300
400
500
600
700
800
SIM
[km
3 /yr
]
0 100 200 300 400 500 600 700 800
OBS[km3/yr]
0
100
200
300
400
500
600
700
800
SIM
[km
3 /yr
]
0 100 200 300 400 500 600 700 800
OBS[km3/yr]
0
100
200
300
400
500
600
700
800
SIM
[km
3 /yr
]
0 100 200 300 400 500 600 700 800
OBS[km3/yr]
0
100
200
300
400
500
600
700
800
SIM
[km
3 /yr
]
0 100 200 300 400 500 600 700 800
OBS[km3/yr]
0
100
200
300
400
500
600
700
800
SIM
[km
3 /yr
]
0 100 200 300 400 500 600 700 800
OBS[km3/yr]
0
100
200
300
400
500
600
700
800
SIM
[km
3 /yr
]
0 100 200 300 400 500 600 700 800
OBS[km3/yr]
0
100
200
300
400
500
600
700
800
SIM
[km
3 /yr
]
0 100 200 300 400 500 600 700 800
OBS[km3/yr]
0
100
200
300
400
500
600
700
800
SIM
[km
3 /yr
]
0 100 200 300 400 500 600 700 800
OBS[km3/yr]
0
100
200
300
400
500
600
700
800
SIM
[km
3 /yr
]
0 100 200 300 400 500 600 700 800
OBS[km3/yr]
0
100
200
300
400
500
600
700
800
SIM
[km
3 /yr
]
0 100 200 300 400 500 600 700 800
OBS[km3/yr]
0
100
200
300
400
500
600
700
800
SIM
[km
3 /yr
]
0 100 200 300 400 500 600 700 800
OBS[km3/yr]
0
100
200
300
400
500
600
700
800
SIM
[km
3 /yr
]
0 100 200 300 400 500 600 700 800
OBS[km3/yr]
0
100
200
300
400
500
600
700
800
SIM
[km
3 /yr
]
0 100 200 300 400 500 600 700 800
OBS[km3/yr]
0
100
200
300
400
500
600
700
800
SIM
[km
3 /yr
]
0 100 200 300 400 500 600 700 800
OBS[km3/yr]
0
100
200
300
400
500
600
700
800
SIM
[km
3 /yr
]
0 100 200 300 400 500 600 700 800
OBS[km3/yr]
0
100
200
300
400
500
600
700
800
SIM
[km
3 /yr
]
0 100 200 300 400 500 600 700 800
OBS[km3/yr]
0
100
200
300
400
500
600
700
800
SIM
[km
3 /yr
]
0 100 200 300 400 500 600 700 800
OBS[km3/yr]
0
100
200
300
400
500
600
700
800
SIM
[km
3 /yr
]
0 100 200 300 400 500 600 700 800
OBS[km3/yr]
0
100
200
300
400
500
600
700
800
SIM
[km
3 /yr
]
0 100 200 300 400 500 600 700 800
OBS[km3/yr]
0
100
200
300
400
500
600
700
800
SIM
[km
3 /yr
]
0 100 200 300 400 500 600 700 800
OBS[km3/yr]
0
100
200
300
400
500
600
700
800
SIM
[km
3 /yr
]
0 100 200 300 400 500 600 700 800
OBS[km3/yr]
0
100
200
300
400
500
600
700
800
SIM
[km
3 /yr
]
0 100 200 300 400 500 600 700 800
OBS[km3/yr]
United_States
0
100
200
300
400
500
600
700
800
SIM
[km
3 /yr
]
0 100 200 300 400 500 600 700 800
OBS[km3/yr]
0
100
200
300
400
500
600
700
800
SIM
[km
3 /yr
]
0 100 200 300 400 500 600 700 800
OBS[km3/yr]
0
100
200
300
400
500
600
700
800
SIM
[km
3 /yr
]
0 100 200 300 400 500 600 700 800
OBS[km3/yr]
0
100
200
300
400
500
600
700
800
SIM
[km
3 /yr
]
0 100 200 300 400 500 600 700 800
OBS[km3/yr]
0
100
200
300
400
500
600
700
800
SIM
[km
3 /yr
]
0 100 200 300 400 500 600 700 800
OBS[km3/yr]
0
100
200
300
400
500
600
700
800
SIM
[km
3 /yr
]
0 100 200 300 400 500 600 700 800
OBS[km3/yr]
National irrigation water withdrawal
N= 127
Fig. 3. Simulated irrigation water withdrawal for each country.The horizontal axis shows the reported value (Food and Agricul-ture Organization, 2007b) and the vertical axis shows the simulatedvalue. The left panel shows countries with irrigation water with-drawal<100 km3 yr−1, and the right panel shows all plots.
WAOB94. This tendency was noticeable in countries thathave warmer climates such as India, Brazil, and southeasternAsian countries, rather than those that have colder climatessuch as European countries. Air temperature is an importantindicator to narrow down the potential cropping period, al-though in warmer countries, air temperature remains abovethe base temperature throughout the year and cannot be usedas an indicator.
3.2 Irrigation water demand
The crop growth module estimated the consumptive waterrequirement (the IRG simulation), but most of the avail-able statistics reported water withdrawal, which includes lossduring delivery and return flow to the river channel or therecharge of groundwater. We used the methodology of Dolland Siebert (2002) to convert the consumptive water use re-quirement (Qconsumptive) to a withdrawal basis (Qwithdrawal).They defined the irrigation efficiency (keff; range from 0 to1) as
keff = Qconsumptive/Qwithdrawal (1)
They compiledkeff for 19 countries and regions worldwide.It ranges from 0.35 to 0.70, reflecting irrigation facilities andpractices. Previous estimates of global total irrigation waterwithdrawal ranged from 2450 km yr−1 to 2660 km yr−1 (Ta-ble 2). Our estimation of 2810 km yr−1 slightly exceeds theupper limit of this range, but is still reasonable.
A country-based comparison of irrigation water with-drawal with the AQUASTAT database (Food and Agricul-ture Organization, 2007b) for 127 countries is provided(Fig. 3). Among countries with irrigation water withdrawal>100 km3 yr−1, water withdrawal in China and the USA wasreproduced well and was within the range of±20%. That inIndia was overestimated at slightly more than +20%, and thatin Pakistan was overestimated considerably at almost twicethe expected value. Countries with irrigation water demandbetween 30 km3 yr−1 and 100 km3 yr−1 can be categorizedinto two groups: Asian monsoon countries, i.e., Thailand,Bangladesh, Indonesia, Japan, Vietnam, and Myanmar; andthe remaining countries, i.e., Iran, Mexico, Uzbekistan Re-public, Egypt, Iraq, Brazil, and Sudan. Irrigation water with-drawal for the Asian monsoon countries was significantly un-derestimated, except for Thailand and Myanmar. It is inter-esting that these countries are all major rice producing coun-tries (see Fig. 2c). In irrigated paddy rice fields, extra watermay be used by farmers to enhance crop growth and to avoidweeds and low-temperature stress (Ishii et al., 1999), whichwas not included in the model. Except for Asian monsooncountries, three of seven countries came within±20% ofthe expected value, and five of seven countries came within±50%. Taking into account the limited reliability of avail-able irrigation information, we judged the estimates to betolerable. The error in simulated irrigation water withdrawalwas less than±50% in 10 of the 17 counties that withdraw>30 km3 yr−1.
www.hydrol-earth-syst-sci.net/12/1027/2008/ Hydrol. Earth Syst. Sci., 12, 1027–1037, 2008

1032 N. Hanasaki et al.: An integrated global water resources model – Part 2
0.00 0.05 0.10 0.15 0.20 0.25 0.30 0.35 0.40 0.45 0.50
Env.Req./Runoff
0.00 0.05 0.10 0.15 0.20 0.25 0.30 0.35 0.40 0.45 0.50
Env.Req./Runoff
Fig. 4. Distribution of the ratio of estimated annual environmentalflow requirement to annual total runoff (both grid-based).(a) Thisstudy and(b) Smakhtin et al. (2004).
3.3 Environmental flow requirement
Because there are no observations of environmental flow re-quirements, the estimated results of the environmental flowrequirement module were compared with those reported bySmakhtin et al. (2004). Using the simulated streamflowof the NAT simulation, two annual environmental flow re-quirements were simulated using the environmental flowrequirement module and the methodology of Smakhtin etal. (2004; Fig. 4). The simulated environmental flow re-quirement ranged from 0% to 40% of the total mean an-nual runoff (Fig. 4a). The minimum of 0% was allocatedif the monthly runoff fell below 1 mm mo−1 throughout ayear, which occurred mainly in arid areas (see Sect. 3.5 ofHanasaki et al., 2008) for a description of the environmentalflow allocation algorithm). The maximum of 40% was allo-cated if the monthly runoff exceeded 10 mm mo−1 through-out a year. The total environmental flow requirement was es-timated at 12 492 km3 yr−1, approximately 32% of the globaltotal runoff of the NAT simulation. The global distributionpattern of the environmental flow requirement was quite sim-ilar to that of runoff.
In contrast, Smakhtin et al. (2004) reported quite a differ-ent global distribution of environmental flow requirements;for most regions of the world, the environmental flow re-quirement ranged between 20% and 30% of the mean an-nual runoff. The low regional variation was inherent intheir classification and allocation of environmental flow re-quirements. The total environmental flow requirement was10 682 km3 yr−1, approximately 27% of the global totalrunoff. The results clearly show that the method that weused (Shirakawa, 2004; Shirakawa, 2005) produced less en-vironmental flow in arid to semi-arid areas and more in trop-ical areas. Our distribution (Fig. 4b) is different from thatof Smakhtin et al. (2004) because the former was calculatedfrom the runoff of the NAT simulation, whereas the latterused the simulated streamflow data of Doll et al. (2003; i.e.,both the input meteorological data and hydrological modelare different in our study). The environmental flow at highlatitudes of North America was much higher in Smakhtin etal. (2004). The hydrological model of Doll et al. (2003) had anatural lake scheme, which buffered the fluctuation in runoff.The natural lakes that are abundant in northern North Amer-ica enlarged theQ90 and the environmental flow requirementcalculated by the algorithm of Smakhtin et al. (2004).
4 Water resources assessment
A global water resources assessment was conducted usingindices. The three indices applied were the withdrawal toavailability ratio, the cumulative withdrawal to water demandratio, and the consumption toQ90 ratio.
4.1 Conventional index
First, the withdrawal to availability ratio (hereafter WWR)was calculated as the ratio of annual water withdrawal to an-nual runoff (renewable freshwater). It was expressed as
WWR=W
Q(2)
whereW is the annual total withdrawal andQ is the annualstreamflow. The areas with WWR<0.2 had low or no stress;areas with 0.2≤WWR<0.4 had medium stress; and areaswith 0.4≤WWR had high stress (Raskin et al., 1997). To ex-clude sparsely populated deserts, grids with<1 person km−2
were masked out of the global distribution of WWR (Fig. 5a).The medium- to high-water-stressed regions extended fromwestern India across the Middle East, northern Africa, thewestern Great Plains of the USA, and northern China to cen-tral Asia. This distribution largely agreed with that of earlierstudies (e.g., Vorosmarty et al., 2000; Alcamo et al., 2003a;Alcamo et al., 2007; Oki and Kanae, 2006), indicating thatglobal water availability and water use are well reproducedin our modeling system on an annual basis. The popula-tion living in water-stressed areas (0.4≤WWR; the stressedpopulation) was estimated to be 1250×106, which is smaller
Hydrol. Earth Syst. Sci., 12, 1027–1037, 2008 www.hydrol-earth-syst-sci.net/12/1027/2008/
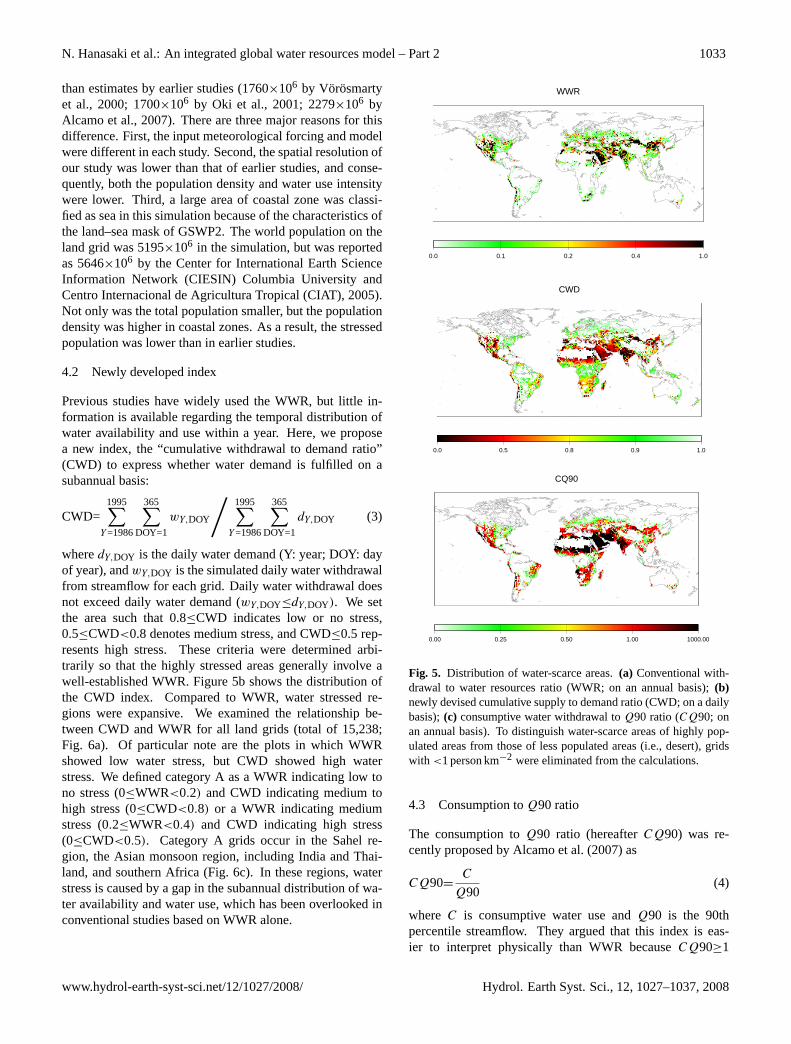
N. Hanasaki et al.: An integrated global water resources model – Part 2 1033
than estimates by earlier studies (1760×106 by Vorosmartyet al., 2000; 1700×106 by Oki et al., 2001; 2279×106 byAlcamo et al., 2007). There are three major reasons for thisdifference. First, the input meteorological forcing and modelwere different in each study. Second, the spatial resolution ofour study was lower than that of earlier studies, and conse-quently, both the population density and water use intensitywere lower. Third, a large area of coastal zone was classi-fied as sea in this simulation because of the characteristics ofthe land–sea mask of GSWP2. The world population on theland grid was 5195×106 in the simulation, but was reportedas 5646×106 by the Center for International Earth ScienceInformation Network (CIESIN) Columbia University andCentro Internacional de Agricultura Tropical (CIAT), 2005).Not only was the total population smaller, but the populationdensity was higher in coastal zones. As a result, the stressedpopulation was lower than in earlier studies.
4.2 Newly developed index
Previous studies have widely used the WWR, but little in-formation is available regarding the temporal distribution ofwater availability and use within a year. Here, we proposea new index, the “cumulative withdrawal to demand ratio”(CWD) to express whether water demand is fulfilled on asubannual basis:
CWD=1995∑
Y=1986
365∑DOY=1
wY,DOY
/1995∑
Y=1986
365∑DOY=1
dY,DOY (3)
wheredY,DOY is the daily water demand (Y: year; DOY: dayof year), andwY,DOY is the simulated daily water withdrawalfrom streamflow for each grid. Daily water withdrawal doesnot exceed daily water demand (wY,DOY≤dY,DOY). We setthe area such that 0.8≤CWD indicates low or no stress,0.5≤CWD<0.8 denotes medium stress, and CWD≤0.5 rep-resents high stress. These criteria were determined arbi-trarily so that the highly stressed areas generally involve awell-established WWR. Figure 5b shows the distribution ofthe CWD index. Compared to WWR, water stressed re-gions were expansive. We examined the relationship be-tween CWD and WWR for all land grids (total of 15,238;Fig. 6a). Of particular note are the plots in which WWRshowed low water stress, but CWD showed high waterstress. We defined category A as a WWR indicating low tono stress (0≤WWR<0.2) and CWD indicating medium tohigh stress (0≤CWD<0.8) or a WWR indicating mediumstress (0.2≤WWR<0.4) and CWD indicating high stress(0≤CWD<0.5). Category A grids occur in the Sahel re-gion, the Asian monsoon region, including India and Thai-land, and southern Africa (Fig. 6c). In these regions, waterstress is caused by a gap in the subannual distribution of wa-ter availability and water use, which has been overlooked inconventional studies based on WWR alone.
0.0 0.1 0.2 0.4 1.0
WWR
0.0 0.5 0.8 0.9 1.0
CWD
0.00 0.25 0.50 1.00 1000.00
CQ90
Fig. 5. Distribution of water-scarce areas.(a) Conventional with-drawal to water resources ratio (WWR; on an annual basis);(b)newly devised cumulative supply to demand ratio (CWD; on a dailybasis);(c) consumptive water withdrawal toQ90 ratio (CQ90; onan annual basis). To distinguish water-scarce areas of highly pop-ulated areas from those of less populated areas (i.e., desert), gridswith <1 person km−2 were eliminated from the calculations.
4.3 Consumption toQ90 ratio
The consumption toQ90 ratio (hereafterCQ90) was re-cently proposed by Alcamo et al. (2007) as
CQ90=C
Q90(4)
where C is consumptive water use andQ90 is the 90thpercentile streamflow. They argued that this index is eas-ier to interpret physically than WWR becauseCQ90≥1
www.hydrol-earth-syst-sci.net/12/1027/2008/ Hydrol. Earth Syst. Sci., 12, 1027–1037, 2008

1034 N. Hanasaki et al.: An integrated global water resources model – Part 2
Table 3. Effects of reservoir operation and environmental flow on the population under water-stressed conditions. Unit: million people.
Reservoir operation Enabled Enabled Disabled Disabled
Environmental flow Enabled Disabled Enabled Disabled
High stress CWD≤0.5 2420 2160 2540 2290Medium stress 0.5<CWD≤0.8 870 790 920 870Low/no stress 0.8<CWD 1880 2210 1710 2010
implies that the entire low monthly runoff in a river basinis depleted. This index takes the seasonality of waterresources into account by usingQ90 information. The es-timated consumptive water requirement is largely exceededin the water-stressed region indicated by the WWR, and thestressed region expands to eastern India, part of SoutheastAsia, southern China, the Sahel, southern Africa, and easternSouth America (Fig. 5c). The distribution is quite similar tothat of CWD.
Although CWD (Fig. 5b) andCQ90 (Fig. 5c) show noclear differences in the distribution of water-stressed areas,CWD is more informative thanCQ90. Figure 6b shows eventhe grid cells withCQ90 of 100 to 1000, which indicates thatthe consumptive water demand exceeds theQ90 by 100 to1000 times, the CWD shows that there are lots of grid cellsin the world in which approximately 80% of the daily waterdemand can be fulfilled. This clearly suggests that evenQ90is far below the annual average consumptive water use; if thewater use is concentrated in water-rich periods, the availabil-ity can be quite high. TheCQ90 indicates water-stressedregions with large seasonality in water availability; however,it provides little information when it exceeds 1. The CWDgives information on the potential availability of water withstrong seasonality. The CWD may be more informative thantheCQ90, such as, for example, in regional water resourcesassessments of the effect of the earlier arrival of streamflowpeaks associated with climate change.
4.4 Effect of reservoirs and environmental flow require-ments
How important are the operations of the 452 largest reser-voirs and environmental flow from a global perspective? Toanswer this question we conducted three additional simu-lations. In the NORES simulation, the reservoir operationmodule was disabled; in the NOENV simulation, the envi-ronmental flow requirement module was disabled; and in theNORESENV simulation, both the reservoir operation mod-ule and environmental flow requirement module were dis-abled. Otherwise, the simulation settings were identical tothose of the FUL simulation. The global water-stressed pop-ulations in terms of the CWD index were estimated for theFUL, NORES, NOENV, and NORESENV simulations (Ta-ble 3). The FUL simulation estimated a stressed populationof 2420×106, whereas the NORES simulation increased the
stressed population by 5% (2540×106) because the disabledreservoir operation decreased daily water availability. In con-trast, the NOENV simulation decreased the stressed popula-tion by 11% (2160×106) because the disabled environmentalflow requirement increased water availability. Finally, theNORESENV simulation decreased the population by 5%(2290×106). Thus, these factors can alter the population un-der high water stress by approximately−11% to +5% (Ta-ble 3), a range that is not negligible for water resources as-sessments.
5 Discussion
5.1 Uncertainty of important assumptions in water with-drawal
The water resources assessment was carried out under twoimportant assumptions. The first assumption was that wateris withdrawn only from river channels. In reality, ground-water, lakes, ponds, and glacial meltwater are major sourcesof water in some parts of the world. In addition, reservoirs<109 m3 that were not included in the model provide con-tributions. These nonriver water resources can be dividedinto renewable and nonrenewable components. For exam-ple, withdrawal from shallow groundwater, reservoirs, lakes,and ponds below the recharge rate is considered renewable.In contrast, withdrawal from deep groundwater and glacialmeltwater and the overexploitation of lakes and ponds areconsidered nonrenewable. The renewable water resourceswere partly included in our simulation because the simu-lated runoff and streamflow are the result of water balancecalculations on land surfaces, and the natural recharge ofgroundwater in lakes and ponds is implicitly included in therunoff. However, this does not apply to nonrenewable waterresources, which were excluded from the simulation. There-fore, the simulated availability of water might be underesti-mated, especially in areas that rely heavily on nonrenewablewater resources; the water use in these areas can be consid-ered less sustainable and vulnerable to water scarcity.
Hydrol. Earth Syst. Sci., 12, 1027–1037, 2008 www.hydrol-earth-syst-sci.net/12/1027/2008/

N. Hanasaki et al.: An integrated global water resources model – Part 2 1035
The second assumption was that only water for consump-tive use is withdrawn from river channels. In reality, a con-siderable amount of the withdrawn water does not reach thedestination because of evaporation and percolation lossesduring delivery. Also, a considerable portion of the with-drawn water is returned to the river through drainage chan-nels and groundwater flow. Consequently, the simulated wa-ter demand is underestimated. Part of the return flow isimplicitly expressed by a simple subsurface flow scheme inthe land surface module, and a portion of irrigated water isdrained and returned to the river.
5.2 Uncertainty in modeling anthropogenic activities
Four major anthropogenic activities were modeled and im-plemented in the model. As stated in Part 1, we did notexpect that the model could reproduce individual anthro-pogenic activities of the past; rather, we tried to reproducethe fundamental basis of these activities. Our modeling wasbased on the assumption that humans act simply and ratio-nally. In some cases, anthropogenic activities in reality arewiser than were those in our model, and our simulation mayhave overestimated water stress. In contrast, in some cases,our modeled activities were too rational or too simple, andour simulation may have underestimated water stress. Fur-ther improvements of algorithms in the anthropogenic activ-ity modules are needed for more realistic simulation.
6 Conclusions
An integrated water resources model was developed that con-sists of six modules to simulate both natural and anthro-pogenic water flows at daily intervals. Using the newly de-veloped water resources model and the meteorological forc-ing input F-GSWP2-B1, global water availability and usewere simulated for 10 years (1986–1995) at a resolution of1◦
×1◦ (latitude and longitude). In this simulation, both theenergy and water balances were closed in each grid cell. Aglobal water resources assessment was conducted using anewly devised indicator, the cumulative withdrawal to de-mand ratio, which detected water-stressed regions that werepreviously overlooked. For example, a gap in the subannualdistribution of water availability and water use was noted inthe Sahel, the Asian monsoon region, and southern Africa.Even where annual water availability exceeds the annual wa-ter demand, because of uneven distribution, available watercan fall below the demand in some periods in a year.
There are a number of potential applications for thismodel. First, it has applications for climate change impactassessment. Climate change is likely to alter future tempera-ture and precipitation patterns and in turn alter the availabil-ity of renewable freshwater and water use. Earlier assess-ments used annually based water stress indicators such asper capita water availability. Arnell (2004) pointed out that
0.0
0.1
0.2
0.3
0.4
0.5
0.6
0.7
0.8
0.9
1.0
CW
D
0.0 0.1 1.0 10.0 100.0 1000.0
WWR
0.0
0.1
0.2
0.3
0.4
0.5
0.6
0.7
0.8
0.9
1.0
CW
D
0.0 0.1 1.0 10.0 100.0 1000.0
WWR
A0.0
0.1
0.2
0.3
0.4
0.5
0.6
0.7
0.8
0.9
1.0
CW
D
0.0 0.1 1.0 10.0 100.0 1000.0
WWR
0.0
0.1
0.2
0.3
0.4
0.5
0.6
0.7
0.8
0.9
1.0
CW
D
0.0 0.1 1.0 10.0 100.0 1000.0
CQ90
Category A
Fig. 6. (a)Scattergram showing the relationship between the with-drawal to water resources ratio (WWR) and the cumulative sup-ply to water demand ratio (CWD) for all calculated grid cells (totalof 15 238). Box A shows the plots in which WWR indicates lowto no stress (0≤WWR<0.2) but CWD indicates medium to highstress (0≤CWD<0.8) or in which WWR indicates medium stress(0.1≤WWR<0.4) but CWD indicates high stress (0≤CWD<0.5).(b) Scattergram showing the relationship between the consumptionto Q90 ratio (CQ90) and the cumulative withdrawal to water re-sources ratio (CWD).(c) Geographical distribution of the plots inbox A.
www.hydrol-earth-syst-sci.net/12/1027/2008/ Hydrol. Earth Syst. Sci., 12, 1027–1037, 2008
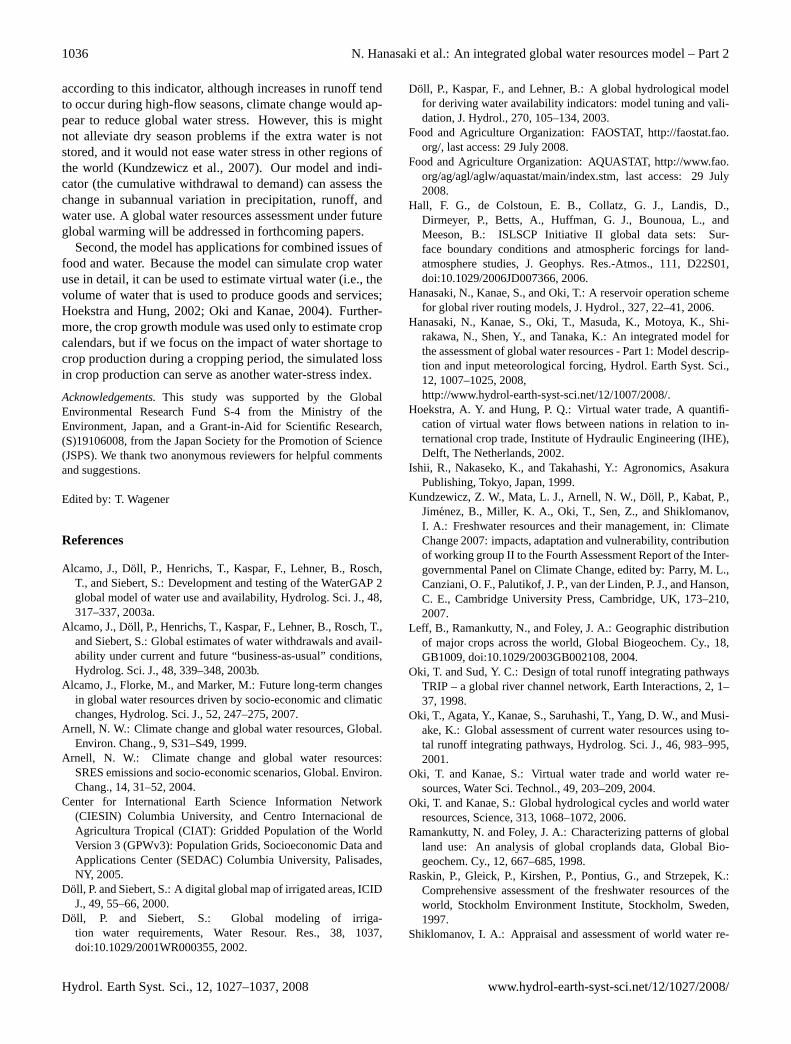
1036 N. Hanasaki et al.: An integrated global water resources model – Part 2
according to this indicator, although increases in runoff tendto occur during high-flow seasons, climate change would ap-pear to reduce global water stress. However, this is mightnot alleviate dry season problems if the extra water is notstored, and it would not ease water stress in other regions ofthe world (Kundzewicz et al., 2007). Our model and indi-cator (the cumulative withdrawal to demand) can assess thechange in subannual variation in precipitation, runoff, andwater use. A global water resources assessment under futureglobal warming will be addressed in forthcoming papers.
Second, the model has applications for combined issues offood and water. Because the model can simulate crop wateruse in detail, it can be used to estimate virtual water (i.e., thevolume of water that is used to produce goods and services;Hoekstra and Hung, 2002; Oki and Kanae, 2004). Further-more, the crop growth module was used only to estimate cropcalendars, but if we focus on the impact of water shortage tocrop production during a cropping period, the simulated lossin crop production can serve as another water-stress index.
Acknowledgements.This study was supported by the GlobalEnvironmental Research Fund S-4 from the Ministry of theEnvironment, Japan, and a Grant-in-Aid for Scientific Research,(S)19106008, from the Japan Society for the Promotion of Science(JSPS). We thank two anonymous reviewers for helpful commentsand suggestions.
Edited by: T. Wagener
References
Alcamo, J., Doll, P., Henrichs, T., Kaspar, F., Lehner, B., Rosch,T., and Siebert, S.: Development and testing of the WaterGAP 2global model of water use and availability, Hydrolog. Sci. J., 48,317–337, 2003a.
Alcamo, J., Doll, P., Henrichs, T., Kaspar, F., Lehner, B., Rosch, T.,and Siebert, S.: Global estimates of water withdrawals and avail-ability under current and future “business-as-usual” conditions,Hydrolog. Sci. J., 48, 339–348, 2003b.
Alcamo, J., Florke, M., and Marker, M.: Future long-term changesin global water resources driven by socio-economic and climaticchanges, Hydrolog. Sci. J., 52, 247–275, 2007.
Arnell, N. W.: Climate change and global water resources, Global.Environ. Chang., 9, S31–S49, 1999.
Arnell, N. W.: Climate change and global water resources:SRES emissions and socio-economic scenarios, Global. Environ.Chang., 14, 31–52, 2004.
Center for International Earth Science Information Network(CIESIN) Columbia University, and Centro Internacional deAgricultura Tropical (CIAT): Gridded Population of the WorldVersion 3 (GPWv3): Population Grids, Socioeconomic Data andApplications Center (SEDAC) Columbia University, Palisades,NY, 2005.
Doll, P. and Siebert, S.: A digital global map of irrigated areas, ICIDJ., 49, 55–66, 2000.
Doll, P. and Siebert, S.: Global modeling of irriga-tion water requirements, Water Resour. Res., 38, 1037,doi:10.1029/2001WR000355, 2002.
Doll, P., Kaspar, F., and Lehner, B.: A global hydrological modelfor deriving water availability indicators: model tuning and vali-dation, J. Hydrol., 270, 105–134, 2003.
Food and Agriculture Organization: FAOSTAT,http://faostat.fao.org/, last access: 29 July 2008.
Food and Agriculture Organization: AQUASTAT,http://www.fao.org/ag/agl/aglw/aquastat/main/index.stm, last access: 29 July2008.
Hall, F. G., de Colstoun, E. B., Collatz, G. J., Landis, D.,Dirmeyer, P., Betts, A., Huffman, G. J., Bounoua, L., andMeeson, B.: ISLSCP Initiative II global data sets: Sur-face boundary conditions and atmospheric forcings for land-atmosphere studies, J. Geophys. Res.-Atmos., 111, D22S01,doi:10.1029/2006JD007366, 2006.
Hanasaki, N., Kanae, S., and Oki, T.: A reservoir operation schemefor global river routing models, J. Hydrol., 327, 22–41, 2006.
Hanasaki, N., Kanae, S., Oki, T., Masuda, K., Motoya, K., Shi-rakawa, N., Shen, Y., and Tanaka, K.: An integrated model forthe assessment of global water resources - Part 1: Model descrip-tion and input meteorological forcing, Hydrol. Earth Syst. Sci.,12, 1007–1025, 2008,http://www.hydrol-earth-syst-sci.net/12/1007/2008/.
Hoekstra, A. Y. and Hung, P. Q.: Virtual water trade, A quantifi-cation of virtual water flows between nations in relation to in-ternational crop trade, Institute of Hydraulic Engineering (IHE),Delft, The Netherlands, 2002.
Ishii, R., Nakaseko, K., and Takahashi, Y.: Agronomics, AsakuraPublishing, Tokyo, Japan, 1999.
Kundzewicz, Z. W., Mata, L. J., Arnell, N. W., Doll, P., Kabat, P.,Jimenez, B., Miller, K. A., Oki, T., Sen, Z., and Shiklomanov,I. A.: Freshwater resources and their management, in: ClimateChange 2007: impacts, adaptation and vulnerability, contributionof working group II to the Fourth Assessment Report of the Inter-governmental Panel on Climate Change, edited by: Parry, M. L.,Canziani, O. F., Palutikof, J. P., van der Linden, P. J., and Hanson,C. E., Cambridge University Press, Cambridge, UK, 173–210,2007.
Leff, B., Ramankutty, N., and Foley, J. A.: Geographic distributionof major crops across the world, Global Biogeochem. Cy., 18,GB1009, doi:10.1029/2003GB002108, 2004.
Oki, T. and Sud, Y. C.: Design of total runoff integrating pathwaysTRIP – a global river channel network, Earth Interactions, 2, 1–37, 1998.
Oki, T., Agata, Y., Kanae, S., Saruhashi, T., Yang, D. W., and Musi-ake, K.: Global assessment of current water resources using to-tal runoff integrating pathways, Hydrolog. Sci. J., 46, 983–995,2001.
Oki, T. and Kanae, S.: Virtual water trade and world water re-sources, Water Sci. Technol., 49, 203–209, 2004.
Oki, T. and Kanae, S.: Global hydrological cycles and world waterresources, Science, 313, 1068–1072, 2006.
Ramankutty, N. and Foley, J. A.: Characterizing patterns of globalland use: An analysis of global croplands data, Global Bio-geochem. Cy., 12, 667–685, 1998.
Raskin, P., Gleick, P., Kirshen, P., Pontius, G., and Strzepek, K.:Comprehensive assessment of the freshwater resources of theworld, Stockholm Environment Institute, Stockholm, Sweden,1997.
Shiklomanov, I. A.: Appraisal and assessment of world water re-
Hydrol. Earth Syst. Sci., 12, 1027–1037, 2008 www.hydrol-earth-syst-sci.net/12/1027/2008/
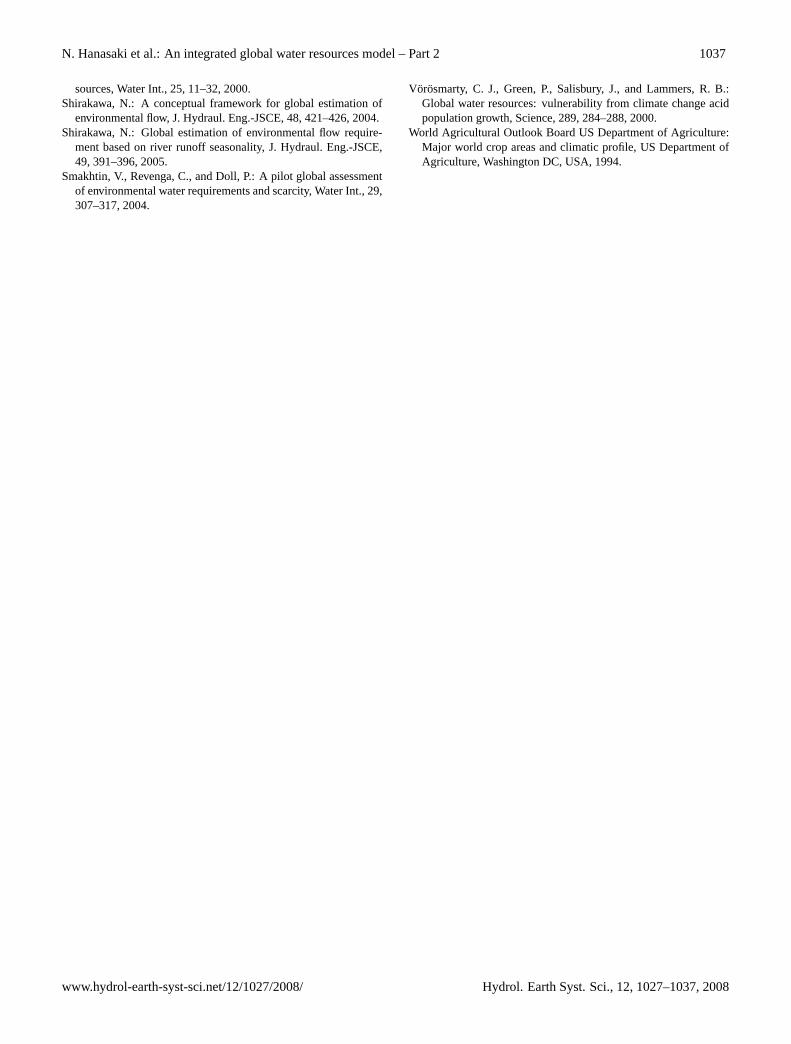
N. Hanasaki et al.: An integrated global water resources model – Part 2 1037
sources, Water Int., 25, 11–32, 2000.Shirakawa, N.: A conceptual framework for global estimation of
environmental flow, J. Hydraul. Eng.-JSCE, 48, 421–426, 2004.Shirakawa, N.: Global estimation of environmental flow require-
ment based on river runoff seasonality, J. Hydraul. Eng.-JSCE,49, 391–396, 2005.
Smakhtin, V., Revenga, C., and Doll, P.: A pilot global assessmentof environmental water requirements and scarcity, Water Int., 29,307–317, 2004.
Vorosmarty, C. J., Green, P., Salisbury, J., and Lammers, R. B.:Global water resources: vulnerability from climate change acidpopulation growth, Science, 289, 284–288, 2000.
World Agricultural Outlook Board US Department of Agriculture:Major world crop areas and climatic profile, US Department ofAgriculture, Washington DC, USA, 1994.
www.hydrol-earth-syst-sci.net/12/1027/2008/ Hydrol. Earth Syst. Sci., 12, 1027–1037, 2008
Copyright © 2022 FDOKUMEN