1 - State Water Resources Control Board
570
1 \ w(&VT-SwRC8-3 I \ I. I I '1 'I u' 1 I I I I' I \ I WATER QUALITY CONTROL PLAN FOR SALINITY I San Francisco Bay/ I Sacramento - San Joaquin - Delta ES 1 91-15WR k 1991 . MENCE A 1 WATER RESOURCES CONTROL BOARD STATE OF CALIFORNIA I I/ /
-
Upload
khangminh22 -
Category
Documents
-
view
2 -
download
0
Transcript of 1 - State Water Resources Control Board

1 \ w(&VT-SwRC8-3
I \
I. I I
'1 'I u'
1 I I I I' I \
I WATER QUALITY
CONTROL PLAN FOR SALINITY
I San Francisco Bay/
I Sacramento - San Joaquin -
Delta ES
1 91-15WR k
1991 . MENCE A
1
WATER RESOURCES CONTROL BOARD STATE OF CALIFORNIA
I I / /

WATER QUALITP CONTROL PLAN FOR SALINITY
San Francisco ~ a y / Sacramento - San Joaquin
Delta Estuary
Report Number, 91-15 WR
Kay 1991
Prepared by the Bay-Delta Section Division of Water Rights
WA!L'ER RESOURCES CONTROL BOARD STATE OF CALIFORNIA

STATE WATER RESOURCES CONTROL BOARD RESOLUTION NO. 91-34
ADOPTION OF THE WATER QUALITY CONTROL PLAN FOR SALINITY -- SAN FRANC1 SCO BAYISACRAMENTO-SAN JOAQU IN DELTA ESTUARY
WHEREAS:
1. The State Water Resources Control Board is responsible for the regulation of activities and factors which affect or may affect the quality of the waters of the State (Water Code Section 13001).
2. The State Board has undertaken a process, under its water quality authority, to develop a set of water quality objectives for salinity, temperature, and dissolved oxygen to protect beneficial uses of the Estuary.
3 . The State Board has conducted 60 days of evidentiary hearing initiated on July 7, 1987, and concluded on August 23, 1990, in accordance with the Federal Clean Water Act (33 U.S.C.A. Sections 1251 to 1387) and the California Water Code, and has considered the evidence introduced at the hear ina.
.I
0 4 . A draft Water Qua1 ity Control Plan for Salinity -- San Francisco/Sacramento- San Joaquin Delta Estuary was formulated and submitted for public review on January 18, 1991.
5. The State Board conducted a public hearing on the draft water quality control plan on March 11, 1991, after notice to all interested parties, in accordance with Federal and State requirements and has considered the oral and written comments submitted.
6. The Water Quality Control Plan, consisting of the Water Quality Control Plan for Sal ini ty -- San Francisco/Sacramento-San Joaquin Delta Estuary, accompanying Technical Appendix, and the comments and responses thereto, has been revised to incorporate appropriate comments received from the interested parties.
7. The water quality objectives in the Water Quality Control Plan--San Francisco BaylSacramento-San Joaquin Delta Estuary will be reviewed at least once every three years.
8. The Water Quality Control Plan is an adjunct to the Basin Plans; together with the Basin Plans, it includes all necessary elements of water quality control plans in accordance with Sections 13241 and 13242 of the California Water Code and Federal requirements.
9. The State Board has prepared the Water Qual ity Control Plan under a certified program as a substitute document for an environmental impact report under Section 21080.5 of the California Pub1 ic Resources Code (California Environmental Quality Act).

THEREFORE BE IT RESOLVED:
1. That the State Board adopts the Water Qua1 ity Control Plan--San Francisco I t
BayISacramento-San Joaquin Delta Estuary (Plan) in accordance with Section 13170 of the Water Code.
2. That the Executive Director is directed to forward copies of the Beneficial Use Designation and Water Quality Objectives portions of the Plan to the - United States Environmental Protect ion Agency for review and approval in accordance with requirements of the Federal Clean Water Act [33 U.S.C.A. Section 1313(c)].
CERTIFICATION
The undersigned, Administrative Assistant to the Board, does hereby certify that the foregoing is a full, true, and correct copy of a resolution duly and regularly adopted at a meeting of the State Water Resources Control Board held ! on May 1, 1991.
~dmini-rative Assistant 50 the Board

FOREWORD
Introduction
Consider water in California and you face a complex brew of physical, technical, political and cultural elements. Most of the State's water supply falls as rain and snow in the north, in the wintertime. Most of the consumptive use occurs south of the Sacramento-San Joaquin Delta, in the summer.
During the past century, the challenge was how best to capture, redistribute '
and safeguard this resource. As a consequence, pioneering projects dot the landscape with reservoirs and water transport canals which lace together the northern and southern parts of the State.
The current challenge is how to balance the redistribution of water to ensure maximum benefit to all of California, its people, its agriculture, its industry and its environment, including how best to protect its quality so that it serves our needs.
Balancing this redistribution is a major function of the State Water Resources Control Board.
Comprehensive Protection for the State's Waters
In California, the use of water must be planned within the framework of source availabi 1 ity, current as we1 1 as future needs and principles embodied in State law. California needs a water supply of sufficient quality to meet all reasonable uses. Although there exist sufficient water sources to meet all reasonable needs, these sources are insufficiently managed and/or developed to provide a reliable supply for all needs.
The Bay-Delta water system is a major source of supply to the State, providing more than half of all water used in California. Therefore, comprehensive planning for the ongoing protect ion, development and management of this unpara'lleled resource is needed.
The State Board has major planning and regulatory responsibilities for the State' s water resources, and specif ical ly the Bay-Del ta system. The State Board is uniquely designed for this task: it has the dual responsibility of protecting the State's water resources as we1 1 as a1 locating the State's existing water supply.
The Basin Plans prepared by the Central Val ley and San Francisco Regional Boards establish water quality objectives to protect beneficial uses of Bay- Delta waters. To supplement those efforts, in 1987, the State Board embarked on a major comprehensive program to protect the waters of the Bay-Delta system. That program is composed of five interrelated components. Each of the components is important and builds on the others.

The five components are: the California Water Qua1 i ty Assessment, adopted in April, 1990; the Pollutant Policy Document, adopted in June 1990; the Inland Waters Plan and the Enclosed Bays and Estuaries Plan, adopted in April, 1991; the Water Quality Control Plan for Salinity for the Bay-Delta, adopted May 1991; and the Scoping and Water Right phases of the Bay-Delta proceedings (the Scoping Phase of which began in March, 1991).
Viewed in the context of these other Plans and actions, the Water Quality Control Plan for Temperature and Salinity represents but one step in a coordinated five-point program.
Genesis of the Bay-Delta Plan
In 1978, the Board issued several comprehensive reports on the uses and protections of the Delta. The proceedings were 1 imited to current and near- term conditions in the Delta.. When the original Delta Plan and accompanying Water Right Decision (D-1485) were issued, the Board realized that the Delta's importance would require another examination. The State Board committed itself to review the Delta Plan i n about ten years.
This commitment as well as applicable court decisions have resulted in the current proceedings and have expanded the scope of the proceeding.
In 1986, the State Court of Appeal issued a decision, also known as the Racanelli or Delta Water Cases decision, addressing legal challenges to the Delta Plan and D-1485. The Court directed the State Board to take a global view toward its dual responsibilities to the State's water resources. According to the Court, the State Board's duty in its water quality role i s to provide reasonable protection for beneficial uses, considering a1 1 demands made on the water. Moreover, the State Board's water allocation role is not confined to the consideration of existing water rights. The Court also recognized that a program to implement protections for the system would be lengthy and complex; the program would involve entities over which the State Board has little or no control, whose actions, however, affect the waterscape.
Content of the Current Bay-Delta Plan: Use of Water Quality Objectives for the Bay-Delta Waters
The current Plan is primari ly concerned with sal ini ty and temperature factors.
Numerous water quality objectives, protecting water quality and the beneficial I
uses of Bay-Delta waters (see Table 1-I), have been established for:
- Salinity at municipal and industrial intakes, - Salinity levels to protect Delta agriculture, - Sal inity levels to protect export agriculture, - Salinity for fish and wildlife resources in the Estuary.

I Water quality objectives have also been established to provide:
- Expansion of the period of protection for striped bass spawning, and - Temperature and dissolved oxygen levels for fisheries in the Delta.
Most importantly, this Plan sets the stage for the real heart of the Bay-Delta proceedings -- determining reasonable protection for a1 1 uses, and determining who will share responsibility for meeting the established water quality objectives.
The Scopinq and Water Right Phases of the Proceedinqs
Immediately after adoption of this Plan, the State Board will conduct scoping hearings on other actions necessary to protect beneficial uses, including flow requirements.
The flow issue is critical to the State Board's final decision. Flow requirements yet to be established will ultimately determine how much water can be exported for consumptive use, as well as how much water is needed to protect fish and wildlife.
Central to all these issues is the question of what amount of water is available and who is required to manage it.
Currently, two major water systems, one State and one Federal, export Delta water to other areas in California. These systems -- the State Water Project (SWP), operated by the California Department of Water Resources (DWR), and the
0 Central Val ley Project (CVP), operated by the U.S. Bureau of Reclamation (Bureau) -- are responsible for meeting sal inity objectives in the Bay-Delta.
I There are, however, approximately 7,000 parties which divert Delta water for usage throughout the State.
In order to establish an equitable means of water supply and distribution as embodied in Racanell i , the State Board has determined that other parties diverting Delta water, not only the CVP and SWP, should be required to meet water quality objectives in the Delta.
A primary task, among many others, of the Scoping and Water Right phases of the proceedings therefore will be the identification of appropriate requirements and of the parties responsible for providing for these needs. Initially, the State Board will review the operations of Sacramento and San Joaquin Val ley reservoirs of 100,000 acre-feet and larger, as we1 1 as those of major direct water diverters, to determine how responsibi 1 ity will be a1 located for meeting the Bay-Del ta Estuary's water qua1 ity and quantity needs. The extent to which smaller projects will be included will be considered during the Scoping Phase.

To complete the Scoping and Water Right phases, consideration will also be given to these issues: a o The record to date, plus the continuation of low runoff and depleted
storage, clearly show that there are insufficiently managed fresh water flows to protect fully all beneficial uses during dry and critical years, and perhaps in subnormal years. Consequent 1 y, decisions are needed regarding new faci 1 it ies, agreements on how to mitigate adverse impacts, modifications on water use and possibly new directives from the Legislature. .
o At the end of the current proceedings (that is, after adopting a water right decision), the State Board wi 1 1 incorporate in a revised Plan of Implementation that wi 1 1 :
- establ ish a time table to carry out best practicable management of the resources and uses thereof; - identify potential new facilities and time schedules for planning and construct ion to achieve best practicable management; - out1 ine suitable mitigation measures based on negotiated agreements to offset losses if some specified beneficial uses are not reasonably protected by direct requirements; - establish requirements to modify uses to reasonably balance the a1 locat ion of fresh water resources and the beneficial uses; and - propose potential new legislative directives.
I n addition, .the State Board must evaluate new major facilities, and consider other actions that are already in the planning stages or under public discussion. These include but are not 1 imited to: 0 Upstream from Delta Auburn Dam and reservoir (could modify water right
terms) ; additional fish hatcheries for salmon and steelhead.
In Delta Delta is 1 and storage (permit terms and conditions) enlarge channels; isolated conveyance.
In Export Areas Los Banos Grandes and Los Vaqueros reservoirs (permit terms and conditions) ; conjunctive use of ground water bas ins; southern Cal iforn ia surface reservoirs.
Mitigation Wetlands additions; improve fish hatchery outputs; improve planting of fish; improve aquatic habitat; reduce infestations of injurious phytoplankton, clams, etc.
Water Use Modification Improve irrigation efficiencies; increase art if icial ground water recharge; increase waste water reclamation.

1 Potential Legislation Set priorities for types of beneficial uses; explore and propose agricultural 1 and retirement where corrective drainage costs are excessive (similar to buy out of environmentally sensitive lands at Lake Tahoe) .
Completion of the water right process will be a complex task. The most difficult decisions 1 ie ahead. Scoping has already begun in March. As we move into the Water Right Phase, the State Board needs the guidance of all parties on the appropriate range of alternatives that should be evaluated -- toward the goal of having a balanced water right decision adopted in late 1992.

WATER QUALITY CONTROL PLAN CONTENTS
Page
.................................................................. Foreword i ........................................................ Table of Contents vi . . ...................................................... List of Appendices X I I . . ............................................ List of Technical Appendices xi1 ... List of Figures ........................................................ x111 .......................................................... List of Tables xiv ....................................................... Citing Information xv
1.0 EXECUTIVE SUMMARY
........................................................ 1.1 Background 1.1 ............................................... 1.2 Procedural Setting -1-1 ................................................. 1.3 Scope of the Plan 1.3 1.4 General Comments .................................................. 1-4 1.5 General Conclusions ............................................... 1-8
.............................. 1.6 Summary of Implementation Requirements 15 8 .......................................... 1.7 Water Qua1 ity Objectives 1.19
2.0 SCOPE OF THE PLAN
...................................................... 2.1 Introduction 2-1 .................................... 2.2 Scope and Purpose of the Plan -2-2 2.3 Authority for Regulation of Water ........................................ in the Bay-Delta Estuary 2-3
3.0 BASIN AND HYDROLOGY DESCRIPTION
..................................................... 3.1 Introduction -3-1 3.2 Water Year Types .................................................. 3-5 3.2.1 Classifying Water Years for a Basin .............................. 3-5 3.2.1.1 Sacramento Bas in Index Description ........................... 3-7 3.2.1.2 San Joaquin Basin Index ...................................... 3-8 3.2.1.3 Eastside Basin ............................................... 3-8 3.2.1.4 Adjustments to Water Year Classification ..................... 3-8 ............................... 3.2.1.5 Differences in Classification -3-10
4.0 BENEFICIAL USES OF BAY-DELTA ESTUARY WATER
4.1 Introduction ...................................................... 4-1 .......................................... 4.2 Beneficial Uses .,. ...... -4-1 5.0 ALTERNATIVE LEVELS OF PROTECTION FOR BENEFICIAL USES OF
BAY-DELTA ESTUARY WATER
5.0 Introduction .......................................................... 5.0.1 Overview 5-1 ........................................ 5.0.2 Hydrologic Considerations 5-2 ............. 5.0.3 Alternative Levels of Protection for Beneficial Uses 5-2

......................................... 5.1 Municipal and Industrial -5-3 .............................................. 5.1.1 Present Conditions -5-3 5.1.2 State Board Considerations ....................................... 5-3 ............................................ 5.1.3 Potential Objectives -5-4
5.2 Tri halomethanes (THMs) and Other Disinfect ion By-Products (DBPs) . . 5.4 ............................................... 5.2.1 Present Conditions 5.5 ...................................... 5.2.2 State Board Considerat ions -5-6 ............................................. 5.2.3 Potential Objectives 5-8
5.3 Agriculture ....................................................... 5-8 ............................................... 5.3.1 Present Conditions 5-9 ................................................ 5.3.1.1 Western Delta 5-9 5.3.1.2 Interior Delta ............................................... 5-10 5.3.1.3 Southern Delta ............................................... 5-10 ...................................... 5.3.2 State Board Considerat ions -5-10 .................................. 5.3.2.1&2 Western and Interior Delta 5-12 ............................................... 5.3.2.3 Southern Delta 5-12 5.3.2.4 San Francisco Bay ............................................ 5-13 ............................................ 5.3.3 Potential Objectives -5-13 ................................... 5.3.3.1 Western and Interior Delta 5-13 ............................................... 5.3.3.2 Southern Delta 5-13
................................. 5.4 Fish and Wildlife Beneficial Uses 5.13 5.4.1 Present Conditions . Entrapment Zone ............................. 5-14 ...................................... 5.4.2 State Board Considerations -5-15 ............................................ 5.4.3 Potential Objectives -5-15
.................................................... 5.5 Chinook Salmon 5.15 ............................................... 5.5.1 Present Conditions 5.16 5.5.1.1 Sal ini ty. Temperature and Dissolved Oxygen 5.16
i ................... 5.5.1.2 Legislation .................................................. 5-17 ....................................... 5.5.2 State Board Considerations 5.17 5!5.2.1 Temperature .................................................. 5.17 5.5.2.2 Fall-Run Chinook Salmon ...................................... 5-20 ................................... 5.5.2.3 Winter-Run Chinook Salmon -5-22 5.5.2.4 Dissolved Oxygen ............................................. 5.23 ..................... 5.5.2.5 Miscellaneous Considerations for Salmon 5-24 5.5.3 Potential Objectives for Chinook Salmon .......................... 5-26 .............................. 5.5.3.1 Temperature for Fa1 1-Run Salmon 5.26 ............................ 5.5.3.2 Temperature for Winter-Run Salmon 5.26 5.5.3.3 Dissolved Oxygen ............................................. 5.26
...................................................... 5.6 Striped Bass 5.27 .............................................. 5.6.1 Present Conditions -5-28 5.6.1.1 Background: D-1485 Objectives ................................ 5-28 5.6.1.2 Current Status ............................................... 5-28 5.6.2 State Board Considerations ....................................... 5-29 .................. 5.6.2.1 Antioch: Period of Protect ion for Spawning 5-30 ............................... 5.6.2.2 Antioch: Relaxation Provision 5-33 ............................ 5.6.2.3 Prisoners Point: EC Modification 5-34 ....................... 5.6.2.4 Prisoners Point: Relaxation Provision 5-36 ....................................... 5.6.2.5 Temperature Objectives 5-36

5.6.3 Potential Objectives ............................................. 5-36 5.6.3.1 Ant ioch: Period of Protect ion for Spawning .................. 5-36 5.6.3.2 Antioch: Relaxation Provision ............................... 5-37 5.6.3.3 Prisoners Point: EC Modification ............................ 5-37 ....................... 5.6.3.4 Prisoners Point: Relaxation Provision 5-38 5.6.3.5 Temperature Objectives ....................................... 5-39
5.7 American Shad ..................................................... 5.39 ............................................... 5.7.1 Present Conditions 5-39 5.7.2 State Board Considerations ....................................... 5-39 5.7.3 Potential Objectives ............................................. 5-40
5.8 Delta Smelt ....................................................... 5-40 5.8.1 Present Conditions .............................................. -5-40 5.8.2 State Board Considerat ions ...................................... -5-41 5.8.3 Potential Objectives ............................................. 5-44
5.9 Other Resident Fish in the Bay-Delta Estuary ...................... 5.44 5.9.1 Present Conditions ............................................. 5-44 5.9.2 State Board Considerations ..................................... 5-45 5.9.3 Potential Objectives ............................................ 5-45
5.10 Su i sun Marsh ...................................................... 5.45 5.10.1 Present Conditions .............................................. 5.45 5.10.2 State Board Considerations ...................................... 5.46 5.10.3 Potential Objectives ............................................ 5.48 5.11 Wildlife Habitat in Other Tidal Marshes ........................... 5-48 5.11.1 Present Conditions .............................................. 5.48 5.11.2 State Board Considerations ...................................... 5-48 5.11.3 Potential Objectives.. .......................................... 5.49
5.12 Benthos .......................................................... -5-49 5.12.1 Present Conditions ............................................. -5-49 5.12.2 State Board Considerations ..................................... -5-50 5.12.3 Potential Objectives ............................................ 5-50
5.13 Marine Habitat .................................................... 5.50 5.13.1 Present Conditions ............................................. -5-50 5.13.2 State Board Considerations ...................................... 5-51 5.13.3 Potential Objectives ............................................ 5-51
5.14 Navigation ....................................................... -5-51 5.14.1 Present Conditions ............................................. -5-51 5.14.2 State Board Considerations ...................................... 5-51 5.14.3 Potential Objectives ............................................ 5.52
5.15 Estuary Recreation Beneficial Uses ................................ 5.52 5.15.1 Present Conditions .............................................. 5.52 5.15.2 State Board Considerations ...................................... 5.53 5.15.3 Potential Objectives ........................................... -5-54
v i i i

...................... 5.16 Export Recreation and Export Fishery Habitat 5.54 ............................................... 5.16.1 Present Conditions 5.54 ...................................... 5.16.2 State Board Considerations 5-54 ............................................ 5.16.3 Potential Objectives 5-54
................................................ 5.17 Export Agriculture 5.54 ............................................. 5.17.1 Present Conditions -5-54 ...................................... 5.17.2 State Board Considerations 5-55 ............................................ 5.17.3 Potential Objectives 5-55
................... 5.18 Matrix of Alternative Water Qua1 ity Objectives -5-55
6.0 EVALUATION OF ALTERNATIVE WATER QUALITY OBJECTIVES
6.1 Introduction ...................................................... 6-1 ........................................ 6.2 Water Quality Alternatives 6-2 6.2.1A Alternative 1A .................................................. 6-9 6.2.16 A1 ternative 1B .................................................. 6-9 6.2.2 Alternative 2 .................................................... 6-10 ............................. 6.2.2.1 Municipal and Industrial Impacts 6-11 ...................................... 6.2.2.2 THM Formation Potential 6-11 6.2.2.3 Agricultural Impacts ......................................... 6-11 6.2.2.4 Salmon ....................................................... 6-11 6.2.2.5 Striped Bass ................................................. 6-11 6.2.2.6 Water Supply .................................................. 6-11 6.2.3 Alternative 3 .................................................... 6-12 6.2.3.1 Municipal and Industrial ..................................... 6-12 6.2.3.2 THM Formation Potential ...................................... 6-12 6.2.3.3 Agricultural Impacts ......................................... 6-13 6.2.3.4 Salmon ....................................................... 6-13 6.2.3.5 Striped Bass ................................................. 6-13 6.2.3.6 Water Supply ................................................. 6-14 6.2.4 Alternative 4 .................................................... 6-15 6.2.4.1 Municipal and Industrial ..................................... 6-15 6.2.4.2 THM Formation Potential ...................................... 6-15 6.2.4.3 Agricultural Impacts ......................................... 6-15 6.2.4.4 Salmon ....................................................... 6-15 6.2.4.5 Striped Bass ................................................. 6-15 6.2.4.6 Water Supply ................................................. 6-15 6.2.5 Alternative 5 .................................................... 6-16 6.2.5.1 Municipal and Industrial ..................................... 6-16 6.2.5.2 THM Formation Potential ..................................... -6-16 6.2.5.3 Agricultural Impacts ......................................... 6-16 6.2.5.4 Salmon ....................................................... 6-16 6.2.5.5 Striped Bass ................................................. 6-16 6.2.5.6 Water Supply ................................................. 6-16 6.2.6 Alternative 6 .................................................... 6-17 6.2.6.1 Municipal and Industrial ..................................... 6-17 6.2.6.2 THM Formation Potential ...................................... 6-17 6.2.6.3 Agricultural Impacts ......................................... 6-17 6.2.6.4 Salmon ....................................................... 6-18 6.2.6.5 Striped Bass ................................................. 6-18 6.2.6.6 Water Supply ................................................. 6-18

6.3 Issues to be Considered in Establishing Water Quality Objectives .. 6.19 6.3.1 Cumulative Impacts of Flow Alternatives .......................... 6.19 6.3.2 Operation Studies ................................................ 6-19 6.3.3 Fish and Wildlife ................................................ 6.20 6.4 The Water Qua 1 i ty Objectives ..................................... -6-21 6.5 Environmental Effects ............................................. 6-23 6.6 Implementation .................................................... 6.23 6.7 Economic Considerations .......................................... -6-23 7.0 PROGRAM OF IMPLEMENTATION
7.1 Introduction ..................................................... -7-1 7.1.1 Outstanding Scoping and Water Right Issues to be Discussed ....... 7-1 7.1.2 Statewide Water Management ...................................... -7-2 7.2 Implementation Measures ........................................... 7-3 7.2.1 General .......................................................... 7-3 7.2.2 Achieving Objectives For Beneficial Uses ......................... 7-3 7.2.2.1 Municipal and Industrial Uses ................................ 7-3 7.2.2.2 Agriculture .................................................. 7-4 7.2.2.3 Chinook Salmon ............................................... 7-5 7.2.2.4 Striped Bass. ................................. ............... 7-5 7.2.2.5 Other Fish and Wildlife ...................................... 7-5 7.2.2.6 Suisun Marsh ................................................. 7-6
7.3 Compliance Monitoring ........................ ... ........em....e.. 7.6 7.3.1 General .......................................................... 7.6 7.3.2 Compliance Monitoring for Specific Beneficial Uses ............... 7-9 7.3.2.1 Municipal and Industrial Uses ..................... .. ........ -7-9 7.3.2.2 Agriculture .................................................. 7-9 ....................................................... 7.3.2.3 Salmon 7.9 7.3.2.4 Striped Bass ................................................. 7.9 7.3.2.5 Other Fish and Wildlife ...................................... 7-10 7.3.2.6 Suisun Marsh ................................................. 7.10
.. ...... 7.4 Special Studies and Reviews ......................... .. .... 7.10 7.4.1 General .......................................................... 7.10 7.4.2 Special Studies For Beneficial Uses .............................. 7-10 7.4.2.1 Municipal and Industrial Uses ............... .. ............... 7.10 ................................................. 7.4.2.2 Agriculture -7-11 7.4.2.3 Salmon ...................................................... -7-12 7.4.2.4 Striped Bass ................................................. 7-13 7.4.2.5 Other Fish and Wildlife Studies .............................. 7.14 7.4.2.6 Marshes Around Suisun Bay .................................... 7.15 7.4.3 Other Special Studies and Reviews ................................ 7.17 7.4.3.1 Aquatic Habitat Status Report ................................ 7.17 7.4.3.2 Modeling Needs ............................................... 7-17
7.5 Scoping and Water.Right Issues ................. ... ............... 7.20 7.5.1 General ......................................................... -7-20 7.5.2 Summary of Beneficial Use Issues ............. .. ................. 7.20

................................ 7.5.2.1 Municipal and Industrial Uses 7-20 7.5.2.2 Agriculture ................................................... 7-21 ....................................................... 7.5.2.3 Salmon 7-21 7.5.2.4 Striped Bass ................................................. 7-21 ............................... 7.5.2.5 Other Fish and Wildlife Issues 7-23 .................................... 7.5.2.6 Marshes Around Suisun Bay 7-23 ............................. 7.5.3 Other Scoping and Water Right Issues 7-24 .................................... 7.5.3.1 Water Year Classification 7-24 ............................................ 7.5.3.2 Economic Analysis 7-25 .............................................. 7.5.3.3 Entrapment Zone 7-25 .......................................... 7.5.3.4 Physical Facilities 7-25 .............................. 7.5.3.5 Agricultural Water Conservation 7-29 .............................................. 7.5.3.6 Conjunctive Use 7-30 ........................................ 7.5.3.7 Suggested Legislation 7-30

APPENDICES
A. Abbreviations for Information Sources and Citations B. List of Abbreviations/Symbols C. Glossary D. Monitoring Stations by Interagency Number and by River Kilometer Index E. Map of Salinity Control Stations F. Notice of Filing G. Transcript Index
TECHNICAL APPENDICES (Avai 1 able Upon Request)
State Board Authority for Regulation of Water in the Bay-Delta Estuary Basin Descriptions Description of Various Components of the New Water Year Classification
40-30-30 Index Beneficial Uses of Bay-Delta Estuary Water Advocated Levels of Protection Tri halomethanes (THMs) Analysis of Corn Yield to Variations in Applied Water and Leach Water
Salinity Chinook Salmon Striped Bass Threatened, Endangered and Candidate Species Suisun Marsh Preservation Agreement -- Technical Analysis Analysis Assumptions for Water Supply Impacts D-1485 Operat ion Studies

Number
FIGURES
Title Page
Boundary of the Bay-Delta Estuary and locations of Estuary exports ...................................................... 3-2
Boundaries of the Sacramento River (5A). Central Sierra .......................... and Delta (58). and San Joaquin (5C) Basins 3.3 ................................ Boundary of the San Francisco Bay Basin 3-4 ................. Sacramento Val ley Water Year Hydrologic Classification 3.6 ................ San Joaquin Valley Water Year Hydrologic Classification 3-9 Mean Spring Flows at Vernal is and San Joaquin Basin Escapement
2 112 Years Later .................................................... 5-18 Relationship between Mean Spring Flows at Vernalis and
San Joaquin Basin Escapement 2 112 Years Later ....................... 5-19 Adjusted Survival Index of Chinook Salmon .............................. 5.21 ............................................... Delta Sme'lt Index Values 5-43 ........................................... SMPA Water Quality Standards 5-47 Delta Hydrologic Scheme ................................................ 6-6 Average Annual Water Supply Impacts .................................... 6-7 Critical ly Dry Period Water Supply Impacts ............................. 6.8
xiii

TABLES
Number Title Page
Water Quality Objectives .............................................. 1-20' .......................... Implementation Requirements for Suisun Marsh 1.21 Selected Results of the Statistical Analysis to Determine ...................................... Optimal Weighting Coefficients -3-8 Sacramento River Basin: Comparison of Proposed Modified ........................ 40-30-30 and Delta Water Year Classification 3.11 Delta Service Area Crop Salt Sensitivity ............................... 5-11 ....................................... Striped Bass Spawning Patterns -5-31 ........................................... Del ta Smelt Abundance Index 5-42 Crops Comprising at Least Five Percent of Either the
CVP or SWP Service Areas and their Sal inity Tolerances .............. 5-55 Matrix of Alternative Water Qua1 ity Objectives ........................ 5-58 .......................... A1 ternat ive Sets of Water Qua1 i ty Objectives 6-3 Water Supply Impacts of the Alternative Sets
of Water Quality Objectives ......................................... 6-5 .............................................. Water Qua 1 i ty Objectives 6-22 Qua1 itat ive Assessment of Impacts .................................... -6-24 ................................................ Environmental Check1 ist 6-25 Bay-Del ta Estuary Water Qua1 i ty Monitoring Program .................... 7-7
xiv

CITING INFORMATION
When citing evidence in the hearing record, the following conventions have been adopted:
Information derived from the TRANSCRIPT:
Ending page and line number (can be same
I L as the starting page) - may be omitted if a single line reference is used Beginning page and line number
Transcript Sequence Number (see Appendix G, ran script Index)
Transcript
Information derived from an EXHIBIT SUBMITTED DURING PHASE I:
Page number, table number, graph number LL Identifying Exhibit abbreviation number of the information source (see-~ppendices A & B, Abbreviations/~ymbols)
Information derived from an EXHIBIT SUBMITTED AFTER PHASE I:
Page number, table number, graph number ~xhibit number
Identifying abbreviation of the information source (see Appendix A & B, Abbreviations/~ymbols)
Phase of the proceedings (WQCP = Water Quality Control Plan, 2/90-Present EIRSP = Environmental Impact Report Scoping Phase)
When citing REFERENCES from outside of the hearing record, the following conventions have been adopted:
~nformation derived from published documents, (a) in the text of the Plan:
Denton, 1985 I I
Year of publication Name of author or agency abbreviation

Denton, 85-3wr.
CITING INFORMATION (Continued)
(b) at the end of the appropriate Plan Chapter:
R.A. 1985. Currents in Suisun Bay. SWRCB, publication No. January 1985.
Complete publication source
Complete title of document cited Publication date Name of author or agency abbreviation
Information derived from Phase I closing BRIEFS: (a) in the text of the Plan:
RIC, Brief, 8 I I I
Page number "Brief
Identifying abbreviation of the information source
(b) at the end of the appropriate Plan Chapter:
Brief of the Rice Industry Committee on Pollutants in the Bay- Delta Estuary, pg. 8.
For a complete list of the abbreviations for information sources, citations and symbols used in this document, see Appendix A and B.
Appendix C is a Glossary of Terms; Appendix G is a Index of Transcripts listing Transcript Sequence Numbers.

I 1.0 EXECUTIVE SUMMARY
1.1 Background
The San Francisco Bay and Sacramento-San Joaquin Delta Estuary (Bay-Delta Estuary) includes the Sacramento-San Joaquin Delta (Delta) , Suisun Marsh and the embayments upstream of the Golden Gate. The Delta and Suisun Marsh are located where California's two major river systems, the Sacramento and San Joaquin rivers, converge to flow westward to where they meet incoming seawater tides flowing through the San Francisco Bay. The beneficial uses of the waters in this system are set forth within the water quality control plans adopted by the San Francisco and the Central Val ley Regional Water Quality Control Boards. The beneficial uses of Delta waters encompass almost all uses of water imaginable. The watershed of. the Bay-Delta Estuary provides drinking water to two-thirds of the State's population and water for a multitude of other urban uses; it supplies some of the State's most productive agricultural areas both inside and outside the Delta; it is one of the largest systems for fish and waterfowl habitat and production in the United States. The Sacramento-San Joaquin Delta serves as a critical 1 ink for projects which transfer water from surplus to deficient areas.
Two major water distribution systems divert water from the Delta: the State Water Project (SWP) operated by the California Department of Water Resources (DWR) and the Central Valley Project (CVP) operated by the United States Bureau of Reclamation (USBR). Numerous other water diversion and management efforts influence the inflows into, flows through, and outflows from the Bay-Del ta estuary.
1.2 Procedural Setting
In July 1987, the State Water Resources Control Board (State Board) opened a public proceeding consistent with direction from the California Court of Appeal in U.S. v. State Water Resources Control Board, 182 Cal.App.3d 82, 227 Cal .Rptr. 161 (1986). To provide a comprehensive approach to water qual ity management, the Board has reviewed and approved amendments to the two relevant regional basin plans, and has adopted a separate Pollutant Pol icy Document (PPD), the Enclosed Bays and Estuaries and Inland Surface Water Plans, and a Water Qual ity Assessment.
1'
This Water Qual ity Control Plan for Salinity, San Francisco BayISacramento- San Joaquin Delta Estuary (Plan), supersedes the regional water qual i ty control plans for the Bay and Delta to the extent of any conflict. This document supersedes the 1978 Delta Plan to the extent that the 1978 Plan addresses the water quality parameters which are the subject of this Plan. In addition to setting water quality objectives for salinity, the 1978 Delta Plan established Delta outflow standards and operational constraints implemented through Water Right Decision 1485 (D-1485). These flow requirements are established for the purpose of assuring flows consistent with the reasonable protection of beneficial uses. The Board has determined that modification of these flow requirements is premature unti 1 the Water Right Phase of these proceedings is completed. Because changes

to these flow requirements are not being proposed as part of the Water Quality Phase of these proceedings, the flow requirements and operational constraints in the 1978 Delta Plan will remain in effect until the conclusion of the Water Right ~hase.1
a \
Further, this document is a substitute for an environmental document, consistent with the process certified under Pub1 ic Resources Code Sect ion 21080.5.
After adoption of this Plan, the Board will commence comprehensive scoping hearings consistent with the California Environmental Quality Act. The purpose of the scoping hearings is to receive evidence from participants to: (1) develop specific a1 ternat ives for reasonable levels of protect ion for beneficial uses; (2) identify the current and potential role that proposed physical faci 1 ities, negotiated settlements, legislative action, and the actions of other agencies should play in the protection of beneficial uses of Bay-Delta waters; (3) draft a matrix of alternatives (to include flow amounts as appropriate); (4) assess implementation of the alternatives; and (5) compile a draft EIR.
Following the public review of the draft EIR prepared by the State Board, a hearing will be held on the draft EIR and on water right matters to which it applies. This Water Right Phase will be conducted as a quasi- adjudicative proceeding at several locations throughout the state. It wi 1 1 conclude with the adoption of a final EIR and a water right decision.
The product of the current Water Quality Phase of the planning process will be updated to reflect findings and conclusions at the end of the Water Right Phase and periodical ly, thereafter, whenever sufficient new informat ion is received.
As set forth above, it is important to note that water quality objectives and water right permit terms for the Delta exist today. They were recognized by the court in U.S. v. State Water Resources Control Board.
i Current permit conditions which seek to protect the Delta are in effect and enforceable pending completion of these full proceedings.
In regard to the Suisun Marsh, the water quality objectives for Suisun Marsh are unchanged from the 1978 Delta Plan. The implementation vehicle, Water Right Decision 1485 (0-1485), was amended in 1985 to change (or delete) some monitoring stations and to revise the schedule for implementat ion. The DWR, USBR, DFG, and Su i sun Resource Conservation
I District (SRCD) have signed and adopted a set of three agreements concerning the Suisun Marsh. These are the Suisun Marsh Preservation
I Agreement (SMPA) , the Monitoring Agreement, and the Mitigation Agreement.
I/ The flow requirements established in the 1978 Oelta Plan are implemented in the Board's Decis ion 1485 and wi 11 be enforced by the Board pursuant to i ts water rights authority unt i 1 new t e r n and condlt ions are adopted In the Water Rights Phase of these proceedings. At the end of the Water Right Phase, this docmnt w i 11 also be updated. At that point the Board wi 11 have evaluated a 11 of the requ iremnts of the 1978 Oelta Plan, and wi 11 have retained or m i i f led those requirements, as appropriate. It wi 11 no longer be necessary for any provision of the I978 Oelta Plan to rema in in effect, except where the Board has decided to adopt that prov is ion, with appropr late m d i f icat ions, in the Water Qua 1 i t y or Water Right Phase of these proceedings.

The SMPA contains water quality standards for the managed marshes of Suisun Marsh which the four signatories would like the State Board to adopt as water qual i ty objectives. The SMPA also describes the physical faci 1 ities that the four signatories have agreed would serve the managed marshes in order to maintain production of preferred waterfowl food plants. The facilities built so far, including the Suisun Marsh Salinity Control Gates (previously cal led the Montezuma Slough Control Structure), have changed the physical regime in the Marsh.
Revised water qual ity objectives incorporating the SMPA (with any modifications necessitated by the biological assessment) wi 1 1 be adopted by the State Board after the biological assessment (discussed in Section 7.4.2.6) is completed. Until that time, the water quality standards in the amended 0-1485 will continue to be implemented; see Table 1-2 for a summary of these standards.
1.3 Scope of the Plan
This Plan is the product of extensive hearings. In this Plan, we make a distinction between thermal loadings and salinity effects caused by man's traditional land use and waste water additions to the waters of the state and those influences directly related to and resulting from the allocation of water for use through water control and diversion. This distinction is premised upon the different way federal and state laws treat waste discharges and the a1 location of water for beneficial use. Waste dischargers are governed by both state and federal law. The appropriate regional boards adopt basin plans designed to regulate thermal loadings and salinity effects, ps well as other pollutant components, of waste discharges. These plans are submitted to the Environmental Protect ion Agency in accordance with the provisions of the Clean Water Act. The allocation of water recognizes both the intended and unintended results of water control and diversion such as those resulting in salinity variations within the Estuary.
This Plan primarily addresses temperature and salinity objectives (for a complete 1 isting, see Table 1-1). Water rights proceedings and other actions will follow in order to implement these objectives and others which can best be addressed in the allocation process. Initially, the State Board will be reviewing operations of Sacramento and San Joaquin Valley reservoirs of 100,000 acre-feet and larger, and major direct diverters, to determine how responsibility will be allocated for meeting the Bay-Delta Estuary's water quality and quantity needs. The extent to which small projects will be included will be considered during the Scoping Phase. The need for determining the specific responsibi 1 ities of other water right holders will be analyzed as we proceed. When the process is completed, the combination of water qual ity planning and the amended water right permits will provide the statutorily mandated reasonable protection of the beneficial uses.

1.4 General Comments
* State Water Planning Programs and the Federal Act \
This Plan fully complies with the State's water quality statutes and with appl icable federal law. The State's water qua1 i ty planning is consistent with the federal Water Pollution Control Act as amended by the Clean Water Act Amendments of 1987. California's water planning program is more broad- based than the federal act, and encompasses planning and implementat ion powers affecting: determinations of waste and unreasonable use, allocations of water use through water rights decisions, review and approval of changes in the manner, timing and location of water use, and sources of pol lution.
* Fish Migration
In the course of these proceedings, evidence was introduced that significant impacts to the fishery are due to the location, method and timing of diversions of water from and upstream of the Delta and are not related to the quality of the water. The impacts to the fishery are due in part' to such factors as:
- direct entrainment losses at the points of diversion from the Delta; - diversion of fish through the Delta Cross Channel into the interior Delta; - reverse flows in various reaches of the San Joaquin River, Old River, Middle River and other Delta channels, caused by the CVP, SWP, CCC and local agricultural diversion pumps; and - the lack of flows in some water years to either hold the entrapment zone in the proper location to provide a nursery area for young striped bass or to move (flush) the young striped bass into Suisun Bay where habitat conditions should be better than in the Delta.
These flow-related issues will be addressed by the State Board in the 1
Scoping and Water Right phases of these proceedings. The State Board I retains the option of setting flow objectives, if appropriate. However, in an effort to expand the Board's, and others8, understanding of the potential benefits to the fishery and the cost in terms of reductions of available offstream water supply, operational information will be needed addressing the above issues. The study needs are discussed in more detail in Chapter 7. Such studies will permit the Board to evaluate a full range of social and economic benefits and costs, and to identify management options that could be implemented to reasonably protect the fishery resources.
* Fish versus People
During the proceedings an issue was raised and described as "fish v. people". Some parties wanted the Board to assign value or weight to peoplei s needs for the water versus fish needs if the circumstances so required. The State Board must ensure reasonable protect ion of beneficial uses. In this case, municipal and industrial uses and aquatic life are the two beneficial uses to be protected. The court in U.S. v SWRCB directed

that the Board was to equitably distribute the dry year shortages as well as the wet year benefits. Such balancing and distribution is the essence of allocation and will be undertaken during the Water Rights Phase of these proceedings. In establishing the reasonable objectives and goals of this Plan, there is no need to choose one beneficial use over the other. All beneficial uses are being reviewed for the reasonable protection of each use, and then for the reasonable protection of a1 1 uses as they relate to each other.
* Location and Operation of the Pumps and Cross Channel Facil ities
The location and operation of the diversion pumps and cross channel facilities within the Delta have direct impacts upon uses in and out of the Delta. Evidence was submitted which dealt with the hydraulic effects of the state and federal diversions and their impacts on fishery resources. The record contains evidence that one of the chief impacts upon fishery beneficial uses is the operation of the diversion pumps, cross channel facilities and other physical facilities within the Delta, during critical times of migration and spawning. The record also reflects the serious potential impacts inherent in the location of the pumps to the beneficial uses of drinking water. The existence of disinfection by- products, caused by the treatment of water containing organic materials that result from decomposition of peat soils, may present a risk to drinking water supplies both in and out of the Delta.
In addressing both the fishery and drinking water impacts, it is necessary to understand their profound implications to uses throughout the state. These are examples of where it is necessary to protect the same resource for two equally important beneficial uses. Any attempt to set numeric objectives or to single out any one permanent implementation condition without a full balancing of the impacts to all uses in and out of the Delta would result in numerous and widespread inequities within California's water supply system.
The Board has broad powers to address these impacts and will also do so in the Scoping and Water Right phases. In 1 ight of the impacts to the fishery and to drinking water supplies, a solution may be to relocate the existing points of diversion for the projects. Therefore, the parties should provide necessary information within the Scoping Phase to enable the State Board to weigh alternatives to the existing places of diversion.
* Role of Fish Hatcheries as a Mitigation Measure
There is evidence of economic, social and resource benefits and impacts from the use of fish hatcheries and growout facilities as resource management tools. Potential negative impacts include disease transmissions and genetic effects on fish. Further evaluation of the influences and impacts of those management tools is required within the scoping and subsequent implementation stages of this process.
* FlowRequirementsfor theBay
Requests have been made for the Plan to contain requirements for more flows to protect the Bay (downstream of Carquinez Straits). To have meaning the concept, of "more flows" must include such factors as water ,year types, time

of year, tidal influences, the relationship of demand to water avai labi 1 ity, etc. There must be a demonstrated connection between flow and the reasonable protection of beneficial uses. Although data were presented on this topic, the Board finds the information inconclusive. The Board will consider Bay flow requirements during the Scoping and Water Right phases of these proceedings and may decide to set flow objectives.
The State Board is supporting a program to produce information about the Bay-Delta system that would be relevant to management decisions (e.g., what appropriate water qua1 ity objectives should the State Board set to reasonably protect beneficial uses being made of waters within the Bay- Delta Estuary complex). The program should:
1. Identify the activities that have an effect on the Bay and Delta and that can be managed (i . e., differentiate between natural phenomena and man- induced activities having an impact on the Bay-Del ta) ;
2. Identify responsibilities for developing studies to a1 low resources agencies to better manage the Bay-Delta system.
3. Develop a stable funding mechanism for the needed studies through fees on point dischargers, nonpoint dischargers and upstream water users.
4. Develop time schedules and oversight committees to ensure timely implementat ion and coordination.
Since planning and executing studies of the Estuary require DFG to work closely with the other member agencies of the IESP, more stable and consistent funding of a1 1 IESP programs is required to achieve maximum benefits from these studies and to achieve effective Estuary management.
* Pu 1 s ingISeasona1 Flows
There was testimony given that the Board should establ i sh pul singlseasonal flows in order to improve stratification within the south Bay. Because the physical and biological importance of stratification is largely unknown, further information is needed and should be developed to determine if and how strat if ication influences or impacts beneficial uses. Further, there appears to be a need to examine stratification, or the ability to influence stratification, through operation of control and diversion facilities. Therefore, the Board believes that pulsing/seasonal flows should be further analyzed by the Operations Workgroup, with a progress report to be provided during the Scoping and Water Right phases of these proceedings.
* Exclusion of Unimpaired Flows
In an examination of the record and review of existing objectives, the Board determined that unimpaired flows are not a feasible alternative to the existing operations. Therefore they are not an appropriate basis for examining, evaluating and balancing the protection of beneficial uses. The Board has considered the existing faci 1 ities, reviewed operational data, analyzed relevant management tools and deliberated upon all submitted economic information. There are sufficient data available to support a partial evaluation of existing conditions. Such an evaluation is necessary

to establ ish objectives and to ultimately refine these objectives after completion of the next portions of these proceedings. Unimpaired flows continue to be used as a basis for estimating available water supply and for determining year types.
* Limitat ions Upon Existing Supplies
Water supplies to southern California have been restricted by court decree and physical circumstance. California's supply from the Colorado River is limited and except for unusual circumstances fixed. Water available to Los Angeles from the Owens Valley and the Mono Lake Basin has been reduced by judicial decree. Various ground water basins within areas using Delta water supplies are facing serious limitations due to pollution or salt water intrusion. The record reflects that substantial increases in population are expected within all areas making use of water from the Delta.
* Water Resources Management.
Whi le the general pub1 ic perception of reasonable conservation efforts includes such measures as odd-even watering days, low flush toilets, flow restrictors, and reasonable use of water by agriculture, much more needs to be done to expand conservation among all water users. Any determination of the reasonable use of water must be prefaced upon a demonstration that reasonable conservation efforts are being undertaken. The showing is the obligation of all users and advocates for the uses. This obligation extends to public trust uses. Temporary changes in fishery harvest regulations should be considered as part of an overall short-term approach to improve the situation until longer-term measures may be instituted. The Board does not believe that such measures should substitute for its own responsibilities to provide suitable habitat. Other public trust management activities may conserve water while maintaining the value of the resource.
Another measure that may be required is the use of water meters throughout the state. Meters draw attention to the fact* that conservation is so fundamental that it requires recognition of the individual's impacts upon water use and demand. Coupled with the need to heighten each individual's understanding of his or her impact upon water use and demand is the need to heighten understanding of the impacts of individual loadings of waste and pol lution into our water systems, Source controls, waste minimization and pol lut ion prevention are necessary conservation measures to be planned for and implemented by all those using the resource;
Along with heightened awareness of conservation must come an understanding and full acceptance of the potential for reclaimed water. While many understand the need to protect the environment through recycling of aluminum, glass and paper, too few appreciate the waste that occurs whenever water is used once and then treated and dumped into the ocean. A good illustration of reclamation occurs in the Santa Ana River Basin. The need to maximize the beneficial use of a1 1 water, particularly that which can be reasonably treated and reused, must become part of the demonstration that reasonable conservation efforts are being undertaken. .

A process being called Urban Water Conservation Best Management Practices (BMP) is being developed by urban water suppl iers, environmental organizations, and other public interest groups statewide. The BMP process represents a consensus among the above groups on the issue of urban water conservation for the Bay-Del ta hearing. The State Water Resources Control Board encourages such consensus recommendat ions.
During the course of the proceedings a number of effective urban and agricultural conservation and reclamation measures were demonstrated. Yet, concerns, attitudes and apprehensions were expressed about the following aspects of conservation, including:
+ Apprehension that water users who were already exercising effective conservation measures would be penal ized if sufficient credit wasn't given for voluntary or existing effort. While the obligation to prove such pre- existing conservation measures remains the burden of those seeking credit for conservation measures, any entity capable of showing historic or existing practices would receive credit in the balancing equation. Additional measures will be required only if they are feasible and reasonable.
* Concern that agricultural users are not conserving as much as they could. Some contend that if agriculture would retire marginal land from production and alter the kinds of crops grown to less water intensive crops, there would be enough water for a1 1 present and foreseeable future needs. A1 1 parties agreed that there is more that all sectors of California could do to conserve. But, conservation alone wi 1 1 not be the answer to the State's supply needs. Further, conservation imposed upon one sector of users based solely upon the amount used by that sector is not a demonstration of the balancing and integration of Cal ifornia's complex water needs. The parties should include more complete data during the Scoping Phase with respect to the potential for conservation by agriculture. During subsequent phases of the proceedings, the State Board wi 1 1 give significant consideration to the Interagency Report of the San Joaquin Val ley Drainage Program.
1.5 General Conclusions (With references to chapter and section, where appropriate)
\
o The State Board has a major but not all-inclusive role in the allocation and protection of water resources. Its decisions are a dynamic part of the total management and protection program affecting water resources.
o Reasonable protection of beneficial uses means that the Board considers avai lable evidence and strikes a balance between the benefit of a water qua1 ity objective and the achievabi 1 ity.of that objective. A partial, nonprioritized listing of factors considered in the balancing of benefit and achievability includes:
- Agreements and accords offered by participating parties for the protect ion and management of the Bay-Del ta Estuary, and reviewed by the Board as to their reasonableness; - Intrinsic values of the beneficial use in addition to quantitative data;

- Lega 1 requirements to protect rare, threatened and endangered species ; - present and future water supplies and demands; - Social and economic values (including impacts to housing and agr i cu 1 ture) ; - Alternatives to achieve comparable protection; and - Existing water quality and water allocation laws.
WATER YEAR TYPES (Chapter 3)
The Bay-Delta Estuary is a dynamic system characterized by wide annual, seasonal, and daily fluctuations in fresh water inflows and ocean derived salinities.
Defining water year types is an essential tool in evaluating the amount of water available.
Water availability is an essential factor in establishing reasonable objectives for ocean, derived salts.
The Board adopts the "40-30-30 Water Year Index" for the Sacramento River Basin as proposed by the Operational Studies Workgroup. In subsequent phases of the proceedings, the Board wishes to examine critically the use of the "subnormal snowmelt" and "year following dry or critical year" provisions which a1 low a1 terations of objectives.
Changes to water year types wi 1 1 include development and refinement of an appropriate index before it can be implemented for the San Joaquin River Basin.
CURRENT AND FUTURE WATER SUPPLY CONDITIONS
On the average, precipitation supplies about 193 MAF per year in California with another 6 MAF coming from out-of-state sources. About 58 percent of this water is used by native vegetation and unirrigated lands; about 25 percent flows to the sea, to salt sinks, or to Nevada; about 14 percent is diverted for offstream uses; and about 3 percent goes to the natural recharge of ground water basins.
The watershed of the Bay-Delta is a major source of supply critical in satisfying the water needs of the entire State.
The Bay-Delta watershed is influenced by water diversion and control. On the average about 40 percent of the flow entering the Delta is unmanaged. However, in dry years less than five percent is unmanaged.
As California's population grows to over thirty-six million people by 2010, the currently developed water supplies wi 1 1 be inadequate to meet the needs of a growing population, expanding economy, and the aquatic environment.
There are about 9.2 milli.on acres of irrigated agricultural land in California, of which approximately 7.3 million are in the Central Valley.

Agricultural acreage is currently not expected to increase. 9 Agricultural demands are partially being met by groundwater ~verdraft in the San Joaquin Val ley.
The Final Report of the Interagency San Joaquin Valley Drainage Program addresses various aspects of agr icu 1 tural conservation. The State Board will consider this and any additional submitted information concerning these matters.
Planning for municipal and industrial water needs must focus on the primary requirements of a reliable supply of .high quality drinking water at an affordable cost.
Reductions in reliable water supplies could have adverse impacts on the economy and the environment of the state.
Conservation, reclamat ion and conjunctive use of local ground water basins are important components of reliable water supplies.
California water supplies have been affected by recent court decisions. The state's dependable share of water from the Colorado River has been reduced to 4.4 MAF per year. Interim court decisions have reduced the City of Los Angeles' water supply from tributaries in the Mono Lake Basin by 50 to 65 TAF. Also, court decisions have 1 imited export of ground water from the Owens Valley Basin to levels lower than originally anticipated by the City of Los Angeles.
Water conservation by the Imperial Irrigation District consistent with State Board Order 88-20 could make water available for use in other parts of the state by 100 TAF in the early 1990s, with a goal of about 368 TAF.
o Ground water is a diminishing resource upon which the state relies. Factors 1 imit ing the avai labi 1 ity of that resource include toxics, overdraft, salt water intrusion, land use practices and lack of recharge and coordinated administrative practices.
WATER QUALITY 08 JECTIVES
o There are numerous influences on the Estuary's beneficial uses. Some are not fully defined, including the impacts of commercial and sport fishing (legal and illegal), the adverse effects of accidentally introduced species (e.g., the clam Potamocorbula amurensis), and the potential problems with genetic alteration in fish resulting from reliance on hatcheries. There are also known harmful effects from toxic materials, dredging, structures, and others, on the health of the aquatic habitats in the Bay-Delta Estuary. (See 5.0)
Salinity Requirements for Municipal and Industrial Water Use
o ' There is a need for water from the best avai,lable sources to meet the drinking water need of all Californians. There is a need to design and implement a comprehensive trihalomethane formation potential (THMFP) monitoring program, and to develop best management practices, or other appropriate means, to control discharges of THMFP . @

For all municipal and industrial intakes within the Bay-Delta Estuary, the Board adopts the 250 mg/l chloride (salinity) objective which is the secondary standard for aesthetics (taste) and corrosion establ i shed by the Department of Health Services. However, additional salinity protection may be needed in some areas to protect drinking water supplies from disinfection by-products (DBPs). (5.1)
The D-1485 objective of 150 mg/l chloride at the Contra Costa Water District's Rock Slough intake protects the municipal and industrial beneficial uses in Contra Costa County and provides benefits to the municipal supplies exported from the Delta. If and when additional storage capacity is built or other information is developed, this objective and its monitoring location will be reviewed. Meanwhile, deleting the 150 mgll chloride objective in D-1485 at the Rock Slough Intake could result in increased bromide concentrat ions and increased sal ini ty and consumer complaints due to the salty taste in the water.(5.1)
Delta water at times contains bromides (often measured via correlations with chlorides) and organic substances which, upon disinfection, increase the risk of forming by-products (including trihalomethanes (THMs)) that are human health concerns. (5.2)
In the Delta THM precursors come from organic carbon in Delta peat soils and from the watershed upstream. Bromides which naturally occur in ocean water and connate water exacerbate the formation of THMs upon disinfection. (5.2)
Existing drinking water standards are being met through a combination of source water controls and current drinking water treatment processes. (5.2)
I f drinking.water standards on DBPs are revised, the State Board will consider modifying existing salinity objectives. (5.2)
In the future the Board will review and weigh all factors that might result in more stringent sal inity objectives for drinking water after disinfection. This includes alternative water disinfection methods. (5.2)
Due to the concerns with DBPs in treated water from the Delta and in keeping with the goal (not objective) of obtaining the best available drinking water, the Board finds that, whenever feasible, municipal water supply agencies should strive to obtain bromide levels of 0.15 mg/l or less (about 50 mg/l chloride in the Delta). Appropriate actions by these supply agencies include encouraging DWR and USBR to work with the SWRCB to ensure development of facilities to make maximum use o f uncontrolled flows through off -stream storage, encouraging those agencies to move water supply intakes to better locations, working with the State and Regional Boards to eliminate problem discharges within the Delta, and continuing the development of a1 ternative water treatment technologies. (5.2)
Western and Interior Delta Agriculture (5.3)
To reasonably protect crops grown in the western and interior Delta, water qua1 i ty objectives were developed using corn as the representative salt- sensitive crop.

Assuming improved leaching practices are used, sal in i t ies up to 1.5 mmhos/cm EC could be allowed during the irrigation season without affecting crop yield. However, the economic costs of these p~actices are not in the record.
Until adequate economic data are available on leaching costs, the Board will maintain the existing salinity objectives.
Southern Delta Agriculture (5.3)
To reasonably protect crops grown in the southern Delta, water quality objectives were developed using beans and alfalfa as representative salt- sensitive crops.
The objective of 0.7 mmhos/cm EC in the southern Delta protects beans during the summer irrigation season and the objective of 1.0 mmhos/cm EC protects alfalfa during the winter irrigation season. These or other adequately protective objectives at specified locations wi 1 1 be implemented over time.
Exported, Water for Agriculture (5.17)
Water is exported from the Delta for agricultural use in the San Joaquin Val ley and southern California,
To reasonably protect crops grown in the export areas, water quality objectives were developed using almond orchards as the representative salt- sensitive crop.
The Board finds that the objective of 1.0 mmhos/cm EC reasonably protects salt-sensitive crops grown in the San Joaquin Val ley and southern California.
Estuarine Habitat (5.4)
Fisheries: (Beneficial uses - Warm, Cold, Migration, Spawning, Rare) The State Board supports the natural perpetuation of species affected by water and water quality. It is the policy of the State to significantly increase the natural production of salmon by the end of this century.
Because of the amounts of data, past practices and pub1 ic interest, striped bass and Central Valley Chinook salmon will be given separate consideration in the development of water quality objectives.
Fish hatcheries for some qpecies are a management tool that will be evaluated for their benefit and operation within the watershed during subsequent phases of the Bay-Delta proceedings.
With respect to temperature and salinity, the objectives set in this Plan protect selected estuarine habitat beneficial uses. There is insufficient information in the record to set specific salinity and temperature objectives for the protection of Delta smelt, American shad, benthos, resident fish or marine habitat outside the Estuary.

1 Chinook Salmon in the Central Valley (5.5)
;@ o The Estuary is a migratory corridor and rearing area for Chinook salmon.
o Hatchery production has kept the total number of fall-run salmon relatively stable.
o The diversity of the gene pool from naturally produced salmon is desirable.
o The Sacramento River winter-run of the Chinook salmon has been listed as an endangered species and wi 1 1 receive additional consideration in the final phases of these proceedings.
o The Board finds that salinity is not a factor affecting salmon as they migrate through the Estuary.
o Elevated temperature is one of the factors which can affect Chinook salmon during their migration through the Delta.
o Temperatures no greater than 68OF during the periods of April through June and September through November at Freeport on the Sacramento River and Vernalis on the San Joaquin River should be achieved by controllable factors, such as waste,discharge controls, increases in riparian canopy, and bypass of warming areas (e.g., Thermalito Afterbay).
o Control lable water qual ity factors are those actions, conditions, or circumstances resulting from human activities that may influence the qual ity of the water of the State, that are subject to the authority of the State Board, or the Regional Board, and that may be reasonably control led. Based on the record in these proceedings, control 1 ing temperature in the Delta uti 1 izing reservoir releases does not appear to be reasonable, due to the distance of the Delta downstream of reservoirs, and uncontrollable factors such as ambient air temperature, water temperatures in the reservoir releases, etc. For these reasons, the State Board considers reservoir releases to control water temperatures in the Delta a waste of water; therefore, the State Board will require a test of reasonableness before consideration of reservoir releases for such a purpose.
o No temperature requirements were submitted for winter-run Chinook salmon. To provide some protection for this endangered species, the more conservative temperature objective of 66°F (developed for the fa1 1-run) is provided for the winter-r-un. This objective should be achieved by control lable factors, as noted above, during the period January through March at Freeport on the Sacramento River,
Striped Bass (5.6)
o Studies over many years indicate that there are numerous factors affecting striped bass abundance, including diversions from the Delta, reduced Delta outflow, flow patterns in the interior Delta, fewer adults, toxic effects, changes in the food chain due to introduced species, recreational angler harvest, and i 1 lega 1 poaching .
o Studies should be continued and additional water operation tests should be
a conduct'ed to determine the effects on striped bass and the best means for their protection.

o In light of various impacts on the fishery, particularly of the export pumps, it is necessary to examine existing points of water diversion. Within the Scoping Phase, the Board will consider alternatives to the existing points of diversion. I
Striped Bass - spawning Habitat from Prisoners Point to Vernal is o Review of the evidence indicates that it may be desirable to expand
existing spawning habitat for striped bass in the Delta. However, the State Board concludes that he most significant factor in the decline of i striped bass is entrainment due to pumping. The State Board will consider act ions to be taken concerning entrainment losses during the Scoping and Water Right phases of the proceedings. Upon examination of the results of these actions, the State Board wi 1 1 consider the issue of expansion of spawning habitat.
Striped Bass - Spawning Habitat from Antioch to Prisoners Point o The major spawning areas for striped bass are the Sacramento River above
the Delta and the San Joaquin River area between Antioch and Prisoners Point.
o The Board finds benefits for the resource in maintaining spawning habitat in this reach by establishing boundary salinities at Antioch of 1.5 and at Prisoners Point of 0.44 mmhos/cm EC from April 15 through May 31. The end date of May 31 may be shortened if data indicate that spawning has ceased.
o Deficiencies in firm supplies and the level of protection afforded by the striped bass spawning objective should be correlated.
o The Board needs better information than is currently available to consider the complete economic relationship between improvements in striped bass spawning habitat and water avai labi 1 i ty.
Marshes
o The Board believes that the managed portions of Suisun Marsh are currently being protected by D-1485 as amended in 1985. The protections, including the operation of the Suisun Marsh Salinity Control Gate, are being used and evaluated. (5.10)
o A biological assessment is needed to assess the water qual ity requirements of the rare, threatened and endangered plants and animals (and their habitats) in the wet lands surrounding Suisun Bay to determine reasonably necessary amendments and additions to the Suisun Marsh objectives. The results will likely not be available in time for inclusion in the final Bay- Delta Environmental Impact Report or water right decision in 1992. When the bioassessment is completed the water qual ity objectives wi 1 1 be evaluated and incorporated as warranted. (5.10)
o Water quality objectivess for San Pablo Bay exist in the Statewide Water Quality Plan for Enclosed Bays and Estuaries of California and in the Water Quality Control Plan for Region 2. (5.11)
11 Entrainment naeans p r i m r i l y the effects of project operations, such as operation o f the Delta Cross Channel gates, export punp ing, and reverse and low r iver flows. plus loca 1 non-project divers ions.

1.6 Summary of Implementation Requirements
water Year Classification (see 7.5.3.1)
The current Sacramento River Water Year Classification approximates annual conditions of water availability with five distinct categories. DWR has proposed the addition of a sliding scale to the classification to smooth the transitions between categories. There is a need for the parties to study this proposal, and submit the results for review during the Scoping Phase of the proceedings.
Due to a previous lack of analytical tools, the San Joaquin River Basin classification needs refinement. The State Board requests the parties to develop a San Joaquin River Basin classification with similar methodology as used for the Sacramento River Basin and submit the results for review during the Scoping Phase of the proceedings. This system, together with the Sacramento River classification, will be used during the Scoping and Water Right Phases to determine how the responsibilities of meeting water qual ity objectives should be distributed.
Municipal and Industrial
There is a. need for water from the best available sources to meet the drinking water needs of all Californians. The parties should advise the State Board during the Scoping Phase on their plans and programs to obtain high qual ity drinking water through the year 2010. (7.2.2.1)
An Interagency Program led by DWR has been formed to continue the work conducted by the Delta Health Effects Study and the Delta M&I Workgroup. The primary task of the new workgroup is to investigate conditions that adversely affect drinking water. The State Board requests this workgroup to design and implement a comprehensive THMFP -monitoring program for the Delta by June 1991, and to present annual progress reports to the State Board commencing in January 1992. (7.4.2.1)
Additional information is required to assess adequately the impact of Delta agricultural drains on THM formation. There is a need to conduct appropriate, comprehensive monitoring of agricultural discharges. The Central Val ley Regional Board shall require the development and implementation of best management practices or other means to appropriately control these discharges. This task should begin in the Rock Slough area. (7.4.2.1)
Western and Interior Delta Agriculture (7.4.2.2)
The Corn Study provides important information on the sensitivity of corn. A leaching study was recently begun to evaluate its effectiveness, practicality, and costs. This information is needed before a new objective can be set to protect the western and interior Delta agriculture. This study should be completed and the results submitted during the Water Right Phase of the proceedings.

Sal t-Load Reduction (7.2.2.2)
o Upon adoption of this Plan, the State Board will request the Central Valley Regional Board to develop an initial salt-load reduction program. The goal of this initial program will be to reduce annual salt-loads discharged to the San Joaquin River by at least 10 percent and to adjust the timing of salt discharges from low flow to high flow periods. During the Water Right Phase of these proceedings, the Re ional Board should discuss how it intends to implement this pro ram for example, drainage operation plans and best management practices 3 . 9 Modeling Needs (7.4.3.2)
o The Board recognizes the need to develop its own water right model ing capability which will assist in the consideration of water transfers, new water rights, review of existing water rights and future alterations of Pelta water qual ity and flow requirements.
o The three-dimensional model currently being developed by USGS for evaluating hydraul ic and biological processes in the various embayments of the San Francisco Bay should be finalized.
o An Interagency Modeling Development and Use Committee should be formed to:
Faci 1 i tate exchange of model ing informat ion and to reduce dupl ication, Improve access of information by a1 1 interested parties Simulate operation of major reservoirs in addition to the CVP and SWP, Consider effects of antecedent conditions, Improve temperature modeling for the Sacramento and San Joaquin River basins,
Improve Delta channel depletion estimates in DAYFLOW, Improve both water qual ity and flow modeling for the San Joaquin River basin,
Update hydrology to reflect current land use and groundwater/surface water interactions.
Monitoring
o There is a need to develop, with the State Board's assistance, a coordinated monitoring program plan to ensure compl iance with the water quality objectives contained in this Plan, and to identify meaningful changes in any significant water qual ity parameters potentially related to implementation of this Plan. The programs specified in Chapter 7 of the Plan should be carried out.
Special Temperature Considerations
o Analysis is needed of the effectiveness of various means to control factors which will help maintain cooler waters in the Sacramento and San Joaquin rivers and their tributaries for the protection of a1 1 runs of Chinook salmon.

The parties maintaining the continuous temperature gauges at Freeport on the Sacramento River and at Vernalis on the San Joaquin River should develop data related to the 68°F temperature objective for protection of salmon. The State Board directs DWR to continue the dissolved oxygen monitoring in the lower San Joaquin River between Turner Cut and Stockton to protect salmon migration.
Special Salinity Monitoring (7.4.2.4)
Continuous EC and temperature monitoring equipment should be installed at various locations in the San Joaquin River between Antioch and Vernal is to obtain data on salinity conditions for striped bass spawning.
The temperature data collected are to be submitted to the State Board which w i 1 1 then make a determination whether control lable factors should be controlled.
Estuarine Habitat (7.4)
Past studies of the estuarine habitat have been extensive. Relatively few investigators have been able to specifically quantify the lower level of conditions that protect the beneficial uses. The studies discussed below should lead to interim actions that can be implemented to protect these uses more effectively.
Salmon (7.4.2.3)
Identify the critical factors influencing smolt survival, including evaluation and implementation of the studies indicated in Chapter 7 of this Plan.
Marshes around Su i sun Bay (7.4.2.6)
A comprehensive biological assessment is being prepared for the rare, threatened and endangered species (and their habitat) of the managed and unmanaged wetlands around Suisun Bay. Studies are needed to determine the relationship between channel water salinity and soil water salinity in the unmanaged tidal wetlands around Suisun Bay.
Scoping and Water Right Issues (7.5)
Only a few parties are currently responsible for meeting water qua1 ity and flow requirements and for compliance monitoring activities within the Delta. The Board requests that information be developed on how these burdens should be distributed over more water right holders and waste dischargers. This information wi 1 1 be considered and used by the Board during the Scoping and Water Right phases of the proceedings.
For the development of alternatives to existing points of diversion and for the coordination of preparedness planning by other agencies, informat ion should be presented during the Scoping Phase on the impact of flood control measures, levee conditions, dredging, channel deepening, barriers and seismic activities.

Striped bass (7.5.2.4)
o The direct entrainment losses of striped bass and other fish 'at the major diversions in the Delta are we1 1 documented. The Bureau of Reclamation and the Contra Costa Water District should each negotiate a fishery agreement with the Department of Fish and Game that would provide for mitigation of the direct entrainment losses at the Tracy Pumping Plant and Contra Costa Pumping Plant No. 1. These agreements should be completed prior to the conclusion of the Water Right Phase. Direct entrainment losses at Delta agricultural diversions are not we1 1 documented. The parties should evaluate such losses and identify corrective measures.
o A real-time monitoring program should be developed and used to assess the daily densities of striped bass eggs and larvae in the Sacramento River during the spring and initiate periodic closure of the Delta Cross Channel to reduce diversion of striped bass into interior Delta channels. Closure of the Delta Cross Channel should be coordinated with short duration pulsed flows in the Sacramento River, in combination with short term reductions in export pumping and reduced reverse flows, to transport striped bass eggs and larvae into the Suisun Bay.
o There is the need to initiate a detailed investigation and evaluation of alternative sites for establishing facilities for rearing juvenile striped bass salvaged from the SWP and CVP facilities for subsequent release to the Bay-Del ta system.
o A detailed review and evaluation of a1 ternative recreational angler harvest management options including, but not 1 imited to, specific area and seasonal closures, alternative size limits including initiation of a slot limit, and restrictions on fishing gear such as use of single barbless hooks should be conducted. In addition, the impacts of poaching on the striped bass population should be evaluated, funding sources for expanded enforcement should be sought, and the unrestricted sale of striped bass in Cal ifornia should be el iminated. Temporary changes in fishery harvest regulations should be considered as part of an overall short-term approach to improve the situation until longer-term measures may be instituted. The Board does not believe such measures should substitute for its own responsibilities to provide suitable habitat.
o Additional water project operation tests should be conducted in the Delta to better determine the effects of diverting water from and upstream of the Delta on striped bass.
Other Aquatic Species (7.5.3)
o Additional means should be developed to assess the general health of the Estuary and serve as a basis for determining the impacts of new projects, physical and operational changes, introduced species, etc. DFG should develop a priority list of tasks to be performed. Consideration should be given to specif ic components, such as American shad, Delta smelt, and the benthos. Also, use of biocriteria should be considered.

San Francisco Bay (7.5.3) 0
f o There is a need to examine further the impacts of San Francisco Bay inflows i on fish, invertebrates, and other pub1 ic trust resources, particularly as
these inflows, including pulse flows, affect the distribution, abundance, and reproductive success of species inside the Estuary. Studies are also needed to provide the 1 inkage, if any, between phytoplankton. and higher trophic levels.
Entrapment Zone (7.5.3.3)
o Studies are needed to provide the degree of 1 inkage between the location and productivity of the entrapment zone and the effects on the population levels of important fish species.
The State Board retains the option of setting flow objectives if appropriate.
1.7 Water Qua1 ity Objectives
To protect beneficial uses of the Bsy-Delta Estuary, the State Board adopts the sal ini ty, temperature and dissolved oxygen objectives 1 isted in Table 1-1.

Sm NOS. INDEX YEAR LOCATION (I-- PARAMEER rlEsmwmON TYPE WPE DATES VALUES
Coatra Costa Cenal C-5 Chloriide (Cl-) Meximum mearr daily, in mgn No! Applicable AU --* 250 lit Pumping Plant #I CHCCC(M
Contra Costa Cenal C-5 Chloride (CJ-) at Pwnpin~ PJam N CHCCC06 - or -
Snn Joaqui~~ River lit D-J2(n~er) CWoride (CJ-) A~~tiacl, Wetor Works Intake R S A W
lMBxiroum man M y 159 mg/l SBcR chloride for at least &e 4030-30 number ddrrys shown &ring the Calendar Year. Must be SacR pmvidsd in htervais d o l w r 4030-30 leas than two weeks dumtkm. (% ofCal& Yaaraborn,in pluenth&)
NQ. of doys each Cal. Year < 150 mgd CI-
W 240 (66%) AN 190 (szn) BN 175 (48%) D 165 (45%) C IS5 (42%)
Wut C d at mouth C-9 Chloride (CI-) Mkimum meaa M y , in mgn Not Appliablw AU Oct-Sty 2.50 ol 'C l i lh CoLvr Forehay
c.. CHWSTO
I N 0
Dcqtli Afcudata C a d DMC- J Chloride (CJ-) Maximum m a n daily, in mg& Nat Apldiceble AU &*P 250 lit Tm.v Pumpiafi PI& CHDMCW
Cuc11e Sk~ugb lit C?V of C- 19 Chloride (CI-) Allixin~um man M y , in m@ Not A p p ~ b l e .411 Oct-Sep 2.50 VIllk?li, 111fnkc / I / SLCCHI6
nncl/l*r LjRrkcr Slougl~ lit Chlorik (Cl-) Alaxirnu~n mean daily, in mg4 Not Applcahlc All Ocr-Scp 250
North b y Aqurrluct lnt& S W 3

r "
... . . ...... TABLE. .j -.I (mnt.) W:A T E R. Q u A L i : . ~ Y o B J E':G.T r v E ST I
I AREA. .:'..' . . '. 1
SAMPLING SITE NOS. INDEX YEAR
LOCATION (I-AIRKI) PARAMETER DESCRlPllON TYPE TYPE DATES VALUES
?:*::;$:~:~~::<:s~$;:~;$~~~~;~' ..................... ::.:; ,::: ;;; :F,,;,:,:.,,,,:: q,$+qi&;T;gf$,gQq, ".'." j,;@;@$~~~:&@~j:y~$@*~~g,g . ..... . . . < . .,., . . . ..,..: . ..,.. ., ,..:.;;,:;; ..,.,..,,.,,,., '% ... .: .... :. ..... ... :.<.:.;: .... m:.::,:..... ::.::.x.:.;.
South Fork Mokelumne River . %-I3 Electrical Con- Maximum'14day running SacR at Terminous RSMKLO8 ductivity (EC) average o f mean daily, in mmhos 40-30-30
Snn Jruryuin River nt Snn Andrws Landing
C4 U~v t r i cd Con- RS.4NO32 ductivity (EC)
Alaximum 1 4 4 y running avcrage id m a 1 daily, in mrnlros
Sac R 40-30-30
0.45 EC April I to
Date Shown W Aug. IS
AN Aug. IS BN Aug. IS D Aug. IS C --
0.45 EC April I k~
Datc Slruwn IV Aug. IS
AN ;lug. I5 BN Aug. IS D Jtrn. 25 C --
EC from Date Sllow~l to
Aug. 15[2/ .-
EC fiom Dntc Shown to
Atrg. 15 121
page 3 01 I:

SAMPLING SITE NOS. INDEX YEAR
LOCATION (I-AIRKI) PARAMETER DESCRIPTION TYPE TYPE DATES VALUES
(To be implemented by 1996) 131 I ;rl SOUTH DELTA 1 Sun Joaquin River at
Airport Way Bridge, V d i s Old Rivcr near
hliddle Rivcr Old Rivcr at
Trncy Rond Bridge Salt Joaguin River
st Brandt Bridge Isitel
C- I0 EIcctrical RSANllZ Conductivity (EC)
C-8 ROLD69
P- I2 ROLDS9
C-6 RSANO73
hlnxitnurn 30-day running average Not Applicable All Apr I-Aug 31 0.7 of m a n h i l y EC, m mmhos Sep 1-Mar 31 1.0
or If n three-paw cottrrncf Itns been implcmenfcd nrnor~g DWR. USBR and the SDIVA. that contract will be rcvicwtrl prior to implementation offhe above and. d c r dm considcrilg tlte needs o f d l t c ~ k.ttcficia1 uses, revisions will hc l ~ d e to ~IJC oh^&&^ and uumpliancJmottitorinp Iocotions noted above, as approprinfc.
Wcst Cnnal at mouth of C-9 Electrical Maximum monthly average o f mean Not Appliable All Oct-Sep 1.0 CIif?ott Court F o h y -and- CH WSTO Conductr'vity (EC) dai7y EC, ill mmItos
Dclta Mendota C a d at DhlC- 1 Trnc-v Pumping Pln~tf CHDMCW
page 4 of 8

WPUNG SITE NOS. INDEX YEAR
LOCATIQN (I-AIR)(I) P A R A M m . DESCRIPT~ON TYPE 1WPE DATES VALUES ................................................. > ;,:.:<.:.: .:.:.:.:; :::: 7 .... "" . . . " ... ...................... :,:.;.>,.:*i.a ................ ;. .............. ;:3.X-.:II:.:.: .. ............................ ........ :.?.*:fi~.:< <<j
D-VED OXYGEN San W u m River bchv? RSANOS- Dissolved &mum &solved oxygen, Not ~ p p h b l e AU Se;p I-N& 30 6.0
TwrrorCut& Stoelbon RSANMI Oxygar @O) h m@
TEMPERATURE SB-0 River at
F n e p a r t d
San J4aguio R i m at Airport Way Bridge, V ' i s
Temperature
Tempmture
RSACISS Temperature
Narrative Ob+ve Not Appfkble
Narrative Objective N& AppliccrMe
Narrative Objective Not Applicable
All m e daily average water tempature s h d not be elevated by wntrollable
AU fktomebove6Sdep. F from the I Street Bridge to F*rf ori the SacraDeoro River. and at \ 'ed is on the Ska Joaquin River bc4wtxn April I throuph June 30 and Seflembm I
AM '7% M y evcrage water temperature sl1aI1 na, & elevated by co~ttmllahle factors above 66 k g . F from the I Stmet Bridge to Freeport on tltc Sacmmei~to River &ween Jat~uaty I through lbw 31.' 141
page 5 of 8


- TABLE 1-1 (cont.) W A T E R Q U A L I T Y O B J E C T I V E S
SAMPLING s m NOS. INDEX YEAR
LOCATION (I-AIRKI) PARAMETER DESCRlPTlON MPE TYPE DATES VALUES
. ,.< ...,.,.:.::::. _ . . .... . ...................... ( I ,.,::.: ..,. .,.,., ;: : :.$: ,;.a.i .:,::;.:z<2.fi ::.:., .. ,:.:. 52.;. . : : : ~ ~ . ; ~ . l ( i ~ ~ ~ i ~ . . ~ ~ f i ; ; ~ ~ ~ ~ : ~ ~ i : .:...@ fi.;t .: .~;cw.:~.:*:$:m;a; w* sfi?w.m a. ~ ; ; : ~ ; ~ t . ~ : ~ ~ ~ . ~ . . ~ ~ . ~ ~ . j : ~ . ~ . ~ : ; ~ ; ~ ~ ~ g;e. .A ; ~ . i . . ~ @ : ~ ~ f i ~ j ' : Q 6~ N'l .. . ". '' "' .. .." "". .::.... .. '5' ..:: ... ; ' '"' ~:.:.:.:".':".:.: ..~;~."~..~:~yY:>"...~:" .... w.. ,.? .,,z*:y,-*: :..: :>*,,,P,:y::~.::~,~;~,~.~,:,~~,..:~.u.:~:~.~.~,..::::~~y,.~:~~.w:v~, w , . : . ~ . . ~ . ~ . : ~ : ? P . > . . : * , F , : e .? v .*..y.:y:<$,:;:::5.?.::.x:.T '=.w.?:v:-- 1 ... ..- .... . . ... . .. .... ...-........ ::': :.. . ... . . . . ... . .. . . ... . .. . . .
When the relaxation provision for Antioch
qmwning prote&on is in effect:
San Joaquin Rivcr at: D-29 Wcctrical Con- 14-day runrrutg average o f mean Not Applicable D&C Apr /-May 31 0.55 Prisoners Point RSAN038 ductivity (EC) daily for tlre period not more (or until spawrri~tg
than the value slrown. in mmltos has e~rdcd) . . . . . . . . . . . . . .; .... i.. .. ...... :.:.:- ..;. :.:.. .:.. .:.::.:.::i.':2:s:;: I.:,:;, ... :, ............................ ,::,:33;c.,: :$:oj#.$,&N:;;M #~ ;~ :~~ ;~ ; : ; : . : : ~ ; f : i ; , ; ;< . : : $ : : .< ,~
In regard to the Suisun Marsh, the water quality oh+tives for Suisut~ Marsh are unchanged from the 1978 Delta Plan. The implc~nentation vchiclc. Watcr R@ht Decision 1485 (0-1485). was amended in 1985 to change (or delete) some monitoring stations and to revise the s~IIc~I~IIc l i ~ r i~nple~ne~~tation. Tlrc DWR. USBR. DFG, and Suisun Resource Consewatjo~t District (SRCD) have signed and adopted a set of tlrrcc ngrccmcrrts concerning tlte Suisun Marsh. These are the Suisun Mars11 Preseration Agreemerrt (SAIPA), the Monitoring Agrecmmt, and the Afitigatio~r Agreement. The SMPA cotrtains water quality standards for the managcd marshes of Suisurr Marsh which the four signatories w d d like tlts Statc B a r d to adopt as water qualay ohjcctives. The SMPA also d&ks the physical facilities that the four signs- - torics hr.s agreed would serve the managed marshes in order to maintain production o f preferred waterfowl food plants. The facilities huL so hr. including tho Suisun Marsh Salir~ify Control Gates (previously caUed the hlonhzuma Slough Control Structure), have changed thc pl~ysiu~l rcgirnc in the Marsli.
Rcvi.wd wtltcr yudity o&ctivc.s incorporati~tp the ShWA (with any rnodilications necasitated hy the bic~logical assessment) will hc adnpfcd l ~ v thc State Buccrd a k r the hiologic~~l a.scs.zmcnt (discussed in Satiotr 7.4.2.6 of the platt) is completed. Until t h t time. t b water y~mlily sta~rdards in the arncndcd D- 1485 will corrti~rue to hc implcmer~tcd; set T& 1-2 lbr a summary of tltese stanahrcls.
page 7 of 8

FOOTNOTES:
111 The Cache Slough objective to be effective only when water is being diverted from this location.
[2] When no date is shown, EC limit continues from April 1.
(31 South Delta Agriculture objectives will be implemented in stages: two interim stages and one final stage. The first interim stage will be implemented with the adoption of the WQCP, the second interim stage by 1994, and the final stage by 1996. Interim Stage 1 - 500 mgll mean monthly TDS all year at Vernalis. Interim Stage 2 - (to be implemented no later than 1994) 0.7 mmhoslcm EC April 1 to August 31, 1.0 mmhoslcm EC September 1 to March 31,30-day running average, at Vernalis and Brandt Bridge; with water quality monitored at three current interior stations - Mossdale, Old River, near Middle River and Tracy Road Bridge. and an additional interior monitoring station on Middle River at Howard Road Bridge. Final Stage - (to be implemented no later than 1996) 0.7 mmhoslcm EC April 1 to August 31,l .O mmhoslcm EC September 1 to March 31,30-day running average, at Vernalis and Brandt Bridge on the San Joaquin River; with two interior stations at Old River Near Middle River and Old River at Tracy Road Bridge. Monitoring stations will be at Mossdale at head of Old river and Middle River at Howard Road Bridge.
OR If a three-party contract has been implemented among DWR, USER and the SDWA, that contract will be reviewed prior to implementation of the above and, after also considering the needs of other beneficial uses, revisions will be made to the objectives and compliancelmontioring locations noted above, as appropriate.
(41 Controllable water quality factors are those actions, conditions, or circumstances resulting from human activities that may influence the quality of the waters of the State, that are subject to the authority of the State Board, or the Regional Board, and that may be reasonably controlled. Based on the record in these proceedings, controlling temperature in the Delta utilizing reservoir releases does not appear to- be reasonable, due to the distance of the Delta downstream of reservoirs and uncontrollable factors such as ambient air temperature, water temperatures in the reservoir releases, etc. For these reasons. the State Board considers reservoir releases to control water temperatures in the Delta a waste of water; therefore, the State Board will require a test of reasonableness before consideration of reservoir releases for such a purpose.
page 8 of 8

SAMPLING rn Nos. E F F E m
LOCATION (I-AIRKI) PARAMEW DESCRlPnON DATES MONTHS VALUES
sacnwmto River at C-2 Elptriical Monrhly average of boab M y Od1,1988 Oct 19.0 CoUiasvdle RSAC081 Cooduct'v~ (EC) high tidc values not to exceed Nov 15.5
the values shown, in mmhdcm Dee 15.5
Molm%~rrm Slough at s-w(-=w) (or dcmoustmte that equivald Jan 12.5 National Std S . U Z . 5 orbeCrcltpr&ction d b e Feb 8.0
provi'ded at tlie locahocahon) Mar 8.0
Montezuma Slough near S49 A P ~ 11.0 Beldon Landing SLMZUII hlay 11.0
0 Chdhurne Slough at
ChadbnurnE Raad @CDpO&)
c. and
I Conlelia Slough 500 It west S or S. P. R.R. crossing at Cygnus
-or- CluuUwurne Slough at c k a d b o ~ R o d @raps@)
and Cordelia Slough at C d i
Ooodyear D W (proposed)
s-21@rop.) SLCBNI
Goodyeor Slough at S-3S(new) Morrow Idand Clubhous: SLGYR03
-or- Goody~~~r Slough, 1.3 mi 975
so& o f Morrow Island SLGYRW /Drainage] Ditch 8t Picrcc
Sukun Slough, 3QO R S42 south o f Void Slough SLSUSl2
or
Oct 1,1993
Wnter Supply lntakcs No Locations for Waterlowl Manapc- spaifid crncnt A m s on Van Sicklc and Chil,ps islands

2.0 SCOPE OF THE PLAN
2.1 Introduction
The initial evidentiary hearing of the Bay-Delta proceedings, Phase I, has been completed. Succeeding phases have been renamed to clarify the purposes each is to serve. They are:
o The Water Qual ity Phase
o The Scoping Phase
o The Water Right Phase
The Water Quality Phase will continue the review, revision and adoption of the Plan. A separate Pollutant Policy Document (PPD) for the Bay- Delta Estuary adopted by the State Board (June, 1990) addresses the effects of certain pollutants on beneficial uses in the Bay-Delta Estuary; it contains policy guidance to be used by the San Francisco Bay Region (2) and the Central Val ley Region (5) when they update their Basin Plans. Other pollutants of concern are addressed in the Statewide Water Qual ity Control Plans for Inland Surface Waters and for Enclosed Bays and Estuaries. The Scoping Phase has already begun on issues related to water quality in the Estuary; it will include scoping hearings on such matters as the pub1 ic trust, physical faci 1 ities, negotiated agreements and potential, administrative and legislative actions. A draft Environmental Impact Report (EIR) will be developed and circulated as a result of the Scoping Phase. Various alternatives developed in the Scoping Phase will be explored in the draft EIR. The Water Right Phase will include a water right hearing with adoption of a final EIR and water right decision(s). In these water right decisions the Board will decide which water users wi 1 1 help meet water qual ity objectives and flow requirements in the Estuary.
During the course of the water qual ity proceedings the Board received evidence on:
o The beneficial uses being made of water flowing into, within, and from the Bay-Delta Estuary;
o The levels of protection which should be afforded these beneficial uses ;
o Reasonable consumptive uses made of Bay-Del ta waters;
o The effects of pollutants on beneficial uses of Bay-Delta Estuary waters; and
o Implementation measures available to achieve the levels of protection necessary to protect the beneficial uses.

2.2 Scope and Purpose of the Plan ,
o Scope
This Plan is a narrowly focused Basin Plan for the waters of the Bay- Delta Estuary. It is to be considered together with other water quality control plans applicable to the waters of the Bay-Delta Estuary, such as the 1978 Delta Plan, the Pollutant Pol icy Document for the Bay-Delta Estuary, and the Statewide Water Qua1 ity Control Plans for Inland Surface Waters and for Enclosed Bays and Estuaries in California, as well as all applicable San Francisco Bay (Region 2) and Central Val ley (Region 5) Regional Basin Plans. This Plan supersedes any existing salinity and temperature objectives to the extent of any conflict.
o Review and Revision
The water quality objectives established in the Plan, together with other currently effective controls, will protect established beneficial uses in compliance with a1 1 applicable state laws.
This Plan is a substitute for a separate environmental document (Public Resources Code Section 21080.5). It therefore includes a discussion of alternatives in order to comply with CEQA's mandate to consider a1 1 reasonable a1 ternatives to the preferred project.
This Plan is not meant to supersede any designation of beneficial uses, objectives (except where conflict exists), or other matter set forth in either the Basin 2 Plan or the Basin 5B Plan. Any questions of whether this Plan supersedes any provisions in either Regions' Plans, or in any other water qua1 ity control plan adopted by the State Board for the waters of the Bay-Delta Estuary, should be addressed to the State Board for an interpretation.
The Plan will undergo public review either on a triennial basis or sooner if needed.
o Flow Considerations
Although flow requirements are not set as objectives in this Plan, the State Board recognizes that flow requirements and salinity objectives are largely met by the regulation of water flow. The reasonableness of a salinity objective can be evaluated by using operation studies to estimate the impacts of these objectives on water supplies. Effects on these suppl ies may be used to evaluate the economic and social costs.

\
o Establ ished Objectives
The State Board has established the following categories of objectives:
- Salinity for municipal and industrial uses, ,
- Salinity for Delta agriculture,
- Sal ini ty for export agriculture,
- Salinity for fisheries in the Delta, - - Temperature and dissolved oxygen for fisheries in the Delta, a.nd
- Salinity for Suisun Marsh habitat.
2.3 Authority for Regulation of Water in the Bay-Delta Estuary - The State Board is responsible for formulating and adopting state policy for water quality control (WC Section 13140). The authorities for regulation of water in the Bay-Delta Estuary are found in Appendix .2.0, State Board Authority. ,

i 3.0 BASIN AND HYDROLOGY DESCRIPTION
' @ Conclusions: WATER YEAR TYPES
o The Bay-Delta Estuary is a dynamic system characterized by wide annual, seasonal, and daily fluctuations in fresh water inflows and ocean derived salinities.
o Definingwateryear types isanessential tool inevaluating theamount of water available.
o Water availability is an essential factor in establishing reasonable objectives for ocean derived salts.
o The Board adopts the "40-30-30 Water Year Indexm for the Sacramnto River Basin as proposed by the Operational Studies Workgroup. In subsequent phases of the proceedings, the Board wishes to examine critically the use of the "subnoma1 snowmelt" and "year following dry or critical yearu provisions which allow alterations of objectives.
o Changes to water year types will include development and refinement of an appropriate index before it can be implemented for the San Joaquin River Basin.
3.1 Introduction
The Bay-Delta Estuary and tributary areas described in this Plan include:
o The Delta (Figure 3-1); o The Delta's tributary areas, that is, the Sa ramento River, the f Central Sierra, the San Joaquin River basins (Figure 3-2); and o The San Francisco Bay and its tributary hydrologic basin
(Figure 3-3).
The Estuary and tributary areas provide about two-thirds of a1 1 the water used in California, including 40 percent of the state's drinking water.
This chapter and Appendix 3.0, Basin Description, outline the hydrologic conditions of the Estuary and its tributary areas by providing a description of each area's:
Physical Characteristics -- the geographical and legal dimensions; and Hydrology -- the characteristics and nature of water movement, which can include:
o Unimpaired Flow Conditions -- the flow that would be available assuming no upstream impoundments, use, or diversions of runoff under current upstream and Delta channel configurations (SWRCB, 3,8).
The Tulare Lake Basin (Central Valley Regional Water Quality Control Board Basin 5D), although part of the Centra 1 Va 1 ley, is not considered to be tributary to the Delta for the purposes o f this Plan.

FIGURE 3-1 Boundary of the Bay-Delta Estuary and locations of Estuary exports (From: SWRCB, 3,s) \

FIGURE 3.2 Boundaries of the Sacramento River (SA), !
Central Sierra and Delta (SB), and San Joaquin (5C) Basins (From: RWQCB 5,1975)

, FIGURE 3-3 Boundary of the San Francisco Bay Basin
(From: SWRCB, 3,12)

Unimpaired flow could also be defined as the present-day conditions if all storage and diversion were to cease. It is not a measure of natural or historic conditions (TI II,114:2-15).
o Historic Flow Conditions -- the flow conditions that actually occurred over the historic hydrological period and were measured at various locations in the Central Valley Basin using flow measuring devices. These flows reflect upstream impoundmenfs, use or diversions of runoff under the existing upstream storage, and channel configuration at the time of measurement.
o Present Level Flow Conditions--the historic flow conditions that have been adjusted to reflect the present level-of -development reservoir operations, consumptive demands and Delta Plan standards or, where appropriate, the recent historic flow conditions from 1972 to the present. Present leve 1 -of -development flows are those estimated by DWR's 1990 level-of-development operations study. The Operations Study, which is conducted using DWR's Planning Simulation Model (DWRSIM) , uses the hydrologic sequence of flows for the years 1922 through 1978. The 1972 to present historical flows represent the conditions under recent levels of water resource development. Compared with the pre-1972 development, the water resources development within the Bay-Del ta watershed has been relatively minor since 1972. New Melones Reservoir, which became operational in 1978, and increasing Delta exports over these years are notable exceptions (SWRCB,3,8).
3.2 Water Year Types
3.2.1 Classifying Water Years for a Basin
Water Year (MY) classification systems provide relative estimates of the amount of water originating in a basin from rainfall and snowmelt runoff, and ground water accretion which is available to meet all demands.
This Plan improves the WY classification system used in the 1978 Delta Plan. The new classification system includes consideration of water avai labi 1 ity from storage 'faci 1 ities as well as seasonal runoff.
Modified Water Year Classification System
This new WY class if icat ion uses the forecasted unimpaired runoff in millions of acre-feet (MAF) from two separate periods of the current water year (April through July and October through March) and a third parameter which accounts for the effects of reservoir storage, in order to determine the runoff classification for any particular year. This new method was used to develop the modified Sacramento Four River Index (Figure 3-4). Refer to Appendix 3.1 for an expanded description of the components of the new classification.

FIGURE 3.4 Sacramento Valley
Water Year Hydrologic Classification
Year classification shall be determined by computation of the following equation: INDEX t 0.4 + X + 0.3 + Y + 0.3 + Z Where: X = Current years April - July
Sacramento Valley unimpaired runoff Y = Current October - March
Sacramento Valley unimpaired runoff Z = Previous years index
The Sacramento Valley unimpaired runoff for the current water year (October 1 of the preceding calendar year through September 30 of the current calendar year) as published in California Department of Water Resources Bulletin 120 is a forecast of the sum of the following locations: Sacramento River above Bend Bridge, near Red Bluff; Feather River, total inflow to Oroville Reservoir; Yuba River at Smartville; American River, total inflow to Folsom Reservoir. Preliminary determinations of year classification shall be made in February, March, and April with final determination in May. These preliminary determinations shall be based on hydrologic conditions to date plus forecasts of future runoff assuming normal precipitation for the remainder of the water year.
Classlflcation lndex Mlllions of Acre-Feet
Wet ........................ ..Equal to or greater than 9.2 .
Above Normal ........ Greater than 7.8 and less than 9.2
Below Normal ........ Equal to or less than 7.8 and greater than 6.5
Dry .......................... Equal to or less than 6.5 and greater than 5.4
Critical .................... Equal to or less than 5.4
YEAR TYPE All Years for All Objectives
Wet
Above Normal
Below Normal
lndex Millions of Acre-Feet
A cap of 10.0 MAF is put on the previous years i m k x (2) to account for required flood control rese~oir releases during wet years.
The year type for the preceding water year will remain in effect until the initial forecast of unimpaired runoff for the current water year is available. CHAWW
3 -6 1

3.2.1.1 Sacramento Basin Index Description
The modified classification splits the index into three terms. The form of the index equation is as follows:
Index = C ~ * X + c 2 * y + c 3 q Where:
C1, C 2 , and C3 are weighting coefficients of 0.4, 0.3 and 0.3, respectively.
And :
X = Apri 1 through July Four River Unimpaired Flow (MAF) Y = October through March Four River Unimpaired Flow (MAF) Z = Previous year's WY index (MAF) having a maximum cap value of
10 MAF.
Division of the index into three terms recognizes that there are distinct differences in seasonal contribution to water avai labi 1 ity and accounts for reservoir carryover storage. The Apri 1-through-Ju ly period's runoff (factor X ) is the most important contribution to water avai labi 1 ity. The runoff contribution during October through March (factor Y) is less important due to flood control limitations on avai lable reservoir storage space. The previous year1 s index (factor Z) is important because it accounts for carryover reservoir storage. A maximum value or cap of 10 MAF expressed in the third term sets a maximum level of the previous year's hydrology that can be maintained as carryover storage due to the limitations of total reservoir capacity and the requirement to maintain a flood control reservation space.
Water Year Classification Breakpoints
The method used to determine the index breakpoints that define the boundaries of the five water year types in the Delta Plan was also used to determine the breakpoints for this modified approach. This method is discussed in Appendix 3.1,
Regression Results
Table 3-1 1 ists some of the regression results of these statistical analyses. These results indicate that breaking the index into two separate hydrologic periods and adding the effect of the previous year1 s hydrology enhances the index' s predictabi 1 i ty.

TABLE 3-1 SELECTED RESULTS OF THE STATISTICAL ANALYSIS TO
DETERMINE OPTIMAL WEIGHTING COEFFICIENTS Weighting R Squared
classif icationll Coefficients(%) Va 1 ue
Proposed Modified 40 -- 30 -- 30 wlcap. .852/ Selected A1 ternat ives 40 -- 20 -- 40 .88
40 -- 30 -- 30 .87 Delta Plan wlnew ~ ~ 3 1 33 -- 67 -- 00 .74 April through July 100 -- 00 -- 00 .66
3.2.1.2 San Joaquin Basin Index
Because of the differences in hydrology between the Sacramento and San Joaquin basins, a separate San Joaquin River Basin classification 5s needed.
The tools that were used in developing the Sacramento Basin Index were not available to develop an index for the San Joaquin Basin. These tools, a San Joaquin River Basin Operations Model and data base, recently became avai lable. Development of the San Joaquin Basin Classification wi 1 1 soon begin. An example of a possible San Joaquin River Basin Classification using Sacramento River Basin coefficients is shown in Figure 3-5.
3.2.1.3 Eastside Basin
A separate classification for the Eastside Basin was not developed. The contribution to the Delta from the eastside rivers, the Cosumnes, Mokelumne and the Calaveras, is small compared to the Sacramento and San Joaqu in Basins. Based on informat ion that indicates the hydrologies of the Eastside Basin and the Sacramento Basin are similar (DWR,l, 1-2;1978 D-1485 Hearing exhibit) , the Sacramento Basin WY classification was also applied to the Eastside Basin.
3.2.1.4 Adjustments to Water Year Classification
In the 1978 Plan classification, two adjustments were created to account for unusual hydrologic conditions: a second classification for a year which follows a critical year, and a sub-normal snowmelt adjustment.
The "year following critical year" classification was developed to account for the effects that depleted reservoir and ground water storage have on the ability of project operations to meet their demands. Because the effects of previous year's conditions are included in the third term of the 40-30-30 Index, the "year following critical year" adjustment is not necessary. The "year following critical year" adjustment applies on1 y to fish and wildlife standards.
11 A1 1 class i f icat ions except proposed modif fed have no cap on third tern.
21 The R squared value for the Proposed Madif ied and Selected Alternatives classif fcat lons are very s imi lar, with the values for the latter k i n g s 1 ight ly higher. It was the consensus of the submrkgroup that the 40-30-30 MICAP Index was the preferable index.
3/ Breakpofnt (BP), or threshold values are revised to reflect 1906 -- 1987 hydrology.

FIGURE 3.5 San Joaquin Valley
Water Year Hydrologic Classification
Year classification shall be determined by computation of the following equation: INDEX = 0.4 * X + 0.3 Y + 0.3 * Z Where: X = Current years April'- July
San Joaquin Valley unimpaired runoff Y = Current October - March
San Joaquin Valley unimpaired runoff Z = Previous years index
The San Joaquin Valley unimpaired runoff for the current water year YEAR TYPE (October 1 of the preceding calendar year through September 30 of All Years for All Objectives the current calendar year) as published in California Department of Water Resources Bulletin 120 is a forecast of the sum of the following locations: Stanislaus River, total flow to New Melones Wet Reservoir; Tuolumne River, total inflow to Don Pedro Reservoir;
. Merced River, total flow to Exchequer Reservoir; San Joaquin River, 3.3 total inflow to Millerton Lake. Preliminary determinations of year classification shall be made in February, March, and April with final determination in May. These preliminary determinations shall be Above
0 based on hydrologic conditions to date plus forecasts of future Normal runoff assuming normal precipitation for the remainder of the water year.
2.8
Classification lndex Millions of Acre-Feet Below
Normal Wet ......................... Equal to or greater than 3.3
Above Normal ....... Greater than 2.8 and less than 3.3 2.2
........ Below Normal Equal to or less than 2.8 and greater than 2.2
Dry ......................... Equal to or less than 22 and greater than 1.8
................... Critical Equal to or less than 1.8
lndex Millions of Acre-Feet
TM is example of the San Joaquin River Basin classibca60n using Saaamento M r Basin coefficie~I~. When the San Joaquin Basin operahs model is finished the San Joapuin Rkrer Basin chss&tion will be developed using the same analytical techruques used for the Saaamenio River B;tsisL
@ * A cap of 4.0 MAF is put on the previous years index (2) to account for required flood control reservoir releases during wet years.
The year type for the preceding water year will remain in effect until the initial forecast of unimpaired runoff for the current water year is mailable.
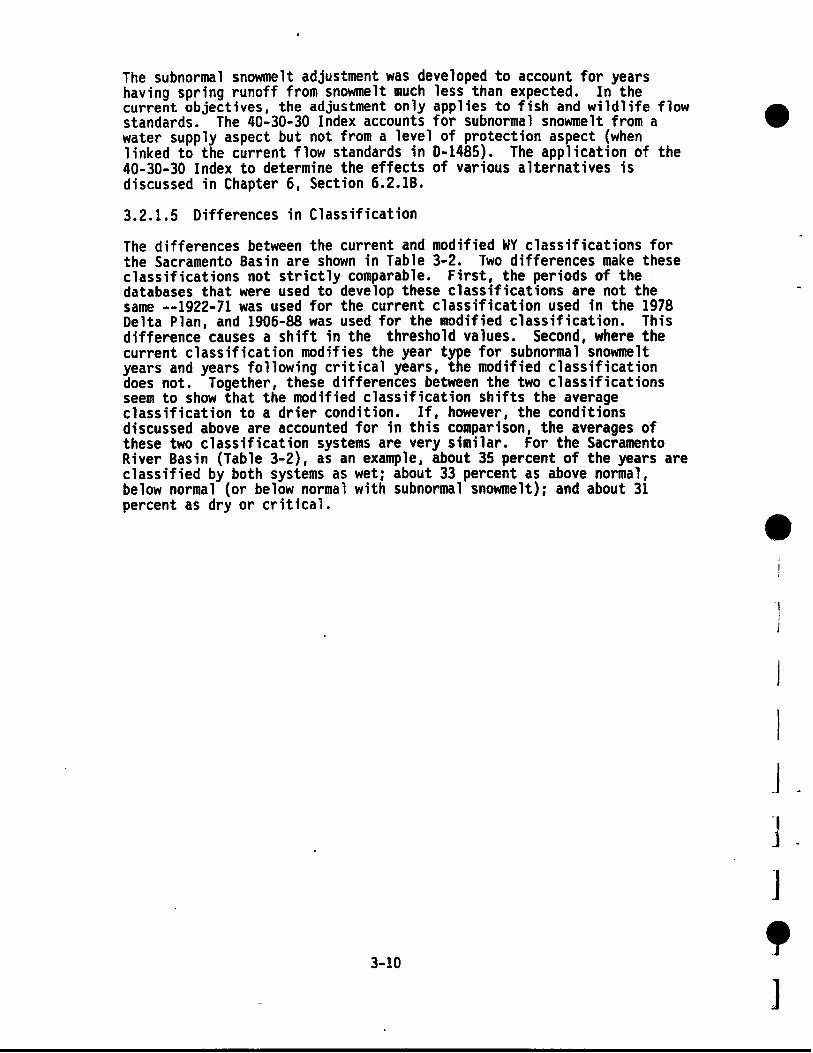
The subnormal snowmelt adjustment was developed to account for years having spring runoff from snowmelt much less than expected. In the current objectives, the adjustment only applies to fish and wildlife flow standards. The 40-30-30 Index accounts for subnormal snowmelt from a water supply aspect but not from a level of protection aspect (when 1 inked to the current flow standards in D-1485). The application of the 40-30-30 Index to determine the effects of various alternatives is discussed in Chapter 6, Section 6.2.18.
3.2.1.5 Differences in Classification
The differences between the current and modified WY class if icat ions for the Sacramento Basin are shown in Table 3-2. Two differences make these classifications not strictly comparable. First, the periods of the databases that were used to develop these classifications are not the same --1922-71 was used for the current classification used in the 1978 Delta Plan, and 1906-88 was used for the modified classification. This difference causes a shift in the threshold values. Second, where the current classification modifies the year type for subnormal snowmelt years and years following critical years, the modified classification does not. Together, these differences between the two classifications seem to show that the modified classification shifts the average classification to a drier condition. If, however, the conditions discussed above are accounted for in this comparison, the averages of these two classification systems are very similar. for the Sacramento River Basin (Table 3-2), as an example, about 35 percent of the years are classified by both systems as wet; about 33 percent as above normal, below normal (or below normal with subnormal snowmelt); and about 31 percent as dry or critical.

TABLE 3-2 SACRAMENTO RIVER BASIN:
COMPARISON OF PROPOSED MODIFIED 40-30-30 AND DELTA WATER YEAR CLASSIFICATION
* Indicates year type has changed from Delta Plan year type
1924 C C 1925 AN D 1926 D D 1927 W W 1928 ANlSS AN 1929 C C 1930 BNlD D * . 1931 C ' C 1932 BNID D 1933 C C 1934 C C 1935 AN BN 1936 AN BN 1937 BN BN 1938 W W 1939 C D 1940 WlAN AN 1941 W W 1942 W W 1943 W W 1944 D D 1945 BN BN 1946 AN BN ' 1947 D D
1966 BNlSS BN 1967 W W 1968 BNISS BN 1969 W W 1970 WISS W * 1971 W W 1972 BNlSS BN 1 973 W AN 1974 W W 1 975 AN W * 1976 C C 1977 C C 1978 W AN 1979 D BN 1980 W AN 1981 D D 1982 W W 1983 W W 1984 WlSS W 1985 D D 1986 WISS W 1987 C D 1988 C C 1989
i

I 4.0 BENEFICIAL USES OF BAY-DELTA ESTUARY WATER
@ 4.1 Introduction i
The beneficial uses of Bay-Delta water are presented here in summary form. For a detailed account, see Appendix 4.0, Beneficial Uses of Bay- Delta Estuary Water.
4.2 Beneficial Uses
Agricultural Supply (AGR) Includes crop, orchard and pasture irrigation, stock watering, support of vegetation for range grazing and all uses in support of farming and ranching operat ions. [SWRCB, Standard Beneficial Uses, Mana ement Memorandum No. 20, March 19733
Cold Fresh-Water Habitat Provides a coldwater habitat to (COLD ) sustain aquatic resources associated
with a coldwater environment. [SWRCB, Standard Beneficial Uses, Management Memorandum No. 20, March 19731
Estuarine Habitat (EST) Provides an essential and unique habitat that serves to accl imate anadromous fishes (salmon, striped bass) migrating into fresh or marine conditions. This habitat also provides for the propagat ion and sustenance of a variety of fish and shellfish, numerous waterfowl and shore birds, and marine mammals. [RWQCBZ, Water Qua1 i ty Control Plan, San Francisco Bay Basin (2), December 19861
Fish Migration (MIGR) Provides a migration route and temporary aquatic environment for anadromous or other fish species. [SWRCB, Standard Beneficial Uses, Management Memorandum No. 20, March 19731
Fish Spawning (SPWN) Provides a high quality aquatic habitat especially suitable for fish spawning. [SWRCB , Standard Benefic i a 1 Uses, Management Memorandum No. 20, March 19731
Groundwater Recharge (GWR) Natural or art if icial recharge for future extraction for beneficial uses and to maintain salt balance or halt saltwater intrusion into freshwater aquifers. [SWRCB, Standard Beneficial Uses, Mana ement Memorandum No. 20, March 19733

Industrial Process Supply (PROC)
Industrial Service Supply (IND)
Includes process water supply and all uses related to the manufacturing of products. [SWRCB, Standard Beneficial Uses, Mana ement Memorandum No. 20, March 1973 ! Includes uses which do not depend primarily on water quality such as mining, cooling water supply, hydraul ic conveyance, gravel washing, fire protection and oil well repressur izat ion. [SWRCB , Standard Beneficial Uses, Management Memorandum No. 20, March 19731
Municipal and Domestic Supply Includes usual uses in comnunityor (MUM mi 1 i tary water systems and domestic uses
from individual water supply systems. [SWRCB, Standard Beneficial Uses, Management Memorandum No. 20, March 1973)
Navigation (NAV) Includes comnercial and naval shipping. [SWRCB, Standard Beneficial Uses, Management Memorandum No. 20, March 19731
Non-Con act Water Recreation 1 Recreational uses which involve the (REC-2) presence of water but do not require
contact with water, such as picnicking, sunbathing, hiking, beachcombing, camping , p 1 easure boating , t idepoo 1 and marine life study, hunting and esthetic enjoyment in conjunction with the above activities as well as sightseeing. [SWRCB, Standard Beneficial Uses, Management Memorandum No. 20, March 1973)
Ocean Commercial and Sport Fishing (COMM)
The commercial collection of various types of fish and shellfish, including those taken for bait purposes, and sport fishing in ocean, bays, estuaries and simi lar non-freshwater areas. [SWRCB, Standard Beneficial Uses, Management Memorandum No. 20, March 19731
11 DHS has recently (10/24/90) suggested different language and three separate parts, Rec. 1, 2 and 3.
4-2

Preservation of Rare and Endangered Species (RARE)
Provides an aquatic habitat necessary, at least in part, for the survival of certain species established as being rare and endangered species. [SWRCB, Standard Beneficial Uses, Management Memorandum No. 20, March 19731
She1 lf ish Harvesting (SHELL) The collection of shellfish such as clams, oysters, abalone, shrimp, crab and lobster for either commercial or sport purposes. [SWRCB, Standard Beneficial Uses, Management Memorandum No. 20, March 19731
Warm Fresh-Water Habitat ( WARM)
Water Contact Recreation (REC- 1 )
Wildlife Habitat (WILD)
Provides a warm-water habitat to sustain aquatic resources associated with a warmwater environment. .[SWRCB , Standard Beneficial Uses, Management Memorandum No. 20, March 19731
Includes all recreational uses involving actual body contact with water, such as swimming, wading, waterskiing, skin diving, surfing, sport fishing, uses in therapeutic spas, and other uses where ingestion of water is reasonably possible. [SWRCB, Standard Beneficial Uses, Mana ement Memorandum No. 20, March 19733
Provides a water supply and vegetative habitat for the maintenance of wildlife. [SWRCB, Standard Beneficial Uses, Management Memorandum No. 20, March 19731

1 5.0 ALTERNATIVE LEVELS OF PROTECTION FOR BENEFICIAL USES OF BAY-DELTA ESTUARY WATER
Conclusions : WATER QUALITY OBJECTIVES
o There are numerous influences on the Estuary's beneficial uses. Some are not fully defined, including the impacts of comsercial and sport fishing ( legal and i 1 legal ) , the adverse effects of accidental ly introduced species (e.g., the clam Potamocorbula arnrrensis), and the possible problems with genetic alteration in fish resulting from reliance on hatcheries. There are also known harmful effects from toxic materials, dredging, structures, and others, on the health of the aquatic habitats in the Bay-Delta Estuary.
5.0.1 Overview
Chapter 4 and Appendix 4.0 identified the beneficial uses of Bay-Delta waters. In this chapter, the evidence supporting these uses is analyzed. Where the data are determined to be both appropriate and adequate to develop water quality objectives and the issue is within the scope of this Plan, potential objectives are established.
The water qua1 ity objectives in the Delta Plan were adopted in 1978. Water Rights Decision 1485 (D-1485) was adopted at the same time as the primary way to implement the Delta Plan. While water quality objectives for the southern Delta were included in the Delta Plan, they were not part of D-1485 and therefore have not been implemented. Water quality objectives in Sui sun Marsh were set but considerat ion of a1 ternat ive objectives proposed in the Sui sun Marsh Preservation Agreement (SMPA) is pending (see 5.10). All of these matters are time consuming since they require substantial funds from the state and federal government, construction of physical faci 1 ities, and subsequent testing o f these facilities to ensure that the desired objectives can be achieved.
Water quality objectives for parts of San Francisco Bay other than the Suisun Marsh were not adopted in the Delta Plan. Development of objectives for the south Delta will commence upon receipt of a negotiated agreement between the South Delta Water Agency (SDWA), USBR, and DWR.
The "estuarine habitat" beneficial use designation, for the purposes of this Plan, is broken down into various components, such as specific fisheries and fish protective habitat, to develop protection for those components addressed during the Phase I hearing. Further, there are several designated beneficial uses addressed in the Basin Plans of Regions 2 and 5 for which the State Board received evidence. However, that evidence did not indicate that salinity, temperature or dissolved oxygen' would affect the beneficial uses of either contact or non-contact recreation or navigation. Therefore, even though discussed in this Plan, sa 1 in i ty , temperature and d i sso 1 ved oxygen objectives are not proposed for these beneficial uses.

Specific water qual i ty objectives have been developed for designated beneficial uses. In the case of estuarine habitat, the State Board has identified certain areas and life stages for the protection of specific fish species. These objectives, the State Board be1 ieves, wi 1 1 provide protection for other species until more appropriate measures are developed. The following uses are designated as beneficial uses to be specially protected by objectives in this Plan: (See Chapter 4 for more detai 1s)
USE AREA
Municipal and Industrial San Francisco Bay-Delta, Export Area (ind, proc, mun, Agriculture (agr 3"" Delta, Export Area Estuarine Habitat (est, migr, spwn, cold, warm, corn)
Chinook Salmon (fall and winter run) Delta Striped Bass Delta Marsh Resource Suisun Marsh
5.0.2 Hydrologic Considerations
Salinity at any particular location in the Delta is dependent upon Delta inflows, agricultural drainage return flows, consumptive uses, exports, tidal stage and the operation of the Delta Cross-Channel gates. The southern Delta is almost exclusively influenced by the San Joaquin River. The internal Delta, on the other hand, is influenced to some degree by both river systems, especially when Delta exports are high. For the purpose of considering river effects on the beneficial uses discussed in this chapter, all of the Estuary locations were considered to be part of the hydrologic class if icat ion of the Sacramento River system, except for the following which were considered to receive water from the San Joaquin River system: San Joaquin River at Vernalis, at Mossdale, at Rough and .Ready Island, at Buckley Cove., and at the former location of Brandt Bridge; the bifurcation of Old and Middle River; Middle River at Howard Road Bridge; and Old River at Tracy Road Bridge.
5.0.3 Alternative Levels of Protection for Beneficial Uses
The fol lowing sections describe alternative levels of each protection for beneficial use in categories:
1. Present Conditions -- The current water qual ity conditions. These are usually reflected in the requirements set forth in 0-1485 as amended or in a few cases more protective requirements contained in agreements between Delta interests and certain water projects. In many cases qual i ty is better than objectives because of uncontrol led flow.
2. State Board Considerations -- State Board analysis of existing objectives, advocated levels of protection, any additional data obtained from agencies with appropriate expertise (e. g., DFG) , peer reviewed 1 i terature, etc.

3. Potential Objectives -- Appropriate A1 ternat ives proposed for each beneficial use. These potential objectives are further analyzed for economic, and environmental effects in Chapter 6.
Levels of Protection advocated by the various parties are contained in Appendix 5.0, under the heading Advocated Levels of Protection. A matrix of the present, advocated and proposed potent ia I objectives concludes the chapter (Table 5-5, A1 ternat ive Water Qua1 ity Objectives).
5.1 Municipal and Industrial
Conclusions: Salinity Requirements
o For all municipal and industrial intakes within the Bay-Delta Estuary, the Board adopts the 250 mg/l chloride (salinity) objective which is the secondary standard for aesthetics (taste) and corrosion establ ished by the Department of Health Services, However, additional sal ini ty protection may be needed in some areas to protect drinking water. supplies from disinfect ion by-products (DBPs) .
o The D-1485 objective of 150 mg/l chloride at the Contra Costa Water District's Rock Slough intake protects the wnicipal and industrial beneficial uses in Contra Costa County and provides benefits to the municipal supplies exported from the Delta. If and when substantial additional storage capacity is built or other information is developed, this objective and its monitoring location will be reviewed. Meanwhile, deleting the 150 q / l chloride objective in D-1485 could result in increased bromide concentrations and increased salinity and consumer complaints due to the salty taste in water.
5.1.1 Present Conditions - (Salinity and Sodium) Municipal and Industrial (M&I) use is currently protected by standards specified in the 1978 Delta Plan or 0-1485 (in this Plan referred to as D- 1485 or current objectives) (see Table 5-5). The'250 mg/l (maximum) chlorides level of protection considered adequate to protect municipal uses is based on the secondary standard for aesthetics (taste) and corrosion set by the Department of Health Services (DHS) and adopted by the Board in 1978 as being in the public interest.
The present objective of 150 mg/l chlorides was established at the Contra Costa Canal Intake during a portion of the year, depending on water year type, in order to protect industrial uses. This standard was intended to protect the historical water supply of two paper manufacturers in the Antioch area by providing a salinity necessary to maintain the quality of industry products. In adopting this standard the State Board recognized that it also provided better water quality to municipal customers.
5.1.2 State Board Considerations
Chlorides
The D-1485 objectives, with the inclusion of a MUN objective at Barker Slough and a conditional MUN objective at Cache Slough, sufficiently protect M&I uses (see Table 5-5).

MUN use is protected with respect to salinity, and taste and odor by the 250 mg/l chloride drinking water standard.
Industrial use is protected by the D-1485 150 mgll periodic chloride objective at Rock Slough and Antioch. Industries requiring water quality of 150 mg/l chloride or less are negotiating with DWR to obtain a1 ternat i ve sources of high qua1 i ty water; negotiations have been successful, although one industry is still negotiating with DWR. The negotiations to eliminate this objective have not been concluded; this is one reason that this objective will be maintained.
The 50 mgll objective recommended for blending purposes for MUN use is addressed in the following section on trihalomethanes.
Because the North Bay Aqueduct diversion point is at Barker Slough and the old diversion point at Cache Slough will be used on occasion as an alternative point of diversion, objectives will be needed at both of these diversion points.
Sod i um
Another issue related to sal ini ty involves the consumption of sodium. Diets high in sodium, especially for people with a history of cardiovascular problems, can contribute to such problems. Some participants in the hearing suggested a sodium objective be adopted to protect against such concerns. Others were concerned that water containing high levels of sodium may reduce the efficiency of dialysis machines. The information presented to the State Board shows that sodium contained in drinking water represents a very small portion of normal daily sodium intake. People on restricted sodium diets should consult their physician and dietitian to revise their diet based on their local water supply or in rare cases consider bottled water low in sodium.
These sodium issues were all debated before adoption of D-1485. No new informat ion was presented compel 1 ing a specific sodium objective. Concerns involving sodium levels can be resolved by achieving the 250 mg/l chloride objective in Delta waters or special action by health professionals.
5.1.3 Potential Objectives
No change (see Table 5-5).
5.2 Trihalomethanes (THMs) and other Disinfection By-Products (DBPs)
Conclusions:
o Delta water at times contains bromides (often measured via correlations with chlorides) and organic substances which, upon disinfection, increase the risk of forming by-products (including trihalol~ethanes (THls)) that are human health concerns.

o In the Delta THM precursors come from organic carbon in Delta peat soils and from the watershed upstream. Bromides which naturally occur in ocean * water and connate water exacerbate the formation of THMs upon disinfection.
o Existing drinking water standards are being met through a combination of source water controls and current drinking water treatment processes.
o If drinking water standards on DBPs are revised, the State Board will consider modifying existing salinity objectives.
o In the future the Board will review and weigh all factors that might result in more stringent salinity objectives for drinking water after disinfection. This includes alternative water disinfection methods.
o Due to the concerns with DBPs in treated water from the Delta and in keeping with the goal (not objective) of obtaining the best available drinking water, the Board finds that, whenever feasible, municipal water supply agencies should strive to obtain bromide levels of 0.15 mg/l or less (about 50 mg/l chloride in the Delta). Appropriate actions by these supply agencies include encouraging DWR and USBR to work with the SURCB to ensure development of faci 1 it ies to make maximum use of uncontrolled flows through off-stream storage, encouraging those agencies to move water supply intakes to better locations, working with the State and Regional Boards to eliminate problem discharges within the Delta, and continuing the developuent of a1 ternative water treatment technologies.
5.2.1 Present Conditions
Trihalomethanes (THMs) are a subset of chemicals known as disinfection by- products (DBPs) which are formed when waters are disinfected. THMs are produced when dissolved organic substances, such as fulvic and humic acids produced by decaying crop residues or peat soil in fresh or saline waters, come in contact with the oxidizing a ents used to disinfect drinking water (T,VI,38:3-5; T,XLVI,99:ll-19 3 . The levels of dissolved organic materials in water are most often assumed to be represented by the total organic carbon (TOC) concentration of the water. However, since TOC is a measure of all organic carbon, not just precursor molecules, it has not been found to be a consistent predictor of THM formation potential (THMFP) in Delta waters. Bromides contribute to the production of THMs and other DBPs. Bromides enter the Delta predominantly from ocean water. Minor sources of bromides are the Sacramento, and San Joaquin rivers, and connate water.
Drinking water supplies with THMs may pose a significant problem because health effects studies have indicated that chloroform and bromoform are animal carcinogens and are suspected human carcinogens (T,VI ,38: 12- 16;DWR ,'226,2). For regulatory purposes, EPA assumes that a1 1 THMs are equally toxic to humans (T,VI ,46:5-7) and in 1979 adopted a water quality standard for total THMs of 100 ug/l (EPA National Primary Drinking Water Regulations, 40 CFR 141). This standard is monitored in distribution systems of domestic water supplies. Sampling is performed at three month intervals and compliance is based upon a running average of four samples (T , X L V I ,118: 1-5). The EPA THM maximum contaminant level (MCL) applies to

treated drinking water, rather than to sources of water, such as the Delta. D-1485 did not include any water quality objective for THMs. It was concluded that for pub1 ic health reasons protection from THMs in water from the Delta is more properly addressed through the use of a1 ternat i ve water treatment techniques or relocat ion of problem intakes rather than through the setting of more stringent salinity or TOC objectives (Second Triennial Review of the Delta Plan, October 1984).
Data presented by the Metropol i tan Water District of Southern Cal ifornia (MWD) show that chlorinated Delta water with postammoniation occasionally has produced finished drinking water with THM concentrations close to the present EPA water quality MCL (Krasner, 1989). In addition, it has been shown that when a water supply, such as the Delta, contains a significant concentration of bromide, THMs and DBPs can also be formed using disinfectants other than chlorine (e.g., ozone) (Delta Municipal and Industrial Water Quality Workgroup, 1989, p.4.; T,V1,44:8-45:l).
Data presented to the Delta Municipal and Industrial Water Qua1 i ty Workgroup (Delta M&I Workgroup) by several researchers demonstrate that the presence of bromide exacerbates the problem of DBP formation in general, as we1 1 as the problem of THM formation. As bromide concentrations in Delta water increase, brominated forms of DBPs and THMs increase and at times dominate the total THM concentration (Krasner, 1989).
By analyzing THMFP data which were generated using a consistent set of collection and analytical techniques, it is possible to draw general conclusions regarding the sources of THMs in drinking water supplies taken from the Delta. Sources of THMFPs in Delta water appear to be ocean tidal waters, Delta organic soils and decaying crop residues, and Sacramento and San Joaquin river inflows to the Delta. One set of calculations concludes that "within-Delta" sources appear to contribute approximately 25 percent of the THMFPs in Delta water (SWC, Brief on Phase 1, February 1, 1988; p. V - 7 ) . DWR is currently conducting a study to determine the THMFP contribution to Delta water quality coming from local agricultural drainage returns (T ,XLVI ,83: 14-84: 12). To date, studies show that the mineral soils in the Delta contribute less THM precursors than the organic soi 1 s (T ,XLV1,84: 13-22).
I f EPA1s MCL for THM is lowered, it is 1 ikely that conventionally treated (chlorinated) Delta water with current inputs of total organic carbon and bromide will not be usable as a direct source of drinking water. At present, because of the correlation between chloride and bromide, when chloride concentrations exceed 100 mg/l and standard chlorination treatment is used, THM concentrations approach, but do not exceed, the current EPA THM MCL of 100 ug/l (Delta M&I Workgroup, Appendix A.10, 1989).
5.2.2 State Board Considerations
Informat ion compi led by members of the Delta M&I Workgroup suggest that a1 ternat ive water treatment techniques may not resolve a1 1 the concerns related to THMs. Reasons for this include:

1. The presence of bromide ions in the Delta (the majority of which come from seawater) and the inability of conventional and non- conventional treatment processes to remove either the bromide ion or the brominated forms of THMs;
2. The formation of other disinfection by-products (DBPs) which are suspected human health hazards by conventional and non-conventional water treatment processes;
3 . The statement by EPA that it will be proposing maximum contaminant levels (MCLs) for disinfectants currently used to treat drinking water (e.g., chlorine and chloramines). New MCLs are also expected for DBPs. These MCLs are 1 ikely to include the DBPs formed by chlorination (e.g., trihalomethanes) as well as other oxidant DBPs.
A discussion of the three reasons mentioned above is found in Appendix 5.1, Tri halomethanes. The discussion is 1 imited to information provided by the Delta M&I Workgroup, from the hearing record of Phase 1, and to other information cited concerning format ion of DBPs resulting from ozonat ion/chlorinat ion treatment of drinking water.
Based on a detailed review of the information presented the State Board has concluded the following:
1. THMs, DBPs and some disinfectants (e.g., chlorine, chloramine and chlorine dioxide) currently in use present possible hazards to human health. Brominated THMs and chloroform are suspected human carcinogens.
2. EPA may be revising the total THM MCL in the near future. The revised standard may be more stringent. Under the current timetable, compliance is expected in 1994.
3 . EPA is expected to set MCLs for other disinfection by-products and for disinfectants. Ranges of MCLs are unknown at this time. Under the current timetable, compliance is expected in 1994.
4. Every disinfectant currently being used produces some kind of disinfectant by-products. New treatment technologies contain technical and economic uncertainties which compound those associated with the health effects and potential regulation of disinfectant by-products.
5 . The presence of bromide ions in the source water exacerbates the THM and DBP concerns. Bromide ions in the source water significant Jy increase levels of brominated DBPs produced by chlorination, chloramination and ozone.
6. A major source of bromide ions in Delta waters is sea water and a re1 ationship has been documented to exist between chloride levels and bromide levels in seawater. However, the relationship between chloride and bromide levels in the Delta needs further study.

7. In addition to bromide, TOC is an important factor in the production of THMs and DBPs. Sources of TOC include seawater and estuarine water, the Sacramento River, the San Joaquin River and the Delta.
8. While the existing MCL for THMs is usually met with the current chloride objective in the Delta, concern exists that a new MCL for THMs is expected from EPA which may not be achieved without great cost to municipal users who divert from the Delta.
Solutions for the THM concern and newly recognized DBP concern do not 1 ie solely with alternative water treatment techniques or relocation of existing intakes. Before costly and unproven steps are taken, there is urgent need for monitoring and research. Also, basic decisions by EPA are needed before objectives can be set to help address the DBP concerns which include THMs. Finally, the State Board realizes that while THMs are the DBP of current concern, further studies may indicate that other DBPs are of greater concern.
5.2.3 Potential Objectives
1. The current 150 mg/l chloride industrial objective which provides ancillary protection to municipal uses.
2. None. A water qual ity objective for THMFP is not appropriate at this time. The non-standardized nature of the analytical technique and the lack of a THMFP to THM correlation work together to render such a water quality objective scientifically unsound. A THM workgroup should be formed to address this, and other THM related issues (see Chapter 7.
3. A 0.15 mg/l bromide (about 50 mg/l chloride) level as advocated by the Delta M&I Workgroup. The State Board wants to examine the effects of setting such an objective. Therefore this concentration level will be identified as a "goal" for further analysis.
5.3 Agriculture
Conclusions:
Western and Interior Delta Agriculture
o To reasonably protect crops grow in the western and interior Delta, water qual ity objectives were developed using corn as the representative salt-sensitive crop.
o Assuming improved leaching practices are used, salinities up to 1.5 nahos/cm EC could be allowed during the irrigation season without affecting crop yield. However, the economic costs of these practices are not in the record.
o Unti 1 adequate economic data are available on leaching costs, the Board will maintain the existing salinity objectives.

Southern Delta Agriculture
@ o To reasonably protect crops grown in the southern Delta, water quality objectives Here developed using beans and alfalfa as representative salt- sensitive crops.
o The objective of 0.7 mnhos/cm EC in the southern Delta protects beans during the sumner irrigation season and the objective of 1.0 mmhos/uu EC protects alfalfa during the winter irrigation season. These objectives or other adequately protective objectives at specified locations wi 11 be implemented over time.
o Southern Delta
The implementation plan is comprised of two interim stages and a final stage.
Interim Stage 1 -- 500 mgll mean monthly TDS all year at Vernalis. Interim Stage 2 -- (to be implemented no later than 1994) 0.7 mmhoslcm EC Apri 1 1 to August 31, 1.0 mrnhos/cm EC September 1 to March 31; 30-day running average at Vernal is and Brandt Bridge, with water qual i ty monitored at three current interior stations -- Mossdale, Old River, near Middle River and Tracy Road Bridge; and an additional interior monitoring station on Middle River at Howard Road Bridge.
Final Stage -- (to be implemented no later than 1996) 0.7 mmhos/cm EC Apri 1 1 to August 31, 1.0 mmhos/cm EC September 1 to March 31; 30-day running average at Vernal is and Brandt Bridge on the San Joaquin River, with two interior stations at Old River near Middle River and Old River at Tracy Road Bridge. Monitoring stations will be at Mossdale at head of Old River and Middle River at Howard Road Bridge.
If a three-party contract has been implemented among DWR, USBR and the SDWA, that contract will be reviewed prior to implementation of the above and, after also considering the needs of other beneficial uses, revisions wi 1 1 be made to the objectives and compl iancelmoni tori ng locat ions noted above, as appropriate.
5.3.1 Present Conditions
5.3.1.1 Western Delta
In 0-1485, an agricultural water quality objective with a base level of 0.45 mmhos/cm EC was set for applied water in the western Delta. This objective is based upon estimates presented in the University of California exhibits. The information provided estimates of the quality needed to provide 100 percent corn yield in this region's subirrigated organic soi 1 (1978 Delta Plan, UC ex. 1,2, and 8). On varying dates during the irrigation season, depending on year type, this objective is adjusted to a lower quality. This adjustment is made for all water year types except wet years at Emmaton and Jersey Point, and above normal years at Jersey Point. The amount of the adjustment is based on the time- weighted average of water qual ity over the period April 1 to August 15 for conditions that would exist without the CVP and the SWP (without project conditions).
5-9

5.3.1.2 Interior Delta
The 0-1485 agricultural water qua1 ity objectives for the interior Delta uses the same estimates as the western Delta. However, under "without project" conditions, water quality in the interior Delta during the irrigation season was better than in the western Delta. Therefore, water year type adjustments for the interior Delta were smaller.
Table 5-5 1 ists western and interior Delta water quality objectives used as the present condition objectives.
5.3.1.3 Southern Delta
Three requirements primari ly control current agricultural conditions in the southern Delta. These are:
o Regional Water Quality Control Board 5 Basin Plan (Basin 5 Plan)
o State Water Resources Control Board Decision 1422
o The terms of the draft contract for settling litigation brought by the SDWA against the USBR and DWR.
Current control1 ing conditions are set by the Basin 5 Plan objective for southern Delta agriculture (Table 5-5). This objective provides that "[iln the San Joaquin River near Vernal is, the mean average TDS concentrat ion shall not exceed 500 mgll over any consecutive 30-day period" (Basin 5 Plan). This objective is set forth in Water Right Decision 1422 (New Melones Decision) (Table 5-5). Upon completion of the New Melones Reservoir the Bureau was required to meet the Basin 5 Plan objective with the necessary reservoir releases (SWRCB Decision 1422, April 1973).
This objective has not always been met, particularly in the recent years of drought. South Delta Water Agency and USBR have agreed on a number of occasions to release the 1 imited supply from New Melones in a pattern which causes the objective to be violated at certain times of year, in order to preserve the dilution capability for more critical periods.
The USBR, SDW9 and DWR entered into the Framework Agreement in October 1986 in an attempt to settle litigation brought by SDWA against the USBR and DWR. Since that time the parties have negotiated a proposed contract to settle the SDWA 1 itigation. The proposed contract was agreed to by DWR's Director, USBR's Director of the Mid-Pacific Regional Office and SDWA's Board of Directors in August 1990. Each party also has its own approval process that must take place before the contract is fully executed.
5.3.2 State Board Considerations
Table 5-1 presents selected information concerning salt threshold and yield levels for sensitive and moderately sensitive surf ace irrigated crops grown on mineral soi 1s (DWR,328). The salt threshold for a particular crop is the level below which no loss in yield is experienced due to soil salinity conditions.


5.3.2.1&2 Western and Interior Delta I Protect ion for western and interior Delta agriculture is primarily based on the protection of corn grown on organic subirrigated soil.
In this region corn is a major salt-sensitive crop. Corn is grown on more than 21 percent of the total Delta land area, including more than 26 percent of the Delta lowlands (DWR,304). To help ensure a reasonable level of protection for agriculture in the western and interior Delta, the fol lowing information, on leaching practices is needed:
(1) The effects of irrigation and leaching water quality on crop yield, (2) The economics of implementing leaching practices, and (3) The practical ity of implementing leaching practices and their
effectiveness.
Based on results from the Corn Study and the subworkgroup on western and interior Delta agriculture, it appears that corn can be grown and maintained with saltier water than proposed in D-1485; however, control led leaching would be required periodically. The controlled leaching would be in addition to any leaching effect from rainfall and winter ponding. (See Appendix 5.2, Analysis of Corn Study to Variations in Applied Water and Leach Water Salinity). Information on the effectiveness, practical ity, and the economics of such leaching needs field demonstration. Unti 1 this information is obtained, the 0-1485 objectives will be continued for the protection of western and interior Delta agriculture.
5.3.2.3 Southern Delta
Beans and alfalfa, the two most widely grown salt-sensitive crops in the southern Delta, were chosen as target crops for the purpose of setting objectives. Meeting the objectives for these crops will protect the less salt-sensitive crops. In developing objectives for beans and alfalfa, the evidence and exhibits from the Phase I hearings, information from the DWR-sponsored South Delta Agricu 1 ture Subworkgroup, and the southern Delta negotiations were taken into considerat ion.
Within the subworkgroup, three key issues were discussed that influence the level of salinity required for the protection of beans and alfalfa: crop response during the early stages of growth, the determination of leaching fractions1 and the effectiveness of rainfall in reducing soil salinity during the irrigation season. The members of the subworkgroups have been unable to reach consensus. The State Board will base its analysis on the University of California's "Guidelines for The Interpretation of Water Quality for Agriculture" and the Delta Plan (1978, Delta Plan, UC ex.D).
The subject of agricultural objectives for the southern Delta should consider ongoing negotiations between DWR, USBR, and SDWA. Care should be exercised in setting objectives so as not to undermine negotiations but to bring the negotiations to a timely and fruitful conclusion. Any agreement resulting from the negotiations will be reviewed by the State Board before the objectives are revised to reflect those contained in the aqreement.
11 Leaching fraction is that fraction o f the total anwunt o f applied water that passes through a crop root zone (SURCB, 29,Z).

5.3.2.4 San Francisco Bay
@ No data have been presented nor a need demonstrated to protect agricu 1 ture in the San Francisco Bay area. Therefore, no a1 ternat ives are being considered for Bay agriculture in this Water Quality Control Plan.
5.3.3 Potential Objectives
5.3.3.1 Western and Interior Delta
No change (see Table 5-5).
5.3.3.2 Southern Delta
A staged implementation of objectives is one alternative. For the reasons stated under "State Board Considerations" it is the only alternative to the existing objective which will be carried forward. The staged implementation plan, which contains two interim stages and a final stage, is discussed in Chapter 7, Program of Implementation. The objectives for the final stage are presented in Table 5-5.
The final stage (to be implemented by 1996) will be 0.7 mmhos/cm EC April 1 to August 31 and 1.0 mmhos/cm EC September 1 to March 31; 30-day running average at Vernalis, Brandt Bridge, Old River near Middle River, and Tracy Road Bridge.
In the final stage of the phased Plan, the State Board will consider requiring full implementation of water quality objectives as set forth in the 1978 Delta Plan for the southern Delta area. Also, any agreement affecting south Delta water quality will be fully reviewed by the State Board prior to implementation of the final stage. The objectives and locations at that time may be revised as the State Board deems appropriate.
5.4 Fish and Wildlife Beneficial Uses
Conclusions:
o The State Board supports the natural perpetuation of species affected by water and water quality. It is the policy of the state to signifi- cantly increase the natural production of salmon by the end of this century.
o Because of the amounts of data, past practices and public perception, striped bass and Central Valley Chinook salmon will be given separate consideration in the development of water qua1 i ty objectives .
o Fish hatcheries for some species are a managent tool that nil 1 be evaluated for their benefit and operation within the watershed during subsequent phases of the Bay-Del ta proceedings.

o With respect to temperature and salinity, the objectives set in this Plan protect selected estuarine habitat k n e f icial uses. There is insufficient infomation in the record to set specific salinity and temperature objectives for the protection of Delta smelt, American shad, benthos, resident fish or marine habitat outside the Estuary.
5.4.1 Present Conditions -- Fishery Habitat Protection (Entrapment Zone) in the Bay-Delta Estuary
In recent years there have been extensive changes in the Bay-Delta Estuary area, the effects of which are not well understood. These changes include:
1. Theintroductionof theAsiancopepod, Sinocalanusdoerrii, andits apparent displacement of the native copepod, Euryte-f inis,
. from the entrapment zone area (DFG,28,25-28);
2. Changes in phytoplankton bloom patterns in the Delta and Suisun Bay, with the appearance of dense blooms of the chain diatom, Melosira, in the central Delta (DFG,28,14-19);
3. Changes in Delta outflow, salinity, and rate of water exports from the Delta (DFG, 20,22-25) ;
4. Increases in releases of water from New Melones Reservoir for interim improvement of southern Delta water quality. (T,XV,21:1-9) ; and
5. The introduction and rapid increase in numbers and range of the Asian clam Potamocorbula and its possible adverse effects on phytoplankton and zooplankton abundance.
The largest concentrations of phytoplankton, zooplankton, and detritus are generally found in the entrapment zone, an area where suspended materials concentrate as a result of two-layered flow circulation (USBR,112). Depending upon season, the type of water year, the tidal stage, and the preceding freshwater flow patterns, the entrapment zone could occur anywhere from upstream of the mouth of the Sacramento River to San Pablo Bay. The timing of phytoplankton blooms and the size of the resulting standing crop have been directly associated with the tidal ly- averaged location of the entrapment zone adjacent to or just upstream of extensive shallow shoal waters (T,XLVI ,44:9-11,48:6-10; CCCWA/EDF,9). The location of the entrapment zone can be approximated from specific conductance values of 2 to 10 millimhoslcm (approximately 1 to 6 parts per thousand (ppt) sal ini ty) (CCCWAIEDF, 9).
The various species of zooplankton are found at different salinities. Neomysis mercedis are most abundant in areas with surface salinities ranging from 1.2 to 4.6 ppt (CCCWA/EDF,8). As salinity intrusion decreases, Neomysis abundance increases (T ,XLI ,54:23-24).

Neomysis feed on a variety of phytoplankton; diatoms are the most important class eaten and are also the most abundant class in the estuary (T,XLI ,54:25-55:3). Other zooplankton also constitute a significant portion of their diet (T,XLI,55:4-5). Both phytoplankton and zooplankton concentrat ions have decl ined, thus reducing the food supply for Neomysis (T,XLI ,55:6-8). Statistical analyses indicate that the abundance of Neomysis increases as its food supply increases (T,XLI ,54:21-23).
Phytoplankton and zooplankton are important parts of the food chain supporting fish and larger invertebrates in the Estuary. There are no current water qual ity objectives specif ical ly to protect phytoplankton and zooplankton. There are some benefits provided by water qual ity objectives set for other beneficial uses, e.g., Delta agriculture or Delta outflow for striped bass spawning and survival.
5.4.2 State Board Considerations
The location of the entrapment zone plays a role in the abundance of phytoplankton and zooplankton in the Suisun Bay area. Salinity is an indication of its location. Because the location of the entrapment zone in Suisun Bay is related primarily to the freshwater outflow, however, the State Board will defer consideration of this issue to the Scoping and Water Right phases of the proceedings.
5.4.3 Potential Objectives
To be discussed in the Scoping and Water Right phases.
5.5 Chinook Salmon
Conclusions:
The Estuary is a migratory corridor and rearing area for Chinook salmon.
Hatchery production has kept the total numbers of fall-run salmn relatively stable.
The diversity of the gene pool from naturally produced salmon is desirable.
The Sacramento River winter-run of the Chinook salmon has been 1 isted as an endangered species and will receive additional consideration in the final phases of these proceedings.
The Board finds that salinity is not a factor affecting salmon as they migrate through the Estuary.
Elevated temperature is one of the factors which can affect Chinook salmon during their migration through the Delta.
Tenperatures no greater than 68°F during the periods of April through June and September through November should be achieved by controllable factors, such as waste discharge controls, increases in riparian canopy, and bypass of warning areas (e.g., Thermal ito Afterbay).

o Controllablewaterqualityfactorsarethoseactions, conditions, or circumstances resulting from human activities that may influence the qual i t y of the water of the State, that are subject to the authority of the State Board, or the Regional Board, and that may be reasonably control led. Based on the record in these proceedings, control 1 ing temperature in the Delta utilizing reservoir releases does not appear to be reasonable, due to the distance of the Delta dawnstream of reservoirs, and uncontrollable factors such as ambient air temperature, water temperatures in the reservoir releases, etc. For these reasons, the State Board considers reservoir releases to control water temperatures in the Delta a waste of water; therefore, the State Board will require a test of reasonableness before consideration of reservoir releases for such a purpose.
o No tvrature requirements were submitted for winter-run Chinook salmon. To provide some protection for this endangered species, the more conservative temperature objective of 66°F (developed for the f a1 1-run) is provided for the winter-run. This objective should be achieved by controllable factors, as noted above, during the period January through March at Freeport on the Sacramento River.
5.5.1 Present Conditions
Flow requirements in D-1485 were established at Rio Vista on the Sacramento River for the protection of Chinook salmon, Oncorh nchus + tshaw tscha. There are no fishery flow requirements for t e San Joaquin + portion o the Delta. In addition to flow requirements, D-1485 contains a provision to close the Delta Cross Channel to minimize cross-Delta movement of salmon. D-1485 does not include any water qual ity objectives for the protection of salmon.
5.5.1.1 Sal inity, Temperature and Dissolved Oxygen
Various water qual i ty conditions can affect Chinook salmon survival in the Delta. The water qual i ty variables under consideration were temperature, dissolved oxygen. (DO) and salinity. During and after Phase I of the proceedings, data were presented on some water quality requirements of the different runs of Chinook salmon during the freshwater 1 ife stages. Most of the informat ion concerning water qual i ty is related to temperature requirements.
No salinity objectives exist for salmon in the Sacramento and San Joaquin basins and Delta, and no sal ini ty .objectives have been proposed. Chinook salmon (adults and juveniles) tolerate and even benefit from a gradual salinity gradient from the upstream headwaters to the ocean. The Chinook salmon as they migrate through the Delta are genetically adapted to migrate well beyond the fresh and salt water boundary.
Natural populations of San Joaquin and Sacramento salmon are declining and San Joaquin populations are undergoing extreme fluctuations (USFWS,31,58). Natural populations of the fall-, late fall-, winter- and spring- Chinook salmon runs are smaller than they were when first recorded by DFG in 1959. The catch of fall-run Chinook salmon has been relatively stable over time because the increasing number of hatchery- produced fish has offset the decline in naturally-produced fish.

The winter-run Chinook salmon has been listed as an Endangered Species under State law by the Fish and Game Commission and as a Threatened Species under federal law by the National Marine Fisheries Service (NMFS). Additional information about this run has been submitted to the State Board (see below).
San Joaquin River flow at Vernal is during smolt emigration has been identified as a major factor affecting subsequent adult escapement of hatchery and natural ly-produced Chinook two and one-half years later (T,XXXVI ,139: 17-22) (Figures 5-1 and 5-2). The temperatures in the south Delta are often too high for smolts (WQCP-USFWS-5). Survival of the hatchery fish transported by truck and released below the Delta is six to eight times better than naturally or hatchery-produced fish emigrating from upstream through the Delta (T,XXXVII ,153:2-154.:1,161:22-162:l).
Very little water quality information is available about the effects of present conditions on salmon smolts migrating through San Francisco Bay. The USFWS did however determine that Chinook survival through San Francisco Bay in 1985 was estimated to be 93 percent based on the ratio of tag recoveries of two and three-year-olds released at both Port Chicago and the Golden Gate Bridge, respectively (Table 15, see USFWS Exhibit 31 for methods). The survival rate in 1984 was 81 percent. Both years had a delta outflow of about 10,000 cfs during the smolt out- migration (WQCP-USFWS-3,54).
5.5.1.2 Legislation for Upper Sacramento River Fishery Resources and Riparian Vegetation Restoration
A number of efforts are being made in both the state legislature and congress to improve the anadromous fishery and the riparian vegetation in the upper Sacramento River. In 1986, Senate Bill 1086 (Nielsen) created an advisory council and action team of federal, state and local agencies and interested parties to develop the Upper Sacramento River Fisheries and Riparian Habitat Management Plan. The plan, submitted in 1989, addressed the issues concerning the decl ining population of anadromous fish in the Sacramento River and listed 22 specific actions to restore and protect the fisheries and riparian vegetation. The plan includes priority issues such as flows, modification of diversion facilities, and temperatures and turbidity control in the Sacramento River. Senate Concurrent Resolution 62 (Nielsen), filed as a follow-up to SB 1086, passed in October, 1989. The Resolution declares that it is state policy to proceed with appropriating sufficient funds to implement the various recommendat ions in the management plan.
5.5.2 State Board Considerat ions
5.5.2.1 Temperature
There are a number of factors that influence water temperatures in the Delta; they include water temperatures of tributary inflow, amount of inflow, solar radiation, ambient temperatures, temperature of irrigation return flow and the extent of the riparian vegetation or shade. There is

Figure 5-1 Mean spring flows at Vernalis
BO'OOo I and San Joaquin Basin escapement 2 1/2 years later
Year
Year

10,000 30,000 Mean sprlng flows (cfs), 1955-1 988
Figure 5-2 Relationship between mean spring flows at Vernalis and San Joaquin Basin escapement 2 112 years later
~ 1 0 0 0

a general relationship between temperature and flow, with a considerable amount of variation in temperature at any given flow (DFG,15,145) (DWR, 562). Water temperatures in the DeltaIEstuary range from optimal to lethal to Chinook salmon depending on at least the above factors. Several methods are being pursued to improve the water temperatures in the Sacramento River and increase the survival rate of the various runs of Chinook salmon. Increased flows to move the juvenile salmon more quickly downstream, thus reducing exposure time to potential hazards, could have an effect on temperature.
The critical periods for fall- and winter-run Chinook salmon in the lower Sacramento and San Joaquin rivers are between December 1 and June 30 and September 1 and November 30 of each year, because these encompass the spawner migration and the juvenile outmigration phases through this area (See Appendix 5.3, Chinook Salmon). The ability and options available to attain a desired temperature objective at Freeport on the Sacramento River or Vernal is on the San Joaquin River during the various water year types have not been fully investigated.
Cooler water temperatures in the Sacramento River during the spring, early summer and fall months benefit different life stages of the winter- run as well as the fall-run Chinook salmon. In the spring and early - .
summer, cooling the river for the outmigrating fall-run smolts would also benefit the winter-run adults spawning upstream. In the fa1 1, c0.01 ing the water for the fa1 1-run spawners would concurrently benefit the rearing o f juvenile winter-run salmon in the river and the beginning of their emigration.
DWR1s consultant testified that, since 1978, temperatures in the . '
Sacramento River at Sacramento have been two to three degrees centigrade
I about four to six de rees Fahrenheit) higher than before 1978 T,XXXVII, 157:ll-15) 9 DWR,562,2). An evaluation of this theory might be possible by using the USBR Sacramento River temperature model (WQCP-'USBR- 127). Smolts emigrating in the months of warmer water temperatures are likely to suffer higher mortalities (T,XXXVII,226:15-20). Both wild and hatchery fish from both river systems are vulnerable to loss due to high temperature (WQCP-USFWS-5). The San Joaquin River portion of the Delta warms sooner than the Sacramento River system and is often about 70°F in early May. In the last few years, fishery investigators have determined that high water temperatures as well as low flows are a major problem for smolts emigrating through the San Joaquin River and Delta. Based on ocean tag recoveries, smolt survival throu h the Delta decreased as mean water temperatures in the Delta increased PusFWs, 31.43). The same relationship is illustrated in Figure 5-3 which indicates the effect of temperature on the survival of emigrating juvenile salmon (See also Appendix 5.3, Chinook Salmon).
In contrast, the survival index generally exceeded 0.50 when the Sacramento River temperature at Freeport was 66OF or less (USFWS,31,43).
5.5.2.2 Fall-run Chinook Salmon
The upstream migration of fa1 1-run Chinook salmon extends from approximately September through November in both the lower San Joaqu in and Sacramento rivers. High water temperatures have blocked or delayed

FIGURE 5-3 Adjusted survival index of Chinook salmon smolts based on trawl recovery versus maximum daily water temperature on release day a t Freeport, Reach 1 (WQCP-USFWS- 1)
TEMPERATURE ( F)

the upstream migration of fall-run Chinook in the years when there were high water temperatures in the fa1 1. Temperatures above 70°F in the San Joaquin River have prevented salmon from migrating upstream from the Delta. This has often coincided with low dissolved oxygen levels especi a1 1 y between Stockton and Turner Cut. (Dissolved oxygen levels can be affected by temperature both directly and indirectly and the solubility of oxygen in the water varies inversely with temperature.) In the fall months in which DFG studied the situation, Chinook salmon were blocked by high water temperature in the lower San Joaquin River and upstream migration resumed when temperatures declined to 65OF. Temperatures between 65°F and 70°F created a partial block to salmon migration (Hal lock et a1 . : 1970). A1 though comparable findings have not been made for conditions in the Sacramento River, temperatures in the lower river, and in the tributaries as well, have sometimes been higher than optimum for adult migrants during the fall months.
Given the timing of the up- and downstream migration of the fall-run Chinook salmon, and the testimony and evidence of the parties at the hearing, the potential temperature objective for fa1 1-run Chinook salmon is 68OF from April 1 through June 30 and from September 1 through November 30.
The f a1 1-run Chinook salmon population has been supported by artificial propagation in hatcheries in both the Sacramento and San Joaquin rivers.
5.5.2.3 Winter-run Chinook Salmon
The winter-run has not been successfully produced in the hatcheries, in spite of numerous attempts. The population of the winter-run has decl ined in recent years, with the 1990 adult population estimated ,to be less than 500 fish. Given the current endangered status of the fish and its recent decline, a more conservative approach should be taken when determining a temperature objective for the winter-run Chinook salmon.
Both adult and young winter-run Chinook salmon would benefit from having a gradual salinity gradient from the Delta to the ocean and temperatures that do not exceed the mid-60 degrees Fahrenheit (memorandum to SWRCB from DFG, August 9, 1989). Temperature tolerances of winter-run Chinook salmon are unknown, although the Department of Fish and Game believes' that they are similar to other Chinook runs. The timing of the outmigration of juveniles and the duration of rearing of the winter-run in the Delta are generally unknown. However, the time of the winter-run outmigration has been estimated from counts made in the upstream areas and subsequent catches of appropriately sized fish in the Delta area. These Chinook are determined to be winter-run by comparison with growth curves of winter-run hatchery fish. From these data, the DFG has determined that the period of peak outmigration through the Delta for juveni le winter-run Chinook salmon is between the months of January and April, with occasional downstream movements of fry during the fall months.
The adult winter-run Chinook salmon begin entering San Francisco Bay in November and continue to be found in the Sacramento-San Joaquin Delta into June. Peak adult migration through the Delta probably occurs from January to March.

Although there was no testimony presented on temperature requirements specifically for the winter-run, based on the hearing record and the testimony presented at the hearing, consideration of the more conservative temperature objective (66°F) for the fa1 1-run Chinook salmon would be appropriate for the winter-run (Appendix 5.3, Chinook Salmon) during the period they are in the Sacramento River.
The winter-run Chinook salmon temperature objective is a cap to prevent water temperature from going higher than the present temperatures in the Delta. It is not a goal. This objective is just one of several ways of providing protection from elevated water temperatures. Other such protection measures include the Thermal Plan (see in Section 5.5.2.5) and the State Board "anti-degradation pol icy", "Statement of Pol icy With Respect to Maintaining High Quality of Water in California," Resolution 68-16.
5.5.2.4 Dissolved Oxygen
No objectives for dissolved oxygen. were developed in D-1485.
The Central Valley Basin Plan (1975, Vol. 1-4-12) states that: "The following objectives apply to Delta waters: The dissolved oxygen concentrations shall not be reduced below the following levels:
- 7.0 mg/l in the Sacramento River (below the I Street Bridge) and in all Delta waters west of the Antioch Bridge; and,
- 5.0 mg/1 in all other Delta waters except for those bodies of water which are constructed for special purposes and from which fish have been excluded or where the fishery is not important as a beneficial use."
"Temperatures over 65OF have partial ly blocked migrations in the San Joaquin River past Stockton and . . . dissolved oxygen concentrations of less than 5 mg/l constitute a virtual barrier to adult migrants" ( u S F W S , ~ ~ , ~ ~ ) . According to Hallock et al. (1970), after four years of investigation, "... no salmon moved past Stockton until the dissolved oxygen had risen to about 4.5 ppm, and the run did not become steady unti 1 oxygen levels were above 5 ppm." To address the problem of low dissolved oxygen levels in the San Joaquin River, an agreement was reached in 1969 between the USFWS, USBR, DWR, and DFG, in part, to take specific actions "...to maintain the dissolved oxygen content in the Stockton Ship Channel generally above 6 ppm when necessary.. . ." DWR monitors DO levels in the San Joaquin River between Stockton and Turner Cut (Stockton Ship Channel) during the fall Chinook salmon migration. (Monitoring data are summarized and a report is submitted by DWR to the SWRCB annually in accordance with Water Right Decision 1485, Order 4(f)). If DO levels drop to 6 mg/l , a temporary rock barrier is installed across the head of Old River to increase San Joaquin River flows past Stockton, thus improving DO levels (T,XXXV11,85:4-22). Better treatment of cannery wastes since 1978 (reducing the biochemical oxygen demand) and improved flows and water qua1 ity from New Melones Reservoir operations were reported to have helped a1 leviate this problem (USFWS,31,94). Since then, the Old River barrier has been installed in the fall of 1979, 1981, 1984, 1987, 1988 and 1989 (H. Proctor, DWR, pers. corn.).

In the lower Sacramento River, no problems with dissolved oxygen levels were identified.
5.5.2.5 Miscellaneous Considerations for Salmon
o Pulse Flows as an Operational Option
Various operational options are available which may be beneficial to the salmon smolts but have n0.t been not fully tested. "Pulse f lows11 are released from Shasta Dam on the Sacramento River to increase flows at the same time salmon smolts are released from the USFWS Coleman Hatchery on Battle Creek (tributary to the Sacramento River). The purpose of the "fish flush" is to move hatchery fish rapidly down the Sacramento River, past a number and variety of potential hazards. Pulse flows (fish flush flows) provide a window of time in which to coordinate the operation of various water diversion facilities, such as the Delta Cross Channel Gates, to maximize survival of the smolts. The fish are released as early in the season as possible to reduce the exposure to adverse water temperatures in the river.
The "pulse flow" experiment has been conducted for the last four years; however, the effects of the experimental operation on the hatchery fish as we1 1 as natural ly produced fish are not yet .fully known. Questions remain on the effects of the pulse flows on the rearing, timing of emigration and survival of the natural fish. The pulse flow experiment was conducted because it would have a beneficial effect, with spring flows higher than in recent years, but substantially less than would have occurred under natural conditions (WQCP-USFWS-2, -3 and-5). Pulse flow experiments are being considered in the San Joaquin River system as well.
o Temperature Model
The USBR temperature model ( WQCP-USBR-127) may be helpf u 1 in evaluating the Sacramento River flows required to achieve various temperature a1 ternat ives at points in the Sacramento' River or Delta during different months. The report on the temperature model describes a monthly time-step reservoir and river model developed as a tool to try to evaluate the effects of CVP and SWP project operations on water temperatures as they affect Chinook salmon in the Sacramento River Basin. Because it is a monthly rather than a daily model, it provides only a qualitative comparison of various operating scenarios. Average monthly temperatures can mask short-term fluctuations in temperature that could be lethal to certain salmon id 1 if e stages. The model, however, given operational flexibility and sufficient water, indicates relative benefits of various options to the instream life stages of the salmonids. A review of the model should be made to help clarify further the factors influencing temperatures in the Delta.
Because the runs of Chinook salmon can be impacted by temperatures in the spring, early summer and fall, it will be imperative to evaluate the f lexi bi 1 i ty of the operat ions and achieve the coldest temperatures possible in the different water year types. The Five-Agency Salmon Management Group is evaluating the costs and benefits of decreasing water temperature and the use of other measures in the Delta to improve salmon smolt survival. A temperature model at present is not available but would be useful for the San Joaquin River.

o Regional Water Qual i ty Control Board Temperature Objectives
The temperature objective in the Centrai Val ley Regional Board's Basin Plan for the Sacramento River is as follows: "The temperature shall not be elevated.. .above 6 8 O F in the reach from Hamilton City to the I Street Bridge during periods when temperature increases wi 1 1 be detrimental to the fishery." This objective is based upon "controllable factors" discussed below. There is no temperature objective on the San Joaquin River system.
The fishery's temperature objective for the Delta specifies: "The natural receiving water temperature of intrastate waters shall not be altered unless it can be demonstrated to the satisfaction of the Regional Board that such alteration in temperature does not adversely affect beneficial uses. " (Water Qual ity Control Plan Report, Central Val ley Region 5, Vol. I, p.1-4-9)
o Thermal Plan
The State Water Resources Control Board adopted on May 18, 1972, A "Water Quality Control Plan for Control of Temperature in the Coastal and Interstate Waters and Enclosed bays and Estuaries in California, " referred to as the "Thermal Plan." The Plan specifies limiting conditions of temperature in wastewaters discharged into interstate and coastal waters, estuaries and enclosed bays. For example, elevated temperature waste discharges into interstate waters designated as "cold" waters are prohibited while this type of discharge into "warm" interstate waters cannot be more than 5°F warmer than the receiving water and shall not cause the temperature in the receiving 'water to rise more than 5'F. Existing thermal discharges into coastal waters, estuaries and enclosed bays must comply with limitations necessary to assure protection of the beneficial uses and, for coastal waters, areas of special biological significance. (Water Qual ity Control Plan Report, Central Val ley Region 5, Val. 11, p.11-9-14).
o Controllable Factors
Water temperature objectives in the Central Val ley Basin Plan apply to controllable water qual ity factors which are defined as: ". . .those actions, conditions, or circumstances resulting from human activities that may influence the qual ity of the waters of the State, that are subject to the authority of the State Board or the Regional Board, and that may be reasonably control led. " (Revised Region 5 Basin Plan for Basins 5 A , 58, and 5C as approved by the State Board on March 22, 1990; also please see Tables 1'-1 and 6-3, page 8 of 8).
In order to implement a water qual ity objective for temperature in the Delta, the Board will examine the controllable factors, and, where reasonable, require maintenance of the water temperatures such that they wi 1 1 not impact, and perhaps will improve, survival of anadromous salmonids.

5.5.3 Potential Objectives for Chinook Salmon
5.5.3.1 Temperature for Fa1 1-Run Salmon
The following objective will be considered for the protection of the fall- run Chinook salmon:
The daily average water temperature shall not be elevated by control lable factors above 68OF from the I Street Bridge to Freeport on the Sacramento River, and at Vernal is on the San Joaquin River between April 1 through June 30 and September 1 through November 30 in a1 1 water year types.
When other factors result in the degradation of water quality beyond the levels of 1 imits established as water qual ity objectives, then control lable factors shall not cause further degradation of water qual i ty.
5.5.3.2 Temperature for Winter-Run Salmon
The following objective will be considered for the protection of the adult and juvenile life stages of the endangered winter-run Chinook salmon:
The daily average water temperature shall not be elevated by controllable factors above 66OF from the I Street Bridge to Freeport on the Sacramento River between January 1 through March 31 in all water years.
5.5.3.3 Dissolved Oxygen
Factors that may contribute to the low levels of dissolved oxygen, in addition to low flows in the San Joaquin River during the fall months, include: 1) the recently deepened ship channel; 2) the enlarged turning basin at the Port of Stockton; 3) the Stockton Sewage Treatment Plant; 4) upstream BOD sources; and 5) commercial use of the dead-end portion of the ship channel.
The following objective is proposed for consideration for the protection of the Chinook salmon in the San Joaquin River:
Minimum dissolved oxygen levels shall not fall below 6 mgll from September 1 through November 30 in all water year types between Stockton and Turner Cut in the San Joaquin River.
Measures to implement this objective include the following: 1) regulation of the effluent from the Stockton Sewage Treatment Plant and other upstream discharges contributing to the BOD load; 2) installation of the temporary barrier or additional barriers as may be needed, 3) investigation of mechanical or chemical methods to oxygenate the water at critical points along the river channel, and 4) increase of flows in the San Joaquin River. A decision on the precise implementation measures wi 1 1 be made during the forthcoming proceedings.

5.6 Striped Bass
* Conclusions:
o Studies over many years indicate that there are numerous factors affecting stripea Bass abundance, including diversions from the Delta, reduced Delta outflow, flaw patterns in the interior Delta, fewer adults, toxic effects, changes in the food chain due to introduced species, recreational angler harvest, and i 1 legal poaching.
o Studiesshouldbecontinuedandadditionalwateroperationtestsshould be conducted to determine the effects on striped bass and the best means for their protection.
o In light of various impacts on the fishery, particularly of the exports pumps, it is necessary to examine existing points of water diversion. Within the Scoping Phase, the Board will consider the alternatives to the existing points of diversion.
Striped Bass - Spawning Habitat from Prisoners Point to Vernalis o Review of the evidence indicates that it may be desirable to expand
existing spawning habitat for striped bass in the Delta. However, the State Board concludes that the most significant factor in the decline of striped bass is entrainment1 due to pumping. The State Board will consider actions to be taken concerning entrainment losses during the Scoping and Water Right phases of the proceedings. Upon examination of the results of these actions, the State Board will consider the issue of expansion of spawning habitat.
@ Striped Bass - Spawning Habitat from Antioch to Prisoners Point o The major spawning areas for striped bass are the Sacramento River above
the Delta and the San Joaquin River area between Antioch and Prisoners Point.
o The Board finds benefits for the resource in maintaining spawning habitat in this reach by establishing boundary salinities at Antioch of 1.5 and at Prisoners Point of 0.44 mnhos/cm EC from Apri 1 15 through b y 31. The end date of May 31 may be shortened if data indicate that spawning has ceased.
o Deficiencies in firm supplies and the level of protection afforded by the striped bass spawning objective should be correlated.
o The Board needs better information than is currently available to consider the complete economic relationship between improvements in striped bass spawning habitat and water availability.
11 Entrainment means primarily the effects of project operations, such as operation of the Delta Cross Channel gates, export punping, and reverse and low r iver flows, plus local m p r o j e c t diversions.
5-27

5.6.1 Present Conditions
5.6.1.1 Background: D-1485 Objectives
Striped bass are specifically protected in D-1485 (Table II,38,39,40). These requirements evolved out of negotiations conducted among DFG, DWR, USFWS, and USBR prior to the 1978 hearing as part of a draft Four-A ency agreement; this agreement was never signed (DFG, 25,133). Sal ini ty 9 EC) objectives at Antioch and at Prisoners Point on the San Joaquin River establish a striped bass 'spawning area estimated to be about 17 miles in length from April 1 to May 5 in all water years. These objectives were first established (in an earlier form) by Water Right Decision 1379, adopted in July 1971. They were established after a review of an earlier State Board Resolution (68-17; Supplemental Water Qua1 i ty Control Pol icy) indicated that striped bass spawning was not being protected. The recommended protection measures were similar to those proposed by a Department of Interior task force on Delta sal inity objectives (Decision 1379, 32).
The objective at Antioch is 1.5 mmhos/cm EC (the first two weeks of protection are provided by a Delta Outflow Index requirement of 6,700 cfs rather than an EC objective to provide some ramping capability for the CVP and SWP water projects). This objective also includes a relaxation provision when the SWP or CVP declares deficiencies in delivery of firm project suppl ies. Upstream, the objectives provide for a maximum of 0.55 mmhos/cm EC at Prisoners Point; no relaxation provision is included.
In May, June and July, minimum Delta Outflow Index flows and limitations on export levels come into effect for protection of young bass. These requirements were designed to help move eggs and young into suitable nursery areas and to reduce entrainment into the SWP and CVP export systems. The Delta outflows were also expected to provide equivalent protection for later spawning in the San Joaquin River, at least in wet, above normal, and below normal water years; outflows during these periods were expected to be higher than the 6,700 cfs estimated to be required to maintain the 1.5 mmhos/cm EC at Antioch under steady-state conditions (1978 Delta Plan, VI-4). Provisions for periodic closure of the Delta Cross Channel gates (to reduce translocation of Sacramento River striped bass eggs and young into the central Delta) and recommendations (not mandatory requirements) for the operat ion of the projects ' fish recovery facilities are included in D-1485. Other than the Delta Cross Channel gate closure, there are no specific objectives for protection of spawning or young bass in the Sacramento River.
5.6.1.2 Current Status
The adult population of striped bass in the Estuary has declined in recent years to about one-third or one-fourth of the population levels seen in the 1960s. A variety of sampling programs are employed to monitor various components of the striped bass population (see Appendix 5.4.1). While the decline rates and patterns may vary somewhat, all programs measuring striped bass abundance show large decl ines (DFG,25,6,9). The primary means of evaluating the overall condition of striped bass between years has been the Striped Bass Index (SBI). The objectives in 0-1485 were designed to maintain the SBI at a long-term

average of 79 (the so-called "without project" conditions). This goal has not been achieved; in 1990, the actual SBI reached an all-time low of 4.3; 1988 was the second-lowest on record with 4.6, and in 1989 the SBI was 5.1. The average SBI for the period 1979-1990 is 19.1 (see Appendix 5.4.2).
In the late 1970s declining striped bass populations indicated that the requirements in D-1485 for protection of striped bass were not achieving their intended and expected results. In response, the State Board organized a Striped Bass Work Group composed of staff from several state and federal agencies and outside consultants to investigate the cause(s) of this decline and to make recommendations on actions to correct it. Subsequent discussion and data analysis have resulted in an expanded and refined list of possible causative factors. These are discussed in Appendix 5.4.3. The relationship of the export area striped bass fishery to the Estuary fishery is discussed in Appendix 5.4.4. In large part, while the reasons for the striped bass decline are known, the relative importance of each factor is not completely understood (WQCP-DFG-3).
5.6.2 State Board Considerations
General: Salinity Objectives
Sal ini ty objectives for striped bass apply to the spawning conditions and limitations for adult striped bass in the San Joaquin River. Striped bass in the Sacramento River spawn we1 1 above the influence of ocean- derived salinity, and, unlike the San Joaquin River, water quality and river flow are sufficient to prevent the formation of upstream salinity barriers to fish passage due to land-derived salts. No D-1485 objectives or advocated positions consider this area, and no alternatives are offered for consideration.
The D-1485 salinity objectives were expected to provide minimal, yet adequate, spawning habitat from approximately Ant ioch to Prisoners Point to sustain a healthy striped bass population. However, the continuing decl ine indicates that some new actions must be considered. Therefore, as one part of an overall program to increase protection for estuarine habitat, it is appropriate to consider modifying the three D-1485 San Joaqu in River spawning objectives.
This section considers temperature in addition to salinity objectives at Antioch and Prisoners Point:
5.6.2.1 Antioch: Period of Protection for Spawning 5.6.2.2 Antioch: Relaxation Provision 5.6.2.3 Prisoners Point: EC Modification 5.6.2.4 Prisoners Point: Relaxation Provision 5.6.2.5 Temperature Objectives

5.6.2.1 Antioch: Period of Protection for Spawning
The current D-1485 objectives provide for striped bass spawning protection in the lower San Joaquin River for a period of 35 days, from Apri 1 1 to May 5. Protection during the first two weeks of this period is permitted to be met by a Delta Outflow Index (DOI) value of 6,700 cfs, rather than the EC objective of 1.5 mmhos/cm, to provide some operational flexibility for the SWP and CVP without significantly degrading protection of spawning habitat. Since spawning activity is minimal in early April in most years, the small variations in salinity which may occur under this provision are not .significant.
After May 5, striped bass spawning habitat is not specifically protected, although spawning in the Delta continues through most of May and occasional ly even into June, depending upon water temperatures and perhaps other factors. Some collateral protection is provided by DO1 flows designated for protection of young bass. The flow requirements in wet, above normal, and below normal water years are generally sufficient to maintain the 1.5 mmhos/cm EC salinity in the vicinity of Antioch (the lower end of the spawning area) or even farther downstream. However, in subnormal snowmelt, dry and critical water years, DO1 requirements are reduced, resulting in loss of spawning habitat. DFG testified that the spawning habitat protection provided under present D-1485 objectives is minimal rather than optimal, and that striped bass would be put under additional stress if the relaxation provision were in effect (see below) (1978 Delta Plan testimony, May 30, 1978, 67:14-19). DFG also testified that the flow requirements (DOI) set for striped bass do not provide adequate protection during dry or critical water years, or those of subnormal snowmel t (TI LXVI I I, 76: 2-4). Therefore, several a1 ternat ive spawning habitat objectives which provide various levels of protection are considered . The current objectives provide protection through May 5. Table 5-2 shows the results of DFG egg sampling in the San Joaquin River. For each year, the date on which a specified percentage of total eggs collected is noted. For example, in 1985, 30 percent of the total number of eggs col lected by DFG that year were collected by May 1. These data are analogous to, and derived in part from, the cumulative total curves in Turner (1976). This table indicates that a May 5 cutoff date for protection of spawning means that only 30 to 40 ercent of the total spawning activity (as measured by eggs collected 7 in any given year has occurred by that date. The data in Table 5-2 indicate that extending the cutoff date to May 31 protects about 95 percent of the spawning activity in most years.
A1 ternative levels of protection may be summarized as fol lows:

TABLE 5-2
STRIPED BASS SPAWING PATTERNS, SAN JOAOUIN RIVER
PERCENT OF LIVE EGGS COLLECTED, BY OATE UATER YEAR I S 40/30/30
YEAR UATER PERCENT OF TOTAL EGGS COLLECTED YEAR >O 5 10 20 30 40 50 60 70 80 90 95 100
, - - - * - - - - - - . - - - - - - . - - - - - - - - - * . * - * - - - - - - - * - - - - - - - - - - - - - - - - - - - - - - - - - - - * - - * - - - - - - - - - - . - - - . - - - - - - . - - - - - . - - - . - - . - - - - . - . - - - - - -
4/26 5/01 5/05 5/14 5/15 5/16 5/16 5/17 5/19 5/21 5/23 5/27 6/13
4/15 4/15 4/27 5/06 5/15 5/16 5/16 5/17 5/18 5/19 5/23 5/25 6/05 Very fen eggs collected; sampling program missed most of spaming; eggs present through 6/19 6/19
4/14 4/15 6/16 4/20 4/25 4/27 5/01 5/02 5/05 5/07 5/08 5/14 6/18 5/03 5/04 5/04 5/06 5/09 5/17 5/18 5/19 5/20 5/23 6/13 6/18 6/22 4/03 4/12 4/26 5/02 5/08 5/08 5/08 5/08 5/10 5/10 5/17 5/24 6/14
4/08 4/11 4/15 4/21 5/02 5/08 5/14 5/17 5/20 5/24 5/27 6/01 6/12
4/21 5/02 5/04 5/05 5/14 5/14 5/15 5/15 5/17 5/18 5/19 5/21 6/30 Sampling begun i n la te May, eggs present from 5/23 t o 7/12; bulk of spaming probably saneuhat ear l ie r 7/12
4/29 5/07 5/08 5/10 5/10 5/10 5/11 5/12 5/13 5/19 5/23 5/31 7/06 Sampling begun i n la te May; eggs present from 5/29 t o 7/01); bulk of spawning probably somewhat ear l ie r 7/04
5/01 5/08 5/11 5/13 5/18 5/21 5/24 5/26 5/27 5/28 6/05 6/06 7/14 4/19 4/20 4/21 4/30 5/01 5/01 5/09 5/14 5/15 5/15 5/15 5/28 6/10
4/16 4/23 4/25 5/02 5/07 5/08 5/09 5/13 5/13 5/14 5/15 5/17 7/01 4/16 4/19 4/24 4/29 5/01 5/03 5/06 5/12 5/13 5/15 5/19 5/22 6/27 4/16 4/21 4/21 4/23 4/30 5/09 5/10 5/11 5/12 5/17 5/22 5/25 7/01
4/12 4/14 4/21 4/23 4/25 4/26 4/27 5/07 5/08 5/09 5/18 5/24 6/15 4/12 4/17 4/18 4/20 4/24 5/03 5/04 5/05 5/06 5/10 5/26 6/01 6/23
AVERAGE DATE - - 4/23 4\26 4/30 5/05 5/08 5/11 8/13 5/14 5/17 5/22 5/27 6/21 OF COLLECTION
FOR PERCENT INDICATED ...................................................
= Values derived f ran curves i n Figure 2 of Turner (1976);
remaining years from cunulative to ta ls of l i v e eggs fran OFG data (Lee Mi l le r )
+ = Eggs present on f i r s t day of sempling (date i n PO colum); some spawning probably occured p r io r t o date shown

A1 ternatives Approximate percent of spawning activity
protected
1. April 1 through Ma 5, with ramping* J 30-40% (present condition
2. April 15 through May 15, without ramping
3. April 1 through May 15, with ramping 60-70%
4. April 15 through May 31, without ramping
5. April 1 through May 31, with ramping 95%
6. Apri 1 1 through May 31, without ramping
* ramping = 6,700 cfs Delta Outflow Index value for period April 1 through April 14
The percent of spawning activity assumed protected under each a1 ternat ive in the table above is determined directly from Table 5-2. The range of percent spawning activity protected is simply the amount of spawning activity measured (i.e., percent of total eggs collected) by the end date of each alternative. There is assumed to be relatively little spawning which occurs before about April 15 each year, so the absence of ramping (i.e., a propriate salinity from April 1 rather than ramping flows to April 14 ! was assumed to add only about 5 percent additional spawning activity protection over that provided by ramping. The relative lack of data before April 15 makes this somewhat speculative, but in any case it is probably not significant.
The State Water Contractors proposed extending protection of spawning activity only to May 21 in dry and critical years (WQCP-SWC-627,3-4).
The present Antioch standard of 1.5 mmhoslcm EC was primarily designed, as is described in Section 5.6.1.1, to provide a suitable spawning habitat upstream of Antioch, not at the Antioch location itself. According to the recollect ion of Don Stevens of DFG (pers. comm. , 3/91), Antioch was chosen as a monitoring point because a salinity monitoring station was already established at the Antioch Water Works. The use of 1.5 mmhos/cm EC at Antioch for spawning protection appears not to be general ly appropriate, since DFG1 s own testimony indicates that striped bass prefer to spawn in freshwater, and that a spawning objective of 0.44 mmhos/cm EC represents the "best scientific evidence" of the water quality needed to restore spawnin in the historical spawning area of the San Joaquin River (DFG-NQCP-9,4) 7 see Section 5.6.2.3). However, the Antioch water qua1 ity objective may continue to serve the purpose of being an ultimate del imiter of spawning habitat; the Antioch objective can also be considered an "implementing measure" since maintaining that objective should produce less saline, and thus more suitable habitat, upstream of Antioch in the San Joaquin River. DFG has observed some spawning in the Antioch to Jersey Point reach, sometimes in ECs of 1.5 mmhos/cm or higher, in some very dry years (1972 and 1977). Laboratory

studies also indicate that egg survival is not affected adversely in water with ECs up to 1.5 mmhos/cm (DFG,P5,46). These conditions have typical ly produced some of the lowest abundance indices, however. We also agree that the striped bass spawning objectives, as proposed, do not in fact designate a spawning reach, but only a single location (Prisoners Point) where appropriate salinities for the majority of spawning, as determined by DFG, are required to be present.
5.6.2.2 Antioch: Relaxation Provision
Decision 1485 provides for a relaxation of the protection for striped bass spawning when the SWP or CVP impose deficiencies in their firm supplies. The EC objective is relaxed proportional to the amount of deficiency imposed. Under extreme conditions, when the projects impose deficiencies of 4.0 MAF or more, D-1485 in theory allows the EC at Antioch to degrade to 25.2 mmhos/cm, which would result in substantial reduction of spawning habitat to an estimated reach of about 9.5 miles or less (Delta Plan and D-1485 Final EIR,V-24 to V-26). However, it was be1 ieved that the Su isun Marsh protect ion objectives (critical years) or Delta agricultural objectives (dry years) would in fact control salinity in the lower San Joaquin River throughout the month of May. Therefore, the actual EC at Antioch, regardless of the size of the deficiency imposed, was not expected to exceed 3.7 mmhos/cm in critical years, and 1.8 mmhos/cm in dry years (letter from SWRCB to EPA Apri 1 3, 1979 -- informat ion based on DWR 1978 Hearing Ex. 78).
As several participants have pointed out, there is considerable confusion about the appropriateness of the proposed relaxat ion criteria, in terms of what salinity is appropriate at Antioch for various deficiency levels. As has been discussed, the 1978 Delta Plan and EIR based the relaxations on a salinitylflow relationship for the Sacramento River, which was assumed to be applicable to the San Joaquin River as well. In addition, the theoretical extent of sal ini ty degradation was supposedly 1 imited to a maximum of 3.7 mmhos/cm EC because of the Chipps Island Suisun Marsh standard. The entire process is built on a series of artificial relationships which are unrelated to the main issue at hand, which is the establishment and maintenance of suitable spawning habitat for striped bass in the San Joaquin River and the relaxation of that habitat requirement when water project firm del iveries are reduced.
The State Board continues to believe that, as stated in its conclusions on striped bass (Section 5.6), the '[dleficiencies in firm supplies and the level of protection afforded by the striped bass spawning objective should be correlated." The present deficiency schedule does not do that, since no specific relationship between extent of habitat and change in salinity intrusion has been made. The present relationship is based on a Sacramento River sal inity/f low relationship. Several participants have appropriately questioned the basis for this relationship.
In 1990, the projects declared a deficiency and invoked the relaxation provision. Despite compl iance with other D-1485 standards, the theoretical expected Antioch maximum EC of 3.7 mmhos/cm was exceeded. In addition, monitoring data from 1990 suggest that ECs greater than 0.44 mmhos/cm occurred throughout nearly all of the striped bass spawning area, not simply at the downstream end.

The State Board would like to relate deficiencies to spawning area in a direct, measurable way: by simply making increases in deficiencies directly related to the shortening of the length of river reach in which suitable spawning habitat will be required to be maintained. The Board be1 ieves this approach would have a' negl igible effect on water suppl ies during most years because 0-1485 provides some umbrel la spawning protection upstream of Antioch by means of the central and western Delta agricu 1 tural standards. These standards are presently under review, and the required water qual ity at some locations may be reduced (salinity increased). By establ ishing a separate spawning habitat objective, no re- evaluation of the effects of water qual ity degradation on striped bass habitat wi 1 1 be required. The present agricultural water qual ity objective includes a level of 0.45 mmhos/cm EC at Jersey Point from Apri 1 1 to August 15 (in all but critical years). This objective essentially duplicates the current EC and starting date requirements for striped bass spawning protection. In Section 7.5.2.4, Program of Implementation, the State Board outlines a proposal for evaluation of the concept of establishment of a specific spawning protection zone and a directly related relaxation provision.
5.6.2.3 Prisoners Point: EC Modification
The D-1485 objective for EC at Prisoners Point on Venice Island is 0.55 mmhos/cm for the period April 1 to May 5, in a1 1 water years, to delimit the upstream end of the San Joaquin River spawning area. No relaxation provision for deficiencies is included. Transfer of water across the Delta to the export pumps results in relatively low salinity in the Prisoners Point area of the San Joaquin River. Salinity in the San Joaqu in River increases upstream of Prisoners Point due to reduced freshwater inflow and saline agricultural return flows from the eastern and southern Delta and from the River above the Delta. Thus, the absence of sal ini ty objectives above Prisoners Point effectively establishes a barrier to adult migration and spawning farther upstream on the San Joaquin River.
Three issues are involved with this standard: period of protection, extension of spawning habitat farther upstream, and appropriate EC levels.
Period of Protect ion
As noted above, there is substantial spawning in the Delta throughout May. Flows through the Mokelumne River system, especially the movement of Sacramento River water through the Delta Cross Channel, most likely provide considerable protection of water quality in the area around Prisoners Point throughout much of the spring months.
For consistency with the objectives proposed for Antioch, the State Board will examine the effect of setting the same period of protection as at Antioch: April 1 to May 31 in all water years.

Extension of Available Spawning Habitat Upstream
The major issue involving the current striped bass spawning objectives is whether the spawning area should be expanded beyond its present size. The present objective results in substantial spawning in the channels which move water to the export pumps in the south Delta; for part of the spawning period (Apri 1), there are no restrictions on export rates. This undoubtedly results in substantial losses of eggs and young. In its comments on the proposed objectives in D-1485, DFG noted that the designated spawning area provided "minimal suitable conditions" (Testimony, 1978 Delta Plan, 4/27/77, XXII, 160:17-19).
In Phase I, DFG testified that striped bass used to spawn farther up the San Joaquin River than at present, but do not do so now because of increased sal ini ty (T ,XLI ,68: 3-20). Despite testimony to the contrary (see for example, U.S. Department of Interior comments, 4/23/90, p.6), numerous records from the early decades of this century indicate that striped bass regularly migrated up the San Joaquin River and its tributaries. As late as 1963, substantial spawning in the San Joaquin River occurred in the reach between Stockton and Mossdale (Farley, 1966). Spawning occurred above Vernal is in 1968, with many of the eggs appearing near Patterson, 104 miles above the mouth of the river (Turner, 1976). In wetter years large striped bass are sti 1 1 seen in the San Joaquin River tributaries (W. Loudermilk, DFG, pers. comm., 1988). It appears that the upper Delta and the tributary rivers may still support striped bass spawning when appropriate habitat conditions are provided.
On the other hand, several arguments have been offered to support retention of the present objective (limit spawning to west of Prisoners Point). These arguments are based primarily on two factors: (1) assumptions that eggs and young that were produced farther u stream would be carried to the export pumps and lost to the Delta; and (2 ! lack of a strong experimental ly-derived correlation between sal inity and spawning success. These arguments are discussed in Appendix 5.4.5.
Appropriate Electrical Conductivity Levels
The Phase I testimony and exhibits indicate that striped bass prefer to spawn in water with an EC of less than 0.3 mmhos/cm (TDS=170 mg/l) (DFG,25,46 and 47). Farley (1966) concluded that striped bass require a TDS of less than 250 mg/l (= 0.44 mmhos/cm EC). It is DFG1s belief that this represents the "best scientific evidence" to restore spawning in the historical spawning area of the San Joaqu in River (WQCP-DFG-4,9). Higher salinities may affect egg survival as well as spawning activity. Turner (1976) found that, in water of 600-800 mg/l TDS (= 1.03-1.36 mmhos/cm EC) on the San Joaquin River above the Delta in 1968, 94 percent of the eggs he collected were dead. However, it is not clear whether this high percent of dead eggs was caused by salinity or some other factor.
Establishing an objective of 0.55 mmhos/cm EC in the reach from Prisoners Point to Vernal is would not expand the spawning area since, based on prior testimony, that EC level would still act as a barrier to migration upstream of Prisoners Point. Likewise, establishing any objective at a single location well up in the Delta (such as at Vernalis) will not

assure that the intervening stretch of river will be of quality adequate for spawning. The appropriate objective must be applied at several points along the San Joaquin River to assure continuity.
5.6.2.4 Prisoners Point: Relaxation Provision
The 0-1485 objective for Prisoners Point did not include a relaxation provision. However, consideration of a relaxat ion provision is appropriate, should one of the alternatives which improve water qua1 ity above the present objective of 0.55 mmhoslcm EC be selected.
5.6.2.5 Temperature Objectives
Evidence presented in Phase I, and analysis of other data, indicate that high water temperatures may result in some possible losses of bass eggs and young. However, these losses are not considered significant . Temperature issues are discussed in Appendix 5.4.6. Based on the informat ion avai lable, no special measures are warranted at this time.
5.6.3 Potential Objectives
In view of the above considerations, the State Board has developed the following potential objectives at these-locations, in addition to the possible retention of the current objectives.
5.6.3.1 Antioch: Period of Protection for Spawning 5.6.3.2 Antioch: Relaxation Provision 5.6.3.3 Prisoners Point: EC Modification 5.6.3.4 Prisoners Point: Relaxation Provision , 5.6.3.5 Temperature Objectives
5.6.3.1 Antioch: Period of Protection for Spawning
Objective 1-A The 14-day running average of the mean daily EC at the Antioch Waterworks Intake on the San Joaquin River shall be not more than 1.5 mmhos/cm for the period April 1 to May 31, or until spawning has ended, in all water years.
Objective 1-B The 14-day running average of the mean daily EC at the Antioch Waterworks Intake on the San Joaquin River shall be not more than 1.5 mmhos/cm for the period April 1 to May 31, or until spawning has ended, in all water years, except that protection during the period April 1 to April 14 may be provided by maintenance of an average Delta Outflow Index for that period of not less than 6,700 cfs.
Objective 1-C The 14-day running average of the mean daily EC at the Antioch Waterworks Intake on the San Joaquin River shall be not more than 1.5 mmhos/cm for the period April 1 to May 31, or until spawning has ended, in wet, above normal, and below normal water years; or for the period April 1 to May 21, or until spawning has ended, in dry and critical water years; except that protect ion during the period April 1 to April 14 in all water years may be provided by maintenance of an average Delta Outflow Index for that peri.od of not less than 6,700 cf s.

5.6.3.2 Antioch: Relaxation Provision
Objective 2-A No relaxation provision.
Objective 2-B The 14-day running average of the mean daily EC at the Antioch Waterworks Intake on the San Joaquin River shall be not more than the values (shown in the table below) corresponding to the deficiencies in firm suppl ies declared by the SWP and CVP, in dry and critical water years, for the period Apri 1 1 to May 31, or until spawning has ended.
Total Annual Declared Deficiencies (MAF)
0.0 0.5 1 .o 1.5 2.0 or more
April 1 to May 31 EC in mmhos/cm
Dry Critical
Linear interpolation is to be used to determine values between those shown .
Objective 2-C Same as 2-8, except that deficiencies are defined as deficiencies in firm supplies declared by a set of water projects representative of the Sacramento River and San Joaquin River watersheds. The specific representative projects and amounts of deficiencies would be defined in subsequent phases of the proceedings under this alternative.
Objective 2-D Same as Objective 2-B or 2-C except the period of protection is April 1 to May 21.
Objective 2-E The 14-day running average of the mean daily EC at the Antioch Waterworks Intake on the San Joaquin River shall be not more than 3.7 mmhos/cm for the period Apri 1 1 to May 31, or unt i 1 spawning has ended, when the Apri 1 1, 40- 30-30 Sacramento Basin Index is equal to or less than 4.8 MAF .
5.6.3.3 Prisoners Point: EC Modification
Objective 3-A The 14-day running average of the mean daily EC shall be not more than 0.30 mmhos/cm (TDS=170 mgll) for the period Apri 1 1 to May 31, or unti 1 spawning has ended, in a1 1 water years, at the following stations: Prisoners Point, Buckley Cove, Rough and Ready Island, Brandt Bridge (site), Mossdale Bridge, and Vernal is.

Objective 3-8 The 14-day running average of the mean daily EC shall be not more than 0.44 mmhoslcm (TDS=250 mgll) for the period April 1 to May 31, or until spawning has ended, in a1 1 water years, at the following stations: Prisoners Point, Buckley Cove, Rough and Ready Island, Brandt Bridge (site), Mossdale Bridge, and Vernalis.
Objective 3-C The 14-day running average of the mean daily EC shall be not more than 0.44 mmhoslcm (TDS=250 mg/l) for the period April 1 to May 31, or until spawning has ended, in wet, above normal, and below normal water years; or for the period April 1 to May 21, or until spawning has ended, in dry and critical water years, at the following stations: Prisoners Point, Buckley Cove, Rough and Ready Island, Brandt Bridge (site), Mossdale Bridge, and Vernal is.
Objective 3-D The 14-day running average of the mean daily EC shall be not more than 0.44 mmhoslcm (TDS=250 mgll) for the period April 1 to May 31, or until spawning has ended, in wet, above normal, and below normal water years, at the following stations: Prisoners Point, Buckley Cove, Rough and Ready Is land, Brandt Bridge (site) , Mossdale Bridge, and Vernal is. In dry and critical water years, the EC objective would be met only at Prisoners Point.
Objective 3-E The 14-day running average of the mean daily EC shall be not more than 0.44 mmhos/cm (TDS=250 mg/l) for the period Apri 1 1 to May 31, or until spawning has ended, at the following river reaches in the respective water years:
Wet Prisoners Point to Vernalis Above Normal Prisoners Point to Mossdale Bridge Be low Norma 1 Prisoners Point to Rough and Ready
Island Dry Prisoners Point to Buckley Cove Critical Prisoners Point only
Objective 3-F The 14-day running average of the mean daily EC at Prisoners Point shall be not more than 0.44 mmhos/cm (TDS=250 mgll) for the period Apri 1 1 to May 31, or unti 1 spawning has ended, in a1 1 water years.
5.6.3.4 Prisoners Point: Relaxation Provision
Objective 4-A No relaxat ion provision.
Objective 4-B The 14-day running averagg of the mean daily EC shall be not more than 0.55 mmhoslcm for the period April 1 to May 31, or until spawning has ended, at Prisoners Point only, when the Antioch relaxation provision for spawning protection is in effect.

(It can be argued that the use of the Sacramento Basin 40- 30-30 Water Year Index, or SWP and CVP deficiency declaration, to trigger a relaxation on an upper San Joaqu i n River objective is inappropriate. However, since consensus has not yet been reached on an appropriate San Joaquin Basin Index, it cannot be applied here. On the other hand, the hydrologic record shows that a critical year in the Sacramento Basin is almost always accompanied by similar conditions in the San Joaquin Basin. The State Board urges participants to complete development of a San Joaquin Basin Index for application to upper San Joaquin River objectives as soon as possible. )
5.6.3.5 Temperature Objectives
No temperature objectives are proposed at the present time for protection of adult striped bass migration and spawning, or for survival of young striped bass.
5.7 ~merican Shad
5.7.1 Present Conditions
There are no D-1485 objectives specifically for the protection of American shad, although the striped bass standards were expected to provide col lateral protection for American shad as we1 1. DFG estimates of population size based on sampling in the mid-1970s suggest that the population is one-third to two-thirds as large as it was in the early decades of this century (DFG,23). About this same time, DFG lowered the dail catch limit from 50 to 25 fish (Michael Meinz, SWRCB, pers. corn., 6/90:, Abundance of adult shad has been relatively stable over the past two decades. However, abundance of juvenile shad may vary by more than an order of magnitude between years, with the strongest year classes occurrin with the highest river flows during the spawning and nursery periods 7 DFG ,23). 5.7.2 State Board Considerations
The decline of American shad in the Estuary from levels found early in the century appears to para1 lel , a1 though perhaps not so severely, the great decl ine seen in East Coast shad populations (USFWS & NMFS, 1977, viii). Declines in East Coast stocks have been attributed to a variety of causes, including pollution, lack of floodplain management, construction of barrier dams without fish passage facilities, and expanded and indiscriminate inshore and off shore fishing , (USFWS & NMFS, 1977, vii-viii). Most of these elements may also be playing a part in the decline in Estuary stocks (DFG,23,23), although DFG cites flows and diversions as the primary areas of concern (T,XXXIX, 16:4-18: 18;47:7-16). DFG also testified that temperature and salinity, as well as flow, were important to production of American shad (T,XXXIX,24:22-25: I), but did not specify what temperature and salinity requirements were critical to shad product ion.

Because no information on salinity requirements for shad was presented or obtained from other sources, no salinity objective is offered. However, shad feed on Neomysis and other zooplankton during their spawning migration through the Delta (see Table A4-8), which suggests that the entrapment zone may serve an important function for adults as well as young of the year of this species. The nature of this function warrants study.
The Delta and its tributary streams, especially in the Sacramento Valley, are major spawning and nursery areas for American shad. If young shad react to high temperatures as many other fish species do, they are most sensitive during their first few days to weeks of growth. Young are found in the Delta and at the SWP facilities in midsummer, indicating substantial summer spawning activity within or near to the Delta (DFG,23,8-10). DFG observations indicate that these eggs and young are susceptible to considerable risk from elevated water temperatures: eggs appeared deformed and fa i 1 ed to develop norma 1 ly when water temperatures were 70°F and above (Michael Meinz, SWRCB, pers. corn., October 1989). As indicated in Table A4-8, the optimum spawning temperature for American shad is between 60" and 70°F. The temperature objective for salmon may serve to protect American shad to some degree. The actual status and population trend of American shad remains unclear. Substantial additional work is recommended in the areas of population, reproduction and ecological requirements for this species, to provide a firm basis for possible future actions.
5.7.3 Potential Objectives
On the basis of the foregoing discussion, no objectives for protection of American shad are proposed at this time.
5.8 Delta Smelt
5.8.1 Present Conditions
Currently there is no 0-1485 objective specifically for the protection of the Delta smelt, Hypomesus transpacificus, in the Delta. The Delta smelt is endemic to the Sacramento-San Joaqwin Delta-Estuary (Moyle, 1989) and, at present, is not known to exist anywhere else in the world (Federal Register, Volume 154, No. 4). Their range extends from below Mossdale on the San Joaquin River and Isleton on the Sacramento River to Suisun Bay, Carquinez Strait and San Pablo Bay during portions of the year (Moyle, 1976).
The population of Delta smelt, once very common in the upper Estuary, has been declining over time and appears to be critically low. Several sources of informat ion regarding long-term trends in Delta smelt numbers are available, the primary ones being: (1) DFG, mid-water trawl surveys (Stevens et al., 1990); (2) research and monitoring data from the University of California at Davis (UC Davis) (Moyle and Herbold, 1989; Moyle and Herbold, 1990); and (3) and screen salvage data from the Byron and Tracy Pumping Plants (SWC, 1990;DFG, 17,l-20). The data from the

pumping plants are not very reliable due to the lack of an effective qua1 ity control program which may have resulted in misidentification (e.g., other species of smelt or other fish altogether) and other recording errors (SWC, 1990). Each data set however indicates a decline in the numbers of Delta smelt.
DFG (Stevens et al., 1990) stated that like the summer townet survey, the fall midwater trawl survey indicates that abundance of Delta smelt has been highly variable and has suffered a major decline. Bay survey catches show a striking decline in Delta smelt abundance after 1981, and since 1981 there has been an irregular but persistent decline. Part of this is due to the fact that the four of the .last five years were low flow years and the population has been concentrated in the Delta. In the seine survey, the lowest average catches of adult Delta smelt occurred in 1980 and 1984-1989. The persistent low catches from 1984-1989 are consistent with the population decline exhibited by the midwater trawl and summer townet surveys. The DFG concluded that 'the relatively stable, albeit low, population is not in imminent danger of extinction," however the Delta smelt may we1 1 "become an endangered species in the foreseeable future."
The Delta Smelt Index (Stevens and Miller, 1983) has been calculated annually from 1967-1990, except for 1974 and 1979 when no surveys were conducted; it shows an overall decrease in population size, especial ly from 1980-1988 (see Table 5-3; Figure 5-4). The population has fluctuated a great deal over the years; however, since 1983, the population has been consistently low. The UC Davis data show a similar trend. Several factors have possibly contributed to the decl ine, including invasions of exotic phytoplankton and invertebrates, entrainment into diversions and modification of the Delta smelt habitat.
5.8.2 State Board Considerations
Delta smelt are affected by the location of the entrapment zone, which appears to be important to their survival. When the entrapment zone is located in the deep, narrow channels of the Delta and Sacramento River, or in Carquinez Strait and the deeper parts of San Pablo Bay, primary productivity is lower (Moyle and Herbold, 1989). When the entrapment zone is located in Suisun Bay, the nutrients and algae can circulate in sunlit water, allowing algae to grow and reproduce rapidly, in turn, providing an abundance of food for plankton-feeding fish, such as the Delta smelt (Moyle, 1989). Years of major decline in the Delta Smelt Index occurred not only in dry years (1987,1988) but also wet years (1982,1986); in both cases, the entrapment zone moved out of Suisun Bay. Thus, Stevens and Mi 1 ler (1983) did not develop a regression model for Delta smelt because a1 1 of the correlations between their abundance and flow measurements were not statistically significant. One of the strongest determinants of Delta smelt abundance is hi h primary productivity (as reflected by phytoplankton abundance in late spring, Apri 1 to June (Moyle and Herbold, 1989).
B

Table 5-3
DELTA SMELT ABUNDANCE INDEX MIDWATER TRAWL SURVEY
1967-1990
........................... YEAR INDEX ........................... 1967 415 1968 697 1969 371 1970 1678 1971 1305 1972 1267 1973 1146 1974 1975 698 1976 497 1977 483 1978 570 1979 1980 1651 1981 375 1982 346 1983 132 1984 181 1985 109 1986 2 12 1987 280 1988 12 6 1989 364 1990 427
Note: Trawl surveys were not conducted in 1974 & 1979.
From Stevens, D.E., L.W. Miller and B.C. Bolster. 1990. Report to the Fish and Game Commission: A status review of the Delta smelt CHypornesus trans~acificus) in California.

Figure 5 4 Delta Smelt Index Values
1 966 1 970 1974 1 978 1 982 1 986 1990
YEAR
Stevens, D.E., LW. Miller and B.C. Bolster. 1990. Report to the F=h and Game Commission: A status review of the Delta smelt (H- trans~acificus) in
California. Department of Fish and Game.

Further study will be required to define more specifically the habitat requirements of the Delta smelt and identify the variables contributing to their decline. The Fish and Game Commission has made a decision not to place the Delta smelt on the endangered species 1 ist; however, further .analyses are being conducted in part for the requirements of the state and federal Endangered Species Acts.
Delta smelt habitat indicates a salinity preference of less than 2 ppt and seldom reater than 10 ppt (Ganssle, 1966 in SWC 1990) (less than 15 mmhos/cm EcQ. Another critical 1 ife history characteristic is that they spawn in sloughs and channels in the upper Delta, although spawning has also been recorded in Montezuma Slough in Suisun Bay (Moyle, 1989; SWC, 1990). They spawn from January through May and where they spawn may be influenced by the location of the fresh-saltwater interface during this time period (Moyle and Herbold, 1990). Peak numbers of smelt are salvaged at the SWP and CVP pumping plants each year during April and May (SWC, 1990, Figure 7). These smelt are either the spawning adults or the larval smelt (the information presented does not indicate which stage of development). One effective means of reducing impacts to the Delta smelt would be to reduce entrainment into the SWP and CVP pumping plants.
The location of the entrapment zone appears to be important to the survival of the Delta smelt. Although the precise level of salinity that separates acceptable and unacceptable spawning conditions is not known, existing knowledge suggests that salinities of 2 ppt or less are desired in Suisun Bay from March through June. The same needs exist for protection of the Delta smelt nursery area in Montezuma Slough (WQCP- USFWS-5). As the entrapment zone is a flow issue, this will be discussed in the Scoping and Water Right Phases of the proceedings.
There is insufjicient information to set an EC or salinity objective for spawning for Delta smelt at present. Further study may provide an objective to help reverse their decl ine. Further studies are proposed for determining, with greater accuracy, the abundance and the factors affecting Delta smelt abundance in the Delta. The details of these studies will be discussed in the Program of Implementation, Chapter 7. Subsequent review of data may lead to appropriate water quality objectives.
5.8.3 Potential Objectives
No potential salinity or temperature objectives can be specified at this time . 5.9 Other Resident Fish in the Bay-Delta Estuary
5.9.1 Present Conditions
The Department of Fish and Game presented information on several species of resident fish found in the Bay-Delta Estuary (Appendix 4). The information on water qua1 ity habitat criteria was of a very general nature. Some species, for example, were said to have a relatively greater preference, or tolerance, for higher levels of dissolved sol ids or turbidity than other species. DFG recently submitted a report on white sturgeon that states the fish move up or downstream in response to salinity changes and that management of the volume of freshwater flow may be important in maintaining the sturgeon population (WQCP-DFG-1) .

5.9.2 State Board Considerations
For the majority of the resident fish of the Estuary, the material presented ,is insufficient to be used to develop water qual ity objectives.
5.9.3 Potential Objectives -- None 5.10 Suisun Marsh
Conclusions:
o The Board believes that the managed portions of Suisun Marsh are currently being protected by D-1485 as amended in 1985. The protections, including the operation of the Suisun Marsh Salinity Control Gate, are being used and evaluated.
o A biological assessment is needed to assess the water quality requirements of the rare, threatened and endangered plants and animals (and their habitats) in the wetlands surrounding Suisun Bay to determine reasonably necessary amendments and addit ions to the Suisun Harsh objectives. The results will likely not be available in time for inclusion in the final Bay-Delta Environmental Impact Report or water right decision in 1992. Shortly thereafter, the objectives will be evaluated and incorporated as warranted.
5.10.1 Present Conditions
Since adoption of the Delta Plan and D-1485 in 1978, the SWP and CVP have been operated to meet the "interim standards." The water quality has thus been equal to or better than the interim standards.
Since the adoption of the 1978 Delta Plan and D-1485, the Four Parties have worked to implement the Plan of Protection (see Appendix 5.6). The interim Suisun Marsh standards in the 1978 Delta Plan, as implemented by D-1485, were met consistently by the DWR and the USBR. The internal marsh control stations on Montezuma Slough at National Steel and near Beldonls Landing became effective on October 1, 1988, in accordance with the amended schedule of compliance approved by the State Board on December 5, 1985 ("amended D-1485").
The improved duck club management schemes discussed in the Plan of Protection have been, for the most part, implemented. Some other intake or drainage improvements may still be needed. Construction of the Suisun Marsh Salinity Control Gate (referred to in the 1978 Delta Plan and described in more detail in the Plan of Protection) was completed in 1988; testing was begun in the winter of 1988-89 and continued through 1990. Full operation of the control gates causes a fairly rapid drop in salinity at Beldonls Landing, with a slower and more limited change in sal ini ty in the western Marsh (farther downstream). Further testing to refine the optimal scheme for operation of the structure was done during the winter of 1990-91. The extent of the control gate's effects on western Suisun Marsh water qual ity will help determine whether or not additional structures mentioned in the Plan of Protection are needed, and, if any are needed, which one(s) would be best.

5.10.2 State Board Considerations
A technical analysis of the water qual ity standards in the SMPA is found in Appendix 5.6, Technical Analysis of the SMPA.
The 1978 Delta Plan listed eight salinity control stations for the original Suisun Marsh objectives. Seven of these stations were interior marsh stations; the eighth was on the Sacramento River at Collinsville Road, upstream of Montezuma Slough. In 1985 the State Board amended D- 1485 to change both some control station locations and the compliance schedule.
The control stations on the Sacramento River at Collinsville (C-2) and Suisun Slough near Volanti Slough (S-42) were not changed. The station on Cordelia Slough above S.P.R.R. (mis-labeled S-32 in the Delta Plan) is actually the same as the station on Cordelia Slough, 500 feet west of the Southern Pacific crossing at Cygnus (S-33).
The station at Miens Landing on Montezuma Slough (S-64) was replaced with National Steel on Montezuma Slough (also S-64), three miles to the south (upstream) of Miens Landing. The station on Montezuma Slough at Cutoff Slough (S-48) was replaced with Montezuma Slough near Beldon 's Landing (S-49), 0.35 miles east of Grizzly Island Bridge, approximately one-half mile upstream from the old station. The station on Goodyear Slough south of Pierce Harbor (S-35) was moved about one-half mile upstream to the Morrow Island Clubhouse, but is still designated S-35. These changes would not seem to change the level of protection afforded by the original Delta Plan stations.
The major change that the amended .D-1485 made in the sal ini ty control stations was the elimination of the two westernmost stations in Suisun Slough near its mouth (mis-labeled S-31 in the Delta Plan, actually designated S-36) and Montezuma Slough near its mouth (no exact designation in the Delta Plan, but often called D-7 in other documents). No substitutes for S-36 and D-7 are proposed. The managed marshes in this area now receive water from inland sources rather than Grizzly or Suisun bays.
Based upon the work done to date, the "Normal Standards" (see Figure 5-5) in the SMPA may adequately protect the managed wetland habitat of the Suisun Marsh. However, the SMPA also contains relaxations of these conditions during dry periods. The State Board needs additional information on the water qual i ty requirements of the rare, threatened, and endangered species identified since DWR prepared the 1984 Plan of Protection before it can consider modifying the current water qual ity objectives.
A biological assessment under CESA and ESA is needed to determine the water qual ity requirements of the rare, threatened, and endangered plants and animals (and their habitats) in the wetlands surrounding Suisun Bay (see Chapter 7 for a description of the information needed). Based upon the results of the biological assessment, the State Board will review the proposed water quality objectives and determine if any changes are needed. The State Board will then, in a later action, assign respons i bi 1 it ies for meeting any changed objectives.

Figure 5-5
SMPA Water Qua l i ty Standards
20.0 19.0 18.0 17.0
16 0 15.0 14.0
g 73.0 12.0 a q1.0
40.0 5 9.0
u 0 0 ru 7 . 0
6 0
5 0 4.0 3.0 2.0 1 .o 0.0
O c t Ebv Dec. .tan. Feb . mr. rP .
Normal Standards [24 Deflclency Stcis.
SMPA-Normal SMPA-~ef iciencyl M o n t h Standards Standards
(Mean Monthly H igh (Mean Monthly High Tide, E.C. i n Tide, E.C. i n
mmhos/cm) . mmhos/cm)
O c t . Nov . Dec. Jan. Feb. Mar . A p r . May
- SMPA A r t i c l e l(f): "Deficiency Periodw sha l l mean (1) a C r i t i c a l Year fol lowing a Dry o r C r i t i c a l Year; o r (2) a Dry Year following a year i n uhich the Four Basin Index was less than 11.35; or (3) the second consecutive Dry Year fol lowing a C r i t i c a l Year.
SMPA A r t i c l e l(r): @Wet Yearo1, UAbove Normal Yearn, UBelou Norm1 Yearn end USubnormel Snomelt Yearn are as defined i n Footnote 2 of Table I 1 o f D-1485 as sdopted by the SMCB i n August 1978. 'Cr i t ica l Yearn and "Dry Year1' are also as defined i n Footnote 2 o f Table I 1 of 0-1485 except that runoff f o r the remainder o f the water year shal l be assumed t o be equal t o the lower value of the 80 percent probabi 1 i t y range, as shorn in the most recent issue of Bul le t i n 120, Water Conditions i n Californiall.

5.10.3 Potential Objectives
In order to allow sufficient time for the biological assessment to be completed, the State Board wi 1 1 continue implementation of the interim standards for Suisun Marsh as identified in the 1978 Delta Plan. An implementation plan is proposed, with the first stage based on D-1485 as amended in 1985. A discussion of this implementation plan is found in Chapter 7 (see also Table 1-2).
5.11 Wildlife Habitat in .Other Tidal Marshes
o Water qual ity objectives for San Pablo Bay exist in the Statewide Water Qua1 ity Plan for Enclosed Bays and Estuaries of California and i n the Water Quality Control Plan for Region 2.
5.11.1 Present Conditions
The tidal marshes outside the legally-defined Suisun Marsh include the southern shore of Suisun Bay (essentially from Pi ttsburg to Martinez) as well as the marshes around San Pablo Bay, Central Bay, and South Bay.
The current objectives provide protect ion for the managed marshes within the legal ly-def ined Suisun Marsh. No water qual ity objectives were set specifically for tidal marshes either inside or outside the legally- defined Su i sun Marsh.
5.11.2 State Board Considerations
The marshes of Central San Francisco Bay and South Bay support mostly pickleweed or cordgrass. DFG testified that they have concluded that these salt marshes would not be adversely affected by changes in the salinity regime in the northernmost portion of the Bay-Delta area (T,XXIX,146:22-147:2). The State Board concurs with the conclusions of DFG and therefore does not plan to set water quality objectives specifically for the protection of the Central and South Bay salt marshes.
San Pablo Bay is a transition zone between the saline waters of Central Bay and the brackish to fresh waters of Suisun Bay (T,XXIX,147:3-6). DFG testified that reductions in Delta outflow could result in a vegetative shift from cattails and tules to more salt-tolerant plant species such as cordgrass and pick leweed (T ,XXIX, 186: 18-25; DFG, 7,ll-12). Such a vegetative shift would be detrimental to some.wildlife species and beneficial to others (T,XXIX,187:1-8,223:15-224:7; DFG,7,11-13). DFG considers some impacts on rare plants to be possible.
There is no evidence that might allow the Board to set water quality objectives at this time specifically for the protection of the San Pablo Bay marshes.

The south shore of Suisun Bay is outside the legally-def ined Suisun Marsh. Many of the plants and animals found in the unmanaged wetlands of the Suisun Marsh are also found in the tidal marshes of the south shore (also called the Contra Costa County shoreline). The federal and state- 1 i sted threatened, endangered, and candidate species found within the legal ly-def ined Suisun Marsh may also be found in the south shore marshes. In addition, the federal and state- 1 isted endangered Cal ifornia least tern (Sterna anti1 larum browni) has two nesting colonies on the south shore (USFWS,20).tional information regarding listed species is found in Appendix 4.6.2 and Appendix 5.5.
In addition to the possible direct effects on the habitat (for animals) or on the survival (for plants, especially) of the listed species, changes in the salinity regime could indirectly affect a species by effects on its prey base. The most sensitive species in this regard is the endangered California least tern. The least terns require a nearby suppl of small fish in shallow water areas (DFG, At the Crossroads 1980, p.101 T . USFWS testified that changes in water quality standards that could result in changes in the location of the entrapment zone could significantly affect the prey base for the tern (T,XXX,6:1-6).
Staff compared the water quality objectives proposed by BCDC for protect ion of the unmanaged tidal marshes outside of the legal ly-def ined Suisun Marsh (BCDC,5,T4) and those for Suisun Marsh in the 1978 Delta Plan (SWRCB11978,Table VI-1,p.VI-33). The BCDC proposal is based on historical records for the period 1950 to 1977 when brackish tidal marshes persisted in the area (BCDC, 5,31-32). Direct comparison of the two sets of values is difficult since BCDC presented only the high-high tide salinities (mean tide salinities adjusted to high tide salinities [BCDC,5,31]) while the 1978 Delta Plan used the daily mean of both high tide salinities.
It is not possible to determine at this time whether or not the stations proposed by BCDC would provide better locations than the 1978 Delta Plan stations at Chipps Isl'and and in Grizzly Bay at which protective levels for south shore tidal marshes can be accurately measured.
5.11.3 Potential Objectives
As stated in Section 5.10.2 a new biological assessment will be prepared. Based on the results of the biological assessment, the State Board will decide if additional objectives should be adopted.
5.12 Benthos
5.12.1 Present Conditions
Densities of benthic organisms are highly variable in the Estuary. A t any location their survival, growth and reproduction can be affected by factors such as predation, disease, parasites, currents which carry them away, sa 1 in i ty re ime, and broodstock population size (DFG, 60,57).
h 9 Density es imates as high as 910 to 1153 grams of biomass per square met r (g/m ) are reported in South Bay channels, and as low as 4 to 17 5 g/m in the channels of San Pablo Bay. Suisun Bay has benthic
11 Abundance or dens f t y o f benthic organlsm measured by biomass per square meter.

invertebrate biomass ranging from 25 to 34 glm2 in channel substrates and from 6 to 30 glm2 in shoal areas (CCCWAIEDF ,lO,T2) . The number of organisms varies much more than the biomass, with a few large animals sometimes equal 1 ing the biomass of many smaller ones. At the Carquinez Strait, thi biomass was made up of about 160,000 and 40,000 organisms/m~ in June and October of 1976; 25.0 0 organisms/m2 in 8 March of 1977; and less than 1,000 organisms/m in October 1977 and in 1978 (Markmann, 1986, F8-F11) . Numbers of organisms per square meter at all stations were ow in 1978; numbers appeared to recover to about 40,000 organismslm~ in the western Delta (Station D4) in 1979 and 1981 , although Carquinez Strait stations were no longer sampled (Markmann ,1986, F8-F11). The brief peak in organism numbers in 1976 and 1977 during a major drought was due in part to an invasion of Suisun Bay by the filter-feeding clam, M a arenaria, which replaced the usual deposi t-f eeding fauna (CCCWA f E D F ~
Only 1 imited evidence on the uses of benthic organisms was presented by participants in Phase I. Sport shellfishing is one use of benthic organisms, but their acceptabi 1 ity may be 1 imited by pollutants (TI LIV, 56: 10-58:4). Both CBE and CCCWAIEDF noted that benthic organisms, especially shellfish, were food for several species of fish in the Estuary, including striped bass, starry flounder, sturgeon, Engl ish sole and staghorn sculpin (T,LIV,59: 14-16;192:5-8).
5.12.2 State Board Considerat ions
Understanding of the benthos and its relationship to the overall .
estuarine ecosystem is still limited, and the introduction and rapid pro1 iferation of Potamocorbula amurensis have further compl icated benthic data analysis. Substantial additional information is required to provide a basis for possible future actions.
5.12.3 Potential Objectives
No objectives are proposed for the protection of benthic organisms at this time.
5.13 Marine Habitat
5.13.1 Present Conditions
The marine habitat outside the Golden Gate is not formally included in the definition of the San Francisco Bay-Delta Estuary (Workplan). However, the nearshore ocean habitat in the Gulf of the Faral lones is closely interrelated with the Estuary by means of freshwater outflow, gravitational circulation, and tidal exchange.
Testimony presented in Phase I concerning outflows from San Francisco Bay described two main effects on marine habitat. The first is that the plume of freshwater in the Gulf of the Faral lones provides for an abundant amount of marine life and thus serves as a concentrated feeding habitat for fish, marine mammals and birds (T,LIV,142:13-153:3). Two bird species which particularly use this plume area are the Brandt's cormorant and the common murre (T,LIV, 154:3-13). The second effect of

San Francisco Bay outflow is related to the movement of organisms, especially the larvae and juveniles of finfish and shellfish, into the Bay (T,LI,267:23-268:4). In certain cases, such as for bay shrimp, movement of larvae out of the Bay into the Gulf of the Faral lones and their return later in the year is facilitated by higher Bay outflows (T,LI,272:6-19). In some circumstances, pulse flows, and their timing, were shown to be important in the determination of abundance of larvae (T,LI,289:5-25). The larvae or adults of English sole, Dungeness crab, Pacific herring and northern anchovy are transported back into the Bay on the bottom current inflows (T,LI,292:15-25).
5.13.2 State Board Considerations
A1 1 evidence presented relates to flow rather than salinity factors. The relationship between outflow and effect on beneficial uses has not been quantified. Therefore, protection for mar'ine habitat will be considered if further information becomes available.
5.13.3 Potential Objectives -- None 5.14 Navigation
5.14.1 Present Conditions
At present, U.S. Army Corps of Engineers (COE) criteria provide primary protection for the navigation beneficial use .in the Estuary and its tributaries. For example, the CVP is required to maintain a flow of 5,000 cfs at Wilkins Slough, just below the Tisdale .Wier on the Sacramento River, for protect ion of shal low water commercial navigation (T,I,43:15-21). In critical years the flow required is 4,000 cfs (Mike Jackson, USBR, pers. comrn., 10/17/89). Likewise, the SWP and CVP export pumps currently operate to COE criteria: maximum flow rates for Clifton Court Forebay are stipulated for various times of the year to maintain minimum depths in South Delta channels (DWR,708,10). There are no .Delta Plan objectives in effect specifically for the protection of this beneficial use.
5.14.2 State Board Considerations
The issues. of water qua1 ity objectives for navigation are concentrated in a few specific areas: present effects of navigation channels and dredging, effects of planned projects to enhance navigation, and consideration of the effects of other projects on the navigation benef icigl use. The present COE requirements are not directly related to sal inity or temperature objectives for protection of the navigation beneficial use.
Navigation in the Estuary is enhanced by a network of deepwater channels to the major ports, including Sacramento and Stockton. These channels .have two major effects. The deeper channels a1 low increased salt water intrusion into the Estuary (T,LVI,176:9-178:8;DWR,709,1-2). The proposed deepening of the Sacramento River Deep Water Ship Channel from its current 30-foot depth to 35 feet (COE, pers. comm., 10189) could result in additional salt water penetration into the Delta in the future.

This increased salinity may have impacts on other beneficial uses such as recreational boating , which could see greater maintenance costs from hull foul ing, c,orrosion of propel lors and structures, and related problems (T,LV,158:1-7). Increased salinity intrusion could increase the amount of carriage water required to maintain Estuary salinity objectives, and may have impacts on other beneficial uses, such as recreation and sport fishing.
The second effect of the .deepwater channels is the impact of dredging and dredge spoi 1s disposal on water qual ity (see, for example, T,XLVII I, 71:20- 102:9). In 1985, nearly 8.6 million cubic yards of material were dredged in the Estuary, at a cost of more than $17 mi 1 1 ion (NOAA, 1986,97). Current and proposed actions, such as the disposal of dredge spoils from Oak land Harbor on Delta island levees, have water qual ity imp1 ications, but these are primarily related to pollutants and turbidity. The water quality impacts of dredging are discussed in the Pollutant Policy Document . Other proposed projects, such as North Delta and South Delta facilities, could affect the navigation beneficial use, but the effects would primarily be the disruption or blockage of navigation channels. Effects of new projects on the navigation beneficial use will be considered when these projects are formal ly proposed.
5.14.3 Potential Objectives
At present there is no information which indicates that salinity or temperature objectives are needed to protect the navigation beneficial use.
5.15 Estuary Recreation Beneficial Use
5.15.1 Present Conditions
There are no Delta Plan objectives for the protection of the estuary recreation beneficial use. The waters of the Estuary are used for a variety of contact and non-contact forms of recreation, including swimming, boating, fishing, hunting, water skiing, and houseboating. The waters are also used for competitive events, marine parades and emerging activities, such as boardsailing and jetskiing. There are a variety of water-oriented, non-contact activities, such as sightseeing and bird watching, which depend on the esthetics or visual quality of the Estuary' s waters to some degree (EBRPD, 1,33).
Delta
SWC presented figures for projected user-days and economic values for freshwater recreation in the Delta as compared to similar types of recreation at storage and export reservoirs and faci 1 ities (SWC,65,24). Freshwater-oriented recreation in the Delta was estimated to be 8.3 mi 1 1 ion user-days in 1977-78, although this number includes some activities which do not depend entirely on the Delta's waters. However, brackish and ocean water activities were not included in the total (SWC,66,5). Testimony and evidence indicated that recreation visits to

Estuary shorel ine park f aci 1 it ies have been growing rapidly compared to the projections used by SWC, i .e., 122 percent in two years vs. 0.8 percent/year (EBRPD124,T1). Mi 1 1 ions of user-days per year and daily values of $20 or more per user day for water use are calculated for recreational use of Estuary water (BISF138,T4). An extrapolation of old studies of Delta recreation has generated estimates in the range of 13 mi 1 1 ion recreation-days annually (PICYA,2,51). No recent information based on recreation use studies is available (T,LV, 137:13-16).
Suisun Marsh and Carquinez Straits Area
Some evidence was submitted on the recreational use of the Suisun Marsh or Carquinez Straits area of the Bay-Delta Estuary. BAAC submitted evidence inferring that bird-watching goes on in the Suisun Marsh (BAAC, 20,26,27). From evidence submitted by EBRPD, estimated recreation at its Contra Costa shorel ine facilities (Antioch and Martinez shoreline) has increased rapidly from 1981 to 1987, growing from 84,000 visitors to 287,000 visitors, or about 240 percent in six years (EBRPDt34,T1). There is little evidence linking the quantity of recreation in this reach to water quality. Both BAAC and EBRPD expressed concern that visitors to these recreational areas would experience losses of the value they place on wildlife and fish resources if those resources were harmed by flow decreases and resulting sal inity increases (T,XXX,45: 12-23; T,LV, 184: 15- 25,185:l-2).
Recreational use in EBRPD units with water quality problems, Point Isabel and San Leandro Bay, increased from 71,000 to 487,000 users between 1981 and 1987, an increase of over 680 percent (EBRPDI34,T1). In comparison, the rate of growth at the nearby, unpolluted Hayward and Mi 1 ler-Knox shorelines has moved from 21,000 users to 196,000, an increase of 830 percent in the same time. There was no specific information on the features which prompt users to attend the various park units, nor on the
' method by which use estimates were made. It does not seem reasonable to suppose that a moderate change (of one or two parts per thousand) in sal ini ty would substantial ly change future recreational use. This might not be true if the change were such as to convert a freshwater beach to saltwater; however, no data are in the record on this subject.
San Francisco Bay and Adjacent Ocean
The Basin Plan for Region 2, the San Francisco Bay Basin, identifies most of the same forms of recreation as in the Delta. Recreational uses are identified for the Pacific Ocean, the San Francisco Bay system and all other surf ace waters (RWQCB ,2,1975). Water-oriented recreation in the San Francisco Bay area was estimated to total over 127 million user-days (BISFI38,T3).
5.15.2 State Board Considerations
Water quality objectives to protect specific fish species and marsh habitat areas are intended to protect recreational uses also.

5.15.3 Potential Objectives
No other objectives for recreational use are proposed for considerat ion.
5.16 Export Recreation and Export Fishery Habitat
5.16.1 Present Conditions
There are no specific Delta Plan objectives for the protection of the export recreation and export fishery habitat. The SWP and CVP reservoirs and conveyance channels provide a warm water fishery habitat, and export area recreation occurs pr imari ly at the reservoirs. Sal inity throughout the system is largely control led by the qual ity .of the Delta water being exported. Water temperature in the export system is a function of ambient Delta water temperatures, export area weather, and project operat ions (flow rates, reservoir storage levels, etc. ) . Water temperatures in reservoirs tend to become critical primari ly under conditions of extreme drawdown.
5.16.2 State Board Considerations
No participant proposed any sal ini ty or temperature objectives specif ical ly for protection of export recreation and fisheries. As stated before, the SWP and CVP operate to not exceed a minimum export water quality of 250 mg/l chlorides.
5.16.3 Potential Objectives
Because the factors which determine water temperature and salinity in the facilities in the export areas are influenced primarily by operation of these faci 1 ities, local water conditions, and Delta water qual ity, establ i shment of a separate specific objective for protect ion of export recreation and export fishery habitat is not warranted.
5.17 Export Agriculture
Conclusions:
o Water is exported from the Delta for agricultural use in the San Joaquin Valley and southern California,
o To reasonably protect crops grown in the export areas, water qual ity objectives were developed using almonds orchards as the representative salt-sensitive crop.
o The Board finds that the objective of 1-0 larahos/cm EC reasonably protects salt-sensitive crops grown in the San Joaquin Valley and southern California.
5.17.1 Present Conditions
The Delta Plan does not contain any water quality objectives for export agriculture.

5.17.2 State Board Considerations
The drinking water objective, which is about 1.0 mmhoslcm EC, would protect most agricultural uses (see Potential Objectives in this section) of the exported water for irrigation of crops grown in the San Joaquin Val ley and southern Cal ifornia. However, whenever a beneficial use of water exists and an appropriate objective can be specified, the use should be provided with specific protection.
5.17.3 Potential Objectives
A water quality objective of 1.0 mmhoslcm EC will be considered for the CVP and SWP export pumps for the protection of export agriculture. This objective fully protects the most sensitive crop in the CVP and SWP service area which constitutes at least 5 percent of each service area, respectively , and provides reasonable protection for minor crops. Based on information on CVP crop acreages (CVPWA, 12; EDF,11 ,G-148), and SWP crop acreages (DWR,489h), the crops which constitute at least 5 percent of either service area are shown in Table 5-4. Salinity tolerances, in terms of EC, of several crops shown in export areas were presented by DWR (DWR, 327).
TABLE 5-4
CROPS COMPRISING AT LEAST FIVE PERCENT OF EITHER THE CVP OR SWP SERVICE AREAS
AND THEIR SALINITY TOLERANCES
Salinity Crop as Crop as Crop as % of Tolerances, % of CVP % of SWP CVP & SWP
Crop EC (mmhoslcm) Service Area Service Area Service Area
Cotton 5.1 36.5 47.2 39.4 Alfalfa 1.3 8.5 9.0 8.6 Wheat 4.0 7.1 6.7 7.0 Tomatoes 1.7 6.9 0.4 5.0 Orchards 1 .O 6.3 15.5 8.8
5.18 Matrix of Alternative Water Qual ity Objectives
Table 5-5, Alternative Water Qual ity Objectives, summarizes beneficial uses according to three categories described in this chapter and Appendix 5.0:
o Present Objectives
o Advocated Levels (of Protection)
o Potential Objectives

Chapter 5 References
Brown and Caldwell . 1989. Delta Drinking Water Qual ity Study. May.
California Department of Fish and Game. 1988. Striped Bass Egg and Larva Monitoring, and effects of flow regulation on the larval striped bass food chain, in the Sacramento-San Joaquin Estuary. Final Report to: The State Water Resources Control Board..
Cal ifornia Department. of Fish and Game. 1989. Description of Winter Chinook Ocean Harvest Model. Prepared in consultation with the National Marine Fisheries Service and the U.S. Fish and Wildlife Service.
California Department of Fish and Game. 1989. Winter run chinook salmon salvage at the SWP and CVP facilities in the South Delta. Memorandum to H. P. Chadwick, Program Manager, Bay-Del ta Project July 13, 1989.
Clark, S. 1989. Delta Municipal and Industrial Water Quality Workgroup to the SWRCB Bay-Del ta Hearing Proceeding, Appendix A1 . Daniel, P. 1989. Delta Municipal and Industrial Water Quality Workgroup to the SWRCB Bay-Del ta Hearing Proceeding , Appendix A6.
Delta Municipal and Industrial Water Qual ity Workgroup to the SWRCB Bay-Del ta Hearing Proceeding , 1989.
Farley, Timothy C. 1966. Striped bass, Roccus saxatilis, spawning in the Sacramento-San Joaquin river systems during 1 9 6 3 m . pp. 28-43. &: Turner, Jerry L. and D.W. Kelley. Ecological Studies of the Sacramento- San Joaquin Delta. Part I1 Fishes of the Delta. California Department of Fish and Game Fish Bulletin 136. 168 pp.
Gaston, J. 1989. Delta Municipal and Industrial Water Quality Workgroup to the SWRCB Bay-Del ta Hearing Proceeding , Appendix 83. Hallock, R.J. and F.W. Fisher. 1985. Status of winter run chinook salmon, .
tshawytscha, in the Sacramento River. DFG Anadromous ~isheries January 25, 1985.
Jung, M. 1989. Delta Municipal and Industrial Water Quality Workgroup to the SWRCB Bay-Del ta Hearing Proceeding, Appendix A8.
Krasner, S. 1989. Delta Municipal and Industrial Water Quality Workgroup to the SWRCB Bay-Del ta Hearing Proceeding, Appendix A10.
Markmann , Car la. 1986. Benthic Monitoring in the Sacramento-San Joaquin Delta. Results from 1975 Through 1981. IESP Technical Report 12. 56 pp.
Means, Thomas H., Consulting Engineer. 1928. Salt Water Problem: San Francisco Bay and Delta of Sacramento and San Joaquin Rivers, April 1928.
Moyle, P.B. 1976. Inland Fishes of California. University of California Press, Berkeley.

Moyle, P.B. and B. Herbold. 1989. Status of the Delta smelt, H omesus transpacif icus. Report to the U.S. Fish and Wildlife Service, 0 ice of Endangered Species, Sacramento, Cal ifornia.
+ Moyle, P.B., J.E. Williams, and E.D. Wikramanayake. 1989. Fish species of special concern of California. Final report prepared for State of California, Department of Fish and Game, Inland Fisheries Division, Rancho Cordova, California. 222 pp.
National Oceanic and Atmospheric Administration. 1986. Marine Environmental Assessment, San Francisco Bay, 1985 Annual Summary. 122 pp.
Slater, D.W. 1963. Winter run chinook salmon in the Sacramento River, California, with notes on water temperature requirements at spawning. Special Scientific Report-Fisheries No. 461, Bureau of Sport Fisheries and Wildlife, U.S. Fish and Wildlife Service.
State Water Contractors. 1990. Response of the State Water Contractors to the petition to 1 ist Delta smelt as an endangered species. Report submitted to the Natural Heritage Division, California Department of Fish and Game.
Stevens, D.E. and L. W. Miller. 1983. Effects of river flow on abundance of young chinook salmon, American shad, longfin smelt, and Delta smelt in the Sacramento-San Joaqu in river system. North American Journal of Fisheries Management 3:245-437.
Stevens, D.E., L. W. Miller. and B.C. Bolster. 1990. Report to the Fish and Game Commission: A status review of the Delta smelt (Hypomesus transpacif icus) in 'California. Department of Fish and Game.
Turner, Jerry L. 1976. Striped bass spawning in the Sacramento and San Joaquin rivers in central California from 1963 to 1972. California Department of Fish and Game 62(2): 106-118.
U.S. Fish and Wildlife Service, and National Marine Fisheries Service. 1977. Proceedings of a Workshop on American Shad. December 14-16, 1976, Amherst, Massachusetts.
Upper Sacramento River Salmon and Steel head Advisory Committee. 1988. An Evaluation of the U.S. Department of Commerce 1987 Ten Point Program to Restore Sacramento River Winter-Run Chinook Salmon. Report No. 5.
Wang , 3. C. S. 1986. Fishes of the Sacramento-San Joaqu in estuary and adjacent waters, California: A guide to the early life histories. Interagency Ecological Study Program for the Sacramento-San Joaquin Estuary, Technical Report 9.
Winkler, K., DWR. Memo to Gerald Johns, SWRCB Staff, October 16, 1989.

SAMPLING ALTERNATIVES1 SITE NOS. INDEX YEAR SOURCE LOCATION (I-AiRKI) PARAMElER DESCRIPTION TYPE TYPE DATES VALUES PRESENT OBJECTlVES D- 148.5 Csche Slough 'at C-19 Chloridc (CI-) Maximrrm mean daily, in mngd Not Applicable All Oct-Sep 250
City of VlllleJb Intake SLCCHI6
0-1485 Contra Coda Csnal C-5 Chloride (CI-) Maximum mean Aaily, in mgd Not Applicable All Oct-Sep 250 st Pumping Plant #I CHCCCO6
D- 1485 Contra Costa Canal C-5 Chloride (CI-) Maximum mean daily I50 mgd D-1485 No. of dn-vs each Cal. at Pumping Plant #I CHCCC06 chloride for at lead the (Water Year) Year < 150 mg4 CI-
- or - number o f days shown during W 240 (66%) Son Jnsquin River at D-12(near) Chloride (CI-) the Calendar Year. Must be 0-1485 AN 190 (52%)
Anrioch Wntcr Works lnbke RSAN007 provided in intervals of not (Water Year) BN 175 (48%) less than two weeks duration. D 165 (45%) (% of Calendar Year showr, ill C I55 (42 F) parenthesis)
D- 1485 Wcst Cnnal at mouth C-9 Chloride (Cl-) Maximum mean M y , in mg4 Not Applicable All Oct-Sep 250 of Clil?m Court Forebny CH WSTO
Dcltn Mendota Cmral DhlC-I Chloride (CI-) Maximum mean dailv, in m f l Not Applicable .411 Od* 250 nt Tmcy Pumping Plant CHDMCdW
ADVOCATED LEVELS D WR Barker Slough at Chloride (CI-) Maximum mean daily, in mgd None Spacifid All Oct-Sep 250
North Bny Aqueduct Intake SLBA R3
USBR B~rker Slough at Chloride (CI-) Maximum mean daily. in mgd None S ' i f i e d All Oct-Sep 250 North Bay Aqueduct Intake SLBAR3
S\VC Bnrkcr Slough nt Chloride (CI-) Maximum mean daqv, in mngd None Specifid All Oct-Sep 250 Nortli Bny Aqued~~ct Intnkc SLBA R3
DWR Contra Costa Cannl C-5 Chloride (CI-) Maximum mean daily, ill mng/l None Spci lcd .411 Oct-Sep 250 nt Ptrrnl~ing Plnnt #I CHCCCO6
V \VR Old River nenr Rnrrch~~ Dcl Rio
D-28A Chloriclc (CI-) Alnximurn mcan dnily. in mng/l None Sp i f i cd 411 Oct-Scp 2.50 ROLD2I
VI
page 1 of 29

A) M U N I C I P A L AND I N D U S T R I A L
SAMPLING ALTERNATIVES SITE NOS. INDEX YEAR SOURCE LOCATION (I-AIRKI) PARAMETER DESCRIPTION TYPE TYPE DATES . VALUES ADVOCATED LEVELS (cont.) USBR Contrn costa canal C-5 Cliloridc (CI-) hlaxirnum mean daily, in m f l None Specified A I1 Oct-Sep 250
at Pumping Plant XI CHCCCO6
SWC Contrn Coste Canal C-5 Chloride (CI-) Mnximum mean daily. in m@ None S e f i e d Nl Oct-Sep 250 nt Pump~ng Plant #I CHCCCO6
SWC Old River ncar Rancl~o Dcl Rio
D-28A Chloride (Cl-) hlnximum mean daily, in mgfl None Specified All Oct-Sep 250 ROLD2I
CCWD Cotitrn Costa Canal at C-5 Chloride (CI-) Maximum mean daily, in mgfl None Spccificd All Apr-Jtm 50 P~~mnping Plant #I 111 CHCCCO6
CCWD Contra Costa Canal C-5 Sodium (Nn +) hlnximum mean daily, in mg/I None Specified All Oct-Scp 20 itt Pumping Plant #I CHCCCO6
DWR Wcst Canal at mouth C-9 Chloride (CI-) Maximum mean h q v . in mgn None S p r i l c d All Oct-Sep 250 o f Clinon Court Forc.hnRv CH WSTO
DWR Dcltn Mcndda Cnnal DMC- I Chloride (CI-) h4nximum mean daily, in m f l None Specified All Oct-Sep 250 nt Trncy Pumping Plant C H D M C W
USER W& Cnnd at mouth C-9 Cliloridc (CI-) hlnximum mean daily, in mgfl None Specxed All Oct-Sep 250 of CliRon Court Ft~rehRy CH WSTO
USBR Dcltn Mendota Cnnd DMC- 1 Chloride (CI-) h4aximum mean daily, in mgfl None Specified All Oct-Sep 250 nt Tracy Pumping Plnnt CHDMCWJ
SWC WLW Canal at mouth C-9 Chloride (CI-) Maximum mean daily, in mgh None Specified All Oct-Sq, 2% 01' C I ; ~ ~ I ~ c o t ~ r t ~nrchn-v CH IVSTO
SWC Dcltn Mcndotn Chnnl DhlC- I Chloridc (CI-) Maximum mean daily, in mgh ' None Spci/ed All Oct-Scp 250 at Tracy Pt~mnping Plant C H D M C m
DWR/SIVC \Vc.st Cannl at mouth C-9 Chloride (CI-) Mnx mnnthlv average. in mngh None Specified All Oct-Scp 160 CONTRACT t~l'(.'liItot~ G~crrt Forchn-v CH IVSTO
page 2 0129

SAMPLING ALTERNATIVES1 SITE NOS. INDEX YEAR SOURCE LOCATION (I-AIRKI) PARAMETER DESCRlPllON MPE TYPE DATES VALUES ADVOCATED LEVELS (cont.) D W S WC West Canal at mouth C-9 Chloride (CI-) Max 10-year average. in mgh None SpecXed All OctSep 55 CONTRACT ofClifion Court Forehay CH WSTO
West Canal at mouth C-9 Total DiaWlved Max monthly avera~e, in mg4 None Specified All Ocf-Sep 440 of CIiRon Court Forebay CH WSTO Solids (TDS)
Wcd Canal at mouth C-9 Total Di.wlved hlnx 10-year average, in mgA All Oct-Sep 220 None SpecXed o r c l i n ~ court F O ~ ~ Y CH WSTO solids VDS)
POTENTAL OBJECTlVES Contra Costs C s d
nt Pumping Plant #I Chloride (CI-)
Cl~loridc (Cl-)
Chlorid~ (CI-)
hlnximum mean daily. in mgA Not Applicable All Oct-Sep 250
Contra Costa Cnnnl at Pumping Plant #I
- hr - Sari Jmquin River at
Antioch Water Works Intake
hlnximrrrn mean daily 150 mfl clrloridc lor at leasf the numbcr ofabys shown during tlte Calendar Year. Must be provided in intervals ofnot less than two weeks duration. (% of Calendnr Year shown in parenthesis)
Sac R 40-30-30
No. o f tla-vs each Ctd. Ymr < IS0 rngll Cl-
240 (66%) 190 (52%) 175 (48%) 165 (45%) I55 (42%)
Wed Canal at mouth of CliRon Court Forehay
c -9 CH WSTO
hlnxirirum mean daily, in mg4 Not Applicable All Oct-Sep 2.50
Ddtn hlendota Canal nt Tracy Pumping Plant
DMC- I CHDMCOOQ
Chloridc (CI-) hlnximum mcnn daily, in mg/l Not AppIieable All
CncIrc Slough at City of vrrl1~;t~ I11tt&c 121
nrrdA>r Rnrkcr Slough nt Nortl: Dry Aquduct Intnkc
c-19 SLCCH 16
hlnnimurn man daily, in mg/I Not Applicable Oct-Sep 250
hlnximurn mean dnily, in mng4 Not Applicable All
page 3 of 29

SAMPLING ALTERNATNEW SITE NOS. INDEX YEAR SOURCE LOCATION ( I -AIRKI) PARAMETER OESCRlPTlON TYPE TYPE DATES VALUES PRESENT OeJECTlVES
EPA All p in ts o f delivery Stnndnrds 1-71
ADVOCATED LEVELS hl WD All M&l sopply intakes
in D c h
Dcltn M&l All A#&/ supply intnkes Workgroup in Delta
Tn'halomethanes Running average of quarterly Not Applicable All Oct-Sep 100[3] (THhfs) sampling. in ugA
Trihalome$hane Precursors (THM Pracursors)
Clrloride (CI-)
POTENTIAL OBJECTIVES Contra Coda C a d at C-5 Chloride (CI-)
Pumping PInnt #I CHCCCM
All M&l srrpply intakes in Dcltn
Clrloride (CI-)
To limit bromide to < = 0.15 mgA
Maximum mean duly I50 mgd chloride for at lead the number o f deys shown d u h g the Calender Year. Must be provided in intervals o f not less than two weeks d~rration. (% of cnlendrrr years slrown in parenthesis)
To limit hromide to < = 0.15 mgfi
Nonc None Norrc To be Specified Specified Specified developed by
S WRCB
Nonc None When 50 mgA Specified Specified Feasihle
Sac R 40-30-30
No. o f dn-vs ead Cal. [4] Year < IS0 mgA CI-
None None \Wen 50 mgA Spccilied Spccificd Fcnsihlc
gage 4 of 29

[TABLE 5 - 5 (cont.) A WATER Q U A L I T Y OBJECTIVE^
SAMPLING STE NOS. INDEX YEAR
SOURCE LOCATION (I-AIRKI) PARAMETER DESCalPTlON MPE TYPE DATES VALUES ."." ?" ""...."'.. ." :..".::.:.:<.:,:,:,:...". .:::5:.5sp::.:.:~:::5:::s:2::.:::.:.:.:~::::~~);~~~ ................. :.:.:.- ....-,....... a, ...., ......:,.,X. ..,:., $ . ; ~ ~ ~ ~ @ ~ ~ & ~ i ~ $ ~ ~ $ ~ ~ $ ~ ~ $ $ ~ , .....,.......r .. .... ..... ..... i.. ..... ........ . .ir.....C ..; .-. :.:.......A,.... . . ... .. .. ..
PRESENT OBJECTIVES 0-1485 Sacramento River
st Emmaton
Snn Jclaguin Rivcr nt Jcrsey Point
ADVOCATED LEVELS CVPWA. Sncramcnfo R i m SWC at Emmaton
- and - Snrr Jonquin Rivcr
ut Jc.r.u:v Poi~rt
D WR Sncrarncrrto River nr Ernnmtt~rr -rind-
Stln Jcu~qrrin Rivttr I I ~ JC~S~.V Pa~i~rr
Electrical Con- Maximum I 4 4 y running 0-1485 ductivjty (EC) average o f mean daily, (Wnter Year)
in mmhos/cm (mmhos) W
AN BN D C
D- IS Elactrical Con- Mnximum I 4 d y running D- 1485 RSANOl8 ductivity (EC) average o f mean daily, in mmhos (Water Year)
0.45 EC April I to
Date Shown Aug. 15 July I June 20 June 15 ..
0.45 EC A p d I to
Date Shown Aug. 15 Aug. 15 June 20 June I 5
--
0-22 Electrical Con- Maximum 14&y running None Specillad 1.5 EC RSAC092 ductivity (EC) average o f mean daily, in mmhos A p d I to
Date Shown D- I5 Electrical Con- Maximum 1 4 d y running None Specified W Aup. IS
RSANOl8 ductiviv (EC) nverngc o f mean dsily, in mmhos AN Aup. 15 EN Aup. I 5 D Atrg. I5 C Jtrl. -31
0-22 Electrical Con- Average motithly, in mmhos RSACO92 citrctivity (EC)
D- I S RSANOll
EC from Date Shown to
Aug. 15 [S] -- 0.63 1.14 1.67 2.78
EC fmm Date Shown to
Aug. 15 151 .- --
0.74 1.35 2.20
3.0 EC Date Shown to
Aug. 15 [5]
-- Aug. I
Norrespecilied ---+-------- Based on Corn Sttrdv -----------
page 5 of 29

SAMPLING s m NOS. INDEX YEAR
SOURCE LOCATION (I-AIRKI) PARAMETER DESCRlPllOPl TYPE TYPE DATES VALUES .:.:.:...: ~::,:.g: ::,..: .. ::: ., :: :..:,..::;>:::,>:.:.:, ..:>,.;::.:.::;:...:<. $ $ : W , @ ~ ~ ~ ~ ~ , ~ ~ ~ & & ~ .. kxi@t!&jgz: .... :.:;:; ''1.. ., :, '-;,:. . , . . . . . . . . . . . . . . .....,... ..,/ .._. _.... 2:. . . . , . .. .. . .. , . ,, ..,, _,
ADVOCATED LEVELS (cont.) CCCWA .Syramento River 0-22 Electrical Con- Maximum 14&y running None Specified All Apr I-Aug I 5 0.45
at Emmaton -and- RSAC092 ductivity (EC) average o f mean M y , in mmhos San Joaquin Rivcr D- 15
at Jcr.w-v Point RSANOIB
C D WA Sacramento River at Emmaton -and-
San Joaquin Rivcr at Jcrscy Point
m N n A L OBJECTNES Sacmrncnto River
at Emmaton
San Joaquin River at Jcrscy Point
0-22 Electrical Con- hlaximum monthly average o f Nonc Spci led All Apr I-Afar 31 0.45 RSAC092 ductivity (EC) mcan daily, in mmltos ------ adiustmcnts not quanti/id ------
D-IS Electrical Con- hlaximum monthly average o f All Apr I-Mar 31 0.45 RSACOl8 ductivity (EC) mcan daily, in mmhos ------ adiustmcnts not qunntified ------
0-22 Electrical Con- Maximum 14&y running Sac R 0.45 EC RSAC092 ductivity (EC) average ofmean &ily, in r n m l ~ d c m 40-30-30 April I to
Datc Show11 W Aug. IS
AN July I BN June 20 D June 15 C --
D- I 5 Electrical Con- Maximum 14-day running SBcR RSANOl8 ductivity (EC) average of mean M y , in mmhos 40-30-30
0.45 EC April I to
Datc S~OWII W Aug. I5
AN Aug. IS BN Junc 20 D June I5 C --
EC fiom Date Shown to
Aug. IS 151 --
0.63 1.14 1.67 2.78
EC fiom Datc Sl1own to
Aug. 15 IS/
page 6 of 29

1 " AREA . . : 1
SAMPLING ALTERNATlVESl !3TE NOS. INDEX YEAR SOURCE LOCATION (I-AIRM) PARAMETER DESCRIPTION TYPE TYPE DATES VALUES
PRESENT OBJECTIVE$ D- 1485 Smrth Fork Mokelumne Rivcr C- 13 Electrical Con- Maximum 14-day runniw 0- 1485 0.45 EC
at Terminous RSMKLO8 ductivitv (EC) avcragc of mean daily, in mrnhos (Water Year) A p d I to Date Shown
W Aug. IS AN Aug. 15 BN Aug. I 5 D Aug. IS C --
Sen Jmquin River C-4 Electrical Con- Maximum 14day running 0-1485 0.45 EC at Sen Andreas Landing RSANO32 ductivity (EC) average of mean i i l y , in mmlros (Water Year) Apd I to
Date Shown W Aug. 15
AN Aug. IS BN Aug. 15 D Jun. 25 C --
ADVOCATED LEVELS NDWA/ Sncrnrnento River DWR nt Emmaton CONTRACT SOII~II Fork Mnkcl~mnc Rivcr
nt Tcrminous Sne Jonquin River
nt Snn Andrcns Lauding Sncrnmcnto Rivcr
nt Rio Vistn Bridge Nrvrth Fork hfokcIurnnc Rivcr
rteltr 14inlrrrrt C;rorSc (c.xctd /c wrrtka sot slwcilic.c/)
EC from Date Shown to
Aug. 15 IS] --
I61 . 0-22 Electrical Con- Maximum 14day running 0- 1485 Per PCr 0.45-3.6 171
RSAC092 dudivity (EC) average o f mean M y , in mmhos (Water Year) contract c m m d C- 13 0.45-1.1 171
RSMLKO8 c4 0.4-5-1.2 /7/
RSAN032 0-24
RSAClOl 0.45-0.6 / 7/
RhlKL020 (7)
page 7 of 29
- -a - - - - - - - c - - - - - -
1
-C- - < r

1 A R E A 1
SAMPLING ALTERNATIVES1 W E NOS. INDEX YEAR SOURCE LOCATION (I-AIRKI) PARAMETER DESCRIPTION MPE TYPE DATES VALUES
ADVOCATED LEVELS (cont.) 161 N D WA/ Sacramento River st Electn'cal Con- Maximum 1 4 4 y running 0-1485 not shown not shorn 0.45-0.6 [7] DWR Walnut Grove -and- RSAC124 ductivity (EC) average o f mean daily, in mmhos (Water Year) CONTRACT Steambont Slough at
Sutter Slough SLSBTI I
ECClD/D WR Old River at CONTRACT Indian Slough
Electrical Con- Maximum I 4 A y running D-1485 not shown not shown 0.45-1.2 171 ROLD32 ductivity (EC) average o f mean L i l y , in mmhos (W&er Year)
DWR South Fork Mokelumne River C-I3 Electrical Con- Maximum 1 4 A y running None S p i l i c d ----- Based on Corn Strtgv ----- at Terminous RSMLKO8 ductivity (EC) average of mean L i l y , in mmhos
San Imquin River C 4 at San Andreas landing -and- RSANO32
Cache Slough near CS-/&my.) Jrtnction Point @mposed) SLCCHOO
DTAC Central Delta Electricdll Con- Maximum I 4 4 y running None Specilied All Apr I-Arlg I 5 1.5-2.5 ductivity (EC) average o f mean L i l y , in mmhos except C
C None
CCCWA Delta lowlands with organic soils
Electrical Con- Maximum 1 4 4 y running None Specified AIl Apr I-Aug 15 0.45 du&'vity (EC) average ofmean daily, m mmhos
C D WA San Jmquin River C 4 Electrical Con- Maximum monthly average o f Nme Specified AIl Apr I-Mar 31 0.45 at Sen Andreas Landing RSAN032 ductivity (EC) mean L i l y , in mmhos ----- except for ------
Aug Sep Oct D --- 0.65 0.60 C 0.41 0.80 0.90
page 8 of 29

[TABLE 5-5(cont) A L T E R N A T I V E W A T
1 AREA 1
SAMPLING s m NOS. INDEX YEAR
SOURCE LOCATION (I-AIRIO) PARAMETER MPE
ADVOCATED LEVELS (cant.) 161 . - south Fbrk Mbkdumne ~ i v c r C-13
at Terminous RSMLK08 Old River near Holland TW
(exact loc. not sptx.) -or- ROLDI9(?) Old River near Rancho Del Rio D-28A
ROLDZl Turner Cut near McDonald M D 4 Island Bridge CFTRNI
Electrical Con- ductivity (EC) Electrical Con- d~lctivity (EC) Electrical Con- ductivity (EC) Electrical Con- ductivity (EC)
Maximum monthly average of Nonespsi led mean daily, in mmhos Maximum monthly average of None Specified mean daily, in mmhos Maximum mor~thly average of None Specified mean daily, in mmhos Maximum monthly average of None Specilied mean daily. in mmhos
TVPE DATES. VALUES
All Apr I-Mar 31 0.45 ------ adJirstmutls qqu~~tilSed ------
All Apr I-Mar 31 0.45 ------ adjustments not quantified ------
All Apr I -Mar -31 0.45 ------ adjustments not quantified ------
All Apr /-Mar 31 0.45 ------ ad9ments not qlrantilied ------
POTENTIAL OBJECTNES South Fark Mokelumne River C-I3 Electrical Con- Maximum 14&y running Sac R
at Termioous RSMKLO8 ductivity (EC) average ofmean h i l y , in mmhos 40-30-30
San Jaaquin River C 4 Electrical Con- h4rimum 14&y running Sac R at San Andreas Landing RSANO32 ductivity (EC) average o f mean hdy , in mmhos 40-30-30
0.45 EC April I to
Date Sltown Aug. IS Aug. IS Aug. I 5 Aug. I 5
--
0.45 EC April I to
Date Show~t Aug. 15 Aup. 15 Aug. 15 Jun. 25
--
EC from Date Slrawn to
Aug. 15 151 -- -- -- --
0.54
EC from Dntc Shaw~~ to
Aug. 15 1-51 -- -- --
0.58 0.87
page 9 of 29

A R E A 1
SAMPLING SITE NOS. INDEX YEAR
SOURCE LOCATION (I-AIRI<I) PARAMETER DESCRlPllON MPE TYPE DATES VALUES ..... <j:;mem:gagq $0 ~$,g ,...... .............. ..... . ,.... ..... ......... ... .................... ...... ...... .... ...... .A,. .....
PRESENT OBJE- 0-1422 [8] San Joaquin River at C-I0 Total Dissolved Mean monthly, in mgA
A i m Way Bridge, Vernalis RSANI I2 solids (TDS) Not Applicable AU Oct-Sep 500
Region 5 San Jmquin River at C- I0 Total Dissolved Maximum M y running average Not Applicable All Oct-Sep SaJ Water Quality A i m Way Bridge, Vernalis RSANll2 Solids (TDS) of mean daily, in mg4 Control Plarr
USBWSDWA San Jmguin River at C- I0 Total Dissolved Maximum 14day runniog average Not Applicable All Apr I-Oct 31 450 AGREEMENT Airprt Way Bridge, V e d i s RSANllZ Solids (TDS) of m a n dairy EC, in mmhos Nov I-Mar 31 500 *
* May be modified by agreement o f parties or because o f emergency conditions. Releases from New Melones Reservoir will be limited to a maximum of 150,IXID AF/water year in addition b relascs to maintain Fish & Water Quality in accordance with 0-1422
ADVOCATED LEVELS SD WA San Jaaguin River at
Airport Way Bridge, Verndis Old R i m
at Tracy Rned Bridge Old River
near Middle River San Joaquin River
at Brarrdt Bridge /site/ Sar Jonguin Rivcr
at Mos.&e Bridge Miildlc Rivcr
nt Howard Rmd Bridgc (>It1 Riwr
Ill \&k~h%!c ID / ~ I ~ J I ~ C
161 c- I0
RSANllZ P- 12
ROLD59 c-8
ROLD69 C-6
RSANO73 c-7
RSANO87 P-I1
RMID34 --
ROLDSI
Totd Dissolved solids (TDS)
Maximum monthly a m g e of None Specified All Mar I-Sep 30 4 0 p ] mean daily, in mgA
Maximum 7&y running None S p X d AU Mar I-Jun 30 400 [9] avenge o f mean ddy, in mgA
Maximum 7&y running None Specifid All Jd I-Oct 31 ,Coop] average o f mean M y , in mgA
Maximum 7day running None Specified All Nor, I -Feh 28 -500 191 avcr~gc o f mean daily, in mgA
page 10 0129

SAMPLING ALTERNATIVES/ SITE NOS. INDEX YEAR SOURCE LOCATION (l-AIRI<I) PARAMETER DESCRSPnON MPE TYPE DATES VALUES
:w.::::.Ii:::3,i:'"::::: :.... .................................... ..................... :,:.:.: ...... :k:w.kGp;3x83kw$;0 uw,w:gm~@~&,ga@gg >~:*:::*:~::~>::.>:E::l.~:.:.E::l.~:~. ...... ..i ................. ;. ..... :.:,, ... : ................
ADVOCATED LEVELS (cont.) USBR Dalta Uplands -- T d Dissolved Maximum mmtlily avenge of None Spa i t id Normal Apr I - ya r 31 8W
SoIi& (TDS) mean daily, in mgA C 6LK)
CVWPA Son Joaquin R k at C-10 Total Dissolved Maximum m y running average All Oct-Sep 500 None Spscilied Airport Way Bridge, V d i s RSANllZ Solids (TDS) o f mean daily, in mg4
P O W A L OWECTMS San Joaquin Rivor at
A i p r t Way Bridge, Vernalis Old River near
Middle River Old River at
Tracy Road Bnige San Joaquin Rim
at Bmndt Bridge [site]
(To k implemented by 1H6) [ lo ] C-10 Electrical
RSANI 12 Conducficfiv$y (EC) C-8
ROLD69 P- 12
ROLD59 C-6
RSANO73
Maximum UMsy running average Not Applicable All Apt I-Aug 31 0.7 ofmem daily EC,in mmhos Scp /-Mar 31 1.0
or If a em-- umtmct has beem implemented among DWR, USER and the SD WA, that constract wil be m i m e d prior to implementation ofthe shove and, after also considering the nee& of other bmef~cial uses, revisions will k made to the obHvcs and compliancJmonitoring 10~0tions norcd
PRESENT OBJECTIVES None specitid for export agriculhrre.
ADVOCATED LEVELS None advocated for export npricttlture.
POTENTIAL OBJECTIVES Wcst Canal at mout11 of C-9 Electrical Maximum month[v avernge of men11 Not Applicnhle All Oct-Scp Clifion Court Forehay -and- CH WSTO Conductivity (EC) &i!v EC,in mmhm
Dcltn Mcndotn Cnnnl nt DMC- I Trncv Ptrmnpinp Plnat CHDMCOOJ
page 11 of 29

SAMPLING MTERNATlVESI SITE NOS. INDM YEAR SOURCE LOCATION (I-AIRI<I) PARAMETER DESCRlPnON lYPE TYPE DATES VALUES
..:.:.:.:.:.:...:.:.:.:.:.:.:.:...:.:.:.:.:...>:.:.:.:.:.:.:: ..:..... .; ~:.:.:.:.:.:.:.:.:.:.:.:,:.,:x:.:;:.;::.:,.&~~j~$ .... .._ ............. :. .._. . ......,..... H::&Qi:Y #@#&ET&,.E,B:e io:T,@;Cf ga$&$$@ j!f)3j& M E:N F$$$$~.N,Q~ .............. . ...................... ... ......,.. fi..:.:.:.:.: ...... : -:- ... . .: ... ;; ... !.. : :.....: ii. .................. ... ... ......... ....... .... . ........... r . . -.. ..... .... .... ..... . ... .............. .. . ..
PRESENT OBJECTIVES None specified
ADVOCATEb LEVELS CCCWA/ Sncrnmcnto River at EDF Chipps lslnnd
CCC WA/ Suisun Bay at EDF Mnrtincz
POTENTIAL OBJECTIVES Nonc Specified
D-I0 Electrical 28&y tidally averaged mean D- 1485 RSAC07.5 Conductivity (EC) hattom salinity less than (Water Year)
value shown in mmhos
0-6 Salinity RSACO56 (TDS)
TioWly averaged bottom D- 1485 salinity lcss than value (Water Ywr) shown in parts per thousand @pr) over at least e 28&y period between d6te.s shown
All Apr I-Sq, 30 2.0 except C
All Oct I-Apr 30 5.0
C
PRESEM OBJECTIVES - DISSOLVED OXYGEN Region 5 Sneramento River and dl All Water Quality Delta waters wcct ofthe Control Plan Antioch Bridge
All othcr Delta waters uce-pt: W - Mnn-mndc bodies of wntcr - Sites where fishery is
not a hcncrrcial usc DFG. USFWS San Jimguin River hctwear RSA NOSO- DWR & USBR T~irimrcr Cut & Stockton RSAN061
ADVOCATED LEVELS - DISSOLVED OXYGEN USFIVS, DFG Snn Jonqciin River hctwccn RSA NOSO-
Tonier Cttt nncl Storkton RSANO61
Dissolved Minimum dissolved oxygen, None Spcdcd All All year 7.0 Oxygen (Do) in mg&
Dissolved M i ~ m u m dissolved oxygen, None Specifred All All year 5.0 OXY@ (DO) in mg/l
Disdved Minimum dissolved oxygen, None Specified All All ycar 6.0 oxygen (DO) li, mg&
Dissolved hlinimum dissoived ox-vgen, None Specified All Sep I -Nov -10 6.0 Oxygen (DO) in mg0
page 12 of 29

~ ~ ( C O ~ ~ L T E R N A T ~ V E WATER Q U A L t t Y O B J E C T ~ V E S ~ -
SAMPLING ALTERNATIVES SITE NOS. INDEX YEAR SOURCE LOCATION (I-AIRKI) PARAMETER DESCRIPTION M P E MPE DATES VALUES
s.g:s:s ;.v.....,.:...~, . ,x .,:;.:.:.:..,:*zGF ,..., :+x.~~:*,;<.y C M N W K C H { c # r t : j ~ j ~ ~ ~ @ : j ~ : I j ; : : j : i ~ .,.. ..... . . . . . . . . . . . , r. ..,.... - .... ..;. ......... ....... ........ ...;.. .... . .. ......... ... . .... . . . ..... ... ? .. :c.... ........ :.::.:.::..;.. .. :.:a........... ..... -... POTENllAL OBJECTIVES - DISSOLVED OXYGEN
Snn Jaequin River hetween RSANOSO- Dissolved Minimum dissolved oxygen. None Specified All Sep I -Nov 30 6.0 Turner Cut & S t d o n RSANiMl Oxygen (DO) in mgh
PRESENT OBJECTIVES - TEMPERATURE Rcpional W& Sncramcnto River from Quality Control Hamilton C i v to 1
Board Basin Street Bridge Plan 5
Rqionnl Wder All Quality Control Delta waters
Board Basin Plans 2 & 5
Thermal Plan EFtu~ry Waters
ADVOCATED LEVELS - TEMPERATURE USF\VS Sncramcttto River at RSACISS
Frcwpr~rt
S~rn Jonqrrin River nt Airptwt C- I 0 1%~ Hriclgc. \~~~rrttrlis nrrcl RS.4NI 12
(01lrcr k~cati~wrs. c p . . Is lc. t~~~ srtcl JL.~SX:Y Point)
Temperature Narrative Objectve All
' The ternperamre shaU not be elevated above 68 degree F in the reach from Hamiltott Citv to the I Street Bridge during periods when tcmperature increases will he detrimeatal to the fishery
(also see page 111-6 o f Basin Plan 5).
Temperature Narrative O b w v e All ** ** The nature/ receiving water temperature of intrastate waters shall not be altered unless 3 can be
demonstrated to the satisfaction ofthe Regional Board that such alteration in temperature does not adversely afTect beneficial uses.
Temperature Narrative Objixtive Al l e m
*** The plan spcities limiting conditions oftemperature in wastewaters dischatgsd into interstnte and coastal waters, eshuriiw and enclosed hays. For example. elevated temperature waste discharges into interstate waters designated as "cold" waters are prohibited while this type o f discharge into "warm " interstate waters cannot he more than 5 d e g m F warmer than the receiving water and shall riot cause the temperature in the receiving water to rise more than 5 d e g m F. Existing thermal discharges into coastal waters, aquaries and enclosed hays sltall comply with limitations necesmy to assure protection ofthe henelicial uses and. for coastal waters, areas o f special biological signiticancc.
Temperature When temperature increases an. controlIahle, they shall k limited to a maximum 7 day surface temnpcrnture.
Temprntr~rc
W Mny I-Jrm IS 66 degrees F A N May I-Jttn IS 66 degrees F BN Ma-v I-Sun 1.5 66 degrees F D May 1-Ala-v 31 66 degrees F C Alny I-Alrp. 31 66 degrees F
page 13 of 29

[ T A B U . ~ - ' ~ ( C O ~ ~ , ) A L T E R N A T I V E WATER.; Q U A t t T Y O B J E C
~ F E 1 SAMPLING sm NOS. INDEX YEAR
SOURCE LOCATION (I-AIRKI) PARAMETER DESCRlPnON TYPE TYPE DATES VALUES
ADVOCATED LEVELS - TEMPERATURE (~oM.1 - - DFG Sacramento River at RSACISS Temperature Narrative Objective
Freeport and
Sen Jmquin River at C- I 0 Temperature Airport Way Bridge, Vernalis RSANll2
Narrative ObJkctive
S WC Sncra~mto Rivcr at Frccport and
RSA CIS5 Temperature 7-day avcrage o f maximum m a n daily surface temperatures
San Jonquin River at C- I 0 Temperature 7dny average o f maximum mean dail-v Airport Way Bridge, Vernalis RSANI12 surfme temperatures
CVPWA Sacramento Rivcr at Freuport nnd
San Joaquin River at C-I0 Airport Way Bridge, Vemdis RSANI I2
POTENTIAL OBJECTIVES - TWPERATURE Sacramento River st
Freeport and
Snn lonquin River nt Aitport Way Bridge, V d i s
Temperature
Temperaturn
Temperature
Temperature
Narrative Objective
Narrative Obk t i ve
Namrrive Ob~ixtivc Not Applicohle
Narrative O b w i v c . Not Applicable
All The tempemure shall not be elevatcd ahovc 68 degrees F during periods when
AN temperature incrw.se.c will be detrimental to the lishery.
All oa-scy, An objective of 68 degrees F a t Freeprt and Vernalis
All would be acceptahle as long as the plan states clear& that an c+iective cannot he mct with flows.
"During the morrtl~s of May and June. thc water temperature to which juvenile chinook are exposed should not e x d temperatures which a n reasonable, taking into account all d e d s on water supplie.~, thc total values inwlved, and the limited nhiltiv to implement specific obectivcs. "
All The daily avcragc watcr temperature shnll not he elevatcd by co~~trollahle
All /scm ahovc 68 degr- F from the I Strcct Bridge to Freeport on the ~ac&mento River, and at Vertralis on the Sen Joaquin Ric,cr bctwecn April I tl~mrt,ch June 30 and Scptemlwr I tl~rc~rrgh Novcrrrhr.r 30 in allj,c.nr [ V ~ S . / / I /
page 14 of 29

SAMPLING SITE NOS. INDEX YEAR
SOURCE LOCATION (I-AIRKI) PARAMETER DESCRIPTION MPE WPE DATES VALUES .... .:...-:;+..:...:<.:.:.:.:::~:~:::~::~: . . . . . . .. . . . . . . . . . -. . . . . . . .,.,.,...,.,.,.,.,. . . . . . ................................... . . . . . . . . Ct+ lN~g ~~,;;;::~*~:ip~g$I:pi;:::<~ j:i:;:::(j,; ,..:::: . ..'. .... ::.., ................... . ...... . . . . . . . . . . . . . . . . . . . * ......... . ...,.... , , , , , , . ,
POTENTIAL OBJECTIVES - TEMPERATURE (cant.) Sncramento River st RSAC155 Temperature N m t i v c Obpefive Not Applicable All The daily avearge water
tempcraturc shdl not k elevsted by controllable lectors s h v e 66 degrees F fmm the I Street Bridge to Freeport on the Sacramento River between January I througlr March 31. 1111
PRESEM OBJECTIVES 0-1485 Sacrnrncnto River at
Clripps Island
D- 1485 Snn Jaaquin River st Aarioch Water Works Intake
ADVOCATED LEVELS Norrc otlrer thnn ahnvc
POTENTIAL OBJECTIVES I -A S I I ~ Jmquin River at
.4atiocIr Water Works Intake
I- B Sncrnnrcrrto River at Clril~ps Islnrrd
D- I0 Delta outflow RSAC075 Index (DOI)
0-12 (near) Electrical Con- RSANO7 ductivity (EC)
0-12 (near) Elextrial Con- RSANO7 ductivity (EC)
D- I 0 Dclta orrtflow RSAC'OZ5 1rrrle:r (DOI)
Average for the period not less than the value shown. in cfs
Average o f mean daily for the period not more than the value shown, in mmhos
14day running average o f mean daily for the period not more tlran value shown, in mmhos
A verngc for the period not less tlrnn the r r l rc slrown. ill cl i
D- I485 All Apr I -Apr 14 6.700 (Water Year)
0- 1485 All Apr IS-hfay 5 1.5 (Watcr Year)
Not Applicable All Apr I-May 31 1.5 (or until spawning Ires ended)
Not .4ppliablc All Apr I-Apr 14 6,700
page 15 of 29 - -. - - ' C I - - -* - L C - - - - -.- -'

SAMPLING ALTERNATIVES SE NOS. SOURCE LOCATION 0-AIRM PARAMEIER DESCRIPTION
INDEX YEAR M P E TYPE DATES VALUES
Snii Joaquin River at D- 12 (near) Electrical Con- 144-v running average o f mean Not Applicable All Apr 15-May 31 1.5 Antioch Water Works Intake RSAN07 ductivity (EC) daily for the period not more (or until spawning
than value shown, in mmhos. has ended)
I -C Sncramcnto Rivcr at D-I0 Dclta outflow Avcrage h r the per id not Not Applicable All Apr I-Apr I4 6.70 Cliipps Islniid RSAC075 Index (DOI) less than the value shown.
in crS
Snri Joaquin River at 0-12 (near) Electrical Con- 14day running average o f mean Not Applicable W,AN&BN Apr 15-hfay -31 1.5 Antioch Water Works lntah-c RSAN07 ductivity (EC) daily for the period not more (or until spawning
than value shown, in mmhos has ended) D&C Apr 15-hlay 21 1.5 .
(or until spawning
-.-...- has ended)
PRESENT OBJECTIVES D-1485 Sna Joaquin River at 0-12 (near) Electrical Con- Average of mean M y for
Antioch Wntcr Works IntAke RSANW7 ductiviv (EC) the period, not more than the values shown wmsponding to the deficiencies taken by
This rclnxtion provision rcplaces the SWP and CVP, in mmhos the ahovc Antioch & C h i p Island standard wlrenmcr the projects irn- dcliciencics in firm supplies.
0-1485 All Apr /-May 5 (Water Year)
Totel Annual Imposed Ddcicncy in Firm
Sripplies (MAF) 0.0 0.5 . 1.0 1.5 2.0 3.0 4.0 or more
page 16 of 29

~ B L E 545(contNt) ALTERNATIVE W A T E R Q U A L I T Y O B J E C T l V E S I IC)SH A N D W I L D L I F E I
ALTERNATIVES SAMPLING sm Nos. INMX YEAR
SOURCE LOCATION (I-- PARAMETER DESCRIPTION TYPE MPE DATES VALUES LTUIPEO BA&8~SAL1#tT'Y:2 A N T l 6 C ~ * S P A ~ N t N G - R E L A X A T I U ~ PROVISI-
ADVOCATED LEVELS None ofher than above
POTENTIAL OBJECTIVES 2-A No rclnxation provision
2-8 San Jnsguin River at 0-12 (near) Antioch Water Works Intake R.9-7
771;s relexntion provision replaces
tlrc nhovc Antioch & Cliipps Island sfnndnrd whenever thc prq@s irnpnse dcficiencies in firm supplies.
Electrical Con- 14-day running average o f m m Total Annual Declnred ductivify (EC) l i l y not more than values shown Deliciencies (MAF)
corresponding to deficiencies in firm supplies declared by the SWP & CVP for the period shown. or until spawning has ended. 0.0
0.5 1.0 1.5
2.0 or more
Linear inkrpofation is to he- used to determine values hetween those shown.
Same ns 2-B. except tlmt dclicicncies are detincd as dcficiencies in f i m supples declared by a set o f wntcr projects repmta t ivc of thc Sacmmeuto River and San Jmquin River watersheds. The spsific rcpre.rntativc projects and amounts of deficiencies will he dcfincd in srrhsequent phases ofthe proceedings.
Apr I-May 31 EC, in mmhos
DV Critical
page 17 of 29
-- . - ----- b - - - - - - - 0 - - *
SAMPLING ALTERNATlVESl SITE NOS. INDEX YEAR SOURCE LOCATION (I-AIRKI) PARAMETER DESCRIPTION TYPE M P E DATES VALUES
~ S V l f I P E O B~$SmSAI iN17Y: ,2 . A N T l O C M - S P A W N I N G - R E L A X A T I Q N PROVISfON(cont) J POTENTIAL OEtJECTlVES (cont.) 2-0 Snmc as Olyktive 2-8 except the period ofprotection
is April I to May 21. 2- E San Joaquin Rivcr at D-12 (near) Electrical Con- 14-dey running average of mean Sac R Apr /-May 31 3.7
Antimh Water Works Intnkc RSANiW7 ductivity (EC) daily for the period not more 40-30-30 (or until spawning than value shown, in mmhos, has ended) when the April I, 40-30-30 Sacramento Basin Index is equal to or less than 4.8 MAF. [I21
1 ' ' ' " S T R I P E D BAS.§*SALIN€TY:3 ; .PRI '~ONERs POlb lT '~SPAWN1NG '. 1 PRESENT D- 1485
OBJECTlVES San Jnoguin River
Prisoners Point ' at 0-29 Electrical Con- Average o f mean daily for 0- 1485 All Apr I-May 5 0.55
RSANO38 ductivity (EC) the period not more than (Water Year) value shown, in mmhos
ADVOCATED LEVELS None otbw than shove
POTENTIAL OBJECTMES 3-A Snn Jonquin River at:
PrLwners Point
Blrcklcy Cove
Roctgh and Rcady Island
Rrnndt Bridge /site]
Electrical Con- 14-day runninp avenge ofmcart D-29 ductivity (EC) daily for the period not more
RSANO38 than value shown, in mmhos P-8
RSANOS6
Not AppIieahIe All Apr I-May 31 0.30 (or until spawning has endcd)
page 18 of 29

NATIVE W A T E R Q U A L I T Y O B J E C T ~ V E S ~
[ c ) F I S H AND W I L D L I F E 7
SAMPLING ALTERNATIVES1 S ~ E NOS. INDEX YEAR SOURCE LOCATION (I-AIRI<I) PARAMETER DESCRlPIlON MPE TVPE DATES VALUES
. .,.. :::.,::., :+. ................................ :.' [ ... ...., ....... ... :.::: 2.e:5i:6:k: <,,:,:,: j:..:~j~{R..[. . . ~'~..~j:&firSj.:$$$$I.A .. .&it, ) ( ) } : ~ & $ ' l:iS:,o: N E R $2: P ,a ,(iN::J'"::s;#+jAj:. N I .N G (C&t ,~$ i . i ; : j~ i$~$~ .'..... .. ........ __.. ... ,... . . . .. . ., . . ... . .... ..... . . . ........,,,. ... ..... ., . . . . . . . . . . . . . . . . . . . . . . , . . POTENTIAL OBJECTIVES (cont.) 3-B Snn Jasguin River nt: Electrical Con- 14&y running average of mean Not Applicable All Aprl-May31 0.44
Prisoners Point 0-29 ductivity (EC) daily for the perid not more (or until spe wning RSANO38 than value shown, in mmhos has endad)
Btteklcy Cove P-8 RSAN056
Rough and Ready Island RSANO62
Brendt Bridge [site] C-6 RSAN073
hfm.Fdale Bridge C-7 RSAN087
Airport Way Bridge. C-I0 Vcmalis RSANl12
3-C Snn Junquin Rivcr at: Prisoners Point
Brnndt Bridge Isitel
M d d e Bridge
Elcdrical Con- 14&y running average of man SI River W.AN. Apr I-May 31 0.44 D-29 ductivity (EC) daily for the penpen& not more (whm devdopod) &BN (or until spnwning
RSAN038 than value shown, in mmhos has ended) P-8
RSANO56 D&C Apr 1-hfay 21 0.44 (or until spnwtrinpr
RSAN062 hns ended) C-6
RSANO73 c-7
RSAN087 c - I 0
RS.4N112
page 19 of 29
- - - - -* - - - - - -

SAMPLING SITE NOs INDEX YEAR
SOURCE LOCATION - PARAMETER DESCRlFllON TYPE TYPE DATES VALUES -
1 STRIPED ftAS$*SALtMi?'Y:& P F ~ ~ S O N E R S P O ~ N T - ~ P A W N I N G ( ~ ~ ~ ~ . ) J POTENllAL OBJECTIVES (cont.) - 7
3- D San Jmquin Rivcr at: Pri.wners Point
Buckley Cove
Rough and Ready Island
Brnndt Bridge /site/
Mossdale Bridge
Airport Way Bridge. Vcrnalis
3-E San Joaquin River at: Pri.umers Point
Buckley Cow
Rotigh and Resd-v Is-land
Brnndt Bridge [sitel
h4ossSeIe Bridge
Airport Wny Bridgc. \/'.rt,,dis
Electrical Con-
0-29 ductivity (EC) RSAN038
P-8 RSAN056
Il-dey running average of mean SI River W.AN. Apr 1-hey 31 0 . 4 daily for the period not more (when developed) &EN (or until spawning than value shown, in mmhos has ended)
D&C Apt I-May 31 0.44 (EC would (or until spawning
only he has ended) met at Prisoners Point)
Electrical Con- 1 4 4 y running average of mean
D-29 ductivity (EC) M y for the period not more
RSANO38 than value shown, in mmhos
P-8 RSANO56
SI River Apr I-May 31 0.45 (when developed) (or until spa w ing
has ended)
W - Prisoners Point to Vernalis AN - Prisoners Point to h1os.dnle
EN - Prisoners Point to Rough and Ready Island
D - Prisoners Point m Bt icky Cove
C - Prisoners Point only
page 20 0129

INDEX YEAR SOURCE LOCATION (I-A/RI<I) PARAMETER DESCRIPTION TYPE WPE DATES VALUES
::.:,.:.: ... ;,.:r,x.:*.y ..:.;. ....... .... .. . .. p ...... . . . . . ..,........-. ::::.:.:.:.:.:.!.;i;:.:.:j:"s,~ . . , R I p , ~ ~ ~ : ~ : ~ . ~ & $ ~ ~ ~ & ~ ~ ~ ~ , ~ ~ : : i : j ~ ~ ; $ . . . ~ ~ ~ ~ : ~ . & ~ Q N E.R Si'iP,,O;tjkj~~:$~ft'fiiiw Nil NO (~~~i;~::,i:f$~i:i._:ji:~ :: 1 .................... .... ......................... '. .: .:.: .:.. . . . , .. .. ,. .. .......... . . ..... . . ... . ... . .. . ...... . . . . . .... . . . . .. . . . .. . . POTENTIAL OWECTNES (cont.) -3- F Snn Joaquin Rivcr nt D-29 Eleetrid Con- 14day running average o f mean Not Applicahlc Ail Apr I-May 31 0.44
Prisoners Point RSAN038 duclivity (EC) dtlily for the period not more (or until spawning than value shown. in mmhos has endad)
1. STfllPEO BASS-SALIN lTY:4 . P R I S O M E R S P O I N T - S P A W N I N G R E L A X A T I O N P R O V I S I O N ' 1 4-A No rclnxation for Pri.wiiers Point when the Antioch relaxntioit
provision for spawning profcction is h &ect.
When the Antiorh relaxation provision for spawning protection
is in effect:
Snn Jtmquin River nt Pri.wiicrs Point
0-29 Electrid Con- RSANO38 ductivity (EC)
I4day running average o f mean
daily for the period not more than value shown, in mmhos
Not Applicahhle D.C Apr I-May 31 0.55 (or until spawning has end&)
page 21 of 29
- - - - - - - -* _ . - -a- -

SAMPLING s m NOS. INDEX YEAR
SOURCE LOCATION (I-AIRKI) PARAMETER DESCRIPTION N P E TYPE DATES VALUES
SUfS.UN MARSH "I PRESENT OBJECTIVES
Sncrnrncnto Rivcr nt Chipps Island
Sncmmmto Rivcr at Collinsville
Mnntcmmn Slnr~gh nt hlims Landing
h4ontaumn Slough at Cutoff Slough
Montcmma Slough ncnr mouth
Srrisun Slough J00 R south of Volnnti Slough
Sui.wn Slough ncar mouth
Girdrdvcar Slough soutlt o f Pierce Hnrhor
Cordcl~i Slough above S. P. R. R. crossing at Cypus
D- I0 E l~ t r i cn l Con- hlnx 28-day running average 0-1485 I Oct /-May 31 12.5 RSACO75 ductirity (EC) of mean daily, in mmhos (Water Year) ------- excepl for -------. .-
D/C O c t l - D ~ 3 1 15.6 only ifprqrpCts arc taking dcficicncics in schedrrled uvttcr supplies
C-2 Electrical Con- RSACOSI ductivit-v (EC) S-mid)
SLMZUZO S-18
SLMZUIO D-7(near) SLMZUOI
S42 SLSUSIZ S-36 SLSUSOI S-35(0ldd) SLGYR02 s-33 SLCRDOS
hlonthly average o f both daily h*h tide values not to excccd the values shown. in mmhm (or demonstrate that cquivale-nt or hdter protection will be provided at the location)
0-1485 All Oct (Watcr Year) (effective Nov
Oct1.1984) Dm Jan Fell Mar A P ~ hlay
Stntim rrrrmhcrs werc incorrect in 0-1485. these are rlre comxtd numbers.
page 22 of 29

rm 5-5(cont.) A L T E R N A T I V E W A T E R Q U A L I T Y O B J E C T I V E S ] FISH A N D WILDLIFE ]
SAMPLING SilE NOS. INDEX YEAR
SOURCE LOCATION (I-AIRKI) PARAMETER DESCRlFllON TYPE TYPE DATES VALUES . i:::::j,:.' "'. . ' .".. '...'..:<::*:::::i" .:.:. . . . . ,., . :.;,.- . . . ,,:; . . . .,.:.:,:.:. . ::.: :.: .:+:.:. ,::S .U;*~'U:;#:::.~ #K& MJ3i:~~!i#if:$::.;.ijglii:;~,.',', :' .,;:.;:,;:.:l'i ........ .... .."... ?:.: i.. :.:.:.:.:... , .:.. ; ..,, :.,. ..,, ...... ... ... ......... , ,., ,, , , ,,y .:( ...,,. .,, . . . . . . . . . . . . .
PRESENT OBJECTIVES (cat) Amended Sacrnmcnto River nt C-2 Electrid Monthly average ofboth daily 0-1485 All Od D- 1485 Collinsvillc RSACO8l Conductivity (EC) high tide values not to exceed (Water Year) (eflective Nov
Montezumn Slough nt Sa4fnew) the values shown, in mmhos Oct 1,1988) Dec Nntionnl Stecl SLh4ZU2.5 (or demonstrate that equivalent Jan
Moittezuma Slough near ,949 or better protection will he Feb Beldm Landing SLMZUII provided at the laxtion) Mar
Chadhumc Slough st Chndbournc Road @-)
And Cordelin Slough 50 /l west
o f S. P. R. R. cros~ing at Cygnus or
C / I ~ ~ & O U ~ ~ I C SIOUR~ Clu~dhoumc Road (prgosod)
and Cordclla Slough at CorddL
Goodyear Ditch @ropsed)
S-2l(pmp.) SLCBNI
S-33 SLCRDW
S-2l@rop.) SLCBNI
S-97@rop.) SLCRD06
Electrid h4onthly average o f b t h daily D-1485 All Conductivity (EC) high tide values not to exceed (Water Year) (eflectt'vc
the values shown. in mmhos Oct 1,1991) (or demons?mte that equivalent or better protection will k provided at the location) or
All (c ffective
Oct 1,1993)
oa Nov Dee Jan Feb Mar A P ~ May
Gnodyeor Slough at S-35(new) Electrical Monthly average o f both doily 0-1485 All OU 19.0 Alorrow Islnnd SLGYRO3 Conductivity (EC) high tide values not to excad (Water Yew) (c ffective Nov 15.5 Clubhou.~ thc values shown, in mmhos Oct 1.1 991) Dcc 15.5
or (or demonstrate that equivalent or Jan 12.5 Gtd-vwr Slouglr, 1.3 mi S- 75(old) or better protection will be All Feb 8.0 soctth d A 4 o m w Island SLGYROQ provided at the location) (e f l i i v e Mnr 8.0 /Drninn~c/ Ditch nt Piercc Oc11.1994) Apr 11.0
.---------------------------------------- May 11.0
page 23 of 29
- - - - - - - - - - - - -
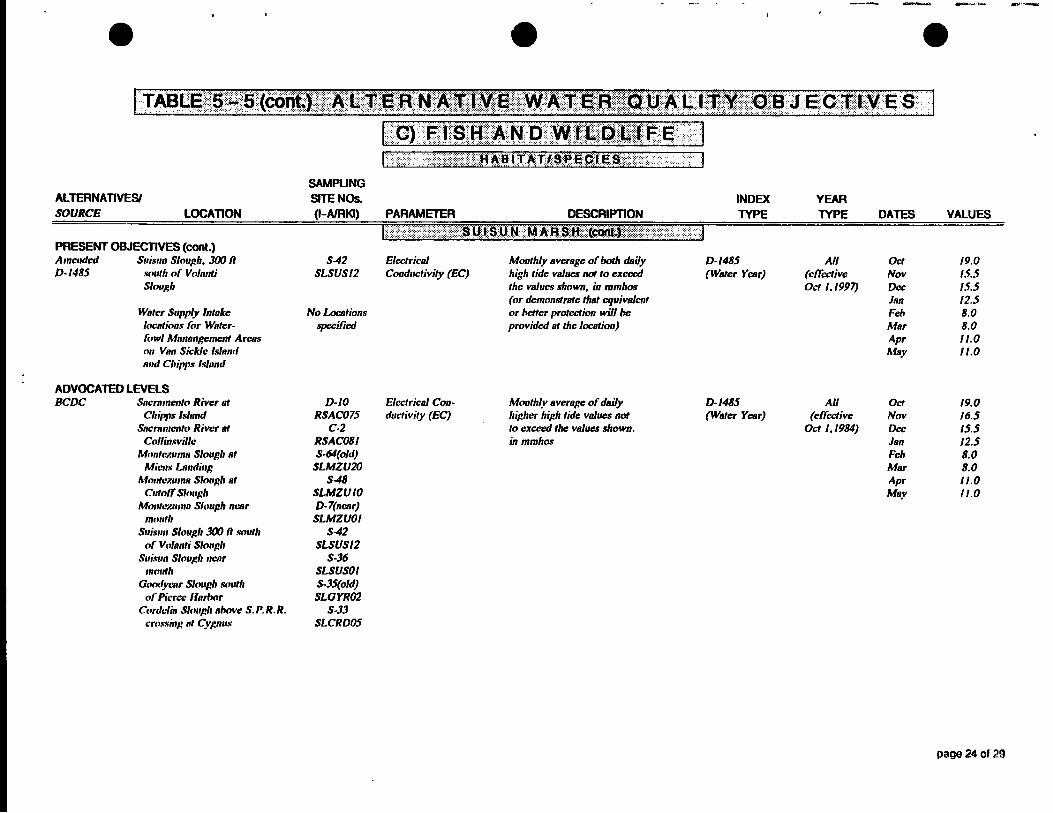
[TABLE:~.- ' :~(co~~;) . A L f ERNATl..vE: W A T E , R T Q U A L I T Y : O ECEI',VES ] ...
. . . .
' c ) F1'SH A N D WI.LD.LIFE 1 HAEITAT!,
-, .... . . ....-
SAMPLING sm NOS. INDEX YEAR
SOURCE LOCATION (I-AIRKI) PARAMETER DESCRIPTION TYPE TYPE DATES VALUES
PRESENT OBJECTIVES fcont.1
Watcr Supply Intake locations for Water- fowl Mnnangement A m s on Van Sickle Island and CItipps Islnnd
ADVOCATED LEVELS BCDC Sncramnento Rivcr at
Chi* Islnnd Sncrntnento Rivcr at
Cdlinsvillc Montcmmna Slough at
Micnx Landing Afntrtczurna Slough at
Cutoff Sl~~ugh Montcirumn Slough ncor
mocrtlt St~isttn Slough Jo It .wtmth
o f VVolsnti Slottgh Suiscmn SlougIt nenr
mt~uth Gmlywr Slough s01rth
of' Picrcc I f a h r (li~rdclia Slocrg11 nhvc S. P. R. R.
crossing nt C-vgnus
S-42 Electrical Monthly average ofhoth daily D- 1485 All Oct SLSUSIZ Condttctivity (EC) high tide values not to exceed (Water Year) (cfla?ive Nov
the values shown, in mmhw Oct1.1997) Dec (or demonstrate that equivalent Inn
No Locations or hener protection will be Feh spailied providd at the location) Afar
A P ~ A fay
D-I0 Elcdrical Con- RSACO75 ductivity (EC)
c-2 RSAC08I S-64(0ld)
SLMZUZO S48
SLMZUIO D-7(nenr) SLMZUOI
S42 SLSUSl2
$36 SLSUSOl S-35(0ld) SLGYRM
s-33 SLCRDO5
Monthl-v average of doily higher high tide values not to excced the values shown. in mmhos
D- 1485 All 013 (Water Year) (effccfive Nov
Oct1.1984) Dcc Ian Feh Mar A P ~ Msv
page 24 of 28

SAMPLING SITE NOS. INDM YEAR
SOURCE LOCATION (I-AIRKI) PARAMETER DESCRlPnON M P E TYPE DATES VALUES
SUfStrN MARSH Icm.3 2 ADVOCATED LRlELS (cont.) SMPAI 131 "Normal Stn~iJBrds *
and "Dclieiency Stnndards "
. - Monitoring Stations same as lbr Amended 0-1485
Electrical Monthly mean ofboth Conductivity (EC) L i l y high tide values
in lnmhos
0-1485 Normal Oct (Water Year) Standards Nov
Dec Jan Feh Mar
APT May
POTENTIAL OBJECTIVES Amcndcd Sncrnn~~nto Rivcr at C-2 Electricnl hlonthly average of lnth daily Not applicable
D- I485 C ~ ~ l l i t ~ s ~ ~ i l l c RSACO8I Co~~ductivity (EC) high tidc values not to exceed Ab~ntczumn Slough nt S-&#(new) the values shorn, in mmhos
Nntional S t d SLMZUZS (or demonstrate that equivalent hlt~ntcztrmna Slough near ,949 or better protection will be
Rcltk~n Lnridin$ SLMZUI I provided at the loeation)
Dcliciency Oct Stltndards Nov
Dcc Jan Feh Mar A P ~ hlny
All Oct
(effecfiyc Nov Oct 1.1988) Dec
Jan Feh Mar
A P ~ Mn-v
page 25 of 29

EBLE 5-5(cont.). . A L T E R N A T I V E . W A T E R Q U A L I T Y O B J E C T I V E S ] P
-. . . ..
1.k) FISH..:AN D W I L D L I F E
INDEX YEAR SOURCE LOCATION a-AIRKn PARAMETER DESCRIPTION NPE TYPE DATES
-
S U I S U N MARSH (COnf.) 1 POTENTIAL OBJECTlVES (cant.) Amended C/rndl)ourne Slorrgh at D-1485 Cl~ndhourne Road (propscd)
and Cordclia Slough 500 fi west
o f S. P. R.R. cmcing at Cygnus
or Clrnchuntc Slouglr at
Clrndbournc Rmd (pro@)
and Cordclin Slough at Cordelin
Gm@vcar Ditch (prop.Fod) ......................................... GcwXrycnr Slough at
hlorrow Ix/and
Cluhhousc or
Gmdycar Slorrxh. 1.3 mi
xrtrth of Morrow Islar~d
/ Draitingcl Ditch nt Pierce
Soisrtn Slough. 300 I? arrrtlr o f Volnnti
Slortgh
\VIIIC~ Srrpp[v lntnkc h~ i t r i t r ~ r~ for Wntcr-
litwl Afffrrnt~geti~t-r~t Arc.rts c rr \'IIO Sia.k/c. Isl~trrd
S-Zl@mp.) Electrical SLCBN I Conductivity (EC)
S-2 I (prop.) SLCBNI
S-35(ncw) Elcctr id SLGYR0.3 Cottdttctivity (EC)
SJZ Elcctriical
SLSUSlZ Corrductivity (EC)
hlcmthl-v average of both L i l y
high tide values not to e . x d the values shown, in mmhos (or demonstrate that equivalent or hcttcr protection will be provided at the location)
Morrth[v average of hoth L i l y high tide values not to exceed
the values shown, in mmhos (or demonstrate that equivdent
or better protection will he provided at the location)
hfo~rtltl~v ovcragc of hoth &illy high tide values not to excccd the valrres shown. in mmhos
(or demonstrate that equivalent
or better protection will he providcd nt the location)
Not applicable All Oct (c R i i v e Nov
Octl.1991) D w Jan
or Feh AR hlnr
(L-Izccfive .4pr
Oct 1.1993) hlav
Not applicable All (c ffxtive Oct 1.1991)
or
All ( eB ' i ve
Oct 1.1994)
Not applicable All (c Rcctivc
Oct 1.1997)
Oct
Nov Dec Jan
Feh Mar
A P ~ Ma-v
Oct Nov
D e Jnn Feb
h4nr
.4pr
A fily
VALUES --- .-
page 26 of 29

SAMPLING W E NOS. INDEX YEAR
SOURCE LOCATION (I-AIRKI) PARAMETER DESCRIPTION MPE MPE DATES VALUES
1 OTHER TIDALh4AR6HES 1 PRESENT OBJECTlVES
None specified
ADVOCATED LEVELS BCDC Srrisun Bay at Mdr tna
Srristrn Slough at mouth
Srrisrrn Bay at Seal Islands (Part Chicago)
Sncramcnto River at Clril~ps Island
POTENTlAL OBJECTIVES . Suisrrn Bay at Martinez
0 -6 Electricd Con- RSAC056 cluctivity (EC)
S-36 SLSUSW
D-2 RSAC063
D-I0 RSACO75
0 -6 El~rtrical Con- RSAC056 ductivity (EC)
Montl~ly average of L i l y I~jglrer high tidc values not to cxcced the valuec shown. in rnrnhos
Monthlv average of daily B~j$er high tide values not
to exceed thc valucs shown.
in rnmhos
0-1485 .411 Feh (Watcr Year) exccpt Mar
C Apr May
D- 1485 All Feh (Water Year) cxcc-pt Mar
C Apr
May
page 27 of 29 - - - - - -0- -

I [ I ] Exact location of diversion point is yet to be determined; West Canal at mouth of Clifton Court Forebay is a possible alternate diversion point.
I 121 The Cache Slough objective to be effective only when water is being diverted from this location.
I [3] EPA safe drinking water maximum contaminant level.
I [4] To prevent exacerbating potential problems with THMs and other DBPs.
I [5l When no date is shown, EC limit continues from April 1.
I [6] Many participants made recommendations that are not quantifiable.
17) Exact value chosen in the indicated range depends on a number of factors and conditions, e.g., Sac. Basin Four-River Index, deficiencies in entitlement deliveries, season, etc.
I [8] A water right permit term is a standard not an objective.
I 191 Objective applies to all seven South Delta stations identified by SDWA.
[ I 01 South Delta Agriculture objectives will be implemented in stages; two interim stages and one final stage. The first interim stage will be implemented with the adoption of the WQCP, the second interim stage by 1994, and the final stage by 1996. lnterim Stage 1 - 500 mgll mean monthly TDS all year at Vernalis. Interim Stage 2 - (to be implemented no later than 1994) 0.7 mmhoslcm EC April 1 to August 31, 1.0 mmhoslcrn EC September 1 to March 31.30-day running average, at Vernalis and Brandt Bridge; with water quality monitored at three current interior stations - Mossdale, Old River, near Middle River and Tracy Road Bridge, and an additional interior monitoring station on Middle River at Howard Road Bridge. Final Stage -- (to be implemented no later than 1996) 0.7 mmhoslcm EC April 1 to August 31,l.O mmhoslcm EC September 1 to March 31,30-day running average, at Vernalis and Brandt Bridge on the San Joaquin River; with two interior stations at Old River Near Middle River and Old River at Tracy Road Bridge. Monitoring stations will be at Mossdale at head of Old river and Middle River at Howard Road Bridge.
OR If a three-party contract has been implemented among DWR, USBR and the SDWA, that contract will be reviewed prior to implementation of the above and, after also considering the needs of other beneficial uses, revisions will be made to the objectives and compliancelmontioring locations noted above, as appropriate.
(1 11 Controllable water quality factors are those actions, conditions, or circumstances resulting from human activities that may influence the quality of the waters of the State, that are subject to the authority of the State Board, or the Regional Board, and that may be reasonably controlled. Based on the record in these proceedings, controlling temperature in the Delta utilizing reservoir releases does not appear to be reasonable, due to the distance of the Delta downstream of
page 28 of 29

reservoirs and uncontrollable factors such as ambient air temperature, water temperatures in the reservoir releases, etc. For these reasons, the State Board considers reservoir releases to control water temperatures in the Delta a waste of water; therefore, the State Board will require a test of reasonableness before consideration of reservoir releases for such a purpose.
(1 21 Only the April 1 Sacramento Valley 40-30-30 lndex value shall be used to determine whether the relaxation provision will be in effect in any particular year. Determination of the April 1 lndex value shall assume normal precipitation conditions for the calculation of the April to July Four River Unimpaired Flow.
[ I 31 Suisun Marsh Preservation Agreement: 1 (9 ... Deficiency Period" shall mean (1) a Critical year following a Dry or Critical Year;
or (2) a Dry Year following a year in which the Four Basin lndex was less than 11.35; or (3) the second consecutive Dry Year following a Critical Year.
l(r) ... "Critical Year" and "Dry Year8 are also defined as in Footnote 2 of Table II of 0-1485 except that runoff for the remainder of the water year shall be assumed to be equal to the lower value of the 80 percent probability range, as shown in the most recent issue of Bulletin 120, "Water Conditions in Californiaw.
page 29 of 29

I I
i
, . 6.0 EVALUATION OF ALTERNATIVE WATER QUALITY OBJECTIVES
I 6.1 Introduction
In Chapter 5 potential objectives for sal ini ty, temperature and dissolved oxygen were developed to protect the beneficial uses made of Bay-Delta water. In this chapter, the adequacy and reasonableness of the potential objectives are evaluated to determine if they or other objectives should be developed by the State Board.
CEQA requires that cumulative impacts be addressed and that a1 ternatives to the project being analyzed be considered. In this case the project is the adoption of a water qual ity control plan to address the direct effects of sal inity, temperature and dissolved oxygen. The State Board's total planning and regulatory processes include consideration of a much broader suite of alternatives than those which fall within the scope of this Plan. The record clearly shows that an important means of helping protect beneficial uses and mitigating for the effects of development is by setting instream flow requirements. Flow standards address problems other than the direct effects of salinity, etc. Therefore the Board has elected to set them in the subsequent broader phases of this process. In order to comply with the spirit of CEQA and to help set the stage for the Scoping and Water Right phases, the State Board has reviewed the effects of differing flow regimes to a limited extent. The results of the analysis are presented herein for informat ion and guidance. A detailed analysis of.flow regimes will be done during the Water Right Phase of these proceedings.
Water Code $13241 requires that the State Board consider, at a minimum, the following factors when establishing water quality objectives:
1) the past, present, and probable future beneficial uses of water; 2) the environmental characteristics of the hydrographic unit,
including the quality of water available to it; 3) the water qual ity conditions that could reasonably be achieved
through the coordinated control of a1 1 factors which affect water quality in the area;
4) economics considerat ions; and 5) the need for developing housing within the region.
- The State Board has reviewed the beneficial uses designated for Bay- Delta waters that are included in the Basin Plans for Regions 2 and 5 and finds that the designations are still appropriate.
- The environmental characteristics of the hydrographic unit can be found in Chapter 3 and Appendix 3.0 of this Plan. The State Board took those characteristics into account in developing possible water quality objectives.
- "The coordinated control of all factors" is discussed in the implementation program found in Chapter 7.

- The only direct economic consequences for which any evidence is forthcoming are the costs of changing leaching practices for Delta agriculture; this analysis is in progress. For reasons which are summarized in Section 6.7, all other economic effects were analyzed using water availability as an indicator of economic cost. These discussions are found in the evaluation of each alternative.
- Protecting the quality of waters designated as M&I svpplies is an essential part of meeting housing needs within the Bay-Delta watershed and export areas.
6.2 Water Qua1 ity A1 ternatives
Several specific objectives have been chosen for consideration in this chapter, ones that cover a broad range of possible protective measures; they represent a 'framework' or 'set of 1 imits' within which alternative mixes of objectives can be compared. Some indication of the protection offered by intermediate alternatives can in this way be provided.
Table 6-1 contains a list of seven potential sets of water quality objectives for the Delta. The alpha-numeric code under the number of the alternative refers to the operation model run (DWRSIM) which was used to evaluate the relative water supply effects of the alternative. The State Board selects Alternative 3 based on the following discussion in this chapter.
The a1 ternat ives were evaluated using DWR' s Planning Simulation Model, DWRSIM, a generalized computer model designed to simulate the operat ion of the CVP and SWP project reservoirs and conveyance facilities. These operation studies are conducted on a monthly time basis and use the historical 57-year hydrologic sequence of flows from water years 1922 through 1978. In addition, these studies account for system operational objectives, physical constraints, statutes, and agreements. These parameters include requirements for flood control in system reservoirs, hydropower generat ion, pumping plant capacities and 1 imitations, and Delta operations to meet water quality objectives. A more detailed description of the DWRSIM model as we1 1 as the operations criteria used in the studies is presented in Appendix 6.1, Analysis Assumptions for Water Supply Impacts.
Operation studies are run with adjustments to the combined CVP-SWP system only. The local non-project reservoirs upstream of the Delta and the CVP Friant Reservoir on the San Joaquin River are pre-operated or have a "predetermined" operation throughout the simulation period. They are not operated to meet Delta objectives. Therefore, the combined CVP-SWP system acts as a surrogate to reflect water supply consequences of the alternatives on a1 1 users in the watershed.
Currently the operations study is not designed to analyze the water needed to meet water qua1 ity objectives for interior stations of the south Delta, nor is it designed to analyze the water distribution effects of the interior Suisun Marsh objectives. Until the Suisun Marsh hydrodynamic and sal ini ty models presently being developed by DWR are completed, any prediction of the effects of changing the interior marsh objectives on Delta outflow (as measured at Chipps Island) or on water exports must be used with caution.

TABLE 6-1
ALTERNATIVE SETS OF WATER QUALITY OBJECTIVES
I t 1 Tho lettor/mbor comblnaflon In parentheses bebw the alternatke numben Identify the corresponding tMm opcratlon study. 171 Chloddm (CI). Bromldes W, Total Wsso lved Solids (TDS), Wssulved Oxygen (DO) In mgll :: Electrical ConductMly (EC) In mmhoslcm :: Tevnperature In degrees Fahrenheit (F). 13) Nlernalhfc &so Includes a goal 010.15 mgll branldes. whkh Is approximately equhralent to 50 mgn chloddes. Thls goal. however. was not modeled 8s part of alternative 3. 141 Qmraliort shldlos W. K7. and N7 usl, an MBI objecthre 01 40 mmhodcm chlorides to provide an operational bufler. [bJ Oprallon shrdy L7 Includes a 1.7 mmhoslcm EC leachlng provision, whlch Is not part of Altemathm 2. LEGEND, 0 SEI-ECTED 16) At Vvrn;i.lls: 450 r n g T1)9 = 0.775 mmhos/crn EC; 500 mgn TDS = 0.860 mmhodcm EC. ALTERNATNE 171 Ttn~ c~lli~nate Sotlihcm Dona agricultural ob)ectives MI be phased In through 1996. The obhthres and lacatlons may be revised as the Board deems appropriate. [fll Ihe Cmpc?r:ctllrc wals and Interior Sttlsun Marsh and dissolved oxygen objectives were not included in the operation studies due to a lack of adequate analytic m o ~ l ~ n g tools. 191 Paw! ;dlcm;dhrc?s nlsn irtclurlu o tdologlcnl associsrml.
1101 NI lbgknlid tb;ttrl ob,juclhrou rc!rtt;dr~ in effa~t lor all alternnlii.

At this time, only rough estimates of a projected salmon survival index can be made, based on general assumptions of flow and temperature. The abi 1 ity to analyze the impacts on salmon from the model runs is limited. Therefore, the discussion of the alternatives is a comment on the relative benefit or impact of a particular alternative on the Chinook salmon.
Water Supply Impacts
The "water supply impacts" of the alternatives are defined as the change in base flows and exports caused by the implementation of the alternative sets of water quality objectives. The base condition, Alternative 1A in Table 6-1, incorporates a present (1990) level of development operations study that uses the water quality objectives of the 1978 Delta Plan, the flow requirements of 0-1485, and Bureau Agreement on the New Melones Reservoir as the controlling Delta criteria.
Table 6-2 presents the water supply consequences of the seven alternative sets of water quality objectives shown in Table 6-1. The water supply impacts are analyzed in terms of the following factors:
o San Joaqu in River Inflow o Sacramento River Inflow o Total Delta Exports o Other Flows/Diversions o Total Delta Outflow
Figure 6-1 shows the water supply parameters used in Table 6-1.
The Table 6-2 results are presented on average annual and Apri 1 through July bases for the 57-year hydrologic period 1922 through 1978 and the critically-dry hydrologic period May 1928 through October 1934. Figures 6-2 and 6-3 graphically show the 57-year average annual. water supply results from Table 6-2. The values shown in Table 6-2 and Figures 6-2 and 6-3 represent the combined effects of the water quality objectives and the new 40-30-30 water year classification. Positive values indicate - an increase in flow or export; negative values indicate a decrease.
The following discussion includes, for each alternative, a short summary of the model results presented in Table 6-2 and brief comments on the reason(s) for any changes from the base condition. The statistical significance of these results cannot be determined.
It must be recognized that the impacts shown on Table 6-2 and Figures 6-2 and 6-3 and discussed in the following pages do not include the potential impacts on water supply of meeting any changes in current Suisun Marsh objective, the revised Antioch relaxation provisions for striped bass or the objectives for interior stations in the south Delta. Each of these objectives could cause a reduction in water available for other beneficial uses. When the impact of one or more of these objectives is known, the State Board will review such objectives for reasonableness and amend them, if necessary.

TABLE 6-2
WATER SUPPLY IMPACTS OF THE
ALTERNATlVE SETS OF WATER QUALW OBJECTIVES
Foomomx
111 c h a w a tmw conditions - ~ a n s t l v e minus ~ a w ; POSIUW dues incocare an I ~ W in now or srpoh LEGEND: 121 The IemnInumbar comblnallon In pmntheew below Iha atternauw numhrs kientlfy the cmraspondlng DWR operation shrdy.
The temperatwe goals and lntcrloi~ulsun Marsh and QssoEHtd o n y p *Was not 0 SELECTED Included In lha operanon studam due to a bclc d adequare analytlc modsang tools. ALTERNATIVE
p] Alternative 18 18 the bass cam ((A) with lha ner 40-30-30 water year classtlication. 141 The ultlmab, 8wthan Della w l O be phased In lhrough 1898. Tha obpclhm and locatlone may be redsed as lhe Board deems apprmte . 151 Opefation shrdies P7. K7, and N7 use an Mall obJecnU, d 4 0 mgn chlorldas to provide an operanonat bmer.
PI. KI, and N7 Include baw Dalta outflows d 3500.8000, and 8000 ds. mspeehely. [el Tom1 Delta E m s Include COnbO Cosm Ulnal. Nmh Bay Aquaduct. and Banks and Tracy Pumplng Aanb. 171 Other FlorrslDlnnstons Include Net Delg Consumptlvs Use. CIly d V-0 dhrerslons. Vclo Bypass Inflow, and Earn Sde Streams Inflow
The Base Condnons Mlues are -ha when the Nal Consumpha U w plus lhe Wly d Vaqo divnslons are mlef than lhe Vclo Bypass Inflow plus Ute Easl Side Sbeams Inflow.
[el TU b i t e o u m ~ equals um San .toam River tnnow + Sacramento ~ h a r Innow - ~ o m i 081m ~xports + other Flowcm~ersons.
WATER SUPPLY P-METER - -
ALTERNATM NAME
- ----- Average - - - - - - -
Sen Joaquin River Inflow SacramentoRiverlnflow TotalDeltaExports [el Other Flows/Diversions171 --------I--------------------
Total Deltaoutflow [el
Critically-Dry Period --
San Joaquin River Inflow Sacramento Rhrer lnflow Total Delta Exports [el Other Flows/Diversions[7~ ---_--- -I-I- Total DeltaOutflow [el
BASE CONDITIONS
A ) _ _- 0-1689 BASE
Annual1
1996 624 15624 5087 6295 1762 1652 -21 1
----- ---------- 12977 3738
1153 315 8890 3141 5290 1448 -726 -645
---------- 4027 1363
CHANGE IN BASE CONDITIONS NEEDED TO MEET OBJECTIVES (TAF) (11
ALTERNATIVE [z]
1 A -- - ~ A L
BASE
~ p r - ~ u ! _ _ ~ ~ n u a ! L - e ~ u ~
0 0 0 0 0 0 0 0
------- ------- 0 0
0 0 0 0 0 0 0 0
-------. _I
0 0
1 B (sl, R BASE Wl40-3040
Annuall
0 0 -6 -16 4 1 0 0
------a ------ -10 -17
0 0 -21 -23
6 1 0 0
--- ------ -27 -24
2 -- A%- 290 CCU15 WAG
Apr-~ul--~nnuall A ~ J U I
0 0 -9 -73 50 20 0 0
------- ----I-- -59 -93
0 0 4 7 -36 63 12 0 0
---- ------- -110 -48
3 I 9 DEL A W T SP
Annuall AWJUI
1 21 -6 -37 -1 3 0 0
-- ---.---- -6 -19
-6 29 -18 -51 -1 1 -6
0 0 - --*-- -13 -16
4 . - 4 ~ ~ 4 a
50 BANKS PP
-@nualI A ~ J U I
1 21 -8 -85
-207 -57 0 0
--.----- ------- 200 -7
-6 29 -19 -190
-364 -147 0 0
---I- --- 339 -14
5 -- -(~1)--14?_51- SO CCU 44 M R SP
~ n n ~ l ] - A ~ - J ~ I
9 86 -8 -127
-399 -123 0 0
-------- -------- 400 82
58 91 -9 -223
-984 -393 0 0
1033 261
6 - 2 4 7 ) -14.31
R.T. 6 E l 3 M R SP
Annuall ~ p r J ~ I
150 290 -6 -179
-674 -224 0 0
--__-___ _______ 818 335
247 273 4 -183
-1078 -321 0 0
-------- ____ ____ 1321 411

FIGURE 6- 1
DELTA HYDROLOGIC SCHEME USED IN THE
WATER SUPPLY IMPACT ANALYSIS
SACRAMENTO RIVER AT SACRAMENTO /
DELTA OUTFLOW
CONSUMPTIVE USE OF
-. p~
MIN. REQUIRED
CARRIAGE
SURPLUS
STREAMS
EXPORTS
SAN JOAQUIN RIVER NEAR VERNALIS

FIGURE 6-2
AVERAGE ANNUAL WATER SUPPLY IMPACTS
SAN JOAQUIN RIVER INFLOW SACRAMENTO RIVER INFLOW
-100 . I 1A 1B 2 3 4 5 6
ALTERNATIVE
TOTAL DELTA EXPORTS
0: -1200 W
2 -1400
-1600 1A 18 2 3 4 5 6
ALTERNATIVE
-100 . 1A 1B 2 3 4 5 6
ALTERNATIVE
TOTAL DELTA OUTFLOW
ALTERNATIVE

FIGURE 6-3
. SAN JOAQUIN RIVER INFLOW SACRAMENTO RIVER INFLOW
CI 300 300
IL a 250 C u
5 250-
200 t u, 200- 0 C a 150 !k 2 150-
; 100 a
2 100- n > n 50 A
3 50- V) 3 K 0
O W C W s 2 -50-
3 -100
0 u-
-47
1A 1B 2 3 4 I I 1 I 5 -100 ,
6 1A 18 2 3 4 5 6 ALTERNATIVE ALTERNATIVE
TOTAL DELTA EXPORTS TOTAL DELTA OUTFLOW 400
0 1600
200 a 5 1400 t 0 V)
t 1200 V) t; -200 t; 1000
a n -400 2 800 ' -600 I > ,- 600 A 0 -800 n $ 400 2-1000 2 200
Z-1200 a w o I- C 2 - 1400 2 -200
- 1600 -400
ALTERNATIVE ALTERNATIVE
03/08/91

dlternative 1A. This is the base: it represents the 'present conditions ' against which the other alternatives are compared. The base conditions include the set of water quality objectives contained in D- 1485 (for more details, see Appendix 6.2, D-1485). Therefore, the model results show no changes from the base. Given the variety of locations and uses, our discussion of the alternatives has considered D-1485 objectives, special modifications used in the operations models, and actual conditions, as appropriate.
The current objectives protect striped bass spawning habitat only through May 5, and protection thereafter declines substantially in dry and critical water years because Delta Outflow Index requirements for protection of eggs and young are substantially lower. The experience of 1990 also shows that in extremely dry years when water deficiencies are imposed the expected maximum Antioch EC of 3.7 mmhos/cm was exceeded, and ECs exceeded 0.44 mmhos/cm at most locations in the central Delta spawning area and approached the present objective (0.55 mmhos/cm) at Prisoners Point.
Alternative 10 is the same as the base condition with the exception of the water year classification. The year type classification used in the water supply impact ana ysis is the 40-30-30 year type classification described in Chapter 3.1 A1 though the 40-30-30 classification does not have any adjustments , the special Decision 1485 subnormal snowmel t adjustment is retained for the reasons explained below. The subnormal snowmelt adjustment only applies to fish and wildlife flows when spring runoff from snowmelt is much less than normal. It is invoked in wet, above normal, and below normal years when the Apri 1 through July unimpaired runoff is 5.9 million acre-feet or less.
The Decision 1485 subnormal snowmelt adjustment and its flow requirements are retained in the operation studies for two reasons. First, the consideration of flow requirements has been deferred to the Scoping and Water Right phases of the proceedings. Second, the use of the 40-30-30 classification with the subnormal snowmelt flow relaxation maintains approximately the same level of flow protection for fish and wildlife as under Decision 1485. Elimination of the subnormal snowmel t adjustment would prematurely alter the flow requirements before the next phase of the proceedings and would compromise the intent to isolate the effect of the technical adjustment to the classification system.
The Water Year Classification Workgroup has reviewed operation study results to determine the relative impact of the flow reduction for subnormal snowmelt on Delta flows and exports. These studies show that the removal of the subnormal snowmel t flow requirements would increase the Delta outflow and reduce the critically-dry period exports (WQCP-DWR- 5 ,4 ) . During the critically dry period, the operations studies results show an average loss in exports of approximately 29 TAF, or a total of about 189 TAF (29 TAF x 6.5 years). During the 57-year period, the average annual export loss is about 20 TAF.
a I / The interim Suisun Marsh objectives were analyzed using the Decisfon 1485 water year type ~las~i f iCkI t iOnS, including the subnom 1 snowme l t adjustment.
6-9

Another "classification adjustment" examined in Chapter 3 is the "year following dry or critical year" relaxation. This relaxation was not included in the water supply impact analysis since the use of the 40-30- 30 classifitation without the "year following dry or critical year" relaxation maintains approximately the same level of flow protection for fish and wildlife as under Decision 1485.
The new year type classification has a relatively small effect; it allows decreases in the total Delta outflow during the 57-year dry and critically-dry periods by 10 and 27 TAF, respectively. The Delta outflow changes are also relatively small for the April through July periods.
These modest changes occur because the new classification shifts the average classification to a slightly drier condition.
The 40-30-30 water year type classification does not affect the flows past Vernal is on the San Joaquin River since, under the control ling USBR southern Delta Agreement, the south Delta agricultural objectives do not vary by year type. The new classification a1 lows for some decreases in Delta inflow from the Sacramento River Basin as well as some additional export from the Delta.
The addition of the 40-30-30 Water Year Index to the base case provides little change in protection for instream uses. As discussed above, the model runs retained the "subnormal snowmelt" category. If a complete 40-30-30 Index (without this category) were implemented some additional outflow would result. The deletion of the "year following dry or critical year" category theoretically would result in additional outflow. However, the new Index offsets this effect by including the previous water year in the formula, resulting in a reclassification of the current water year into a drier category compared to the base case. Thus the Delta outflow remains essentially unchanged. This may result in a small decrease in protection for spawning and for eggs and young after May 5 compared to the base case. The frequency of occurrence or severity of deficiency for the relaxation provision is probably not changed significantly under this alternative.
Further, like the basic condition, Alternative 1B retains the 150 mg/l chloride industrial objective for a portion of the year at the Contra Costa Canal intake. This was retained for evaluation so as to avoid exacerbation of public health hazards that may be caused by the formation of disinfection by-products when the water is treated. Alternative 3 has the same proviso.
Alternative 2 has four differences from the base condition including the use of the 40-30-30 water year classification. The M&I objective is 250 mg/l all year at the Contra Costa Canal Intake. The westernlinterior Delta Agriculture objective is 1.5 mmhoslcm EC for April 1 through August 15 at Emmaton and Jersey Point and adjusted to 3.0 mmhoslcm EC from August 1 through August 15 in critical years. The SMPA Suisun Marsh objectives are the deficiency standards: 12.5 to 15.6 EC, depending on the month, at Chipps Island.

6.2.2.1 Municipal and Industrial Impacts
Salinity - A 250 mgll chloride objective at the Contra Costa Canal Intake year-round would make paper industries unable, at times, to produce salt- sensitive products without some form of water treatment. The 1978 Delta Plan specified a chloride objective of 150 mgll for a portion of the year solely to protect the paper industries. However, the continued need of that objective is quest ionable because no evidence was presented indicating that such a need still exists.
6.2.2.2 THM Formation Potential
As new and pending drinking water standards take effect, the water quality objectives in Alternative 2 may result in negative impacts for purveyors of Delta water. These negative impacts may take the form of violation of state and federal drinking water standards for disinfection by-products. It is not possible to accurately quantify those impacts at present.
6.2.2.3 Agricultural Impacts
Western and Interior Delta - The 1.513.0 mmhos/cm EC objectives are based on the results of the interagency Corn Study. These objectives would allow salinity to increase during wet, above normal, and below normal years, and a decrease in dry and critical years in the western Delta. In the interior Delta the objectives would allow an increase in all but critical years, and decrease in critical years. There should be little or no effect on corn yield due to these objectives if adequate leaching is performed. However, the effectiveness and economic effects of additional leaching practices are not yet known.
Southern Delta - Same as base, no impact. 6.2.2.4 Salmon - Same as base. 6.2.2.5 Striped Bass
This alternative does not make any direct changes in striped bass protection, but may have indirect effects because of changes in the Contra Costa Canal and western Delta objectives. Reduced Sacramento River inflow and increased exports may have some negative impact on survival of eggs and young in most years. However, the increased protection for western Delta agriculture may provide some incremental increased protection in critical years, as is shown by the slight increased Sacramento River inflow in these years.
.6.2.2.6 Water Supply
This alternative would produce the largest reduction in total Delta outflow and, consequently, the largest increase in exports. This alternative would allow decreases in the total Delta outflow during the 57-year and critical ly-dry periods by 59 and 110 TAF, respectively. The corresponding increases in exports during the two hydrologic periods are 50 and 63 TAF, respectively.

These changes are caused by the modifications in the municipal and industrial objective and the westernlinterior Delta agricu 1 tural objectives.
The impact of the interior Suisun Marsh objectives specified in the Su i sun Marsh Preservation Agreement has not been quantified because of a lack of adequate f low/sal inity relationships.
Alternative 3 in Table 6-1 is the "Selected" alternative. Seven objectives in this alternative (in addition to the water year classification) differ from the base. The southern Delta agriculture objective is based on the UC guidelines for the water quality requirement of two important salt-sensitive crops, beans and alfalfa. The recommended water qua1 i ty for beans is an EC of 0.7 mmhoslcm from Apr i 1 1 to September 30; for alfalfa it is an EC of 1.0 mmhoslcm from October 1 through March 31. Export agriculture is set at an EC of 1.0 mmhos/cm in all year types. For fish and wildlife, the recommended objective for striped bass spawning at Antioch is an EC of 1.5 mmhoslcm from April 15 (with ramping) to May 31, or until spawning has ended (to be determined by monitoring), and 1.6 to 3.7 mmhoslcm in deficiency years. The other objectives for striped bass spawning are 0.44 mmhoslcm at Prisoners Point from Apri 1 1 through May 31, or until spawning has ended, and 0.55 mmhos/cm in deficiency years.
The recommended temperature objective for Chinook salmon is 68°F from April 1 to June 30 for the protection of fall-run Chinook smolts and from September 1 to November 30 for the protection of fall-run Chinook salmon adults both at Freeport on the Sacramento River and Vernal is on the San Joaquin River. A temperature of 66°F is specified from January 1 to March 31 at Freeport for the protection of winter-run Chinook salmon smolts and adults. The objective is subject to available "controllable factors" as defined in Chapter 5, Section 5.5. The dissolved oxygen objective is 6.0 mgll from September 1 through November 30 at Vernal is for the upstream migration of fa1 1-run Chinook salmon in the San Joaquin River.
Also, while the Suisun Marsh objective is the same as the base condition, a biological assessment is to be conducted. This assessment would include the tidal marshes and inventory of rare, threatened and endangered species habitat as we1 1.
6.2.3.1 Municipal and Industrial
Salinity - Same as base, no impact. Note that the 150 m 11 chloride objective for industry for a portion of the year was eva uated for the same reasons stated in Alternative 1B.
P 6.2.3;2 THM Formation Potential
Alternative 3 will not result in .any measurable negative or positive impact on THM formation over base conditions, assuming standard chlorination treatment is used.

6.2.3.3 Agriculture
Western a,nd Interior Delta - With the hydrologic conditions that have occurred and the leaching practices that have been used since 0-1485 was adopted, agriculture in the western and interior Delta has been maintained or enhanced under the base level of protection. This alternative retains this same level of protection and does not impose additional management or other economic costs on western or interior Delta farmers.
Southern Delta - The objectives were set to protect beans and alfalfa, based on University of California guide1 ines. However, allowable salinity levels were lowered to account for leaching limitations in the southern Delta. The impact of these objectives could be an improvement in overall growing conditions.
6.2.3.4 Salmon
Under Alternative 3 during the April through July period, San Joaquin River inflow would increase in average years; the Sacramento River inflow would decrease. The degree to which the increased flow would affect water temperatures in the San Joaquin River cannot be determined at present. A salmon smolt survival model based on spring water temperatures in the San Joaquin River has not yet been developed. The correlation that has been demonstrated -between spring outflow in the San Joaquin River and adult returns two and a half years later indicates that the increased flow in the spring months may improve conditions for the outmigrating salmon smolts in the San Joaquin River.
Using the smolt survival index for the Sacramento River (USFWS), based on average April to June flow at Rio Vista, and the flow computed under this alternative, the only year type in which average salmon smolt survival index would be greater than 0.50 would be in wet years. Above normal water years would provide an average survival index of 0.42 and the remainder of the year types less than 0.30.
The implementation of the dissolved oxygen objective has not been fully explored. Apparently there is at least one source of effluent in the vicinity which contains high BOD; the lack of natural circulation in the Stockton turning basin may also negatively affect the DO levels. A partial analysis est imat ing the flow required (September and November only) to change the dissolved oxygen level 1 mgll using a multiple regression analysis was submitted. Further analysis of the impacts of the water quality objectives will be made in the forthcoming proceedings. Several methods to improve DO levels besides increasing inflow are available including the traditional installation of the seasonal barrier in Old River.
6.2.3.5 Striped Bass
This a1 ternat ive provides direct increased protection for striped bass spawning compared to the base case. The period of protection is extended through May 31, which covers nearly a1 1 of the period of spawning on the San Joaquin River. In addition, the 3.7 mmhos/cm EC limit on the Antioch
relaxat ion provision should provide some small additional protect ion. The '
definition of deficiency will be re-examined in later phases of these proceedings; the frequency of the deficiency declaration, as well as the numerical salinity limits, will further define the level of impact on striped bass spawning.
Likewise, the change in the maximum EC at Prisoners Point from 0.55 to 0.44 mmhos/cm shou 1 d theoretical 1 y improve spawning conditions in this area. However, due to umbrella protections, water quality is almost always better than 0.44 mmhos/cm EC at this location. The State Board prefers specific protection rather than relying on umbrella protection. Also, the protection period has been extended from May 5 to May 31. The relaxation to 0.55 mmhoslcm EC during deficiency periods retains the base condition, and appears not to be exceeded (based on 1990 data), so there is no change in protection here.
The model run used to simulate Alternative 3 assumes some increase in San Joaquin River flow, little change in exports, reduced Sacramento River flow and reduced Delta outflow. The impacts on indirect protection for eggs and young under this alternative, as modeled, are unclear.
Potential Objective 2E in Section 5.6.3.2 for the Antioch relaxation provision cal led for a relaxation to 3.7 mmhoslcm EC whenever the Sacramento Val ley 40-30-30 Index was equal to or less than 4.8 MAF. This alternative was not modeled, and it is not included in Table 6-1. However, it is discussed here for informational purposes. Since it was designed to reflect actual or anticipated years of deficiency (1977, 1990, 1928-1934, etc.), the impacts of using this alternative should be essentially the same as Alternative 1B with a 3.7 mmhos/cm EC limit on the Antioch relaxation provision. Its substitution in Alternatives 3 through 5 should result in somewhat reduced protection because the Antioch value goes immediately to 3.7 mmhoslcm EC regardless of the amount of deficiency, rather than according to a sliding scale as in these alternatives and 0-1485. However, direct comparisons with these other a1 ternat ives are not possible because the definition and frequency of deficiency conditions have not yet been defined . 6.2.3.6 Water Supply
Without considering the potential impact of meeting the revised Antioch relaxation provision for striped bass and the interior objectives in the south Delta, and assuming that the existing Suisun Marsh standards are not revised, Alternative 3 would allow decreases in the total Delta outflow as shown in Table 6-2. This water is obtained by decreasing the total Delta exports and decreasing the Delta inflows from both the Sacramento and San Joaquin River basins.
The principal reason for the decrease in Delta outflow is the new 40-30-30 year type, which allowed for more water to be stored in the Sacramento River Basin.
The level of impact on water supplies of this alternative, not including the impact of the striped bass relaxation provision and the interior south Delta objectives, is less than 0.5 percent of the dry period exports of the CVP and SUP.

Alternative 4 is the same as Alternative 3 except for the M&I objective. Alternative 4 adds a bromide (Br-) objective of 0.15 mg/l (50 mg/l) C1 in all years at Banks Pumping Plant.
6.2.4.1 Municipal and Industrial
Drinking Water Quality - Salinity - The impact of setting a 50 mg/l chloride objective at Banks Pumping Plant will be to lower chloride levels at the Contra Costa Canal intake to less than 140 mg/l if seawater intrusion were the primary source of the chlorides. The chloride levels at the Banks Pumping Plant will be improved significantly; the lower salinity levels in SWP water delivered via the Banks Pumping Plant will enhance reclamation efforts and will improve the taste of the water and reduce corrosion.
6.2.4.2 THM Formation Potential
Alternative 4 will result in improved water quality, that is, less THM formation potential, over Alternative 3, particularly at the Banks Pumping Plant. This positive effect at Banks Pumping Plant may result in lower THM formation potential in the water at Rock Slough. It is not possible to quantify these impacts.
6.2.4.3 Agriculture
Western and Interior Delta - Same as Alternative 3 Southern Delta - Same as Alternative 3 6.2.4.4 Salmon - Same as Alternative 3 6.2.4.5 Striped Bass
This provides the same level of direct protection for striped bass spawning as Alternative 3. The indicated increase in San Joaquin River inflow and Delta outflow, combined with reductions in exports, may provide additional indirect protection for eggs and young even though Sacramento River inflow is reduced.
6.2.4.6 Water Supply
Alternative 4 is the same as Alternative 3 except for the additional 0.15 mg/l bromide objective at the Banks Pumping Plant to meet the trihalo- methane objective. The changes in exports and total outflow are shown in Table 6-2.

Alternative 5.is also the same as Alternative 3 except for a change in the M&I and striped bass objectives. This alternative changes the location of M&I bromide objective of 0.15 mgll to the Contra Costa Canal intake all year. It extends the location of the striped bass spawning objective from Prisoners Point to the area between Vernal is and Prisoners Point.
6.2.5.1 Municipal and Industrial
The 50 mg/l chloride objective at Contra Costa Canal will significantly reduce salinity levels at this intake. This will result in more improvement in water qua1 i ty than A1 ternat ive 4.
6.2.5.2 THM Formation Potential
Alternative 5 would result in more positive impacts for Delta water purveyors (less THM formation potential) than Alternative 4. It is believed that the chloridelbromide levels provided by this alternative would result in THM levels well below the current maximum contaminant level (MCL) of 100 parts per b i 1 1 ion (ppb).
6.2.5.3 Agriculture
Western and Interior Delta - Same as base Southern Delta - Same as Alternative 3 6.2.5.4 Salmon - Same as Alternative 3 6.2.5.5 Striped Bass
This alternative provides for expansion of spawning habitat beyond Prisoners Point to Vernal is , potential ly restoring access to spawning habitat formerly available in the upper San Joaquin River and its tributaries. The effects of deficiencies are the same as for Alternative 3. This alternative also provides additional protection for eggs and young because of reduced exports and additional San Joaquin River inflow. It has been hypothesized that a1 lowing spawning farther upstream wi 1 1 simply expose these eggs and young to entrainment, and other effects of the projects, through Old River. Even if some are lost by this method, there may still be a net increase in survival because of reductions in exports and reverse flows, since substantial spawning would still occur in the central Delta area where reverse flows and entrainment have substantial impacts. Given the recommendations of DFG, consideration of this a1 ternat ive wi 1 1 be deferred unt i 1 the entrainment quest ion of project operations is dealt with.
6.2.5.6 Water Supply
Alternative 5 is the same as Alternative 4 except for the additional 0.15 mgll bromide objective at the Contra Costa Canal Pumping Plant #I and the extension of the Prisoners Point striped bass spawning objective upstream on the San Joaquin River to Vernalis. The principal reason for the

increase in total Delta outflow is the increased carriage water needed to meet the 0.15 mg/l bromide (50 mg/l chloride) objective at the Contra Costa Canal. Like Alternative 4, the primary source of this additional water is from a corresponding reduct ion' in exports and/or reduct ion in upstream diversion and use.
The combined effect of the southern Delta agricultural objective and the Prisoners Point to Vernalis (0.44 mmhos/cm EC) striped bass spawning objective requires an additional 9 and 58 TAF, respectively, in the 57- year and critical ly-dry period flows. Since Alternative 4, which includes the agriculture objective and the Vernal is inflow, is independent of the change in exports, the differences in the Alternative 4 and 5 Vernalis flows represent the additional water needed for the Prisoners Point striped bass spawning objective. Consequently, about 8 and 64 TAF of additional Vernal is flows are needed to meet the striped bass objective during the average and dry conditions, respectively.
The overall water supply effects of this alternative are considered more ,
adverse than A1 ternative 4.
Alternative 6 includes the bromide objective of 0.15 mgll at the Contra Costa Canal Intake and changes five other objectives from the "Recommended" alternative. In the striped bass spawning objective at Antioch, the provision for the higher EC values during deficiency years (1.6 to 3.7 mmhos/cm) is deleted. It also eliminates both the provision for raising the EC during this period if spawning ends earlier and the ramping flow between April 1 and April 15. The striped bass spawning objective between Vernalis and Prisoners Point is changed to an EC of 0.3 mmhoslcm from April 1 to May 31. The Suisun Marsh wildlife objective is modified from the Alternative 3 to include the original D-1485 objectives. For the protection of the Tidal Marshes and Rare, Threatened and Endangered Species, an objective of 15 to 20 mmhos/cm EC is set from February 1 through May 31 at Martinez in all years. The final change is the Chinook salmon temperature objective. The water temperature in the Sacramento and San Joaquin rivers in the fall and spring is reduced to 66'F for the protection of fall-run Chinook salmon.
6.2.6.1 Municipal and Industrial
While.it is likely that this alternative would provide water quality equal to or slightly better than Alternative 5, the degree of improvement would be dependent upon the source of water to the San Joaquin River. Currently there is no model adequately sensitive to quantify the water qua1 i ty changes.
6.2.6.2 THM Formation Potential - See 6.2.6.1 6.2.6.3 Agriculture
Western and Interior Delta - While the objectives are the same as in Alternative 3, the "umbrella" protection provided by the other objectives is likely to provide water of lower salinity to the Delta agricultural areas. This should, in turn, reduce the need for leaching.
Southern Delta - See 6.2.6.3 6.2.6.4 Salmon
This alternative provides an increase in San Joaquin River inflow on the average during the months Apr i 1 through July. However, the Sacramento River inflow is decreased during this period. Therefore this alternative would probably not improve the temperature conditions in the Sacramento River in the spring but temperatures may be improved in the San Joaquin River. In addition, because total Delta outflow is increased over the base condition and exports are decreased, it is possible that salmon rearing habitat in the Suisun Bay would be improved and reverse flows and entrainment into the pumps may be reduced. These conditions should result in minor improvements for salmon.
6.2.6.5 Striped Bass
This alternative provides full protection for striped bass spawning from April 1 to May 31 from Antioch to Vernalis, with no relaxation provision. Substantial increases in San Joaquin River inflow and Delta outflow, combined with substantial decreases in exports, also would provide extensive additional protection for eggs and young, especially in dry and critical years.
6.2.6.6 Water Supply
Alternative 6 provides the largest change from the base conditions. The additional increase in required Delta outflow, compared to Alternative 5, is due to the tidal marshes objective at Martinez and the more stringent striped bass objective. The 57-year exports decrease by 674 TAF or about 11 percent. The critical ly-dry period exports decrease by 1078 TAF or about 20 percent.
The water supply impacts of the "original" Decision 1485 Suisun Marsh objectives, if met solely with Delta outflow, were estimated to be 2 mi 1 1 ion acre-feet per year in the 1978 Plan (SWRCB,3, VI-11). However, this estimate should be used with caution since no documentation was provided to support it. Furthermore, this estimate has not been re- evaluated to reflect the effect of the Suisun Marsh Salinity Control Gate or future Marsh facilities.
The 0.3 mmhos/cm Vernal i s to Prisoners Point striped bass spawning objective significantly increases the required Vernalis flow.
A comparison of the historical temperature data in the Sacramento River with the temperature objectives shows that, from 1978 through 1985, the five-day average temperatures are greater than the temperature objective of 66OF approximately 2 percent of the time in Apri 1, 23 percent of the time in May, and 79 percent of the time in June. A similar comparison for the San Joaquin River shows that the f ive-day average temperatures are greater than 66OF approximately 27 percent of the time in May and 43 percent of the time in June (WQCP-CVPWA-202).

6.3 Issues to be Considered in Establishing Water Quality Objectives
The imp1 ications of these alternatives are substantial, Any changes in salinity and temperature objectives can have pronounced effects on the economic health of California and on the protection of such resources as fish and wildlife. The total amounts of, and the parties responsible for fresh water flows in the watershed have yet to be determined. Attempts to model the effects of these factors is limited but improving rapidly. Any figures used to estimate the effects of these alternatives must be viewed with caution -- and with the commitment that these objectives can and must be a1 tered when appropriate.
6.3.1 Cumulative Impacts of Flow Alternatives
The overall approach to the flow objectives is to' provide increased protection for the salmon outmigration period and most of the striped bass spawning season, protecting both the adults and the young. The establishment and maintenance of the entrapment zone would be for the benefit of the Chinook salmon and the striped bass, as well as numerous other vertebrate and invertebrate species. It is recognized that a number of the parties are actively negotiating in an attempt to reach agreement on fishery protection measures. The State Board encoura es these efforts.
alternatives and other options which may be proposed. ? Any product of these negotiations will be evaluated a ong with flow
During the course of the proceedings, evidence was introduced stating that the addition of physical solutions, such as facilities, could greatly benefit the various beneficial uses of Bay-Delta waters. Evidence was also introduced that the most significant impacts to the fishery are due to the location, method, and timing of diversions, all of which affect instream flows.
As stated in Chapter 6.1 and to the extent discussed, two different flow a1 ternat ives were developed to analyze their water supply effects. One flow a1 ternat ive used the objectives developed for the selected Alternative 3; the other used the objectives developed for Alternative 6. The same flows were added to both. They range, depending upon water year type, from 2,900 to 30,000 cfs at Chipps Island for the protection of striped bass eggs and larvae; from 2,500 to 22,500 cfs at Rio Vista for salmon outmigration in the Sacramento River and from 500 to 14,000 cfs at Vernalis in the San Joaquin River; and about 15,000 cfs for placement of the entrapment zone around Chi'pps Island.
These additional flows would result in Delta exports decreasing by 800 and 983 TAF, respectively, while the San Joaquin River inflow to the Delta would increase by 575 and 300 TAF, respectively. These comparative estimates are based upon operation study outputs.
6.3.2 Operation Studies
In this evaluation, the effects of the potential objectives were compared insofar as possible with the existing condition, or base case. The a1 ternative objectives were reviewed for environmental impact, economic consequences and water cost.

One of the tools used in this analysis is the modelling results produced by DWR under the guidance of the operations studies workgroup. The model 1 ing results provide valuable insight into the effects of various objectives. There are important 1 imitations that must be recognized. The operations model generally uses the conditions of Water Right Decision 1485 (under which the CVP and SWP have operated for the past 12 years) as the base case. However, some changes have been made in recent months to improve the models, and a1 1 of the variations have not been rerun with the new assumptions. Further, the "1990 level of developmentu used in the model does not reflect actual diversions at this time. The model 1 ing for the San Joaquin Basin is not as refined as is the case for the Sacramento/Delta. In recent years salinity objectives in the south Delta have been specified in Water Right Decision 1422, but the modelling uses slightly different objectives, based on a USBR/South Delta agreement. Given the variety of locations and beneficial uses, our discussion of the alternatives has considered D-1485 objectives, special modifications used in the operations models, and actual conditions, as appropriate.
The DWR representatives most fami 1 iar with the models agree that their work products should not be used to attempt to quantify effects of changes in objectives precisely. However, it has been agreed that they are very useful in establishing the relative effects of various assumptions.
In summary, better information will become available as the efforts to refine the models continue. This will be true in the foreseeable future. Despite the limitations described above, there is no valid basis for delaying our evaluation or for deferring use of the currently available model runs as a primary tool in our analysis of alternatives (See Appendix 6.3, Operation Studies. )
6.3.3 Fish and Wildlife
We recognize the importance of the protection of aquatic resources which may be primarily dependent upon aquatic habitat in the Delta. However, the State Board has received inconsistent recommendat ions regarding one of the most obvious problems, i.e., striped bass. With respect to spawning objectives , DFG has recommended deferring act ions to restore this habitat to later phases of the hearing process, in part because it has concerns about the benefits which will accrue in view of possible large diversions of eggs and larvae to the SWP and CVP pumps via Old River. DFG does agree that expansion of appropriate habitat would be beneficial in the long run.
USFWS also recdgnizes that the benefits to striped bass which would be obtained by improving habitat at this time may be limited. However, it identified the issue as a water quality issue, and recommended establishing the additional salinity objectives at this time as a first step, to be combined with flows, diversion restrictions and/or physical f aci 1 ities developed in later phases to provide overall increased protection.

Various participants have argued that there is no evidence that striped bass spawning habitat is limiting, and that striped bass have been observed to spawn in water with salinity higher than 0.44 mmhos/cm EC. Laboratory tests also suggest that eggs can survive and hatch in higher salinity water (see Section 5.6.2.1). On the other hand, observations on other striped bass populations indicate that, given a choice, all prefer to spawn above the limits of seawater intrusion. In the San Joaquin River, upstream salinity barriers appear to inhibit their ability to move entirely out of the effects of ocean salinity. We agree that the evidence for whether spawning habitat is limiting for striped bass, and what the maximum allowable salinity might be, is not definitive, part icu 1 arly when comparing laboratory and field observations. However, we also recognize that spawning success, as measured by survival of eggs and young bass, is inextricably linked to the effects of flows, toxics, and other factors, so that distinguishing the effects of spawning habitat salinity alone may be impossible. Additional studies and data analysis on actual spawning conditions, spawning locations in different year types, and spawning success are sorely needed. We invite a1 1 participants to evaluate this question further, and we propose that a thorough review of this objective be undertaken at the next Triennial Review of this Plan (see Program of Implementation, Section 7.5.2.4).
Data supporting the 0.44 mmhos/cm EC are not without question and the data on the potential effects of extending the striped bass spawning protection from Prisoners Point to Vernalis are too inconclusive to warrant setting the potential objective as the water qual ity objective.
6.4 The Water Qua1 ity Objectives
The State Board be1 ieves that, on balance, the objectives contained in Table 6-3 (Alternative 3 in Table 6-1) best protect the beneficial uses of the waters of the Bay-Delta Estuary.
o Minor improvements are provided from the 1978 Delta Plan.
o The State Board did not hear any compelling testimony nor did it receive any exhibits indicating that major changes were needed in sal ini ty , temperature or dissolved oxygen water qual i ty objectives for the Bay-Delta Estuary.
o The 150 mg/l chloride objective is being retained in order to protect municipal water quality at present levels until more is known about the public health hazards of disinfection by-products.
o The objectives 'for agriculture continue the existing water qual ity objectives or the recognized agreements containing them.
o The change in the striped bass objective for Prisoners Point recognizes the existing condition in the area, setsla lower salinity objective to prevent degradation and extends the spawning period protect ion.
o This alternative will have some minimal effect on water distribution. Therefore, the economic impacts of this plan will also be minimal.

.. . : . . ' .'$ .. . . ' : .,.... .
' ... : ... - ' . . . 'TABLE:"6+3 . . .WAT.E'.R:QUA~ITY OBJE.C.T~V"ES . . ' I
SAMPLING SE NOS. INDEX YEAR
LOCATION (I-AIRKI) PARAMETER DESCRIPTION TYPE TYPE DATES VALUES
Contra Costa Canal C-5 Chloride (CI-) Maximum mean daily, in mgA Not Applicable All Oct-Sep 250 nt Pumping PIant N CHCCCO6
Contra Cosls Canal C-5 Chloride (CI-) M~ximum mean daily 150 mgfl Sac R No. of ohys each Cal. nt Pumping Plant #I CHCCCO6 chloride for at least the 40-30-30 Year < 150 mg/l CI-
- or - number of days shown during W 240 (66%) Snn Joaquin River st D- 12(ncar) Chloride (CI-) the Calendar Year. Must be Sac R AN 190 (52%)
Antioch Water Works Intake RSANOOI provided in intervals of not 40-30-30 BN 175 (48%) less than two weeks duration. D 165 (45%) (% of Calendar Year shown in C I55 (42%) parenthesis)
\V& Canal at mouth C-9 Chloride (CI-) M~ximum mean daily, in mgA Not Applicable All Oct-Sep 250 of CIiRon Court Forehay CH WSTO
'7' N
Dclta Mendata Canal DMC- I Chloride (CI-) Maximum mean daily, in mgA Not Applicable All Oct-Sep 250 h) at Tracy Pumping Plant CHDMCW
Cncltc Slough at City of C- 19 Chloride (CI-) M~ximum mean daily, in mgA Not Applicable All Oct-Sep 250 V~l lc jo lntnke 111 SLCCHl6
snd/or Barker Slough st Chloride (CI-) Mnxirnum mean Li ly . 15 mgA Not Applicable All Ocf-Sep 2H)
North 88-v Aquedtrct Intnkc SLBAR3
page 1 of 8
- - - - -a- - - - - - -

SAMPLING W E NOS. INDM YEAR
LOCATION (I-AIRKI) P A R A M m OESCRIPnON TYPE TYPE DATES VALUES
Sncrnmcnto River at E~nrimtm
San J q u i n River at J c r ~ y Point
0-22 Elcctrid Con- A4nximum 14dny running RSAC092 ductivi@ (EC) avernge of mean M y ,
in mmhdcm (mmhos)
D- 1.5 f?feCt~kIl/ c0n- M8xim~m /4-&y mmhg &C R RSANOl8 ductivity (EC) nverage of mean daily, h mmhm 40-30-30
0.45 EC April I to
Dnte Shown Aug. IS July I
June 20 June IS
--
0.45 EC April 1 to
Date Showr Aug. IS Aug. IS June 20 June IS
--
EC horn Dntc Shown to
Aug. IS 121 --
0.63 1.14 1.67 2.78
EC from Dnte Shown to
Aug. 15 121 -- --
0.74 1.35 2.20
page 2 of 8

SAMPLING SITE NOS. INDEX YEAR
LOCATION (I-AIRKI) PARAMETER DESCRIPTION TYPE TYPE DATES VALUES
< l , ; ~ ~ ~ # $ ~ ~ ; @ ~ # ~ & ; : g 2 ~ , : ::;*:$..::, . . . , . . . . . . . . . . . . . , . , . , . . . . . . . , , , . . . . . , . . . . , . . . . .
South Fork Mokelumne Rivcr C-13 Electrical Con- hfnximum 14-dey running Sac R 0.45 EC EC from Date nt Tcrminous RSMKLO8 ductivity (EC) ntrragc o f mean &i/y, in mmhos 40-30-30 April I to Shown to
Date Shown Aup. 15 121 W Aug. 15 --
AN' Aup. 15 -- BN Aug. 15 -- D Aug. 15 -- C -- 0.54
Snn Jnaquin Rivcr fit Snn Andreas Landing
C-4 Electrical Con- RSA NO32 ductivity (EC)
Mnximum 14-day running nvcrngc o f mean daily. in mmhm
Sac R 40-30-30
0.45 EC April I to
Date Shown W Aug. 15
AN Aug. 15 BN Atrg. 15 D Jm. 25 C -a
EC from Date Shown to
Aug. 15 121 --
page 3 of 8
- - - - - - -t , - - - - - -

- I TABLE 6-3 (corn.), W A T E R QUALITY OBJECTIVES I
SAMPLING !WE NOS. INDEX YEAR
LOCATION (I-- PARAMETW DESCRlPTlON MPE MPE DATES VALUES
(To be implemented by 1996) I31 1 Q S O O T H DI?&"~'A' f Snn Jonquin River at
Airport Way Bridge, Vcrndis Old Rivcr near
Middle Rivcr
Old River at
Tracy Road Bridge Snn lonquin River
at Brandt Bridge [sac]
c- I0 RSANI I2
c-8 ROLD69
P- 12 ROLD59
C-6 RSAN073
Yectrid Maximum 30-dsy running avcragc N d Appli~dhle All Apr I-Aug 31 0.7 Conductivity (EC) o f mean daily EC. in mmhos Sep I-Mar 31 1.0
or I f a th ra -paq wntract has I~cerr implemented among DWR.
USBR and the SD WA. that contract will he rcviewed prior to implementution of the alwve and, affer also considering the needs o f other henelicial uss. revisions will bc made to the ah@tives and compIi~Ee/monitorhg locations noted above. as appropriate.
West CBnal at mooth of C-9 Electrical Maximum monthly average of mean Nat AppIicabIc All Oa-Sq, 1.0
CIiRcm Court F h y -and- CHWSTO Conduch'vity (EC) dairy EC, in m m h
DsIta Mendabs Cad et DMC-I
Trac-v Pumping Plant CHDMCOW
page 4 of 8

SAMPLING SITE hJOs. INDEX YEAR
LOCATION (I-AIRKI) PARAMETER DESCRIPTION TVPE TYPE DATES VALUES.
DISSOLVED OXYOEN Snn Jaepum River hetween RSANOSO- Dissolved Minimum dissolved oxygen, Not Applicable All Sep I-Nov 30 6.0
Turner Cut & S t d o n RSAN061 Oxygen (DO) in mg/l
TEMPERATURE Sncrarnento River at RSACISS Temperature
Frcvport and
Snn Jaequin River at Airport C-10 Temperature Wny Bridge. Verndis RSANllZ
Sncrnmento River at Fr~wpnrt
RSACISS Temperature
Narrative
Narrative
Objsclve Not Applicable All " re el
Objxtive Not Applicable rVI ti /r F R 0,
h JI r1 W
Narrative Objocive Not Applicshle
The deqv nverepe water :mprsturc shall not he leveted hv co~rtrollable tctors above 68 deg. F -om the I Street Bridge to iecport on the Sacmrnento liver. and at Vernalis a the Son Joaquin River etween April I through gnc 30 and Scptemhcr I trough November 30 in all ater year t y p . ' 141
All 'Thc Li ly average water temperature shall not he elevated by controllable fictors ahve 66 deg. F frorn t11c I Strcct Bridpe to Frecprt on tlrc Sacramento Riwr hctwccr~ Janunty I through hfnrch 31. " [4]
page 5 of 8


1 1 .. . TABLE 6-3 (conf.) W A T E R Q U A t i T Y O .BJECTIVES
I &A'B~TAPf8PECIt?S SAMPLING SITE NOS. INDEX YEAR
LOCATION (I-ARKQ PARAMlETER DESCRlFllON TYPE M P E DATES VALUES
When the relaxation provision for Antioch spawning protection is in effect:
Son Jollguin River at: 0-29 Electrical Con- 14-day running average o f mean ' Not Applicable D&C Apr I-May 31 0.55 Prisoners Point RSANO38 ductivity (EC) daily for the period not more (or until spawning
than the value shown, in mmhos has ended)
In regard to the Suisun Marsh. the water quality objxtives for Suisun Marsh are unchanged from the 1978 Delta Plan. The implcmcntation vehiclc. Water Right Decision 1485 (0-1485). was amended in 1985 to clianpe (or delete) some monitoring stations and to w i s e thc schnlule lor implementation. The DWR. USBR. DFG, and Suisnn Resource Conservation District (SRCD) hnve signed and adnptcd a set o f three a~rccmenb concming the Suisun Marsh. These are the Suisun Marsh Preservation Agreement (SMPA). the Monitoring Agreement. and the Mitigation Agreement. The SMPA contains water quality standards for the managed marshes o f Suisun Marsh which the four signatoriee would like the State &wrd to adopt as water quality objectives. The SMPA also describes the physical facilities that the four signa- tories have agreed would serve the managed marshes in order to maintain production o f preferred waterfowl f d plnnts. The 7hecilities built so far. including the Suisun Marsh Salinity Control Gates @reviously called the Montauma Slough Control S(ructure), have changed the physical regime in the Marsh.
Revised water quality ohktives incorporating the SMPA (with any modifications necwitalad by the biological amemmart) will he adopted by the State Board aRer the biological nse,wmcnt (discusd in Section 7.4.2.6 o f the plan) is completed. Until that time. the water quality standards in the amended D- 1485 will continue to be implemented; see Table 1-2 for a summary o f theso standards.
page 7 of 8

FOOTNOTES:
[ l ] The Cache Slough objective to be effective only when water is being diverted from this location.
(21 When no date is shown, EC limit continues from April 1.
131 South Delta Agriculture objectives will be implemented in stages: two interim stages and one final stage. The first interim stage will be implemented with the adoption of the WQCP, the second interim stage by 1994, and the final stage by 1996. lnterim Stage 1 - 500 mgll mean monthly TDS all year at Vernalis. Interim Stage 2 - (to be implemented no later than 1994) 0.7 mmhoslcm EC April 1 to August 31, 1.0 mmhoslcm EC September 1 to March 31,30-day running average, at Vernalis and Brandt Bridge; with water quality monitored at three current interior stations -- Mossdale, Old River, near Middle River and Tracy Road Bridge, and an additional interior monitoring station on Middle River at Howard Road Bridge. Final Stage - (to be implemented no later than 1996) 0.7 mmhoslcm EC April 1 to August 31,l.O mmhoslcm EC September 1 to March 31,30-day running average, at Vernalis and Brandt Bridge on the San Joaquin River; with two interior stations at Old River Near Middle River and Old River at Tracy Road Bridge. Monitoring stations will be at Mossdale at head of Old river and Middle River at Howard Road Bridge.
OR If a three-party contract has been implemented among DWR, USBR and the SDWA, that contract will be reviewed prior to implementation of the above and, after also considering the needs of other beneficial uses, revisions will be made to the objectives and compliancelmontioring locations noted above, as appropriate.
141 Controllable water quality factors are those actions, conditions, or circumstances resulting from human activities that may influence the quality of the waters of the State, that are subject to the authority of the State Board, or the Regional Board, and that may be reasonably controlled. Based on the record in these proceedings, controlling temperature in the belta utilizing reservoir r e l q does not appear to be reasonable, due to the distance of the Delta downstream of reservoirs and uncontrollable factors such ns ambient air temperature, water temperatures in the reservoir releases, etc. For these reasons, the State .Board cofi&ers resenrbir releases to control water temperatures in the Delta a waste of water; therefore, the State Board wjll require a test of reasonableness before consideration of reservoir releases for such a purpose.
page 8 of 8

Table 6-4 provides a qualitative assessment of the impacts of the various alternatives and illustrates the basis for the selection of Alternative No. 3. Alternatives lA, 18, and 2 would fail to implement several water quality improvements which are within the scope of this plan and which are now reasonably achievable. A1 ternative 4 would provide positive, but unquantif ied benefits with respect to M&I use. There would be a definite cost in water supply to provide the benefit. As explained in Chapter 5, the uncertainty surrounding the issue of disinfect ion by-products makes it premature to attempt a. final analysis of the benefits and detriments of this alternative. Alternatives 5 and 6 suffer the same defects. Additionally, expansion of the bass spawning area is premature, as is amendment of marsh objectives in advance of the biological assessment. Work on those issues must be completed before the benefits of more stringent objectives can be fairly compared to the high water supply cost. None of those alternatives (except No. 2) have any potential for growth inducing impacts. In conclusion, Alternative No. 3 is the most reasonable of those evaluated.
6.5 Environmental Effects
The State Board will prepare a separate EIR for the upcoming water right decision(s). The Scoping Phase of this Proceeding will help the State Board identify the issues to be addressed in that EIR; the EIR may refer to and build upon this environmental analysis, if appropriate.
The analysis of impacts in this discussion is confined to the effects of adopting or revising certain selected water qua1 ity objectives in the 1978 Delta Plan and D-1485, as amended. This discussion does not, and indeed cannot, thoroughly analyze the effects of decisions which may be made in the future by the State Board or other public or private entities. In particular, this analysis assumes that the flow standards contained in the 1978 Delta Plan (and implemented in D-1485) will remain in effect. The impacts of any future changes in flow standards will be fully analyzed in conjunction with any decision or decisions to change those standards in the upcoming EIR on the water rights decision.
An environmental check1 ist of possible impacts from the proposed State Board objectives is presented in Table 6-5. The State Board has concluded that the Plan wi 1 1 not have any significant or potentially significant effects. Impacts of specific objectives are analyzed in Chapter 5 and in the preceeding sections of this chapter.
6.6 Implementation
The means of implementing these objectives are discussed in Chapter 7 of this Plan.
6.7 Economic Considerat ions
During these proceedings, the State Board has often been told that California's water resources are vital to its economy, both in areas where water originates and where it is imported.

TABLE 6-4
QUALITATIVE ASSESSMENT OF IMPACTS
LEGEND:
+ BENEFICIAL IMPACT 0 INSIGNIFICANT IMPACT - ADVERSE IMPACT
BENEFICIAL USE /
IMPACT CRITERIA
MUNICIPAL AND INDUSTRIAL - -
SALINITY .- - -- TRIHALOMETHANE FORMATION POTENTIAL - - . - . - - . . -. . - -- -.
. -- . - . - . - - - AORICULTURE . . . - . .- - - - - - - - - - . - . .
- -. . . -. -. . - - - -- - -. -. - - WESTERN I INTERIOR DELTA WATER QUALrrY - .
SELECTED ALTERNATIVE
NOTE:
ALTERNATIVE
This summary provides a gross.
subjective indication ot the
dlrectlon ~ n d rnagn~lude of changes
.in cond~ttons 01110191
1A BASE
0 -- 0
, - .- - -
. . .. . - - . - . . - . 0
SOUTHERN DELTA WATER QUALITY -- - 0 -- EXPORT WATER QUALITY -- - -- 0
. .-. . . . . . .-
16 BASE Wl
40-30-30 W
0 - 0
- -. . - - - 0
0
0
0
0
0
0
0
- -- FISH AND W L W F E --- - - --
-- - . - . -. . - - - - . -- . - .
STRIPED BASS HABITAT - -- - - - -- .. - - - . . -. - . SUlSUN MARSH WILDLIFE HABITAT . - -. . - - - - - . .-. - TIDAL MARSHES R. T. & E SPECIES HABITAT - . . . . . - - .. . . . . - -. - - - - .
SALMON HABITAT - -- - - - - - -. - --
. - . - - - . -- - . - - - - WATER SUPPLY - . - - - .. - -. . . - . - - - . - - - -- - - . -
- .. . . . - -- -- .. . .- . -- .
WATER SUPPLY
- - . - . -- - 0 . -. . . -.
0
0 - - - . 0
-.
0
2 2W CL CCCI
1.5 W DEL AG
- - -
0 + + + - - . . . . . - . + + -
3
S DEL AGl
ANT SPAWN
0 - - -- + + +
. . . .. - .
- . -. - - ~ - 0 0 - . - -
0 . 0 0 0 .-- ...~r+o!. --
4 50 CL
BANKS PP
+ + +
- .
+
.. - 0 - - 0
- - - -~ - - 0
5 50 CLCCCI
0.44 VERN SP
. -. - - -. - + + - - - . - -- -
- + - -- - 0
0
+ --
--- 0
8
R.T. & El 0.3 VERN SP
+ + .
+ 0
0
+ .
-- -
-. . .
+ .- - - - - -- +--- -+- --
-. -
- . - . + - -- -. +7-: I . 4 - . - -- - . -. . - - I - -

Revsedd 11 January 1991
T A B L E 6 - 5
I ENVIRONMENTAL CHECKLIST
I. BACKGROUND Name of Proponent: State Water Resources Control Board Address: Executive Director
P.O. Box 100 Sacramento, CA 9581 0
Telephone: (91 6) 445-3085, James W. Baetge Date of Checklist: December 13, 1990 Agency Requiring Checklist: State Water Resources Control Board Proposal: Adoption of Water Quality Control Plan for Salinity and
Temperature for the San Francisco BayISacramento-San Joaquin Delta Estuary
11; ENVIRONMENTAL IMPACTS
Legend: Y=yes ?=maybe N=no
1 Earth. Will the proposal result in:
a. Unstable earth conditions or in changes in geologic substructures? N
b. Disruptions, displacements, com- paction or overcovering of the soil? N
c. Change in topography or ground surface relief features? N
d. The destruction, covering or modification of any unique geologic or physical featured N
e. Any increase in wind or water erosion of soils, either on or off the site? N
1. Changes in deposition or erosion of beach sands, or changes in siltation, deposition or erosion which may modify the channel of a river or stream or the bed of the ocean or any bay, inlet, or lake?
g. Exposure of people or properly to geologic hazards such as earthquakes, landslides, mudslides, ground failure, or similar hazards?
2 Air. Will the proposal result in:
a. Substantial air emissions or deterioration of ambient air quality?
b. The creation of objectionable odors? c. Alteration of air movement, moisture, or
temperature, or any change in climate, either locally or regionally?

Ravtsed 1 1 January 1661
T A B L E 6-S(C0NT.)
I I . ENVIRONMENTAL IMPACTS (CONT.)
Legend: Y=yes ?=maybe N=no
3 Water. Wtil the proposal result in:
a. Changes In currents, or the course or direction of water movements, in either marine or fresh waters?
b. Changes in absorption rates, drainage patterns, or the rate and amount of surface runoff?
c. Alterations in the course or flow of flood waters?
d. Change in the amount of surface water in any water body?
e. Discharge into surface waters, or in any alteration of surface water quality including but not limited to temperature, dissolved oxygen, or turbidity?
1. Alteration of the direction or rate of flow of ground waters?
g. Change in quantity of ground waters, either through direct additions or withdrawals, or through interception of an aquifer by cuts or excavations?
h. Substantial reduction in the amount of water otherwise available for public water supplies?
. i. Exposure of people or property to water related hazards such as flooding or tidal waves?
4 Plant Life. Will the proposai result in:
a. Change in the diversity of species, or number of any species of plants (including trees, shrubs, grass, crops, and aquatic plants)?
b. Reduction of the numbers of any unique, rare, or endangered species of plants?
c. Introduction of a new species of plants into an area, or in a barrier to the normal replenishment of existing species?
d. Reduction of acreage of any agricultural crop?
5 Animal Life. Will the proposal result in:
a. Change in the diversity of species, or numbers of any species of animals (birds, land animals including reptiles, fish and shellfish, benthic organisms or insects?
b. Reduct~on of the numbers of any unique, threatened or endangered species?

Rar.sed 11 January '991
T A B L E 6-5(CONT.)
II. ENVIRONMENTAL IMPACTS (CONT.)
Legend: Y=yes ?=maybe N=no
c. Introduction of new species of animals Into an area. or result in a barrier to the migrat~on or movement of animals? N
d. Deterioration to existing fish or wildlife habitat? N
6 Noise. Will the proposal result in:
a. Increases in existing noise levels? b. Exposure of people to severe noise
levels?
7 L~ght and Glare. Will the proposal produce new light or glare?
8 Land Use. Will the proposal result in a sub- stantial alteration of the present or planned use of an area? N
9 Natural Resources. Will the proposal result in:
a. Increase in the rate of use of any natural resources?
10 Risk of Upset. Will the proposal involve:
a. A risk of an explosion or the release of hazardous substances (including, but no! limited to, oil, pesticides, chemicals or radiation) in the event of an accident or upset conditions?
b. Possible interference with an emergency response plan or an emergency evacuation plan?
11 Population. Will the proposal alter the location. distribution, density, or growth rate of the human population of an area?
12 Housing. Will the proposal affect existing housing, or create a demand for additional housing?
13 Transportation and Circulation. Will the proposal result in:
a. Generation of substantial additional vehicular movement?,
b. Effects on exisling parking facilities. or demand for new parking?

Ire, sea 11 Janua'r 1991
T A B L E 6-5(CONT.)
II. ENVIRONMENTAL IMPACTS (CONT.)
Legend: Y=yes ?=maybe N=no
c. Substantial effect on existing transportation systems? N
d. Alterations to present patterns cf circulation or movement of people andlor goods? N
e. Alterations to waterborne, air, or rail traffic? N
1. Increase in traffic hazards to motor vehicles, bicyclists, or pedestrians? N
14 Public Services. Will the proposal have an effect upon, or result in a need for new or altered governmental services in any of the following areas:
a. Fire protection? b. Police protection? c. Schools? d. Parks or other recreational
facilities? 1. Maintenance of public facilities.
including roads? g. Other governmental services?
15 Energy. Will the proposal result in:
a. Use of substantial amounts of fuel or energy? N
b. Substantial increase in demand upon existing sources of energy, or require the development of new sources of energy? N
16 Utilities. Will the proposal result in a need for new systems, or substantial alterations to the following utilities:
a. Sewerage? b. Water? c. Electricity? d. Natural gas? a. Tele~hone?
17 Human Health. Will the proposal result in:
a. Creation of any health hazard or potential health hazard (excluding mental health)? N
b. Exposure of people to potential health hazards? N
18 Aesthetics. Will the proposal result in the obstruction of any scenic vista or view open to the public, or will the proposal result in the creation of an aesthetically offensive site open to public view? N

R6r.seJ 11 January 1991
T A B L E 6-5(CONT.)
1 1 . ENVIRONMENTAL IMPACTS (CONT.)
Legend: Y=yes ?=maybe N=no
19 Recreation. Will the proposal result in an impact upon the quality or quantity of existing recreational opportunities? N
20 Cultural Resources.
a. Will the proposal result in the alteration or the destruction of a prehistoric or historic archaeological site?
b. Will the proposal result in adverse physical or aesthetic effects to a prehistoric or historic building, structure, or object?
c. Does the proposal have the potential to cause a physical change which would affect unique ethnic cultural values?
d. Will the proposal restrict existing religious or sacred uses within the potential impact area?
21 Mandatory Findings of Significance.
a. Does the proposal have the potential to degrade the quality of the environment, substantially reduce the habitat of a fish or wildlife species, cause a fish or wildlife population to drop below self-sustaining levels, threaten to eliminate a or animal community, reduce the number or restrict the range of a rare, threatened, or endangered plant or animal, or eliminate important examples of the major periods of California history or prehistory?
b. Does the project have the potential to achieve short-term, to the disadvantage of long-term, environmental goals?
c. Does the project have impacts which are individually limited, but cumulatively considerable?
d. Does the project have environmental effects which will cause substantial adverse effects on human beings, either directly or indirectly?

I 3 r v se; '' J;. -arr ' * ' a '
T A B L E 6-5(CONT.)
Ill. DISCUSSION OF ENVIRONMENTAL IMPACTS
Responses to any Y or ? answers are found in the text.
IV. DETERMINATION
On the basis of this evaluation, I find that 111e proposed project will not have any significant adverse effects on the environment because the State Board has set the water quality objectives at levels designed to adequately protect the designated beneficial uses of the Sacramento-San Joaquin Delta and San Francisco Bay waters.
2) 0 4&-L.x& E. ;-*vt,w s i r 1 4 1
signs@,/ Date E h d t k D ? h a - i r ~ lg~osn=m -b&.,ep-
Title for the State Water Resources Control Board

The following data were offered as pol icy statements. The degree of dependency on imported water varies, but is high in the San Francisco Bay area and in the San Joaquin Valley; dependency is also high in southern California. The San Diego region is 96 percent dependent on imported water (TI LXXIPOL ,48).
For municipal and' industrial use, the prime requirements are reliability of supply and high quality drinking water. Planning for the future must focus on improved re1 iabil,,ity of supply and improvement in water qua1 ity.
Population and economic project ions indicate growing M&I water demands. California's population today is just under 30 million. The state's population grew by 750,000 in 1989 (SWC,612,p.l). The Department of Finance has estimated that the state's population will increase to 36,280,000 by 2010 (DOF,1987). The DOF expects the population of the six most populated counties in southern Cal ifornia--Ventura, Los Angeles , Orange, Riverside, San Bernardino, and San Diego counties to increase from the 1986 level of 15,290,000 people to 20,200,000 by 2010 (SWC,6,7). With average daily water use of 188 gallons per capita, this imp1 ies a rise in California water use of approximately 1,322,000 AF, and a rise in southern California water use of a little over 1,033,000 AF by 2010 (DWR, 14,91-113). The expected additional M&I demand for Bay Delta water supply is a result both of the loss of alternative water supplies and of the increase in population (SWC,4,6).
A reliable supply of imported water is one of the most important elements of southern California's economic strength. Southern California has an estimated 6.5 mil 1 ion jobs, about 50 percent of the people employed in the state, income of around $260 billion, which accounts for about 55 percent of the state's tax revenue (T,LXXIPOL,114). A reduction in water supply wi 1 1 cause a loss of productivity, income, and jobs. The analysis of this must rest on examination of marginal costs of water to marginal industries. SWC estimates suggest that a 45 percent reduction in the M&I projected water supply (approximately 2,592,000 AF) in the year 2000, would cause a loss of 1.5 million jobs and cause a potential income loss estimated at $98 bi 1 1 ion (SWC, 51,16;SWC, 3,3). These estimates and others will be studied to determine the marginal costs of developing replacement water supplies, and the effects of shifting part of the burden from the industrial to the municipal sector.
The loss of jobs and income in southern California would have economic impacts beyond the region. Related jobs and income would be lost in other areas of the state as a result of jobs and income loss in southern California. This would also mean a significant loss of sales tax and income tax revenue to the state of California. Local governments would also lose tax revenues such as the occupancy tax for motels and hotels. Some examples from pol icy statements indicate the importance of imported water to the economic well being of the state and southern California. The building industry is said to generate about $55 billion in business activity representing about 22 percent of the economy of the region (T,LXXI IIPOL ,54). Flower and ornamental plant sales in San Diego county total about $400 million per year and about 5,000 jobs are dependent on this industry in San Diego county (T,LXXIPOL,71). It is estimated that

the flower and ornamental plant industry uses about 600,000 AF of water per year (T,LXXIPOL, 73). A related industry, landscape contractors, is said to have 1,700 members statewide with sales of $10.2 billion (T , LXXIPOL, 109).
The value of agriculture, using water exported from the Bay-Delta, is discussed in the Technical Appendix (see Sections 4.0.4.1 and 4.0.9.2).
In the future the SWP and the CVP plan to expand deliveries to new areas and to areas experiencing increased need. SWP is studying a Coastal Branch which wi 1 1 supply water to Santa Barbara and San Luis Obispo counties , and an East Branch en1 argement which wi 1 1 increase del iveries to the eastern part of the MWD's service area, and to San Bernardino County and the Antelope Val ley. CVP is studying an extended San Felipe Branch which will supply water to Monterey and Santa Cruz counties, as we1 1 as an American River Aqueduct which will increase deliveries to EBMUD's service area in the Bay Area. SWP is also planning additional transfer and storage facilities at the following locations to increase its water distribution capabilities: the Kern Water Bank, Los Banos Grandes Reservoir, the south Delta, the north Delta, and additional pumps at the Delta Pumping Plant (DWR,707,42-53).
The issues discussed in this section address water quantity rather than qual ity. The availability of water for export uses is not significantly affected by this Plan. As stated in Section 6.1 and elsewhere, flow (water quantity) issueswill bedealtwith indetail duringthewater , . Rights Phase of the proceedings. Interested parties that have provided testimony during the water qual ity phase should be prepared to discuss marginal costs and marginal value of water in their areas of interest.

7.0 PROGRAM OF IMPLEMENTATION
A program of implementation is required in all water quality control plans (Water Code Section 13242). This chapter provides the program of implementation; it includes a discussion of how and when the water quality objectives set forth in this Plan are to be implemented, along with issues that need further study and that will be considered in the Scoping and Water Right phases of the proceedings and beyond.
To outline actions that will, or need to be taken, the discussion in this chapter has been divided into:
7.2 Implementation Measures 7.3 Comp 1 i ance Monitoring 7.4 Special Studies and Reviews 7.5 Scoping and Water Right Issues.
7.1.1 Outstanding Scoping and Water Right Issues to be Discussed
The State Board wi 1 1 use its water qua1 ity and water right authorities and actions by others to implement the objectives in this Plan. Implementation alternatives will be further examined during the Scoping Phase. Those measures requiring water a1 location adjustments wi 1 1 be determined by the State Board during the Water Right Phase of the proceedings.
At the end of the current proceedings (that is, after adopting a water right decision), the State Board will incorporate a revised Plan of Implementation that:
- establishes a timetable to carry out best practicable management of the resources and uses thereof;
- identifies potential new facilities and time schedules for planning and construction to achieve best practicable management;
- out 1 ines suitable mitigation measures based on negotiated agreements to offset losses if some specified beneficial uses are not reasonably protected;
- requires modified uses to reasonably balance the allocation of fresh water resources to the beneficial uses; and
- proposes either new legislative directives or suggestions for that kind of legislation.
In addition, the State Board will evaluate new major facilities:
Upstream from Delta Auburn Dam and Reservoir (could modify water right terms); additional fish hatcheries for salmon and steel head.

In Delta
In Export Areas
Mitigation
Delta island storage (permit terms and conditions) enlarge channels; isolated conveyance.
Los Banos Grandes and Los Vaqueros (permit terms and conditions) ; conjunctive use of ground water basins; southern Cal ifornia surf ace reservoirs.
Wetlands addit ions; improve fish hatchery outputs; improve planting of fish; improve aquatic habitat; reduce infestations of injurious phytoplankton, clams, etc.
Water Use Modification Improve irrigation efficiencies; retire agricultural land that causes drainage and other problems; increase artificial ground water recharge; increase waste water reclamation.
Potential Legislation Set priorities for types of beneficial uses; fund agricultural land retirement where corrective drainage costs are high (similar to buy out of environmentally sensitive lands at Lake Tahoe).
7.1.2 Statewide Water Management
Achievement of reasonable protect ion for beneficial uses wi 1 1 require better management of Cal ifornia' s water resources and equitable sharing of responsibilities to meet water qual ity objectives in the Bay-Delta Estuary.
All users of Estuary waters must share in the responsibility of meeting objectives to protect Bay-Del ta beneficial uses. A1 1 users should pursue reclamation and conservation of water to their full feasible potential.
Currently, only certain permits of the CVP and SWP facilities are required to meet Bay-Del ta Estuary water qual ity and flow objectives. (Other users are required to cease diversion when those projects are releasing stored water for Delta Water Qua1 ity) . These projects represent only about one-half of the almost 30 mi 1 1 ion acre-feet of storage capacity within the watershed. The State Board will consider an equitable sharing of this responsibi 1 ity among a1 1 users of Bay-Delta Estuary waters during the Scoping and Water Right phases of these proceedings. A first step that the State Board will consider during the Scoping Phase is expansion of the responsibility for maintaining Estuary water quality to all in-basin reservoirs larger than 100,000 acre-feet. This action would add 31 reservoirs to the list of those assigned this responsibi 1 ity. Almost 90 percent of the water stored in the watershed would then be operated to help maintain Estuary objectives. The extent to which smaller projects will be included will be considered during the Scoping Phase.

7.2 Implementat ion Measures
7.2.1 General
New measures are limited to a Salt ioad Reduction Program and a staged implementation of water quality objectives in the southern Delta.
In regard to the Suisun Marsh, the water quality objectives for Suisun Marsh are unchanged from the 1978 Delta Plan. The implementation .
vehicle, Water Ri ht Decision 1485 (0-1485)) was amended in 1985 to change (or delete 3 some monitoring stations and to revise the schedule for implementat ion. The DWR, USBR, DFG, and Suisun Resource Conservation District (SRCD) have signed and adopted a set of three agreements concerning the Suisun Marsh. These are the Suisun Marsh Preservation Agreement (SMPA) , the Monitoring Agreement, and the Mitigation Agreement. The SMPA contains water qual i ty standards for the managed marshes of Suisun Marsh which the four signatories would like the State Board to
.
adopt as water quality objectives. The SMPA also describes the physical facilities that the four signatories have agreed would serve the managed marshes in order to maintain production of preferred waterfowl food plants. The facilities built so far, including the Suisun Marsh Salinity Control Gates (previously cal led the Montezuma Slough Control Structure), have changed the physical regime in the Marsh.
Revised water qual ity objectives incorporating the SMPA (with any modifications necessitated by the biological assessment) will be adopted by the State Board after the biological assessment (discussed in Section 7.4.2.6) is completed. Until that time, the water quality standards in the amended D-1485 will continue to be implemented; see Table 1-2 for a summary of these standards.
7.2.2 Achieving Objectives for Beneficial Uses
7.2.2.1 Municipal and Industrial Uses
General Requirements
o There is a need for water from the best available sources to meet the drinking water needs of all Californians. The water supply agencies should advise the State Board during the Scoping Phase on their plans and programs to obtain high quality drinking water through the year 2010.
o Within the Delta and in Export Areas
There are no differences between the M&I water quality objectives developed in this Plan and those developed in D-1485. With minor exceptions, these objectives are currently being met. The existing requirements and operations include mechanisms for dealing with violations which occur. Therefore, no new implementation measures are needed. Currently DWR and USBR are responsible for meeting these objectives.

o Westel I : Tnterior delta
There are no differences between the objectives for agriculture on the Western and interior Delta developed in this Plan and those developed in D-1485. With minor exceptions these objectives are currently being met.
o Southern Delta 1 The implementation plan is comprised of two interim stages and a final stage. I Interim Stage 1 -- 500 mgll mean monthly TDS all year at Vernalis. Interim Stage 2 -- (to be implemented no later than 1994) 0.7 mmhos/cm EC April 1 to August 31, 1.0 mmhos/cm EC September 1 to March 31, 30-day running average, at Vernalis and Brandt Bridge; with water quality monitored at three current interior stations -- Mossdale, Old River, near Middle River and Tracy Road Bridge, and an additional interior monitoring station on Middle River at Howard Road Bridge.
Final Stage -- (to be implemented no later than 1996) 0.7 mmhos/cm EC Apri 1.1 to August 31, 1.0 mmhos/cm EC September 1 to March 31, 30-day running average, at Vernal is and Brandt Bridge on the San Joaquin River; with two interior stations at Old River near Middle River and Old River at Tracy Road Bridge. Monitoring stations wi 1 1 be at Mossdale at head of Old River and Middle River at Howard Road Bridge.
If a three-party contract has been implemented among DWR, USBR and the SDWA, that contract will be reviewed prior to implementation of the above and, after also considering the needs of other beneficial uses, revisions wi 1 1 be made to the objectives and compl iancelmonitoring locat ions noted above, as appropriate.
o Export Agr i cu 1 ture
The export agriculture EC objective is presently met at virtually all times. The salt load reduction goal discussed here will help to continue achieving this objective.
o Salt Load Reduction Goal
o Upon adoption of this Plan, the State Board will request the Central Val ley Regional Board to develop and adopt a salt-load reduction program. The goal of this initial program will be to reduce annual salt-loads discharged to the San Joaquin River by at least 10 percent and to adjust the timing of salt discharges from low flow to high flow periods. During the Water Right Phase of these proceedings, the Regional Board should discuss how it intends to implement this program (for example, drainage operat ion plans and best management practices).

The goal of this program shall be to reduce the salt load discharged to the San Joaquin River by at least 10 percent. This amount should be achieved by increasing the irrigation efficiency on the west side of the San Joaquin River Basin to a target level of 73 percent with a five percent leaching fraction as recommended by the Agricultural Water Conservation Workgroup. This should reduce the annual subsurf ace drainage from tile drained portions of the west side by about 40 percent as envisioned by the State Board's Technical Committee and the San Joaquin Val ley Drainage Program (see EDF, 11 ,V-13-20 and San Joaquin Val ley Drainage Program, 1990). Since about 25 percent of the annual San Joaquin River salt load is from west side subsurface drainage, this drainage reduction amounts to a 10 percent reduction in annual San Joaquin River salt load (0.40 x 0.25 = 0.10) based on State Board staff modeling results (see EDF,ll,Appendix C). Annual salt loads could be further decreased by reducing and recycling tailwater discharges to the San Joaquin River from the west side.
In addition to annual reduction in salt load, it would also be possible to adjust the timing of salt load discharge from the west side of the San Joaquin River Basin through storage of drainage flows (see Pickett and Kratzer, 1988). The need for dilution flows from the east side of the San Joaquin River Basin to meet seasonal water quality standards in the southern Delta would be reduced.
The salt load reduction policy, which would help to protect beneficial uses in the southern Delta, should be achieved through development of best management practices and waste discharge requirements for non-point source dischargers. The Central Val ley Regional Board should present the pol icy to the State Board no later than the Water Right Phase of the proceedings. If adequate progress is not being made, the State Board will proceed under its authorities.
7.2.2.3 Chinook Salmon
The temperature objectives at Freeport on the Sacramento River and at Vernalis on the San Joaquin River are to be implemented through controllable factors (see Section 5.5.2.5). Methods of implementation will be discussed during the Scoping Phase.
7.2.2.4 Striped Bass
The striped bass spawning protection objectives set specific EC requirements at Antioch and Prisoners Point. These objectives will be implemented by flows, primari ly by Sacramento River flows in most years. Responsi bi 1 i ty for meeting these requirements by specific water rights holders will be determined in the Scoping and Water Rights phases.
7.2.2.5 Other Fish and Wildlife
No implementat ion measures are needed currently, since there are insufficient data to set water qua1 ity objectives for this beneficial use. Additional data are requested to help determine if objectives are needed.

7.2.2.6 Suisun Marsh I The implementation schedule for the Suisun Marsh objectives is the schedule in D-1485, as amended in 1985 (see Table 1-2). Once the biological assessment described in Section 7.4.2.6 is completed, the irnplementat ion schedule wi 1 1 be reviewed and, if necessary, revised.
7.3 Compliance Monitoring
7.3.1 General
The goals of the compliance monitoring program are to (1) ensure compliance with the water qua1 ity objectives contained in this Plan; and (2) identify meaningful changes in any significant water quality parameters potentially affecting the designated beneficial uses. In the main, the compliante monitoring stations in Table 7-1 are the same, or only slightly relocated, stations as in the original D-1485 adopted in 1978. The only differences are in Suisun Marsh and south Delta agriculture. The Suisun Marsh control stations have been changed to those in the 1985 amendment to D-1485. Some compliance monitoring stations have been added in the south Delta (see Table 7-1 for details). Any additional monitoring not required by D-1485 will have to be adopted in future actions by the Board.
o Operate and maintain continuous electrical conductivity recorders at the stations indicated in Table 7-1 to report representative water quality conditions.
o Conduct water quality profiles in the main navigation channels 'in South Bay and between the Golden Gate Bridge on the west and Stockton and Rio Vista on the east, using a boat-mounted continuous recorder for the fol lowing parameters: water temperature, electrical conductivity, pH, dissolved oxygen, turbidity, and in vivo chlorophyll.
o Establish continuous recorders at representative stations in selected channel sections of the Bay-Delta Estuary to collect information on air and water temperature, wind velocity and direction, pH, dissolved oxygen, turbidity, and, where feasible, in vivo chlorophyll. These data should be evaluated and correlated with conditions as they exist in the adjacent main channels.
o Conduct ongoing and future monitoring surveys recommended by DFG and concurred with by the State Board, concerning food chain relationships and fish and wildlife impacts as they are affected by implementation of this Plan. The responsibility for funding and performing these surveys and preparing a report will be addressed and assessed during the Scoping and Water Right Phases of the proceedings.
The results of the above monitoring should be provided to the State Board and other interested agencies upon request. Detai led annual reports summarizing the previous water year's findings and detailing future study plans shall be submitted to the State Board by April 1 of each year. This report will not be required until after the Water Right Phase.

TABLE 7-1 BAY-DELTA ESTUARY WATER QUALITY MONITORING PROGRAM (11
Station Location
C2 Sacramento R~ver @ Coll~nsv~lle
C3 Sacramento Rrver @ Greens Landlng C4 San Joaquin Rrver @ San Andreas Landrng C5 Contra Costa Canal @ PP#l C6 San Joaqurn R~ver @ Brandt Brrdge (slte) C7 San Joaquln River @ Mossdale C8 Old River near Middle River C9 West Canal @ mouthfintake to Clifton Ct. Forebay ClO San Joaquin River near Vernalis C13 Mokelumne Rlver @ Terminous C19 Cache Slough @ City of Valiejo Intake NBA North Bay Aqueduct Intake @ Barker Slough D4 Sacramento River above Point Sacramento D6 Suisun Bay at Bulls Head Po~nt nr. Mart~nez D7 Grizzly Bay @ Dolphin nr. Suisun Slough D8 Suisun Bay off Middle Point nr. Nichols D9 Honker Bay near Wheeler Point D l0 Sacramento River @ Chipps Island D l 1 Sherman Lake near Antioch D l2 San Joaquin Rlver @ Antioch Shtp Canal D12N San Joaquin River @ Antroch Water Works D14A Big Break near Oakley Dl5 San Joaquin River @ Jersey Point D l6 San Joaquin River @ Twitchell 1st. D l9 Franks Tract near Russo's Land~ng
D22 Sacramento River @ Emmaton D24 Sacramento River below Rio Vista Bridge
- Sacramento River @ Freeport (RSAC155)
D26 San Joaquln River @ Potato Point D28A Old River near Rancho Del Rio D29 San Joaquin River @ Prisoners Point D42 San Pablo Bay near Rodeo DMCl Delta Mendota Canal MD6 Sycamore Slough near Mouth MD7 South Fork Mokelumne River below Sycamore St. MDlO D~sappointment Slough @ Blshop Cut Turner Cut @
- Light 26 (RSAN050) 7
E C
C
C C
C 171 C C C
C [I ] CnEMP
C
c 171 c 171
CIFLOW
c I71
C
C FLOW TEMP
C C
c I71
Baw' Param.
PI
SMN
SMN
SMlM SMlM
SMN SMN S W S M N SMN SMlM SMlM SMN
SMN SMlM SMN SMlM SMlM SMlM
SMN SMlM
S M N
SM/M SMN
SMlM
Slough (RSAN052) S A P8 San Joaquin Rlver 1.5 Km NW of Rough 8 Ready
Island @ Light 40 (Buckley Cove) (RSAN056) - San Joaquin Rlver @ Country Club Landrng @ Light 43 (RSAN059) - San Joaquin River @ Rough 8 Ready Island (RSAN062) - San Joaquin Rlver between Turner Cut 8 Stockton (RSAN050 - RSANOGI)
Phyto:
PI
SMlM
SMlM
S M N
S M N
SMlM SMlM S M N
S M N
S M N
S M N
S M N
SMIM
S M N
SMlM
SA C
C
C
D.O. cont.
Phos..TDS* A CI 141
M
M
M M
M M M M M M M M
M M M M M M
M M
M
M M
M
SMlM
SMlM
SMlM
H.MIPest
151
S A
S A
S A SA
S A
S A SA
S A
SA
S A
--- S M N
Benthos
161 - 1
S A
M
SA .
S A
S A
S A
S A
S A
S A
S A
S A
S A
S A
I

TABLE 7-1 (cont.) BAY-DELTA ESTUARY WATER QUALITY MONITORING PROGRAM [I]
Column Abbreviation Key
E.C. - Electrical Conductivity
B.P. - Base Parameters
Phyto.- Phytoplankton
Phos. TDS 6 CI- - Phosphorous. Total Dissolved Solids. and Chlorides
H.MIPest.- Heavy Metals . Pesticides
Station Location
PI0 Middle River @ Borden Highway P l l Middle River @ Howard Road Bridge P I 2 Old River @ Tracy Road Bridge S21 Chadbourne Slough @ Chadbourne Road S33 Cordelia Slough. 550 A. west of Southern
Pacific crossing at Cygnus S35 Goodyear Slough at Morrow Island Clubhouse S36 Suisun Slough near Mouth S42 Suisun Slough 300 A. south of Volantl Slough S49 Montezuma Slough near Beldon's Landing S54 Montezuma Slough @ Hunter's Cut S64 Montezuma Slough @ National Steel S75 Goodyear Slough 1.3 mi. south of Morrow lsland
[Drainage] Ditch @ Pierce S97 Cordelia Slough @ Cordelia-Goodyear D~tch
(proposed) - Water supply Intake locations on Van Sickle lsland and Chlpps lsland
C - SM - M -
SA - G.H. -
Continuous
Semi-Monthly (twice a month)
Monthly
Semi-annually (spring and fail)
Gage Height
E.C.
C1G.H. C1G.H.
C C/G.H. C2G.H.
C1G.H. C1G.H. Cm.H. C1G.H. C1G.H. C1G.H. C1G.H.
C/G.H.
C1G.H.
The compliance monitoring needed for this plan or Decidon 1485 are u e d . Air and water temperature. electrical conductivity. pH. dissolved oxygen, Iurbidity. water depth to 1146 light intensity. wcchi disc depth. volatile and non-volatile suspended solids. nitrate.nitrite. mmonia. total organk nitrogen.
Base' Pwm.
121 SMlM
SMlM
SMN
chlorophyll a, silica.
Enumeration and identification to the species level where possible.
Phyo.'
R
SMmA
Orthophosphate and total phosphorus.
Heavy metals - arsenic. cadmium, chromiun (all valences), copper. iron, lead. manganese. mercury. zinc.
Phor..ms* 6 CI 141
M
M
M
Pesticides - chlorinated hydrocarbones to include: Aldrin. Altrazine. BHC, Chlodane. Dacthal, DDD. DDE. DDT. Dieldrin. Endrin. Endosulfan. Heptachlor. Kelthane. Undane, Methoxychlor. Simsdne. Toxaphene. PCB.
Sampling to take place in water column and bottom sediments. Sediment mmples are b be tnken in tranrmta acroes the channel.
H .M IP~~~
151
Benthic samples are to include identification and enumeration to the lowest taxonomic level possible. %mplee to be taken in transects across the channel. Continuation of this aspect of the mmitaing program will be reevaluated annually.
Benthos
161 ,
Municipal and Industrial lntake objectives are specified in chlorides. EC can be monitored and ConVenWl to chlorides.

7.3.2 Compliance Monitoring for Specific Beneficial Uses
7.3.2.1 knicipal and Industrial
Barker Slough, the diversion point for the recently completed North Bay Aqueduct, is monitored and additional monitoring requirements are needed. The Cache Slough Intake, the previous location of the diversion point for the Vallejo M & I water supply, will be used only on a limited and irregular basis. Therefore, monitoring need only be done at the Cache Slough Intake when diversions occur.
7.3.2.2 Agriculture
See Table 7-1 for appropriate monitoring requirements.
7.3.2.3 Salmon
Monitoring of temperature to verify achievement of the proposed objective would require recording and reporting daily temperatures at' Freeport on the Sacramento River and Vernalis on the San Joaquin River. This requirement should be carried out by USGS until other responsible parties are identified.
The temperature data collected are to be submitted to the State Board, which wi 1 1 then make a determination whether controllable factors should be control led.
DO levels in the lower San Joaquin River have been monitored by DWR between Turner Cut and Stockton since at least 1969. DWR should continue the monitoring for the protection of Chinook salmon in the lower San Joaquin River.
7.3.2.4 Striped Bass
Compl iance with the Antioch objective is presently documented by continuous monitoring of EC at Antioch, as well as by grab samples taken as part of the DWR compliance monitoring program. Prisoners Point does not have a continuous monitor in place since D-1485 does not require one. Apparently, no monitoring was required at Prisoners Point because the objective was in effect for such a short time period each year. Some monitoring has been accompl'ished by the taking of occasional grab samples at Prisoners Point, and by extrapolation from observations taken at a monitoring location in Potato Slough. These data have indicated that ECs at Prisoners Point have apparently not exceeded the current objective of 0.55 mmhos/cm EC for the period Apri 1 1 to May 5. Given the proposed lowered EC objective in the present Plan and the extended period of protect ion, continuous monitoring should be instituted at Prisoners Point (see also discussion in Special Studies, 7.4).

7.3.2.5 Other Fish and Wildlife
o Benthos
For the present time, the 1978 Delta Plan benthic monitoring program will continue unchanged, pending any changes resulting from input received during the Scoping and Water Right phases.
7.3.2.6 Suisun Marsh
See Table 7-1 for appropriate monitoring requirements.
7.4 Special Studies and Reviews
o Past studies of the estuarine habitat have been extensive. Relatively few have led to specifically quantify the loner levels of conditions that protect the beneficial uses. The studies discussed below should lead to actions that can be implemented to protect these uses more effectively.
7.4.1 General
The purpose of special studies is to develop a better understanding of the hydrology, hydrodynamics, water qua1 i ty, water use, and significant ecological interactions of the Bay-Delta Estuary and its watershed and export areas. The activities necessary to accomplish this goal include performing special studies and developing and enhancing physical, chemical, and biological predictive tools. This information will be necessary for future revisions of this Plan and for use in the Scoping and Water Right phases of the proceedings.
7.4.2 Special Studies for Beneficial Uses
7.4.2.1 Municipal and Industrial Uses
o Additional information is required to assess adequately the impact of Delta agricultural drains on THM formation. There is a need to conduct appropriate, comprehensive monitoring of agricultural discharges. The Central Val ley Regional Board shall require the development and implementation of best management practices or other means to appropriately control these discharges. This task should begin in the Rock Slough area.
o An Interagency Program led by DWR has been formed to continue the work conducted by the Delta Health Effects Study and the Delta M&I Workgroup. The primary task of the new workgroup is to investigate conditions that adversely affect drinking water. The State Board requests this workgroup to design and implement a comprehensive THMFP monitoring program for the Delta by June 1991, and to present annual progress reports to the State Board commencing in January 1992.

The primary tasks of the new workgroup should be to:
1) Continue the studies conducted by DWR to assess completely the impact of agricultural drain discharges affecting the Delta with relation to THMFP. Agricultural drains located near municipal water supply intakes which are suspected of causing significant effects on drinking water quality should be given priority. The State and Regional Boards shall employ appropriate measures to ensure monitoring can be conducted. Design and implement a comprehensive THMFP monitoring program for the Delta by July 1991. This program should be designed around the Municipal Water Qua1 i ty Investigation. Results and recommended actions should be completed no later than January 1, 1993.
2) Encourage continued research on various techniques of disinfect ion which may reduce or eliminate the production of hazardous DBPs. Research should focus on promising techniques such as PREOZONATION and ozonat ionlchlor inat ion/ammoniat ion. Progress of research and recommended actions should be reported by January 1, 1992.
3) Develop a correlation between THMFP, as measured by the monitoring program, and THM concentrat ions in treated drinking water.
o Western and Interior Delta
o Thecornstudyprovides important informationon thesensitivityof corn. A leaching study was recently begun to evaluate its effectiveness, practicality, and costs. This information is needed before a new objective can be set to protect the western and interior Delta agriculture. This study should be completed and the results submitted during the Hater Right Phase of the proceedings.
o Southern Delta Agriculture
The information presented in Phase I and in the Southern Delta Agriculture Subworkgroup has shown that more information is needed to resolve differences. A study in the following areas is needed:
- crop requirements during germination and the early stage of growth, - potential leaching fractions,
- effectiveness of rainfall in reducing leaching requirement, - timing of the objective, and - response of crops other than beans and alfalfa. This proposed study should be jointly-funded by the beneficiaries, performed by the University of Cal ifornia Cooperative Extension and completed in time to be used in the next Triennial Review.

7.4.2.3 Salmon
The Five Agency Salmon Committee (composed of DFG, DWR, USBR, USFWS, and NMFS) will continue to pursue studies which identify the critical factors influencing smolt survival. In the short-term, studies will probably be designed to investigate the influence of temperature, especial ly in the San Joaquin River, on smolt survival. The effect of temperature will be analyzed in relation to various release sites, diversion curtailments, export levels, reverse flows, total outflow levels, migratory routes, Bay survival, etc. The State Board recommends that the Committee work with agricultural representatives to study whether agricultural methods can be modified to minimize increasing the temperature of the receiving water in the Sacramento and San Joaquin River waters during April through June.
SWC recommended that a salmon and striped bass punchcard management system be implemented by DFG to assist them in more accurately assessing the total annual catch of salmon and striped bass in the inland sport fishery. Such a program could be useful as we1 1 for the ocean sport fishery.
Water quality parameters, such as temperature and dissolved oxygen, have been discussed in terms of the fall-run Chinook salmon. Winter-run may also be adversely affected by these parameters. There is no evidence of a winter-run in the San Joaquin River system; however, the winter-run of Sacramento River (and possibly Calaveras River) origin may be drawn into the central and south Delta during the up-or downstream migrations. Therefore, two things need to be investigated: 1) when and where do the winter-run migrate through the Delta, and 2) what are the ranges of temperatures and dissolved oxygen in those areas during those times. . The Five Agency Salmon Management Committee should investigate the particular methods possible to better define the critical pathways and times of occurrence of winter-run in the Delta. As stated in Chapter 5.5.2.3 in the Bay-Delta DFG differentiates winter-run salmon from fall-run salmon by size difference. We recommend that DFG continue its effort to find a better method of differentiation.
Salmon Smolt Survival in the Delta
There is a great variety of potential studies that would improve our understanding of salmon smol t survival in the Sacramento-San Joaquin Delta. Some of these have been implemented and will be continued. The studies 1 isted below (Kjelson et al., 1990) are not necessarily 1 isted by priority and should be considered by the Five Agency Committee for implementation.
All appropriate studies will be considered; the list of studies is not meant to be exclusive.
- Evaluate the survival of smolts under a wide range of inf lowlexport ratios with particular emphasis to ratios between 1.0 and 5.0 when inflow is greater than about 5000 cfs.

- .Document the proportion of smolts that are diverted into upper Old River under varied flows, export rates and tidal conditions.
- Measure. survival of fish released above the upper Old River diversion point ( i .e., Vernal is or Mossdale) to compare with survival data from past releases in upper Old R'iver and in the San Joaquin River at Dos Reis Park.
- Evaluate survival of smolts, tagged with coded wires and released in the lower Mokelumne River, at Jersey Point, Dos Reis Park, and lower Old River at varied export and inflow levels.
- Evaluate the effect of high cross Delta flow on smolt survival migrating out of the San Joaquin River as would characterize conditions with DWR's Delta alternative projects. A barrier in upper Old River with high exports would yield such conditions.
- Evaluate the relative proportion of smolts entering the intakes to Clifton Court Foreb,ay and the CVP1s Tracy Facility.
- Evaluate direct and indirect mortality in the Delta using multiple release locations in varied channels and control release sites at the intakes to Clifton Court Forebay and the Tracy Facility.
- Evaluate the louver efficiencies and general effectiveness o f the Tracy Fish Facility.
- Evaluate smolt survival in the San Joaquin Delta at varied temperatures (60" to 70°F).
- Evaluate the difference in survival of smolts that are restricted to salvage at the Tracy Facilities to those that are vulnerable to both Clifton Court and the CVP intakes.
- Evaluate the effectiveness of pulse flows of different timing, magnitude and duration in the Sacramento and San Joaquin rivers.
The studies already implemented are evaluated on an annual basis and are compared among years. Study designs are evaluated and improved each year prior to the fall-run Chinook salmon smolt emigration period. Any modification of water quality objectives should be based on the results of the annual studies compiled to date.
7.4.2.4 Striped Bass
o Continuous EC and temperature monitoring equipment should be instal led at various locations in the San Joaquin River between Antioch and Vernalis to obtain data on salinity conditions for striped bass spawning.

The Interagency Ecological Study Program and others need to study:
1. EC and the effects of different salinities on striped bass and their habitat between Antioch and Prisoners Point;
2. Water qual ity effects of salinity and temperature on eggs and larval development, particularly in the San Joaquin River;
3. The annual die-off of striped bass to determine if it is due to water qual i ty factors;
4. The effects of agricultural return flows on striped bass;
5. The actual patterns of spawning periodicity , locat ions, water qual i ty conditions, and fate of eggs and young; and
6. The impact of introduced exotic organisms, e.g., Potamocorbula amurensis, and other factors on striped bass food -
These studies could provide data which are critical to our understanding of the effects of water qual ity on striped bass migration and spawning success.
7.4.2.5 Other Fish and Wildlife Studies
o American Shad
The DFG data on American shad suggest a pattern of relationships between upstream migration into tributary streams for spawning and subsequent early rearing of young. The role of the Delta and Suisun Bay areas as spawning and nursery habitat is not clearly presented in terms which can be quantified to establ ish water qual ity objectives, flow requirements or operational constraints. Substantial additional information is required before the State Board can implement either water quality objectives or water right permit terms and conditions for the protection of this fishery in the Estuary. Participants should plan to present information and any demonstrations that specific objectives are needed at the next Trienniel Review.
o Delta Smelt
In 1991, DFG should analyze existing data on environmental conditions, including reverse flows, affecting Delta smelt growth, survival, reproductive success and spatial distribution; this information should be ready for submittal to the State Board during the Scoping Phase.
The feasibility of a mark and recapture study or other study to better document seasonal movements and habitat preferences of Delta smelt in its various life stages should be investigated by DFG. Such a study would require a few years of sampling to document trends, and should be completed and analyzed by the Trienniel Review of the Plan.

Historical SWP and CVP data on Delta smelt salvage has not been very reliable. DFG is confident that, currently, quality control is sufficient for the enumeration of trends in species composition. DFG will be assuming responsibility for enumerating fish at the SWP facility this next year. Improvements in procedures will be made in future. Salvage data on Delta smelt from both facilities, including sampling methods, should be submitted during the forthcoming proceedings.
o Benthos
Benthic communities in various parts of the Estuary must be viewed in terms of their role in the overall Estuary. Their relative value, particularly in terms of balancing the needs of various beneficial uses, is difficult to determine when compared to striped bass, agricultural crops or other beneficial uses which can be more readily measured and compared. Parties should be prepared to discuss ways to answer these questions in terms of the overall functioning of the Estuary, as well as the specific reactions of individual species or groups of species (such as bay shrimp) to changing salinity, flow, and other conditions. Parties should plan to present these discussions during the Scoping and Water Right Phases.
7.4.2.6 Marshes around Suisun Bay
A. Biological Assessment
o A new comprehensive Biological Assessment is being conducted concerning the rare, threatened and endangered species (and their habitat) of the managed and unmanaged wetlands around Suisun Bay.
The informat ion needed for the Biological Assessment under CESA includes:
1. A f u 1 1 description of the Sacramento-San Joaquin Del ta/San Francisco Bay region, with an explanation of the area affected by any proposed changes in the water qua1 ity objectives, plus maps.
2. The known and potential distribution of rare, threatened, and endangered species in the region and affected area based on recent field surveys. In addition, the State Board needs information about any federal candidate species and any species of special concern to DFG in order to discuss fully possible impacts on those species as required under CEQA.
3. Any additional informat ion on species distribution and habitat requirements from the 1 iterature, scientific data review, and discussion with experts.
4. Analysis of the possible effects of the proposed water quality objectives on these listed species, including any cumulative effects.
5. An analysis of alternatives designed to reduce or eliminate adverse effects to listed species.

For Item 1, the State Board has sufficient information to describe the Bay-Delta region. The State Board is as yet unable to delineate in any clear way the actual area where the water qual ity objectives could result in detectable changes in water qual ity. Adoption of the SMPA water qual ity objectives for the Suisun Marsh and Bay would, according to DWR, result in higher salinities in Grizzly and Honker bays, but the full extent of the affected area is not clear (DWR,511,11-18,27,60). Salinity modeling studies are needed to allow the State Board to predict the effects of these objectives better.
For items 2 and 3, the State Board has information for some of the listed specie,^, but in some cases it is neither recent nor geographically comprehensive. Most of the information has been collected or noted during work done for other purposes, and is thus spotty both in time and geography. Where information is missing, additional studies will be needed. Compilation of information from the literature as well as from unpublished data sources can be done in parallel with field work. Additional laboratory studies determining the salinity requirements of some of the rare plants may be needed.
For item 4, once a sufficiently accurate salinity model is operable and the environmental requirements of the various species are known, this analysis can proceed. The relative effects of alternatives on other beneficial uses can then be estimated and a final set of objectives chosen.
DWR has volunteered to conduct the biological assessment to evaluate the impacts of adopting the SMPA standards as water quality objectives. The State Board will need an acceptable biological assessment on or before April 1, 1996, allowing review of the results of the assessment as part of its regular triennial review.
B. Studies
o Studies are needed to determine the relationship between channel water salinity and soil water salinity in the tidal wetlands around Suisun Bay.
These studies should include at least:
1) A regular monitoring program for the managed areas of one or more of the channel islands (Roe, Ryer, Snag, and Freeman islands) including a) the EC of the applied water; the EC of water in the root zone, and the seed production per acre at two or more sites; and b) continuous EC measurements of the applied water and monthly measurements of the soil water from October through.June (the results should be reported as mean monthly EC of applied water, monthly EC of soil water, and annual seed production per acre).
2) A regular monitoring program for the unmanaged tidal wetlands within the legally-defined Suisun Marsh including: at least one site on either Joice or Grizzly Island near the mouth of Montezuma Slough, a site north of Cutoff Slough, a site on one or more of the channel islands or on the shore of Simmons Island facing the channel islands, and a site on Van Sickle or Wheeler Island facing Honker Bay. This

distribution of sites should give the State Board sufficient information to determine the effects of the water quality objectives and to estimate the effects of any changes that may be proposed or needed in the future.
3) The interagency programs, including the Suisun Marsh Fish Monitoring Program, and the Neomysi s/Zooplankton Survey, are on-going ; coordination of these activities should provide the State Board with the information necessary to monitor the effects of the water quality objectives.
7.4.3 Other Special Studies and Reviews
7.4.3.1 Aquatic Habitat Status Report
Although many individual studies on various aspects or species have been conducted over the years, an integrated picture of the overall condition or "health" of the Estuary has not been produced. Such an overall condition or status report is needed to provide a context for past, present and future conditions in the Delta. The data are sufficient in many areas to provide at least an overall view of recent (last 20 to 25 years) changes and current status. Such a status report would provide an overall context in which to view proposals for new projects, physical structures and operational changes, and for the impacts of newly introduced species, etc. Future sampling and monitoring programs should be designed and executed with a view to integrating the results obtained into a comprehensive overview.
Parties should discuss during the Scoping Phase the feasibility of preparing such a report, the responsibilities and plans for developing it and means to update and revise this status report on a regular basis. Parties should consider the idea of an annual oral summary review and presentation to the State Board as one way to communicate and update this status report, combined with appropriate documentation and timely data analysis.
7.4.3.2 Modeling Needs
A. Current Modeling
o The three-dimensional model currently being developed by USGS for evaluating hydraul ic and biological processes in the various ernbayments of the San Francisco Bay should be finalized.
o An Interagency Modeling Development and Use Conmittee should be formed to:
- f aci 1 itate exchange of model ing information and to reduce dupl ication, - improve access of information to all interested parties - simulate operations of major reservoirs in addition to the CVP and SW,
- consider effects of antecedent conditions,

- improve temperature modeling for the Sacramento and San Joaquin River basins,
- improve Delta channel depletion estimates in DAYFLOW,
- improve both water qua1 ity and flow modeling for the San Joaquin River Basin,
- update hydrology to reflect current land use and groundwater/surface water interactions.
To facilitate the exchange of modeling information and to reduce the dupl ication of modeling work, some members of the modeling community have suggested that an Interagency Model ing Development and Use Committee should be formed. As envisioned, this committee would meet periodically to perform the following tasks:
o Work cooperatively to develop and improve computer models and data bases;
o Train new model users on the proper use of existing and new computer mode 1 s ;
o Inform others on the advances in computer technology, including geographic information systems (GIs) ; and
o Review various study modeling assumptions, and assure that when assumptions are varied they are clearly documented when reporting model outputs.
DWR, USBR, CCWD, the State Board and other participants of the Operation Studies Workgroup are already working together to improve the operat ion studies model, DWRSIM. DWRSIM, which simulates the operation of the CVP and SWP reservoirs and conveyance faci 1 ities, is being revised by incorporating the following:
o Flowlsal inity relationships that consider antecedent (preceding) conditions.
o A new up-to-date hydrology, which is the result of more recent land use information.
o The new Central Valley Ground Water Simulation Model, which significantly improves the estimates of ground and surface water interaction.
The Board encourages DWR to 1 ink DWRSIM with major M&I operations models such as those in the Los Angeles, San Diego, Sacramento and San Francisco Bay areas.

The Board be1 ieves that models would be improved by incorporating field data from the following types of studies:
o Water quality profiles in the main navigation channels in South Bay and between the Golden Gate Bridge on the west and Stockton and Rio Vista on the east, by the use of a boat-mounted continuous recorder for the f o 1 lowing parameters: water temperature, electrical conductivity, pH, dissolved oxygen, turbidity, and in vivo chlorophyll;
o Better description of ,Delta hydrology, including inflow and outflow measurements, amount of in-Delta diversions, and channel velocities; and
o Water quality, tidal height, water temperature, turbidity, meteorologica 1 and other data throughout the Estuary.
B. State Board Modeling Capabi 1 ity
o The Board recognizes the need to develop its arrn modeling capability which wi 11 assist in the consideration of appropriate water transfers, new water rights, review of existing water rights and future alterations of Delta water qual ity and flow requireraents.
To further improve the modeling capabi 1 ity of the water community, the State Board is conducting a management study to determine the feasibility of enhancing the State Board's modeling capabi 1 ity. The purpose of this enhancement would be to ensure that the State Board (and others) have adequate resources to evaluate the water supply, environmental, and economic impacts of future water qual ity objectives, flow standards, or faci 1 ity proposals. The possible modeling enhancement study approaches include, but are not limited to: (1) no-action, (2) more reliance on other state and federal water agencies, (3) more reliance on private consulting firms, and (4) enhancement of the State Board's "in-house" model ing capabi 1 ity. In addit ion, the management study wi 1 1 address the need for enhancement of water right and water resources databases that wi 1 1 be needed for modeling purposes.
C. Fishery Models
The following fishery models, in addition to any others that may be proposed, may be considered, as appropriate, in the impact analysis:
o Abundance and Survival of Delta Smolts in the Sacramento-San Joaquin Estuary by the USFWS.
The USFWS (since 1978) has annually conducted research on the survival and abundance of Chinook smolts and fry as they migrate down the Sacramento through the Estuary. The research has led to the development of several different models, including: annual index of abundance of fall-run smolts; smolt survival based on adults returns 2-112 years later; and smolt survival index using flow, temperature, percent diverted at Walnut Grove, export rates and migration route variables. A San Joaquin River smolt survival index is being developed based on different release sites, various levels of inflow from the San Joaquin River, SWP and CVP export rates and ocean recoveries of adults.

o Chinook Salmon Population Model for the Sacramento River Basin by BioSystems Analysis, Jnc.
This model estimates the abundance of fall-run Chinook salmon under a given set of flow and temperature conditions, mortality parameters, and assumptions about harvest in the ocean and river fisheries for the Sacramento River Basin. At present it serves as an indicator of the population trends as it has not yet been calibrated. Another version is presently being developed for winter-run Chinook salmon.
o Draft San Joaquin River System Chinook Salmon Population Model by EA Engineering, Science and Technology.
This is mechanistic simulation model representing the principle factors influencing the abundance and production of fall-run Chinook salmon in the San Joaquin River Basin.
7.5 Scoping and Water Right Issues
o Only a few parties are currently responsible for meeting water quality and flow requirements and for compliance monitoring activities within the Delta. The Board requests that information be developed on how these burdens of meeting the objectives should be distributed over more water right holders and waste dischargers. This information wi 11 be considered and used by the State Board during the Scoping and Water Right phases of the proceedings.
o Forthedeveloplaentof a l te rna t i ves toex is t ingpo in tso f diversionand for the coordination of preparedness planning by other agencies, information should be presented during the Scoping Phase on the impact of flood control measures, levee conditions, dredging, channel deepening, barriers and seismic activities.
7.5.1 General
In addition to implementation issues related to water qua1 ity objectives in this Plan, other issues, as illustrated in Chapter 7.1.1, will be considered in the Scoping and Water Rights phases. To facilitate preparation for those phases, expected issues are summarized below. The list includes matters which have been discussed specifically in earlier sections.
7.5.2 Summary of Beneficial Use Issues
7.5.2.1 Municipal and Industrial Uses
- Retention of the 150 mgll chloride objective for industry, - Within the Delta Export water quality to enhance reclamation, - Relative advantages and disadvantages of maintaining high water levels in SWP terminal reservoirs.

7.5 .2 .2 Agriculture
o Western and Interior Delta
- Consideration of objectives for crops other than corn
- Cost and feasibility of leaching
o Southern Delta Agriculture
A request by SDWA that "[wlater quality required at the inflow points would be specified as a function of net daily inflow rate and of channel depletion by months for the channel reaches receiving water from each inflow point."; and that I1[t]he required net daily inflow rates at each inflow point would be in accordance with a monthly schedule sufficient t o ,maintain the required unidirectional net flow in each channel reach" (SDWA,116,2).
7.5.2.3 Salmon
- Flow needs of migrating salmon - Use, timing and quantity of water for pulse flows - Appropriate use of hatcheries to supplement natural production 7.5 .2 .4 Striped Bass
Agreements and information on the following issues will be helpful f o r developing an appropriate environmental impact report.
o The direct entrainment losses of striped bass and other fish at the major diversions in the Delta are we1 1 documented. The Bureau of Reclamation and the Contra Costa Water District should each negotiate a fishery agreement with the Department of Fish and Game that would provide for mitigation of the direct entrainment losses at the Tracy Pumping Plant and Contra Costa Pumping Plant No. 1. These agreements should be completed prior to the conclusion of the Water Right Phase. Direct entrainment losses at Delta agricultural diversions are not well documented. The parties should evaluate such losses and identify corrective measures.
o A real-time monitoring program should be developed and used to assess the daily densities of striped bass eggs and larvae in the Sacramento River during the spring and initiate periodic closure of the Delta Cross Channel to reduce diversion of striped bass into interior Delta channels. Closure of the Delta Cross Channel should be coordinated with short duration pulsed flows in the Sacramento River, in combination with short- term reductions in export pumping and reduced reverse flaws, to transport striped bass eggs and larvae into the Suisun Bay.

o There is the need to initiate a detailed investigation and evaluation of alternative sites for establishing facilities for rearing juvenile striped bass salvaged from the SUP and CVP facilities for subsequent release to the Bay-Delta system.
o A detailed review and evaluation of alternative recreational angler harvest management options including, but not limited to, specific area and seasonal closures, alternative size limits including initiation of a slot 1 imit, and restrictions on fishing gear such as use of single barbless hooks should be conducted. In addition, the impacts of poaching on the striped bass population should be evaluated, funding sources for expanded enforcement should be sought, and the unrestricted sale of striped bass in California should be eliminated. Temporary changes in fishery harvest regulations should be considered as part of an overall short-term approach to improve the situation unt i 1 longer-term aeasures may be instituted. The Board does not believe such measures should substitute for its awn responsibi 1 ities to provide suitable habitat .'
o Additional water project operation tests should be conducted in the Delta to better determine the effects of diverting water from and upstream of the Delta on striped bass.
To make certain that the State Board develops water quality objectives that are based on sound scientific data, and which are appropriately protective of striped bass spawning habitat, we request DFG to analyze the protective values of setting up a specific spawning habitat zone of 0.44 mrnhos/cm EC, or some other more appropriate EC value, in the river reach between Jersey Point and Prisoners Point. Analysis of historical springtime EC data indicates that 0.44 mmhoslcm EC at Jersey Point would apparently maintain an EC at Antioch of just about 1.5 mmhoslcm, which DFG would like to retain. DFG should also analyze the possibility and the effects of relating a relaxation provision to declared deficiencies. Specifically, DFG should be prepared to discuss the effects of reducing the spawning habitat by moving the downstream end of the spawning habitat reach upstream from Jersey Point a distance proportional to the percent reduction in delivery of firm supplies, along the lines proposed in the table below. In the remaining reach, the 14-day running average of the mean daily EC would be no more than 0.44 mmhoslcm EC for the period Apri 1 1 to May 31, or until spawning has ended.
Percent De 1 i very Reduct ion Percent River Reach Reduced 0 0
Deficiencies are defined as deficiencies in firm supplies declared by a set of water projects representative of the Sacramento River and San Joaquin River watersheds. The specific projects and amounts of deficiencies would be defined in subsequent phases of these proceedings.

DWR should be prepared to discuss the potential effects, i.e., water costs, that would result if the State Board were to adopt water quality objectives as out1 ined above. The Board would 1 ike to hear from USBR, USFWS and any other interested parties on this subject at the next Triennial Review.
7.5.2.5 Other Fish and Wildlife Issues
o Marine Habitat
Issues concerning marine habitat center on the effects of Bay outflow rather than salinity, and so will be considered in the Scoping and Water Right phases.
o Navigation
Effects on beneficial uses of deepening the Sacramento Deep Water Ship Channel
o Export Recreation and Export Fishery Habitat
In the Scoping Phase, participants should be prepared to discuss the effects of more variable levels and flows on fishery habitat, especially as related to temperature stress, turbidity, algal growth, dissolved oxygen depressions and other water qual ity considerat ions.
Documentation is required of the types and extent of water-associated recreational activities, particularly in terms of present usage of both reservoir activities and f lowing-stream activities (fly-fishing, rafting, kayaking, etc.). In addition, estimates are needed of the potential impacts of changes in operations on recreational activities, or on storage levels of reservoirs both upstream and in the export areas. Participants should be prepared to discuss these topics in at least qual itative terms during the Scoping Phase, and have quantitative data available by the Water Right Phase. With the type of information addressed above, the State Board will be better able to develop a balanced water management program.
o Estuary Recreation
The information presented during Phase 1 was based upon data gathered over ten years ago. Current surveys of recreational uses of facilities within the Estuary are needed. Appropriate agencies should provide current data.
7.5.2.6 Marshes around Suisun Bay
A biological assessment wi 1 1 be continuing during these phases.

7.5.3 Other Scoping and Water Right Issues
o Additional means includingtheuseof biocriteriashouldbedevelopedto assess the general health of the Estuary and serve as a basis for determining the impacts of new projects, physical and operational changes, introduced species, etc. DFG should develop a priority list of tasks to be performed. Consideration should be given to specific components such as American shad, Delta smelt, and the benthos. Also, use of biocriteria should be considered.
o There is a need to examine further the impacts of San Francisco Bay inflows on fish, invertebrates, and other pub1 ic trust resources, particularly as these inflows, including pulse flows, affect distribution, abundance, and reproduction success of species inside the Estuary. Studies are also needed to provide the 1 inkage, if any, between phytoplankton, and higher trophic levels.
7.5.3.1 Water Year Classification
o The current Sacramento River Water Year Classification approximates annual conditions of water availability with five distinct categories. The Water Year Classification subworkgroup has adopted, in concept, the addition of a sliding scale to the classification to smooth the transitions betneen categories. There is a need for the parties to study this proposal and submit the results for review during the Scoping Phase of the proceedings.
o Due toaprevious lackof analytical tools, theSan JoaquinRiver Basin classification needs refinement.
There is a need for the parties to develop a San Joaquin River Basin classification with similar methodology as used for the Sacramento River Basin and submit the results for review during the Scoping Phase of the proceedings. Other issues, such as the variation in hydrologies among tributary basins, and the absence of coordination between the major San Joaquin River basin reservoirs, can then also be addressed. This system, together with the Sacramento River classification, will be used during the Scoping and Water Right phases to determine how the responsibilities of meeting water quality objectives should be distributed.
Development of Annual Four Basin Unimpaired Flow
Part of the process to determine each water year's classification is the estimation of the Sacramento and San Joaquin basins' Four River Unimpaired Flow Indexes, a measure of seasonal wetness. For the months of February through May, estimates of these unimpaired flow indices are made on the first of each month. Unimpaired flow is estimated from both measured and forecasted flows and snowpack amounts. The hydrologic portion of the water year index that relies on forecasts is subject to assumptions made by the forecaster. This forecasting process is performed by DWR. There is no documentation explaining this process. The assumptions and process should be documented and readily available. DWR should convene a technical forum for interested parties for the purpose of providing the parties with the details of the methodology and assumptions used in the forecasting process. After this initial forum,

additional meetings should be convened only when the methodology or the assumptions are changed.
7.5.3.2 Economic Analysis
The Scoping Phase will help identify alternative methods to provide the protect ions needed for the beneficial uses made of Bay-Delta waters. 40 determine if an alternative is reasonable the State Board considers economic effects. For example, studies wi 11 be needed to determine the costs of south Delta facilities, the cost of dilution releases to the farmers required to forego use of water, and the secondary costs associated with reservoir reoperation and other actions. Determination of the overall costs of alternatives will require input from technical studies on the appropriate mixes of required actions.
7.5.3.3 Entrapment Zone
o Studies are needed to better define the degree of linkage between the location and productivity of the entrapment zone and the effects on the population levels of important fish species.
The Phase I hearing record includes many pages of exhibits and testimony concerning the importance of the entrapment zone. The definition and placement of the entrapment zone is more closely tied to freshwater outflow than to salinity. Further consideration of this issue will occur in the Scoping and Water Right Phases of these proceedings. During the Scoping Phase, the State Board seeks further information on the following:
1. The location of the entrapment zone in relation to freshwater outflow;
2. The importance of the entrapment zone organisms in the fish food chains, especially with regard to striped bass, Delta smelt, and out- migrating salmon smolts;
3. The significance of introduced invertebrates, both benthic f i 1 ter- feeders and zooplankton, on food supplies in the Bay-Delta waters,
4. The relative importance of phytoplankton, bacteria and detritus as food sources for higher trophic levels in the entrapment zone;
5. The relationship between entrapment zone location and level of primary productivity or phytoplankton concentrations; and
6. The relationship between phytoplankton abundance, zooplankton abundance and fish productivity.
These topics are not exclusive; if any parties believe that other subjects need to be addressed, they are welcome to introduce them.
7.5.3.4 Physical Facilities
Information Needed on Physical Facilities
During the first two phases of the Bay-Delta proceedings several parties indicated that proper facilities would help stretch the water supply to

meet more of the needs of various beneficial uses. Included in these discussions were several isolated faci 1 i ties to provide better water qual i ty for export M&I , hatcheries to help supplement the populat ions of specific fisheries and reservoirs to help store water from times of surplus for distribution during times of need (see below). While the State Board supports these concepts in theory, it must have detailed information as to their effects on beneficial uses in the Estuary.
Isolated facilities can provide better water quality for M&I use. However, some questions need to be answered:
o Are there appropriate and cost-effective ways of isolating this water from that large volume of water exported for agriculture purposes which do not need the higher quality? What would be the effects of this facility on areas of origin, on the Bay-Delta Estuary's aquatic habitat, etc.
o Since this water would be expensive, should consideration of separate plumbing for internal domestic use be addressed? To help reduce project cost should the use of existing rights-of-way be considered?
New reservoirs are being planned south of the Delta. The State Board be1 ieves that additional information is needed particularly in regard to the timing and amount of diversions to these facilities. During the Scoping Phase, parties should be prepared to discuss the potential effects of diversions to South-of -the-Del ta reservoirs on beneficial uses in the Estuary.
Specific Physical Facilities and Projects to be Discussed in the Scoping Phase
A. Delta Water Management Facilities - Three DWR Delta Water management programs comprise a plan to enhance the SWP capability to increase exports while attempting to solve problems affecting Delta beneficial uses. These programs are:
1) The North Delta Water Management Program - The primary objectives of this program are to help alleviate flooding in the north Delta area, reduce reverse flow in the lower San Joaquin River, improve water qual i ty, reduce fishery impacts, and improve water supply re1 iabi 1 ity. Secondary objectives are to improve navigation and enhance recreational opportunities. Under this program the South Fork Mokelumne River will be dredged, the Delta Cross Channel gates may be modified, partial tide gate structures in the Sacramento River may be built to raise water levels in the Sacramento to divert additional water into the Delta Cross Channel, a partial tide gate structure in Three-Mile Slough may be built, and a new Sacramento River connecting channel near Hood or Isleton may be built to divert additional flow through the interior of the Delta.
2) The Western Delta Management Program - This program includes four major issues: flood control, water qual ity, wildlife concerns, and water supply reliability. Sherman Island, the major Delta island situated farthest west, is the focus of this program. Levee rehabilitation and land acquisition for the development of wildlife and wetland habitat will be a part of this program.

3) The South Delta Water Management Program - The objectives of this program are to help solve the following problems: water level and water circulation related to agricultural needs in the south Delta, water,quality, project water supply reliability, and fishery impacts. Under this program four barriers will be installed in the south Delta, a portion of Middle River will be enlarged, Clifton Court Forebay will be enlarged, and an additional forebay will be constructed on the northern half of Victoria Island with a siphon connection to Clifton Court Forebay (DWR & USBR, 1990).
B. Isolated Facilities - The purpose of such a facility is to isolate water being conveyed from the Sacramento River to Clifton Court, from the Delta. This facility would improve the salinity, and drinking water quality of this water, while theoretically reducing the carriage water requirement and permitting better control of Delta circulation (Brown and Caldwell, Delta Drinking Water Quality Study, May 1989). The reduction of the carriage water requirement and the control of circulation patterns has the potential for enhancing the beneficial uses that continue to be made of water directly from the Estuary. There is a great concern among many, especially northern Californians, that the isolated facility would be operated in a manner that would harm the Estuary. Proponents of the isolated facility have stated that protection of all Delta beneficial uses is a primary concern, and that an isolated facility would not be built without guaranteeing this protection. A number of a1 ternative isolated faci 1 ities have been suggested. The facilities most often discussed are the following:
1) Peripheral Canal - This is a 42-mile-long isolated channel rejected by California voters in 1982. This facility would convey water from the Sacramento River around the Delta, releasing a portion of it for Delta channel flow improvement, and del ivering the remaining water to Clifton Court Forebay and then to the Delta export pumps.
2) Dual Transfer System - This faci 1 ity would convey about half of the water being exported from the Delta through existing channels, and the remainder in a isolated channel extending from Hood on the Sacramento River to the Clifton Court Forebay.
3) Bifurcated System - This facility is the same as the Dual Transfer System, except that it would provide a bifurcated transmission system south of the Delta so that only high quality water would be delivered to southern California for M&I purposes.
4) Sierra Source-to-User System - This isolated facility would be comprised of a number of faci 1 ities used to convey water for M&I water use from the Feather River/Sacramento River confluence around the Delta and directly to the Tracy Pumping Plant.
C. Auburn Dam - The proposed Auburn Dam was originally designed to be a 2.3 MAF mu1 tipurpose reservoir for water supply, power, recreation, flood control, and fishery enhancement. Construction was begun in 1967 but stopped in 1976 to permit further study of seismic and design issues. Environmental issues have further affected the future of the Auburn Dam. Currently, there are three proposals for an Auburn Dam: a dry dam used only for flood control, a flood control dam with the

flexibility to allow later expansion to a multi-purpose dam, and a full mu1 t i-purpose dam (DWR & USBR, 1390).
D. Kern Water Bank - The Kern Water Bank (KWB) is a conjunctive use ground water project being developed by DWR, in conjunction with the Kern County Water Agency and local water districts, to augment the dependable water supply of the SWP. The KWB would a1 low storage and extracti0.n of ground water, in coordination with the operation of surface water storage and conveyance facilities. In general, water would be banked in the' basin during years of above-average water supply and withdrawn during drier years, when surf ace water suppl ies are below average. The first stage, with a capacity of 300 TAF, is planned for development by 1991, with maximum capacity of 1 MAF planned for development by 1994 or 1995 (DWR & USBR, 1990).
E. Los Banos Grandes Reservoir - The Los Banos Grandes Reservoir (LBG) is proposed to be solely an SWP off-stream water supply facility filled with water from the Cal ifornia Aqueduct. LBG wi 1 1 provide operational flexibility for the SWP to allow improved operation for the fisheries and enable a greater shift in exports to months when fish are not as abundant and when very high Delta outflows occur. The current schedule estimates that the LBG facilities could be completed and in operation by the year 2002 (DWR & USBR, 1990).
F. Los Vaqueros Reservoir - The proposed Los Vaqueros Reservoir, to be operated by the Contra Costa Water District, will be a 100,000-AF reservoir in the hills southeast of Contra Costa County. The purpose of this reservoir is to improve the quality and reliability of delivered water and is scheduled for completion in 1995 (Jones & Stokes, 1991).
G. Delta Wetlands Project - The Delta Wetlands Project is proposed by Bedford Properties, a land development company, to store water seasonally on four Delta islands (Bacon and Bouldin islands, and Holland and Webb tracts) and to manage the islands for wetland wi ldl ife habitat during July-December. Stored water would be diverted from unregulated Delta outflow when available during January-Apri 1 of each year. Stored water (up to 270,000 AF) would be discharged from the islands during May-July for sale to various water users (Jones & Stokes, 1990).
H. Additional Banks Pumping Plant Capacity - DWR is installing four additional pumping units at the Banks Pumping Plant, increasing the pumping capacity from 6,400 cf s to 10,300 cf s. In order to operate the Banks Pumping Plant above 6,400 cfs a revised Corps of Engineers permit is required. These pumps begin operation in 1991 and will provide standby capacity for the present units and permit a larger share of the pumping with cheaper off-peak power. DWR plans to divert more water during the winter to facilitate offstream storage reservoirs and groundwater recharge operat ions south of the Delta (DWR & USBR, 1990).
I. Baldwin and Stockton Ship Channel Projects - These two ship channel projects, undertaken by the Corps of Engineers, wi 1 1 deepen existing or create new channels that will allow larger commerce shipping access to inland ports.

Desalination Projects - In California, desalting is used to reclaim brackish ground water, desalt sea water, and treat water for such industries as the electronics industry, which require processed water of high purity. The principal limitation of desalting is its high cost, which is directly linked to its high energy requirements. Of various desalting techniques, the membrane processes (reverse osmosis and electro-dialysis) offer the best potential to further reduce costs and thus increase use. Recent research has been able to reduce the energy requirements dramatically. With further reductions in the energy requirements and future increases in competition for water supplies, desalting is becoming a viable alternative for the development of marginal water supply (DWR & USBR, 1990). Currently, Santa Barbara, Marin, and MWD are considering construction of desalting facilities to develop marginal water supply during dry periods.
K. Reclamation Projects - Reclaimed water is used for various purposes, including crop and landscape watering, industrial cooling, and ground water recharge. Industries sometimes recycle water at a facility to recover heat or materials, to save water, and to eliminate the cost of discharge to a municipal system. Waste water can be treated to drinking water qua1 ity, but the higher cost of such treatment, institutional prohibitions, and public reluctance to use reclaimed water discourages its use when water of equal quality is available from other sources. Urban water managers continue to seek suitable locations to replace drinking quality water with treated municipal waste water for such applications as landscape and crop irrigation. The greatest potential for wider use exists in the coastal areas of southern Cal ifornia where hundreds of thousands of acre-feet of treated water are discharged to the ocean every year. Dual or separate delivery water systems are being studied. These dual delivery systems will separate water delivered for human consumption from reclaimed water del ivered for irrigation or industrial uses. Use of wastewater for M&I purposes has not received complete acceptance by the public and the health authorities (DWR, Bulletin 160-87, pp. 53- 54).
The parties should be prepared to discuss in detail these and other issues concerning physical faci 1 it ies during the Scoping Phase of the proceedings. The Board wi 1 1 use this information to form a balanced decision in the Water Right Phase.
7.5.3.5 Agricultural Water Conservation
The overall goal of the Agricultural Water Conservation Workgroup and its Subworkgroups is to identify potential water savings (annual and seasonal) through increased irrigation efficiency within the following constraints:
1) Maintain present level of crop production (i.e., protection of "present" beneficial use),
2) Maintain present amount of annual net recharge to ground water in non- saline sink areas,

3) Reduce annual net recharge to ground water in saline sink areas (if possible) by increasing irrigation efficiencies to the minimum target efficiency for irrigation, and
4) Maintain salt balance in the crop root zone as necessary to maintain present crop productivity.
The Workgroup will attempt to identify annual savings in saline sink areas and seasonal savings in non-saline sink areas. The State Board
, anticipates receiving valuable information from the Agricultural Water Conservation Workgroup during the Scopi ng Phase.
7.5.3.6-Conjunctive Use
The State Water Project Conjunctive Use (SW'PCU) Workgroup is evaluating both put-and-take or seasonal storage, and long-term storage forms of. conjunctive use. The SWPCU Workgroup's study area is primarily the SWP service areas. The workgroup intends to provide the State Board with a report for the Scoping Phase. This report should detail the following information for the major ground water basins of California:
(1) existing ground water production capacity, (2) imported water del ivery capacity, (3) ground water-surface water del ivery overlap, (4) existing recharge capacity, (5) available capacity by month, (6) potential existing recharge faci 1 ity expansion, (7) potential new recharge faci 1 ity projects, and (8) ground water basin constraints.
7.5.3.7 Suggested Legislation
Water Rights Monitoring
Under the Porter-Cologne Act (Water Code Section 13267(b)), a Regional Board may require any discharger of waste to prepare technical or monitoring program reports. No simi lar provision a1 lows the State Board to require technical or monitoring program reports from water right holders who divert and use water from a watercourse. The diversion and use of water may cause adverse effects to downstream beneficial uses of water. For example, the diversion and use of water may adversely affect aquatic life downstream, cause seawater intrusion into underground water supplies, cause pollution as a result of return flows into rivers, and impair the water supplies of other water users.
While the State Board is able to require new appropriators of surface water to monitor potential impacts, the State Board cannot conveniently require existing water right holders to initiate new monitoring programs. In order to require an existing water right holder to conduct a monitoring program under current law, the State Board must conduct an enforcement act ion, a change petition proceeding, a proceeding to prevent waste and unreasonable use under Article X , Section 2 of the Constitution or a proceeding to apply the public trust doctrine.
Legislation should authorize the State Board through administrative means to require monitoring by individual water right holders where such a requirement is related to the individual's diversion. The legislation should also authorize the State Board to impose annual fees on a1 1 permit

and license holders to assure that an adequate compliance monitoring program can be implemented.
Screening of Agricultural Diversions
Screening of agricultural diversions in the Delta has been identified as a method of improving young striped bass and salmon survival in the Estuary. A recent survey by DWR determined there are over 1,900 pumps and siphons in the Delta with intake pipe diameter ranging from 3 to 36 inches (Sato et 31., 1987 in Hopelain 1989). Salmon entrainment data collected in the Delta and Feather River ranged from averages of 1.38 to 4.66 salmon per acre foot, respectively and average numbers of juvenile striped bass lost through Delta agricultural diversions during Apri 1 through July, 1978 and 1979 were 19 and 12 mill ion, respectively (Hopelain, 1989).
Fish and Game Code, Sections 5980 through 6028 apply to screening and preventing fish losses through water diversion intakes. The sections essentially state that if a diversion was constructed after 1971 and adversely affects fish populations, the owner is required to construct, operate and maintain a screen on the diversion. If the diversion was constructed prior to 1971 and is larger than 250 cfs, the costs of screening is to be shared equally by the owner and DFG. If the diversion was constructed prior to 1971 and is less than 250 cfs, the entire cost of screening is to be borne by DFG. Most Delta agricul-tural diversion fa1 1 into the latter category with the financial responsibi 1 ity resting with DFG; consequently, the agricultural diversions remain unscreened.
. DFG should prepare a report to SWRCB presenting a plan of action and possible sources of funding and proposed legislation by the beginning of the Water Right Phase of the proceedings.
Final ly, a program is needed to produce information about the Bay-Delta system relevant to management decisions. Such a program should:
1) Identify the manageable (man-induced) effects on the Bay-Delta;
2) Identify responsibilities for developing studies to allow resource agencies to better manage .the Bay-Delta system;
3) Develop a stable funding mechanism through fees on point source dischargers, non-point source dischargers and upstream water users; and
4) Develop time schedules and oversight committees to ensure timely implementation and coordination.

REFERENCES
Department of Water Resources and United States Bureau of Reclamation. 1990. South Delta Water Management Program, Phase I of Water Banking Program, Draft Environmental Impact Report/Environmental Impact Statement. Chapter 6 - Cumulative Impacts. June 1990,
Hopelain, James S. 1989. Sacramento-San Joaquin Delta Agricultural Diversions Status Report for 1989. Department of Fish and game, Inland Fisheries Division, Sacramento, California.
Jones and Stokes Associates, Inc. 1990. Draft Environmental Impact Report/Environmental Impact Statement for the Delta Islands project of Delta Wetlands, a California Corporation. (JSA 87-119.) Prepared for: State Water Resources Control Board, Division of Water Rights, and U.S. Army Corps of Engineers, Sacramento District, Sacramento, California.
Jones and Stokes Associates, Inc. 1991. Scoping report for the Contra Costa Water District, Los Vaqueros project stage 2 Environmental Impact Report/Environmental Impact Statement. (JSA 90-0211. ) Prepared for: Contra Costa Water District, Concord, California. Sacramento, California.
Kjelson, M.B. Loudermilk, D. Hood and P. Brandes. 1990. The Influence of San Joaquin River Inflow, Central Valley and State Water Project Exports and Migration Route on Fall-Run Chinook Smolt Survival in the Southern Delta During the Spring of 1989. Supplemental Annual Progress Report, FY 89 Work Guidance Part C. U.S. Fish and Wildlife Service.
Pickett, P.J. and C.R. Kratzer. 1988. An evaluation of drainage reduct ion as a method for meeting recommended water qua1 i ty objectives for selenium, salinity and'boron in the San Joaquin River. Report to the San Joaquin Valley Drainage Program. June 1988. 50p.
San Joaquin Val ley Drainage Program. 1990. A Management Plan for Agricultural Subsurf ace Drainage and Related Problems on the Westside San Joaquin Val ley. September 1990. 183p.
Spaar, Stephani A. Interagency Ecological Study Program for the Sacramento-San Joaqu in Estuary. Technical Report 17 (March 1988) : Suisun Marsh Control Gate Prepro ject Fishery Resource Evaluation.

APPENDICES
A. Abbreviations for Informat ion Sources and Citations B. List of Abbreviations/Symbols C. Glossary D. Monitoring Stations by Interagency Number and by River Kilometer Index E . Map of Salinity Control Stations F. Notice of Filing G. Transcript Index

Page No. ' 1 01/11/91
APPENDIX A ABBREVIATIONS FOR
INPORKATION SOURCES AND CITATIONS
ABBREVIATION N AllE
ACH
ACWD AFC6WCD
AH1 ANTIOCH ASA
BAAC BAD A
BALIA
BCDC
BISF
BUSCH Bureau
CALCWD
CBE
CCCWA
CCIQW --
'* CCWD) h i CFBF
CNPS
COE
CSP A
CVAWU
CVPWA
CVWD
CWA
THE CITIES OF AVENAL, COALINGA 8 HURON ALAUEDA COUNTY WATER DISTRICT ALAUEDA FLOOD CONTROL AND dATER CONSERVATION DISTRICT AQUATIC HABITAT INSTITUTE THE CITY OF ANTIOCH CALIFORNIA ASSOCIATION OF SANITATION AGENCIES BAY AREA AUDUBON COUNCIL BAY AREA DISCHARGERS ASSOCIATION BAY AREA LEAGUE OF INDUSTRIAL ASSOCIATIONS SAN FRANCISCO BAY CONSERVATION AND DEVELOPHENT COHHISSION THE BAY INSTITUTE OF SAN FRANCISCO ANHEUSER-BUSCH COHPANIES U. S. BUREAU OF RECLAHATION (ale0 USBR) CALAVERAS COUNTY WATER DISTRICT CITIZENS FOR A BETTER ENVIRONHENT CONTRA COSTA COUNTY WATER AGENCY CONCERNED CITIZENS FOR IUPROVED QUALITY WATER CONTRA COSTA WATER DISTRICT CENTRAL DELTA WATER AGENCY CALIFORNIA FARU BUREAU FEDERATION CASITAS HUNICIPAL WATER DISTRICT CALIFORNIA NATIVE PLANT SOCIETY U. S. ARHY CORPS OF ENGINEERS (also U. S. Corps CALIFORNIA SPORTFISHING PROTECTION ALLIANCE CENTRAL VALLEY AGRICULTURAL WATER USERS CENTRAL VALLEY PROJECT WATER ASSOCIATION COACHELLA VALLEY WATER DISTRICT CALIFORNIA WATERFOWL ASSOCIATION

Pegs No. 2 01/11/91
APPENDIX A ABBREVIATIONS FOR
INFORHATION SOURCES AND CITATIONS
ABBREVIATION NAME
CWPC
CWPC
CWPCA
CWPCA
DAWDY DDWD DELTAWET
DFG
DOF DR WD DTAC
DUNNING
DWA DWR E A
EBHUD
EBRPD
ECCID
EDF EP A
EWID
HOOPA KCWA LADWP
LCC LWVC
nAS MET HID HWD
COHHITTEE FOR WATER POLICY CONSENSUS COHHITTEE FOR WATER POLICY CONSENSUS CALIFORNIA WATER POLLUTION CONTROL ASSOCIATION CALIFORNIA WATER POOLUTION CONTROL ASSOCIATION DAVID R. DAWDY DEVILS DEN WATER DISTRICT DELTA WETLANDS ( e. k. e. BEDFORD PROPERTIES, INC. ) CALIFORNIA DEPARTHENT OF FISH AND GAHE DEPARTMENT OF FINANCE DUDLEY RIDGE WATER DISTRICT DELTA TRIBUTARY AGENCIES COHHITTEE HARRISON C. DUNNING, PROFESSOR OF LAW DESERT WATER AGENCY DEPARTHENT OF WATER RESOURCES EA ENGINEERING, SCIENCE AND TECHNOLOGY, INC. EAST BAY MUNICIPAL UTILITY DISTRICT EAST BAY REGIONAL PARK DISTRICT EAST CONTRA COSTA IRRIGATIOH DISTRICT ENVIRONHENTAL DEFENSE FUND U. S. ENVIRONHENTAL PROTECTION AGENCY (elso Agency) EHPIRE WESTSIDE IRRIGATION DISTRICT FOOD AND AGRICULTURAL ORGANIZATION OF THE UNITED NATIONS HOOPA VALLEY TRIBE KERN COUNTY WATER AGENCY LOS ANGELES DEPARTMENT OF WATER AND POWER LEAGUE OF CALIFORNIA CITIES LEAGUE OF WOHEN VOTERS OF CALIFORNIA HARIN AUDUBON SOCIETY SEE HWD HODESTO IRRIGATION DISTRICT THE HETROPOLITAN WATER DISTRICT OF SOUTHERN CALIFORNIA (formerly NET)

Page No. 3 01/11/51
APPENDIX A ABBREVIATIONS FOR
TNFORMATION SOURCES AND CITATIONS
ABBREVIATION NAME
NASOC NDWA NH I NMFS
NRDC
OFWD OWD PALHDALE PCFFA
PCWD PGLE PICYA
PRBO RIC RWQCB-2
Region 2 Region 5 SACTO SACTOCO SAVESF
SCLDF
SCVWD
scnc
SDIEGO
SDWA SFBAWUA
SFEP
NATIONAL AUDUBON SOCIETY NORTH DELTA WATER AGENCY NATURAL HERITAGE INSTITUTE U. S. NATIONAL MARINE FISHERIL; SERVICE U. S. NATIONAL OCEANOGRAPHIC AND ATMOSPHERIC ADHINISTRATION NATURAL RESOURCES DEFENSE COUNCIL OAK FLAT WATER DISTRICT OAKLEY WATER DISTRICT PALUDALE WATER DISTRICT PACIFIC COAST FEDERATION OF FISHERHEN'S ASSOCIATIONS PLACER COUNTY WATER DISTRICT PACIFIC GAS & ELECTRIC PACIFIC INTER-CLUB YACHT ASSOCIATION POINT REYES BIRD OBSERVATORY RICE INDUSTRY COHUITTEE SAN FRANCISCO BAY REGIONAL WATER QUALITY CONTROL BOARD (REGION 2 ) LOS ANGELES REGIONAL WATER QUALITY CONTROL BOARD (REGION 4 ) CENTRAL VALLEY REGIONAL WATER QUALITY CONTROL BOARD (REGION 5 See RWQCB-2 See RWQCB-5 THE CITY OF SACRAMENTO THE COUNTY OF SACRAUENTO SAVE THE SAN FRANCISCO BAY ASSOCIATION, THE SANTA ANA WATERSHED PROJECT AUTHORITY THE SIERRA CLUB LEGAL DEFENSE FUND SANTA CLARA VALLEY WATER DISTRICT SOUTHERN CALIFORNIA WATER COXHITTEE, INC. SAN DIEGO COUNTY WATER AGENCY AND THE CITY OF SOUTH DELTA WATER AGENCY SAN FRANCISCO BAY AREA WATER USERS ASSOCIATION EPA'e SAN FRANCISCO ESTUARINE PROJECT

Page No. 4 01/11/91
APPENDIX A ABBREVIATIONS FOR
INFORUATION SOURCES AND CITATIONS
ABBREVIATION N AHE
SFRISCO
SHELL SIERRA SJVAWC
SRCD
SRWCA
SWC SWRCB
TIBCEN
TID TLBWSD
TRACY TRI-TAC
TRICO U AC USBR
USDA-SCS
USDI
USFDA
USFWS USGS VCC WACOC
YCWD Y OLO
THE CITY AND COUNTY OF SAN FRANCISCO SHELL OIL COUPANY SIERRA CLUB, THE SAN JOAQUIN VALLEY AGRICULTURAL WATER COUUITTEE SACRAMENTO UUNICIPAL UTILITY DISTRICT SUISUN RESOURCE CONSERVATION DISTRICT SACRAHENTO RIVER WATER CONTRACTORS ASSOCIATION STATE WATER CONTRACTORS CALIFORNIA STATE WATER RESOURCES CONTROL BOARD (also State Board) THE ROHBERG TIBURON CENTER FOR ENVIRONHENTAL STUDIES TURLOCK IRRIGATION DISTRICT TULARE LAKE BASIN WATER STORAGE DISTRICT THE CITY OF TRACY TRI-AGENCY TECHNICAL ADVISORY COUHITTEE -- LCC, CASA AND CWPCA TRINITY COUNTY UNITED ANGLERS OF CALIFORNIA U. S. BUREAU OF RECLAMTION (also Bureau ) U. S. DEPARTWENT OF AGRICULTURE - SOIL CONSERVATION SERVICE (8160 SCS) U. S. DEPARTHENT OF THE INTERIOR (also DO11 U. S. FOOD AND DRUG ADUINISTRATION (also FDA) U.S. FISH AND WILDLIFE SERVICE U. S. GEOLOGICAL SURVEY VALLEJO CHAHBER OF COHHERCE WATER ADVISORY COUHITTEE OF ORANGE COUNTY YUBA COUNTY WATER DISTRICT YOLO COUNTY FLOOD CONTROL AND WATER CONSERVATION DISTRICT

Page No. 1 01/11/91
APPENDIX B LIST OF ABBREVIATIONS/SYHBOLS
ABBREVIATION: DEFINITION SYrr BOL
As BAT BOD BU
Br Br - CAC
CCC CCR
CEQA
CESA
CFR
COD CP
CVP CWC C 1 C1- D-1485
DBP(s) DXC DO DO1 Delta Delta Plan
EC
ECe
Acre-Foot = 43,560 cubic feet = 325,900 gallons Acre-Feet per year Total applied water (in
acre-f eet per acre Arsenic Beet available technology Biochemical oxygen demand Beneficially ueed applied water (in acre-feet per acre) Bromine Bromide ion California Administrative Code (OBSOLETE--Now Cal. Code of Regulations, CCR ) Contra Costa Canal California Code of Regulations (formerly Cal. Adminietrative Code, CAC) California Environmental Quality Act California Endangered Species Act U. S. Code of Federal Regulations Chemical oxygen demand Amount of vater applied due to cultural practices (in ac-f t/ac ) Central Valley Project California Water Code Chlorine Chloride ion SWRCB Water Rights Decision 1485 (1978) Disinfection by-product(6) Delta-Xendota Canal Dieeolved oxygen Delta outflov index Sacramento-Sen Joaquin Delta 1978 SWRCB WQCP - Sacramento-Sen Jouquin Delta and Suieun Xareh Electrical conductivity (also refered to as specific conductance) Electrical conductivity of a soil saturation extract (generally in dS/m)

Page No. A '7
01/11/91 APPENDIX B
LIST OF ABBREVIATIONS/SYWBOLS
ABBREVIATION/ DEFINITION SYHBOL
ECi
Estuary
FSA ( s GAC I-A/RKI
IDHAHP
HAF HCL(s)
HGD nLtw H n Ni PIE PPD Plan
Region 2
Region 5A
Region 5B
Region 5C
SBI SnPA
SHR
Electrical conductivity of applied irrigation vater Electrical canductivitv of sol1 vater In the root zcr.e (ECsv approx. = ECe / 0.6 San Francisco Bay and Sacramento-Sen Joaquin Delta Estuary Flov study areeta) Granular activated carbon Interagency/River Kilometer Index Station Code Interagency Delta Health Aspects Honitoring Program Irrigation efficiency (in acre-feet per acre) Hunicipal and Induetrial (generally associated vith .water supply.) Hillion acre feet Haximum contaminant level(s) (associated with drinking vater Haximum contaminant level goal ( s Hillion(s of) gallons per day Hean lover lov vater Hanganese Nickel Preirrigation efficiency Pollutant Policy Document 1988 or 1990 Draft Water Quality Control Plan ( a l ~ o WQCP ) Sen Francisco Bay Basin (also Basin 2) . See RWQCB-2 Sacramento River Basin (also Basin 5A) Sacramento-San Joaquin Delta Basin (also Basin 5B) San Joaquin River Basin (also Basin 5C) Striped base index Suisun Harsh Preservation Agreement Applied vater needed for soil moisture replacement (in ac-ft/ac) Suspended solids

Page No. 3 01/11/91
APPENDIX B LIST OF ABBREVIATIONS/SYnBOLS
ABBHEVIATIO! i / DEFlNlTION SYMBOL
SWP Se TAF TDS
THH(s) THMBr ( s ) THMFP
TOC TTHHFP
WQCP
YOY ac cf s
State Water Project Selenium Thousand acre feet Totel dissolved tfilt~~ehle) scjlids Trihalomethanets) Brominated trihalomethane(s) Trihalomethane formation potential Total organic carbon Total trihalomethane formation potential 1988 or 1990 Draft Water Quality Control Plan (also Plan) Water year (October 1 through September 30) Young-of-year Acre = 43,560 square feet Cubic feet per second = 448.8 gallons per minute = 1.983 acre-f eet per day DeciSiemen/meter = 1.0 milliSiemen/cm (a measure of electrical conductivity) Foot or feet Grams per liter Gallons per square meter Gallons per capita per day Hour ( s ) Pound (avdp. ) = 16 oz (avdp. ) = 453.6 grams neter or meters = 3.28 feet milliSiemene per centimeter = millimhos per centimeter Ililligrams per liter (approximately equal to ppm in aqueous solutions) nillimhos per centimeter = 1,000 umhoa/cm (a measure of EC Parts per billion (approximately equal to ug/l in aqueous solutions) Partn per million (equal to mg/kg, approx. equal to mg/l in aqueous solutiions) Partn per thousand (approximately equal to g/l in aqueous solutions)

Page No. 4 01/11/91
APPENDIX B LIST OF ABSREVIATIONS/SYIIBOLS
ABBREVIATION/ DEFINITION SY UBOL
eq. ft. Square foot or feet eq. mi. Square mile = 640 acres = 259
hectares uS/cm HicroSiemens per centimeter =
micromhos per centimeter ia meaeure of EC)
ug/l tlicrograms per liter (approximately equal to ppb in aqueous solutions)
umhoe/cm Micromhos per centimeter (a measure of EC)

Page No. i 05/16/91
APPENDIX C
CiLOSSARY
WORD/PHRASE DEFINITION
1-in-20 dry year A statistical term refering to a vater year with e total annual runoff exceeded by 95X of the water years vhich are 1ikely.to occur.
Acaricide (Miticide) A material used primarily in the control of plant-feeding mites (acarids) especially splder mites. Typical acaricides vith little insect-killing efficiency arc chlorobenzilate, Kelthane, and Omite. Some insecticides, especially phosphorous compounds, ere effective also against mites. [Farm Chernicale Handbook, 19871
Acre-foot (AF) The quantity of vater which vill cover an acre of land to e depth of one foot ( i. e. 43,560 cubic feet or 325,900 gallons 1 .
Alevin
Algae
Ambient
See Fry.
Simple rootless plente that grow in bodies of rater at rates in relative proportion to the amounts of nutrients available in the water or, in the case of nitrogen, in the atmosphere overlying the vater body.
The prevailing condition in the vicinity, ueually relating to some physical measurement such ae temperature. Sometimes used as a synonym for background. [SWRCB Order No. WQ 85-13
Anadromous Pertaining to fish that spend part of their life cycle in the ocean and return to freshrater streams to spawn. [SWRCB Order No. WQ 85-11
Anaerobic Life or processes that can occur without free oxygen.
Applied water The quantity af water delivered to the intake to a city'e water eyetsm, the farm head gate, the factory, and for wildlife, the amount of rater supplied to a nareh or other wetland either directly or by incidental drainage flows. [DWR Bulletin 1601
Aquifer State of California definition:
A geologic formation, group of formations or part of a formation that ie water bearing and which transmits water in sufficient quantity to supply springe and pumping wells. lDWR Bulletin 74-813
Federal definitions:
(1) A formation, group of formations, or part of a formation that contains sufficient saturated permeable material to

Page No. 2 05/16/91
APPENDIX C
GLOSSARY
Arsenic (Ae)
Bacteria
DEFINITION f yield significant quantities of vater to wells and springs (10 CFR 960.2)
( 2 ) A geologic formation, group of format~ons, or part of a formation capable of yieldlng a significant amount of ground vater to vells or springs. Any saturated zone created by uranlum or thorlum recovery operations voula not be
i considered an aquifer unless the zone le or potentially is (a) hydraulically interconnected to a natural aquifer, (b) capable of discharge to surface vater, or (c) reasonably acceseible because of migration beyond the vertical
I projection of the boundary of the land transferred for long-term government ownership and care (10 CFR 40 Appendix A).
I (3) A zone, stratum, or group of strata that can etore or transmit vater in sufficient quantities for specific use (30 CFR 710.5).
I ( 4 ) A geological formation, groups of formations, or part of a formation, that is capable of yielding a significant
I amount of vater to a re11 or spring (40 CFR 146.03; 260.10; 270.2).
( 5 ) A geologic formation, group of formations, or portion of 8 formation capable of yielding usable quantitiee of ground vater to vells or springs (40 CFR 257.3-4). [USGS, Federal Glossary of Selected Terms: Subsurface-Water Flov end Solute
I Transport, August 19893 ,
A highly poisonoue metallic element. Arsenic and its compounds are used in insecticidee, veed killers and industrial processes. [SWRCB Order No. WQ 85-13
! Arsenic occurs in two environmentally significant valence states, Ae +3 or As 111 (trivalent) and As * 5 or As V (pentavalent), vith different toxic propertiee. The varioue organic forms of arsenic include: aethylated forms, arseno-lipids, arseno-sugars, arseno-betaine, and
i erseno-choline.
Single-cell, microscopic organisms that possess rigid cell valls; mey be aerobic (need oxygen), enaerobic (no oxygen present), or facultative (either vith or vithout oxygen); can cause disease; and some are important in the etabilization of solid vastee. tReeources Conservation
l- Glossary 3 I
Banke Pumping Plant, The Department of Water Resources' State Water Project main I
Harvey 0. deltapumping plant located West of Tracy. The eource of the

Page No. 05/16/91
WORDiPHRASE
APPENDIX C
GLOSSARY
DEFINITION
Basin Plan
Bathymetry
water in the California Aqueduct.
A plan for the protection of rater quality prepared by e Regional Water Quality Control Board in response to the Porter Cologne Water Quality Control Act also contalns Water Quality Standards for the federal Clean Water Act.
Heasurements of the differences in depth between mean lover lov water and the bottom of the bay.
Bay-Delta Estuary San Francisco Bay, the Sacramento-San Joaquin Delta end (the Estuary) Suisun Harsh, as defined in Sec. 6610 and 6611 of the Cal.
Governmerit Code, Sec. 12220 of the Cal. Water Code, and Sec. 29101 and 29101.5 of the Cal. Public Resources Code, respectively.
Beneficial uses
Benthos
Best available technology (BAT)
Best management practices (BnPs)
'Beneficla1 uses" of the vaters of the state that may be protected against quality degradation include but ere not limited to, domestic, municipal, agricultural and industrial supply; power generation; recreation; esthetic enjeyment; navigation; and preservation and enhancement of fish, vildlife, and other aquatic resources or preserves. lCWC Sec. 13050(f)I
Equivalent to "designated usesg under federal lev.
The whole assemblage of plants or animals living on the bottom of a water body: distinguished from plankton.
The best technology, treatment technique, or other means which the Administrator [of the EPAI finds, after examination for efficacy under field conditions and not solely under laboratory conditions, are available (taking c ~ e t lhta cannlderatioa,. For the purpoeee of setting WCLe f ~ r eynthetlc organic chemlcale, any BAT muet be at least as effective as granular activated carbon. 140 CFR 141.23
State definition:
A practice, or combination of practices, that is the most effective and feasible means of controlling pollution generated by nonpoint sources for the attainment of water quality objectives. 123 CCR 26011
Federal definition:
A practice, or combination of practices, that is determined after . . . p roblem assessment, examination of alternative practices, and appropriate public participation to be the most effective, practicable (including technological,

Page No. 4 05/16/91
APPENDIX C
GLOSSARY
DEFINITION
economic, and institutional considerations) means of preventing or reducing the amount of pollution generated by nonpoint sources to a level compatible vith vater quality goals. t40 CFRI
Bioaccumulative A characteristic of a chemical species vhen the rate cf intake into a living organism 1s greater thar, the rate of excretion or metabolism. This results in an increase in tissue concentration relative to the expoeure concentration.
Bioassay A method for determining the relative toxicity (or other biological activity) of a eubetance by observing its effect6 on a suitable organism under controlled conditions.
Biochemical oxygen The results of an empirical test in which standardized demand (BOD) laboratory procedures are used to determine the relative
oxygen requirements of vastewatere, effluents, and polluted vatere. [Standard Methods ..., 14th ed., 19751
Ueually considered, the amount of oxygen required by bacteria vhile stabilizing decomposable organic matter under aerobic conditions. The BOD test is,videly used to determine the pollutional strength of domestic and induetrial vastes in terms of the oxygen that they vill require if discharged into natural vatercourses in which aerobic conditions exist. The test is eesentially a bioassay procedure involving the measurement of oxygen consumed by living organisms (mainly bacteria) while utilizing the organic matter present in a vaste, under conditions as eimilar as possible to those that occur in nature. [Sevyer, C.N. and McCarty, P.L., Chemistry for Sanitary Engineers, 19671
Bioconcentration The positive difference in concentration of a chemical betveen vater and that in an organism living in that body of rater due to direct uptake of the chemical from the vater. [SWRCB Order No. WQ 85-13
Biocriterion (plural Short for nbiological criterion" The numerical or narrative biocriteria) expression of the biological characteristice of ambient
aquatic communities (often structural measures, e.g., species composition, organism abundance or diversity). Biocriteria, as generally applied in State programs, are designed to reflect attainable characterietics under minimally impacted conditions. As such, biocriterla describe the ecological potential for aquatic community health in a given vatershed, drainage baein or ecological region. CEPA, Report of the National Workehop on Instream Biological Honitoring and Criteria, Lincolnvood, IL, 12/2-4/87]

Page No. 05/16/91
APPENDIX C
%DRD/PHHASE DEFINITION
Biodegradable Any substance that decomposes through the action of microorganisms.
Biornagfilf lctitxon The net accumulation and increase of a substance in an orqanisrn as a result of consuming organisms from lower trophlc levels, e. y., the ccnsumption of algae by fish or vater plants by ducks. LSWRCB Order No. WQ 85-13
Biomass
Blota
Bloom
Cancer
Carcinogen
Carquinez Strait
Carriage vater
Central Bay
The total amount of living material, plants and/or animel, above or belov ground in a particular habitat or area. t40 CFR I
All living organisms that exist in an area.
A proliferation of algae and/or higher aquatic plants in a body of vater.
Any disorder of cell growth that results in invaeion and destruction of surrounding healthy tissue by the abnormal cells.
Any agent that produces cancer, e,g. tobacco smoke, silica and asbestos particles, certain industrial chemicals, and ionizing radiation (such as X-rays and ultraviolet rays).
The narrov strait between Suisun end Sen Pablo bays. It has a mean surface area of 12 sq. mi., mean depth of 29 ft., and mean volume of 223,000 AF.
The amount of Delta outflov needed to meet all of the water quality requirements of D-1485 less (minus) that needed to meet the requirements excluding those for Contra Costa Canal at Pumping Plant No, 1 (DS) and Clifton Cturt Forebay Intak~ at Weet Cenal (C9). The quentity of additional Delta outflov (carriage vater) ie a function of Delta export pumping and south Delte inflov rates. It is necessary to reduce the effects of sea vater intrusion into the Delta around the south side of Sherman Island (reverse flovs up the San Joaquin River 1.
This definition differs from that used by others in that it does not include additional Delta outflov which may be needed to meet certain contractual obligations of the Department of Water Resources. IT,III,8:25-10:233
Central Sen Francisco Bay. That portion of Sen Francisco Bay bounded by the Golden Gate, Sen Francieco-Oakland Bay and Richmond-San Rafael bridges. Surface area = 103 sq. mi. at HLLW, mean depth = 35 ft, and mean volume = 2.307 HAF.

Page No. 6 05/16/91
APPENDIX C
GLOSSARY
WORD/PHRASE DEFINITION
Cheelcal oxygen The results of a laboratory chemical analytical technique demand (COD) vhich is used to measure the amount of oxygen required to
oxidize all compounds in a sample of vater, organic and I
inorganic. [Environmental Glossary 4th ed.1
Chicramrtlr,ation The use oi a comtinatlon or' chlor~ne and a~amoiiie to i
disinfect water supplies.
Chloride (C1-1 The ionic form of the gaeeous element chlorine, usually found as a metallic salt vith potessium or sodium. [SWRCB Order No. WQ 85-13
Chlorinated A class of pesticides vhich contain chlorine, carbon, and hydrocarbons hydrogen. See Chlorinated organic insecticides and
acaricides. [Farm Chemical Handbook, 19873
They include solvents (e. g. , TCE, TCA 1, heat exchangers (e. g., PCBs), contaminants (e. g., TCDD, TCDF), herbicides (e. g., ZAP 1, and wood preservatives t e. g. , Pentachlorphenol).
Chlorinated organic The organic-chlorine chemicale form one of three principal insecticides and pesticide families. This class in the insecticides and acaricides acaricides has related pharmacological effects, and EPA hes
limited the total amount of these related chemicals for residue purposes. Included are the folloving chemicals and their metabolitee:
Aldrin BHC (benzene hexachloride) Chlorbenside Chlordane Chlorobenzilate DDT Dicof 01 Dieldrin Endosulfan
Endrin Heptachlor Lindane Wethoxychlor Uirex Ovex TDE Tetradifon Toxaphene
[Farm Chemicals Handbook, 19873
Chlorination The application of chlorlne to drinking water, sevage, or industrial vaste to disinfect or oxidize undesxrable compounds.
Chlorine (C1) A greenish yellov, poisonous, readily liquified gaseous element of the halogen group, vith a suffocating odor, obtained principally from common salt, and videly used in industry, medicine, etc. [Funk 8 Wagnells Standard College

Page No. 05/16/91
APPENDIX C
LLOCSARY
Chrorr,r,sc?n~f E
Coagulation
Dictionary, 19731
Commonly used to disinfect drinking water and to bleach paper pulp.
Thread-like bodies occurring in animal and plant cell nuclei; they contain genes, the material that makes possible the transfer of characteristics from parent to offspring.
A clumping of particlea in water or wastewater which may result in the settling out of suspended materials. often induced by the addition of chemicale euch as lime or alum, or a change in the diesolved ions in a water body such as . that which occur6 in an estuary when the fresh water inflow mixes vith intruding seawater (i.e., in the entrapment zone ) .
Coliform organisms All of the aerobic and faculative anaerobic, gram-negative, nonepore-forming, rodehaped bacteria that ferment lactose vith gas formation within 48 hr at 35 degrees C. [Standard Hethods ..., 14th ed., 19751
Large numbers of these organisms are found in the intestinal tracts of humans and warm-blooded enimale, their presence in water is often used as an indicator of pollution or potentially pathogenic bacterial contamination.
Colloidal matter
Conductance (Specific)
Finely divided solids vhich will not settle by gravity but may be removed by coagulation or biological action or membrane filtration.
See Electrical conductivity.
The management of eurfece-end ground-water reeourcee in a coordinated operation to the end that the total yield of such a eystem over a period of yeare exceeds the sum of the yield6 of the separate components of the system resulting from the uncoordinated operation.
The objective of conjunctive use is to increase the yield, reliability of supply, and general efficiency of a water system by diverting water from streams or surface reservoirs for conveyance to and etorage in ground-water basins for latter use when .eurf ace water is not available. [Coe, J. J. , Conjunctive Use-Advantages, Constrainte, and Examples, ASCE Journal of Irrigation and Drainage, v. 116, no. 3, HaylJune 19903
Connate water State definition:

Page No. 8 05/16/91
APPENDIX C
GLOSSARY
DEFINITION
Water entrapped in the interstices of a sedimentary rock at the time it vas deposited. These vaters may be fresh, bracki~h, or saline in character. Usually applies only to vater found in geologically older formations. IDWR Bulletin 74-81 I
Federal definition:
Water entrapped in the interstices of a sedimentary or extrusive igneous rock at the time of its deposition. [USGS, Federal Glossary of Selected Terms: Subsurface-Water Flov and Solute Transport, August 19893
Conservative A constituent (or property) the concentration of which is constituent (or not effected by chemical or biological processee. property [T, XLV, 5:16-5:253
Contaminant Federal definition:
Any physical, chemical, biological, or radioactive substance or matter in vater. I40 CFR 141.23
Contamination State definition:
An impairment of the quality of the waters of the state by waste to a degree vhich creates a hazard to the public health through poisoning or through the spread ob disease ... includlingl any equivalent effect resulting from the diepoeal of waste, whether or not waters of the state ere affected. [CWC Sec. 13050(k)3
Federal definition:
The addition to vater of any substance or property preventing the use or reducing the ueability of vater. Sometimes considered synonymous with pollution. IUSGS, Federal Glossary of Selected Terms: Subsurface-Water Flow and Solute Transport, August 19893
Copepod
Crustacea
One of an order (Copepoda) of small, free-svimmlng, fresh-water and marine crustaceans. [Funk & Wagnalls Standard College Dicionary, 19733
A class of anthropoids containing over 35,000 specie= distributed vorldvide, mainly in freshwater and marine habitats, vhere they constitute a major component of plankton. Crustaceans include shrimps, crabs, and lobsters, copepods, and the terrestrial woodlice. The segmented body usually has a distinct head (bearing compound eyes, two

Page No. 9 05/16/51
APPENDIX C
GLOSSARY
DEFINITION
pairs of antennae, and various mouth parts), thorax, and abdomen, and is protected by a shell-like carapace. Each body segment may bear a pair of branched (biramoue) appendages ueed for locomotion, as gills, and for filtering food particles from the vater. Appendages in the head region are modified to form javs and in the abdominal region are often reduced or absent. Typically, the eggs hatch to produce a free-svimming nauplius larva. This develops either by a series of moults or undergoee metamorphosis to the adult form. [Dictionary of Biology, Warner Books3
Current flow Flov conditions es they exist et present. The factors conditions considered vhen defining flov conditions include: land and
water use patterns, reservoir capacities.and operating rules, channel configurations, diversion point locations aand capacities, etc. Hydrologic investigations typically impose various sets of flov conditions upon the available 'hydrologic recordn and analyze the resultant effects. Within thie Plan current flow conditions are those used by the Department of Water Resources to produce the results from their 1990 level of development Operations Study (e.g., DWR Exhibit 30). The DWR Operations Study used the hydrologic record for WY 1922 through 1978.
- DAYFLOW
DDT
A Department of Water Resources flov accounting model ueed to calculate daily Delta outflov at Chipps Island. It also estimates interior Delta flows at specified locations, and fish-related parameters and indices.
The firet chlorinated hydrocarbon ineecticide It ha8 a half-life of 15 years and can collect in fatty tiesues of certain animals. EPA banned registration and interetate sale of DDT for virtually all but emergency uses in the U.S. in 1972 Leceuee of it8 pereietence in the environment and acaumulation in the food chain. '
CHEMICAL NAHE: Dichloro diphenyl trichloroethane. The principal isomer present (not lee8 than 70%) is 1, 1,l-trichloro-2, 2-bis (p-chloropheny1)-ethane. [Farm Chemicals Handbook, 19873
Dabbllng duck A duck which feeds in ehallow water, usually from the surface or by 'tipping-up." Generally a species in the family Anatidae.
Deep percolation The drainage of soil veter downward by gravity below the maximum effective depth of the root zone toward etorage in subsurface strata. tUSGS, Federal Gloesary of Selected Terms: Subsurface-Water Flov and Solute Transport, August 1989 3

Page No. 10 05/16/91
APPENDIX C
GLOSSARY
WORD/PHRASE
Defoliant
Degradation
Delta
Delta channel depletion
Demereal
Deterioration
Diatom
Disinfectant
Disinfection
Diseolved oxygen (DO)
Diving duck
DEFINITION
Any substance or mixture of substances intended for causing the leaves or foliage to drop from a plant, with or without causing 'abscission. [Federal Insecticide, Fungicide, and Rodenticide Act1
The act or process of degrading, specifically: A process of transition from a higher to a lower quality or level. [American Heritage Dictionary3
The Sacramento-San Joaquin rivers delta as defined in the CWC Sec. 12220.
The diversions of Delta channel waters via pumps, siphons, and subsurface seepage onto the Delta uplands and lowlands for consumptive use by agriculture and native plants. IT, I, 121: et. eeq. 3
The consumptive uae values used by the USBR and DWR to operate the CVP and SUP were fixed in the Federal-State Hemorandum of Agreement dated April 9, 1969.
Free-swimming on or near the bottom of a water body (as opposed to benthic, which is within or attached to the bottom, and pelagic, which is free-swimming in the water column ) . An impairment of water quality. [DWR Bulletin 74-813
I A marine or fresh-vater plankton, unicellular or colonial, belonging to the family Chlorophyceae of microscopic green algae, characterized by bivalve walls containing silica. [Funk 8 Wagnalle Standard College Dictionary, 19731
Any oxidant, including but not limited to chlorine, chlorine dioxide, chloramines, and ozone added to water that in any part of the treatment or distribution process, that is I intended to kill or inactivate pathogenic microorganisms. I L40 CFR 141.23
A process which inactivates pathogenic organisms in water bp chemical oxidants or equivalent agents. C40 CFR 141.23 I - A measure of the amount of oxygen available for biochemical 1- activity in a given amount of water. Adequate levels of DO 1 ere needed to support aquatic life. Lor diesolved oxygen concentrations can result from inadequate waste treatment. [Environmental Glossary 4th ed.1 1
1
A duck which feeds on bottom organisms while swimming,

Page No. ? 1 05/16/91
APPENDIX C
GLOSSARY
Dredge sediment (spoil
Drinklng vater
Ebb tide
Economic poisons
Edmonston, A. D. Pumping Plant
Effluent
El Nino
Electrical conductivity or conductance (EC)
DEFINITION
uaualiy fully submerged. Generally in the famlly Aythyidae.
The material removed from the bottom of a vater body by the process of dredging which must be disposed of.
The removal of material from the bottom of vater bodies uslng a scooping or suction machine.
(Excluding Surface Water) Ground vaters suitable, or potentially suitable, for municipal or domeetic vater supply are defined to be:
All ground vater, vith the exception of:
( 1 ) portions of aquifers vith vatere in excess of 10,000 mg/l TDS,
(2) vaters with existing or potential beneficial use designations vhich are unsuitable for domestic or municipal use, end
(3) subsurface oil-bearing zones.
(This definition is not intended for any purpose other than this document
The reflux of tide vater; the outgoing or falling tide: opposed to flood tide. [Webster's Nev Universal Unabridged Dictionary, 2nd. ed., 19793
Chemicals used to control pests, disinfect, preserve vood, and other agricultural products; anti-foulant paints, and defoliants for cash crops such as cotton (see pesticide).
The Department of Water Resources State Water Project (SWP), pumping plant located at tho south end of tho San Joaquin Valley. The przme mover for ell SUP vater used eouth of the Tehachepi Hounteins, in Southern California.
(1) Solid, liquid, or gaseous vastes thet enter the environment as a by-product of man-oriented proceeeee.
(2) The discharge or overflow of fluid from ground or subsurface storage.
A veather phenomenon also knov as the "Southern oscillation^ which refers to a periodic failure of upvelling off Peru and associated vind and current changes in the Pacific Ocean.
The EC of a vater sample is an indirect measure of the total dissolved solids (TDS) or salinity levels of a vater sample (i.e., the higher the EC the greater the TDS). Electrical conductivity, or specific conductance, is generally measured

Page No. 12 05/16/91
APPENDIX C
GLOSSARY
DEFINITION
Enrichment
Entrainment
in milli- or micro- mhos, or milliSiemene per centimeter ( mmhos/cm, umhos/cm or dS/cm, respective1 y . ) . State definitions:
The relative ability of water to cunduct electrical current. It depends on the ion concentration of and c6n be used tc
approximate the total filterable residue (total dissolved solids) in the water. [23 CCR 26011
A meaeure of the ability of water to conduct electricity current at 77 degrees F ( 2 5 degrees C ) . It ie related to the total concentration of ionizable solids in the water. [DWR Bulletin 74-903
Federal definition:
CAI measure of the ability of material to conduct an electrical current. For water samples, it depends on the concentration and type of ionic constituents in the water and temperature of the water; and it ie expreesed in siemens per meter. [USGS, Federal Glossary of Selected Terms: Subsurface-Water Flow and Solute Transport, August 19891
Sewage effluent, or agricultural drainage or runoff adding nutrients (nitrogen, phosphorus, carbon compounds) to a water body, greatly increasing the growth potential for algae and aquatic plants.
For purpose6 of this report entrainment is meant to include primarily the effects of project operations, such ae closure of the Delta Cross Channel gates, pumping, and reverse and low flows.
Entrapment zone An area in an estuary where suspended materials (including certain biota) eccumulate. Net upstream transport of the particulate materials that eettle into the bottom density current is nullified by the net downstream transport of materials in the river inflow. As a result, certain suspended materials concentrate in the area where the bottom currents are nullified (see Null Zone). [Arthur, J.F. and Ball, H.D., The Significance of the Entrapment Zone Location to the Phytoplankton Standing Crop in the SF Bay-Delta Estuary, USBR, November 19801
Escapement
Estuary
The number of adult salmon escaping harveet and returning to the spawning grounds.
The mouth of a stream which serves as a mixing zone for fresh and ocean water. nouths of streams which are

Page No.. 13 05/16/91
APPENDIX C
GLOYSARY
WORD/?HSASE DEFINITION
temporarily separated from the ocean by sandbars are considered as.estuaries by the SWRCB. Estuarine vaters are generally considered to extend from a bay or the open ocean to a point upstream where there is no significant mixing of fresh water and seavater. Estuarine waters are considered to extend seaward if significant mixing of f r e ~ h and seawater occurs in the open coastal waters. [SWRCE, Watex Quality Control Policy far the Enclosed Bays and Estuaries of California, nay 19741
In this document Estuary is used vhen referring to the San Francisco Bay and Sacramento-Sen Joaquin Delta Estuary.
Euryhaline Designating aquatic organisms that can tolerate a wide range of salinity. Euryhaline organisms may be found in an estuary (salt content approximately 14 parts per 1000) or in the open sea (salt content 35 parts per 1000). [Dictionary of Life Sciences, 2nd ed., revised, 19831
Evaporation The process by vhich a substance passes from liquid or solid state to the vapor state, [Glossary of Geology, 19721
Evapotranspiration The combined loss of vater from a given area by evaporation from the land and transpiration from plants. IUSGS, Federal Glossary of Selected Terms: Subsurface-Water Flov and Solute Transport, August 19891
Exchange contractore Those vho formerly diverted vater from the San Joaquin River, but exchanged their diversion rights for a contract that granted more coneistent vater supplies from the Delta nendota Canal. The maximum contractual entitlement of these users is 0.84 million AF/yr. [USBR, Factsheet : #Exhibits and Testimony before SWRCB, Bay-Delta Hearing 1987', 19871
Fe~.til izex
Filter feeding
Flocculation
Flood tide
Any organic or inorganic material of natural or eynthetic origin that is added to e soil to supply elements eseential to plant grovth. [Reeources Coneervation Glossary1
A method of feeding, found in many aquatic invertebrates, in vhich minute food particles are ingested from the surrounding vater. Filter feeders are common in plankton and benthos communities. [Hartin, E.A., Dictionary of Life Sciences, 2nd ed., 19833
A process to enhance agglomeration or collection of smaller floc particles into larger, more easily settleable particles through gentle stirring by hydraulic or mechanical means. 140 CFR 141.21
The rising tide: opposed to ebb tide. [Websterns Nev

Page No. 14 05/16/91
APPENDIX C
GLOSSARY
Flov-weighted sampling
Flushing
Food chain
Food web
Fry
Geochemistry
Geometric mean
Grab eample
Gravitational circulation
Gravitational overturn
DEFINITION
Universal Unabridged Dictionary, 19791
Samples taken in a manner that allows determination of mass emissions, i.e., samples taken in proportion to the rate of flov of a river or stream.
The process by whlch contaminant conterrtrations In 6 Sody of water are diluted by river inflov and, where applicable, tidal exchange of .newm uncontaminated water combined vith the net advection of the contaminants avay from their source by residual currents.
The pyramidal relationship of producers (plants) and consumers (animals) by vhich solar energy 1s converted through photosynthesis to plant tissue which is consumed t.y animals which are in turn consumed. At each step up the fcod chain coneumers are usually larger but fewer in number.
The sum of the interacting food chains in an ecological community. CSWRCB Ofder No. W. Q. 85-13
The stage in the life of a fish between the hatching of the egg and the absorption of the yolk sac (same as sac fry or elevin). From this stage until they attain e length of one inch the young fish are considered advanced fry. [Bell, H.C., Fisheries Handbook of Engineering Requirements and Biological Criteria, U. S. COE, 19861
The science dealing vith the chemistry of the earth's crust.
The antilogarithm of the mean of a group of logarithms of a measured variable. The geometric mean i~ used to transform logarithmically dietributed numbers for statistical purposes. (See definitions for Logarithm and Logarithmic Distribution.
A single sample taken at an instant in time to represent the conditions at that instant.
Net internal motions caused by horizontal density gradients. The denser fluid flovs along the bottom and lighter fluid along the surface in an attempt to restore a stable verticel stratification. In the case of a longitudinal salinity gradient, this produces a net landward bottom current and compensating seavard current of fresher water at the surface. Also refered to as Baroclinic Circulation. (Also see Null Zone. )
The formation of a lens of fresh water on the surface of an estuary during a period of high runoff. Also refered to as

Page No. 05/16/31
APPENDIX C
GLOSSARY
Ground water
Gravitational Overflov. This eurface layer can spread beyond the mouth of the estuary into the ocean.
(1 ) That part of the subsurface vater that is in the saturated zone.
( 2 ) Luosoly, ell subsurface water as dietinct from surface vater.
(3) All vater which occurs belov the land surface. It includes both vater vithin the unsaturated and saturated zones.
( 4 ) The water belov the land surface in a'zone of saturation, for purposes of this appendix, ground vater is the vater contained vithin an aquifer (10 CFR 40 Appendix A).
( 5 ) All vater vhich occurs belov the land eurface (10 CFR 60.2).
(6) All subsurface vater as distinct from surface veter (10 CFR 960 I .
( 7 ) Subsurface vater that fills available openings in rock or soil materials to the extent that they are considered vater- saturated t 30 CFR 710.5).
(8) vater belov the land surfece In a zone of eaturation (40 CFR 270.2; 40 CFR 146.3; 40 CFR 144.3).
(9) vater in a saturated zone or stratum beneath the eurface of land or vater (40 CFR 300.6; 40 CFR 257.3-4).
Qi-,aund water hanking The act, t y a public agency, of recharging or replenishing a ground water basin. There is an account kept on the vater recharged and it is extracted in dry years to meet dry-year needs. A ground vater bank is operated very much the same as a surface reservoir. The extraction of the stored vater is controlled by the public agency and is not restricted to overlying users such as is the case vith normal ground water use. See Overdraft correction programs.
Ground water basin A ground vater basin consists of an area underlain by permeable material8 vhich are capable of storing or furnishing a significant vater supply; the basin includes both the surface area and the permeable materials beneath it. tDWR Bulletin 74-813
Ground vater The condition of a ground vater basin in vhich the amount of

Page No. 16 05/16/91
WORDIPHRASE DEFINITION
APPENDIX C
GLOSSARY
overdraf t ground water withdrawn under current development exceeds the amount of water that replenishes the basin over a hydrologically mean period. [DWR Bulletin 1181 !
Grow-out facilities Ponds at a.hatchery or pumping facility where fish are kept. until they are large enough to survive on their own. 1
I
Gyre
Habitat
Hard water
A circular or spiral motion: whirl: revolution.
The sum of environmental conditione in a epecific place that is occupied by an organism, population, or community.
I Those waters that require considerable amounts of soap to produce a foam or lather and that also produce scale in hot-water pipes, heaters, boilers, and other units in which
I the temperature of water is increased materially. [Sawyer, I C. N. and WcCarty, P. L., Chemistry For Sanitary Engineers, I 1967 3
Hardness A vaters content of metallic (i.e., poeitive) polyvalent ione, principally calcium and magnesium, that react with eodium soaps to produce solid soaps and that react with
I negative ione, when the water ie evaporated In boilers, to produce eolid boiler scale. Hardneee ie usually expreeeed ee a1 mg/l of equivalent calcium carbonate (CaC03). [Camp, T.R. and Heserve, R. L., Water And Its Impurities, 19743 I
i Hazardoue material (a) wHazardoue materialw means a substance or combination of
subetancee which, because of ite quantity, concentration, or physical, chemical, or infectioue characteristics, may:
I
(1) Cause, or eignificantly contribute to an increase in serious irreversible, or incapacitating reversible, illness; or
( 2 ) Pose a substantial present or potential hazard to I
human health or environment when improperly treated, stored, transported or dispoeed of or otherwiee managed. ! (b) Unless expressly provided otherwise,the term whazardous materiala shall be understood to also include extremely hazardous material. t22 CCR 6610C et seq.1 I-
Heavy metals netellic elements like mercury (Hg), chromium tCr), cadmium (Cd), arsenic (As), and lead (Pb), with high molecular reighte. They can damage living things at low concentrations and tend to accumulate in the food chain.
Herbicides All subetances or mixtures of substances used to control or destroy undesirable plants.
I

Page No. 17 05/16/91
APPENDIX C
GLOSSARY
WORD/PHRASE DEFINITION
Historic flovs Depending on the context used can mean either;
(1) those flows before man began influencing river flows (i.c., the Natural Flov), ISWRCE,31 or
( 2 ) flov condltion~ that actually occured ovel the historic hydrological period and vere measured at various locations in the Central Valley Basin using flow measuring devices. Theee flows reflect upstream impoundments, diversions or use of runoff under the existing upstream storage and channel configurations at the time of measurement. [SWC Comments on January 19, 1990 Draft Revised WQCP, p, 6, April 9, 19903
Homologous
Hybrid
In Biology: Anatomical features of different organisms (species) which correspond in structure and evolutionary origin, as the flipper of a seal and the arms of a human being. [American Heritage Dictionary 2nd ed.1
In Chemistry: The members of e series of organic compounds having the same structure, but in vhich each differs from the preceding one by a constant increment, as the methane series. [Funk & Wagnalls Standard College Dictionary, 19731
An offspring of tvo animals or plant6 of different races, breeds, varieties, species, or genera.
Hybridization The act or process of producing hybrids.
Hydraulics The branch of physics having to do with the mechanical properties of water and other liquids and with the application of these properties in engineering.
Hydrocarbone A large and important graup af aryanic campaunda that contain only hydrogen and carbon. There ere tvo types, saturated and unsaturated. Saturated hydrocarbons are those in vhich adjacent carbon atoms ere joined by a single valence bond and all other valences are satisfied by hydrogen. Unsaturated hydrocarbons have at least two carbon atoms that are joined by more than one valence bond and all remaining valences are satisfied by hydrogen.
The saturated hydrocarbons form a vhole series of compounds starting with one carbon atom and increasing one carbon atom, stepwise. These compounds are also knovn as the paraffin series, the methane series, and as the alkanes. The principal source is petroleum. Gasoline is a mixture containing several of them; diesel fuel is another such mixture.

Page No. 18 05/16/91
APPENDIX C
GLOSSARY
Hydrodynamics
Hydrology
Impairment
In vivo
Injection well
Insecticides
Irrigation efficiency (IE)
DEFINITION
The unsaturated hydrocarbons are usually seperated into four classee: (i) the ethylene series of compounds all contain one double valence bond betveen two adjacent carbon atoms; (11) the diolefin series of compounds all contain two double bonds in thelr moleculee; (iii) the polyene~ contain more than two double bonds, these compounds occur I n the westewaters produced by the canning industry (the chlorane demand of wastewaters containing polyenes is extremely high); (iv) the acetylene series of uneaturated hydrocarbons have a triple bond between adjacent carbon atoms, these compounds ere found in some industrial wastewater (particularly those from the manufacture of some types of synthetic rubber).
The motion and action of water and other liquids, ~.e., the dynamics of liquids, and the study thereof.
The science of vater in nature: its properties, distribution, and behavior.
A change in quality of water which makes it less suitable for beneficial use. [DWR Bulletin 74-811
Designating biological processes that are performed, outzide living organisme, traditionally In a test tube, lDictionery of Life Sciences, 2nd ed., 19763
Any bored, drilled, driven shaft, dug pit, or hole in the ground into which water or fluid is diecherged, and eny associeted subsurface sppurtenancee, and the depth of vhich 18 greeter than the circumference of the shaft, pit, or hole. [CWC Sec. 130513
All eubstancee or mixtures of subetances intended for preventing or inhibiting the establishment, reproduction, development, or growth of, destroying or repelling any member of the Class Insecta or other allied Classes in the Phylum Arthropod8 considered to be a pest.
The efficiency of a single on-farm Irrigation; the ratio of the depth of water beneficially used ( B U ) to the depth of appl~ed water (AM), expresseE as a percent.
[Westlands Water District, Water Conservation and Drainage Reduction Programs, 1987-1988, Definition of Terms, November 19893

Page No. 15 05/lL/91
APPENDIX C
CLOSSARY
WORD/PHRASE DEFINITION
Kesterson National A vaterfovl management area adjacent to Kesterson Reservoir Wildlife Refuge in Merced county California which was originally planned to (Kester &on NWR utilize Sen Luis Drain water. When first established,
Kesterson Natlonal Wildlife Refuge (NWR) used a mixture of fresh CVP water nnd local tailwater to develop wetland habitat. As the use of Sarr Luis Drain water, including an increasing proportion of tile drain waters, was phased in, deformities and reproductive abnormalities began to affect the birds nesting there. tSWRCB Order No. WQ 85-11
Keeterson Reservoir A water storage facility adapted as an interim evaporation baein for the Central Valley Project San Luis Drain. [SWRCB Order No. WQ 85-13
Larvae
Leachate
Leaching
The juvenile stage in the life cycle of most invertebrates, amphibians, and fish, which hatch from eggs, is unlike the adult in form, and is usually incapable of sexual reproduction. It develops into the adult by undergoing metamorphosis. Larvae can feed themeelvee and are otherwise self-supporting. Examples are the tadpoles of frogs, the caterpillars of butterflies, and the ciliated planktonic larvae of many marine animals. [Dictionary of Biology. Warner Books1
Any fluid formed by the drainage of liquids from waste or by the percolation of liquid through waste. It includes any constituents extracted from the vaste and diesolved or suspended in the fluid. 123 CCR 2061
The flushing of salts from the soil by the downward percolation of water.
Leaching fraction That fraction of the total amount of epplied water that peeeee through a crop root zone. [SWRCB, 29,21
Lead (Pb)
Levee
A soft, malleable, ductile, bluish white dense metallic element, with a variety of toxic ealts. [SWRCB Order No. WO 85-1 1
An embankment, especially along the shore of a river, built for portection against floods. [Funk 8 Wagnalls Standard College Dictionary, 19731
Logarithm (Log) The exponent expressing the power to which a fixed number (the base) must be raised in order to produce a given number (the antilogarithm). The most common logarithms are for the base 10. For example, 3 is the base 10 logarithm of 1,000 -- 100 is the base 10 antilogarithm of 2. See Natural logarithum

Page No. 20 05/16/91
APPENDIX C
GLOSSARY
WORD/PHRASE DEFINITION I Logarithmic The distribution of a set of observations of a variable distribution which is limited at its lover end by zero (i.e., cannot have
a value of less than zero) but is otherwise unre~trained. I
The logarithms of the observations of a logarithmically distributed variable are symmetrical about (i.e., 50% above and 50% below) the logarithm of the geometric mean of thc variable.
I Logarithmic mean (or See definition of geometric mean. log mean
Lunar day The time of rotation of the moon about the earth, 24.84 hours.
Manganese (Hn) A hard, brittle, grayish white metallic element, oxidizing readily and forming an important component of certain alloys, as manganese eteel. [Funk & Wagnalls Standard College Dictionary, 19731
I I
Harsh or marshland A tract of low, wet, soft land; swamp; bog; morass; fen. I Haximum contaminant The maximum permissible level of a contaminant in weter level (HCL) which is delivered to the free flowing outlet of the
ultimate user of a public water system, except in the case of turbidity where the maximum permissible level is measured at the point of entry to the distribution system. Contaminants added to the water under circumstances controlled by the user, except those resulting from
I corrosion of piping and plumbing caused by water quality, are excluded from this definition. 140 CFR 141.21 1
Haximum contaminant The maximum level of a contaminant in drinking water at level goal (HCLG) which no known or anticipated adverse effect on the health
or persons would occur, and which allows an adequate margin of safety. Haximum contaminant level goals are nonenforceable goals. 140 CFR 141.21 I
Haximum total The maximum concentration of total trihalomethanes produced trihalomethane in a given water containing a disinfectant residual after 7 potential (HTTP or days at a temperature of 25 degrees C or above. t40 CFR HTP ) 141.21 I Heasured flow The flow of water determined with a measuring device. I
i A unit of measure for electrical conductivity equal to the reciprocal, or inverse, of the standard unit of electrical resistance, the ohm. One mho is equal to one Siemen, the standard unit of electrical conductivity. I

Page No. 2 1 05/16/,91
APPENDIX C
GLOSSARY
DEFINITION
An agent that causes an increase in the number of mutants (see mutation) in a population. tlutagens operate either by causing changes in the DNA of the genes, so interfering with the coding system, or by causing chromosome damage.
A sudden random change in the genetic material of a cell that may cause it and all cells derived from it to differ in appearance or behavior from the normal type. A relatively abrupt and permanent change in DNA that can be transmitted during cell division.
Natiorral Pollutant The national program for issuing, modifying, revoking and Discharge reissuing, terminating, monitoring and enforcing permits, Elimination Sy~tem and imposing and enforcing pretreatment requirements, under ( NPDES ) sections 307, 318, 402, and 405 of the Clean Water Act. The
term includes appoved state programs. 140 CFRl
Natural or true The embayment and channel flovs vhich existed st the time of natural flow the first Spanish exploratkon of California, i.e.,' before
the Gold Rush.
Neap tide
Nekton
Nev vater
Nickel (Ni)
Nitrate
The tide occurring just after the first and third quarters of the lunar month: at these times the difference between high and low tides is smallest. [Webester's Nev Universal Unebridged Dictionary, 2nd. ed., 19791
The aggregate of animal organisms capable of evimming freely, relatively independent of currente, vaves, etc., ranging in eize from microorganisms to vhales. Compere to "Plankton"
Water vhich has not entered the Bay for at least several tide1 cyclee. [Denton and Hunt, 19861
A herd, ductile, mallable, silver-vhite metallic element of the iron-cobalt group.
An ion composed of one atom of nitrogen bound to three atoms of oxygen. An important plant nutrient. In high concentrations, it can bind to hemoglobin resulting in methemoglobinemia. also refers to salts of the nitrate ion vith other ionic substances, usually metals. [SWRCB Order NO. we 65-11
Non-point source Causes of vater pollution that are not associated vith point sources, such as agricultural fertilizer runoff, or sediment from construction. Examples include ti) Agriculturally related non-point sources of pollution including runoff from manure disposal areas, and from land used for livestock and
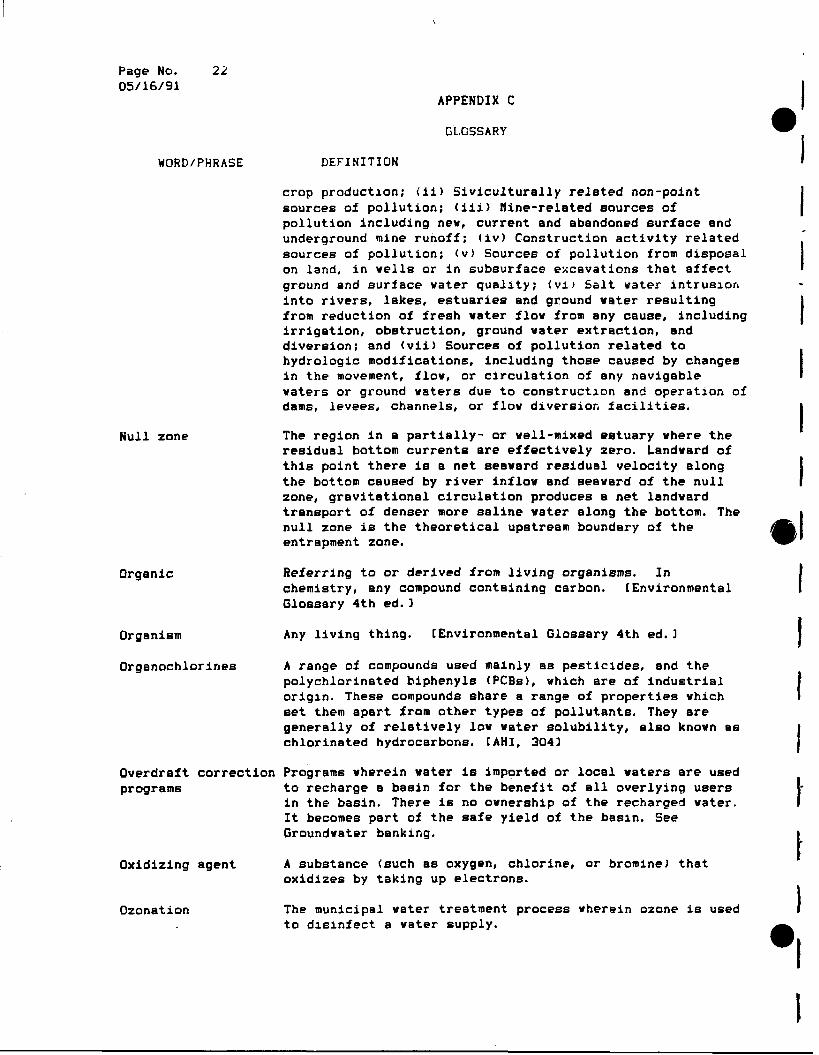
Page No. 2i 05/16/91
APPENDIX C
GL.QSSARY
Null zone
Organic
Organism
Organochlorines
DEFINITION
crop production; (11) Siviculturally related non-point sources of pollution; (iii) nine-related sources of pollution including new, current and abandoned surface and underqround mine runoff; (iv) Construction activity related sources of pollution; ( v ) Sources of pollution from disposal on land, in wells or in subsurface excavations that affect ground and surface vater quality; (vl ) Salt v a t e r intrusion into rivers, lakes, estuaries and ground water resulting from reduction of fresh water flow from any cause, including irrigation, obstruction, ground water extraction, and diversion; and (vii) Sources of pollution related to hydrologic modifications, including those caueed by changes in the movement, flow, or circulation of any navigable waters or ground vaters due to construct~on and operstlon of dams, levees, channels, or flov diversior, facilities.
The region in a partially- or vell-mixed estuary where the residual bottom currents are effectively zero. Landward of this point there is a net seavard residual velocity along the bottom caused by river inflov and seavard of the null zone, gravitational circulation produces a net landward transport of denser more saline water along the bottom. The null zone is the theoretical upstream boundary of the entrapment zone.
Referring to or derived from living organisms. In chemistry, any compound containing carbon. [Environmental Glossary 4th ed. 1
Any living thing. [Environmental Glossary 4th ed.1
A range of compounds used mainly as pesticldee, and the polychlorinated biphenyls (PCBs), which are of industrial origin. These compounds share a range of properties which set them apart from other typee of pollutants. They are generally of relatively low vater solubility, also known as chlorinated hydrocarbons. [AHI, 3041
Overdraft correction Programs wherein water is imported or local waters are used programs to recharge a basin for the benefit of all overlying users
in the basin. There is no ownership of the recharged water. It becomes part of the safe yield of the basln. See Groundwater banking.
Oxidizing agent
Ozonat i on
A substance (such as oxygen, chlorine, or bromine1 that oxidizes by taking up electrons.
The municipal water treatment process vherein ozone is used to dlslnfect a vater supply.

Page Nc, 2 3 05/16/91
WORD/PHRASE
Ozone
PEROXONE
Partially-mixed estuary
Peat
Pelagic
Perozonation
Pesticide
Phytoplankton
Piscivore
APPENDIX C
tl.OSS.4liY
DEFINITION
An unstable allotropic form of oxygen, 03, vith a pungent odor like that of chlorine, formed variously, as by the passage of electricity through the air. It is e powerful oxidizing agent, much more active than ordinary oxygen, and is used for bleaching oils, vaxes, ivory, flour, [paper bulpl and starch, and for disinfect~ng drinking water. [Funk & Wagnalls Standard College Dictionary, 19733
A combination of ozone and hydrogen peroxide.
An estuary in vhich vertical mixing due to tidal currents is large enough to prevent a distinct vertical density stratification between fresh and seaveter but not strong enough to completely remove any vertical variation in density. The northern reach of San Francisco Bay is typical of a partially-mixed estuary.
A substance consisting of partially carbonized vegetable materiel, chiefly mosses, found usually in bogs. [Funk & Wagnalls Standard College Dictionary, 19731
Describes open-vater (or deep-vater) habitat or those organisms vhich depend upon it.
The use of PEROXONE to disinfect vater.
All chemical agents vhich are ueed for the control of some noxious insect, plant, or animal. Pesticide compounds, synthetic as vell as substances vhich occur in nature, can be categorized into four groups es follovs:
(1) Chlorinated hydrocarbons containing carbon, hydrogen, and ahlorine, Examplee are DDT, toxaphene, lindane, chlordane, and endrin.
( 2 ) Organic phospborue (thiophosphate) compounds of phosphorus, oxygen, carbon, and hydrogen. Examplee are parathion and malathion.
(3) Organic compounds including organic sulfur compounds, organic mercurials, dinitrophenols, carbamates, and natural products such as rotenone, nicotine, and strychnine.
( 4 ) Inorganic compounds of copper sulfate, arsenate of lead, zinc, chlorine, thallium, calcium arsenate, and sodium floroacetate. CASCE, SA 5, p. 28, October, 19673
Free-floating aquatic plants.
Fish eater.

Page No. 24 05/16/91
WORD/PHRASE
Plankton
Point source
Pollution
Polychlorinated biphenyls (PCBs)
Postammoniation
Potable water
Preammoniation
Precipitation
Preirrigation
APPENDIX C
GLOSSARY
DEFINITION
The animal and plant organisms that drift or float vith currents, waves, etc., unable to influence their ovn coures, ranging.in size from microorganisms to 3ellyfish: distlnguished from benthos. Compare to 'Nektonm. [Funk b Wagnalls Standard College Dictionary, 19731
Any discernible, confined and discrete conveyance, including but not limited to any pipe, ditch, channel, tunnel, conduit, well, discrete fissure, container, rolling stock, concentrated animal feeding operation, or vessel or other floating craft, from vhich pollutants are or may be discharged. This term does not include agricultural stormvater discharges end return flov~ from lrrlgated agriculture. [CWA, Sec. 502 (14) I
An alteration of the quality of the vaters of the state by veste to a degree which unreasonably effects (1) such waters for beneficial uees, or ( 2 ) facilities which serve ~ u c h beneficial uses. nPollutionn may include ncontaminetionw. [CWC Sec. 13050(1)1
The introduction into the groundwater of the state of an active ingredient, other specific product, or degradation product of an active ingredient of an economlc poison above a level, with an adequate margin of safety, that does not cause adverse health effects. CCFAC Sec. 131421
A mixture of compounds compoeed of the biphenyl molecule which has been chlorinated to varying degrees. [Environmental Glossary, 4th ed.1
PCBs are considered an environmental problem because of their abundance, very great persistence, and considerable toxicity to aquatic biota. [AHI,3041
The addition of ammonia to water as the last step in municipal vater treatment.
Suitable for drinking. [Funk & Wagnalls Standard College Dictionary, 19731
The addition of ammonia to water as it first enters a municipal vater treatment, prior to the application of any other water treatment process.
The discharge of vater (as rain, snow or hail) from the atmosphere upon the earth's surface. tDWR Bulletin 1181
The efficiency of an on-farm preirrigation; the ratlo of the

Page No. 05/16/91
APPENDIX C
GLOSSARY
WORD/PHRASE
efficiency (PIE)
Progreseive vave
Pulse flow
Quality of water
Rare species
Recharge
Reclaimed water
Rc~a-.ui tment
Reservoir reoperation
Residual current
Residual disinfectant concentration
Residue
DEFII l IT ION
sum of the depth of vater used for soil moleture replacement (SWR1) and cultural practices (CP1) to the depth of applled vater (Awl), expressed as a percent. No leaching requirement is included. [Westlands Water District, Water Conservation and Dra~nagr Reducti~n Proprams, 1987-1988, Deflnltion of 'Teres, November 19891
A tidally-driven weve which travels along an estuary. This type of vave occurs in long shallow estuaries where there is a significant frictional resistance to the tidal flov and only veak vave reflection at the head of the estuary. The tide in the northern reach of San Francisco Bay travels upgtream as a progressive vave.
A substantial increase in the flow of vater folloved by a decrease vlthin a relatively short period of time.
The chemical, physical, biological, bacteriological, radiological, and other properties and characteristics of water which affect its use. [CWC Sec. 13050(h)l
A species, subspeclee, or variety is rare vhen, although not presently threatened with extinction, it is in such small numbers throughout its range that It may become endangered if its present environment worsens. [CFGC Sec. 19013
The flow to ground water storage from precipitation, infiltration from streams, and other sources of water. [DWR Bulletin 1183
Water vhich, as a result of treatment of waste, is euitable for e direct beneficial use or a controlled use that would not otherwiee occur. [CWC Sec. 13050(n)I
Addlti~n Ly reproduction of now individuele to a papuletion.
A quantitative study in vhich the operating rules for a reservoir are changed from the rules actually used in the historical operation of the reservoir. The nev operating rules result in different releases from the reservoir than actually occurred historically.
The net transport of a particle averaged over a complete tidal cycle.
The concentration of disinfectant measured in mg/l in a representative sample of vater. 140 CFR 141.21
Generally refers to that portion of a sample remaining after

Page No. 26 05/16/91
APPENDIX C
GLOSSARY
DEFINITION
Resource
drying at 103-105 degrees C or 180 degrees C to a constant weight. [Standard Hethods . . . 14th ed., 19751 Under certain circumstances, the toxic material found when a sample has been analyzed; usually refers to a toxicant in a food or tissue sample, expressed as a proportion of the original velght. [SWRCB Order No. W0 85-11
That which is, or may be, readily available ae a source of supply or support; anything that can be drawn upon when needed, whether material or non-material. C Resource Conservation Glossary3
Reverse flov In the context of thie report, the term reverse flow refers to net flov being in the upstream direction in the Southern and Western Delta. This condition occurs betveen approximately the western end of Sherman Island (in the Delta) and the export pumps when Delta inflow is relatively, low and Delta consumptive uees and exports are high.
Riparian Pertaining to the banks and other terrestial environs adjacent to water bodies, vatercourses, and surface-emergent aquifers (e. g. springs, seeps, oases) , vhose vaters provide eoil moisture significantly in excees of that otherwise available through local precipitation. Vegetation typical of thie environment is dependent on the availability of excees water.
Riparian water right The right to use vater on land bordering a stream. See also Water rights. [SWRCB Order No. WQ 85-13
Riparian wetland A zone which may be periodically inundated by v a t e r , characterized by moist soil and aseociated vegetation; typically bounded on one border by a drier upland and on the other by a freshwater body. [SWRCB Order No. WQ 85-11
Riverine
Run
Runoff
Pertaining to or like a river; riparian. [Funk 8 Wagnalln Standard College Dictionary, 19733
To migrate, especially to move in a shoal in order to spavn. [American Heritage Dictionary 4th ed.3
That part of precipitation vhich is not abeorbed by soil, evaporated, or transpired by plants, but f ~ n d s its way into streams as surface flow. [Fundamentals of Ground Water Contamination Glossary, 19851
Any precipitation, leachate, or liquid that drains from any part of a vaste management unit. 123 CCR 26013

Page No. 2 7 05/16/ 92
APPENDIX C
C-LOSSARY
WORD/PHRASE
Salinity
Salvage
Sen Peblo Bay
Saturated zone
DEFINITION
The total concentration of dissolved ions in water, a conservative property. [T, XLV, 5 : 12-5:251
The .salt cor,tent of a water. [SWRCB Order No. W Q 85-11
U~ually expres~ed as ppt. (g/l), or ppm tmg/lj.
Those fish diverted avay from or removed from screens et intakes to diversion structures end subsequently returned to b vater body.
The portion of San Francisco Bey encompes~ing the area from the Richmond-San Rafael Bay Bridge on the.eouth side to the Petaluma River on the north and the Cerquinez Strait on the east. It has a surface area of 105 sq. mi. at HLLW, mean depth of 9 ft., end mean surface area of 605,000 AF.
An underground zone in vhich all openings in and betveen natural geologic materials are filled vith vater. 123 CCR 2601 1
Secondary treatment Biochemical treatment of vastevater after a primary stage, using microorganisms to consume the organic material in the vastevater. Use of trickling filters, or the activated sludge process, removes floating end settleable solids and about 90 percent of oxygen demanding substances (BOD) end suspended solids (TSS).
Selenium (Se)
Semidiurnal tide
Shoal
Shorebird
A non-metallic element chemically resembling sulfur. Essential for animals at trace concentrations, selenium is toxic to animals in deficient or excessive dietary exposure. [SWRCB Order No, W Q 85-11
aelenlum oomra an t h e e envia-anmentally eignlficant valence statee Se -2 (eelenide), Se +4 (selenite), and Se +6 (eelenate), vith different toxic properties.
A tidal variation consisting of tvo high and two low tides per lunar day (24.84 hre). In Sen Francisco Bay, the cycle typically consists of a high high folloved by a lov low, a lov high, a high low and back to a high high tide.
A shallov place in any body of water, or en assemblage or multitude; throng (i.e., a school of fish). [Funk & Wagnells Standard College Dictionary, 19733
Any of various birds (suborder Charadrii) that frequent beaches and aleo the shcres of inland vaters, including the snipe, sandpiper, and plover. [Funk & Wagnal?~ Etandard

Page No. 29 05/16/91
WORD/PHRASE DEFINITION
Siemen
Slot llmit
Slough
Sludge
Smolt
College Dictionary, 19733
The standard unit of electrical conductivity, equal to 1 mho. The reciprocal, or inverse, of the standard unit of electrical resistance, the ohm.
Fishlng regulaticin v r i i c h permite taking of fish only vlth specified lengths, usually medium-sized fish to protect both very young or immature fish and very large, older and typically more fecund (high reproductive capacity) fish.
A stagnant swamp, backwater, bayou, inlet, or pond in vhich waterbacks up. [Funk & Wagnalle Standard College Dictionary, 19731
Residual solids afid seml-solids from the treatment of vater, wastewater, and other liquids. It does not include liquid effluent discharged from treatment processes. 123 CCR 26011
An anadromous fish that is physiologically ready to undergo the transition from freoh to salt water; age varies
I depending on species and environmental conditions. [Bell, n.c., 19861
Soluble, e. g., Any substance capable of passing through a membrane filter soluble selenium with a rated pore diameter of 0.45 microns. [Standard
Methods.. . , 14th ed., 19751
Capable of entering into ~olution or of being diesolved; as, a soluble substance. [Webster'e Nev Universal Unabridged Dictionary, 19791
South Bay
Species
The portion of the San Francieco Bay etretching from the Sen Francisco-Oakland Bay Bridge on the north to Hountain Viev in the south. It has a surface area of 214 sq. mi. at HLLW, mean depth of 11 ft. and mean volume of 1,507,000 AF
A unit used in the classification of plants and animals. Ideally a species is deflned as a group of organisms that I
interbreed with each other to produce fertile offspring. Members of different animal species do not normally interbreed; if they do, the progeny are sterile. Hybrids of !- two plant species are usually sterile but may occasionally be made fertile by allopolyploidy [doubling the number of chromosome8 present in the sterile hybrid]. Hembers of the same species usually resemble each other closely, but vhen species are subdivided into subspecies, clines, or
I cultivated varieties, the members of these eubgroupe often

Page No. 05/16/91
APPENDIX C
GLOSSARY
WORD/PH~ASL DEFINITION
Spring tide
Standard
Standing wave
Statevide plan
differ from one another in appearance. lDictionary of Llfe Sciences, 2nd ed., 19761
(1) The tide that appears at or soon after the new moon and the full moon: it is normally the hlghest tide of the month.
(2) Any great flov, rush or flood. IWebsterDs New Unabridged Dictionary, 19791
See Water Quality Standard.
A wave vhich does not travel so the point of maximum amplitude (crest to trough) remains fixed in space. Standing waves occur in an estuary when the resistance to the flov is small. The tide in South Bay ie an example of a standing wave.
A vater quality control plan adopted by the State Water Resources Control Board in accordance vith the provisions of Cal.Water Code Sec. 13240 to 13244, for waters where vater quality etandarde are required by the Federal Water Pollution Control Act. Such plans supersede regional vater quality control plane for the same waters to the extent of a conflict. CCWC Sec. 131703
Striped bass index An index of the number of young bass vhich have survived t SBI ) through their firet eummer. Young bass are sampled vith nets
vhich are moet efficient for fish about 1.5 inches in length. Sampling methods are consistent (vith respect to location, frequency, technique, etc.) so that the number of young striped bass caught may be compared with the catch at various locations year to year. The number of young bass ceuyht by the etandard eempling methode allovs etatieticel treatment of data to eetlmete the abundance af young striped baee and to correlate changes in the number caught vith changes in environmental factore. [SWRCB, Final EIR for the 1978 WQCP and D-14853
Su.beurf ace agricultural drainage system
Suisun Bay
A set of tile drains, collectors and, in moet cases, one or more sump pumps vhich are installed in a field to remove vater from the root zone of any crop8 vhich may be planted. Generally installed in areas vith shallow perched vater tables.
The portion of Sen Francisco Bay between the entrance to the Carquinez Strait and Chipps Island, including Grizzly and Honker bays. It has a surface area of 36 sq. mi. at HLLW, mean depth of 14 ft. end mean volume of 323,000 AF.

Page No. 30 05/16/31
WORD/PHRASE
Suisun Harsh
Suspended solids (SS)
Threatened or endangered
Tidal prism
Tile drains
Total dinsolved solids (TDS)
Toxic pollutants (elements, metals organics)
APPENDIX C
GLOSSARY
DEFINITION
The marshlande generally located in southern Solano County, south of the cities of Fairfield and Suisun City. It is bordered on the south by Sui~un Bay including Grizzly and Honker bays, and the confluence of the Sacramento arid San Joaquin rivers: on the east from Denverton alona Shiloh Rsad to Collinsville. Suisun Harsh occupies an area of 116,000 acres, including about 88,000 acres belov the five-foot contour It 18 the largest contiguous brackish vater marsh in the United States.
Suisun Harsh's boundaries are legally defined in CPRC Sec. 29101 and 29101.5.
Tiny particles of solids dispersed but undissolved in a solid, liquid, or gas. Suepended sclid~ in sevage cloud the veter and require epecial treatment to remove (Environmental Gloasary 4th ed.). Generally considered thoae particles eubject to Brownian diffueion.
Fish and wildlife, and plants are in danger of or threatened vith extinction because their habitats are threatened vith destruction, adverse modification, or severe curtailment, or because of over exploitation, disease, perdition, or other factors. tCFGC Sec. 20513
The increase in vater volume landvard of a given crose-section from lov tide to high tide. Related to the tldal volume on the ebb and flood tide and the cumulative upstream inflows.
A Syetem of clay pipes inetalled beneath irrigated lande ta ertificially remove veter eatureting the 8011 of the crop root zone by gravity flov.
A measure of the salinity equal to the amount of material remaining after evaporating a vater sample at 103 to 105 degrees Celsius (formerly centigrade) for one hour. [SWRCB Order No. WQ 85-11
Total dissolved nolids levels are expressed in units of veight per unit of volume (e. g. mg/l).
Those pollutants, or combinations of pollutants, [elements, or metals,or organics1 including disease-causing agents, vhich
after discharge and upon exposure, ingestion, inhalation, or assimilation into any organism, either directly from the environment or indirectly by ingestion through food chains, vill cause death, disease, behavioral abnormalities, cancer, genetlc mutations, physiological malfunctions, or physical

Page No. 3 1 05/16/91
APPENDIX C
GLOSSARY
DEFINITION
Toxicant
deformations, in such organisms or their offspring. [Resource Conservation Glossaryl
(1) A chemical that controls pests by killing rather than repelling them.
( 2 ) A harmful substance or agent that may injure an exposed organism. CEnvironmental Glossary 4th ed.1
Trace elements Those elements [metals or organics3 generally present in (metals or organics) natural vater samples at concentrations of less than one
milligram per liter. [SWRCB Order No. WQ 85-11
Tracy Pumping Plant The U.S. Bureau of Reclamation Central Valley Project pumping plant in the Delta vest of Tracy. The source of the vater in the Delta-Hendota Canal.
Transpiration The photosynthetic and phyeiological process by which plants release vater into the air in the form of vater vapor. [Resource Con~ervation Glossary1
Tributary area The vhole area or region from vhich a vaterbody receives its
a supply of vater. An alternative phrase for vaterehed.
- Triennal basis Once every three years.
Trihalomenthane The analytical results from a non-etandard laboratory formation potential technique vhich is used on rev vater supplies in an attempt ( THHFP ) to quantify the likelihood that trihalomethanes rill be
formed when the vater is disinfected.
Trihelomethenes Singular; One of the family of organic compounds, (THHs) or Total named as derivatives of methane (CH41, vherein three of the trihalomethanee foui- hydrogen attme are each euhetituted by a halogen atom ( TTHHe 1 l e . g , , chlorine, bromine1 in the molecular etructure. C40
CFR 141.21
Plural; (1) A subset of chemicale knovn as disinfection by-products (DBPs) vhich are formed vhen raters are disinfected. THns are produced vhen dissolved organic substances, such as fulvic and humic acids produced by decaying crop residues or peat soil in fresh or saline vaters, come in contact vith the oxidizing agents used to disinfect drinking veter. IT, VI, 38:3-5; T, X L V I , 99:ll-193
( 2 ) The sum of the concentration in sg/l of the trihalomethane compounde (trichloromethane tchloroforml, dibromochloromethane, bromodichloromethane, and tribromomethane [bromoform3), rounded to tvo significant figures. [40 CFR 141.23

Page No. 32 05/16/91
APPENDIX C
GLOSSARY
WORDIPHRASE
Tule
Turbidity
Unimpaired flov
Unsatureted zone
Usable storage cepaci t y
Waste
Weter borne
Water quality
Water quality control
Water quality control plan
DEFINITION
A large bulrush (Scirpus acutus) growing on damp or flooded lend in the southvestern United Steteo. [Funk & Wagnalls'Stenderd College Dictionary, 19731
Hazy air due to the presence of particles and pollutants; e similar cloudy condition in water due to suspended silt or organic matter. [Environmental Glossary 4th ed.3
The embayment and channel flows rhich vould exist in the absence of upstream impoundments and diversions of rainfall or snovmelt runoff, but in the presence of existing channel configurations, both upstream and in the Delta.
The underground zone in vhich not ell openings in and betveen natural geologic material ere filled vith veter. The zone may contain veter or other liquid held by capillary forces, or percolating liquids. 123 CCR 26011
The quantity of ground water that can be economically vithdravn from storage. [DWR Bulletin 1181
Sevege and any and all other vaste substances, liquid, solid, gaseous, or radioactive, associated vith human hebitetion, or of human or animal origin, or from any producing, manufacturing, or 'processing operetion of whatever nature, including such waste placed within containers of whatever nature prior to, end for purposes of, disposal. CWC Sec. 13050 (d) 3
(1) Floating on or eupported by vater; afloat.
(2) Transported by vater, as freight.
(3) Transmitted in reter, as a diseese germ. [American Heritage Dictionary1
See Quality of rater.
The regulation of any activity or factor vhich may affect the quelity of the reter of the state and includes the prevention end correction of vater pollution and nuisance. [CWC Sec. 13050(i) I
A designation or establiehment for the raters vithin a specified area of (1) beneficial use6 to be protected, (2) rater quality objectives, end ( 3 ) a program of implementation needed for achieving veter quelity objectives. [CWC Sec. 13050( j) 1

Page No. 3 3 05/16/91
APPENDIX C
GLOSSARY
WORD/PHRASE DEFINITION
Water quality The limits or levels of water quality constituents or objective characteristics vhich are established for the reasonable
protection of beneficial uses of vater or the prevention of nuisance vithin a specific area and time frame. Water quality objectives may be either numerical or narrative. [CWC Sec. 130501
Factors to be considered in establishing vater quality objectives shall include, but not be limited to all of the folloving:
(a) past, preaent, and probable future beneficial uses of vater,
(bl environmental characterietics of the hydrographic unit under consideration, including the quality of vater available thereto,
(c) vater quality conditions that could reasonably be achieved through the coordinated control of ell factors vhich affect vater quality in the area,
(d) economic considerations, and (el the need for developing housing vithin the region.
[CWC Sec. 13241 3
Water quality A term used in connection vith the federal Clean Water Act standard vhich is roughly equivalent to rater quality objectives and
designated beneficial uses.
Water rights A form of property rights vhich give their holder the right to use public vaters. During the history of California, a variety of procedures have been in effect by vhich a person could acqulre a water right A summery follows:
Appropriativo righte lnltieted prlor to December 19, 1914 - prior to the 1914 etatutee vhlah eetehllehed the present eyetem for appropriating vater (taking vater end putting it to a use removed from property adjoining the vater source) tvo methods of appropriation existed. Prior to 1872, appropriative righte could be acquired eimply by taking vater and putting it to beneficial use. In 1872, Sections 1410 through 1422 of the California Civil Code enacted a permissive procedure by vhich priority of righte could be established as of the date of posting of notice of intention to appropriate vater, subject to a shov of diligence in carrying out construction of divereion vorks and actual use of vater. Appropriator8 vho did not follov the permissive procedure had priority from the date of actually putting the vater to uee. Because in en appropriative vater rights system, first in priority means firet served by available veter, considerable advantage attaches to an earlier date of

Page No. 3 4 05/16/91
APPENDIX C
GLOSSARY
WORD/PHRASE DEFINITION
appropriation.
Appropriative rights initiated after December 19, 1914 - an appropriation of vater muet now comply with provisions of Part Tvo, Division Tvo of the California Water Code. The rlght to uee vater appropriated under earlier procedures as vell as under the current procedure maybe lost by abandonment or non-use.
Riparian rights - an ovner of land adjoining a vater source hae, under common lev, the right to uee a share of the vater available from the source. Only those parcels of land adjoining the source may be eerved by it under rlparian right, unless a nonadjoining parcel was at one time part of a riparian parcel and the riparian right was transferred vhen the parcel was sold. No priority ie established for riparian righte, and all riparian users muet share the available eupply. Riparian ovnere have priority of use over all sppropriatore.
Prescriptive righte - rights obtained when water is taken and put to use for five years even though other right holders' interests are damaged, if the injured partiee take no action in their own defenee. California Water Code Section 1225 end State Water Resource6 Control Board policies have made obtaining eecure prescriptive rights eeeentially impoesible since 1914. [SWRCB Order No. WQ 85-1 1
Waters of the state Any water, surface or underground, including ealine vatere within the boundaries of the etate. LCWC Sec. 13050(e)I
Watershed The land area that draine into a body of water. [Environmental Gloesary 4th ed.1 Aleo see Tributary area
Winter ponding The practice of flooding large agricultural field areas for the purpoee of controlling veeds, and reducing salt concentrations in the upper region of the eoil profile. Secondary benefit6 are recreation, poeeible ealt leaching.
Yearling
Yolk
Yolk sac
An organism that is one year old but has not completed its second year.
The etore of food materiel, moetly protein and fat, that is preeent in the eggs of most animale. [Hartin, E. A., Dictionary of Life Sciences, 2nd ed., 19831
The four extraembryonic membranes that surround vertebrates during early development. The yolk sac form^ as a ventral

Poge No. 3 5 05/16/91.
APPENDIX C
GLOSSARY
outgrowth of the embryonic gut of moet fish, reptiles, end birds. As the yolk i s absorbed the gac is vithdravninto the embryo. [Hartin, E. A. , Dictionary of Life Sciences, 2nd ed., 19833
Younq-of-year ( Y O Y ) Fish of other organisms less than one ( 1 ) year old.
Zooplankton Free-floating aquatic enimale.

Page Nu. i 01/11/91
INTERAGENCY RIVER (I-A) KILOHETER NURBER INDEX (RKI)
NUUBER
RSAC155 RSANOSO
SLSBTll
D-07 (NEAR) SLUZUOl D-28A ROLD2 1 HD-04 CFTRN 1
S-35 (NEW) SLGYR03
5-63 SLDENOl 5-64 (NEW) SLMZU25
5-75 (OLD) SLGYR04
APPENDIX D UONITORING STATIONS
(ORDERED BY INTERAGENCY NUNBER)
STATION NAHE
NORTH FORK HOKELUUNE RIVER NEAR WALNUT GROVE (EXACT LOCATION NOT SPECIFIED) OLD RIVER NEAR HOLLAND TRACT (EXACT LOCATION NOT SPECIFIED) OLD RIVER AT INDIAN SLOUGH OLD RIVER AT WESTSIDE IRRIGATION DISTRICT INTAKE SACRAMENTO RIVER AT WALNUT GROVE SACRAHENTO RIVER AT FREEPORT SAN JOAQUIN RIVER AT TURNER CUT SAN JOAQUIN RIVER AT STOCKTON SAN JOAQUIN RIVER AT ROUGH AND READY ISLAND STEAMBOAT SLOUGH AT SUTTER SLOUGH SUISUN BAY AT SEAL ISLANDS (PORT CHICAGO) SUISUN BAY AT MARTINEZ GRIZZLY BAY DOLPHIN 2.5 KH. NORTH OF GARNET POINT UONTEZUUA SLOUGH NEAR HOUTH OLD RIVER NEAR RANCHO DEL RIO TURNER CUT NEAR HCDONALD ISLAND BRIDGE SAN JOAQUIN RIVER AT BUCKLEY COVE SUISUN SLOUGH AT BOYNTON SLOUGH CORDELIA SLOUGH AT IBIS CUT SUISUN SLOUGH NEAR HOUTH CORDELIA SLOUGH ABOVE SOUTHERN PACIFIC R. R. CROSSING AT CYGNUS GOODYEAR SLOUGH AT HORROW ISLAND CLUBHOUSE SUISUN SLOUGH AT HOUTH MONTEZUHA SLOUGH AT CUTOFF SLOUGH DENVERTON SLOUGH HONTEZUUA SLOUGH AT NATIONAL STEEL GOODYEAR SLOUGH 1.3 UILES SOUTH OF MORROW ISLAND [DRAINAGE] DITCH AT PIERCE

Page No. 2 01/11/91
INTERAGENCY RIVER (I-A) KILOMETER NUHBER INDEX (RKI)
NUHBER
APPENDIX D HONITORING STATIONS
(ORDERED BY INTERAGENCY NUHBER)
STATION NAHE
HILL SLOUGH (EXACT LOCATION NOT SPECIFIED) SUISUN SLOUGH AT HUNTER CUT

Page Nu. 1 Olt'll/91
INTERAGENCY RIVER (I-A) KILOMETER NUMBER INDEX (RKI)
NUMBER
MD-04 CFTRNl
S-17 SLCRD07 S-63 SLDENOl S-35 (NEW) SLGYR03
5-75 (OLD) SLGYR04
S-64 (NEW) SLHZU25
APPENDIX D MONITORING STATIONS
!ORDERED BY RIVER KILOMETER INDEX)
STATION NAHE
TURNER CUT NEAR MCDONALD ISLAND BRIDGE GRIZZLY BAY DOLPHIN 2.5 KW. NORTH OF GARNET POINT NORTH FORK HOKELUUNE RIVER NEAR WALNUT GROVE (EXACT LOCATION NOT SPECIFIED) OLD RIVER NEAR HOLLAND TRACT (EXACT LOCATION NOT SPECIFIED) OLD RIVER NEAR RANCHO DEL RIO OLD RIVER AT INDIAN SLOUGH OLD RIVER AT WESTSIDE IRRIGATION DISTRICT INTAKE SUISUN BAY AT HARTINEZ SUISUN BAY AT SEAL ISLANDS (PORT CHICAGO) SACRAHENTO RIVER AT WALNUT GROVE SACRAUENTO RIVER AT FREEPORT SAN JOAQUIN RIVER AT TURNER CUT SAN JOAQUIN RIVER AT BUCKLEY COVE SAN JOAQUIN RIVER AT STOCKTON SAN JOAOUIN RIVER AT ROUGH AND READY ISLAND CORDELIA SLOUGH ABOVE SOUTHERN PACIFIC R. R. CROSSING AT CYGNUS CORDELIA SLOUGH AT IBIS CUT DENVERTON SLOUGH GOODYEAR SLOUGH AT MORROW ISLAND CLUBHOUSE GOODYEAR SLOUGH 1.3 WILES SOUTH OF HORROW ISLAND [DRAINAGE] DITCH AT PIERCE HILL SLOUGH (EXACT LOCATION NOT SPECIFIED) MONTEZUHA SLOUGH NEAR HOUTH UONTEZUHA SLOUGH AT CUTOFF SLOUGH HONTEZUMA SLOUGH AT NATIONAL STEEL STEAMBOAT SLOUGH AT SUTTER SLOUGH SUISUN SLOUGH AT MOUTH

Pege No. .2 01/11/91
INTERAGENCY RIVER (I-A) KILOHETER NUWBER INDEX (RKI)
NUUBER
APPENDIX D HONITORING STATIONS
(ORDERED BY RIVER KILOHETER INDEX)
STATION NAHE
SUISUN SLOUGH NEAR MOUTH SUISUN SLOUGH AT HUNTER CUT SUISUN SLOUGH AT BOYNTON SLOUGH

Appendix F
NOTICE OF FILING
TO: Any Interested Person FROM: State Water Resources Control Board, Division of Water Rights
P.O. Box 2000 Sacramento. CA 9581 0
SUBJECT: Notice of Filing Submitted under Section 21 080.5 of the Public Resources Code
PROJECT PROPONENT: State Water Resources Control Board
PROPOSED Water Quality Control Plan for Salinity and Temperature for San Francisco Bay PROJECT: and the Sacramento-San Joaquin Delta Estuary
CONTACT PERSON: Ronald Bachman (91 6) 322-9869
PROJECT San Francisco Bay and the Sacramento-San Joaquin Delta Estuary LOCATION: (Bay-Delta Estuary)
PROJECT DESCRIPTION: Adoption of the Water Quality Control Plan described above.
This is to advise all interested parties that the State Water Resources Control Board is going to consider the adoption of a water quality control plan for the Bay-Delta Estuary. Action on this proposed plan will be taken in accordance with Section 21 080.5 of the Public Resources Code, which exempts this regulatory program from the requirement to prepare an environmental impact report under the California Environmental Quality Act (Public Resources Code 21000 et Seq.), and with other applicable laws and regulations.
Copies of the substitute document, including a proposed Environmental Checklist and a discussion of reasonable alternatives and feasible mitigation measures to minimize any significant adverse environmental impacts, can be obtained from Mr. Bachman (see above).
Comments on the proposed adoption should be submitted by March 11, 1991.
Signed: '.tj, &f ,/<~[g
Title: D i v i s i o n Chief for the State Water Resources Control Board .
Dare:
fi

Fage No. i 051 17i91
A P P E N D I X G TEANSCRlPT INDEX
H E A R I N G H E ~ k 1 t i G TIRE R E P r J H T E 3 C . ; TRANSCRIPT PHASE L ~ A T E VGLUHE SEQUENCE
N U H B E R N U M B E R
07/07/97 AH 07/08/87 A H 07/09/87 AM 07/13/87 AM 0'7f14/P7 AH 07/14/67 AM 07/21/87 AM 0?/22/87 AM 07/23/87 A H 07/23/87 AM 07/17/87 AM 07/28/87 AM 07/29/87 AM 0?/30/87 AM 07/30/87 P H 07/31/87 A H 08/11/87 A H 08/12/87 A H 08/12/87 P H 08/13/87 AM 08/13/87 A H 08/14/87 A l l 08/15/87 A H 08/24/87 A H 08/25/87 A l l 08/25/87 P M 08/26/87 AM 08/27/87 A H 08/28/87 AM 09/08/87 A H 09/09/87 AM 09/14/07 AM 09/14/87 P M 09/15/87 A H 09/16/87 A H 09/21/87 AM 09/22/87 A H 09/23/87 A H 09/24/87 AM 09/29/87 A H 09/29/87 P M 10/13/87 A H 10/14/87 A H 10/15/87 AH 10126187 AM 10/27/87 AM 10/28/87 A H 10/28/87 P H
I I I I f 1 I v V A V B V I V I I V I I I I X X X I X I 1 X I 11 X I V xv X V I X V I I X V I I I X I X X X X X I X X I I X X I I I X X I V xxv X X V I X X V I I X X V I I I X X I X X X X X X X I X X X I I X X X I I I X X X I V X X X V X X X V I X X X V I I X X X V I I I X X X I X X L X L I X L I I X L I I I - X L I V X L V X L V I X L V I I
I I I 111 I v V A V B v I V I I V I I I I X X x 1 X I 1 X I 1 1 X I V P O L X v X V I X V I I X V I I I P O L X I X X X X X I X X I I X X I I I X X I V X X V P O L X X V I X X V I I X X V I I I X X I X X X X X X X I X X X I I P O L X X X I I I X X X I V xxxv X X X V I X X X V I I X X X V I I I X X X I X X L P O L X L I X L I I X L I I I X L I V X L V X L V I X L V I I P O L

Page No. 2 05/17/91
APPENDIX G TRANSCRIPT INDEX
HEARING HEARING TIRE REPORTERS TRANSCRIPT PHASE DATE VOLUHE SEQUENCE
NUHBER NUMBER
I I I I I I I I I I I I I I I I I I I PPD PPD WOCP WQCP WQCP WQCP wocp WQCP WOCP WQCP WQCP WQCP WQCP WQCP WQCP WQCP WQCP WQCP WQCP WQCP E I RSP WQCP EIRSP EIRSP WOCP
XLVIII XLIX ,
L LI LI I LI I I LI v LV LV I LVI I LVIII LIX LX LX I LXII
I I I 111 I I I v VI VII I I I I I I I v v VI VII VIII IX X
XLV I 1-I XLIX L L I LI I LIII LIV L V LV I LVII LVIII LIX LX LX I LXII LXIII LXIV LXV LXVIA LXVIB LXVII LXVIIPOL LXVIII LXIX LXX LXXPOL LXX LXXI LXXIPOL LXXII LXXIII LXXIIIFOL LXXIV LXXV LXXVPOL LXXVI LXXVII LXXVIII LXXIX LXXX LXXXI LXXXI I LXXXIII

Appendix E: Map of Salinity Control Stations
Technical Appendix
WATER QUALITY CONTROL PLAN FOR SALINITY
San Francisco Bay/ Sacramento - San Joaquin
Delta Estuary 91-16WR May 1991
WATER RESOURCES CONTROL BOARD STATE OF CALIFORNIA
Technical Appendix
WATER QUALITP CONTROL PLAN FOR SALINITY
San Francisco Bay/ Sacramento - San Joaquin
Delta Estuary
Report Number, 91-16 WR
Prepared by the Bay-Delta Section Division of Water-ghts
WATER RESOURCES CONTROL BOARD STATE OF CALIFORNIA
TECHNICAL APPENDICES
i Fable of Contents i i Appendices Figures iv Appendices Tables vi Citing Information
State Board Authority for Regulation of Water in the Bay-Delta Estuary Basin Descriptions Description of Various Components of the New Water Year Classification 40-30-30 Index
Beneficial Uses of Bay-Delta Estuary Water Advocated Levels of Protection Tri halomethanes (THMs) Analysis of Corn Yield to Variations in Applied Water and Leach Water
Salinity Chinook Salmon Striped Bass Threatened, Endangered and Candidate Species Suisun Marsh Preservation Agreement - Technical Analysis Analysis Assumptions for Water Supply Impacts D-1485 Operation Studies

APPENDICES FIGURES
Number Title Page
A3.0-1 Boundaries of the Sacramento River (5A). Central Sierra and ....................... Delta (5B). and San Joaquin (5C) Basins .3. 0.2 A3.0-2 Interbasin Water Transfers for a 1980 Level of .................... . Development and the Annual Amounts in AF/YR 3 0.4 A3.0-3 Salinity. Flow and Salt Load in the San Joaquin River ....................... near Vernal is (5 Year Running Averages) .3. 0.6 A3.0-4 Unimpaired Flows Versus Measured Flows for the San Joaquin Basin . 3.0-8 A3.0-5 Boundary of the Bay-Delta Estuary and Locations of the
Estuary Exports ................................................ 3.0.9 A3.0-6 Means and Standard Deviations of Net Monthly Discharges of
the Sacramento-San Joaquin Delta into San Francisco Bay at Chipps Island. 1956.85 ..................................... .3.0.12 ........................ A3.0.7 Location Map Irrigation Diversion Points .3. 0.13 ................ A3.0.8 Location Map Agricultural Drainage Return Points .3. 0.14 ............. A3.0.9 Delta Circulation Patterns. High Flows. High Export .3. 0.16 .............. A3.0.10 Delta Circulation Patterns. Low Flows. High Export .3. 0.17
A3.0.11 Delta Circulation Patterns. High Flows. No Export ............... .3. 0.18 ................ A3.0.12 Delta Circulation Patterns. Low Flows. No Export .3. 0.19 ............... A3.0.13 Delta Circulation Patterns. Low Flows. Low Export .3. 0.20 ................... A3.0.14 Sal inity-Outf low Relationship at Coll insvi 1 le .3. 0.21 A3.0-15 1920-1977 Maximum Annual Salinity Intrusion
Sacramento-San Joaquin Delta .................................. .3. 0.22 ..................................... A3.0.16 Present Level Delta Outflow .3.0.24 ............................. A3 . 0.17 Boundary of San Francisco Bay Basin .3. 0.26 A3.0-18 Location Map of San Francisco Bay Showing the
Four . Sub-Regions and the Sacramento-San Joaquin Delta ......... .3. 0.28 A3.0-19 Map of the Central Bay and the Region Immediately ....................................... Outside the Golden Gate .3. 0.30 ............................................ A3.0.20 Map of San Pablo Bay .3. 0.31 ............................................... A3.0.21 Map of Suisun Bay .3.0.32 A3.0-22 Diagram of Estuarine Circulation for a Partially
Mixed Estuary ................................................. .3.0.34 ............................................ A3.0.23 Map of the South Bay .3. 0.35 ............................. A3.0.24 San Francisco Bay Area Local Runoff .3. 0.37 A3.1-1 Plot of Data Points. Regression Curve and Index
Threshold Values for Modified Water Index 40-30-30 with Cap .... 3.1.3 A3.1-2 Estimated Delta Plan and 40-30-30 Indices for the
Sacramento and San Joaquin Val leys . 1906.88 ................... .3. 1.5 A4- 1 Sacramento-San Joaqu in De 1 ta Approximate Locat ion of
Organic Soil ................................................... 4.0.6 ............................ A4-2 Delta Land Use and Dedicated Acreage .4. 0.7 A4-3 Estimate of Annual Ocean Harvest of Central Valley ................................................ Chinook Salmon .4. 0.12 A4-4 Timing of Life History for the Four Races of Chinook Salmon
in the Sacramento River Basin ................................. .4. 0.14 A4-5 Spawning Escapement of the Four Races of Chinook Salmon
in the Upper Sacramento River Basin ........................... .4. 0.15 A4-6 Mean Monthly Salvage of Chinook Salmon at the State Water Project
Fish Protective Facility. 1968.1986 ........................... .4. 0.18 A4-7 State Water Project Recreation Developments ..................... .4. 0.46

APPENDICES FIGURES (CONTINUED)
SMPA Water Qua1 ity Standards.. . . . . . . . . . . . . . . . . . . . . . . . . . . . . . . . . . . .5.0-17 THM Formation Potential in the Delta, 5-year Median, 1983-87. .... 5.1-2 THM Formation Potential in the Delta under Low Flow Conditions,
October 1985.. . . . . . . . . . . . . . . . . . . . . . . . . . . . . . . . . . . . . . . . . . . . . . . . . -5.1-3 THM Formation Potential in the Delta under High Flow Conditions, March 1986*. . . . . . . . . . . . . . . . . . . . . . . . . . . , . . . . . . . . . . . . . . . . . . . . . . . .5.1-4
Irrigation vs. Pond Leach Water Quality at Emmaton for maximum yield.. . . . . . . . . . . . . . . . . . . . . . . . . . . . . . . . . . . . . . . . . . . . -5.2-3
Irrigation vs. Pond Leach Water Quality at Emmaton for Maximum Yield.. . . . . . . . . . . . . . . . . . . . . . . . . . . . . . . . . . . . . . . . . . . . .5.2-4
Variation in Corn Yield with Different Leaching Practices at Emmaton.. ................................................... 5.2-5
Striped Bass Index.. . . . . . . . . . . . . . . . . . . . . . . . . . . . . . . . . . . . . . . . . . . . . -5.4-5 Delta Striped Bass Index.. . . . . . . . . . . . . . . . . . . . . . . . . . . . . . . . . . . . . . . .5.4-6 Total Delta Exports.. . . . . . . . . . . . . . . . . . . . . . . . . . . . . . . . . . . . . . . . . . . . .5.4-9 Delta Hydrologic Scheme Used in the Water Supply Impact Analysis. 6.1-2
i i i

APPENDICES TABLES
Number Title Page
Estimated Delta Outflow Requirements of the 1978 Delta Plan ..... .3. 0.25 Bathymetric Data for San Francisco Bay .......................... .3. 0.27 Selected Results of the Statisical Analyses to Determine Optimal Weighting Coefficients ................................. 3.1.2
Sacramento Basin WY class if icat ion Threshold Values and ........................................ Year Type Distribution .3. 1.4 Sacramento Basin WY Classification. 40-30-30 with Cap. April Verification ............................................. 3.1.6
Sacramento Basin WY Classification. 40-30-30 with Cap. ............................................. July Verification .3. 1.7 Sacramento Basin WY classification. 40-30-30 with Cap. .......................................... October Verification .3.1.8 Sacramento Basin WY Classification. Comparison of Verification .......................... Results for Selected Classifications .3. 1.9 Major Municipal Water Demands ................................... .4. 0.3 Crop Acreages and Percentages Based on Data Collected During
the Period 1977-1984 for the Sacramento-San Joaquin Delta ...... 4. 0.9 1985 Economic Value of Delta Crops and Livestock ................. 4.0.10 Crops Produced in Contra Costa Water District . 1986 ............. .4. 0.10 Chinook Salmon Environmental Requirements and ........................................... Life History Stages .4.0.16 Estimated Average Annual Harvest of Chinook Salmon and the
Hatchery Contribution to the Catch of Central Val ley Salmon ... .4. 0.19 Estimated Do1 lar Value of Chinook Salmon Caught in California ... .4. 0.20 American Shad Environmental Requirements and Life History Stages.4.0-23 Fishes of the Delta .............................................. 4.0.25 Most Common Bay Fin Fish Collected from Demersal. Pelagic and
Nearshore Areas by DFG. 1980.1986 ........................... ; . .4. 0.30 Life History and Descriptive Information for the Most Abundant ....................................... Species of Fish Col lected .4.0.31 Municipal and Industrial Water Contracts. Central Val ley Project 4.0-38 SWP Water Deliveries for Agriculture. Municipal and Industrial
Uses. Recreation Use at SWP Faci 1 ities and Hydroelectric Energy. 1962 to 1985 .......................................... .4. 0.39
Delta Drinking Water Diversions and Areas Served ................ .4. 0.40 CVP Export Areas ................................................. 4.0.41 Agricultural Water Exports and Service Areas by CVP Unit for
the 1985 Water Year ............................................ 4.0.42 Major Crops Grown in the CVP Export Area by Acreage and
Approximate Gross Cash Value ................................... 4.0.43 Major Crops Grown in the San Joaquin Valley Portion of the
SWP Export Area by Acreage and Gross Cash Value ................ 4.0.44

Su isun Marsh Preservation Agreement water qua1 i ty .............................................. control stations .5.0.16 ......................................... Mil 1s Plant THM Results .5.1=7 ........................................ Jensen Plant THM Results .5.1.8 Cost for Existing Surface Water Treatment Plants to Add ............................................... Ozone Treatment .5. 1.11 ...... Cost for Existing Surface Water Treatment Plants to Add GAC 5. 1.13 Some Disinfectants and Disinfection By-Products Considered ............................. for Development of MCLGs and MCLs .5. 1.14 Survival Indices for Chinook Salmon Smolts ...................... .5. 3.3 Actual and Predicted Striped Bass Index Values ................... 5.4.3 Total Delta Exports. Cfs: SWP. CVP. and CCC .................... .5. 4.8 Average Annual and April-July Water Supply Impacts of the A1 ternative Sets of Water Qua1 ity Objectives .................... .6. 3.3

CITING INFORMATION
When citing evidence in the hearing record, the following conventions have been adopted:
Information derived from the TRANSCRIPT: - Ending page and line number (can be same LL as the starting page) - may be omitted
if a single line reference is used Beginning page and line number
Transcript Sequence Number (see Appendix G, Transcript Index)
Transcript
Information derived from an EXHIBIT SUBMITTED DURING PHASE I:
- Page number, table number, graph number PI- Identifying Exhibit abbreviation number of the information source (see Appendices A & B, Abbreviations/Symbols)
Information derived from an EXHIBIT SUBMITTED AFTER PHASE I:
Page number, table number, graph number Exhibit number
Identifying abbreviation of the information source (see Appendix A & B, Abbreviations/Symbols)
Phase of the proceedings (WQCP = Water Quality Control Plan, 2/90-Present EIRSP = Environmental Impact Report Scoping Phase)
When citing REFERENCES from outside of the hearing record, the following conventions have been adopted:
Information derived from published documents, (a) in the text of the Plan:
Denton, 1985
Year of publication Name of author or agency abbreviation

CITING INFORMATION (Continued)
(b) at the end of the appropriate Plan Chapter:
Denton, 85-3wr.
R.A. 1985. Currents in Suisun Bay. SWRCB, Publication No. January 1985.
Complete publication source
Complete title of document cited Publication date Name of author or agency abbreviation
Information derived from Phase I closing BRIEFS: (a) in the text of the Plan:
RIC, Brief, 8 I I I
Page number "Brief
Identifying abbreviation of the information source
(b) at the end of the appropriate Plan Chapter:
Brief of the Rice Industry Committee on Pollutants in the Bay- Delta Estuary, pg. 8.
For a complete list of the abbreviations for information sources, citations and symbols used in this document, see Appendix A and B.
Appendix C is a Glossary of Terms; Appendix G is a Index of Transcripts listing Transcript Sequence Numbers.

APPENDIX 2.0
STATE BOARD AUTHORITY FOR REGULATION OF WATER IN THE BAY-DELTA ESTUARY
The State Board is responsible for formulating and adopting state policy for water quality control (WC Section 13140). The Water Code states that activities and factors which may affect the quality of waters of the state "...shall be regulated to attain the highest water qual ity which is reasonable considering all demands being made and to be made on those waters and the total values involved.. ."(WC Section 13000).
Through the basin planning process, the State and Regional Boards formulate and adopt Basin Plans specifying water qual ity objectives to ensure reasonable protection for designated beneficial uses of water (WC Sections 13170, 13240).
The Board's authority to conduct a new proceeding establishing water qual ity objectives for the Bay-Delta Estuary and to implement these objectives by amending water rights is affected by several statutes and court decisions. These include:
a. State Board authority to adopt water quality control plans. WC Section 13170.
b. Reserved jurisdiction, in permits of the CVP, SWP, and new appropriators since about 1965 within the watershed, to add specific terms and conditions.
c. Continuing authority to condition water rights. Cal. Const. Art. XI Section 2; Water Code Sections 100, 275, 1050; United States v. State Water Resources Control Board (1986) 182 Cal .App.3d 82, 129, 227, Cal. Rptr. 161.
d. Statutory authority to condition water rights for protection of all beneficial uses, for protection of the public interest, and for compl iance with appropriate water qual i ty control plans. Water Code Sections 1253, 1257 and 1258.
e. Continuing authority to reexamine water rights under the pub1 ic trust doctrine. National Audubon Society v. Superior Court (1983) 33 Cal.3d 419, 447, 189 Cal.Rptr. 346.
f . The Delta Protection Act at Water Code Sections 12200-12220, the Watershed of Origin protections at Water Code Sections 11460-11463, the County of Origin protections at Water Code Sections 10505 and 10505.5, and the San Joaquin River Protection Act at Water Code Sect ions 12230-12233.
g. Cal ifornia Environmental Qua1 i ty Act (CEQA) at Pub1 ic Resources Code Section 21000 et seq.
h. The California Endangered Species Act at Fish and Game Code Section 2050 et seq.; the federal Endangered Species Act at 16 US Code Section 1531 et seq.

This Plan establishes or amends water quality objectives for three constituents of water in the Bay-Del ta Estuary: sal ini ty, temperature, and dissolved oxygen. In a water right proceeding that will follow adoption of this Plan, the Board will consider how and whether to implement these objectives by managing the water supply. Because of the relationship between the water quality objectives in this Plan and management of the water supply, a brief description of relevant water supply and water right laws is provided below.
In addition to general water right laws, four major water supply statutes affect the water supply to the Delta and the export of water from the Delta. These are the Delta Protection Act, the Watershed and the County of Origin provisions and the San Joaquin River Act. With the exception of the San Joaquin River Act, these statutes do not directly apply to water quality planning. However, they will affect the water right decision in which the Board will consider implementing the water quality objectives in this Plan.
The Delta Protection Act at Water Code Section 12200 et seq. provides that no water shall be exported from the Delta (1) which is necessary to provide salinity control and an adequate water supply for the users of water in the Delta (Section 12202), or (2) to which the users within the Delta are entitled (Section 12203). Section 12204. The Act contains a legislative finding that it is necessary to the peace, health, safety and welfare of the people of the state that an adequate water supply in the Delta be maintained that is sufficient to maintain and expand agriculture, industry, urban, and recreational development in the Delta area, and to provide a common source of fresh water for export to areas of water deficiency. Section 12201. The Act also allows substitution of a water supply to the Delta in lieu of the water supply that is provided as a result of salinity control, if substitution is in the public interest and the Delta users have no added financial burden as a result of the substitution. The delivery of water for Delta or export use is subject to the Watershed of Origin provisions and the County of Origin provisions. Sections 12201 and 12202.
The San Joaquin River Act at Water Code Section 12230 et seq. specifically protects the reach of the San Joaquin River between the Merced River and the Middle River. This law affects part of the southern Delta. While the Act focuses on the quality of water in the affected reach, the Act applies to both water qua1 ity and water rights decisions. It applies to all water diversions for which an application was filed after June 17, 1961. Section 12233. The Act declares state pol icy that nobody should divert water from the San Joaquin River to which the users along the protected reach are entitled. Section 12231. Further, the Act forbids the State Board and other state agencies from causing further significant degradation of the water quality in the specified reach. Section 12232.
The Watershed of Origin provisions at Water Code Sect ions 11460-11463 prohibit the State Water Project and the federal Central Val ley Project from depriving "a watershed or area wherein water originates, or an area immediately adjacent thereto which can conveniently be suppl ied

with water therefrom.. . " " ... of the prior right to all the water reasonably required to adequately supply the beneficial needs of the watershed, area, or any of the inhabitants or property owners therein.' Sections 11460 and 11128. While these provisions apparently have no direct effect upon the establishment of water qual ity objectives, they may affect the Board's implementation of the objectives in a water rights proceeding. Section 11462.
The County of Origin provisions at Water Code Sections 10505 and 10505.5 apply to water rights acquired pursuant to state-filed applications to appropriate water. The state filed numerous applications, generally with very early water right priority dates, for projects which may be needed to develop, used, or conserve the state's water resources. Section 10505, adopted 1927, provides: "No priority under this part shall be released nor assignment made of any application that will, in the judgement of the Board, deprive the county in which the water covered by the application originates of any such water necessary for the development of the county," Sect ion 10505.5, adopted in 1969, provides that any subsequent permit issued on a state filed application shall provide that the permit and any 1 icense issued on the permit shall not authorize the use of any water outside the county of origin which is necessary for the development of the county. These provisions, 1 ike the Watershed of Origin provisions, have no direct effect upon the establishment of water qual ity objectives. However, they may affect implementation of the objectives in water rights proceeding.
In addition, during the Water Right Phase of these proceedings, the Board will consider the obligations of the various water right holders whose diversions and uses of water affect the beneficial uses of the waters to the Bay-Delta Estuary. In that consideration, the Board will have to take into account the existing water right priority system, which has been established by statutory and case law in California. However, as the Court of Appeal held in & v. State Water Resources Control Board (1986) 227 Cal .Rptr. 161, 189, the State Board has authority to revise water right priorities to ensure that the requirements of California Constitution Article X , Section 2 are satisfied. The water right priority system, with a few exceptions, gives first priority to riparian right holders. All riparian right holders along a stream have equal rights with one another, and must share in any shortages. Appropriative right holders general ly are junior in priority to riparian right holders. As an example, the CVP and the SWP are appropr iative right holders. Appropriative right holders have a right to take water in accordance with their order of priority. To illustrate, if all of the appropriative right holders 1 ined up at a water tank in their order of priority with buckets, each one would be able to fill a bucket in turn until the tank was empty. A1 1 of those whose priority was too low to reach the tank before it was empty would get no water. Under the modern appropriative rights system, water rights receive a priority according to the date when the appropriator filed an application to appropriate water. Water Code Sect ions 1450, 1455. The oldest appropriations, therefore, must be satisfied before newer appropriations can get water.

Implementation of Legal Authority
Recognizing uncertainties associated with proposed project faci 1 it ies to be constructed and the need for additional information on the Bay- Delta ecosystem, the State Board limited the Delta Plan in 1978 to current and near-term conditions in the Delta. The State Board stated it would review the 1978 Water Quality Control Delta Plan in about ten years. This commitment as we1 1 as recent court decisions have called for the current hearing and have expanded the scope of its proceedings.
Specifically, in 1 6, the State Court of Appeal, First District, 97 issued a decision, also known as the Racanelli or Delta Water Cases decision, addressing legal challenges to D-1485 and the Delta p l a n . The court directed the State Board to take a global perspective of water resources in developing water qua1 i ty objectives: The State Board's duty in its water quality role is to provide reasonable protection for beneficial uses, considering all demands made on the water. The State Board's salinity control function in the Bay-Delta should not be solely related to its water right function. Furthermore, the decision recognized that an implementation program may be a lengthy and complex process that requires significant time intervals and action by entities over which the State Board may have little or no control.
In the State Board's view, the court's decision means that the State Board must consider all relevant factors in determining whether the protect ion afforded a beneficial use by the objectives is reasonable. For this Plan, these factors include not only the factors specifically listed in Water Code Section 13241, but also the unique role of the Bay- Delta Estuary in the State's water supply and environment. Because of the wide distribution of water from the Delta, the State Board in developing this Plan has carefully weighed the uses of the water both within and outside the Estuary to decide whether the objectives provide reasonable protection to the beneficial uses. Also in considering the objectives, the State Board has taken into consideration the legislative policies set forth in the Water Code at Section 13000 and the State Board's Statement of Policy with Respect to Maintaining High Quality of Waters in California, adopted in 1968 in Resolution 68-16. As applied to waters for which water quality standards are required under the federal Clean Water Act, Resolution 68-16 incorporates by reference the three-prong test set forth in the federal antidegradation policy at 40 CFR 131.12(a). Order No. WQ 86-17.
In the Water Right Phase, when it considers implementation of the water quality objectives in this Plan, the State Board will use an analytic process which will include water right holders in addition to the State Water Project and the federal Central Val ley Project. As the Court of Appeal observed, the principal enforcement mechanism available to the
1 / United States v. State Hater Resources Control Board (1986) 182 Ca l.App. 3d 82, 227 Cal. Rptr. 161
2.0-4

State Board to control pollution from seawater intrusion is its regulation of water rights to control diversions which cause degradation of water quality. & at 227 Cal.Rptr. 184. Since 1928 when the voters approved California Constitution Article X , Section 2, all water users, riparians and appropriators alike, are subject to a universal limitation that water use must be reasonable and for a beneficial purpose. This "rule of reasonable use", according to the Court, is the cardinal principle in making water right decisions. Id., at 227 Cal.Rptr. 171. According to the Court, the State Board has broad power to strike the proper balance between the interests in water qua1 ity and the export of water, in deciding whether a particular activity is reasonable. at 227 Cal .Rptr. 188. The determination of reasonableness is ord~nar~ly a question of fact. Id. Both the State Board's authority and the court's recent decision have guided the reassessment developed in this Plan.
California Environmental Qual ity Act (CEQA)
Pursuant to Section 15251 (g) Title 14, California Code of Regulations (C.C.R. ) , the State Board's Water Qual ity Control (Basin) Planning Program is a "certified program" by the Secretary for Resources. As a certified program it is exempt from the requirements of preparing a separate environmental document. However, preparation of bas in plans under the Program remains subject to other provisions in- CEQA, including discussion of a1 ternatives to the proposed objectives and mitigation measures to avoid or reduce any significant or potentially significant effects on the environment.
This Plan identifies the competing uses of Bay-Delta waters and provides, in terms of sal inity and temperature, reasonable protection for each use; it identifies alternatives and mitigation measures to avoid or reduce any significant or potentially significant effects that this Plan might have on the environment. Therefore, this Plan is a substitute for a CEQA document as set forth in 14 C.C.R. Section 15252 (see Appendix F, Notice of Filing).

APPENDIX 3.0
BASIN DESCRIPTIONS
Precipitation in California
On the average, precipitation supplies about 193 MAF per year in Cal ifornia with another 6 MAF coming from out-of -state sources. About 58 percent of this water is used by native vegetation and unirrigatcd lands; about 25 percent flows to the sea, to salt sinks, and to Nevada; about 14 percent is diverted for offstream uses; and about 3 percent goes to the natural recharge of ground water basins (calculated from information in DWR Bulletin 160-83, pg.88).
Sacramento River Basin
Physical Description
The Sacramento River Basin, Basin 5A in Figure A3.0-1, includes the westerly drainage of the Sierra Nevada and the Cascade ranges, the easterly drainage of the Coast Range, and the valley floor. The Basin covers about 26,500 square miles (16,960,000 acres) and extends from the Goose Lake Basin at the Oregon border to the American River Basin (RWQCB 5, 1975). The Basin includes the watersheds of the following major tributaries: McCloud, Pit, Sacramento, Feather, Yuba, Bear, and American rivers, and Cottonwood, Stony, Cache, and Putah creeks.
The Sacramento Valley floor ranges from 30 to 45 miles wide in the central and southern parts, but narrows to five miles at its northern end; it slopes southward from about 300 feet above sea level at the north end near Red Bluff to sea level at Suisun Bay. The crestl ine of the Sierra Nevada generally ranges from 8,000 to 10,000 feet, while the crestl ine of the Coast Range extends from 2,000 to 8,000 feet. Due to the large snowpack at higher elevations in the Basin, the greatest volume of streamflow above the reservoirs occurs during snowmelt in the spring and early summer.
Hydro 1 ogy
The Sacramento River Basin receives water transfers from other basins via the following projects:
o Trinity River o Sly Park o Little Truckee Ditch o Echo Lake Conduit
The Basin exports water to other basins via the following projects:
o Putah South Canal o Folsom South Canal o Tule Lake Diversion o North Fork Ditch o Folsom Lake Diversion

.
FIGURE A3.0-1 Boundaries of the Sacramento River @A), Central Sierra and Delta (5B), and San Joaquin (5C) Basins
(From: RWQCB 5,1975)
DELTA BOUNDRY
t

The amounts of these and other interbasin transfers are shown in Figure A3.0-2 (DWR,19). The basin boundaries in this figure differ somewhat from the boundaries defined in this Plan; however, it provides a good illustration of the magnitude of interbasin water transfers from the Sacramento River Basin to other areas in California.
Water from the Sacramento River Basin enters the Delta from two major waterways, the Sacramento River near Sacramento and the Yolo Bypass just west of Sacramento. Under present conditions and in years of normal runoff, the Sacramento River Basin contributes about 70 percent of the total runoff to the Estuary (Bay and Delta) (SWRCB,3,3).
Central Sierra Basin
Physical Description
Basin 5B in Figure A3.0-1 is referred to as the Central Sierra Basin (SWRCB, 3,4). This Basin includes the watersheds of the Cosumnes, Mokelumne, and Calaveras rivers. This Basin encompasses about 3,800 square mi les (2,432,000 acres).
Hydro 1 ogy
Introduction
The Central Sierra Basin inflow to the Delta comes from three river systems, the Cosumnes, Mokelumne and Calaveras, sometimes cal led the "Eastside Streams.' The Central Sierra Basin receives water from the Sacramento River Basin via the:
o Folsom South Canal, and o the Folsorn Lake Diversion.
Water is exported from the Central Sierra Basin via the following projects:
o Moke 1 umne Aqueduct o Sly Park, and o South Bay Aqueduct.
In years of normal runoff, Basin 58 contributes about five percent of the total inflow to the Delta (SWRCB,3,3).
As of 1987, about 242,000 acre-feet of water (about one-third of the average annual Mokelumne River flow) were diverted into the Mokelumne Aqueduct for use in the east San Francisco Bay area (EBMUD,1,9).
San Joaquin River Basin
Physical Description
The San Joaquin River Basin, Basin 5C in Figure A3.0-1, encompasses over 11,000 square miles (7,040,000 acres) between the crests of the Sierra Nevada and Coast ranges, and stretches southward from the Delta to the drainage divide between the San Joaquin and Kings rivers. The valley

FIGURE A3.0-2 lnterbasin water transfers for a 1980 level of development and the annual amounts in AFNR (From: DWR, 19)

floor in the Basin measures about 50 miles wide by 100 miles long, and slopes from an elevation of about 250 feet at the southern end to near sea level at the northern end (RWQCB 5, 1975). In years of normal runoff, the San Joaquin River Basin now contributes about 15 percent of the total measured runoff to the Estuary (SWRCB, 3,3).
The Kings River historically flowed into Fresno Slough and into the San Joaquin River. Due to upstream controls and diversions, this occurs now about once every three years (DWR,26,33). Due to this discontinuity, the Kings River is now considered to be part of the Tulare Lake Basin, Basin 5D, and not part of the San Joaquin River Basin.
Hydro 1 ogy
The major tributaries in Basin 5C to the San Joaquin River are the Merced, Tuolumne, and Stanislaus rivers which originate in the Sierra Nevada. Peak streamf lows above the reservoirs general ly occur later in spring than the Sacramento Basin because the San Joaquin Basin mountain ranges are general ly higher than those in the Sacramento Basin. Smal ler tributaries, consisting of runoff from the Coast Range and/or agricultural drainage, include the following:
o Salt and Mud sloughs o Panoche o Little Panoche o Los Banos o Orestimba o Del Puerto creeks
Water is imported into the San Joaquin River Basin from the Delta via the Delta-Mendota Canal (DMC) of the CVP and via the SWP (Oak Flat Water District). Water is exported from the Basin via the following projects (see Figure A3.0-2):
o Friant-Kern Canal (CVP), o Hetch Hetchy Aqueduct, and o San Felipe Unit (CVP).
About 77,000 acres in the San Joaquin River Basin have subsurface agricultural drainage systems which discharge to the San Joaquin River, primarily via Mud and Salt sloughs (EDF,ll, 1-1). During the irrigation season and occasional ly fol lowing the flushing of agricultural drainage water from duck clubs in January and February, agricultural drainage makes up a significant portion of San Joaquin River flows and constituent loads (EDF, 11 ,V-36,V-44,V-46&V-47). The San Joaquin River contains considerably higher concentrations of several constituents (including nitrates, selenium, arsenic, nickel and manganese) than the Sacramento River (AHI,302,219,231). Figure A3.0-3 shows that the salinity has increased since 1930. The salt load for a given flow has increased since 1985 primarily due to the bypassing of agricultural drainage around the Grassland Water District directly into the San Joaquin River.

SALT LOAD IN MILLION TONSNEAR
TOTAL ANNUAL FLOW IN MILLION ACRE FEETNEAR TOTAL DlSSOLVED SOLIDS IN HUNDRED MILLIGRAMSILITER

The current water quality objective set by the Delta Plan for the San Joaquin River Basin is a monthly mean of 500 ppm TDS for the San Joaquin River near Vernal is (RWQCB,5, 1975). For the period of 1975 through 1987, the 500 ppm TDS objective was met in a1 T but two critical 1y dry water years, 1976 and 1977, as well as the beginning of Water Year 1978. However, this 12-year period was dominated by wet years -- six wet, two above normal, two dry, and two critical.
The operation of the Friant-Kern Canal and Delta-Mendota Canal units o f the CVP began around 1950. The basin exchanges associated with these CVP units, as well as the consumptive use and reservoir storage aspects of these and other more recent projects on the eastside of the San Joaquin Valley, have significantly altered flow relationships for the San Joaquin River Basin. A comparison of this relationship for the pre-1950 period and the post-1950 period is shown in Figure A3.0-4 (EDF,ll,II-30). The two regression 1 ines in the figure are significantly different, indicating that the total amount of flow measured at Vernal is (the entry point of the San Joaquin Rives to the Delta) has decreased since 1950.
The Delta
Physical Description
The Delta is a roughly triangular area of about 1,150 square miles (738,000 acres) extending from Chipps Island near Pittsburg on the west to Sacramento on the north and to the Vernalis gaging station on the south (see Figure A3.0-5) (California Water Code Section 12220). This area includes those waterways above the confluence of the Sacramento and San Joaquin rivers which are influenced by tidal action, and about 800 square miles (512,000 acres) of agricultural lands which derive their water supply from these waterways. The total surface area of these waterways is over 75 square miles (48,000 acres), with an aggregate navigable length of about 550 miles. Major tributaries to the Delta include the Sacramento and San Joaquin rivers. Minor contributors include the eastside streams -- the Cosumnes, Mokelumne, and Calaveras rivers and Dry Creek -- and the Yolo Bypass.
Water is exported directly from the Delta at five major locations (identified by number on Figure A3.0-5):
o Tracy Pumping Plant (1) o Clifton Court Intake (2) o Contra Costa Canal at Pumping Plant No. 1 (3) o City of Vallejo Intake at Cache Slough (4) o North Bay Aqueduct Intake at Barker Slough (5)
(The City of Vallejo, although it still maintains a standby intake at Cache Slough)
Hydro 1 ogy
Background
In its original condition, the Delta was a vast, flat marsh traversed by an ever-changing network of channels and sloughs that divided the area into islands (SWC ,262,AZ-15). "During the flood season, the Delta became a great inland lake; when the floodwater receded, the network of sloughs

FIGURE A3.04 Unimpaired flows versus measured flows for the San Joaquin Basin
12-
I I-
10- I- W W lL 9- W a : z 0 7- -I -I - I 6-
z - 3 s- 2 IL
4- P W a 3 3- V) a w 2 2-
I -
0
L E G E N D
- 1930 - 1950
0 - 1951 - 1980 0
Qm = 1.09 Q u - 2310 r = 0 . 9 5 2 a m = 0.767 a~ - I 4 5 0
(1930- 1950) r = 0.930 ( 1951- 1980)
0 0 1 1 I I I I I I I I
0 2 4 6 k 10 I:
UNIMPAIRED FLOW IN MILLION ACRE FEET
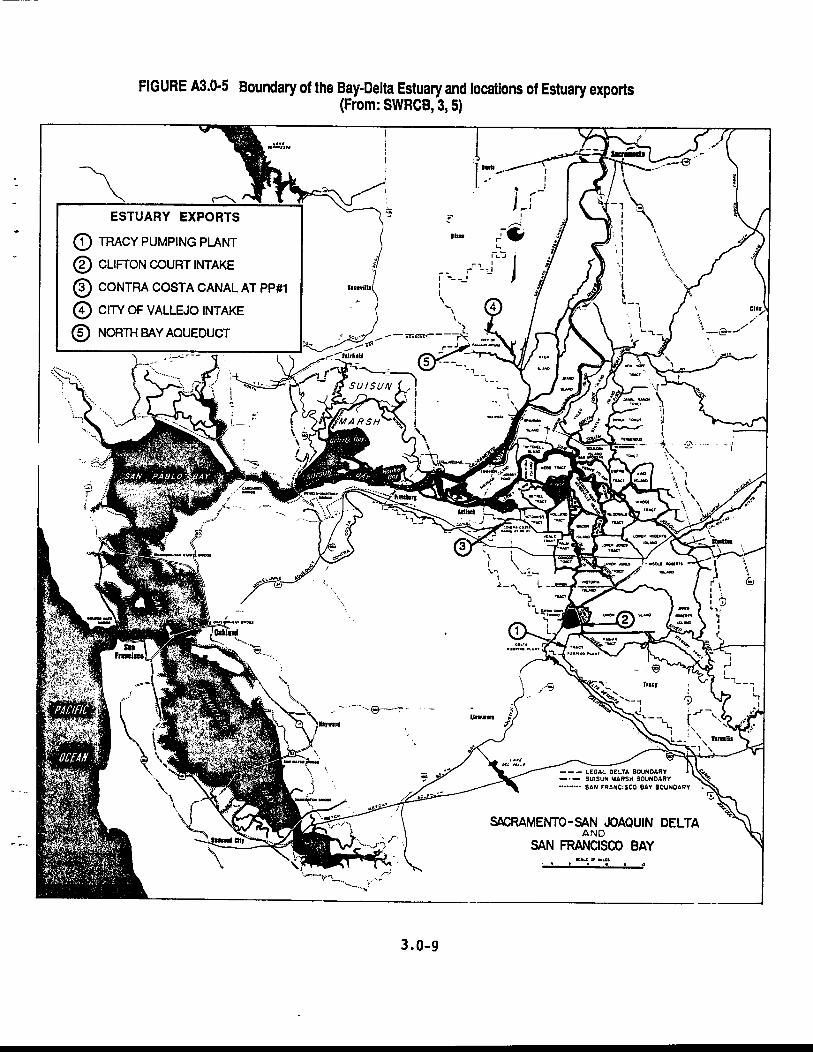
FIGURE A3.0-5 Boundary of the Bay-Delta Estuary and locations of Estuary exports (From: SWRCB, 3,5)
TRACY PUMPING PLANT
CUFTON COURT INTAKE
CONTRA COSTA CANAL AT PP#1
CITY OF VAUWO INTAKE
NORTH BAY AQUEDUCT
SACRAMEMO-SAN JOAQUlN DELTA
SAN FRANCISCO BAY

and channels reappeared throughout the marsh" (DWR, 707,67). In the 1860s, reclamat ion began on low-lying areas, and local landowners undertook cooperative levee construction to allow the lands to be farmed. By the 1920s about 415,000 acres were completely reclaimed and in agricultural production (SWRCB, 13,111-4) ; and "{m}any miles of entirely new channels had been dredged, and f arm1 ands, small communities , highways and ut i 1 it ies were protected-- often tenuously--by 1,100 mi les of levees, many of them built on peat soils" (DWR,707,67).
The export of water directly from the Delta first took place in 1940 with the completion of the Contra Costa Canal, a unit of the CVP. In 1951, water supplying the Delta-Mendota Canal began to be exported at the CVP1s Tracy Pumping Plant (~WR,707,67). In the same year the Delta Cross Channel and control gates were constructed near Walnut Grove to allow a more efficient transfer of water to the Tracy pumps (SWRCB, 13,111-6). With the start of operation of the State Water Project's (SWP) Harvey 0. Banks Pumping Plant in 1967, Delta exports were again increased. By 1975, the combined deliveries of waters exported by both the CVP and SWP totaled 4.8 million acre-feet per year. The total CVP and SWP Delta exports are projected to reach 6.6 million acre-feet per year by the year 2000 (USBR ,2,27).
Delta Flows
o Delta Inflow
Freshwater flow into the Delta comes primarily from the Sacramento and San Joaquin rivers, with small contributions from the Mokelumne and Cosumnes rivers (SWRCB, 13,111-7). Under present conditions, these river systems contribute approximately 85, 10, and 5 percent, respectively, of the average annual inflow to the Delta (not the Estuary) (DWR, 1987, from DWR ' 1990 Level of Development Operation Model Output').
o In-Delta Flow
The flows in the Delta channels result from a combination of Delta inflows, Delta agricultural use, exports, and the counteracting force of the tides from the Pacific Ocean through the San Francisco Bay. The net flow is normally downstream, out of the Delta. However, many times the flows change direction and move back upstream on incoming tides. Tidal ly influenced flow reversals are a twice dai ly natural phenomena occurring throughout the Bay-Delta Estuary; it is only during extremely large flooding events that tidal forces are overcome throughout the tidal cycle. Such tidally-caused flow reversals occur over most of the Delta although they are often marked in parts of the Delta by the influence of Delta diversions, including export pumping (SWRCB,13,III- 11). The distance of the upstream movement, and the extent of saline intrusion, vary depending on the flows in the Delta channels and the opposing force of (SWRCB, 14,II-1).
o Delta Outflow
The major factors affecting Delta outflow are the tides, stream runoff, upstream and Delta channel depletions, Delta exports, upstream use and upstream reservoir operations.

Delta outflow is highly seasonal and generally is characterized by large winter inflows from rainfall runoff generated by Pacific storms, and small, relatively steady inflows during the dry summers from reservoir releases. Delta outflow commonly exceeds 35,000 cf s from December through April, whereas it is usually less than 14,000 cfs from July through October (USGS, lO,6).
Flow Measurement
The net Delta outflow at Chipps Island is not directly measurable since, at times, it may be less than five percent of the flows due to the tides (SWRCB, 14, IV-7). However, an estimate of net Delta outflow is important for purposes of water qua1 ity control and water resource management (SWRCB,13,III-16). The net Delta outflow at Chipps Island is usually estimated by performing a water balance at the western boundary of the Delta, Chipps Island. The water balance involves adding the total Delta inflow and Delta precipitation runoff, then subtracting Delta channel depletions and Delta exports (DWR,47,2).
DWR has estimated the daily Delta outflow at Chipps Island for water years 1956 through 1985 using the flow accounting model, DAYFLOW. DAYFLOW is also used to estimate interior Delta flow at specified locations and fish- related parameters and indices (DWR,47). Figure A3.0-6 presents the means and standard deviations of Delta outflows computed by DAYFLOW for water years 1956 through 1985 (USGS, 10,6).
Another commonly used estimate of Delta outflow, especially for the daily operation of the CVP and SWP, is the Delta Outflow Index (DOI). The DO1 is similar to the DAYFLOW Delta outflow but does not include the flows from smaller peripheral streams entering the Delta, such as the Mokelumne and Calaveras rivers, or the Yolo Bypass flows. Because of these differences, the DO1 is considered to be less representative than the DAYFLOW Delta outflow estimate (USBR,111,16).
Delta Channel Depletion, Exports and Reverse Flow
One of the critical factors in determining Delta outflow is Delta channel depletion, that is, "...the diversions of Delta channel waters via pumps, siphons, and subsurface seepage into the Delta uplands and low nds for consumptive use by agriculture and native plants" (DWR ,36,3-4)17. The Delta channel depletions (not including precipitation) range from approximately 34 TAF in January to 278 TAF in July (DWR,1988,0peration Study). Currently, over 1,600 diversion locat ions have been identified within the Delta (T,II ,189:17).
The locations of agricultural irrigation diversion and drainage return points are shown in Figures A3.0-7 (DWR,49,1) and A3.0-8 (DWR,64,1).
The consunptive use values used by the USBR and DWR to operate the CVP and SUP were fixed in the Federa 1-State Menwrandum of Agreement dated Apr i 1 9, 1969. The consuyt ive use va lues were based on: (1) a 1955 Delta land use survey; (2) estimates of consunptive use by ident i f fed crops; (3) changes in so i 1 rn isture; and (4) estimates of leaching requirements (SWRCB, 13,111-16). While the consunpt ive use values are adjusted seasona 1 ly, they are not adjusted for water year types, thereby introducing error into the Delta outflow ca leu lat ions (USBR, 111,16).

FIGURE A3.0-6
(FROM USGS E X H I B I T 10, PAGE 6 )
OCT NOV DEC JAN FEB MAR APR MAY JUN JUL AUG SEP
Month o f water year
--Means and standard deviations of net monthly discharges of ' the Sacramento-San Joaquin Delta in to San Francisco Bay a t Chipps Island, 1956-85 from estimates of the Sta te of California (1986). Also shown are arbitrary divis ions of the months into high (>1 000 m3/s [35,000 f t3 / s ] 1, transit ion (400-1,000 m3/s [14,000-35,000 f t3/s] ) , . and low (o100 nJ/s [14,000 f t3/s] 1 de l ta discharges.

DWR-49 - -9 - *
)r -. .. 6 1 . " /,.. *b-_L_.-L- /4 ."-,. *
FIGURE A3.0-7 t 4 -s .-

FIGURE A3.0-8 /.
N LOCATION MAP AGRICULTURAL DRAINAGE +
4 P
C RETURN POINTS .c...r,.,
i >
\t t -,..- ..7
. c;.:'
..mi.. 3 .."IS ; :c--.- ..',is,..-
c Drarnage Pumping Plant lone or mote) ,... _ ._ . - 5 - _ '. Survey conducted during 1986-07 : :::::;: -... --..'/ by G. Sato e t al
.. .. . . . T
/ :
. .- .' ., : . .,.*.,-: - ?"., .:A=-.. :z.-, - . .
C : . > . e --- . r C . . .:. 1 . ".?$
C . .-.

Water supplies for export by the CVP and SWP are obtained from surplus Delta flows, when avai lable, and from upstream reservoir releases, when Delta inflow is low and surplus flows are unavailable. Upstream reservoir releases from the Sacramento River Basin m t e r the Delta via the Sacramento River and Yolo Bypass. A portion of this water is then used within t-he Delta to meet agricultural needs, a portion is exported by various projects, and the remainder flows into San Francisco Bay as Delta outflow. Some of these releases are drawn to the CVP and SWP pumps through interior Delta channels facilitated in part by the CVP's Delta Cross Channel at Walnut Grove (DWR, 707,69).
When export rates are high, the net flow of water can move in an upstream direct ion toward the export pumps (SWRCB, 13,111-11). This is known as reverse flow. During periods of high Delta inflow and high export, there is some reverse flow, but enough water is available from the San Joaquin River, eastern Delta tributaries (Central Sierra Basin) and water transported from the Sacramento River via the Delta Cross Channel to meet export demands (Figure A3.0-9).
When there are high exports, low San Joaquin River inflows and high Delta consumptive uses, however, the normal water path changes, causing a reversal of flows around the western end of Sherman Island where the Sacramento River and the San Joaquin River meet (SWRCB, 13; I1 1-23) (Figure A3.0-10). As water travels around Sherman Island, it mixes with saltier ocean water entering as tidal inflow and is drawn upstream into the San Joaquin River and other channels by the CVP and SWP pumping plants (DWR,707,69). Figures A3.0-11 through A3.0-13 show other typical Delta flow patterns (DWR,5la-e) .
Delta Flow and Salinity
Salinity is one of the major water quality factors affecting the beneficial uses of Delta water. Figure A3.0-14 shows the relati nship between flow and salinity at Collinsville in the western Delta 19. The form of the relationship is typical of the flow-salinity relationships in the western Delta.
Upstream storage faci 1 ities, in-basin depletions, and Delta exports have reduced winter and spring Delta outflows. Releases from upstream storage facilities, on the other hand, have increased summer and fall Delta outflows (SWRCB, 14,II-1). These changes in flows have correspondingly changed the extent and timing of salinity intrusion into the Delta. Figure A3.0-15 shows the maximum annual salinity intrusion into the Delta from 1920 through 1977 (DWR,60). Supplemental releases due to storage facilities since the 1940s have generally kept salinity intrusion, as indicated by the 1000 ppm chloride line in the Delta, at a point farther west, or downstream, than had been the case before that period.
Historica 1 ly, the sa 1 inity of the waterways in the Delta has been expressed in chlorides (Cl) or tota 1 dissolved so 1 ids (IDS) concentrat ions, and, more recently, in e lectr ica 1 conduct iv i ty (EC). However, somet ims i t is necessary to convert one unit of sal infty to another. Consequently, 'Unit Conversion Equations" are used to convert any one of the parameters to any of the others a t various locations in the Delta using specif fc f o m l a s for gecrgraphic location and water year type (DWR,61,1).

FIGURE A3.0-9

FIGURE 63.0-10

FIGURE A3.0-11

FIGURE A3.0-12

FIGURE A3.0-13

FIGURE 83.0-14
DWR-58 SALINITV-OUTFLOW RELATIONSHIP @ COLLINSUILLE
MONTHLY MEAN OF D A I L V H I G H & D A I L V MEAN EC
-- MONTHLY NEnN OF DAILY HIGH EC MONTHLY MEAN OF DAILY MEAN EC
NOTE: UALUES DETERMINED USING SALDIF UERSION 2.0
22000
20000
- \ -
\ - \ -
18000 - -
16000 - - -
0 - z W
loo00 - - 0 W
BOO0 - -
-----------
0 2000 4000 6000 8000 10000 12000 14000 16000 18000 20000
NET DELTA OUTFLOW I N CFS


The Delta Plan currently requires only the CVP and SWP to meet specified flow and salinity standards within the Delta and Suisun Marsh (SWRCB,15,5). Figure A3.0-16 shows the estimated avera e monthly Delta outflows under the present level of development (DWR,30 3 ; the present level of Delta outflow is composed of three factors: minimum amounts required by D-1485 standards, carriage water, and surplus Delta outflow. Estimates of the component required by D-1485 standards are given in Table A3.0-1.
San Francisco Bay and Basin
Physical Description
The boundary of San Francisco Bay (SWRCB,~,~) extends from the Golden Gate Bridge on the west to the Delta on the east and includes areas subject to tidal action up to mean high tide, areas 100 feet landward of the mean high tide shoreline, saltponds, and managed wetlands. This definition includes the entire Suisun Marsh as part of San Francisco Bay. Suisun Marsh, as defined by Section 29101 of the Public Resources Code, includes the waterways north of Suisun, Grizzly, and Honker bays which are subject to tidal action and the adjacent lands whose management is dependent on tidal action of these waters. This definition generally follows the San Francisco Bay Conservation and Development Commission (BCDC) boundary as defined in Government Code Sections 66610 and 66611.
San Francisco Bay consists of about 805 s uare miles (515,000 acres) (BCDC, 1982) including: 420 square miles ? 269,000 acres of open water (470 square miles when saturated mud flats are included 1 , 125 square miles (80,000 acres) of tidal marshes; 110 square miles (70,000 acres) of Suisun Marsh; 80 square miles (51,000 acres) of diked historic baylands; and 70 square miles (45,000 acres) of saltponds and other managed wet lands.
The San Francisco Bay Basin (Figure A3.0-17) is defined as the area contributing local runoff to the Bay. This description differs somewhat from the Basin Plan boundary of Region 2 (RWQCB 2, 1986), which includes the entire San Francisco Bay Basin as well as coastal area from Dillon Beach to San Gregorio. The total area of the San Francisco Bay Basin i s about 3,870 square miles, or 2,477,000 acres (SWRCB, 3,Appendix F) . The major streams contributing to local runoff to the Bay are the Napa, Petaluma, and Guadalupe rivers, and the Alameda, Coyote, Sonoma and Walnut creeks. Water is imported to the Basin via the following water projects (see Figure A3.0-2) : Mokelumne Aqueduct, Hetch Hetchy Aqueduct, South Bay Aqueduct, Contra Costa Canal, Putah South Canal, Sonoma Petaluma Aqueducts, and North Bay Aqueduct.
In years of normal runoff, the San Francisco Bay Basin contributes about ten percent of the total flow, including Delta outflow, to the San Francisco Bay (SWRCB,3,3). From 1970 through 1982, the runoff into the Bay from rainfall averaged about 57 percent of the total San Francisco Bay Basin local runoff, with the rest being municipal and industrial discharges (SWRCB,3,35; Appendix R).

FIGURE A3.0-16
PRESENT LEVEL DELTA OUTFLOW USING 1922- 1978 MONTHLY AVERAGE HYDROLOGY
3.0
PRESENT LEVEL
DELTA OUTFLOW
OCT NOV DEC JAN FEB MAR APR MAY JUN JUL AUG SEP
MONTH

TABLE A3.0-1
ESTIMATED DELTA OUTFLOW REQUIREMENTS OF THE
1978 DELTA P U N
I I I I
f o u l i n 1MIJo Kre-feet 8.728 5,566 3,BjC 5,018 3.673 5*lC0 3JB9 3'gu2 lorn 3s082
bhr. Lhs s t w a g e s s c my b.0 cf Stas:., Crcvllle and Folsaa Bcwrvoirr i r e cncrcshcC in Celr nod conrol r r e r v ~ C ~ c ~ . : If s tuaEes a r e a c r o a c M (rre We. 1) then 6,600. I f 5-7 CfT users are ?ak:ag de:lciencles ln ft-n supplies thea 8.500 cts far e r l t i c d Ye=. I f autmru;il on%=lt *xn w c lccer lldt. h?*x pro2rct uaers (CF k.6 Sf: a r e Uksr,; deric lwsi~: , othew?se 9.505 CIS. Ds;rarWeat of Ua:er Beswr=es
Divlrior. of 0psriticr.s anC Kz2'*~acce

FIGURE A3.0-17 Boundary of the San Francisco Bay Basin (From: SWRCB, 3,12)

Hydro 1 ogy
San Francisco Bay, excluding the Delta, but including saturated m d f lats, has a total water surface area of approximately 300,000 acres or 470 square mi les at mean lower low water (MLLW). The area, mean depth and volume of the subregions of the Bay are summarized in Table A3.0-2 (Cheng and Garner, 1984). The locations of the Bay's subregions are shown in Figure A3.0-18. These subregions differ from the description in the Region 2 Basin Plan (RWQCB,2,1986) and are based solely on hydrodynamics.
Table A3.0-2 BATHYMETRIC DATA FOR SAM FRANCISCO BAY (Adapted from Cheng and Gardner, 1984)
Surface Area Mean Mean
Reg ion at MLLW (sq mi)
Depth Vo 1 ume (ft) (AF)
Central Bay 103 35 2,307,000 San Pablo Bay 105 9 605,000 Carquinez Strait 12 29 223,000 Suisun Bay 36 14 323,000 South Bay 214 11 1-i507,000
San Francisco Bay (Total) 470 17 4,965,000
San Francisco Bay is unique among American estuaries in having two arms or reaches, the northern including San Pablo and Suisun bays, and the southern extending from the Oakland-Bay Bridge to Mountain View. The northern reach receives discharge from the Sacramento-San Joaqu in Delta, approximately 90 percent of the freshwater inflow to San Francisco Bay. The southern reach primarily receives local runoff, storm drain and treatment plant discharges and Delta outflow in very high flow events. Between the two reaches is the Central Bay bounded by the Richmond-San Rafael, Oakland-Bay, and Golden Gate bridges. The Central Bay is deeper than either of the two reaches (SWRCB,431,18-19).
o Freshwater Inflow
Excluding water from the Delta, freshwater inflows come into the Bay primarily via the Napa and Petaluma rivers which provide local drainage to the northern part of San Pablo Bay; via Walnut Creek and Suisun Slough which enter Suisun Bay; via Pinole and Novato creeks which enter the San Pablo Bay; and via San Lorenzo, Matadero and Coyote creeks which enter the South Bay. In addition, many municipal and industrial wastewater treatment plants and combined sewer overflows contribute to the Bay inflows (SWRCB, 3,ll-16). Because these freshwater inflows into the Bay are small compared to Delta outflow, they are often ignored in calculations of total inflow to the Bay. In the southern portion of the South Bay, a1 1 tributary streams have intermittent, local runoff (excluding effluent) (BISF,6,56-59).

FIGURE A3.0-18 Location map of San Francisco Bay showing the four sub-regions and the Sacramento-San Joaquln Delta.
(Source: Denton and Hunt, 1986)
CAROUINEZ
RICHMOND - SAN BRIDGE
OAKLAND - SAN FRANCISCO - BAY BRIDGE
-
DUMBARTON
A
1 2 2 O 30' 1 2 2 O 15' 1 2 2 " o1 121°45'
3.0-28

o Tidal Exchange
Immense f l o ~ s are exchanged between the hay and the ocean on tidal currents driven by the gravitational attraction between the earth, the sun and moon. Their exact size is not known (USGS,3 updated,5), but tidal flows entering San Francisco Bay at the Golden Gate Bridge have been estimated to average greater than 2.5 million cfs (BISF,6,51). Because of complex circulation eddies outside the entrance to the Bay, only a portion the water fTooding in from the ocean is "new" water, i.e., water which has not entered the Bay for at least several tidal cycles (Denton and Hunt, 1986).
- Central Bay
Flood tides first entering the central Bay pass on either side of Alcatraz Island, through Raccoon Strait between the Tiburon Peninsula and Angel Island; tides then flow northwards through San Pablo Strait into San Pablo Bay and southwards beneath the Oakland-Bay Bridge into south Bay (Figure A3.0-19).
- San Pablo Bay
The main tidal flows in San Pablo Bay pass along a natural channel that runs between San Pablo Strait, then across the shallow Pinole Shoal and through Carquinez Strait to the east (Figure A3.0-20). The maximum depth in the two straits is about 83 feet, decreasing to about 20 to 25 feet over Pinole Shoal. A 600-foot-wide shipping channel, dredged to a depth of 35 feet across the shallow Pinole Shoal, provides shipping access to the Mare Island Naval Shipyard and the ports of Sacramento and Stockton. The areas north and south of the shipping channel are very shallow; one- half of the area of San Pablo Bay has a depth of less than six feet.
- Suisun Bay and Marsh
Having the smallest surface area of the four embayments, Suisun Bay is situated in the northeastern reach of San Francisco Bay between the cities of Benicia and Antioch (Figure A3.0-21). The entire Suisun Bay and Marsh area, including two subbays, Grizzly and Honker, consists of 84,190 acres, of which about 26,880 acres are bays and sloughs. The remaining 57,310 acres are diked and managed wetlands. (Approximately 45,710 acres of managed wetlands are privately-owned and used primari ly for duck hunting; 10,490 acres are owned by the State of California as a waterfowl management area, wildlife refuge and pub1 ic recreation area; and 1,110 acres are controlled by the U.S. Navy (SWRCB, 1978)).
The main tidal flows are along a few well-defined channels separated by islands and shallow gravel banks. During most periods of outflow from the Delta, Suisun Bay is the usual location of the estuary's 'null zone' (defined as the region in a partially or we1 1-mixed estuary where the residual bottom currents are effectively zero). Upstream of this area there is a net downstream, or seaward, residual velocity along

FIGURE A3.0-19 Map of the Central Bay and the region immediately outside Golden Gate. The dotted line shows the 60 ft depth contour and the dashed line is the 18 ft contour.
(Source: Denton and Hunt, 1986)
SAN RAFAEL 0
RICHMOND
122~35' 122~30' 122~25' l22O2on

FIGURE A3.0-20 Map of San Pablo Bay. The 18 11 (5.5) depth contour is plotted as a dashed llne and indicates the location of the main channel, m e dotted line shows the extent of the mudflats m u n d the bay.
(Source: Denton and Hunt, 1986)
SAN PABLO 0 5 KM -

FIGURE A3.8-21

the bottom caused by river inflow. Seaward of the nu1 1 zone, gravitational circulation produces a transport, for the most part toward land, of denser more saline water along the bottom. The null zone is significant because it is the theoreticar upstream boundary of the entrapment zone, the area in the estuary where suspended materials, including biota, accumulate (USBR,112,407). Figure A3-Q-22 is a diagram of estuarine: circulation for a partial ly mixed estuary such as Suisun Bay; it illustrates the relationships between flows, salinities, and the null and entrapment zones (CCCWA/EDF, 1,56).
The salinity of water within Suisun Bay varies seasonally with the volume of freshwater outflow from the Delta. Salinities of the water in Montezuma Slough are lower than in Suisun Bay itself for a longer period of time each year because the Slough lies further upstream and receives freshwater inflow from the Sacramento River and other tributary channels first. For the most part, low salinity water stays in the Suisun Marsh channels later in the spring and early summer, but higher salinity water remains later in the fall before the Marsh channels are flushed by increasing Delta outflows (SWRCB, 1978).
By most definitions, Suisun Bay includes Suisun Marsh, located to the north of the main body of the Bay. The Marsh was a natural fresh to brackish water marsh prior to widespread reclamation for agricultural purposes in the early 1900s. However, because of increasing problems with salinity in the 1930s, the reclaimed marsh lands were gradually converted to private duck clubs and state Wildlife Management Areas.
- South Bay
The entrance to the South Bay from the Central Bay is separated by Treasure and Yerba Buena islands into two passages, one to the east that is 30 to 35 feet deep and one to the west that is 70 feet deep at the Oak land-San Francisco Bay Bridge (Figure A3 .O-23). Because the South Bay receives only minor amounts of local freshwater inflows, it is essentially a tidal lagoon. Tidal currents in South Bay are greatest along the main channel on the western side of the Bay. In the South Bay, evidence suggests three distinct mixing zones exist: (1) between the Oakland-San Francisco Bay Bridge and San Bruno Shoal, a relatively shal Tow area with water depths of about 11 to 26 feet between Bay Farm Island and Oyster Point; (2) between the San Bruno Shoal and the San Mateo Bridge; and (3) in the area south of the San Mateo Bridge. A navigation channel, 500 feet wide and 29 feet deep, is maintained across the San Bruno Shoal.
The salinity of the South Bay remains close to the level of the ocean (33 to 35 parts per thousand) throughout most of the year, except during periods of high Delta outflow. During particularly hot, dry periods when evaporation rates are high, the South Bay can act as a "negative" estuary where salinity levels actually increase in the southern extremities (Denton and Hunt, 1986).

FIGURE A3.0-22 Diagram of Estuarine Circulation for a Partially Mixed Estuary (Source: CCCWMDF, 1, Figure 12)
SAL IN ITY ( p p t )
SEA
VER

FIGURE A3.0-23 Map of the South Bay. The dashed line shows the 18 ft depth cantour. (Source: Denton and Hunt, 1986)
OAKLAND

Currents differ in the South Bay according to Delta outflows. From analyses of current data for summer wind conditions and low Delta discharges, the USGS has concluded that net currents in South Bay north of San Bruno Shoal are southward along the eastern side and northward along the western side of the Bay (USGS,3,25). Following high outflow pulse events, a lens of freshwater can spread southwards, depending on wind and tide conditions, into the Central and South Bays over more saline water that is flowing toward the ocean. This process, which is known as gravitational overturn, a1 lows large volumes of freshwater to enter the South Bay (Denton and Hunt, 1986). The significant density difference between the two flows acts to inhibit vertical mixing. When Delta outflow subsides, reintrusion of ocean water raises the salinities in Central Bay above those in South Bay, and the direction of circulation reverses; that is, surface waters again flow seaward (USGS ,3,26).
o Local Runoff
In the San Francisco Bay Basin, almost all of the local runoff comes from rainfall, with minor amounts from snowmelt runoff and groundwater depletion. However, the local runoff is somewhat depleted due to inf i 1 tration, evapotranspiration, and storage in reservoir impoundments. Unl ike the areas upstream of the Bay Basin with considerable snowfall, the precipitation runoff in the Bay Basin occurs almost immediately after the precipitation events.
Upstream storage and regulated releases required by the Delta Plan have provided higher levels of inflow from the Delta in most of the summer months, especially in dry and critical ly dry years. Significant amounts of effluent from industrial and municipal sources are discharged into the Bay, but the effects of these additional flows are not known.
A variety of factors have altered the effects of Bay Basin local runoff. These include upstream reservoirs, the change in land use patterns from native vegetation to agricultural vegetation, impermeable surfaces such as . concrete or asphalt, and the effects of ground water pumping. For example, the extensive expansion of streets, parking lots, and drainage conduits a1 low less rainfall to reach the ground water and subsequently greater amounts to flow directly into the Bay. Wastewater treatment plant discharges and water imports into the Bay Basin have also changed the locations, and greatly increased the quantity of local inflows to the Bay. DWR developed a local runoff survey for separate Bay Basin hydrologic areas and a summary of wastewater discharge for the period of water years 1970 through 1982 (Figure A3.0-24) (SWRCB, 3 ,Appendix R) .

FIGURE A3.0-24
SAN FRANCISCO BAY AREA LOCAL RUNOFF (SUM OF DSA'S 90-96 FOR YRS. 1970-1982)
400
OCT NOV DEC JAN FEB MAR APR MAY JUN JUL AUG SEP
MONTH = EFFLUENT DISCHARGE LOCAL RUNOFF

APPENDIX 3.1
DESCRIPTION OF VARIDUX COMPONENTS OF THE NEW WATER YEAR CLASSIFICATION
40-30-30 INDEX
The new water year classification, the 40-30-30 Index, is described in the main text of the Water Quality Control Plan. This appendix provides a detailed description of the following steps taken to develop this index:
o Determination of Weighting Coefficients o Results of Regression Analysis o Determination of Water Year Classification Breakpoints o Verification Process o Adjustments to Water Year Classification, and o Source of Database
o Sacramento Bas in Index (40-30-30 Index)
The modified classification splits the index into three terms. The form of the index equation is as follows:
Index = Cl*X + C2*Y + C3*Z
Where: C1, C2, and C3 are weighting coefficients of 0.4, 0.3 and 0.3, respectively.
And: X = April through July Four River Unimpaired Flow (MAF) Y = October through March Four River Unimpaired Flow (MAF) Z = Previous year's WY Index (MAF) having a maximum cap value of
value of 10 MAF.
o Determination of Weighting Coefficients
The weighting coefficients set the relative importance of each term, and so essentially control the accuracy of the index. To determine the optimal values for these coefficients, a statistical analysis was performed to establish an index equation that produced the highest correlation to water availability. Increasing the second and third term's weighting coefficients with respect to the first improved the correlation. This improvement reached a plateau after a relatively small increase and remained at that level over a wide range of weighting coefficient combinations. Choice of 0.4, 0.3, and 0.3 for the weighting coefficients, C1, C2, and C3 respectively, was based on obtaining a high degree of correlation, and a final condition that the coefficients be simple numbers so that the index would remain relatively easy to work with.
o Results of Regression Analysis
Table A3.1-1 lists some of the regression results of these statistical analyses made to determine the optimal weighting coefficients and also lists the results of regressing the water availability against Delta Plan classification availability. This comparison indicates that breaking the index into two separate hydrologic periods and adding the effect of the previous year's hydrology enhances the index's reliability.

TABLE A3.1-1 Selected Results of the Statistical Analyses to
Determine Optimal Weighting Coefficients
Weighting R Squared Classification Coefficients(%) Value
Proposed Modified 40 -- 30 -- 30 w/cap.l/ 0.8521 Selected A1 ternat ives 40 -- 20 -- 40 0.88
40 -- 30 -- 30 0.87 Delta Plan wlnew B P ~ / 33 -- 67 -- 00 0.74 April through July 100 -- 00 -- 00 0.66
Figure A3.1-1 shows a plot of the Sacramento Basin Water Year (WY) Index vs. July Water Availability with the regression curve for 57 years of data, 1922 through 1978, for the optimal weighting coefficients.
o Determination of Water Year Classification Breakpoints
The Delta Plan Water Year classification defines the boundaries of five water year types: wet, above normal, below normal, dry, or critically dry. This classification defines normal Sacramento Valley inflow, the boundary between above normal and below normal, as the logarithmic mean, or fiftieth percentile, of the Sacramento Basin's Four River Index for the period 1922 through 1971. In other words, there is an equal chance that Sacramento Basin Index wi 1 1 either exceed or not exceed the logarithmetic mean of 15.7 million acre feet (MAF). The boundary between an above normal year and a wet year is set at the 70 percent probabi 1 ity, 19.6 MAF. The boundaries for dry and critically dry years, 30 percent (12.5 MAF) and 15 percent (10.2 MAF) probabi 1 ity, respectively, were developed by identifying the Sacramento Basin Four River Index flows which had a potential for water supply shortages or critical water supply shortages for project operations. The years DWR identified as having a potential for shortages are (DWR,1,1978 Delta Plan hearing exhibit):
o Shortages: 1926, 1930, 1932, 1944, 1947, 1949, 1955, 1959, 1960, 1961, and 1964.
o Critical Shortages: 1924, 1929, 1931, 1933, 1934, and 1939.
The drought years 1976 and 1977 occurred after this analysis was completed and so were not included as years of critical shortage.
The methodology used to determine the index breakpoints that define the boundaries of the five water year types in the Delta Plan classification, was also used to determine the breakpoints for the new classification. An updated database was used with this methodology. Changes in the database are :
11 This class i f ica t ion has a cap o f 10 MF on. the third term. 21 The R squared value for the Proposed Modif fed and Selected A 1 ternat ives class i f icat ions are very similar, with the
values for the lat ter being sl ight ly higher. It was the consensus o f the subworkgroup that the 40-30-30 wlcap Index was the preferable index.
31 Breakpoint (BP), or threshold values are revised to ref lect 1906 -- 1987 hydrology.

FIGURE A3.1-1
PLOT O F DATA P O I N T S , REGRESSION CURVE AND INDEX THRESHOLD VALUES F O R MODIFIED WATER INDEX 40-30-30 W/CAP
Month of July 14
-
Wet -
-
AN
- BN ...... 6.5 ..........................................................................................................................
Water Availability (MAF) Note: Shade areas indicate ranges where index correctly estimates water availability.
Area above shaded area indicates index over predicts amount of water availability. Area below shaded area indicates index under predicts amount of water availability.

- An extended database, 1906 -- 1988 -- was used, and - Two additional years with the potential for project shortages were
included, 1939 and 1985.
New threshold flow levels and the percentage distributions were developed. Figure A3.1-2 shows a plot of the probability that the index value will be equal to or less than a particular value. The Delta Plan and the new classification threshold values and year type distributions are shown in Table A3.1-2.
Table A3.1-2
SACRAMENTO BAS1 N WY CLASSIFICATION THRESHOLD VALUES AND YEAR TYPE DISTRIBUTION
Delta Plan ~lassificationl/
Year TY pe
Thresh01 d Value (MAF)
1906 -- 1988 Expected Actual
% No. Years % No. Years
W Greater than 19.6 30 25 41 34 AN Less than 19.6, greater than 15.7 20 17 12 10 BN Less than 15.7, greater than 12.5 28 23 18 15 D Less than 12.5, greater than 10.2 11 9 16 13 C Less than 10.2 11 9 13 11
New Classification -- 40-30-30 Index
Year Type
Threshold Value (MAF)
1906 -- 1988 Expected Actual
% No. of % No. of
W Greater than 9.2 30 25 35 29 AN Less than 9.2, greater than 7.8 20 17 13 11 B N Less than 7.8, greater than 6.5 26 21 20.5 17 D Less than 6.5, greater than 5.4 13 11 20.5 17 C Less than 5.4 11 9 11 9
o Verification Process
A study was performed to analyze how we1 1 the predicted water year type reflected the water availability for that year. Tables A3.1-3, A3.1-4 and A3.1-5 show the results of this study. The first step in this study was to determine the threshold values for water availability volume that corresponded to the threshold flow volume levels. Regression curves, one of which is shown in Figure A3.1-1 were used to calculate these amounts. Figure A3.1-1 is a plot of WY Index vs. July water availability for 57 years of data, 1922 through 1978; included is the regression curve for the plotted points. Figure A3-1.1 also illustrates the verification by showing the areas where the WY Index predicts water avai labi 1 ity correctly and the distribution of the 57 years of index values in regard to these areas.
11 Adjustments fur subnormal snowmelt and year following c r i t i c a l p a r condition are not included in the Delta Plan class i f icat ion data.


TABLE A3.1-3 Sacramento WY Classification
40-30-30 WICAP April Verification
12383 21473 12157 19588 11489 18473 11378 17891 11272 18829 11045 18278 10402 1W80' 10373 17882 10187 18284 10153 17118 9788 18174' 9834 18805 8653 17730 9525 17113 9353 17478
8184 15755 8874 17518" 8879 15025' 8630 18027 8581 16888 8514 18442 8272 14820 7832 15818
15273 7751 13708 7687 15858" 7282 16413 " 7243 14408 7182 16098 7120 14732 '
7062 14630 8978 11818' 6870 13105 ' 8800 14880 8754 14401 6849 15127 6818 14750
1 3335 8408 13657 ** 6395 13180 8347 13635 " 8201 13970 " 8136 13819" 8090 14104" 5888 12000 6747 12451 6677 13838 "
1 047 5811 13588" 253 1.48% 1039 6583 12951 1932 5475 8438' -1828 1 1.32%
5400 1 1 364 1878 5258 12812 * * 1248 7.33% 1829 5218 11370" 8 0.03% W33 4628 7775 1934 4074 7578 CRlT 1924 3873 8110 1931 3880 7388 -77 3085 841 2
AVO. 4.02%
Water availability less than expected from index " Water availability greater than expected horn index

TABLE 63.1 -4 Sacramento WY Classification
40-30-30 WICAP July Verification
1830 5899 8833 DRY 1 om 5747 esee 1881 5877 10488 " 473 4.731 1847 561 1 10308 ** 31 5 3.15% 1 939 6583 gtisB 1832 5476 8251 ' -2256 26.52%
5400 8507 1978 5258 8924 " 1117 13,130h 1 929 5218 8330 1833 4828 541 1 1834 4074 5384 1824 3873 6567 1831 3660 481 3 1077 3005 4605
AVG. 6.01%
WET
Water availabllity less than expected from index '* Water availability greater than expected from index

TABLE A3.1-5 Sacramento WY Classification
40-30-30 WICAP October Verification
Water availability less than expected from index * * Water availability greater than expected tom index

These water availability threshold levels define the range of water availability for each year type. If a given year's water availability fell outside its respective water availability range, then it was assumed that the water year index incorrectly predicted the water year type.
TABLE A3.1-6
Sacramento Basin WY Classification Comparison of Verification Results for
Selected Classifications
No. of No. of Correct Incorrect Average
Classification Month Predict ions Predict ions Variance(%)
40-30-30 Index Apr i 1 38 (40-30-30) July 37
October 33
Delta Plan WY April 3 1 (33-67-00) July 27
October 27
April -- July Apr i 1 30 ( 100-00-00) July 29
October 27
Table A3.1-6 compares the results of the proposed new classification with other a1 ternative classifications. The results indicate that the new classification has significantly fewer incorrect predictions and the degree of error is significantly smaller than with the Delta Plan classification.
o Adjustments to Water Year Classification
In the Delta Plan classification, two adjustments were created to account for unusual hydrologic conditions; a second classification for a year which follows a critical year, and a sub-normal snowmelt adjustment. The "year following critical year" classification was developed to account for the effects that depleted reservoir and ground water storage have on the abi 1 ity of project operations to meet their demands. In this secondary classification the boundary of a wet year is raised to 22.5 MAF, an 80 percent probability of occurrence. The boundary for an above normal year remains the same at 15.7 MBF. The below normal year classification is el iminated, and the boundary between a dry and a critical ly dry year is raised to 12.5, the previous boundary for a below normal year. The "year following critical year" classification applies only to fish and wildlife objectives.
The sub-normal snowme1 t adjustment was developed to account for unusual deficiencies in snowpack storage. This adjustment is made in years where the percentage of precipitation, in the form of snowfall, is much less than expected. Under normal conditions , a great proport ion of winter
precipitation is stored in the snowpack and released over a long period of time as the snowpack melts. Under sub-normal snowmelt conditions, a greater proportion of the precipitation falls in the form of rainfall and cannot be stored in the snowpack nor reservoirs and is released as uncontrolled or surplus flow. The sub-normal snowmelt adjustment applies only to the fish and wildlife objectives.
The adjustments that were necessary in the Delta Plan classification are less important in this modified classification system.
Because the effects of previous year's conditions are included in the third term of the index, the "year following critical year" modification is not necessary.
The subnormal snowmelt modification, to a large extent, is accounted for with the inclusion of the third term and with the difference in weighting coefficients between the first and second terms. DWR has identified the following years, between the period 1922 - 1978, as subnormal snowmelt years :
- Subnormal snowmelt years: 1928, 1951, 1960, 1966, 1968, 1970, and 1972.
Table A3.1-4 shows that for the month of July, after spring snowmelt has finished, the modified index correctly predicts the amount of water available during subnormal snowmelt years three out of seven times, and under-predicts the amount of water available three out of seven times. Therefore, the index does not predict more water than is available six out of seven of the subnormal snowmelt years. Only 1970's index overpredicts water availability. This indicates that subnormal snowmelt conditions are highly accounted for in the index.
A modification for subnormal snowmelt would be beneficial if it could account for unusual hydrologic conditions not predicted in the index, and not cause other errors while accomplishing this. However, the current subnormal snowmelt modification causes the 40-30-30 Index to be less accurate, and therefore is not included as an adjustment to the index.
o Source of Database
The source of the database used to develop water avai labi 1 ity for this analysis was DWR operation study run number 628. This operation study assumed 1990 level demands and conditions, D-1485 Delta flow and water quality standards, and the amended D-1485 Suisun Marsh standards with no facilities.

APPENDIX 3
REFERENCES
o BCDC. 1982. Diked Historic Baylands of San Francisco Bay; Findings, Source Policies, and Maps. Adopted October 21, 1982.
o Cheng, T.T., and Gardner, J.W. 1984. Tides, Tidal and Residual Currents in San Francisco Bay, 1979-1980, USGS Water Resources Investigation Report 84-4339, February 1984.
o Denton, R.A., and Hunt, J.R. 1986. Currents in San Francisco Bay--Final Report, SWRCB Pub1 icat ion No. 86-7wr, March 1986.
o Orlob, G.T. 1982. "Without Project" Water Quality. Memorandum from Dr. G.T. Orlob of G.T.Orlob and Associates to Diverters, South Delta Water Agency on February 10, 1982.
o RWQCB 2. 1986. Water Qual ity Control Plan Report, San Francisco Bay Basin (2) , Part I, December 1986.
o RWQCB 5. 1975. Water Qual ity Control Plan Report, Sacramento River Basin (5A), Sacramento-San Joaquin Delta Basin (5B), San Joaquin Basin (5C). Volume 11.
o SWRCB. 1978. Final Environmental Impact Report for the Water Quality Control Plan and Water Right Decision, Sacramento-San Joaquin Delta and Su isun Marsh, August 1978. Sacramento, Cal ifornia.
o 1906 through 1920--DWR Division of Planning Statewide Planning Branch, 4/14/80; 1921 through 1978--DWR Exhibit 7, except as stated below; 1969 through 1983 Sacramento River near Red Bluff --DWR Cal ifornia Data Exchange Center, 1/15/88; 1984 through 1987--DWR Cal if ornia Data Exchange Center, 1/15/88.

APPENDIX 4.0
BENEFICIAL USES OF BAY-DELTA ESTUARY WATER
Conclusions: CURRERT AND FUTURE WATER SUPPLY CONDITIONS
o The majority of surface water in California (about 55 percent) flows to the sea, into salt sinks or into Nevada.
o The watershed of the Bay-Delta is a major source of supply critical in satisfying the water needs of the entire State.
o The Bay-Delta watershed is influenced by water diversion and control. On the average about 40 percent of the flaws entering the Delta are unmanaged. However, in dry years less than five percent is unmanaged.
o As California's population grows to over thirty-six million people by 2010, the adequacy of currently developed water supplies to meet the needs of a growing population, expanding economy, and the aquatic environment will diminish.
o There are about 9.2 million acres of irrigated agricultural land in California.
o Agricultural acreage is not expected to increase in the Central Val ley.
o Current 1 y developed surf ace water suppl ies do not meet existing agricultural water requirements. This is demonstrated by the fact that agricu 1 tural demands are partial 1 y being met by groundwater overdraft in the San Joaquin Valley.
o Agricultural water conservation in areas that receive water frm the Delta is important but will not satisfy the State's water needs since less than 20 percent of the agricultural water demand is met by water exported from the Delta.
o Planning for municipal and industrial water needs must focus on the primary requirements of a reliable supply of drinking water.
o Reductions in re1 iable water supplies wi 11 have adverse impacts on the economy of the state.
o Conservation, reclamat ion and maxiaum conjunctive use of local ground water basins are important components of reliable water supplies.
o Cal ifurnia water suppl ies have been affected by recent court decisions. The state's share of water from the Colorado River has been reduced to 4.4 M, an m u n t the courts will likely limit still further. Interim court decisions have reduced the city of Los Angeles' water supply fm tributaries in the Mum Lake Basin by 50 to 65 TAF. Also, court decisions have 1 imited export of ground water from the Owens Val ley Basin to levels lower than originally anticipated by the City.

Water conservation by the Imperial Irrigation District consistent with State Board Order 88-20 could make water available for use in other parts of the state by 100,008 AF in the early 1990s, with a long-term goal of about 368,000 AF.
Ground water is a resource upon which the state relies. Factors 1 imiting the avai labi 1 ity of that resource include toxics, overdraft, salt water intrusion and land use practices.
4.0.1 Introduction
"'Beneficial uses' of the waters of the state that may be protected against degradation include, but are not necessari ly 1 imited to, domestic, municipal, agricultural and industrial supply; power generat ion; recreation; esthetic enjoyment; navigation; and preservation and and other aquatic resources or Water Qua1 i ty Control Act, Water Code
This chapter discusses the many beneficial uses made of Bay-Delta waters which were addressed during the Phase I hearings. Only after beneficial uses have been properly identified can appropriate water qua1 ity objectives and other control policies be established. A clear understanding of each beneficial use provides a foundat ion for establishing the levels of protection needed.
This Plan complements specific beneficial uses in the Basin Plans of the San Francisco Bay and Central Val ley Regional Water Qual ity Control Boards. There are additional beneficial uses made of these waters as addressed in these Basin Plans. The beneficial uses discussed in this Plan are not therefore meant to be exclusive.
The discussion of beneficial uses has been separated into estuary and export uses. Estuarine habitat is also a specific beneficial use discussed in the Basin Plan of the San Francisco Bay Regional Water Qual i ty Control Board. During Phase I of the proceedings, information was submitted on specific subtopics, e.g., striped bass, Chinook salmon, various human uses of the habitat.# These issues are addressed here in a similar fashion. Habitat is separated into the Delta's water, generally fresh, and the Bay's waters, generally brackish and saltwater habitats, to help identify the general salinity conditions.
4.0.2 Uses of Estuary Water for Municipal and Domestic Supply Purposes Within the Estuary
Municipal and Domestic Supply (MUN) includes establ ished uses in community or mi 1 itary water systems as we1 1 as domestic uses from private systems (RWQCB 5, 1975).
Current and projected MUN water use of Delta surface water is presented in Table A4.0-1. Delta cities that rely on this water are Antioch, Pittsburg, Tracy and Oakley. Pittsburg and Oakley obtain water supplies from Rock Slough via the Contra Costa Canal; Tracy obtains its supply from Old River via the Delta-Mendota Canal. Antioch diverts 4 . directly from the San Joaquin River during high flow periods when water

quality is satisfactory and at other times obtains part from the Contra Costa Canal. The City of Sacramento maintains a standby diversion facility on the Sacramento River in the upper Delta, but usually diverts from two other facilities on the American and Sacramento rivers upstream of t k Delta. The cities of Stockton, Tracy, Rio Vista, and other Delta communities rely to various degrees on ground water for MUN water supplies (SWRCB 5, 1978).
TABLE A4-1
MAJOR MUNICIPAL WATER DEMANDS
1986 Population
City of Tracy 25,300 Antioch 40,734 Pittsburg 53,125 Oakley County W.D. 8,436
Year 2000 Population
City of Tracy 33,000 (1990) Ant ioch 78,900 Pi ttsburg 59,100 Oakley County W.D. N/A
Hater Demands (AF)
Year 2000 Water Demands (AF)
(Table adapted from information found in City of Tracy (CT), Exhibit Nos. 2 & 3; Contra Costa Water District (CCWO)', Exhibit Nos. 7, 24 & 25).
4.0.3 Industrial Beneficial Uses
Industrial use is comprised of three separate beneficial uses:
o Industrial Service Supply (IND) "includes uses which do not depend primarily on water qua1 ity such as mining, cooling water supply, hydraul ic conveyance, gravel washing, fire protect ion, and oi 1 we1 1 repressurizat ion".
o Industrial Process Supply (PROC) "includes process water supply and a1 1 uses related to the manufacturing of productsn.
o Hydroelectric Power Generation (POW) "is that supply used for hydropower generat ion" (RWQCB 5, 1975).
Very l ittle information on Bay-Delta industrial use was presented in Phase I of the proceedings. Two Bay-Del ta industries, Fibreboard Louisiana-Pacif ic Corporation (Fibreboard) and She1 1 Oi 1 Company, presented testimony, but no exhibits. Contra Costa Water District (CCWD) and DWR presented exhibits and testimony, but of a limited scope. The total amount of water delivered from the Contra Costa Canal to major industrial water users in the Delta totaled 22,733 acre-feet in 1985 and 15,519 acre-feet in 1986 (CCWD,26).

4.0.3.1 Antioch-Pittsburg Area
Fibreboard, a large kraft paper mi 1 1 located on the south shore of the San Joaquin River approximately five miles east of Antioch, produces 1 inerboard, corrugating medium, and fiber board from wood chips (hearing for D-1485,RT,Vol .XVII ,p. 135). Fibreboard presented the only testimony supporting the need for process water with not more than 150 ppm chloride for the production of corrugated box linerboard (TI IV,92:25-93:6; T , IX,75:23,81:23). To keep the chlorinity in their linerboard (used in corregated boxes) at levels which will not corrode canned goods, Fi breboard maintains the sal ini ty of their process water below 150 mg/l chloride (T,IX,75:23-81:23).
Fibreboard has two main sources of water, direct pumping from the San Joaquin River and CCWD. When the chlorinity in the San Joaquin River supply is higher than 150 ppm, a partial supply o f water is purchased from CCWD; when the chlorinity level reaches 250 ppm, the entire supply is taken from the Contra Costa Canal (T,IX,77:23-78:6). A third, relatively minor source is ground water from two we1 1s that provide between 500,000 and 800,000 gallons per day.
4.0.3.2 Industries Outside of the Antioch-Pittsburg Area
Shell Oil Company in Martinez, which obtains most of its water supply from the Contra Costa Canal, was the only Bay-Delta industry located outside the Antioch-Pittsburg area to present testimony during Phase I (T, IX41:ll-14) Shell Oil Company's testimony was related to re1 iabi 1 i ty of supply (TI IX,46: 12-13). Three other industries near Tracy, H. J. Heinz Company, Laprino Cheese and Laura Scudders, which obtain their water supply from the DMC or local ground water supplies, were identified but did not present testimony (TI IX, ll:4-12; T, IX,21:21- 25).
4.0.4 Estuary Agriculture Beneficial Uses
Agr icu 1 tural uses include crops, orchards, and pasture irrigation, stock watering, support and vegetation for ran e, grazing and all uses in support of farming and ranching operations 9 RWQCB 5B, 1975). 4.0.4.1 Delta Agriculture
About three-quarters of the Delta land area (515,000 acres) is farmed with water from the channels and sloughs adjacent to each individual island in the Delta (DWR,304). The Delta's climate and soil permit a wide variety of crops to be grown; corn and grain are the predominant crops.
Soils in the Delta fa1 1 generally into two categories, organic and mineral. Farmed organic soils constitute 68 percent of the total cropped area and mineral soi 1s the remaining 32 percent. Organic soils are usually found in the Delta lowlands, that is, the land area below an elevation of +5 feet mean sea level. Delta uplands are those areas above +5 feet mean sea level. Mineral soils are found in both the Delta lowlands and uplands.

Delta Organic Soils
The Delta's organic or peat soils were formed in a wetland environment that existed prior to the area's reclamation for agriculture. These peat soils were formed through the biological decomposition o f marsh plants and grasses under anaerobic conditions. Current land use is constantly reducing the amount of Delta organic soi 1s. Organic mater i a1 s are no longer being deposited, whi le increased decomposition and oxidation from natural processes and farm practices are occurring at high rates. High winds also transport dried organic soils out of the Delta. Consequently, many of the lowland Delta islands are sinking at the rate of one to three inches per year and the actual acreage of the organic soi 1 s is a1 so being reduced (T, LV ,82: 20-25).
The high permeability of organic soils and their low surface elevation compared to surrounding waterways produces high ground water table conditions. The high ground water table, along with problems associated with uneven decomposition and sett 1 ement of organic so i 1 s , makes subirri ation the primary method of water application for crop production. 9 Subirrigation is an irrigation technique by which water is delivered to the crop root zone by horizontal flow through the soil from the spud ditches.)
The quality of irrigation water, and the effects o rainfall and other
need for leaching. I/ farm practices including, possibly, winter ponding , all reduce the
Delta Mineral Soils
Delta mineral soils were formed through deposition of sands and minerals eroded from the Sierra Nevada by various streams tributary to the Delta. These soils are generally found in the Delta uplands.
On mineral soils, the area in Figure A4-1 which is not designated as organic soil, surface irrigation is the common irrigation method. Water is applied to the soi 1 surface, usually through furrow, sprinkler, or flood irrigation. Unlike organic soils, salts in the surface-irrigated mineral soi 1s are brought into the soi 1 column from the surface with the applied water. Excess salts are removed during irrigation and after harvest by applying irrigation water to flush the salt into the lower ground water table. Some leaching may also be accomplished with winter rainfall.
Delta Crop Production
Agriculture was introduced into the Delta in the 1860s and was well established by the turn of the century; it has maintained its current level since the 1920s (see Figure A4-2). Delta agriculture is important economical ly at both the regional and statewide level.
11 Winter pondfng, currently in use in the Delta, is the practice of flooding Iarge agricultural f ield a= for the purpose of contro 1 1 ing weeds, and reducing sa l t in the upper reg ion of the so i 1 prof i 1e. Other benefits are recreation, and poss ib ly sa 1 t leaching.

FIGURE A4-1 Sacramento - San Joaquin Delta Approximate Location Of Organic Soils
(Sons With Greater Than 25% Ofgenic Matter) Source: DWR BuUeUn 192.82, Delta Levees lnvestlgetlon Dee. 1982 also DWR ExhIblt 303

FIGURE A4-2 Delta Land Use and Dedicated Acreage
Delta lowlands, Agriculture (Below Elevation 5 Feet)
1 860 1 900 1940 1 980
DELTA LAND USE
Adapted from: Bulletin 76 - Delta Water Faclitiis, December 1960
4.0-7

Crop production information was presented by DWR for the Delta lowlands and uplands (DWR,304). Corn was the predominant crop grown in the Delta during the period 1977-84, accounting for 25.8 percent of the total cropped acreage (Table A4-2). Grain is grown on an additional 21.5 percent of the cropped acreage, followed by tomatoes, alfalfa and mixed pasture; other crops such as sugar beets, deciduous trees and safflower account for most of the remainder. Crop and livestock production in the Delta has a gross sale value of approximately $500 mi 1 1 ion (Table A4-3), with field and truck crops making up 57 percent of that total.
4.0.4.2 Bay Agriculture
Very little information was presented in the hearing sessions on agriculture outside of the legal limits of the Delta but within the boundaries of San Francisco Bay Region. Contra Costa Water District presented records showing crop production for their district (CCWD,48) (Table A4-4).
4.0.5 Beneficial Uses Made of the Estuary's Aquatic Habitat
a This section discusses some of the specific data presented during Phase I as they relate to the following five major beneficial uses addressed in the current Water Qua1 ity Control Plans (Basin Plans) of the San Francisco Bay and Central Val ley Regions:
o Freshwater Habitat -- which provides habitat to sustain aquatic resources for cold water (COLD) and warm water (WARM) species.
o Fish Migration (MIGR) -- which provides a migration route and temporary aquatic environment for anadromous and other fish species. This beneficial use is also subdivided for warm and cold water species.
o Fish Spawning (SPWN) -- which provides a high quality aquatic habitat suitable for fish spawning.
o Wildlife Habitat (WILD) -- which provides a water supply and vegetation habitat for the maintenance of wildlife. The two most important types of wildlife habitat are riparian and wetland habitats.

TABLE A4-2
CROPACREAGESANDPERCENTAGES~ BASED ON DATA COLLECTED DURING THE PERIOD 1977--1984
FOR THE SACRAMENTO-SAN JOAQUIN DELTA (From DWR, 304)
1/ Percentages computed by State Board staff.
2/ Cole crop include those from the cabbage family.

TABLE A4-3
1985 ECONOMIC VALUE OF DELTA CROPS AND LIVESTOCK (From DWR, 340)
Gross Value of Delta Area ($Million)
Agricultural Low1 and Upland Total Category
Field Crops 100.4 67.2 167.6 Truck Crops 76.9 34.6 111.5 Tree Fruit/ 25.1 18.2 43.2 Nut & Wine Seed & Nursery 7.9 1.8 9.7 - Livestock 9.9 144.5 154.5
TOTAL $220.2 $266.3 $486.5
TABLE A4-4
CROPS PRODUCED IN CONTRA COSTA WATER DISTRICT, 1986
Crop
Corn Alfalfa Irrigated Pasture Other miscel laneous field crops
Apricots Grapes* Almonds* Walnuts
Acres -
* Not irrigated in 1986
o Preservation of Rare, Threatened and Endangered Species (RARE) -- which provides an aquatic habitat necessary, at least in part, for the survival of certain species established as being rare, threatened or endangered under the Cal iforn ia Endangered Species Act (CESA) .
The fishery resources of the Estuary depend upon complex ecosystems for a variety of purposes during different life stages and in different
I--- seasons and water year types. The Estuary provides habitat for the entire life cycle, or a critical portion of the life cycle, for close to 150 fish species and a vast aquatic food web of invertebrates, including she1 lf ish and crustaceans, and planktonic organisms. The .. - fishery provides valuable resources for many other terrestrial and aquatic wildlife species as well.

The relationship between aquatic habitat and water quality requirements has been documented for relatively few species. Studies normally focus on important commercial and recreational species such as Bay shrimp, Dungeness crab, Chinook salmon, striped bass, and American shad. There is still much debate about the relationship between water quality and quantity and the changes in fishery resources even for the we1 1 studied species . Sections 4.0.5.1 and 4.0.5.2. summarize available information on fish, invertebrates and rare, threatened and endangered animals and plants in the Estuary. There are two major subdivisions: Section 4.0.5.1 discusses fishery habitat for species which mostly use freshwater habitat; Sect ion 4.0.5.2 discusses those which mostly use estuarine habitat.
4.0.5.1 Delta Habitat
This section considers the habitat for species that primarily use the freshwater of the Delta upstream of Chipps Island. Suisun Bay and the other downstream estuarine areas (San Pablo, San Francisco and South bays) are discussed in Section 4.0.5.2.
Phytoplankton and Zooplankton
The importance of phytoplankton and zooplankton (including the opossum shrimp, Neomysis mercedis) and their place in the food chain of fish and larger invertebrates was discussed at length in Phase I of the proceedings (see, for example, DFG, 28,14; T,XXXIX, 15: 16-19,28: 13- 29: 14,70:19-71:8; T,XLI ,52:19-53:5,59:1-4). The young of striped bass and other game fish, and all life stages of forage fish, feed on zooplankton and Neom sis (DFG,28, I ) , which in turn feed on smal ler zooplankton and -h-y- p ytopl ankton (DFG, 28,l-4). Phytoplankton abundance is itself dependent on light, flow, salinity and nutrients. The complex interact ions of these components are discussed in the hearing record.
Chinook Salmon
o Races and Migration
Chinook, or king salmon, Oncorhynchus tshaw tscha, is a native, co 1 dwater , anadromous s p e m r --T cocomrcia and recreational importance in Cal ifornia. From about 1955 through 1965, Sacramento Bas in Chinook salmon escapement averaged above 250,000 fish. Over the last 20 years the total number of naturally produced adult salmon has declined to around 100,000 fish while escapement of hatchery reared fish has increased to about 90,000 fish (DWR,559,74) (Figure A4-3). Annual Sacramento Basin escapement and commercial ocean harvest have become relatively stable in the last 20 years (DWR,559,47-74; USFWS,31,2). The estuarine gill net fishery for salmon was outlawed in 1957. Since then the ocean commercial troll harvest of Central Valley salmon has averaged about 324,000 fish, approximately 57 percent of all Chinook harvested in Cal ifornia. The ocean recreational catch has averaged close to 60,000 fish and the inland sport harvest is estimated to be about 35,000 fish (USFWS, 31,103,176-179; DWR, 56,57-59).

FIGURE A4-3 Estimate of annual ocean harvest of Central Valley Chinook salmon (After DWR, 561,2, Figure llC3)
1916 1921 1926 1931 1936 1941 1946 1951 1956 1961 1966 1971 1976 1981 1986
Year

Adult Chinook salmon migrate through the Estuary from the ocean to spawning areas in the upper Sacramento-San Joaqu in River bas ins. Four races, a1 1 be1 ieved to be genetically distinct (USFWS,31, log), spawn in the upper Sacramento Basin (USFWS,29,4). Each race is named for the time of year when the upstream migration (run) occurs. There are fall-, late fall-, winter- and spring-runs. Some hybridization between runs, especially spring and fa1 1 runs, may have occurred due to the fact that the timing of spawning overlaps and there is less suitable spawning habitat than was historically available. The two remaining areas where significant numbers of genetical ly pure strains of spring- run Chinook exist are in Mil 1 and Deer Creeks (USFWS,29,6). Because the spawning runs of the four races overlap in the upper Sacramento River, a1 1 1 ife stages may be found in a1 1 months (see Figure A4-4). The USFWS stated that the occurrence of four races of Chinook salmon in a single river basin is unique in the United States (T,XXXV,16:24- 17: 1).
The fa1 1-run, comprising up to 90 percent of a1 1 Chinook spawning in the Central Valley, migrates upstream from about late July through December (USFWS,29,5). Smal ler populations of late-fa1 1, winter-, and spring-run fish spawn in the upper Sacramento River (see Figure A4-5). The winter-run was formerly the second largest but today is the smal lest (T ,XXXV, 22:6-14) and is now designated as an "endangered" species under the Cal ifornia Endangered Species Act and a "threatened" species under the federal Endangered Species Act.
The Sacramento River and its tributaries produce at least 80 percent of a1 1 Central Valley Chinook salmon (USFWS,31 ,I). During the years 1953- 1986, the San Joaquin River Basin contributed at least 10 percent of the Central Val ley salmon produced for 13 years and at least 17 percent for three years (DFG,15,Appendix 1). Prior to the closure of Friant Dam on the San Joaquin River, there was a spring-run fn the upper river (DFG,15,8). Today, only the fall-run spawns in the Merced, Tuolumne and Stanislaus rivers (DFG,15,4). There are also small runs in the Moke 1 umne and Cosumnes Rivers (SWRCB ,435,35).
o Development and Migration
The developmental stages and habitat requirements for each stage are generally the same for the four races of Chinook salmon in the Central Valley. However, the different life stages use different locations and require different habitat conditions as they develo within the Sacramento-San Joaquin River basins (see Table A4-5 ! . Spawning and incubation take place upstream of the Delta. Juveniles and occasionally fry rear in the Delta. While rearing, young salmon feed for about two months or more on a diet of aquatic and terrestrial insects and zooplankton (USFWS ,29,4;USFWS, 31 J4;SWRCB ,450,5-4). Peak fry abundance occurs in the Delta in February and March (USFWS,31,7). As they grow and move into the Bay habitat, Neo sis (opossum shrimp), Coro hium (an amphipod) and Crangon (Bay shrimp become important prey i tems SWRCB ,433,113) . -7-
+

FIGURE A 4 4 Timing of life history stages for the four races of Chinwk salmon in the Sacramento River Basin
(After USFWS, 29,5, Figure 2)
I I JUL 1 AUG I SEP I OCT I NOV I DEC I JAN I FEB I MAR I APR I MAY I JUN
( ADULT I MERATION
I ADULT I MIGRATION
SPAWNING
INCUBATION
REARING AND I MIGRATION

FIGUREW Spawning escapement of the four races of Chinook Salmon in the Upper Sacramento River Basin
(After USFWS, 29,7- 10,Flgures 3-6, & update from D. Palnter, DFG)
FALL * LATE-FALL ** 140 36
34 - 130 - 32 -
120 - 30 - g 1 1 0 - c 28 -
0 26 - EGloo - EQ 2 4 - #U #U V)c C f 2 2 - + g g o - o A 0; 2 0 - = 8 0 - b s 1 8 - 2: *+ 70 - nk 1 6 - E- E w 14 -
60 - * 1 2 - 50 - 10 -
8 - 40 - 6 - 30 I I 8 t I 8 I I I I , 4 7 I I , I I I I
66 70 7 4 78 8 2 86 90 66 7 0 7 4 7 8 82 8 6 90 YEAR YEAR
WINTER **
YEAR
SPRING **
2 1 3 66 70 74 78 82 8 6 90
YEAR
* Upper Sacramento River 1967- 1989
** Chlnook Salmon Counts Past Red Bluff Diversion Dam 1967- 1989
SLA Y133190

TABLE A4-5 Chinook Salmon Environmental Requirements and Life History Stages
Life Slage Location Duration (race) Flow Water Quality Other
Adult Pacilic Ocean July-Dsc (fall) Adequate flow Temperature Migration Bay-Delta lo Ocl-Mar (Late-Fall) of home slream Chinook Mlgrallon Range
upstream water lo locale Optlmum: 49-57.5OF Jan-June (wlnler) spawnlng grounds Dissolved Oxygen mid Mar-Aug (sprlng) and cover redds 26 mgll
Spawning Upper reaches Ocl-mid Jan (lall) Stable flow wlthoul Temperature Clean gravel of all major Jan-Apr (late lall) extreme llucluallon Chlnook Gen'l Spawning Range subslrale rivers and Apr-mid July (winler) sullicienl lo cover Lower Threshold: 42OF with good slreams in Aug-Nov (spring) and aerate redds Upper Threshold: 5a0F circulalion Sacramento- Dissolved Oxygen through redd San Joaquln 2 7 mgll Rlver Baslns below dams
P lncubatlon Spawnlng Ocl-Apr (lall) same as above same as above
0 (Egg-Alevin) grounds Jan-Jul (lale fall)
w (see above) May-Oct (wlnter) 01 mid Aug-mid Jan (sprlng)
Rearing Upslream, Dec-Mar (fall) Stable flow to Temperalure (Fry-Junvenile) Delta, and Apr-Aug (lale fall) prevent stranding Chlnook Optlmum Range
upper estuary mld Aug-Nov (winter) Can tolerale Lower Lethal: 32OF late Nov-Jan (spring) greater llows and Upper Lethal: 79OF
velocltles as they Preferred Range: 45-58OF malurg and move Dissolved Oxygen lnlo deeper waler~ 26 mgll
Smoll Mlgralion
Downstream lo Apr-June (UI) Tolerate hlgher same as above Bay-Delta Aug-Jan (lale fall) flows lyplcal of (Water Qualily Estuary to Nov-late Apr (wlnler) sprlng snow melt data from Pacific Ocean Feb-Apr (spring) or ralny season. Bell 1973)
tielps move smolls downstream
same as above
Olet ol aquatic and terrestrial insects, cruslaceans
Diet o l Neomvsls Cranqon. Corophlum, and aqualic and lerreslrial lnsecls (SWRCB,433,133)

Including natural 1 y-produced fish and hatchery-reared salmon released in or above the Delta (USFWS, 31,27), the annual fall smolt run that passed Chipps Island between 1978 and 1985 was estimated to range from 10 to 50 million fish (USFWS,31,25). Dn the average, it takes an individual fall-run smolt three weeks to emigrate from the upper Sacramento to the ocean (one week to reach the Delta and about two weeks to pass through the Delta and Bay) (USFWS, 31,32). Smolt emigration through the Delta usually peaks in May (Figure A4-4) (USFWS, 31,22). However, smol ts from different tributaries leave their natal streams and move into the Delta at different times and there are year-to-year variations in the timing of emi ration (USFWS,31,23). The fa1 1 run emigration from Apri 1 through June ? USFWS, 31,17) coincides with historical flow increases caused by snow melt (~WR,561,6). Fall- run fry tend to enter the Delta with high flows following winter storms (memo from D. Stevens to H.K. Chadwick, June 19, 1989). The USFWS has determined through mark-recapture studies that fry released upstream survive better than those released in the Delta in wet years (USFWS;3,35; USFWS,2,27). San Joaquin River Basin fall-run smolts emigrate somewhat earlier during this period than Sacramento River Basin smol ts (USFWS, 31,23). The increase in Delta smolt abundance observed in October and November is probably the late-fall race or year1 ing, fa1 1-run salmon. The winter- and spring-runs emigrate from January through March.
Peak abundance of salmon salvaged at the state's Delta pumping plant confirm this seasonal pattern of young salmon abundance in the Delta (see Figure A4-6).
o Survival and Abundance
Smolts migrate downstream to the ocean where they mature for two or more years. Recoveries of adults in the ocean, tagged as smolts and released in Suisun Bay, indicate that only about two percent survive. Thus, 10 to 50 million smolts would produce 200,000 to 1,000,000 fish available to the ocean fishery (i.e., 10,000,000 x .02 = 200,000 adults or 2 percent survival rate from smolt entering salt water to attaining adulthood) (USFWS,31,27). The commercial harvest of Central Val ley Chinook is about 350,000 to 450,000 fish (see Figure A4-3). The number of fish escaping harvest and mortality and returning to the spawning grounds each year is known as annual escapement. Survival from eggs to returnin adults in a stable population was reported to average 0.04 percent qDWR, 561,3). No detailed evidence was presented regarding overall survival rates for Sacramento-San Joaquin Basin Chinook salmon.
o Salmon Harvest and Economic Value
Table A4-6 shows the average estimated ocean commercial and sport catch of Central Valley Chinook salmon in California and an estimate of the proport ion supported by hatchery product ion (DWR ,559,45). The estimated 1977-1986 California commercial harvest of Chinook salmon from the Central Val ley averaged we1 1 over 300,000 fish per year (USFWS,31, 177,Appendix 32), representing almost 60 percent of the total ocean catch of Chinook salmon in California during this period.

FIGURE A4-6 Mean monthly salvage of Chinook salmon at the State Water Project fish protective facility, 1968 - 1986 (From DFG, 17, Appendix , Table 4)
* about 100 f ish

TABLE A4-6 Estimated Average Annual Harvest of Chinook Salmon and the Hatchery Contribution t o the Catch of Central Valley Salmon
Percent of Ocean Comnercial Catch Catch f ran Central Ocean Sport Catch
Ocean cornnerd a1 of Central Valley Valley Chinook o f Central Valley
C q t ~ h I f Chinook 1/ (2/1) Chinook 2/ Year (1) (2) (3) (4)
---- --------t=S=I~=-OtDI~==PPI=a=PIf=i==PCI=P===5~s-~55===PsDZ==I====D=====D===~==PE5t==i:===PI=It========D=z=5===I=z=
1952- 1979 65&282 320,982 57 52,157 I I
Percent Hatchery Sport + Carmercial Ocean Coamercial Chinook in Central Catch o f Central + Sport Catch o f Valley Catch
Valley Chinook Hatchery Chinook 3/ (6/5) (2+4) (6) (7)
Year (5) P ~ ~ ~ i F i i C I S S z l t P O I D P t P ~ i P E P P D i t ~ E P P ~ ~ P P P D 5 P i P P D P P P P P D D P I D P I I ~ 5 ~ P D I ~ E P ~ I 5 5 ~ ~ ~ P I I P ~ O 5 ~ I I ~ E E ~ ~ I I ~ I P P i ~ ~ E P ~ ~ ~ 5 ~ ~ ~ ~ t ~ ~ P ~ E I O D ~
1952-1970 373,139 7,407 2.0
I/ From DUR,561,57, Appendix A-3.
2/ From DUR,561,58-60, Appendix A-4. 3/ From DUR,559,44-45, Table 111-4. The period o f time covers 1957-1970 fo r the American
River hatchery alone. Subsequent years include the Feather River hatchery production through 1984. Contributions by other Central Valley hatcheries were not determined.
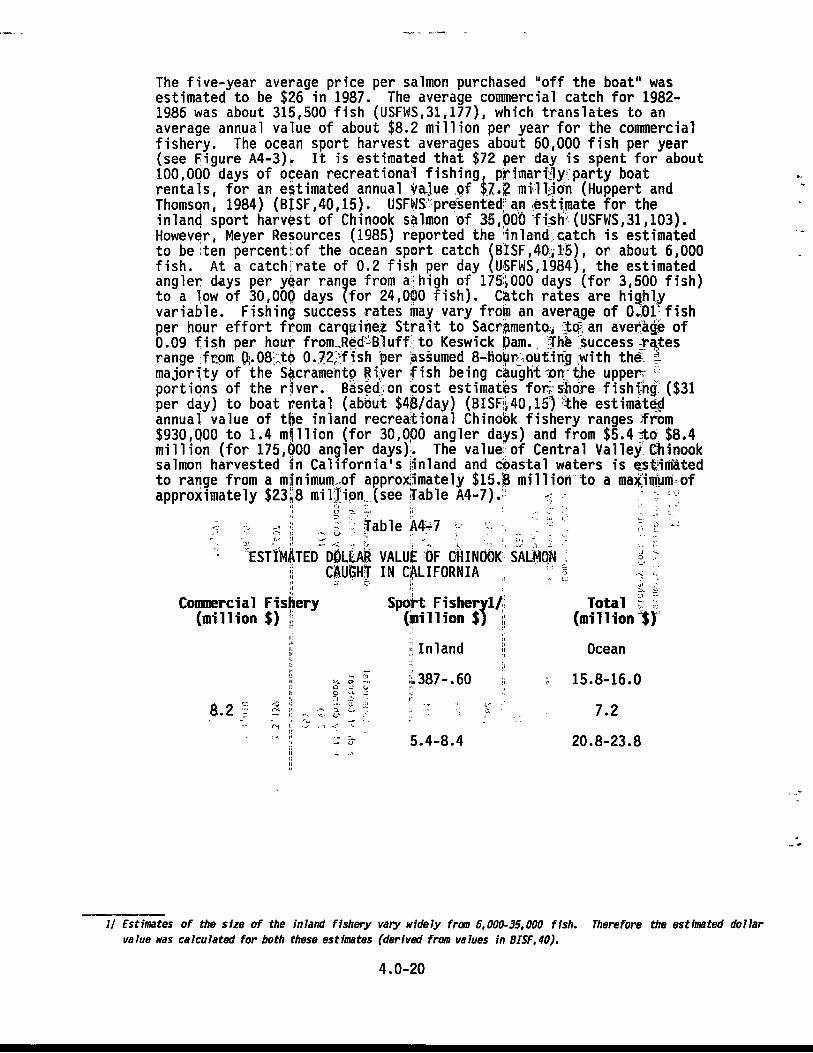
The five-year average price per salmon purchased "off the boat" was estimated to be $26 in 1987. The average commercial catch for 1982- 1986 was about 315,500 fish (USFWS,31,177), which translates to an average annual value of about $8.2 mi 1 1 ion per year for the commercial fishery. The ocean sport harvest averages about 60,000 fish per year (see Figure A4-3)# It is estimated that $72 per day is spent for about 100,000 days of ocean recreat iona31 fishing primarizly~ party boat rentals, for an estimated annual v J u e pf $ 2 . ~ mi1T:ion (Huppert and Thomson, 1984) (BISF ,40,15). USFWS' pr&ent&d' an (estimate for the inland sport harvest of Chinook salmon of 35,000 fish- (USFWS,31,103). However, Meyer Resources (1985) reported the inland catch is estimated to be ten percentlrof the ocean sport catch BISFI40,E5), or about 6,000 fish. At a catch'lrate of 0.2 fish per day I USFWS,1984), the estimated angler days per y#ar ran e from a; high of 175:iOOO days (for 3,500 fish) to a low of 30,OOQ days !for 24,OPO fish). Catch rates are high9 variable. Fishing success rates may vary from an average of 0GO1 fish per hour effort from carqeinez Strait to Sacr~menta, $q an aver%& of 0.09 f i sh per hour f rom,Red:,Bluff( to Keswick flam. Thi3 Success $@es range ftom Q.0839 0.32c2,:f ish per ps5umed 8-iIo~r~~oudng with the: "L major jty of the S#crament~ Ri,ver fish being caught an.: the upper; port ions of the river. Based. on cost estimatks f o K ~ h d b e f ishfng ($31 per day) to boat rental (about $48/day) (BISFli40,15] $he estimate$ annual value of the inland recreational Chinobk fishery ranges from $930,Q00 to 1.4 mljllion (for 30,OPO angler days) and from $5.4 to $8.4 million (for 175,000 angler days). The value of Central Valley Chinook salmon harvested in Cal ifornia' s ;inland and c'oastal waters is @$mated to range from a minimum,-of approx:imately $15.B mil lion to a [email protected] approximately $23:8 mil Jipn (see table A4-7).: -.. -
1, - - 2 = - $1 - a, , . .
- - Sable A4-7 , -. r j , -q I ' 7 I' -
0 i, - U , * *I \/ --. r P > , 4 1 2
w~ 'EST'IM~ATED DOLLAR: V A L U ~ *OF OHINOOK' S A L M ~ I = [ CJ CI A *
; C$Ubfl - IN ChLIFORNIA L . L -
1 I - - -. -
4 - Co-rcial ~isber~ spit Fisher l/i Total ; :: (mil lion $) ii (pillion $1 i; (million 3)'
I!
I I, 11
I ( , I i/ Inland Ocean 1 8 - /I .- )>
'L .? .... 5 - 1"
i.387-.60 i; /I
; 15.8-16.0 G 'LL - I
t : .C ii
:I .3 ::, -" I: .. ., .-. I' : 8.2 ; lli 1; ,., .p 2. " ;. . tc . , - , I -* - . >
7.2 ,- ! . . < ..
I . . * , * .- 2. - 1.1 5.4-8.4 I! i ,.I
20.8-23.8 1:
!I
11 Estimates o f the size o f the inland fishery vary widely from 6,000-35,000 fish. Therefore the estfmted dollar value was calculated for both these estimates (derived from values in BISF, 40).

Striped Bass
Striped bass, Morone saxati 1 is, were successful ly introduced into the Estuary at Martinez w m l a n t i n g of about 140 fish from the Navesink River, New Jersey, on June 18, 1879. A second planting of 300 fish occurred in 1882 (BISF,58,2). The stock expanded quickly and before 1890 supported a commercial fishery that was terminated in 1935 due to a population decl ine (BISF,47,27). While an important recreational fishery continues to the present, recent decl ines have caused concern.
o Migration and Spawning
The striped bass is a warm water, anadromous fish. Most of its adult 1 ife is spent in San Francisco Bay and adjacent ocean areas (T,XLI ,67:1- 7). In the fall the adults migrate upstream and spend the winter in Suisun Bay and the western Delta. In spring the adults move farther upstream to spawn in the Sacramento River between Sacramento and Colusa and in the western and central Delta portion of the San Joaquin River between Antioch and Venice Island (T,XLI,67:1-16). Spawning typically occurs in the Delta from late Apri 1 through Ma and in the Sacramento River from mid-May to mid-June (T,XLI ,67:22-25 T . About one-half to two- thirds of the eggs that are spawned are produced in the Sacramento River, with the remainder in the Delta (T,XLI,67:20-22).
About 3 mm in diameter, striped bass eggs drift with the currents and hatch in two to three days (T,XLI,69:ll-13). The larvae first subsist on the remainder of their yolk sacs and oil droplets and continue to drift until they are about six mm in length, when they start feeding on zooplankton (copepods and cladocerans) (BISF ,47,35). They soon consume larger organisms , especially the opossum shrimp, Neomysis mercedis, which remains the dominant food organism through the first two years of life before the bass shift to larger food, including Bay shrimp and forage fish (T,XLI,70:1-8).
The majority of bass larvae tend to concentrate in the entrapment zone in Suisun Bay and the western Delta, although in very high flow years the entrapment zone and the larvae may be found farther down the Estuary (T,XLI,69:15-24). The lower San Joaquin River appears to be a less desirable nursery area than in former years. Higher larval mortalities here appear to be the cause for the decline of the Delta portion of the Striped Bass Index (SBI) (T,XLIII,30:17-23,31:11-15).
Striped bass represent a substantial resource throughout the Estuary, upstream on the Sacramento River, in coastal waters and in export canals and reservoirs (see Appendix Sections 4.0.9.3 and 4.0.9.5). From 1983 to 1985, sales of striped bass stamps (required by law for fishing ) averaged over 560,000 per year (NOAA ,1986). Annua 1 recreational catches of striped bass (excluding reservoirs and aqueducts) vary from 100,000 to 400,000 fish (T,XLI ,70: 17-18), and are taken mainly from private boats or along the shoreline. Charter boats take 10 to 15 percent of the catch (T,XLI,70:25-71:17). Apart from the fishery, striped bass are valuable in the food chain of the Estuary.

Their eggs and small larvae serve as food for other fish and invertebrates. Being principal predators in the river and estuarine food chains, larger bass contribute to the control of the size of forage fish populations.
American Shad
American shad, Alosa sapidissima, is a warm water, anadromous fish species. Shad =introduced to the Delta from the east coast in the late 1800s and within ten years a commercial gill net fishery developed. Over one mi 1 1 ion pounds (lbs) per year were regularly harvested. DFG estimated that in 1917, at an average weight of three Ibs per fish, almost two mi 1 1 ion shad were caught, representing about 5.8 million lbs (DFG,23,16). By the late 1940s the fishery declined, and by 1957 commercial fishing of shad ended when gi 1 1 nettin was prohibited to protect other fisheries (DFG,23,1; SWRCB,405,42 3 . Estimates from a 1976-1977 survey indicate a population of about three mil 1 ion American shad spawners (T,XXXIX,13:11-12; DFG,23,15). A popular shad sport fishery exists in the Sacramento, San Joaquin, American, Feather, and Yuba rivers and in the Delta. Surveys in the late 1970s indicate that between 35,000 and 55,000 angler days were spent in catching about 79,000 to 140,000 shad (DFG,23,1-2). No specific data on the value of the shad fishery are available. However, if shore fishing expenditures average about $31 per angler day (Thomson and Huppert, 1987), the total annual value ranges from $2.4 to $4.3 million.
The 1 ife history stages and habitat requirements of American shad are shown in Table A4-8. Adult shad spend three to five ears in the ocean K before they reach maturity (SWRCB,450,33) and enter t e lower Estuary in the fall; they migrate through the Delta from about March through May to upstream spawning grounds (T,XXXIX, 13:23-24), actively feeding on copepods and cladocerans, as we1 1 as Neomysis and Coro hium ,m, (DFG,23,12; SWRCB,433,100). Peak adult numbers occur in t e upper Delta in May (DFG,23,5).
Historical ly, spawning occurred throughout the tidal fresh water reaches of the San Joaquin and Sacramento rivers and upstream from about May through July. Today, the lower San Joaquin River no longer supports significant spawning activity (T,XXXIX, 14: 3-23). Spawning occurs primarily from May to June in the north Delta, the Sacramento River above Hood up to the Red Bluff diversion dam, and the major tributaries of the Sacramento River (DFG, 23,2-4; SWRCB,450,3-3; DFG,13,21; SWRCB,405,41).
After shad spawn, the fertilized eggs sink and drift with the current until hatching about 4 to 6 days later (SWRCB,405,41). When river flows are high, more shad eggs are carried further downstream and the im ortance of the Delta as rearing habitat increases (T,XXXIX,15:13- 15r. The major shad nursery areas are located in the Feather River below the mouth of the Yuba River, the lower American River, the Sacramento River from Colusa to Sacramento, and the north- Delta (DFG,23,8;T,XXXIX, 15:3-15:6). Shad nursery habitat is mostly upstream from striped bass nursery habitat (T,XXXIX,49:1-49:s) and overlaps with
\

TABLEA4-8 --American Shad Environmental Requirements and L i fe History Stages ( f ram DFG, 23;DFG, 13 ;SWRCB, 405;SWRCB, 433
L i f e Stage - - Location ---- Period Flow Water Qua l i ty Other ------------------
Adult from Pacif ic Ocean March-May low flows reduce temperature d i e t is Migration through Bay-Delta s i z e o f run i n 57-75O F -- Neomysis and
t o upstream freshwater t r i b u t a r i e s other zooplankton t r ibu ta r i e s
Spawning upper Sacramento River April-early higher flows increase 63-75' F spawn over to Red Bluff Diversion July . numbers spawning i n optimum = sand o r gravel Dam and major t r i b u t a r i e s , t r i b u t a r i e s 60-70' F North Delta, Mokelumne and
CI Old River. Formerly San Joaquin R.
? ri,
Egg lower Sacramento R. MayJuly higher flows Incubat ion below Colusa , Feather car ry more
and American Rivers, eggs i n t o Delta Delta
Rear in g same a s above
Juvenile Delta-Estuar y Emigration t o Bay o r
Pacif ic Ocean
June-Sept more juveniles produced when flows a r e h i gher
l a t e June- December
feed on t e r r e s t r i a l
insec ts , zooplankton
d i e t is ---- Neomysis, Corophium_, l a rva l f i s h , copepods

Chinook salmon rearing areas. In rearing areas upstream from the Delta, young shad concentrate near the water surface, feeding on terrestrial insects that drop into the water from riparian vegetation (SWRCB,433,101). From about June through August in the Delta, young shad feed on zooplankton before emigrating as juveniles during September to December (DFG,23,11; SWRCB,450,3-3). Most shad emigrate by the end of their first year (DFG,23,10). However, some may remain in San Francisco, San Pablo, and Suisun bays and Suisun Marsh for a second year or may not emigrate to the ocean at all (DFG,23,10-11). According to DFG relatively few yearling shad use the Suisun Marsh channels (T,XXXIX,46:1-5).
Other Resident and Anadromous Fish
There are over 30 species of resident, warm water fishes in the Estuary (DFG,24,2), more than half of which were introduced. Most resident fish are members of one of three families: Centrarchidae, sunfish; Cyprinidae, minnows; and Ictaluridae, catfish.
o Background
These families support popular recreational fisheries in the Delta, where white catfish, Ictalurus catus, are the most commonly caught resident game fish, fol lowed b y m e m o u t h bass, Micro terus salmoides, and then other sunfish. Statewide, sunfish, catfish -%T an argemouth bass are the second, third, and fourth most commonly caught game fish (DFG, 24,5). Non-game resident fish are important components in the estuarine food web both as predators and prey (DFG,24,6). An important introduced forage species, the threadf in shad, Dorosoma etenense, is consumed by striped bass, largemouth bass and other sunf * is (SWRCB,450,3-10). Table A4-9 lists the resident species of the Estuary. Only fish of specific interest or concern are discussed below.
o Catfish
Of the four species of introduced catfish (see Table A4-9), the white catfish, by far the most numerous (DFG,24,4), supports a significant recreational fishery. In the southern Delta where EC and turbidity were greater, white catfish were the most numerous resident fish species (DFG,24,28).
o Other Anadromous Species
Several other native, anadromous fish use the Delta as a migration corridor and nursery habitat. They are the green sturgeon, Acipenser medirostris; the white sturgeon, Acipenser transmontanus: and the steelhead rainbow trout, Oncorh nchus m y k i s m a l m o gairdneri airdneri ) (SWRCB , 4 0 5 . 3 8 ) - A . Other than information
in SWRCB exhibits, no testimony or recommendations were made in Phase I of the proceedings regarding these species' uses of the Delta.
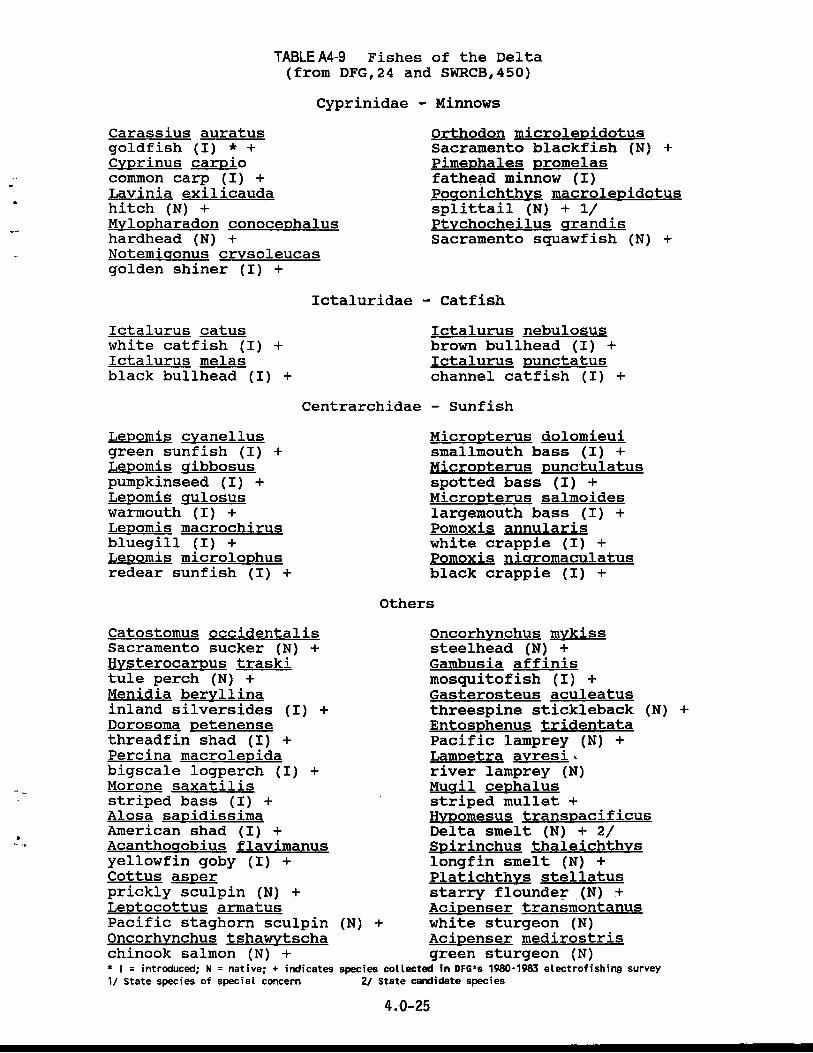
TABLEA4-9 Fishes of the Delta (from DFG,24 and SWRCB,450)
Cyprinidae - Minnows Carassius auratus goldfish (I) * + Cvprinus carpio common carp (I) + Lavinia exilicauda hitch (N) + Mvlosharadon conoce~halus hardhead (N) + Notemiuonus crysoleucas golden shiner (I) +
Orthodon microle~idotus Sacramento blackfish (N) + Pime~hales sromelas fathead minnow (I) Pouonichthvs macrole~idotus splittail (N) + 1/ Ptvchocheilus urandis Sacramento squawfish (N) +
Ictaluridae - Catfish Ictalurus catus white catfish (I) + Ictalurus melas black bullhead (I) +
Lesomis cyanellus green sunfish (I) + Lesomis uibbosus pumpkinseed (I) + Lesomis aulosus warmouth (I) + Lesomis macrochirus bluegill (I) + Lesomis microloshus redear sunfish (I) +
Ictalurus nebulosus brown bullhead (I) + Ictalurus sunctatus channel catfish (I) +
Centrarchidae - Sunfish Microsterus dolomieui smallmouth bass (I) + Microsterus sunctulatus spotted bass (I) + Microsterus salmoides Sargemouth bass (I) + Pomoxis annularis white crappie (I) + Pomoxis nisromaculatus black crappie (I) +
Others
Catostomus occidentalis Oncorhvnchus mvkiss Sacramento sucker (N) + steelhead (N) + Hvsterocamus traski Gambusia affinis tule perch (N) + mosquitofish (I) + Menidia bervllina Gasterosteus aculeatus inland silversides (I) + threespine stickleback (N) + Dorosoma setenense Entos~henus tridentata threadfin shad (I) + Pacific lamprey (N) + Percina macrolesida Lamsetra avresi a
bigscale logperch (I) + river lamprey (N) Morone saxatilis Muuil ce~halus striped bass (I) + striped mullet + Alosa saPidissima Hmomesus trans~acificus American shad (I) + Delta smelt (N) + 2/ Acanthoaobius flavimanus Ssirinchus thaleichthvs yellowfin goby (I) + longfin smelt (N) + Cottus asser Platichthvs stellatus prickly sculpin (N) + starry flounder (N) + Lestocottus armatus Acisenser transmontanus Pacific staghorn sculpin (N) + white sturgeon (N) Oncorhvnchus tshawvtscha Acisenser medirostris chinook salmon (N) + green sturgeon (N) * I = introdwed; N = native; + indicates species collected in DFG1s 1980-1983 electrofishing survey 1/ State species of special concern 2/ State candidate species

An intense commercial sturgeon fishery existed in the 1 8 0 0 ~ ~ but was closed in 1901 after the catch plummeted. The fishery reopened in 1910, was closed in 1917, and in 1954 reopened for recreational purposes only (SWRCB ,430,453). Angl ing is popular in the Sacramento River up to Colusa, in the Delta (SWRCB,405,35-36), and in the bays. Sturgeon are taken in San Francisco Ba where they congregate to feed during the herring runs (SWRCB,430,454 y . Party boats reportedly harvested 2,400 sturgeon in 1967. There is no information on the recent magnitude of the fishery.
Adult steelhead migrate upstream from the ocean during the spring through fa1 1. Spawning occurs from December through April in tributaries above the Delta. Like salmon, steelhead return home to their natal stream; unlike salmon, not all adults die after spawning. Steelhead are known to have spawned up to four or more times (SWRCB, 405,60; SWRCB ,450,5-7). There are several seasonal runs of steel head migrating through the Delta (SWRCB,405,59-60; SWRCB,450,5-6). The size of the recreational fishery for steelhead adults and juveniles is unknown.
o Species of Concern
The Sacramento splittail, Po onichth s macrolepidotus, is one of two species of special concern w ecause its m s restricted to the Bay-Delta Estuary and it has recently declined in abundance (USFWS,35,1). The other, the Delta smelt, Hypomesus transpacif icus, once abundant in Suisun Marsh and the Delta, has under one a precipitous decline since the early 1970s (usFWS,~~,~~!. Both fish have been recommended as candidate species by the USFWS to be studied to determine whether they should be added to the federal Endangered and Threatened 1 ist ( U S F W S , ~ ~ , 11)~.
The splittail is a cate ory 2 candidate and the Delta smelt is a category 1 candidate. 9 A category 1 species is one for which the USFWS has substantial information to support a proposal for listing as endangered or threatened. A category 2 species is one for which information available indicates that a proposal for listing is possibly appropriate but that the data available are not conclusive.)
A petition was submitted June 9, 1989 to the Fish and Game Commission to list the Delta smelt as an endangered species under the California Endangered Species Act. On August 29, 1989, the Commission accepted the petition and for one year the Delta smelt was a candidate species. During this time DFG staff reviewed the pertinent data and recommended that the species be listed as threatened. The Fish and Game Commission on August 31, 1990 decided that there was insufficient evidence to 1 ist the species at all and that further studies on the species should be .- conducted. The Delta smelt remains a species of Special Concern. ..
L ist ing refers to a process established under state and federal Endangered Species Act by which Native species are identified. Those I isted are determined to be in imnedfate jeopardy of extinction ("endangered") or to be ..? present in such small numbers throughout their range that they may become endangered i f their present environment worsens (rare plant or threatened species) (Ca 1 ifornia Fish and Game Code Sect ions, 7 , and 2068; 16 USC Sect ion 1531 e t seq. )
2/ Section 670.1, T i t le 14, CCR and Sections 2072 and 2072 and 2072.3 of the Fish and Game Code.

The USFWS was petitioned by the Cal ifornia-Nevada Chapter of the American Fisheries Society on June 26, 1990 to list the Delta smelt as an endangered species under the federal Endangered Species Act. A USFWS administrative finding on the petition request stated that substantial information was presented such that 1 isting may be warranted. This initiates a one year review period, from the date of receipt of the petition (6/29/90), in which the USFWS will gather information on which to make a determination on whether to list the Delta smelt. Until this determination is made, its status remains a category 1 candidate species.
The informat ion on resident freshwater species and other anadromous fish presented in the Phase I hearing was mostly descriptive. No quantitative data were presented on the relationship between population abundance, distribution and sal inity regimes.
Subsequent investigations have revealed that the Delta smelt inhabit the open surface water of the Delta and Suisun Bay and live about one year. The adult Delta smelt spawn in freshwater between the months of December and April (Moyle, 1976) and most apparently die after spawning. The buoyant larvae are washed downstream until they reach the entrapment zone, where the currents keep them suspended and circulating with the zooplankton, which is their food. During the larval stage, from approximately April through June, the smelt are not yet of sufficient size to be efficient swimmers and effectively pursue their prey. Therefore, a high density of prey items in suitable habitat offers an advantageous environment for rearing (Moyle, pers. comm., 10189). The smelt grow rapidly and within six to nine months reach adult length. In the next three months the smelt become sexually mature and move up into the freshwater to spawn. All sizes are found primarily in the main channels of the Delta and Suisun Marsh, and the open water of Suisun Bay (Moyle, 1989). Delta smelt, most of the year, are found in water of less than 2 ppt TDS (2.9 mmhos/cm EC) and occasional1 are found in water up to 10 to 12 ppt TDS (14.6 to 17.5 mmhoslcm ECf (Moyle, 1989). Spawning occurs in freshwater when the water temperatures are between 7 and 15°C (44.6 to 59°F) (Wang, 1986).
4.0.5.2 Bay Habitat
Suisun, San Pablo, San Francisco and south San Francisco (South) bays are considered here. Since, for this Plan, Suisun Bay is considered to be part of the Bay, it is included here for purposes of discussion.
Fishery Habitat Protection (Entrapment Zone)
As in the freshwater portions of the Estuary, phytoplankton and zooplankton form important parts of the food chain in the more saline portions of the Estuary. Many fish rely upon the presence of copepods and cladocerans, e.g., Neom sis, Coro hium, and La uno ammarus. These zooplankton in turn fee A--% upon etritus an upon *the phytop an ton, primary producers. Maximum phytoplankton product ion for this Estuary appears to occur when outgoing freshwater and incoming ocean water mix at approximately the upstream end of Suisun Bay (USBR,lll,B; USBR, 112,53-70). The area just downstream of this location, known as the entrapment zone, is a concentration site for certain diatoms, detritus, Neomysis and other zooplankton (USBR, 111,27).

The Sui sun Bay normal ly receives enough annual fluctuation in sal inity that neither marine nor freshwater filter-feeding benthic organisms could establ ish themselves and survive indefinitely (Nichols, 1985). However, the recently introduced benthic clam, Potamocorbula, a pears to be much more euryhaline (tolerant of wide ranges in salinity 7 , and so has been able to survive throughout the Bay. It has even penetrated upstream in the Delta as far as Rio Vista (Jan Thompson, USGS, personal communication, 1/90).
In addition to the Suisun Bay entrapment zone, a proposal was made to develop a second entrapment zone in San Pablo Bay. This second entrapment zone (or at least an area with stratified flow with a strong horizontal sal inity gradient) is proposed to provide additional phytoplankton production (CCCWA/EDF, 3,23).
Finally, regarding phytoplankton, a roposal was made to enhance their production in South Bay (CCCWA/EDF,4!. Research has shown that the clam Macoma balthica tended to show growth rate increases consistent with microalgae availability, including phytoplankton (T,LI,181:20- 182: 15).
Benthic Invertebrates
"The benthos' is the community of invertebrate animals (worms, clams, shrimp, etc.) living on the bottom of aquatic environments. These animals consume organic matter that grows on, or settles to the bottom and in turn become food for fish and other consumers including humans" (TIBCEN, 23,65). Benthic invertebrates in the Estuary tolerate a range of salinities; some prefer different flows and salinities at different life stages (DFG,59,14). There are species requiring only freshwater, species requiring a combination of salt and freshwater, and those surviving only in saltwater. For example, some specigs prefer fresher water during early life stages and as juveniles are found in the upper reaches of the estuary, whereas adults prefer higher sal inities and occupy the Bay (DFG,59,22). Adult shrimp occupy bottom areas in their preferred habitat, whi le shrimp larvae are found in less sal ine surface layers. These behavioral differences, combined with the effects of the two-layered flow in the Bay, result in different distributional patterns of young and old shrimp (USBR,110,15). For example, Cran on % spp. shrimp breed in the Bay, produce planktonic larvae which may e carried into the ocean near shore by surface water, drop down as benthic post-larvae and re-enter the estuary carried by gravitational circulation (DFG,59,23).
The fol lowing benthic organisms found in the Estuary are part of the food chain which supports popular sport or commercial fisheries and wintering waterfowl :
o mollusks, including clams (Macoma balthica, & arenaria, Tapes japonica, Gemma gemma Corbicula s ' m s s e l s Isc a ium demi ssum, M ti Ius edul i m r s (Ostrea l u r i d a a i Is pizzaus--
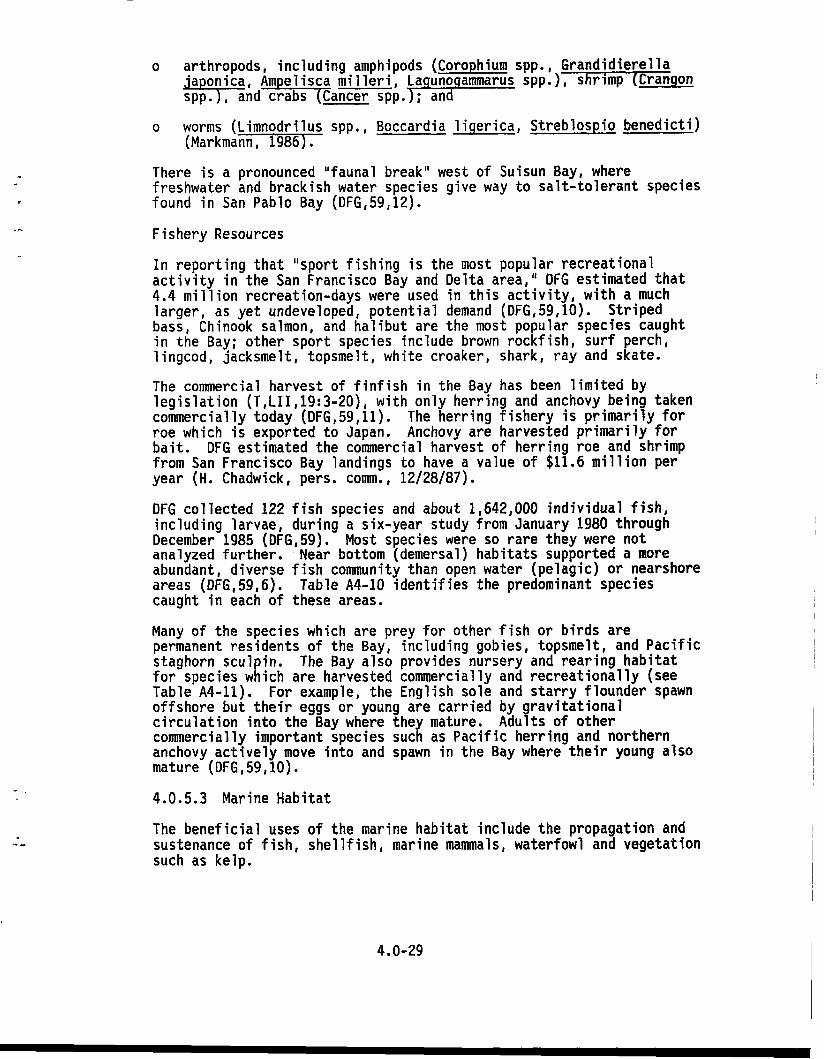
o arthropods, including amphipods (Corophium spp., Grandidierella 'a onica, Am elisca mi 1 leri, La uno ammarus spp. ), shrimp (Crangon i*nd+ancer spp . I+
o worms (Limnodri lus spp., Boccardia 1 igerica, Streblospio benedicti) (Markmann , 1986).
There is a pronounced "faunal break" west of Suisun Bay, where freshwater and brackish water species give way to salt-tolerant species found in San Pablo Bay (DFG,59,12).
F i shery Resources
In reporting that "sport fishing is the most popular recreational activity in the San Francisco Bay and Delta area," DFG estimated that 4.4 million recreation-days were used in this activity, with a much larger, as yet undeveloped, potential demand (DFG,59,10). Striped bass, Chinook salmon, and halibut are the most popular species caught in the Bay; other sport species include brown rockfish, surf perch, 1 ingcod, jacksmelt, topsmelt, white croaker, shark, ray and skate.
The commercial harvest of finfish in the Bay has been limited by legislation (T,LII ,19:3-20), with only herring and anchovy being taken commercially today (DFG,59,11). The herring fishery is primarily for roe which is exported to Japan. Anchovy are harvested primarily for bait. DFG estimated the commercial harvest of herring roe and shrimp from San Francisco Bay landings to have a value of $11.6 million per year (H. Chadwick, pers. comm., 12/28/87).
DFG collected 122 fish species and about 1,642,000 individual fish, including larvae, during a six-year study from January 1980 through December 1985 (DFG,59). Most species were so rare they were not analyzed further. Near bottom (demersal ) habitats supported a more abundant, diverse fish community than open water (pelagic) or nearshore areas (DFG, 59,6). Table A4-10 identifies the predominant species caught in each of these areas.
Many of the species which are prey for other fish or birds are permanent residents of the Bay, including gobies, topsmelt, and Pacific staghorn sculpin. The Bay also provides nursery and rearing habitat for species which are harvested commercial ly and recreational ly (see Table A4-11). For example, the English sole and starry flounder spawn offshore but their eggs or young are carried by gravitational circulation into the Bay where they mature. Adults of other commercially important species such as Pacific herring and northern anchovy actively move into and spawn in the Bay where their young also mature (DFG, 59,lO).
4.0.5.3 Marine Habitat
The beneficial uses of the marine habitat include the propagation and sustenance of fish, shellfish, marine mammals, waterfowl and vegetation such as kelp.

TABLE A4-10
Most common Bay fish collected from dernersal, pelagic and nearshore areas by DFG, 1980-1986 (From: DFG, 59,6)
SHORE HABITAT PELAGIC HABITAT DEMERSAL HABITAT .-c
Atherino~s affini~ topsmelt
Enaraulis mordax Spirlnchus thaleichthvq Northern anchovy longfin smelt
Clupea harenaus ~allasi Spirinchus thaleichthvg Enaraulis mordax Pacific herring longfin smelt Northern anchovy
Enaraulis mordax Northern anchovy
Clupea harenaus ~allasj Pacific herring
Atherinopsis californiensis Morone saxatilis jacksmelt striped bass
Morone saxatili~ striped bass
Pacific staghorn sculpin
Menidia bervllina, tidewater silverside
Clevelandia ios arrow goby
Cvmatoaaster aaareaatq shiner perch
Micrometrus minimus dwarf perch
Acanfhoaoblusflavlmaous yellowfin goby
Morone saxatilis striped bass
shiner perch
Parophws vetulug English sole
Genvonemus llneatus whlte croaker
Leptocottus arrnatua Pacific staghorn sculpin
CRharichthvs stlamaeu~ speckled sanddab
Acanthoaobius flavlmanus yellowfln goby
Platlchthvs stellatus starry flounder
Clupea harenaus ~allasl Paclfic herring

TABLE A4-11 Life history and descriptive information for the most abundant species of fish collected. (DFG,59)
N = native, I = introduced, E = estuarine, M = marine, SSFB = South San Francisco Bay, CSFB = Central San Francisco Bay, SPB = San Pablo Bay, S B = Suisun Bay, P = plankton, B = benthos, F = fish
r
spec'es origin
N
N
N
N
N
N
N
I
N
N
N
N
N
Species
Pacific herring
Longfin smelt
Pac. staghorr scuipin
Starry flounder
Speckled sanddab
English sole
California tongueflsh
Yellowfln goby
Arrow goby
Bay goby
Topsmelt
Jacksmeit
Northern anchovy
Spec'es type
M
E
E
E
M
fd
M
E
M
Y
M
M
M
Preferred habitat
Pelagic
Pelagic
Demersal
Demersal
Demersal
Demersal
Demersal
Demersal
Demersal
Demetsal
UttoraU Pelagic
Pelagic
Pelagic
Spawning ti,
Fall - Wlnter
Winter
Winter
Winter
All Year
Winter
Summer Fall
Winter
Spring - Summer
Summer - Fall
Summer
Spring - Summer
Spring - Summer
Center of population
Ocean
SPB
CSFB - SPB
Ocean Bay
Ocean
Ocean
Ocean
SPB- SB
SSFB SPB
CSFB
SSFB
Ocean
Ocean
Importance of species
Commercial Forage
Forage
Forage
Commercial Recreation
Forage
Commercial
Forage
Forage Commercial
Forage
Forage
Forage
Recreation Forage
Commercial Forage
use of
Nursery Spawning
Nursery Residence
Residence
Nursery Residence
Nursery
Nursery
Nursery
Residence
Residence
Residence
Residence
Nursery SpaMng
Spawning Nursety
Life history
Spawning locatlon
Bay
Rivers
Bay
Ocean
Ocean
Ocean
Ocean
Bay
Bay
Bay
Bay
Bay = Ocean
Ocean
kresry area
SSFB SPB
SPB
Bay
SB- Delta
Ocean - CSFB
Ocean - Bay
Ocean - CSFB
SB - Delta
SSFB SPB
SSFB . SPB
SSFB - CSFB
SSFB - CSFB
Ocean
Ufe stage food
P
P
F,B
B
B
B
B
B
B
B
B
F
P
major source
~weniie'
P
P
B
B
B
B
B
B
B
B >
B
P
P

The protection of marine habitat in many cases will be accomplished by measures to protect wi ldl ife habitat. Some marine habitats may require special protection. Water quality requirements for some individual marine species are not we1 1 known (RWQCB 2, 1986).
4.0.6 Wetlands Habitat
Wetlands are those areas that are inundated or saturated by surface or groundwater that under normal circumstances support a prevalence of vegetation adapted for 1 ife in saturated soi 1s. Wetlands include marshes, swamps, and riparian areas. Wildlife habitat is the most significant actual and potential beneficial use of wetlands (RWQCB 2, 1986) . 4.0.6.1 Delta
The Delta area totals about 738,000 acres, including about 515,000 acres in agriculture; about 50,000 surf ace acres of meandering channels; 7,000 acres of shrub-brush and woodland riparian habitat; 7,000 acres of freshwater marsh and about 32,000 acres of urban habitat (DFG,6,1). Freshwater marsh and riparian habitat support the greatest diversity of plant and animal species (DFG,6,4). The Delta currently supports from 450,000 to 600,000 migratory waterfowl during the winter, with thousands of shorebirds and wadin birds making use of the shallows of seasonally flooded fields 9 DFG,6,6). Over 230 species of birds and 43 species of mammals occur in the Delta (DFG,6,1). There are also 15 reptile species and eight amphibian species reported or thought to occur in the Delta (Delta Wildlife Habitat Protection and Restoration Plan, DFG & USFWS, 1986).
Migratory waterfowl in particular use spilled and unharvested corn and other grain crops, especially when Delta islands are a1 lowed to be ponded or flooded for leaching. purposes (DFG,6,4). Sandhi 1 1 cranes now depend on wet or flooded pasture and cultivated grains (DFG,6,4&7). The peregrine falcons depend upon waterfowl for a major part of their diet (USFWS, 17,2).
4 .O. 6.2 Rare, Threatened and Endangered Species
In the Delta many of the following animals are so uncommon they have been identified on official 1 ists of rare, threatened or endangered species by wildlife agencies. Seven bird species are listed by either the state or federal government as threatened or endangered. Two more bird species are candidates for federal 1 isting (DFG,6,3; USFWS, 19, 20,21), The giant garter snake is a state-listed threatened species as well as a candidate for federal listing as either threatened or endangered (DFG,6,3; USFWS ,22). Two mammals, the riparian brush rabbit and the riparian woodrat, are candidates for federal listing as threatened or endangered; three invertebrates also are federal ly 1 isted as threatened or endangered and thirteen plants are 1 isted by federal and/or state agencies as rare, threatened or endangered (DFG, 6,3).

In Suisun Marsh, several sensitive11 plant species have been identified (CNPS, 3). These are the soft bird' s-beak (Cordylanthus mollis mollis), Mason's lilaeopsis (also known as the mud squill, m p s i s s o n i i ) , Delta tule pea (Lath rus jepsonii 'e sonii), and Suisun a s t e v r chilensis var. le&The soft bir % Is- eak and Mason's 1 i laeopsis are 1 isted by t h e e as "rare" and by the federal government as "candidate" species. The Delta tule pea, the Suisun slough thistle (Cirsium hydrophilum var. h dro hilum) and the Suisun aster are also federal candidate species. -57 CNPS as testified that the California hibiscus (Hibiscus californicus) is a sensitive species even though it is not state or federally listed.
There are also several animal species in the Marsh that have been designated by the USFWS or the DFG as threatened or endangered. These are the salt marsh harvest mouse (Reithrodontomys raviventris) , the California clapper rai 1 (Ral lus longirostris obsoletus), the California black rai 1 (Lateral lus j a m s i s coturniculus),the winter-run Chinook s a l m m nchus tschawytscha). The salt marsh harvest mouse and the Ca + ifornia clapper rail are listed as "endangered" by both the State of California and the federal government. The California black rail is listed as "threatened" by the State of Cal ifornia and is a federal candidate species. The winter-run Chinook salmon is listed as "threatened" by the federal government and "endangered" by the state (USFWS, 17; T,XXIX, 112:24-112: 15; T,XXX,5:4- 11; List of State and Federal Endangered and Threatened Animals in Cal ifornia, DFG, Revised Apri 1 1989; Notice of Findings of Sacramento River Winter-Run King Salmon, California Fish and Game Commissio-n, May 22, 1989).
The USFWS is reviewing a petition to list the Suisun song sparrow (Melospiza melodia maxi 1 laris) as endangered or threatened (USFWS, pers. comm.',). The salt marsh common ye1 low throat (a bird)
trichas sinuosa) and the Suisun ornate shrew (Sorex ornatus candidate species (memo from DFG to m, June
The endangered salt marsh harvest mouse and the California clapper rail are also found in the tidal marshes around San Pablo Bay (USFWS,17,1; USFWS, 18; USFWS, 19; DFG,7,7; T,XXX,5:12-15). Both species are dependent upon dense cover composed of pickleweed and a1 1 ied plant species; adjacent, higher elevation escape cover for refuge from high water is needed (DFG,7,7; DFG,7,11-12). Any expanded areas of cordgrass and pickleweed which may occur if soi 1 sal ini ties increase, however, will not necessarily be useful to these endangered species because the areas with adequate escape cover are limited. The black rai 1 , a state-1 isted threatened species and a federal candidate species, is also found in the San Pablo Bay marshes (DFG,7,7,12; USFWS,16,4; USFWS,21). The Delta tule pea, Mason's lilaeopsis, and the soft bird's-beak are also found in the marshes of north San Pablo Bay (DFG,7,13; T,XXIX,144:25-145:l).
11 As used in this chapter, "sensitive p lants" includes stat& 1 isted "rare* and federa 1 "candidate" species.
4.0-33

In San Francisco Bay, a variety of species of wildlife listed as threatened or endangered by state or federal wi ldl ife agencies depend on Bay habitats for all or part of the year. Salt marsh harvest mice, California clapper rai 1, black rail, California brown pelican, and California least tern are 1 isted (DFG,7,13). In Bay marshes, both soft bird's-beak and Mason's 1 i laeopsis occur near the upper reaches of the Bay.
4,.0.6.3 Suisun Marsh
Suisun Marsh, with an area of 116,000 acres, including about 88,000 acres below the f ive-foot contour, is the largest contiguous brackish water marsh in the United States (T,XXIX,lZ;DFG,5,1). The major habitat types are managed marshes that are subject to control led inundation and drainage (generally for the enhancement of waterfowl habitat) and tidal marshes that are influenced by the water regime in the channels. There are also substantial areas of habitat consisting mostly of annual grasses and weedy growth, cropland and open ground. Between 54,000 acres (T,XXX, 110:AA4-5) and 57,000 acres (DFG, 5,3) are marshland, of which approximately 10,000 acres are tidal marsh (T,XXX,49:21,110:5). Estimates differ, depending on the definitions used and the areas examined, as to what proportion of the marsh acreage is managed and what is tidally influenced. By all estimates, most (80 to 90 percent) of the marshland is managed for plant species considered beneficial to wintering waterfowl (DFG,5,6).
The principal waterfowl using Suisun Marsh in winter are pintail, ma1 1 ard , shoveler, widgeon and green-winged teal. Ma1 lard, gadwall, and cinnamon teal breed here. The plants which are preferred food items for wintering waterfowl are alkali bulrush, brass buttons, and fat-hen (DFG, 5,9). During the remainder of the year, invertebrates are important food for pre-nest ing females and broods of duck1 ings (DFG,5,13).
4.0.6.4 Other Tidal Marshes
San Francisco Bay's tidal marshes, ranging from fresh to salt water habitats, include 53 square miles of tidal marsh, 15 square miles of diked marsh and 55 square miles of diked ponds (DFG,7,1). Large areas of tidal wetland occur on the northeast shore of San Pablo Bay, specifically Tubbs Island, Napa and Petaluma Marsh. Diked marshes, ponds and mudf lats are extensive in the South Bay (DFG,7,1).
Bay area wetlands and aquatic habitats support over half of the Pacific flyway s wintering population of such waterfowl as canvasback ducks and are very important .for scaup, scoters and redhead ducks. Aquatic habitat and aquatic invertebrates are important in their contribution to the food supply of higher forms of Bay wildlife. One of the most important food items for canvasback ducks is the clam Macoma balthica; two other mol lusks, arenaria and Musculus senhousia, are extensively eaten. These mollusks are also food for clapper rails, as are a variety of other invertebrates (DFG, 7,9).

Although many Bay tidal marshes are relatively isolated from the Delta outflow of low sal inity water, the nearby Bay waters are affected by stratification, gravitational circulation, and flushing induced by outflow. To the degree that mollusk and fish species and aquatic habitat productivity changes in the Bay, the value of the adjacent marshes and beaches for sensitive wildlife, such as rails, terns, and pelicans, may change (DFG,7,10-12).
4.0.7 Estuary Recreation Beneficial Use
The waters of the Estuary are used for water contact recreation, including swimming, boating, fishing, hunting, water skiing, and houseboating. The waters are also used for competitive events, marine parades and emerging activities, such as boardsai 1 ing and jetski ing (EBRPD, 1-33). There are also a variety of water-oriented, non-contact activities such as sightseeing, bird watching and beachcombing, all of which depend on the esthetic or visual qua1 ity of the Estuary's waters to some degree (EBRPD, 1-33).
4.0.7.1 Sacramento-San Joaquin Delta and Tributaries
Evidence was provided which projected user days and economic values for freshwater recreation in the Delta as compared to similar types of recreation at storage and export reservoirs and faci 1 it ies (SWC, 65,24). Freshwater-oriented recreation in the Delta was estimated to be 8.3 million user days in 1977-78, although this number includes some activities which do not depend entirely on the Delta's waters. Brackish water, ocean and estuary activities were not included in the total (SWC,66,5). Testimony and evidence were also provided which indicated that recreation visits to Estuary shorel ine park faci l ities have been growing rapidly compared to the projections used by SWC, i.e., 122 percent in two years compared to 0.8 percent/year (T,LV,160:17-161:l; EBRPD,24,T1). Millions of user days and daily values of $20 or more per user for water use are calculated for each recreational user of Estuary water (BISF, 38 ,T4). An extrapolat ion of old studies of Delta recreation has generated estimates in the range of 13 mi 1 1 ion recreation-days annually (PICYA,2,51). Testimony by SWC suggested that these estimates were high and should be reduced to 6.95 mi 1 1 ion. No current information based on recreation use studies during this decade is available (T,LV,137:13-16).
4.0.7.2 Suisun Marsh and Carquinez Strait Area
Some evidence was submitted on the recreational use of the Suisun Marsh or Carquinez Strait area of the Bay-Delta Estuary. BAAC submitted evidence inferring that bird watching goes on in the Suisun Marsh (BAAC, 20;26;27). From evidence submitted by EBRPD, estimated recreation at its Contra Costa shorel ine faci 1 ities (Antioch and Martinez shoreline) increased greatly between 1981 and 1987, growing from 84,000 visitors to 287,000 visitors, or about 340 percent in six years (EBRPD,34,Tl). Although there is little evidence linking the number of visitors in this reach to water quality, both BAAC and EBRPD expressed concern that visitors to these recreational areas would experience losses of the value they place on wildlife and fish resources, which might be harmed if flow decreased and salinity increased (T,XXX,45:12-23; T,LV, 184: 15-25,185:l-2).

The recreational use of EBRPD units with water quality problems Point Isabel and San Leandro Bay, increased from 71,000 users in 1981 to 487,000 users in 1987, an increase of over 680 percent (EBRPD, 34,Tl). This occurred despite serious heavy metal contamination at these beaches. In comparison, the use of the nearby, unpolluted Hayward and Mi 1 ler-Knox shorelines has grown from 21,000 users in 1981 to 196,000 in 1987, an increase of 930 percent. There was no specific information on the features which prompt users to attend the various park units, nor on the method by which use estimates were made. Moreover, it is noteworthy that users did not avoid contaminated sites, and it does not seem reasonable to suppose that a moderate change (of one or two parts per thousand) in salinity would substantially change future recreational use. This might not be true if the change were such as to convert a freshwater beach to saltwater; however, no data are in the record on this subject.
4.0.7.3 San Francisco Bay Basin
The Basin Plan for Region 2, the San Francisco Bay Basin, identifies most of the same forms of recreation as the Delta. Recreational uses are also identified for the Pacific Ocean and the San Francisco Bay system and a1 1 other surface waters (RWQCB 2, 1986). Water-oriented recreation in the San Francisco Bay area was estimated to total over 127 mi 1 1 ion user-days (BISF138,T3).
4.0.8 Other Beneficial Uses
4.0.8.1 Navigation
Navigation in the Estuary includes commercial, naval, and recreational activities. There are seven major ports in the Estuary (San Francisco, Oakland, Alameda, Redwood City, Richmond, Stockton, and Sacramento), serving more than 5,000 ships annually (NOAA, 1986,8); there are also numerous oi 1 transfer terminals located between Richmond and Suisun Bay. In 1984, imports at the Estuary's seven major ports were worth $10,419,000, while exports were worth $6,295,000 (NOAA, 1986). Six mill ion tons of cargo have been transported annually in the Stockton and Sacramento deep-water ship channels (DWR, 1987). In 1985 there were 143,646 recreational boats registered in the nine counties surrounding San Francisco Bay (NOAA, 1986), and about 82,000 pleasure boats were registered in the Delta area (DWR, 1987). These Delta area boaters are served by more than 8,500 berths, 119 docks and 27 launching facilities (DWR, 1987).
4.0.8.2 Dilution of Pollutants
Freshwater flows to dilute pollutants in the Estuary and upstream was a subject of considerable testimony during Phase I. Under both the Porter-Colo ne Act (Sect ion 13050(f ) ) and EPA Regulations CFR13l.l0(a 3 ), neither waste disposal or transport nor waste
(40
assimilation can be designated as beneficial uses. This does not, however, preclude the State Board from addressing any act ion(s) which may have curtailed the natural assimilative capacity of the Estuary.

4.0.9 Uses of Water Exported From the Bay-Del ta Estuary
The following sections address water use in the areas of export, that is, the areas defined for purposes of this Plan as being outside the legal boundary of, and receiving water diverted from, the Bay-Delta Estuary.
4.0.9.1 Municipal and Industrial Uses
Most of California's population lives in semi-arid areas where population and industrial expansion have exceeded the abi 1 ity of many communities to meet their water needs with local sources. Local as well as distant communities have seen the Estuary's waters as a means to meet their needs.
Municipal and Industrial (M&I) water exports to local areas outside the Estuary began in 1929 when EBMUD initiated the first export of Delta suppl ies by diverting Mokelumne River water through its Mokelumne Aqueduct to Alameda and Contra Costa counties. In 1934 San Francisco began diverting water from the Tuolumne River through the Hetch-Hetchy Project for use in San Francisco, San Mateo, and Alameda counties. In 1940 the Contra Costa Canal (CCC), the first unit of the CVP, was completed and began supplying water to the Ant ioch-P i ttsburg area. The City of Val lejo began importing Delta surface water from Cache Slough in 1953. USBR began diverting Putah Creek water via the Putah South Canal to Fairf ield and Benicia in 1957. In 1965 the South Bay Aqueduct of the SWP began exporting an interim supply of Delta water from the Delta-Mendota Canal (DMC) to Alameda and Santa Clara counties. The North Bay Aqueduct Phase I1 faci 1 ities of the SWP divert Delta waters from Barker Slough tributary to Lindsey and Cache sloughs, and connect to the Phase I facilities just west of Cordelia to deliver water to Solano and Napa counties (DWR,207,1-7).
The first exports to distant municipalities began in 1968 when the federal CVP began exporting water to Coal inga, Huron and Avenal through the DMC and San Luis Canal (DWR,204,1). In 1971 the SWP's California Aqueduct began exporting water to southern Cal ifornia through the Edmondston Pumping Plant over the Tehachapi Mountains (DWR,207,1-7).
CVP M&I deliveries in 1986 were estimated 381,204 AF with a projected delivery in the year 2010 of 936,072 AF (Table A4-12) (USBR, 1987). In 1985, SWP M&I deliveries were approximately 1,008,000 AF (Table A4-13) (DWR,461 ,I). No estimate of SWP projected deliveries to southern California for M&I use was presented. Table A4-14 1 ists state and federal water transfer f aci 1 it ies and the areas each serve.
Popu 1 at ion and economic project ions indicate growing M&I water demands. The Department of Finance has estimated that the state population wi 1 1 increase from 27,000,000 people in 1986 to 36,280,000 people in 2010 (DOF, 1987). Of this, the population of the six most populated counties in southern Cal ifornia--Ventura, Los Angeles , Orange, Riverside, San Bernardino, and San Diego--are expected to increase from a 1986 level of 15,290,000 people to 20,220,000 in 2010 (SWC,6,7). The expected additional M&I demand for Bay-Delta water supply is a result both of the loss or degradation of a1 ternative water supplies and of increases in population (SWC,4,6).

TABLE A4-12 MUNICIPAL AND INDUSTRIAL WATER CONTRACTS
CENTRAL VALLEY PROJECT (acre-feet)
Folsom Prison dl
a/ Quantity is a contract maximum or is projected MBI use within a cornbination M&i/agricultural water service contract. hl Deliveries may include water transferred from other contrators or purchased under provisions of the contract and may therefore be higher than contract maximum c l Includes Solano FCWCD and Napa Co. FCWCD of Solano Project dl Conlract includes watel lights; no payment is made to the United States for water rights water. 01 PIHSOII~ use includes City of Napa which will cease when North Bay Aqueduct completed.
SOIJICH: USBR, Factsheet' "Exhibits arid Testimony before SWRCB. Bay-Delta Hearing. 1987". 1987

TABLE A4-13 SWP WATER DELIVERIES FOR AGRICULTURE, MUNICIPAL AND INDUSTRIAL USES,
RECREATION USE AT SWP FACILITIES AND HYDROELECTRIC ENERGY, 1962 to 1985.
I I Water Delivered (Acre-Feet) I Hydroelectric (
Entitlement Water I Other 0 Municipal & I Agricultural I Total ] Municipal & l~gricultural
Year ( Industrial Use I Use 1 I Industrial Use I Use
liveries Other I Total
1962 1 1 963 1 964 1965 1966 1 967 1 968 1969 1970 1971 1 972 1973 1974 1975 1976 1977 1978 1979 1980 1981 1982 1 983 1984 1985
Total dl
I I
C
Days) h 30,000
105,000 331,600 449,800 482,700 455,200 931,300
1,554,800 1,804,800 2,085,900 1,971.200 2,502,000 4,073,600 4,189,300 4,239,600 3,951,900 5,773,700 5,298,700 5,701,900 6,017,800 6,187,700 5,838,200 6,273,100
Recreation Supported (Recreation
hours) c l
628,000 2,614,000 2,679,000 3,302,000 1,922,000 3,298,000 4,672,000 3,159,000 2,131,000
958,000 2,882,000 2,485,000 2,988,000 3,358,000 5,097,000 5,419,000 3,368,000
Energy Generated (megawatt-
al Includes reconsolidation repayment water. emer ency relief water. r ulated delivery of looal supply, non-SWP water delivered to Napa County FCBWDC through &P facilities cpnve nce of CVP water (8ncluding Decision %I5 water), recreation water, and demonstration ground water fill withdrawal.
bl A recreation day is the isi it o&e person to a recreation area for any art of one da c l lncl des SWP share of eneration from H att-Thermalito San Luis Bevi~ Canyon, karne, and Castaic Powerplants. d l In acddition, SWP damsgave revented m#lions of dollars'worth of doad damage. e l Revised and corrected from. bulletin 132-85 to reflect 557 acre-feet of 1978 exchange water (MWDSC Basin) changed from other water to municipal and industrial use
entitlement water. 11 Revised and corrected from. Bulletin 132-85 to reflect 128 acre-feet of 1982 exchange water (MWDSC Basin) changed from other water to municipal and industrial use
entitlement water.
(DWR.461)

TABLE A4-14
DIVERSION POINT (Transfer Faci 1 i ty )
State Faci 1 ities
B rker sloughl/ f~orth Bay Aqueduct)
CI if ton Court (South Bay Aqueduct)
(Cal ifornia Aqueduct)
DELTA DRINKING WATER DIVERSIONS AND AREAS SERVED (From SWC, 76, 6)
Federal Facilities
Rock Slough (Contra Costa Canal)
Old River (Del ta-Mendota Canal)
Area Served
Sol ano-Napa County Fairf ield Vacavi 1 le Val le jo Benicia Napa American Canyon
L i vermore Va 1 1 ey Alameda CWD Santa Clara Valley WD
~vena l2/ Coa 1 i nga2/ Kern County WA Antelope Val ley MWDSC San Diego CWA Crest 1 ine-Lake Arrowhead San Bernardino Val ley Palm Springs Indio
Concord Oak 1 ey Pittsburg Antioch Martinez Pleasant Hill Walnut Creek
Tracy Huron Dos Palos
11 Cache Slough is used as an alternative diversion point for this transfer.
21 CWP contractor served f r m joint-use faci 1 i t ies o f the Ca 1 f fornia Aqueduct.
4.0-40

In the future the SWP and the CVP plan to expand deliveries to new areas and to areas experiencing increased need. SWP is studying a Coastal Branch which wi 1 1 supply water to Santa Barbara and San Luis Obispo counties, and an East Branch enlargement which will increase deliveries to the eastern part of the Metropolitan Water District's service area, and to San Bernardino County and the Antelope Valley. CVP is studying an extended San Fel ipe Branch which will supply water to Monterey and Santa Cruz counties, as we1 1 as an American River Aqueduct which wi 1 1 increase deliveries to EBMUD's service area in the Bay Area. SWP is also planning additional transfer and storage facilities at these locations that will increase its water distribution capabi 1 ities: the Kern Water Bank, Los Banos Grandes Reservoir, the South Delta, the North Delta Facilities, and additional pumps at the Delta Pumping Plant (DWR, 707,42-53).
4.0.9.2 Agriculture
There were about 9.5 mil 1 ion acres of irrigated agricultural land in California in 1980. The Central Valley (not including the Delta) contained approximately 6.9 mil 1 ion acres of this total (DWR, 401,29; DWR, 304).
The CVP and SWP export water from the Estuary to support many farming and ranching operations (RWQCB 5, 1975). The main area of agricultural use of export waters is the San Joaquin Val ley; three of its counties, Fresno, Kern, and Tulare, ranked first, second, and third in the nation in gross cash receipts from annual farm marketing in 1982 (CVAWU,41). The CVP exports water primarily for agricultural use to the San Joaquin Valley, with smaller amounts exported to other areas (see Table A4-15).
By 1970 the entitlement of agricultural contractors (including exchange contractorsl/) to CVP export waters totaled over two mi 1 1 ion AF/yr (CVPWA,10-I). With the addition of the Cross Valley Canal Unit and expansion of the San Luis Unit, the 1980 total was almost 2.5 million AF/yr (CVPWA, 10-1).
TABLE A4-15
CVP EXPORT AREAS
Export Area
San Joaquin Basin
Tulare Lake Basin
Contra Costa County
Santa Clara 81 San Benito Counties
CVP Unit
Delta Mendota Canal San Luis Mendota Pool
San Luis Cross Val ley Canal
Contra Costa Canal
San Felipe Unit
11 Exchange contractors forolerly diverted from the San Joaquin River, but exchanged their diversion rights for a contract that granted nwre consistent w t e r supplies from the DM. The mawitman contractual entitlament of these users is 0.84 mi 11 ion AFtyr (USBR, 1987).

During the 1985 Water Year, the various units of the CVP exported a total of about 2.79 mil lion AF of water to serve 1.22 mil 1 ion acres (Table A4-16).
TABLE A4-16
AGRICULTURAL WATER EXPORTS AND SERVICE AREAS BY CVP UNIT FOR THE 1985 WATER YEAR
CVP Unit Hater Exported (AF) Area Served (ac)
Delta Mendota Canal 1,050,000 356,000 (including exchange (CVPWA, 11 ; USBR , (T,XXVI ,186:6-8,ll-17) contractors) 1984;USBR,1985)
San Luis
Mendota Pool
1,545,000 698,000 (CVPWA, 11) (T ,XXVI ,186a: 24)
94,000 42,000 (CVPWA, 11) (T,XXVI ,187:14)
Cross Valley Canal 102,000 125,000 (Schafer, 1988) (CVPWA, 11 (b)-3)
Contra Costa Canal 895 (T,XXVI ,185: 16-21)
TOTAL 2,792,000 1,221,000
The recently completed San Felipe Unit began deliveries in mid-1987, two contracts for which have been executed total 1 ing 68,600 AF/yr (T,XXVI, 194:2-8). The projected water use by the existing CVP contractors is not expected to differ substantially from the 1985 Water Year level (T,XXVI ,208:6-8). However, additional CVP suppl ies are needed to help solve ground water overdraft if present uses are maintained (T,XXVI ,209:6-13).
SWP exports water for agricultural use via the California Aqueduct to Oak Flat WD in the San Joaquin Basin, to the Tulare Lake Basin and to southern California, and via the South Bay Aqueduct to Santa Clara and Alameda counties. The volume of SWP deliveries to the 13 southern California contractors for agricultural use was not identified in the hearing record. The annual SWP exports for agricultural use (excluding southern California) increased from about 237,000 AF in 1968 to about 1.3 mi 1 1 ion AF in 1985 (DWR,461). The future demand for exported SWP water for agriculture should not change substantially from this 1985 amount (DWR, 707,ll). However, additional SWP suppl ies are needed to he1 p solve ground water overdraft (SWC, 412,5).

The main change in agricultural production in the San Joaquin Valley since 1955 has been the increased acreage devoted to the production of vegetables, fruits and nuts (CVAWU,26). The acreage of vegetables increased from about 250,000 acres in 1955 to almost 400,000 in 1985. The acreage devoted to the production of fruits and nuts increased from about 550,000 acres in 1955 to about 1,300,000 acres in 1985 (CVAWU,26). The acreages of field crops and seeds in the San Joaquin Val ley have remained relatively stable since 1955. Overall, the acreage devoted to these four major commodity groups (vegetables, fruits and nuts, field crops, and seeds) in the San Joaquin Valley has increased about 25 percent from 1955 to 1985, from about 3.7 million acres to about 4.6 mi 1 1 ion acres (CVAWU ,26).
In 1985, the CVP units listed in Table A4-16 delivered over 2.7 million AF of water to over 1.2 million acres in the export areas of the San Joaquin Val ley to produce crops with a gross value of about $1.2 billion (CVPWA,12&13; EDF,ll,G-148) (Table A4-17). These numbers do not include the contribution from the Friant-Kern Canal, Madera Canal, or Mi 1 lerton Lake units of the CVP. These units are considered to be in the upstream areas of the San Joaquin Valley, not the export area.
In 1985, the SWP delivered over 1.3 million AF of water to about 445,000 acres of the San Joa uin Valley to produce crops with a gross value of about $431 million ?DWR,489h) (Table A4-18). These numbers do not include the agricultural uses of water in southern California.
TABLE A4-17
MAJOR CROPS GROWN IN THE CVP EXPORT AREA BY ACREAGE AND APPROXIMATE GROSS CASH VALUE
(from DWR, 489 h)
Cotton Alfalfa Wheat Tomatoes Melons Barley Other
TOTAL
~ c r e a ~ e f 1 Gross Cash ~alue2/ (thousands of acres) (mi 11 ions of do1 lars)
21 CVPWA, 12&13; EDF,lI, E l M . Values of an average crop ($/acre from CVPWA 12&13) are nu1 t ipl fed by crop acreages for the exchange contractor area (from EDF,ll, G148) to get appropriate cash va lue.

TABLE A4-18
MAJOR CROPS GROWN IN THE SAN JOAQUIN VALLEY PORTION OF THE SWP EXPORT AREA
BY ACREAGE AND GROSS CASH VALUE (From DWR,489 h)
Crop Acreage Gross Cash Value
(thousands of acres) (mi 1 1 ions of do1 lars)
Cotton 210 154 Alfalfa 40 27 Almonds 3 5 26 Wheat 30 9 Pistachios 18 28 Wine grapes 18 13 Table Grapes 6 28 Oranges 4 19 Carrots 5 18 Other 7 9 109
TOTAL 445 431
Since water usage and acreage for livestock, poultry, and dairy production were not separately identified in the hearing record by CVP or SWP export areas, an accurate account of the effect of export water on the market values of these products cannot be given. In addition, because these areas often use supplemental water supplies from ground water and local sources, only a part of the value of agricultural production in the export area can be directly attributed to project exports. An indirect indication, however, can be made from the fact that the market value of 1 ivestock, poultry and dairy products for the entire San Joaquin Valley in 1982 was over half the value of all crops (CVAWU, 28) :
Crops $455 mi 1 1 ion $933 mil 1 ion $4,039 mil 1 ion
Livestock, $199 million $751 million $2,053 million Pou 1 try Dairy
4.0.9.3 Fishery Habitat
Export fishery habitat consists primari ly of the reservoirs and conveyance channels used for movement and storage of Bay-Delta water south of the Delta. In all cases this habitat may be classified as warm water fishery habitat. The major facilities discussed here and in Section 4.0.9.5 (Export Recreation) are:

o San Joaquin Va 1 ley and San Francisco Bay Area
Del ta-Mendota Canal, San Luis Canal, Edmund G. Brown Cal ifornia Aqueduct, Lake Del Valle, Bethany Reservoir, San Luis Reservoir (and 0 ' Nei 1 1 Forebay), and Los Banos Grandes Reservoir.
o Southern California
West Branch Cal ifornia Aqueduct (Pyramid Lake, Castaic Lake), East Branch Cal ifornia Aqueduct (Si lverwood Lake, Lake Perris) (SWC,65,6).
Recreational access at all SWP facilities is shown in Figure A4-7 (SWC,65,6). Expansion of this habitat wi 1 1 not occur unless additional faci 1 ities are built (e.g., Los Banos Grandes Reservoir) (DWR,707).
Some of the eggs and larvae of some fish entrained into the export pumps survive and develop in the aqueducts and some of the reservoirs such as Bethany Reservoir and San Luis Reservoir (and O'Neill Forebay) (SWC, 65,45). The hearing record is unclear whether these populations are self-sustaining or are maintained by additional entrainment. In other reservoirs, the majority of fish are planted for recreational fishing (SWC,65,47) (see Section 4.0.9.5). (It was inferred from SWC,65,47 that DFG plants the fish in these reservoirs, but no direct evidence was presented. ) No informat ion was presented on which species are planted, or what percent of total statewide fish planting is dedicated to SWP facilities.
The aqueducts tend to provide a relatively stable habitat for fish because the export water qua1 ity is determined by municipal and industrial standards, and because water depth in the aqueducts does not change. In some reservoirs, such as San Luis, the habitat may change significantly due to either seasonal variation in temperature or drawdown to meet water demands. The San Luis Reservoir recreational storage objective for Labor Day is 6,900 acres of surface area, or approximately half the surface area of the full reservoir (DWR, 708,14). This converts to an 83 percent reduction in storage and, therefore, a significant reduction in fishery habitat. Other reservoirs, especially the terminal SWP reservoirs in southern California, are operated to retain more stable water levels because of the level of recreational activity on them (T,XXXIX,122:2-9) and the potential need as an emergency water supply in the event of an aqueduct outage. DWR presented the specific operating criteria for their facilities (DWR, 708).
4.0.9.4 Export Wetland Use
Water exported from the Sacramento-San Joaquin watershed provides some marsh and riparian habitat wherever it is delivered. Examples of important wildlife uses may be found in a number of export areas (SWRCB, 14,111-9). Water in SWP reservoirs and in wild1 ife areas in pouthern Cal ifornia provides aquatic habitat where there might formerly have been none or replaces wetland habitat which was damaged or destroyed by earl ier urbanization or water development. Substantial waterfowl habitat is maintained with DMC water in the Grassland Water District, an area that formerly received water from San Joaquin River overflows and agricultural return flows which ceased when Friant Dam began operations (EDF, 11,II-2).

FIGURE A4-7 State Water Project Recreation Developments (From: SWC, 65,6)
ABBREVIATION: SRA - STATE RECREATION AREA
FAS - FISHING ACCESS SITE
ANTELOPELAKE SRA
FRENCHMAN LAKE SRA
BETHANYRESERVOR LAKE E L VALE STATE RECREATION AREA
CANYON ROAD FAS
RVEL AVENUE FAS
SAN LUIS RESERVOIR SRA W PANOCHE RESERVOIR
WAX-IN FISHING (208 MI
WAX-IN FlSHlffi (83 MI
LONGVIEW ROAD FAS

4.0.9.5 Export Recreation
The aqueducts and reservoirs in the S W P ~ / facilities are used for recreation in both central and southern California. Fishing and bicycle riding are the main activities along the aqueducts, and numerous fishing access points are available along them (SWC,65,6) (see FiguPe A4-7). The reservoirs are used for a wide variety of water- contact and non-water contact activities, including fishing, swimming, boating, waterskiing, camping, picnicking and bird watching (SWC,65,5). About five million visitors used the SWP facilities south of the Delta in 1985, and they spent an estimated $95 mi 1 1 ion to travel to and use these sites (SWC,65,7,14). More than one mil lion game fish were stocked in 1985 (SWC,65,7) to support recreational fishing activity in the four southern Cal ifornia SWP reservoirs. No evidence was presented on a1 ternat ive sites for freshwater recreation in southern Cal ifornia.
11 Discussion is limited to recreational activities directly related to export fac i l i t ies af the SUP. No i n f o m t ion was provided on recreation a t CVP export faci l i t ies other than those used jointly by the CYP 8nd SUP, which are included in the SMP descriptions. These faci 1 it ies are 1 fsted In Section 4.0.8.3 (Export Fishery Habitat).

APPENDIX 4
REFERENCES
o Be1 1 , M.C. 1973. Fisheries Handbook of Engineering Requirements and Biological Criteria. U.S. Army Corps of Engineers, N. Pacific Division, Port 1 and, Oregon.
o California Department of Fish and Game, and U.S. Fish and Wildlife Service. 1980. Sacramento-San Joaquin Delta Wildlife Habitat Protection and Restorat ion Plan.
o Department of Finance. January 1987. Report 86-E-2.
o Department of Water Resources. 1931. Bulletin 27, "Variation and Control of Sal ini ty in the Sacramento-San Joaquin Delta and Upper San Francisco Bay", 1931, pgs. 21 and 47.
o Department of Water Resources. 1982. Draft Environmental Impact Report. Proposed Additional Pumping Units. Harvey 0, Banks Delta Pumping Plant.
o Department of Water Resources. October 1983. Bulletin 166-3, "Urban Water Use in California", pgs. 1-25.
o Department of Water Resources. 1987. Sacramento-San Joaquin Delta Atlas.
o Huppert, 0. D., and C. J. Thompson. 1984. Demand Analysis of Partyboat Angling in California Using the Travel Cost Method. NOAA Admin. Report LJ-84-06.
o Markmann , Car la. 1986. Benthic Monitoring in the Sacramento-San Joaqu in Delta. Results from 1975 through 1981. IESP Technical Report 12. 56pp.
o Meyer Resources, Inc. 1985. The Economic Value of Striped Bass, Morone saxati 1 is, Chinook Salmon, Oncorhynchus tschawytscha, and steel hea-t ' m h u s m kiss) of the Sacramento and San Joaquin River systems. Sacramento, Ca 3-T i ornia, Dept. of Fish and Game Admin. Report No. 85-03.
. .
o National Oceanic and Atmospheric Administration. 1986. Marine Environmental Assessment, San Francisco Bay, 1985 Annual Summary. 122 pp.
o Regional Water Qual ity Control Board 2. 1986. Water Qual ity Control Plan, San Francisco Bay Basin, Volume I.
o Regional Water Qual ity Control Board 4. 1975. Water Qual ity Plan Report 48, Volume I, p.1-2-2.
o Regional Water Qual ity Control Board 5. 1975 and 1978. Water Qual ity Control Plan Reports 5A and 58, Volume I.
o State Water Resources Control Board. 1978. Environmental Impact Report for the Water Quality Control Plan and Water Right Decision, Sacramento-San Joaquin Delta and Suisun Marsh, p. 142, 143. August, 1978.

o Thomson, C. J. and Hu pert, D.D. 1987. Results of the Bay Area Sportf ish Economic Study (BASE ! , NOAA Tech. , Memo. NMFS, NOAA-TM-NMFS-SWFC-78.
o U.S. Bureau of Reclamation, Factsheet Exhibits and Testimony before SWRCB, Bay-Del ta Hearing, 1987:
1952 Report of Operations and Table 14, December; 1984 Report of Operations, Table 28, December;
- 1985 Repart of Operat ions, Table 28, December. A
o U.S. Fish and Wildlife Service. 1984. Coleman National Fish Hatchery- Station Development Plan (Anderson, California) .

APPENDIX 5.0 ADVOCATED LEVELS OF PROTECTION
The objectives advocated by various parties for the protection of beneficial uses of Bay-Del ta waters are discussed below.
5.0.1 Municipal and Industrial
5.0.1.1 Salinity and Sodium
Advocated Levels of Protect ion
The fol lowing organizations have recommended that the D-1485 objectives be retained in total or in part to protect M&I use (DWR,280; T,LIX,189:1- 7; T ,VI ,125:4-15). Modifications to D-1485 M&I standards were recommended by DWR, USBR, SWC, MIDITID, CVPWA and CCWD. DWR and USBR are unified in their recommended modifications; SWC s recommended modifications are similar to those made by DWR and USBR. The parties' recommendat ions, presented in Table 5-5, are:
o DWR and USBR
Eliminate the 250 mg/l maximum mean daily chloride quality standard at Cache Slough. The City of Vallejo will divert water from the newly finished North Bay Aqueduct; the Cache Slough diversion point will only be used as a secondary M&I supply source (DWR,280).
Add a qual ity objective at the North Bay Aqueduct intake at Barker Slough. The recommended objective would be set at a maximum mean daily chloride level of 250 mg/l for a1 1 water year types. Barker Slough is an M&I diversion point for Napa, Vallejo, and Sonoma counties (DWR, 280).
o DWR, USBR, SWC, MIDITID, and CVPWA
Eliminate the 150 mg/l chloride quality standard at both the Antioch Water Works Intake on the San Joaquin River and the Contra Costa Canal Intake at Rock Slough. This standard is set to protect industrial uses in the Antioch-Pittsburg area. The recommendation to eliminate this standard is based on the evidence indicating that diversion of water for industry of this qual ity at Antioch is not reasonable when considering the Delta outflow required to maintain it (DWR,280; T, LIX, 149: 12-20; WQCP-MIDITID-7, 13; WQCP-CVPWA-205,2).
Add quality objectives at Old River near Rock Slough and Cache Slough near Junction Point. The recommended objectives would be set at a maximum mean daily chloride level of 250 mg/l for a1 1 water year types. These objectives wi 1 1 help in determining an "a1 location of responsibility" for meeting the standard at the Contra Costa Canal Intake, the North Bay Aqueduct Intake, and the City of Vallejo Intake (DWR,280; T,VI ,97:8-19; T,LIX,213:8-214:8; WQCP-DWR-14,7).

o CCWD
A goal of providing the "best achievable" water quality for drinking water suppl ies should be promoted (WQCP-CCWD-20,8).
Retain the 150 mg/l chloride objective for protection of M&I use, including disinfection by-product concerns, as specified in the Delta P 1 an (WQCP-CCWD-20,l).
Add a 50mg/chloride objective for the protection of M&I use for port ions of a1 1 years, except during prolonged droughts (WQCP-CCWD- 20,l).
Add a quality objective at the site of the future intake to the Kel logg/Los Vaqueros Reservoir. The location of the intake has not yet been determined. The recommended objective would be set at a maximum chloride level of 50 mg/l for the months of April through June (T,VII ,57:1319; T,VII ,118:16-120,9).
Fi breboard Louisiana-Pacif ic Corporation (Fiberboard), a witness for CCWD, presented the only testimony that supported the need for process water containing not more than 150 ppm chloride for the production of linerboard T,IX,75:23-81:23). To keep the chlorinity in their linerboard I used in corregated boxes) at levels which will not corrode canned goods, this process water is kept below 150 mgll chloride (T,IX,75:23-81:23). When the chlorinity in the San Joaquin River supply is higher than 150 mgll , a partial supply of water is purchased from CCWD; when the chlorinity level reaches 250 mgll, the entire supply is taken from the Contra Costa Canal ( T I IX,77:23-78:6).
5.0.1.2 Trihalomethanes (THMs) and other Disinfection By-Products (DBPs)
Advocated Levels of Protect ion
Parties who presented testimony and exhibits on the issue of THMs included CCWD, DWR, EBMUD, SWC, the Palmdale Water District, and the cities of San Francisco, Tracy, Avenal , Coal inga and Huron.
The fol lowing alternatives were discussed by the parties cited during and after the Phase I hearings.
o SWC, CCWD, and California Urban Water Agencies
Several alternatives for source control of THMs were put forth.
- Discharge Delta island agricultural drains downstream of the Delta to eliminate the contribution of THM precursor materials from the Delta islands (T,XLVI, 141:ll-142: 10).
- Take Municipal and Industrial water supplies from tributary streams above the Delta (T,XLVI,136:7-13; Brown and Caldwell, 1989, 4-35).

- Treat the Delta island agricultural drainage before discharge into the surrounding channels (Brown and Caldwel 1 , 1989, 4-35).
Chlorine is currently the disinfectant of choice for most municipalities (T,VI ,129:5-16). In order to meet the anticipated EPA treated drinking water qual ity standards for THMs and DBPs, municipalities may be required to modify present treatment plants, construct major new faci 1 ities, and apply new technology to achieve more stringent levels of treatment (T,XLVI ,121:22-122: 16). Two possible revised treatment scenarios were discussed:
- Disinfect with ozone followed by chloramination to maintain a disinfectant residual in the distribution systems used to distribute domestic water. However, ozonation of water with high levels of bromide or TOC can still produce DBPs of health concern concentration levels; or
- Use granular activated carbon (GAC) adsorption to remove dissolved organics followed by disinfection with chlorine. However, data were presented which indicate that GAC absorption for removing THM precursors from Delta water may be "extraordinarily high". Furthermore, it was stated that GAC would require frequent regeneration and that California air quality standards may not allow siting of GAC regeneration furnaces in the state (T,46,138:5- 142: 10;WQCP-SWC,601,12-18).
o Metropol i tan Water District of Southern California (MWD)
MWD discussed the possibility of the State Board developing a water qual ity objective for THM precursors in Delta water that is to be used for domestic purpose (T,XLVI ,142:3-5), thus shifting the burden of treatment for THMs from the domestic water supplier to the source of the THM precursors.
o Delta Municipal and Industrial Water Qua1 ity Workgroup
The Delta M&I Workgroup submitted several statements on THMs in its October 1989 draft report to the Board although there were dissenting opinions voiced by members representing organizations in the workgroup.
Bromide and chlortde are correlated in Delta waters; thus, a chloride objective can be set for the purpose of maintaining sufficiently low levels of bromide to ensure that treated domestic water supplies do not contain excessive levels of brominated THMs or other brominated DBPs.
Future EPA MCLs for treated domestic water supplies may be more stringent, and will be difficult to meet unless bromide levels in raw water supplies From the Delta are less than 0.15 mg/l (corresponding to chl~ride levels belobv 50 mg/l).
Total organic carbon (TOC) in water supplies contributes to production of THMs as well as that of other DBPs in water treatment plants. A reduction in Delta water TOC levels will aid in meeting expected drinking water MCLs for THMs and DBPs.
Agr icu 1 tural drains, Delta channels and tributary streams are sources of the TOC and THMFP levels in raw domestic water supplies taken from the Delta. THMFP levels in Delta agricultural drain waters often exceed the THMFP levels in adjacent channels by factors of ten or more.
Data collected at the water treatment plants of several of the members of the Workgroup show definite relationships between raw water bromide levels and treated water levels for several DBPs. On the basis of those relationships and the bromide to chloride correlation observed in Delta water, the Workgroup recommended that a 50 mg/l chloride water quality objective, when feasible, be set for Delta Municipal and Industrial water supply intakes for the purpose of maintaining bromide levels below 0.15 mgll.
The Workgroup recognizes that meeting a 50 mgll chloride water qual ity objective throughout the Delta at all times is not feasible under all water supply conditions with the physical distribution and storage facilities presently available to the major water suppliers (e.g., DWR and USBR) or the water purveyors (e. g., CCWD, MWD, EBMUD) . Because of their ability to store high quality water for subsequent blending with waters of lesser quality, various proposed facilities, such as the Buckhorn, Los Vaqueros and Los Banos Grandes offstream storage reservoirs, may help reduce the period of time the recommended 50 mg/l chloride water quality objective would need to be met in the Delta. However, not all M and I users of Delta water have access to offstream storage faci 1 ities to receive such benefits. Other faci 1 ities and solutions should be studied and evaluated to help determine a strategy for meeting the recommended 50 mg/l chloride objective.
Several parties to the Workgroup recommended that, in the short term, salinity levels be provided at the Delta water supply intakes which are less than or equal to those achieved under current water quality objectives.
o Cal if ornia Department of Water Resources
During Phase I of the Bay-Delta proceedings, DWR recommended that the construction of Delta facilities should be considered as potential means to improve project (SWP and CVP) operational flexibility and export water qual ity. The faci 1 it ies recommended for consideration were North and South Delta channel improvements, en 1 argement of Clifton Court Forebay, relocation of the Contra Costa Canal Intake, and additional pumping capacity at the Harvey 0. Banks Pumping Plan.
DWR did not concur with the Delta M&I Workgroup statements, based on the following four points:

- EPA1s Strawman Rule for THM standards is very preliminary, and it is premature to use this "rule" as the basis for making Delta water supply decisions of great importance to Cal ifornia.
- DWR disagrees with the recommendation to set a chloride objective for the purpose of maintaining sufficiently low levels of bromide. The reason for this is that chloride is added to surface waters by activities such as the use of fertilizers. Chloride is also leached from soils and is contributed by shallow ground water. There is no reason to believe that these sources of chlorides also add bromides in the classic seawater ratio of .003 BR:C1. Therefore, the chloride vs. bromide relationship may vary significantly at different locations in the Delta.
Significant data are only now being collected to prove or disprove this relationship. Also, new technology now makes direct bromide measurements practical ; therefore, bromides should be specif ical ly addressed in the salinity plan.
- Meeting a 50 mg/l chloride objective at M&I stations with the present configuration of the Delta would reduce critical period water suppl ies by over 1 mi 1 1 ion acre-feet per year.
- DWR recommends against setting a total organic carbon objective because their data indicate that TOC and THM formation potential often do not correlate well.
5.0.2 Agriculture
Advocated Levels of Protect ion
o Central Delta Water Agency (CDWA)
Water Qua1 i ty Objectives:
The agricultural water qua1 ity objectives for the Delta should be set at a minimum water quality of 0.45 mmhos/cm EC year round except for "relaxations" in the drier months of drier years. The objective should not require a "leaching regimen" more rigorous than 'winter flooding" or "fall subirrigation" more frequently than once in three years (CDWA,Brief ,26-27).
Monitoring Locations:
The CDWA requests that monitoring stations be established at Old River near Holland Tract or Rancho Del Rio and on Turner Cut near McDonald Island Bridge, in addition to those previously established by the Delta Plan at Emmaton, Jersey Point, San Andreas Landing and Terminous (cDWA,~rief ,27).

o Central Val ley Project Water Association (CVPWA)
Water Qual i ty Objectives :
The Delta Corn Study provides adequate data from which to establish sal inity objectives for Delta agriculture. (WQCP-CVPWA-205,3).
Objectives should be established at 1.5 mmhoslcm EC for the April 1 through August 15 period at Emmaton and Jersey Point. This objective should be adjusted to 2.78 mmhoslcm EC at Emmaton, and 2.20 mmhos/cm at Jersey Point in critical water years. No objectives need be established for the areas of the Delta covered by contracts with the Department of Water Resources. DWR currently meets the Delta Plan standards in contracts with ECCID and NDWA (CVPWA, Brief ,49; WQCP-CVPWA- 205,14).
o Contra Costa Water Agency (CCWA)
Water Qual i ty Objectives:
To achieve a 100 percent yield of corn, CCWA recommends that the EC water quality standard necessary be set at 0.45 mmhoslcm for organic soils in the Delta (CCWA,Brief,l7).
o Contra Costa Water District (CCWD)
Water Qual ity Objectives:
Agricultural discharges in the Delta should be monitored and regu 1 ated. (WQCP-CCWD-20,l) .
o Delta Tributaries Agency Committee (DTAC)
Water Quality Objectives:
DTAC recommends that the Delta Plan agricultural standard for the Central Delta be relaxed and that it range from 1.5 to 2.5 deciSiemensImeter in a1 1 but critical years (one decisiemenlmeter is equal .to one mmholcm EC). No objectives were suggested for critical years (DTAC, Br ief ,6).
Leaching Objectives:
Water qua1 ity standards should be careful ly establ ished "to provide fa1 1 leaching water at the levels needed to leach a necessary minimum amount of salt from the crop root zone of Delta soils, but such leaching standard should be related to the quantity of water available for such leaching" (DTAC,Brief, 6-7).

Southern Delta Objectives:
DTAC recommends that the Board impose a short timetable for completion of the negotiations between SDWA, DWR, and USBR. Pending completion of such an agreement, the Board should require elimination of reverse flows in the San Joaquin River which are attributable to export pumping, and require continuance of Delta Plan standards (DTAC, Brief ,6- 7 ) -
o Department of Water Resources (DWR)
Water Qual i ty Objectives:
"Water qual ity objectives for the western and central Delta should be based upon the results and information derived from the Corn Study" (DWR,Brief,28). No specific numerical water quality criteria were recommended.
Monitoring Locations:
DWR recommends that specific Delta agricultural objectives for the irrigation season should be adopted for the following locations: (1) Sacramento River at Emmaton; (2) San Joaquin River at Jersey Point; (3) Mokelumrte River at Terminous; (4) San Joaquin River at San Andreas Landing; and (5) Cache Slough near Junction Point (DWR,Brief ,SO-31). Furthermore, the water quality objective at Emmaton should be el iminated when overland water supply faci 1 it ies are developed for Sherman Island (DWR,Brief ,32). The objective would be moved to the intake of the overland faci 1 ities.
Southern Delta Objectives:
Negotiations should be completed among the DWR, USBR, SDWA to provide permanent solutions to the problems of local water level, water qual ity and circulation in the southern Delta (DWR,Brief ,32).
o North Delta Water Agency (NDWA) and East Contra Costa Irrigation District (ECCID)
Water Qual i ty Objectives:
NDWA and ECCID recommend that no change be made in Delta agricultural water objectives which would impair the contractual rights and obligations embodied in the contracts amang NDWA, ECCID, and DWR (NDWA, Br ief ,2) . These standards are out 1 ined in summaries of testimony for ECCID and NDWA.

o South ~elta Water Agency (SDWA)
SDWA advocated two sets of recommendations. The first are recommendations with no southern Delta faci 1 ities (SDWA, 115,l-2). The second are recommendations with southern Delta faci 1 ities (SDWA, 116,l- 2)
Water Qual ity Objectives (Without Faci 1 ities):
SDWA recommends that water quality at any monitoring point should not exceed an average of 400 mgll TDS for the period March 1 through September 30 and must not exceed 400 mg/l TDS on a seven-day running average between March 1 through June 30 and 500 mg/l TDS seven-day running average between July 1 and October 31. A TDS of 550 mgll would be the maximum permissible seven-day running average between November 1 and February 28 (T,XV, 31 : 15-31 :23).
SDWA also recommended that the minimum monthly flow at Vernal is be adequate to maintain the above water quality.
Monitoring Locations (Without Facilities):
SDWA proposes monitoring for water qual ity in the San Joaquin River near Vernalis, Mossdale, the bifurcation of Middle River and Old River, Middle River at Howard Road Bridge, San Joaquin River at, or near, the former location of Brandt Bridge, Old River at Tracy Boulevard, and Old River at Westside Irrigation District intake (SDWA,115,1).
Water Qual ity Objectives (With Faci 1 ities):
"Water quality required at the inflow points would be specified as a function of net daily inflow rate and of channel depletion by months for the channel reaches receiving water from each inflow point. The values would be initially determined by mathematical modeling of the system to give water quality equivalent to the no barrier standards. The required net daily inflow rates at each inflow point would be in accordance with a monthly schedule sufficient to maintain the required unidirectional net daily flow in each channel reachu (SDWA,116,2).
Monitoring Locations (With Faci 1 ities) :
"Water qual ity would be monitored at Vernal is, on the downstream (intake) side of each barrier, at the former location of Brandt Bridge on the San Joaquin River north of Old River, and at Tracy Boulevard on Grant Line Canal. Flow would be measured at Vernal is and through each barrier" (SDWA, 116,l-2).
o State Water Contractors (SWC)
Western and Interior Delta:
The State Water Contractors believe that the Corn Study provides adequate data, and the State Board should use the Corn Study as a basis for setting new salinity objectives in the western and interior
Delta. Western Delta agriculture can be protected at full yield with a 1.5 mmhoslcm EC applied water objective, in combination with winter leaching operations and rainfall to maintain the soil salinity below the corn salt tolerance level prior to planting. In critical hydrological years, the applied water objective should be relaxed to 2.78 mmhos/cm EC at Emmaton and 2.20 mmhos/cm EC at Jersey Point for the growing season. New objectives should be based on a 28-day running average to coincide with the lunar cycle.
With regard to the protection of Delta agriculture in the interior Delta, the existing 0-1485 agriculture salinity objective of 0.45 m m ~ s l c m EC at San Andreas Landing and Terminous should be maintained, at least until completion of the leaching studies discussed below. The 14-day running average in D-1485 should be changed to a 28-day running average.
Additional leaching studies initiated in the DWR-sponsored Western/Interior Delta Agriculture Workgroup are needed. The new leaching studies are appropriately focusing on the cost and effectiveness of existing leaching practices that growers have described in the workshop sessions. A winter leaching objective is not needed for reasonable protection of Delta agriculture.
Monitoring Locations:
The measuring station at Emmaton in the Sacramento River should be relocated to Three Mile Slough upon completion of overland water supply facilities to serve Sherman Island (SWC,Brief,I-43).
Southern Delta:
"The 1978 Delta Plan southern Delta salinity objectives should not be implemented. "
Better water quality for the interior stations within the southern Delta will probably be obtained by implementing the agreement (between SDWA, the Bureau, and DWR) that will provide a permanent solution to the southern Del tan s water level and qua1 i ty problems. Therefore, the State Board can be assured the three-party agreement will provide the water quality protection needed within the southern Delta.
o Bureau of Reclamation with support from the U.S. Department of Interior
Western and Interior Delta:
The results of the Corn Study, presented in Phase I of these hearings, supports an objective of 1.5 mmhos/cm EC. (WQCP-USBR-126,l).

Southern Delta:
The USBR presented testimony on the leaching requirements for beans, fruit and nuts, vineyards, corn and alfalfa, the five most salt- sensitive crops grown in the Delta uplands (USBR, lOA&lOB; USBR ,14A&14B). From these leaching requirements, average irrigation season water qua1 ity objectives of 800 mgll TDS in a normal water year and 600 mg/l TDS in a dry one were developed for Delta agriculture (T,XV,139:15-139:21). USBR did not formalize these requirements into recommendat ions (T,XV, 140:3-140:9).
5.0.3 Fish and Wildlife Beneficial Uses
5.0.3.1 Fishery Habitat Protection (Entrapment Zone) in the Bay-Delta Estuary
Advocated Levels of Protection:
o CCWAIEDF
CCWAIEDF recommend that the entrapment zone be maintained in upper Su i sun Bay for maximum phytoplankton abundance. The recommended objective is a 28-day tidal ly-averaged mean bottom salinity at Chipps Island of 2 ppt TDS or less from April through September, except in a one-in-twenty dry year. This objective would result in a maximum habitat area occurring (CCWAIEDF, 1).
They also suggest that a flow objective be set for the period from April through June to position a second entrapment zone in San Pablo Bay. This objective would apply in all years except those when the unimpaired Delta outflow for the prior October through March period is less than the 30-percentile dry year, as determined by the average October-through-March unimpaired Delta outflow (CCWAIEDF, 3).
CCWAIEDF concluded that grazing by benthic organisms can have a significant inhibiting effect on the standing crop depending upon the relative rates of removal versus the rates of production (T,XLVI ,29:8- 10). In order to limit the intrusion of marine benthic organisms into Suisun Bay, CCWAIEDF recommend that the tidally-averaged bottom salinity at Martinez should be less than 5 p t over at least a 28-day period between October and Apr i 1 (cCWAIEDF , 2j. The standard would not apply in the event of a one-in-20 dry year as determined by unimpaired Delta outflow (CCWAIEDF ,2).
5.0.3.2 Chinook Salmon
Advocated Levels of Protect ion
Most of the parties presenting testimony on Chinook salmon agreed that specific causes of salmon mortality upstream and in the Delta should be addressed to improve survival rates of juvenile fish. The major differences dealt with: (1) when, where, and what actions should be taken; and (2) which factors were the most influential on adult and/or young salmon survival and production. Only the fishery agencies and environmental groups presented proposed levels of protection that differed significantly from current State Board objectives .-

The primary factors identified by the USFWS, DFG and others that im rove smolt survival in the Delta are: (1) higher spring flows, (2! water temperatures below the stressful range of about 66' to 68OF, (3) minimizing the adverse impacts of water diversion that transport Sacramento Basin fish through the Delta Cross Channel and Georgiana Slough, (4) minimizing reverse flows that transport San Joaquin Basin fish away from their normal migration routes to CVP and SWP export pumps, and (5) minimizing diversions into upper Old River in the San Joaquin River Delta (T,XXXVI ,156:21-23; USFWS,31,62).
Following the September 1987 testimony on Chinook salmon, a five- agency working group was formed to begin discussions on how to deal with problems identified at that time. Membership includes staff from the USFWS, DFG, NMFS, USBR, DWR, and consultants from these agencies (T,XLIII ,78:12-23). Other groups such as the SWC and DTAC have participated in the discussion and planning process. A document summarizing the general goals listed possible actions to achieve these goals (DFG,65).
The goal set forth by the five-agency working group is to "...analyze actions which will improve the survival rates of juvenile salmon migrating downstream through the Sacramento or San Joaquin Rivers and the Delta" (DFG,65,2). The group plans to evaluate the cost and effectiveness of various actions proposed to increase salmon survival (DFG,65,2). These actions included evaluation of ways to increase or modify: current Delta flows, physical structures and/or operational changes to enhance survival and food supplies and to decrease diversion losses, and water temperatures (DFG, 65,4-5).
The positions of the various parties on water quality and related issues with regard to Chinook salmon in Phase I of the hearings are summarized below.
o SWC (SWC,201,22-27; T,LIX, 170:7-173: 13)
SWC recommended current striped bass flow standards be maintained as the salmon flow objectives until adequate data are available to determine whether changes are required.
SWC also recommended that the State Board adopt a salmon-management program including: short-term measures to increase the number of salmon spawning in the streams and rivers of the Central Valley; a comprehensive program of research, monitoring and full scale testing to provide the basis for developing a long-term program to achieve the goal s .
o DWR (T,XLIII,219:2-221:8)
Having presented data on the impacts of elevated temperatures on smolt survival, DWR did not propose any modifications in operation or flows in the Delta to minimize the impacts. DWR recommended that the existing striped bass standards should be the salmon standards.

o USBR (T,LXI, 120:24-131:6)
USBR recommended: An increase in natural salmon production; development of a system-wide management plan that addresses conditions in all salmon habitats; structural solutions, such as screens, to improve Delta survival instead of flow increases since structural solutions would minimize impacts on other beneficial uses; continuation of interagency studies and refine monitoring to determine effectiveness of new programs; operational f lexi bi 1 ity to respond to recommendations of the five-agency salmon group, and no change in existing standards unt i 1 the recommendation of the f ive-agency salmon group can be evaluated.
o DTAC, TIDIMID (DTAC,Brief ,9-14)
DTAC and TID/MID recommended that the smolt survival index not be used as a standard. Field studies using wild salmon should be carried out to address the effects of temperature on salmon survival and DFG, USFWS and NMFS should examine the effects of fishery management pol icies on salmon escapement.
o USFWS (USFWS131,3ld- j and 47)
USFWS recommended: The protection of Sacramento Basin fall-run smolts from April 1 through June 30.and San Joaquin Basin smolts from April 1 through June 15; the elimination of reverse flows during smolt emigration; the prevention of delays to adult migrants; and maintenance of unobstructed migration routes. Survival goals could be achieved by a combination of flow, operational and physical modifications. USFWS a1 so recommended that the dissolved oxygen levels be maintained above 5 mgll between Stockton and Turner Cut in the San Joaquin River in the fall months. No other participants made specific recommendations in regard to dissolved oxygen levels in either the San Joaquin or Sacramento rivers.
The USFWS recommended that salmon not be diverted from the Sacramento River at Walnut Grove, from the San Joaquin River at its junction with Upper Old River, and that water temperature be decreased to protect Delta salmon if it can be accomplished with a net benefit to fish.
o NMFS (T,LXI,22:24-28:4)
NMFS recommended that: In the Sacramento River system, Delta smolt survival for all four races should be that which occurred under 1940 levels of water development; the Plan should contain a blend of physical and operational management measures as we1 1 as some increment of flow increase to improve smolt survival; and interim standards should be established for the San Joaquin River System to improve salmon product ion.

o DFG (T ,XLI I I, 76:24-80: 24; DFG, 64 and 30)
DFG recommended that: survival of each race in the Delta should be based on 1940 historical levels; survival rate for Sacramento Basin fall-run salmon should be based on the USFWS flow to survival relationship in Exhibit 31; flow reversal should be eliminated by 1995 in the San Joaquin River and in Old and Middle rivers; survival levels in the San Joaquin River should also be based on historical levels (but these still need to be defined); and physical and operational measures should be considered to achieve protection.
o BISF (BISF, Brief ,8586 and 93-98)
BISF recommended that there should be objectives for wet, median, and dry year spring flows at levels greater than D-1485; and that outflows could be reduced in dry years provided compensating flows are available in other years. BISF also supported other measures proposed by USFWS.
5.0.3.3 Striped Bass
Advocated Levels of Protect ion
The issue of what to do about the decline in striped bass dominated much of the exhibits and testimony in Phase I and the Water Quality Phase, and the debate continues. Two main positions have evolved out of the debate. The first position is that there is still not enough known about the cause(s) for the decline of striped bass or that causes other than water qual i ty problems are responsible for the decl ine; therefore, the current objectives should remain in effect. In particular, greatly enhanced springtime flows, as advocated by DFG, USFWS and other participants in Phase I, should not be instituted at this time, but other interim measures, such as increased hatchery production, should be implemented (SWC, 203,4-5).
The second position is that, for whatever reasons, the striped bass are in serious decline and something substantial needs to be done now, even if we do not know all the answers. In particular, the current objectives are not providing adequate protection and should be modified to provide increased springtime Delta outflow and greater curtailments of spring and early summer exports for protect ion of young bass (USFWS,47,5; DFG, 64,6; WQCP-USFWS-5).
The recommendations proposed by the participants fa1 1 into three major categories: flow and diversions, sal inity and temperature, and "other". This third category includes operational changes, monitoring, physical facilities, special studies, changes in fishing regulations, control of pol 1 ut ion sources, and other non-water qual i ty, non-f low recommendat ions. The only recommendat ions discussed here are those relating to development of sal inity and temperature objectives.

o Salinity
For striped bass, the major issue relating to salinity was the establishment and maintenance of a suitable spawning area in the lower San Joaquin River. Current D-1485 objectives establ ish a spawning area between Antioch and Prisoners Point. DFG data show that striped bass do not migrate upstream into the eastern Delta past locations where the EC is greater than 0.55 mmhoslcm (DFG,25,44-46). In addition, the majority of striped bass apparently prefer to spawn in water of less than 0.3 mmhoslcm EC. DFG has testified that the formation of a salinity barrier in the mainstem San Joaquin River above Venice Island tends to restrict s awning runs and spawning activity in that area (T,XL1,68:1-69:10!. DFG also testified that historically striped bass did spawn above the Delta in the San Joaquin River system, but this activity has diminished due to reduced flows and degraded water qua1 i ty (T,XLII ,56: 5-19).
No participant other than DFG discussed the spawning zone sal inity issue in Phase I (except indirectly by recommending continuation of the current D-1485 objectives) . Those participants who wanted to make changes in these objectives recommended increases in Delta outflow or reductions in a1 lowable export levels, rather than salinity changes. The spawning zone issue received considerably more discussion in the February 1990 Workshop and the August 1990 hearing. The water development community general ly opposed any significant changes in the present objectives at this time, while DFG and USFWS agree that expansion of the habitat would be desirable. Salinity protection discussions are found in Section 5.6.2 and in Appendix 5.4.5.
o Temperature
No participant advocated any temperature protect ion objectives for adult bass migration or spawning, or for young bass survival. A review of two DWR exhibits and other relevant information on temperature effects on striped bass is presented in Appendix 5.4.6.
5.0.3.4 American Shad
Advocated Levels of Protect ion
TIBCEN and USFWS recommended flows for protection of American shad; USFWS a1 so recommended certain operational modifications to provide additional protection. BISF made no specific recommendations for American shad, but did recommend flows for the entrapment zone to provide adequate food. USBR recommended more comprehensive management of the system for protection of American shad and other resources (USDI ,Brief ,24). A1 1 other participants either made no recommendat ion or indicated that current objectives, or new objectives advocated for the protect ion of striped bass, would also provide adequate protection for shad. None of the proposed objectives were for salinity or temperature, except as related to the current 0-1485 objectives for protection of striped bass spawning habitat.

5.0.3.5 Delta Smelt
Advocated Levels of Protect ion
No specific recommendations for water qua1 ity objectives for the Delta smelt were discussed during Phase I.
Since conclusion of the Phase I hearings, a petition has been filed with the California Fish and Game Commission requesting that Delta smelt be added to the 1 ist of endangered s ecies under the California Endangered Species Act (See Appendix 4.0.5.1 7 . The Delta smelt was a candidate species for the state endangered species list for one year. DFG reviewed the petition and pertinent data and recommended that the species be 1 isted as threatened. The Fish and Game Commission at the August 31, 1990 meeting decided that there was insufficient evidence to list the species. Consequently, the Delta smelt presently has no legal status under the California Endangered Species Act. Under the federal Endangered Species Act (Federal Register, Volume 154, No. 4) the Delta smelt is 1 isted as a category 1 species. USFWS was petitioned in June, 1990 to 1 ist the Delta smelt as a federal endangered species. (See Appendix 4.0.5.1). A number of possible factors in the Delta could be contributing to the population decl ine. However, the petit ion recommended that the " . . . best and probably only way of preventing it (Delta smelt) from becoming extinct is to maintain high enough freshwater outflow through the Delta to keep the entrapment zone in Suisun Bay during March, April, May and June for most years. The entrapment zone should not be upstream from Suisun Bay for more than two years in a row" (Moyle and Herbold, 1989).
5.0.4 Suisun Bay Wildlife Habitat Beneficial Use
5.0.4.1 Suisun Marsh
Advocated Levels of Protection
o DWR, USBR, DFG, SRCD--Su isun Marsh Preservation Agreement (SMPA)
At the Phase I hearing addressing wildlife, DWR provided testimony and exhibits describing the measures taken by DWR, USBR, DFG and SRCD (called the Four Parties) to meet the Delta Plan requirements (DWR,503; 504; 506A; 5068; 507A; 5078; 508A; 5088; 509; 510; 511; 512; 513; 514; 517 A-B; 518; 519; 520 & 521). The measures included the Plan of Protection far the Suisun Marsh, Suisun Marsh Preservatian Agreement, Mitigation Agreement, and Monitoring Agreement. (See Table A5.0-1 and Figure A5.0-1 for the water qua1 ity control stations and "standards", respectively, in the SMPA. )
o BCDC
BCDC proposed that the Board revoke its decision of December 5, 1985, which amended the standards comp 1 i ance schedu 1 e in D- 1485 and changed monitoring locations (BCDC, 5,31; T,XXIX,238:22-25). The BCDC testimony also proposed an additional standard to protect tidal marshes adjacent to Suisun Bay (BCDC, 5, T4; T,XXIX, 239: 25-240: 2). It. is BCDC's position that the Board's 1985 amendments to D-1485 reduced

Table A5.0-1
SUlSUN MARSH PRESERVATION AGREEMENT WATER QUALITY CONTROL STATIONS
Sacramento River at C-2 Collinsvilie RSAC081
Montezuma Slough at S-64 effective National Steel, 3 mi SLMZU25 Oct 1 .I 988 south of Miens Landing
Montezuma Slough near S-49 Beldon Landing (0.35 SLMZU11 mi east of Grizzly Island Bridge)
Chadbourne Slough at S-21 Chadbourne Road SLBCNOl
and effective
Cordelia Slough 500 11 S-33 Nov 1,1992 west of S.P.R.R. crossing SLCRDW at Cygnus
Chadbourne Slough at S-21 Chadbourne Road SLBCNOl effective
Nov 1,1994 and
Cordelia Slough at S-97 Cordelia-Goodyear Ditch SLCRWG
Goodyear Slough at S-35 effective Morrow Island SLGY R03 Nov 1,1992 Clubhouse
Goodyear Slough, 1.3 mi S-75(old) south of Morrow SLGYRM effective Island Ditch Nov 1.1995
Suisun Slough, 300 ft S-42 South of Volanti SLSUSl2 effective Slough Nov 1,1998
Water Supply Intake No Locations locations for Water- specifled fowl Manangement Areas on Van Sickle Isl. and Chlpps Isl.

Figure A5.0-1
SMPA Water Qual i t y Standards
20.0
19.0 18.0 17.0
16.0
15.0
14.0
6 I 3 . O
a ;::: f ,0.0
r 9.0
" 0 . 0
W 7 0
6.0
5.0
4.0 3.0 2.0
1.0 0.0
act. NOV. k c . a n . ~ e b . mr . Ap-. -Y
Normal Stancards [24 Deflcrency St*.
Month
Oct . Nov . Dec. Jan. Feb. Mar. Apr. May
SMPA-Normal Standards
(Mean Monthly High Tide, E.C. in mmhos/cm)
SMPA-~ef iciencyl Standards
(Mean Monthly High Tide, E.C. in mmhos/cm)
A - I SMPA A r t i c l e l(f): ooDeficiency Periodoo shal l mean (1) a C r i t i c a l Year fol lowing a Dry o r C r i t i c a l Year; o r (2) a Dry Year following a year i n which the Fwr Basin Index was less than 11.35; o r (3) the second consecutive Dry Year following a C r i t i c a l Year.
" - SMPA A r t i c l e l(r): loUet Yearoo, IoAbove Normal YearI1, loBelow Normal Yeart1 and olSubnormal Snoumelt Yearo1 are as defined i n Footnote 2 of Table I 1 o f D-1485 as adopted by the SURCB i n August 1978. "Cr i t i ca l Yearo1 and IoDry YearM are also as defined i n Footnote 2 o f Table 11 of D-1485 except that runoff f o r the remainder o f the uater year shal l be assumed t o be equal t o the Lower value o f the 80 percent probabi l i ty range, as shown i n the most recent issue of B u l l e t i n 120, l1Water Conditions i n Californialo.

protection for unmanaged tidal marshes and delayed the implementation of measures to protect water qual ity and beneficial uses in the managed wetlands of the Suisun Marsh (BCDC,5,5). BCDC contends that approximately 40 percent of the 10,000 acres of unmanaged tidal brackish marshes around Suisun Bay which were original ly protected by the Delta Plan are not protected under present conditions (BCDC, 5,12; BAAC,4; USFWS,17;18;19;20).
o BAAC
BAAC recommended a flow and salinity standard which provides greater protection for brackish water tidal marshes than does the Delta Plan (T ,XXX, 52:6-22). In addition, they recommended that sal inity objectives for water qual ity in tidal marshes (levels not s ecif ied) be set for summer rather than ending in May (T,XXX,54:10-21 ! . The position of BAAC was that the brackish water marshes have already been degraded and they would like to see them improved and restored more toward their natural condition, which would require more stringent salinity standards (T,XXX,94:20-95:2). The BAAC testimony did not explicitly state what those freshwater flows or what salinity standards should be to adequately approach natural conditions.
5.0.4.2 Wildlife Habitat in Other Tidal Marshes
Advocated Levels of Protect ion
o DFG
The DFG testified that they do not expect reductions in Delta outflow to change the vegetative character of the tidal marshes in the central or southern portions of San Francisco Bay. Those tidal marshes are already fairly sal ine and support mostly pickleweed or cordgrass. They testified that the marshes around the periphery of San Pablo Bay, which contain some rare plants, could be subject to some harmful impacts if there were significant reductions in outflow. (DFG did not indicate whether peak or annual outflow reductions are under consideration.) They also stated that the marshes around Suisun Bay, including those on the southern shore from about Martinez to Pittsburgh would likely change from the existing emergent brackish water vegetative pattern to one more characteristic of sal ine marshes. The degree of change would depend upon the magnitude of the change in Delta outflow (T,XXIX,146:17-148:3). DFG did not propose any water qual ity objectives to address this possible change in vegetative character.
o BCDC and EDF
BCDC and EDF proposed salinity objectives to protect the brackish water tidal marshes around Sui sun Bay (BCDC, 5,T4; EDF, 19,A). They proposed that the monthly average of the daily high-high tide electrical conductivity be no more than 15 mmhoslcm during February and March, 18 mmhoslcm during April, and 20 mmhoslcm during May. BCDC

proposed that these salinity objectives be met at the following locations: Martinez, the mouth of Suisun Slough at Grizzly Bay, Port Chicago, and Chipps Island. The salinity objectives for February and March would apply at all stations during all water year types except for the 1-in-10 dry year; the objectives for April and May would apply in a7 1 water year types (BCDC, 5, T4).
o BAAC
BAAC maintains that the brackish water marshes have already been degraded and they would like to see them improved and restored more toward their natural condition, which would require more stringent sal ini ty standards than the present objectives (T,XXX, 94:20-95:2). BAAC did not indicate how the brackish marshes fared during historical dry periods such as 1928 to 1934,
BAAC recommended that flow and salinity objectives be set to provide greater protection for brackish water tidal marshes than does the Delta Plan (T,XXX,52:6-22). In addition, they recommended that the salinity objectives for water quality in tidal marshes (the levels are not specified) be set for summer rather than ending in May (T,XXX,54:10-21). The BAAC testimony did not explicitly state what freshwater flows or what salinity standards should be to adequately approach natural conditions.
5.0.5 Benthos
Advocated Levels of Protect ion
The benthic grazing hypothesis was proposed to explain the low phytoplankton and zooplankton populations during the 1976-1977 drought (CCWA/EDF, 7,385). In Suisun Bay, the benthic salt-tolerant, filter- feeding population (especial ly arenaria, which increased ten-fold compared to non-drought conditions) apparently become sufficiently abundant to be capable of filtering the equivalent of the entire volume of Suisun Bay in a day.
With this amount of feeding, it is hypothesized that benthic filter- feeders consumed virtually all phytoplankton and nutrient material in the water column. The pelagic (open-water) food web, which is based on phytoplankton, was therefore replaced by the benthic food web (CCWA/EDF, 7,386). CCWA/EDF is concerned this phenomenon would occur more frequently in the future with additional water development and exports. To address these concerns, CCWA/EDF proposed a 28-day tidal ly-averaged, bottom salinity of 5 ppt at Chipps Island in upper Suisun Bay to repel salt-tolerant benthic organisms from the entrapment zone area in Suisun Bay (T,LIV,316:16-317:3). This objective would apply from October through April in all years, exce t the one-in-twenty dry year (T ,LIV,258:20-259: 1; EDF,Brief ,7 ! . No comparable objective was proposed for San Pablo Bay (T,LIV,259:13-14). No participant proposed specific temperature or salinity objectives for the protection of the benthos.

5.0.6 Other Beneficial Uses
Other beneficial uses of the Estuary include navigation and contact and noncontact water recreation. Uses that are part of noncontact water recreation also include esthetic appreciation and educational and scientific study (RWQCB5, 1975, 5B, 1-2-2).
5.0.6.1 Navigation
Advocated Levels of Protection
Commercial Navigation -- no advocate for commercial navigation presented any testimony during Phase I of t h e proceedings.
Recreational Navigation -- PICYA recommended that there be improvements at the Delta Cross Channel for boat passage, protection of existing unleveed Delta islands, and maintenance of through navigation (PICYA,4), but these are not related to salinity or temperature objectives.
5.0.6.2 Estuary Recreation Beneficial Use
Advocated Levels of Protection
o EBRPD
EBRPD submitted testimony and exhibits which showed that there has been rapid growth (122 percent increase in two years) in water- oriented recreation within their jurisdiction (EBRPD,34,1).
EBRPD and PICYA emphasized their common interest in having abundant supplies of uncontaminated fish to provide boaters and fishers with an opportunity to experience successful fishing (PICYA, 1,3; EBRPD,34,3).
0 SWC
No explicit objectives were proposed by SWC for the protection of recreational uses in the Estuary. SWC argued instead that increased diversions would have no effect on recreational fishing in the Bay- Delta, and would be to the state's economic advantage because of higher recreational values in Southern California (SWC,66,12).
o BISF
BISF submitted exhibits and testimony regarding recreational uses of the San Francisco Bay area (BISF,38,T2; T,XXX, 174:29), and identified the values of a variety of water-oriented recreational activities from the California State Parks and Recreation Department's PARIS model (BISF,38,T3).
5.0.6.3 Export Recreation and Export Fishery Habitat
Advocated Levels of Protection
No participant proposed any sal inity or temperature objectives for export recreation or export fishery habitat distinct from the levels provided by the protection of municipal and industrial uses.

5.0.6.4 Export Agriculture
Advocated Levels of Protect ion
No specific water quality objectives were advocated for export agriculture during Phase 1 of the proceedings. Tolerances, in terms of EC, to salinities o f several crops grown in export areas was presented by DWR (DWR, 327). The crops addressed wi 1 1 theoretical ly experience reduced yields if the irrigation water exceeds these sal ini ty tolerances.

APPENDIX 5.1 TRIHALOMETHANES (THMS )
5.1.1 Types of THMs
Four different types of THMs, compounds consisting of a carbon atom combined with one h drogen atom and three halogen atoms (usually, chlorine or brominef, are commonly created in drinking water when it is disinfected (T,VI,38:5-8). Combinations of the halogens can exist in a1 1 four possible permutations: chloroform, (containing three chloride ions), bromodichloromethane (one bromide and two chloride ions), di bramochloromethane two bromide and one chloride ions), and bromoform (three bromide ions) T,VI ,45: 11-17).
5.1.2 Tri halomethane Formation Potential (THMFP)
In order to evaluate alternative water supplies, suppl iers of domestic water have developed analytical techniques to determine the potential of a water supply to produce THMs within the utility's water distribution system. The analytical techniques measure the trihalomethane formation potential (THMFP) of the water. The techniques for determining the THMFP of a water sample have not been standardized, nor can the THMFP of a raw water supply correlate directly to THM concentrations of the water in a distribution system after water treatment. However, lower THMFP levels in source water do indicate lower THM concentrations after water treatment.
Based upon data from the Interagency Delta Health Aspects Monitoring Program (IDHAMP), the THMFP of water increases as it travels across the Delta (DWR,225). The 50 percent probability of occurrence values for THMFPs in Cache Slough, Rock Slough, Delta-Mendota Canal, Clifton Court, and H.O. Banks Pumping Plant are 740, 430, 440, 450, and 480 ugll, respectively. The levels in the Sacramento River at Greens Landing and the San Joaquin River near Vernal is (the principle Delta source of fresh water) are 250 and 450 ug/l, respectively. Using these values, the THMFP of water moving across the Delta increased by approximately 170 ug/l (SWC,204,11-15). Although a significant correlation has not been developed between the THMFP of a source water and the THM concentration of the treated water delivered to a domestic user, the THMFP levels present in Delta waters are nonetheless a significant water treatment issue to users of Delta water (T,XLVI ,122: 17-142: 10).
Figures A5.1-1, A5.1-2 and A5.1-3 show the THM formation potential (THMFP) in the Delta for a 5-year median, 1983-1987 (Figure A5.1-1); under low flow conditions, October 1985 (Figure A5.1-2); and under high flow conditions, March 1986 (Figure A5.1-3). Five key water quality stations located in the Delta are shown in these figures. Each station is represented by a pie chart that is divided into two portions. The shaded portion shows the fraction of the total that contains brominated THMFPs; the unshaded portion shows the fraction that contains only chloroform. The Mallard Island station in Figures A5.1-1 and A5.1-2 indicates that seawater is the primary source of bromide ions.

Figure A5.1-1
SCALE IN MILES
LEGEND TOTAL 260
GREENE'S LANDING
Chlorof odn Fornation Potential Cug/L)
Area o f h e / s Proportional t o Total T W P
TOTAL 909
MALLAPD ISLAND
,
TOTAL 430
BANI ': TlIrQk. 4618 -/EP~IALI 2
THM FORMATION POTENTIAL IN THE DELTA, BYEAR MEDIAN, 1983-1987
(F'rom DWR: The Delta as a somce of drinking water)
5.1-2

LEGEND
Bronlnated Methane forn. Potential (ug/L)
Chtorof orn Fornation Potential <ug/L>
Area of Pie is Proport~onal t o Total THMFP
S a i r ~ n e n t ; ~ 2 0 2 3 6
K A L E IN MILES
TOTAL 215
GHEENE'S LAtJDING
TOTAL 1020
MALLARD ISLAtJD
T C ? . -L 540 \<-/
BArJh3 T C T A L 4 1 C
.,,ER'drL::
TBM FORMATION POTENTIAt IN TIIE DELTA UNDER LOW FLOW CONDFIlONS , OCTOBER 1988
(From DWR: The Delta as a source of d r i i g water)

LEGEND
Bronlnated Methane Form Potential <ug/L)
Chlorof w n Fornat~on Potential <ug/L>
Area o f Ple la Proport~onal t o Total THMPP

result in the product ion of disinfect ion by-products (DBPs) other than THMs. For example, ozone reacts with bromine to form bromate and hypobromous acid, which in turn reacts with dissolved organics to form bromoform (Daniel, 1989).
5.1.4 Human Health Effects
Although EPA is currently evaluating the cancer risk of THMs as a class of chemicals, each brominated THM has already been classified as a probable or possible human carcinogen by the EPA (Delta M&I Workgroup Report, Appendix A, M. McGuire and S. Krasner, MWD). Also, it is currently believed that brominated THMs pose a greater hazard to human health than the totally chlorinated THM (chloroform) (Delta M&I Workgroup Report, 1989, p. 5).
5.1.5 Water Treatment Problems
A1 1 conventional treatment processes, including chlorination, chloraminat ion and ozonation, result in the production of brominated THMs and other brominated DBPs when bromide ions are present (Delta W&I Workgroup, p.3). When both organic matter and bromide ions exist in water, THM concentrat ions increase more rapidly during or after chlorination compared to water without bromide ions (T. Aizawa et al., "Effect of Bromide Ions on Trihalomethane Formation in Water" - _Aqua, Vol. 38, pp. 165-175, 1989). Some of the conclusions drawn by Alzawa include:
temperature. The pH affects the dissociation.^? chlorine in water and determines its oxidized ratio with bromide.
2. In the reaction of THM formation, chloroform concentration was reduced in proportion to bromide ion concentrat ion. However, the concentration of total THM increases with the augmentation of bromide ions with the same amount of chlorine dosage. The increase in total THM concentration is up to two times higher than in the absence of bromide ions.
3. Even when residual chlorine is not present, the THM intermediates, once formed, are hydrolyzed depending on the pH and water temperature. The stabi 1 i ty of the chlorinated intermediate and the
, brominated intermediate are different. The intermediates which contain greater amounts of bromide show a greater extent and a faster rate of hydrolysis.
These findings parallel those reported by participants of the Delta M&I workgroup after they analyzed the relationships among chloride, bromide, total THM concentrations. For example, data from the Metropol itan Water District's Mil 1s and Jensen Water Treatment Plants for 1985 to 1989 (Tables A5.1-1 and A5.1-2) indicate that both the bromide level and concentration of brominated THMs increased as water supply chloride levels increased. The total THM concentration

Figure A5.1-2 shows that the brominated THMFPs measured during October 1985, increased to three times the median value at Harvey 0. Banks Pumping Plant and six times the median value at Rock Slough, as a result of seawater intruding into the Delta during low flow conditions. However, the brominated THMFP values in the Sacramento and San Joaquin rivers remained near median values. In contrast, Figure A5.1-3 (THMFP under high flow conditions) shows that the brominated THMFP at the export pumps is reflected by the influences of both seawater and the San Joaquin River (IDHAMP - Summary of Monitoring Results, 1983 to 1987).
Of the total median brominated THMFP concentrations from the Sacramento and San Joaquin rivers only, the San Joaquin concentrations are nine times greater than those in the Sacramento River. The sources of bromides in the San Joaquin River are not known. Possible sources are connate water, from marine sediments found in the San Joaquin drainage, and bromide-containing Delta water used in San Joaquin agriculture (IDHAMP - Summary of Monitoring Results, 1983 to 1987).
5.1.3 Bromide Ions
Bromide ions are present in seawater, typical ly at concentrations about 0.003 times the concentration of chloride ions. Measurements by agencies using Delta water for raw drinking water show a relationship of this same type. MWD developed the following linear regression, equation relating bromide and chloride ions for SWP water delivered to their service area:
Br- = 0.00289 (Cl-) + 0.00671
Where;
Br- = The bromide ion concentration, in mg/l, and C1- = The chloride ion concentration, in mg/l
The correlation coefficient for the above equation is definitely significant (r = 0.955) (Krasner, 1989, p. 3). An apparent second, though less significant, source of bromide ions is connate ground water which enters the San Joaquin River upstream of Vernal is (Jung, 1989, p. 6). Some connate waters with relatively high bromide levels exist beneath at least two Delta islands (i.e., Bouldin Island and Empire Tract) and may contribute bromide ions to the agricultural discharges from those islands (Winkler, 1989; DWR,225,22).
The difficulties with bromine arise for two reasons: one is due to its molecular weight, the other is due to the chemistry of bromine. The atomic weight of bromine is approximately twice that of chlorine, so the substitution of bromine for chlorine in a molecule increases the molecular weight. Drinking water standards are set on a weight basis. Thus, the existing EPA 100 ugll THM water qua1 ity standard that is met when no bromine is present may not be met if a significant amount of bromine is substituted for chlorine (without changing anything else) (Delta M&I Workgroup, 1989, p. 4. ) . Chemical reactions involving bromine in water treatment systems which do not use free chlorine can

TABLE A5.1-1 Mills Plant THM Results*
Date -
Plant Influent Plant Effluent Temp EC Cl- Br' CHCl3 CBC12Br CHClBr2 CHB-
*~reatment plmt : pre-cfrlo~ination/post-ammoniat ion.
#bee chlorine only.
Referenee: Delta MI & I Workgroup Report, Appendhr A
SEP-25-89 HON 16:36

TABLE A5.1-2 Jensen Plant THM Resultst
Plant Inf luent Plant Ef f lueat -
Temp. EC C1' Br' CHC13 CHC12Br CHClBr2 CHBr _. Date - O c - umho/cm mg/t mg/L VR/L ug/L vg/L *
8/15/85 18 447
8/85 CMP 35
11/14/83 18 451
11/85 CMP 4 5
5/9/89 131 0.39 6/89 CMP 123 7/89 CMP 125 7/18/89## 16 4 18 43 38
r re at men t plant t pre-chlorination/pos t-ammoniation.
t h r e e chlorine only.
CMP - monthly composite sample.
Reference: Delta M & I Workgroup Report, Appendh A
S E P - 2 5 - 8 9 NON 16:36 G 3 P . 16

increased to approximately 100 ug/l; this forced MWD to change its disinfectant from chlorine to chloramines. As chloride concentrations increase in Delta water, the accompanying increases in bromide concentrations result in higher total THM formation upon disinfection (Delta M&I Workgroup - S.Krasner). Data presented by researchers (Krasner, McGuire et al., AWWA Journal, Au ust 1989; also Delta M&I Workgroup Report. Appendix A, Krasner, MwDB indicate that elevated levels of bromide result in THM concentrations that are close to, or in excess of, current standards.
Theoretically, the Delta water THM problem could be resolved through removing either the bromide ions or total organic carbon (TOC) from the water prior to treatment or the THMs after treatment. However, there are no conventional treatment methods that will efficiently and economically remove THM precursors, TOC, bromide ions or THMs. Conventional treatment methods include chlorination, chloraminat ion and ozonation; these can be used in various combinations to limit the formation of THMs. In the process of disinfection, however, these technologies will cause the formation of other DBPs (Delta M&I Workgroup Report, p. 3).
While mentioned above under conventional treatment, ozonationlpost- chloramination is considered to be an advanced water treatment technology by some members of the water treatment community and of the Delta M&I Workgroup. Other non-conventional or advanced water treatment technologies include ul tra-f il tration, reverse osmosis, granular activated carbon (GAC), and PEROXONE. These technologies are discussed below:
o Ozonat ion/post-chloraminat ion is considered to be the treatment o f choice at many water treatment plants. This treatment method will result in reduced THM concentrations in delivered water, particularly if bromide ions are not present in the source water. However, the use of ozone will result in the formation of other DBPs which are currently under regulatory consideration. The Delta M&I Workgroup concluded that ozonated water containing high bromide levels will result in the production of brominated THMs. Based on informat ion submitted in the Workgroup report, it appears that ozonation/post-chloramination may be a viable water treatment technology if a revised EPA objective (standard) for THMs is around 50 ug/ 1.
Information recently obtained by the State Board (pers. comm. with P. Daniel and P. Meyerhofer of Camp, Dresser, and McKee, Inc.) suggests that water treatment using ozonation/chlorination with the addition of a trace amount of ammonia upstream of the ozone contactor may result in very low THM levels, less than 3 ug/l. Other DBPs produced are similarly low. Water spiked to a 2.0 mg/l bromide level corresponds to approximately a 690 mg/l chloride level when back calculated using the bromide/chloride ion concentrat ion relationship. However, inaccuracies are magnified when using the relationship at levels being discussed.

Uncertainties exist using the ozonation/chlorination/arnoniation water treatment method. The work completed to date is very preliminary and thus far no conclusions can be drawn. Additional uncertainties include:
- Bromamine, a DBP may form as a result of ammonia reacting chemically with bromide. The extent of this reaction and resultant odor threshold of the bromamine are unknown at this time.
- Ammonia may act as a source of nitrogen for bacterial growth, resulting in high regrowth. Further investigation is needed.
MWD1s estimated capital costs for conversion to ozone treatment is $300 mil lion. Estimated total annual cost for conversion to ozone (amortized capital costs and operations and maintenance costs) are approximately $67.5 mi 1 1 ion. (Delta M&I Workgroup Report, Appendix A, S. Krasner, MWD.) Table A5.1-3 shows the costs for adding ozone treatment to existing water treatment plants.
o Theoretically, it may be possible to remove the bromide ion and TOC prior to disinfection by ul tra-f i ltration. However, according to the Delta M&I Workgroup Report, " . . .ul tra-f i 1 trat ion has not been used in full-scale at any major United States plant and is too new a technology to be re1 ied upon to meet the needs of the next five to ten years" (S. Krasner, Delta M&I Workgroup Report, p.9).
o Reverse osmosis could theoretically eliminate the THM and DBP problems even with the current TOC and bromide levels found in Delta source waters. However, the associated costs would be very high. MWD claims it would cost about $0.5 billion to convert 150,000 AF of Delta quality water to quality similar to that of the Mokelumne River and approximately $3 billion for MWD1s total supply (pers. corn., D. Clemmer, MWD). This estimate does not include the associated costs for brine disposal which absorbs about 10 to 15 percent of the del ivered water supply (pers. comm. , J. Gaston).
o Granulated Activated Carbon (GAC), according to the Delta M&I Workgroup Report, wi 1 1 not remove inorganic ions such as chlorides or bromides; however, simulated distribution testing indicates that it will remove organic THM precursors (TOC) to levels that would produce 5 to 10 ug/l THMs. (The simulated distribution system test was developed by MWD to mirror actual treatment conditions that would be found in a water treatment plant). A study completed by MWD which focused on the reduction of THMs and other DBPs to very low levels, concluded that GAC is an expensive way to control THMs. The siting of GAC regeneration furnaces in southern Cal ifornia would present a problem due to the atmospheric emissions of toxic by-products. MWD has estimated that the approximate costs for conversion of its treatment facilities to GAC technology would be $1.3 billion in capital costs and $421 million in yearly total

TABLE 85.1-3 Cost for exlstlng surface water
treatment plants to add ozone treatment
DESIGN CAPITAL AMORITIZED 0 & H TOTAL AGENCY PLANT NAME FLOW COST CAPITAL COST COST
MOD $Million $Hil/yr. $Mil/yr. $Mil/yr. = = = = = = = = = = = = = = = = = = = = = = = = = = = = = = = = = = = = e = = = = = = = = = = = = = = = = = = = = = = = = = = = = = = = = = = = = = = = = = = = = = = = = = = = = = = = Alameda CFCWOD, Zone 7 Patterson Pass 14 $4.2 $0.42 $0.41 $0.84 Alameda CFCWOD, Zone 7 Del Valle 18 $4.0 $0.60 $0.47 , $0.07 Alameda CWD 10 $3.3 $0.34 80.30 $0.64 Amerioan Canyon WD 2 $1.1 $0.12 $0.17 $0.28 Antelope Val/East Kern Eastside 3 $1.6 $0.16 $0.10 $0.36 Antelope Val/East Kern Rosamond 14 $4.2 $0.42 $0.41 $0.84 Antelope Val/East Kern Quarte Hill 2 8 $8.8 . $0.67 $0.61 $1.28 Antioch 16 $4.6 $0.46 $0.44 $0.91 Avenal . . 2 81.1 80.12 $0.17 $0.28 Benioia, City of 10 $3.3 $0.34 $0.30 $0.64 Castaio Lake Water Agan. Earl E. Schmidt 12 $3.8 $0.36 $0.30 $0.77 Coalinga 12 $3.8 $0.38 $0.38 80.77 Contra Costa WD Bol lman DO $14.4 $1.47 $1.68 $3.13 Crestline-Lake Arrow. Crestline-Lk.Arrow 6 $2.1 $0.21 $0.22 $0.43 Fairf leld Waterman 2 2 $6.6 $0.57 $0.63 81.10 Fairf ield Fairf ield 30 $8.9 $0.70 $0.84 81.34 Huron 2 81.1 80.12 $0.17 $0.28 Kern Co WA, ID #4 2 8 $8.6 $0.87 $0.81 $1.28 Martinea, City of 12 $3.8 $0.38 $0.30 $0.77 Metropolitan WD SoCal Hills 238 $27.6 82.80 $3.80 86.30 Metropolitan WD SoCal Skinner 664 $48.6. $4.94 $8.02 $12.06 Metropolitan WD SoCal Jensen 870 $66.6 $8.68 $13.65 $20.24 Metropolitan WD SoCal Weymouth 600 $46.3 $4.82 $7.74 $12.38 Metropolitan WD GoCal Diamer 710 $67.3 $5.84 $0.68 $16.62 Naps . Hennassey 20 $6.3 90.64 $0.60 $1.04 Naval AS-Lemoore 8 $2.0 $0.29 80.28 $0.67 Oakley 6 82.4 $0.24 82.49 $2.73 Palmdale 12 $3.8 $0.38 $0.30 $0.77 Pittsburg 12 13.8 $0.38 $0.30 $0.77 Santa Clara VWD Penitenoia 40, $8.4 . $0.86 $0.83 $1.68 Santa Clara VWD Rinoonada 76 $12.8 $1.30 $1.24 $2.64 Santa Clara VWD Banta Teresa 100 816.6 81.68 $1.94 $3.61 Traoy 12 83.8 $0.38 80.39 $0.77 Valle jo 6 $2.1 $0.21 $0.22 $0.43 Valle jo 30 $6.0 $0.70 $0.84 '$1.34 ----------------------------------------------
T O T A L S r 3620 8304 $40.18 $60.36 $100.63
AHORTXZI6D COST AT 8% AND 20 YEARS
Reference: Delta M & I workgroup report, Appendix A

costs (amortized capital costs plus operations and maintenance costs). This is based on meeting a revised total THM maximum contaminant level (MCL) of 25 ugll (Delta M & I Workgroup Report, Appendix A, S. Krasner, MWD).
The SWC have also estimated costs for meeting GAC technology. They estimate $2 billion in capital costs and $344 million in operations and maintenance costs per year for a total annual cost of $549 million (Table A5.1-4). This would yield an aggregate cost of $140/AF (T,XLVI,138:5-10). It was not made clear what THM MCL level this technology could meet.
o PEROXONE is the combination of ozone and hydrogen peroxide. Delta M&I Workgroup participants believe that this technology shows promise for disinfection, oxidation of taste and odor compounds, and control of DBPs. Costs associated with this technology are lower than the others previously discussed. MWD has estimated that the approximate costs for conversion to PEROXONE would be $200 million. The effectiveness and reliability of PEROXONE have yet to be demonstrated at full scale. The Delta M&I Workgroup Report (Appendix A, S. Krasner , MWD) states that unresolved quest ions remain concerning how large-scale hydraul ic mixing systems wi 1 1 affect the reactions between hydrogen peroxide and ozone, and whether disinfection efficiencies demonstrated in pilot-scale studies can be confirmed at full-scale. MWD is proceeding with plans to test PEROXONE at a 5.5 mgd demonstration treatment plant, the results of which should be available in 1992 (Delta M&I Workgroup Report, p. 9).
5.1.6 Regulatory Problems
DBPs were not recognized as potential human health hazards present in treated drinking water in the 1978 Delta Plan and subsequent triennial reviews. Information on the subject was not available at that time. Currently, limited information is available. In summary, this information is limited to the general facts that DBPs are formed as a result of disinfecting drinking water; that DBPs are suspected human health hazards; and that DBPs will likely be regulated by EPA in the near future, around 1994. DBPs are being addressed here in recognition of the fact that, while much uncertainty exists regarding their formation and health effects, the minimization of DBPs should be considered in the search for any long-term solution regarding Delta drinking water quality.
Every chemical disinfectant currently being used roduces DBPs (Delta M&I Workgroup Report, Appendix A; S. Krasner, MwDP. The EPA is currently considering the establishment of MCLs for certain DBPs and for disinfectants used to treat drinking water supplies. MCLs for disinfectants and for DBPs are scheduled to be proposed in late 1991 and finalized in fall 1992, barring development of new information that would require reevaluation and additional time for public comment. Under this time schedule, compliance by water districts would be required in 1994 (Delta M&I Workgroup Report, Appendix A; S. Clark, EPA) .

TABLE A5.14 Cost for existing surfam water treatment plants to add GAC
AGENCY PLANT NAME DEBION CAPITAL AMORITIZED 0 & H TOTAL FLOW COST CAPITAL COST C08T MOB $Million SMil/yr. $Mil/yr. SMil/yr.
======t================tt===================z===========3=====z============================= Alameda CFCWOD, Zone 7 Patterson Pass 14 816 $1.6 81.5 $3.1 Alameda CFCWOD, Zone 7 Del Valle 18 $10 $1.0 $1.9 $3.8 Alameda CWD 10 $13 $1.3 $1.1 $2.4 Amerioan Canyon WD 2 $6 $0.6 $0.3 $0.0 Antelope Val/East Kern Eastside 3 $7 $0.7 $0.4 $1.1 Antelope Val/East Kern Rosamond 14 816 $1.6 81.6 $3.1 Antalopa Val/East Kern Quartt Hill 28 $26 $2.6 $2.0 $6.4 Ant iooh 16 917 81.7 $1.7 $3.4 Avenal . . 2 $8 $0.6 SO. 3 80.0 Beniaia, City of 10 813 $1.3 $1.1 82.4 Camtalo Lake Water Agen. Earl E. Sohmidt a 12 $14 $1.4 $1.3 $2.7 Coalinga 12 $14 , 81.4 $1.3 $2.7 Contra Costa WD Bollman 90 86 1 $6.2 $0.1 816.3 Crestline-Lake Arrow. Crestline-Lk.Arrow 5 $0 $0.0 $0.6 $1.5 Fairf ield Waterman 2 2 $21 $2.1 $2.3 $4.4 Fairf ield Fairfield 30 826 82.6 $3.1 86.7 Huron 2 86 80.6 $0.3 80.0 Kern Co WA, ID 84 28 $2 6 $2.6 82.8 86.4 Martineo, City of 12 814 $1.4 $1.3 $2.7 Metropolitan WD SoCal Mills 236 8138 $14.1 823.0 838.0 Metropolitan WD 8oCal Skinner 664 8282 828..7 861.0 880.8 Metropolitan WD SoCal Jensen 670 $304 $40.1 $83.5 $123.6 Metropolitan WD SoCal Weymouth 600 8264 826.0 847.4 874.3 Metropelitan WD BoCal Dierner 710 8346 836.2 869.7 8104.0 Napa . Hennessay 20 $20 92.0 82.1' $4.1 Naval AS-Lemoore 8 811 $1.1 80. 0 82.0 Oakley 8 810 81.0 80.7 $1.7 Palmdals . 12 814 81.4 81.3 82.7 Pi ttaburg 12 $14 81.4 81.3 82.7 Banta Clara VWD Penitenoia 4 0 832 83.3 84.1 87.4 Santa Clara VWD Rinoonada 75 S62 86.3 87.6 812.8 Santa Clara VWD Banta Teresa 100 886 88.7 810.0 618.7 Traoy 12 $14 81.4 81.3 82.7 Vallejo 6 10 $0.9 80.8 81. S Vallejo 30 $26 $2.6 83.1 $6.7
--0.- L-II..-.-----------~..-.-............-.~I.----
T Q T A L S r 3620 82,021 8206.0 $344.3 8640.3
AMORTIZAPION AT 8% AND 20 YEARS
Reference: Delta M & I workgroup report, Appendix A

Table A5.1-5 lists some of the disinfectants and DBPs considered for MCLs and maximum contaminant level goal (MCLGs) by EPA. If a contaminant is a known or possible human carcinogen, then the MCLG is set at zero. A balance of the health risk of DBPs with the health risks of microbial disease is established by EPA when considering establishment of MCLs. The following narrative is derived from Appendix A of the Delta M&I Workgroup Report, as presented by J. Orme, EPA.
According to EPA, classes of DBPs rather than the individual compounds themselves will probably be regulated in much the same way as THMs. MCLs will likely continue to be considered on a mass per volume basis.
Much uncertainty exists concerning the hazards to human health posed by these disinfectants. For example, chlorine has been used as a disinfectant for nearly eighty years without undergoing rigorous toxicological testing to determine its effects on human health from ingestion. Studies indicate that chlorine can affect kidneys and thyroid hormone levels of laboratory animals. A weak correlation has a1 so been establ ished between consumption of chlorinated surface water and bladder cancer in humans. Chlorine dioxide affects red blood cells and appears to have developmental and neurotoxic effects. Chloramines affect the organ weights of rats and mice. Additional risk assessment studies for these disinfectants are underway.
TABLE A5.1-5 SOME DISINFECTANTS AND DISINFECTION
BY-PRODUCTS CONSIDERED FOR DEVELOPMENT OF MCLGS AND MCLS
Disinfectants
Chlorine Chlorine Dioxide Chloramine (Ozone is not being considered because no residual is left upon which to base an MCL)
Disinfect ion By-Products
~rihalomethanes: Chloroform Bromof orm Bromodichloromethane D i bromoch 1 oromethane
Chlorinated Acetic Acids/Brominated Acetic Acids Chlorinated Alcohols Chlorinated Aldehydes Chlorinated Ketones Chlorite and Chlorate Haloacetoni tri les Ch lorophenols Chloropicrin Cyanogen Chloride Iodide, Iodate Bromide, Bromate MX
Reference: M&I Workgroup Report, Appendix A
5.1-14

Brominated THMs have been classified as a probable or possible human carcinogen by EPA. Chloroform is still suspected to be a carcinogen. Chlorinated acetic acids have been found to occur in concentrations equal to THMs. Animal studies suggest that certain species of the chlorinated acetic acids are potent neurotoxins and may also be carcinogenic. Based on animal studies, haloacetonitriles are believed to be carcinogenic. Health hazards associated with chloropicrin are currently under study. A1 though health effect informat ion on cyanogen chloride is limited, it was used as a nerve gas agent in World War I. MX is known as a highly unstable potent mutagen. Studies on this chemical continue.
The formation of DBPs is dependent upon several variables: bromide concentrat ion, oxidant concentrat ion, contact time, the presence of dissolved organics, temperature, and pH. In short, every method of water treatment has advantages and disadvantages. In a recent DBP survey of 35 utilities conducted for the California Department of Health Services by the EPA, it was found that THMs measured by weight, were the largest class of DBPs found. The next significant class found were the haloacetic acids, followed by the aldehydes. Of the 35 utilities in the study, only three employed ozone, yet almost all had detectable levels of formaldehyde and acetaldehyde. (Aldehydes were initial ly discovered as by-products of ozonat ion; however, they also appear to be caused by chlorination) (AWWA Journal, August 1989).
Ozonat ion/chloraminat ion is frequently mentioned by many water treatment plant managers as the alternative treatment of choice for reduction of THMs. Ozone alone should not produce chloroform or other chlorinated DBPs. However, if bromide ions are present in the source water, ozonation will cause the formation of hypobromous acid, which will react with organic precursor material to form brominated forms of THMs. In addition, chloramination tends to increase the formation of cyanogen chloride at the same time it decreases the formation of THMs (Delta M&I Workgroup Report, Appendix A; M. McGuire and S. Krasner, MWD) .

APPENDIX 5.2 ANALYSIS OF CORN YIELD TO VARIATIONS IN APPLIED
WATER AflD LEACH HATER SALINITY
To ensure a reasonable level of protection for western and interior Delta agriculture informat ion is needed in the fol lowing three areas:
1. The impacts of irrigation and leaching water quality on crop yield,
2. The economics of implementing various leaching practices, and
3. The practicality of implementing and the effectiveness of various leaching practices.
The Corn Study developed information on the impacts of irrigation and leaching water quality on corn yield, only limited information on the practicality of implementing and the effectiveness of specialized leaching practices, and no informat ion on the practical ity, effectiveness, and economics.
Although insufficient information is available to set a water quality objective, it is important to discuss the progress made in the first area, impacts of irrigation and leaching water quality on corn yield.
o Salinity Requirements for Corn
Sal inity requirements to maximize the yield of corn grown on organic subirrigated soi 1s are based on the testimony and exhibits from Phase I and the results of a modified DWR DELCORN model (modified DELCORN). This body of information indicates that corn yield is affected by both short-term water quality and long-term, average water quality. Evidence indicates that in order to maintain maximum corn yield, in the short-term, the maximum 14-day running average of daily average salinities of applied water should be no more than 1.5 mmhos/cm EC from April 1 through July 31. After July 31 salinity levels may rise to a level of up to 6.0 mhos/cm EC without affecting yield (SWRCB,24,1). Proper corn yield also requires long- term average irrigation water quality maintain so salinity at a level 11 requiring a particular frequency of pond leaching . The frequency of pond leaching is determined by considering the practicality and the economic effects of the farming practices needed to maintain maximum corn yield.
Pond leaching is that practice which is p e r f o h by constructing berm a m n d an area and flooding the area. Fol lowing an extended period of f loodlng, the f ie ld is drained to prepare for cropptng. Dra lnage ditches and drainage pups are ass& to be in operat ion throughout the leachfng period (DWR,334,2). Pond leaching occurs in the months of December through February when the previous irrigation seasons's average saturated so i 1 extract sa 1 inity (ECef exceeds 2.1 mhoslcm EC.

To help determine this long-term average water qual ity objective, the modified DELCORN model was used to identify possible alternative levels of irrigation and leaching objectives needed to protect western and interior Delta agriculture. DWR's DELCORN model's algorithm uses Hoffman's equations, which were presented as SWRCB evidence in Phase I of the Hearing (SWCRB,23-30). These equations describe the relationships between seasonally applied water quality, soil salinity, and yield. DWR's DELCORN model applies a 57-year hydrology to these equations at a number of locations in the western and interior Delta to simulate a history of soil salinities and subsequent yields. The DWR DELCORN model has gained general acceptance, with some reservations. The model is be1 ieved to overestimate the frequency that leaching is required. A comparative impact analysis is therefore considered more re1 iable than a predictive study.
o Description of Comparative Impact Analysis
The modified DELCORN model was used to develop pond leaching frequency curves for the comparative impact analysis. Each curve identifies a set of combinations of irrigation and pond leach water qual ity needed to maximize corn yield, given a particular hydrologic condition.
Inspection of these curves illustrates the importance to agriculture of a factor general ly overlooked, that is, "umbrella protection". Western and interior Delta agricultural water qual ity is not only determined by agricultural water qual ity objectives, but much of the time by the incidental effect of unregulated flow releases and objectives protecting other beneficial uses. These incidental benefits are given the term "umbrella protection". Most of the time umbrella protection controls agricultural water quality in the western and interior Delta. The following analysis determines that the factor controlling the quality of water that agriculture receives will not be the long-term average water quality objective, but either the umbrella protection or the 1.5 mmhos/cm EC maximum irrigation water qual ity objective over the irrigation season.
o Comparative Impact Analysis of Irrigation and Leaching Water
Figure A5.2-1 shows the estimated pond leaching frequencies that are required if there is no umbrella protection. A wide range of combinations of irrigation and pond leach water qual ity can be used to attain a part icu 1 ar leaching frequency. For a given leaching frequency the optimal EC concentration to obtain the objectives with the minimum Delta outflow is shown by the intersection of the appropriate leaching frequency curve and the minimum required outflow curve (see Figure A5.2-1). Figure A5.2-2 shows the estimated pond leaching frequencies that are required if uncontrol led reservoir releases and Delta Plan level umbrel la protection are available. Figure A5.2-3 shows present level of development or base condition impacts for a 57-year hydrology.
The curves shown in Figures A5.2-1 and A5.2-2 and information from Figure A5.2-3 are used in a comparative analysis to determine the relative effects between the current or base condition and various other levels of protection, based on frequency of leaching. In this comparative analysis, a base condition and two alternative conditions are chosen. These alternative conditions are then compared to the base condition to arrive at an incremental effect.

FIGURE A5.2-1
a > .- A
0
G -.i= W EL- .-
IRRIGATION VS. POND LEACH WATER QUALITY AT EMMATON FOR MAXIMUM YIELD
DATA GENERATED USING DWR'S DELCORN MODEL
- : : . . . . 'ri) ~ & . + ~ j $ + a ~ ; ~ f ~ e ~ ~ i : : . . . : : : : : :/ : ; . . . . . . . . . . . . . . . . . . . . . . . . . . . . . . . . . . . . . . . . . . . . . . . . . . . . . . . . . . . . & ~&a'Fio.& .& uinbi&fypl.4tjd;lf f ; ; : Ij . . . . . . . . . . . . . ': . . . . . . . . . . . .t:. :....:::. :::::::K . . . . . . . . . . . . . . . . . . . . . . . . . . . . . . . . . . . . . . . . . . . . . . . . . . . . . . . . . . . . . . . . . . . . . . . . . . . . . . . . . . . . . . .
Curve of Minimum Required Outflow for Various Leaching Frequencies Equation of Curve: Y = 3.1 531 E-02+EXP(2.1170*X)
I I I 1 I I
1 .o 2.0
Pond Leach Water Quality Objective (EC), nlxnllos/cillz
A For a given leaching frequency the optimal concentrations (EC) to obtain the objectives with minimum flow is shown by the intersection of the flow curve and the appropriate frequency curve.

FIGURE A5.2-2
IRRIGATION VS. POND LEACH WATER QUALITY A T EMMATON FOR MAXIMUM YIELD
DATA GENERATED USING DWR'S DELCORN MODEL
0 1 .O 2.0 3.0 3.4 Pond Leach Water Quality Standard
(EC), mmhos/cm

FIGURE A5.2-3 Variation in Corn Yield With Different Leaching Practices at Emmaton
Assuming 1990 Level of Development Hydrology bAeetfng M485 Standards (Study A)
(Cornled Pond Leaching Equatfon Incorporated)
POND LEACH WHENEVER MEAN SOIL SAUNlTV EXCEEDS 21 d9m 57 YEAR AVERAGE YIELD 3: 99 %
12 PERIODS OF POND LEACHING
Y EAA
LEGEND: + = Pond Leaching Performed
&
The current objectives, including umbrel la protect ion, were chosen as the base condition for this comparative analysis. DWR provided this information from a model simulation (see Figure A5.2-3). The results indicate that, under this base condition, pond leaching would be required 12 times during this 57-year period, approximately once every five years.
The first alternative level of protection studied was that level of salinity, assuming Delta Plan umbrella protection, for which the frequency of leaching was the same as for the base condition; once in five years. This level of salinity can be determined by looking at the plot of curves in Figure A5.2-2. From these curves it can be seen that a short- term maximum irrigation salinity objective of approximately 1.2 mmhos/cm EC and virtually any level of leach water quality will achieve a pond leaching frequency of once in five years. In comparison, this frequency is the same one that was achieved under the base or current condition. This comparat ive analysis indicates that setting a short-term maximum irrigation water quality objective of 1.2 mmhos/cm EC and no leach water quality objective will provide the same protection to western and interior Delta agriculture as the base condition, that is, the present level.
The second a1 ternat ive level of protect ion studied assumed Delta Plan umbrella protection, and a salinity level for irrigation of 1.5 mmhos/cm EC, the indicated short-term maximum a1 lowable salinity for irrigation water quality. Figure A5.2-2 indicates the effect would be to increase the pond leaching frequency to approximately once in four years. At this level of salinity, approximately one to two more periods of pond leaching would be required during the historical 57-year period as compared to the one in five year leaching frequency condition, or base condition.
This second comparative analysis, evaluating the incremental difference between the second a1 ternative ' s short-term objective at a threshold level of 1.5 mmhoslcm EC and the base condition, indicates that the control 1 ing factor will not be the average water qua1 ity objective, but will be either the umbrel la protection or the maximum short-term irrigation water qua1 i ty objective.

APPENDIX 5.3 CHINOUK SALPlUt4
Numerous and complex field and laboratory studies have been conducted to determine how temperatures affect Chinook salmon. The survival results of field studies, when compared to temperature data, differ from the literature on temperature tolerance experiments. The field studies indicate a roughly 1 inear relationship between molt survival and temperature, whereas, the lethal temperature tests indicate curvi 1 inear and threshold relationships (WQCP-USFWS-0,3; WQCP MIDITID-1; WQCP-SWC-605). The laboratory studies control the conditions to which the fish are subjected and the responses of the fish are generally attributable to those conditions. In the field studies, the fish subjected to high water temperatures may die either directly due to the temperatures or indirectly due to becoming more susceptible to the hazards of predation, entrainment, etc., because of the temperatures. The following testimony and evidence describe the influence of temperatures and other conditions on Chinook salmon.
- Chinook salmon are a cold water species and water temperatures below 60°F are required for spawning and the survival and growth of eggs and fry (USFWS,29,4; USFWS, 31,4;T,XXXV ,43:68). The virulence of many diseases affectin Chinook salmon is reduced when temperatures are below 600F (USFWS, 29,233. Juveni le emigrants (smolts) can tolerate water temperatures somewhat higher than 600F but above about 65OF a variety of stress effects occur (DWR, 562,3; DWR, 563,l-3; USFWS,31,4 and 42; DFG, 15,23-27). Water temperatures above 18°C (64.4"F considered undesirable for Chinook juveniles (USFWS, 31,38
(DFG, 15,25-26) ; 760F is lethal (USFWS,31,42). temperatures of about 680F or more, smolts are highly stressed
- Sublethal or stressful temperatures can cause increased suscepti bi 1 ity to disease, predation and entrainment (Letter from DFG to SWRCB dated August 9, 1989).
- Laboratory studies have shown that a salmon smolt's tolerance of elevated temperatures is improved when food supply is optimal (DWR,563,1- 3). DWR1s consultants testified that DFG1s records indicate that the abundance of Neom sis, one of the primary foods of emigrating salmon (T,X~XV11,207* has decreased significantly in the last 20 years (T,XXXVI I ,207:25-208: 1) and that upstream and estuarine food supplies may be poor. Taken together, these conditions could aggravate the effects of higher temperatures during emigration (T,XMVI I ,207:3-9).
- Acclimatization increases the short-term temperature stress tolerance. Survival in elevated temperatures wi 1 1 depend upon the temperature to which the fish are acclimatized and factors contributing to the response of the fish may include ration or nutrition, salinity and size (DFG, 15,23).

- Survival in both the Sacramento and San Joaquin basins may be reduced when spring water temperatures are above the stressful range of 66 to 70°F (T,XXXVI ,159:17-20; DWR,562,60; T,XXXVI ,150:24-151:ll; DFG,15,26- 27).
- Available information indicates that temperatures are not optimal in the San Joaquin and Sacramento rivers, especial ly during smol t outmigration in May and June (USFWS,31,144). The USFWS found smolt survival in the Delta decreases as water temperatures increase between the City of Sacramento and Suisun Bay (USFWS, 31,42).
- Upstream factors identified as contributing to the decline in natural salmon production include loss of habitat from construction and operation of dams and diversion (T,XXXV,25:20-23; DFG, 15,8; T,XXXV,33:7- 37: 12). Stressful (sublethal) to lethal water temperatures, reduced or fluctuating flows, and harmful concentration of toxins are also factors (USFWS, 29; DWR, 561).
High water temperatures are associated with increased smolt mortality; however, other conditions in the Delta, such as flow, direction of flow, food availability and migration paths, may also influence their survival (USFWS,31,254,138) (USFWS, 1988). The results of the USFWS smolt survival studies indicate that variable rates of mortality occur between 60 and 75°F depending upon the location where the smolts were released (USFWS, 1988).
Chinook salmon smolts were marked and released at the various sites and recaptured at Chipps Island. Variables that may have also influenced survival include the temperature differences between the hatchery truck, the temperature at the release site, and the duration of exposure to the elevated temperatures. The survival index i s useful as a reflection of trends and general magnitude of change in survival as conditions change.
The following table is a summary of predicted smolt survival indices in the Sacramento River Delta during the spring under various export levels, percent of flow diverted through the Delta Cross Channel and under various water temperatures (Predicted Appendix Table 5.3-1).
Fa1 1-run Chinook salmon:
Fall-run Chinook salmon are affected by temperatures in the fall during the upstream migration and in the spring during the outmigrat ion. When inflows are high, fa1 1-run Chinook fry rear in the upper Estuary from approximately January to March. Fall-run smolts emigrate from approximately April through June, and the adults migrate upstream from August through November. The temperature impact in the Delta on the fa1 1-run smolts occurs during the late spring, Ma and June, when water temperatures are warming (r ,XXXVII ,226: 15-20!.

Appendix Table 5.3-1 Suwival Indices for Chinook Salmn Smolts Migrating through the Sacramento River Delta Under Varied Water Temperatures, Percent Diverted at Walnut Grove and CVPlSWP Export Rates (WQCP-USFWS-0).
Exoort Rate Tem~erature ( O F )
2,000 cfs 60 - 62 - 64 - 66 - 68 - 70
Percent Diverted 0 0.64 0.51 0.4 0.3 0.22 0.15
Expart Rate T m g e r a ~ r e f0 fl 6,000 cfs
60 - 52 64 - 66 - 68 - 70 Percent Diverted
0 Q.64 0.51 0.4 0.3 0.22 0.1 5
Export Rate -("n 10,000 cfs
a - 62 - 64 @ - 68 - 70 Percent Diverted
0 0.64 0.51 0.4 0.3 0.22 (0.4 5

The various life stages of the Chinook salmon occurring in the lower reaches of the Sacramento River during the high temperature months are:
May June July August September October
Fa 1 1 -run smolts smolts -- adu 1 ts adults adults Late Fall-run smolts smolts -- -- smolts smoltsl
adults W inter-run adults adults -- -- Spr i ng-run adults adults -- -- (fry111 (fry) -- (Letter to SWRCB from DFG, August 9, 1989; USFWS,29,5, Figure 2).
Also, see Figure A4-4 on page 4.0-14 of this Appendix.
11 " Young winter-nm salmon potential 1y could enter the estuary as early as Sept-r following early storms".
5 .3-4

APPENDIX 5.4 STRIPED BASS
5.4.1 Methods to Assess the Population Levels of Striped Bass
Adults:
1. Petersen Estimate--Mark and recapture method; 1969 to present; sampled at specific stations in Delta and Sacramento River; creel census (see below) contributes data from San Francisco Bay and ocean areas; statistical analysis of number of fish recaptured which were marked previously.
2. Catch Per Unit Effort (CPUE) Index--Index of population based on number of fish caught per standardized unit of time; same locations as for Petersen estimate; 1969 to present except 1977, 1978, and 1981; possibly more re1 iable than Petersen estimate (DFG, 25 ,Appendix 1).
3. Tag Returns--1958 to present, except 1962-1964 and 1967-1968; analysis of tags returned by fisherman; provides basis for comparison of fishing vs. "natural" mortality.
4. Party Boat Census--Monthly reports submitted by party boat operators, required since 1938, plus direct sampling by creel census since 1970's; provide information on numbers of fish caught, number of angler-days, per cent of total catch by party boats, length and age composition, and related information.
5. Creel Census--Surveys of shore1 ines, minor piers, and private and party boats; begun 1969, continued most years since, with increased effort in recent years with Striped Bass Stamp Fund support; locations surveyed, particularly ports, vary depending on catch success; *provides data on catch rates, fish sizes, pro ortion of population which is tagged (part of Petersen Estimate process ! , and other information.
Eggs, Larvae and Juveni les:
1. Petersen Fecundity Estimate--Annual since 1977; combines Petersen population estimate with fecundity (egg number) data from Striped Bass Health Monitoring Program, with certain correction factors (age and number of fish spawning), to estimate total number of eggs produced.
2. CPUE Fecundity Index--Uses same procedure as above except that uses catch per unit effort (CPUE) index value for number of spawning females rather than Petersen estimate.
3. Egg and Larva Survey--Area sampled is variable but standardized in recent years to Suisun Bay, central and western Delta, and Sacramento River to Colusa; 1966-1973, 1975, 1977, 1984-1986, 1988-1990; intensive sampling at 75 stations in spring to monitor number, growth, movement and mortality of larvae up to about 14 mm in length; Sacramento River stations also monitor egg abundance and movement (but these stations not sampled in 1988 to 1990).
4. Tow Net Survey--1959 to present, except 1966; Delta and Suisun Bay; biweekly sampling at 30 to 40 stations in summer until average length of young bass exceeds 38 mm length; provides index of abundance (actual Striped Bass Index, or SBI) and distributional information.
5. Midwater Trawl--Throughout Bay-Delta Estuary up to Rio Vista and Clifton Court Forebay; 1967 to present except 1974 and 1979; typically monthly tows between September and December at a variable number of stat ions; gives measure of young-of -the-year abundance; more variable than SBI, but correlates we1 1 with it.
Related Surveys:
1. Salvage Records--Provides numbers of fish salvaged from Skinner Fish Protective Faci 1 ity in SWP Clifton Court Forebay, and from Tracy Fish Faci 1 ity at CVP Tracy Pumps intake channel ; Skinner reports annual from about 1970 to present, Tracy records back to 1950's; provide general estimates of population trends and densities based on numbers salvaged over time.
2. Striped Bass Health Monitoring Program--1978 to present, not all years; 1984 to 1988 under consistent format; analysis of tissues of 40 prespawning adult female fish from Rio Vista and Antioch; provides samples for fecundity data; program undergoing extensive review at the present time.
3. Other--Various other special purpose studies which provide special information on striped bass (Export Curtailment Study, gut content analysis, summer die-off monitoring, etc.).
5.4.2 Striped Bass Index (SBI)
The striped bass populations in the Estuary have declined substantially in recent years, in terms of numbers of both adult and young bass. The D- 1485 objectives have not maintained the SBI at the "without project" predicted index level of 79, the expected level of protection under these objectives; nor have they stopped the decline which had begun to become evident even before the objectives were established. Based on a mathematical relationship (predicted SBI) developed by DFG, the actual SBI under the D-1485 objectives for the period 1979-1985 should have averaged about 69 (corrected from DFG,25,134-136 after consul tat ion with DFG staff). In fact, during those years the actual SBI avera ed 22.4, about one-third of the predicted SB1 (corrected from DFG,25,136~ For the period 1979-1990, during which the 0-1485 objectives have ieen in effect, the predicted SBI average is 60.95, while the actual SBI average is 19.1; or 31.3% of the predicted value (Table A5.4-1).
The actual SBI is a value obtained after extensive field sampling and measuring of young striped bass each summer. This value is a measure of the relative abundance of young striped bass in the Estuary when the average length of the young-of-the-year population is 38 mm (1.5 inches). It is called an index because it is a relative value and is not directly translatable into an absolute value of the number of young bass in the Estuary. However, it is a legitimate and relatively sensitive measure of

TABLE A5.4-1 ACTUAL AND PREDICTED STRIPED BASS INDEX VALUES
---------.------ ACTUAL I N D E X - - - - - - - - - - - - - - - - - - - - - - - - - - PREDICTED I N D E X - - - - - - - - - - YEAR DATE DELTA SUlSUN TOTAL DELTA% DELTA SUlSUN TOTAL ACTUAL %
YEAR TYPE SET INDEX INDEX INDEX OF TOTAL INDEX INDEX INDEX OF PRED. (1)
********t****MH**Mm****HM*MH**H******W********M** (2) (2) (2)
*********M******M*******rbt*********
1956 U - 47.1 53.6 100.6 - 1957 BN - 44.1 39.4 83.6 - 1958 U - 42.3 56.2 98.5 - 1959 D J U L Y 1 2 30.7 3.0 33.7 91.1 35.2 -7.9 27.3 123.4 1960 BN/SS JULY 17 32.0 13.6 45.6 70.2 41 -3 8.9 50.2 90.8 1961 D JULY 21 25.2 6.4 31.6 79.7 37.9 3.2 41.1 77.0 1962 BN JULY 26 46.8 32.1 78.9 59.3 42.5 32.0 74.5 105.9 1963 U A U G 0 3 38.2 43.5 81.7 46.8 37.8 45.7 83.5 97.8 1 964 D AUC02 54.7 20.7 75.4 72.5 39.2 19.9 59.1 127.5 1965 U JULY 31 49.4 67.8 117.2 42.2 40.1 43.6 83.7 140.0 1966 BN/SS MOT DETERHINED 36.3 6.2 42.5 - 1967 U AUG12 35.1 73.6 108.7 32.3 33.8 57.3 91.1 119.3 1968 BN/SS J U L Y 1 9 39.6 17.7 57.3 69.1 26.3 15.4 41.8 137.2 1969 U AIJG 09 33.6 40.2 73.8 45.5 34.5 55.9 90.4 81.6 1970 U/SS JULY 18 36.6 41.9 78.5 46.6 34.7 28.7 63.4 123.8 1971 W AUG11 24.6 45.0 69.6 35.3 30.8 50.1 81.0 86.0 1972 BN/SS JULY25 13.4 21.1 34.5 38.8 10.8 22.4 33.2 103.9 1973 U JULY 15 15.6 47.1 62.7 24.9 21.9 29.5 51.3 122.2 1974 U J U L Y 2 2 17.4 63.4 80.8 21.5 15.1 46.8 61.9 130.6 1975 AN JULY 30 23.4 42.1 65.5 35.7 30.8 50.4 81.2 80.7 1976 C J U L Y 1 6 21.1 14.8 35.9 58.8 24.3 19.2 43.5 82.5 1977 C JULY 24 8.3 0.7 9.0 92.2 37.1 7.0 44.1 20.4 1978 U JULY 23 16.5 13.1 29.6 55.7 29.6 32.0 61.6 48.1 1979 D JULY I 9 5.4 11.5 16.9 32.0 25.3 36.9 62.2 27.2 1980 U JULY I 5 2.8 11.2 14.0 20.0 31.5 46.6 78.2 17.9 1981 D JULY 02 15.4 13.7 29.1 52.9 34.4 24.7 59.0 49.3 1982 U JULY 30 9.5 39.2 48.7 19.5 25.4 53.8 79.2 61.5 1 983 W AUG 05 1.2 14.2 15.4 7.8 17.3 57.1 74.4 20.7 1984 U/SS JULY 13 6.3 20.0 26.3 24.0 26.8 40.1 66.9 39.3 ~~ D J U L Y 1 6 2.2 4.1 6.3 34.9 21.8 25.4 47.2 13.4 1986 U/SS JULY 09 23.8 41.1 64.9 36.7 29.5 38.0 67.5 96.2 1987 C JUNE 22 7.3 5.3 12.6 57.9 22.9 15.4 38.3 32.9 1 988 C JULY 24 3.9 0.7 4.6 84.8 17.2 12.8 30.0 15.3 1989 (3) BN JULY 11 3.1 2.0 5.1 60.8 26.1 31.4 57.5 8.9 1990 C JULY 18 2.8 1.5 4.3 65.1 (4) 36.6 24.7 61.3 7.0
=========3=======SI===============e=
NOTES: 1 = D-1485 YEAR TYPE (U = YET; AN = MOVE N W L ; BN = BELOU NORMAL; D = DRY; C = CRITICAL; SS = SUBNORMAL SHOUMELT)
2 = PREDICTED INDEX BASED ON REGRESSION OF ACTUAL ABUNDANCE, OUTFLOWS AND DIVERSIONS FOR THE YEARS 1959 TO 1976, EXCEPT 1966 (ACTUAL SBI NOT DETERMINED) AND 1972 (ANDRUS ISLAND FLOODING)
3 = DRY YEAR TYPE FOR FISH AND WILDLIFE OBJECTIVES; VALUES CORRECTED F R W THOSE PRESENTED I N EXHIBIT UQCP-DFG-2 (PERS. COMM., LEE MILLER, DFG, 09/06/90>
4 = 1990 PREDICTED INDEX VALUES BASED ON PRELIMINARY F L W DATA

the change in abundance between years. The actual SBI tends to underestimate the young bass abundance in very high outflow years because many of the fish are carried downstream beyond the DFG sampling stations. The influence of high flow in recent years, especially in 1983 and perhaps to some extent in 1982, may have induced a small portion of the total decline in the actual SBI observed in the last decade. The large declines measured in dry years would not be so affected, however. Changing the station locations might provide a better measure in wet years, but would compl i cate cal cu 1 at ion of index values and comparison between years. (The actual SBI has been measured every year since 1959, except 1966. )
The actual SBI is the sum of two separate indices: the Suisun Bay index and the Delta index (Table A5.4-1; Figure A5.4-1). The proportion of young bass in the Delta and in Suisun Bay depends on flow; in years with higher outflow, a higher proportion of young bass are usually found in Suisun Bay (Don Stevens, DFG, pers. comm., 1989). This general pattern existed through the 1960's. Analysis of the actual SBI data indicates a substantial shift in the distribution and abundance patterns of young striped bass in recent years. In the early 1970s the actual SBI declined, in large part because the Delta index began to contribute a much smaller proportion of the total index regardless of flow conditions (Figure A5.4- 2). After the 1976-77 drought, the Delta index contributed a high proportion of the total index only in very dry years when very few young bass were able to be moved into Suisun Bay, and total numbers of young bass were at record low levels.
There has been considerable confusion in the testimony in Phase I concerning whether the SBI in D-1485 has "worked" or "failed". The reason is that the D-1485 objectives were based on a redicted SBI, a 5-- mathematical formula based on the relationship o the historical record of young bass abundance (actual SBI) to spring Delta outflow and exports. This formula provided a prediction of what the SBI ought to be each year, given certain flow and export conditions; it was used to develop the export and outflow requirements in D-1485. The discrepancy between the predicted and the actual SBI is the reason that some participants stated that "the SBI has failed". However, the actual SBI has not failed, even if it may somewhat underestimate the abundance of young fish in very wet years. It continues to provide a comparative measure of young bass abundance among years.
Various reasons have been proposed for the failure of the predicted SBI. For example, the State Water Contractors suggest that the reason for the failure is that the underlying assumptions are still correct, but "that factors in addition to flow are contributing to the problems experienced by striped bass" (wQCP-SWC-608,51). However, a strong argument can be made that the predicted SBI model has been used outside the range of flows and diversion rates from which it was derived. The original relationship among outflows, diversions and the predicted SBI was based on data developed during the period 1959-1970. During this period, exports in the spring months were primarily by the CVP Tracy pumps, and several major upstream storage projects (Orovi 1 le and New Melones reservoirs) had not been completed or had not yet had a significant effect on the Delta. As shown in Table A5.4-2 and Figure A5.4-3 total Delta exports were


FIGURE A5.4-2 ELTA STRIPED BASS INDEX
YEAR

relatively constant at about 3,500 cfs during the April through July period. However, during the 1971 through 1976 period, when the decline in the Delta portion of the SBI began to become apparent, total exports for the April through July period increased to an average of nearly 5,900 cfs. Part of this increase was due to a series of experiments to test the effects of increased pumping on striped bass survival (Don Stevens, DFG, pers. corn., 1/90). The data developed during the 1959 through 1976 period were used to develop both the predicted SBI and the 1978 D-I485 objectives. During the fifteen years of data between 1959 and 1976 (no sampling in 1966, and 1972 data were not used because of the Andrus Island flooding), average exports in the Apri 1 through July period exceeded 6,000 cfs only twice (1973 and 1974), or thirteen percent of the years. On the other hand, during the twelve years that the D-1485 objectives have been in effect, average April through July exports have exceeded 6,000 cfs in seven years, or 58 percent of the years. The average April through July exports during the years under D-1485 objectives were 6452 cfs, or about 50 percent higher than the period 1959 through 1976.
DFG offers substantial additional evidence that the influence of spring outflow and export rates on young striped bass abundance may be substantial ly greater than previously be1 ieved, and that the high export rate experiments in the early 1970's may have helped to trigger the low abundance values seen in the late 1970's and 1980's (WQCP-DFG-3,26).
5.4.3 Possible Reasons for the Striped Bass Decline
Many reasons have been proposed to explain the decline in striped bass abundance. In 1982, the Striped Bass Working Group, composed of Interagency staff and outside consultants, examined the available data and proposed four major hypotheses for the decline. These were:
o inadequate food supply for the young bass, o direct entrainment losses in diversions
and changes in Delta hydrology due to divers ions and exports,
o toxic substances, and o lack of sufficient striped bass eggs.
These four hypotheses served as the basis for the exhibits and testimony of DFG (DFG,25) and SWC (SWC,203) in Phase I. Since then, considerable additional discussion and data analysis have resulted in an expanded and refined list of possible causative factors. This list is discussed in a new DFG report (Department of Fish and Game, 1989). The more recent 1990 DFG draft report (WQCP-DFG-3) specif ical ly addresses the decline of the bass . The major points of the Management Plan and the 1990 report are similar and summarized below. While all the causes listed in the DFG Plan are summarized below, it is likely that only a few factors are the probable causes for the majority of the recent decl ine: reduced inflow and outflow; diversions; pol lutants; and introduction of exotic organisms, especially as related to food- chain disruptions.

YEAR ------------ -------- ----
1953 1954 1955 1956 1957 1958 1959 1960 1961 1962 1963 1964 1965 1966 1967 1 968
* 1969 1970 1971
*I972 1973
1974 1975 1976
**I977 1978 1979 1980 1981 1982 1983 1984 1985
*I986 1987 1988 1989
***I990 .-.----..-.. AVERAGE
TABLE A5.4-2. TOTAL DELTA EXPORTS, CFS; SUP, CVP, AND CCC (Diversions to Byron-Bethany I r r igat ion D is t r ic t , North Bay Aqueduct, and Ci ty of Vallejo not included)
APRIL . - - - - - - - .-------
1422 2052 2283 704
2353 152
2757 2605 2900 2761 1231 3065 1204 3108 1207 5380 3212 4653 4431 6356 3352 4203 6304 5037 1295 3271 5882 5343 8090 9603 3814 7685 7342 4696 7021 8577
10435 9743 *-.-..- 4356
MAY --------- ---------
2110 1371 2447 4 23
2186 599
2661 2688 2837 2963 2774 3261 3193 3381 1921 561 1 3270 4012 4549 6495 6501 7130 5583 5488 2987 3058 6245 4630 4478 5994 3293 5929 6215 6260 5313 6164 6198 3487
---..-.- 4045
JUNE .----------- .- ------ ----
2312 3000 3194 1179 3277 m
3564 3825 3992 3799 3543 3795 3694 4075 2162 4708 2494 4997 5768 5350 7355 9130 4520 4152 739
762 1 634 1 5961 4032 3935 5010 6165 6530 61 77 5184 6007 5240 3591
-- .-------- 4400
JULY .--------- .---------
2904 3292 3205 3248 3591 2931 4005 4095 4656 4229 4198 4619 4361 4597 2697 5168 3382 5227 6509 5074 7693
10691 5184 4109 845
8088 9339 6869 7046 4032 5207 9457 9465 8607 8953 8247 9539 6335
- - - - - - * . - ,
5571
TOTAL -------. -------.
8748 971 5
11129 5554
11407 4454
12987 13213 14385 13752 11746 14740 12452 15161 7987
20867 12358 18889 21257 23275 24901 31 154 21591 18786 5866
22038 27807 22803 23646 23564 17324 29236 29552 25740 26471 28995 31412 23156 . - . - -*-- 18372
A-M- J- J
AVG --------- --------- 2187 2429 2782 1389 2852 11 14 3247 3303 3596 3438 2937 3685 31 13 3790 1997 5217 3090 4722 5314 5819 6225 7789 5398 4697 1467 5510 6952 5701 591 2 5891 4331 7309 7388 6435 6618 7249 7853 5789
-.---... 4593
M- J- J
AVG .--------- .--------a
2442 2554 2949 1617 3018 1434 3410 3536 3828 3664 3505 3892 3749 4018 2260 5162 3049 4745 5609 5640 71 83 8984 5096 4583 1524 6256 7308 5820 5185 4654 4503 71 84 7403 7015 6483 6806 6992 4471
4672
AVERAGES APRIL-JULY MAY - JULY 1 - .............................................
1953-1967 2791 3058 w
1968-1990 5 768 5724 * - 1979-1990 6452 6152 1953- 1990 4593 4672 1959- 1970 351 1 3735 1959-1976 4299 4551 1971 - 1976 5874 6182
* = Values di f ferent from DAYFLOW; effects of island flooding and dewatering not included
** = SUP and CVP impose deficiencies i n deliveries *** = SUP and CVP impose deficiencies i n deliveries; California Aqueduct
unavailable May 1 t o mid-July for repairs; preliminary values, from CVP Operations Off ice, 09/05/90

FIGURE A5.4-3. TOTAL DELTA EXPORTS (COMBINED SWP, CVP AND CCC; APRIL - JULY AVERAGE; 1990 PRELIMINARY) 8 - - - - -. - - -- --.- .. - --- -.. - ---- - - - - - - - - --- - - ---- - --
I ! X - ---TI
YEAR

1. Delta and Upstream Water Diversions
Seven separate water diversion operations in and above the Delta impact striped bass. These impacts include: direct entrainment of eggs and young, losses during salvage from fish screens, increased predation at screens and at release points for salvaged fish, disruption of migration routes, translocation of Sacramento River eggs and young into the central Delta, and disruption of young bass food supplies (plankton).
The major sources of water diversions in and above the Delta are:
o The SWP Delta pumps, rated at 6,300 cfs, with construction underway to expand capacity to 10,300 cfs in the early 1990's;
o the CVP Tracy pumps, rated at 4,600 cfs;
o the Contra Costa Canal pumps, with a diversion capacity of 350 cfs;
o the North Bay Aqueduct pumps, rated at 175 cfs;
o the Pittsburg and Contra Costa PG&E power plants, with a combined intake capacity of about 4,600 cfs;
o approximately 1,600 to 1,800 unscreened agricultural diversions and subsurface seepage in the Delta, which may divert up to 4,500 cfs in July; and
o an undetermined number of agricultural , municipal and industrial diversions above the Delta on the Sacramento and San Joaquin rivers and their tributaries.
2. Reduced Delta Outflows
Extensive water development and conservation projects, combined with water exports, have changed the pattern of Delta outflows, especially by outflow reductions during the spring and early summer months critical to spawning and young bass survival. Striped bass are affected in several ways: spawning habitat is reduced, the time required to move young to nursery areas is increased, the nursery habitat is restricted, food (plankton) production is reduced, and the effects of exports on translocat ion and reverse flows is enhanced. Combined with armoring (r iprapping) of upstream and Delta levees, upstream development may result in increased water clarity in the Delta, which may also cause increased predation on striped bass eggs and young.
3. Low San Joaquin River Flows
Low river flows combined with high dissolved solids levels, caused primarily by agricultural return flows, produce a salinity barrier in the Stockton area, which inhibits upstream migration by adults and

reduces spawning habitat. Reduced San Joaquin River flow also exacerbates the effects of export operations and reduced Delta outflows by enhancing cross-Delta flows and reverse flows in western, central and southern Delta channels.
4. Water Pol lution
Toxic organic chemicals (petrochemicals and pesticides) and toxic trace elements (mercury, selenium, copper, cadmium, zinc, etc.) may have acute or chronic effects on adults, eggs and young of striped bass, or on their food chain. Pollutant-caused stress or other physiological dysfunction may a1 so reduce resistance to diseases, parasites, predators and adverse environmental conditions.
5. Navigation Structures, Dredging and Spoi 1 Disposal
Activities related to channel maintenance are primarily water qua1 ity issues, due to resuspension of toxic materials. However, related effects -- such as excessive turbidity; abrasion of fish gills and other body parts; disruption of food chains; disturbance of migration, spawning and feeding; and loss of habitat -- may also result from navigation maintenance activities.
6. Filling of Estuary Tidelands
Filling of open water areas reduces bass and bass-food habitats and reduces the tidal prism in the Estuary. Reducing the tidal prism reduces the pollutant flushing capabi 1 ity of the Estuary, which may result in water quality problems for the bass or its food chain.
7. I1 legal Take and Poaching
The striped bass population is affected to an unknown degree by the i l legal taking of bass by means of catching more than legal 1 imits, taking undersize fish, and using nets.
8. Diseases and Parasites
Diseases and parasites stress, debilitate or kill both young and aduTt striped bass. The incidence and severity of these problems are affected by toxic substances, food avai labi 1 ity and other factors. The Striped Bass Health Monitoring Program has not demonstrated any distinct patterns of decreases in health or increases in parasitism in Bay-Delta Estuary fish since monitoring began in 1978.
9. Annual Die-off of Adult Bass
Almost every year there is a summer die-off of adult bass in the Carquinez Strait area. The cause is unknown, but may be related to liver dysfunction, possibly caused by toxic organic pollutants.

10. Commercial Bay Shrimp Fishery
The distributions of juvenile bass and market-size bay shrimp overlap considerably in various parts of the Estuary. Young bass are killed during shrimp netting operations. Regulations have been changed to reduce this incidental kill, but further information is required to determine the extent of the problem.
11. Exotic (Introduced) Aquatic Organisms
Various species of fish and invertebrates have been introduced into the Estuary from other areas. Some of these introductions, such as striped bass and American shad, were planned; the resources were managed to develop and maintain these fisheries. Other introductions were not planned. These unauthorized introductions of exotic species, primarily through the dumping of ballast water from foreign shipping, have had harmful effects on striped bass and their food supply. For example, the yellowfin goby, Acanthogobius flavimanus, feeds voraciously on invertebrates and small fish, and so may compete with striped bass for food; it may also prey on small bass. Introduced oriental zooplankton species have experienced explosive population growth in the upper portions of the Estuary in the last decade, and preliminary tests suggest that at least one species is less suitable as a food source for striped bass than the native copepod, Eurytemora affinis. The rapid establishment of the introduced clam, Potamocorbula amurensis, with its high water-f i 1 tering rates, may be having significant impacts on phytoplankton and zooplankton abundance in the striped bass nursery areas in Suisun Bay. Once established, it is virtually impossible to eradicate aquatic animal species from as open and complex an environment as the Estuary.
Overfishing is not viewed at present by DFG as a cause of the decline because anglers harvest only 15 to 25 percent of the adult population annually. This is viewed as bein "well within safe limits for a typical striped bass population" ? DFG, 1989,p.31). The more restrictive fishing regulations enacted in 1982 should have reduced the catch somewhat, but since there is no control on the number of striped bass anglers or the number of individual fishing days, the effect is not known.
13. Genetic or Other Unknown Factor 11
Because of the decline of several distinct populations of striped bass across the country in a short span of time, there has been some thought that a common factor, such as a genetic 1 ink, might be involved. In addition, the Bay-Delta population originated from a very small stock, with presumably limited genetic diversity. Therefore, this population could be less resilient in the changing environment of the Estuary than would be the case with a larger gene pool.
ll Not included as factors by DFG (DFG, 1989).
5.4-12

5.4.4 Export Area Striped Bass Fishery
In evaluating the decline of striped bass, it should also be noted that the measurements of the decline apply to the Estuary only. Substantial numbers of eggs and larvae are exported from the Estuary by the CVP and SWP systems. These provide the basis for a sustained striped bass fishery throughout the San Joaquin Val ley and even in the SWP terminal reservoirs in southern Cal ifornia. Unfortunately, there are few data available on the size or condition of these populations, or how these populations have been affected b changes in the Estuary. DFG testif led (T,LXVIII, III,63:15-22f that those fish in the export facilities do not support the estuarine fishery, nor are they part of it, except that nearly a1 1 of those fish originated in the Estuary. The development of this fishery in the export facilities is a by- product of the CVP and SWP systems, but should not be viewed as partial mitigation for the impacts of the export systems on the Estuary striped bass population. As the Estuary population decl ines, these export area populations may also be expected to decline, as they are probably not self -sustaining by means of successful spawning in the aqueducts or reservoirs.
5.4.5 Discussion of Issues Associated with Striped Bass Spawning in the San Joaquin River
In the August 1990 Workshop, the SWC presented an analysis of several issues related to striped bass spawning. Dr. Charles Hanson made a series of points about the validity and applicability of the data presented in previous sessions and in the June 1990 Revised Draft Plan. These points reflect the concerns of other participants which were presented at both the February and August Workshops. These points may be summarized as follows:
(1 ) management of stream temperature for salmon protect ion could affect striped bass spawning (T,LXXV,VII ,85:7-86:3);
(2) most spawning data support the contention of DFG researchers that bass prefer to spawn in fresh water (less than 200 mgll TDS (~0.35 mmhos/cm EC)), but two years (1968 and 1972) show that spawning occurred in higher sal ini ty waters (WQCP-SWC-623B) ;
(3) the spawning area in the Delta appears to be fairly constant regard 1 ess of apparent EC (WQCP-SWC-623C) ;
(4) no consistent pattern of egg survival and salinity could be determined; once the eggs are hardened, there is no apparent relationship between survival and incubation salinity;
(5) there were no consistent differences in egg survival between the Sacramento and San Joaquin rivers, and no consistent relationship between egg survival and San Joaquin River flow, or Delta outflow;
(6) expanding the spawning area upstream of Prisoners Point on the San Joaquin River may expose eg s and young to additional entrainment from the SWP and CVP pumps fT, LXXV,VII ,106: 11-18).

Based on their analysis, the SWC concluded that striped bass reproductive success in the San Joaquin River and the Delta is not a water quality problem in the range of salinities found in the present spawning area (TI LXXV, VI I, 107: 22-108: 5).
The analysis provided by the SWC makes several interesting and important points; these points require some additional discussion, however. Each point listed above will be considered in turn.
(1) Concerns about temperature control for salmon detrimental 1 y affecting striped bass are probably unfounded. The temperatures proposed for salmon protect ion (66-68OF), are we1 1 above those associated with the onset of striped bass spawning (59-61°F). Turner (1976) noted that in the years 1963, 1964 and 1965, almost 90 percent of spawning occurred in water temperatures between 63OF and 68°F.
(2) The two years (1968 and 1972) in which significant spawning occurred in water more sal ine than 200 mg/1 TDS (=0.35 mmhos/cm EC) were years in which salinity intruded into the spawning area, as Turner noted (1976, p. 112). He further noted (1976, p. 118) that "striped bass universal ly spawn in essentially freshwater, although in a number of estuaries they do spawn immediately upstream of the limits of ocean salinity intrusion, as they do in the lower San Joaquin River". If they cannot move farther upstream due to the Prisoners Point salinity barrier, then substantial spawning will occur in somewhat more saline water, as seen in 1968 and 1972. Possible effects of this are discussed below in re1 at ion to egg hardening (No. 4).
(3) While the spawning area in the Delta does appear to be fairly constant, based on examination of WQCP-SWC-623C, what is not indicated on the exhibit is that in at least five of the seven years indicated (1968-1972), no sampl ing was conducted above Prisoners Point. Even if the bass did spawn farther upstream, the data would not reflect it. In addition, the use of Delta outflow as a surrogate for EC may not be appropriate, since most Delta outflow is from the Sacramento River. Higher outflow does not necessarily mean low EC in the upper San Joaquin River.
There are related issues concerning this discussion of spawning area. First, as noted, if water quality above Prisoners Point is such that the fish cannot move upstream, then of course they wi 1 1 spawn in whatever habitat is available to them. Second, the smaller channels with faster currents in the upper river would tend to move eggs relatively quickly downstream into the wider channels of the lower river, where slower currents and tidal action would tend to concentrate the eggs, thus suggesting that a higher percentage of spawning might be occurring there than would actually be the case.
Third, the lack of tag returns from adult striped bass from the San Joaquin River above Prisoners Point is also used as evidence that the fish are not using this area. If the water quality prohibits upstream migration, then fish will, in fact, not be

caught there. Tag returns also indicate where fish are being caught, not where all the fish are. If the fishing for bass is known to be good in a particulate area, then the tag returns will reflect that increased fishing pressure. Tag returns are not an unbiased sampling tool. DFG testified that fishing used to be much better for striped bass in the San Joaquin River system than it is at present (T,XLII ,55: 16-56: 19).
Final ly, as discussed by Mr. Chadwick (DFG) and Dr. Hanson (SWG) (T,LXXV,VII ,I1 1 : 3-14), regular exposure to higher sal inity water in a spawning area could cause striped bass to desert that area or use it less. It is possible that striped bass have largely abandoned the upper San Joaquin River as a spawning area.
(4) The point about high egg survival even in saline water once the eggs are hardened is important. The key is that the eggs were first hardened in fresh water. While the data suggest that EC's normally found in the Delta are comparable to the laboratory experimental salinity range, EC intrusion during deficiency period relaxations could result in less effective hardening of the eggs. This may result in lower survival as water temperatures increase (see Appendix 5.4.6). Additional work in this area may be warranted.
(5) The SWC analysis showed no consistent differences in egg survival between the Sacramento and San Joaqu i n rivers (WQCP-SWC-623H). This conclusion was based on DFG data (DFG, 1988, T21). However, this same report (Table 16) showed that the average percent of 1 ive eggs collected over six years (1972, 1975, 1977, 1984, 1985, 1986) in the Sacramento River was 58.5 percent, while in the San Joaquin River it was 41.5 percent, or 29 percent less than the Sacramento River. Taken together, the data indicate that egg survival, once development has begun, is not consistently different, but that the number of eggs laid which are viable is substantially lower in the San Joaquin River. This suggests that the present spawning habitat or other conditions in the San Joaquin River may result in lower spawning success.
Exhibit WQCP-SWC-623K shows no relationship between percent of live eggs and either April Vernalis flow or April Delta outflow. It should be noted that no more than 30 percent of total spawning occurred during April in any of the six ears included (see Water Quality Control Plan, Table 5-2, p. 5-31 ! .
(6) The concern about increased entrainment of eggs and young due to SWP and CVP faci 1 ities should spawning habitat be expanded to Vernal is has been raised by various parties. It is argued that the present condition, while far from ideal, at least may provide some protection against the influence of the pumps for some of the Delta population. No evidence was presented to support this position.

A few final comments are appropriate. As noted, the DFG data used in these analyses are taken at various locations, with different kinds of gear, and for different purposes. Therefore, these data must be cautiously interpreted. Experimental data are 1 imited, and definitive field tests are difficult to complete successfully. Additional data are required on the actual effects of salinity (and other factors) on spawning and survival of eggs and young. For example, the variations in survival which appear to occur in the 0.3-0.8 mmhos/cm EC range are crucial to our understanding of what striped bass in the San Joaquin River really need.
5.4.6 Effects of Temperature on Striped Bass Adults, Eggs and Young
The effects of temperature on adult striped bass appear to primarily involve the range of temperatures at which spawning occurs. High water temperatures may occasional ly appear to inhibit spawning, but a review of historical spawning patterns indicates that spawning is more often delayed by low temperatures. Since spawning correlates with increasing temperatures, it appears that most spawning is completed before the upper end of the suitable temperature range occurs.
DWR presented a review of the migration patterns of adult striped bass as related to temperature, especial ly the "thermal niche" hypothesis, which suggests that striped bass mi rate in response to selection for a specific temperature range (DWR,608 3 . No pattern of temperature selection was noted for adult bass in the Estuary. However, the first- year tag return data used in the analysis did demonstrate a changing pattern of bass migration, with a smaller proportion of the population migrating down into the lower Estuary and the ocean than in earlier years. DFG also reviewed the data and, while not concluding that there was no relationship, did not recommend any specific temperature objectives (DFG, 25,24-26).
DWR exhibit 607 discusses the possible effects of high water temperature on survival of e gs and oung of striped bass in the Delta and in the Sacramento River 9 DWR,607 T . The report indicates that optimal temperature ranges for eggs and young are 16" to 20°C (62"- 68"F), and that reduced survival occurs below 14°C (57°F) and above 23°C (73.4"F). The report concludes that low temperatures are not a problem in the spawning areas, since adults spawn at temperatures above 15°C (5g°F), and the water in the Delta tends to remain warm throughout the spawning period. Likewise, the temperature range in the Delta stays below the upper 1 imit during the spawning and early development period. The report indicates that, in some years, there may be some losses due to high water temperatures in the Sacramento River, especially of eggs and young larvae of late spawning fish. DWR1s analysis of the recent spawning pattern suggests that these losses represent only a few percent of the total Sacramento River spawn, and are not significant. No recommendat ions for temperature controls on the Sacramento River for protection of striped bass were proposed by DWR or any other participant. However, the report noted that potential effects of high temperatures on older larvae (beyond the yolk-sac stage) were not examined, and that Suisun Bay and Delta temperatures exceeded 23°C (73.4"F) by early July in 1981, 1984 and 1985.

The major impact that temperature may have on developing eggs and larvae is the rate of development. Albrecht (1964) noted that the rate of yolk absorption at 75OF was twice as fast as at 62-64T. Thus, presence of food in the water column may be more critical at warmer temperatures, and lack of food may lead to higher rates of starvation, which is one of the sug ested major causes for the decline in the SBI. Turner and Farley (1971 3 found that a combination of hi her temperatures (7Z°F) and higher salinity (1,000 m I1 TDSq resulted in no egg survival. However, "hardening" of the eggs 9 formation of a vitelline membrane around the egg after fertilization) in fresh water rather than in saline water resulted in much higher survival when the eggs were subsequently exposed to higher water temperatures and more saljne conditions. Given that water temperatures have exceeded the upper limits of the survival ran e (23°C; 73.4"F) in early June in several recent years (DWR,607,15 3 , the maintenance of low salinity in the Delta spawning area in low flow years may be critical to the survival of more eggs.

APPENDIX 5.5 THREATENED, ENDANGERED AND CANDIDATE SPECIES
5.5.1 Animals
The salt marsh harvest mouse, the Suisun ornate shrew, and the California clapper rai 1 are found primarily in the more saline areas of Suisun Marsh where pickleweed is common. The DFG testified that they do not expect these species to be adversely affected by an increase in channel water salinity in the marsh (T,XXIX,168:13-16).
The California black rail is found in saltwater, brackish, and freshwater marshes. Direct loss of habitat by conversion of marshes to other land uses is thought to be the primary reason for its decline (DFG, 1988 Annual Report on the Status of Cal ifornial s State Listed Threatened and Endangered Plants and Animals, p.28). No information was presented to indicate how the black rail may respond directly to changes in the salinity regime. The black rail requires high tide refuges with considerable vegetative cover to hide from predators when its usual feeding areas are inundated. These refuges are not common in the Suisun Bay marshes. Unless it occurred immediately adjacent to these refuge areas, expansion of the more salt- tolerant vegetation would not result in significant increases in available habitat (T,XXX,41:4-19). DFG indicated that they do not expect changes in the vegetation patterns in the bird's range to significantly affect the black rail (DFG,7,12).
The salt marsh yellow throat is a subspecies of the common yellow throat. BAAC testified that there would be negative impacts on this bird from increased salinity in the Suisun Bay marshes. However, BAAC also stated that there is a question as to which subspecies is found in Suisun Marsh (T,XXX,39:12-28).
The Suisun song sparrow is typically found in brackish tidal marshes. DFG estimates that less than 10 percent of the historically available habitat still exists, and that is in disconnected fragments and narrow strips. Increases in salinity would further reduce the available habitat (DFG, 1988 Annual Report, pp. 40-41).
Adult winter-run Chinook salmon migrate upstream through Suisun Bay and Marsh between November and April. Young smolts from the subsequent spawning are found in Suisun Bay from about November to late April. An analysis of the water quality needed for salmon is found in Section 5.5.2 of the Plan.
Delta smelt are found primarily in the fresher water of the Delta and Marsh. An analysis of the water quality objectives needed for the smelt is found in Section 5.8.2 of the Plan.
The monitoring requirements in the 1978 Delta Plan for the Suisun Marsh do not specif ical ly address rare, threatened, or endangered species, a1 though by inference the plan of protection (Marsh Plan) required in D-1485 term 7(a) is intended to ensure protection of all Marsh wildlife. There are a number of federal candidate species being studied for possible listing. Whi le federal candidate species receive no special legal protection, they must be considered during analysis of this Plan because they may be

proposed for 1 isting at any time and would then gain rotection under the federal Endangered Species Act (T,XXX,7:4-13,8:24-9:3!. (Note: A state "candidate" species is, 1 ike a federal "proposed" species, being a m l y under full review for 1 isting and is protected under the California Endangered Species Act. ) If federal candidate species are 1 isted, the possible effects of the water quality objectives on those species must be analyzed. If the effects are adverse, either the water qual ity objectives must be changed or mitigation measures must be devised to eliminate the adverse effects. Part of the triennial review of the water quality control plan will be to review the effects on threatened and endangered species to determine if the water qual ity objectives are providing adequate protection. This review would be the most likely forum for any necessary revisions of the objectives.
5.5.2 Plants
Suitable pore water sal inity ranges from zero to minus five megapascals (MPa) (comparable to a range of zero to four parts per thousand (ppt) salinity, or zero to 6.25 mmhoslcm EC) for the five sensitive plants species. The California hibiscus and Delta tule pea, which are freshwater plants, can tolerate zero to minus two megapascals and Mason's lilaeopsis and Suisun aster, which tolerate somewhat brackish conditions can tolerate minus two to minus three MPa in Suisun Marsh (comparable to four to six ppt salinity, or 6.25 to 9.36 mmhos/cm EC) (T,XXX,76:5-23). On the other hand, soft bird's-beak, which grows in saline areas, could tolerate minus four to minus five MPa (comparable to 8 to 10 ppt salinity, or 12.5 to 15.6 mmhoslcm EC). These are maximum pore water potentials and should not be reached unti 1 after the March to July growing season (T,XXX, 79:12-14).
DFG developed a method for producing desired soil salinities in the managed wetlands based on surface water quality and timing of applied water (DFG,5,T3). Though we recognize that the ratios of surface water salinity to pore water salinity may be different for unmanaged wetlands, until special studies are completed the use of the DFG method is warranted.
Increased sal ini ty in tidal ly influenced channels would cause increased physiological stress on plants, resulting in decreased reproduction and productivity, eventual ly leading to changes in the plant and dependent animal community (CNPS,4,5-8). Water qual ity objectives a1 lowing higher salinity levels than at present would likely increase plant stress, decrease photosynthetic productivity of marsh plants, ki 11 salt-sensitive plant species, retard growth of new plants, and reduce plant species diversity (CNPS,4,10; T,XXX,68:20-70:20). The Mason's lilaeopsis, the California hibiscus, the Delta tule pea, and the Suisun aster would be adversely affected by chan es in flow or salinity in the Suisun Marsh area (CNPS.3; T,XXX,66:11-67:13!. The soft bird's-beak is a salt marsh plant and would not be stressed unduly if salinity increased; the other species would be less likely to survive, would have reduced growth or seed production, or would become less numerous (T,XXX,70: 19-23). The CNPS testified that in recent years freshwater flow to the Suisun Marsh has been insufficient to prevent reductions in productivity even during normal years (T,XXX,79:15-20).

Once a population of a rare species is eliminated, it is very unlikely to be re-establ i shed because of the scarcity of seed sources (T ,XXX,81:22-24). Thus, although common species, suck as alkali bulrush, may be adequately protected or able to recover from a period of exposure to higher salinities during a critical or dry water year, sensitive species would be at risk. A salinity objective would need to be set at a level which permits the sensitive species to sustain normal survival, productivity, and germination.

APPENDIX 5.6 SUISUW MARSH PRESERVATION AGREEMENT -- TECHNICAL ANALYSIS
In 1928 a report was prepared describing the salt water problem in the San Francisco Bay and Sacramento-San Joaquin Delta (Means, 1928). By this date the combined effects of upstream diversions for irrigation during the summer had significantly increased the salinity of the water in Suisun Bay, which was ordinarily a fresh water body (Means, 1928, p. 10). Between 1902 and 1920 the area irrigated in the Central Val ley increased manyfold (Means, 1928, p. 11). By 1928 constructed reservoir capacity in the "Golden Gate watershedN totaled approximately 4,000,000 acre-feet, with another 5,400,000 acre-f eet of capacity being considered (Means, 1928, pp. 12-13). Nearly all of these reservoirs were used for irrigation within the watershed and for power generation. There was 1 i ttle out-of-basin transport.
It is obvious from the brief historical summary above that the initial increase in salinity of Suisun Bay occurred prior to the construction of the CVP and the SWP; in fact, salinity control in the Delta was one of the justifications for the CVP.
Export water from the Delta watershed to other parts of Cal ifornia commenced in the late 19501s, e.g., D-935, D-990. A series of hearings held by the State Board in the 1960's and 1970's to establish operating conditions for the CVP and the SWP led to the preparation of the 1978 Delta Plan and Water Right Decision 1485.
The permanent standards for wildlife protection in the 1978 Delta Plan, were also included in D-1485 (adopted August 1978).
The State Board determined that immediate compl iance with the permanent standards for Suisun Marsh solely by fresh water outflow would be an unreasonable use of water. It was stated in the 1978 Delta Plan that "[tlhe interim standards do not provide complete protect ion to Suisun Marsh. The interim standards require some modification of [state and federal] project operations to benefit the Marsh, but rely primarily on the occurrence of uncontrolled outflows to protect the Marsh unti 1 1984" (1978 Delta Plan, p. VI-12).
The State Board expected DWR and USBR to complete the construction of facilities to protect Suisun Marsh habitat by 1984. D-1485 required water right permittees DWR and USBR, in cooperation with other agencies, to develop a plan for protection of the Suisun Marsh (Marsh Plan) by July 1, 1979. This Marsh Plan was to provide a monitoring network, construction of physical f aci 1 it ies , operat ion and management procedures for the f aci 1 it ies and assurances by land managers to maintain the Marsh as a brackish water wetland (SWRCB,1978,26). DWR and USBR were required to manage the Marsh to produce high quality feed and habitat for waterfowl and other wildlife and to implement the Marsh Plan for full protection of the Marsh by October 1, 1984 (SWRCB, 1978,26-27). The final Plan of Protection for Suisun Marsh (Plan of Protection) (DWR,511) was completed in February 1984. When D-1485

was amended in 1985, the Board granted extensions of time and modifications to monitoring locations in the water right permits of the SWP and CVP (DWR,505); these same changes were not made in the Delta Plan. The interim standards have remained in effect until the present.
After the Plan of Protection was com leted, DWR, USBR, DFG, and the Suisun Resource Conservation District (SRCD ! negotiated a set of three agreements concerning the managed wetlands. One of these, the Suisun Marsh Preservation Agreement (SMPA) , was designed to provide the managed wetlands of the Suisun Marsh with water quality suitable for the production of those particular marsh plants (especially alkali bulrush and fat hen) which are im ortant food for waterfowl (T,XXIX, 15:17-20,32:23-33:1,106:14-21,116:s- 1 0 The water quality standards in the SMPA differ from the standards proposed in the 1984 Plan of Protection in using a different definition for "Dry" and "Critical " years for determining when the "Deficiency Standards" would be imposed on the Suisun Marsh. The 1984 Plan of Protection used the definitions in the 1978 Delta Plan; the SMPA modified the definition (see footnote to Figure A5.0-I), decreasing the predicted level of precipitation for the remainder of a water year and increasing the number of "Dry" and "Critical" years predicted for the Marsh. The State Board does not know the environmental effects of this difference.
The Biological Assessment prepared for the Plan of Protection and subsequently used for the SMPA was completed in 1981. The focus of the analysis was on the direct impacts of physical structures (e.g., Suisun Marsh Salinity Control Gate) on the salt marsh harvest mouse and the California clapper rail (the only species then on the threatened and endangered species 1 ists) . During the informal consul tat ion process for this Plan, DFG pointed out that there have been changes in the situation since 1981 that indicate a new biological assessment is required. Since the 1981 biological assessment was prepared, additional species have been 1 isted as rare, threatened or endangered in the Suisun Marsh area. There are also other species, e.g., federal candidate species, that, while they are not listed under the federal and state Endangered Species Acts, must be considered; harming them would be considered a significant effect on the environment (CEQA Guide1 ines, Sect ions 15064 and 15065). See Section 5.10 and Appendix 4.0 for a more complete discussion of these issues.
The plan of protection prepared by the Four Parties (DWR, DFG, USBR, SRCD) is not fully consistent with the 1978 Delta Plan. According to testimony, the Four Parties have signed an agreement to implement the plan of protection, including the monitoring they have developed (T,XXIX,27: 7-23). The agreement binds the parties to petition the Board to find that the actions are appropriate to protect the Marsh and to substitute the proposed standards for the 1978 Delta Plan standards (DWR, 506A, 16-17).
The standards in the SMPA differ from the 1978 Delta Plan in several ways. One of the most significant differences is the use of a special set of definitions for water year types that ap lies to fish and wildlife protection beneficial uses (DWR1506B,l(r P ). This set of definitions was not included in the Plan of Protection in 1984; it has not been subjected

to analysis under CEQA and was not considered in the biological assessments done under CESA and ESA. The SMPA in its "Initial Standards" (DWR, 506B, 3(a) ( i i ) ) uses a "minimum 14-day running average" of the Delta Outflow Index instead of the Delta Plan's "minimum dail " index in one of the Chipps Island1 s outflow standards (sWRCB, 1978.TV1-11. Another difference is the elimination of two monitoring stations, one in Grizzly Bay at the mouth of Montezuma Slough and another at the mouth of Suisun Slough (S-36), and the relocation of some of the other stations further inland (SWRCB,1978; DWR,506B,TII and Fig.1; DWR,509,510; T,XXIX,17:24- 25,49:20-50:12) as well as the rescheduling of the construction of the facilities called for in the SMPA (DWR,505,521). The use of deficiency standards is also new to the SMPA (DWR, 506B ,3(c) ; T,XXIX, 18:20-22,19:25- 21:1,34:16). These factors taken together could increase the salinity in the western and "fringe" areas of the legally-defined Suisun Marsh provided under the SMPA compared to the 1978 Delta Plan (T,XXIX, 16:25-17:1,40:23- 44:3,45:1-46:7,47:3-48:3).

APPENDIX 5 REFERENCES
Alabaster, J.S. 1967. The survival of salmon (Salmo salar L.) and sea trout (S. trutta L.) in fresh and saline water at high temperatures.
Alabaster, J.S. and R. Lloyd. 1980. Water Quality Criteria for Freshwater Fish. Food and Agriculture Organization of the United Nations, Butterworths, London.
Albrecht, Arnold B. 1964. Some observations on factors associated with survival of striped bass eggs and larvae. California Department of Fish and Game 50: 100-113.
Be1 1, M. C. 1973. Fisheries handbook of engineering requirements and biological criteria. U. S. Army Corps of Engineers, N. Pacific Div., Port 1 and.
Boles, G.L. ,et al. 1988. Water temperature effects on chinook salmon (~ncorh~nchus tshawytscha) with emphasis on the Sacramento River. A 1 i terature review. Department of Water Resources, Northern District.
Brett, J.R. 1952. Temperature tolerance of young Pacific salmon, genus Oncorhynchus.Fish,Res.Bd.Can.9:265-323.
Brett, J.R.,W.C. Clarke, and J.E. Shelbourn. 1982. Experiments on thermal requirements for growth and food conversion efficiency of juvenile chinook salmon, Oncorhynchus tshawytscha. Can .Tech. , Report of Fish. and Aquatic Sci . No 1127.
Brown and Caldwell. 1989. Delta Drinking Water Quality Study, May, 1989.
California Department of Fish and Game. 1988. Striped bass egg and larva monitoring, and effects of flow regulation on the larval striped bass food chain, in the Sacramento-San Joaquin Estuary. Final Report to: The State Water Resources Control Board. 120pp.
California Department of Fish and Game. 1989. The Striped Bass Restoration and Management Plan for the Sacramento-San Joaquin Estuary, Phase I. 39pp. Clark, S. 1989. Delta Municipal and Industrial Water Quality Workgroup to the SWRCB Bay-Del ta Hearing Proceeding, Appendix A1 , 1989. Combs, B. D. and R.E. Burrows. 1957. Threshold temperatures for normal development of chinook salmon eggs. Prog. Fish Cult. 19(1):3-6.
Coutant, C.C. 1973. Effect of thermal shock on vulnerability of juvenile salmonids to predation. Journal of Fish Resources Board, Canada 30:965-973.
Daniel, P. Delta Municipal and Industrial Water Quality Workgroup to the SWRCB Bay-Del ta Hearing Proceeding, Appendix A6, 1989
Delta Municipal and Industrial Water Qua1 i ty Workgroup to the SWRCB Bay-Del ta Hearing Proceeding, 1989

Gaston, J. 1,!389. Delta Municipal and Industrial Water Quality Workgro.up to the SWRCB Bay-Del ta Hearing Proceeding, Appendix A3, 1989.
Hallock, R.J. and F.W. Fisher. 1985. Status of the winter-run chinook salmon Oncorhynchus tshawytscha, in the Sacramento River. Calif. Dept. of Fish and Game, Anad. Fish. Br., Office Report 28 pp.
Hanson, C.H. 1990. Laboratory Information on the Effect of Water Temperature on Juvenile Chinook Salmon in the Sacramento and San Joaquin Rivers: A Literature Review. Report submitted by the State Water Contractors to the State Water Resources Control Board, WQCP-SWC-605.
Jung, M. Delta Municipal and Industrial Water Quality Workgroup to the SWRCB Bay-Del ta Hearing Proceeding, Appendix A8, 1989.
Kilgour, D.M.,R.W. McCauley, and W. Kwain. 1985. Modeling the lethal-effects of high temperature on fish., Canadian Journal of Fisheries and Aquatic Sciences 42: 947-051.
Kjelson, M., S. Greene, and P. Brandes. 1989. Delta smolt survival model report. Report of the Delta Salmon Team. 50 pp.
Krasner, S. Delta Municipal and Industrial Water Quality Workgroup to the SWRCB Bay-Del ta Hearing Proceeding, Appendix A10, 1989.
Moyle, P.B. 1976. Inland Fishes of California. University of California Press, Berkeley.
Means, Thomas H. , Consulting Engineer. 1928. Salt Water Problem: San Francisco Bay and Delta of Sacramento and San Joaquin Rivers, April 1928.
Morhardt, J.E. And F. Ligon. 1990. Possible Effects of High Water Temperature on migrating Chinook salmon (Oncorhynchus tshaw tscha) smolts in
Resources Control Board, WQCP-MIDITID. + the San Joaquin River. Draft Report submitted by MIDITID to t e State Water
Moyle, P.B. and B. Herbold. 1989. Status of the Delta smelt, H ornesus
Endangered Species. P-- transpacificus. Report to the U.S. Fish and Wildlife Service, 0 fice of
Orsi, J. J. 1971. Thermal shock and upper lethal temperature tolerances of young king salmon, Oncorhynchus tshawytscha, from the Sacramento-San Joaquin River system. C a l i f o r n i a t e p n t of Fish and Game, Anadromous Fisheries Branch, Administrative Report 71-11.
Regional Water Quality Control Board 5. Water Quality Control Plan Reports (5A); (58) Volume I.
Reuter, J.E. and W.T. Mitchell. 1987. Spring Water Temperatures of the Sacramento River. Prepared for Cal . Dept. Water Res. 65 pp. Rich, A.A. 1987. Report on studies conducted by Sacramento county to determine the water tewperatures which optimize growth and survival in juvenile chinook salmon (Oncorh nchus tshaw tscha) in the lower American River . Prepared for McDon&d*Sacramento. 50 pp .

Stevens, D.E. and L. W. Miller. 1983. Effects of river flow on abundance of young chinook salmon, American shad, longfin smelt, and Delta smelt in the Sacramento-San Joaquin river system. North American Journal of Fisheries Management 3:245-437.
Taylor, Eric B. 1988. Water temperature and velocity as determinants of microhabitats of juvenile chinook and coho salmon in a laboratory stream channel. Trans. Am. Fish. Soc. 117:22-28.
Turner, Jerry L. 1976. Striped bass spawning in the Sacramento and San Joaquin rivers in Central California from 1963 to 1972. California Department of Fish and Game 62:106-118.
Turner, Jerry L. and Timothy C. Farley. 1971. Effects of temperature, salinity, and dissolved oxygen on the survival of striped bass eggs and larvae. Cal ifornia Department of Fish and Game 57:268-273.
U.S. Fish and Wildlife Service, and National Marine Fisheries Service. 1977. Proceedings of a Workshop on American Shad. December 14-16, 1976, Amherst, Massachusetts.
U. S. Fish and Wildlife Service. 1988. Determine Survival and Productivity of Juveni le Ch'inook Salmon in the Sacramento-San Joaquin Estuary, Annual Progress Report. Fisheries Assistance Off ice, Stockton, CAI 56 pp.
U. S. Fish and Wildlife Service. 1989. Determine Survival and Productivity of Juveni le Chinook Salmon in the Sacramento-San Joaquin Estuary, Annual Progress Report. Fisheries Assistance Off ice, Stockton, CA.
Wang , J. C. S. 1986. Fishes of the Sacramento-San Joaquin estuary and adjacent waters, California: A guide to the early life histories. Interagency Ecological Study Program for the Sacramento-San Joaquin Estuary, Technical Report 9.
Winkler, K. DWR Memo to Gerald Johns, SWRCB Staff, October 16, 1989.

APPENDIX 6.1 ANALYSIS ASSUMPTIONS FOR WATER SUPPLY IMPACTS
This section discusses the assumptions and operations criteria used in operation studies to help analyze the effects of the various alternatives examined in this
p Plan. Only the major assumptions used in the operation studies are summarized. . + 1. The following hydrologic base represents the average monthly flow and
-., sal inity conditions in the Bay-Delta Estuary under the 1978 Delta Plan.
o 1990 level-of -development 1922-1978 Delta flows
2. All of the Estuary's water quality objective locations were assigned to the Sacramento River system 40-30-30 hydrologic class if icat ion, except the following locations, which were assigned to the yet to be developed San Joaquin River system 40-30-30 hydrologic classification:
o San Joaquin River near Vernalis
o San Joaquin River at the former location of Brandt Bridge
o Bifurcation of Old and Middle rivers
o Old River at Tracy Road Bridge
3. The Delta flow and salinity conditions necessary to meet objectives can be achieved through controlling flow, exports, or gate operations at the Delta "control points". The Delta control points, which are illustrated in Figure A6.1-1, are as follows:
o Chipps Island o San Joaquin River near Vernal is o Sacramento River at Sacramento o The Banks and Tracy Pumping Plants o The Delta Cross-Channel near Walnut Grove
4. The following basic equations apply for the hydrologic base:
o The Delta outflow at Chipps Island, DO is defined as follows:
DO = DI - NETCU - VALDIV - TOTEXP (1)
Where: DI = Delta inflow NETCU = Net Delta consumptive use
VALDIV = City of Vallejo diversions TOTEXP = Total CVP and SWP Delta exports
o The Delta inflow, DI, is defined as follows:
DI = SAC + YOLO + SJR + EAST

FIGURE A6.1-1
DELTA HYDROLOGIC SCHEME USED IN THE
WATER SUPPLY IMPACT ANALYSIS
DELTA OUTFLOW
SACRAMENTO RIVER AT SACRAMENTO /
CONSUMPTIVE USE OF
MIN. REQUIRED
CARRIAGE W A
SURPLUS
CONTRACOSTA
EXPORTS
SAN JOAQUIN RIVER NEAR VERNALIS
CONTROL POINT

Where: SAC 5 Sacramento River at Sacramento flow (including return flow from depletion area 21)
YOLO = Yolo Bypass flow SJR = San Joaquin River at Vernal is flow EAST = Eastside tributaries ' flow (Mokelumne, Cosumnes,
and Calaveras rivers)
o The net consumptive use, NETCU, is defined as follows:
NETCU = CU - PREC (3)
Where: CU = Delta consumptive use PREC = Delta precipitation
o The City of Vallejo diversions, VALDIV, are the Delta diversions by the City of Vallejo.
o The total CVP and SWP Delta exports, TOTEXP, is defined as follows:
TOTEXP = BANKS + TRACY + CCC + NBA (4)
Where: BANKS = Total Banks Pumping Plant exports TRACY = Tracy Pumping Plant exports CCC = Contra Costs Canal exports NBA = North Bay Aqueduct exports
o The Delta outflow, DO, can also be divided into three components:
DO = MINRQDO + CWDO + SURPDO (5)
Where: MINRQDO = Minimum required Delta outflow at Chipps Island CWDO = Carriage water requirement at Chipps Island SURPDO = Surplus Delta outflow at Chipps Island
5. BASIC DWRSIM ASSUMPTIONS
The No-Action Alternative was used as a base for comparison with the other alternatives.
o 1990 level hydrology and upstream area depletions and the study period for October 1921 through September 1978.
o Minimum Delta outflow requirements to meet SWRCB D-1485 standards, assuming the interim Suisun Marsh criteria.
o Carriage water requirements based on a1 lowable exportlsal ini ty repulsion curves for Rock Slough, designed to maintain a water quality of 150 ppm or 250 ppm of chloride as per D-1485. (Actual values used in the stud are 130 ppm and 225 ppm respectively, to provide an operational buffer. T
o CVPISWP sharing of responsibility for the coordinated operation of the two projects is maintained per the Coordinated Operations Agreement, with storage withdrawals for in-basin use split 75 percent CVPl25 percent SWP and unstored flow for export split 55 percent CVP and 45 percent SWP.

o CVP operations Criteria:
- Trinity River minimum fish flows below Lewiston Dam are 340/220/140 TAF per year using the Shasta criteria, per the recent 1981 agreement with the USFWS.
' - Sacramento River minimum fish flows below Keswick Dam reflect the criteria specified in the USBR agreement with DF6 (as modified by letter agreement of October 8, 1981). This flow ranges between 2,300 to 3,900 cfs per Shasta criteria and depends on the time of the year.
- Sacramento River navigation flows are maintained at 4,000 cfs (April- October) or 3,000 cfs (November-March) at Wilkins Slough. Flows are modif iedlreduced in critical water years.
- American River minimum fish and recreation flows are maintained per USBR operations criteria (1,500 to 2,000 cfs) as long as sufficient storage is available in Folsom Reservoir. In dry and critical years, minimum flows may be reduced to SWRCB D-893 requirements (250 to 500 cfs) in order to maintain minimum storage levels in Folsom Reservoir.
- The San Joaquin River water quality standards at Vernal is are maintained as described below (see New Melones Operations Criteria in the Base Case Studies).
- 1990-level CVP annual demands in TAFIYear are as follows:
Contra Costa Canal 120 DMC and Exchange 1,609 CVP San Luis Unit 1,331 Cross Valley Canal 128 San Luis Interim Deliveries 140 San Felipe Unit 104
Total CVP Delta ~xports-2
Folsom South Canal 65 Other American River Demands 288
- CVP agricultural deficiencies are imposed as follows: 25 percent in years 1924, 1931, 1932, 1933, and 1934; and 50 percent in 1977.
- CVP Tracy Pumping Plant capacity is 4,600 cfs, but constraints along the Delta-Mendota Canal can limit export capacity. Pumping is also limited to 3,000 cfs in May and June in accordance with D-1485 criteria for striped bass survival.
- Wheeling of CVP water through SWP facilities to San Luis Reservoir is permitted only when unused SWP Banks Pumping Plant capability is available. Annually, the amount of CVP water wheeled is limited to the sum of (1) what is needed to offset the CVP Tracy Pumping Plant's compliance with the D-1485 criteria; and (2) the amount needed to meet the 128 TAF/year CVP Cross Val ley Canal demand.

o SWP Operations Criteria
- Feather River fishery flows are maintained per the agreement between DWR and the DFG (August 26, 1983). In normal years these minimum flows are 1,700 cfs from October through March and 1,000 d s from Apri 1 through September, with lower minimum flows a1 lowed in dry/critical years.
- Sherman Island Overland facility is assumed to be in operation, satisfying the water qua1 ity requirements specified in the DWR contract with the North Delta Water Agency.
- SWP Banks Pumping Plant average monthly capacity with existing pumps is assumed to be 6,240 cfs. Pumping is also limited to 3,000 cfs in May and June, and 4,600 cfs in July to comply with D-1485 criteria for striped bass survival. Additionally, SWP pumping is limited to 2,000 d s in May and/or June when storage withdrawals from Lake Orovi 1 le occur (January 5, 1987 Interim Agreement between DWR and DFG).
- 1990-level SWP annual export demands (TAF/year) are developed from the State Water Project Analysis Off ice's long-range project ions from Bulletin 132-88, as tabulated below:
Entitlement Schedu 1 ed Request Surplus
North Bay Aqueduct 27 South Bay Aqueduct 186 SWP Dos Amigos demand 2,954
Total Demands 3,167
Agricultural portion 1,241 M&I portion 1,857 Recreation and losses 69
o Water Year Classifications
- The 1978 Delta Plan classification was used in the no-action alternative.
- The new (40-30-30) water year class if icat ion (including subnormal snowmelt) proposed by the Water Year Classification Subworkgroup was used in all studies, except the no-action alternative.
- The 1978 Delta Plan classification was used in the Suisun Marsh in all studies.
o New Melones Operations Criteria in the Base Case Studies (From WQCP-DWR-4A)
The operations criteria used in modeling New Melones Reservoir for the Bay- Delta operation studies is based on the State Water Resources Control Board' s Decision 1422 and two succeeding agreements as summarized below:

- In April 1973 the State Water Resources Control Board issued the "New Melones Project Water Rights Decision", D-1422. This decision requires an annual New Melones release of up to 98,000 acre-feet for the maintenance of fish and wildlife. In addition, the Decision has a provision requiring additional releases of up to 70,000 acre-feet per year to maintain 500 ppm total dissolved sol ids at Vernal is year-round.
- The first agreement is the October 1986 interim agreement between the South Delta Water Agency, the U.S. Bureau of Reclamation, and the California Department of Water Resources. The provisions of this agreement which are modeled are as follows:
1. Flows of the San Joaquin River at Vernalis will be maintained at not less than 500 cfs.
2. The salinityof the San JoaquinRiver at Vernaliswill be maintained at 450 ppm TDS or better for the irrigation season (Apri 1 - October) and 500 ppm TDS or better for the remainder of the year (November - March).
3. Flows of the San Joaquin River at Vernalis will be maintained at not less than the following monthly volumes (TAFImonth):
OCT NOV DEC JAN FEB MAR APR MAY JUN JUL AUG SEP
4. The releases from New Melones required to meet the above criteria are 1 imited to a maximum of 150,000 acre-feet per water year in addition to the releases made to maintain fish and water quality in accordance with D-1422.
- The second agreement i s the June 1987 agreement between the California Department of Fish and Game and the U.S. Bureau of Reclamation which sets interim instream fish flows on the Stani slaus River below New Melones Reservoir. This agreement provides for a minimum annual Stanislaus River fish flow at 98,300 acre-feet and a maximum of 302,100 acre-feet. The actual required fish flow for any given year is based upon the available water supply for that year.

APPENDIX 6.2 D-1485
The final parameter under the Base condition is flow. Flow objectives are held constant for each alternative. These flow objectives include stream flows (Salmon Migration), Delta Outflow (Striped Bass Survival and Suisun Marsh) and divers ions (Operational Constraints), some of which variable depending on year type. The water year classification system used is based on the "Four Rivers Index" for the period of 1922-1971.
In D-1485, the objectives for M&I beneficial uses were set at a maximum mean daily 250 mgll chloride at the Contra Costa Canal Intake at Pumping Plant No. 1 with an additional maximum mean daily chloride level equal to or less than 150 mgll a minimum of 42 to 66% of time, depending on the water year type.
The westernlinterior Delta agricultural objectives range from a maximum 14-day running average mean daily EC (mmhos/cm) of 0.45 on April 1 up to 2.78 EC on August 15 depending on the location and year type. This objective is based on the University of California (UC) exhibits which used estimates of the water qual ity needed to provided 100 percent corn yield in this region's subirrigated organic soil. The southern Delta agricultural objectives are based on the 1990 agreement between the USBR and SDWA. The base objectives, 450 TDS from Apri 1 1 to October 31 and 500 TDS from November 1 to March 31, are in effect until the ultimate conditions are phased in. The southern Delta agricultural objectives do not vary with year type. In D-1485, there were no water qual i ty objectives for export agriculture.
The Striped Bass objective at Antioch was 1.5 mmhoslcm EC from April 15 to May 5 in a1 1 water years and ranged from 1.5/cm up to 25.2 EC in years when the projects impose deficiencies in firm supplies. At Prisoners Point for the protection of Striped Bass spawning, the average mean daily EC is not to exceed an EC of 0.55 from April 1 to May 5 in all year types.
The Suisun Marsh objectives for the protection of wildlife includes the interim objectives of a maximum running average of mean daily 12.5 mmhoslcm EC from January through May up to 15.6 mmhos/cm from October through December in dry or critical years with deficiencies plus the amended D-1485 (SMPA) interior Delta objectives of 8.0-19.0 EC depending on the month, to be phased in. At the time D-1485 was adopted no objectives were developed for the tidal marshes or rare, threatened and endangered species.
Water quality objectives for the protection of Chinook salmon were not included in D-1485. The Region 5 Basin Plan includes temperature and dissolved oxygen objectives. The Basin Plan water temperature objective specifies a 68°F water temperature objective from Hamilton City to the I- Street Bridge on the Sacramento River "when temperature increases will be detrimental to the fishery". The water temperature objectives in the Basin Plan apply to "controllable factors". The Region 5 Basin Plan specifies that dissolved oxygen concentrations shall not be reduced below: "7.0 mgll in the Sacramento River below the I-Street Bridge and in all Delta water west of the Antioch Bridge; and 5.0 mgll in all other Delta waters except for those bodies of water which are constructed for special purposes and from which fish have been excluded or where the fishery is not important as a beneficial use".

APPENDIX 6.3 OPERATION STUDIES
The water supply impacts are defined as the change in base flows, exports, or storage caused by the implementation of the alternative sets of water qual ity objectives. The base condition incorporates a present (1990) level of development operations study that uses the water qual ity standards of the 1978 Delta Plan and the New Melones Reservoir criteria as the control 1 ing Delta criteria.
The a1 ternatives were evaluated using DWR' s Planning Simulation Model, DWRSIM, a generalized computer model designed to simulate the operation of the CVP and SWP project reservoirs and conveyance faci 1 ities. These operation studies are conducted on a monthly time basis and use the historical 57-year hydrologic sequence of flows from water years 1922 through 1978. In addition, these studies account for system operational objectives, physical constraints, and legal and institutional statutes or agreements. These parameters include requirements for flood control in system reservoirs, hydropower generation, pumping plant capacities and 1 imitations, and minimum Delta operations to meet water qual ity objectives. A more detailed description of the DWRSIM model as well as the operations criteria used in the operation studies is presented in Appendix 6.1.
Operation studies are run with adjustments to the combined CVP-SWP system only. The local non-project reservoirs upstream of the Delta and the CVP Friant Reservoir on the San Joaquin River are pre-operated or have a "predetermined" operation throughout the simulation period. They are not operated to meet Delta objectives. Therefore, the combined CVP-SWP system acts as a surrogate to reflect the water supply impacts of the alternatives.
Since the SWP and CVP provide the major reservoir storage in the Sacramento River Basin, the DWRSIM model provides a reasonable simulation of the flow of the Sacramento River inflow to the Delta. As indicated above, a1 1 of the reservoirs in the San Joaquin River Basin, except New Melones, are "pre-operated" . The results of these pre-operat ions are used to prepare the San Joaquin Basin input data for DWRSIM. Most, if not a1 1, of these pre-operations were produced from 15 to 20 years ago and may not be representative of present level reservoir operations. As a result, the estimates of Delta inflow from the San Joaquin River produced by DWRSIM may not be representative of conditions and therefore, should be used only with these constraints in mind.
The operations studies uti 1 ize a complex series of assumptions, especially with respect to Central Valley hydrology and Delta f lowlsalinity relationships. DWR and others are conducting ongoing evaluations of the assumptions using information from the field and new analytical techniques. Revisions to assumptions underlying the operations studies are probable during the current hearing proceedings. The degree to which new assumptions may alter estimated water supply impacts or the conclusions drawn from operations studies is not known.

The water supply impacts, which are shown in the Table A6.3-1, are the changes in the fol lowing parameters:1/2
o San Joaqu in River Inflow o Sacramento River Inflow o Combined Total Delta Outflow plus Exports o Project Deliveries
Project del iveries impacts are combined changes in CVP-SWP del iveries and reservoir storage, this value is called the change and is defined as follows:
1) The total change in project deliveries, plus
2) 0.7 times the net change in storage of Sacramento basin project reservoirs during the period, plus
3) The net change in storage of San Joaquin basin reservoirs during the period, plus
4) The net change in storage of San Luis Reservoir during the period.
The storage change adjustment of 0.7 for the Sacramento Basin reservoirs is to approximate the loss to carriage water that would occur if water is released from storage for export in the Delta during balanced conditions. No carriage water correction is necessary for storage releases from the San Joaquin Basin reservoirs.
The total water supply impact of each alternative is the sum of the impacts due to the new 40-30-30 classification and the water quality objectives. The new classification is presented separately, however, to differentiate between the water supply impacts due to the classification and those due to changes in the objectives.
1 Table 6-2 also 1 ists "Other Flows", which is included to provide a cop le te Delta flow balance. I n a1 1 studies, these Other Flows are assumed not to change.
2 The reader is cautioned that the change in average annua 1 c r i t ica 1 period deliveries is not a to ta l ly accurate re f lec t ion o f change in "project yield" as the i n i t la 1 reservoir storages beginning the c r i t i c a l period may d i f fe r be tween studies.

TABLE A6.3-1 AVERAGE ANNUAL AND APRIL-JULY WATER SUPPLY IMPACTS OF THE ALTERNATIVE SETS OF WATER QUALnrY OBJECTIVES
Sari Joaquin River Inflow 3060 1120 Sacramento River Inflow 22980 7507 Total Delta Exports 161 6693 1845
6244 390
17511 6268 8558 1878 1880 -141
1201 290 ion1 3757
FOOTNOTES: Ill Change In base condltons - Alternative mlnue Base: Positive values Indicate an Increase in flow M export. 121 The lenerlnumber mblnat lon in parentheses below the alternative numbers identify the ooneepondlng DWR oprauon study. 131 Alternative 1B ta the base case (1A) with the new 4030-30 water year hi f*atfon. 141 Operation studies P7. K7. and N7 use an Mhl objecllve of 40 mg/l chlorides to pmvide an operationel buftsr. 151 Total Delta Exports Include Conna Costa Canal. Nanh Bay Aqueducl, and Bunks and Trey Pumping PPante. [El Other Flowa/Diverslone Include Net Delta Consurnpthre Use. Clty ol Vallefo diverslone. Ydo Bypass hfbm. end Eaer Side Bneams Inflow.
The Base CondlUons values are negallve when the Net Consumpthm Use plus the Ciiy of VaNefo dlvetufons are greater than the Yolo Bypass Inflow plus Ule East SWe Streams Infbw.
[?I Total Delta Outflow equals the San Joaquln Rher lnllow + Sacramento M e r Inflow - Total Delta + Other FlowslDiv(~~bns. 181 Project Delfvey Index Is the sum of critical period delhreries change plus 70 percent ot net criticel pwtd etorage in the Senamento River Basin
and 100 percent of the net critlcal period storage change In San Joaquln River Bash and San Lub Reservoir divided by 6.5 yesrs. In all studlse, the current 'surplus' water in New Melones Reservoir is assumsd to be avaHsble for Delia objecthrm.

TABLE A6.3-l(Cont.) AVERAGE ANNUAL AND APRIL-JULY WATER SUPPLY IMPACTS OF M E ALTERNATIVE SFTS OF WATER QUALITY OBJECTIVES
4 -183 -384 -1 -1078 -321
Sacramento Rlver Inflow 22980 7607 8693 1845
Other Flows/Dhrersion
Sacramento River Inflow 10771 3757 -28 -214 -47 -304 44 -471 Total Delta Exports 15)
FOOTNOTES: [ t l Change In base ondltone -Alternative mlnue Bese; Positive values lndlcate an Inorease In flowaexpmr [Zj The lenerlnumbar combination In parentheeee ba lm the alternaUve numbers MenHfy the mesponding DWRopaalh ebldy. 14 Alternatke 1B ie the base case ((A) with the new 40-30-30 water year dassiflcatla. 141 Operation shldles PI. K7. and N7 use an M U objectlre of 40 mgn chlorldss m provide an operatlmal buffer. 14 Total Della Eqmrta InJude Contra CoslaCanal. N& Bey Aqueduct, and Banb and Trecy Pumphg Plank 161 Other flo+sl[)ivemlons Indude Net Delta Consumptive Use, City of Vallelodlvembns. Yob Bypsps b~flcr. and EeaSde Saeama lnflow.
The Bese bndltlone values are negative when the Net ConsumpUve Uee plue the Clly of Valk,jodkwalons are greater than the Yolo Bypaee lnflow plue the East SMe Streams Inflow.
[7j Total Delta Oufflow equab, the San Joaquln River lnflow + Sacramento River lnflow - Total Delta Gpmta +Other FloWDiverabne. 18.1 Project Delkety index b the sum of witlcal period deliveries change plue 70 percent of net uitlcal perbd storage In the h s n t o Wver Basin
and tW1 percent of the net critlcal period etorage change In San Joaquln River Basin and San Luh Rssbnoh divided by 8 6 yeam. In ell shldles, the current 'surplus' water In New Melonee Resewolr ie mumed to be avallabk la Dsllaabjectlv~~.

Appendix
RESPONSES TO COMMENTS ON THE DRAFT WATER QUALITY
CONTROL PLAN ( January 1991 )
San Francisco Bay/ Sacramento - San Joaquin
Delta Estuary
April 1991 WATER RESOURCES CONTROL BOARD
STATE OF CALIFORNIA

RESPONS@S TO COMMEEl!S ON THE DRAFT WaTER QUALITY
COlYTROL PLAN (January 1991)
San Francisco Bay/ Sacramento - San Joaquin
Delta Estuary
Report Number, 91-11 WR
May 1991
Prepared by the Bay-Delta Section Division 0% Water Rfghts
aATER msomCEs ccm!ROL BOARD STATE OF CBLIPORHIB

Preface
"RESPONSES TO. CQMENlTS "
The State Boar& wishes to thank the participants %w submitting eomnlents m the January 1991 Draft Water Qua1 ity Control Plan far Salinity for the San Fra~ci,sco Bay-Delta Estuary.
The "Respmses to CommentsU document distributed in this mailing summarizes the comments received on the January 1991 Draft Plan. Responses to these commnts are divided into two sections (which are in turn organized by chapters of the P15an): the first lists the comments and responses that resulted in cha es in the Draft + Plan; the second lists those which resulted in no changes. hese responses to comments were made available at the April 2, 1991 Board Meeting. Only the format of presenting the responses has been changed in this document.

Table of Contents
Page
.................................................................. Preface i Table of Contents ........................................................ ili
Section I. Camments that Resulted in Changes iln Text of the Plan .................................................. General Comments.. -1-1 ................................... Chinaok-Temperature Objectives 1-1 ..................................................... Suisun Marsh 1-3 Specific Comments . .......................,.......................... 1-5 ........................................................ Chapter 1 1-5 ........................................................ Chapter 5 1-12 ............................ ........................ Chapter 6 ... -1-23 ........................................................ Chapter 7 1-28
Section 11. Comments that Resulted in No Changes in Text of the Plan .................................................... General Comments .11.1 ............................................................ Flow -11-1 ................... .................... Negotiated Agreements .... -11-1 ........................................ Environmental Conditians .I 1.2 .............................................. Operation Studies. -11-3 ............................................... Combined Effects. -11-3 .................................................... Striped Bass -11-3 Municipal and Industrial Water Quality Issues . .................................... Trihalomethanes ........ .. -11-5 .................................. Chinook-Temperature Objectives .I 1.6 ........................ Municipal and Industrial Use ............. I 1.7 ....................................... Water Quality Control Plan 11-7
................................................... Specific Comments .I 1.13 ....................................................... Chapter 1 .I 1.13 Chapter 2 ........................................................ I 1.16 ........................................................ Chapter 3 I 1-17 ........................................................ Chapter 4 11-18 ....................................................... Chapter 5 -11-18 ...................................... Municipal and Industrial -11-19 .................................................. Agriculture ..I 1.21 ............................................. Fish and Wildlife -11-23 Relationship of Striped Bass Spawning Protection Relaxation ................................... Provisions to Water Supply 11-34 ................................. Data Needs. Gaps and Tests .. . .11.35 ................................. Period of Spawning Protect ion -11-37 ....................................................... Chapter 6 -11-42 ....................................................... Chapter 7 -11-48
Sect ion I I I. Technical Appendices Comments and Responses ............................................... I 11-1
Section IV. Addendum to the "Responses to Commentsu ...................... IV-1

SECTION I
Comments that Resulted in Changes in Text of the Plan
General Comments
Chi nook-Temperature Ob ject ives
Comment: Various agencies consider the temperature objectives to be generally impractical and unreasonable and note that the Plan includes the exclusion of reservoir releases as a control lable factor. USBR be1 ieves that facilities to improve salmon passage through the Delta are actions that need to be considered in the evaluation of alternatives to meet the various beneficial uses and suggests that such facilities be identified and studied by appropriate work groups (WQCP-USBR- 1298, Page 2, last paragraph, Page 3, first paragraph; WQCP- SWC-631,2, first para. ; WQCP-DWR-25, Page 4, third paragraph).
Response: The wording of the f a1 1 -run Chinook salmon temperature objective is going to be changed as follows:
Change in text: "The daily average water temperature shall not be elevated by controllable factors above 68°F from the I Street Bridge to Freeport of the Sacramento River, and at Vernal is on the San Joaquin River between April 1 through June 30 and September 1 through November 30 in all water year types. "
Response: The wording of the winter-run Chinook salmon temperature objective is going to be changed as follows:
Change in text: "The daily average water temperature shall not be elevated by controllable factors above 66°F from the I Street Bridge to Freeport on the Sacramento River between January 1 through March 31 ." This wording will be inserted in the following places in the text and tables of the Plan:
Tables 1-1, 5-5 and 6-3; and Pages 1-13, 5-15, and 5-25.
Response: To address the concerns expressed above, other changes wi 1 1 also be included.
1) Table 1-1, Page 8 of 8
Change in text: "Based on the record in these proceedings, controlling temperature in the Delta utilizing reservoir releases does not appear to be reasonable, due to the distance of the Delta downstream of reservoirs and uncontrollable factors such

ambient air temperature, water temperatures in the reservoir releases, etc. For these reasons, the State Board considers reservoir releases to control water temperatures in the Delta a waste of water; therefore, the State Board wi 1 1 require a test of reasonableness before considerat ion of reservoir re 1 eases for such a purpose. "
2) Table 5-5, Page 28 of 28
Change in text: "Based on the record of these proceedings, controlling water temperature in the Delta utilizing reservoir releases does not appear to be reasonable, due to the distance of the Delta downstream of reservoirs and uncontrollable factors such as ambient air temperatures in the reservoir releases, etc. For these reasons, the State Board considers reservoir releases to control water temperatures in the Delta a waste of water; therefore, the State Board will require a test of reasonableness before consideration of reservoir releases for such a purpose."
3) Table 6-3, Page 8 of 8
Change in text: "Based on the record in these proceedings, controlling temperature in the Delta ut i 1 izing reservoir releases does not appear to be reasonable, due to the distance of the Delta downstream of reservoirs and uncontrollable factors such as ambient air temperature, water temperatures in the reservoir releases, etc. For these reasons, the State Board considers reservoir releases to control water temperatures in the Delta a waste of water; therefore, the State Board will require a test of reasonableness before consideration of reservoir releases for such a purpose. "
4) Page 1-13
Change in text: "Control lable water qual ity factors are those actions, conditions, or circumstances resulting from human activities that may influence the qual ity of the water of the State, that are subject to the authority of the State Board, or the Regional Board, and that may be reasonably control led. Based on the record in these proceedings, control 1 ing temperature in the Delta utilizing reservoir releases does not appear to be reasonable, due to the distance of the Delta downstream of reservoirs and uncontrollable factors such as ambient air temperature, water temperatures in the reservoir releases, etc. For these reasons, the State Board considers reservoir releases to control water temperatures in the Delta a waste of water; therefore, the State Board will require a test of reasonableness before consideration of reservoir releases for such a purpose."

5) Page 5-15
Change in text: "Control lable water qual i ty factors are Chose actions, conditions, or circumstances resulting from human activities that may influence the qual ity of the water of the State, that are subject to the authority of the State Board, or the Regional Board, and that may be reasonably control led. Based on the record in these proceedings, control 1 ing temperature in the Delta utilizing reservoir releases does not appear to be reasonable, due to the distance of the Delta downstream of reservoirs and uncontrollable factors such as ambient air temperature, water temperatures in the reservoir releases, etc. For these reasons, the State Board considers reservoir releases to control water temperatures in the Delta a waste of water; therefore, the State Board wi 1 1 require a test of reasonableness before considerat ion of reservoir releases for such a purpose."
6) Page 7-4
Change in text: Delete "Chapter 5" and insert "Section 5.5.2.5".
Suisun Marsh
Comment: The Plan deletes salinityobjectives for Suisun Marsh (WQCP- SCLDF-1, page 9, point IV.).
Response: The following wording will be added to the Plan for clarification of the status of the objectives that apply to Suisun Marsh.
Change in text: "In regard to the Suisun Marsh, the water quality objectives for Suisun Marsh are unchanged from the 1978 Delta Plan. The implementation vehicle, Water Right Decision 1485 (D-1485), was amended in 1985 to change (or delete) some monitoring stations and to revise the schedule for implementation. The DWR, USBR, DFG, and Suisun Resource Conservation District (SRCD) have signed and adopted a set of three agreements concerning the Suisun Marsh. These are the Suisun Marsh Preservation Agreement (SMPA) , the Monitoring Agreement, and the Mitigation Agreement. The SMPA contains water qual ity standards for the managed marshes of Suisun Marsh which the four signatories would 1 ike the State Board to adopt as water qual ity objectives. The Mitigation Agreement describes the physical facilities that the four signatories have agreed would serve the managed marshes in order to maintain production of preferred waterfowl food plants. The f aci 1 it ies built so far, including the Suisun Marsh Salinity Control Gates (previously called the Montezuma Slough Control Structure), have changed the physical regime in the Marsh.

Revised water qua1 ity objectives incorporating the SMPA (with any modifications necessitated by the biological assessment) will be adopted by the State Board after the biological assessment (discussed in Section 7.4.2.6) is completed. Until that time, the water quality standards in the amended D-1485 will continue to be implemented; see Table 1-2 for a summary of these standards. "

Specific Comments
Page 1-4, last sentehce; contihuin~ on t o p.1-5;
Comment: Change tri halomethanes to disinfect ion by-products (WQCP-SWC- 632,7114).
Response t Coment hoted.
ChaWge iR text: "The-exi stence of disinfect ion by-products, caused by the treatment of water containing bromides that natural ly occur in ocean water and containing organic materials that result from decomposition. . . "
Page 1-4
Commknt: The description of reverse flows should include the San Joaquin River above the confluence of the Mokelumne River, and Old and Middle rivers (WQCP-DFG-5,l).
Response: Agree.
Change in Text: ". . .reverse f fows in various reaches of the San Joaquin River, Old River, Middle River and other Delta channels, taused by the CVP, SWP, CCC and local agricultural dSversSon pumps; afid.. .'I
Page 1-6
Comment: More stable funding is required for theentire Interagency Ecological Study Program, not just DFG (WQCP-USFWS-7,3).
Response: Agree. Text wi 11 be changed. The State Board on 'two occasions has attempted to improve funding for thfs program through the 1 egislature, but was unsuccessful.
Change in text: "Since planning and executing studies of the Estuary require DFG to work closely with the other member agencies of the IESP, more stable and consistent funding of all IESP programs is required to achieve maximum benefits from these studi-es and to achieve effective Estuary management.
Page 1-7, Water Resources Management
Comment: Add the following or a second paragraph to page 1-7. " A process being called Urban Water Conser,vatian Best Management Practices (BMP) is being developed by urban water suppl iers , environmental organizatiofis, and ather pub1 ic interest groups statewide. The BMP process represents a consensus among the above groups on an &ppuldpria* msolut ion of the urban water conservation for these, Bay-Del'ta hearings. the State Water Resources Control Board encourages such consensus recommendat ions. " (WQCP-SWC-633,3).
Response: We agree with the comment in general.
Change in text: "A process being called Urban Water Conservation Best Management Practices (BMP) is being developed by urban water suppl iers, environmental organizations, and other pub1 ic interest groups statewide. The BMP process represents a consensus among the above groups on the issue of urban water conservation for the Bay-Delta hearing. The State Water Resources Control Board encourages such consensus recommendat ions. "
Page 1-7, Proposed Review of Striped Bass Fishing Regulations
Comment: Pages 1-7, 1-18, 7-20 - Board has responsibility to set water qual ity and water rights objectives to protect public trust resources, without regard to how the harvest of those resources is regulated by other agencies. No evidence that present management practices interfere with the Board' s ability to carry out its duties. No conceptual relationship between water conservation measures and the regulation of public trust resource harvest. Request these references be removed (WQCP-DFG-5,5).
Comment: Pages 1-7, 1-18, 7-20 - Inappropriate to include fish harvest management changes as a Water Resource Management tool; is not the responsibility of the Board to manage fish harvests. The State Board has responsibility to set water qual ity and water right objectives to protect public trust resources regardless of how are managed (WQCP-NMFS-1,2-3).
Comment: Page 1-7 - A change in fishing regulations is a poor choice for a reasonable choice in water resources management when the problem of low populations is habitat damage rather than inappropriate fishing regulations (WQCP-USFWS-7,3).
Response: We agree that discussion of fishing regulations in the context of water management options is not appropriate, and it will be deleted. We also agree that setting water qual ity standards to protect habitat should be independent of fishery management decisions. However, the Board be1 ieves it appropriate to recommend, at least for consideration by other agencies as part of an overall implementation plan, temporary changes in fishery harvest regulations.
Change in text: "Temporary changes in fishery harvest regulations should be considered as part of an overall short-term approach to improve the situation until longer-term measures may be instituted. The Board does not believe such measures should substitute for its own responsibilities to provide suitable habitat. "

Page 1-10; eighth bullet, of the Plan:
Comment: Sentence should indicate that planning for M&I water needs must focus on requirements of a reliable supply of hi h ualit drinking water at an affordable cost (WQCP- WC-632,7- w e-
Response: Comment noted. .. Change in text: ". . . a reliable supply of high quality drinking water.. ."
Page 1-11 "Salinity Requirements ..." Comment: General conclusions should be added adopting the concept of
best available source for drinking water, and recognizing the need to develop a program to reduce the impacts of THM precursors from Delta agricultural drains. (Suggested language is included) (WQCP-SWC-632,4).
Response: Agree; Suggested language wi 1 1 be included.
Change in text: "There is a need for water from the best available sources to meet the drinking water need of all Californians. There is a need to design and implement a comprehensive trihalomethane format ion potential (THMFP) monitoring program, and to develop best management practices, or other appropriate means, to control discharges of THMFP . "
Page 1-11; third bullet; last sentence:
Comment: Currently states that "deleting the 150 mg/l objective could result in increased bromide concentrations and substantially increased treatment costs". Should be revised to read that decreasing the objective cou 1 d resu 1 t in increased bromide concentrat ions and increased sal ini ty and consumer complaints due to the salty taste in the water. (WQCP-SWC-632,107).
Response: Agree.
Chanae in text: " . . .+increased bromide concentrations and increased sal ini ty and consumer complaints due to the salty taste in the water. (WQCP-SWC-632,l-7). (5.1)
Page 1-11; sixth, seventh and eighth bullets and p. 5-5; second, third and fourth bullets (language is similar for all referenced bullets); p. 5-6, following the fourth paragraph: p. 5-7; Item No. 2 and Item No. 3: p. 5-8; Item No.3 and Item No. 8: p. 6-12; Section 6.2.3.2:
Comment: Suggest deleting a1 1 referenced bul lets and adding new paragraphed 1 anguage . The proposed 1 anguage includes a discussion on the contribution of agricultural drainage from Delta islands, and requests the State Board, DWR and USBR to

develop measures, costs and an implementation schedule to achieve a chloride objective of 50 mg/l at all Delta M&I intakes. A report on the subject is to be prepared by March 1992. The proposed language also states that as a result of the new and existing drinking water regulations, water utilities treating Delta water will continue to violate and increase the rate of violation of those standards due to current Delta water qua1 ity (WQCP-SWC-632,l-7).
Response: Disagree with deleting the referenced bullets in favor of the proposed 1 anguage. However, agree with revising the seventh bullet on p. 1-11 (the third bullet on p. 5-5).
The proposed 1 anguage concludes that agricu 1 tural drainage from Delta islands contributes 40 to 45 percent of the THMFP in the Delta during irrigation months, and 38 to 52 percent durin the winter leaching period in water year 1988 (emphasis added 3 . Including this information as a conclusion in the Plan would be misleading. The information provided is based on a first estimate, has not been confirmed, is for one single dry water year, and covers the entire Delta as opposed to a particular location such as the Cl ifton Court Pumping Plant. As such, the information should be considered preliminary (Bruce Agee, DWR, pers. comm.).
The proposed language also indicates that water uti 1 ities treating Delta water currently violate drinking water standards and that this rate of violation will increase as a result of new water regulations. This language is misleading. Violat ions of current drinking water standards by water utilities occur very infrequently, certainly not on a consistent basis as the proposed language seems to imply. Also, it is not a certainty that new drinking water regulations wi 1 1 result in stricter standards (see Contact Report dated March 15, 1991 re. conversation between Leo Winternitz, SWRCB; Bruce Macler, EPA; and Alexis Milea, DHS).
The proposed language states that the DWR and USBR will work with the SWRCB to develop measures, costs and an implementation schedule to achieve a chloride objective of 50 mg/l at a1 1 Delta M&I intakes, and to prepare a report by March 1992. This issue is a subject for the Scoping Phase and therefore it is premature as a conclusionary action for this Plan.
SWC recommends'deleting the seventh bullet on p. 1-11, (third bullet on p. 5-5) because the statement directly links DBP regulations and salinity, implying that drinking water quality is the only consideration for salinity revisions. Disagree with deleting the bullet but agree that the statement should be revised.
Change in text: "If drinking water standards on DBPs are revised, the State Board will consider modifying existing salinity objectives."

Page 1-11; last bullet, and p. 5-5; fifth bullet (language is similar in both bullets):
Comment: The statements indicate that municipal water supply agencies have sufficient power to control chloride and bromide levels in the Delta, and this is not the case. Language is suggested to correct this impression. Language includes actions that drinking water supply agencies could take to try meeting a 50 mg/l chloride objective (WQCP-SWC-632,l-7).
Response: Comment noted.
Change in text: . . . "encouraging DWR and the USBR to work with the SWRCB to ensure development of facilities to make maximum use of uncontrol led flows through off -stream storage, encouraging those agencies to move water supply intakes to better locations, working with the State and Regional Boards to eliminate problem discharges within the Delta, continuing the development of alternative water treatment technologies. " (5.2).
Page 1-13
Comment: Suggest adding "poaching" to the factors affecting striped bass abundance. Suggest finding should read ". . .and recreational angler harvest, and i 1 legal poaching. (WQCP-SWC- 631,2,12).
Response: Agreed. Comment noted.
Change in text: "...recreatfonal angler harvest, and illegal poaching."
Page 1-14, Marshes, first paragraph
Comment: The name "Montezuma Slough Control Structure" should be replaced, wherever it occurs in this Plan, with the name "Su isun Marsh Sal ini ty Control Gate" (WQCP-DWR-24,ll).
Response: Comment noted.
Change in text: The name "Montezuma Slough Control Structure" will be replaced, wherever it occurs in this Plan, with the name "Suisun Marsh Sal inity Control Gate" (WQCP-DWR-24,ll).
Page 1-14
Comment: Unclear how closure of the Delta Cross Channel gates can cause south Delta entrainment. In some cases it can reduce Sacramento River losses (WQCP-USFWS-7,3).

Response: Agree. The footnote will be reworded,
Change in text: "Entrainment means primarily the effects of project operations, such as operation of the Delta Cross Channel gates, export pumping, and reverse and low river flows, plus local non-pro ject diversions. "
Page 7-21
Comment: It should be made clear that the first para raph refers to the Sacramento River Water Year Classification qWQcP-CVPWA-210,36- 37).
Response: Agree.
Change in text: Page 7-21, Section 7.5.3.1., para 1, and Page 1-15, Section 1.6, para 1, will be amended as follows: "The current Sacramento River Basin Water Year Classification.. . "
Pages 1-15 fourth bullet and Page 7-9 fifth paragraph immediately following Section 7.4.2.1.
Comment: The language in these sections should be revised to strengthen the direction to the Central Valley Regional Board relative to actions needed regarding the Delta island drains. The Regional Board should be directed to take firm action regarding the Delta drains. These tasks are to begin in the Rock Slough and Cl if ton Court Forebay areas (WQCP-SWC-632,l- 7)
Response: Agree with the intent to strengthen direction to the Central Valley Board and with the proposed language revisions.
Change in text: ".....Central Valley Regional Board shall require the development and implementat ion of best management practices or other means to appropriately control these discharges. "
Page 1-16, last para.
Comment: USBR suggests that the wording of this sentence should be changed to include a1 1 runs of Chinook salmon (WQCP-USBR-129B, Page 1, paragraph 4).
Response: The sentence will be changed.
Change in text: "Analysis is needed of the effectiveness of various means to control factors which will help maintain cooler water in the Sacramento and San Joaquin rivers and their tributaries for the protection of all runs of Chinook salmon."

Page 1-17
Comment: USFWS states that the paragraph on temperature monitoring should also indicate how the temperature data is to be used (WQCP-USFWS-7, Page 3, 6th specific comment).
Response: The following sentence wi 1 1 be added to the referenced paragraph (and to Page 7-8, section 7.3.2.3, first paragraph).
Change in text: "The temperature data collected are to be submitted to the State Board which will then make a determination whether controllable factors should be control led."
Page 1-17, Estuarine Habitat, first paragraph
Comment: It was suggested that the second sentence be changed to read:
"Relatively few investigators have been able to specifically quantify the lower level of conditions that protect the beneficial uses. " (WQCP-USFWS-7,3)
Response: The text in the Plan will be changed as suggested.
Change in text: "Relatively few investigators have been able to specifically quantify the lower level of conditions that protect the beneficial uses."
Page 1-17, Scoping and Water Right Issues (7.5), first paragraph
Comment: The Board should modify the language in this paragraph to reflect the fact that the burden of compliance monitoring will a1 so need to be distributed (WQCP-SWC-633,5).
Response: The first paragraph will be changed.
Change in text (changed and added language underlined): "Only a few parties are currently responsible for meeting water quality and flow requirements and for compliance monitoring activities within the Delta. The Board requests t h a t e v e l o p e d on how these burdens should be distributed . . . . "
Page 1-19, Entrapment Zone (7.5.3.3), and Page 7-22, Section 7.5.3.3, introductory paragraph
Comment: USFWS did not agree with the qualifying phrase "if any" in the statement and that "the statement should simply read as follows: 'Studies are needed to better define the linkage between.. . ' (WQCP-USFWS-7,7). DWR, SWC, and CVPWA stated that the later references to the linkage of fish productivity to the entrapment zone do not include the qualifier; they claim that there is no linkage at all (WQCP-DWR-24,14; WQCP-SWC- 631,l; WQCP-SWC-633,5-6; WQCP-CVPWA-210,ll).

Response: The degree of linkage is what is in doubt. The language in the Plan, on pages 1-19 and 7-22, will be changed.
Change in text: "Studies are needed to better define the degree of linkage between the location and productivity of the entrapment zone and the effects on the population levels of important fish species. " [new words under1 ined]
Page 5-1, Section 5.0.1, paragraph 3
Comment: The second sentence implies that the South Delta negotiated agreement wi 1 1 be accepted as the South Delta water qua1 ity objectives. The sentence should be reworded to read as follows: "Development of objectives for the South Delta will commence upon receipt of a negotiated agreement between. . . " (WQCP-USFWS-7,4).
Response: This statement referes to implementation of the 1978 Delta Plan objectives, not the Draft Plan objectives. This sentence will be clarified.
Change in text: "Implementation of the Delta Plan objectives for the Southern Delta were initially postponed until suitable circulation and water supply faci 1 it ies were completed. Implementation of these objectives was further delayed at the request of the South Delta Water Agency (SDWA), USBR, and DWR, awaiting the results of continuing negotiations among these three agencies. "
Page 5-7; Item No.6
Comment: Question the need to study the chloride/bromide relationship in the Delta unless there is evidence that another, as yet undiscovered , bromide source is expected to exist (WQCP-SWC- 632,7-14).
Response: Agreed.
Change in text: "A major source of bromide ions in Delta waters is sea water and a relationship has been documented to exist between chloride levels and bromide levels in sea water."
Pages 5-9 and 5-12
Comment: Meeting agricultural objectives at interior South Delta stations is contrary to the intent of the negotiated contract. With the contract in place, the water quality objectives should only apply to the station at Vernalis. The proposed objectives are infeasible and, theref ore, should not be included (WQCP-DWR-24,7; WQCP-SWC-630,3-4; WQCP-CVPWA-210,lO).

Response: Evidence has not been shown that it is impossible to meet the interior agricultural objectives. Implementation wi 1 1 look at not only Project operations but other various solutions, including; non-Pro ject operations, a salt-seduction program, and physical facilities. The following wording replaces that which describes the southern Delta portion of Section 7.2.2.2 on page 7-3 of the Plan.
Change in text: "a Southern Delta The implementation plan is comprised of two interim stages and a final stage.
Interim Stage 1 -- 500 mg/l mean monthly TDS all year at Vernal is.
Interim Stage 2 -- (to be implemented no later than 1994) 0.7 mmhos/cm EC Apri 1 to August 31, 1.0 mmhos/cm EC September 1 to March 31; 30-day running average at Vernal is and Brandt Bridge, with water quality monitored at three current interior stations -- Mossdale, Old River, near Middle River and Tracy Road Bridge; and an additional interior monitoring station on Middle River at Howard Road Bridge.
Final Stage -- (to be implemented no later than 1996) 0.7 mmhos/cm EC April to August 31, 1.0 mmhos/cm EC September 1 to March 31; 30-day running average at Vernalis and Brandt Bridge on the San Joaquin River, with two interior stations at Old River near Middle River and Old River at Tracy Road Bridge. Monitoring stations will be at Mossdale at head of Old River and Middle River at Howard Road Bridge."
If a three-party contract has been implemented among DWR, USBR and the SDWA, that contract will be reviewed prior to implementation of the above and, after also considering the needs of other beneficial uses, revisions will be made ta the objectives and compl iancelmoni toring locat ions noted above, as appropriate.
The above change will also be reflected in Tables 1-1, 5-5 and 6-3, and 7.2.2.2 text.
Page 5-9
Comment: The Framework Agreement has been superceded by the terms of the draft contract (WQCP-USBR-129Al 2).
Response: Agree. The WQCP, Page 5-9, Section 5.3.1.3, "Southern Delta" first paragraph, third bullet, will be edited.
Change in text: "o The terms of the draft contract for settling litigation brought by the SDWA against the USBR and DWR. "

Pages 5-14 and 5-15, Section 5.4.1
Comment: It was suggested that an item about Potamocorbula be added to the list of recent changes in the Delta found on page 5-14 (WQCP-SWC-631,3-4; WQCP-CVPWA-210,ll).
Response: The following item wi 1 1 be added (and the format of items 3 and 4 modified as needed).
Change in text: " 5. The introduction and rapid increase in numbers and range of the Asian clam Potamocorbula and its possible adverse effects on phytoplankton and zooplankton abundance. 'I
Page 5-16 para. 1
Comment: CVPWA comment includes a suggested revision of the first sentence: Various water qual ity conditions, such as temperature, dissolved oxygen (DO) and sal ini ty , affect Chinook salmon survival in the Delta (WQCP-CVPWA-210, Pa e 12, last paragraph; WQCP-SWC-631, Page 5, paragraphs 3 and 4 3 .
Response: The referenced sentence will be changed to read as follows:
Change in text: "Various water qual ity conditions can affect Chinook salmon survival in the Delta. The water quality variables under consideration were temperature, dissolved oxygen (DO) and salinity."
Page 5-19, Sec. 5.5.2.1 para. 1
Comment: USFWS recommends wording changes describing the time periods of the temperature objective in terms of salmon 1 ife stages; it states that the sentence, regarding the ability and options to attain a desired temperature objective have not been fully investigated, is misleading because USBR temperature model 1 ing shows that flow does reduce temperature (WQCP-USFWS-7, Page 5, paragraph 3).
CVPWA suggests that 1) the paragraph be rewritten and provides the suggested revision, states 2) among other things that there are no winter-run Chinook in the San Joaquin River (WQCP- CVPWA-210, Page 16, last paragraph).
Response: Regarding the wording describing the time periods: wording changed. The first sentence should be reworded for clarification. Regarding the sentence on the ability and options to attain the temperature objective: This is not meant to be misleading, evidence was presented that showed it is not feasible to use only flow to achieve the temperature objectives. If flow is to be used at certain times of the year during certain water year types that evidence needs to be presented to the State Board (see IV. Controllable Factors: response to comments A. and B. ).

Change in text: "The critical periods for fall- and winter-run Chinook salmon in the lower Sacramento and San Joaquin Rivers are between December 1 and June 30 and September 1 and November 30 of each year, because these encompass the spawner migration and the juveni le outmigrat ion phases through this area (See Appendix 5.3, Chinook Salmon). "
Page 5-19, Page 5-24
Comment: EPA notes that the text states that increased flows could have an effect on temperatures, however there is no explanation given for excluding reservoir releases from "controllable factors". The plan recommends the temperature objectives be subject to "controllable factors". This should not be an explicit part of the objective but part of the Program of Implementat ion ( WQCP-EPA-1, Page 2, paragraphs 2-4; WQCP-SCLDF- 3, Page 1).
Response: Please see response to USBR comments in GENERAL COMMENTS, Chinook-Temperature Objectives which includes changes in the text (pages, 1-1 and 1-2).
Page 5-22
Comment: DFG considers the objectives for fish and wild1 ife reasonable except for the 66OF objective for the winter run Chinook salmon because it implies that it would be acceptable to warm the river during the winter. Because there is no evidence that a temperature problem exists from January to March, it is recommended that the objective be deleted. ( WQCP-DFG-5, Page 2, paragraph 1; WQCP-USFWS-7,Page 5, paragraph 4 (no page reference for the Plan); WQCP-CVPWA-210, Page 12, paragra h 4- R 5 (Page 5-15); WQCP-CVPWA-210, Page 20, last two paragrap s (Pa e 5-22); and WQCP-CVPWA-210, Page 23, paragraph 2 (Page 5- 26) 3 .
Response: The temperature objective for winter run is to provide protection for a 1 isted species during the time when they are most likely to be in the Delta. If additional information is provided that more precisely defines the timing of their migration through the Delta and their temperature requirements while in the Delta, this information can be incorporated Into the triennial review process.
Change in text (the following wording will be inserted into Page 5-22 of the Plan): "The winter-run Chinook salmon temperature objective is a cap to prevent water temperature from going higher than the -
present temperatures in the Delta. It is not a goal. This objective is just one of several ways of providing protection from elevated water temperatures. Other such protect ion measures include the Thermal Plan (see in Section 5.5.25) and the State Board "anti-degradation policy", "Statement o f Policy With Respect to Maintaining High Quality of Water in California", Resolution 68-16."

Page 5-26
Comment: DWR states that even with the instal lation of the temporary rock barrier at the head of Old River, a dissolved oxygen (DO) level of 6 mg/l cannot be maintained September 1 through November 30 in the San Joaquin River near Stockton (WQCP-DWR- 12). More description is needed of the many factors not related to the SWP and CVP operations that contribute to the DO problem, including: 1) the recently deepened ship channel; 2) the enlarged turning basin at the Port of Stockton; 3) the Stockton Sewage Treatment Plant; 4) upstream BOD sources; and 5) commercial use of the dead-end portion of the ship channel, where the DO often falls to zero. The Plan of Implementation should specify how this objective will be met. Two methods are suggested for improving DO levels; additional methods should be considered (WQCP-DWR-24, Page 11, last paragraph-Pa e 12, paragraphs 1-2; WQCP-DWR-25, Page 4, last paragraph;) 9 WQCP- CVPWA-210, Page 23, last paragraph-Page 24; WQCP-CVPWA-210, Page 35).
Response: The text (Page 5-23, paragraph 3) will be amended to include the following sentences.
Change in text: "Factors that may contribute to the low levels of dissolved oxygen, in addition to low flows in the San Joaquin River during the fall months, include: 1) the recently deepened ship channel; 2) the enlarged turning basin at the Port of Stockton; 3) the Stockton Sewage Treatment Plant; 4) upstream BOD sources; and 5) commercial use of the dead-end portion of the ship channel.
Measures to implement this objective include the following: 1) regulation of the effluent from the Stockton Sewage Treatment Plant and other upstream discharges contributing to the BOD load; 2) install the temporary barrier or additional barriers as may be needed, 3) investigate mechanical or chemical methods to oxygenate the water at critical points along the river channel, and 4) increase flow in the San Joaqu in River. A decision on the precise implementat ion measures wi 1 1 be made during the forthcoming proceedings. "
Page 5-30
Comment: The text does not explain how estimates of spawning activit were determined for the table on this page (WQCP-SHC-631,13!.
Response: The text in Section 5.6.2.1 will be modified to explain the procedure.
Change in text: "The percent of spawning activity assumed protected under each alternative in the table above is determined directly from Table 5-2. The range of percent spawning activity protected is simply the amount of spawning activity measured (i .e.,

percent of total eggs collected) by the end date of each alternative. There is assumed to be relatively little spawning which occurs before about April 14 each year, so the absence of ramping (i.e., appropriate salinity from April 1 rather than ramping flows to April 15) was assumed to add only about 5 percent additional spawning activity protection over that provided by ramping. The relative lack of data before Apri 1 15 makes this somewhat speculative, but in any case it is probably not significant. "
Ant ioch and Prisoners Point Spawning and Relaxat ion Objectives
Pages 5-27 through 5-35
Comment: Page 5-27 to 5-28 - The scientific basis for the 1.5 EC objective at Antioch is not described in the Plan (WQCP-EPA- 1,519
Comment: Page 5-27 to 5-34 - The objective of 1.5 EC at Antioch is not supported by the evidence. The record shows that spawning standards should be less than 0.33 mmhos/crn. The standards shou 1 d be expanded to designate spec if ic river segments, rather than just specific points (WQCP-SCLDF-1,6).
Comment: Page 5-32 to 5-33 - The striped bass spawning standard in the central Delta is set at a single location (Prisoners Point) ( WQCP-CWPC- 1,8).
Comment: Page 5-32 to 5-33 - The benefits of the proposed change in the Prisoners Point ob 'ective from 0.55 to 0.44 mmhos/cm are not supported by data ~WQCP-DHR-24. 13).
Comment: Page 5-30 to 5-32 - The relaxation provision is incorrectly tied to the Suisun Marsh D-1485 standard at Chipps Island ( WQCP-SWC-630,607).
Comment: Page 5-30 to 5-32 - Even with a relaxation to an Antioch EC of 4.4 mmhos/cm, ten to fifteen miles of spawning habitat would st i 1 1 remain (WQCP-SWC-630,8).
Comment: Page 5-32 to 5-33 - No evidence that striped bass spawning is being adversely impacted by current objective of 0.55 mmhos/cm at Prisoners Point, and it should be retained (WQCP-SWC- 630.9).
Comment: Page 5-27 - The statement "deficiencies in firm supplies and the level of protection afforded by the striped bass spawning objective should be correlated" is unclear (WQCP-USFWS-7,5).
Comment: Page 5-30 - No technical basis exists for estimating the length of spawning habitat in the San Joaquin River when Antioch EC is 25.2 mmhos/cm. Very little biologically-based information available to relate spawning and Antioch EC and deficiencies (WQCP-SWC-631,131.

Comment: Page 5-35 - There is no scientific evidence to justify changing the D-1485 relaxation provision to 3.7 mmhos/cm EC. No justification to retain a relaxation provision beyond 3 MAF ( WQCP-CVPWA-210,26).
Comment: (Page 6-20 a1 so) - Agrees that considerable uncertainty regarding potential benefits of striped bass sal ini ty ab jectives. Arthur's work shows "ample production of striped bass eggs and larvae". Significance of various findings should be determined prior to making any final determinations on sal ini ty objectives (WQCP-CVPWA-210,33).
Response: (Since all of this response will also be used for changes in text, each change will be labeled as to where in the Plan it will be inserted).
Change in text, Page 5-30: "The present Antioch standard of 1.5 mmhoslcm EC was primarily designed, as is described in Section 5.6.1.1, to provide a suitable spawning habitat upstream of Antioch, not at the Antioch location itself. According to the recollection of Don Stevens of DFG (pers. corn., 3/91), Antioch was chosen as a monitoring point because a salinity monitoring station was already established at the Antioch Water Works. The use of 1.5 mmhoslcm EC at Antioch for spawning protection appears not to be generally appropriate, since DFG's own testimony indicates that striped bass prefer to spawn in freshwater, and that a spawning objective of 0.44 mmhos/cm EC represents the "best scientific evidence" of the water qua1 ity needed to restore spawning in the historical spawning area of the San Joaquin River (WQCP-DFG-4,9) (see Sect ion 5.6.2.3). However, the Antioch water quality objective may continue to serve the purpose of being an ultimate delimiter of spawning habitat; the Antioch objective can also be considered an "implementing measure" since maintaining that objective should produce less saline, and thus more suitable habitat, upstream of Antioch in the San Joaquin River. DFG has observed some spawning in the Antioch to Jersey Point reach, sometimes ifi EC's of 1.5 mmhos/cm or higher, in some very dry years (1972 and 1977). Laboratory studies also indicate that egg survival is not affected adversely in water with EC's up to 1.5 mhos/cm (DFG, 25,46). These conditions have typically produced some of the lowest abundance indices, however. We also agree that the striped bass spawning objectives, as proposed, do not in fact designate a spawning reach, but only a single location (Prisoners Point) where appropriate salinities for the majority of spawning, as determined by DFG, are required to be present . "

Change in text, Page 5-32: "As several participants have pointed out, there is considerable confusion about the appropriateness of the proposed relaxation criteria, in terms of what salinity is appropriate at Antioch for various deficiency levels. As has been discussed, the 1978 Delta Plan and EIR based the relaxations on a salinity/flow relationship for the Sacramento River, which was assumed to be applicable to the San Joaquin River as well. In addition, the theoretical extent of salinity degradation was supposedly limited to a maximum of 3.7 mmhos/cm EC because of the Chipps Island Suisun Marsh standard. The entire process is built on a series of artificial relationships which are unrelated to the main issue at hand, which is the establishment and maintenance of suitable spawning habitat for striped bass in the San Joaquin River and the relaxat ion of that habitat requirement when water project firm del iveries are reduced.
The State Board continues to be1 ieve that, as stated in its conclusions on striped bass (Section 5.6), the "[dlef iciencies in firm supplies and the level of protection afforded by the striped bass spawning objective should be correlated". The present deficiency schedule does not do that, since no specific relationship between extent of habitat and change in salinity intrusion has been made. The present relationship is based on a Sacramento River salinity/flow relationship. Several participants have appropriately questioned the basis for this relationship.
In 1990, the projects declared a deficiency and invoked the relaxation provision. Despite compliance with other 0-1485 standards, the theoretical expected Ant ioch maximum EC of 3.7 mmhos/cm was exceeded. In addition, monitoring data from 1990 suggest that EC1s greater than 0.44 mmhos/cm occurred throughout nearly all of the striped bass spawning area, not simply at the downstream end.
The State Board would like to relate deficiencies to spawning area in a direct, measurable way: by simply making increases in deficiencies directly related to the shortening of the length of river reach in which suitable spawning habitat will be required to be maintained. The Board believes this approach would have a negl igi ble effect on water suppl ies during most years because D-1485 provides some umbrel la spawning protection upstream of Antioch by means of the central and western Delta agricultural standards. These standards are presently under review, and the required water qual ity at some locations may be reduced (salinity increased). By establishing a separate spawning habitat objective, no re- evaluation of the effects of water quality degradation on striped bass habitat wi 1 1 be required. The present agricultural water qual i ty objective includes a level of 0.45 mmhos/cm EC at Jersey Point from April 1 to Au ust 15 (in all but critical years). This objective essential I y duplicates the current EC and starting date requirements for striped bass

spawning protection. In Section 7.5.2.4, Program of Implementat ion, we out1 ine a proposal for evaluation of the concept of establ ishment of a specific spawning protect ion zone, and a directly related relaxation provision. "
Change in text, Page 6-20: "Various participants have argued that there is no evidence that striped bass spawning habitat is limiting, and that striped bass have been observed to spawn in water with salinity higher than 0.44 mmhos/cm EC. Laboratory tests also suggest that eggs can survive and hatch in higher salinity water (see Section 5.6.2.1). On the other hand, observations on other striped bass populations indicate that, given a choice, all prefer to spawn above the limits of seawater intrusion. In the San Joaquin River, upstream salinity barriers appear to inhibit their ability to move entirely out of the effects of ocean salinity. We agree that the evidence for whether spawning habitat is limiting for striped bass, and what the maximum allowable salinity might be, is not definitive, particularly when comparing laboratory and field observations. However, we a1 so recognize that spawning success, as measured by survival of eggs and young bass, is inextricably linked to the effects of flows, toxics, and other factors, so that distinguishing the effects of spawning habitat salinity alone may be impossible. Additional studies and data analysis on actual spawning conditions, spawning locations in different year types, and spawning success are sorely needed. We invite a1 1 participants to evaluate this question further, and we propose that a thorough review of this objective be undertaken at the next Triennial Review of this Plan (see Program of Implementation, Section 7.5.2.4).U
Change in text, Page 7-20: "To make certain that the State Board develops water quality objectives that are based on sound scientific data, and which are appropriately protective of striped bass spawning habitat, we request DFG to analyze the protective values of setting up a specific spawning habitat zone of 0.44 mmhos/cm EC, or some other more appropriate EC value, in the river reach between Jersey Point and Prisoners Point. Analysis of historical springtime EC data indicates that 0.44 mmhos/cm EC at Jersey Point would apparently maintain an EC at Antioch of just about 1.5 mmhos/cm, which DFG would like to retain. DFG should also analyze the possibility and the effects of relating a relaxation provision to declared deficiencies. Specifically, DFG should be prepared to discuss the effects of reducing the spawning habitat by moving the downstream end of the spawning habitat reach upstream from Jersey Point a distance proportional to the percent reduction in delivery of firm supplies, along the lines proposed in the table below. In the remaining reach, the 14-day running average of the mean daily EC would be no more than 0.44 mmhos/cm EC for the period Apri 1 1 to May 31, or until spawning has ended.

Percent Delivery Reduction Percent River Reach Reduced
0 0 1-10 10 11-20 20 21-30 30 31-40 40 >40 40
Def ictencies are defined as deficiencies in firm supplies declared by a set of water projects representative of the Sacramento River and San Joaquin River watersheds. The specific projects and amounts of deficiencies would be defined in subsequent phases of these proceedings.
DWR should be prepared to discuss the potential effects, i.e., water costs, that would result if the State Board were to adopt water quality objectives as outlined above. The Board would 1 i ke to hear from USBR, USFWS and any other interested parties on this subject at the next Triennial Review."
Page 5-38 to Page 5-42
Comment: DWR states that the Plan relies heavily on the work of Moyle and Herbold for the Delta smelt analyses and that other authors (SWC, DWR and DFG) provide a more thorough and up-to- date analysis (WQCP-DM-24, page 13, last paragraph).
Response: Between the text of the Plan and the Technical Appendix, there were ten references used for the Delta smelt analysis. Of these, Moyle was sole or primary author of four of these, one of which was a 1990 publication. Of the other six not authored by Moyle, three were published in 1990 which were analyses by SWC, USFWS and DFG.
Exhibit WQCP-USFWS-7 submitted to the State Board on March 11, 1991, contained an additional reference for Delta smelt (Moyle, Wi 11 iams, and Wikramanayake 1989) which has been reviewed and included in the Plan.
Changes in text:
Add the following publications to the list of references:
Moyle, P.B., J. E. Wi 1 1 iams, and E. D. Wikramanayake. 1989. Fish species of special concern of California. Final report prepared for State of California, Department of Fish and Game, Inland Fisheries Division, Rancho Cordova, California. 222 pp.
State Water Contractors. 1990. Response to the State Water Contractors to the petition to list Delta smelt as an endangered species. Report submitted to the Natural Heritage Division, California Department of Fish and Game.

Add the following reference as a footnote to Table 5-3 and Figure 5-4 in the Plan: Stevens, D. E., L. W. Miller and B. C. Bolster. 1990. ReDort to the Fish and Game Commission: A status review of ihe Delta smelt (Hypomesus transpacif icus) in California. Department of Fish and Game.
Page 5-39, paras. 2 and 3
Comment: SWC suggest wording be included that DFG (1990) states that the population of Delta smelt is currently stable and provides additional language describing the population trends (WQCP-SWC- 361, Page 16, paragraphs 3 and 4).
Response: The statement that the population is increasing is misleading. The following sentences wi 1 1 be added to the referenced paragraph.
Change in text: "DFG (1990) stated that like the summer townet survey, the fall midwater trawl survey indicates that abundance of Delta smelt has been highly variable and has suffered a major decline. Bay survey catches show a striking decline in Delta smelt abundance after 1981, and since 1981 there has been an irregular but persistent decline. Part of this is due to the fact that the four of the last five years were low flow years and the population has been concentrated in the Delta. In the seine survey, the lowest average catches of adult Delta smelt occurred in 1980 and 1984-1989. The persistent low catches from 1984-1989 are consistent with the population decline exhibited by the midwater trawl and summer townet surveys. The DFG concluded that "the relatively stable, albeit low, population is not in imminent danger of extinction, however, the Delta smelt may we1 1 "become an endangered species in the foreseeable future.""
Page 5-42, para. 4
Comment: SWC suggest including mention of details and cost of proposed studies (WQCP-SWC-361, Page 18, paragraph 1).
Response: The following sentence will be added to the 4th paragraph after the second sentence:
Change in text: "Further studies are proposed for determining with greater accuracy, the abundance and the factors affecting Delta smelt abundance, in the Delta."

Table 5-5, Page 6 of 28; and Appendix, Page 5.0-7
Comment: The WQCP incorrectly states DWR1s advocated level of protection. DWR1s previous leaching recommendations are withdrawn' and should be deleted from the WQCP (WQCP-DWR-24,9).
Response: Agree. The WQCP wi 11 be revised to show DMR's correct advocated level of protection for western and interior Delta agriculture.
Change in text: Table 5-5, page 6 of 28, "Advocated Levels" DWR's indicated recommendation for a winter ponding objective at Cache Slough and San Andreas Landing is deleted. Appendix, page 5.0-7, third paragraph, titled "Winter Ponding Objective": title and paragraph will be deleted.
Page 6-3
Comment: Footnote 3 of Table 6-1 is misleading in that Alternative 3 is described with a goal of 0.15 mg/l bromide. However, this standard is not modeled in the supporting Study H7 (WQCP-DWR- 24,3).
Response: Footnote 3 wi 1 1 be revised by adding "This goal, however, was not modeled as part of alternative 3."
Comment: Footnote 6 of Table 6-1 contains approximate total dissolved solids to electrical conductivity instead of exact values (WQCP-DWR-24,3).
Response: The exact conversion values, as presented by DWR, will be used in footnote 6.
Change in text to reflect above.
Pages 6-4 and 6-14
Comment: The discussion of the impacts of the proposed objectives an water supply is incomplete. It does not even consider the impacts of any changes in the Suisun Marsh objectives, interior south Delta objectives or the Antioch relaxation provision for striped bass. It is not possible to determine whether the proposed objectives are "rea~onable~~ as required by law without knowing the ultimate water cost (WQCP-SWC- 633,2,14).
Response: As recommended by SWC, the following will be added as the last paragraph of section 6.2.

Change in text: "It must be recognized that the impacts shown on Table 6-2 and Figures 6-2 and 6-3 and discussed in the following pages do not include the potential impacts on water supply of meeting any changes in current Suisun Marsh objective, the revised Antioch relaxation provisions for striped bass or the objectives for interior stations in the south Delta. Each of these objectives could cause a reduction in water available for other beneficial uses. When the impact of one or more of these objectives is known, the Board will review such objectives for reasonableness and amend them, if necessary."
In addition, the following will be added to beginning of paragraph 1 of section 6.2.3.6.
Change in text: "Without considering the potential impact of meeting the revised Antioch relaxation provision for striped bass and the interior objectives in the south Delta, and assuming that the existing Suisun Marsh standards are not revised,. . . " Change in text: Delete "increases" and insert "decreases."
The following will replace the second paragraph.
Change in text: "The principal reason for the decrease in Delta outflow is the new 40-30-30 year type, which allowed for more water to be stored in the Sacramento River Basin."
The last paragraph wi 1 1 be amended.
"The level of impact on water supplies of this alternative, not including the impact of the striped bass relaxation provision and the interior south Delta objectives, is less than ..."
Page 6-5, 6-7, 6-8, 6-11 and 6-18
Comment: Tables 6-2 and A6.3-1, and Figures 6-2 and 6-3. contain incorrect values for the Sacramento River Inflow, Total Delta Exports, and Total Delta outflow (WQCP-DWR-24; Chapter 6, Page 6-5, Page 6-7, Page 6-8, Appendix Pages 6.3-3 and 6.3-4).
Response: The State Board errata presented on March 11, 1991, shows the correct values for the Plan. Table A6.3-1 and the text will be revised accordingly.
- .
Change in text, 6-11 Delete "39" and insert "59" Delete "56" and insert "110" Delete "42" and insert "50" Delete "51" and insert "63"

Change in text: (Page 6-18) Delete "682" and insert "674" Delete "1090" and insert "1078" Delete "21" and insert "20"
Page 6-10
Comment: The 3.0 mmhos/cm EC relaxation for western and interior Delta agriculture applies to the first 15 days in August of critical years in the model simulation (WQCP-DWR-24,9; WQCP-SWC- 633,14).
Response: Page 6-10, Section 6.2.2, second sentence, wi 1 1 be changed.
Chanae in text: " , . .hd adjusted to 3.0 mmhos/cm EC from August 1 through August 15 in critical years."
Page 6-11, first paragraph
Comment: It is not clear what this paragraph is supposed to say. It appears that drinking water and fishery issues have been mixed. Recommended wording suggested (WQCP-SWC-632,7014).
Response: Agree with new recommended language:
Change in text: "As new and pending drinking water standards take effect the water quality objectives in Alternative 2 may result in negative impacts for purveyors of Delta water. These negative impacts may take the form of violation of State and Federal drinking water standards for Disinfection By-Products. It is not possible to accurately quantity those impacts at present."
Page 6-13 para. 3
Comment: SWC suggest removing the reference to the USFWS smolt survival index based on flow (WQCP-SWC-631, Page 20, paragraph 4 and 5)
Response: The use of this equation, along with other analyses that may be conducted in the future, is valid insofar as the relationship between flow and smolt survival has been used to indicate an overall relative response in smolts survival to changes in flow, water temperature, diversion fraction and total exports.
Change in text: "Using the smolt survival index for the Sacramento River (USFWS) . . . smolt survival index would be greater than 0.50 would be in wet years. Above normal water years would provide an average survival index of 0.42 and the remainder of the year types less than 0.30."

Page 6-13, para. 3
Comment: CVPWA suggests deleting the sentence stating that no estimates have been made on the additional flow required to improve dissolved oxygen (WQCP-CVPWA-210, Page 31-Page 32, paragraphs 1-2).
Response: Referenced sentence (Page 6-13, section 6.2.3.4. , paragraph 3, third sentence) should read as follows:
Change in text: "A partial analysis estimating the flow required (September and November only) to change the dissolved oxygen level 1 mg/l using a multiple regression analysis was submitted. Further analysis of the impacts of the water qua1 ity objectives wi 1 1 be made in the forthcoming proceedings."
Page 6-14
Comment: The date should be May 31, not May 30 (WQCP-SWC-633,15).
Response: Agree. Text will be corrected.
Change in text: "... to May 31."
Page 6-14
Comment: Paragraphs 2 and 4 both describe the water regime under Alternative 3, but the statements are confusing and contradictory (WQCP-USFW-7,6).
Response: We agree. Paragraph 2 reflected spring conditions only, while paragraph 4 referred to annual water supply impacts. .However, both statements are incorrect; newer model runs, the results of which were presented as SWRCB errata at the March 11 .
hearing, show different impacts and flows.
Change in text: " The model run used to simulate Alternative 3 assumes some increase in San Joaquin River flow, little change in exports, reduced Sacramento River flow and reduced Delta outflow. The impacts on indirect protection for eggs and young under this alternative, as modeled, are unclear."
Page 6-15; First paragraph and second paragraph, second sentence: p. 6-22; first full paragraph below the bullets, second sentence:
Comment: The language does not completely state the impacts on water su pl ies. Recommended wording is suggested (WQCP-SWC-632,7- 14r.

Response: Comments noted. Language will be revised accordingly.
Change in text: (Page 6-15, first paragraph)
"The impact of setting a 50 mg/l chloride objective at Banks Pumping Plant will be to lower chloride levels at the Contra Costa Canal intake to Tess than 140 mg/l if seawater intrusion were the primary source af the chlorides. The chloride levels at the Banks Pumping Plant will be improved significantly; the lower salinity levels in SWP water delivered via the Banks Pumping Plant wi 11 enhance reclamation efforts and w i 1 1 improve the taste of the water and reduce corrosion."
(Page 6-15, second paragraph, second sentence)
"This positive effect at Banks Pumping Plant may result in lower THM formation potential in the water at Rock Slough."
Page 6-16
Comment: Additional Delta outflow could come froma reduction in upstream diversions instead of, or in addition to, reduced exports. A suggested revision would be "Like Alternative 4, the primary source of this additional water is from a corresponding reduct ion in exports and/or reduct ion in upstream diversion and use. " (WQCP-DWR-24; Chapter 6)
Response: Implementation of these objectives wi 1 1 be better defined in the Water Right Phase of the proceedings. For simplicity, the operation studies assumed that all reductions would come from exports. The wording will be revised as suggested.
Change in text: "Like Alternative 4, the primary source of this additional water is from a corresponding reduct ion in exports and/or reduction in upstream diversion and use."
Page 6-20, Table 6-3, page 5 of 8
Comment: The following clause needs to be inserted (WQCP-DWR-24,13).
Response: We agree. Table will be changed.
Change in text: "Relaxation Provision -- replaces the above Antioch and Chipps Island Standard whenever the projects impose deficiencies in firm supplies".
Page 6-22, paragraph 1, sentence 3
Comment: This sentence should be revised as follows to more accurately state the impact of Alternative 4 on M&I use; "Alternative 4 would provide pos it ive, but unquant if ied benefits with respect to M&I use (WQCP-SWC-633,16). "

Response: Agree. The WQCP will be amended as indicated in the SWC's comment.
Change in text: "A1 ternat ive 4 would provide positive, but unquant if ied benefits with respect to M&I use."
Page 7-3, Section 7.2.2.2, "South Delta"
Comment: All stage 1,2,and 3 objectives should be identified (WQCP- CVPWA-210,34; WQCP-EPA-1,l).
Response: Change in text to reflect new wording in Section 5.3.1.3 (5- 9)
Page 7-8, top of page [Section 7.3.1 General {Compl iance Monitoring)]
Comment: The general monitoring surveys discussed in this paragraph should be expanded to include wildlife as well as fisheries (WQCP-DFG-5,4).
Response: The first sentence of this paragraph will be changed.
Change in text (changed and added wording under1 ined) : "o Conduct ongoing and future monitoring surveys recommended by
DFG and concurred with by the State Board, concerning food chain relationships and fish and wildlife impacts as they are affected by implementation of this Plan."
Page 7-8, paragraph 5, last sentence
Comment: SWC proposes wording changes (WQCP-SWC-631, Page 23, paragraph 2-5).
Response: These changes will be made.
Change in text: change "DWR/USBRU to "USGS"
Page 7-9; Section 7.4.2.1, second paragraph:
Comment: Contrary to what is stated in the Plan, a Disinfection By- Product Workgroup has, to this date, not yet been formed (WQCP;DWR; Oral Comment 3/11/91).
Response: Agree.
Change in text: "A disinfection by-product (DBP) Workgroup has not been formed . . . "

Pages 7-9 to 7-18, Section 7.4 Special Studies and Reviews
Comment: There is agreement about the need for special studies as outlined in this section and concerns about the limits that resources -- time, personnel, and money -- put on being able to implement this ambitious set of tasks (WQCP-USBR-129A, 3; WQCP-SWC-631,24; WQCP-CVPWA-210,36).
Response: The following rewording will be added to Page 7-15.
Change in text: "There is a need to develop a list of priorities among routine and special studies and a more detailed definition of what each study's goal(s) should be. The forum for the technical scientific studies (biological, hydrodynamic, etc.) would be the Interagency Ecological Study Program. Other studies that do not fit into the Program could be undertaken by contract to a consultant or through a work group."
Comment: There is a typographical/edi t ing error on page 7-15, numbered paragraph 3 (WQCP-DWR-24,14).
Response: The first sentence will be changed. (added wording under 1 ined) :
Change in text: "3) The interagency programs, including the Suisun Marsh Fish
Monitoring Program and the Neomysis/Zoopl ankton Survey, are on- going; ..."
Page 7-10; second paragraph, second sentence:
Comment: Results of research and recommended actions by a Disinfection By-Product workgroup cannot be completed by 1/1/92, primarily because research on water treatment technologies is an on- going process. Recommended language is that "progress of research and recommended actions be reported by January 1, 1992" (WQCP-SWC-632,7-14).
Response: Comment noted. Language wi 1 1 be revised accordingly.
Change in text: 'I.. . "progress of research and recommended actions be reported by January 1, 1992".
Page 7-11
Comment: SWC proposes wording changes (WQCP-SWC-631, Page 23, paragraph 2-5).

Response: These changes will be made.
Change in text: 1) Page 7-11, 1st paragraph, last sentence: change April and May to during April through June; 2) Paragraph 2, first sentence: include striped bass after both references to salmon and delete steelhead; and 3) Paragraph 3, last sentence: delete sentence.
Page 7-11
Comment: USFWS comments are: 1) June should be included in the last sentence, 2) the Consumnes River should be changed to the Calaveras River, and 3) are other smolt survival studies, besides the ones listed, to be considered (WQCP-USFWS-7, Page 7, paragraph 2-4)?
Response: Text will be changed.
Change in text: 1) (Same page, paragraph 3, third sentence) "Consumnes will be changed to Ca 1 averas ; and 2) "All appropriate studies will be considered; the list of studies was not meant to be exclusive."
Page 7-13
Comment: DFG states that it is not accurate to say that species are often misidentified and they are confident that quality control is sufficient for the enumeration of trends in species composit ion, etc (WQCP-DFG-5;Page 4, 11).
Response: In response to the comment, the text of the Plan (Page 7-13, last paragraph) will be modified as follows:
Change in text: "Historical SWP and CVP data on Delta smelt salvage has not been very reliable. DFG is confident that, currently, quality control is sufficient for the enumeration of trends in species composition. DFG will be assuming responsibi 1 ity for enumerating fish at the SWP facility this next year. Improvements in procedures wi 1 1 be made in the future. Salvage data on Delta smelt from both facilities, including sampl ing methods, should be submitted during the forthcoming proceedings."
Page 7-13
Comment: SWC suggest change to the sentence addressing DFG investigations in 1991 (WQCP-SWC-631, Page 24, paragraph 3).

Response: The referenced sentence (first paragraph and sentence under Delta Smelt) will he reworded.
Change in text: "In 1991, DFG should analyze existing data on envir~nmental conditions, including reverse flows, affecting Delta =It growth, survival, repmhctive success and spatial distribut.ion; . , . I~
Page 7-16, sec 7.4.3.2
Comment: USFWS states that biological models need to be addressed in this section as well (WQCP-USFWS-7, Page 7, paragraph 6).
Response: Text will be amended to include a section C. which nil l read as follows:
Change in text: "C. Fishery Models The following fishery models, in addition to any others that may be proposed, may be considered, as appropriate, in the impact analysis:
o Abundance and Survival of Delta Smolts in the Sacramento-San Joaquin Estuary by the USFWS.
The USFWS (since 1978) has annually conducted research on the survival and abundance of Chinook smolts and fry as they migrate down the Sacramento through the Estuary. The research has lead to the development of several different models, including: annual index of abundance of fall-run smolts; smlt survival based on adults returns 2 1/2 years later; and smlt survival index using flow, temperature, percent diverted at Walnut Grove, export rates and migration route variables. A San Joaquin River smolt survival index is being developed based on different release sites, various levels of inflow form the San Joaquin River, SWP and CVP export rates and ocean recoveries of adults . o Chinook Salmon Population Model for the Sacramento River Basin by BioSystems Analysis, Inc.
This model estimates the abundance of fa1 1-run Chinook salmon under a given set of flow and temperature conditions, mortal i ty parameters, and assumptions about harvest in the ocean and river fisheries for the Sacramento River Basin. At present it serves as an indicator of the population trends as it has not yet been calibrated. Another version is presently being developed for winter-run Chinook salmon.
o Draft San Joaquin River System Chinook Salmon Population Mode l by EA Engineering , Science and Techno l ~ g y . This is mechanistic simulation model representing the principle factors influencing the abundance and production of fall-run Chinook salmon in the San Joaquin River Basin."

Page 7-20, para. 1
Comment: DFG agrees with need to evaluate striped bass hatchery product ion, including rearing salvaged juveni le bass. Such an evaluation is presently underway. But it is premature to prejudge the merits of a 1,000,00 rearing goal, compared to other o tions, at this time. Request goal be deleted (WQCP- DFG-5,5 ! .
Comment: (Page 1-18 also) - How was goal of 1,000,000 striped bass from growout faci 1 ities determined? May not be sufficient to restore the population (WQCP-USFWS-7,3).
Response: Agree.
Change in text: The specific goal statement will be deleted.
Page 7-21
Comment: It should be made clear that the first para raph refers to the Sacramento River Water Year Class if icat ion ~WQCP-CVPWA-210, 36- 37).
Response: Agree.
Change in text: Page 7-21, Section 7.5.3.1., para 1, and Page 1-15, Sectio'n 1.6, para 1, wi 1 1 be amended as follows: "The current Sacramento River Basin Water Year Classification.. . "
Page 7-21
Comment: The WQCP should state the acceptance of the sliding scale concept (WQCP-DWR-24,5).
Response: The Water Year Classification subworkgroup has unanimously accepted the concept of the sliding scale. To reflect this point, the statement in the WQCP, page 7-21, section 7.5.3.1; "DWR has proposed the addition of a sliding scale to the classification to smooth the transitions between categories.", will be changed.
Chanae in text: he-water Year Classification subworkgroup has adopted, in concept, the addition of a sliding scale to the classification to smooth the transit ions between categories. "

Page 7-22
Comment: Technical forum to discuss the Sacramento Four-Basin Index forecast process (WQCP-DWR-24, 5).
Response: Page 7-22 of the WQCP states the need for this technical forum. Assumptions are a part of each years forecast. These assumptions may vary depending on the particular years hydrologic conditions. Each years assumptions should be explained in this forum. Also, the other part of the forecasting process that does not depend on assumptions should be explained and documented.
Change in text: "DWR should convene a technical forum for interested parties for the purpose of providing the parties with the details of the methodology and assumptions used in the forecasting process. After this initial forum, additional meetings should be convened only when the methodology or the assumptions are changed. 'I

SECTION I I
Comments that Resulted in & Changes in Text of the Plan
General Comments
Flow
Comment: The State Board should have addressed flow and water project operations as well as water quality objectives in this Plan (WQCP-USMFS-1,l; WQCP-SCLDF-2,Z).
Response: State Board review of the information submitted during Phase I and the Water Qua1 ity Phase of the proceedings indicated that specific sal inity, temperature and dissolved oxygen levels could be determined which would provide protections to the beneficial uses addressed in the Plan. The appropriate place to provide this type of protection is a water qual ity control plan. However, water quantity issues, such as flow and project operations are more appropriately addressed in the portion of the proceedings leading to a water right decision. The State Board retains the option of setting flow objectives, if appropriate.
As previously stated the State Board will consider all information addressing flow and water project operations, and their relation to beneficial uses made of Bay-Delta waters during the Scoping and Water Right phases of the proceedings. In regard to water project operations the State Board wi 1 1 not be looking at the Central Valley Project (CVP) and State Water Project (SWP) solely. The State Board hopes to receive data which will allow it to address operations of all water projects including reservoirs larger than 100,000 acre-feet and direct water diversions of 100 cfs or greater. (The State Board will review smaller projects and their effects after completion of these proceedings, as data become avai lable. )
The State Board be1 ieves that this Bay-Del ta proceedings process should be a dynamic one. Thus, if, during the Scoping or Water Right phases of the proceedings, analysis of new information indicates that a water qual ity objective adopted during ear 1 ier phases of the proceedings may be inappropriate, the State Board can open a specific hearing to address that beneficial use. Similarly, a water right hearing can be opened if appropriate new data become avai 1 able.
No change in text.
Negotiated Agreements
Comment: The State Board should not rely upon the use or the acceptabi 1 i ty of negotiated agreements to protect beneficial uses adequately (WQCP-USNMFS-1,Z;WQCP-USFWS-7,2).

Response: The State Board believes that beneficial use protections derived from negotiations must be considered by the State Board. The State Board wi 1 1 review the agreements thoroughly to make sure that the specific beneficial use(s) effected are protected and to determine that protection of beneficial uses potential ly effected have not been compromised. The State Board does not intend to abrogate its responsibi 1 ity.
No change in text.
Environmental Conditions
Comment: The Plan represents virtually no improvement in the environmental conditions of the Estuary over those in the 1978 Plan that the State Board admitted are inadequate (WQCP-SCLDF- 1,2;EPA).
Response: Upon review of the data, the State Board found several aspects for which it could provide specific water qua1 ity protection including: expanding seasonal protection for striped bass, and temperature and dissolved oxygen protections for salinon in the Sacramento and San Joaquin rivers within the Delta area. Most of the information received by the State Board which indicated potential improvement in the protections to be afforded beneficial uses made of Bay-Del ta waters addressed various flow conditions. As previously mentioned both flow and water project operations will be addressed during the Scoping and Water Right phases of the proceedings.
Comment: Issues were raised regarding Delta outflow in relation to entrapment zone locat ion and phytoplankton blooms (WQCP-SCLDF- 2,3)*
Response: The Board has decided to take up these and other flow issues in the Scoping Phase of the proceedings. The State Board, however, does retain the option of setting flow objectives; if appropriate.
Comment: The State Board is recommended to direct staff to update and revise the technical portions of the Plan prior to commencement of the water rights phase of the proceedings (WQCP-WACOC-5,3).
Response: The State Board is always interested in using the most accurate and up-to-date information avai lable. During the Scoping Phase, participants are encouraged to submit any information that they feel wi 1 1 be of use to the State Board in developing the environmental impact report (EIR) for the water right decision.
No change in text for all comments.

Operation Studies
Comment: The Prisoner's Point/Vernal is Striped Bass Spawning objective was only modeled when the standard was imposed at Vernalis (WQCP-DWR-24, on Chapter 6 of the Plan).
Response: Comment noted. See the response to WQCP-SWC-633 deal ing with pages 6-2 and 6-14. [The reason for not modeling this objective and a qualitative analysis of the impact was deleted from ear 1 ier drafts. ]
Comment: Suisun Marsh Wild1 ife standards are met only as per D-1485 interim standards in all operation studies. This needs to be made explicitly clear (WQCP-DWR-24, on Chapter 6 of the Plan).
Response: Comment noted. See the response to WQCP-SWC-633 dealing with pages 6-2 and 6-14. [This explanation was deleted from earlier drafts.]
Comment: Southern Delta agricultural objectives aremodeled onlyat Vernalis, at the proposed interior stations (WQCP-DWR-24).
Response: Comment noted. See the response to WQCP-SWC-633 deal ing with pages 6-2 and 6-14. [This explanation was deleted from earlier drafts.]
No change in text.
Combined Effects
Comment: The plan does not analyze the impacts of its proposed actions on the estuary at the same time as evaluating the effect on water diversions. Consequently, the plan cannot inherently be considered to be a "balancing" of competing beneficial uses. The systematic analysis of the impact of any particular management program for the estuary requires examining the combined effect of all the overlapping flow and salinity requirements for the estuary on a particular component of the ecosystem (WQCP-SCLDF-2, on Chapter 6 of the Plan).
Response: The State Board has committed itself to an extensive evaluation of alternative management programs for the Estuary. Much analysis has been accomplished in the Plan and much more, the State Board recognizes, needs to be done in the Scoping and Water Right phases.
No change in text.
Striped Bass
Comment: The plan assumes, but does not require, maintenance of the 1978 Plan flow standards, which could lead to further ecosystem deterioration if these were modified in the future (WQCP-SCLDF-2,3).

Response: The D-1485 flow standards remain in effect until they are modified, if necessary, as part of a water right decision.
No change in text.
Comment: The Plan would not restore striped bass to historic levels, as accepted by the State Board in its restoration goal in 1978 (WQCP-SCLDF-2 , 3)
Response: We agree; however, in the limited scope of this plan, full restoration is not proposed. Even DFG has acknowledged that without flows and faci 1 ities, restoration to historic levels is impossible. The State Board will consider flow and faci 1 ities alternatives in the Scoping and Water Right phases. The State Board does retain the option of setting flow objectives, if appropriate.
No change in text.
Comment: The State Board rejected alternative sets of standards, including its own Alternative 5 originally recommended in 1988, which would restore striped bass and salmon to "historic" levels (WQCP-SCLDF-2,3).
Response: This alternative is beyond the scope of the present plan, because it includes flow requirements. This and other alternatives will be considered in the Scoping and Water Right phases.
No change in text.
Comment: The sal ini ty standard proposed for striped bass spawning cannot be realistically evaluated, and is meaningless without accompanying flow and pumping standards to protect the young bass produced (WQCP-CWPC-1,lO).
Response: We agree that because any salinity standard necessarily includes flow, the overall beneficial effects of salinity standards cannot be evaluated independent of possible related flow effects. However, the issue of spawning protection is separate from protection of eggs and young. The latter is a flow and diversions issue which will be dealt with in the Scoping and Water Right phases. The salinity objective for spawning is not meaningless , however. As proposed, protect ion would be provided for nearly all of the spawning period on the San Joaquin River independent of any umbrella protection, and slightly greater protection is provided in dry and critical years than is now the case under D-1485.
No change in text.
Comment: The present Plan is shifted toward protection of exports rather than protect ion of the Estuary, and continued imbalance can be expected in later phases of the hearings (CWPC - Fullerton Analysis, Page 6, para. 3).

Comment: The June 1990 Revised Draft Plan stated many strong commitments to protecting the aquatic environment. These have been in large part removed, and USFWS are concerned about the balancing process and criteria (WQCP-USFWS-7,l).
Response: The State Board revised the text to respond to concerns expressed by many participants that the previous draft was not appropriately balanced in its wording. All beneficial uses wi 1 1 be reasonably protected. It is inappropriate to prejudge at this time how the protection of beneficial uses will ultimately be balanced.
No change in text.
Comment: The use of the Sacramento River Basin Index may be appropriate, but if the system results in a shift towards a greater frequency of dry year occurrences, any adverse impacts on fish and wildlife must be identified and mitigated (WQCP- USFWS-7,l).
Response: The Sacramento River Basin Index more accurately reflects actual water conditions in the basin, which suggests that the pattern is slightly drier than previously believed. During the Scoping and Water Right phases, the State Board will consider deletion of two water year designations, the tlsubnormal snowmel t" and the "year fol lowing critical year", which presently reduce protection for fish and wild1 ife more than for other beneficial uses. If included in the final Sacramento River Basin Index, these changes will mitigate for the slightly higher incidence of dry years in the new Index.
No change in text.
Municipal and Industrial Water Qua1 i ty Issues - Trihalomethanes Comment: The water qual i ty objectives for drinking water suppl ies
proposed in the Plan may be adequate for the time being until the disinfection by-product and surface water treatment rules are effective. Water treatment technology is not the single answer to drinking water qual ity problems. Improvement of source water qual ity is essential (WQCP-SWC-632,3).
Comment: Implementation of objectives should not rely exclusively on water right modifications but should also include actions by other agencies, negotiated settlements, physical facilities and legislative action (WQCP-DWR-24,15-16).
Comment: Water at 250 mg/l chlorides does not provide adequate protection for M&I supplies. M&I water supplies cannot consistently meet current THM standards with a year round supply at 250 mgll. The Scoping phase of the hearings should include careful examination of CCWD1s proposal for a 50 mgll chloride objective for portions of most years. The current Plan does not do this (WQCP-CCWD-21,Z).

Comment: Agree that there is no cause to modify existing salinity (chloride) objectives for M&I. If drinking water standards are modified by EPA then it would be appropriate for the Board to consider new objectives as part of the triennial review process.
Strongly supports the Board's recommendat ion for a detai led study of agricultural discharges and development of best management practices to reduce impacts on Delta water quality and drinking suppl ies (WQCP,EPA).
Response To A1 1 Comments: Current text supports these comments.
No change in text.
Chinook-Temperature Objectives
Comment: DFG states that they recommend adoption of the proposed 68°F temperature objective although it is higher than optimum, because: 1) the existing temperature criterion in the Basin 5 Water Quality Control Plan; 2) the nature of the empirical evidence presented to the Board; and 3) many measures which could be implemented would lower temperatures in eneral rather than being targeted specif ical ly for 68OF PWQCP-DFG-~; Page 2, paragraph 3).
Response: It would be extremely difficult, and probably not possible, to effectively or accurately control temperatures in the Delta, especially to within a range of a few degrees, given such a complex and dynamic system. A temperature value in a narrative objective provides sl ightly more guidance than would be available without that value. The intent of this value is to indicate a boundary by which to evaluate the relative health or quality of the Delta for fisheries habitat. (See discussion on reservoir releases to control Delta water temperatures. )
No change in text.
Comment: The Committee provides a summary of the changes in the temperature and dissolved oxygen objectives between the June 1990 and January 1991 draft Plans. It states that the 68°F objective is too high, that a more appropriate objective would have been a maximum of 63"F, and that the controllable factors language provides a huge "loophole". In addition, there is speculation that the SWRCB may intend to eliminate the salmon flow provisions of D-1485 in lieu of this temperature objective ( WQCP-Commi ttee for Water Pol icy Consensus, Page 5, paragraphs 1-3, concerning Pages 5-15, 5-20).
Response: Please see Specific Comments on pages 5-15 through 5-25 concerning Chinook-temperature objectives in response to comments in WQCP-EPA-1, Page 1; WQCP-SCLDF-1, Page 5; WQCP- CVPWA-210, page 23.
No change in text.

Municipal and Industrial Use
Comment: Objectives providing 150 mg/l C1 and better protection, including CCWD1s proposed 50 mg/l objective for part of the year, should be addressed in the Scoping and Water Right phases (WQCP-CCWD-21,Z).
Response: Comment noted.
No change in text.
Comment: Assessing water supply impacts should rely on both operat ion study results and an additional independent salinity analysis of- the operations studies. The proposed Modeling development and Use group s hou 1 d resolve these issues ( WQCP-CCWD-21,2).
Response: Comment noted.
No change in text.
Comment: The need for high water quality during times of uncontrolled flows should be addressed (WQCP-CCWD-21,2),
Response: With respect to chlorides, M&I supply is reasonably protected under a1 1 hydrologic conditions.
No change in text.
Water Qua1 ity Control Plan
Comment: The current 500 TDS Vernal is all-year standard should not be supplanted unti 1 a1 1 the downstream standards are ful ly implemented. The San Joaquin River Protection Act, at Water Code Sect ions 12230-12233 prohibits the Board from taking actions that would lead to further degradation of this reach of the San Joaqu in River (WQCP-SWDA-36).
Response: Water Code Section 12232 provides that the Board shall do nothing, in connection with its responsibi 1 ities, to cause further significant degradation of the quality of water in the reach of the San Joaquin River between the Merced River and the Middle River. The 500 mg/l standard currently in force would be supplanted with the April through August 0.7 mmhos/cm EC standard and the September through March 1.0 mmhos/cm EC standard no later than 1994 when a new control station at Brandt Bridge, in addition to the Vernalis station, must meet this standard. By 1996 this standard must be met at all the control stations. This standard wi 1 1 provide better qua1 ity in the irrigation season and poorer quality in other parts of the year. This is the same long-term standard as in the 1978 Delta Plan. The Plan differs only in that it proposes to implement the standard regardless of whether there are circulation facilities. It is not a degradation.
No change in text.

Comment: The final water qua1 ity control plan represents virtually no improvement in the environmental conditions of the Estuary over the admittedly inadequate 1978 Plan (WQCP-SCLDF-1 , Pages 2-3).
Response: The water quality control plan provides adequate protection against sal ini ty, temperature and dissolved oxygen for the beneficial uses. The Plan provides at least as much protection for the beneficial uses with regard to salinity, temperature and dissolved oxygen as the 1978 Delta Plan. It does not change the flow standards; nor, contrary to the comment, does it allow any reduction in Delta outflow. Contrary to the comment, the Board. has not found that the standards are unprotective. Any statements in unadopted drafts are not the Board's position unless they are adopted in this Plan. While the Board recognizes the importance of flows in protecting beneficial uses, it be1 ieves that the proper context in which to consider new flow objectives is in a water right proceeding. In the upcoming water right proceeding, the State Board retains the option o f setting flow objectives to protect the beneficial uses.
No change in text.
Comment: The final water quality control plan violates the Porter- Cologne Act and the Clean Water Act, as follows: (a) it does not identify all beneficial uses which could recover through flow augmentation and pollution abatement; (b) the Plan fails to identify water quality objectives for all existing and potential beneficial uses; (c) the Plan fails to establish a program of implementation for beneficial uses; (d) the Plan fails to describe and regulate the flow of water; (e) the Plan generally fails to protect instream beneficial uses (WQCP- SCLDF-1, Pages 4-5).
Response: This response addresses the alleged individual violations in order.
The Plan identifies all of the existing beneficial uses by listing the same uses which are listed in the water quality control plans for the San Francisco Bay Region and for the Central Valley Region. The Plan supplements protections in the plans for the two regions for all of these beneficial uses, to the extent that they require additional protection with regard to the parameters of salinity, dissolved oxygen, and temperature. The Plan does not violate the applicable requirements for identification of beneficial uses.
b ) This Plan is only one component of the water quality planning for the Estuary. Water quality objectives for all of the identified beneficial uses are not established in this Plan for two general reasons: first, the Plan protects only with regard to the three parameters, and leaves the balance of required protections to the Regional Board plans; second, the Board can provide protection only insofar as it knows what protection is needed.

The commenter misconstrues the deletion of the "antidegradation" standards since the previous draft. Rather than revising the Suisun Marsh standards and adding the old standards back as "antidqradation" standards, the Board will keep the standards that have been in effect until such time as it decides whether to replace them with different objectives in a future p l m and water rCght decision.
The commenter also suggests that the Board should provide objectives for South San Francisco Bay, to reduce the concentration of toxic pollutants. The Board disagrees. Development of objectives for toxic pollutants remains assigned to the San Francisco Bay Regional Water Qua1 ity Control Board. This Plan is an adjunct to the Basin Plan for the San Francisco Bay Region; it does not supplant the Basin Plan. The Basin Plan contains objectives for toxic pollutants; such objectives are not within the scope af this Plan.
Further, the Board has no basis for requiring objectives to dilute pollutants in the South Bay. The Board's regulation at 14 CCR Section 780(b)(l) provides that the Board shall not modify a permit or license to meet water quality objectives in water qual ity control plans unless the Board finds that adequate waste discharge requirements have been prescr i bad and are in effect with respect to the discharges which have a substantial effect on the water quality, and that the water qual ity objectives cannot be achieved solely through the control of waste discharges. No such findin can be made. Further, EPA1s regulation at 40 CFR 131.10(a 3 provides that waste assimilation shall not be a designated use of water.
The commenter also argues that subjecting the temperature objectives to control lable factors ts inappropriate and should apply only to implementation. Water temperature is inf Tuenced by natural variations in ambient temperature and precipitation, as well as man's activities-. On same hot days no amount of cold water nor any other measures could. achieve temperature requirements in a reach. Further, to release large amounts of water to cool the DeTta could under some circumstances be considered unreasonable. Without the "controllable factors" requirement to establish the times when the objective is in effect, the objective could not always be achieved; objectives should be achievable. See Water Code Section 13241(c). The Board will continue to subject the temperature objectives to "control lable factors. "
As the commenter notes, adequate implementation is required by the Clean Water Act, at 33 USCA Section 1313(e)(3)(F), for revised or new water qual ity standards. Only three standards are added or revised in the Plan, for Chinook salmon temperature, Chinook salmon dissolved oxygen, and export agriculture. Therefore, only three changes in implementation measures are required. The existing implementatian measures in the 1978 Delta Plan remain in effect where they are not

changed. Three new implementation measures are detailed in the Plan: one is added for implementation of the southern Delta agricultural standards even though the standards are unchanged; implementat ion is added for the Chinook salmon temperature standard, which will be met by controlling controllable factors that affect water temperature; implementation is added for the new export agriculture standard and for other beneficial uses as we1 1, in the form of a salt load reduction policy to be prepared by the Central Valley Regional Board.
An additional implementation measure is added elsewhere in these responses, for the dissolved oxygen standard for Chinook salmon.
In addition, paragraph 7.2.2.3 is revised elsewhere in these responses, to provide additional explanation of the implementation measures that may be used to meet the temperature requirement for Chinook salmon.
(d The Plan does not have to revise or add new objectives for flow. Because flow requirements directly affect the exercise of water rights, the final establishment of such requirements must be done in a water right proceeding. Flow plays two distinct roles in protection of the Estuary's water. It is important in this water qual ity control lan because it is a measure which may be used to implement t 6 e water quality objectives. It has in addition a separate role in protecting the Estuary's beneficial uses, because it represents the movement of a volume of water. This second role is not a subject of water qual ity objectives. While a water qual ity control plan is not precluded from discussing flows that would protect beneficial uses other than by implementing a level of water qual ity, such a discussion is not required in a water quality control plan.
The commenter is confusing these two roles of flow. As a result, the commenter thinks that the location of the entrapment zone is a qual ity issue. In fact, the qual ity of the entrapment zone would be about the same wherever it was located, so a specific flow is not needed to implement the quality of the entrapment zone. While the volume of moving water can determine its location in the Estuary, it does not affect the quality.
(4 The Board disagrees with the commenter's assertion that the Plan is based on protection of water rights and not protection of water qual ity. The Plan is developed to protect salinity, temperature, and dissolved oxygen parameters of water qual ity.
No change in text.
Comment: The final water quality plan violates the California Environmental Qua1 ity Act. (WQCP-SCLDF-1, Pages 7 to the top of page 9)

Response: This comment makes several assertions: (a) that the range of alternatives is not adequate; (b)that the Plan does not adopt mitigation measures to avoid adverse effects of water export; (c) that the Plan incorrectly states in the environmental check1 ist that the Plan wi 1 1 have no adverse environmental impacts. These are discussed individually below.
(a ) The Board has 1 isted seven alternatives, ranging from the base conditions in the current water qua1 ity control plan through an alternative that would provide much better protection than the preferred a1 ternat ive. SCLDF' s comments apparently contemplate a broader scope than the Plan has, and correspondingly request a broader environmental analysis. While one can always imagine more alternatives, the law does not require considerat ion of a1 ternatives that are infeasible or impossible to achieve. The Plan considers all beneficial uses within the limited scope of the Plan, which is narrow. The Plan is an adjunct to other plans, not the whole of water quality planning for the Estuary. Flow issues and alternatives will be fully evaluated during the Scoping and Water Right phases of the proceedings.
As explained below, the Board disagrees with Sierra Club's assertion that there are adverse impacts as a result of adoption of this Plan. Because there are no adverse effects, no mitigation measures are required. Whi le future actions to adopt implementation measures suggested by this Plan may have adverse environmental effects, it is too speculative what those effects may be, and until the actual measures are up for considerat ion, it is premature to adopt mi tigat ion measures for them.
( C ) Sierra Club is incorrect that the Plan will have an adverse effect on the environment, for two reasons: first, the Plan sets objectives which provide for water quality and beneficial use protection which is equal to or better than the current conditions in the Estuary; second, even though one can speculate that some possible future actions might have an adverse effect, implementation of the Plan itself will not resu 1 t in adverse effects compared with current conditions. CEQA does not consider an action to have an adverse effect unless, compared with current conditions, the effect is adverse. The commenter apparently wants the Board to im rove water quality in the Estuary over current conditions. d k "admissions" to which the Sierra Club refers do not refer to the matters decided in this Plan, but to other proposals and possible future actions. Because there are no adverse effects of action, no mitigation measures are required.
Comment: The Plan violates California's antidegradation policy, because it doesn't propose flow standards (WQCP-SCLDF-1, page 9, point I V . ) .
Response: The absence of new flow objectives in the Plan is not a degradation, since the Board is leaving in place for now the flow standards in the 1978 Delta Plan.

No change in text.
Comment: The Board's plan approval process denied the public a fair hearing, because of ex parte contacts (WQCP-SCLDF-1, Page 9, point V ) .
Response: Copies of some prel iminary drafts were circulated during the fall of 1990 to parties in all representative categories of interest for comment. The prel iminary drafts were pub1 ic documents when they were circulated. The Board is unaware of any bias, since it took into account all interests in preparing its next full draft. The next full draft, released in January 1991 was provided to all parties for comment, and the Board held a hearing on it, on March 11, 1991. Thus, the parties had a full opportunity to review the changes since the June 1990 draft and comment on them before Board action.
No change in text.
Comment: The Board failed to follow the rule-making procedures out1 ined in the Administrative Procedure Act (WQCP-SCLDF-1, Page 9, point V I ) .
Response: The adoption of a water qua1 ity control plan is not subject to the rulemaking procedures in the Administrative Procedures Act. Rather, it is subject to the procedural requirements of the Water Code.
No change in text.

Specific Comments
Chapter 1
Page 1-2, fifth paragraph
Comment: As a minimum, the water quality objectives fur M&I relative to the DBP regulations will be reexamined at the triennial review, or before, if 'EPA proposes revised regulations (WQCP- SWC-632,l-7).
Response : Current Plan 1 anguage is satisfactory . Recommended new language is too specific and is out of context w i t h the rest of the sect ion.
No change in text.
Page 1-4, "Fish vs. People"
Comment: There are laws and court decisions concerning the standing of fish and wildlife values in "balancing" beneficial use protections (WQCP-DFG-5,3; WQCP-NMFS-1,l)
Response: Comment noted.
No change in text.
Page 1-9; Page 3-10, Section 3.2.1.4; Page 6-9, Section 6.2.18; and Appmdix, Page 3-1-10
Comment: There is an inconsistency in the WQCP regarding the need for a subnormal snowmel t adjustment (WQCP-CVPWA-210,2).
Response: Though the current subnormal snowmel t adjustment is not recommended, it was kept in the Impact Analysis to artificially neutralize the impact of the new classification on the SWP of flow objectives. This was dune because flow objectiv.es, and the flow relaxations tied to the water year classification are issues that will be addressed in the Scoping and Water Right phases. As new informatim becomes available, the subnormal snowmelt adjustment will be reviewed as appropriate.
No change in text.
Page 1-10, second bullet from bottom of page
Comment: A comment concerning water conservation by Imperial Irrigation District (WQCP-SWC-633,3-4).
Response: Comment noted.
No change in text.

Page 1-11; second bullet; p.5-3; first bullet under 5.1:
Comment: The 250mg/l chloride standard is for taste onlyand not for corrosion as indicated in the Plan (WQCP-SWC-632,7-14) .
Response: Comments noted.
No change in text.
Page 1-11; fourth bullet; p.5-4, last sentence
Comment: The language in these sections should be revised to state that current drinking water violations are occurring as a result of Delta-based supplies, and that as a result of the Surface Water Treatment Rule becoming effective in 1993, many more water su pliers wi 1 1 exceed the existing standard (WQCP-SWC- 632,7-14f.
Response: Violat ions of current drinking water standards occur infrequently, certainly not on a consistent basis. The net effect of the surface water treatment rule regarding production of Disinfection by-products (DBPs) is very dependent upon the operating procedures of individual systems. Therefore, it cannot be factually stated that the new rule will result in an increased production of DBPs. Therefore, *language should not be revised.
No change in text.
Page 1-12
Comment: The Tracy area in the south Delta is served by the CVP via the Bureau's Tracy export pumps. This location has a lower qual ity objective in the summer than the south Delta. Because of a lower rainfall in the Tracy area than in the rest of the south Delta, the CVP export pumps could arguably have a higher qual ity objective than the rest of the south Delta (WQCP-USBR- 129B,1; WQCP-SDWA-36,l).
Response: The effect of rainfall will be addressed in the proposed South Delta Agriculture Study. Proposed interior stations are intended to protect all of the south Delta including the Bureau's Tracy export pumps. South Delta and export agriculture protect ions overlap at the Tracy export pumps.
No change in text.
Page 1-12; Page 5-12, Sections 5.3.2.1 and 2
Comment: Board staff analysis indicates that 1.5 mmhoslcm EC requires only one additional period of leaching during a 57-year period. Based on this analysis 1.5 mmhos/cm EC is reasonable and should be set for the protection of western and interior Delta agriculture prior to receiving an economic analysis of the costs of leaching (WQCP-DWR-24,8; WQCP-SWC-630,2; WQCP-SWC- 633,4 & 7; WQCP-CVPWA-210,2-3).

Comment: 1.5 mmhos/cm EC is not reasonable protection for western and interior Delta agriculture as it is based on receiving "umbrel la" protect ion (CDWA -Testimony) .
Response: The Board staff analysis indicated one to two additional periods of leaching during a similar hydrologic period that occurred between 1922 and 1978, with a current level of development, current facilities, and the balance of D-1485 standards. The hydrology, development, facilities, and standards a1 1 provide a certain level of "umbrella protect ion", additional protect ion not provided by the objective. If any of these change, the "umbrella protectiont1 and therefore the leaching frequency wi 1 1 change. The Board cannot base protection of a beneficial use on an unsubstantial 'umbrel la protection", but must provide protection that wi 1 1 be sufficient irregardless of other circumstances.
No change in text.
Page 1-13, 5-15
Comment: CVPWA agrees with the exclusion of reservoir releases from controllable factors; and CVPWA and SWC state that it is unclear what the time period is for measuring the temperature objective (WQCP-CVPWA-210, Page 4, paragraph 1, WQCP-CVPWA- 210, Page 11, last paragraph-Page 12, 3rd paragraph; WQCP-SWC- 631, Page 4, last two paragraphs).
Response: Please see response to USBR comments in GENERAL COMMENTS, Ch inook-Temperature Objectives which includes changes in the text.
The time period for measuring the temperature objective is one day as it is the mean of multiple measurements within each day during the months specified. Remainder of comment considered.
No change in text.
Page 1-13
Comment: DWR notes that the clause excluding reservoir releases from controllable factors should be included in the footnotes in the two referenced tables (Table 1-1; Table 6-3;) (WQCP-DWR- 25, Page 4, 3rd paragraph; WQCP-USBR-129B, Page 1, paragraph 3)
Response: Please see response to USBR comments in GENERAL COMMENTS, Chinook-Temperature Objectives which includes changes in the text.
Change in text.

Page 1-13
Comment: SWC agrees with the exclusion of reservoir releases as a means to control temperatures however the text implies that reservoir releases would be a "controllable factor" if not specif ical ly excluded. Suggested revision of wording is provided (WQCP-SWC-631, Page 2, first paragraph).
Response: At present it appears unreasonable to meet the temperature objectives with reservoir releases. Studies *do need to be conducted and additional evidence presented on the feasibi 1 ity of using reservoir releases to achieve decreases in temperatures in the Estuary especially in the spring and fa1 1 months. The State Board welcomes any input regarding the appropriateness of using reservoir releases and any other controllable factors during certain times of the year during certain water years to improve conditions for salmon in the Delta.
We don't understand the statement that EPA interprets a statement to mean that a1 1 measures available to control pol lutants and protect designated uses should be considered in the state's implementat ion plans for these standards.
No change in the text.
Page 1-16 fourth bullet; p.7-16, Section 7.4.3.2 Modelling Needs:
Comment: A model to be developed should investigate the formation of THM and other DBP precursors in the Delta (WQCP;SWC-632,7-14).
Response: Comment noted.
No change in text.
Page 1-18
Comment: Support concept of addi t iona 1 water project operat ion tests. Question of how substantial tests will be; could they include spring-t ime export curtai lments? (WQCP-USFWS-7, Page 3, para. . ..\
Response: The detai 1s of particular test criteria should be developed through the IESP. Spring curtai lment experiments are certainly important to consider.
No change in text.
Chapter 2
Page 2-2, Section 2.2 Scope and Purpose of the Plan, second bullet
Comment: Questions were raised about the Boardi s use of a substitute document for an environmental impact report ( WQCP-WACOC-5,2).

Response: The water quality planning process is a certified program under the Cal ifornia Environmental Qua1 i ty Act (CEQA) Guide 1 ines Sect ion 15251 (9).
No change in text.
Page 2-2; Fourth paragraph:
Comment: The sentence needs to be strengthened to reflect the need to review the Plan so as to incorporate changes in the Disinfection By-Product Regulations. Language is provided for the recommended change (WQCP-SWC-632,l-7).
Response: It is already stated that the Plan shall undergo a triennial review or sooner if needed. Additional specific revision is not necessary.
No change in text.
Chapter 3
Page 3-7, Section 3.2.1.1
Comment: Expand the explanation of the regress ion analysis (WQCP-CVPWA- 210,7).
Response: An eqpanded explanat ion is contained in Appendix 3.1.
No change in text.
Page 3-8
Comment: The prel iminary nature of the San Joaquin River Basin Classification Index should be emphasized in the WQCP (WQCP- CVPWA-210,7).
Response: There is no proposal for a San Joaquin River Basin Classification Index, just an example of a possible a 1 ternat i ve . No change in text.
Page 3-8, Section 3.2.1.2
Comment: The San Joaquin River Basin Water Year Classification must account for the out-of-basin diversions of water by the Hetch Hetchy and Friant-Kern Projects (WQCP-MID/TID-9,3-4).
Response: Comment noted. This issues will be addressed in the San Joaquin Water Year Classification subworkgroup.
No change in text.

Page 3-10, Section 3.2.1.5
Comment: Table 3-2 is not included in the WQCP (WQCP-CVPWA-210,8).
Response: Comment noted.
Table will be included in the final Plan.
Chapter 4
Page 5-1, last paragraph (concerning page 4-1 in the Plan.)
Comment: The comment states, "[wle agree with the Plan that 'estuarine habitat' should not be designated as a beneficial useu (see WQCP-SWC-633, p. 6).
Response: The Plan does not make that statement. "Estuarine Habitat" is a designated beneficial use of the Bay-Delta Estuary (WQCP, p.4-1).
No change in text.
Chapter 5
Genera 1 Comment: Questions were raised about the relative lengths of the
discussions of the various beneficial uses, with the implication that length of section equated with importance of beneficial use (WQCP-WACOC-5,3).
Response: The length of discussion for each beneficial use or component thereof is related to the complexity of the particular issue and to the volume of evidence submitted. Increasing the length of a technical discussion without need is a waste of resources. The Scoping Phase is specif ical ly intended to provide a forum for discussion of specific implementation measures, As such, an isolated facility will be looked at as one possible way to obtain better quality water for municipal and industrial supplies. The water quality control plan is not the State Board's dedicated arena for a detailed analysis of any physical facilities.
No change in text.
Page 5-1
Comment: Statement is misleading in talking about various influences on beneficial uses, including commercial and sports fishing, while not mentioning export pumping, because focuses on the least of the concerns. Entire paragraph is inappropriate for discussion on water qua1 ity objectives. (WQCP-USFWS-7,4).
Response: Comment noted. Issues such as the importance of export pumping are discussed elsewhere in the Plan.
No change in text.

Page 5-1, last paragraph
Comment: The comment states, "[w]e a p e with the Plan that 'estuarine habitat' should not be designated as a beneficial use" (WQCP- SWC-633, p. 6).
Response: The Plan does not make that statement. "Estuarine Habitat" is a designated benefic i sl. use of the Bay-De 1 ta Estuary (See t h e Plan, g. 4-1).
No change in text.
Page 5-2, Section 5.0.3
Comment: The use of the D-1485 water quality standards as the "no project" a1 ternat ive was questioned (WQCP-DFG-5, ; WQCP-NMFS- 1 1 - 2 ) Both agencies want the Board to use the "historical without-project conditions for the CVP and the SWP and any ather rojects included in the water rights decision" (WQCP- mFs-i y .
Response: The Board has decided that the D-1485 standards, as amended, form an adequate base condition for this Plan. Furthermore, the Board, having heard a1 1 the evidence, be1 ieves that f l.ow conditions are the primary factors needed for protection of the fish and wildlife beneficial use; these conditions will be considered On the upcoming phases of the proceedings. The State Board retains the option of setting flow objectives, if appropriate.
No change in text.
Municipal and Industrial
Page 5-3, Section 5.1
Comment: 250 mg/l C1 doesldoes not provide adequate protection for M&I suppl ies, whi le 150 mg/l C1 for industry islis not reasonable (WQCP-CCWD-21,2 (against 250 mg/l C1, for 150 mg/l Cl); WQCP- MIDITID-9,l; WQCP-USBR-129A, 1 ; WQCP-SWC-633,6; WQCP-CVPWA- 210,8 (for 250 mg/l C1, against 150 mg/l CT),
Response: The WQCP states that a level of 250 mg/l C1 sufficiently protects municipal use for aesthetics and corrosion as set by the Department of Health Services. Consumer acceptance is accounted for in the consideration of aesthetics and corrosion. Industry is protected in the WQCP at a level of 150 mg/l C1, not 250 mg/l C1. The extent of the industrial beneficial use is two paper industries within the Bay-Delta Estuary boundaries. Testimony was presented on these industries requirements. Evidence submitted by DWR and CCWD conflict as to the significance of the amount of water required to meet this objective. Public health concerns are discussed in the section on Tri halomethanes.
No change in text.
Page 5-3, Section 5.1
Comment: Relocation of theCCWD8s Rock Slough Intakewill also result in a need to reevaluate the appropriateness of this objective (WQCP-CVPWA-210,8).
Response: Comment noted.
No change in text.
Page 5-3 second bullet last sentence
Comment: The paragraph should be changed to reflect future conditions. Also, adverse human health effects cannot be substantiated. Proposed language is provided (WQCP-SWC-632 , 1-7).
Response: Agree with the proposed wording to revise the sentence concerning adverse human health effects. However, disagree with the remainder of the proposed wording. It is not certatn that should DBP regulations be changed, they will be more strict. EPA and DHS have confirmed this.
No change in text.
Page 5-4, Section 5.1.3
Comment: Additional M&I control points are needed in Old River and in Cache Slough to help allocate responsibility for meeting M&I objectives (WQCP-DWR-24,6).
Response: A1 location of responsibi 1 ity for meeting water qua1 ity objectives wi 1 1 be addressed in the Scoping and Water Right' phases o f the proceedings. Additionally, the subject area to address this issue is more appropriately, agricultural drainage reduct ion, not M&I beneficial uses.
No change in text.
Page 5-5, Section 5.2.1
Comment: Revise language to state that Total Organic Carbon (TOC) is a consistent predictor of THMFP in Delta waters (WQCP-SWC-632,7- 14).
Response: According to Hutton, when referencing Jung , DOC (Dissolved Organic Carbon), a component of TOC, is not a consistent predictor of THMFP in Delta waters (Hutton, P. "Tri halomethane Formation Potential in the Sacramento-San Joaquin Delta: A Mathematical Model, Cal ifornia Department of Water Resources Draft Report, Jan. 1991, p.5: Jung, M. "Delta Island Drainage Investigation Report" Cal ifornia Department of Water Resources Final Report, June 1990, p.93).
No change in text.
Page 5-5; Last paragraph; Page 5-6, following the third paragraph:
Comment: Revise language to indicate that the latest data suggests that bromodichToromethane may be the THM of highest toxicological concern and if individual THM1s are regulated, users of Delta water could be significantly impacted by sea water intrusion ( WQCP-SWC-632,T-14).
Response: Such language is speculative. According to EPA, not much toxicological data exists for brominated compounds. Therefore, it is likely that the first set of rules will not key in on brominated compounds (Contact Report dated March 15, 1991 re. conversation between Leo Winternitz, SWRCB; Bruce Macler , EPA; and Alexis Milea, DHS).
No change in text.
Page 5-6; first paragraph:
Comment: Revise first sentence to state that D-1485 did not include any water quality objectives for THM1s because the THM standard was not adopted unti 1 1979, one year after adoption of D-1485 (WQCP-SWC-632,7-14).
Response: Agreed
D-1485 did not include any water quality abjective f o r M ' s because the tri halomethane standard was not adopted unti 1 1979, one year after the adoption of D-1485. It was concluded, during the 1984 Trienniel Review, that, for public health reasons, protection from THMs in water from the Delta is more properly addressed through the use of alternate water treatment techniques or re locat ion of problem intakes rather than through the setting of more stringent salinity or TOC objectives . No change in text.
Agr i cu 1 ture
Page 5-8
Comment: Protect ion for western and interior Delta agriculture should be based only on corn (WQCP-DWR-24,B).
Response: The WQCP states that the western and interior Delta "...water quality objectives were developed using corn as the representative crop". Central Delta Water Agency has requested protection for crops other than corn outside of the corn growing season. This is a reasonable request that will be addressed in the Scoping and Water Right phases.
No change in text.

Pages 5-9 and 1-12
Comment: In 1 ieu of the proposed interior South Delta objectives the Board should adopt the Framework Agreement between the SDWA, DWR , and USBR (WQCP-CVPWA-210,3; WQCP-SWC-630,3-4).
Comment: The Board should insert into the WQCP a statement that if the agreement is not fully approved and executed by the end of the Water Right phase of these proceedings, the Board will reopen the WQCP to consider adoption of additional objectives (WQCP- SWC-630,3-4).
Comment: The Board should wait for the completion of agreements between the parties before adopting objectives for southern Delta agriculture (WQCP-USBR-129A, 2).
Response: This would not expedite the negotiations. Also, it would not sufficiently guarantee protection of south Delta agriculture given the history of delays in setting objectives. If new information becomes available, page 7-10, section 7.4.2.2, "Southern Delta Agriculture", of the WQCP, indicates that the south Delta objectives could be reviewed and if warranted changed in the next Triennial Review.
No change in text.
Page 5-9, Section 5.3
Comment : More information needs to be developed concerning crop sensitivity to salinity during early stages of growth, potential leaching fractions, effectiveness of rainfall and timing of objectives for crops other than alfalfa. If such information warrants, then the objectives should be modified ( WQCP-USBR-129~~ 1).
Response: It is, agreed that this information is needed. This information is described on page 7-10, section 7.4.2.2.
No change in text.
Pages 5-10, and 5-12, and Table 5-5
Comment: Threemile Slough should be established as an alternative control point to Emmaton, to become effective when the Contract between DWR and the North Delta Water Agency has been ful ly implemented (WQCP-DWR-24,lO).
Response: Western and interior agriculture objectives have not been changed in the WQCP. Location of objective stations will be addressed along with leaching and economic information at a 1 ater date.
No change in text.

Page 5-12
Comment: The WQCP I s agricultural ob jectivcs for the interior south Delta conflicts with the statement that care should be given "so as not to undermine negotiations but to bring the negattations to a timely and fruitful coaclusion"', and is contrary to the intent of the negotiated contract. With the cantract in place, the water quality objectives should only appTy to the stat ion at Vernal is (WQCP-DWR-24,7; WQCP-SWC- 630,3).
Response: Page 5-12, Section 5.3.2.3, and Page 5-13, Section 5.3.3.2, "Southern Delta", sufficiently address the relationship between the negotiations and the WQCP. Page 5-13, of the WQCP states "...(any) agreement affecting south Delta water quality will be fully reviewed by the State Board prior to implementation of the final stage. The objectives and locations at that time may be revised as the State Board deems appropriate. " This statement a1 lows the Board the needed flexibility to protect south Delta agriculture should the negotfations fail, while additionally not giving advantage to any negotiating party. Further detai 1s of the negotiations are unnecessary to the MQCP.
No change in text.
Page 5-13 (Table 5-5)
Comment: South Delta agriculture objectives should be maintained on a 14-day running average instead of a 30-day mnthl y average. More stations need to be monitored in the south Delta (WQCP- SDWA-36,l).
Response: Protection for south Delta agriculture is accomplished by phasing in the 1978 WQCP objectives, while giving regard to the South Delta negotiations. Variations ta the 1978 WQCP objectives will be addressed when either or both the negotiations or the South Delta Agriculture Study have heen finished.
No change in text.
Fish and Wildlife
- Page 5-14,Section 5.4, Para. 1
Comment: The USFWS points out that the referenced Conclusion states that there is insufficient information in the record to set specific sal ini ty and temperature objectives for the protection of Delta smelt. USFWS states there is information on the range of temperature and salinity tolerances for Delta smelt, the general habitat type inhabited by Delta smelt in

the Estuary, and the strong association of Delta smelt abundance with high phytoplankton and zooplankton productivity when the entrapment zone was situated in the Suisun Bay. In addition, in 1990, the USFWS was petitioned to list the Delta smelt as endangered (WQCP-USFWS-7,4 & 5).
Response: For the most part, all of this information is included in the sections of the Plan (Pages 5-38 through 5-42) and the Technical Appendix (Pages 4-27, 4-28) addressing Delta smelt . This information is general, and without additional information, it would be difficult to state that the Delta smelt would be protected by establ ishing any particular EC objective at a specific station during a specific portion of the year. The location of the entrapment zone in the vicinity of Suisun Bay does appear to be associated with subsequent relative abundance of Delta smelt. The issue of the entrapment zone wi 1 1 be addressed in subsequent proceedings.
No change in text.
Page 5-15
Comment: Other comments from the same exhibits are on details of the discussion (WQCP-SWC-631,3-4; WQCP-CVPWA-210,ll).
Response: Since the Board has decided that ". . .the location of the entrapment zone in Suisun Bay is related primarily to the freshwater outflow," they "...will defer consideration of this issue to the Scoping and Water Right Phases of the proceedings" (page 5-15). The State Board does, however, retain the option of setting objectives, if appropriate. Participants are encouraged to submit data on this and related subjects during the upcoming phases.
No change in text.
Page 5-15
Comment: SWC comments that the role of salmon fry rearing in the Delta has not been documented. The survival rate and contribution of fry rearing (compared to smolt rearing) in the Delta to adult stock should be examined and documented as part of the ongoing fishery investigation program (WQCP-SWC-631, Page 4, Chinook salmon section).
Response: We agree that the contribution of fry rearing in the Delta to the adult stock is not well documented; however, it is documented by USFWS that considerable numbers of fry are present in the Delta, especially during the years of high inflow (USFWS, 31,82-92). The relative contribution of those fry to the adult stock may well reflect the quality of the

Page 5-16, para. 6
Comment: SWC suggests removing the references to the San Joaquin River when stating that the natural population of Chinook salmon is decl ining and refers to the reference USFWS,31,58 (WQCP-SWC- 361,6).
Response: The reference to (USFWS,31,58) will be changed to (DFG115,Appendix 1) in the first sentence of the 4th paragraph on Page 5-16. This references a table which contains the data demonstrating that San Joaquin River tributary Chinook salmon stocks as we1 1 as Sacramento River stocks have declined since the beginning of the period of record in 1953.
No change in text.
Page 5-16 to 5-19, para. 6
Comment : CVPWA suggests revision to referenced paragraph based on the assumption that the paragraph is intended to conclude that salinity is not a factor affecting Chinook salmon during their migration through the Delta (WQCP-CVPWA-210,14).
Response: The assumption that this paragraph is intended to make or support this conclusion is incorrect. In fact it was to provide an indication of the information that is known regarding smol t survival during their emigration through San Francisco Bay.
No change in text,
Page 5-17,para. 6
Comment: SWC suggests deleting the reference to the natural ly produced fish in the sentence referring to the increased survival rates of those hatchery fish trucked around the Delta (WQCP-SWC- 361,6).
Response: Survival rates of juveni le wild fish migrating downstream and through the Delta is assumed to be somewhat the same as that of hatchery fish because they are exposed to the same environmental conditions, travel the same migratory pathways and are exposed to the same diversions as the hatchery fish. The publication, USFWS (1990), Abundance and Survival of Juvenile Chinook Salmon in the Sacramento-San Joaquin Estuary, states that the survival rates of "wild" fish are correlated with temperatures at Freeport as are the survival rates of the hatchery fish.
No change in text.

fishery habitat in the Delta. Fry rearing in the Delta may we1 1 warrant further investigation, however that does not warrant the removal of the reference to fry rearing from the text.
No change in text.
Page 5-15
Comment: SWC suggests additional wording supporting the conclusion that upstream reservoirs can not reasonably control water temperatures in the Delta; CVPWA agrees (WQCP-SWC-631,5,11,12; WQCP-CVPWA-210,4,11) .
Response: Please see response to USBR comments in GENERAL COMM€NTS, Chinook-Temperature Objectives which includes changes in the text (pages, 1-6 and 1-7).
No change in text.
Page 5-16, para. 5
Comment: CVPWA comment includes: 1) suggested revisions to the sentence regarding San Joaquin River flow at Vernal is and salmon escapement two and one half years later; and 2) suggested modification of portion discussing trucking of fish (WQCP- CVPWA-210,13).
Response: 1) Referenced sentence will read as follows: San Joaquin River flow at Vernalis during April through June has been identified as a major factor affecting smolt survival; and mean flows during these months is correlated to subsequent adult escapement of hatchery and naturally produced Chinook salmon two and one-half years later (T ,XXXVI ,139: 17-22).
Comment considered.
No change in text.
Page 5-16, para. 6
Comment: SWC suggests that the correlation between adult escapement and flow may be the result of an autocorrelation between hydrologic conditions and other environmental variables such as water temperature which may be influencing salmon smolt survival and SWC provides a suggested revision (WQCP-SWC- 361,6).
Response: Comment noted; however, the sentence came from testimony during a hearing and therefore cannot be changed.
No change in text.

Page 5-17
Comment: The comment states that Figure 5-1 should be clearly labeled to indicate 2 1/2 years lag time (WQCP-SWC-361,6).
Response: The figure is adequately labeled, however it will be updated as time permits.
No change to Figure 5-1.
Page 5-18
Comment: SWC suggests relabeling and updating Figure 5-2 (WQCP-SWC- 361,6).
Response: This figure will be updated as time permits.
No change to Figure 5-2 at present.
Page 5-19, para. 1
Comment: CVPWA suggests revision to paragraph addressing factors that influence water temperatures (WQCP-CVPWA-210,14).
Response: The suggestions do not clarify the intent or meaning of the text.
No change in text.
Page 5-19 para. 2
Comment: SWC provides a suggested revision of a sentence addressing the Upper Sacramento River Fisheries and Riparian Habitat Management Plan (WQCP-SWC-361,7).
Response: The revised wording does not clarify the meaning of the sentence and the list of issues was not meant to be inclusive.
No change in text.
Page 5-19, para 3
Comment: SWC suggests deleting the reference to the Delta in the sentence discussing water temperatures because "concerns have focused primarily on areas such as Freeport on the Sacramento River.. . I' (WQCP-SWC-361,7).
Response: Freeport and Vernal is are within the legal boundary of the Delta and therefore the reference to the Delta is appropriate.
No change in text.

Page 5-19
Comment: SWC states that lethal water temperatures in the Delta have not been substantiated for juvenile salmon in the Delta and therefore the word lethal should be deleted and replaced with the word stressful (WQCP-SWC-361,7).
Response: WQCP-SWC-605, Page 3, states that the upper lethal temperature for juvenile chinook salmon was determined by Brett to be above 77°F (25°C) for acclimation at or above 59 OF. In some years, temperatures above 25°C occur at Freeport and Vernalis, within the Delta (USGS temperature monitoring data), during the times of the year when juvenile salmon may be present.
No change in text.
Page 5-19, para 3
Comment: SWC comments refer to the sentence regarding Itpulse flows" (WQCP-SWC-361,7).
Response: The statement that increased flows could have an affect on water temperatures is consistent with the evidence presented by several parties.
No change in text.
Page 5-19
Comment: CVPWA states that there are no winter-run Chinook in the San Joaquin River (WQCP-CVPWA-210,16).
Response: USFWS notes that winter-run have been observed in the Calaveras River (WQCP-USFWS-7,7).
No change in text.
Page 5-20
Comment: SWC suggest revision of the wording regarding cool river temperatures as benefitting the fa1 1 and winter runs (WQCP-SWC- 361,8).
Response: The proposed wording confuses the timing and presence of the two runs during the spring and early summer.
No change in text.
Page 5-20, last para.
Comment: SWC comments are in regard to water temperature conditions in the Delta as opposed to Freeport (WQCP-SWC-361,8).

Response: Please see above comments regarding legal boundary of the Delta and the USGS temperature monitoring data.
No change in text.
Page 5-20
Comment: SWC comments on Figure 5-3 and the use of the USFWS survival index as opposed to survival rates (WQCP-SWC-361,8).
Response: This sentence refers to Figure 4-4 (USFWS,31,43) as stated, which shows Delta smolt survival based on recoveries of adult marked salmon correlated with mean water temperatures. It does not refer to Figure 5-3, which is only one component of an annual survival index as it represents only one reach. The older references use survival interchangeably with survival i ndex . No change in text.
Page 5-20
Comment: CVPWA discusses the smolt survival index relative to temperatures (WQCP-CYP-210,18).
Response: Comments noted.
No change in text.
Page 5-20
Comment: CVPWA in this comment discusses the relative importance of dissolved oxygen and temperature on the upstream migration o f salmon in the San Joaquin River (WQCP-CVP-210,19).
Response: Comments considered.
No change in text.
Page 5-20, last para.
Comment: SWC comments that 1) the section discussing the blockage of migrating adult salmon in the San Joaquin River due to high temperatures and low dissolved oxygen levels in the fall is difficult to interpret; 2) the statement should be based on cited scientific references supported by quantitative data; and 3) tagging studies conducted in the San Joaquin River were difficult to interpret (WQCP-SWC-361,9).

Response: 1) The section discussing the blockage of migrating adult salmon in the San Joaquin River is based on Hallock et a1 (1970), as cited in the text; 2) it is the only study conducted in the Delta of a phenomenon specific to this particular area which is of concern due to the timing of its occurrence and the simultaneous presence of migrating salmon and; 3) the results of the referenced study are difficult to interpret because it is difficult if not impossible to distinguish whether the fish are reacting to the low dissolved oxygen levels or to the high temperatures or to a combination of the two variables. Please see above comments on the Dissolved Oxygen objective.
No change in text.
Page 5-22 and 5-24
Comment: SWC suggests 1) deleting a reference to the fact that the fa1 l - run Chinook salmon population has been supported by hatchery production in the Sacramento and San Joaquin Rivers; 2) deleting the phrase: "based on the hearing record an& the testimony presented at the hearing"; and 3) deleting a statement that was taken from the stated reference, WQCP-USFWS 2, 3 and 5 (WQCP-SWC-361 ,lo).
Response: Comments considered, however the sentences state facts.
No change in text.
Page 5-23
Comment: CVPWA proposes changes in wordin in the section addressing "pulse f lowsU (WQCP-CVPWA-210,213.
Response: Comments noted.
No change in text.
Page 5-24, para. 2
Comment: CVPWA discusses the USBR temperature model and su gests rewording of the paragraph addressing this model WQCP-CVPWA- 210,21).
9 Response: Comments considered
No change in text.
Page 5-24
Comment: SWC suggests changing the wording to include the statement that temperature models need to be developed (WQCP-SWC- 361,lO).

Response: The comment was considered but it was not soff iciently clear what these temperature models might accompl ish. Sometimes models are less useful than investigative research. The USBR temperature model will no doubt evolve as future needs are identified. Please see above section on Evaluation of Water QuaTity Alternatives.
Mo change in text.
Page 5-24
Comment: SWC suggests deleting the phrase, "achieve the coldest temperature possible" , because cold water temperatures may interfere with other fish species (WQCP-SWC-361,ll).
Response: During the forthcoming proceedings, the possi bi 1 ity af and degree to which the water can be cooled to benefit juvenile salmon wi 1 1 be further investigated.
No change in text.
Page 5-25, para. 3
Comment: SWC suggests: 1) consideration of controTlable fac*rs clws not include areas of the "the Delta", and 2) the rtatemenlt regarding the potential benefits of maintaining water temperatures is an extremely weak statement (WQCP-SWt-361,ll).
Response: Freeport and Vernal is are within the legal boundary o f the Delta. The statement was meant to be of a general nabre because it is expected that additional information will be presented' on this topic.
No change i,n text.
Page 5-25
Comment: CVPWA suggests emphasizing that stored water cannot reasonably controT temperatures.
Comment summarizes the substance of the temperature objectives and states there is little scientific justificaticm for the temperature objectives in the plan. EPA cannot approve objectives that are not supported by avai lable- scient if Dc evidence (WQCP-CVPWA-210,22; WQCP-EPA-1,l; WQCP-SCLDF-1,5; WQCP-CVPWA-210,23).
Response: Board staff reviewed a plethora of scientific data on laboratory experiments and field studies dealing with the effect of water temperature on juvenile Chinook salmon. Laboratory experiments indicate that there is a considerable range of temperatures at which salmon can thrive or merely

survive. Laboratory data are not directly applicable to the environmental conditions in the Delta. The USFWS field experiments, do not and cannot document the conditions through which the salmon smolts migrate. They do indicate that mortality increases with increasing temperatures, however, temperature is not the only factor causing mortality in the Delta. Smolt survival rates vary with time of outmigration, flow, temperature, export rates, migration paths, etc.. Our knowledge of the interplay of these factors and how they affect smolts survival in the Delta is imprecise. The very nature of field experiments, especially those in the Delta, is that they often provide ambiguous results, subject to interpretation. This situation is not likely to change, much less improve in the short-term, even with additional study.
The temperature objectives specify that the 66 and 68°F values are to be maximum values because that is the range above which it is found that the salmon become "stressedu or their overall condition deteriorates. Also, of all of the USFWS smolt survival studies, these temperatures were associated with the mid-range of the survival rates.
There are limited data available regarding the effects of temperatures on adult Chinook salmon either from laboratory experiments or from field studies. The field study in the Sai Joaquin River which provided the data on temperatures during the upstream migration of fall-run Chinook also provided informat ion on dissolved oxygen. The two environmental factors are related and quite possibly have a synergistic effect on the salmon migration behavior. Even with limited and imprecise information, it is possible to conclude that: 1) an upper temperature 1 imit for adult Chinook salmon migration is desirable; 2) temperatures are generally above desirable levels for migrating salmon in the Delta in the fall months; and 3) 68°F is at the upper end of desirable temperatures to provide passage to adult salmon through the Delta.
No change in text.
Page 5-25
Comment: EPA also questions whether different temperature objectives should be set for different salmon runs. The plan notes that DFG believes that temperature tolerances for winter run are similar to those of other runs. A fully protective objective is appropriate to ensure that all runs are protected (WQCP-EPA- 1,l; WQCP-SCLDF-3, 2).
Response: There is no precise method for determining what temperatures in the Delta provide adequate protection for Chinook salmon. A range of 66 to 68OF was identified as the boundary between providing appropriate protection and unacceptable conditions.

In the Delta during the spring and early summer months, it would be unreasonable to set temperature objectives within a conservative range of temperatures, say 55 to 60°F. Because the winter run is a federal and state listed species, the lower end of the range was determined to be appropriate for this run as its survival is more tenuous.
No change in text.
Page 5-25, Table 6-3
Comment: MIDITID states that: 1) the temperature objective on the San Joaquin River is probably not achievable, 2) the definitions of controllable factors should all be consistent, and 3) the dates of the San Joaquin River temperature objective should be changed to exclude the months of June and September because the smolt outmigration may end in the first week in June and ambient air temperature is the major factor control 1 ing water tem erature in most Septembers (WQCP-MIDITID-9,2; WQCP-DFG- 5,2 ! .
Response: 1) Comment considered; 2) appropriate changes have been made in the text (for example see page 1-13); and 3) timing of outmigration is often highly variable between years and in the San Joaquin River, a portion of the smolts do outmigrate in June in some years. The purpose of including June is to consider these smolts. Adult salmon are present in the lower San Joaquin River in September. We agree that ambient air temperature is not a controllable factor and that it may be difficult to control temperatures in September. The State Board welcomes information on those factors that are controllable for the improvement of fisheries habitat in the 1 ower Sacramento and San Joaqu in Rivers . Please see response to USBR comments in GENERAL COMMENTS, Chinook-Temperature Objectives which includes changes in the text (pages, 1-6 and 1-7).
No change in text.
Page 5-26
Comment: EPA agrees that the dissolved oxygen objective is necessary but questions the scientific basis for deciding that the objective should only be in effect for three months and why different potions of the Delta should be subject to different objectives for dissolved oxygen (WQCP-EPA-1,2; WQCP-SCLDF-1 , 6)
Response: Prior to this Plan, there were no water qua1 ity objectives for dissolved oxygen objectives for the interior Delta except the Basin 5 Water Quality Control Plan which allowed a 5 mgll

dissolved oxygen objective in areas "from which fish have been excluded or where the fishery is not important as a beneficial use" and orovided a 7.0 ma/l objective in the Sacramento River (below I street Bridge) and in all Delta water west of the Antioch Bidge. Through DWR monitoring data and DFG research, a particular area during a particular time of year was identified where the local dissolved oxygen levels inhibited the movement of migrating salmon through the lower San Joaquin River. If, in the future, it is found that the low levels of dissolved oxygen occur during other times of the year in other areas in the Delta, within fisheries habitat, the Plan can incorporate those modifications during the triennial review process.
No change in text.
Comment: Page 5-29 Suggest removing the words "minimal, but" from a discussion of the adequacy of the D-1485 salinity objectives (WQCP-SWC-631,13).
Response: We disagree. As noted farther down in Section 5.6.2.1, DFG described the spawning habitat protections under D-1485 as minimal. We accept their evaluation.
No change in text.
Comment: Page 5-30 - Reference to the estimated size of the spawning area available (9.5 miles) when Antioch EC is 25.2 mmhos/cm (extreme relaxat ion condition) should be removed because no technical basis exists for making this statement. The length of the spawning area is in fact "relatively constant" (between ten and twenty miles in length) in high and low flows though it may move up and down the river (WQCP-SWC-631,13).
Response: We disagree. This section is intended to provide the historical context in which the present standard was developed and presented in the 1978 Delta Plan and Final EIR. As we indicate in Section I of this document, we also find the technical basis to be inadequate, but this finding does not change the historical facts and references. We also disagree that a change in spawning area from twenty miles width to only ten (a 50% reduct ion) constitutes a "relatively constant" size.
No change in text.
Relationship of Striped Bass Spawning Protect ion Relaxat ion Provisions to Water Supply
Pages 5-32 through 5-37
Comment: Page 5-32 - DFG disagress with using total Basin water supply rather than deficiencies as the basis for relaxation of the striped bass spawning objectives, because fish and wildlife

frequently take deficiencies in protect ion under the present standards while water deliveries are not cut. They advocate closer 1 inkage between fish and wildlife deficiencies and water del ivery deficiencies (WQCP-DFG-5,2).
Comment: Page 5-35 to 5-37 - Commends Board for rethinking approach to relaxation provisions. Use of CVP and SWP may not be appropriate, since may be triggered by management decisions. If relaxat ion provisions included, recommend ap roach of A 1 ternative 2-E (Section 5.6.3.2) (WQCP-EPA-1,5 ! .
Comment: Page 5-35 to 5-37 - The current and proposed relaxation provisions may not be adequate to protect striped bass for extended dry periods, and cannot accept without scientific evidence to support ( WQCP-EPA-1,6).
Comment: Page 5-35 to 5-37 - The proposed relaxation standards do not identify the scientific basis for the Board's conclusion that these provisions wi 1 1 protect striped bass spawning during extended drought conditions (WQCP-SCLDF-1,6).
Response: The procedure addressed in Section I of this document would tie reduction in spawning habitat directly and proportionally to shortages in project del iver ies , which is more appmpr iate that the method used at present. DFG and EPA have concerns that other approaches may be more appropriate, particularly by relating fish and wildlife deficiencies to other deficiencies. The use of the Sacramento River Basin Index could, if the State Board elects to do so, after completion of the Scoping and Water Right phases, delete two criteria (year following critical year, and subnormal snowmel t) which at present reduce protection for fish and wildlife while not changing protection for other beneficial uses. In addition, the Board will consider other approaches, such as the tying of export levels to water availability, and requiring certain minimum amounts of carryover storage in project reservoirs, in the scaping and water rights phases.
No change in text.
Data Needs, Gaps and Tests
Pages 5-33 through 5-37
Comment: Plan should use all available models for Plan analysis, including fishery models, such as Dr. Botsford's [UC Davis] ( WQCP-NMFS-1,2).
Comment: Page 5-33 - Need to conduct investigations of the relationship between EC and spawning in the San Joaquin River, as we1 1 as the relationship between egg and larval survival and EC (WQCP- SWC-631,14-15).

Comment: Pages 5-33 to 5-34 - Conf 1 icting information on survival of striped bass eggs in various salinities; statement about poor survival in upper San Joaquin River as possibly related to high sal ini ty should be deleted (WQCP-CVPWA-210,25-26).
Comment: Page 5-33 to 5-34 - Statement on poor egg survival as possibly related to high salinity in the San Joaquin River above the Delta (Turner, 1976) should be removed in absence of better understanding of sal ini tylhatching success relationship. Need detailed field work and better analysis of existing DFG data sets (WQCP-SWC-631,14-15).
Comment: Page 5-34 - Statement on temperature effects on striped bass eggs and young needs scientific references. Need analyses of temperature effects on striped bass spawning success, especial 1 y where temperature needs may conf 1 ict with salmon requirements (WQCP-SWC-631,15).
Comment: Page 5-36 - Analysis of DFG data needed to determine relationship of salinity and s awning location in the San Joaquin River (WQCP-SWC-631,16 ! .
Comment: Page 5-37 - Reiteration of concern about temperature and striped bass egg and larval survival (WQCP-SWC-631,16).
Comment: Page 5-55 - Some bi bl iographic references missing (WQCP-SWC- 631,19).
Comment: Page 6-13 - Need better data analysis so that can demonstrate an actual rather than a "theoretical" improvement in spawning protection at Prisoners Point (WQCP-SWC-631,21).
Comment: Page 6-20 - Agree that should use models to analyze different alternatives for striped bass, but should use the best available models in subsequent phases to provide quantified impact assessments (WQCP-USFWS-7,6).
Response: The State Board agrees that additional informat ion is required in nearly every area of discussion related to the setting of water qua1 i ty objectives and other requirements. We urge participants to avail themselves of any models and data available, and to share these data and analyses as much and as early as possible. It is possible to quibble with nearly any statement in the Plan; the San Joaquin River salinity statement is one example. The statement should be viewed as an area of concern for the Board, and as a call for further investigation, both in terms of salinity effects on egg survival and in terms of additional investigations of upstream spawning success when conditions in the San Joaquin River are sufficient to allow upstream migration. The word "theoretical" in relation to Prisoners Point was intended only

to indicate that the proposed objective of 0.44 mmhos/cm EC was already achieved at that location under most conditions, not that the benefit of 0.44 mmhoslcm was theoretical.
No change in text.
C o m n t : Page 5-33 - Suggest removing the word "substantial" from the sentence "This undoubtedly resu 1 ts in substantial losses of eggs and young.", with regard to striped bass spawning in channels which move water to the export pumps (WQCP-SWC- 631,14).
Response: We disagree. Losses due to reverse flows, entrainment, and translocation are implicated as the biggest factor in the striped bass decline.
No change in text.
Comment: Page 5-33 - Suggest removing the word "substantial" from the sentence, "as late as 1963, substantial spawning in the San Joaquin River occurred in the reach between Stockton and Mossdale (Farley, 1966). " (USFWS-SWC-631,14).
Response: We disagree. The data from Farley (1966) show that this area was one of the two most productive spawning areas on the river that year.
No change in text.
Period of Spawning Protection
Pages 5-34 through 5-37
Comment: Page 5-34 - Suggest the wording on the period of striped bass spawning be revised to read "the period Apri 1 1 to May 31, or such ear 1 ier date when biological sampl ing has demonstrated that spawning has ended. " (SWC-WQCP-631,15).
Comment: Pages 5-34 to 5-37 - EPA cannot support the provision until the Board demonstrates how such a determination can be made accurately given normal fluctuations in water levels and spawning activity (WQCP-EPA-1,5).
Comment: Pages 5-34 to 5-37 - The standard which includes "or until spawning ends" defies implementat ion, because the terminat ion of spawning activity is difficult to predict and identify from one year to the next (WQCP-SCLDF-1,6).
Comment: Pages 5-34 to 5-37 - The extension of the spawning period protection from May 10 [sic] to May31 may cost the projects 10,000 acre-feet of yield, but the inclusion of the phrase "or until spawnin has ended', will largely eliminate this impact. Dr. Hansenls !sic] wort shows that in dry and critical years spawning ends ear 1 ier [WQCP-SWC-630,8-9).

Comment: Pages 5-34 to 5-37 - Exhibit DWR-WQCP-11 showed that 99% of spawning occurs before May 21, theref ore the benefit of extending the period to May 31 is speculative, at best (WQCP- DWR-24,12-13).
Response: The State Board added the phrase "or until spawning ends" to provide reasonable protect ion, and yet also recognize the variability in biological systems. The Board has specifically not stipulated what measurement should be used to determine a n spawning ends so that a wide variety of approaches to provide this informat ion may be explored. We therefore are not making the wording change suggested in SWC-WQCP-631. We disagree that 99% of spawning is completed by May 31, as DWR suggests; only 2 of the 15 years of data summarized in Table 5- 2 in Section 5.6.2.1 show that even 95% of spawning activity was completed by May 21. To suggest that the benefits of this extension are "speculative" is to deny the data on the actual period of spawning in the San Joaquin River. Nor do we find that this protection, and its effect on yield, to be unreasonable, given that only about 30-40% of spawning activity is protected at the present time in dry and critical years.
We disagree that spawning necessarily ends earlier in dry and critical years; for example, 1977, the driest year on record, showed a late spawning period. We also disagree that this phrase wi 1 1 serve as a ready means to shorten the period of protection, as SWC suggests. The State Board will place the burden of proof on those who wish to shorten the period of protection. For the present time, we will require that requests for early curtailment of this objective be supported by proof based on real-time data for that particular year, not on general statistical relationships. Thus, we also disagree that the objective is not implementable in its present form, as EPA and SCLDF suggest. The proposed objective provides substantial ly increased protect ion for striped bass spawning independent of umbrel la protect ions, and yet provides appropriate flexibility to reflect actual conditions.
No change in text.
Page 5-38, last para.
Comment: SWC suggests adding the phrase, "whose taxonom has been characterized as 'confusing' (DFG 1990)", to t e second sentence (WQCP-SWC-361,16).
Z Response : Comment considered .
No change in text.
Page 5-39
Comment: CVPWA comments address the variability of the annual Delta smelt abundance and the reasons for that variabilitv: and suggest changes to the section on Delta smelt (WQCPZCVPWA- 210,26).
Response: Comments noted.
No change in text.
Page 5-39, para. 4
Comment: SWC suggests, in part, inclusion of a phrase statjng that DFG concluded that there is "no evidence" that Delta outflow has had major effects on Delta smelt abundance (DFG, 1990) (WQCP-SWC-361,17).
Response: It would be more appropriate to say that although there may be no correlation directly between outflow and abundance of Delta smelt there does appear to be an indirect relationship. Flow affects the location of the entrapment zone and the location of the entrapment zone has an effect on Delta smelt product ion. Other comments considered.
No change in text.
Page 5-42, para. 2
Comment: SWC suggests adding a reference to the peripheral canal as a method for reducing impacts to the Delta smelt by reducing entrainment into the CVP and SWP (WQCP-SWC-361,18).
Response: Methods of reducing impacts to Delta smelt, as well as sther fish species, from entrainment by diversion by the CVP and SWB will be discussed in the forthcoming phases.
No change in text.
Page 5-42, para.3
Comment: SWC suggests deleting the sect ion addressing the entrapment zone (WQCP-SWC-361'18).
Response: Comment considered.
No change in text.
Pages 5-43 and 5-44, Section 5.10 Suisun Marsh
Comment: The choice of monitoring stations was questioned, especially in regard to the Board's rationale for the differences between the 1978 Delta Plan and the amendments to D-1485 which were

made in 1985 (WQCP-EPA-1; WQCP-SCLDF-1,7; WQCP-SCLDF-2,2-3; WQCP-CWPC-1,6-7). In addition, "...the 10,000 plus acres of tidal marshes are not being addressed directly or indirectly in the Final Draft Plani1 is a concern (WQCP-USFWS-7,5). More is needed in the biological assessment than simply an endangered species review; "[tlhe studies should include 1) wet lands outside the legal ly-def ined Suisun Marsh; 2) other alternatives in addition to the SMPA standards; and 3) the full range of species that depend upon marsh resources, in addition to endangered species" (WQCP-EPA-1). USFWS opinion is that "...the waterfowl resources using the 10,000 plus acres of tidal marshes in Suisun Marsh need to have their water qual ity needs addressed as we1 1 " (WQCP-USFWS-7,5).
Some participants advocate that the Board adopt the SMPA water qual ity standards for the Suisun Marsh, ". . .pending the completion of an endangered species review for the entire Bay- Delta plan" (WQCP-DWR-25,5; WQCP-USBR-129A, 3; WQCP-SWC-633,ll- 12). SWC recommends " . . .that the Board adopt the {interim) objectives contained in Decision 1485, before it was amended, unti 1 the biological assessment is completed" (WQCP-SWC-630,lO- 11; "interim" added during testimony on March 11, 1991).
Response: After reviewing the information presented to date, the State Board has concluded that ll. . .the 'Normal Standards' . . . in the SMPA may adequately protect the managed wetland habitat of the Suisun Marsh" and that there is a need for ". . .additional information on the water qual i ty requirements of the rare, threatened, and endangered species and their habitat in the marshes around Suisun Bay . . . before it can consider modifying the current water qual ity objectives" (WQCP, p. 5-44).
No change in text.
Comment: Only a part of the money available for "...improved duck club management schemes.. . " (WQCP , p.5-43) has been spent and that "...the Lower Joice Island fill/drain facility has not been constructed" (WQCP-DWR-24,lO).
Response: The duck club management schemes referred to are the fill- circulate-drain cycle options designed for the operation of each club. The word "schemesu, as used here, does not include any facility construction as such.
No change in text.
Page 5-44, last paragraph
Comment: The Board needs to be careful to fully satisfy both the federal and state endangered species acts (WQCP-NMFS-1,2; WQCP- USFWS-7,7).
Response: This is the Board's intent; the assistance of NMFS, USFWS, and DFG will be appreciated.
No change in text.

Comment: There was a comment on the "rare" classification (WQCP-SWC- 633,12,17).
Response: Many of the designated "rare" plants are also federal candidate species and as such must be considered in the assessment, even though there is no direct protection given to them.
l4o change in text.
Page 5-48
Comment: Sect ion should include data from D-1485 monitoring program, should include discussion of review of benthic monitorina " program, and changes resulting from Potamocorbula clam introduction (WQCP-SWP-631,18-19).
Response: Much of the data presented in this section is from the D-1485 monitoring program, as summarized by Markmann (1986). The data on Potamocorbula are not as thoroughly analyzed as ear 1 ier data. The entire compl iance monitoring is under review by a committee of the IESP. The Board has chosen not to recommend any major revisions to the current program pending completion of this review and its evaluati-on by the Board.
No change in text.
Page 5-51, Delta [Recreation]
Comment: There was disagreement with the discussion of the 1 imited informat ion avai lable to the Board (WQCP-SUC-633,12-13).
Response: Unless additional (and up-to-date) infarmation becomes available, the Board sees no reason to change the discussisn in the Plan.
No change in text.
Page 5-53, Export Agriculture
Comment: The 1.0 mmhoslcm EC objective is too high (WQCP-SDWA-36,l).
Response: The 1.0 mmhoslcm EC objective for export agriculture is based upon reasonable protection of the beneficial use. The export pumps wi 1 1 receive umbrel la protect ion from South Delta objectives. Thus, this 1.0 EC objective will not cause a degradation of export water qua 1 i ty.
The 5% leaching fraction mentioned on page 7-4 is the average minimum leaching fraction for the export area. With a 73% irrigation efficiency the actual average leaching fraction will probably be more like 10 to 15% due to incidental deep percolation losses. Thus, the 1.0 mmhos/cm EC objective appears to provide reasonable protection of export

agriculture. Also, higher leaching fractions in the San Joaquin Val ley would just exacerbate the problem of agricultural drainage in the San Joaquin River.
No change in text.
Chapter 6
Pages 6-4 to 6-13, 6-13, paras. 1 and 2
Comment: The USFWS comments relate to the impacts on salmon smolt survival from the analysis of the water supply impacts of the various water qual ity a1 ternatives (WQCP-USFWS-7,6; WQCP-CVPWA- 210,30-31).
Response: The assessments of the impacts to salmon smolt survival based on the water supply impacts, resulting from the various water qual ity alternatives, is very preliminary and of a general nature. The results of the water supply impacts analysis are provided only in terms of acre-feet in only two year types, average and critical, based on the 57 years of record. Assessment of impacts to salmon smolts wi 1 1 depend on how much, when and where the flows occurs. This analysis will be done during the scoping phase of the Proceedings (See Chinook- Upstream effects of Delta flow requirements).
No change in text.
Page 6-4, Paragraph 2
Comment: The plan does not provide a complete definition of water supply impacts in that it does not include impacts on upstream reservoir storage and the timing of the flows (WQCP-DWR-24,4; WQCP-DWR-15,4).
Response: Comment noted. Table A6.3-1 from Appendix 6 presents the "Project Deliveries" water supply impacts, which includes CVP and SWP reservoir storages. [Project Del iver ies was deleted from earlier drafts.]
No change in text.
Page 6-5, TABLE 6-2, Water Supply Impacts.. . Comment: A question was raised about the interpretation of the "-9"
figure describing "Total Delta Exports" in the results of the operations studies for Alternative 3 (WQCP-WACOC-5,4).
Response: The '-9" figure represents a decrease of 9,000 acre-feet per year in total Delta exports when compared to the base of 6,295,000 acre-f eet a1 lowed under D-1485. This small reduction is not significantly different from zero. The State Board has concluded that there will be no significant adverse environmental impacts due to the adoption of this Plan (Plan,6- 29).
No change in text.

Page 6-5, 6-7, 6-8
Comment: Studies should not be analyzed by comparing Delta outflow. Decreases in Delta outflow could be due to additional upstream reservoir storage and not necessarily due to Delta objectives (WQCP-DWR-24'6-5,6-7,6-8,6.3-3 and 6.3-4).
Response: Numerous studies have been performed using Delta outflow as an indicator of water supply impacts. Delta flaws and exports as we1 1 as reservoir storages will be considered in the final draft . No change in text.
Page 6-10
Comment: The discussion of the paper industries needs, sal inity treatments capabi 1 i ty, and negotiations should be expanded in the WQCP (WQCP-DWR-24,6).
Response: Section 5.1.2 of the WQCP sufficiently discusses the paper industries needs, and the relationship between the negotiations and the WQCP. Discussion of the paper industries sal inity treatment capabi 1 ity would not add necessary information to the WQCP.
No change in text.
Page 6-13 para. 2
Comment: SWC suggests substituting June for July in the period of April through July in the discussion of the impact assessment of the water qua1 i ty A1 ternatives (WQCP-SWC-631,ZO).
Response: The reason the period Apri 1 through July is used here is because the operation studies identify this period separately because the fish and wildlife objectives are introduced in April and are not removed until July. This analysis of the alternatives was very preliminary and wi 1 1 be more thoroughly analyzed in the forthcoming proceedings.
No change in text.
Page 6-13 para. 2
Comment: SWC suggests: 1) stating that it is a fact that there is no data available to evaluate the relationship between water temperature and smolt survival on the San Joaquin River, and 2) deleting wording stating that spring outflow in the San Joaquin River is correlated with adult salmon returns two and one half years later because it is a f low-based consideration and should be addressed later (WQCP-SWC-631,20).

Response: 1) It is not a fact that there are no data available to evaluate the relationship between water temperature and smolt survival in the San Joaquin River, and 2) in this section of the Plan, we are making a preliminary attempt to analyze the water supply impacts of the alternatives and the resulting impacts to the salmon. In subsequent Proceedings, these issues wi 1 1 be more thoroughly addressed.
No change in text.
Comment: NMFS urges the Board to broaden its consideration of computer models to include the Chinook population model (CPOP) for the Sacramento River Bas in (WQCP-NMFS-1,Z).
Response: There are several models such as CPOP that can be used as tools to assess the impacts of various operation alternatives on the salmon resources upstream and in the Delta. In the preparation of the Draft Environmental Impact Report, a1 1 available and appropriate tools will be utilized to assess the impacts of the project alternatives to be considered (See Chinook-Program of Implementation; also see 'Response to WQCP- USFWS-7, para. 6, regarding 7-16, Section 7.4.3.2 of the Plan.)
No change in text.
Comment: NMFS points out that the Board may also need to consider the Delta flow effects of Shasta reservoir carry-over storage regimes, that may be required for successful maintenance of suitable salmonid spawning and incubation temperatures in the upper Sacramento River (WQCP-NMFS-1,2).
Response: The State Board wi 1 1 consider the upstream effects, including the effects on fisheries, of the alternative flow requirements in the Delta during the Scoping Phase and later in the Water Right Phase. The State Board is very aware of the upper Sacramento River temperature issues and their effects on salmonid production. This issue will need to be further addressed in the context of implementation of the proposed temperature objectives for protection of Chinook salmon at Freeport during the spring months.
No change in text.
Page 6-17
Comment: CVPWA suggests revisions to the wording, discussing the evaluation of alternative water qua1 ity objectives (Alternative 6) and the potential impacts on Chinook salmon (WQCP-CVPWA-210,32).

Response: A thorough analysis of the impacts of the various water qual ity objectives on salmon resources wi 1 1 be done during the Scoping Phase of the proceedings.
No change in text.
Page 6-17
Comment: $WC suggests rembval of wording in which there is speculation as to the relative benefits of the water qualit alternatives to the juveni le Chinook salmon (WQCP-SWC-631,21 1 .
Response: The wording is speculative and the relative cost and benefits of the water qual ity alternatives wi 1 1 be analyzed during the forthcoming proceedings.
No change in text.
Page 6-18
Comment: Alternative 6 does not provide full protection against entrainment of striped bass eggs and larvae in the San Joaquin River (WQCP-SWC-631,22).
Response: We agree, but as the text indicates, this refers to salihity protection for adult spawning, not to protection for the products of that spawning. There was no intention to suggest that eggs and larvae are not subject to entrainment losses under this alternative.
No change in text.
Page 6-19
Comment: DWR disagrees with the statement "Further, the '1990 level of development' used in the model does not reflect actual diversions at this time (WQCP-DWR-24,4).
Response: Reviewing the past ten years of DWR Bulletin 132 publications, 5-year entitlement del ivery project ions consistently overestimate actual enti tlement deliveries. On an average basis this analysis indicates this overestimation is significant. In 1989, a critical year where local supplies in export areas were deficient and the SWP requ frement i hcreased, the actual entitlement delivery was 2.85 MAF. Deliveries under normal hydrologic conditions would likely be less. Bulletin 132-90 projects 1990 entitlement deliveries wi 1 1 be 3.3 MAF, for a normal hydrologic condition, a increase of 450 TAF in one year. The Board staff is currently investigating this issue with MWD and DWR staff.
No change in text.

Page 6-19
Comment: CVPWA suggests that the section entitled Cumulative Impacts of Flow Alternatives should be deleted because it does not address water quality issues and the improvement in the entrapment zone through flow objectives may not necessarily provide the benefits to salmon and striped bass contemplated in this sect ion (WQCP-CVPWA-210,32; WQCP-SWC-631,22).
Response: Comments considered. This issue will be considered further in the subsequent proceedings.
No change in text.
Expansion of Striped Bass Spawning Habitat Upstream to Vernalis
Page 6-20
Comment: At this time there is little use in expanding striped bass spawning habitat in the San Joaquin River. Evidence indicates that striped bass are not spawning habitat limited under present conditions. Unt i 1 problems of rearing habitat downstream and dislocation are corrected, 1 ittle 1 ikely benefit to striped bass (WQCP-USBR-129A,2).
Coment : DWR1 s comments regarding lack of evidence supporting expansion of the spawning objectives were not reflected in the Final Draft (WQCP-DWR-25,5).
Comment: EPA disagress with the decision not to extend spawning habitat to Vernalis. While it agrees that pumping is the biggest factor affecting striped bass, this should not be used as basis for excluding other objectives that would help restore and maintain striped bass. Given the continued decline, it is difficult to understand rationale for rejecting objectives to improve habitat. This problem underscores the need to develop an integrated set of standards to improve spawning and migrat ion conditions for striped bass (WQCP-EPA-1,5).
Comment: The decision to not expand spawning habitat is nonsensical in view of the continuing decline of striped bass population. The State Board should make every effort to improve habitat. It is unconscionable to reject habitat objectives because it has failed to address the entrainment losses problem. The State Board must address both problems to assure restoration of the striped bass fishery (WQCP-SCLDF-1,6).
Comment: The only major improvement in standards compared to the 1978 Plan was "blackballed" by the State Board. The reasons were the potential water costs and the doubtful benefit the objective would produce, because the Board was also not addressing the required flow and export restrictions at this time. When and if pumping restrictions are set, the Board will once again consider the issue (Section 5.6) (WQCP-CWPC- 118)

Comment: (Page 1-14, para. 1, also) USFWS cannot understand why the State Board cannot set a Vernal is spawning objective now, and implement it later, if indeed it is a desirable action. Objectives should be set realizing that it may take time and varied act ions to achieve implementation (WQCP-USFWS-7,3).
Comment: (Page 6-20, Section 6.3.3, para. 3) USFWS1s opinion is that the Final Draft text and their testimony support the extension of the spawning objective to Vernalis, with qualifications as to its implementation (WQCP-USFWS-7,6).
Response: The State Board remains unconvinced that extension of the striped bass spawning habitat upstream to Vernal is would produce any significant beneficial effects, given the present configuration and water project operations in the Delta. The Board remains open to further consideration of this issue in subsequent phases and in the Triennial Review.
No change in text.
Page 6-22, Sect ion 6.5, Environmental Effects, paragraph 3
Comment: Two questions were asked: 1) if the Plan is essentially identical to the 1978 Delta plan, as inferred by the first bullet in Section 6.4, page 6-20; and 2) if the Environmental Checkl ist refers ". . .only to the adoption of the objectives or to their ultimate implementation?" (WQCP-USFWS-7,6).
Response: In answer to I), other than the striped bass spawning objectives, the proposed Plan is essentially identical to the 1978 Delta Plan. In answer to 2) , the Board has 1 imited the discussion to the adoption of the objectives since the actual implementation methods will be determined in the upcoming phases of these proceedings and will be subjected to an environmental analysis at that time.
No change in text.
Pages 6-24 to 6-29, TABLE 6-5, Environmental Checklist
Comment: Questions were raised about some of the items in the checklist based upon the misunderstanding of the "-9" figure in Table 6- 2 ( WQCP-WACOC-54-6).
Response: See response to Page 6-5.
Pages 6-24 to 6-29, Environmental Checkl ist
Comment: There was disagreement with the "Nol1 response for the following check1 ist i tems (WQCP-SWC-631,22):
3a. Changes in currents, or the course or direction of water movements, in either marine or fresh waters?
3h. Substantial reduction in the amount of water otherwise available for pub1 ic water supplies?

5a. Change in the diversity of species, or numbers of any species of animals ... ?
Response: The Board's "No" responses were based on the conclusion that there would be no adverse impacts due to the adoption of the water qual ity objectives. Beneficial impacts need not be discussed "...because the State Board has set the water qual i ty objectives at levels designed to adequately protect the designated beneficial uses of the Sacramento-San Joaquin Delta and San Francisco Bay waters" (WQCP, p.6-29).
No change in text.
Page 6-31, last paragraph
Comment: The Board's conclusion that "[tlhe availability of water for export uses is not significantly affected by this Plan" was questioned. The comment stated that "[tlhe amount of water required to meet the objectives in the south Delta interior stations and the revised Antioch relaxation provision or the water required to meet any revised Suisun Marsh objectives is unknown, but could be significant" (WQCP-SWC-633,16).
Response: Based on the available information that there is a ". . . lack of specificity in the ability to accurately model water supply impacts associated with various water qual ity objectives.. .I1
(WQCP-SWC-631,22), the State Board sees no reason to change the statement in the Plan. There has been testimony that are various ways to implement the water quality objectives. The effects of proposed implementat ion measures wi 1 1 be analyzed in the upcoming phases of the proceedings.
No change in text.
Chapter 7
Page 7-3, Section 7.2.2.2, "Western and Interior Delta"
Comment: The Board should establish procedures by which an individual objective can be modified independently of the entire WQCP when additional information becomes available, for instance when the leaching study is completed (WQCP-USBR-129A,2).
Response: As stated on page 1-2 of the Plan, the State Board intends to review information as it becomes available and to update objectives as warranted.
No change in text.
Page 7-3
Comment: This section should recognize that these objectives will be changed if the results of the leaching study called for in Section 7.4.2.2 show that requiring Delta farmers to practice Best Management Practices such as leaching is reasonable (WQCP- SWC-633,17; WQCP-CVPWA-210,34).

Response: Section 7.2.2.2 addresses implementation of proposed objectives. Proposed objectives are the same as those that are currently implemented, theref ore further implementat ion measures are not necessary. Also, page 1-2, paragraph 4 of the WQCP explains when new information will be incorporated into the WQCP as follows: "The product of the current Water Qua1 ity Phase of the planning process wi 1 1 be updated to reflect findings and conclusions at the end of the Water Right Phase and periodical ly, thereafter, whenever sufficient new information is received."
No change in text.
Page 7-3, Section 7.2.2.2, "South Delta"
Comment: This section on southern Delta Agriculture, should be expanded to address South Delta negotiations and the impossibility of meeting the proposed objectives (WQCP-DWR-24,15).
Response: These issues are sufficiently addressed in previous chapters of the WQCP. See other comments on south Delta agriculture.
No change in text.
Page 7-4, Agriculture
Comment: The Salt-Load Reduction Goal may be too difficult to meet ( WQCP-MTDITID-92; WQCP-CVPWA-210,34 ; WQCP-SDWA-36,2).
Response: Based on the reasoning on page 7-4 we believe that a 10% salt load reduction is a reasonable goal and see no reason to change this goal. This evaluation is supported by the results of the State Board's Technical Committee and the San Joaquin Val ley Drainage Program.
No change in text.
Pages 7-5 and 7-6
Comment: It is premature to specify compl iance monitoring requirements. This subject area should be open to discussion and even developed by a workgroup (WQCP-USBR-120,3; WQCP-DMR-24,14).
Response: The State Board believes that there should be no hiatus in compliance monitoring. The Interagency Ecological Studies Program (IESP) is in the process of reviewing the data developed from the D-1485 compl iance monitoring program. The State Board would appreciate receiving the analysis and recommended changes of the IESP as soon as they become available. Upon review the State Board will make appropriate changes. Unti 1 that time the compliance monitoring program addressed in the Plan should continue.

There is an aspect of this monitoring program that the State Board would 1 ike discussed during the Scoping Phase which is, cost sharing to fund this program. Currently this program is funded solely by CVP and SWP contractors. There are many projects affecting either the water quality or flow into the Bay-Delta and therefore possibly the beneficial uses made of Bay-Delta waters. Funding considerations and mechanisms should start with reservoirs greater than 100,000 acre-feet and direct diverters of 100 cfs or more.
No change in text.
Page 7-5, Section 7.2.2.6 Suisun Marsh
Comment: A petition to change the compliance schedule for the Suisun Marsh objectives from that approved in the 1985 amendment to D- 1485 to the schedule set forth in the SMPA (calculated from the operational date of the Montezuma Slough Control Structure) has been submitted (WQCP-DWR-24,lO).
Response: The State Board has received that petition and it is being reviewed . No change in text.
Page 7-6, Table 7-1, Bay-Del ta Estuary Water Qua1 i ty Monitoring Program
Comment: There is no discussion in the draft report of a State Board critique and statistical analysis of the database collected as part of the existing D-1485 monitoring program (WQCP-SWC- 633,23).
Response: The State Board agrees that such an analysis is a good idea. Furthermore, the State Board be1 ieves that all the monitoring being performed in the Estuary needs to be evaluated. We would support the allocation of sufficient funds to the Interagency Ecological Study Program to perform the necessary work.
No change in text.
Comment: The following corrections should be made to Table 7-1 (WQCP- DWR-24,ll) :
1. There are two stations numbered "D12"; and 2. Gauge height records should be added to any Marsh compliance
stations that do not have them listed.
Response: Comment noted.
No change in text.

Page 7-8, Section 7.3.2.1
Comment: What is the reason for requesting additional monitoring requirements for the North Bay Aqueduct Intake at Barker Slough (WQCP-DWR-24,7).
Response: No monitoring station had been created at Barker Slough at the time of the request.
No change in text.
Page 7-9
Comment: The SCLDF states that the State Board did not analyze the impacts of the alternative sets of objectives on esturarine resources and that if it had, it would have determined that salmon populations would be managed at substantially lower levels, with more frequent population crashes than occurred in DFG ' s historic base1 ine period of 1922-1967 (WQCP-SCLDF-2, 9 \
Page 7-9, Page 7-19
Comment: CVPWA suggests revisions and states that the SWRCB should work with interested parties to focus attention on improving the ability to define quantitative relationships between biological processes and hydrological conditions within the Bay-Delta system. The impact of harvest of salmon populations needs to be assessed as well as the losses to unscreened or improperly screened divers ions (WQCP-CVPWA-210,36).
Response: The analysis of the impacts of the various water quality objectives on salmon resources will be done during the scoping phase of the Proceedings (See Chinook-Upstream effects of Delta flow requirements). It would be appropriate to analyse losses to a1 1 screened and unscreened divers ions, including diversions by the projects, in the Delta at that time as well.
No change in text.
Pages 7-9 to 7-27, Sections 7.4 and 7.5
Comment: Additional special studies should be undertaken before commencement of the Water Right Phase (WQCP-WACOC-56,7).
Response: The State Board intends that the studies outlined in these sections be at least started during the upcoming Scoping Phase of the proceedings. Not a1 1 of them will be completed before the Water Right Phase commences. As information from these studies becomes available, the State Board will take new data into account under either its water quality or water right authority and make changes as appropriate.
No change in text.

Pages 7-11 and 7-12
Comment: SWC suggest revisions to the wording of the proposed studies (WQCP-SWC-631,24).
Response: These are listed directly from Kjelson et al., 1990 and it would be inappropriate to change the wording. It is stated in the text that these studies are to be considered by the Five Agency Salmon Committee for implementation.
No change in text.
Page 7-11
Comment: CVPWA states that an additional study objective should be added to this section to determine the component of smolt mortality due to causes other than temperature that have been incorporated into the smol t survival index (WQCP-CVPWA-210,35- 36).
Response: The list of studies is not exclusive (see above response to WQCP-USFWS-7, Page 7). It is doubtful whether it would be possible to attribute components of smolt mortality with predati~n~associated with temperature, as it is not possible to attribute smolt mortality to temperature alone.
No change in text.
Page 7-16
Comment: The proposed Interagency Model ing Development and Use Committee (IMDUC) is not needed since the Department-sponsored Operation Studies Workgroup is appropriately addressin the pertinent issues. A new committee would be redundant WQCP- DWR-24,7-16).
a Response: The function of the Operation Studies Workgroup is to analyze
the water supply impacts of the proceedings' water qua1 ity, flow, and implementation alternatives. The purpose of the proposed IMDUC is to enhance the modeling efforts of glJ modeling studies, not just those related to the proceedings. Consequently, the IMDUC is needed unless the Operation Studies Workgroup is willing to expand its role to perform, on an ongoing basis, the tasks listed on page 7-16.
No change in text.
Page 7-16
Comment: The recommended Model ing Development and Use Committee should be structured to investigate inde endent salinity analysis of operat ion studies (WQCP-CCWD-21,7 ! .
Response: Comment noted.
No change in text.

Page 7-16
Comment: It is critical that the modelling studies be prioritized to achieve the most useful results for the Boardi s future decisions. Completion of the Bureau of Reclamation-funded San Joaquin River 0 eration Model is needed as soon as possible (NQcP-USFWS-7, 77.
Response: Comment noted.
No change in text.
Page 7-19, Section 7.5.2.2
Comment: The Board should provide protection for western and interior Delta agriculture durin a1 1 periods of the year where water is used by agriculture 9 CDWA-Testimony)
Response: The WQCP states that the western and interior Delta ". . .water quality objectives were developed using corn as the representative crop". Central Delta Water Agency has requested that protection for crops other than corn outside of the corn growing season. This is a reasonable request that will be addressed in the Scoping and Water Right phases.
No change in text.
Page 7-20, Section 7.5.2.5
Comment: Detai led information on upstream and export area recreation and fishery habitat is requested here for consideration in the Scoping and Water Right phases, but little concern about this issue is expressed in Section 5.16 (USFWS-WQCP-7,7).
Response: The objectives proposed in this Plan do not, of themselves, have any significant effects in terms of project operations, flows, and water storage. In the Scoping and Water Right phases, protection for other beneficial uses not covered in this Plan may require some degree of modification of project operat ions, flows, and reservoir storage levels. These may have significant effects on reservoir and instream recreation, instream habitat, reservoir fish habitat, and wild1 ife habitat. The Board needs information on these potential impacts to use in its balancing process.
No change in text.
Page 7-21
Comment: It is not necessary that the San Joaquin River Basin Water Year Classification be similar to the Sacramento (WQCP-CVPWA- 210,36-37).

Response: Comment noted.
No change in text.
Pages 7-23 to 7-27, Section 7.5.3.4 Physical Facilities
Comment: It was requested that the Western Suisun Marsh Salinity Control Project be added to the list (WQCP-DWR-24,ll).
Response: Since the list was not intended to be exclusive, the State Board sees no compelling reason to expand the list at this time.
No change in text.
Pages 7-23 to 7-27
Comment: NRDC claims that 1) the constraints listed on page 7-27 are "... unduly restrictive and technically misguided, and result in a process which greatly underestimates the potential for water savings.. . "; and 2) ". . . although the Board has treated the potential for new physical facilities extensively (pages 7- 23 through 7-27), it has provided no description of opportunities for agricultural water conservation. "
NRDC also comments on the adequacy (or lack thereof) of the work done to date by the Agricultural Water Conservation Workgroup (WQCP-NRDC-0) .
Response: The State Board be1 ieves these issues are f low-related and belong in the Scoping and Water Right phases, where they wi 1 1 receive appropriate analysis.
No change in text.

SECTION I11
Technical Appendices Comments and Responses
APPENDIX 3.1
Page 3.1-1
Comment: The Sacramento Basin Index equation is incorrect (WQCP-USBR- 129B ,4; WQCP-CVPWA-210,38).
Response : Agree.
Change in text: The Sacramento Basin Index equation wi 1 1 be amended as follows: "Index = Cl*X + C2*Y + C3*ZU
Page 3.1-2, bu 1 let - Determination of Water Year Classification Breakpoints, paragraph 1, sentence 3,
Comment: The term "flows" is incorrectly used (WQCP-CVPHA-210,38).
Response: Agree.
Change in text (underl ined) : *In other words, there is an equal chance that the Sacramento Basin Index will..."
Page 3.1-4 bullet - Verification Process, paragraph 1, sentence 6 Comment: Figure A3-1.1 is incorrectly referenced as Figure A3-1 (WQCP-
CVPWA-210,38).
Response: Agree.
Change in text (underl ined) : Reference figure correct 1 y as Figure A3-14.
Page 3.1-4, "Verification Process"
Comment: The derivation of water avai labi 1 ity should be addressed. Appendix, Pages 3.1-6 through 3.1-9, The available water supply is not defined or calculated in the appendix or el sewhere (WQCP-CVPWA-210,38,39).
Response: A discuss ion of water avai labi 1 i ty (avai 1 able water supply) was not included for the purpose of brevity.
No change in text.

Page 3.1-5
Comment: The San Joaquin Basin Index is still under development and no derivation or description of this relationship is found. Therefore, reference to the San Joaquin Basin Index should be removed (WQCP-CVPWA-210,38-39).
Response: Comment noted. A description of a possible San Joaquin Basin Index can be found in the WQCP.
No change in text.
Page 3.1-10
Comment : The subnormal snowmel t adjustment should not be el iminated from consideration (WQCP-DWR-24,5-6).
Response: The WQCP does not eliminate the subnormal snowmelt adjustment from consideration. On page 3.1-10 the WQCP states that if a subnormal snowmel t adjustment increased the accuracy of the index, then it would be beneficial. To clarify this point, the last sentence in the last paragraph of the section titled "Adjustments to Water Year Classification" is changed.
Change in text: "However, the current subnormal snowmel t modification. . . "
APPENDIX 4.0
Page 4.0-5, Section 4.0.4.1, "Delta Organic Soils", paragraph 2
Comment: The definition of subirrigation is incorrect (WQCP-USBR- 129B, 2).
Response: Agree.
Chan e in text: ". . .?subirrigation is an irrigation technique by which water is delivered to the crop root zone by horizontal flow through the soil from the spud ditches)."
Page 4.0-5, Section 4.0.4.1, "Delta Mineral Soils"
Comment: Most leaching in mineral soils is probably accomplished during the first few irrigations during the season and not after harvest (WQCP-USBR-129B, 2).
Response: Comment noted. The WQCP will be modified to reflect the contribution of irrigation to salt leaching.
Change in text: "Excess salts are removed during irrigation and after harvest.. . "

Page 4.0-5, Section 4.0.4.1. "Delta Organic Soils", paragraph 3
Comment: Information is insuff icicnt to conclude that I1(u)nder present conditions in the Delta, leaching measures are not current1 necessary on a regu 1 ar basis (WQCP-DWR-24; WQCP-USBR-129B, 2 1 . "
Response: Agree.
Change in text: The Appendix to the WQCP will be amended by deleting the first sentence, third paragraph, Page 4-5, in the section titled "Delta Organic Soi 1s".
Comment: There was a lengthy discussion of their concept of beneficial uses and "balancing" (WQCP-USBR-129B, 2-4).
Response: The Board has designated the beneficial uses of the Bay-Delta Estuary waters, based on the general statements in the Cal ifornia Water Code Section 14050(f) and the requirements of the federal regulations (40 CFR 131.10) promulgated under the Clean Water Act by EPA. This designation is reconfirmed in Chapter 4 of this Plan. The State Board sees no compelling reason to change the beneficial use descriptions in response to this comment.
No change in text.
Comment: Revision of Section 4.0.5.1 Delta Habitat (pageA4-11) "...to provide a stronger emphasis on the relationship between water quality parameters and habitat conditions for the various fish, invertebrates and algae inhabiting the Bay-Del ta system" was requested (WQCP-SWC-631,25).
Response: Until the State Board has received sufficient evidence to allow a better discussion of such relationships, there is no compelling reason to change the description in this section.
No change in text.
Comment: The quest ion on WQCP-CVPWA-210,39 is answered in our response to the earlier comment on page 5-14.
Page 4.0-17
Comment: SWC comments that the fact that the Columbia River does not provide habitat for four races of Chinook salmon should be verified (WQCP-SWC-631,25).
Response: The availability of fisheries habitat in the Columbia River is beyond the scope of this document; however, there are three runs of Chinook salmon in the Columbia River, spring, summer and fall.
No change in text.
Page 4.0-17
Comment: SWC comments that Table 1.4-5, Chinook Salmon Environmental Requirements and Life History Stages, should be updated to include more recent information (WQCP-SWC-631,25).
Response: A new table may be prepared for subsequent documents.
No change in text.
Chinook-Inland Catch Rates as Relates to Value of the Fishery
Comment: USBR references pub1 icat ion (USFWS 1984) and recently compiled information for the period of October 1, 1989-October 1 1990 and states that the use of the 0.02 catch value may underestimate the number of fish caught per outing thereby affecting the valuation of fish related recreation (WQCP-USBR- 129B,4).
Response: Comment considered, informat ion wi 1 1 be reviewed. The following may be added (Page 4-19, paragraph 2, in front of last two sentences on the page).
Change in text: "Catch rates are highly variable. Fishing success rates may vary from an average of 0.01 fish per hour effort from Carquinez Strait to Sacramento, to an average of 0.09 fish per hour from Red Bluff to Keswick Dam. The success rates range from 0.08 to 0.72 fish per assumed 8-hour outing with the majority of the Sacramento River fish being caught on the upper portions of the river."
APPENDIX 5.0
Page 5.0-14, para. 2
Comment: Page 5.0-14, para. 2 - USBR believes the discussion of the position of the water development community, DFG and USFWS concerning increasing spawning habitat is misleading. Present Delta configuration will not help but it may be worthwhile to increase spawning habit later (WQCP-USBR-129~~ I).
Response: Comment noted.
No change in text.
APPENDIX 5.2
Page 5.2-1
Comment: The time interval for compliance of the objective should be average soil salinity over the growing season, not maximum dai ly sal inity (WQCP-DWR-24,9).

Response: This issue was discussed in the Western and Interior Delta Agriculture subworkgroup. Terry Prichard, the subworkgroups agricultural expert in the western and interior Delta, recommends an interval of compliance of 14 days (Letter to S. Humpert, June 12, 1990). Based on Mr. Prichardls recommendation, the statement in WQCP Appendix 5.2, page 5.2-1 in the section titled "Salinity Requirements for Corn", which states, "State Board Exhibit 24 indicates that, in the short- term, to maintain maximum corn yield, the maximum daily salinity of applied water should be no more than 1.5 mmhos/cm EC from April 1 through July 31 (SWRCB,24,1).", will be deleted and a clarifying statement will be added.
Change in text: "Evidence indicates that in order to maintain maximum corn yield, in the short-term, the maximum 14-day running average of daily average salinities of applied water should be no more than 1.5 mmhos/cm EC from April 1 through July 31. "
APPENDIX 5.3
Page 5.3-1, para 2
Comment: USFWS states that the reference USFWS exhibits and testimony was misrepresented by referring to Chinook salmon spawning and egg incubation temperature requirements being less than 60°F. Page 5.3-3, Table 5.3-1) Reference should be WQGP-USFWS-1 WQCP-USFWS-7,8).
Response: This was not meant to mislead but was a shorthand method of describing the early 1 if e history temperature requirements as being less than 60°F. Referenced text will be amended.
Change in text to Table 5.3-1: "According to one pub1 icat ion, temperature requirements for the early life stages of Chinook salmon are as follows: Spawning and egg incubation: 49-56OF; Fry and juvenile rearing: 45-58OF (Be1 1, 1973). "
Page 5.3-1, third bullet
Comment: CVPWA states that the reference in the text to the testimony, "upstream and estuarine food supplies may be poor" is taken out of context (WQCP-CVPWA-210,39).
Response: Comments considered
No change in text.
Page 5.3-1, third bullet
Comment: SWC comment addresses elevated temperatures and food supply of juveni le salmon (WQCP-SWC-631,26).

Response: The referenced sentence is correct and is not inconsistent with the testimony. We are familiar with the different pub1 ications authored by Brett. This appendix cannot describe or contain all of the information on this topic. This section is an attempt to give a range of parameters and issues concerning Chinook salmon and temperature. Comments noted.
No change in text.
Page 5.3-2
Comment: CVPWA states that the text ignore a variety of sources of impact to upstream habitat and survival and suggests other to be included (WQCP-CVPWA-210,40),
Response: The text gives dams and diversions as an example of an impact to upstream habitat. A complete list would be too cumbersome. The additional impacts suggested, loss by entrainment, loss of gravel, additional predator habitat, etc., are impacts associated with dams and diversions.
No change in text.
Page 5.3-2, second to last paragraph, first sentence
Comment: CVPWA states that the numbers in Appendix Table 5.3-1 should be described as predicted (WQCP-CVPWA-210,40).
Response: Comment noted.
Change in text: "The following table is a summary of predicted smolt survival indices. ... etc. The title of Appendix Table 5.3-1 will be changed to include the word "predicted."
Page 5.3-3, Table 5.3-1
Comment: Similar comment to that of CVPWA (WQCP-SWC-361,26).
Response: Comment noted.
Change in text: The word predicted wi 1 1 be included in the text and in the Table title.
APPENDIX 5.4
Page 5.4-10
Comment: Low San Joaquin River flowmay be associated with salinity, but no evidence that bass are spawning habitat limited. Releases from New Melones have improved south Delta water qua1 ity (WQCP-USBR-129B, 2).

Response: The general discussion on spawning habitat and its 1 imitations is presented in Section I of this document. Concerning the improved south Delta water qual i ty, improvement there does I ittle good if striped bass are prevented from taking advantage of the improved water qual ity because of salinity barriers farther downstream, or because the water quality is still not sufficient to provide adequate habitat.
No change in text.
Page 5.4-11
Comment: Recent evidence suggest that the summer dieoff may be due to toxic organic pol lutants (WQCP-USBR-129B,2).
Response: Comment noted and the text will be modified.
Change in text: "The cause is unknown, but may be related to liver dysfunction, possibly caused by toxic organic pollutants."
Pages 5.4-14ff
Comment: Extensive discussion of various technical issues related to striped bass, also discussed in comments on Plan -text (SWC- WQCP-631,26-28).
Response: Comment noted. These issues have been responded to already in above responses.
No change in text.

SECTION IV
Addendum to the "Responses to Comments"
on The Water Quality Control for Salinity
The following comments were received after the State Board's special Board meeting on April 2, 1991.
Department of Fish and Game (DFG) Comment
Comment: DFG submitted a comment memo dated Apri 1 19, 1991, on the Compiled Revisions (April, 1991) to the Draft Water Quality Control Plan. They stated that the description of the Suisun Marsh Mitigation Agreement was incorrect on pages 1-2 and 7- 31, and Tables 1-1 and 6-3 of the Final Draft of the Plan
t January, 1991). The Suisun Marsh Preservation Agreement SMPA) , not the Mitigation Agreement, includes the descriptions of physical facilities.
Response: Agree. The text will be corrected in the appropriate places.
Sierra Club Legal Defense Fund (SCLDF) Comments
A. Chinook Salmon Temperature Objectives
Comment: In a letter dated April 15, 1991, SCLW states that the State Board contends that the use of reservoir releases to control water temperature is not "reasonable, due to the distance of the Delta downstream of reservoirs and control lable factors such ambient air temperature, etc. . . ". SCLDF be1 ieves that the State Board1 s position is mistaken, that regulating reservoir releases is indeed a controllable factor and in fact is the principle means available by which man can affect water temperature, etc. The Plan describes the USBR temperature model that will help evaluate Sacramento River flows required to achieve various temperature a1 ternatives. There is no identification of any other feasible "controllable factors" that may influence temperatures. It is not clear why reservoir releases were excluded from cans iderat ion, even though they are the only logical "controllable factor" that could possibly affect water temperature.
Response: It is not that reservoir releases cannot affect temperatures, rather that amount required to do so is so great, because of the distance from major reservoirs to the Delta. For this reason, releasing water for the purpose of temperature control is considered unreasonable and a waste of water. The State Board will require a test of reasonableness before considerat ion of reservoir releases for such a purpose.

In regard to other possible controllable factors, Section 5.5 of the Plan includes waste discharge controls, increases in riparian canopy, and bypassing of warming areas (e.g., Thermal i to Afterbay). As specified in the "Responses to Comments," the Plan will be changed in several sections:
Footnote 11 in Tables 1-1, 5-5 and 6-3; and Section 1.5, Page 1-13, and Section 5.5, Page 5-15.
B. The Specific Objectives for Salmon are Inadequate
Comment: In the April 15, 1991 letter, SCLDF also states that: 1) the State Board does not provide a logical or adequate explanation for the bifurcation of the temperature objective (66°F for the winter-run and 68°F temperature for all other races); 2) the "Responses to Comments" jumps from discussing a protection level of 66°F to a level of 60°F, without addressing the range in between (60 to 65°F) which evidence has demonstrated is the range needed to adequately protect salmon; 3) the "Response" does not address SCLDF1s concern that protection for winter- run should also apply to all other runs; and 4) it is erroneous to claim that there is no precise method for determining what temperatures in the Delta adequately protect Chinook salmon despite evidence that salmon require temperatures below 65°F.
Response : As stated in the April 1991 "Responses to Comments" (under Page 5-22 heading), the State Board considers the winter-run salmon temperature objective as a cap. The temperature objectives for the winter and other runs are based on the entirety of the exhibits submitted by all parties at the hearings and workshops to date, as well as other pertinent publications, all of which are summarized in the Technical Appendix of the Plan. This information was not duplicated in the Responses to Comments. The objective is a narrative objective not a numerical objective, and as such serves as a guide to water managers regarding salmonid habitat in the Delta.
C. EC Standards
Comment: On page 3 of the Apri 1 15, 1991 letter, SCLDF states that the Plan should adopt the DFG recommendation on EC now, rather than retain "an admittedly inadequate standard".
Response: As noted on page 1-20 of the "Responses to comment^,^^ retaining the 1.5 mmhoslcm EC at Antioch retains an EC value of approximately 0.44 mmhos/cm at Jersey Point. So retaining the present Antioch standard does what DFG wanted to accomplish in D-1485, which was to provide spawning habitat upstream of Antioch. A water quality objective at Antioch of 1.5 mmhos/cm EC for striped bass spawning protection has been recognized since 1967.

Comment: On page 4 of the same letter, SCLDF states that, given the claimed lack of critical scientific EC data, the need for additional studies, and the precipitous decline in the striped bass population, the State Board stpuld be conservative and set a standard of 0.3 mmhos/cm EC from Antioch to Vernal is, in conjunction with pumping restrictions.
Response: The State Board must set standards based on appropriate scientific data, and must be able to justify those standards. The State Board feels that it does not have adequate data to support such a standard at this time. If inadequate spawning habitat protection is not the major cause of the decline, as most participants acknowledge, then changing the standard wi 1 1 have little effect in and of itself, though the resultant flows might increase survival of eggs and young. In addition, pumping restrictions are not part of this phase, and will do nothing to protect adu 1 t spawning habitat. Pumping restrictions might also benefit survival of eggs and young, but again that is a separate issue unrelated to adult spawning protection. That issue will be discussed in the Scoping and Water Right phases.
D. Beneficial Uses
Comment: The State Board admits that a1 1 beneficial uses are not fully protected by the Plan, yet states that the water quality objectives are set at levels designed to adequately protect the designated beneficial uses of the Estuary (WQCP-SCLDF- 3 1 7 ) .
Response: These two statements are not incompatible. The Plan addresses the water qua1 ity aspects of sal inity, temperature and oxygen concentrat ions which were identified with protecting beneficial uses. The State Board be1 ieves that the water quality objectives set forth in the Plan provide adequate protection of the designated beneficial uses. The State Board has determined that providing any more protect ion for the Estuary's beneficial uses from the effects of the parameters would require an unreasonable amount of water. However, there are non-water quality aspects such as entrainment and flow which the State Board will address in the forthcoming Water Right Phase. The State Board routinely holds focused actions on specific policies on water quality parameters contained in its Basin Plans, Ocean Plan and other planning documents. The Water Qua1 ity Control Plan for the Bay-Delta is similarly focused and must be viewed in con junction with the Regional Board Basin Plans, the Inland Surface Waters and Bays and Estuaries plans, and the State Board's water right decisions that affect this water body.

E. Flow Standards
Comment: In the Apri 1, 1991 letter, SCLDF states in several places that the State Board was remiss in not including flow standards in the Plan (WQCP-SCLDF-3,5,6).
Response: While the Board does state that flow is necessary to protect beneficial uses, this statement does not indicate that the physical aspect of water is a water quality parameter. As SCLDF recognizes, the State Board identifies flow requirements when they can be tied to water qual ity effects on a beneficial use. However, even though flow in its own right may provide protection of a beneficial use, these protections are to be addressed in water right decisions rather than in the Water Qua1 ity Control Plan for these proceedings. The State Board be1 ieves that a1 1 the submitted data regarding protection levels for the beneficial uses of Bay-Delta waters were analyzed and appropriate water qual i ty objectives developed.