Urbanisation and Water Resources Management
133
Urbanisation and Water Resources Management: A Study of East Sikkim District A Thesis Submitted To Sikkim University In Partial Fulfilment of the Requirement for the Degree of Doctor of Philosophy By Lakpa Doma Sherpa Department of Economics School of Social Sciences March 2020
-
Upload
khangminh22 -
Category
Documents
-
view
0 -
download
0
Transcript of Urbanisation and Water Resources Management

Urbanisation and Water Resources Management:
A Study of East Sikkim District
A Thesis Submitted
To
Sikkim University
In Partial Fulfilment of the Requirement for the
Degree of Doctor of Philosophy
By
Lakpa Doma Sherpa
Department of Economics
School of Social Sciences
March 2020

This Thesis is dedicated to my grandmother
Late. Sumi Sherpa


ACKNOWLEDGEMENT
I express my sincere and heartfelt gratitude to my supervisor Dr. Komol Singha, Associate
Professor, Department of Economics, Sikkim University for proper supervision and
valuable suggestions incorporated to complete this thesis. His excellent guidance
throughout in research immensely helped me to bring constructive research quest at the
time of research and writing in this thesis. I thank him for tirelessly going through all the
contents in details and giving timely corrections to complete my thesis. I always admire
his motivations that helped me in the right track. I’m very fortunate to have you as my
PhD mentor (like brother) who is always there to supports, guide and shows the right
direction not only in research but also in way of life. Thank you once again, for being a
part of this wonderful research experienced and this very research journey will not limit
here.
I would like to thanks all teachers of Department of Economics for their valuable
suggestions and constructive arguments for my research work. Earnest thanks to Dr.
Rajesh Raj S.N, Dr. Komol Singha and Dr. Manesh Choubey, faculty members from
Department of Economics, Sikkim University, for the courses they taught during course
work for PhD.
I’m thankful to the officials of various department, such as Forest and Environment
department, Water Security and Public Heath Engineering Department and Directorate of
Economics, Statistics, Monitoring and Evaluation department under Government of
Sikkim for providing data, reports and information that was required for my research work.
Most parts of my thesis were written at the library of Sikkim University and I’m very
grateful to all the staffs and Librarian of Sikkim University for their supports and providing
all the necessary study materials for writing this thesis.

I appreciate the supports that I have received from my family members and friends
especially, my nephew Pempa Dorjee, niece Nim Deeki, sister Nima, friends Nitisha,
Laxmi and Sneha for helping in the fieldwork for the study. I’m very grateful to these
people.
Lakpa Doma Sherpa

CONTENTS
Page No.
DECLARATION
PLAGIARISM CHECK CERTIFICATE
CERTIFICATE
ACKNOWLEDGMENT
LIST OF TABLES iv-vi
LIST OF FIGURES vii
LIST OF ABBREVIATIONS viii
CHAPTER I: PRELUDE TO URBANISATION 1-10
1.1 Introduction 1-2
1.2 Urbanisation pattern and expansion 2-5
1.3 Urbanisation issues and problems in Sikkim 5-10
1.4 Organization of the study 10
CHAPTER II: LITERATURE REVIEW AND 11-20
THEORETICAL FRAMEWORK
2.1 Background 11-13
2.2 Urbanisation concept in developing Countries 13-16
2.3 Concept on connecting urbanisation and water 16-19
2.4 Urban water pricing 19-20
2.5 Research gap 20
i

CHAPTER III: OBJECTIVES, METHODOLOGY 21-28
AND RESEARCH IMPLICATIONS
3.1 Research questions and objectives of the study 21-22
3.2 The sources of data, sampling and methodology 22
3.3 Secondary sources and techniques employed 22-25
3.4 Primary sources of data, sampling and methodology 25-28
CHAPTER IV: URBANISATION VIS-À-VIS WATER 29-44
RESOURCES MANAGEMENT
4.1 Urbanisation in East Sikkim District 29-34
4.2 Sources of urban water supply 34-44
CHAPTER V: URBANISATION TREND AND DOMESTIC 45-76
WATER RESOURCES MANAGEMENT: EVIDENCE
FROM THE PRIMARY SURVEY
5.1 Urbanisation trend in East Sikkim district 47-53
5.2 Water Availability in the Urban East Sikkim District 54
5.3 Socio-Economic status of the surveyed Households 54-61
5.4 Water Use Activities at Household Level 61-64
5.5 Water requirement in urban centres 64-68
5.6 Regression on per capita domestic water consumption 68-70
5.7 Season for deteriorating domestic water quality 71-74
5.8 Cost estimation on water purification 74-76
CHAPTER VI: URBAN DOMESTIC WATER SUPPLY 77-94
POLICY IN EAST SIKKIM DISTRICT
6.1 Introduction 77-79
6.2 Water Policy in Urban East Sikkim District 79-83
6.3 Resources Allocation for Water Supply in Sikkim 84-89
6.4: Policy Option 89-94
ii

CHAPTER VII: CONCLUSIONS, SUMMARY AND 95-102
RECOMMENDATIONS
7.1 Introduction 95-96
7.2 Summary of the study 96-101
7.3 Recommendations and policy implications 101-102
REFERENCES 103-113
APPENDIX 114-117
URKUND ANALYSIS RESULT 118
iii

LIST OF TABLES
Table No. Name of Table Page No.
4.1 Degree of Urbanisation (in %) 30
4.2 Indicators of Urbanisation in East Sikkim 31
District (1981 to 2015)
4.3 Urbanisation index (UI) for East Sikkim district 32
from 1981-2015
4.4 Percentage of Household Access to Safe 36
Drinking Water in Sikkim
4.5 Percentage of Sources of Drinking Water in 37
Sikkim (in 1998)
4.6 Standard Rating of Water Quality Categories 43
(in %)
4.7 Descriptive Statistics of Water Quality 44
Parameters (2010-2015)
5.1 Percentage of Migrant and Original Households 48
in East Sikkim District
5.2 Migration Growth Rate before and after Merger 48
(in %) in East Sikkim
5.3 Migrant Household(s) in Different Year 48-50
(Number and Growth Rate) in East Sikkim District
5.4 Descriptive Statistics of the Domestic Households 54
5.5 Occupational Structure of the Sample Households 56
(in No.)
5.6 No. of households connected with different water 57
supply sources
5.7 Types of distance of main water supply across 58
different water sources
5.8 No. of households getting hours of water across 59
different sources
iv

5.9 Urbanisation vis-à-vis domestic water resources 60
management (% of household depending on
different sources of water) in urban East Sikkim
district
5.10 Share of Household using 100% of water sources 62
for different activities
5.11 Percentage share of Household using 90% to 60% 63
of water sources for different activities
5.12 Percentage share of Household using 60-30% 63-64
of water sources for different activities
5.13 Percentage share of household using 30-5% of 64
different water sources for different activities
5.14 Quantity of water consumption per person per day 65
from different sources (in Litre)
5.15 Income groups of the households based on monthly 66
expenditure
5.16 Frequency distribution of water sources across 67
different income groups
5.17 Per capita water consumption per day across 68
income groups
5.18 Ordinary Least Square Result 69
5.19 Detecting Multi-collinearity Problem 70
5.20 Months having water quality problem at households 71
5.21 Socio-Economic status of the households across 72
income groups
5.22 Household following different techniques for 73
purification of domestic drinking water
5.23 Different measures adopted by households for safe 74
drinking water across different income groups
5.24 Drinking Water Purification cost and Different Measures 75
5.25 Ordinary Least Square Result 76
v

6.1 Non-volumetric Tariff as per No. of Taps 81
6.2 Volumetric Tariff based on Metered 83
per kilo-litre (1000 litre)
6.3 Existing Fee for water service connection in Sikkim 83
6.4 Growth rate of annual state plan outlay and revenue 84-85
collection from water supply of Sikkim 2003-2012
6.5 Revenue expenditure on water supply and sanitation 85-87
of Sikkim 1981-2015
6.6 Maintenance and Operational Expenditure Water 88
Supply in East Sikkim district 2004-2015 to 2015-2016
6.7 Three Scenario Open to the Water Users (Households) 89
6.8 Household’s choice for water policy in Urban East 91
Sikkim district
6.9 Classification of scenario based on types of residency 92
in urban East Sikkim district
6.10 Number of households adopting water saving 93
technologies
vi

LIST OF FIGURES
Figure No. Name of Figure Page No.
1.1 Urban Continuum 3
4.1 Growth Trend of Urbanisation in East 33
Sikkim district (1981 to 2015)
4.2 Expansion of Settlement Pattern in Gangtok 34
(1930 and 2011)
4.3 Rainfall Pattern in Sikkim (1981 to 2014) 36
4.4 Study location of river site in Sikkim 42
4.5: Water Quality Index in Nine River Locations 43
(2010-2015)
5.1 Concentration and Year of Establishing Industries 46
in Sikkim
5.2 Urbanisation Growth trend in East Sikkim district 50
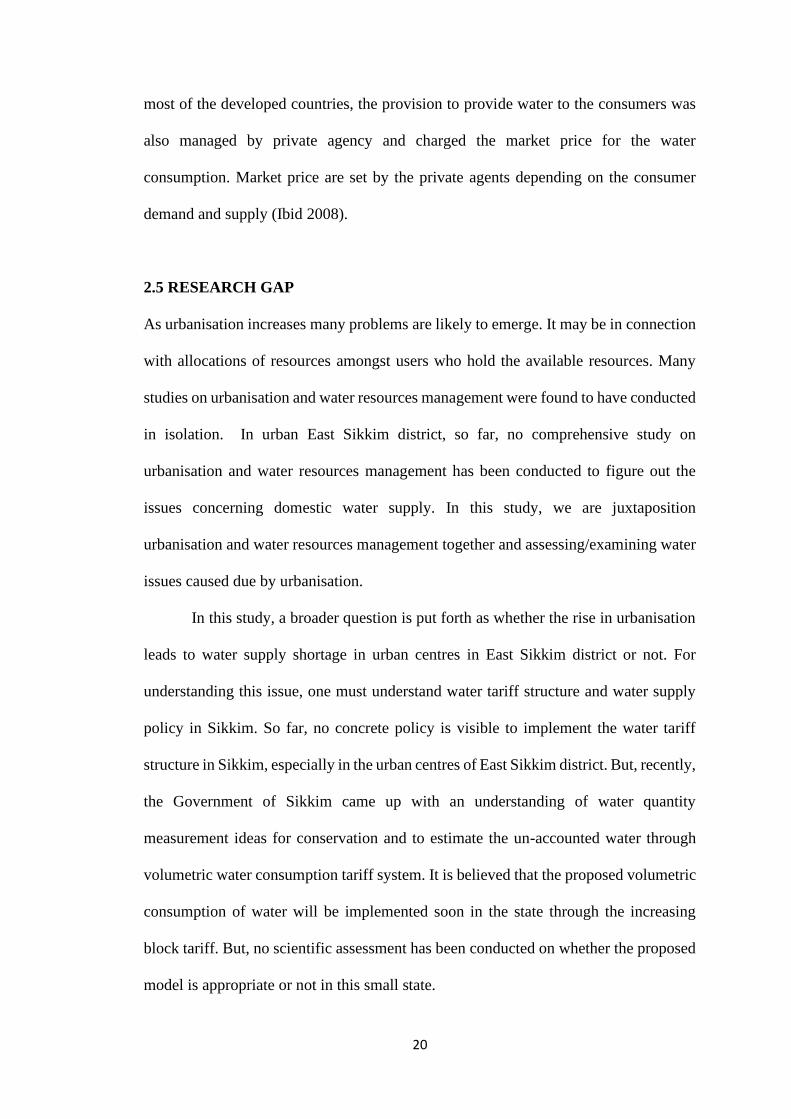
5.3 Household Water Connection through Pipelines 52
Provided by the PHE Department
5.4 Privately Managed Water Connection and Reservoir 53
5.5 Age Composition of the Respondents 55
5.6 Educational Attainment of the Household Members 55
5.7 Religion Background of the Households 56
5.8 Urban houses using natural spring as accessible 62
Source of water supply
6.1 The household practicing roof water harvesting in 94
urban East Sikkim district
vii

LIST OF ABBREVIATIONS
Asian Development Bank ADB
Atal Mission for Rejuvenation and Urban Transformation AMRUT
Bureau of Indian Standard BIS
Biochemical Oxygen Demand BOD
Compound Annual Growth Rate CAGR
Central Ground Water Board CGWB
Central Pollution Control Board CPCB
Gross Domestic Product GDP
Geographic Information System GIS
Government of India GoI
Government of Sikkim GoS
Gross State Domestic Product GSDP
Jawaharlal Nehru National Urban Renewal Mission JNNURM
Kilo Litre KL
Litre Per Capita Per Day LPCD
Millennium Development Goals MDGs
Multiple Linear Regression Modal MLRM
Most Probable Number MPN
Ministry of Urban Development MoUD
Non-lapsable central pool of resources NLCPR
North Eastern Council NEC
North Eastern Region NER
Ordinary Least Square OLS
Panchayat Raj Institutions PRIs
Rajiv Gandhi National Drinking Water Mission RGNDWM
State Annual Action Plan SAAP
Sustainable Development Goals SDGs
State of Environment Report Sikkim SERS
State Pollution Control Board SPCB
Total Educational Institute TEI
Total main worker in non-agricultural activities TMWNAA
Total Number of Registered and Functioning Industrial units TRI
Total Registered Vehicles TRV
Total Urban Households TUHH
Total Urban Population TUP
Urban Development and Housing Department UDHD
Urbanisation Index UI
Urban Local Bodies ULB
United Nation UN
United Nation Development Planning UNDP
Variance Inflation Factors VIF
World Health Organization WHO
Water Security and Public Health Engineering Department WS&PHED
Water Quality Index WQI
viii

1
CHAPTER I
PRELUDE TO URBANISATION
1.1 INTRODUCTION
Urbanisation is a dynamic process, which links with the growth of urban centres,
changes in the economic activities and rise in population. The rapid urbanisation of the
twenty-first century is marked as a period of industrialisation, modernisation, economic
agglomeration that reflects the economic development and social transformation of any
region (McDonald et al. 2014). Urbanisation has also got its impact on transforming
economic and social value of the people (Lollen 2015; Brown et al. 2009; Montagomery
2008; Jenerette and Larsen 2006). According to the United Nations’ Development
Programme report, around 3.6 billion people are living in the urban areas in 2011 and
it could add another 2.6 billion additional urban dwellers by 2050 (UNDP 2015). All
the new urban dwellers (additional 2.6 billion) will require water for various purposes,
but there is little knowledge about where these urban centres and additional population
obtaining their water supply network from and the implication of infrastructure for the
global water cycle (Padowski and Jawitz 2013). When the urban centres started rising
at a very fast pace during the era of industrial revolution in the developed nations and
thereafter in other nations, the provision of clean water became increasingly an
important issue (Vo 2008; Biswas 2006). According to the United Nation’s Millennium
Development Goals (MDGs) report 2015, though around 147 countries globally have
met the drinking water target, halve the proportion of people of these countries are still
not able to reach or afford safe drinking water. Despite this achievement of providing
safe drinking water, the water scarcity affects 40 percent of the people in the world, and
it is projected to increase further (UNDP 2015, pp.7-8).

2
However, the pace and pattern of urbanisation have not been same everywhere, vary
from country to country and region to region because of its various policy measures,
which in turn, shapes the growth of urban centres. The urbanisation phenomenon is
everywhere, but looking at the number of urban centres and by population size, it varies
from 50,000 in Japan, 5,000 in India, 2,500 in United States and 1,000 in Canada
(Lollen 2015). Though the concept of urban centre or urbanisation is also not uniform
and same everywhere. It is well defined and accepted in different ways by different
countries. In India, urbanisation is considered or an area is called as urban centre if at
least one of the following conditions given below (out of the two) is satisfied (GoI
2018):
a) All administrative units that have been defined by statute as urban like
Municipal Corporation, Cantonment Board or notified town area committee,
etc. Further, the statutory towns with population of one lakh and above are
categorised as towns.
b) A place satisfying the following three criteria: 1) a minimum population of
5,000 people, 2) at least 75 percent of male working population engaged in non-
agricultural activities, and 3) density of population of at least 400 persons per
sq. km.
1.2 URBANISATION PATTERN AND EXPANSION
According to Bhagat and Mohanty (2009) urbanisation is interlinked with the migration
and economic activities. Though the casual relation between these two is not established
scientifically, one thing is clear that the migration is very much intertwined with the
urbanisation process. As per the concept adopted in India, migration is reported by place

3
of birth and place of last residency. By definition of the former concept, by place of
birth, around 84.2 percent people in India are migrated from one part to another and 85
percent of the people are reported to have migrated from the last place of residence
(Registrar General of India 2001). Another research study conducted by Shah and
Kulkarni (2015) on the topic of urban continuum, depicted in Figure 1.1, shows the four
stages of urban expansion that are taking place in the urbanisation process.
Figure 1.1: Urban Continuum
Source: Shah and Kulkarni (2015)
As core expanded and agglomeration taking place in urban areas (as shown in
Figure 1.1), the need for water supply resources arises in different-sized urban
settlements at various stage of growth (Shah and Kulkarni 2015). In the context of India,
urbanisation process is seemed to be an unplanned and unmanaged growth, which in
turn, leads to urban sprawl (Banerjee 2009). When the urban dwellers increase to more

4
than double or increase to 800 million by 2050, it consequently might lead to pressure
on the available physical, social and economic infrastructures like urban transport,
supply of water, educational and health institutions (Shah and Kulkarni 2015). The
changing pace and pattern of the development activities and their land use planning for
the housing and the industrial areas have a considerable impact on the environment as
well as on livelihood of the people. The changing land-use patterns have altered the
water bodies, especially the river courses, along with major shift to deforestation,
converting the agricultural lands into towns and cities. Industrial discharged effluents
through pipes into rivers has severely impacted on water quality, which in turn, leads
to increase in bio-chemical oxygen demand1 and decrease in dissolved oxygen
concentration in the river downstream (Brown et al. 2014). However, improvement in
technological treatment plant can enhance the water quality largely in developed world
and aquatic ecosystem (Ibid 2014). Environmental degradation and pressure on land
have been taking place at the very fast pace and causing excessive water pollution,
water shortage in the urban centres (Shah and Kulkarni 2015; Banerjee 2009). The
negative impact of urbanisation on the environment of the cities and urban centres are
the serious issues documented in most of the urban environmental research. The effects
of urbanisation are critical. According to the Ministry of Urban Development,
Government of India, 20 percent of the country’s urban households do not have access
to safe drinking water service because of the improper waste management system in
the country (Sridhar and Reddy 2010). The poor governance and the institutional
overlapping activities lead to poorer public service delivery in most of the cities of India
(Ibid 2010).
1 Bio-chemical oxygen demand is the amount of dissolved oxygen needed by
aerobic biological organisms to break down organic material present in a given water sample at certain
temperature over a specific time period.

5
According to the 74th Amendment of the Constitution of India, the roles,
responsibilities, governance structure, etc. of the urban local bodies (ULBs) have been
clearly laid down. This includes formulation of plans for economic development and
social justice, urban planning, water supply, sanitation, solid waste management, public
health, urban forestry, environmental protection, slum improvement, urban poverty
alleviation and among others. The state finance commission and the statutory district
planning committees are empowered for urban planning, so that they (ULBs) are able
to exercise their autonomy fully. However, implementation of the Amendment has been
uneven across states. In order to encourage states to improve basic services and ensure
good urban governance, the Central Government has launched the Jawaharlal Nehru
National Urban Renewal Mission (JNNURM) in 2005. Infrastructure is one of the
indicators for urban service delivery system and poor infrastructure leads to a
significant gap in water service delivery system in the country. Therefore, it is believed
that there should be a reasonable tax must be charged for basic services in order to meet
at least the operation and maintenance charges. Of course, it needs further investigation.
1.3 URBANISATION ISSUES AND PROBLEMS IN SIKKIM
Sikkim lies in the Eastern Himalayan range, which is a source of fresh water to the
inhabitants. The various water resources are available in the form of glaciers, rivers and
natural springs. Around 84 glaciers covering an area about 440.30 km2 (SER 2016) is
present in the state of Sikkim. The state has two important rivers namely, Rangeet and
Teesta. The gravity-based water supply from different lakes and springs of Sikkim
serves the major sources of domestic drinking water to the inhabitants (Ibid 2016). The
entire area of Sikkim is hilly with steep slope and 84.31 percent of it is covered with
forests. The retention of rain water under the ground seems to be very high in the state

6
because of the less surface run-off due to vast forests cover. The rainfall record was
more than 3800 mm in the Sikkim (CGWB 2008). In the state, urbanisation process
seems to be very rapid, especially in the East Sikkim district, in which the capital city,
Gangtok is also situated and most of the industrial units are concentrated. With this
rapid urbanisation process in the East Sikkim district, should there be any water issue?
The Registrar General of India (2011) observed, as there should not be any major
problem regarding the domestic water resources in Sikkim because of the availability
of water sources vis-a-vis small population size in the state. But the population in the
state, especially in the East Sikkim district, has been increasing rapidly (may be referred
the data in the following sections). Majority of the state’s population is concentrated in
and around the Gangtok city, which falls under the East Sikkim district of Sikkim.
Therefore, the issue needs a thorough assessment and proper study.
When we assess very closely, it is seen that the rapid urbanisation process in
Sikkim is a very recent phenomenon, started in the last 20-30 years. But, the pace of
urbanisation process in Sikkim seems to be faster than that of the all India scenario
(data may be corroborated in the following sections). As per population criteria, in the
2011 population census, the total population of Sikkim stands at 6, 10, 577 (which is
the sum total of 43,709 in North Sikkim district, 1, 36, 435 in the West Sikkim district,
1, 46, 850 in South Sikkim district and 2, 83, 583 in East Sikkim district). Of the total,
25.15 percent of the state’s population live in the urban areas. Particularly, in the East
Sikkim district comprising of 964 km2 of the state’s total geographical area (7, 096 sq.
km.), a total of 43.19 percent of the district’s population live in urban areas while 56.81
percent live in the rural areas. The major urban centres in the East Sikkim district,
according to Population census 2011 are, Gangtok (capital city of Sikkim), Singtam,
Rangpo and Rhenock (Census town). The distribution of workers (male) working

7
population in non-agriculture activities in East Sikkim district is 97.93 percent
(Registrar General of India 2011). The growth of urban towns has increased from one
in 1981 to eight in 2001 and the growth rate of population residing in urban areas has
increased from 2 percent in 1951 to 11 percent in 2011 in Sikkim (Ibid 2011).
To cater the ever increasing water requirement in East Sikkim district, the central
programme called, the Jawaharlal Nehru National Urban Renewal Mission (JNNURM)
has been in place since 2005. Though state claims that the supply of water is sufficient
for the inhabitant, albeit no exact quantification is made. There is no guarantee that
quality drinking water is being provided to the public in the urban centres of East district
in Sikkim. In fact, the water quality of rivers in Sikkim seems to be deteriorated with
the growth of urbanisation and industrialisation, especially in the Rangpo, Singtam, and
Ranipool urban centres in East Sikkim district. As per information provided by the State
Pollution Control Board (SPCB), in 2010, the faecal coliform bacteria count found in
the river water at Rangpo area was recorded at 220, and increased by 255 in the year
2013, which exceeds the permissible limit (0 counts/100 ml) set by the World Health
Organization2 (WHO 2008; Metzger and Moench 1994). It also indicates that the
contamination of river water leads to the water crisis in the urban centres located on the
riversides. This might possibly due to the ever-increasing urban migration and the
newly established industries, which include a number of pharma companies.
Understanding the ever-increasing demand for water in this new state, for
managing the water supply in East Sikkim district, a large amount of funds has been
allocated for infrastructure development by the state government as well as various
2 World Health Organization set one of the essential parameters to measure the water quality is total
coliform. It is recognized as suitable microbiological indicator of water quality. The presence of the
coliform bacteria in drinking water indicates that disease causing organisms may be present in the water
system

8
institutions of the Central government. How far the service delivery of water is
sufficient for the urban centres in East Sikkim district requires a thorough assessment.
The Sikkim Water Supply and Water Tax Act 1986 regulates the supply of water,
realisation of charges for supply of water and tax on water. Under this Act, the state
government is supposed to provide water supply to different sectors such as domestic,
commercial and others. In order to supply of water, the government necessarily should
construct and maintain water work infrastructure in the forms of stand popes, wells or
pumps, etc. The supply of water for domestic sector under this Act means the supply
for household requirements, barring some commercial activities (GoS 1986, pp. 1-2).
In nutshell, the trend of urbanisation in Sikkim has been very rapid and its causal
effect on natural resources and environment has also been noticed and catastrophic.
Following the growth of urbanisation, the water supply management of the government
has become one of the most important challenges, not only in the urban centres, but
also in the rural areas. This raises a big question, whether the rapid urbanisation process
is moving at the same pace with water resources management3 in Sikkim, especially in
the East Sikkim district.
One of the important issues concerning the governance, managing various
departments in Sikkim, is not happening under the single umbrella. Different divisions
of administration are looking at different bodies. Therefore, managing the issues related
with water under the division of Public Health Engineering Department (PHED)
requires lengthy procedures and requires prior permission from other departments. For
instance, for repairing a damaged public water supply network requires to take prior
permission from the Urban Development and Housing Department (UDHD) to dig the
3 Water resources management is the aggregate of policies and regulation used to provide clean water to
meet human needs in different sectors and its jurisdictions in order to sustain the water natural system
upon which we depend.

9
road sides where the water pipelines are laid. This takes a lot of time for one
administrative works before getting into the exact work. There is also an issue related
to the revenue incurred for operation and maintenance of expenditure of water supply
as well as rebuilding of road areas. Since the urban planning is in the infant stage, there
is no appropriate blue print for the urban management for water supply network and
distribution to the growing population in the state. Let us take a case of the urban water
supply distribution network in Siliguri, which is one of the cities in Darjeeling district,
under West Bengal state in India, is controlled by the municipality, and its
administrative setup and water distribution are under a single unit that looks after all
the divisions of proper management of water to the public. The single unit can handle
the matter properly without any delay. There is a process of decentralisation of all the
institutions under one umbrella, i.e. Municipality. But such decentralisation process
under water work is not present in the state of Sikkim.
Increase in population, urbanisation and industrialisation together with spatial
and temporal variations in water availability, water quality problems, etc. lead to the
higher demand for quality drinking water in Sikkim. The availability of quality water
resources per capita has not only declined, but also the quantity of it has reduced over
the years. Realizing the shortage of quality and quantity water resources, the
government of Sikkim was compelled to organise a workshop on the importance of
drinking water under the theme, “Hamara Jal Hamara Jeevan” (our water our life) in
2015 at in Gangtok (GoS 2015-16). This workshop was a part of the “India Water Week
2015” to address the issue of water resources management at the local level and to
generate awareness to the public regarding the need for water conservation practices.
Since the declining of snowfall and perennial water stream in the hills and depletion of
ground water level in the plain areas, the issue was needed to consider very seriously

10
by every stakeholder and decided to take proactive measures like afforestation and
adoption of rain water harvesting techniques for water conservation.
1.4 ORGANIZATION OF THE STUDY
For convenient of the general readers, the present thesis is divided into seven chapters.
In chapter I, it starts with a brief introduction of urbanisation and water resources
management, followed by the urbanisation pattern and its expansion and issues related
to the water resources in the study area, the East Sikkim district. The second chapter
focuses on the literature review and the conceptual framework. In chapter III, this
chapter covers objectives, methodology and implications of the study areas. In this
section, the methodology and techniques employed to justify the research questions or
objectives set are also presented. Chapter IV deals with the analysis of data collected
through the secondary sources on urbanisation trends, patterns, and water quality issues
in Sikkim and at the national level. In chapter V, using primary data, the section focuses
and analyses on the microscopic study of East Sikkim district and the major findings.
In chapter VI, urban water policy and reforms and its implementation at the state level
are discussed. Last chapter (Chapter VII) summarises the study, makes concluding
remarks of the study and provides some feasible recommendations for the benefits of
policy makers and researchers.

11
CHAPTER II
LITERATURE REVIEW AND THEORETICAL FRAMEWORK
2.1 BACKGROUND
Urbanisation process, which is rapidly taking place in the modern world today, is also
linked with the demographic transition and migration theory, and that includes rural-
urban migration. One group of researchers (Dyson 2011; de Vries 1990) believe that
the decline in urban mortality leads to urban transitional growth, while others (Preston
1979; Harris and Todaro 1970; Lewis 1954) hypothesis that urbanisation is actually
triggered by migration activities. Wagner and Ward (1980) further stated that, the
natural increase in population and migration have equally contributed to the growth of
urbanisation.
In literary term, demographic transition refers to the population cycle, changing
from one demographic pattern to another. As per traditional population theory believes
in changing demographic transition into three stages. In the first stage, population
growth remains at the balanced state because of the high birth and death rate. In the
stage two, rapid population growth happens due to the falling in mortality rate with
increasing fertility rate as a result of the advancement of medical sciences. Therefore,
rapid population growth leads to urbanisation through a various channel of economic
activities like industrialisation, modernisation, commercialisation, etc. But, in stage
three, manageable rate of natural increase in population is achieved because of the
falling both birth and death rate. Through the operation of population composition such
as mortality, fertility and migration, it can possibly change the structure of areas from
being predominantly rural to urban centres (Dyson 2011). In the case of developing

12
countries, the activities of migration and the economic activities have much more
influenced on the agglomeration process of the urban centres (Ibid 2011). Most of the
traditional studies on urbanisation have been centred on migration, agglomeration and
its carrying capacity. In fact, the classic model of rural-urban migration and expansion
of urban centres propounded by Arthur Lewis also endorsed that the process of
urbanisation is inevitable. A study done by Bocquier and Costa (2015) in Sweden and
Belgium found that the engine of urban growth is related with demographic transition,
conferred with unstable and negative relations in the urban growth process. While the
process of migration bears a direct or positive relationship with the urbanisation
phenomena in the long run. It is evident in most of the developing countries, which was
explained through the differences in expected income rather than actual income
between urban and rural areas (Harris and Todaro 1970). When urbanisation is
associated with industrialisation, which further creates economic growth in developing
countries, it experiences a faster rate of rural-urban migration (Preston 1979). But, in
the countries where economic growth occur at the very slow pace, urbanisation process
expedites due to natural increase of the population (Ibid 1979). The land-use change
patterns occurred must faster than the population growth in urban centres, showed the
positive relationship between urbanisation and economic growth (Bai et al. 2017). In
China, as urbanisation increases, there has been a positive relationship between
industrialisation, consumption and energy and carbon emission (Ibid 2017).
At the conceptual level, defining urbanisation process has not been same
everywhere because of various factors that determine the growth of urban centres. It
also varies from country to country and region to region. Mostly, the definition of
urbanisation accepted by respective countries is based on their suitable parameters that
fit into urban context. Some countries take density of population as the sole parameter

13
of defining urbanisation, while others consider population size along with working
population engaged in non-agricultural activities is considered as basic criteria of
defining urbanisation (Lollen 2015). Historically as well, the pace and pattern of
urbanisation were different in different parts of the world. In the following sections, we
will discuss the urbanisation growth theories in the context of developed and
developing countries.
2.2 URBANISATION CONCEPT IN DEVELOPING COUNTRIES
The basic conceptual framework for urbanisation in the developing countries emerged
from the colonies (colonised countries), which were ruled by the developed nations.
Urbanisation theory in the developing countries are linked with modernisation theory,
dependency theory and world system theory (Fox 2012). The modernisation theory
emphasises on economic growth and the start-up programmes with the industrialisation
process in the developing countries, mainly because of the backwardness of the regions
and weak technological set ups. But, the proponents of dependency theory emphasise
the disadvantage sides of the developing countries vis-a-vis developed world nations.
In order to accrue economic globalism, the poorer countries should involve in the
market for trading or exchange in traditional patterns of agricultural produces indirectly
needed for the product manufacturing in the countries (Clark 2000, pp. 20-21). The
world economy in a way help to bridge the gaps between economic expansion and
contraction through the various links of interconnected exchange among nations due to
urban development (Ibid 2000).
Both modernisation and dependency theory help in the expansion of the urban
centres and provides opportunity for market-led urban growth. The world system theory
taking international linkages provides the scope for further urban growth. The growth

14
process of urbanisation in developing countries over the last 10 decades seems to have
highly concentrated in urban cities and towns (Henderson 2002) and also in next 30
years, the world’s population growth will be expected mostly in developing countries’
urban centres (Cohen 2006). The percentage share of urbanised region in the developing
nations started rising comparatively at the faster pace. For example, the United States
started becoming urbanised 70 percent in 1960 to 75 percent in 1990 compared to the
developing countries like Republic Korea where 40 percent of the country were
urbanised in 1970 and rose to 78 percent in 1990. The developed countries took almost
90 years to achieve 75 percent of urbanisation level but within 20 years developing
countries have been able to reach the same level of urbanisation (Henderson 2002). At
the same time, developing countries are facing the major challenges in connection with
urbanisation compared to developed nations. With this rapid growth of cities and towns,
developing countries have witnessed the shortage of the necessary institutional capacity
to manage urban governance (Cohen 2006). In the process of urbanisation, the
fundamental changes that will happen is with regards to the urban management and the
governance of urbanisation. As the population growth involves in it, many problems
are likely to come up with the rise of population in the urbanisation process and in the
urban centres. In developing countries, people with social capital will likely to have
more influence on reaching the basic public services. But poorer people can have
drastically lower level of those public delivery services. In a large number of urban
residents in developing countries, if proper policy management is not present, then there
will be major environmental health challenges linking with insufficient access to clean
drinking water, inadequate sewerage facilities and insufficient solid waste management
(Ibid 2006). Cities also discharged ever increasing amount of waste into the air,

15
freshwater bodies, etc. and which in turn leads to alarming water quality and aquatic
ecosystem.
The influx of population in urban centres leads to rise in demand for water.
Urban water services delivery is important for a country’s economic growth, for
increase in productivity and reduction in poverty (Mathur and Thakur 2006). The theory
and evidence suggested that there exists a positive relationship between growth of
urbanisation and water demand (McDonald et al. 2014). In a similar fashion, a study
conducted by Jiang et al. (2014) found that as urban growth increases caused to
increasing demand for fresh water. Since most of the studies on urbanisation link with
the water security due to its increasing demand with the rising population and economic
development (Shaban and Sharma 2007). This rising pattern of water scarcity poses a
greater threat to water sustainability in different parts of the world. The United Nation’s
sustainable development goals (SDGs) are also working in a way to provide the clean
water and sanitation for all by 2030 (UN 2018).
As of the causal direction, Jiang et al. (2014) found in China that economic
growth is mainly caused by urbanisation and non-agricultural productivity. But at the
same time, with these rising economic activities the opportunity cost for water use and
allocations of water among various users have increased. The rise in urban centres leads
to rise in demand more domestic water and industrial sector, and on the other hand,
reduction in the amount of water allocated in the agricultural sector. McDonald (2014)
further stated that effective assessment of urban water requirements should take into
consideration of infrastructure as well as financial development for limiting water stress
in any areas. In this setting, Mathur and Thakur (2006) discussed about the reform,
which is required in urban water sector in India through appropriate price setting. Water
being considered as a “commodity” by the World Bank in 1990, the Eight Five Year

16
Plan (1992-1997) of India emphasised that water should be supplied based on its
effective demand, backed by cost recovery principles and also managed by private
agency (Sampat 2007).
Mathur and Thakur (2006) stated that water pricing charged in most of the cities
and towns in India are low as compared to the expenditure incurred in its provision. On
an average, price recovered from the sale of water and other charges are approximately
22 percent to 25 percent lower than its maintenance and operation expenditures (Ibid
2006). Consequently, this led to poor service delivery to public in terms of areas
coverage for the services. Pierce (2016) also found that most of the cities in India
collect far less revenue than the required amount to cover the existing cost of providing
basic public services delivery such as water and sanitation, electricity and waste
collection. In India, to render this water services delivery in cities, the revenue used is
less than 1 percent of Gross Domestic Product (GDP) compared to 5 percent in Brazil
and 6 percent in South Africa, which is even far lesser than the revenue required to
maintain the urban sustainability (Ibid 2016). Therefore, proper reforms are needed in
water sector with the growing urbanisation to mitigate the water problems and enhance
the service delivery to the water users.
2.3 CONCEPT ON CONNECTING URBANISATION AND WATER
The twenty-first century is marked as a period of rapid transformation of the people’s
life, moving from rural to an urbanised life. This period of rapid urbanisation is linked
with modernisation and industrialisation, which reflects economic transformation and
development. Many cities around the world have experienced a drastic upsurge in
economic growth, due to agglomeration, population growth with human capital,
technological development and political changes (Liu et al. 2015). In reality,

17
urbanisation has not only linked with the economic growth, but also led to
transformation of the people life socially, culturally and politically (Lollen 2015;
Brown et al. 2009; Montagomery 2008; Jenerette and Larsen 2006). In 2018, around
1.7 billion people, which account for 23 percent of the world population, lived in the
city. It is further expected to rise and 28 percent of the population that will be
concentrating in cities by 2030 and the urban population is projected to increase in all
class sizes, while rural population is projected to decline from 45 percent in 2018 to 40
percent in 2030 (UN 2018). Population growth in the less developed countries’ urban
areas are more rapid. On an average, annual growth rate in these nations is 2.4 percent
per year between 2000 and 2030 (Boberg 2005). This growth is generally caused by
several factors such as natural increase in population, indicating more birth and less
mortality, accompanied by high rural to urban migration and inclusion of rural areas
into peri-urban or urban areas (Rukmani 1994). There exists a significant difference in
pace and pattern of urbanisation in the world. This variation are visible everywhere, in
the developed, developing and less developing regions. The countries like Caribbean
and Latin American nations have been highly urbanised in the last few decades, which
account for 75 percent of the population living in urban areas in 2000, higher proportion
compared to Europe. It is expected that these regions will undergo a rapid population
growth of 84 percent in 2030. In Asia and Africa, where half of the population lived in
rural areas. Urban areas are expected to grow by 57 percent in Africa and 23 percent in
Asia from 2018 to 2030 (UN 2018).
Migration does influence growth of urban centres, especially in the developing
countries. United Nations estimated that 50 percent of urban growth in the early 1980s
was due to the net migration, movement of population from rural to urban areas and
reclassification of rural areas into urban. During this period, in China, urban growth

18
was 72 percent, much higher than that of the other Asian nations, which was estimated
at 45 percent (UN 2015). Despite the rural-to-rural and urban-to-urban migration
prevalent in many countries, much attention is given by the policy makers more on to
understand the transitional phase from rural-to-urban migration.
The population size matters a lot when it comes to the use of resources including
water consumption. Their relationship is non-linear in terms of resources availability
and population size (Boberg 2005). The magnitude of the population growth severely
impacts on the fresh water resources availability. As urbanisation increases the
resources associated in it will definitely increase. Urbanisation affects the required
quantity and quality of water supply. The quantity demand for water vary in different
economic activities and in different stages. The demand of water is very high in
agriculture, followed by industries and domestic sectors, and it depends upon the
different income groups as well. In low income countries, to manage the urban water
supply is very difficult. The water allocation and governing systems are mostly found
to be very ineffective in poor countries and that leads to demand-supply gap. There is
also a wide difference in per capita water use in domestic sector. In developed countries,
the use of per capita freshwater is high. In United Kingdom and United States of
America, around 334 litres and 578 litres of water respectively were used per person
per day compared to the less developing countries like Africa where around 47 litres of
water is found to be used per person per day and 95 litres per person per day in Asia
(Ibid. 2005). This implies that the high income countries are found to have consumed
more water per capita and water withdrawal is also high in those countries. Water use
per capita also goes up slightly high as countries move from the low income to lower
middle income, to upper middle income and further to the high income level. When

19
economy grows the proportion of water consumption demand in domestic and
industrial sectors will increase by 55 percent in the year 2050 (UN 2015).
2.4 URBAN WATER PRICING
In most of the countries, the water pricing is either based on volumetric or non-
volumetric consumption to the end users. The urban water is usually billed on a
volumetric basis (Mann 1970), and therefore, water pricing acts as an important
instrumental tool for the conservation of existing resource, improving efficient used,
bringing social equity and securing financial sustainability of water used today and
tomorrow (World Bank 1999). The basic reasons for implementation of volumetric
consumption of water in most parts of the cities is likely to put forth with the arguments
as creation of an incentives in terms of repairing water leakages pipes as well as to
account for un-accounted water consumption and proper water resources management.
The volumetric account of water does have effect on water users, because they do
respond to a price increase from zero to some positive rate after imposition of metering
system (Howe and Linaweaver 1967). Water pricing is one of the important reforms in
water sector. Proper price setting for water will increase the revenue and enhance the
water coverage amongst different users. But selecting appropriate pricing is a central
problem in economics (Sorenson et al. 1978). Most of the price setting for water is
decided through the control over the water resources management. Based on the rules
and regulations of the countries, one holds authority to manage and provide water to
the end users. In some countries, water is totally controlled by the command authority
who acts as a sole responsible agent to provide the water to the common public and
charge the administered prices. The administered price is basically imposed by public
agency in the absence of an interactive market process (Ayoo and Horbulyk 2008). In
20
most of the developed countries, the provision to provide water to the consumers was
also managed by private agency and charged the market price for the water
consumption. Market price are set by the private agents depending on the consumer
demand and supply (Ibid 2008).
2.5 RESEARCH GAP
As urbanisation increases many problems are likely to emerge. It may be in connection
with allocations of resources amongst users who hold the available resources. Many
studies on urbanisation and water resources management were found to have conducted
in isolation. In urban East Sikkim district, so far, no comprehensive study on
urbanisation and water resources management has been conducted to figure out the
issues concerning domestic water supply. In this study, we are juxtaposition
urbanisation and water resources management together and assessing/examining water
issues caused due by urbanisation.
In this study, a broader question is put forth as whether the rise in urbanisation
leads to water supply shortage in urban centres in East Sikkim district or not. For
understanding this issue, one must understand water tariff structure and water supply
policy in Sikkim. So far, no concrete policy is visible to implement the water tariff
structure in Sikkim, especially in the urban centres of East Sikkim district. But, recently,
the Government of Sikkim came up with an understanding of water quantity
measurement ideas for conservation and to estimate the un-accounted water through
volumetric water consumption tariff system. It is believed that the proposed volumetric
consumption of water will be implemented soon in the state through the increasing
block tariff. But, no scientific assessment has been conducted on whether the proposed
model is appropriate or not in this small state.

21
CHAPTER III
OBJECTIVES, METHODOLOGY AND RESEARCH
IMPLICATIONS
With the background and literature reviews discussed in chapter II, it is understood that
the study on urbanisation is intertwined with water issues in the urban cities and towns.
Even in the East Sikkim district, the urbanisation is very rapidly taking place. Many
studies have been conducted by different scholars on urbanisation and water issues
separately and independently. Whether the issue of water resources is really connected
with the urbanisation process needs a careful analysis. Based on the research problem
discussed, three major research questions have been put forth to capture the overall
understanding of urbanisation and water resources management in this study.
3.1 RESEARCH QUESTIONS AND OBJECTIVES OF THE STUDY
From the background mentioned above, this study tries to explore some of the research
questions as given below:
1. Is the ever growing urbanisation process proportionately supported by the required
quality and quantity water supply in East Sikkim district?
2. Is the water problem negatively related with the income level in East Sikkim
district?
3. Is the existing policy of domestic water management system effective in the wake
of rapid upsurge of urbanisation in the East Sikkim district?
The specific objectives of the study are given below:
1. To assess the growth and trend of urbanisation in East Sikkim district.

22
2. To assess quantity and quality drinking water demand with the emergence
of urbanisation in East Sikkim district.
3. To examine the existing domestic water policy in the East Sikkim district.
3.2 THE SOURCES OF DATA, SAMPLING AND METHODOLOGY
This section discusses methodology and methods employed in the study. Besides, this
section covers the sources of relevant data used, areas of study undertaken and sampling
techniques and area of the study. This study is supported by both secondary and primary
data. To understand overall urbanisation process and trend in the study area, using
secondary data, the descriptive statistics like percentage and share of the population and
share of migrant population have been employed. Further, an urbanisation index has
also been constructed to capture the trend of the urbanisation process. We have also
collected information through primary field survey, conducted in the month of June-
July 2018. To understand urbanisation, migration is taken as one of the important
variables used in this study. The information pertaining to domestic water resources (in
litres) could not be collected through secondary sources. Therefore, a field survey was
carried out to generate the quantity of water consumption (in litres) to understand
quantity water required in the domestic sector.
3.3 SECONDARY SOURCES AND TECHNIQUES EMPLOYED
The secondary data related to urban population and workers working in non-agricultural
activities over the period from 1981 to 2015 were collected from the population census
office located in Gangtok. The other sources of the secondary data have been gathered
from the various government reports and the published annual data for the period from
1981 to 2015. The data related to river water quality were collected from the State

23
Pollution Control Board (SPCB), Govt. of Sikkim over the period from 2010 to 2015.
The data on water infrastructure for water works on operation and maintenance
expenditure from the period of 2004 to 2015 were collected from the handbooks of
demand for grant in water under the Department of Water Security and Public Health
Engineering Department (WS & PHED), Government of Sikkim. As the proposed
study focuses on the urbanisation and water resources management in the East Sikkim
district, using the information collected through secondary data, an urbanisation index
and a river water quality index were constructed. For the construction of urbanisation
index, we have used six indicators. They are: total urban population, total urban
household, total main workers in non-agricultural activities, total educational
institutions, total numbers of registered and functioning industrial unit and total
registered vehicles in urban East Sikkim district. These indicators were incorporated
arbitrarily based on their importance and relevance. The individual index values were
normalized by using the following formula:
Index =Actual value − Minimum value
Maximum value − Minimum value
After getting individual index value, composite index was constructed to understand
urbanisation index.
As of the data on river water quality, information collected by the state
government (the State Pollution Control Board, Government of Sikkim, Gangtok) from
nine different stations of the major rivers flowing from upstream, Chungthang under
North Sikkim district which pass through the middle of the state (Sikkim) to
downstream, Melli which falls under the state boundary of both Sikkim and West
Bengal state have been used. The sketch of the river channel flowing through the state

24
is given in Figure 4.4 in chapter IV. In order to see the difference in physio-chemical
parameters of water— pH, conductivity, nitrate, biochemical oxygen demand (BOD),
total coliform and faecal coliform, the information collected from the nine river stations
were considered for the periods from 2010 to 2015. The monthly water quality data
were also analysed, and the assessments have been made based on the comparison
between the different parameters with their threshold values defined by the World
Health Organization (WHO).
The Water Quality Index (WQI) is one of the most useful and efficient methods
for analysing surface and ground water quality and its suitability for drinking (Seth et
al. 2016). The WQI also provides the valuable information pertaining to the composite
influence of different water quality parameters to the concerned citizens and policy
makers (Akoteyon et al. 2011). In this study, we have used the weighted arithmetic
index to construct WQI by using six water quality parameters mentioned above. The
WQI is constructed by using the following formula:
WQI = ∑𝑊𝑖𝑄𝑖
∑𝑊𝑖
Where, Wi is the unit weight for each water quality parameters— pH, conductivity,
nitrate, biochemical oxygen demand (BOD), total coliform and faecal coliform.
Again, Wi is calculated using the following equation:
Wi = K/Si
Where, K is the constant proportionality and Si is the standard permissible value set by
World Health Organization (WHO) of the ith parameter.
Further, the quality rating Qi is calculated using the following equation:
Qi= Vi/Si

25
Where, Vi is estimated value of the ith parameter at a given sampling point. The standard
rating of water quality given by Brown et al. (1970) is depicted in chapter IV, and we
have compared it with water quality of nine rivers stations located in Sikkim.
3.4PRIMARY SOURCES OF DATA, SAMPLING AND METHODOLOGY
As of the primary data, a well-structured questionnaire has been formulated, especially
for the households who are currently residing in urban areas of East Sikkim district.
The questionnaire covers the components of demographic characteristics, quantum of
water supply consumed per day per head, amount of water supplied by the government
agency. The field survey covered 355 households. We have used multi-stage sampling
technique to identify the final household or respondents. In the first stage, we have
identified the district having the highest percentage of population in Sikkim. Based on
the criteria, defined by the population census of India 2011, we have selected three
urban centres and one census town from East Sikkim district. The selected urban centres
for the field survey are: Gangtok, Singtam, Rangpo and a census town i.e., Rhenok from
East Sikkim district. Within the selected urban centres, we have selected the wards in
each urban centres. Since Gangtok has got the highest percentage of population,
followed by Rangpo, Singtam and Rhenok, we have used proportion of population to
select sample size from urban centres of East Sikkim district. Accordingly, the total 355
sample respondents were decomposed as: 280 sample size from Gangtok, followed by
30 sample size from Rangpo, 25 sample size from Singtam and 20 from Rhenok. To
identify the respondents, random sampling method was used. The respondents were
interviewed at their respective homes, depending on their availability and suitability.
Starting from the first research objective and to quantify domestic water resource
availability vis-à-vis urbanisation in the East Sikkim district, two types of inhabitants

26
namely owner and renters residing in urban East Sikkim district have been surveyed.
To understand migration trend, which indirectly captures population growth and
urbanisation trend, we asked the respondents about their years of residency in the
present place. Increasing migration basically adds to the population pressure, which in
turn leads to increasing demand for water. Further, analysing the basic requirement of
water in urban East Sikkim district, we asked the respondents about their water storage
capacity (in litres). As socio-economic characteristics influence water consumption
patterns the socio-economic variables have also been considered. The socio-economic
variables such as the highest educational attainment by the family members, family
size, per capita monthly family expenditure and hours of water supply, which
influenced per capita water consumption have been included. Descriptive statistics have
been employed to understand the per capita domestic water consumption. Usually,
people belong to the higher income strata may likely to get more necessary amenities
compared to lower income bracket. To understand the effect of income on water supply
availability, we have taken the proxy of monthly expenditure as income level of the
present household. Based on the convenience, we have categorized each household into
five income groups: Lower income group (A), Lower middle income group (B), Middle
income group (C), Middle higher income group (D) and Higher income group (E), in
order to estimate per capita water consumption per day across income groups.
Further, to understand the per capita water consumption effect on the variables
selected, we have used multiple linear regression model given below:
Yi = β0+β1 X1 +β2 X2+ β3 X3 +………. + Ui
Where Yi measures the ith per capita water consumption per day (In litre)
β0 measures the intercept term
βi measures the slope coefficient values of ith independent

27
variables
Xi includes (X1, X2, X3….) measures the ith independent variables
Ui measures the ith error terms in the model
A log transformation is being used in this exercise, in order to deal with outliers
in the variables present in the regression analysis. To check multi-collinearity problem
present in our study, we employed a set of variance inflation factors (VIF). We regress
on each explanatory variable from selected parameters and calculated for VIFs is given
in equation below:
VIF =1
1 − R2
Our second objective intent to examine the economic analysis of demand for
drinking water quality. We have analysed the cost estimation on water purification the
household adopted for producing quality water, especially for drinking purposes. While
surveying the respondents were asked about their spending power on water quality
improvement. The proper way to clean drinking water is possible through either boiling
or filtering the water. Therefore, there may present some variations in the methods
adopted by households for cleaning drinking water. Based on this, we have collected
the components related to cost of water purification device the household acquired at
their respective houses. With presumption that there are households who do not use
filter but do boil the water before drinking, we have kept fixed cost of boiling water is
Rs 60 per person per annum. To estimate the average expenditure the households
incurred for producing one litre of quality drinking water, we have simply taken the
capital and maintenance cost of the filter the household incurred over the life time of
the filter. Here, capital and operational and maintenance cost include investment on
filter, interest charges and life span of the filter. To calculate the boiling cost for
drinking, we have used Rs 60 as annual fixed charge for 730 litres (2 litres in 365 days

28
is considered as minimum drinking water) for boiling cost per person per year in this
study. We have also assumed that each individual required 2 litres of clean water for
drinking purpose in a day. For estimating the unit cost (per liter of safe drinking water),
we have adopted the methods used by Roy et al. (2004).
To understand the policy variable responsible for per capita cost on producing
one litre of quality water, we have used the regression model. Since to avoid the outlier
in the variables selected in the model, we have transformed the model from linear to
log-log linear regression model. This regression analysis will help us to capture the in-
build relationship between dependent and independent variables. The interpretation of
the estimated mean value of the dependent variable gives the value of the independent
variables.
As given in the third objective, the study tried to examine the existing policy on
domestic water resource in East Sikkim district. We have used both the secondary and
primary data to understand this objective. From secondary data sources, we are
introspecting the various water policy measures adopted in India and its impact in the
state of Sikkim. For understanding the possibility of switching from non-meter to meter
water supply connection decision made by the water authority, we have carried out an
experimental method to justify the public’s choice preference. In this study, we have
created three scenarios for water supply system; namely 1. Existing scenario or status-
quo (Non-Volumetric), 2. Proposed (Volumetric) and 3. Alternative managed by
private agency (Volumetric). By asking respondents three scenarios, we derive the
individual households’ preference for domestic water supply.

29
CHAPTER IV
URBANISATION VIS-À-VIS WATER RESOURCES MANAGEMENT
4.1 URBANISATION IN EAST SIKKIM DISTRICT
Sikkim, located on the foothills of the eastern Himalaya, merged with the Indian union
on 16th May 1975. In terms of population, in 2011, it was estimated at 6.07 lakhs,
considered to be the least populous state in the country. Large scale migration in Sikkim
started from the 1930s till 1980s, especially during the British India and on the eve of
the country’s independence. However, after the merger, internal migrants increased
manifold, much higher than that of the international migrants. In this manner, in the
state of Sikkim, the migrant population (both internal and international) outnumbered
the local population, estimated at 61 per cent of the total state’s population in 1981 and
marginally declined to 57 per cent in 1991 (Bhutia and Srivastava 2014, p. 2). The
decadal growth rate of population, in 1981, it was around 51 per cent, the ever highest
growth rate in the state’s history. Thereafter, the ethnic violence in Bhutan in the early
1990s between the Nepali and the Dzongkha (Bhutanese) might have also added to the
decadal growth of Sikkim’s migrant population (Singh and Singha 2016, pp. 226-246).
Urban centres are, generally, the preferred destinations for the migrants.
Understandably, the East Sikkim district, especially the Gangtok (capital city of the
state and East Sikkim district head quarter) and its surrounding towns have been the
preferred destinations for the migrant population in Sikkim. For instance, 65.02 percent
of the total migrant population of the state are found in East Sikkim district alone,
mainly in Gangtok and its surrounding urban centres (Bhutia and Srivastava 2014, p.
3). In this manner, urbanisation pace in Sikkim has been very fast, especially in the East

30
Sikkim district. In simple parlance, the process of population shift from rural to urban
centres, if not exclusively, is also considered as urbanisation. In this context, Pradhan
(2004, p. 177) said, “rapid population growth is one of the main reasons for increasing
the number of people on the move for livelihood, and migration has been a major factor
of rapid population growth in urban areas in less developed countries”. In quantitative
term, the degree of urbanisation, especially in the East Sikkim district, the urban
population has increased from 18 per cent in 1991 to 43 percent in 2011. Detail may be
referred to Table 4.1
Table 4.1: Degree of Urbanisation (in %)
Year 1971 1981 1991 2001 2011
India 18.24 23.34 25.72 27.78 31.16
Sikkim 9.37 16.15 9.1 11.07 25.15
East Sikkim District 20.00 31.00 18.00 22.00 43.00
Source: Author’s Estimation from: Registrar General of India, Census of India (1971,
1981, 1991, 2001 & 2011)
To understand urbanisation process in Sikkim scientifically, by employing
secondary data available in the public domain, an urbanisation index is constructed in
this section and the indicators/components used in constructing index are depicted in
Table 4.2. While constructing the index, urban population growth and urban economic
activities have also been considered and the same concept was also reflected in many
other studies (e.g. Bhagat and Mohanty 2009; Bairoch and Goertz 1986, etc.). In this
study, slightly different from the studies mentioned above, altogether six indicators
have been used to construct the composite urbanisation index. The indicators included
in index construction are as follows– 1) total urban population, 2) total number of urban
households, 3) the main workers involved in non-agricultural activities, 4) total
educational institute, 5) total number of registered and functioning industrial unit, and

31
6) total registered vehicles. To arrive at the individual index, the values of the indicators
were normalized by using the following formula:
Index =Actual value − Minimum value
Maximum value − Minimum value
The year to year growth rate and exponential growth rate of urban population
from 1981 to 2015 in East Sikkim district alone were found to be 4.07 per cent and 4.61
per cent respectively. The growth rate of registered vehicles in Sikkim has also
increased significantly from 1981 to 2015 at the tune of 14.52 per cent (year to year
growth) and its Compound Annual Growth Rate (CAGR) was found to be around 13
per cent during the same period. The growth rate (CAGR) of registered and functioning
industrial units from 1981 to 2015 in East Sikkim district was found to be around 13.25
per cent. This reflects the urbanisation rate in the East Sikkim district and it can be
considered as one of the most urbanised districts in the state.
Table 4.2: Indicators of Urbanisation in East Sikkim District (1981 to 2015)
Indicators Year to Year
growth rate CAGR
Total urban population (TUP) 4.07 4.61
Total urban household (TUHH) 4.50 5.22
Total main worker in non-agricultural activities (TMWNAA) 3.79 4.33
Total educational institutes (TEI) 2.54 2.66
Total No. registered and functioning industrial units (TRI) 12.69 13.25
Total registered vehicles (TRV)* 14.52 12.70
Source: Author’s estimation
*Due to lack of data exclusively for East Sikkim District, it is taken for entire Sikkim
Table 4.3 given below depicts the construction of urbanisation index over the
period from 1981 to 2015 in East Sikkim district. We have also estimated composite

32
urbanisation index by adding altogether six indicators of urbanisation index from 1981
to 2015.
Table 4.3: Urbanisation index (UI) for East Sikkim district from 1981-2015
Year TUP
index
TUHH
index
TMWNAA
index
TRI
index
TEI
index
TRV
index
COMPOSITE
UI
1981 0.09 0.09 0.13 0.00 0.00 0.00 0.30
1982 0.08 0.08 0.11 0.00 0.02 0.00 0.29
1983 0.07 0.07 0.10 0.00 0.04 0.01 0.28
1984 0.06 0.06 0.09 0.00 0.06 0.01 0.28
1985 0.05 0.05 0.07 0.00 0.08 0.02 0.28
1986 0.04 0.04 0.06 0.00 0.11 0.03 0.28
1987 0.03 0.03 0.05 0.03 0.13 0.04 0.31
1988 0.02 0.02 0.04 0.04 0.15 0.05 0.33
1989 0.02 0.02 0.03 0.05 0.18 0.07 0.36
1990 0.01 0.01 0.02 0.05 0.20 0.10 0.38
1991 0.00 0.00 0.00 0.07 0.23 0.13 0.42
1992 0.01 0.01 0.01 0.07 0.25 0.14 0.50
1993 0.03 0.03 0.03 0.09 0.28 0.15 0.59
1994 0.04 0.04 0.04 0.10 0.31 0.16 0.69
1995 0.05 0.05 0.05 0.12 0.33 0.17 0.78
1996 0.07 0.07 0.07 0.15 0.36 0.18 0.91
1997 0.09 0.09 0.09 0.16 0.39 0.19 1.01
1998 0.10 0.11 0.10 0.17 0.42 0.21 1.11
1999 0.12 0.13 0.12 0.24 0.45 0.22 1.29
2000 0.14 0.15 0.14 0.26 0.49 0.24 1.41
2001 0.16 0.17 0.16 0.27 0.52 0.24 1.52
2002 0.20 0.20 0.20 0.27 0.55 0.26 1.68
2003 0.24 0.24 0.24 0.31 0.59 0.30 1.91
2004 0.28 0.28 0.28 0.33 0.62 0.36 2.15
2005 0.32 0.32 0.32 0.36 0.66 0.40 2.39
2006 0.37 0.37 0.37 0.52 0.70 0.46 2.80
2007 0.43 0.43 0.43 0.60 0.74 0.51 3.13
2008 0.49 0.48 0.49 0.80 0.78 0.54 3.58
2009 0.55 0.55 0.55 0.86 0.82 0.60 3.92
2010 0.62 0.62 0.62 0.98 0.86 0.70 4.40
2011 0.70 0.69 0.70 0.98 0.90 0.81 4.78
2012 0.77 0.77 0.77 0.99 0.95 0.86 5.11
2013 0.85 0.85 0.85 0.99 0.99 0.90 5.43
2014 0.92 0.92 0.92 1.00 1.00 0.95 5.71
2015 1.00 1.00 1.00 1.00 1.00 1.00 6.00
Source: Author’s estimate

33
Figure 4.1 depicts the trend line analysis of the urbanisation index, constructed by using
the formula given in methodology section. The year to year growth rate of urbanisation
is estimated at 9.77 percent over the period from 1981 to 2015.
Figure 4.1 Growth Trend of Urbanisation in East Sikkim district (1981 to 2015)
Source: Author’s estimate
There has been a dynamic shift in terms of demographic, land used and
settlement patterns in Gangtok, Sikkim. A study conducted by Paul et al. (2016) by
using remote sensing and geographic information system (GIS) technique witnessed a
rapid transformation of settlement pattern in and around the Gangtok city. It is also
understood that any change in land cover area reflects the environmental change.
Therefore, there is a drastic change in the patterns of residential, industrial and
commercial areas of Gangtok, which has reached new stage of development in terms of
urban growth.
y = 0.0275x - 0.18R² = 0.8482
-0.40
-0.20
0.00
0.20
0.40
0.60
0.80
1.00
1.20
19
81
19
83
19
85
19
87
19
89
19
91
19
93
19
95
19
97
19
99
20
01
20
03
20
05
20
07
20
09
20
11
20
13
20
15
Urbanisation Index
Linear(Urbanisation Index)

34
Figure 4.2: Expansion of Settlement Pattern in Gangtok (1930 and 2011)
Source: Paul et al. (2016)
4.2 SOURCES OF URBAN WATER SUPPLY
The state of Sikkim is endowed with rich water resources such as glaciers, rivers and
natural springs. Around 84 glaciers, covering an area of about 440.30 sq. km (SER
2016) do provide major sources of water in Sikkim. Large numbers of natural springs
are also present in the state of Sikkim, estimated at around 2000 natural springs (Sharma
et al. 2013). In most parts of the rural Sikkim, springs provide main source of water and
80 percent of rural population depends on this water source for drinking as well as

35
irrigation purposes (ibid 2013). Even in some parts of the urban areas in Sikkim get
water from natural spring for various activities.
In Sikkim, water supply is based on gravity flow, which serves as a major source of
domestic and drinking water to the inhabitants. Usually springs get recharged well in
the monsoon season, serve as a source of domestic water supply for a quite large number
of people and slowly getting dried at the end of the winter season. In the process, as
water table of the springs rises during the rainy season it hits the rock surface and flows
from it, which serves as potable water for more than 5 months in a year. In Sikkim,
there are many perennial springs, which serve as drinking water source to people
throughout the year. Water security and public health engineering department is the
sole distributor of required water for the public, and the task of maintaining quality of
water supplied to the residents in urban centres of Sikkim is also shouldered by this
department. According to the census data available from the last two decades, 2001 to
2011, depicted in Table 4.4, it is seen that a considerable decline in the percentage of
urban households access to safe drinking water in Sikkim, which includes tap water
provided by the public health engineering department, Government of Sikkim. Hand
pump and tube-well as a source of domestic water consumption used by inhabitant of
Sikkim has declined from 97 percent to 92 percent in 2001 and 2011 respectively
(Census 2011). On the other hand, there has been an increase in the percentage of
household access to safe drinking water in rural Sikkim from 67 percent to 83 percent
during the same period. The declined in urban residents accessed to safe drinking water
may be associated with many other factors like increased in the population growth and
reduction in the rainfall pattern over the periods. The percentage growth of urban
population in Sikkim was 11 percent in 2001 and increased to 25 percent in 2011.

36
Table 4.4: Percentage of Household Access to Safe Drinking Water in Sikkim
Source: Registrar General of India, Census (1981, 1991, 2001 & 2011)
In Sikkim, there has been a clear evidence of declining rainfall pattern over the
years probably be due to the climate change, of course, it requires scientific analysis.
Figure 4.3: Rainfall Pattern in Sikkim (1981 to 2014)
Source: Sikeniv.nic.in
For instance, the rainfall pattern over the period from 1981 to 2014 (refer to Fig.
4.3) is found to have slightly declined and perhaps, this may along with the growth in
urban population, be the major factor for reducing access to safe drinking water for the
residents over the year in Sikkim. If this trend continues, in future, there will be a
shortage of water in urban areas to a great extent. On an average, the annual rainfall
level till 2011 in the state was recorded at around 2500 mm to 3500 mm, but it has been
declining since then and dropped below 2000 mm in 2012.
Table 4.5 presented below shows the percentage of drinking water sources in each
district, which includes rural and urban areas. In 1998, the two districts of Sikkim
Year 1981 1991 2001 2011
Total 30.3 73.1 70.7 85.3
Rural 21.7 70.8 67.0 82.7
Urban 71.9 92.8 97.1 92.2

37
namely East and North were found to have accessed to higher percentage of the urban
tap water supply and lower percentage of natural spring and others water sources. As
shown in Table 4.5, from 1998, the percentage of urban households access to safe
drinking water was estimated at 90 percent in East Sikkim district (Gyatso and Bagdas
1998) and increased to 97 percent in 2001 (Census 2001). But, in 2011, there was a
slight decline in percentage of access to safe drinking water, down by 4.9 percent.
Table 4.5: Percentage of Sources of Drinking Water in Sikkim (in 1998)
Source
EAST WEST SOUTH NORTH
Rural Urban Rural Urban Rural Urban Rural Urban
Tap 74.8 89.9 85.7 76.4 78 61.6 63.6 91.4
Natural Spring 20.0 8.1 10.4 15.1 15.5 31.1 33.1 6.9
Others 5.2 1.9 3.9 8.5 6.5 7.3 3.2 1.6
Source: Gyatso and Bagdas (1998)
As happened elsewhere, following the rise of urbanisation the issue of water
shortage in the Himalayan state of Sikkim is also felt. To what extent and in which
manner the water issue is being experienced by the Sikkimese require a thorough
analysis. Is this only a quantity issue or quality issue? It is also understood that the rise
in population leads to water quality and quantity problems. In Sikkim also, with the
rapid rise in construction activities and encroachment in the forest lands lead to rise in
runoff water and population level due to the inability of concrete land to absorb
rainwater and waste water flow into water system. Forest helps to store water and
reduces pollutants and erosion. With rapid urban growth, tremendous pressure on land
and water was felt. Financial constraint, inefficient delivery mechanism such as
insufficient management and technical skills put extra burden on water quality that is
being supplied to public. Population growth in cities is faster than the service delivery
provision, decline in percentage of clean water and it results to low quality of life.

38
River is also one of the important sources of water supply to the public. In the less
developing countries, river water is directly used for consumption purposes at
household level. In Sikkim, the drinking water is not directly related to river water. If
the rapid growth of urban towns leads to scarcity of water, then to manage water supply
for the residents, river water can be considered as one of the sources of water supply.
The quality of surface water, river water in this context, is a serious concern at present,
due to urban sprawl, industrialisation and deforestation in the recent past. In order to
attain sustainable development and to manage to provide safe drinking water, surface
water quality and quantity must be monitored (Seth et al. 2016). Till very recently,
around 80 percent of the India’s population drink unsafe and polluted water. More than
2 million people die annually due to water-borne diseases (Kirch 2002). Sikkim has
two important rivers namely— Teesta and Rangeet. These rivers along with their
tributaries, from the left bank tributaries of Teesta are Lachung chu, Chakung chu,
Dikchu, Rani Khola and Rangpo chu, and from the right bank tributaries lies Zemu chu
and Rangyong chu. At Melli, Teesta merges with river Rangeet, which originated from
Rathong glaciers. The major tributaries of Rangeet are the Rangbong, Relli, Rathong
and Kalej (SERS 2016), and it provides drinking water to the people of East Sikkim.
Today, most of the river water are getting polluted due to the anthropogenic activities,
domestic wastes, weathering of rocks, etc., which in turn affect the physio-chemical
and biological properties of water (Kulkarni and Pawar 2006; Lamtura et al. 2014; Patil
et al. 2014; Scheili et al. 2016). The same is also happening in Sikkim and its water
bodies. A study by Kirch (2002) tried to investigate the impact of urbanisation on water
bodies, especially the river water, and found that development and growth of
urbanisation negatively affect water quality, and poor management of urbanisation
turns out to be the main problem of water shortage.

39
Limited study is found in this regard in Sikkim especially the carrying capacity
of water resources and water quality monitoring in the urban centres and the rivers
located in the urban centres. Therefore, this section attempts to assess water quality,
including river water, which flow through the towns, in and around Gangtok. The water
quality at the source, the glaciers in the up-stream Himalayan range, is generally
considered as very good and clean, but urbanisation has greatly affected the
downstream water quality. As of the data on the water quality, the rivers flowing from
the upstream, Chungthang (North Sikkim district) to Melli, downstream is getting
polluted as it moves down. Data on the water quality measuring parameters of the rivers
flowing through the urban centres of East Sikkim district were obtained from the
government publication as well as through the interview with official from the state
pollution control board of Government of Sikkim GoS, Gangtok. Water samples were
collected by the GoS (2016) from the nine river stations for the period from 2010 to
2015. For understanding water quality in this study areas, the physio-chemical
parameters of water such as: pH, conductivity, nitrate, biochemical oxygen demand
(BOD), total coliform and faecal coliform have been used. In this study we have taken
six parameters of water quality. The definition of each parameters is explained as
followed:
pH in as an indicator of the water quality as acidic or alkaline. According to
World Health Organization set the limit value for pH 6.5 to 8.5 because the freshwater
aquatic organism needs a pH in this range. If any change in this limit, then water become
bitter taste causing corrosion, damaging mucous membrane, and also affecting aquatic
life (Narashima Rao et al. 2011).
Conductivity measures of the ability of a solution such as water in a river to
pass current. During the periods of low flow river water has greater influence on

40
conductivity which is one of the indicators that polluting discharges have entered the
water. Therefore, water with absolutely no impurities determine conductivity is very
poorly performed.
Nitrate is produces with the help of blue-green algae. The legumes of blue green
algae have the ability to covert nitrogen gas into nitrate and plants uses this to build
protein. Nitrate is an indicator of water quality presences in water bodies. It has an
adverse effect on health, if nitrate value increases above 45mg/l. In ground water, the
presence of nitrate is very high due to high solubility capacity in water bodies (Nas and
Ali, 2006). The WHO set permissible standard below 45 mg/l. The large amount of
nitrate present in water causes “Blue-Baby disease in bottle fed infant” (Knobeloch et
al. 2000).
Biochemical oxygen demand (BOD) measured the level of dissolved oxygen
required by micro-organisms to decompose organic matter present in water bodies. This
organic matter includes urban runoff which carries waste from streets and sidewalk,
plant decay, waste generated from residential and industrial areas. If there is a large
quantity of organic waste in the water supply, there will also be a lots of micro-organism
present working to break down this waste. In this case, the demand for oxygen will also
be high. So, the BOD level will be high. As the waste is break down, BOD levels will
begin to decline. The WHO set permissible standard at 2 mg/l or less.
Coliform are known to be a group of bacteria (pathogenic organisms). It is an
indicator of contamination of human or animal faecal waste in the water. The existing
of it can causes various water borne diseases like diarrhea, typhoid and hepatitis
(Theron and Cloete 2002; Elkp et al. 2003; Sood et al. 2008). The WHO set permissible
limit 0 MPN/100 ml for drinking water. The central pollution control board (CPCB) of

41
India has given the standard for the drinking water source without conventional
treatment, total coliforms Organism MPN/100ml shall be 50 or less.
Faecal coliform refers to bacterial contamination of natural water. Usually, its
present in the digestive tracks of warm blooded animals, including humans and are
excreted in the feces. The improper channel of waste product of humans and animals
can contribute to increase of faecal coliform in streams or rivers. The WHO set
permissible limit 0 MPN/100 ml for drinking water.
The monthly water quality data were analysed, and the assessments have been
followed by comparing different parameters with their threshold values defined by the
World Health Organization (WHO). Due to shortage of time series data on river water
quality, indicators prior to 2010, for understanding river quality, this study is limited to
the period from 2010 to 2015. To understand, river water quality in Sikkim, we have
constructed the water quality index (WQI). The WQI provides, the valuable information
pertaining to the composite influence of different water quality parameters (Akoteyon
et al. 2011).
The standard rating of water quality according to WQI (Brown et al. 1970) is
given in Table 4.6 and compared it with water quality of nine stations located in Sikkim.
Figure 4.4 shows the location of nine stations of river in Sikkim, which is the area of
study. The marked green circles areas represent the location of river sites and red line
represents the flow of rivers from upper-stream at Chungthang till downstream, located
at Melli.

42
Figure 4.4: Study location of river site in Sikkim
Source: Google map of Sikkim.

43
Table 4.6: Standard Rating of Water Quality Categories (in %)
Source: Brown et al. (1970)
Figure 4.5 depicts the water quality index (WQI) for the period from 2010 to
2015. Though the water quality rating in each site found to be low (lesser the WQI
value better the performance) in up-stream stations like Chungthang and Dikchu. Its
value is found to be higher than that of the standard norm of 50 per cent set by Brown
et al. (1970). As we assess the river water quality, which is flowing all the way through
the Gangtok city, at different stations from the up-stream river at Burtuk to down-
stream at Melli, the water quality rating was found to be decreasing as it goes down
from upstream to downwards (Fig. 4.5).
Figure 4.5: Water Quality Index in Nine River Locations (2010-2015)
Source: Author’s estimation
The deterioration of river water quality has already crossed threshold value set by
Brown et al. (1970) that is more than 50 percent indicating the unsustainable water
020406080
100120140160
WQ
I
201020112012201320142015
WQI (Scale) Rating
0-25 Excellent water quality
26-50 Good water quality
51-75 Poor water quality
76-100 Very poor water quality
>100 Unsuitable water quality

44
quality. This is found in all the river location in the study area of Sikkim. Table 4.7,
shows the mean value of each of the parameters.
Table 4.7: Descriptive Statistics of Water Quality Parameters (2010-2015)
Variable Observatio
n
Mean Std.
Dev.
Min Ma
x
WHO
Standar
d
pH 54 6.37 0.18 6 6.5 6.5 –
8.5
Conductivity μmhos/ cm 54 275 11.93 250 300 < 800
Nitrate mg/l 54 2.47 0.28 2.2 3.2 < 45
Biochemical oxygen
demand mg/l
54 3.43 0.70 2.15 4.5 < 2
Total coliform
MNP/100ml
54 163.14 70.91 40 300 < 50
Fecal coliform
MNP/100ml
54 59.04 39.47 23 170 <50
Source: Author’s calculation
On an average, three water quality parameters are not up to the mark set by WHO.
There is an increase in parameters of water quality, such as biochemical oxygen
demand, total coliform and fecal coliform. The standard value of biochemical oxygen
demand should be less than 2 mg/l, but in Sikkim, it is found that the value is greater
than 3mg/l. Similarly, for the total coliform and fecal coliform have crossed the
threshold value of less than 50 MNP/100 for drinking water measure set by WHO.
Urbanisation process deteriorates river water quality, mainly attributed by industrial
growth in urban areas.

45
CHAPTER V
URBANISATION TREND AND DOMESTIC WATER RESOURCES
MANAGEMENT: EVIDENCE FROM THE PRIMARY SURVEY
From the secondary data analysis made in the previous chapter (in Chapter IV) it is
quite clear that the expansion of urban centres and urbanisation process is primarily
driven not only by the growth of urban population and rural-urban migration, it is also
contributed largely by the process of industrialisation. Further, it is also understood that
the urbanisation pattern in the East Sikkim district has been a very rapid, and the year
to year growth rate of urbanisation was found to be at the tune of 9.77 percent over the
period from 1981 to 2015. At the same time, the percentage of the household access to
safe drinking water in the district was found to be declining at the tune of 4.9 percent
from 2001 to 2011. The shortage of domestic water resources was also found to be very
apparent in the district. In short, as urbanisation rate increases the problem of domestic
water resources aggravated. To corroborate the result given by the secondary data, this
section/chapter analyses the primary data collected from the East Sikkim district. Since
the rise in population in the urban centres is considered as one of the measures of
urbanisation, the immigration or the migrant population in the district is also included
as an important determinant of urbanisation.
Urbanisation, at the one side, rises economic activities basically through the
growth of industrial activities and trade and business. On the other side, it decreases
water quality and quantity. From the assessment on water quality measure analysed
through river water in the East Sikkim district in the previous chapter it is understood
that the quality of the river water was found to be declining due to the urbanisation and

46
industrialisation in the district. Since water quality, especially the river water, is found
to be deteriorating over the years there is a possibility of declining quality in other water
sources as well where the people of the district are getting domestic water from.
Therefore, this chapter tries to see the veracity of findings/results given by the
secondary data in previous chapter. For convenient of the readers, the present chapter
is divided into two sections as: 1) growth and trend of urbanisation and water sources
available (in term of liter) for the urban household consumption in the East Sikkim
district, and 2) demand for drinking water quality for the households.
Figure 5.1: Concentration and Year of Establishing Industries in Sikkim
Source: Singha, Sherpa and Jaman (Forthcoming)
Figure 5.1 shows the areas of concentration of industries and their establishment periods
in the state of Sikkim. Most of the industries are found to be concentrated in the East

47
Sikkim district and it led to a large number of labour migration, increased migrant
population in this district. Secondly, most of the industries concentrated in this district
are also found to have established after 2007. Since the industrialisation, urbanisation
and rise in population including migration have been taking place at the very rapid rate
in the East Sikkim, the present study also incorporated the above-mentioned
components. Field survey of this study is also conducted in the urban centres of the
district where the industrial units are concentrated the most.
5.1 URBANISATION TREND IN EAST SIKKIM DISTRICT
To address the first research question, as whether the ever growing urbanisation
proportionately supported by the required quality and quantity of water in the East
Sikkim district or not, the present study conducted a primary survey on 355 households
living in the urban centres of East Sikkim district. The selected urban centres in the
district are: Gangtok, Singtam, Rangpo and Rhenock.
As mentioned above, migrant population forms a major portion of the
population in East Sikkim district. In this study, the households moving from rural to
urban within the district, inter-district migration (movement of the people from other
districts to East Sikkim district), immigrant population (migrated from outside the
states, including international immigrants) have been included to understand the
migrant population over the years. Since the migrants primarily aim at the urban centres
as their destination, this process ultimately adds up to the urban population over the
years. Urban population includes both migrant population and early/original
inhabitants. Original population in this study is defined as the people living in the
survey areas (East Sikkim district) before 1948, country’s independence in 1947.

48
Table 5.1: Percentage of Migrant and Original Households in East Sikkim District
Household Category Number
Migrant households* 242
(68.16)
Original households** 113
(31.83)
Total 355
(100)
Source: Field survey
Note: Figures in the parenthesis represent the percentage of the total
*Migrant implies the household came in East Sikkim district after 1947
**Original households, living in the East Sikkim district before 1948
Table 5.1 depicts the share of sample households in the district between the original
inhabitant (live on or before 1948) and the migrant households (migrated after 1947).
Of the total 355 sample households, only 113 households turned out to be original
inhabitants and 242 households are the migrant households, came after 1947. In
percentage terms, they constitute 31.83 percent and 68.16 percent respectively. Before
the state’s merger with Indian union, from the period of 1948 to 1975, the households
migrated to urban East Sikkim district, the survey areas were found to be only 21.
Table 5.2: Migration Growth Rate before and after Merger (in %) in East
Sikkim
Before 1975 After 1975 to 2018
15.67 68.17
Source: Author’s estimate
Table 5.2 depicts the growth rate of migration before and after merger in East Sikkim
district and Table 5.3 depicts the growth rate of migrant households over the period
from 1948 to 2018. On an average, the year-to-year growth rate of migrant households
was estimated at 13.48 percent over the period from 1948 to 2018.
Table 5.3: Migrant Household(s) in Different Year (Number and Growth
Rate) in East Sikkim District
Year Total
Household
Total
Migrant
Household
Year-wise
Migrant
Household added
Migrant Growth
Rate** (in %)
Base-Year* 113 - --
1948 114 1 1 --

49
Year Total
Household
Total
Migrant
Household
Year-wise
Migrant
Household added
Migrant Growth
Rate** (in %)
1950 115 2 1 100
1955 116 3 1 100
1958 117 4 1 50
1964 118 5 1 33
1965 119 6 1 25
1968 126 13 7 20
1969 127 14 1 117
1970 130 17 3 8
1972 131 18 1 21
1973 133 20 2 6
1975 134 21 1 11
1976 136 23 2 5
1978 146 33 10 10
1980 147 34 1 43
1982 148 35 1 3
1983 159 46 11 3
1985 161 48 2 31
1986 165 52 4 4
1987 166 53 1 8
1988 180 67 14 2
1989 182 69 2 26
1990 184 71 2 3
1991 187 74 3 3
1992 194 81 7 4
1993 205 92 11 9
1994 207 94 2 14
1995 209 96 2 2
1996 214 101 5 2
1997 219 106 5 5
1998 232 119 13 5
1999 234 121 2 12
2000 249 136 15 2
2001 250 137 1 12
2002 252 139 2 1
2003 265 152 13 1
2004 269 156 4 9
2006 276 163 7 3
2007 279 166 3 4
2008 295 182 16 2
2009 300 187 5 10
2010 306 193 6 3
2011 315 202 9 3

50
Year Total
Household
Total
Migrant
Household
Year-wise
Migrant
Household added
Migrant Growth
Rate** (in %)
2012 317 204 2 5
2013 322 209 5 1
2014 329 216 7 2
2015 335 222 6 3
2016 343 230 8 3
2017 349 236 6 4
2018 355 242 6 3
Source: Author’s estimation based on the Primary survey
* indicates the original household in the urban East Sikkim district before 1948
**Year to year growth rate (growth rate compared to previous year)
Figure 5.2: Urbanisation Growth trend in East Sikkim district
Source: Author’s estimate based on Primary data
Using population growth as the migration rate, Figure 5.2 shows the growing trend of
urbanisation in East Sikkim over the period from 1948 to 2018. On the eve of Sikkim
merged with Indian union in 1975, the total migrant households in East Sikkim was
very negligible (20 migrant households) and it has increased to more than four times
till date. The finding from the primary survey data of this study in the context of growth
rate of migrant households and population, which is further considered as
“urbanisation” is truly supported by a study conducted by Bhutia and Srivastava (2014).
Since the 1980s, following the setting up of many development activities (after the
merger with India in 1975) many migrants have reached the urban centres of the state.
y = 1.52xR² = 0.9775
0
10
20
30
40
50
60
70
80

51
Of course, there is an issue of causal direction between the two (urbanisation and
migration), which requires scientific investigation. There are number of factors which
attract many migrants in Sikkim. To mention a few, the infrastructural development
activities, good environmental, accommodative attitude of the people of Sikkim
towards the visitors/migrants, North-east Industrial and Investment Promotion Policy
2007, etc. may be mentioned. Also, Sikkim being one of the most peaceful states in the
country, in terms of law and order situation, migrants prefer to come to Sikkim.
From the primary data analysis, it is found that on an average, the year to year
growth rate of migration in the study area was found to be 13.48 percent over the period
from 1948 to 2018. At this rate of growth of migration, many issues are likely to face
by the people in the state. One of the pertinent issues in this context is the domestic
water resources management, and majority of the migrants generally target urban
centres, of course, migration status in the rural areas in the present study district is not
examined. Since rise in migration is also one of the major factors for increasing
population, and in turn rise in demand for safe domestic water, the issue of it is directly
related to the water demand/issue as well. In this study, we have tried to understand
how the public are managing water when the growth pace of urbanisation in the East
Sikkim district is very high.
Water plays an important role and it sustains life on the planet. Water is the
backbone of an economy, and one cannot imagine growth of any sector in the economy
without water. Sikkim lies in the Himalayan range, endowed with rich perennial flow
of the glacier, river and natural springs. The main sources of water for the public in this
study area is drawn from the tap water supplied by the government, privately managed
tap water, spring (in local parlance Dhara), dug-wells, bore-well and rivers. Of the
sources mentioned, the tap water is the main water supply source at households which
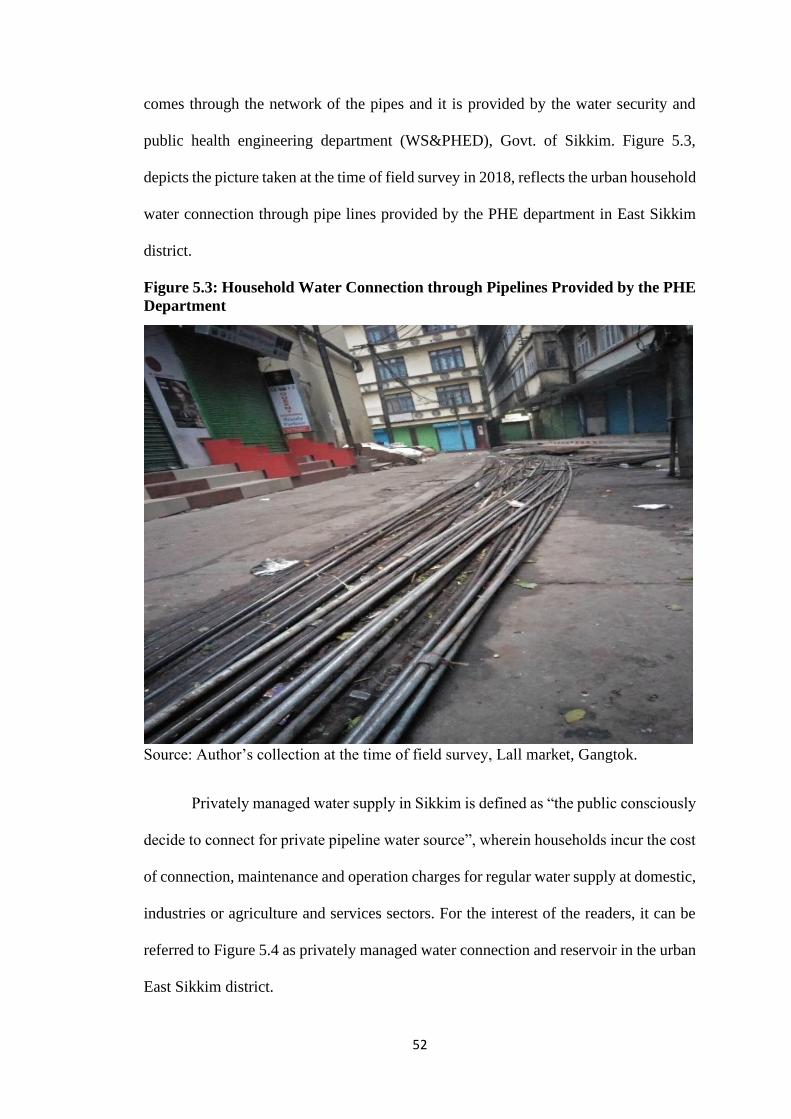
52
comes through the network of the pipes and it is provided by the water security and
public health engineering department (WS&PHED), Govt. of Sikkim. Figure 5.3,
depicts the picture taken at the time of field survey in 2018, reflects the urban household
water connection through pipe lines provided by the PHE department in East Sikkim
district.
Figure 5.3: Household Water Connection through Pipelines Provided by the PHE
Department
Source: Author’s collection at the time of field survey, Lall market, Gangtok.
Privately managed water supply in Sikkim is defined as “the public consciously
decide to connect for private pipeline water source”, wherein households incur the cost
of connection, maintenance and operation charges for regular water supply at domestic,
industries or agriculture and services sectors. For the interest of the readers, it can be
referred to Figure 5.4 as privately managed water connection and reservoir in the urban
East Sikkim district.

53
Figure 5.4: Privately Managed Water Connection and Reservoir
Source: Source: Author’s collection at the time of field survey at Upper Sichey.
Of course, people mostly depend on PHED supply water and private pipe line is taken
as an alternative or stand-by to the former. In case of short-supply of tap water, the
public will go for private pipeline water supply connections, spring or bore well water.
Spring water is the natural and free flowing water on the land surface which comes
through the overfilled of the aquifers. Well and bore-well water are the result of
extraction of water through deep boring under the ground. River water is a natural
stream of fresh water flowing from the glaciers, lake and other tributaries. In urban
centres, water security and public health engineering department (WS & PHED), Govt.
of Sikkim is the sole provider of tap water to the public. As per norm, under the
supervision of WS & PHED, the water is filtered before distributing to the public.

54
5.2 WATER AVAILABILITY IN THE URBAN EAST SIKKIM DISTRICT
The main water supply sources in the study survey areas are primarily: 1) for the
Gangtok Municipal Council area is from the river Ratey chu and the main water
treatment plant is located at selep tank, installed at Gangtok, 2) for the Nagar Panchayat
areas of Singtam, water source is located at Chalamthang (a sub-division of Pakyong),
3) for the Rangpo, water source location are at Dikling and Kamarey (a sub-division of
Pakyong), and 4) for the water supply source of Rhenock are located at sudunglakhang
(a sub-division of Rongli) and kopchey (a sub-division of Namchi).
5.3 SOCIO-ECONOMIC STATUS OF THE SURVEYED HOUSEHOLDS
Using the primary survey data, the descriptive statistics are presented in Table 5.4
and the different pictorial presentation are depicted in Figure 5.5, Figure 5.6 and
Figure 5.7.
Table 5.4: Descriptive Statistics of the Domestic Households
Variables Obs. Mean Min Max Std. Dev.
Family size (In number) 355 4.76 1 12 2.13
Hours of water supply (In a day) 355 2.95 1 5 1.55
Year of migration* 355 14.89 0 71 15.82
Highest educational attainment by
family members (Years of schooling)
355 12.2 0 17 3.98
Family’s monthly expenditure**
(In Rupees)
321 19900 3000 80000 10149
Source: Primary Field Survey
* In the year of migration, we have included both the original and migrated
households.
** In the field survey, only 321 households (of the total 355 sample households)
revealed their monthly expenditure that includes expenditure on food and non-
food items
The average family size of the sample household is 5 members and the mean hours of
water supply in the survey areas is 3 hours per day. The average period of the migrants
staying in the survey areas (who have come to the urban East Sikkim district)
irrespective of their origin is 15 years. The highest educational attainment by the

55
members in the sample families is 12 years of schooling, which indicates upper primary
to secondary education. The mean monthly expenditure of the family is Rs. 19900/-
which includes both food and non-food items. The following section deals with the
basic socio-economic status of the surveyed households, which include age
composition of the family members, educational status, religious category, etc. It is
done in keeping in the mind that the socio-economic characteristics of the households
do influence their water consumption behavior.
Figure 5.5: Age Composition of the Respondents
Of the total 355 sample
households surveyed, 40.45
percent of them (members of
the sample households) are
belonged to age groups of
15-35 years, followed by
30.69 percent of persons belonged to age groups of 30-60 years. A total of 12.89 percent
and 8.57 percent of persons are belonged to age groups of 7-14 years and below 6 years
of age respectively. While, hardly around 7.35 percent of persons are found to be
belonged to above 60 years of age groups.
Figure 5.6: Educational Attainment of the Household Members
As of the educational
attainment, we have found
that 48 percent of family
members completed their
upper primary to senior
secondary education.
Around 20 percent of the
9%1%17%
48%
20%5%
Illiterate
Skilled (No formalschool)
Primary (1-5)
Upper primary tosenior secondary (6-12)Graduation(General/(Tech/Professional)Post-Graduation andabove (General/Tech/Professional)
8.57 12.89
40.4530.69
7.390
10
20
30
40
50
Below 6years
7-14 years 15-35 years 36-60 years Above 60years

56
family members of the sample households have graduated from college and hardly 5
percent of the family members are found to be having post graduate and above
qualification. Around 17 percent of family members are found to have studied till
primary level and 9 percent of family members are found to be illiterate.
Figure 5.7: Religion Background of the Households
Within religious
background, a total of
58.87 percent of
households are found
to be belonged to
Hinduism. While, 31.55 percent and 7.61 percent of households are belonged to
Buddhist and Christian community respectively. Around 1.69 percent 0.28 percent of
households are belonged to Muslim and Others communities respectively.
Table 5.5: Occupational Structure of the Sample Households (in No.)
Occupational Structure Family’s main
source of income
Subsidiary source of
income
Agriculture 2 (0.56) 0
Govt. Employee 97 (27.37) 56 (15.77)
Private Employee 68 (19.15) 26 (7.32)
Self-Employee 32 (9.01) 11 (3.10)
Retired 29 (8.16) 1 (0.28)
Casual worker 4 (1.13) 0
Combination of farming, salaried
and self-employed 1 (0.28) 0
Business 57 (16.05) 34 (9.58)
Others* 65 (18.31) 11 (3.10)
No Source 0 139 (60.85)
Total 355 (100) 355 (100)
Source: Author’s estimate based on primary survey data
Note: Figures in the parenthesis represent the percentage of the total
* indicate the other occupation like driver, home guard, security guard,
etc.
58.87
7.611.69
31.55
0.280
10
20
30
40
50
60
70
Hindu Christian Muslim Buddhist Others

57
Table 5.5 indicates the occupational structure and the main source of income of head
of the family members are represented in Table 5.5. We have found that 27.37 percent
of the head of families are employed in govt. sector, 19.15 percent earning source is
from private jobs (salaried). Around, 18.31 percent and 16.05 percent of head of
families’ sources of income are from others and business respectively. When we asked
the households regarding whether they have subsidiaries sources of income, we found
that 60.85 percent of households do not have any subsidiaries earning sources. But
15.77 percent of families do have the subsidiaries sources of income from govt. jobs,
and 9.58 percent and 7.32 percent of households earning from business and private
employee respectively.
Table 5.6: No. of households connected with different water supply sources
Sources No. of Household
Tap water (Govt./PHED) 240(67.60)
Private Pipeline 50(14.08)
Both (Tap water & private pipeline) 58(16.34)
Spring 2(0.56)
Others* 5(1.41)
Total 355(100)
Source: Author’s estimate based on primary survey data
Note: Figures in the parenthesis represent the percentage of the total
* includes purchasing water, well, & borrowing from/depend on neighbors.
Table 5.6 shows different water supply sources, the sample households connected for
domestic purposes in the urban East Sikkim district. The main sources of domestic
water supply for the households is from the PHED through pipe line. In term of number,
it is 240 households out of 355 total sample sizes who depends solely on this source
and in percentage term, it is 67.60 percent of the total sample households. On the other
hand, 14.08 percent of households are having access to only private pipeline water
supply (pipeline/tap managed by the private/individual) and 16.34 percent of
households depends both on government tap (PHED) and private pipeline water supply,

58
and remaining around 1.97 percent of sample households get water from spring and
others sources at their door step. Altogether, we have found that tap water source is
having the highest 98.02 percentage share of water supply (which includes both the
government managed tap, private pipeline). Usually, in urban centres, the scope of
having more than one sources of water supply is very limited and the same result was
also found in our study as well.
According to the definition given by the Registrar General of India (2011), to
measure a distance of the main water supply sources, the households receiving water
can be classified into three categories: a). Within house, b). Shared but in the same
building and c). Away from the premises. Therefore, we have used the same concept to
understand the distance of main water supply the households connect water at their
respective houses. We have found that 79 percent of households are having water
supply within house across different water sources. The percentage of tap water source
within house premises is 69 percent compared to other water supply sources and these
figures are presented in the Table 5.7. The percentage of shared water connection in
the same building/premise is the highest sources, which account for 68 percent.
Table 5.7: Types of distance of main water supply across different water
sources
Premise Tap
water
Private
pipeline
Both Tap and
private water
Others* Total
Within house 193
(68.92)
37
(13.21)
48
(17.42)
2
(0.71)
280
(78.87)
Share, but in
same building
40
(67.79)
9
(15.30)
10
(16.95)
0
(0)
59
(16.62)
Away from
premises
7
(43.75)
4
(25.00)
0
(0)
5
(31.25)
16
(4.51)
Total 240
(67.32)
50
(14.10)
5
(1.40)
7
(1.97)
355
(100)
Source: Author’s estimate primary survey data
Note: Figures in the parenthesis represent the percentage of the total.
* includes spring, purchasing water, well, & borrowing from/depend on
neighbors.

59
The daily water supply collections (in hours) in urban East Sikkim district varies from
less than one hour to around four hours in different households and from different
sources are presented in Table 5.8.
Table 5.8: No. of households getting hours of water across different sources
Hours
water
supply
Tap water
(PHED)
Pvt.
Pipeline
Both (Tap
& Pvt.
Pipeline)
Others* Total
<1 70 3 13 1 87
(24.51)
1-2 hrs 76 3 9 3 91
(25.63)
2-3 hrs 37 4 6 0 47
(13.24)
3-4 hrs 20 4 3 0 27
(7.60)
>4 hrs 37 36 27 3 103
(28.73)
Total 240 50 58 7 355
(100)
Source: Author’s estimate based on Primary survey data.
Note: Figures in the parenthesis represent the percentage of the total.
* includes spring, purchasing water, well, & borrowing from/depend on
neighbors.
We have observed that 25 percent of the households receiving water from different
sources are getting less than one hour of water supply in a day. At the same time, 29
percent of households getting more than four hours of water supply in a day. As
urbanisation process increases at rapid pace the evidence of reducing hour of water
supply is visible in the urban centres. But, merely reducing hour of water supply does
not support the situation of shortage of water. There are various factors that caused to
shortage of water. They are mainly, the nature of water use, the demand for water in
other sectors, rapid population growth, etc. Connecting the urbanisation trend pattern
with domestic water resources management in terms of percentage of households

60
depending on different sources of water in East Sikkim district, the following Table 5.9,
depicts the percentage change of urbanisation growth rate vis-à-vis the rate of change
in different sources of water over the period from 1998 to 2018.
Table 5.9: Urbanisation vis-à-vis domestic water resources management (% of
household depending on different sources of water) in urban East Sikkim district
1998* 2018** Change (%)
Urbanisation rate 51.29 68.17 16.88
Tap water 89.9 98.02 8.12
Spring 8.1 0.56 -7.54
Others 1.9 1.41 -0.49
Sources: Author’s estimation.
Note: a) * indicate the data on the year 1998 especially for water, the households
getting for drinking was taken from the Gyatso and Bagdas (1998)
b) ** For the year 2018, data was collected from primary field survey
undertaken in the month of June-July 2018.
The percentage of urbanisation growth rate was 51.29 percent in 1998 and increased to
68.17 percent in 2018. These data are collected from primary field survey. Whereas,
the domestic households accessing tap water supply increased from 89.9 percent to
98.02 percent in 1998 to 2018 respectively. But the domestic water sources drawing
from other sources showed a consistent decline. For spring water supply, the percentage
of household depending on it has decreased from 8.1 percent to 0.56 percent during the
same period. We have found that, as urbanisation growth rate increases the tap water
supply connection growth rate is at the increasing trend, but other water sources
including spring for the domestic consumption started decreasing. In the study areas of
urban East Sikkim district, we have found that the rate of change of urbanisation seems
to be quite high, estimated at around 16.88 percent of urbanisation compared to the rate
of change of tap water with 8.12 percent from the period of 1998 to 2018. Nevertheless,
the household access to safe drinking water is still higher than that of the urbanisation
rate.

61
To understand the concept of sustainability4 of domestic water resources availability
vis-à-vis urbanisation in East Sikkim district, we are considering the quantity of water
consumption as a basic parameter in the study. The following sections will discuss the
water use activities and water requirement in term of quantity of water consumption per
person per day to capture the core context of sustainability of domestic water resources
in the study area.
5.4 WATER USE ACTIVITIES AT HOUSEHOLD LEVEL
Water is used for various activities at the households, such as drinking and cooking,
bathing and toilet, washing clothes and others (includes water use for gardening and
washing vehicles) activities. Within these activities of water use at domestic
households, the consumption of water used for bathing and toilet is the highest,
followed by washing clothes and others activities. For the share of water consumption
used for drinking and cooking purposes is very less (Shaban and Sharma 2007). Table
5.10 shows different sources of water consumption by households for different
activities. We found that the households using 100 percentage of water from the tap
connection do use for all purposes. Of the households depending on tap water, provided
by the PHED, around 65 percent of water is used for drinking and cooking purpose, 64
percent for bathing and toilet, 62 percent for washing clothes and 63 percent for others
activities that include washing car and gardening purposes. For those who depend on
100 percentage water from the private pipeline water, only 13 percent of households
used for drinking and cooking and 14 percent for remaining other domestic activities.
Around 4 percent of households use spring as an alternative/accessible source of water
4 Sustainability is defined to ensure the high quality and quantity of water supply will be
universally accessible to the public irrespective of their socio-economic conditions.

62
supply. Figure 5.8 shows some of the pictures of urban households using natural spring
for different household activities in urban East Sikkim district.
Table 5.10: Share of Household using 100% of water sources for different
activities
Activities Tap water
(PHED)
Private
pipeline
Purchas
e
Spring Others*
Drinking & cooking 232
(65.35)
46
(12.96)
1
(0.28)
11
(3.10)
3
(0.85)
Bathing & toilet 226
(63.66)
48
(13.52)
0
(0)
8
(2.25)
9
(2.54)
Washing clothes 221
(62.25)
48
(13.52)
0
(0)
17
(4.79)
8
(2.25)
Others** 224
(63.10)
48
(13.52)
0
(0)
16
(4.51)
10
(2.82)
Source: Author’s estimate based on primary survey data
Note: Figures in parenthesis represent the percentage of the total
* includes well, borrowing from/depend on neighbors
** include the household’s activities like car washing and water use for gardening.
Figure 5.8: Urban houses using natural spring as accessible source of water supply
Source: Field Survey at Bishal Goan, Gangtok.

63
The percentage share of household using 90 percent to 60 percent of water sources for
different water activities depicted in Table 5.11 below. We have found that 3 percent
of water is used for drinking and cooking, bathing and toilet, washing clothes and others
activities of households depend on private pipeline water source compared to the rest
of other water sources. This was mainly attributed with the fall in the household sample
size as percentage share figure.
Table 5.11: Percentage share of Household using 90% to 60% of water sources for
different activities
Activities Tap water Private
pipeline
Spring River Others*
Drinking & Cooking 4
(1.13)
14
(3.94)
6
(1.69)
0
(0)
1
(0.28)
Bathing & Toilet 4
(1.13)
12
(3.38)
4
(1.13)
2
(0.56)
2
(0.56)
Washing Clothes 4
(1.13)
11
(3.10)
2
(0.56)
0
(0)
2
(0.56)
Others** 2
(0.56)
12
(3.38)
1
(0.28)
0
(0)
2
(0.56)
Source: Author’s estimate based on primary survey data
Note: Figures in parenthesis represent the percentage term
* includes well, borrowing from/depend on neighbors
** include the household’s activities like car washing and water use for gardening.
Table 5.12 shows that the households using 60-30 percent of water sources for different
activities. We have found that household depends both tap and private pipeline water
uses 5 percent for various household’s water activities. We have also found that the
household using water source from spring used is very minimum.
Table 5.12: Percentage share of Household using 60-30% of water sources for
different activities
Activities Tap water Private pipeline Spring
Drinking &
Cooking
18
(5.07)
18
(5.07)
0
(0)
Bathing & Toilet 20
(5.63)
20
(5.63)
1
(0.28)
Washing Clothes 21
(5.92)
20
(5.63)
1
(0.28)

64
Others** 21
(5.92)
20
(5.63)
1
(0.28)
Source: Author’s estimate based on primary survey data
Note: Figures in parenthesis represent percentage term
** include the household’s activities like car washing and water use for
gardening.
Table 5.13 shows the households depend on tap water provided by the PHED. Around
5 percent of water is used for drinking and cooking, bathing and toilet purposes, 4
percent of water is used for washing clothes and others activities compared to others
water sources
Table 5.13: Percentage share of household using 30-5% of different water sources
for different activities
Activities Tap water Private pipeline Purchase Spring Others*
Drinking & Cooking 20
(5.63)
1
(0.28)
1
(0.28)
2
(0.56)
1
(0.28)
Bathing & Toilet 19
(5.35)
3
(0.85)
0
(0)
2
(0.56)
2
(0.56)
Washing Clothes 15
(4.23)
4
(1.13)
0
(0)
1
(0.28)
1
(0.28)
Others** 15
(4.23)
1
(0.28)
0
(0)
0
(0)
1
(0.28)
Source: Author’s estimate based on primary survey data
Note: Figures in parenthesis represent the percentage term
* includes well, borrowing from/depend on neighbors
** includes the household activities like car washing and water use for
gardening.
5.5 WATER REQUIREMENT IN URBAN CENTRES
The basic requirement of water is associated with the nature of water use, food habits,
level of economic growth, culture and working conditions. According to the National
commission for urbanisation 1988 in India suggested that 90-100 litres per capita per
day is needed to lead a quality and healthy life (Sridhar and Reddy 2010). As per the
norm set by the Bureau of Indian Standard (BIS), a minimum of water of 200 litres per
person per day should be provided to high income group for domestic consumption in
town and cities and 135 litres per person per day to the low-income group (Shaban and

65
Sharma 2007). The World Health Organization 2003 (Howard and Bartram 2003) has
classified level of water access to the public as:
1. No access (consumption below 5 litres per capita per day)
2. Basic access (Average consumption of 20 litres per capita per day)
3. Intermediate access (Average consumption of 50 litres per capita per day)
4. Full access (Average consumption about 100 and above litres per capita per day)
To understand domestic consumption pattern of required water per capita per day in
urban East Sikkim district, we have given range of water in term of litres is given in
Table 5.14.
Table 5.14: Quantity of water consumption per person per day from different
sources (in Litre) Tap water Private
pipeline
Both Others*
Water
Consumption
(in LPCD)
Obs
.
Mean
value
Obs. Mean
value
Obs
.
Mean
value
Obs
.
Mean
Valu
e
3-20 34 12.44 2 12 6 16.39 4 7
21-30 14 27.59 2 24 6 29.46 1 30
31-40 15 36.16 - - - - 1 33.33
41-50 8 46.94 - - 3 40.89 - -
51-60 7 54.88 2 60 2 54.20 - -
Above 60 162 208.78 44 248.82 41 239.9
4
1 75
Source: Author’s estimate primary survey data
* includes spring, purchasing water, well, & borrowing from/depend on neighbors.
From the primary survey presented in Table 5.14, we found in the urban East Sikkim
district, out of 355 sample households, 248 households have about full access of water
supply across different water sources, as per the norm set by the WHO. The mean value
of water from tap is 208.78 litres, private pipeline is 248.82 litres and from both (tap
and private pipeline) is 239.94 litres. We have also found that 107 households in our
study area are getting water below the standard quantity set by the WHO i.e., 135 litres

66
of water per person per day. In around, 30 percent of the households are having
intermediate access to water consumption (in litres) per capita per day. Therefore, we
can conclude that as urbanisation rate increases at 68.17 percent led to 70 percent of
household accessing on an average the water consumption at above 60 litres per person
per day in East Sikkim district in the year 2018.
As urbanisation increases, simultaneously there exists various dimensions that
interplay with water consumption. The required quantity of water supply possibly
depends on the income of the households. To understand the effect of income on the
household water supply, while surveying, we asked respondents about their current
expenses on food and non-food items. Based on this information provided by
respondents on monthly expenditure on food and non-food, was considered the sum of
the two expenditure components as a proxy for household income. From monthly
consumption expenditure, we have categorised each household into five income
groups: low income group (A), low-middle income group (B), middle income group
(C), middle-higher income group (D) and higher income group (E).
Table 5.15: Income groups of the households based on monthly expenditure
Income groups Monthly Household Expenditure
low income group (A) Below Rs. 10000
low-middle income group (B) Rs. 10000-20000
Middle income (C) Rs. 20000-30000
Middle higher income (D) Rs. 30000-40000
Higher income (E) Above Rs. 40000
Source: Author’s estimate based on primary survey data
We have set the least expenditure the household incur i.e., below Rs. 10,000 as
low income group. Similarly, for the rest of income categorization from total monthly
expenditure is presented in Table 5.15. Within income categories, we have found that
around 33 percent of household belong to low-middle income group, 10.98 percent of

67
households belong to low income group and 5.35 percent of households are in higher
income group, who use different water sources available for domestic consumption in
the urban areas of East Sikkim district. From the primary survey, 9.57 percent of
households did not reveal their total monthly expenditure (refer Table, 5.16).
Table 5.16: Frequency distribution of water sources across different income
groups
Income range
(In Rs.) Tap
water
Private
pipeline
Both
(Tap and private
pipeline water )
Others
*
Total
frequency
Income not
stated 26 5 3 0
34
(9.57)
Below 10000 26 5 5 3
39
(10.98)
10000-20000 79 13 21 4
117
(32.95)
20000-30000 62 14 14 0
90
(25.35)
30000-40000 33 12 10 0
56
(15.78)
Above 40000 13 1 5 0
19
(5.35)
Total 240 50 58 7
355
(100)
Source: Author’s estimate Primary survey data
Note: Figures in the parenthesis represent percentage of the total
* includes purchasing water, well, & borrowing from/depend on neighbors.
When we compared the per capita water consumption (in term of litres) per day
across the different income groups, it is revealed that these figures are above the
recommended level or the norms set by the National Commission for Urbanisation. The
commission has recommended per capita water supply of 90-100 litres per day, which
is needed for domestic sector for healthy and quality of life to the public. As income
increases, from low (Below Rs. 10, 000) to middle higher income (Rs. 30,000 - 40,000)
groups, per capita water consumption increases from 115.68 litres to 230 litres per
person per day. The estimate of per capita water consumption is depicted in Table 5.17.

68
Table 5.17: Per capita water consumption per day across income groups
Income range Household
Obs.
Total water
consumed (in litres)
Per-capita water
consumption (in litres)
Income not stated 34 24799 147.42
Below 10k 39 10227 115.68
10-20k 117 44325 123.07
20-30k 90 59414 186.35
30-40k 56 64541 230.43
Above 40k 19 11895 218.36
Source: Author’s estimate based on primary household survey
5.6 REGRESSION ON PER CAPITA DOMESTIC WATER CONSUMPTION
In this section, we use an econometric analysis to understand the determinants for per
capita domestic water consumption at the household level. Our basic model is
represented in the following equation given as:
log Yi = β0+ β1 logX1 + β2 log X2 + β3 log X3 +.............+ βn log Xn + €
Where, Yi is the measured dependent variable, β0 denoted the intercept, which is a
constant term, the β’s measures each slope coefficients which represent the elasticity of
dependent variable with respect to explanatory variables i.e., the percentage change in
dependent variable for a given percentage change in explanatory variables and €
denoted the random error terms in the model. From equation (1), we follow the ordinary
least square methods to estimate the value of each β’s parameter.
A multiple linear regression model is used to estimate the contribution of the
various determining factors that a household demands/consumes water (in term of per
capita water in litres) in a day. It also helps to check their level of significance. The
explanatory variables in this model are— the hours of water supply, family size, highest
educational attainment in the family (year of schooling), per capita monthly expenditure
of the household measured in rupee term and types of residency which is captured in

69
the binary form (renter or owner). The dependent variable in this study is the per capita
water consumption. Table 5.18 shows the empirical finding of each slope coefficient of
the variables. As we can see from OLS result, the selected parameters such as hours of
water supply and types of residency variables are found to be statistically significant at
1 % level and highest educational attainment is significant at 5% level. Family size and
per capita monthly expenditure of the family member’s variables is significant at 10 %
level. From the analysis, we have found the positive relationship between the dependent
and independent variables for the selected parameters namely— hours of water supply,
monthly expenditure of the households and highest educational attained by the family
members. For family size, the relationship with per capital water consumption is
negative in our study finding.
Table 5.18: Ordinary Least Square Result
Source: Author’s estimation based on household primary survey
Note: a). ***, ** and * indicates significance at 1%, 5% and 10% level respectively.
b). Standard errors are given in the parentheses.
The interpretation of this finding is that if one percent increase in hour of water
supply at households, the per capita water consumption per day will goes up by 1.88
percent keeping others variables constant. On an average, an increase in one percent
Dependent variable: Log Per capita water consumption (in litres/day)
Independent variables Coefficient value
Log Hours of water supply 1.88
(0.041)***
Log Family size -0.10
(0.057)*
Log Highest educational attainment by the member of
Households
0.10
(0.053)**
Log Per capita monthly expenditure of the households 0.07
(0.043)*
Types of residency (owner=1; renter =0) 0.15
(0.046)***
Intercept term 1.55
(0.38)***
Number of observations 321
R squared 0.89

70
higher level of education attained by family members will led to increase in per capita
water consumption by 0.10 percent. When the per capita monthly expenditure goes up
by one percent then on an average the per capita water use per day will also increase by
0.07 percent, which indicates that the higher income will have higher per capita water
consumption. Being owner category of the household, further, increase in per capita
water consumption by 15 percent vis-à-vis renter type of households.
Usually, in the multiple linear regression model, we have more than two
explanatory variables. Some of the selected variables in the model seem to be highly
correlated with others variables. To check for the problem of multi-collinearity, we use
set of variance inflation factors (VIF). We regress on each explanatory variable from
selected parameters and calculation for VIFs is given in equation below:
VIF =1
1 − R2
For any VIF < 5, then multi-collinearity is not severe in the study (Kacapyr 2015). We
used stata12.0 software to calculate VIF for each regression by giving command vif
(refer Table 5.19) that shows the calculated value of VIF for each explanatory variable.
We found that all the selected explanatory variables are free from multi-collinearity
problem. Therefore, the individual explanatory variables explained the model well in
this study.
Table 5.19: Detecting Multi-collinearity Problem
Source: Author’s estimation based on primary survey data
Variables VIF 1/VIF
Hours of water supply in a day 1.25 0.79993
Family size 1.63 0.61223
Highest education attained by the family member 1.17 0.85358
Per capita monthly expenditure of the households 1.53 0.65287
Types of residency 1.27 0.78935
Mean VIF 1.37
71
5.7 SEASON FOR DETERIORATING DOMESTIC WATER QUALITY
To understand the impact of seasonality of deteriorating water quality, we have asked
household respondents about the water quality issue during seasons-wise in the study
areas. Most of the responses that we have received from households is that usually in
the months of rainy season from May to July the household faced the deteriorating
domestic water quality. Otherwise, the appearance of water seems to be clear and clean
as reported by the respondent.
We have found that 84.51 percent of the households are having domestic water
quality problem mostly during the rainy seasons starting from May to August and 8.74
percent of household are having water quality issues in winter season. Only 1.13 percent
of household are having water quality throughout the year and 5.63 percent are not
facing the water quality problems from various water sources available for the
consumption (refer Table 5.20).
Table 5.20: Months having water quality problem at households
Months Household responses
(December - January – February) 31
(8.74)
(May – June - July – August) 300
(84.51)
(January to December) 4
(1.13)
No water quality problem 20
(5.63)
Source: Author’s estimate (primary field survey)
Note: Figures in the parenthesis are in percentage of total population size.
Larger numbers of households in our study are facing water quality issue but
the question arises, how they are managing with drinking water quality issue at this
juncture? In the next section, we intend to assess demand for drinking water quality in
urban East Sikkim. Drinking water is the most important thing among the various water
use activities the households. Drinking water should be free from any form of impurity

72
or should have its acceptable standard in terms of physical, chemical or bacteriological
parameters, so that it can be safely used for drinking purpose (Roy et al. 2004). To
assess the quality of drinking water services in the absence of explicit market, then each
household will be able to impose some amount of money for water quality services.
The improvement in water quality helps the consumers in various way of reducing
water bone diseases and improvement in health condition of an individual. Then there
will be willingness to pay for such an improvement on water quality (Ibid 2004). The
two most important factors that the households take into consideration are the ability of
the households to spend. To examine the demand for domestic drinking water quality
in the urban East Sikkim district, we are looking through the imposition of water
charges and ability to pay across expenditure on water quality improvement. Across
different income strata, we are looking at the purification methods adopted by
households as well as the purification cost that households incurred for drinking water
quality. Table 5.21 shows the socio-economic status of the surveyed households across
income groups, including educational attainment vis-a-vis income level. The higher
educational attainment level gives awareness related with the basic public service
delivery. But, at the same time, average family size is also positively related with the
monthly expenditure.
Table 5.21: Socio-Economic status of the households across income groups
Monthly
expenditure
No. of house-
hold size
Average
household size
Average Highest educational
attainment by the household
members
Income not stated 34 5.35 12.58
Below 10k 39 3.69 12.23
10-20K 117 4.44 12.54
20-30k 90 4.77 12.81
30-40k 56 5.66 12.87
Above 40k 19 5.26 15.47
Total 355 4.86 12.47
Source: Author’s estimation based on primary survey data

73
In general, an average person requires 2 litres of water per day for drinking purpose
(Roy et. al. 2004). In this study, it reveals that the households in urban East Sikkim
district adopted two methods for water purification in order to produce the drinking
water quality. One is the traditional method used by household i.e., to boil the drinking
water and other method is to use modern technique to clean water using filter at the
household level. Table 5.22 and Table 5.23 show different measures that the households
follow for drinking water across sources and income groups. We have observed that
42.81 percent of households used the both methods for purification of water and 53.80
percent of household followed the traditional method for water purification. Only, 3.38
percent of households do not use any methods for water purification.
Table 5.22: Household following different techniques for purification of domestic
drinking water
Sources Only
Boil
Only
Filter Boil & Filter
Consume
as it is Total
Tap water 130 21 82 7 240
(67.60)
Private pipeline 26 4 18 2 50
(14.08)
Tap and private
pipeline 31 1 23 3
58
(16.34)
Others* 4 1 2 0 7
(1.97)
Total 191
(53.80)
27
(7.60)
125
(35.21)
12
(3.38)
355
(100)
Source: Author’s estimate Primary survey data
Note: Figures given in the parentheses indicate percentage of the total.
* includes spring purchasing water, well, & borrowing from/depend on neighbors.

74
Table 5.23: Different measures adopted by households for safe drinking water
across different income groups
Income
range
Modes
Not
stated
income
Below
10k
10-
20k
20-
30k
30-
40k
Above
40k Total
Only Boil 24 28 72 37 26 4 191
Only Filter 2 2 11 6 2 4 27
Boil & Filter 7 6 31 43 27 11 125
Consume as it is 1 3 3 4 1 0 12
Total 34 39 117 90 56 19 355
Source: Author’s estimation based on primary survey data
5.8 COST ESTIMATION ON WATER PURIFICATION
In urban areas, people are becoming more conscious about the quality of water they
drink. The demand for water quality increases as the level of educational standard
increases. We found that more than half of the population from our sample household
go for tradition approach for water purification i.e., boils the water before drinking.
Around 343 households use both the filter and boiling methods for purification of
drinking purposes. To estimate the average expenditure, the households incur for
producing one litre of drinking water quality, we have simply taken the capital and
maintenance cost of the filter the household used over the life time of the filter. Here,
capital and operation and maintenance cost include investment on filter, interest charges
and installation cost over the lifetime use of the filter. From the field survey,
information have been gathered and collected from each of the household with regard
to the cost pattern of the filters used by the households. For estimating the part of the
unit cost, for capital investment, we have adopted the methods adopted by Roy et al.
(2004).

75
From the analysis of data, we found that the different valuations of water quality the
households incur which is starting from 0.08/litre to Rs. 2.30/ litre in ours study. We
have calculated the average unit cost of drinking water represented in Table 5.24.
Table 5.24: Drinking Water Purification cost and Different Measures
Modes No. of HHs Average per unit filter
cost (in Rs/Litre)
Only Boiling 191 (53.80) 0.07
Only Filter 27 (7.60) 0.77
Filter and Boiling 125 (35.21) 0.67
Non-of the above 12 (3.38) 0.00
Source: Author’s estimation based on primary survey data
Note: a). Figures in the parenthesis indicate the percentage of Households using
different mode of water purification.
b). Control for the family size of 4 members.
The household decision regarding purification technique adopted will depend on the
ability of the household to pay. The perception about water quality purification
technique will likely to change among households. The empirical analysis of this
variation will help us to identify policy tools towards the water management. To
understand this, we have considered the highest educational attainment among the
family members as an indicator of access to relevant information available for the
public regarding filter information for water purification. This indicator determines
decision of the household adopting water filter by incurring extra cost on it. To identify
the policy variables, we have employed the multiple linear regression model. From the
households of 310 (out of the 355 sample households) who used at least one of the
techniques to clean water before drinking, it is observed that each slope coefficient
given in Table 5.25 shows a positive relation with the unit cost per litre of water in a
day. We have found that the highest educational attained by the family members
provide the necessary information about the water quality and at the same time pass the
information about the use of the filter.

76
Table 5.25 Ordinary Least Square Result
Dependent variable: Log unit cost per litre of filter water
Independent variables Coefficient value
Log per capita monthly expenditure of the households 0.52
(0.11)***
Log highest educational attainment in the family 0.77
(0.31)***
Intercept term -7.85
(1.10)***
Number of observations 310
R Square 0.10
Source: Author’s estimation based on household primary survey.
*** indicate significance at 1% level and the Standard errors are given in the
parentheses.
The monthly expenditure of the household plays an important role to understand the
ability to pay for filter use. The interpretation of slope coefficient value explained that
as one percent increase in monthly expenditure, on an average the unit cost of filter
water goes up by 0.523 percent. Similarly, one percent increase in the educational
attainment of the family members, on an average, the unit cost of filter water goes up
by 0.767 percent.
From the analysis of primary data, we have found that there is season for
deteriorating tap water quality supply, especially in the rainy season and not much
quantity problem as urbanisation rises in East Sikkim district.

77
CHAPTER VI
URBAN DOMESTIC WATER SUPPLY POLICY IN EAST SIKKIM
DISTRICT
6.1 INTRODUCTION
Urban water resources management and planning deal with the laws, institutions and
policies that are framed by the government, private agency or local bodies. While
planning for water resources management, the issue of environment is given special
priority (Cosier and Shen 2009; Gupta 2001). In most of the countries, government
agencies act as a regulators and distributors of water service delivery to the public.
These features show a monopoly characteristics and essential nature of the water sector
control by the government (Cosier and Shen 2009). Water users believe that water as
an essential commodity for survival, merit good and it should be distributed freely.
Over the years, in the world, the water supply volume showed a consistent pattern of
underpricing to the public (Hirshleifer and Milliman 1967). This may be because of the
rational reallocation of water supply, which had never been considered. With the
growth of urbanisation, there is a need for economic optimization of water use today
and tomorrow. The water allocations among different sectors such as domestic
consumption, industries, agricultural use, etc. face a major challenge in distribution not
only in the country but also globally (Kumar and Pandit 2016; Gupta 2001). The rapidly
expanding cities requires more water for human use and the cities or urban centres
require higher per capita water as compared to rural areas (Kumar and Pandit 2016).
With these different scenario of water uses and needs, hardly we see any consensus

78
among stakeholders on what needs to be done to meet the growing challenges of water
policy in front.
Water being a state subject under the constitution of India or being a merit good,
the government has the primary role and responsibility to use and control of water
sector. At the national level, since the 1950s, various schemes and programmes have
been implemented for drinking water supply. The first National Water Supply and
Sanitation Programme was launched in 1954 for providing safe drinking water to urban
and rural areas and the first National Water Policy came into existence in 1987 under
the Ministry of Water Resources, Government of India. The 74th Constitutional
Amendment Act was passed in 1992 to form urban local bodies (ULBs) consisting of
Municipal Corporation, Municipal Council and Nagar Panchayats in urban areas
(Hamid 2004). Subsequently, in 1993, the Accelerated Urban Water Supply
Programme was launched in urban centres for providing safest and adequate water, for
the population less than 20,000 as per census 1991 (GoI 1994). Under this scheme,
matching grants was equally shared between state and central government. During the
Eight Five Years Plan period (1992-1997), the problem of water supply sector was
identified and various reforms were suggested. One reform agenda was placed, that is
water was considered as “commodity”. Thereafter, privatization of water sector began
and all local bodies were given responsibility for operation and maintenance of water
works in the country. Under the Ninth Five Years Plan period (1997-2002), the major
objective was to provide 100 percent water supply coverage both in urban and rural
India. In 2002, the government of India has started Swajaldhara Pragramme for
National Drinking Water Supply under the Rajiv Gandhi National Drinking Water
Mission (RGNDWM). Under this programme, the Panchayat Raj Institutions (PRIs)
and the local government bodies became the sole responsibility for water supply and

79
management and sanitation schemes (Joshi 2004). But, still we find many lacunae for
proper implementation of these various programmes in our country. The earlier two
versions of the National Water Policy 1987 and 2002 and the recently implemented
National Water policy 2012 in the country have made no such impact on improving
Water Resources Management (Pandit and Biswas 2019). In Indian context, focus on
water planning is based on quantity rather than quality of water, which is just opposite
to the European countries that emphasized on water quality along with water quality
(Ibid 2019).
The service delivery of water supply in Indian cities over the years is
continuously inadequate and found to be unreliable quality. The sector suffers from
chronic operational inefficiency due to lack of infrastructure development and
expenditure on it. The problem further aggravated due to uneconomic tariff structure,
low collection efficiency and high level of leakage of water from pipes lying on surface
of the earth (Ibid 2011). Rapid urbanisation along with unplanned growth of cities and
towns are adding more problems to the existing ones. With the increase in population,
urbanisation and industrialisation together with spatial and temporal variations in water
availability, the water quality problems led to the higher demand for water in any
region. In Sikkim as well, the problem is being felt recently.
6.2 WATER POLICY IN URBAN EAST SIKKIM DISTRICT
There was no specific urban water policy as such in the state of Sikkim till very recently.
In 2007, a general policy called the State Water Policy was framed on the line of
National Water Policy of 1987, guided by the policies and programmes for water
resources management and its development in the state (GoS 2009). The economic

80
expansion process in the state leading to increasing demand for a diverse used of water
requirement in various sectors namely, domestic, hydro power, industries, agriculture,
production and recreation activities. Proper water policy management is the need of the
hour. In Sikkim, the trend of rainfall pattern is also declining over the period from 2011
to 2014. The availability of water from rainfall showed inconsistent pattern. There are
cases where the springs in some parts of the state are getting dried one after another,
which further rose to the urgency to look into the water policy decisions.
The water resources management basically deals with two types of management
namely the technical and efficient water managements. The technical management is
defined as the water provided by the department through different channel of supply. It
is related to maintenance of water supply network by government agency. An efficient
management deals with how public are taking initiative to maximize the optimal use of
water available. Water resources management deals with the various water extraction
sources on the surface, such as the glacier, rivers and springs in Sikkim. The ample
amount of rainfall will indicate the less insecurity of water in the state. But state of
Sikkim has been witnessing a declining trend of rainfall in the recent past (SERS 2016).
The population is unevenly distributed in the state of Sikkim, wherein the East district
of Sikkim being the densely populated, relating with water management model, i.e.,
technical and efficient water management. The former management of water
distribution in urban East Sikkim district covers 89.9 percent of families, having access
to tap drinking water sources (Census 2011) and later water management covers 83.66
percent of domestic households as per primary survey conducted by this study in the
month of June-July 2018 (Field survey 2018). As per Sikkim Water Supply and Water
Tax Act 1986 says that:

81
“The government may provide any area with a water supply to wholesome
water for public, for commercial, domestic and other par-subject to
availability of water. For the purpose of such supply the government shall
cause to be constructed or maintained such water works as may be
necessary and may erect stand pipes, wells or pumps for the use by public
of area. The supply of water for domestic purposes under this Act means
supply for any purpose except the following namely: a. for any trades,
manufacture or business………” (GOS 1986, pp.1-2).
Further, the existing rules and regulations of Sikkim Water Supply Act 1990 regulated
by the water security and public health engineering department (PHED), government
of Sikkim mentions that the distribution network of water supply was carried by non-
volumetric approach. This was done on the basis of number of taps used by domestic
and commercial purposes. Table 6.1 depicts the water tariff based on non-volumetric
distribution in Sikkim. The government of Sikkim hereby makes further rules to amend
the Act of 1990 called the Sikkim Water Supply rules 2014. Under this amendment
rules, the water supply services shall be rationalised with the introduction of volumetric
tariff that will replace the tap-based tariff (GoS 2014). The past and present rules and
regulations introduced by the government of Sikkim is executed by the PHED. Whether
the equitable distribution of water required by public actually meet or not is one of the
concerns with the upsurge of urbanisation.
Table 6.1: Non-volumetric Tariff as per No. of Taps
Sl. No. Number of Taps Domestic
(in Rupees)
Commercial
(in Rupees)
1 1-3 taps 90 180
2 4-7 taps 150 290
3 8-12 taps 250 390
4 Every tap in excess of 12 50 100
Source: Public Health Engineering Dept., Government of Sikkim (2014)

82
The existing tap-based tariff approach indicates the installation of number of taps
charge the different rates of water supply for domestic and commercial activities. Table
6.1 indicates as the number of tap increases from the range of 1-3 taps to 4-7 taps, there
are varied rates of tariff charged for domestic and commercial connections. The
domestic households are paying rupees 90 as compared to commercial water
connections which are paying double of the domestic connection. As the slab increased
from 4-7 taps the commercial connection is paying rupee 290. Under state annual action
plan (SAAP) report, the government has diagnosed service level gaps for the state as
per information provided by the urban local bodies and concerned department of water
supply under PHED. The universal coverage in water supply has been addressed by the
state. According to the SAAP, the imbalance in the demand and supply is being
addressed through ongoing schemes under Asian Development Bank (ADB). The
recommendations given by the Ministry of Urban Development (MoUD) the water
supply requirement for the Gangtok area can be met through metering works and
replacement of smaller diameters pipeline called secondary feeder mains. With this
suggestion, the government has amended the existing rules of Water Supply Act 1990
and called it as Water Supply Rules 2014. Based on this amended rule, the concerned
department of water security and public health engineering department has given the
volumetric tariff based rates for domestic water users in Sikkim. Till date, the water
security and public health engineering department have not initiated the collection of
water tariff based on volumetric approach. Table 6.2, present the volumetric tariff based
on metered per kilo-litre. The main ideas behind the proposed implementation of
volumetric tariff on water in urban Sikkim is to bring down the wastage of water and
account for un-accounted water due to pipe lines break or pilferage.

83
Table 6.2: Volumetric Tariff based on Metered per kilo-litre (1000 litre)
Sl. no Volumetric Domestic (Rs./KL) Commercial
(Rs./KL)
1 First 20 KL 5 10
2 20-40 KL 8 13
3 40-60 KL 12 17
4 Every KL above 60 KL 20 20
Source: Public Health Engineering Dept., Government of Sikkim (2014)
Whether this initiative taken by government under PHE department will work out in
the future for managing water supply and equitable water distribution to public is one
of the important challenges for water policy in front. The government of Sikkim wants
to switch from non-volumetric to volumetric water supply consumption pattern for
public at large. But whether public at large are happy regarding the policy initiated by
the state is a matter of investigation. To understand public choice regarding the decision
made by the policy maker on water supply, we are focusing on the decision made by
public on water supply policy services for domestic sector in urban East Sikkim district.
Table 6.3: Existing Fee for water service connection in Sikkim
Sl.no Service Fee (Rupees)
1 Cost of application form for new connection/shifting 25
2 New connection fee 600
3 Shifting charge of supply point /connection point 300
4 Re-connection fee 100
5 Fee for No objection certificate 60
Source: Public Health Engineering Department, Government of Sikkim
Table 6.3 represents the fee for water service connection. The initial cost of water
supply connection come around rupee 685 (which includes cost of application, new
connection fee and fee for no objection certificate). Despite this low fee structure, the
coverage of water supply connection in Gangtok town status is 75 percent (SAAP
2016).

84
6.3 RESOURCES ALLOCATION FOR WATER SUPPLY IN SIKKIM
For meeting the ever increasing requirement of water in East Sikkim district, a Central
programme called the Jawaharlal Nehru National Urban Renewal Mission (JNNURM)
along with the Atal Mission for Rejuvenation and Urban Transformation (AMRUT)
have been in place in Gangtok town. In the remaining urban centres, the water supply
funding is done through various programme implemented by the central government as
well as the state such as non-lapsable central pool of resources (NLCPR) from 1998-99
and development of North-Eastern Council (NEC) from 2003-04 (GoS 2015). During
1998, Sikkim was recognised as part of the North Eastern Region (NER) of the country
and in the year 2002 fully integrated in the region. This amalgamation with the NER
benefits the state of Sikkim for availing funding from NLCPR and NEC. There was the
allocation of expenditure from the state plan as well as from the Central government
for managing the water supply in Sikkim. The growth rate of annual state plan
outlay/expenditure and revenue collection from water supply of Sikkim is depicted in
Table 6.4.
Table 6.4 Growth rate of annual state plan outlay and revenue collection from
water supply of Sikkim 2003-2012
Sl.no Year
State plan
outlay
(Rupees in
lakhs)
Growth
rate State
plan outlay
(%)
Revenue
collection
(Rupees in
lakhs)
Growth rate of
Revenue
collection (%)
1 2002-03 350 - 72.83 -
2 2003-04 950 171.43 74.25 1.95
3 2004-05 875 -7.9 95.38 28.46
4 2005-06 855 -2.29 100.56 5.43
5 2006-07 961 12.4 196.74 95.64
6 2007-08 1755 82.62 201.66 2.5
7 2008-09 1936.99 10.37 252.04 24.98
8 2009-10 2006.93 3.61 253.48 0.57

85
Sl.no Year
State plan
outlay
(Rupees in
lakhs)
Growth
rate State
plan outlay
(%)
Revenue
collection
(Rupees in
lakhs)
Growth rate of
Revenue
collection (%)
9 2010-11 1830.53 -8.79 254.21 0.29
10 2011-12 1540.99 -15.82 287.65 13.15
11 2012-13 3039.08 97.22 271.85 -5.49
Source: Author’s computation from the Annual Report, 2012-13. WS&PHED,
Government of Sikkim
The year to year growth rate of state plan outlay and revenue collection was 171.43
percent and 1.95 percent during 2003-04. On an average, the growth rate of state plan
outlay was 34.28 percent and revenue collection were 16.57 percent over the period
from 2003 to 2012. These figures indicate the state plan outlay is double times higher
than the revenue collected from the water users of Sikkim from 2003 to 2012.
The water supply and sanitation expenditure of Sikkim data are summarised in
Table 6.5, for the period from 1981 to 2015. The percentage of expenditure on water
supply and sanitation to total expenditure in Sikkim is found to be less than 1 percent
during the period from 2004 to 2015, while the state population is increasing every year
at the tune of 1.22 percent (Census 2011). The per capita water user charge showed a
consistent pattern of increasing trends of Rs. 218 to Rs. 647 from 2004 to 2015 (refer
Table 6.5).
Table 6.5 Revenue expenditure on water supply and sanitation of Sikkim
1981-2015
Year
Water supply
and sanitation
expenditure
(in Lakh)
Total
expenditure
(in Lakh)
% Water supply
and sanitation
expenditure to
Total expenditure
Per capita
user
charge/Rev
enue (Rs)
1981-82 0 3173 0.00 0.00
1982-83 0 3546 0.00 0.00
1983-84 0 4928 0.00 0.00
1984-85 0 5857 0.00 0.00

86
Year
Water supply
and sanitation
expenditure
(in Lakh)
Total
expenditure
(in Lakh)
% Water supply
and sanitation
expenditure to
Total expenditure
Per capita
user
charge/Rev
enue (Rs)
1985-86 116 7758 1.50 0.00
1986-87 152 8126 1.87 42.39
1987-88 773 9846 7.85 210.23
1988-89 229 11316 2.02 60.74
1989-90 227 11527 1.97 58.72
1990-91 291 12815 2.27 73.41
1991-92 374 15509 2.41 92.01
1992-93 412 17973 2.29 98.51
1993-94 409 18891 2.17 95.04
1994-95 531 52642 1.01 119.91
1995-96 651 88119 0.74 142.87
1996-97 701 111886 0.63 149.51
1997-98 715 125810 0.57 148.20
1998-99 964 149560 0.64 194.19
1999-00 1089 150997 0.72 213.19
2000-01 1020 76331 1.34 194.06
2001-02 1046 166425 0.63 193.40
2002-03 1161 188262 0.62 212.07
2003-04 1288 118093 1.09 232.44
2004-05 1224 172349 0.71 218.23
2005-06 1400 176761 0.79 246.60
2006-07 1498 188756 0.79 260.68
2007-08 1775 234856 0.76 305.16
2008-09(RE) 2360 238075 0.99 400.84
2009-10(BE) 2073 256715 0.81 347.85
2010-11
(Accounts) 2484 290753 0.85 411.79
2011-12 (RE) 2219 355904 0.62 363.43
2012-13 (BE) 1651 357002 0.46 267.14

87
Year
Water supply
and sanitation
expenditure
(in Lakh)
Total
expenditure
(in Lakh)
% Water supply
and sanitation
expenditure to
Total expenditure
Per capita
user
charge/Rev
enue (Rs)
2013-14
(Accounts) 2219 345796 0.64 354.72
2014-15
(Accounts) 2837 373095 0.76 448.04
2015-16 (RE) 4149 431275 0.96 647.35
Source: Planning Commission, Hand book of statistics of Indian states, Reserve Bank
of India. RE = Revised Estimate, BE = Budget Estimate.
The revenue collection of urban water in Sikkim is low as compared to the state
plan outlay incurred under its provision. Per capita charge of water is increasing every
year. This is reflected in the Table 6.5. In India’s major cities as well, an appropriate
price setting reform for the domestic water users is needed (Sauri 2013). This is because
of the price charged from the urban water users are lower as compared to the cost
incurred (Mathur and Thankur 2006). The price charged is 20 to 25 percent lower than
that of the operation and maintenance costs (Ibid 2006). Even though, there is much
difference between the revenue collection and state plan expenditure in water supply in
the state of Sikkim. In nutshell, if price mechanism reforms happen, then that could
lead to the proper management of resources allocation not only for revenue generation
but also in terms of proper use of the available water resources (Sauri 2013). There is a
negative relationship between the two, as higher price charge with lower water
consumption and higher water security in future (Ibid 2013).
The water security and public health engineering department, government of
Sikkim, demand No. 33 is related to the demand for grants on water supply programme
in Sikkim. The Table 6.6 shows the maintenance and operation expenditure on water
supply and sewage in East district of Sikkim.

88
Table 6.6: Maintenance and Operational Expenditure Water Supply in
East Sikkim district 2004-2015 to 2015-2016
Year Plan Non-plan Rs. (In Lakh)
2004-05 4900 15177 200.77
2005-06 7284 13660 209.44
2006-07 12400 12294 246.94
2007-08 13990 13475 274.65
2008-09 21398 14500 358.98
2009-10 6342 14700 210.42
2010-11 20000 16900 369.00
2011-12 23584 15400 389.84
2012-13 18261 16987 352.48
2013-14 18248 16262 345.1
2014-15 18248 17035 352.83
2015-16 12951 29610 425.61
Source: Handbook of Demand for grant in Water, PHE, Dept. Government of Sikkim
For efficient management of water supply to the general public, the government
should collect at least the maintenance and operation expenditure on water works. From
the given data on revenue collection on water supply of Sikkim represented in the Table
6.4 shows a lower and still unable to recover the maintenance and operation cost of
water supply in East district of Sikkim. This reflects that the state of Sikkim needs a
proper mechanism to look into an alternative to the system, to at least cover the
maintenance costs. In this step, the policy makers have decided to account for water use
through volumetric consumption and distribution of water to the different users. But,
whether people are happy with the decision taken by water authority, especially on
domestic water sector. To understand this paradigm on domestic water policy in East
Sikkim district, we have conducted a choice based experiment for water service
delivery, in the month of June-July, 2018. The primary survey was conducted for
domestic sector based on the household preference for domestic water policy and we

89
asked household respondents to select one scenario which they consider the best out of
the three scenarios given to them. They are depicted in Table 6.7.
6.4: Policy Option
Any implementations of policy for welfare of masses needs thorough understanding of
the public participation. To understand the domestic water supply policy in East Sikkim
district, we have considered the public preference for water supply policy. Using the
tools of choice based experimental methods, we have designed and developed the
choice set, a set of attributes affecting water supply policy to reflect the true
characteristic of water supply policy. To identify the attributes related to water supply
policy, we have chosen four attributes (details given in Table 6.7), namely 1.
Connection, 2. Water Supply Quantity/quality, 3. Governance and 4. Bill for water
supply service.
Table 6.7: Three Scenario Open to the Water Users (Households)
SCENARIO 1 2 3
ATTRIBUTES Existing System
(Non-volumetric)
Proposed by the
Government
(Volumetric)
Alternative
(Privatization)
CONNECTION Without meter Meter Meter
SUPPLY/QUALIT
Y
Limited supply,
approx. 1-3 hrs/day.
Regular (Seemingly)
[As per norm the
supply of should be
24x7, but it is not
happing in most of
the cities in India at
present]
Regular
GOVERNANCE Government Government Private agency
RENT/BILL Normal (Per
connection)
block-wise per unit
consumption
Higher than
Government
Source: Primary Field Survey

90
In scenario 1, it basically portrays the existing system for water supply operating
in urban East Sikkim district, wherein the status quo represented the connection of
water supply at household is without meter system, quantity of water supply is limited
to 1 to 3 hours per day and PHE department takes charge of distribution and
maintenance of water supply work and households pay flat rate of tariff for water
consumption per month.
In scenario 2, it is the proposed policy decision made by the policy maker
(Government of Sikkim) for distributing water to the general public. This scenario is
little different from scenario 1, wherein the meter system has been introduced by the
PHE department to account for volumetric consumption of water supply and tariff for
water consumption is based on the block-wise per unit consumption of water mentioned
in Table 6.2. Further, the department has assured that the quantity of water supply will
be on the regular basis i.e., 24x7 hours of water supply at domestic sector. Since, most
of the developed cities and towns in India are already using the meter system of water
supply for domestic consumption. But still, they are not getting water for 24x7 hours.
So, this seems to be myth in the case of the urban East Sikkim district as well.
In scenario 3, we have included the privately managed water supply distribution
for the general public as an alternative policy. Under this system, water is mainly
governed by the private agencies for distribution and maintenance water works. In this
system, water tariff charge will be higher than other previous two scenario (1 and 2).
When the experiment was conducted based on these three scenarios, we have
found that there were mixed responses of the choice of scenario and it is represented in
Table 6.8.

91
Table 6.8 Household’s choice for water policy in Urban East Sikkim district
Choice of Scenario Number of choices made by Households
Existing System (1) 180
(50.70)
Proposed by the Government (2) 82
(23.10)
Alternative (Private) (3) 93
(26.20)
Total 355
(100)
Source: Author’s estimate based on primary survey data
Note: Figures in parenthesis represented the percentage of the total.
The finding of households’ choice based preference for water policy in urban
East Sikkim district are found that 50.70 percent of households still prefer the existing
system of water supply and followed by 26.2 percent of households prefer the privately
managed water supply distribution. Around, 23.1 percent of households prefer the
meter system at water supply consumption provided by PHE department. From the
findings, we can conclude that most of households in urban East Sikkim district have
the preference of existing water supply system (without meter) of water supply for
domestic consumption.
In urban East Sikkim district, we have two types of classification of residency
i.e., owner and renter of the households given in Table 6.9. Based on this classification,
we have found that 52 percent of owner and 50 percent of the renter of households have
the same existing system preference choice for domestic water policy. The remaining
23.81 percent of owner of the households have shown their preference for proposed
meter system governed by PHE department and 24.49 percent households looks for
private agency distribution for domestic water policy. In case of renter type of
households, the preference choice of water policy for domestic sector is more or less
same for owner type of households. There is not much difference in case for the

92
preference choice of water policy which households actually demanding in the urban
East Sikkim district.
Table 6.9 Classification of scenario based on types of residency in urban East
Sikkim district
Scenario Number of households
(owner type)
Number of households
(renter type)
Existing System 76
(51.7)
104
(50)
Proposed by the
Government
35
(23.81)
47
(22.6)
Alternative (Private) 36
(24.49)
57
(27.4)
Total 147
(100)
208
(100)
Source: Author’s estimate based on primary field survey;
Note: Figures in parenthesis represent percentage term of the total.
More or less the same preference choice between owner and renter types of the
households indicate that people of urban East Sikkim district are happy with the existing
water policy. Though some of the households have complained regarding the current
water supply system, the urban East Sikkim district is still in the better position in
regard to water supply provision, even if it is not compared to other districts of the state.
For sustainable domestic water supply provision in the long run, it is required to
improve infrastructure as well as knowledge of water recycling techniques and water
saving technologies, which will be much helpful for the conservation and preservation
of water resources in this hill state.
While surveying, we have put few questions regarding whether the households
follow any water conservation technique or not. We have found that 310 households
out of 355 total household do not adopt any water recycling technique. Only 45
households are found to be practicing the water recycling techniques at households. We
have asked the few questions, whether the households adopt for water recycling

93
techniques as: 1). after cleaning cloth, the water is used for bathroom purposes, 2).
kitchen used water is for gardening, and 3). any others. Now, the questions regarding
water saving technologies, such as installation of water harvesting system at building,
we found that none of the urban East Sikkim district has installed rain water harvesting
system at their respective building. Only 15.77 percent of households are using roof
water harvesting practice.
Table 6.10 Number of households adopting water saving technologies
Water saving technologies Response given
in Yes
Shower head 84
(23.66)
Semi-Washing Machine 87
(24.51)
Rain Water Harvesting system installed at building 0
(0)
Roof Water Harvesting practice at household 56
(15.77)
Source: Author’s estimate based on primary survey data
Note: Figures are in parenthesis shows the percentage term.
Table 6.10 shows a detail of the number of households adopting water saving
technologies in urban East Sikkim district. Altogether 23.66 percent and 24.51 percent
of household are using showerhead5 and semi-washing machine respectively. None of
the households in urban East Sikkim district used rain water harvesting system. This
further indicates that urban East Sikkim district is in the better position when observing
other major cities of the country, in term of domestic water supply. Figure 6.1 depicts
the urban household practicing roof water harvesting and this figure was taken at the
time of field survey in the study areas.
5 Study done by Sharpe, W.E (1987) found that there was significant reduction in
water usage corresponding to the installation of shower head as a water saving
technology.

94
Figure 6.1 The household practicing roof water harvesting in urban East Sikkim
district
Source: Picture taken at the time of field survey. The location is nearby Tathangchen
area.

95
CHAPTER VII
CONCLUSIONS, SUMMARY AND RECOMMENDATIONS
7.1 INTRODUCTION
This chapter covers a brief summary of the analysis made in the previous chapters.
Findings and discussion made above provide a set of recommendations. As we have
understood that urban growth or the urbanisation process is a dynamic one, which
connects and attracts the people towards urban centres. The urban centres of the East
Sikkim district are relatively the preferred destinations not only for the migrants from
outside state but also from the inter-district migrants of the state and rural-urban
migrants of the same district. The degree of urbanisation in urban East Sikkim district
is comparatively higher than that of the India’s major cities, which accounts for 43
percent in East Sikkim District vis-a-vis 31 percent of all India level (Population Census
2011). At this degree of urbanisation, whether the urban dwellers face water shortage
for domestic consumption is a subject of discussion. The present study is the modest
attempt to assess the urbanisation and water resources management in the urban East
Sikkim district. For this, we raised three major research questions, they are:
1. Is the ever growing urbanisation proportionately supported by the required
quality and quantity water supply for the people of East Sikkim district?
2. Is the water problem negatively related with the income level in East Sikkim
district?
3. Is the existing policy of domestic water management system effective in the
wake of rapid upsurge of urbanisation in the East Sikkim district?

96
To answer these major research questions, we have employed both secondary and
primary data. Using secondary data, growth trend of the population and urbanisation
have been estimated. At the same time, river water quality is also measured in the study
area. From primary data, per capita water consumption was measured and whether the
availability of the water is related with the growth of income level is also assessed.
Public choice of water distribution system was considered for the water supply policy
in East Sikkim district.
7.2 SUMMARY OF THE STUDY
First, to defined the concept of urbanisation, we have simply constructed urbanisation
index taking secondary data sources available for urban East Sikkim district. Therefore,
we found that year to year growth rate of urbanisation was 9.77 percent over the period
from 1981 to 2015 in the East Sikkim district. At the same time, the urban inhabitants
of the state of Sikkim receive water from various sources like tap (both private and state
managed), natural spring and others. However, there is no specific information about
the quantity of water consumed by different sectors like agriculture, industrial and
household sectors. Nevertheless, on an average, the per capita domestic water
consumption in the East Sikkim district is found to be 235 litres.
As per the literature surveyed in the study, urbanisation is interlinked with
migration. Therefore, from the primary data we have considered the years of migration
of household as urbanisation and we found that growth rate of migration was 68.16
percent in the urban East Sikkim district. On an average, the year to year growth rate
of migration was found to be 13.48 percent over the period from 1948 to 2018. To
understand, how people at large managing water with the growth of urbanisation,
97
through primary field survey, we found that 83.66 percent of the sample households got
tap water connection (which includes both PHED tap and private pipeline connection),
followed by private pipeline source exclusively in urban East Sikkim district. Since,
migration is one of the major factors for increasing the demand for water, migrated
populations have added in the total population. From the present analysis it is found
that 247 households are having full access to domestic water supply (that is more than
100 LPCD) as per recommendation made by the WHO norms. The mean value of water
from tap is 208.78 litres, private pipeline is 248.82 litres and from both (tap and private
pipeline) is 239.94 litres. To understand the effect of urbanisation, the required quantity
of water supply may depend on the household income. We have taken proxy of monthly
expenditure, which includes food and non-food items of households to capture the
household income. Based on consumption of monthly expenditure, we have divided the
households into five categories: low income group (A), low-middle income group (B),
middle income group (C), middle-higher income group (D) and higher income group
(E). While comparing the households across income groups for water consumption in
LPCD, from the estimated figures, as income level rises the level of access to water
also rises. For instances, as income increases from low (Below Rs. 10, 000) to middle
higher income (Rs. 30,000 - 40,000) groups, per capita water consumption also
increases from 115.68 litres to 230 litres per person per day. It indicates that these
figures are above the recommended quantity and standard set by the National
Commission on Urbanisation. The commission has recommended per capita water
supply of 90-100 litres per day, which is required at the domestic sector for healthy and
quality life. This indicates that the urban households of East Sikkim district are still in
the better position in terms of per capita water availability with the growth of
urbanisation.

98
To understand the variables that influence the per capita water consumption, we
have used multiple linear regression model (MLRM) and the finding from OLS
estimators on per capita water consumed (dependent variable) by the household in a
day is statistically significant at 1 percent level for the independent variables selected
for the study are namely, hours of water supply and the types of residency. The highest
educational attainment by the family members is one of the independent variables and
it is also found to be statistically significant at 5 percent. We have found that family
size and per capita monthly expenditure of the family member’s variables is significant
at 10 percent. We have also found that the positive relationship between per capita water
consumption with hours of water supply, rise in educational attainment in the family,
per capita monthly expenditure and the types of residency. On the other hand, as
expected, there is a negative relationship between the per capita water availability with
the family size. As family size increases there is a fall in per capita water consumption
level. Some of the selected independent variables may be correlated. To check this, we
have run test for multi-collinearity problem and the results from the variance inflation
rate (VIF) shows that no multi-collinearity was present in the model for the selected
variables. Therefore, the finding also shows that the signs of all variables selected for
our study are appropriate.
While investigating the economic analysis on demand for drinking water
quality, the household incur for producing quality of water supply in the study areas is
estimated. To estimate the average expenditure per litre of clean drinking water the
households incurred, willingness to pay money method was employed. In this case, we
have looked into the purification cost that households incurred for producing potable
water. The information collected on the purification cost involves the filter used in the
household. We found that more than half of the sample used the traditional approach of

99
safe drinking water i.e., boiling water before drinking. The per unit cost on drinking
water quality the households incur from only boiling was estimated at Rs. 0.07 per litre,
followed by filtering cost at Rs 0.77 per litre, and both the filter and boiling cost together
estimated at an average of Rs 0.67 per litre.
The empirical analysis on willingness to pay money for producing quality of
drinking water by households help us to identify the main policy instrument towards
water quality management. To understand this, we have considered two major
indicators namely: 1. Highest educational attained among the family members and 2.
The monthly household expenditure. The first indicator i.e., highest educational
attained among the family members as an indicator of access to relevant information
available for the public regarding filter information for water purification. This
indicator determines decision of the household adopting water filter by incurring extra
cost in getting safe drinking water. Public at large may understand that as urban areas
expand due to increase in population growth. In that case, the knowledge of education
plays a vital role to get the most suitable information of filter use to provide the clean
water for drinking purposes. To identity the policy variables, we have used OLS
estimators to understand the variables from 310 households sample size who used at
least one of the techniques to clean water before drinking. Therefore, the result shows
that per capita monthly expenditure of the households and highest educational
attainment in the family are statistically significant at 1 percent level. From these
findings it is understood that as urbanisation rises in the East Sikkim district households
do use filter to clean water at their respective places for drinking purposes.
In order to understand an appropriate policy on domestic water resources in the
urban East Sikkim, it is very important to identify the existing policy. As per the
information provided by the Govt. of Sikkim, there is no distinct urban water policy as

100
such in place. Nevertheless, there is a rough draft called the State Water Policy 2007 in
line with the national water policy of 1987, which gives direction in terms of
formulating policies and programmes for water resources management in the state. For
any policy to function smoothly it is very much necessary for a systematic
infrastructural development. Similarly, in case of growth and development of water
resources management, it needs a proper policy at state level. Looking at the spectrum
of revenue collection from water supply distribution, it seems to be very low compared
to its cost of management in the state. On an average, the growth rate of annual state
plan expenditure on domestic water was 34.28 percent and revenue collected was 16.57
percent over the period from 2003 to 2012. This implies that expenditure was double
times higher than that of the revenue generated from the water supply. This may be
possibly due to inappropriate pricing policy of the state that led to fall in revenue
generation. The present system of supplying water follows the rules and regulations of
Sikkim Water Supply Act 1990, regulated by the water security and public health
engineering department (PHED), Government of Sikkim, and the distribution network
of water supply was carried through the non-volumetric approach. This was done on
the basis of number of taps used by domestic and commercial purposes. The existence
of tap based tariff approach indicates different rates for domestic and commercial
connection. For the universal coverage of water supply in Sikkim, the government has
further proposed to amend the existing water supply policy and switching over to
metering system. The idea of implementation of volumetric consumption of water in
urban Sikkim can somehow account for un-accounted or leakages in the water supply
system. According to this volumetric consumption of water, the water pricing is based
on the unit of water used and the govt. has introduced the four block pricing under this
scheme. In the first block, for 20 kilo-litres, the charge proposed for domestic sector is

101
Rs. 5. As the slab of block increases, the charge also increases. Till date, the policy of
volumetric consumption of water charge has not been implemented. In order to
understand the effect of this water policy, we need to understand the people’s choice
regarding which policy works better for them. Based on this, we have tested an
experimental analysis to understand the public choice regarding the decision they select
for the water policy. We found that people are indifferent between the volumetric meter
policy and existing water supply connection system. There is not much difference in
case of the preference choice of water policy in the urban East Sikkim district.
In terms of domestic water resources via-a-vis urbanisation, the state of Sikkim
is not at the cross road. Because, water recycling technique is not adopted, and
households have no problem of water quantity in urban East Sikkim district. But, from
primary data analysis, we have found that there is seasonal deterioration of tap water
quality, especially in the rainy season. Still, people at large are happy with the existing
water policy of the state. Nevertheless, deteriorating water quality and depleting water
bodies in the state are the warning bells. Government must not be taken it lightly, must
be conscious and ready for sustainable water development actions and plans.
7.3 RECOMMENDATIONS AND POLICY IMPLICATIONS
The state of Sikkim has a strict migration policy, but still the migrant population (both
internal and international) are still increasing, outnumbered the local population. The
decadal growth rate of population in 1981 in the state was around 51 percent, the ever
highest rate in the state’s history. The phenomenon of the rapid urbanisation is taking
place in the state of Sikkim. At the same time, the state is doing much better in terms
of growth in Gross State Domestic Product (GSDP) and per capita income of the state
was Rs. 2.91 lakhs in 2016-17 current prices (GoS 2018). A strong policy on water
resources management is very important to sustain further development in the state of

102
Sikkim. The state should also implement the proper allocation of water among different
sectors. The annual budget for water sector should be enhanced. The water governing
body should come up with the ideas to levy appropriate price for water for different
sector and activities, so that the operational and maintenance expenditure on water
works should be covered. Infrastructural development for water work is the basic
requirements for proper delivery of basic water services with the growth of
urbanisation.
With the rise in urbanisation the construction sector has also increased at the
fast rate and this in turn leads to the proper arrangement of the domestic water
connection network in the urban centres. Water harvesting policy must be framed and
scientific water harvesting technique must be encouraged. For any proper
implementation of the policy, public participation is needed and therefore, even for
water conservation practices, public awareness is very important.

103
REFERENCES
• Akoteyon, I.S., Omotayo, A.O., Soladoye, O. & Olaoye, H.O. (2011): “Determination
of Water Quality Index and Suitability of Urban River for Municipal Water Supply in
Lagos-Nigeria”. European Journal of Scientific Research, 54(2), 263-271.
• Ayoo, C.A. and Horbulyk, T.M. (2008): “The potential and Promise of Water Pricing”.
Journal of International Affairs, 61(2): 91-104.
• Bai, X.; McPhearson, T.; Cleugh, H.; Nagendra, H.; Tong, X.; Zhu, T.; Zhu, Y.G.
(2017): “Linking Urbanization and the Environment: Conceptual and Empirical
Advances”. The Annual Review of Environment Resource, 42: 215-240.
• Bairoach, P. and Goertz, G. (1986): “Factors of urbanization in the nineteenth century
developed countries: A descriptive and econometric analysis”. Urban Studies, 23: 285-
305
• Banerjee (2009): “urban challenges in 21st century India urbanization and its impact on
environment and infrastructure”. In Simhadri (Ed.), Urban Environment and
Geoinformatics. Jaipur: Rawat publications, 1-37.
• Bhagat, R.B and Mohanty, S (2009): “Emerging pattern of urbanization and the
contribution of migration in urban growth in India”. Asian Population Studies, 5(1): 5-
20.
• Bhutia, G.T. and Srivastava, R.K. (2014): “Migration in Sikkim: Facts and reflections”,
Indian Streams Research Journal, 4(3): 1-7.
• Biswas, A (2006): “Water Management for Major Urban Centres”. Water Resources
Development. Routledge, 22:183-197.

104
• Bocquier, P. and Costa, R. (2015): “Which transition comes first? Urban and
demographic transition in Belgium and Sweden”. Demographic Research, 33: 1297-
1332.
• Boberg, J (2005): “Demographic Influences on water resources”. In Boberg. J (Ed.),
How demographic changes and water management policies affect freshwater
resources. Published by RAND Corporation.
• Brown, R.M., McClelland, N.I., Deininger, R.A. & Tozer, R.G. (1970): “A Water
Quality Index Do we Dare?”. Water Sewage Works, 117(10), 339-343.
• Brown, R.R.; Keath, N. and Wong, T.H.F. (2009): “Urban water management in cities:
historical, current and future regimes”. Water Science technology, 59, 847-855.
• Brown, L.E; Pitts, C.S; Dunn, A.M. (2014): “Aquatic ecosystems”. In Holden J (Ed.),
Water Resources An integrated approach. Routledge Taylor and Francis Group,
London and New York.
• Census (2011): Post Enumeration survey. New Delhi: Registrar General of India. 2011.
• Clark, D. (2000): “World Urban Development: Processes and patterns at the end of the
twentieth centuries”. Geography, 85(1):15-23.
• CGWB (2008): “Ground Water Information Booklet East Sikkim District, Sikkim”.
Retrieved on 10 January 2020
[www.sikkimsprings.org/dv/Educational%20research/EastSikkim.pdf.].
• Cohen, B. (2006): “Urbanization in developing countries: Current trends, future
projections and key challenges for sustainability”, Technology In society, 28: 63-80.
• Cosier, M and Shen, D (2009): “Urban water management in China”. Water Resources
Development, Routledge, Taylor and Francis Group, 25(2): 249-268.
• Crase, L.; O’keefe, S. and Burston, J. (2007): “Inclining Block tariff for urban water”.
A Journal of Policy Analysis and Reform, 14(1): 69-80.

105
• de Vries, J. (1990). “Problems in the measurement, description, and analysis of
historical urbanization”. In: Van der Woude, A., Yayami, A., and de Vries, J. (eds.)
Urbanization in History. Oxford: Clarendon Press: 43–60.
• Dyson, T. (2011): “The Role of the Demographic Transition in the process of
urbanization”. Demographic Transition and its Consequence, Population Council, 34-
54.
• Elko L., Rosenbach K. and Sinnott J. (2003): “Cutaneous Manifestation of Waterborne
Infection”. Current Infectious Disease Reports, 5(5): 398-406.
• Fox, S. (2012): “Urbanization as a Global Historical Process. Theory and Evidence
from Sub-Sahara Africa”. Population and Development Review, 38(2): 285-310.
• Friedman, K.; Heaney, J.P.; Morales, M.; Palenchar, J. (2011): “Water Demand
Management Optimisation Methodology”, American Water Works Association, Wiley,
103(9): 74-84.
• GoI (1994): “Accelerated Urban Water Supply Programme”. Ministry of Urban
Development, New Delhi. Retrieved on 10 February 2020 from
(http://mohua.gov.in/upload/uploadfiles/files/91.pdf).
• GoI (2018): Census of India 2011- Circular No. 2, Dated 4th September 2018, Office of
the Registrar General, New Delhi: Government of India.
• GoS (1986). “The Sikkim water supply and water tax Act, 1986”, Gangtok:
Government of Sikkim. [Retrieved February 3, 2020 http://sikkim-wsphed.gov.in/wp-
content/uploads/2017/07/PDF-17-WATER-SUPPLY-ACT-A4.pdf].
• GoS (2009): “Irrigation and Flood Control Department Government of Sikkim,
Gangtok”. Retrieved on 3rd December 2019 from (http://www.sikkim-
irrigation.gov.in/resource/state-water-policy.doc).

106
• GoS (2013): Annual Report 2012-13 “Water Security and Public Health Engineering
Department, Govt. of Sikkim”, Gangtok.
• GoS (2014): “Water Security and PHE Department”, Government of Sikkim, Gangtok.
Retrieved on 16 November 2018, [http://sikkim-wsphed.gov.in/?page_id=449].
• GoS (2015): “Audit Report for the year ended 31st march 2014”. Gangtok, Government
of Sikkim, Retrieved on 10th February 2020 from
(https://cag.gov.in/sites/default/files/audit_report_files/Sikkim_Social_Economic_Rev
enue General_1_2015_Chap_5.pdf)
• GoS (2015-16). “Annual administrative report for the five years”, Forest, Environment
& Wildlife Management Department, Gangtok: Government of Sikkim.
• GoS (2016): SPCB. Compiled by: Environment centre Sikkim, Environment and
wildflife Management Department, Government of Sikkim. [Retrieved on 27
September, 2015 http://www.sikenvis.nic.in/home.aspx]
• GoS (2018): “Medium Term Fiscal Plan for Sikkim 2018-19 to 2020-21”. Govt. of
Sikkim finance, revenue and expenditure department Gangtok. Retrieved on 16
February 2020 from [http://sikkimfred.gov.in/FRBM/Documents/2018-
19/Sikkim%20MTFP%20-%202018-19.pdf].
• Gupta, A.D (2001): “Challenges and opportunities for water resources management in
Southeast Asia”. Hydrological Science Journal, 46(6): 923-935.
• Gyato, T.R and Bagdas, B.B (1998): “Health Status in Sikkim”. Department of Health
and family welfare, Govt. of Sikkim, Gangtok.
• Hamid, A (2004): “74TH Amendment: An overview”. CCS Research Internship paper,
Centre for Civil Society, New Delhi. Retrieved on 2nd December 2019 from
(https://ccs.in/internship_papers/2004/2.%2074th%20Amendment_Areeba.pdf).

107
• Harris, J. R. and Todaro, M. P. (1970): “Migration, Unemployment and Development:
a Two-Sector Analysis”. The American economic review, 60(1): 126-142.
• Henderson, V. (2002): “Urbanization in Developing Countries”, The World Bank
Research Observer. 17(1): 89-112, Oxford University Press.
• Hirshleifer, J and Milliman, J.W (1967): “Urban Water Supply: A Second Look”. The
American Economic Review, 57(2): 169-178.
• Howard, G and Bartram, J (2003): “Domestic Water Quantity: Service Level and
Health”. WHO, Geneva.
• Howe, C.W and Linaweaver, F.P. (1967): “The impact of price on residential water
demand and its relation to system design and price structure”. Water Resource
Research, 3(1): 13-32.
• Jenerette, G.D. and Larsen, L. (2006): “A global perspective on changing sustainable
urban water supplies” Global Planet. Change 50: 202-211.
• Jiang, L.; Wu, F.; Liu, Y. and Deng, x. (2014): “Modeling the impacts of Urbanisation
and Industrial Transformation on Water Resources in China: An Integrated Hydro-
Economic CGE Analysis”. Sustainability, 6: 7586-7600.
• Joshi, D. (2004): “Secure Water- Whither Poverty? Livelihoods in the DRA: A case
study of the water supply programme in India”. Overseas Development Institute, ISBN
0850037328.
• Kacapyr, E. (2015): “A Guide to Basic Econometric Techniques”. Routledge, Taylor
and Francis Group, London and New York.
• Kirch, A. (2002): “Impact of Tourism and urbanization on water supply and water
quality in Manali, Northern India”. Canadian water Resources Journal, 27(4): 383-
400.

108
• Knobeloch L, Salna B, Hogan A, Postle J, Anderson H (2000): “Blue babies and nitrate
contaminated well water”. Environmental Health Perspective, 108(7):675–678
• Kulkarni, M.K & Pawar N.J (2006): “Impact of Urbanization on the quality of ground
water in the Ramnadi basin Pune”. Indian Journal Environmental Protection, 26(10):
877-884.
• Kumar, D and Pandit, C.M. (2016): “India’s water management debate: Is the civil
society making it everlasting?”. International Journal of Water Resources
Development, 1-4.
• Lamture, S.V., Ghorade I.B. & Patil S.S (2014): “Groundwater quality assessment of
kundalika dam command area, Beed district (Maharashtra)”. Golden Reaseach
Thoughts, 3 (12): 1-6.
• Lewis, W.A. (1954): “Economic Development with unlimited supplies of Labour”,
Machester school of Economic and Social Studies, 22: 139-191.
• Liu, T.Y; Su, C.W. and Jiang, X.Z. (2015): “Is economic growth improving
urbanisation? A cross-regional study of China”. Urban Studies, 52(10): 1883-1898.
• Lollen, T. (2015): “Urbanization in Arunachal Pradesh”, In Mandal R.K (Ed.),
Development of Tribal people of North East India issues and challenges, New Delhi:
Concept publishing company Pvt. Ltd, 156-167.
• Mann, P.C. (1970): “A New Focus in Water Supply Economics Urban Water Pricing”.
Journal American Water Works Association, 62(9): 534-537.
• Mathur, O.P & Thankur, S (2006): “Urban Water Pricing Setting the stage for
Reforms”. UNDP, Retrieved on 09 June 2018
[http://iipa.org.in/common/pdf/PAPER%203_Urban%20Water%20Pricing.pdf].
• McDonald, R.I.; Weber, K.; Padowki, J.; Florke, M.; Schneider, C.; Green, P.A.;
Gleeson, J.; Eckman, S.; Lehner, B.; Balk, D.; Boucher, T.; Grill, G.; Montgomery, M.

109
(2014): “Water on an urban planet: Urbanization and the reach of urban water
infrastructure”. Global Environmental change, 27: 96-105, Elsevier.
• Montagomery, M (2008): “The urban transformation of the developing world.”
Science, 31: 761-764.
• Metzger, H. and Moench, M (1994): “Ground Water Availability for Drinking In
Gujarat: Quantity,Quality and Health Dimensions”. Economic and Political Weekly,
29(13): 31-41.
• Narashima, R.C; Dorairaju, S.V; Bujagendra, R.M; Chalapathi, P.V (2011). “Statistical
analysis of drinking water quality and its impact on human health in Chandragiri, near
Tirupati, India”. www.eco-web.com/edi/111219.html
• Nas, B. and Ali, B. (2006): “Ground water contamination by nitrates in the city of
Konya (Turkey): A GIS perspective”. Journal of Environmental Management, 9(1):
30–37.
• Padowski, J.C. and Jawitz, J.W. (2013): “Water availability and vulnerability of 225
large cities in the United States”. Water Resources management, 48: 134-141.
• Pandit, C and Biswas, A (2019): “India’s National Water Policy: ‘Feel good’ document,
nothing more”. International Journal of Water Resources Development, Routledge,
Taylor and Francis Group, DOI:10.1080/07900627.2019.1576509.
• Patil S.S., Gandhe H.D. & Ghorade I.B (2014). “Physico- chemical assessment of
groundwater quality of Ahmednagar industrial area”. Environmental Science, 4(4):
228-230
• Paul, K.; Sharma, D.; Mukherjee, R.; Sengupta, R. and Tamang, K.L. (2016):
“Demographic characteristics and changing land use pattern in Gangtok, Sikkim (1971-
2011)”. International Journal of Geomatics and Geoscience, 6(4): 1769-1981.

110
• Pierce, G. (2016): “Fiscal Transfers and Urban Policy Magnitude and Mechanism of
Urban Dependency”. Economic and Political Weekly, (L1)42: 44-53.
• Pradhan, P.K. (2004): “Population growth, migration and urbanisation: Environmental
consequences in Kathmandu valley, Nepal”. In Unruh, J.D., Krol, M.S. and Kliot N.
(eds.): Environmental Change and its Implications for Population Migration, 177-199,
Dordrecht (Netherlands): Springer.
• Preston, S.H. (1979): “Urban growth in developing countries”. Population and
Development Review, 5(2): 195-215.
• Roy, J., Chattopadhyay, S., Mukherjee, S., Kanjilal, M., Samajpati, S., and Roy, S
(2004): “An Economic Analysis of demand for water quality case of Kolkata”,
Economic and political weekly, 39(2): 186-192.
• Rukmani, R. (1994) “Urbanisation and Social-Economic change in Tamil Nadu, 1901-
91”. Economic and Political Weekly, 29(51-52): 3263-3272.
• SAAP (2016): “State Annual Action Plan: FY (2015-16)” retrieved on 24 may 2017
http://amrut.gov.in/writereaddata/SikkimSAAP.pdf.
• Sampat, P. (2007): “Swajaldhara or Pay-Jal-dhara Right to Drinking water in
Rajasthan”. Economic and Political Weekly, 42(52): 102-110.
• Sauri, D. (2013): “Water Conservation: Theory and Evidence in urban Areas of the
Developed world”. Annual Review Environment Resources, 38: 227-248.
• Scheili, A., Delpla I., Sadiq R., & Rodriguez, M.J. (2016). “Impact of Raw Water
Quality and Climate Factors on the variability of Drinking Water Quality in small
system”. Water Resource Management Science, 30: 2703-2718. Springer
• Singh, M.A. and Singha, K. (2016). “Democracy and ethnic politics in Sikkim” In
Singha, K. and Singh, M.A. (eds.), Identity, Contestation and Development in Northeast
India, 226-246, New Delhi: Routledge.

111
• Seth, R., Mohan, M., Singh, P., Singh, R., Dobhal, R., Singh, K.P., & Gupta, S. (2016):
“Water quality evaluation of Himalayan Rivers of Kumaun region, Uttarakhand, India”.
Application Water Science, 6: 137-147. Springer
• SERS (2016): “Draft State of Environment Report Sikkim” retrieved on 22 may 2017
[http://sikenvis.nic.in/WriteReadData/UserFiles/file/Draft%20SoE%20Sikkim%2020
16%20%2014_03_2017.pdf].
• Shaban, A. and Sharma, R.N. (2007): “Water Consumption Patterns in Domestic
Households in Major cities”. Economic and Political Weekly, 42(23): 2190-2197.
• Shah, M and Kulkarni, H (2015): “Urban Water Systems in India Typologies and
Hypotheses”. Economic & Political Weekly, 1:30.
• Sharma, S.; Kumar, K.; Singh, K.K (2013): “Water security in the mid-elevation
Himalayan watershed, East district with focus in the state of Sikkim”. Theme Water,
Water security, Water Security, Water Planning and Management, Kohima workshop,
Nagaland.
• Sharpe, W.E. (1987): “Water and Energy conservation with bathing shower flow
controls”. Journal of American Water Works Association, 70(2): 93-97.
• Sibly, H. (2006): “Urban Water Pricing”. A Journal of Policy Analysis and Reform,
13(1): 17-30.
• Singha, K., Sherpa, L. D. and Jaman, M. S. (Forthcoming): “Urbanisation and economic
growth: Experience from the Himalayan state of Sikkim”, Economic and Political
Weekly.
• Sood A, Singh KD, Pandey P, Sharma S (2008): “Assessment of bacterial indicators
and physicochemical parameters to investigate pollution status of Gangetic River
system of Uttarakhand (India)”. Ecological Indicators, 8(5):709–717.

112
• Sorenson, J. Tschirhart, J and Winston, A. (1978): “A theory of pricing under
decreasing costs”. The American Economic Review, 68(4): 614-624.
• Sridhar, K.S and Reddy, A.V (2010): “State of Urban services in India’s cities spending
and financing.” Oxford University Press, New Delhi
• Theron, J. and Cloete, T. E. (2002): “Emerging Waterborne Infections: Contributing
Factors, Agents, and Detection Tools”. Critical Reviews in Microbiology, 28(1): 1-26.
• Tiwari, P and Gulati, M (2011): “Efficiency of urban water supply utilities in India”.
International Journal of Water Resources Development, Routledge, Taylor and Francis
Group, 27(2): 361-374.
• UNDP, (2011): “World Urbanization Prospects: The 2011 Revision.” United Nations
population division. New York.
• UN (2015): “Water for sustainable world”. The United Nations world water
development report, 2015. Retrieved on 2 December 2019 from
[https://sustainabledevelopment.un.org/content/documents/1711Water%20for%20a%
20Sustainable%20World.pdf]
• UN, (2018): “The World’s cities in 2018”, Economic and Social Affairs. Retrieved
on13march2019[http://www.un.org/en/development/desa/population/publications/pdf/
urbanization/the_worlds_cities_in_2018_data_booklet.pdf].
• Vo, P.L. (2008): “Urbanisation and water management in Ho Chi Minh City, Vietnam-
issues, challenges and perspectives”. GeoJournal, 70: 75-89. Springer.
• Wagner, F.E. and Ward, J.O. (1980): “Urbanization and migration in Brazil”. The
American Journal of Economics and Sociology, 39(3): 249-259.
• Whittington, D. (1992): “Possible Adverse Effects of Increasing Block Water Tariff in
Developing Countries”. Economic Development and Cultural Change, 41(1): 75-87.
• WHO (2003): “Right to water”, WHO, Geneva.

113
• WHO, (2008): “Guidelines for Drinking Water Quality”. Third edition incorporating
first and second addenda, volume 1, Geneva 2008.

114
APPENDIX
Sikkim University (A Central University of India)
Gangtok-737102
(The information sought through this questionnaire is purely for the purpose of PhD
dissertation)
Urbanisation and Water Resources Management: A Study of East Sikkim
District
Lakpa Doma Sherpa
PhD Scholar
Department of Economics
Sikkim University, Gangtok
Interview Schedule for Households
Sl.
No
QUESTIONS
SOCIO-ECONOMIC STATUS OF DOMESTIC
HOUSE:
RESPONSE
1 Respondent’s Name:
2a Family size (In number)
2b.
M –
2c.
F-
3 Religion
(Hindu – 1, Christian – 2, Muslim – 3, Buddhist – 4, Others
–5)
4 Family’s main source of income
(Agriculture- 1, Employee (Govt.) - 2, Employee (Pvt.) - 3,
Self-Employee - 4, Retired - 5, Casual worker - 6,
Combination of farming, salaried and self-employee - 7,
Business – 8, Others – 9 (Specify))
5 Subsidiaries source of Income (code same as given in
Sl.No. 4)
6 Caste (General – 1, Schedule Caste – 2, Schedule Tribe – 3,
Other Backward Classes – 4, others –5)
7 Age – group of family
members (In number)
8
No. of the highest Educational qualification
attained by the groups divided

115
Below 6 years
8a. Primary (1-5)
7 – 14 years
8b. Upper primary to senior
secondary (6-12)
15 – 35 years
8c.Graduation
(General/(Tech/Professional)
36 – 60 years
8d. Post-Graduation and above
(General /Tech/Professional)
Above 60 years
8e. Skilled (No formal school)
8f. Illiterate
TYPE OF RESIDENT
9 Owner/land lord – 1, Renter/tenant – 0
10 When did you come to Urban East Sikkim (In year)
(in case of original inhabitant is from Urban East Sikkim –
0)
WATER RELATED INFORMATION
11
Do you have water supply connection
(No- 0, Govt.- 1, Private (Self-managed pipeline) –2 , Both
Govt. & Pvt. 3, Can’t say which type -4)
12 Type of water taps connection
(connection within the house – 1, share, but in the same
building–2, Away from the premise – 3)
13 How many hours of drinking/domestic purpose water you
set per day?
(< 1hr - 1; 1-2 hrs - 2; 2-3 hrs – 3; 3-4 hrs – 4 ; > 4 hrs or
24/7 – 5 )
14 What is your perception of water quality (Extremely bad –
1; Bad –2; Manageable–3)
15 What precaution your family takes for drinking water
(Straining – 1; Boil water– 2; Filter water – 3; use water
filter and boil – 4; R.O Filter – 5; consume as it is – 6)
16 If water filter is used, what is your annual expenditure on it
[including start-up cost plus the installation cost &
operational & maintenance] (in Rs.) (will calculate per
capita expenditure using total exp/family size)
17 Any water related disease/sickness reported in the family
from the last one year (No – 0; Yes – 1 (e.g., Diarrheal,
Dysentery, Typhoid fever, rashes/scabies); Don’t know–2)
18. Different usage of water in domestic sector
%
share
of
water
Item PHED Private
Pipeline
Purch
ased
from
the
Sprin
g
Riv
er
others
(Well,
rain
Total

116
usag
e
Marke
t
water,
etc.)
18a Drinking and
Cooking
100
18b Bathing &
Toilet
100
18c Washing
clothes
100
18d Others
100
19. Quantity of water Availability from different sources
19a
Water
availability
(per day in
ltr.)
19b Regular – 1;
Occasionally
– 0
19c In which seasons or months you feel drinking water quality usually goes
down (Please indicate the year from which you feel drinking water quality
has deteriorated)
Jan Feb Mar Apr Ma
y
Jun
e
July Aug Sep
t
Oct N
ov
Dec
20 In which months you face water shortage and how much litres of water your
need at that time (Please indicate below in litres term)
21 For how long you have been facing this problem?
(Mention the year)
22 If you face water problem/short supply, which alternative
source(s) you look for: Bottle water – 1; Water tanker – 2;
Spring – 3; Well – 4; River – 5; others (specify name) – 6
23 What is your opinion/reasons for this shortage (if any)
Poor management of department – 1; Population growth –
2; Natural factors (less recharge) – 3; Others (specify) – 4
24 Do you follow the water recycling techniques at house?
No – 0; After cleaning cloth, the water is used for
bathroom purposes – 1; kitchen water is for gardening – 2;
Others (specify name) – 3.
24a From which year you have been practicing it?
25 Do you used the following (Any water saving technologies
are used at household) (Shower – 1; Semi-washing-
Machines – 2; Rain water harvesting system installed at
building – 3)

117
25a From which year you have been practicing it?
26 Per capita Household's monthly expenditure – (the standard measure of
economic status)
26a. Food items
(Rs)
26b.Non-Food items
(Rs)
26c. Total (Rs)
27 Which of the scenario would you like to choose?
SCENARIO 1 2 3
ATTRIBUTES Existing
System
Proposed by the
Govt.
Alternative
(Private)
CONNECTION Without meter Meter Meter
SUPPLY/QUANTIT
Y
Limited supply,
approx. 1-3
hrs/day.
Regular (Seemingly)
[As per norm the
supply of should be
24x7, but it is not
happing in most of
the cities in India at
present]
Regular
GOVERNANCE Govt. Govt. Private agency
RENT/BILL Normal (Per
connection)
Normal (Per unit) Higher than
Govt.
28 Why you want to select this scenario?

118
Urkund Analysis Result
Analysed Document: Lakpa Doma Sherpa PhD Thesis entitled Urbanisation and
Water Resources Management A Study of East Sikkim
District.docx (D64772009)
Submitted: 3/3/2020 1:09:00 PM
Submitted By: [email protected]
Significance: 1 %
Sources included in the report:
Chapter 1-4 Bib Final 16.9.docx (D56290734)
https://lawsisto.com/Read-State-Act/MTQxMQ==/THE-SIKKIM-WATER-SUPPLY-
AND-WATER-TAXACT-1986
Instances where selected sources appear:
4
URKUND