Revised Draft Water Resources Management Plan
322
Yorkshire Water | Revised Draft Water Resources Management Plan 2019 1 Revised Draft Water Resources Management Plan Yorkshire Water Services Ltd September 2018
-
Upload
khangminh22 -
Category
Documents
-
view
1 -
download
0
Transcript of Revised Draft Water Resources Management Plan

Yorkshire Water | Revised Draft Water Resources Management Plan 2019 1
Revised Draft Water Resources Management Plan Yorkshire Water Services Ltd
September 2018
Yorkshire Water | Revised Draft Water Resources Management Plan 2019 2
Executive Summary
About our Water Resources Management Plan
Our Water Resources Management Plan 2019 is one of the key plans that will help
us to ensure that our customers get what they have told us is their highest priority –
a reliable and sustainable supply of good quality, clean water. The plan describes
how we will ensure that we continue to have sufficient water to supply our
customers, in the face of future challenges such as climate change, population
growth and environmental pressures.
In Spring 2018 we published our draft WRMP19 for consultation. Following this
consultation we have revised our plan, taking into account representations received
from stakeholders and consultees. Any changes to the plan have been highlighted in
yellow for clarity in this revised draft WRMP19.
Our revised draft WRMP19 provides a long-term view of these challenges, planning
for the next 25 years. We have also extrapolated data to give us a prediction as to
what our water resources situation could be in 40 years’ time; although the further
into the future we project, the greater the uncertainty.
The requirement for Water Resources Management Plans to be published every five
years is set out in the Water Industry Act 1991. It is therefore a well-established and
mature part of our business planning process. As with previous plans, our revised
draft WRMP19 has been prepared in line with guidance that is provided by the
Environment Agency. In addition, there are numerous other well documented
approaches that we take to build individual components of the plan – for example,
UKWIR methods for calculating water resources yield, and guidance on how to take
a risk-based approach to planning.
What challenges do we face?
Yorkshire Water already has one of the most resilient water resource systems in the
country. There are a number of reasons for this. Firstly, our grid network allows us to
move water around Yorkshire to help balance supply with demand. Secondly, we
take our water from a variety of different types of water supply, balancing across
Yorkshire Water | Revised Draft Water Resources Management Plan 2019 3
reservoirs, rivers and groundwater sources. Thirdly, we plan for extreme droughts
that go well beyond those that we have experienced in our historical record.
This level of resilience was recognised by the independent work carried out for
Water UK’s Water Resources Long Term Planning Framework report, published in
late 2016, which stated:
• Yorkshire Water “now plans to a higher level of resilience than any
other part of the country”; and,
• Yorkshire Water is one of only two companies that “plan for resilience
to droughts that are worse than those seen in the historic record”.
Further, the report’s independent modelling validated our own assessment of the
resilience of our water supply system.
However, despite our current high level of resilience, we cannot afford to be
complacent at a time where the world around us is changing. With an increasing
population, uncertainty about our future climate, and our customers rightly expecting
more from us, we need to continue to evolve our plans. We need to be innovative
and ambitious, whilst at the same time recognising the importance of security and
resilience when planning for water resources.
In addition, our customers remain concerned about affordability now and into the
future. We need to find ways of addressing the pressures we face in the future
through a changing climate, population growth and environmental protection without
causing customers’ bills to become unaffordable.
The key challenges that our revised draft WRMP19 has identified, and addresses,
are:
• a Yorkshire population that is projected to increase by one million by
2045;
• a projected loss of 100Ml/d supply by 2045, due to climate change;
• ongoing environmental pressure to reduce the amount that we
abstract; and,
Yorkshire Water | Revised Draft Water Resources Management Plan 2019 4
• ensuring that we can continue to provide high levels of resilience and
meet our agreed levels of service, against a backdrop of maintaining
bills at a level that is affordable for all our customers.
How have we created our plan?
Our revised draft WRMP19 shows how we will balance the demand for water and
the available supply of water in the short, medium and long term, projecting up to 40
years into the future. It is built up from two key components – a demand forecast,
and a supply forecast. These forecasts are compared to identify whether, or when,
we may have a deficit. A deficit occurs when, in a dry year, the forecast demand
(plus an allowance for headroom) exceeds the forecast supply.
If, or when, we reach such a position, the plan identifies potential options to address
the forecast deficit. A ‘twin track’ approach is used, looking at ways of reducing
demand whilst also exploring options for increasing supply. It is not acceptable, or
sustainable, to simply plan to extract more water from the environment.
Our revised draft WRMP19 covers the two water resource zones which make up the
Yorkshire Water region. These zones are the Grid Surface Water Zone, which
covers over 99% of our customers, and the East Surface Water Zone, which is a
small area covering Whitby and part of the North York Moors National Park.
Supply forecast
We have worked closely with the Environment Agency to understand where
environmental pressures may reduce the amount of water available to us in the
future. We will continue to investigate areas that may be affected by reduced
abstraction, to ensure that we balance environmental needs with the requirement for
maintaining service resilience.
We have updated our assessment of the impact of our changing climate on water
resources. Customers have told us that they want to see clear plans for managing
the challenges presented by climate change.
We have also considered how water quality may change in the future, and how we
will need to invest in a range of solutions to ensure that we do not compromise on
Yorkshire Water | Revised Draft Water Resources Management Plan 2019 5
the quality of water supplied to customers. We will continue to work closely with land
owners, land managers and the agriculture sector to enhance the resilience of our
raw water sources, as the first stage in the journey of ensuring water quality from
source to tap. We have ensured that our revised draft WRMP19 is aligned with the
requirements of our drinking water quality regulator, the Drinking Water Inspectorate.
We have also considered how we might need to respond to the risk of invasive non-
native species, and the risks that these may present to current and future water
transfers between catchments. We have been working closely with the Environment
Agency, and other organisations including the University of Leeds, to understand
this risk and how best it can be mitigated.
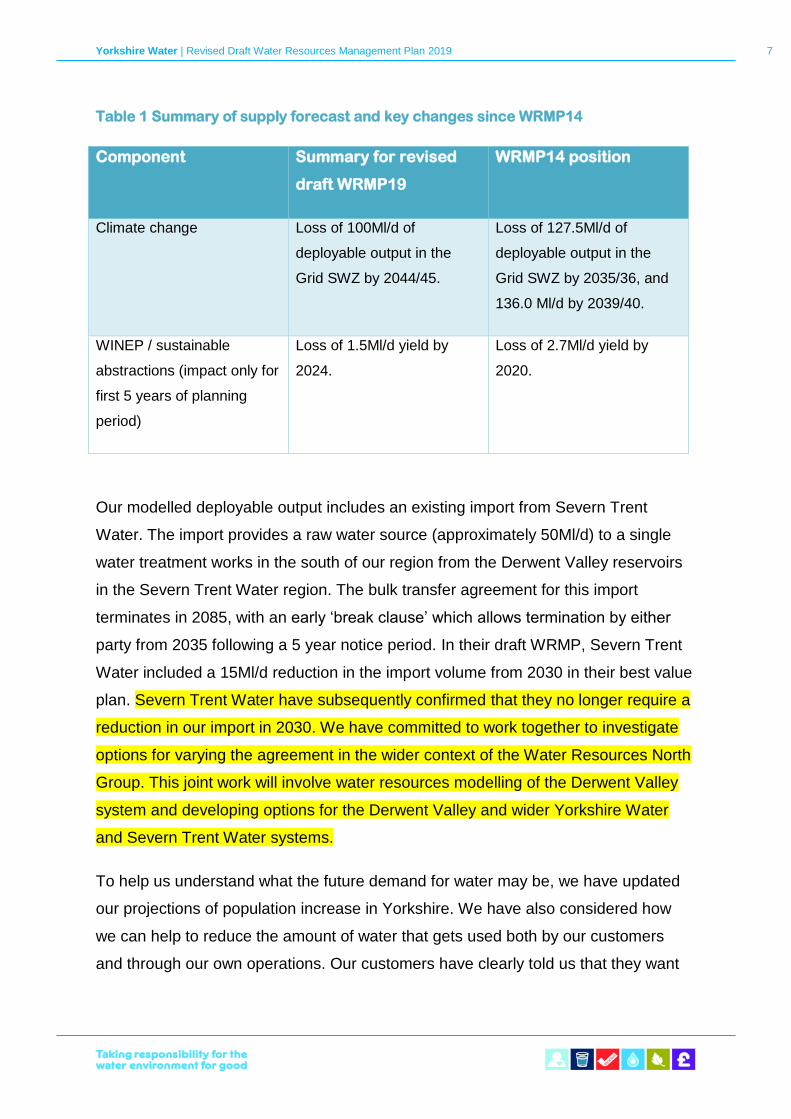
The key components of our supply forecast, and a summary of how these
components have changed since our last plan, are shown in Table 1 below.
However, because climate change is the component that has the biggest single
impact on our future supply forecast, and because our climate change forecast has
changed since WRMP14, we have also included below some more detailed
commentary on climate change.
Climate change
Our last plan (WRMP14) projected that we would have a supply demand deficit
(against headroom, in a dry year) by 2018/19. Our revised draft WRMP19 shows
that we now do not expect to see this deficit before the mid-2030s. One of the key
reasons for this difference is that our approach to climate change has changed.
The three most significant changes are:
• In WRMP14 we used UK Climate Projections 2009 (UKCP09) medium
emissions forecasts to the 2030s. However, the Environment Agency
guidelines on which forecasts to use have now changed so for the
draft WRMP19 we are using forecasts to the 2080s.
• As in WRMP14, we are using 20 selected climate change model
scenarios (out of 10,000 that are included in the UKCP09 dataset). For
WRMP14 we analysed the data and selected 10 low probability dry
scenarios and 10 from across the whole range of climate change
Yorkshire Water | Revised Draft Water Resources Management Plan 2019 6
projections. We modelled these 20 scenarios, and used the median.
For our draft WRMP19 we again carried out an intermediate
vulnerability assessment, and based on this selected 20 from across
the whole range of scenarios, using statistical sampling stratification to
get a representative sample. We also included three dry scenarios in
our assessments.
• In WRMP14 we used the Environment Agency scaling equations. In
this plan, we are not using the new Environment Agency scaling
equations, but are instead following guidance and using an alternative
interpolation (similar to that used in 2014, but with a less steep initial
gradient). We are doing this because using the current Environment
Agency scaling gives a loss of about 70Ml/d by year 1 of AMP7
(2020/21), which we do not believe to be a likely scenario in Yorkshire.
We have discussed this approach with the Environment Agency and
with our external auditor, and both agreed that a decrease of 70Ml/d
by 2020/21 was unlikely.
Although we are showing a reduced impact of climate change in the revised draft
WRMP19 compared to WRMP14, climate change remains the biggest single
influence on our long-term future water resources prospects. A new set of climate
projection data for the UK (UKCP18) will be published in 2018. To ensure that we
understand what this new data is telling us, we are representing the UK Water
Industry on the UKCP18 users’ group, and we are leading work looking at how the
UK water industry will use this latest evidence for future planning.
Yorkshire Water | Revised Draft Water Resources Management Plan 2019 7
Table 1 Summary of supply forecast and key changes since WRMP14
Component Summary for revised
draft WRMP19
WRMP14 position
Climate change Loss of 100Ml/d of
deployable output in the
Grid SWZ by 2044/45.
Loss of 127.5Ml/d of
deployable output in the
Grid SWZ by 2035/36, and
136.0 Ml/d by 2039/40.
WINEP / sustainable
abstractions (impact only for
first 5 years of planning
period)
Loss of 1.5Ml/d yield by
2024.
Loss of 2.7Ml/d yield by
2020.
Our modelled deployable output includes an existing import from Severn Trent
Water. The import provides a raw water source (approximately 50Ml/d) to a single
water treatment works in the south of our region from the Derwent Valley reservoirs
in the Severn Trent Water region. The bulk transfer agreement for this import
terminates in 2085, with an early ‘break clause’ which allows termination by either
party from 2035 following a 5 year notice period. In their draft WRMP, Severn Trent
Water included a 15Ml/d reduction in the import volume from 2030 in their best value
plan. Severn Trent Water have subsequently confirmed that they no longer require a
reduction in our import in 2030. We have committed to work together to investigate
options for varying the agreement in the wider context of the Water Resources North
Group. This joint work will involve water resources modelling of the Derwent Valley
system and developing options for the Derwent Valley and wider Yorkshire Water
and Severn Trent Water systems.
To help us understand what the future demand for water may be, we have updated
our projections of population increase in Yorkshire. We have also considered how
we can help to reduce the amount of water that gets used both by our customers
and through our own operations. Our customers have clearly told us that they want
Yorkshire Water | Revised Draft Water Resources Management Plan 2019 8
us to reduce how much water is wasted through leakage, and in response to this we
have set ourselves ambitious targets for leakage reduction.
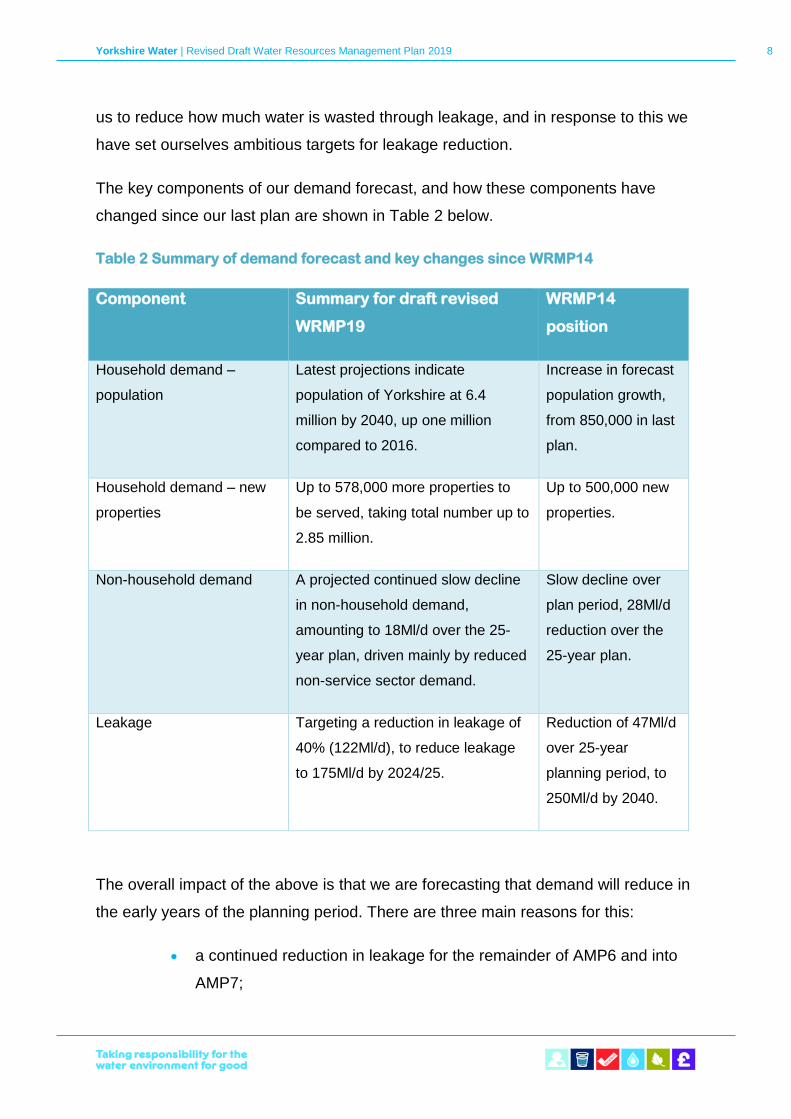
The key components of our demand forecast, and how these components have
changed since our last plan are shown in Table 2 below.
Table 2 Summary of demand forecast and key changes since WRMP14
Component Summary for draft revised
WRMP19
WRMP14
position
Household demand –
population
Latest projections indicate
population of Yorkshire at 6.4
million by 2040, up one million
compared to 2016.
Increase in forecast
population growth,
from 850,000 in last
plan.
Household demand – new
properties
Up to 578,000 more properties to
be served, taking total number up to
2.85 million.
Up to 500,000 new
properties.
Non-household demand A projected continued slow decline
in non-household demand,
amounting to 18Ml/d over the 25-
year plan, driven mainly by reduced
non-service sector demand.
Slow decline over
plan period, 28Ml/d
reduction over the
25-year plan.
Leakage Targeting a reduction in leakage of
40% (122Ml/d), to reduce leakage
to 175Ml/d by 2024/25.
Reduction of 47Ml/d
over 25-year
planning period, to
250Ml/d by 2040.
The overall impact of the above is that we are forecasting that demand will reduce in
the early years of the planning period. There are three main reasons for this:
• a continued reduction in leakage for the remainder of AMP6 and into
AMP7;
Yorkshire Water | Revised Draft Water Resources Management Plan 2019 9
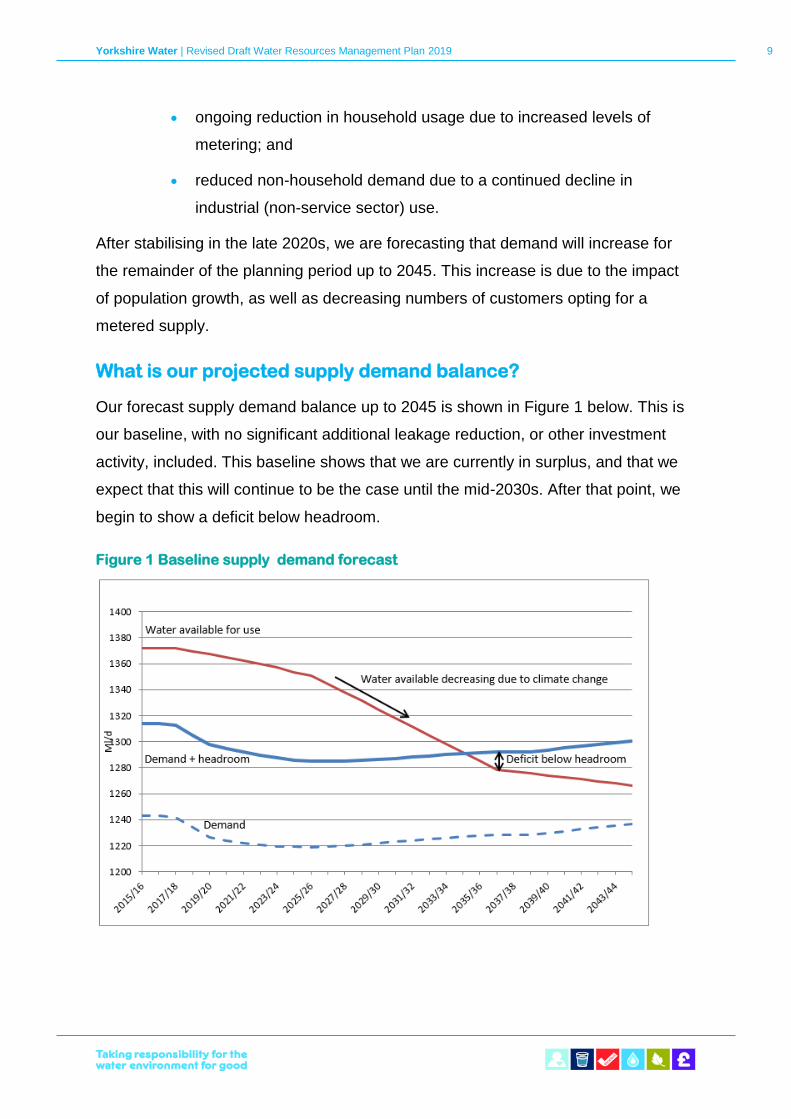
• ongoing reduction in household usage due to increased levels of
metering; and
• reduced non-household demand due to a continued decline in
industrial (non-service sector) use.
After stabilising in the late 2020s, we are forecasting that demand will increase for
the remainder of the planning period up to 2045. This increase is due to the impact
of population growth, as well as decreasing numbers of customers opting for a
metered supply.
What is our projected supply demand balance?
Our forecast supply demand balance up to 2045 is shown in Figure 1 below. This is
our baseline, with no significant additional leakage reduction, or other investment
activity, included. This baseline shows that we are currently in surplus, and that we
expect that this will continue to be the case until the mid-2030s. After that point, we
begin to show a deficit below headroom.
Figure 1 Baseline supply demand forecast
Yorkshire Water | Revised Draft Water Resources Management Plan 2019 10
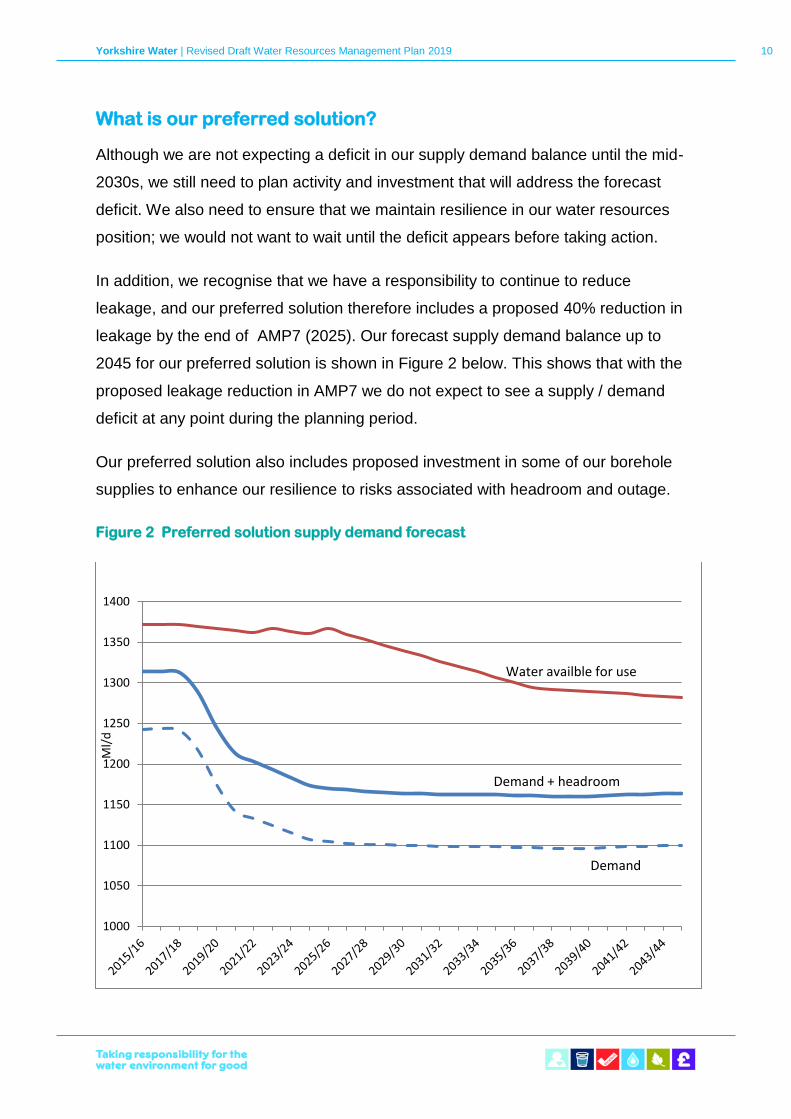
What is our preferred solution?
Although we are not expecting a deficit in our supply demand balance until the mid-
2030s, we still need to plan activity and investment that will address the forecast
deficit. We also need to ensure that we maintain resilience in our water resources
position; we would not want to wait until the deficit appears before taking action.
In addition, we recognise that we have a responsibility to continue to reduce
leakage, and our preferred solution therefore includes a proposed 40% reduction in
leakage by the end of AMP7 (2025). Our forecast supply demand balance up to
2045 for our preferred solution is shown in Figure 2 below. This shows that with the
proposed leakage reduction in AMP7 we do not expect to see a supply / demand
deficit at any point during the planning period.
Our preferred solution also includes proposed investment in some of our borehole
supplies to enhance our resilience to risks associated with headroom and outage.
Figure 2 Preferred solution supply demand forecast
1000
1050
1100
1150
1200
1250
1300
1350
1400
Ml/
d
Demand + headroom
Demand
Water availble for use
Yorkshire Water | Revised Draft Water Resources Management Plan 2019 11
`
Summary
Our revised draft WRMP19 indicates a risk of a deficit during the 25-year planning
period beginning 2034/35. This is predominantly due to the forecast impact of
climate change on deployable output. However, the predicted impact is less
extreme than WRMP14 due to a change in the forecasting methodology, and to
reflect the fact there has been no reduction in supply due to climate change this
AMP. Increased demand management activity, including additional leakage
reduction, also reduced the deficit.
For our preferred solution to meet this forecast deficit, we have chosen to implement
an ambitious 40% leakage reduction target by 2025. In addition to this leakage
reduction activity, we will investigate two supply options to provide additional
resilience. The supply options are scheduled for implementation in 2022/23 and
2025/26, provided the results of the investigations determine that the abstraction
licences are sustainable.
In selecting our preferred plan, we have chosen a solution that minimises
environmental risks, meets customer and regulatory preferences and is flexible and
sustainable in an uncertain future. This is in line with the needs we, our customers
and our stakeholders identify as priorities in our new long-term strategy for
Yorkshire Water.
We believe that our revised draft WRMP19 will help us to ensure that customers
continue to get what they prioritise highest – a reliable and sustainable supply of
clean water. Our draft plan also shows that we can maintain our current high levels
of water resources resilience into the future, helping to ensure that bills remain
affordable. Other activities that our customers consider to be important – such as
reducing leakage – will help to contribute to our sustained resilience.
In addition, recognising that we have a role to play in supporting not only the
resilience of our region, but also the resilience of the UK as a whole, we have taken
a lead in setting up Water Resources North. This group, which comprises
representation from across water companies in the north of England as well as key
regulators, will provide a focal point for co-ordinating water resources across the
north. It will also allow for integrated and consistent consideration of the
Yorkshire Water | Revised Draft Water Resources Management Plan 2019 12
`
opportunities that we collectively have to transfer water to other parts of the country
and contribute to enhanced national water resilience.
Yorkshire Water | Revised Draft Water Resources Management Plan 2019 13
`
Contents
1 Introduction ....................................................................................................... 14
2 Developing our plan .......................................................................................... 24
3 Supply forecast.................................................................................................. 39
4 Demand forecast ............................................................................................. 111
5 Leakage forecast ............................................................................................. 162
6 Water efficiency and demand reduction strategy ............................................ 172
7 Allowing for uncertainty ................................................................................... 183
8 Baseline supply demand balance .................................................................... 194
9 Options appraisal ............................................................................................ 197
10 Grid Surface Water Zone preferred solution ................................................ 241
11 Future resilience of preferred solution .......................................................... 266
12 Final planning scenario supply demand balance ......................................... 270
13 List of tables ................................................................................................. 281
14 List of figures ................................................................................................ 284
15 Bibliography ................................................................................................. 287
16 Glossary of terms ......................................................................................... 292
17 Appendices .................................................................................................. 295
Yorkshire Water | Revised Draft Water Resources Management Plan 2019 14
`
1 Introduction
Overview of our Water Resources Management Plan
Water companies are required to produce a Water Resources Management Plan
(WRMP) every five years. Our Water Resources Management Plan sets out our
plans to maintain a balance between supply and demand for the minimum statutory
25-year period from 2020 to 2045. However, to help ensure that we are planning for
the long-term resilience of water supply to our customers, we have also looked at
the potential supply demand balance for 15 years beyond this period, up to 2060.
The plan considers how issues such as population growth and climate change may
alter future demand for water in Yorkshire, as well as the supplies that are available
to us.
In Spring 2018 we published our draft WRMP19 for consultation. Following this
consultation we have revised our plan, taking into account representations received
from stakeholders and consultees. Any changes to the plan have been highlighted
in yellow for clarity in this revised draft WRMP19.
Our previous WRMP was published in 2014 and will be superseded by this new
plan when finalised.
We have prepared this plan in accordance with the Water Resources Planning
Guideline (Environment Agency and Natural Resources Wales, 2017) and Guiding
This section describes why we need to prepare a Water Resources
Management Plan. It identifies that, although we currently have a high level
of water resources resilience, we still face some challenges. This section
goes on to outline the work that we have completed to inform our plan and
identify how it supports us in ensuring that we provide what our customers
want. Finally, it references relevant Government policy and regulator
guidance that has supported our approach to our plan.
Yorkshire Water | Revised Draft Water Resources Management Plan 2019 15
`
principles for water resource planning (Defra, 2016). These guidelines defines the
methods that we use for estimating the components of supply and demand that
inform our plan.
Our plan also identifies how we will take a twin track approach to ensure that we
maintain a resilient balance between demand and supply into the future. The twin
track approach recognises that both demand management (reduction) measures
and additional supply (new resource) options have a role to play in maintaining a
water supply balance. It is not acceptable to simply abstract more water from the
environment; we must also work to reduce the amount of water used by ourselves
and by our customers.
The revised draft WRMP19 demonstrates how we will maintain the levels of service
that we have agreed with our customers, and specifically how we will maintain our
minimum level of service of no more than one Temporary Use Ban (TUB, formerly
known as hosepipe bans) in 25 years, or a 4% risk of occurrence in any year, in line
with our draft Drought Plan 2018.
What challenges do we face?
We have one of the most resilient water resource systems in the country. Firstly, our
grid network allows us to move water around Yorkshire to help balance supply with
demand. Secondly, we take our water from a variety of different types of water
supply, balancing across reservoirs, rivers and groundwater sources. Thirdly, we
plan for extreme droughts that go well beyond those that we have experienced in
our historical record.
This level of resilience was recognised by the independent work carried out for the
Water Resources Long Term Planning Framework (Water UK, 2016) report, which
stated:
• Yorkshire Water “now plans to a higher level of resilience than any
other part of the country”; and
• Yorkshire Water is one of only two companies that “plan for resilience
to droughts that are worse than those seen in the historic record”.
Yorkshire Water | Revised Draft Water Resources Management Plan 2019 16
`
The report’s independent modelling validated our own assessment of the resilience
of our water supply system.
However, despite our current high level of resilience, we cannot afford to be
complacent at a time where the world around us is changing. With an increasing
population and uncertainty about our future climate, and with our customers rightly
expecting more from us, we need to continue to evolve our plans. We need to be
innovative and ambitious, whilst at the same time recognising the importance of
security and resilience when planning for water resources.
In addition, our customers remain concerned about affordability now and into the
future. We need to find ways of addressing the pressures we face in the future
through a changing climate, population growth and environmental protection without
causing customers’ bills to become unaffordable.
The key challenges that our revised draft WRMP19 has identified, and addresses,
are:
• a Yorkshire population that is projected to increase by one million by
2045;
• a projected loss of 100Ml/d supply by 2045, due to climate change;
• ongoing environmental pressure to reduce the amount that we
abstract; and
• ensuring that we can continue to provide high levels of resilience and
meet our agreed levels of service, against a backdrop of maintaining
bills at a level that is affordable for all our customers.
What have we done to inform our WRMP?
To help us understand future demand for water we have updated our projections of
population in Yorkshire. We have also considered how we can help to reduce the
amount of water that gets used both by our customers and through own operations.
Our ambition is to reduce how much water is lost through leakage, and we will be
setting ourselves challenging targets for leakage reduction.
Yorkshire Water | Revised Draft Water Resources Management Plan 2019 17
`
On the supply side, we have worked closely with the Environment Agency to
understand where environmental pressures may reduce the amount of water
available to us in the future. We have also updated our assessment of the impact of
our changing climate on water resources.
We have considered how water quality may change in the future, and how we will
need to invest in a range of solutions to ensure that we do not compromise on the
quality of water supplied to customers. We will continue to work closely with land
owners, land managers and the agriculture sector to enhance the resilience of our
raw water sources, both in terms of volume and water quality.
In developing our plan, we have thought about how as a company we impact on
Yorkshire’s environment, its economy and people as we carry out our activities. As
well as talking to our customers to find out their priorities, we have engaged expert
assistance to provide us with the latest understanding of the challenges that we
face.
What are our customer telling us?
Since 2015 we have held nearly 30,000 customer conversations. This has helped
us understand more about what is important to our customers now and in the future.
We have talked to our customers about how water plays a part in their lives and the
dependencies that we all have on water. These conversations have helped us to
develop our long-term strategy, which was published in March 2018.
As part of our last strategy review in 2013, customers told us their priorities for the
next 25 years. This led to key outcomes for Yorkshire Water and a series of
performance commitments against which we measure ourselves.
Customers are now telling us that their priorities remain the same but they want us
to deliver them in different ways. We therefore need to change the way we work so
that we can continue to meet our customers’ expectations.
Our customers have clearly told us that their number one priority is a reliable supply
of clean, good quality, water. They need to know that their water supply is secure,
wholesome and sustainable. Our customers also want us to stop failures in service
Yorkshire Water | Revised Draft Water Resources Management Plan 2019 18
`
from affecting their lives. We need to ensure that our water supply system is
resilient.
Our customers have also told us that they want us to waste less water through
leakage. Throughout discussions with our customers a key message was the need
for us to demonstrate where and how we will go above our standard duties and
encourage customer support by showing that we are ‘doing our bit’. We received a
clear message that we cannot expect our customers to embrace changes in their
own water use if they do not see a change in our approach to leakage.
We know that our customers are concerned about climate change. They want to
know that we have clear plans in place for how we intend to manage climate change
challenges. Our customers also remain concerned about affordability.
Currently we provide approximately five million customers with water. Our latest
forecasts indicate that we may need to supply an additional one million customers
over the next 25 years. We need to know that we can continue to supply not only
our existing customers, but also those new customers who will join us in the future.
To reflect our customers’ priorities, and ensure that we can deliver against the
challenges outlined above, we have set out five goals in our new long term strategy.
Our water supply goal states that “we will always provide our customers with
enough safe water, we will not waste water and we will always protect the
environment”.
Our revised draft WRMP19 is one of the key components that will help us to deliver
this goal. We will start by looking at ourselves, the water that we use, and the water
that is lost through leakage. We have set ourselves ambitious leakage reduction
targets, and will be using innovative new techniques to help us drive down the cost
of identifying and repairing leaks. We will also continue to work closely with our
customers to make sure that we all have enough water without increasing our
demands on natural resources.
Our revised draft WRMP19 describes how we will ensure that we continue to have
sufficient water to supply our customers, in the face of climate change, population
growth and environmental pressures.
Yorkshire Water | Revised Draft Water Resources Management Plan 2019 19
`
This plan ensures that we will continue to provide our customers with a secure
water supply that meets demand both now and in the future.
Full details of our engagement with customers for business planning and the draft
WRMP19 are provided in Appendix C.
What are our regulators telling us?
In the lead-up to the publication of our draft WRMP19, Defra and our regulators
published a series of guidance documents. In summary, these set out expectations
to secure the long-term resilience of water supplies because of climate change and
an increasing population. The focus has been on environmental protection and
innovation in the form of markets, trading between companies, demand
management and the active involvement of our customers, for instance, in setting
levels of service as well as demand management options. Overall the guidance
documents promote a WRMP that is longer-term in its perspective and fully
embedded in company business planning.
In Creating a great place for living. Enabling resilience in the water sector (Defra,
2016), Defra noted that climate change, through changing weather patterns such as
higher summer temperatures and lower summer rainfall, and population growth
pose long term challenges on the water sector in England. This is because both
impact on the balance of water supply and the customer demand for water.
The Defra document set out a policy road map to adapt to climate change which
has continued through the UK Climate Change Risk Assessment (Committee on
Climate Change, 2017), and we anticipate the 2018 National Adaptation
Programme will encourage coordinated activity.
In response, the water industry published Water Resources Long Term Planning
Framework (Water UK, 2016) to look at our water needs over the next 50 years, and
the strategic options that could meet these needs. It noted additional drivers of a
growing economy, environmental pressures on abstraction and that future droughts
maybe more severe than those experienced to date and sought to improve
coordination of resilience across the country.
Yorkshire Water | Revised Draft Water Resources Management Plan 2019 20
`
In tandem, Ofwat has evolved its regulatory framework in line with its new duty to
further the long-term resilience of the water sector, to take account of the long-term
challenges posed by climate change, population growth and changes in consumer
behaviour.
Delivering Water 2020: Consulting on our methodology for the 2019 price review
(Ofwat, 2017) sets expected improvements in long-term water planning for PR19.
These included the integration of the development of our WRMP into our business
planning and referenced previous Ofwat guidance. This previous guidance
emphasised the need to clearly set out the outcomes we plan to deliver for our
customers, the resilience of supplies, the risks to delivery of those outcomes and
evidence that we have considered the full range of options for mitigating those risks.
We anticipate the guidance to be consolidated in the final Ofwat 2019 price review
methodology.
The Government’s strategic priorities and objectives for Ofwat (Defra, 2017) sets
out Defra’s priorities for Ofwat and the water industry in two overarching priorities:
• securing long-term resilience: Customers expect resilient services,
now and in the future – but some regions are exposed to substantial
risks from service failures, for example due to drought; and
• protecting customers: Every home and business depends on a
resilient water industry – but not everyone can afford their water bill.
The document included a third priority: Ofwat should promote markets to drive
innovation and achieve efficiencies in a way that takes account of the need to
further: (i) the long-term resilience of water and wastewater systems and services;
and / or (ii) the protection of vulnerable customers.
The Guidance Note: Long term planning for the quality of drinking water supplies
(Drinking Water Inspectorate, 2017) which requires our WRMP19 to take account of
all statutory drinking water quality obligations, and to include plans to meet their
statutory obligations in full.
The Water industry strategic environmental requirements (WISER) Strategic steer to
water companies on the environment, resilience and flood risk for business planning
Yorkshire Water | Revised Draft Water Resources Management Plan 2019 21
`
purposes (Environment Agency and Natural England, 2017) sets out the obligations
and expectations for the water industry during the price review period 2020 to 2025
(PR19). It provided further security of supply guidance on resilience, demand
measures, leakage, drought management, future sustainability changes and
protecting the environment.
Following preparation of our draft WRMP19 the Government published A Green
Future: Our 25 Year Plan to Improve the Environment in January 2018, which sets
out their plans to improve the environment within a generation. Within this plan are
goals and targets for water management, with the aim of achieving clean and
plentiful water by improving at least three quarters of waters to be close to their
natural state as soon as is practicable.
The plan sets out how this will be achieved through a number of goals including:
• reducing the damaging abstraction of water from rivers and
groundwater, ensuring that by 2021 the proportion of water bodies
with enough water to support environmental standards increases from
82% to 90% for surface water bodies and from 72% to 77% for
groundwater bodies;
• reaching or exceeding objectives for rivers, lakes, coastal and ground
waters that are specially protected, for biodiversity or drinking water
as per River Basin Management Plans; and
• supporting Ofwat’s ambitions on leakage, minimising the amount of
water lost through leakage year on year, with water companies
expected to reduce leakage by at least an average of 15% by 2025.
The National Infrastructure Commission published its National Infrastructure
Assessment in July 2018. The report included proposals to ensure resilience to
extreme drought through additional supply and demand reduction, to minimise the
impact of severe weather and climate change and reduce the risks of drought and
flooding.
The Commission also published a stand-alone report Preparing for a drier future:
England’s water infrastructure needs in April 2018. This sets out a twin-track
approach to manage water supply and demand through increased water supply
Yorkshire Water | Revised Draft Water Resources Management Plan 2019 22
`
system capacity, managing demand and reducing leakage. The report suggests that
this could be achieved through: delivering a national water transfer network and
additional water supply infrastructure by the 2030s; halving water lost through
leakage by 2050 and reducing customer demand through smart metering.
Most recently, Defra, the Environment Agency, the Drinking Water Inspectorate and
Ofwat sent a joint letter to water companies in August 2018, setting out
requirements to build resilience in water resources management in England. The
letter describes how ambitious and co-ordinated leadership across industry,
government and regulatory bodies is needed to meet this challenge. It sets out
requirements for water companies including greater ambition in areas such as
demand management (leakage and customer water use), coordinated water
resources planning and use of competition and markets.
Our revised draft WRMP19 has addressed the priorities of the Government and our
regulators to ensure we can continue to meet the needs of people, businesses and
the environment of Yorkshire.
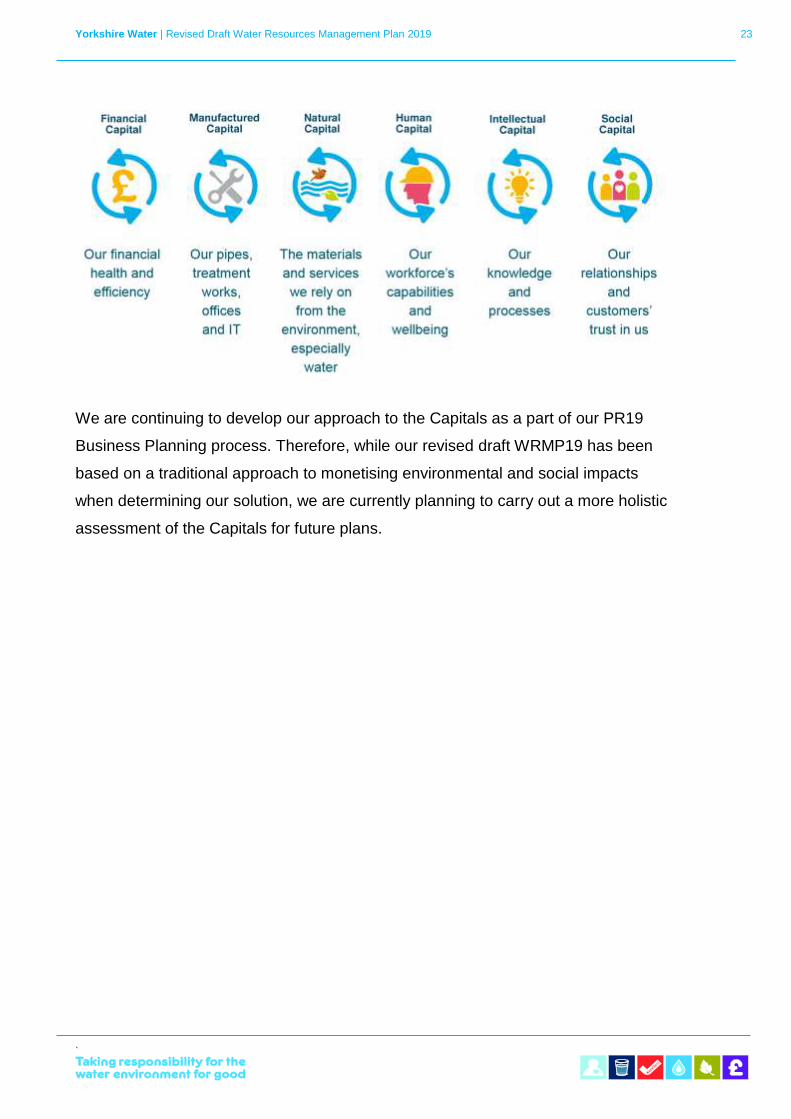
The Capitals
We are embedding the concept of the Capitals into our long-term business planning,
to help us ensure the affordability and resilience of our essential public services for
current and future generations. The Capitals are the valuable assets which are
critical to the success of any organisation, and effective management of the Capitals
helps ensure the resilience of our business. We consider the six capitals illustrated
below: Financial, Manufactured, Natural, Social, Human and Intellectual capital.
Yorkshire Water | Revised Draft Water Resources Management Plan 2019 23
`
We are continuing to develop our approach to the Capitals as a part of our PR19
Business Planning process. Therefore, while our revised draft WRMP19 has been
based on a traditional approach to monetising environmental and social impacts
when determining our solution, we are currently planning to carry out a more holistic
assessment of the Capitals for future plans.
Yorkshire Water | Revised Draft Water Resources Management Plan 2019 24
`
2 Developing our plan
The WRMP process
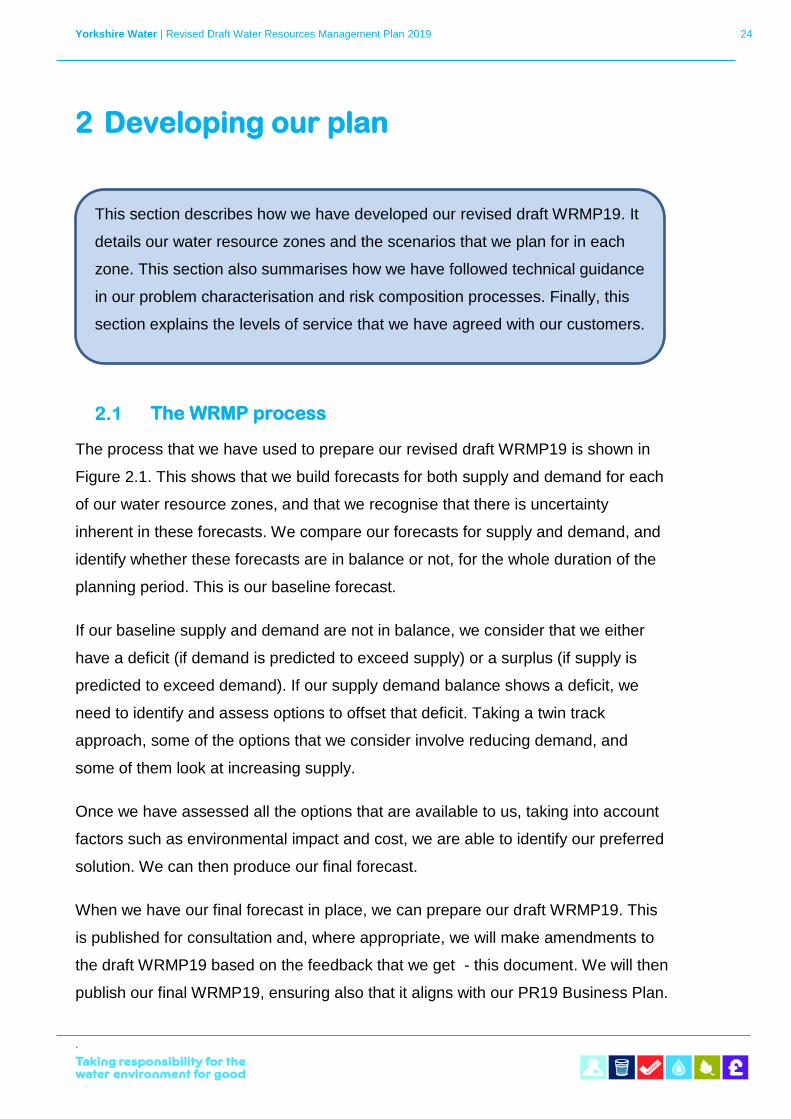
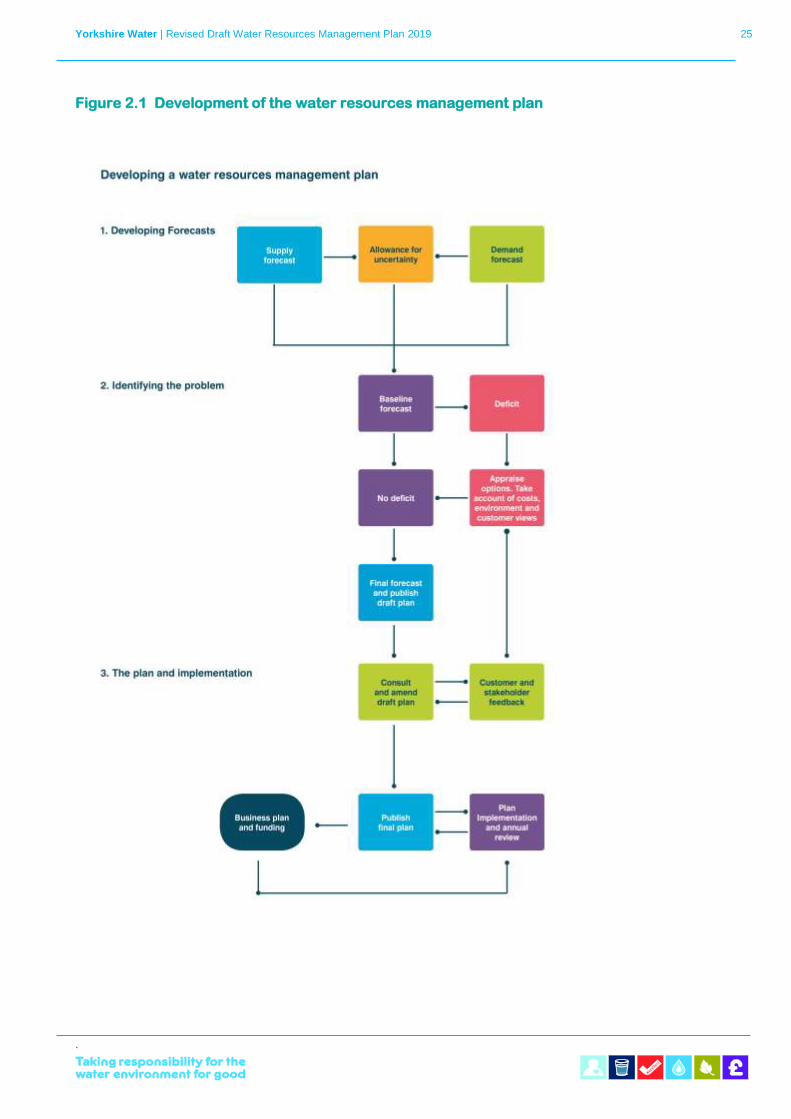
The process that we have used to prepare our revised draft WRMP19 is shown in
Figure 2.1. This shows that we build forecasts for both supply and demand for each
of our water resource zones, and that we recognise that there is uncertainty
inherent in these forecasts. We compare our forecasts for supply and demand, and
identify whether these forecasts are in balance or not, for the whole duration of the
planning period. This is our baseline forecast.
If our baseline supply and demand are not in balance, we consider that we either
have a deficit (if demand is predicted to exceed supply) or a surplus (if supply is
predicted to exceed demand). If our supply demand balance shows a deficit, we
need to identify and assess options to offset that deficit. Taking a twin track
approach, some of the options that we consider involve reducing demand, and
some of them look at increasing supply.
Once we have assessed all the options that are available to us, taking into account
factors such as environmental impact and cost, we are able to identify our preferred
solution. We can then produce our final forecast.
When we have our final forecast in place, we can prepare our draft WRMP19. This
is published for consultation and, where appropriate, we will make amendments to
the draft WRMP19 based on the feedback that we get - this document. We will then
publish our final WRMP19, ensuring also that it aligns with our PR19 Business Plan.
This section describes how we have developed our revised draft WRMP19. It
details our water resource zones and the scenarios that we plan for in each
zone. This section also summarises how we have followed technical guidance
in our problem characterisation and risk composition processes. Finally, this
section explains the levels of service that we have agreed with our customers.
Yorkshire Water | Revised Draft Water Resources Management Plan 2019 25
`
Figure 2.1 Development of the water resources management plan
Yorkshire Water | Revised Draft Water Resources Management Plan 2019 26
`
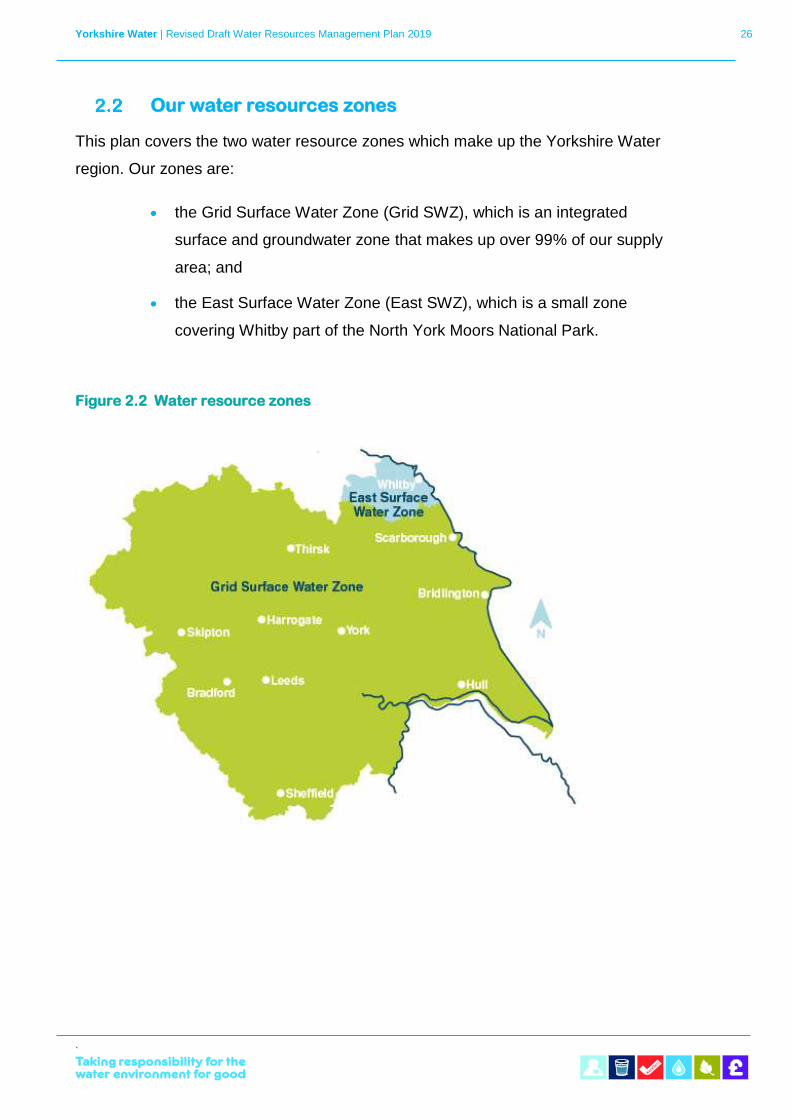
Our water resources zones
This plan covers the two water resource zones which make up the Yorkshire Water
region. Our zones are:
• the Grid Surface Water Zone (Grid SWZ), which is an integrated
surface and groundwater zone that makes up over 99% of our supply
area; and
• the East Surface Water Zone (East SWZ), which is a small zone
covering Whitby part of the North York Moors National Park.
Figure 2.2 Water resource zones
Yorkshire Water | Revised Draft Water Resources Management Plan 2019 27
`
Water resource zone integrity
In Water Resources Planning Tools, (UKWIR, 2012), a water resources zone is
defined as:
“The largest possible zone in which all resources, including external transfers, can
be shared and hence the zone in which all customers will experience the same risk
of supply failure from a resource shortfall.”
The Environment Agency has published guidelines on ensuring the integrity of water
resource zones, Water resource zone integrity, (Environment Agency, 2016). These
guidelines include pro formas for decision trees to establish if a resource zone
complies with the Environment Agency definition.
The pro formas for the Grid SWZ and the East SWZ are shown in Appendix A of the
Deployable Output and Climate Change Technical Report which will be provided to
the Environment Agency and available on request. This appendix describes how
both the Grid SWZ and the East SWZ meet the definition of a resource zone.
The Grid SWZ is a large conjunctive use zone and, although not all resources within
the zone can be shared, some of the major resources can be moved and used to
support supplies in different areas. Due to the interconnected grid, the risk of supply
failure is the same throughout the zone. Supplies can be moved around effectively
to manage resource shortfalls.
A water resources computer simulation model, Water Resources Allocation Plan
simulation (WRAPsim), is used to model our water supply network. The model is
used to evaluate river flows, water storage and levels of service. WRAPsim
schematics for the two resource zones are shown in Appendix B of the Deployable
Output and Climate Change Technical Report. The schematics show major
pipelines, treatment works, sources and demand zones. Our system is too complex
to show the capacities and system constraints on these schematics, although these
are all included in the WRAPsim model.
The schematics, associated system constraints, and resource zone integrity pro
formas were shared and discussed with the Environment Agency in 2017, and the
integrity of the resource zones was agreed.
Yorkshire Water | Revised Draft Water Resources Management Plan 2019 28
`
Supply availability
We have produced a forecast of supplies over the next 40 years. This takes into
consideration the factors which either increase or decrease our deployable output.
We model supply availability using our water resource simulation model. This model
takes account of constraints in our supply system and historic inflows and calculates
how much water can be supplied, while maintaining a level of service of no more
than a 4% risk of a temporary use ban in each year (one temporary use ban per 25
years on average) in both resource zones.
We also take account of temporary reductions to resource and treatment availability,
for example to allow us to maintain our assets, in our planning. This is known as
outage.
We allow for uncertainty within our supply and demand forecasts through a target
headroom approach. Our supply forecast is described in detail in Section 3.
Demand forecast
We have also produced a forecast of how demand will change over the next 40
years. This forecast takes into consideration factors which could result in both an
increase and decrease in demand. The key factors forecast to influence future
demand for water include changes to population, housing, economic prospects,
household metering and leakage management. Our demand forecast is described in
detail in Section 4.
Supply demand balance
We use our forecasts of future supply and demand to calculate a supply demand
balance for each of our two water resource zones. This balance compares the
forecast water available with the forecast demand for each year of the planning
period. If this balance shows a deficit between the available supply and the demand
for water, we need to identify solutions to close the gap.
Yorkshire Water | Revised Draft Water Resources Management Plan 2019 29
`
Available options
We have considered a wide range of options that could be used to address a future
deficit in our supply demand balance. These options include those that will reduce
demand, such as:
• leakage reduction;
• mains replacement;
• pressure management; and
• water efficiency.
As part of our twin track approach, we have also considered options for new water
resources, for example:
• reservoir dam height raising;
• new resources (e.g. new borehole or river abstraction);
• desalination; and
• water trading/bulk transfers from other water companies.
Option assessment
We have assessed each option to define how much benefit (deficit reduction) it
could provide. We also assess how much each option would cost, considering its
whole life costs across a range of areas including capital, operational, social,
environmental and carbon. When selecting our preferred solution we consider the
options costs and benefits to determine the best value solution over the long term.
To establish which of our options would deliver the greatest benefit, we have
assessed each option, against the following criteria:
• Will the option meet the supply demand deficit whilst maintaining the
current level of service?
• Is the option cost-efficient?
• Is it supported by our customers?
• Does it align with the outcomes presented in our Business Plan?
Yorkshire Water | Revised Draft Water Resources Management Plan 2019 30
`
• Does it minimise environmental impacts?
Problem characterisation
Before producing our draft WRMP19 we carried out a problem characterisation
evaluation in line with the UKWIR WRMP 2019 Methods – Decision Making Process
guidance, (Atkins, 2016). The problem characterisation is carried out for each water
resource zone and is used to evaluate the strategic needs and the complexity of
individual zones. The guidance provides a decision-making framework to help water
companies select appropriate investment appraisal and optimisation methodologies
based on the outputs of the problem characterisation.
As we completed our problem characterisation at the start of our WRMP process,
we based it on our WRMP 2014 supply and demand components and any new
information available at the time of assessment such as potential sustainability
reductions.
Problem characterisation is Stage 3 of the decision-making framework. Following
the methodology provided in UKWIR WRMP 2019 methods – Risk Based Planning,
(Atkins, 2016), we fed the output from Stage 3 into our risk based planning
methodology. We then used the outputs from the risk based planning method as
inputs to Stage 5 of the decision-making framework, “identify and define data inputs
to model”.
In WRMP14, we forecast that the Grid SWZ baseline scenario would be in deficit
from 2018/19 onwards. By contrast, the much smaller East SWZ showed a surplus
for the full 25-year planning period. We determined a solution to the Grid SWZ
deficit in WRMP14 using The Economics of Balancing Supply and Demand (EBSD)
Guidelines (UKWIR, 2002). This provided us with a least cost solution to the deficit,
which we assessed against environmental impacts and customer preferences to
develop our final solution.
For this plan, in line with guidance, we have completed problem characterisation for
both the Grid SWZ and the East SWZ. At the time of this evaluation we assumed
that the Grid SWZ would be in deficit following revision of the supply demand
balance components. This means that we would need to select an appropriate
Yorkshire Water | Revised Draft Water Resources Management Plan 2019 31
`
modelling method to identify a solution to the revised deficit. We assumed this
because that is what our WRMP14 showed.
In WRMP14, our forecast for the East SWZ surplus was large, showing 30% greater
supply availability than forecast demand. When starting work on the draft WRMP19,
we had no concerns that any of the supply and demand components would have
changed significantly since WRMP14. We carried out a problem characterisation to
understand the complexity of the zone and if there were any issues that were not
apparent in the previous plan.
For both zones, we identified a risk that the Water Framework Directive (WFD)
requirements for achieving sustainable catchments by 2027 had the potential to
reduce our available licence capacity. We did not expect any licence reductions to
impact on the East SWZ deployable output due to the large supply surplus in this
zone. There was a risk that the Grid SWZ deployable output would be affected.
However, when were at the stage of problem characterisation for this plan we had
insufficient information to assess the scale of the risk at the stage of problem. We
have worked closely with the Environment Agency to understand this risk as we
have developed our new plan.
There are two parts to our problem characterisation assessment:
• Strategic needs (“how big is the problem?”) - a high-level assessment
of the scale of need for new water resources and/or demand
management strategies; and
• Complexity factors (“how difficult is it to solve?”) - an assessment of
the complexity of issues that affect investment in a water resource
zone or area.
Our assessment of strategic needs includes three headline questions that explore
the size of any potential supply demand deficit, and the cost (in relative terms) of the
supply and demand management options. The three strategic WRMP risk questions
apply to three types of risk:
• S -supply-side risks;
• D - demand-side risks; and
Yorkshire Water | Revised Draft Water Resources Management Plan 2019 32
`
• I - investment programme risks.
The assessment of the complexity factors provides an understanding of the nature
of the risks and vulnerabilities within the draft WRMP19. It raises several questions
on the supply-side, demand-side and investment programme complexity factors of
the supply-demand balance.
The aim of this process is to identify whether these complexities, in combination
with the level of strategic risk, indicate that methods beyond the previous EBSD
methodology should be considered. These factors also provide an indication of
which tools may be suitable.
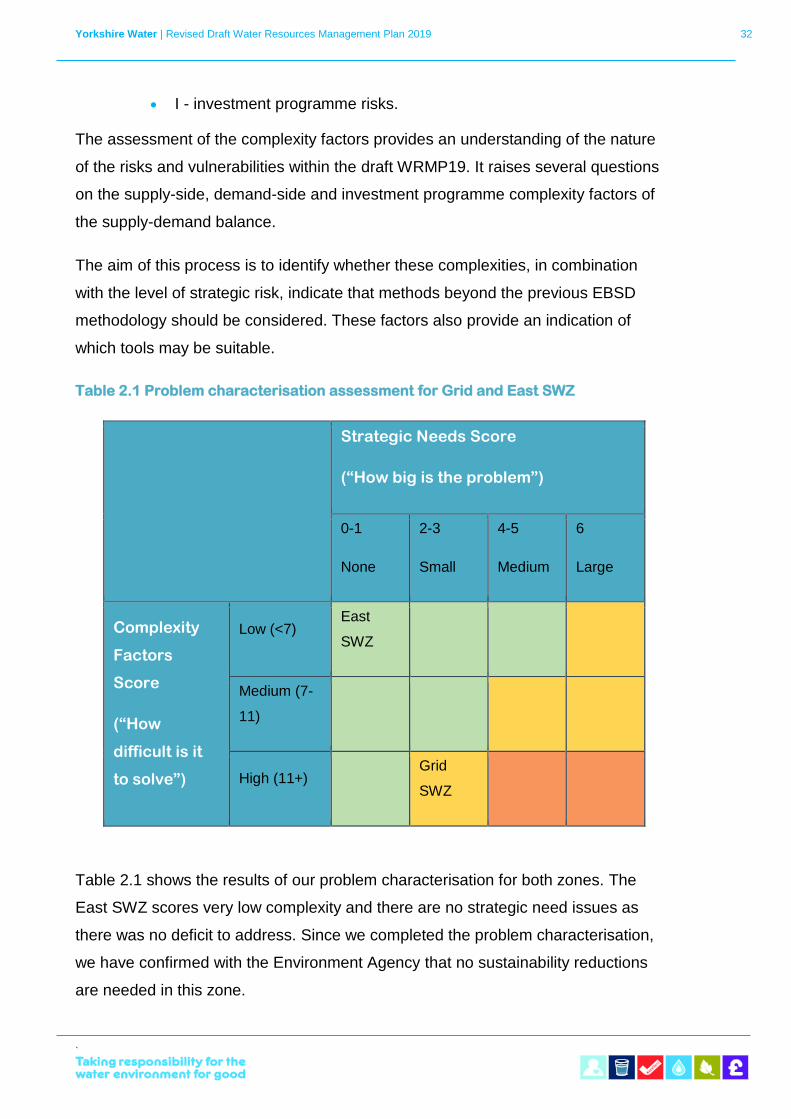
Table 2.1 Problem characterisation assessment for Grid and East SWZ
Strategic Needs Score
(“How big is the problem”)
0-1
None
2-3
Small
4-5
Medium
6
Large
Complexity
Factors
Score
(“How
difficult is it
to solve”)
Low (<7) East
SWZ
Medium (7-
11)
High (11+)
Grid
SWZ
Table 2.1 shows the results of our problem characterisation for both zones. The
East SWZ scores very low complexity and there are no strategic need issues as
there was no deficit to address. Since we completed the problem characterisation,
we have confirmed with the Environment Agency that no sustainability reductions
are needed in this zone.
Yorkshire Water | Revised Draft Water Resources Management Plan 2019 33
`
In WRMP14 for the Grid SWZ, we forecast a deficit, primarily because climate
change would reduce the amount of water available for us to supply to customers in
this zone. For the draft WRMP19, we identified an additional risk that sustainability
reductions may also reduce Grid SWZ supply. Our problem characterisation
classified the overall Grid SWZ problem as small, because demand remained
relatively stable and the solution presented at WRMP14 was not considered to be
contentious. However, the Grid SWZ complexity factors placed us inside the amber
classification. This was partly due to the complexities associated with potentially
significant sustainability reductions.
The methodology that we selected to address the anticipated deficit for this plan
was to use the EBSD methodology to determine the solution to several scenarios.
This would include the baseline supply demand forecast scenario with known
sustainability reductions included. We also based alternative scenarios on the
unconfirmed sustainability reductions, which would lead to greater losses in
demand. This allowed us to understand how these larger potential reductions might
impact on our solution. At this stage, our original intention was to apply the Real
Options Analysis methodology if the scenarios presented a number of different
pathways that could lead to alternative solutions.
However, we have worked closely in consultation with the Environment Agency to
understand the implications of WINEP (the Water Industry National Environment
Programme). From this work, we now know that sustainability reductions will not
cause a deficit in the baseline scenario in either of our zones. We still need to carry
out further investigations during AMP7 to understand sustainability reductions on a
number of groundwater and river abstraction licences. We have run some scenarios
looking at impacts on supply. However, in agreement with the Environment Agency
we have not identified any supply demand scenarios based on these potential
licence reductions.
As we have no specific risk scenarios due to sustainability reductions to test against
the future solution we did not included a Real Options analysis in the draft
WRMP19. This position is unchanged for the revised plan.
Yorkshire Water | Revised Draft Water Resources Management Plan 2019 34
`
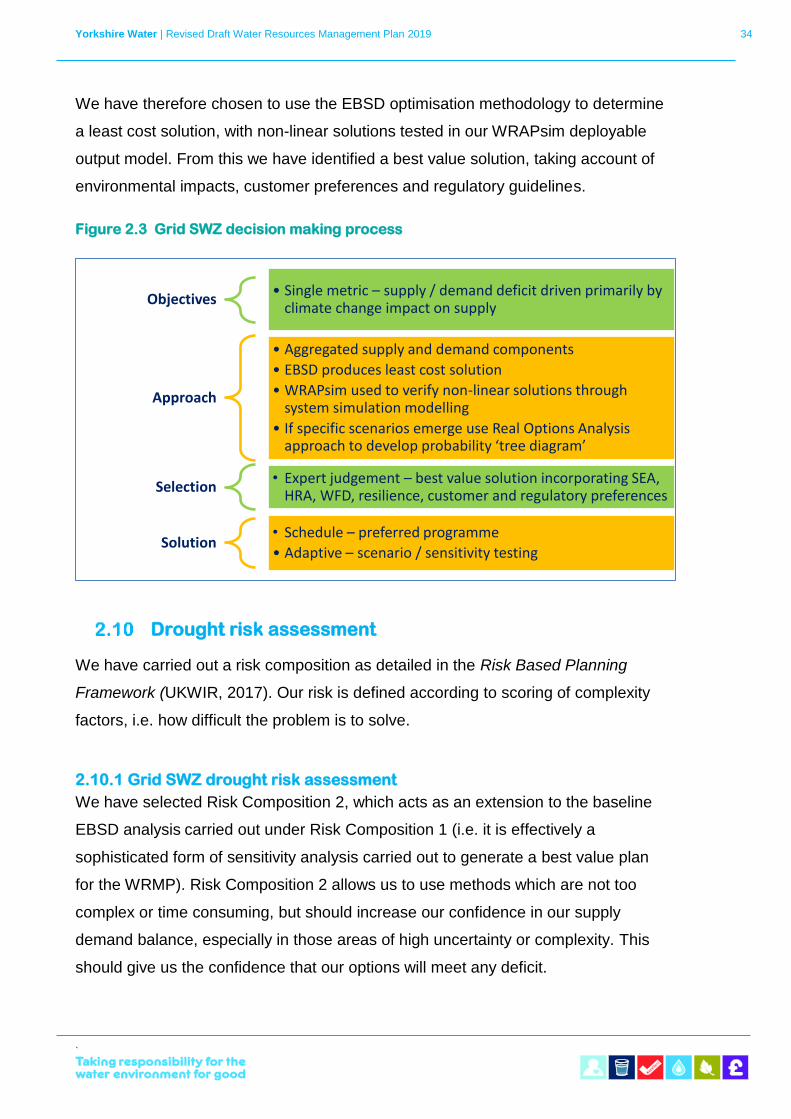
We have therefore chosen to use the EBSD optimisation methodology to determine
a least cost solution, with non-linear solutions tested in our WRAPsim deployable
output model. From this we have identified a best value solution, taking account of
environmental impacts, customer preferences and regulatory guidelines.
Figure 2.3 Grid SWZ decision making process
Drought risk assessment
We have carried out a risk composition as detailed in the Risk Based Planning
Framework (UKWIR, 2017). Our risk is defined according to scoring of complexity
factors, i.e. how difficult the problem is to solve.
2.10.1 Grid SWZ drought risk assessment
We have selected Risk Composition 2, which acts as an extension to the baseline
EBSD analysis carried out under Risk Composition 1 (i.e. it is effectively a
sophisticated form of sensitivity analysis carried out to generate a best value plan
for the WRMP). Risk Composition 2 allows us to use methods which are not too
complex or time consuming, but should increase our confidence in our supply
demand balance, especially in those areas of high uncertainty or complexity. This
should give us the confidence that our options will meet any deficit.
Objectives• Single metric – supply / demand deficit driven primarily by
climate change impact on supply
Approach
• Aggregated supply and demand components
• EBSD produces least cost solution
• WRAPsim used to verify non-linear solutions through system simulation modelling
• If specific scenarios emerge use Real Options Analysis approach to develop probability ‘tree diagram’
Selection• Expert judgement – best value solution incorporating SEA,
HRA, WFD, resilience, customer and regulatory preferences
Solution• Schedule – preferred programme
• Adaptive – scenario / sensitivity testing
Yorkshire Water | Revised Draft Water Resources Management Plan 2019 35
`
Benefits of demand restrictions are included within the supply side estimates of yield
using the same control rules contained in the behavioural WRAPsim model that is
used to provide our deployable output assessment.
We believe that the way in which we calculate our deployable output and levels of
service is compatible with Risk Composition 2. Our inclusion of demand side
drought options, and of (reliable) supply side options allows our conjunctive use
deployable output to reflect that of the whole system, and complements the ground
water methodologies, which already account for supply side losses in drought yield.
In addition, we clearly explain the benefits offered by both demand and supply side
drought options included in our deployable output assessment, and extend our
analyses to include plausible droughts outside our historic record. We also calculate
deployable output for different scenarios, and we explain the influence of supply
side interventions in relation to the links with our Drought Plan.
For this plan, climate change remains the driver for significant future uncertainty and
sensitivity analysis to still be appropriate. We have assessed headroom using A re-
evaluation of the Methodology for Assessing Headroom (UKWIR, 2002). We have
also included a more extreme climate change scenario in our sensitivity testing.
2.10.2 East SWZ drought risk assessment
The modelling complexity for the East SWZ is low, as determined by our problem
characterisation assessment. The East SWZ is included in our WRAPsim water
resources behavioural model used to model deployable output, and in most cases
we will use the same methodologies for the East SWZ as we do for the Grid SWZ.
However, we use less complex methods for climate change assessment for the
East SWZ due to the lower vulnerability to climate change.
2.10.3 Drought resilience statement
We have planned our system so that it can withstand any drought that is as severe
as those that we have seen since our historical record began in 1920, including an
appropriate allowance for climate change. We also test our investment proposals
against a plausible range of future droughts. This helps us to ensure that our
Yorkshire Water | Revised Draft Water Resources Management Plan 2019 36
`
investment represents a good balance between cost, environment and resilience to
severe droughts.
In addition, we plan for more severe droughts than we have experienced in our
historical record. We define our deployable output relative to our levels of service,
and this means that our quoted deployable output is less than it would be if it were
defined by any one of our drought events. This is demonstrated in Table 10 of the
water resources planning tables, which is described more fully in Section 3.7.
Planning scenarios
Our plan is based on the dry year annual average for demand, and on our
deployable output calculated from our 95-year inflow record (1920-2014) for supply.
Our East SWZ is supplied by a run-of river source (where water is abstracted
directly from the river and not via storage reservoirs or lagoons), and small springs
with limited storage. In addition, the area sees an increase in its population during
the summer, due to tourism, and therefore could be susceptible to peak summer
demands. However, the deployable output in the East SWZ is considerably greater
than both average and peak demand. Therefore, there is no risk to supply in a time
of high demand.
Network flexibility in our Grid SWZ means it is not susceptible to supply demand
issues at times of unusually high demand.
Therefore, we plan for a dry year annual average scenario only in each zone as a
critical period scenario planning is not required.
Our deployable output is defined by our levels of service, which means that no
single drought in our historic record is our design drought. It is worth noting,
however, that our most extreme drought in most areas was the one which occurred
in 1995/96.
Our plan uses a climate change scenario to forecast supplies for the duration of the
planning period and beyond, but we have a resilience tested plan where we
consider alternative scenarios.
Yorkshire Water | Revised Draft Water Resources Management Plan 2019 37
`
Levels of Service
Our deployable output is defined by our levels of service of:
• temporary use bans no more frequently than 1 in 25 years on average
(4% probability in any one year);
• drought orders no more frequently than 1 in 80 years on average
(1.3% probability in any one year); and
• emergency restrictions no more than 1 in 500 years on average (0.2%
probability in any one year).
• These levels of service apply throughout our planning period.
Our levels of service and deployable output are inextricably linked, and we fully
discuss our levels of service in Section 3.5. We outline our deployable output for our
chosen level of service. However, in Table 10 of our water resources planning
tables, we also demonstrate the different estimates we obtain for deployable output
for different design droughts, including an Environment Agency reference scenario
with a return period of 1 in 200 years (0.5% probability in any one year).
The Environment Agency has asked us to demonstrate that we are resilient to a
drought with a return period of 1 in 200 years without having need to implement
emergency restrictions such as stand pipes and rota cuts. Our 1995/96 drought has
a return period higher than this (depending on the return period analysis used), and
our modelling shows we would require only level 3 restrictions (ordinary drought
orders) for an event such as this. This level of resilience is reflective of the
investments that we have made since 1995/96 in creating and reinforcing our grid
system.
Our analyses in Table 10 demonstrate that even for a 3 year drought with a return
period of over 1 in 400 years, we would not need to resort to rota cuts, although we
would plan to implement some of our long-term drought options.
The Water Resources Long Term Planning Framework (Water UK, 2016) confirms
that we plan to a much higher level of resilience than most other water companies,
as do our drought response surfaces, shown in Section 3.7.
Yorkshire Water | Revised Draft Water Resources Management Plan 2019 38
`
We have also been asked to quantify deployable output and incremental costs of
ensuring resilience (no stand pipes or rota cuts) at the Environment Agency
reference level of service. This are shown in Section 3.5.
Yorkshire Water | Revised Draft Water Resources Management Plan 2019 39
`
3 Supply forecast
Water resources
The Yorkshire Water region is bound in the west and north by the hills of the
Pennines and the North York Moors respectively. The southern and eastern parts of
the region are low lying. Annual average rainfall in the region is highest in areas of
the Pennines, whilst low lying areas average less than half the volume of rainfall
each year, with little seasonal variation.
Urban areas in the west and south are principally supplied from reservoirs in the
Pennines. The Pennines and the valleys of the rivers Don, Aire, Wharfe, Calder,
Nidd and Colne are the largest upland sources of water in the region. We operate
over 100 impounding reservoirs, of which two are major pumped storage reservoirs.
The total storage capacity of all the supply reservoirs is 160,410 mega litres (Ml).
We have an agreement with Severn Trent Water to abstract up to 21,550Ml per year
from the Derwent Valley reservoirs in Derbyshire. This water is used to supply part
of South Yorkshire.
In the eastern and northern parts of the region, the major water sources are
boreholes and river abstractions, chiefly from the rivers of the North York Moors and
the Yorkshire Wolds.
Most of these water resources are now connected by a grid network. This enables
highly effective conjunctive use of different water resources, which mitigates risk
This section describes how we have calculated how much water we can
supply now and in the future – our supply forecast. We explain what we have
included in our forecast, and how we have considered the effects of climate
change. We show the links between our levels of service and deployable
output and explain how we have considered other factors that may affect how
much water we can supply.
Yorkshire Water | Revised Draft Water Resources Management Plan 2019 40
`
and allows optimal planning, optimal source operation, and resilient sources of
supply both in drought and during floods.
Approximately 45% of the water that we supply is from impounding reservoirs, 30%
from rivers and 25% from boreholes. This varies from year to year depending on
weather conditions. In the dry year annual average planning scenario rivers are
used more, with about 40% of supply coming from reservoirs, 40% from rivers, and
20% from groundwater.
As described previously, our region is divided into two water resource zones for
planning purposes. Each zone represents a group of customers who receive the
same level of service from either groundwater or surface water sources.
The Grid SWZ represents a highly integrated surface and groundwater zone that is
dominated by the operation of lowland rivers and Pennine reservoirs. The eastern
area of this zone, is supplied mainly from borehole sources located in the Yorkshire
Wolds and along the east coast (this was previously the East groundwater zone).
This area is linked to the grid by the east coast pipeline completed in 2012.
In some parts of our region, there is the potential opportunity for changes to
reservoir management to be made to help manage flood risk. This is illustrated by
the trial that we carried out at Hebden Bridge over winter 2017/18. We will continue
to explore this issue, recognising that possible flood risk benefits must be balanced
against other risks such as water resources resilience and reservoir safety. We will
continue to report on our partnership work on this issue through the Calderdale
Flood Partnership Board.
The East SWZ is supplied by a river abstraction and moorland springs in the Whitby
area.
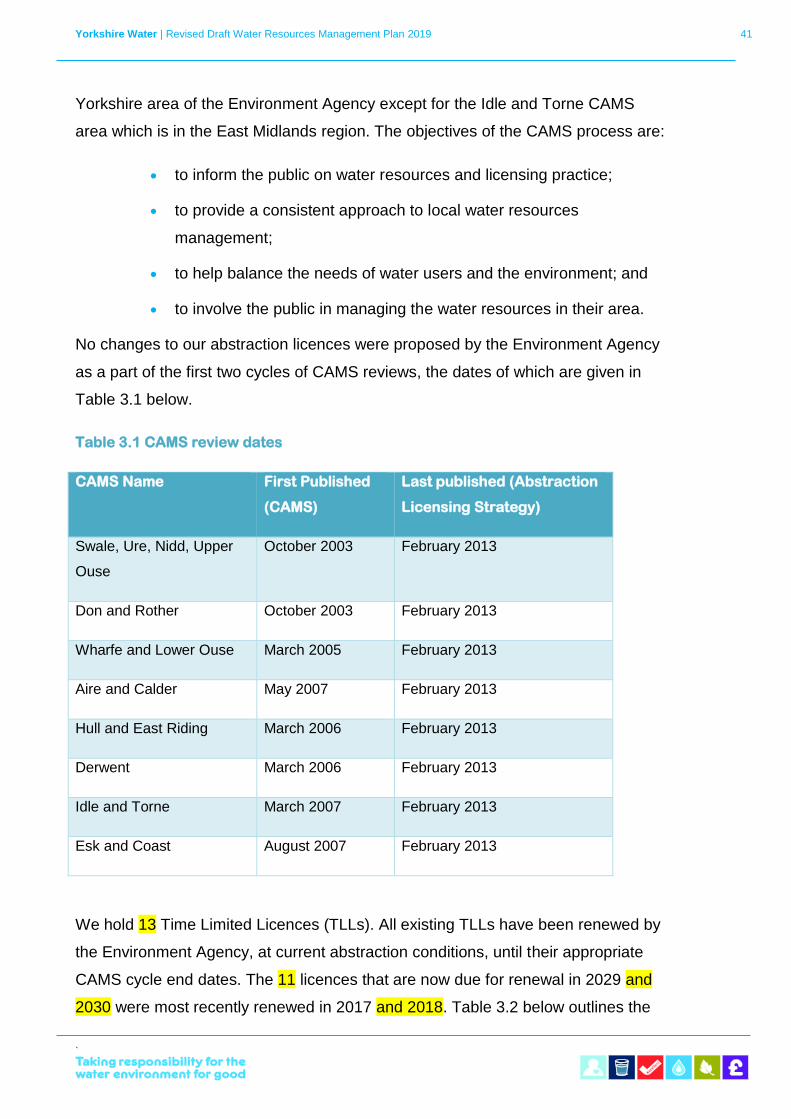
Resources and abstraction licences
We have 100 public water supply abstraction licences for 156 sources. These have
been reviewed as part of the Environment Agency’s Catchment Abstraction
Management Strategies (CAMS), renamed Abstraction Licensing Strategies in
2013. Table 3.1 lists the CAMS areas in the Yorkshire Water region. All are in the
Yorkshire Water | Revised Draft Water Resources Management Plan 2019 41
`
Yorkshire area of the Environment Agency except for the Idle and Torne CAMS
area which is in the East Midlands region. The objectives of the CAMS process are:
• to inform the public on water resources and licensing practice;
• to provide a consistent approach to local water resources
management;
• to help balance the needs of water users and the environment; and
• to involve the public in managing the water resources in their area.
No changes to our abstraction licences were proposed by the Environment Agency
as a part of the first two cycles of CAMS reviews, the dates of which are given in
Table 3.1 below.
Table 3.1 CAMS review dates
CAMS Name First Published
(CAMS)
Last published (Abstraction
Licensing Strategy)
Swale, Ure, Nidd, Upper
Ouse
October 2003 February 2013
Don and Rother October 2003 February 2013
Wharfe and Lower Ouse March 2005 February 2013
Aire and Calder May 2007 February 2013
Hull and East Riding March 2006 February 2013
Derwent March 2006 February 2013
Idle and Torne March 2007 February 2013
Esk and Coast August 2007 February 2013
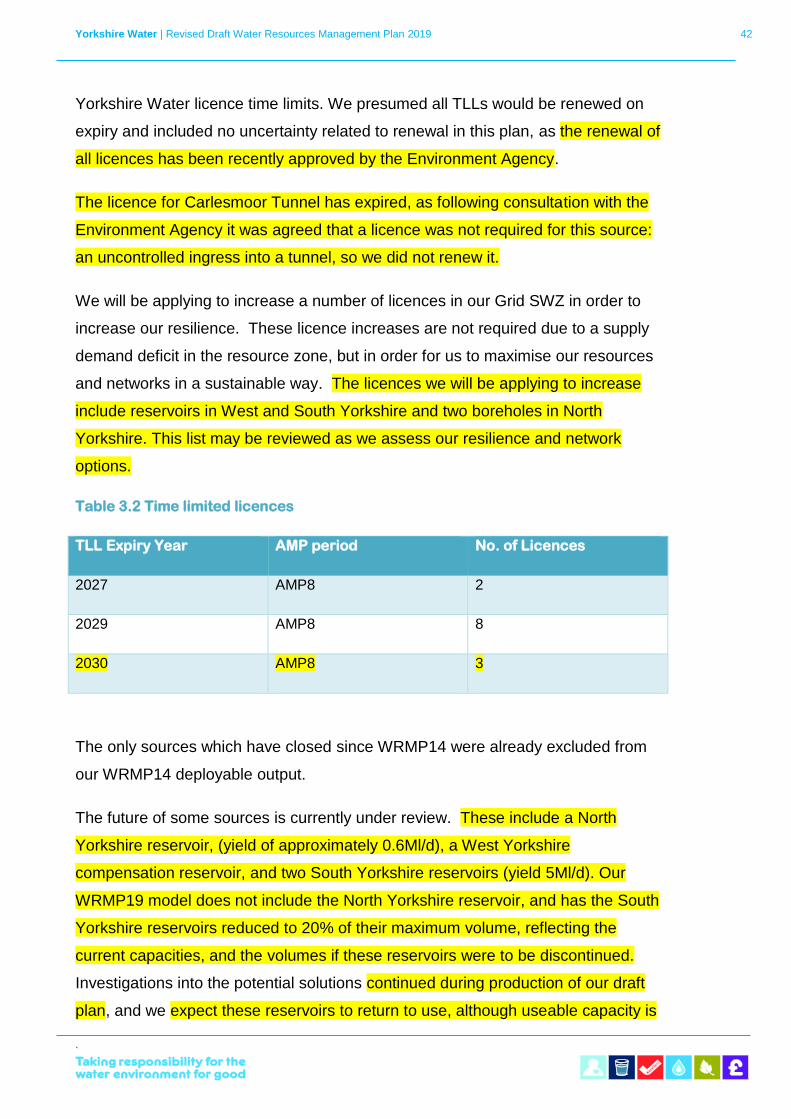
We hold 13 Time Limited Licences (TLLs). All existing TLLs have been renewed by
the Environment Agency, at current abstraction conditions, until their appropriate
CAMS cycle end dates. The 11 licences that are now due for renewal in 2029 and
2030 were most recently renewed in 2017 and 2018. Table 3.2 below outlines the
Yorkshire Water | Revised Draft Water Resources Management Plan 2019 42
`
Yorkshire Water licence time limits. We presumed all TLLs would be renewed on
expiry and included no uncertainty related to renewal in this plan, as the renewal of
all licences has been recently approved by the Environment Agency.
The licence for Carlesmoor Tunnel has expired, as following consultation with the
Environment Agency it was agreed that a licence was not required for this source:
an uncontrolled ingress into a tunnel, so we did not renew it.
We will be applying to increase a number of licences in our Grid SWZ in order to
increase our resilience. These licence increases are not required due to a supply
demand deficit in the resource zone, but in order for us to maximise our resources
and networks in a sustainable way. The licences we will be applying to increase
include reservoirs in West and South Yorkshire and two boreholes in North
Yorkshire. This list may be reviewed as we assess our resilience and network
options.
Table 3.2 Time limited licences
TLL Expiry Year AMP period No. of Licences
2027 AMP8 2
2029 AMP8 8
2030 AMP8 3
The only sources which have closed since WRMP14 were already excluded from
our WRMP14 deployable output.
The future of some sources is currently under review. These include a North
Yorkshire reservoir, (yield of approximately 0.6Ml/d), a West Yorkshire
compensation reservoir, and two South Yorkshire reservoirs (yield 5Ml/d). Our
WRMP19 model does not include the North Yorkshire reservoir, and has the South
Yorkshire reservoirs reduced to 20% of their maximum volume, reflecting the
current capacities, and the volumes if these reservoirs were to be discontinued.
Investigations into the potential solutions continued during production of our draft
plan, and we expect these reservoirs to return to use, although useable capacity is
Yorkshire Water | Revised Draft Water Resources Management Plan 2019 43
`
not yet certain. We hope to know more by the time we produce our final plan, and
have used the same values as used in our draft WRMP19 in this revised plan.
Baseline operations
The process of planning and managing baseline water resources in Yorkshire is part
of a fully integrated approach to operational planning from source to tap across the
whole region. Our main objective is to ensure that good quality water is supplied at
minimum cost to customers and the environment.
We have a weekly management process to determine key flow target settings
(reservoirs, rivers, boreholes, water treatment works and pipelines) for the week
ahead. The process uses the WRAP (Water Resource Allocation Plan) computer
model, to determine the best use of available resources to meet demand and
maintain security of supplies. Resources are selected to minimise costs,
environmental impacts and carbon emissions.
The WRAP model takes account of expected demands, reservoir and groundwater
operating rules, control curves and licensing constraints. Temporary constraints
such as outages for maintenance work or water quality problems are also taken into
account. The management of river resources is subject to licence conditions which
restrict abstractions at times of low flow and permit increased abstractions during
higher flows, typically in the autumn and winter.
Deployable output assessment
To determine deployable output, we have followed the methodology defined in the
Water resources planning tools (UKWIR, 2012); Annex E of Water resource and
supply: agenda for action (Department of the Environment,1996), Re-assessment of
water company yields (Environment Agency,1997) and A Unified Methodology for
the Determination of Deployable Output from Water Sources (UKWIR/Environment
Agency 2000). Other deployable output assessment methods used include
Handbook of source yield methodologies (UKWIR, 2014).
The Water resources planning tools (UKWIR, 2012), report describes a risk based
approach for assessing deployable output, so that the degree of complexity required
Yorkshire Water | Revised Draft Water Resources Management Plan 2019 44
`
depends on the nature of the source or group of sources being assessed. The
revised methodology realigns existing tools for calculating deployable output within
a risk based framework. Many of the previous reports and methods used for
assessment of deployable output are discussed below, and are still relevant,
representing the existing tools used by the Water resources planning tools (UKWIR,
2012) methodology. The methodology takes into account the vulnerability to climate
change.
The Grid SWZ is a large and complex conjunctive use resource zone, so the
assessment method used must be one suited to this highly complex zone.
This revised draft WRMP19 provides a summary of our deployable output
assessment. Further detail is given in the Deployable Output and Climate Change
Technical Report, which has been provided to the Environment Agency and is
available on request.
3.4.1 Ground Water deployable output assessment
We maintain an ongoing programme of work to performance test our operational
boreholes and we have reassessed the deployable output of our groundwater
sources, using a source reliable output (SRO) assessment, for the revised draft
WRMP19. The average output that a groundwater source can be relied upon to
produce in a drought year is termed the average demand drought condition
deployable output.
3.4.2 Regional deployable output modelling
We model our deployable output using our WRAPsim water resources simulation
model. Our deployable output is the highest demand we can meet whilst still
meeting our levels of service, and we use the explicit levels of service method
described in the Handbook of source yield methodologies (UKWIR, 2014).
We have updated our WRAPsim model for the following components: extension of
inflow records, review of the demand profiles, update to hydraulic and treatment
capacities, update of groundwater source reliable output studies, update of power
and chemical costs, and abandoned sources. We have reviewed water treatment
work maxima to reflect changes in reliable throughput due to a number of factors
Yorkshire Water | Revised Draft Water Resources Management Plan 2019 45
`
such as water quality. Our technical report outlines maximum water treatment works
capacities used in the WRMP14 and revised draft WRMP19 WRAPsim models, and
indicates the reason for any changes. This is discussed in more detail in Section
3.15.2.
For the Grid SWZ, the WRAPsim water resources modelling software is used to
carry out the analysis required for the determination of deployable output. The
model incorporates the following, which are required for the determination of
deployable output:
• the same demand profile should be used for every year of the
simulation;
• the defined physical capacities of the existing system should be
adopted for the simulation;
• each modelled system must incorporate emergency storage;
• inflows from 1920 to 2014 (ensuring a long simulation including critical
droughts of 1920s, 1930s and mid 1990s);
• licence conditions are adherred to;
• demands are maximised to the point of failure as required for the
determination of deployable output, by re running the model at
increasing demands until the levels of service are just met; and
• the deployable output for the 1 in 25 year temporary use ban level of
service for the year 2017/18 is the demand of the Grid SWZ demand
zone.
The supply reservoirs and the Hull borehole group in the WRAPsim model are
modelled using control lines. The yield of the individual reservoirs and the control
lines are calculated using minimum inflow sequences. This is to establish what
reservoir stocks are required, given the historic minimum inflows, to maintain a
given yield through the worst historic conditions.
Since we operate the sources within the Grid SWZ together, multiple control lines
with notional costs, called penalty functions, are used to balance stocks between
reservoirs across the region. This ensures that reservoir stocks are balanced
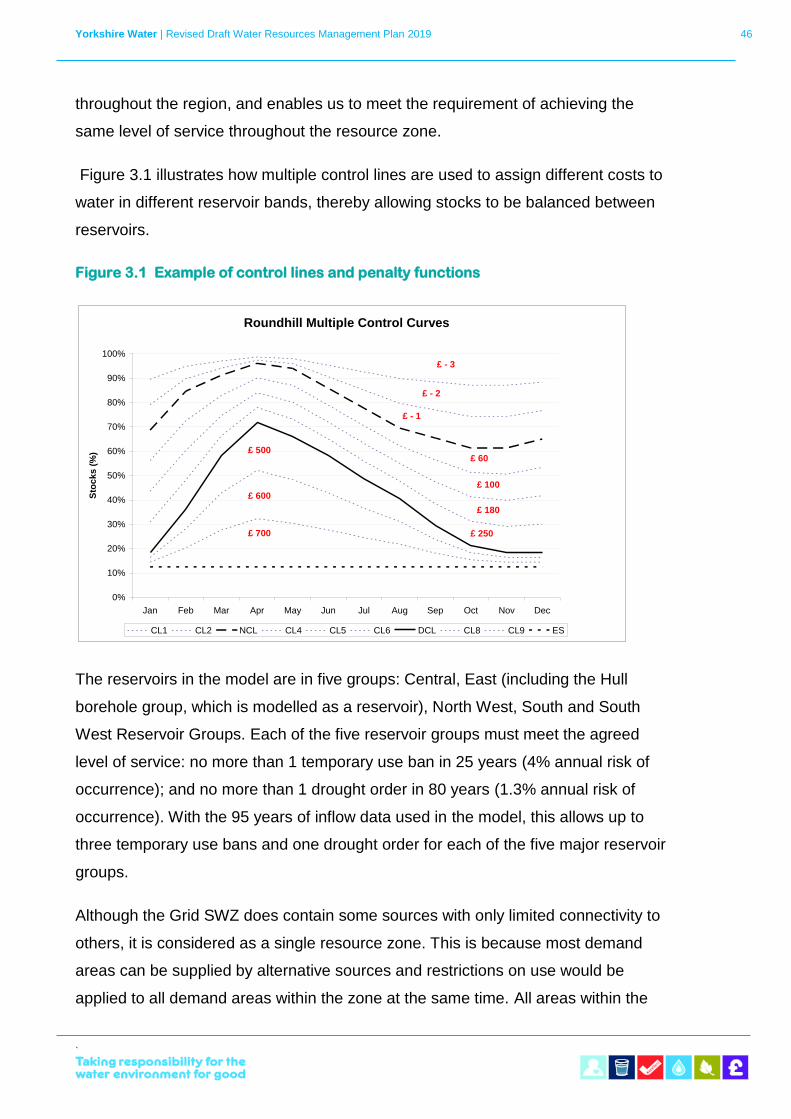
Yorkshire Water | Revised Draft Water Resources Management Plan 2019 46
`
throughout the region, and enables us to meet the requirement of achieving the
same level of service throughout the resource zone.
Figure 3.1 illustrates how multiple control lines are used to assign different costs to
water in different reservoir bands, thereby allowing stocks to be balanced between
reservoirs.
Figure 3.1 Example of control lines and penalty functions
The reservoirs in the model are in five groups: Central, East (including the Hull
borehole group, which is modelled as a reservoir), North West, South and South
West Reservoir Groups. Each of the five reservoir groups must meet the agreed
level of service: no more than 1 temporary use ban in 25 years (4% annual risk of
occurrence); and no more than 1 drought order in 80 years (1.3% annual risk of
occurrence). With the 95 years of inflow data used in the model, this allows up to
three temporary use bans and one drought order for each of the five major reservoir
groups.
Although the Grid SWZ does contain some sources with only limited connectivity to
others, it is considered as a single resource zone. This is because most demand
areas can be supplied by alternative sources and restrictions on use would be
applied to all demand areas within the zone at the same time. All areas within the
Roundhill Multiple Control Curves
0%
10%
20%
30%
40%
50%
60%
70%
80%
90%
100%
Jan Feb Mar Apr May Jun Jul Aug Sep Oct Nov Dec
Sto
ck
s (
%)
CL1 CL2 NCL CL4 CL5 CL6 DCL CL8 CL9 ES
£ - 3
£ - 2
£ - 1
£ 60
£ 100
£ 180
£ 250
£ 500
£ 600
£ 700
Yorkshire Water | Revised Draft Water Resources Management Plan 2019 47
`
Grid SWZ meet the level of service defined, i.e. no more than 1 temporary use ban
in 25 years, on average.
The critical periods of drought are found to vary from one area to another, with the
1929, 1959 and 1995/6 events being dominant in Yorkshire. However, over the
long-term each of the areas will fail a similar number of times for at least one of the
restrictions.
When using the WRAPsim model to determine deployable output, we maximise
demands to the point of failure. The model is re-run at increasing demands until the
level of service is just met. This demand is the deployable output for the 1 in 25
years temporary use bans level of service (for the Grid SWZ). The demand of the
Grid SWZ is the combined demand of all the WRAPsim demand zones within the
Grid SWZ at the regional demand, when the level of service is just met (excluding
the demand met by the Severn Trent import).
The sources in the East SWZ are constrained by the capacity of the River Esk water
treatment works, and this is what determines deployable output in the East SWZ.
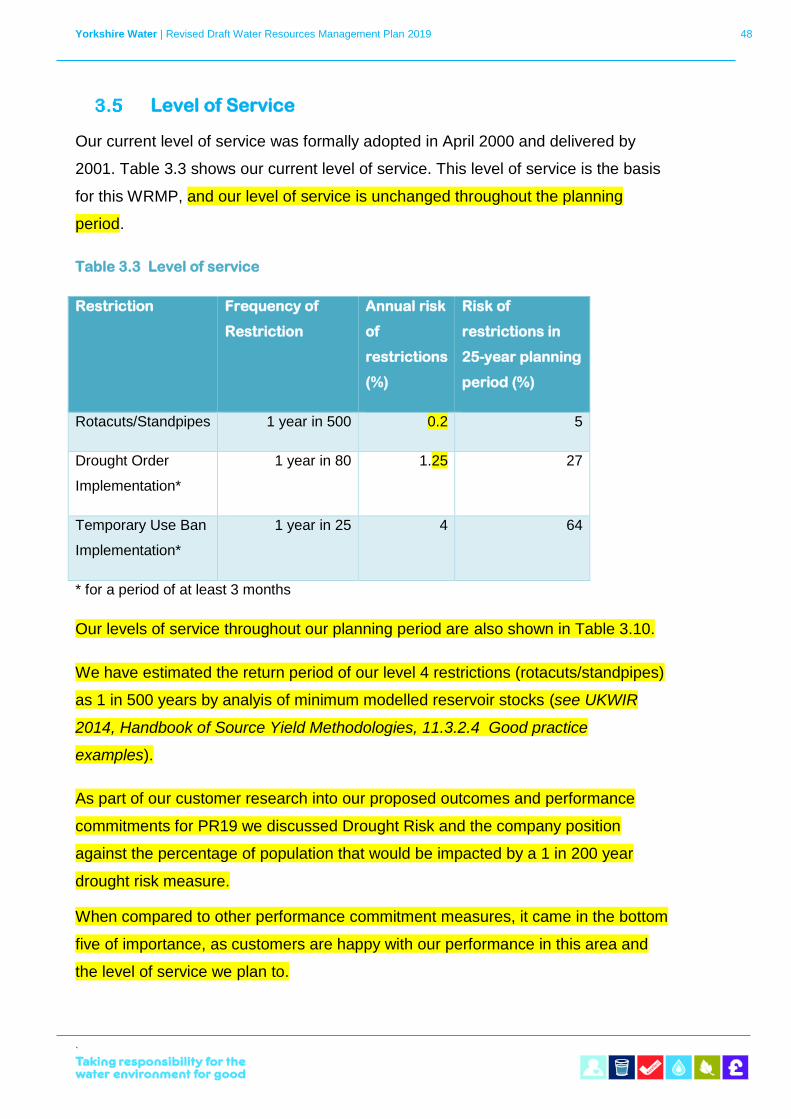
Yorkshire Water | Revised Draft Water Resources Management Plan 2019 48
`
Level of Service
Our current level of service was formally adopted in April 2000 and delivered by
2001. Table 3.3 shows our current level of service. This level of service is the basis
for this WRMP, and our level of service is unchanged throughout the planning
period.
Table 3.3 Level of service
Restriction Frequency of
Restriction
Annual risk
of
restrictions
(%)
Risk of
restrictions in
25-year planning
period (%)
Rotacuts/Standpipes 1 year in 500 0.2 5
Drought Order
Implementation*
1 year in 80 1.25 27
Temporary Use Ban
Implementation*
1 year in 25 4 64
* for a period of at least 3 months
Our levels of service throughout our planning period are also shown in Table 3.10.
We have estimated the return period of our level 4 restrictions (rotacuts/standpipes)
as 1 in 500 years by analyis of minimum modelled reservoir stocks (see UKWIR
2014, Handbook of Source Yield Methodologies, 11.3.2.4 Good practice
examples).
As part of our customer research into our proposed outcomes and performance
commitments for PR19 we discussed Drought Risk and the company position
against the percentage of population that would be impacted by a 1 in 200 year
drought risk measure.
When compared to other performance commitment measures, it came in the bottom
five of importance, as customers are happy with our performance in this area and
the level of service we plan to.
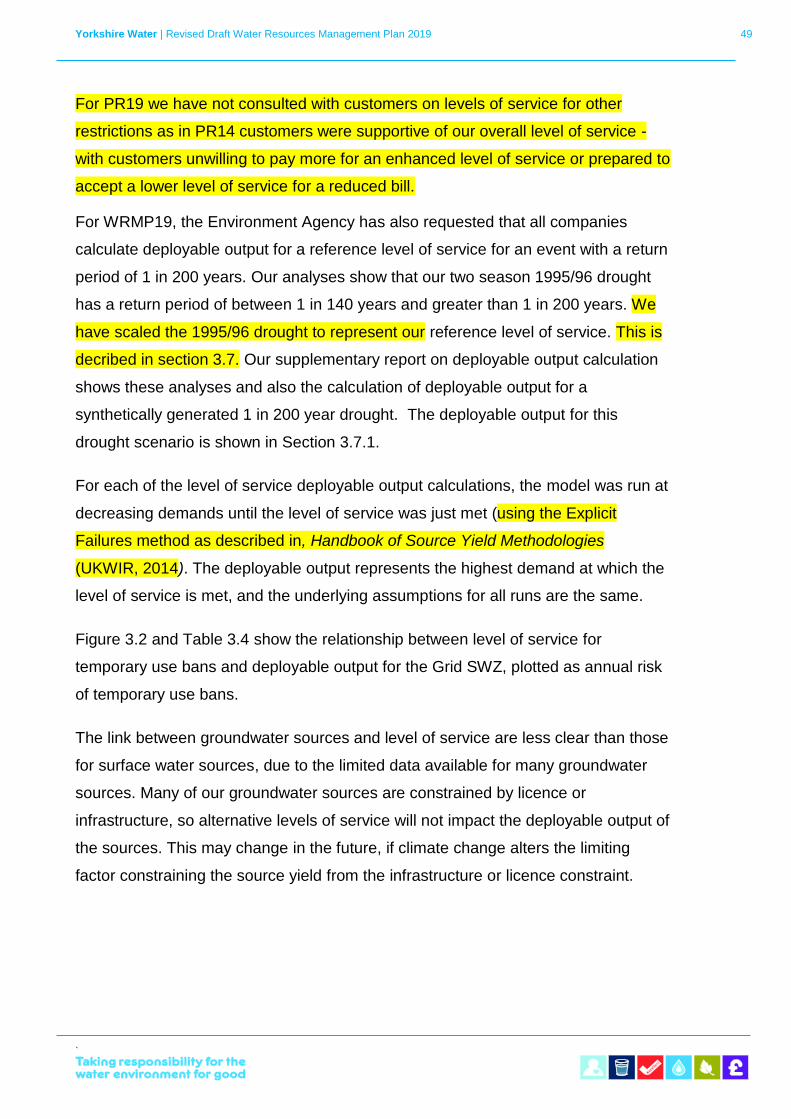
Yorkshire Water | Revised Draft Water Resources Management Plan 2019 49
`
For PR19 we have not consulted with customers on levels of service for other
restrictions as in PR14 customers were supportive of our overall level of service -
with customers unwilling to pay more for an enhanced level of service or prepared to
accept a lower level of service for a reduced bill.
For WRMP19, the Environment Agency has also requested that all companies
calculate deployable output for a reference level of service for an event with a return
period of 1 in 200 years. Our analyses show that our two season 1995/96 drought
has a return period of between 1 in 140 years and greater than 1 in 200 years. We
have scaled the 1995/96 drought to represent our reference level of service. This is
decribed in section 3.7. Our supplementary report on deployable output calculation
shows these analyses and also the calculation of deployable output for a
synthetically generated 1 in 200 year drought. The deployable output for this
drought scenario is shown in Section 3.7.1.
For each of the level of service deployable output calculations, the model was run at
decreasing demands until the level of service was just met (using the Explicit
Failures method as described in, Handbook of Source Yield Methodologies
(UKWIR, 2014). The deployable output represents the highest demand at which the
level of service is met, and the underlying assumptions for all runs are the same.
Figure 3.2 and Table 3.4 show the relationship between level of service for
temporary use bans and deployable output for the Grid SWZ, plotted as annual risk
of temporary use bans.
The link between groundwater sources and level of service are less clear than those
for surface water sources, due to the limited data available for many groundwater
sources. Many of our groundwater sources are constrained by licence or
infrastructure, so alternative levels of service will not impact the deployable output of
the sources. This may change in the future, if climate change alters the limiting
factor constraining the source yield from the infrastructure or licence constraint.
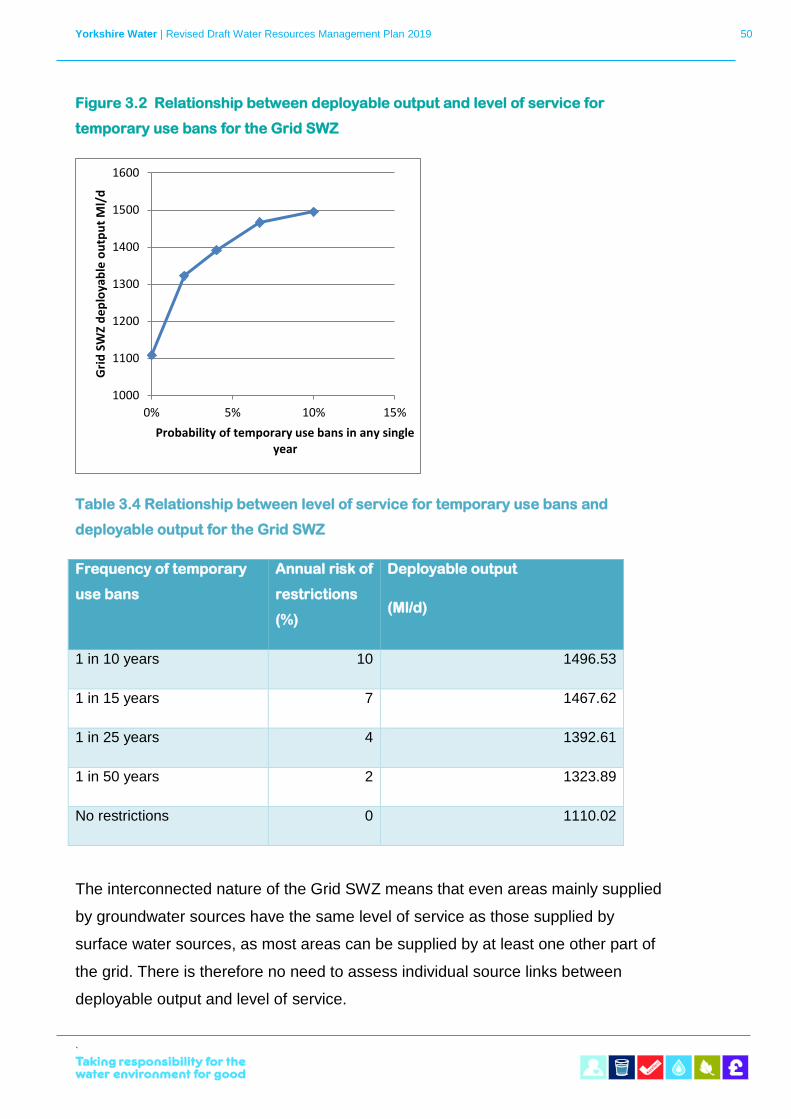
Yorkshire Water | Revised Draft Water Resources Management Plan 2019 50
`
Figure 3.2 Relationship between deployable output and level of service for
temporary use bans for the Grid SWZ
Table 3.4 Relationship between level of service for temporary use bans and
deployable output for the Grid SWZ
Frequency of temporary
use bans
Annual risk of
restrictions
(%)
Deployable output
(Ml/d)
1 in 10 years 10 1496.53
1 in 15 years 7 1467.62
1 in 25 years 4 1392.61
1 in 50 years 2 1323.89
No restrictions 0 1110.02
The interconnected nature of the Grid SWZ means that even areas mainly supplied
by groundwater sources have the same level of service as those supplied by
surface water sources, as most areas can be supplied by at least one other part of
the grid. There is therefore no need to assess individual source links between
deployable output and level of service.
1000
1100
1200
1300
1400
1500
1600
0% 5% 10% 15%
Gri
d S
WZ
de
plo
yab
le o
utp
ut
Ml/
d
Probability of temporary use bans in any single year
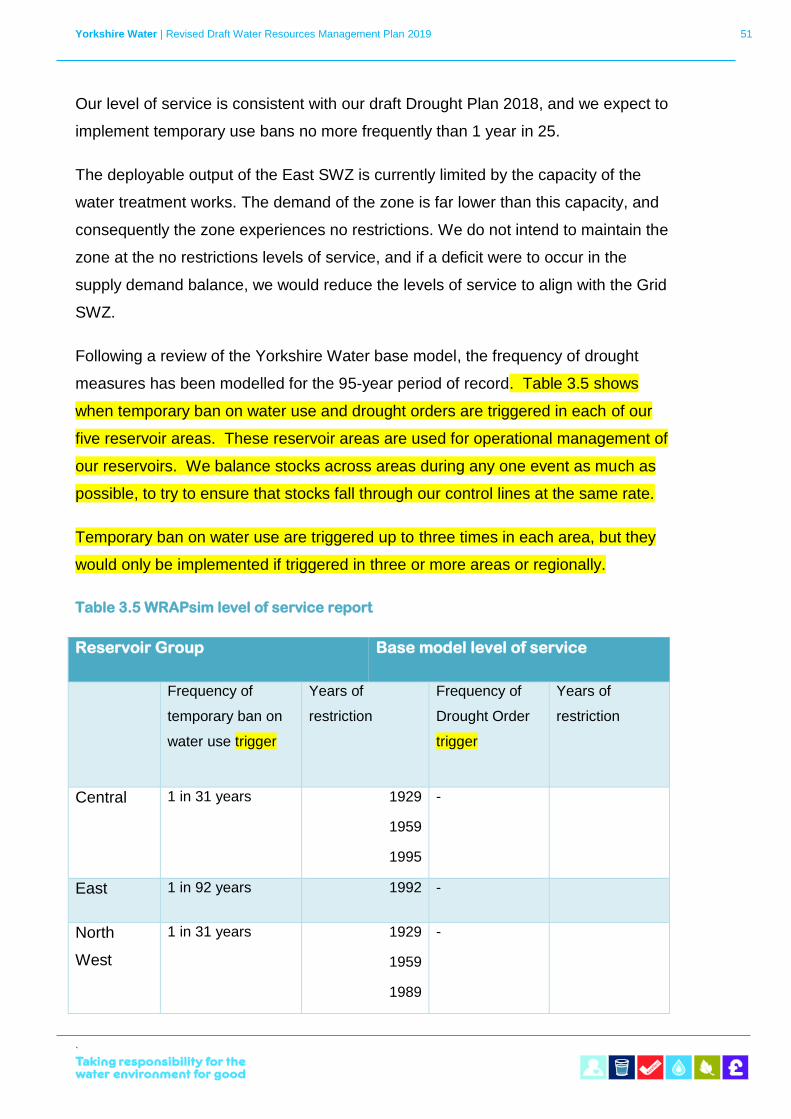
Yorkshire Water | Revised Draft Water Resources Management Plan 2019 51
`
Our level of service is consistent with our draft Drought Plan 2018, and we expect to
implement temporary use bans no more frequently than 1 year in 25.
The deployable output of the East SWZ is currently limited by the capacity of the
water treatment works. The demand of the zone is far lower than this capacity, and
consequently the zone experiences no restrictions. We do not intend to maintain the
zone at the no restrictions levels of service, and if a deficit were to occur in the
supply demand balance, we would reduce the levels of service to align with the Grid
SWZ.
Following a review of the Yorkshire Water base model, the frequency of drought
measures has been modelled for the 95-year period of record. Table 3.5 shows
when temporary ban on water use and drought orders are triggered in each of our
five reservoir areas. These reservoir areas are used for operational management of
our reservoirs. We balance stocks across areas during any one event as much as
possible, to try to ensure that stocks fall through our control lines at the same rate.
Temporary ban on water use are triggered up to three times in each area, but they
would only be implemented if triggered in three or more areas or regionally.
Table 3.5 WRAPsim level of service report
Reservoir Group Base model level of service
Frequency of
temporary ban on
water use trigger
Years of
restriction
Frequency of
Drought Order
trigger
Years of
restriction
Central 1 in 31 years 1929
1959
1995
-
East 1 in 92 years 1992 -
North
West
1 in 31 years 1929
1959
1989
-
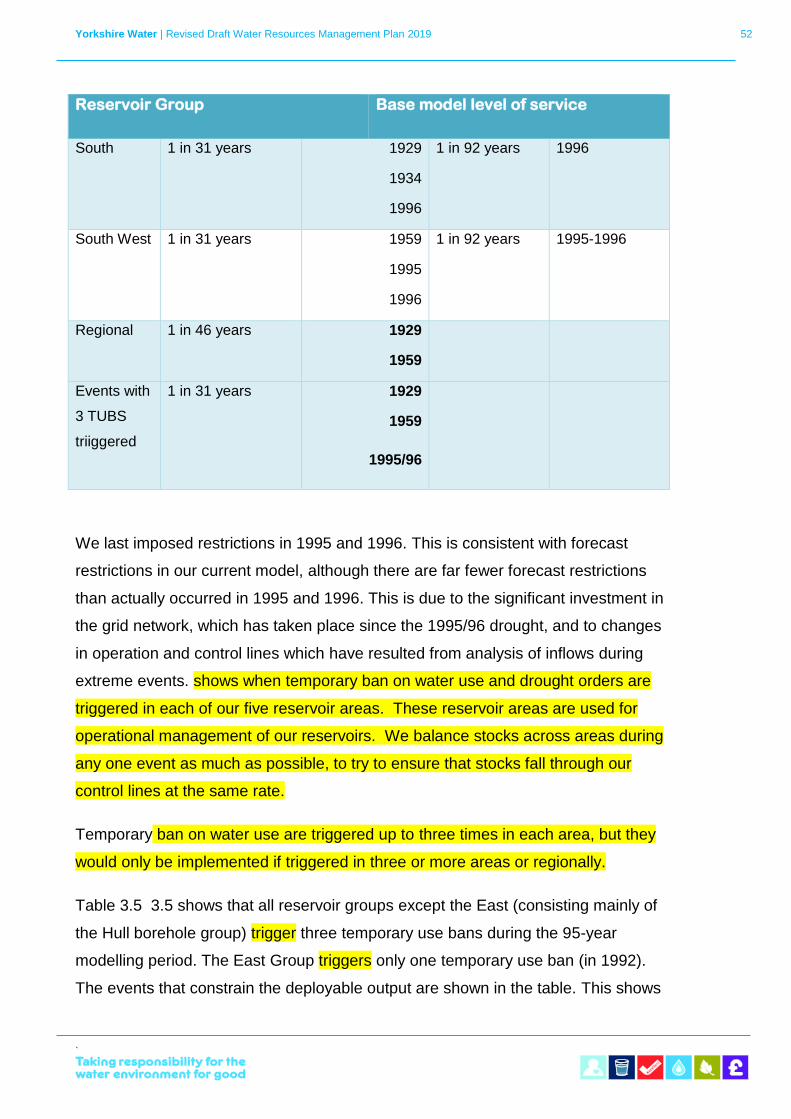
Yorkshire Water | Revised Draft Water Resources Management Plan 2019 52
`
Reservoir Group Base model level of service
South 1 in 31 years 1929
1934
1996
1 in 92 years 1996
South West 1 in 31 years 1959
1995
1996
1 in 92 years 1995-1996
Regional 1 in 46 years 1929
1959
Events with
3 TUBS
triiggered
1 in 31 years 1929
1959
1995/96
We last imposed restrictions in 1995 and 1996. This is consistent with forecast
restrictions in our current model, although there are far fewer forecast restrictions
than actually occurred in 1995 and 1996. This is due to the significant investment in
the grid network, which has taken place since the 1995/96 drought, and to changes
in operation and control lines which have resulted from analysis of inflows during
extreme events. shows when temporary ban on water use and drought orders are
triggered in each of our five reservoir areas. These reservoir areas are used for
operational management of our reservoirs. We balance stocks across areas during
any one event as much as possible, to try to ensure that stocks fall through our
control lines at the same rate.
Temporary ban on water use are triggered up to three times in each area, but they
would only be implemented if triggered in three or more areas or regionally.
Table 3.5 3.5 shows that all reservoir groups except the East (consisting mainly of
the Hull borehole group) trigger three temporary use bans during the 95-year
modelling period. The East Group triggers only one temporary use ban (in 1992).
The events that constrain the deployable output are shown in the table. This shows
Yorkshire Water | Revised Draft Water Resources Management Plan 2019 53
`
that different events are significant in different areas, with restrictions triggered in
the different reservoir groups in different years. However, all areas meet our stated
level of service and are therefore subject to the same risks of supply restrictions. In
addition, temporary bans in water use are triggered in three areas in only three
years: 1929, 1959 and 1995/1996, confirming our stated levels of service.
The duration of temporary use bans and drought orders are assumed to be at least
three months, as once we have imposed a temporary use ban we are unlikely to lift
such a ban until reservoir stocks have made a considerable recovery. Therefore,
this minimum three-month duration is a sensible one to apply.
The incorporation of the borehole sources previously in the East GWZ into the Grid
SWZ within the model for the revised draft WRMP19 resulted in an improved level
of service in the East Reservoir Group (Hull reservoirs and borehole group, which
are the only borehole sources modelled as a reservoir within the WRAPsim model).
The East Reservoir Group has a higher modelled level of service than the surface
water reservoir groups because it is different in nature (shown by the relatively flat
control lines), as it is predominantly an aquifer source. In modelled operation, the
yield is limited below the normal control line, but, in reality, we would overdraw the
source depending on conditions elsewhere in the system. The links of the grid to the
areas supplied by the East Reservoir Group mean that these customers still
experience the same levels of service as others within the Grid SWZ.
Reported deployable output
The deployable output for each resource zone is shown in Table 3.6. The Grid SWZ
deployable output is calculated from the water resource simulation model. The
deployable output of the East SWZ is the sum of the deployable outputs in the zone,
which includes any locked in yield not utilised in the water resource simulation
model, and is limited by the capacity of the River Esk Water Treatment Works.
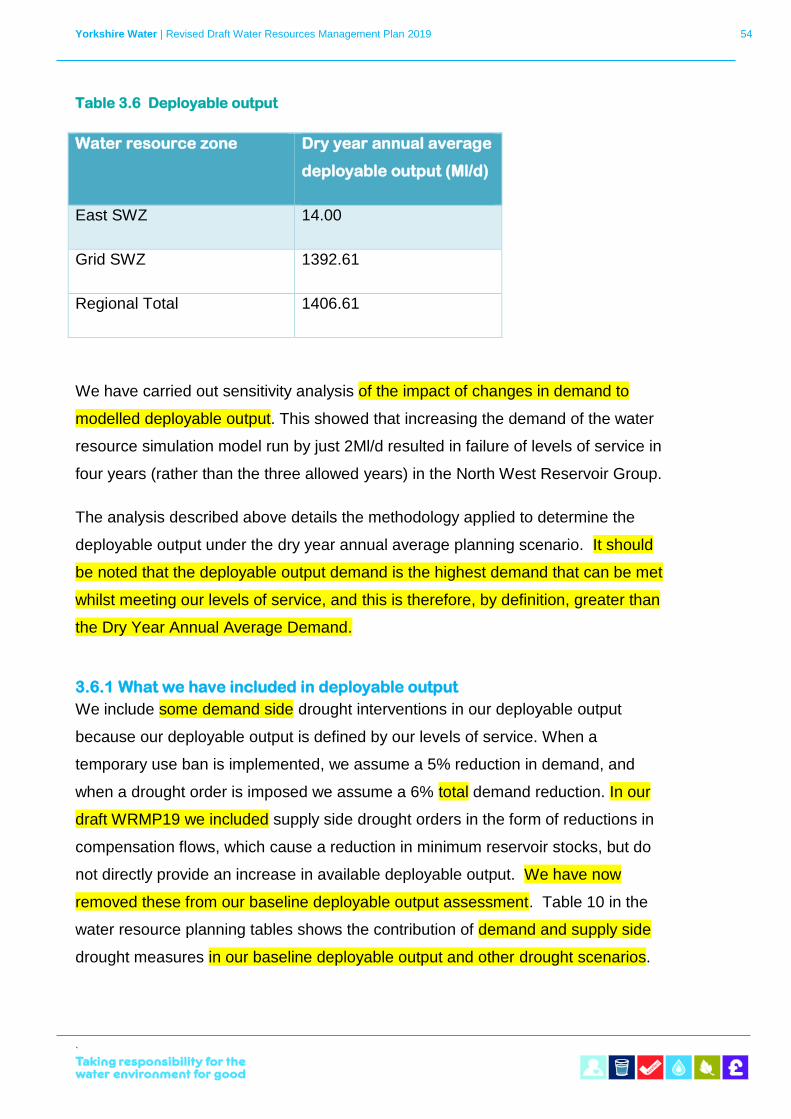
Yorkshire Water | Revised Draft Water Resources Management Plan 2019 54
`
Table 3.6 Deployable output
Water resource zone Dry year annual average
deployable output (Ml/d)
East SWZ 14.00
Grid SWZ 1392.61
Regional Total 1406.61
We have carried out sensitivity analysis of the impact of changes in demand to
modelled deployable output. This showed that increasing the demand of the water
resource simulation model run by just 2Ml/d resulted in failure of levels of service in
four years (rather than the three allowed years) in the North West Reservoir Group.
The analysis described above details the methodology applied to determine the
deployable output under the dry year annual average planning scenario. It should
be noted that the deployable output demand is the highest demand that can be met
whilst meeting our levels of service, and this is therefore, by definition, greater than
the Dry Year Annual Average Demand.
3.6.1 What we have included in deployable output
We include some demand side drought interventions in our deployable output
because our deployable output is defined by our levels of service. When a
temporary use ban is implemented, we assume a 5% reduction in demand, and
when a drought order is imposed we assume a 6% total demand reduction. In our
draft WRMP19 we included supply side drought orders in the form of reductions in
compensation flows, which cause a reduction in minimum reservoir stocks, but do
not directly provide an increase in available deployable output. We have now
removed these from our baseline deployable output assessment. Table 10 in the
water resource planning tables shows the contribution of demand and supply side
drought measures in our baseline deployable output and other drought scenarios.
Yorkshire Water | Revised Draft Water Resources Management Plan 2019 55
`
3.6.2 Deployable output confidence label
These estimates of deployable output are based on records of 95 years of data. For
some sources these data are all gauged, but for most there is a mixture of gauged
and modelled data. A large amount of work has been carried out over the years to
create the data series for sites where data were not previously available. Efforts
have been made to obtain suitable data by extending the record and modelling to
create the best possible available series. We therefore believe the confidence
applied to the deployable output estimate according to Water Resources Planning
Tools (UKWIR, 2012) is AB for both of our resource zones. Confidence grade A is
assigned because the data is available and of consistent quality. Confidence grade
B is assigned due to the record length (71-99 years of data).
For the East SWZ, we have simulated river flow data from 1920 to 2015 for this
source, with river flows always greater than 20Ml/d. This is well above the
deployable output for the zone, even without the inclusion of the spring sources.
The development of the River Esk model for the East SWZ is described fully in the
Deployable Output and Climate Change Technical Report.
Our resilience to droughts
We are one of just a few water companies that plan for droughts worse than those
in our historic record. This is because our worst drought in 1995/96 was longer and
drier than any we had experienced, and we were not prepared for it. Since then we
have improved our infrastructure links and our resilience to droughts.
We have carried out return period analyses on rainfall and inflow data, and used
these to inform the production of drought response surfaces. We originally produced
a drought response surface for our draft Drought Plan 2017, analogous to the
response surfaces produced in the report Understanding the performance of water
supply systems during mild to extreme droughts (Environment Agency, 2015). For
our revised draft WRMP19, we have produced further response surfaces.
Yorkshire Water | Revised Draft Water Resources Management Plan 2019 56
`
3.7.1 Return Period Analysis
In order to asses our resilience to droughts we have tested our system against a
range of droughts.
We have calculated the return period of droughts of different durations based on
analyses of our historic rainfall and inflows records. The results of the return period
analyses give different return periods for individual historic drought events.
We have estimated the return period of events ending in August and November, as
recommended for our system in the UKWIR, 2017, Drought Vulnerability
Framework.
For each drought duration, from 6 months to 48 months in increments of 6 months,
and for both November and August end months, we have;
• Calculated the minimum inflows sequences
• Constructed a flow frequency curve using the Gringorten formula
• Fitted a Generalised Pareto frequency distribution to the lowest 20% of flows
(so that the distribution is fitted to low flows only and is a genuine extreme
value distribution and not an attempt to fit the data to all years. (Malamud et
al, 1996)
The distributions have been fitted to each drought duration in isolation, and the
results are indicative of the droughts we have experienced. The 1995-96 drought
was a particularly extreme event, with the 18 month totals for both inflows and
rainfalls having a lower percentage of the long term average than the 12 month
events. This particularly severe 18 month event reduces the estimates for all
droughts of duration 18, 30 and 42 months.
We have also carried out analyses of monthly rainfall for some events, using both
the methods described above and Tabony tables. The difference in results between
analyses methods are discussed in further detail in our Technical Report on
Deployable Output and Climate Change.
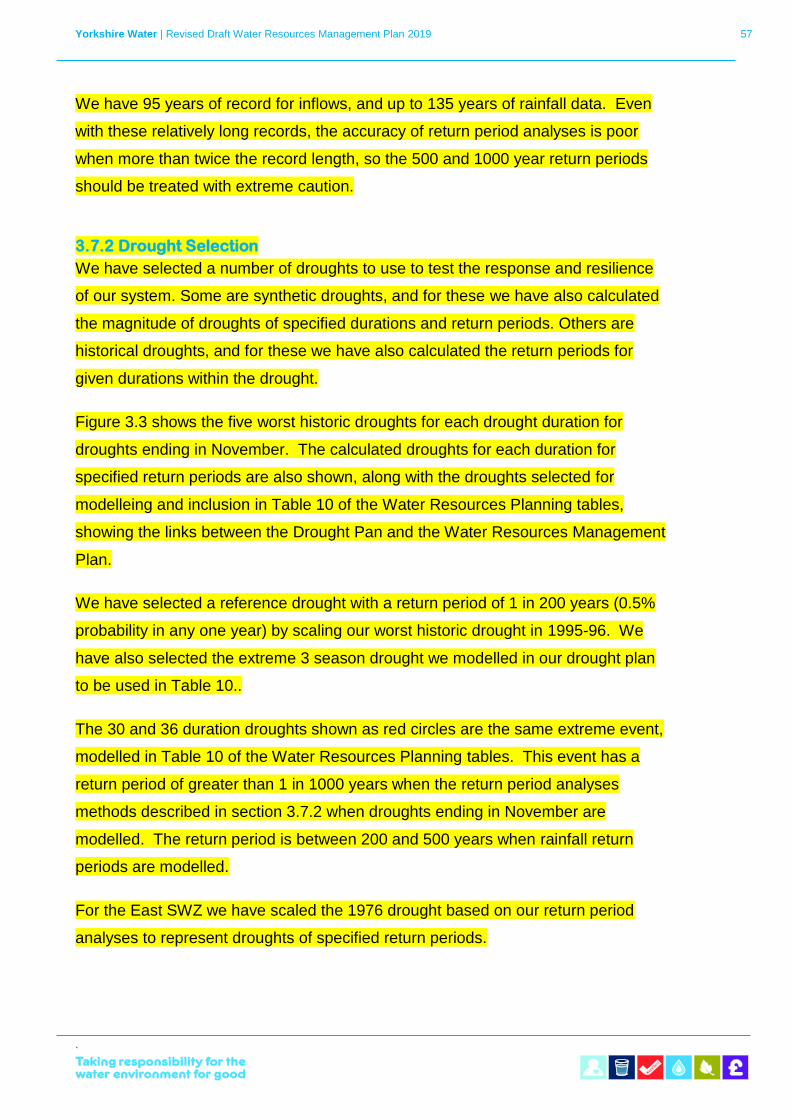
Yorkshire Water | Revised Draft Water Resources Management Plan 2019 57
`
We have 95 years of record for inflows, and up to 135 years of rainfall data. Even
with these relatively long records, the accuracy of return period analyses is poor
when more than twice the record length, so the 500 and 1000 year return periods
should be treated with extreme caution.
3.7.2 Drought Selection
We have selected a number of droughts to use to test the response and resilience
of our system. Some are synthetic droughts, and for these we have also calculated
the magnitude of droughts of specified durations and return periods. Others are
historical droughts, and for these we have also calculated the return periods for
given durations within the drought.
Figure 3.3 shows the five worst historic droughts for each drought duration for
droughts ending in November. The calculated droughts for each duration for
specified return periods are also shown, along with the droughts selected for
modelleing and inclusion in Table 10 of the Water Resources Planning tables,
showing the links between the Drought Pan and the Water Resources Management
Plan.
We have selected a reference drought with a return period of 1 in 200 years (0.5%
probability in any one year) by scaling our worst historic drought in 1995-96. We
have also selected the extreme 3 season drought we modelled in our drought plan
to be used in Table 10..
The 30 and 36 duration droughts shown as red circles are the same extreme event,
modelled in Table 10 of the Water Resources Planning tables. This event has a
return period of greater than 1 in 1000 years when the return period analyses
methods described in section 3.7.2 when droughts ending in November are
modelled. The return period is between 200 and 500 years when rainfall return
periods are modelled.
For the East SWZ we have scaled the 1976 drought based on our return period
analyses to represent droughts of specified return periods.
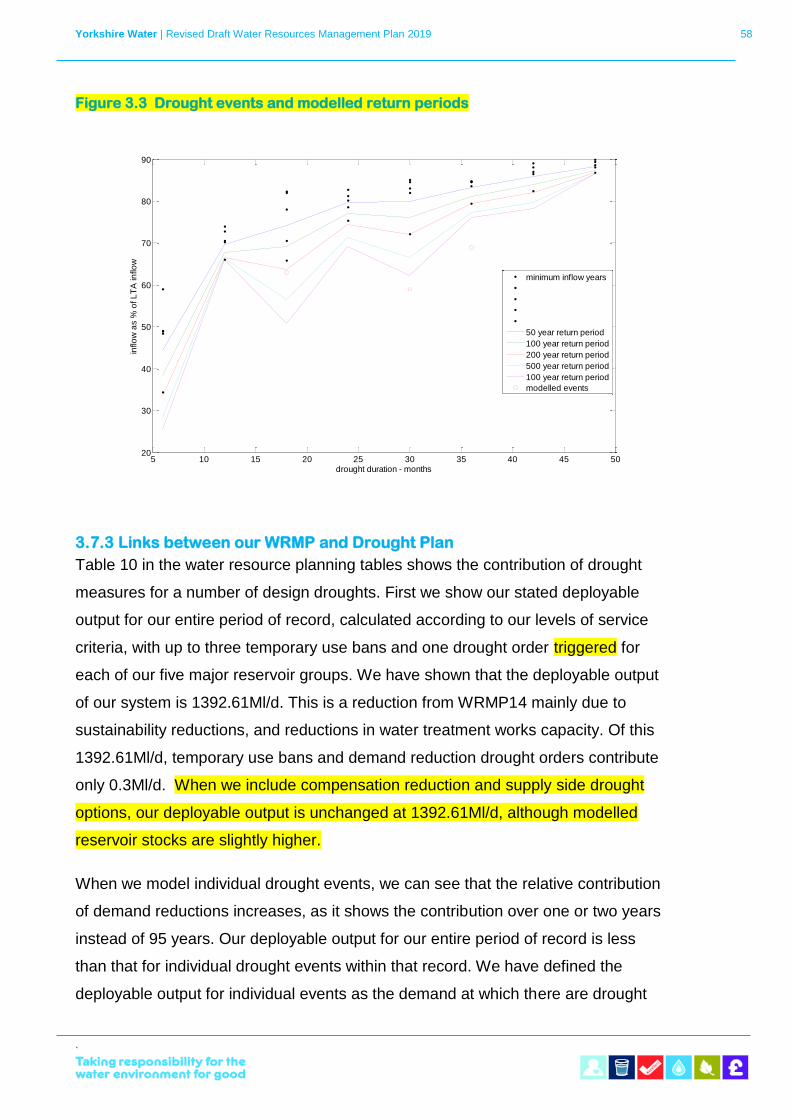
Yorkshire Water | Revised Draft Water Resources Management Plan 2019 58
`
Figure 3.3 Drought events and modelled return periods
3.7.3 Links between our WRMP and Drought Plan
Table 10 in the water resource planning tables shows the contribution of drought
measures for a number of design droughts. First we show our stated deployable
output for our entire period of record, calculated according to our levels of service
criteria, with up to three temporary use bans and one drought order triggered for
each of our five major reservoir groups. We have shown that the deployable output
of our system is 1392.61Ml/d. This is a reduction from WRMP14 mainly due to
sustainability reductions, and reductions in water treatment works capacity. Of this
1392.61Ml/d, temporary use bans and demand reduction drought orders contribute
only 0.3Ml/d. When we include compensation reduction and supply side drought
options, our deployable output is unchanged at 1392.61Ml/d, although modelled
reservoir stocks are slightly higher.
When we model individual drought events, we can see that the relative contribution
of demand reductions increases, as it shows the contribution over one or two years
instead of 95 years. Our deployable output for our entire period of record is less
than that for individual drought events within that record. We have defined the
deployable output for individual events as the demand at which there are drought
5 10 15 20 25 30 35 40 45 5020
30
40
50
60
70
80
90
drought duration - months
inflo
w a
s %
of L
TA
in
flo
w
minimum inflow years
50 year return period
100 year return period
200 year return period
500 year return period
100 year return period
modelled events
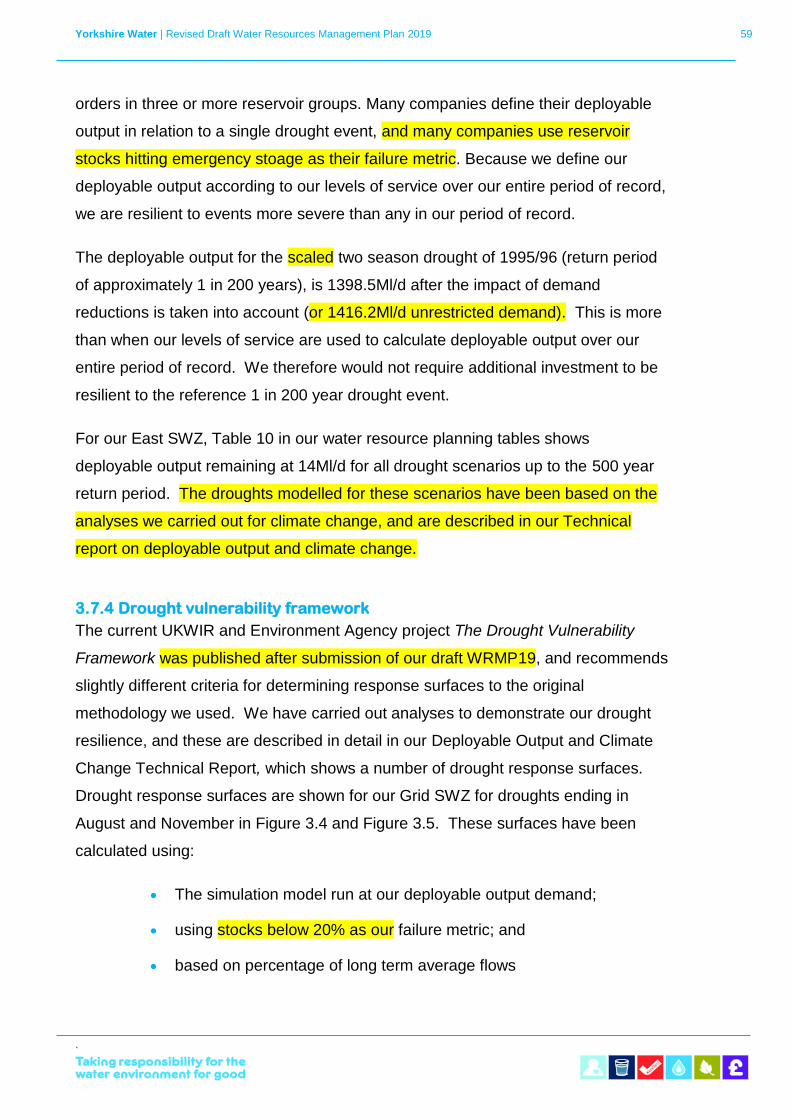
Yorkshire Water | Revised Draft Water Resources Management Plan 2019 59
`
orders in three or more reservoir groups. Many companies define their deployable
output in relation to a single drought event, and many companies use reservoir
stocks hitting emergency stoage as their failure metric. Because we define our
deployable output according to our levels of service over our entire period of record,
we are resilient to events more severe than any in our period of record.
The deployable output for the scaled two season drought of 1995/96 (return period
of approximately 1 in 200 years), is 1398.5Ml/d after the impact of demand
reductions is taken into account (or 1416.2Ml/d unrestricted demand). This is more
than when our levels of service are used to calculate deployable output over our
entire period of record. We therefore would not require additional investment to be
resilient to the reference 1 in 200 year drought event.
For our East SWZ, Table 10 in our water resource planning tables shows
deployable output remaining at 14Ml/d for all drought scenarios up to the 500 year
return period. The droughts modelled for these scenarios have been based on the
analyses we carried out for climate change, and are described in our Technical
report on deployable output and climate change.
3.7.4 Drought vulnerability framework
The current UKWIR and Environment Agency project The Drought Vulnerability
Framework was published after submission of our draft WRMP19, and recommends
slightly different criteria for determining response surfaces to the original
methodology we used. We have carried out analyses to demonstrate our drought
resilience, and these are described in detail in our Deployable Output and Climate
Change Technical Report, which shows a number of drought response surfaces.
Drought response surfaces are shown for our Grid SWZ for droughts ending in
August and November in Figure 3.4 and Figure 3.5. These surfaces have been
calculated using:
• The simulation model run at our deployable output demand;
• using stocks below 20% as our failure metric; and
• based on percentage of long term average flows
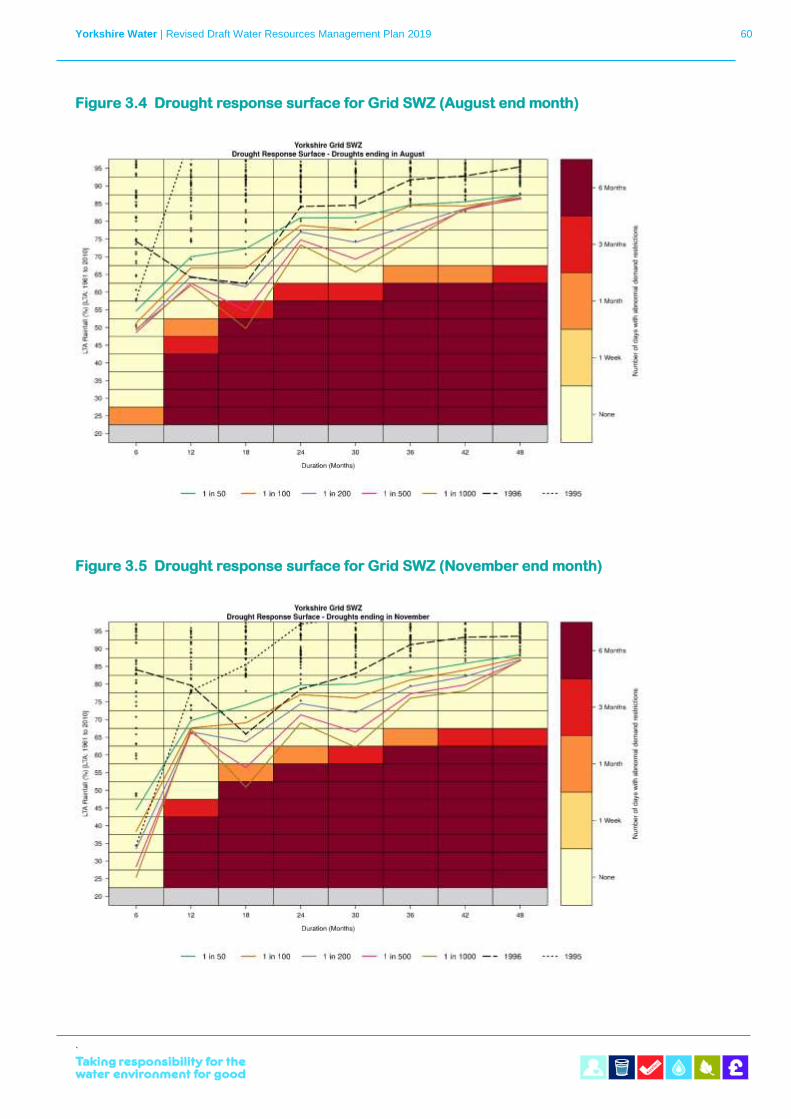
Yorkshire Water | Revised Draft Water Resources Management Plan 2019 60
`
Figure 3.4 Drought response surface for Grid SWZ (August end month)
Figure 3.5 Drought response surface for Grid SWZ (November end month)
Yorkshire Water | Revised Draft Water Resources Management Plan 2019 61
`
Our drought response surfaces show that we would not have level 4 restrictions for
any event with a return period of less than 1 in 200 years.
In addition, we have produced response surfaces to show the period of time when
ordinary drought orders would be implemented, as we believe these provide a better
understanding or our drought resilience (the UKWIR 2017 Drought Vulnerability
Framework also used this metric in the case study of our system). These surfaces
are shown in our Deployable Output and Climate Change Technical Report, and
show that for droughts with a return period of 200 years or less there would be no
restrictions droughts ending in November, but for droughts ending in August, there
would be up to 6 months of restrictions for droughts of 18 months. However, the
surfaces do correspond well to our levels of service, with only the 1995/96 drought
triggering drought orders in our historical record. The droughts modelled to
produce these response surfaces are synthetic ones, based on an average inflow
year, with flow ranging from 25% of average to 95% of average, for 6 month
intervals. Real droughts are not so uniform, so these surfaces can only give an
indication of our system response to droughts. It should also be noted that there are
uncertainties in the return period analyses, with the most extreme droughts in our
record having return period of between 1 in 100 years and 1 in 1000 years
depending on analysis method.
Both response surfaces show lower flows relative to the long term average for 18
month events than for the 24 month event. This is due to the extreme nature of the
1995-96 drought. Both of these also show restrictions for the 18 month events and
not the 24 month events for both the 500 year and 1000 year return periods. This is
partly due to the uncertainty related to estimating such high return periods from
relatively short data sets, but also because the events ending in November are
different. A 24 month drought ending in November started in December, whereas
an 18 month drought endig in November started in June, so these events will have
different characteristics, and it may be the case that a longer drought ending ina
given month may have less severe restrictions than a shorter one.
Following the methodology of the DVF, we have not produced response surfaces for
the East SWZ, as the screening indicated it was not required.
Yorkshire Water | Revised Draft Water Resources Management Plan 2019 62
`
3.7.5 Drought resilience
Resilience is a key part of the Water Resources Management Plan and features
prominently within our PR19 Business Plan. We believe our water resources
modelling shows that we are resilient to drought. We plan to a drought more severe
than any individual drought in our period of record because we base our deployable
output on the levels of service of up to three temporary use bans and one drought
order, and not on reservoir stocks reaching emergency storage. The most severe
drought in our period of record is also a very extreme event, so we are confident
that our system is resilient to a high return period event.
This is supported by the Water Resources Long Term Planning Framework (Water
UK, 2016) report which states that we are one of only two water companies that
plan to events more severe than those experienced. This is mainly because of the
extreme experience of the 1995/96 drought which was unlike anything we had seen
before, and the fact that our deployable output is limited by our levels of service with
respect to temporary use bans in three out of our five reservoir groups. It is
therefore these less severe events which limit our deployable output.
We carried out a high-level screening assessment within the drought vulnerability
framework, which indicates no requirement to produce drought response surfaces
for our East SWZ.
Resilience
3.8.1 Resilience modelling
The Environment Agency Water Resource Planning Guideline and the Guiding
principles for water resources planning (Defra, 2016) include testing the resilience of
water supply systems to events other than drought, such as flooding and freeze
thaw. This includes testing resilience not only to historic events but also to future
events that could reasonably be foreseen. If appropriate, options to improve the
resilience of our water supply network to these non-drought hazards should be
included in our plan.
Resilience of our business and services has been a focus for a long time. Our
customers consistently tell us this is a priority and the reliability of our essential
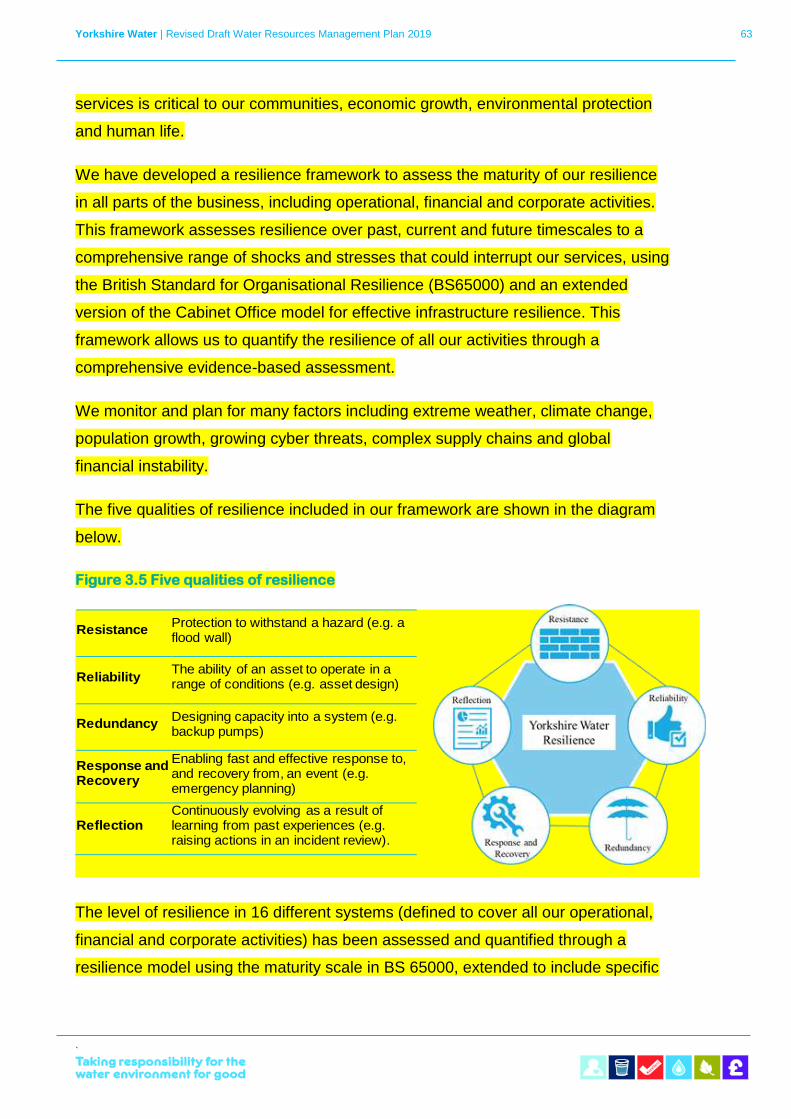
Yorkshire Water | Revised Draft Water Resources Management Plan 2019 63
`
services is critical to our communities, economic growth, environmental protection
and human life.
We have developed a resilience framework to assess the maturity of our resilience
in all parts of the business, including operational, financial and corporate activities.
This framework assesses resilience over past, current and future timescales to a
comprehensive range of shocks and stresses that could interrupt our services, using
the British Standard for Organisational Resilience (BS65000) and an extended
version of the Cabinet Office model for effective infrastructure resilience. This
framework allows us to quantify the resilience of all our activities through a
comprehensive evidence-based assessment.
We monitor and plan for many factors including extreme weather, climate change,
population growth, growing cyber threats, complex supply chains and global
financial instability.
The five qualities of resilience included in our framework are shown in the diagram
below.
Figure 3.5 Five qualities of resilience
The level of resilience in 16 different systems (defined to cover all our operational,
financial and corporate activities) has been assessed and quantified through a
resilience model using the maturity scale in BS 65000, extended to include specific
Resistance Protection to withstand a hazard (e.g. a flood wall)
Reliability The ability of an asset to operate in a range of conditions (e.g. asset design)
Redundancy Designing capacity into a system (e.g. backup pumps)
Response and Recovery
Enabling fast and effective response to, and recovery from, an event (e.g. emergency planning)
Reflection Continuously evolving as a result of learning from past experiences (e.g. raising actions in an incident review).
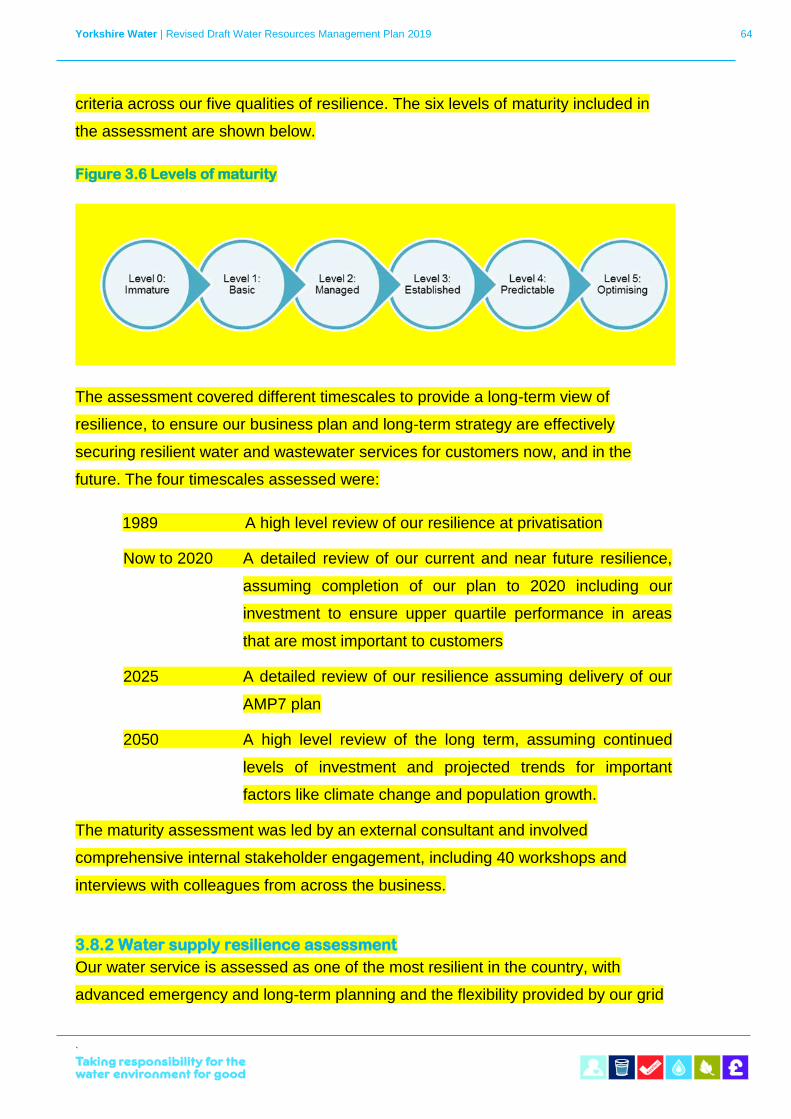
Yorkshire Water | Revised Draft Water Resources Management Plan 2019 64
`
criteria across our five qualities of resilience. The six levels of maturity included in
the assessment are shown below.
Figure 3.6 Levels of maturity
The assessment covered different timescales to provide a long-term view of
resilience, to ensure our business plan and long-term strategy are effectively
securing resilient water and wastewater services for customers now, and in the
future. The four timescales assessed were:
1989 A high level review of our resilience at privatisation
Now to 2020 A detailed review of our current and near future resilience,
assuming completion of our plan to 2020 including our
investment to ensure upper quartile performance in areas
that are most important to customers
2025 A detailed review of our resilience assuming delivery of our
AMP7 plan
2050 A high level review of the long term, assuming continued
levels of investment and projected trends for important
factors like climate change and population growth.
The maturity assessment was led by an external consultant and involved
comprehensive internal stakeholder engagement, including 40 workshops and
interviews with colleagues from across the business.
3.8.2 Water supply resilience assessment
Our water service is assessed as one of the most resilient in the country, with
advanced emergency and long-term planning and the flexibility provided by our grid
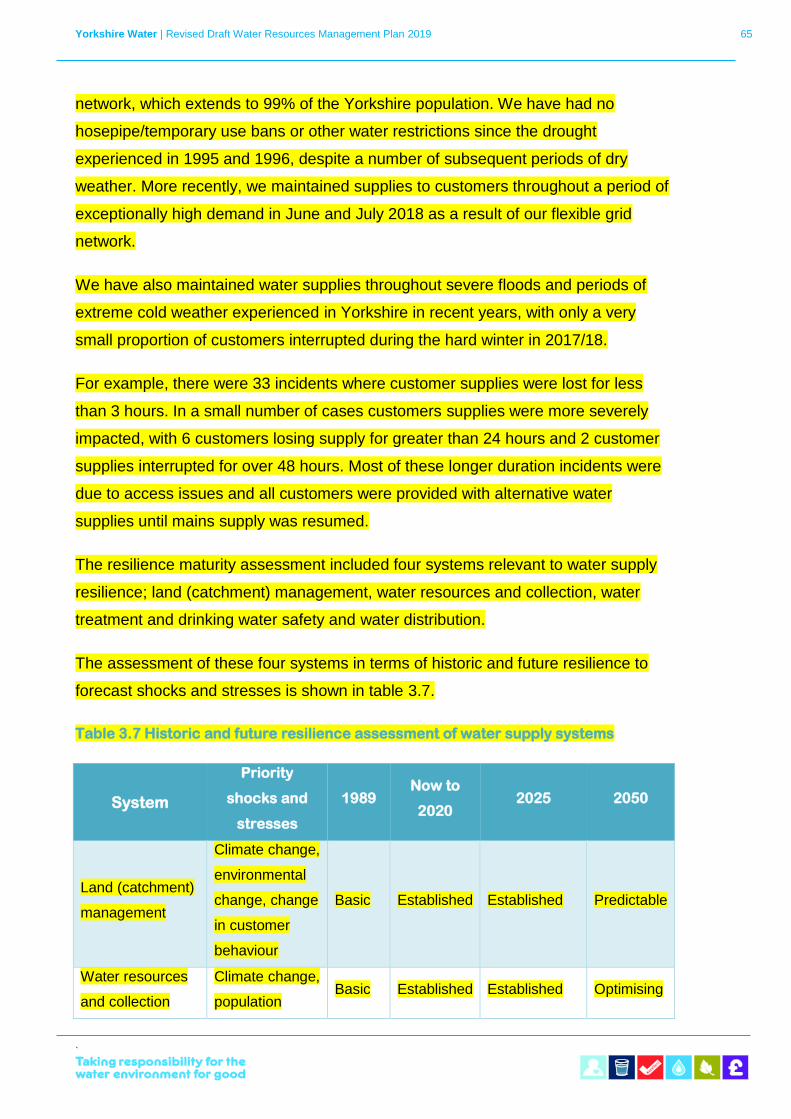
Yorkshire Water | Revised Draft Water Resources Management Plan 2019 65
`
network, which extends to 99% of the Yorkshire population. We have had no
hosepipe/temporary use bans or other water restrictions since the drought
experienced in 1995 and 1996, despite a number of subsequent periods of dry
weather. More recently, we maintained supplies to customers throughout a period of
exceptionally high demand in June and July 2018 as a result of our flexible grid
network.
We have also maintained water supplies throughout severe floods and periods of
extreme cold weather experienced in Yorkshire in recent years, with only a very
small proportion of customers interrupted during the hard winter in 2017/18.
For example, there were 33 incidents where customer supplies were lost for less
than 3 hours. In a small number of cases customers supplies were more severely
impacted, with 6 customers losing supply for greater than 24 hours and 2 customer
supplies interrupted for over 48 hours. Most of these longer duration incidents were
due to access issues and all customers were provided with alternative water
supplies until mains supply was resumed.
The resilience maturity assessment included four systems relevant to water supply
resilience; land (catchment) management, water resources and collection, water
treatment and drinking water safety and water distribution.
The assessment of these four systems in terms of historic and future resilience to
forecast shocks and stresses is shown in table 3.7.
Table 3.7 Historic and future resilience assessment of water supply systems
System
Priority
shocks and
stresses
1989 Now to
2020 2025 2050
Land (catchment)
management
Climate change,
environmental
change, change
in customer
behaviour
Basic Established Established Predictable
Water resources
and collection
Climate change,
population Basic Established Established Optimising
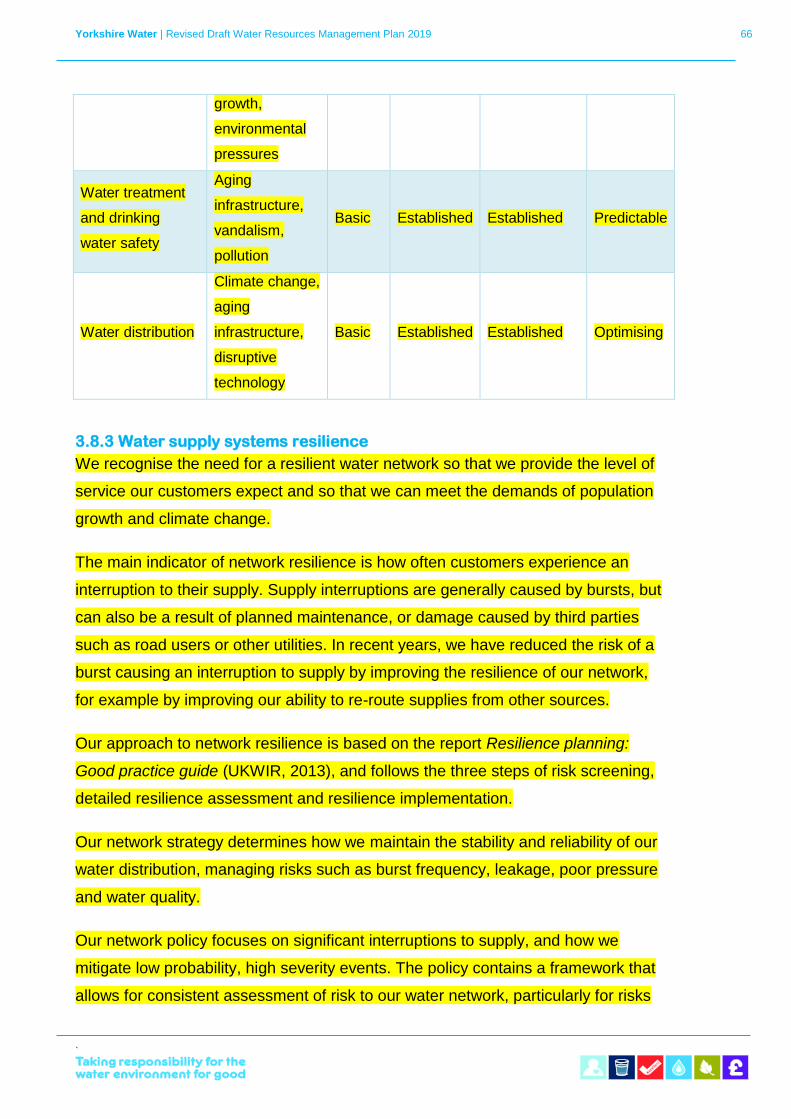
Yorkshire Water | Revised Draft Water Resources Management Plan 2019 66
`
growth,
environmental
pressures
Water treatment
and drinking
water safety
Aging
infrastructure,
vandalism,
pollution
Basic Established Established Predictable
Water distribution
Climate change,
aging
infrastructure,
disruptive
technology
Basic Established Established Optimising
3.8.3 Water supply systems resilience
We recognise the need for a resilient water network so that we provide the level of
service our customers expect and so that we can meet the demands of population
growth and climate change.
The main indicator of network resilience is how often customers experience an
interruption to their supply. Supply interruptions are generally caused by bursts, but
can also be a result of planned maintenance, or damage caused by third parties
such as road users or other utilities. In recent years, we have reduced the risk of a
burst causing an interruption to supply by improving the resilience of our network,
for example by improving our ability to re-route supplies from other sources.
Our approach to network resilience is based on the report Resilience planning:
Good practice guide (UKWIR, 2013), and follows the three steps of risk screening,
detailed resilience assessment and resilience implementation.
Our network strategy determines how we maintain the stability and reliability of our
water distribution, managing risks such as burst frequency, leakage, poor pressure
and water quality.
Our network policy focuses on significant interruptions to supply, and how we
mitigate low probability, high severity events. The policy contains a framework that
allows for consistent assessment of risk to our water network, particularly for risks
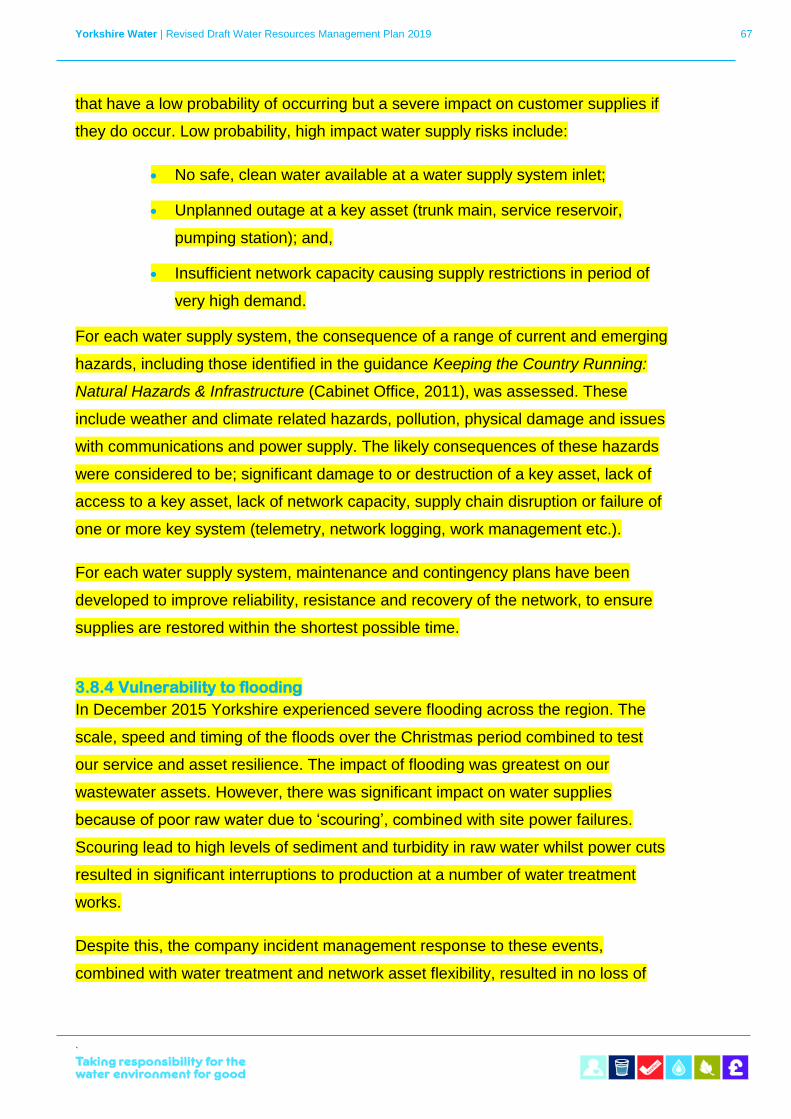
Yorkshire Water | Revised Draft Water Resources Management Plan 2019 67
`
that have a low probability of occurring but a severe impact on customer supplies if
they do occur. Low probability, high impact water supply risks include:
• No safe, clean water available at a water supply system inlet;
• Unplanned outage at a key asset (trunk main, service reservoir,
pumping station); and,
• Insufficient network capacity causing supply restrictions in period of
very high demand.
For each water supply system, the consequence of a range of current and emerging
hazards, including those identified in the guidance Keeping the Country Running:
Natural Hazards & Infrastructure (Cabinet Office, 2011), was assessed. These
include weather and climate related hazards, pollution, physical damage and issues
with communications and power supply. The likely consequences of these hazards
were considered to be; significant damage to or destruction of a key asset, lack of
access to a key asset, lack of network capacity, supply chain disruption or failure of
one or more key system (telemetry, network logging, work management etc.).
For each water supply system, maintenance and contingency plans have been
developed to improve reliability, resistance and recovery of the network, to ensure
supplies are restored within the shortest possible time.
3.8.4 Vulnerability to flooding
In December 2015 Yorkshire experienced severe flooding across the region. The
scale, speed and timing of the floods over the Christmas period combined to test
our service and asset resilience. The impact of flooding was greatest on our
wastewater assets. However, there was significant impact on water supplies
because of poor raw water due to ‘scouring’, combined with site power failures.
Scouring lead to high levels of sediment and turbidity in raw water whilst power cuts
resulted in significant interruptions to production at a number of water treatment
works.
Despite this, the company incident management response to these events,
combined with water treatment and network asset flexibility, resulted in no loss of
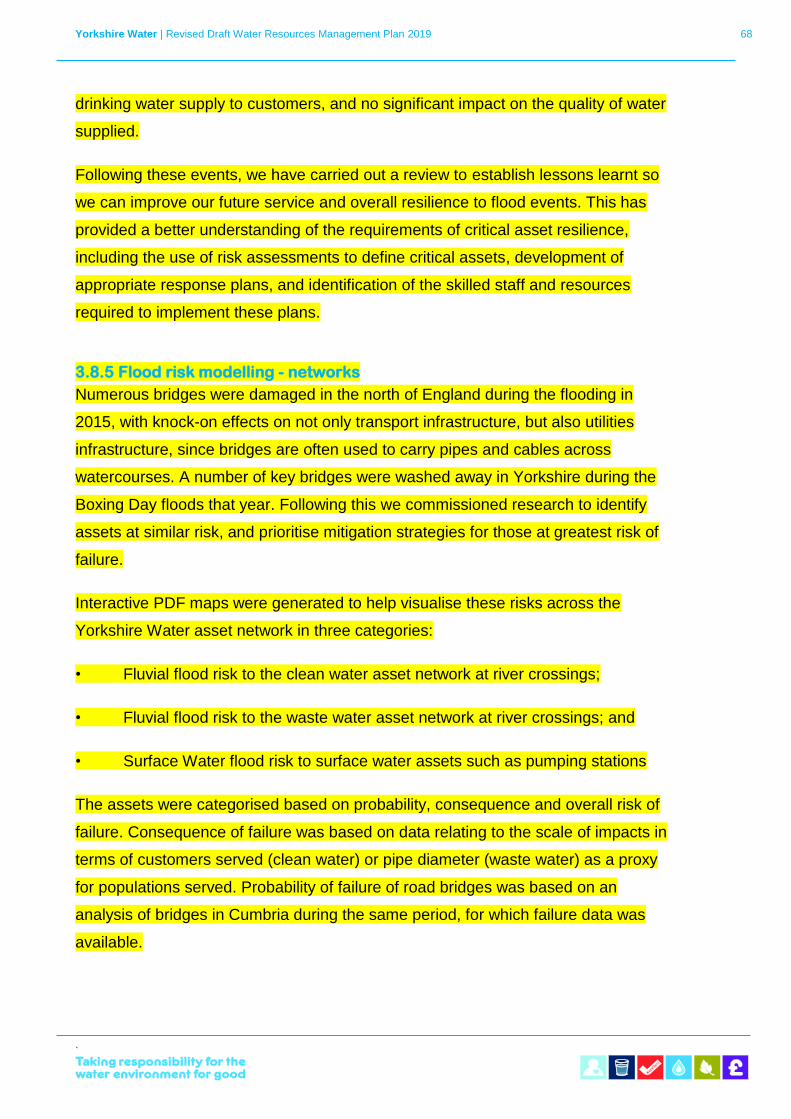
Yorkshire Water | Revised Draft Water Resources Management Plan 2019 68
`
drinking water supply to customers, and no significant impact on the quality of water
supplied.
Following these events, we have carried out a review to establish lessons learnt so
we can improve our future service and overall resilience to flood events. This has
provided a better understanding of the requirements of critical asset resilience,
including the use of risk assessments to define critical assets, development of
appropriate response plans, and identification of the skilled staff and resources
required to implement these plans.
3.8.5 Flood risk modelling - networks
Numerous bridges were damaged in the north of England during the flooding in
2015, with knock-on effects on not only transport infrastructure, but also utilities
infrastructure, since bridges are often used to carry pipes and cables across
watercourses. A number of key bridges were washed away in Yorkshire during the
Boxing Day floods that year. Following this we commissioned research to identify
assets at similar risk, and prioritise mitigation strategies for those at greatest risk of
failure.
Interactive PDF maps were generated to help visualise these risks across the
Yorkshire Water asset network in three categories:
• Fluvial flood risk to the clean water asset network at river crossings;
• Fluvial flood risk to the waste water asset network at river crossings; and
• Surface Water flood risk to surface water assets such as pumping stations
The assets were categorised based on probability, consequence and overall risk of
failure. Consequence of failure was based on data relating to the scale of impacts in
terms of customers served (clean water) or pipe diameter (waste water) as a proxy
for populations served. Probability of failure of road bridges was based on an
analysis of bridges in Cumbria during the same period, for which failure data was
available.
Yorkshire Water | Revised Draft Water Resources Management Plan 2019 69
`
This allows spatial identification of assets with the highest risk of damage or
collapse during a flood event. The information has been used to support
identification of high risk river crossing assets for investment in PR19.
3.8.6 Flood risk modelling – non-network assets
As part of our climate change adaptation report we have assessed the risk to our
assets from fluvial, coastal and reservoir flooding. This risk assessment has enabled
us to prioritise investment at our most vulnerable and most critical sites. Where we
have not been able to invest in capital measures, we have put in place operational
contingency plans. Investment in a networked asset base and water supply grid
provides flexibility to re-route supplies from alternative sources and avoid the impact
of individual asset availability on customers.
We also have an Incident Management Framework for dealing with events beyond
our normal operating conditions. This approach is in line with the guidance Keeping
the Country Running: Natural Hazards & Infrastructure (Cabinet Office, 2011) which
suggests activity is required across the four themes of Resistance, Reliability,
Redundancy and Response and recovery to deliver effective resilience.
Following the significant flooding events in recent years we have carried out a multi-
phase project to quantify the resilience of our above-ground assets to fluvial
flooding. This involved an assessment of a range of evidence and information such
as hydraulic river models, topographic surveys, LiDAR data and interviews with site
operators. The impact of climate change on assets’ level of resilience was assessed
where data was available. Site specific reports for 150 most critical at-risk sites
(water and wastewater assets) were produced, including predicted flood depths,
current level of resilience and the height of critical equipment such as electrical
control panels.
The project was used to inform the development of our fluvial flood risk guidance
document. This sets out our aspiration to protect assets from a fluvial flood event
with a 1 in 200-year (0.5% annual probability) return period. Five water treatment
assets were identified as being at higher risk of fluvial flooding. Proposals to
enhance flood resilience at these sites have been included in our 25-year
investment planning optimisation.
Yorkshire Water | Revised Draft Water Resources Management Plan 2019 70
`
We have also examined the risk of our above ground assets to pluvial (surface
water) flooding.
3.8.7 Vulnerability to extreme weather
Climate change and extreme weather can impact our network in a number of ways;
cold weather causes pipes to become brittle and burst, intensive rainfall causes
landslips which can expose and damage pipes, high river flows cause scour and
damage to bridge crossings, and dry weather causes the ground to shrink and
move, affecting pipes and other structures.
Freeze-thaw is the most influential factor on leakage from cast iron pipes, which
make up most of our distribution network. We have developed a water temperature
predicative model which uses forecast air temperature and current water
temperature to predict the point at which the water temperature will drop below the
level at which we see an impact on the network – resulting in increased leakage and
network failure. The predictive model provides seven days’ notice and there are
separate thresholds and monitors for river and reservoir sources.
This information is used to inform our winter planning and operational response to
cold weather and subsequent freeze-thaw events. We take a stepped approach to
winter planning that escalates as necessary to ensure an effective response to cold
weather. Our ‘Winter Plan’ has three trigger levels – Winter Operations, Winter
Escalation and Winter Emergency. The trigger levels for each of these are based on
performance against our leakage target, air and water temperature, and the number
of outstanding repair and maintenance jobs. Use of this information allows us to
maintain resilient supplies to customers in the event of extreme cold weather.
Our winter planning and preparation was tested in Winter 2018, during the thaw
following the cold weather in late February and early March. We experienced the
highest March demand in 21 years, primarily due to leaks on customer pipes and
within business properties. In advance of the severe weather forecast we
significantly increased the deployment of leakage resources to prepare for the
predicted increases in leakage and demand. We implemented an incident team
resource plan, increasing roles within our control room and call centre, and staffing
Yorkshire Water | Revised Draft Water Resources Management Plan 2019 71
`
key water treatment works 24 hours a day to manage water production and ensure
strategic storage levels were maintained.
Resilience of our network to freeze-thaw is robust due to a number of factors: our
ability to model and manage supply and demand and balance reservoir levels
across the region due to our grid network; telemetered logging of DMAs to quickly
identify leaks, and our ability to rezone the network quickly to carry out repairs; and
our winter planning which allows us to understand and plan for the potential impact
of cold weather on demand and our network.
3.8.8 Enhancing water supply resilience
We recognise the need for a resilient water network to provide the level of service
our customers expect and to meet the future demands of population growth and
climate change. Current resilience of our water network has been assessed as
‘Established’ under our resilience maturity model, as described in section 3.8.1. To
improve network resilience to an ‘Optimising’ level, we need to consider all aspects
of resilience: resistance, reliability, redundancy, response, recovery and review.
Although renewal and refurbishment of assets such as water mains and pumping
stations remains key to maintaining supplies to customers, optimal network
resilience will be delivered through a combination of asset investment, operational
best practice and use of new technologies to provide innovative and cost-effective
solutions for proactive management of the water network.
For example, use of mains failure data and development of predictive models to
optimise our interventions on the network, and continuing to develop our ‘calm
networks’ operational best practice, with activities such as value operator training,
pressure management and optimal mains replacement.
This combined approach of investment and operational best practice will minimise
the number of incidents and events occurring on the water network and allow a
quick and effective response when incidents do occur. This will allow the resilience
of our water network to improve from ‘established’ to ‘predictable’ and ultimately
‘optimising’ over future planning periods.
Yorkshire Water | Revised Draft Water Resources Management Plan 2019 72
`
3.8.9 Water catchment resilience
Sustainable land management practices are critical to the resilience of our water
services. We are one of the largest landowners in Yorkshire, with 28,000 hectares of
land across the region. We own about a third of the land from which we source
water to supply customers. This ownership enables us to work closely with our farm
tenants and other stakeholders to lead by example in our land management
practices and actively support resilience. We also work with other landowners and
stakeholders across Yorkshire to protect all our sources of water.
Working with many stakeholders over the last 15 years and more, we have matured
conservation measures in response to water pollution from unsustainable land
practices.
The quality of the raw water we collect in our reservoirs has been deteriorating in
many catchments over recent decades, primarily a consequence of unsustainable
land management practices. Whilst we enhance water treatment capabilities to
ensure our customers always receive the highest quality drinking water, we also
have a range of programmes to address the issues at source to secure long-term
resilience.
Our catchment management programme includes managing our 25,000 hectares of
natural habitats to protect Yorkshire’s raw water and biodiversity. In our region,
many of the key catchments contain upland peat which must be in a good natural
state to provide clean water to our reservoirs, rivers and water treatment works. In
an area with high biodiversity and good land management practices, the diverse and
complex community of plants, animals and micro-organisms work efficiently to filter
and remove contaminants. Our programme also includes tackling a range of water
quality issues, such as colour, pesticides, nitrates and saline intrusion.
The Sustainable Futures initiative is unique in the UK in terms of bringing together
farmers, global food and drink producers, non-government organisations and supply
chain partners - currently involving 190 farmers managing 150,000 acres of
Yorkshire. Working with the consultants at Future Food Solutions, we have recently
launched the next phase of this programme, called Sustainable Landscapes, with
three trials across Yorkshire. A key focus is to collaboratively explore innovative
ways to prevent farmland soil being lost to waterways. This helps our resilience by
Yorkshire Water | Revised Draft Water Resources Management Plan 2019 73
`
reducing the amount of pesticides, nutrients and soil entering our rivers and
aquifers. It also helps the farmers involved make their businesses more sustainable
and profitable.
Recently we have expanded our catchment programmes to help prevent flooding,
planting 20,000 trees in the Calder Valley as the first of one million to be planted
across the region over the next ten years. In addition to supporting our core water
and drainage services, our approach to land management also improves resilience
by supporting the economy, enabling recreation, protecting biodiversity and storing
carbon.
We are expanding our existing land management programmes and introducing new
ones to mitigate a legacy of unsustainable practices that are threatening the
resilience of our services. Looking ahead, we recognise the need to further our
efforts because this legacy is likely to be compounded by growing pressures to the
natural environment from the changing climate, increasing pollution and population
growth.
These are long-term interventions and it may take many years for the full impacts
and benefits to be delivered. We continue monitoring the effects of our approach to
inform our evolving land strategy. We are committed to protecting and enhancing
the range of benefits that people take from our land, particularly for water quality,
flood protection, nature conservation, recreation and carbon storage. We are using
our six capitals approach to better quantify these benefits to inform improved
decision making and investment choices.
We are committed to working in partnership and taking innovative approaches to
sustainably manage our land, and to influence other land owners to do the same.
We are also committed to sharing our research and monitoring data and working
with policy makers to ensure effective legislation and incentive systems. The reform
of the Common Agricultural Policy presents a great opportunity to ensure it is best
supporting land owners to manage land sustainably for the long-term.
Yorkshire Water | Revised Draft Water Resources Management Plan 2019 74
`
Biodiversity and ecosystems
All schemes featured in our revised draft WRMP19 were assessed against Strategic
Environmental Assessment (SEA) criteria which included the objective ‘to protect,
conserve and enhance natural capital and the ecosystem services from natural
capital that contribute to the economy’ (for details of the SEA refer to Section 9.3).
Through consultation with regulators and key stakeholders such as regional Rivers
and Wildlife Trusts, we have adopted three key principles to take forward within our
future biodiversity programme:
• Ecological resilience – we want to see stronger, healthier
ecosystems, more able to withstand the impacts of low frequency high
magnitude events such as droughts or CSO spills. We recognise we
have a diffuse impact on aquatic systems across the region and want
to ensure that we can compensate for this in a sustainable manner.
• An ambition of a net gain to biodiversity – we want to ensure that
our own negative impacts on regional biodiversity are minimised,
mitigated, and where appropriate, compensated for, and that we
understand the natural value across our estate to enable us to
manage it appropriately.
• Innovation and partnership – we recognise we cannot just do more
of the same, and to fully catalyse benefits for regional biodiversity, we
need to work differently, work with others and focus on how to deliver
the outcome, not record an output.
The programme includes:
• A biodiversity enhancement programme, facilitating volunteering, and
access to our sites for our customers and colleagues;
• Management of our Local Wildlife sites;
• Conservation of key aquatic and riparian species, where we have a
unique ability to make a meaningful difference;
Yorkshire Water | Revised Draft Water Resources Management Plan 2019 75
`
• A catchment-scale fish resilience programme, which will enhance the
benefits of our standard investments, by working through Catchment
Partnerships; and
• Outperforming SSSI Common Standards Monitoring condition targets
and SAC and SPA conservation objectives on our land.
The delivery of these obligations is captured through our ‘Land conserved and
enhanced’ performance commitment for PR19. We are also trialling an innovative
commitment based on the additional environmental value we can generate from our
resources, such as land holdings. Through our Beyond Nature programme, we
intend to introduce new tenancies across our agricultural estate, with a stated
outcome of delivering a wide range of ecosystem services and not just financial
return.
The Water industry strategic environmental requirements (WISER) (Environment
Agency, 2017) document gives a clear expectation that water companies will
develop measures to contribute to biodiversity priorities, and through extensive
consultation, we are confident our expected AMP7 programme of biodiversity
focused measures will deliver this.
We realise that the most effective way to achieve an outcome will be to integrate
biodiversity considerations across our schemes and plans, rather than deliver them
as stand-alone schemes. As such, we have and will continue to revise our capital
scheme framework requirements, repair and maintenance policies and land
management practices to deliver this. Biodiversity is now a key consideration within
our corporate investment Decision Making Framework, and is becoming more
central to our corporate approach to valuation and planning through its inclusion
within our developing natural capital models.
We are presently working to ensure that the Biodiversity Net Gain: Good practice
principles for development (CIEEM, CIRA, IEMA, 2016) are incorporated within our
AMP7 capital works frameworks, particularly given the emphasis on biodiversity net
gain within the revised National Planning Policy Framework (Ministry of Housing,
Communities & Local Government, 2018) and the update to Defra’s biodiversity
offsetting metric due in Autumn 2018.
Yorkshire Water | Revised Draft Water Resources Management Plan 2019 76
`
Sustainability reductions
We have worked with the Environment Agency to support Water Framework
Directive (WFD) and River Basin Management Plans (RBMP) objectives in relation
to ensuring our abstractions are sustainable.
Sustainability reductions are derived from the Environment Agency’s Water Industry
National Environment Programme (WINEP) programme. The principal driver behind
the reductions is the WFD, specifically Heavily Modified Water Bodies (HMWB) and
the requirement to prevent deterioration in the status of waterbodies. All our
reservoirs are either designated as HMWB themselves or are located within a
designated heavily modified river waterbody.
Under WFD, these types of waterbodies are required to meet Good Ecological
Potential (GEP). One of the measures required to meet GEP is the introduction of a
new, or modification of an existing compensation flow from a reservoir. This can
impact on the yield of individual sources and can affect the deployable output of the
whole system.
Environment Agency WFD investigations have identified which reservoirs and/or
abstractions require flow measures and we have subsequently carried out an
options appraisal on these sites, working closely with the Environment Agency and
using national guidance.
Where abstractions are causing or at risk of causing WFD deterioration of
waterbodies, there is no requirement for the mitigation to be cost beneficial, and
mitigation measures must be put in place.
This process has identified which schemes are cost beneficial and which are not,
and some schemes have been screened out on this basis. Our WRAPsim model
rebalances available water resources and as a result the combined effect of a
number of schemes can have a more onerous sustainability impact than a single
scheme in isolation. A number of combined runs were performed in WRAPsim to
give an overall sustainability reduction.
The most beneficial combination of schemes involves modifying a maintained flow,
introducing compensation flows at three sites, modifying the existing compensation
Yorkshire Water | Revised Draft Water Resources Management Plan 2019 77
`
flow from one site and increasing the hands off flow requirements at three sites.
Overall, this results in a sustainability reduction of 1.5Ml/d which will take effect by
2024. It was not cost beneficial to introduce an appropriate baseline flow regime at
two sites and as a result they have been taken forward for river re-engineering
solutions.
The Environment Agency may identify additional reservoirs and/or abstractions
requiring flow measures in subsequent phases of the WINEP. Our view is that any
additional schemes should be progressed through the AMP7 Flow Adaptive
Management scheme. This allows for modelling and investigation of any new
changes, with the aim of permanent implementation (potentially resulting in a yield
loss) in AMP8. The Environment Agency has agreed in principle with this approach.
We have agreed with the Environment Agency that we should carry out
investigations during AMP7 for a number of abstractions which have been
highlighted in the WINEP as having the potential to cause WFD damage or
deterioration. These investigations will help us understand the impact of
groundwater abstractions in areas of East and South Yorkshire, and the impact of
hands off flows for an abstraction on the River Ouse. Another Habitats Directive
investigation will look at the requirements for and impacts of hands off flows for our
abstractions on the River Derwent, working with the Environment Agency and
Natural England (see section 3.14.2).
Any changes to abstractions as a result of these investigations may affect our
deployable output in the future, or may affect the yield of options to address a
supply/demand deficit, but they do not affect our current deployable output for
WRMP19.
An additional HMWB mitigation measure is the improvement of fish passage. We
have worked with the Environment Agency to improve fish passage by constructing
fish passes or removing barriers in the Don, Ure, Aire and Wharfe catchments. We
continue to work with the Environment Agency on WINEP and are planning further
fish passage schemes in AMP7 in the Don, Calder, Aire and Wharfe catchments.
By working with the Environment Agency to ensure that our abstractions remain
sustainable, we are also contributing to wider environmental aspirations such as
Yorkshire Water | Revised Draft Water Resources Management Plan 2019 78
`
those outlined in the Government’s Biodiversity 2020 policy, Biodiversity 2020: A
strategy for England’s wildlife and ecosystem services (Defra, 2011). Our ongoing
work to enhance upland catchments, including our commitments to improve the
condition of Sites of Special Scientific Interest (SSSIs), also contributes towards this
objective. In addition, our emerging approach to the use of the six capitals –
including natural – will help to further embed the principles of supporting ecosystem
services within our future plans. This recognises also the value of the multiple
benefits that catchment restoration can provide, including not only water quality, but
also water retention, carbon capture and biodiversity.
Invasive non-native species (INNS)
We recognise that our abstraction operations present a pathway by which Invasive
Non-Native Species (INNS) may spread. To help mitigate the risk of spread, we
have been working closely with the Environment Agency, Defra and the Non-Native
Species Secretariat and other water companies to implement our proportional
actions from the GB Invasive Non-Native Species Strategy.
In summary, we have been working to understand the risk INNS pose to our
operations through an extensive risk assessment and survey exercise across our
reservoirs and water treatment works. We have been improving biosecurity through
the funding of a biosecurity project officer in conjunction with other regional
stakeholders such as Leeds University and the Environment Agency. We are also
one of eight water companies supporting and funding the recent re-launch of Defra’s
‘Check, Clean, Dry’ biosecurity campaign, aimed at reducing the risk of INNS
reaching our reservoirs and rivers on anglers and sailors equipment).
We recognise through the Environment Agency’s position statement on raw water
transfers, that new schemes creating a new hydrological link will require mitigation
to prevent spread of all life stages of any INNS. This is currently an infeasible task
given the diversity of mitigation required to deal with microscopic organisms through
to plant fragments and fish. This is recognised in the Environment Agency’s PR19
guidance issued to water companies, and as such, we will be researching effective
mitigation during the AMP7 period to enable us to meet this requirement in future.
Yorkshire Water | Revised Draft Water Resources Management Plan 2019 79
`
The position statement notes that mitigation will be required on existing transfers on
a gradual basis. Options to deliver this mitigation on a risk prioritised basis have
been included within our PR19 submission for delivery in the AMP7 and AMP8
periods.
Abstraction reform
In accordance with the guidelines, we have not planned for any changes in
deployable output as a result of abstraction reform. The expectation is that at the
time of reform abstraction licences will be sustainable, or a plan will be in place to
make them sustainable. The sustainability of our abstraction licences is addressed
through our work with the Environment Agency on the WINEP, described in Section
3.10.
Climate change
3.13.1 Introduction
The Water Resources Planning Guideline (Environment Agency and Natural
Resources Wales, 2017) states that a company’s plan should consider the impact of
climate change on baseline supply at resource zone level. The guidance includes
several methods for incorporating climate change and hydrological uncertainty in
supply forecasts. The guideline is largely based on Climate change approaches in
water resources planning - overview of new methods (Environment Agency, 2013),
and the more recent 2017 guidelines and supplements. In addition, we use
evidence from reports produced for WRMP14.
The Deployable Output and Climate Change Technical Report fully describes the
approach we have taken to climate change modelling. We have adopted the risk
based approach recommended in the guidelines, by first assessing the vulnerability
of our water resources zones to climate change, and then developing models
according to the results of this risk based analysis. We have shared our proposed
methodology and results with Ofwat and the Environment Agency.
This section of the revised draft WRMP19 gives an overview of the development
stages that we have taken in investigating the indicators of climate change in the
Yorkshire Water | Revised Draft Water Resources Management Plan 2019 80
`
region to date. It shows how we have carried out basic and intermediate
vulnerability analyses of our sources to climate change.
For the Grid SWZ we have calculated factors which represent the effects of climate
change on river flows and reservoir inflows in Yorkshire catchments. We have done
this using methods recommended in the Water Resources Planning Guideline
(Environment Agency and Natural Resources Wales, 2017). These factors have
been applied to the WRAPsim model inflow files, and we have run the model to
calculate the deployable output of the system in 2085. We have interpolated
deployable output in the years between 2017 and 2085. We have chosen not to use
the trajectory recommended in the guidance, which linearly interpolates between
1975 and 2085, and would result in a loss of deployable output of 69Ml/d in the year
2018/19, which we do not believe is a likely scenario for Yorkshire. We have
discussed this approach with the Environment Agency.
Any effects of climate change on deployable output will be considered relative to the
deployable output of our base model in 2017/18.
For the East SWZ we have carried out tier 1 analysis as described in the Water
Resources Planning Guideline (Environment Agency and Natural Resources Wales,
2017). and repeated the analyses carried out for WRMP14, using an update of the
models derived for the River Esk.
3.13.2 Indicators of climate change
Before WRMP14, we commissioned Mott MacDonald to analyse updated trends for
a number of sites and describes the application of seven different trend tests to
rainfall, flow and temperature series. The results, which were reported in YWS
Climate Change Trends: Climatic Change Evidence and Trend Analysis for
Yorkshire (Mott MacDonald, 2012), indicated statistically significant trends in only
two series (Derwent and Hebden Water). However, these trends showed
differences in patterns. Analysis of Central England Temperatures (CET) data
generally showed significant upward trends in average annual and seasonal
temperatures.
Yorkshire Water | Revised Draft Water Resources Management Plan 2019 81
`
Analyses were also carried out in other research projects commissioned by
Yorkshire Water including; the Climate Change Risk Assessment (CCRA) and
drought duration modelling (Duration Modelling: Impact of multi-year drought events
on resources and assets, WRc, 2012). The CCRA formed part of a four phase
project to inform PR14 and longer term planning. Phase 1 was an impact and
vulnerability assessment that provided both a look back at recent extreme weather
events, and a comprehensive understanding of climate change projections for the
Yorkshire and Humber region. The CCRA formed the second phase. The third
phase was a detailed risk assessment, and these fed into the fourth phase, our
detailed policy position on climate change.
Recent climatic events appear to fit with the climate change predictions indicated in
the United Kingdom Climate Projections 2009 (UKCP09) scenarios, although to
date no specific individual event can be attributed to climate change. Despite trend
analyses not being conclusive, it is prudent to base our WRMP19 on the best
available evidence for climate change over the next 25 years, which is currently the
UKCP09 projections, although UKCP18 projections are expected next year.
We have not carried out further trend analyses since WRMP14, but the literature is
unanimous that the impacts of climate change are increasing. In recent years, we
have had extreme rainfall events causing flooding (Winter 2015/16), and research
has been published indicating that climate change has made such events more
likely (CEH, 2016), but it is not possible to attribute an individual event, or series of
events to climate change.
3.13.3 Basic vulnerability assessment
The basic vulnerability assessment determines whether a resource zone is classed
as high, medium or low vulnerability with respect to climate change, based on the
WRMP14 climate change impacts. The Grid SWZ mid scenario had a loss of
deployable output of 9%, and a range (difference between the wet and dry
scenarios) of 18%, making it a high vulnerability zone.
Table 3.7 shows the thresholds used for defining high, medium and low vulnerability
zones, and the East SWZ and Grid SWZ are plotted on it in their respective
positions.
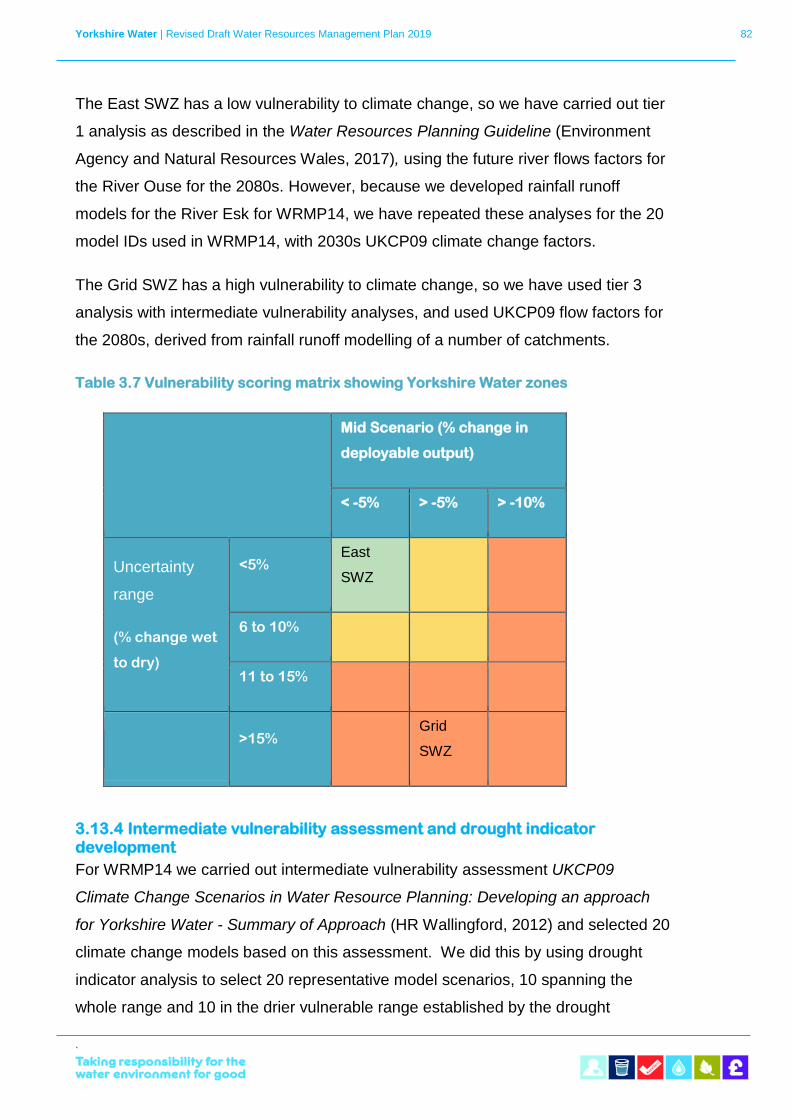
Yorkshire Water | Revised Draft Water Resources Management Plan 2019 82
`
The East SWZ has a low vulnerability to climate change, so we have carried out tier
1 analysis as described in the Water Resources Planning Guideline (Environment
Agency and Natural Resources Wales, 2017), using the future river flows factors for
the River Ouse for the 2080s. However, because we developed rainfall runoff
models for the River Esk for WRMP14, we have repeated these analyses for the 20
model IDs used in WRMP14, with 2030s UKCP09 climate change factors.
The Grid SWZ has a high vulnerability to climate change, so we have used tier 3
analysis with intermediate vulnerability analyses, and used UKCP09 flow factors for
the 2080s, derived from rainfall runoff modelling of a number of catchments.
Table 3.7 Vulnerability scoring matrix showing Yorkshire Water zones
Mid Scenario (% change in
deployable output)
< -5% > -5% > -10%
Uncertainty
range
(% change wet
to dry)
<5% East
SWZ
6 to 10%
11 to 15%
>15% Grid
SWZ
3.13.4 Intermediate vulnerability assessment and drought indicator development
For WRMP14 we carried out intermediate vulnerability assessment UKCP09
Climate Change Scenarios in Water Resource Planning: Developing an approach
for Yorkshire Water - Summary of Approach (HR Wallingford, 2012) and selected 20
climate change models based on this assessment. We did this by using drought
indicator analysis to select 20 representative model scenarios, 10 spanning the
whole range and 10 in the drier vulnerable range established by the drought
Yorkshire Water | Revised Draft Water Resources Management Plan 2019 83
`
indicator analysis. All samples were weighted, with the 10 dry samples assigned a
low probability to avoid a skew in resulting deployable output. However we believe
that our calculated deployable output for WRMP14 with climate change was skewed
towards the drier range due to the large proportion of dry scenarios, and due to the
fact that our record includes the exceptional drought of 1995/96. Scaling of this
drought results in extremely low deployable output assessments.
For the revised draft WRMP19 we have still carried out the initial and intermediate
vulnerability assessments, but this time for the 2080s rather than the 2030s, as
required in the guidance. In addition, we have selected fewer scenarios in the drier
range this plan. Instead, we have used stratification (Sampling Techniques.
Cochran, 1977), to select 20 samples from the entire range of projections, with an
additional three in the driest and hottest range. For the selection of 20 scenarios, we
have selected more scenarios from areas of the stratified data where there were
more model IDs, to ensure our samples are as representative as possible.
3.13.5 How we have used UKCP09 projections for water resources modelling
For the 23 model scenarios selected, we have used the Yorkshire and Humber
administrative region rainfall factors and temperature changes (from which Potential
Evapo-transpiration (PET) factors have been derived), and applied them to eight
catchments for which rainfall runoff models were available. We have used fewer
rainfall runoff models than we used for WRMP14, because for many cases the
factors derived from different modelled catchments were very similar.
The UKCP09 model scenarios were applied to each of these rainfall runoff models,
and flow series and factors were developed. These factors were then applied to the
WRAPsim inflow files for 23 projections to establish the system deployable output
for each of the 23 climate change model scenarios.
WRAPsim inflows, which are not modelled by rainfall runoff models, have been
assigned factors from the closest similar modelled catchment.
The use of the drought indicator analysis and the targeted sample approach has
allowed us to use only 23 rather than a recommended 100 or more samples without
the targeted sampling, which would not have been feasible. We have, however
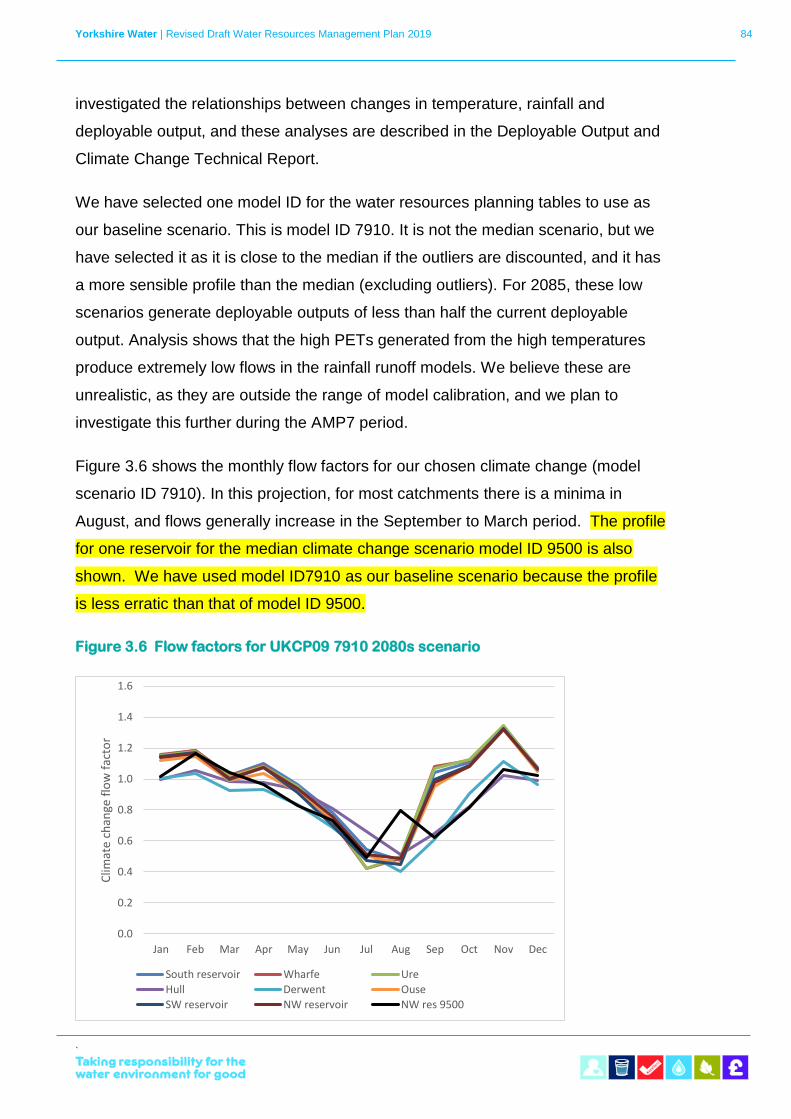
Yorkshire Water | Revised Draft Water Resources Management Plan 2019 84
`
investigated the relationships between changes in temperature, rainfall and
deployable output, and these analyses are described in the Deployable Output and
Climate Change Technical Report.
We have selected one model ID for the water resources planning tables to use as
our baseline scenario. This is model ID 7910. It is not the median scenario, but we
have selected it as it is close to the median if the outliers are discounted, and it has
a more sensible profile than the median (excluding outliers). For 2085, these low
scenarios generate deployable outputs of less than half the current deployable
output. Analysis shows that the high PETs generated from the high temperatures
produce extremely low flows in the rainfall runoff models. We believe these are
unrealistic, as they are outside the range of model calibration, and we plan to
investigate this further during the AMP7 period.
Figure 3.6 shows the monthly flow factors for our chosen climate change (model
scenario ID 7910). In this projection, for most catchments there is a minima in
August, and flows generally increase in the September to March period. The profile
for one reservoir for the median climate change scenario model ID 9500 is also
shown. We have used model ID7910 as our baseline scenario because the profile
is less erratic than that of model ID 9500.
Figure 3.6 Flow factors for UKCP09 7910 2080s scenario
0.0
0.2
0.4
0.6
0.8
1.0
1.2
1.4
1.6
Jan Feb Mar Apr May Jun Jul Aug Sep Oct Nov Dec
Clim
ate
chan
ge f
low
fac
tor
South reservoir Wharfe Ure
Hull Derwent Ouse
SW reservoir NW reservoir NW res 9500
Yorkshire Water | Revised Draft Water Resources Management Plan 2019 85
`
We strongly believe our drought in 1995/96 is such an extreme case that the
application of factors to this results in a far lower deployable output than would be
the case if this drought had not occurred. It is likely that the 1995/96 drought
represents climate change that has already occurred, although we will not be able to
establish this for many years to come. The application of climate change factors to
this severe two year drought results in very low deployable output estimates. We
therefore believe it is appropriate to select a scenario which does not give us an
excessive deployable output loss when applied to this extreme drought.
3.13.6 Interpolation of deployable output
The WRAPsim model is used to calculate deployable output for the baseline year
and for the 2080s (the year 2085). We need to calculate the deployable output for
all years of the planning period, and so to achieve this we interpolate between 2017
and 2085. The guidelines suggest using a linear trend from 1975 to 2085, but the
guidance also acknowledges that this may not be suitable for all areas. We
discussed our use of alternative scaling equations with our local Environment
Agency and with our external auditor, and both agreed that a drop of 70Ml/d by
2020/21 was unlikely.
We have elected to calculate factors between 2017 and 2085, joining the 1975 to
2085 trajectory by the end of our planning period. This enables production of a
smooth time series of deployable output, and avoids step changes in estimated
deployable output, which might artificially influence the timing of investment
decisions. The calculation of the trajectory is described in the Deployable Output
and Climate Change Technical Report, which shows the different options we
considered for the trajectory of climate change between 2017 and 2085 for one of
the climate change model IDs. The recommended Environment Agency equation
from the WRMP guidelines interpolates linearly between 1975 and 2085, and this
results in a step change . We do not believe this trajectory is suitable, because it
ignores the fact that the deployable output we have calculated is based on our
climate up to 2017, and backdates the current deployable output to 1975, and then
applies climate change to that value
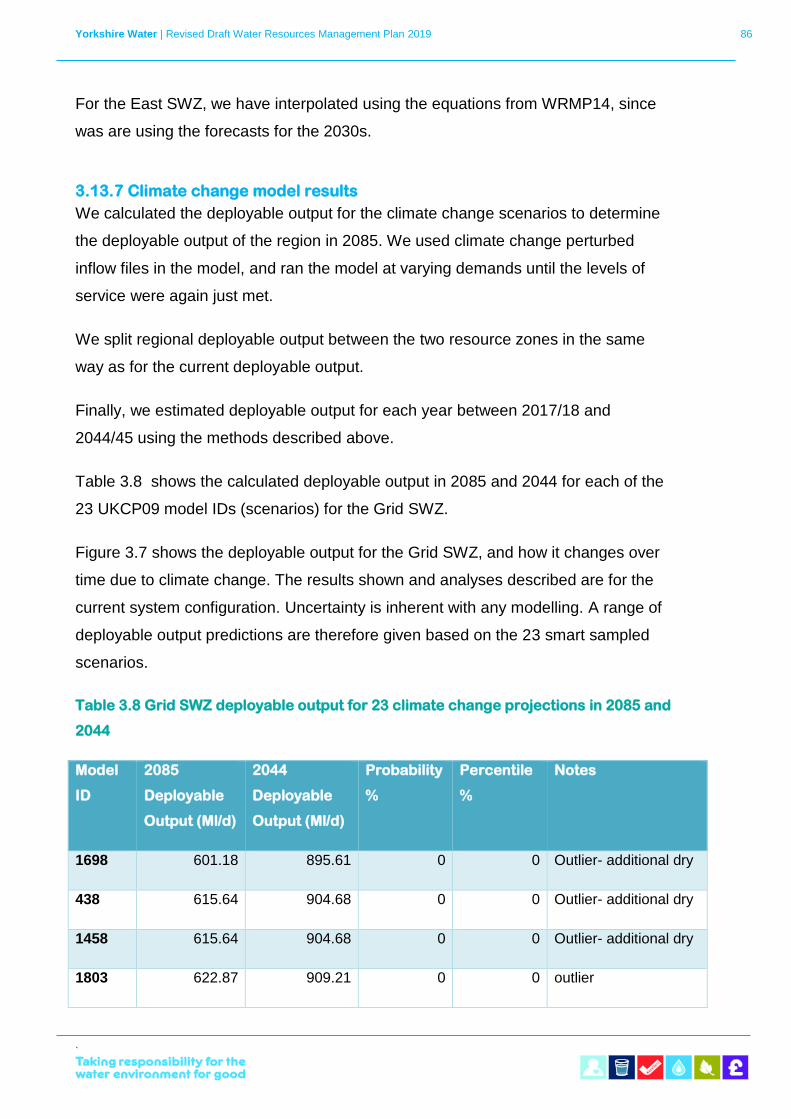
Yorkshire Water | Revised Draft Water Resources Management Plan 2019 86
`
For the East SWZ, we have interpolated using the equations from WRMP14, since
was are using the forecasts for the 2030s.
3.13.7 Climate change model results
We calculated the deployable output for the climate change scenarios to determine
the deployable output of the region in 2085. We used climate change perturbed
inflow files in the model, and ran the model at varying demands until the levels of
service were again just met.
We split regional deployable output between the two resource zones in the same
way as for the current deployable output.
Finally, we estimated deployable output for each year between 2017/18 and
2044/45 using the methods described above.
Table 3.8 shows the calculated deployable output in 2085 and 2044 for each of the
23 UKCP09 model IDs (scenarios) for the Grid SWZ.
Figure 3.7 shows the deployable output for the Grid SWZ, and how it changes over
time due to climate change. The results shown and analyses described are for the
current system configuration. Uncertainty is inherent with any modelling. A range of
deployable output predictions are therefore given based on the 23 smart sampled
scenarios.
Table 3.8 Grid SWZ deployable output for 23 climate change projections in 2085 and
2044
Model
ID
2085
Deployable
Output (Ml/d)
2044
Deployable
Output (Ml/d)
Probability
%
Percentile
%
Notes
1698 601.18 895.61 0 0 Outlier- additional dry
438 615.64 904.68 0 0 Outlier- additional dry
1458 615.64 904.68 0 0 Outlier- additional dry
1803 622.87 909.21 0 0 outlier
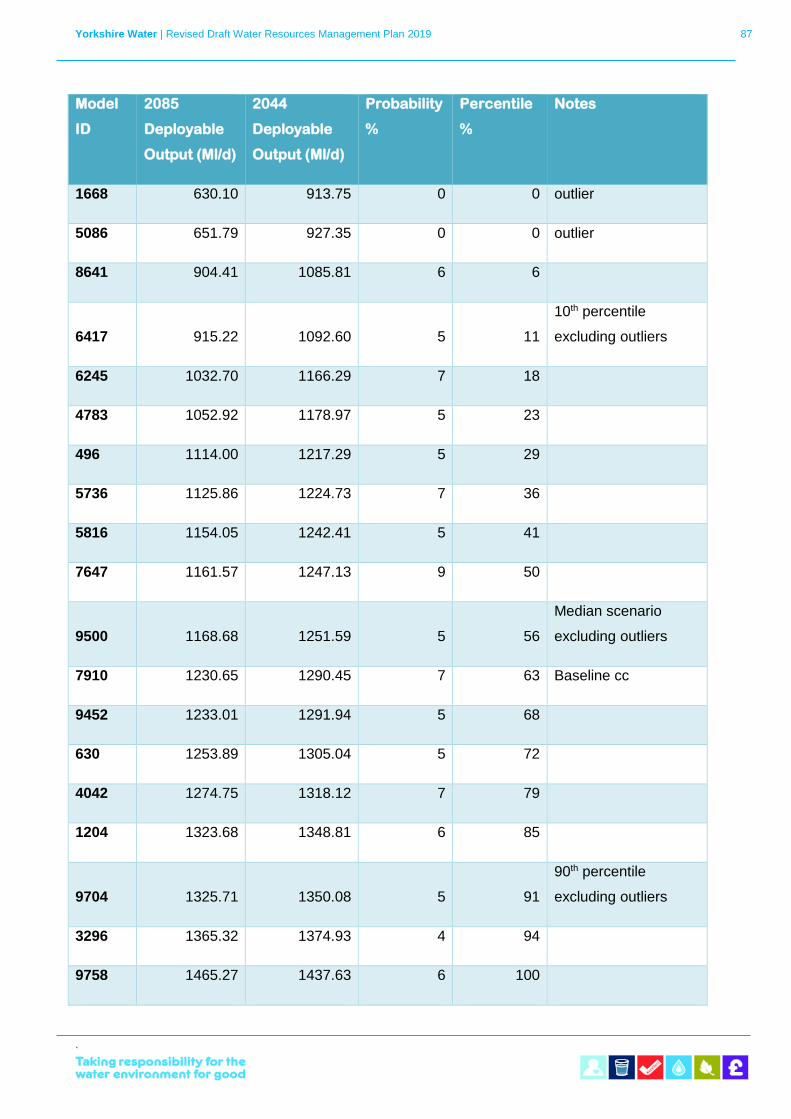
Yorkshire Water | Revised Draft Water Resources Management Plan 2019 87
`
Model
ID
2085
Deployable
Output (Ml/d)
2044
Deployable
Output (Ml/d)
Probability
%
Percentile
%
Notes
1668 630.10 913.75 0 0 outlier
5086 651.79 927.35 0 0 outlier
8641 904.41 1085.81 6 6
6417 915.22 1092.60 5 11
10th percentile
excluding outliers
6245 1032.70 1166.29 7 18
4783 1052.92 1178.97 5 23
496 1114.00 1217.29 5 29
5736 1125.86 1224.73 7 36
5816 1154.05 1242.41 5 41
7647 1161.57 1247.13 9 50
9500 1168.68 1251.59 5 56
Median scenario
excluding outliers
7910 1230.65 1290.45 7 63 Baseline cc
9452 1233.01 1291.94 5 68
630 1253.89 1305.04 5 72
4042 1274.75 1318.12 7 79
1204 1323.68 1348.81 6 85
9704 1325.71 1350.08 5 91
90th percentile
excluding outliers
3296 1365.32 1374.93 4 94
9758 1465.27 1437.63 6 100
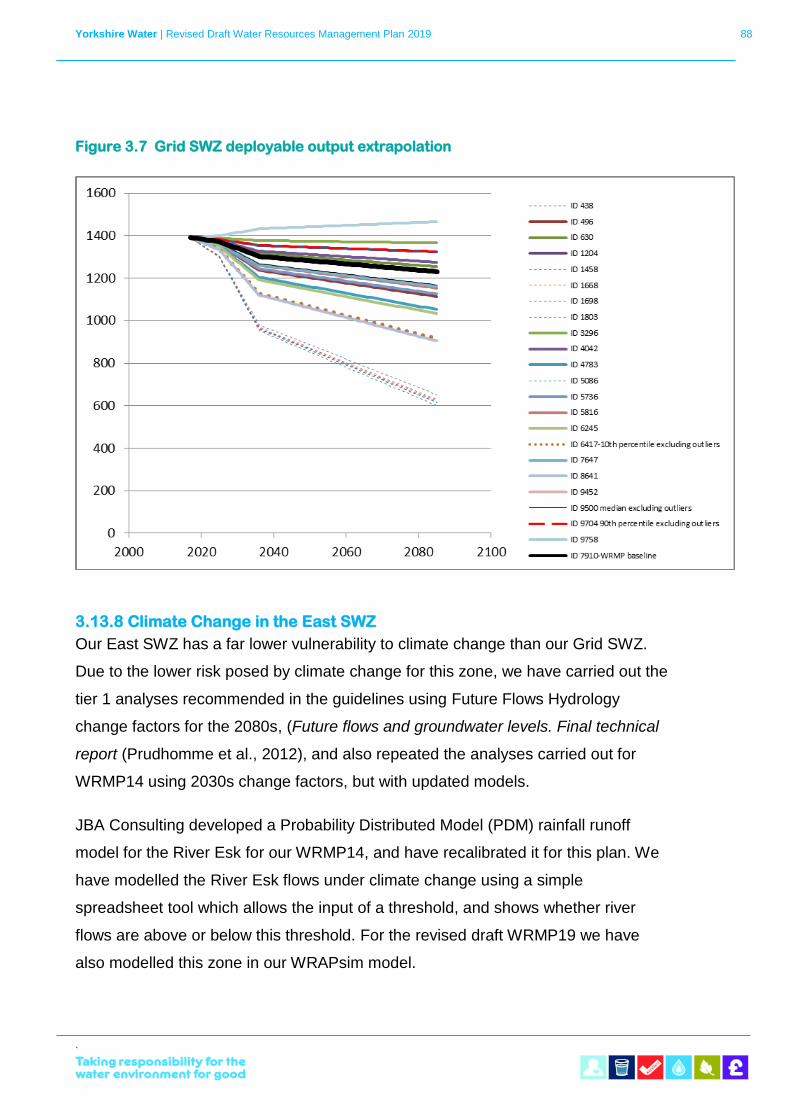
Yorkshire Water | Revised Draft Water Resources Management Plan 2019 88
`
Figure 3.7 Grid SWZ deployable output extrapolation
3.13.8 Climate Change in the East SWZ
Our East SWZ has a far lower vulnerability to climate change than our Grid SWZ.
Due to the lower risk posed by climate change for this zone, we have carried out the
tier 1 analyses recommended in the guidelines using Future Flows Hydrology
change factors for the 2080s, (Future flows and groundwater levels. Final technical
report (Prudhomme et al., 2012), and also repeated the analyses carried out for
WRMP14 using 2030s change factors, but with updated models.
JBA Consulting developed a Probability Distributed Model (PDM) rainfall runoff
model for the River Esk for our WRMP14, and have recalibrated it for this plan. We
have modelled the River Esk flows under climate change using a simple
spreadsheet tool which allows the input of a threshold, and shows whether river
flows are above or below this threshold. For the revised draft WRMP19 we have
also modelled this zone in our WRAPsim model.
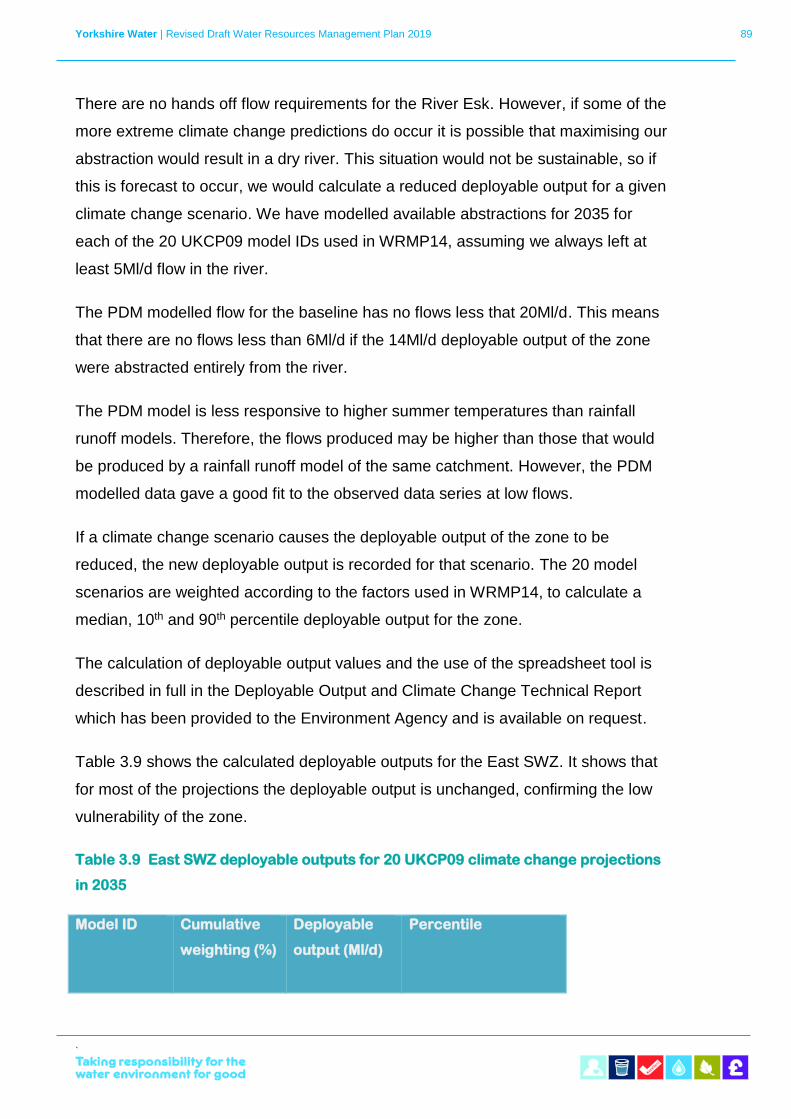
Yorkshire Water | Revised Draft Water Resources Management Plan 2019 89
`
There are no hands off flow requirements for the River Esk. However, if some of the
more extreme climate change predictions do occur it is possible that maximising our
abstraction would result in a dry river. This situation would not be sustainable, so if
this is forecast to occur, we would calculate a reduced deployable output for a given
climate change scenario. We have modelled available abstractions for 2035 for
each of the 20 UKCP09 model IDs used in WRMP14, assuming we always left at
least 5Ml/d flow in the river.
The PDM modelled flow for the baseline has no flows less that 20Ml/d. This means
that there are no flows less than 6Ml/d if the 14Ml/d deployable output of the zone
were abstracted entirely from the river.
The PDM model is less responsive to higher summer temperatures than rainfall
runoff models. Therefore, the flows produced may be higher than those that would
be produced by a rainfall runoff model of the same catchment. However, the PDM
modelled data gave a good fit to the observed data series at low flows.
If a climate change scenario causes the deployable output of the zone to be
reduced, the new deployable output is recorded for that scenario. The 20 model
scenarios are weighted according to the factors used in WRMP14, to calculate a
median, 10th and 90th percentile deployable output for the zone.
The calculation of deployable output values and the use of the spreadsheet tool is
described in full in the Deployable Output and Climate Change Technical Report
which has been provided to the Environment Agency and is available on request.
Table 3.9 shows the calculated deployable outputs for the East SWZ. It shows that
for most of the projections the deployable output is unchanged, confirming the low
vulnerability of the zone.
Table 3.9 East SWZ deployable outputs for 20 UKCP09 climate change projections
in 2035
Model ID
Cumulative
weighting (%)
Deployable
output (Ml/d)
Percentile
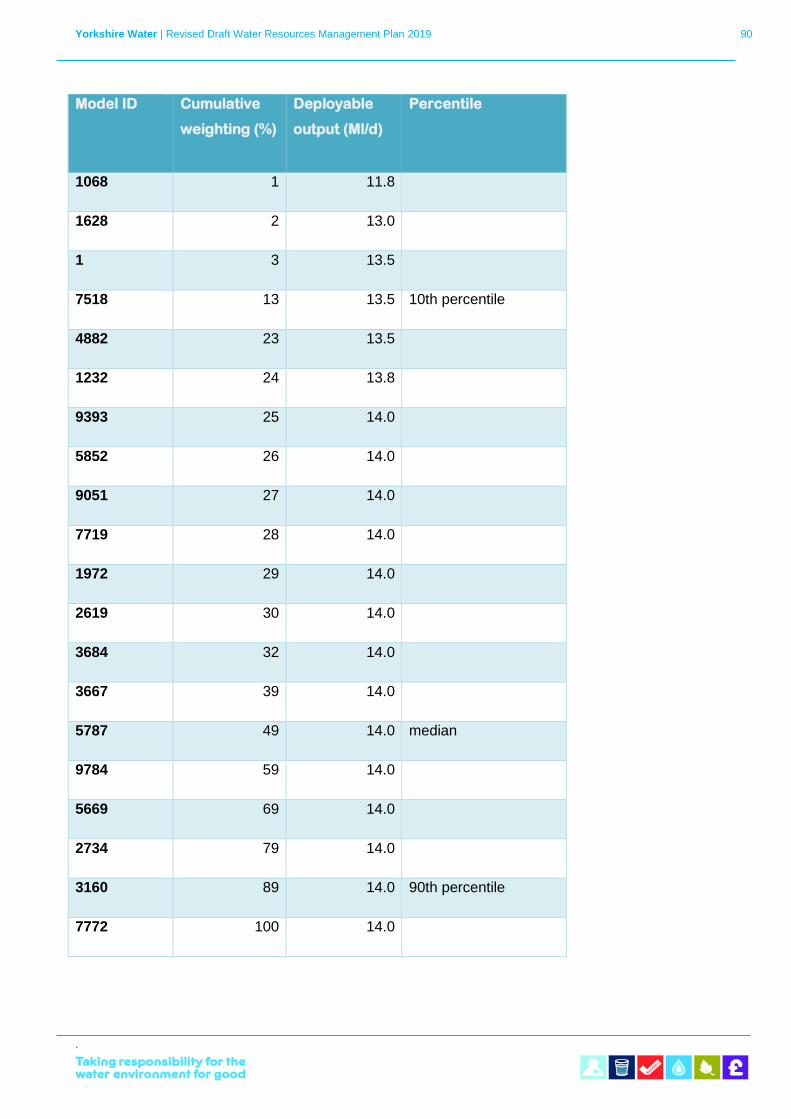
Yorkshire Water | Revised Draft Water Resources Management Plan 2019 90
`
Model ID
Cumulative
weighting (%)
Deployable
output (Ml/d)
Percentile
1068 1 11.8
1628 2 13.0
1 3 13.5
7518 13 13.5 10th percentile
4882 23 13.5
1232 24 13.8
9393 25 14.0
5852 26 14.0
9051 27 14.0
7719 28 14.0
1972 29 14.0
2619 30 14.0
3684 32 14.0
3667 39 14.0
5787 49 14.0 median
9784 59 14.0
5669 69 14.0
2734 79 14.0
3160 89 14.0 90th percentile
7772 100 14.0
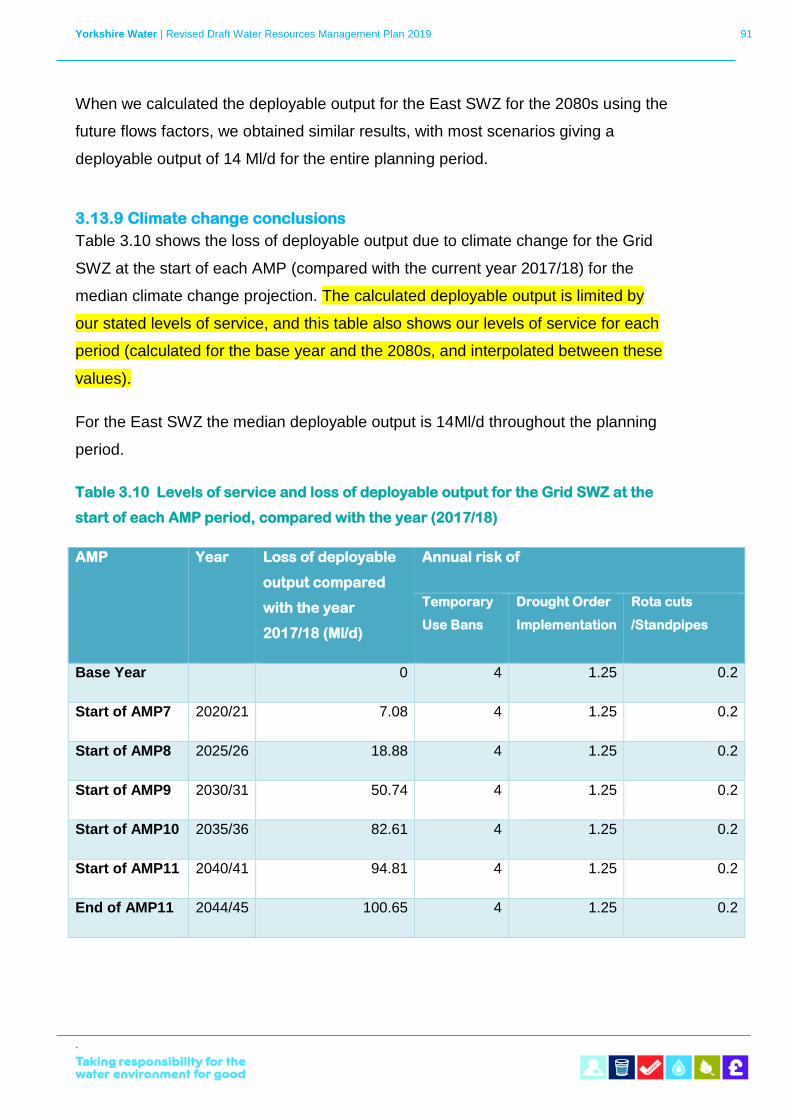
Yorkshire Water | Revised Draft Water Resources Management Plan 2019 91
`
When we calculated the deployable output for the East SWZ for the 2080s using the
future flows factors, we obtained similar results, with most scenarios giving a
deployable output of 14 Ml/d for the entire planning period.
3.13.9 Climate change conclusions
Table 3.10 shows the loss of deployable output due to climate change for the Grid
SWZ at the start of each AMP (compared with the current year 2017/18) for the
median climate change projection. The calculated deployable output is limited by
our stated levels of service, and this table also shows our levels of service for each
period (calculated for the base year and the 2080s, and interpolated between these
values).
For the East SWZ the median deployable output is 14Ml/d throughout the planning
period.
Table 3.10 Levels of service and loss of deployable output for the Grid SWZ at the
start of each AMP period, compared with the year (2017/18)
AMP Year Loss of deployable
output compared
with the year
2017/18 (Ml/d)
Annual risk of
Temporary
Use Bans
Drought Order
Implementation
Rota cuts
/Standpipes
Base Year 0 4 1.25 0.2
Start of AMP7 2020/21 7.08 4 1.25 0.2
Start of AMP8 2025/26 18.88 4 1.25 0.2
Start of AMP9 2030/31 50.74 4 1.25 0.2
Start of AMP10 2035/36 82.61 4 1.25 0.2
Start of AMP11 2040/41 94.81 4 1.25 0.2
End of AMP11 2044/45 100.65 4 1.25 0.2
Yorkshire Water | Revised Draft Water Resources Management Plan 2019 92
`
A summary of deployable outputs for both resource zones, and how the deployable
output changes over time, can be found in the Deployable Output and Climate
Change and Technical Report.
Previous analyses indicated that the factor with most influence on the calculated
yield of our supply system is the inclusion of the 1995/96 drought in the data
analysed. The yield was compared using flow factors, catchment factors and
catchment modelled inflows. The different methods produced similar results for the
same time periods, but only flow factors could be used for the entire period of
record, dating back to the 1920s.
We consider that to best estimate our deployable output and level of service, the
longest possible records should be used. This gives the most robust estimates of
current deployable output and deployable output under climate change scenarios.
Only flow factors can allow us to use our entire record length, as we do not have
calibrated rainfall runoff models for all the catchments modelled in our WRAPsim
model.
The Deployable Output and Climate Change Technical Report details how we have
modelled the effects of climate change on groundwater sources, and the sensitivity
analysis that has been carried out, to investigate the effects of different UKCP09
model IDs. The relative effect of climate change on groundwater and surface water
sources is also discussed.
We are confident that the use of 23 smart samples offers the best and most feasible
method of using the UKCP09 scenarios to model the effects of climate on
deployable output. We are aware of the high degree of uncertainty associated with
the climate change forecasts, and the nature and consequences of these forecasts.
During the AMP7 period we will continue our investigations into climate change
trends, catchment models, and the use of the upcoming UKCP18 projections for
water resources planning. To ensure that we understand what this new data is
telling us, we are representing the UK Water Industry on the UKCP19 users’ group,
and we are leading work looking at how the UK water industry will use this latest
evidence for future planning.
Yorkshire Water | Revised Draft Water Resources Management Plan 2019 93
`
Implications of climate change on groundwater will be considered as part of ongoing
work. We will continue to carry out groundwater modelling to assess the potential
impact of climate change on yield.
We intend to use the UKWIR methodology developed in the 2017 UKWIR report
Climate Change and the WRMP, and this will give us an idea whether the range of
predicted future climates would result in deployable output reductions, and what
changes in climate we would be resilient to, enabling us to focus analyses on those
that were most likley.
We will also take into account any additional guidance that is published after the
release of the UKCP18 scenarios.
We also intend to investigate the relationship between temperature change and
Potential Evapo-transpiration, as we believe this has skewed the modelled flows in
some of our modelled scenarios. Future climates predict temperatures outside
calibration range of current rainfall runoff and Potential Evaporation models. This
should give greater certainty in the range of likely modelled deployable outputs.
Until the release of UKCP18, we are unable to provide further details of proposed
investigations.
Scenarios to test our resilience
As part of our resilience tested plan, we have run a number of scenarios looking at
the effect of various potential changes in supply on our deployable output. These
scenarios are described below.
3.14.1 Failure of River Derwent weir
We have two abstractions from the River Derwent. The intake for one abstraction is
upstream of a weir and sluice structure. These structures, which are owned by the
Environment Agency and Yorkshire Wildlife Trust, are in a poor state of repair, and
the Environment Agency has asked us to consider the risk of failure of these assets
in our WRMP19. The consequence of catastrophic failure of these structures is that
our ability to abstract at low river flows would be compromised. Our Asset Integrity
engineers have inspected these structures, and do not believe that catastrophic
Yorkshire Water | Revised Draft Water Resources Management Plan 2019 94
`
failure is likely in the near future. Should failure occur, our ability to abstract at most
flows would be unaffected, with an impact only occurring at low flows. We have
carried out a risk review in relation to the failure of this weir, and should short term
mitigation be required, we would install temporary pumps below the level of the
intake structure to allow abstraction. A site mitigation plan has been developed to
this effect. These assets are most likely to fail when river flows are high, as a result
of flood events and a build up of debris behind the structures. The effects of failure,
however, would only be felt when river flows were very low, so in the event of
failure, we would have plenty of time to implement our mitigation plan before very
low flows returned.
As a worst-case scenario, we have modelled the effect of not being able to abstract
at this intake at low flows, and this results in a reduction of deployable output of
104Ml/d in the base year. This reduction is caused by a failure to meet demands in
the driest years, rather than levels of service failures. Because we believe this asset
failure to be unlikely, and because we have a mitigation plan in place to enable
abstraction at low flows in the event of such a failure, we have not carried out a
supply demand balance model of this scenario.
To ensure the most appropriate mitigation of this risk in the long-term, assuming
that the condition of the weir and sluice assets deteriorate further, we plan to
undertake an investigation in the AMP7 period that will review this intake in its
entirety; the dependence on the weir and sluice structures is contained within the
scope of the investigation.
3.14.2 River Derwent Common Standards Monitoring Guidance (CSMG) thresholds
Natural England and the Environment Agency have ongoing Habitats Directive
investigations into the River Derwent. They have agreed to continue these
investigations, and committed to providing a hydrological target (either flow or level)
by 2021. If they fail to agree a target, there will be no action. In the absence of such
a target, we have modelled the standard CSMG targets for the two River Derwent
abstractions. Imposing these targets (only 20% flow can be abstracted) results in a
loss of deployable output of 130Ml/d in the base year. Again, this reduction is
Yorkshire Water | Revised Draft Water Resources Management Plan 2019 95
`
caused by a failure to meet demands in the driest years, rather than levels of
service failures.
3.14.3 Severn Trent import uncertainty
We use a different water resources simulation model to Severn Trent Water.
Because of this, and the fact that we each model our own systems, our modelled
averages of the Severn Trent Water import are different. We have a modelled value
of 51.87Ml/d and Severn Trent Water model 48.46Ml/d. We account for climate
change uncertainty of the Severn Trent Water import in our headroom, but we have
also modelled scenarios where the import is reduced to below the value that Severn
Trent Water model using their simulation model. This modelling shows our
deployable output is unchanged if we use this import down to a level of 43Ml/d.
3.14.4 South Yorkshire reservoirs returning to full capacity
Two reservoirs in South Yorkshire are currently under investigation for reservoir
safety schemes. Currently one of these reservoirs is being kept at only 20% of its
capacity, and it has been included in our deployable output assessment at this
capacity. It is possible that the preferred solutions enable a fuller use of these
reservoirs. Scenario modelling has shown that returning these two reservoirs to full
capacity (from 1,058Ml back to 2,779Ml) results in an increase in deployable output
of 5Ml/d.
3.14.5 No supply side options in deployable output modelling
Our WRAPsim model assumes that supply side drought options are implemented
when group reservoir stocks fall below the drought control line. We have modelled
a scenario where this does not occur, and this is shown in Table 10 of our water
resources planning tables. This demonstrates that although supply side drought
options (reduction in compensation flows) are included in our model, our deployable
output is not dependent on them, and they simply result in elevated reservoir stocks.
3.14.6 Climate change scenarios
Climate change represents one of our largest risks to deployable output, and is also
one of our largest areas of uncertainty. We have modelled deployable output for 23
Yorkshire Water | Revised Draft Water Resources Management Plan 2019 96
`
climate change scenarios using our WRAPsim model, and used only one of these
(7910) for our baseline forecast in our supply/demand balance.
We have used model ID 9500 as an additional scenario because it is the median
(excluding outliers) of the 23 scenarios and represents a worse case than our
chosen scenario.
Water Transfers
3.15.1 Raw water transfers
In our WRAPsim model, the Severn Trent Water import has an average of
51.87Ml/d. We have consulted with Severn Trent Water, and their modelling gives
an average export from their system of 48.46 Ml/d. Although there is a small
difference in our modelled values, we have modelled scenarios where the average
of the import from Severn Trent Water is only 48Ml/d. In our model, this does not
change our deployable output. Severn Trent Water have also modelled a scenario
with our assumed 51.87Ml/d export from their system. We are therefore confident
that Severn Trent Water would be able to supply our import at a rate of 51.87Ml/d,
and that if we could only import their modelled value of 48.46 Ml/d, our deployable
output would not be compromised. Any uncertainty will be accounted for in our
headroom component.
We have modelled the Severn Trent Water import for our climate change models.
As with our other climate change modelling, we have used model ID 7910 for our
water resource planning tables and used the others to calculate the headroom
component for the Severn Trent Water import. This resulted in a year on year
reduction in volume during the planning period.
Severn Trent Water has carried out its own climate change modelling which shows
our import reducing to 47.95Ml/d by 2045.
Yorkshire Water | Revised Draft Water Resources Management Plan 2019 97
`
The Severn Trent Water values differ to the Yorkshire Water value for a number of
reasons:
• Yorkshire Water used factors for the Humber river basin/ Yorkshire
region whereas Severn Trent Water used flow factors for the Severn
river basin/ Midlands region;
• We both used a risk based approach, which identifies UKCP09 model
IDs based on drought indicator analysis and the risk of low reservoir
stocks. The risk based analysis allowed the selection of model ID's
which best represent each companies’ level of risk but these model
IDs are not the same; and
• Severn Trent Water have used 2030s climate change scenarios, and
we have used 2080s.
In addition, we use a different water resource model to Severn Trent Water, we
each have different levels of service and we each model our supply region but do
not model other company's regions.
We have worked with Severn Trent Water to improve the way we model the transfer
between our systems for WRMP19, but modelling differences in different models
are inevitable. We both model our own system in detail, and make assumptions
about the use each other makes of the reservoirs. Our scenario modelling has
shown our estimates are robust to this modelling uncertainty.
The Severn Trent Water import is transferred directly via a tunnel from an
impounding reservoir to our water treatment works, where it is treated via
appropriate treatment processes to required water quality standards. Due to the
direct transfer of water to the treatment works there is no quality risk to a receiving
waterbody.
This raw water import is the primary water supply to the treatment works and the
treatment process has been designed to produce water to appropriate potable water
standards.
The bulk transfer agreement for this import terminates in 2085, with a early ‘break
clause’ which allows termination by either party from 2035 following a 5 year notice
Yorkshire Water | Revised Draft Water Resources Management Plan 2019 98
`
period. In their draft WRMP, Severn Trent Water included a 15Ml/d reduction in the
import volume from 2030 in their best value plan. Severn Trent Water have
subsequently confirmed that they no longer require a reduction in our import in
2030. We have committed to work together to investigate options for varying the
agreement in the wider context of the Water Resources North Group. This joint work
will involve water resources modelling of the Derwent Valley system and developing
options for the Derwent Valley and wider Yorkshire Water and Severn Trent Water
systems.
3.15.2 Treated water exports and imports
We have one minor treated water export from the Grid SWZ to Anglian Water
Services. In line with previous years, we have assumed the export is 0.31Ml/d
throughout the planning period.
Drinking water quality
The WRMP takes account of all statutory obligations for drinking water quality.
Protection of raw and treated water quality is fundamental to water resources
resilience and maintenance of our current and future deployable output.
In terms of the quality of drinking water supplies, we abide by Section 68(1) of the
Water Industry Act 1991 and apply this governance to both our own sources and
existing and potential transfers, in compliance within Regulation 15 of the Water
Supply (Water Quality) Regulations 2016. We take a consistent approach to
drinking water quality across both water resource zones.
In preparation of the revised draft WRMP19 we have followed guidance on drinking
water quality provided in the Water Resource Planning Guideline. No specific
guidance was provided by the Drinking Water Inspectorate for the draft WRMP19 or
the water quality submission for the 2019 Price Review.
As part of the assurance process we made a clear statement to the Chief Inspector
of Drinking Water that our draft WRMP19 did not assume operating in ways which
compromised drinking water quality to meet future demand for water. Where we
experience or predict non-compliance with drinking water quality standards, due to
Yorkshire Water | Revised Draft Water Resources Management Plan 2019 99
`
the impact of raw water deterioration, we take action in a range of ways to mitigate
this.
In general, where raw water deterioration drives the risk of failure in drinking water
quality in the period during AMP7 to mid-AMP8 we will provide enhanced treatment
processes, supported by catchment management activity to ensure the sustainability
of the solution. Where Drinking Water Directive failure appears likely between mid
AMP8 and AMP10 we will promote catchment management to secure raw water
quality, supported by minor treatment enhancements. Where raw water deterioration
poses long-term risk to drinking water quality we will promote catchment
management activity to prevent this impacting on drinking water quality.
In planning this activity, we have regard to the use of Drinking Water Protected
Areas and Water Safeguard Zones as enablers for this activity. Catchment schemes
are developed with the Environment Agency through WINEP methodologies and
drinking water treatment improvement schemes are developed with the Drinking
Water Inspectorate through their Undertakings and Notices processes. There are a
range of uncertainties associated with water quality management through catchment
schemes; some, such as product substitution for metaldehyde give clear cause and
effect; whereas others, such as peatland restoration may deliver benefits over a
much longer timescale.
For over 10 years we have undertaken remedial and protective activity within our
catchments with the aim of reducing the risk of water quality deterioration,
particularly mitigating an increasing trend in colour from upland catchments.
Our long-term strategic objective is to meet the standards required by the Drinking
Water Directive, together with our national requirements, and we have plans and
processes in place to achieve this goal over time.
We currently have one significant potential area of non-compliance with these
standards, relating to the risk of seasonal failures of the standard for the pesticide
metaldehyde. The other risk is production of disinfection by-products (DBP -
trihalomethanes) caused by the increase in dissolved organic carbon (DOC) in many
of our raw waters. The chlorination of DOC residuals after treatment results in the
formation of DBPs, which we have an obligation to minimise (Regulation 26).
Yorkshire Water | Revised Draft Water Resources Management Plan 2019 100
`
Our plan is to take a twin-track approach to protecting drinking water quality and
deployable output. We are proposing more catchment activity through WINEP in the
AMP7 period and beyond, with the goal of halting the decline in raw water quality
and consequent risks to treated water quality. However, evidence gained over the
past 10 years has shown that, in some catchments, land management will not
provide a sufficiently rapid improvement in water quality. In these cases, catchment
management will be complemented by water treatment solutions. This may involve
additional treatment stages, such as MIEX (magnetic ion exchange), or upgrading
and expanding existing treatment assets.
Further detail of our approach to resilient catchment management is provided in
section 3.8.9.
3.16.1 Source protection
Under the WFD, water sources are protected and mechanisms are in place to
identify Drinking Water Protected Areas for catchments where there is a risk of
deterioration, mainly through human activity. Where action is required, Safeguard
Zones, sub-catchment areas can then be defined in collaboration with the
Environment Agency, allowing the causes of deterioration to be addressed by
working with landowners and interested parties under a Safeguard Zone Action Plan
(SgZ-AP).
The Environment Agency has defined Source Protection Zones for groundwater
sources used for public drinking water supply. These zones show the risk of
contamination from activities that may cause pollution of the groundwater. The
Environment Agency uses these zones to set up pollution prevention measures in
areas at higher risk, and to monitor the activities of potential polluters nearby.
3.16.2 Water quality risks
Our three primary risks to drinking water quality are colour from the peat uplands,
pesticides from lowland rivers, and nitrate, especially in groundwater. These require
a range of solutions to mitigate the risk to drinking water supply.
Yorkshire Water | Revised Draft Water Resources Management Plan 2019 101
`
3.16.3 Colour
Increasing raw water colour is a risk in upland catchments due to deterioration of
peatlands. The major cause of this degradation is how the vegetation on top of the
peat has been historically managed. Overgrazing, artificial drainage (known as
grips), atmospheric pollution and the burning of heather for grouse moor
management all lower the water table and damage the structure of the underlying
peat.
A long-term programme is ongoing to restore the hydrology of peatland catchments
in Yorkshire. We work with stakeholders to re-vegetate bare peat and to identify
mutually beneficial land management practices and policies which will deliver a
sustainable ecosystem across Yorkshire's upland catchments. This will reduce the
colour in raw water from these catchments, preventing water quality deterioration
and loss of deployable output.
3.16.4 Pesticides
Our approach to pesticide reduction is the development of partnerships to promote
best practice in pesticide use and alternative approaches to pest management,
reducing the reliance on chemical control. In partnership with Natural England, we
employ catchment officers to promote catchment sensitive farming in high risk sub
catchments to protect both drinking water quality and deployable output.
3.16.5 Nitrate
Nitrate is a risk to our groundwater sources, as these are in the lowland areas of
Yorkshire where arable farming predominates and fertiliser use is widespread. In
the past few years we have investigated the risk to our catchments from nitrate
application. This will now allow us to work with farmers in high risk areas to better
manage the catchment and reduce water quality and outage risks.
In addition to catchment management we consider treatment options, such as
blending groundwater from different sources to ensure nitrate levels in supplies are
kept within the required limits.
Yorkshire Water | Revised Draft Water Resources Management Plan 2019 102
`
Outage
Outage is a planning allowance used to represent temporary reductions in water
available for use (WAFU) due to planned or unplanned events. Headroom,
described in Section 7, is also a planning allowance and is used to account for risks
of permanent reductions in future supply.
Further reductions in supply occur during the process of abstracting and treating
water before putting into supply. These are explained in Section 3.18.
We assess outage using the methodology: Outage Allowances for Water Resource
Planning (UKWIR, 1995). The UKWIR method assumes past performance is a good
indicator of future performance and we use information on previous outage events.
For this plan, we have based outage on data recorded between 1998 and 2016.
Outage allowances are assessed at resource zone level. We produce outage
assessments for the dry year annual average scenario for both the Grid and East
SWZs. This section provides a summary of our outage assessemnt. Further
technical detail is provided in a supporting Outage Assessment Technical Report,
which has been provided to the Environment Agency and available on request.
The Grid SWZ outage assessment includes unplanned events, planned events,
reservoir safety events and licence margins. The East SWZ outage assessment
includes unplanned and planned events only. As the East SWZ is a small zone
relying on a river abstraction with support from a spring source, there are no
reservoirs to include in the assessment. Licence margins are only relevant to one
river abstraction in the Grid SWZ.
We calculate outage for unplanned events, planned events and reservoir safety
events using a probabilistic software model. Data on events is derived from a
Yorkshire Water database known as KAM (Key Asset Management). Events that
impact on our assets are recorded on this database, including any reduction in the
amount of water an asset can produce.
Yorkshire Water | Revised Draft Water Resources Management Plan 2019 103
`
3.17.1 Unplanned outage
Unplanned outages are unforeseen events which occur with sufficient regularity that
the probability and severity of the outage event can be predicted from previous
events. The UKWIR methodology defines the following categories as unplanned
outages: pollution of source, turbidity, nitrates, algae, power and system failure.
The methodology prescribes a probabilistic approach to assessing unplanned
outage, which considers the duration and magnitude of previous outage events. We
modified this approach to include frequency of events to make an allowance for the
risk of the event reoccurring.
We obtain data on previous unplanned outage events from the KAM database and
discussions with operational staff. From this data, we derive minimum, average and
maximum distributions of duration, magnitude and frequency for individual outage
events. The distributions are considered for each month of the year as some
outage issues, such as algae include a seasonality factor.
We input the distributions for each event into the outage model. The model uses
probabilistic methods to combine outage data for individual events and determines
monthly unplanned outage allowances for each water resource zone. The monthly
outage results for each zone are provided for a range of certainty levels between
zero and 100%. The outage allowance increases with increasing levels of certainty.
It is not economical to plan for a 100% level of certainty. As in previous plan
submissions, we have chosen to plan for the median or 50% level of certainty.
3.17.2 Reservoir safety outage
Statutory requirements of reservoir maintenance require reservoirs to be periodically
drawn down for inspection and repairs. Around 45% of supply to the Grid SWZ is
from reservoirs in our region and outage in this zone includes an allowance for loss
of yield due to reservoir safety schemes. The East SWZ assessment does not
require an outage allowance for reservoir safety as this zone contains no
impounding reservoirs.
Yorkshire Water | Revised Draft Water Resources Management Plan 2019 104
`
We have calculated a total outage allowance for reservoir safety schemes using the
outage probabilistic model. The data used in the model is based on loss of yield
recorded in Yorkshire Water databases for previous drawdowns.
The model calculates reservoir safety outage for each month of the year over a
range of certainties between zero and 100%. As with unplanned outage, we plan for
the 50% level of certainty.
3.17.3 Planned outage
We assess outage due to planned events for both water resource zones. Planned
outages result from a requirement to maintain the serviceability of assets.
Maintenance of assets, such as water treatment works, river water abstraction
works and raw water transmission mains, has the potential to lead to a temporary
reduction in deployable output.
We schedule the majority of maintenance for periods when demand is low and
alternative sources can be made available. However, this is not always possible and
We have not included any planned outage as a result of capital schemes to be
delivered in AMP7. A number of schemes that have resulted from our Drinking
Water Quality programme will temporarily reduce the output of several water
treatment works while the work is being implemented. We have not included any
additional outage allowance for these schemes as the work will be phased and
storage managed to minimised the actual outage. The impact of the water quality
schemes on outage in the final planning scenario is discussed in Section 12.1.
Additional outages will also occur as a result of other general maintenance
schemes, for example, replacing pumps at river intakes or rapid gravity filters at
water treatment works. In most cases the schemes will be delivered when there
will be no or minimum impact on the supply demand balance. However, some
planned outage will result from these schemes.
Planned outage for future events is dependent on the feasibility of delaying the
schemes in a dry year when the water is needed. As water availability and the
timing of a dry period are unknown, it is not possible to provide an accurate estimate
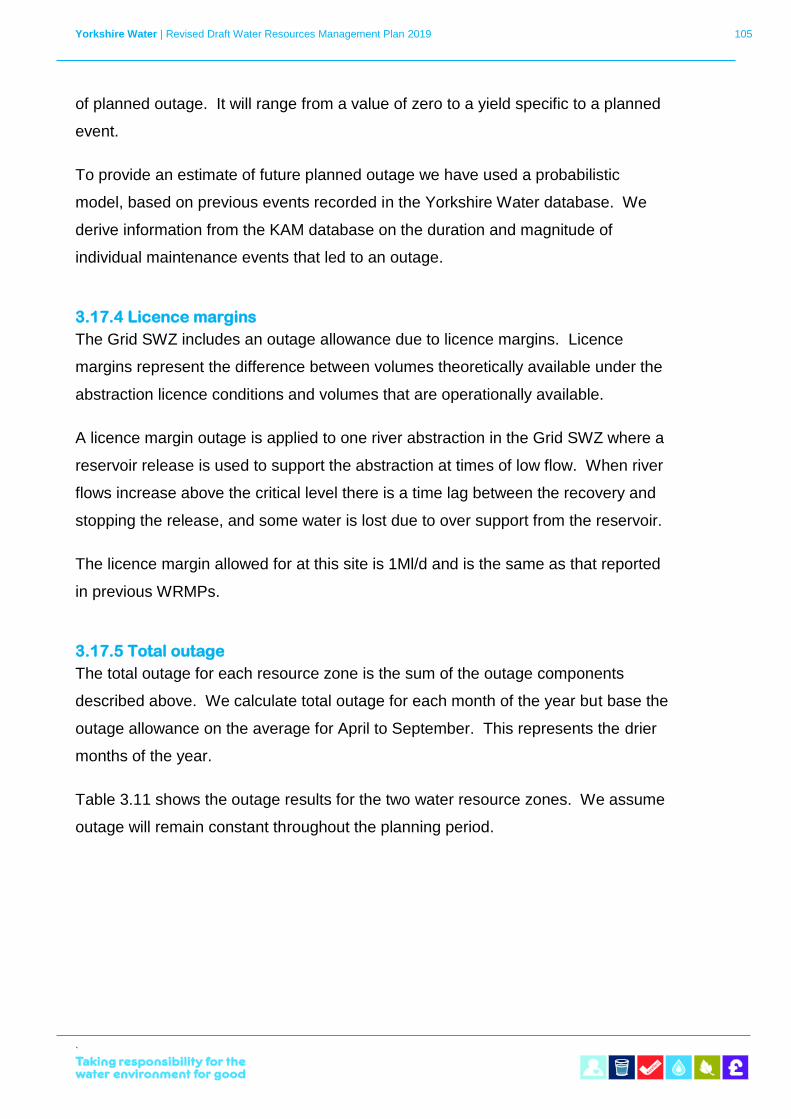
Yorkshire Water | Revised Draft Water Resources Management Plan 2019 105
`
of planned outage. It will range from a value of zero to a yield specific to a planned
event.
To provide an estimate of future planned outage we have used a probabilistic
model, based on previous events recorded in the Yorkshire Water database. We
derive information from the KAM database on the duration and magnitude of
individual maintenance events that led to an outage.
3.17.4 Licence margins
The Grid SWZ includes an outage allowance due to licence margins. Licence
margins represent the difference between volumes theoretically available under the
abstraction licence conditions and volumes that are operationally available.
A licence margin outage is applied to one river abstraction in the Grid SWZ where a
reservoir release is used to support the abstraction at times of low flow. When river
flows increase above the critical level there is a time lag between the recovery and
stopping the release, and some water is lost due to over support from the reservoir.
The licence margin allowed for at this site is 1Ml/d and is the same as that reported
in previous WRMPs.
3.17.5 Total outage
The total outage for each resource zone is the sum of the outage components
described above. We calculate total outage for each month of the year but base the
outage allowance on the average for April to September. This represents the drier
months of the year.
Table 3.11 shows the outage results for the two water resource zones. We assume
outage will remain constant throughout the planning period.
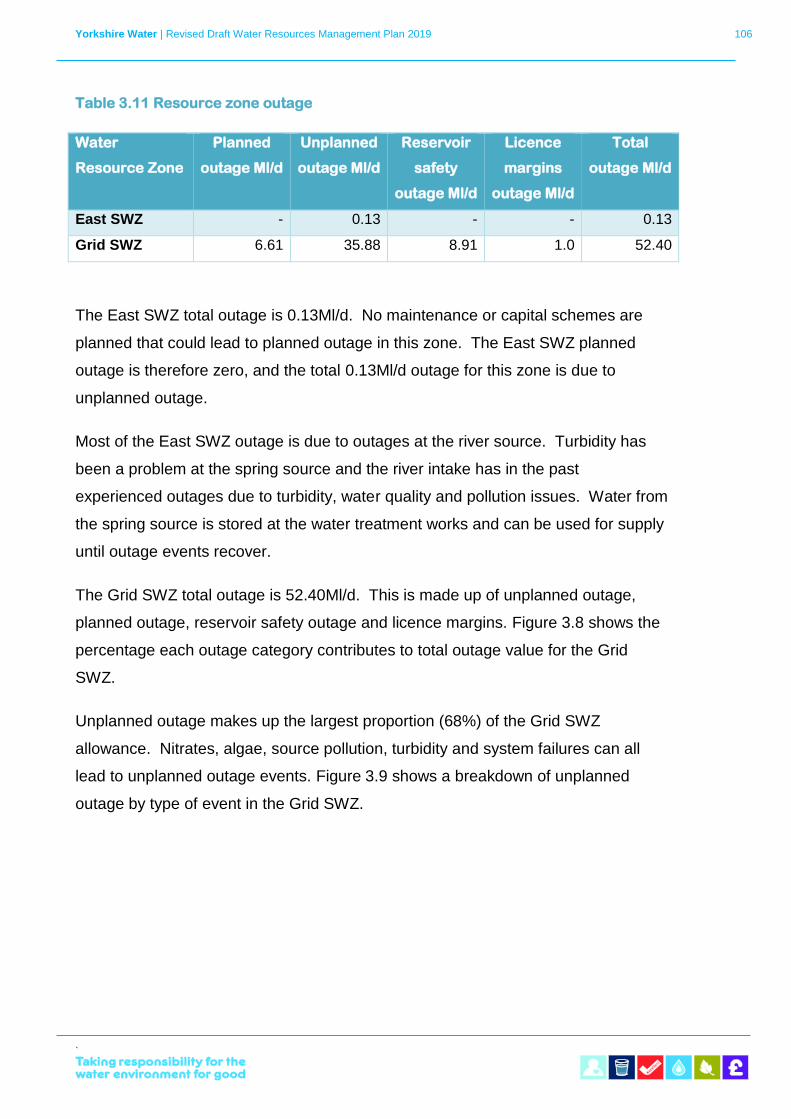
Yorkshire Water | Revised Draft Water Resources Management Plan 2019 106
`
Table 3.11 Resource zone outage
Water
Resource Zone
Planned
outage Ml/d
Unplanned
outage Ml/d
Reservoir
safety
outage Ml/d
Licence
margins
outage Ml/d
Total
outage Ml/d
East SWZ - 0.13 - - 0.13
Grid SWZ 6.61 35.88 8.91 1.0 52.40
The East SWZ total outage is 0.13Ml/d. No maintenance or capital schemes are
planned that could lead to planned outage in this zone. The East SWZ planned
outage is therefore zero, and the total 0.13Ml/d outage for this zone is due to
unplanned outage.
Most of the East SWZ outage is due to outages at the river source. Turbidity has
been a problem at the spring source and the river intake has in the past
experienced outages due to turbidity, water quality and pollution issues. Water from
the spring source is stored at the water treatment works and can be used for supply
until outage events recover.
The Grid SWZ total outage is 52.40Ml/d. This is made up of unplanned outage,
planned outage, reservoir safety outage and licence margins. Figure 3.8 shows the
percentage each outage category contributes to total outage value for the Grid
SWZ.
Unplanned outage makes up the largest proportion (68%) of the Grid SWZ
allowance. Nitrates, algae, source pollution, turbidity and system failures can all
lead to unplanned outage events. Figure 3.9 shows a breakdown of unplanned
outage by type of event in the Grid SWZ.
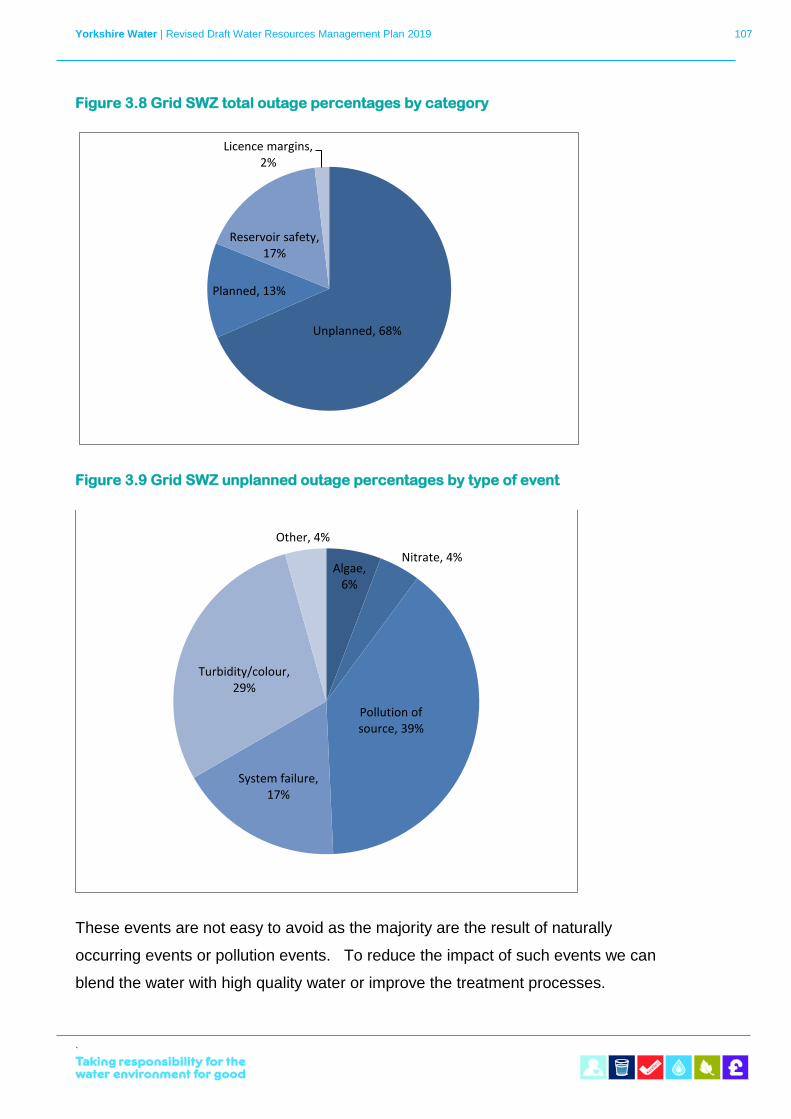
Yorkshire Water | Revised Draft Water Resources Management Plan 2019 107
`
Figure 3.8 Grid SWZ total outage percentages by category
Figure 3.9 Grid SWZ unplanned outage percentages by type of event
These events are not easy to avoid as the majority are the result of naturally
occurring events or pollution events. To reduce the impact of such events we can
blend the water with high quality water or improve the treatment processes.
Unplanned, 68%
Planned, 13%
Reservoir safety, 17%
Licence margins, 2%
Algae, 6%
Nitrate, 4%
Pollution of source, 39%
System failure, 17%
Turbidity/colour, 29%
Other, 4%
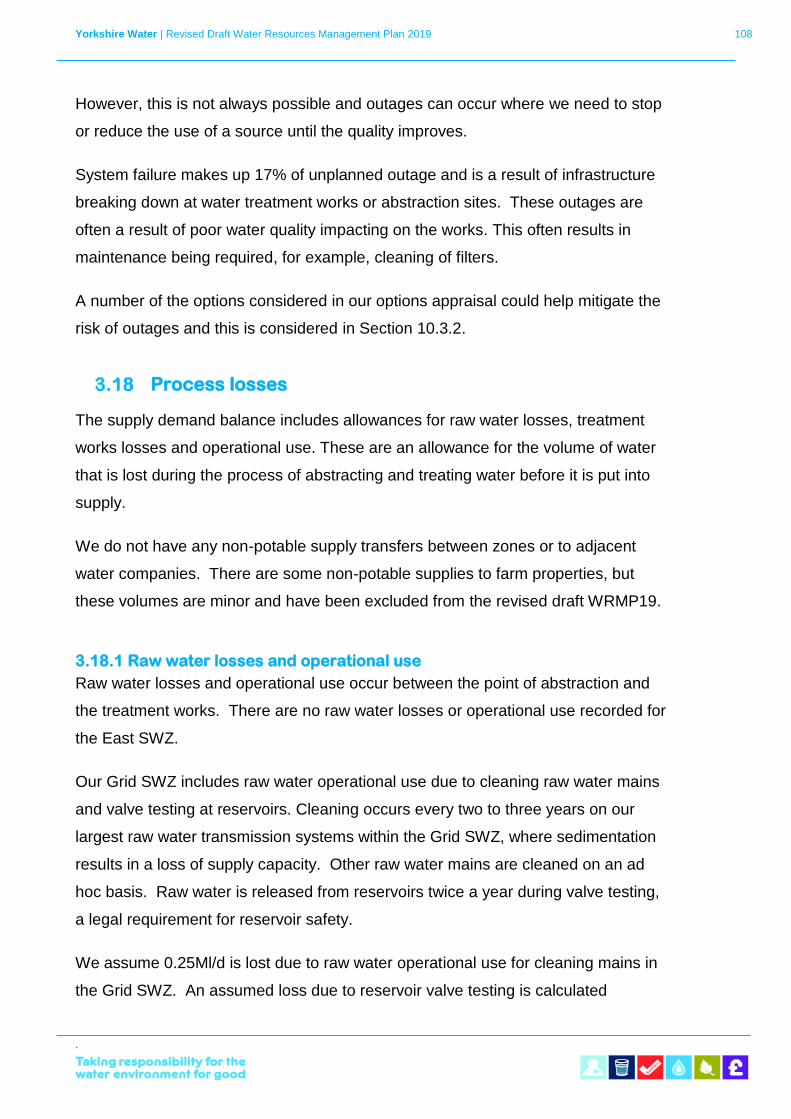
Yorkshire Water | Revised Draft Water Resources Management Plan 2019 108
`
However, this is not always possible and outages can occur where we need to stop
or reduce the use of a source until the quality improves.
System failure makes up 17% of unplanned outage and is a result of infrastructure
breaking down at water treatment works or abstraction sites. These outages are
often a result of poor water quality impacting on the works. This often results in
maintenance being required, for example, cleaning of filters.
A number of the options considered in our options appraisal could help mitigate the
risk of outages and this is considered in Section 10.3.2.
Process losses
The supply demand balance includes allowances for raw water losses, treatment
works losses and operational use. These are an allowance for the volume of water
that is lost during the process of abstracting and treating water before it is put into
supply.
We do not have any non-potable supply transfers between zones or to adjacent
water companies. There are some non-potable supplies to farm properties, but
these volumes are minor and have been excluded from the revised draft WRMP19.
3.18.1 Raw water losses and operational use
Raw water losses and operational use occur between the point of abstraction and
the treatment works. There are no raw water losses or operational use recorded for
the East SWZ.
Our Grid SWZ includes raw water operational use due to cleaning raw water mains
and valve testing at reservoirs. Cleaning occurs every two to three years on our
largest raw water transmission systems within the Grid SWZ, where sedimentation
results in a loss of supply capacity. Other raw water mains are cleaned on an ad
hoc basis. Raw water is released from reservoirs twice a year during valve testing,
a legal requirement for reservoir safety.
We assume 0.25Ml/d is lost due to raw water operational use for cleaning mains in
the Grid SWZ. An assumed loss due to reservoir valve testing is calculated
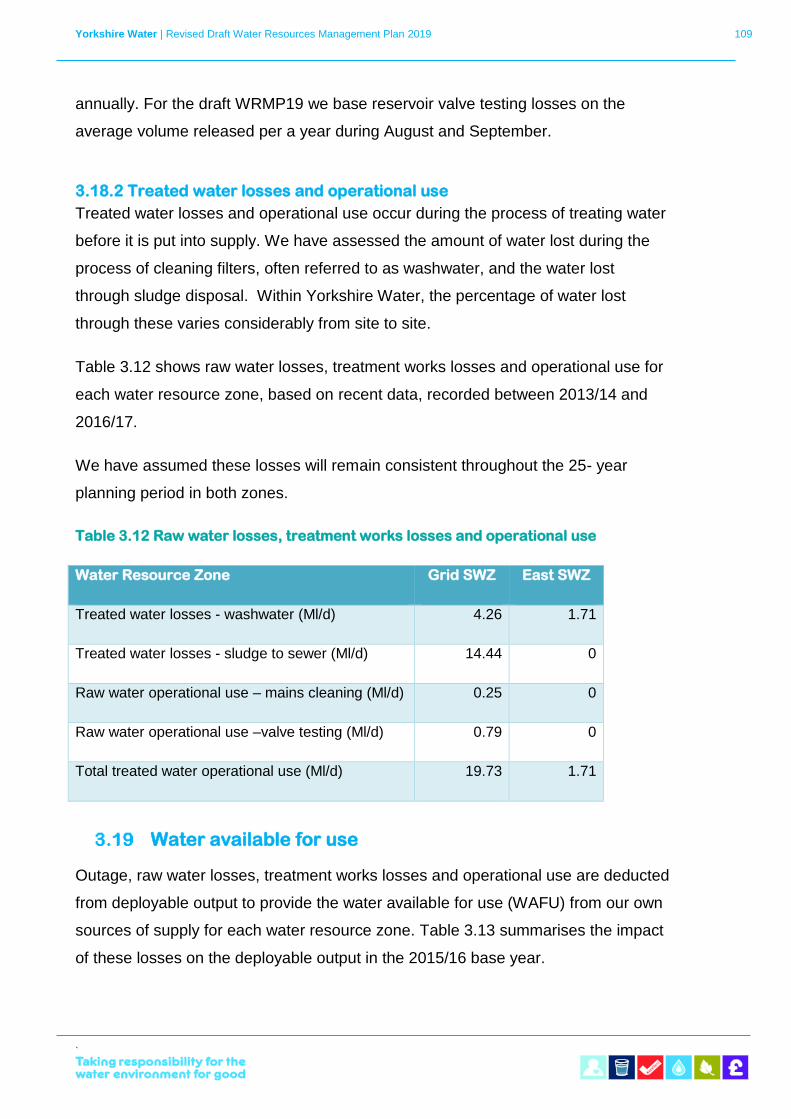
Yorkshire Water | Revised Draft Water Resources Management Plan 2019 109
`
annually. For the draft WRMP19 we base reservoir valve testing losses on the
average volume released per a year during August and September.
3.18.2 Treated water losses and operational use
Treated water losses and operational use occur during the process of treating water
before it is put into supply. We have assessed the amount of water lost during the
process of cleaning filters, often referred to as washwater, and the water lost
through sludge disposal. Within Yorkshire Water, the percentage of water lost
through these varies considerably from site to site.
Table 3.12 shows raw water losses, treatment works losses and operational use for
each water resource zone, based on recent data, recorded between 2013/14 and
2016/17.
We have assumed these losses will remain consistent throughout the 25- year
planning period in both zones.
Table 3.12 Raw water losses, treatment works losses and operational use
Water Resource Zone Grid SWZ East SWZ
Treated water losses - washwater (Ml/d) 4.26 1.71
Treated water losses - sludge to sewer (Ml/d) 14.44 0
Raw water operational use – mains cleaning (Ml/d) 0.25 0
Raw water operational use –valve testing (Ml/d) 0.79 0
Total treated water operational use (Ml/d) 19.73 1.71
Water available for use
Outage, raw water losses, treatment works losses and operational use are deducted
from deployable output to provide the water available for use (WAFU) from our own
sources of supply for each water resource zone. Table 3.13 summarises the impact
of these losses on the deployable output in the 2015/16 base year.
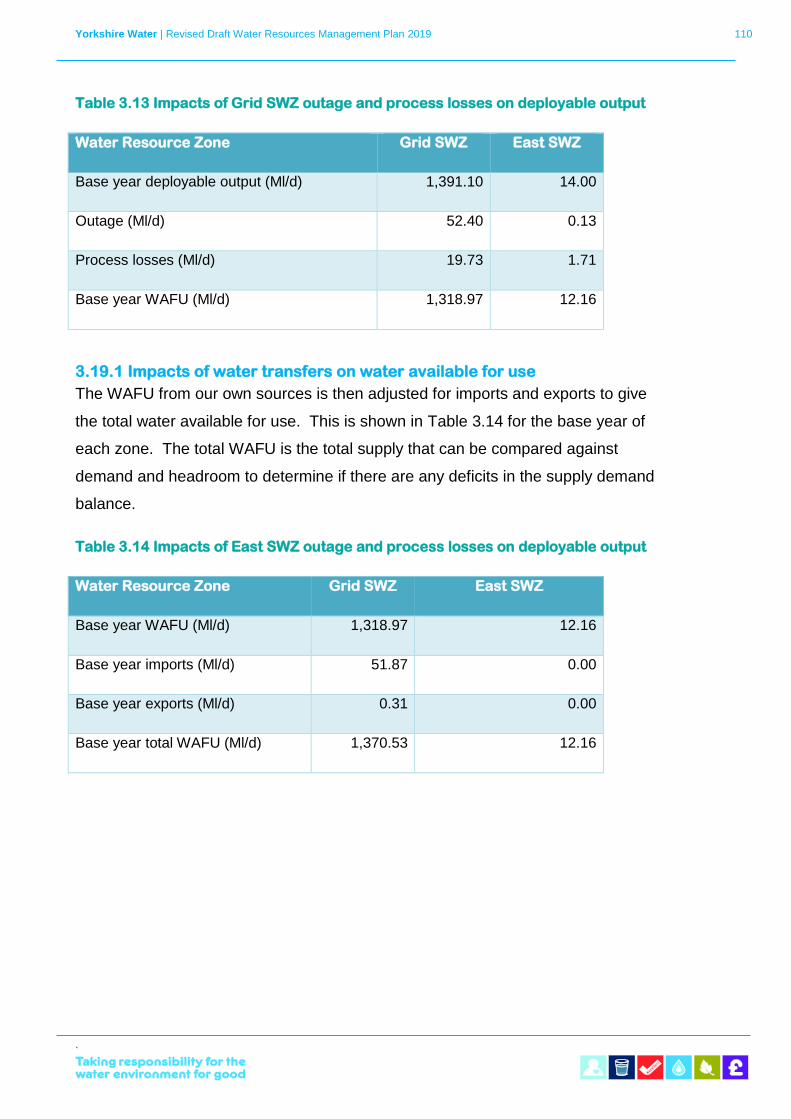
Yorkshire Water | Revised Draft Water Resources Management Plan 2019 110
`
Table 3.13 Impacts of Grid SWZ outage and process losses on deployable output
Water Resource Zone Grid SWZ East SWZ
Base year deployable output (Ml/d) 1,391.10 14.00
Outage (Ml/d) 52.40 0.13
Process losses (Ml/d) 19.73 1.71
Base year WAFU (Ml/d) 1,318.97 12.16
3.19.1 Impacts of water transfers on water available for use
The WAFU from our own sources is then adjusted for imports and exports to give
the total water available for use. This is shown in Table 3.14 for the base year of
each zone. The total WAFU is the total supply that can be compared against
demand and headroom to determine if there are any deficits in the supply demand
balance.
Table 3.14 Impacts of East SWZ outage and process losses on deployable output
Water Resource Zone Grid SWZ East SWZ
Base year WAFU (Ml/d) 1,318.97 12.16
Base year imports (Ml/d) 51.87 0.00
Base year exports (Ml/d) 0.31 0.00
Base year total WAFU (Ml/d) 1,370.53 12.16
Yorkshire Water | Revised Draft Water Resources Management Plan 2019 111
`
4 Demand forecast
Introduction
A 25-year demand forecast has been produced to cover the period 2015/16 to
2044/45. This forecast is based on assumptions about how the key factors
influencing water demand will change over the plan period. We have also extended
our forecast of demand an additional 15 years to ensure we have resilience into the
future.
This section provides a summary of our methodologies and modelled outputs.
Further technical detail is provided in a supporting Demand Forecasting Technical
Report, which has been provided to the Environment Agency and is available on
request.
The demand forecast is produced for our two water resource zones, the Grid SWZ
and the East SWZ, individually and the Yorkshire Water region.
A conservative approach is taken to forecasting demand (dry year annual average),
which includes assumptions of climate change and dry year uplift as standard.
The demand forecast has been prepared in line with the best practice methodology
set out in the WRMP19 Methods – Household Consumption Forecasting (UKWIR,
2016); Population, household property and occupancy forecasting (UKWIR, 2016);
and the Water Resources Planning Guideline (Environment Agency and Natural
Resources Wales, 2017).
This section describes how we have calculated how much demand for water
there will be, now and in the future – our demand forecast. We explain what
we have included in our forecast, and how we have considered the effects of
factors such as increasing population, new development, water that is lost or
wasted – for example through leakage – and changing patterns of use.
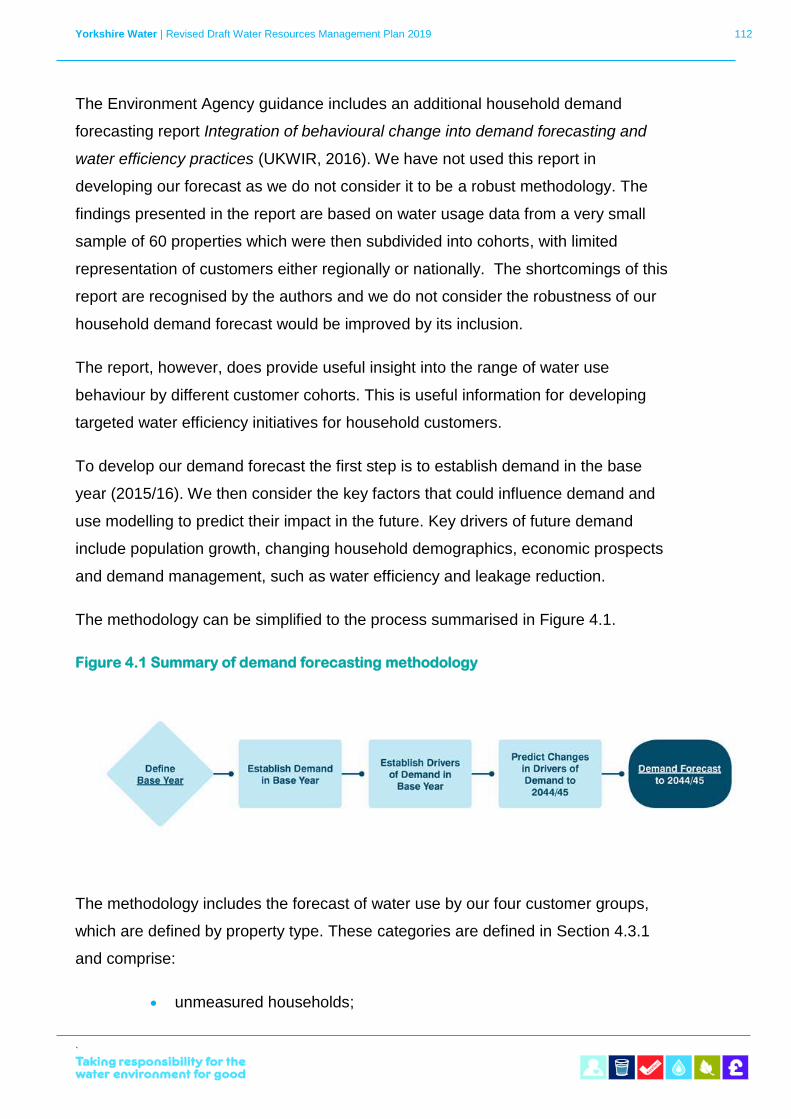
Yorkshire Water | Revised Draft Water Resources Management Plan 2019 112
`
The Environment Agency guidance includes an additional household demand
forecasting report Integration of behavioural change into demand forecasting and
water efficiency practices (UKWIR, 2016). We have not used this report in
developing our forecast as we do not consider it to be a robust methodology. The
findings presented in the report are based on water usage data from a very small
sample of 60 properties which were then subdivided into cohorts, with limited
representation of customers either regionally or nationally. The shortcomings of this
report are recognised by the authors and we do not consider the robustness of our
household demand forecast would be improved by its inclusion.
The report, however, does provide useful insight into the range of water use
behaviour by different customer cohorts. This is useful information for developing
targeted water efficiency initiatives for household customers.
To develop our demand forecast the first step is to establish demand in the base
year (2015/16). We then consider the key factors that could influence demand and
use modelling to predict their impact in the future. Key drivers of future demand
include population growth, changing household demographics, economic prospects
and demand management, such as water efficiency and leakage reduction.
The methodology can be simplified to the process summarised in Figure 4.1.
Figure 4.1 Summary of demand forecasting methodology
The methodology includes the forecast of water use by our four customer groups,
which are defined by property type. These categories are defined in Section 4.3.1
and comprise:
• unmeasured households;
Yorkshire Water | Revised Draft Water Resources Management Plan 2019 113
`
• measured households;
• unmeasured non-households; and,
• measured non-households.
Each of the property categories have their own set of demand drivers and
assumptions for future growth rates. These include population projections,
households switching to paying by meter (domestic meter optants), new
connections and the economic environment.
In addition, there are also minor components of demand, which include distribution
operational use (water used by Yorkshire Water for operational purposes) and water
taken unbilled. Leakage also forms part of the demand forecast.
There are various terms used in relation to demand for water, which include
different components. The main terms used in this report and the planning tables
are defined as follows:
• Consumption - the water used by a property. It includes the volume
of water used and meter under registration but excludes supply pipe
leakage.
• Total Water Delivered - comprises the volume of water supplied from
treatment works, less the volume the water company uses
(distribution system operational use) or is lost through the company’s
pipes (leakage).
• Distribution Input - the average amount of drinking water entering
the distribution system to be supplied to consumers in an appointed
water company’s area of supply. This is essentially total demand for
water as it includes consumption, leakage, water taken unbilled and
distribution system operational use.
The following key data sources and assumptions have been included in the
forecast:
• Yorkshire Water historical operational data;
Yorkshire Water | Revised Draft Water Resources Management Plan 2019 114
`
• plan based population and household projections incorporating data
from local planning strategies from Local Authorities;
• the effect of climate change on demand for water;
• micro-component based household demand forecast; and,
• macro-economic based non-household demand forecast.
The base year
The base year has been defined for the WRMP19 as 2015/16, which covers the
year April 2015 to March 2016.
We calculated the water balance for the base year. This compares the measured
volume of water into supply from our treatment works (distribution input) with the
sum of the measured and estimated components of demand. The reported
distribution input exceeds the water that can be accounted for, therefore there is an
adjustment for this surplus water. The maximum likelihood estimation (MLE)
technique has been used to allocate this discrepancy across all components based
on the accuracy of measurement. For example, metered volumes are more
accurate than volumes obtained from estimates and assumptions, and therefore the
accuracy bands and volume adjustment around these components are smaller.
The water balance for the base year has been adjusted in line with new guidance
from UKWIR entitled Consistency of Reporting Performance Measures (UKWIR,
2017). This affects the water accounted for and therefore the amount of surplus
water that needs to be incorporated into the MLE adjustment. The amended
assumptions will be incorporated into future annual reporting of total leakage.
The adjusted MLE table is presented in Table 4.1. The right-hand column (post
MLE) is the base year data used as the basis for the demand forecast.
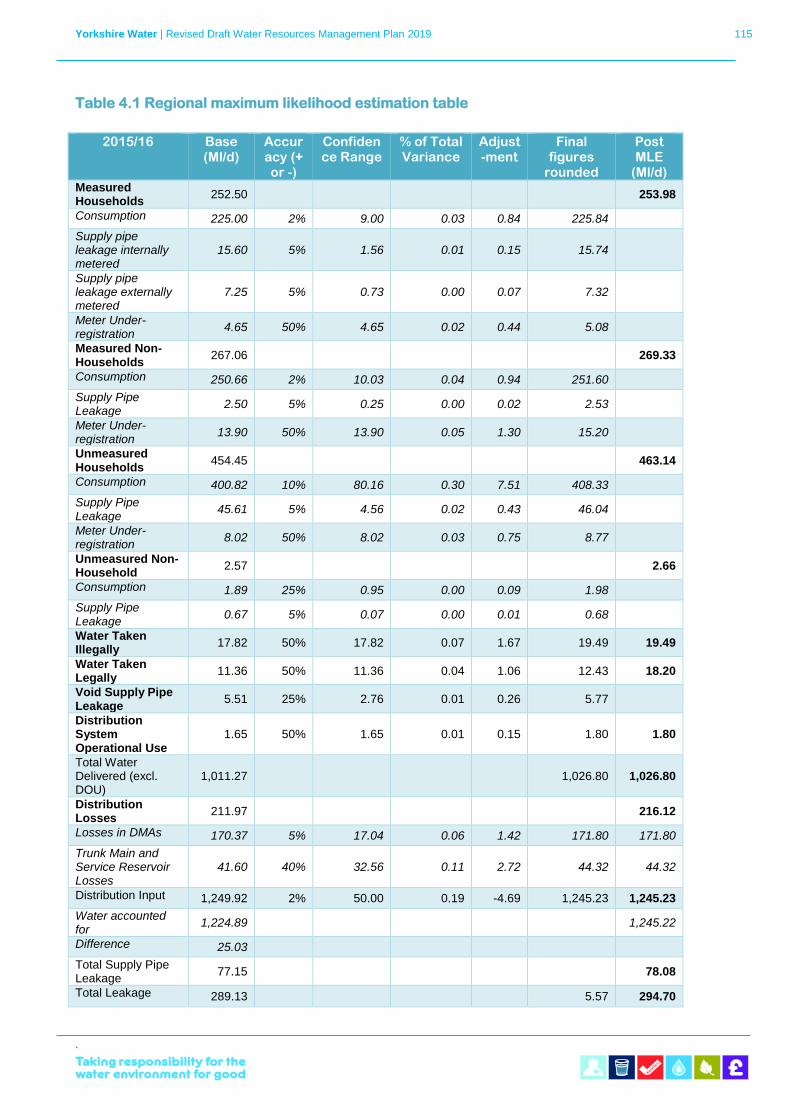
Yorkshire Water | Revised Draft Water Resources Management Plan 2019 115
`
Table 4.1 Regional maximum likelihood estimation table
2015/16 Base (Ml/d)
Accuracy (+ or -)
Confidence Range
% of Total Variance
Adjust-ment
Final figures
rounded
Post MLE
(Ml/d) Measured Households
252.50
253.98
Consumption 225.00 2% 9.00 0.03 0.84 225.84
Supply pipe leakage internally metered
15.60 5% 1.56 0.01 0.15 15.74
Supply pipe leakage externally metered
7.25 5% 0.73 0.00 0.07 7.32
Meter Under-registration
4.65 50% 4.65 0.02 0.44 5.08
Measured Non-Households
267.06
269.33
Consumption 250.66 2% 10.03 0.04 0.94 251.60
Supply Pipe Leakage
2.50 5% 0.25 0.00 0.02 2.53
Meter Under-registration
13.90 50% 13.90 0.05 1.30 15.20
Unmeasured Households
454.45
463.14
Consumption 400.82 10% 80.16 0.30 7.51 408.33
Supply Pipe Leakage
45.61 5% 4.56 0.02 0.43 46.04
Meter Under-registration
8.02 50% 8.02 0.03 0.75 8.77
Unmeasured Non-Household
2.57
2.66
Consumption 1.89 25% 0.95 0.00 0.09 1.98
Supply Pipe Leakage
0.67 5% 0.07 0.00 0.01 0.68
Water Taken Illegally
17.82 50% 17.82 0.07 1.67 19.49 19.49
Water Taken Legally
11.36 50% 11.36 0.04 1.06 12.43 18.20
Void Supply Pipe Leakage
5.51 25% 2.76 0.01 0.26 5.77
Distribution System Operational Use
1.65 50% 1.65 0.01 0.15 1.80 1.80
Total Water Delivered (excl. DOU)
1,011.27
1,026.80 1,026.80
Distribution Losses
211.97
216.12
Losses in DMAs 170.37 5% 17.04 0.06 1.42 171.80 171.80
Trunk Main and Service Reservoir Losses
41.60 40% 32.56 0.11 2.72 44.32 44.32
Distribution Input 1,249.92 2% 50.00 0.19 -4.69 1,245.23 1,245.23
Water accounted for
1,224.89
1,245.22
Difference 25.03
Total Supply Pipe Leakage
77.15
78.08
Total Leakage 289.13
5.57 294.70
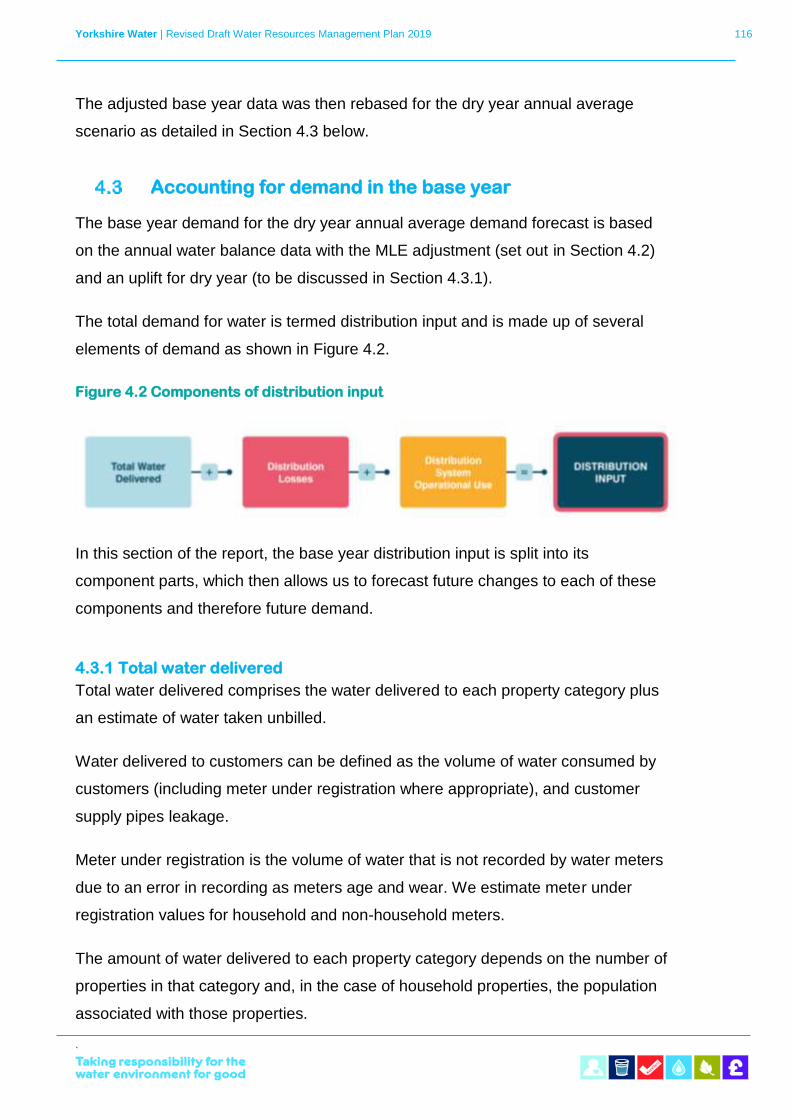
Yorkshire Water | Revised Draft Water Resources Management Plan 2019 116
`
The adjusted base year data was then rebased for the dry year annual average
scenario as detailed in Section 4.3 below.
Accounting for demand in the base year
The base year demand for the dry year annual average demand forecast is based
on the annual water balance data with the MLE adjustment (set out in Section 4.2)
and an uplift for dry year (to be discussed in Section 4.3.1).
The total demand for water is termed distribution input and is made up of several
elements of demand as shown in Figure 4.2.
Figure 4.2 Components of distribution input
In this section of the report, the base year distribution input is split into its
component parts, which then allows us to forecast future changes to each of these
components and therefore future demand.
4.3.1 Total water delivered
Total water delivered comprises the water delivered to each property category plus
an estimate of water taken unbilled.
Water delivered to customers can be defined as the volume of water consumed by
customers (including meter under registration where appropriate), and customer
supply pipes leakage.
Meter under registration is the volume of water that is not recorded by water meters
due to an error in recording as meters age and wear. We estimate meter under
registration values for household and non-household meters.
The amount of water delivered to each property category depends on the number of
properties in that category and, in the case of household properties, the population
associated with those properties.
Yorkshire Water | Revised Draft Water Resources Management Plan 2019 117
`
We therefore need to establish the number of properties, estimated population (if
appropriate) and water consumption for each of these property categories.
Properties
The number of properties in each customer category in the base year is extracted
from our billing file.
The occupied properties are divided into four categories:
• Measured households - domestic properties with a meter (meter can
be internal or external).
• Unmeasured households - domestic properties without a meter that
pay for water based on the rateable value of the property.
• Measured non-households - commercial properties with a meter.
• Unmeasured non-households - commercial properties without a
meter.
The other two property categories, household voids and non-household voids, are
properties that are registered as empty on our billing file.
Population
We estimate population for all four occupied property categories: measured
household, unmeasured household, measured non-household and unmeasured
non-household.
For households, population is derived from known property numbers multiplied by
an occupancy rate for that category.
Previously, we have obtained estimated occupancy data from limited surveys of
household customers. For the draft WRMP, occupancy rates have been provided by
CACI Ltd for every household on the billing file in December 2016.
The occupancy rates used in the base year are detailed in Table 4.2 below.
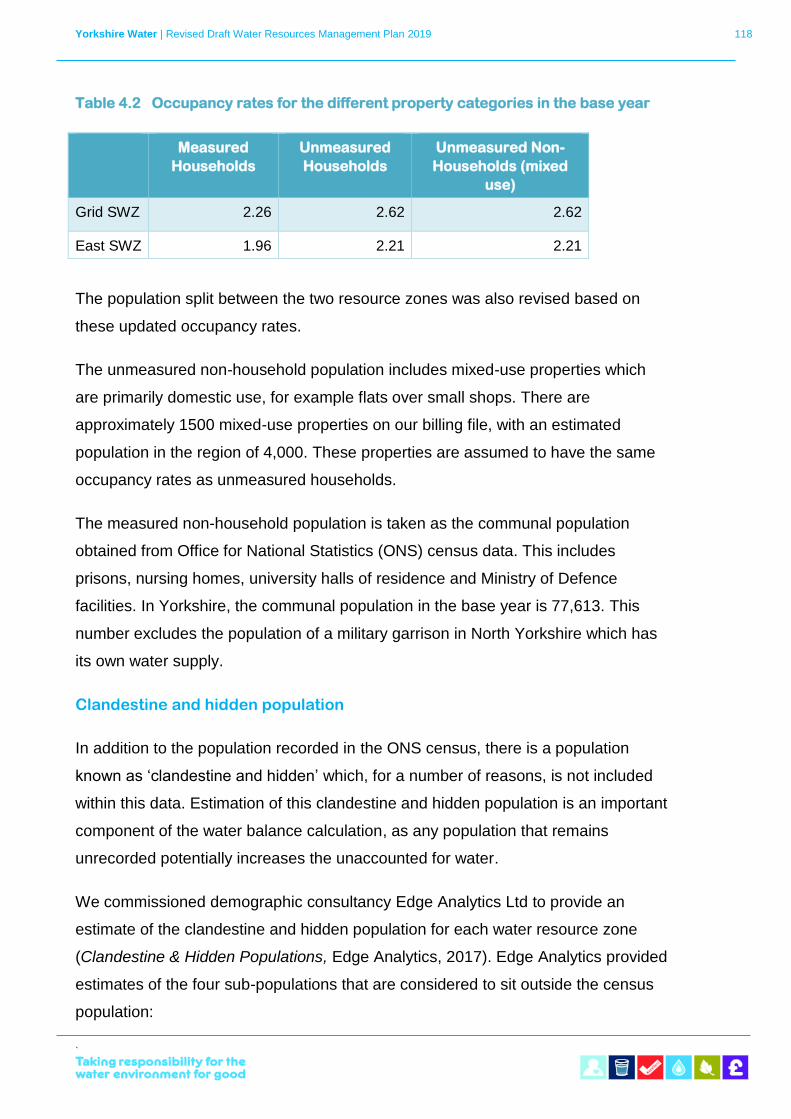
Yorkshire Water | Revised Draft Water Resources Management Plan 2019 118
`
Table 4.2 Occupancy rates for the different property categories in the base year
Measured
Households
Unmeasured
Households
Unmeasured Non-
Households (mixed
use)
Grid SWZ 2.26 2.62 2.62
East SWZ 1.96 2.21 2.21
The population split between the two resource zones was also revised based on
these updated occupancy rates.
The unmeasured non-household population includes mixed-use properties which
are primarily domestic use, for example flats over small shops. There are
approximately 1500 mixed-use properties on our billing file, with an estimated
population in the region of 4,000. These properties are assumed to have the same
occupancy rates as unmeasured households.
The measured non-household population is taken as the communal population
obtained from Office for National Statistics (ONS) census data. This includes
prisons, nursing homes, university halls of residence and Ministry of Defence
facilities. In Yorkshire, the communal population in the base year is 77,613. This
number excludes the population of a military garrison in North Yorkshire which has
its own water supply.
Clandestine and hidden population
In addition to the population recorded in the ONS census, there is a population
known as ‘clandestine and hidden’ which, for a number of reasons, is not included
within this data. Estimation of this clandestine and hidden population is an important
component of the water balance calculation, as any population that remains
unrecorded potentially increases the unaccounted for water.
We commissioned demographic consultancy Edge Analytics Ltd to provide an
estimate of the clandestine and hidden population for each water resource zone
(Clandestine & Hidden Populations, Edge Analytics, 2017). Edge Analytics provided
estimates of the four sub-populations that are considered to sit outside the census
population:
Yorkshire Water | Revised Draft Water Resources Management Plan 2019 119
`
• Irregular migrants, which typically refers to the stock of migrants in a
country who are not entitled to reside there.
• Edge Analytics used a report produced by London School of
Economics (LSE) Economic impact on London and the UK of an
Earned Regularisation of Irregular Migrants in the UK (Gordon et al,
2009) which provides a low, medium and high estimate of irregular
migrants in the UK. An estimated 70% of this population is in London.
Edge Analytics have disaggregated the remaining 30% into local
authority areas that are fully or partially within Yorkshire Water’s
operational boundaries. This was done in proportion to the average
annual National Insurance Number registrations recorded to non-EU
foreign nationals between 2012 and 2016, relative to the total for the
rest of the UK. The estimates were then rescaled in recognition that
the LSE report estimates are likely to have increased since 2007.
• Short-term residents, which refers to someone who is only resident
in the UK for between 1 and 12 months.
• There are two subtle sub-categories within this category, which
includes short-term residents who stayed for between 1 and 12
months to work or study, and short-term migrants who stays for a
period of between 3 and 12 months. Edge Analytics used ONS
census data from 2011 on short-term residents and annual statistics
on short-term migrants to develop low medium and high estimates of
the short-term resident population.
• People staying at a second address, which include armed forces
bases, addresses used by people working away from home, a
student’s home address, the address of another parent or guardian or
a holiday home.
• Edge Analytics used second address statistics from the 2011 Census
to form the basis of this population estimate. Additional assumptions
around the number of nights these addresses are used were
incorporated to provide low, medium and high scenarios for an
equivalent full time population.
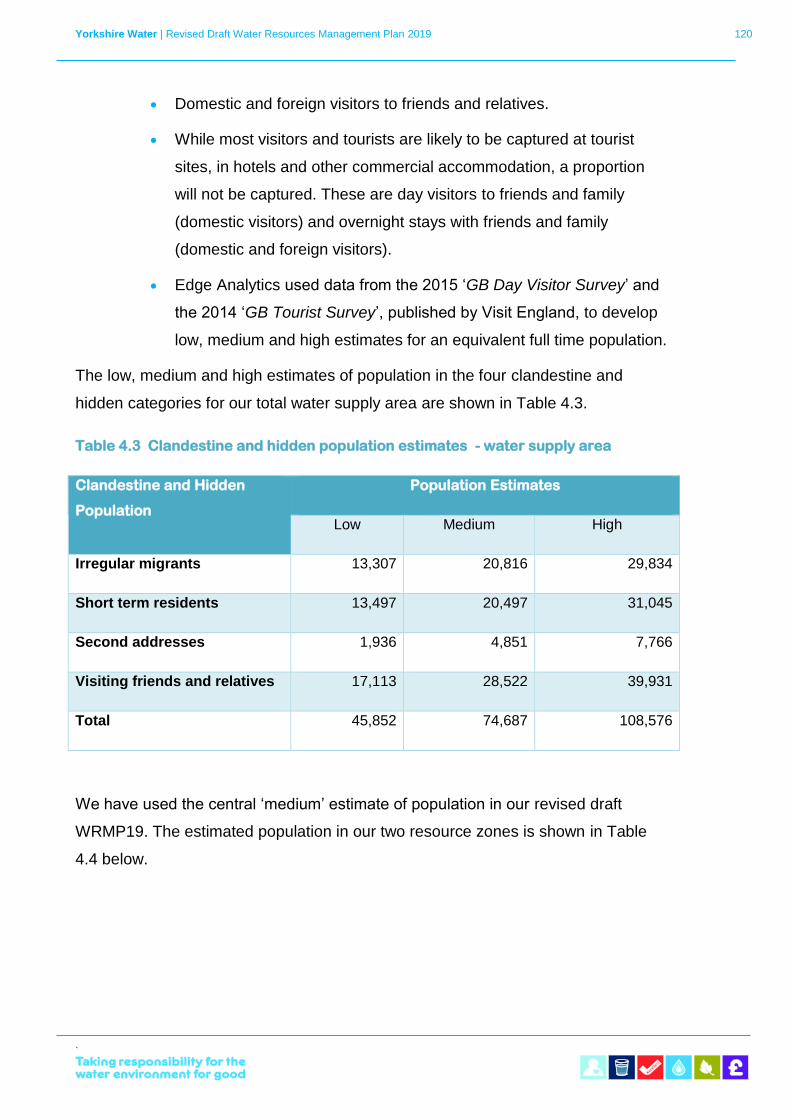
Yorkshire Water | Revised Draft Water Resources Management Plan 2019 120
`
• Domestic and foreign visitors to friends and relatives.
• While most visitors and tourists are likely to be captured at tourist
sites, in hotels and other commercial accommodation, a proportion
will not be captured. These are day visitors to friends and family
(domestic visitors) and overnight stays with friends and family
(domestic and foreign visitors).
• Edge Analytics used data from the 2015 ‘GB Day Visitor Survey’ and
the 2014 ‘GB Tourist Survey’, published by Visit England, to develop
low, medium and high estimates for an equivalent full time population.
The low, medium and high estimates of population in the four clandestine and
hidden categories for our total water supply area are shown in Table 4.3.
Table 4.3 Clandestine and hidden population estimates - water supply area
Clandestine and Hidden
Population
Population Estimates
Low Medium High
Irregular migrants 13,307 20,816 29,834
Short term residents 13,497 20,497 31,045
Second addresses 1,936 4,851 7,766
Visiting friends and relatives 17,113 28,522 39,931
Total 45,852 74,687 108,576
We have used the central ‘medium’ estimate of population in our revised draft
WRMP19. The estimated population in our two resource zones is shown in Table
4.4 below.
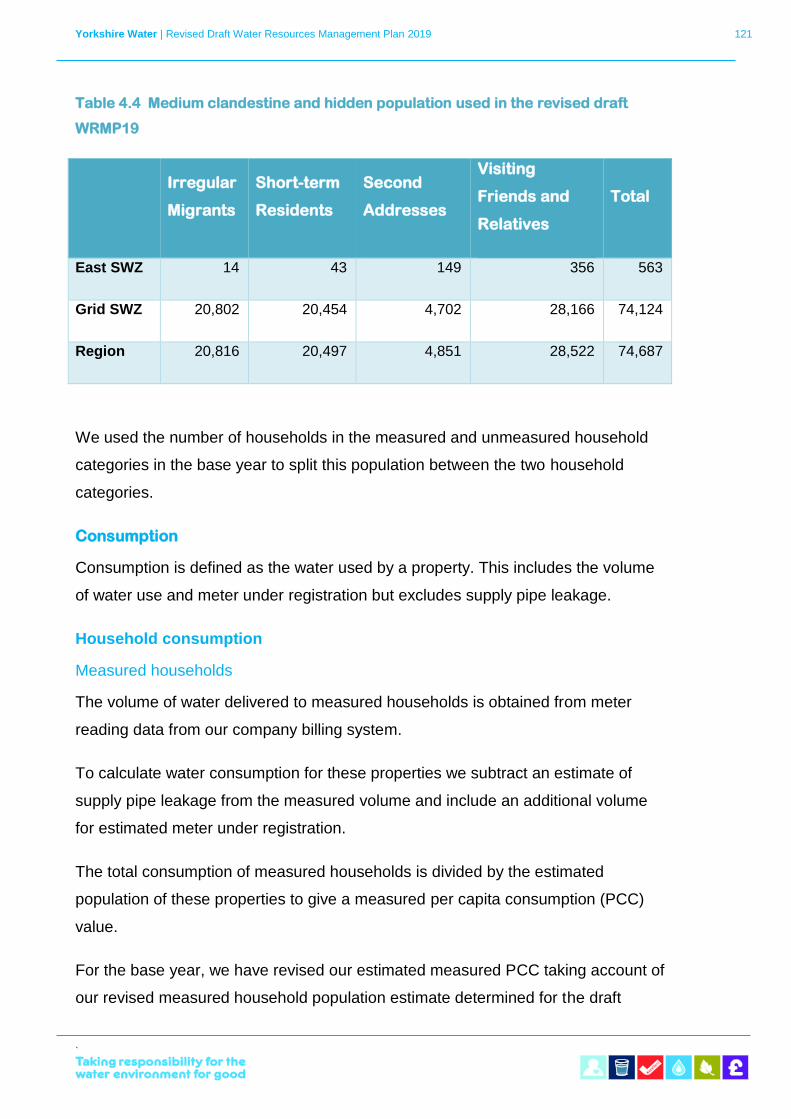
Yorkshire Water | Revised Draft Water Resources Management Plan 2019 121
`
Table 4.4 Medium clandestine and hidden population used in the revised draft
WRMP19
Irregular
Migrants
Short-term
Residents
Second
Addresses
Visiting
Friends and
Relatives
Total
East SWZ 14 43 149 356 563
Grid SWZ 20,802 20,454 4,702 28,166 74,124
Region 20,816 20,497 4,851 28,522 74,687
We used the number of households in the measured and unmeasured household
categories in the base year to split this population between the two household
categories.
Consumption
Consumption is defined as the water used by a property. This includes the volume
of water use and meter under registration but excludes supply pipe leakage.
Household consumption
Measured households
The volume of water delivered to measured households is obtained from meter
reading data from our company billing system.
To calculate water consumption for these properties we subtract an estimate of
supply pipe leakage from the measured volume and include an additional volume
for estimated meter under registration.
The total consumption of measured households is divided by the estimated
population of these properties to give a measured per capita consumption (PCC)
value.
For the base year, we have revised our estimated measured PCC taking account of
our revised measured household population estimate determined for the draft
Yorkshire Water | Revised Draft Water Resources Management Plan 2019 122
`
WRMP. Due to an increase in estimated measured household population, the
measured household PCC has decreased slightly.
Unmeasured households
Unmeasured households are properties where water charges are based on the
rateable value of the property rather than a metered supply. The consumption of
water by these properties is estimated from our Domestic Consumption Monitor
(DCM). The DCM consists of, on average, 1000 unmeasured properties which have
logged meters installed but which continue to pay for water on an unmetered basis.
The properties have been selected to be representative of our unmeasured property
base, including property type, number of occupants and geographic location.
Consumption data from all properties on the survey is obtained daily through a
telemetry system. From this we obtain the average daily volume of water used by
our unmeasured household customers, known as unmeasured household PCC.
Household meter under registration
As described earlier, meter under registration is the volume of water that is not
recorded by water meters due to an error in recording as meters age and wear. For
metered and unmetered households, we assume a meter under registration value of
2%. This is based on previous flow testing of meters, and relative age and
throughput of billing meters and meters at properties on our domestic consumption
monitor.
The base year household PCCs are then uplifted to create the dry year annual
average scenario. This uplift is discussed in at the end of this section.
Clandestine and hidden population water use
Previously we added the estimated water use by the clandestine and hidden
population onto our estimated unmeasured household consumption as a set
volume.
For this plan, the clandestine and hidden population is divided between the
measured and unmeasured household categories, as discussed previously. For the
measured households, we assume that the consumption of this population is
captured by the water meters at these properties. Therefore, no additional volume is
Yorkshire Water | Revised Draft Water Resources Management Plan 2019 123
`
added in to this category. For the unmeasured households, the clandestine and
hidden population are assumed to have the same PCC as the rest of the
unmeasured household population. Their consumption is therefore calculated in the
same way as the rest of the unmeasured household population.
Non-household consumption
The volume of water consumed by non-household properties is derived from billed
volumes in 2015/16. This data was obtained from our non-household billing file for
the base year. In the future, following the opening of the non-household retail
market, this information will be obtained from the central market operating system
(CMOS).
Non-household meter under registration
We also add an estimate of meter under registration onto the measured non-
household volume obtained from the billing file to account for under recording due to
meter aging and wear.
Previously we have used an industry average meter under registration estimation
for measured non-households. However, as part of our data improvement plan we
have determined a Yorkshire Water specific value for meter under registration. Six
DMAs were selected which contained predominantly non-household properties. The
588 non-household properties within these DMAs provided a wide range business
types, including service and non-service industries, farms, a university and city
centre premises, covering many industry classifications and average daily
consumption bands.
An assessment of both meter under registration and appropriateness of the existing
meter size was carried out on all meters at these properties. The process was
carried out to ensure any potential double counting of the impact of meter age and
meter size on meter under registration was eliminated.
Statistical analysis of the meter under registration due to meter age and size in the
sample was carried out and applied proportionately across all our non-household
meter stock. This provided a meter under registration value for measured non-
households of 5.49%.
Yorkshire Water | Revised Draft Water Resources Management Plan 2019 124
`
Void properties
Both household and non-household void properties have no population associated
with them and therefore they do not have any consumption. The only water
delivered to these properties therefore is supply pipe leakage, which is not part of
consumption.
Supply pipe leakage
Supply pipe leakage is defined as leakage from pipes located within property
boundaries, i.e. between our main and the customers’ taps. This applies to all
property types.
Within the measured households category, the meters can be positioned either
internal or external to the property boundary, which makes a difference in terms of
supply pipe leakage rate. The position of the meter is recorded in our billing file.
If the meter is located externally to the boundary, any leakage on the supply pipe
between the meter and the property will be registered by the meter. If the supply
pipe leakage is significant, this will result in a higher than usual metered volume and
bill value.
If the meter is located internally within the property any leakage on the supply pipe
between the boundary and the property will not be registered on the meter and will
not impact the measured volume and bill value.
As a result, the time taken for supply pipe leakage on an externally metered
property to be identified is likely to be less than for an internally metered property,
due to the abnormally high bill value. Consequently, the estimated supply pipe
leakage rate for externally metered properties is higher than the estimated value for
internally metered properties.
The base year supply pipe leakage rates are calculated from the total leakage
reported to Ofwat as part of Annual Performance Reporting.
Water taken unbilled
Water taken unbilled includes water taken legally and illegally that is not paid for by
the customer. As this water use is unbilled the volume has been estimated using
Yorkshire Water | Revised Draft Water Resources Management Plan 2019 125
`
best available information. We estimate the volume of water taken unbilled annually
as part of our water balance calculation. The total estimated volume remains
relatively constant at approximately 30Ml/d (2% of distribution input) each year.
Water taken legally includes water used for fire-fighting and training, standpipe
use, and unbilled water used at our own operational and office sites.
We provide a free potable water supply to 320 properties in Yorkshire. Of these, 85
are classed as farms. In many cases these are historic agreements drawn up in
return for access to private land (for example, a raw or treated water main crossing
private land). Water use by these properties has been estimated based on average
unmeasured household use and published data on water use at small and medium
livestock farms. In 2015/16 the estimated water used by these properties was
approximately 1Ml/d.
On average 900 to 1000 metered standpipes are on hire to contractors each day.
The metered volume recorded for the standpipes is collected monthly. The average
metered volume for 2015/16 was 0.36Ml/d.
Each year we receive data from the four Fire and Rescue Services in Yorkshire.
These detail the number of primary and secondary fires attended, and where water
has been used for fire-fighting. In 2015/16, 6,500 primary and 10,000 secondary
fires were attended. Detailed analysis of historic data and water-using equipment
used for fire-fighting has provided an estimate of average water use at primary and
secondary fires. This data is used to estimate the annual water used for fire-fighting
in Yorkshire. In 2015/16 this was estimated to be approximately 1Ml/d.
Water use at all Yorkshire Water operational and office sites is metered but not
billed. In 2015/16, the metered water use at Yorkshire Water sites was 4.5Ml/d.
The total volume of water taken legally unbilled in 2015/16 was 11.36Ml/d. Our
adjusted MLE value (12.43Ml/d) has been used for the base year volume.
Water taken illegally includes occupied voids, illegal hydrant use and illegal
connections.

Yorkshire Water | Revised Draft Water Resources Management Plan 2019 126
`
At any one time, there are approximately 100,000 void household properties on our
billing file. These properties are visited by Yorkshire Water staff to determine if the
void status is valid. Approximately 45% of properties visited are found to be
occupied. Assumed duration of occupancy, average household occupancy rate and
PCC are used to estimate water use by these customers.
For non-household customers, an automated process in our billing file identifies void
properties with recorded water use or frequent change of occupier. An average non-
household consumption volume is used to estimate water use at these properties.
Additionally, an income protection team has been in operation for several years,
identifying water-using properties that are not on our billing file.
The estimated water use by illegal connections and occupied voids is in the region
of 12Ml/d. We also estimate illegal hydrant use to be approximately 4Ml/d.
The total volume of water taken illegally unbilled in 2015/16 was 17.82Ml/d. Our
adjusted MLE value (19.49Ml/d) has been used for the base year volume.
Dry year effect
In accordance with the Water Resources Planning Guideline (Environment Agency
and Natural Resources Wales, 2017), the demand forecast has been prepared for a
dry year annual average scenario.
To determine demand in a dry year we have used methodologies presented in the
report WRMP19 methods – Household Consumption Forecasting (UKWIR, 2015).
Weather affects household water use. In general, water use increases during
periods of dry warm weather due to increased garden watering and personal
washing. Therefore, the most accurate approach to estimating dry year demand is
to analyse historic weather effects on household level consumption data.
Historic demand and weather data were analysed to determine annual average
demand for a typical ‘normal’ year and typical ‘dry’ year, and to develop weather-
demand models. This analysis was then used to adjust consumption in our base
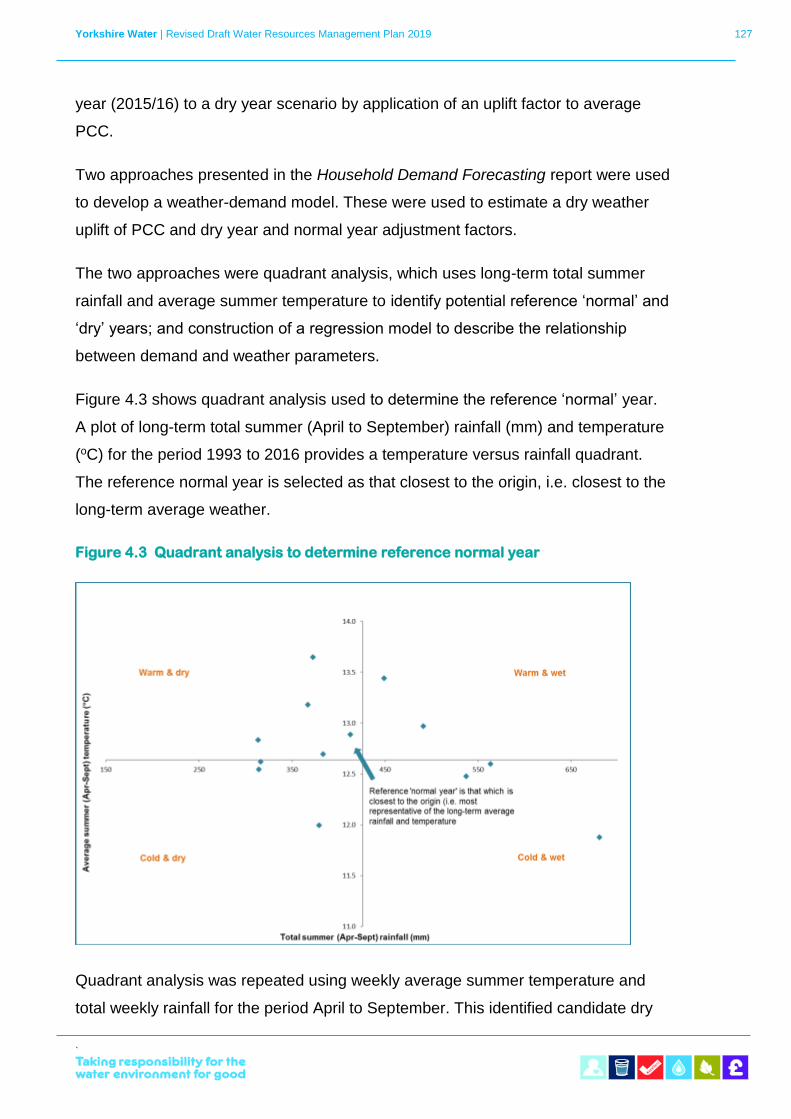
Yorkshire Water | Revised Draft Water Resources Management Plan 2019 127
`
year (2015/16) to a dry year scenario by application of an uplift factor to average
PCC.
Two approaches presented in the Household Demand Forecasting report were used
to develop a weather-demand model. These were used to estimate a dry weather
uplift of PCC and dry year and normal year adjustment factors.
The two approaches were quadrant analysis, which uses long-term total summer
rainfall and average summer temperature to identify potential reference ‘normal’ and
‘dry’ years; and construction of a regression model to describe the relationship
between demand and weather parameters.
Figure 4.3 shows quadrant analysis used to determine the reference ‘normal’ year.
A plot of long-term total summer (April to September) rainfall (mm) and temperature
(oC) for the period 1993 to 2016 provides a temperature versus rainfall quadrant.
The reference normal year is selected as that closest to the origin, i.e. closest to the
long-term average weather.
Figure 4.3 Quadrant analysis to determine reference normal year
Quadrant analysis was repeated using weekly average summer temperature and
total weekly rainfall for the period April to September. This identified candidate dry
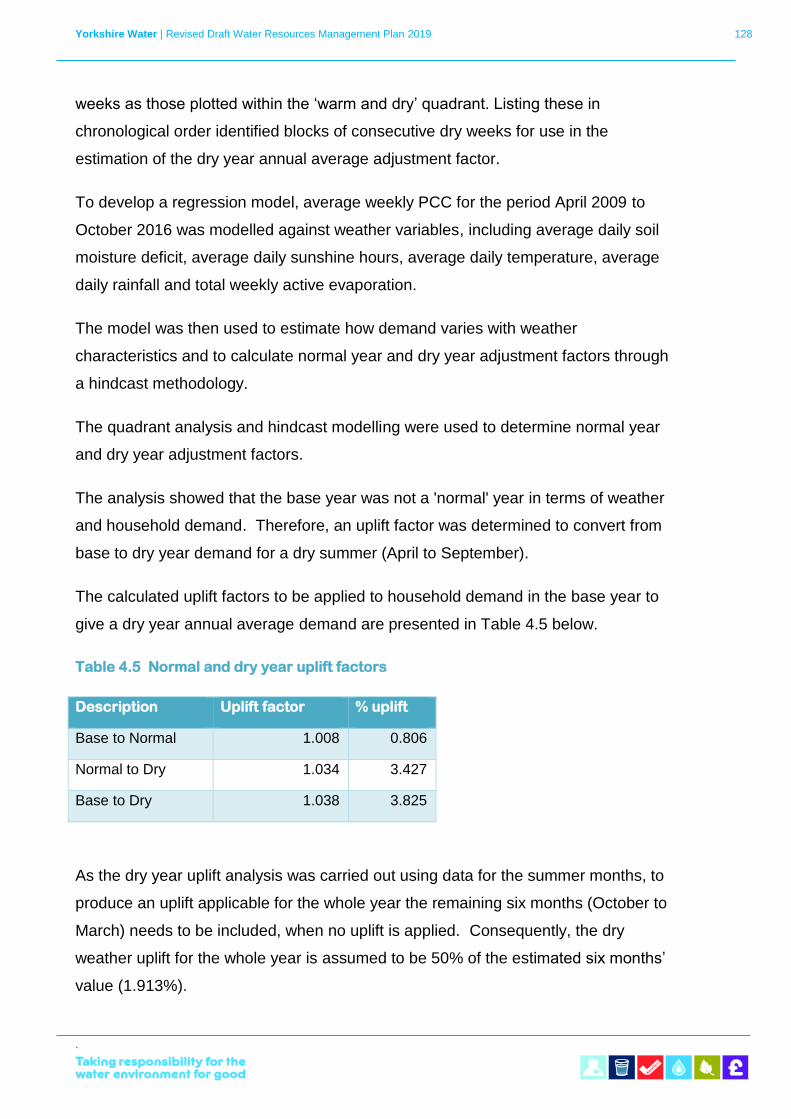
Yorkshire Water | Revised Draft Water Resources Management Plan 2019 128
`
weeks as those plotted within the ‘warm and dry’ quadrant. Listing these in
chronological order identified blocks of consecutive dry weeks for use in the
estimation of the dry year annual average adjustment factor.
To develop a regression model, average weekly PCC for the period April 2009 to
October 2016 was modelled against weather variables, including average daily soil
moisture deficit, average daily sunshine hours, average daily temperature, average
daily rainfall and total weekly active evaporation.
The model was then used to estimate how demand varies with weather
characteristics and to calculate normal year and dry year adjustment factors through
a hindcast methodology.
The quadrant analysis and hindcast modelling were used to determine normal year
and dry year adjustment factors.
The analysis showed that the base year was not a 'normal' year in terms of weather
and household demand. Therefore, an uplift factor was determined to convert from
base to dry year demand for a dry summer (April to September).
The calculated uplift factors to be applied to household demand in the base year to
give a dry year annual average demand are presented in Table 4.5 below.
Table 4.5 Normal and dry year uplift factors
Description Uplift factor % uplift
Base to Normal 1.008 0.806
Normal to Dry 1.034 3.427
Base to Dry 1.038 3.825
As the dry year uplift analysis was carried out using data for the summer months, to
produce an uplift applicable for the whole year the remaining six months (October to
March) needs to be included, when no uplift is applied. Consequently, the dry
weather uplift for the whole year is assumed to be 50% of the estimated six months’
value (1.913%).
Yorkshire Water | Revised Draft Water Resources Management Plan 2019 129
`
PCC differs between measured and unmeasured properties. Therefore, the
estimate of the adjustment from base year to dry year is pro rata’d as per the annual
proportional split of total volume (Ml/d) between measured and unmeasured
properties.
4.3.2 Distribution losses
Distribution losses are total leakage less total supply pipe leakage. Total leakage for
the base year, taken from our adjusted MLE table, was 294.7Ml/d and total supply
pipe leakage was 78.0Ml/d. Therefore, distribution losses were 216.7Ml/d.
Leakage is explained in more detail in Section 5. Briefly, it comprises:
• service reservoir leakage and trunk main leakage (44.65Ml/d in base
year); and
• leakage in distribution management areas (DMAs), of which 31.17%
is estimated to be supply pipe leakage.
4.3.3 Distribution system operational use
The final component of the base year distribution input is distribution system
operational use. This is water we use for activities such as mains flushing, service
reservoir cleaning and water quality testing at our water treatment works and in
distribution (from our water mains and service reservoirs and from customers’ taps).
In our base year, we cleaned 180 service reservoirs and treated water storage
tanks, collected 74,000 treated water samples for water quality testing and carried
out over 6,000 mains flushing operations. The estimated water use for this activity in
2015/16 was 1.8Ml/d.
4.3.4 Water resource zones split
The water resource planning tables that support this revised draft WRMP19 are
completed at a water resource zone level. Therefore, all the elements of the
demand forecast discussed above are split between the Grid SWZ and the East
SWZ.
The water delivered to each property category is based on the number of properties
or population in each zone. For the other components, such as water taken unbilled
Yorkshire Water | Revised Draft Water Resources Management Plan 2019 130
`
and distribution system operational use, zone ratios were used to split the volume of
water between the water resource zones.
Background to forecast changes in demand to 2044/45
The forecast demand to 2044/45 is built up from forecast changes in each
component of distribution input.
4.4.1 Water delivered
The forecast water delivered is driven by our own policies; changes to property
numbers, population and consumption; and climatic variations.
Yorkshire Water policies
The first changes that affect the forecast water delivered, relate to our own policies.
We have a policy of demand management, through both reduction in customers’
water use by metering and water efficiency, and through reduction in leakage on our
own distribution system.
Metering strategy
The household properties which opt to switch to a metered supply are known as
domestic meter optants (DMOs).
We promote domestic meters in our communication to customers through billing
and on our website, however demand in recent years has slowed. This is due to
several factors:
• There is a strong correlation between the value of unmetered
customers’ bills and the number of meter optants each year. When
unmetered bills increase, there is a corresponding increase in
customers opting for a metered supply. In the last few years,
increases in unmeasured bill values have been relatively small, and
this has resulted in lower meter optants in these years.
• Historically we have promoted a metered supply to customers with
affordability issues as a means of managing their water charges. In
recent years, there has been a decrease in the number of such
Yorkshire Water | Revised Draft Water Resources Management Plan 2019 131
`
customers choosing to switch to a metered supply. Instead they elect
to join one of our customer support schemes such as Water Direct,
Water Support and Resolve, which help customers with low income or
bill arrears manage their water charges.
A meter penetration forecast has been developed taking account of these factors.
The assumptions behind this forecast are as follows:
• for the base year and lead-in years (AMP6) the number of DMOs is
set at the average of the previous 5 years (34,054); and
• from the end of AMP6, a gradual decline in the number of DMOs to
15,000 per year by 2030/31 (AMP9), which is then a fixed rate for the
rest of the planning period.
This decline reflects the decreasing number of unmeasured households both
available to opt and with a financial benefit of opting.
Our plan for the next few years is to use customer segmentation data to promote
metering to customers who would benefit financially from a metered supply, for
example, high rateable value, low occupancy properties. We anticipate that this will
allow us to achieve the forecast DMO levels in this plan.
Following publication of our draft WRMP19 we have continued to develop our
approach to encouraging customers to opt to a metered supply. We are forecasting
a decline in meter optants throughout the planning period as the number of
unmeasured households decreases and those customers segments most likely to
opt to a metered supply have already done so.
However, customers are increasingly asking if we can offer a similar arrangement to
the energy sector, where suppliers are obliged to ensure customers are on the best
tariff and this is an opportunity to encourage metering. We are reviewing accounts
of customers who could save money from having a water meter installed. Where we
estimate the customer would benefit financially we will offer a 2 year trial of a meter.
During the trial period, we will assess whether the customers have saved money. If
they haven't, we will switch them back to the unmetered rate.
Yorkshire Water | Revised Draft Water Resources Management Plan 2019 132
`
As a pilot, we have identified 100,000 customers who are currently in a property
with a high rateable value and a small number of occupants. Therefore, their bills
are likely to be higher than they would be if they were billed according to the amount
of water they consume. If the pilot is successful, we will review the accounts of
approximately 650,000 unmetered customers to identify those who might be better
off on a metered supply.
While this initiative will increase the number of metered customers and ensure we
meet our forecast meter penetration, it may not drive a significant demand reduction
as the reduced bill value from moving from a high rateable value bill to a lower
metered bill may not result in a financial incentive to reduce water use.
The cost of the metering programme, including meter installation and meter reading
is included in our Business Plan.
As Yorkshire is not classed as an area of water stress, compulsory metering is not
an option. However, we have included additional meter optants, metering on change
of occupancy and provision of smart meters as feasible options in our plan.
In addition to meter optants, all new build properties are fitted with a water meter.
Because of DMOs and new connections we forecast that 84% of all households will
be metered by 2044/45.
Water efficiency savings
Our water efficiency and demand reduction strategy is set out in Section 5. This
describes how water efficiency is an integral part of water resource planning now
and in the future. In our long-term strategy, which we will publish in March 2018, we
set out our goal to take less from the environment, maximise reuse of the water we
abstract and reduce water losses including leakage.
Demand management resulting from metering and water efficiency activity is central
to our demand forecast for household and non-household customers.
For household customers, we will continue to promote behavioural change in water
use and to provide water saving devices through free packs and home audits.
Yorkshire Water | Revised Draft Water Resources Management Plan 2019 133
`
The water saving from this activity, in combination with increasing ownership of
water efficient appliances, drive the downward trend in PCC presented in our
household demand forecast.
We are also forecasting a continuing downward trend in total non-household water
demand, driven by decreasing water use by the non-service sector. A variety of
factors influence long-term non-household water demand, but economic growth and
the development of water efficient technologies are considered central. The forecast
of non-household demand provided by Route2 is driven by a combination of macro-
economic factors and an underlying drive for efficiency.
Water efficiency is intrinsically part of the forecast household PCCs and the
measured non-household consumption forecast and no additional reduction in the
demand forecast due to Yorkshire Water activity has been included.
Leakage
Our baseline leakage forecast is covered in detail in Section 5. The forecast
changes to total leakage impact on supply pipe leakage, which affects water
delivered. The remainder of leakage comprises distribution losses.
Reported total leakage in the base year was 294.7Ml/d. For WRMP14 we calculated
the sustainable economic level of leakage (SELL) at 297.1Ml/d, reducing to
287.1Ml/d by 2019/20. For the baseline planning scenario in this draft WRMP19
forecast leakage remains fixed at the 2019/20 value throughout the 25-year
planning period.
We plan to decrease leakage significantly by the end of AMP7. To achieve this, we
plan to start this activity within the last 2 years of the current AMP (2018/19 and
2019/20), effectively starting a 7-year programme of activity to get to where we want
to be by the end of AMP7.
To represent this leakage activity in the WRMP19 we have incorporated all the
planned activity for AMP6 and AMP7 into the final planning scenario (leaving the
baseline demand forecast unchanged). This allows all additional leakage activity
Yorkshire Water | Revised Draft Water Resources Management Plan 2019 134
`
within the planned programme, including costs and volume reduction detail, to be
presented in the WRMP data tables.
The information is included in columns J and K ('For info 2018/19' and 'For info
2019/20') within Tables 6 (Preferred (Scenario Yr)) and 8 (FP Demand), and also
detailed in Table 5 Feasible options.
This approach provides more clarity than alternatively representing the AMP6
leakage activity as a step change within the baseline demand forecast in 2018/19
and 2019/20, without any supporting information within the planning tables.
Properties and population
The amount of water delivered to each property category depends on the number of
properties in that category and any associated population.
Property and population data for the base year was extracted from the billing file
and is used as the basis for the forecasts in future years.
Households
Household properties
The forecast for total household properties and their associated population was
produced by Edge Analytics Ltd, Population, Household & Property Forecasts
(Edge Analytics, 2016). To meet our requirements, two population forecasts were
prepared. The first is a housing-led scenario, using housing growth evidence from
Local Plans, known as a plan-based forecast. The second is based on the latest
2014-based Sub-National Population Projections (SNPP) from the ONS, known as a
trend-based forecast.
The Water Resources Planning Guidelines (Environment Agency and National
Resources Wales, 2017), emphasizes the importance of using housing growth
evidence from Local Plans. Therefore, we have selected to use the plan-based
property and population forecast from Edge Analytics for the draft WRMP.
Edge Analytics collected Local Plan housing growth evidence from all local
authorities that are either wholly or partially within the Yorkshire Water operational
Yorkshire Water | Revised Draft Water Resources Management Plan 2019 135
`
boundary. At the time, each of the 25 local authorities and 3 National Park
authorities was at a different stage of Local Plan development. Some plans were
adopted, whereas others were under development or open for consultation.
Where available, the annual allocation of the overall housing target was taken from
the information provided by each local authority. When not available, the overall
housing target was distributed equally over the Local Plan period, with adjustments
made to account for historic completions if this was available.
These annual housing growth trajectories formed the basis of the plan-based
household forecast used in the demand forecast.
Under the trend-based forecast, which is based on historic trends in births, deaths
and migration, the number of household properties and population forecast are
significantly less than the plan-based forecast. The impact of this potentially lower
number of households and population on future demand for water has been
assessed and included in our allowance for uncertainty, as described in Section 7 of
this plan.
The plan-based forecasts of household properties and population were rebased to
align with our billing file in the base year.
The total household properties were divided between the measured and
unmeasured household categories using our DMO forecast and the new builds
forecast taken from the Edge Analytics forecast, as follows:
• Measured households = measured households in previous year +
new builds + DMOs
• Unmeasured households = unmeasured households in previous year
- DMOs
The household property forecast is presented in Figure 4.4.
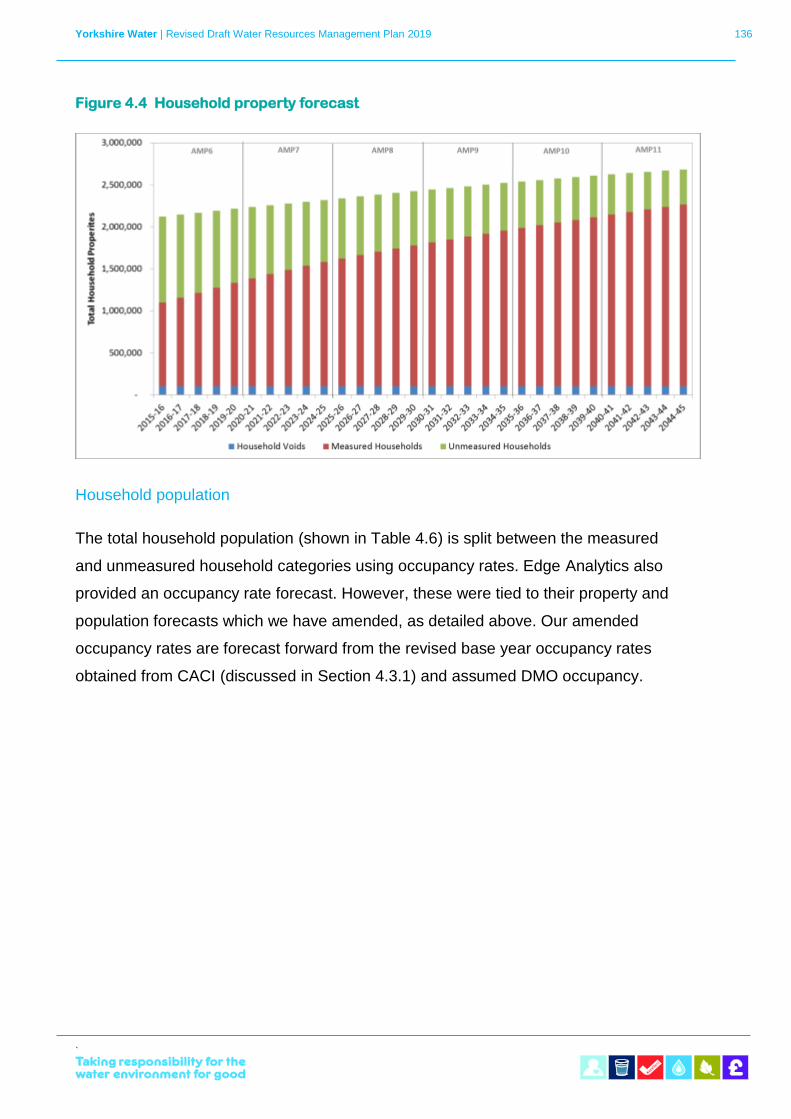
Yorkshire Water | Revised Draft Water Resources Management Plan 2019 136
`
Figure 4.4 Household property forecast
Household population
The total household population (shown in Table 4.6) is split between the measured
and unmeasured household categories using occupancy rates. Edge Analytics also
provided an occupancy rate forecast. However, these were tied to their property and
population forecasts which we have amended, as detailed above. Our amended
occupancy rates are forecast forward from the revised base year occupancy rates
obtained from CACI (discussed in Section 4.3.1) and assumed DMO occupancy.
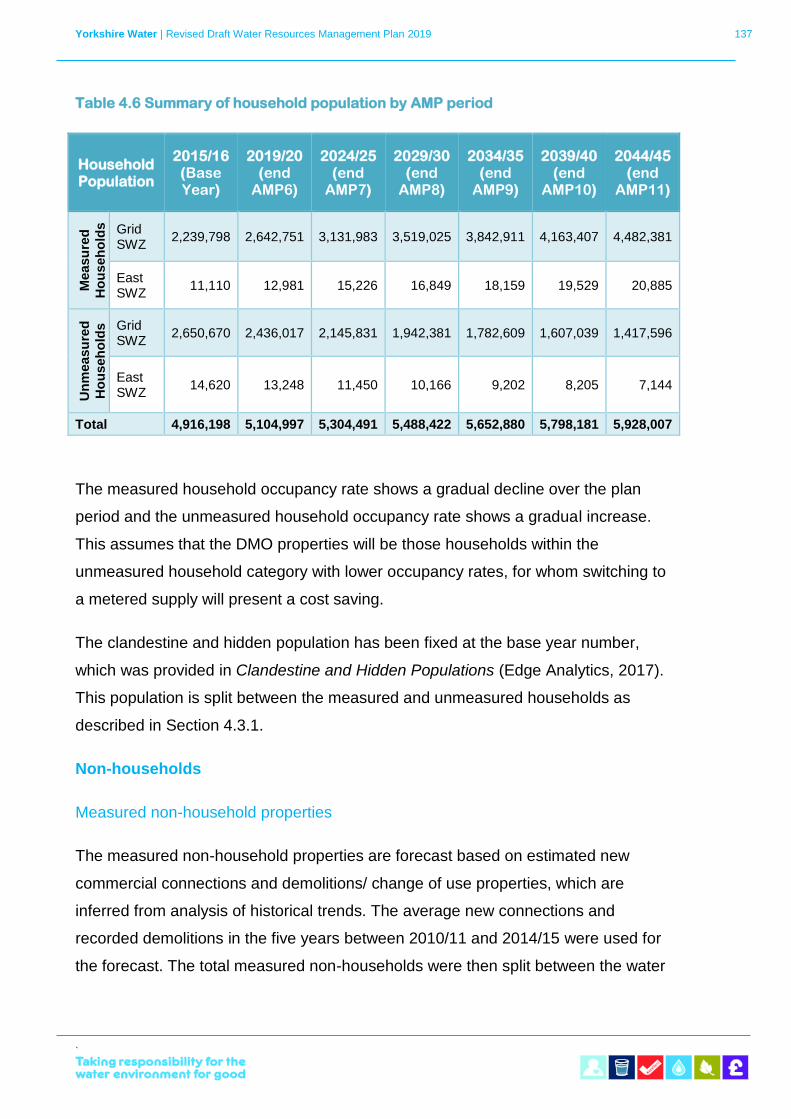
Yorkshire Water | Revised Draft Water Resources Management Plan 2019 137
`
Table 4.6 Summary of household population by AMP period
Household Population
2015/16 (Base Year)
2019/20 (end
AMP6)
2024/25 (end
AMP7)
2029/30 (end
AMP8)
2034/35 (end
AMP9)
2039/40 (end
AMP10)
2044/45 (end
AMP11)
Measu
red
Ho
useh
old
s
Grid SWZ
2,239,798 2,642,751 3,131,983 3,519,025 3,842,911 4,163,407 4,482,381
East SWZ
11,110 12,981 15,226 16,849 18,159 19,529 20,885
Un
measu
red
Ho
useh
old
s
Grid SWZ
2,650,670 2,436,017 2,145,831 1,942,381 1,782,609 1,607,039 1,417,596
East SWZ
14,620 13,248 11,450 10,166 9,202 8,205 7,144
Total 4,916,198 5,104,997 5,304,491 5,488,422 5,652,880 5,798,181 5,928,007
The measured household occupancy rate shows a gradual decline over the plan
period and the unmeasured household occupancy rate shows a gradual increase.
This assumes that the DMO properties will be those households within the
unmeasured household category with lower occupancy rates, for whom switching to
a metered supply will present a cost saving.
The clandestine and hidden population has been fixed at the base year number,
which was provided in Clandestine and Hidden Populations (Edge Analytics, 2017).
This population is split between the measured and unmeasured households as
described in Section 4.3.1.
Non-households
Measured non-household properties
The measured non-household properties are forecast based on estimated new
commercial connections and demolitions/ change of use properties, which are
inferred from analysis of historical trends. The average new connections and
recorded demolitions in the five years between 2010/11 and 2014/15 were used for
the forecast. The total measured non-households were then split between the water
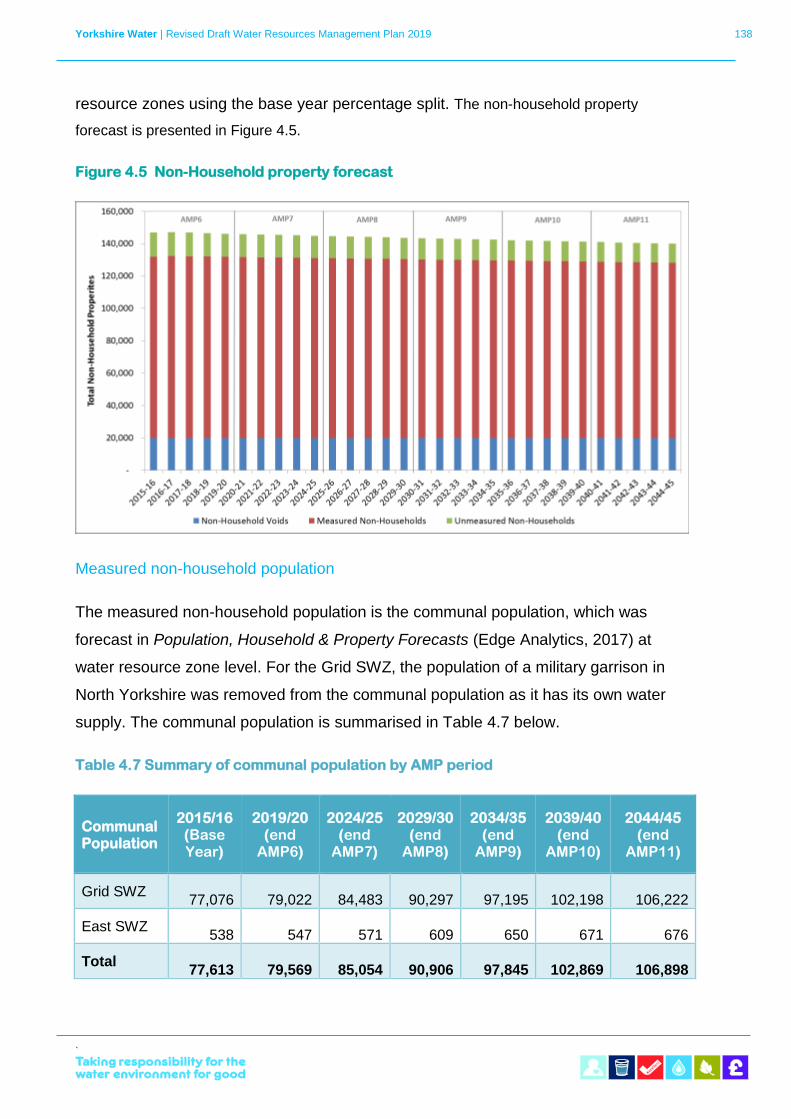
Yorkshire Water | Revised Draft Water Resources Management Plan 2019 138
`
resource zones using the base year percentage split. The non-household property
forecast is presented in Figure 4.5.
Figure 4.5 Non-Household property forecast
Measured non-household population
The measured non-household population is the communal population, which was
forecast in Population, Household & Property Forecasts (Edge Analytics, 2017) at
water resource zone level. For the Grid SWZ, the population of a military garrison in
North Yorkshire was removed from the communal population as it has its own water
supply. The communal population is summarised in Table 4.7 below.
Table 4.7 Summary of communal population by AMP period
Communal Population
2015/16 (Base Year)
2019/20 (end
AMP6)
2024/25 (end
AMP7)
2029/30 (end
AMP8)
2034/35 (end
AMP9)
2039/40 (end
AMP10)
2044/45 (end
AMP11)
Grid SWZ
77,076
79,022
84,483
90,297
97,195
102,198
106,222
East SWZ
538
547
571
609
650
671
676
Total
77,613
79,569
85,054
90,906
97,845
102,869
106,898
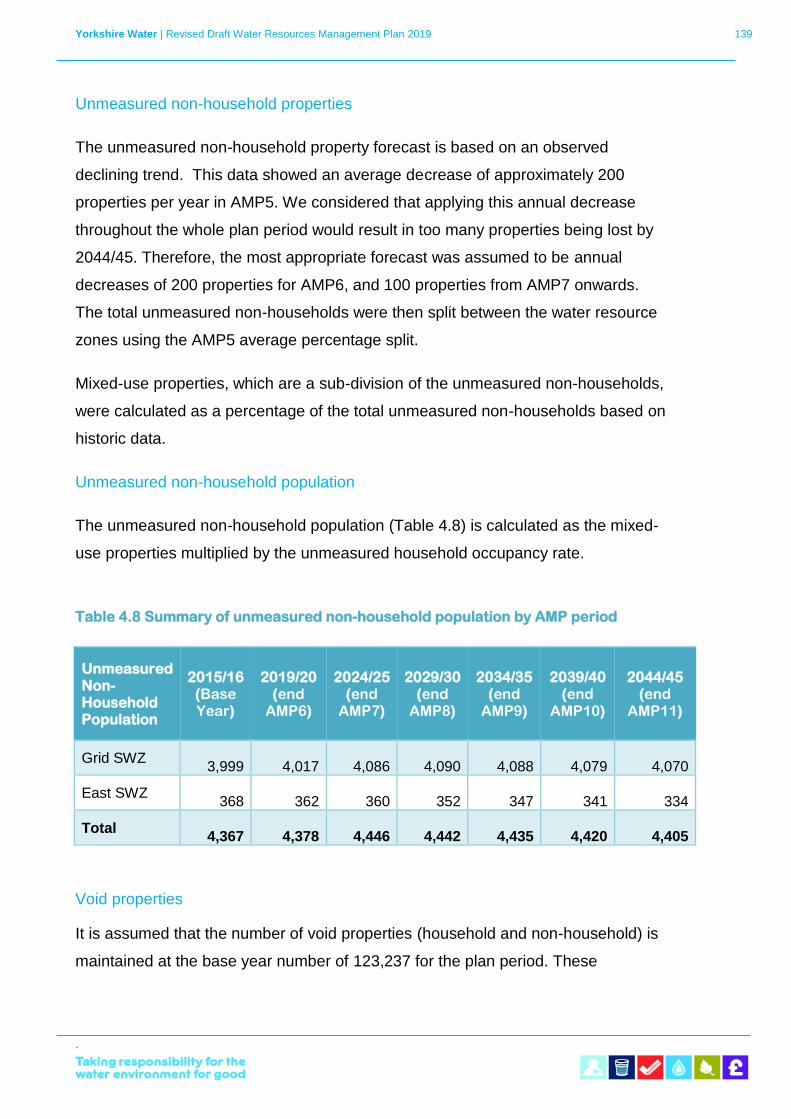
Yorkshire Water | Revised Draft Water Resources Management Plan 2019 139
`
Unmeasured non-household properties
The unmeasured non-household property forecast is based on an observed
declining trend. This data showed an average decrease of approximately 200
properties per year in AMP5. We considered that applying this annual decrease
throughout the whole plan period would result in too many properties being lost by
2044/45. Therefore, the most appropriate forecast was assumed to be annual
decreases of 200 properties for AMP6, and 100 properties from AMP7 onwards.
The total unmeasured non-households were then split between the water resource
zones using the AMP5 average percentage split.
Mixed-use properties, which are a sub-division of the unmeasured non-households,
were calculated as a percentage of the total unmeasured non-households based on
historic data.
Unmeasured non-household population
The unmeasured non-household population (Table 4.8) is calculated as the mixed-
use properties multiplied by the unmeasured household occupancy rate.
Table 4.8 Summary of unmeasured non-household population by AMP period
Unmeasured Non-Household Population
2015/16 (Base Year)
2019/20 (end
AMP6)
2024/25 (end
AMP7)
2029/30 (end
AMP8)
2034/35 (end
AMP9)
2039/40 (end
AMP10)
2044/45 (end
AMP11)
Grid SWZ
3,999
4,017
4,086
4,090
4,088
4,079
4,070
East SWZ
368
362
360
352
347
341
334
Total
4,367
4,378
4,446
4,442
4,435
4,420
4,405
Void properties
It is assumed that the number of void properties (household and non-household) is
maintained at the base year number of 123,237 for the plan period. These
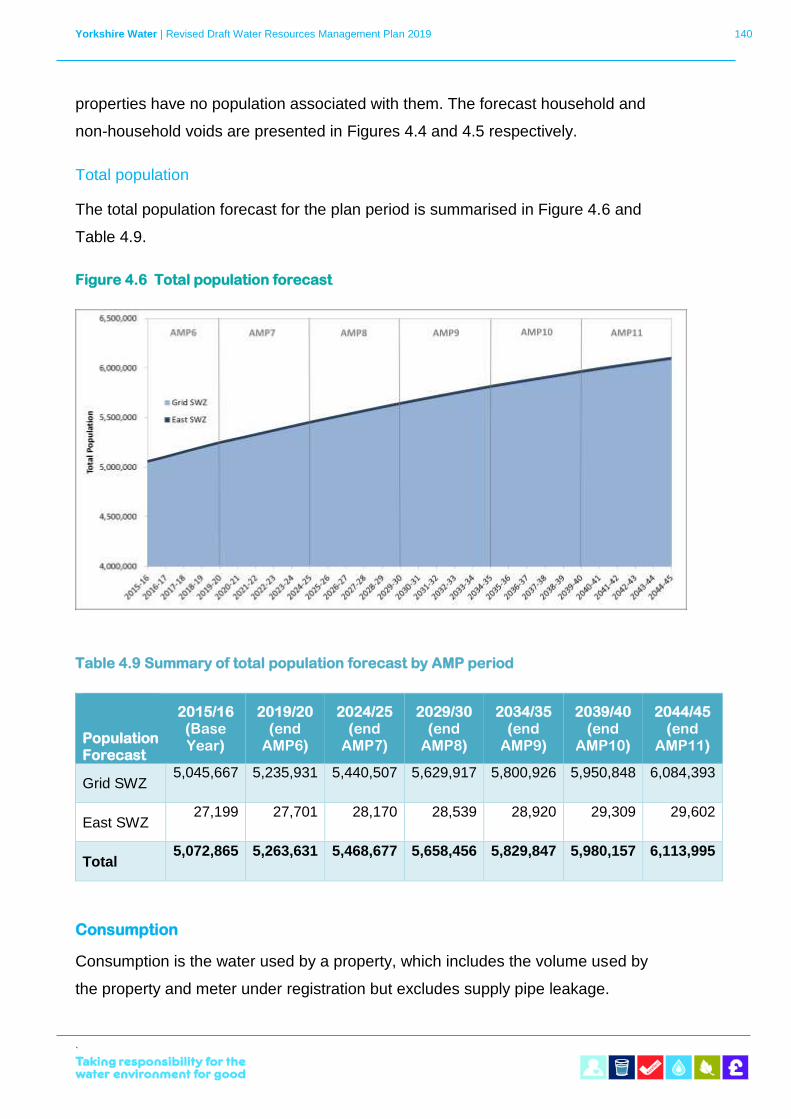
Yorkshire Water | Revised Draft Water Resources Management Plan 2019 140
`
properties have no population associated with them. The forecast household and
non-household voids are presented in Figures 4.4 and 4.5 respectively.
Total population
The total population forecast for the plan period is summarised in Figure 4.6 and
Table 4.9.
Figure 4.6 Total population forecast
Table 4.9 Summary of total population forecast by AMP period
Population Forecast
2015/16 (Base Year)
2019/20 (end
AMP6)
2024/25 (end
AMP7)
2029/30 (end
AMP8)
2034/35 (end
AMP9)
2039/40 (end
AMP10)
2044/45 (end
AMP11)
Grid SWZ 5,045,667 5,235,931 5,440,507 5,629,917 5,800,926 5,950,848 6,084,393
East SWZ 27,199 27,701 28,170 28,539 28,920 29,309 29,602
Total 5,072,865 5,263,631 5,468,677 5,658,456 5,829,847 5,980,157 6,113,995
Consumption
Consumption is the water used by a property, which includes the volume used by
the property and meter under registration but excludes supply pipe leakage.
Yorkshire Water | Revised Draft Water Resources Management Plan 2019 141
`
Household consumption
The forecast volume of water used by household properties is calculated from PCC
and population.
We commissioned water consultants Artesia Consulting Ltd to develop a household
consumption model, which provides PCC for measured and unmeasured
households throughout the plan period - Yorkshire Water WRMP19 Household
Consumption Forecast, (Artesia Consulting, 2017). Following guidance provided in
the WRMP19 Methods - Household Consumption Forecasting (UKWIR, 2015),
Artesia Consulting used multivariate linear regression modelling of validated historic
demand data to create consumption models for our two water resource zones.
The multivariate linear regression models integrate drivers of future household
demand, such as occupancy, property type, socio-demographics and meter
penetration. The models can be used to test sensitivities of different parameters,
such as meter uptake and maximum meter penetration.
Artesia Consulting validated their models using four different approaches:
• Firstly, the model was constructed using standard statistical methods
from which uncertainty can be quantified.
• Secondly, the model was validated temporally, both within the trainer
set and by applying the model to historic data and forecasting
forwards to the current year and comparing with reported figures.
• Thirdly, the model was validated spatially at household level.
• Finally, the model coefficients were shown to be similar between
models derived from different Yorkshire Water databases.
In preparation of our household demand model we have chosen to segment our
customers by meter status, property type, occupancy rate and socio-demographic
profile, due to the availability of comprehensive data for these segments. We have
not segmented by behavioural typology as we currently have insufficient customer
information of this type available to allow us to do this. We therefore have not used
the methodology described in Customer behaviour and water use: A good practice
Yorkshire Water | Revised Draft Water Resources Management Plan 2019 142
`
manual and roadmap for household consumption forecasting (UKWIR, 2012) in
developing our demand model.
Artesia Consulting combined observed micro-component trends with calculated
endpoint scenarios to derive possible trends in water use. For example, the water
efficiency of washing machines and dishwashers is improving, whereas frequency
and duration of showering may be increasing. From this they have derived potential
scenarios of water use based on upper and lower trends.
• The sustainable development scenario assumes the current
regulatory-driven efficiency in technology will continue beyond 2045,
resulting in water use reductions that are currently not economically
viable.
• Conversely the market forces scenario assumes the projected trend
in micro-components does not continue beyond 2022. This would be
driven by the decoupling of UK building standards from current
standards.
• The two calculated trends are considered by Artesia Consulting to be
the extremes that represent the upper and lower bounds of the
forecast. The observed trend was averaged with the sustainable
development and market forces trend to give a central trend.
The central trend has been used as the forecasting trend within the measured and
unmeasured household demand forecast. The central model outputs provide
measured and unmeasured household PCC and per household consumption (PHC)
forecasts for the planning period. We add uplifts for climate change and dry year to
the household PCC values.
The PCC forecasts derived from the sustainable development and market forces
scenarios have been included in our modelling of uncertainty for this plan (Section
7).
Yorkshire Water | Revised Draft Water Resources Management Plan 2019 143
`
Climate change
Following guidance from the Environment Agency, we have used the climate
change scenarios presented in the Impact of Climate Change on Demand (UKWIR,
2012) to determine the potential impact of climate change on customer demand.
We have assumed that the Severn Trent scenarios are more appropriate to
Yorkshire Water than the Thames Water scenarios, due to geographical and
climatic similarities. We selected the Household Annual Average for the Humber
North region as the most appropriate climate change scenario for the Yorkshire
Water supply area. We also selected the mid-range P50 percentile scenario within
the Humber North region as there is no evidence to justify use of the higher or lower
ranges.
The Defra commissioned report Climate Change and Demand for Water (CCDeW,
2003) states that the major impact of climate change in north east England is likely
to be on garden use and personal washing. Climate change has therefore been
added on to these two micro-components of household demand.
The result is a forecast growth in household consumption due to climate change of
0 to 0.61% over the planning period.
Figure 4.7 demonstrates the forecast increase in household demand due to climate
change.
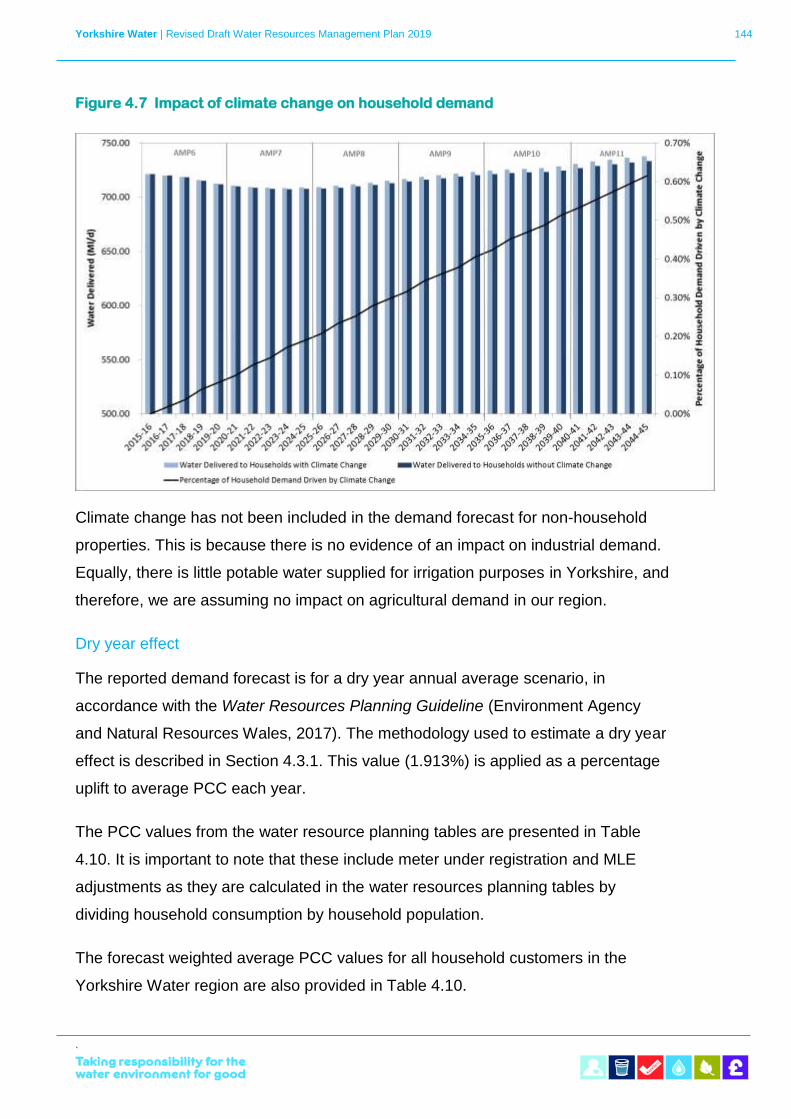
Yorkshire Water | Revised Draft Water Resources Management Plan 2019 144
`
Figure 4.7 Impact of climate change on household demand
Climate change has not been included in the demand forecast for non-household
properties. This is because there is no evidence of an impact on industrial demand.
Equally, there is little potable water supplied for irrigation purposes in Yorkshire, and
therefore, we are assuming no impact on agricultural demand in our region.
Dry year effect
The reported demand forecast is for a dry year annual average scenario, in
accordance with the Water Resources Planning Guideline (Environment Agency
and Natural Resources Wales, 2017). The methodology used to estimate a dry year
effect is described in Section 4.3.1. This value (1.913%) is applied as a percentage
uplift to average PCC each year.
The PCC values from the water resource planning tables are presented in Table
4.10. It is important to note that these include meter under registration and MLE
adjustments as they are calculated in the water resources planning tables by
dividing household consumption by household population.
The forecast weighted average PCC values for all household customers in the
Yorkshire Water region are also provided in Table 4.10.
Yorkshire Water | Revised Draft Water Resources Management Plan 2019 145
`
Currently we have 50% metered households, and this number is increasing each
year due to meter optants and new development. Unmeasured household PCC is
forecast to decline due to increasing water efficient behaviour and ownership of
water efficient appliances, such as dishwashers and washing machines.
The forecast is for a slightly increasing measured household PCC driven by:
• those households that use more water gradually switching to a
metered supply; and
• increasing numbers of low occupancy households, which have an
associated higher PCC (proportionately higher water use per person
due to use of appliances such as washing machines/dishwashers).
The average household PCC is forecast to decline due to an increasing proportion
of measured households (with associated lower PCC), increasing water efficient
behaviour and use of water efficient appliances.
To comply with the Water Resources Planning Guideline (Environment Agency and
Natural Resources Wales, 2017), Artesia Consulting produced a micro-component
forecast which was developed from property survey data.
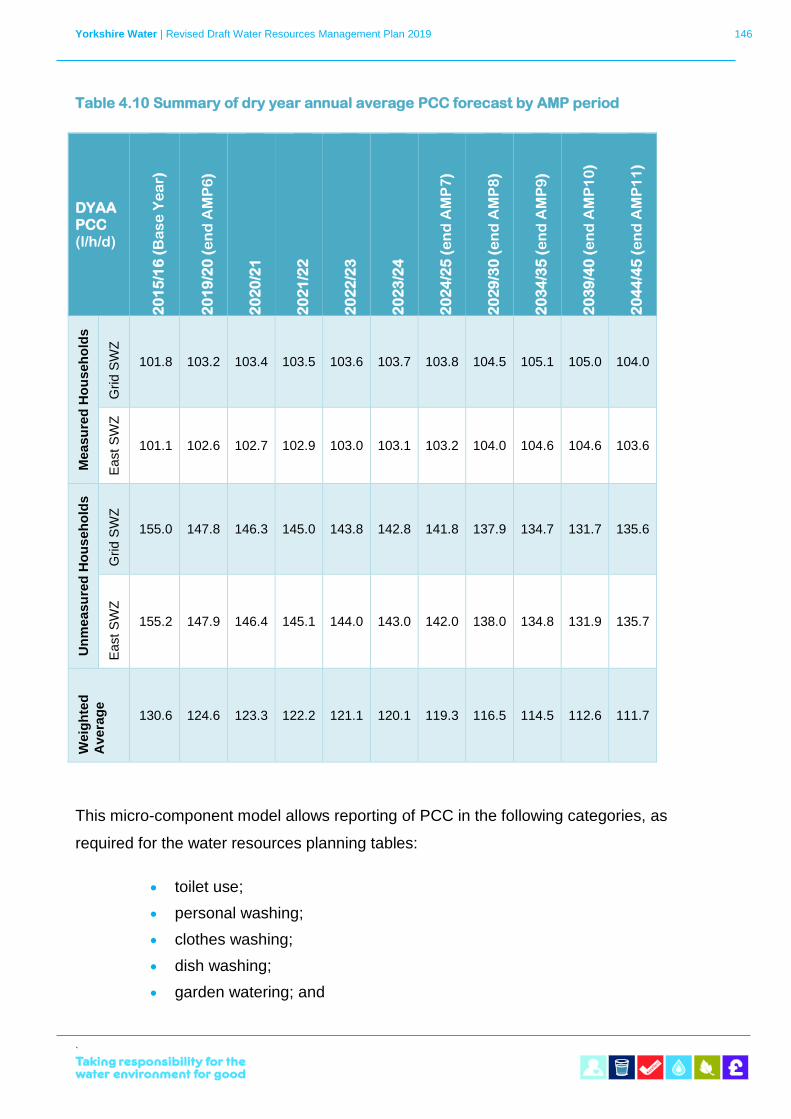
Yorkshire Water | Revised Draft Water Resources Management Plan 2019 146
`
Table 4.10 Summary of dry year annual average PCC forecast by AMP period
DYAA PCC (l/h/d)
20
15
/16
(B
as
e Y
ea
r)
20
19
/20
(e
nd
AM
P6
)
20
20
/21
20
21
/22
20
22
/23
20
23
/24
20
24
/25
(e
nd
AM
P7
)
20
29
/30
(e
nd
AM
P8
)
20
34
/35
(e
nd
AM
P9
)
20
39
/40
(e
nd
AM
P1
0)
20
44
/45
(e
nd
AM
P1
1)
Measu
red
Ho
useh
old
s
Grid S
WZ
101.8 103.2 103.4 103.5 103.6 103.7 103.8 104.5 105.1 105.0 104.0
East
SW
Z
101.1 102.6 102.7 102.9 103.0 103.1 103.2 104.0 104.6 104.6 103.6
Un
measu
red
Ho
us
eh
old
s
Grid S
WZ
155.0 147.8 146.3 145.0 143.8 142.8 141.8 137.9 134.7 131.7 135.6
East
SW
Z
155.2 147.9 146.4 145.1 144.0 143.0 142.0 138.0 134.8 131.9 135.7
Weig
hte
d
Avera
ge
130.6 124.6 123.3 122.2 121.1 120.1 119.3 116.5 114.5 112.6 111.7
This micro-component model allows reporting of PCC in the following categories, as
required for the water resources planning tables:
• toilet use;
• personal washing;
• clothes washing;
• dish washing;
• garden watering; and
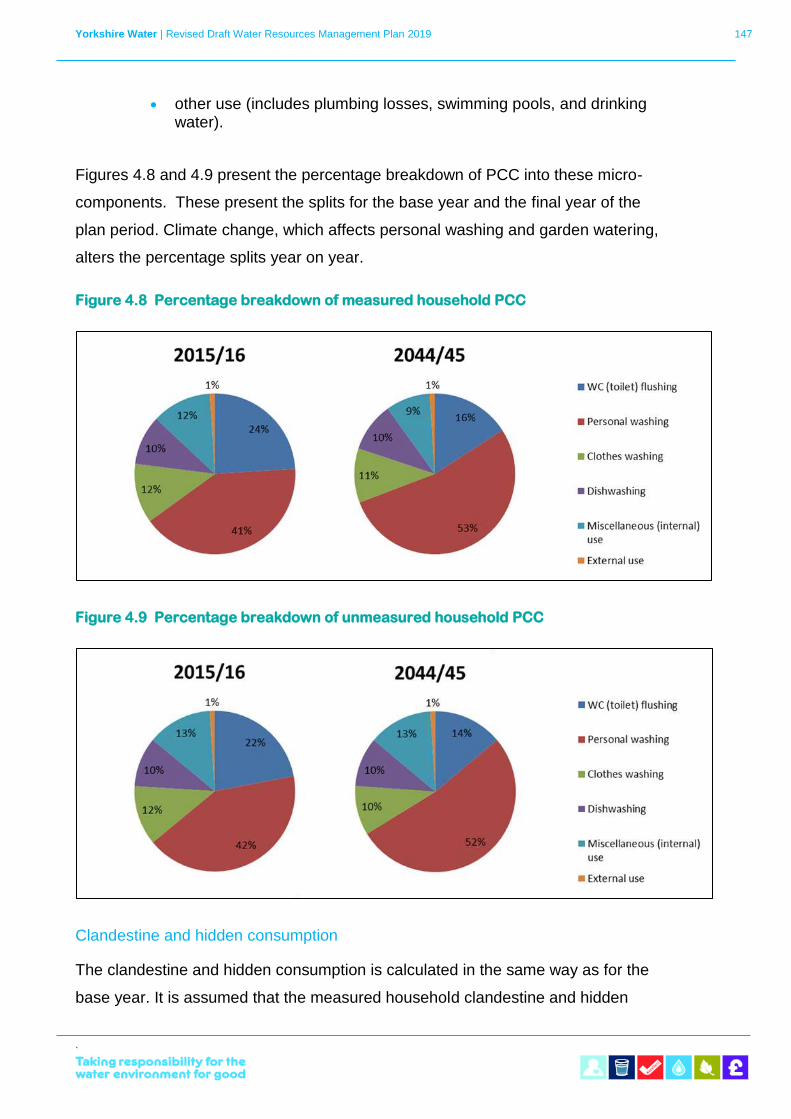
Yorkshire Water | Revised Draft Water Resources Management Plan 2019 147
`
• other use (includes plumbing losses, swimming pools, and drinking water).
Figures 4.8 and 4.9 present the percentage breakdown of PCC into these micro-
components. These present the splits for the base year and the final year of the
plan period. Climate change, which affects personal washing and garden watering,
alters the percentage splits year on year.
Figure 4.8 Percentage breakdown of measured household PCC
Figure 4.9 Percentage breakdown of unmeasured household PCC
Clandestine and hidden consumption
The clandestine and hidden consumption is calculated in the same way as for the
base year. It is assumed that the measured household clandestine and hidden
Yorkshire Water | Revised Draft Water Resources Management Plan 2019 148
`
consumption is captured by water meters and therefore no additional consumption
is included. For the unmeasured household clandestine and hidden population,
consumption is calculated using the unmeasured household PCC.
Measured non-household consumption There have been several changes associated with the measured non-household
sector in recent years. The opening of the retail market has seen several changes in
customer classification. In developing our measured non-household demand
forecast we have used a dataset that reflects the eligibility criteria regarding the
measured non-household retail market in England.
As part of our preparation for market opening, we reviewed our measured non-
household portfolio to ensure that all eligible customers are in the market. The
demand dataset uses to develop our forecast demand reflects the current eligibility
criteria in historic measured volumes.
Measured non-household demand within Yorkshire has been broadly declining over
the last twenty years. In developing our demand forecast we have looked separately
at the two categories of measured non-household customers, non-service and
service sectors. A steady increase in total demand from the service sectors has
been observed, with a steady decline in total demand from the non-service sector.
We have collaborated with Route2 Sustainability Ltd (Route2) to develop multiple
regression analysis models to forecast long-term water demand. Separate models
were developed for non-service and service sectors, to reflect the differing demand
profiles of these broad customer groups over time. Historic demand for the period
1997 to 2016 was used to develop the models, providing demand forecasts for the
period 2017 to 2060.
Multiple regression analysis uses known values known as ‘independent’ variables to
predict an unknown value, or ‘dependant’ variable. Water demand in the modelling
is the dependent variable, with three independent variables used to determine future
water demand.
A variety of factors can influence long-term service and non-service sector water
demand. We considered 120 independent macro-economic variables to determine
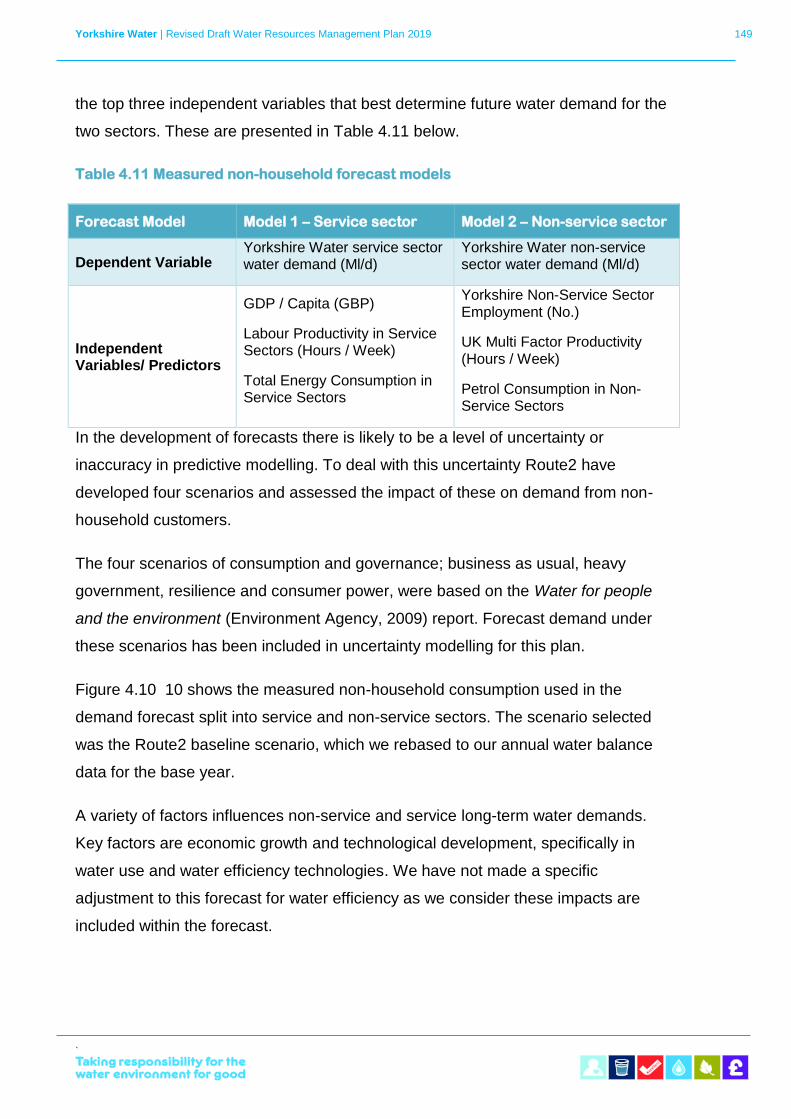
Yorkshire Water | Revised Draft Water Resources Management Plan 2019 149
`
the top three independent variables that best determine future water demand for the
two sectors. These are presented in Table 4.11 below.
Table 4.11 Measured non-household forecast models
Forecast Model Model 1 – Service sector Model 2 – Non-service sector
Dependent Variable Yorkshire Water service sector water demand (Ml/d)
Yorkshire Water non-service sector water demand (Ml/d)
Independent Variables/ Predictors
GDP / Capita (GBP)
Labour Productivity in Service Sectors (Hours / Week)
Total Energy Consumption in Service Sectors
Yorkshire Non-Service Sector Employment (No.)
UK Multi Factor Productivity (Hours / Week)
Petrol Consumption in Non-Service Sectors
In the development of forecasts there is likely to be a level of uncertainty or
inaccuracy in predictive modelling. To deal with this uncertainty Route2 have
developed four scenarios and assessed the impact of these on demand from non-
household customers.
The four scenarios of consumption and governance; business as usual, heavy
government, resilience and consumer power, were based on the Water for people
and the environment (Environment Agency, 2009) report. Forecast demand under
these scenarios has been included in uncertainty modelling for this plan.
Figure 4.10 10 shows the measured non-household consumption used in the
demand forecast split into service and non-service sectors. The scenario selected
was the Route2 baseline scenario, which we rebased to our annual water balance
data for the base year.
A variety of factors influences non-service and service long-term water demands.
Key factors are economic growth and technological development, specifically in
water use and water efficiency technologies. We have not made a specific
adjustment to this forecast for water efficiency as we consider these impacts are
included within the forecast.
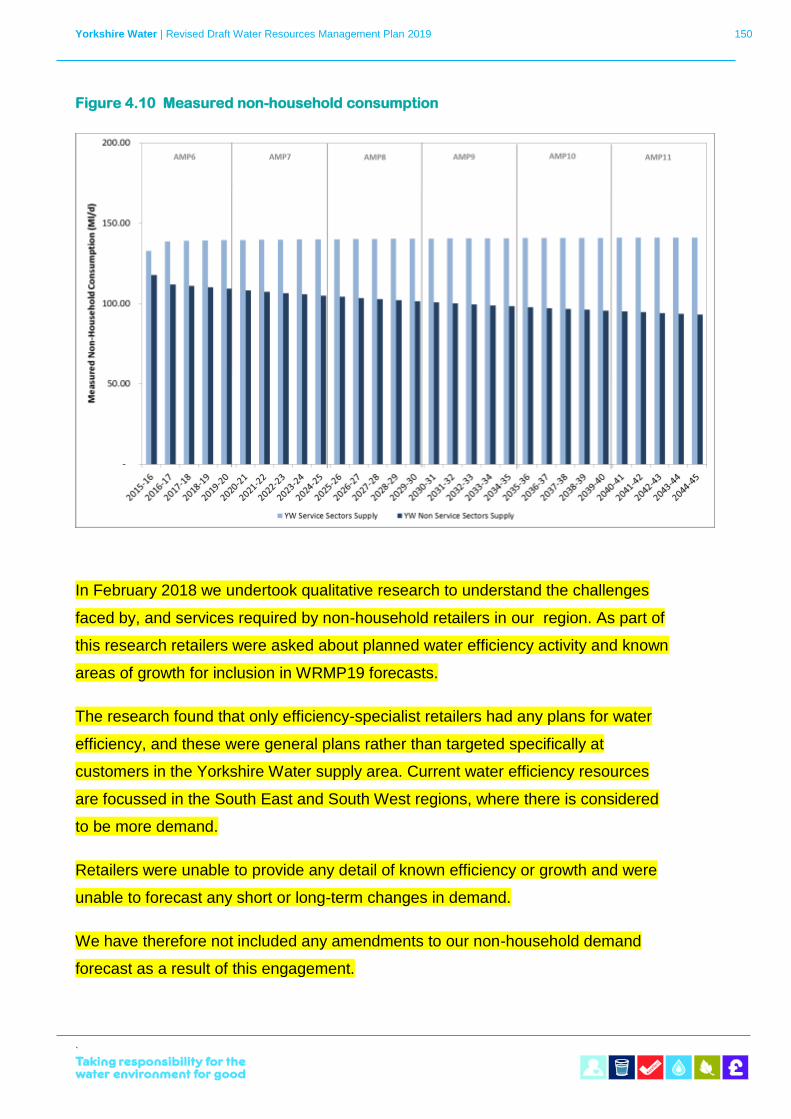
Yorkshire Water | Revised Draft Water Resources Management Plan 2019 150
`
Figure 4.10 Measured non-household consumption
In February 2018 we undertook qualitative research to understand the challenges
faced by, and services required by non-household retailers in our region. As part of
this research retailers were asked about planned water efficiency activity and known
areas of growth for inclusion in WRMP19 forecasts.
The research found that only efficiency-specialist retailers had any plans for water
efficiency, and these were general plans rather than targeted specifically at
customers in the Yorkshire Water supply area. Current water efficiency resources
are focussed in the South East and South West regions, where there is considered
to be more demand.
Retailers were unable to provide any detail of known efficiency or growth and were
unable to forecast any short or long-term changes in demand.
We have therefore not included any amendments to our non-household demand
forecast as a result of this engagement.
Yorkshire Water | Revised Draft Water Resources Management Plan 2019 151
`
We have also considered the potential impact of new customers swapping from a
non-public water supply, such as salad growers requiring a potable water supply.
This requirement has historically been minimal in Yorkshire and it is considered
unlikely to become a significant driver of demand in the future.
Unmeasured non-household consumption
The estimated volume of water used by unmeasured non-households has been
revised in line with best practice provided in Consistency of Reporting Performance
Measures (UKWIR, 2017). The report recognises that this component is normally a
small proportion of total non-household demand and suggests that an estimate of
consumption is derived from a study of the consumption of Standard Industry
Classification (SIC) equivalent measured non-households of similar SIC categories.
However, this would lead to a significant over estimation in unmeasured non-
household volume, as it is incorrect to assume that unmeasured non-household and
measured non-household properties within a SIC category have similar water use.
Unmeasured non-household properties have very low or irregular water use
compared to measured non-households, and because of this fitting a meter at these
properties is not cost beneficial.
As these unmeasured non-household properties are low consumers, the
methodology was revised to limit comparison with metered non-households with
similarly low water use. For this exercise measured properties with water use of less
than 0.349m3/day were considered, which was the current average unmeasured
household consumption.
This gives a total unmeasured non-household consumption of 2.12Ml/d, and an
estimated volume per property of 125l/prop/day.
Meter under registration
Meter under registration is assumed to remain at the base year rate. The meter
under registration percentages for measured households, unmeasured households
and measured non-households are given in Section 4.3.1. Meter under registration
does not apply to unmeasured non-households.
Yorkshire Water | Revised Draft Water Resources Management Plan 2019 152
`
Supply pipe leakage
The forecast total volume of supply pipe leakage is directly linked to total leakage.
Total supply pipe leakage has been estimated to be 31.17% of leakage in DMAs.
This was calculated from an assessment of properties on our Domestic
Consumption Monitor. The supply pipe leakage volume is allocated to all properties
based on estimated leakage rates for different property types and meter locations.
We have three different supply pipe leakage rates for properties:
• standard supply pipe leakage rate for unmeasured and internally
metered properties;
• measured households with meters located external to the property
(half standard rate); and
• measured non-household (one-quarter standard rate).
As the total number of properties in each category varies each year, the supply pipe
leakage rates vary subtly each year also.
4.4.2 Water taken unbilled
We estimate the volume of water taken unbilled annually as part of our water
balance calculations. The total estimated volume remains constant at around 30Ml/d
(2% of distribution input) each year. Therefore, the amount of water taken unbilled is
assumed to be fixed at the base year volume (31.92Ml/d) for the remainder of the
plan period.
4.4.3 Distribution losses
As discussed in Section 4.3.2, distribution losses comprise leakage from service
reservoirs and trunk mains, plus the losses in DMAs which are not supply pipe
leakage.
The leakage from service reservoirs and trunk mains for the base year was
estimated as 44.65Ml/d. This volume has been applied throughout the plan period.
Leakage in DMAs, excluding supply pipe leakage, is also fixed throughout the plan
period from 2019/20 at 166.83Ml/d.
Yorkshire Water | Revised Draft Water Resources Management Plan 2019 153
`
4.4.4 Distribution system operational use
The volume of water used for distribution system operations (for example, mains
flushing, service reservoir cleaning and water quality testing) is assumed to be fixed
during the plan period at the base year volume (1.80Ml/d).
Forecast demand to 2044/45
4.5.1 Water delivered
Household water delivered
The forecast regional water delivered to household properties over the planning
period is presented in Figure 4.11 and Table 4.12. Note that this includes the dry
year uplift and climate change impact on demand.
The measured household water delivered is forecast to increase from 256.04Ml/d in
the base year to 521.02Ml/d by 2044/45. This increase is a combination of
increased property numbers (new build households and DMOs) and a small uplift
due to climate change.
The unmeasured household water delivered is forecast to decrease over the
planning period, from 465.12Ml/d in the base year to 216.80Ml/d in 2044/45. This is
due to a continuing trend of households switching to a metered supply.
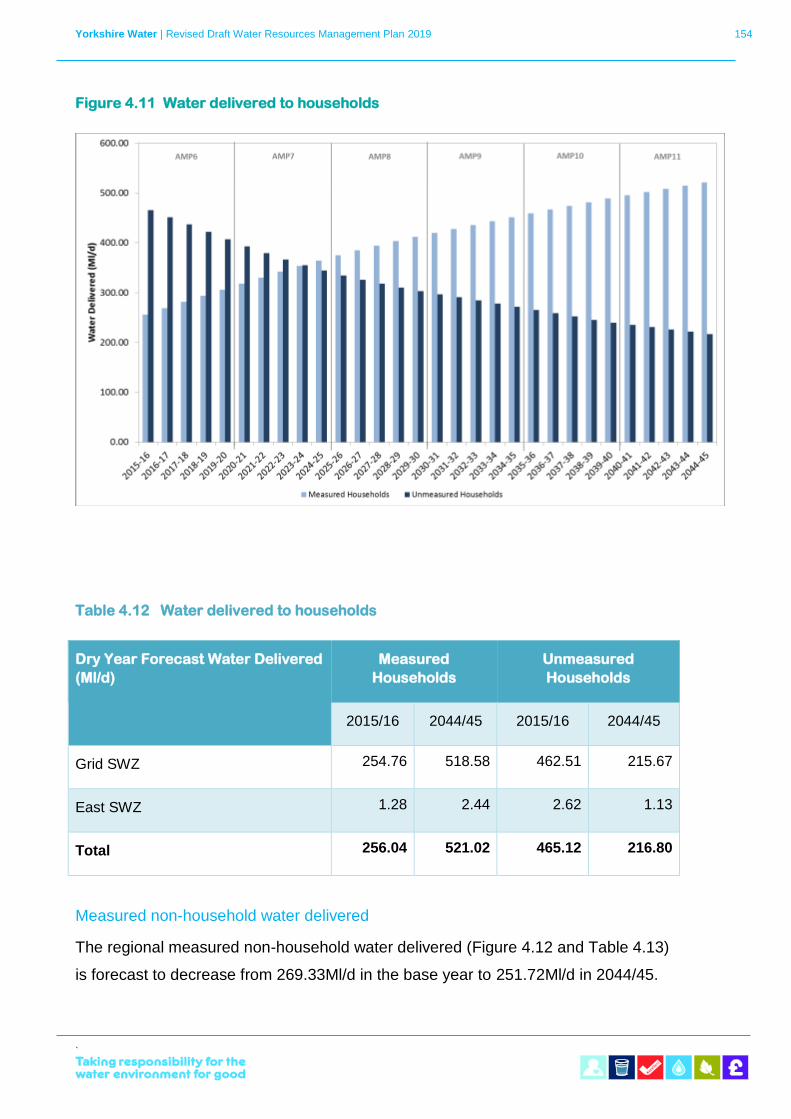
Yorkshire Water | Revised Draft Water Resources Management Plan 2019 154
`
Figure 4.11 Water delivered to households
Table 4.12 Water delivered to households
Dry Year Forecast Water Delivered
(Ml/d)
Measured
Households
Unmeasured
Households
2015/16 2044/45 2015/16 2044/45
Grid SWZ 254.76 518.58 462.51 215.67
East SWZ 1.28 2.44 2.62 1.13
Total 256.04 521.02 465.12 216.80
Measured non-household water delivered
The regional measured non-household water delivered (Figure 4.12 and Table 4.13)
is forecast to decrease from 269.33Ml/d in the base year to 251.72Ml/d in 2044/45.
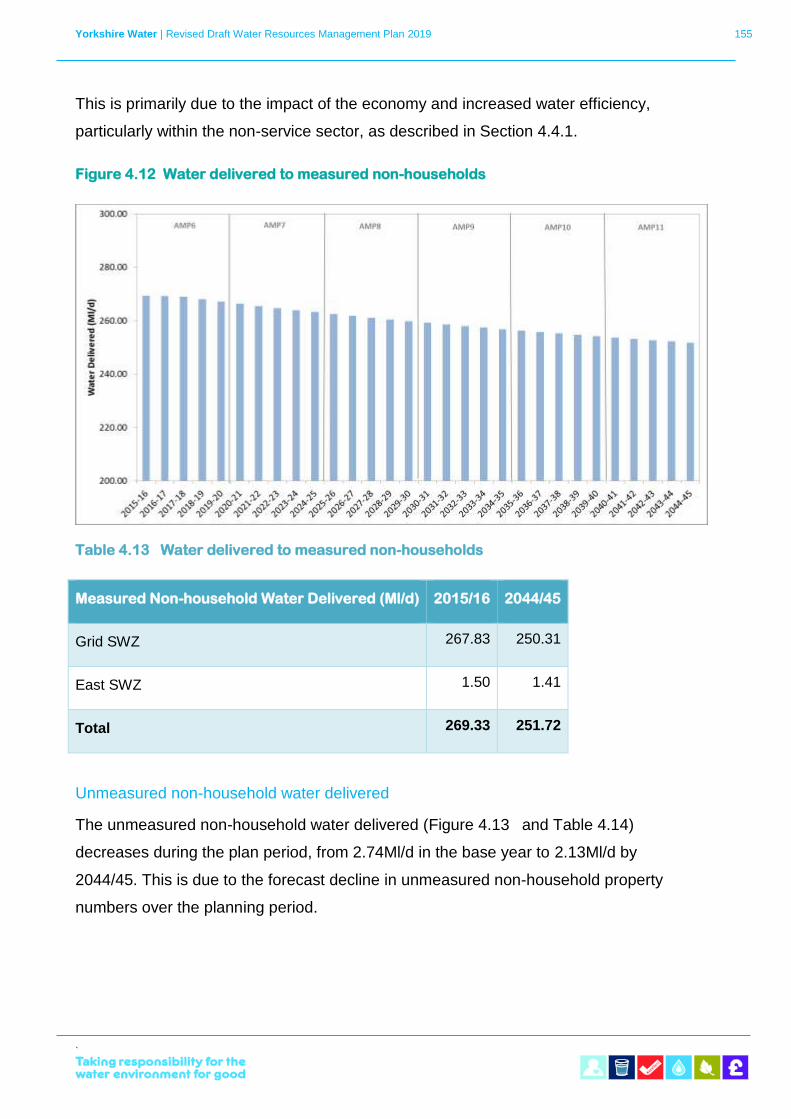
Yorkshire Water | Revised Draft Water Resources Management Plan 2019 155
`
This is primarily due to the impact of the economy and increased water efficiency,
particularly within the non-service sector, as described in Section 4.4.1.
Figure 4.12 Water delivered to measured non-households
Table 4.13 Water delivered to measured non-households
Measured Non-household Water Delivered (Ml/d) 2015/16 2044/45
Grid SWZ 267.83 250.31
East SWZ 1.50 1.41
Total 269.33 251.72
Unmeasured non-household water delivered
The unmeasured non-household water delivered (Figure 4.13 and Table 4.14)
decreases during the plan period, from 2.74Ml/d in the base year to 2.13Ml/d by
2044/45. This is due to the forecast decline in unmeasured non-household property
numbers over the planning period.
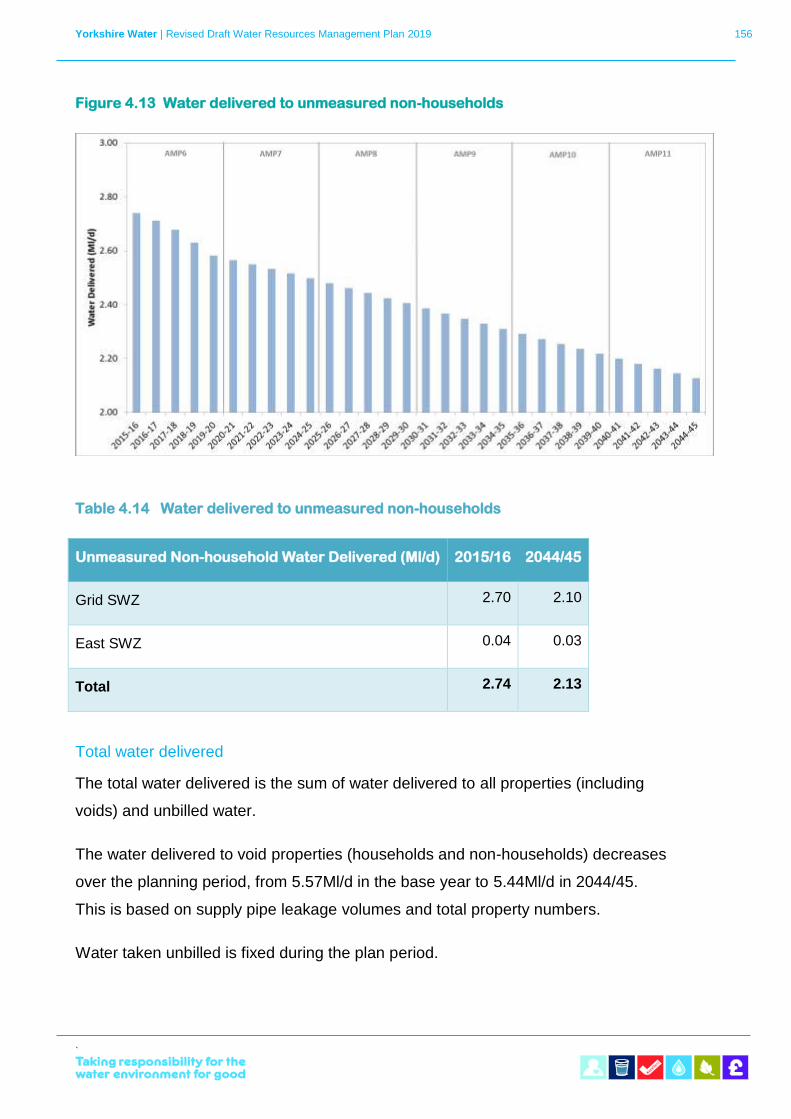
Yorkshire Water | Revised Draft Water Resources Management Plan 2019 156
`
Figure 4.13 Water delivered to unmeasured non-households
Table 4.14 Water delivered to unmeasured non-households
Unmeasured Non-household Water Delivered (Ml/d) 2015/16 2044/45
Grid SWZ 2.70 2.10
East SWZ 0.04 0.03
Total 2.74 2.13
Total water delivered
The total water delivered is the sum of water delivered to all properties (including
voids) and unbilled water.
The water delivered to void properties (households and non-households) decreases
over the planning period, from 5.57Ml/d in the base year to 5.44Ml/d in 2044/45.
This is based on supply pipe leakage volumes and total property numbers.
Water taken unbilled is fixed during the plan period.
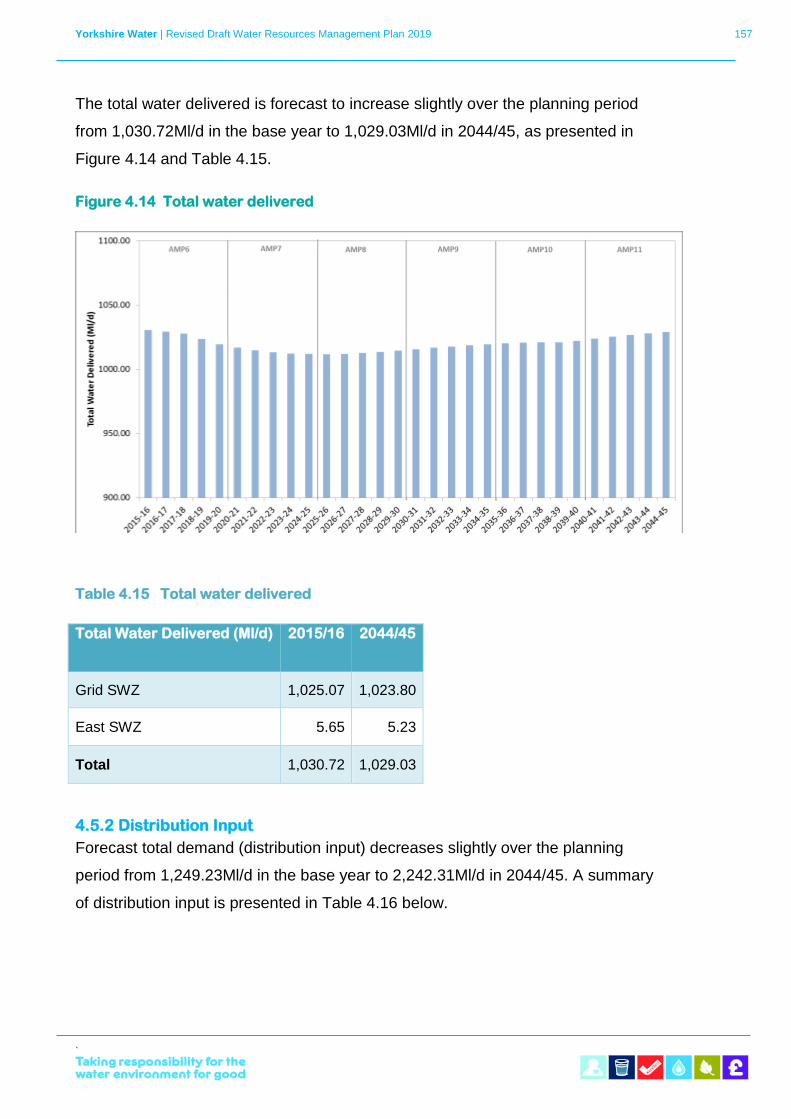
Yorkshire Water | Revised Draft Water Resources Management Plan 2019 157
`
The total water delivered is forecast to increase slightly over the planning period
from 1,030.72Ml/d in the base year to 1,029.03Ml/d in 2044/45, as presented in
Figure 4.14 and Table 4.15.
Figure 4.14 Total water delivered
Table 4.15 Total water delivered
Total Water Delivered (Ml/d) 2015/16 2044/45
Grid SWZ 1,025.07 1,023.80
East SWZ 5.65 5.23
Total 1,030.72 1,029.03
4.5.2 Distribution Input
Forecast total demand (distribution input) decreases slightly over the planning
period from 1,249.23Ml/d in the base year to 2,242.31Ml/d in 2044/45. A summary
of distribution input is presented in Table 4.16 below.
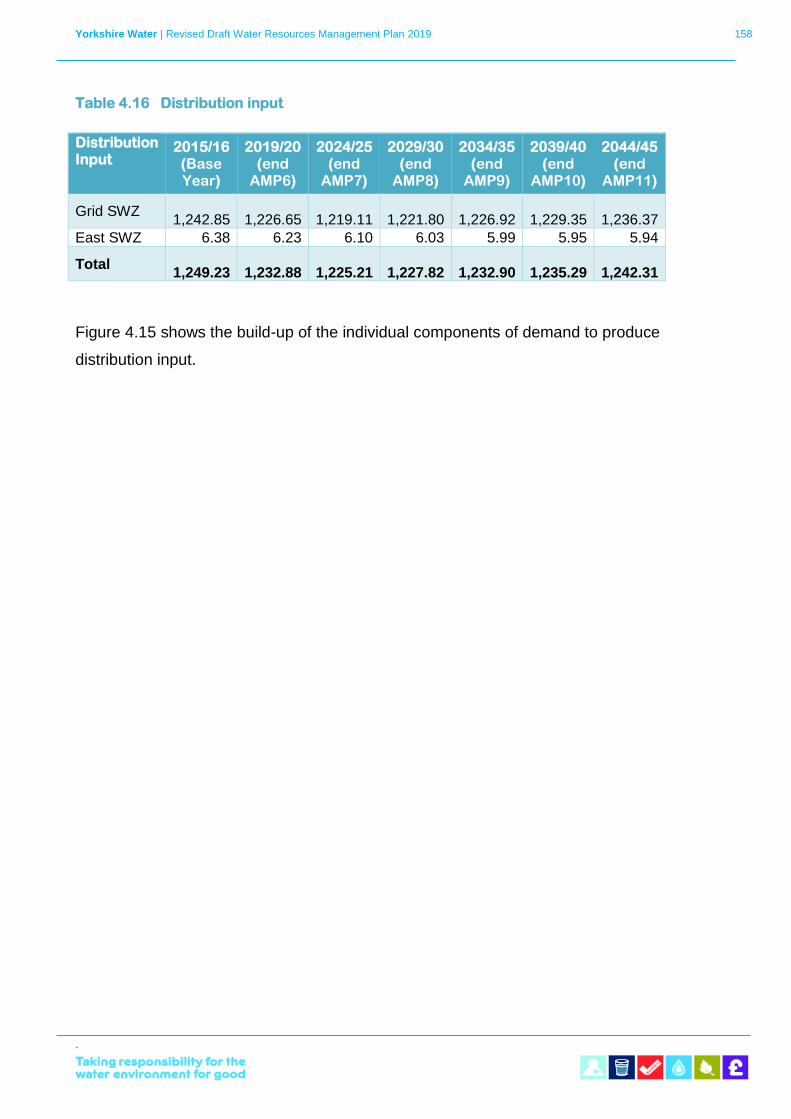
Yorkshire Water | Revised Draft Water Resources Management Plan 2019 158
`
Table 4.16 Distribution input
Distribution Input
2015/16 (Base Year)
2019/20 (end
AMP6)
2024/25 (end
AMP7)
2029/30 (end
AMP8)
2034/35 (end
AMP9)
2039/40 (end
AMP10)
2044/45 (end
AMP11)
Grid SWZ
1,242.85
1,226.65
1,219.11
1,221.80
1,226.92
1,229.35
1,236.37
East SWZ 6.38 6.23 6.10 6.03 5.99 5.95 5.94
Total
1,249.23
1,232.88
1,225.21
1,227.82
1,232.90
1,235.29
1,242.31
Figure 4.15 shows the build-up of the individual components of demand to produce
distribution input.
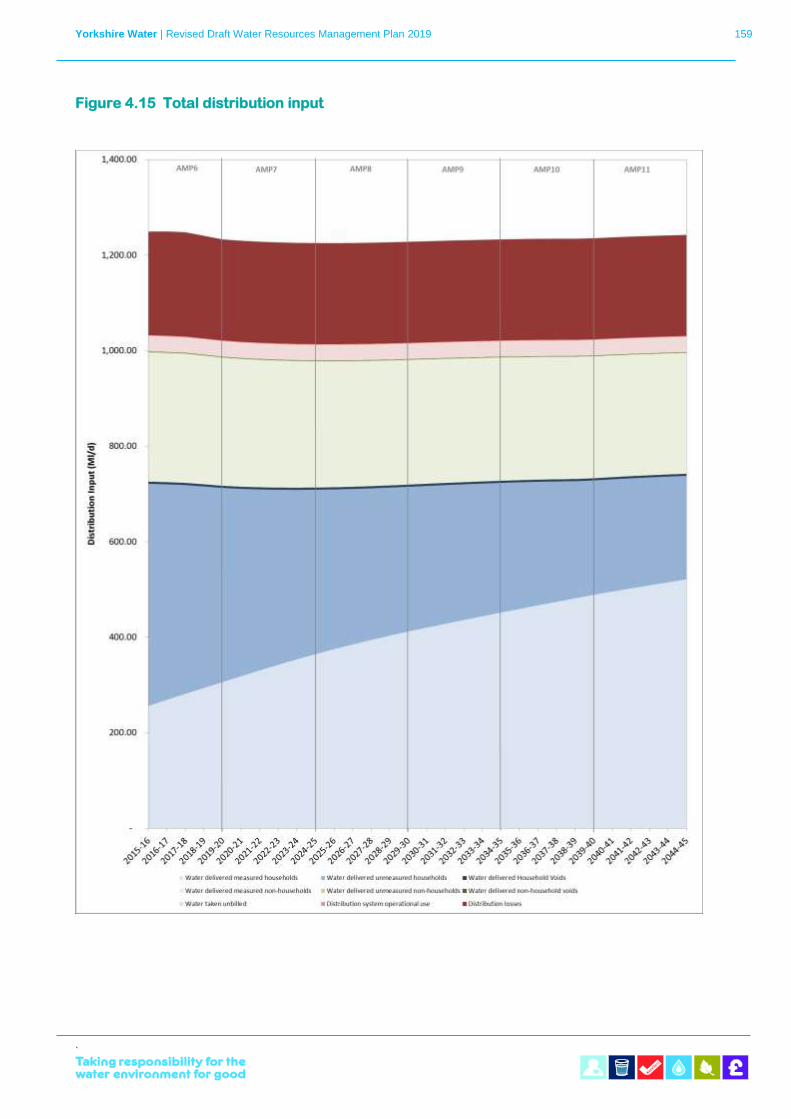
Yorkshire Water | Revised Draft Water Resources Management Plan 2019 159
`
Figure 4.15 Total distribution input
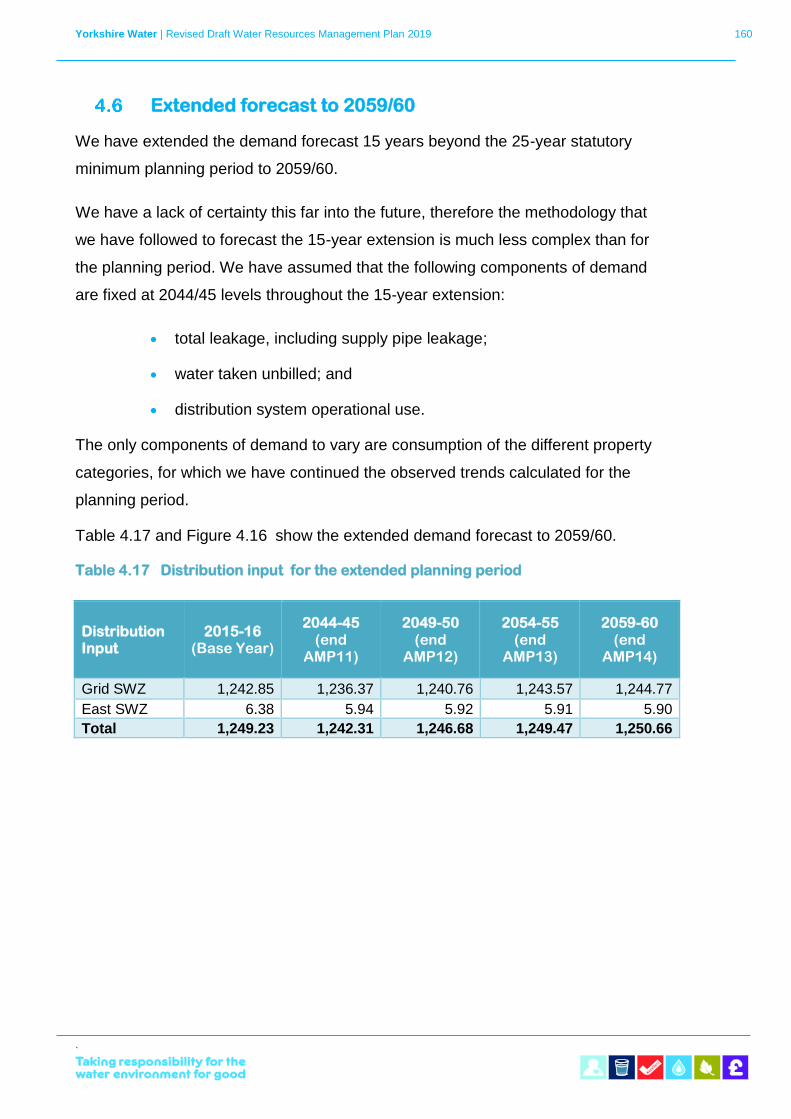
Yorkshire Water | Revised Draft Water Resources Management Plan 2019 160
`
Extended forecast to 2059/60
We have extended the demand forecast 15 years beyond the 25-year statutory
minimum planning period to 2059/60.
We have a lack of certainty this far into the future, therefore the methodology that
we have followed to forecast the 15-year extension is much less complex than for
the planning period. We have assumed that the following components of demand
are fixed at 2044/45 levels throughout the 15-year extension:
• total leakage, including supply pipe leakage;
• water taken unbilled; and
• distribution system operational use.
The only components of demand to vary are consumption of the different property
categories, for which we have continued the observed trends calculated for the
planning period.
Table 4.17 and Figure 4.16 show the extended demand forecast to 2059/60.
Table 4.17 Distribution input for the extended planning period
Distribution Input
2015-16 (Base Year)
2044-45 (end
AMP11)
2049-50 (end
AMP12)
2054-55 (end
AMP13)
2059-60 (end
AMP14)
Grid SWZ 1,242.85 1,236.37 1,240.76 1,243.57 1,244.77
East SWZ 6.38 5.94 5.92 5.91 5.90
Total 1,249.23 1,242.31 1,246.68 1,249.47 1,250.66
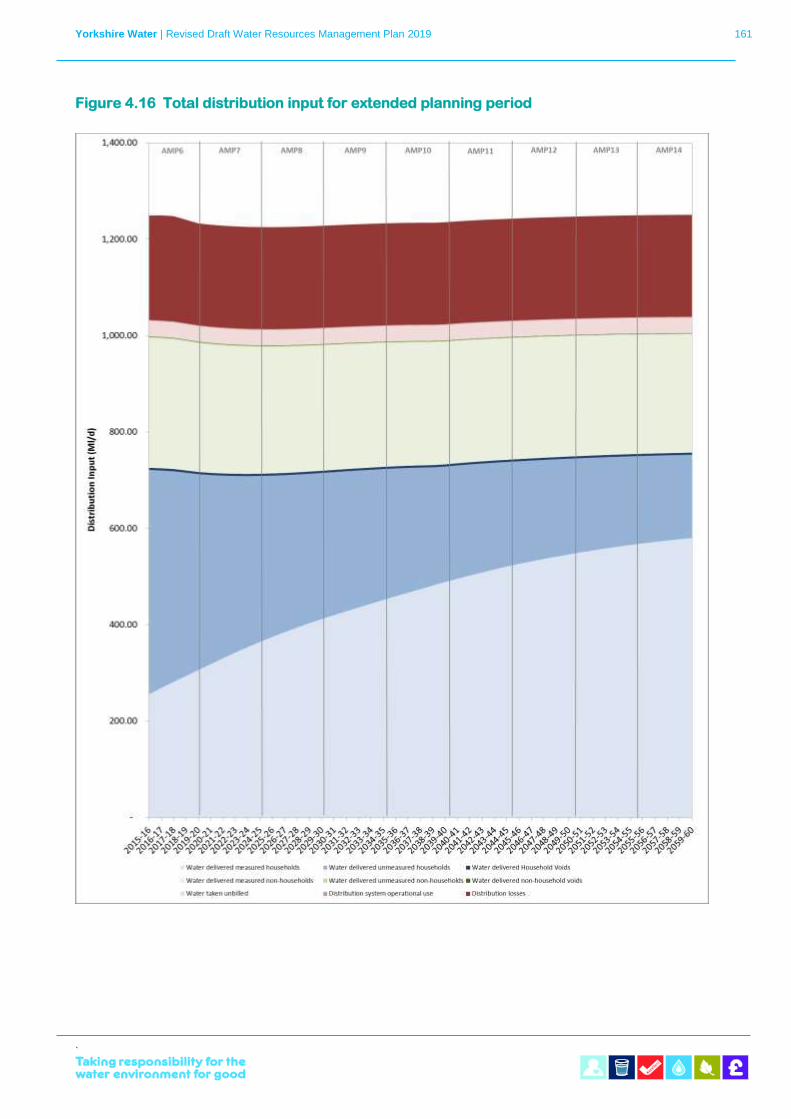
Yorkshire Water | Revised Draft Water Resources Management Plan 2019 161
`
Figure 4.16 Total distribution input for extended planning period
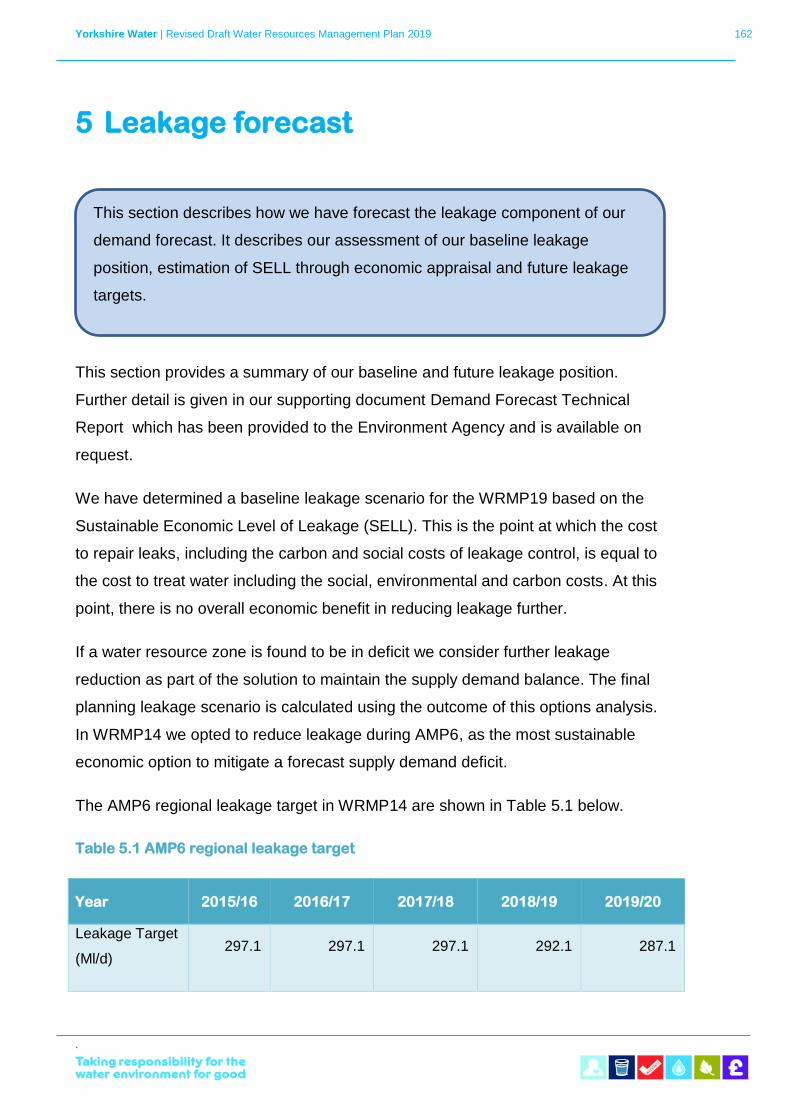
Yorkshire Water | Revised Draft Water Resources Management Plan 2019 162
`
5 Leakage forecast
This section provides a summary of our baseline and future leakage position.
Further detail is given in our supporting document Demand Forecast Technical
Report which has been provided to the Environment Agency and is available on
request.
We have determined a baseline leakage scenario for the WRMP19 based on the
Sustainable Economic Level of Leakage (SELL). This is the point at which the cost
to repair leaks, including the carbon and social costs of leakage control, is equal to
the cost to treat water including the social, environmental and carbon costs. At this
point, there is no overall economic benefit in reducing leakage further.
If a water resource zone is found to be in deficit we consider further leakage
reduction as part of the solution to maintain the supply demand balance. The final
planning leakage scenario is calculated using the outcome of this options analysis.
In WRMP14 we opted to reduce leakage during AMP6, as the most sustainable
economic option to mitigate a forecast supply demand deficit.
The AMP6 regional leakage target in WRMP14 are shown in Table 5.1 below.
Table 5.1 AMP6 regional leakage target
Year 2015/16 2016/17 2017/18 2018/19 2019/20
Leakage Target
(Ml/d) 297.1 297.1 297.1 292.1 287.1
This section describes how we have forecast the leakage component of our
demand forecast. It describes our assessment of our baseline leakage
position, estimation of SELL through economic appraisal and future leakage
targets.
Yorkshire Water | Revised Draft Water Resources Management Plan 2019 163
`
We have reviewed our SELL for the revised draft WRMP19, through analysis of
leakage reduction activity and cost data recorded in recent years.
Consistent leakage reporting
During AMP6, Water UK and the UK water companies have worked together to
derive a more consistent method for reporting leakage. The outcome of this work
has been published in the report Consistency of Reporting Performance Measures
(UKWIR, 2017).
For the remainder of AMP6, water companies are required to report leakage
performance following existing reporting methodology and ‘shadow report’ total
leakage in accordance with the consistent methods.
We have fully applied the calculation changes, combined with our planned data
improvements, to both 2015/16 data for use in our WRMP19 leakage forecast and
SELL calculation, and to 2016/17 data for shadow reporting. However, to be fully
compliant with consistency of reporting we require additional monitoring to increase
sample sizes in 5 of the 16 data quality measures described within the UKWIR
report. These will not have a significant impact on reported leakage or the
components of the water balance.
In 2015/16 the actual leakage reported was 285.11Ml/d. This was recalculated using
consistent reporting methods to 293.71Ml/d, an increase of 3%. In 2016/17, the
actual leakage reported was 295.17Ml/d, against a target of 297.1Ml/d. This was
recalculated using consistent reporting methodology to 296.56Ml/d for shadow
reporting, an increase of 0.5%. Consistency of reporting has had little impact on the
components of the water balance, but is not consistent between the years.
We have an ongoing leakage data improvement plan, much of which supports
progress towards leakage consistency reporting. A number of components of the
water balance, such as estimates of plumbing losses, unmeasured non-household
consumption and meter under registration have been reviewed.
Additionally, an occupancy model for improved estimation of household night use
allowance and PCC developed. These improvements have been applied to historic
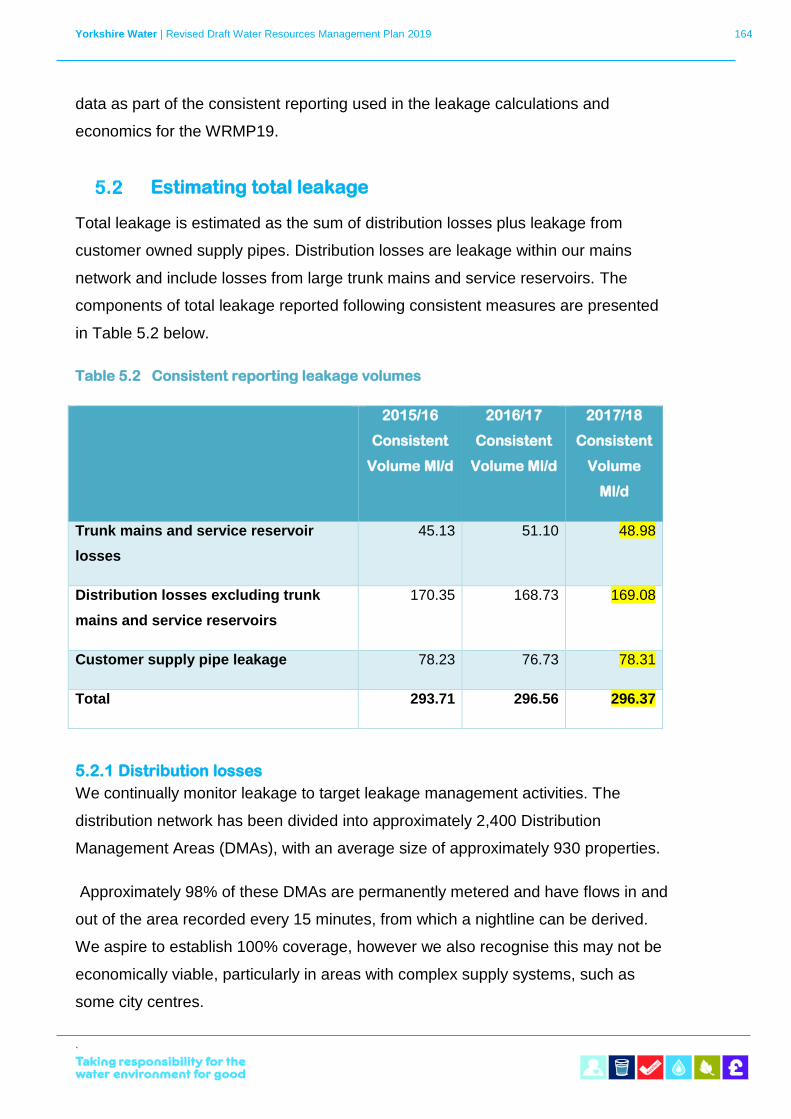
Yorkshire Water | Revised Draft Water Resources Management Plan 2019 164
`
data as part of the consistent reporting used in the leakage calculations and
economics for the WRMP19.
Estimating total leakage
Total leakage is estimated as the sum of distribution losses plus leakage from
customer owned supply pipes. Distribution losses are leakage within our mains
network and include losses from large trunk mains and service reservoirs. The
components of total leakage reported following consistent measures are presented
in Table 5.2 below.
Table 5.2 Consistent reporting leakage volumes
2015/16
Consistent
Volume Ml/d
2016/17
Consistent
Volume Ml/d
2017/18
Consistent
Volume
Ml/d
Trunk mains and service reservoir
losses
45.13 51.10 48.98
Distribution losses excluding trunk
mains and service reservoirs
170.35 168.73 169.08
Customer supply pipe leakage 78.23 76.73 78.31
Total 293.71 296.56 296.37
5.2.1 Distribution losses
We continually monitor leakage to target leakage management activities. The
distribution network has been divided into approximately 2,400 Distribution
Management Areas (DMAs), with an average size of approximately 930 properties.
Approximately 98% of these DMAs are permanently metered and have flows in and
out of the area recorded every 15 minutes, from which a nightline can be derived.
We aspire to establish 100% coverage, however we also recognise this may not be
economically viable, particularly in areas with complex supply systems, such as
some city centres.
Yorkshire Water | Revised Draft Water Resources Management Plan 2019 165
`
Monitoring of night-time flows within DMAs, when usage is at its lowest, allows
derivation of leakage estimates. Permanent loggers are installed on DMA meters.
Most are telemetered loggers, using GPRS technology, which enables DMA flow
data to be gathered every 30 minutes for operational purposes and twice daily for
leakage purposes.
This data is processed by our leakage and pressure monitoring system Netbase,
which calculates the level of leakage in each DMA. For consistent reporting, the
average of the seven-day night flow taken between 3am and 4am is used to
produce the DMA weekly leakage level aggregated for annual figures.
An allowance for household and non-household night use is subtracted from the
average gross nightline to produce the average net nightline. Large night users are
logged and the logged data subtracted from the DMA net nightline. This is the best
estimate of all the leakage within the DMA, including supply pipe leakage.
Where properties are not within an established DMA, and are therefore not
monitored, we undertake a full sounding of the area each year to identify potential
leakage.
Leakage detection staff use a variety of traditional techniques such as sounding of
fittings, step-tests, correlator surveys, acoustic noise logger surveys and more
innovative techniques, such as the use of satellite imaging.
Repairs are carried out by a service partner. All repair jobs are tracked in our
operational reporting database, so that repair times and backlogs are closely
monitored.
5.2.2 Trunk mains losses
Trunk mains are defined as all mains between the treatment works outlet and the
inlet to DMAs, and include distribution of water to and from service reservoirs. We
have 4,278km of trunk mains. Each year we carry out flow balances on a sample of
the trunk mains network. The number of successful flow balances is increasing
annually, from 7.8% of our trunk main length in 2009/10 to 17.8% in 2016/17. For
consistent reporting in 2015/16 we calculated trunk main losses to be 10.11
m3/km/d which is 43.26 Ml/d.
Yorkshire Water | Revised Draft Water Resources Management Plan 2019 166
`
Trunk main detection and repair has historically been mainly reactive due to the
difficulties in identifying and pinpointing trunk main leakage. Recent improvements
in correlating technology have enabled proactive detection and repair.
5.2.3 Service reservoir losses
There are two components of service reservoir losses; structural leakage and losses
due to overflow. Location of service reservoir leakage is part of our service reservoir
maintenance programme. This is a rolling programme of cleaning and inspection
based on factors including water quality compliance, asset age, date of last
refurbishment and known structural faults.
Following cleaning and inspection a drop test is carried out on the refilled service
reservoir to assess leakage. The reservoir is filled, inlets and outlets are shut off,
and changes in water level over 24 hours are recorded; any drop in level will
indicate a leak. Under the rolling inspection programme, all service reservoirs are
assessed for leakage every one to five years. Those reservoirs with the highest risk
of leakage or ingress are prioritised for assessment.
As well as losses through the structure of service reservoirs, water can be lost
through reservoir overflows. The volume of water lost through a period of overflow is
estimated from the duration of high alarm events at service reservoir sites.
5.2.4 Customer supply pipe leakage
The total volume of supply pipe leakage is estimated to be 31.2% of leakage within
DMAs. This was calculated from an assessment of properties on our Domestic
Consumption Monitor survey. We are carrying out research into supply pipe leakage
and this may improve future leakage analysis.
We provide a free repair service for all domestic supply pipes which are not under
buildings. Domestic customers can claim one free repair in a two-year period. We
also provide a commercial service for detection and repair of any commercial supply
pipe leaks.
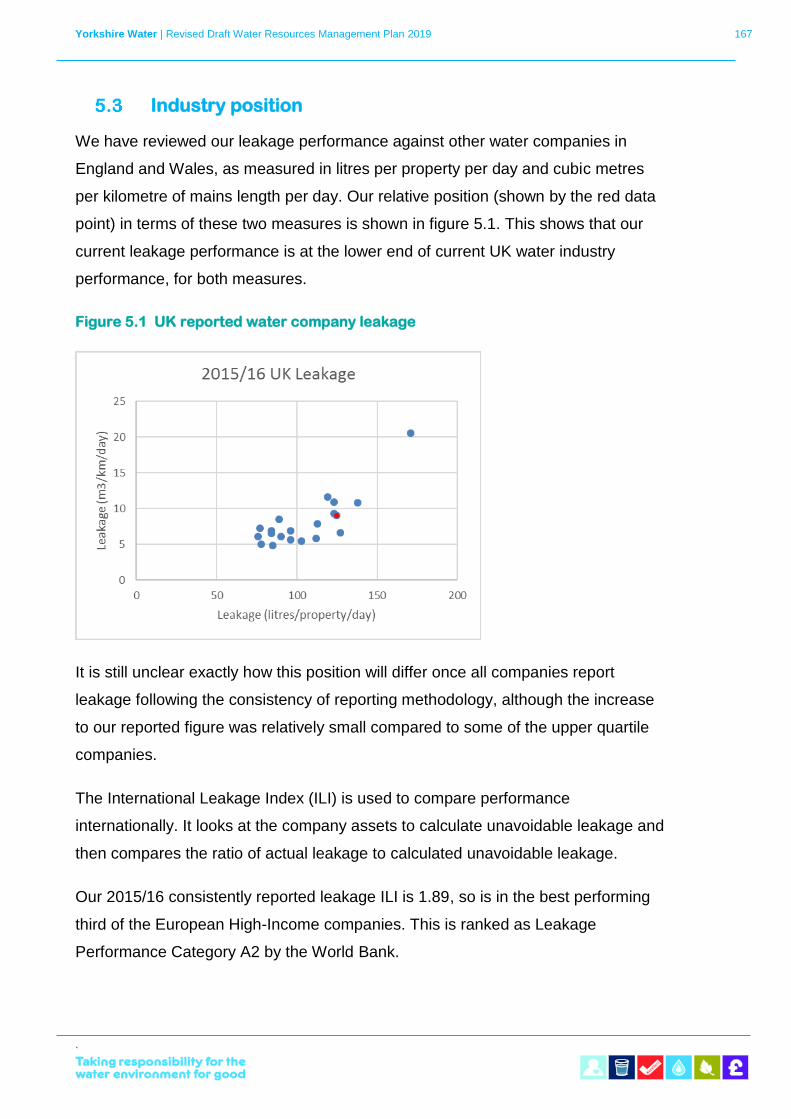
Yorkshire Water | Revised Draft Water Resources Management Plan 2019 167
`
Industry position
We have reviewed our leakage performance against other water companies in
England and Wales, as measured in litres per property per day and cubic metres
per kilometre of mains length per day. Our relative position (shown by the red data
point) in terms of these two measures is shown in figure 5.1. This shows that our
current leakage performance is at the lower end of current UK water industry
performance, for both measures.
Figure 5.1 UK reported water company leakage
It is still unclear exactly how this position will differ once all companies report
leakage following the consistency of reporting methodology, although the increase
to our reported figure was relatively small compared to some of the upper quartile
companies.
The International Leakage Index (ILI) is used to compare performance
internationally. It looks at the company assets to calculate unavoidable leakage and
then compares the ratio of actual leakage to calculated unavoidable leakage.
Our 2015/16 consistently reported leakage ILI is 1.89, so is in the best performing
third of the European High-Income companies. This is ranked as Leakage
Performance Category A2 by the World Bank.
Yorkshire Water | Revised Draft Water Resources Management Plan 2019 168
`
In both the UK and internationally, lower leakage levels are achieved by companies
with a supply demand deficit, high cost of water and high levels of meter
penetration. We are not currently in this situation, but aspire to reduce leakage as
part of our preferred plan to increase resilience and flexibility of water supplies in the
future.
Leakage economic appraisal
We have adopted the water company specific recommendations from the Review of
the calculation of sustainable economic level of leakage and its integration with
water resource management planning, (SMC, 2012). Since WRMP14 we have
made significant improvements in our accounting of the cost and benefit of active
leakage control, so we now have robust data for analysis.
For this WRMP we carried out a leakage economic appraisal to provide the
following information:
• calculation of the short-run SELL using 2015/16 reported leakage;
• calculation of the short-run SELL using the consistency of reporting
methodology for 2015/16; and
• cost of leakage reduction options to meet a supply demand deficit.
The SELL is the economic level of leakage including the environmental and social
costs of leakage and leakage reduction.
Updated modelling of the SELL was carried out by RPS Water consultancy, using
consistent leakage data and other Yorkshire Water specific cost data from the
baseline year 2015/16. Environmental, social and carbon costs of leakage control
were determined using appropriate methodologies to align with Providing Best
Practice Guidance on the Inclusion of Externalities in the ELL Calculation
(Ofwat/RPS, 2008).
The total cost of leakage and leakage reduction for different leakage levels has
been calculated. The SELL is the level of leakage at which the total cost is at a
minimum.
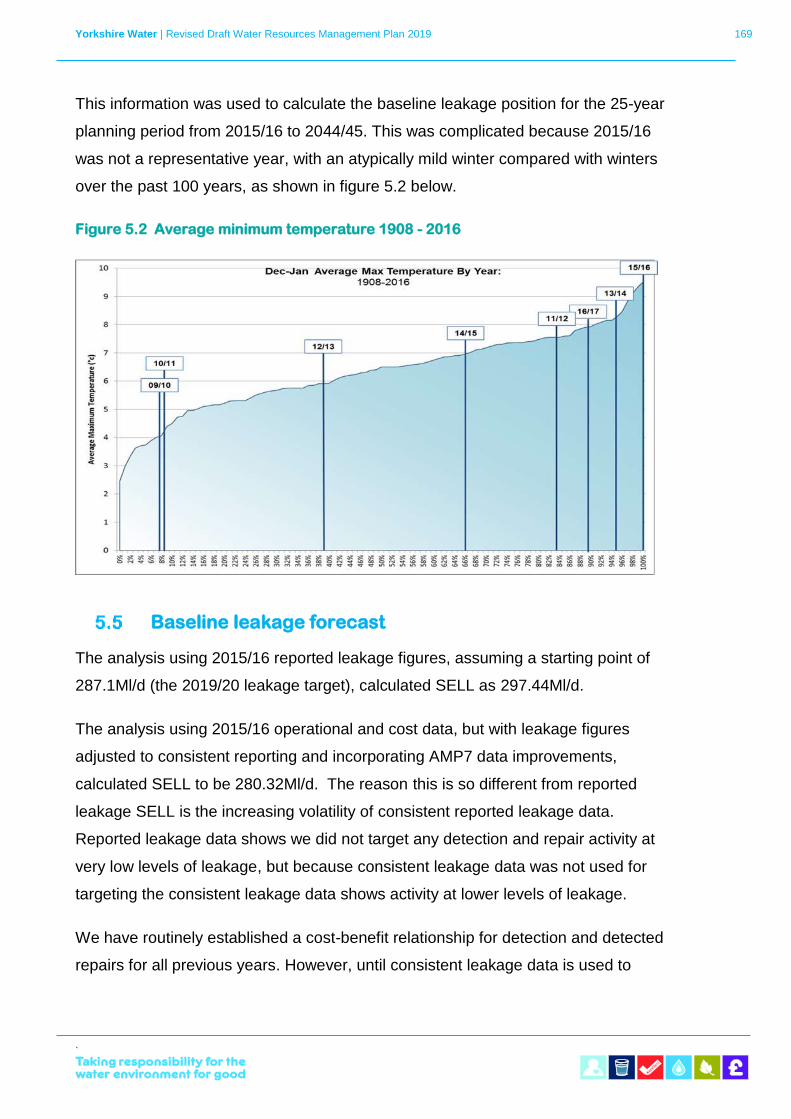
Yorkshire Water | Revised Draft Water Resources Management Plan 2019 169
`
This information was used to calculate the baseline leakage position for the 25-year
planning period from 2015/16 to 2044/45. This was complicated because 2015/16
was not a representative year, with an atypically mild winter compared with winters
over the past 100 years, as shown in figure 5.2 below.
Figure 5.2 Average minimum temperature 1908 - 2016
Baseline leakage forecast
The analysis using 2015/16 reported leakage figures, assuming a starting point of
287.1Ml/d (the 2019/20 leakage target), calculated SELL as 297.44Ml/d.
The analysis using 2015/16 operational and cost data, but with leakage figures
adjusted to consistent reporting and incorporating AMP7 data improvements,
calculated SELL to be 280.32Ml/d. The reason this is so different from reported
leakage SELL is the increasing volatility of consistent reported leakage data.
Reported leakage data shows we did not target any detection and repair activity at
very low levels of leakage, but because consistent leakage data was not used for
targeting the consistent leakage data shows activity at lower levels of leakage.
We have routinely established a cost-benefit relationship for detection and detected
repairs for all previous years. However, until consistent leakage data is used to
Yorkshire Water | Revised Draft Water Resources Management Plan 2019 170
`
determine this activity, the level of volatility means it is inappropriate to use this
cost-benefit relationship for future planning.
5.5.1 Impact of non-leakage activity on baseline leakage
We have assessed the potential impact of activity carried out in our distribution on
leakage and SELL.
Mains renewal for burst reduction or water quality drivers will not have a significant
impact on leakage reduction. In 2012, we undertook significant mains renewal
activity to address 17 high burst rate and high leakage DMAs in Leeds. This was
successful at reducing burst rate and the cost of leakage control in future years but
did not show any discernible leakage reduction.
During AMP7 we plan to renew 0.3% of water mains/year to maintain asset
reliability and burst frequencies.
Increasing meter penetration does not have a notable impact on leakage targets
or the SELL calculation because, although it is likely to result in customers reporting
lower volume supply pipe leakage and hence a 0.6% reduction in leakage, repair of
these supply pipes increases repair costs per Ml/d saved.
Property growth is expected to continue at 20,000 properties per year. We have
carried out detailed investigation into distribution leakage levels in new build
housing estates and found leakage between the DMA meter and the household
meters at the edge of the customer’s supply pipes to be 50 litres per property per
day. This is much higher than expected as it does not include trunk main leakage or
supply pipe leakage. Further investigations are ongoing, because this indicates that
leakage increase due to property growth is predicted at 0.3% per year.
Innovation is necessary to ensure that detection and repair costs are achievable at
much lower levels of leakage than the basis of the current model. The 2015/16 data
incorporates all our improved methods of leakage management and the benefits of
pressure management activity carried out in the preceding years.
Our ongoing data improvement plan uses new and emerging methods of accounting
for leakage to help separate leakage from demand, to improve our targeting of
Yorkshire Water | Revised Draft Water Resources Management Plan 2019 171
`
leakage management activities. We have assessed known new techniques for
inclusion in our plan, and continuously pursue more innovative options. The
efficiency this will deliver is unpredictable and is likely to be insignificant compared
to the increased cost of moving to, and maintaining, aspirational leakage levels.
If we are to achieve an aspirational leakage reduction, this will require new and
alternative techniques. For example, we have previously identified that the level of
background leakage due to ‘weeps’ and ‘seeps’ is a key limiting factor in both
leakage reduction and the prohibitive cost of leakage reduction. We commissioned
a consultant to look at alternative options for sealing ‘weeps’ and’ seeps’, but with
limited success.
Final planning leakage forecast
As noted above, our current leakage performance is at the lower end of UK water
industry performance. We know that our customers want us to reduce leakage,
particularly when they are given information about our performance in comparison
to other companies. Further, there have been clear government and regulatory
signals about the need for the industry as a whole to reduce leakage. So not only do
we need to improve our performance when measured against the current
performance of the rest of the industry, we also expect the rest of the industry to
improve as well.
Therefore, although we are not forecasting a supply/demand deficit until 2024/35,
we have set ourselves an ambitious plan to reduce leakage by 40% by 2025, from
297.1 Ml/d to 175.1 Ml/d. We have identified, costed and quantified a series of
feasible options to deliver this reduction, which will reduce leakage below the SELL.
This is included in Section 9 and includes our approach to alternative techniques to
traditional ‘find and fix’ such as pressure management and DMA optimisation. It also
details our approach to targeting trunk main and supply pipe leakage.
Yorkshire Water | Revised Draft Water Resources Management Plan 2019 172
`
6 Water efficiency and demand reduction
strategy
Water efficiency is an integral part of water resource planning for the future. Water
companies have had a duty to promote the efficient use of water to all customers
since 1996, and its importance increases as the risks to water and energy supply
increase. By promoting water saving benefits to our customers, reducing our own
use of water in the production of potable and treatment of wastewater and building
partnerships we can help keep demand low and reduce our reliance on natural
resources.
Our long-term strategy, which was published in March 2018, sets goals for us to
meet future challenges to clean and waste water services and meet our customers’
expectations. Our goal for water supply is that we will always provide our customers
with enough safe water, we will not waste water and always protect the
environment.
The key themes of our water efficiency strategy are:
• communicating the water efficiency message to our customers; and
• a continued drive for innovation and best practice to reduce demand
for water.
We continue to actively promote water saving to our customers through household
water efficiency initiatives. The Water Act 2014 introduced non-household water
retail competition in England in April 2017. Since retail separation, Yorkshire Water
is responsible for wholesale water supply and household retail in the Yorkshire
region but not non-household retail services. Non-household billing and customer
This section describes how we intend to continue promoting water efficiency to
our customers and investigate new innovative measures for reducing demand
in the future.
Yorkshire Water | Revised Draft Water Resources Management Plan 2019 173
`
service provision is delivered by a number of retailers operating in the Yorkshire
Water region.
Although we are no longer directly supplying non household customers in our
region, we still have a responsibility to promote water efficiency to commercial water
users. We are looking at new and innovative means of working with this sector to
help reduce their water use. This could include working in collaboration with retailers
in our region or offering commercial users new services, such as non potable water
supplies from recycled water, described in more detail below.
Household customer water efficiency
Our household customer water efficiency strategy is summarised below:
• Water saving packs - household customers can request free water
saving packs. The products offered are a flow reducing showersave,
cistern displacement device, shower timer, tap inserts and self-audit
leaflet. Customers can select which products they would like to
receive.
• Household audit and retrofit service - customers will be offered our
‘Fit2Save’ service where a technician will visit properties and fit
appropriate water saving devices.
• Promotion and sales of water butts to customers - discounted water
butts are available to customers through our website.
• Behavioural change – we encourage behaviour changes through:
o Water efficiency information on our website including a water use calculator
o Water efficiency tips and self-audit leaflets
o The Green Classroom school pack and visits to our education centres.
In recent years, we have focused our household customer water saving activity on
the provision of free water saving packs that customers self-fit. This has been
successful in our region, with free pack giveaways of 30,000 to 40,000 per year.
Yorkshire Water | Revised Draft Water Resources Management Plan 2019 174
`
Recent studies, including a Yorkshire Water project in the Huddersfield area, have
concluded the free packs do not achieve the savings originally assigned to them in
annual reporting assumptions provided by Ofwat in AMP5. Our project concluded
that savings were no more than five litres per property per day (l/p/d), compared to
around 50 l/p/d previously assumed. This can, in part, be attributed to the fact that
customers ordering the free packs do not necessarily fit the products.
From 2018 to 2020 we are delivering a trial project where we offer to visit
customers’ properties and fit water saving devices free of charge. If successful we
will continue to offer this service from 2020 onwards.
We will also continue to offer the free self-fit packs, but at a lower promotional level.
This assumes that customers who actively seek to order the free packs are more
likely to fit them and therefore achieve savings.
Communication campaign strategy
We are taking a new approach to our behaviour change campaigns to make sure
we are reaching the right customers with the right messages, at the right time. We
will use our customer insight to identify how different segments of customers use
water in different ways, and what messages and incentives are most likely to
change their behaviour and attitude to water and the amount they use.
In the past, we have delivered broad awareness campaigns across the whole of the
region, to encourage customers to use less water and to promote our free water
saving packs. We are now moving to a more “micro” approach to talk to different
communities in the right way, at the right time. We hope to see a real change in
behaviour and to promote positive attitudes at a household and community level.
Using Experian data, we have identified the different demographics of our customer
base in Yorkshire, in total we have nine ‘Mosaic’ types and all the types have
different characteristics, attitudes, income, locations etc. We use the Mosaic types
to get to know our customers more and identify the right channels to use and what
messages they might be interested in.
Yorkshire Water | Revised Draft Water Resources Management Plan 2019 175
`
The Experian data has helped us identify which four of the nine Mosaic types have
the highest water consumption. These are:
• ‘Starting Out’ (young families likely to have a couple of children,
living in semi-detached and terraced properties with lower to mid-
affluence);
• ‘Affluent Families’ (families likely to have children, living in larger
detached properties in suburban areas of Yorkshire);
• ‘Urban Families’ (families likely to have more than 2 adults living at
home, living in semi-detached and terraced properties with slightly
different habits and behaviour where water usage is concerned); and
• ‘Rural Retirees’ (people aged 60+ living alone or in couples in
detached properties in rural areas whose children have left home).
Using this insight, we know the parts of our region these segments of customers are
most likely to live, and can target these customers using channels that will appeal to
each individual segment. For example, we will use local newspapers and village
halls for ‘Rural Retirees’ to maximise engagement. For ‘Affluent Families’, we might
use social media for targeted messaging.
We will also change the messaging of the campaign to suit each segment, as the
insight helps us to understand both current situations and what the drivers for
saving water might be. As an example, we might emphasise the impact on the
environment and the future of our region to influence ‘Affluent Families’ behaviour
and attitudes to water. For ‘Urban Families’, we might talk about the direct impact on
them and potentially their bills as this would be a more compelling reason for them
to use less water.
In addition to different messaging, we will also have different packs, giveaways and
offers for each segment. For ‘Starting Out’ families we will offer child friendly packs,
targeted to people with young children who may need to save both time and money.
We will encourage uptake through product giveaways or competition prizes that will
benefit customer group. For ‘Starting out’ this could be ‘Bath Buoys’ or ‘Baby Dams’.
For the ‘Rural Retirees’ segment we will run similar competitions and offers but for
gardening items such as water butts or watering cans.
Yorkshire Water | Revised Draft Water Resources Management Plan 2019 176
`
The customer segmentation approach has identified that the ‘Starting Out’ segment
are most likely to respond to a home water audit offer. When we trial the visit and fit
service, we will offer it in areas that include this segment of customers and include
messaging and incentives that are likely to appeal to the starting out segment. We
will track the success of the visits over the course of the campaign and if the
feedback is successful in terms of the customers’ experience during the visits, we
will trial this approach across some of the different segments.
We will also promote the customer campaign and hoem audit trials in areas of our
Grid SWZ with potential risks to resilience, to help prevent this becoming a pressure
on our water supply.
Free supply-pipe repairs
We continue to offer free supply pipe repairs, to ensure that supply pipe leakage is
kept to a minimum. This contributes to a reduction in demand.
Our policy is to raise customer awareness of supply pipe ownership and give
options to manage the associated responsibility. Under the policy we repair a
leaking supply pipe free of charge for household customers, however further repairs
are at the customer’s own expense for two years following repair.
Metering
We operate a free meter option scheme. Details of the scheme are given on our
website. This includes a water use calculator to allow customers to calculate their
likely water bill on a metered supply. A forecast of domestic meter optants is
included in the demand forecast. Further details are provided in Section 4.4.1 of this
plan.
Water savings are typically seen after the installation of a meter, due to the
increased financial incentive to use less water. These savings are a major
contribution to water efficiency.
Currently around 50% of our household customers have a metered supply. We are
forecasting an average of 34,054 optants per year from 2015/16 to 2019/20, which
is the average number of optants in the previous 5 years. This is forecast to
Yorkshire Water | Revised Draft Water Resources Management Plan 2019 177
`
decrease gradually to 15,000 per annum by 2030/31, and remain fixed at this rate
for the remainder of the planning period, reflecting the decreasing number of
unmeasured households available to opt, and with a financial benefit of opting.
At this point the potential number of optants per year becomes increasingly
uncertain due to the increasingly unpredictable nature of the remaining unmeasured
household property base in terms of meter opting. This is a forecast based on
assumed activty and will be reappraised and reassessed for WRMP24 based on
optant activity in AMP7 and any changes to our metering policy at that time.
By 2044/45 we are predicting 64% of base year unmeasured household properties
will have opted to be metered. Including all new properties, which are metered as a
legal standard, we are forecasting 84% household metering by 2044/45.
Metering is instinctively an appropriate method of charging for water and sewerage,
based on payment for use. However, metering is expensive compared to
unmeasured billing and would significantly increase customers’ bills through the
additional cost of the meter, a replacement cost every 10 to 15 years and the
ongoing operating costs of servicing a measured account. The cost of metering
coupled with a policy of maintaining an element of customer choice, results in a
continued policy of demand led (meter optant) household metering in Yorkshire.
Selective metering
Selective metering is the installation of meters at existing billed household
properties where a customer has not chosen to have a meter fitted.
Under the Water Act 1991, we can selectively meter properties when there is a
change of occupier or at properties that meet certain criteria for water use. For
example, if the water supply to a property is used to automatically refill a pond or
swimming pool with capacity greater than 10,000 litres or for watering a gardening
with a fixed irrigation system.
Currently we do not have a policy of selective metering in either circumstance, and
therefore we have no associated water savings for this category. However, one of
Yorkshire Water | Revised Draft Water Resources Management Plan 2019 178
`
the investment options for WRMP19 is a scheme for metering properties on change
of occupancy.
Tariffs
We have considered the use of tariffs as a potential demand management option.
We have investigated the use of social tariffs but this impacts on the ‘retail’ element
of the bill and is not based on varying tariffs for different levels of water use.
Use of tariffs for demand management would require properties to be metered to
allow a finacial benefit for reduced water use. Current meter penetration in
Yorkshire is just over 50%, and therefore we consider the use of tariffs for demand
management to be an unfeasible option at this stage.
We also have insufficient information to quatify the potential water savings from tariff
schemes for WRMP19.
Sub potable water supply
We aim to provide our customers with a sustainable and affordable water supply for
the future. By reusing and recycling water that has already been used in supply, we
can reduce the water we are required to take from the environment to meet our
customers’ needs. This reduces the overall demand for water, and the need for
investment in new assets and infrastructure for both clean and waste water
services.
Similarly, potable water for some purposes can be replaced with grey water or
rainwater. This can be for household as well as non-household use, for example
flushing toilets or watering gardens.
6.7.1 Final effluent reuse
We are investigating how to reuse and recycle existing water supplies for use by
non-household water users. We can do this by substituting potable water supplies
with non-potable water supplies where it is appropriate.
For example, the combined use of industries in Hull is over 7 billion litres of potable
water every year, most of which is for industrial cooling down processes. By using
Yorkshire Water | Revised Draft Water Resources Management Plan 2019 179
`
non-potable water for these processes, we could offset 5% of our total potable water
production.
Over the next two years we will be trialling a number of projects to understand how
we can supply non-potable water to non-household partners across the region in a
sustainable, safe and commercially viable way.
The non-potable supply will be provided by a nearby wastewater treatment works
and piped direct to the non-household user. This will reduce the volume of potable
water we treat and supply to these companies, which reduces our total chemical
and energy requirements during the production of potable water. The water supply
will be separate to the companies’ potable supply and only used for specific
purposes where non-potable water is suitable.
There are three small pilot schemes proposed for delivery between 2018 and 2020.
The first scheme will be implemented at one of our own waste water treatment
works in South Yorkshire. It will use final effluent for a stage of treatment that
traditionally utilises potable water. If successful, this could be repeated at several of
our other waste water treatment works.
Secondly, pilot projects are planned with two companies in our region to use final
effluent from nearby wastewater treatment works. This pilot will inform our future
strategy and policy on sub potable water use and help determine the commercial
and regulatory viability of these policies and practices for delivery on a wider scale.
The third project is planned for one of our largest wastewater treatment works in the
Bradford area. This project has two deliverables; firstly, the land surrounding the
works has the potential to be developed for domestic, industrial and amenity value.
Our Innovation Team is developing a plan for these developments to be exemplars
of sustainability and case studies for circular economy application. The
developments will aim to maximise water reuse, using a variety of approaches
including sub-potable water systems, delivering a significant reduction in household
consumption and potable water offset in industry.
Secondly the works will demonstrate the capabilities of new and emerging
technologies to produce water across a variety of standards, informing the range of
Yorkshire Water | Revised Draft Water Resources Management Plan 2019 180
`
water products available to non-household customers and options to consider for
additional water treatment facilities in the future.
All three schemes will inform how we supply non-potable water to non-household
partners across the region in a sustainable, safe and commercially viable way.
These schemes will achieve relatively small savings on the volume of water we
abstract for potable supply per a year. However, the learning from the projects will
be used to offer the service to larger water users and we have identified a company
that could potentially use nearly 20Ml/d of non-potable water.
6.7.2 Integrated Water Management
As the population in our region increases there will be more requirement for new
housing developments. This will increase future demand for water and put pressure
on our waste water network and treatment processes if we do not invest in new
assets and infrastructure.
To reduce investment in new assets and infrastructure we are proposing to work
with developers to provide a non-potable water supply for two new settlements
planned in the Leeds and Harrogate areas. Approximately 4,000 new houses are
proposed for the Leeds development, construction will be carried out over several
years with 1,850 houses to be built by 2028. Development beyond that date is
dependent on local planning permissions. Around 3,000 houses are planned for the
Harrogate settlement.
To meet water demands, options are available to connect the properties to existing
water supplies. For the treatment of waste water, a new waste water treatment
works is likely to be required and additional infrastructure for transporting, storing
and pumping waste water before treatment.
Alongside traditional methods for delivering and disposing of water to customers,
Integrated Water Management (IWM) has been considered. IWM is the
management of the water cycle (water efficiency, potable water demands, non-
potable water demands, surface water, wastewater and water supply) in harmony
with the built environment through planning and urban design. Within this approach
Yorkshire Water | Revised Draft Water Resources Management Plan 2019 181
`
the water cycle is considered from the outset and throughout the planning and
design process for developments.
Water management approaches involve:
• understanding of the local constraints, such as local environment,
infrastructure capacity and available space;
• making the best use of existing infrastructure and delaying or
minimising the need for reinforcements and upgrades; and
• provision of resource security and greater resilience in the future.
IWM approaches can deliver multiple benefits, including reduced cost of water
abstraction and treatment, reduced pumping of potable water and wastewater,
increased headroom in water supply and drainage networks, and reduced footprint
of wastewater treatment plants.
The IWM approach aims to meet the demands for water that can be satisfied by
non-potable quality water. There are several processes available and the
approaches considered for the Leeds development included:
• higher water efficiency measures - based on Building Regulations
Part G and assumed water demand of 105 l/d per person;
• rainwater harvesting – supply of rainwater from rooftops for non-
potable water use;
• stormwater harvesting – use rain water from catchment surfaces for
non-potable water use; and
• greywater reuse – recycle water used for domestic purposes such as
showering and dish-washing for non-potable water use.
We are currently working with the developers of the housing projects to include
provision of some of the above techniques during the construction of the new
properties. This will reduce the waste water infrastructure requirements for the
development. It will not change the requirement for connecting the properties to a
potable water supply, but will reduce the volume of water we abstract, treat and
Yorkshire Water | Revised Draft Water Resources Management Plan 2019 182
`
pump to these customers. The homeowners are likely to save on their water bills if
non-potable water is supplied at a rate below the potable water supply.
Reducing our own water use
Our long-term goal for water supply aims to reduce the water that we use, and the
water that is lost through leakage. We will use innovation to help us drive down the
cost of identifying and repairing leaks so that we save water and money. Our sub-
potable use trial at a waste water treatment works will provide an understanding of
how we can make more use of final effluent instead of potable water in waste water
treatment.
The feasible options for this WRMP19 include several options for reducing our own
use of water during the process of producing potable water at our clean treatment
works. Our PR19 perfomance commitments include a Recycling Peformance
Commitment. This is discussed as part of our final planning scenario in Section 12.
Water efficiency options
Customer side management options have also been included in the feasible options
available to meet a supply demand gap. This includes; increased metering,
including metering on change of occupancy; plumbing loss benefits linked to supply
pipe leakage reduction options; and an enhanced home water use audit service
delivered to a greater number of households each year.
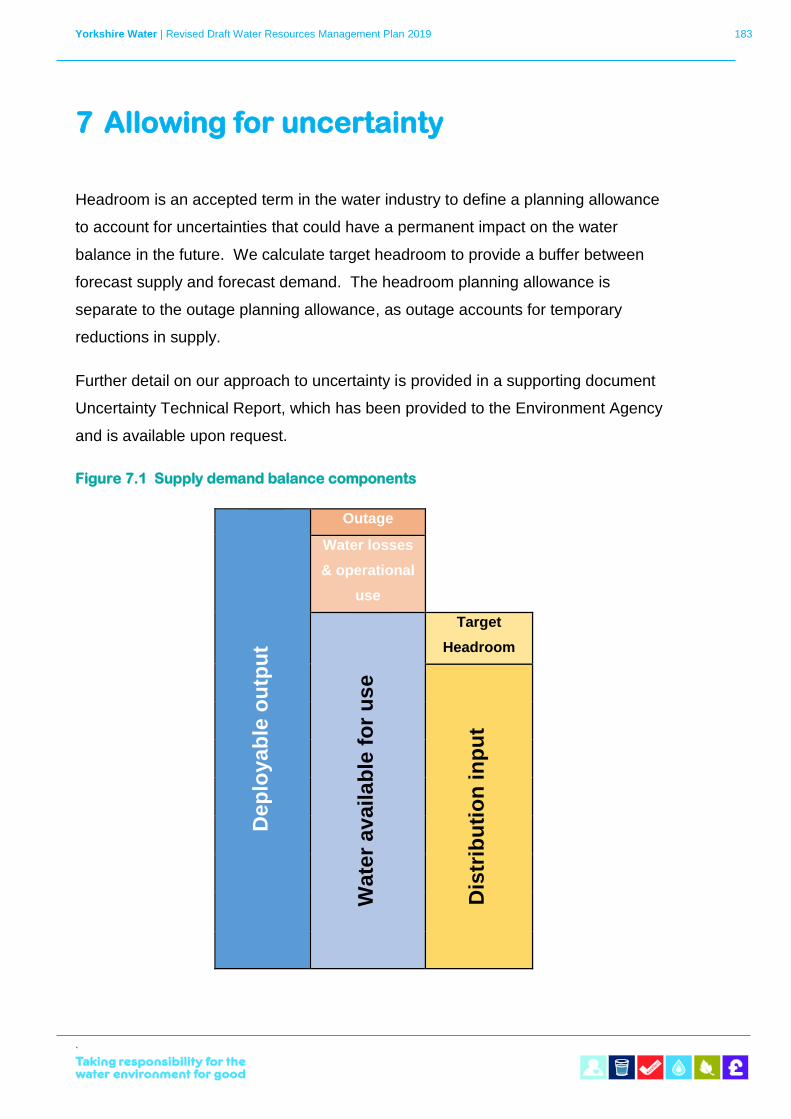
Yorkshire Water | Revised Draft Water Resources Management Plan 2019 183
`
7 Allowing for uncertainty
Headroom is an accepted term in the water industry to define a planning allowance
to account for uncertainties that could have a permanent impact on the water
balance in the future. We calculate target headroom to provide a buffer between
forecast supply and forecast demand. The headroom planning allowance is
separate to the outage planning allowance, as outage accounts for temporary
reductions in supply.
Further detail on our approach to uncertainty is provided in a supporting document
Uncertainty Technical Report, which has been provided to the Environment Agency
and is available upon request.
Figure 7.1 Supply demand balance components
Dep
loyab
le o
utp
ut
Outage
Water losses
& operational
use
Wate
r availa
ble
fo
r u
se
Target
Headroom
Dis
trib
uti
on
in
pu
t
Yorkshire Water | Revised Draft Water Resources Management Plan 2019 184
`
We calculate target headroom and available headroom to ensure demand will be
met over the 25-year planning period. Available headroom is the water available
once the forecast demand is met. Target headroom is a buffer we allow between
supply and demand for specified uncertainties that impact permanently on our ability
to meet demand in a water resource zone.
Figure 7.1 shows target headroom as a component in the supply demand balance.
We must ensure WAFU is greater or equal to distribution input plus target headroom
throughout the planning period. If WAFU is less than distribution input plus target
headroom, measures must be taken to ensure the deficit will be met.
As for previous plans, we have calculated target headroom following the UKWIR
guidance An Improved Methodology for Assessing Headroom (UKWIR, 2002) and
used a stochastic model to produce an estimate of target headroom at a range of
percentiles. This is included in the UKWIR WRMP 2019 Methods – risk based
planning guidance (Atkins, 2016) as an accepted methodology for calculating target
headroom.
The East SWZ supply demand forecast showed a surplus throughout the WRMP14
planning period and our problem characterisation concluded that the traditional
target headroom method was appropriate.
The Grid SWZ was initially classed as small strategic needs with high complexity in
its problem characterisation, due to climate change driving a deficit for WRMP14
and a risk of sustainability reductions increasing the deficit in WRMP19. We
therefore considered if a “scenario based method” headroom approach was
appropriate. It has since been confirmed that there are no defined sustainability
reduction scenarios which would drive a deficit in the zone and supply side climate
change is the only risk driving a deficit in WRMP19.
We therefore considered it most appropriate to use the UKWIR 2002 headroom
methodology for the Grid SWZ target headroom. We do, however, include an
alternative, more extreme climate change scenario, in our sensitivity testing for the
zone.
Yorkshire Water | Revised Draft Water Resources Management Plan 2019 185
`
We assessed the supply demand balance in this plan at target headroom values to
ensure the security of supply is maintained at the current levels of service. This
assessment is in line with the Intermediate Approach presented in the Economics of
Balancing Supply and Demand Methodology (UKWIR, 2003)
The UKWIR 2002 headroom methodology prescribes a probabilistic approach to
assessing headroom, applying probability distributions to individual headroom
components. We use a stochastic model to derive the target headroom for the 25-
year planning period. Headroom components are based on known risks to supply
and collated in consultation with key Yorkshire Water staff.
Headroom components
Headroom components can be divided into two categories, those that represent the
uncertainties in the supply forecast and those that represent the uncertainties in the
demand forecast. We consider headroom components for each water resource
zone individually, to provide target headroom values for the dry year annual average
scenario for each zone.
Table 7.1 shows the headroom components we considered for each zone based on
the UKWIR 2002 methodology. In accordance with the Water Resources Planning
Guideline, we do not include uncertainty due to unconfirmed sustainability
reductions.
We have not identified any vulnerable surface water headroom risks in either zone
over the planning period and no vulnerable groundwater risks in the East SWZ.
There is one vulnerable groundwater source in the Grid SWZ and 14 groundwater
headroom risks due to pollution. This includes nitrates, pesticides, saline intrusion,
bacterial contamination and cryptosporidium. Some sites are affected by more than
one risk, and interdependencies are accounted for in the headroom assessment to
ensure no double counting.
We included uncertainty due to the impact of climate change on source yields in the
Grid SWZ and East SWZ headroom estimates. This was based on the methodology
applied to both zones in the deployable output climate change assessment. For
each of the two zones, the analysis produced climate change forecasts over a range
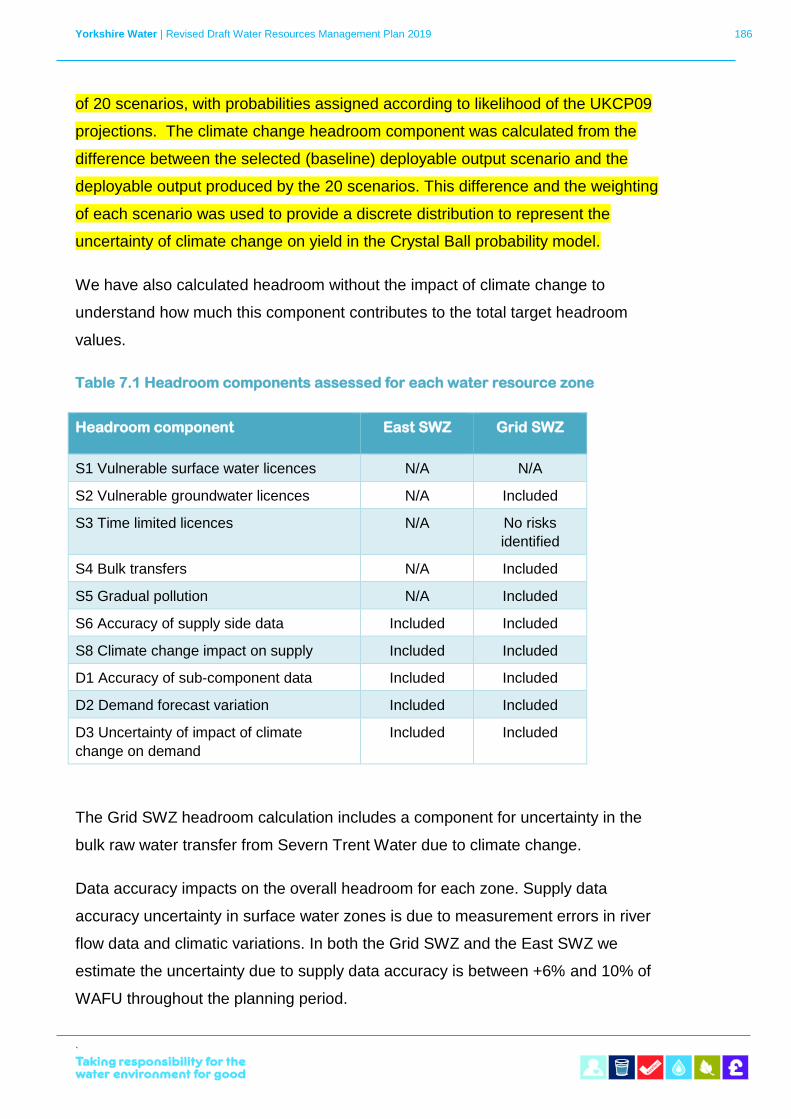
Yorkshire Water | Revised Draft Water Resources Management Plan 2019 186
`
of 20 scenarios, with probabilities assigned according to likelihood of the UKCP09
projections. The climate change headroom component was calculated from the
difference between the selected (baseline) deployable output scenario and the
deployable output produced by the 20 scenarios. This difference and the weighting
of each scenario was used to provide a discrete distribution to represent the
uncertainty of climate change on yield in the Crystal Ball probability model.
We have also calculated headroom without the impact of climate change to
understand how much this component contributes to the total target headroom
values.
Table 7.1 Headroom components assessed for each water resource zone
Headroom component East SWZ Grid SWZ
S1 Vulnerable surface water licences N/A N/A
S2 Vulnerable groundwater licences N/A Included
S3 Time limited licences N/A No risks
identified
S4 Bulk transfers N/A Included
S5 Gradual pollution N/A Included
S6 Accuracy of supply side data Included Included
S8 Climate change impact on supply Included Included
D1 Accuracy of sub-component data Included Included
D2 Demand forecast variation Included Included
D3 Uncertainty of impact of climate
change on demand
Included Included
The Grid SWZ headroom calculation includes a component for uncertainty in the
bulk raw water transfer from Severn Trent Water due to climate change.
Data accuracy impacts on the overall headroom for each zone. Supply data
accuracy uncertainty in surface water zones is due to measurement errors in river
flow data and climatic variations. In both the Grid SWZ and the East SWZ we
estimate the uncertainty due to supply data accuracy is between +6% and 10% of
WAFU throughout the planning period.
Yorkshire Water | Revised Draft Water Resources Management Plan 2019 187
`
Uncertainty in the demand forecast has been applied to both water resource zones.
We attribute the uncertainty in demand data accuracy to measurement error.
Demand is measured by recording the volume of water going into supply, known as
distribution input. The meters we use to record distribution input have an accuracy
specification of +/- 2%. Therefore, for both zones, we estimate demand data
accuracy to increase or decrease distribution input by up to 2%. We have
maintained this accuracy over the planning period.
We account for uncertainty in our forecast demand for household and non-
household properties. For households, we have considered uncertainty in our
forecasts of domestic meter optants, per capita consumption and population. For
non-households, we have considered uncertainty in future growth or decline in
service and non-service sectors, based on modelled scenarios.
All estimated uncertainty for household and non-household properties are combined
into one component known as demand forecast variation.
The demand forecast also includes an assumption on the change in water use due
to climate change. The headroom assessment component allows for + / - 50%
uncertainty of the increase built into the baseline demand forecast.
Target headroom calculation
We assign probability distributions in the stochastic model to represent the
uncertainties of each individual headroom component. The model calculates target
headroom at five-year intervals between 2020/21 and 2044/45. It combines the
probability distributions to produce headroom estimates for levels of certainty
between zero and 100% in 5% increments.
A headroom estimate with a zero-percentile risk would provide no certainty that
supply will meet demand over the planning period. Whereas, a 100th percentile risk
would mean there is no risk that supply would not meet demand. The A Re-
evaluation of the Methodology for Assessing Headroom (UKWIR, 2002)
methodology does not include guidance on the percentile risk water companies
should plan for in the supply demand balance.
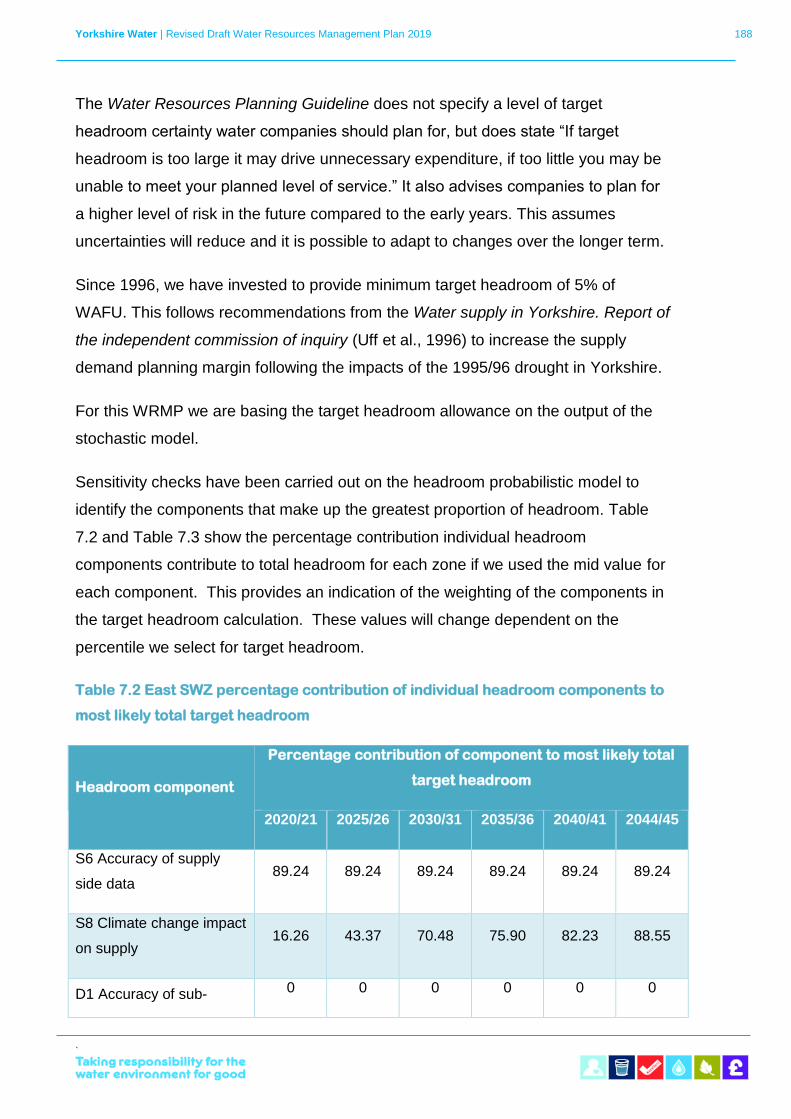
Yorkshire Water | Revised Draft Water Resources Management Plan 2019 188
`
The Water Resources Planning Guideline does not specify a level of target
headroom certainty water companies should plan for, but does state “If target
headroom is too large it may drive unnecessary expenditure, if too little you may be
unable to meet your planned level of service.” It also advises companies to plan for
a higher level of risk in the future compared to the early years. This assumes
uncertainties will reduce and it is possible to adapt to changes over the longer term.
Since 1996, we have invested to provide minimum target headroom of 5% of
WAFU. This follows recommendations from the Water supply in Yorkshire. Report of
the independent commission of inquiry (Uff et al., 1996) to increase the supply
demand planning margin following the impacts of the 1995/96 drought in Yorkshire.
For this WRMP we are basing the target headroom allowance on the output of the
stochastic model.
Sensitivity checks have been carried out on the headroom probabilistic model to
identify the components that make up the greatest proportion of headroom. Table
7.2 and Table 7.3 show the percentage contribution individual headroom
components contribute to total headroom for each zone if we used the mid value for
each component. This provides an indication of the weighting of the components in
the target headroom calculation. These values will change dependent on the
percentile we select for target headroom.
Table 7.2 East SWZ percentage contribution of individual headroom components to
most likely total target headroom
Headroom component
Percentage contribution of component to most likely total
target headroom
2020/21 2025/26 2030/31 2035/36 2040/41 2044/45
S6 Accuracy of supply
side data 89.24 89.24 89.24 89.24 89.24 89.24
S8 Climate change impact
on supply 16.26 43.37 70.48 75.90 82.23 88.55
D1 Accuracy of sub- 0 0 0 0 0 0
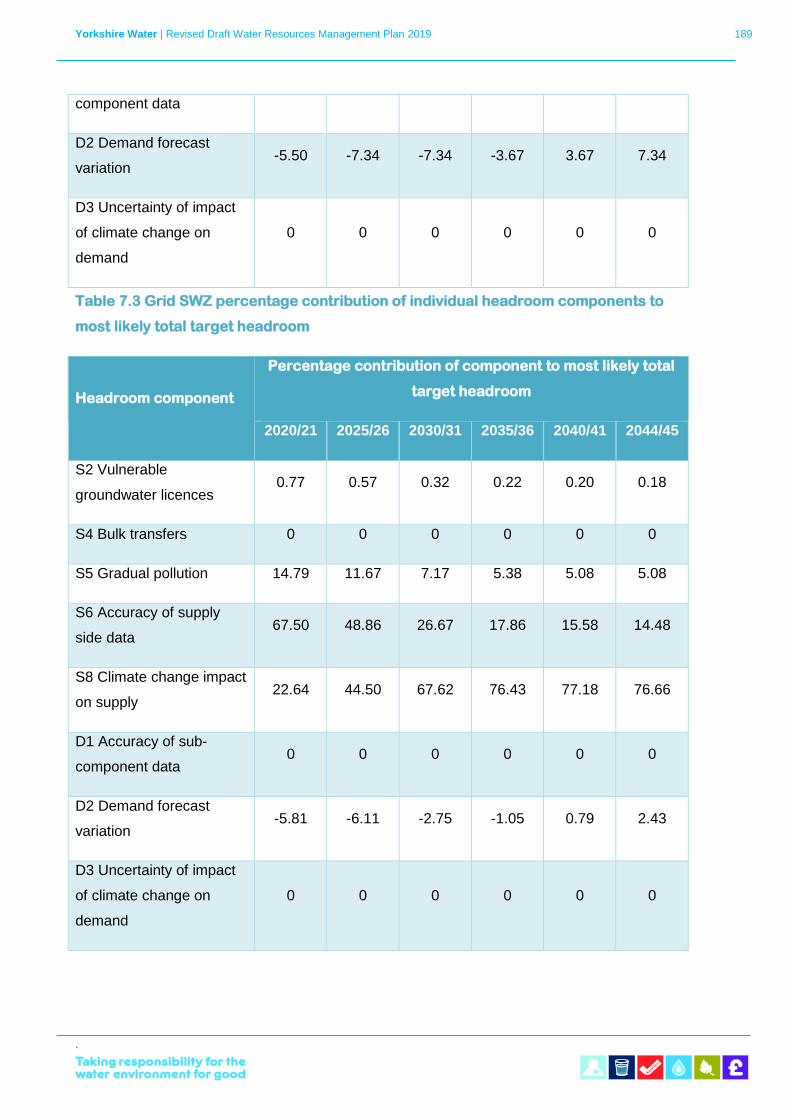
Yorkshire Water | Revised Draft Water Resources Management Plan 2019 189
`
component data
D2 Demand forecast
variation -5.50 -7.34 -7.34 -3.67 3.67 7.34
D3 Uncertainty of impact
of climate change on
demand
0 0 0 0 0 0
Table 7.3 Grid SWZ percentage contribution of individual headroom components to
most likely total target headroom
Headroom component
Percentage contribution of component to most likely total
target headroom
2020/21 2025/26 2030/31 2035/36 2040/41 2044/45
S2 Vulnerable
groundwater licences 0.77 0.57 0.32 0.22 0.20 0.18
S4 Bulk transfers 0 0 0 0 0 0
S5 Gradual pollution 14.79 11.67 7.17 5.38 5.08 5.08
S6 Accuracy of supply
side data 67.50 48.86 26.67 17.86 15.58 14.48
S8 Climate change impact
on supply 22.64 44.50 67.62 76.43 77.18 76.66
D1 Accuracy of sub-
component data 0 0 0 0 0 0
D2 Demand forecast
variation -5.81 -6.11 -2.75 -1.05 0.79 2.43
D3 Uncertainty of impact
of climate change on
demand
0 0 0 0 0 0
Yorkshire Water | Revised Draft Water Resources Management Plan 2019 190
`
For both zones, the greatest risk is due to supply side components of uncertainty for
data accuracy and climate change (S6 and S8). At the start of the planning period,
accuracy of supply side data makes up the largest proportion of headroom in both
zones. Climate change uncertainty becomes less certain over the planning period,
and is significantly increasing over the 25 years.
At the 50th percentile uncertainty level, by the end of the 25 years the East SWZ
supply side climate change headroom uncertainty is equal to data inaccuracy.
Whereas for the Grid SWZ supply side climate change results in a significant
increase in headroom uncertainty, more than five times the uncertainty due to
supply side data inaccuracy by 2045.
The East SWZ baseline scenario shows no change to deployable output due to
climate change. The alternative climate change scenarios provided a headroom
component with a 76% chance of no change due to climate change. From 2030
onwards, there is a low risk (less than 1%) of climate change reducing deployable
ouput by more than 2Ml/d and a less than 2% chance of an impact greater than
0.6Ml/d throughout the planning period. The East SWZ supply demand balance has
sufficient surplus to meet even the most extreme climate change scenario (see
Section 8.1).
For the Grid SWZ the potential impacts of climate change are significant and the
impacts of the 20 deployable output scenarios (see Section 3.13) vary greatly. From
2030 onwards over 50% of the Grid SWZ headroom allowance is due to the impact
of climate change on supply. In our baseline scenario, the climate change impact is
based on a scenario, that is close to the median if the outliers are discounted, and it
has a more sensible profile than the median (excluding outliers). The 20 climate
change scenarios in the headroom component show by 2045 there is a 40% chance
the climate change impacts could be less than predicted in the baseline scenario
and a 60% chance they could be greater. This means there is a high risk of under
or over investing in the risks of climate change. We therefore included a slightly
more extreme climate change scenario in our dWRMP, see Section 9.7.
The most extreme climate change scenarios included in the headroom component
represent a 10% chance loss of supply could be over 300Ml/d greater than the
Yorkshire Water | Revised Draft Water Resources Management Plan 2019 191
`
baseline scenario by 2045. At the beginning of the planning period the scenarios
predict the impact of climate change could be up to 27Ml/d greater than the baseline
scenario or 10Ml/d less. We have sufficient surplus (see Section 8.2) in the Grid
SWZ baseline dry year annual average scenario to meet this early risk and our final
planning scenario will improve our surplus. We will review the risk of climate change
for future WRMPs to improve our understanding of the potential risks.
The most significant demand component of headroom is due to forecast variation in
both zones. This is negative at the start of the planning period as there is a risk
demand could be less than assumed in the baseline.
For the Grid SWZ, uncertainty due to gradual pollution also presents a significant
risk. Although the risk of loss of supply does not change over the planning period it
becomes less significant as climate change uncertainty increases.
Headroom assessment results
Table 7.4 shows the target headroom results using the selected percentile profile for
each zone. For the East SWZ, we selected a profile with a percentile risk starting at
the 95th percentile in the first five years of the planning period and decreasing in
five percentiles with each five-year interval. This provides a target headroom
allowance of nearly 8% of WAFU at the beginning of the planning period reducing to
5% by 2045.
We selected the 95th percentile at the beginning of the planning period to minimise
the risks in the East SWZ, as this small zone has limited supply flexibility compared
to the Grid SWZ. A decreasing profile was selected as it is appropriate to accept a
higher level of risk in the future than at present.
For the Grid SWZ, we have selected the 80th percentile risk at the beginning of the
planning period, reducing to the 70th percentile in 2025 and the 55th percentile in
2030. We have then maintained headroom at this value for the remainder of the
planning period. This provides a target headroom value around 5% of WAFU
throughout the planning period.
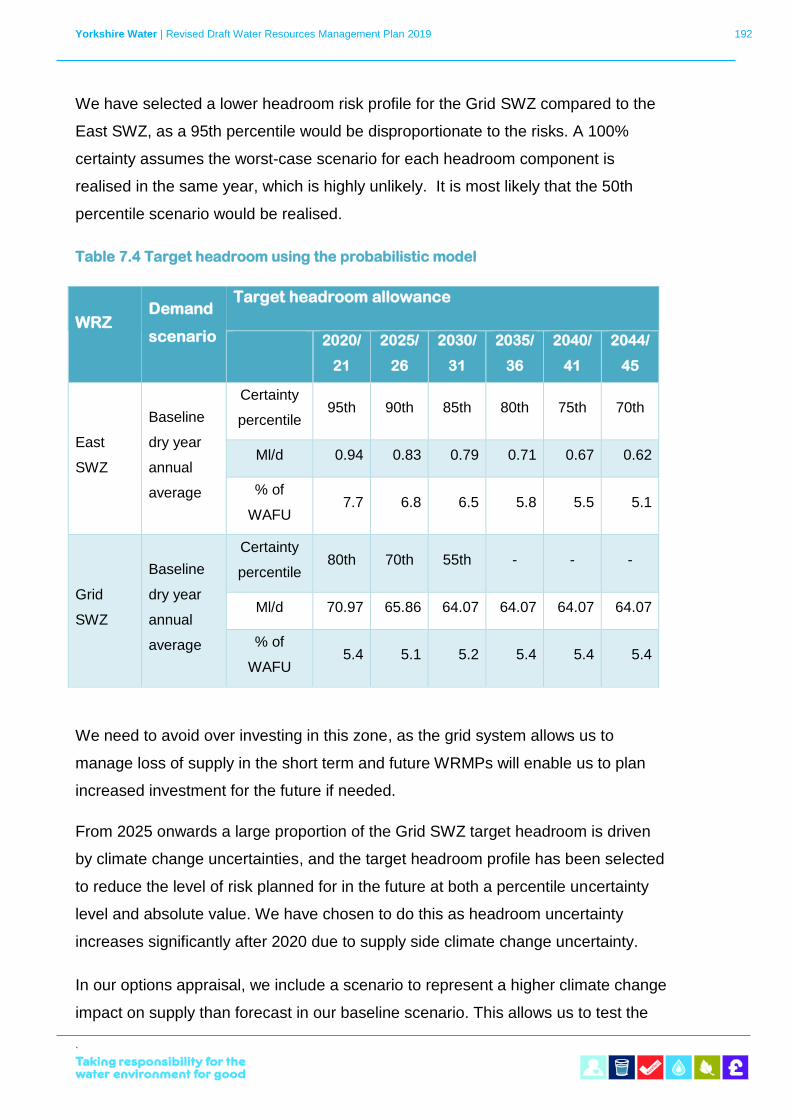
Yorkshire Water | Revised Draft Water Resources Management Plan 2019 192
`
We have selected a lower headroom risk profile for the Grid SWZ compared to the
East SWZ, as a 95th percentile would be disproportionate to the risks. A 100%
certainty assumes the worst-case scenario for each headroom component is
realised in the same year, which is highly unlikely. It is most likely that the 50th
percentile scenario would be realised.
Table 7.4 Target headroom using the probabilistic model
WRZ Demand
scenario
Target headroom allowance
2020/
21
2025/
26
2030/
31
2035/
36
2040/
41
2044/
45
East
SWZ
Baseline
dry year
annual
average
Certainty
percentile 95th 90th 85th 80th 75th 70th
Ml/d 0.94 0.83 0.79 0.71 0.67 0.62
% of
WAFU 7.7 6.8 6.5 5.8 5.5 5.1
Grid
SWZ
Baseline
dry year
annual
average
Certainty
percentile 80th 70th 55th - - -
Ml/d 70.97 65.86 64.07 64.07 64.07 64.07
% of
WAFU 5.4 5.1 5.2 5.4 5.4 5.4
We need to avoid over investing in this zone, as the grid system allows us to
manage loss of supply in the short term and future WRMPs will enable us to plan
increased investment for the future if needed.
From 2025 onwards a large proportion of the Grid SWZ target headroom is driven
by climate change uncertainties, and the target headroom profile has been selected
to reduce the level of risk planned for in the future at both a percentile uncertainty
level and absolute value. We have chosen to do this as headroom uncertainty
increases significantly after 2020 due to supply side climate change uncertainty.
In our options appraisal, we include a scenario to represent a higher climate change
impact on supply than forecast in our baseline scenario. This allows us to test the
Yorkshire Water | Revised Draft Water Resources Management Plan 2019 193
`
solution against future climate change risks, and reduces the need to account for
climate change in the target headroom allowance. However, we have still allowed
for some uncertainty due to climate change in the baseline scenario target
headroom allowance. This takes a more precautionary approach than excluding
climate change, without risking large investment in schemes that would be
unnecessary if the worst case does not occur.
Reducing uncertainty
Our options for meeting any supply demand deficit are considered in Section 9. This
includes identification of options that could reduce headroom uncertainties (Table
9.2). For this WRMP we have identified a number of options that could help mitigate
risks due to pollution impacting on groundwater use in the Grid SWZ (component S5
Gradual pollution).
Our catchment management programme discussed in Section 3.16 will be our
primary solution to mitigating pollution risks. However, we will consider the
additional benefits of options that can help reduce headroom risks in our options
appraisal.
Risks due to data accuracy and climate change cannot be reduced due to
implementation of any specific options, but it is recognised that by reducing demand
at a regional level we can reduce the risks to our level of service. In future WRMPs
our understanding of the impacts of climate change on water resources in our
region may improve.
Demand variation (D2) is largely due to customer behaviour (PCC), population
growth and new property development. These are beyond the control of Yorkshire
Water and no options are included to reduce these uncertainties.
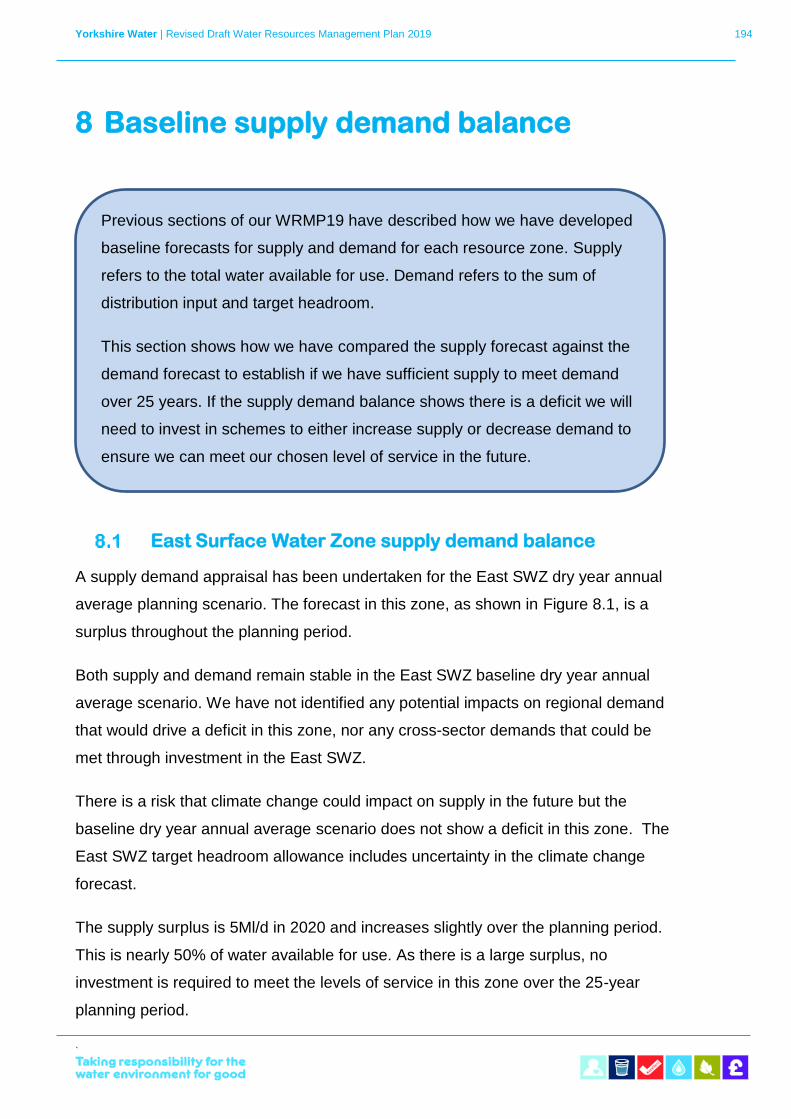
Yorkshire Water | Revised Draft Water Resources Management Plan 2019 194
`
8 Baseline supply demand balance
East Surface Water Zone supply demand balance
A supply demand appraisal has been undertaken for the East SWZ dry year annual
average planning scenario. The forecast in this zone, as shown in Figure 8.1, is a
surplus throughout the planning period.
Both supply and demand remain stable in the East SWZ baseline dry year annual
average scenario. We have not identified any potential impacts on regional demand
that would drive a deficit in this zone, nor any cross-sector demands that could be
met through investment in the East SWZ.
There is a risk that climate change could impact on supply in the future but the
baseline dry year annual average scenario does not show a deficit in this zone. The
East SWZ target headroom allowance includes uncertainty in the climate change
forecast.
The supply surplus is 5Ml/d in 2020 and increases slightly over the planning period.
This is nearly 50% of water available for use. As there is a large surplus, no
investment is required to meet the levels of service in this zone over the 25-year
planning period.
Previous sections of our WRMP19 have described how we have developed
baseline forecasts for supply and demand for each resource zone. Supply
refers to the total water available for use. Demand refers to the sum of
distribution input and target headroom.
This section shows how we have compared the supply forecast against the
demand forecast to establish if we have sufficient supply to meet demand
over 25 years. If the supply demand balance shows there is a deficit we will
need to invest in schemes to either increase supply or decrease demand to
ensure we can meet our chosen level of service in the future.
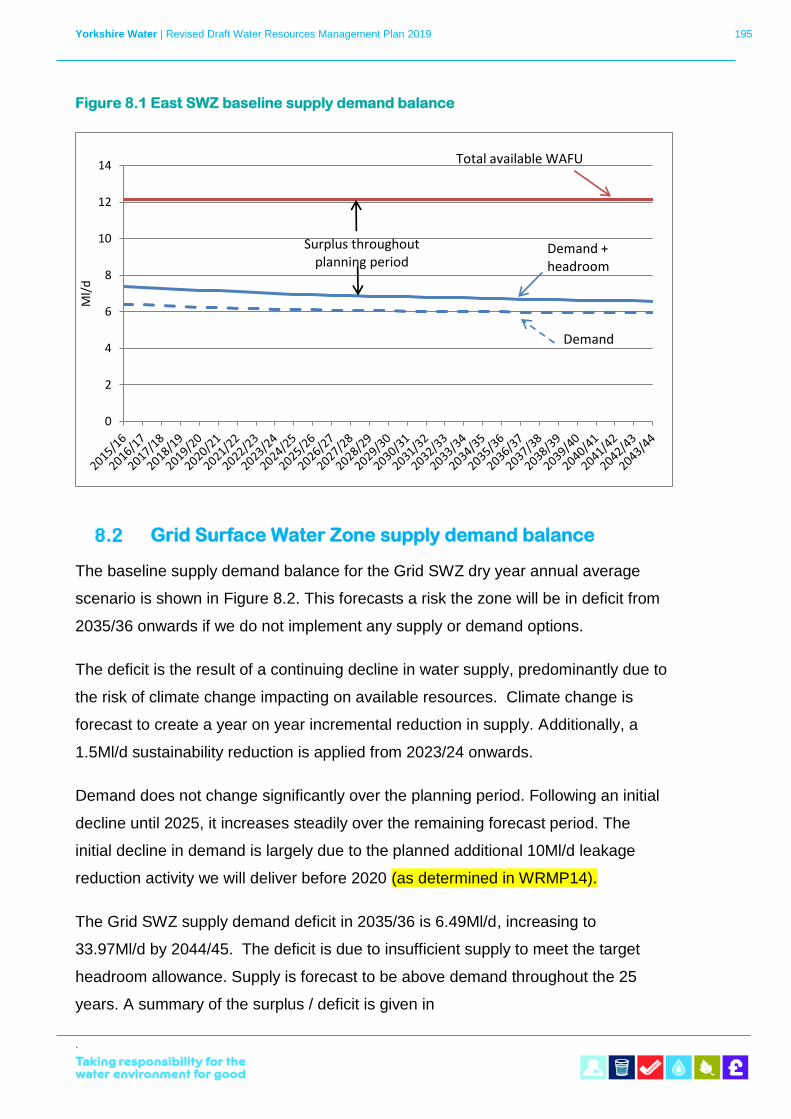
Yorkshire Water | Revised Draft Water Resources Management Plan 2019 195
`
Figure 8.1 East SWZ baseline supply demand balance
Grid Surface Water Zone supply demand balance
The baseline supply demand balance for the Grid SWZ dry year annual average
scenario is shown in Figure 8.2. This forecasts a risk the zone will be in deficit from
2035/36 onwards if we do not implement any supply or demand options.
The deficit is the result of a continuing decline in water supply, predominantly due to
the risk of climate change impacting on available resources. Climate change is
forecast to create a year on year incremental reduction in supply. Additionally, a
1.5Ml/d sustainability reduction is applied from 2023/24 onwards.
Demand does not change significantly over the planning period. Following an initial
decline until 2025, it increases steadily over the remaining forecast period. The
initial decline in demand is largely due to the planned additional 10Ml/d leakage
reduction activity we will deliver before 2020 (as determined in WRMP14).
The Grid SWZ supply demand deficit in 2035/36 is 6.49Ml/d, increasing to
33.97Ml/d by 2044/45. The deficit is due to insufficient supply to meet the target
headroom allowance. Supply is forecast to be above demand throughout the 25
years. A summary of the surplus / deficit is given in
0
2
4
6
8
10
12
14
Ml/
d
Demand + headroom
Demand
Total available WAFU
Surplus throughout planning period
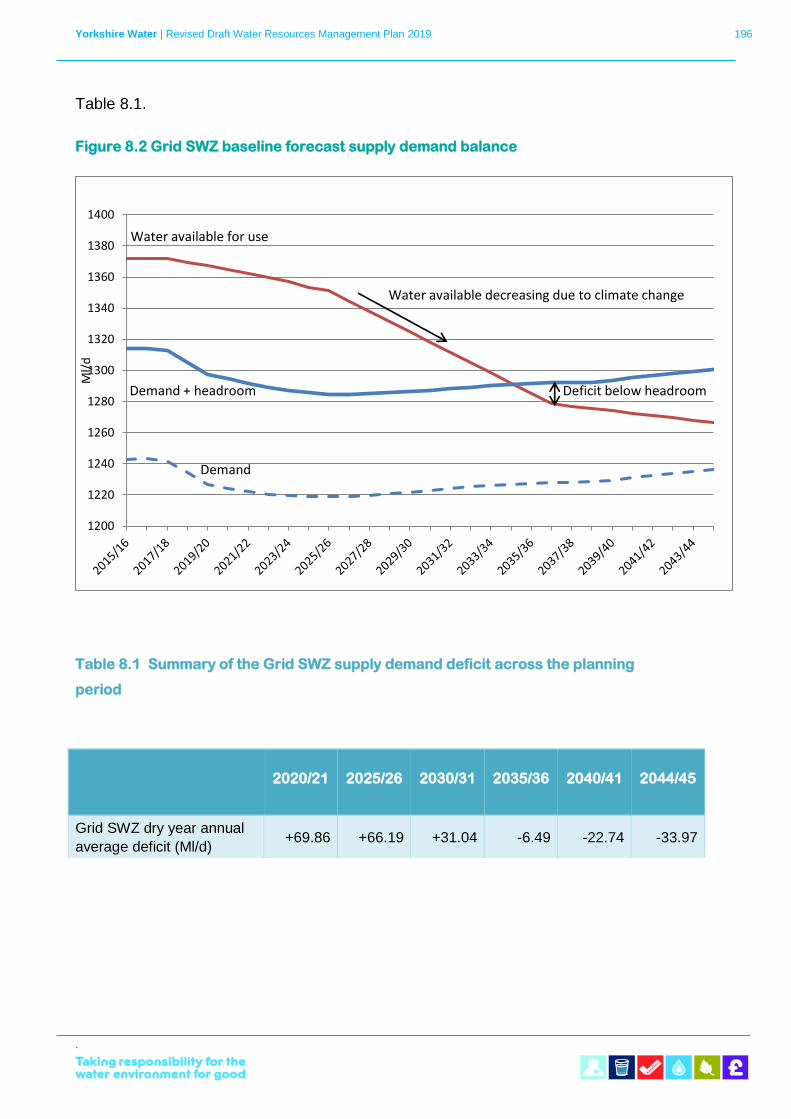
Yorkshire Water | Revised Draft Water Resources Management Plan 2019 196
`
Table 8.1.
Figure 8.2 Grid SWZ baseline forecast supply demand balance
Table 8.1 Summary of the Grid SWZ supply demand deficit across the planning
period
1200
1220
1240
1260
1280
1300
1320
1340
1360
1380
1400
Ml/
d
Water available decreasing due to climate change
Deficit below headroom Demand + headroom
Demand
Water available for use
2020/21 2025/26 2030/31 2035/36 2040/41 2044/45
Grid SWZ dry year annual
average deficit (Ml/d) +69.86 +66.19 +31.04 -6.49 -22.74 -33.97
Yorkshire Water | Revised Draft Water Resources Management Plan 2019 197
`
9 Options appraisal
To close the deficit identified in the Grid SWZ, we need to invest in schemes that
will either reduce future demand or provide additional supply. To select an
appropriate solution to the deficit we consider all the options available and
determine which are feasible. We then carry out an options appraisal to determine
which of the feasible options provide the best value solution to the deficit over the
long term.
The options appraisal aims to determine a solution that is sustainable against
infrastructure limitations and future uncertainties, whilst minimising environmental
impacts and meeting customers’ preferences. We also incorporate government
policy and regulatory requirements of Defra, Ofwat, Natural England and the
Drinking Water Inspectorate into our decision making.
Infrastructure limitations on the feasible options are identified through our WRAPsim
model. Environmental, customer and regulatory preferences are incorporated into
our performance commitments, and we ensure our final solution to the deficit aligns
with these commitments. Known future uncertainties can be considered through
scenario or sensitivity testing. Unknown uncertainties are harder to plan for and
often mean a flexible solution is preferred over the lowest cost solution.
Deciding on future options
Our options appraisal was carried out in accordance with:
• Final Water Resources Planning Guideline (Environment Agency,
2017);
• The economics of supply and demand (UKWIR, 2002);
This section described the options we have considered to meet the Grid SWZ
deficit and the process we have carried out to provide a solution to the deficit.
Yorkshire Water | Revised Draft Water Resources Management Plan 2019 198
`
• UKWIR WRMP 2019 methods - Decision Making Process: Guidance;
and
• UKWIR WRMP 2019 methods - Risk Based Planning: Guidance.
Inline with the UKWIR WRMP 2019 methods - Decision Making Process: Guidance,
at the start of the planning process we carried out a problem characterisation
assessment for our two water resource zones. This was based on our WRMP14
and any known changes since our last plan. The East SWZ baseline scenario is in
surplus throughout the 25-year planning period therefore an options appraisal is not
required.
As the Grid SWZ was forecast to be in deficit we used the problem characterisation
assessment to review the possible methods we could use to determine the best
solution. Our selected methodology is an aggregated approach with deterministic
values of the supply and demand components over a 25-year planning period. This
is the methodology defined in the Economics of balancing supply and demand
(UKWIR, 2002) methodology.
We use a bespoke optimisation model known as WRIO (Water Resources
Investment Optimiser) to determine the least cost solution. The lowest cost solution
is derived from whole life costs, which include monetised costs for environmental
impacts on recreation and tourism, social traffic interruptions and carbon emissions,
as well as the economic costs.
The WRIO model includes interdependencies between options, such as
prerequisites and mutual exclusions. Some resource options have non-linear
impacts, wherein the option benefit is dependent on the deficit scenario and the
potential implementation of other resource options. Any resource options selected
in the least cost solution are assessed using our WRAPsim simulation model and
this may lead to adjustments in yield benefits.
We then consider non-monetary factors in our decision making to determine the
best value solution. These include customer and regulatory preferences,
environmental and social impacts and resilience benefits of options. Environmental
and social non-monetised costs are determined through a Strategic Environmental
Assessment (SEA), Habitats Regulation Assessment (HRA) and WFD assessment.
Yorkshire Water | Revised Draft Water Resources Management Plan 2019 199
`
To take account of non-monetised factors we may decide to constrain out some of
the feasible options or delay/bring forward certain schemes. We then re-run the
optimisation model to provide a solution that is our preferred solution. This may take
several iterations of the process.
The steps involved in moving from our least cost solution to our preferred solution to
meet the Grid SWZ deficit are outlined below, and summarised in Figure 9.1.
9.1.1 Options appraisal process
Step 1. Collate an unconstrained list of options.
Step 2. Determine which of the unconstrained options are feasible options that
have potential to meet the deficit in the Grid SWZ.
Step 3. Determine costs for each feasible option. This will include capital,
operating, carbon, environmental and social costs.
Step 4. Carry out a SEA and HRA for each option.
Step 5. Input the 25-year supply demand balance and all feasible options and
associated costs into WRIO.
Step 6. Run WRIO with all feasible options available to meet the deficit. This
will provide an initial least cost solution to the deficit.
Step 7. Use our WRAPsim model to confirm the yield availability of any
resource options selected as part of the least cost solution. This
allows us to account for any non-linear options selected by WRIO
modelling as part of the least cost solution.
Step 8. Re-run WRIO with option yields adjusted as determined in step 7.
This provides the “final” least cost solution to the supply demand
deficit. We may need to repeat steps 6 and 7 until an appropriate
least cost solution is identified.
Yorkshire Water | Revised Draft Water Resources Management Plan 2019 200
`
Step 9. Review the least cost solutions against the SEA outputs to determine
which options would require delivery of mitigation measures
environmental monitoring or, if the potential impacts are unacceptable,
removal from the solution.
Step 10. Assess any additional benefits of the feasible options and if there are
any drivers to “constrain in” specific options as part of the solution. For
example, options which may:
• enhance resilience;
• meet the preferences of our customers, stakeholders and regulators;
• align with government policy;
• comply with our business objectives and PR19 performance
commitments.
Step 11. Review our willingness to pay survey outputs and if this has any
impact on the preferred solution, for example, are customers willing to
pay for an increased level of service or willing to accept a reduced
level of service.
Step 12. Re-run WRIO with the available options amended following steps 9 to
11. This may exclude some options entirely, delay or bring forward
implementation of options or constrain in options to meet objectives in
addition to the deficit. It may be necessary to repeat steps 5 to 11 until
we determine the best value solution that balances potentially
conflicting views while meeting our objectives.
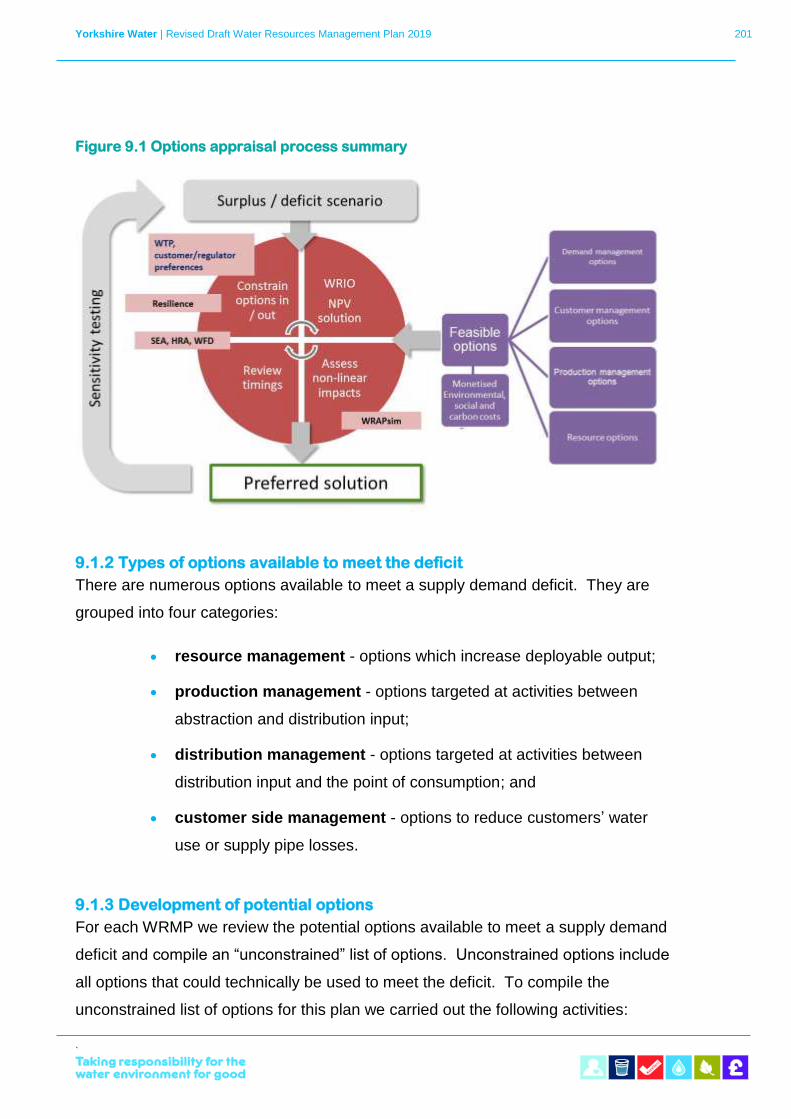
Yorkshire Water | Revised Draft Water Resources Management Plan 2019 201
`
Figure 9.1 Options appraisal process summary
9.1.2 Types of options available to meet the deficit
There are numerous options available to meet a supply demand deficit. They are
grouped into four categories:
• resource management - options which increase deployable output;
• production management - options targeted at activities between
abstraction and distribution input;
• distribution management - options targeted at activities between
distribution input and the point of consumption; and
• customer side management - options to reduce customers’ water
use or supply pipe losses.
9.1.3 Development of potential options
For each WRMP we review the potential options available to meet a supply demand
deficit and compile an “unconstrained” list of options. Unconstrained options include
all options that could technically be used to meet the deficit. To compile the
unconstrained list of options for this plan we carried out the following activities:
Yorkshire Water | Revised Draft Water Resources Management Plan 2019 202
`
• reviewed the WRMP14 list of options to determine if they are still
technically feasible;
• reviewed the options suggested in the WR27 Water Resources
Planning Tools, UKWIR 2012 report;
• consulted third parties to review existing third party options and
identify new options; and
• consulted Yorkshire Water staff with knowledge of our supply system
and operations, water production planning and service delivery.
To identify which of the options included in the unconstrained list should be
investigated further we reviewed the technical, environmental, carbon and social
attributes of each option at a high level. The technical attributes considered were
yield increase/demand decrease; construction/delivery costs; time to implement;
asset life of infrastructure; and resilience benefits.
This information was used to assess the schemes against the following criteria:
• Does the option address the problem?
• Does the option avoid breaching any unalterable constraints?
• Is the option promotable/does it meet regulatory and stakeholder
expectations?
• Is the risk of the option failing acceptable?
• Should the option be taken through to the feasible list?
The answers to these questions were used to determine if the options were suitable
to include in the options appraisal. This resulted in a sub-set of the unconstrained
list of options, which is referred to as the “feasible” list. The unconstrained list, which
is all the potential options we considered, is presented in Appendix A.1.
The feasible list is provided in Appendix A.2 with a brief description of each option.
Details of the feasible options are provided in a supporting WRMP19 Options
Technical Report, which was provided to the Environment Agency and made
available on request.
Yorkshire Water | Revised Draft Water Resources Management Plan 2019 203
`
9.1.4 Resilience options
For WRMP19 we have considered vulnerabilities to future supply that are not
addressed by meeting our planned level of service. Our outage assessment
includes risks based on previous experience and provides an allowance for short
term losses of supply. We have sufficient storage or alternative resources to ensure
these outages do not impact on our levels of service.
There is a risk that extreme events cause one or more of our water treatment works
or sources of supply to be out of supply or severely reduced for a prolonged period.
To understand how resilient we are to these risks and where improvements can be
made, our Asset Planning Team has carried out a preliminary assessment to
identify the water treatment works that are most vulnerable to extreme outage
events.
Vulnerability was assessed by ranking them against a number of common
hazards/threats, in line with the list of hazards presented in Resilience planning:
good practice guide (UKWIR, 2013). In addition, we considered the performance of
each works and likelihood of assets failing in the future.
The works identified as most vulnerable are in areas highlighted as being at
increased risk of water supply failure due to reliance on single assets and/or
sources of supply. We identified 10 principal threats that are a potential risk in our
region and these are presented in Table 9.1.
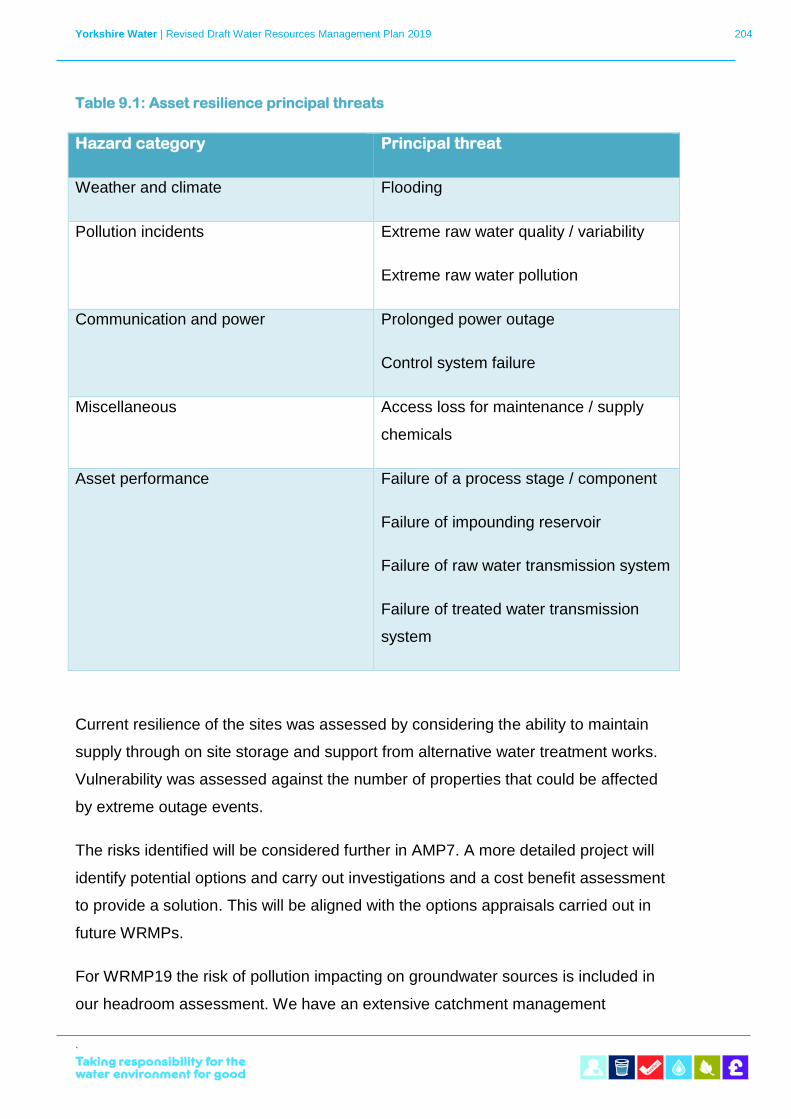
Yorkshire Water | Revised Draft Water Resources Management Plan 2019 204
`
Table 9.1: Asset resilience principal threats
Hazard category Principal threat
Weather and climate Flooding
Pollution incidents Extreme raw water quality / variability
Extreme raw water pollution
Communication and power Prolonged power outage
Control system failure
Miscellaneous Access loss for maintenance / supply
chemicals
Asset performance Failure of a process stage / component
Failure of impounding reservoir
Failure of raw water transmission system
Failure of treated water transmission
system
Current resilience of the sites was assessed by considering the ability to maintain
supply through on site storage and support from alternative water treatment works.
Vulnerability was assessed against the number of properties that could be affected
by extreme outage events.
The risks identified will be considered further in AMP7. A more detailed project will
identify potential options and carry out investigations and a cost benefit assessment
to provide a solution. This will be aligned with the options appraisals carried out in
future WRMPs.
For WRMP19 the risk of pollution impacting on groundwater sources is included in
our headroom assessment. We have an extensive catchment management
Yorkshire Water | Revised Draft Water Resources Management Plan 2019 205
`
programme that is being delivered in our region to reduce the risks of outages or
loss of supply due to pollution in the future, see Section 3.14. Because of this, we
will not be investing in any large resource schemes to mitigate these risks.
We have, however, considered which of the feasible options could provide
resilience benefits through reducing outage and headroom risks, including potential
for outages not previously experienced. This may lead to us prioritising some
options above others if they can achieve multiple benefits, rather than investing in
options that only address the level of service risk.
In addition to outage due to water quality we have considered risk of outage in
areas where future housing developments are planned. North Yorkshire has been
identified as an area of concern due to potential development in the area. We have
sufficient resources to meet the demand but are potentially at risk if outages occur.
WINEP investigations will be carried out on a number of our groundwater sources
with potential of leading to sustainability reductions. This will not lead to a reduction
in deployable output, as there are conjunctive use systems where the licence
capacity is greater than the source reliable output.
We have identified a risk in the East Yorkshire area of the Grid SWZ, where the
combined impact of sustainability reductions and increasing nitrate and turbidity
levels could create a greater risk of outages in this area.
A number of our resource options would provide alternative supplies to make our
conjunctive use system more resilient to outage at water treatment works.
Some of our feasible options are also included in our Drought Plan as long-term
drought options. We are currently resilient to a repeat of any previous droughts in
our region and long-term drought options would only be required in an
unprecedented event. We therefore do not consider drought resilience to be a driver
for investment in options for WRMP19 as there would be a risk of creating
redundant assets.Table 9.2 provides the options that are included in our feasible
options list and that would enhance grid links in our WRMP19, mitigate outage risks
due to unknown sustainability reductions or are included in our Drought Plan as long
term drought options.
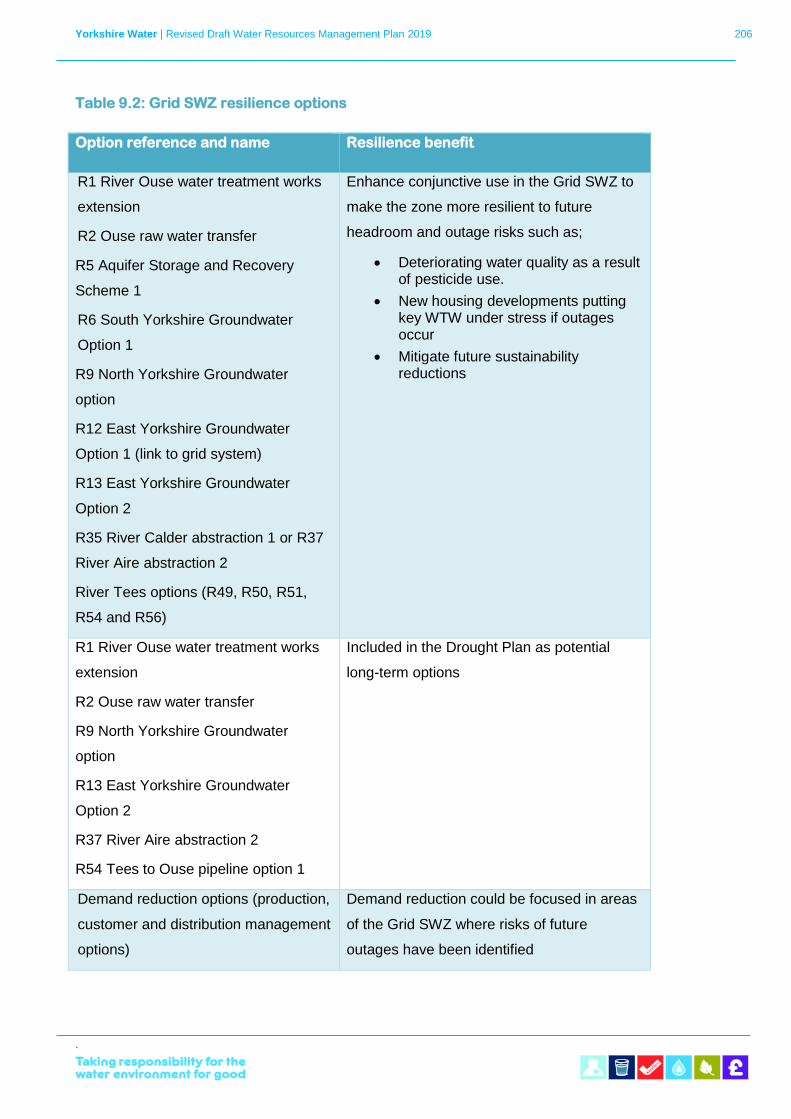
Yorkshire Water | Revised Draft Water Resources Management Plan 2019 206
`
Table 9.2: Grid SWZ resilience options
Option reference and name Resilience benefit
R1 River Ouse water treatment works
extension
R2 Ouse raw water transfer
R5 Aquifer Storage and Recovery
Scheme 1
R6 South Yorkshire Groundwater
Option 1
R9 North Yorkshire Groundwater
option
R12 East Yorkshire Groundwater
Option 1 (link to grid system)
R13 East Yorkshire Groundwater
Option 2
R35 River Calder abstraction 1 or R37
River Aire abstraction 2
River Tees options (R49, R50, R51,
R54 and R56)
Enhance conjunctive use in the Grid SWZ to
make the zone more resilient to future
headroom and outage risks such as;
• Deteriorating water quality as a result of pesticide use.
• New housing developments putting key WTW under stress if outages occur
• Mitigate future sustainability reductions
R1 River Ouse water treatment works
extension
R2 Ouse raw water transfer
R9 North Yorkshire Groundwater
option
R13 East Yorkshire Groundwater
Option 2
R37 River Aire abstraction 2
R54 Tees to Ouse pipeline option 1
Included in the Drought Plan as potential
long-term options
Demand reduction options (production,
customer and distribution management
options)
Demand reduction could be focused in areas
of the Grid SWZ where risks of future
outages have been identified
Yorkshire Water | Revised Draft Water Resources Management Plan 2019 207
`
9.1.5 Third party options
When compiling our list of potential options, we consult with third parties who could
provide potential solutions. Third party options can include upstream services such
as the provision of water, leakage detection and demand management. For
WRMP19 we have engaged with our neighbouring water companies and other third
parties including the Coal Authority and the Canal and Rivers Trust.
Neighbouring water company options
During the pre-consultation phase we met with our neighbouring water companies -
Northumbrian Water, United Utilities, Severn Trent Water and Anglian Water - to
discuss potential water trading opportunities. These discussions included both the
import and export of water.
Our discussion with Northumbrian Water identified options to import water from the
River Tees, with variations on how the water could be transferred. There are no
options available for us to export water to Northumbrian Water.
We include three options for importing water from Northumbrian Water. These
include an option to transfer raw water from a Northumbrian Water abstraction point
on the River Tees to the Yorkshire Dales supply area, where a new treatment works
would be constructed. As an alternative to this we include an option to import
treated water from Northumbrian Water to the Yorkshire Dales. Both these options
have potential to provide 15Ml/d additional resource to the Grid SWZ.
Our third option to import from Northumbrian Water is a raw water transfer from the
River Tees to an existing water treatment works in the York area. This would
require construction of a new pipeline. The option could provide up to 140Ml/d and
is the largest of our feasible options. The option is divided into three phases of
increasing volume, as it may be more cost efficient to transfer a lower volume. The
first phase provides 50Mld and is the maximum spare licence capacity
Northumbrian Water could provide as a transfer.
Phases 2 and 3 would require additional licence permissions from the Environment
Agency for volumes greater than 50Ml/d. They would also require a new pump and
electricity supply to be installed to transfer water from Kielder to the River Tees.
Yorkshire Water | Revised Draft Water Resources Management Plan 2019 208
`
Our discussions with Northumbrian Water for this plan confirmed it has potential to
provide a transfer, but the terms and the exact volume would need to be determined
through a bulk transfer agreement, with Yorkshire Water funding any additional
infrastructure requirements.
Our meeting with United Utilities identified two confirmed options for an import from
United Utilities. We previously included an export from Yorkshire Water to United
Utilities via the Huddersfield Canal. Discussions with the Canal and Rivers Trust for
this plan identified that they may potentially require the water from United Utilities
themselves, and would not be able to agree the transfer to Yorkshire Water.
The two United Utilities imports included in our feasible options are both for a 1Ml/d
volume. One option would connect an existing raw water pipeline to deliver water to
the North Yorkshire area of the Grid SWZ. The other would involve installing a clean
water pipeline, also to provide supply to North Yorkshire.
Discussions with Severn Trent Water identified one export and no import options.
Our export would transfer up to 20Ml/d of treated water from South Yorkshire to
Severn Trent Water via a new pipeline.
Discussions with Anglian Water did not identify any imports or exports for this draft
WRMP19, but did open discussions on a potential shared resource development
that may become feasible in future WRMPs.
An outline of all feasible imports and exports is provided in Appendix B. We have
not identified a bulk transfer as part of our preferred solution and Severn Trent
Water does not require a transfer from Yorkshire Water.
Water Resources North – co-ordinating across the north to support national
resilience
Recognising that we have a role to play in supporting not only the resilience of our
region, but also the resilience of the UK as a whole, we have taken a lead in setting
up Water Resources North. This group, which comprises representation from across
water companies in the north of England as well as key regulators, will provide a
focal point for co-ordinating water resources across the north. Further, it will allow
Yorkshire Water | Revised Draft Water Resources Management Plan 2019 209
`
for integrated and consistent consideration of the opportunities that, collectively,
northern water companies have to transfer water to other parts of the country and
contribute to enhanced national water resilience.
Other third party options
We have met with the Coal Authority and the Canal & River Trust to discuss third
party licence trading. There were no Canal & River Trust options developed from
these discussions.
The Coal Authority proposed several mine water discharges in our region and
provided water quality data. We selected two of the sites for further investigation,
however the options were constrained out due to risks the water could not be
treated to the correct standard for potable water supply. Although it was noted that
transferring the supply via reservoirs could provide some dilution to mitigate the
risks.
In 2018 we published water resources market information alongside our draft
WRMP19, using a data template provided by Ofwat. This will enable third parties to
identify opportunities to provide new water resources and demand management and
leakage services. For Yorkshire Water, this will allow us to engage further with third
parties and encourage development of potential options.
9.1.6 Water market
We recognise that the use of third party options and a water resource market could
help us deliver resilience, cost efficiency and innovations.
We are therefore currently developing a water bidding market and plan to stimulate
this market through early engagement with potential participants via a new Markets
Portal.
We have met with a specialist licence trading consultant to understand available
water resources and potential opportunities for in our region. We also plan to help
strengthen and protect national resilience in the longer term by understanding the
need for and approach to transporting water around our country. This will be
facilitated through the Water Resources North group.
Yorkshire Water | Revised Draft Water Resources Management Plan 2019 210
`
As part of our initiative to explore the water resources market, we have developed a
geographic information system (GIS) tool which shows all third-party and our own
abstraction points in Yorkshire. This tool makes potential trades more visible and
helps us to identify locations where we may be able to optimise the use of existing
third-party water abstraction licences.
We will pursue trades where they make us more efficient or resilient, meeting the
needs of our customers, stakeholders and the environment.
Our aim is to improve regional and national resilience, reduce waste and support
innovation through three initiatives: pursue increased trading to deliver efficient and
reduce the need for capital expenditure; utilise experts to introduce improved
approaches and technology; and, collaborate to do more than we could alone.
The Yorkshire Water Market Portal will list all opportunities for the water
management market, including water resources, demand management and leakage
services. By 2020 the portal will allow us to share trade opportunities quicker the
published Market Information requirements as it will enable:
• Communication between us and other water companies or third
parties, including the ability to submit bids;
• Engagement with the market when we want to understand potential
solutions before starting procurement (market testing); and,
• A route for the market to submit prospective solutions unrelated to a
specified requirement.
The portal will be supported by our Trading and Procurement Code, Bid Assessment
Framework and a proportional procurement process. We are currently investigating
any perceived barriers to entry.
Developing the market
We are reaching out to participants to stimulate interest, and our published Market
Information is the first step in this process. We have also asked third parties to tell
us what other market information they need to help us drive resilience, innovation
and efficiency into water resources. All market participants will be able to review and
comment on our approach and systems before we go live.
Yorkshire Water | Revised Draft Water Resources Management Plan 2019 211
`
Bilateral trading market
We are reaching out to participants to stimulate interest, and our published Market
Information is the first step in this process. We have also asked third parties to tell
us what other market information they need to help us drive resilience, innovation
and efficiency into water resources. All market participants will be able to review and
comment on our approach and systems before we go live.
9.1.7 Option costing
We calculated build costs and operating costs for each feasible option, as presented
in Table 5 of the water resource planning tables. For most new resource and
production schemes the cost components for construction were provided by our unit
cost database. The unit cost data base provides costs for capital components based
on previous schemes we have delivered.
Options that have not been developed in our region previously, such as
desalination, are based on a desk study and inflated to today’s prices. Our
experience of delivering schemes provided the costs data for a number of the
distribution and customer management options. We used desk based research
studies to cost options where new techniques would be delivered.
9.1.8 Environmental, social and carbon costs
We have considered the monetised and non-monetised costs of the environmental,
social and carbon impacts of the feasible options in our options appraisal. The non-
monetised environmental and social impacts are determined in a Strategic
Environmental Assessment, as described in Section 9.3.
We assessed carbon, environmental and social monetised costs for all feasible
options through a desk-based study. Costs for new schemes were calculated and
costs for schemes included in WRMP14 were reappraised.
The Environmental Valuation in Water Resources Planning - Additional Information
(Environment Agency, 2016) recommends the use of a risk-based approach to
assessment of environmental and social impacts of the plans. This allows water
companies to implement a proportional level of effort when assessing the
Yorkshire Water | Revised Draft Water Resources Management Plan 2019 212
`
externalities (i.e. unintended environmental, including carbon emissions, and social
impacts) of the plan, and not be required to monetise all impacts.
For the environmental impacts, the Environment Agency encourages the use of the
ecosystem services approach as a first step in assessing the WRMPs, although it
also presents alternative appraisal methodologies. For the draft WRMP19, we
identified environmental impacts using the ecosystem services approach and were
also informed by results of the Strategic Environmental Assessment.
The monetisation of impacts focused on the ecosystem service of recreation and
tourism. The rationale for this, the method applied, and data used to calculate and
monetise the value of the impacts are further explained in an Environmental
Economics Technical Report which has been provided to the Environment Agency
and is available upon request.
The embedded (capital) carbon impacts, measured in tCO2e (tonnes of carbon
dioxide emissions), were assessed following the recommendations of the guidance
A Framework for Accounting for Embodied Carbon in Water Industry Assets
(UKWIR, 2012). Whereas, operational carbon impacts measured in tCO2e
emissions, were estimated using a Yorkshire Water specific methodology (Turner
and Townsend, 2016).
Capital carbon impacts were monetised using the traded cost of carbon, while the
operational carbon impacts were monetised using both the traded and non-traded
cost of carbon, depending on whether the operational input is or is not in scope of
the EU Emissions Trading Scheme (EU ETS).
The only social impacts considered are traffic related costs due to the construction
work for WRMP options. Social costs in relation to traffic were developed in a
Yorkshire specific study, Lane Rental Charging – A Way Forward (Stone and
Webster, 2002). This was used for the calculation of traffic costs of the relevant draft
WRMP19 options, and further information on the methodology and other data used
can be found in the technical report.
The environmental, social and carbon monetised costs and benefits are included in
Table 5 of the water resource planning tables.
Yorkshire Water | Revised Draft Water Resources Management Plan 2019 213
`
Determining the solution
Once we have collated our feasible list of options and calculated the costs we input
the data into our WRIO optimisation model. The costs and benefits for each
feasible option are calculated in accordance with Section 6.7 of the Final Water
Resources Planning Guideline (Environment Agency, 2017).
The WRIO model inputs include the following data for each individual option and
further information is provided in Appendix B:
• yield benefit as a supply increase or a demand reduction;
• yield ramp up – percentage yield available each year until achieve
100%;
• first feasible year of operation – allow for investigations and
construction;
• build and replacement capital costs divided into civil, instrumentation
and automation (ICA), land and mechanical and electrical (M&E);
• environmental, social and carbon capital (build) costs;
• fixed and variable operating costs and benefits, including
environmental, social and carbon;
• build profile – percentage of capital cost invested each year before
and after the first year of utilisation;
• prerequisite option – link to another option that must be selected
before the option can be in use and the “lag” time between
implementation; and
• mutual exclusions / option dependencies – option selection is
dependent on the selection of another option(s), for example, we may
have more than one option available to utilise an individual river or
groundwater resource but can only utilise one of the potential
schemes.
The WRIO model uses the above cost / benefit information for individual options to
identify the least cost solution that ensures supply can meet demand plus target
Yorkshire Water | Revised Draft Water Resources Management Plan 2019 214
`
headroom for each year of the 25-year planning period. It optimally schedules
investment to meet the projected deficit at minimum net present cost (NPC). It can
also provide a solution to a 40-year planning period.
The WRIO model utilises a linear/integer programming approach, as described in
the report, The Economics of Balancing Supply and Demand (Environment Agency
and UKWIR, 2002).
The integer programme technique selects a schedule of options that will, in
aggregate, meet any projected deficit in each year, from the base year to the end of
the 25-year planning horizon. The selected schedule of options has the least net
present value (NPV).
The output from the model includes average incremental cost (AIC), average
incremental social cost (AISC) and net present value (NPV), as defined in The
Economics of Balancing Supply and Demand report, based on the output of the
scheme.
Costs and benefits are discounted over a 100-year period as this is the lifetime of
the longest lasting asset. The model bases discount rates and net present value
calculations on the criteria specified in the Water Resources Planning Guideline
(Environment Agency and Natural Resources Wales, 2017). For each feasible
option, it calculates the profile of the costs over 100 years, split into capital
(including maintenance and replacement costs); operating (both fixed and variable
costs) and financing costs.
Financing costs are calculated as a stream of annual costs over the life of the
option, using an assumed 3.6% average cost of capital (the “vanilla” real wholesale
weighted average cost of capital (WACC) in PR14). The NPV of all costs is then
calculated using the Treasury Test Discount rate as set out in the HM Treasury
“Green Book” (Appraisal and Evaluation in Central Government, HM Treasury,
2003). This is 3.5% for years 0 to 30 of the appraisal period, 3.0% for years 31 to
75, and 2.5% for years 76 to125.
WRIO produces AICs and AISCs for all options using their first feasible
implementation year (as shown in Table 5 of the water resources planning tables).
Yorkshire Water | Revised Draft Water Resources Management Plan 2019 215
`
9.2.1 WRAPsim modelling of options
To cost the schemes for the Grid SWZ, each feasible supply side option is assigned
a yield that could be available from implementing the individual scheme. However,
the final yield of each scheme is influenced by the supply demand balance scenario
and the other options selected. WRAPsim modelling is used to determine the
option yield, taking into account the hydrological conditions and infrastructure
constraints of the Grid SWZ at the given deficit.
We cannot confirm the option yield in WRAPsim until after the supply demand deficit
is known. For example, the River Ouse Raw Water Transfer option has a maximum
capacity of 60Ml/d, but the amount taken will depend on the available treatment
capacity at the receiving water treatment works. We cannot take 60Ml/d if the water
treatment works does not have this spare capacity. However, we cannot determine
the yield the option can provide until the impacts of climate change and
sustainability reductions are known, as these factors will impact on the volume of
water available to treat at the treatment works.
WRAPsim also needs to consider the cumulative impact of the options selected.
The yield of the scheme may be dependent on the other schemes selected,
particularly if the yields are to be treated at the same treatment works.
An initial run of the optimisation model with the schemes at their maximum capacity
provides an initial solution to the deficit. Any resource schemes selected are then
considered in WRAPsim to determine how much of the maximum yield could be
used in the dry year annual average scenario. The schemes are considered in
WRAPsim in correlation with each other to account for any interdependencies. The
yields of options in the optimisation model are then revised to include any
reductions due to hydrological and infrastructure constraints. This stage is only
required if the initial optimisation run selects resource schemes with uncertain
yields.
9.2.2 Impact of climate change on options
None of our options have been found to be directly affected by climate change. The
options in our preferred solution have been modelled with our selected climate
Yorkshire Water | Revised Draft Water Resources Management Plan 2019 216
`
change scenario to ensure that the options are robust to climate change. This is
fully described in the Climate Change and Deployable Output Technical Report.
Strategic Environmental Assessment, Habitats Regulation Assessment and Water Framework Directive
The non-monetised environmental, social and carbon impacts of each option have
been considered in a Strategic Environmental Assessment (SEA). The full output of
the SEA is provided in an Environmental Report, which is published on our website
alongside this document.
We have reviewed all available guidance; Strategic Environmental Assessment and
Habitats Regulation Assessment Directive (UKWIR, 2012) and A Practical Guide to
the Strategic Environmental Assessment (ODPM, 2005), and determined that the
WRMP falls under the SEA. Notably, this is because the WRMP will include
schemes that will required an Environmental Impact Assessment (EIA).
The SEA and the WRMP options appraisal have been informed by a Habitats
Regulations Assessment (HRA) Screening Report. The Water Resources Planning
Guideline (Environment Agency and Natural Resources Wales, 2017) also
recommends water companies include the net impacts of the solution on waterbody
status under the WFD in the environmental and social assessment. A WFD
Assessment has therefore been carried out to inform the SEA and assess the
impact of the least-cost plan on WFD requirements for no deterioration to
waterbodies. The findings of the HRA and WFD assessments were submitted to the
relevant regulators (Environment Agency and Natural England, where relevant) for
consultation during July and August 2017. The HRA and WFD compliance
assessment reports were also submitted to these regulators at the time of
publishing the draft WRMP19, although these have subsequently been updated to
include further work post-consultation.
The SEA, HRA and WFD assessments are used in the options appraisal to help
determine a preferred solution that reduces the risk of detrimental impact to the
environment. Figure 9.2 outlines the process for integrating the SEA, HRA and WFD
into the options appraisal.
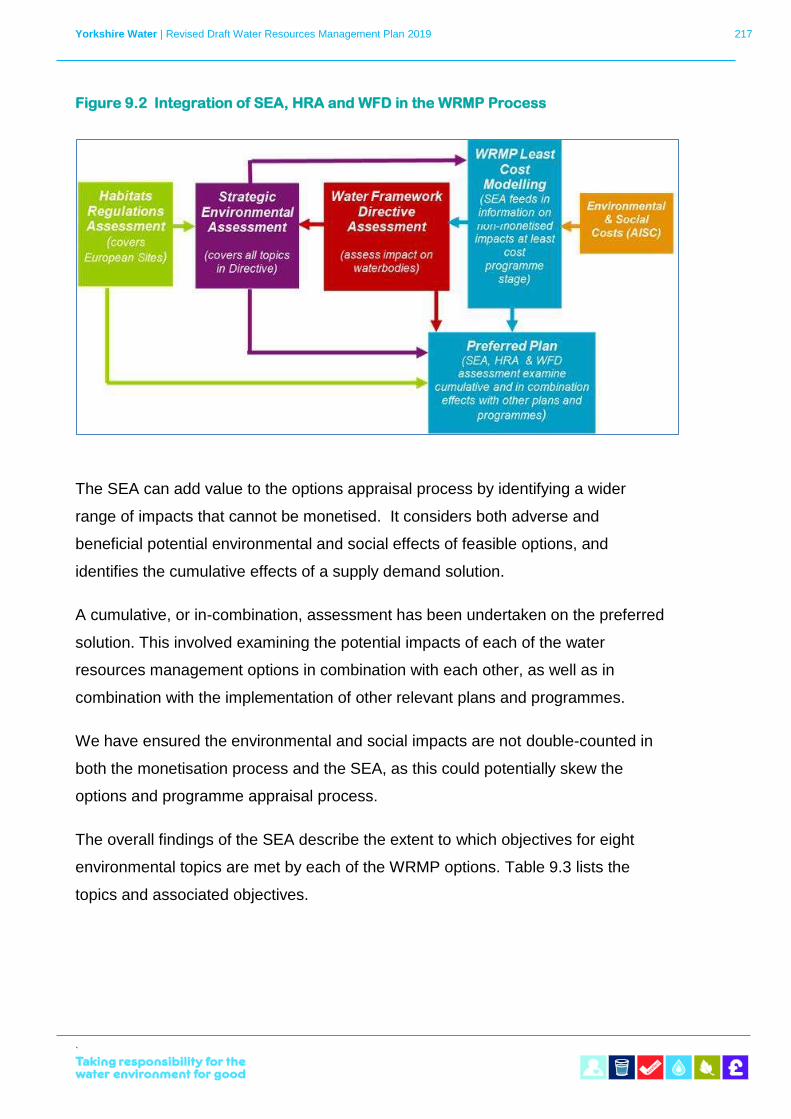
Yorkshire Water | Revised Draft Water Resources Management Plan 2019 217
`
Figure 9.2 Integration of SEA, HRA and WFD in the WRMP Process
The SEA can add value to the options appraisal process by identifying a wider
range of impacts that cannot be monetised. It considers both adverse and
beneficial potential environmental and social effects of feasible options, and
identifies the cumulative effects of a supply demand solution.
A cumulative, or in-combination, assessment has been undertaken on the preferred
solution. This involved examining the potential impacts of each of the water
resources management options in combination with each other, as well as in
combination with the implementation of other relevant plans and programmes.
We have ensured the environmental and social impacts are not double-counted in
both the monetisation process and the SEA, as this could potentially skew the
options and programme appraisal process.
The overall findings of the SEA describe the extent to which objectives for eight
environmental topics are met by each of the WRMP options. Table 9.3 lists the
topics and associated objectives.
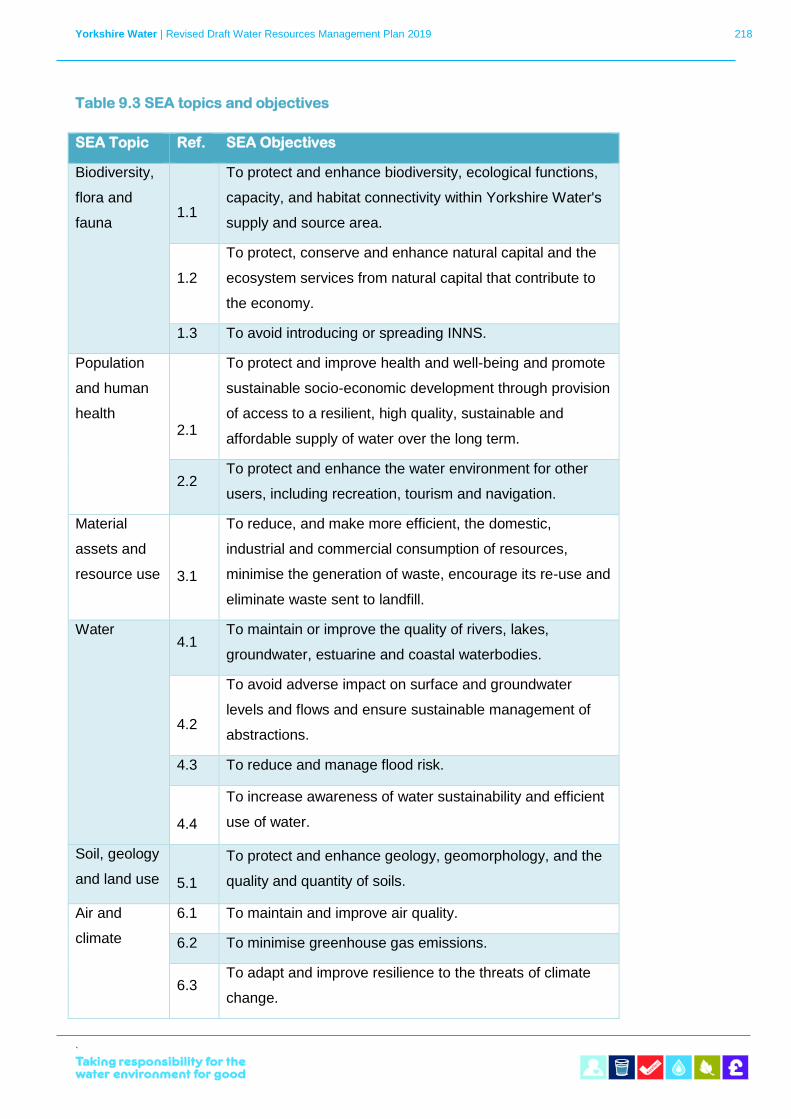
Yorkshire Water | Revised Draft Water Resources Management Plan 2019 218
`
Table 9.3 SEA topics and objectives
SEA Topic Ref. SEA Objectives
Biodiversity,
flora and
fauna
1.1
To protect and enhance biodiversity, ecological functions,
capacity, and habitat connectivity within Yorkshire Water's
supply and source area.
1.2
To protect, conserve and enhance natural capital and the
ecosystem services from natural capital that contribute to
the economy.
1.3 To avoid introducing or spreading INNS.
Population
and human
health
2.1
To protect and improve health and well-being and promote
sustainable socio-economic development through provision
of access to a resilient, high quality, sustainable and
affordable supply of water over the long term.
2.2 To protect and enhance the water environment for other
users, including recreation, tourism and navigation.
Material
assets and
resource use
3.1
To reduce, and make more efficient, the domestic,
industrial and commercial consumption of resources,
minimise the generation of waste, encourage its re-use and
eliminate waste sent to landfill.
Water 4.1
To maintain or improve the quality of rivers, lakes,
groundwater, estuarine and coastal waterbodies.
4.2
To avoid adverse impact on surface and groundwater
levels and flows and ensure sustainable management of
abstractions.
4.3 To reduce and manage flood risk.
4.4
To increase awareness of water sustainability and efficient
use of water.
Soil, geology
and land use
5.1
To protect and enhance geology, geomorphology, and the
quality and quantity of soils.
Air and
climate
6.1 To maintain and improve air quality.
6.2 To minimise greenhouse gas emissions.
6.3 To adapt and improve resilience to the threats of climate
change.
Yorkshire Water | Revised Draft Water Resources Management Plan 2019 219
`
SEA Topic Ref. SEA Objectives
Archaeology
and cultural
heritage
7.1
To conserve and enhance the historic environment,
heritage assets and their settings and protect
archaeologically important sites.
Landscape
and visual
amenity
8.1
To protect and enhance designated and undesignated
landscapes, townscapes and the countryside.
A ten-point impact assessment scale was used, using the effect categories: major
adverse; moderate adverse, minor adverse; negligible adverse; no adverse effect,
no beneficial effect, negligible beneficial, minor beneficial; moderate beneficial and
major beneficial. This report considers the outputs of the SEA on the least cost
solution and the preferred solution. The SEA outputs for all the feasible options can
be found in the SEA Environmental Report.
Customer views on options
For WRMP14 we carried out research into customer preference and prioritisation of
the different investment options available.
A two-stage approach using qualitative and quantitative research was used. An
exploratory, qualitative phase was used to refine the options to ensure they were
understood by customers, and the quantitative phase was used to establish which
options consumers preferred.
Customers were asked to rate a range of potential options before and after being
provided with information on the cost, environmental impact and security of the yield
for each option.
Initially customers’ preference was for mains replacement and leakage reduction.
Priority was also given to schemes such as reservoir de-silting, water efficiency and
supply pipe renewal. When provided with cost, environmental impact and yield
security information, preference was for leakage reduction, metering and water
mains replacement.
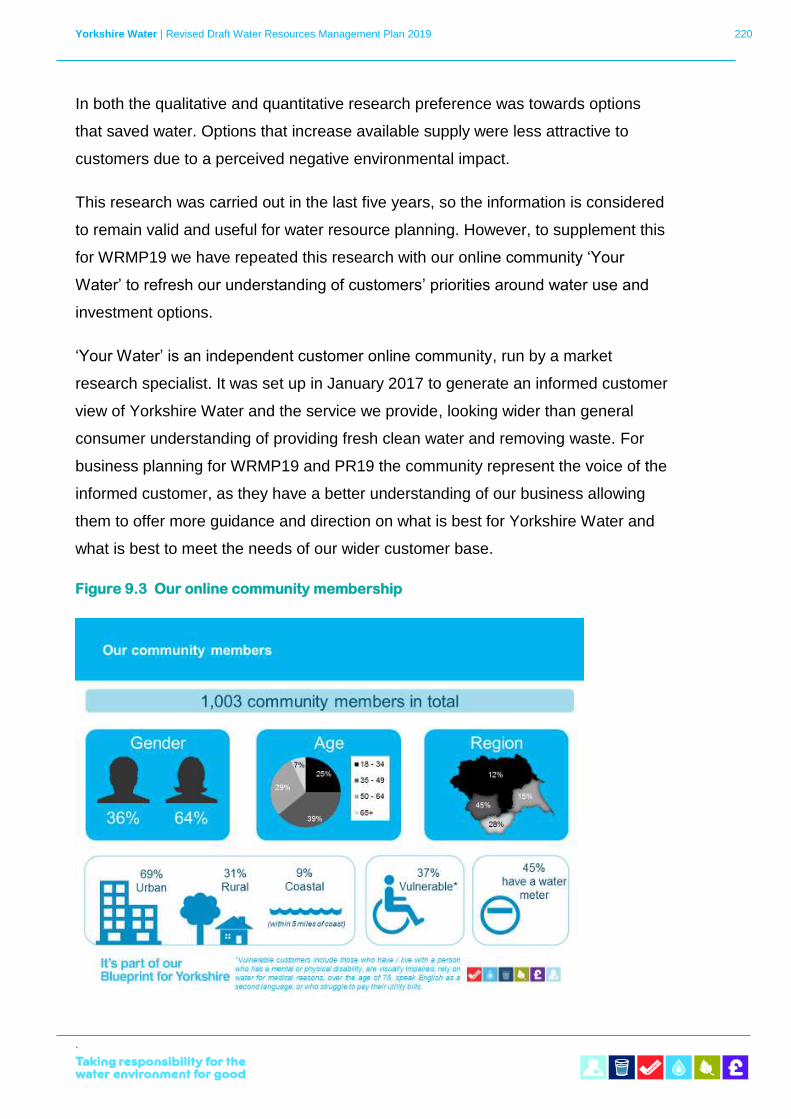
Yorkshire Water | Revised Draft Water Resources Management Plan 2019 220
`
In both the qualitative and quantitative research preference was towards options
that saved water. Options that increase available supply were less attractive to
customers due to a perceived negative environmental impact.
This research was carried out in the last five years, so the information is considered
to remain valid and useful for water resource planning. However, to supplement this
for WRMP19 we have repeated this research with our online community ‘Your
Water’ to refresh our understanding of customers’ priorities around water use and
investment options.
‘Your Water’ is an independent customer online community, run by a market
research specialist. It was set up in January 2017 to generate an informed customer
view of Yorkshire Water and the service we provide, looking wider than general
consumer understanding of providing fresh clean water and removing waste. For
business planning for WRMP19 and PR19 the community represent the voice of the
informed customer, as they have a better understanding of our business allowing
them to offer more guidance and direction on what is best for Yorkshire Water and
what is best to meet the needs of our wider customer base.
Figure 9.3 Our online community membership
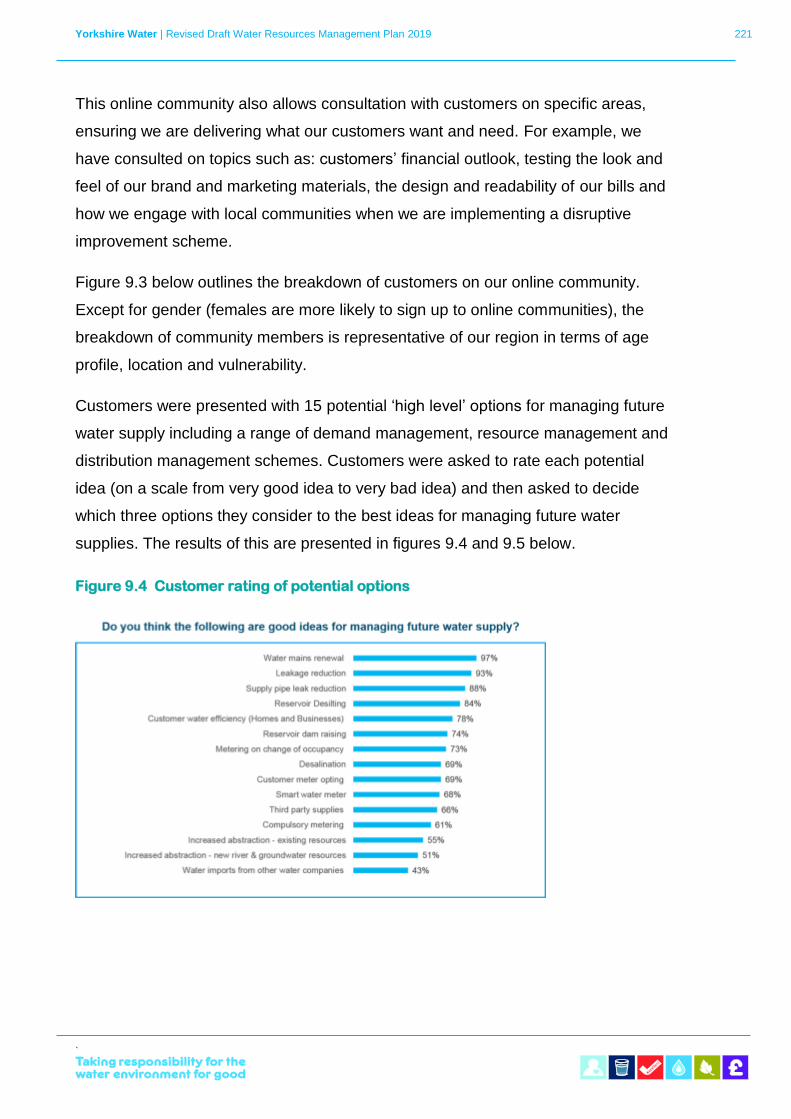
Yorkshire Water | Revised Draft Water Resources Management Plan 2019 221
`
This online community also allows consultation with customers on specific areas,
ensuring we are delivering what our customers want and need. For example, we
have consulted on topics such as: customers’ financial outlook, testing the look and
feel of our brand and marketing materials, the design and readability of our bills and
how we engage with local communities when we are implementing a disruptive
improvement scheme.
Figure 9.3 below outlines the breakdown of customers on our online community.
Except for gender (females are more likely to sign up to online communities), the
breakdown of community members is representative of our region in terms of age
profile, location and vulnerability.
Customers were presented with 15 potential ‘high level’ options for managing future
water supply including a range of demand management, resource management and
distribution management schemes. Customers were asked to rate each potential
idea (on a scale from very good idea to very bad idea) and then asked to decide
which three options they consider to the best ideas for managing future water
supplies. The results of this are presented in figures 9.4 and 9.5 below.
Figure 9.4 Customer rating of potential options
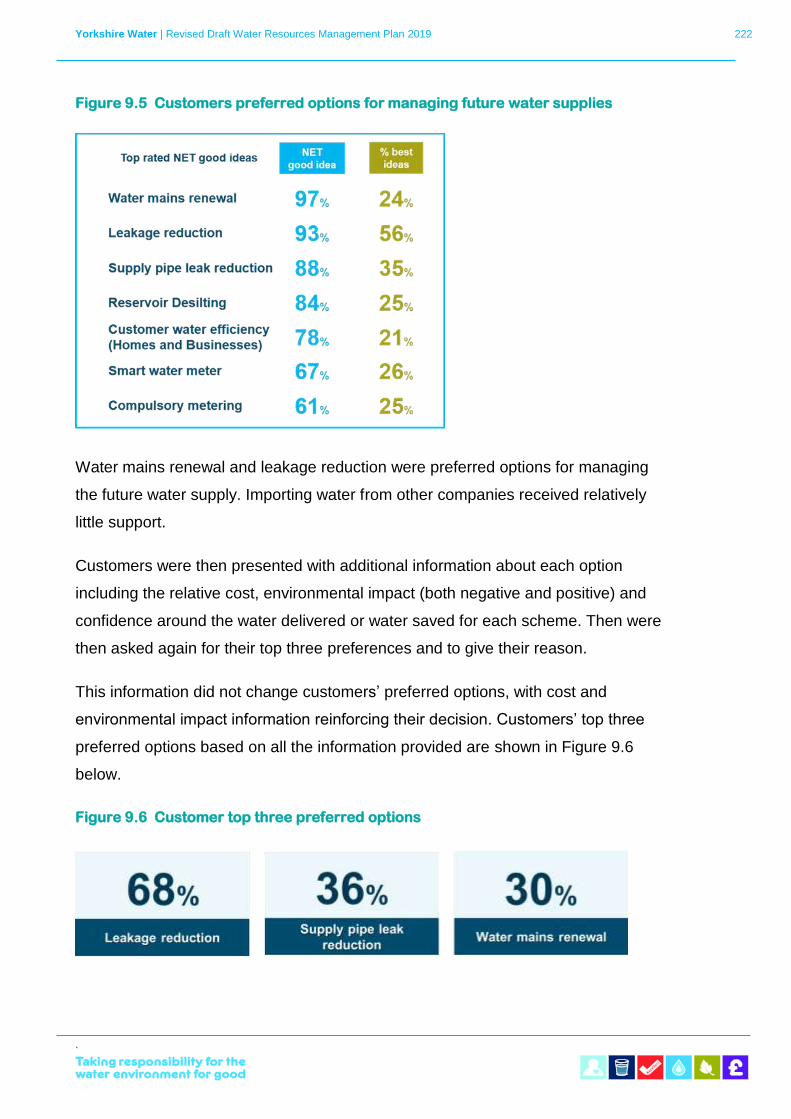
Yorkshire Water | Revised Draft Water Resources Management Plan 2019 222
`
Figure 9.5 Customers preferred options for managing future water supplies
Water mains renewal and leakage reduction were preferred options for managing
the future water supply. Importing water from other companies received relatively
little support.
Customers were then presented with additional information about each option
including the relative cost, environmental impact (both negative and positive) and
confidence around the water delivered or water saved for each scheme. Then were
then asked again for their top three preferences and to give their reason.
This information did not change customers’ preferred options, with cost and
environmental impact information reinforcing their decision. Customers’ top three
preferred options based on all the information provided are shown in Figure 9.6
below.
Figure 9.6 Customer top three preferred options
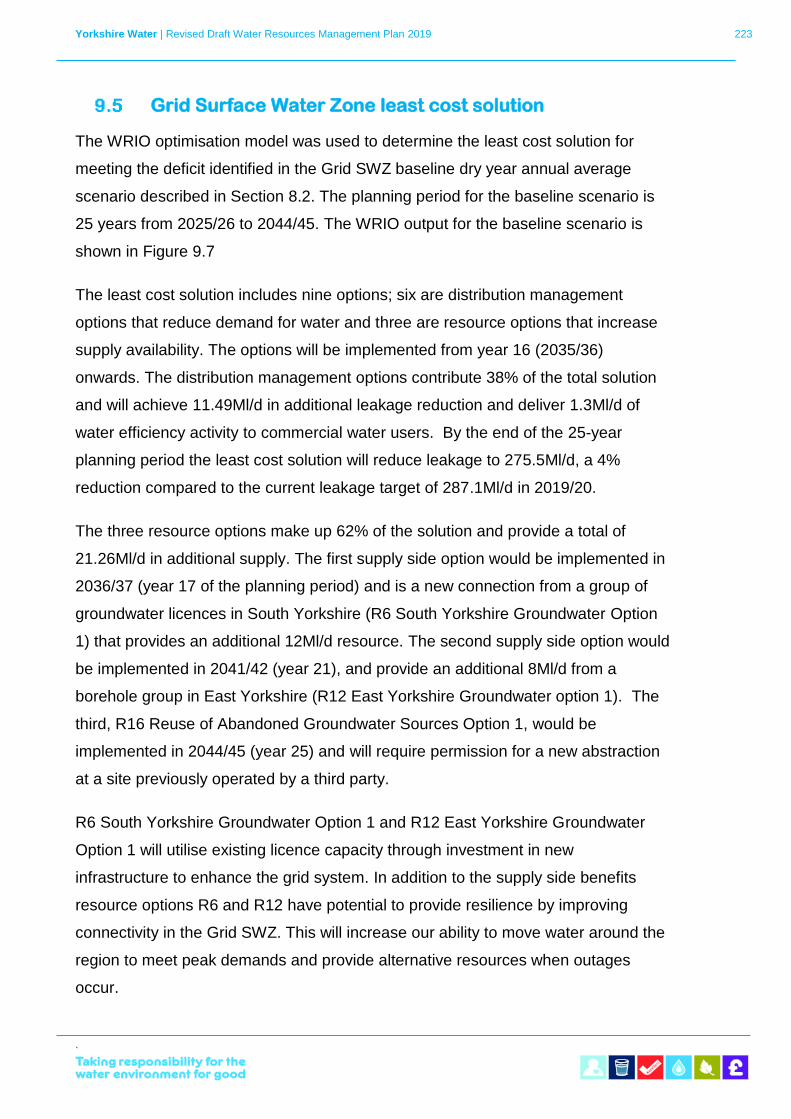
Yorkshire Water | Revised Draft Water Resources Management Plan 2019 223
`
Grid Surface Water Zone least cost solution
The WRIO optimisation model was used to determine the least cost solution for
meeting the deficit identified in the Grid SWZ baseline dry year annual average
scenario described in Section 8.2. The planning period for the baseline scenario is
25 years from 2025/26 to 2044/45. The WRIO output for the baseline scenario is
shown in Figure 9.7
The least cost solution includes nine options; six are distribution management
options that reduce demand for water and three are resource options that increase
supply availability. The options will be implemented from year 16 (2035/36)
onwards. The distribution management options contribute 38% of the total solution
and will achieve 11.49Ml/d in additional leakage reduction and deliver 1.3Ml/d of
water efficiency activity to commercial water users. By the end of the 25-year
planning period the least cost solution will reduce leakage to 275.5Ml/d, a 4%
reduction compared to the current leakage target of 287.1Ml/d in 2019/20.
The three resource options make up 62% of the solution and provide a total of
21.26Ml/d in additional supply. The first supply side option would be implemented in
2036/37 (year 17 of the planning period) and is a new connection from a group of
groundwater licences in South Yorkshire (R6 South Yorkshire Groundwater Option
1) that provides an additional 12Ml/d resource. The second supply side option would
be implemented in 2041/42 (year 21), and provide an additional 8Ml/d from a
borehole group in East Yorkshire (R12 East Yorkshire Groundwater option 1). The
third, R16 Reuse of Abandoned Groundwater Sources Option 1, would be
implemented in 2044/45 (year 25) and will require permission for a new abstraction
at a site previously operated by a third party.
R6 South Yorkshire Groundwater Option 1 and R12 East Yorkshire Groundwater
Option 1 will utilise existing licence capacity through investment in new
infrastructure to enhance the grid system. In addition to the supply side benefits
resource options R6 and R12 have potential to provide resilience by improving
connectivity in the Grid SWZ. This will increase our ability to move water around the
region to meet peak demands and provide alternative resources when outages
occur.
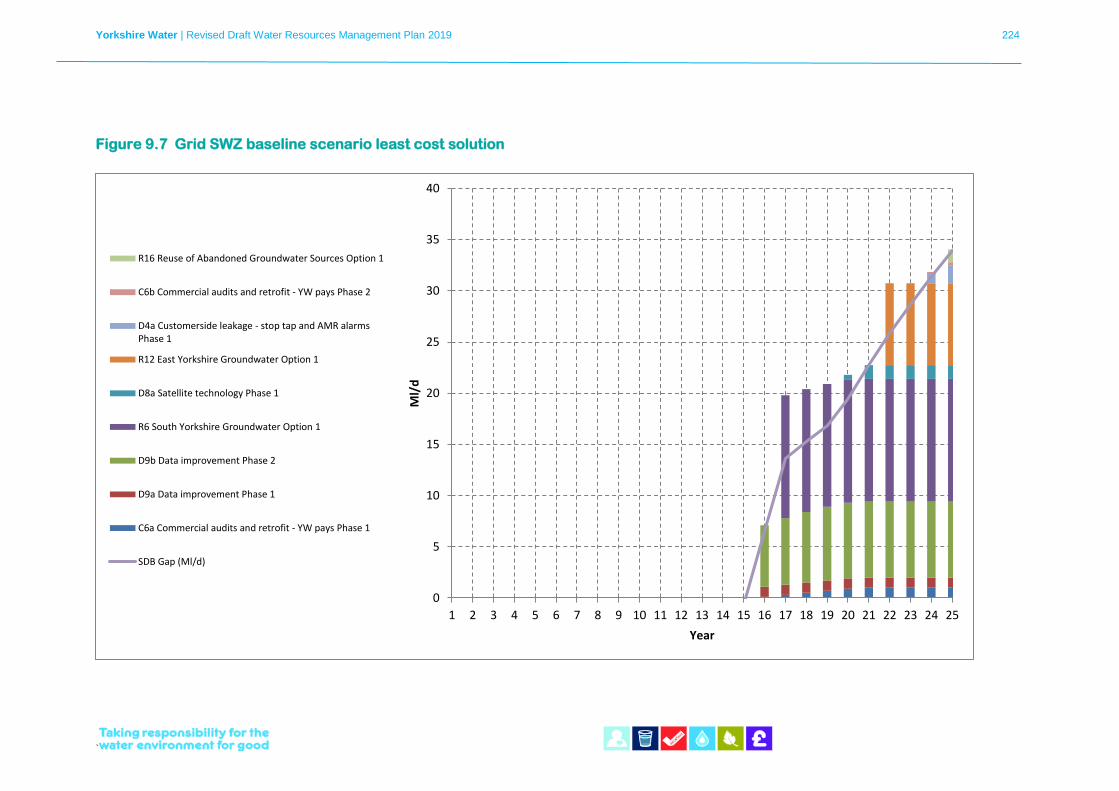
Yorkshire Water | Revised Draft Water Resources Management Plan 2019 224
`
Figure 9.7 Grid SWZ baseline scenario least cost solution
0
5
10
15
20
25
30
35
40
1 2 3 4 5 6 7 8 9 10 11 12 13 14 15 16 17 18 19 20 21 22 23 24 25
Ml/
d
Year
R16 Reuse of Abandoned Groundwater Sources Option 1
C6b Commercial audits and retrofit - YW pays Phase 2
D4a Customerside leakage - stop tap and AMR alarmsPhase 1
R12 East Yorkshire Groundwater Option 1
D8a Satellite technology Phase 1
R6 South Yorkshire Groundwater Option 1
D9b Data improvement Phase 2
D9a Data improvement Phase 1
C6a Commercial audits and retrofit - YW pays Phase 1
SDB Gap (Ml/d)

Yorkshire Water | Revised Draft Water Resources Management Plan 2019 225
`
However, the licences are included in WINEP investigations and there is a risk the
yield benefit could reduce if sustainability reductions are applied to these licence
groups. WINEP investigations will be carried out by 2022 to determine the impact on
our current licence permissions. The uncertainty over these options would be
resolved by the time we were required to implement either option but this does pose
a risk to the delivery of the least cost solution.
SEA of least cost solution
Table 9.3 provides a summary of the SEA outputs for the least cost solution. Most
impacts are negligible, but there are several minor adverse and minor beneficial
impacts. There is one solution that has a moderate adverse impact in relation to
one SEA objective (R6 South Yorkshire Groundwater Option 1).
The R6 South Yorkshire Groundwater Option 1 solution is present in the least cost
solution from our plan. However, this scheme is in WINEP and, although abstraction
would be within existing licence conditions, there is a risk of potential deterioration
between classes, and potential flow reduction impacts on dependent surface water
body status.
The R12 East Yorkshire Groundwater Option 1 is also present in the least cost
solution. Again, this is a WINEP scheme and although the licensed limit is
underutilised there is currently an embargo on future abstractions due to potential
saline intrusions.
For both schemes, further investigations would need to be carried out to confirm
these impacts before we could be confident the schemes could be implemented.
The third resource option presented in the low cost solution is R16 Reuse of
abandoned groundwater source option 1. However, this scheme is dependent on a
third party agreeing to sell assets and the Environment Agency granting an
abstraction licence to Yorkshire Water.
We have also reviewed the SEA results of all the selected options to consider the
actions we can take to mitigate the environmental and social impacts. It is not
always practical to constrain out all schemes where there are potential negative
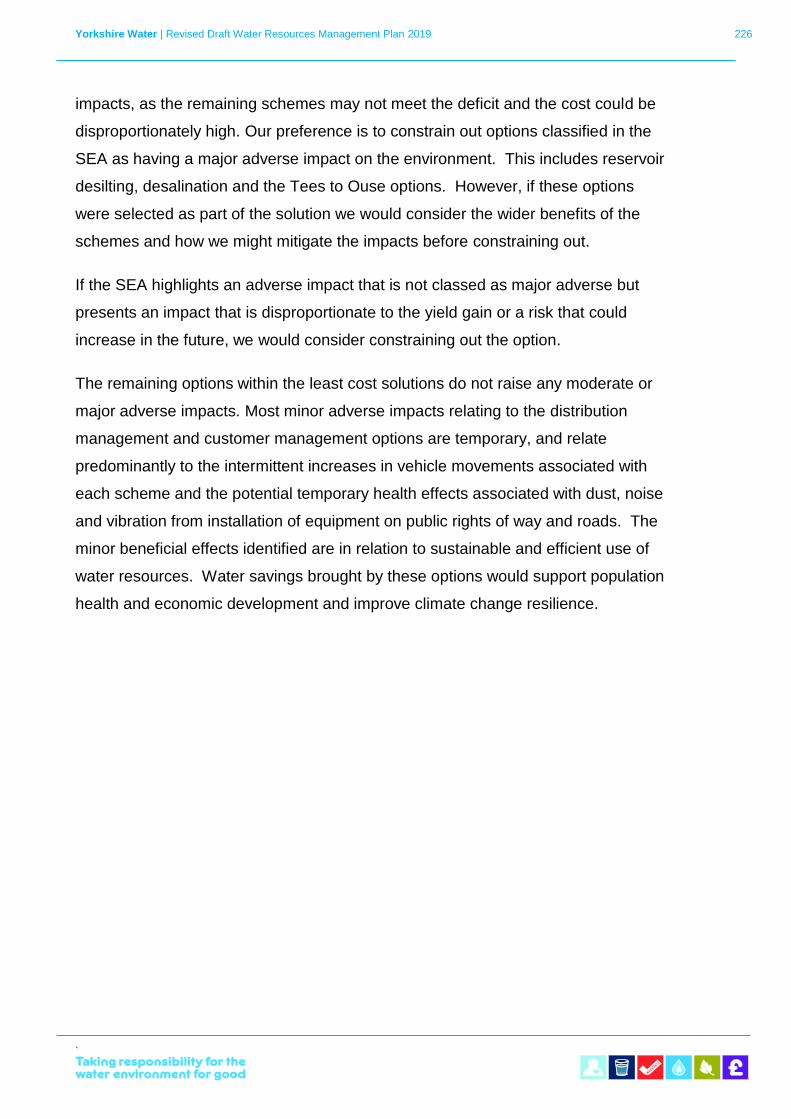
Yorkshire Water | Revised Draft Water Resources Management Plan 2019 226
`
impacts, as the remaining schemes may not meet the deficit and the cost could be
disproportionately high. Our preference is to constrain out options classified in the
SEA as having a major adverse impact on the environment. This includes reservoir
desilting, desalination and the Tees to Ouse options. However, if these options
were selected as part of the solution we would consider the wider benefits of the
schemes and how we might mitigate the impacts before constraining out.
If the SEA highlights an adverse impact that is not classed as major adverse but
presents an impact that is disproportionate to the yield gain or a risk that could
increase in the future, we would consider constraining out the option.
The remaining options within the least cost solutions do not raise any moderate or
major adverse impacts. Most minor adverse impacts relating to the distribution
management and customer management options are temporary, and relate
predominantly to the intermittent increases in vehicle movements associated with
each scheme and the potential temporary health effects associated with dust, noise
and vibration from installation of equipment on public rights of way and roads. The
minor beneficial effects identified are in relation to sustainable and efficient use of
water resources. Water savings brought by these options would support population
health and economic development and improve climate change resilience.
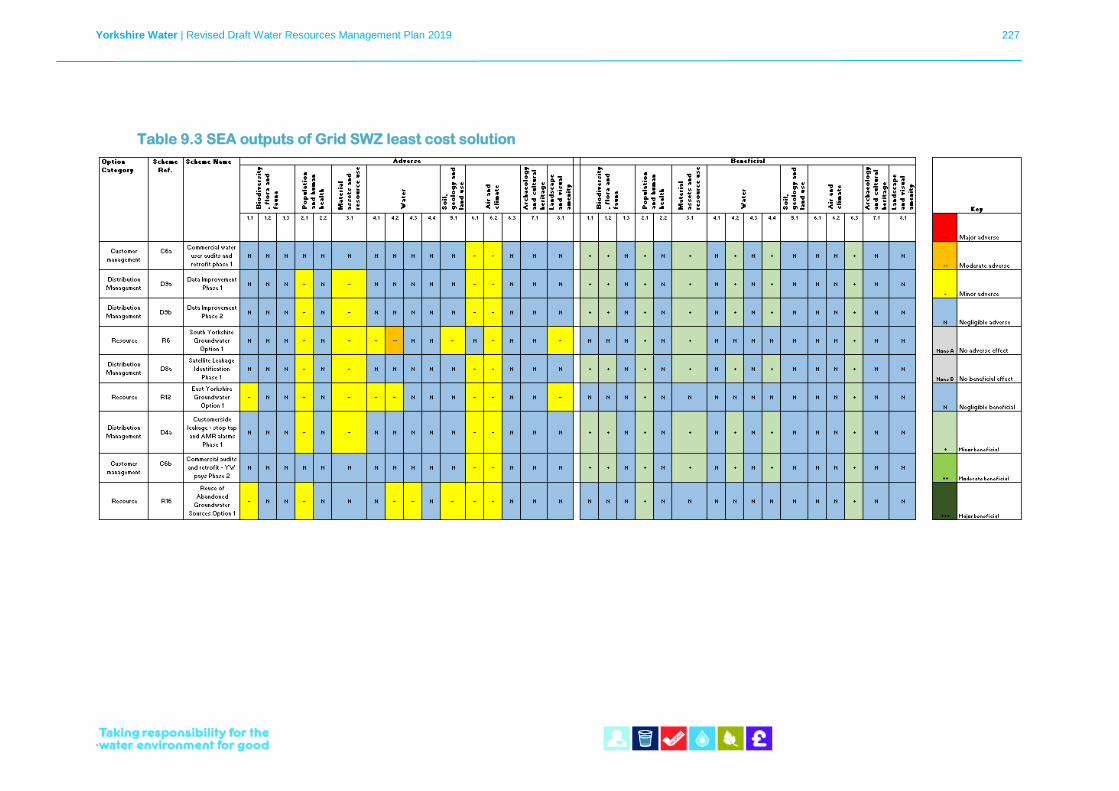
Yorkshire Water | Revised Draft Water Resources Management Plan 2019 227
`
Table 9.3 SEA outputs of Grid SWZ least cost solution
Yorkshire Water | Revised Draft Water Resources Management Plan 2019 228
`
Grid Surface Water Zone sensitivity testing
The deficit presented in our baseline scenario is driven by a risk that hotter and drier
summers will reduce water availability in the future. It is not possible to accurately
predict how severe the impact will be. We have modelled 23 climate change
scenarios impacting on supply, as described in Section 3.11, and selected a
scenario to represent the risk of climate change reducing supply in our baseline dry
year annual average scenario.
There is a risk that we have underestimated the impact of climate change on future
supply availability in the baseline scenario, and the reduction in water available for
use may decline at a much steeper rate. This would require greater intervention
than required in the baseline scenario. Climate change is likely to continue to impact
on water availability beyond the 25-year planning period and this may lead to an
alternative solution being selected.
Alternatively, climate change could be less severe than predicted in the baseline
scenario and we want to be confident our plan is resilient to an uncertain future.
To ensure there is no risk to future security of supply it is important that we consider
alternative future scenarios that allow for uncertainty not evident in the headroom
assessment. We have also developed a number of new leakage techniques and
have created scenarios to increase our leakage activity beyond our current target. In
total, we have considered five supply-demand balance scenarios, all representing
the dry year annual average:
Scenario 1: Baseline dry year annual average: 25-year forecast, leakage activity
maintaining the current 287Ml/d target, climate change based on model ID 7910.
Scenario 2: More extreme climate change: 25-year forecast, leakage activity
maintaining the current 287Ml/d target, climate change based on the median
scenario excluding outliers, model ID 9500.
Scenario 3: Baseline extended to a 40-year period: leakage activity maintaining
the current 287Ml/d target, climate change based on model ID 7910.
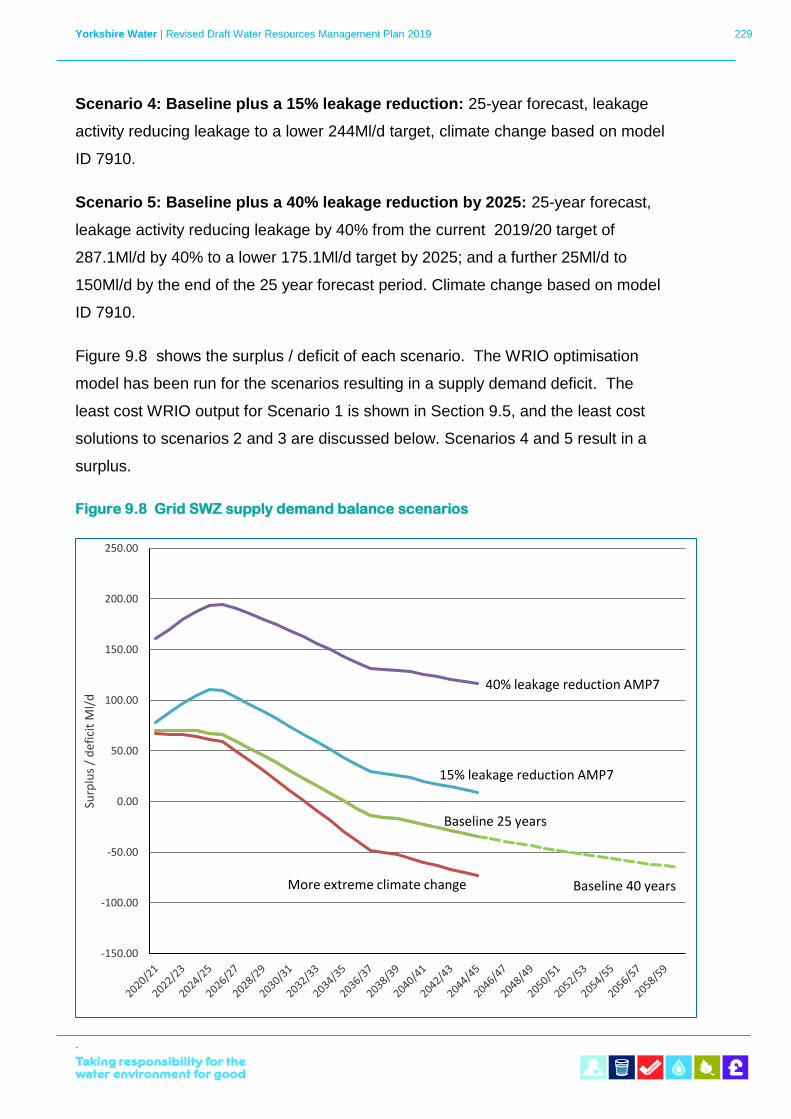
Yorkshire Water | Revised Draft Water Resources Management Plan 2019 229
`
Scenario 4: Baseline plus a 15% leakage reduction: 25-year forecast, leakage
activity reducing leakage to a lower 244Ml/d target, climate change based on model
ID 7910.
Scenario 5: Baseline plus a 40% leakage reduction by 2025: 25-year forecast,
leakage activity reducing leakage by 40% from the current 2019/20 target of
287.1Ml/d by 40% to a lower 175.1Ml/d target by 2025; and a further 25Ml/d to
150Ml/d by the end of the 25 year forecast period. Climate change based on model
ID 7910.
Figure 9.8 shows the surplus / deficit of each scenario. The WRIO optimisation
model has been run for the scenarios resulting in a supply demand deficit. The
least cost WRIO output for Scenario 1 is shown in Section 9.5, and the least cost
solutions to scenarios 2 and 3 are discussed below. Scenarios 4 and 5 result in a
surplus.
Figure 9.8 Grid SWZ supply demand balance scenarios
-150.00
-100.00
-50.00
0.00
50.00
100.00
150.00
200.00
250.00
Surp
lus
/ d
efic
it M
l/d
Baseline 40 yearsMore extreme climate change
15% leakage reduction AMP7
Baseline 25 years
40% leakage reduction AMP7
Yorkshire Water | Revised Draft Water Resources Management Plan 2019 230
`
Scenarios 2 and 3 provide a supply demand balance worse than the baseline
(Scenario 1) driven by climate change. Risks to the supply forecast in addition to
climate change are considered in Section 3.14, and no further future supply
scenarios have been identified for WRMP19.
Demand is not driving a deficit in the supply demand balance and we have not
identified any alternative demand forecasts to the baseline driven by regional
demand or cross sector demand. We do however recognise that the solution to our
forecast deficit could have benefits outside our region or to other water abstractors if
we create a surplus in the future.
9.7.1 Scenario 2: more extreme climate change solution
Scenario 2, a more extreme climate change scenario has forecast supply based on
the median climate change scenario excluding outliers. The supply demand balance
for Scenario 2 results in a deficit of 9.01Ml/d starting in 2032/33 (year 13) and
increasing to 73.20Ml/d by 2044/45 (year 25).
We have produced two potential solutions to this scenario, both based on the EBSD
least cost approach. The first solution, shown in Figure 9.9, is to implement seven
feasible options, six of which are distribution management options and one a
resource option. Distribution management accounts for 18% of the total solution
benefit. Two of the demand reduction options are to deliver water efficiency to non-
household water users and the remaining four would reduce leakage.
The two non-household water audit and retrofit options (C6a and C6b) would each
be delivered over a five-year period to reduce demand by 1Ml/d. The four leakage
reduction options would reduce leakage by 11.49Ml/d or 4% of the current target of
287Ml/d, the same as the baseline least cost solution (Scenario 1).
The single supply side option included in the solution makes up 82% of the benefit
and is option R2 Ouse Raw Water Transfer. The option provides an additional
60Ml/d of supply by making use of a currently under-utilised Yorkshire Water
licenced abstraction on the River Ouse. New infrastructure would be installed to
pipe water from the point of abstraction to a water treatment works in the York area.
Yorkshire Water | Revised Draft Water Resources Management Plan 2019 231
`
The licence used in the R2 Ouse Raw Water Transfer is included in WINEP and the
future reliability of the licence is uncertain. To understand the implications of a
reduced benefit of the option we reran the scenario in WRIO with the R2 Ouse Raw
Water Transfer benefit reduced to 40Ml/d (reference R2b).
The solution, shown in Figure 9.10 , still includes the Ouse Raw Water Transfer at
40Ml/d (R2b) alongside the leakage reduction and commercial audit and retrofit
options included in Figure 9.9 . In addition, two of the supply side options selected
as part of the baseline scenario (Scenario 1) least cost solution have also been
selected. These are R6 South Yorkshire Groundwater Option 1 and R12 East
Yorkshire Groundwater Option 1.
As discussed in relation to the least cost solution to Scenario 1, these schemes are
also on the WINEP lists and the future yield benefit is uncertain.
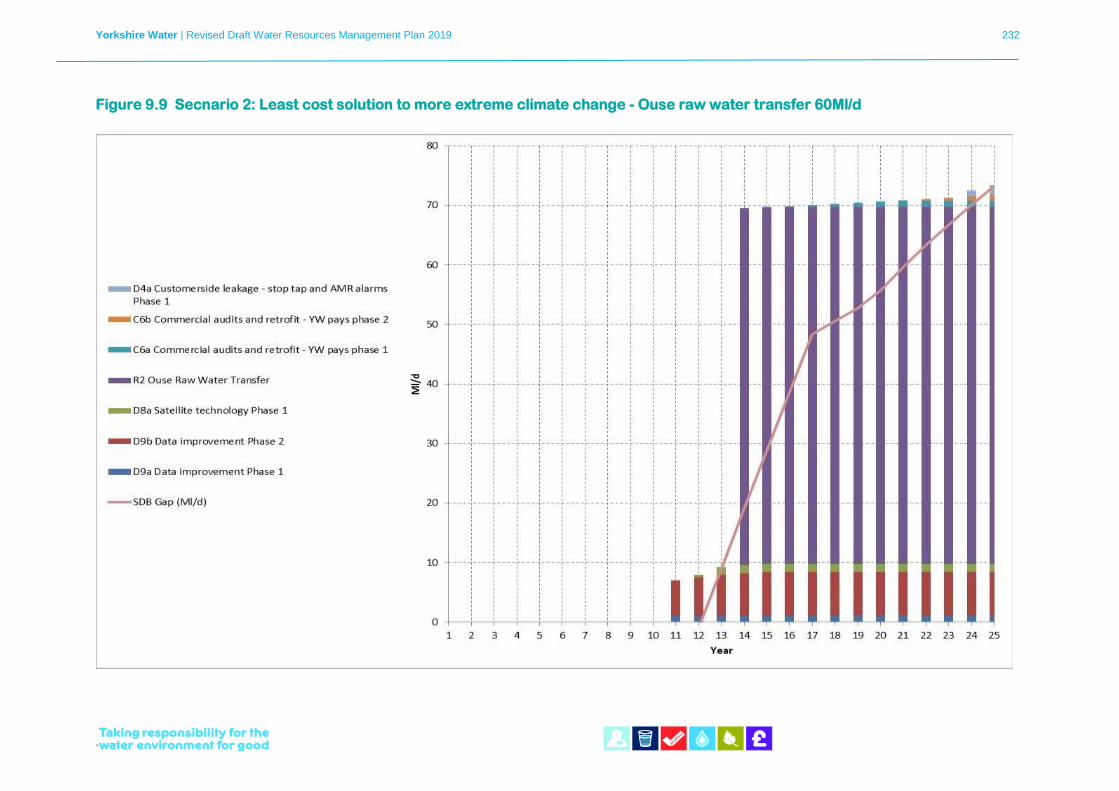
Yorkshire Water | Revised Draft Water Resources Management Plan 2019 232
`
Figure 9.9 Secnario 2: Least cost solution to more extreme climate change - Ouse raw water transfer 60Ml/d
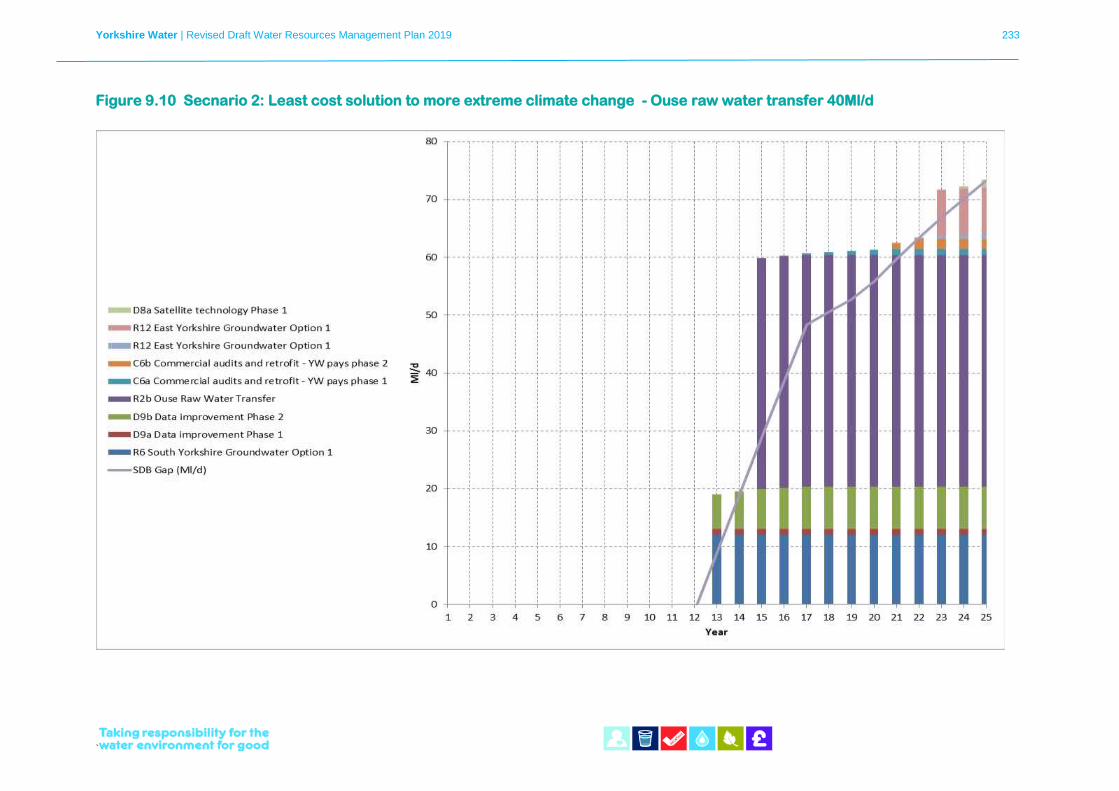
Yorkshire Water | Revised Draft Water Resources Management Plan 2019 233
`
Figure 9.10 Secnario 2: Least cost solution to more extreme climate change - Ouse raw water transfer 40Ml/d
Yorkshire Water | Revised Draft Water Resources Management Plan 2019 234
`
9.7.2 Scenario 3: Baseline extended to a 40-year period solution
The third Grid SWZ scenario extends the baseline scenario (Scenario 1) by 15
years to determine the solution to a 40-year supply demand forecast. The
deployable output forecast for Scenario 3 extends the baseline climate change
impact and supply continues to reduce throughout the planning period. The
demand forecast is calculated by continuing the consumption trend of the 25-year
forecast to year 40 of the extended planning period, as described in Section 4.6.
The solution to Scenario 3 is shown in Figure 9.11 The deficit of 33.97Ml/d in year
25 (2044/45) of the baseline scenario increases to 64.99Ml/d by the end of the
extended planning period (2059/60). By 2059/60 this solution would implement 15
options, made up of 11 distribution management options and four resource options.
Distribution management options make up 64% of the solution and consist of nine
leakage reduction options and two water efficiency options. The remaining 36% of
the deficit is met by four resource options, which include the three resource options
(R6, R12 and R16) contributing to the least cost 25 year baseline solution (Scenario
1) and an additonal 2Ml/d from R9 North Yorkshire Groundwater Option.
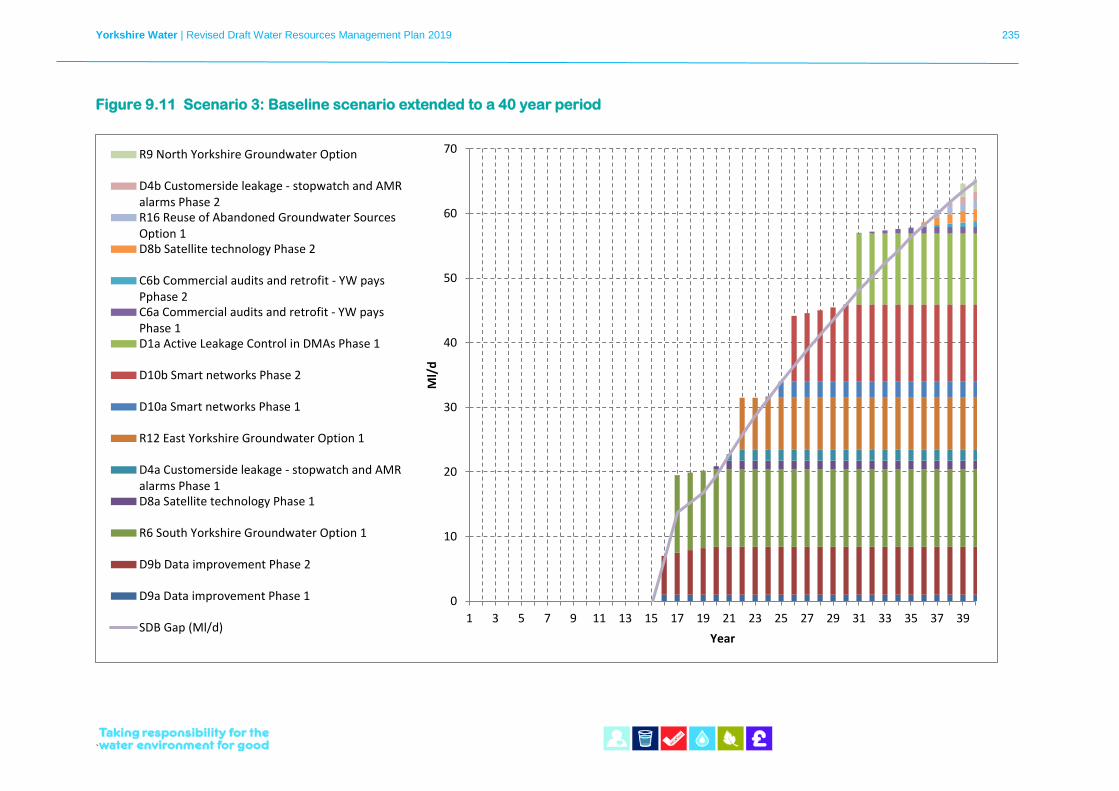
Yorkshire Water | Revised Draft Water Resources Management Plan 2019 235
`
Figure 9.11 Scenario 3: Baseline scenario extended to a 40 year period
0
10
20
30
40
50
60
70
1 3 5 7 9 11 13 15 17 19 21 23 25 27 29 31 33 35 37 39
Ml/
d
Year
R9 North Yorkshire Groundwater Option
D4b Customerside leakage - stopwatch and AMRalarms Phase 2R16 Reuse of Abandoned Groundwater SourcesOption 1D8b Satellite technology Phase 2
C6b Commercial audits and retrofit - YW paysPphase 2C6a Commercial audits and retrofit - YW paysPhase 1D1a Active Leakage Control in DMAs Phase 1
D10b Smart networks Phase 2
D10a Smart networks Phase 1
R12 East Yorkshire Groundwater Option 1
D4a Customerside leakage - stopwatch and AMRalarms Phase 1D8a Satellite technology Phase 1
R6 South Yorkshire Groundwater Option 1
D9b Data improvement Phase 2
D9a Data improvement Phase 1
SDB Gap (Ml/d)
Yorkshire Water | Revised Draft Water Resources Management Plan 2019 236
`
9.7.3 Scenario 4: 15% leakage reduction
Our fourth scenario implements a 15% reduction in leakage by 2025. We have
included this scenario in response to regulatory preferences.
Ofwat has proposed in its draft PR19 methodology that water companies deliver
ambitious leakage reductions. This outlines that companies will need to achieve the
following minimum reductions during AMP7 (2020 to 2025) or justify why not:
• at least a 15% reduction (one percentage point more than largest
reduction commitment at PR14); and
• largest actual percentage reduction achieved by a company since
PR14.
The Guiding principles for water resource planning (Defra, 2016) include a
requirement for water companies to continue a downward trend in leakage reduction
and set challenging leakage targets, informed by customers’ views on leakage and
potential for innovation in the future.
The Water Resources Planning Guideline (Environment Agency and Natural
Resources Wales, 2017) advises water companies to include a scenario for
reducing leakage by 15% in 2020-25, as indicated in Ofwat's draft methodology for
PR19, and show the effects of this on supply and demand options.
Our leakage target at the end of AMP6 (2019/20) is 287Ml/d and a 15% reduction
over AMP7 reduces it to 244Ml/d by 2025. To achieve the 15% reduction, we have
investigated new leakage techniques and the costs for delivery. We have identified
the leakage reduction options that we could feasibly implement and these are
described in Appendix A.2. These options are included in our WRIO optimisation
model and were available for selection in all five of our scenarios.
We have used our WRIO optimisation model to select the least cost solution from all
the available leakage options to achieve a 15% (43.1Ml/d) reduction against our
current leakage target of 287.1Ml/d between 2020 and 2025.
Yorkshire Water | Revised Draft Water Resources Management Plan 2019 237
`
In total, we have nine feasible leakage options available to us, each divided into
phases in WRIO to allow flexibility in the timing of implementation. This results in a
total of 56 phases of leakage reduction available for selection.
Five of the feasible leakage option phases have been selected to provide the
solution to Scenario 4, baseline scenario plus a 15% leakage reduction. The
programme to deliver the least cost leakage options to achieve the 15% reduction in
leakage by 2025 is shown in Figure 9.12
The additional demand reduction measures in the Scenario 4 solution equate to
43.15Ml/d leakage reduction. As the 15% leakage reduction strategy implements
this demand reduction by 2025, the baseline Grid SWZ deficit of 33.97Ml/d in
2044/45 is met without the need for any further measures over the 25-year baseline
scenario.
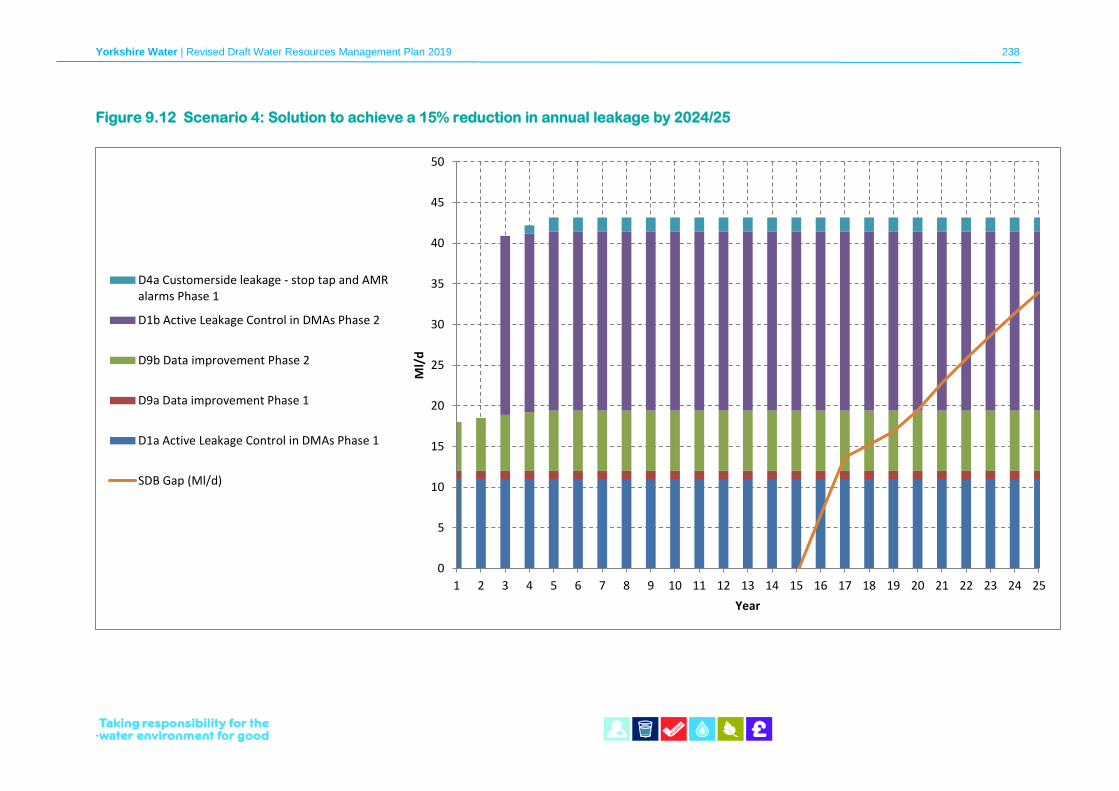
Yorkshire Water | Revised Draft Water Resources Management Plan 2019 238
`
Figure 9.12 Scenario 4: Solution to achieve a 15% reduction in annual leakage by 2024/25
0
5
10
15
20
25
30
35
40
45
50
1 2 3 4 5 6 7 8 9 10 11 12 13 14 15 16 17 18 19 20 21 22 23 24 25
Ml/
d
Year
D4a Customerside leakage - stop tap and AMRalarms Phase 1
D1b Active Leakage Control in DMAs Phase 2
D9b Data improvement Phase 2
D9a Data improvement Phase 1
D1a Active Leakage Control in DMAs Phase 1
SDB Gap (Ml/d)
Yorkshire Water | Revised Draft Water Resources Management Plan 2019 239
`
9.7.4 Scenario 5: 40% leakage reduction
Our fifth scenario implements a 40% reduction in leakage by 2025 to achieve a
regional target of 155Ml/d. From 2025 onwards we continue to reduce leakage to
meet a target of 150Ml/d by the end of the planning period. This is in line with the
Environment Agency Water resource planning guidelines stating an expectation for
water companies to continue to reduce leakage beyond 2025, following the National
Infrastructure Commission (NIC) report on England’s Water Infrastructure.
This scenario requires implementation of all nine of the feasible leakage reduction
options by 2044/45. To achieve a 40% leakage reduction target by 2025 we have
started the leakage reduction programme in 2018/19.
Figure 9.13 shows the programme of implementation of the nine leakage options.
Each option is delivered in phases over 27 years from 2018/19 to 2044/45. We have
included further leakage reduction from 2025/26 onwards at a much reduced rate.
This is to demonstrate our ambition to continue to reduce leakage beyond 2025. In
future WRMPs we will consider any new techniques that become available and
review our leakage target with each iteration.
To meet the 40% reduction in our leakage target we do not require the total benefit
from the nine available leakage options. The leakge reduction benefits from D1a
and D1b, find and fix active leakage control, and D6b and D6c, DMA engineering
and presure management, are therefore reduced in Scenario 5 to represent the
required utilisation of the schemes.
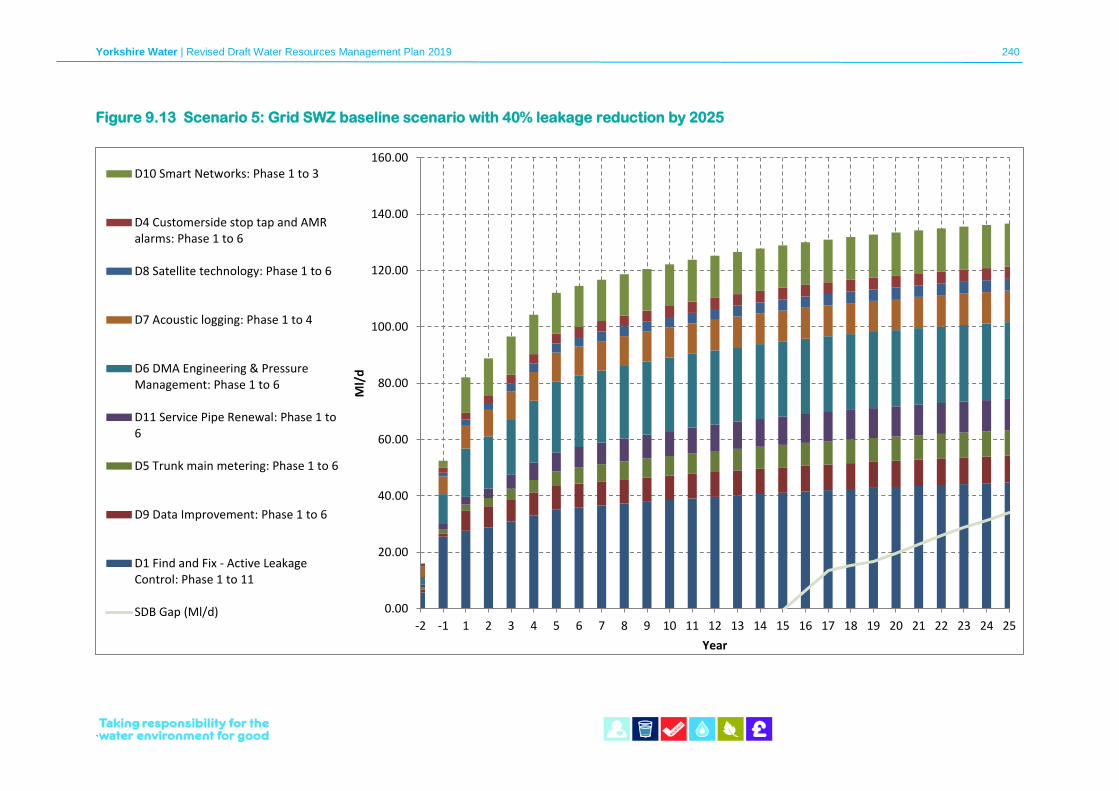
Yorkshire Water | Revised Draft Water Resources Management Plan 2019 240
`
Figure 9.13 Scenario 5: Grid SWZ baseline scenario with 40% leakage reduction by 2025
0.00
20.00
40.00
60.00
80.00
100.00
120.00
140.00
160.00
-2 -1 1 2 3 4 5 6 7 8 9 10 11 12 13 14 15 16 17 18 19 20 21 22 23 24 25
Ml/
d
Year
D10 Smart Networks: Phase 1 to 3
D4 Customerside stop tap and AMRalarms: Phase 1 to 6
D8 Satellite technology: Phase 1 to 6
D7 Acoustic logging: Phase 1 to 4
D6 DMA Engineering & PressureManagement: Phase 1 to 6
D11 Service Pipe Renewal: Phase 1 to6
D5 Trunk main metering: Phase 1 to 6
D9 Data Improvement: Phase 1 to 6
D1 Find and Fix - Active LeakageControl: Phase 1 to 11
SDB Gap (Ml/d)
Yorkshire Water | Revised Draft Water Resources Management Plan 2019 241
`
10 Grid Surface Water Zone preferred
solution
We have chosen to implement a 40% leakage reduction target by 2025 as our
preferred solution for meeting the forecast deficit identified in the Grid SWZ 25-year
baseline scenario. From 2025 onwards we have included further leakage reduction
over the remainder of the planning period to reduce the target to 150Ml/d. This is
presented as Scenario 5 above. In addition to the leakage reduction, we will
investigate two supply options to provide additional resilience, R9 North Yorkshire
Groundwater and R13 East Yorkshire Groundwater Option 2. The supply options
are scheduled for implementation in 2022/23 and 2025/26, provided the results of
the investigations determine that the licences are sustainable.
10.1.1 Our decision-making process
In selecting our preferred plan, we have chosen a solution that minimises
environmental risks, meets customer and regulatory preferences and is flexible and
sustainable in an uncertain future. This is in line with the needs we, our customers
and our stakeholders identify as priorities in our new long-term strategy for
Yorkshire Water, and with the six capitals approach that we are embedding into our
business plan and day to day approaches.
Through a broad consideration of risks and impacts across the six capitals
(financial, manufactured, natural, social, human and intellectual) we can make more
informed long-term decisions that recognise the inherent trade-offs between
environmental, financial and societal costs and benefits.
This section of our WRMP describes how we have used all the information
presented within this plan to identify our final planning scenario – our preferred
solution.
Yorkshire Water | Revised Draft Water Resources Management Plan 2019 242
`
During the development of the draft WRMP19, we were very conscious of the
challenge set by Ofwat in the draft PR19 methodology regarding reductions in
leakage and the link between this and the strategy guidance from the UK
government. The UK Infrastructure Commission has also recommended that
reductions in leakage should be a priority. These challenges resonated strongly
with messages we received from our customer engagement, and also the work on
the foundations for our new long-term strategy. Our focus on the Total Impact Value
Assessment and Six Capitals model emphasises the importance of demand-side
rather that supply side solutions, and so in identifying solutions for the emerging
deficit in the mid-2030s, our immediate focus was on leakage reduction.
Our analysis showed that a leakage reduction of 15% would be sufficient to close
the emerging deficit, and this would also satisfy one element of Ofwat’s leakage
challenge. However, the leakage challenge in the draft methodology had several
component parts: the requirement for all companies to achieve upper quartile
performance, and then to improve by a further 15%. It was this dual challenge that
led to the 40% leakage target.
Historically, we have set and met targets for leakage at the level indicated by SELL.
Our relative abundance of water resources and our ability to move water around our
region using our water grid has resulted in our on-target leakage performance being
at a higher relative level than companies in more water stressed areas. To close the
gap to upper-quartile performance requires a 25% improvement, therefore the 40%
target represents a combination of this catch-up and the additional 15% stretch.
At the time of publication of the draft WRMP19, our planning was influenced by the
dual challenge in the Ofwat draft PR19 methodology. However, conscious that the
final methodology might be different from the draft, our Board decided to progress
with the 15% target. Once the final methodology was published and re-confirmed
the overall leakage challenge, we moved to alter the published plan to include the
40% leakage reduction.
The decisions were taken by our Board immediately after publication of the final
methodology, and the Yorkshire Forum for Water Customers were consulted
throughout. A key feature of our approach is to start our PR19 plan early by re-
Yorkshire Water | Revised Draft Water Resources Management Plan 2019 243
`
investing totex outperformance savings to improve performance across the four
common upper-quartile performance commitments, with our Shareholders forgoing
incentive payments (or a possible reduction in gearing) to do this. The Customer
Forum were consulted both on the nature of the revised targets and in the use of the
totex incentive to fund these.
Our focus on leakage was supported by a number of considerations, two concerning
other demand side solutions and two supply side alternatives:
The estimated per capita consumption of Yorkshire customers is already low,
indicating that further progress may be challenging. We also believe that reducing
leakage is an essential precursor to customers’ demand management. Without
significantly reducing leakage, it is likely to be more difficult to persuade customers
to reduce their own consumption. As part of our overall PR19 plan, we also have a
stretching target to reduce per capita consumption further.
As our supply area does not meet the definition of being water stressed, we do not
have any basis (under current arrangements) to adopt universal metering. Our focus
remains on an optant-led policy. As described previously, we are also introducing a
new commitment to identify customers who might benefit from a metered supply,
and pro-actively contact such customers to encourage them to consider opting for a
meter.
For supply side options our first consideration was around the long-term
sustainability of such approaches given the impact on our consumption of natural
capital. Our customers have emphasised the importance of environmental
improvements and given the long-term population growth and climate change
projections, we consider it is important to adopt good practice as soon as possible.
So even if expansion of supply side options produced a lower near-term incremental
cost than some aspects of leakage reduction, the long-term costs (particularly when
considering a six-capital approach) point to demand side rather than supply side
options.
The second supply side option consideration was the potential future development
of water trading. We believe that the environment for trading will be substantially
improved if a company has already driven forward on leakage reduction. If a
Yorkshire Water | Revised Draft Water Resources Management Plan 2019 244
`
company has not improved its leakage performance, this will tend to act as a barrier
to trading. Third parties will be less interested in developing possible traded options
if they are effectively competing against water released by improved leakage
performance.
The two borehole solutions included in our preferred solution were identified outside
of the supply-demand balance calculation and not selected to meet the deficit. The
R13 East Yorkshire Borehole option is being implemented to replace the current
licence in this area, where the borehole has not been used in recent years due to
bacteria contamination. Alternative sources in the grid system have meant we could
meet demand without this licensed resource. However, our PR19 maintenance
programme has identified we should bring the borehole back into supply to ensure
we are resilient to future risks of increasing nitrates at nearby boreholes and
uncertainty over licence reductions in this area due to WINEP. We could therefore
invest in the current site to bring it back into supply. However, it was identified that a
relocation of the borehole would reduce the risk of the maintenance scheme failing
due to the bacteria at the original site.
The North Yorkshire borehole option was selected to provide security to a local area
where we can meet current and future demand with current sources as it can be
supported from a nearby, larger treatment works. However, there is much
uncertainty over potential housing development in the area and the source was
identified as a low cost solution (£10,000 capital cot)) to increase resilience when
outages occur in the future. The alternatives to the borehole licence variation would
be one of the options to transfer water from the Tees to the Dales (R49, R50 or
R51). These options would incur capital costs of between £13 million to £50 million,
provide resource in excess of what was required (15Ml/d) and have a greater
environmental impact due to the infrastructure required to transfer the water.
Summary of risks to the Grid SWZ supply demand balance
The Grid SWZ baseline 25-year scenario and the sensitivity testing we have carried
out using a more extreme climate change scenario and extended planning period
has identified risks to the supply demand balance of this zone. In addition to this,
Yorkshire Water | Revised Draft Water Resources Management Plan 2019 245
`
our investigations into headroom and potential outages that we could experience in
the future has highlighted a need to enhance resilience in the zone. In summary, the
following risks have been identified:
• Climate change is likely to significantly impact on future supply but the
scale and timing of the deficit is uncertain.
• Headroom and outage risks due to pollution are currently mitigated
through our conjunctive use system within the Grid SWZ. However,
where water quality is deteriorating there is a risk of more severe
outages in the future.
• WINEP investigations could lead to sustainability reductions on some
of our groundwater sources. This will not impact on deployable output
but could reduce the availability of blending sources that allow us to
avoid outages due to nitrate/turbidity pollution, particularly in the East
Yorkshire area of the Grid SWZ.
• WINEP has also identified a risk of a future sustainability reduction on
a key river abstraction on the River Derwent. The risk is due to a
potential change to the revised Common Standards Monitoring
Guidance. There is insufficient evidence to create a scenario for this
potential risk for WRMP19.
• In AMP7 we will investigate the resilience of key water treatment
works in our region in the event of outages not previously
experienced. Under current demand our integrated system has
managed previous outage events without interruption to supply.
However, it is recognised that in areas where new housing
developments are planned there will be greater pressure on key water
treatment works during outage events and future investment to
enhance resilience in our grid system could be needed.
The least cost solution to the baseline scenario (Scenario 1) is met by six
distribution management (38%) and three resource schemes (62%). Our scenario
testing on a more extreme climate change scenario (Scenario 2) and an extended
Yorkshire Water | Revised Draft Water Resources Management Plan 2019 246
`
planning period (Scenario 3) showed further interventions could be required in the
future.
The supply side schemes selected in the least cost solutions to Scenario 1 are R6
South Yorkshire Groundwater option 1, R12 East Yorkshire Groundwater option 1
and R16 Reuse of Abandoned Groundwater Sources Option 1. The solution to
Scenario 2 includes both R6 and R12 and one additional resource opiton, R2b Ouse
raw water transfer. Scenario 3 includes R6, R12 and R16 plus an additonal
resource option, R9 North Yorkshire Groundwater Option. As well as increasing
available resources in the Grid SWZ to help meet the deficit, schemes R6, R9, R12
and R2b would enhance the resilience of the zone by increasing the potential to
move water around the region when outages or peak demands occur.
Three of the resource schemes, R6, R12 and R2b, would make use of existing
licenced resources that are currently underutilised. However, all three of these
schemes are included in WINEP and investigations will be carried out in early
AMP7. This creates some uncertainty over the sustainability of the options and may
result in a reduced yield benefit. For the Ouse raw water transfer we have reduced
the potential benefit from 60Ml/d to 40Ml/d to determine if it is cost effective at a
lower volume.
Although we are not forecasting a deficit in our baseline supply demand balance
until 2035/36, we need to implement a solution that will be sustainable to future
risks, and for this WRMP the uncertainty over the three supply side schemes means
we must consider alternative solutions. However, AMP7 investigations will help
confirm the feasibility of the options for WRMP24.
Option R13 East Yorkshire Groundwater option 2, which is included in the preferred
solution, will relocate an existing licence provided the Environment Agency approve
our licence application. The current licence is not used but is included on in WINEP.
We have selected this option to provide resilience and the demand reduction from
the leakage options will close the future supply demand deficit. We are not relying
on the R13 resource to meet the supply demand balance. Investigations will be
carried out to understand the environmental impacts of the potential abstraction. If
the investigation results in a reduced benefit the source would still provide resilience
Yorkshire Water | Revised Draft Water Resources Management Plan 2019 247
`
as it will be used in conjunction (under current infrastructure) with the East Yorkshire
boreholes, which may also be reduced as a result of WINEP investigations.
Benefits of the Grid SWZ preferred solution
Our preferred solution to reduce leakage by 40% by 2025, with further reductions up
to 2045, and to invest in two new supply schemes will address the forecast deficit,
help maintain resilience to future outage risks and provide a surplus if climate
change is more severe than the baseline forecast. The forecast supply/demand
balance with our preferred solution implemented is shown in Figure 10.1 The full
benefits of the preferred plan are outlined below:
• Meet the baseline scenario supply demand deficit, securing our levels
of service over the 25-year planning period.
• Meet Defra’s expectation for a downward leakage trend.
• Achieve Ofwat’s requirements for at least 15% leakage reduction
target by 2025, whilst also improving our own leakage performance
signifcantly when compared to the rest of the UK water industry.
• Meets our own and customer preferences to reduce leakage and to
take less water from the environment.
• Deliver a social and wellbeing benefit to customers by reducing the
volume we abstract from rivers and reservoirs that they use for
recreation.
• Provide resilience to outages by developing two new resources and
reducing the average daily demand required from our key water
treatment works. Overall water into supply will reduce therefore the
two new supply schemes are required for resilience only and will be
used in conjunction with other sources to alleviate outage risks.
• Relies on demand reduction, providing a more sustainable solution
than new supplies if water becomes more scarce in the future through
further sustainability reductions or Abstraction Reform.
Yorkshire Water | Revised Draft Water Resources Management Plan 2019 248
`
• Reduces our daily energy and chemical consumption, and the
resultant carbon footprint, by reducing the volume of water we are
required to treat and deliver through our supply network.
• Increases flexibility of choice over where we source and treat water to
put into supply so that we can avoid more polluted water sources that
require advanced treatment.
• An early start on implementation will ensure we can maintain demand
at a lower level prior to the risks of climate change reducing supply to
a critical point. It will also mitigate any reduction to our River Derwent
licenced abstraction.
• In the event of droughts, we will be more resilient and not require as
much reliance on drought orders and permits.
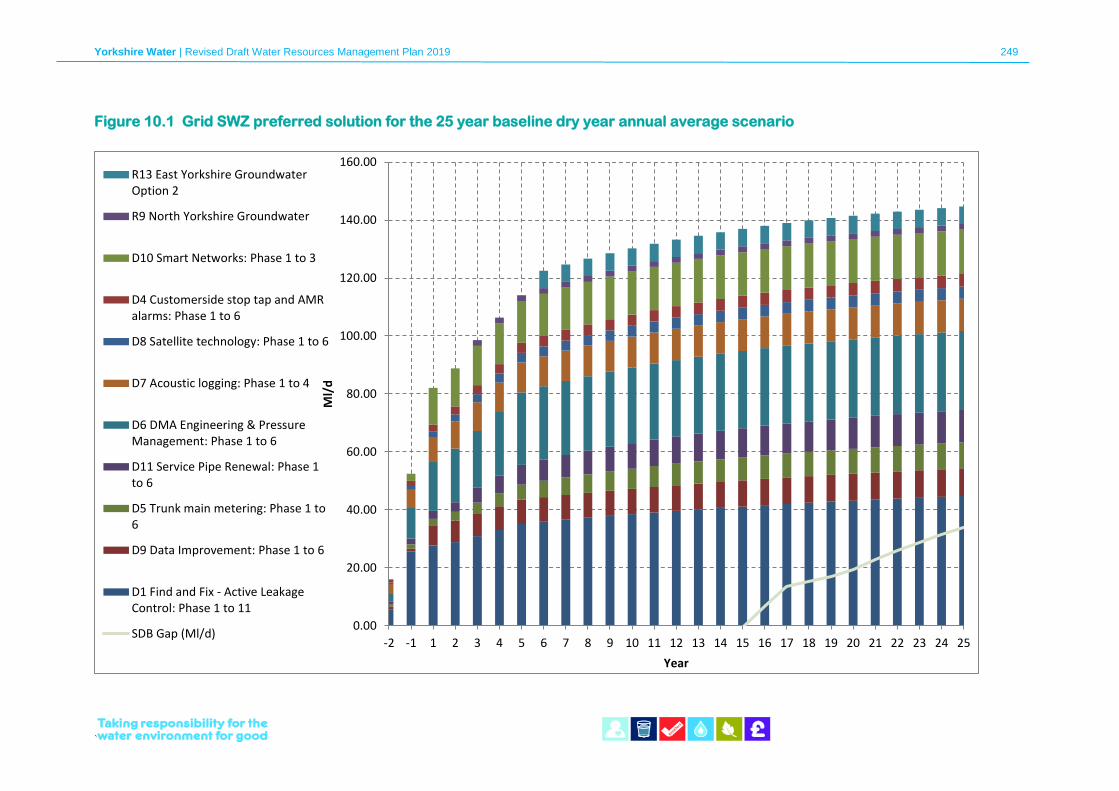
Yorkshire Water | Revised Draft Water Resources Management Plan 2019 249
`
Figure 10.1 Grid SWZ preferred solution for the 25 year baseline dry year annual average scenario
0.00
20.00
40.00
60.00
80.00
100.00
120.00
140.00
160.00
-2 -1 1 2 3 4 5 6 7 8 9 10 11 12 13 14 15 16 17 18 19 20 21 22 23 24 25
Ml/
d
Year
R13 East Yorkshire GroundwaterOption 2
R9 North Yorkshire Groundwater
D10 Smart Networks: Phase 1 to 3
D4 Customerside stop tap and AMRalarms: Phase 1 to 6
D8 Satellite technology: Phase 1 to 6
D7 Acoustic logging: Phase 1 to 4
D6 DMA Engineering & PressureManagement: Phase 1 to 6
D11 Service Pipe Renewal: Phase 1to 6
D5 Trunk main metering: Phase 1 to6
D9 Data Improvement: Phase 1 to 6
D1 Find and Fix - Active LeakageControl: Phase 1 to 11
SDB Gap (Ml/d)
Yorkshire Water | Revised Draft Water Resources Management Plan 2019 250
`
10.3.1 Demand reduction benefits
A breakdown of the yield benefits of the preferred solution is presented in Figure 10.1
and Table 10.1. The preferred solution will deliver nine distribution management options
to reduce our current leakage volume and two resource options to provide additional
resilience in the Grid SWZ.
The leakage options will be delivered through a total of 56 phases. The first phase of
each leakage option and the second phase of find and fix active leakage control (D2a)
will be delivered in AMP6 to provide an early start in delivery to achieve the targeted
40% leakage reduction by 2025. From 2025 onwards we aim to continue leakage
reduction, although at a much reduced rate, as current leakage techniques reach their
limts. However, available leakage techniques will be reviewed with each iteration of the
WRMP to assess if there is greater potential to reduce leakage in the future.
The leakage reduction options, will reduce water into supply by a total of 137Ml/d by
2044/45. The two resource options will provide a combined 8Ml/d additional resource.
The demand reduction benefits of the leakage options will remove the deficit forecast to
start in 2035/36 in the baseline 25-year planning period.
10.3.2 Resilience benefits of the Grid SWZ preferred solution
The resource options we have selected as part of our preferred solution are a 2Ml/d
annual average and peak increase to an existing groundwater abstraction in North
Yorkshire (R9) and a relocation of a 6Ml/d annual average, 9Ml/d peak groundwater
licence in East Yorkshire (R13). The investment in the two borehole supplies will
enhance resilience to headroom and outage risks.
The R13 East Yorkshire Groundwater Option 2 is proposed as an improved location to
an existing licenced abstraction that has been closed due to bacterial contamination.
The licence is no longer included in our deployable output as our conjunctive use
system can meet demand and cope with outages under current conditions.
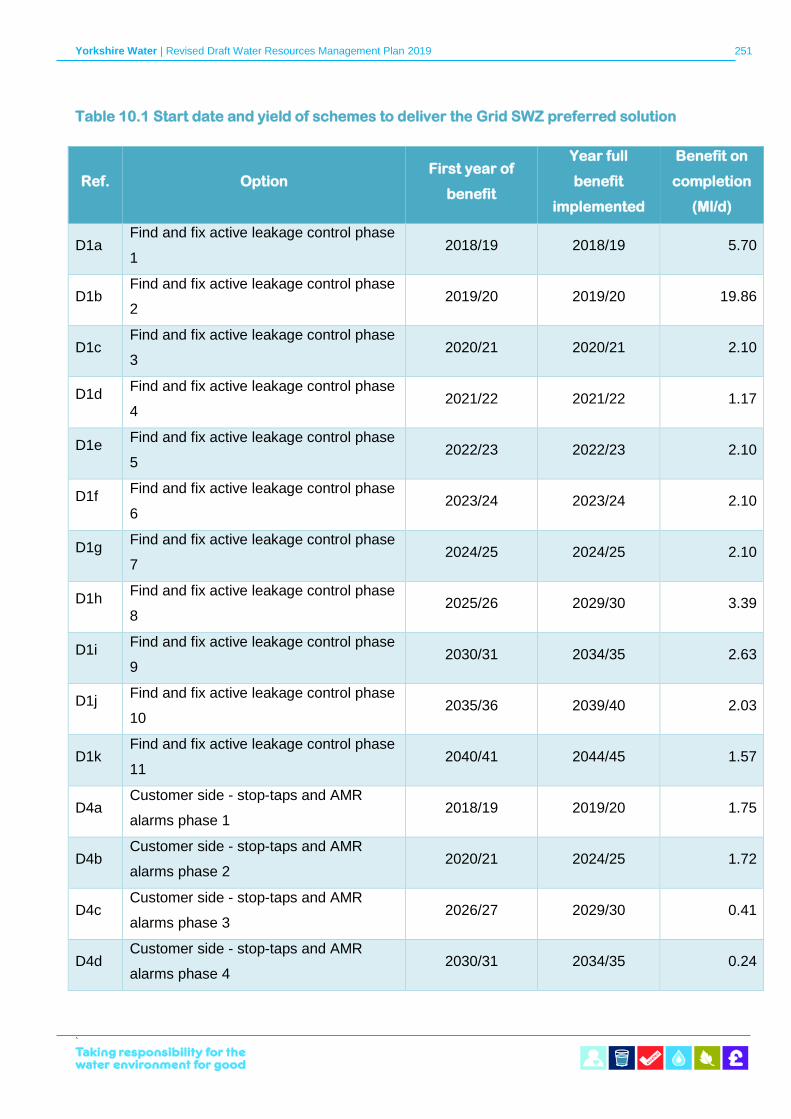
Yorkshire Water | Revised Draft Water Resources Management Plan 2019 251
`
Table 10.1 Start date and yield of schemes to deliver the Grid SWZ preferred solution
Ref. Option First year of
benefit
Year full
benefit
implemented
Benefit on
completion
(Ml/d)
D1a Find and fix active leakage control phase
1 2018/19 2018/19 5.70
D1b Find and fix active leakage control phase
2 2019/20 2019/20 19.86
D1c Find and fix active leakage control phase
3 2020/21 2020/21 2.10
D1d Find and fix active leakage control phase
4 2021/22 2021/22 1.17
D1e Find and fix active leakage control phase
5 2022/23 2022/23 2.10
D1f Find and fix active leakage control phase
6 2023/24 2023/24 2.10
D1g Find and fix active leakage control phase
7 2024/25 2024/25 2.10
D1h Find and fix active leakage control phase
8 2025/26 2029/30 3.39
D1i Find and fix active leakage control phase
9 2030/31 2034/35 2.63
D1j Find and fix active leakage control phase
10 2035/36 2039/40 2.03
D1k Find and fix active leakage control phase
11 2040/41 2044/45 1.57
D4a Customer side - stop-taps and AMR
alarms phase 1 2018/19 2019/20 1.75
D4b Customer side - stop-taps and AMR
alarms phase 2 2020/21 2024/25 1.72
D4c Customer side - stop-taps and AMR
alarms phase 3 2026/27 2029/30 0.41
D4d Customer side - stop-taps and AMR
alarms phase 4 2030/31 2034/35 0.24
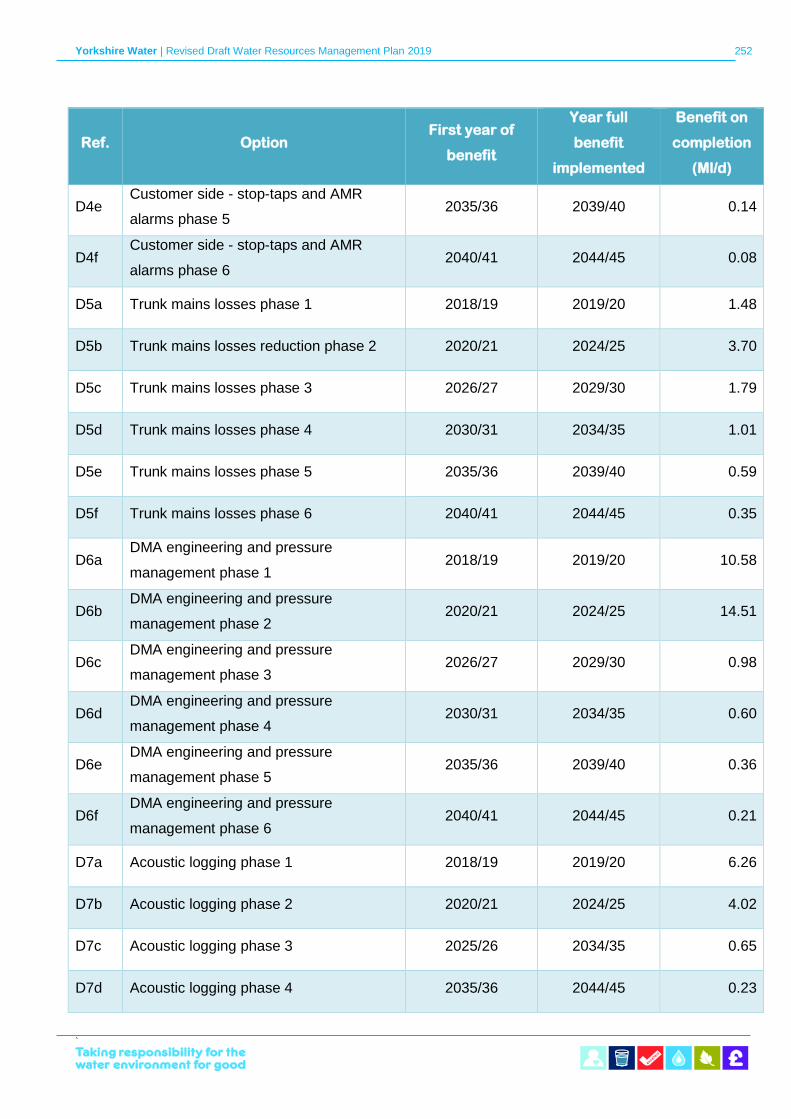
Yorkshire Water | Revised Draft Water Resources Management Plan 2019 252
`
Ref. Option First year of
benefit
Year full
benefit
implemented
Benefit on
completion
(Ml/d)
D4e Customer side - stop-taps and AMR
alarms phase 5 2035/36 2039/40 0.14
D4f Customer side - stop-taps and AMR
alarms phase 6 2040/41 2044/45 0.08
D5a Trunk mains losses phase 1 2018/19 2019/20 1.48
D5b Trunk mains losses reduction phase 2 2020/21 2024/25 3.70
D5c Trunk mains losses phase 3 2026/27 2029/30 1.79
D5d Trunk mains losses phase 4 2030/31 2034/35 1.01
D5e Trunk mains losses phase 5 2035/36 2039/40 0.59
D5f Trunk mains losses phase 6 2040/41 2044/45 0.35
D6a DMA engineering and pressure
management phase 1 2018/19 2019/20 10.58
D6b DMA engineering and pressure
management phase 2 2020/21 2024/25 14.51
D6c DMA engineering and pressure
management phase 3 2026/27 2029/30 0.98
D6d DMA engineering and pressure
management phase 4 2030/31 2034/35 0.60
D6e DMA engineering and pressure
management phase 5 2035/36 2039/40 0.36
D6f DMA engineering and pressure
management phase 6 2040/41 2044/45 0.21
D7a Acoustic logging phase 1 2018/19 2019/20 6.26
D7b Acoustic logging phase 2 2020/21 2024/25 4.02
D7c Acoustic logging phase 3 2025/26 2034/35 0.65
D7d Acoustic logging phase 4 2035/36 2044/45 0.23
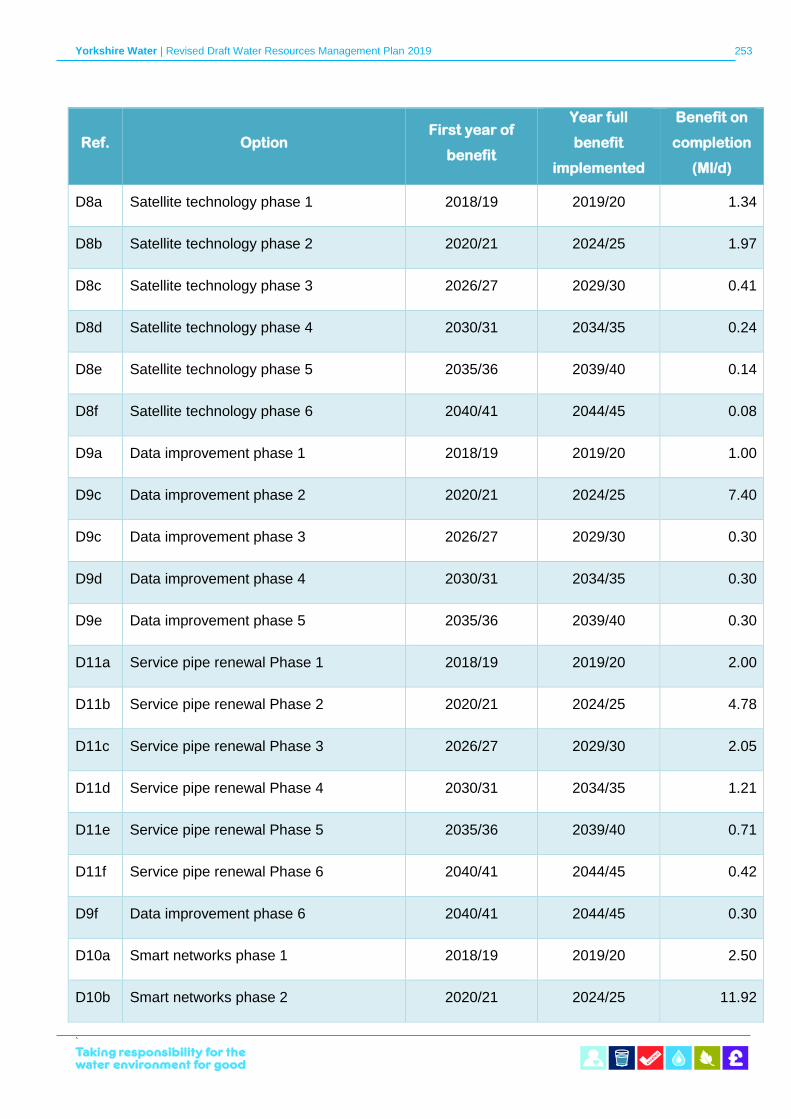
Yorkshire Water | Revised Draft Water Resources Management Plan 2019 253
`
Ref. Option First year of
benefit
Year full
benefit
implemented
Benefit on
completion
(Ml/d)
D8a Satellite technology phase 1 2018/19 2019/20 1.34
D8b Satellite technology phase 2 2020/21 2024/25 1.97
D8c Satellite technology phase 3 2026/27 2029/30 0.41
D8d Satellite technology phase 4 2030/31 2034/35 0.24
D8e Satellite technology phase 5 2035/36 2039/40 0.14
D8f Satellite technology phase 6 2040/41 2044/45 0.08
D9a Data improvement phase 1 2018/19 2019/20 1.00
D9c Data improvement phase 2 2020/21 2024/25 7.40
D9c Data improvement phase 3 2026/27 2029/30 0.30
D9d Data improvement phase 4 2030/31 2034/35 0.30
D9e Data improvement phase 5 2035/36 2039/40 0.30
D11a Service pipe renewal Phase 1 2018/19 2019/20 2.00
D11b Service pipe renewal Phase 2 2020/21 2024/25 4.78
D11c Service pipe renewal Phase 3 2026/27 2029/30 2.05
D11d Service pipe renewal Phase 4 2030/31 2034/35 1.21
D11e Service pipe renewal Phase 5 2035/36 2039/40 0.71
D11f Service pipe renewal Phase 6 2040/41 2044/45 0.42
D9f Data improvement phase 6 2040/41 2044/45 0.30
D10a Smart networks phase 1 2018/19 2019/20 2.50
D10b Smart networks phase 2 2020/21 2024/25 11.92
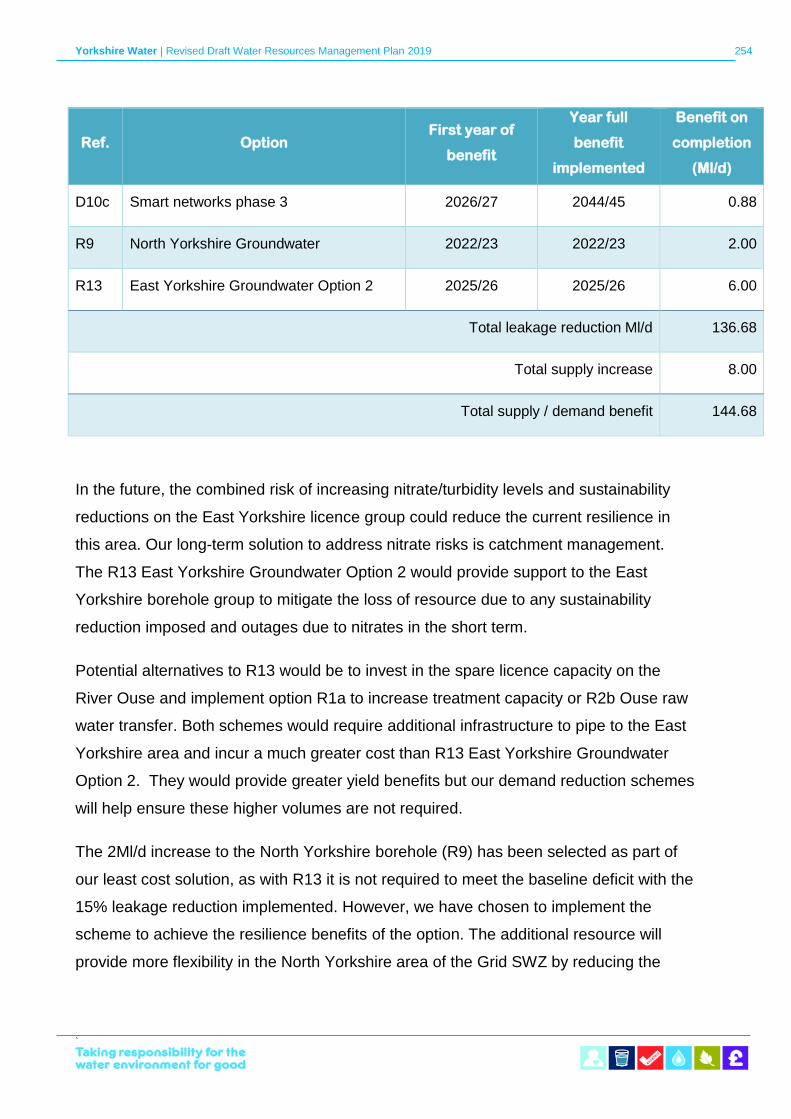
Yorkshire Water | Revised Draft Water Resources Management Plan 2019 254
`
Ref. Option First year of
benefit
Year full
benefit
implemented
Benefit on
completion
(Ml/d)
D10c Smart networks phase 3 2026/27 2044/45 0.88
R9 North Yorkshire Groundwater 2022/23 2022/23 2.00
R13 East Yorkshire Groundwater Option 2 2025/26 2025/26 6.00
Total leakage reduction Ml/d 136.68
Total supply increase 8.00
Total supply / demand benefit 144.68
In the future, the combined risk of increasing nitrate/turbidity levels and sustainability
reductions on the East Yorkshire licence group could reduce the current resilience in
this area. Our long-term solution to address nitrate risks is catchment management.
The R13 East Yorkshire Groundwater Option 2 would provide support to the East
Yorkshire borehole group to mitigate the loss of resource due to any sustainability
reduction imposed and outages due to nitrates in the short term.
Potential alternatives to R13 would be to invest in the spare licence capacity on the
River Ouse and implement option R1a to increase treatment capacity or R2b Ouse raw
water transfer. Both schemes would require additional infrastructure to pipe to the East
Yorkshire area and incur a much greater cost than R13 East Yorkshire Groundwater
Option 2. They would provide greater yield benefits but our demand reduction schemes
will help ensure these higher volumes are not required.
The 2Ml/d increase to the North Yorkshire borehole (R9) has been selected as part of
our least cost solution, as with R13 it is not required to meet the baseline deficit with the
15% leakage reduction implemented. However, we have chosen to implement the
scheme to achieve the resilience benefits of the option. The additional resource will
provide more flexibility in the North Yorkshire area of the Grid SWZ by reducing the
Yorkshire Water | Revised Draft Water Resources Management Plan 2019 255
`
need to support the area from a nearby larger water treatment works. This releases
capacity at this works to provide support to other areas as required.
The alternatives to this scheme would be to implement one of the Tees to Dales options
or to invest in the Ouse (R1a or R2b) schemes and additional infrastructure to transfer
to the Dales area. These schemes would be more expensive than R9 North Yorkshire
borehole, but have the advantage of providing an additional 15Ml/d.
The final plan surplus will be 110.69Ml/d, which exceeds the 33.97Ml/d deficit forecast
in 2044/45. The two resource options are to provide resilience against potential outages
and overall our preferred solution will result in less water being taken from the
environment daily.
We are not relying on the two supply side options to close the gap in the baseline
scenario. The additional resource could help ensure that we are in a good position if the
impact of climate change on supply is more severe than predicted in our baseline
scenario. However, if the results of the investigations into the options conclude they are
not sustainable or the licences are permitted at a lower volume then this will not create
a gap in the final planning supply demand balance for this WRMP.
Customer support
Appendix C details the extensive customer engagement we have carried out as a
central part of PR19 and WRMP19 planning, to help us understand more about what is
important to our customers now and in the future. This process has provided an
appraisal of customers’ views on current and potential leakage levels and the
information in Appendix C has been presented with specific reference to this and other
activity relevant to water resource planning.
All research undertaken was conclusive about our customers’ expectations on current
and future leakage performance. Customers were disappointed with our current leakage
performance and comparative industry position and expected to see significant leakage
reduction prioritised over the short, medium and long term.
Yorkshire Water | Revised Draft Water Resources Management Plan 2019 256
`
We also discussed our draft plan with our independent customer challenge group, the
Yorkshire Forum for Water Customers. The Forum was set up in 2012 and is made up
of key groups in Yorkshire who collectively represent Yorkshire Water’s customers.
The Yorkshire Forum for Water Customers’s Environment Sub-Group was established
to support the main Forum in challenging the company’s activities on issues relating to
the environment. This has included consideration of Company submissions to Ofwat,
the Government, the Drinking Water Inspectorate (DWI), the Environment Agency and
Natural England.
The Sub Group have discussed the draft WRMP19 over many meetings and have
examined the guidance, the drivers, our approach, environmental impacts, the
proposed solutions, the technical papers, the assurance, the Board assurance and the
public consultation. The Sub Group involvement has continued with regard to
consultation representations, our statement of response and drafting of the revised draft
WRMP19.
The Sub Group has been supportive of our process and approach to WRMP19 and
reviewed and challenged a version of the draft WRMP19 documents and helped
improve the clarity, coherence and readability draft WRMP19 published for consultation.
The Sub Group also challenged the demand management options in light of the secure
supply demand balance. They requested a presentation on demand management to
understand the range of activity and the reasoning for the demand management plans
and the ambitious leakage target in particular. The discussions have concluded with the
group being supportive of the draft WRMP19 and they will continue to be engaged in
the production of the final WRMP19.
Habitats Regulations Assessment of the preferred solution
A HRA has been prepared to assess the potential for likely significant effects of the
WRMP options on sites designated under the Habitats Directive, Birds Directive and the
international Ramsar Convention. The findings have been discussed with Natural
England and the Environment Agency.
Yorkshire Water | Revised Draft Water Resources Management Plan 2019 257
`
The HRA screening assessment of the preferred solution has concluded that, except for
one option, and with mitigation taken into account, the preferred plan is not likely to
have significant effects on the integrity of any of these designated sites based on
current information and designations. There was some initial uncertainty around the R9
North Yorkshire Groundwater Option scheme. Stage 1 HRA screening indicated that
likely significant effects on the SAC could not be ruled out as a result of the
implementation of the scheme. HRA Guidance indicates that the Plan making authority
(in this case Yorkshire Water) shall adopt, or otherwise give effect to the Plan, only after
having ascertained that it will not adversely affect the integrity of a European site. As
such, a Stage 2 HRA was required to determine whether the implementation of the
Scheme could impact on the conservation objectives or the qualifying features of the
SAC, the results of which have been discussed with Natural England.
Subsequent to the completion of the Stage 2 assessment, the HRA report has been
updated to include an appendix (appendix B) to provide Information to Inform the
Appropriate Assessment. Available information indicates that the scheme will not, alone
or in-combination with other plans or projects, have an impact on the conservation
objectives or the qualifying features of the SAC. As such, the scheme will not have a
significant adverse effect on the integrity of the site.
It should be noted that Yorkshire Water is undertaking a HIA and water features
assessment to confirm potential impacts associated with this scheme. This scheme is
not likely to be required before 2022, and any information to support the conclusions of
the Appropriate Assessment and reduce uncertainty, will therefore be available before
the scheme is considered. It is also important to note that this scheme has been
included to improve resilience only, therefore if a subsequent assessment
demonstrated a likely significant effect, alternative options within the preferred plan
would be implemented to meet demand
Potential in-combination effects within the draft WMRP19 were assessed. The
distribution management schemes would have no impact on any designated sites either
alone, or in-combination with any other schemes. The R9 North Yorkshire Groundwater
Option Scheme and the R13 East Yorkshire Groundwater option 2 are located
approximately 75km apart, and in-combination impacts are considered unlikely.
Yorkshire Water | Revised Draft Water Resources Management Plan 2019 258
`
Cumulative assessment of the draft WRMP19 with other water company draft WRMPs,
drought plans, and other relevant programmes and plans have been carried out. No in-
combination impacts have been identified for any schemes within the draft plan or any
other schemes, plans or projects within Yorkshire Water’s or neighbouring water
company operational areas.
Water Framework Directive Assessment of the Preferred Plan
In line with regulatory guidance, we have carried out a WFD assessment of the
preferred solution to ensure that none of the schemes, either in isolation or in-
combination, would lead to a deterioration in waterbody status.
The following objectives were set out to test for in the WFD compliance assessment:
Objective 1: To prevent deterioration between status classes of any waterbody
Objective 2: To prevent the introduction of impediments to the attainment of Good WFD
status or potential for the waterbody. It is noted that for some
waterbodies, it is accepted that achievement of Good status or potential is
currently technically infeasible or disproportionately costly. Where this is
the case, the test is applied to the currently agreed objectives for that
water body rather than against Good status/potential.
Objective 3: To ensure that the planned programme of measures in the RBMP to help
attain the WFD objectives for the waterbody (or the environmental
objectives in the 2015 RBMPs) are not compromised
Objective 4: To ensure the achievement of the WFD objectives in other waterbodies
within the same catchment are not permanently excluded or compromised.
Two further objectives were set to review and document if the option
assists the meeting of WFD objectives, which is over and above a test of
WFD compliance of the option:
Objective 5: To assist the attainment of the WFD objectives for the waterbody
Yorkshire Water | Revised Draft Water Resources Management Plan 2019 259
`
Objective 6: To assist the attainment of the objectives for associated WFD protected
areas.
The WFD assessment report has been shared with the Environment Agency and has
concluded that:
• Only one scheme (R13 East Yorkshire Groundwater option 2) has the
potential to lead to deterioration between classes for aquatic
macroinvertebrates in the dependant surface water body. The risk of this
effect requires further investigation and is currently assessed as
uncertain.
• Only one scheme (R13 East Yorkshire Groundwater option 2) has the
potential to introduce an impediment to the achievement of good quality
status for the groundwater water body the abstraction would be from.
Specifically, this relates to risk of impeding the achievement of Good
status for the Saline Intrusion test (Poor status in RBMP2) and linked
effects on achieving Good status for Chemical status (Poor in RBMP2).
The risk of these effects requires further investigation and is currently
assessed as uncertain.
• None of the options in the preferred plan, alone or in combination,
impede the planned RBMP2 programme of measures to help attain WFD
objectives for any water body.
• None of the options in the preferred plan, alone or in combination, affect
the WFD objectives of other water bodies, beyond those uncertain risks
listed above for the linked river water body, i.e. the dependant surface
water body for the groundwater water body at risk from Option R13 (East
Yorkshire Groundwater Option 2).
• None of the options in the preferred plan, alone or in combination,
compromise the attainment of good status or good potential objectives for
any waterbodies.
• None of the options in the preferred plan, alone or in combination,
compromise the attainment of objectives for WFD protected areas.
Yorkshire Water | Revised Draft Water Resources Management Plan 2019 260
`
SEA cumulative impact assessment of the preferred plan
A cumulative assessment of the preferred programme was undertaken to consider
whether the preferred solution options, when constructed or operated together, led to
additional effects on each of the SEA topics. Table 10.3 provides a summary of the
SEA outputs for the preferred plan.
Most of the distribution management options included in the preferred plan are
compatible, with implementation of each option increasing the overall volume of water
savings made. There is a small risk that the simultaneous implementation of the
distribution management schemes could lead to cumulative adverse impacts, whereby
disturbance to human health, resource, and air greenhouse gas emissions could
increase due to network repair and enhancement activities. However, any such
cumulative impacts would be minor, as most of these activities would be localised and
small in scale, and could be effectively mitigated through careful project management
and best practice construction methods.
There is no potential for cumulative impacts between the two resource management
options included in the preferred plan, as they abstract from different aquifers. R9 North
Yorkshire Groundwater option boreholes abstract from the confined Millstone Grit
Group aquifer, while R13 East Yorkshire Groundwater option 2 boreholes would target
the Sherwood Sandstone Group aquifer.
At a plan level, cumulative effects with other relevant plans, programmes and projects
were also considered. These included our Drought Plan, draft WRMPs and drought
plans from neighbouring water companies, Environment Agency Drought Plans, Canal
and River Trust Management Plans, Local Development Frameworks, National Policy
Statements and National/Regional Infrastructure Plans, and major projects. No
significant cumulative impacts were identified between the draft WRMP and any other
relevant plans, programmes and projects.
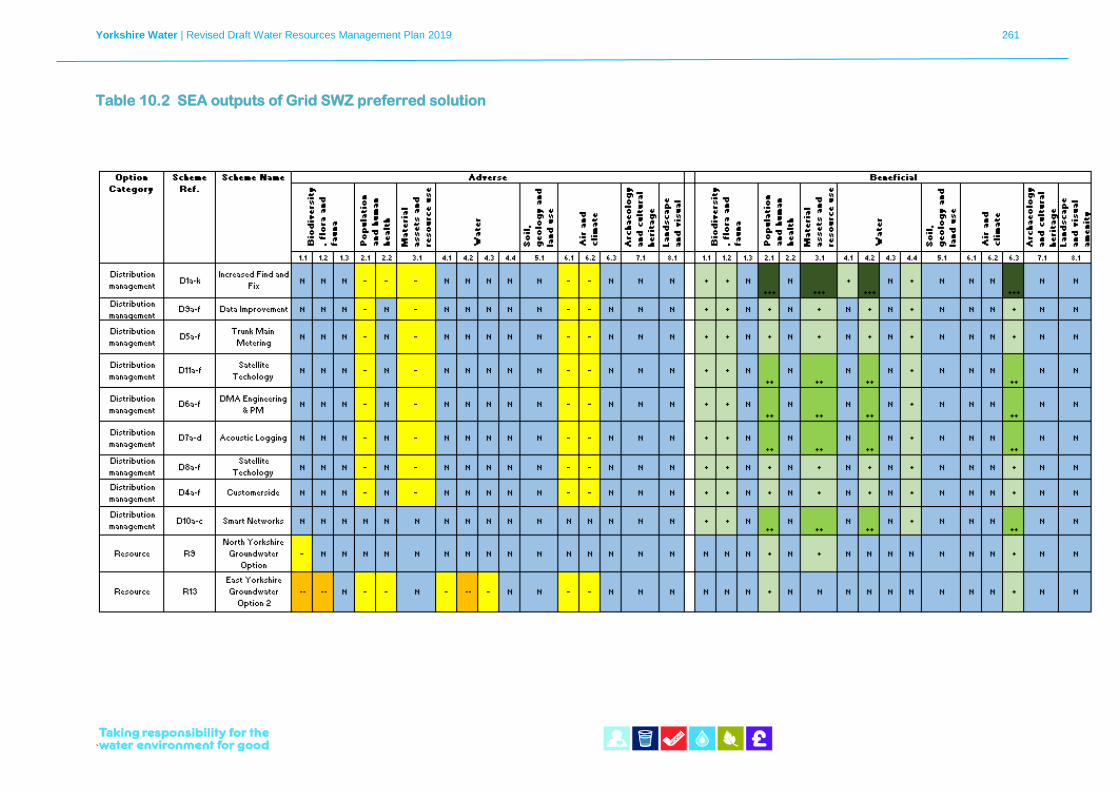
Yorkshire Water | Revised Draft Water Resources Management Plan 2019 261
`
Table 10.2 SEA outputs of Grid SWZ preferred solution
Yorkshire Water | Revised Draft Water Resources Management Plan 2019 262
`
10.7.1 Mitigation and monitoring
Consideration of mitigation measures has been an integral part of the SEA process.
The SEA appraisals have been based on residual impacts that are likely to remain
after the implementation of reasonable mitigation.
Table 11.1 in Section 11 gives a timeline of the implementation of the two resource
options included in the preferred solution. This includes a period of monitoring and
assessment to show when the investigations of the environmental effects would be
carried out.
Where appropriate, the SEA has identified additional mitigation measures that may
be required, either during the construction phase or operational phase of the
resource options in the preferred solution. These mitigation measures will be further
defined during the more detailed design stages of the schemes as they come
forward for implementation. Mitigation measures will also be discussed as
appropriate with the environmental regulators, planning authorities and English
Heritage, as appropriate.
Appropriate monitoring has been identified in the SEA to track any potential
environmental effects during implementation of the options, which will in turn trigger
deployment of suitable and practicable mitigation measures. Prior to
implementation, we will review the specific requirements for environmental
monitoring in consultation with the Environment Agency, Natural England and
English Heritage, as appropriate.
We will fully comply with the requirements of The Water Supply (Water Quality)
Regulations 2016 Regulation 15, when considering introducing any new sources to
be used ultimately for drinking water. Specifically, we will meet the arrangements
stated in Drinking Water Inspectorate (DWI) Information Letter 06/2012, around
providing adequate information to the DWI; appropriate sampling and monitoring;
reporting requirements; following our Drinking Water Safety Planning risk
assessment methodology; and submission of Regulation 28 documentation as
necessary.
Yorkshire Water | Revised Draft Water Resources Management Plan 2019 263
`
Scenario comparison
We considered five scenarios in determining the solution to the deficit forecast in the
Grid SWZ, see Sections 9.5 and Error! Reference source not found.. Table 10.3
compares the costs and benefits of each scenario. We include an additional
scenario in the table, which is to achieve our 40% reduction on our current leakage
target but not continue leakage reduction beyond 2025 as in our preferred solution
(scenario 5).
The costs are presented as net present value (NPV) over 100 years and includes all
expenditure costs, capital, operating, carbon, social and environmental. Our
preferred solution will meet our long-term objective to provide our customers with a
secure and sustainable water supply that will be resilient to climate change
uncertainty, whilst reducing the volume we are required to take from the
environment.
The initial NPV costs to implement the solution are presented with and without
AMP6 expenditure. The initial leakage target reduction of 62.5Ml/d by 2019/20 is
being funded from efficiency savings made in AMP6 (current period). The
investment required to reduce the leakage target by a further 60Ml/d in AMP7 is
included in our business plan for PR19.
Our preferred plan for WRMP19 shows a continued reduction in leakage levels to
2045. This is incorporating customer and stakeholder views on reducing demand
and meets the Environment Agency’s expectation for water companies to continue
to reduce leakage beyond 2025. By creating a surplus in the Grid SWZ we will
create additional potential benefits, such as capacity for Yorkshire Water to support
the national water resilience agenda, should this be required in the future.
Leakage reduction costs beyond 2025 represent continuation of the leakage
techniques we have identified to achieve the 40% leakage target reduction. We do
not expect that these activities will form the basis of our longer term leakage
reduction, but they do allow for a realistic indicative cost to be presented in
WRMP19. Beyond AMP7 our ambition is to continue to reduce leakage, however
we assume the costs to achieve this will reduce.
Yorkshire Water | Revised Draft Water Resources Management Plan 2019 264
`
As the planning period progresses, we will actively seek measures to make current
leakage reduction techniques more efficient and we expect new technology to make
further reductions feasible at a lower cost. We produce WRMPs and business plans
every five years and with each iteration we will review the leakage techniques
available and the costs and benefits. For WRMP24 we will revise all components of
the supply demand balance of the Grid SWZ, taking into account new information on
the future risks and updated regulatory and customer requirements. As part of the
process we will review our future leakage target in line with the supply demand
balance and choose the interventions which offer the greatest value to customers,
stakeholders and the environment.
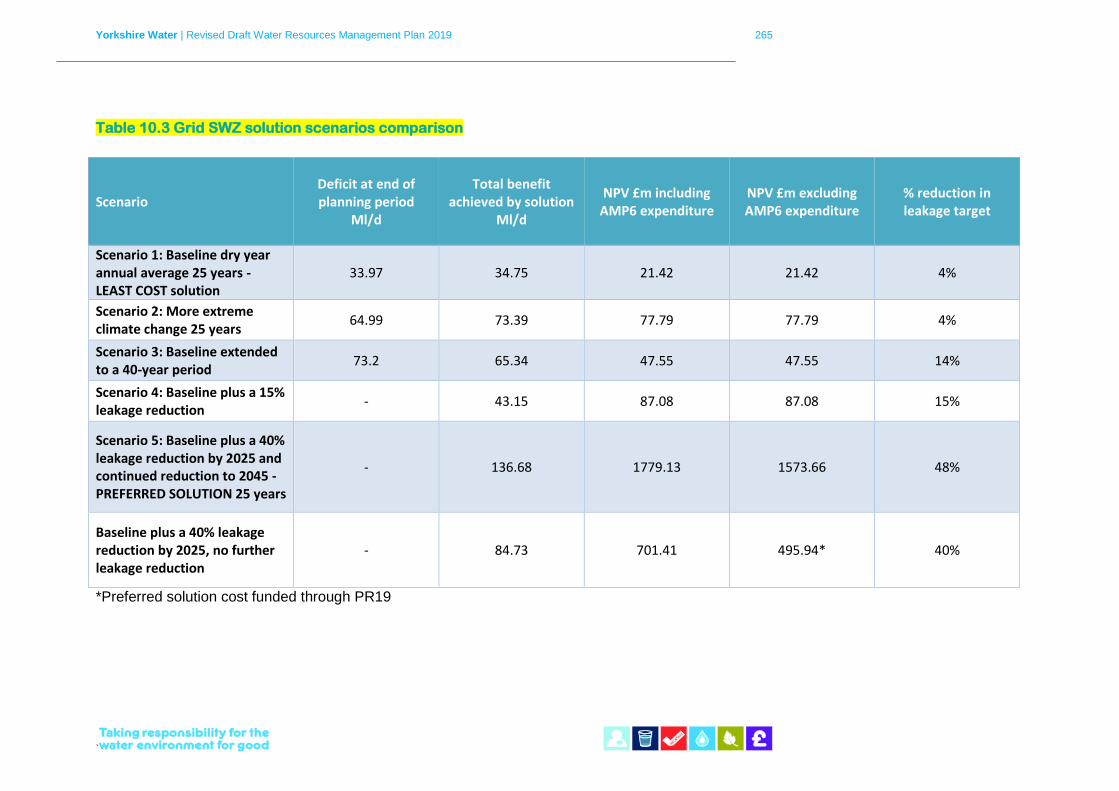
Yorkshire Water | Revised Draft Water Resources Management Plan 2019 265
`
Table 10.3 Grid SWZ solution scenarios comparison
Scenario Deficit at end of planning period
Ml/d
Total benefit achieved by solution
Ml/d
NPV £m including AMP6 expenditure
NPV £m excluding AMP6 expenditure
% reduction in leakage target
Scenario 1: Baseline dry year annual average 25 years - LEAST COST solution
33.97 34.75 21.42 21.42 4%
Scenario 2: More extreme climate change 25 years
64.99 73.39 77.79 77.79 4%
Scenario 3: Baseline extended to a 40-year period
73.2 65.34 47.55 47.55 14%
Scenario 4: Baseline plus a 15% leakage reduction
- 43.15 87.08 87.08 15%
Scenario 5: Baseline plus a 40% leakage reduction by 2025 and continued reduction to 2045 - PREFERRED SOLUTION 25 years
- 136.68 1779.13 1573.66 48%
Baseline plus a 40% leakage reduction by 2025, no further leakage reduction
- 84.73 701.41 495.94* 40%
*Preferred solution cost funded through PR19
Yorkshire Water | Revised Draft Water Resources Management Plan 2019 266
`
11 Future resilience of preferred solution
Resilience is a critical aspect of the WRMP and our service to customers. Our
preferred plan ensures the Grid SWZ supply demand balance will remain in surplus
throughout the 25-year baseline dry year annual average scenario, the extended 40
year scenario and the more extreme climate change 25 year scenario.
Implementation of the preferred solution will create a 110.69Ml/d surplus in the
supply demand balance by 2044/45 and a 79.67Ml/d surplus in 2059/60.
Early implementation of our leakage reduction activities will make sure we are more
resilient to droughts and prepared for future sustainability reductions. There is a
potential our River Derwent abstraction licence will be reduced in the near term.
Investigatons and options appraisals in AMP7 will clarify unknown sustainabiltiy
reducitons.
For this WRMP we are planning for a reduced impact of climate change compared
to WRMP14 in our baseline scenario. Climate change is the biggest single influence
on our long-term supply demand balance forecasts. We have tested the plan
against two further scenarios, an extended 40-year planning period and an extreme
climate change scenario. This helps us understand the futrue risks and how we
might adapt to a worse case than the baseline scenario, without over planning at
this stage when the impacts are still very uncertain.
To improve our understanding of climate change impacts we will use the UKCP18
climate projection data for future water resoure planning and in AMP7 we will
continue our investigations into climate change as discussed in Section 3.13.
The least cost optimisation result for Scenarios 2 shows the R2b Ouse raw water
transfer scheme could be required for meeting the deficit if it is greater than forecast
in baseline 25-year planning. The preferred solution to reduce leakage by 40% by
2025 would negate the need for this investment in new resource to meet a deficit,
although it would still have resilience benefits. It is also a feasible solution to be
considered if the Severn Trent import reduces or ceases in the future.
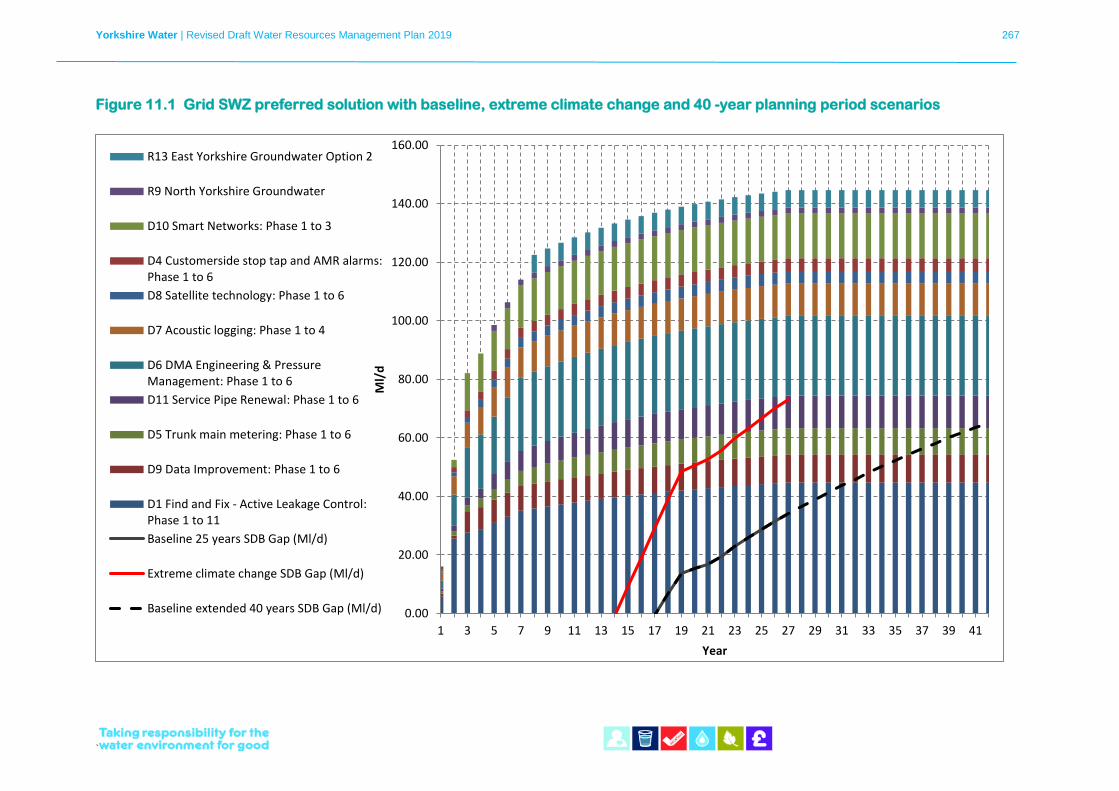
Yorkshire Water | Revised Draft Water Resources Management Plan 2019 267
`
Figure 11.1 Grid SWZ preferred solution with baseline, extreme climate change and 40 -year planning period scenarios
0.00
20.00
40.00
60.00
80.00
100.00
120.00
140.00
160.00
1 3 5 7 9 11 13 15 17 19 21 23 25 27 29 31 33 35 37 39 41
Ml/
d
Year
R13 East Yorkshire Groundwater Option 2
R9 North Yorkshire Groundwater
D10 Smart Networks: Phase 1 to 3
D4 Customerside stop tap and AMR alarms:Phase 1 to 6
D8 Satellite technology: Phase 1 to 6
D7 Acoustic logging: Phase 1 to 4
D6 DMA Engineering & PressureManagement: Phase 1 to 6
D11 Service Pipe Renewal: Phase 1 to 6
D5 Trunk main metering: Phase 1 to 6
D9 Data Improvement: Phase 1 to 6
D1 Find and Fix - Active Leakage Control:Phase 1 to 11
Baseline 25 years SDB Gap (Ml/d)
Extreme climate change SDB Gap (Ml/d)
Baseline extended 40 years SDB Gap (Ml/d)
Yorkshire Water | Revised Draft Water Resources Management Plan 2019 268
`
The R2 Ouse Raw Water Transfer option would benefit the supply demand balance
in a dry year scenario but a more resilient solution could be to invest in additional
treatment capacity at the point of abstraction, this is the R1a River Ouse water
treatment works extension. This would increase the ability for transferring the water
around the Grid SWZ and increase our resilience to extreme outages.
For this WRMP, we are not planning to implement either of the Ouse schemes as
our preferred sltuion will provide us with a significant surplus. We will carry out
further resilience investigations in AMP7 on the potential optons to mitigate extreme
outages and offset any reduction in the Severn Trent import. We are currently
investigating how we will model, and potentially monetise, the value of resilience
(referred to as the ‘resilience dividend’ by the Rockerfeller Foundation and others),
with a view to incorporating this into our six capitals approach to be used in future
WRMPs.
As there is potential an Ouse scheme could be required in the future, we will carry
out environmental investigations alongside those required for the R9 North
Yorkshire and R13 East Yorkshire Groundwater schemes which are part of the
preferred plan. These investigations are outlined in Table 11.1.
Our preferred solution for the long term is to avoid reliance on increases abstraction
to meet future deficits and to reduce the water we take from the environment. We
will continue to investigate innovative solutions to reduce demand through further
leakage reduction and other demand reduction solutions, as described in Section 6
Water efficiency and demand reduction strategy. While investment in resource
schemes can help to reduce the deficit, demand reduction measures are our
preference and first priority because they tend to result in fewer negative impacts on
natural and social capital.
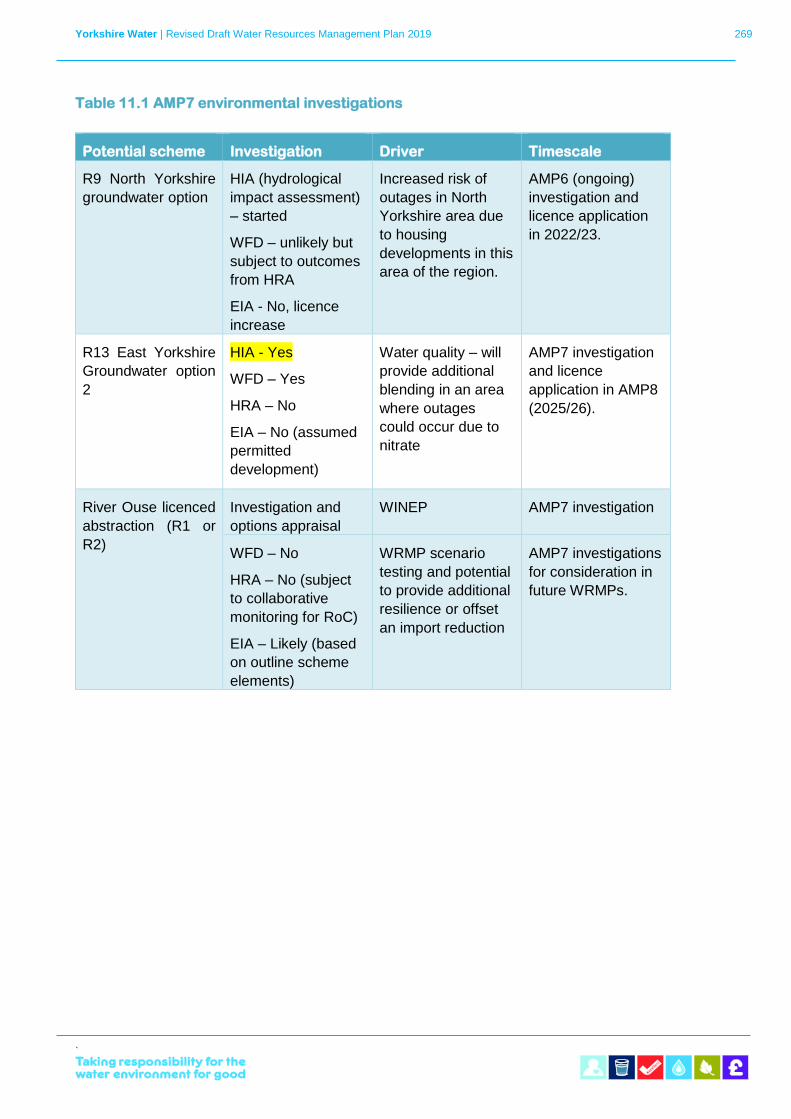
Yorkshire Water | Revised Draft Water Resources Management Plan 2019 269
`
Table 11.1 AMP7 environmental investigations
Potential scheme Investigation Driver Timescale
R9 North Yorkshire
groundwater option
HIA (hydrological
impact assessment)
– started
WFD – unlikely but
subject to outcomes
from HRA
EIA - No, licence
increase
Increased risk of
outages in North
Yorkshire area due
to housing
developments in this
area of the region.
AMP6 (ongoing)
investigation and
licence application
in 2022/23.
R13 East Yorkshire
Groundwater option
2
HIA - Yes
WFD – Yes
HRA – No
EIA – No (assumed
permitted
development)
Water quality – will
provide additional
blending in an area
where outages
could occur due to
nitrate
AMP7 investigation
and licence
application in AMP8
(2025/26).
River Ouse licenced
abstraction (R1 or
R2)
Investigation and
options appraisal
WINEP AMP7 investigation
WFD – No
HRA – No (subject
to collaborative
monitoring for RoC)
EIA – Likely (based
on outline scheme
elements)
WRMP scenario
testing and potential
to provide additional
resilience or offset
an import reduction
AMP7 investigations
for consideration in
future WRMPs.
Yorkshire Water | Revised Draft Water Resources Management Plan 2019 270
`
12 Final planning scenario supply
demand balance
Once we have implemented our preferred solution for the Grid SWZ both our water
resource zones will be in surplus throughout the 25-year baseline period. The
surplus is the volume available above demand plus target headroom.
PR19 Business Plan
Since publishing our draft WRMP19 we submitted our PR19 Business Plan on 3rd
September. Our Business Plan determines investment to maintain our services to
customers over the next five years, from 2020 to 2025. A number of the PR19
Business Plan schemes will impact on our supply-demand balance and this has
been built into our final planning scenario.
As part of the business plan process we have identified performance commitments
we aim to achieve over the PR19 period. We have chosen to implement a Water
Recycling Performance Commitment to help reduce our impact on the environment.
Our long term goal is to remove surface water from our sewers and recycle all
waste water, protecting the environment from sewer flooding and pollution. By the
end of the 2020-25 period we are aiming to use at least 6.29Ml/d of water less than
we currently do in our water and wastewater treatment works (WTWs and WwTWs).
To achieve this we will:
• Increase the volume of process water we are able to re-use of at our
clean and wastewater treatment sites, and
This section gives the final planning scenario for our WRMP19 – the surplus
available with our preferred solution implemented. It describes the impact our
preferred solution will have on our future leakage targets and on our carbon
footprint.
Yorkshire Water | Revised Draft Water Resources Management Plan 2019 271
`
• Introduce the use of final effluent from our wastewater treatment sites
for commercial applications where subpotable water is suitable.
We are going to increase the volume of water which we recycle at six of our water
treatment works by 5.54 M/d, by re-using washwater. We will do this by the end of
2022/23, achieving a small step (about 0.5%) in reducing our own daily water
consumption as a company. On the wastewater side of the business, we are still
exploring all the options for contributions to achieving the performance commitment.
We have a plan to substitute potable water use for final effluent at a small
wastewater tratment works in South Yorkshire and are investigating opportunities to
proivde final effluent as a non-potable substitute to some of industrial water users in
our region.
The washwater re-use schemes we plan to deliver are three of the reduction in
WTW process loss options for our Grid SWZ, two additional schemes not previously
identified in the Grid SWZ and one in the East SWZ. Once delivered, the process
losses forecast in our Grid SWZ supply-demand balance will reduce by 4.83Ml/d
and 0.71Ml/d in our East SWZ from 2022/23 onwards.
In addition to activities under the Recycling performance commitment, we are
promoting water management with both household and commercial water users
under our Working With Others, Per Capita Consumption and Surface Water
Attenuated & Removed commitments. These performance commitments involve
collaboration outside of what we can directly control on our own sites. In addition to
the base water efficiency activities we discuss in Section 6.1, these performance
commitments will provide rainwater harvesting through water butts and community
raingardens. The Surface Water Attenuated & Removed commitment will target
water efficiency activities to areas where we will trial customer water efficiency
activities as a substuitute to traditional measures for reducing outflow from our
waste water works during dry weather.
Since publishing our draft WRMP19 we have also submitted our Drinking Water
Quality programme to the DWI. This identifies investment required in the PR19
Business Plan to improve water treatmernt site performance or mitigate against
deterioating water quality. There are three water treatment work improvement
schemes included in the Drinking Water Quality programme that have potential to
Yorkshire Water | Revised Draft Water Resources Management Plan 2019 272
`
impact on the outage allowance in the Grid SWZ and we have adjusted the outage
assumptions for the sites in the Crystal Ball stochastic model. For each of the
events the percentage loss now has a minimum value of zero, to represent the best
case scenario that no lossess are experienced, the average value has been
reduced by 50% of the pre scheme values and the maximum value is unchanged, to
represent that on occassion events could still result in the maximum losses
previously experienced. The stochastic model has been rerun to determine the
change in outage allowance and the baseline Grid SWZ total outage of 52.40Ml/d is
reduced to 49.79Ml/d. The revised dWRMP19 Grid SWZ final planning scenario
outage has been changed to 49.97Ml/d from AMP8 onwards until the end of the
planning period. The dWRMP Grid SWZ outage allowance of 52.40Ml/d has been
retained for AMP7 in the final planning scenario to represent the current risk before
the schemes are implemented.
We have incorporated the reduction in water treatment works’ washwater losses
into our final planning scenarios for the Grid SWZ and East SWZ planning tables
and incoporating the changes to outage into the Grid SWZ planning table.
The PR19 Business Plan also includes investment in our clean water distribution
system to ensure we can meet demand created by new supplies in our region due
to housing development. A future investment need has been identified in an area in
North Yorkshire that receives its supply predominantly from a groundwater source
due to plans to build up to 2,000 new houses. In the short term we are applying for
an increase in the current licence, this is one of the boreholes mentioned in Section
3.2. In the longer term we are planning to ensure an addition 1Ml/d can be supplied
to the area. As this is a small, localised issue it is not apparent in the WRMP supply-
demand balance assessments. Our PR19 Business Plan has included investment in
clean water distribution to install additional distribution mains to meet the demand.
An alternative to this would be to further increase our licence at groundwater source
and invest in additonal assets (standby borehole and UV treatment) at the site.
Further investigations will determine which solution we will deliver. Both the clean
water distribution option and the groundwater licence increase option have been
added to our environmental impact asessments as options R62 North Yorkshire
rural distribution enhancement and R63 North Yorkshire Groundwater 2. The results
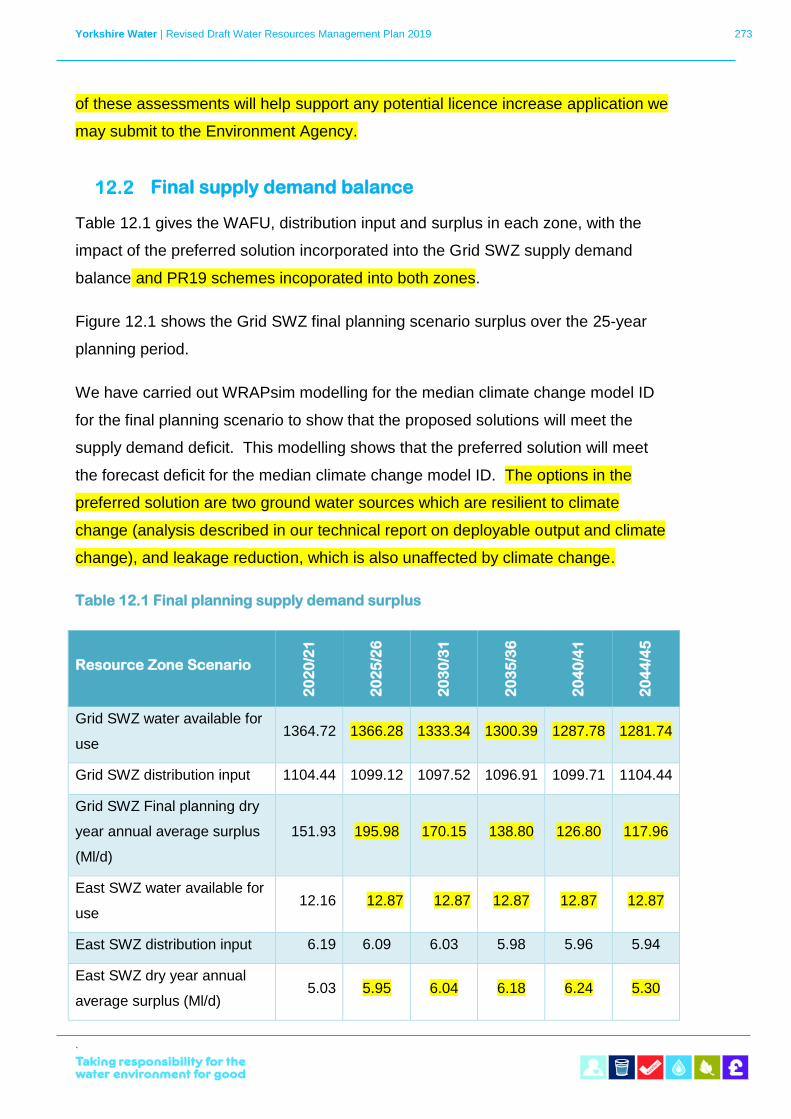
Yorkshire Water | Revised Draft Water Resources Management Plan 2019 273
`
of these assessments will help support any potential licence increase application we
may submit to the Environment Agency.
Final supply demand balance
Table 12.1 gives the WAFU, distribution input and surplus in each zone, with the
impact of the preferred solution incorporated into the Grid SWZ supply demand
balance and PR19 schemes incoporated into both zones.
Figure 12.1 shows the Grid SWZ final planning scenario surplus over the 25-year
planning period.
We have carried out WRAPsim modelling for the median climate change model ID
for the final planning scenario to show that the proposed solutions will meet the
supply demand deficit. This modelling shows that the preferred solution will meet
the forecast deficit for the median climate change model ID. The options in the
preferred solution are two ground water sources which are resilient to climate
change (analysis described in our technical report on deployable output and climate
change), and leakage reduction, which is also unaffected by climate change.
Table 12.1 Final planning supply demand surplus
Resource Zone Scenario
20
20
/21
20
25
/26
20
30
/31
20
35
/36
20
40
/41
20
44
/45
Grid SWZ water available for
use 1364.72 1366.28 1333.34 1300.39 1287.78 1281.74
Grid SWZ distribution input 1104.44 1099.12 1097.52 1096.91 1099.71 1104.44
Grid SWZ Final planning dry
year annual average surplus
(Ml/d)
151.93 195.98 170.15 138.80 126.80 117.96
East SWZ water available for
use 12.16 12.87 12.87 12.87 12.87 12.87
East SWZ distribution input 6.19 6.09 6.03 5.98 5.96 5.94
East SWZ dry year annual
average surplus (Ml/d) 5.03 5.95 6.04 6.18 6.24 5.30
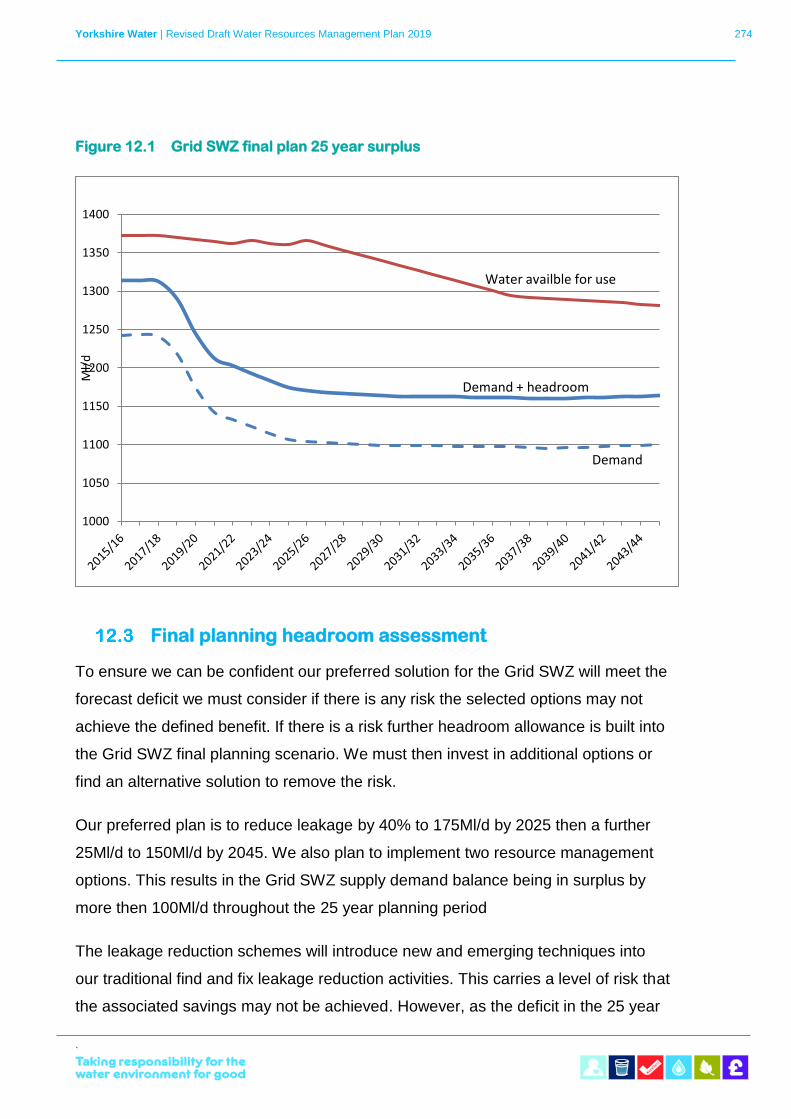
Yorkshire Water | Revised Draft Water Resources Management Plan 2019 274
`
Figure 12.1 Grid SWZ final plan 25 year surplus
Final planning headroom assessment
To ensure we can be confident our preferred solution for the Grid SWZ will meet the
forecast deficit we must consider if there is any risk the selected options may not
achieve the defined benefit. If there is a risk further headroom allowance is built into
the Grid SWZ final planning scenario. We must then invest in additional options or
find an alternative solution to remove the risk.
Our preferred plan is to reduce leakage by 40% to 175Ml/d by 2025 then a further
25Ml/d to 150Ml/d by 2045. We also plan to implement two resource management
options. This results in the Grid SWZ supply demand balance being in surplus by
more then 100Ml/d throughout the 25 year planning period
The leakage reduction schemes will introduce new and emerging techniques into
our traditional find and fix leakage reduction activities. This carries a level of risk that
the associated savings may not be achieved. However, as the deficit in the 25 year
1000
1050
1100
1150
1200
1250
1300
1350
1400
Ml/
d
Demand + headroom
Demand
Water availble for use
Yorkshire Water | Revised Draft Water Resources Management Plan 2019 275
`
plan starts at 6.49Ml/d in 2035/36 and increases to 33.97Ml/d by 2044/45 it is
significantly below the surplus created by our preferred solution. Therefore, we have
not built any uncertainty for the solution not meeting the deficit into the final target
headroom allowance.
We have set a target to reduce leakage by 40% by 2025. This means the options
will be implemented early in the planning period before the forecast deficit in
2035/36. We therefore have additional security in that, if there is any shortfall, we
would be able to address this in future planning cycles of the WRMP. The final
planning target headroom is the same as the baseline headroom as shown in
Tables 12.2. The available headroom for the Grid SWZ final planning scenario is at
the 100th percentile in 2020/21 reducing to the 70th percentile by 2044/45.
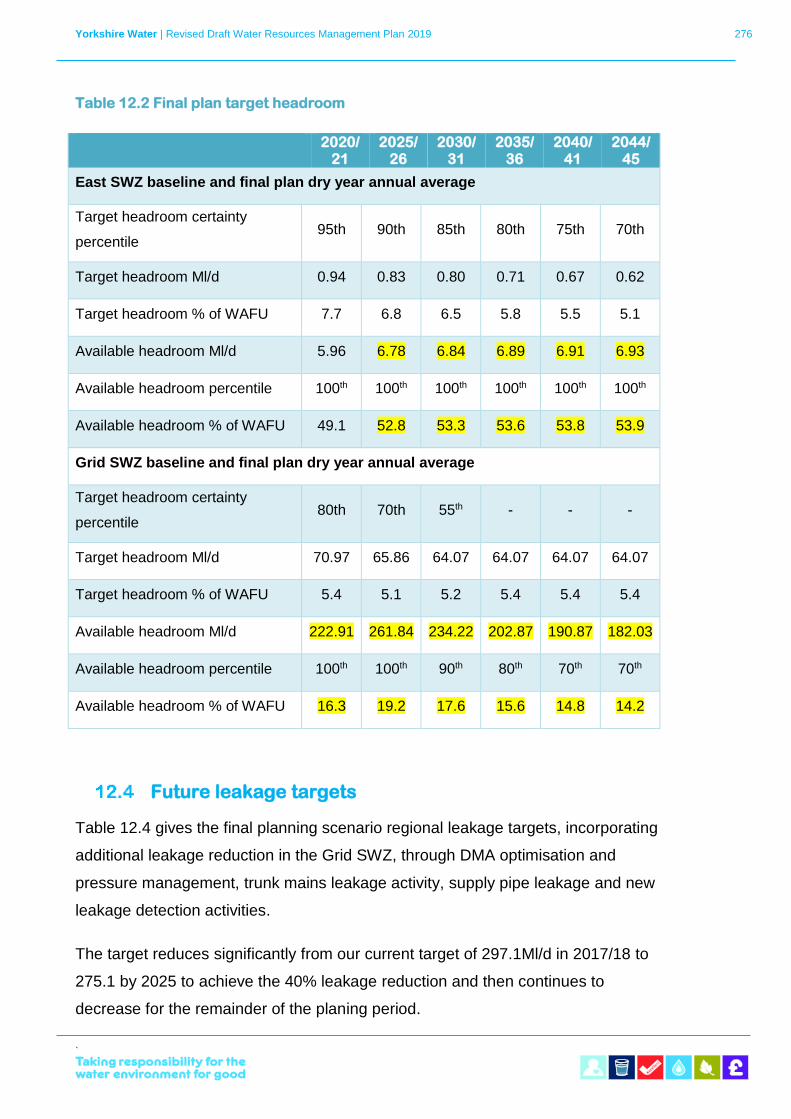
Yorkshire Water | Revised Draft Water Resources Management Plan 2019 276
`
Table 12.2 Final plan target headroom
2020/21
2025/26
2030/31
2035/36
2040/41
2044/45
East SWZ baseline and final plan dry year annual average
Target headroom certainty
percentile 95th 90th 85th 80th 75th 70th
Target headroom Ml/d 0.94 0.83 0.80 0.71 0.67 0.62
Target headroom % of WAFU 7.7 6.8 6.5 5.8 5.5 5.1
Available headroom Ml/d 5.96 6.78 6.84 6.89 6.91 6.93
Available headroom percentile 100th 100th 100th 100th 100th 100th
Available headroom % of WAFU 49.1 52.8 53.3 53.6 53.8 53.9
Grid SWZ baseline and final plan dry year annual average
Target headroom certainty
percentile 80th 70th 55th - - -
Target headroom Ml/d 70.97 65.86 64.07 64.07 64.07 64.07
Target headroom % of WAFU 5.4 5.1 5.2 5.4 5.4 5.4
Available headroom Ml/d 222.91 261.84 234.22 202.87 190.87 182.03
Available headroom percentile 100th 100th 90th 80th 70th 70th
Available headroom % of WAFU 16.3 19.2 17.6 15.6 14.8 14.2
Future leakage targets
Table 12.4 gives the final planning scenario regional leakage targets, incorporating
additional leakage reduction in the Grid SWZ, through DMA optimisation and
pressure management, trunk mains leakage activity, supply pipe leakage and new
leakage detection activities.
The target reduces significantly from our current target of 297.1Ml/d in 2017/18 to
275.1 by 2025 to achieve the 40% leakage reduction and then continues to
decrease for the remainder of the planing period.
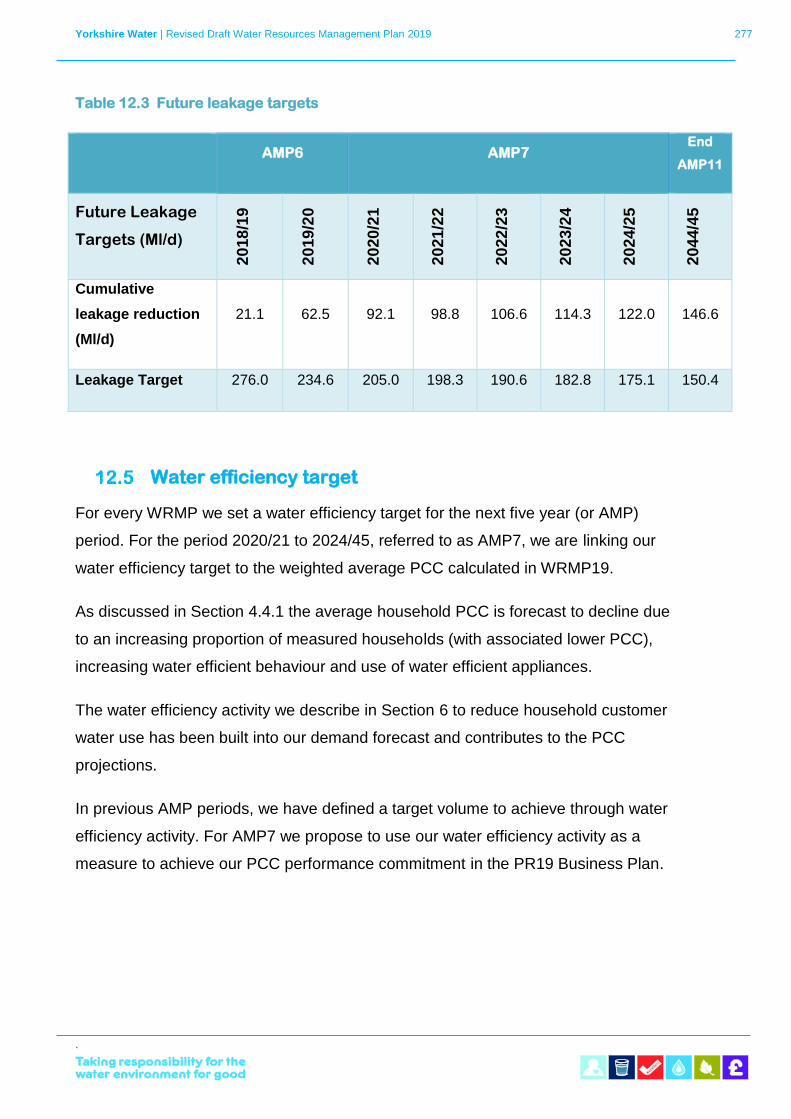
Yorkshire Water | Revised Draft Water Resources Management Plan 2019 277
`
Table 12.3 Future leakage targets
AMP6 AMP7
End
AMP11
Future Leakage
Targets (Ml/d) 2
018
/19
20
19
/20
20
20
/21
20
21
/22
20
22
/23
20
23
/24
20
24
/25
20
44
/45
Cumulative
leakage reduction
(Ml/d)
21.1 62.5 92.1 98.8 106.6 114.3 122.0 146.6
Leakage Target 276.0 234.6 205.0 198.3 190.6 182.8 175.1 150.4
Water efficiency target
For every WRMP we set a water efficiency target for the next five year (or AMP)
period. For the period 2020/21 to 2024/45, referred to as AMP7, we are linking our
water efficiency target to the weighted average PCC calculated in WRMP19.
As discussed in Section 4.4.1 the average household PCC is forecast to decline due
to an increasing proportion of measured households (with associated lower PCC),
increasing water efficient behaviour and use of water efficient appliances.
The water efficiency activity we describe in Section 6 to reduce household customer
water use has been built into our demand forecast and contributes to the PCC
projections.
In previous AMP periods, we have defined a target volume to achieve through water
efficiency activity. For AMP7 we propose to use our water efficiency activity as a
measure to achieve our PCC performance commitment in the PR19 Business Plan.
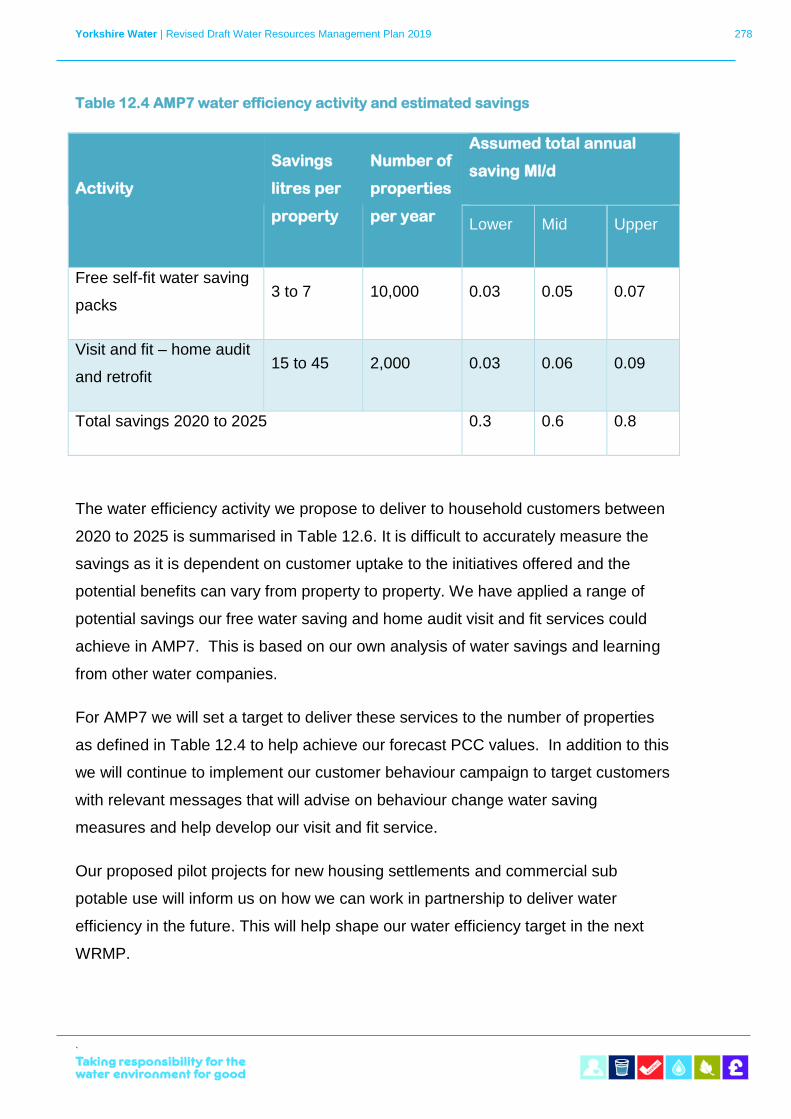
Yorkshire Water | Revised Draft Water Resources Management Plan 2019 278
`
Table 12.4 AMP7 water efficiency activity and estimated savings
Activity
Savings
litres per
property
Number of
properties
per year
Assumed total annual
saving Ml/d
Lower Mid Upper
Free self-fit water saving
packs 3 to 7 10,000 0.03 0.05 0.07
Visit and fit – home audit
and retrofit 15 to 45 2,000 0.03 0.06 0.09
Total savings 2020 to 2025 0.3 0.6 0.8
The water efficiency activity we propose to deliver to household customers between
2020 to 2025 is summarised in Table 12.6. It is difficult to accurately measure the
savings as it is dependent on customer uptake to the initiatives offered and the
potential benefits can vary from property to property. We have applied a range of
potential savings our free water saving and home audit visit and fit services could
achieve in AMP7. This is based on our own analysis of water savings and learning
from other water companies.
For AMP7 we will set a target to deliver these services to the number of properties
as defined in Table 12.4 to help achieve our forecast PCC values. In addition to this
we will continue to implement our customer behaviour campaign to target customers
with relevant messages that will advise on behaviour change water saving
measures and help develop our visit and fit service.
Our proposed pilot projects for new housing settlements and commercial sub
potable use will inform us on how we can work in partnership to deliver water
efficiency in the future. This will help shape our water efficiency target in the next
WRMP.
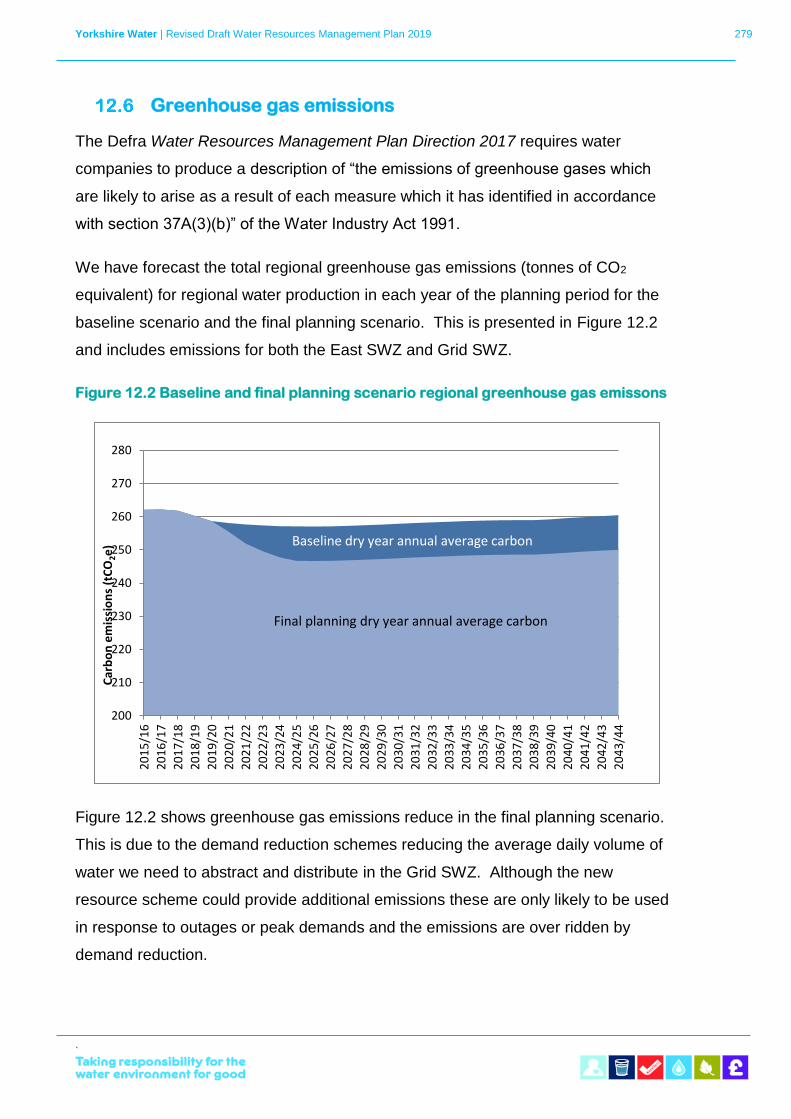
Yorkshire Water | Revised Draft Water Resources Management Plan 2019 279
`
Greenhouse gas emissions
The Defra Water Resources Management Plan Direction 2017 requires water
companies to produce a description of “the emissions of greenhouse gases which
are likely to arise as a result of each measure which it has identified in accordance
with section 37A(3)(b)” of the Water Industry Act 1991.
We have forecast the total regional greenhouse gas emissions (tonnes of CO2
equivalent) for regional water production in each year of the planning period for the
baseline scenario and the final planning scenario. This is presented in Figure 12.2
and includes emissions for both the East SWZ and Grid SWZ.
Figure 12.2 Baseline and final planning scenario regional greenhouse gas emissons
Figure 12.2 shows greenhouse gas emissions reduce in the final planning scenario.
This is due to the demand reduction schemes reducing the average daily volume of
water we need to abstract and distribute in the Grid SWZ. Although the new
resource scheme could provide additional emissions these are only likely to be used
in response to outages or peak demands and the emissions are over ridden by
demand reduction.
200
210
220
230
240
250
260
270
280
20
15
/16
20
16
/17
20
17
/18
20
18
/19
20
19
/20
20
20
/21
20
21
/22
20
22
/23
20
23
/24
20
24
/25
20
25
/26
20
26
/27
20
27
/28
20
28
/29
20
29
/30
20
30
/31
20
31
/32
20
32
/33
20
33
/34
20
34
/35
20
35
/36
20
36
/37
20
37
/38
20
38
/39
20
39
/40
20
40
/41
20
41
/42
20
42
/43
20
43
/44
Car
bo
n e
mis
sio
ns
(tC
O2e
) Baseline dry year annual average carbon
Final planning dry year annual average carbon
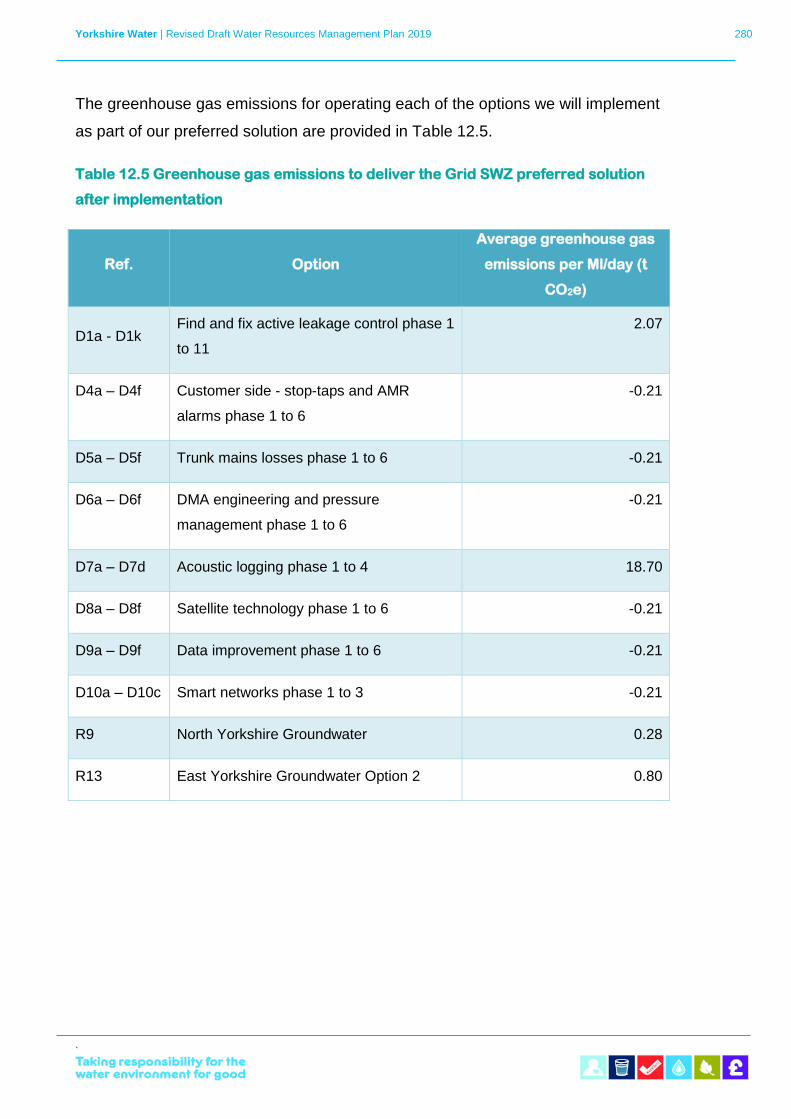
Yorkshire Water | Revised Draft Water Resources Management Plan 2019 280
`
The greenhouse gas emissions for operating each of the options we will implement
as part of our preferred solution are provided in Table 12.5.
Table 12.5 Greenhouse gas emissions to deliver the Grid SWZ preferred solution
after implementation
Ref. Option
Average greenhouse gas
emissions per Ml/day (t
CO2e)
D1a - D1k Find and fix active leakage control phase 1
to 11
2.07
D4a – D4f Customer side - stop-taps and AMR
alarms phase 1 to 6
-0.21
D5a – D5f Trunk mains losses phase 1 to 6 -0.21
D6a – D6f DMA engineering and pressure
management phase 1 to 6
-0.21
D7a – D7d Acoustic logging phase 1 to 4 18.70
D8a – D8f Satellite technology phase 1 to 6 -0.21
D9a – D9f Data improvement phase 1 to 6 -0.21
D10a – D10c Smart networks phase 1 to 3 -0.21
R9 North Yorkshire Groundwater 0.28
R13 East Yorkshire Groundwater Option 2 0.80
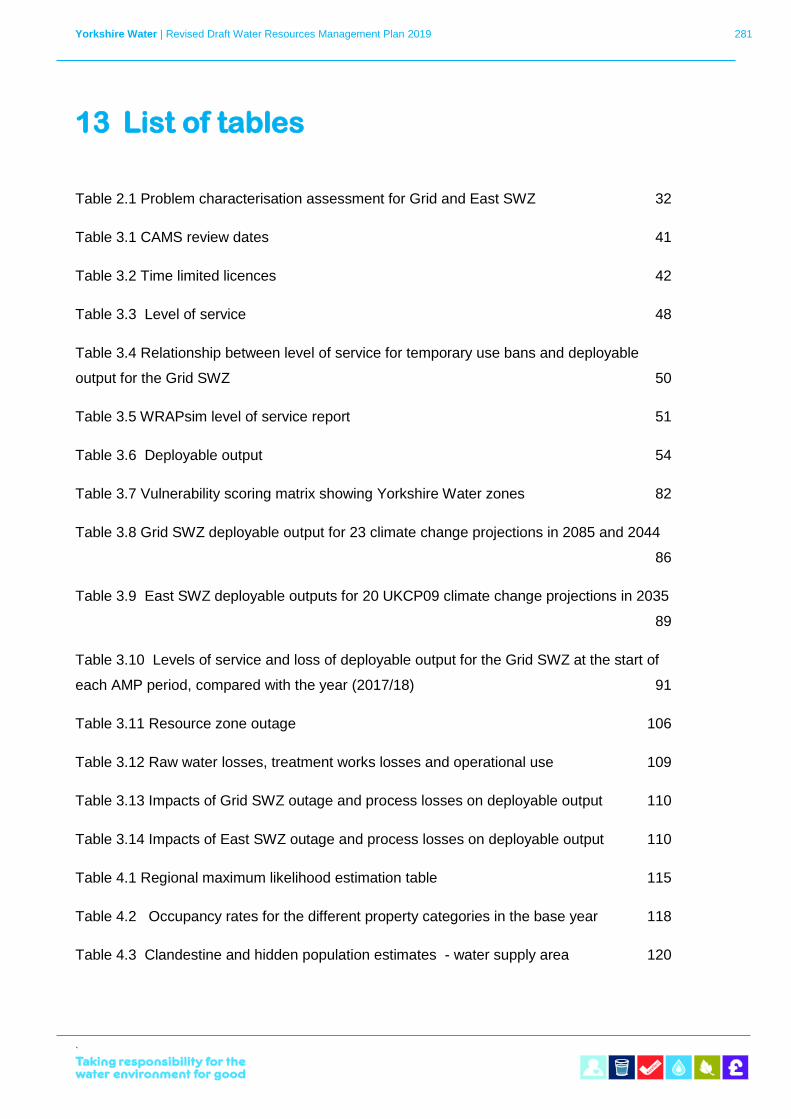
Yorkshire Water | Revised Draft Water Resources Management Plan 2019 281
`
13 List of tables
Table 2.1 Problem characterisation assessment for Grid and East SWZ 32
Table 3.1 CAMS review dates 41
Table 3.2 Time limited licences 42
Table 3.3 Level of service 48
Table 3.4 Relationship between level of service for temporary use bans and deployable
output for the Grid SWZ 50
Table 3.5 WRAPsim level of service report 51
Table 3.6 Deployable output 54
Table 3.7 Vulnerability scoring matrix showing Yorkshire Water zones 82
Table 3.8 Grid SWZ deployable output for 23 climate change projections in 2085 and 2044
86
Table 3.9 East SWZ deployable outputs for 20 UKCP09 climate change projections in 2035
89
Table 3.10 Levels of service and loss of deployable output for the Grid SWZ at the start of
each AMP period, compared with the year (2017/18) 91
Table 3.11 Resource zone outage 106
Table 3.12 Raw water losses, treatment works losses and operational use 109
Table 3.13 Impacts of Grid SWZ outage and process losses on deployable output 110
Table 3.14 Impacts of East SWZ outage and process losses on deployable output 110
Table 4.1 Regional maximum likelihood estimation table 115
Table 4.2 Occupancy rates for the different property categories in the base year 118
Table 4.3 Clandestine and hidden population estimates - water supply area 120
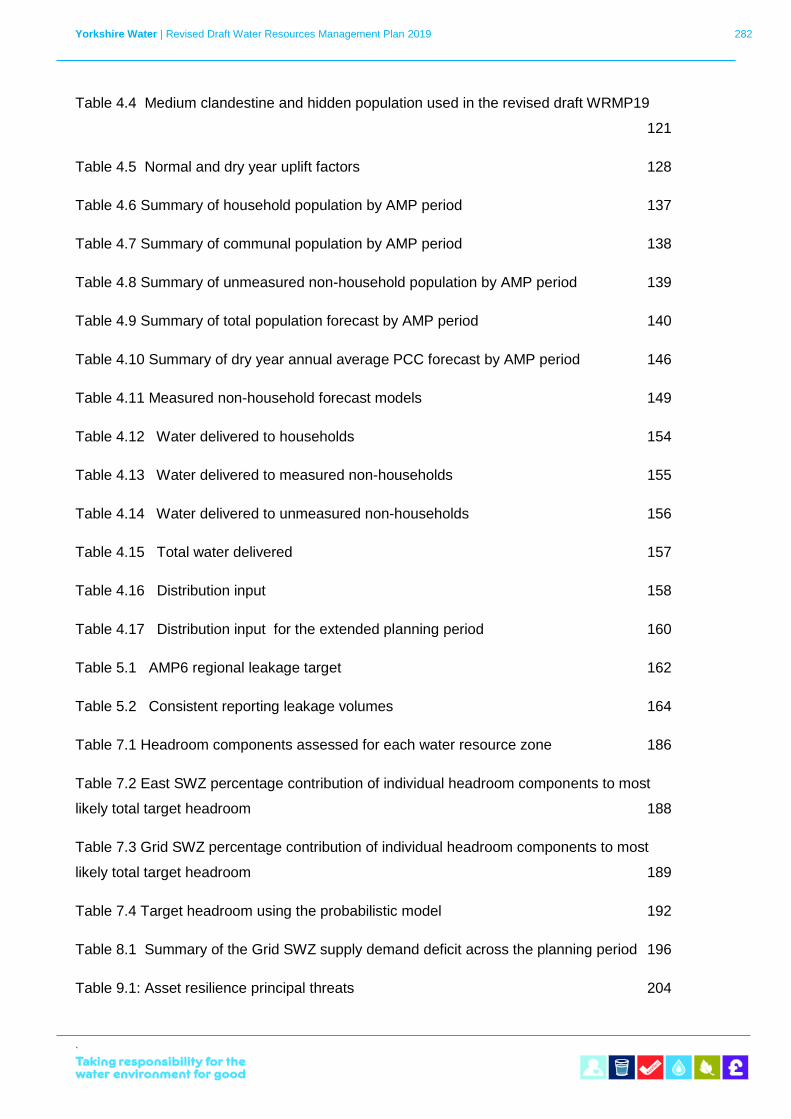
Yorkshire Water | Revised Draft Water Resources Management Plan 2019 282
`
Table 4.4 Medium clandestine and hidden population used in the revised draft WRMP19
121
Table 4.5 Normal and dry year uplift factors 128
Table 4.6 Summary of household population by AMP period 137
Table 4.7 Summary of communal population by AMP period 138
Table 4.8 Summary of unmeasured non-household population by AMP period 139
Table 4.9 Summary of total population forecast by AMP period 140
Table 4.10 Summary of dry year annual average PCC forecast by AMP period 146
Table 4.11 Measured non-household forecast models 149
Table 4.12 Water delivered to households 154
Table 4.13 Water delivered to measured non-households 155
Table 4.14 Water delivered to unmeasured non-households 156
Table 4.15 Total water delivered 157
Table 4.16 Distribution input 158
Table 4.17 Distribution input for the extended planning period 160
Table 5.1 AMP6 regional leakage target 162
Table 5.2 Consistent reporting leakage volumes 164
Table 7.1 Headroom components assessed for each water resource zone 186
Table 7.2 East SWZ percentage contribution of individual headroom components to most
likely total target headroom 188
Table 7.3 Grid SWZ percentage contribution of individual headroom components to most
likely total target headroom 189
Table 7.4 Target headroom using the probabilistic model 192
Table 8.1 Summary of the Grid SWZ supply demand deficit across the planning period 196
Table 9.1: Asset resilience principal threats 204
Yorkshire Water | Revised Draft Water Resources Management Plan 2019 283
`
Table 9.2: Grid SWZ resilience options 206
Table 9.3 SEA topics and objectives 218
Table 10.1 Start date and yield of schemes to deliver the Grid SWZ preferred solution 251
Table 10.3 SEA outputs of Grid SWZ preferred solution 261
Table 10.3 Grid SWZ solution scenarios comparison 265
Table 11.1 AMP7 environmental investigations 269
Table 12.1 Final planning supply demand surplus 273
Table 12.2 Final plan target headroom 276
Table 12.3 Future leakage targets 277
Table 12.4 AMP7 water efficiency activity and estimated savings 278
Table 12.5 Greenhouse gas emissions to deliver the Grid SWZ preferred solution after
implementation 280
Yorkshire Water | Revised Draft Water Resources Management Plan 2019 284
`
14 List of figures
Figure 2.1 Development of the water resources management plan 25
Figure 2.2 Water resource zones 26
Figure 2.3 Grid SWZ decision making process 34
Figure 3.1 Example of control lines and penalty functions 46
Figure 3.2 Relationship between deployable output and level of service for temporary use
bans for the Grid SWZ 50
Figure 3.3 Drought events and modelled return periods 58
Figure 3.3 Drought response surface for Grid SWZ (August end month) 60
Figure 3.4 Drought response surface for Grid SWZ (November end month) 60
Figure 3.5 Flow factors for UKCP09 7910 2080s scenario 84
Figure 3.6 Grid SWZ deployable output extrapolation 88
Figure 3.7 Grid SWZ total outage percentages by category 107
Figure 3.8 Grid SWZ unplanned outage percentages by type of event 107
Figure 4.1 Summary of demand forecasting methodology 112
Figure 4.2 Components of distribution input 116
Figure 4.3 Quadrant analysis to determine reference normal year 127
Figure 4.4 Household property forecast 136
Figure 4.5 Non-Household property forecast 138
Figure 4.6 Total population forecast 140
Figure 4.7 Impact of climate change on household demand 144
Figure 4.8 Percentage breakdown of measured household PCC 147
Figure 4.9 Percentage breakdown of unmeasured household PCC 147
Yorkshire Water | Revised Draft Water Resources Management Plan 2019 285
`
Figure 4.10 Measured non-household consumption 150
Figure 4.11 Water delivered to households 154
Figure 4.12 Water delivered to measured non-households 155
Figure 4.13 Water delivered to unmeasured non-households 156
Figure 4.14 Total water delivered 157
Figure 4.15 Total distribution input 159
Figure 4.16 Total distribution input for extended planning period 161
Figure 5.1 UK reported water company leakage 167
Figure 5.2 Average minimum temperature 1908 - 2016 169
Figure 7.1 Supply demand balance components 183
Figure 8.1 East SWZ baseline supply demand balance 195
Figure 8.2 Grid SWZ baseline forecast supply demand balance 196
Figure 9.1 Options appraisal process summary 201
Figure 9.2 Integration of SEA, HRA and WFD in the WRMP Process 217
Figure 9.3 Our online community membership 220
Figure 9.4 Customer rating of potential options 221
Figure 9.5 Customers preferred options for managing future water supplies 222
Figure 9.6 Customer top three preferred options 222
Figure 9.7 Grid SWZ baseline scenario least cost solution 224
Figure 9.8 Grid SWZ supply demand balance scenarios 229
Figure 9.9 Secnario 2: Least cost solution to more extreme climate change - Ouse raw
water transfer 60Ml/d 232
Figure 9.10 Secnario 2: Least cost solution to more extreme climate change - Ouse raw
water transfer 40Ml/d 233
Figure 9.11 Scenario 3: Baseline scenario extended to a 40 year period 235
Yorkshire Water | Revised Draft Water Resources Management Plan 2019 286
`
Figure 9.12 Scenario 4: Solution to achieve a 15% reduction in annual leakage by 2024/25
238
Figure 9.13 Scenario 5: Grid SWZ baseline scenario with 40% leakage reduction by 2025
240
Figure 10.1 Grid SWZ preferred solution for the 25 year baseline dry year annual average
scenario 249
Figure 11.1 Grid SWZ preferred solution with baseline, extreme climate change and 40 -
year planning period scenarios 267
Figure 12.1 Grid SWZ final plan 25 year surplus 274
Figure 12.2 Baseline and final planning scenario regional greenhouse gas emissons 279
Yorkshire Water | Revised Draft Water Resources Management Plan 2019 287
`
15 Bibliography
Artesia Consulting, 2017, Yorkshire Water WRMP19 Household Consumption
Forecast
Arup, 2013, Yorkshire Water AMP5 PR14 Water Resources Options
Cascade, 2012, Strategic Environmental Assessment of the Water Resources
Management Plan
CEH, 2016, https://www.ceh.ac.uk/news-and-media/blogs/flood-science-
developments-following-uk-201516-winter-floods, last viewed 1/12/17
CIEEM, CIRA, IEMA, 2016, Biodiversity Net Gain: Good practice principles for
development
CLG, 2007, Code for Sustainable Homes
Cochran, W, Sampling Techniques 3rd ed, 1977, Chapter 5, Further aspects of
stratified sampling, The construction of strata
Committee on Climate Change, 2017, UK Climate Change Risk Assessment
DECC, 2012, A brief guide to the carbon valuation methodology for UK policy
appraisal
DECC, 2015, Updated short-term traded carbon values used for modelling purposes
Defra, 2009, UKCP09: UK Climate Change Projections
Defra, 2011, Biodiversity 2020: A strategy for England’s wildlife and ecosystem
services
Defra, 2012, Water White Paper – Water for Life
Defra, 2016, Creating a great place for living. Enabling resilience in the water sector
Defra, 2017, The Government’s strategic priorities and objectives for Ofwat
Yorkshire Water | Revised Draft Water Resources Management Plan 2019 288
`
Defra, 2017, The Water Resources Management Plan (England) Direction 2017
Department of the Environment, 1996, Water resource and supply: agenda for
action
Downing, T.E. et al, 2003, CCDEW: Climate Change and the Demand for Water
Drinking Water Inspectorate, 2017, Guidance Note: Long term planning for the
quality of drinking water supplies
Edge Analytics, 2016, Population, Household & Property Forecasts
Edge Analytics, 2017, Yorkshire Water Clandestine and Hidden Populations
Eftec, 2012, Benefits Assessment Guidance (report for Environment Agency)
Environment Agency, 1997, Re-assessment of Water Company Yields.
Environment Agency, 2013, Climate change approaches in water resources
planning – overview of new methods
Environment Agency 2015, Understanding the performance of water supply
systems during mild to extreme droughts Report – SC120048/R
Environment Agency, Natural Resources Wales, 2017, Water Resources Planning
Guideline: Interim update
Environment Agency, 2017, Water industry strategic environmental requirements
(WISER) Strategic steer to water companies on the environment, resilience and
flood risk for business planning purposes
Environment Agency and Natural Resources Wales, 2013, Water Stressed Areas –
Final Classification
HR Wallingford, 2012, UKCP09 Climate Change Scenarios in Water Resource
Planning: Developing an approach for Yorkshire Water- Summary of Approach
Yorkshire Water | Revised Draft Water Resources Management Plan 2019 289
`
Ministry of Housing, Communities & Local Government, 2018, National Planning
Policy Framework
Mott MacDonald, 2012, YWS Climate Change Trends: Climatic Change Evidence
and Trend Analysis for Yorkshire
National Infrastructure Commission, 2018, National Infrastructure Assessment
National Infrastructure Commission, 2018, Preparing for a drier future: England’s
water infrastructure needs
Nera, 1998, The Environmental and Social Value of Leakage Reduction
ODPM, 2005, A Practical Guide to the Strategic Environmental Assessment.
Ofwat/RPS, 2008, Providing Best Practice Guidance on Inclusion of Externalities in
the ELL Calculation
Ofwat, 2016, Eligibility guidance on whether non-household customers in England
and Wales are eligible to switch their retailer
Ofwat, 2017, Delivering Water 2020: Consulting on our methodology for the 2019
price review
Prudhomme, C., Crooks, S., Jackson, C., Kelvin, J., Young, A., 2012, Future flows
and groundwater levels. Final technical report.
RPA, 1998, The Environmental Costs and Benefits of Water Resources: A
Preliminary Methodology. (Prepared on behalf of the Environment Agency)
RPS Water, 2008, Ofwat, Environmental Economics Consultancy: Leakage
Methodology Review Project, Providing Best Practice Guidance on the Inclusion of
Externalities in the ELL calculation
Route2, 2017, Non-Household Water Demand Forecasting
SMC, 2012, Review of the calculation of sustainable economic level of leakage and
its integration with water resource management planning, report for Environment
Agency, Ofwat, Defra
Yorkshire Water | Revised Draft Water Resources Management Plan 2019 290
`
Turner and Townsend, 2016, Whole Life Cost Assessment Guidance Document:
Supporting Asset Management and the wider Yorkshire Water business in the
standardised assessment of Whole Life Cost and Carbon
Uff J, Mawer P, Herrington P, 1996, Water supply in Yorkshire. Report of the
independent commission of inquiry
UKWIR, 1995, Outage Allowances for Water Resource Planning
UKWIR,1999, Estimating Legitimate Non-Household Night Use Allowances
UKWIR/Environment Agency, 2000, A Unified Methodology for the Determination of
Deployable Output from Water Sources
UKWIR, 2002, A Re-evaluation of the Methodology for Assessing Headroom
UKWIR, 2002, The Economics of Balancing Supply and Demand (EBSD) Guidance
UKWIR, 2009, Factors affecting the Natural Rate of Rise of Leakage
UWKIR, 2011, Best practice for the derivation of cost curves in economic level of
leakage
UKWIR, 2012, Water Resources Planning Tools
UKWIR, 2012, A Framework for Accounting for Embodied Carbon in Water Industry
Assets (12/CL/01/15)
UKWIR, 2012, Strategic Environmental Assessment and Habitats Regulation
Assessment Directiv.
UKWIR, 2012, Impact of Climate Change on Demand Main Report (13/CL/04/12)
UKWIR, 2013, Economics of Supply Pipe Leakage
UKWIR, 2013, Resilience planning: good practice guide
UKWIR, 2014, Handbook of source yield methodologies
Yorkshire Water | Revised Draft Water Resources Management Plan 2019 291
`
UKWIR, 2015, WRMP19 methods – Household Consumption Forecasting (Report
ref. 15/WR/02/9)
UKWIR, 2015, Leakage Upstream of District Meters
UKWIR, 2016, Factors Affecting Minimal Achieved Levels of Leakage
UKWIR, 2016, Population, household property and occupancy forecasting
UKWIR, 2016, Integration of behavioural change into demand forecasting and water
efficiency
UKWIR, 2016, WRMP 2019 Methods – Decision Making Process: Guidance
UKWIR, 2016, WRMP 2019 Methods - Risk Based Planning: Guidance
UKWIR, 2017, Consistency of Reporting Performance Measures (Report Ref. 17/RG/04/5) UKWIR, 2018, Climate Change and the WRMP
URS Scott Wilson and CCRM, 2011, Climate Change Risk Assessment, Phase 1:
Impact and Vulnerability Assessment
Water UK, 2016, Long Term Water Resources Planning Framework
WRc and Stone and Webster, 2003, Future approaches to leakage target setting for
water companies in England and Wales: an investigation by WRc with Stone and
Webster Consultants for the Tripartite Group of the Department for Environment,
Food and Rural Affairs, the Environment Agency and Ofwat (The Tripartite Report)
WRc, 2012, Duration Modelling - impact of multi-year drought events on resources
and assets
WRc, 2012, Water Consumption of Homes Built to Part G and Code for Sustainable
Homes Standards
Yorkshire Water | Revised Draft Water Resources Management Plan 2019 292
`
16 Glossary of terms
AISC Average Incremental Social Cost
AMP Asset Management Period (5-year price review period)
AMP6 Planning period 2015-16 to 2019-20
AMP7 Planning period 2020-21 to 2024-25
BRE Building Research Establishment
BL Background leakage
CAMS Environment Agency’s Catchment Abstraction Management Strategies
(local licensing strategies that set out how water resources will be
managed within a catchment area)
CCP Constraint Challenge Process
COPI Construction Output Prices Index
CROW Act Countryside and Rights of Way Act 2000
DCL Drought Control Line
DCM Domestic Consumption Monitor
Defra Department for Environment, Food and Rural Affairs
DMA Distribution Management Area - Yorkshire Water leakage control zone
(also known as District Metered Area)
DO Deployable Output
DWI Drinking Water Inspectorate
EA Environment Agency
Yorkshire Water | Revised Draft Water Resources Management Plan 2019 293
`
ELL Economic level of leakage
GCM Global Circulation Models
GWZ Groundwater Zone (Environment Agency Water Resource Zone)
HOF Hands Off Flow licence conditions that require abstraction to cease (or
reduce) when river flows fall below a specified level
HRA Habitats Regulations Assessment
KAMS Key Asset Management System – Yorkshire Water asset reporting system
l/h/d Litres per head per day
LoS Level of Service
Ml/d Mega litres per day
MLE Maximum Likelihood Estimation
MSL Marginal Storage Line
NCL Normal Control Line
NEP National Environmental Program
NPC Net Present Cost
NPV Net Present Value
Ofwat Water Services Regulation Authority
PCC Per Capita Consumption
PMZ Production Management Zone – Yorkshire Water operational planning zone
PR14 Price Review submission to Ofwat 2014
SDS Strategic Direction Statement
SEA Strategic Environmental Assessment
Yorkshire Water | Revised Draft Water Resources Management Plan 2019 294
`
SELL Sustainable economic level of leakage
SRO Source Reliable Output
SSSI Site of Special Scientific Interest
SWZ Surface Water Zone (Environment Agency Water Resource Zone)
TLL Time Limited Licence
UKCP09 United Kingdom Climate Projections 2009
UKCP18 United Kingdom Climate Projections 2018
WAFU Water Available For Use
WFD Water Framework Directive
WINEP Water Industry National Environment Programme
WRAP Water Resources Allocation Plan (water supply network model)
WRAPsim Water Resources Allocation Plan simulation (water network simulation
model)
WRIO Water Resources Investment Optimiser
WRZ Water Resource Zone
WTP Willingness to Pay Survey
YWS Yorkshire Water Services Limited
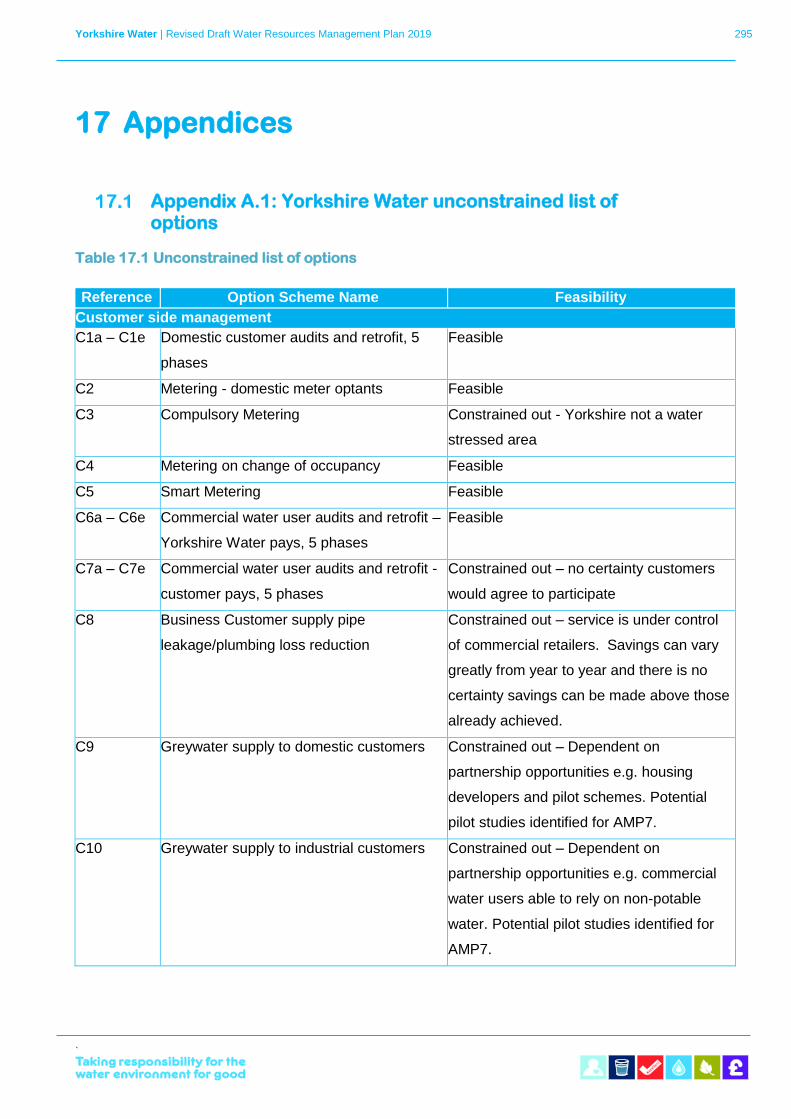
Yorkshire Water | Revised Draft Water Resources Management Plan 2019 295
`
17 Appendices
Appendix A.1: Yorkshire Water unconstrained list of options
Table 17.1 Unconstrained list of options
Reference Option Scheme Name Feasibility
Customer side management
C1a – C1e Domestic customer audits and retrofit, 5
phases
Feasible
C2 Metering - domestic meter optants Feasible
C3 Compulsory Metering Constrained out - Yorkshire not a water
stressed area
C4 Metering on change of occupancy Feasible
C5 Smart Metering Feasible
C6a – C6e Commercial water user audits and retrofit –
Yorkshire Water pays, 5 phases
Feasible
C7a – C7e Commercial water user audits and retrofit -
customer pays, 5 phases
Constrained out – no certainty customers
would agree to participate
C8 Business Customer supply pipe
leakage/plumbing loss reduction
Constrained out – service is under control
of commercial retailers. Savings can vary
greatly from year to year and there is no
certainty savings can be made above those
already achieved.
C9 Greywater supply to domestic customers Constrained out – Dependent on
partnership opportunities e.g. housing
developers and pilot schemes. Potential
pilot studies identified for AMP7.
C10 Greywater supply to industrial customers Constrained out – Dependent on
partnership opportunities e.g. commercial
water users able to rely on non-potable
water. Potential pilot studies identified for
AMP7.
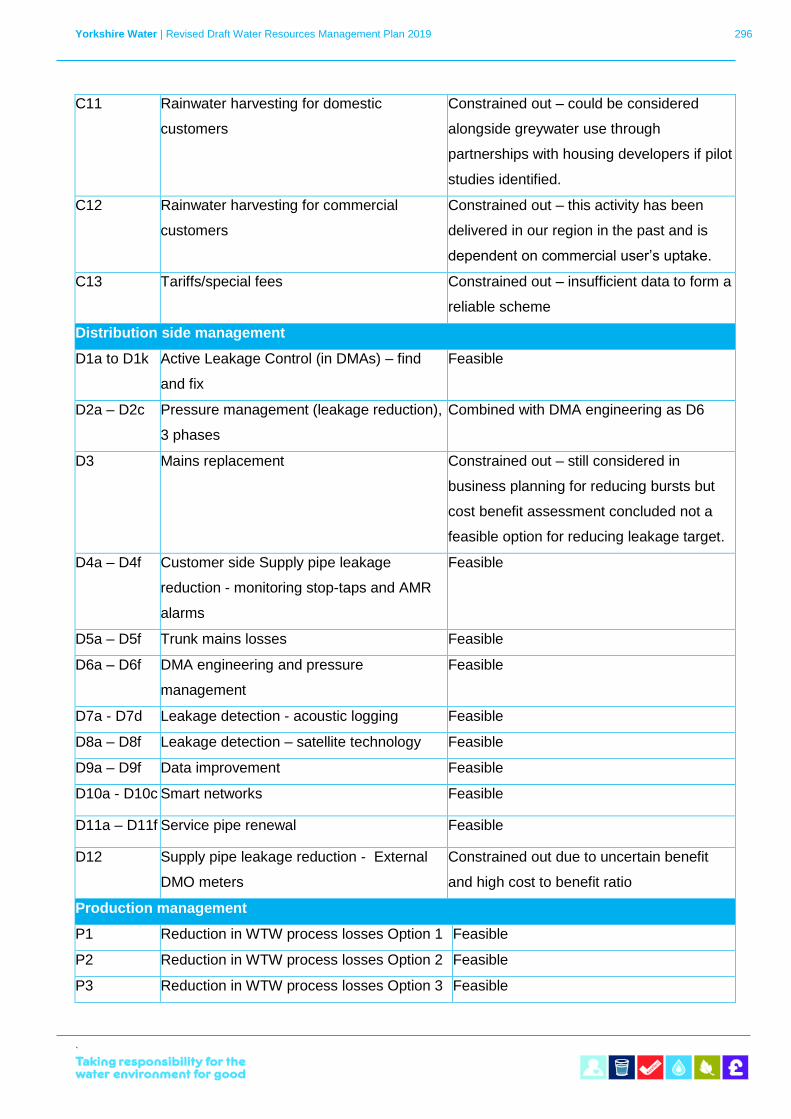
Yorkshire Water | Revised Draft Water Resources Management Plan 2019 296
`
C11 Rainwater harvesting for domestic
customers
Constrained out – could be considered
alongside greywater use through
partnerships with housing developers if pilot
studies identified.
C12 Rainwater harvesting for commercial
customers
Constrained out – this activity has been
delivered in our region in the past and is
dependent on commercial user’s uptake.
C13 Tariffs/special fees Constrained out – insufficient data to form a
reliable scheme
Distribution side management
D1a to D1k Active Leakage Control (in DMAs) – find
and fix
Feasible
D2a – D2c Pressure management (leakage reduction),
3 phases
Combined with DMA engineering as D6
D3 Mains replacement Constrained out – still considered in
business planning for reducing bursts but
cost benefit assessment concluded not a
feasible option for reducing leakage target.
D4a – D4f Customer side Supply pipe leakage
reduction - monitoring stop-taps and AMR
alarms
Feasible
D5a – D5f Trunk mains losses Feasible
D6a – D6f DMA engineering and pressure
management
Feasible
D7a - D7d Leakage detection - acoustic logging Feasible
D8a – D8f Leakage detection – satellite technology Feasible
D9a – D9f Data improvement Feasible
D10a - D10c Smart networks Feasible
D11a – D11f Service pipe renewal Feasible
D12 Supply pipe leakage reduction - External
DMO meters
Constrained out due to uncertain benefit
and high cost to benefit ratio
Production management
P1 Reduction in WTW process losses Option 1 Feasible
P2 Reduction in WTW process losses Option 2 Feasible
P3 Reduction in WTW process losses Option 3 Feasible
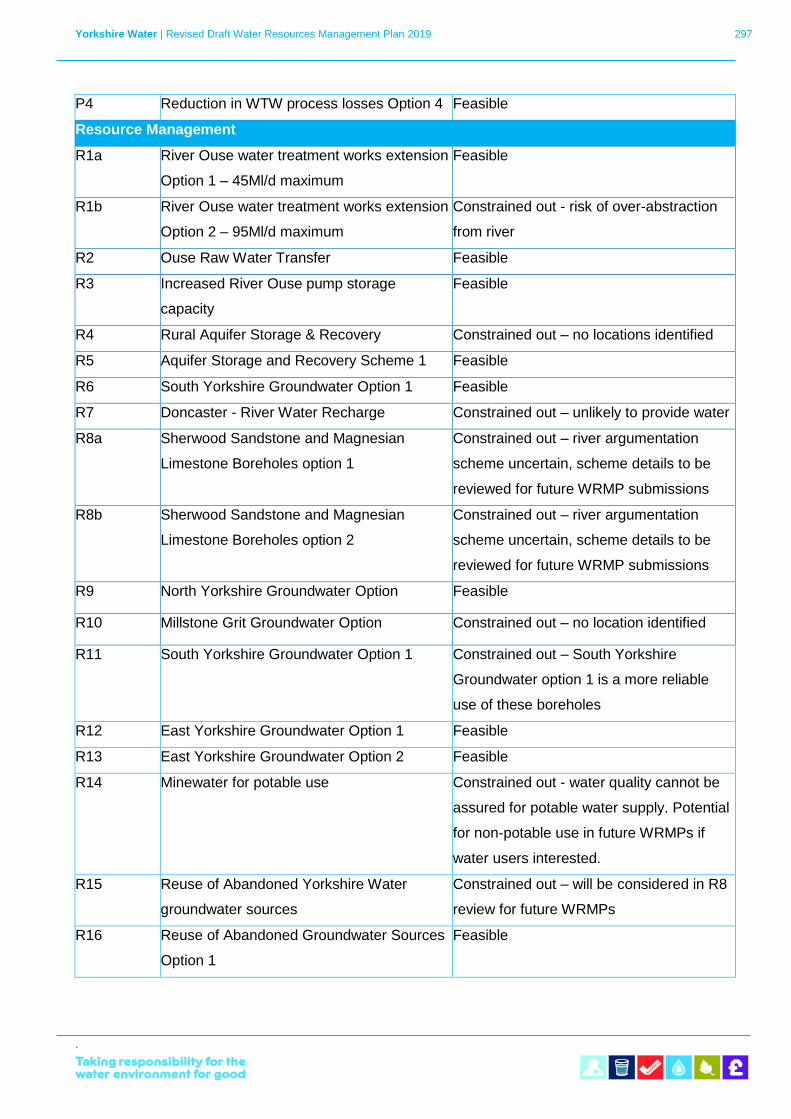
Yorkshire Water | Revised Draft Water Resources Management Plan 2019 297
`
P4 Reduction in WTW process losses Option 4 Feasible
Resource Management
R1a River Ouse water treatment works extension
Option 1 – 45Ml/d maximum
Feasible
R1b River Ouse water treatment works extension
Option 2 – 95Ml/d maximum
Constrained out - risk of over-abstraction
from river
R2 Ouse Raw Water Transfer Feasible
R3 Increased River Ouse pump storage
capacity
Feasible
R4 Rural Aquifer Storage & Recovery Constrained out – no locations identified
R5 Aquifer Storage and Recovery Scheme 1 Feasible
R6 South Yorkshire Groundwater Option 1 Feasible
R7 Doncaster - River Water Recharge Constrained out – unlikely to provide water
R8a Sherwood Sandstone and Magnesian
Limestone Boreholes option 1
Constrained out – river argumentation
scheme uncertain, scheme details to be
reviewed for future WRMP submissions
R8b Sherwood Sandstone and Magnesian
Limestone Boreholes option 2
Constrained out – river argumentation
scheme uncertain, scheme details to be
reviewed for future WRMP submissions
R9 North Yorkshire Groundwater Option Feasible
R10 Millstone Grit Groundwater Option Constrained out – no location identified
R11 South Yorkshire Groundwater Option 1 Constrained out – South Yorkshire
Groundwater option 1 is a more reliable
use of these boreholes
R12 East Yorkshire Groundwater Option 1 Feasible
R13 East Yorkshire Groundwater Option 2 Feasible
R14 Minewater for potable use Constrained out - water quality cannot be
assured for potable water supply. Potential
for non-potable use in future WRMPs if
water users interested.
R15 Reuse of Abandoned Yorkshire Water
groundwater sources
Constrained out – will be considered in R8
review for future WRMPs
R16 Reuse of Abandoned Groundwater Sources
Option 1
Feasible
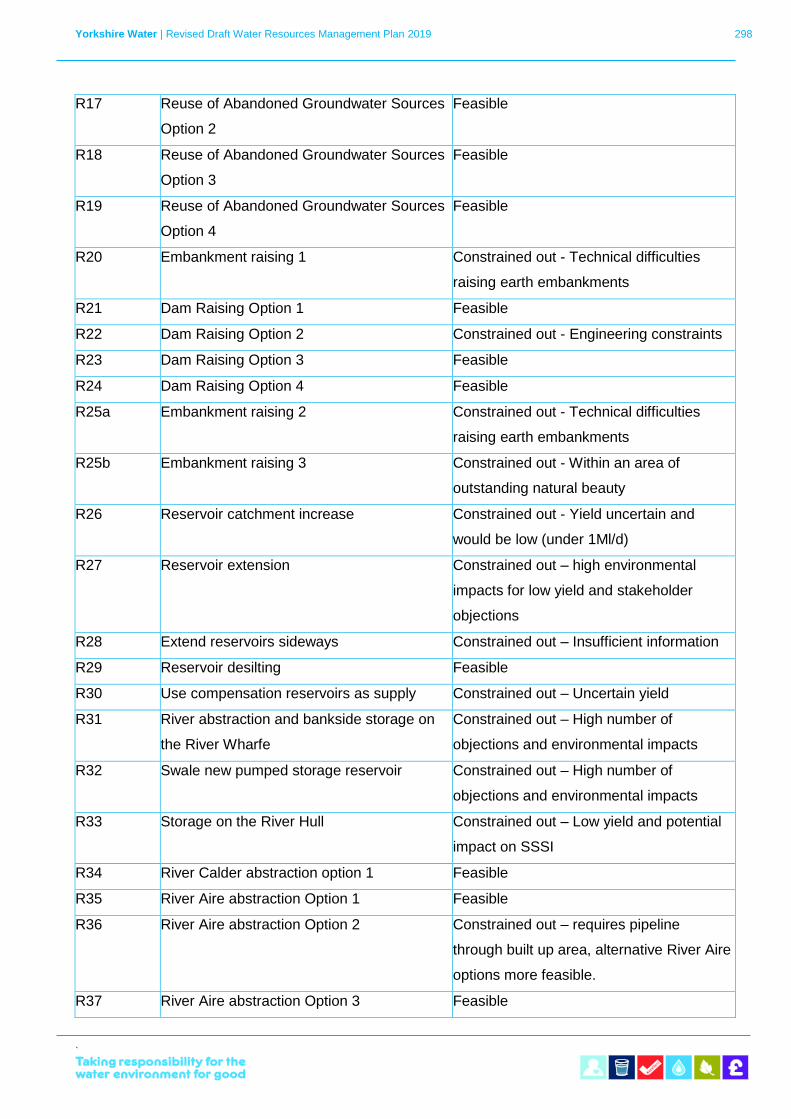
Yorkshire Water | Revised Draft Water Resources Management Plan 2019 298
`
R17 Reuse of Abandoned Groundwater Sources
Option 2
Feasible
R18 Reuse of Abandoned Groundwater Sources
Option 3
Feasible
R19 Reuse of Abandoned Groundwater Sources
Option 4
Feasible
R20 Embankment raising 1 Constrained out - Technical difficulties
raising earth embankments
R21 Dam Raising Option 1 Feasible
R22 Dam Raising Option 2 Constrained out - Engineering constraints
R23 Dam Raising Option 3 Feasible
R24 Dam Raising Option 4 Feasible
R25a Embankment raising 2 Constrained out - Technical difficulties
raising earth embankments
R25b Embankment raising 3 Constrained out - Within an area of
outstanding natural beauty
R26 Reservoir catchment increase Constrained out - Yield uncertain and
would be low (under 1Ml/d)
R27 Reservoir extension Constrained out – high environmental
impacts for low yield and stakeholder
objections
R28 Extend reservoirs sideways Constrained out – Insufficient information
R29 Reservoir desilting Feasible
R30 Use compensation reservoirs as supply Constrained out – Uncertain yield
R31 River abstraction and bankside storage on
the River Wharfe
Constrained out – High number of
objections and environmental impacts
R32 Swale new pumped storage reservoir Constrained out – High number of
objections and environmental impacts
R33 Storage on the River Hull Constrained out – Low yield and potential
impact on SSSI
R34 River Calder abstraction option 1 Feasible
R35 River Aire abstraction Option 1 Feasible
R36 River Aire abstraction Option 2 Constrained out – requires pipeline
through built up area, alternative River Aire
options more feasible.
R37 River Aire abstraction Option 3 Feasible
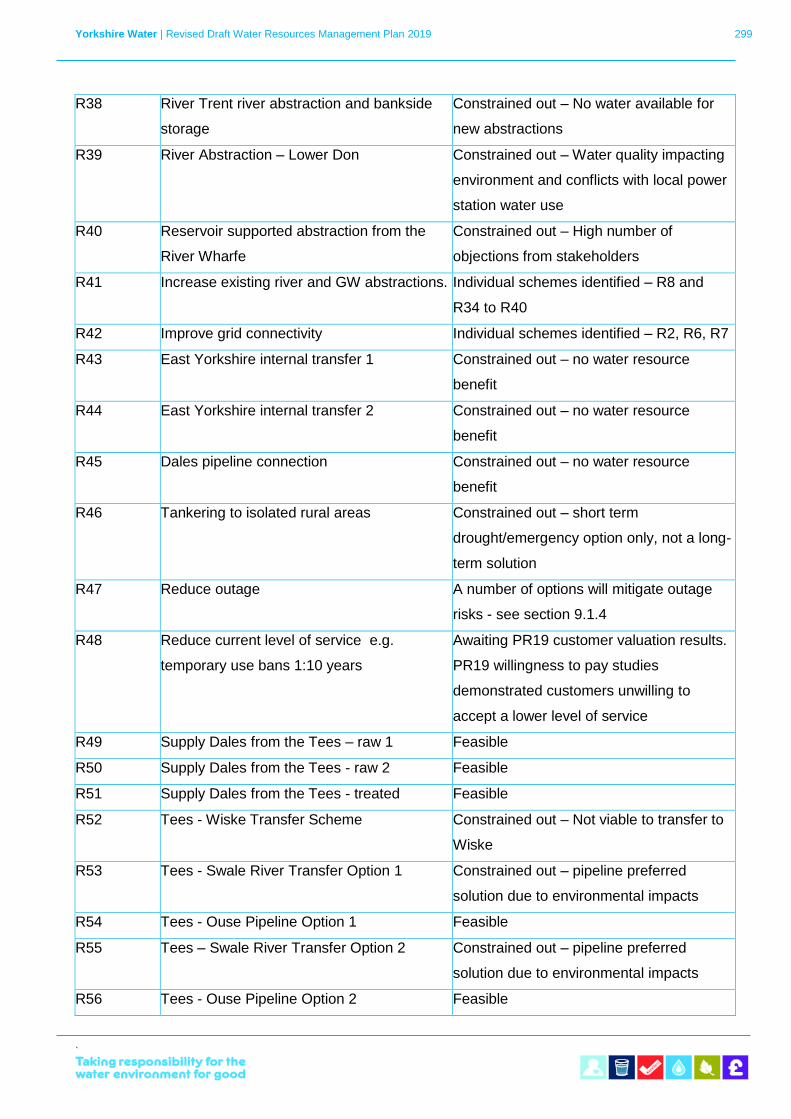
Yorkshire Water | Revised Draft Water Resources Management Plan 2019 299
`
R38 River Trent river abstraction and bankside
storage
Constrained out – No water available for
new abstractions
R39 River Abstraction – Lower Don Constrained out – Water quality impacting
environment and conflicts with local power
station water use
R40 Reservoir supported abstraction from the
River Wharfe
Constrained out – High number of
objections from stakeholders
R41 Increase existing river and GW abstractions. Individual schemes identified – R8 and
R34 to R40
R42 Improve grid connectivity Individual schemes identified – R2, R6, R7
R43 East Yorkshire internal transfer 1 Constrained out – no water resource
benefit
R44 East Yorkshire internal transfer 2 Constrained out – no water resource
benefit
R45 Dales pipeline connection Constrained out – no water resource
benefit
R46 Tankering to isolated rural areas Constrained out – short term
drought/emergency option only, not a long-
term solution
R47 Reduce outage A number of options will mitigate outage
risks - see section 9.1.4
R48 Reduce current level of service e.g.
temporary use bans 1:10 years
Awaiting PR19 customer valuation results.
PR19 willingness to pay studies
demonstrated customers unwilling to
accept a lower level of service
R49 Supply Dales from the Tees – raw 1 Feasible
R50 Supply Dales from the Tees - raw 2 Feasible
R51 Supply Dales from the Tees - treated Feasible
R52 Tees - Wiske Transfer Scheme Constrained out – Not viable to transfer to
Wiske
R53 Tees - Swale River Transfer Option 1 Constrained out – pipeline preferred
solution due to environmental impacts
R54 Tees - Ouse Pipeline Option 1 Feasible
R55 Tees – Swale River Transfer Option 2 Constrained out – pipeline preferred
solution due to environmental impacts
R56 Tees - Ouse Pipeline Option 2 Feasible
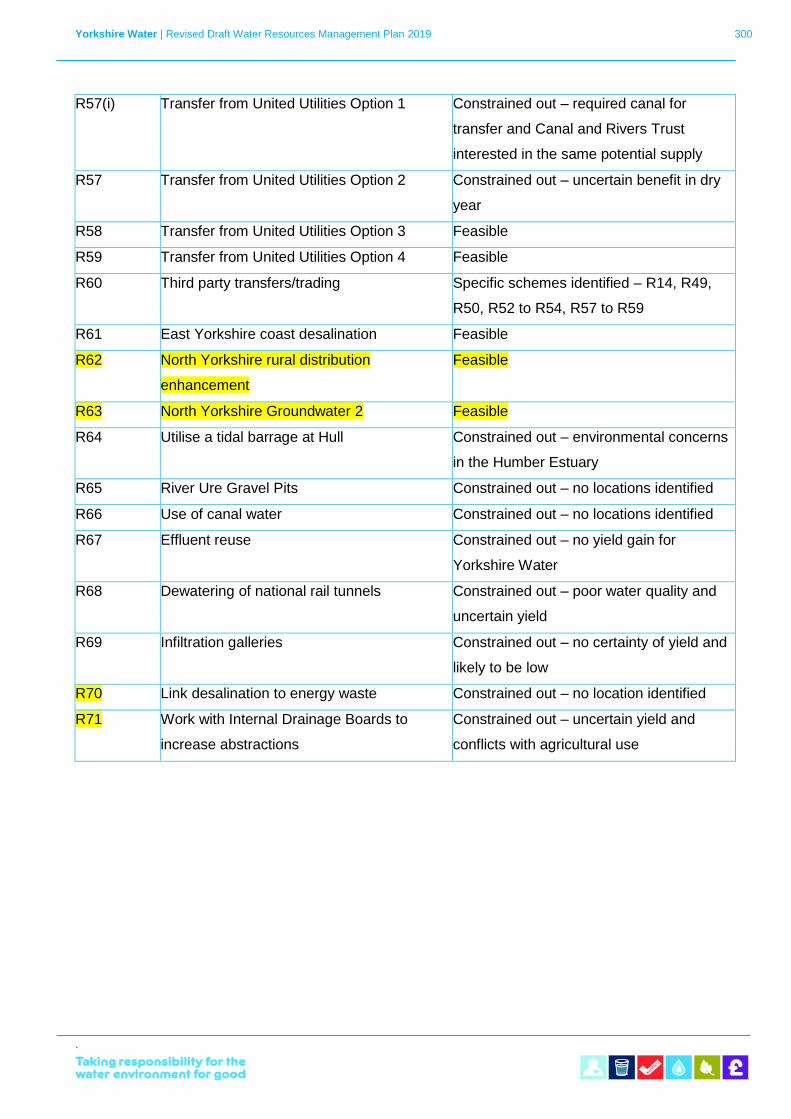
Yorkshire Water | Revised Draft Water Resources Management Plan 2019 300
`
R57(i) Transfer from United Utilities Option 1 Constrained out – required canal for
transfer and Canal and Rivers Trust
interested in the same potential supply
R57 Transfer from United Utilities Option 2 Constrained out – uncertain benefit in dry
year
R58 Transfer from United Utilities Option 3 Feasible
R59 Transfer from United Utilities Option 4 Feasible
R60 Third party transfers/trading Specific schemes identified – R14, R49,
R50, R52 to R54, R57 to R59
R61 East Yorkshire coast desalination Feasible
R62 North Yorkshire rural distribution
enhancement
Feasible
R63 North Yorkshire Groundwater 2 Feasible
R64 Utilise a tidal barrage at Hull Constrained out – environmental concerns
in the Humber Estuary
R65 River Ure Gravel Pits Constrained out – no locations identified
R66 Use of canal water Constrained out – no locations identified
R67 Effluent reuse Constrained out – no yield gain for
Yorkshire Water
R68 Dewatering of national rail tunnels Constrained out – poor water quality and
uncertain yield
R69 Infiltration galleries Constrained out – no certainty of yield and
likely to be low
R70 Link desalination to energy waste Constrained out – no location identified
R71 Work with Internal Drainage Boards to
increase abstractions
Constrained out – uncertain yield and
conflicts with agricultural use
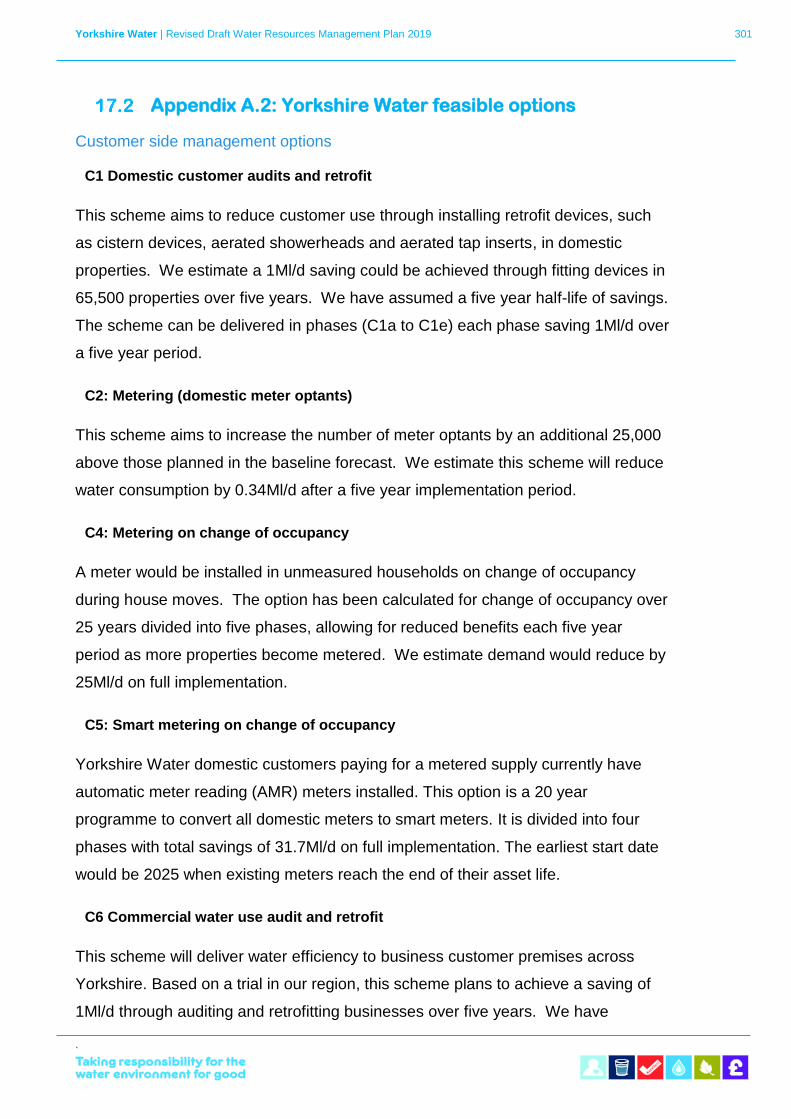
Yorkshire Water | Revised Draft Water Resources Management Plan 2019 301
`
Appendix A.2: Yorkshire Water feasible options
Customer side management options
C1 Domestic customer audits and retrofit
This scheme aims to reduce customer use through installing retrofit devices, such
as cistern devices, aerated showerheads and aerated tap inserts, in domestic
properties. We estimate a 1Ml/d saving could be achieved through fitting devices in
65,500 properties over five years. We have assumed a five year half-life of savings.
The scheme can be delivered in phases (C1a to C1e) each phase saving 1Ml/d over
a five year period.
C2: Metering (domestic meter optants)
This scheme aims to increase the number of meter optants by an additional 25,000
above those planned in the baseline forecast. We estimate this scheme will reduce
water consumption by 0.34Ml/d after a five year implementation period.
C4: Metering on change of occupancy
A meter would be installed in unmeasured households on change of occupancy
during house moves. The option has been calculated for change of occupancy over
25 years divided into five phases, allowing for reduced benefits each five year
period as more properties become metered. We estimate demand would reduce by
25Ml/d on full implementation.
C5: Smart metering on change of occupancy
Yorkshire Water domestic customers paying for a metered supply currently have
automatic meter reading (AMR) meters installed. This option is a 20 year
programme to convert all domestic meters to smart meters. It is divided into four
phases with total savings of 31.7Ml/d on full implementation. The earliest start date
would be 2025 when existing meters reach the end of their asset life.
C6 Commercial water use audit and retrofit
This scheme will deliver water efficiency to business customer premises across
Yorkshire. Based on a trial in our region, this scheme plans to achieve a saving of
1Ml/d through auditing and retrofitting businesses over five years. We have
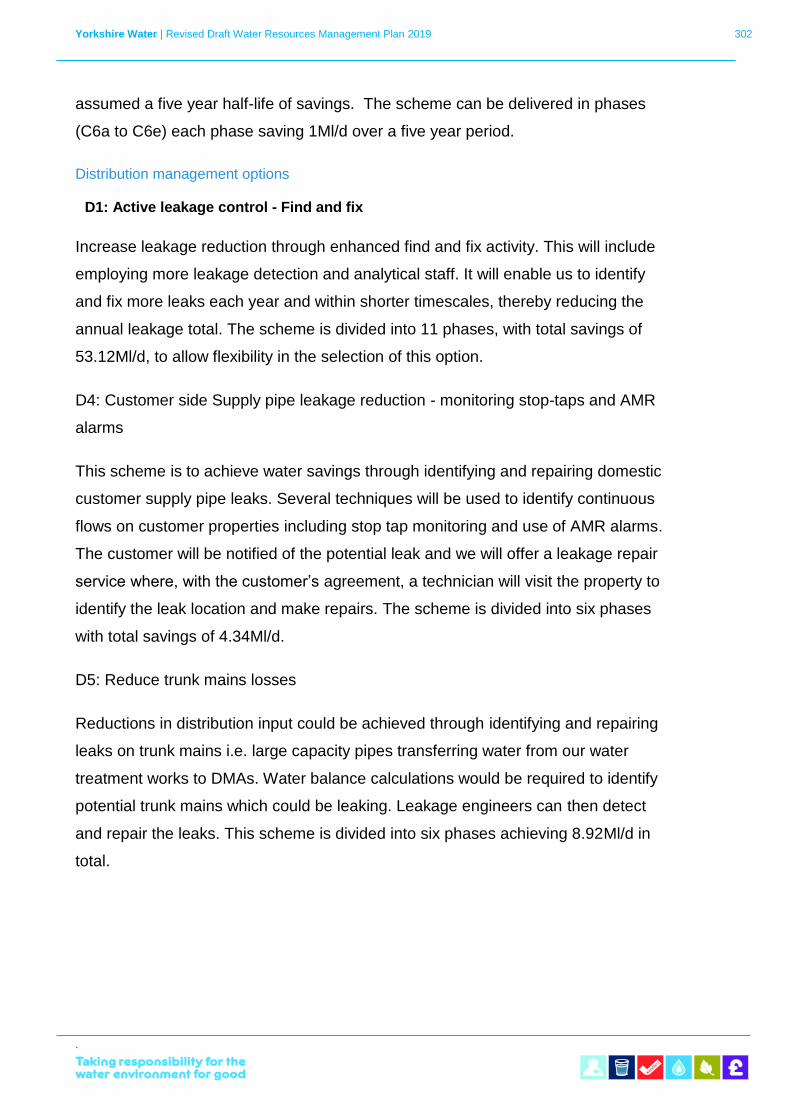
Yorkshire Water | Revised Draft Water Resources Management Plan 2019 302
`
assumed a five year half-life of savings. The scheme can be delivered in phases
(C6a to C6e) each phase saving 1Ml/d over a five year period.
Distribution management options
D1: Active leakage control - Find and fix
Increase leakage reduction through enhanced find and fix activity. This will include
employing more leakage detection and analytical staff. It will enable us to identify
and fix more leaks each year and within shorter timescales, thereby reducing the
annual leakage total. The scheme is divided into 11 phases, with total savings of
53.12Ml/d, to allow flexibility in the selection of this option.
D4: Customer side Supply pipe leakage reduction - monitoring stop-taps and AMR
alarms
This scheme is to achieve water savings through identifying and repairing domestic
customer supply pipe leaks. Several techniques will be used to identify continuous
flows on customer properties including stop tap monitoring and use of AMR alarms.
The customer will be notified of the potential leak and we will offer a leakage repair
service where, with the customer’s agreement, a technician will visit the property to
identify the leak location and make repairs. The scheme is divided into six phases
with total savings of 4.34Ml/d.
D5: Reduce trunk mains losses
Reductions in distribution input could be achieved through identifying and repairing
leaks on trunk mains i.e. large capacity pipes transferring water from our water
treatment works to DMAs. Water balance calculations would be required to identify
potential trunk mains which could be leaking. Leakage engineers can then detect
and repair the leaks. This scheme is divided into six phases achieving 8.92Ml/d in
total.
Yorkshire Water | Revised Draft Water Resources Management Plan 2019 303
`
D6: DMA engineering and pressure management
DMA optimisation reduces leakage by intensive investigation by our skilled
engineers, which either finds a very small number of significant large volume leaks,
or sets DMAs up to remove anomalies and enable more effective DMA targeting.
We have included two types of DMA optimisation, DMA engineering and DMA
resizing. For many of our DMAs these techniqiues are combined with pressure
management to achieve the most benenfit. This scheme is divided into six phases
achieving 32.88Ml/d in total.
D7: Acoustic logging
Acoustic logging in DMAs would reduce leakage through more rapid identification of
leaks compared to traditional find and fix activity. This scheme aims to install
acoustic loggers in DMAs where analysis indicates a higher than average rate of
rise. This scheme is divided into four phases achieving 11.16Ml/d.
D8: Satelite technology
This option is similar to D7 above but uses satellites to detect leaks in less time than
traditional find and fix activity. This scheme is divided into 6 phases to achieve
4.18Ml/d total savings.
D9 Data improvement
Improve data used in leakage calculations through more trials and data validation of
plumbing losses, meter under registration, night use, trunk mains losses and supply
pipe leakage; also increased DMA coverage. This will help in targeting leakage find
and fix and help accurately report leakage. This scheme is divided into 6 phases to
achieve 9.60Ml/d total savings.
D10 Smart networks
Reduce leak run time and the volume lost per leak by analytics to reduce
awareness and detection time. This may require additional data logging. This
scheme is divided into three phases to achieve 15.30Ml/d.
Yorkshire Water | Revised Draft Water Resources Management Plan 2019 304
`
Production management options
P1a and P1d: Reduce water treatment works process losses
We have identified four water treatment works in the Grid Surface Water Zone
where water lost during the treatment process could be reduced through installing
more efficient infrastructure.
Resource management options
R1a: River Ouse water treatment works extension
This scheme involves extending an existing water treatment works in York to
provide an additional 22Ml/d on average. This would utilise the same existing
licence on the River Ouse as R2. We would only implement one of the two
schemes.
R2: Ouse Raw Water Transfer
The scheme would abstract up to 60Ml/d of raw water from the River Ouse for
treatment near York. Constraints in the Grid SWZ limit the volume that can be used
in supply. This volume is partly dependent on other schemes being developed and
we estimate 40Ml/d would be available. The scheme requires construction of a new
river intake, pumping station and pumping main from the point of abstraction to the
point of treatment.
R3: Increased River Ouse pumped storage capacity
The scheme involves construction of a new transfer main and pumping station
between the River Ouse and a nearby water treatment. The scheme could be used
to maximize an existing abstraction licence on the Ouse. This is not the same Ouse
licence as R1 and R2 and this scheme could be delivered independently. We
estimate it would provide an additional 10Ml/d.
R5: Aquifer Storage and Recovery Scheme 1
This scheme involves the use of new pumped boreholes to artificially ‘recharge’ the
Sherwood Sandstone aquifer, allowing the use of this water supply during drier
periods. We estimate the average yield of the artificial recharge would be 10Ml/d.
Yorkshire Water | Revised Draft Water Resources Management Plan 2019 305
`
R6: South Yorkshire groundwater scheme
A potential 12Ml/d of yield can be attained from an underutilised group of
groundwater sources in South Yorkshire. A short length of pipeline would be
required to link the sources to the grid system for internal transfer.
R9: North Yorkshire Groundwater
This scheme involves applying for an increase to an existing groundwater
abstraction licence in North Yorkshire. This would increase yield by 2Ml/d.
R12: East Yorkshire groundwater option 1
Up to an additional 8Ml/d yield is estimated to be available from an existing licenced
groundwater group in East Yorkshire. This scheme would enhance the existing
pumping capacity of existing infrastructure to transfer additional water from the
boreholes to the grid system.
R13: East Yorkshire groundwater option 2
This scheme proposes to relocate an existing borehole in the East Yorkshire area to
replace the yield lost from an asset that is no longer in use due to water quality
issues. A licence variation on the existing abstraction would be required. This
source could provide the grid system with up to 6Ml/d annual average (9Ml/d peak)
although in the dry year scenario the total yield may not be required. However, it
would provide support to the East Yorkshire borehole group when outages occur.
R16 to R19: Re-use abandoned industrial licences Options 1, 2, 3 and 4
We have four individual schemes to utilise abstraction licences previously owned by
commercial businesses. The licences are now revoked and we would apply to the
Environment Agency for a new abstraction licence. We have costed four
abandoned borehole sources across the region, which have a total potential yield of
6.4Ml/d. Each would require a length of pipeline to connect the groundwater source
to a water treatment works.
R21: Dam raising Option 1
Yorkshire Water | Revised Draft Water Resources Management Plan 2019 306
`
This scheme involves raising the height of an existing dam wall of a reservoir in the
Pennines. We estimate the scheme would increase deployable output by 0.28Ml/d.
R23: Dam raising Option 3
This scheme involves raising the height of the existing dam wall of a reservoir in the
Pennines. We estimate the scheme would increase deployable output by 0.05Ml/d.
R24: Dam raising Option 4
This reservoir scheme involves increasing the height of an existing dam of a
reservoir in the Pennines. The scheme is expected to increase deployable output
by 2Ml/d.
R29: Reservoir de-silting
This scheme aims to increase the capacity of 26 reservoirs through dredging and
desilting. The silt would be taken to a landfill site. The scheme is estimated to
increase deployable output by 111Ml/d and take 7 years for full implementation.
R34: River Calder abstraction Option 1
This scheme is a new abstraction from the River Calder. It requires construction of
a pumping station and water main, and transport of water to an existing water
treatment works. We estimate the scheme would provide 10Ml/d and be operational
after four years. This scheme would be subject to the Environment Agency granting
a licence and specifying constraints at lower flows.
R35: River Aire abstraction Option 1
This scheme is a new abstraction licence on the River Aire. It would involve the
construction of a pumping station and water main in order to abstract and then
transport water to an existing water treatment works. We estimate the scheme
would provide 10Ml/d and be operational after three years. This scheme would be
subject to the Environment Agency granting a licence and specifying constraints at
lower flows.
Yorkshire Water | Revised Draft Water Resources Management Plan 2019 307
`
R37: River Aire abstraction Option 3
This is a third potential new abstraction site on the River Aire. It involves
construction of a pumping station, new water main and bankside storage reservoir.
The scheme could also require construction of a new treatment works or the
upgrading of an existing treatment works. We estimate it could provide 20Ml/d and
be operational after three years. This scheme would be subject to the Environment
Agency granting a licence and specifying constraints at lower flows.
R49, R50 and R51: Supply Dales from the Tees
These schemes give three options to supply 15Ml/d of raw or treated water to the
Dales from an abstraction on the River Tees. R49 is a raw water import from
Northumbrian Water. R50 is virtually the same scheme as R49 but we would apply
for our own abstraction licence on the River Tees. R51 is a treated water import
from Northumbrian Water.
R54 and R56: Tees to Ouse pipeline
This is an alternative to the above scheme where the water will be abstracted from
the River Tees and delivered to our treatment works by a raw water main. R54 is a
raw water import from Northumbrian Water, whereas R56 is the same scheme but
we will apply for our own abstraction licence on the river Tees. The scheme is
designed to be delivered in three phases to allow flexibility in the option.
R58: Transfer from United Utilities Option 2
This scheme would utilise an existing pipeline connection between United Utilities
and Yorkshire Water. The transfer would provide 1Ml/d of raw water for use in the
Grid SWZ.
R59: Transfer from United Utilities Option 3
This scheme would install 6km of pipeline to connect the Grid SWZ to an existing
United Utilities’ pipeline. The transfer would supply the Grid SWZ with 1Ml/d of
treated water.
Yorkshire Water | Revised Draft Water Resources Management Plan 2019 308
`
R61: Desalination
This scheme involves construction of a water treatment works on the East Yorkshire
coast to treat sea water. The scheme involves construction of; pumped beach wells
for seawater abstraction, water mains from the wells to the water treatment works,
and water mains from the water treatment works to the Grid SWZ supply network.
The scheme would employ reverse osmosis as a ‘lower-energy’ method of
desalinisation. The water treatment works would include pre-treatment, post-
treatment and energy recovery, and is predicted to increase deployable output by
20Ml/d. The scheme would be implemented after six years dependent on
appropriate planning and environmental investigations.
R62: North Yorkshire rural distribution enhancement
This scheme will link a rural area in North Yorkshire, predominantly supplied by a
groundwater source, to a water treatment in York. It will require a new clean water
pipeline to connect to the WTW and allow transfer of at least 1Ml/d. This will be
within current licensing permisioions.
R63: North Yorkshire Groundwater 2
This scheme will require a licnece application for an additional abstraction of 1Ml/d
from an existing groundwater source in North Yorkshire. Current infrastructure will
be sufficient to abstract the additional supply however, for resilience an additional
borehole will be drilled to provide a stand by asset. UV treament will also be
installed.
E1: Transfer to United Utilities
This scheme is a Yorkshire Water export to United Utilities. It requires a 5Ml/d
release from a Yorkshire Water reservoir into the Huddersfield Canal for United
Utilities to abstract downstream. United Utilities does not require this export as part
of its WRMP 2019 solution.
E2: Transfer to Severn Trent Water
This scheme is a Yorkshire Water export to Severn Trent Water. The scheme is
designed to provide 20Ml/d treated water on average and 25Ml/d peak, via a new
Yorkshire Water | Revised Draft Water Resources Management Plan 2019 309
`
pipeline from South Yorkshire to Severn Trent Water’s supply area. We would be
required to construct a new storage reservoir adjacent to an existing storage
reservoir used to supply our customers. Severn Trent Water does not require this
export as part of its WRMP 2019 solution.
Yorkshire Water | Revised Draft Water Resources Management Plan 2019 310
`
Appendix B: Yorkshire Water optimisation model
Our optimisation model determines the least cost solution from the monetary,
environmental and social costs and benefits of the feasible options, using the
methodology recommended in the Economics of Balancing Supply and Demand
(Environment Agency and UKWIR, 2002). The assumptions, constraints and data
inputs used in the model are listed below.
The costs and benefits included in the model for each feasible option are:
o Capital expenditure – initial build costs and replacement. Divided into civil,
land, mechanical and engineering and ICA (instrumentation, control and
automation)
o Operating expenditure - fixed and variable
o Environmental and social capex build and replacement
o Environmental and social opex - fixed and variable
o Carbon capex build and replacement
o Carbon opex- fixed and variable.
In addition to the above we input the following for each individual schemes:
o The build ramp up with cost spread out where required, i.e. capex
expenditure is spread over the number of years it takes to deliver a scheme
o The yield provided by scheme (either an increase in resource or reduction in
demand)
o The earliest date the scheme can provide yield (either partial or 100%
depending on individual schemes). This allows for the planning and build
time that is required
o The yield build up. Some schemes provide 100% of yield once the scheme
delivery is complete other schemes such as metering will produce a gradual
build-up of yield as meters are installed over a number of years
o Supply demand over 25 years or 40 years – this gives the surplus/deficit for
individual years.
Yorkshire Water | Revised Draft Water Resources Management Plan 2019 311
`
The model determines the least cost solution by calculating the whole life costs of
options over 100 years (the lifetime of the longest lasting asset), starting from the
year the scheme build starts.
The least cost solution provided by the model is for a 25 year or a 40 year time
period starting 2015/16 (first year of AMP6).
In accordance with Environment Agency 2016 guidelines we have used a discount
rate of 3.6% for financing costs and for all other costs used the Treasury Discount
rate as set out in the HM Treasury “Green Book”.
The price base for costs is 2016/17 – where applicable costs have been inflated to
this base.
If an option is dependent on another option, this has been accounted for in the
model so that only one can be selected if they are exclusive (e.g. only one of the
two Tees to Ouse transfer options can be implemented). Or if an option is linked to
another option and one is a prerequisite of the other (e.g. D2 three phases of
pressure management) this is accounted for in the model.
The environmental and social costs have been calculated using the Benefits
Assessment Guidance (EA, 2012) and are described in the Draft WRMP 2013
Environmental Economics technical submission (Yorkshire Water, 2013). The
carbon cost calculations are also described in this report.
Yorkshire Water | Revised Draft Water Resources Management Plan 2019 312
`
Appendix C: Customer engagement for PR19 and WRMP19 planning
17.4.1 Overview
As a fundamental part of PR19 and WRMP planning, we have undertaken a
significant programme of customer engagement. This has helped us understand
more about what is important to our customers now and in the future.
We have talked to our customers about how water plays a part in their lives and the
dependencies that we all have on water. These conversations have helped us to
develop our long-term strategy, which we published in January 2018.
As part of our last strategy review in 2013, customers told us their priorities for the
next 25 years. This led to key long- term outcomes for Yorkshire Water and a series
of performance commitments against which we measure ourselves for the period
2015-2020.
In preparation for PR19 and the development of our draft WRMP19, we set about
gaining an in-depth understanding of our customers, to ensure that we meet their
expectations in both the foreseeable future and over the long-term.
17.4.2 Valuing Water
Prior to customer engagement we consulted the data we already hold as a
company. This involved a review of incident data, customer call volumes, customer
complaints and social media interactions, to understand the areas causing greatest
customer dissatisfaction. The findings informed our first primary research study,
called Valuing Water. The Valuing Water project used a multi-method approach to
explore the value customers place on our services. It sought to understand
customer expectations and aspirations for Yorkshire Water and the services we
deliver, in the context of the macro-level challenges we face on population growth
and climate change.
From this early study, our customers primary long-term priorities included:
• Reducing water wastage and leaks;
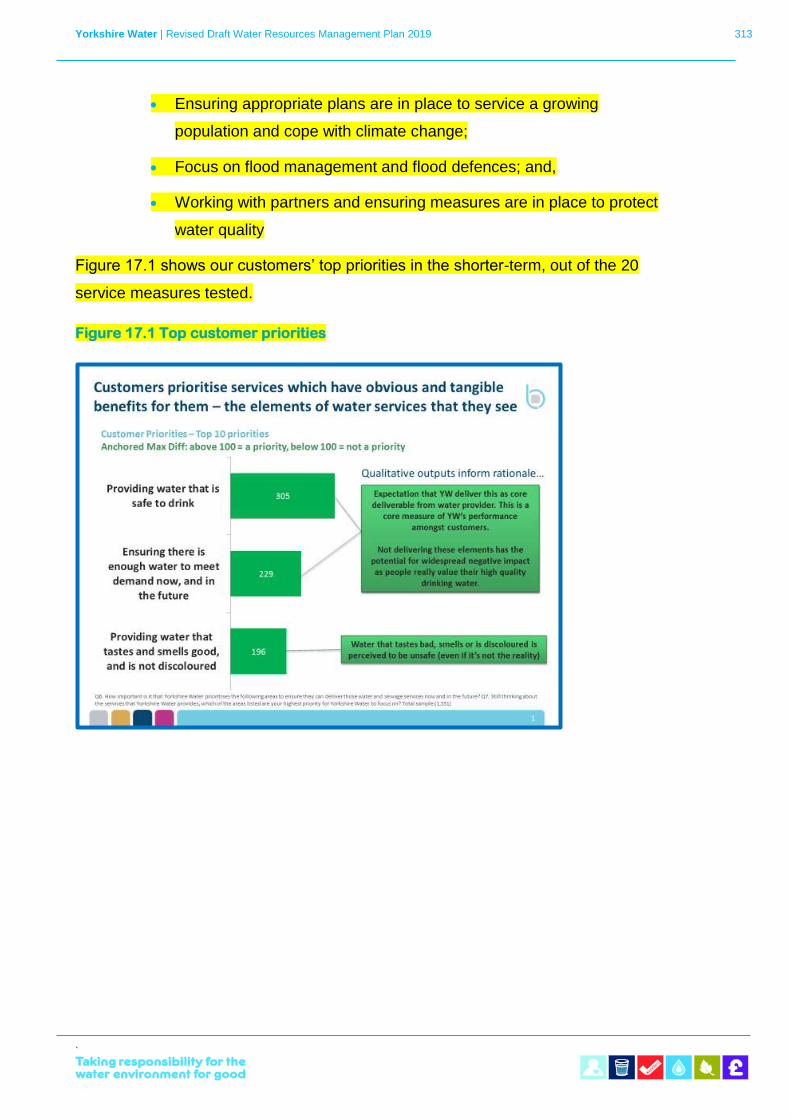
Yorkshire Water | Revised Draft Water Resources Management Plan 2019 313
`
• Ensuring appropriate plans are in place to service a growing
population and cope with climate change;
• Focus on flood management and flood defences; and,
• Working with partners and ensuring measures are in place to protect
water quality
Figure 17.1 shows our customers’ top priorities in the shorter-term, out of the 20
service measures tested.
Figure 17.1 Top customer priorities
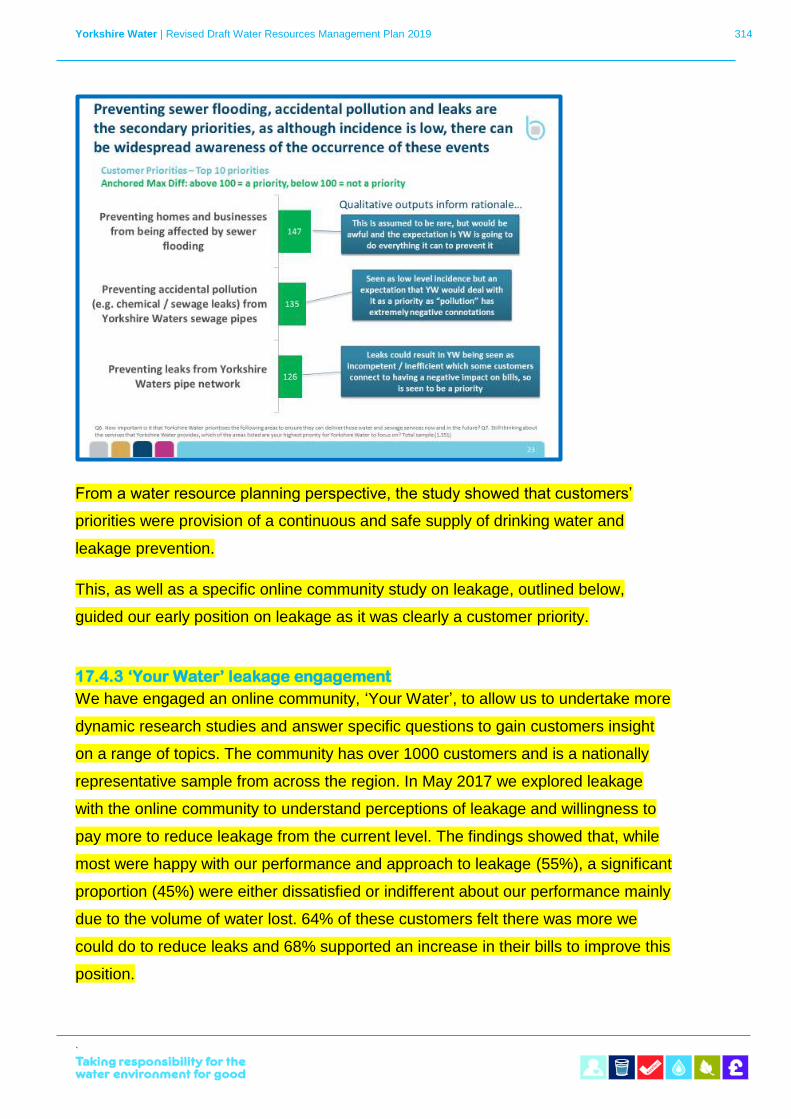
Yorkshire Water | Revised Draft Water Resources Management Plan 2019 314
`
From a water resource planning perspective, the study showed that customers’
priorities were provision of a continuous and safe supply of drinking water and
leakage prevention.
This, as well as a specific online community study on leakage, outlined below,
guided our early position on leakage as it was clearly a customer priority.
17.4.3 ‘Your Water’ leakage engagement
We have engaged an online community, ‘Your Water’, to allow us to undertake more
dynamic research studies and answer specific questions to gain customers insight
on a range of topics. The community has over 1000 customers and is a nationally
representative sample from across the region. In May 2017 we explored leakage
with the online community to understand perceptions of leakage and willingness to
pay more to reduce leakage from the current level. The findings showed that, while
most were happy with our performance and approach to leakage (55%), a significant
proportion (45%) were either dissatisfied or indifferent about our performance mainly
due to the volume of water lost. 64% of these customers felt there was more we
could do to reduce leaks and 68% supported an increase in their bills to improve this
position.
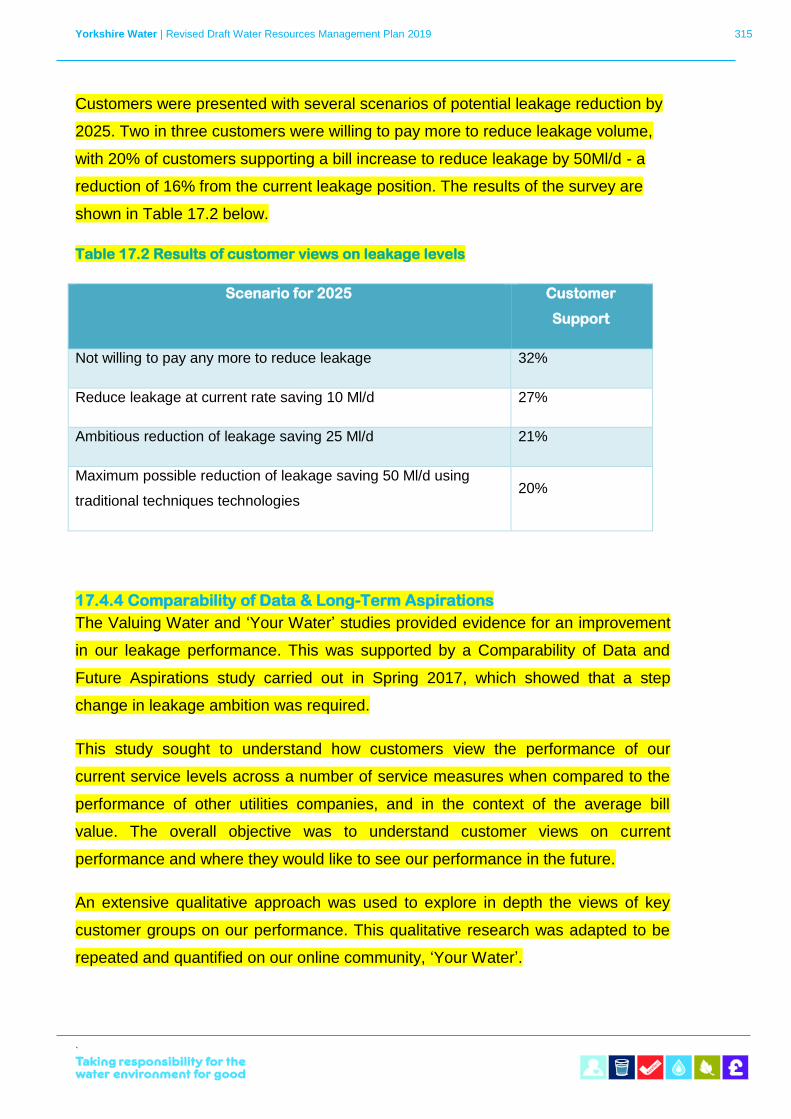
Yorkshire Water | Revised Draft Water Resources Management Plan 2019 315
`
Customers were presented with several scenarios of potential leakage reduction by
2025. Two in three customers were willing to pay more to reduce leakage volume,
with 20% of customers supporting a bill increase to reduce leakage by 50Ml/d - a
reduction of 16% from the current leakage position. The results of the survey are
shown in Table 17.2 below.
Table 17.2 Results of customer views on leakage levels
Scenario for 2025 Customer
Support
Not willing to pay any more to reduce leakage 32%
Reduce leakage at current rate saving 10 Ml/d 27%
Ambitious reduction of leakage saving 25 Ml/d 21%
Maximum possible reduction of leakage saving 50 Ml/d using
traditional techniques technologies 20%
17.4.4 Comparability of Data & Long-Term Aspirations
The Valuing Water and ‘Your Water’ studies provided evidence for an improvement
in our leakage performance. This was supported by a Comparability of Data and
Future Aspirations study carried out in Spring 2017, which showed that a step
change in leakage ambition was required.
This study sought to understand how customers view the performance of our
current service levels across a number of service measures when compared to the
performance of other utilities companies, and in the context of the average bill
value. The overall objective was to understand customer views on current
performance and where they would like to see our performance in the future.
An extensive qualitative approach was used to explore in depth the views of key
customer groups on our performance. This qualitative research was adapted to be
repeated and quantified on our online community, ‘Your Water’.
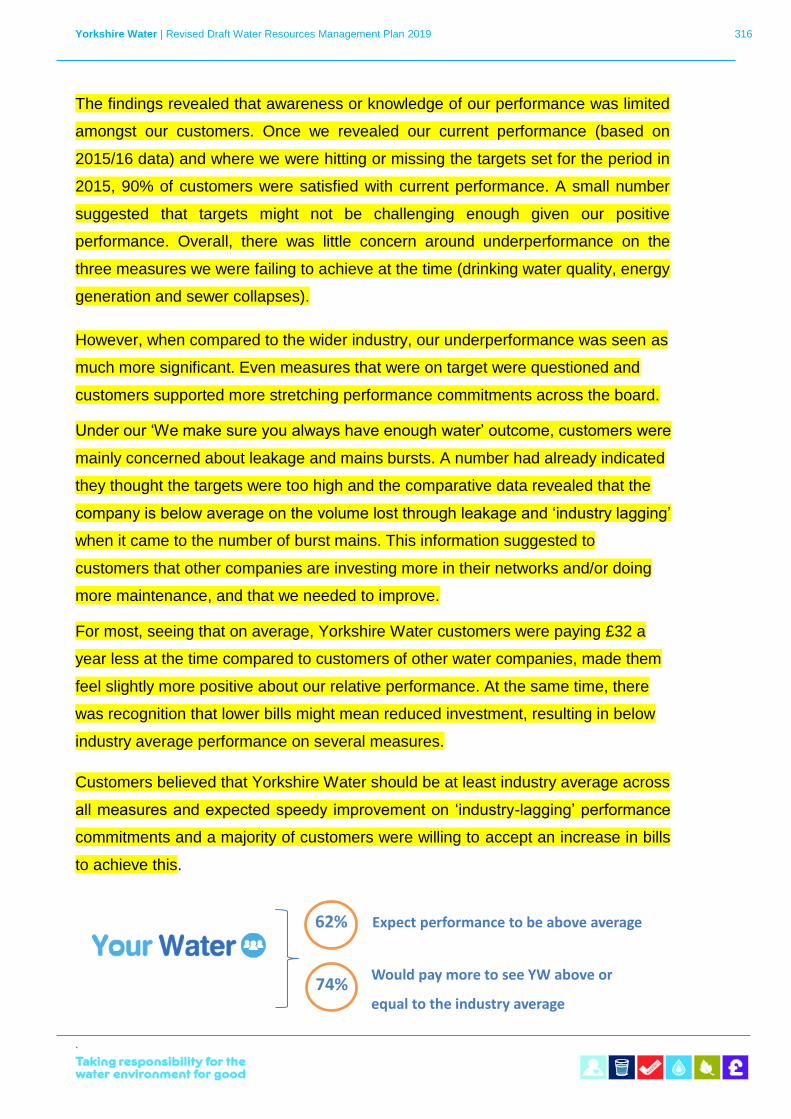
Yorkshire Water | Revised Draft Water Resources Management Plan 2019 316
`
The findings revealed that awareness or knowledge of our performance was limited
amongst our customers. Once we revealed our current performance (based on
2015/16 data) and where we were hitting or missing the targets set for the period in
2015, 90% of customers were satisfied with current performance. A small number
suggested that targets might not be challenging enough given our positive
performance. Overall, there was little concern around underperformance on the
three measures we were failing to achieve at the time (drinking water quality, energy
generation and sewer collapses).
However, when compared to the wider industry, our underperformance was seen as
much more significant. Even measures that were on target were questioned and
customers supported more stretching performance commitments across the board.
Under our ‘We make sure you always have enough water’ outcome, customers were
mainly concerned about leakage and mains bursts. A number had already indicated
they thought the targets were too high and the comparative data revealed that the
company is below average on the volume lost through leakage and ‘industry lagging’
when it came to the number of burst mains. This information suggested to
customers that other companies are investing more in their networks and/or doing
more maintenance, and that we needed to improve.
For most, seeing that on average, Yorkshire Water customers were paying £32 a
year less at the time compared to customers of other water companies, made them
feel slightly more positive about our relative performance. At the same time, there
was recognition that lower bills might mean reduced investment, resulting in below
industry average performance on several measures.
Customers believed that Yorkshire Water should be at least industry average across
all measures and expected speedy improvement on ‘industry-lagging’ performance
commitments and a majority of customers were willing to accept an increase in bills
to achieve this.
74% Would pay more to see YW above or
equal to the industry average
62% Expect performance to be above average
Yorkshire Water | Revised Draft Water Resources Management Plan 2019 317
`
Regarding future performance, there were only two performance commitments
where a large but gradual improvement was expected:
• Yorkshire Water minimises the amount of water that is lost from the
network; and,
• Yorkshire Water generates energy using renewable technology.
The volume of water being lost from the network was a cause for concern from the
beginning of the discussions/interviews, so it was not unexpected that customers
wanted to see significant improvements in this measure.
This study was conclusive about our customers’ expectations on current and future
leakage performance. This informed our leakage ambition for PR19 and beyond.
17.4.5 Outcomes & Performance Commitments
All of the research undertaken shaped the development of our Business Plan
submission and the content of our draft WRMP19. A key part of this was the
development of our Outcomes and Performance Commitments for 2020-2025.
All customer insight gathered through the research projects were combined with
company aspirations to develop a set of five new ‘big goals’ and performance
commitments. These goals and performance commitments were tested with
customers through a significant qualitative research project undertaken with
customers right across our region, including vulnerable and ethnic minority
customers. The aim was to achieve a package of outcomes, performance
commitments and incentives that customers understand and are happy to support.
The findings showed that overall there was a high level of support for the big goals
and performance commitments, with ‘Water supply’ and ‘Environment’ being the
strongest goals in terms of levels of support; around 90% of customers surveyed
supported the water supply big goal.
Tying into support for the big goals, performance commitments related to Water
Supply were amongst the performance commitments considered to be the most
important overall. Out of the top 10 of the 49 performance commitments tested, 6
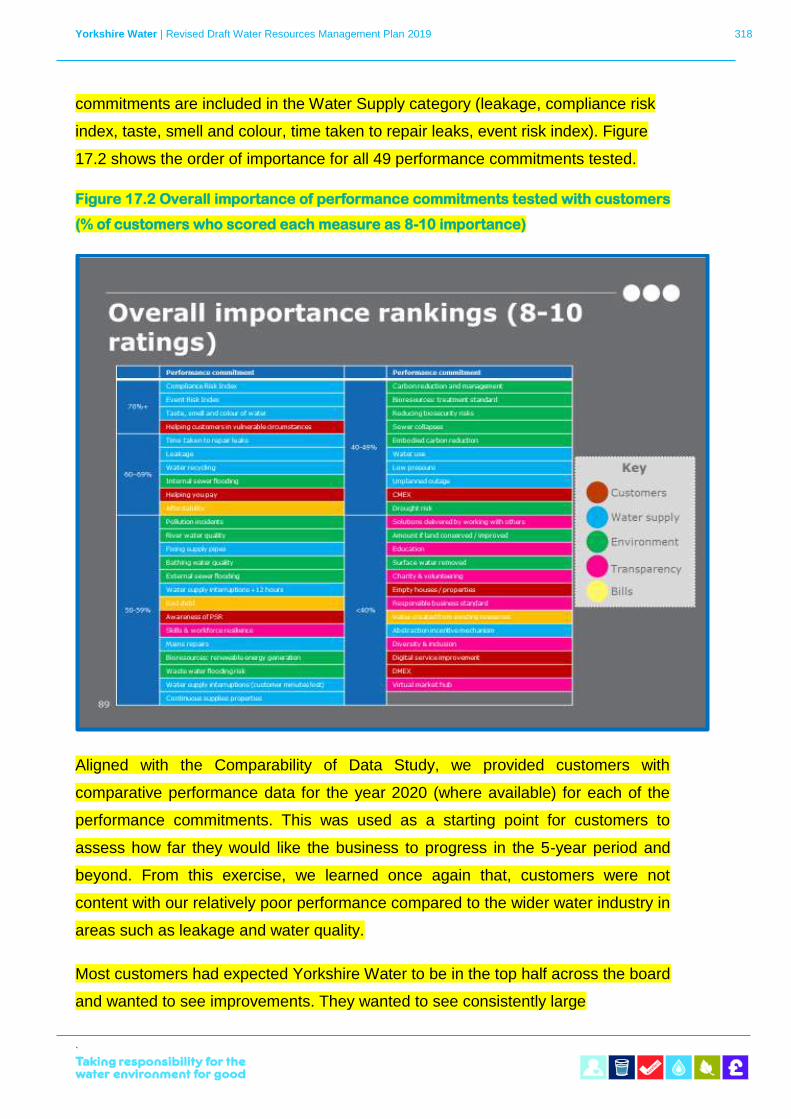
Yorkshire Water | Revised Draft Water Resources Management Plan 2019 318
`
commitments are included in the Water Supply category (leakage, compliance risk
index, taste, smell and colour, time taken to repair leaks, event risk index). Figure
17.2 shows the order of importance for all 49 performance commitments tested.
Figure 17.2 Overall importance of performance commitments tested with customers
(% of customers who scored each measure as 8-10 importance)
Aligned with the Comparability of Data Study, we provided customers with
comparative performance data for the year 2020 (where available) for each of the
performance commitments. This was used as a starting point for customers to
assess how far they would like the business to progress in the 5-year period and
beyond. From this exercise, we learned once again that, customers were not
content with our relatively poor performance compared to the wider water industry in
areas such as leakage and water quality.
Most customers had expected Yorkshire Water to be in the top half across the board
and wanted to see improvements. They wanted to see consistently large
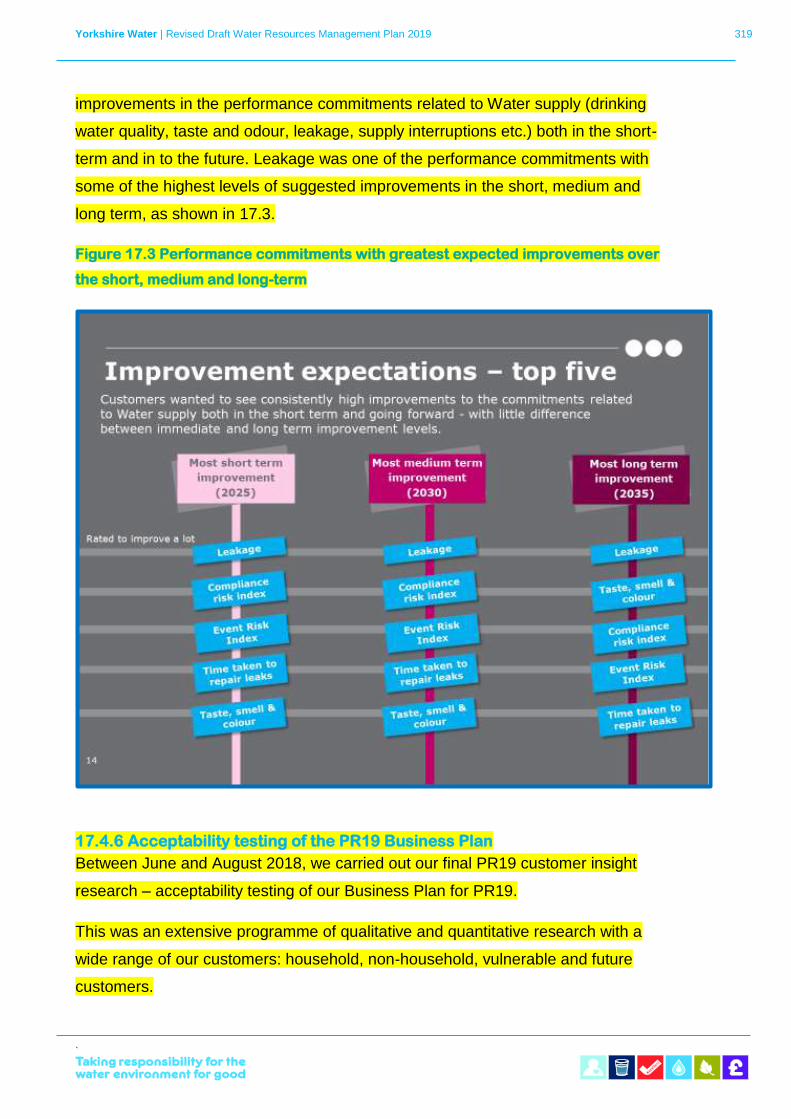
Yorkshire Water | Revised Draft Water Resources Management Plan 2019 319
`
improvements in the performance commitments related to Water supply (drinking
water quality, taste and odour, leakage, supply interruptions etc.) both in the short-
term and in to the future. Leakage was one of the performance commitments with
some of the highest levels of suggested improvements in the short, medium and
long term, as shown in 17.3.
Figure 17.3 Performance commitments with greatest expected improvements over
the short, medium and long-term
17.4.6 Acceptability testing of the PR19 Business Plan
Between June and August 2018, we carried out our final PR19 customer insight
research – acceptability testing of our Business Plan for PR19.
This was an extensive programme of qualitative and quantitative research with a
wide range of our customers: household, non-household, vulnerable and future
customers.
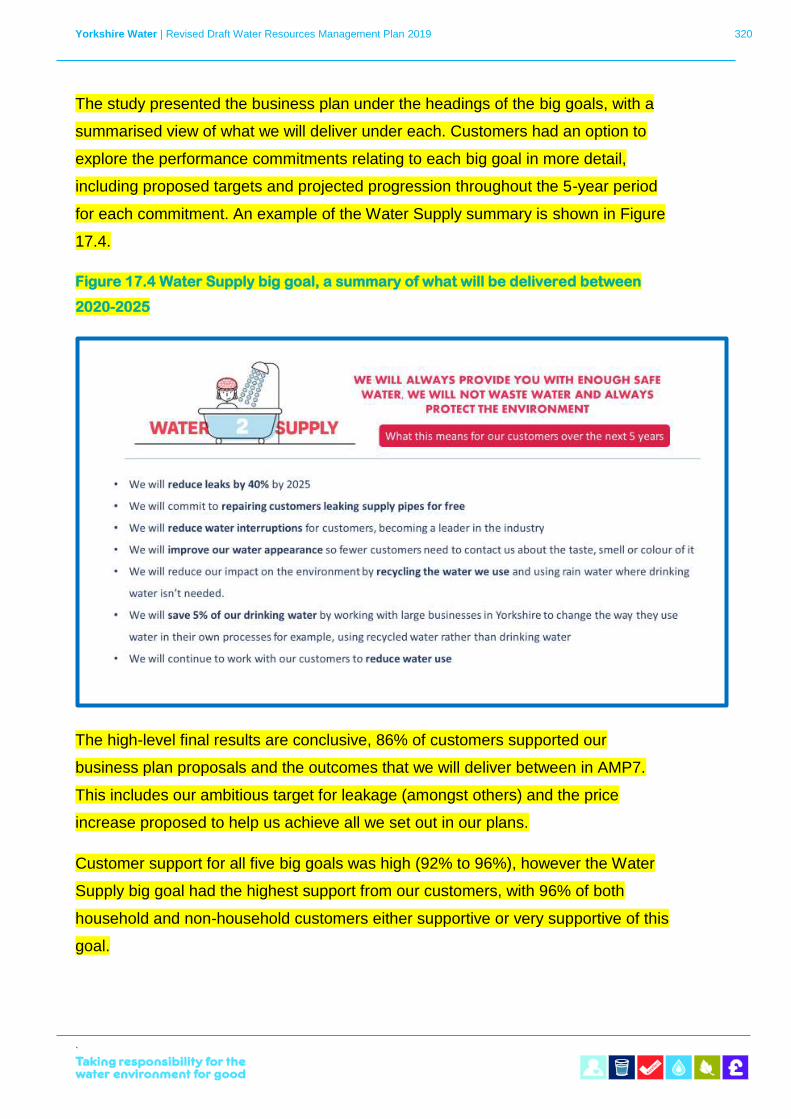
Yorkshire Water | Revised Draft Water Resources Management Plan 2019 320
`
The study presented the business plan under the headings of the big goals, with a
summarised view of what we will deliver under each. Customers had an option to
explore the performance commitments relating to each big goal in more detail,
including proposed targets and projected progression throughout the 5-year period
for each commitment. An example of the Water Supply summary is shown in Figure
17.4.
Figure 17.4 Water Supply big goal, a summary of what will be delivered between
2020-2025
The high-level final results are conclusive, 86% of customers supported our
business plan proposals and the outcomes that we will deliver between in AMP7.
This includes our ambitious target for leakage (amongst others) and the price
increase proposed to help us achieve all we set out in our plans.
Customer support for all five big goals was high (92% to 96%), however the Water
Supply big goal had the highest support from our customers, with 96% of both
household and non-household customers either supportive or very supportive of this
goal.

Yorkshire Water | Revised Draft Water Resources Management Plan 2019 321
`

Western House, Halifax Road, Bradford BD6 2SZ yorkshirewater.com